ANNEXURE A Annual Report 2018/19 This Annual Report is compiled in terms of the Local Government: Municipal Finance Management Act, 2003 (Act 56 of 2003) and the Local Government: Municipal Systems Act, 2000 (Act 32 of 2000). Drakenstein Municipality Civic Centre Berg River Boulevard Paarl, 7622 Website: www.drakenstein.gov.za Telephone: 021 807 4500 Email: [email protected] Toll free: 080 131 3553

Welcome message from author
This document is posted to help you gain knowledge. Please leave a comment to let me know what you think about it! Share it to your friends and learn new things together.
Transcript
ANNEXURE A
Annual Report
2018/19
This Annual Report is compiled in terms of the Local Government: Municipal Finance Management Act, 2003
(Act 56 of 2003) and the Local Government: Municipal Systems Act, 2000 (Act 32 of 2000).
Drakenstein Municipality
Civic Centre
Berg River Boulevard
Paarl, 7622
Website: www.drakenstein.gov.za Telephone: 021 807 4500 Email: [email protected]
Toll free: 080 131 3553
Annual Report 2018/19
2
TABLE OF CONTENTS
GLOSSARY ................................................................................................................................. 20
ACRONYMS ............................................................................................................................... 23
1. EXECUTIVE MAYOR’S FOREWORD AND EXECUTIVE SUMMARY ........................... 27
COMPONENT A: EXECUTIVE MAYOR’S FOREWORD ................................................................ 27
1.1 EXECUTIVE MAYOR’S FOREWORD ............................................................................. 27 COMPONENT B: EXECUTIVE SUMMARY .................................................................................. 29
1.2 CITY MANAGER’S OVERVIEW ..................................................................................... 29 1.3 MUNICIPAL OVERVIEW .............................................................................................. 31 1.3.1 Vision 2032 ................................................................................................................. 31 1.3.2 Values ......................................................................................................................... 31 1.3.3 Demographics and Socio-economic Information ...................................................... 31 1.3.3.1 Socio-Economic Status information ........................................................................... 32 1.3.3.2 Demographic Profile .................................................................................................. 32 1.3.3.3 Household Profile ....................................................................................................... 33 1.3.3.4 Labour Profile ............................................................................................................. 33 1.3.3.5 Economic Profile ........................................................................................................ 34 1.3.3.6 Safety and Security Profile ......................................................................................... 35 1.3.3.7 Environment ............................................................................................................... 36 1.3.3.8 Health ......................................................................................................................... 36 1.4 SERVICE DELIVERY OVERVIEW ................................................................................... 36 1.4.1 Basic Service Delivery Performance Highlights .......................................................... 37 1.4.2 Basic Service Delivery Challenges .............................................................................. 37 1.4.3 Proportion of Households with access to Basic Services ........................................... 38 1.5 FINANCIAL HEALTH OVERVIEW .................................................................................. 39 1.5.1 Statement of Financial Performance Overview ......................................................... 39 1.5.2 Financial viability highlights ....................................................................................... 40 1.5.3 Financial viability challenges ...................................................................................... 40 1.5.4 Operating ratios ......................................................................................................... 42 1.5.5 Capital expenditure .................................................................................................... 43 1.5.6 Municipal Standard Chart of Accounts (mSCOA) ....................................................... 44 1.6 ORGANISATIONAL DEVELOPMENT OVERVIEW.......................................................... 44 1.6.1 Municipal Transformation and Organisational Development Highlights .................. 44 1.6.2 Municipal Transformation and Organisational Development Challenges ................. 45 1.6.3 MFMA Minimum Competencies ................................................................................ 45 1.7 AUDITOR-GENERAL REPORT ...................................................................................... 45 1.7.1 Audited outcomes ...................................................................................................... 46 1.8 STATUTORY ANNUAL REPORT PROCESS .................................................................... 46 2. GOVERNANCE .................................................................................................... 48
COMPONENT A: POLITICAL AND ADMINISTRATIVE GOVERNANCE ......................................... 48
2.1 INTRODUCTION .......................................................................................................... 48 2.2 GOOD GOVERNANCE PERFORMANCE HIGHLIGHTS .................................................. 48 2.3 GOOD GOVERNANCE CHALLENGES ........................................................................... 48 2.4 POLITICAL GOVERNANCE ........................................................................................... 49
Annual Report 2018/19
3
2.4.1 Full-time Officer Bearers ............................................................................................ 49 2.4.2 Council ........................................................................................................................ 51 2.4.2.1 Political Decision Making ........................................................................................... 51 2.4.3 Mayoral Committee ................................................................................................... 51 2.4.4 Portfolio Committees ................................................................................................. 54 2.4.4.1 Corporate Services Portfolio Committee ................................................................... 54 2.4.4.2 Planning and Development Portfolio Committee ...................................................... 54 2.4.4.3 Engineering Services Portfolio Committee ................................................................ 55 2.4.4.4 Finance Portfolio Committee ..................................................................................... 55 2.4.4.5 Community Services Portfolio Committee ................................................................ 56 2.4.5 Municipal Public Accounts Committee (MPAC) ......................................................... 57 2.4.6 Audit Committee ........................................................................................................ 57 2.4.7 Fraud and Risk Management Committee (FARMCO) ................................................ 59 2.5 ADMINISTRATIVE GOVERNANCE ............................................................................... 59 COMPONENT B: INTERGOVERNMENTAL RELATIONS .............................................................. 63
2.6 INTRODUCTION .......................................................................................................... 63 2.7 COOPERATIVE GOVERNANCE AND INTERGOVERNMENTAL RELATIONS ................... 63 2.7.1 National Intergovernmental Structures ..................................................................... 63 2.7.2 Provincial Intergovernmental Structures ................................................................... 63 2.7.3 District Intergovernmental Structures ....................................................................... 65 2.7.4 Municipal Entities ....................................................................................................... 65 2.7.5 Municipal Partnerships .............................................................................................. 65 COMPONENT C: PUBLIC ACCOUNTABILITY AND PARTICIPATION ............................................ 66
2.8 INTRODUCTION .......................................................................................................... 66 2.9 PUBLIC MEETINGS ...................................................................................................... 66 2.9.1 Mayoral Business Stakeholder Initiative .................................................................... 67 2.9.2 IDP/Budget Roadshows .............................................................................................. 67 2.9.3 IDP Sector Engagements ............................................................................................ 68 2.10 REPRESENTATIVE FORUMS ........................................................................................ 68 2.10.1 IDP Representative Forum ......................................................................................... 69 2.11 WARD COMMITTEES .................................................................................................. 69 COMPONENT D: CORPORATE GOVERNANCE .......................................................................... 71
2.12 INTRODUCTION .......................................................................................................... 71 2.13 RISK MANAGEMENT ................................................................................................... 71 2.14 INTERNAL AUDIT ........................................................................................................ 72 2.15 ANTI-CORRUPTION AND FRAUD ................................................................................ 73 2.16 SUPPLY CHAIN MANAGEMENT .................................................................................. 74 2.16.1 Overview of Supply Chain Management ................................................................... 74 2.16.2 Bid Committees .......................................................................................................... 74 2.16.2.1 Bid Committees Structure .......................................................................................... 74 2.16.2.2 Awards made by the Bid Adjudication Committee .................................................... 74 2.16.2.3 Awards made by Accounting Officer ......................................................................... 74 2.16.2.4 Objections lodged ...................................................................................................... 75 2.16.3 Formal Quotations (Above R30,000 and below R200,000) Procurement Processes 75 2.16.4 Disposal Management ............................................................................................... 75 2.17 BY-LAWS AND POLICIES ............................................................................................. 75
Annual Report 2018/19
4
2.18 WEBSITE ..................................................................................................................... 77 2.19 COMMUNICATION ..................................................................................................... 77 2.20 COMMUNITY SATISFACTION SURVEYS ...................................................................... 78 2.21 PUBLIC SATISFACTION WITH MUNICIPAL SERVICE DELIVERY.................................... 78 2.21.1 Customer Satisfaction Survey .................................................................................... 78 2.21.2 Complaints Management ........................................................................................... 79 3. SERVICE DELIVERY PERFORMANCE ..................................................................... 80
COMPONENT A: OVERVIEW OF PERFORMANCE WITHIN THE ORGANISATION ...................... 80
3.1 INTRODUCTION .......................................................................................................... 80 3.1.1 Legislative Requirements ........................................................................................... 81 3.1.2 Organisational Performance ...................................................................................... 81 3.1.3 Performance Management Policy ............................................................................. 81 3.1.4 The IDP and the Budget ............................................................................................. 82 3.2 SERVICE DELIVERY AND BUDGET IMPLEMENTATION PLAN (SDBIP) ......................... 83 3.2.1 The Municipal Scorecard (Top-Layer SDBIP) .............................................................. 84 3.2.1.1 One-year detailed plan with the following components: .......................................... 84 3.2.1.2 Top-Layer KPI’s were prepared based on the following: ........................................... 84 3.2.2 Amendment of the Top-Layer SDBIP ......................................................................... 84 3.2.3 Actual Performance ................................................................................................... 84 3.2.4 Monitoring of the SDBIP ............................................................................................ 85 3.3 INDIVIDUAL PERFORMANCE ...................................................................................... 85 3.3.1 Executive Directors and Managers Directly Accountable to the City Manager ........ 86 3.3.2 Other Municipal Officials ........................................................................................... 86 3.4 SERVICE DELIVERY AND BUDGET IMPLEMENTATION PLAN (TOP-LAYER) ................. 86 COMPONENT B: BASIC SERVICES ............................................................................................. 87
3.5 WATER SERVICES ........................................................................................................ 87 3.5.1 Service Statistics ......................................................................................................... 87 3.5.2 Service Delivery Levels ............................................................................................... 89 3.5.3 Capital Expenditure .................................................................................................... 90 3.5.4 Major Projects Implemented ..................................................................................... 91 3.5.5 Operating Expenditure ............................................................................................... 92 3.5.6 Employee Statistics .................................................................................................... 92 3.6 WASTE WATER (SANITATION) SERVICES .................................................................... 93 3.6.1 Service Statistics ......................................................................................................... 93 3.6.2 Service Delivery Levels ............................................................................................... 94 3.6.3 Capital Expenditure .................................................................................................... 95 3.6.4 Major Projects Implemented ..................................................................................... 96 3.6.5 Operating Expenditure ............................................................................................... 97 3.6.6 Employee Statistics .................................................................................................... 97 3.7 ELECTRICITY SERVICES ................................................................................................ 98 3.7.1 Service Statistics ......................................................................................................... 98 3.7.2 Service Delivery Levels ............................................................................................. 100 3.7.3 Capital Expenditure .................................................................................................. 101 3.7.4 Major Projects Implemented ................................................................................... 101 3.7.5 Operating Expenditure ............................................................................................. 102 3.7.6 Employee Statistics .................................................................................................. 102
Annual Report 2018/19
5
3.8 WASTE MANAGEMENT (REFUSE COLLECTIONS, WASTE DISPOSAL & RECYCLING) 103 3.8.1 Service Statistics ....................................................................................................... 103 3.8.2 Service Delivery Levels ............................................................................................. 104 3.8.3 Capital Expenditure .................................................................................................. 105 3.8.4 Major Projects Implemented ................................................................................... 106 3.8.5 Operating Expenditure ............................................................................................. 107 3.8.6 Employee Statistics .................................................................................................. 107 3.9 HOUSING .................................................................................................................. 108 3.9.1 Housing Projects ...................................................................................................... 108 3.9.2 Housing Administration ........................................................................................... 109 3.9.3 Rental Stock and Support Service Division .............................................................. 109 3.9.4 Housing Pipeline ....................................................................................................... 111 3.9.5 Housing Statistics ..................................................................................................... 112 3.9.6 Evictions ................................................................................................................... 113 3.9.6.1 Summary of Prevention of Illegal Eviction and Unlawful Occupation of Land (PIE)
Data Base ................................................................................................................. 113 3.9.6.2 Summary of Finalised Cases ..................................................................................... 113 3.9.6.3 Summary of Extension of Security of Tenure Act (ESTA) Data Base ........................ 113 3.9.6.4 Summary of Finalised Cases ..................................................................................... 113 3.9.7 Capital Expenditure .................................................................................................. 114 3.9.8 Operating Expenditure ............................................................................................. 114 3.9.9 Employee Statistics .................................................................................................. 115 3.10 FREE BASIC SERVICES AND INDIGENT SUPPORT ...................................................... 115 3.10.1 Access to free basic services .................................................................................... 116 3.10.2 Free basic services per basic service ........................................................................ 116 COMPONENT C: ROAD TRANSPORT ....................................................................................... 117
3.11 ROADS AND STORMWATER ..................................................................................... 117 3.11.1 Transport .................................................................................................................. 117 3.11.2 Traffic Engineering ................................................................................................... 117 3.11.3 Roads ........................................................................................................................ 117 3.11.3.1 Roads Statistics ........................................................................................................ 118 3.11.4 Stormwater Drainage ............................................................................................... 119 3.11.4.1 Stormwater Statistics ............................................................................................... 119 3.11.5 Capital Expenditure .................................................................................................. 120 3.11.6 Major Projects Completed ....................................................................................... 120 3.11.7 Operating Expenditure ............................................................................................. 121 3.11.8 Employee Statistics .................................................................................................. 121 COMPONENT D: PLANNING AND ECONOMIC DEVELOPMENT .............................................. 123
3.12 INTRODUCTION ........................................................................................................ 123 3.13 PLANNING SERVICES ................................................................................................ 123 3.13.1 Section: Spatial Planning, Heritage and G.I.S ........................................................... 123 3.13.1.1 Sub-Section: Spatial Planning ................................................................................... 123 3.13.1.2 Sub-Section: Heritage............................................................................................... 124 3.13.1.3 Sub-Section: Geographical Information Services (GIS) ............................................ 124 3.13.1.4 Major Projects Completed ....................................................................................... 124 3.13.2 Section: Building Control .......................................................................................... 126 3.13.2.1 Building Control Statistics ........................................................................................ 127
Annual Report 2018/19
6
3.13.2.2 Major Projects Completed ....................................................................................... 128 3.13.3 Section: Land Use Planning and Surveying .............................................................. 129 3.13.3.1 Service Statistics ....................................................................................................... 130 3.13.3.2 Major Projects Completed ....................................................................................... 130 3.13.4 Capital Expenditure .................................................................................................. 131 3.13.5 Operating Expenditure ............................................................................................. 131 3.13.6 Employee Statistics .................................................................................................. 132 3.14 ECONOMIC GROWTH (INCLUDING TOURISM AND MARKET PLACES) ..................... 132 3.14.1 Economic Growth ..................................................................................................... 133 3.14.1.1 Economic Growth Environment ............................................................................... 133 3.14.1.2 Economic Growth Achievements ............................................................................. 134 3.14.1.3 Economic Growth Challenges .................................................................................. 134 3.14.1.4 EPWP Job Creation ................................................................................................... 135 3.14.2 Tourism and Market places ...................................................................................... 135 3.14.2.1 Tourism Achievements............................................................................................. 136 3.14.2.2 Tourism Challenges .................................................................................................. 136 3.14.3 Capital Expenditure .................................................................................................. 137 3.14.4 Major Projects Completed ....................................................................................... 137 3.14.5 Operating Expenditure ............................................................................................. 137 3.14.6 Employee Statistics .................................................................................................. 138 3.15 RURAL DEVELOPMENT ............................................................................................. 139 3.15.2 Relocation of Vlakkeland Small Farmers .................................................................. 139 3.15.3 Greywater Household Food Garden Initiative ......................................................... 140 3.15.4 New Orleans Park Portable Vegetable Gardens ...................................................... 140 3.15.5 1 Household 1 Hectare (1HH1Ha) Project in Saron ................................................. 140 3.15.6 Blueberry Project ..................................................................................................... 140 3.15.7 Allocation of Jojo tanks to rural schools .................................................................. 141 3.15.8 Bursaries to rural matriculants ................................................................................ 141 3.15.9 Driver’s licence programme for rural unemployed youth ....................................... 141 3.15.10 Driver’s licence programme for rural matriculants ................................................. 141 3.15.11 Development of a Rural Housing Policy ................................................................... 141 COMPONENT E: COMMUNITY AND SOCIAL SERVICES........................................................... 143
3.16 INTRODUCTION ........................................................................................................ 143 3.17 LIBRARY SERVICES .................................................................................................... 143 3.17.1 Service Statistics ....................................................................................................... 144 3.17.2 Service Delivery Levels ............................................................................................. 145 3.17.3 Capital Expenditure .................................................................................................. 145 3.17.4 Major Projects Completed ....................................................................................... 145 3.17.5 Operating Expenditure ............................................................................................. 145 3.17.6 Employee Statistics .................................................................................................. 146 3.18 CEMETERIES AND CREMATORIA .............................................................................. 147 3.18.1 Service Statistics ....................................................................................................... 147 3.18.2 Service Delivery Levels ............................................................................................. 147 3.18.3 Capital Expenditure .................................................................................................. 147 3.18.4 Major Projects Completed ....................................................................................... 148 3.18.5 Operating Expenditure ............................................................................................. 148 3.18.6 Employee Statistics .................................................................................................. 148
Annual Report 2018/19
7
3.19 COMMUNITY HALLS, FACILITIES AND THUSONG CENTRES ..................................... 149 3.19.1 Service Statistics ....................................................................................................... 149 3.19.2 Service Delivery Levels ............................................................................................. 150 3.19.3 Capital Expenditure .................................................................................................. 150 3.19.4 Major Projects Completed ....................................................................................... 150 3.19.5 Operating Expenditure ............................................................................................. 151 3.19.6 Employee Statistics .................................................................................................. 151 3.20 CHILD CARE, AGED CARE AND SOCIAL PROGRAMMES ............................................ 152 3.20.1 Service Statistics ....................................................................................................... 153 3.20.2 Service Delivery Levels ............................................................................................. 153 3.20.3 Capital Expenditure .................................................................................................. 154 3.20.4 Major Projects Completed ....................................................................................... 154 3.20.5 Operating Expenditure ............................................................................................. 155 3.20.6 Employee Statistics .................................................................................................. 155 COMPONENT F: ENVIRONMENTAL PROTECTION .................................................................. 157
3.21 INTRODUCTION ........................................................................................................ 157 3.22 ENVIRONMENTAL MANAGEMENT (INCLUDING POLLUTION CONTROL) ................ 157 3.22.1 Service Statistics ....................................................................................................... 158 3.22.2 Capital Expenditure .................................................................................................. 158 3.22.3 Major Projects Completed ....................................................................................... 158 3.22.4 Operating Expenditure ............................................................................................. 160 3.22.5 Employee Statistics .................................................................................................. 160 3.23 BIODIVERSITY AND LANDSCAPE (INCLUDING OPEN SPACES) .................................. 161 3.23.1 Service Statistics ....................................................................................................... 161 3.23.2 Service Delivery Levels ............................................................................................. 161 3.23.3 Capital Expenditure .................................................................................................. 161 3.23.4 Major Projects Completed ....................................................................................... 162 3.23.5 Operating Expenditure ............................................................................................. 162 3.23.6 Employee Statistics .................................................................................................. 163 COMPONENT G: SECURITY AND SAFETY ................................................................................ 164
3.24 INTRODUCTION ........................................................................................................ 164 3.25 TRAFFIC, LICENSING AND LAW ENFORCEMENT ...................................................... 164 3.25.1 Service Statistics ....................................................................................................... 164 3.25.2 Service Delivery Levels ............................................................................................. 165 3.25.3 Capital Expenditure .................................................................................................. 165 3.25.4 Major Projects Completed ....................................................................................... 165 3.25.5 Operating Expenditure ............................................................................................. 165 3.25.6 Employee Statistics .................................................................................................. 166 3.26 FIRE AND DISASTER MANAGEMENT ........................................................................ 167 3.26.1 Fire Services ............................................................................................................. 167 3.26.1.1 Service Statistics ....................................................................................................... 168 3.26.1.2 Service Delivery levels .............................................................................................. 168 3.26.2 Disaster Management .............................................................................................. 169 3.26.2.1 Service Delivery Levels ............................................................................................. 169 3.26.3 Capital Expenditure .................................................................................................. 169 3.26.4 Major Projects Completed ....................................................................................... 170 3.26.5 Operating Expenditure ............................................................................................. 170
Annual Report 2018/19
8
3.26.6 Employee Statistics .................................................................................................. 170 COMPONENT H: SPORT AND RECREATION ............................................................................ 172
3.27 INTRODUCTION ........................................................................................................ 172 3.27.1 Holiday Resorts ........................................................................................................ 172 3.27.1.1 Service Statistics ....................................................................................................... 172 3.27.1.2 Service Delivery levels .............................................................................................. 172 3.27.2 Sport Grounds and Halls .......................................................................................... 172 3.27.2.1 Service Statistics ....................................................................................................... 173 3.27.2.2 Service Delivery Levels ............................................................................................. 173 3.27.3 Swimming Pools ....................................................................................................... 173 3.27.3.1 Service Statistics ....................................................................................................... 174 3.27.3.2 Service Delivery Levels ............................................................................................. 174 3.27.4 Capital Expenditure .................................................................................................. 174 3.27.5 Major Projects Completed ....................................................................................... 175 3.27.6 Operating Expenditure ............................................................................................. 175 3.27.7 Employee Statistics .................................................................................................. 176 COMPONENT I: CORPORATE POLICY OFFICES AND OTHER SERVICES ................................... 177
3.28 INTRODUCTION ........................................................................................................ 177 3.29 EXECUTIVE AND COUNCIL SUPPORT ........................................................................ 177 3.29.1 Service Statistics ....................................................................................................... 178 3.29.2 Service Delivery levels .............................................................................................. 178 3.29.3 Capital Expenditure .................................................................................................. 179 3.29.4 Major Projects Completed ....................................................................................... 179 3.29.5 Operating Expenditure ............................................................................................. 179 3.29.6 Employee Statistics .................................................................................................. 180 3.30 FINANCIAL SERVICES ................................................................................................ 180 3.30.1 Service Statistics ....................................................................................................... 181 3.30.2 Service Delivery levels .............................................................................................. 181 3.30.3 Capital Expenditure .................................................................................................. 181 3.30.4 Major Projects Completed ....................................................................................... 182 3.30.5 Operating Expenditure ............................................................................................. 182 3.30.6 Employee Statistics .................................................................................................. 182 3.31 HUMAN RESOURCE SERVICES .................................................................................. 183 3.31.1 Service Statistics ....................................................................................................... 184 3.31.2 Service Delivery Levels ............................................................................................. 184 3.31.3 Capital Expenditure .................................................................................................. 184 3.31.4 Major Projects Completed ....................................................................................... 185 3.31.5 Operating Expenditure ............................................................................................. 185 3.31.6 Employee Statistics .................................................................................................. 186 3.32 INFORMATION AND COMMUNICATION TECHNOLOGY (ICT) SERVICES .................. 186 3.32.1 ICT Governance and Administration ........................................................................ 187 3.32.2 Information Systems ................................................................................................ 187 3.32.3 Service Statistics ....................................................................................................... 188 3.32.4 Operations and Support ........................................................................................... 188 3.32.5 Capital Expenditure .................................................................................................. 189 3.32.6 Major Projects Completed ....................................................................................... 189 3.32.7 Operating Expenditure ............................................................................................. 190
Annual Report 2018/19
9
3.32.8 Employee Statistics .................................................................................................. 190 3.33 PROPERTY SERVICES ................................................................................................. 191 3.33.1 Service Statistics ....................................................................................................... 191 3.33.2 Service Delivery Levels ............................................................................................. 192 3.33.3 Capital Expenditure .................................................................................................. 192 3.33.4 Major Projects Completed ....................................................................................... 193 3.33.5 Operating Expenditure ............................................................................................. 193 3.33.6 Employee Statistics .................................................................................................. 194 3.34 LEGAL SERVICES ....................................................................................................... 194 3.34.1 Service Statistics ....................................................................................................... 195 3.34.2 Service Delivery levels .............................................................................................. 195 3.34.3 Capital Expenditure .................................................................................................. 195 3.34.4 Major Projects Completed ....................................................................................... 196 3.34.5 Operating Expenditure ............................................................................................. 196 3.34.6 Employee Statistics .................................................................................................. 197 3.35 RISK MANAGEMENT ................................................................................................. 197 3.35.1 Service Statistics ....................................................................................................... 197 3.35.2 Service Delivery levels .............................................................................................. 198 3.35.3 Capital Expenditure .................................................................................................. 198 3.35.4 Major Projects Completed ....................................................................................... 198 3.35.5 Operating Expenditure ............................................................................................. 198 3.35.6 Employee Statistics .................................................................................................. 199 3.36 PROCUREMENT SERVICES ........................................................................................ 200 3.36.1 Service Statistics ....................................................................................................... 200 3.36.2 Service Delivery Levels ............................................................................................. 200 3.36.3 Capital Expenditure .................................................................................................. 200 3.36.4 Major Projects Completed ....................................................................................... 201 3.36.5 Operating Expenditure ............................................................................................. 201 3.36.6 Employee Statistics .................................................................................................. 201 4. ORGANISATIONAL DEVELOPMENT PERFORMANCE .......................................... 203
COMPONENT A: INTRODUCTION TO THE MUNICIPAL WORKFORCE .................................... 203
4.1 INTRODUCTION ........................................................................................................ 203 4.2 TOTAL EMPLOYMENT ............................................................................................... 203 4.2.1 Employee Totals per GFS Classification ................................................................... 203 4.2.2 Employee Vacancy Rate per Occupational Level ..................................................... 204 4.2.3 Employee Turnover rate .......................................................................................... 205 4.3 EMPLOYMENT EQUITY ............................................................................................. 205 4.3.1 Employment Equity Targets/Actuals by Race Classification .................................... 205 4.3.2 Employment Equity Targets/Actuals by Gender Classification ................................ 206 4.3.3 Employment Equity by Race and Gender within Occupational Levels .................... 206 COMPONENT B: MANAGING THE MUNICIPAL WORKFORCE ................................................ 207
4.4 INTRODUCTION ........................................................................................................ 207 4.4.1 Policies...................................................................................................................... 207 4.4.2 Sick Leave ................................................................................................................. 208 4.4.2.1 Sick Leave per Department/ Division ....................................................................... 208 4.4.2.2 Sick Leave per Occupational Level ........................................................................... 208
Annual Report 2018/19
10
4.4.3 Injuries ...................................................................................................................... 209 4.4.3.1 Injuries per Department........................................................................................... 209 4.4.3.2 Injuries per Occupational Level ................................................................................ 209 4.4.3.3 Cost of Injuries ......................................................................................................... 210 4.4.3.4 Cost of Injuries per Department .............................................................................. 210 4.4.4 Suspensions .............................................................................................................. 210 4.4.4.1 Suspensions per Department ................................................................................... 210 4.4.4.2 Suspensions per Occupational Level ........................................................................ 210 COMPONENT C: CAPACITATING THE MUNICIPAL WORKFORCE ........................................... 211
4.5 INTRODUCTION ........................................................................................................ 211 4.5.1 Skills Matrix .............................................................................................................. 211 4.5.2 Skills Development – Training Provided .................................................................. 211 4.5.3 Skills Development – Budget Allocation .................................................................. 213 4.5.4 MFMA Minimum Competencies .............................................................................. 213 COMPONENT D: MANAGING THE WORKFORCE EXPENDITURE ............................................ 214
4.6 INTRODUCTION ........................................................................................................ 214 4.6.1 Personnel Expenditure ............................................................................................. 214 4.6.2 Personnel Expenditure per Line Item ...................................................................... 215 4.7 DISCLOSURES OF FINANCIAL INTERESTS .................................................................. 216 5. FINANCIAL PERFORMANCE .............................................................................. 217
COMPONENT A: STATEMENT OF FINANCIAL PERFORMANCE ............................................... 217
5.1 INTRODUCTION ........................................................................................................ 217 5.2 FINANCIAL SUMMARY .............................................................................................. 217 5.3 FINANCIAL PERFORMANCE OF OPERATIONAL SERVICES ........................................ 219 5.4 GRANT PERFORMANCE ............................................................................................ 219 5.4.1 Grants received and its performance ...................................................................... 219 5.4.2 Grants received from sources other than DoRA ...................................................... 221 5.5 REPAIRS AND MAINTENANCE EXPENDITURE ........................................................... 221 5.6 FINANCIAL RATIOS ................................................................................................... 222 5.6.1 Current Ratio ............................................................................................................ 222 5.6.2 Cost Coverage Ratio ................................................................................................. 223 5.6.3 Outstanding Service Debtors to Revenue Ratio ...................................................... 223 5.6.4 Debt Coverage Ratio ................................................................................................ 224 5.6.5 Capital Charges to Operating Expenditure Ratio ..................................................... 224 5.6.6 Creditors System Efficiency Ratio ............................................................................ 225 5.6.7 Employee Cost Ratio ................................................................................................ 225 5.6.8 Repairs and Maintenance as a Percentage (%) of the Carrying Value of Property,
Plant and Equipment ................................................................................................ 226 5.6.9 Repairs and Maintenance Ratio as a % of Total Operating Expenditure ................. 226 COMPONENT B: SPENDING AGAINST CAPITAL BUDGET ....................................................... 227
5.7 INTRODUCTION ........................................................................................................ 227 5.8 CAPITAL EXPENDITURE ............................................................................................. 227 5.8.1 Capital Expenditure on Basic Services Infrastructure .............................................. 227 5.8.2 Capital Expenditure on Social Infrastructure ........................................................... 227 5.8.3 Capital Expenditure on Operational Infrastructure ................................................. 228 5.9 CAPITAL EXPENDITURE SOURCES OF FINANCE ........................................................ 228
Annual Report 2018/19
11
5.9.1 Grants ....................................................................................................................... 229 5.9.2 Own Revenue from CRR ........................................................................................... 229 5.9.3 External Borrowings ................................................................................................. 229 5.9.3.1 Gearing Ratio ............................................................................................................ 229 5.9.3.2 Expansion of Tax Base .............................................................................................. 230 5.10 CAPITAL SPENDING ON FIVE LARGEST PROJECTS .................................................... 231 5.11 BASIC SERVICES AND INFRASTRUCTURE BACKLOGS ............................................... 231 5.11.1 Service Backlogs ....................................................................................................... 231 5.11.2 MIG Expenditure on Service Backlogs ..................................................................... 232 COMPONENT C: CASH FLOW MANAGEMENT AND INVESTMENT ......................................... 233
5.12 INTRODUCTION ........................................................................................................ 233 5.13 CASH FLOW .............................................................................................................. 233 5.14 BORROWINGS .......................................................................................................... 234 5.15 INVESTMENTS .......................................................................................................... 235 5.16 PUBLIC PRIVATE PARTNERSHIPS .............................................................................. 236 COMPONENT D: OTHER FINANCIAL MATTERS ...................................................................... 237
5.17 SUPPLY CHAIN MANAGEMENT ................................................................................ 237 5.17.1 Acquisitions .............................................................................................................. 237 5.17.2 Compliance, Risk, Performance and Reporting ....................................................... 237 5.17.3 Tender Evaluations and Contract Management ...................................................... 237 5.17.4 Logistics and Disposal Management ........................................................................ 237 5.17.5 Tender Committee Administration .......................................................................... 237 5.18 GRAP COMPLIANCE .................................................................................................. 237 6. AUDITOR-GENERAL AUDIT FINDINGS ............................................................... 240
COMPONENT A: AUDITOR-GENERAL OPINION ON 2018/19 FINANCIAL YEAR ..................... 240
6.1 AUDITOR-GENERAL REPORT FOR 2018/19 .............................................................. 240 6.1.1 Auditor-General report on the 2018/19 financial statements ................................ 240 6.1.2 Auditor-General report on other legal and regulatory matters .............................. 240 6.1.2.1 Predetermined objectives ........................................................................................ 241 6.1.2.2 Compliance with legislation ..................................................................................... 241 6.1.2.3 Internal control ........................................................................................................ 241 6.2 CONCLUDING COMMENT ........................................................................................ 241 COMPONENT B: AUDITOR-GENERAL OPINION FOR 2017/18 FINANCIAL YEAR .................... 242
6.3 AUDITOR-GENERAL REPORT FOR 2017/18 .............................................................. 242 6.3.1 Auditor-General Report on the 2017/18 Annual Financial Statements .................. 242 6.3.2 Auditor-General Report on other matters ............................................................... 242 6.3.2.1 Pre-determined objectives ...................................................................................... 242 6.3.2.2 Compliance with legislation ..................................................................................... 243 6.3.2.3 Internal control ........................................................................................................ 243 6.4 CONCLUDING COMMENT ........................................................................................ 243 7. ANNEXURES .................................................................................................... 244
ANNEXURE A: COUNCILLORS, COMMITTEE ALLOCATION AND COUNCIL ATTENDANCE ...... 244
ANNEXURE B: COMMITTEES AND COMMITTEE PURPOSES ................................................... 246
ANNEXURE C: SECOND AND THIRD TIER ADMINISTRATIVE STRUCTURE .............................. 247
ANNEXURE D: FUNCTIONS OF MUNICIPALITY ....................................................................... 250
Annual Report 2018/19
12
ANNEXURE E: WARD REPORTING .......................................................................................... 251
ANNEXURE F: WARD INFORMATION ..................................................................................... 262
ANNEXURE G: RECOMMENDATIONS OF THE MUNICIPAL AUDIT COMMITTEE .................... 263
ANNEXURE H: LONG TERM CONTRACTS AND PUBLIC PRIVATE PARTNERSHIPS ................... 265
ANNEXURE I: DISCLOSURES OF FINANCIAL INTEREST ............................................................ 266
ANNEXURE J: REVENUE COLLECTION PERFORMANCE ........................................................... 273
ANNEXURE J (I): REVENUE COLLECTION BY VOTE .................................................................. 273
ANNEXURE J (II): REVENUE COLLECTION PERFORMANCE BY SOURCE .................................. 274
ANNEXURE K: CONDITIONAL GRANTS RECEIVED ................................................................... 275
ANNEXURE L: CAPITAL EXPENDITURE – NEW AND UPGRADE/RENEWAL PROJECTS ............ 276
ANNEXURE L (I): CAPITAL EXPENDITURE – NEW ASSETS ....................................................... 276
ANNEXURE L (II): CAPITAL EXPENDITURE – UPGRADE PROJECTS .......................................... 279
ANNEXURE L (III): CAPITAL EXPENDITURE –RENEWAL PROJECTS .......................................... 282
ANNEXURE M: CAPITAL PROGRAMME BY PROJECT .............................................................. 286
ANNEXURE N: CAPITAL PROGRAMME BY PROJECT BY WARD ............................................... 287
ANNEXURE O: SERVICE CONNECTION BACKLOGS AT SCHOOLS AND CLINICS....................... 288
ANNEXURE P: SERVICE BACKLOGS EXPERIENCED BY THE COMMUNITY WHERE ANOTHER
SPHERE OF GOVERNMENT IS RESPONSIBLE FOR SERVICE PROVISION.................................. 289
ANNEXURE Q: DECLARATION OF LOANS AND GRANTS MADE BY THE MUNICIPALITY ......... 291
ANNEXURE R: DECLARATION OF RETURNS NOT MADE IN DUE TIME UNDER MFMA S71 .... 295
ANNEXURE S: PRESIDENTIAL OUTCOME FOR LOCAL GOVERNMENT .................................... 296
8. VOLUMES ........................................................................................................ 297
VOLUME I: REPORT OF THE AUDITOR-GENERAL ................................................................... 297
VOLUME II: AUDIT OUTCOME IMPROVEMENT PLAN ............................................................ 306
VOLUME III: REPORT OF THE AUDIT COMMITTEE ................................................................. 307
VOLUME IV: 2018/2019 ANNUAL AUDITED FINANCIAL STATEMENTS .................................. 310
VOLUME V: 2018/2019 ANNUAL PERFORMANCE REPORT ................................................... 439
Annual Report 2018/19
13
LIST OF TABLES
Table 1: Socio-Economic Status ............................................................................................... 32
Table 2: Population Details ...................................................................................................... 33
Table 3: Household breakdown by ethnic group ..................................................................... 33
Table 4: Employment by sector ................................................................................................ 34
Table 5: Value of Economic Activity by Sector ......................................................................... 35
Table 6: Safety and Security Statistics ...................................................................................... 35
Table 7: Number of HIV positive people .................................................................................. 36
Table 8: Statement of Financial Performance Overview ......................................................... 40
Table 9: Operating Ratios ......................................................................................................... 42
Table 10: Total Capital Expenditure ......................................................................................... 43
Table 11: Financial Competency Development - Progress Report .......................................... 45
Table 12: Statutory Annual Report Process ............................................................................. 47
Table 13: Political Structure ..................................................................................................... 49
Table 14: Mayoral Committee ................................................................................................. 52
Table 15: Corporate Services Portfolio Committee ................................................................. 54
Table 16: Planning and Development Portfolio Committee .................................................... 55
Table 17: Engineering Service Portfolio Committee ................................................................ 55
Table 18: Finance Portfolio Committee ................................................................................... 56
Table 19: Community Services Portfolio Committee ............................................................... 56
Table 20: Audit Committee ...................................................................................................... 58
Table 21: Top Administrative Structure ................................................................................... 60
Table 22: Public Meetings ........................................................................................................ 70
Table 23: Top Ten Strategic Risks identified ............................................................................ 72
Table 24: Immovable assets disposed ...................................................................................... 75
Table 25: By-Laws introduced during 2018/19 ........................................................................ 76
Table 26: Bylaws passed ........................................................................................................... 76
Table 27: Municipal Website Content and Currency of Material ............................................ 77
Table 28: Customer Satisfaction Survey 2019 .......................................................................... 79
Table 29: Total use of water by sector (cubic metres) ............................................................. 88
Table 30: Water Service Delivery Levels .................................................................................. 89
Table 31: Households - Water Service Delivery Levels below the minimum .......................... 90
Table 32: Capital Expenditure 2018/19 - Water Services ........................................................ 91
Table 33: Operating Revenue and Expenditure: Water Services ............................................. 92
Table 34: Employees - Water Services ..................................................................................... 92
Table 35: Service Statistics - Waste Water (Sanitation) Services ............................................. 93
Table 36: Sanitation Service Delivery Levels - Households ...................................................... 94
Table 37: Households - Sanitation Service Delivery Levels below the minimum .................... 95
Table 38: Capital Expenditure 2018/19 - Waste Water (Sanitation) Services ......................... 95
Table 39: Operating Revenue and Expenditure: Waste Water (Sanitation) Services .............. 97
Annual Report 2018/19
14
Table 40: Employees - Waste Water (Sanitation) Services ...................................................... 98
Table 41: Electricity Service Delivery Levels - Households ...................................................... 99
Table 42: Electricity Service Delivery Levels below the minimum - Formal & Informal
Settlements ............................................................................................................................ 100
Table 43: Capital Expenditure 2018/19 - Electricity Services................................................. 101
Table 44: Operating Revenue and Expenditure: Electricity Services ..................................... 102
Table 45: Employees - Electricity Services ............................................................................. 103
Table 46: Solid Waste Removal Service Delivery Levels ........................................................ 105
Table 47: Capital Expenditure 2017/18 - Waste Management (Refuse Collection, Waste
Disposal and Recycling) .......................................................................................................... 105
Table 48: Operating Revenue and Expenditure: Solid Waste Removal Services ................... 107
Table 49: Employees - Waste Management (Refuse Collection, Waste Disposal and Recycling)
................................................................................................................................................ 107
Table 50: Housing Projects - Management and Maintenance ............................................... 109
Table 51: Rental Housing Projects – Management, Maintenance and Upgrading of Rental
Stock ....................................................................................................................................... 110
Table 52: Housing Pipeline Projects ....................................................................................... 111
Table 53: Housing Statistics .................................................................................................... 112
Table 54: Capital Expenditure 2018/19 - Housing Services ................................................... 114
Table 55: Operating Revenue and Expenditure: Housing Services ........................................ 115
Table 56: Employees - Housing Services ................................................................................ 115
Table 57: Free basic services delivered per service ............................................................... 116
Table 58: Gravel Road Infrastructure ..................................................................................... 118
Table 59: Asphalted Road Infrastructure ............................................................................... 119
Table 60: Stormwater Infrastructure ..................................................................................... 120
Table 61: Capital Expenditure 2018/19 - Roads & Stormwater (Traffic Engineering Included)
................................................................................................................................................ 120
Table 62: Operating Revenue and expenditure: Roads and Stormwater Services ................ 121
Table 63: Employees - Roads and Stormwater Services ........................................................ 122
Table 64: Applications for Land Use Development ................................................................ 127
Table 65: Service Statistics - Land Use Planning & Surveying ................................................ 130
Table 66: Capital Expenditure 2018/19 - Planning Services .................................................. 131
Table 67: Operating Revenue and Expenditure: Planning Services ....................................... 131
Table 68: Employees - Planning Services ............................................................................... 132
Table 69: Job creation through EPWP Projects ...................................................................... 135
Table 70: Capital Expenditure 2018/19 - Economic Growth (Tourism & Market Places
Included) ................................................................................................................................. 137
Table 71: Operating Revenue and Expenditure: Economic Growth and Tourism ................. 138
Table 72: Employees - Economic Growth (including Tourism and Market Places) ............... 138
Table 73: Service Statistics for Libraries ................................................................................. 144
Table 74: Capital Expenditure 2018/19 - Library Services ..................................................... 145
Annual Report 2018/19
15
Table 75: Operating Revenue and Expenditure: Library Services .......................................... 146
Table 76: Employees - Library Services .................................................................................. 146
Table 77: Capital Expenditure 2018/19 - Cemeteries & Crematoria ..................................... 148
Table 78: Operating Revenue and Expenditure: Cemeteries Services .................................. 148
Table 79: Employees - Cemeteries and Crematoria ............................................................... 149
Table 80: Town Halls, Community Halls and Thusong Centres .............................................. 149
Table 81: Capital Expenditure 2018/19 - Community Halls, Facilities and Thusong Centres 150
Table 82: Operating Revenue and Expenditure: Community Halls, Facilities and Thusong
Centres ................................................................................................................................... 151
Table 83: Employees - Community Halls, Facilities and Thusong Centres ............................. 151
Table 84: Capital Expenditure 2018/19 - Child Care, Aged Care & Social Programmes ........ 154
Table 85: Operating Revenue and Expenditure: Child Care, Aged Care & Social Programmes
................................................................................................................................................ 155
Table 86: Employees - Child Care, Aged Care and Social Programmes ................................. 156
Table 87: Environmental Management - Service Statistics ................................................... 158
Table 88: Capital Expenditure 2018/19 - Environmental Management (Pollution Control
Included)- ............................................................................................................................... 158
Table 89: Operating Revenue and Expenditure: Environmental Management (Pollution
Control Included) .................................................................................................................... 160
Table 90: Employees: Environmental Management .............................................................. 160
Table 91: Capital Expenditure 2018/19 - Biodiversity & Landscape (Open Spaces Included)
................................................................................................................................................ 162
Table 92: Operating Revenue and Expenditure: Biodiversity and Landscaping .................... 162
Table 93: Employees - Biodiversity and Landscaping (Parks) ................................................ 163
Table 94: Traffic, Licensing and Law Enforcement Service Data ............................................ 164
Table 95: Capital Expenditure 2018/19 - Traffic, Licensing and Law Enforcement ............... 165
Table 96: Operating Revenue and Expenditure: Traffic, Licensing and Law Enforcement .... 166
Table 97: Employees - Traffic, Licensing and Law Enforcement ............................................ 166
Table 98: Fire Service Data ..................................................................................................... 168
Table 99: Fire Safety – Activities/Inspections ........................................................................ 168
Table 100: Fire Fighter Training ............................................................................................. 168
Table 101: Capital Expenditure 2017/18 - Fire & Disaster Management .............................. 169
Table 102: Operating Revenue and Expenditure: Fire and Disaster Management Services . 170
Table 103: Employees - Fire and Disaster Management ....................................................... 171
Table 104: Population utilisation of holiday resorts .............................................................. 172
Table 105: Sport codes utilisation of sport facilities .............................................................. 173
Table 106: Capital Expenditure 2018/19 - Holiday Resorts, Sport Facilities and Swimming
Pools ....................................................................................................................................... 174
Table 107: Operating Revenue and Expenditure: Holiday Resorts, Sport Facilities and
Swimming Pools ..................................................................................................................... 176
Table 108: Employees - Sport and Recreation ....................................................................... 176
Annual Report 2018/19
16
Table 109: Service Statistics for the Executive and Council ................................................... 178
Table 110: Capital Expenditure 2018/19 - Executive and Council ......................................... 179
Table 111: Operating Revenue and Expenditure: Executive and Council .............................. 179
Table 112: Employees - Executive and Council Support ........................................................ 180
Table 113: Debt Recovery ...................................................................................................... 181
Table 114: Capital Expenditure 2018/19 - Financial Services ................................................ 181
Table 115: Operating Revenue and Expenditure: Financial Services (Procurement Services
Excluded) ................................................................................................................................ 182
Table 116: Employees - Financial Services (Procurement Services Excluded) ....................... 183
Table 117: Service Statistics for Human Resources Services ................................................. 184
Table 118: Capital Expenditure 2018/19 - Human Resource Services ................................... 185
Table 119: Operating Revenue and expenditure: Human Resource Services ....................... 185
Table 120: Employees - Human Resources ............................................................................ 186
Table 121: Capital Expenditure 2018/19 - Information and Communication Technology (ICT)
Services ................................................................................................................................... 189
Table 122: Operating Revenue and Expenditure: Information and Communication
Technology (ICT) Services ....................................................................................................... 190
Table 123: Employees - Information and Communication Technology (ICT) Services .......... 191
Table 124: Properties sold ...................................................................................................... 191
Table 125: Properties leased .................................................................................................. 192
Table 126: Capital Expenditure 2018/19 - Property Services ................................................ 193
Table 127: Capital and Maintenance Projects ....................................................................... 193
Table 128: Operating Revenue and Expenditure: Property Management Services .............. 194
Table 129: Employees Property Services ............................................................................... 194
Table 130: Service Statistics - Legal Services .......................................................................... 195
Table 131: Capital Expenditure 2018/19 - Legal Services ...................................................... 196
Table 132: Operating Revenue and Expenditure: Legal Services ........................................... 196
Table 133: Employees - Legal Services (Legal Services and Property Administration) ......... 197
Table 134: Capital Expenditure 2018/19 - Risk Management Services ................................. 198
Table 135: Operating Revenue and Expenditure: Risk Management Services ...................... 199
Table 136: Employees - Risk Management ............................................................................ 199
Table 137: Capital Expenditure 2018/19 - Procurement Services ......................................... 200
Table 138: Operating Revenue and Expenditure: Procurement Services .............................. 201
Table 139: Employees - Procurement Services ...................................................................... 202
Table 140: Total Employees per GFS Classification ................................................................ 204
Table 141: Employee Vacancy Rate per Occupational Level ................................................. 204
Table 142: Turnover Rate ....................................................................................................... 205
Table 143: Employment Equity Targets / Actuals by Race Classification .............................. 205
Table 144: Employment Equity Targets / Actuals by Gender Classification .......................... 206
Table 145: Number employees by Race and Gender within the Occupational Levels .......... 206
Table 146: HR Policies and Plans ............................................................................................ 207
Annual Report 2018/19
17
Table 147: Sick Leave per Department/Division .................................................................... 208
Table 148: Sick Leave per Occupational Level ....................................................................... 208
Table 149: Number of injuries on duty .................................................................................. 209
Table 150: Injuries per Department ....................................................................................... 209
Table 151: Injuries per Occupational Level ............................................................................ 209
Table 152: Cost of Injuries per Department ........................................................................... 210
Table 153: Skills Matrix .......................................................................................................... 211
Table 154: Skills Development - Training Provided ................................................................ 212
Table 155: Skills Development - Budget Allocation ............................................................... 213
Table 156: Financial Competency Development - Progress Report ...................................... 213
Table 157: Personnel Expenditure per Line Item ................................................................... 215
Table 158: Financial Summary ............................................................................................... 217
Table 159: Financial Performance of Operating Expenditure by GFS Classification .............. 219
Table 160: Operating Transfers and Grants ........................................................................... 220
Table 161: Grants received from sources other than the Division of Revenue Act (DoRA) .. 221
Table 162: Capital Expenditure on Basic Services Infrastructure .......................................... 227
Table 163: Capital Expenditure on Social and Economic Infrastructure ................................ 227
Table 164: Capital Expenditure on Operational Infrastructure ............................................. 228
Table 165: Capital Expenditure - Funding Sources 2018/2019 .............................................. 228
Table 166: Capital Spending of Five Largest Capital Projects ................................................ 231
Table 167: Basic Services Backlogs ......................................................................................... 232
Table 168: Municipal Infrastructure Grant (MIG) Expenditure on 2018/19 Service Backlogs
................................................................................................................................................ 232
Table 169: Cash Flow Outcomes ............................................................................................ 233
Table 170: Actual Borrowings ................................................................................................ 234
Table 171: Municipal Investments ......................................................................................... 235
Table 172: GRAP Compliance List ........................................................................................... 238
Table 173: Auditor-General Report on 2018/19 Financial Performance ............................... 240
Table 174: Auditor-General Report on 2018/19 Other Matters ............................................ 240
Table 175: Auditor-General Report on 2017/18 Financial Performance ............................... 242
Table 176: Auditor-General Report on 2017/18 Other Matters ............................................ 242
Table 177: Councillors, Committees allocated and Council attendance ............................... 244
Table 178: Committees (other than Mayoral Committee) and purposes of committees ..... 246
Table 179: Second and Third-tier Structure ........................................................................... 247
Table 180: Municipal Functions ............................................................................................. 250
Table 181: Functionality of Ward Committees ...................................................................... 251
Table 182: Ward - Capital Projects ......................................................................................... 262
Table 183: Basic Service Provision ......................................................................................... 262
Table 184: Top four Service Delivery Priorities ...................................................................... 262
Table 185: Municipal Audit Committee Recommendations .................................................. 263
Table 186: Long-term Contracts (Eight largest contracts active in 2018/19) ........................ 265
Annual Report 2018/19
18
Table 187: Public Private Partnerships entered into 2018/19 ............................................... 265
Table 188: Disclosure of Financial Interests ........................................................................... 266
Table 189: Revenue Collection Performance by GFS Vote .................................................... 273
Table 190: Revenue Performance by Source ......................................................................... 274
Table 191: Conditional Grants excluding MIG ....................................................................... 275
Table 192: Capital Expenditure - New Assets ........................................................................ 276
Table 193: Capital Expenditure – Upgrade Programme ........................................................ 279
Table 194: Capital Expenditure- Renewal Programme .......................................................... 282
Table 195: 2017/18 Capital Programme by Main Project ...................................................... 286
Table 196: Capital Programme by Project by Ward 2018/19 ................................................ 287
Table 197: Service Backlogs - Schools and Clinics .................................................................. 288
Table 198: Service backlogs experienced by the community where another sphere of
government is the service provider ....................................................................................... 289
Table 199: Declaration of loans and grants made by the Municipality 2018/19 .................. 291
Table 200: MFMA S71 returns not made during 2018/19 according to reporting
requirements .......................................................................................................................... 295
Table 201: Presidential outcome for Local Government ....................................................... 296
Table 202: Audit Outcome Improvement Plan ...................................................................... 306
Annual Report 2018/19
19
LIST OF FIGURES
Figure 1: Macro Organisational Structure ................................................................................ 60
LIST OF GRAPHS
Graph 1: Capital Expenditure 2018/19 .................................................................................... 44
Graph 2: Water use by Sector .................................................................................................. 88
Graph 3: Households Access to Water ..................................................................................... 88
Graph 4: Sanitation/Sewerage Connections ............................................................................ 93
Graph 5: Electricity Service Delivery Statistics ......................................................................... 99
Graph 6: Solid Waste Disposal and Diversion Statistics ......................................................... 104
Graph 7: Workforce Expenditure Trends ............................................................................... 214
Graph 8: Repairs and Maintenance Expenditure trends ....................................................... 221
Graph 9: Current Ratio ........................................................................................................... 222
Graph 10: Cost Coverage Ratio .............................................................................................. 223
Graph 11: Outstanding Service Debtors to Revenue Ratio .................................................... 223
Graph 12: Debt Coverage Ratio.............................................................................................. 224
Graph 13: Capital Charges to Operating Expenditure Ratio .................................................. 224
Graph 14: Creditors System Efficiency Ratio .......................................................................... 225
Graph 15: Employee Cost Ratio ............................................................................................. 225
Graph 16: Repairs and Maintenance as a % of the Carrying Value of Property, Plant &
Equipment .............................................................................................................................. 226
Graph 17: Repairs and Maintenance as a % of Total Operating Expenditure ....................... 226
Graph 18: External Borrowings as a Percentage of Total Operating Revenue (Gearing Ratio)
................................................................................................................................................ 230
Graph 19: Borrowings ............................................................................................................ 235
Graph 20: Investments ........................................................................................................... 236
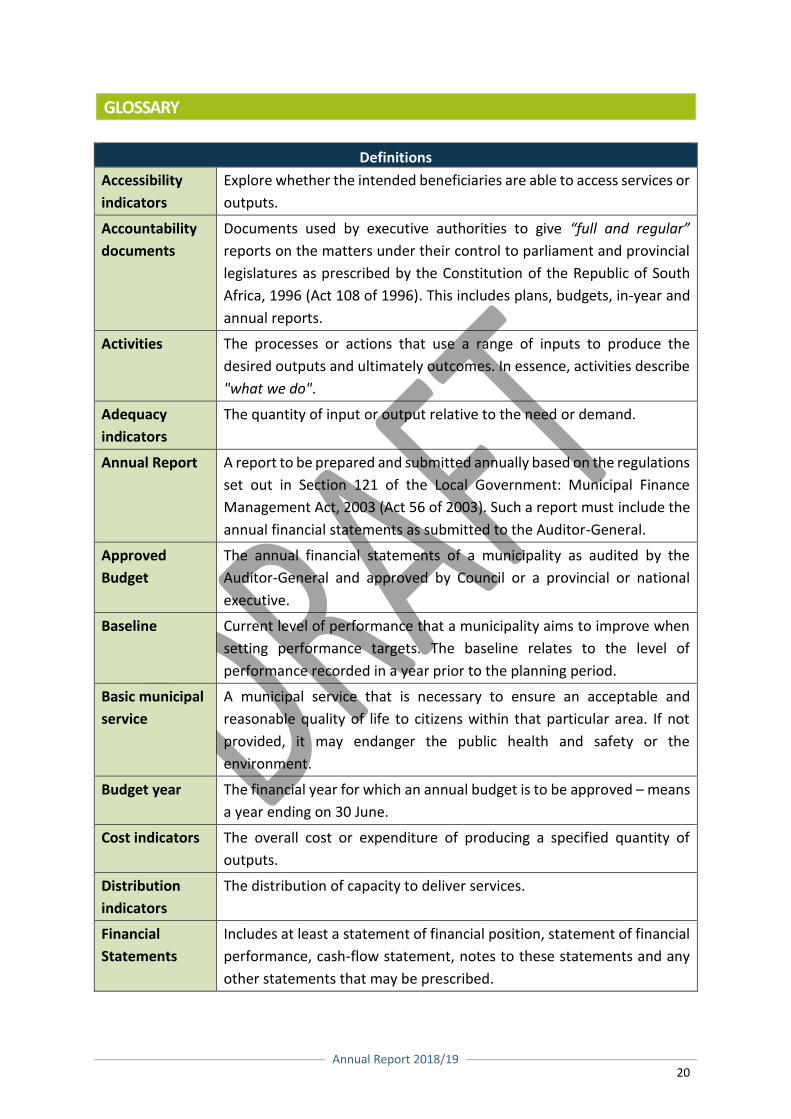
Annual Report 2018/19
20
GLOSSARY
Definitions
Accessibility
indicators
Explore whether the intended beneficiaries are able to access services or
outputs.
Accountability
documents
Documents used by executive authorities to give “full and regular”
reports on the matters under their control to parliament and provincial
legislatures as prescribed by the Constitution of the Republic of South
Africa, 1996 (Act 108 of 1996). This includes plans, budgets, in-year and
annual reports.
Activities The processes or actions that use a range of inputs to produce the
desired outputs and ultimately outcomes. In essence, activities describe
"what we do".
Adequacy
indicators
The quantity of input or output relative to the need or demand.
Annual Report A report to be prepared and submitted annually based on the regulations
set out in Section 121 of the Local Government: Municipal Finance
Management Act, 2003 (Act 56 of 2003). Such a report must include the
annual financial statements as submitted to the Auditor-General.
Approved
Budget
The annual financial statements of a municipality as audited by the
Auditor-General and approved by Council or a provincial or national
executive.
Baseline Current level of performance that a municipality aims to improve when
setting performance targets. The baseline relates to the level of
performance recorded in a year prior to the planning period.
Basic municipal
service
A municipal service that is necessary to ensure an acceptable and
reasonable quality of life to citizens within that particular area. If not
provided, it may endanger the public health and safety or the
environment.
Budget year The financial year for which an annual budget is to be approved – means
a year ending on 30 June.
Cost indicators The overall cost or expenditure of producing a specified quantity of
outputs.
Distribution
indicators
The distribution of capacity to deliver services.
Financial
Statements
Includes at least a statement of financial position, statement of financial
performance, cash-flow statement, notes to these statements and any
other statements that may be prescribed.
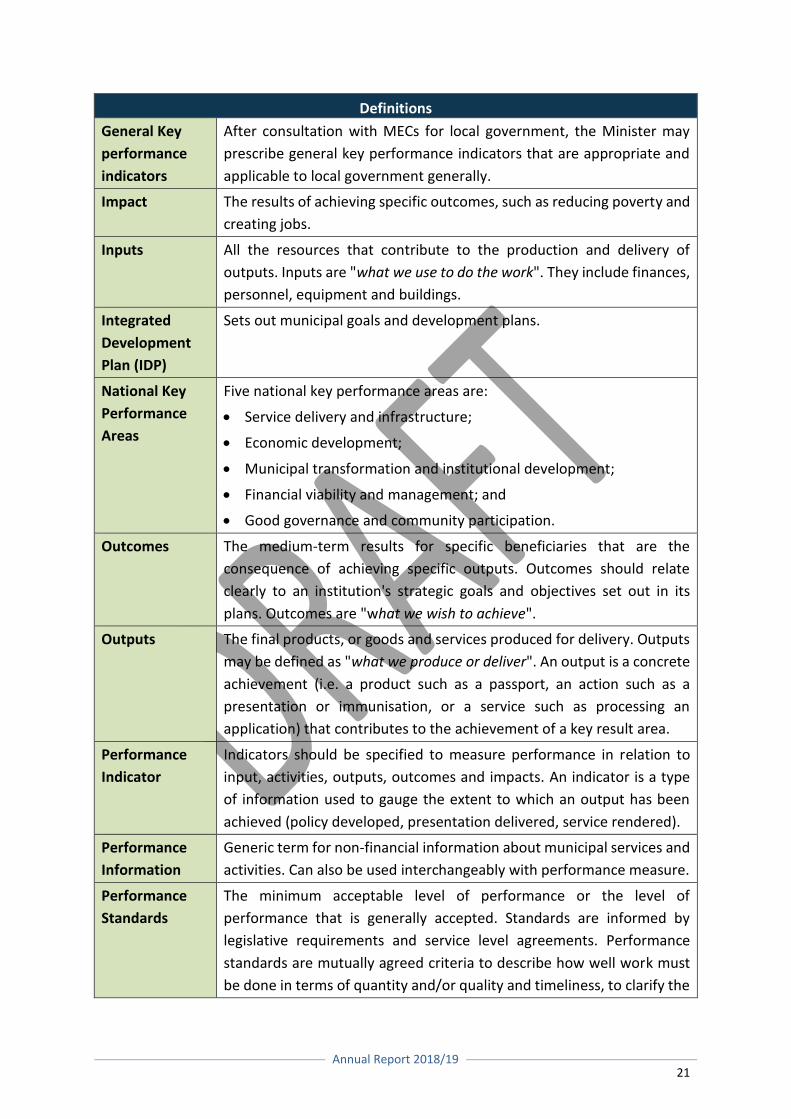
Annual Report 2018/19
21
Definitions
General Key
performance
indicators
After consultation with MECs for local government, the Minister may
prescribe general key performance indicators that are appropriate and
applicable to local government generally.
Impact The results of achieving specific outcomes, such as reducing poverty and
creating jobs.
Inputs All the resources that contribute to the production and delivery of
outputs. Inputs are "what we use to do the work". They include finances,
personnel, equipment and buildings.
Integrated
Development
Plan (IDP)
Sets out municipal goals and development plans.
National Key
Performance
Areas
Five national key performance areas are:
Service delivery and infrastructure;
Economic development;
Municipal transformation and institutional development;
Financial viability and management; and
Good governance and community participation.
Outcomes The medium-term results for specific beneficiaries that are the
consequence of achieving specific outputs. Outcomes should relate
clearly to an institution's strategic goals and objectives set out in its
plans. Outcomes are "what we wish to achieve".
Outputs The final products, or goods and services produced for delivery. Outputs
may be defined as "what we produce or deliver". An output is a concrete
achievement (i.e. a product such as a passport, an action such as a
presentation or immunisation, or a service such as processing an
application) that contributes to the achievement of a key result area.
Performance
Indicator
Indicators should be specified to measure performance in relation to
input, activities, outputs, outcomes and impacts. An indicator is a type
of information used to gauge the extent to which an output has been
achieved (policy developed, presentation delivered, service rendered).
Performance
Information
Generic term for non-financial information about municipal services and
activities. Can also be used interchangeably with performance measure.
Performance
Standards
The minimum acceptable level of performance or the level of
performance that is generally accepted. Standards are informed by
legislative requirements and service level agreements. Performance
standards are mutually agreed criteria to describe how well work must
be done in terms of quantity and/or quality and timeliness, to clarify the
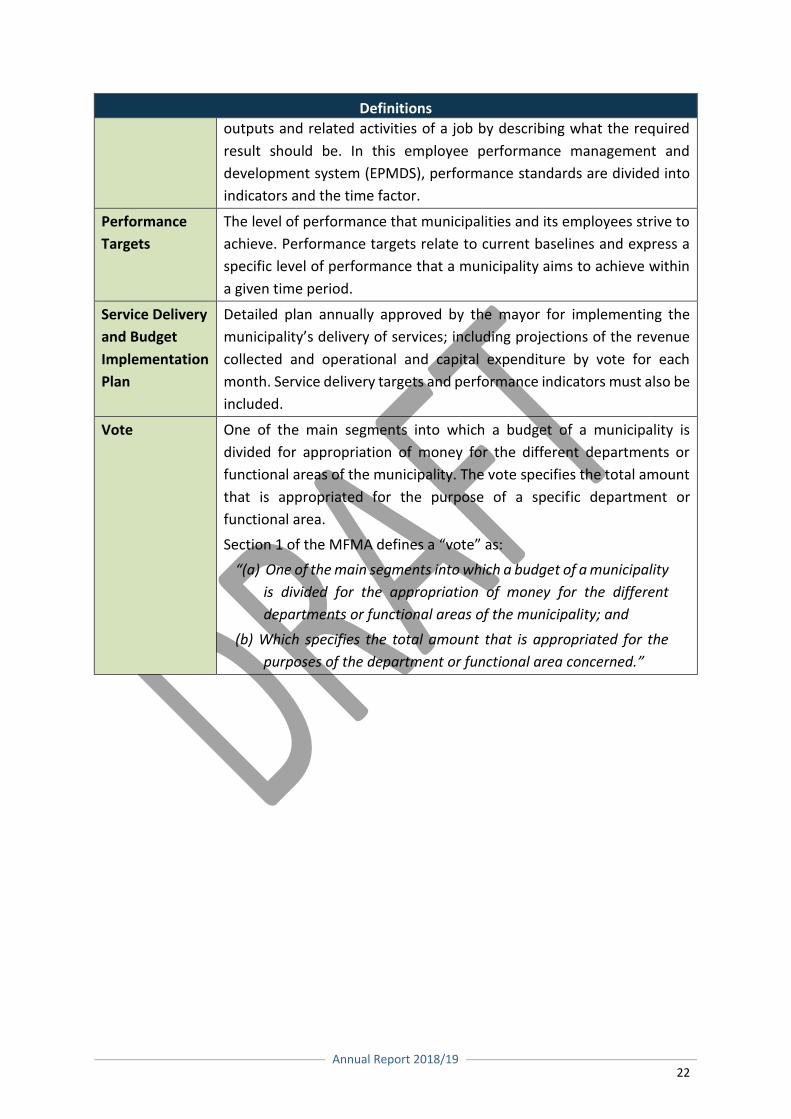
Annual Report 2018/19
22
Definitions
outputs and related activities of a job by describing what the required
result should be. In this employee performance management and
development system (EPMDS), performance standards are divided into
indicators and the time factor.
Performance
Targets
The level of performance that municipalities and its employees strive to
achieve. Performance targets relate to current baselines and express a
specific level of performance that a municipality aims to achieve within
a given time period.
Service Delivery
and Budget
Implementation
Plan
Detailed plan annually approved by the mayor for implementing the
municipality’s delivery of services; including projections of the revenue
collected and operational and capital expenditure by vote for each
month. Service delivery targets and performance indicators must also be
included.
Vote One of the main segments into which a budget of a municipality is
divided for appropriation of money for the different departments or
functional areas of the municipality. The vote specifies the total amount
that is appropriated for the purpose of a specific department or
functional area.
Section 1 of the MFMA defines a “vote” as:
“(a) One of the main segments into which a budget of a municipality
is divided for the appropriation of money for the different
departments or functional areas of the municipality; and
(b) Which specifies the total amount that is appropriated for the
purposes of the department or functional area concerned.”
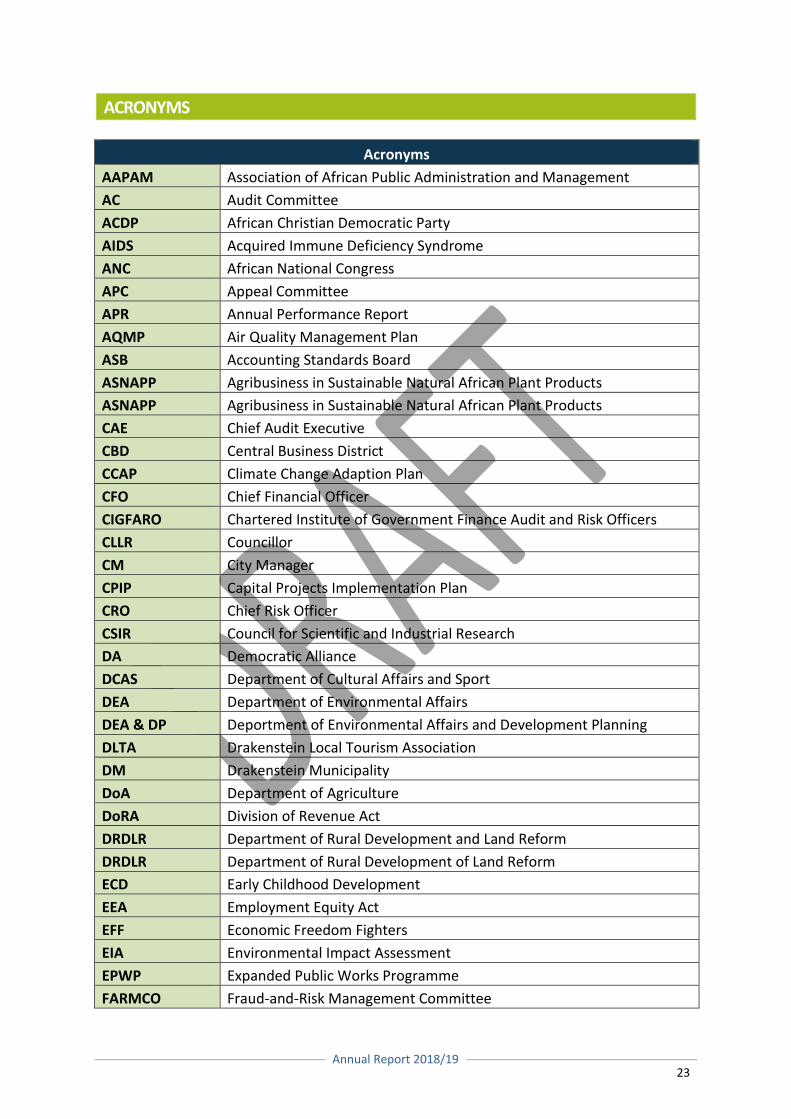
Annual Report 2018/19
23
ACRONYMS
Acronyms
AAPAM Association of African Public Administration and Management
AC Audit Committee
ACDP African Christian Democratic Party
AIDS Acquired Immune Deficiency Syndrome
ANC African National Congress
APC Appeal Committee
APR Annual Performance Report
AQMP Air Quality Management Plan
ASB Accounting Standards Board
ASNAPP Agribusiness in Sustainable Natural African Plant Products
ASNAPP Agribusiness in Sustainable Natural African Plant Products
CAE Chief Audit Executive
CBD Central Business District
CCAP Climate Change Adaption Plan
CFO Chief Financial Officer
CIGFARO Chartered Institute of Government Finance Audit and Risk Officers
CLLR Councillor
CM City Manager
CPIP Capital Projects Implementation Plan
CRO Chief Risk Officer
CSIR Council for Scientific and Industrial Research
DA Democratic Alliance
DCAS Department of Cultural Affairs and Sport
DEA Department of Environmental Affairs
DEA & DP Deportment of Environmental Affairs and Development Planning
DLTA Drakenstein Local Tourism Association
DM Drakenstein Municipality
DoA Department of Agriculture
DoRA Division of Revenue Act
DRDLR Department of Rural Development and Land Reform
DRDLR Department of Rural Development of Land Reform
ECD Early Childhood Development
EEA Employment Equity Act
EFF Economic Freedom Fighters
EIA Environmental Impact Assessment
EPWP Expanded Public Works Programme
FARMCO Fraud-and-Risk Management Committee
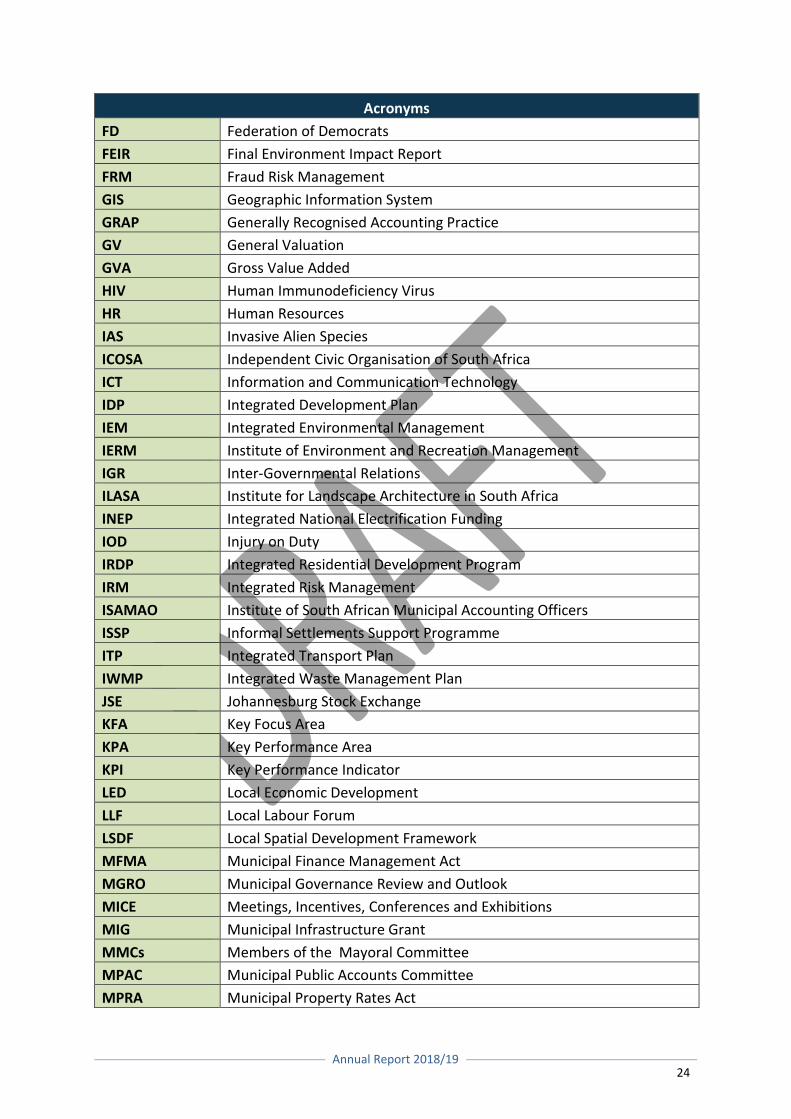
Annual Report 2018/19
24
Acronyms
FD Federation of Democrats
FEIR Final Environment Impact Report
FRM Fraud Risk Management
GIS Geographic Information System
GRAP Generally Recognised Accounting Practice
GV General Valuation
GVA Gross Value Added
HIV Human Immunodeficiency Virus
HR Human Resources
IAS Invasive Alien Species
ICOSA Independent Civic Organisation of South Africa
ICT Information and Communication Technology
IDP Integrated Development Plan
IEM Integrated Environmental Management
IERM Institute of Environment and Recreation Management
IGR Inter-Governmental Relations
ILASA Institute for Landscape Architecture in South Africa
INEP Integrated National Electrification Funding
IOD Injury on Duty
IRDP Integrated Residential Development Program
IRM Integrated Risk Management
ISAMAO Institute of South African Municipal Accounting Officers
ISSP Informal Settlements Support Programme
ITP Integrated Transport Plan
IWMP Integrated Waste Management Plan
JSE Johannesburg Stock Exchange
KFA Key Focus Area
KPA Key Performance Area
KPI Key Performance Indicator
LED Local Economic Development
LLF Local Labour Forum
LSDF Local Spatial Development Framework
MFMA Municipal Finance Management Act
MGRO Municipal Governance Review and Outlook
MICE Meetings, Incentives, Conferences and Exhibitions
MIG Municipal Infrastructure Grant
MMCs Members of the Mayoral Committee
MPAC Municipal Public Accounts Committee
MPRA Municipal Property Rates Act
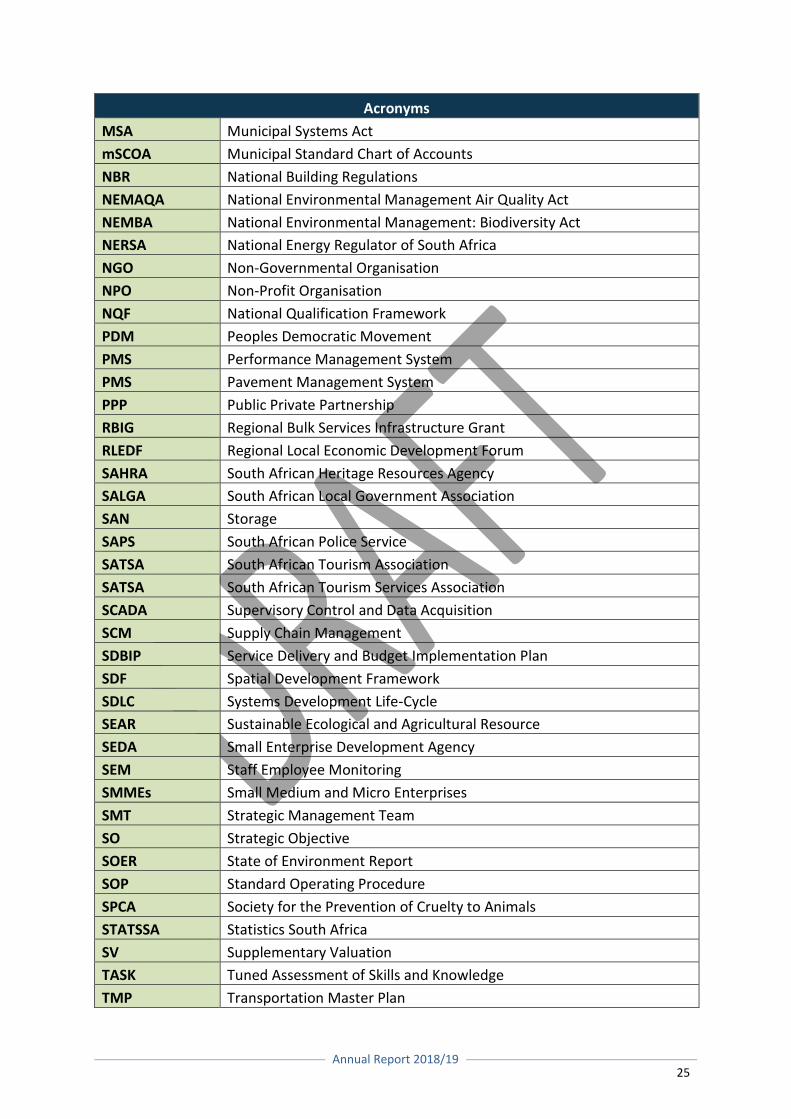
Annual Report 2018/19
25
Acronyms
MSA Municipal Systems Act
mSCOA Municipal Standard Chart of Accounts
NBR National Building Regulations
NEMAQA National Environmental Management Air Quality Act
NEMBA National Environmental Management: Biodiversity Act
NERSA National Energy Regulator of South Africa
NGO Non-Governmental Organisation
NPO Non-Profit Organisation
NQF National Qualification Framework
PDM Peoples Democratic Movement
PMS Performance Management System
PMS Pavement Management System
PPP Public Private Partnership
RBIG Regional Bulk Services Infrastructure Grant
RLEDF Regional Local Economic Development Forum
SAHRA South African Heritage Resources Agency
SALGA South African Local Government Association
SAN Storage
SAPS South African Police Service
SATSA South African Tourism Association
SATSA South African Tourism Services Association
SCADA Supervisory Control and Data Acquisition
SCM Supply Chain Management
SDBIP Service Delivery and Budget Implementation Plan
SDF Spatial Development Framework
SDLC Systems Development Life-Cycle
SEAR Sustainable Ecological and Agricultural Resource
SEDA Small Enterprise Development Agency
SEM Staff Employee Monitoring
SMMEs Small Medium and Micro Enterprises
SMT Strategic Management Team
SO Strategic Objective
SOER State of Environment Report
SOP Standard Operating Procedure
SPCA Society for the Prevention of Cruelty to Animals
STATSSA Statistics South Africa
SV Supplementary Valuation
TASK Tuned Assessment of Skills and Knowledge
TMP Transportation Master Plan
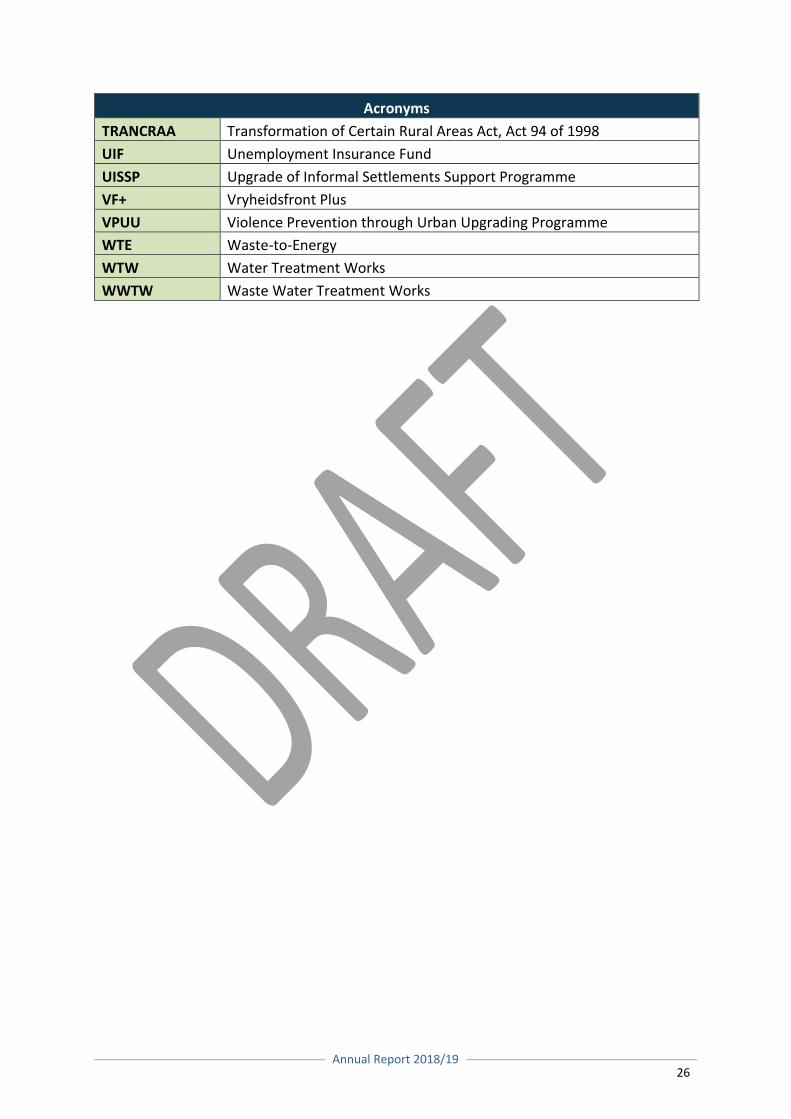
Annual Report 2018/19
26
Acronyms
TRANCRAA Transformation of Certain Rural Areas Act, Act 94 of 1998
UIF Unemployment Insurance Fund
UISSP Upgrade of Informal Settlements Support Programme
VF+ Vryheidsfront Plus
VPUU Violence Prevention through Urban Upgrading Programme
WTE Waste-to-Energy
WTW Water Treatment Works
WWTW Waste Water Treatment Works
Annual Report 2018/19
27
1. EXECUTIVE MAYOR’S FOREWORD AND EXECUTIVE SUMMARY
COMPONENT A: EXECUTIVE MAYOR’S FOREWORD
1.1 EXECUTIVE MAYOR’S FOREWORD
In 2017 Council adopted its Vision 2032 strategy in recognition of Drakenstein Municipality’s
secondary city status and the need to meet the needs of our rapidly changing and growing
city. The Vision, which encapsulates our drive for excellence, is aligned to the Provincial
Growth and Development Strategy and the National Development Plan and seeks to create
an enabling environment for growth; development; employment and job creation; enhancing
the quality of life of our residents; maintaining good corporate governance; and sound
financial management.
Good governance entails addressing the needs of the public through consultation and
communication; and being accountable to the citizens of Drakenstein as required by the
Municipal Systems Act, 2000 (Act 32 of 2000). Council undertook a number of processes to
achieve this goal, including establishing new ward committees; issuing monthly newsletters
and press releases; holding consultative meetings with a wide range of stakeholders; and
rebuilding our municipal website. Accountability is enforced through performance contracts
signed by the Members of the Mayoral Committee (MMCs) and Senior Management and is
monitored by the Executive Mayor and Council on a monthly basis.
The 2016 Community Survey Report from Statistics South Africa (STATSSA) indicates that the
population of Drakenstein has reached 280,195 making up 71,686 households. Drakenstein’s
unemployment is estimated at 18.3% of the economically active population. The growth in
population is accompanied by various challenges, in particular the ongoing demand for state-
provided accommodation. The Municipality has a verified waiting list of 19,801 persons
compared with a total waiting list of 41,659 persons who seek housing assistance. The
Municipality has responded by planning and rolling out a number of projects, including the
Vlakkeland project (some 2,550 mixed typology and affordability opportunities) and the Erf
16161 Development (2,078 GAP and social rental opportunities).
In order to develop a vibrant and resilient economy a number of projects have been launched
to promote the industrial, financial and commercial sectors. Given the need to focus and
maximise our resources five catalytic zones were identified throughout Drakenstein, namely
the N1 Corridor, South City Corridor, Paarl East/West Integration Corridor, North City Corridor
and the Hinterland catalytic zones, wherein development and resources will be concentrated
over the next 15 years.
Annual Report 2018/19
28
The Annual Report 2018/19 provides detail on various bulk infrastructure projects being
undertaken to facilitate the envisioned accelerated growth. These projects are only possible
through strategic partnerships with other spheres of government, the private sector and the
community of Drakenstein as we cannot meet the challenges that we face on our own.
I remain grateful to Council, the Deputy Executive Mayor, the Mayoral Committee and the City
Manager, all of whom continue to guide our staff, resources and operations to make
Drakenstein a City of Excellence.
CLLR CONRAD POOLE
EXECUTIVE MAYOR
Annual Report 2018/19
29
COMPONENT B: EXECUTIVE SUMMARY
1.2 CITY MANAGER’S OVERVIEW
The Drakenstein Municipality is a Category B municipality with powers and functions assigned
in terms of Sections 155 and 156 of the Constitution of the Republic of South Africa, 1996 (local
government matters referred to in Schedules 4 and 5). These powers and functions are
exercised subject to Chapter 5 of the Municipal Structures Act, 117 of 1998 and Chapter 3 of
the Local Government Municipal Systems Act, 32 of 2000. The municipality covers an area of
1,539 km² and consists of 33 wards. It comprises of five towns of which two, Paarl and
Wellington, are the primary urban nodes.
We acknowledge the role of provincial and national government and regularly engage on
platforms to share information and best practices. These platforms include but are not limited
to SALGA, ISAMAO, CIGFARO, Premiers Coordinating Forum and Municipal Managers Forum.
This Annual Report and twelfth consecutive unqualified audit opinion and fifth clean audit
opinion bears testament to what can be accomplished in local government through a focussed
approach on service delivery. In presenting the 2018/19 Annual Report we affirm that
Drakenstein Municipality has made massive strides towards its vision of “A city of excellence”,
which is guided by values of transparency, excellence, responsiveness, accountability,
accessibility and integrity.
The vision is supported by the following strategic objectives:
To promote proper governance and public participation;
To ensure financial sustainability;
To provide an effective and efficient workforce by aligning our institutional
arrangements to our overall strategy;
To ensure efficient infrastructure and energy supply for all citizens;
To facilitate sustainable economic environment through the development of related
initiatives including job creation and skills development;
To contribute to the health and safety of communities through the pro-active
identification, prevention, mitigation and management of health including
environmental health, fire and disaster risks; and
To assist and facilitate with the development and empowerment of the poor and the
most vulnerable that include the elderly, youth and disabled.
The various key service delivery improvements achieved during the year under review is a
result of good planning and execution. Numerous important projects were completed which
Annual Report 2018/19
30
inter alia covered bulk sewerage, water reticulation, roads and electricity distribution. These
are providing thousands of Drakenstein residents with improved basic services, setting the
tone for future economic growth and development.
The overall financial performance of the Municipality in 2018/2019 confirms sound financial
management, with the revenue increasing year on year in line with the annual target. In
previous financial years, increased capital infrastructure investment funded through
borrowing was necessary to unlock economic growth and cater for future demand. Our focus
over the past financial year was on revenue enhancement and protection, stringent
expenditure management and cost containment aligned to National Treasure regulations.
Furthermore processes were initiated to lower our current gearing ratio and shift our focus
from capital expenditure to infrastructure maintenance with no compromise on service
delivery.
The Capital Budget spending for the 2018/19 financial year yielded a result of 101.6% in terms
of the Final Capital Adjustments Budget. The Municipality’s actual operating revenue and
expenditure yielded results of 94.8% and 96.3% respectively, when compared to the Final
Operating Adjustments Budget. The 2018/19 financial year realised an operating deficit of
R43.7 million as opposed to the budgeted deficit of R6.5 million of the Final Operating
Adjustments Budget. A negative variance of R37.2 million therefore materialised; mainly due
to an additional R33.9 million indigent subsidy given to indigent households over and above
the R137.5 million equitable share received for the provision of free basic services to indigent
households.
Throughout the financial year we strived to maintain a strong payment ratio by consistent and
vigorous actions, including the effective implementation of the Debtors Policy. This is evident
in the ability of the Municipality to fund its operations and service its debts. However, the
challenges accompanied by the provision of affordable quality services in an efficient and
effective manner to our residents remain.
Overall, Drakenstein Municipality remains focussed on fulfilling our vision and excelling as the
largest local municipality in the Western Cape. Our greatest encouragement is the continued
support and commitment of our residents and business community on all service delivery
fronts.
DR JOHAN LEIBBRANDT
CITY MANAGER
Annual Report 2018/19
31
1.3 MUNICIPAL OVERVIEW
Drakenstein Municipality is the second largest municipality in the Western Cape, 18th top
municipality in South Africa and 10th Secondary City in terms of the budget size. The
Municipality is characterised by scenic landscape, precious natural and cultural heritage,
quality educational institutions and sporting facilities, thriving agricultural economy and
unrivalled access to the regional and logistics networks.
1.3.1 Vision 2032
In broad terms the vision statement expresses the type of city we envisage for the future:
“A city of excellence.”
1.3.2 Values
The Long-term Strategic Plan (Vision 2032) is grounded in the following values which define
the character of Drakenstein Municipality and can be observed in the conduct of the
leadership and employees as they perform the mandate and responsibilities bestowed upon
them:
Transparency;
Excellence;
Responsiveness;
Accountability;
Accessibility; and
Integrity.
1.3.3 Demographics and socio-economic information
This section provides a succinct overview of the socio-economic status of Drakenstein
Municipality. This profiling is important to assist the municipality when determining the
optimal allocation of resources between the municipal wards and across the population, in a
manner that provides and assures sustainable growth and equity.
Most importantly, the socio-economic information below compliment and inform the
Integrated Development Plan (IDP) to ensure effective use of resources, improved service
delivery, attract additional funding and strengthen democratic values.
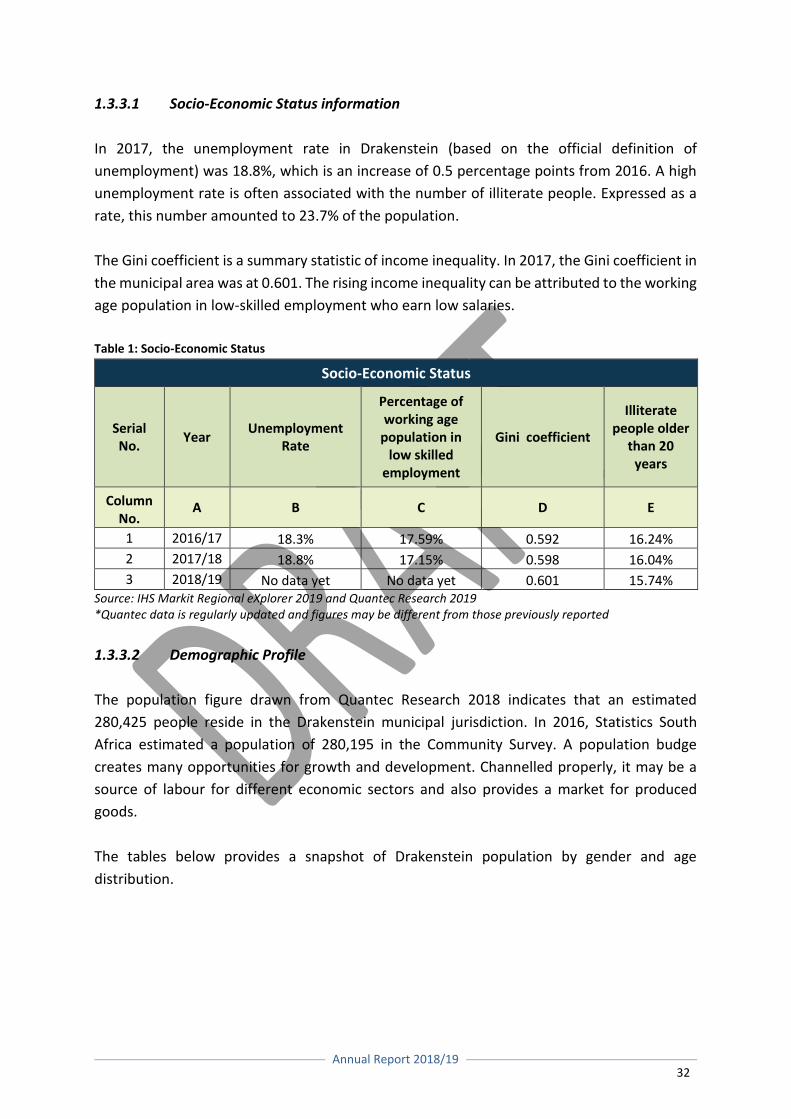
Annual Report 2018/19
32
1.3.3.1 Socio-Economic Status information
In 2017, the unemployment rate in Drakenstein (based on the official definition of
unemployment) was 18.8%, which is an increase of 0.5 percentage points from 2016. A high
unemployment rate is often associated with the number of illiterate people. Expressed as a
rate, this number amounted to 23.7% of the population.
The Gini coefficient is a summary statistic of income inequality. In 2017, the Gini coefficient in
the municipal area was at 0.601. The rising income inequality can be attributed to the working
age population in low-skilled employment who earn low salaries.
Table 1: Socio-Economic Status
Socio-Economic Status
Serial No.
Year Unemployment
Rate
Percentage of working age
population in low skilled
employment
Gini coefficient
Illiterate people older
than 20 years
Column No.
A B C D E
1 2016/17 18.3% 17.59% 0.592 16.24%
2 2017/18 18.8% 17.15% 0.598 16.04%
3 2018/19 No data yet No data yet 0.601 15.74% Source: IHS Markit Regional eXplorer 2019 and Quantec Research 2019 *Quantec data is regularly updated and figures may be different from those previously reported
1.3.3.2 Demographic Profile
The population figure drawn from Quantec Research 2018 indicates that an estimated
280,425 people reside in the Drakenstein municipal jurisdiction. In 2016, Statistics South
Africa estimated a population of 280,195 in the Community Survey. A population budge
creates many opportunities for growth and development. Channelled properly, it may be a
source of labour for different economic sectors and also provides a market for produced
goods.
The tables below provides a snapshot of Drakenstein population by gender and age
distribution.
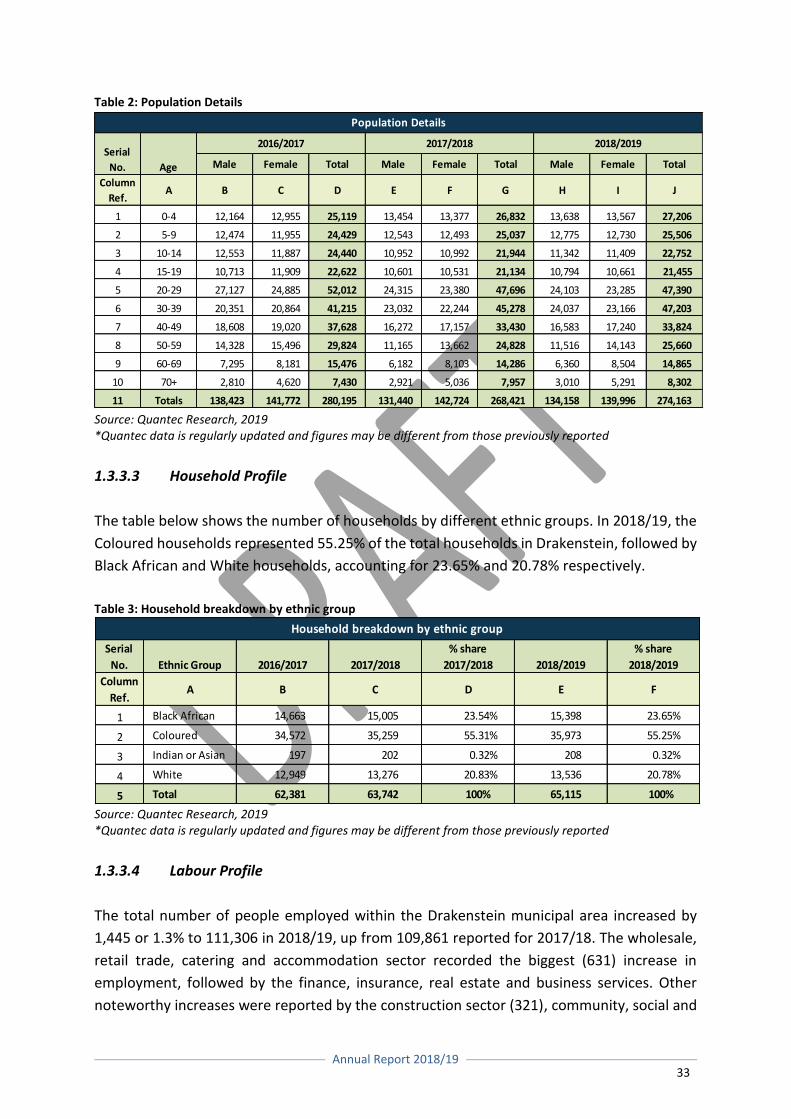
Annual Report 2018/19
33
Table 2: Population Details
Source: Quantec Research, 2019 *Quantec data is regularly updated and figures may be different from those previously reported
1.3.3.3 Household Profile
The table below shows the number of households by different ethnic groups. In 2018/19, the
Coloured households represented 55.25% of the total households in Drakenstein, followed by
Black African and White households, accounting for 23.65% and 20.78% respectively.
Table 3: Household breakdown by ethnic group
Source: Quantec Research, 2019 *Quantec data is regularly updated and figures may be different from those previously reported
1.3.3.4 Labour Profile
The total number of people employed within the Drakenstein municipal area increased by
1,445 or 1.3% to 111,306 in 2018/19, up from 109,861 reported for 2017/18. The wholesale,
retail trade, catering and accommodation sector recorded the biggest (631) increase in
employment, followed by the finance, insurance, real estate and business services. Other
noteworthy increases were reported by the construction sector (321), community, social and
Male Female Total Male Female Total Male Female Total
Column
Ref.A B C D E F G H I J
1 0-4 12,164 12,955 25,119 13,454 13,377 26,832 13,638 13,567 27,206
2 5-9 12,474 11,955 24,429 12,543 12,493 25,037 12,775 12,730 25,506
3 10-14 12,553 11,887 24,440 10,952 10,992 21,944 11,342 11,409 22,752
4 15-19 10,713 11,909 22,622 10,601 10,531 21,134 10,794 10,661 21,455
5 20-29 27,127 24,885 52,012 24,315 23,380 47,696 24,103 23,285 47,390
6 30-39 20,351 20,864 41,215 23,032 22,244 45,278 24,037 23,166 47,203
7 40-49 18,608 19,020 37,628 16,272 17,157 33,430 16,583 17,240 33,824
8 50-59 14,328 15,496 29,824 11,165 13,662 24,828 11,516 14,143 25,660
9 60-69 7,295 8,181 15,476 6,182 8,103 14,286 6,360 8,504 14,865
10 70+ 2,810 4,620 7,430 2,921 5,036 7,957 3,010 5,291 8,302
11 Totals 138,423 141,772 280,195 131,440 142,724 268,421 134,158 139,996 274,163
Population Details
Serial
No. Age
2016/2017 2017/2018 2018/2019
Serial
No. Ethnic Group 2016/2017 2017/2018
% share
2017/2018 2018/2019
% share
2018/2019
Column
Ref.A B C D E F
1 Black African 14,663 15,005 23.54% 15,398 23.65%
2 Coloured 34,572 35,259 55.31% 35,973 55.25%
3 Indian or Asian 197 202 0.32% 208 0.32%
4 White 12,949 13,276 20.83% 13,536 20.78%
5 Total 62,381 63,742 100% 65,115 100%
Household breakdown by ethnic group
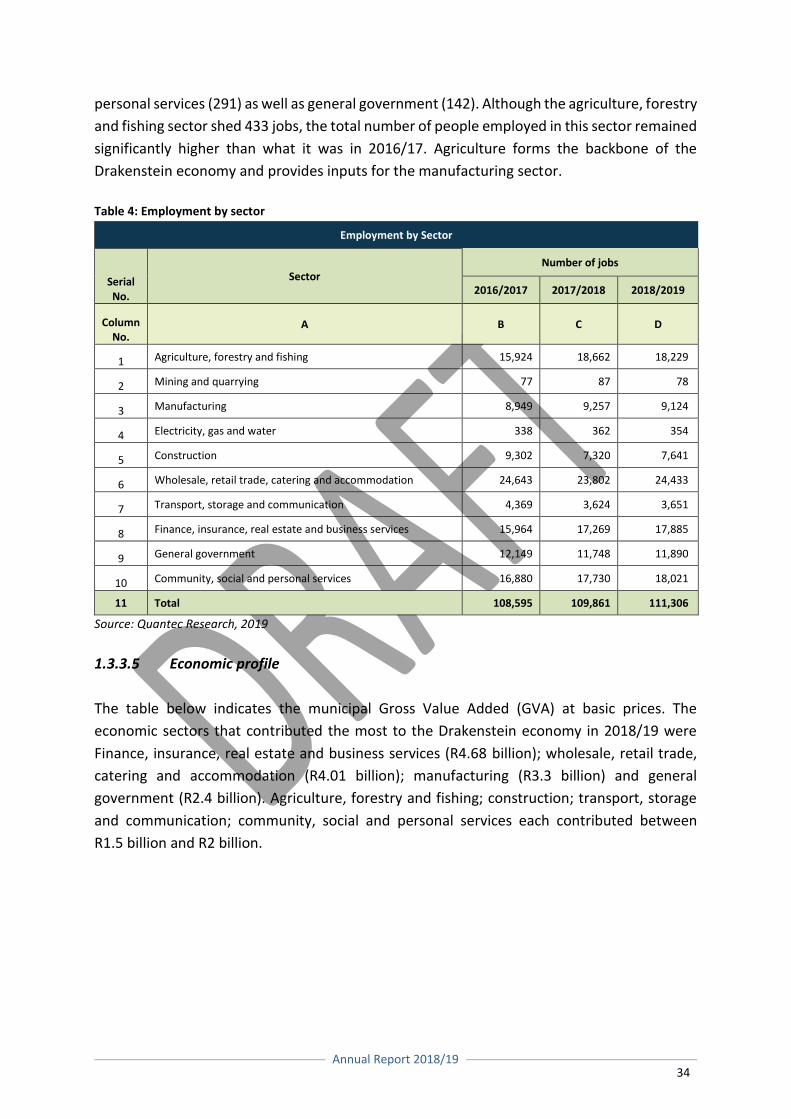
Annual Report 2018/19
34
personal services (291) as well as general government (142). Although the agriculture, forestry
and fishing sector shed 433 jobs, the total number of people employed in this sector remained
significantly higher than what it was in 2016/17. Agriculture forms the backbone of the
Drakenstein economy and provides inputs for the manufacturing sector.
Table 4: Employment by sector
Employment by Sector
Serial No.
Sector Number of jobs
2016/2017 2017/2018 2018/2019
Column No.
A B C D
1 Agriculture, forestry and fishing 15,924 18,662 18,229
2 Mining and quarrying 77 87 78
3 Manufacturing 8,949 9,257 9,124
4 Electricity, gas and water 338 362 354
5 Construction 9,302 7,320 7,641
6 Wholesale, retail trade, catering and accommodation 24,643 23,802 24,433
7 Transport, storage and communication 4,369 3,624 3,651
8 Finance, insurance, real estate and business services 15,964 17,269 17,885
9 General government 12,149 11,748 11,890
10 Community, social and personal services 16,880 17,730 18,021
11 Total 108,595 109,861 111,306
Source: Quantec Research, 2019
1.3.3.5 Economic profile
The table below indicates the municipal Gross Value Added (GVA) at basic prices. The
economic sectors that contributed the most to the Drakenstein economy in 2018/19 were
Finance, insurance, real estate and business services (R4.68 billion); wholesale, retail trade,
catering and accommodation (R4.01 billion); manufacturing (R3.3 billion) and general
government (R2.4 billion). Agriculture, forestry and fishing; construction; transport, storage
and communication; community, social and personal services each contributed between
R1.5 billion and R2 billion.
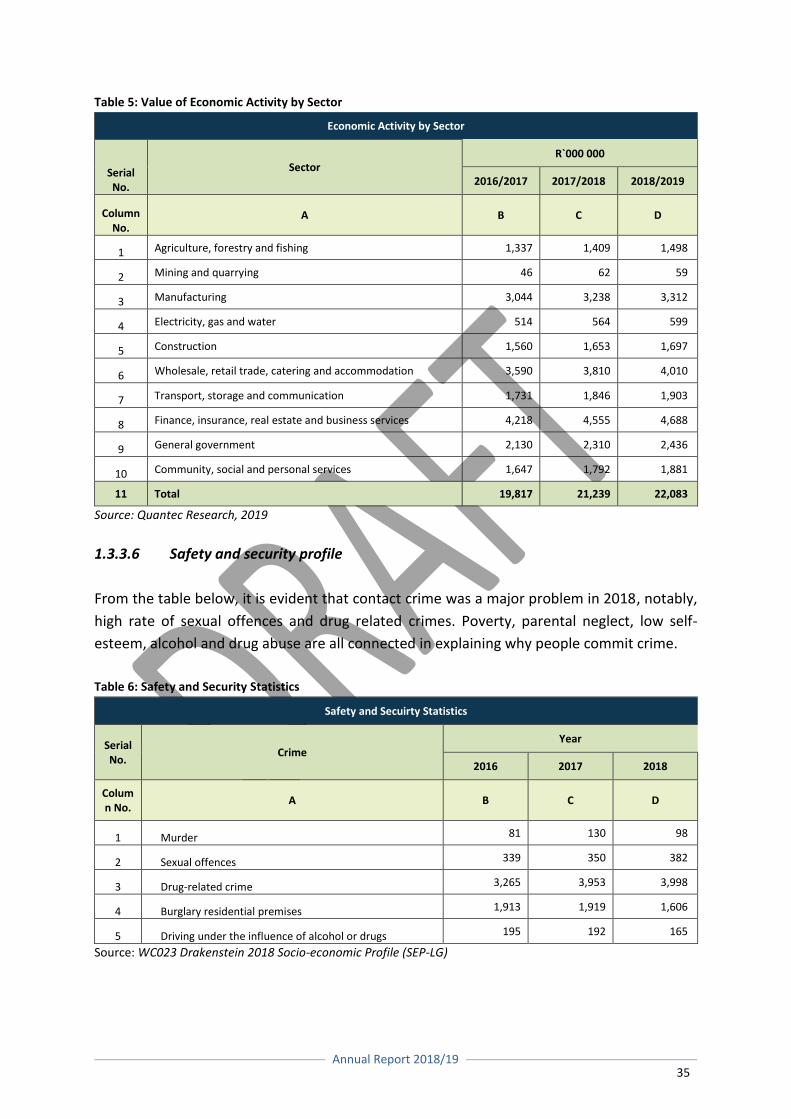
Annual Report 2018/19
35
Table 5: Value of Economic Activity by Sector
Economic Activity by Sector
Serial No.
Sector R`000 000
2016/2017 2017/2018 2018/2019
Column No.
A B C D
1 Agriculture, forestry and fishing 1,337 1,409 1,498
2 Mining and quarrying 46 62 59
3 Manufacturing 3,044 3,238 3,312
4 Electricity, gas and water 514 564 599
5 Construction 1,560 1,653 1,697
6 Wholesale, retail trade, catering and accommodation 3,590 3,810 4,010
7 Transport, storage and communication 1,731 1,846 1,903
8 Finance, insurance, real estate and business services 4,218 4,555 4,688
9 General government 2,130 2,310 2,436
10 Community, social and personal services 1,647 1,792 1,881
11 Total 19,817 21,239 22,083
Source: Quantec Research, 2019
1.3.3.6 Safety and security profile
From the table below, it is evident that contact crime was a major problem in 2018, notably,
high rate of sexual offences and drug related crimes. Poverty, parental neglect, low self-
esteem, alcohol and drug abuse are all connected in explaining why people commit crime.
Table 6: Safety and Security Statistics
Safety and Secuirty Statistics
Serial No.
Crime Year
2016 2017 2018
Column No.
A B C D
1 Murder 81 130 98
2 Sexual offences 339 350 382
3 Drug-related crime 3,265 3,953 3,998
4 Burglary residential premises 1,913 1,919 1,606
5 Driving under the influence of alcohol or drugs 195 192 165
Source: WC023 Drakenstein 2018 Socio-economic Profile (SEP-LG)
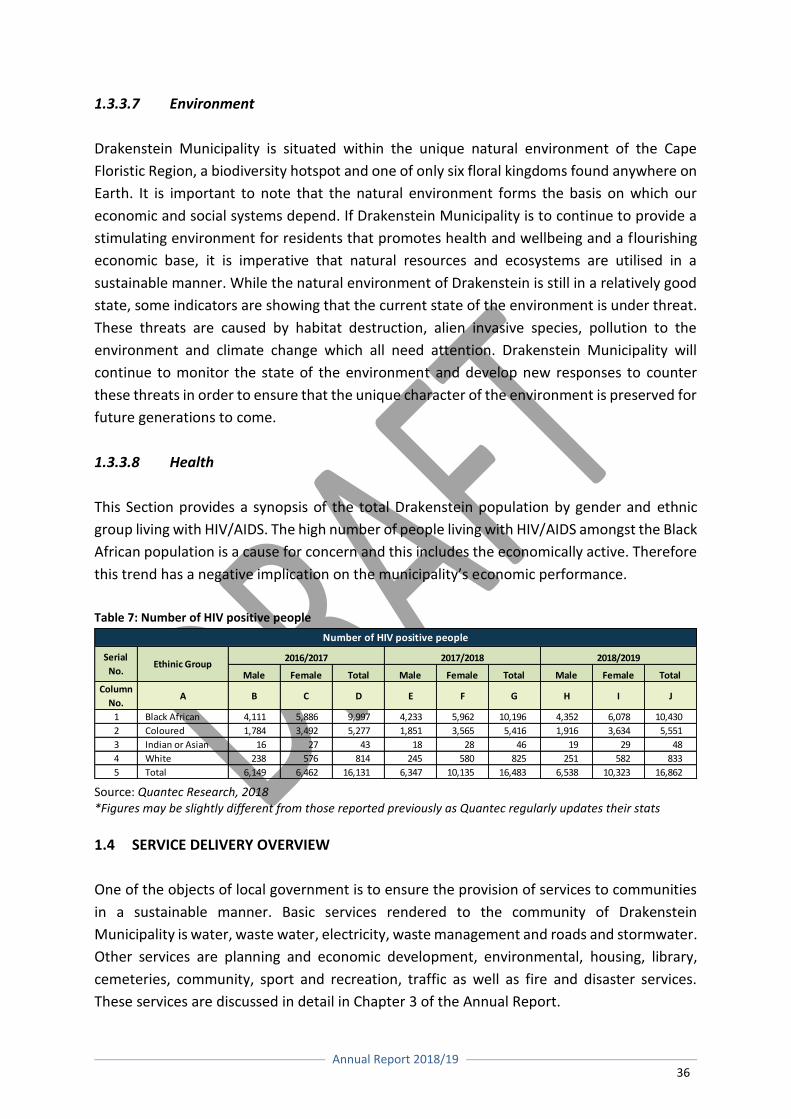
Annual Report 2018/19
36
1.3.3.7 Environment
Drakenstein Municipality is situated within the unique natural environment of the Cape
Floristic Region, a biodiversity hotspot and one of only six floral kingdoms found anywhere on
Earth. It is important to note that the natural environment forms the basis on which our
economic and social systems depend. If Drakenstein Municipality is to continue to provide a
stimulating environment for residents that promotes health and wellbeing and a flourishing
economic base, it is imperative that natural resources and ecosystems are utilised in a
sustainable manner. While the natural environment of Drakenstein is still in a relatively good
state, some indicators are showing that the current state of the environment is under threat.
These threats are caused by habitat destruction, alien invasive species, pollution to the
environment and climate change which all need attention. Drakenstein Municipality will
continue to monitor the state of the environment and develop new responses to counter
these threats in order to ensure that the unique character of the environment is preserved for
future generations to come.
1.3.3.8 Health
This Section provides a synopsis of the total Drakenstein population by gender and ethnic
group living with HIV/AIDS. The high number of people living with HIV/AIDS amongst the Black
African population is a cause for concern and this includes the economically active. Therefore
this trend has a negative implication on the municipality’s economic performance.
Table 7: Number of HIV positive people
Source: Quantec Research, 2018 *Figures may be slightly different from those reported previously as Quantec regularly updates their stats
1.4 SERVICE DELIVERY OVERVIEW
One of the objects of local government is to ensure the provision of services to communities
in a sustainable manner. Basic services rendered to the community of Drakenstein
Municipality is water, waste water, electricity, waste management and roads and stormwater.
Other services are planning and economic development, environmental, housing, library,
cemeteries, community, sport and recreation, traffic as well as fire and disaster services.
These services are discussed in detail in Chapter 3 of the Annual Report.
Male Female Total Male Female Total Male Female Total
Column
No.A B C D E F G H I J
1 Black African 4,111 5,886 9,997 4,233 5,962 10,196 4,352 6,078 10,430
2 Coloured 1,784 3,492 5,277 1,851 3,565 5,416 1,916 3,634 5,551
3 Indian or Asian 16 27 43 18 28 46 19 29 48
4 White 238 576 814 245 580 825 251 582 833
5 Total 6,149 6,462 16,131 6,347 10,135 16,483 6,538 10,323 16,862
Number of HIV positive people
2016/2017 2017/2018 2018/2019Serial
No.Ethinic Group
Annual Report 2018/19
37
1.4.1 Basic service delivery performance highlights
Water services invested R173.5 million in water infrastructure for the year under review.
These investments were in boreholes infrastructure, replacing bulk water and water
reticulation systems, reservoirs and water treatment works.
The upgrade of the Wellington and Paarl wastewater treatment plants has resulted in huge
dividends insofar as the improved effluent quality to the Berg River. The 2019/2020 capital
expenditure will focus on improving the instrumentation within our Scientific Services to
ensure that reliable analysis are conducted to enhance a high standard of process operations
to our wastewater treatment facilities.
The replacing of 66KV electricity cables between the Dalweiding, Palmiet and Parys 66/11KV
substations was the biggest electricity project. This investment amounted to R72.1 million and
together with other electricity projects the total investment in electricity infrastructure
amounted to R133.6 million for the year under review.
Solid waste mini drop-off facilities were constructed in Mbekweni, along the R301 at a cost of
R180,000. Polywood Street refuse bins to the value of R190,000 were purchased and placed
within Paarl and Wellington CBD.
The biggest investment in road and stormwater infrastructure was the R39.3 million for the
upgrading of the Berg River Boulevard between Lady Grey and Optenhorst Streets to a dual
carriageway.
1.4.2 Basic service delivery challenges
The biggest challenge for rendering water services is to secure water during periods of
drought. The current funding needs to invest in water infrastructure is R2.64 billion and this
will have to be addressed in the next 10 to 15 years.
The biggest challenge for rendering waste water services is to complete the upgrade of the
Paarl Waste Water Treatment Works at an estimated R236 million. The current funding needs
to invest in waste water infrastructure is R1.1 billion and this will have to be addressed in the
next five to ten years.
To ensure electricity supply to all Drakenstein future consumers and to accommodate all
future developments, serious investment in electricity infrastructure needs to take place. At
least one 40MVA and two 20MVA new electricity substations needs to be constructed.
Furthermore, the Parys, Palmiet, Denneburg, Dwarsrivier and Slot of the Paarl (five)
Annual Report 2018/19
38
substations, needs to be upgraded from a 15MVA to a 20MVA transformers. This co-inside
with the upgrade of 66KV cables to 132KV lines to cater for new demands and densification.
The landfill airspace survey conducted in November 2018 indicated that the remaining useful
life of the Wellington Landfill site is till August 2020. An application has been submitted to
DEA&DP, to increase the current height of 12 metres to 18 metres. This will extend the lifespan
of the facility with 5 to 7 years. A consultant has been appointed to investigate alternative
disposal methods in order to maximise the useful life of the facility.
Some progress has been made in the development of infrastructure in road and storm water.
Resealing of streets in accordance with the pavement management system led to a reduction
in the formation of potholes and attention to refurbishment of storm water systems resulted
in the reduction of maintenance.
Roads and stormwater infrastructure needs amounts to R0,9 billion. The construction of the
Berg River Boulevard from Optenhorst Street to the R45 will cost an estimated R370 million.
This project must be instigated by the Department of Transport and Public Works in
conjunction with Drakenstein municipality with the route planning and expropriation of the
required land between Retief Street and the R45 being the first phase. The completion of this
project will have the effect of redistributing the traffic congestion by providing alternative
routes.
The greater Vlakkeland, Groenheuwel and adjoining areas requires substantial investment in
stormwater development to mitigate the risk of flooding in the low-lying areas. The estimated
cost for this action is R148 million.
1.4.3 Proportion of households with access to basic services
All formal households have access to electricity, water, waste water and waste management
services.
All backyarders (estimated to be 2,972 households) do have access to electricity, water, waste
water and waste management services on the formal site.
The 41 informal settlements comprising of 5,999 households and an estimated 10,846
residents do have access to water, waste water and waste management services. A total of
3,027 informal structures do not have access to electricity.
Annual Report 2018/19
39
1.5 FINANCIAL HEALTH OVERVIEW
The Municipality has made a concerted effort to ensure that the limited resources of the
organisation are utilised in a sustainable and responsible manner. The financial overview of
the organisation can be summarised as follows:
The Municipality has a significant revenue base that continues to grow substantially when
compared with previous years. This revenue base has enabled the organisation to aggressively
increase the external gearing to address its capital infrastructure needs. However, future
increases in tariffs would have to be benchmarked against the consumer’s ability to pay.
Lower tariff increases coupled with higher inflation and slower economic growth could
hamper the Municipality’s infrastructure investment programme.
The liquidity levels of the organisation are under strain, as a decline in the current assets to
current liabilities ratio materialised due to the aggressive investment in bulk infrastructure
that led to the short-term portion of external borrowings increasing significantly. The liquidity
ratio (current assets/current liabilities) of the organisation as at 30 June 2019, was 0.61 to 1
as opposed to the ratios of 0.95 to 1 (2017/18), 1.17 to 1 (2016/17), 1.30 to 1 (2015/16) and
1.09 to 1 (2014/15) for the previous four financial years. The municipality predicted certain
growth patterns - linked to the investment in bulk infrastructure - which have not materialised
as planned due to both a slowdown in the economy of South Africa as well as the severe
drought experienced by the Western Cape in the past 4 years, which has significantly affected
revenue streams. The Municipality is still confident that the growth in medium to high income
developments are increasing, albeit slower than expected 4 years ago. This is seen in the
developments south of Boland Cricket stadium, Paarl south of the N1 as well as around
Wellington.
The overall financial operational performance of the organisation can be considered as being
finely balanced with very little room for budgetary mistakes. The Auditor-General assessed
the overall financial viability of the Municipality as at 30 June 2019 as yellow (concerning).
1.5.1 Statement of Financial Performance Overview
The actual deficit of R43.7 million for the 2018/19 financial year compared with the final
adjustments budget deficit of R6.5 million resulted in a negative variance of R37.2 million. The
main reason for that was an additional R33.9 million indigent subsidy given to indigent
households over and above the R137.5 million equitable share received for the provision of
free basic services to indigent households.
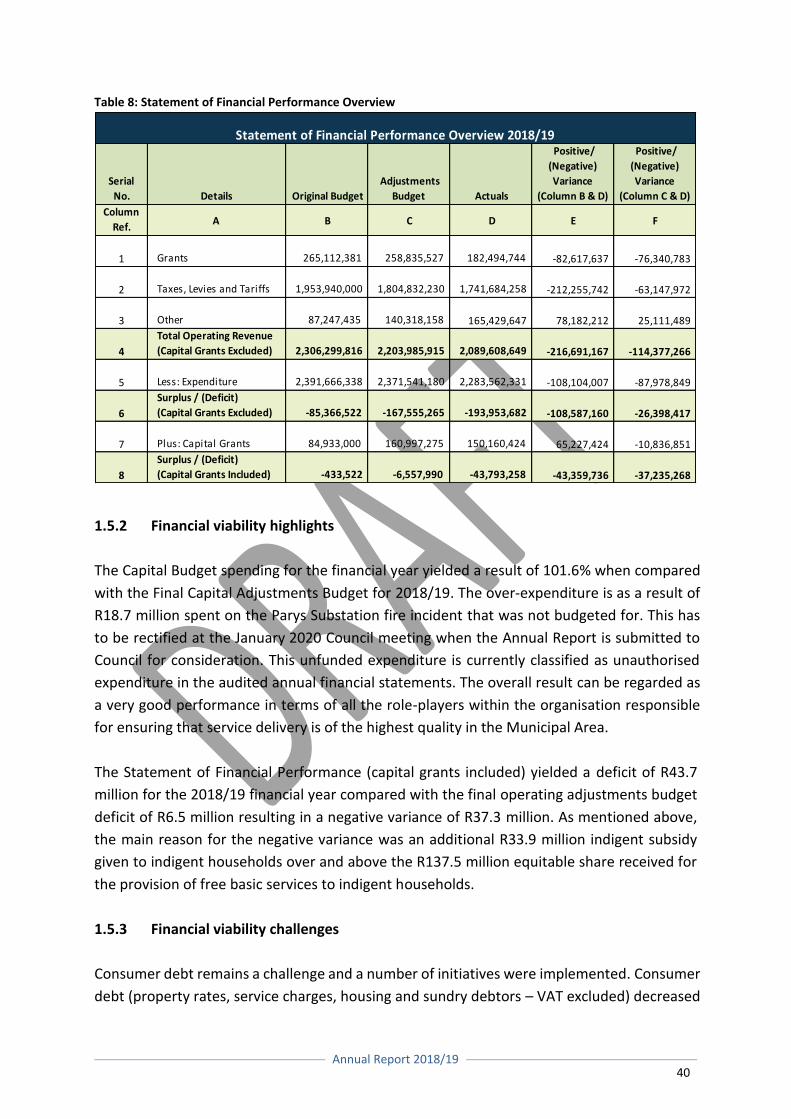
Annual Report 2018/19
40
Table 8: Statement of Financial Performance Overview
1.5.2 Financial viability highlights
The Capital Budget spending for the financial year yielded a result of 101.6% when compared
with the Final Capital Adjustments Budget for 2018/19. The over-expenditure is as a result of
R18.7 million spent on the Parys Substation fire incident that was not budgeted for. This has
to be rectified at the January 2020 Council meeting when the Annual Report is submitted to
Council for consideration. This unfunded expenditure is currently classified as unauthorised
expenditure in the audited annual financial statements. The overall result can be regarded as
a very good performance in terms of all the role-players within the organisation responsible
for ensuring that service delivery is of the highest quality in the Municipal Area.
The Statement of Financial Performance (capital grants included) yielded a deficit of R43.7
million for the 2018/19 financial year compared with the final operating adjustments budget
deficit of R6.5 million resulting in a negative variance of R37.3 million. As mentioned above,
the main reason for the negative variance was an additional R33.9 million indigent subsidy
given to indigent households over and above the R137.5 million equitable share received for
the provision of free basic services to indigent households.
1.5.3 Financial viability challenges
Consumer debt remains a challenge and a number of initiatives were implemented. Consumer
debt (property rates, service charges, housing and sundry debtors – VAT excluded) decreased
Serial
No. Details Original Budget
Adjustments
Budget Actuals
Positive/
(Negative)
Variance
(Column B & D)
Positive/
(Negative)
Variance
(Column C & D)
Column
Ref.A B C D E F
1 Grants 265,112,381 258,835,527 182,494,744 -82,617,637 -76,340,783
2 Taxes, Levies and Tariffs 1,953,940,000 1,804,832,230 1,741,684,258 -212,255,742 -63,147,972
3 Other 87,247,435 140,318,158 165,429,647 78,182,212 25,111,489
4
Total Operating Revenue
(Capital Grants Excluded) 2,306,299,816 2,203,985,915 2,089,608,649 -216,691,167 -114,377,266
5 Less: Expenditure 2,391,666,338 2,371,541,180 2,283,562,331 -108,104,007 -87,978,849
6
Surplus / (Deficit)
(Capital Grants Excluded) -85,366,522 -167,555,265 -193,953,682 -108,587,160 -26,398,417
7 Plus: Capital Grants 84,933,000 160,997,275 150,160,424 65,227,424 -10,836,851
8
Surplus / (Deficit)
(Capital Grants Included) -433,522 -6,557,990 -43,793,258 -43,359,736 -37,235,268
Statement of Financial Performance Overview 2018/19
Annual Report 2018/19
41
by R34.3 million from R308.8 million as at 30 June 2018 to R274.5 million as at 30 June 2019.
Although the outstanding balance has decreased, it should be seen against the higher than
expected irrecoverable debt that was written off during the year. The relationship between
the ever-increasing tariffs and outstanding debtors is an indication that consumers are
struggling to meet their obligations in terms of payment for services. The worsening economic
climate puts pressure not only on the world economy, but also filters down to households in
municipalities globally.
The debtors’ payment period for the 2018/19 financial year (before considering the provision
for impairment) was 59.2 days, which is below the targeted number of 70 days. The number
of days for the 2017/18 financial year (before considering the provision for impairment) was
77.4 days. The Municipality’s debtors’ collection period in days (after impairment) decreased
to 45.2 days as at 30 June 2019 compared with the 47.5 days as at 30 June 2018. The
Municipality’s debtors’ collection period in days (before impairment) decreased by 18.2 days
and the Municipality’s debtors’ collection period in days (after impairment) decreased by
2.3 days during the financial year under review.
The ability of Council to finance the capital programme from internally generated funds
remains a big challenge. This challenge has an inverse relationship with the increasing external
loan debt of Council, which amounted to 78.4% of total operating revenue (conditional capital
and operational grants excluded) at the end of the 2018/19 financial year. Although Council
policy wise has capped the gearing ratio percentage at 50%, urgent upgrades in revenue
generating bulk infrastructure to enable increased development and therefore an increased
revenue base necessitated that we accelerate our capital programme. Investment in bulk
infrastructure was needed, such as the upgrading of the bulk sewerage line in Southern Paarl,
upgrading of the Wellington WWTW, upgrading of 66Kv electricity cable networks,
construction of the Courtrai reservoir and upgrading of Berg River Boulevard, to unlock any
further developments in order to attract investors that can broaden the Municipality’s tax
base.
In terms of future infrastructure investments, a less aggressive approach will be followed as
from the 2019/20 financial year to ensure that the gearing ratio will decrease to about 73.6%
in the 2019/20 financial year and to about 46.9% in accordance with the Long Term Financial
Plan by the 2023/24 financial year. The Municipality has restructured a major part of its current
10 year external loans in the first half of the 2019/20 financial year and has resolved not to
take up any further new external loans so as to reduce the gearing ratio.
The Municipality envisage to generate an operating cash surplus for the 2019/20 financial year
and to generate sustainable operating cash surpluses for the subsequent financial years for
infrastructure investment. This approach will reduce the Municipality’s dependency on
external borrowings for capital infrastructure investment.
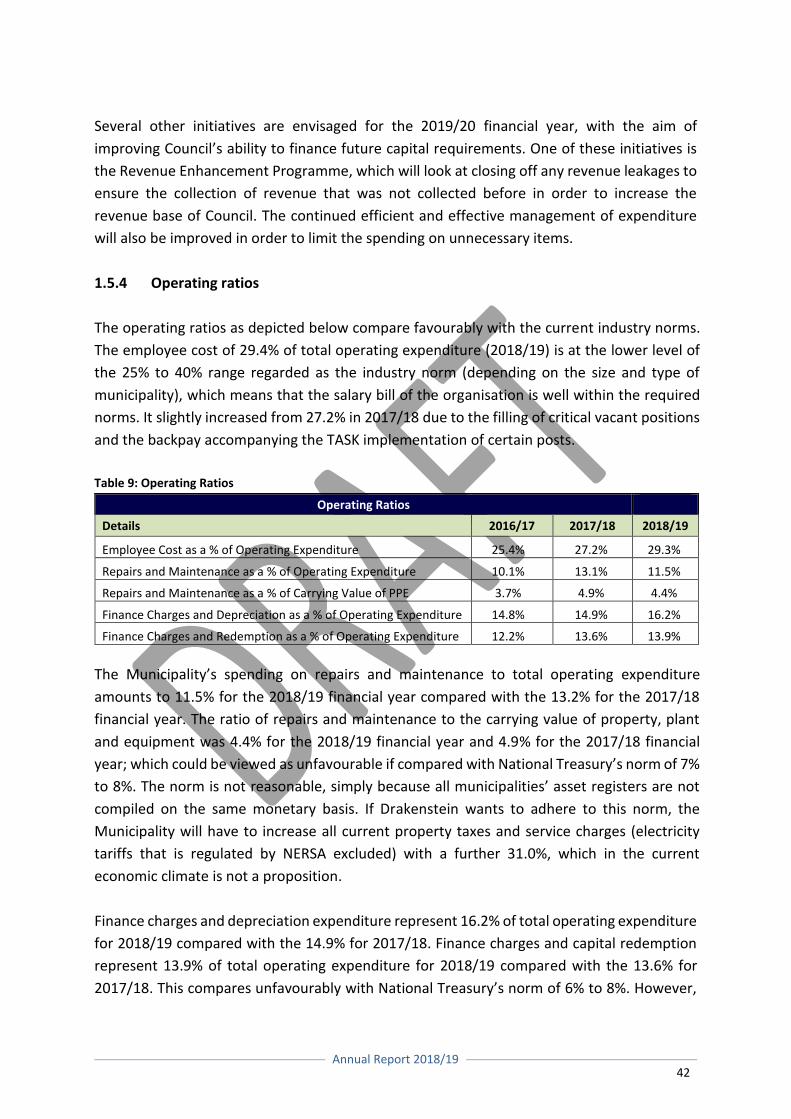
Annual Report 2018/19
42
Several other initiatives are envisaged for the 2019/20 financial year, with the aim of
improving Council’s ability to finance future capital requirements. One of these initiatives is
the Revenue Enhancement Programme, which will look at closing off any revenue leakages to
ensure the collection of revenue that was not collected before in order to increase the
revenue base of Council. The continued efficient and effective management of expenditure
will also be improved in order to limit the spending on unnecessary items.
1.5.4 Operating ratios
The operating ratios as depicted below compare favourably with the current industry norms.
The employee cost of 29.4% of total operating expenditure (2018/19) is at the lower level of
the 25% to 40% range regarded as the industry norm (depending on the size and type of
municipality), which means that the salary bill of the organisation is well within the required
norms. It slightly increased from 27.2% in 2017/18 due to the filling of critical vacant positions
and the backpay accompanying the TASK implementation of certain posts.
Table 9: Operating Ratios
Operating Ratios
Details 2016/17 2017/18 2018/19
Employee Cost as a % of Operating Expenditure 25.4% 27.2% 29.3%
Repairs and Maintenance as a % of Operating Expenditure 10.1% 13.1% 11.5%
Repairs and Maintenance as a % of Carrying Value of PPE 3.7% 4.9% 4.4%
Finance Charges and Depreciation as a % of Operating Expenditure 14.8% 14.9% 16.2%
Finance Charges and Redemption as a % of Operating Expenditure 12.2% 13.6% 13.9%
The Municipality’s spending on repairs and maintenance to total operating expenditure
amounts to 11.5% for the 2018/19 financial year compared with the 13.2% for the 2017/18
financial year. The ratio of repairs and maintenance to the carrying value of property, plant
and equipment was 4.4% for the 2018/19 financial year and 4.9% for the 2017/18 financial
year; which could be viewed as unfavourable if compared with National Treasury’s norm of 7%
to 8%. The norm is not reasonable, simply because all municipalities’ asset registers are not
compiled on the same monetary basis. If Drakenstein wants to adhere to this norm, the
Municipality will have to increase all current property taxes and service charges (electricity
tariffs that is regulated by NERSA excluded) with a further 31.0%, which in the current
economic climate is not a proposition.
Finance charges and depreciation expenditure represent 16.2% of total operating expenditure
for 2018/19 compared with the 14.9% for 2017/18. Finance charges and capital redemption
represent 13.9% of total operating expenditure for 2018/19 compared with the 13.6% for
2017/18. This compares unfavourably with National Treasury’s norm of 6% to 8%. However,
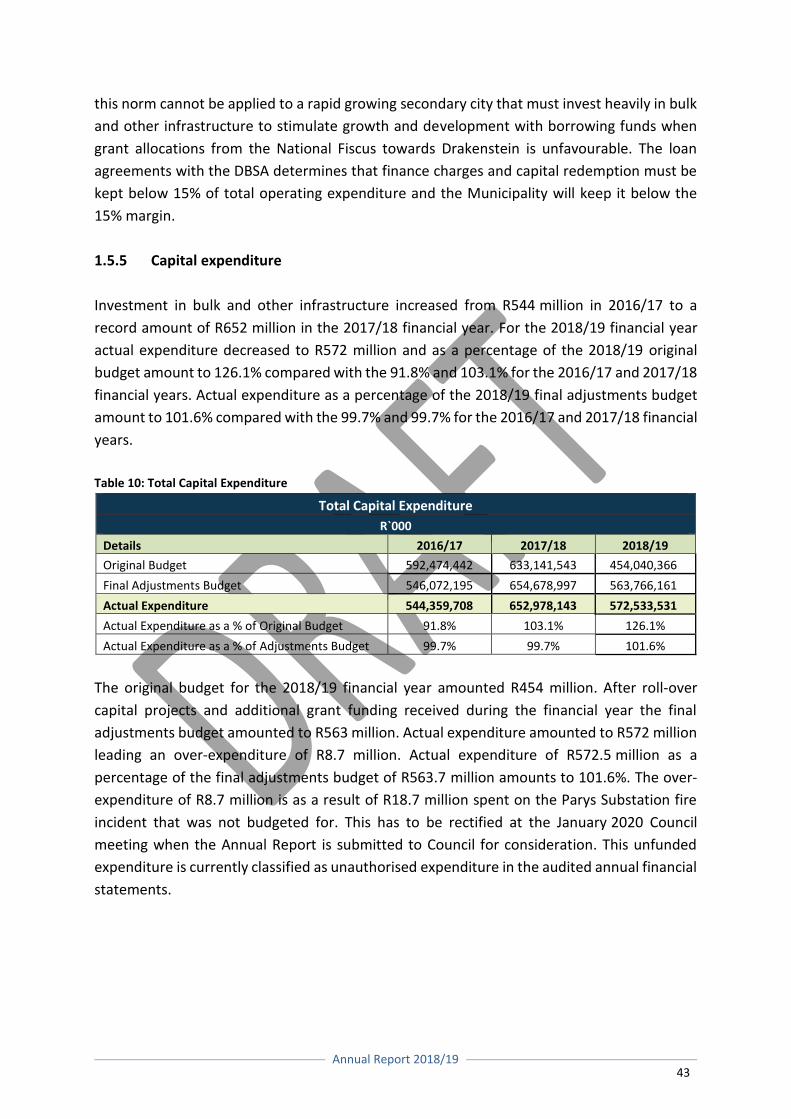
Annual Report 2018/19
43
this norm cannot be applied to a rapid growing secondary city that must invest heavily in bulk
and other infrastructure to stimulate growth and development with borrowing funds when
grant allocations from the National Fiscus towards Drakenstein is unfavourable. The loan
agreements with the DBSA determines that finance charges and capital redemption must be
kept below 15% of total operating expenditure and the Municipality will keep it below the
15% margin.
1.5.5 Capital expenditure
Investment in bulk and other infrastructure increased from R544 million in 2016/17 to a
record amount of R652 million in the 2017/18 financial year. For the 2018/19 financial year
actual expenditure decreased to R572 million and as a percentage of the 2018/19 original
budget amount to 126.1% compared with the 91.8% and 103.1% for the 2016/17 and 2017/18
financial years. Actual expenditure as a percentage of the 2018/19 final adjustments budget
amount to 101.6% compared with the 99.7% and 99.7% for the 2016/17 and 2017/18 financial
years.
Table 10: Total Capital Expenditure
Total Capital Expenditure
R`000
Details 2016/17 2017/18 2018/19
Original Budget 592,474,442 633,141,543 454,040,366
Final Adjustments Budget 546,072,195 654,678,997 563,766,161
Actual Expenditure 544,359,708 652,978,143 572,533,531
Actual Expenditure as a % of Original Budget 91.8% 103.1% 126.1%
Actual Expenditure as a % of Adjustments Budget 99.7% 99.7% 101.6%
The original budget for the 2018/19 financial year amounted R454 million. After roll-over
capital projects and additional grant funding received during the financial year the final
adjustments budget amounted to R563 million. Actual expenditure amounted to R572 million
leading an over-expenditure of R8.7 million. Actual expenditure of R572.5 million as a
percentage of the final adjustments budget of R563.7 million amounts to 101.6%. The over-
expenditure of R8.7 million is as a result of R18.7 million spent on the Parys Substation fire
incident that was not budgeted for. This has to be rectified at the January 2020 Council
meeting when the Annual Report is submitted to Council for consideration. This unfunded
expenditure is currently classified as unauthorised expenditure in the audited annual financial
statements.
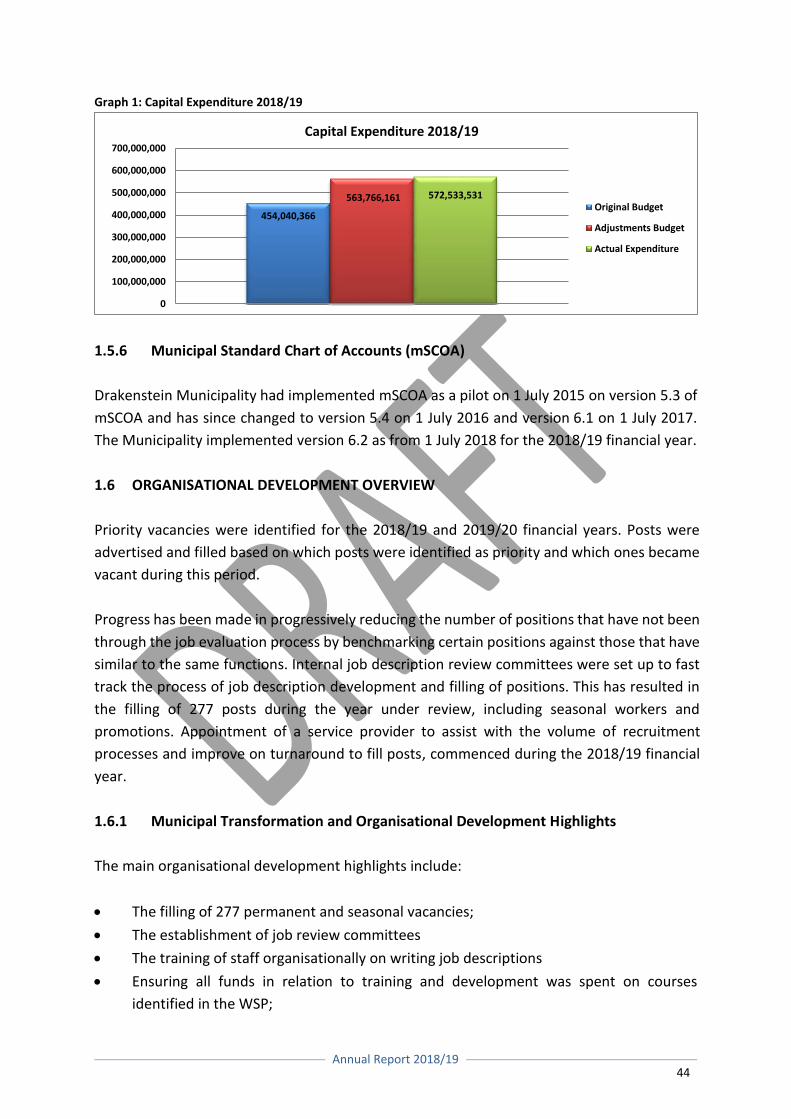
Annual Report 2018/19
44
Graph 1: Capital Expenditure 2018/19
1.5.6 Municipal Standard Chart of Accounts (mSCOA)
Drakenstein Municipality had implemented mSCOA as a pilot on 1 July 2015 on version 5.3 of
mSCOA and has since changed to version 5.4 on 1 July 2016 and version 6.1 on 1 July 2017.
The Municipality implemented version 6.2 as from 1 July 2018 for the 2018/19 financial year.
1.6 ORGANISATIONAL DEVELOPMENT OVERVIEW
Priority vacancies were identified for the 2018/19 and 2019/20 financial years. Posts were
advertised and filled based on which posts were identified as priority and which ones became
vacant during this period.
Progress has been made in progressively reducing the number of positions that have not been
through the job evaluation process by benchmarking certain positions against those that have
similar to the same functions. Internal job description review committees were set up to fast
track the process of job description development and filling of positions. This has resulted in
the filling of 277 posts during the year under review, including seasonal workers and
promotions. Appointment of a service provider to assist with the volume of recruitment
processes and improve on turnaround to fill posts, commenced during the 2018/19 financial
year.
1.6.1 Municipal Transformation and Organisational Development Highlights
The main organisational development highlights include:
The filling of 277 permanent and seasonal vacancies;
The establishment of job review committees
The training of staff organisationally on writing job descriptions
Ensuring all funds in relation to training and development was spent on courses
identified in the WSP;
454,040,366
563,766,161 572,533,531
0
100,000,000
200,000,000
300,000,000
400,000,000
500,000,000
600,000,000
700,000,000
Capital Expenditure 2018/19
Original Budget
Adjustments Budget
Actual Expenditure
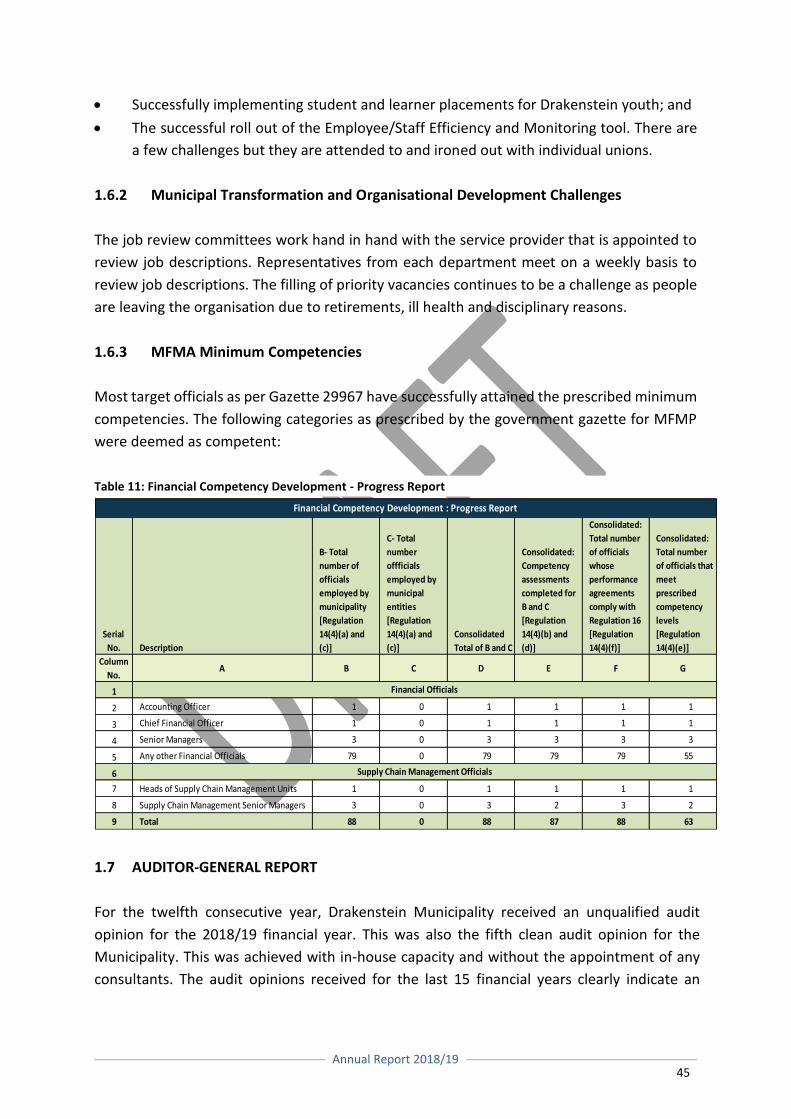
Annual Report 2018/19
45
Successfully implementing student and learner placements for Drakenstein youth; and
The successful roll out of the Employee/Staff Efficiency and Monitoring tool. There are
a few challenges but they are attended to and ironed out with individual unions.
1.6.2 Municipal Transformation and Organisational Development Challenges
The job review committees work hand in hand with the service provider that is appointed to
review job descriptions. Representatives from each department meet on a weekly basis to
review job descriptions. The filling of priority vacancies continues to be a challenge as people
are leaving the organisation due to retirements, ill health and disciplinary reasons.
1.6.3 MFMA Minimum Competencies
Most target officials as per Gazette 29967 have successfully attained the prescribed minimum
competencies. The following categories as prescribed by the government gazette for MFMP
were deemed as competent:
1.7 AUDITOR-GENERAL REPORT
For the twelfth consecutive year, Drakenstein Municipality received an unqualified audit
opinion for the 2018/19 financial year. This was also the fifth clean audit opinion for the
Municipality. This was achieved with in-house capacity and without the appointment of any
consultants. The audit opinions received for the last 15 financial years clearly indicate an
Table 11: Financial Competency Development - Progress Report
Serial
No. Description
B- Total
number of
officials
employed by
municipality
[Regulation
14(4)(a) and
(c)]
C- Total
number
offficials
employed by
municipal
entities
[Regulation
14(4)(a) and
(c)]
Consolidated
Total of B and C
Consolidated:
Competency
assessments
completed for
B and C
[Regulation
14(4)(b) and
(d)]
Consolidated:
Total number
of officials
whose
performance
agreements
comply with
Regulation 16
[Regulation
14(4)(f)]
Consolidated:
Total number
of officials that
meet
prescribed
competency
levels
[Regulation
14(4)(e)]
Column
No.A B C D E F G
1
2 Accounting Officer 1 0 1 1 1 1
3 Chief Financial Officer 1 0 1 1 1 1
4 Senior Managers 3 0 3 3 3 3
5 Any other Financial Officials 79 0 79 79 79 55
6
7 Heads of Supply Chain Management Units 1 0 1 1 1 1
8 Supply Chain Management Senior Managers 3 0 3 2 3 2
9 Total 88 0 88 87 88 63
Supply Chain Management Officials
Financial Officials
Financial Competency Development : Progress Report
Annual Report 2018/19
46
improvement in leadership and control on the matters that the Auditor-General focuses on
during its audits:
1.7.1 Audited outcomes
2018/19: Unqualified audit opinion with no other matters (clean audit opinion);
2017/18: Unqualified audit opinion with other matters;
2016/17: Unqualified audit opinion with no other matters (clean audit opinion);
2015/16: Unqualified audit opinion with no other matters (clean audit opinion);
2014/15: Unqualified audit opinion with no other matters (clean audit opinion);
2013/14: Unqualified audit opinion with no other matters (clean audit opinion);
2012/13: Unqualified audit opinion with other matters;
2011/12: Unqualified audit opinion with other matters;
2010/11: Unqualified audit opinion with other matters;
2009/10: Unqualified audit opinion with other matters;
2008/09: Unqualified audit opinion with other matters;
2007/08: Unqualified audit opinion with other matters;
2006/07: Qualified audit opinion with other matters;
2005/06: Qualified audit opinion with other matters; and
2004/05: Qualified audit opinion with other matters.
The unqualified and qualified audit opinions have to do with the Annual Financial Statements.
The other matters deal with predetermined objectives and legislative compliance issues.
Further details can be found in the Audit Outcome Improvement Plan attached as Volume III
to the Annual Report 2018/19.
1.8 STATUTORY ANNUAL REPORT PROCESS
The statutory processes to follow to compile an Annual Report are depicted in the table below.
The process starts in July each year with the compilation of the Annual Report and continues
until the end of March the following year when Council accepts the Annual Report and the
Oversight Report on the Annual Report.
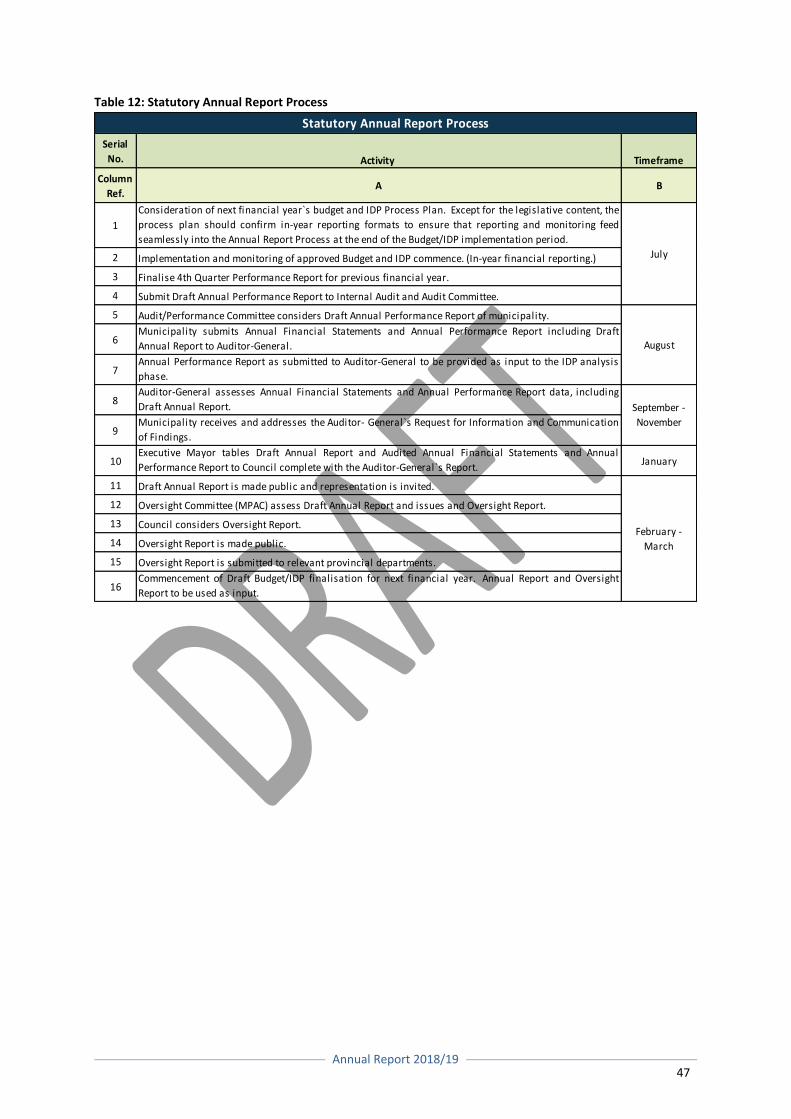
Annual Report 2018/19
47
Table 12: Statutory Annual Report Process
Serial
No. Activity Timeframe
Column
Ref.A B
1
Consideration of next financial year`s budget and IDP Process Plan. Except for the legislative content, the
process plan should confirm in-year reporting formats to ensure that reporting and monitoring feed
seamlessly into the Annual Report Process at the end of the Budget/IDP implementation period.
2 Implementation and monitoring of approved Budget and IDP commence. (In-year financial reporting.)
3 Finalise 4th Quarter Performance Report for previous financial year.
4 Submit Draft Annual Performance Report to Internal Audit and Audit Committee.
5 Audit/Performance Committee considers Draft Annual Performance Report of municipality.
6Municipality submits Annual Financial Statements and Annual Performance Report including Draft
Annual Report to Auditor-General.
7Annual Performance Report as submitted to Auditor-General to be provided as input to the IDP analysis
phase.
8Auditor-General assesses Annual Financial Statements and Annual Performance Report data, including
Draft Annual Report.
9Municipality receives and addresses the Auditor- General`s Request for Information and Communication
of Findings.
10Executive Mayor tables Draft Annual Report and Audited Annual Financial Statements and Annual
Performance Report to Council complete with the Auditor-General`s Report.January
11 Draft Annual Report is made public and representation is invited.
12 Oversight Committee (MPAC) assess Draft Annual Report and issues and Oversight Report.
13 Council considers Oversight Report.
14 Oversight Report is made public.
15 Oversight Report is submitted to relevant provincial departments.
16Commencement of Draft Budget/IDP finalisation for next financial year. Annual Report and Oversight
Report to be used as input.
July
August
September -
November
February -
March
Statutory Annual Report Process
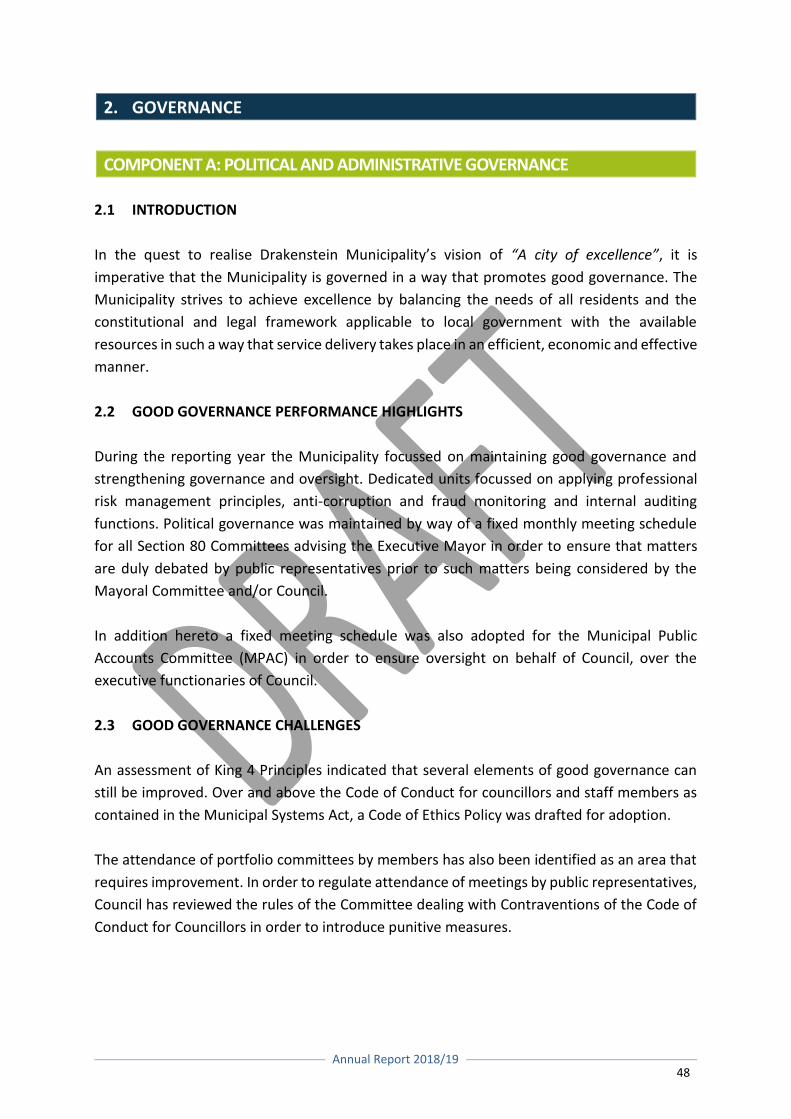
Annual Report 2018/19
48
2. GOVERNANCE
COMPONENT A: POLITICAL AND ADMINISTRATIVE GOVERNANCE
2.1 INTRODUCTION
In the quest to realise Drakenstein Municipality’s vision of “A city of excellence”, it is
imperative that the Municipality is governed in a way that promotes good governance. The
Municipality strives to achieve excellence by balancing the needs of all residents and the
constitutional and legal framework applicable to local government with the available
resources in such a way that service delivery takes place in an efficient, economic and effective
manner.
2.2 GOOD GOVERNANCE PERFORMANCE HIGHLIGHTS
During the reporting year the Municipality focussed on maintaining good governance and
strengthening governance and oversight. Dedicated units focussed on applying professional
risk management principles, anti-corruption and fraud monitoring and internal auditing
functions. Political governance was maintained by way of a fixed monthly meeting schedule
for all Section 80 Committees advising the Executive Mayor in order to ensure that matters
are duly debated by public representatives prior to such matters being considered by the
Mayoral Committee and/or Council.
In addition hereto a fixed meeting schedule was also adopted for the Municipal Public
Accounts Committee (MPAC) in order to ensure oversight on behalf of Council, over the
executive functionaries of Council.
2.3 GOOD GOVERNANCE CHALLENGES
An assessment of King 4 Principles indicated that several elements of good governance can
still be improved. Over and above the Code of Conduct for councillors and staff members as
contained in the Municipal Systems Act, a Code of Ethics Policy was drafted for adoption.
The attendance of portfolio committees by members has also been identified as an area that
requires improvement. In order to regulate attendance of meetings by public representatives,
Council has reviewed the rules of the Committee dealing with Contraventions of the Code of
Conduct for Councillors in order to introduce punitive measures.
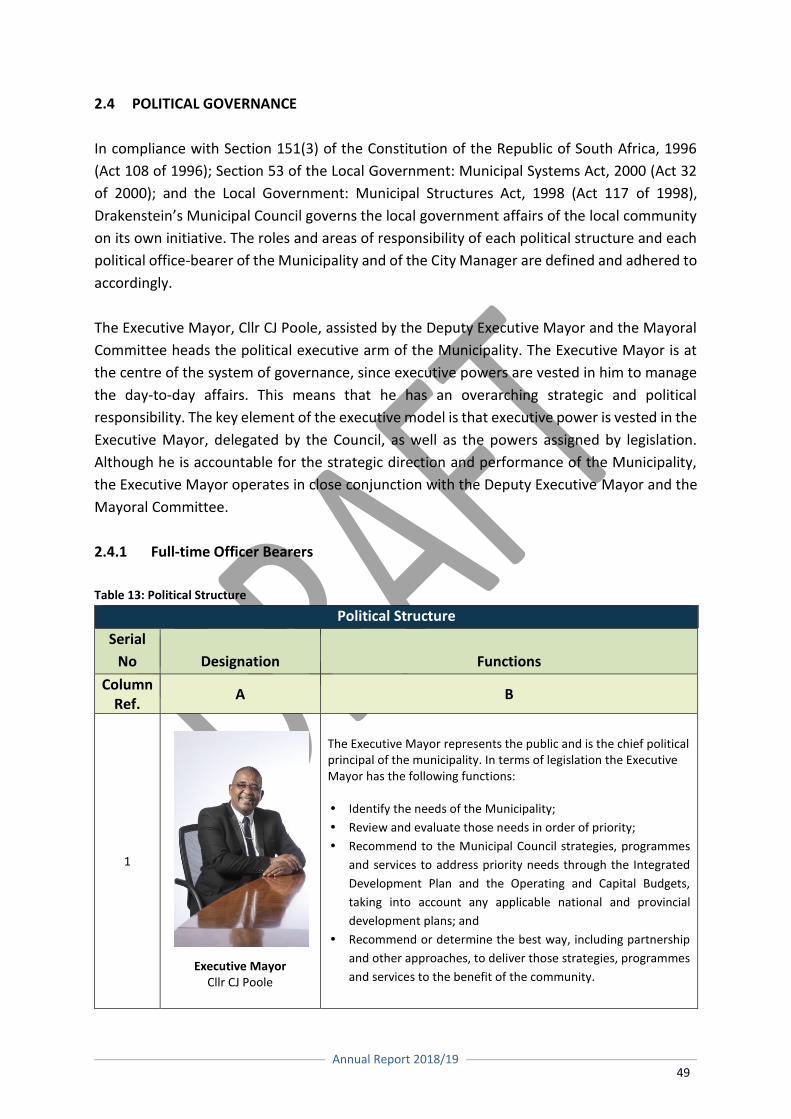
Annual Report 2018/19
49
2.4 POLITICAL GOVERNANCE
In compliance with Section 151(3) of the Constitution of the Republic of South Africa, 1996
(Act 108 of 1996); Section 53 of the Local Government: Municipal Systems Act, 2000 (Act 32
of 2000); and the Local Government: Municipal Structures Act, 1998 (Act 117 of 1998),
Drakenstein’s Municipal Council governs the local government affairs of the local community
on its own initiative. The roles and areas of responsibility of each political structure and each
political office-bearer of the Municipality and of the City Manager are defined and adhered to
accordingly.
The Executive Mayor, Cllr CJ Poole, assisted by the Deputy Executive Mayor and the Mayoral
Committee heads the political executive arm of the Municipality. The Executive Mayor is at
the centre of the system of governance, since executive powers are vested in him to manage
the day-to-day affairs. This means that he has an overarching strategic and political
responsibility. The key element of the executive model is that executive power is vested in the
Executive Mayor, delegated by the Council, as well as the powers assigned by legislation.
Although he is accountable for the strategic direction and performance of the Municipality,
the Executive Mayor operates in close conjunction with the Deputy Executive Mayor and the
Mayoral Committee.
2.4.1 Full-time Officer Bearers
Table 13: Political Structure
Political Structure
Serial
No Designation Functions
Column Ref.
A B
1
Executive Mayor Cllr CJ Poole
The Executive Mayor represents the public and is the chief political principal of the municipality. In terms of legislation the Executive Mayor has the following functions: Identify the needs of the Municipality;
Review and evaluate those needs in order of priority;
Recommend to the Municipal Council strategies, programmes
and services to address priority needs through the Integrated
Development Plan and the Operating and Capital Budgets,
taking into account any applicable national and provincial
development plans; and
Recommend or determine the best way, including partnership
and other approaches, to deliver those strategies, programmes
and services to the benefit of the community.
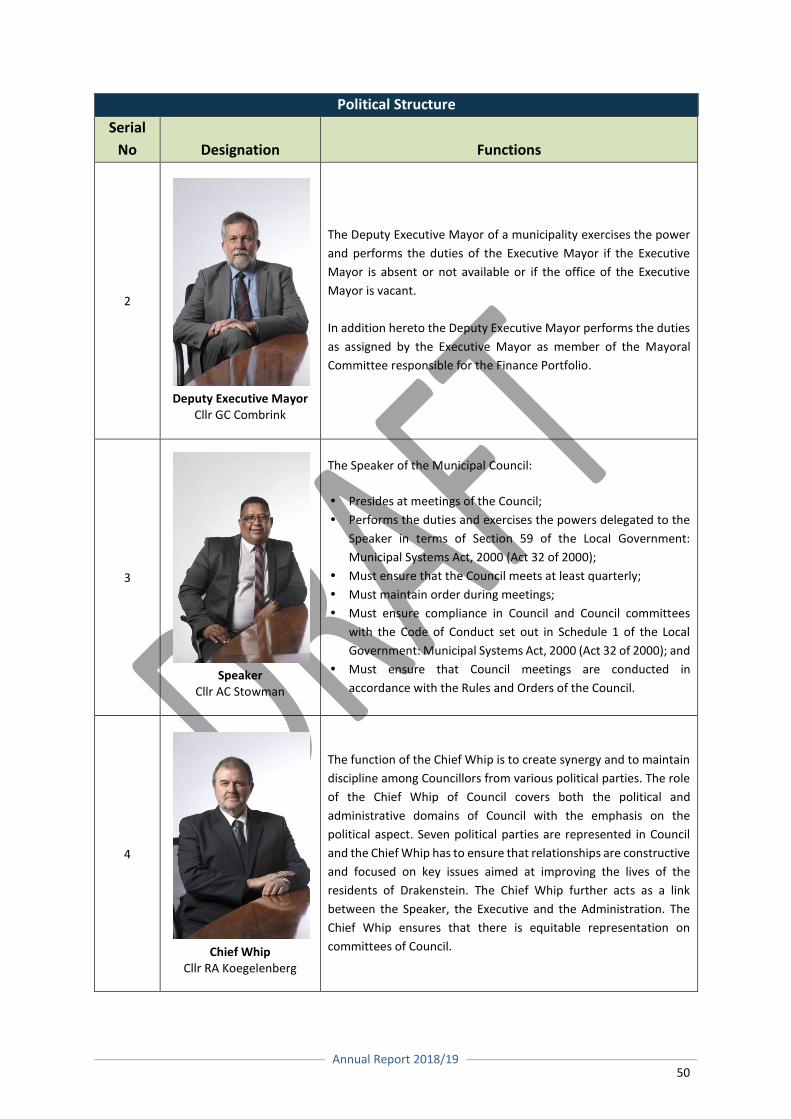
Annual Report 2018/19
50
Political Structure
Serial
No Designation Functions
2
Deputy Executive Mayor Cllr GC Combrink
The Deputy Executive Mayor of a municipality exercises the power
and performs the duties of the Executive Mayor if the Executive
Mayor is absent or not available or if the office of the Executive
Mayor is vacant.
In addition hereto the Deputy Executive Mayor performs the duties
as assigned by the Executive Mayor as member of the Mayoral
Committee responsible for the Finance Portfolio.
3
Speaker Cllr AC Stowman
The Speaker of the Municipal Council:
Presides at meetings of the Council;
Performs the duties and exercises the powers delegated to the
Speaker in terms of Section 59 of the Local Government:
Municipal Systems Act, 2000 (Act 32 of 2000);
Must ensure that the Council meets at least quarterly;
Must maintain order during meetings;
Must ensure compliance in Council and Council committees
with the Code of Conduct set out in Schedule 1 of the Local
Government: Municipal Systems Act, 2000 (Act 32 of 2000); and
Must ensure that Council meetings are conducted in
accordance with the Rules and Orders of the Council.
4
Chief Whip Cllr RA Koegelenberg
The function of the Chief Whip is to create synergy and to maintain
discipline among Councillors from various political parties. The role
of the Chief Whip of Council covers both the political and
administrative domains of Council with the emphasis on the
political aspect. Seven political parties are represented in Council
and the Chief Whip has to ensure that relationships are constructive
and focused on key issues aimed at improving the lives of the
residents of Drakenstein. The Chief Whip further acts as a link
between the Speaker, the Executive and the Administration. The
Chief Whip ensures that there is equitable representation on
committees of Council.
Annual Report 2018/19
51
2.4.2 Council
Council’s primary role is to govern the Municipality in a democratic and accountable manner,
to perform legislative and executive functions and generally to fulfil its roles and
responsibilities as set out in the Constitution of the Republic of South Africa, 1996 (Act 108 of
1996). It focuses on legislation, decision-making, oversight and participatory roles and has
delegated executive functions to the Executive Mayor, other office bearers, the City Manager
and other staff members where applicable.
Drakenstein Municipal Council consists of 33 ward councillors and 32 proportionally elected
councillors. Political parties are represented through elected councillors from the DA (43),
ANC (15), EFF (2), ACDP (1), VF+ (1), PDM (1), FD (1) and ICOSA (1).
2.4.2.1 Political Decision Making
Section 160(3) of the Constitution of the Republic of South Africa, 1996 (Act 108 of 1996)
prescribes the manner in which Council takes decisions. A quorum of all Councillors must be
present to take any decision and the majority of the votes cast results in a legal decision. The
exception to this rule is that when any of the following issues are determined, it is determined
by a decision taken with a supporting vote of a majority of all its members:
The passing of bylaws;
The approval of budgets;
The imposition of rates and other taxes, levies and duties; and
The raising of loans.
2.4.3 Mayoral Committee
The Executive Mayor is supported by a Mayoral Committee. Each member of the Mayoral
Committee has a portfolio with specific functions. The Executive Mayor may delegate specific
responsibilities to each member of the Mayoral Committee. Any powers and duties delegated
to the Executive Mayor by the Municipal Council must be exercised and performed by the
Executive Mayor together with the other members of the Mayoral Committee.
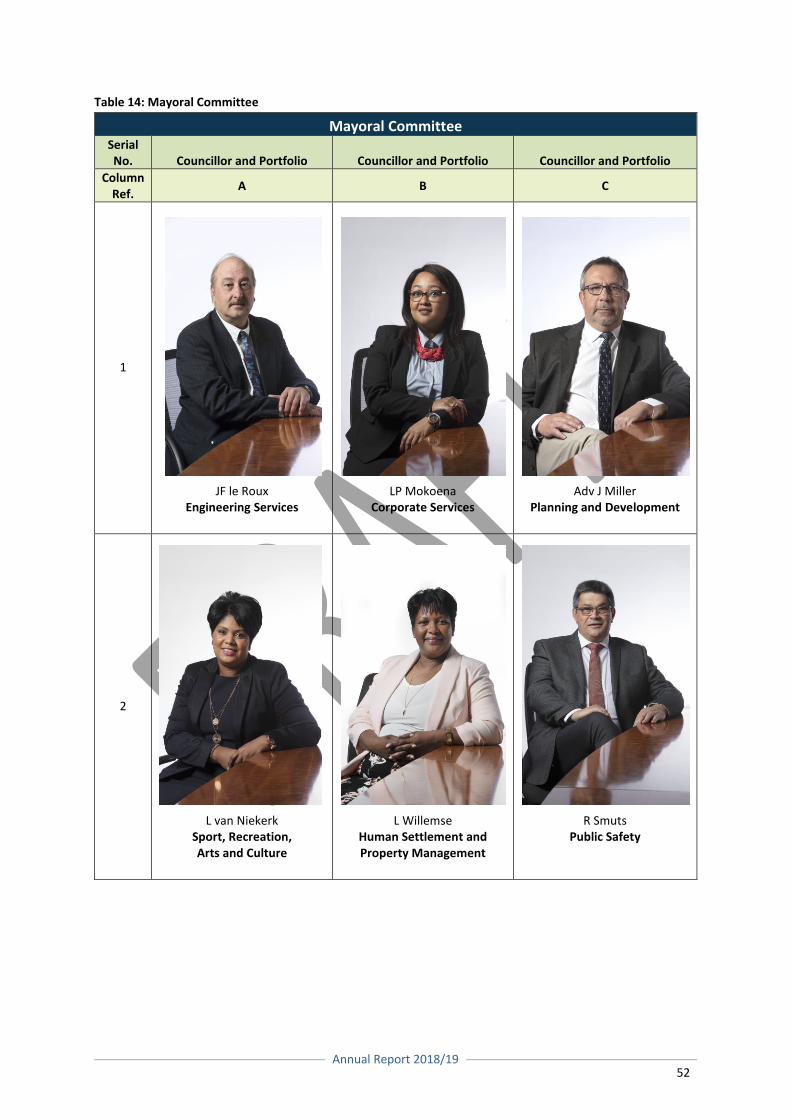
Annual Report 2018/19
52
Table 14: Mayoral Committee
Mayoral Committee Serial No. Councillor and Portfolio Councillor and Portfolio Councillor and Portfolio
Column Ref.
A B C
1
JF le Roux Engineering Services
LP Mokoena Corporate Services
Adv J Miller Planning and Development
2
L van Niekerk
Sport, Recreation, Arts and Culture
L Willemse
Human Settlement and Property Management
R Smuts
Public Safety
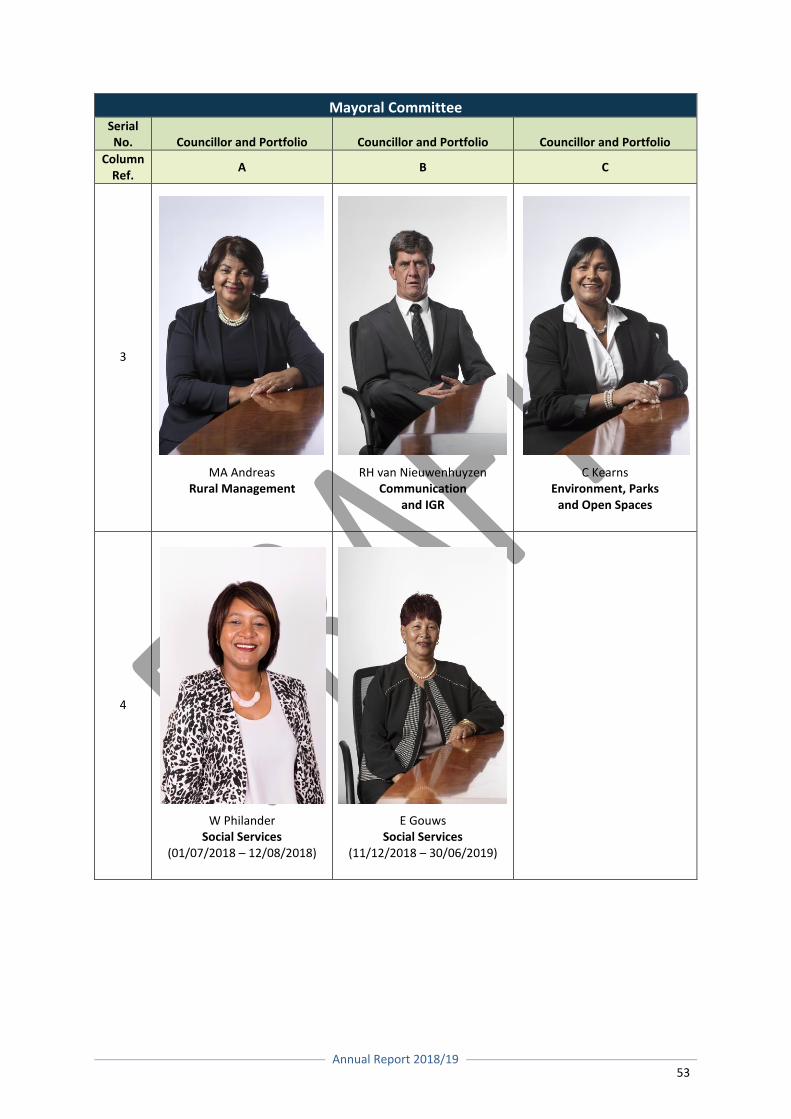
Annual Report 2018/19
53
Mayoral Committee Serial No. Councillor and Portfolio Councillor and Portfolio Councillor and Portfolio
Column Ref.
A B C
3
MA Andreas Rural Management
RH van Nieuwenhuyzen Communication
and IGR
C Kearns Environment, Parks
and Open Spaces
4
W Philander Social Services
(01/07/2018 – 12/08/2018)
E Gouws Social Services
(11/12/2018 – 30/06/2019)
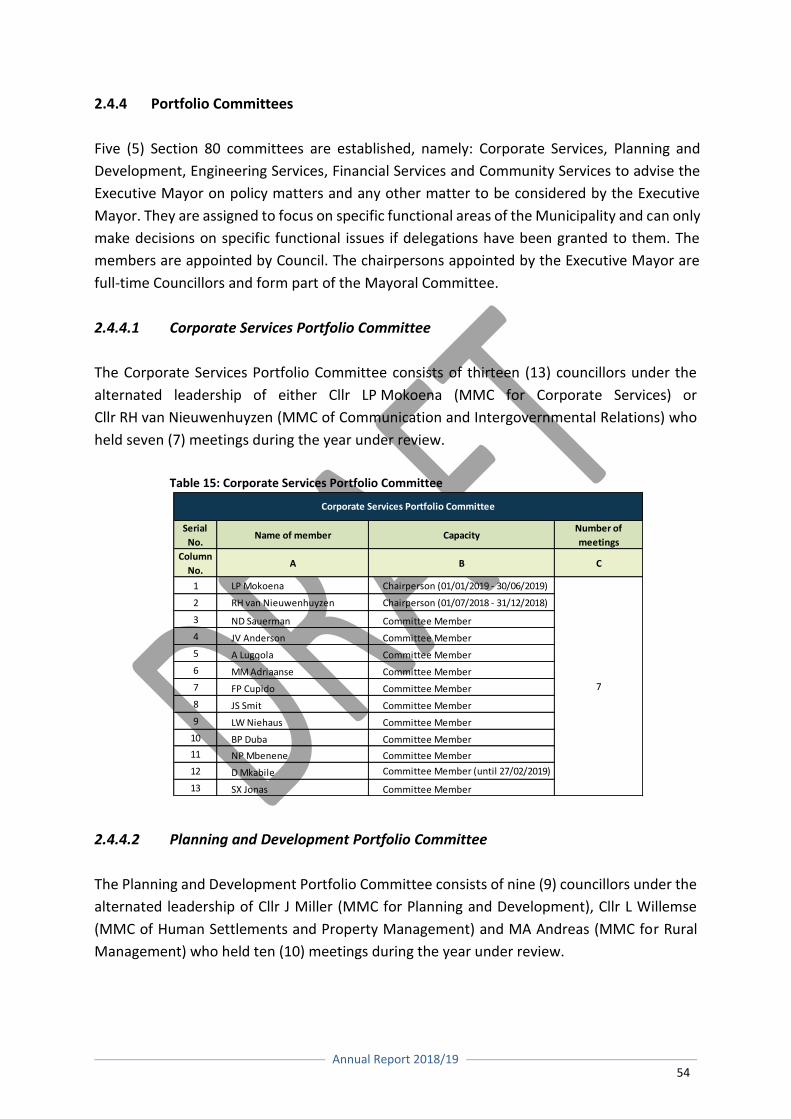
Annual Report 2018/19
54
2.4.4 Portfolio Committees
Five (5) Section 80 committees are established, namely: Corporate Services, Planning and
Development, Engineering Services, Financial Services and Community Services to advise the
Executive Mayor on policy matters and any other matter to be considered by the Executive
Mayor. They are assigned to focus on specific functional areas of the Municipality and can only
make decisions on specific functional issues if delegations have been granted to them. The
members are appointed by Council. The chairpersons appointed by the Executive Mayor are
full-time Councillors and form part of the Mayoral Committee.
2.4.4.1 Corporate Services Portfolio Committee
The Corporate Services Portfolio Committee consists of thirteen (13) councillors under the
alternated leadership of either Cllr LP Mokoena (MMC for Corporate Services) or
Cllr RH van Nieuwenhuyzen (MMC of Communication and Intergovernmental Relations) who
held seven (7) meetings during the year under review.
Table 15: Corporate Services Portfolio Committee
2.4.4.2 Planning and Development Portfolio Committee
The Planning and Development Portfolio Committee consists of nine (9) councillors under the
alternated leadership of Cllr J Miller (MMC for Planning and Development), Cllr L Willemse
(MMC of Human Settlements and Property Management) and MA Andreas (MMC for Rural
Management) who held ten (10) meetings during the year under review.
Serial
No.Name of member Capacity
Number of
meetings
Column
No.A B C
1 LP Mokoena Chairperson (01/01/2019 - 30/06/2019)
2 RH van Nieuwenhuyzen Chairperson (01/07/2018 - 31/12/2018)
3 ND Sauerman Committee Member
4 JV Anderson Committee Member
5 A Lugqola Committee Member
6 MM Adriaanse Committee Member
7 FP Cupido Committee Member
8 JS Smit Committee Member
9 LW Niehaus Committee Member
10 BP Duba Committee Member
11 NP Mbenene Committee Member
12 D Mkabile Committee Member (until 27/02/2019)
13 SX Jonas Committee Member
7
Corporate Services Portfolio Committee
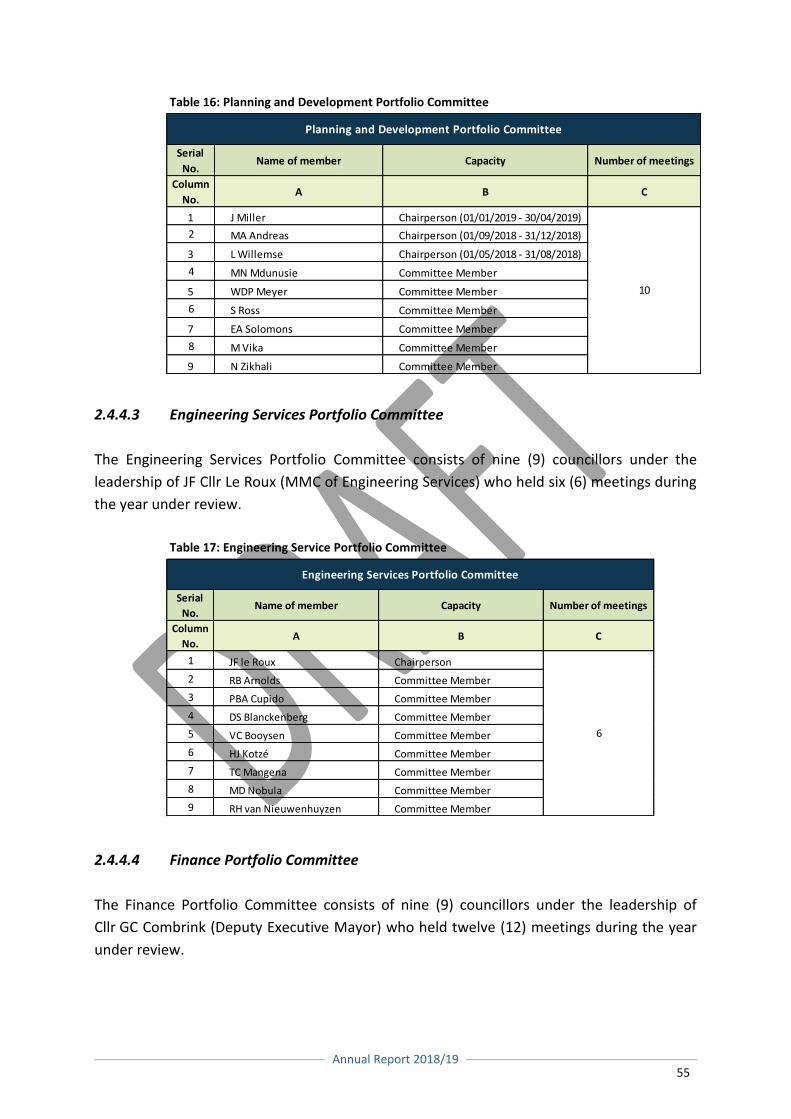
Annual Report 2018/19
55
Table 16: Planning and Development Portfolio Committee
2.4.4.3 Engineering Services Portfolio Committee
The Engineering Services Portfolio Committee consists of nine (9) councillors under the
leadership of JF Cllr Le Roux (MMC of Engineering Services) who held six (6) meetings during
the year under review.
Table 17: Engineering Service Portfolio Committee
2.4.4.4 Finance Portfolio Committee
The Finance Portfolio Committee consists of nine (9) councillors under the leadership of
Cllr GC Combrink (Deputy Executive Mayor) who held twelve (12) meetings during the year
under review.
Serial
No.Name of member Capacity Number of meetings
Column
No.A B C
1 JF le Roux Chairperson
2 RB Arnolds Committee Member
3 PBA Cupido Committee Member
4 DS Blanckenberg Committee Member
5 VC Booysen Committee Member
6 HJ Kotzé Committee Member
7 TC Mangena Committee Member
8 MD Nobula Committee Member
9 RH van Nieuwenhuyzen Committee Member
Engineering Services Portfolio Committee
6
Serial
No.Name of member Capacity Number of meetings
Column
No.A B C
1 J Miller Chairperson (01/01/2019 - 30/04/2019)
2 MA Andreas Chairperson (01/09/2018 - 31/12/2018)
3 L Willemse Chairperson (01/05/2018 - 31/08/2018)
4 MN Mdunusie Committee Member
5 WDP Meyer Committee Member
6 S Ross Committee Member
7 EA Solomons Committee Member
8 M Vika Committee Member
9 N Zikhali Committee Member
Planning and Development Portfolio Committee
10
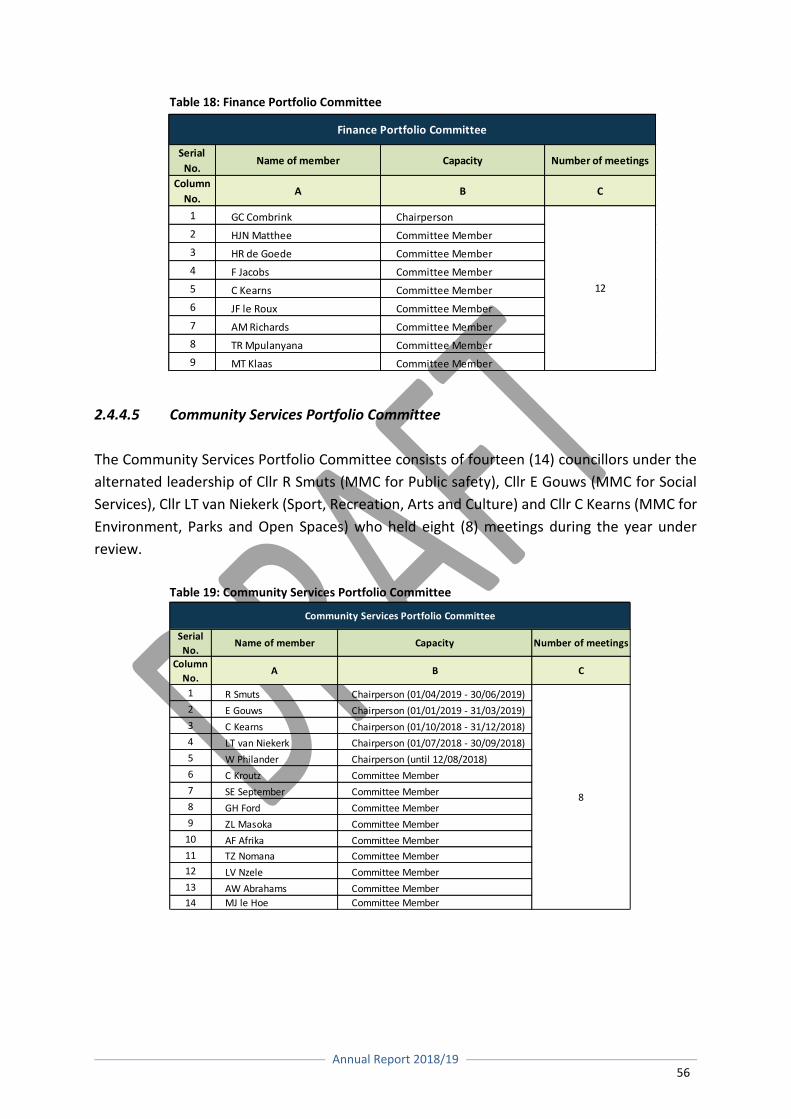
Annual Report 2018/19
56
Table 18: Finance Portfolio Committee
2.4.4.5 Community Services Portfolio Committee
The Community Services Portfolio Committee consists of fourteen (14) councillors under the
alternated leadership of Cllr R Smuts (MMC for Public safety), Cllr E Gouws (MMC for Social
Services), Cllr LT van Niekerk (Sport, Recreation, Arts and Culture) and Cllr C Kearns (MMC for
Environment, Parks and Open Spaces) who held eight (8) meetings during the year under
review.
Table 19: Community Services Portfolio Committee
Serial
No.Name of member Capacity Number of meetings
Column
No.A B C
1 GC Combrink Chairperson
2 HJN Matthee Committee Member
3 HR de Goede Committee Member
4 F Jacobs Committee Member
5 C Kearns Committee Member
6 JF le Roux Committee Member
7 AM Richards Committee Member
8 TR Mpulanyana Committee Member
9 MT Klaas Committee Member
Finance Portfolio Committee
12
Serial
No.Name of member Capacity Number of meetings
Column
No.A B C
1 R Smuts Chairperson (01/04/2019 - 30/06/2019)
2 E Gouws Chairperson (01/01/2019 - 31/03/2019)
3 C Kearns Chairperson (01/10/2018 - 31/12/2018)
4 LT van Niekerk Chairperson (01/07/2018 - 30/09/2018)
5 W Philander Chairperson (until 12/08/2018)
6 C Kroutz Committee Member
7 SE September Committee Member
8 GH Ford Committee Member
9 ZL Masoka Committee Member
10 AF Afrika Committee Member
11 TZ Nomana Committee Member
12 LV Nzele Committee Member
13 AW Abrahams Committee Member
14 MJ le Hoe Committee Member
Community Services Portfolio Committee
8
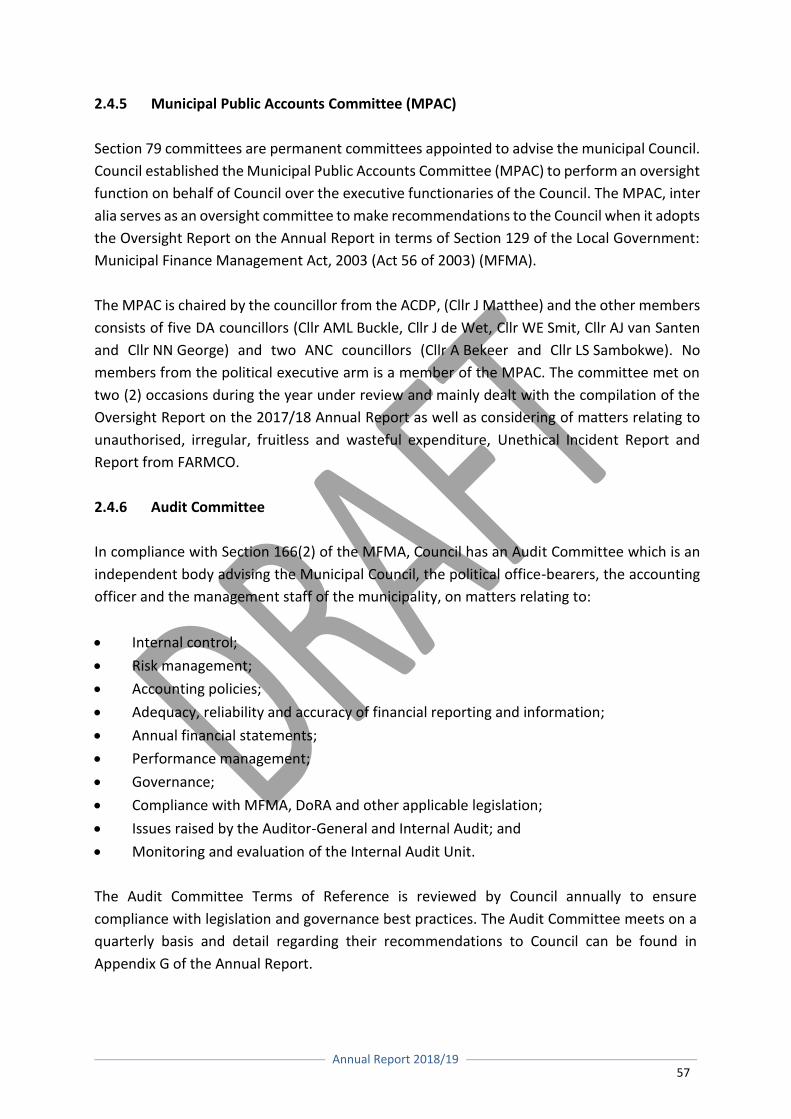
Annual Report 2018/19
57
2.4.5 Municipal Public Accounts Committee (MPAC)
Section 79 committees are permanent committees appointed to advise the municipal Council.
Council established the Municipal Public Accounts Committee (MPAC) to perform an oversight
function on behalf of Council over the executive functionaries of the Council. The MPAC, inter
alia serves as an oversight committee to make recommendations to the Council when it adopts
the Oversight Report on the Annual Report in terms of Section 129 of the Local Government:
Municipal Finance Management Act, 2003 (Act 56 of 2003) (MFMA).
The MPAC is chaired by the councillor from the ACDP, (Cllr J Matthee) and the other members
consists of five DA councillors (Cllr AML Buckle, Cllr J de Wet, Cllr WE Smit, Cllr AJ van Santen
and Cllr NN George) and two ANC councillors (Cllr A Bekeer and Cllr LS Sambokwe). No
members from the political executive arm is a member of the MPAC. The committee met on
two (2) occasions during the year under review and mainly dealt with the compilation of the
Oversight Report on the 2017/18 Annual Report as well as considering of matters relating to
unauthorised, irregular, fruitless and wasteful expenditure, Unethical Incident Report and
Report from FARMCO.
2.4.6 Audit Committee
In compliance with Section 166(2) of the MFMA, Council has an Audit Committee which is an
independent body advising the Municipal Council, the political office-bearers, the accounting
officer and the management staff of the municipality, on matters relating to:
Internal control;
Risk management;
Accounting policies;
Adequacy, reliability and accuracy of financial reporting and information;
Annual financial statements;
Performance management;
Governance;
Compliance with MFMA, DoRA and other applicable legislation;
Issues raised by the Auditor-General and Internal Audit; and
Monitoring and evaluation of the Internal Audit Unit.
The Audit Committee Terms of Reference is reviewed by Council annually to ensure
compliance with legislation and governance best practices. The Audit Committee meets on a
quarterly basis and detail regarding their recommendations to Council can be found in
Appendix G of the Annual Report.
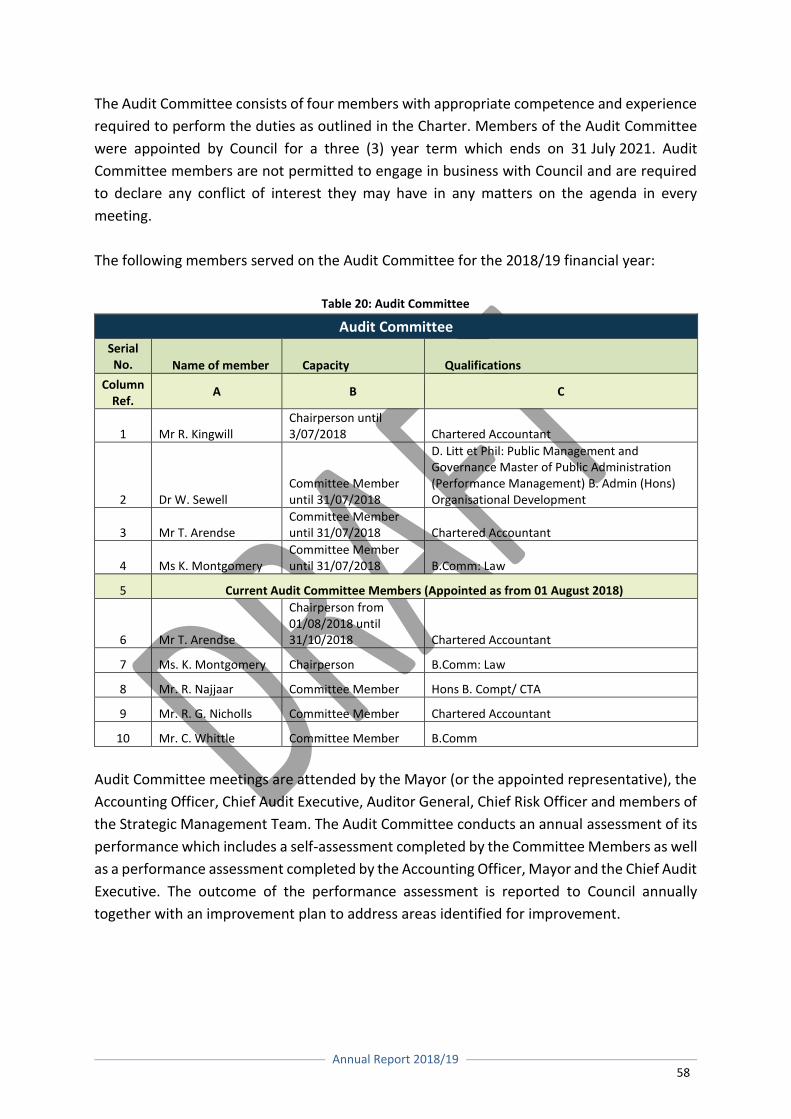
Annual Report 2018/19
58
The Audit Committee consists of four members with appropriate competence and experience
required to perform the duties as outlined in the Charter. Members of the Audit Committee
were appointed by Council for a three (3) year term which ends on 31 July 2021. Audit
Committee members are not permitted to engage in business with Council and are required
to declare any conflict of interest they may have in any matters on the agenda in every
meeting.
The following members served on the Audit Committee for the 2018/19 financial year:
Table 20: Audit Committee
Audit Committee
Serial No. Name of member Capacity Qualifications
Column Ref.
A B C
1 Mr R. Kingwill Chairperson until 3/07/2018 Chartered Accountant
2 Dr W. Sewell Committee Member until 31/07/2018
D. Litt et Phil: Public Management and Governance Master of Public Administration (Performance Management) B. Admin (Hons) Organisational Development
3 Mr T. Arendse Committee Member until 31/07/2018 Chartered Accountant
4 Ms K. Montgomery Committee Member until 31/07/2018 B.Comm: Law
5 Current Audit Committee Members (Appointed as from 01 August 2018)
6 Mr T. Arendse
Chairperson from 01/08/2018 until 31/10/2018 Chartered Accountant
7 Ms. K. Montgomery Chairperson B.Comm: Law
8 Mr. R. Najjaar Committee Member Hons B. Compt/ CTA
9 Mr. R. G. Nicholls Committee Member Chartered Accountant
10 Mr. C. Whittle Committee Member B.Comm
Audit Committee meetings are attended by the Mayor (or the appointed representative), the
Accounting Officer, Chief Audit Executive, Auditor General, Chief Risk Officer and members of
the Strategic Management Team. The Audit Committee conducts an annual assessment of its
performance which includes a self-assessment completed by the Committee Members as well
as a performance assessment completed by the Accounting Officer, Mayor and the Chief Audit
Executive. The outcome of the performance assessment is reported to Council annually
together with an improvement plan to address areas identified for improvement.
Annual Report 2018/19
59
2.4.7 Fraud and Risk Management Committee (FARMCO)
FARMCO has been established by Council to assist the Accounting Officer (City Manager) to
fulfil his fraud and risk management responsibilities in accordance with prescribed legislation
and corporate governance principles. This is achieved by reviewing the effectiveness of the
Municipality’s fraud and risk management systems, practices and procedures and providing
recommendations for improvement.
The Committee is regulated by the Fraud and Risk Management Charter which stipulates that
FARMCO shall meet at least four (4) times per annum in terms of a schedule of agreed meeting
dates to be determined at the beginning of each financial year. FARMCO can convene further
meetings to discuss urgent matters at the discretion of the FARMCO Chairperson.
In accordance to the Charter, four meetings were held on 3 August 2018, 26 October 2018,
15 February 2019 and 3 May 2019.
Matters for discussion include quarterly oversight of various risk registers and the
implementation of actions to mitigate risk, reported unethical incidents and monitoring the
risk management implementation plan.
2.5 ADMINISTRATIVE GOVERNANCE
The City Manager is the Accounting Officer of the Municipality and also the head of the
Administration. His primary function is to serve as chief custodian of service delivery and the
implementation of political priorities.
He is assisted by his Strategic Management Team (SMT), which comprises of the Executive
Directors of the five departments established in the new organogram. There are also four
divisional managers reporting directly to the City Manager as indicated in the chart below. The
SMT meets on at least a weekly basis to discuss current priorities, strategic interventions to
improve service delivery and new initiatives based on feedback from political leadership,
departments and the local community.
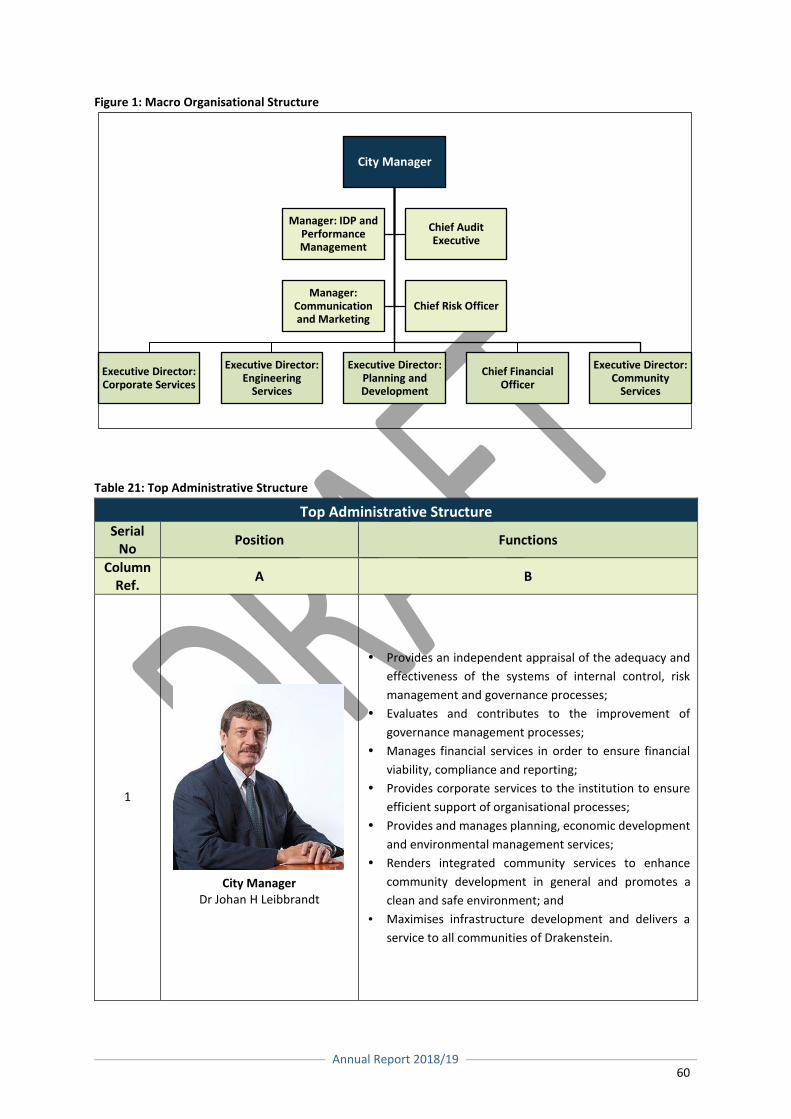
Annual Report 2018/19
60
Figure 1: Macro Organisational Structure
Table 21: Top Administrative Structure
Top Administrative Structure Serial
No Position Functions
Column Ref.
A B
1
City Manager Dr Johan H Leibbrandt
Provides an independent appraisal of the adequacy and
effectiveness of the systems of internal control, risk
management and governance processes;
Evaluates and contributes to the improvement of
governance management processes;
Manages financial services in order to ensure financial
viability, compliance and reporting;
Provides corporate services to the institution to ensure
efficient support of organisational processes;
Provides and manages planning, economic development
and environmental management services;
Renders integrated community services to enhance
community development in general and promotes a
clean and safe environment; and
Maximises infrastructure development and delivers a
service to all communities of Drakenstein.
City Manager
Executive Director: Corporate Services
Executive Director: Engineering
Services
Executive Director: Planning and Development
Chief Financial Officer
Executive Director: Community
Services
Manager: IDP and Performance Management
Chief Audit Executive
Manager: Communication and Marketing
Chief Risk Officer
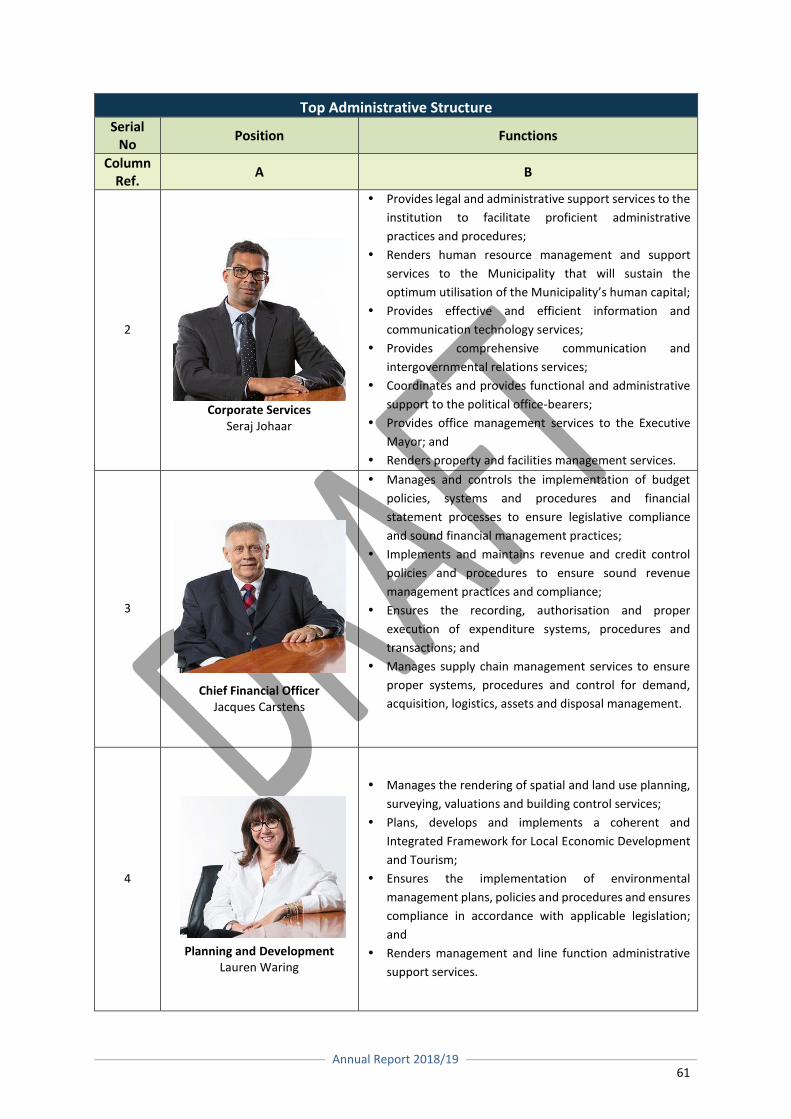
Annual Report 2018/19
61
Top Administrative Structure Serial
No Position Functions
Column Ref.
A B
2
Corporate Services Seraj Johaar
Provides legal and administrative support services to the
institution to facilitate proficient administrative
practices and procedures;
Renders human resource management and support
services to the Municipality that will sustain the
optimum utilisation of the Municipality’s human capital;
Provides effective and efficient information and
communication technology services;
Provides comprehensive communication and
intergovernmental relations services;
Coordinates and provides functional and administrative
support to the political office-bearers;
Provides office management services to the Executive
Mayor; and
Renders property and facilities management services.
3
Chief Financial Officer Jacques Carstens
Manages and controls the implementation of budget
policies, systems and procedures and financial
statement processes to ensure legislative compliance
and sound financial management practices;
Implements and maintains revenue and credit control
policies and procedures to ensure sound revenue
management practices and compliance;
Ensures the recording, authorisation and proper
execution of expenditure systems, procedures and
transactions; and
Manages supply chain management services to ensure
proper systems, procedures and control for demand,
acquisition, logistics, assets and disposal management.
4
Planning and Development Lauren Waring
Manages the rendering of spatial and land use planning,
surveying, valuations and building control services;
Plans, develops and implements a coherent and
Integrated Framework for Local Economic Development
and Tourism;
Ensures the implementation of environmental
management plans, policies and procedures and ensures
compliance in accordance with applicable legislation;
and
Renders management and line function administrative
support services.
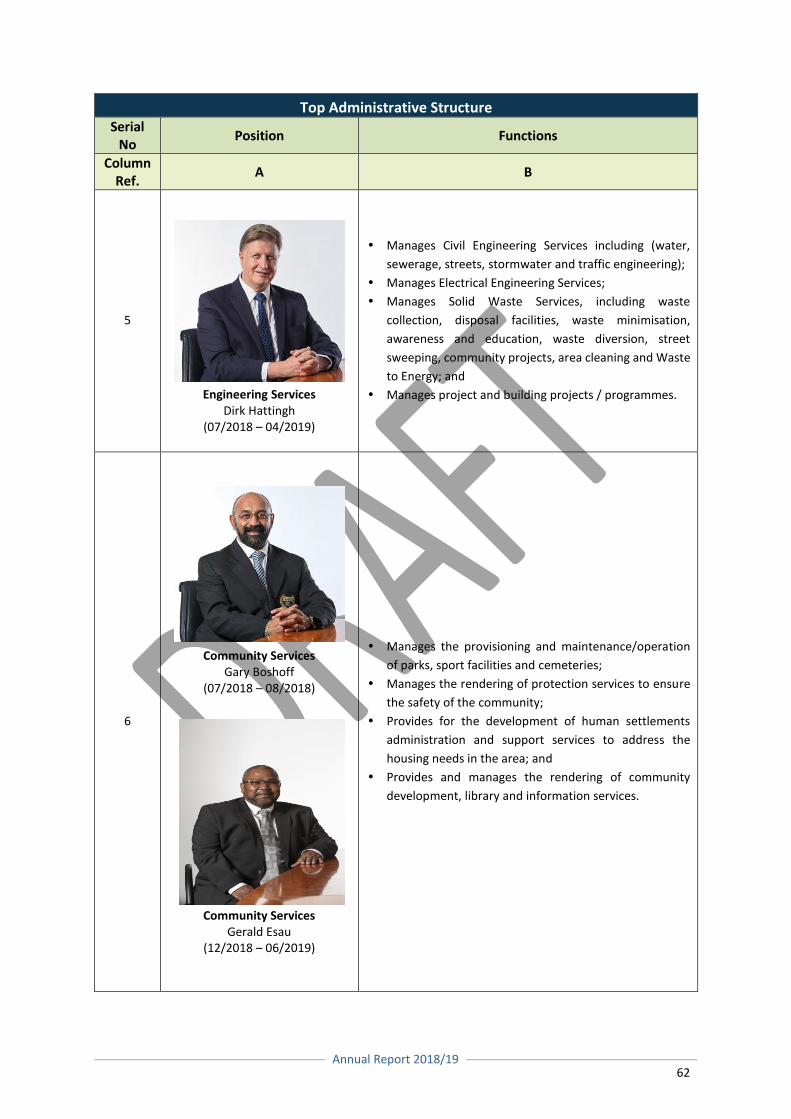
Annual Report 2018/19
62
Top Administrative Structure Serial
No Position Functions
Column Ref.
A B
5
Engineering Services Dirk Hattingh
(07/2018 – 04/2019)
Manages Civil Engineering Services including (water,
sewerage, streets, stormwater and traffic engineering);
Manages Electrical Engineering Services;
Manages Solid Waste Services, including waste
collection, disposal facilities, waste minimisation,
awareness and education, waste diversion, street
sweeping, community projects, area cleaning and Waste
to Energy; and
Manages project and building projects / programmes.
6
Community Services Gary Boshoff
(07/2018 – 08/2018)
Community Services Gerald Esau
(12/2018 – 06/2019)
Manages the provisioning and maintenance/operation
of parks, sport facilities and cemeteries;
Manages the rendering of protection services to ensure
the safety of the community;
Provides for the development of human settlements
administration and support services to address the
housing needs in the area; and
Provides and manages the rendering of community
development, library and information services.
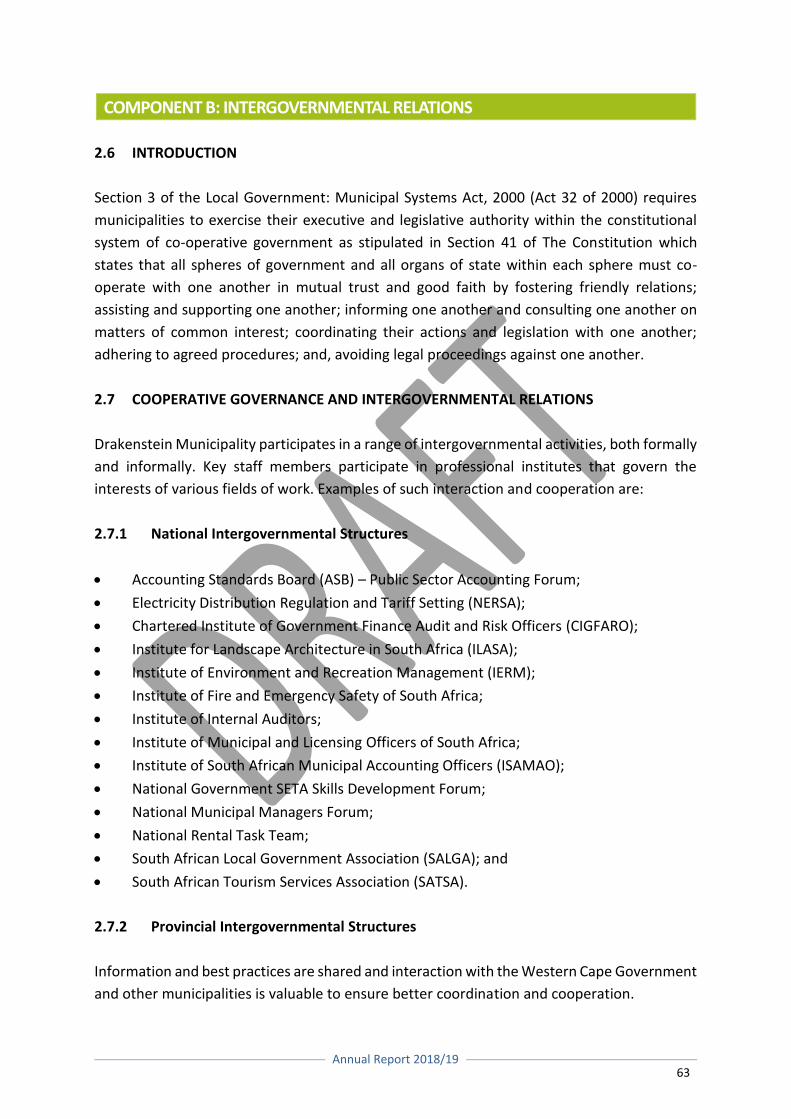
Annual Report 2018/19
63
COMPONENT B: INTERGOVERNMENTAL RELATIONS
2.6 INTRODUCTION
Section 3 of the Local Government: Municipal Systems Act, 2000 (Act 32 of 2000) requires
municipalities to exercise their executive and legislative authority within the constitutional
system of co-operative government as stipulated in Section 41 of The Constitution which
states that all spheres of government and all organs of state within each sphere must co-
operate with one another in mutual trust and good faith by fostering friendly relations;
assisting and supporting one another; informing one another and consulting one another on
matters of common interest; coordinating their actions and legislation with one another;
adhering to agreed procedures; and, avoiding legal proceedings against one another.
2.7 COOPERATIVE GOVERNANCE AND INTERGOVERNMENTAL RELATIONS
Drakenstein Municipality participates in a range of intergovernmental activities, both formally
and informally. Key staff members participate in professional institutes that govern the
interests of various fields of work. Examples of such interaction and cooperation are:
2.7.1 National Intergovernmental Structures
Accounting Standards Board (ASB) – Public Sector Accounting Forum;
Electricity Distribution Regulation and Tariff Setting (NERSA);
Chartered Institute of Government Finance Audit and Risk Officers (CIGFARO);
Institute for Landscape Architecture in South Africa (ILASA);
Institute of Environment and Recreation Management (IERM);
Institute of Fire and Emergency Safety of South Africa;
Institute of Internal Auditors;
Institute of Municipal and Licensing Officers of South Africa;
Institute of South African Municipal Accounting Officers (ISAMAO);
National Government SETA Skills Development Forum;
National Municipal Managers Forum;
National Rental Task Team;
South African Local Government Association (SALGA); and
South African Tourism Services Association (SATSA).
2.7.2 Provincial Intergovernmental Structures
Information and best practices are shared and interaction with the Western Cape Government
and other municipalities is valuable to ensure better coordination and cooperation.
Annual Report 2018/19
64
These structures provide important support and guidance to staff in maintaining and
enhancement of professional work standards. Issues pertaining to service delivery and
matters of common interest are discussed at the following forums:
Accounting Standards Board (ASB) – Public Sector Accounting Forum;
Berg River Partnership for Collaboration;
Berg River Steering Committee;
CFO Forum;
Chief Audit Executive Forum;
Chief Finance Officers’ Forum;
Chief Risk Officers Forum;
City of Cape Town Water Resilience Advisory Committee;
Department of Environmental Affairs & Development Planning – WCRAG;
Department of Water & Sanitation Water Care Forum;
Disaster Management Forum;
EPWP coordinating meetings;
Provincial IDP Managers’ Forum;
Informal Settlements Support Programme (ISSP);
Institute of Waste Management of South Africa;
IPC2 Intermodal Planning Committee;
Legislative and Constitutional Task Team;
MIG coordinating meetings;
Ministerial Mayors’ Forum;
MinMay Tech Forum;
MPRA Forum;
Municipal Accountant Forum;
Municipal Governance Review and Outlook (MGRO);
Municipal Managers’ Forum;
Municipal Planning Heads Forum;
Premier’s Coordinating Forum;
Provincial Affordable and Social Housing Steering Committee;
Provincial Local Government SETA Skills Development Forum;
Provincial Speakers’ Forum
PSG4 Sustainable Ecological and Agricultural Resource Base (SEAR) Work Group;
Public Participation and Communications Forum;
Records Management Forum;
SALGA Working Groups;
Supply Chain Management Provincial Working Group;
TDA Cape Town;
Violence Prevention through Urban Upgrading (VPUU);
Annual Report 2018/19
65
Waste Management Officers’ Forum;
Waste Minimisation Interest Group;
Western Cape Accounting Working Committee;
Western Cape Air Quality Officers’ Forum;
Western Cape ICT Strategic Forum;
Western Cape Municipal Planning Heads Forum; and
Western Cape Provincial Asset Management Forum.
2.7.3 District Intergovernmental Structures
The following are district forums in which the municipality participates in focusing on service
delivery and information sharing:
Cape Winelands Biosphere Reserve;
Cape Winelands District CRO and CAE Forum;
Cape Winelands Human Settlements Regional Forum;
Cape Winelands Regional Local Economic Development Forum (RLEDF);
Cape Winelands Skills Development Facilitators’ Forum;
Cape Winelands Waste Managers’ Forum;
Disaster Management Institute of SA;
District Co-ordinating Forum;
District IDP Managers’ Forum;
District Public Participation and Communications Forum;
District SCM Forum;
EPWP District Forum;
Institute of Municipal Public Safety of SA;
Municipality’s Local Labour Forum; and
Rural Development District Joint Operational Committee.
2.7.4 Municipal Entities
No municipal entities have been established within the Drakenstein Area.
2.7.5 Municipal Partnerships
Drakenstein Municipality is in partnership with the City of Neumarkt in Germany. The
partnership revolves around climate change-related aspects and involves municipal
development cooperation, migration and development on a local level.
Annual Report 2018/19
66
COMPONENT C: PUBLIC ACCOUNTABILITY AND PARTICIPATION
2.8 INTRODUCTION
In terms of Section 6 of the Local Government: Municipal Systems Act, 2000 (Act 32 of 2000)
the administration of a municipality must:
“(a) Be responsive to the needs of the local community;
(b) Facilitate a culture of public service and accountability amongst staff;
(c) Take measures to prevent corruption;
(d) Establish clear relationships, and facilitate cooperation and communication between
itself and the local community;
(e) Give members of the local community full and accurate information about the level
and standard of municipal services they are entitled to receive; and
(f) Inform the local community how the municipality is managed, of the costs involved
and the persons in charge.”
To comply with the above, the Municipality has established the legislatively required
structures such as Section 80 Portfolio Committees advising the Executive Mayor as well as
Council committees such as the Municipal Public Accounts Committee (MPAC), Section 62
Appeals Committee, and Special (Disciplinary) Committee dealing with the Code of Conduct
for councillors, as well as a Fraud and Risk Management Committee. In addition hereto, an
Audit Committee comprising of independent external professionals also advises Council. The
Audit Committee also serves as the Municipality’s Performance Audit Committee and meets
quarterly. A quarterly report reflecting the Audit Committee’s recommendations relating to
the areas of financial management and control, performance management, internal control,
risk management and governance matters is tabled in Council.
These structures represent a segregation of duties amongst public representatives and staff to
ensure accountability, oversight, transparency and good governance and also assist the
Municipality to discharge the necessary public accountability responsibilities.
2.9 PUBLIC MEETINGS
Chapter 4 of the Local Government: Municipal Systems Act, 2000 (Act 32 of 2000) compels
municipalities to establish appropriate mechanisms, processes and procedures to enable the
local community to participate in the affairs of the municipality. During the year under review,
the Municipality used the following mechanisms to comply with this legislative requirement:
Ward committee meetings (discussed in more detail below);
Public notices in local and regional newspapers;
Annual Report 2018/19
67
Monthly public newsletters distributed to all account holders;
Press releases as and when required;
Receipt and consideration of petitions and objections;
Public IDP and consultative meetings; and
Functioning of a municipal website, regularly updated with recent news.
Stakeholder and community engagements to determine and undertake development
priorities form the cornerstone of the IDP. Needs are dynamic and by virtue of its changing
nature, have to be reviewed frequently. The annual review of the IDP is a process which assist
the Municipality to further enhance its service delivery outputs and outcomes and through
the Performance Management System, implemented by the Municipality, it ensures that the
Municipality remains accountable to the local community, the various sectors and business
alike.
The Municipal Council ensures that its oversight role is sufficiently mandated by the populace
voice of its local community, through fully embracing the principles of participatory
democracy. This is being achieved through a well-functioning Ward Committee System, robust
public participation through our various development planning processes and regular
communication with the community through public meetings, community newsletters, radio
and various other print and electronic media including the Municipal Website.
2.9.1 Mayoral Business Stakeholder Initiative
During the period under review, the City Manager introduced an initiative to further enhance
the relationship between the Municipality and our various stakeholders, representing a vast
range of sectors. This concept centres around interactions with stakeholders on strategically
selected themes to ensure that the Municipality responds more efficiently and appropriately
to specific service needs and to facilitate a much stronger strategic link between the
perspectives of stakeholders’ priorities and the municipal IDP and long-term strategy. The
achievement of having a common understanding of the status quo of Drakenstein, the
secondary city, amongst all stakeholders, is critical in creating a stable platform from which
municipal planning can take place, resources prioritised and implementation monitored in a
much more sensible fashion.
2.9.2 IDP/Budget Roadshows
The IDP is about determining stakeholder and community needs and priorities which need to
be addressed in order to contribute to the improvement of the quality of life of residents
within the Municipal Area. Various stakeholders and sectors were involved during the draft
IDP development process and this process comprised of 69 IDP meetings of which 66 were
Annual Report 2018/19
68
ward-based IDP meetings, two sector-based engagements and one IDP Representative Forum
meeting.
2.9.3 IDP Sector Engagements
Drakenstein Municipality must play a role in ensuring integration and co-ordination between
the various sectors and cross-sectoral dimensions of development, to achieve social,
economic and ecological sustainability.
To ensure that municipal priorities are addressed, and in the spirit of co-operative governance,
the planning process of all spheres of government must be aligned with and inform each
other. This requires that municipal planning processes takes into account the legislative,
policy, and strategic approaches of the line departments of national and provincial
government.
Whilst the IDP is the overall strategic development plan for a municipality, prepared in terms
of the Municipal System Act, Act 32 of 2000, that guide decision-making, budgeting and
development in the municipality, the Spatial Development Framework (SDF) presents the long
term vision of the desired spatial form of the municipality. The SDF is thus a critical component
to the IDP to direct municipal and private sector spending and investment by providing spatial
proposals and strategies (thus the location and nature of development) which will support
economic growth and integrated human settlements.
The IDP and SDF information was interrogated in order to support the notion that the two
strategic documents are aligned as required in terms of the Municipal System Act, Act 32 of
2000, Spatial Planning and Land Use Management Act, Act 16 of 2013 and the Land Use
Planning Act, Act 3 of 2014.
2.10 REPRESENTATIVE FORUMS
In accordance with Section 15 of the Local Government: Municipal Planning and Performance
Regulations (No. 796, 24 August 2001), Drakenstein Municipality established an IDP
Representative Forum to enhance community participation in:
The drafting and implementation of the Municipality's IDP; and
The monitoring, measurement and review of the Municipality's performance in relation
to the key performance indicators and performance targets set by the Municipality.
Annual Report 2018/19
69
2.10.1 IDP Representative Forum
The participation of stakeholders in the I DP Representative Forum has been very influential
in further strengthening the sectoral integration of operational and strategic planning with
civil society and other spheres of government.
2.11 WARD COMMITTEES
Section 73 of the Local Government: Municipal Structures Act, 1998 (Act 117 of 1998) deals
with the establishment of ward committees and stipulates the following:
“(1) If a metropolitan or local council establishes ward committees, it must establish a
ward committee for each ward in the municipality.
(2) A ward committee consists of:
(a) The councillor representing that ward in the council, who must also be the
chairperson of the committee; and
(b) Not more than 10 other persons.”
Ward committees form an essential part of the public participation process and these
structures are particularly useful to ensure a relationship between Councillors and ward
residents. It provides the opportunity to discuss local matters that concern the residents in
that ward. The Municipality annually avails funding to each ward in order to undertake specific
projects in such wards. Ward committees play an important role in this regard as they advise
on the projects they would like to be implemented. These ward projects further strengthen
the relationship between the Municipality and the communities due to the direct impact that
the ward committees can make on development projects in their wards.
The purpose of ward committees are:
To act as an advisory committee to the Ward Councillor and Council;
To ensure two-way communication to and from the community;
To identify ward specific needs and to refer same to the administration and Council for
attention;
To actively partake in the annual IDP ward based public meetings;
To assist the Ward Councillor in identifying ward projects and ward capital projects;
To identify stakeholders in the wards and to liaise with them regarding matters needing
attention; and
To discuss ward related Council agenda items and to make inputs regarding same if
necessary.
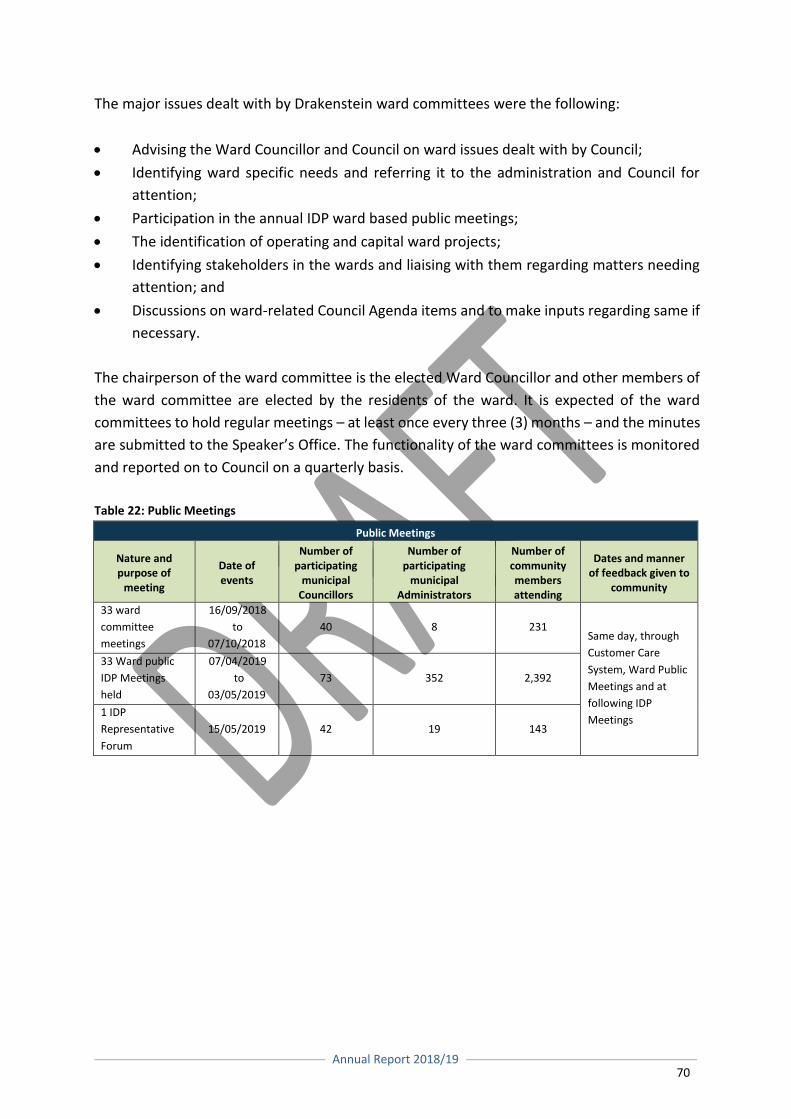
Annual Report 2018/19
70
The major issues dealt with by Drakenstein ward committees were the following:
Advising the Ward Councillor and Council on ward issues dealt with by Council;
Identifying ward specific needs and referring it to the administration and Council for
attention;
Participation in the annual IDP ward based public meetings;
The identification of operating and capital ward projects;
Identifying stakeholders in the wards and liaising with them regarding matters needing
attention; and
Discussions on ward-related Council Agenda items and to make inputs regarding same if
necessary.
The chairperson of the ward committee is the elected Ward Councillor and other members of
the ward committee are elected by the residents of the ward. It is expected of the ward
committees to hold regular meetings – at least once every three (3) months – and the minutes
are submitted to the Speaker’s Office. The functionality of the ward committees is monitored
and reported on to Council on a quarterly basis.
Table 22: Public Meetings
Public Meetings
Nature and purpose of
meeting
Date of events
Number of participating
municipal Councillors
Number of participating
municipal Administrators
Number of community members attending
Dates and manner of feedback given to
community
33 ward
committee
meetings
16/09/2018
to
07/10/2018
40 8 231 Same day, through
Customer Care
System, Ward Public
Meetings and at
following IDP
Meetings
33 Ward public
IDP Meetings
held
07/04/2019
to
03/05/2019
73 352 2,392
1 IDP
Representative
Forum
15/05/2019 42 19 143
Annual Report 2018/19
71
COMPONENT D: CORPORATE GOVERNANCE
2.12 INTRODUCTION
Governance in Drakenstein Municipality encompasses line functions pertaining to political
and administrative governance, audit, risk management, organisational and individual
performance management, public participation and IDP, intergovernmental relations, public
communication, human resource management, organisational development and legal
services. The governance function is supported by an independent Audit Committee,
comprising of external specialists having the necessary skills to provide effective oversight of
the Municipality’s systems of internal control, risk management and governance processes.
The Audit Committee is supported in its role by the Internal Audit function which performs
audits in terms of an approved audit plan and reports to the Audit Committee on a quarterly
basis. The Municipal Public Accounts Committee (MPAC) comprises of independent
Councillors. In order to promote independence and objectivity, the MPAC is chaired by a
Councillor from a political party other than the majority party in Council.
2.13 RISK MANAGEMENT
Section 62(i)(c) of the MFMA requires a municipality to have and maintain an effective,
efficient and transparent system of risk management.
There is a danger that risks which fall outside traditional functions may go unmanaged and
have serious consequences on the institutional objectives. The need for broad-based risk
management is thus critical as it will also ensure that risks which were not previously given
adequate attention are now properly managed. Risk management processes that are
integrated in the institution’s existing structures are likely to be more effective in producing
the desired service delivery and other objectives.
The Risk Management Division supports the Municipality’s governance structure by aligning
its operations and practices, which includes the identification, assessment and mitigation of
future risks, with the principles contained in the King IV Report on Corporate Governance for
South Africa 2016 (King IV). A Combined Assurance policy, which will guide the implementation
of Combined Assurance, was approved by Council in November 2018
The Risk Management Division is responsible for the risk management function at Drakenstein
Municipality through facilitation and advising on fraud and risk management issues. This
entails the development of policies, strategies, plans and processes.
Drakenstein Municipality established a Fraud and Risk Management Committee (FARMCO),
which meets on a quarterly basis and assists in the development and revision of all policies,
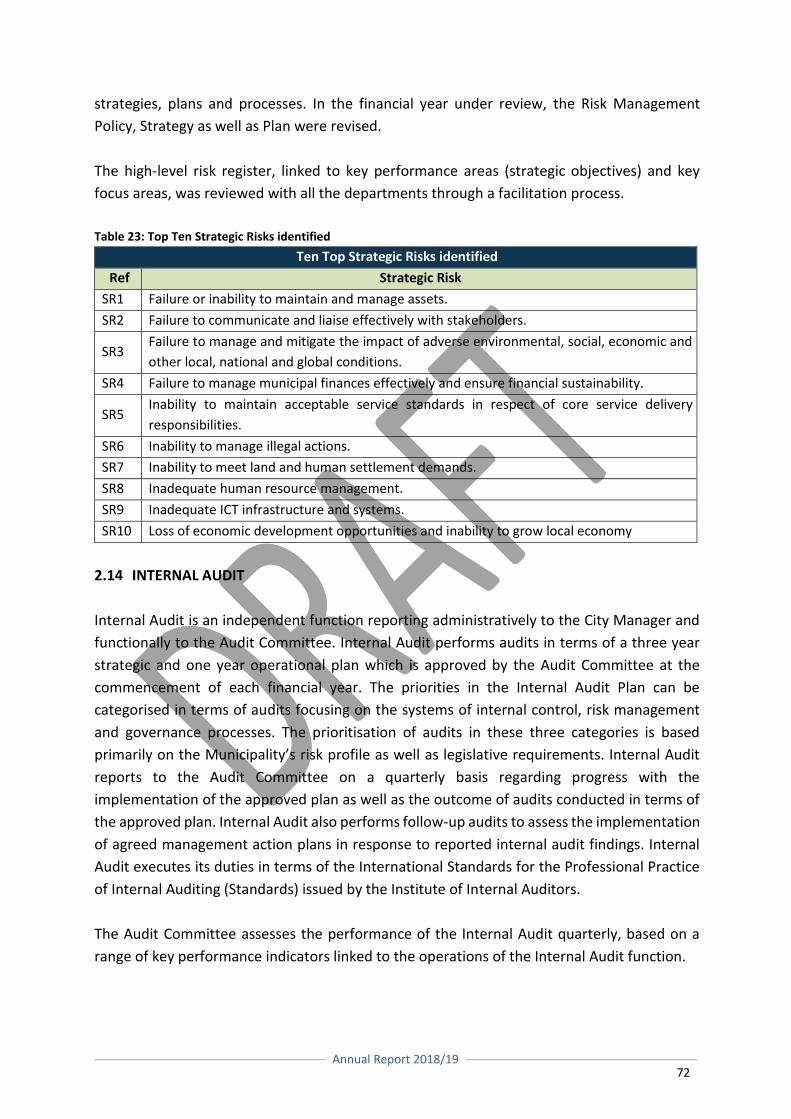
Annual Report 2018/19
72
strategies, plans and processes. In the financial year under review, the Risk Management
Policy, Strategy as well as Plan were revised.
The high-level risk register, linked to key performance areas (strategic objectives) and key
focus areas, was reviewed with all the departments through a facilitation process.
Table 23: Top Ten Strategic Risks identified
Ten Top Strategic Risks identified
Ref Strategic Risk
SR1 Failure or inability to maintain and manage assets.
SR2 Failure to communicate and liaise effectively with stakeholders.
SR3 Failure to manage and mitigate the impact of adverse environmental, social, economic and
other local, national and global conditions.
SR4 Failure to manage municipal finances effectively and ensure financial sustainability.
SR5 Inability to maintain acceptable service standards in respect of core service delivery
responsibilities.
SR6 Inability to manage illegal actions.
SR7 Inability to meet land and human settlement demands.
SR8 Inadequate human resource management.
SR9 Inadequate ICT infrastructure and systems.
SR10 Loss of economic development opportunities and inability to grow local economy
2.14 INTERNAL AUDIT
Internal Audit is an independent function reporting administratively to the City Manager and
functionally to the Audit Committee. Internal Audit performs audits in terms of a three year
strategic and one year operational plan which is approved by the Audit Committee at the
commencement of each financial year. The priorities in the Internal Audit Plan can be
categorised in terms of audits focusing on the systems of internal control, risk management
and governance processes. The prioritisation of audits in these three categories is based
primarily on the Municipality’s risk profile as well as legislative requirements. Internal Audit
reports to the Audit Committee on a quarterly basis regarding progress with the
implementation of the approved plan as well as the outcome of audits conducted in terms of
the approved plan. Internal Audit also performs follow-up audits to assess the implementation
of agreed management action plans in response to reported internal audit findings. Internal
Audit executes its duties in terms of the International Standards for the Professional Practice
of Internal Auditing (Standards) issued by the Institute of Internal Auditors.
The Audit Committee assesses the performance of the Internal Audit quarterly, based on a
range of key performance indicators linked to the operations of the Internal Audit function.
Annual Report 2018/19
73
The following assurance engagements were approved, completed and reported to the Audit
Committee in terms of the 2018/19 Internal Audit Plan:
Recruitment and Selection;
Records Management;
Physical Security Controls over Cash;
Financial Statements Review;
Billing;
Replacement of Fleet Vehicles;
Insurance of Council Assets;
Risk Management;
Declaration of Councillor Interests;
Financial Controls;
MFMA Compliance;
DoRA Compliance;
Housing Waiting List;
Quarter 4 Review of Performance Results;
Review of Annual Performance Report;
Functionality of the Performance Management System;
Compliance with the Municipal Systems Act;
Quarter 1 Review of Performance Results;
Quarter 2 Review of Performance Results;
Quarter 3 Review of Performance Results;
Review of Annual Report; and
Annual Inventory Count.
2.15 ANTI-CORRUPTION AND FRAUD
The Fraud and Risk Management Committee (FARMCO) meets on a quarterly basis and assists
with the development and revision of all policies, strategies, plans and processes relating to
fraud risk management. The Fraud Prevention Policy and Strategy are incorporated in the Risk
Management Policy and last approved on 29 November 2017, with the next review due in the
2020/21 financial year.
FARMCO review the effectiveness of prevention initiatives, detection techniques as well as
progress made in any forensic investigations, and thereby also function as an oversight body.
Drakenstein Municipality appointed Whistle Blowers (Toll free number 0800 555 337) to
provide an anonymous fraud and ethics hotline service for the reporting of alleged theft, fraud
and corruption.
Annual Report 2018/19
74
2.16 SUPPLY CHAIN MANAGEMENT
The SCM Policy was reviewed during the 2018/19 financial year. Certain amendments to the
SCM Policy were tabled before Council in order to improve operational efficiency. The
Municipality is required to forward its SCM Policy to the Western Cape Provincial Treasury on
an annual basis for scrutiny and compliance verifications against the Model SCM Policy that
was issued by the National Treasury. The purpose of this exercise is to determine whether the
Municipal SCM Policy deviates from the stipulations of the SCM Regulations. Drakenstein
Municipality’s SCM Policy complies with the regulatory framework.
2.16.1 Overview of Supply Chain Management
The Supply Chain Management functions cuts across all departments. Although governance is
at its core, Supply Chain Management plays a vital role in contributing towards service delivery
in a manner that is fair, equitable, transparent, competitive and cost-effective.
2.16.2 Bid Committees
The Municipality applies the bid committee system for procurement above R200,000 (Value
Added Tax included) and for the procurement of long term contracts. The Bid Committees
namely the Bid Specification Committee, the Bid Evaluation Committee and the Bid
Adjudication Committee are all functioning effectively.
2.16.2.1 Bid Committees Structure
The Bid Committee members are appointed by the City Manager in line with the relevant
legislation.
2.16.2.2 Awards made by the Bid Adjudication Committee
For the 2018/19 financial year the Bid Adjudication Committee made 54 awards and
recommended 19 awards to the Accounting Officer.
2.16.2.3 Awards made by Accounting Officer
For the 2018/19 financial year the Accounting Officer approved 19 awards that were
recommended by the Bid Adjudication Committee.
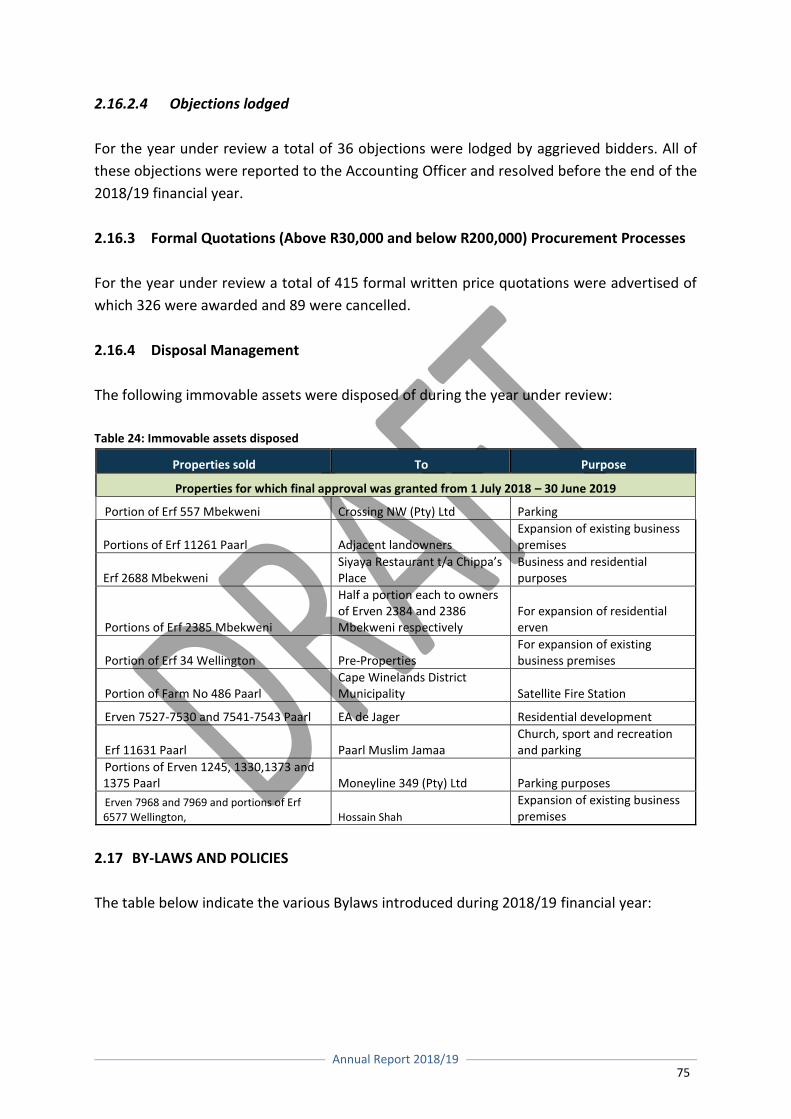
Annual Report 2018/19
75
2.16.2.4 Objections lodged
For the year under review a total of 36 objections were lodged by aggrieved bidders. All of
these objections were reported to the Accounting Officer and resolved before the end of the
2018/19 financial year.
2.16.3 Formal Quotations (Above R30,000 and below R200,000) Procurement Processes
For the year under review a total of 415 formal written price quotations were advertised of
which 326 were awarded and 89 were cancelled.
2.16.4 Disposal Management
The following immovable assets were disposed of during the year under review:
Table 24: Immovable assets disposed
Properties sold To Purpose
Properties for which final approval was granted from 1 July 2018 – 30 June 2019
Portion of Erf 557 Mbekweni Crossing NW (Pty) Ltd Parking
Portions of Erf 11261 Paarl Adjacent landowners Expansion of existing business premises
Erf 2688 Mbekweni Siyaya Restaurant t/a Chippa’s Place
Business and residential purposes
Portions of Erf 2385 Mbekweni
Half a portion each to owners of Erven 2384 and 2386 Mbekweni respectively
For expansion of residential erven
Portion of Erf 34 Wellington Pre-Properties For expansion of existing business premises
Portion of Farm No 486 Paarl Cape Winelands District Municipality Satellite Fire Station
Erven 7527-7530 and 7541-7543 Paarl EA de Jager Residential development
Erf 11631 Paarl Paarl Muslim Jamaa Church, sport and recreation and parking
Portions of Erven 1245, 1330,1373 and 1375 Paarl Moneyline 349 (Pty) Ltd Parking purposes
Erven 7968 and 7969 and portions of Erf 6577 Wellington, Hossain Shah
Expansion of existing business premises
2.17 BY-LAWS AND POLICIES
The table below indicate the various Bylaws introduced during 2018/19 financial year:
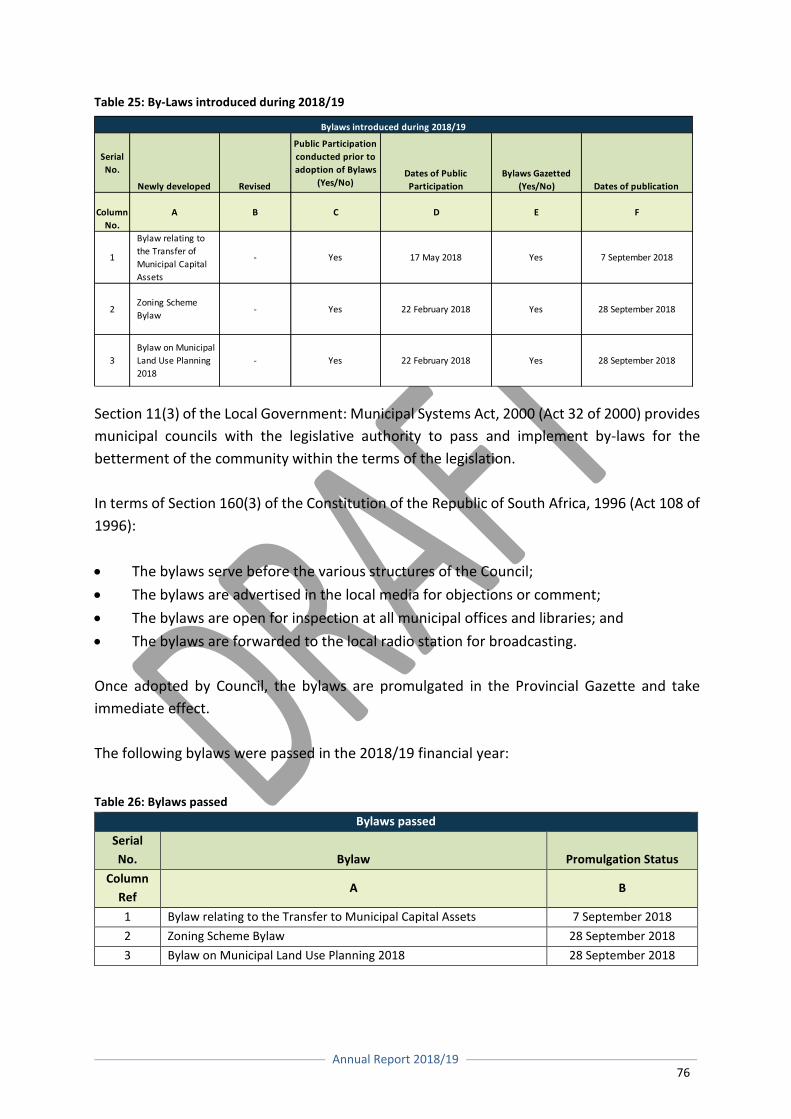
Annual Report 2018/19
76
Table 25: By-Laws introduced during 2018/19
Section 11(3) of the Local Government: Municipal Systems Act, 2000 (Act 32 of 2000) provides
municipal councils with the legislative authority to pass and implement by-laws for the
betterment of the community within the terms of the legislation.
In terms of Section 160(3) of the Constitution of the Republic of South Africa, 1996 (Act 108 of
1996):
The bylaws serve before the various structures of the Council;
The bylaws are advertised in the local media for objections or comment;
The bylaws are open for inspection at all municipal offices and libraries; and
The bylaws are forwarded to the local radio station for broadcasting.
Once adopted by Council, the bylaws are promulgated in the Provincial Gazette and take
immediate effect.
The following bylaws were passed in the 2018/19 financial year:
Table 26: Bylaws passed
Bylaws passed
Serial
No. Bylaw Promulgation Status
Column
Ref A B
1 Bylaw relating to the Transfer to Municipal Capital Assets 7 September 2018
2 Zoning Scheme Bylaw 28 September 2018
3 Bylaw on Municipal Land Use Planning 2018 28 September 2018
Serial
No.
Newly developed Revised
Public Participation
conducted prior to
adoption of Bylaws
(Yes/No)Dates of Public
Participation
Bylaws Gazetted
(Yes/No) Dates of publication
Column
No.
A B C D E F
1
Bylaw relating to
the Transfer of
Municipal Capital
Assets
- Yes 17 May 2018 Yes 7 September 2018
2Zoning Scheme
Bylaw- Yes 22 February 2018 Yes 28 September 2018
3
Bylaw on Municipal
Land Use Planning
2018
- Yes 22 February 2018 Yes 28 September 2018
Bylaws introduced during 2018/19
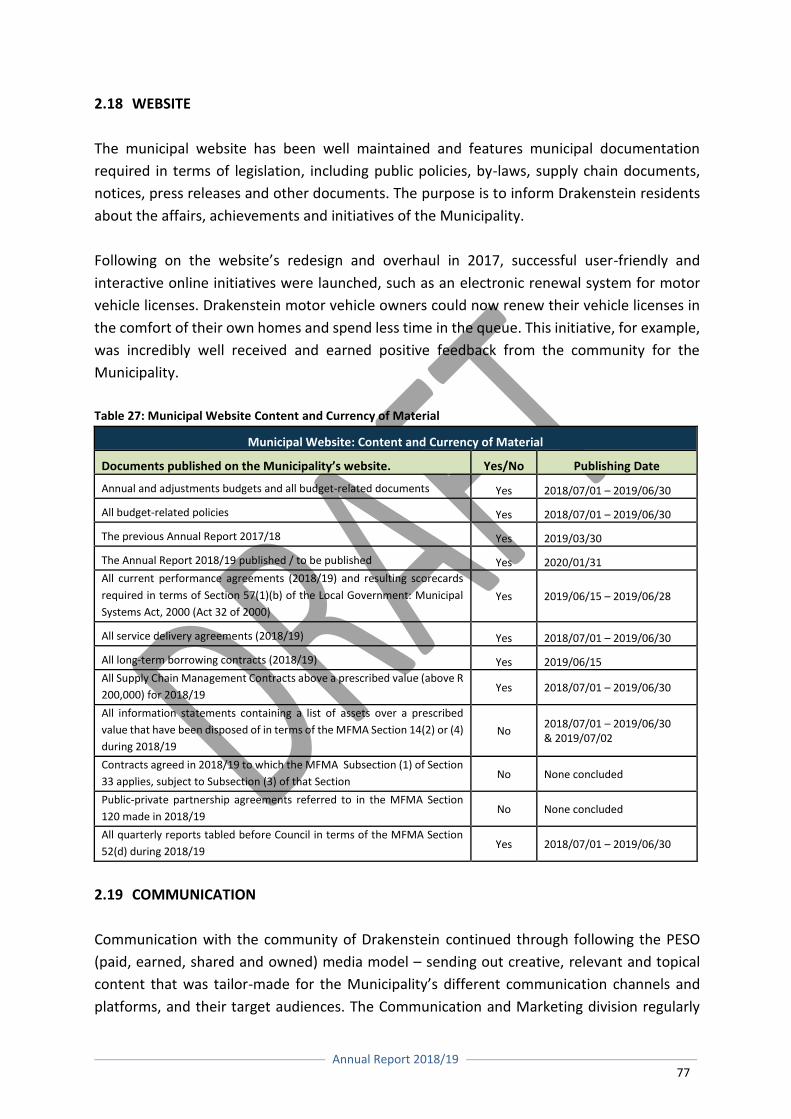
Annual Report 2018/19
77
2.18 WEBSITE
The municipal website has been well maintained and features municipal documentation
required in terms of legislation, including public policies, by-laws, supply chain documents,
notices, press releases and other documents. The purpose is to inform Drakenstein residents
about the affairs, achievements and initiatives of the Municipality.
Following on the website’s redesign and overhaul in 2017, successful user-friendly and
interactive online initiatives were launched, such as an electronic renewal system for motor
vehicle licenses. Drakenstein motor vehicle owners could now renew their vehicle licenses in
the comfort of their own homes and spend less time in the queue. This initiative, for example,
was incredibly well received and earned positive feedback from the community for the
Municipality.
Table 27: Municipal Website Content and Currency of Material
Municipal Website: Content and Currency of Material
Documents published on the Municipality’s website. Yes/No Publishing Date
Annual and adjustments budgets and all budget-related documents Yes 2018/07/01 – 2019/06/30
All budget-related policies Yes 2018/07/01 – 2019/06/30
The previous Annual Report 2017/18 Yes 2019/03/30
The Annual Report 2018/19 published / to be published Yes 2020/01/31
All current performance agreements (2018/19) and resulting scorecards
required in terms of Section 57(1)(b) of the Local Government: Municipal
Systems Act, 2000 (Act 32 of 2000)
Yes 2019/06/15 – 2019/06/28
All service delivery agreements (2018/19) Yes 2018/07/01 – 2019/06/30
All long-term borrowing contracts (2018/19) Yes 2019/06/15
All Supply Chain Management Contracts above a prescribed value (above R
200,000) for 2018/19 Yes 2018/07/01 – 2019/06/30
All information statements containing a list of assets over a prescribed
value that have been disposed of in terms of the MFMA Section 14(2) or (4)
during 2018/19
No 2018/07/01 – 2019/06/30 & 2019/07/02
Contracts agreed in 2018/19 to which the MFMA Subsection (1) of Section
33 applies, subject to Subsection (3) of that Section No None concluded
Public-private partnership agreements referred to in the MFMA Section
120 made in 2018/19 No None concluded
All quarterly reports tabled before Council in terms of the MFMA Section
52(d) during 2018/19 Yes 2018/07/01 – 2019/06/30
2.19 COMMUNICATION
Communication with the community of Drakenstein continued through following the PESO
(paid, earned, shared and owned) media model – sending out creative, relevant and topical
content that was tailor-made for the Municipality’s different communication channels and
platforms, and their target audiences. The Communication and Marketing division regularly
Annual Report 2018/19
78
placed advertisements (print and radio); sent out press releases to media (print, radio and
online), invited media to events and responded to media enquiries; as well as shared news
regarding municipal projects, programmes, initiatives and achievements on social media, the
municipal website, and external and internal newsletters.
At the same time the municipal brand was reinforced and enhanced by distributing quality
promotional items; displaying branding and banners at key events; and exercising the
Municipality’s marketing rights at supported events. A significant amount of reputation
management was also done to protect the brand.
The Municipality’s Facebook page – launched on 1 June 2018 – continued to achieve excellent
and consistent growth. Much of this growth was organic, thanks to original and relevant
content directly affecting the community of Drakenstein. By the end of June 2019, the
Drakenstein Municipality Facebook page had a total of 11 424 followers.
Guided by a new corporate identity manual the Municipality continued to roll out its new logo
and brand, embodying its vision of a city of excellence.
When the Annual Report is completed, it is made available at all the libraries and the two
Thusong Centres, in addition to the required distribution to other spheres of government. The
MPAC scrutinises the report and also invites public comment on it.
2.20 COMMUNITY SATISFACTION SURVEYS
During 1 February until 31 May 2019, the Municipality conducted a Customer Satisfaction
Survey in order to determine the perceived level of services and to enable the Municipality to
actively plan and focus on the improvement of service standards where needed. This is an
ongoing effort to raise the bar towards service excellence.
2.21 PUBLIC SATISFACTION WITH MUNICIPAL SERVICE DELIVERY
2.21.1 Customer Satisfaction Survey
The Municipality has once again conducted a customer satisfaction survey amongst all its
residents in order to establish the level of satisfaction experienced by the Municipality’s
customers. A link was created from the Municipality’s website where residents could
complete the survey in a language of their choice. Hard copies of the survey were made
available at Drakenstein community centres, libraries, traffic centres, and municipal
helpdesks. The survey questionnaire comprised of 25 questions. The same questions were
asked in English, Afrikaans and Xhosa. A total of 359 responses were received across all
surveys.
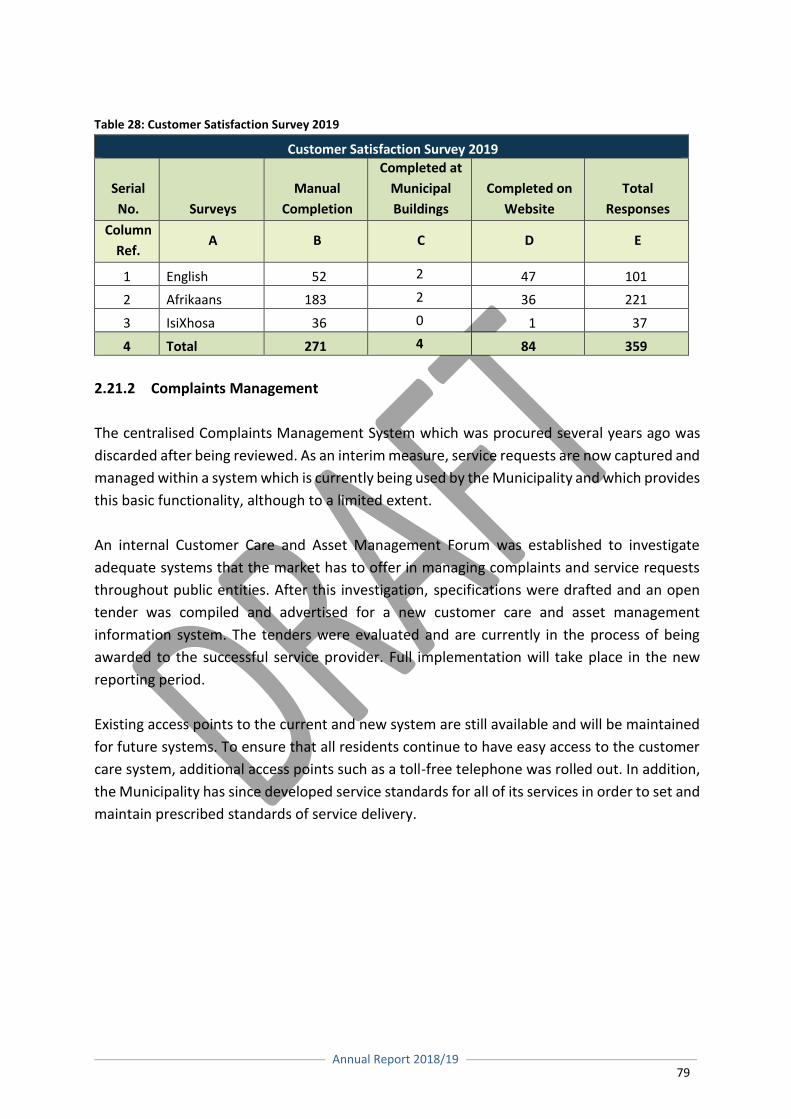
Annual Report 2018/19
79
Table 28: Customer Satisfaction Survey 2019
Customer Satisfaction Survey 2019
Serial
No. Surveys
Manual
Completion
Completed at
Municipal
Buildings
Completed on
Website
Total
Responses
Column
Ref. A B C D E
1 English 52 2 47 101
2 Afrikaans 183 2 36 221
3 IsiXhosa 36 0 1 37
4 Total 271 4 84 359
2.21.2 Complaints Management
The centralised Complaints Management System which was procured several years ago was
discarded after being reviewed. As an interim measure, service requests are now captured and
managed within a system which is currently being used by the Municipality and which provides
this basic functionality, although to a limited extent.
An internal Customer Care and Asset Management Forum was established to investigate
adequate systems that the market has to offer in managing complaints and service requests
throughout public entities. After this investigation, specifications were drafted and an open
tender was compiled and advertised for a new customer care and asset management
information system. The tenders were evaluated and are currently in the process of being
awarded to the successful service provider. Full implementation will take place in the new
reporting period.
Existing access points to the current and new system are still available and will be maintained
for future systems. To ensure that all residents continue to have easy access to the customer
care system, additional access points such as a toll-free telephone was rolled out. In addition,
the Municipality has since developed service standards for all of its services in order to set and
maintain prescribed standards of service delivery.
Annual Report 2018/19
80
3. SERVICE DELIVERY PERFORMANCE
COMPONENT A: OVERVIEW OF PERFORMANCE WITHIN THE ORGANISATION
3.1 INTRODUCTION
Performance management is a process that measures the implementation of the
organisation’s strategic objectives. It is also a management tool to plan, monitor, measure and
review performance indicators to ensure efficiency, effectiveness and the impact of service
delivery by the municipality.
At local government level, performance management is institutionalised through the
legislative requirements of the performance management process. Performance
management provides the mechanism to measure whether targets are met in line with the
strategic objectives as set by the organisation.
Section 152 of the Constitution of the Republic of South Africa, 1996, deals with the objectives
of local government and paves the way for performance management. The idea of a
government that is accountable is important to meet the needs of Drakenstein Municipality.
The democratic values and principles in terms of section 195(1) are also linked with the
concept of performance management, with reference to the principles of the following,
among others to:
Promote the effective, efficient and economic use of resources;
Ensure accountable public administration;
Be transparent by providing information;
Be responsive to the needs of the community; and
Facilitate a culture of public service and accountability.
The Local Government: Municipal Systems Act (MSA) of 2000 requires municipalities to
establish a performance management system. Further, the MSA and the Municipal Finance
Management Act (MFMA) require the Integrated Development Plan (IDP) to be aligned to the
municipal budget. The monitoring of organisational performance of the budget must be done
against the IDP on a quarterly basis via the Service Delivery and Budget Implementation Plan
(SDBIP). The report is made public after the Council has been informed of the quarterly
progress against set targets.
In addition, Regulation 7(1) of the Local Government: Municipal Planning and Performance
Management Regulations of 2001 states that “A Municipality’s Performance Management
System entails a framework that describes and represents how the municipality’s cycle and
Annual Report 2018/19
81
processes of performance planning, monitoring, measurement, review, reporting and
improvement will be conducted, organised and managed, including determining the roles of
the different role players”. Performance management is not only relevant to the organisation
as a whole, but also to the individuals employed in the organisation, as well as the external
service providers and the municipal entities. This framework, inter alia, reflects the linkage
between the IDP, the Budget and the SDBIP.
3.1.1 Legislative Requirements
In terms of section 46(1)(a) of the Local Government: Municipal Systems Act, a municipality
must prepare an Annual Performance Report (APR) for each financial year that reflects the
municipality’s and any service provider’s performance during the financial year. The APR must
furthermore indicate the development and service delivery priorities and the performance
targets set by the municipality for the financial year, and based on the results indicate what
corrective measures were or are to be taken to improve performance. The 2018/19 APR is
attached to this Annual Report as Volume V.
3.1.2 Organisational Performance
Strategic performance assessment indicates how well the Municipality is meeting its
objectives and which policies and processes are working. All government institutions must
report on strategic performance to ensure that service delivery is effective, efficient and
economical. Municipalities must develop strategic plans and allocate resources for
implementation. Implementation must be monitored on an ongoing basis and the results
must be reported on during the financial year to various role players to enable them to
implement corrective measures timeously as and when required.
The APR highlights the strategic performance in terms of the municipality’s Top-Layer Service
Delivery and Budget Implementation Plan (SDBIP), high-level performance in terms of the
strategic objectives of the municipality and performance on the National Key Performance
Indicators prescribed in terms of section 43 of the Municipal Systems Act of 2000.
3.1.3 Performance Management Policy
The Municipality adopted a Performance Management (PM) Policy during 2011. The
Municipality reviewed the policy during the 2018/19 financial year. The PM Policy articulates
the Municipality’s objectives in order to promote accountability and the overall strategy of
the Municipality. Therefore, the main principles of the PM Policy are that it must be feasible
in terms of the available resources to the Municipality and that the PM Policy must serve as
an enabling mechanism for employees to achieve their performance objectives and targets.
Annual Report 2018/19
82
Performance management has been introduced in the Local Government: Municipal Systems
Act, Act 32 of 2000 (hereafter referred to as the MSA). The MSA is specific with regards to
performance management. Each municipality must develop a performance management
system (PMS) in order to enhance service delivery inputs in order to maximise outputs to the
community. The MSA emphasise the amplified role of Council in performance management.
Legislative enactments which govern performance management in municipalities are found in
various documents. As outlined in Section 40 of the MSA, Drakenstein Municipality must
establish mechanisms to monitor and review its Performance Management System (PMS) so
as to measure, monitor, review, evaluate and improve performance at organisational,
departmental and lower levels.
3.1.4 The IDP and the Budget
The Municipality has developed a long term 15 year strategy (2017/2032) for Drakenstein to
realise a vision: to evolve into “A city of excellence” within the next fifteen years. Key facets of
the vision are economic dynamism; quality of life for all; a strong well-governed brand; and
financial sustainability.
The IDP 2017/2032 (inclusive of Vision 2032) details a comprehensive needs analysis and big
moves, key initiatives, projects and programmes to address these challenges in partnership
with other spheres of government, the private sector and civil society.
The Integrated Development Plan, together with its long-term trajectory, will be reviewed
annually to accommodate changes in the municipal environment, including community
priorities. In turn, the revised IDP will inform changes to the budget, key performance
indicators and targets of the Municipality.
The Municipal IDP must be reviewed every year to ensure that:
Municipalities and communities keep track of progress in implementing development
projects and spending the municipal budget; and
Communities are provided with an opportunity to review their needs and make possible
changes to the priorities listed in the municipal IDP.
The IDP is the principal planning instrument that guides and informs the municipal budget.
The Drakenstein Municipality’s PMS is the primary mechanism to monitor, review and
improve the implementation of its IDP and to measure the progress made in achieving the
objectives as set out in the IDP.
Annual Report 2018/19
83
The Five-Year Performance Framework reflects the connection between the strategic
framework of the Municipality, as detailed in the previous chapter and IDP implementation
through Key Performance Indicators and Targets to measure performance of the IDP for the
five years.
These are annually revised in line with Section 34 of the Local Government: Municipal Systems
Act, No. 32 of 2000 which compels a municipal council to review its integrated development
plan annually in accordance with an assessment of its performance measurements in terms
of section 41 to the extent that changing circumstances so demand.
A conducive performance management culture will ensure that the developmental objectives
as construed in the IDP gets relevance in the performance agreements of senior managers and
consequence implementation thereof.
3.2 SERVICE DELIVERY AND BUDGET IMPLEMENTATION PLAN (SDBIP)
The organisational performance is evaluated by means of a municipal scorecard (Top-Layer
SDBIP). Performance objectives, as reflected in the municipal scorecard, are required to be
practical, measurable and based on the key performance indicators.
The SDBIP is a tool that converts the IDP and budget into measurable criteria of how, where
and when the strategies, objectives and normal business processes of the Municipality are
implemented.
It also allocates responsibility to directorates to deliver the services in terms of the IDP and
the budget.
MFMA Circular No. 13 is a clarification of the Municipal Budget and Reporting Regulations,
Schedule A1, General Notice 393 in Government Gazette 32141 and prescribes that:
The IDP and Budget must be aligned;
The Budget must address the strategic priorities;
the SDBIP should indicate what the Municipality is going to do during the next 12
months; and
The SDBIP should form the basis for measuring the performance against goals set during
the Budget/IDP processes.
The Top-Layer SDBIP was prepared as described in the paragraphs below and approved by the
Executive Mayor, Cllr Conrad Poole on 28 June 2018 in terms of section 53(1)(c)(ii) of the Local
Government: Municipal Finance Management Act of 2003. It was made public on the
municipal website within five working days after approval by the Executive Mayor.
Annual Report 2018/19
84
3.2.1 The Municipal Scorecard (Top-Layer SDBIP)
The municipal scorecard (Top-Layer SDBIP) consolidates service delivery targets set by
Council/executive management and provides an overall picture of the performance of the
Municipality as a whole, reflecting performance in its strategic priorities for the 2018/19
financial year. The scorecard is the performance evaluation tool and is used during the
informal and formal performance assessment of the City Manager and executive managers.
Components of the Top-Layer SDBIP include:
3.2.1.1 One-year detailed plan with the following components:
Monthly projections of revenue to be collected for each source;
Expected revenue to be collected;
Monthly projections of expenditure (operating and capital) and revenue for each vote;
Quarterly projections of service delivery targets and performance indicators for each
vote;
Non-financial, measurable performance objectives in the form of targets and indicators;
Output management objectives; and
Level and standard of service being provided to the community.
3.2.1.2 Top-Layer KPI’s were prepared based on the following:
Key performance indicators (KPIs) for the programmes/activities identified to address
the strategic objectives as documented in the IDP in co-operation with the community
who identifies developmental priorities;
KPIs identified during the IDP public participation process and KPIs that need to be
reported to key municipal stakeholders; and
KPIs to address the required national minimum reporting requirements.
3.2.2 Amendment of the Top-Layer SDBIP
The Top-Layer SDBIP was amended during the 2018/19 financial year through Council
Resolution 7.2 at a Council meeting held on 27 February 2019.
3.2.3 Actual Performance
The Municipality utilises an electronic web-based, real time performance-based system on
which KPI owners update actual performance on a monthly basis. KPI owners report on the
results of the KPI by documenting the following information on the performance system:
Annual Report 2018/19
85
The actual result in terms of the set target;
A performance comment;
Actions to improve the performance by the submission of corrective measures to meet
the set target for the reporting interval in question, if the target was not achieved.
It is the responsibility of every KPI owner to maintain a portfolio of evidence to support actual
performance results updated and provide it to the Internal Auditor and Auditor General upon
request during the quarterly and annual audit testing.
3.2.4 Monitoring of the SDBIP
Municipal performance is measured as follows:
Mid-year assessment and submission of the mid-year report to the Executive Mayor in
terms of section of Section 72(1)(a) and 52(d) of the Local Government Municipal
Finance Management Act to assess the performance of the Municipality during the first
half of the financial year;
Quarterly performance was subjected to an internal audit and the results of their
findings were submitted to the Audit Committee; and
Quarterly performance reports are submitted to Council for information.
3.3 INDIVIDUAL PERFORMANCE
The Human Resources Management Division is responsible for the Individual Performance
Management System that is rolled out to municipal staff through a Staff/Employee Efficiency
Monitoring programme. The purpose of the SEM programme is to manage and improve
efficiency by enabling a higher level of staff participation and involvement in planning, delivery
and evaluation of work performance.
The SEM is a component of the PMS in Drakenstein and ensures integrated work planning,
target setting, performance reporting and feedback.
This Staff/Employee Efficiency Monitoring Template is completed by all employees not
evaluated on the formal PMS. Both the employee and the supervisor are expected to
complete and agree to the KPIs and targets based on the individuals job description.
The Employee Efficiency Monitoring Exercise encourages supervisor and employee
engagement, coaching and mentoring, skills transfer and also enhances communication
between managers, supervisors and employees. Managers will be able to identify skills gaps
of employees through this tool. Employee Monitoring takes place on a quarterly basis.
Annual Report 2018/19
86
3.3.1 Executive Directors and Managers Directly Accountable to the City Manager
The Municipal Systems Act (MSA), 2000 (Act 32 of 2000) prescribes that the Municipality must
enter into performance based agreements with all section 57-employees and that
performance agreements must be reviewed annually and published for public interest. This
process and the format are further regulated by Regulation 805 (August 2006), MSA.
The performance agreements for the section 57 appointments for the 2018/19 financial year
were signed during July 2018 as prescribed. They include performance agreements for the:
City Manager;
Chief Financial Officer;
Executive Director: Corporate Services;
Executive Director: Planning and Development;
Executive Director: Community Services; and
Executive Director: Engineering Services.
The appraisal of the actual performance in terms of the signed agreements takes place twice
per annum as regulated. The mid-year performance assessment for the City Manager and
executive managers for the 2018/19 financial year took place on 15 January 2019. The final
evaluations of the City Manager and Executive Directors for the 2018/19 financial year has
tentatively been scheduled for 4 December 2019.
3.3.2 Other Municipal Officials
The Municipality has introduced Employee Efficiency Monitoring as a means to ensure that all
employees commit to what is expected from them in terms of performing their functions and
also as a means to encourage continuous employee and supervisor engagement. The
monitoring tool is intended for all employees who do not undergo formal performance
evaluation.
Employee Monitoring is rolled out in phases to all employees and is monitored through the
Organisation Development and Efficiency Section in HR. Each department is required to
conduct this exercise on a quarterly basis. The IDP and PMS Division is responsible for the top
three reporting levels of management.
3.4 SERVICE DELIVERY AND BUDGET IMPLEMENTATION PLAN (TOP-LAYER)
The SDBIP results for the year under review are reflected in the Annual Performance Report
attached as Volume V to the Annual Report.
Annual Report 2018/19
87
COMPONENT B: BASIC SERVICES
Water, electricity, waste water and refuse removal services are fundamentally important basic
services to ensure a healthy and safe environment for all Drakenstein inhabitants. These basic
services sections play a very important part in the planning and implementation of basic
services in all formally established township developments as well as informal settlements in
the Drakenstein Area over which the Municipality has control.
3.5 WATER SERVICES
The main objective of the Water Section is to provide water services in an effective, efficient
and sustainable manner in respect of service delivery and to ensure that all people in
Drakenstein Municipality’s Management Area have access to adequate, safe, appropriate and
affordable water services, using water wisely.
Other objectives are to upgrade existing water mains to new and higher standards and to
extend the service life of existing bulk water infrastructure in accordance with the Water
Master Plan.
The rapid rate of urbanisation is resulting in many cities and towns in South Africa facing major
challenges of providing their increasing population with adequate and sustainable water
services. On top of this, extensive parts of the continent are currently water stressed and these
areas struggle to reconcile the water requirements and the water resources. Intensive water
demand management and diligent personnel saved the Drakenstein area from a day zero
situation and we did succeed in providing water, at only 120 litres per person per day.
Apart from providing potable water to all our urban residents, we are obliged to fulfil our
other basic functions of upgrading the existing infrastructure, extending the network and to
effectively maintain the existing network.
3.5.1 Service Statistics
It is clear from the table below that water use dropped significantly from the 2015/16 to
2018/19 financial year due to the drought and water restrictions implemented over the last
three financial years. Residential use was the biggest contributor in water savings. Water
losses decreased from 14.88% to 2018/19 to 13.21% as at 30 June 2019.
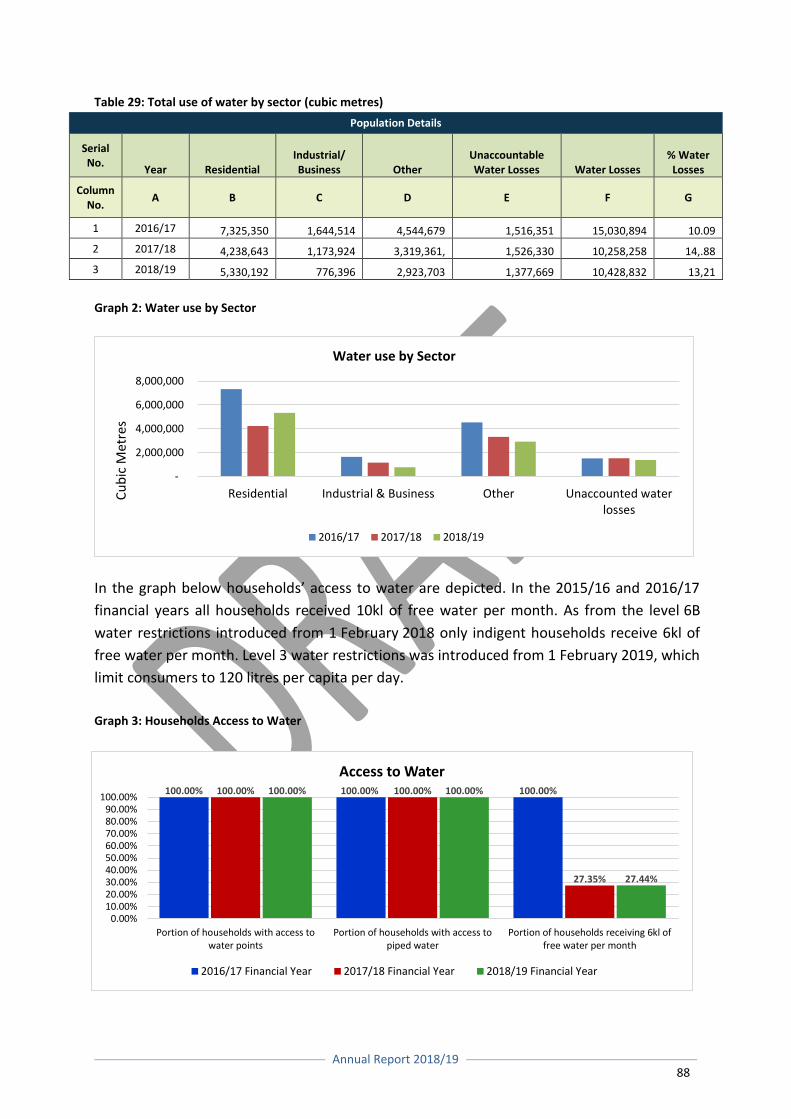
Annual Report 2018/19
88
Table 29: Total use of water by sector (cubic metres)
Population Details
Serial No.
Year Residential Industrial/ Business Other
Unaccountable Water Losses Water Losses
% Water Losses
Column No.
A B C D E F G
1 2016/17 7,325,350 1,644,514 4,544,679 1,516,351 15,030,894 10.09
2 2017/18 4,238,643 1,173,924 3,319,361, 1,526,330 10,258,258 14,.88
3 2018/19 5,330,192 776,396 2,923,703 1,377,669 10,428,832 13,21
Graph 2: Water use by Sector
In the graph below households’ access to water are depicted. In the 2015/16 and 2016/17
financial years all households received 10kl of free water per month. As from the level 6B
water restrictions introduced from 1 February 2018 only indigent households receive 6kl of
free water per month. Level 3 water restrictions was introduced from 1 February 2019, which
limit consumers to 120 litres per capita per day.
Graph 3: Households Access to Water
* Note that the percentage of households with access to water indicated in the graph does not include rural households
-
2,000,000
4,000,000
6,000,000
8,000,000
Residential Industrial & Business Other Unaccounted waterlosses
Cu
bic
Met
res
Water use by Sector
2016/17 2017/18 2018/19
100.00% 100.00% 100.00%100.00% 100.00%
27.35%
100.00% 100.00%
27.44%
0.00%10.00%20.00%30.00%40.00%50.00%60.00%70.00%80.00%90.00%
100.00%
Portion of households with access towater points
Portion of households with access topiped water
Portion of households receiving 6kl offree water per month
Access to Water
2016/17 Financial Year 2017/18 Financial Year 2018/19 Financial Year
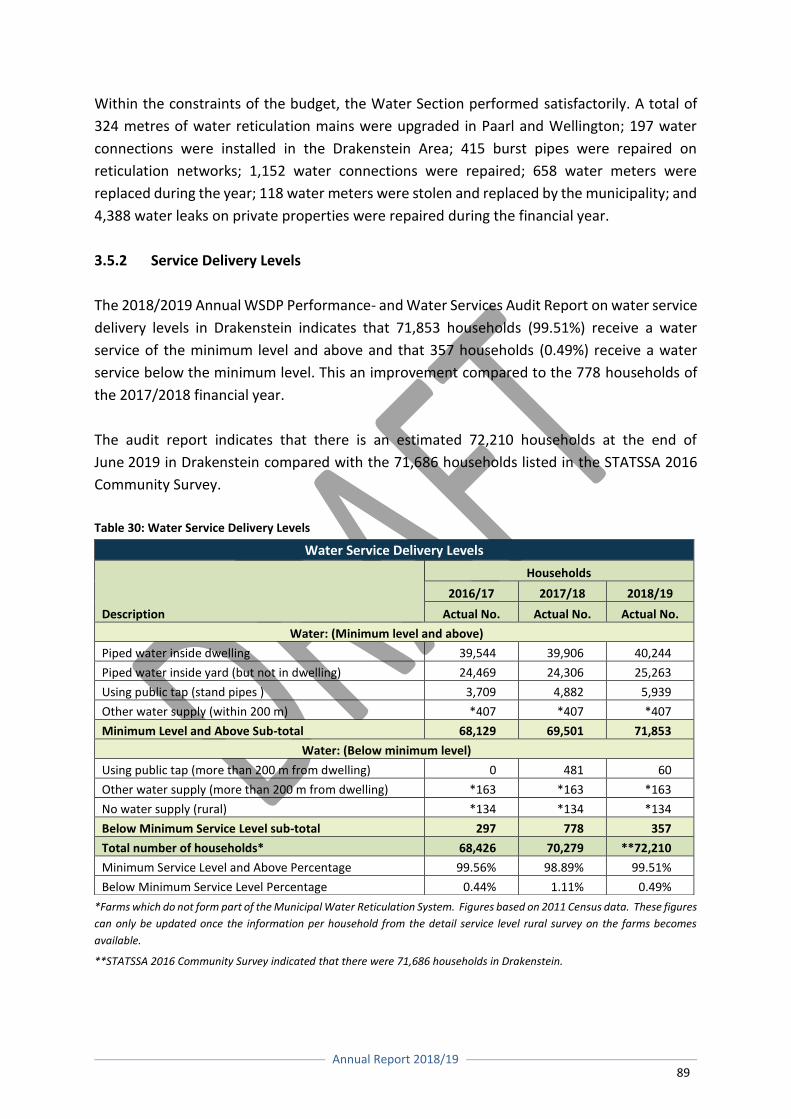
Annual Report 2018/19
89
Within the constraints of the budget, the Water Section performed satisfactorily. A total of
324 metres of water reticulation mains were upgraded in Paarl and Wellington; 197 water
connections were installed in the Drakenstein Area; 415 burst pipes were repaired on
reticulation networks; 1,152 water connections were repaired; 658 water meters were
replaced during the year; 118 water meters were stolen and replaced by the municipality; and
4,388 water leaks on private properties were repaired during the financial year.
3.5.2 Service Delivery Levels
The 2018/2019 Annual WSDP Performance- and Water Services Audit Report on water service
delivery levels in Drakenstein indicates that 71,853 households (99.51%) receive a water
service of the minimum level and above and that 357 households (0.49%) receive a water
service below the minimum level. This an improvement compared to the 778 households of
the 2017/2018 financial year.
The audit report indicates that there is an estimated 72,210 households at the end of
June 2019 in Drakenstein compared with the 71,686 households listed in the STATSSA 2016
Community Survey.
Table 30: Water Service Delivery Levels
*Farms which do not form part of the Municipal Water Reticulation System. Figures based on 2011 Census data. These figures
can only be updated once the information per household from the detail service level rural survey on the farms becomes
available.
**STATSSA 2016 Community Survey indicated that there were 71,686 households in Drakenstein.
Water Service Delivery Levels
Description
Households
2016/17 2017/18 2018/19
Actual No. Actual No. Actual No.
Water: (Minimum level and above)
Piped water inside dwelling 39,544 39,906 40,244
Piped water inside yard (but not in dwelling) 24,469 24,306 25,263
Using public tap (stand pipes ) 3,709 4,882 5,939
Other water supply (within 200 m) *407 *407 *407
Minimum Level and Above Sub-total 68,129 69,501 71,853
Water: (Below minimum level)
Using public tap (more than 200 m from dwelling) 0 481 60
Other water supply (more than 200 m from dwelling) *163 *163 *163
No water supply (rural) *134 *134 *134
Below Minimum Service Level sub-total 297 778 357
Total number of households* 68,426 70,279 **72,210
Minimum Service Level and Above Percentage 99.56% 98.89% 99.51%
Below Minimum Service Level Percentage 0.44% 1.11% 0.49%
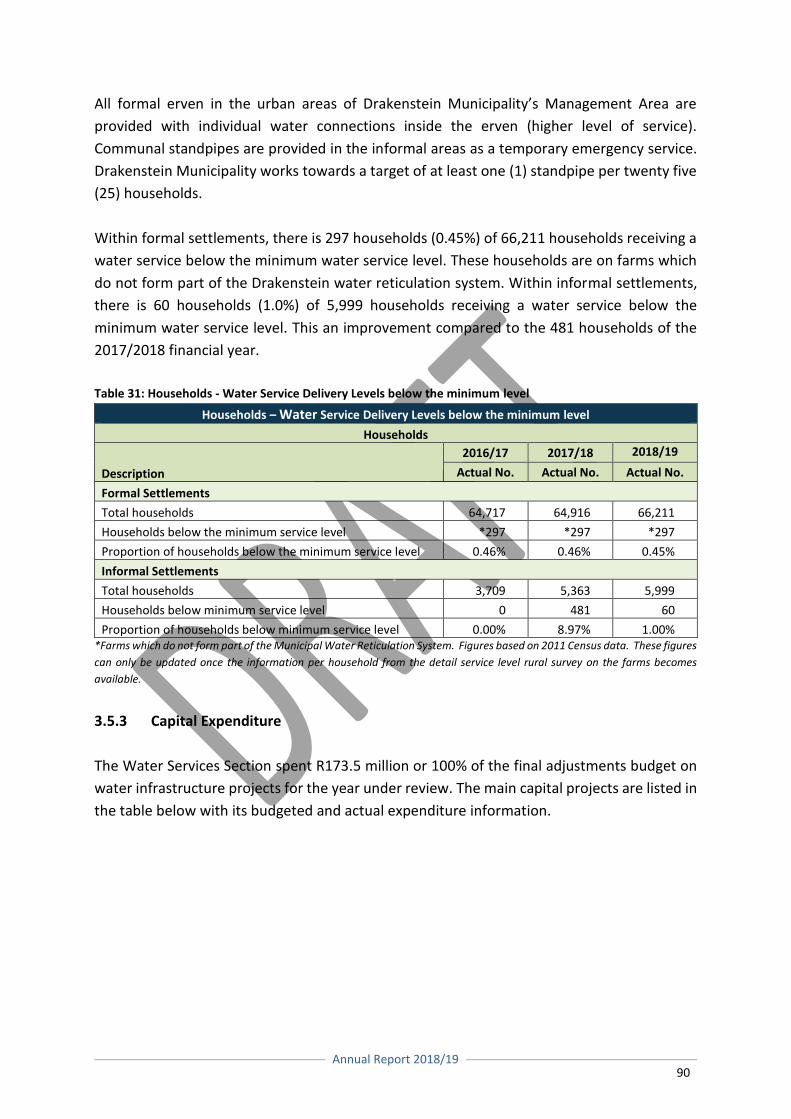
Annual Report 2018/19
90
All formal erven in the urban areas of Drakenstein Municipality’s Management Area are
provided with individual water connections inside the erven (higher level of service).
Communal standpipes are provided in the informal areas as a temporary emergency service.
Drakenstein Municipality works towards a target of at least one (1) standpipe per twenty five
(25) households.
Within formal settlements, there is 297 households (0.45%) of 66,211 households receiving a
water service below the minimum water service level. These households are on farms which
do not form part of the Drakenstein water reticulation system. Within informal settlements,
there is 60 households (1.0%) of 5,999 households receiving a water service below the
minimum water service level. This an improvement compared to the 481 households of the
2017/2018 financial year.
Table 31: Households - Water Service Delivery Levels below the minimum level
Households – Water Service Delivery Levels below the minimum level
Households
Description
2016/17 2017/18 2018/19
Actual No. Actual No. Actual No.
Formal Settlements
Total households 64,717 64,916 66,211
Households below the minimum service level *297 *297 *297
Proportion of households below the minimum service level 0.46% 0.46% 0.45%
Informal Settlements
Total households 3,709 5,363 5,999
Households below minimum service level 0 481 60
Proportion of households below minimum service level 0.00% 8.97% 1.00% *Farms which do not form part of the Municipal Water Reticulation System. Figures based on 2011 Census data. These figures
can only be updated once the information per household from the detail service level rural survey on the farms becomes
available.
3.5.3 Capital Expenditure
The Water Services Section spent R173.5 million or 100% of the final adjustments budget on
water infrastructure projects for the year under review. The main capital projects are listed in
the table below with its budgeted and actual expenditure information.
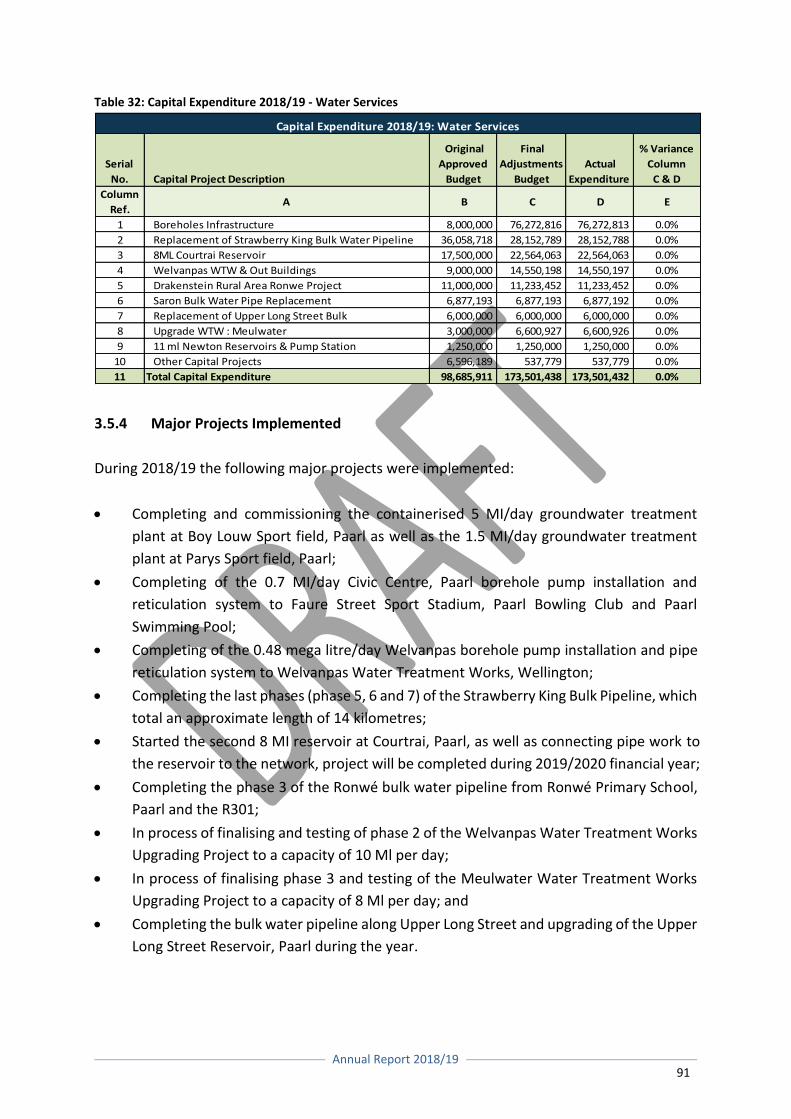
Annual Report 2018/19
91
Table 32: Capital Expenditure 2018/19 - Water Services
3.5.4 Major Projects Implemented
During 2018/19 the following major projects were implemented:
Completing and commissioning the containerised 5 MI/day groundwater treatment
plant at Boy Louw Sport field, Paarl as well as the 1.5 MI/day groundwater treatment
plant at Parys Sport field, Paarl;
Completing of the 0.7 MI/day Civic Centre, Paarl borehole pump installation and
reticulation system to Faure Street Sport Stadium, Paarl Bowling Club and Paarl
Swimming Pool;
Completing of the 0.48 mega litre/day Welvanpas borehole pump installation and pipe
reticulation system to Welvanpas Water Treatment Works, Wellington;
Completing the last phases (phase 5, 6 and 7) of the Strawberry King Bulk Pipeline, which
total an approximate length of 14 kilometres;
Started the second 8 MI reservoir at Courtrai, Paarl, as well as connecting pipe work to
the reservoir to the network, project will be completed during 2019/2020 financial year;
Completing the phase 3 of the Ronwé bulk water pipeline from Ronwé Primary School,
Paarl and the R301;
In process of finalising and testing of phase 2 of the Welvanpas Water Treatment Works
Upgrading Project to a capacity of 10 Ml per day;
In process of finalising phase 3 and testing of the Meulwater Water Treatment Works
Upgrading Project to a capacity of 8 Ml per day; and
Completing the bulk water pipeline along Upper Long Street and upgrading of the Upper
Long Street Reservoir, Paarl during the year.
Serial
No. Capital Project Description
Original
Approved
Budget
Final
Adjustments
Budget
Actual
Expenditure
% Variance
Column
C & D
Column
Ref.A B C D E
1 Boreholes Infrastructure 8,000,000 76,272,816 76,272,813 0.0%
2 Replacement of Strawberry King Bulk Water Pipeline 36,058,718 28,152,789 28,152,788 0.0%
3 8ML Courtrai Reservoir 17,500,000 22,564,063 22,564,063 0.0%
4 Welvanpas WTW & Out Buildings 9,000,000 14,550,198 14,550,197 0.0%
5 Drakenstein Rural Area Ronwe Project 11,000,000 11,233,452 11,233,452 0.0%
6 Saron Bulk Water Pipe Replacement 6,877,193 6,877,193 6,877,192 0.0%
7 Replacement of Upper Long Street Bulk 6,000,000 6,000,000 6,000,000 0.0%
8 Upgrade WTW : Meulwater 3,000,000 6,600,927 6,600,926 0.0%
9 11 ml Newton Reservoirs & Pump Station 1,250,000 1,250,000 1,250,000 0.0%
10 Other Capital Projects 6,596,189 537,779 537,779 0.0%
11 Total Capital Expenditure 98,685,911 173,501,438 173,501,432 0.0%
Capital Expenditure 2018/19: Water Services
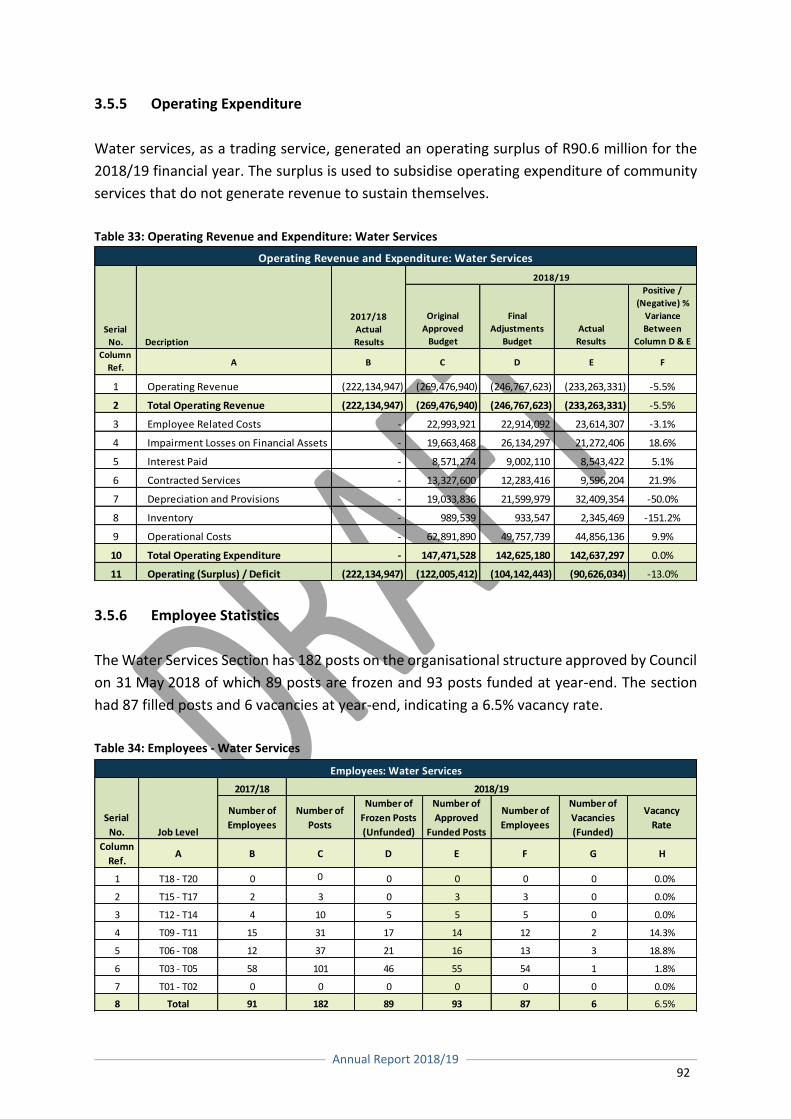
Annual Report 2018/19
92
3.5.5 Operating Expenditure
Water services, as a trading service, generated an operating surplus of R90.6 million for the
2018/19 financial year. The surplus is used to subsidise operating expenditure of community
services that do not generate revenue to sustain themselves.
Table 33: Operating Revenue and Expenditure: Water Services
3.5.6 Employee Statistics
The Water Services Section has 182 posts on the organisational structure approved by Council
on 31 May 2018 of which 89 posts are frozen and 93 posts funded at year-end. The section
had 87 filled posts and 6 vacancies at year-end, indicating a 6.5% vacancy rate.
Table 34: Employees - Water Services
2017/18
Number of
Employees
Number of
Posts
Number of
Frozen Posts
(Unfunded)
Number of
Approved
Funded Posts
Number of
Employees
Number of
Vacancies
(Funded)
Vacancy
Rate
Column
Ref.A B C D E F G H
1 T18 - T20 0 0 0 0 0 0 0.0%
2 T15 - T17 2 3 0 3 3 0 0.0%
3 T12 - T14 4 10 5 5 5 0 0.0%
4 T09 - T11 15 31 17 14 12 2 14.3%
5 T06 - T08 12 37 21 16 13 3 18.8%
6 T03 - T05 58 101 46 55 54 1 1.8%
7 T01 - T02 0 0 0 0 0 0 0.0%
8 Total 91 182 89 93 87 6 6.5%
2018/19
Employees: Water Services
Serial
No. Job Level
Original
Approved
Budget
Final
Adjustments
Budget
Actual
Results
Positive /
(Negative) %
Variance
Between
Column D & E
Column
Ref.A B C D E F
1 Operating Revenue (222,134,947) (269,476,940) (246,767,623) (233,263,331) -5.5%
2 Total Operating Revenue (222,134,947) (269,476,940) (246,767,623) (233,263,331) -5.5%
3 Employee Related Costs - 22,993,921 22,914,092 23,614,307 -3.1%
4 Impairment Losses on Financial Assets - 19,663,468 26,134,297 21,272,406 18.6%
5 Interest Paid - 8,571,274 9,002,110 8,543,422 5.1%
6 Contracted Services - 13,327,600 12,283,416 9,596,204 21.9%
7 Depreciation and Provisions - 19,033,836 21,599,979 32,409,354 -50.0%
8 Inventory - 989,539 933,547 2,345,469 -151.2%
9 Operational Costs - 62,891,890 49,757,739 44,856,136 9.9%
10 Total Operating Expenditure - 147,471,528 142,625,180 142,637,297 0.0%
11 Operating (Surplus) / Deficit (222,134,947) (122,005,412) (104,142,443) (90,626,034) -13.0%
Serial
No. Decription
2017/18
Actual
Results
2018/19
Operating Revenue and Expenditure: Water Services
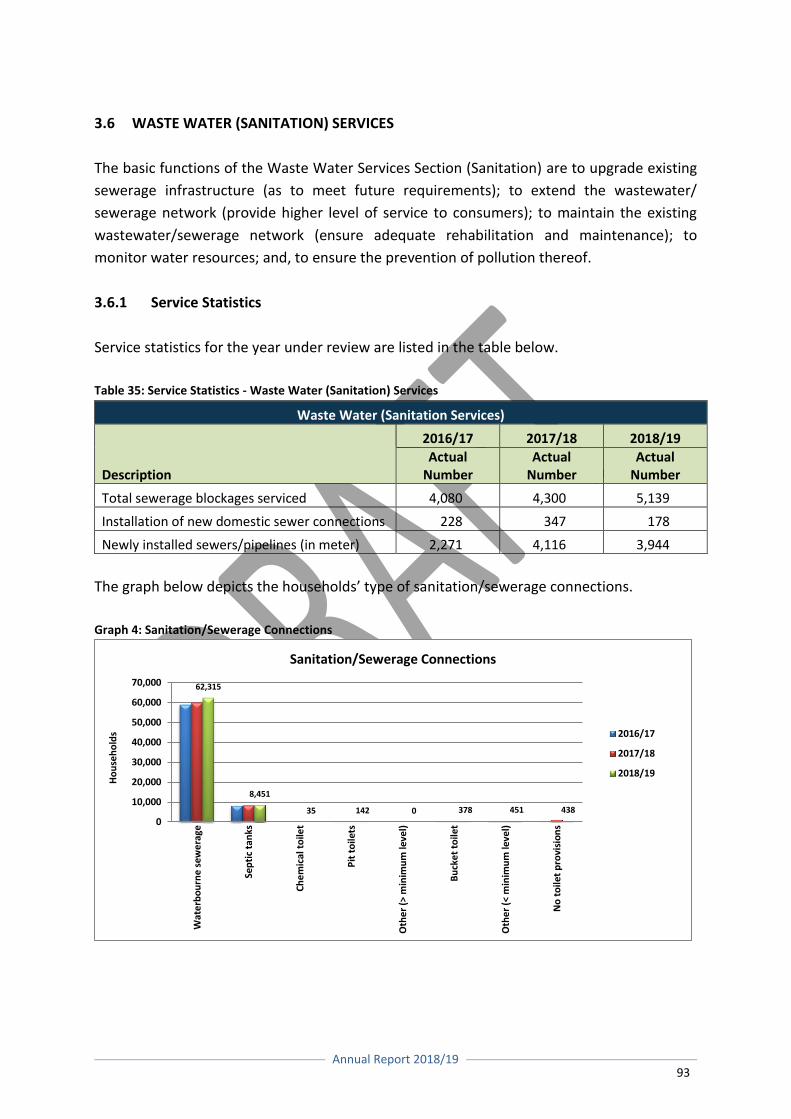
Annual Report 2018/19
93
3.6 WASTE WATER (SANITATION) SERVICES
The basic functions of the Waste Water Services Section (Sanitation) are to upgrade existing
sewerage infrastructure (as to meet future requirements); to extend the wastewater/
sewerage network (provide higher level of service to consumers); to maintain the existing
wastewater/sewerage network (ensure adequate rehabilitation and maintenance); to
monitor water resources; and, to ensure the prevention of pollution thereof.
3.6.1 Service Statistics
Service statistics for the year under review are listed in the table below.
Table 35: Service Statistics - Waste Water (Sanitation) Services
Waste Water (Sanitation Services)
Description
2016/17 2017/18 2018/19
Actual Number
Actual Number
Actual Number
Total sewerage blockages serviced 4,080 4,300 5,139
Installation of new domestic sewer connections 228 347 178
Newly installed sewers/pipelines (in meter) 2,271 4,116 3,944
The graph below depicts the households’ type of sanitation/sewerage connections.
Graph 4: Sanitation/Sewerage Connections
62,315
8,451
35 142 0 378 451 438
0
10,000
20,000
30,000
40,000
50,000
60,000
70,000
Wat
erb
ou
rne
sew
era
ge
Sep
tic
tan
ks
Ch
em
ical
to
ilet
Pit
to
ilets
Oth
er
(> m
inim
um
leve
l)
Bu
cke
t to
ilet
Oth
er
(< m
inim
um
leve
l)
No
to
ilet
pro
visi
on
s
Ho
use
ho
lds
Sanitation/Sewerage Connections
2016/17
2017/18
2018/19
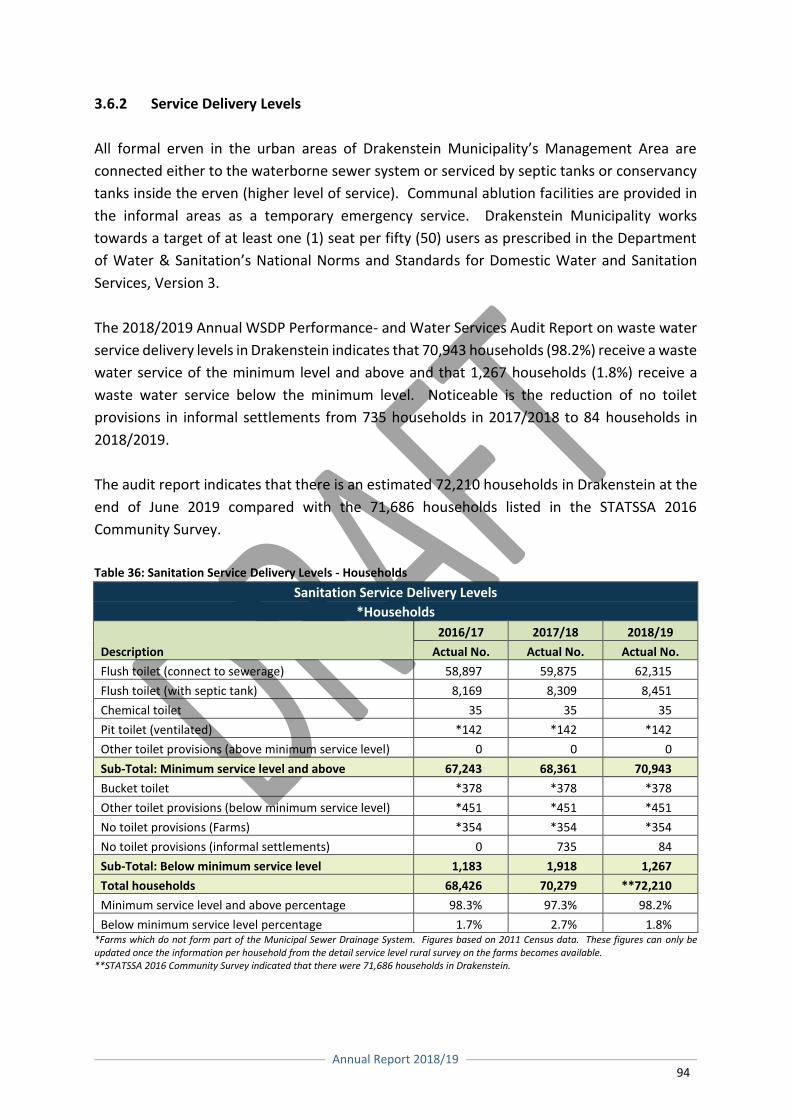
Annual Report 2018/19
94
3.6.2 Service Delivery Levels
All formal erven in the urban areas of Drakenstein Municipality’s Management Area are
connected either to the waterborne sewer system or serviced by septic tanks or conservancy
tanks inside the erven (higher level of service). Communal ablution facilities are provided in
the informal areas as a temporary emergency service. Drakenstein Municipality works
towards a target of at least one (1) seat per fifty (50) users as prescribed in the Department
of Water & Sanitation’s National Norms and Standards for Domestic Water and Sanitation
Services, Version 3.
The 2018/2019 Annual WSDP Performance- and Water Services Audit Report on waste water
service delivery levels in Drakenstein indicates that 70,943 households (98.2%) receive a waste
water service of the minimum level and above and that 1,267 households (1.8%) receive a
waste water service below the minimum level. Noticeable is the reduction of no toilet
provisions in informal settlements from 735 households in 2017/2018 to 84 households in
2018/2019.
The audit report indicates that there is an estimated 72,210 households in Drakenstein at the
end of June 2019 compared with the 71,686 households listed in the STATSSA 2016
Community Survey.
Table 36: Sanitation Service Delivery Levels - Households
*Farms which do not form part of the Municipal Sewer Drainage System. Figures based on 2011 Census data. These figures can only be updated once the information per household from the detail service level rural survey on the farms becomes available. **STATSSA 2016 Community Survey indicated that there were 71,686 households in Drakenstein.
Sanitation Service Delivery Levels
*Households
Description
2016/17 2017/18 2018/19
Actual No. Actual No. Actual No.
Flush toilet (connect to sewerage) 58,897 59,875 62,315
Flush toilet (with septic tank) 8,169 8,309 8,451
Chemical toilet 35 35 35
Pit toilet (ventilated) *142 *142 *142
Other toilet provisions (above minimum service level) 0 0 0
Sub-Total: Minimum service level and above 67,243 68,361 70,943
Bucket toilet *378 *378 *378
Other toilet provisions (below minimum service level) *451 *451 *451
No toilet provisions (Farms) *354 *354 *354
No toilet provisions (informal settlements) 0 735 84
Sub-Total: Below minimum service level 1,183 1,918 1,267
Total households 68,426 70,279 **72,210
Minimum service level and above percentage 98.3% 97.3% 98.2%
Below minimum service level percentage 1.7% 2.7% 1.8%
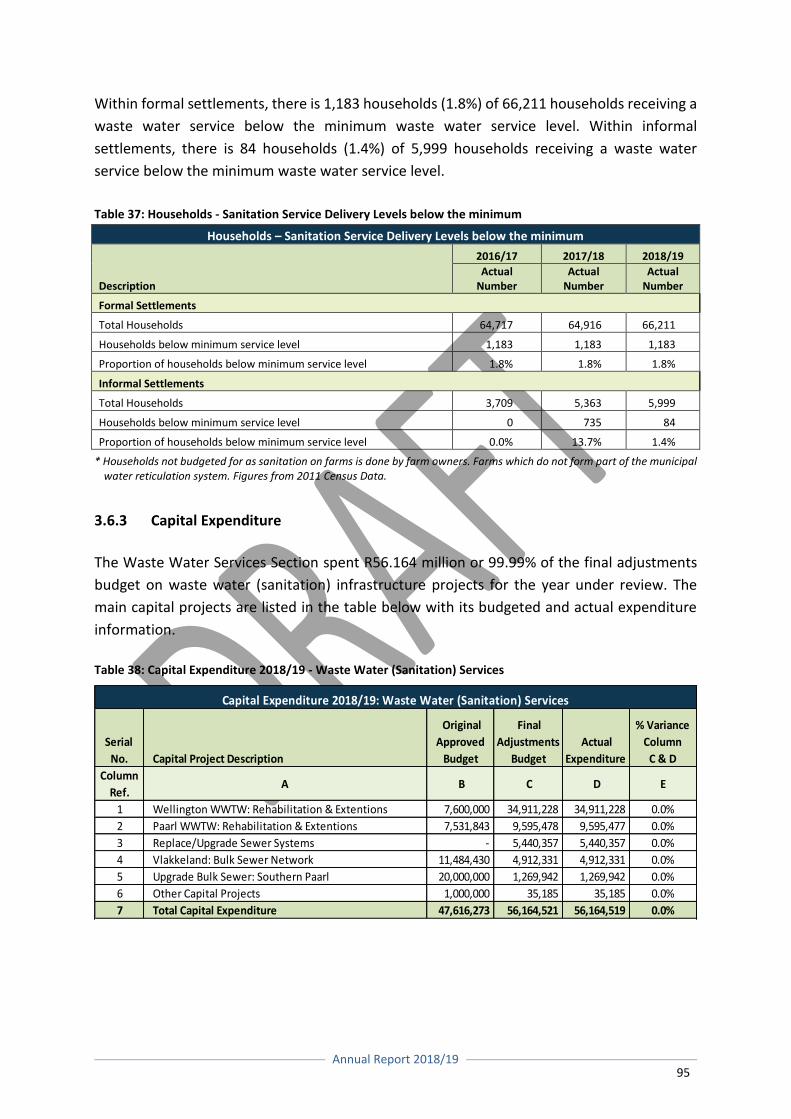
Annual Report 2018/19
95
Within formal settlements, there is 1,183 households (1.8%) of 66,211 households receiving a
waste water service below the minimum waste water service level. Within informal
settlements, there is 84 households (1.4%) of 5,999 households receiving a waste water
service below the minimum waste water service level.
Table 37: Households - Sanitation Service Delivery Levels below the minimum
Households – Sanitation Service Delivery Levels below the minimum
Description
2016/17 2017/18 2018/19
Actual Number
Actual Number
Actual Number
Formal Settlements
Total Households 64,717 64,916 66,211
Households below minimum service level 1,183 1,183 1,183
Proportion of households below minimum service level 1.8% 1.8% 1.8%
Informal Settlements
Total Households 3,709 5,363 5,999
Households below minimum service level 0 735 84
Proportion of households below minimum service level 0.0% 13.7% 1.4%
* Households not budgeted for as sanitation on farms is done by farm owners. Farms which do not form part of the municipal water reticulation system. Figures from 2011 Census Data.
3.6.3 Capital Expenditure
The Waste Water Services Section spent R56.164 million or 99.99% of the final adjustments
budget on waste water (sanitation) infrastructure projects for the year under review. The
main capital projects are listed in the table below with its budgeted and actual expenditure
information.
Table 38: Capital Expenditure 2018/19 - Waste Water (Sanitation) Services
Serial
No. Capital Project Description
Original
Approved
Budget
Final
Adjustments
Budget
Actual
Expenditure
% Variance
Column
C & D
Column
Ref.A B C D E
1 Wellington WWTW: Rehabilitation & Extentions 7,600,000 34,911,228 34,911,228 0.0%
2 Paarl WWTW: Rehabilitation & Extentions 7,531,843 9,595,478 9,595,477 0.0%
3 Replace/Upgrade Sewer Systems - 5,440,357 5,440,357 0.0%
4 Vlakkeland: Bulk Sewer Network 11,484,430 4,912,331 4,912,331 0.0%
5 Upgrade Bulk Sewer: Southern Paarl 20,000,000 1,269,942 1,269,942 0.0%
6 Other Capital Projects 1,000,000 35,185 35,185 0.0%
7 Total Capital Expenditure 47,616,273 56,164,521 56,164,519 0.0%
Capital Expenditure 2018/19: Waste Water (Sanitation) Services
Annual Report 2018/19
96
3.6.4 Major Projects Implemented
The commissioning of the Wellington Wastewater Treatment Works from a capacity of
7Ml/d to 16Ml/d to ensure sufficient capacity for new developments and the
improvement of effluent quality to the Berg River;
The commissioning of the Paarl Wastewater Treatment Works biological reactors oxygen
transfer to aid in the biological process of biomass and eventually improve the effluent
quality to the Berg River; and
Implementation of re-use effluent at the Paarl Wastewater Treatment Works to ensure
that the use of potable water for irrigation and construction be reduced and thus
contributing positively towards water demand management and water security in the
drought period. This project is in the project preparation stage.
Provision of basic sanitation services to informal settlements where 124 toilets in total
were provided to 9 informal settlements;
Rehabilitation of the sewer networks in Paarl, Mbekweni and Wellington by method of
trenchless technology (i.e. pipe cracking) or conventional open trench pipe replacement.
A total of 3,944m of pipe were replaced in the following areas: Pipe rehabilitation in Paarl:
Skool Street;
Plein Street;
Riparia Street;
Upper Long Street;
Lantana Street (Phase 1);
Lantana Street (Phase 2);
Albert Street;
Jan van Riebeeck Road (Fabrinox);
Kwikkie Street;
Loerie Street;
Rene Street;
Build it;
Champagne Street;
Van der Poels Doordrift; and
Ribbok Street.
Pipe rehabilitation in Wellington:
Mossie Street;
Newton pump station;
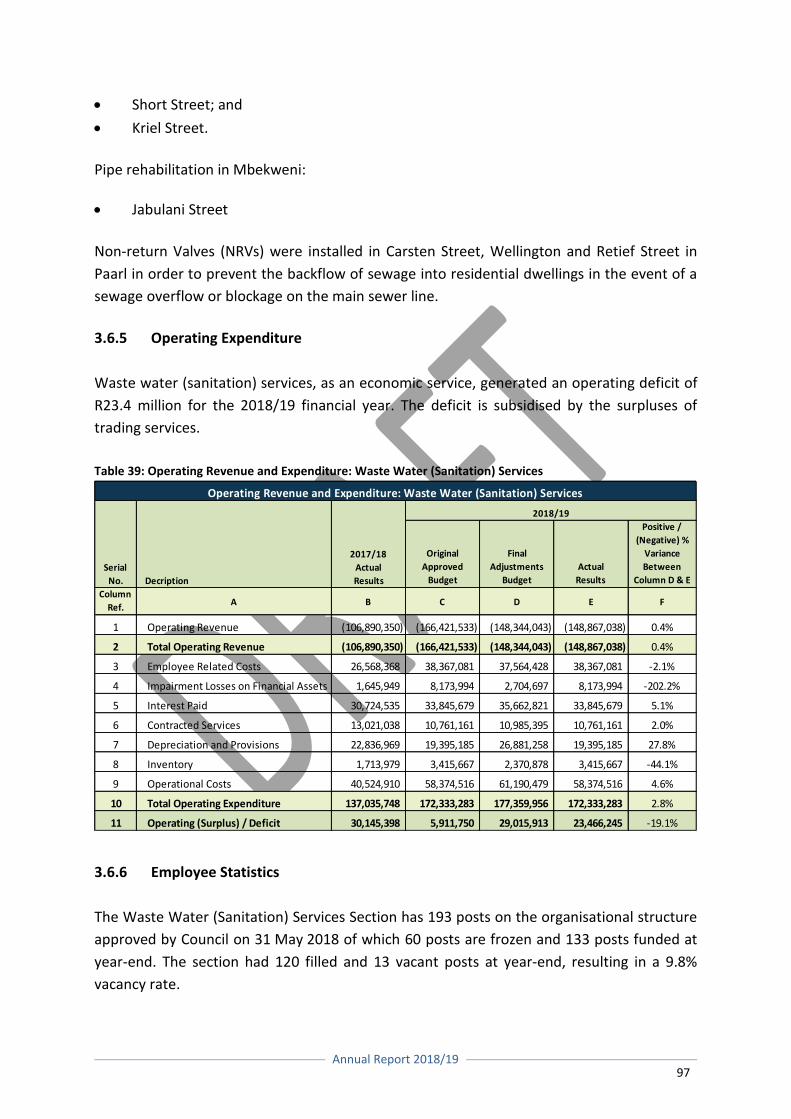
Annual Report 2018/19
97
Short Street; and
Kriel Street.
Pipe rehabilitation in Mbekweni:
Jabulani Street
Non-return Valves (NRVs) were installed in Carsten Street, Wellington and Retief Street in
Paarl in order to prevent the backflow of sewage into residential dwellings in the event of a
sewage overflow or blockage on the main sewer line.
3.6.5 Operating Expenditure
Waste water (sanitation) services, as an economic service, generated an operating deficit of
R23.4 million for the 2018/19 financial year. The deficit is subsidised by the surpluses of
trading services.
Table 39: Operating Revenue and Expenditure: Waste Water (Sanitation) Services
3.6.6 Employee Statistics
The Waste Water (Sanitation) Services Section has 193 posts on the organisational structure
approved by Council on 31 May 2018 of which 60 posts are frozen and 133 posts funded at
year-end. The section had 120 filled and 13 vacant posts at year-end, resulting in a 9.8%
vacancy rate.
Original
Approved
Budget
Final
Adjustments
Budget
Actual
Results
Positive /
(Negative) %
Variance
Between
Column D & E
Column
Ref.A B C D E F
1 Operating Revenue (106,890,350) (166,421,533) (148,344,043) (148,867,038) 0.4%
2 Total Operating Revenue (106,890,350) (166,421,533) (148,344,043) (148,867,038) 0.4%
3 Employee Related Costs 26,568,368 38,367,081 37,564,428 38,367,081 -2.1%
4 Impairment Losses on Financial Assets 1,645,949 8,173,994 2,704,697 8,173,994 -202.2%
5 Interest Paid 30,724,535 33,845,679 35,662,821 33,845,679 5.1%
6 Contracted Services 13,021,038 10,761,161 10,985,395 10,761,161 2.0%
7 Depreciation and Provisions 22,836,969 19,395,185 26,881,258 19,395,185 27.8%
8 Inventory 1,713,979 3,415,667 2,370,878 3,415,667 -44.1%
9 Operational Costs 40,524,910 58,374,516 61,190,479 58,374,516 4.6%
10 Total Operating Expenditure 137,035,748 172,333,283 177,359,956 172,333,283 2.8%
11 Operating (Surplus) / Deficit 30,145,398 5,911,750 29,015,913 23,466,245 -19.1%
Operating Revenue and Expenditure: Waste Water (Sanitation) Services
Serial
No. Decription
2017/18
Actual
Results
2018/19
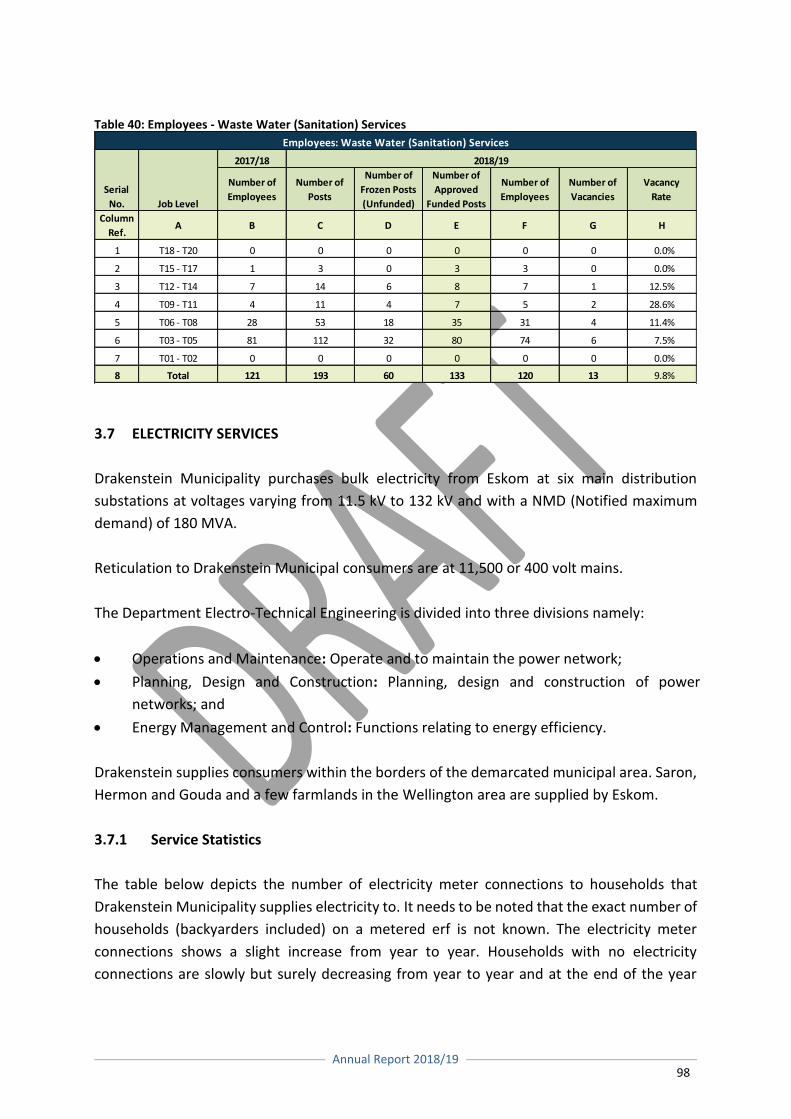
Annual Report 2018/19
98
Table 40: Employees - Waste Water (Sanitation) Services
3.7 ELECTRICITY SERVICES
Drakenstein Municipality purchases bulk electricity from Eskom at six main distribution
substations at voltages varying from 11.5 kV to 132 kV and with a NMD (Notified maximum
demand) of 180 MVA.
Reticulation to Drakenstein Municipal consumers are at 11,500 or 400 volt mains.
The Department Electro-Technical Engineering is divided into three divisions namely:
Operations and Maintenance: Operate and to maintain the power network;
Planning, Design and Construction: Planning, design and construction of power
networks; and
Energy Management and Control: Functions relating to energy efficiency.
Drakenstein supplies consumers within the borders of the demarcated municipal area. Saron,
Hermon and Gouda and a few farmlands in the Wellington area are supplied by Eskom.
3.7.1 Service Statistics
The table below depicts the number of electricity meter connections to households that
Drakenstein Municipality supplies electricity to. It needs to be noted that the exact number of
households (backyarders included) on a metered erf is not known. The electricity meter
connections shows a slight increase from year to year. Households with no electricity
connections are slowly but surely decreasing from year to year and at the end of the year
2017/18
Number of
Employees
Number of
Posts
Number of
Frozen Posts
(Unfunded)
Number of
Approved
Funded Posts
Number of
Employees
Number of
Vacancies
Vacancy
Rate
Column
Ref.A B C D E F G H
1 T18 - T20 0 0 0 0 0 0 0.0%
2 T15 - T17 1 3 0 3 3 0 0.0%
3 T12 - T14 7 14 6 8 7 1 12.5%
4 T09 - T11 4 11 4 7 5 2 28.6%
5 T06 - T08 28 53 18 35 31 4 11.4%
6 T03 - T05 81 112 32 80 74 6 7.5%
7 T01 - T02 0 0 0 0 0 0 0.0%
8 Total 121 193 60 133 120 13 9.8%
2018/19
Employees: Waste Water (Sanitation) Services
Serial
No. Job Level
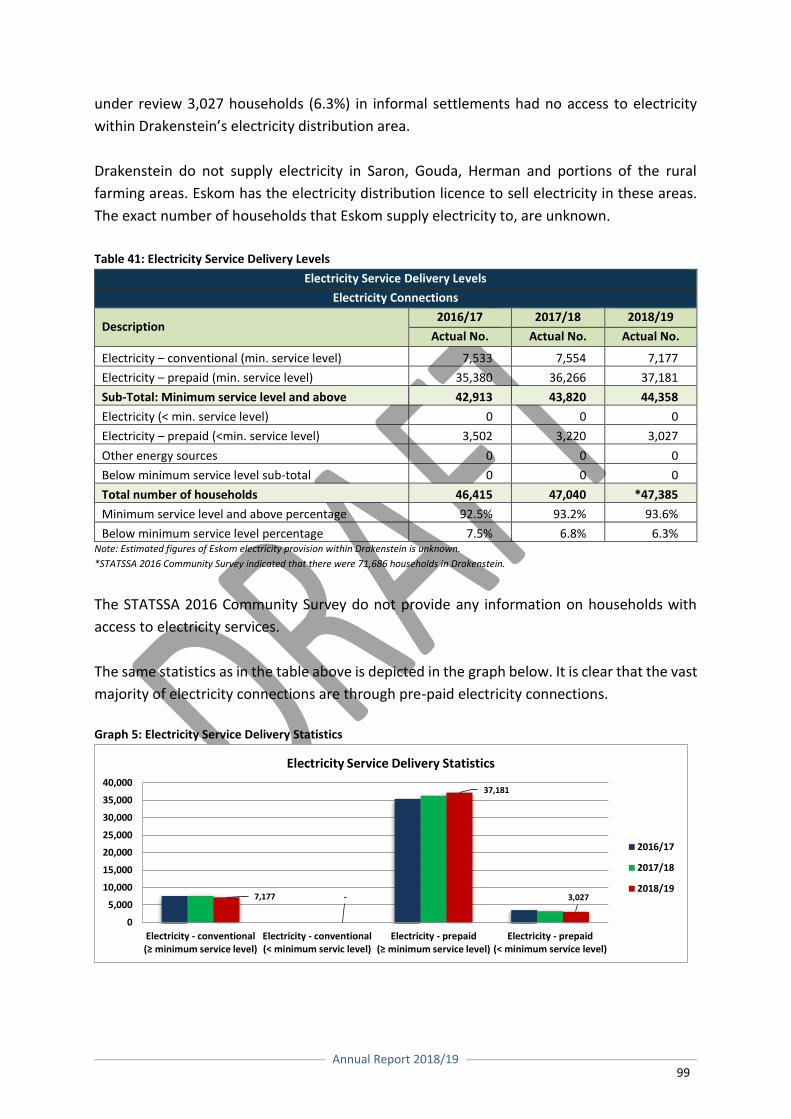
Annual Report 2018/19
99
under review 3,027 households (6.3%) in informal settlements had no access to electricity
within Drakenstein’s electricity distribution area.
Drakenstein do not supply electricity in Saron, Gouda, Herman and portions of the rural
farming areas. Eskom has the electricity distribution licence to sell electricity in these areas.
The exact number of households that Eskom supply electricity to, are unknown.
Table 41: Electricity Service Delivery Levels
Electricity Service Delivery Levels
Electricity Connections
Description 2016/17 2017/18 2018/19
Actual No. Actual No. Actual No.
Electricity – conventional (min. service level) 7,533 7,554 7,177
Electricity – prepaid (min. service level) 35,380 36,266 37,181
Sub-Total: Minimum service level and above 42,913 43,820 44,358
Electricity (< min. service level) 0 0 0
Electricity – prepaid (<min. service level) 3,502 3,220 3,027
Other energy sources 0 0 0
Below minimum service level sub-total 0 0 0
Total number of households 46,415 47,040 *47,385
Minimum service level and above percentage 92.5% 93.2% 93.6%
Below minimum service level percentage 7.5% 6.8% 6.3% Note: Estimated figures of Eskom electricity provision within Drakenstein is unknown.
*STATSSA 2016 Community Survey indicated that there were 71,686 households in Drakenstein.
The STATSSA 2016 Community Survey do not provide any information on households with
access to electricity services.
The same statistics as in the table above is depicted in the graph below. It is clear that the vast
majority of electricity connections are through pre-paid electricity connections.
Graph 5: Electricity Service Delivery Statistics
7,177 -
37,181
3,027
0
5,000
10,000
15,000
20,000
25,000
30,000
35,000
40,000
Electricity - conventional (≥ minimum service level)
Electricity - conventional(< minimum servic level)
Electricity - prepaid (≥ minimum service level)
Electricity - prepaid(< minimum service level)
Electricity Service Delivery Statistics
2016/17
2017/18
2018/19
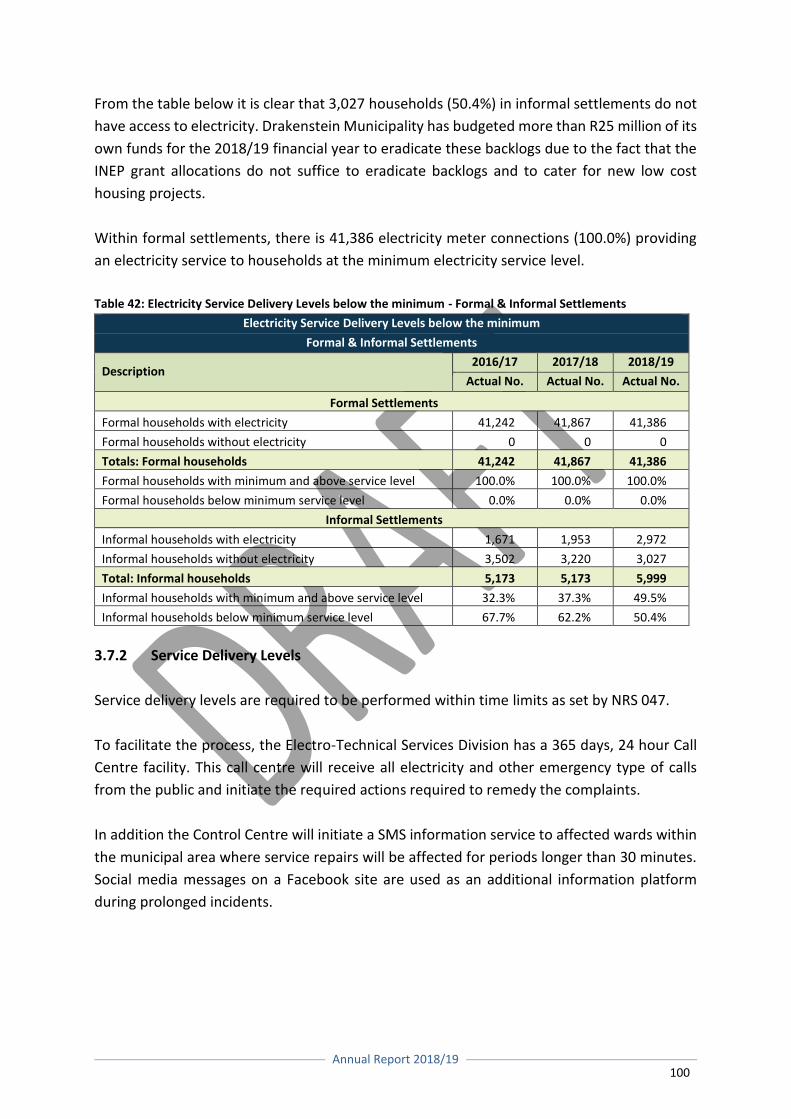
Annual Report 2018/19
100
From the table below it is clear that 3,027 households (50.4%) in informal settlements do not
have access to electricity. Drakenstein Municipality has budgeted more than R25 million of its
own funds for the 2018/19 financial year to eradicate these backlogs due to the fact that the
INEP grant allocations do not suffice to eradicate backlogs and to cater for new low cost
housing projects.
Within formal settlements, there is 41,386 electricity meter connections (100.0%) providing
an electricity service to households at the minimum electricity service level.
Table 42: Electricity Service Delivery Levels below the minimum - Formal & Informal Settlements
Electricity Service Delivery Levels below the minimum
Formal & Informal Settlements
Description 2016/17 2017/18 2018/19
Actual No. Actual No. Actual No.
Formal Settlements
Formal households with electricity 41,242 41,867 41,386
Formal households without electricity 0 0 0
Totals: Formal households 41,242 41,867 41,386
Formal households with minimum and above service level 100.0% 100.0% 100.0%
Formal households below minimum service level 0.0% 0.0% 0.0%
Informal Settlements
Informal households with electricity 1,671 1,953 2,972
Informal households without electricity 3,502 3,220 3,027
Total: Informal households 5,173 5,173 5,999
Informal households with minimum and above service level 32.3% 37.3% 49.5%
Informal households below minimum service level 67.7% 62.2% 50.4%
3.7.2 Service Delivery Levels
Service delivery levels are required to be performed within time limits as set by NRS 047.
To facilitate the process, the Electro-Technical Services Division has a 365 days, 24 hour Call
Centre facility. This call centre will receive all electricity and other emergency type of calls
from the public and initiate the required actions required to remedy the complaints.
In addition the Control Centre will initiate a SMS information service to affected wards within
the municipal area where service repairs will be affected for periods longer than 30 minutes.
Social media messages on a Facebook site are used as an additional information platform
during prolonged incidents.
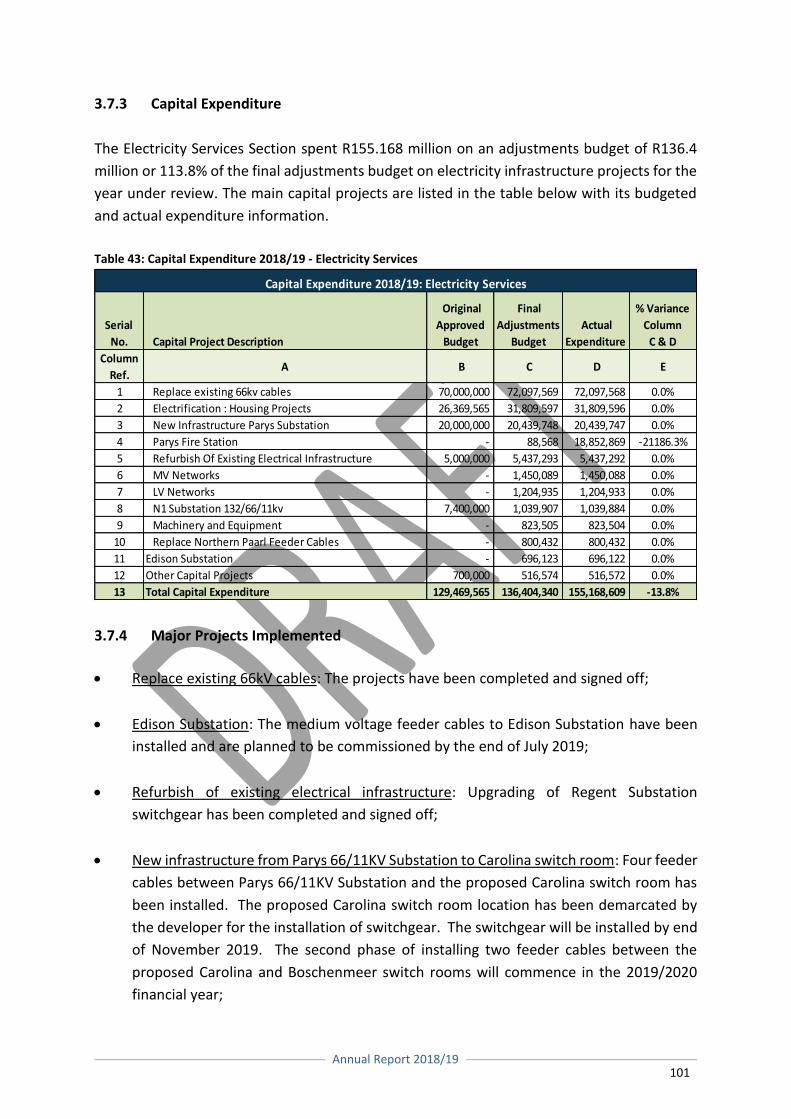
Annual Report 2018/19
101
3.7.3 Capital Expenditure
The Electricity Services Section spent R155.168 million on an adjustments budget of R136.4
million or 113.8% of the final adjustments budget on electricity infrastructure projects for the
year under review. The main capital projects are listed in the table below with its budgeted
and actual expenditure information.
Table 43: Capital Expenditure 2018/19 - Electricity Services
3.7.4 Major Projects Implemented
Replace existing 66kV cables: The projects have been completed and signed off;
Edison Substation: The medium voltage feeder cables to Edison Substation have been
installed and are planned to be commissioned by the end of July 2019;
Refurbish of existing electrical infrastructure: Upgrading of Regent Substation
switchgear has been completed and signed off;
New infrastructure from Parys 66/11KV Substation to Carolina switch room: Four feeder
cables between Parys 66/11KV Substation and the proposed Carolina switch room has
been installed. The proposed Carolina switch room location has been demarcated by
the developer for the installation of switchgear. The switchgear will be installed by end
of November 2019. The second phase of installing two feeder cables between the
proposed Carolina and Boschenmeer switch rooms will commence in the 2019/2020
financial year;
Serial
No. Capital Project Description
Original
Approved
Budget
Final
Adjustments
Budget
Actual
Expenditure
% Variance
Column
C & D
Column
Ref.A B C D E
1 Replace existing 66kv cables 70,000,000 72,097,569 72,097,568 0.0%
2 Electrification : Housing Projects 26,369,565 31,809,597 31,809,596 0.0%
3 New Infrastructure Parys Substation 20,000,000 20,439,748 20,439,747 0.0%
4 Parys Fire Station - 88,568 18,852,869 -21186.3%
5 Refurbish Of Existing Electrical Infrastructure 5,000,000 5,437,293 5,437,292 0.0%
6 MV Networks - 1,450,089 1,450,088 0.0%
7 LV Networks - 1,204,935 1,204,933 0.0%
8 N1 Substation 132/66/11kv 7,400,000 1,039,907 1,039,884 0.0%
9 Machinery and Equipment - 823,505 823,504 0.0%
10 Replace Northern Paarl Feeder Cables - 800,432 800,432 0.0%
11 Edison Substation - 696,123 696,122 0.0%
12 Other Capital Projects 700,000 516,574 516,572 0.0%
13 Total Capital Expenditure 129,469,565 136,404,340 155,168,609 -13.8%
Capital Expenditure 2018/19: Electricity Services
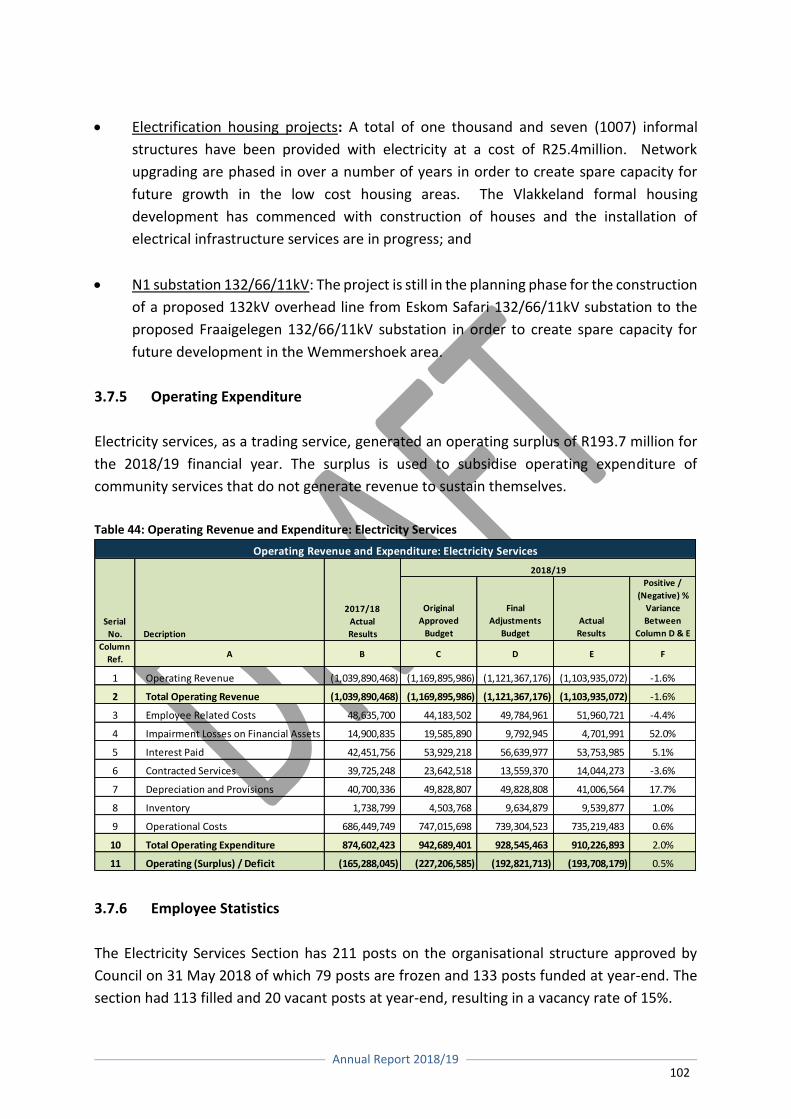
Annual Report 2018/19
102
Electrification housing projects: A total of one thousand and seven (1007) informal
structures have been provided with electricity at a cost of R25.4million. Network
upgrading are phased in over a number of years in order to create spare capacity for
future growth in the low cost housing areas. The Vlakkeland formal housing
development has commenced with construction of houses and the installation of
electrical infrastructure services are in progress; and
N1 substation 132/66/11kV: The project is still in the planning phase for the construction
of a proposed 132kV overhead line from Eskom Safari 132/66/11kV substation to the
proposed Fraaigelegen 132/66/11kV substation in order to create spare capacity for
future development in the Wemmershoek area.
3.7.5 Operating Expenditure
Electricity services, as a trading service, generated an operating surplus of R193.7 million for
the 2018/19 financial year. The surplus is used to subsidise operating expenditure of
community services that do not generate revenue to sustain themselves.
Table 44: Operating Revenue and Expenditure: Electricity Services
3.7.6 Employee Statistics
The Electricity Services Section has 211 posts on the organisational structure approved by
Council on 31 May 2018 of which 79 posts are frozen and 133 posts funded at year-end. The
section had 113 filled and 20 vacant posts at year-end, resulting in a vacancy rate of 15%.
Original
Approved
Budget
Final
Adjustments
Budget
Actual
Results
Positive /
(Negative) %
Variance
Between
Column D & E
Column
Ref.A B C D E F
1 Operating Revenue (1,039,890,468) (1,169,895,986) (1,121,367,176) (1,103,935,072) -1.6%
2 Total Operating Revenue (1,039,890,468) (1,169,895,986) (1,121,367,176) (1,103,935,072) -1.6%
3 Employee Related Costs 48,635,700 44,183,502 49,784,961 51,960,721 -4.4%
4 Impairment Losses on Financial Assets 14,900,835 19,585,890 9,792,945 4,701,991 52.0%
5 Interest Paid 42,451,756 53,929,218 56,639,977 53,753,985 5.1%
6 Contracted Services 39,725,248 23,642,518 13,559,370 14,044,273 -3.6%
7 Depreciation and Provisions 40,700,336 49,828,807 49,828,808 41,006,564 17.7%
8 Inventory 1,738,799 4,503,768 9,634,879 9,539,877 1.0%
9 Operational Costs 686,449,749 747,015,698 739,304,523 735,219,483 0.6%
10 Total Operating Expenditure 874,602,423 942,689,401 928,545,463 910,226,893 2.0%
11 Operating (Surplus) / Deficit (165,288,045) (227,206,585) (192,821,713) (193,708,179) 0.5%
Operating Revenue and Expenditure: Electricity Services
Serial
No. Decription
2017/18
Actual
Results
2018/19
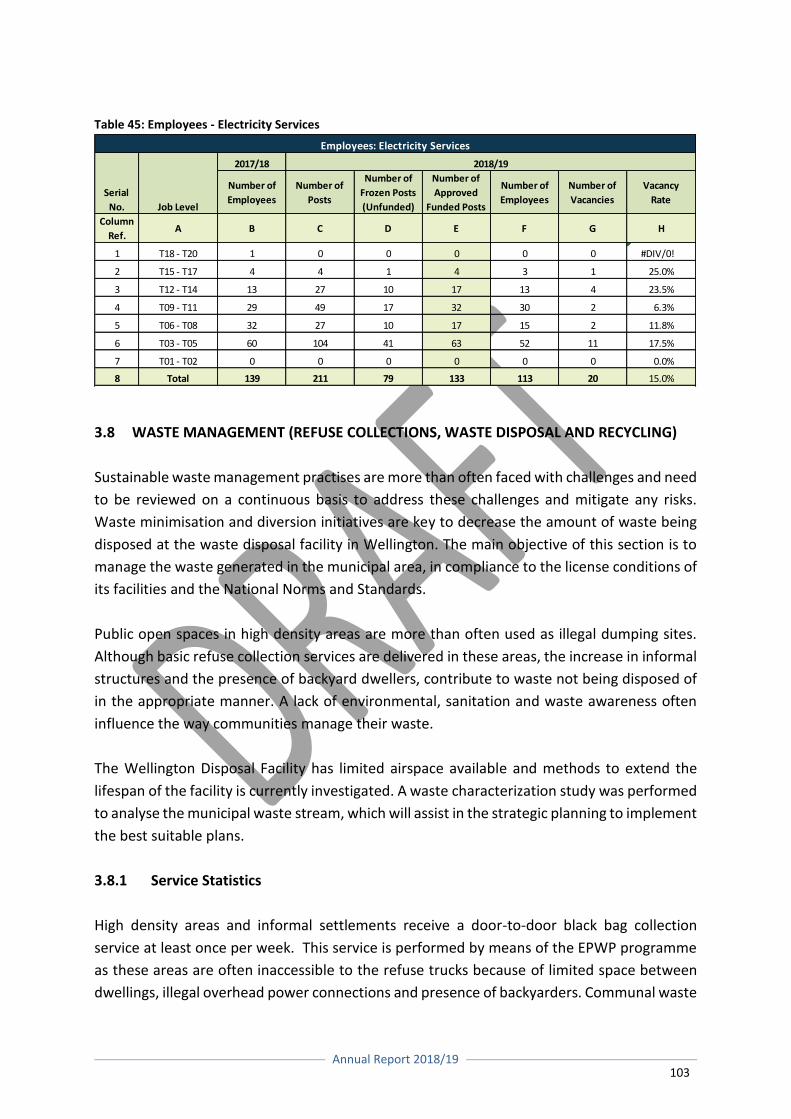
Annual Report 2018/19
103
Table 45: Employees - Electricity Services
3.8 WASTE MANAGEMENT (REFUSE COLLECTIONS, WASTE DISPOSAL AND RECYCLING)
Sustainable waste management practises are more than often faced with challenges and need
to be reviewed on a continuous basis to address these challenges and mitigate any risks.
Waste minimisation and diversion initiatives are key to decrease the amount of waste being
disposed at the waste disposal facility in Wellington. The main objective of this section is to
manage the waste generated in the municipal area, in compliance to the license conditions of
its facilities and the National Norms and Standards.
Public open spaces in high density areas are more than often used as illegal dumping sites.
Although basic refuse collection services are delivered in these areas, the increase in informal
structures and the presence of backyard dwellers, contribute to waste not being disposed of
in the appropriate manner. A lack of environmental, sanitation and waste awareness often
influence the way communities manage their waste.
The Wellington Disposal Facility has limited airspace available and methods to extend the
lifespan of the facility is currently investigated. A waste characterization study was performed
to analyse the municipal waste stream, which will assist in the strategic planning to implement
the best suitable plans.
3.8.1 Service Statistics
High density areas and informal settlements receive a door-to-door black bag collection
service at least once per week. This service is performed by means of the EPWP programme
as these areas are often inaccessible to the refuse trucks because of limited space between
dwellings, illegal overhead power connections and presence of backyarders. Communal waste
2017/18
Number of
Employees
Number of
Posts
Number of
Frozen Posts
(Unfunded)
Number of
Approved
Funded Posts
Number of
Employees
Number of
Vacancies
Vacancy
Rate
Column
Ref.A B C D E F G H
1 T18 - T20 1 0 0 0 0 0 #DIV/0!
2 T15 - T17 4 4 1 4 3 1 25.0%
3 T12 - T14 13 27 10 17 13 4 23.5%
4 T09 - T11 29 49 17 32 30 2 6.3%
5 T06 - T08 32 27 10 17 15 2 11.8%
6 T03 - T05 60 104 41 63 52 11 17.5%
7 T01 - T02 0 0 0 0 0 0 0.0%
8 Total 139 211 79 133 113 20 15.0%
2018/19
Employees: Electricity Services
Serial
No. Job Level
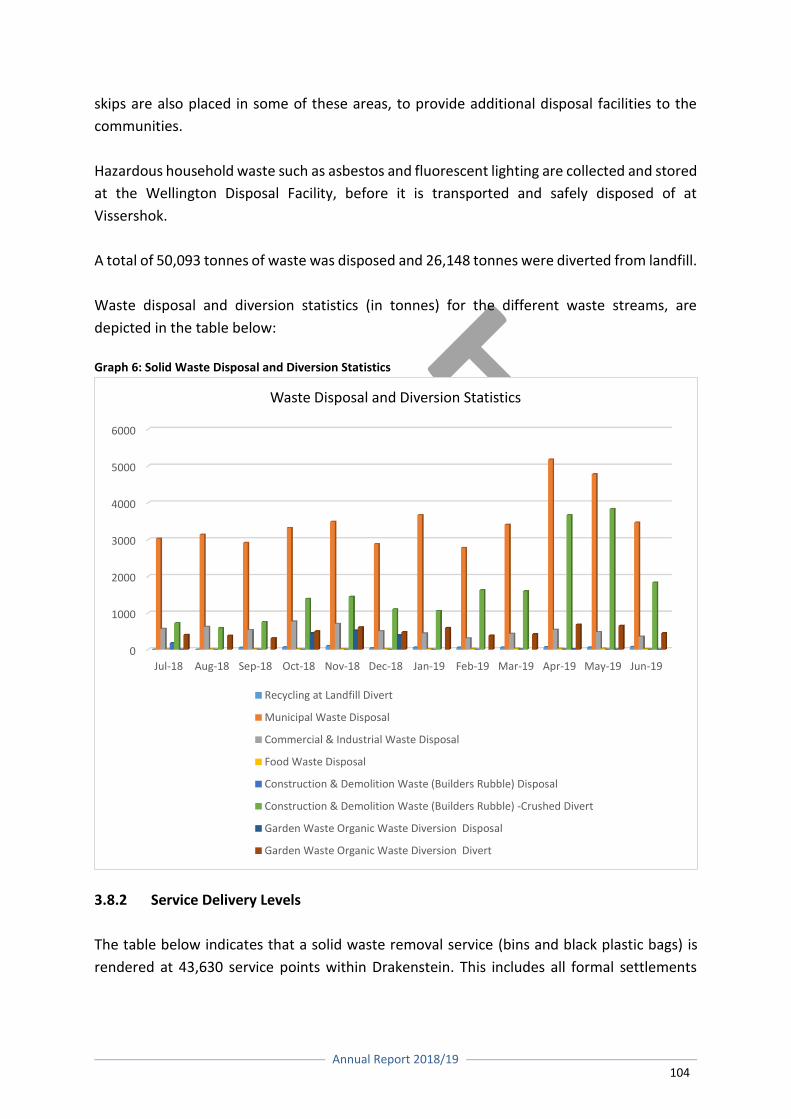
Annual Report 2018/19
104
skips are also placed in some of these areas, to provide additional disposal facilities to the
communities.
Hazardous household waste such as asbestos and fluorescent lighting are collected and stored
at the Wellington Disposal Facility, before it is transported and safely disposed of at
Vissershok.
A total of 50,093 tonnes of waste was disposed and 26,148 tonnes were diverted from landfill.
Waste disposal and diversion statistics (in tonnes) for the different waste streams, are
depicted in the table below:
Graph 6: Solid Waste Disposal and Diversion Statistics
3.8.2 Service Delivery Levels
The table below indicates that a solid waste removal service (bins and black plastic bags) is
rendered at 43,630 service points within Drakenstein. This includes all formal settlements
0
1000
2000
3000
4000
5000
6000
Jul-18 Aug-18 Sep-18 Oct-18 Nov-18 Dec-18 Jan-19 Feb-19 Mar-19 Apr-19 May-19 Jun-19
Waste Disposal and Diversion Statistics
Recycling at Landfill Divert
Municipal Waste Disposal
Commercial & Industrial Waste Disposal
Food Waste Disposal
Construction & Demolition Waste (Builders Rubble) Disposal
Construction & Demolition Waste (Builders Rubble) -Crushed Divert
Garden Waste Organic Waste Diversion Disposal
Garden Waste Organic Waste Diversion Divert
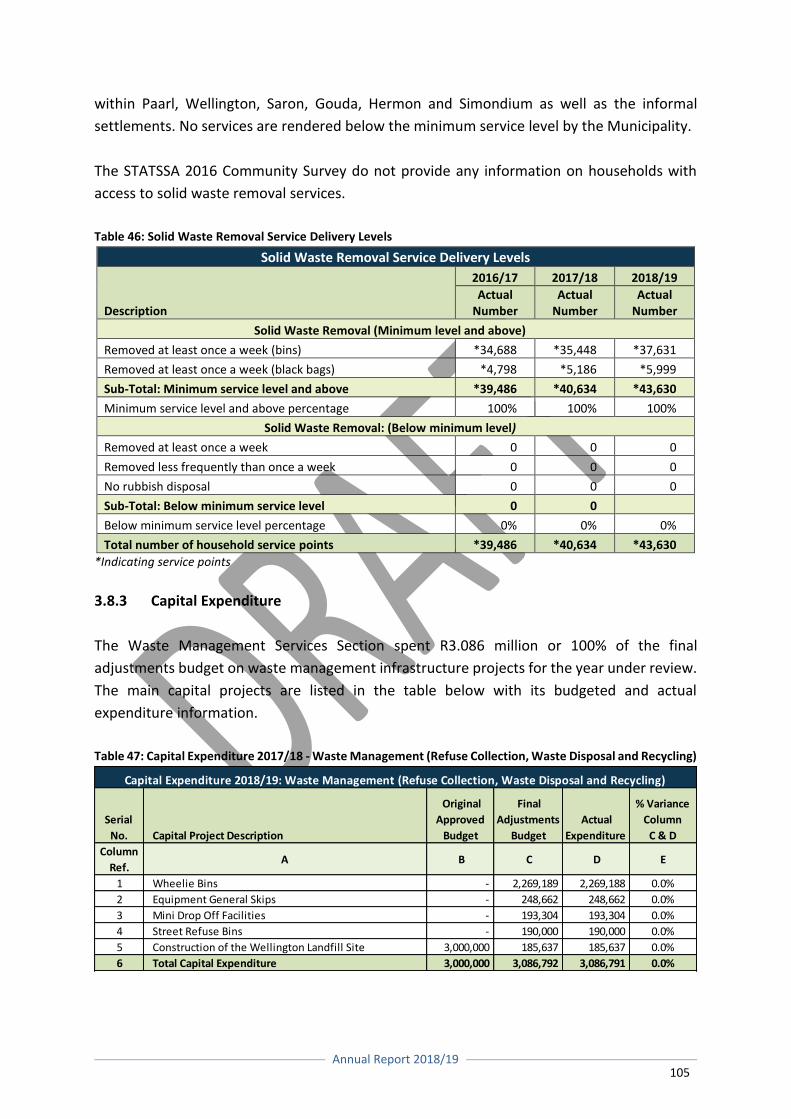
Annual Report 2018/19
105
within Paarl, Wellington, Saron, Gouda, Hermon and Simondium as well as the informal
settlements. No services are rendered below the minimum service level by the Municipality.
The STATSSA 2016 Community Survey do not provide any information on households with
access to solid waste removal services.
Table 46: Solid Waste Removal Service Delivery Levels
Solid Waste Removal Service Delivery Levels
Description
2016/17 2017/18 2018/19
Actual Number
Actual Number
Actual Number
Solid Waste Removal (Minimum level and above)
Removed at least once a week (bins) *34,688 *35,448 *37,631
Removed at least once a week (black bags) *4,798 *5,186 *5,999
Sub-Total: Minimum service level and above *39,486 *40,634 *43,630
Minimum service level and above percentage 100% 100% 100%
Solid Waste Removal: (Below minimum level)
Removed at least once a week 0 0 0
Removed less frequently than once a week 0 0 0
No rubbish disposal 0 0 0
Sub-Total: Below minimum service level 0 0
Below minimum service level percentage 0% 0% 0%
Total number of household service points *39,486 *40,634 *43,630
*Indicating service points
3.8.3 Capital Expenditure
The Waste Management Services Section spent R3.086 million or 100% of the final
adjustments budget on waste management infrastructure projects for the year under review.
The main capital projects are listed in the table below with its budgeted and actual
expenditure information.
Table 47: Capital Expenditure 2017/18 - Waste Management (Refuse Collection, Waste Disposal and Recycling)
Serial
No. Capital Project Description
Original
Approved
Budget
Final
Adjustments
Budget
Actual
Expenditure
% Variance
Column
C & D
Column
Ref.A B C D E
1 Wheelie Bins - 2,269,189 2,269,188 0.0%
2 Equipment General Skips - 248,662 248,662 0.0%
3 Mini Drop Off Facilities - 193,304 193,304 0.0%
4 Street Refuse Bins - 190,000 190,000 0.0%
5 Construction of the Wellington Landfill Site 3,000,000 185,637 185,637 0.0%
6 Total Capital Expenditure 3,000,000 3,086,792 3,086,791 0.0%
Capital Expenditure 2018/19: Waste Management (Refuse Collection, Waste Disposal and Recycling)
Annual Report 2018/19
106
3.8.4 Major Projects Implemented
Capital Projects:
Three (3) mini drop-off facilities were built on the open space adjacent to the R301 in
Mbekweni, to provide an area where the public can drop off excess waste. This area used
to be a hotspot for illegal dumping. The overall cleanliness of the area has improved
since the construction of these facilities; and
Polywood pavement bins were purchased and placed throughout the municipal area.
These bins make provision for the separation of recyclable (dry) waste and non-
recyclable (wet) waste.
Operational Projects:
The separation-at-source programme has been extended to the remaining formal
housing areas in Wellington, as well as a portion of Mbekweni;
Schools, businesses and farms are continuously embarking on waste minimisation
projects with assistance of the Solid Waste Section;
A topographical survey was performed at the Wellington landfill site during late 2018 to
determine the current levels of the waste body. The current height restriction of 12m
has not been reached yet. The available airspace calculated from the latest survey done
up to 12m height, is 303 604m³(November 2018). Current available airspace (30 April
2019) is 221, 309, 69m³.Using the actual airspace consumed between the two latest
topographical surveys (which includes cover material) and an annual growth rate of
2,56% as per STATS SA in line with population growth, the available airspace up to 12m
height will be consumed by August 2020;
Fifty (50) informal jobs were created by accommodating former informal collectors at
the waste disposal facility and Material Recovery Facility. Recyclable material which is
dropped off at the facilities as well as those separately collected from households, is
sorted and baled by these beneficiaries. The success of this project/ initiative resulted
in Drakenstein being invited by other municipalities to assist them with illegal
scavengers on their landfill sites. The highlight of the project is the nomination of
Drakenstein as a finalist in the category for municipal initiatives, in a competition run by
Petco. Drakenstein was awarded as the winner of this category;
Green waste has been chipped and transported to a licensed composting facility. Some
of the well decomposed green waste is locally used in a pilot project for the organic
farming of herbs; and
Crushed builder’s rubble is being used on internal roads at the disposal facility and as
covering material.
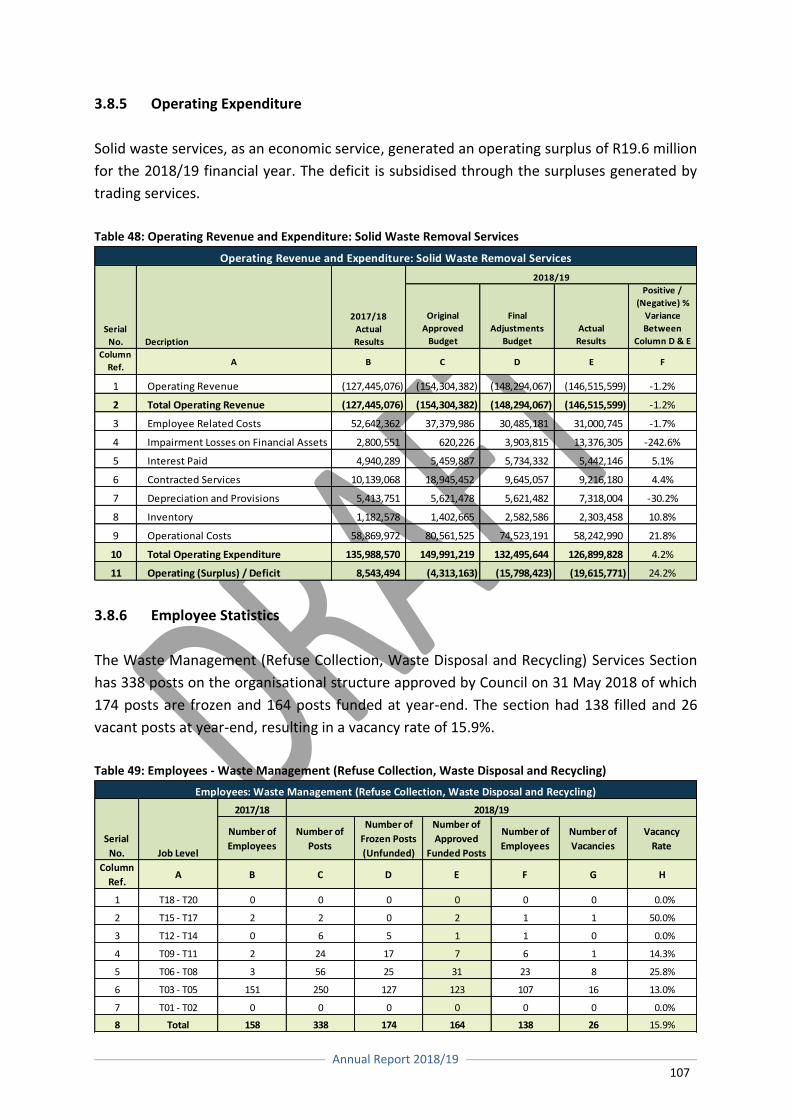
Annual Report 2018/19
107
3.8.5 Operating Expenditure
Solid waste services, as an economic service, generated an operating surplus of R19.6 million
for the 2018/19 financial year. The deficit is subsidised through the surpluses generated by
trading services.
Table 48: Operating Revenue and Expenditure: Solid Waste Removal Services
3.8.6 Employee Statistics
The Waste Management (Refuse Collection, Waste Disposal and Recycling) Services Section
has 338 posts on the organisational structure approved by Council on 31 May 2018 of which
174 posts are frozen and 164 posts funded at year-end. The section had 138 filled and 26
vacant posts at year-end, resulting in a vacancy rate of 15.9%.
Table 49: Employees - Waste Management (Refuse Collection, Waste Disposal and Recycling)
2017/18
Number of
Employees
Number of
Posts
Number of
Frozen Posts
(Unfunded)
Number of
Approved
Funded Posts
Number of
Employees
Number of
Vacancies
Vacancy
Rate
Column
Ref.A B C D E F G H
1 T18 - T20 0 0 0 0 0 0 0.0%
2 T15 - T17 2 2 0 2 1 1 50.0%
3 T12 - T14 0 6 5 1 1 0 0.0%
4 T09 - T11 2 24 17 7 6 1 14.3%
5 T06 - T08 3 56 25 31 23 8 25.8%
6 T03 - T05 151 250 127 123 107 16 13.0%
7 T01 - T02 0 0 0 0 0 0 0.0%
8 Total 158 338 174 164 138 26 15.9%
2018/19
Employees: Waste Management (Refuse Collection, Waste Disposal and Recycling)
Serial
No. Job Level
Original
Approved
Budget
Final
Adjustments
Budget
Actual
Results
Positive /
(Negative) %
Variance
Between
Column D & E
Column
Ref.A B C D E F
1 Operating Revenue (127,445,076) (154,304,382) (148,294,067) (146,515,599) -1.2%
2 Total Operating Revenue (127,445,076) (154,304,382) (148,294,067) (146,515,599) -1.2%
3 Employee Related Costs 52,642,362 37,379,986 30,485,181 31,000,745 -1.7%
4 Impairment Losses on Financial Assets 2,800,551 620,226 3,903,815 13,376,305 -242.6%
5 Interest Paid 4,940,289 5,459,887 5,734,332 5,442,146 5.1%
6 Contracted Services 10,139,068 18,945,452 9,645,057 9,216,180 4.4%
7 Depreciation and Provisions 5,413,751 5,621,478 5,621,482 7,318,004 -30.2%
8 Inventory 1,182,578 1,402,665 2,582,586 2,303,458 10.8%
9 Operational Costs 58,869,972 80,561,525 74,523,191 58,242,990 21.8%
10 Total Operating Expenditure 135,988,570 149,991,219 132,495,644 126,899,828 4.2%
11 Operating (Surplus) / Deficit 8,543,494 (4,313,163) (15,798,423) (19,615,771) 24.2%
Operating Revenue and Expenditure: Solid Waste Removal Services
Serial
No. Decription
2017/18
Actual
Results
2018/19
Annual Report 2018/19
108
3.9 HOUSING
The Housing and Human Settlements Division of the municipality is located in the Department:
Community Development. It consist of two sections, namely Housing Projects and Technical
Support Services and Rental Stock and Housing Demand and Operations.
3.9.1 Housing Projects
The Housing Projects section is primarily responsible for the development of new housing
opportunities, facilitate social and affordable housing and the upgrade of informal
settlements with the ultimate aim to formalise these settlements.
The target for the year was the delivery of 300 opportunities (inclusive of providing access to
services, top structures and temporary housing structures).
Achievements/important events during the year include:
Over 500 sites and 300 houses were under construction at the Vlakkeland Catalytic
Housing Development at the end of the financial year. Poor weather conditions
unfortunately caused delays to any handover of houses taking place during the
2018/2019 financial year and had to be postponed to the new financial year;
Commencement with the planning for the upgrade of 11 informal settlements;
Commencement of the last civil works at the Lantana Development after being delayed
for almost two years due to structures in the way of construction. It is anticipated that
the civils will be completed toward the end of August 2019 (in new financial year) after
which the last 25 houses as part of the informal settlement upgrade will be
implemented.
Handover of over 275 title deeds to beneficiaries of different housing projects;
56 sites serviced were developed at the Schoongezicht Housing Development with a
further 22 under construction at the end of the financial year with completion envisaged
toward September 2019. The balance of the site to be serviced during the 2019/2020
financial year.
Three housing roadshows were hosted during the year: These roadshows mostly
focused on beneficiaries of the Vlakkeland Housing Project. The municipality also
introduced housing summits during the year. The summits were introduced to allow
communities a platform to engage the Municipality on only housing related matters.
Follow up sessions are planned for the new financial year.
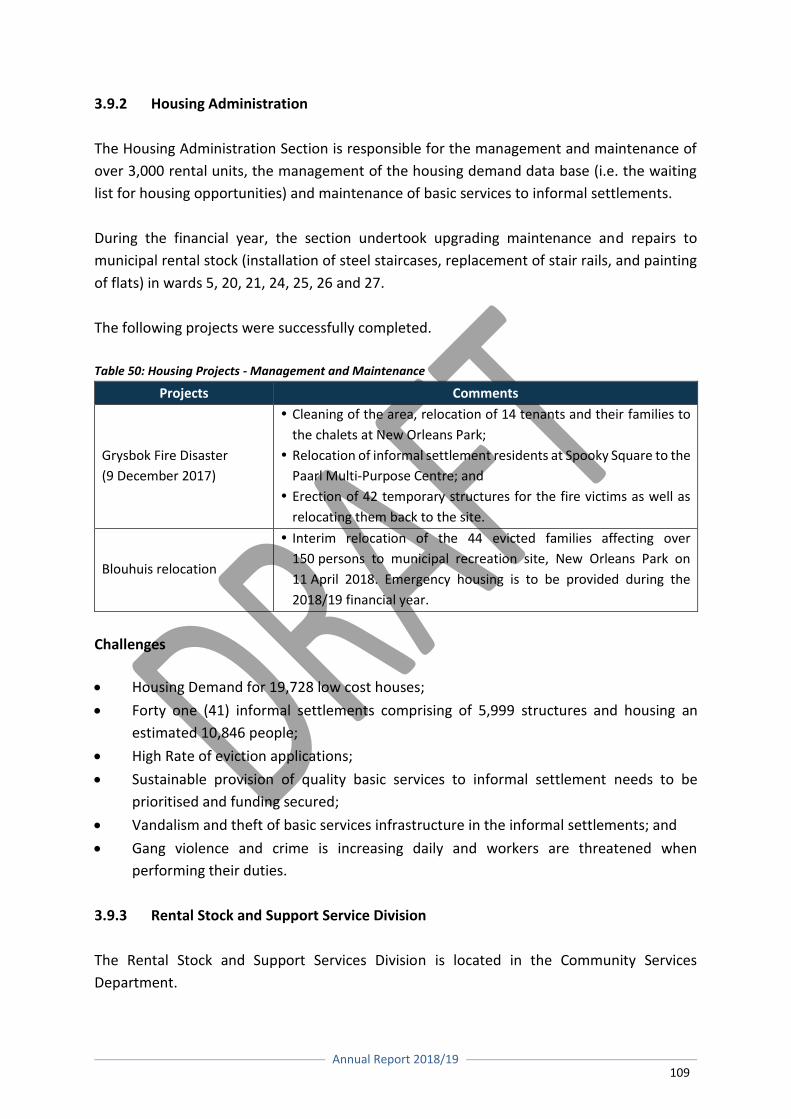
Annual Report 2018/19
109
3.9.2 Housing Administration
The Housing Administration Section is responsible for the management and maintenance of
over 3,000 rental units, the management of the housing demand data base (i.e. the waiting
list for housing opportunities) and maintenance of basic services to informal settlements.
During the financial year, the section undertook upgrading maintenance and repairs to
municipal rental stock (installation of steel staircases, replacement of stair rails, and painting
of flats) in wards 5, 20, 21, 24, 25, 26 and 27.
The following projects were successfully completed.
Table 50: Housing Projects - Management and Maintenance
Projects Comments
Grysbok Fire Disaster
(9 December 2017)
Cleaning of the area, relocation of 14 tenants and their families to
the chalets at New Orleans Park;
Relocation of informal settlement residents at Spooky Square to the
Paarl Multi-Purpose Centre; and
Erection of 42 temporary structures for the fire victims as well as
relocating them back to the site.
Blouhuis relocation
Interim relocation of the 44 evicted families affecting over
150 persons to municipal recreation site, New Orleans Park on
11 April 2018. Emergency housing is to be provided during the
2018/19 financial year.
Challenges
Housing Demand for 19,728 low cost houses;
Forty one (41) informal settlements comprising of 5,999 structures and housing an
estimated 10,846 people;
High Rate of eviction applications;
Sustainable provision of quality basic services to informal settlement needs to be
prioritised and funding secured;
Vandalism and theft of basic services infrastructure in the informal settlements; and
Gang violence and crime is increasing daily and workers are threatened when
performing their duties.
3.9.3 Rental Stock and Support Service Division
The Rental Stock and Support Services Division is located in the Community Services
Department.
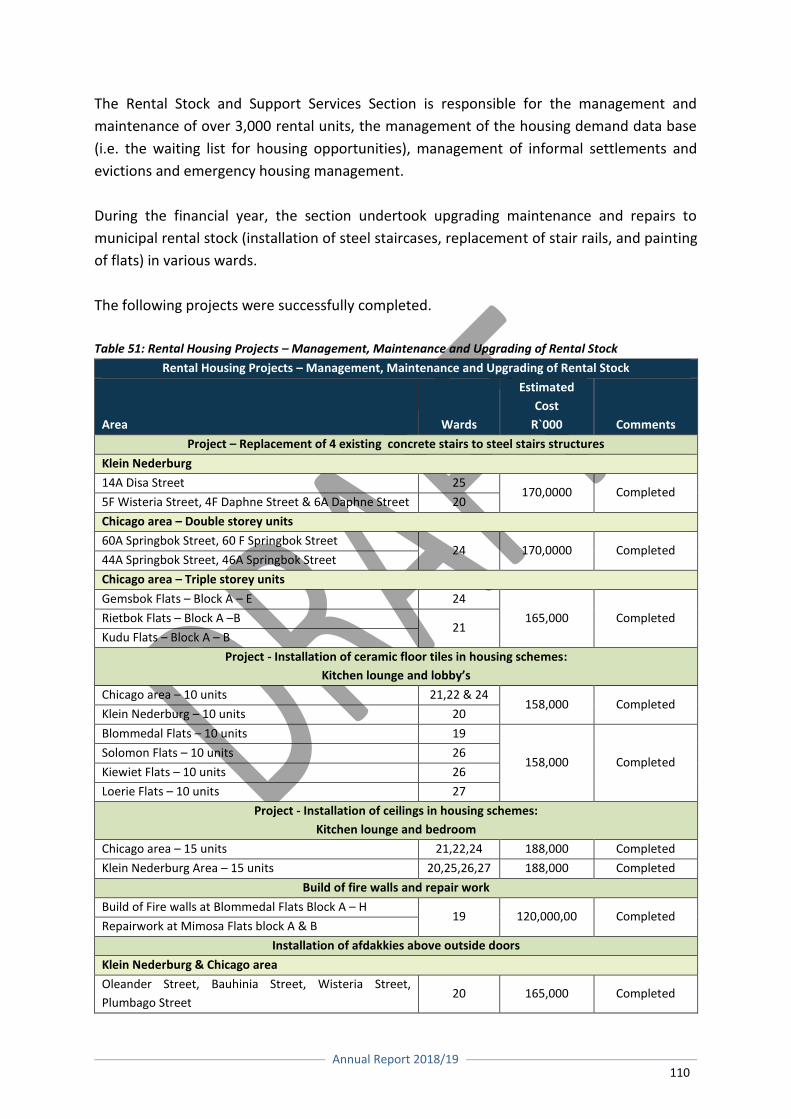
Annual Report 2018/19
110
The Rental Stock and Support Services Section is responsible for the management and
maintenance of over 3,000 rental units, the management of the housing demand data base
(i.e. the waiting list for housing opportunities), management of informal settlements and
evictions and emergency housing management.
During the financial year, the section undertook upgrading maintenance and repairs to
municipal rental stock (installation of steel staircases, replacement of stair rails, and painting
of flats) in various wards.
The following projects were successfully completed.
Table 51: Rental Housing Projects – Management, Maintenance and Upgrading of Rental Stock
Rental Housing Projects – Management, Maintenance and Upgrading of Rental Stock
Area Wards
Estimated
Cost
R`000 Comments
Project – Replacement of 4 existing concrete stairs to steel stairs structures
Klein Nederburg
14A Disa Street 25 170,0000 Completed
5F Wisteria Street, 4F Daphne Street & 6A Daphne Street 20
Chicago area – Double storey units
60A Springbok Street, 60 F Springbok Street 24 170,0000 Completed
44A Springbok Street, 46A Springbok Street
Chicago area – Triple storey units
Gemsbok Flats – Block A – E 24
165,000 Completed Rietbok Flats – Block A –B 21
Kudu Flats – Block A – B
Project - Installation of ceramic floor tiles in housing schemes:
Kitchen lounge and lobby’s
Chicago area – 10 units 21,22 & 24 158,000 Completed
Klein Nederburg – 10 units 20
Blommedal Flats – 10 units 19
158,000 Completed Solomon Flats – 10 units 26
Kiewiet Flats – 10 units 26
Loerie Flats – 10 units 27
Project - Installation of ceilings in housing schemes:
Kitchen lounge and bedroom
Chicago area – 15 units 21,22,24 188,000 Completed
Klein Nederburg Area – 15 units 20,25,26,27 188,000 Completed
Build of fire walls and repair work
Build of Fire walls at Blommedal Flats Block A – H 19 120,000,00 Completed
Repairwork at Mimosa Flats block A & B
Installation of afdakkies above outside doors
Klein Nederburg & Chicago area
Oleander Street, Bauhinia Street, Wisteria Street,
Plumbago Street 20 165,000 Completed
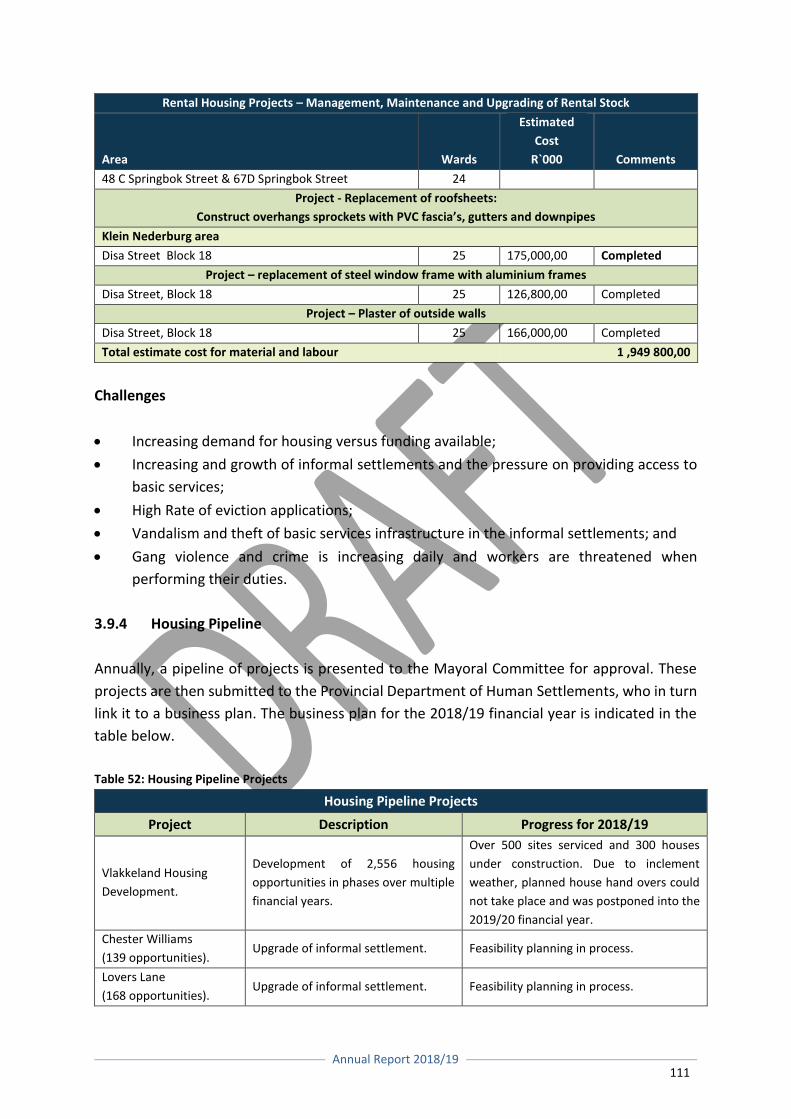
Annual Report 2018/19
111
Rental Housing Projects – Management, Maintenance and Upgrading of Rental Stock
Area Wards
Estimated
Cost
R`000 Comments
48 C Springbok Street & 67D Springbok Street 24
Project - Replacement of roofsheets:
Construct overhangs sprockets with PVC fascia’s, gutters and downpipes
Klein Nederburg area
Disa Street Block 18 25 175,000,00 Completed
Project – replacement of steel window frame with aluminium frames
Disa Street, Block 18 25 126,800,00 Completed
Project – Plaster of outside walls
Disa Street, Block 18 25 166,000,00 Completed
Total estimate cost for material and labour 1 ,949 800,00
Challenges
Increasing demand for housing versus funding available;
Increasing and growth of informal settlements and the pressure on providing access to
basic services;
High Rate of eviction applications;
Vandalism and theft of basic services infrastructure in the informal settlements; and
Gang violence and crime is increasing daily and workers are threatened when
performing their duties.
3.9.4 Housing Pipeline
Annually, a pipeline of projects is presented to the Mayoral Committee for approval. These
projects are then submitted to the Provincial Department of Human Settlements, who in turn
link it to a business plan. The business plan for the 2018/19 financial year is indicated in the
table below.
Table 52: Housing Pipeline Projects
Housing Pipeline Projects
Project Description Progress for 2018/19
Vlakkeland Housing
Development.
Development of 2,556 housing
opportunities in phases over multiple
financial years.
Over 500 sites serviced and 300 houses
under construction. Due to inclement
weather, planned house hand overs could
not take place and was postponed into the
2019/20 financial year.
Chester Williams
(139 opportunities). Upgrade of informal settlement. Feasibility planning in process.
Lovers Lane
(168 opportunities). Upgrade of informal settlement. Feasibility planning in process.
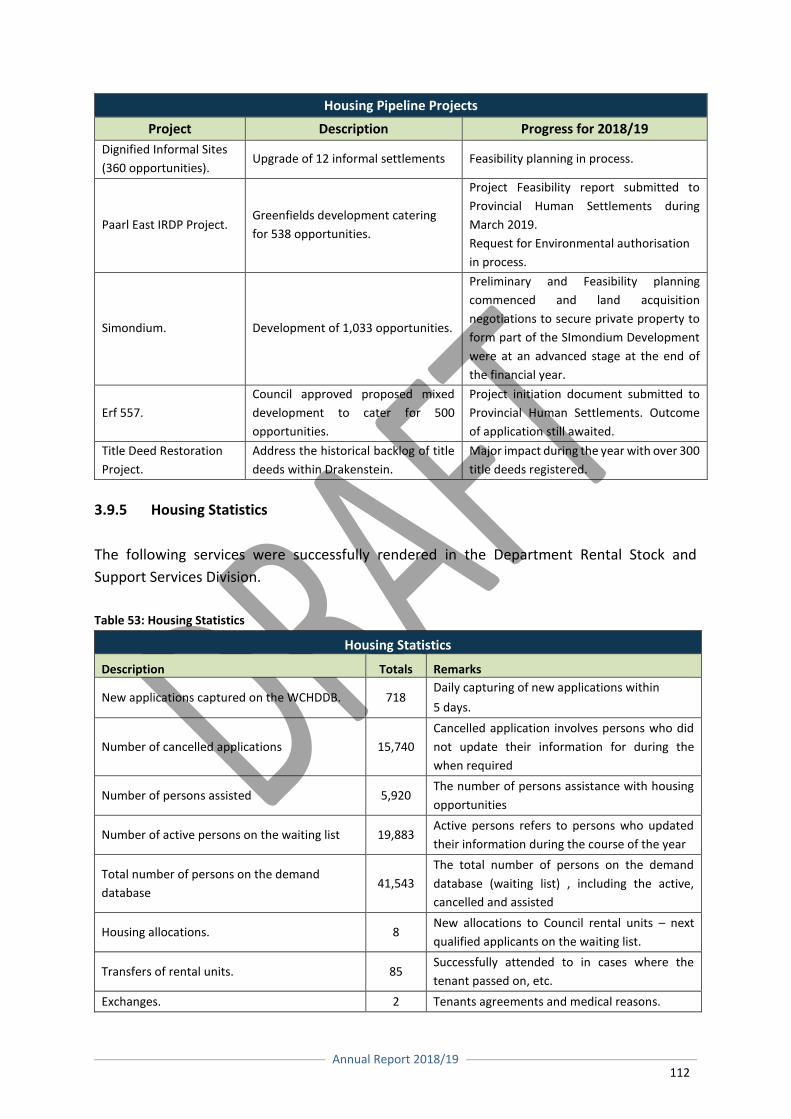
Annual Report 2018/19
112
Housing Pipeline Projects
Project Description Progress for 2018/19
Dignified Informal Sites
(360 opportunities). Upgrade of 12 informal settlements Feasibility planning in process.
Paarl East IRDP Project. Greenfields development catering
for 538 opportunities.
Project Feasibility report submitted to
Provincial Human Settlements during
March 2019.
Request for Environmental authorisation
in process.
Simondium. Development of 1,033 opportunities.
Preliminary and Feasibility planning
commenced and land acquisition
negotiations to secure private property to
form part of the SImondium Development
were at an advanced stage at the end of
the financial year.
Erf 557.
Council approved proposed mixed
development to cater for 500
opportunities.
Project initiation document submitted to
Provincial Human Settlements. Outcome
of application still awaited.
Title Deed Restoration
Project.
Address the historical backlog of title
deeds within Drakenstein.
Major impact during the year with over 300
title deeds registered.
3.9.5 Housing Statistics
The following services were successfully rendered in the Department Rental Stock and
Support Services Division.
Table 53: Housing Statistics
Housing Statistics
Description Totals Remarks
New applications captured on the WCHDDB. 718 Daily capturing of new applications within
5 days.
Number of cancelled applications 15,740
Cancelled application involves persons who did
not update their information for during the
when required
Number of persons assisted 5,920 The number of persons assistance with housing
opportunities
Number of active persons on the waiting list 19,883 Active persons refers to persons who updated
their information during the course of the year
Total number of persons on the demand
database 41,543
The total number of persons on the demand
database (waiting list) , including the active,
cancelled and assisted
Housing allocations. 8 New allocations to Council rental units – next
qualified applicants on the waiting list.
Transfers of rental units. 85 Successfully attended to in cases where the
tenant passed on, etc.
Exchanges. 2 Tenants agreements and medical reasons.
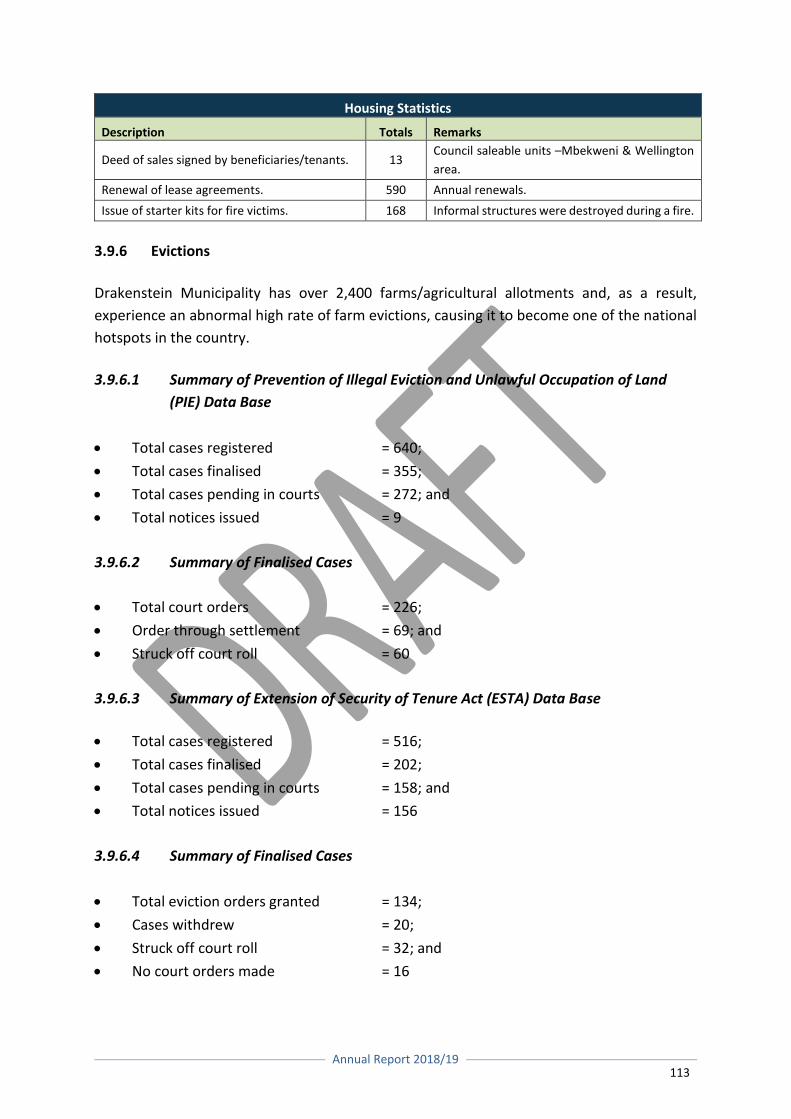
Annual Report 2018/19
113
Housing Statistics
Description Totals Remarks
Deed of sales signed by beneficiaries/tenants. 13 Council saleable units –Mbekweni & Wellington
area.
Renewal of lease agreements. 590 Annual renewals.
Issue of starter kits for fire victims. 168 Informal structures were destroyed during a fire.
3.9.6 Evictions
Drakenstein Municipality has over 2,400 farms/agricultural allotments and, as a result,
experience an abnormal high rate of farm evictions, causing it to become one of the national
hotspots in the country.
3.9.6.1 Summary of Prevention of Illegal Eviction and Unlawful Occupation of Land
(PIE) Data Base
Total cases registered = 640;
Total cases finalised = 355;
Total cases pending in courts = 272; and
Total notices issued = 9
3.9.6.2 Summary of Finalised Cases
Total court orders = 226;
Order through settlement = 69; and
Struck off court roll = 60
3.9.6.3 Summary of Extension of Security of Tenure Act (ESTA) Data Base
Total cases registered = 516;
Total cases finalised = 202;
Total cases pending in courts = 158; and
Total notices issued = 156
3.9.6.4 Summary of Finalised Cases
Total eviction orders granted = 134;
Cases withdrew = 20;
Struck off court roll = 32; and
No court orders made = 16
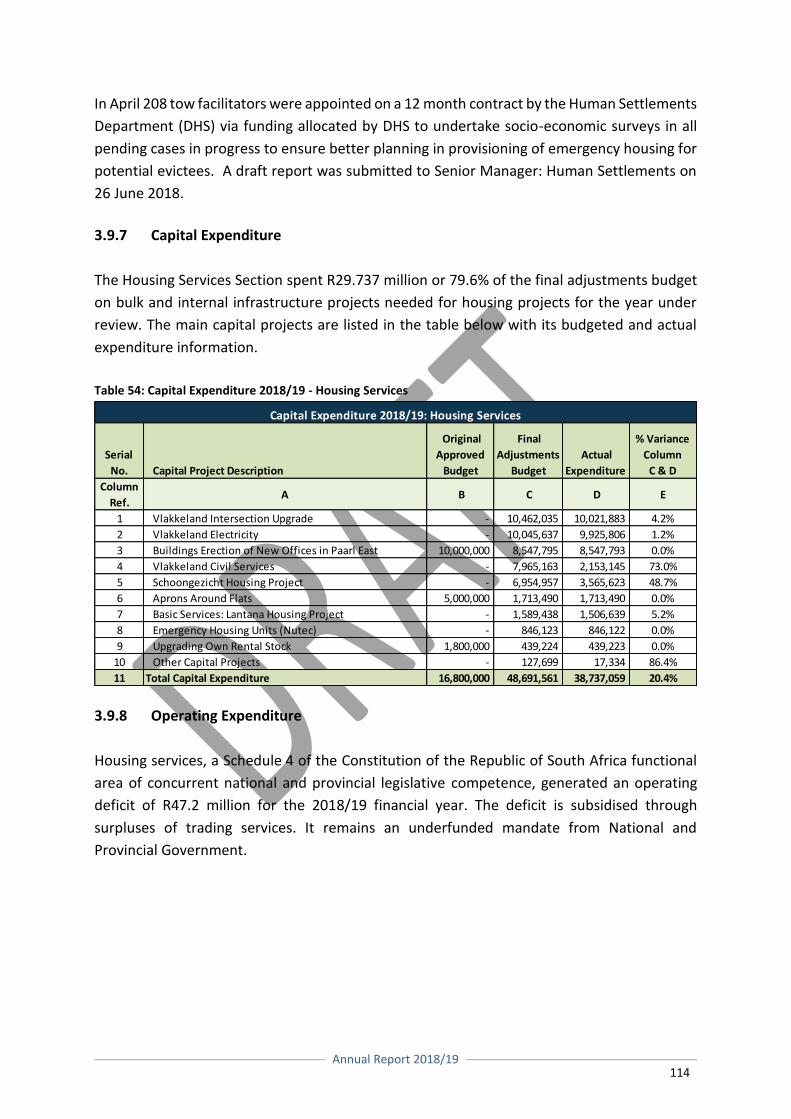
Annual Report 2018/19
114
In April 208 tow facilitators were appointed on a 12 month contract by the Human Settlements
Department (DHS) via funding allocated by DHS to undertake socio-economic surveys in all
pending cases in progress to ensure better planning in provisioning of emergency housing for
potential evictees. A draft report was submitted to Senior Manager: Human Settlements on
26 June 2018.
3.9.7 Capital Expenditure
The Housing Services Section spent R29.737 million or 79.6% of the final adjustments budget
on bulk and internal infrastructure projects needed for housing projects for the year under
review. The main capital projects are listed in the table below with its budgeted and actual
expenditure information.
Table 54: Capital Expenditure 2018/19 - Housing Services
3.9.8 Operating Expenditure
Housing services, a Schedule 4 of the Constitution of the Republic of South Africa functional
area of concurrent national and provincial legislative competence, generated an operating
deficit of R47.2 million for the 2018/19 financial year. The deficit is subsidised through
surpluses of trading services. It remains an underfunded mandate from National and
Provincial Government.
Serial
No. Capital Project Description
Original
Approved
Budget
Final
Adjustments
Budget
Actual
Expenditure
% Variance
Column
C & D
Column
Ref.A B C D E
1 Vlakkeland Intersection Upgrade - 10,462,035 10,021,883 4.2%
2 Vlakkeland Electricity - 10,045,637 9,925,806 1.2%
3 Buildings Erection of New Offices in Paarl East 10,000,000 8,547,795 8,547,793 0.0%
4 Vlakkeland Civil Services - 7,965,163 2,153,145 73.0%
5 Schoongezicht Housing Project - 6,954,957 3,565,623 48.7%
6 Aprons Around Flats 5,000,000 1,713,490 1,713,490 0.0%
7 Basic Services: Lantana Housing Project - 1,589,438 1,506,639 5.2%
8 Emergency Housing Units (Nutec) - 846,123 846,122 0.0%
9 Upgrading Own Rental Stock 1,800,000 439,224 439,223 0.0%
10 Other Capital Projects - 127,699 17,334 86.4%
11 Total Capital Expenditure 16,800,000 48,691,561 38,737,059 20.4%
Capital Expenditure 2018/19: Housing Services
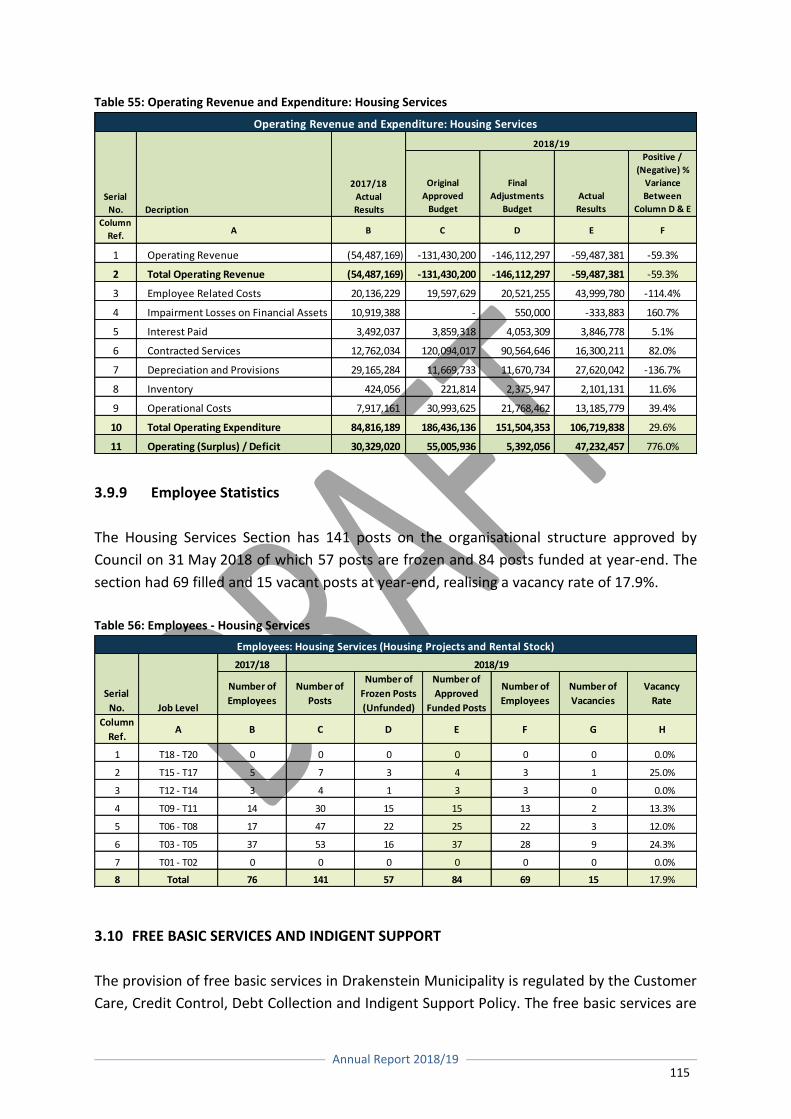
Annual Report 2018/19
115
Table 55: Operating Revenue and Expenditure: Housing Services
3.9.9 Employee Statistics
The Housing Services Section has 141 posts on the organisational structure approved by
Council on 31 May 2018 of which 57 posts are frozen and 84 posts funded at year-end. The
section had 69 filled and 15 vacant posts at year-end, realising a vacancy rate of 17.9%.
Table 56: Employees - Housing Services
3.10 FREE BASIC SERVICES AND INDIGENT SUPPORT
The provision of free basic services in Drakenstein Municipality is regulated by the Customer
Care, Credit Control, Debt Collection and Indigent Support Policy. The free basic services are
2017/18
Number of
Employees
Number of
Posts
Number of
Frozen Posts
(Unfunded)
Number of
Approved
Funded Posts
Number of
Employees
Number of
Vacancies
Vacancy
Rate
Column
Ref.A B C D E F G H
1 T18 - T20 0 0 0 0 0 0 0.0%
2 T15 - T17 5 7 3 4 3 1 25.0%
3 T12 - T14 3 4 1 3 3 0 0.0%
4 T09 - T11 14 30 15 15 13 2 13.3%
5 T06 - T08 17 47 22 25 22 3 12.0%
6 T03 - T05 37 53 16 37 28 9 24.3%
7 T01 - T02 0 0 0 0 0 0 0.0%
8 Total 76 141 57 84 69 15 17.9%
2018/19
Employees: Housing Services (Housing Projects and Rental Stock)
Serial
No. Job Level
Original
Approved
Budget
Final
Adjustments
Budget
Actual
Results
Positive /
(Negative) %
Variance
Between
Column D & E
Column
Ref.A B C D E F
1 Operating Revenue (54,487,169) -131,430,200 -146,112,297 -59,487,381 -59.3%
2 Total Operating Revenue (54,487,169) -131,430,200 -146,112,297 -59,487,381 -59.3%
3 Employee Related Costs 20,136,229 19,597,629 20,521,255 43,999,780 -114.4%
4 Impairment Losses on Financial Assets 10,919,388 - 550,000 -333,883 160.7%
5 Interest Paid 3,492,037 3,859,318 4,053,309 3,846,778 5.1%
6 Contracted Services 12,762,034 120,094,017 90,564,646 16,300,211 82.0%
7 Depreciation and Provisions 29,165,284 11,669,733 11,670,734 27,620,042 -136.7%
8 Inventory 424,056 221,814 2,375,947 2,101,131 11.6%
9 Operational Costs 7,917,161 30,993,625 21,768,462 13,185,779 39.4%
10 Total Operating Expenditure 84,816,189 186,436,136 151,504,353 106,719,838 29.6%
11 Operating (Surplus) / Deficit 30,329,020 55,005,936 5,392,056 47,232,457 776.0%
Operating Revenue and Expenditure: Housing Services
Serial
No. Decription
2017/18
Actual
Results
2018/19
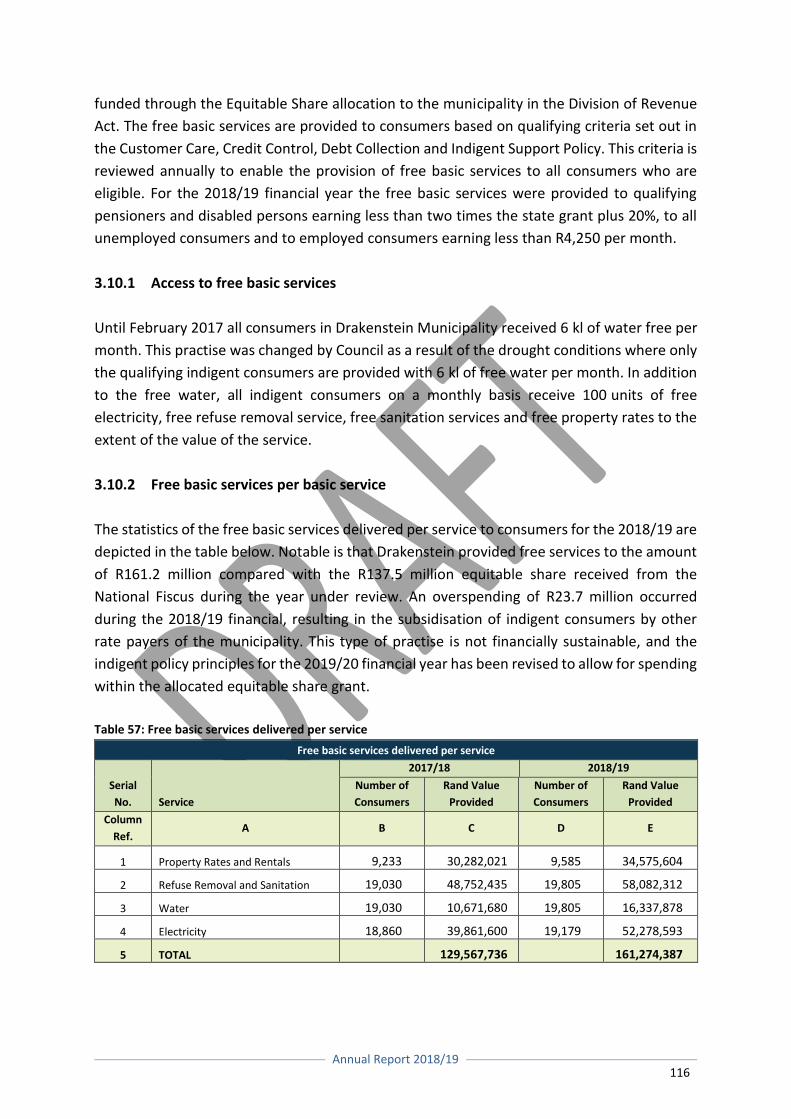
Annual Report 2018/19
116
funded through the Equitable Share allocation to the municipality in the Division of Revenue
Act. The free basic services are provided to consumers based on qualifying criteria set out in
the Customer Care, Credit Control, Debt Collection and Indigent Support Policy. This criteria is
reviewed annually to enable the provision of free basic services to all consumers who are
eligible. For the 2018/19 financial year the free basic services were provided to qualifying
pensioners and disabled persons earning less than two times the state grant plus 20%, to all
unemployed consumers and to employed consumers earning less than R4,250 per month.
3.10.1 Access to free basic services
Until February 2017 all consumers in Drakenstein Municipality received 6 kl of water free per
month. This practise was changed by Council as a result of the drought conditions where only
the qualifying indigent consumers are provided with 6 kl of free water per month. In addition
to the free water, all indigent consumers on a monthly basis receive 100 units of free
electricity, free refuse removal service, free sanitation services and free property rates to the
extent of the value of the service.
3.10.2 Free basic services per basic service
The statistics of the free basic services delivered per service to consumers for the 2018/19 are
depicted in the table below. Notable is that Drakenstein provided free services to the amount
of R161.2 million compared with the R137.5 million equitable share received from the
National Fiscus during the year under review. An overspending of R23.7 million occurred
during the 2018/19 financial, resulting in the subsidisation of indigent consumers by other
rate payers of the municipality. This type of practise is not financially sustainable, and the
indigent policy principles for the 2019/20 financial year has been revised to allow for spending
within the allocated equitable share grant.
Table 57: Free basic services delivered per service
Free basic services delivered per service
Serial
No. Service
2017/18 2018/19
Number of
Consumers
Rand Value
Provided
Number of
Consumers
Rand Value
Provided
Column
Ref. A B C D E
1 Property Rates and Rentals 9,233 30,282,021 9,585 34,575,604
2 Refuse Removal and Sanitation 19,030 48,752,435 19,805 58,082,312
3 Water 19,030 10,671,680 19,805 16,337,878
4 Electricity 18,860 39,861,600 19,179 52,278,593
5 TOTAL 129,567,736 161,274,387
Annual Report 2018/19
117
COMPONENT C: ROAD TRANSPORT
3.11 ROADS AND STORMWATER
In accordance with the principles of Key Performance Area 4: Physical Infrastructure and
Services as well as Key Focus Area 26 relating to Transport, Traffic Engineering, Roads and
Stormwater, the activities of this section focuses on the development and maintenance of
infrastructure for the conveyance of people and goods in all its forms. Further functions
include the installation and maintenance of regulatory items to effectively safeguard residents
and users of the infrastructure as well as the maintenance and installation of infrastructure to
mitigate risk resulting from adverse weather conditions.
3.11.1 Transport
At present the main means of public transport are minibus taxis for local commuting and train
and bus for long distance travel.
3.11.2 Traffic Engineering
The Traffic Engineering Section is responsible for the maintenance of all traffic light
installations, traffic signage, road markings as well as directional and tourism signage as may
be required.
Planning for the installation of additional traffic signals at crucial problematic intersections is
done on a continuous basis to be implemented as the provision of the required budget is
affected. On provincial roads, the installation of traffic signals is done in collaboration with the
Provincial Department of Transport.
The section also determines whether traffic calming installations are warranted and installs
the infrastructure as determined in accordance with available budget.
The section performed very well during the year. In total approximately 20,125 square metres
of general road markings were maintained in Paarl; 48 raised intersections; 338 pedestrian
crossings were constructed; 518 speed bumps were installed; 266 intersections; 986 parking
spaces, 1058 stop signs; 352 yield signs.
3.11.3 Roads
The function of the roads section is to attend to the upgrade of the existing roads and streets,
to extend and improve the network, and maintain all classes of roads.
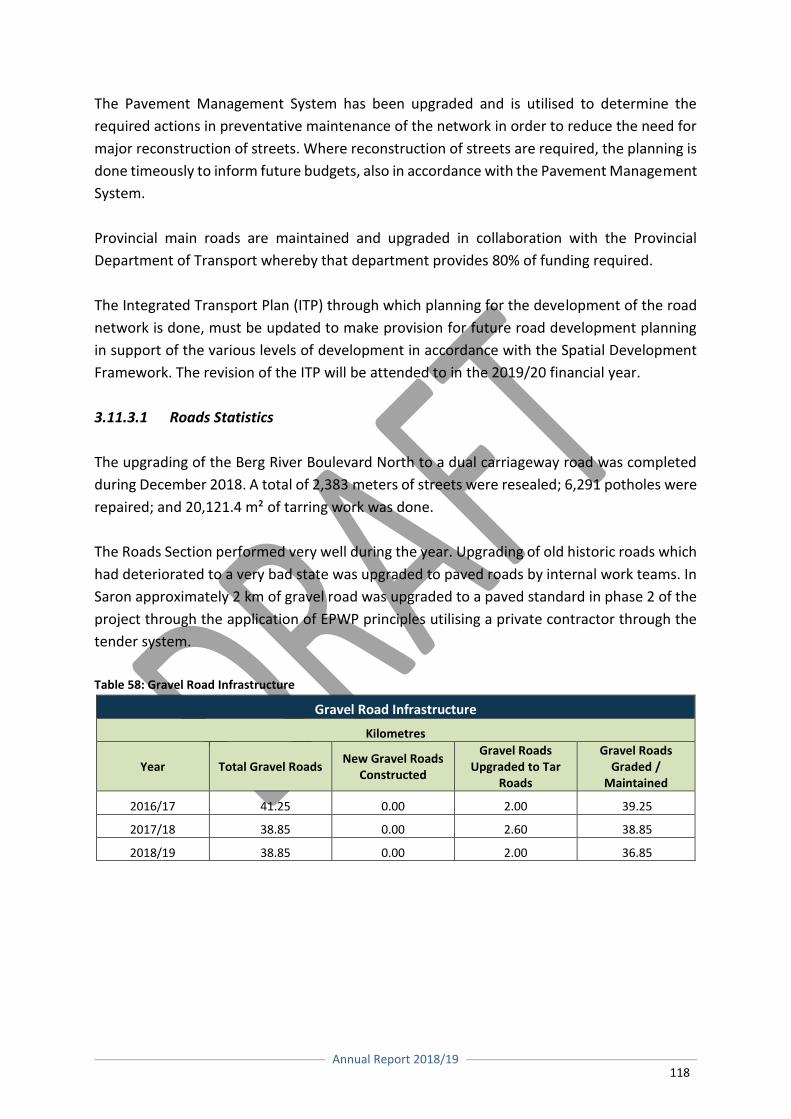
Annual Report 2018/19
118
The Pavement Management System has been upgraded and is utilised to determine the
required actions in preventative maintenance of the network in order to reduce the need for
major reconstruction of streets. Where reconstruction of streets are required, the planning is
done timeously to inform future budgets, also in accordance with the Pavement Management
System.
Provincial main roads are maintained and upgraded in collaboration with the Provincial
Department of Transport whereby that department provides 80% of funding required.
The Integrated Transport Plan (ITP) through which planning for the development of the road
network is done, must be updated to make provision for future road development planning
in support of the various levels of development in accordance with the Spatial Development
Framework. The revision of the ITP will be attended to in the 2019/20 financial year.
3.11.3.1 Roads Statistics
The upgrading of the Berg River Boulevard North to a dual carriageway road was completed
during December 2018. A total of 2,383 meters of streets were resealed; 6,291 potholes were
repaired; and 20,121.4 m² of tarring work was done.
The Roads Section performed very well during the year. Upgrading of old historic roads which
had deteriorated to a very bad state was upgraded to paved roads by internal work teams. In
Saron approximately 2 km of gravel road was upgraded to a paved standard in phase 2 of the
project through the application of EPWP principles utilising a private contractor through the
tender system.
Table 58: Gravel Road Infrastructure
Gravel Road Infrastructure
Kilometres
Year Total Gravel Roads New Gravel Roads
Constructed
Gravel Roads Upgraded to Tar
Roads
Gravel Roads Graded /
Maintained
2016/17 41.25 0.00 2.00 39.25
2017/18 38.85 0.00 2.60 38.85
2018/19 38.85 0.00 2.00 36.85
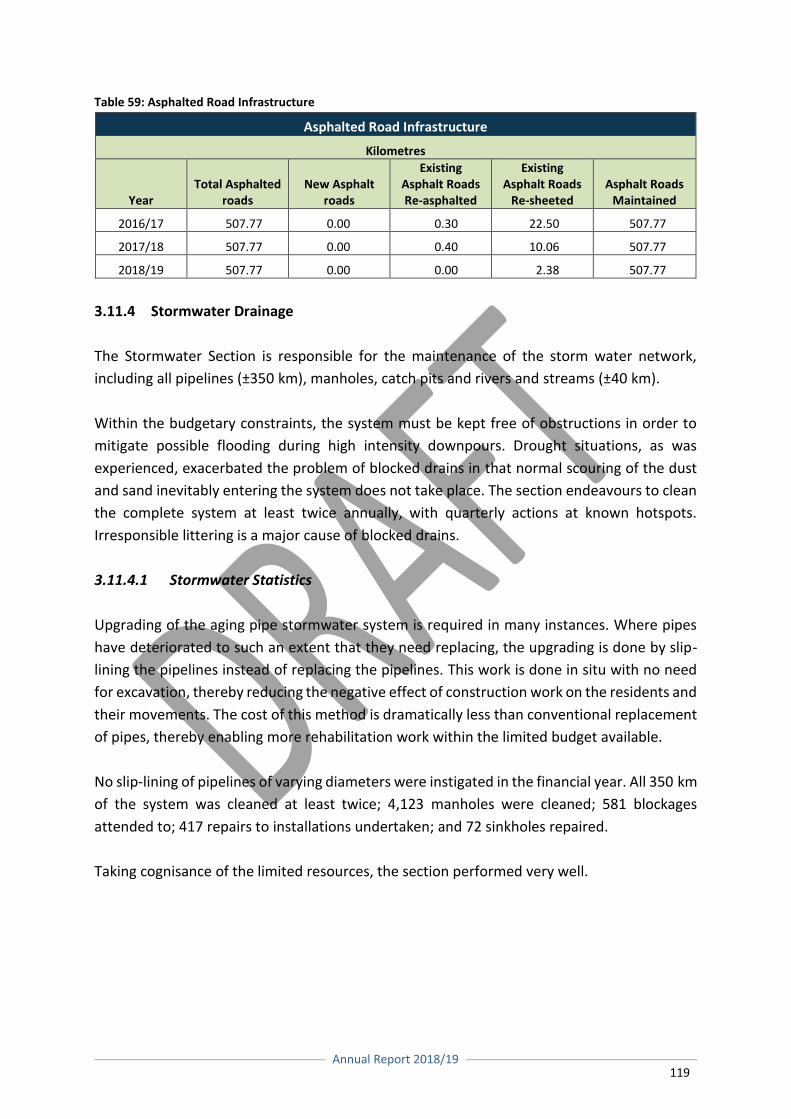
Annual Report 2018/19
119
Table 59: Asphalted Road Infrastructure
Asphalted Road Infrastructure
Kilometres
Year Total Asphalted
roads New Asphalt
roads
Existing Asphalt Roads Re-asphalted
Existing Asphalt Roads
Re-sheeted Asphalt Roads
Maintained
2016/17 507.77 0.00 0.30 22.50 507.77
2017/18 507.77 0.00 0.40 10.06 507.77
2018/19 507.77 0.00 0.00 2.38 507.77
3.11.4 Stormwater Drainage
The Stormwater Section is responsible for the maintenance of the storm water network,
including all pipelines (±350 km), manholes, catch pits and rivers and streams (±40 km).
Within the budgetary constraints, the system must be kept free of obstructions in order to
mitigate possible flooding during high intensity downpours. Drought situations, as was
experienced, exacerbated the problem of blocked drains in that normal scouring of the dust
and sand inevitably entering the system does not take place. The section endeavours to clean
the complete system at least twice annually, with quarterly actions at known hotspots.
Irresponsible littering is a major cause of blocked drains.
3.11.4.1 Stormwater Statistics
Upgrading of the aging pipe stormwater system is required in many instances. Where pipes
have deteriorated to such an extent that they need replacing, the upgrading is done by slip-
lining the pipelines instead of replacing the pipelines. This work is done in situ with no need
for excavation, thereby reducing the negative effect of construction work on the residents and
their movements. The cost of this method is dramatically less than conventional replacement
of pipes, thereby enabling more rehabilitation work within the limited budget available.
No slip-lining of pipelines of varying diameters were instigated in the financial year. All 350 km
of the system was cleaned at least twice; 4,123 manholes were cleaned; 581 blockages
attended to; 417 repairs to installations undertaken; and 72 sinkholes repaired.
Taking cognisance of the limited resources, the section performed very well.
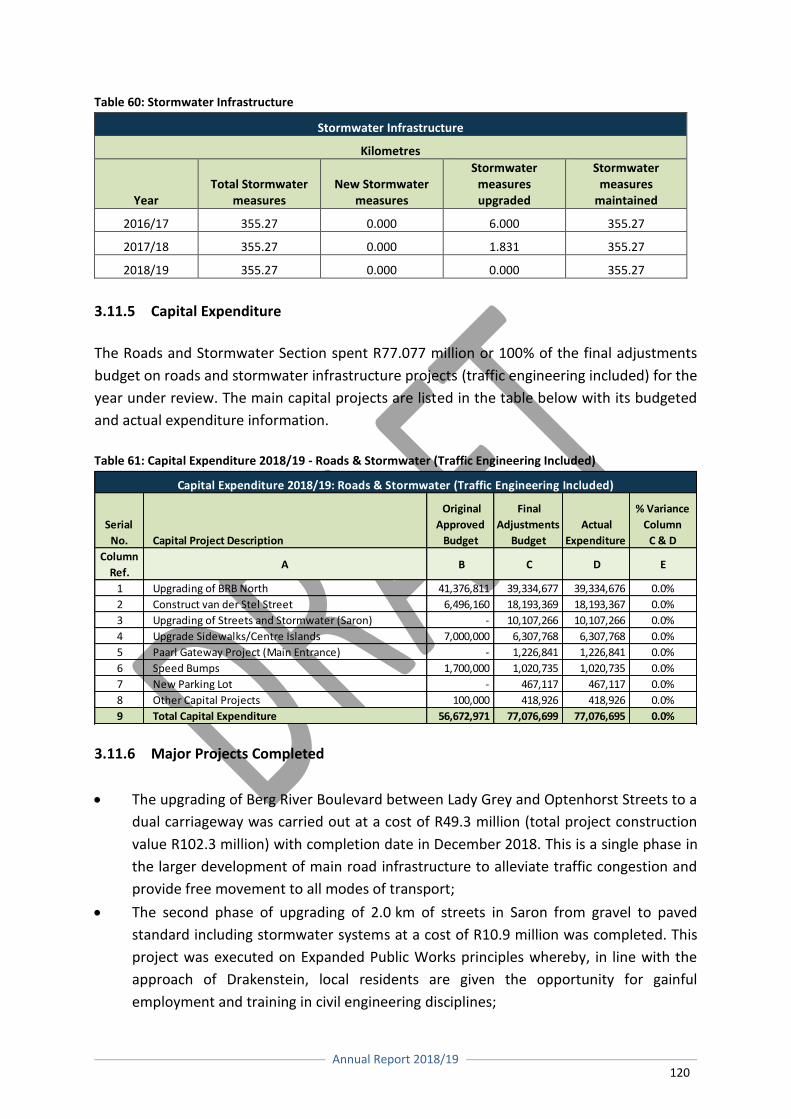
Annual Report 2018/19
120
Table 60: Stormwater Infrastructure
Stormwater Infrastructure
Kilometres
Year Total Stormwater
measures New Stormwater
measures
Stormwater measures upgraded
Stormwater measures
maintained
2016/17 355.27 0.000 6.000 355.27
2017/18 355.27 0.000 1.831 355.27
2018/19 355.27 0.000 0.000 355.27
3.11.5 Capital Expenditure
The Roads and Stormwater Section spent R77.077 million or 100% of the final adjustments
budget on roads and stormwater infrastructure projects (traffic engineering included) for the
year under review. The main capital projects are listed in the table below with its budgeted
and actual expenditure information.
Table 61: Capital Expenditure 2018/19 - Roads & Stormwater (Traffic Engineering Included)
3.11.6 Major Projects Completed
The upgrading of Berg River Boulevard between Lady Grey and Optenhorst Streets to a
dual carriageway was carried out at a cost of R49.3 million (total project construction
value R102.3 million) with completion date in December 2018. This is a single phase in
the larger development of main road infrastructure to alleviate traffic congestion and
provide free movement to all modes of transport;
The second phase of upgrading of 2.0 km of streets in Saron from gravel to paved
standard including stormwater systems at a cost of R10.9 million was completed. This
project was executed on Expanded Public Works principles whereby, in line with the
approach of Drakenstein, local residents are given the opportunity for gainful
employment and training in civil engineering disciplines;
Serial
No. Capital Project Description
Original
Approved
Budget
Final
Adjustments
Budget
Actual
Expenditure
% Variance
Column
C & D
Column
Ref.A B C D E
1 Upgrading of BRB North 41,376,811 39,334,677 39,334,676 0.0%
2 Construct van der Stel Street 6,496,160 18,193,369 18,193,367 0.0%
3 Upgrading of Streets and Stormwater (Saron) - 10,107,266 10,107,266 0.0%
4 Upgrade Sidewalks/Centre Islands 7,000,000 6,307,768 6,307,768 0.0%
5 Paarl Gateway Project (Main Entrance) - 1,226,841 1,226,841 0.0%
6 Speed Bumps 1,700,000 1,020,735 1,020,735 0.0%
7 New Parking Lot - 467,117 467,117 0.0%
8 Other Capital Projects 100,000 418,926 418,926 0.0%
9 Total Capital Expenditure 56,672,971 77,076,699 77,076,695 0.0%
Capital Expenditure 2018/19: Roads & Stormwater (Traffic Engineering Included)
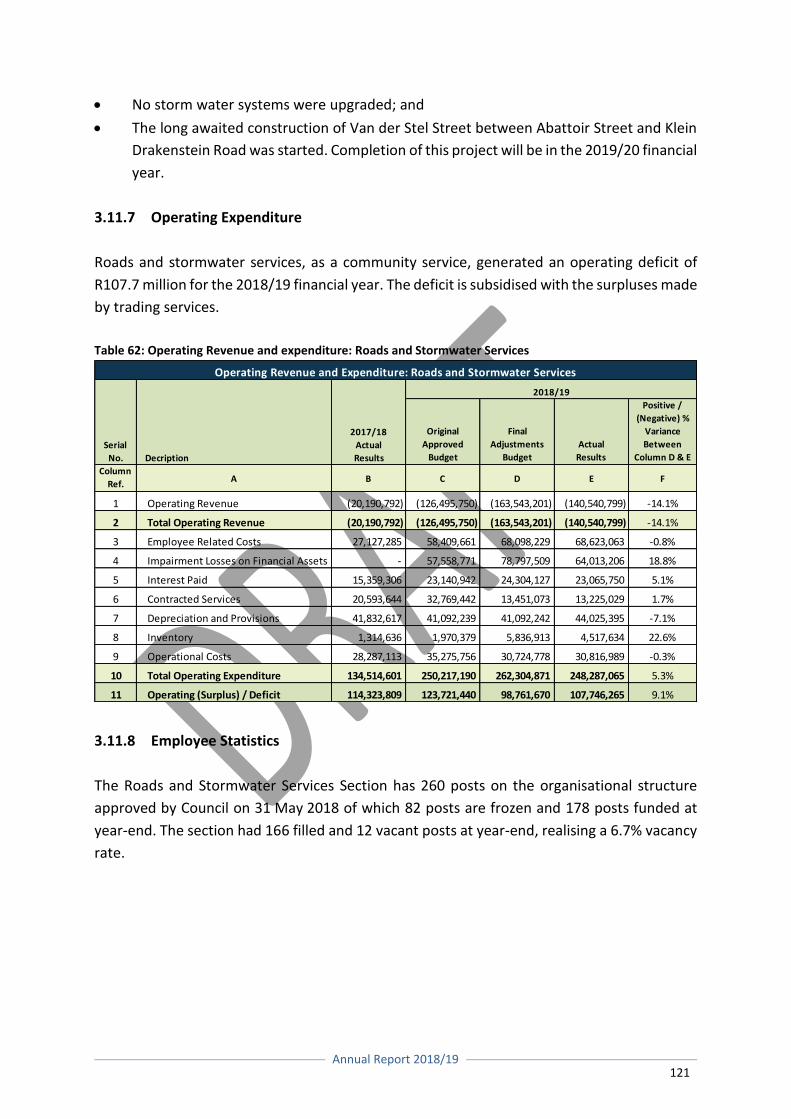
Annual Report 2018/19
121
No storm water systems were upgraded; and
The long awaited construction of Van der Stel Street between Abattoir Street and Klein
Drakenstein Road was started. Completion of this project will be in the 2019/20 financial
year.
3.11.7 Operating Expenditure
Roads and stormwater services, as a community service, generated an operating deficit of
R107.7 million for the 2018/19 financial year. The deficit is subsidised with the surpluses made
by trading services.
Table 62: Operating Revenue and expenditure: Roads and Stormwater Services
3.11.8 Employee Statistics
The Roads and Stormwater Services Section has 260 posts on the organisational structure
approved by Council on 31 May 2018 of which 82 posts are frozen and 178 posts funded at
year-end. The section had 166 filled and 12 vacant posts at year-end, realising a 6.7% vacancy
rate.
Original
Approved
Budget
Final
Adjustments
Budget
Actual
Results
Positive /
(Negative) %
Variance
Between
Column D & E
Column
Ref.A B C D E F
1 Operating Revenue (20,190,792) (126,495,750) (163,543,201) (140,540,799) -14.1%
2 Total Operating Revenue (20,190,792) (126,495,750) (163,543,201) (140,540,799) -14.1%
3 Employee Related Costs 27,127,285 58,409,661 68,098,229 68,623,063 -0.8%
4 Impairment Losses on Financial Assets - 57,558,771 78,797,509 64,013,206 18.8%
5 Interest Paid 15,359,306 23,140,942 24,304,127 23,065,750 5.1%
6 Contracted Services 20,593,644 32,769,442 13,451,073 13,225,029 1.7%
7 Depreciation and Provisions 41,832,617 41,092,239 41,092,242 44,025,395 -7.1%
8 Inventory 1,314,636 1,970,379 5,836,913 4,517,634 22.6%
9 Operational Costs 28,287,113 35,275,756 30,724,778 30,816,989 -0.3%
10 Total Operating Expenditure 134,514,601 250,217,190 262,304,871 248,287,065 5.3%
11 Operating (Surplus) / Deficit 114,323,809 123,721,440 98,761,670 107,746,265 9.1%
Operating Revenue and Expenditure: Roads and Stormwater Services
Serial
No. Decription
2017/18
Actual
Results
2018/19

Annual Report 2018/19
122
Table 63: Employees - Roads and Stormwater Services
2017/18
Number of
Employees
Number of
Posts
Number of
Frozen Posts
(Unfunded)
Number of
Approved
Funded Posts
Number of
Employees
Number of
Vacancies
Vacancy
Rate
Column
Ref.A B C D E F G H
1 T18 - T20 0 0 0 0 0 0 0.0%
2 T15 - T17 2 2 0 2 2 0 0.0%
3 T12 - T14 2 6 2 4 3 1 25.0%
4 T09 - T11 6 13 5 8 8 0 0.0%
5 T06 - T08 25 49 21 28 27 1 3.6%
6 T03 - T05 130 190 54 136 126 10 7.4%
7 T01 - T02 0 0 0 0 0 0 0.0%
8 Total 165 260 82 178 166 12 6.7%
2018/19
Employees: Roads and Stormwater Services
Serial
No. Job Level
Annual Report 2018/19
123
COMPONENT D: PLANNING AND ECONOMIC DEVELOPMENT
3.12 INTRODUCTION
The Planning and Development Department includes Building Control, Land Surveying, Land
Use Planning, Spatial Planning, Heritage, geographical information services, Environmental
Management, Rural Development and Economic Growth and Tourism. The Department is
responsible for sustainable and pro-active planning and compliance monitoring of the natural
and built environment. The Department facilitates the physical, social and economic
development and growth.
3.13 PLANNING SERVICES
The Division: Planning Services deals with spatial planning, geographical information services,
heritage, building control, land use planning and surveying matters.
3.13.1 Section: Spatial Planning, Heritage and G.I.S
The Spatial Planning, Heritage and Geographical Information Services Section consists of a
Spatial Planning Sub-Section, a Heritage Sub-Section and a Geographical Information Services
Sub-Section.
3.13.1.1 Sub-Section: Spatial Planning
The purpose of spatial planning is to provide a framework for the spatial vision and form of
Drakenstein Municipality. The Spatial Development Framework (SDF) provides guidelines for
future development and growth of the Municipal Area in a predictable manner to enhance
the quality of life of its residents.
The Sub-Section Spatial Planning is responsible for:
Compiling, amending and/or reviewing a Spatial Development Framework;
Preparing Local Spatial Development Frameworks for certain identified areas in
Drakenstein Municipality;
Developing policies and strategies guiding the long-term development of the
Municipality;
Commenting on land use applications and environmental processes; and
Commenting on other local, provincial and national spatial policies, legislation and
documents.
Annual Report 2018/19
124
3.13.1.2 Sub-Section: Heritage
The purpose of heritage is to identify, protect and manage the heritage resources and cultural
landscapes of the Drakenstein Municipality. The sub-section also renders comments on land
use planning applications and building plan applications.
3.13.1.3 Sub-Section: Geographical Information Services (GIS)
The main purpose of the G.I.S. Sub-Section is to provide and maintain Geographic Information
System services and products for the department, provide G.I.S. related guidance and support
to managers and staff, and to take an active role in the development and maintenance of
organisational Geographic Information System services.
3.13.1.4 Major Projects Completed
Major projects being undertaken by the section consists of:
2020 Drakenstein Spatial Development Framework (SDF): A new SDF is currently being
compiled in terms of Section 26(e) of the Local Government: Municipal Systems Act,
2000 (Act 32 of 2000). The process was initiated by the Spatial Planning Sub-Section in
September 2018. The compilation of the new SDF is envisaged to guide new investment,
give effect to the priorities as stated in the Integrated Development Plan (IDP) and to
identify priority areas for strategic intervention. It is planned that the SDF will be
finalised and approved by Council in May 2020.
Local Spatial Development Framework for Klapmuts North: This local framework will
deliver a spatial vision for the Klapmuts area which will be able to respond to future
development changes and pressures. The final Local Spatial Development Framework
for Klapmuts North was referred to Council in June 2019 for approval and adoption. A
decision on the Local Spatial Development Framework for Klapmuts North will be made
early in the 2019/20 financial years.
Local Spatial Development Framework for the Klein Drakenstein Road and Lady Grey
Street: The study area for the framework comprises the Paarl Central Business District
(CBD), the CBD interface with the Berg River, sections of the Arboretum and adjacent
erven, the Huguenot Station area and the Klein Drakenstein Road area. The final Local
Spatial Development Framework for Klein Drakenstein Road and Lady Grey Street was
referred to Council in June 2019 for approval and adoption. A decision on the Local
Spatial Development Framework for the Klein Drakenstein Road and Lady Grey Street
will be made early in the 2019/20 financial year.
Annual Report 2018/19
125
Identification of Land for Cemetery Purposes Study: Extension of Parys Cemetery: This
project arises from the lack of cemetery space within Drakenstein. A process to obtain
the necessary permissions in order to extend the Parys Cemetery was initiated. A service
provider was appointed to obtain the necessary environmental authorisations and land
use rights. The necessary specialist studies as required have been completed and it is
expected that permission to extend the cemetery will be obtained in 2019/20.
Drakenstein Mountain Slope Policy: This planning policy provides a means to guide and
manage certain types of development on mountain slopes, but it also provides a unique
opportunity to connect the public with nature and create social and economic
opportunities, where applicable. The final Drakenstein Mountain Slope Policy was
referred to Council in June 2019 for approval and adoption. It is anticipated that a
decision on the Drakenstein Mountain Slope Policy will be made early in the 2019/20
financial year.
Paarl Hamlet Urban Design Framework and De Poort Business Model: The Municipality
initiated a project for the compilation of a Paarl Hamlet Urban Design Framework and
the De Poort Business Model in February 2019. The Paarl Hamlet Urban Design
Framework is a policy document which consists of plans, projects and initiatives that will
assist in achieving the desired spatial form and physical structure of the Paarl Hamlet
Precinct. The De Poort Business Model will provide guidance of how to optimally utilise
the De Poort property, from an institutional, financial and management perspective.
Ou Tuin Precinct Study: The Municipality initiated a project to study forced removals
within the Municipality, starting with the Ou Tuin precinct. The focus of the project is to
identify the history of the area, boundaries of the area, interviewing members of the
original community, identify and grade remnants of the original precinct and identify
opportunities for commemoration, redress or celebration. The final Ou Tuin Precinct
Study will be referred to Council in August 2019 for a decision.
Heritage Photographic Competition 2018: Heritage month is an opportunity to celebrate
the diversity and heritage of South Africa. The Heritage Sub-Section initiated an annual
photography competition to raise awareness on heritage within the municipal area and
afford residents, young and old, the opportunity to visually display their understanding
of heritage. The competition was open to primary school learners, secondary school
learners and amateur photographers and the prizes are unique cultural heritage
experiences which help to foster a better understanding of the heritage around us. The
competition was a success based on the submissions received, which culminated in a
prize ceremony on 6 September 2018.
Annual Report 2018/19
126
Devolution of heritage competency: Drakenstein Municipality is engaging in a process
with Heritage Western Cape to devolve certain provincial heritage competencies
towards the Municipality in terms of the National Heritage Resources Act, Act 25 of 1999.
Heritage Western Cape is currently preparing guideline and policy documents which will
assist in the approval and implementation of proposed heritage area and the process of
devolving certain provincial heritage competencies.
3.13.2 Section: Building Control
Municipalities by law must manage the way in which land within their area of jurisdiction is used
and how buildings are erected. The Land Use Planning and Survey Section deals with the use of
land and the Building Control Section deals with building activities, which entails new buildings,
additions and alterations to existing buildings and temporary structures.
All municipalities administer the National Building Regulations and Building Standards Act, 1977
(Act 103 of 1977), the regulations embodied in the act and the South African Standard Code of
Practice (SANS 10400 for the application of the regulations). The purpose thereof is to ensure
that buildings are designed and built in such a manner that people can live, work and play in a
healthy and safe built environment.
The National Building Regulations require that no person may erect, alter, add on or convert a
building without the prior approval of the local authority.
Building plans are assessed against the requirements of the building standards regulations, any
other applicable legislation, and 23 sections of the SANS 10400, that deal with various aspects of
a building.
Once building plans are approved, the building inspectors carry out three compulsory
inspections:
The inspection of all foundation trenches and the positioning of the building on-site;
The inspection of all new drainage installations; and
On completion of a building a final inspection (completion) is carried out as no building
may be occupied without an occupation certificate.
Prior to the issuing of the occupation certificate, the building inspector ensures compliance
with the structural aspects, fire installation, health requirements, electrical installation, roads
and stormwater requirements, drainage installation, energy efficiency of the structure and
compliance with the approved building plan.
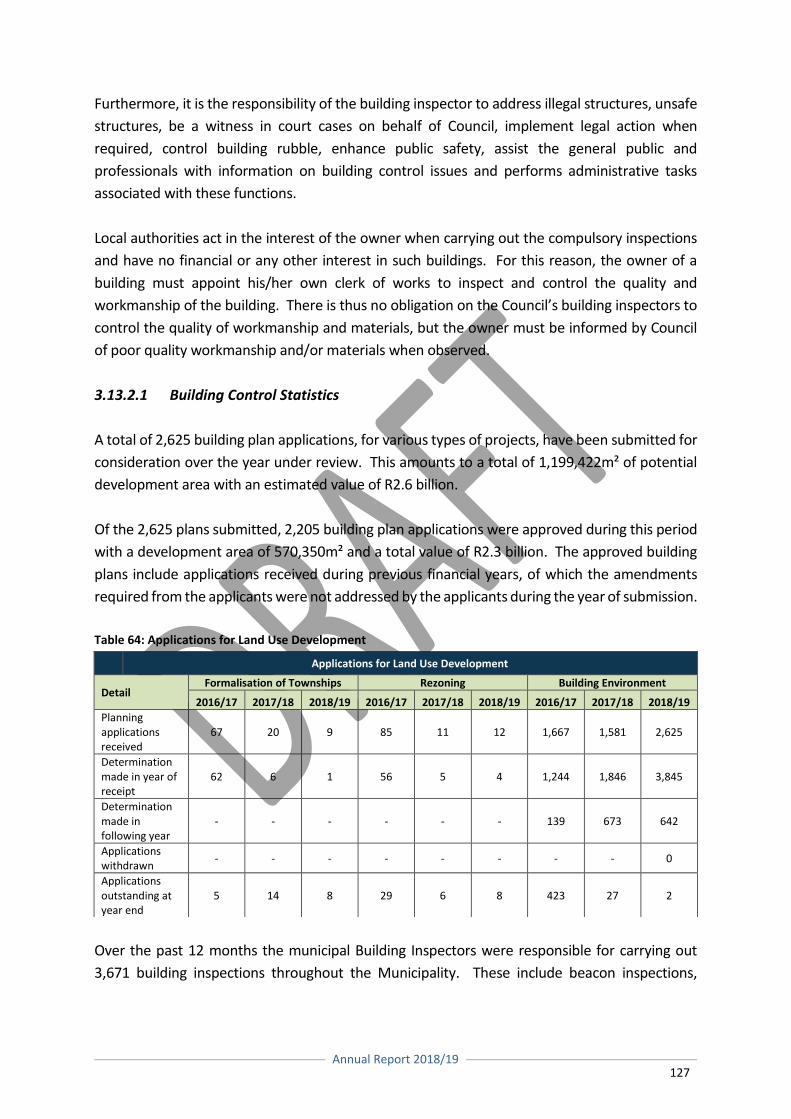
Annual Report 2018/19
127
Furthermore, it is the responsibility of the building inspector to address illegal structures, unsafe
structures, be a witness in court cases on behalf of Council, implement legal action when
required, control building rubble, enhance public safety, assist the general public and
professionals with information on building control issues and performs administrative tasks
associated with these functions.
Local authorities act in the interest of the owner when carrying out the compulsory inspections
and have no financial or any other interest in such buildings. For this reason, the owner of a
building must appoint his/her own clerk of works to inspect and control the quality and
workmanship of the building. There is thus no obligation on the Council’s building inspectors to
control the quality of workmanship and materials, but the owner must be informed by Council
of poor quality workmanship and/or materials when observed.
3.13.2.1 Building Control Statistics
A total of 2,625 building plan applications, for various types of projects, have been submitted for
consideration over the year under review. This amounts to a total of 1,199,422m² of potential
development area with an estimated value of R2.6 billion.
Of the 2,625 plans submitted, 2,205 building plan applications were approved during this period
with a development area of 570,350m² and a total value of R2.3 billion. The approved building
plans include applications received during previous financial years, of which the amendments
required from the applicants were not addressed by the applicants during the year of submission.
Table 64: Applications for Land Use Development
Over the past 12 months the municipal Building Inspectors were responsible for carrying out
3,671 building inspections throughout the Municipality. These include beacon inspections,
Applications for Land Use Development
Detail Formalisation of Townships Rezoning Building Environment
2016/17 2017/18 2018/19 2016/17 2017/18 2018/19 2016/17 2017/18 2018/19
Planning applications received
67 20 9 85 11 12 1,667 1,581 2,625
Determination made in year of receipt
62 6 1 56 5 4 1,244 1,846 3,845
Determination made in following year
- - - - - - 139 673 642
Applications withdrawn
- - - - - - - - 0
Applications outstanding at year end
5 14 8 29 6 8 423 27 2
Annual Report 2018/19
128
commencement/foundation inspections, drainage inspections, completion inspections as well as
Certificate of Occupation inspections.
Furthermore, a total of 309 complaints from the public were received and addressed at an
average of 25.75 complaints per month.
3.13.2.2 Major Projects Completed
During 2018/19, the following two new bylaws were drafted:
Building Control Bylaw: The bylaw is supplementary to Act 103 of 1977 (Act) and the
National Building Regulations (NBR) to ensure uniformity with regard to building
standards, the erection of buildings and the submission, consideration and approval of
building plans. All persons, including organs of state, must submit building plans and
specifications for consideration and approval by the municipality in respect of buildings
as provided for in this bylaw, the Act and the NBR and shall pay the required fees as
contemplated in section 8.
The bylaw addresses various elements which include:
Approval required for buildings to be erected;
Buildings that require approval of the municipality:
Containers, air-conditioning unit, pool pumps, bore holes, solar energy systems,
wind turbines, etc.;
Certificate of occupancy;
Compliance and enforcement;
Offences and penalties; and
Appeals.
The bylaw served at the Mayoral Committee on 22 May 2019 and was then advertised for public
participation which has subsequently closed and comments will be incorporated within the
bylaw where applicable. The bylaw will be tabled with Council for approval in 2019/2020.
Problem Premises Bylaw: The bylaw is supplementary to the Act and the NBR to ensure
the proper care and maintenance of buildings and premises, whether vacant or
occupied. This bylaw applies to all problem premises situated within the area of jurisdiction
of the municipality.
The municipality may consider the realities of the Drakenstein, the different customs, cultures,
circumstances, geographical areas, kinds of premises, and the municipality may determine the
areas of applicability.
Annual Report 2018/19
129
The bylaw addresses various key elements which includes:
Appointment of authorised officials;
Entry by authorised official of buildings and land;
Declaration of problem premises;
Recovery of cost;
Appeals; and
Offences and penalties.
The bylaw served at the Planning Portfolio Committee on 10 April 2019. The bylaw was
advertised for public participation which has subsequently closed and comments will be
incorporated within the bylaw where applicable. The bylaw will be tabled with Council for
approval in 2019/2020.
3.13.3 Section: Land Use Planning and Surveying
The Land Use Planning and Surveying Section is responsible to ensure the orderly and
sustainable development and management of the built environment within the Drakenstein
Municipal area, through creating an enabling environment in order to give effect to the
municipality’s vision of creating “A city of excellence”.
Land-use planning refers to a wide range of activities that direct the future use of land and
manage the current use thereof: to ensure the optimal use of land within a political, social,
cultural, environmental and economic context.
The section is mainly responsible for the processing of applications for land use changes (by
means of rezoning, consent uses, departures, temporary departures, amendment of
conditions of approval and removal of restrictive title conditions), as well as farm subdivisions,
urban subdivisions and exempted subdivisions. The section is furthermore responsible for the
scrutinising of building plans for compliance with zoning parameters and site dimensions, as
well as attending to illegal land uses.
The most important instruments used in land use management is the Zoning Scheme Bylaw
and the Bylaw on Municipal Land Use Planning. In order to comply with the provisions of new
planning legislation, a new single zoning scheme for the whole of the Drakenstein Municipal
area has been developed and adopted by Council during June 2018. In addition, the process
of amending and refining the Drakenstein Bylaw on Municipal Land Use Planning has also been
completed and approved by Council. Both these documents were successfully implemented
during October 2018.
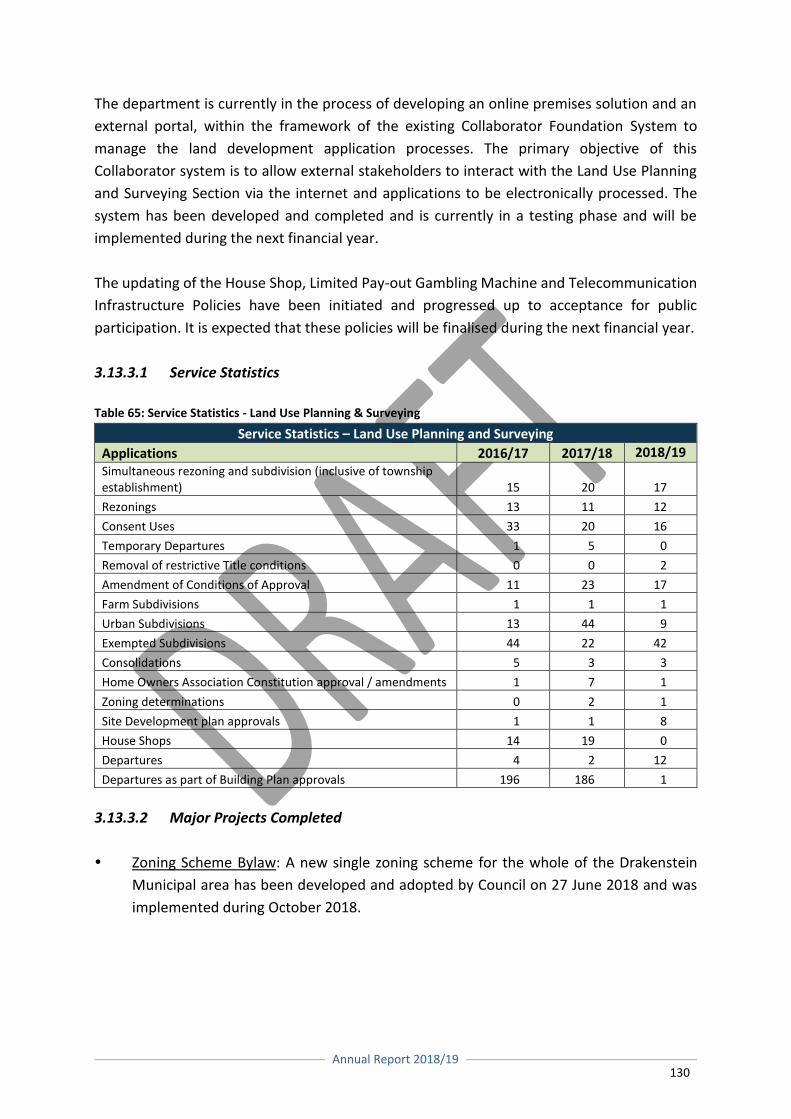
Annual Report 2018/19
130
The department is currently in the process of developing an online premises solution and an
external portal, within the framework of the existing Collaborator Foundation System to
manage the land development application processes. The primary objective of this
Collaborator system is to allow external stakeholders to interact with the Land Use Planning
and Surveying Section via the internet and applications to be electronically processed. The
system has been developed and completed and is currently in a testing phase and will be
implemented during the next financial year.
The updating of the House Shop, Limited Pay-out Gambling Machine and Telecommunication
Infrastructure Policies have been initiated and progressed up to acceptance for public
participation. It is expected that these policies will be finalised during the next financial year.
3.13.3.1 Service Statistics
Table 65: Service Statistics - Land Use Planning & Surveying
Service Statistics – Land Use Planning and Surveying
Applications 2016/17 2017/18 2018/19 Simultaneous rezoning and subdivision (inclusive of township establishment) 15 20 17
Rezonings 13 11 12
Consent Uses 33 20 16
Temporary Departures 1 5 0
Removal of restrictive Title conditions 0 0 2
Amendment of Conditions of Approval 11 23 17
Farm Subdivisions 1 1 1
Urban Subdivisions 13 44 9
Exempted Subdivisions 44 22 42
Consolidations 5 3 3
Home Owners Association Constitution approval / amendments 1 7 1
Zoning determinations 0 2 1
Site Development plan approvals 1 1 8
House Shops 14 19 0
Departures 4 2 12
Departures as part of Building Plan approvals 196 186 1
3.13.3.2 Major Projects Completed
Zoning Scheme Bylaw: A new single zoning scheme for the whole of the Drakenstein
Municipal area has been developed and adopted by Council on 27 June 2018 and was
implemented during October 2018.
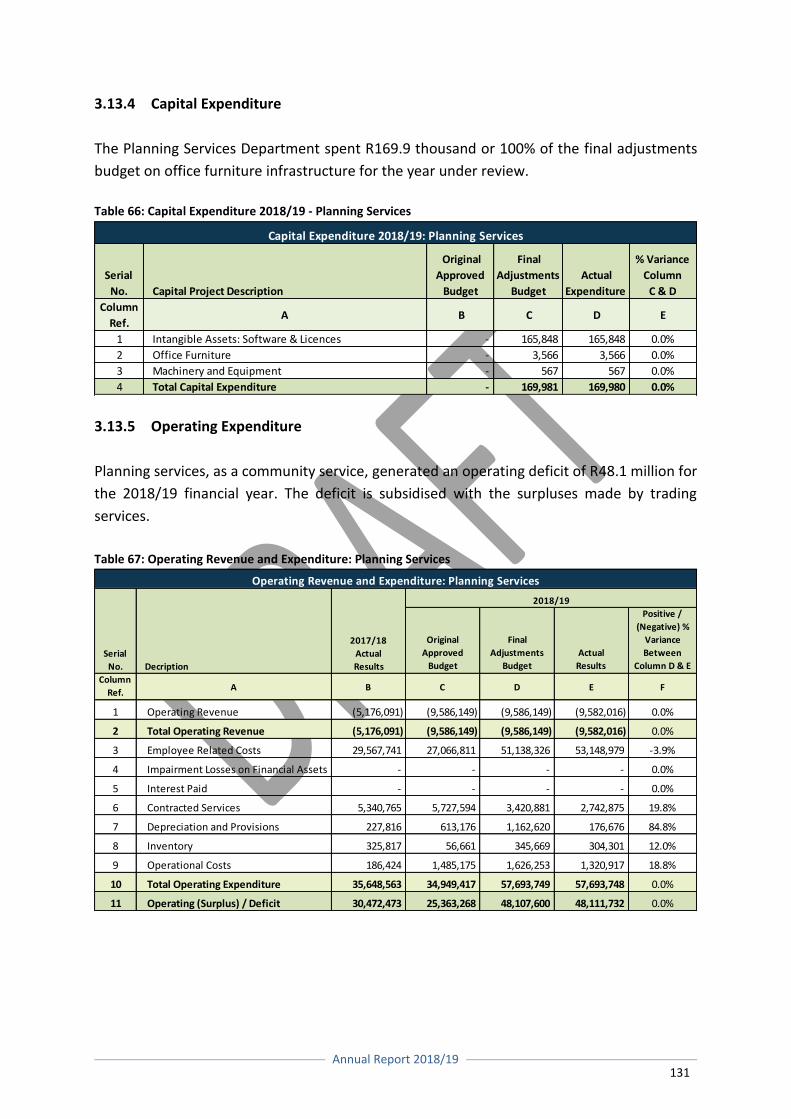
Annual Report 2018/19
131
3.13.4 Capital Expenditure
The Planning Services Department spent R169.9 thousand or 100% of the final adjustments
budget on office furniture infrastructure for the year under review.
Table 66: Capital Expenditure 2018/19 - Planning Services
3.13.5 Operating Expenditure
Planning services, as a community service, generated an operating deficit of R48.1 million for
the 2018/19 financial year. The deficit is subsidised with the surpluses made by trading
services.
Table 67: Operating Revenue and Expenditure: Planning Services
Serial
No. Capital Project Description
Original
Approved
Budget
Final
Adjustments
Budget
Actual
Expenditure
% Variance
Column
C & D
Column
Ref.A B C D E
1 Intangible Assets: Software & Licences - 165,848 165,848 0.0%
2 Office Furniture - 3,566 3,566 0.0%
3 Machinery and Equipment - 567 567 0.0%
4 Total Capital Expenditure - 169,981 169,980 0.0%
Capital Expenditure 2018/19: Planning Services
Original
Approved
Budget
Final
Adjustments
Budget
Actual
Results
Positive /
(Negative) %
Variance
Between
Column D & E
Column
Ref.A B C D E F
1 Operating Revenue (5,176,091) (9,586,149) (9,586,149) (9,582,016) 0.0%
2 Total Operating Revenue (5,176,091) (9,586,149) (9,586,149) (9,582,016) 0.0%
3 Employee Related Costs 29,567,741 27,066,811 51,138,326 53,148,979 -3.9%
4 Impairment Losses on Financial Assets - - - - 0.0%
5 Interest Paid - - - - 0.0%
6 Contracted Services 5,340,765 5,727,594 3,420,881 2,742,875 19.8%
7 Depreciation and Provisions 227,816 613,176 1,162,620 176,676 84.8%
8 Inventory 325,817 56,661 345,669 304,301 12.0%
9 Operational Costs 186,424 1,485,175 1,626,253 1,320,917 18.8%
10 Total Operating Expenditure 35,648,563 34,949,417 57,693,749 57,693,748 0.0%
11 Operating (Surplus) / Deficit 30,472,473 25,363,268 48,107,600 48,111,732 0.0%
Operating Revenue and Expenditure: Planning Services
Serial
No. Decription
2017/18
Actual
Results
2018/19
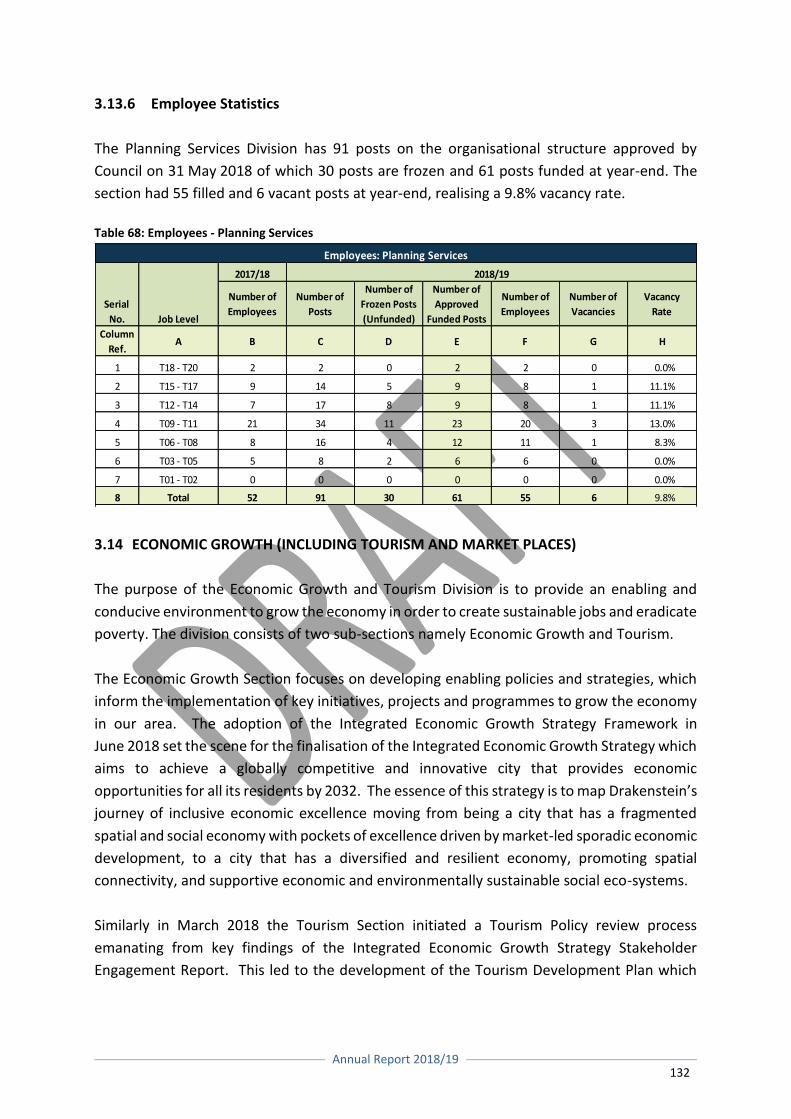
Annual Report 2018/19
132
3.13.6 Employee Statistics
The Planning Services Division has 91 posts on the organisational structure approved by
Council on 31 May 2018 of which 30 posts are frozen and 61 posts funded at year-end. The
section had 55 filled and 6 vacant posts at year-end, realising a 9.8% vacancy rate.
Table 68: Employees - Planning Services
3.14 ECONOMIC GROWTH (INCLUDING TOURISM AND MARKET PLACES)
The purpose of the Economic Growth and Tourism Division is to provide an enabling and
conducive environment to grow the economy in order to create sustainable jobs and eradicate
poverty. The division consists of two sub-sections namely Economic Growth and Tourism.
The Economic Growth Section focuses on developing enabling policies and strategies, which
inform the implementation of key initiatives, projects and programmes to grow the economy
in our area. The adoption of the Integrated Economic Growth Strategy Framework in
June 2018 set the scene for the finalisation of the Integrated Economic Growth Strategy which
aims to achieve a globally competitive and innovative city that provides economic
opportunities for all its residents by 2032. The essence of this strategy is to map Drakenstein’s
journey of inclusive economic excellence moving from being a city that has a fragmented
spatial and social economy with pockets of excellence driven by market-led sporadic economic
development, to a city that has a diversified and resilient economy, promoting spatial
connectivity, and supportive economic and environmentally sustainable social eco-systems.
Similarly in March 2018 the Tourism Section initiated a Tourism Policy review process
emanating from key findings of the Integrated Economic Growth Strategy Stakeholder
Engagement Report. This led to the development of the Tourism Development Plan which
2017/18
Number of
Employees
Number of
Posts
Number of
Frozen Posts
(Unfunded)
Number of
Approved
Funded Posts
Number of
Employees
Number of
Vacancies
Vacancy
Rate
Column
Ref.A B C D E F G H
1 T18 - T20 2 2 0 2 2 0 0.0%
2 T15 - T17 9 14 5 9 8 1 11.1%
3 T12 - T14 7 17 8 9 8 1 11.1%
4 T09 - T11 21 34 11 23 20 3 13.0%
5 T06 - T08 8 16 4 12 11 1 8.3%
6 T03 - T05 5 8 2 6 6 0 0.0%
7 T01 - T02 0 0 0 0 0 0 0.0%
8 Total 52 91 30 61 55 6 9.8%
2018/19
Employees: Planning Services
Serial
No. Job Level
Annual Report 2018/19
133
outlines the strategic pillars to ensure that Drakenstein is adequately prepared to become a
premier global destination of choice.
3.14.1 Economic Growth
The Integrated Economic Strategy outlines Drakenstein’s roadmap to inclusive and
sustainable economic growth. The core pillars that support this vision are:
Governance and institutions;
Infrastructure;
Partnerships; and
Shared identity and social cohesion.
The Division has adopted an integrated building block approach and has already commenced
with a number of policy interventions and institutional arrangements to ensure that the
municipality has the foundational enablers in place to give effect to the strategy.
3.14.1.1 Economic Growth Environment
During the 2018-2019 financial year we continued to build on developing the strategic
enablers to facilitate economic growth. This included:
Promoting Drakenstein as an investment friendly destination that focuses on the
development of priority sectors such as Agriculture, Informal Sector, Tourism,
Manufacturing, Transport and Logistics through the establishment of a Development
and Investment Forum to ease investment facilitation in Drakenstein.
Upgrading and expansion of suitable infrastructure to small and informal businesses to
grow Small Medium and Micro Enterprises (SMMEs) and broaden economic
participation in Drakenstein;
Strengthening existing strategic partnerships with the private sector and other spheres
of Government to implement key skills development initiatives so that the unemployed
can access meaningful employment;
Facilitate access to finance and other business support for small businesses through the
establishment of sustainable partnerships with other spheres of Government; and
Implementation of community based tourism products to broaden participation and
product diversification
Annual Report 2018/19
134
3.14.1.2 Economic Growth Achievements
Below are some of the highlights we achieved during the 2018/19 financial year:
The implementation of phase two of the three- year Contractor Development
Programme which focuses on upskilling 16 emerging contractors that are registered on
the municipal supplier database;
Development of an Investment Incentive Policy to encourage investors to shift an
investment decision towards a particular strategically identified region or priority sector
as defined in Drakenstein’s Vision 2032;
Upgrading of two business hives in Mbekweni and Gouda and the relocation of informal
trading structures in Klein Drakenstein Road, Paarl East to support micro- enterprises
and informal businesses;
Strengthening the partnership with Imperial Cargo Ltd, a Johannesburg Stock Exchange
(JSE) listed company, to train twenty matriculants to become long-distance heavy vehicle
drivers; and
Providing a capacity building programme that focused on business support training for
Informal traders to focus on enhancing the Informal Economy in Drakenstein.
The Integrated Economic Growth Strategy was completed in May 2019 and during the next
financial year the Division will focus on articulating how this bold strategy will be implemented.
The implementation of this Strategy will largely depend on the integration of cross- functions
within the municipality but also the extent to which the municipality will rely on private sector
and civil society organisations. The essence of this implementation plan will be partnerships
that work for the greater good of Drakenstein. The Division will focus on the implementation
of a number of priority projects that are categorised within the six strategic enablers as
identified in the Integrated Economic Growth Strategy namely:
Investor Facilitation;
Investment promotion;
Infrastructure;
Business and industrial parks;
Small business linkages; and
Skills development.
3.14.1.3 Economic Growth Challenges
Capacity challenges because of unfilled vacancies to perform critical tasks;
Limited access to economic data sources;
Lack of sufficient built infrastructure to facilitate access to trading spaces;

Annual Report 2018/19
135
Too much red tape which prevents the acceleration of sustainable economic growth in
the municipality;
Vandalism of economic infrastructure built to enable economic growth; and
External economic shocks because of the lack of a diversified economy.
A need for locational branding and marketing to increase investment exists;
Lack of affordable broadband and water security are important to ensure large scale
investment ;
Lack of relevant skills and high youth unemployment remain major risks; and
Lack of a one stop business support service centre to serve investors and SMMEs.
3.14.1.4 EPWP Job Creation
The Expanded Public Works Program is a program designed in order to provide temporary
work opportunities for the unemployed in order to make them more employable in the future.
The Municipality obtained a conditional grant from the National Department of Public Works
and toped it up with own funding to reach more beneficiaries. The EPWP grant allocation for
2018/19 of R4.43 million is 228% more than the 2014/15 allocation of R1 million, due to better
quality reporting and exceeding the targets set by Provincial Government. As a result, in
excess of 1,000 more job opportunities were created annually in the 2018/19 period,
compared to previous years.
The following table depicts the number of EPWP Projects and the number of jobs created
through EPWP projects over the last three financial years.
Table 69: Job creation through EPWP Projects
Job creation through Expanded Public Works Programme (EPWP) Projects
Details Number of EPWP Projects
Number of Jobs created
through EPWP Projects
2016/17 8 1,600
2017/18 19 1,309
2018/19 20 1,804
3.14.2 Tourism and Market places
Tourism remains one of Drakenstein’s priority sectors as it continues to be a sector with
significant low barriers which allow for entrepreneurship and particularly youth and women
employment opportunities. In recent years the municipality has increased its institutional
capacity and competencies to demonstrate the importance of this sector specifically in light
of the fact that it continues to be a significant contributor to the Gross Domestic Product of
Drakenstein.
Annual Report 2018/19
136
The establishment of the Drakenstein Local Tourism Association (DLTA) in 2013 marked the
institutionalisation of tourism destination marketing in Drakenstein. During the past five years
Drakenstein has increased the grant allocation year on year because of the notable successes
this solid partnership has generated. Despite the overall decline in tourism arrivals, the sector
remains buoyant and during the next five years Drakenstein will continue to focus on
diversifying the area’s tourism product offering and ensure that we provide a functional
world-class enabling environment so that tourists can experience tourism excellence
throughout the tourism value chain in Drakenstein.
3.14.2.1 Tourism Achievements
Below are some of the highlights we achieved during the 2018/19 financial year:
Provision of three marketing platforms to beneficiaries of the Integrated Arts and Crafts
Route in collaboration with Drakenstein Local Tourism Association;
Facilitated business support to the value of R300,000 for a crafter in Mbekweni as part
of phase 2 of the Integrated Arts and Craft Route.
Expansion of the Wine Service Training partnership with the National Department of
Tourism which included a 100% increase in beneficiary uptake from 30 to 60 students to
be trained as Sommeliers over a two-year period;
Supported twenty four events with a total value of R2,668,900. This included at least
seven incubation events; and
Launched the Former President Nelson Mandela Photo Exhibition with the People of
Drakenstein as a Madiba Legacy Project in Drakenstein.
3.14.2.2 Tourism Challenges
Lack of Transformation in the Tourism industry;
Limited access to relevant tourism economic data sources;
The negative impact of the existing tourism flows on the destination;
Lack of sufficient Tourism signage infrastructure to enhance the visitor experience;
Lack of Sports Tourism focus;
Lack of focused Events and Meetings, Incentives, Conferences and Exhibitions (MICE)
Strategy;
Lack of support to diversify the tourism product offering in Drakenstein;
Lack of Film Locations Policy; and
Lack of distinct brand differentiation to articulate Drakenstein’s unique tourism offering.
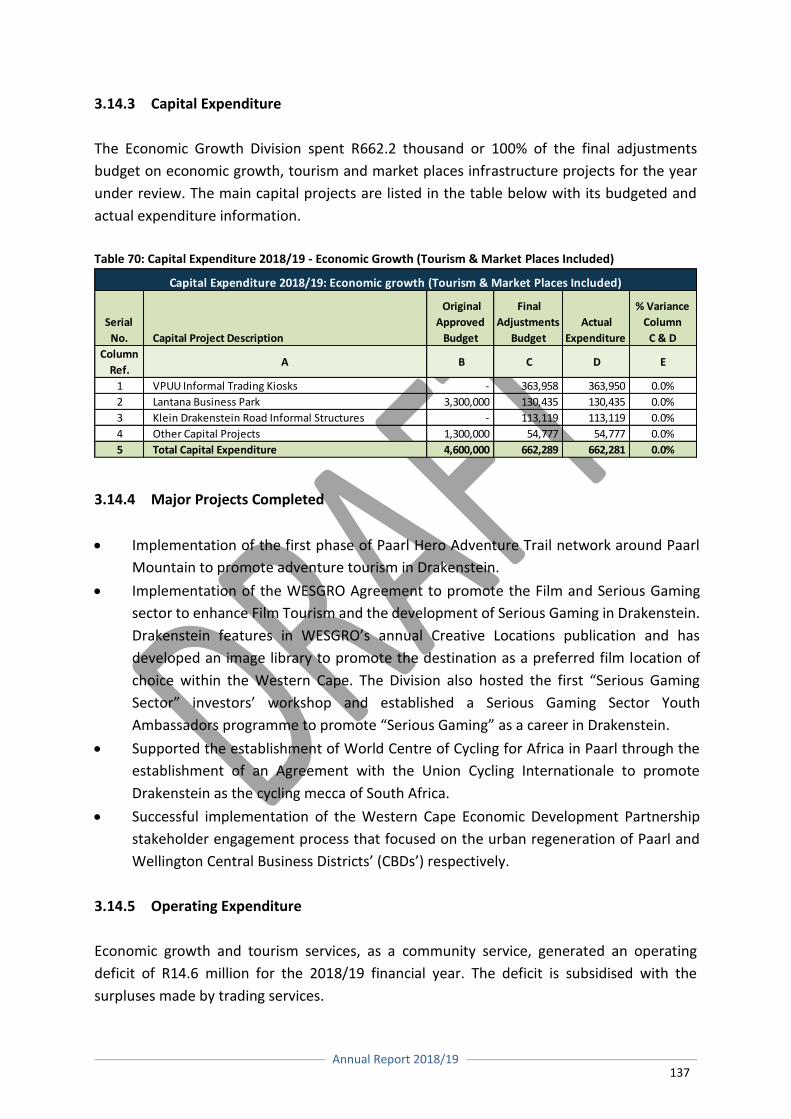
Annual Report 2018/19
137
3.14.3 Capital Expenditure
The Economic Growth Division spent R662.2 thousand or 100% of the final adjustments
budget on economic growth, tourism and market places infrastructure projects for the year
under review. The main capital projects are listed in the table below with its budgeted and
actual expenditure information.
Table 70: Capital Expenditure 2018/19 - Economic Growth (Tourism & Market Places Included)
3.14.4 Major Projects Completed
Implementation of the first phase of Paarl Hero Adventure Trail network around Paarl
Mountain to promote adventure tourism in Drakenstein.
Implementation of the WESGRO Agreement to promote the Film and Serious Gaming
sector to enhance Film Tourism and the development of Serious Gaming in Drakenstein.
Drakenstein features in WESGRO’s annual Creative Locations publication and has
developed an image library to promote the destination as a preferred film location of
choice within the Western Cape. The Division also hosted the first “Serious Gaming
Sector” investors’ workshop and established a Serious Gaming Sector Youth
Ambassadors programme to promote “Serious Gaming” as a career in Drakenstein.
Supported the establishment of World Centre of Cycling for Africa in Paarl through the
establishment of an Agreement with the Union Cycling Internationale to promote
Drakenstein as the cycling mecca of South Africa.
Successful implementation of the Western Cape Economic Development Partnership
stakeholder engagement process that focused on the urban regeneration of Paarl and
Wellington Central Business Districts’ (CBDs’) respectively.
3.14.5 Operating Expenditure
Economic growth and tourism services, as a community service, generated an operating
deficit of R14.6 million for the 2018/19 financial year. The deficit is subsidised with the
surpluses made by trading services.
Serial
No. Capital Project Description
Original
Approved
Budget
Final
Adjustments
Budget
Actual
Expenditure
% Variance
Column
C & D
Column
Ref.A B C D E
1 VPUU Informal Trading Kiosks - 363,958 363,950 0.0%
2 Lantana Business Park 3,300,000 130,435 130,435 0.0%
3 Klein Drakenstein Road Informal Structures - 113,119 113,119 0.0%
4 Other Capital Projects 1,300,000 54,777 54,777 0.0%
5 Total Capital Expenditure 4,600,000 662,289 662,281 0.0%
Capital Expenditure 2018/19: Economic growth (Tourism & Market Places Included)
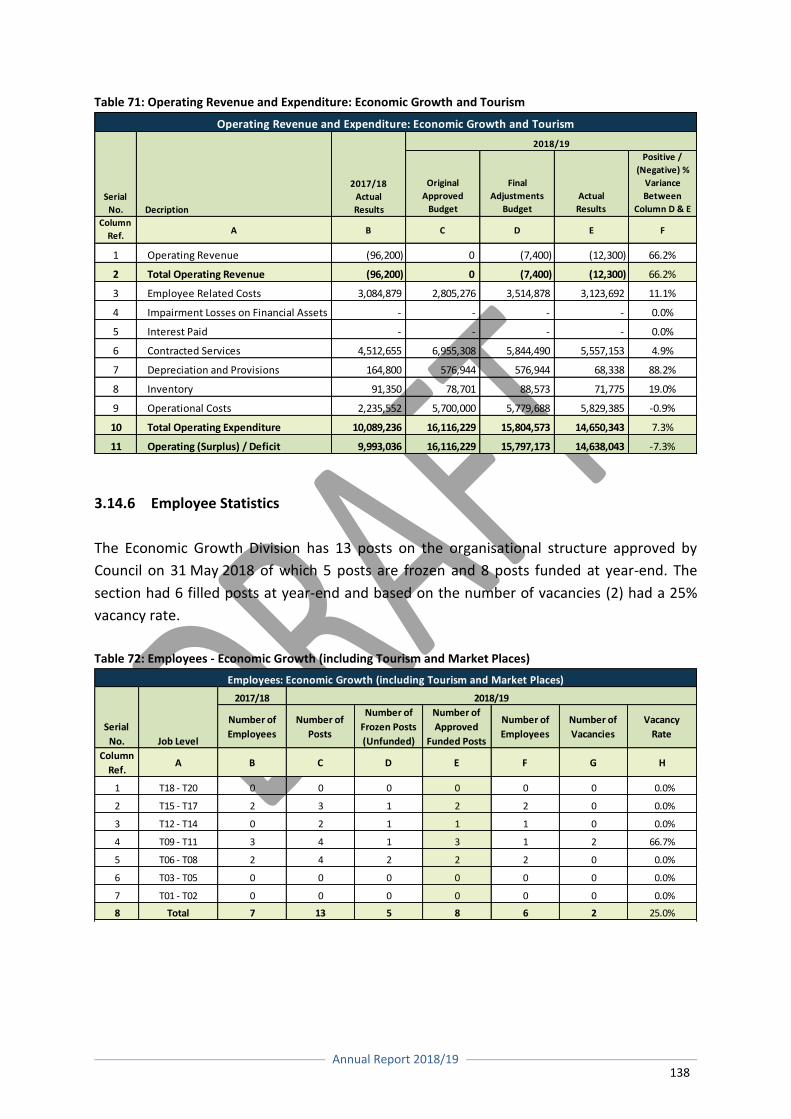
Annual Report 2018/19
138
Table 71: Operating Revenue and Expenditure: Economic Growth and Tourism
3.14.6 Employee Statistics
The Economic Growth Division has 13 posts on the organisational structure approved by
Council on 31 May 2018 of which 5 posts are frozen and 8 posts funded at year-end. The
section had 6 filled posts at year-end and based on the number of vacancies (2) had a 25%
vacancy rate.
Table 72: Employees - Economic Growth (including Tourism and Market Places)
2017/18
Number of
Employees
Number of
Posts
Number of
Frozen Posts
(Unfunded)
Number of
Approved
Funded Posts
Number of
Employees
Number of
Vacancies
Vacancy
Rate
Column
Ref.A B C D E F G H
1 T18 - T20 0 0 0 0 0 0 0.0%
2 T15 - T17 2 3 1 2 2 0 0.0%
3 T12 - T14 0 2 1 1 1 0 0.0%
4 T09 - T11 3 4 1 3 1 2 66.7%
5 T06 - T08 2 4 2 2 2 0 0.0%
6 T03 - T05 0 0 0 0 0 0 0.0%
7 T01 - T02 0 0 0 0 0 0 0.0%
8 Total 7 13 5 8 6 2 25.0%
2018/19
Employees: Economic Growth (including Tourism and Market Places)
Serial
No. Job Level
Original
Approved
Budget
Final
Adjustments
Budget
Actual
Results
Positive /
(Negative) %
Variance
Between
Column D & E
Column
Ref.A B C D E F
1 Operating Revenue (96,200) 0 (7,400) (12,300) 66.2%
2 Total Operating Revenue (96,200) 0 (7,400) (12,300) 66.2%
3 Employee Related Costs 3,084,879 2,805,276 3,514,878 3,123,692 11.1%
4 Impairment Losses on Financial Assets - - - - 0.0%
5 Interest Paid - - - - 0.0%
6 Contracted Services 4,512,655 6,955,308 5,844,490 5,557,153 4.9%
7 Depreciation and Provisions 164,800 576,944 576,944 68,338 88.2%
8 Inventory 91,350 78,701 88,573 71,775 19.0%
9 Operational Costs 2,235,552 5,700,000 5,779,688 5,829,385 -0.9%
10 Total Operating Expenditure 10,089,236 16,116,229 15,804,573 14,650,343 7.3%
11 Operating (Surplus) / Deficit 9,993,036 16,116,229 15,797,173 14,638,043 -7.3%
Operating Revenue and Expenditure: Economic Growth and Tourism
Serial
No. Decription
2017/18
Actual
Results
2018/19
Annual Report 2018/19
139
3.15 RURAL DEVELOPMENT
Drakenstein Municipality has 33 wards of which nine (27.3%) are considered as rural.
Agriculture is one of the key drivers of the Drakenstein and Cape Winelands economies. The
Municipality strives to alleviate poverty in rural areas in a programmatic manner through
human resource development and the implementation of sustainable socio-economic
development programmes. These interventions are only possible through collaboration with
all spheres of government and the rural community.
On 27 June 2018 Council approved the Rural Development Strategy for Drakenstein
Municipality, including a vision for Rural Development: “A sustainable rural economy through
partnership and innovation”. The core focus of the Rural Development Strategy is to facilitate
change in our citizens’ environments to enable the poor to earn more, invest in themselves
and their communities and to contribute towards the development of their communities. The
strategy proposes a ward-based approach to rural development in the rural wards, linked to
the IDP of the Municipality.
For the year under consideration the Rural Development Division brought about targeted
sustainable interventions in the rural communities of Drakenstein through:
Skills development, targeting the youth and women;
Facilitating access to financial assistance for rural learners to further their studies;
Establishing food security within the rural hinterland; and
Facilitating the work of the Department of Rural Development and Land Reform.
The division was actively involved during the 2018/19 financial year in the following projects:
3.15.1 Transformation (TRANCRAA) Process in Saron
The Department of Rural Development and Land Reform (DRDLR) are the delegated authority
facilitating the transfer of land, held in Trust by the Minister, to the communities of the
respective TRANCRAA areas. There is one such area in Drakenstein, namely Saron. A facilitator
appointed by DRDLR as from 3 August 2018 to 3 October 2018 concluded the land rights
enquiry in Saron. This report will be tabled to Council upon receipt, where after it will be
presented to the Minister of Rural Development and Land Reform.
3.15.2 Relocation of Vlakkeland Small Farmers
The municipality is required to ensure that Vlakkeland (Erven 8381 to 8397), Paarl is vacant
from farming activities to allow for the proposed housing project planning and development.
Annual Report 2018/19
140
Municipal owned land in Gouda-Erf 585, Erf 607 and Farm Halfgewaagd was identified as most
suitable for relocation of Vlakkeland Small Farmers.
An application for approval to proceed with implementation plan was submitted to
Department of Environmental Affairs and Development Planning (DEA&DP) on
14 September 2018. DEA&DP responded, insisting on basic assessment to be done on land
involved which is currently underway.
3.15.3 Greywater Household Food Garden Initiative
All people in SA have access to food in sufficient quantity and quality to meet their basic
nutritional needs and preserve their health on a daily basis with dignity. One of the key focus
areas of the Rural Development division was the establishment of vegetable gardens at rural
schools in Drakenstein. The production of vegetables at schools not only fed many hungry
learners, but also assisted them to link the activities in the garden with the curriculum.
Establishment of vegetable gardens at Groenberg and Simondium Primary Schools is in
progress and three more rural schools are targeted for 2019/20 financial year, namely
Kersboslaagte-, Alfons- and Ronwe Primary Schools.
3.15.4 New Orleans Park Portable Vegetable Gardens
In collaboration with the Department of Agriculture (DoA) the division allocated portable
vegetable gardens to 14 families who, after a Court-ordered eviction were housed by the
Municipality in New Orleans Park. Each garden comes with already planted vegetables and a
gardening tool kit to assist the group to maintain their gardens effectively. Regular visits are
undertaken by DoA to ensure the sustainability of project.
3.15.5 1 Household 1 Hectare (1HH1Ha) Project in Saron
The Department of Rural Development and Land Reform (DRDLR) identified the Saron
community as beneficiaries in this initiative based on the 1 household 1 hectare model. The
project was approved by National Department of Rural Development and Land Reform with
budget of R5.7 million for production inputs, tractor, truck, gardening tools, irrigation system
and fencing. The handover of implements by Deputy Minister Rural Development and Land
Reform took place on 6 April 2019.
3.15.6 Blueberry Project
Agribusiness in Sustainable Natural African Plant Products (ASNAPP) was approached by
Department of Agriculture to assist in giving more black farmers the opportunity to get access
to the production of blueberries. Unfortunately the project had to be discontinued, as the
Annual Report 2018/19
141
application for funding was declined by Jobs Fund.
3.15.7 Allocation of Jojo tanks to rural schools
The harvesting of rainwater is one of the cheapest ways to acquire water, but the purchasing
of water tanks is a problem for these schools as most of them are so-called “no-school fee”
institutions. The department facilitated the acquisition of 9 Jojo tanks which were donated by
Jojo SA. These were handed over to the Principals of selected schools by the Executive Mayor
on 22 November 2018.
3.15.8 Bursaries to rural matriculants
Rural learners previously competed with urban learners for financial support for tertiary
education. For the year under review bursary funds were ring-fenced for rural learners and on
19 March 2019 the bursaries were awarded to 9 successful applicants by the Executive Mayor
to continue their tertiary education at different institutions.
3.15.9 Driver’s licence programme for rural unemployed youth
The provision of driver’s licences have become a focus point in an effort to alleviate the
unemployment rate and to address the urgent skills development needs of the rural
communities. Driver’s licences could be used to assist the local community to pursue their
own job creation initiatives and in so doing contribute towards the Economic growth of the
community. The division assisted 43 rural unemployed youth to acquire their learner’s
licences. A mining company, Afrimat Aggregates, declared their willingness to donate
R160,000 to the municipality to assist the 43 rural unemployed to acquire their code 10
driver’s licences.
3.15.10 Driver’s licence programme for rural matriculants
The municipality has identified the roll out of a driver’s licence programme at secondary
schools in Drakenstein targeting the rural matriculants as a priority for the 2018/19 financial
year. Name lists of rural matriculants were received from various schools in Drakenstein. A
total of 29 rural matriculants successfully completed their learner’s licence tests.
3.15.11 Development of a Rural Housing Policy
The Drakenstein Housing Policy previously contained rural housing as well, but after thorough
consideration it was decided to unbundle said policy and present Rural Housing as a stand-
alone policy document. Adjustments to policies are critical to improve the effectiveness
Annual Report 2018/19
142
thereof and to ensure that the purpose and goal of the policy is still being met. The draft policy
underwent public participation and will now serve before Council for final approval.
Annual Report 2018/19
143
COMPONENT E: COMMUNITY AND SOCIAL SERVICES
3.16 INTRODUCTION
This part of the report deals with library services, cemeteries and crematoria, community
halls, facilities, and Thusong centres, services to childcare, aged care and social programmes
rendered during the year under review.
3.17 LIBRARY SERVICES
Libraries in Drakenstein Municipality no longer loan books exclusively, it provides a wide range
of services to our communities. Amongst others, it offers space for community programmes,
on-line access, etc. We are striving to introduce our communities to the World Wide Web.
Patrons are encouraged to open email accounts.
The Library and Information Services Section has 18 service points throughout Drakenstein.
Some of these sites are equipped with computers and Wi-Fi hotspots through the broadband
initiative, providing the communities free Internet access in the library and on their own
devices. This expansion brought enhancement to those communities without access to the
World Wide Web. Librarians and staff work equally hard to make a difference in the lives of
people in the Drakenstein communities.
Libraries do perform various functions such as:
Issuing a free library card to anyone who lives within the ambit of Drakenstein
Municipality, people outside our borders need to pay a subscription fee;
A library card makes it so easy to check out books, download digital resources, and use
online resources to help with entertainment and study;
A library card gives patrons hours of computer access at any library location and also
access to books from other libraries across and outside the Municipality through
interlibrary loans for patron’s convenience;
Each library has free programmes for all ages such as computer classes, arts,
mathematics and other cultural activities;
Some libraries have open tables and rooms for study as well as larger rooms for public
and cultural use and community meetings;
The library is the space for collaboration and meet-up maker sessions to help patrons
learn all about relevant awareness and educational topics;
Libraries also have free community services at some locations, during regular open
hours, but often also available during evenings and weekends;
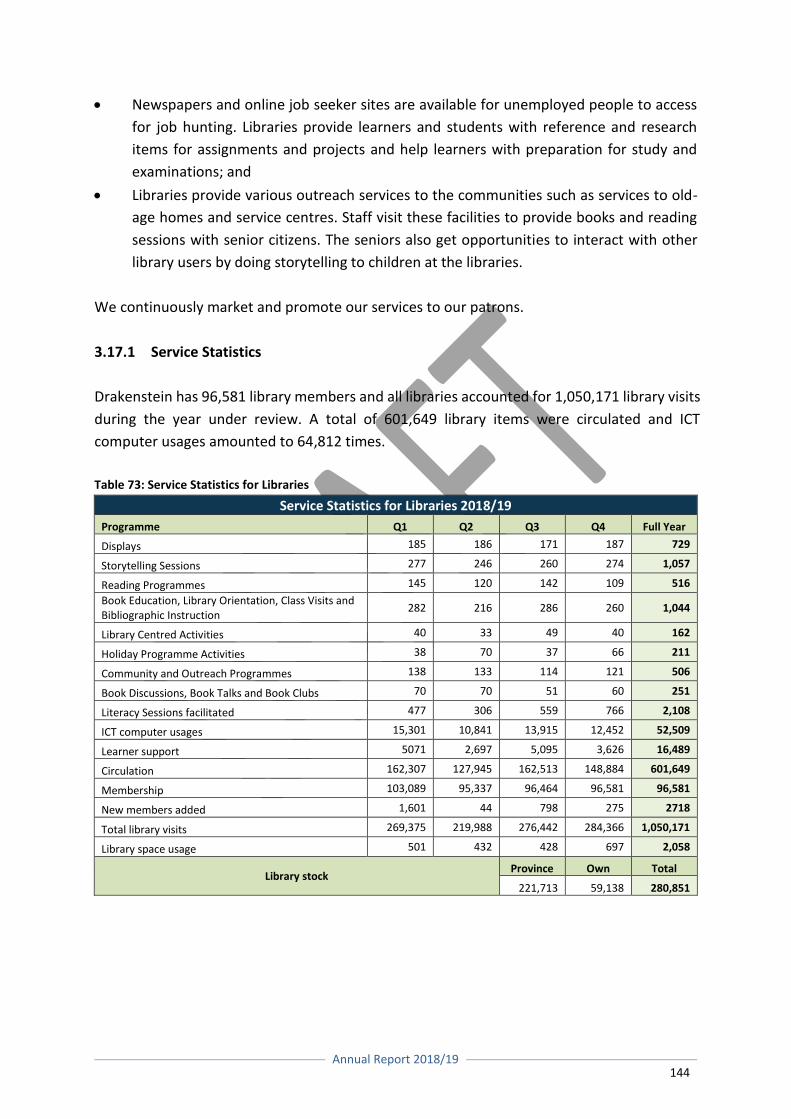
Annual Report 2018/19
144
Newspapers and online job seeker sites are available for unemployed people to access
for job hunting. Libraries provide learners and students with reference and research
items for assignments and projects and help learners with preparation for study and
examinations; and
Libraries provide various outreach services to the communities such as services to old-
age homes and service centres. Staff visit these facilities to provide books and reading
sessions with senior citizens. The seniors also get opportunities to interact with other
library users by doing storytelling to children at the libraries.
We continuously market and promote our services to our patrons.
3.17.1 Service Statistics
Drakenstein has 96,581 library members and all libraries accounted for 1,050,171 library visits
during the year under review. A total of 601,649 library items were circulated and ICT
computer usages amounted to 64,812 times.
Table 73: Service Statistics for Libraries
Service Statistics for Libraries 2018/19
Programme Q1 Q2 Q3 Q4 Full Year
Displays 185 186 171 187 729
Storytelling Sessions 277 246 260 274 1,057
Reading Programmes 145 120 142 109 516
Book Education, Library Orientation, Class Visits and Bibliographic Instruction
282 216 286 260 1,044
Library Centred Activities 40 33 49 40 162
Holiday Programme Activities 38 70 37 66 211
Community and Outreach Programmes 138 133 114 121 506
Book Discussions, Book Talks and Book Clubs 70 70 51 60 251
Literacy Sessions facilitated 477 306 559 766 2,108
ICT computer usages 15,301 10,841 13,915 12,452 52,509
Learner support 5071 2,697 5,095 3,626 16,489
Circulation 162,307 127,945 162,513 148,884 601,649
Membership 103,089 95,337 96,464 96,581 96,581
New members added 1,601 44 798 275 2718
Total library visits 269,375 219,988 276,442 284,366 1,050,171
Library space usage 501 432 428 697 2,058
Library stock Province Own Total
221,713 59,138 280,851
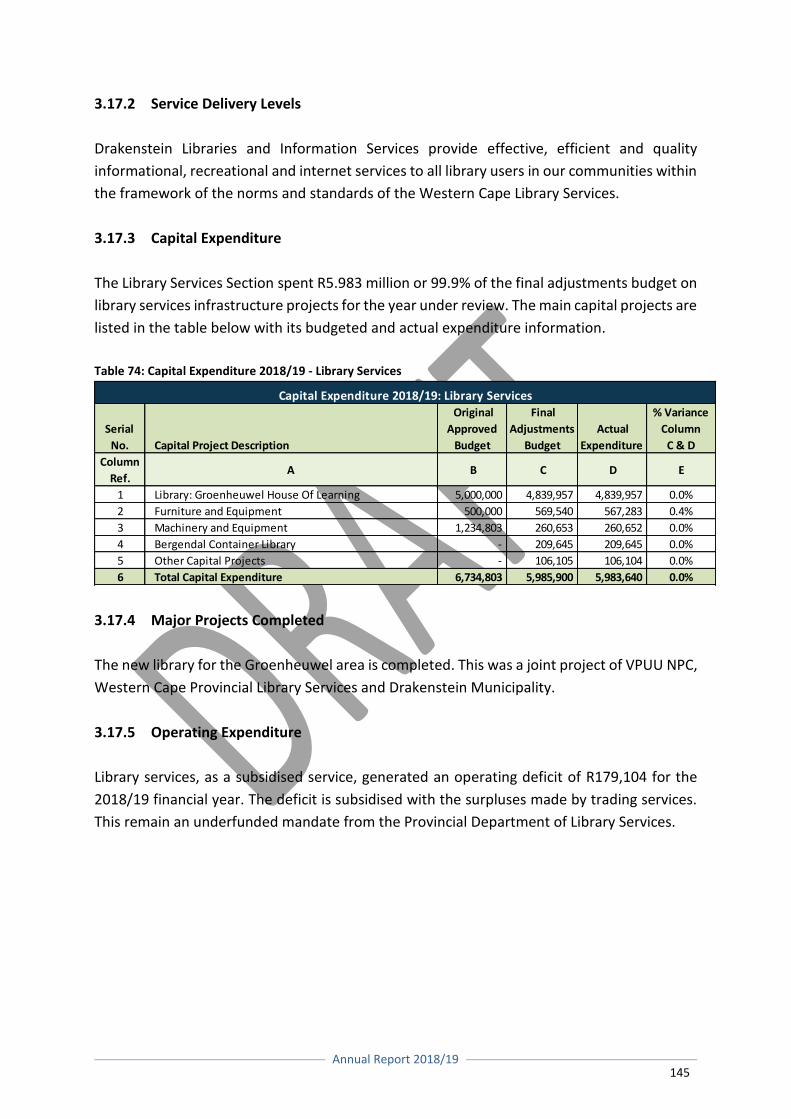
Annual Report 2018/19
145
3.17.2 Service Delivery Levels
Drakenstein Libraries and Information Services provide effective, efficient and quality
informational, recreational and internet services to all library users in our communities within
the framework of the norms and standards of the Western Cape Library Services.
3.17.3 Capital Expenditure
The Library Services Section spent R5.983 million or 99.9% of the final adjustments budget on
library services infrastructure projects for the year under review. The main capital projects are
listed in the table below with its budgeted and actual expenditure information.
Table 74: Capital Expenditure 2018/19 - Library Services
3.17.4 Major Projects Completed
The new library for the Groenheuwel area is completed. This was a joint project of VPUU NPC,
Western Cape Provincial Library Services and Drakenstein Municipality.
3.17.5 Operating Expenditure
Library services, as a subsidised service, generated an operating deficit of R179,104 for the
2018/19 financial year. The deficit is subsidised with the surpluses made by trading services.
This remain an underfunded mandate from the Provincial Department of Library Services.
Serial
No. Capital Project Description
Original
Approved
Budget
Final
Adjustments
Budget
Actual
Expenditure
% Variance
Column
C & D
Column
Ref.A B C D E
1 Library: Groenheuwel House Of Learning 5,000,000 4,839,957 4,839,957 0.0%
2 Furniture and Equipment 500,000 569,540 567,283 0.4%
3 Machinery and Equipment 1,234,803 260,653 260,652 0.0%
4 Bergendal Container Library - 209,645 209,645 0.0%
5 Other Capital Projects - 106,105 106,104 0.0%
6 Total Capital Expenditure 6,734,803 5,985,900 5,983,640 0.0%
Capital Expenditure 2018/19: Library Services
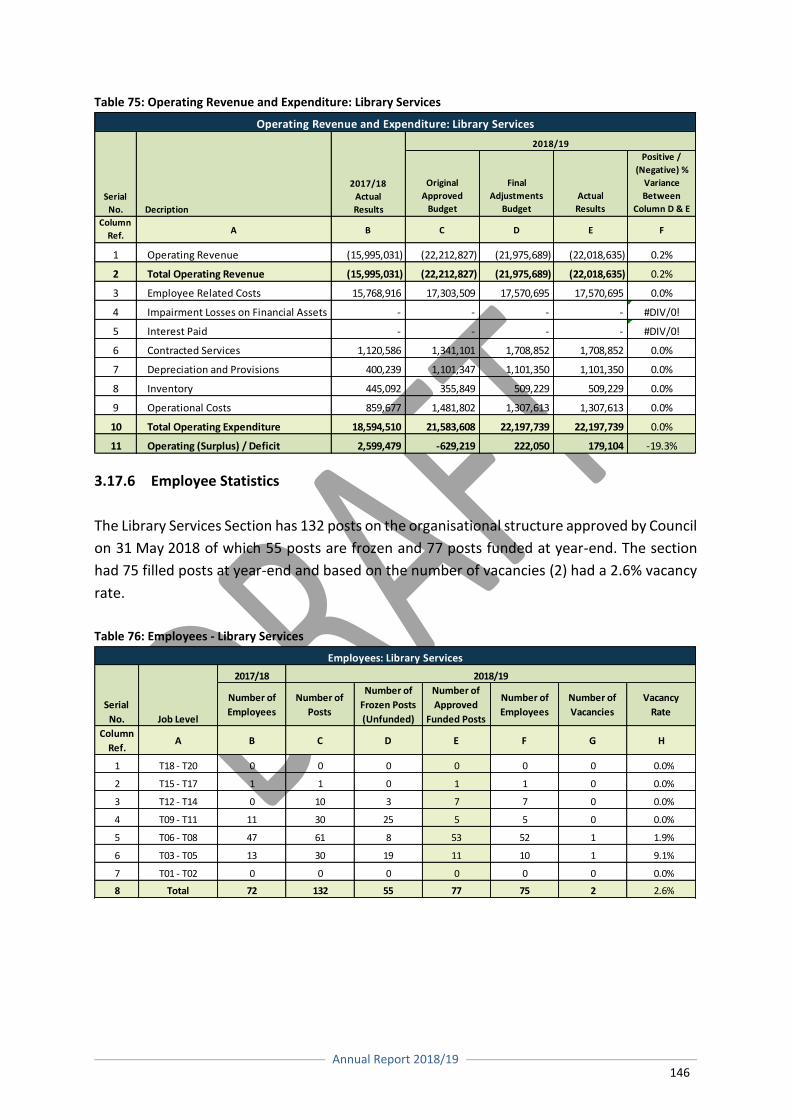
Annual Report 2018/19
146
Table 75: Operating Revenue and Expenditure: Library Services
3.17.6 Employee Statistics
The Library Services Section has 132 posts on the organisational structure approved by Council
on 31 May 2018 of which 55 posts are frozen and 77 posts funded at year-end. The section
had 75 filled posts at year-end and based on the number of vacancies (2) had a 2.6% vacancy
rate.
Table 76: Employees - Library Services
2017/18
Number of
Employees
Number of
Posts
Number of
Frozen Posts
(Unfunded)
Number of
Approved
Funded Posts
Number of
Employees
Number of
Vacancies
Vacancy
Rate
Column
Ref.A B C D E F G H
1 T18 - T20 0 0 0 0 0 0 0.0%
2 T15 - T17 1 1 0 1 1 0 0.0%
3 T12 - T14 0 10 3 7 7 0 0.0%
4 T09 - T11 11 30 25 5 5 0 0.0%
5 T06 - T08 47 61 8 53 52 1 1.9%
6 T03 - T05 13 30 19 11 10 1 9.1%
7 T01 - T02 0 0 0 0 0 0 0.0%
8 Total 72 132 55 77 75 2 2.6%
2018/19
Employees: Library Services
Serial
No. Job Level
Original
Approved
Budget
Final
Adjustments
Budget
Actual
Results
Positive /
(Negative) %
Variance
Between
Column D & E
Column
Ref.A B C D E F
1 Operating Revenue (15,995,031) (22,212,827) (21,975,689) (22,018,635) 0.2%
2 Total Operating Revenue (15,995,031) (22,212,827) (21,975,689) (22,018,635) 0.2%
3 Employee Related Costs 15,768,916 17,303,509 17,570,695 17,570,695 0.0%
4 Impairment Losses on Financial Assets - - - - #DIV/0!
5 Interest Paid - - - - #DIV/0!
6 Contracted Services 1,120,586 1,341,101 1,708,852 1,708,852 0.0%
7 Depreciation and Provisions 400,239 1,101,347 1,101,350 1,101,350 0.0%
8 Inventory 445,092 355,849 509,229 509,229 0.0%
9 Operational Costs 859,677 1,481,802 1,307,613 1,307,613 0.0%
10 Total Operating Expenditure 18,594,510 21,583,608 22,197,739 22,197,739 0.0%
11 Operating (Surplus) / Deficit 2,599,479 -629,219 222,050 179,104 -19.3%
Operating Revenue and Expenditure: Library Services
Serial
No. Decription
2017/18
Actual
Results
2018/19
Annual Report 2018/19
147
3.18 CEMETERIES AND CREMATORIA
Drakenstein Municipality has 14 cemeteries. With the high number of dormant cemeteries a
heavy burden is placed on Parys Cemetery especially from the overflow from Wellington and
Simondium. The Cemeteries Section created additional burial space by narrowing cemetery
roads. Parys Cemetery, Gouda (55km from Paarl), Saron (73km from Paarl) and Hermon (43km
from Paarl) have reasonable space available. EIA studies are being done at Parys Cemetery to
acquire more space. Property management identified two (2) farms for possible acquisition
for Cemetery purposes.
We are currently in the process of finding alternative land for burial space. Several pockets of
land has been identified which includes municipal land, provincial land and land that belongs
to private owners.
The department is also in the process to review the Burial Policy to allow grace recycling. This
will allow families to re-use family grave sites for love-ones.
This innovative move will instantly generate all burial sites as heritage space.
3.18.1 Service Statistics
During the year under review 1,351 burials took place at an average of 114 burials per month.
In Parys Cemetery alone there were 859 burials. Drakenstein Municipality does not have a
municipal crematorium. After an investigation it was decided that the proposed crypts system
project as an alternative burial method was not viable in terms of grave yield.
3.18.2 Service Delivery Levels
The aim is to maintain cemeteries every 6 to 8 weeks. This includes horticultural maintenance
and minor grave maintenance.
3.18.3 Capital Expenditure
The Cemeteries Section spent R1.6 million or 100% of the final adjustments budget on
cemetery services infrastructure projects for the year under review.
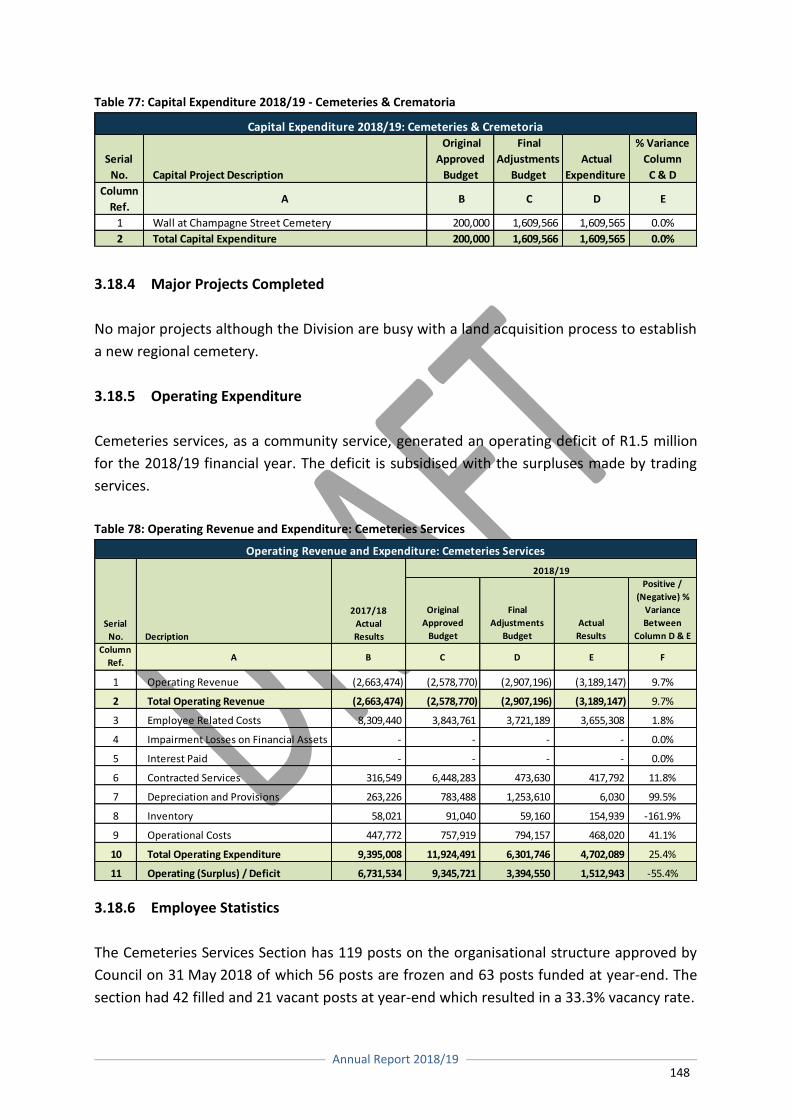
Annual Report 2018/19
148
Table 77: Capital Expenditure 2018/19 - Cemeteries & Crematoria
3.18.4 Major Projects Completed
No major projects although the Division are busy with a land acquisition process to establish
a new regional cemetery.
3.18.5 Operating Expenditure
Cemeteries services, as a community service, generated an operating deficit of R1.5 million
for the 2018/19 financial year. The deficit is subsidised with the surpluses made by trading
services.
Table 78: Operating Revenue and Expenditure: Cemeteries Services
3.18.6 Employee Statistics
The Cemeteries Services Section has 119 posts on the organisational structure approved by
Council on 31 May 2018 of which 56 posts are frozen and 63 posts funded at year-end. The
section had 42 filled and 21 vacant posts at year-end which resulted in a 33.3% vacancy rate.
Serial
No. Capital Project Description
Original
Approved
Budget
Final
Adjustments
Budget
Actual
Expenditure
% Variance
Column
C & D
Column
Ref.A B C D E
1 Wall at Champagne Street Cemetery 200,000 1,609,566 1,609,565 0.0%
2 Total Capital Expenditure 200,000 1,609,566 1,609,565 0.0%
Capital Expenditure 2018/19: Cemeteries & Cremetoria
Original
Approved
Budget
Final
Adjustments
Budget
Actual
Results
Positive /
(Negative) %
Variance
Between
Column D & E
Column
Ref.A B C D E F
1 Operating Revenue (2,663,474) (2,578,770) (2,907,196) (3,189,147) 9.7%
2 Total Operating Revenue (2,663,474) (2,578,770) (2,907,196) (3,189,147) 9.7%
3 Employee Related Costs 8,309,440 3,843,761 3,721,189 3,655,308 1.8%
4 Impairment Losses on Financial Assets - - - - 0.0%
5 Interest Paid - - - - 0.0%
6 Contracted Services 316,549 6,448,283 473,630 417,792 11.8%
7 Depreciation and Provisions 263,226 783,488 1,253,610 6,030 99.5%
8 Inventory 58,021 91,040 59,160 154,939 -161.9%
9 Operational Costs 447,772 757,919 794,157 468,020 41.1%
10 Total Operating Expenditure 9,395,008 11,924,491 6,301,746 4,702,089 25.4%
11 Operating (Surplus) / Deficit 6,731,534 9,345,721 3,394,550 1,512,943 -55.4%
Operating Revenue and Expenditure: Cemeteries Services
Serial
No. Decription
2017/18
Actual
Results
2018/19
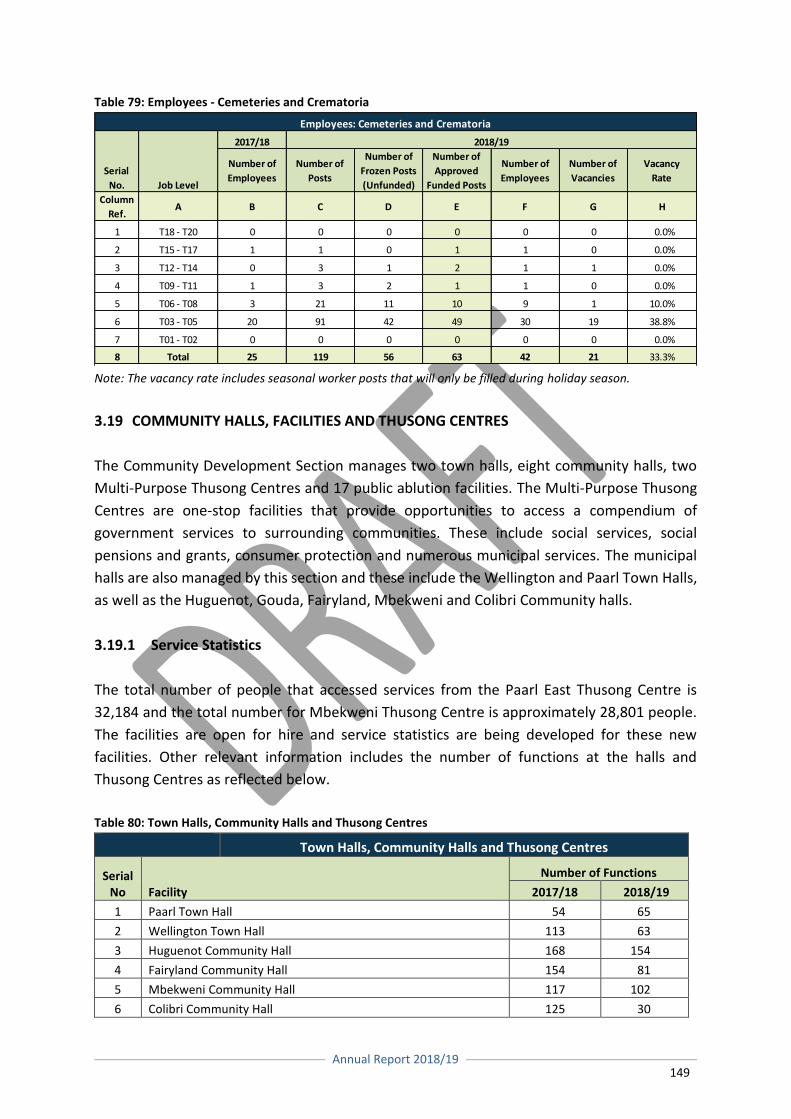
Annual Report 2018/19
149
Table 79: Employees - Cemeteries and Crematoria
Note: The vacancy rate includes seasonal worker posts that will only be filled during holiday season.
3.19 COMMUNITY HALLS, FACILITIES AND THUSONG CENTRES
The Community Development Section manages two town halls, eight community halls, two
Multi-Purpose Thusong Centres and 17 public ablution facilities. The Multi-Purpose Thusong
Centres are one-stop facilities that provide opportunities to access a compendium of
government services to surrounding communities. These include social services, social
pensions and grants, consumer protection and numerous municipal services. The municipal
halls are also managed by this section and these include the Wellington and Paarl Town Halls,
as well as the Huguenot, Gouda, Fairyland, Mbekweni and Colibri Community halls.
3.19.1 Service Statistics
The total number of people that accessed services from the Paarl East Thusong Centre is
32,184 and the total number for Mbekweni Thusong Centre is approximately 28,801 people.
The facilities are open for hire and service statistics are being developed for these new
facilities. Other relevant information includes the number of functions at the halls and
Thusong Centres as reflected below.
Table 80: Town Halls, Community Halls and Thusong Centres
Town Halls, Community Halls and Thusong Centres
Serial No Facility
Number of Functions
2017/18 2018/19
1 Paarl Town Hall 54 65
2 Wellington Town Hall 113 63
3 Huguenot Community Hall 168 154
4 Fairyland Community Hall 154 81
5 Mbekweni Community Hall 117 102
6 Colibri Community Hall 125 30
2017/18
Number of
Employees
Number of
Posts
Number of
Frozen Posts
(Unfunded)
Number of
Approved
Funded Posts
Number of
Employees
Number of
Vacancies
Vacancy
Rate
Column
Ref.A B C D E F G H
1 T18 - T20 0 0 0 0 0 0 0.0%
2 T15 - T17 1 1 0 1 1 0 0.0%
3 T12 - T14 0 3 1 2 1 1 0.0%
4 T09 - T11 1 3 2 1 1 0 0.0%
5 T06 - T08 3 21 11 10 9 1 10.0%
6 T03 - T05 20 91 42 49 30 19 38.8%
7 T01 - T02 0 0 0 0 0 0 0.0%
8 Total 25 119 56 63 42 21 33.3%
2018/19
Employees: Cemeteries and Crematoria
Serial
No. Job Level
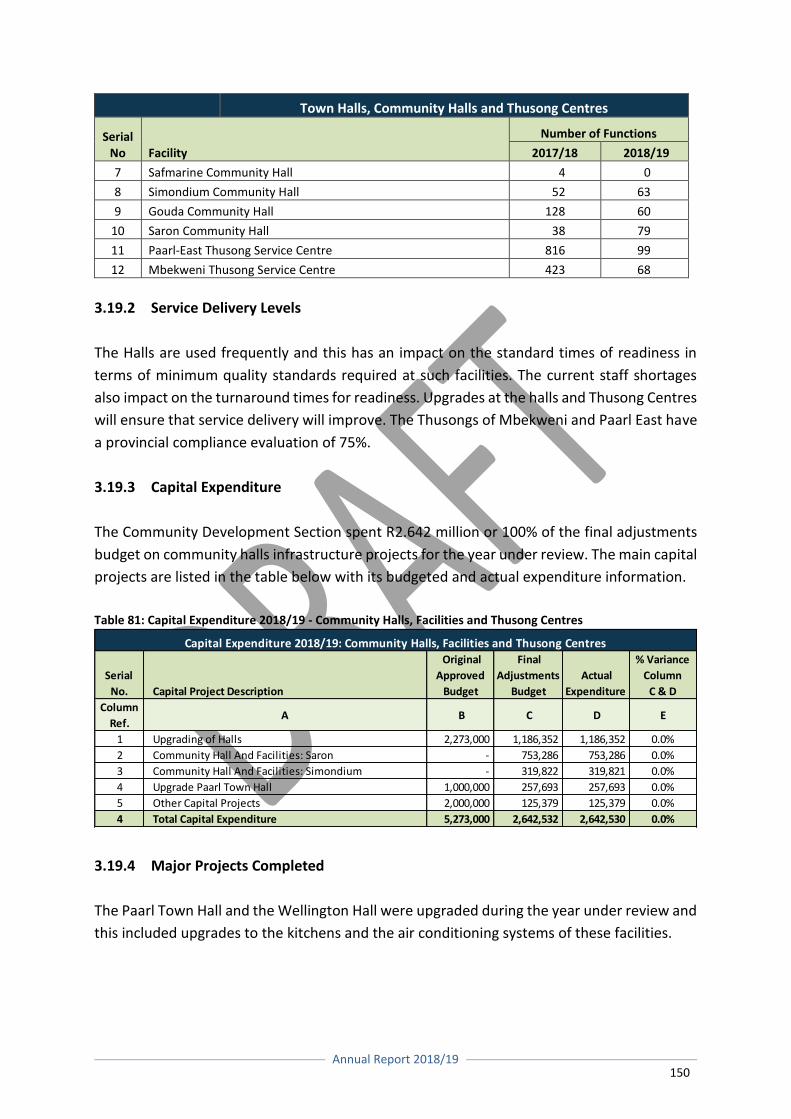
Annual Report 2018/19
150
Town Halls, Community Halls and Thusong Centres
Serial No Facility
Number of Functions
2017/18 2018/19
7 Safmarine Community Hall 4 0
8 Simondium Community Hall 52 63
9 Gouda Community Hall 128 60
10 Saron Community Hall 38 79
11 Paarl-East Thusong Service Centre 816 99
12 Mbekweni Thusong Service Centre 423 68
3.19.2 Service Delivery Levels
The Halls are used frequently and this has an impact on the standard times of readiness in
terms of minimum quality standards required at such facilities. The current staff shortages
also impact on the turnaround times for readiness. Upgrades at the halls and Thusong Centres
will ensure that service delivery will improve. The Thusongs of Mbekweni and Paarl East have
a provincial compliance evaluation of 75%.
3.19.3 Capital Expenditure
The Community Development Section spent R2.642 million or 100% of the final adjustments
budget on community halls infrastructure projects for the year under review. The main capital
projects are listed in the table below with its budgeted and actual expenditure information.
Table 81: Capital Expenditure 2018/19 - Community Halls, Facilities and Thusong Centres
3.19.4 Major Projects Completed
The Paarl Town Hall and the Wellington Hall were upgraded during the year under review and
this included upgrades to the kitchens and the air conditioning systems of these facilities.
Serial
No. Capital Project Description
Original
Approved
Budget
Final
Adjustments
Budget
Actual
Expenditure
% Variance
Column
C & D
Column
Ref.A B C D E
1 Upgrading of Halls 2,273,000 1,186,352 1,186,352 0.0%
2 Community Hall And Facilities: Saron - 753,286 753,286 0.0%
3 Community Hall And Facilities: Simondium - 319,822 319,821 0.0%
4 Upgrade Paarl Town Hall 1,000,000 257,693 257,693 0.0%
5 Other Capital Projects 2,000,000 125,379 125,379 0.0%
4 Total Capital Expenditure 5,273,000 2,642,532 2,642,530 0.0%
Capital Expenditure 2018/19: Community Halls, Facilities and Thusong Centres
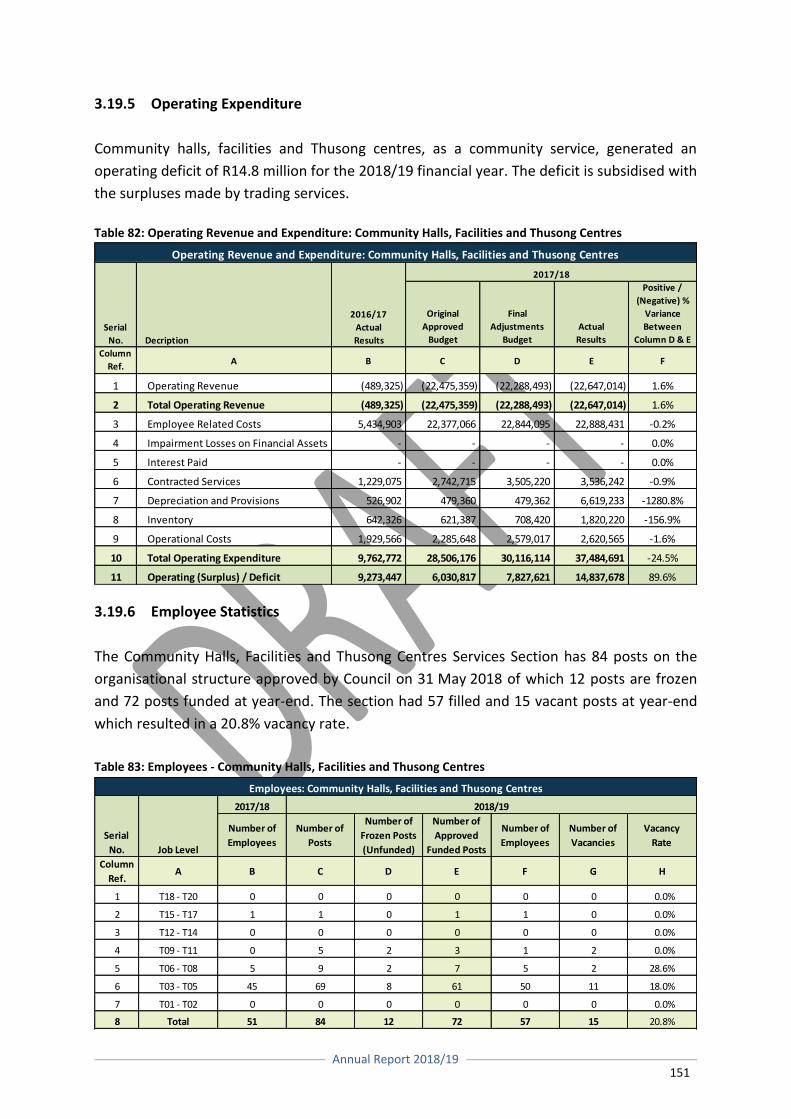
Annual Report 2018/19
151
3.19.5 Operating Expenditure
Community halls, facilities and Thusong centres, as a community service, generated an
operating deficit of R14.8 million for the 2018/19 financial year. The deficit is subsidised with
the surpluses made by trading services.
Table 82: Operating Revenue and Expenditure: Community Halls, Facilities and Thusong Centres
3.19.6 Employee Statistics
The Community Halls, Facilities and Thusong Centres Services Section has 84 posts on the
organisational structure approved by Council on 31 May 2018 of which 12 posts are frozen
and 72 posts funded at year-end. The section had 57 filled and 15 vacant posts at year-end
which resulted in a 20.8% vacancy rate.
Table 83: Employees - Community Halls, Facilities and Thusong Centres
2017/18
Number of
Employees
Number of
Posts
Number of
Frozen Posts
(Unfunded)
Number of
Approved
Funded Posts
Number of
Employees
Number of
Vacancies
Vacancy
Rate
Column
Ref.A B C D E F G H
1 T18 - T20 0 0 0 0 0 0 0.0%
2 T15 - T17 1 1 0 1 1 0 0.0%
3 T12 - T14 0 0 0 0 0 0 0.0%
4 T09 - T11 0 5 2 3 1 2 0.0%
5 T06 - T08 5 9 2 7 5 2 28.6%
6 T03 - T05 45 69 8 61 50 11 18.0%
7 T01 - T02 0 0 0 0 0 0 0.0%
8 Total 51 84 12 72 57 15 20.8%
Employees: Community Halls, Facilities and Thusong Centres
Serial
No. Job Level
2018/19
Original
Approved
Budget
Final
Adjustments
Budget
Actual
Results
Positive /
(Negative) %
Variance
Between
Column D & E
Column
Ref.A B C D E F
1 Operating Revenue (489,325) (22,475,359) (22,288,493) (22,647,014) 1.6%
2 Total Operating Revenue (489,325) (22,475,359) (22,288,493) (22,647,014) 1.6%
3 Employee Related Costs 5,434,903 22,377,066 22,844,095 22,888,431 -0.2%
4 Impairment Losses on Financial Assets - - - - 0.0%
5 Interest Paid - - - - 0.0%
6 Contracted Services 1,229,075 2,742,715 3,505,220 3,536,242 -0.9%
7 Depreciation and Provisions 526,902 479,360 479,362 6,619,233 -1280.8%
8 Inventory 642,326 621,387 708,420 1,820,220 -156.9%
9 Operational Costs 1,929,566 2,285,648 2,579,017 2,620,565 -1.6%
10 Total Operating Expenditure 9,762,772 28,506,176 30,116,114 37,484,691 -24.5%
11 Operating (Surplus) / Deficit 9,273,447 6,030,817 7,827,621 14,837,678 89.6%
Operating Revenue and Expenditure: Community Halls, Facilities and Thusong Centres
Serial
No. Decription
2016/17
Actual
Results
2017/18
Annual Report 2018/19
152
3.20 CHILD CARE, AGED CARE AND SOCIAL PROGRAMMES
The Community Development Section is responsible for poverty relief initiatives, support to
vulnerable groups, including youth, gender, the elderly, the disabled, street people, alcohol
harms reduction programme and the Early Childhood Development (ECD) Sector. It also
manages the distribution of the Grant in Aid Funds and assists the IDP office with the
operations of Mayoral Ward Projects in the 33 wards.
The strategic, programmatic focus of the section is to develop and establish social support
networks and to develop and promote community livelihood strategies. The principles guiding
the implementation of programmes and projects are based on labour-intensive job creation
initiatives that sustain and support impoverished households.
The Early Childhood Development (ECD) Sector is serviced by the Community Development
Section. The top service delivery priorities for the sector were:
To facilitate the registration of ECD’s with the National Department of Social Services,
with all stakeholders in the sector, located within the Drakenstein Municipal Area. This
process included mobilising all stakeholders both local and provincial to participate in
workshops aimed in recognising the challenges and unblocking red tape and
bureaucratic bottlenecks;
To facilitate training for ECD practitioners on the needs that were identified by the ECD
Forum as priority training needs. Training focused on training for ECD practitioners.
Other training also focused on health and sanitation training for ECD practitioners within
the context of the drought;
To renovate and upgrade the ECD facilities. Permission was granted to construct an ECD
facility in the Fairyland/Groenheuwel area and the construction of this facility has
started;
The ECD skills course on Health and Hygiene in the context of the current drought
situation was attended by 56 participants. The second skills workshop on the 1st
thousand days of development held with the ECD sector was attended by 36 people;
The Gender Commission also facilitated workshops with the Gender Forum on Gender
Awareness and the role of women in society; and
Support to the Elderly Forum consisted of quarterly meetings with the sector and
logistical and financial support with the programmes and projects in which the Elderly
Forum participated. This included the Provincial Elderly Games held at the Dal Josaphat
Stadium, World Day of Prevention of Elderly Abuse recognition of the contribution of
the Elderly held in the Dal Josaphat Stadium.
The section also facilitated various skills development workshops for the unemployed youth,
which included, Weed-Eating and Brush Cutting Training, First Aid Training, Waiter Training,
Annual Report 2018/19
153
and Computer Training. The aim of the skills training was to empower unskilled and
unemployed youth with skills so that they could immediately access job opportunities. Two
skills development workshops were facilitated for the Drakenstein ECD Sector in the rural
areas, including participants from Simondium and Wellington farm areas.
3.20.1 Service Statistics
Some service statistics are:
The Community Development Section held two meetings per quarter with the ECD
Forums of Mbekweni, Paarl and Wellington;
The ECD skills course on Health and Hygiene in the context of the current drought
situation was attended by 56 participants;
The second skills workshop on the 1st Thousand days of Development held with the ECD
Sector was attended by 36 people;
The Community Development Section held quarterly meetings with the Gender Forum
and facilitated two workshops which was attended by 19 and 22 participants per
workshop respectively;
The Gender Month Programme was also managed by the Community Development
Section and similarly the 16 Days of Activism Against Women and Child Abuse
Programme is managed; and
The Community Development Section held quarterly meetings with the Elderly Forum
with support of transport for the Elderly Forum in the Drakenstein municipal area to
attend the Golden Games.
3.20.2 Service Delivery Levels
The Community Development Section plans and executes two meeting per quarter with the
ECD Forums of Wellington, Paarl and Mbekweni. The meetings addresses the service needs of
the different ECD Forums. The section also plans to facilitate two skills development
workshops with the sector.
The section also holds quarterly meetings with the Gender Forum and facilitates two
empowerment workshops. One workshop focuses on human rights and the other focuses on
gender empowerment.
The section holds quarterly meetings with the Elderly Forum to address the needs of the
Elderly in the Drakenstein municipal area.
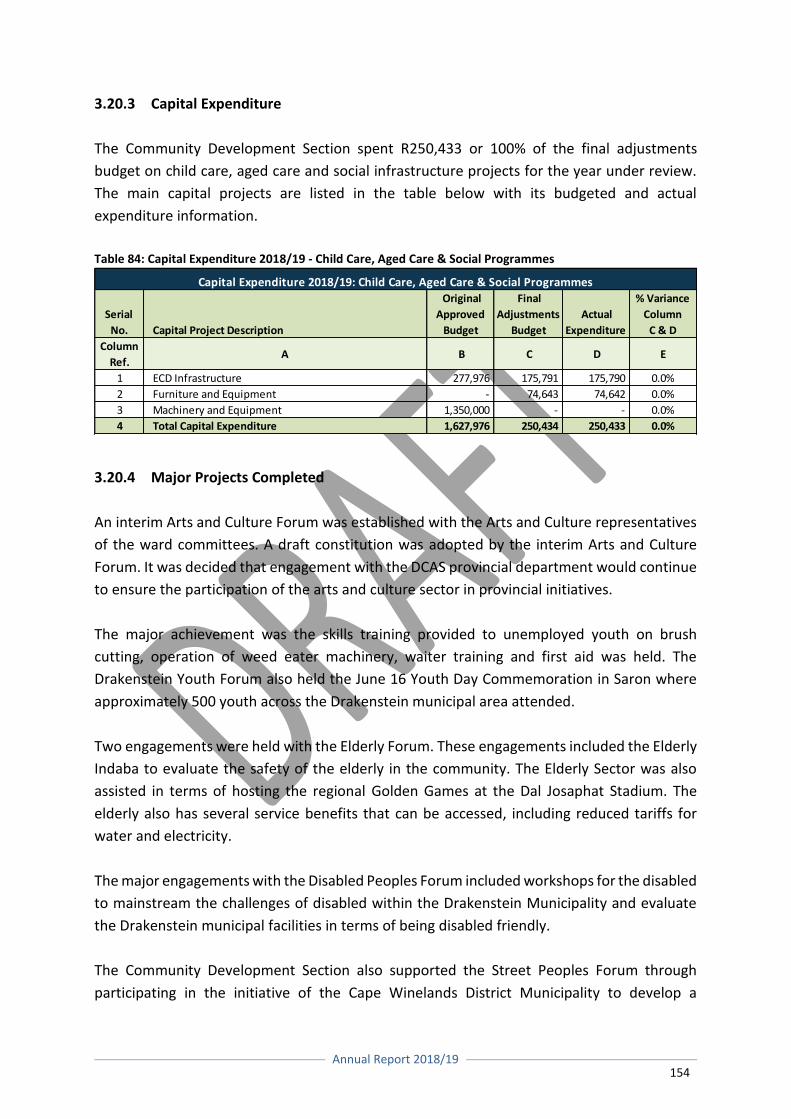
Annual Report 2018/19
154
3.20.3 Capital Expenditure
The Community Development Section spent R250,433 or 100% of the final adjustments
budget on child care, aged care and social infrastructure projects for the year under review.
The main capital projects are listed in the table below with its budgeted and actual
expenditure information.
Table 84: Capital Expenditure 2018/19 - Child Care, Aged Care & Social Programmes
3.20.4 Major Projects Completed
An interim Arts and Culture Forum was established with the Arts and Culture representatives
of the ward committees. A draft constitution was adopted by the interim Arts and Culture
Forum. It was decided that engagement with the DCAS provincial department would continue
to ensure the participation of the arts and culture sector in provincial initiatives.
The major achievement was the skills training provided to unemployed youth on brush
cutting, operation of weed eater machinery, waiter training and first aid was held. The
Drakenstein Youth Forum also held the June 16 Youth Day Commemoration in Saron where
approximately 500 youth across the Drakenstein municipal area attended.
Two engagements were held with the Elderly Forum. These engagements included the Elderly
Indaba to evaluate the safety of the elderly in the community. The Elderly Sector was also
assisted in terms of hosting the regional Golden Games at the Dal Josaphat Stadium. The
elderly also has several service benefits that can be accessed, including reduced tariffs for
water and electricity.
The major engagements with the Disabled Peoples Forum included workshops for the disabled
to mainstream the challenges of disabled within the Drakenstein Municipality and evaluate
the Drakenstein municipal facilities in terms of being disabled friendly.
The Community Development Section also supported the Street Peoples Forum through
participating in the initiative of the Cape Winelands District Municipality to develop a
Serial
No. Capital Project Description
Original
Approved
Budget
Final
Adjustments
Budget
Actual
Expenditure
% Variance
Column
C & D
Column
Ref.A B C D E
1 ECD Infrastructure 277,976 175,791 175,790 0.0%
2 Furniture and Equipment - 74,643 74,642 0.0%
3 Machinery and Equipment 1,350,000 - - 0.0%
4 Total Capital Expenditure 1,627,976 250,434 250,433 0.0%
Capital Expenditure 2018/19: Child Care, Aged Care & Social Programmes
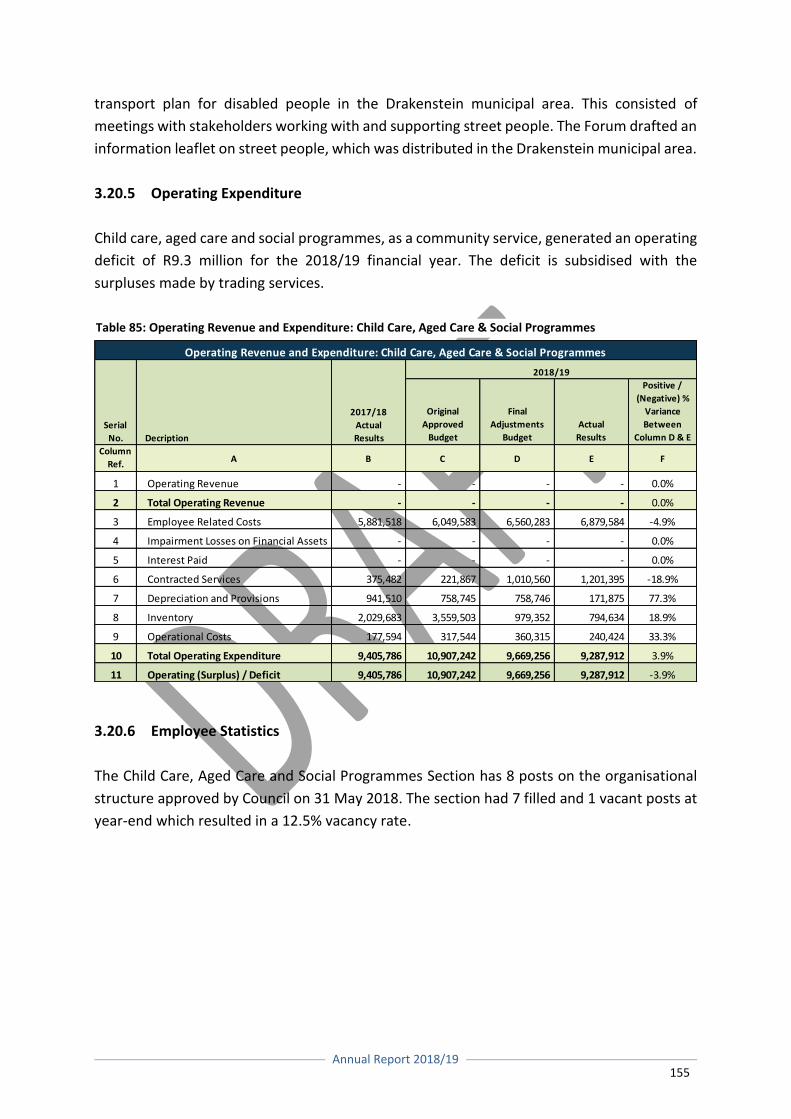
Annual Report 2018/19
155
transport plan for disabled people in the Drakenstein municipal area. This consisted of
meetings with stakeholders working with and supporting street people. The Forum drafted an
information leaflet on street people, which was distributed in the Drakenstein municipal area.
3.20.5 Operating Expenditure
Child care, aged care and social programmes, as a community service, generated an operating
deficit of R9.3 million for the 2018/19 financial year. The deficit is subsidised with the
surpluses made by trading services.
3.20.6 Employee Statistics
The Child Care, Aged Care and Social Programmes Section has 8 posts on the organisational
structure approved by Council on 31 May 2018. The section had 7 filled and 1 vacant posts at
year-end which resulted in a 12.5% vacancy rate.
Table 85: Operating Revenue and Expenditure: Child Care, Aged Care & Social Programmes
Original
Approved
Budget
Final
Adjustments
Budget
Actual
Results
Positive /
(Negative) %
Variance
Between
Column D & E
Column
Ref.A B C D E F
1 Operating Revenue - - - - 0.0%
2 Total Operating Revenue - - - - 0.0%
3 Employee Related Costs 5,881,518 6,049,583 6,560,283 6,879,584 -4.9%
4 Impairment Losses on Financial Assets - - - - 0.0%
5 Interest Paid - - - - 0.0%
6 Contracted Services 375,482 221,867 1,010,560 1,201,395 -18.9%
7 Depreciation and Provisions 941,510 758,745 758,746 171,875 77.3%
8 Inventory 2,029,683 3,559,503 979,352 794,634 18.9%
9 Operational Costs 177,594 317,544 360,315 240,424 33.3%
10 Total Operating Expenditure 9,405,786 10,907,242 9,669,256 9,287,912 3.9%
11 Operating (Surplus) / Deficit 9,405,786 10,907,242 9,669,256 9,287,912 -3.9%
Operating Revenue and Expenditure: Child Care, Aged Care & Social Programmes
Serial
No. Decription
2017/18
Actual
Results
2018/19
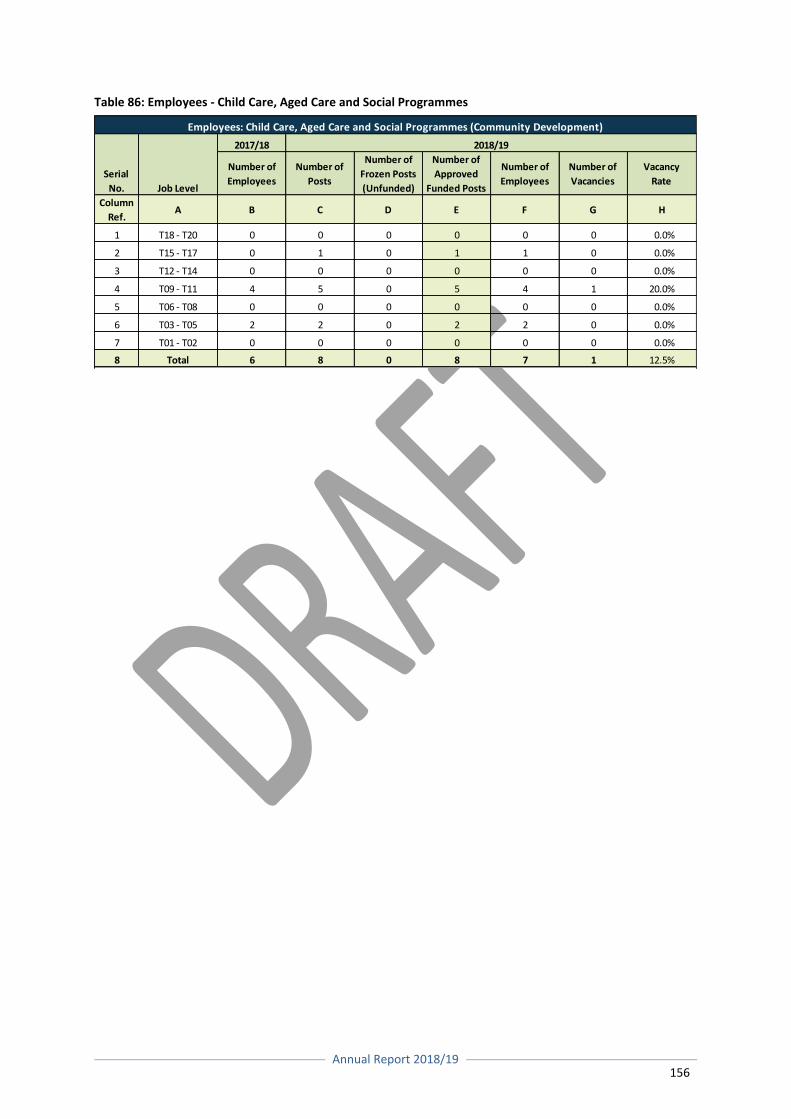
Annual Report 2018/19
156
Table 86: Employees - Child Care, Aged Care and Social Programmes
2017/18
Number of
Employees
Number of
Posts
Number of
Frozen Posts
(Unfunded)
Number of
Approved
Funded Posts
Number of
Employees
Number of
Vacancies
Vacancy
Rate
Column
Ref.A B C D E F G H
1 T18 - T20 0 0 0 0 0 0 0.0%
2 T15 - T17 0 1 0 1 1 0 0.0%
3 T12 - T14 0 0 0 0 0 0 0.0%
4 T09 - T11 4 5 0 5 4 1 20.0%
5 T06 - T08 0 0 0 0 0 0 0.0%
6 T03 - T05 2 2 0 2 2 0 0.0%
7 T01 - T02 0 0 0 0 0 0 0.0%
8 Total 6 8 0 8 7 1 12.5%
2018/19
Employees: Child Care, Aged Care and Social Programmes (Community Development)
Serial
No. Job Level
Annual Report 2018/19
157
COMPONENT F: ENVIRONMENTAL PROTECTION
3.21 INTRODUCTION
The natural environment supports all life on earth but it is currently under severe threat due
to human activities which are causing unprecedented climate change, habitat loss, alien
species invasions and excessive pollution which have a significant impact on the health and
functioning of our ecosystems. If we are to continue to prosper and develop in a sustainable
manner, it is vitally important that we take active measures to protect the environment. While
environmental protection is the responsibility of all municipal line departments, Drakenstein
Municipality has a dedicated Environmental Management Division that plays a coordinating
role between various departments in order to ensure that residents have access to a clean and
healthy environment. In addition to this, Drakenstein Municipality has adopted an
environmental policy that commits to the full implementation of Integrated Environmental
Management (IEM) throughout the organisation.
3.22 ENVIRONMENTAL MANAGEMENT (INCLUDING POLLUTION CONTROL)
The Environmental Management Division is placed within the Planning and Development
Department. The Environmental Management Division consists of three sections including,
Environmental Planning and Sustainability; Environmental Management Systems Monitoring
and Compliance; as well as Natural Resource Management. The divisions’ service delivery
focus is to ensure that residents enjoy an environment that is safe, not harmful to their well-
being and is protected for future generations by protecting and enhancing the Municipality’s
natural assets and by ensuring that our natural resources are utilised sustainably.
The Environmental Planning and Sustainability Section plays a proactive role in planning for
sustainable development through several initiatives including the development of the
Environmental Management Framework, the implementation of the Climate Change
Adaptation Plan, by commenting on development applications and coordinating the Climate
Partnership with the City of Neumarkt, Germany.
The Environmental Management Systems, Monitoring and Compliance Section plays an active
role in monitoring threats to the environment and ensuring compliance with environmental
legislation. These goals are achieved through the implementation of the municipal
Environmental Management System, performing Environmental Management Inspector
duties, responding to environmental pollution incidents, managing environmental emergency
incidents in accordance with Section 30 of the National Environmental Management Act 107
of 1998, and executing the air quality management and noise control functions.
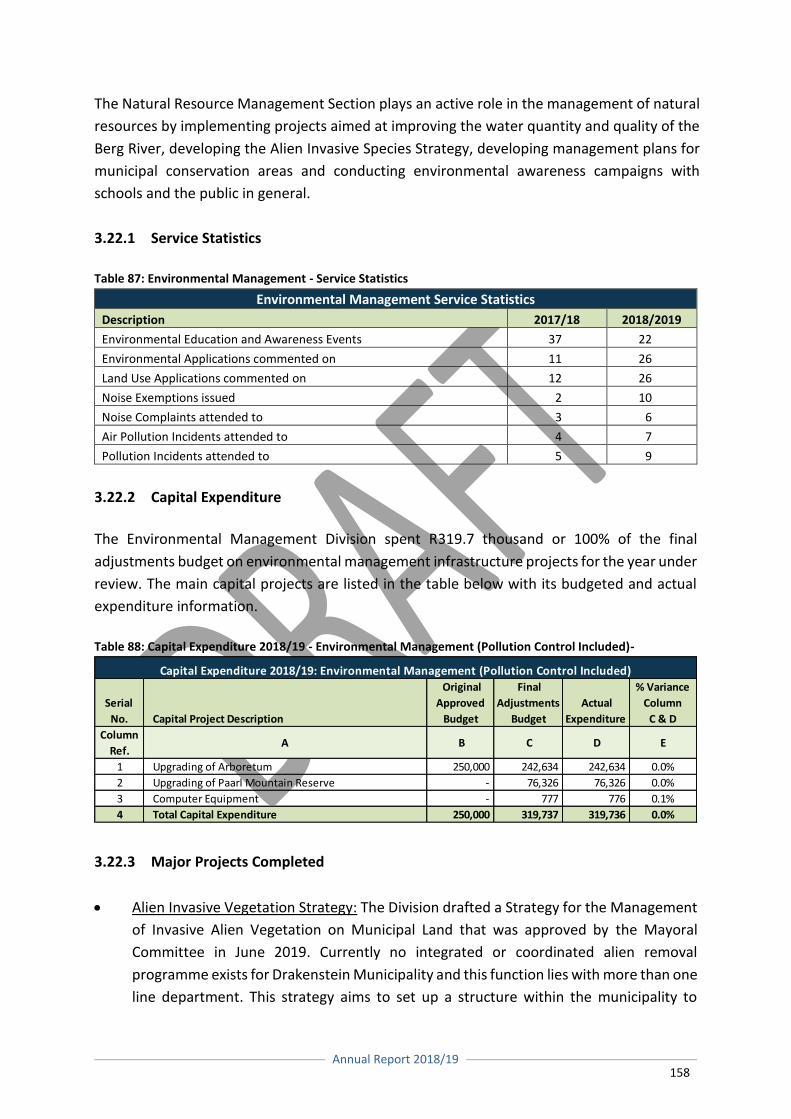
Annual Report 2018/19
158
The Natural Resource Management Section plays an active role in the management of natural
resources by implementing projects aimed at improving the water quantity and quality of the
Berg River, developing the Alien Invasive Species Strategy, developing management plans for
municipal conservation areas and conducting environmental awareness campaigns with
schools and the public in general.
3.22.1 Service Statistics
Table 87: Environmental Management - Service Statistics
Environmental Management Service Statistics
Description 2017/18 2018/2019
Environmental Education and Awareness Events 37 22
Environmental Applications commented on 11 26
Land Use Applications commented on 12 26
Noise Exemptions issued 2 10
Noise Complaints attended to 3 6
Air Pollution Incidents attended to 4 7
Pollution Incidents attended to 5 9
3.22.2 Capital Expenditure
The Environmental Management Division spent R319.7 thousand or 100% of the final
adjustments budget on environmental management infrastructure projects for the year under
review. The main capital projects are listed in the table below with its budgeted and actual
expenditure information.
Table 88: Capital Expenditure 2018/19 - Environmental Management (Pollution Control Included)-
3.22.3 Major Projects Completed
Alien Invasive Vegetation Strategy: The Division drafted a Strategy for the Management
of Invasive Alien Vegetation on Municipal Land that was approved by the Mayoral
Committee in June 2019. Currently no integrated or coordinated alien removal
programme exists for Drakenstein Municipality and this function lies with more than one
line department. This strategy aims to set up a structure within the municipality to
Serial
No. Capital Project Description
Original
Approved
Budget
Final
Adjustments
Budget
Actual
Expenditure
% Variance
Column
C & D
Column
Ref.A B C D E
1 Upgrading of Arboretum 250,000 242,634 242,634 0.0%
2 Upgrading of Paarl Mountain Reserve - 76,326 76,326 0.0%
3 Computer Equipment - 777 776 0.1%
4 Total Capital Expenditure 250,000 319,737 319,736 0.0%
Capital Expenditure 2018/19: Environmental Management (Pollution Control Included)
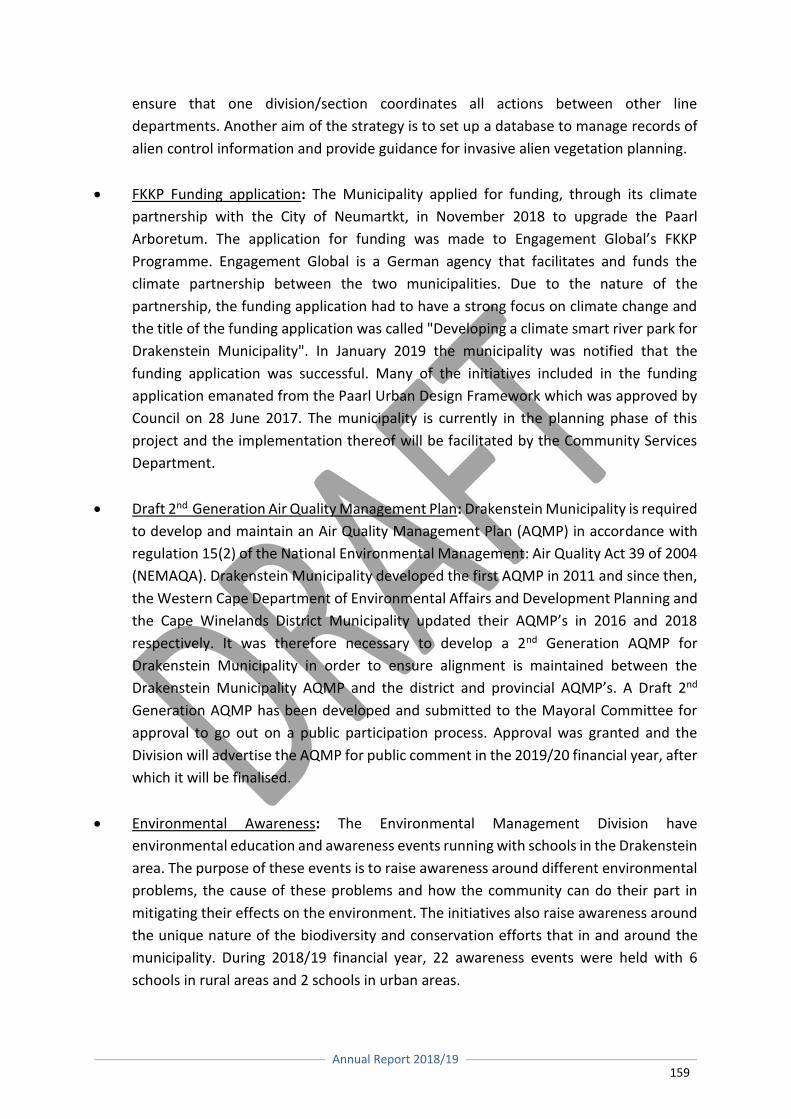
Annual Report 2018/19
159
ensure that one division/section coordinates all actions between other line
departments. Another aim of the strategy is to set up a database to manage records of
alien control information and provide guidance for invasive alien vegetation planning.
FKKP Funding application: The Municipality applied for funding, through its climate
partnership with the City of Neumartkt, in November 2018 to upgrade the Paarl
Arboretum. The application for funding was made to Engagement Global’s FKKP
Programme. Engagement Global is a German agency that facilitates and funds the
climate partnership between the two municipalities. Due to the nature of the
partnership, the funding application had to have a strong focus on climate change and
the title of the funding application was called "Developing a climate smart river park for
Drakenstein Municipality". In January 2019 the municipality was notified that the
funding application was successful. Many of the initiatives included in the funding
application emanated from the Paarl Urban Design Framework which was approved by
Council on 28 June 2017. The municipality is currently in the planning phase of this
project and the implementation thereof will be facilitated by the Community Services
Department.
Draft 2nd Generation Air Quality Management Plan: Drakenstein Municipality is required
to develop and maintain an Air Quality Management Plan (AQMP) in accordance with
regulation 15(2) of the National Environmental Management: Air Quality Act 39 of 2004
(NEMAQA). Drakenstein Municipality developed the first AQMP in 2011 and since then,
the Western Cape Department of Environmental Affairs and Development Planning and
the Cape Winelands District Municipality updated their AQMP’s in 2016 and 2018
respectively. It was therefore necessary to develop a 2nd Generation AQMP for
Drakenstein Municipality in order to ensure alignment is maintained between the
Drakenstein Municipality AQMP and the district and provincial AQMP’s. A Draft 2nd
Generation AQMP has been developed and submitted to the Mayoral Committee for
approval to go out on a public participation process. Approval was granted and the
Division will advertise the AQMP for public comment in the 2019/20 financial year, after
which it will be finalised.
Environmental Awareness: The Environmental Management Division have
environmental education and awareness events running with schools in the Drakenstein
area. The purpose of these events is to raise awareness around different environmental
problems, the cause of these problems and how the community can do their part in
mitigating their effects on the environment. The initiatives also raise awareness around
the unique nature of the biodiversity and conservation efforts that in and around the
municipality. During 2018/19 financial year, 22 awareness events were held with 6
schools in rural areas and 2 schools in urban areas.
Annual Report 2018/19
160
3.22.4 Operating Expenditure
Environmental management services (pollution control included), as a community service,
generated an operating deficit of R2.5 million for the 2018/19 financial year. The deficit is
subsidised with the surpluses made by trading services.
Table 89: Operating Revenue and Expenditure: Environmental Management (Pollution Control Included)
3.22.5 Employee Statistics
The Environmental Management Division has 17 posts on the organisational structure
approved by Council on 31 May 2018 of which 9 posts are frozen and 8 posts funded at year-
end. The section had 3 filled posts at year-end and based on the number of vacancies (2) had
a 25.0% vacancy rate.
Table 90: Employees: Environmental Management
2017/18
Number of
Employees
Number of
Posts
Number of
Frozen Posts
(Unfunded)
Number of
Approved
Funded Posts
Number of
Employees
Number of
Vacancies
Vacancy
Rate
Column
Ref.A B C D E F G H
1 T18 - T20 0 0 0 0 0 0 0.0%
2 T15 - T17 0 1 0 1 1 0 0.0%
3 T12 - T14 2 9 4 5 4 1 20.0%
4 T09 - T11 0 6 5 1 1 0 0.0%
5 T06 - T08 1 1 0 1 0 1 100.0%
6 T03 - T05 0 0 0 0 0 0 0.0%
7 T01 - T02 0 0 0 0 0 0 0.0%
8 Total 3 17 9 8 6 2 25.0%
2018/19
Employees: Environmental Management
Serial
No. Job Level
Original
Approved
Budget
Final
Adjustments
Budget
Actual
Results
Positive /
(Negative) %
Variance
Between
Column D & E
Column
Ref.A B C D E F
1 Operating Revenue - - -638,199 -158,202 0.0%
2 Total Operating Revenue - - -638,199 -158,202 0.0%
3 Employee Related Costs 1,271,426 1,257,568 1,460,489 1,420,975 2.7%
4 Impairment Losses on Financial Assets - - - - 0.0%
5 Interest Paid - - - - 0.0%
6 Contracted Services 456,091 930,000 1,225,400 1,047,522 14.5%
7 Depreciation and Provisions - - - - 0.0%
8 Inventory 29,242 133,403 72,300 63,093 12.7%
9 Operational Costs 62,812 161,440 149,655 132,559 11.4%
10 Total Operating Expenditure 1,819,572 2,482,411 2,907,844 2,664,149 8.4%
11 Operating (Surplus) / Deficit 1,819,572 2,482,411 2,269,645 2,505,947 10.4%
Operating Revenue and Expenditure: Environmental Management (Pollution Control Included)
Serial
No. Decription
2017/18
Actual
Results
2018/19
Annual Report 2018/19
161
3.23 BIODIVERSITY AND LANDSCAPE (INCLUDING OPEN SPACES)
Biodiversity is maintained by the Nature Conservation Section under the auspices of the Parks
Section. The Environmental Management Section does the spatial environmental planning.
The Parks Section also contributes to this function through the clearing of invasive alien
vegetation, fire management and management of protected areas.
3.23.1 Service Statistics
Tree planting was limited due to the drought which was experienced.
Trees were again donated to the community at the Drommedaris Housing Development as
part of the sustainability strategy whereby the new house owners took direct responsibility
for the planting and aftercare of the trees they received.
In total 86 new trees were planted and donated, inclusive of indigenous and Mediterranean
species suitable to the local climatic conditions. Tree planting also contributes to the reduction
of the municipal carbon footprint.
Invasive Alien Plants (IAPs) pose a direct threat not only to South Africa’s biological diversity,
but also to water security, the ecological functioning of natural systems and the productive
use of land. The eradication of invasive alien plants was limited to the Paarl Mountain Nature
Reserve and forms part of the Invasive Alien Plant Strategy. For the year under review,
668 hectares IAP’s were eradicated and 3.8 kilometres firebreak, which includes follow-up
sites.
3.23.2 Service Delivery Levels
Eradication projects are based on best practice standards as dictated by Working for Water, a
national initiative by the Department of Environmental Affairs.
Tree watering has taken place within the stipulations of Water Restrictions Regulations using
treated effluent water on street trees.
3.23.3 Capital Expenditure
The Nature Conservation Section had no capital projects for the year under review.
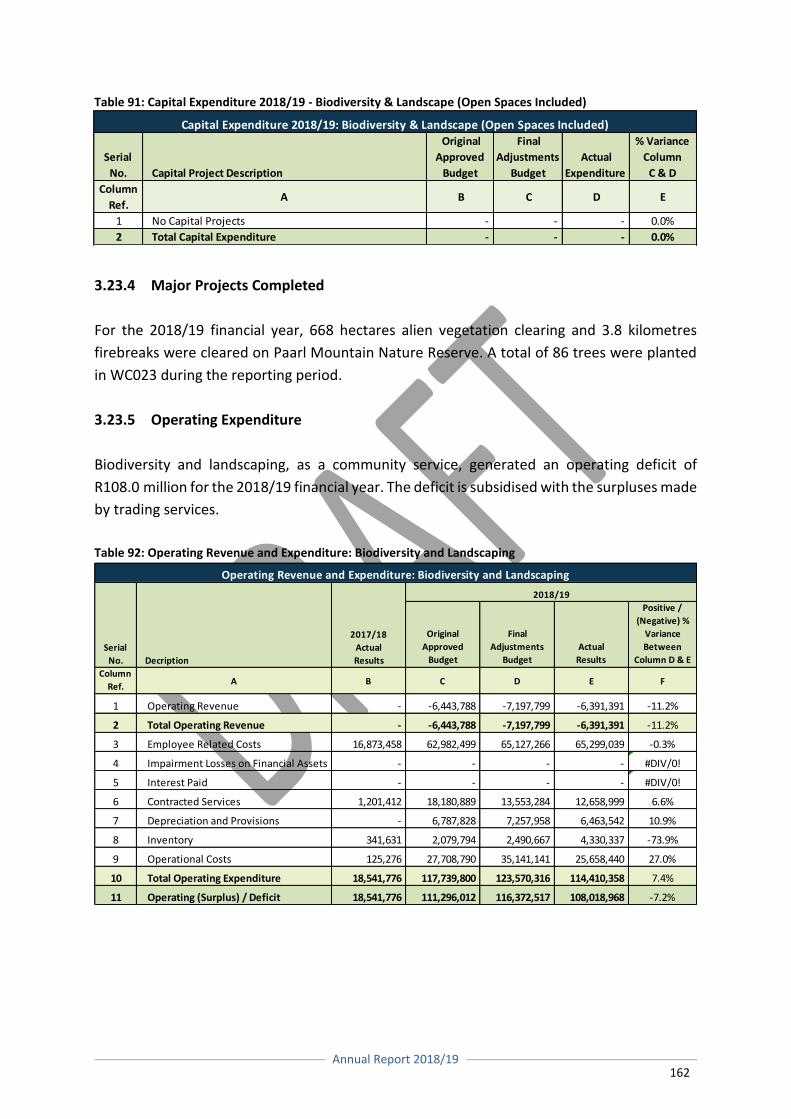
Annual Report 2018/19
162
Table 91: Capital Expenditure 2018/19 - Biodiversity & Landscape (Open Spaces Included)
3.23.4 Major Projects Completed
For the 2018/19 financial year, 668 hectares alien vegetation clearing and 3.8 kilometres
firebreaks were cleared on Paarl Mountain Nature Reserve. A total of 86 trees were planted
in WC023 during the reporting period.
3.23.5 Operating Expenditure
Biodiversity and landscaping, as a community service, generated an operating deficit of
R108.0 million for the 2018/19 financial year. The deficit is subsidised with the surpluses made
by trading services.
Table 92: Operating Revenue and Expenditure: Biodiversity and Landscaping
Serial
No. Capital Project Description
Original
Approved
Budget
Final
Adjustments
Budget
Actual
Expenditure
% Variance
Column
C & D
Column
Ref.A B C D E
1 No Capital Projects - - - 0.0%
2 Total Capital Expenditure - - - 0.0%
Capital Expenditure 2018/19: Biodiversity & Landscape (Open Spaces Included)
Original
Approved
Budget
Final
Adjustments
Budget
Actual
Results
Positive /
(Negative) %
Variance
Between
Column D & E
Column
Ref.A B C D E F
1 Operating Revenue - -6,443,788 -7,197,799 -6,391,391 -11.2%
2 Total Operating Revenue - -6,443,788 -7,197,799 -6,391,391 -11.2%
3 Employee Related Costs 16,873,458 62,982,499 65,127,266 65,299,039 -0.3%
4 Impairment Losses on Financial Assets - - - - #DIV/0!
5 Interest Paid - - - - #DIV/0!
6 Contracted Services 1,201,412 18,180,889 13,553,284 12,658,999 6.6%
7 Depreciation and Provisions - 6,787,828 7,257,958 6,463,542 10.9%
8 Inventory 341,631 2,079,794 2,490,667 4,330,337 -73.9%
9 Operational Costs 125,276 27,708,790 35,141,141 25,658,440 27.0%
10 Total Operating Expenditure 18,541,776 117,739,800 123,570,316 114,410,358 7.4%
11 Operating (Surplus) / Deficit 18,541,776 111,296,012 116,372,517 108,018,968 -7.2%
Operating Revenue and Expenditure: Biodiversity and Landscaping
Serial
No. Decription
2017/18
Actual
Results
2018/19
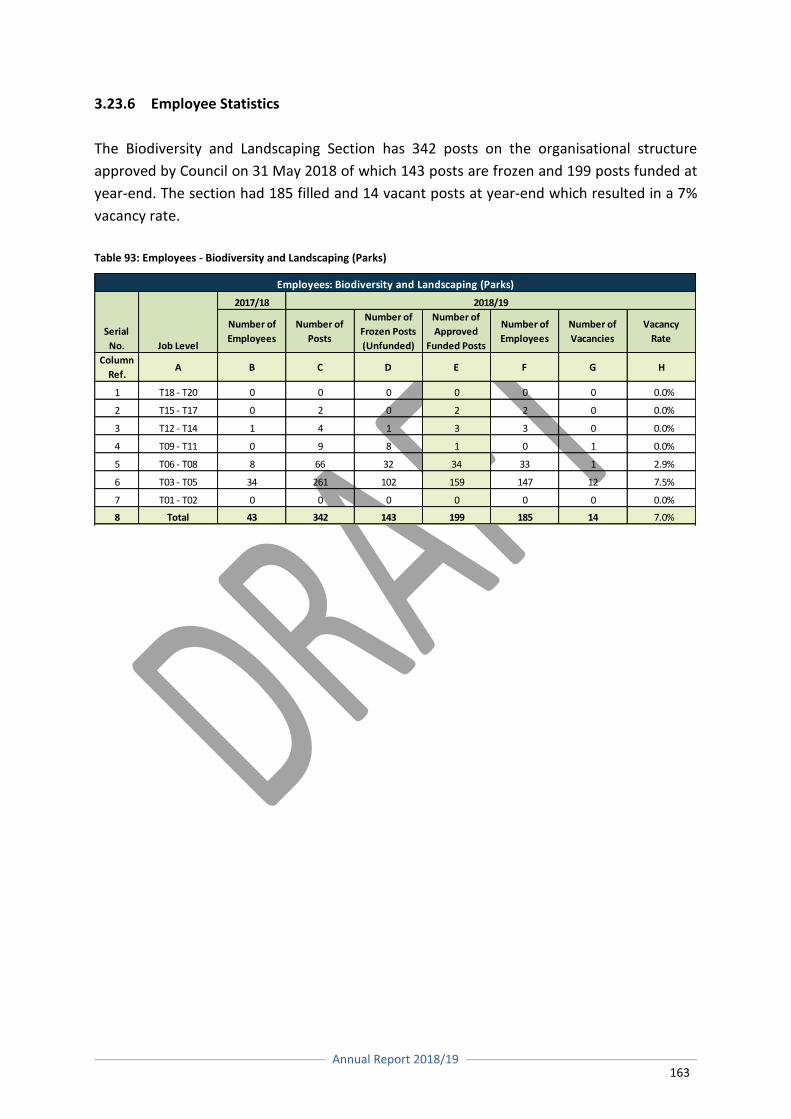
Annual Report 2018/19
163
3.23.6 Employee Statistics
The Biodiversity and Landscaping Section has 342 posts on the organisational structure
approved by Council on 31 May 2018 of which 143 posts are frozen and 199 posts funded at
year-end. The section had 185 filled and 14 vacant posts at year-end which resulted in a 7%
vacancy rate.
Table 93: Employees - Biodiversity and Landscaping (Parks)
2017/18
Number of
Employees
Number of
Posts
Number of
Frozen Posts
(Unfunded)
Number of
Approved
Funded Posts
Number of
Employees
Number of
Vacancies
Vacancy
Rate
Column
Ref.A B C D E F G H
1 T18 - T20 0 0 0 0 0 0 0.0%
2 T15 - T17 0 2 0 2 2 0 0.0%
3 T12 - T14 1 4 1 3 3 0 0.0%
4 T09 - T11 0 9 8 1 0 1 0.0%
5 T06 - T08 8 66 32 34 33 1 2.9%
6 T03 - T05 34 261 102 159 147 12 7.5%
7 T01 - T02 0 0 0 0 0 0 0.0%
8 Total 43 342 143 199 185 14 7.0%
Employees: Biodiversity and Landscaping (Parks)
Serial
No. Job Level
2018/19
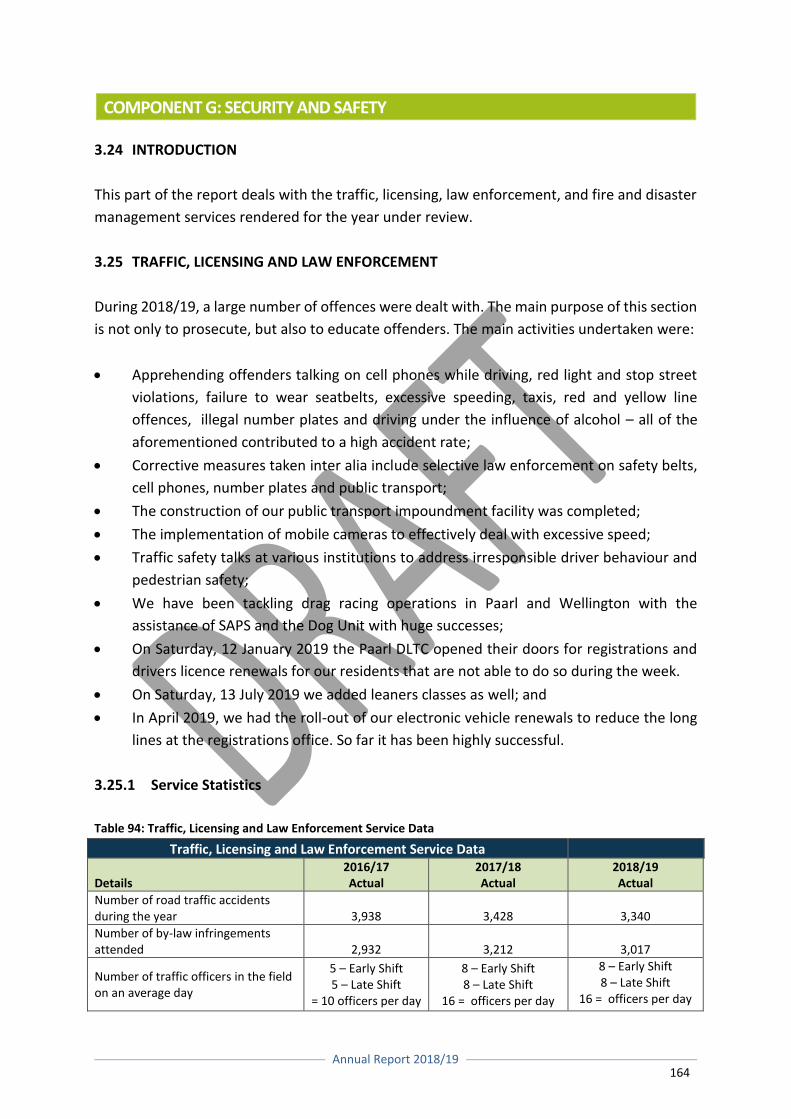
Annual Report 2018/19
164
COMPONENT G: SECURITY AND SAFETY 3.24 INTRODUCTION
This part of the report deals with the traffic, licensing, law enforcement, and fire and disaster
management services rendered for the year under review.
3.25 TRAFFIC, LICENSING AND LAW ENFORCEMENT
During 2018/19, a large number of offences were dealt with. The main purpose of this section
is not only to prosecute, but also to educate offenders. The main activities undertaken were:
Apprehending offenders talking on cell phones while driving, red light and stop street
violations, failure to wear seatbelts, excessive speeding, taxis, red and yellow line
offences, illegal number plates and driving under the influence of alcohol – all of the
aforementioned contributed to a high accident rate;
Corrective measures taken inter alia include selective law enforcement on safety belts,
cell phones, number plates and public transport;
The construction of our public transport impoundment facility was completed;
The implementation of mobile cameras to effectively deal with excessive speed;
Traffic safety talks at various institutions to address irresponsible driver behaviour and
pedestrian safety;
We have been tackling drag racing operations in Paarl and Wellington with the
assistance of SAPS and the Dog Unit with huge successes;
On Saturday, 12 January 2019 the Paarl DLTC opened their doors for registrations and
drivers licence renewals for our residents that are not able to do so during the week.
On Saturday, 13 July 2019 we added leaners classes as well; and
In April 2019, we had the roll-out of our electronic vehicle renewals to reduce the long
lines at the registrations office. So far it has been highly successful.
3.25.1 Service Statistics
Table 94: Traffic, Licensing and Law Enforcement Service Data
Traffic, Licensing and Law Enforcement Service Data
Details 2016/17 Actual
2017/18 Actual
2018/19 Actual
Number of road traffic accidents during the year 3,938 3,428
3,340
Number of by-law infringements attended 2,932 3,212
3,017
Number of traffic officers in the field on an average day
5 – Early Shift 5 – Late Shift
= 10 officers per day
8 – Early Shift 8 – Late Shift
16 = officers per day
8 – Early Shift 8 – Late Shift
16 = officers per day
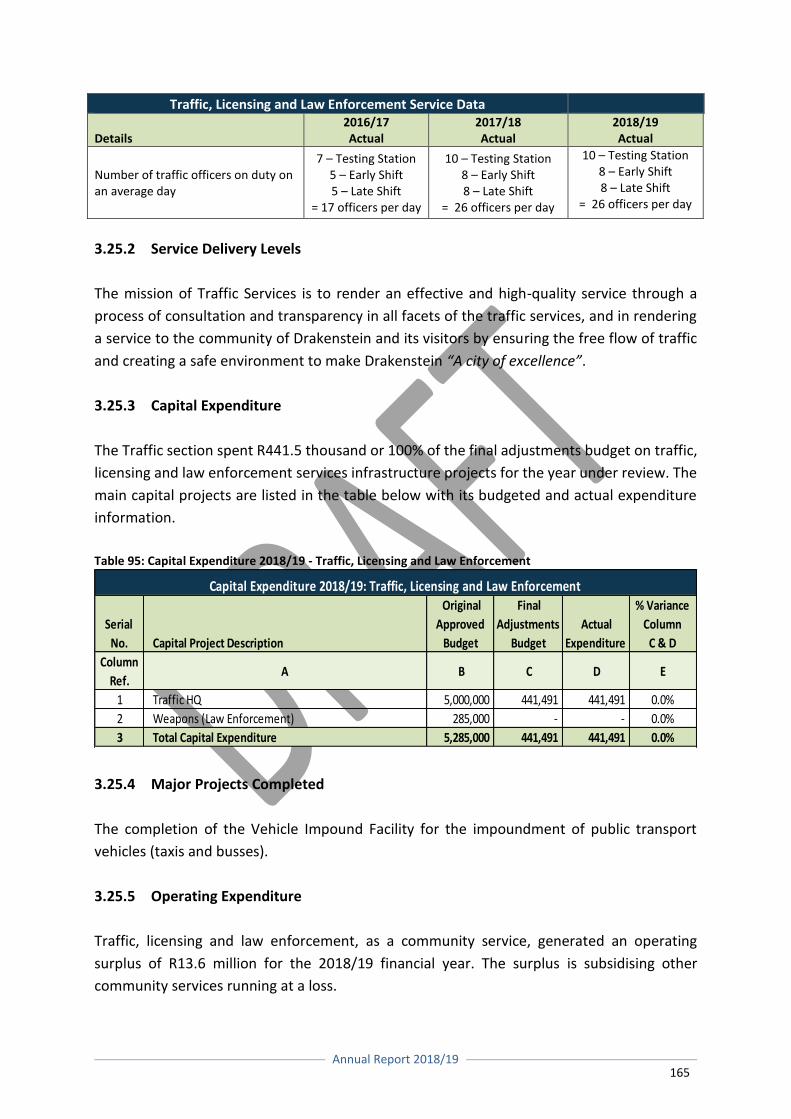
Annual Report 2018/19
165
Traffic, Licensing and Law Enforcement Service Data
Details 2016/17 Actual
2017/18 Actual
2018/19 Actual
Number of traffic officers on duty on an average day
7 – Testing Station 5 – Early Shift 5 – Late Shift
= 17 officers per day
10 – Testing Station 8 – Early Shift 8 – Late Shift
= 26 officers per day
10 – Testing Station 8 – Early Shift 8 – Late Shift
= 26 officers per day
3.25.2 Service Delivery Levels
The mission of Traffic Services is to render an effective and high-quality service through a
process of consultation and transparency in all facets of the traffic services, and in rendering
a service to the community of Drakenstein and its visitors by ensuring the free flow of traffic
and creating a safe environment to make Drakenstein “A city of excellence”.
3.25.3 Capital Expenditure
The Traffic section spent R441.5 thousand or 100% of the final adjustments budget on traffic,
licensing and law enforcement services infrastructure projects for the year under review. The
main capital projects are listed in the table below with its budgeted and actual expenditure
information.
Table 95: Capital Expenditure 2018/19 - Traffic, Licensing and Law Enforcement
3.25.4 Major Projects Completed
The completion of the Vehicle Impound Facility for the impoundment of public transport
vehicles (taxis and busses).
3.25.5 Operating Expenditure
Traffic, licensing and law enforcement, as a community service, generated an operating
surplus of R13.6 million for the 2018/19 financial year. The surplus is subsidising other
community services running at a loss.
Serial
No. Capital Project Description
Original
Approved
Budget
Final
Adjustments
Budget
Actual
Expenditure
% Variance
Column
C & D
Column
Ref.A B C D E
1 Traffic HQ 5,000,000 441,491 441,491 0.0%
2 Weapons (Law Enforcement) 285,000 - - 0.0%
3 Total Capital Expenditure 5,285,000 441,491 441,491 0.0%
Capital Expenditure 2018/19: Traffic, Licensing and Law Enforcement
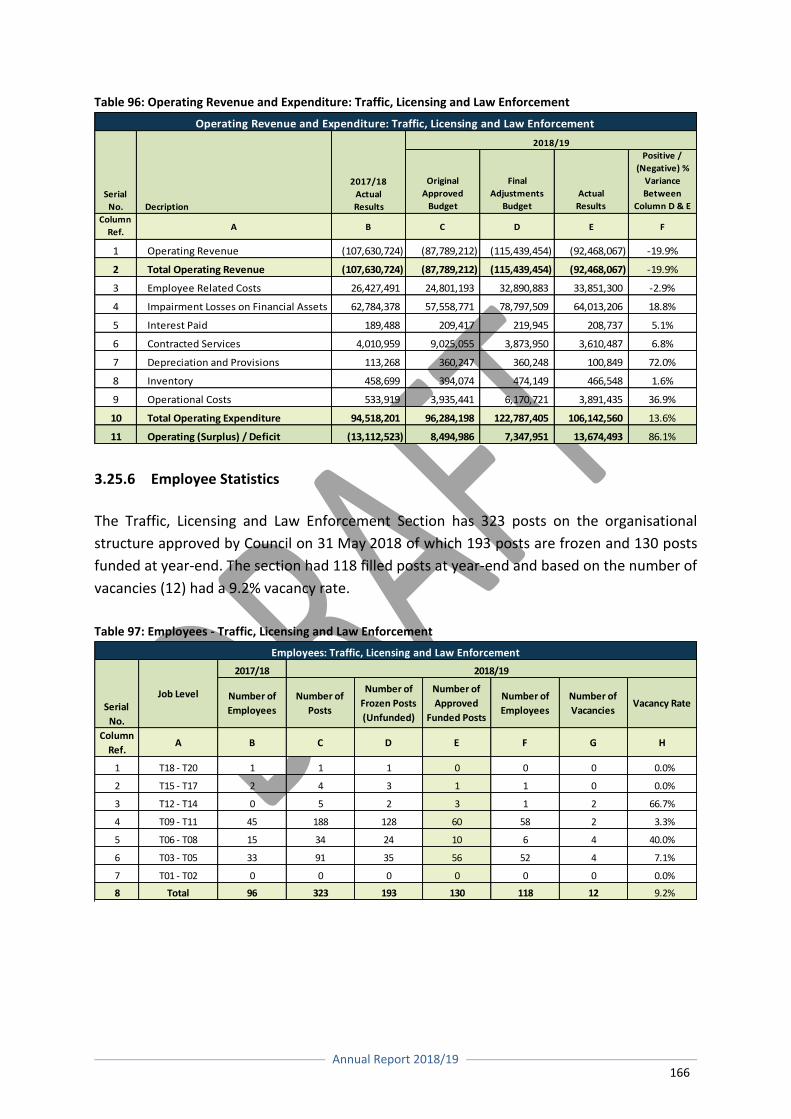
Annual Report 2018/19
166
Table 96: Operating Revenue and Expenditure: Traffic, Licensing and Law Enforcement
3.25.6 Employee Statistics
The Traffic, Licensing and Law Enforcement Section has 323 posts on the organisational
structure approved by Council on 31 May 2018 of which 193 posts are frozen and 130 posts
funded at year-end. The section had 118 filled posts at year-end and based on the number of
vacancies (12) had a 9.2% vacancy rate.
Table 97: Employees - Traffic, Licensing and Law Enforcement
2017/18
Number of
Employees
Number of
Posts
Number of
Frozen Posts
(Unfunded)
Number of
Approved
Funded Posts
Number of
Employees
Number of
Vacancies Vacancy Rate
Column
Ref.A B C D E F G H
1 T18 - T20 1 1 1 0 0 0 0.0%
2 T15 - T17 2 4 3 1 1 0 0.0%
3 T12 - T14 0 5 2 3 1 2 66.7%
4 T09 - T11 45 188 128 60 58 2 3.3%
5 T06 - T08 15 34 24 10 6 4 40.0%
6 T03 - T05 33 91 35 56 52 4 7.1%
7 T01 - T02 0 0 0 0 0 0 0.0%
8 Total 96 323 193 130 118 12 9.2%
2018/19
Employees: Traffic, Licensing and Law Enforcement
Serial
No.
Job Level
Original
Approved
Budget
Final
Adjustments
Budget
Actual
Results
Positive /
(Negative) %
Variance
Between
Column D & E
Column
Ref.A B C D E F
1 Operating Revenue (107,630,724) (87,789,212) (115,439,454) (92,468,067) -19.9%
2 Total Operating Revenue (107,630,724) (87,789,212) (115,439,454) (92,468,067) -19.9%
3 Employee Related Costs 26,427,491 24,801,193 32,890,883 33,851,300 -2.9%
4 Impairment Losses on Financial Assets 62,784,378 57,558,771 78,797,509 64,013,206 18.8%
5 Interest Paid 189,488 209,417 219,945 208,737 5.1%
6 Contracted Services 4,010,959 9,025,055 3,873,950 3,610,487 6.8%
7 Depreciation and Provisions 113,268 360,247 360,248 100,849 72.0%
8 Inventory 458,699 394,074 474,149 466,548 1.6%
9 Operational Costs 533,919 3,935,441 6,170,721 3,891,435 36.9%
10 Total Operating Expenditure 94,518,201 96,284,198 122,787,405 106,142,560 13.6%
11 Operating (Surplus) / Deficit (13,112,523) 8,494,986 7,347,951 13,674,493 86.1%
Operating Revenue and Expenditure: Traffic, Licensing and Law Enforcement
Serial
No. Decription
2017/18
Actual
Results
2018/19
Annual Report 2018/19
167
3.26 FIRE AND DISASTER MANAGEMENT
3.26.1 Fire Services
Functionally, the Fire Department is divided into five areas, namely: operations, training,
support services, fire safety and disaster risk management. Within these functional areas, the
following activities take place or are conducted:
Operations: The division operates a 24-hour service and an emergency control centre,
which responds to all incidents in the municipal area immediately with targeted
predetermined response times. The Municipality is proud to report that it achieves
these goals most of the time due to the geographical location of all fire stations. The Fire
Service has four fire stations that are located in Paarl, Wellington, Mbekweni and Saron.
Professional Fire-Fighter Training: The Drakenstein Municipality is accredited as a Fire
Training Centre and provides professional fire-fighting training to all appointed Fire
Service personnel and to neighbouring fire services. The training centre also
complements other accredited training centres in the region. The objective of
continuous training is to improve the skills and development of the firefighting
personnel in order to provide a professional service to the communities we serve. During
the reporting period, 106 Fire Service Officials received continuous training relating to
the scope of the work they perform.
Public and Life Safety Training: A total of 1,601 children from primary and pre-primary
schools were recipients of the Fire and Life Safety Programme: Stop, Drop and Roll, Learn
Not to Burn and Crawl Low under Fire. These programmes are aimed at fire and life
safety within the communities.
Support Services: The Fire Service operates a 24-hour emergency control and dispatch
centre. All emergency calls are received by the centre and, depending on the emergency,
the relevant vehicles are dispatched to attend to the incidents. The incidents are not
confined to fire calls only. Professionally trained fire fighters responded to rescue and
medical incidents, chemical incidents, and other special services calls such as flooding
and etcetera.
Fire Safety: This section focuses on risk, and building inspections, in compliance with the
National Building Regulations and the Building Standards Act, and related by-laws.
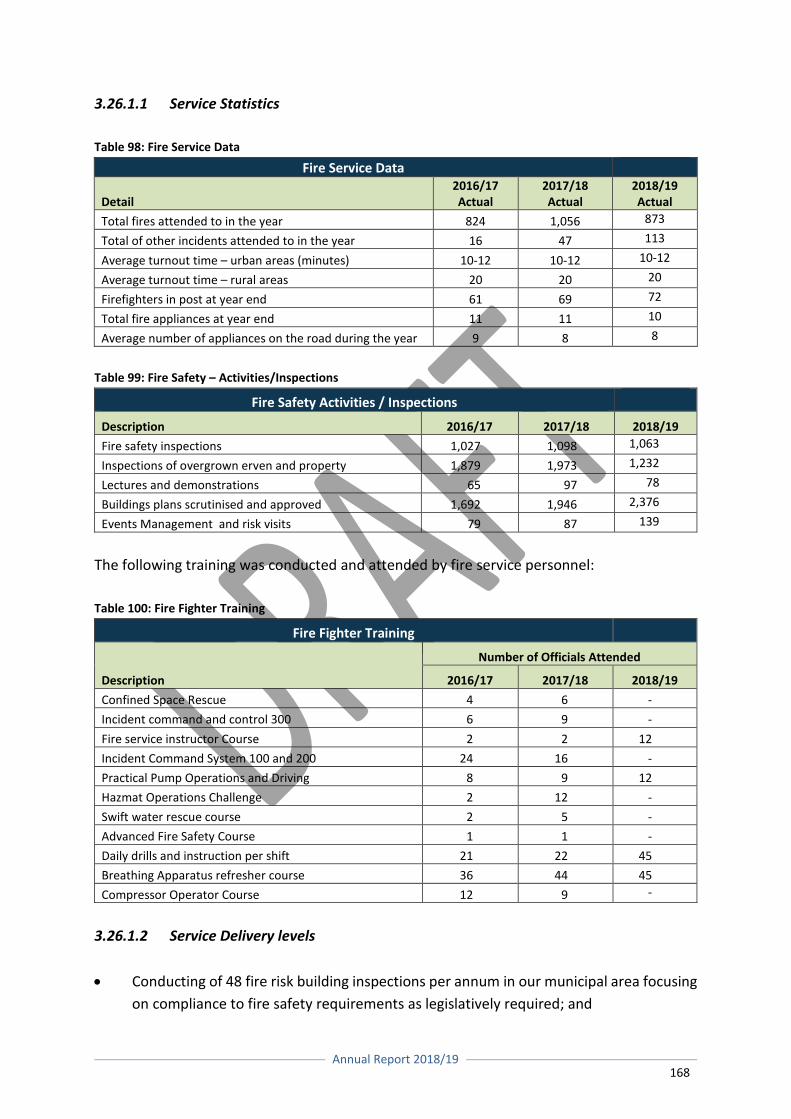
Annual Report 2018/19
168
3.26.1.1 Service Statistics
Table 98: Fire Service Data
Fire Service Data
Detail 2016/17 Actual
2017/18 Actual
2018/19 Actual
Total fires attended to in the year 824 1,056 873
Total of other incidents attended to in the year 16 47 113
Average turnout time – urban areas (minutes) 10-12 10-12 10-12
Average turnout time – rural areas 20 20 20
Firefighters in post at year end 61 69 72
Total fire appliances at year end 11 11 10
Average number of appliances on the road during the year 9 8 8
Table 99: Fire Safety – Activities/Inspections
Fire Safety Activities / Inspections
Description 2016/17 2017/18 2018/19
Fire safety inspections 1,027 1,098 1,063
Inspections of overgrown erven and property 1,879 1,973 1,232
Lectures and demonstrations 65 97 78
Buildings plans scrutinised and approved 1,692 1,946 2,376
Events Management and risk visits 79 87 139
The following training was conducted and attended by fire service personnel:
Table 100: Fire Fighter Training
Fire Fighter Training
Description
Number of Officials Attended
2016/17 2017/18 2018/19
Confined Space Rescue 4 6 -
Incident command and control 300 6 9 -
Fire service instructor Course 2 2 12
Incident Command System 100 and 200 24 16 -
Practical Pump Operations and Driving 8 9 12
Hazmat Operations Challenge 2 12 -
Swift water rescue course 2 5 -
Advanced Fire Safety Course 1 1 -
Daily drills and instruction per shift 21 22 45
Breathing Apparatus refresher course 36 44 45
Compressor Operator Course 12 9 -
3.26.1.2 Service Delivery levels
Conducting of 48 fire risk building inspections per annum in our municipal area focusing
on compliance to fire safety requirements as legislatively required; and
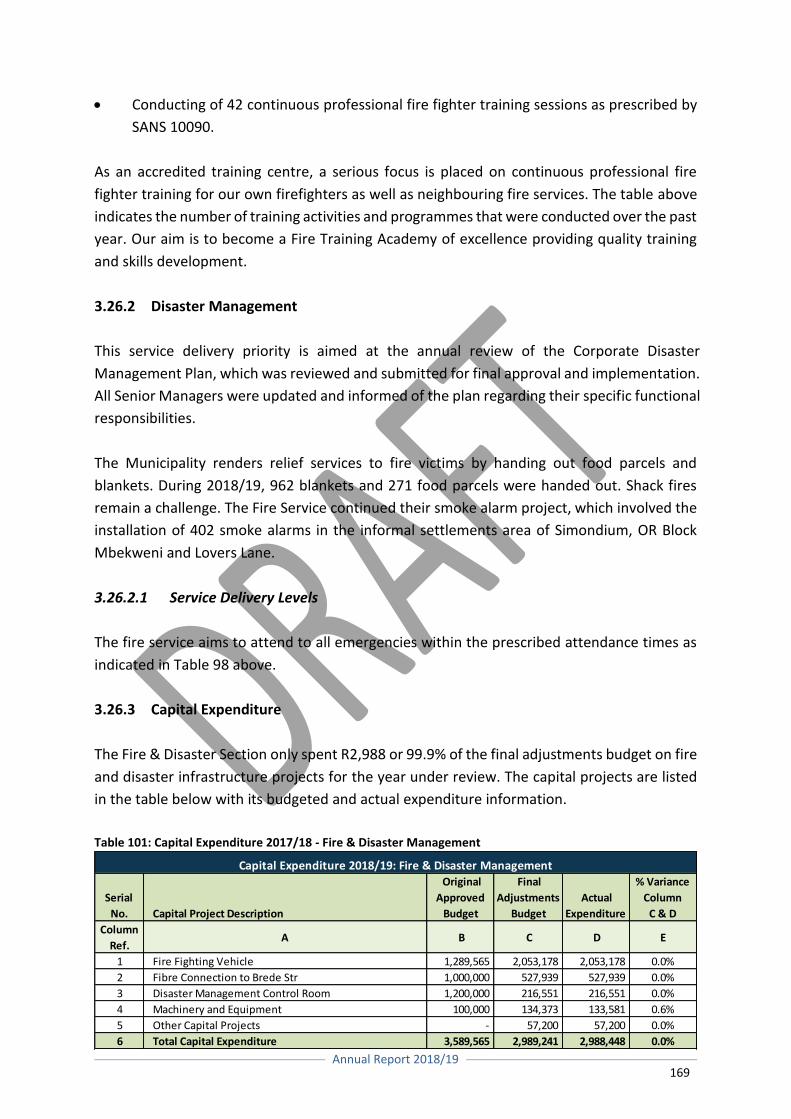
Annual Report 2018/19
169
Conducting of 42 continuous professional fire fighter training sessions as prescribed by
SANS 10090.
As an accredited training centre, a serious focus is placed on continuous professional fire
fighter training for our own firefighters as well as neighbouring fire services. The table above
indicates the number of training activities and programmes that were conducted over the past
year. Our aim is to become a Fire Training Academy of excellence providing quality training
and skills development.
3.26.2 Disaster Management
This service delivery priority is aimed at the annual review of the Corporate Disaster
Management Plan, which was reviewed and submitted for final approval and implementation.
All Senior Managers were updated and informed of the plan regarding their specific functional
responsibilities.
The Municipality renders relief services to fire victims by handing out food parcels and
blankets. During 2018/19, 962 blankets and 271 food parcels were handed out. Shack fires
remain a challenge. The Fire Service continued their smoke alarm project, which involved the
installation of 402 smoke alarms in the informal settlements area of Simondium, OR Block
Mbekweni and Lovers Lane.
3.26.2.1 Service Delivery Levels
The fire service aims to attend to all emergencies within the prescribed attendance times as
indicated in Table 98 above.
3.26.3 Capital Expenditure
The Fire & Disaster Section only spent R2,988 or 99.9% of the final adjustments budget on fire
and disaster infrastructure projects for the year under review. The capital projects are listed
in the table below with its budgeted and actual expenditure information.
Table 101: Capital Expenditure 2017/18 - Fire & Disaster Management
Serial
No. Capital Project Description
Original
Approved
Budget
Final
Adjustments
Budget
Actual
Expenditure
% Variance
Column
C & D
Column
Ref.A B C D E
1 Fire Fighting Vehicle 1,289,565 2,053,178 2,053,178 0.0%
2 Fibre Connection to Brede Str 1,000,000 527,939 527,939 0.0%
3 Disaster Management Control Room 1,200,000 216,551 216,551 0.0%
4 Machinery and Equipment 100,000 134,373 133,581 0.6%
5 Other Capital Projects - 57,200 57,200 0.0%
6 Total Capital Expenditure 3,589,565 2,989,241 2,988,448 0.0%
Capital Expenditure 2018/19: Fire & Disaster Management
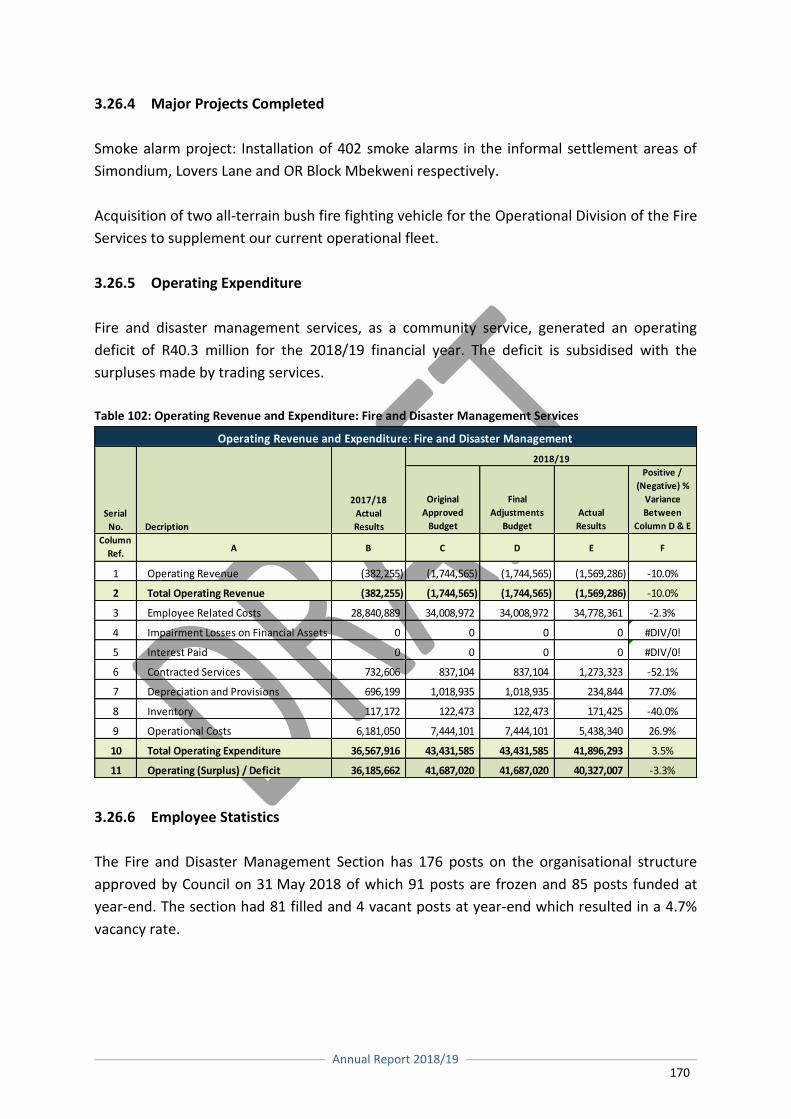
Annual Report 2018/19
170
3.26.4 Major Projects Completed
Smoke alarm project: Installation of 402 smoke alarms in the informal settlement areas of
Simondium, Lovers Lane and OR Block Mbekweni respectively.
Acquisition of two all-terrain bush fire fighting vehicle for the Operational Division of the Fire
Services to supplement our current operational fleet.
3.26.5 Operating Expenditure
Fire and disaster management services, as a community service, generated an operating
deficit of R40.3 million for the 2018/19 financial year. The deficit is subsidised with the
surpluses made by trading services.
Table 102: Operating Revenue and Expenditure: Fire and Disaster Management Services
3.26.6 Employee Statistics
The Fire and Disaster Management Section has 176 posts on the organisational structure
approved by Council on 31 May 2018 of which 91 posts are frozen and 85 posts funded at
year-end. The section had 81 filled and 4 vacant posts at year-end which resulted in a 4.7%
vacancy rate.
Original
Approved
Budget
Final
Adjustments
Budget
Actual
Results
Positive /
(Negative) %
Variance
Between
Column D & E
Column
Ref.A B C D E F
1 Operating Revenue (382,255) (1,744,565) (1,744,565) (1,569,286) -10.0%
2 Total Operating Revenue (382,255) (1,744,565) (1,744,565) (1,569,286) -10.0%
3 Employee Related Costs 28,840,889 34,008,972 34,008,972 34,778,361 -2.3%
4 Impairment Losses on Financial Assets 0 0 0 0 #DIV/0!
5 Interest Paid 0 0 0 0 #DIV/0!
6 Contracted Services 732,606 837,104 837,104 1,273,323 -52.1%
7 Depreciation and Provisions 696,199 1,018,935 1,018,935 234,844 77.0%
8 Inventory 117,172 122,473 122,473 171,425 -40.0%
9 Operational Costs 6,181,050 7,444,101 7,444,101 5,438,340 26.9%
10 Total Operating Expenditure 36,567,916 43,431,585 43,431,585 41,896,293 3.5%
11 Operating (Surplus) / Deficit 36,185,662 41,687,020 41,687,020 40,327,007 -3.3%
Operating Revenue and Expenditure: Fire and Disaster Management
Serial
No. Decription
2017/18
Actual
Results
2018/19

Annual Report 2018/19
171
Table 103: Employees - Fire and Disaster Management
2017/18
Number of
Employees
Number of
Posts
Number of
Frozen Posts
(Unfunded)
Number of
Approved
Funded Posts
Number of
Employees
Number of
Vacancies Vacancy Rate
Column
Ref.A B C D E F G H
1 T18 - T20 0 0 0 0 0 0 0.0%
2 T15 - T17 3 3 0 3 3 0 0.0%
3 T12 - T14 5 13 8 5 4 1 20.0%
4 T09 - T11 3 34 30 4 3 1 25.0%
5 T06 - T08 69 113 45 68 66 2 2.9%
6 T03 - T05 4 13 8 5 5 0 0.0%
7 T01 - T02 0 0 0 0 0 0 0.0%
8 Total 84 176 91 85 81 4 4.7%
2018/19
Employees: Fire and Disaster Managament
Serial
No.
Job Level
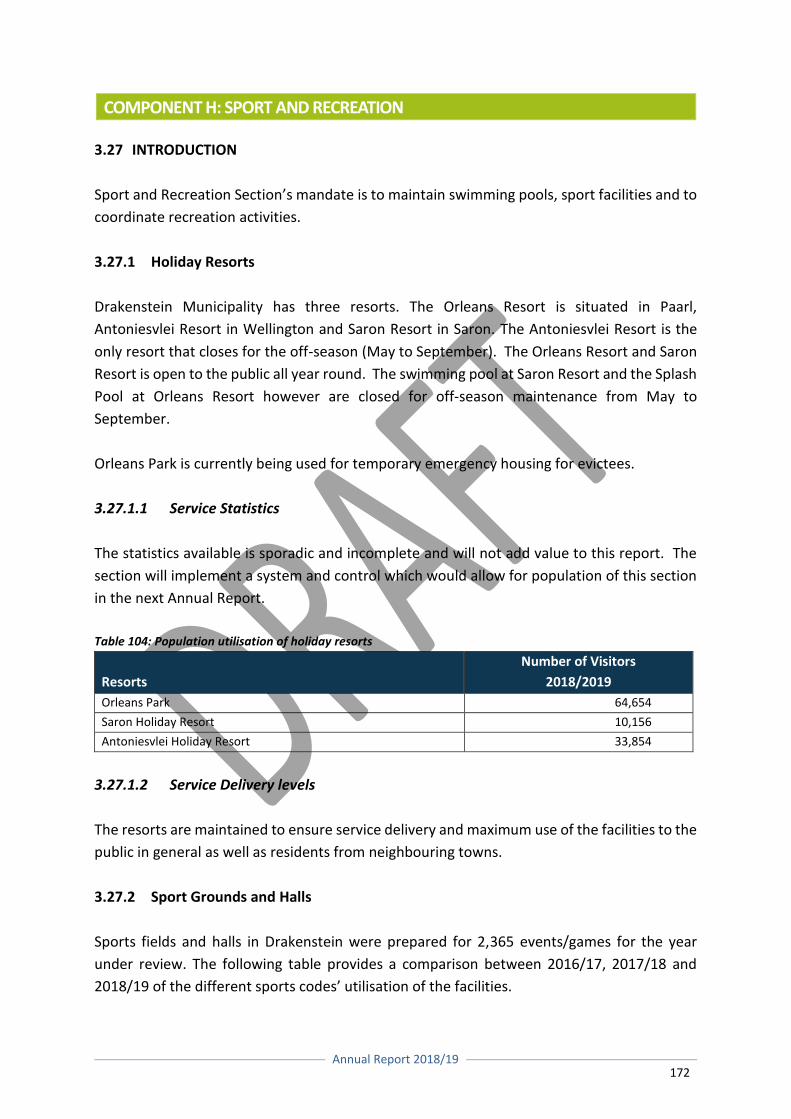
Annual Report 2018/19
172
COMPONENT H: SPORT AND RECREATION 3.27 INTRODUCTION
Sport and Recreation Section’s mandate is to maintain swimming pools, sport facilities and to
coordinate recreation activities.
3.27.1 Holiday Resorts
Drakenstein Municipality has three resorts. The Orleans Resort is situated in Paarl,
Antoniesvlei Resort in Wellington and Saron Resort in Saron. The Antoniesvlei Resort is the
only resort that closes for the off-season (May to September). The Orleans Resort and Saron
Resort is open to the public all year round. The swimming pool at Saron Resort and the Splash
Pool at Orleans Resort however are closed for off-season maintenance from May to
September.
Orleans Park is currently being used for temporary emergency housing for evictees.
3.27.1.1 Service Statistics
The statistics available is sporadic and incomplete and will not add value to this report. The
section will implement a system and control which would allow for population of this section
in the next Annual Report.
Table 104: Population utilisation of holiday resorts
Resorts
Number of Visitors
2018/2019
Orleans Park 64,654
Saron Holiday Resort 10,156
Antoniesvlei Holiday Resort 33,854
3.27.1.2 Service Delivery levels
The resorts are maintained to ensure service delivery and maximum use of the facilities to the
public in general as well as residents from neighbouring towns.
3.27.2 Sport Grounds and Halls
Sports fields and halls in Drakenstein were prepared for 2,365 events/games for the year
under review. The following table provides a comparison between 2016/17, 2017/18 and
2018/19 of the different sports codes’ utilisation of the facilities.
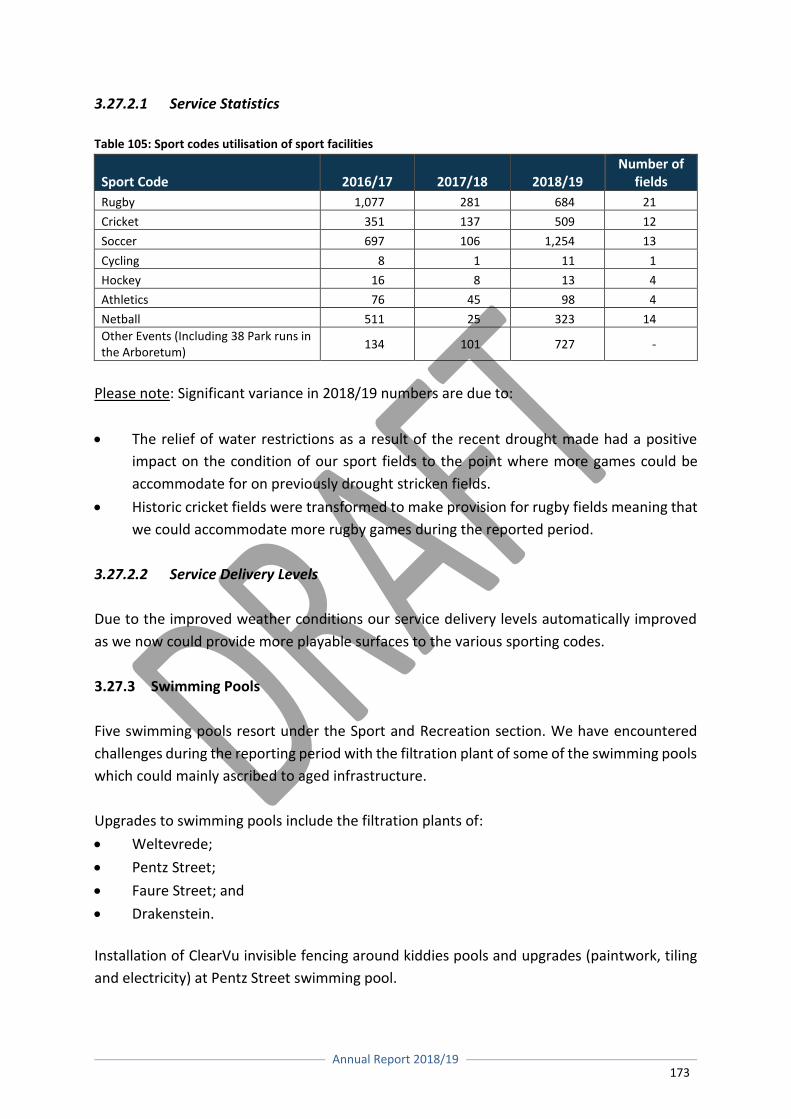
Annual Report 2018/19
173
3.27.2.1 Service Statistics
Table 105: Sport codes utilisation of sport facilities
Sport Code 2016/17 2017/18 2018/19 Number of
fields
Rugby 1,077 281 684 21
Cricket 351 137 509 12
Soccer 697 106 1,254 13
Cycling 8 1 11 1
Hockey 16 8 13 4
Athletics 76 45 98 4
Netball 511 25 323 14
Other Events (Including 38 Park runs in the Arboretum)
134 101 727 -
Please note: Significant variance in 2018/19 numbers are due to:
The relief of water restrictions as a result of the recent drought made had a positive
impact on the condition of our sport fields to the point where more games could be
accommodate for on previously drought stricken fields.
Historic cricket fields were transformed to make provision for rugby fields meaning that
we could accommodate more rugby games during the reported period.
3.27.2.2 Service Delivery Levels
Due to the improved weather conditions our service delivery levels automatically improved
as we now could provide more playable surfaces to the various sporting codes.
3.27.3 Swimming Pools
Five swimming pools resort under the Sport and Recreation section. We have encountered
challenges during the reporting period with the filtration plant of some of the swimming pools
which could mainly ascribed to aged infrastructure.
Upgrades to swimming pools include the filtration plants of:
Weltevrede;
Pentz Street;
Faure Street; and
Drakenstein.
Installation of ClearVu invisible fencing around kiddies pools and upgrades (paintwork, tiling
and electricity) at Pentz Street swimming pool.
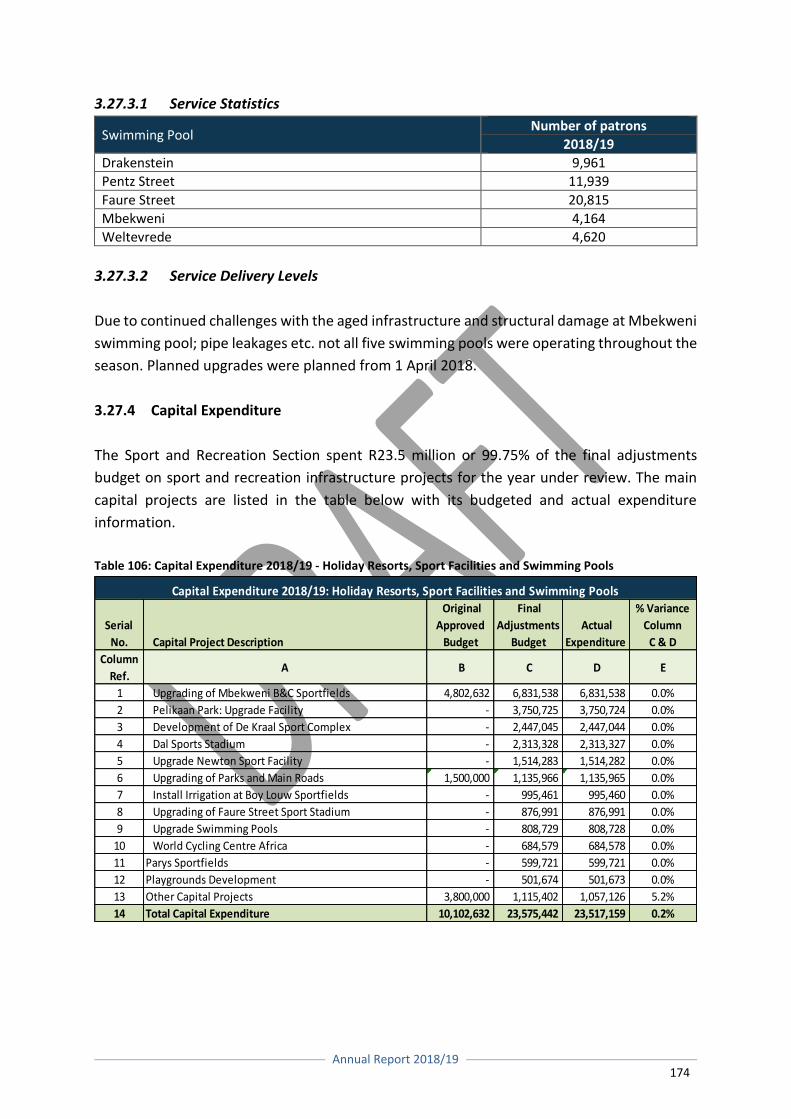
Annual Report 2018/19
174
3.27.3.1 Service Statistics
Swimming Pool Number of patrons
2018/19
Drakenstein 9,961
Pentz Street 11,939
Faure Street 20,815
Mbekweni 4,164
Weltevrede 4,620
3.27.3.2 Service Delivery Levels
Due to continued challenges with the aged infrastructure and structural damage at Mbekweni
swimming pool; pipe leakages etc. not all five swimming pools were operating throughout the
season. Planned upgrades were planned from 1 April 2018.
3.27.4 Capital Expenditure
The Sport and Recreation Section spent R23.5 million or 99.75% of the final adjustments
budget on sport and recreation infrastructure projects for the year under review. The main
capital projects are listed in the table below with its budgeted and actual expenditure
information.
Table 106: Capital Expenditure 2018/19 - Holiday Resorts, Sport Facilities and Swimming Pools
Serial
No. Capital Project Description
Original
Approved
Budget
Final
Adjustments
Budget
Actual
Expenditure
% Variance
Column
C & D
Column
Ref.A B C D E
1 Upgrading of Mbekweni B&C Sportfields 4,802,632 6,831,538 6,831,538 0.0%
2 Pelikaan Park: Upgrade Facility - 3,750,725 3,750,724 0.0%
3 Development of De Kraal Sport Complex - 2,447,045 2,447,044 0.0%
4 Dal Sports Stadium - 2,313,328 2,313,327 0.0%
5 Upgrade Newton Sport Facility - 1,514,283 1,514,282 0.0%
6 Upgrading of Parks and Main Roads 1,500,000 1,135,966 1,135,965 0.0%
7 Install Irrigation at Boy Louw Sportfields - 995,461 995,460 0.0%
8 Upgrading of Faure Street Sport Stadium - 876,991 876,991 0.0%
9 Upgrade Swimming Pools - 808,729 808,728 0.0%
10 World Cycling Centre Africa - 684,579 684,578 0.0%
11 Parys Sportfields - 599,721 599,721 0.0%
12 Playgrounds Development - 501,674 501,673 0.0%
13 Other Capital Projects 3,800,000 1,115,402 1,057,126 5.2%
14 Total Capital Expenditure 10,102,632 23,575,442 23,517,159 0.2%
Capital Expenditure 2018/19: Holiday Resorts, Sport Facilities and Swimming Pools
Annual Report 2018/19
175
3.27.5 Major Projects Completed
Various capital projects were undertaken by Community Services during the 2018/19 financial
year. Most of the projects were multi-year projects was completed in 2018/19 and others will
be completed in the 2019/20 financial year.
Upgrading Of Mbekweni B & C Sports Field: This multi-year project is currently
underway. Phase II of the works include upgrading of ablution facilities at the
grandstand, access control with ticket office and parking area. Additional items to be
done include upgrading of tennis courts and cricket nets;
Pelican Park: Upgrade Facility: This multi-year project is currently underway. This phase
includes the construction of a boundary wall, new ablution facilities and upgrading of
existing facilities;
Upgrading Swimming Pools and Equipment: Various components of the swimming pool
infrastructure have been upgraded, including pool pumps and piping, ablution facilities
and showers, as well as minor building upgrades;
Upgrading of Faure Street Sport Stadium: The project entailed the installation of an
electronic score board and the installation of new rugby posts;
Upgrading Parys Sport Field: Upgrading of the ablution block, change rooms, stoep area.
Upgrading of Dal Josaphat Stadium: Upgrade of netball courts, ablution blocks, fencing
in-between fields, lighting at athletics track;
De Kraal Sporting Facility: This multi-year project includes the construction of a new
storm water system, removal of trees, bulk earthworks, construction of boundary wall
and new ticket offices. The proposed sporting infrastructure will be completed in the
2020/21 year; and
Upgrade Newton Sport Facility: This multi-year project consists of the construction of
new pavilions for the existing rugby fields.
3.27.6 Operating Expenditure
Holiday resorts, sport facilities and swimming pools services, as a community service,
generated an operating deficit of R92.6 million for the 2018/19 financial year. The deficit is
subsidised with the surpluses made by trading services.
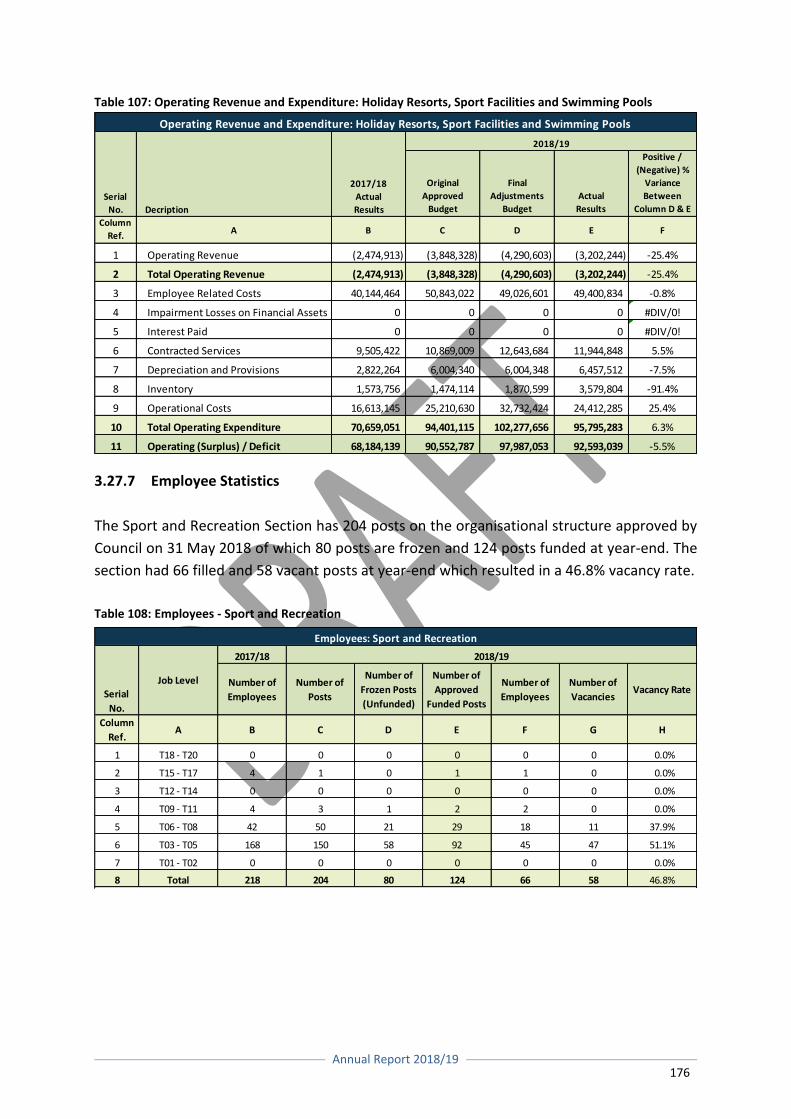
Annual Report 2018/19
176
Table 107: Operating Revenue and Expenditure: Holiday Resorts, Sport Facilities and Swimming Pools
3.27.7 Employee Statistics
The Sport and Recreation Section has 204 posts on the organisational structure approved by
Council on 31 May 2018 of which 80 posts are frozen and 124 posts funded at year-end. The
section had 66 filled and 58 vacant posts at year-end which resulted in a 46.8% vacancy rate.
Table 108: Employees - Sport and Recreation
2017/18
Number of
Employees
Number of
Posts
Number of
Frozen Posts
(Unfunded)
Number of
Approved
Funded Posts
Number of
Employees
Number of
Vacancies Vacancy Rate
Column
Ref.A B C D E F G H
1 T18 - T20 0 0 0 0 0 0 0.0%
2 T15 - T17 4 1 0 1 1 0 0.0%
3 T12 - T14 0 0 0 0 0 0 0.0%
4 T09 - T11 4 3 1 2 2 0 0.0%
5 T06 - T08 42 50 21 29 18 11 37.9%
6 T03 - T05 168 150 58 92 45 47 51.1%
7 T01 - T02 0 0 0 0 0 0 0.0%
8 Total 218 204 80 124 66 58 46.8%
2018/19
Employees: Sport and Recreation
Serial
No.
Job Level
Original
Approved
Budget
Final
Adjustments
Budget
Actual
Results
Positive /
(Negative) %
Variance
Between
Column D & E
Column
Ref.A B C D E F
1 Operating Revenue (2,474,913) (3,848,328) (4,290,603) (3,202,244) -25.4%
2 Total Operating Revenue (2,474,913) (3,848,328) (4,290,603) (3,202,244) -25.4%
3 Employee Related Costs 40,144,464 50,843,022 49,026,601 49,400,834 -0.8%
4 Impairment Losses on Financial Assets 0 0 0 0 #DIV/0!
5 Interest Paid 0 0 0 0 #DIV/0!
6 Contracted Services 9,505,422 10,869,009 12,643,684 11,944,848 5.5%
7 Depreciation and Provisions 2,822,264 6,004,340 6,004,348 6,457,512 -7.5%
8 Inventory 1,573,756 1,474,114 1,870,599 3,579,804 -91.4%
9 Operational Costs 16,613,145 25,210,630 32,732,424 24,412,285 25.4%
10 Total Operating Expenditure 70,659,051 94,401,115 102,277,656 95,795,283 6.3%
11 Operating (Surplus) / Deficit 68,184,139 90,552,787 97,987,053 92,593,039 -5.5%
Operating Revenue and Expenditure: Holiday Resorts, Sport Facilities and Swimming Pools
Serial
No. Decription
2017/18
Actual
Results
2018/19
Annual Report 2018/19
177
COMPONENT I: CORPORATE POLICY OFFICES AND OTHER SERVICES
3.28 INTRODUCTION
In terms of Section 4(2) of the Local Government: Municipal Systems Act, 2000 (Act 32 of
2000), a municipal council must, within the municipality’s financial and administrative
capacity, and having regard for practical considerations:
Exercise the municipality’s executive and legislative authority and use the resources of
the municipality in the best interests of the community;
Provide, without favour or prejudice, democratic and accountable government;
Encourage the involvement of the community;
Strive to ensure that municipal services are provided to the community in a financially
and environmentally sustainable manner;
Consult the community on the level, quality, range and impact of municipal services and
the available options for service delivery;
Give members of the community equitable access to the municipal services to which
they are entitled;
Promote and undertake development in the municipality;
Promote gender equity in the exercise of the municipality’s executive and legislative
authority;
Promote a safe and healthy environment in the municipality; and
Contribute, together with other organs of state, to the progressive realisation of the
fundamental rights contained in Sections 24, 25, 26, 27 and 29 of the Constitution of the
Republic of South Africa, 1996 (Act 108 of 1996).
3.29 EXECUTIVE AND COUNCIL SUPPORT
A council must annually review:
The needs of the community;
Its priorities to meet those needs;
Its processes for involving the community;
Its organisational and delivery mechanisms for meeting those needs; and
Its overall performance in achieving the objects of local government as set out in the
Constitution of the Republic of South Africa, 1996 (Act 108 of 1996).
In terms of the Local Government: Municipal Structures Act, 1998 (Act 117 of 1998), the
municipal council must elect an executive mayor and other office-bearers. The executive
mayor appoints a mayoral committee to assist the executive mayor. The municipal council may
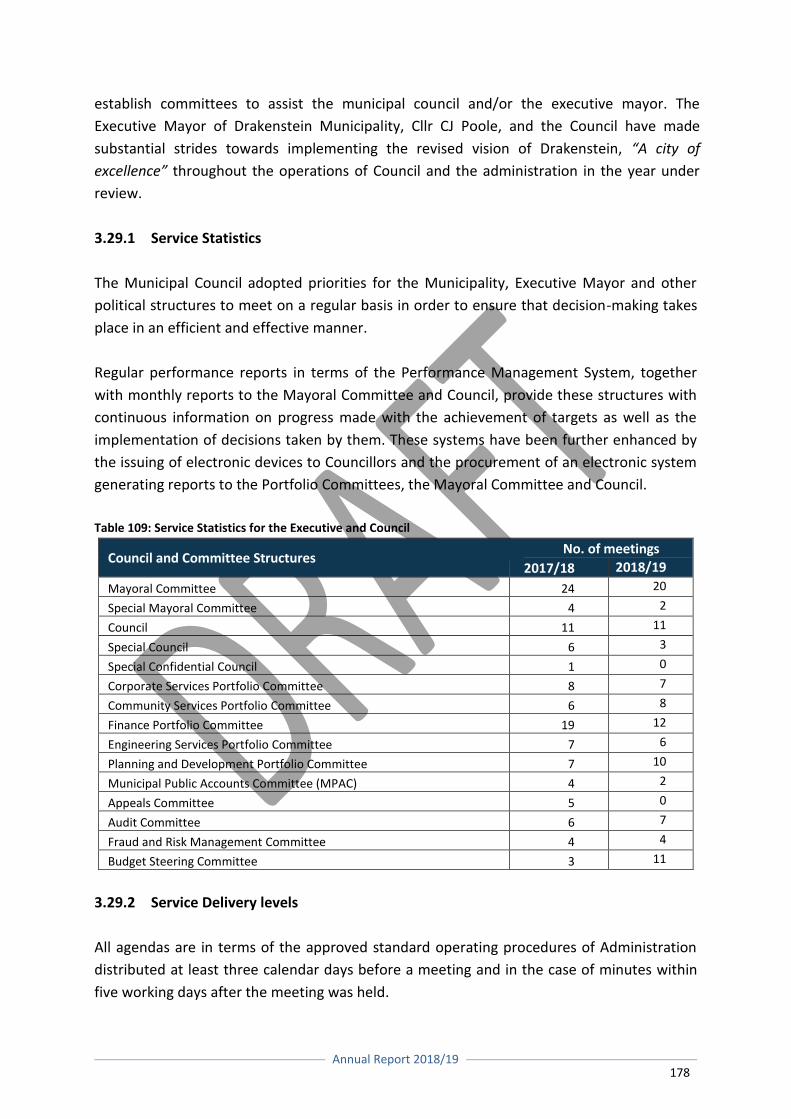
Annual Report 2018/19
178
establish committees to assist the municipal council and/or the executive mayor. The
Executive Mayor of Drakenstein Municipality, Cllr CJ Poole, and the Council have made
substantial strides towards implementing the revised vision of Drakenstein, “A city of
excellence” throughout the operations of Council and the administration in the year under
review.
3.29.1 Service Statistics
The Municipal Council adopted priorities for the Municipality, Executive Mayor and other
political structures to meet on a regular basis in order to ensure that decision-making takes
place in an efficient and effective manner.
Regular performance reports in terms of the Performance Management System, together
with monthly reports to the Mayoral Committee and Council, provide these structures with
continuous information on progress made with the achievement of targets as well as the
implementation of decisions taken by them. These systems have been further enhanced by
the issuing of electronic devices to Councillors and the procurement of an electronic system
generating reports to the Portfolio Committees, the Mayoral Committee and Council.
Table 109: Service Statistics for the Executive and Council
Council and Committee Structures No. of meetings
2017/18 2018/19
Mayoral Committee 24 20
Special Mayoral Committee 4 2
Council 11 11
Special Council 6 3
Special Confidential Council 1 0
Corporate Services Portfolio Committee 8 7
Community Services Portfolio Committee 6 8
Finance Portfolio Committee 19 12
Engineering Services Portfolio Committee 7 6
Planning and Development Portfolio Committee 7 10
Municipal Public Accounts Committee (MPAC) 4 2
Appeals Committee 5 0
Audit Committee 6 7
Fraud and Risk Management Committee 4 4
Budget Steering Committee 3 11
3.29.2 Service Delivery levels
All agendas are in terms of the approved standard operating procedures of Administration
distributed at least three calendar days before a meeting and in the case of minutes within
five working days after the meeting was held.
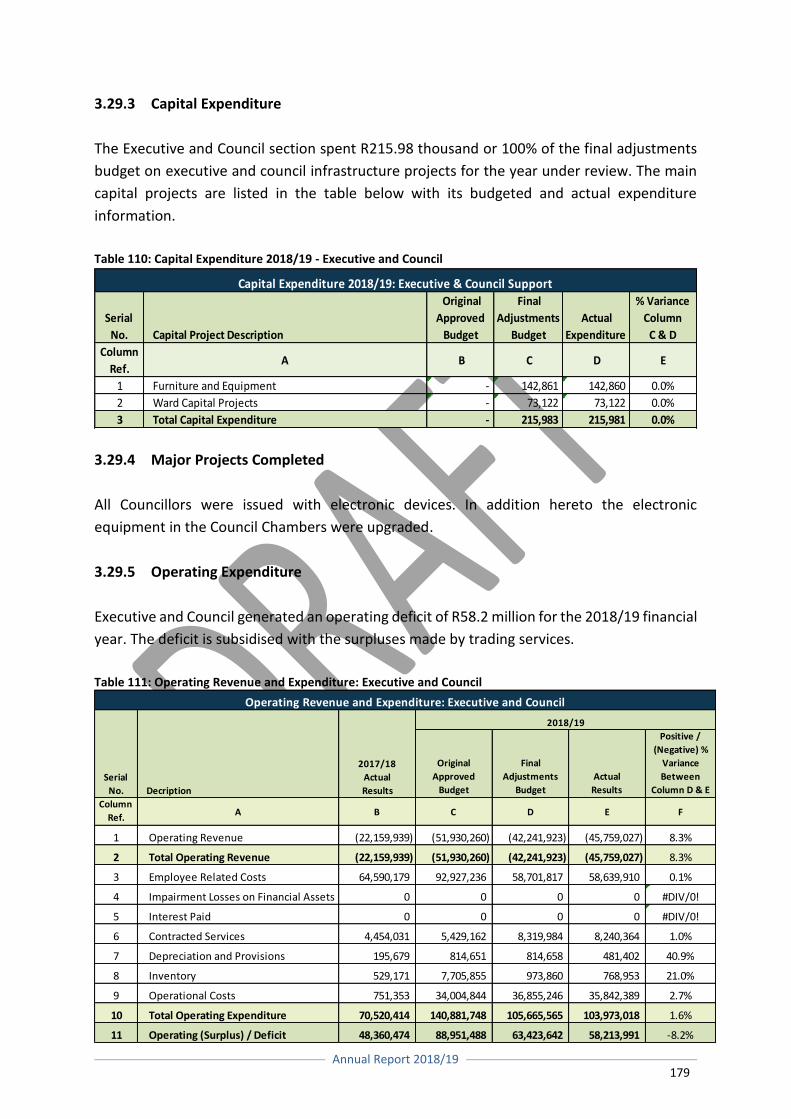
Annual Report 2018/19
179
3.29.3 Capital Expenditure
The Executive and Council section spent R215.98 thousand or 100% of the final adjustments
budget on executive and council infrastructure projects for the year under review. The main
capital projects are listed in the table below with its budgeted and actual expenditure
information.
Table 110: Capital Expenditure 2018/19 - Executive and Council
3.29.4 Major Projects Completed
All Councillors were issued with electronic devices. In addition hereto the electronic
equipment in the Council Chambers were upgraded.
3.29.5 Operating Expenditure
Executive and Council generated an operating deficit of R58.2 million for the 2018/19 financial
year. The deficit is subsidised with the surpluses made by trading services.
Table 111: Operating Revenue and Expenditure: Executive and Council
Serial
No. Capital Project Description
Original
Approved
Budget
Final
Adjustments
Budget
Actual
Expenditure
% Variance
Column
C & D
Column
Ref.A B C D E
1 Furniture and Equipment - 142,861 142,860 0.0%
2 Ward Capital Projects - 73,122 73,122 0.0%
3 Total Capital Expenditure - 215,983 215,981 0.0%
Capital Expenditure 2018/19: Executive & Council Support
Original
Approved
Budget
Final
Adjustments
Budget
Actual
Results
Positive /
(Negative) %
Variance
Between
Column D & E
Column
Ref.A B C D E F
1 Operating Revenue (22,159,939) (51,930,260) (42,241,923) (45,759,027) 8.3%
2 Total Operating Revenue (22,159,939) (51,930,260) (42,241,923) (45,759,027) 8.3%
3 Employee Related Costs 64,590,179 92,927,236 58,701,817 58,639,910 0.1%
4 Impairment Losses on Financial Assets 0 0 0 0 #DIV/0!
5 Interest Paid 0 0 0 0 #DIV/0!
6 Contracted Services 4,454,031 5,429,162 8,319,984 8,240,364 1.0%
7 Depreciation and Provisions 195,679 814,651 814,658 481,402 40.9%
8 Inventory 529,171 7,705,855 973,860 768,953 21.0%
9 Operational Costs 751,353 34,004,844 36,855,246 35,842,389 2.7%
10 Total Operating Expenditure 70,520,414 140,881,748 105,665,565 103,973,018 1.6%
11 Operating (Surplus) / Deficit 48,360,474 88,951,488 63,423,642 58,213,991 -8.2%
Operating Revenue and Expenditure: Executive and Council
Serial
No. Decription
2017/18
Actual
Results
2018/19
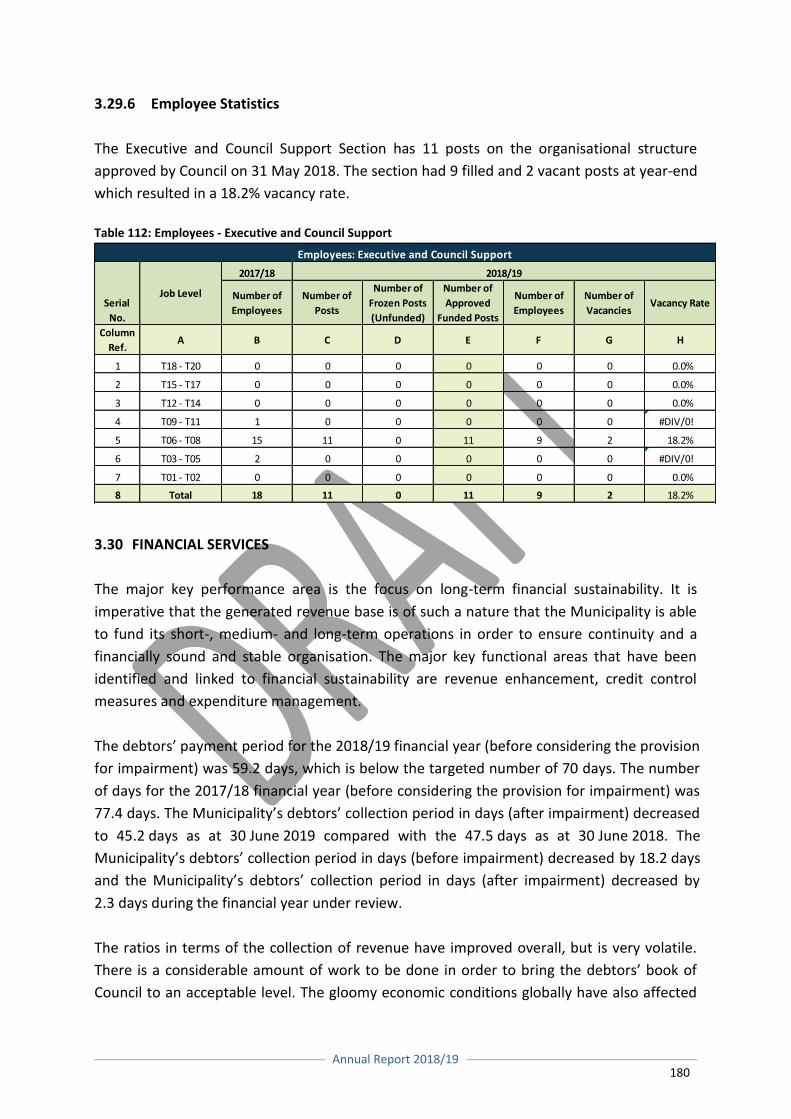
Annual Report 2018/19
180
3.29.6 Employee Statistics
The Executive and Council Support Section has 11 posts on the organisational structure
approved by Council on 31 May 2018. The section had 9 filled and 2 vacant posts at year-end
which resulted in a 18.2% vacancy rate.
Table 112: Employees - Executive and Council Support
3.30 FINANCIAL SERVICES
The major key performance area is the focus on long-term financial sustainability. It is
imperative that the generated revenue base is of such a nature that the Municipality is able
to fund its short-, medium- and long-term operations in order to ensure continuity and a
financially sound and stable organisation. The major key functional areas that have been
identified and linked to financial sustainability are revenue enhancement, credit control
measures and expenditure management.
The debtors’ payment period for the 2018/19 financial year (before considering the provision
for impairment) was 59.2 days, which is below the targeted number of 70 days. The number
of days for the 2017/18 financial year (before considering the provision for impairment) was
77.4 days. The Municipality’s debtors’ collection period in days (after impairment) decreased
to 45.2 days as at 30 June 2019 compared with the 47.5 days as at 30 June 2018. The
Municipality’s debtors’ collection period in days (before impairment) decreased by 18.2 days
and the Municipality’s debtors’ collection period in days (after impairment) decreased by
2.3 days during the financial year under review.
The ratios in terms of the collection of revenue have improved overall, but is very volatile.
There is a considerable amount of work to be done in order to bring the debtors’ book of
Council to an acceptable level. The gloomy economic conditions globally have also affected
2017/18
Number of
Employees
Number of
Posts
Number of
Frozen Posts
(Unfunded)
Number of
Approved
Funded Posts
Number of
Employees
Number of
Vacancies Vacancy Rate
Column
Ref.A B C D E F G H
1 T18 - T20 0 0 0 0 0 0 0.0%
2 T15 - T17 0 0 0 0 0 0 0.0%
3 T12 - T14 0 0 0 0 0 0 0.0%
4 T09 - T11 1 0 0 0 0 0 #DIV/0!
5 T06 - T08 15 11 0 11 9 2 18.2%
6 T03 - T05 2 0 0 0 0 0 #DIV/0!
7 T01 - T02 0 0 0 0 0 0 0.0%
8 Total 18 11 0 11 9 2 18.2%
2018/19
Employees: Executive and Council Support
Serial
No.
Job Level
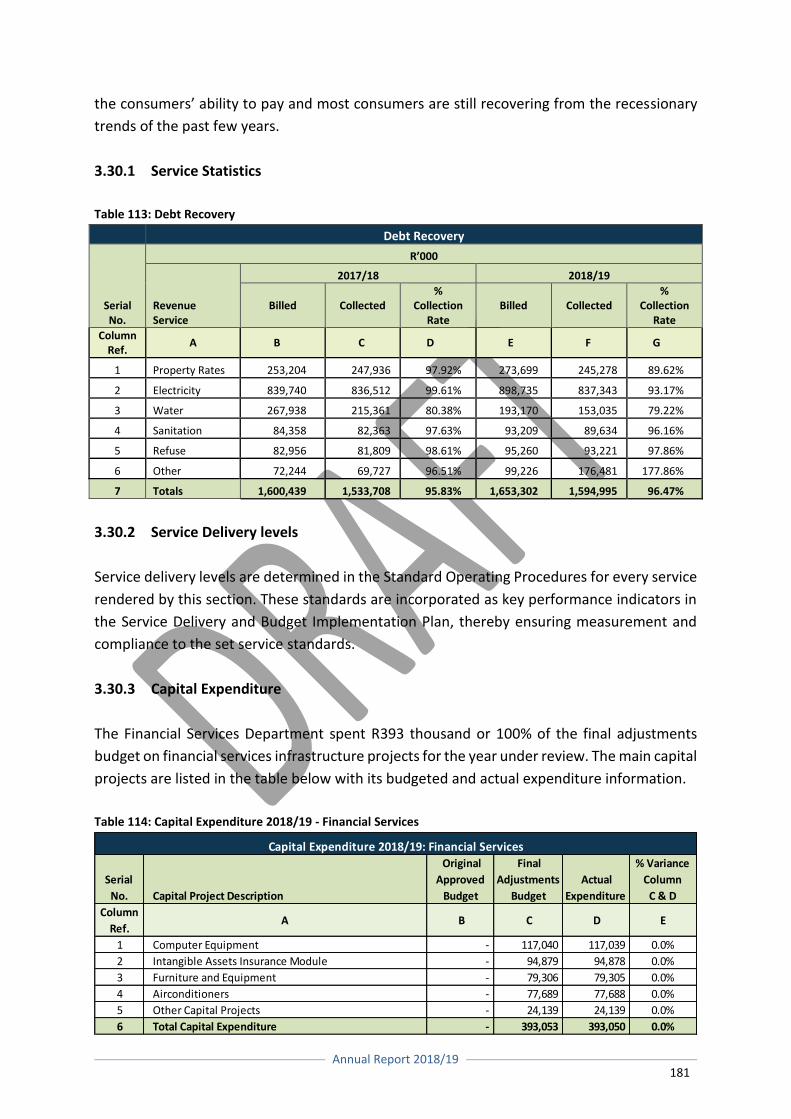
Annual Report 2018/19
181
the consumers’ ability to pay and most consumers are still recovering from the recessionary
trends of the past few years.
3.30.1 Service Statistics
Table 113: Debt Recovery
Debt Recovery
Serial No.
R’000
Revenue Service
2017/18 2018/19
Billed Collected %
Collection Rate
Billed Collected %
Collection Rate
Column Ref.
A B C D E F G
1 Property Rates 253,204 247,936 97.92% 273,699 245,278 89.62%
2 Electricity 839,740 836,512 99.61% 898,735 837,343 93.17%
3 Water 267,938 215,361 80.38% 193,170 153,035 79.22%
4 Sanitation 84,358 82,363 97.63% 93,209 89,634 96.16%
5 Refuse 82,956 81,809 98.61% 95,260 93,221 97.86%
6 Other 72,244 69,727 96.51% 99,226 176,481 177.86%
7 Totals 1,600,439 1,533,708 95.83% 1,653,302 1,594,995 96.47%
3.30.2 Service Delivery levels
Service delivery levels are determined in the Standard Operating Procedures for every service
rendered by this section. These standards are incorporated as key performance indicators in
the Service Delivery and Budget Implementation Plan, thereby ensuring measurement and
compliance to the set service standards.
3.30.3 Capital Expenditure
The Financial Services Department spent R393 thousand or 100% of the final adjustments
budget on financial services infrastructure projects for the year under review. The main capital
projects are listed in the table below with its budgeted and actual expenditure information.
Table 114: Capital Expenditure 2018/19 - Financial Services
Serial
No. Capital Project Description
Original
Approved
Budget
Final
Adjustments
Budget
Actual
Expenditure
% Variance
Column
C & D
Column
Ref.A B C D E
1 Computer Equipment - 117,040 117,039 0.0%
2 Intangible Assets Insurance Module - 94,879 94,878 0.0%
3 Furniture and Equipment - 79,306 79,305 0.0%
4 Airconditioners - 77,689 77,688 0.0%
5 Other Capital Projects - 24,139 24,139 0.0%
6 Total Capital Expenditure - 393,053 393,050 0.0%
Capital Expenditure 2018/19: Financial Services
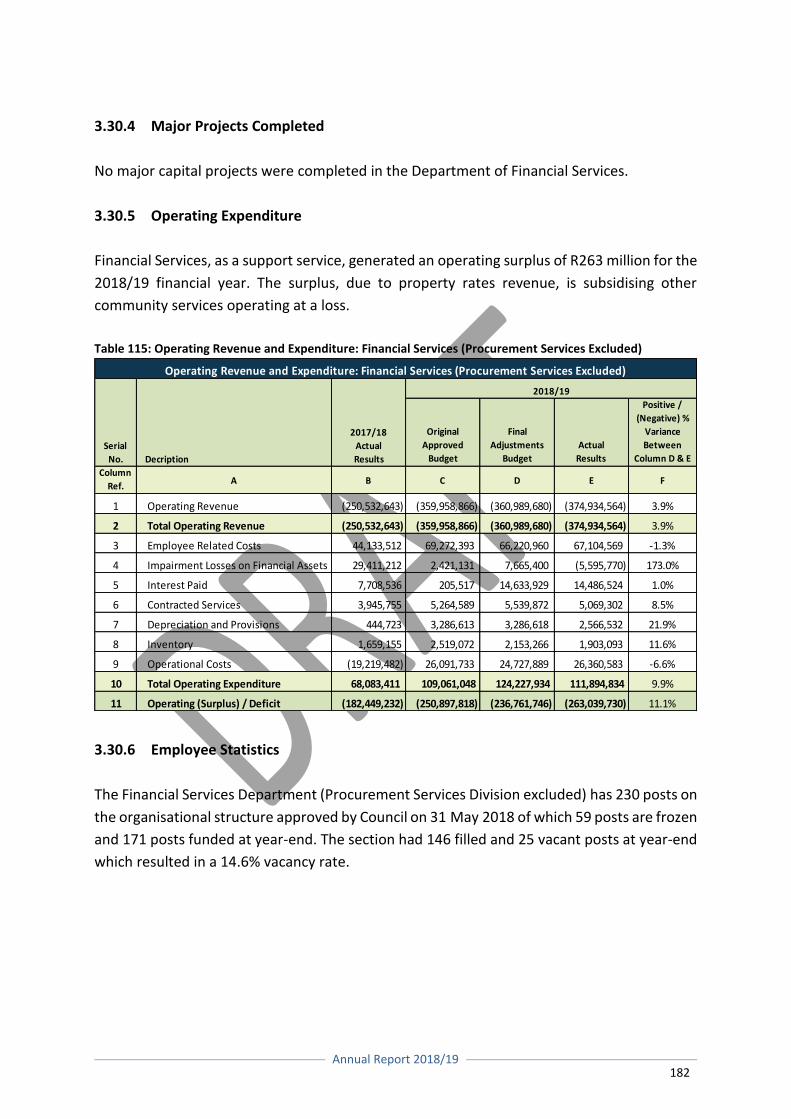
Annual Report 2018/19
182
3.30.4 Major Projects Completed
No major capital projects were completed in the Department of Financial Services.
3.30.5 Operating Expenditure
Financial Services, as a support service, generated an operating surplus of R263 million for the
2018/19 financial year. The surplus, due to property rates revenue, is subsidising other
community services operating at a loss.
Table 115: Operating Revenue and Expenditure: Financial Services (Procurement Services Excluded)
3.30.6 Employee Statistics
The Financial Services Department (Procurement Services Division excluded) has 230 posts on
the organisational structure approved by Council on 31 May 2018 of which 59 posts are frozen
and 171 posts funded at year-end. The section had 146 filled and 25 vacant posts at year-end
which resulted in a 14.6% vacancy rate.
Original
Approved
Budget
Final
Adjustments
Budget
Actual
Results
Positive /
(Negative) %
Variance
Between
Column D & E
Column
Ref.A B C D E F
1 Operating Revenue (250,532,643) (359,958,866) (360,989,680) (374,934,564) 3.9%
2 Total Operating Revenue (250,532,643) (359,958,866) (360,989,680) (374,934,564) 3.9%
3 Employee Related Costs 44,133,512 69,272,393 66,220,960 67,104,569 -1.3%
4 Impairment Losses on Financial Assets 29,411,212 2,421,131 7,665,400 (5,595,770) 173.0%
5 Interest Paid 7,708,536 205,517 14,633,929 14,486,524 1.0%
6 Contracted Services 3,945,755 5,264,589 5,539,872 5,069,302 8.5%
7 Depreciation and Provisions 444,723 3,286,613 3,286,618 2,566,532 21.9%
8 Inventory 1,659,155 2,519,072 2,153,266 1,903,093 11.6%
9 Operational Costs (19,219,482) 26,091,733 24,727,889 26,360,583 -6.6%
10 Total Operating Expenditure 68,083,411 109,061,048 124,227,934 111,894,834 9.9%
11 Operating (Surplus) / Deficit (182,449,232) (250,897,818) (236,761,746) (263,039,730) 11.1%
Operating Revenue and Expenditure: Financial Services (Procurement Services Excluded)
Serial
No. Decription
2017/18
Actual
Results
2018/19
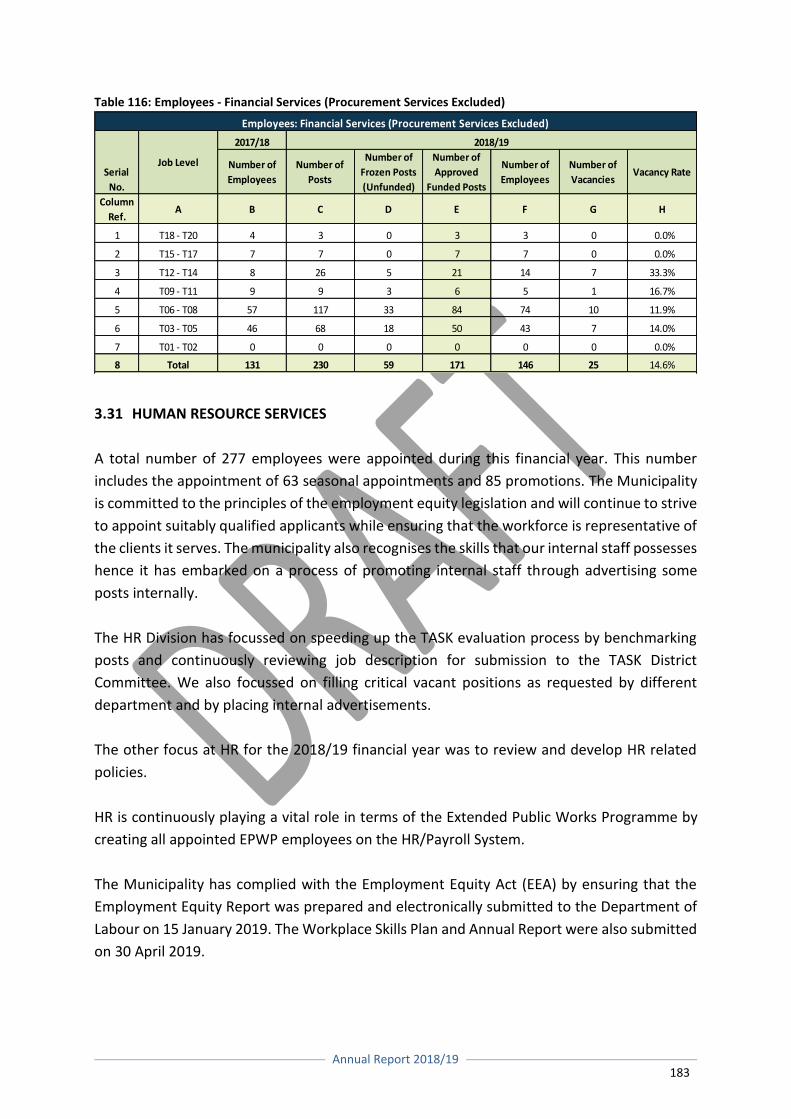
Annual Report 2018/19
183
Table 116: Employees - Financial Services (Procurement Services Excluded)
3.31 HUMAN RESOURCE SERVICES
A total number of 277 employees were appointed during this financial year. This number
includes the appointment of 63 seasonal appointments and 85 promotions. The Municipality
is committed to the principles of the employment equity legislation and will continue to strive
to appoint suitably qualified applicants while ensuring that the workforce is representative of
the clients it serves. The municipality also recognises the skills that our internal staff possesses
hence it has embarked on a process of promoting internal staff through advertising some
posts internally.
The HR Division has focussed on speeding up the TASK evaluation process by benchmarking
posts and continuously reviewing job description for submission to the TASK District
Committee. We also focussed on filling critical vacant positions as requested by different
department and by placing internal advertisements.
The other focus at HR for the 2018/19 financial year was to review and develop HR related
policies.
HR is continuously playing a vital role in terms of the Extended Public Works Programme by
creating all appointed EPWP employees on the HR/Payroll System.
The Municipality has complied with the Employment Equity Act (EEA) by ensuring that the
Employment Equity Report was prepared and electronically submitted to the Department of
Labour on 15 January 2019. The Workplace Skills Plan and Annual Report were also submitted
on 30 April 2019.
2017/18
Number of
Employees
Number of
Posts
Number of
Frozen Posts
(Unfunded)
Number of
Approved
Funded Posts
Number of
Employees
Number of
Vacancies Vacancy Rate
Column
Ref.A B C D E F G H
1 T18 - T20 4 3 0 3 3 0 0.0%
2 T15 - T17 7 7 0 7 7 0 0.0%
3 T12 - T14 8 26 5 21 14 7 33.3%
4 T09 - T11 9 9 3 6 5 1 16.7%
5 T06 - T08 57 117 33 84 74 10 11.9%
6 T03 - T05 46 68 18 50 43 7 14.0%
7 T01 - T02 0 0 0 0 0 0 0.0%
8 Total 131 230 59 171 146 25 14.6%
2018/19
Employees: Financial Services (Procurement Services Excluded)
Serial
No.
Job Level
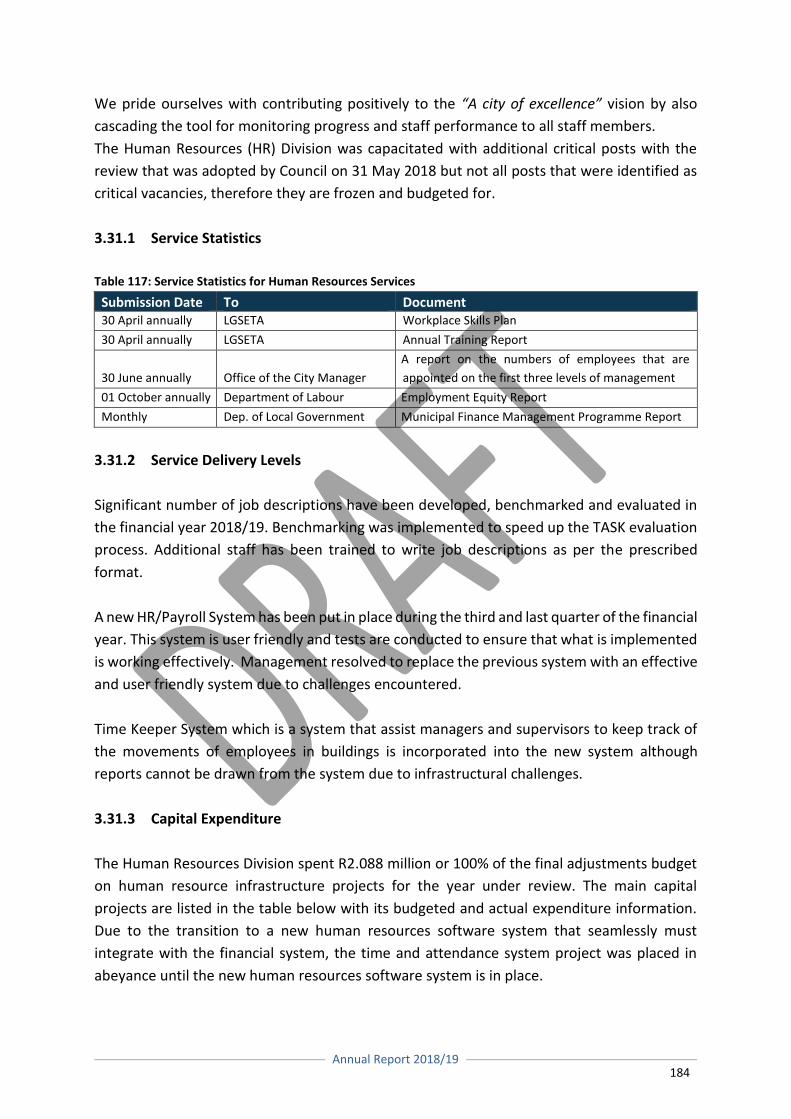
Annual Report 2018/19
184
We pride ourselves with contributing positively to the “A city of excellence” vision by also
cascading the tool for monitoring progress and staff performance to all staff members.
The Human Resources (HR) Division was capacitated with additional critical posts with the
review that was adopted by Council on 31 May 2018 but not all posts that were identified as
critical vacancies, therefore they are frozen and budgeted for.
3.31.1 Service Statistics
Table 117: Service Statistics for Human Resources Services
Submission Date To Document 30 April annually LGSETA Workplace Skills Plan
30 April annually LGSETA Annual Training Report
30 June annually Office of the City Manager
A report on the numbers of employees that are
appointed on the first three levels of management
01 October annually Department of Labour Employment Equity Report
Monthly Dep. of Local Government Municipal Finance Management Programme Report
3.31.2 Service Delivery Levels
Significant number of job descriptions have been developed, benchmarked and evaluated in
the financial year 2018/19. Benchmarking was implemented to speed up the TASK evaluation
process. Additional staff has been trained to write job descriptions as per the prescribed
format.
A new HR/Payroll System has been put in place during the third and last quarter of the financial
year. This system is user friendly and tests are conducted to ensure that what is implemented
is working effectively. Management resolved to replace the previous system with an effective
and user friendly system due to challenges encountered.
Time Keeper System which is a system that assist managers and supervisors to keep track of
the movements of employees in buildings is incorporated into the new system although
reports cannot be drawn from the system due to infrastructural challenges.
3.31.3 Capital Expenditure
The Human Resources Division spent R2.088 million or 100% of the final adjustments budget
on human resource infrastructure projects for the year under review. The main capital
projects are listed in the table below with its budgeted and actual expenditure information.
Due to the transition to a new human resources software system that seamlessly must
integrate with the financial system, the time and attendance system project was placed in
abeyance until the new human resources software system is in place.
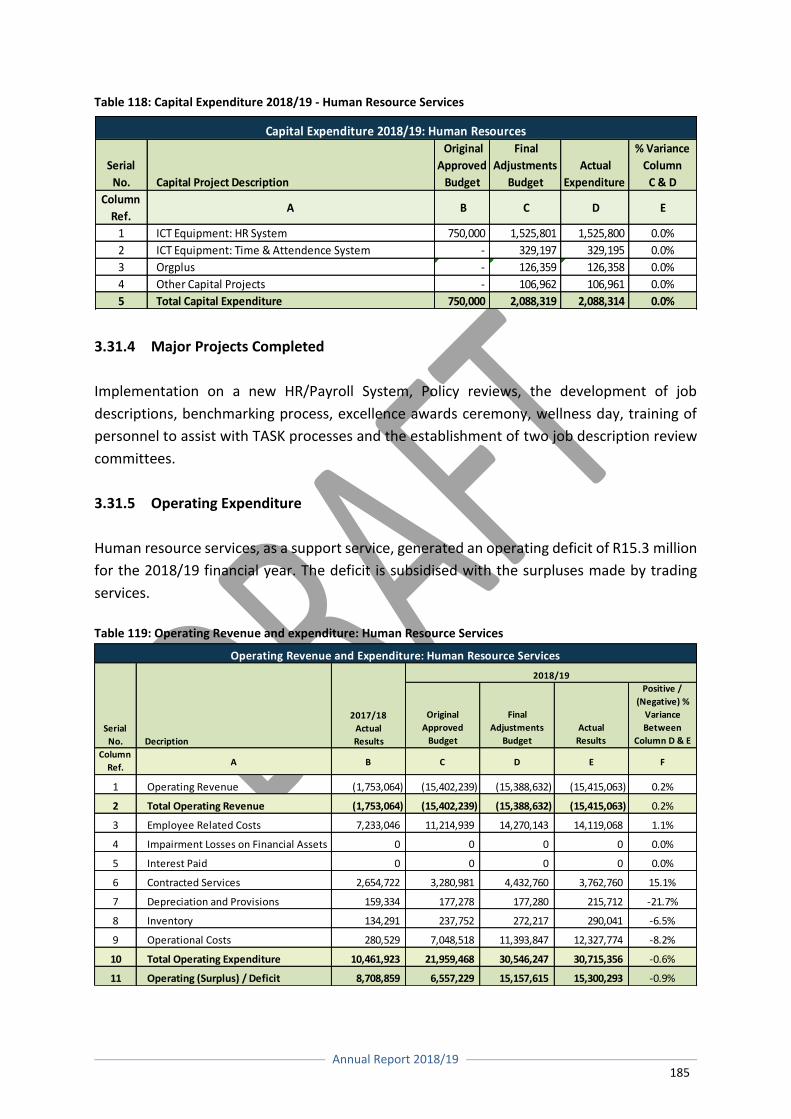
Annual Report 2018/19
185
Table 118: Capital Expenditure 2018/19 - Human Resource Services
3.31.4 Major Projects Completed
Implementation on a new HR/Payroll System, Policy reviews, the development of job
descriptions, benchmarking process, excellence awards ceremony, wellness day, training of
personnel to assist with TASK processes and the establishment of two job description review
committees.
3.31.5 Operating Expenditure
Human resource services, as a support service, generated an operating deficit of R15.3 million
for the 2018/19 financial year. The deficit is subsidised with the surpluses made by trading
services.
Table 119: Operating Revenue and expenditure: Human Resource Services
Serial
No. Capital Project Description
Original
Approved
Budget
Final
Adjustments
Budget
Actual
Expenditure
% Variance
Column
C & D
Column
Ref.A B C D E
1 ICT Equipment: HR System 750,000 1,525,801 1,525,800 0.0%
2 ICT Equipment: Time & Attendence System - 329,197 329,195 0.0%
3 Orgplus - 126,359 126,358 0.0%
4 Other Capital Projects - 106,962 106,961 0.0%
5 Total Capital Expenditure 750,000 2,088,319 2,088,314 0.0%
Capital Expenditure 2018/19: Human Resources
Original
Approved
Budget
Final
Adjustments
Budget
Actual
Results
Positive /
(Negative) %
Variance
Between
Column D & E
Column
Ref.A B C D E F
1 Operating Revenue (1,753,064) (15,402,239) (15,388,632) (15,415,063) 0.2%
2 Total Operating Revenue (1,753,064) (15,402,239) (15,388,632) (15,415,063) 0.2%
3 Employee Related Costs 7,233,046 11,214,939 14,270,143 14,119,068 1.1%
4 Impairment Losses on Financial Assets 0 0 0 0 0.0%
5 Interest Paid 0 0 0 0 0.0%
6 Contracted Services 2,654,722 3,280,981 4,432,760 3,762,760 15.1%
7 Depreciation and Provisions 159,334 177,278 177,280 215,712 -21.7%
8 Inventory 134,291 237,752 272,217 290,041 -6.5%
9 Operational Costs 280,529 7,048,518 11,393,847 12,327,774 -8.2%
10 Total Operating Expenditure 10,461,923 21,959,468 30,546,247 30,715,356 -0.6%
11 Operating (Surplus) / Deficit 8,708,859 6,557,229 15,157,615 15,300,293 -0.9%
Operating Revenue and Expenditure: Human Resource Services
Serial
No. Decription
2017/18
Actual
Results
2018/19
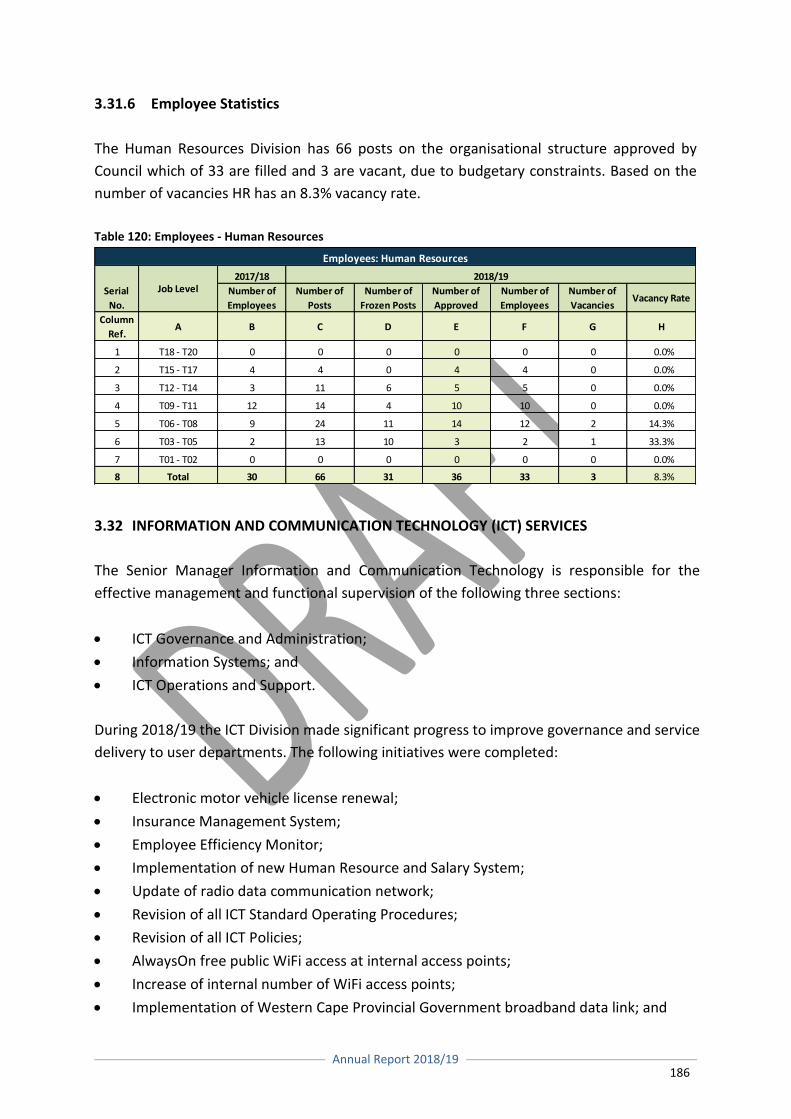
Annual Report 2018/19
186
3.31.6 Employee Statistics
The Human Resources Division has 66 posts on the organisational structure approved by
Council which of 33 are filled and 3 are vacant, due to budgetary constraints. Based on the
number of vacancies HR has an 8.3% vacancy rate.
Table 120: Employees - Human Resources
3.32 INFORMATION AND COMMUNICATION TECHNOLOGY (ICT) SERVICES
The Senior Manager Information and Communication Technology is responsible for the
effective management and functional supervision of the following three sections:
ICT Governance and Administration;
Information Systems; and
ICT Operations and Support.
During 2018/19 the ICT Division made significant progress to improve governance and service
delivery to user departments. The following initiatives were completed:
Electronic motor vehicle license renewal;
Insurance Management System;
Employee Efficiency Monitor;
Implementation of new Human Resource and Salary System;
Update of radio data communication network;
Revision of all ICT Standard Operating Procedures;
Revision of all ICT Policies;
AlwaysOn free public WiFi access at internal access points;
Increase of internal number of WiFi access points;
Implementation of Western Cape Provincial Government broadband data link; and
2017/18
Number of
Employees
Number of
Posts
Number of
Frozen Posts
Number of
Approved
Number of
Employees
Number of
Vacancies Vacancy Rate
Column
Ref.A B C D E F G H
1 T18 - T20 0 0 0 0 0 0 0.0%
2 T15 - T17 4 4 0 4 4 0 0.0%
3 T12 - T14 3 11 6 5 5 0 0.0%
4 T09 - T11 12 14 4 10 10 0 0.0%
5 T06 - T08 9 24 11 14 12 2 14.3%
6 T03 - T05 2 13 10 3 2 1 33.3%
7 T01 - T02 0 0 0 0 0 0 0.0%
8 Total 30 66 31 36 33 3 8.3%
2018/19
Employees: Human Resources
Serial
No.
Job Level
Annual Report 2018/19
187
Upgrading of the Internet access speed and improved e-mail scanning.
3.32.1 ICT Governance and Administration
The section is responsible for the:
Administration of the ICT Division;
Processing of financial data;
Technical management of the processes related to the SOLAR financial system; and
Development and implementation of governance mechanisms and controls for the
management of information and communication technology.
In the year under review, measures were taken to improve the management and control of
the use of information and communication technology and tighten the controls for the
processing of financial data. A newly developed ICT Master Framework was consulted and
adopted through Labour Relations and finalised for approval by Council. A register of ICT
projects was implemented to keep track of all related initiatives in the municipality. The ICT
Strategic Plan was revised on a quarterly basis in order to keep it current with development
in the municipality.
The head of the section, due to the nature of his expertise in the field of Corporate Governance
of ICT, took part in the following:
Hessequa Municipality in the development and implementation of ICT related policies
and practices;
Assisted the Department of Public Service and Administration in the revision of the
Public Service Corporate Governance of ICT Policy Framework with its related
implementation guideline and assessment standard;
Presented at the South African chapter of the Association of African Public
Administration and Management (AAPAM) seminar on the use of technology in citizen
engagement; and
Presented at the AAPAM 39th Round Table in Botswana on the same topic.
3.32.2 Information Systems
Information Systems are primarily responsible for:
Business process redesign and optimisation;
Management of business application systems and databases, developed both internally
as well externally.
Annual Report 2018/19
188
Development and maintenance of an Enterprise Architecture in Business Application
Systems; and
Strategic oversight of municipal GIS.
The section plays a key role in the strategic direction of ICT within the municipality and as such
is consulted on key municipal deliverables.
In the previous financial year (2017/18) this section spearheaded the review of the
municipality’s mission critical systems and recommended the replacement of three
systems that failed to meet the municipality’s needs. Subsequently – in the current
year under review – this section:
Coached the replacement of the Asset Management and Service Management
System, as well as reviewing the quality of the business requirements.
Coordinated the implementation of the new Payroll and HR System. The Payroll
and Time and Attendance Modules were implemented successfully. The Human
Resources Module as well as the Employee Self-Service Module are in the process
of implementation.
Documented and managed the implementation of the Electronic Motor Vehicle License
Renewal process. This new electronic process allows constituents to renew their motor
vehicle licenses online, thus eliminating the need to stand in long queues. It has a
significant positive impact in the community and is widely praised - as is evident in one
such publication in the Paarl Post newspaper.
3.32.3 Service Statistics
Operationally the section provides continuous support for the development, enhancement
and maintenance of more than 200 application systems and databases throughout the
Municipality.
3.32.4 Operations and Support
This section is responsible for:
Planning, implementing and managing the ICT operations environment;
Providing facilities to ensure the secure and optimal availability of all ICT infrastructure,
telecommunications systems and data;
ICT service desk and support function; and
All ICT hardware deployed within Drakenstein Municipality resides under this section.
All ICT service infrastructure are currently hosted in a server room with a backup site to ensure
continuity of service. This includes:
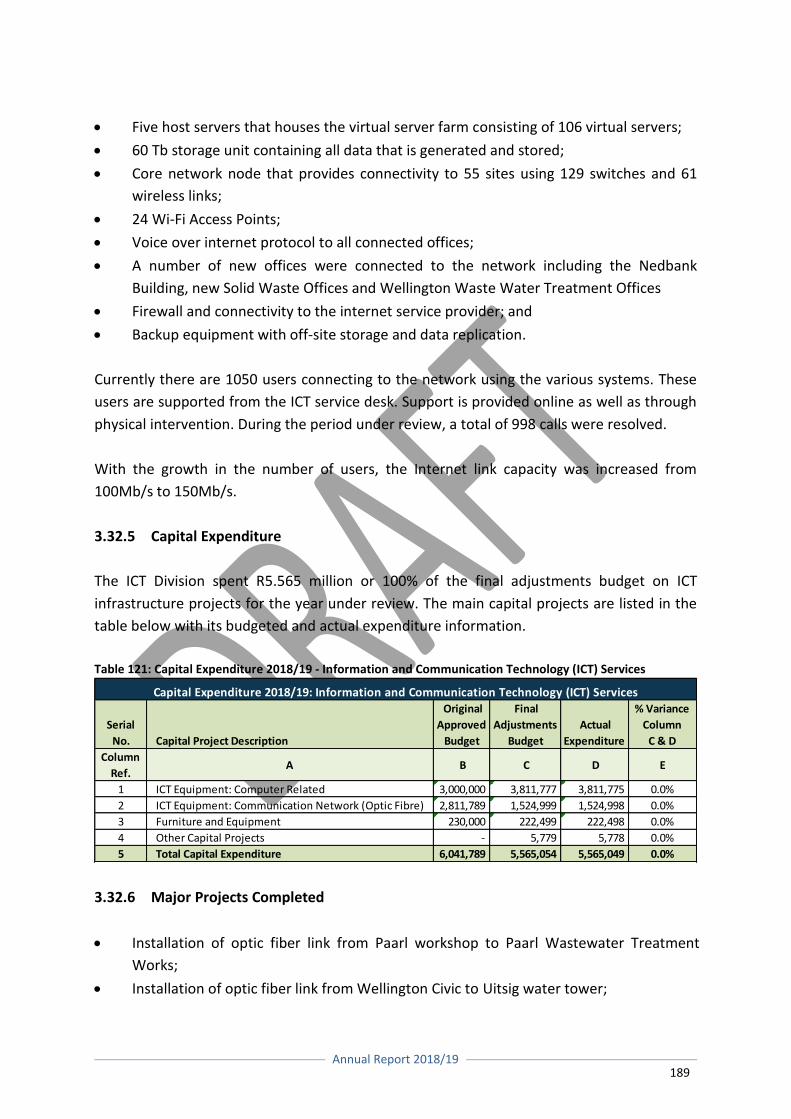
Annual Report 2018/19
189
Five host servers that houses the virtual server farm consisting of 106 virtual servers;
60 Tb storage unit containing all data that is generated and stored;
Core network node that provides connectivity to 55 sites using 129 switches and 61
wireless links;
24 Wi-Fi Access Points;
Voice over internet protocol to all connected offices;
A number of new offices were connected to the network including the Nedbank
Building, new Solid Waste Offices and Wellington Waste Water Treatment Offices
Firewall and connectivity to the internet service provider; and
Backup equipment with off-site storage and data replication.
Currently there are 1050 users connecting to the network using the various systems. These
users are supported from the ICT service desk. Support is provided online as well as through
physical intervention. During the period under review, a total of 998 calls were resolved.
With the growth in the number of users, the Internet link capacity was increased from
100Mb/s to 150Mb/s.
3.32.5 Capital Expenditure
The ICT Division spent R5.565 million or 100% of the final adjustments budget on ICT
infrastructure projects for the year under review. The main capital projects are listed in the
table below with its budgeted and actual expenditure information.
Table 121: Capital Expenditure 2018/19 - Information and Communication Technology (ICT) Services
3.32.6 Major Projects Completed
Installation of optic fiber link from Paarl workshop to Paarl Wastewater Treatment
Works;
Installation of optic fiber link from Wellington Civic to Uitsig water tower;
Serial
No. Capital Project Description
Original
Approved
Budget
Final
Adjustments
Budget
Actual
Expenditure
% Variance
Column
C & D
Column
Ref.A B C D E
1 ICT Equipment: Computer Related 3,000,000 3,811,777 3,811,775 0.0%
2 ICT Equipment: Communication Network (Optic Fibre) 2,811,789 1,524,999 1,524,998 0.0%
3 Furniture and Equipment 230,000 222,499 222,498 0.0%
4 Other Capital Projects - 5,779 5,778 0.0%
5 Total Capital Expenditure 6,041,789 5,565,054 5,565,049 0.0%
Capital Expenditure 2018/19: Information and Communication Technology (ICT) Services
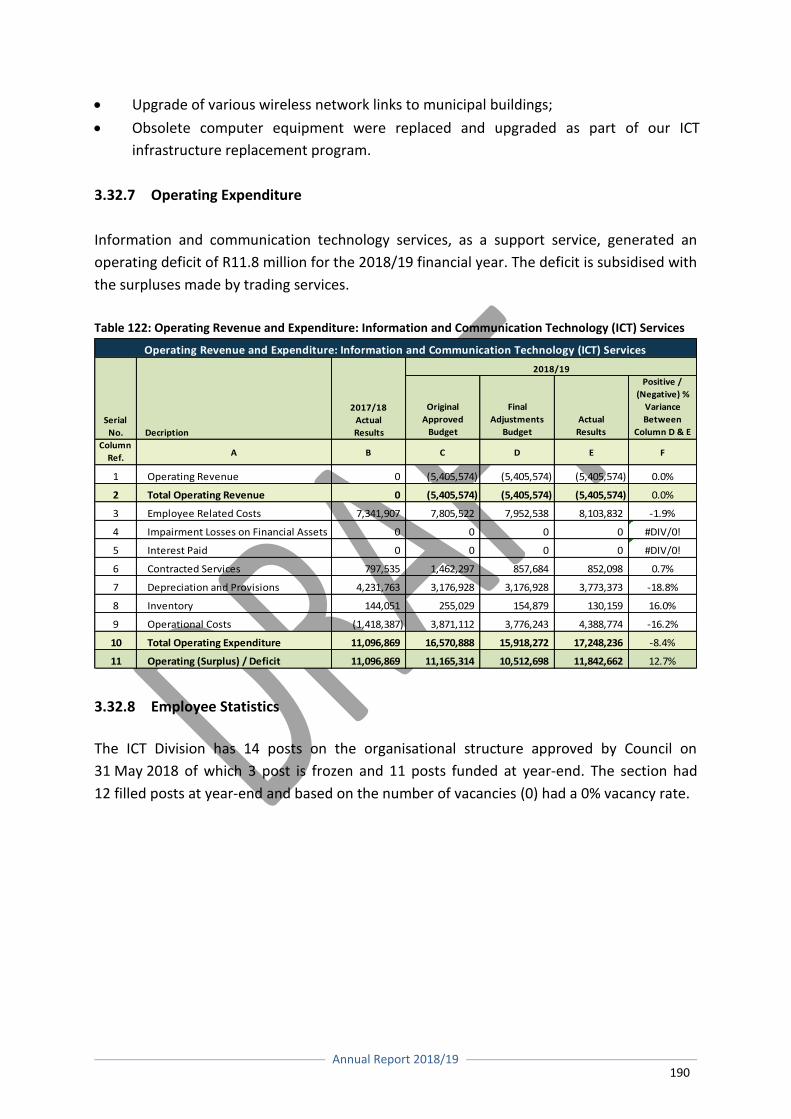
Annual Report 2018/19
190
Upgrade of various wireless network links to municipal buildings;
Obsolete computer equipment were replaced and upgraded as part of our ICT
infrastructure replacement program.
3.32.7 Operating Expenditure
Information and communication technology services, as a support service, generated an
operating deficit of R11.8 million for the 2018/19 financial year. The deficit is subsidised with
the surpluses made by trading services.
Table 122: Operating Revenue and Expenditure: Information and Communication Technology (ICT) Services
3.32.8 Employee Statistics
The ICT Division has 14 posts on the organisational structure approved by Council on
31 May 2018 of which 3 post is frozen and 11 posts funded at year-end. The section had
12 filled posts at year-end and based on the number of vacancies (0) had a 0% vacancy rate.
Original
Approved
Budget
Final
Adjustments
Budget
Actual
Results
Positive /
(Negative) %
Variance
Between
Column D & E
Column
Ref.A B C D E F
1 Operating Revenue 0 (5,405,574) (5,405,574) (5,405,574) 0.0%
2 Total Operating Revenue 0 (5,405,574) (5,405,574) (5,405,574) 0.0%
3 Employee Related Costs 7,341,907 7,805,522 7,952,538 8,103,832 -1.9%
4 Impairment Losses on Financial Assets 0 0 0 0 #DIV/0!
5 Interest Paid 0 0 0 0 #DIV/0!
6 Contracted Services 797,535 1,462,297 857,684 852,098 0.7%
7 Depreciation and Provisions 4,231,763 3,176,928 3,176,928 3,773,373 -18.8%
8 Inventory 144,051 255,029 154,879 130,159 16.0%
9 Operational Costs (1,418,387) 3,871,112 3,776,243 4,388,774 -16.2%
10 Total Operating Expenditure 11,096,869 16,570,888 15,918,272 17,248,236 -8.4%
11 Operating (Surplus) / Deficit 11,096,869 11,165,314 10,512,698 11,842,662 12.7%
Operating Revenue and Expenditure: Information and Communication Technology (ICT) Services
Serial
No. Decription
2017/18
Actual
Results
2018/19
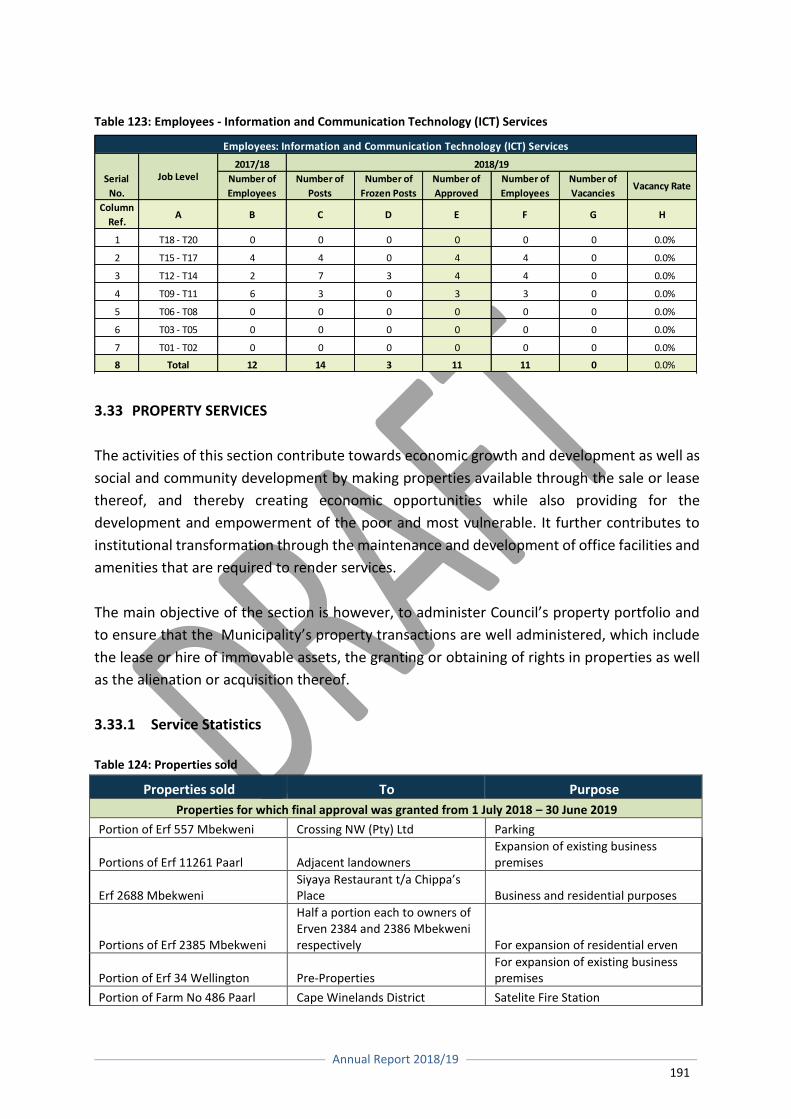
Annual Report 2018/19
191
Table 123: Employees - Information and Communication Technology (ICT) Services
3.33 PROPERTY SERVICES
The activities of this section contribute towards economic growth and development as well as
social and community development by making properties available through the sale or lease
thereof, and thereby creating economic opportunities while also providing for the
development and empowerment of the poor and most vulnerable. It further contributes to
institutional transformation through the maintenance and development of office facilities and
amenities that are required to render services.
The main objective of the section is however, to administer Council’s property portfolio and
to ensure that the Municipality’s property transactions are well administered, which include
the lease or hire of immovable assets, the granting or obtaining of rights in properties as well
as the alienation or acquisition thereof.
3.33.1 Service Statistics
Table 124: Properties sold
Properties sold To Purpose
Properties for which final approval was granted from 1 July 2018 – 30 June 2019
Portion of Erf 557 Mbekweni Crossing NW (Pty) Ltd Parking
Portions of Erf 11261 Paarl Adjacent landowners
Expansion of existing business premises
Erf 2688 Mbekweni Siyaya Restaurant t/a Chippa’s Place Business and residential purposes
Portions of Erf 2385 Mbekweni
Half a portion each to owners of Erven 2384 and 2386 Mbekweni respectively For expansion of residential erven
Portion of Erf 34 Wellington Pre-Properties
For expansion of existing business premises
Portion of Farm No 486 Paarl Cape Winelands District Satelite Fire Station
2017/18
Number of
Employees
Number of
Posts
Number of
Frozen Posts
Number of
Approved
Number of
Employees
Number of
Vacancies Vacancy Rate
Column
Ref.A B C D E F G H
1 T18 - T20 0 0 0 0 0 0 0.0%
2 T15 - T17 4 4 0 4 4 0 0.0%
3 T12 - T14 2 7 3 4 4 0 0.0%
4 T09 - T11 6 3 0 3 3 0 0.0%
5 T06 - T08 0 0 0 0 0 0 0.0%
6 T03 - T05 0 0 0 0 0 0 0.0%
7 T01 - T02 0 0 0 0 0 0 0.0%
8 Total 12 14 3 11 11 0 0.0%
2018/19
Employees: Information and Communication Technology (ICT) Services
Serial
No.
Job Level
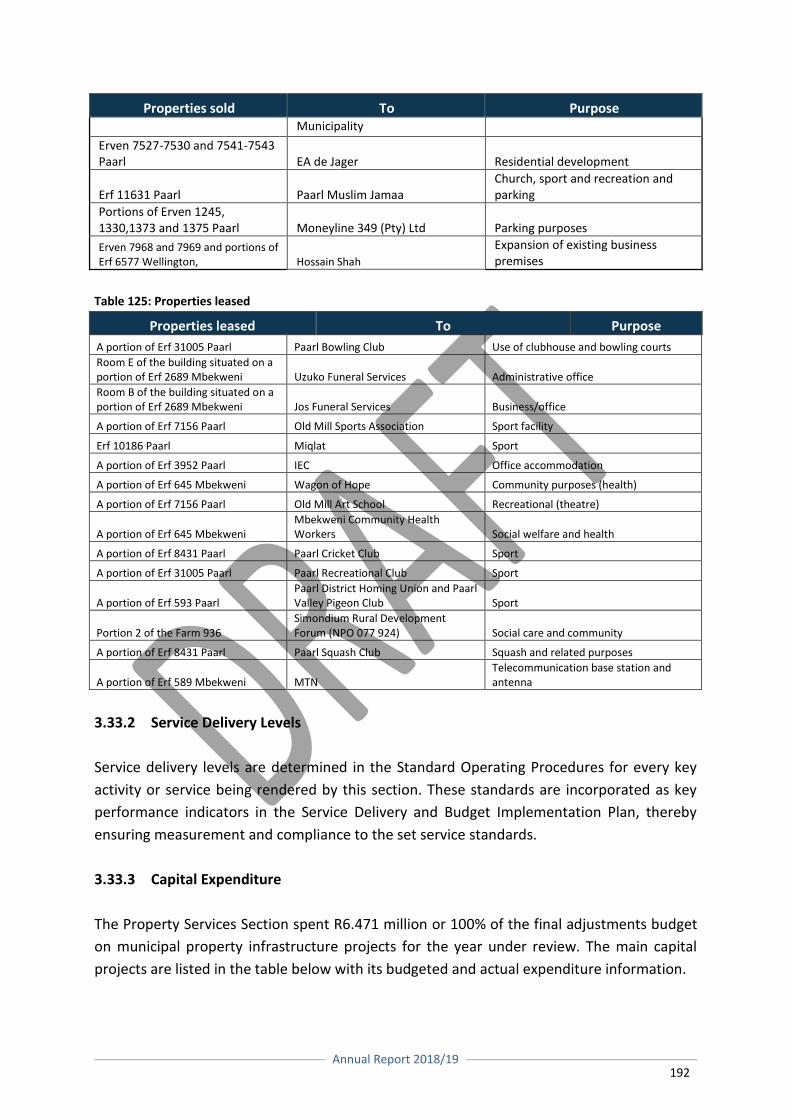
Annual Report 2018/19
192
Properties sold To Purpose Municipality
Erven 7527-7530 and 7541-7543 Paarl EA de Jager Residential development
Erf 11631 Paarl Paarl Muslim Jamaa
Church, sport and recreation and parking
Portions of Erven 1245, 1330,1373 and 1375 Paarl Moneyline 349 (Pty) Ltd Parking purposes
Erven 7968 and 7969 and portions of Erf 6577 Wellington, Hossain Shah
Expansion of existing business premises
Table 125: Properties leased
Properties leased To Purpose
A portion of Erf 31005 Paarl Paarl Bowling Club Use of clubhouse and bowling courts
Room E of the building situated on a portion of Erf 2689 Mbekweni Uzuko Funeral Services Administrative office
Room B of the building situated on a portion of Erf 2689 Mbekweni Jos Funeral Services Business/office
A portion of Erf 7156 Paarl Old Mill Sports Association Sport facility
Erf 10186 Paarl Miqlat Sport
A portion of Erf 3952 Paarl IEC Office accommodation
A portion of Erf 645 Mbekweni Wagon of Hope Community purposes (health)
A portion of Erf 7156 Paarl Old Mill Art School Recreational (theatre)
A portion of Erf 645 Mbekweni Mbekweni Community Health Workers Social welfare and health
A portion of Erf 8431 Paarl Paarl Cricket Club Sport
A portion of Erf 31005 Paarl Paarl Recreational Club Sport
A portion of Erf 593 Paarl Paarl District Homing Union and Paarl Valley Pigeon Club Sport
Portion 2 of the Farm 936 Simondium Rural Development Forum (NPO 077 924) Social care and community
A portion of Erf 8431 Paarl Paarl Squash Club Squash and related purposes
A portion of Erf 589 Mbekweni MTN Telecommunication base station and antenna
3.33.2 Service Delivery Levels
Service delivery levels are determined in the Standard Operating Procedures for every key
activity or service being rendered by this section. These standards are incorporated as key
performance indicators in the Service Delivery and Budget Implementation Plan, thereby
ensuring measurement and compliance to the set service standards.
3.33.3 Capital Expenditure
The Property Services Section spent R6.471 million or 100% of the final adjustments budget
on municipal property infrastructure projects for the year under review. The main capital
projects are listed in the table below with its budgeted and actual expenditure information.
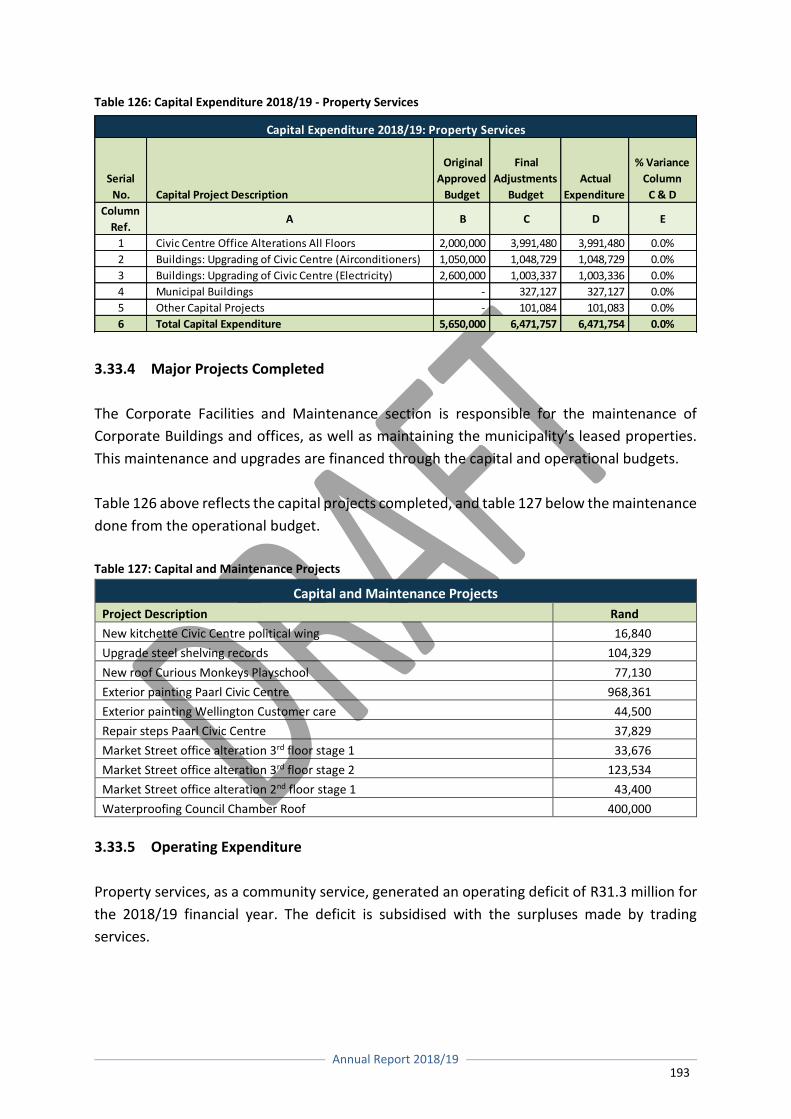
Annual Report 2018/19
193
Table 126: Capital Expenditure 2018/19 - Property Services
3.33.4 Major Projects Completed
The Corporate Facilities and Maintenance section is responsible for the maintenance of
Corporate Buildings and offices, as well as maintaining the municipality’s leased properties.
This maintenance and upgrades are financed through the capital and operational budgets.
Table 126 above reflects the capital projects completed, and table 127 below the maintenance
done from the operational budget.
Table 127: Capital and Maintenance Projects
Capital and Maintenance Projects
Project Description Rand
New kitchette Civic Centre political wing 16,840
Upgrade steel shelving records 104,329
New roof Curious Monkeys Playschool 77,130
Exterior painting Paarl Civic Centre 968,361
Exterior painting Wellington Customer care 44,500
Repair steps Paarl Civic Centre 37,829
Market Street office alteration 3rd floor stage 1 33,676
Market Street office alteration 3rd floor stage 2 123,534
Market Street office alteration 2nd floor stage 1 43,400
Waterproofing Council Chamber Roof 400,000
3.33.5 Operating Expenditure
Property services, as a community service, generated an operating deficit of R31.3 million for
the 2018/19 financial year. The deficit is subsidised with the surpluses made by trading
services.
Serial
No. Capital Project Description
Original
Approved
Budget
Final
Adjustments
Budget
Actual
Expenditure
% Variance
Column
C & D
Column
Ref.A B C D E
1 Civic Centre Office Alterations All Floors 2,000,000 3,991,480 3,991,480 0.0%
2 Buildings: Upgrading of Civic Centre (Airconditioners) 1,050,000 1,048,729 1,048,729 0.0%
3 Buildings: Upgrading of Civic Centre (Electricity) 2,600,000 1,003,337 1,003,336 0.0%
4 Municipal Buildings - 327,127 327,127 0.0%
5 Other Capital Projects - 101,084 101,083 0.0%
6 Total Capital Expenditure 5,650,000 6,471,757 6,471,754 0.0%
Capital Expenditure 2018/19: Property Services
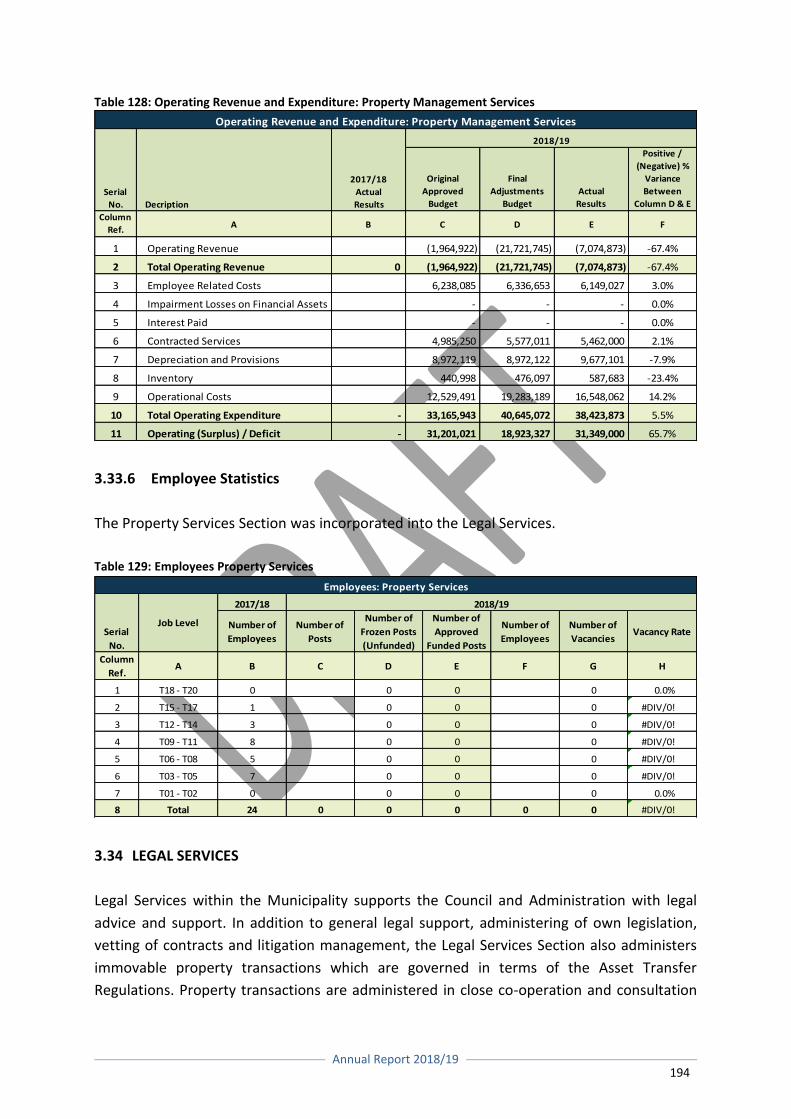
Annual Report 2018/19
194
Table 128: Operating Revenue and Expenditure: Property Management Services
3.33.6 Employee Statistics
The Property Services Section was incorporated into the Legal Services.
Table 129: Employees Property Services
3.34 LEGAL SERVICES
Legal Services within the Municipality supports the Council and Administration with legal
advice and support. In addition to general legal support, administering of own legislation,
vetting of contracts and litigation management, the Legal Services Section also administers
immovable property transactions which are governed in terms of the Asset Transfer
Regulations. Property transactions are administered in close co-operation and consultation
2017/18
Number of
Employees
Number of
Posts
Number of
Frozen Posts
(Unfunded)
Number of
Approved
Funded Posts
Number of
Employees
Number of
Vacancies Vacancy Rate
Column
Ref.A B C D E F G H
1 T18 - T20 0 0 0 0 0.0%
2 T15 - T17 1 0 0 0 #DIV/0!
3 T12 - T14 3 0 0 0 #DIV/0!
4 T09 - T11 8 0 0 0 #DIV/0!
5 T06 - T08 5 0 0 0 #DIV/0!
6 T03 - T05 7 0 0 0 #DIV/0!
7 T01 - T02 0 0 0 0 0.0%
8 Total 24 0 0 0 0 0 #DIV/0!
2018/19
Employees: Property Services
Serial
No.
Job Level
Original
Approved
Budget
Final
Adjustments
Budget
Actual
Results
Positive /
(Negative) %
Variance
Between
Column D & E
Column
Ref.A B C D E F
1 Operating Revenue (1,964,922) (21,721,745) (7,074,873) -67.4%
2 Total Operating Revenue 0 (1,964,922) (21,721,745) (7,074,873) -67.4%
3 Employee Related Costs 6,238,085 6,336,653 6,149,027 3.0%
4 Impairment Losses on Financial Assets - - - 0.0%
5 Interest Paid - - - 0.0%
6 Contracted Services 4,985,250 5,577,011 5,462,000 2.1%
7 Depreciation and Provisions 8,972,119 8,972,122 9,677,101 -7.9%
8 Inventory 440,998 476,097 587,683 -23.4%
9 Operational Costs 12,529,491 19,283,189 16,548,062 14.2%
10 Total Operating Expenditure - 33,165,943 40,645,072 38,423,873 5.5%
11 Operating (Surplus) / Deficit - 31,201,021 18,923,327 31,349,000 65.7%
Operating Revenue and Expenditure: Property Management Services
Serial
No. Decription
2017/18
Actual
Results
2018/19
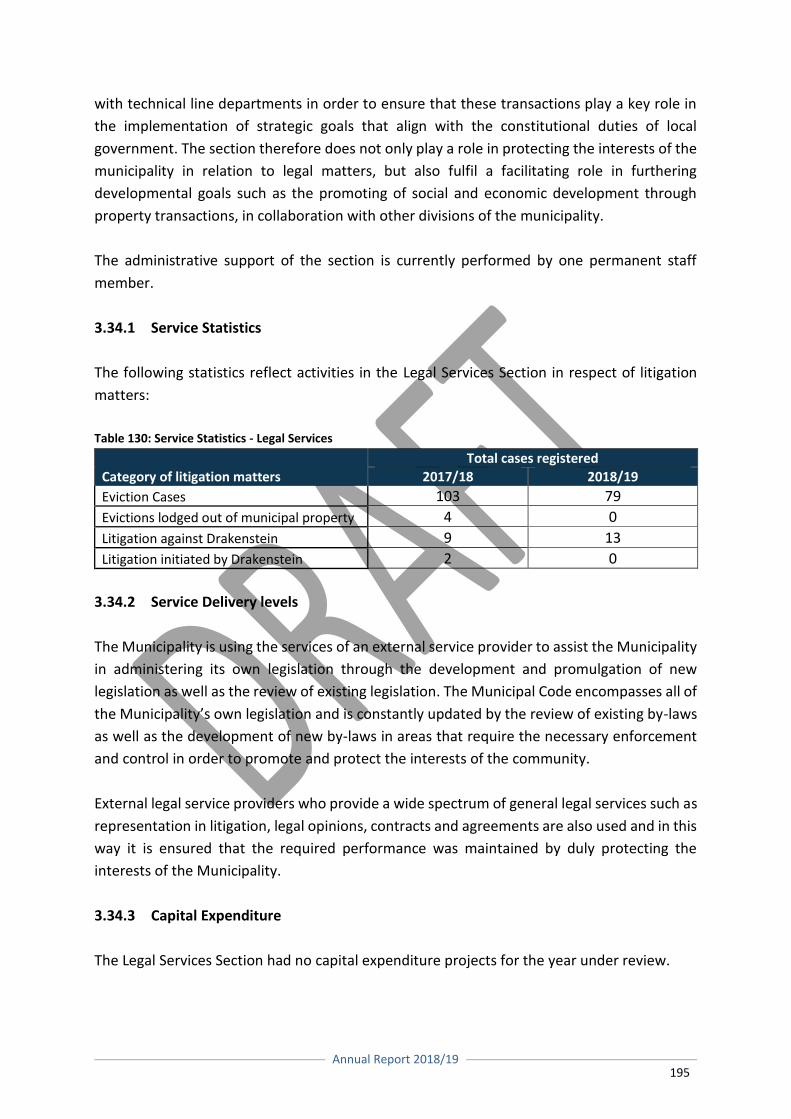
Annual Report 2018/19
195
with technical line departments in order to ensure that these transactions play a key role in
the implementation of strategic goals that align with the constitutional duties of local
government. The section therefore does not only play a role in protecting the interests of the
municipality in relation to legal matters, but also fulfil a facilitating role in furthering
developmental goals such as the promoting of social and economic development through
property transactions, in collaboration with other divisions of the municipality.
The administrative support of the section is currently performed by one permanent staff
member.
3.34.1 Service Statistics
The following statistics reflect activities in the Legal Services Section in respect of litigation
matters:
Table 130: Service Statistics - Legal Services
Category of litigation matters Total cases registered
2017/18 2018/19
Eviction Cases 103 79
Evictions lodged out of municipal property 4 0
Litigation against Drakenstein 9 13
Litigation initiated by Drakenstein 2 0
3.34.2 Service Delivery levels
The Municipality is using the services of an external service provider to assist the Municipality
in administering its own legislation through the development and promulgation of new
legislation as well as the review of existing legislation. The Municipal Code encompasses all of
the Municipality’s own legislation and is constantly updated by the review of existing by-laws
as well as the development of new by-laws in areas that require the necessary enforcement
and control in order to promote and protect the interests of the community.
External legal service providers who provide a wide spectrum of general legal services such as
representation in litigation, legal opinions, contracts and agreements are also used and in this
way it is ensured that the required performance was maintained by duly protecting the
interests of the Municipality.
3.34.3 Capital Expenditure
The Legal Services Section had no capital expenditure projects for the year under review.
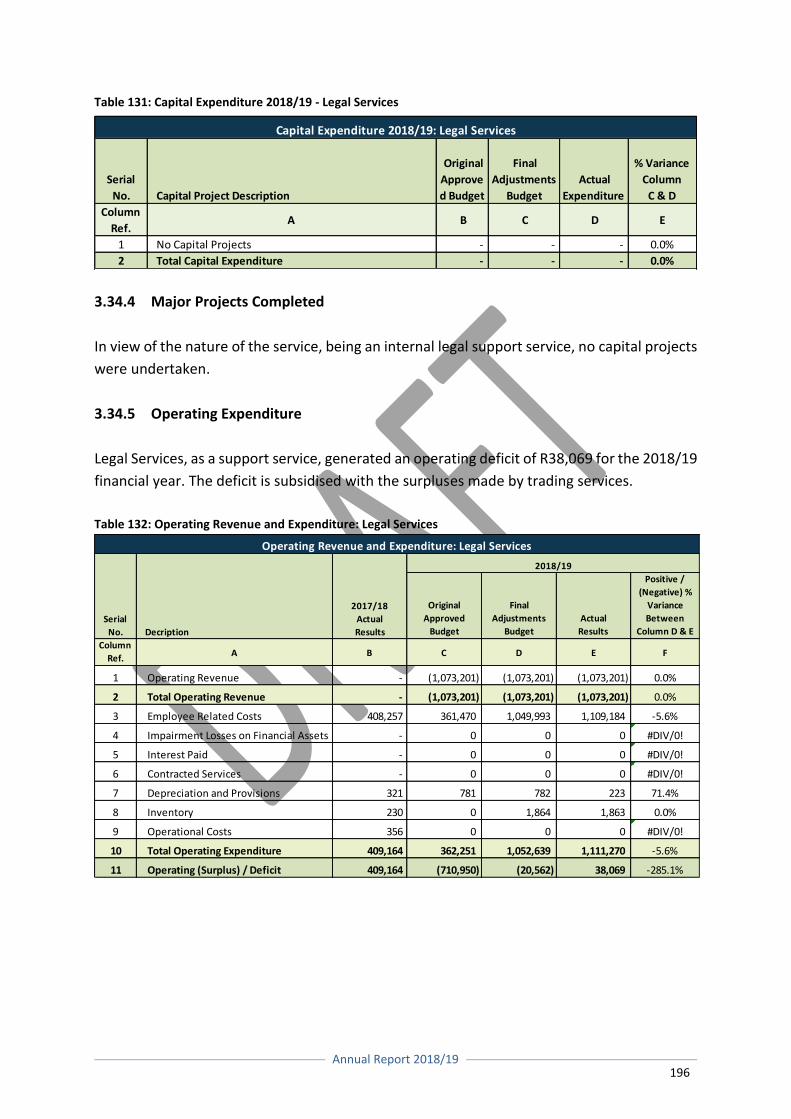
Annual Report 2018/19
196
Table 131: Capital Expenditure 2018/19 - Legal Services
3.34.4 Major Projects Completed
In view of the nature of the service, being an internal legal support service, no capital projects
were undertaken.
3.34.5 Operating Expenditure
Legal Services, as a support service, generated an operating deficit of R38,069 for the 2018/19
financial year. The deficit is subsidised with the surpluses made by trading services.
Table 132: Operating Revenue and Expenditure: Legal Services
Serial
No. Capital Project Description
Original
Approve
d Budget
Final
Adjustments
Budget
Actual
Expenditure
% Variance
Column
C & D
Column
Ref.A B C D E
1 No Capital Projects - - - 0.0%
2 Total Capital Expenditure - - - 0.0%
Capital Expenditure 2018/19: Legal Services
Original
Approved
Budget
Final
Adjustments
Budget
Actual
Results
Positive /
(Negative) %
Variance
Between
Column D & E
Column
Ref.A B C D E F
1 Operating Revenue - (1,073,201) (1,073,201) (1,073,201) 0.0%
2 Total Operating Revenue - (1,073,201) (1,073,201) (1,073,201) 0.0%
3 Employee Related Costs 408,257 361,470 1,049,993 1,109,184 -5.6%
4 Impairment Losses on Financial Assets - 0 0 0 #DIV/0!
5 Interest Paid - 0 0 0 #DIV/0!
6 Contracted Services - 0 0 0 #DIV/0!
7 Depreciation and Provisions 321 781 782 223 71.4%
8 Inventory 230 0 1,864 1,863 0.0%
9 Operational Costs 356 0 0 0 #DIV/0!
10 Total Operating Expenditure 409,164 362,251 1,052,639 1,111,270 -5.6%
11 Operating (Surplus) / Deficit 409,164 (710,950) (20,562) 38,069 -285.1%
Operating Revenue and Expenditure: Legal Services
Serial
No. Decription
2017/18
Actual
Results
2018/19
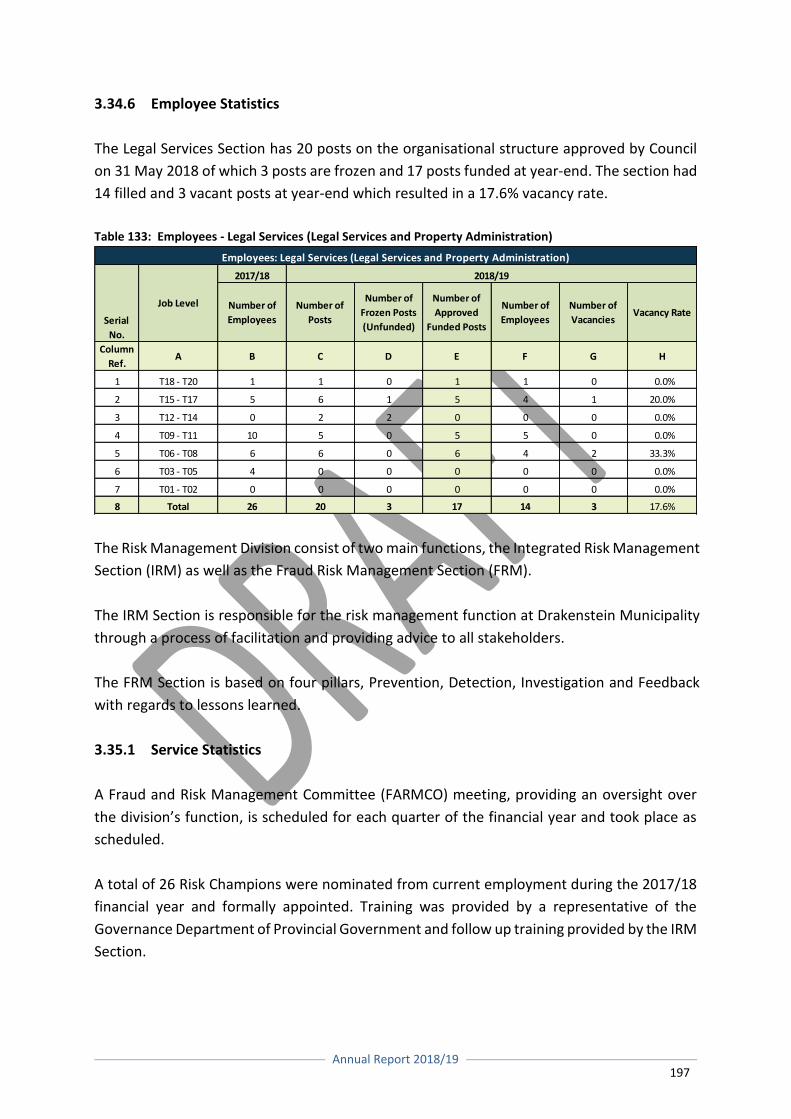
Annual Report 2018/19
197
3.34.6 Employee Statistics
The Legal Services Section has 20 posts on the organisational structure approved by Council
on 31 May 2018 of which 3 posts are frozen and 17 posts funded at year-end. The section had
14 filled and 3 vacant posts at year-end which resulted in a 17.6% vacancy rate.
Table 133: Employees - Legal Services (Legal Services and Property Administration)
3.35 RISK MANAGEMENT
The Risk Management Division consist of two main functions, the Integrated Risk Management
Section (IRM) as well as the Fraud Risk Management Section (FRM).
The IRM Section is responsible for the risk management function at Drakenstein Municipality
through a process of facilitation and providing advice to all stakeholders.
The FRM Section is based on four pillars, Prevention, Detection, Investigation and Feedback
with regards to lessons learned.
3.35.1 Service Statistics
A Fraud and Risk Management Committee (FARMCO) meeting, providing an oversight over
the division’s function, is scheduled for each quarter of the financial year and took place as
scheduled.
A total of 26 Risk Champions were nominated from current employment during the 2017/18
financial year and formally appointed. Training was provided by a representative of the
Governance Department of Provincial Government and follow up training provided by the IRM
Section.
2017/18
Number of
Employees
Number of
Posts
Number of
Frozen Posts
(Unfunded)
Number of
Approved
Funded Posts
Number of
Employees
Number of
Vacancies Vacancy Rate
Column
Ref.A B C D E F G H
1 T18 - T20 1 1 0 1 1 0 0.0%
2 T15 - T17 5 6 1 5 4 1 20.0%
3 T12 - T14 0 2 2 0 0 0 0.0%
4 T09 - T11 10 5 0 5 5 0 0.0%
5 T06 - T08 6 6 0 6 4 2 33.3%
6 T03 - T05 4 0 0 0 0 0 0.0%
7 T01 - T02 0 0 0 0 0 0 0.0%
8 Total 26 20 3 17 14 3 17.6%
2018/19
Employees: Legal Services (Legal Services and Property Administration)
Serial
No.
Job Level
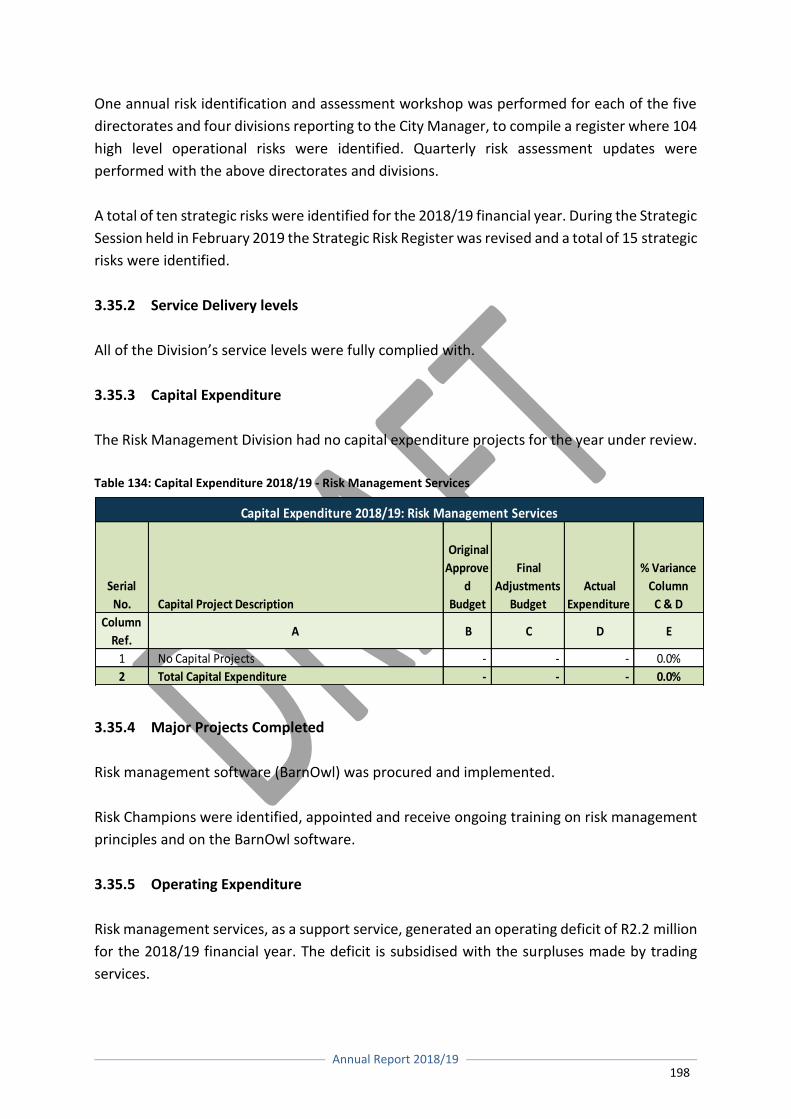
Annual Report 2018/19
198
One annual risk identification and assessment workshop was performed for each of the five
directorates and four divisions reporting to the City Manager, to compile a register where 104
high level operational risks were identified. Quarterly risk assessment updates were
performed with the above directorates and divisions.
A total of ten strategic risks were identified for the 2018/19 financial year. During the Strategic
Session held in February 2019 the Strategic Risk Register was revised and a total of 15 strategic
risks were identified.
3.35.2 Service Delivery levels
All of the Division’s service levels were fully complied with.
3.35.3 Capital Expenditure
The Risk Management Division had no capital expenditure projects for the year under review.
Table 134: Capital Expenditure 2018/19 - Risk Management Services
3.35.4 Major Projects Completed
Risk management software (BarnOwl) was procured and implemented.
Risk Champions were identified, appointed and receive ongoing training on risk management
principles and on the BarnOwl software.
3.35.5 Operating Expenditure
Risk management services, as a support service, generated an operating deficit of R2.2 million
for the 2018/19 financial year. The deficit is subsidised with the surpluses made by trading
services.
Serial
No. Capital Project Description
Original
Approve
d
Budget
Final
Adjustments
Budget
Actual
Expenditure
% Variance
Column
C & D
Column
Ref.A B C D E
1 No Capital Projects - - - 0.0%
2 Total Capital Expenditure - - - 0.0%
Capital Expenditure 2018/19: Risk Management Services
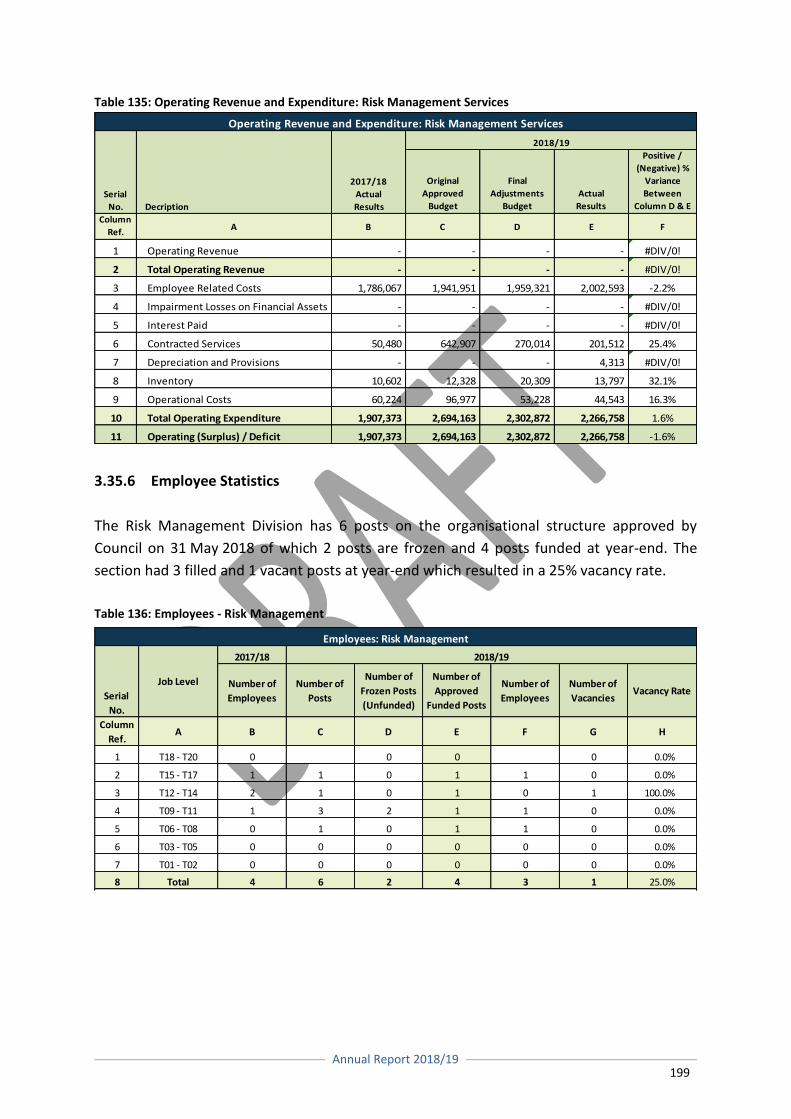
Annual Report 2018/19
199
Table 135: Operating Revenue and Expenditure: Risk Management Services
3.35.6 Employee Statistics
The Risk Management Division has 6 posts on the organisational structure approved by
Council on 31 May 2018 of which 2 posts are frozen and 4 posts funded at year-end. The
section had 3 filled and 1 vacant posts at year-end which resulted in a 25% vacancy rate.
Table 136: Employees - Risk Management
2017/18
Number of
Employees
Number of
Posts
Number of
Frozen Posts
(Unfunded)
Number of
Approved
Funded Posts
Number of
Employees
Number of
Vacancies Vacancy Rate
Column
Ref.A B C D E F G H
1 T18 - T20 0 0 0 0 0.0%
2 T15 - T17 1 1 0 1 1 0 0.0%
3 T12 - T14 2 1 0 1 0 1 100.0%
4 T09 - T11 1 3 2 1 1 0 0.0%
5 T06 - T08 0 1 0 1 1 0 0.0%
6 T03 - T05 0 0 0 0 0 0 0.0%
7 T01 - T02 0 0 0 0 0 0 0.0%
8 Total 4 6 2 4 3 1 25.0%
2018/19
Employees: Risk Management
Serial
No.
Job Level
Original
Approved
Budget
Final
Adjustments
Budget
Actual
Results
Positive /
(Negative) %
Variance
Between
Column D & E
Column
Ref.A B C D E F
1 Operating Revenue - - - - #DIV/0!
2 Total Operating Revenue - - - - #DIV/0!
3 Employee Related Costs 1,786,067 1,941,951 1,959,321 2,002,593 -2.2%
4 Impairment Losses on Financial Assets - - - - #DIV/0!
5 Interest Paid - - - - #DIV/0!
6 Contracted Services 50,480 642,907 270,014 201,512 25.4%
7 Depreciation and Provisions - - - 4,313 #DIV/0!
8 Inventory 10,602 12,328 20,309 13,797 32.1%
9 Operational Costs 60,224 96,977 53,228 44,543 16.3%
10 Total Operating Expenditure 1,907,373 2,694,163 2,302,872 2,266,758 1.6%
11 Operating (Surplus) / Deficit 1,907,373 2,694,163 2,302,872 2,266,758 -1.6%
Operating Revenue and Expenditure: Risk Management Services
Serial
No. Decription
2017/18
Actual
Results
2018/19
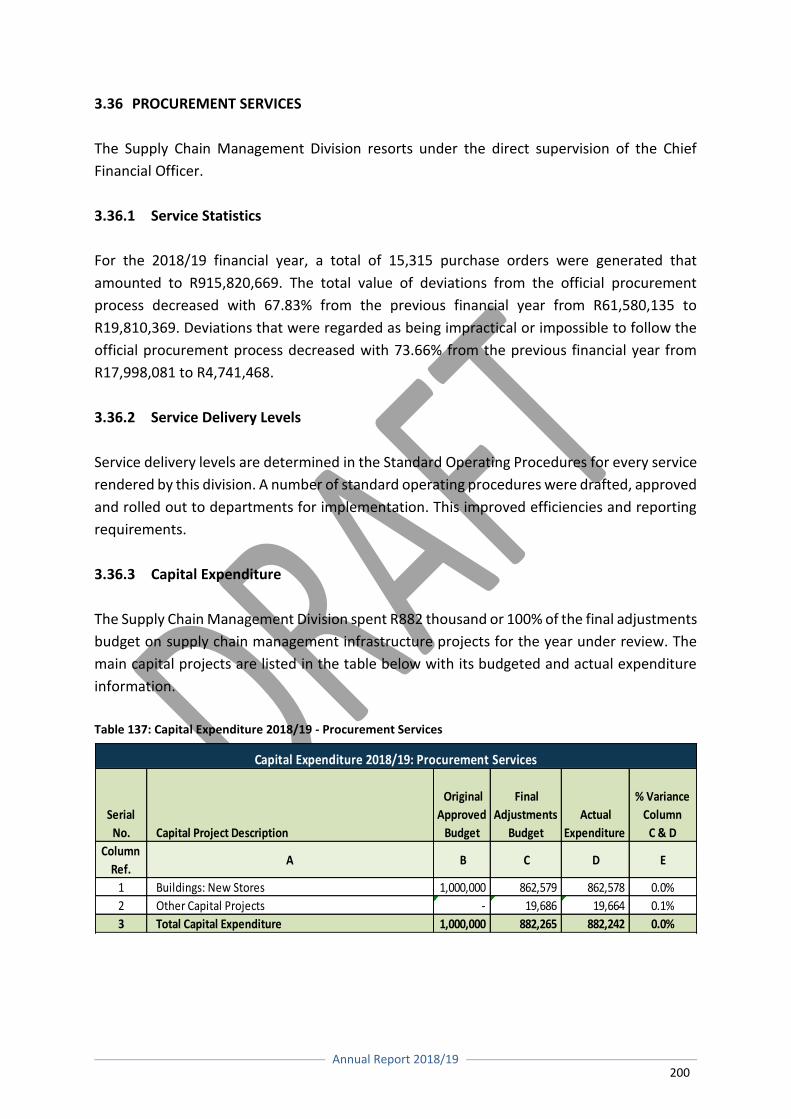
Annual Report 2018/19
200
3.36 PROCUREMENT SERVICES
The Supply Chain Management Division resorts under the direct supervision of the Chief
Financial Officer.
3.36.1 Service Statistics
For the 2018/19 financial year, a total of 15,315 purchase orders were generated that
amounted to R915,820,669. The total value of deviations from the official procurement
process decreased with 67.83% from the previous financial year from R61,580,135 to
R19,810,369. Deviations that were regarded as being impractical or impossible to follow the
official procurement process decreased with 73.66% from the previous financial year from
R17,998,081 to R4,741,468.
3.36.2 Service Delivery Levels
Service delivery levels are determined in the Standard Operating Procedures for every service
rendered by this division. A number of standard operating procedures were drafted, approved
and rolled out to departments for implementation. This improved efficiencies and reporting
requirements.
3.36.3 Capital Expenditure
The Supply Chain Management Division spent R882 thousand or 100% of the final adjustments
budget on supply chain management infrastructure projects for the year under review. The
main capital projects are listed in the table below with its budgeted and actual expenditure
information.
Table 137: Capital Expenditure 2018/19 - Procurement Services
Serial
No. Capital Project Description
Original
Approved
Budget
Final
Adjustments
Budget
Actual
Expenditure
% Variance
Column
C & D
Column
Ref.A B C D E
1 Buildings: New Stores 1,000,000 862,579 862,578 0.0%
2 Other Capital Projects - 19,686 19,664 0.1%
3 Total Capital Expenditure 1,000,000 882,265 882,242 0.0%
Capital Expenditure 2018/19: Procurement Services
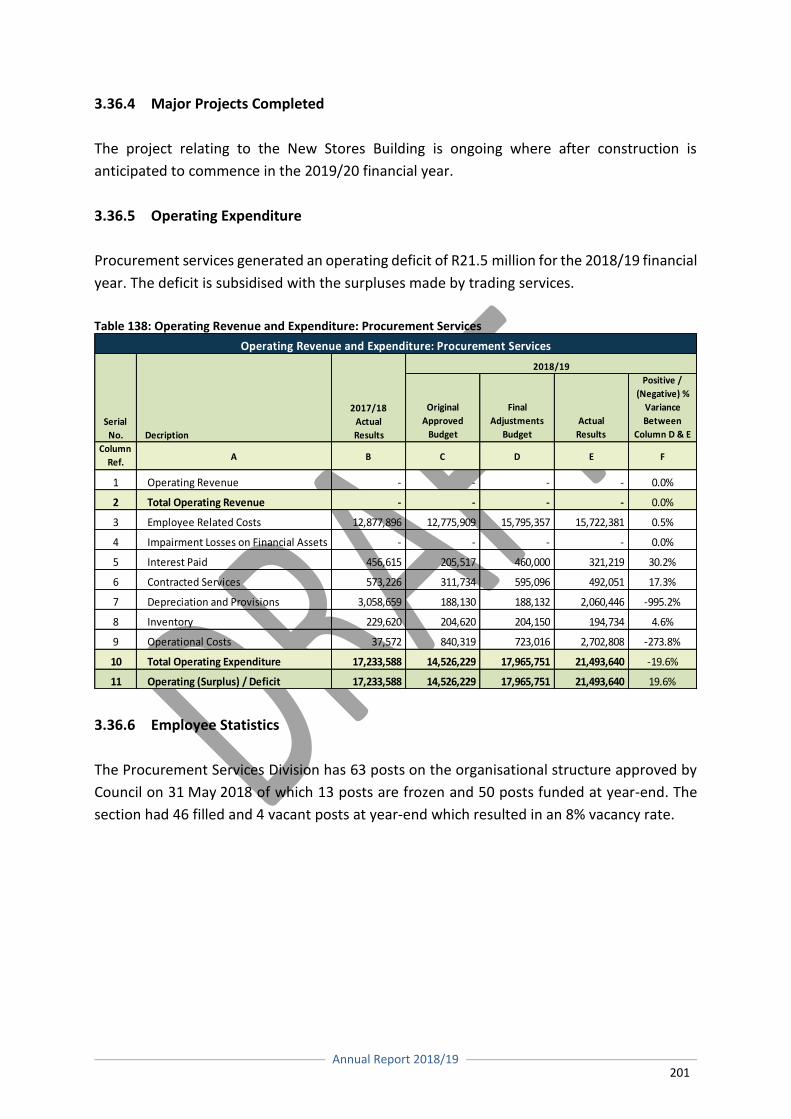
Annual Report 2018/19
201
3.36.4 Major Projects Completed
The project relating to the New Stores Building is ongoing where after construction is
anticipated to commence in the 2019/20 financial year.
3.36.5 Operating Expenditure
Procurement services generated an operating deficit of R21.5 million for the 2018/19 financial
year. The deficit is subsidised with the surpluses made by trading services.
Table 138: Operating Revenue and Expenditure: Procurement Services
3.36.6 Employee Statistics
The Procurement Services Division has 63 posts on the organisational structure approved by
Council on 31 May 2018 of which 13 posts are frozen and 50 posts funded at year-end. The
section had 46 filled and 4 vacant posts at year-end which resulted in an 8% vacancy rate.
Original
Approved
Budget
Final
Adjustments
Budget
Actual
Results
Positive /
(Negative) %
Variance
Between
Column D & E
Column
Ref.A B C D E F
1 Operating Revenue - - - - 0.0%
2 Total Operating Revenue - - - - 0.0%
3 Employee Related Costs 12,877,896 12,775,909 15,795,357 15,722,381 0.5%
4 Impairment Losses on Financial Assets - - - - 0.0%
5 Interest Paid 456,615 205,517 460,000 321,219 30.2%
6 Contracted Services 573,226 311,734 595,096 492,051 17.3%
7 Depreciation and Provisions 3,058,659 188,130 188,132 2,060,446 -995.2%
8 Inventory 229,620 204,620 204,150 194,734 4.6%
9 Operational Costs 37,572 840,319 723,016 2,702,808 -273.8%
10 Total Operating Expenditure 17,233,588 14,526,229 17,965,751 21,493,640 -19.6%
11 Operating (Surplus) / Deficit 17,233,588 14,526,229 17,965,751 21,493,640 19.6%
Operating Revenue and Expenditure: Procurement Services
Serial
No. Decription
2017/18
Actual
Results
2018/19
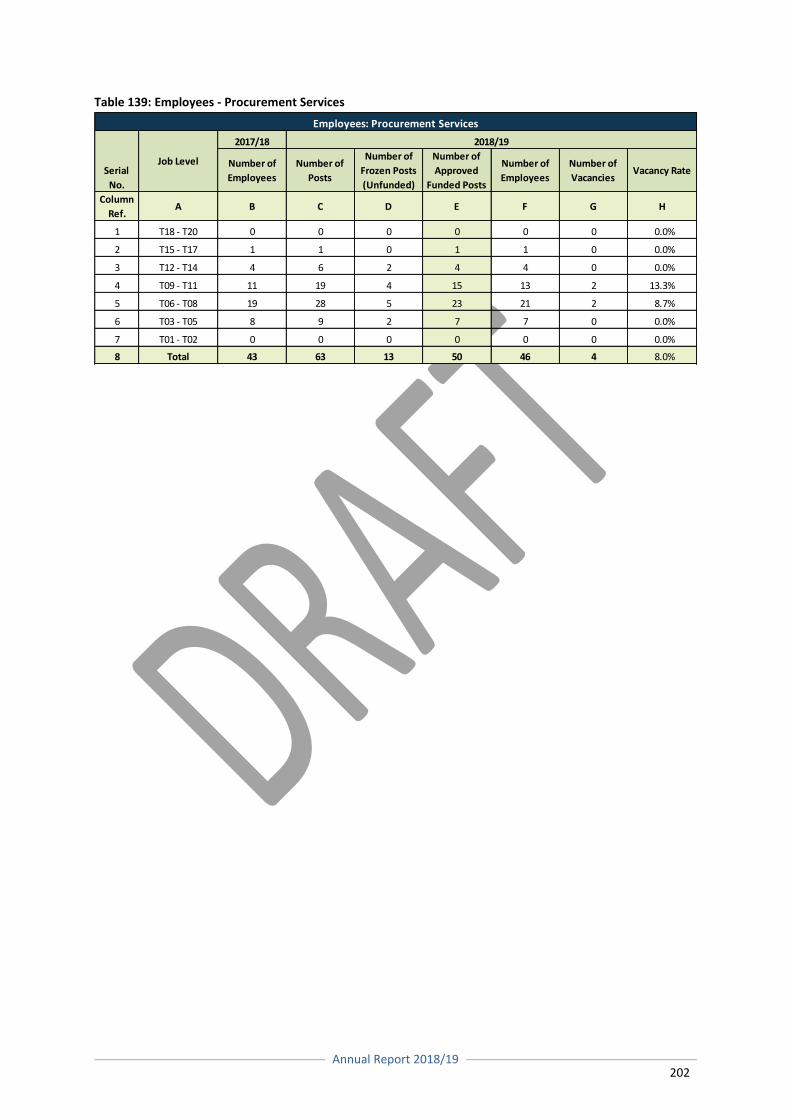
Annual Report 2018/19
202
Table 139: Employees - Procurement Services
2017/18
Number of
Employees
Number of
Posts
Number of
Frozen Posts
(Unfunded)
Number of
Approved
Funded Posts
Number of
Employees
Number of
Vacancies Vacancy Rate
Column
Ref.A B C D E F G H
1 T18 - T20 0 0 0 0 0 0 0.0%
2 T15 - T17 1 1 0 1 1 0 0.0%
3 T12 - T14 4 6 2 4 4 0 0.0%
4 T09 - T11 11 19 4 15 13 2 13.3%
5 T06 - T08 19 28 5 23 21 2 8.7%
6 T03 - T05 8 9 2 7 7 0 0.0%
7 T01 - T02 0 0 0 0 0 0 0.0%
8 Total 43 63 13 50 46 4 8.0%
2018/19
Employees: Procurement Services
Serial
No.
Job Level
Annual Report 2018/19
203
4. ORGANISATIONAL DEVELOPMENT PERFORMANCE
COMPONENT A: INTRODUCTION TO THE MUNICIPAL WORKFORCE
4.1 INTRODUCTION
One major role that the Human Resources is tasked with is to ensure that employees are
looked well after and that their morale is enhanced on a continuous basis. The following
programmes were implemented in the 2018/19 financial year and are implemented annually:
Employee Wellness;
Women’s Day;
Employee Excellence Awards;
Christmas decorations;
Tekkie Day;
Mandela Day; and
Employee Assistance Program which is taking place on daily basis.
4.2 TOTAL EMPLOYMENT
The total number of employees at the end of June is 1,870 and we have filled 277 positions in
the financial year 2018/19.
4.2.1 Employee Totals per GFS Classification
The total number of employees (1,870) at the end of the 2018/19 financial year is depicted
per GFS classification or functional area in the table below. The organisational structure
approved by Council on 31 May 2018 provides for 3,521 posts taking Drakenstein’s future
growth into consideration.
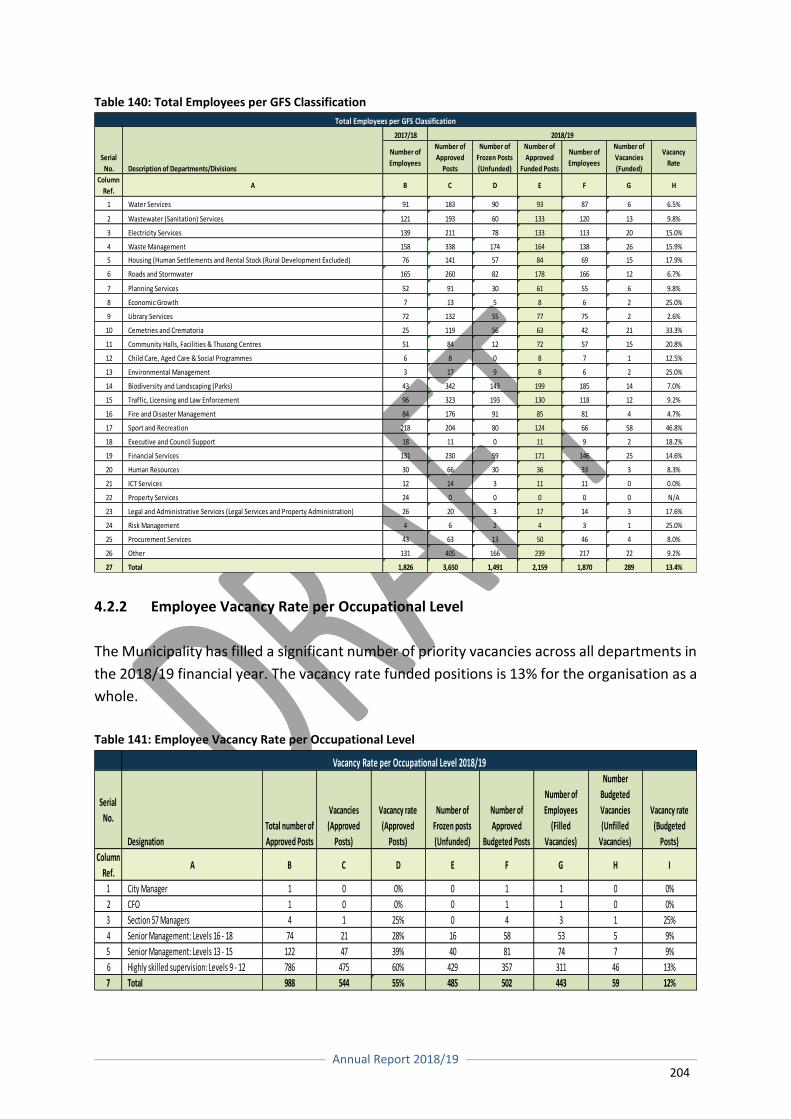
Annual Report 2018/19
204
Table 140: Total Employees per GFS Classification
4.2.2 Employee Vacancy Rate per Occupational Level
The Municipality has filled a significant number of priority vacancies across all departments in
the 2018/19 financial year. The vacancy rate funded positions is 13% for the organisation as a
whole.
Table 141: Employee Vacancy Rate per Occupational Level
2017/18
Number of
Employees
Number of
Approved
Posts
Number of
Frozen Posts
(Unfunded)
Number of
Approved
Funded Posts
Number of
Employees
Number of
Vacancies
(Funded)
Vacancy
Rate
Column
Ref.A B C D E F G H
1 Water Services 91 183 90 93 87 6 6.5%
2 Wastewater (Sanitation) Services 121 193 60 133 120 13 9.8%
3 Electricity Services 139 211 78 133 113 20 15.0%
4 Waste Management 158 338 174 164 138 26 15.9%
5 Housing (Human Settlements and Rental Stock (Rural Development Excluded) 76 141 57 84 69 15 17.9%
6 Roads and Stormwater 165 260 82 178 166 12 6.7%
7 Planning Services 52 91 30 61 55 6 9.8%
8 Economic Growth 7 13 5 8 6 2 25.0%
9 Library Services 72 132 55 77 75 2 2.6%
10 Cemetries and Crematoria 25 119 56 63 42 21 33.3%
11 Community Halls, Facilities & Thusong Centres 51 84 12 72 57 15 20.8%
12 Child Care, Aged Care & Social Programmes 6 8 0 8 7 1 12.5%
13 Environmental Management 3 17 9 8 6 2 25.0%
14 Biodiversity and Landscaping (Parks) 43 342 143 199 185 14 7.0%
15 Traffic, Licensing and Law Enforcement 96 323 193 130 118 12 9.2%
16 Fire and Disaster Management 84 176 91 85 81 4 4.7%
17 Sport and Recreation 218 204 80 124 66 58 46.8%
18 Executive and Council Support 18 11 0 11 9 2 18.2%
19 Financial Services 131 230 59 171 146 25 14.6%
20 Human Resources 30 66 30 36 33 3 8.3%
21 ICT Services 12 14 3 11 11 0 0.0%
22 Property Services 24 0 0 0 0 0 N/A
23 Legal and Administrative Services (Legal Services and Property Administration) 26 20 3 17 14 3 17.6%
24 Risk Management 4 6 2 4 3 1 25.0%
25 Procurement Services 43 63 13 50 46 4 8.0%
26 Other 131 405 166 239 217 22 9.2%
27 Total 1,826 3,650 1,491 2,159 1,870 289 13.4%
2018/19
Description of Departments/Divisions
Total Employees per GFS Classification
Serial
No.
Serial
No.
Designation
Total number of
Approved Posts
Vacancies
(Approved
Posts)
Vacancy rate
(Approved
Posts)
Number of
Frozen posts
(Unfunded)
Number of
Approved
Budgeted Posts
Number of
Employees
(Filled
Vacancies)
Number
Budgeted
Vacancies
(Unfilled
Vacancies)
Vacancy rate
(Budgeted
Posts)
Column
Ref.A B C D E F G H I
1 City Manager 1 0 0% 0 1 1 0 0%
2 CFO 1 0 0% 0 1 1 0 0%
3 Section 57 Managers 4 1 25% 0 4 3 1 25%
4 Senior Management: Levels 16 - 18 74 21 28% 16 58 53 5 9%
5 Senior Management: Levels 13 - 15 122 47 39% 40 81 74 7 9%
6 Highly skilled supervision: Levels 9 - 12 786 475 60% 429 357 311 46 13%
7 Total 988 544 55% 485 502 443 59 12%
Vacancy Rate per Occupational Level 2018/19
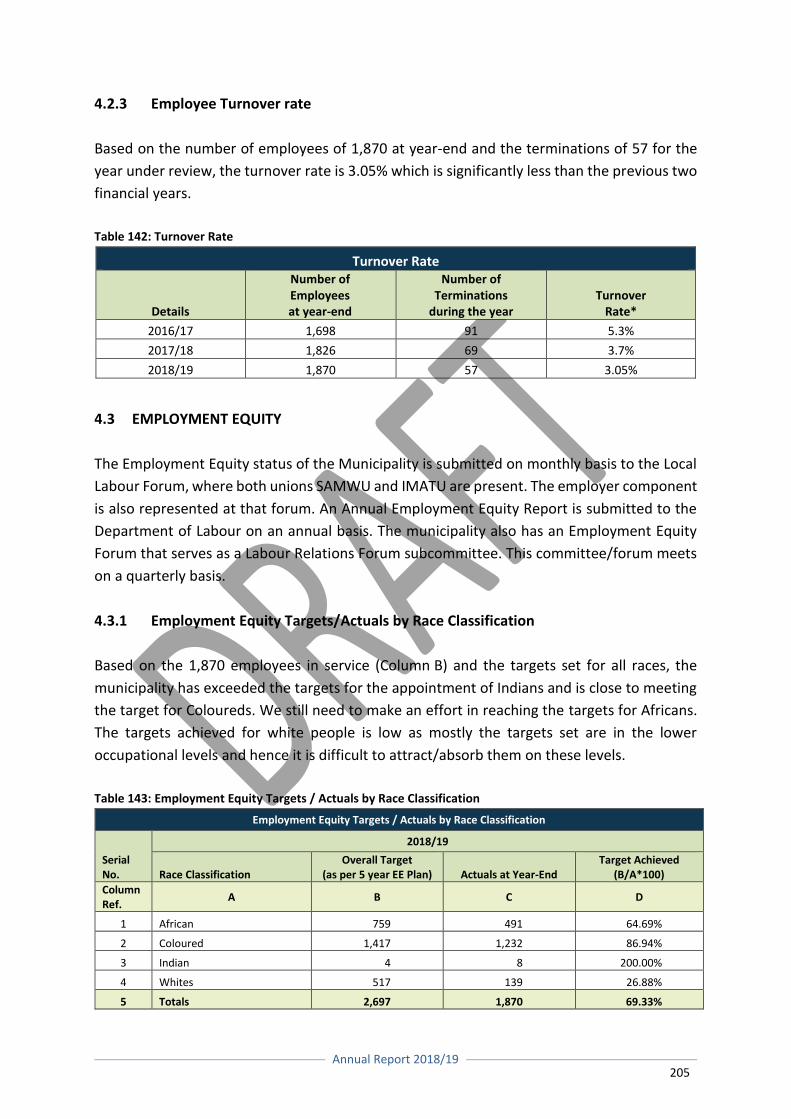
Annual Report 2018/19
205
4.2.3 Employee Turnover rate
Based on the number of employees of 1,870 at year-end and the terminations of 57 for the
year under review, the turnover rate is 3.05% which is significantly less than the previous two
financial years.
Table 142: Turnover Rate
Turnover Rate
Details
Number of Employees at year-end
Number of Terminations
during the year Turnover
Rate*
2016/17 1,698 91 5.3%
2017/18 1,826 69 3.7%
2018/19 1,870 57 3.05%
4.3 EMPLOYMENT EQUITY
The Employment Equity status of the Municipality is submitted on monthly basis to the Local
Labour Forum, where both unions SAMWU and IMATU are present. The employer component
is also represented at that forum. An Annual Employment Equity Report is submitted to the
Department of Labour on an annual basis. The municipality also has an Employment Equity
Forum that serves as a Labour Relations Forum subcommittee. This committee/forum meets
on a quarterly basis.
4.3.1 Employment Equity Targets/Actuals by Race Classification
Based on the 1,870 employees in service (Column B) and the targets set for all races, the
municipality has exceeded the targets for the appointment of Indians and is close to meeting
the target for Coloureds. We still need to make an effort in reaching the targets for Africans.
The targets achieved for white people is low as mostly the targets set are in the lower
occupational levels and hence it is difficult to attract/absorb them on these levels.
Table 143: Employment Equity Targets / Actuals by Race Classification
Employment Equity Targets / Actuals by Race Classification
Serial No.
2018/19
Race Classification Overall Target
(as per 5 year EE Plan) Actuals at Year-End Target Achieved
(B/A*100)
Column Ref.
A B C D
1 African 759 491 64.69%
2 Coloured 1,417 1,232 86.94%
3 Indian 4 8 200.00%
4 Whites 517 139 26.88%
5 Totals 2,697 1,870 69.33%
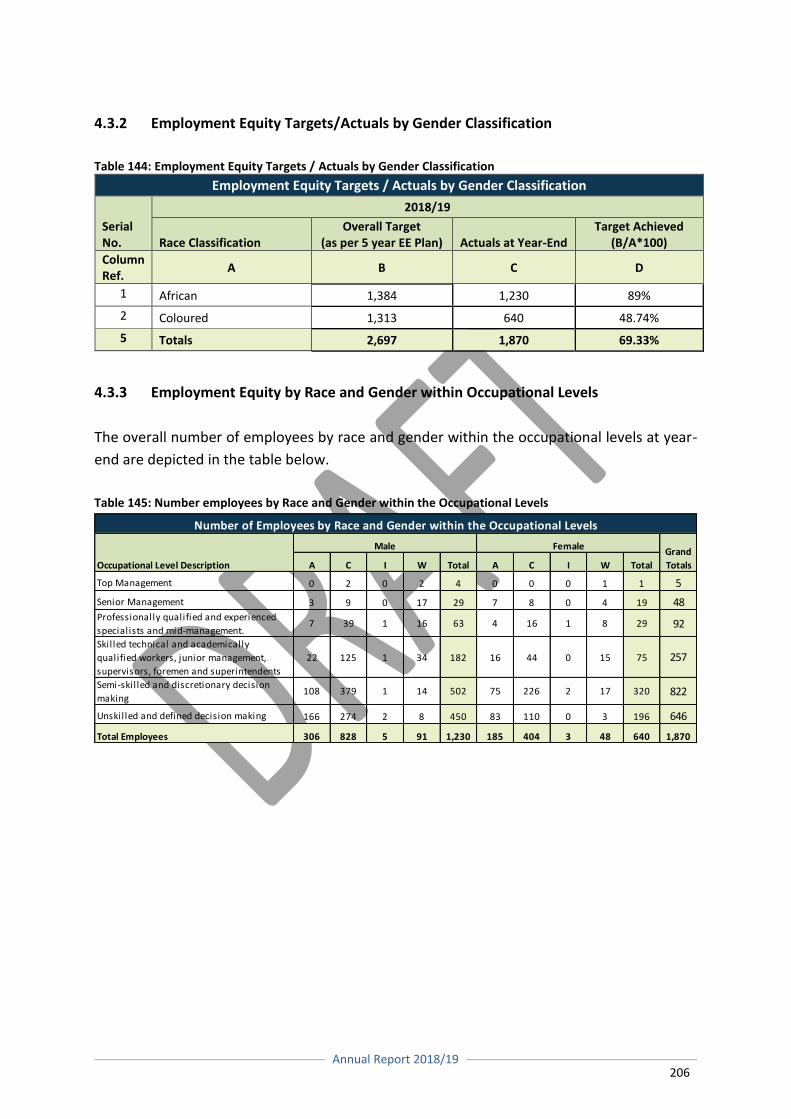
Annual Report 2018/19
206
4.3.2 Employment Equity Targets/Actuals by Gender Classification
Table 144: Employment Equity Targets / Actuals by Gender Classification
Employment Equity Targets / Actuals by Gender Classification
Serial No.
2018/19
Race Classification Overall Target
(as per 5 year EE Plan) Actuals at Year-End Target Achieved
(B/A*100)
Column Ref.
A B C D
1 African 1,384 1,230 89%
2 Coloured 1,313 640 48.74%
5 Totals 2,697 1,870 69.33%
4.3.3 Employment Equity by Race and Gender within Occupational Levels
The overall number of employees by race and gender within the occupational levels at year-
end are depicted in the table below.
Table 145: Number employees by Race and Gender within the Occupational Levels
A C I W Total A C I W Total
Top Management 0 2 0 2 4 0 0 0 1 1 5
Senior Management 3 9 0 17 29 7 8 0 4 19 48Professionally qualified and experienced
specialists and mid-management.7 39 1 16 63 4 16 1 8 29 92
Skilled technical and academically
qualified workers, junior management,
supervisors, foremen and superintendents
22 125 1 34 182 16 44 0 15 75 257
Semi-skilled and discretionary decision
making108 379 1 14 502 75 226 2 17 320 822
Unskilled and defined decision making 166 274 2 8 450 83 110 0 3 196 646
Total Employees 306 828 5 91 1,230 185 404 3 48 640 1,870
Male FemaleGrand
TotalsOccupational Level Description
Number of Employees by Race and Gender within the Occupational Levels
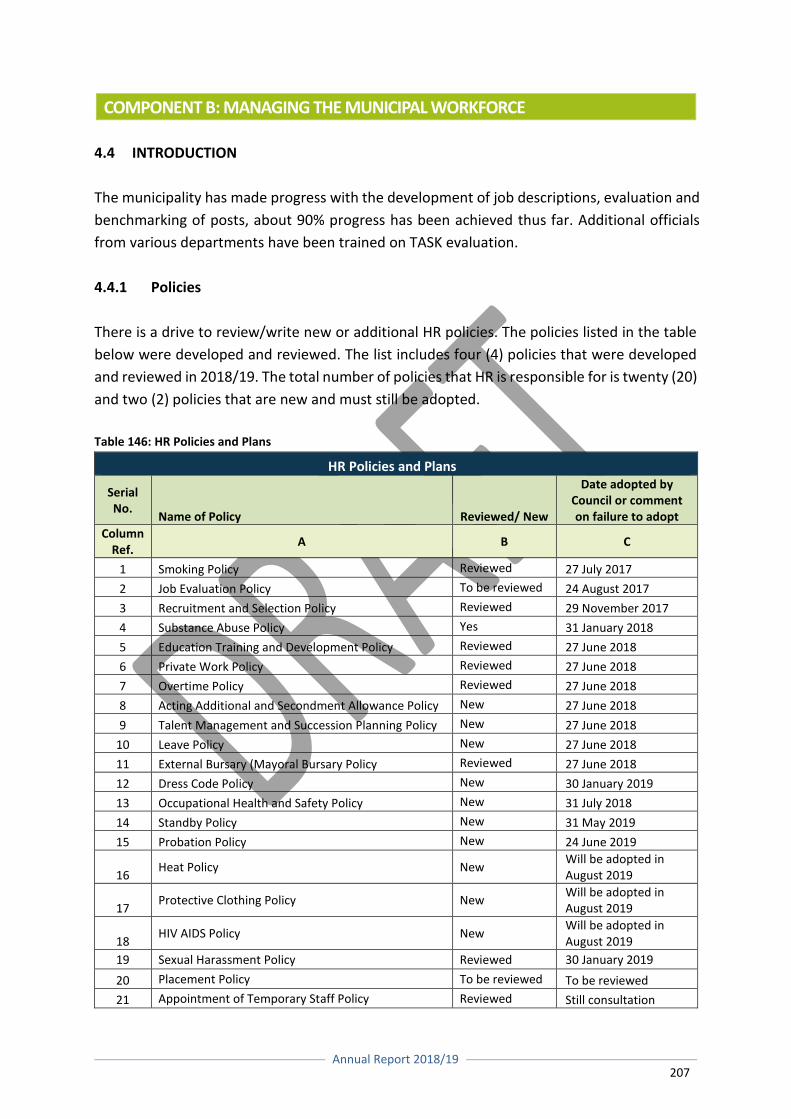
Annual Report 2018/19
207
COMPONENT B: MANAGING THE MUNICIPAL WORKFORCE
4.4 INTRODUCTION
The municipality has made progress with the development of job descriptions, evaluation and
benchmarking of posts, about 90% progress has been achieved thus far. Additional officials
from various departments have been trained on TASK evaluation.
4.4.1 Policies
There is a drive to review/write new or additional HR policies. The policies listed in the table
below were developed and reviewed. The list includes four (4) policies that were developed
and reviewed in 2018/19. The total number of policies that HR is responsible for is twenty (20)
and two (2) policies that are new and must still be adopted.
Table 146: HR Policies and Plans
HR Policies and Plans
Serial No.
Name of Policy Reviewed/ New
Date adopted by Council or comment on failure to adopt
Column Ref.
A B C
1 Smoking Policy Reviewed 27 July 2017
2 Job Evaluation Policy To be reviewed 24 August 2017
3 Recruitment and Selection Policy Reviewed 29 November 2017
4 Substance Abuse Policy Yes 31 January 2018
5 Education Training and Development Policy Reviewed 27 June 2018
6 Private Work Policy Reviewed 27 June 2018
7 Overtime Policy Reviewed 27 June 2018
8 Acting Additional and Secondment Allowance Policy New 27 June 2018
9 Talent Management and Succession Planning Policy New 27 June 2018
10 Leave Policy New 27 June 2018
11 External Bursary (Mayoral Bursary Policy Reviewed 27 June 2018
12 Dress Code Policy New 30 January 2019
13 Occupational Health and Safety Policy New 31 July 2018
14 Standby Policy New 31 May 2019
15 Probation Policy New 24 June 2019
16 Heat Policy New
Will be adopted in August 2019
17 Protective Clothing Policy New
Will be adopted in August 2019
18 HIV AIDS Policy New
Will be adopted in August 2019
19 Sexual Harassment Policy Reviewed 30 January 2019
20 Placement Policy To be reviewed To be reviewed
21 Appointment of Temporary Staff Policy Reviewed Still consultation
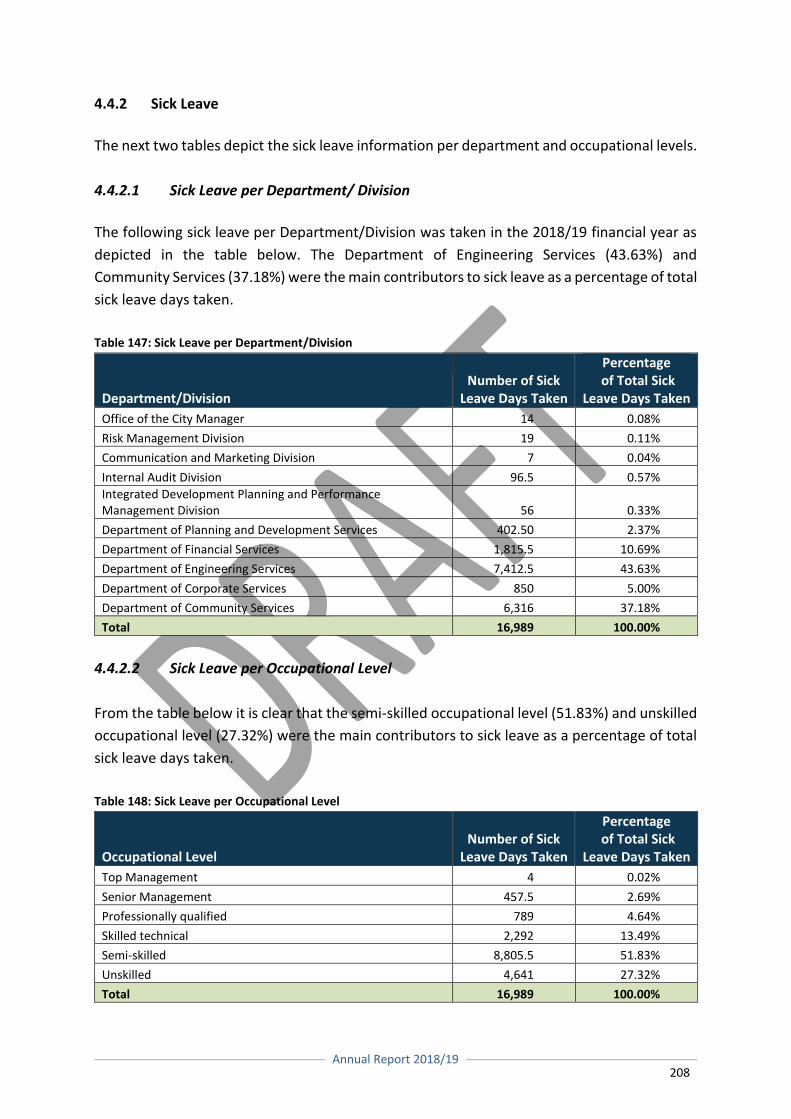
Annual Report 2018/19
208
4.4.2 Sick Leave
The next two tables depict the sick leave information per department and occupational levels.
4.4.2.1 Sick Leave per Department/ Division
The following sick leave per Department/Division was taken in the 2018/19 financial year as
depicted in the table below. The Department of Engineering Services (43.63%) and
Community Services (37.18%) were the main contributors to sick leave as a percentage of total
sick leave days taken.
Table 147: Sick Leave per Department/Division
Department/Division Number of Sick
Leave Days Taken
Percentage of Total Sick
Leave Days Taken
Office of the City Manager 14 0.08%
Risk Management Division 19 0.11%
Communication and Marketing Division 7 0.04%
Internal Audit Division 96.5 0.57%
Integrated Development Planning and Performance Management Division 56 0.33%
Department of Planning and Development Services 402.50 2.37%
Department of Financial Services 1,815.5 10.69%
Department of Engineering Services 7,412.5 43.63%
Department of Corporate Services 850 5.00%
Department of Community Services 6,316 37.18%
Total 16,989 100.00%
4.4.2.2 Sick Leave per Occupational Level
From the table below it is clear that the semi-skilled occupational level (51.83%) and unskilled
occupational level (27.32%) were the main contributors to sick leave as a percentage of total
sick leave days taken.
Table 148: Sick Leave per Occupational Level
Occupational Level Number of Sick
Leave Days Taken
Percentage of Total Sick
Leave Days Taken
Top Management 4 0.02%
Senior Management 457.5 2.69%
Professionally qualified 789 4.64%
Skilled technical 2,292 13.49%
Semi-skilled 8,805.5 51.83%
Unskilled 4,641 27.32%
Total 16,989 100.00%
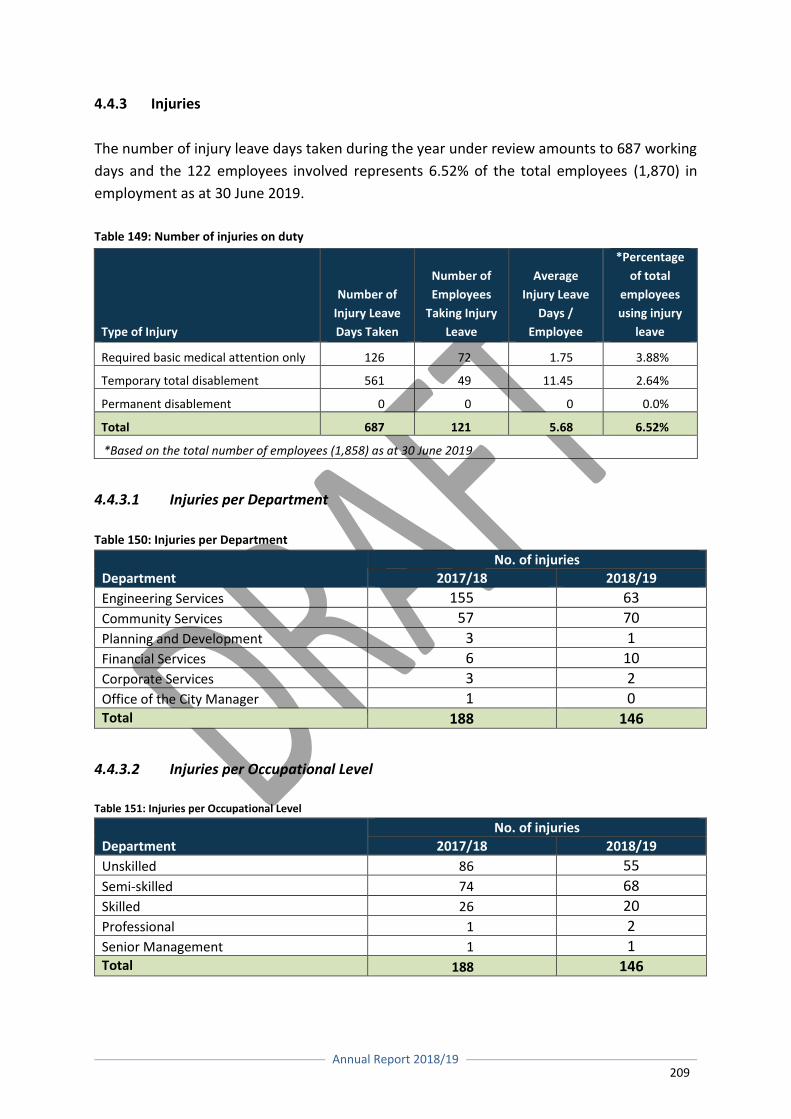
Annual Report 2018/19
209
4.4.3 Injuries
The number of injury leave days taken during the year under review amounts to 687 working
days and the 122 employees involved represents 6.52% of the total employees (1,870) in
employment as at 30 June 2019.
Table 149: Number of injuries on duty
4.4.3.1 Injuries per Department
Table 150: Injuries per Department
Department No. of injuries
2017/18 2018/19
Engineering Services 155 63
Community Services 57 70
Planning and Development 3 1
Financial Services 6 10
Corporate Services 3 2
Office of the City Manager 1 0 Total 188 146
4.4.3.2 Injuries per Occupational Level
Table 151: Injuries per Occupational Level
Department No. of injuries
2017/18 2018/19
Unskilled 86 55
Semi-skilled 74 68
Skilled 26 20
Professional 1 2
Senior Management 1 1 Total 188 146
Type of Injury
Number of
Injury Leave
Days Taken
Number of
Employees
Taking Injury
Leave
Average
Injury Leave
Days /
Employee
*Percentage
of total
employees
using injury
leave
Required basic medical attention only 126 72 1.75 3.88%
Temporary total disablement 561 49 11.45 2.64%
Permanent disablement 0 0 0 0.0%
Total 687 121 5.68 6.52%
*Based on the total number of employees (1,858) as at 30 June 2019
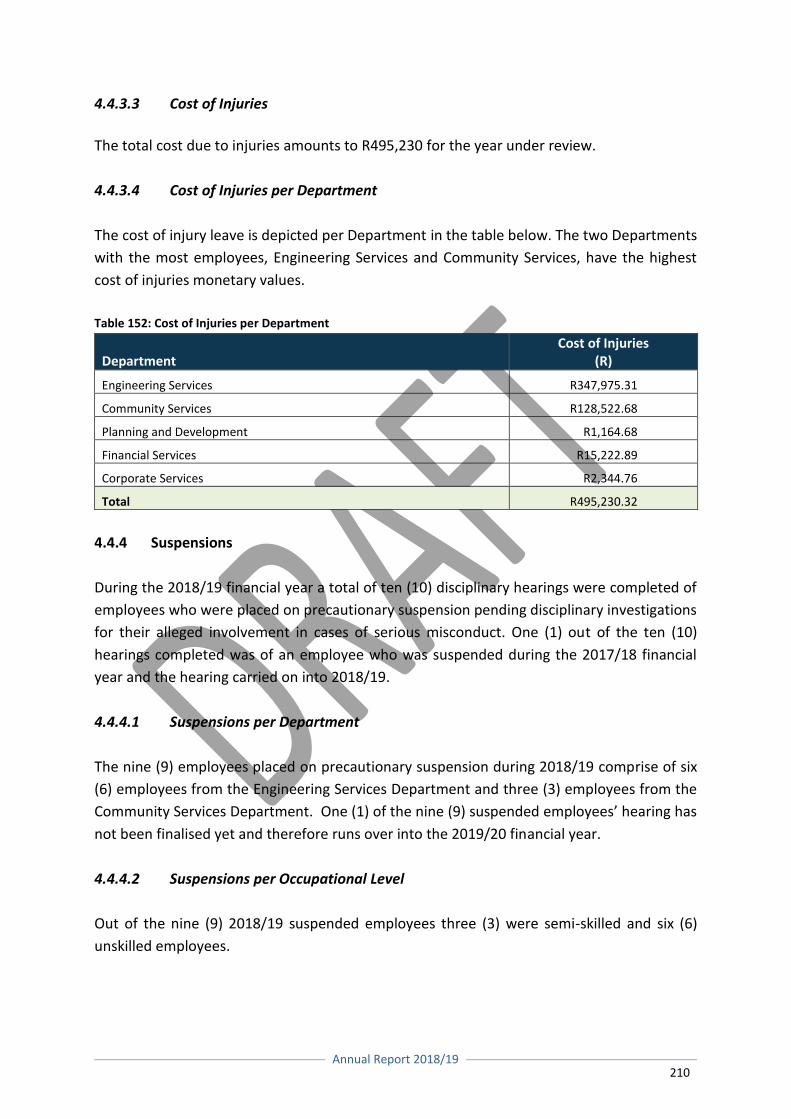
Annual Report 2018/19
210
4.4.3.3 Cost of Injuries
The total cost due to injuries amounts to R495,230 for the year under review.
4.4.3.4 Cost of Injuries per Department
The cost of injury leave is depicted per Department in the table below. The two Departments
with the most employees, Engineering Services and Community Services, have the highest
cost of injuries monetary values.
Table 152: Cost of Injuries per Department
Department Cost of Injuries
(R)
Engineering Services R347,975.31
Community Services R128,522.68
Planning and Development R1,164.68
Financial Services R15,222.89
Corporate Services R2,344.76
Total R495,230.32
4.4.4 Suspensions
During the 2018/19 financial year a total of ten (10) disciplinary hearings were completed of
employees who were placed on precautionary suspension pending disciplinary investigations
for their alleged involvement in cases of serious misconduct. One (1) out of the ten (10)
hearings completed was of an employee who was suspended during the 2017/18 financial
year and the hearing carried on into 2018/19.
4.4.4.1 Suspensions per Department
The nine (9) employees placed on precautionary suspension during 2018/19 comprise of six
(6) employees from the Engineering Services Department and three (3) employees from the
Community Services Department. One (1) of the nine (9) suspended employees’ hearing has
not been finalised yet and therefore runs over into the 2019/20 financial year.
4.4.4.2 Suspensions per Occupational Level
Out of the nine (9) 2018/19 suspended employees three (3) were semi-skilled and six (6)
unskilled employees.
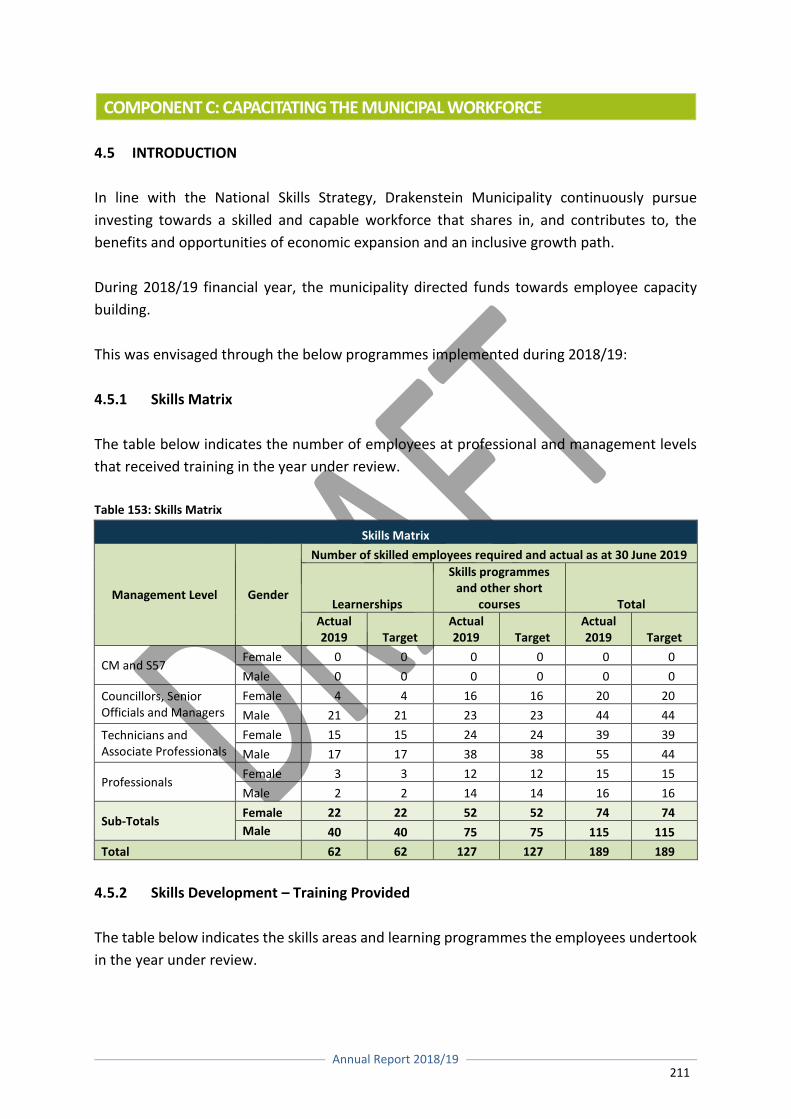
Annual Report 2018/19
211
COMPONENT C: CAPACITATING THE MUNICIPAL WORKFORCE
4.5 INTRODUCTION
In line with the National Skills Strategy, Drakenstein Municipality continuously pursue
investing towards a skilled and capable workforce that shares in, and contributes to, the
benefits and opportunities of economic expansion and an inclusive growth path.
During 2018/19 financial year, the municipality directed funds towards employee capacity
building.
This was envisaged through the below programmes implemented during 2018/19:
4.5.1 Skills Matrix
The table below indicates the number of employees at professional and management levels
that received training in the year under review.
Table 153: Skills Matrix
Skills Matrix
Management Level Gender
Number of skilled employees required and actual as at 30 June 2019
Learnerships
Skills programmes and other short
courses Total
Actual 2019 Target
Actual 2019 Target
Actual 2019 Target
CM and S57 Female 0 0 0 0 0 0
Male 0 0 0 0 0 0
Councillors, Senior Officials and Managers
Female 4 4 16 16 20 20
Male 21 21 23 23 44 44
Technicians and Associate Professionals
Female 15 15 24 24 39 39
Male 17 17 38 38 55 44
Professionals Female 3 3 12 12 15 15
Male 2 2 14 14 16 16
Sub-Totals Female 22 22 52 52 74 74
Male 40 40 75 75 115 115
Total 62 62 127 127 189 189
4.5.2 Skills Development – Training Provided
The table below indicates the skills areas and learning programmes the employees undertook
in the year under review.
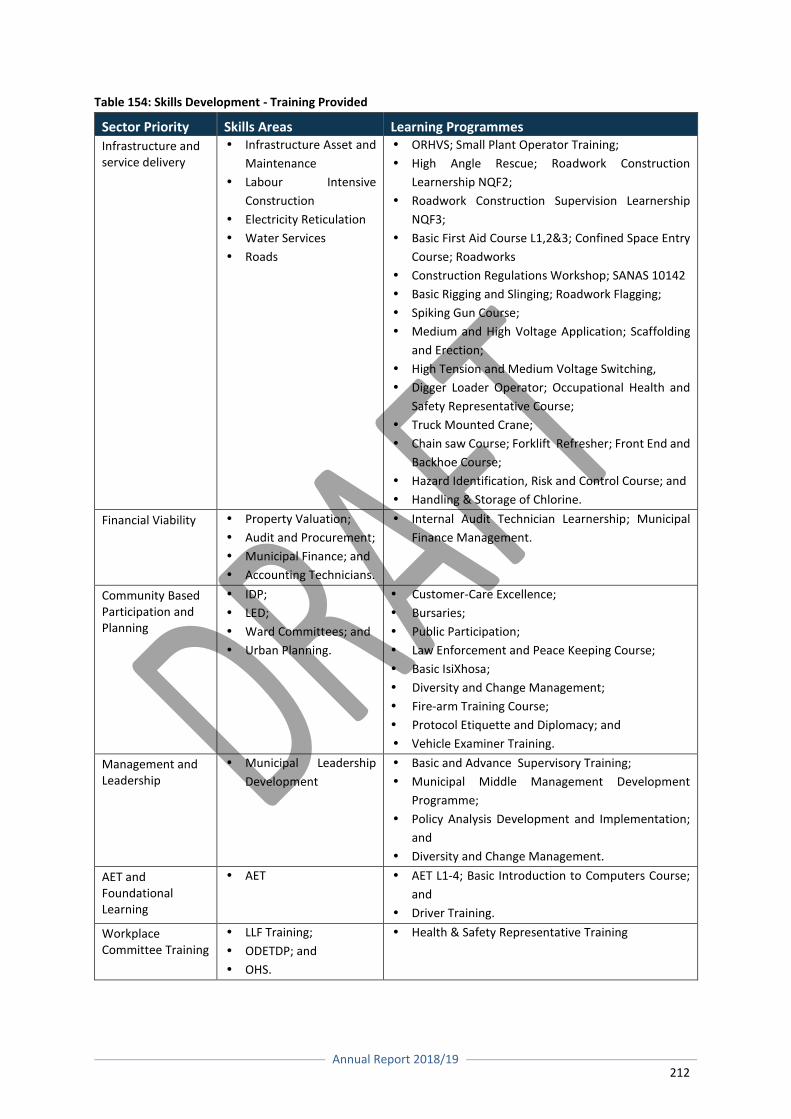
Annual Report 2018/19
212
Table 154: Skills Development - Training Provided
Sector Priority Skills Areas Learning Programmes
Infrastructure and service delivery
Infrastructure Asset and
Maintenance
Labour Intensive
Construction
Electricity Reticulation
Water Services
Roads
ORHVS; Small Plant Operator Training;
High Angle Rescue; Roadwork Construction
Learnership NQF2;
Roadwork Construction Supervision Learnership
NQF3;
Basic First Aid Course L1,2&3; Confined Space Entry
Course; Roadworks
Construction Regulations Workshop; SANAS 10142
Basic Rigging and Slinging; Roadwork Flagging;
Spiking Gun Course;
Medium and High Voltage Application; Scaffolding
and Erection;
High Tension and Medium Voltage Switching,
Digger Loader Operator; Occupational Health and
Safety Representative Course;
Truck Mounted Crane;
Chain saw Course; Forklift Refresher; Front End and
Backhoe Course;
Hazard Identification, Risk and Control Course; and
Handling & Storage of Chlorine.
Financial Viability Property Valuation;
Audit and Procurement;
Municipal Finance; and
Accounting Technicians.
Internal Audit Technician Learnership; Municipal
Finance Management.
Community Based Participation and Planning
IDP;
LED;
Ward Committees; and
Urban Planning.
Customer-Care Excellence;
Bursaries;
Public Participation;
Law Enforcement and Peace Keeping Course;
Basic IsiXhosa;
Diversity and Change Management;
Fire-arm Training Course;
Protocol Etiquette and Diplomacy; and
Vehicle Examiner Training.
Management and Leadership
Municipal Leadership
Development
Basic and Advance Supervisory Training;
Municipal Middle Management Development
Programme;
Policy Analysis Development and Implementation;
and
Diversity and Change Management.
AET and Foundational Learning
AET AET L1-4; Basic Introduction to Computers Course;
and
Driver Training.
Workplace Committee Training
LLF Training;
ODETDP; and
OHS.
Health & Safety Representative Training
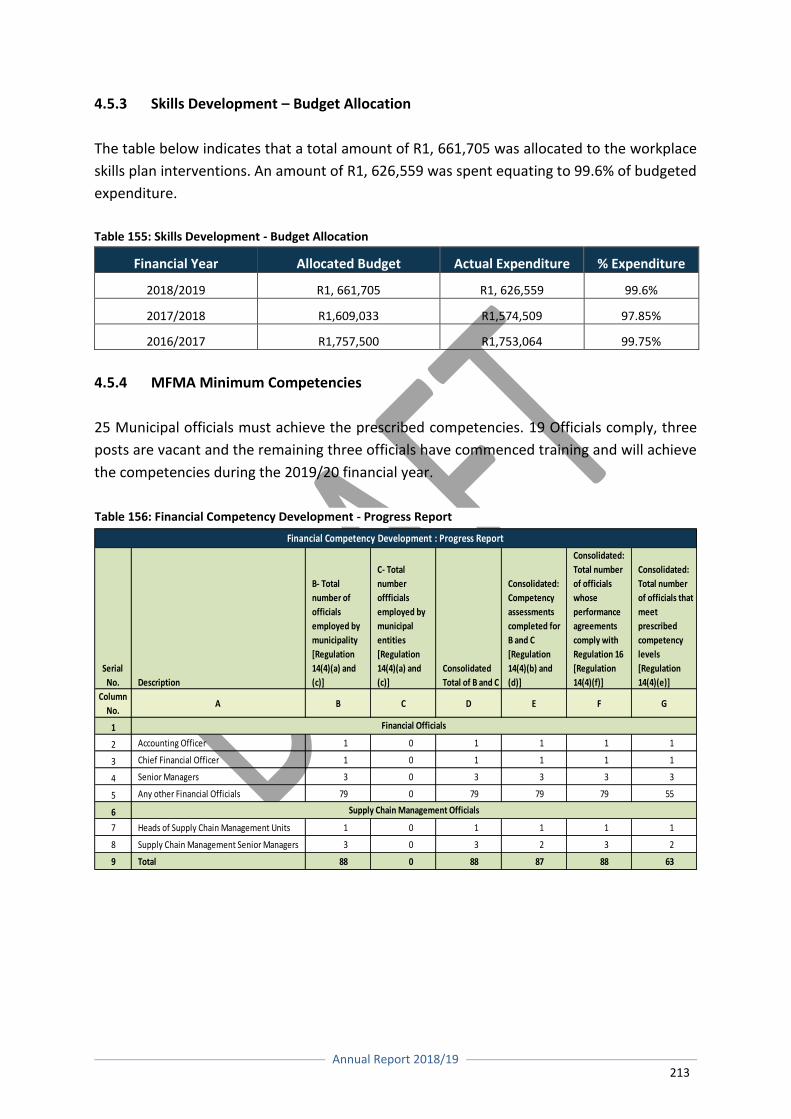
Annual Report 2018/19
213
4.5.3 Skills Development – Budget Allocation
The table below indicates that a total amount of R1, 661,705 was allocated to the workplace
skills plan interventions. An amount of R1, 626,559 was spent equating to 99.6% of budgeted
expenditure.
Table 155: Skills Development - Budget Allocation
Financial Year Allocated Budget Actual Expenditure % Expenditure
2018/2019 R1, 661,705 R1, 626,559 99.6%
2017/2018 R1,609,033 R1,574,509 97.85%
2016/2017 R1,757,500 R1,753,064 99.75%
4.5.4 MFMA Minimum Competencies
25 Municipal officials must achieve the prescribed competencies. 19 Officials comply, three
posts are vacant and the remaining three officials have commenced training and will achieve
the competencies during the 2019/20 financial year.
Serial
No. Description
B- Total
number of
officials
employed by
municipality
[Regulation
14(4)(a) and
(c)]
C- Total
number
offficials
employed by
municipal
entities
[Regulation
14(4)(a) and
(c)]
Consolidated
Total of B and C
Consolidated:
Competency
assessments
completed for
B and C
[Regulation
14(4)(b) and
(d)]
Consolidated:
Total number
of officials
whose
performance
agreements
comply with
Regulation 16
[Regulation
14(4)(f)]
Consolidated:
Total number
of officials that
meet
prescribed
competency
levels
[Regulation
14(4)(e)]
Column
No.A B C D E F G
1
2 Accounting Officer 1 0 1 1 1 1
3 Chief Financial Officer 1 0 1 1 1 1
4 Senior Managers 3 0 3 3 3 3
5 Any other Financial Officials 79 0 79 79 79 55
6
7 Heads of Supply Chain Management Units 1 0 1 1 1 1
8 Supply Chain Management Senior Managers 3 0 3 2 3 2
9 Total 88 0 88 87 88 63
Supply Chain Management Officials
Financial Officials
Financial Competency Development : Progress Report
Table 156: Financial Competency Development - Progress Report
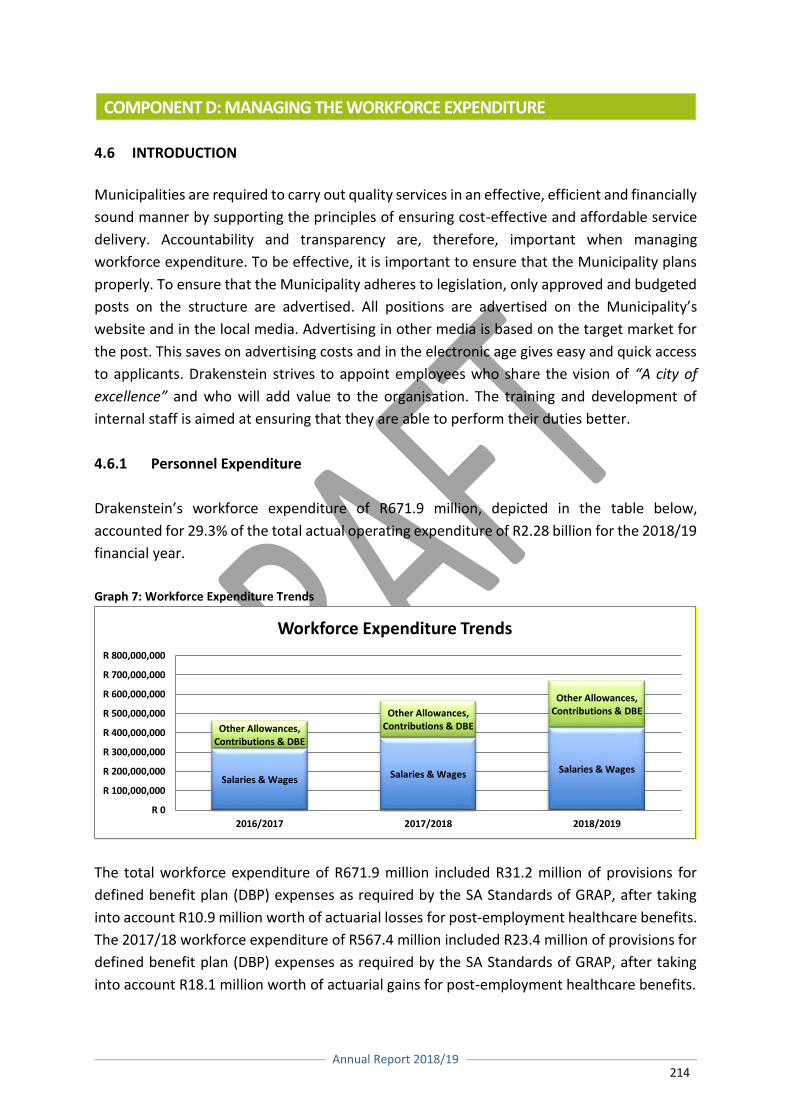
Annual Report 2018/19
214
COMPONENT D: MANAGING THE WORKFORCE EXPENDITURE
4.6 INTRODUCTION
Municipalities are required to carry out quality services in an effective, efficient and financially
sound manner by supporting the principles of ensuring cost-effective and affordable service
delivery. Accountability and transparency are, therefore, important when managing
workforce expenditure. To be effective, it is important to ensure that the Municipality plans
properly. To ensure that the Municipality adheres to legislation, only approved and budgeted
posts on the structure are advertised. All positions are advertised on the Municipality’s
website and in the local media. Advertising in other media is based on the target market for
the post. This saves on advertising costs and in the electronic age gives easy and quick access
to applicants. Drakenstein strives to appoint employees who share the vision of “A city of
excellence” and who will add value to the organisation. The training and development of
internal staff is aimed at ensuring that they are able to perform their duties better.
4.6.1 Personnel Expenditure
Drakenstein’s workforce expenditure of R671.9 million, depicted in the table below,
accounted for 29.3% of the total actual operating expenditure of R2.28 billion for the 2018/19
financial year.
Graph 7: Workforce Expenditure Trends
The total workforce expenditure of R671.9 million included R31.2 million of provisions for
defined benefit plan (DBP) expenses as required by the SA Standards of GRAP, after taking
into account R10.9 million worth of actuarial losses for post-employment healthcare benefits.
The 2017/18 workforce expenditure of R567.4 million included R23.4 million of provisions for
defined benefit plan (DBP) expenses as required by the SA Standards of GRAP, after taking
into account R18.1 million worth of actuarial gains for post-employment healthcare benefits.
Salaries & WagesSalaries & Wages Salaries & Wages
Other Allowances, Contributions & DBE
Other Allowances, Contributions & DBE
Other Allowances, Contributions & DBE
R 0
R 100,000,000
R 200,000,000
R 300,000,000
R 400,000,000
R 500,000,000
R 600,000,000
R 700,000,000
R 800,000,000
2016/2017 2017/2018 2018/2019
Workforce Expenditure Trends
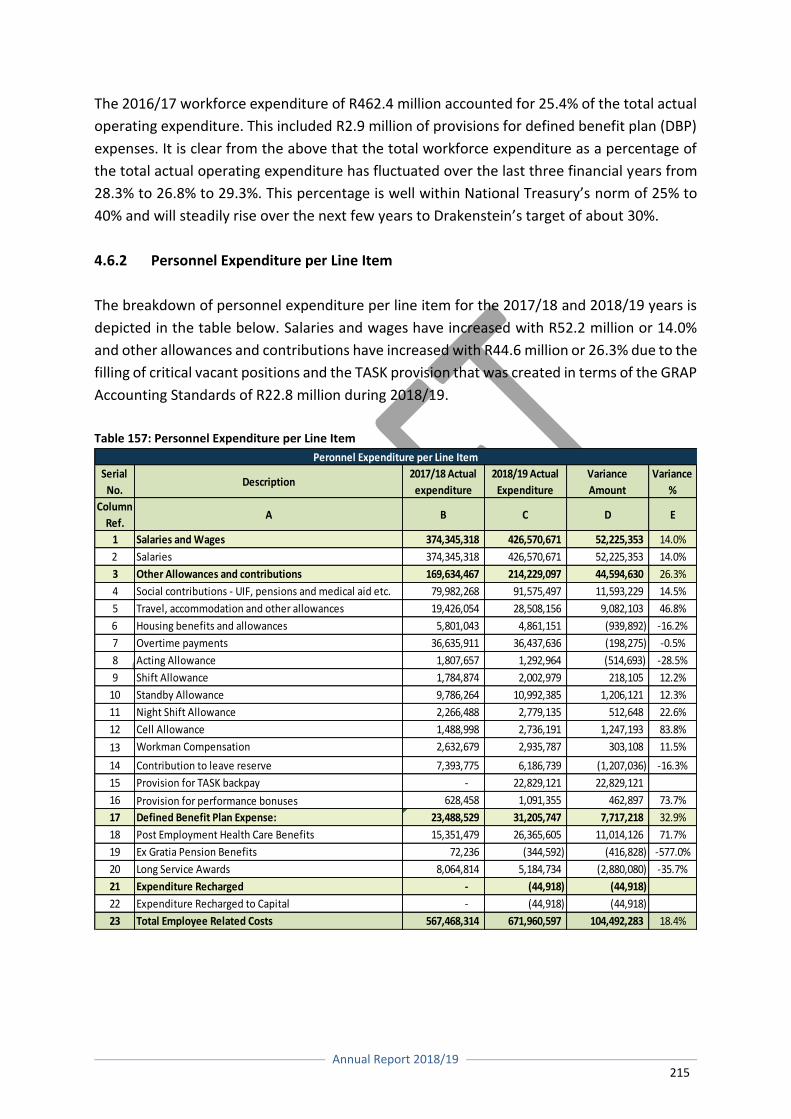
Annual Report 2018/19
215
The 2016/17 workforce expenditure of R462.4 million accounted for 25.4% of the total actual
operating expenditure. This included R2.9 million of provisions for defined benefit plan (DBP)
expenses. It is clear from the above that the total workforce expenditure as a percentage of
the total actual operating expenditure has fluctuated over the last three financial years from
28.3% to 26.8% to 29.3%. This percentage is well within National Treasury’s norm of 25% to
40% and will steadily rise over the next few years to Drakenstein’s target of about 30%.
4.6.2 Personnel Expenditure per Line Item
The breakdown of personnel expenditure per line item for the 2017/18 and 2018/19 years is
depicted in the table below. Salaries and wages have increased with R52.2 million or 14.0%
and other allowances and contributions have increased with R44.6 million or 26.3% due to the
filling of critical vacant positions and the TASK provision that was created in terms of the GRAP
Accounting Standards of R22.8 million during 2018/19.
Table 157: Personnel Expenditure per Line Item
Serial
No.Description
2017/18 Actual
expenditure
2018/19 Actual
Expenditure
Variance
Amount
Variance
%
Column
Ref.A B C D E
1 Salaries and Wages 374,345,318 426,570,671 52,225,353 14.0%
2 Salaries 374,345,318 426,570,671 52,225,353 14.0%
3 Other Allowances and contributions 169,634,467 214,229,097 44,594,630 26.3%
4 Social contributions - UIF, pensions and medical aid etc. 79,982,268 91,575,497 11,593,229 14.5%
5 Travel, accommodation and other allowances 19,426,054 28,508,156 9,082,103 46.8%
6 Housing benefits and allowances 5,801,043 4,861,151 (939,892) -16.2%
7 Overtime payments 36,635,911 36,437,636 (198,275) -0.5%
8 Acting Allowance 1,807,657 1,292,964 (514,693) -28.5%
9 Shift Allowance 1,784,874 2,002,979 218,105 12.2%
10 Standby Allowance 9,786,264 10,992,385 1,206,121 12.3%
11 Night Shift Allowance 2,266,488 2,779,135 512,648 22.6%
12 Cell Allowance 1,488,998 2,736,191 1,247,193 83.8%
13 Workman Compensation 2,632,679 2,935,787 303,108 11.5%
14 Contribution to leave reserve 7,393,775 6,186,739 (1,207,036) -16.3%
15 Provision for TASK backpay - 22,829,121 22,829,121
16 Provision for performance bonuses 628,458 1,091,355 462,897 73.7%
17 Defined Benefit Plan Expense: 23,488,529 31,205,747 7,717,218 32.9%
18 Post Employment Health Care Benefits 15,351,479 26,365,605 11,014,126 71.7%
19 Ex Gratia Pension Benefits 72,236 (344,592) (416,828) -577.0%
20 Long Service Awards 8,064,814 5,184,734 (2,880,080) -35.7%
21 Expenditure Recharged - (44,918) (44,918)
22 Expenditure Recharged to Capital - (44,918) (44,918)
23 Total Employee Related Costs 567,468,314 671,960,597 104,492,283 18.4%
Peronnel Expenditure per Line Item
Annual Report 2018/19
216
4.7 DISCLOSURES OF FINANCIAL INTERESTS
Disclosures have been made by officials and Councillors concerning their financial interests,
as required by Municipal Performance Regulations 805 of 2006 and are set out in Appendix I.
No transgressions due to financial interests occurred.
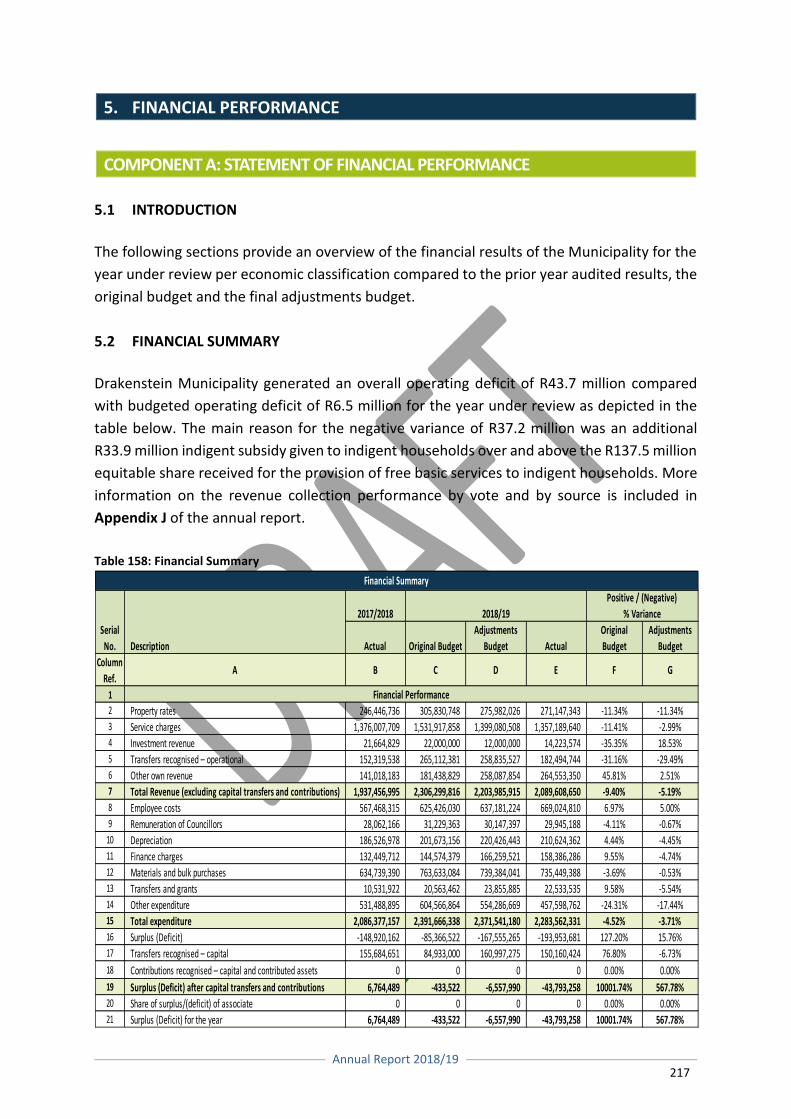
Annual Report 2018/19
217
5. FINANCIAL PERFORMANCE
COMPONENT A: STATEMENT OF FINANCIAL PERFORMANCE
5.1 INTRODUCTION
The following sections provide an overview of the financial results of the Municipality for the
year under review per economic classification compared to the prior year audited results, the
original budget and the final adjustments budget.
5.2 FINANCIAL SUMMARY
Drakenstein Municipality generated an overall operating deficit of R43.7 million compared
with budgeted operating deficit of R6.5 million for the year under review as depicted in the
table below. The main reason for the negative variance of R37.2 million was an additional
R33.9 million indigent subsidy given to indigent households over and above the R137.5 million
equitable share received for the provision of free basic services to indigent households. More
information on the revenue collection performance by vote and by source is included in
Appendix J of the annual report.
Table 158: Financial Summary
2017/2018
Actual Original Budget
Adjustments
Budget Actual
Original
Budget
Adjustments
Budget
Column
Ref.A B C D E F G
1
2 Property rates 246,446,736 305,830,748 275,982,026 271,147,343 -11.34% -11.34%3 Service charges 1,376,007,709 1,531,917,858 1,399,080,508 1,357,189,640 -11.41% -2.99%4 Investment revenue 21,664,829 22,000,000 12,000,000 14,223,574 -35.35% 18.53%5 Transfers recognised – operational 152,319,538 265,112,381 258,835,527 182,494,744 -31.16% -29.49%6 Other own revenue 141,018,183 181,438,829 258,087,854 264,553,350 45.81% 2.51%7 Total Revenue (excluding capital transfers and contributions) 1,937,456,995 2,306,299,816 2,203,985,915 2,089,608,650 -9.40% -5.19%8 Employee costs 567,468,315 625,426,030 637,181,224 669,024,810 6.97% 5.00%9 Remuneration of Councillors 28,062,166 31,229,363 30,147,397 29,945,188 -4.11% -0.67%
10 Depreciation 186,526,978 201,673,156 220,426,443 210,624,362 4.44% -4.45%11 Finance charges 132,449,712 144,574,379 166,259,521 158,386,286 9.55% -4.74%12 Materials and bulk purchases 634,739,390 763,633,084 739,384,041 735,449,388 -3.69% -0.53%13 Transfers and grants 10,531,922 20,563,462 23,855,885 22,533,535 9.58% -5.54%14 Other expenditure 531,488,895 604,566,864 554,286,669 457,598,762 -24.31% -17.44%15 Total expenditure 2,086,377,157 2,391,666,338 2,371,541,180 2,283,562,331 -4.52% -3.71%16 Surplus (Deficit) -148,920,162 -85,366,522 -167,555,265 -193,953,681 127.20% 15.76%17 Transfers recognised – capital 155,684,651 84,933,000 160,997,275 150,160,424 76.80% -6.73%
18 Contributions recognised – capital and contributed assets 0 0 0 0 0.00% 0.00%
19 Surplus (Deficit) after capital transfers and contributions 6,764,489 -433,522 -6,557,990 -43,793,258 10001.74% 567.78%20 Share of surplus/(deficit) of associate 0 0 0 0 0.00% 0.00%21 Surplus (Deficit) for the year 6,764,489 -433,522 -6,557,990 -43,793,258 10001.74% 567.78%
Financial Summary
Serial
No.
2018/19
Positive / (Negative)
% Variance
Financial Performance
Description
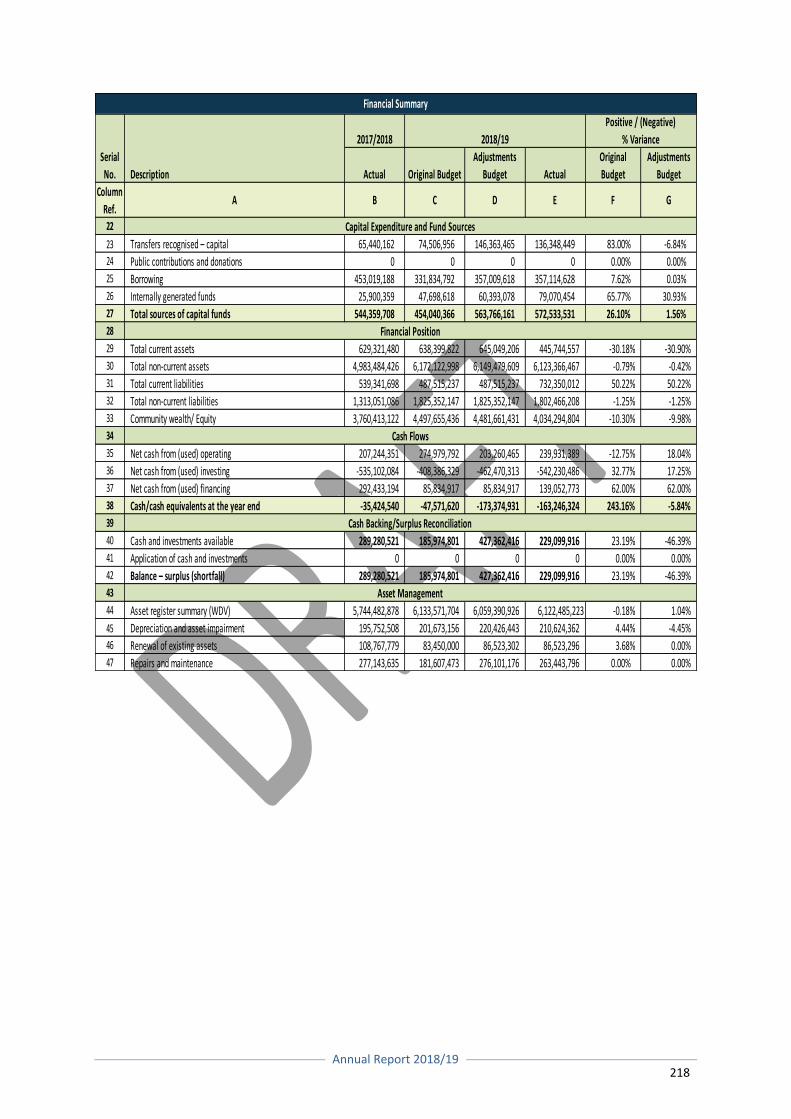
Annual Report 2018/19
218
2017/2018
Actual Original Budget
Adjustments
Budget Actual
Original
Budget
Adjustments
Budget
Column
Ref.A B C D E F G
22
23 Transfers recognised – capital 65,440,162 74,506,956 146,363,465 136,348,449 83.00% -6.84%24 Public contributions and donations 0 0 0 0 0.00% 0.00%25 Borrowing 453,019,188 331,834,792 357,009,618 357,114,628 7.62% 0.03%26 Internally generated funds 25,900,359 47,698,618 60,393,078 79,070,454 65.77% 30.93%27 Total sources of capital funds 544,359,708 454,040,366 563,766,161 572,533,531 26.10% 1.56%28
29 Total current assets 629,321,480 638,399,822 645,049,206 445,744,557 -30.18% -30.90%30 Total non-current assets 4,983,484,426 6,172,122,998 6,149,479,609 6,123,366,467 -0.79% -0.42%31 Total current liabilities 539,341,698 487,515,237 487,515,237 732,350,012 50.22% 50.22%32 Total non-current liabilities 1,313,051,086 1,825,352,147 1,825,352,147 1,802,466,208 -1.25% -1.25%33 Community wealth/ Equity 3,760,413,122 4,497,655,436 4,481,661,431 4,034,294,804 -10.30% -9.98%34
35 Net cash from (used) operating 207,244,351 274,979,792 203,260,465 239,931,389 -12.75% 18.04%36 Net cash from (used) investing -535,102,084 -408,386,329 -462,470,313 -542,230,486 32.77% 17.25%37 Net cash from (used) financing 292,433,194 85,834,917 85,834,917 139,052,773 62.00% 62.00%38 Cash/cash equivalents at the year end -35,424,540 -47,571,620 -173,374,931 -163,246,324 243.16% -5.84%39
40 Cash and investments available 289,280,521 185,974,801 427,362,416 229,099,916 23.19% -46.39%41 Application of cash and investments 0 0 0 0 0.00% 0.00%42 Balance – surplus (shortfall) 289,280,521 185,974,801 427,362,416 229,099,916 23.19% -46.39%43
44 Asset register summary (WDV) 5,744,482,878 6,133,571,704 6,059,390,926 6,122,485,223 -0.18% 1.04%
45 Depreciation and asset impairment 195,752,508 201,673,156 220,426,443 210,624,362 4.44% -4.45%46 Renewal of existing assets 108,767,779 83,450,000 86,523,302 86,523,296 3.68% 0.00%47 Repairs and maintenance 277,143,635 181,607,473 276,101,176 263,443,796 0.00% 0.00%
Financial Summary
Serial
No.
2018/19
Positive / (Negative)
% Variance
Asset Management
Capital Expenditure and Fund Sources
Financial Position
Cash Flows
Cash Backing/Surplus Reconciliation
Description
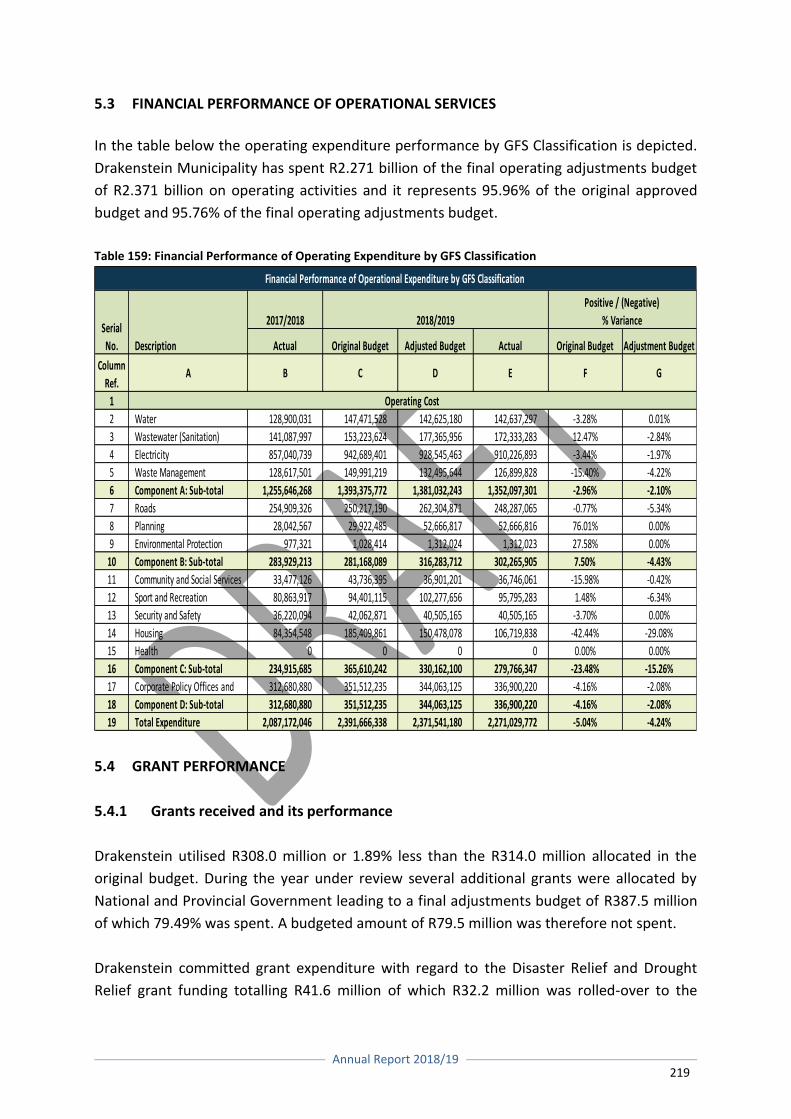
Annual Report 2018/19
219
5.3 FINANCIAL PERFORMANCE OF OPERATIONAL SERVICES
In the table below the operating expenditure performance by GFS Classification is depicted.
Drakenstein Municipality has spent R2.271 billion of the final operating adjustments budget
of R2.371 billion on operating activities and it represents 95.96% of the original approved
budget and 95.76% of the final operating adjustments budget.
Table 159: Financial Performance of Operating Expenditure by GFS Classification
5.4 GRANT PERFORMANCE
5.4.1 Grants received and its performance
Drakenstein utilised R308.0 million or 1.89% less than the R314.0 million allocated in the
original budget. During the year under review several additional grants were allocated by
National and Provincial Government leading to a final adjustments budget of R387.5 million
of which 79.49% was spent. A budgeted amount of R79.5 million was therefore not spent.
Drakenstein committed grant expenditure with regard to the Disaster Relief and Drought
Relief grant funding totalling R41.6 million of which R32.2 million was rolled-over to the
2017/2018
Actual Original Budget Adjusted Budget Actual Original Budget Adjustment Budget
Column
Ref.A B C D E F G
1
2 Water 128,900,031 147,471,528 142,625,180 142,637,297 -3.28% 0.01%
3 Wastewater (Sanitation) 141,087,997 153,223,624 177,365,956 172,333,283 12.47% -2.84%
4 Electricity 857,040,739 942,689,401 928,545,463 910,226,893 -3.44% -1.97%
5 Waste Management 128,617,501 149,991,219 132,495,644 126,899,828 -15.40% -4.22%
6 Component A: Sub-total 1,255,646,268 1,393,375,772 1,381,032,243 1,352,097,301 -2.96% -2.10%
7 Roads 254,909,326 250,217,190 262,304,871 248,287,065 -0.77% -5.34%
8 Planning 28,042,567 29,922,485 52,666,817 52,666,816 76.01% 0.00%
9 Environmental Protection 977,321 1,028,414 1,312,024 1,312,023 27.58% 0.00%
10 Component B: Sub-total 283,929,213 281,168,089 316,283,712 302,265,905 7.50% -4.43%
11 Community and Social Services 33,477,126 43,736,395 36,901,201 36,746,061 -15.98% -0.42%
12 Sport and Recreation 80,863,917 94,401,115 102,277,656 95,795,283 1.48% -6.34%
13 Security and Safety 36,220,094 42,062,871 40,505,165 40,505,165 -3.70% 0.00%
14 Housing 84,354,548 185,409,861 150,478,078 106,719,838 -42.44% -29.08%
15 Health 0 0 0 0 0.00% 0.00%
16 Component C: Sub-total 234,915,685 365,610,242 330,162,100 279,766,347 -23.48% -15.26%
17 Corporate Policy Offices and 312,680,880 351,512,235 344,063,125 336,900,220 -4.16% -2.08%
18 Component D: Sub-total 312,680,880 351,512,235 344,063,125 336,900,220 -4.16% -2.08%
19 Total Expenditure 2,087,172,046 2,391,666,338 2,371,541,180 2,271,029,772 -5.04% -4.24%
Financial Performance of Operational Expenditure by GFS Classification
Serial
No.
Operating Cost
2018/2019
Positive / (Negative)
% Variance
Description
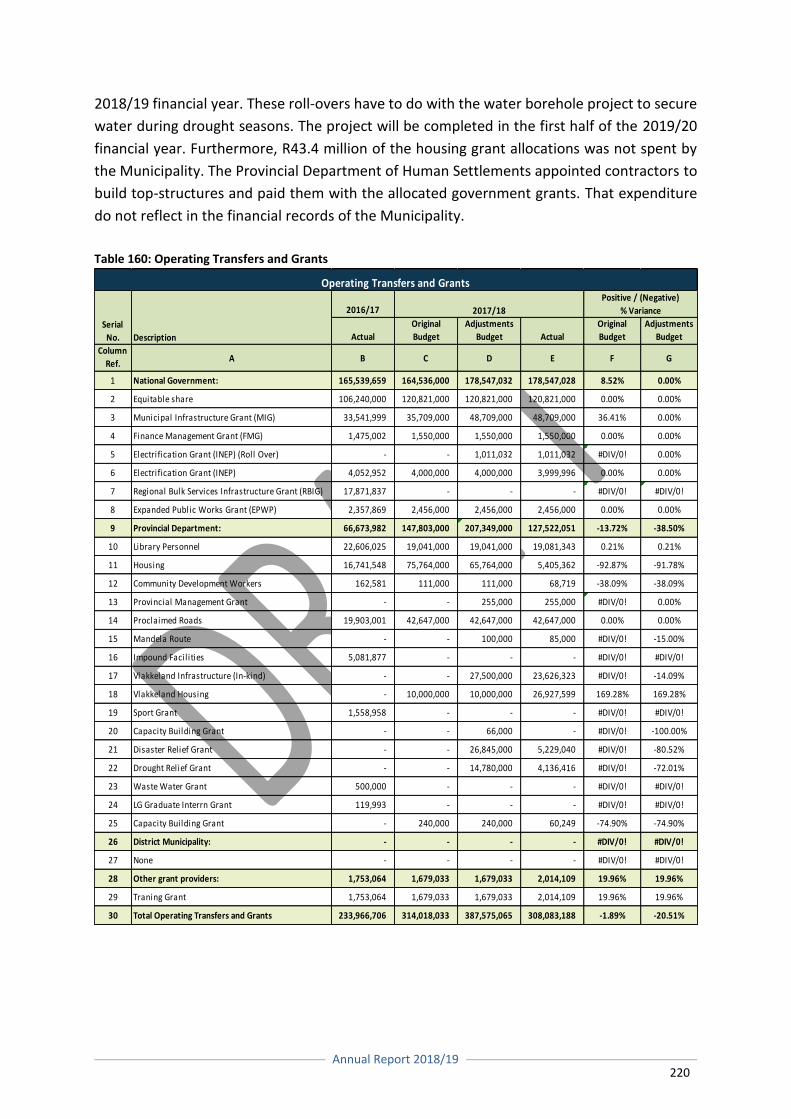
Annual Report 2018/19
220
2018/19 financial year. These roll-overs have to do with the water borehole project to secure
water during drought seasons. The project will be completed in the first half of the 2019/20
financial year. Furthermore, R43.4 million of the housing grant allocations was not spent by
the Municipality. The Provincial Department of Human Settlements appointed contractors to
build top-structures and paid them with the allocated government grants. That expenditure
do not reflect in the financial records of the Municipality.
Table 160: Operating Transfers and Grants
2016/17
Actual
Original
Budget
Adjustments
Budget Actual
Original
Budget
Adjustments
Budget
Column
Ref.A B C D E F G
1 National Government: 165,539,659 164,536,000 178,547,032 178,547,028 8.52% 0.00%
2 Equitable share 106,240,000 120,821,000 120,821,000 120,821,000 0.00% 0.00%
3 Municipal Infrastructure Grant (MIG) 33,541,999 35,709,000 48,709,000 48,709,000 36.41% 0.00%
4 Finance Management Grant (FMG) 1,475,002 1,550,000 1,550,000 1,550,000 0.00% 0.00%
5 Electrification Grant (INEP) (Roll Over) - - 1,011,032 1,011,032 #DIV/0! 0.00%
6 Electrification Grant (INEP) 4,052,952 4,000,000 4,000,000 3,999,996 0.00% 0.00%
7 Regional Bulk Services Infrastructure Grant (RBIG) 17,871,837 - - - #DIV/0! #DIV/0!
8 Expanded Public Works Grant (EPWP) 2,357,869 2,456,000 2,456,000 2,456,000 0.00% 0.00%
9 Provincial Department: 66,673,982 147,803,000 207,349,000 127,522,051 -13.72% -38.50%
10 Library Personnel 22,606,025 19,041,000 19,041,000 19,081,343 0.21% 0.21%
11 Housing 16,741,548 75,764,000 65,764,000 5,405,362 -92.87% -91.78%
12 Community Development Workers 162,581 111,000 111,000 68,719 -38.09% -38.09%
13 Provincial Management Grant - - 255,000 255,000 #DIV/0! 0.00%
14 Proclaimed Roads 19,903,001 42,647,000 42,647,000 42,647,000 0.00% 0.00%
15 Mandela Route - - 100,000 85,000 #DIV/0! -15.00%
16 Impound Facil ities 5,081,877 - - - #DIV/0! #DIV/0!
17 Vlakkeland Infrastructure (In-kind) - - 27,500,000 23,626,323 #DIV/0! -14.09%
18 Vlakkeland Housing - 10,000,000 10,000,000 26,927,599 169.28% 169.28%
19 Sport Grant 1,558,958 - - - #DIV/0! #DIV/0!
20 Capacity Building Grant - - 66,000 - #DIV/0! -100.00%
21 Disaster Relief Grant - - 26,845,000 5,229,040 #DIV/0! -80.52%
22 Drought Relief Grant - - 14,780,000 4,136,416 #DIV/0! -72.01%
23 Waste Water Grant 500,000 - - - #DIV/0! #DIV/0!
24 LG Graduate Interrn Grant 119,993 - - - #DIV/0! #DIV/0!
25 Capacity Building Grant - 240,000 240,000 60,249 -74.90% -74.90%
26 District Municipality: - - - - #DIV/0! #DIV/0!
27 None - - - - #DIV/0! #DIV/0!
28 Other grant providers: 1,753,064 1,679,033 1,679,033 2,014,109 19.96% 19.96%
29 Traning Grant 1,753,064 1,679,033 1,679,033 2,014,109 19.96% 19.96%
30 Total Operating Transfers and Grants 233,966,706 314,018,033 387,575,065 308,083,188 -1.89% -20.51%
Operating Transfers and Grants
Description
Serial
No.
2017/18
Positive / (Negative)
% Variance
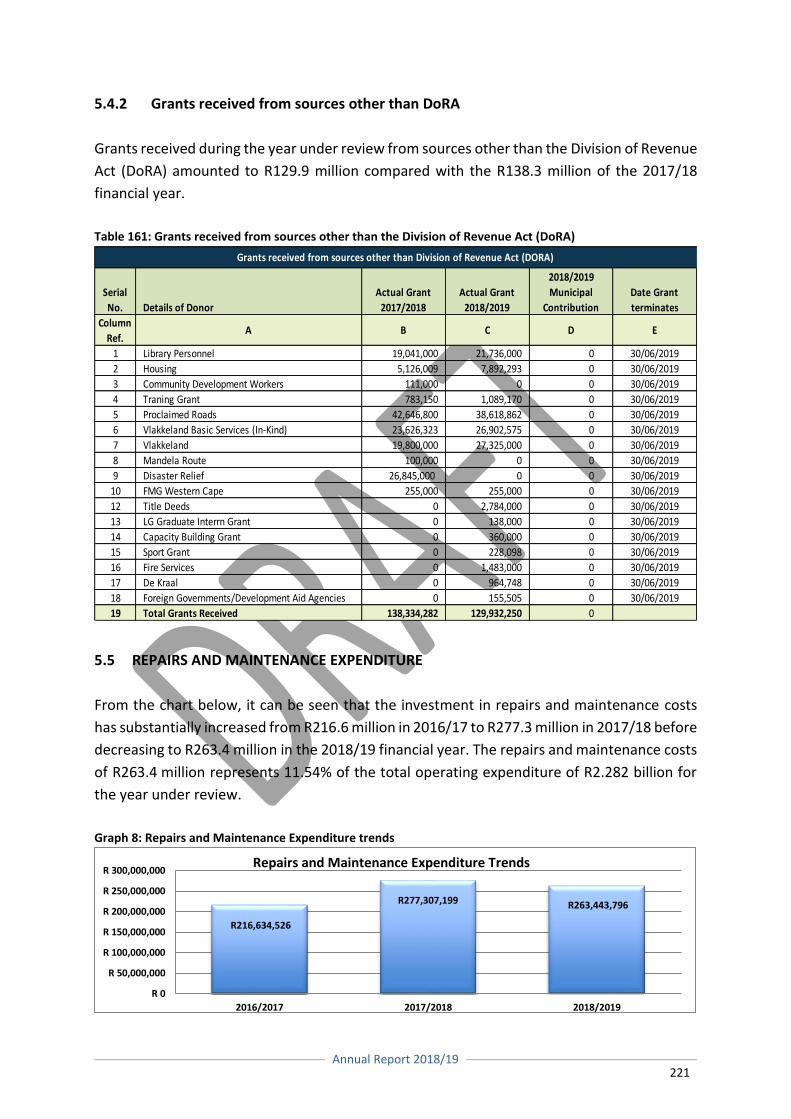
Annual Report 2018/19
221
5.4.2 Grants received from sources other than DoRA
Grants received during the year under review from sources other than the Division of Revenue
Act (DoRA) amounted to R129.9 million compared with the R138.3 million of the 2017/18
financial year.
Table 161: Grants received from sources other than the Division of Revenue Act (DoRA)
5.5 REPAIRS AND MAINTENANCE EXPENDITURE
From the chart below, it can be seen that the investment in repairs and maintenance costs
has substantially increased from R216.6 million in 2016/17 to R277.3 million in 2017/18 before
decreasing to R263.4 million in the 2018/19 financial year. The repairs and maintenance costs
of R263.4 million represents 11.54% of the total operating expenditure of R2.282 billion for
the year under review.
Graph 8: Repairs and Maintenance Expenditure trends
R216,634,526
R277,307,199 R263,443,796
R 0
R 50,000,000
R 100,000,000
R 150,000,000
R 200,000,000
R 250,000,000
R 300,000,000
2016/2017 2017/2018 2018/2019
Repairs and Maintenance Expenditure Trends
Serial
No. Details of Donor
Actual Grant
2017/2018
Actual Grant
2018/2019
2018/2019
Municipal
Contribution
Date Grant
terminates
Column
Ref.A B C D E
1 Library Personnel 19,041,000 21,736,000 0 30/06/2019
2 Housing 5,126,009 7,892,293 0 30/06/2019
3 Community Development Workers 111,000 0 0 30/06/2019
4 Traning Grant 783,150 1,089,170 0 30/06/2019
5 Proclaimed Roads 42,646,800 38,618,862 0 30/06/2019
6 Vlakkeland Basic Services (In-Kind) 23,626,323 26,902,575 0 30/06/2019
7 Vlakkeland 19,800,000 27,325,000 0 30/06/2019
8 Mandela Route 100,000 0 0 30/06/2019
9 Disaster Relief 26,845,000 0 0 30/06/2019
10 FMG Western Cape 255,000 255,000 0 30/06/2019
12 Title Deeds 0 2,784,000 0 30/06/2019
13 LG Graduate Interrn Grant 0 138,000 0 30/06/2019
14 Capacity Building Grant 0 360,000 0 30/06/2019
15 Sport Grant 0 228,098 0 30/06/2019
16 Fire Services 0 1,483,000 0 30/06/2019
17 De Kraal 0 964,748 0 30/06/2019
18 Foreign Governments/Development Aid Agencies 0 155,505 0 30/06/2019
19 Total Grants Received 138,334,282 129,932,250 0
Grants received from sources other than Division of Revenue Act (DORA)
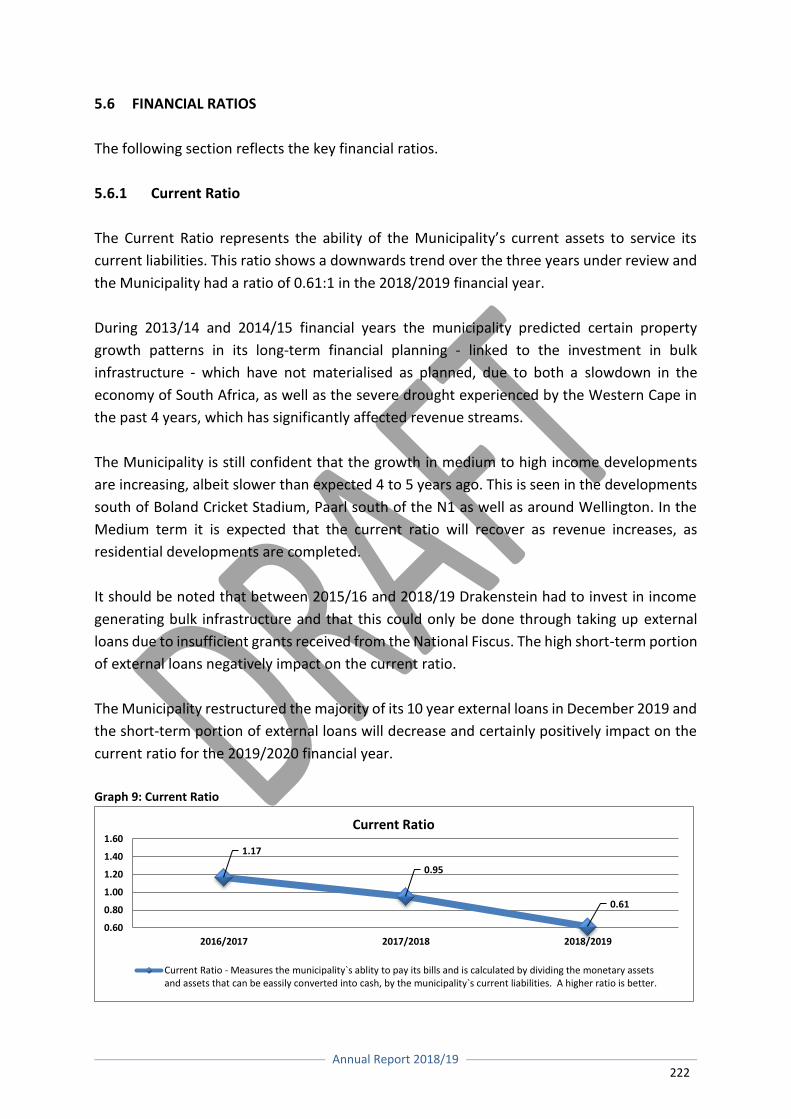
Annual Report 2018/19
222
5.6 FINANCIAL RATIOS
The following section reflects the key financial ratios.
5.6.1 Current Ratio
The Current Ratio represents the ability of the Municipality’s current assets to service its
current liabilities. This ratio shows a downwards trend over the three years under review and
the Municipality had a ratio of 0.61:1 in the 2018/2019 financial year.
During 2013/14 and 2014/15 financial years the municipality predicted certain property
growth patterns in its long-term financial planning - linked to the investment in bulk
infrastructure - which have not materialised as planned, due to both a slowdown in the
economy of South Africa, as well as the severe drought experienced by the Western Cape in
the past 4 years, which has significantly affected revenue streams.
The Municipality is still confident that the growth in medium to high income developments
are increasing, albeit slower than expected 4 to 5 years ago. This is seen in the developments
south of Boland Cricket Stadium, Paarl south of the N1 as well as around Wellington. In the
Medium term it is expected that the current ratio will recover as revenue increases, as
residential developments are completed.
It should be noted that between 2015/16 and 2018/19 Drakenstein had to invest in income
generating bulk infrastructure and that this could only be done through taking up external
loans due to insufficient grants received from the National Fiscus. The high short-term portion
of external loans negatively impact on the current ratio.
The Municipality restructured the majority of its 10 year external loans in December 2019 and
the short-term portion of external loans will decrease and certainly positively impact on the
current ratio for the 2019/2020 financial year.
Graph 9: Current Ratio
1.17
0.95
0.61
0.60
0.80
1.00
1.20
1.40
1.60
2016/2017 2017/2018 2018/2019
Current Ratio
Current Ratio - Measures the municipality`s ablity to pay its bills and is calculated by dividing the monetary assetsand assets that can be eassily converted into cash, by the municipality`s current liabilities. A higher ratio is better.
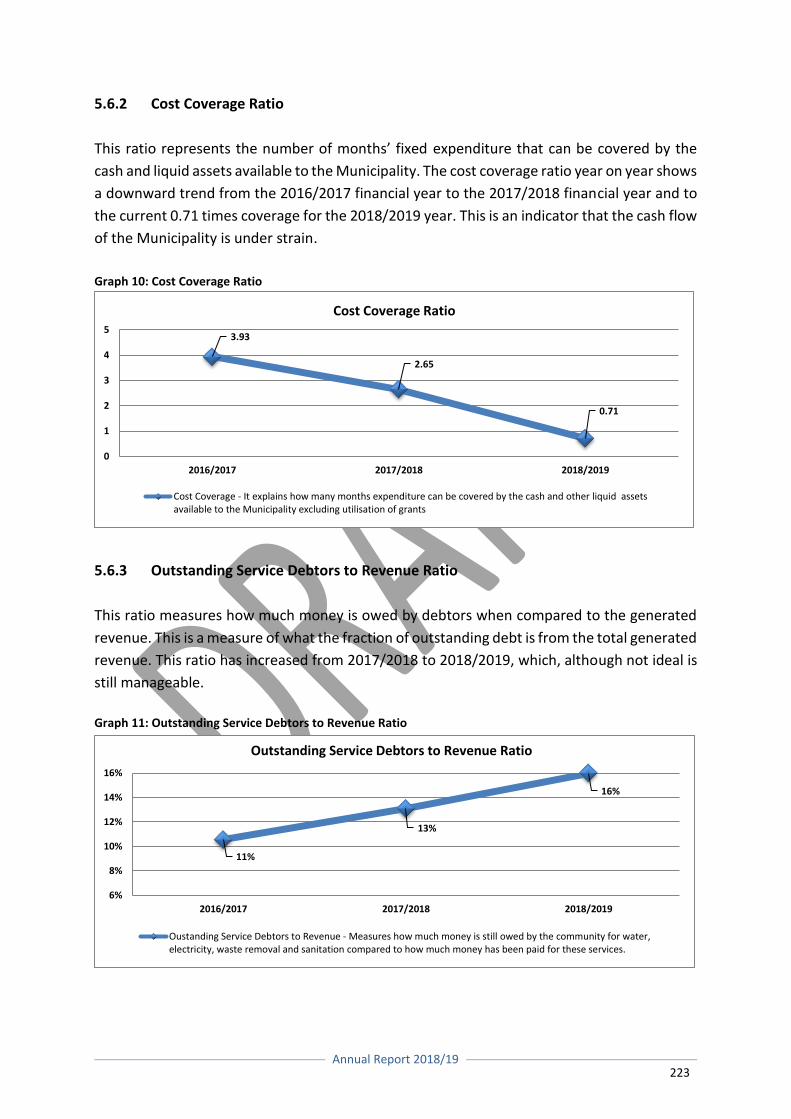
Annual Report 2018/19
223
5.6.2 Cost Coverage Ratio
This ratio represents the number of months’ fixed expenditure that can be covered by the
cash and liquid assets available to the Municipality. The cost coverage ratio year on year shows
a downward trend from the 2016/2017 financial year to the 2017/2018 financial year and to
the current 0.71 times coverage for the 2018/2019 year. This is an indicator that the cash flow
of the Municipality is under strain.
Graph 10: Cost Coverage Ratio
5.6.3 Outstanding Service Debtors to Revenue Ratio
This ratio measures how much money is owed by debtors when compared to the generated
revenue. This is a measure of what the fraction of outstanding debt is from the total generated
revenue. This ratio has increased from 2017/2018 to 2018/2019, which, although not ideal is
still manageable.
Graph 11: Outstanding Service Debtors to Revenue Ratio
3.93
2.65
0.71
0
1
2
3
4
5
2016/2017 2017/2018 2018/2019
Cost Coverage Ratio
Cost Coverage - It explains how many months expenditure can be covered by the cash and other liquid assetsavailable to the Municipality excluding utilisation of grants
11%
13%
16%
6%
8%
10%
12%
14%
16%
2016/2017 2017/2018 2018/2019
Outstanding Service Debtors to Revenue Ratio
Oustanding Service Debtors to Revenue - Measures how much money is still owed by the community for water,electricity, waste removal and sanitation compared to how much money has been paid for these services.
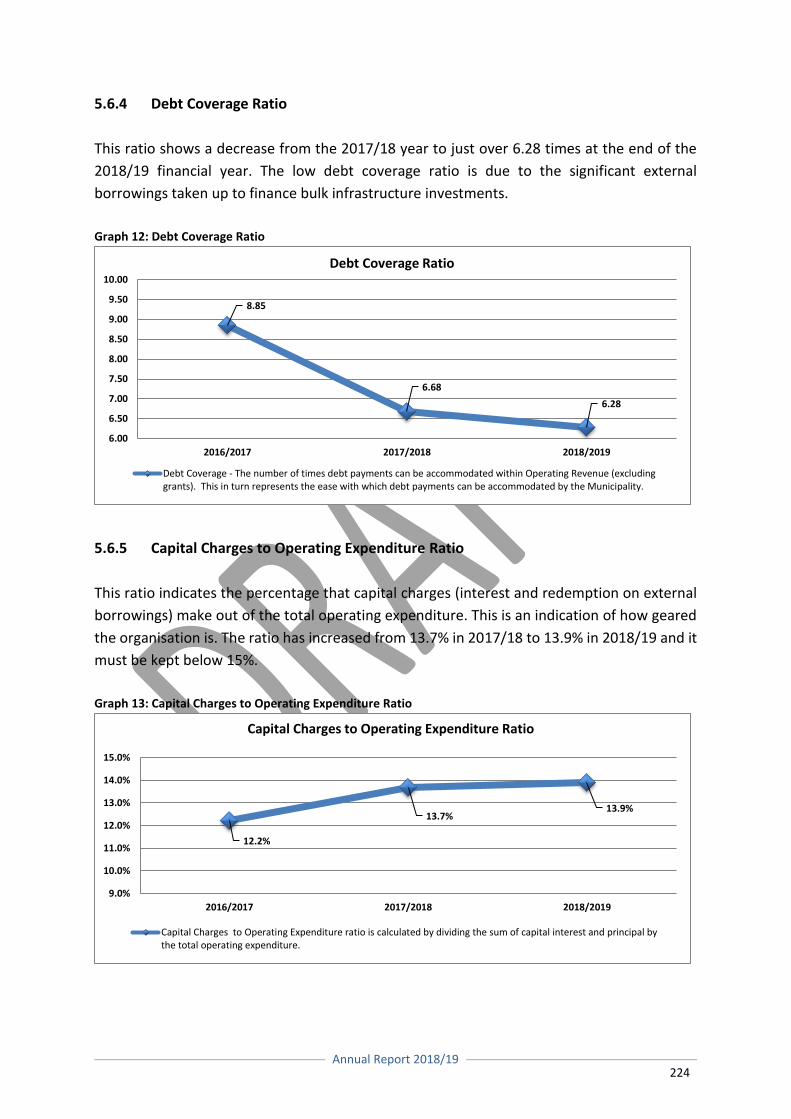
Annual Report 2018/19
224
5.6.4 Debt Coverage Ratio
This ratio shows a decrease from the 2017/18 year to just over 6.28 times at the end of the
2018/19 financial year. The low debt coverage ratio is due to the significant external
borrowings taken up to finance bulk infrastructure investments.
Graph 12: Debt Coverage Ratio
5.6.5 Capital Charges to Operating Expenditure Ratio
This ratio indicates the percentage that capital charges (interest and redemption on external
borrowings) make out of the total operating expenditure. This is an indication of how geared
the organisation is. The ratio has increased from 13.7% in 2017/18 to 13.9% in 2018/19 and it
must be kept below 15%.
Graph 13: Capital Charges to Operating Expenditure Ratio
8.85
6.68
6.28
6.00
6.50
7.00
7.50
8.00
8.50
9.00
9.50
10.00
2016/2017 2017/2018 2018/2019
Debt Coverage Ratio
Debt Coverage - The number of times debt payments can be accommodated within Operating Revenue (excludinggrants). This in turn represents the ease with which debt payments can be accommodated by the Municipality.
12.2%
13.7%13.9%
9.0%
10.0%
11.0%
12.0%
13.0%
14.0%
15.0%
2016/2017 2017/2018 2018/2019
Capital Charges to Operating Expenditure Ratio
Capital Charges to Operating Expenditure ratio is calculated by dividing the sum of capital interest and principal bythe total operating expenditure.
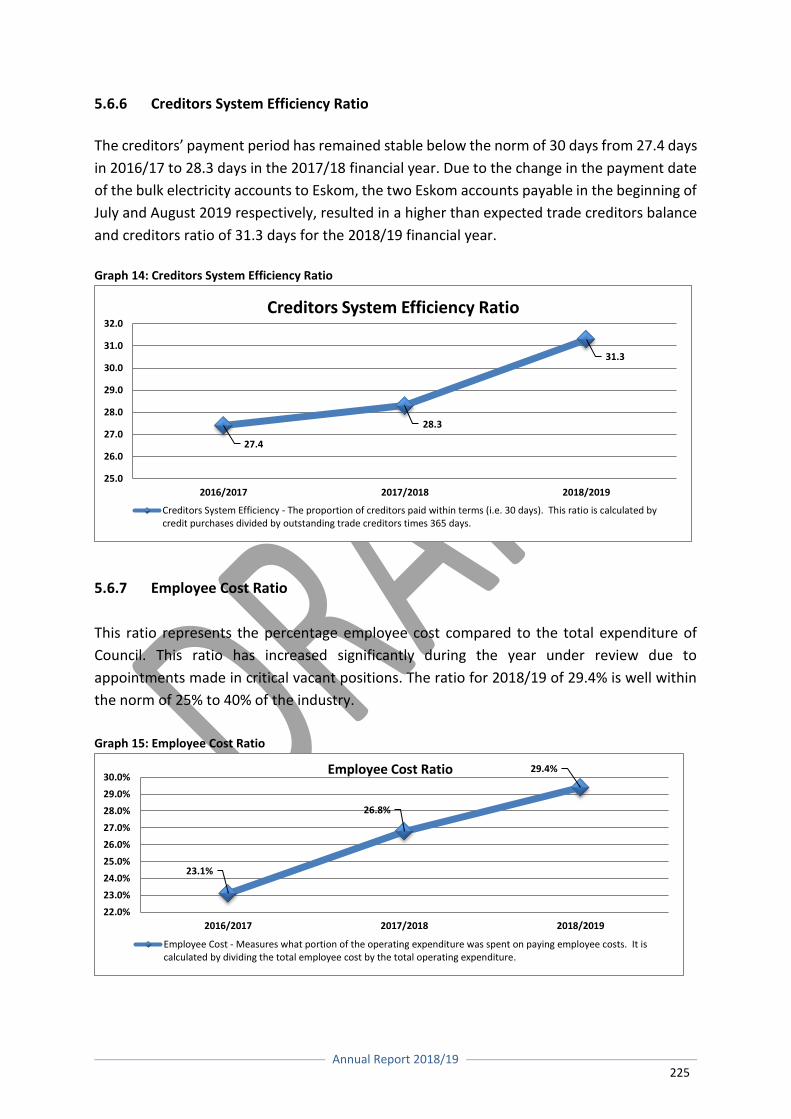
Annual Report 2018/19
225
5.6.6 Creditors System Efficiency Ratio
The creditors’ payment period has remained stable below the norm of 30 days from 27.4 days
in 2016/17 to 28.3 days in the 2017/18 financial year. Due to the change in the payment date
of the bulk electricity accounts to Eskom, the two Eskom accounts payable in the beginning of
July and August 2019 respectively, resulted in a higher than expected trade creditors balance
and creditors ratio of 31.3 days for the 2018/19 financial year.
Graph 14: Creditors System Efficiency Ratio
5.6.7 Employee Cost Ratio
This ratio represents the percentage employee cost compared to the total expenditure of
Council. This ratio has increased significantly during the year under review due to
appointments made in critical vacant positions. The ratio for 2018/19 of 29.4% is well within
the norm of 25% to 40% of the industry.
Graph 15: Employee Cost Ratio
27.4
28.3
31.3
25.0
26.0
27.0
28.0
29.0
30.0
31.0
32.0
2016/2017 2017/2018 2018/2019
Creditors System Efficiency Ratio
Creditors System Efficiency - The proportion of creditors paid within terms (i.e. 30 days). This ratio is calculated bycredit purchases divided by outstanding trade creditors times 365 days.
23.1%
26.8%
29.4%
22.0%
23.0%
24.0%
25.0%
26.0%
27.0%
28.0%
29.0%
30.0%
2016/2017 2017/2018 2018/2019
Employee Cost Ratio
Employee Cost - Measures what portion of the operating expenditure was spent on paying employee costs. It iscalculated by dividing the total employee cost by the total operating expenditure.
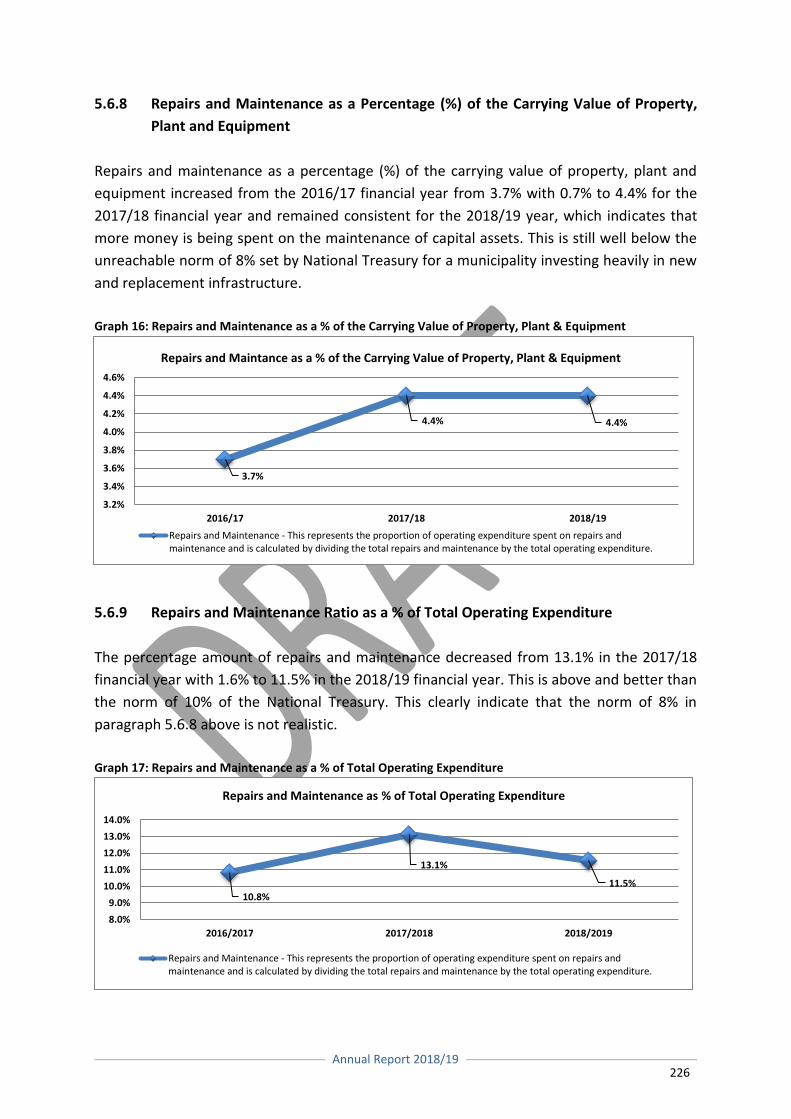
Annual Report 2018/19
226
5.6.8 Repairs and Maintenance as a Percentage (%) of the Carrying Value of Property,
Plant and Equipment
Repairs and maintenance as a percentage (%) of the carrying value of property, plant and
equipment increased from the 2016/17 financial year from 3.7% with 0.7% to 4.4% for the
2017/18 financial year and remained consistent for the 2018/19 year, which indicates that
more money is being spent on the maintenance of capital assets. This is still well below the
unreachable norm of 8% set by National Treasury for a municipality investing heavily in new
and replacement infrastructure.
Graph 16: Repairs and Maintenance as a % of the Carrying Value of Property, Plant & Equipment
5.6.9 Repairs and Maintenance Ratio as a % of Total Operating Expenditure
The percentage amount of repairs and maintenance decreased from 13.1% in the 2017/18
financial year with 1.6% to 11.5% in the 2018/19 financial year. This is above and better than
the norm of 10% of the National Treasury. This clearly indicate that the norm of 8% in
paragraph 5.6.8 above is not realistic.
Graph 17: Repairs and Maintenance as a % of Total Operating Expenditure
3.7%
4.4% 4.4%
3.2%
3.4%
3.6%
3.8%
4.0%
4.2%
4.4%
4.6%
2016/17 2017/18 2018/19
Repairs and Maintance as a % of the Carrying Value of Property, Plant & Equipment
Repairs and Maintenance - This represents the proportion of operating expenditure spent on repairs andmaintenance and is calculated by dividing the total repairs and maintenance by the total operating expenditure.
10.8%
13.1%
11.5%
8.0%
9.0%
10.0%
11.0%
12.0%
13.0%
14.0%
2016/2017 2017/2018 2018/2019
Repairs and Maintenance as % of Total Operating Expenditure
Repairs and Maintenance - This represents the proportion of operating expenditure spent on repairs andmaintenance and is calculated by dividing the total repairs and maintenance by the total operating expenditure.
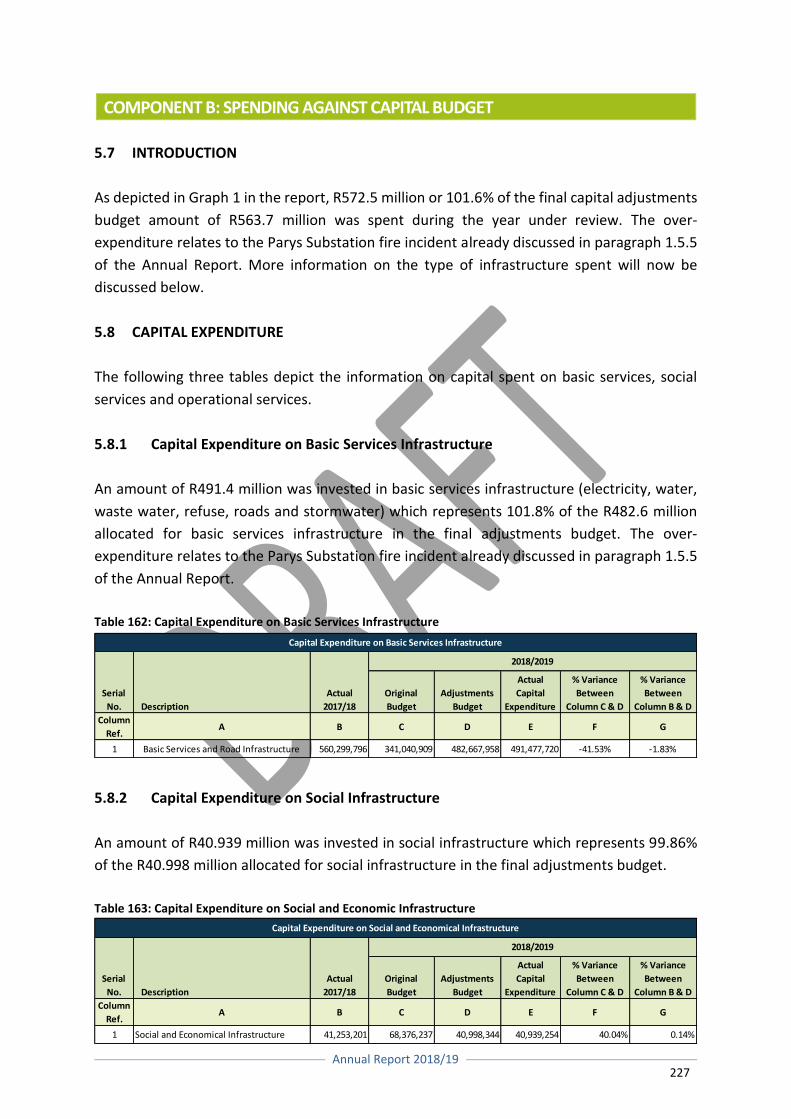
Annual Report 2018/19
227
COMPONENT B: SPENDING AGAINST CAPITAL BUDGET
5.7 INTRODUCTION
As depicted in Graph 1 in the report, R572.5 million or 101.6% of the final capital adjustments
budget amount of R563.7 million was spent during the year under review. The over-
expenditure relates to the Parys Substation fire incident already discussed in paragraph 1.5.5
of the Annual Report. More information on the type of infrastructure spent will now be
discussed below.
5.8 CAPITAL EXPENDITURE
The following three tables depict the information on capital spent on basic services, social
services and operational services.
5.8.1 Capital Expenditure on Basic Services Infrastructure
An amount of R491.4 million was invested in basic services infrastructure (electricity, water,
waste water, refuse, roads and stormwater) which represents 101.8% of the R482.6 million
allocated for basic services infrastructure in the final adjustments budget. The over-
expenditure relates to the Parys Substation fire incident already discussed in paragraph 1.5.5
of the Annual Report.
Table 162: Capital Expenditure on Basic Services Infrastructure 5.8.2 Capital Expenditure on Social Infrastructure
An amount of R40.939 million was invested in social infrastructure which represents 99.86%
of the R40.998 million allocated for social infrastructure in the final adjustments budget.
Table 163: Capital Expenditure on Social and Economic Infrastructure
Description
Original
Budget
Adjustments
Budget
Actual
Capital
Expenditure
% Variance
Between
Column C & D
% Variance
Between
Column B & D
Column
Ref.A B C D E F G
1 Basic Services and Road Infrastructure 560,299,796 341,040,909 482,667,958 491,477,720 -41.53% -1.83%
Capital Expenditure on Basic Services Infrastructure
2018/2019
Actual
2017/18
Serial
No.
Description
Original
Budget
Adjustments
Budget
Actual
Capital
Expenditure
% Variance
Between
Column C & D
% Variance
Between
Column B & D
Column
Ref.A B C D E F G
1 Social and Economical Infrastructure 41,253,201 68,376,237 40,998,344 40,939,254 40.04% 0.14%
Capital Expenditure on Social and Economical Infrastructure
Serial
No.
Actual
2017/18
2018/2019
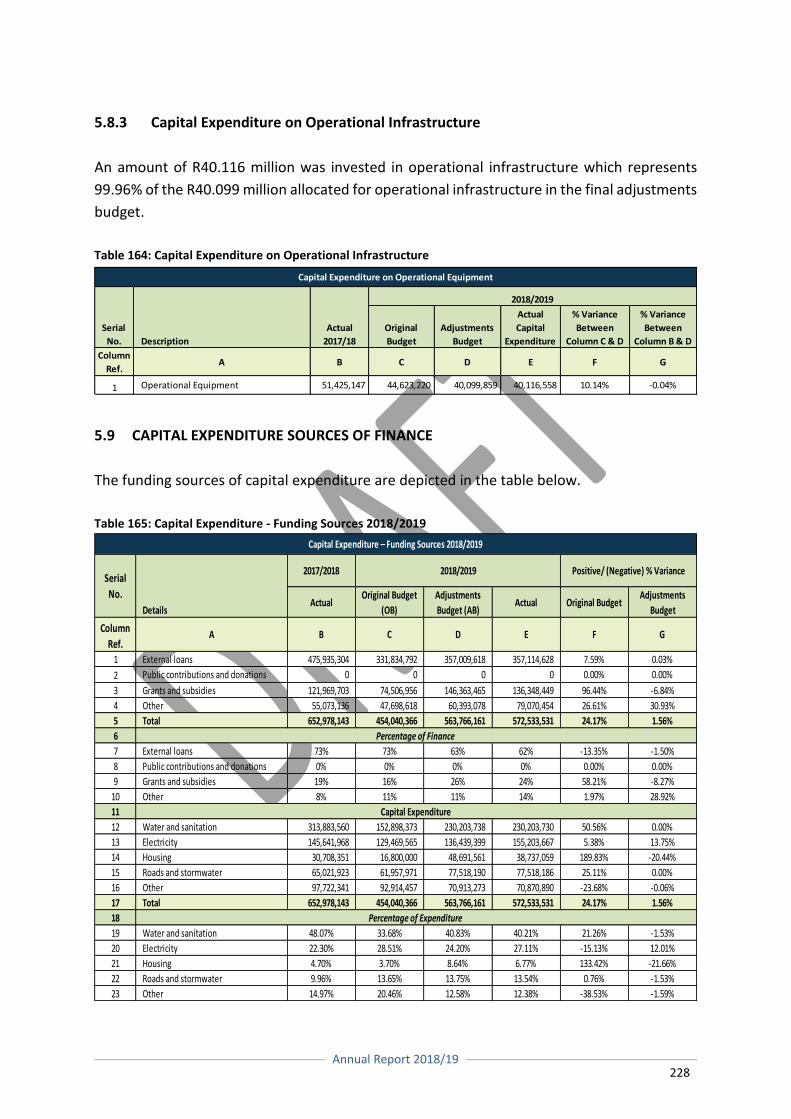
Annual Report 2018/19
228
5.8.3 Capital Expenditure on Operational Infrastructure
An amount of R40.116 million was invested in operational infrastructure which represents
99.96% of the R40.099 million allocated for operational infrastructure in the final adjustments
budget.
Table 164: Capital Expenditure on Operational Infrastructure
5.9 CAPITAL EXPENDITURE SOURCES OF FINANCE
The funding sources of capital expenditure are depicted in the table below.
Table 165: Capital Expenditure - Funding Sources 2018/2019
Description
Original
Budget
Adjustments
Budget
Actual
Capital
Expenditure
% Variance
Between
Column C & D
% Variance
Between
Column B & D
Column
Ref.A B C D E F G
1 Operational Equipment 51,425,147 44,623,220 40,099,859 40,116,558 10.14% -0.04%
Serial
No.
Actual
2017/18
2018/2019
Capital Expenditure on Operational Equipment
2017/2018
ActualOriginal Budget
(OB)
Adjustments
Budget (AB)Actual Original Budget
Adjustments
Budget
Column
Ref.A B C D E F G
1 External loans 475,935,304 331,834,792 357,009,618 357,114,628 7.59% 0.03%
2 Public contributions and donations 0 0 0 0 0.00% 0.00%
3 Grants and subsidies 121,969,703 74,506,956 146,363,465 136,348,449 96.44% -6.84%
4 Other 55,073,136 47,698,618 60,393,078 79,070,454 26.61% 30.93%
5 Total 652,978,143 454,040,366 563,766,161 572,533,531 24.17% 1.56%
6
7 External loans 73% 73% 63% 62% -13.35% -1.50%
8 Public contributions and donations 0% 0% 0% 0% 0.00% 0.00%
9 Grants and subsidies 19% 16% 26% 24% 58.21% -8.27%
10 Other 8% 11% 11% 14% 1.97% 28.92%
11
12 Water and sanitation 313,883,560 152,898,373 230,203,738 230,203,730 50.56% 0.00%
13 Electricity 145,641,968 129,469,565 136,439,399 155,203,667 5.38% 13.75%
14 Housing 30,708,351 16,800,000 48,691,561 38,737,059 189.83% -20.44%
15 Roads and stormwater 65,021,923 61,957,971 77,518,190 77,518,186 25.11% 0.00%
16 Other 97,722,341 92,914,457 70,913,273 70,870,890 -23.68% -0.06%
17 Total 652,978,143 454,040,366 563,766,161 572,533,531 24.17% 1.56%
18
19 Water and sanitation 48.07% 33.68% 40.83% 40.21% 21.26% -1.53%
20 Electricity 22.30% 28.51% 24.20% 27.11% -15.13% 12.01%
21 Housing 4.70% 3.70% 8.64% 6.77% 133.42% -21.66%
22 Roads and stormwater 9.96% 13.65% 13.75% 13.54% 0.76% -1.53%
23 Other 14.97% 20.46% 12.58% 12.38% -38.53% -1.59%
Capital Expenditure – Funding Sources 2018/2019
Percentage of Expenditure
Serial
No.
2018/2019 Positive/ (Negative) % Variance
Details
Capital Expenditure
Percentage of Finance
Annual Report 2018/19
229
5.9.1 Grants
Grants, as depicted in the table above, amounted to R136.3 million or 23.8% of the total
capital expenditure of R572.5 million for the year under review. This is significantly more than
the R121.9 million or 18.7% of the total capital expenditure of R652.9 million for the 2017/18
financial year.
5.9.2 Own Revenue from CRR
Own revenue, as depicted in the table above, amounted to R79.0 million or 13.8% of the total
capital expenditure of R572.5 million for the year under review. This is significantly more than
the R55.1 million or 8.4% of the total capital expenditure of R652.9 million for the 2017/18
financial year.
5.9.3 External Borrowings
Notable is that Drakenstein had to finance the investment into moveable and immovable
infrastructure mainly through external borrowings of R357.1 million or 62.4% of the total
capital expenditure of R572.5 million for the year under review. The external borrowings taken
up in the 2017/18 financial year amounted to R475.9 million or 72.9% of the total capital
expenditure of R652.9 million for the 2017/18 financial year. These investments significantly
affect Drakenstein’s gearing ratio that will be discussed in paragraph 5.9.3.1 below.
5.9.3.1 Gearing Ratio
Drakenstein Municipality is experiencing unprecedented pressure from developers who want
to develop in Drakenstein and these developments put pressure on our bulk infrastructure
services, which needs to be upgraded to ensure service delivery. Additional to these
developments are the Vlakkeland Catalytic Housing Project (2,556 housing opportunities) and
the Mountain Ridge Erf 16161 GAP / Affordable Housing Project with about another 1,500
housing opportunities as well as developments south of Boland Cricket Stadium, Paarl South
of the N1 as well as around Wellington. Drakenstein therefore had to invest in bulk
infrastructure between the 2015/16 and 2018/19 financial years.
From Table 165 above it is clear that significant of amounts of money was invested in bulk
infrastructure. During the 2017/18 and 2018/19 financial years; investment in water and
sanitation infrastructure amounted to R313.8 million and R230.2 million respectively;
investment in electricity infrastructure amounted to R145.6 million and R155.2 million
respectively; and investment in roads and stormwater infrastructure amounted to R65.0
million and R77.5 million respectively.
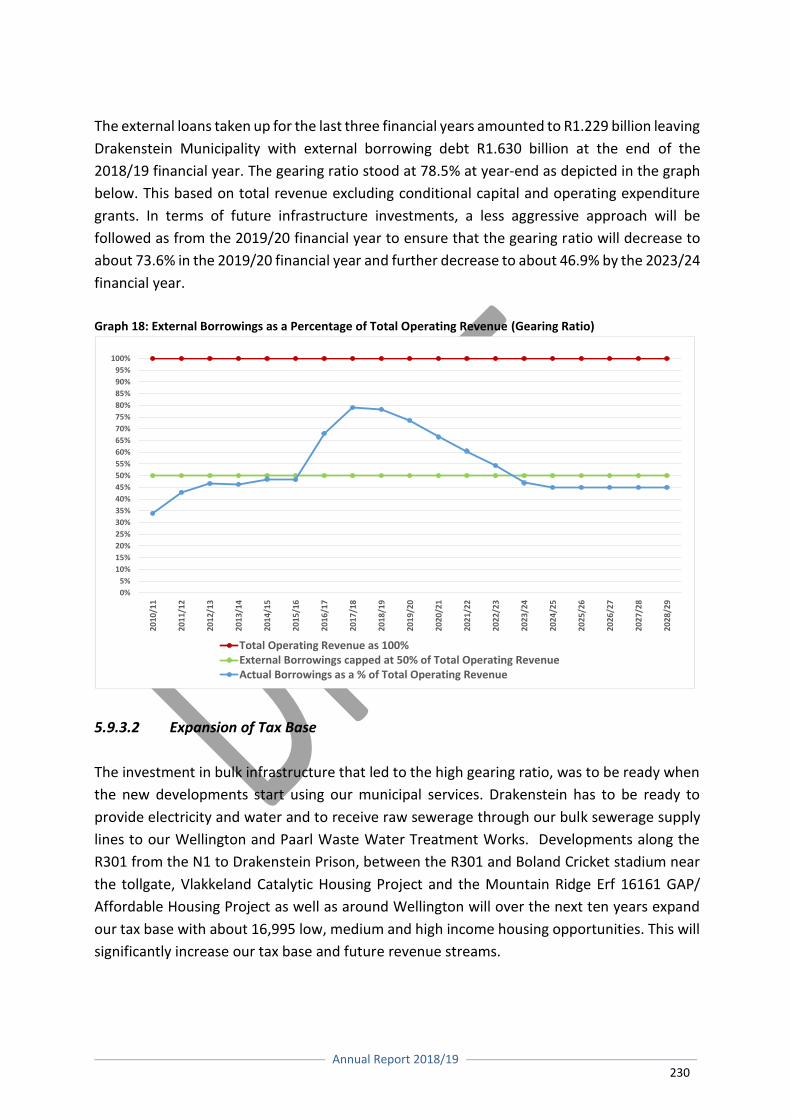
Annual Report 2018/19
230
The external loans taken up for the last three financial years amounted to R1.229 billion leaving
Drakenstein Municipality with external borrowing debt R1.630 billion at the end of the
2018/19 financial year. The gearing ratio stood at 78.5% at year-end as depicted in the graph
below. This based on total revenue excluding conditional capital and operating expenditure
grants. In terms of future infrastructure investments, a less aggressive approach will be
followed as from the 2019/20 financial year to ensure that the gearing ratio will decrease to
about 73.6% in the 2019/20 financial year and further decrease to about 46.9% by the 2023/24
financial year.
Graph 18: External Borrowings as a Percentage of Total Operating Revenue (Gearing Ratio)
5.9.3.2 Expansion of Tax Base
The investment in bulk infrastructure that led to the high gearing ratio, was to be ready when
the new developments start using our municipal services. Drakenstein has to be ready to
provide electricity and water and to receive raw sewerage through our bulk sewerage supply
lines to our Wellington and Paarl Waste Water Treatment Works. Developments along the
R301 from the N1 to Drakenstein Prison, between the R301 and Boland Cricket stadium near
the tollgate, Vlakkeland Catalytic Housing Project and the Mountain Ridge Erf 16161 GAP/
Affordable Housing Project as well as around Wellington will over the next ten years expand
our tax base with about 16,995 low, medium and high income housing opportunities. This will
significantly increase our tax base and future revenue streams.
0%
5%
10%
15%
20%
25%
30%
35%
40%
45%
50%
55%
60%
65%
70%
75%
80%
85%
90%
95%
100%
2010
/11
2011
/12
2012
/13
2013
/14
2014
/15
2015
/16
2016
/17
2017
/18
2018
/19
2019
/20
2020
/21
2021
/22
2022
/23
2023
/24
2024
/25
2025
/26
2026
/27
2027
/28
2028
/29
Total Operating Revenue as 100%External Borrowings capped at 50% of Total Operating RevenueActual Borrowings as a % of Total Operating Revenue
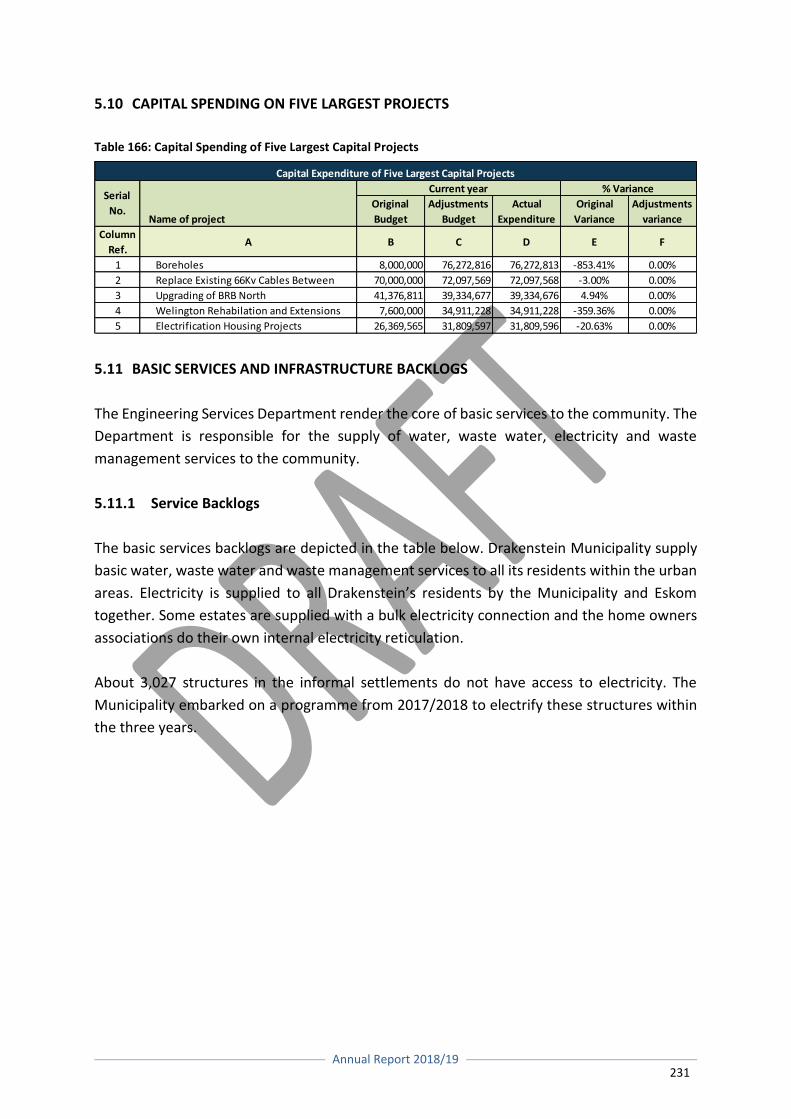
Annual Report 2018/19
231
5.10 CAPITAL SPENDING ON FIVE LARGEST PROJECTS
Table 166: Capital Spending of Five Largest Capital Projects
5.11 BASIC SERVICES AND INFRASTRUCTURE BACKLOGS
The Engineering Services Department render the core of basic services to the community. The
Department is responsible for the supply of water, waste water, electricity and waste
management services to the community.
5.11.1 Service Backlogs
The basic services backlogs are depicted in the table below. Drakenstein Municipality supply
basic water, waste water and waste management services to all its residents within the urban
areas. Electricity is supplied to all Drakenstein’s residents by the Municipality and Eskom
together. Some estates are supplied with a bulk electricity connection and the home owners
associations do their own internal electricity reticulation.
About 3,027 structures in the informal settlements do not have access to electricity. The
Municipality embarked on a programme from 2017/2018 to electrify these structures within
the three years.
Original
Budget
Adjustments
Budget
Actual
Expenditure
Original
Variance
Adjustments
variance
Column
Ref.A B C D E F
1 Boreholes 8,000,000 76,272,816 76,272,813 -853.41% 0.00%
2 Replace Existing 66Kv Cables Between 70,000,000 72,097,569 72,097,568 -3.00% 0.00%
3 Upgrading of BRB North 41,376,811 39,334,677 39,334,676 4.94% 0.00%
4 Welington Rehabilation and Extensions 7,600,000 34,911,228 34,911,228 -359.36% 0.00%
5 Electrification Housing Projects 26,369,565 31,809,597 31,809,596 -20.63% 0.00%
Name of project
Current year % Variance
Capital Expenditure of Five Largest Capital Projects
Serial
No.
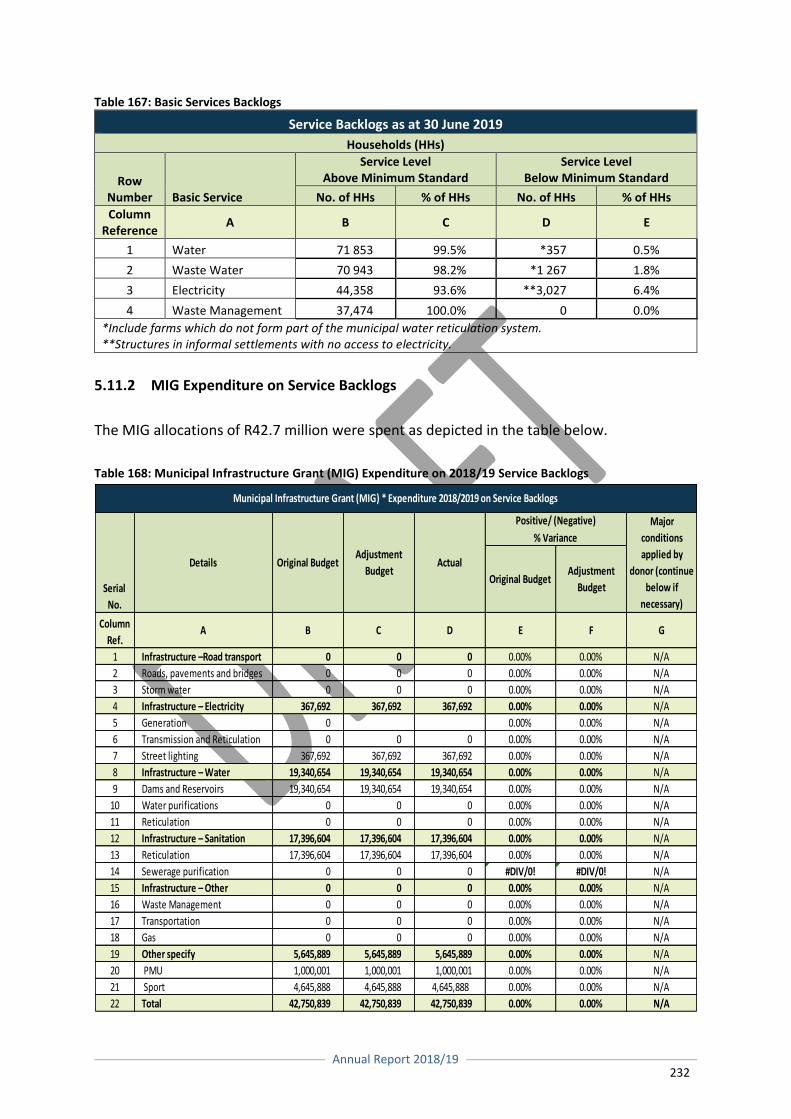
Annual Report 2018/19
232
Table 167: Basic Services Backlogs Service Backlogs as at 30 June 2019
Households (HHs)
Row Number Basic Service
Service Level Above Minimum Standard
Service Level Below Minimum Standard
No. of HHs % of HHs No. of HHs % of HHs
Column Reference
A B C D E
1 Water 71 853 99.5% *357 0.5%
2 Waste Water 70 943 98.2% *1 267 1.8%
3 Electricity 44,358 93.6% **3,027 6.4%
4 Waste Management 37,474 100.0% 0 0.0%
*Include farms which do not form part of the municipal water reticulation system. **Structures in informal settlements with no access to electricity.
5.11.2 MIG Expenditure on Service Backlogs
The MIG allocations of R42.7 million were spent as depicted in the table below.
Table 168: Municipal Infrastructure Grant (MIG) Expenditure on 2018/19 Service Backlogs
Original BudgetAdjustment
Budget
Column
Ref.A B C D E F G
1 Infrastructure –Road transport 0 0 0 0.00% 0.00% N/A
2 Roads, pavements and bridges 0 0 0 0.00% 0.00% N/A
3 Storm water 0 0 0 0.00% 0.00% N/A
4 Infrastructure – Electricity 367,692 367,692 367,692 0.00% 0.00% N/A
5 Generation 0 0.00% 0.00% N/A
6 Transmission and Reticulation 0 0 0 0.00% 0.00% N/A
7 Street lighting 367,692 367,692 367,692 0.00% 0.00% N/A
8 Infrastructure – Water 19,340,654 19,340,654 19,340,654 0.00% 0.00% N/A
9 Dams and Reservoirs 19,340,654 19,340,654 19,340,654 0.00% 0.00% N/A
10 Water purifications 0 0 0 0.00% 0.00% N/A
11 Reticulation 0 0 0 0.00% 0.00% N/A
12 Infrastructure – Sanitation 17,396,604 17,396,604 17,396,604 0.00% 0.00% N/A
13 Reticulation 17,396,604 17,396,604 17,396,604 0.00% 0.00% N/A
14 Sewerage purification 0 0 0 #DIV/0! #DIV/0! N/A
15 Infrastructure – Other 0 0 0 0.00% 0.00% N/A
16 Waste Management 0 0 0 0.00% 0.00% N/A
17 Transportation 0 0 0 0.00% 0.00% N/A
18 Gas 0 0 0 0.00% 0.00% N/A
19 Other specify 5,645,889 5,645,889 5,645,889 0.00% 0.00% N/A
20 PMU 1,000,001 1,000,001 1,000,001 0.00% 0.00% N/A
21 Sport 4,645,888 4,645,888 4,645,888 0.00% 0.00% N/A
22 Total 42,750,839 42,750,839 42,750,839 0.00% 0.00% N/A
Municipal Infrastructure Grant (MIG) * Expenditure 2018/2019 on Service Backlogs
Positive/ (Negative) Major
conditions
applied by
donor (continue
below if
necessary)
Serial
No.
Details Original Budget ActualAdjustment
Budget
% Variance
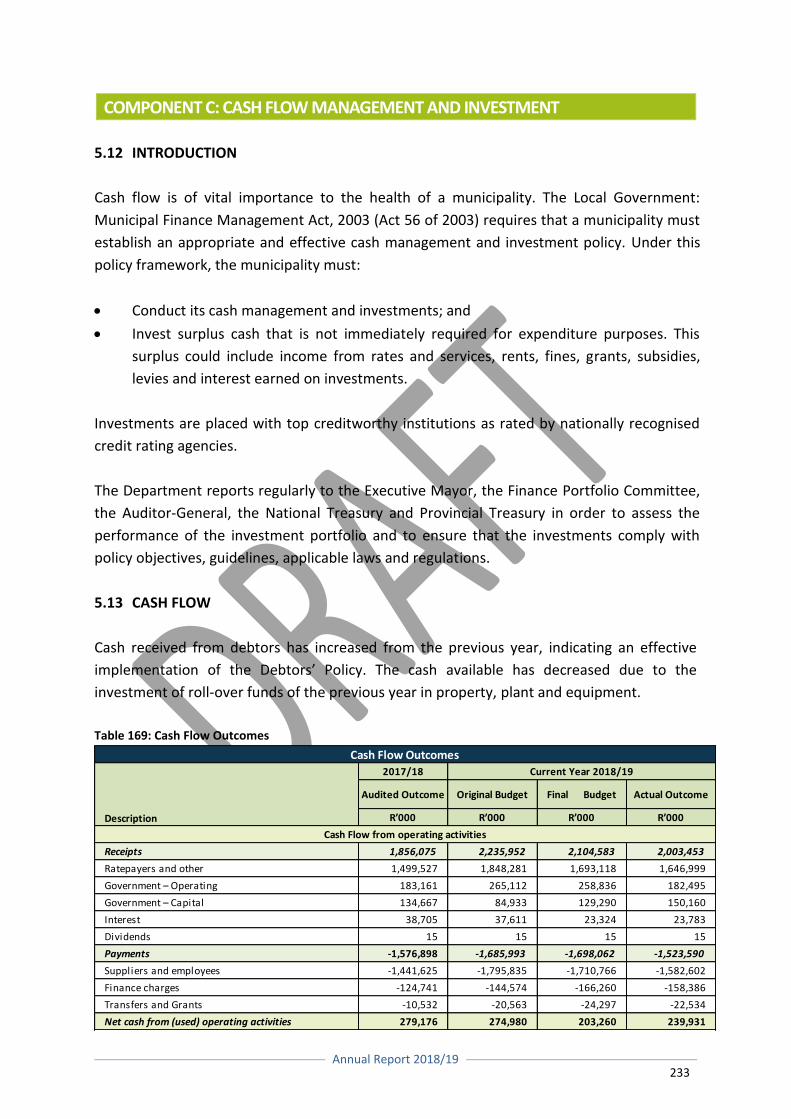
Annual Report 2018/19
233
COMPONENT C: CASH FLOW MANAGEMENT AND INVESTMENT
5.12 INTRODUCTION
Cash flow is of vital importance to the health of a municipality. The Local Government:
Municipal Finance Management Act, 2003 (Act 56 of 2003) requires that a municipality must
establish an appropriate and effective cash management and investment policy. Under this
policy framework, the municipality must:
Conduct its cash management and investments; and
Invest surplus cash that is not immediately required for expenditure purposes. This
surplus could include income from rates and services, rents, fines, grants, subsidies,
levies and interest earned on investments.
Investments are placed with top creditworthy institutions as rated by nationally recognised
credit rating agencies.
The Department reports regularly to the Executive Mayor, the Finance Portfolio Committee,
the Auditor-General, the National Treasury and Provincial Treasury in order to assess the
performance of the investment portfolio and to ensure that the investments comply with
policy objectives, guidelines, applicable laws and regulations.
5.13 CASH FLOW
Cash received from debtors has increased from the previous year, indicating an effective
implementation of the Debtors’ Policy. The cash available has decreased due to the
investment of roll-over funds of the previous year in property, plant and equipment.
Table 169: Cash Flow Outcomes
2017/18
Audited Outcome Original Budget Final Budget Actual Outcome
R’000 R’000 R’000 R’000
Receipts 1,856,075 2,235,952 2,104,583 2,003,453
Ratepayers and other 1,499,527 1,848,281 1,693,118 1,646,999
Government – Operating 183,161 265,112 258,836 182,495
Government – Capital 134,667 84,933 129,290 150,160
Interest 38,705 37,611 23,324 23,783
Dividends 15 15 15 15
Payments -1,576,898 -1,685,993 -1,698,062 -1,523,590
Suppliers and employees -1,441,625 -1,795,835 -1,710,766 -1,582,602
Finance charges -124,741 -144,574 -166,260 -158,386
Transfers and Grants -10,532 -20,563 -24,297 -22,534
Net cash from (used) operating activities 279,176 274,980 203,260 239,931
Cash Flow Outcomes
Description
Current Year 2018/19
Cash Flow from operating activities
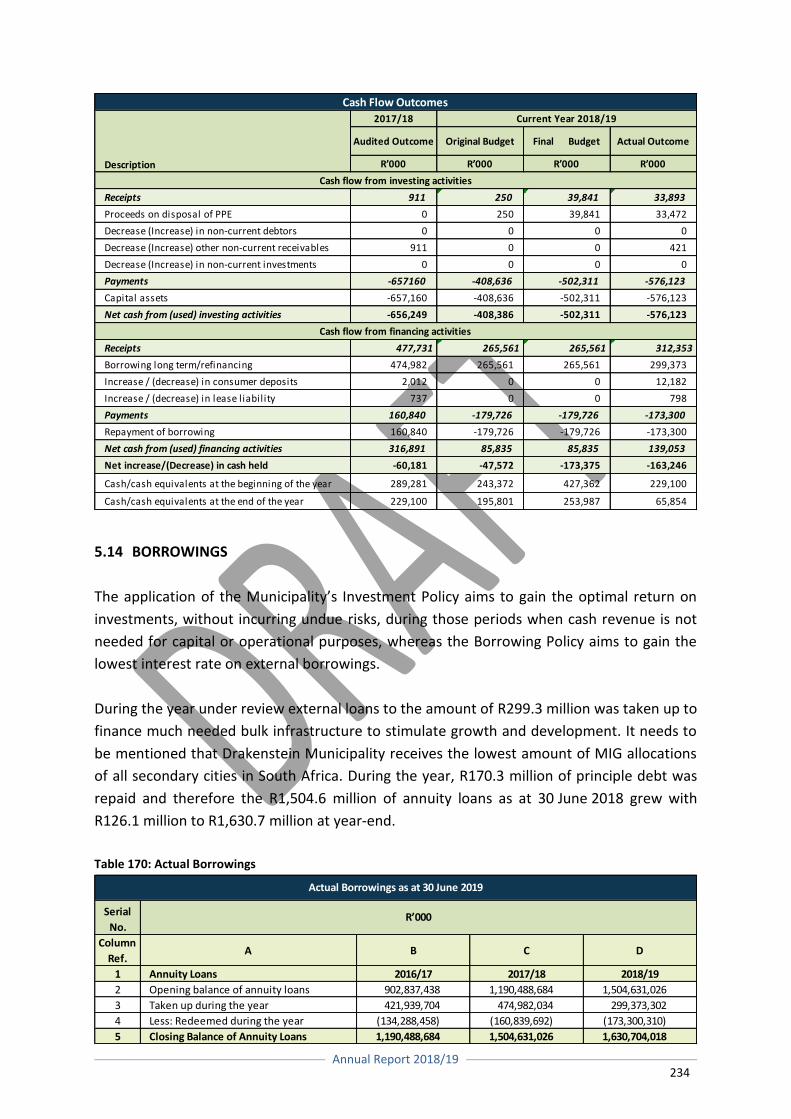
Annual Report 2018/19
234
5.14 BORROWINGS
The application of the Municipality’s Investment Policy aims to gain the optimal return on
investments, without incurring undue risks, during those periods when cash revenue is not
needed for capital or operational purposes, whereas the Borrowing Policy aims to gain the
lowest interest rate on external borrowings.
During the year under review external loans to the amount of R299.3 million was taken up to
finance much needed bulk infrastructure to stimulate growth and development. It needs to
be mentioned that Drakenstein Municipality receives the lowest amount of MIG allocations
of all secondary cities in South Africa. During the year, R170.3 million of principle debt was
repaid and therefore the R1,504.6 million of annuity loans as at 30 June 2018 grew with
R126.1 million to R1,630.7 million at year-end.
Table 170: Actual Borrowings
Serial
No.
Column
Ref.A B C D
1 Annuity Loans 2016/17 2017/18 2018/19
2 Opening balance of annuity loans 902,837,438 1,190,488,684 1,504,631,026
3 Taken up during the year 421,939,704 474,982,034 299,373,302
4 Less: Redeemed during the year (134,288,458) (160,839,692) (173,300,310)
5 Closing Balance of Annuity Loans 1,190,488,684 1,504,631,026 1,630,704,018
R’000
Actual Borrowings as at 30 June 2019
2017/18
Audited Outcome Original Budget Final Budget Actual Outcome
R’000 R’000 R’000 R’000
Receipts 911 250 39,841 33,893
Proceeds on disposal of PPE 0 250 39,841 33,472
Decrease (Increase) in non-current debtors 0 0 0 0
Decrease (Increase) other non-current receivables 911 0 0 421
Decrease (Increase) in non-current investments 0 0 0 0
Payments -657160 -408,636 -502,311 -576,123
Capital assets -657,160 -408,636 -502,311 -576,123
Net cash from (used) investing activities -656,249 -408,386 -502,311 -576,123
Receipts 477,731 265,561 265,561 312,353
Borrowing long term/refinancing 474,982 265,561 265,561 299,373
Increase / (decrease) in consumer deposits 2,012 0 0 12,182
Increase / (decrease) in lease liability 737 0 0 798
Payments 160,840 -179,726 -179,726 -173,300
Repayment of borrowing 160,840 -179,726 -179,726 -173,300
Net cash from (used) financing activities 316,891 85,835 85,835 139,053
Net increase/(Decrease) in cash held -60,181 -47,572 -173,375 -163,246
Cash/cash equivalents at the beginning of the year 289,281 243,372 427,362 229,100
Cash/cash equivalents at the end of the year 229,100 195,801 253,987 65,854
Cash flow from financing activities
Cash Flow Outcomes
Description
Current Year 2018/19
Cash flow from investing activities
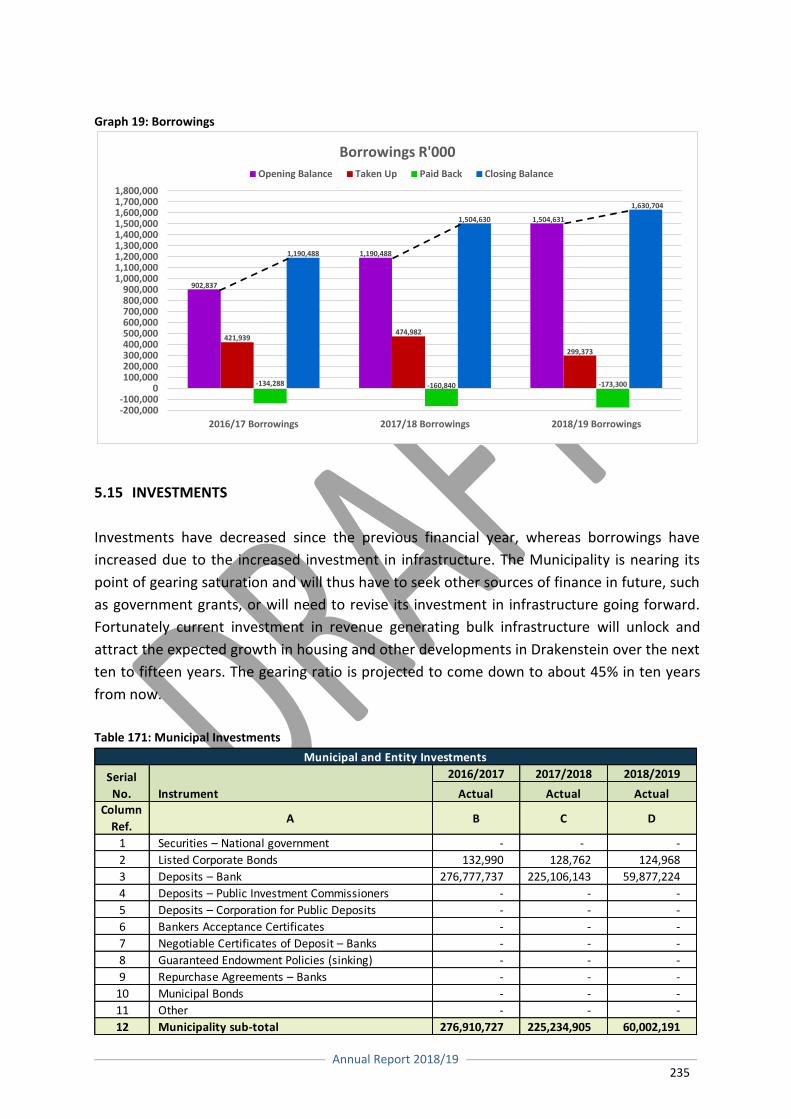
Annual Report 2018/19
235
Graph 19: Borrowings
5.15 INVESTMENTS
Investments have decreased since the previous financial year, whereas borrowings have
increased due to the increased investment in infrastructure. The Municipality is nearing its
point of gearing saturation and will thus have to seek other sources of finance in future, such
as government grants, or will need to revise its investment in infrastructure going forward.
Fortunately current investment in revenue generating bulk infrastructure will unlock and
attract the expected growth in housing and other developments in Drakenstein over the next
ten to fifteen years. The gearing ratio is projected to come down to about 45% in ten years
from now.
Table 171: Municipal Investments
2016/2017 2017/2018 2018/2019
Actual Actual Actual
Column
Ref.A B C D
1 Securities – National government - - -
2 Listed Corporate Bonds 132,990 128,762 124,968
3 Deposits – Bank 276,777,737 225,106,143 59,877,224
4 Deposits – Public Investment Commissioners - - -
5 Deposits – Corporation for Public Deposits - - -
6 Bankers Acceptance Certificates - - -
7 Negotiable Certificates of Deposit – Banks - - -
8 Guaranteed Endowment Policies (sinking) - - -
9 Repurchase Agreements – Banks - - -
10 Municipal Bonds - - -
11 Other - - -
12 Municipality sub-total 276,910,727 225,234,905 60,002,191
Serial
No. Instrument
Municipal and Entity Investments
902,837
1,190,488
1,504,631
421,939474,982
299,373
-134,288 -160,840 -173,300
1,190,488
1,504,630
1,630,704
-200,000-100,000
0100,000200,000300,000400,000500,000600,000700,000800,000900,000
1,000,0001,100,0001,200,0001,300,0001,400,0001,500,0001,600,0001,700,0001,800,000
2016/17 Borrowings 2017/18 Borrowings 2018/19 Borrowings
Borrowings R'000
Opening Balance Taken Up Paid Back Closing Balance
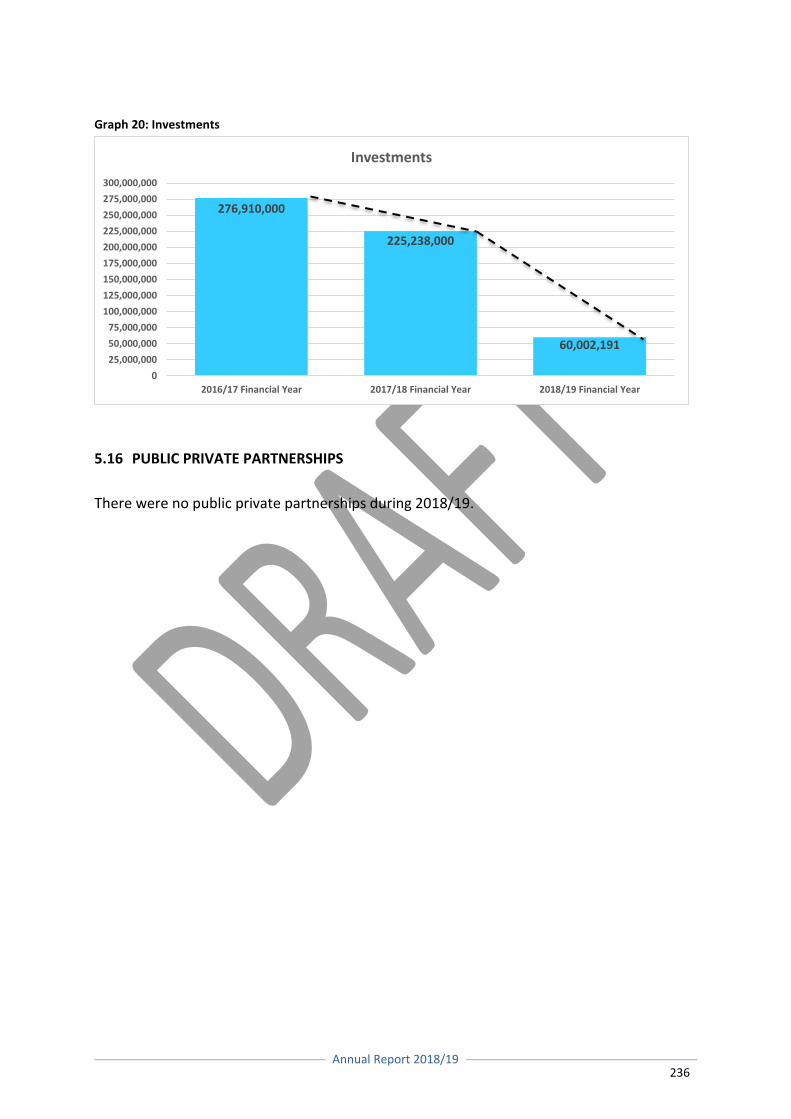
Annual Report 2018/19
236
Graph 20: Investments
5.16 PUBLIC PRIVATE PARTNERSHIPS
There were no public private partnerships during 2018/19.
276,910,000
225,238,000
60,002,191
0
25,000,000
50,000,000
75,000,000
100,000,000
125,000,000
150,000,000
175,000,000
200,000,000
225,000,000
250,000,000
275,000,000
300,000,000
2016/17 Financial Year 2017/18 Financial Year 2018/19 Financial Year
Investments
Annual Report 2018/19
237
COMPONENT D: OTHER FINANCIAL MATTERS
5.17 SUPPLY CHAIN MANAGEMENT
The Supply Chain Management Division consists out of the following sections which covers all
elements as required by the Municipal Supply Chain Management Regulations:
5.17.1 Acquisitions
This section deals with procurements up to a value of R200,000 (VAT included).
5.17.2 Compliance, Risk, Performance and Reporting
This section deals with the compliance to SCM processes, reporting on SCM actions as
required by legislation as well as assessing risk areas within the SCM environment.
5.17.3 Tender Evaluations and Contract Management
This section deals with procurements above the value of R200,000 (VAT included). It
furthermore deals with contract management and implementation in conjunction with user
departments.
5.17.4 Logistics and Disposal Management
This section deals with the management of the Municipal Stores as well as the disposal of
movable assets.
5.17.5 Tender Committee Administration
This section deals with the administrative processes and logistical support associated with the
bid committees
5.18 GRAP COMPLIANCE
The Municipality has fully implemented the Standards of GRAP (Generally Recognised
Accounting Practice) in accordance with the MFMA and Directive 5 issued by the Accounting
Standards Board (ASB) and did not deviate from any standard.
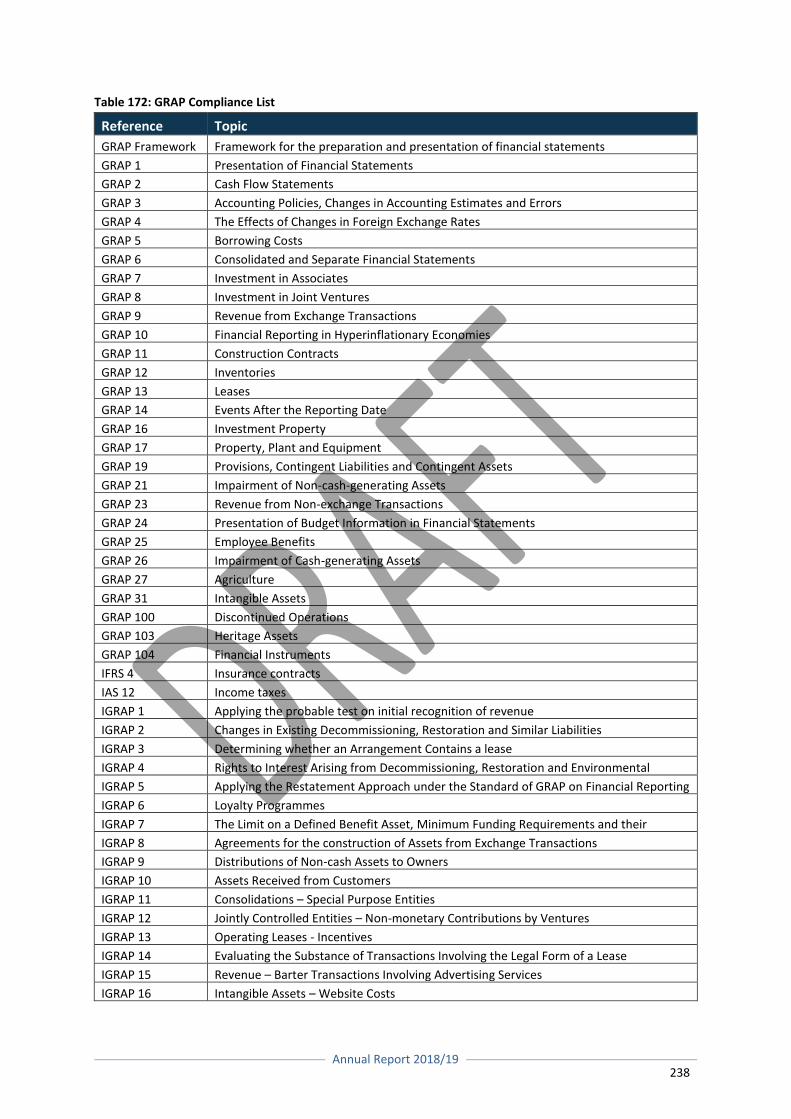
Annual Report 2018/19
238
Table 172: GRAP Compliance List
Reference Topic
GRAP Framework Framework for the preparation and presentation of financial statements
GRAP 1 Presentation of Financial Statements
GRAP 2 Cash Flow Statements
GRAP 3 Accounting Policies, Changes in Accounting Estimates and Errors
GRAP 4 The Effects of Changes in Foreign Exchange Rates
GRAP 5 Borrowing Costs
GRAP 6 Consolidated and Separate Financial Statements
GRAP 7 Investment in Associates
GRAP 8 Investment in Joint Ventures
GRAP 9 Revenue from Exchange Transactions
GRAP 10 Financial Reporting in Hyperinflationary Economies
GRAP 11 Construction Contracts
GRAP 12 Inventories
GRAP 13 Leases
GRAP 14 Events After the Reporting Date
GRAP 16 Investment Property
GRAP 17 Property, Plant and Equipment
GRAP 19 Provisions, Contingent Liabilities and Contingent Assets
GRAP 21 Impairment of Non-cash-generating Assets
GRAP 23 Revenue from Non-exchange Transactions
GRAP 24 Presentation of Budget Information in Financial Statements
GRAP 25 Employee Benefits
GRAP 26 Impairment of Cash-generating Assets
GRAP 27 Agriculture
GRAP 31 Intangible Assets
GRAP 100 Discontinued Operations
GRAP 103 Heritage Assets
GRAP 104 Financial Instruments
IFRS 4 Insurance contracts
IAS 12 Income taxes
IGRAP 1 Applying the probable test on initial recognition of revenue
IGRAP 2 Changes in Existing Decommissioning, Restoration and Similar Liabilities
IGRAP 3 Determining whether an Arrangement Contains a lease
IGRAP 4 Rights to Interest Arising from Decommissioning, Restoration and Environmental Rehabilitation Funds IGRAP 5 Applying the Restatement Approach under the Standard of GRAP on Financial Reporting in Hyperinflationary Economies IGRAP 6 Loyalty Programmes
IGRAP 7 The Limit on a Defined Benefit Asset, Minimum Funding Requirements and their Interaction IGRAP 8 Agreements for the construction of Assets from Exchange Transactions
IGRAP 9 Distributions of Non-cash Assets to Owners
IGRAP 10 Assets Received from Customers
IGRAP 11 Consolidations – Special Purpose Entities
IGRAP 12 Jointly Controlled Entities – Non-monetary Contributions by Ventures
IGRAP 13 Operating Leases - Incentives
IGRAP 14 Evaluating the Substance of Transactions Involving the Legal Form of a Lease
IGRAP 15 Revenue – Barter Transactions Involving Advertising Services
IGRAP 16 Intangible Assets – Website Costs
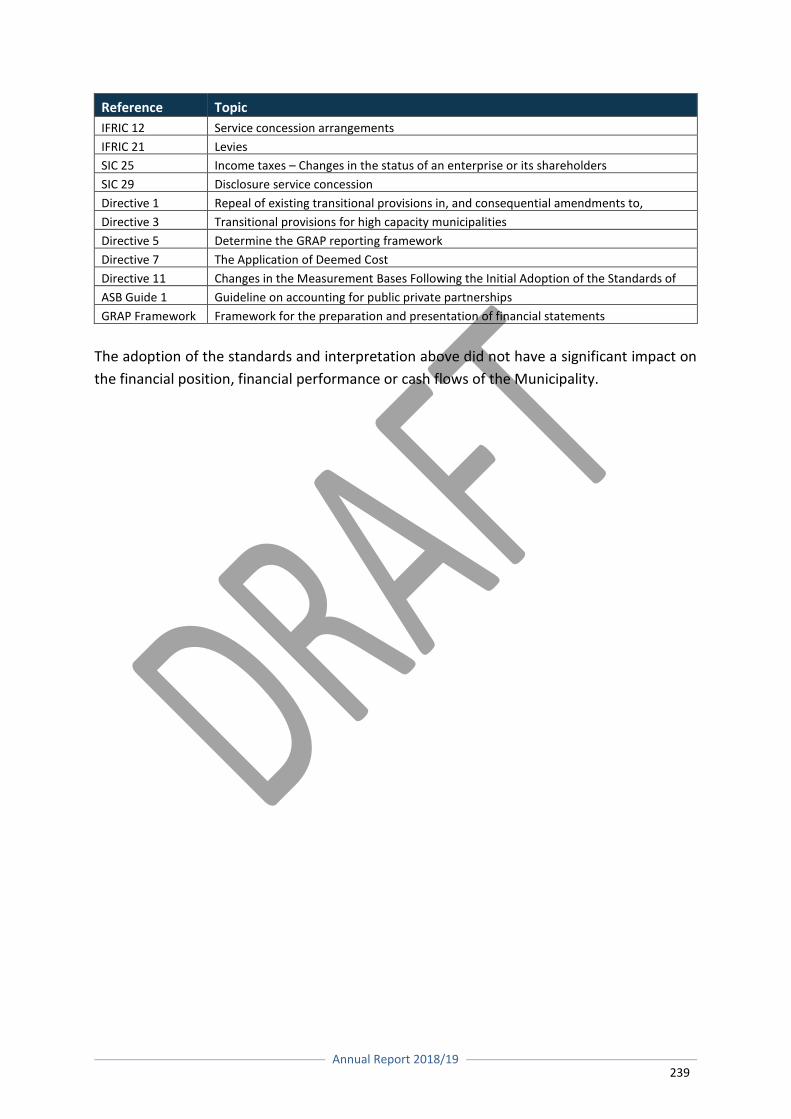
Annual Report 2018/19
239
Reference Topic
IFRIC 12 Service concession arrangements
IFRIC 21 Levies
SIC 25 Income taxes – Changes in the status of an enterprise or its shareholders
SIC 29 Disclosure service concession
Directive 1 Repeal of existing transitional provisions in, and consequential amendments to, standards of GRAP Directive 3 Transitional provisions for high capacity municipalities
Directive 5 Determine the GRAP reporting framework
Directive 7 The Application of Deemed Cost
Directive 11 Changes in the Measurement Bases Following the Initial Adoption of the Standards of GRAP ASB Guide 1 Guideline on accounting for public private partnerships
GRAP Framework Framework for the preparation and presentation of financial statements
The adoption of the standards and interpretation above did not have a significant impact on
the financial position, financial performance or cash flows of the Municipality.
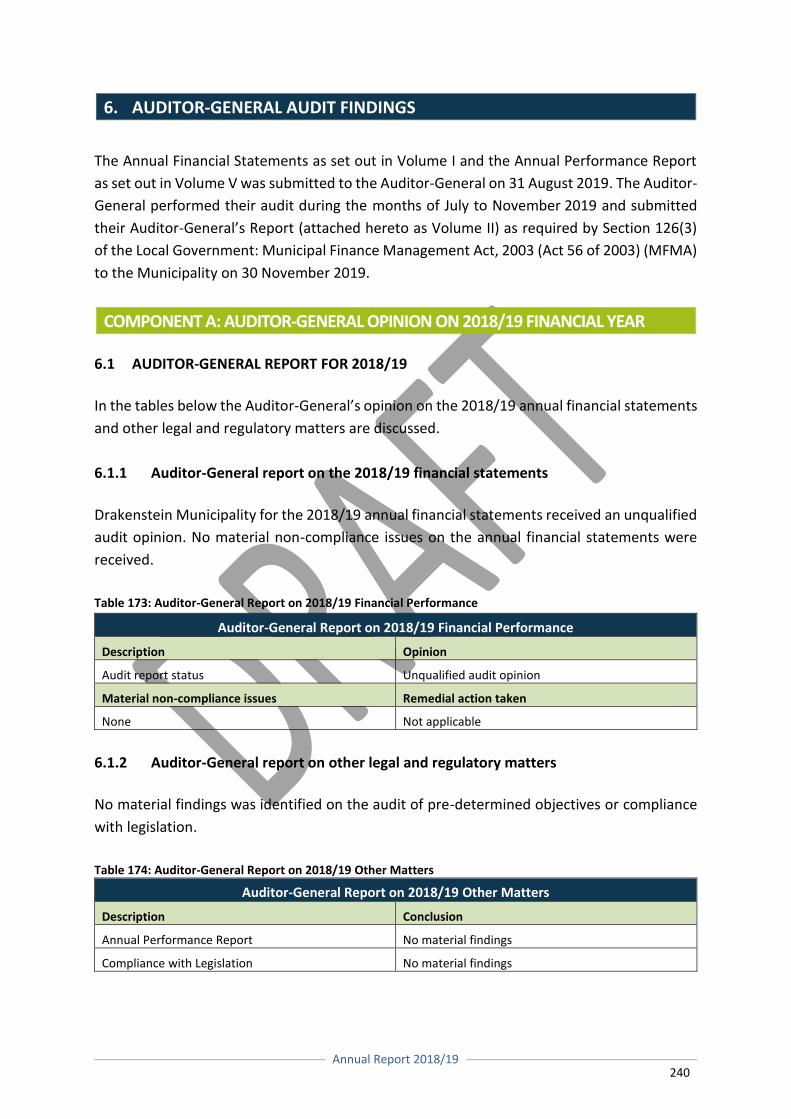
Annual Report 2018/19
240
6. AUDITOR-GENERAL AUDIT FINDINGS
The Annual Financial Statements as set out in Volume I and the Annual Performance Report
as set out in Volume V was submitted to the Auditor-General on 31 August 2019. The Auditor-
General performed their audit during the months of July to November 2019 and submitted
their Auditor-General’s Report (attached hereto as Volume II) as required by Section 126(3)
of the Local Government: Municipal Finance Management Act, 2003 (Act 56 of 2003) (MFMA)
to the Municipality on 30 November 2019.
COMPONENT A: AUDITOR-GENERAL OPINION ON 2018/19 FINANCIAL YEAR 6.1 AUDITOR-GENERAL REPORT FOR 2018/19
In the tables below the Auditor-General’s opinion on the 2018/19 annual financial statements
and other legal and regulatory matters are discussed.
6.1.1 Auditor-General report on the 2018/19 financial statements
Drakenstein Municipality for the 2018/19 annual financial statements received an unqualified
audit opinion. No material non-compliance issues on the annual financial statements were
received.
Table 173: Auditor-General Report on 2018/19 Financial Performance
Auditor-General Report on 2018/19 Financial Performance
Description Opinion
Audit report status Unqualified audit opinion
Material non-compliance issues Remedial action taken
None Not applicable
6.1.2 Auditor-General report on other legal and regulatory matters
No material findings was identified on the audit of pre-determined objectives or compliance
with legislation.
Table 174: Auditor-General Report on 2018/19 Other Matters
Auditor-General Report on 2018/19 Other Matters
Description Conclusion
Annual Performance Report No material findings
Compliance with Legislation No material findings
Annual Report 2018/19
241
6.1.2.1 Predetermined objectives
Drakenstein Municipality received no material findings on the audit of pre-determined
objectives as reported in the Annual Performance Report attached as Volume V to the Annual
Report.
6.1.2.2 Compliance with legislation
Drakenstein Municipality received no material findings on compliance with key legislation as
set out in the general notice issued in terms of the PAA.
6.1.2.3 Internal control
The Auditor-General did not identify any significant deficiencies in internal control.
6.2 CONCLUDING COMMENT
The Auditor-General therefore gave Drakenstein Municipality an unqualified audit opinion
with no material findings on pre-determined objective or compliance with key legislation.
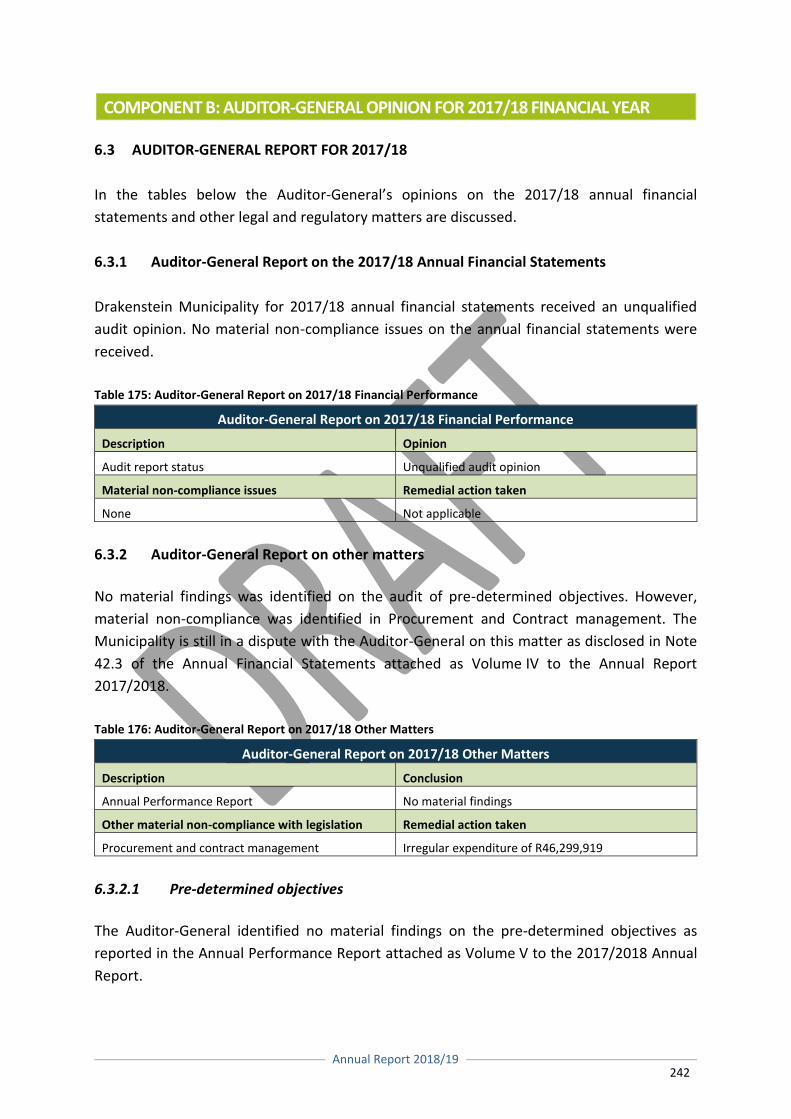
Annual Report 2018/19
242
COMPONENT B: AUDITOR-GENERAL OPINION FOR 2017/18 FINANCIAL YEAR 6.3 AUDITOR-GENERAL REPORT FOR 2017/18
In the tables below the Auditor-General’s opinions on the 2017/18 annual financial
statements and other legal and regulatory matters are discussed.
6.3.1 Auditor-General Report on the 2017/18 Annual Financial Statements
Drakenstein Municipality for 2017/18 annual financial statements received an unqualified
audit opinion. No material non-compliance issues on the annual financial statements were
received.
Table 175: Auditor-General Report on 2017/18 Financial Performance
Auditor-General Report on 2017/18 Financial Performance
Description Opinion
Audit report status Unqualified audit opinion
Material non-compliance issues Remedial action taken
None Not applicable
6.3.2 Auditor-General Report on other matters
No material findings was identified on the audit of pre-determined objectives. However,
material non-compliance was identified in Procurement and Contract management. The
Municipality is still in a dispute with the Auditor-General on this matter as disclosed in Note
42.3 of the Annual Financial Statements attached as Volume IV to the Annual Report
2017/2018.
Table 176: Auditor-General Report on 2017/18 Other Matters
Auditor-General Report on 2017/18 Other Matters
Description Conclusion
Annual Performance Report No material findings
Other material non-compliance with legislation Remedial action taken
Procurement and contract management Irregular expenditure of R46,299,919
6.3.2.1 Pre-determined objectives
The Auditor-General identified no material findings on the pre-determined objectives as
reported in the Annual Performance Report attached as Volume V to the 2017/2018 Annual
Report.
Annual Report 2018/19
243
6.3.2.2 Compliance with legislation
Drakenstein Municipality had to disclose irregular expenditure of R16.9 million on the
expansion award for the upgrade and extension of the Wellington Waste Water Treatment
Works to 16ML/day: Mechanical and Electrical Installation Contract CES 07/2015 as well as
R29.3 million on the expansion award for the upgrade and extension of the Wellington Waste
Water Treatment Works to 16ML/day: Civil Works Contract CES 08/2015 for similar work done
at the Paarl Waste Water Treatment Works. The expansions were awarded by management
about ten months after the original award. The Auditor-General could find no fault with the
quality of the work done, but ruled that the additional work should have followed an open
bidding process.
With regard to the dispute, the relevant inter-governmental dispute mechanisms and/or any
other avenues will be implemented, which could result in an alteration of the disclosure in
terms of section 126(5) of the MFMA. The outcome of this process will determine if further
investigation is required.
6.3.2.3 Internal control
Drakenstein Municipality’s internal control findings was limited to the internal control
deficiencies that led to the irregular expenditure finding due to an alleged incorrect supply
chain process followed.
6.4 CONCLUDING COMMENT
The Auditor-General therefore gave Drakenstein Municipality an unqualified audit opinion
with no material findings on pre-determined objective findings but with one material non-
compliance irregular expenditure finding
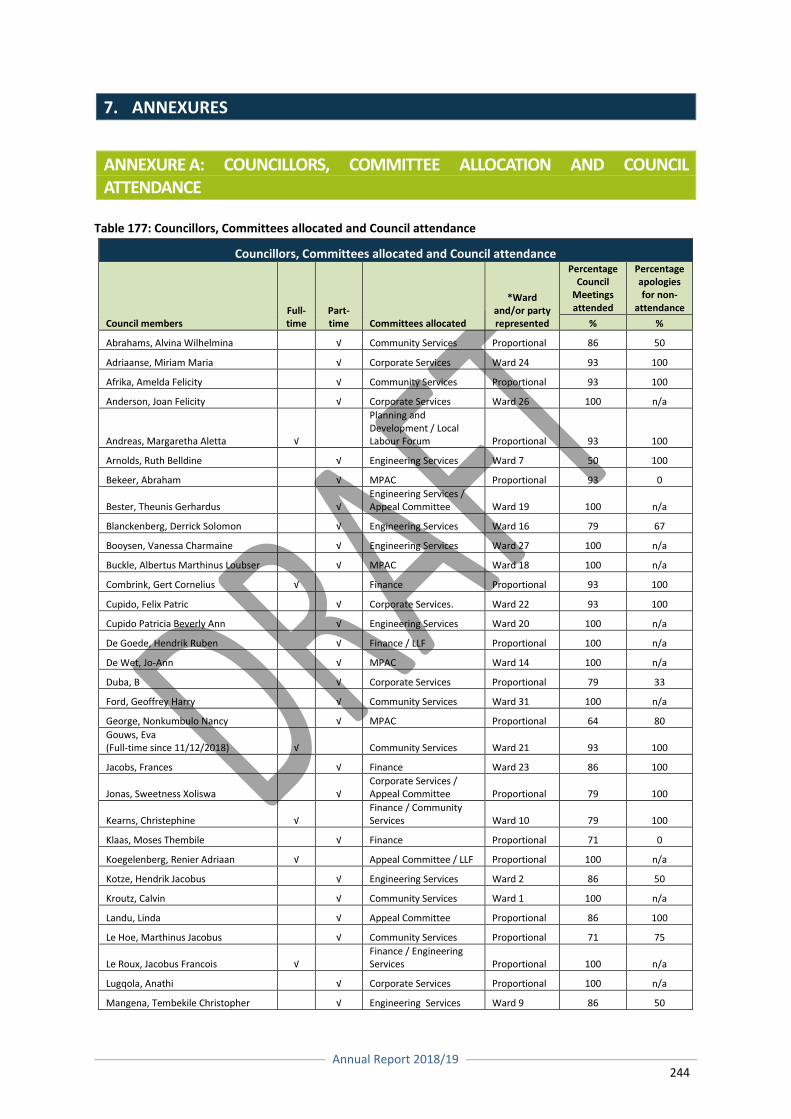
Annual Report 2018/19
244
7. ANNEXURES
ANNEXURE A: COUNCILLORS, COMMITTEE ALLOCATION AND COUNCIL ATTENDANCE
Table 177: Councillors, Committees allocated and Council attendance
Councillors, Committees allocated and Council attendance
Council members Full- time
Part-time Committees allocated
*Ward and/or party represented
Percentage Council
Meetings attended
Percentage apologies for non-
attendance
% %
Abrahams, Alvina Wilhelmina √ Community Services Proportional 86 50
Adriaanse, Miriam Maria √ Corporate Services Ward 24 93 100
Afrika, Amelda Felicity √ Community Services Proportional 93 100
Anderson, Joan Felicity √ Corporate Services Ward 26 100 n/a
Andreas, Margaretha Aletta √
Planning and Development / Local Labour Forum Proportional 93 100
Arnolds, Ruth Belldine √ Engineering Services Ward 7 50 100
Bekeer, Abraham √ MPAC Proportional 93 0
Bester, Theunis Gerhardus √ Engineering Services / Appeal Committee Ward 19 100 n/a
Blanckenberg, Derrick Solomon √ Engineering Services Ward 16 79 67
Booysen, Vanessa Charmaine √ Engineering Services Ward 27 100 n/a
Buckle, Albertus Marthinus Loubser √ MPAC Ward 18 100 n/a
Combrink, Gert Cornelius √ Finance Proportional 93 100
Cupido, Felix Patric √ Corporate Services. Ward 22 93 100
Cupido Patricia Beverly Ann √ Engineering Services Ward 20 100 n/a
De Goede, Hendrik Ruben √ Finance / LLF Proportional 100 n/a
De Wet, Jo-Ann √ MPAC Ward 14 100 n/a
Duba, B √ Corporate Services Proportional 79 33
Ford, Geoffrey Harry √ Community Services Ward 31 100 n/a
George, Nonkumbulo Nancy √ MPAC Proportional 64 80
Gouws, Eva (Full-time since 11/12/2018) √ Community Services Ward 21 93 100
Jacobs, Frances √ Finance Ward 23 86 100
Jonas, Sweetness Xoliswa √ Corporate Services / Appeal Committee Proportional 79 100
Kearns, Christephine √ Finance / Community Services Ward 10 79 100
Klaas, Moses Thembile √ Finance Proportional 71 0
Koegelenberg, Renier Adriaan √ Appeal Committee / LLF Proportional 100 n/a
Kotze, Hendrik Jacobus √ Engineering Services Ward 2 86 50
Kroutz, Calvin √ Community Services Ward 1 100 n/a
Landu, Linda √ Appeal Committee Proportional 86 100
Le Hoe, Marthinus Jacobus √ Community Services Proportional 71 75
Le Roux, Jacobus Francois √ Finance / Engineering Services Proportional 100 n/a
Lugqola, Anathi √ Corporate Services Proportional 100 n/a
Mangena, Tembekile Christopher √ Engineering Services Ward 9 86 50
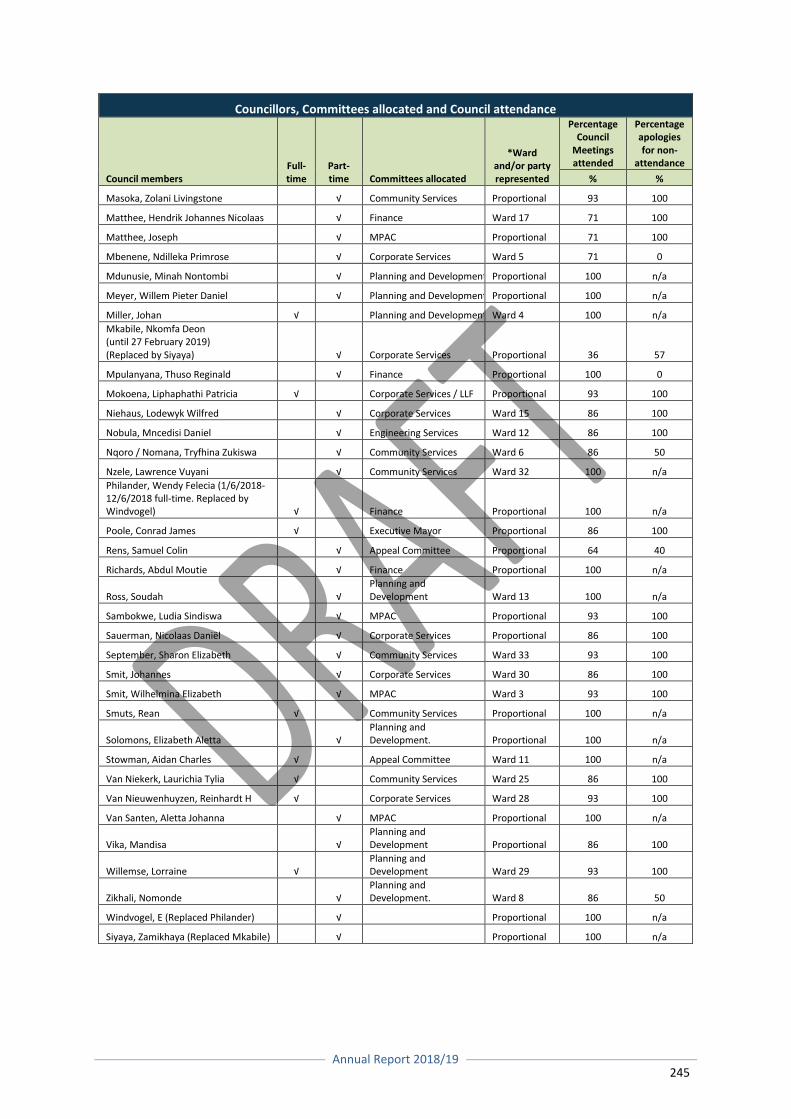
Annual Report 2018/19
245
Councillors, Committees allocated and Council attendance
Council members Full- time
Part-time Committees allocated
*Ward and/or party represented
Percentage Council
Meetings attended
Percentage apologies for non-
attendance
% %
Masoka, Zolani Livingstone √ Community Services Proportional 93 100
Matthee, Hendrik Johannes Nicolaas √ Finance Ward 17 71 100
Matthee, Joseph √ MPAC Proportional 71 100
Mbenene, Ndilleka Primrose √ Corporate Services Ward 5 71 0
Mdunusie, Minah Nontombi √ Planning and Development Proportional 100 n/a
Meyer, Willem Pieter Daniel √ Planning and Development Proportional 100 n/a
Miller, Johan √ Planning and Development Ward 4 100 n/a
Mkabile, Nkomfa Deon (until 27 February 2019) (Replaced by Siyaya) √ Corporate Services Proportional 36 57
Mpulanyana, Thuso Reginald √ Finance Proportional 100 0
Mokoena, Liphaphathi Patricia √ Corporate Services / LLF Proportional 93 100
Niehaus, Lodewyk Wilfred √ Corporate Services Ward 15 86 100
Nobula, Mncedisi Daniel √ Engineering Services Ward 12 86 100
Nqoro / Nomana, Tryfhina Zukiswa √ Community Services Ward 6 86 50
Nzele, Lawrence Vuyani √ Community Services Ward 32 100 n/a
Philander, Wendy Felecia (1/6/2018-12/6/2018 full-time. Replaced by Windvogel) √ Finance Proportional 100 n/a
Poole, Conrad James √ Executive Mayor Proportional 86 100
Rens, Samuel Colin √ Appeal Committee Proportional 64 40
Richards, Abdul Moutie √ Finance Proportional 100 n/a
Ross, Soudah √ Planning and Development Ward 13 100 n/a
Sambokwe, Ludia Sindiswa √ MPAC Proportional 93 100
Sauerman, Nicolaas Daniël √ Corporate Services Proportional 86 100
September, Sharon Elizabeth √ Community Services Ward 33 93 100
Smit, Johannes √ Corporate Services Ward 30 86 100
Smit, Wilhelmina Elizabeth √ MPAC Ward 3 93 100
Smuts, Rean √ Community Services Proportional 100 n/a
Solomons, Elizabeth Aletta √ Planning and Development. Proportional 100 n/a
Stowman, Aidan Charles √ Appeal Committee Ward 11 100 n/a
Van Niekerk, Laurichia Tylia √ Community Services Ward 25 86 100
Van Nieuwenhuyzen, Reinhardt H √ Corporate Services Ward 28 93 100
Van Santen, Aletta Johanna √ MPAC Proportional 100 n/a
Vika, Mandisa √ Planning and Development Proportional 86 100
Willemse, Lorraine √ Planning and Development Ward 29 93 100
Zikhali, Nomonde √ Planning and Development. Ward 8 86 50
Windvogel, E (Replaced Philander) √ Proportional 100 n/a
Siyaya, Zamikhaya (Replaced Mkabile) √ Proportional 100 n/a
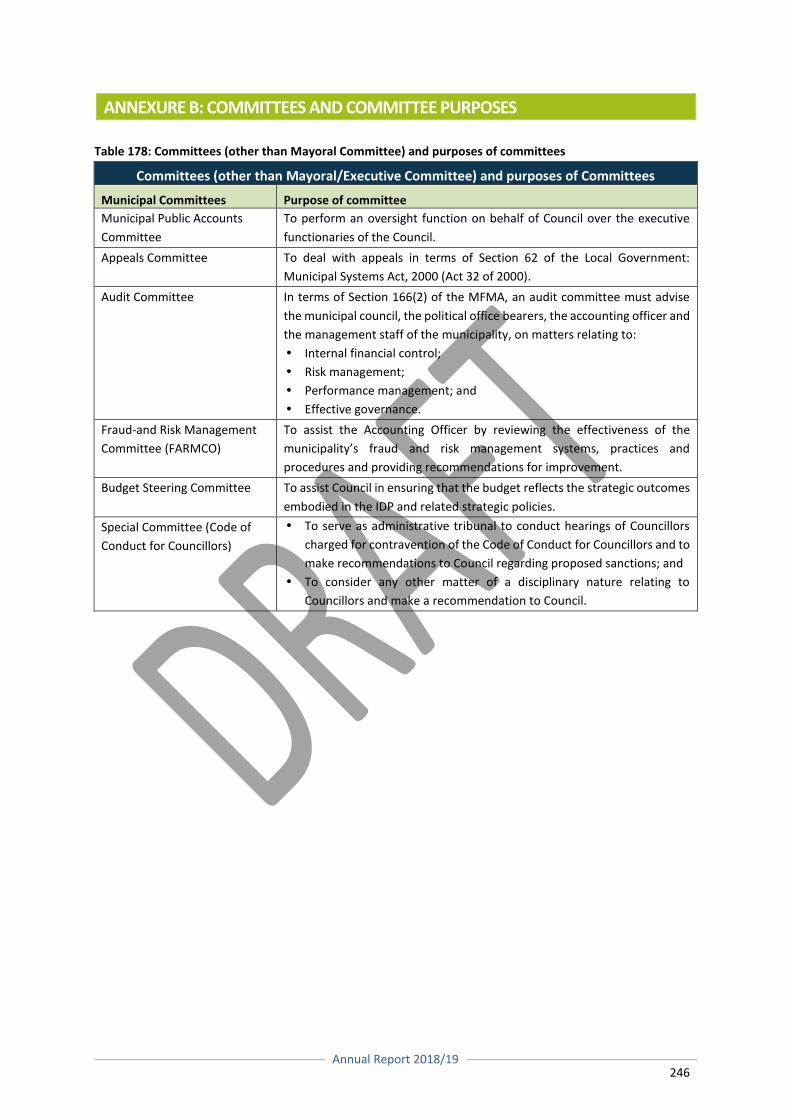
Annual Report 2018/19
246
ANNEXURE B: COMMITTEES AND COMMITTEE PURPOSES
Table 178: Committees (other than Mayoral Committee) and purposes of committees
Committees (other than Mayoral/Executive Committee) and purposes of Committees
Municipal Committees Purpose of committee
Municipal Public Accounts
Committee
To perform an oversight function on behalf of Council over the executive
functionaries of the Council.
Appeals Committee To deal with appeals in terms of Section 62 of the Local Government:
Municipal Systems Act, 2000 (Act 32 of 2000).
Audit Committee In terms of Section 166(2) of the MFMA, an audit committee must advise
the municipal council, the political office bearers, the accounting officer and
the management staff of the municipality, on matters relating to:
Internal financial control;
Risk management;
Performance management; and
Effective governance.
Fraud-and Risk Management
Committee (FARMCO)
To assist the Accounting Officer by reviewing the effectiveness of the
municipality’s fraud and risk management systems, practices and
procedures and providing recommendations for improvement.
Budget Steering Committee To assist Council in ensuring that the budget reflects the strategic outcomes
embodied in the IDP and related strategic policies.
Special Committee (Code of
Conduct for Councillors)
To serve as administrative tribunal to conduct hearings of Councillors
charged for contravention of the Code of Conduct for Councillors and to
make recommendations to Council regarding proposed sanctions; and
To consider any other matter of a disciplinary nature relating to
Councillors and make a recommendation to Council.
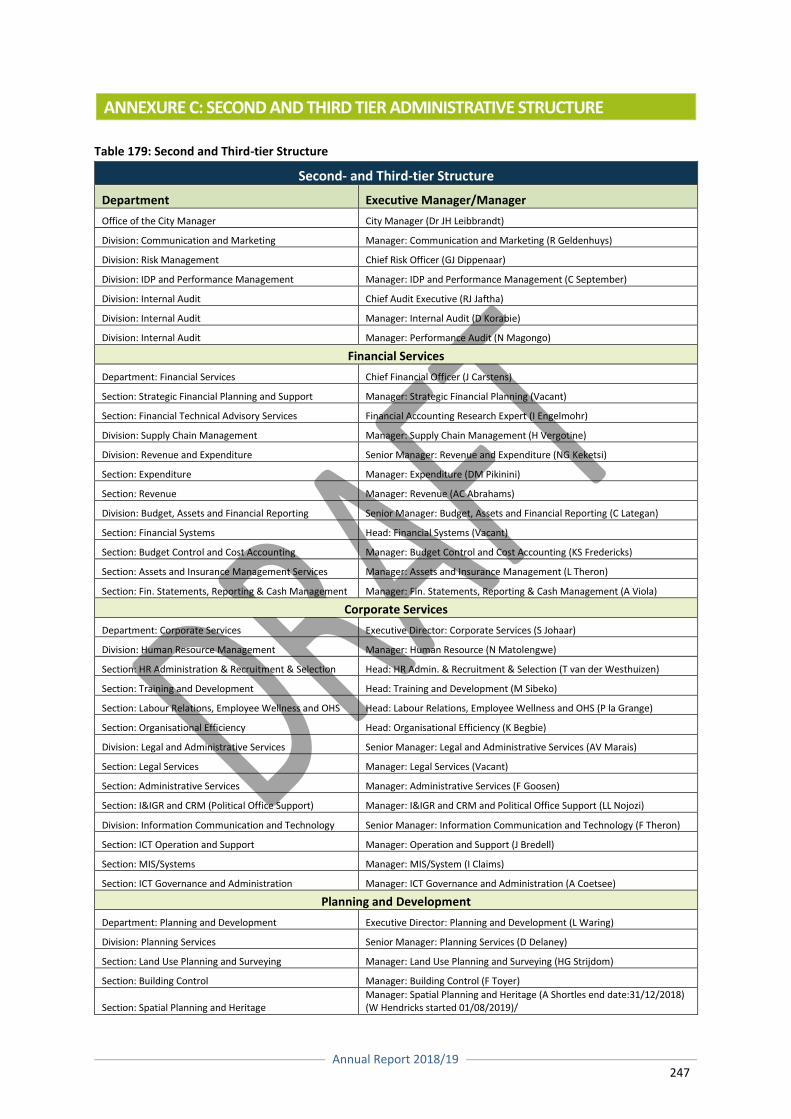
Annual Report 2018/19
247
ANNEXURE C: SECOND AND THIRD TIER ADMINISTRATIVE STRUCTURE
Table 179: Second and Third-tier Structure
Second- and Third-tier Structure
Department Executive Manager/Manager
Office of the City Manager City Manager (Dr JH Leibbrandt)
Division: Communication and Marketing Manager: Communication and Marketing (R Geldenhuys)
Division: Risk Management Chief Risk Officer (GJ Dippenaar)
Division: IDP and Performance Management Manager: IDP and Performance Management (C September)
Division: Internal Audit Chief Audit Executive (RJ Jaftha)
Division: Internal Audit Manager: Internal Audit (D Korabie)
Division: Internal Audit Manager: Performance Audit (N Magongo)
Financial Services
Department: Financial Services Chief Financial Officer (J Carstens)
Section: Strategic Financial Planning and Support Manager: Strategic Financial Planning (Vacant)
Section: Financial Technical Advisory Services Financial Accounting Research Expert (I Engelmohr)
Division: Supply Chain Management Manager: Supply Chain Management (H Vergotine)
Division: Revenue and Expenditure Senior Manager: Revenue and Expenditure (NG Keketsi)
Section: Expenditure Manager: Expenditure (DM Pikinini)
Section: Revenue Manager: Revenue (AC Abrahams)
Division: Budget, Assets and Financial Reporting Senior Manager: Budget, Assets and Financial Reporting (C Lategan)
Section: Financial Systems Head: Financial Systems (Vacant)
Section: Budget Control and Cost Accounting Manager: Budget Control and Cost Accounting (KS Fredericks)
Section: Assets and Insurance Management Services Manager: Assets and Insurance Management (L Theron)
Section: Fin. Statements, Reporting & Cash Management Manager: Fin. Statements, Reporting & Cash Management (A Viola)
Corporate Services
Department: Corporate Services Executive Director: Corporate Services (S Johaar)
Division: Human Resource Management Manager: Human Resource (N Matolengwe)
Section: HR Administration & Recruitment & Selection Head: HR Admin. & Recruitment & Selection (T van der Westhuizen)
Section: Training and Development Head: Training and Development (M Sibeko)
Section: Labour Relations, Employee Wellness and OHS Head: Labour Relations, Employee Wellness and OHS (P la Grange)
Section: Organisational Efficiency Head: Organisational Efficiency (K Begbie)
Division: Legal and Administrative Services Senior Manager: Legal and Administrative Services (AV Marais)
Section: Legal Services Manager: Legal Services (Vacant)
Section: Administrative Services Manager: Administrative Services (F Goosen)
Section: I&IGR and CRM (Political Office Support) Manager: I&IGR and CRM and Political Office Support (LL Nojozi)
Division: Information Communication and Technology Senior Manager: Information Communication and Technology (F Theron)
Section: ICT Operation and Support Manager: Operation and Support (J Bredell)
Section: MIS/Systems Manager: MIS/System (I Claims)
Section: ICT Governance and Administration Manager: ICT Governance and Administration (A Coetsee)
Planning and Development
Department: Planning and Development Executive Director: Planning and Development (L Waring)
Division: Planning Services Senior Manager: Planning Services (D Delaney)
Section: Land Use Planning and Surveying Manager: Land Use Planning and Surveying (HG Strijdom)
Section: Building Control Manager: Building Control (F Toyer)
Section: Spatial Planning and Heritage Manager: Spatial Planning and Heritage (A Shortles end date:31/12/2018) (W Hendricks started 01/08/2019)/
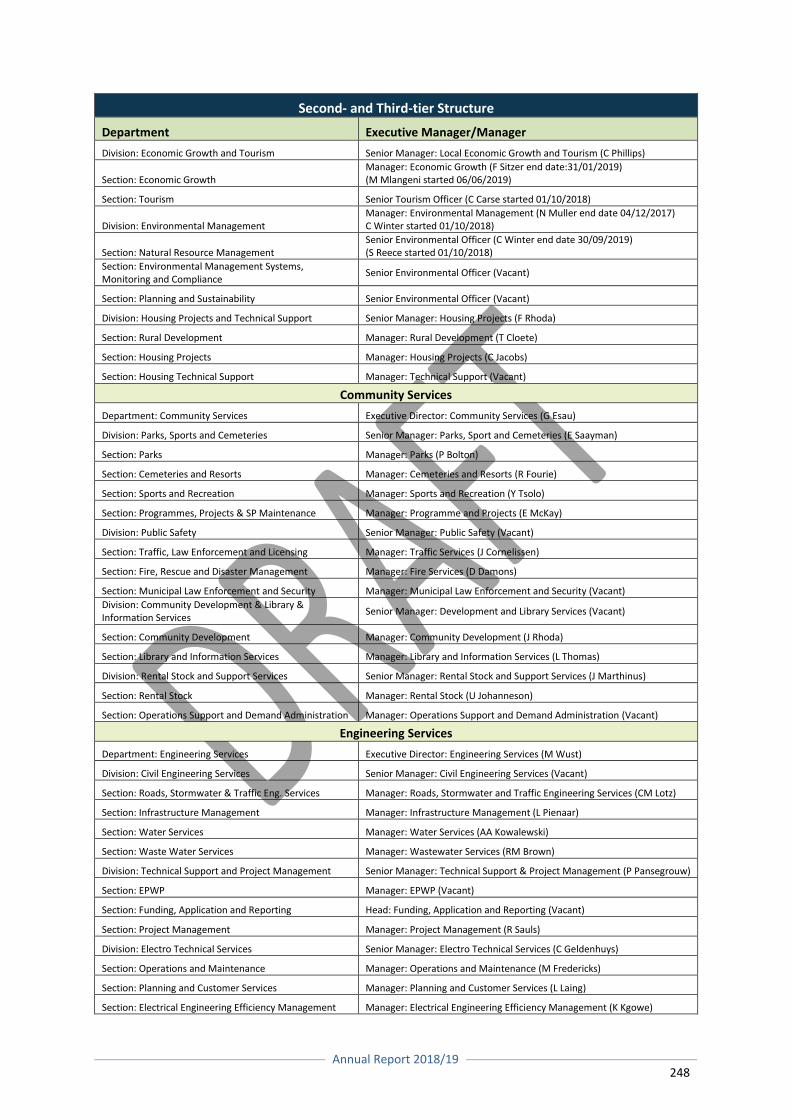
Annual Report 2018/19
248
Second- and Third-tier Structure
Department Executive Manager/Manager
Division: Economic Growth and Tourism Senior Manager: Local Economic Growth and Tourism (C Phillips)
Section: Economic Growth Manager: Economic Growth (F Sitzer end date:31/01/2019) (M Mlangeni started 06/06/2019)
Section: Tourism Senior Tourism Officer (C Carse started 01/10/2018)
Division: Environmental Management Manager: Environmental Management (N Muller end date 04/12/2017) C Winter started 01/10/2018)
Section: Natural Resource Management Senior Environmental Officer (C Winter end date 30/09/2019) (S Reece started 01/10/2018)
Section: Environmental Management Systems, Monitoring and Compliance
Senior Environmental Officer (Vacant)
Section: Planning and Sustainability Senior Environmental Officer (Vacant)
Division: Housing Projects and Technical Support Senior Manager: Housing Projects (F Rhoda)
Section: Rural Development Manager: Rural Development (T Cloete)
Section: Housing Projects Manager: Housing Projects (C Jacobs)
Section: Housing Technical Support Manager: Technical Support (Vacant)
Community Services
Department: Community Services Executive Director: Community Services (G Esau)
Division: Parks, Sports and Cemeteries Senior Manager: Parks, Sport and Cemeteries (E Saayman)
Section: Parks Manager: Parks (P Bolton)
Section: Cemeteries and Resorts Manager: Cemeteries and Resorts (R Fourie)
Section: Sports and Recreation Manager: Sports and Recreation (Y Tsolo)
Section: Programmes, Projects & SP Maintenance Manager: Programme and Projects (E McKay)
Division: Public Safety Senior Manager: Public Safety (Vacant)
Section: Traffic, Law Enforcement and Licensing Manager: Traffic Services (J Cornelissen)
Section: Fire, Rescue and Disaster Management Manager: Fire Services (D Damons)
Section: Municipal Law Enforcement and Security Manager: Municipal Law Enforcement and Security (Vacant)
Division: Community Development & Library & Information Services
Senior Manager: Development and Library Services (Vacant)
Section: Community Development Manager: Community Development (J Rhoda)
Section: Library and Information Services Manager: Library and Information Services (L Thomas)
Division: Rental Stock and Support Services Senior Manager: Rental Stock and Support Services (J Marthinus)
Section: Rental Stock Manager: Rental Stock (U Johanneson)
Section: Operations Support and Demand Administration Manager: Operations Support and Demand Administration (Vacant)
Engineering Services
Department: Engineering Services Executive Director: Engineering Services (M Wust)
Division: Civil Engineering Services Senior Manager: Civil Engineering Services (Vacant)
Section: Roads, Stormwater & Traffic Eng. Services Manager: Roads, Stormwater and Traffic Engineering Services (CM Lotz)
Section: Infrastructure Management Manager: Infrastructure Management (L Pienaar)
Section: Water Services Manager: Water Services (AA Kowalewski)
Section: Waste Water Services Manager: Wastewater Services (RM Brown)
Division: Technical Support and Project Management Senior Manager: Technical Support & Project Management (P Pansegrouw)
Section: EPWP Manager: EPWP (Vacant)
Section: Funding, Application and Reporting Head: Funding, Application and Reporting (Vacant)
Section: Project Management Manager: Project Management (R Sauls)
Division: Electro Technical Services Senior Manager: Electro Technical Services (C Geldenhuys)
Section: Operations and Maintenance Manager: Operations and Maintenance (M Fredericks)
Section: Planning and Customer Services Manager: Planning and Customer Services (L Laing)
Section: Electrical Engineering Efficiency Management Manager: Electrical Engineering Efficiency Management (K Kgowe)
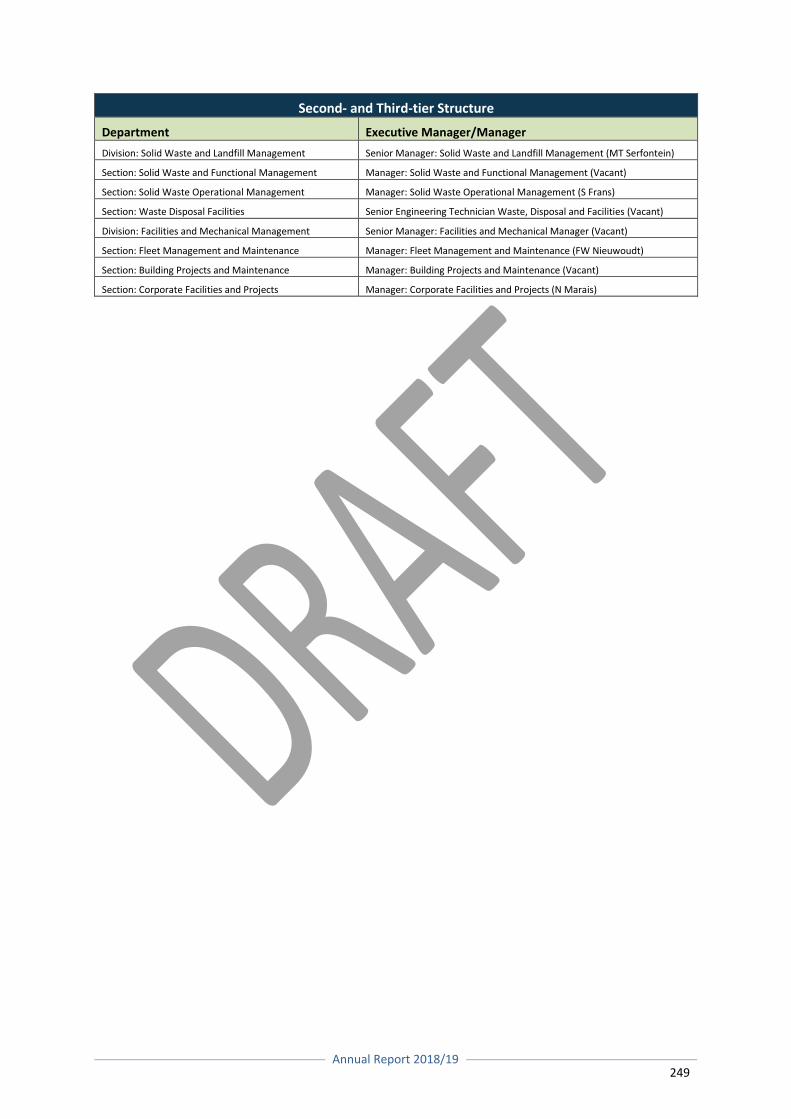
Annual Report 2018/19
249
Second- and Third-tier Structure
Department Executive Manager/Manager
Division: Solid Waste and Landfill Management Senior Manager: Solid Waste and Landfill Management (MT Serfontein)
Section: Solid Waste and Functional Management Manager: Solid Waste and Functional Management (Vacant)
Section: Solid Waste Operational Management Manager: Solid Waste Operational Management (S Frans)
Section: Waste Disposal Facilities Senior Engineering Technician Waste, Disposal and Facilities (Vacant)
Division: Facilities and Mechanical Management Senior Manager: Facilities and Mechanical Manager (Vacant)
Section: Fleet Management and Maintenance Manager: Fleet Management and Maintenance (FW Nieuwoudt)
Section: Building Projects and Maintenance Manager: Building Projects and Maintenance (Vacant)
Section: Corporate Facilities and Projects Manager: Corporate Facilities and Projects (N Marais)
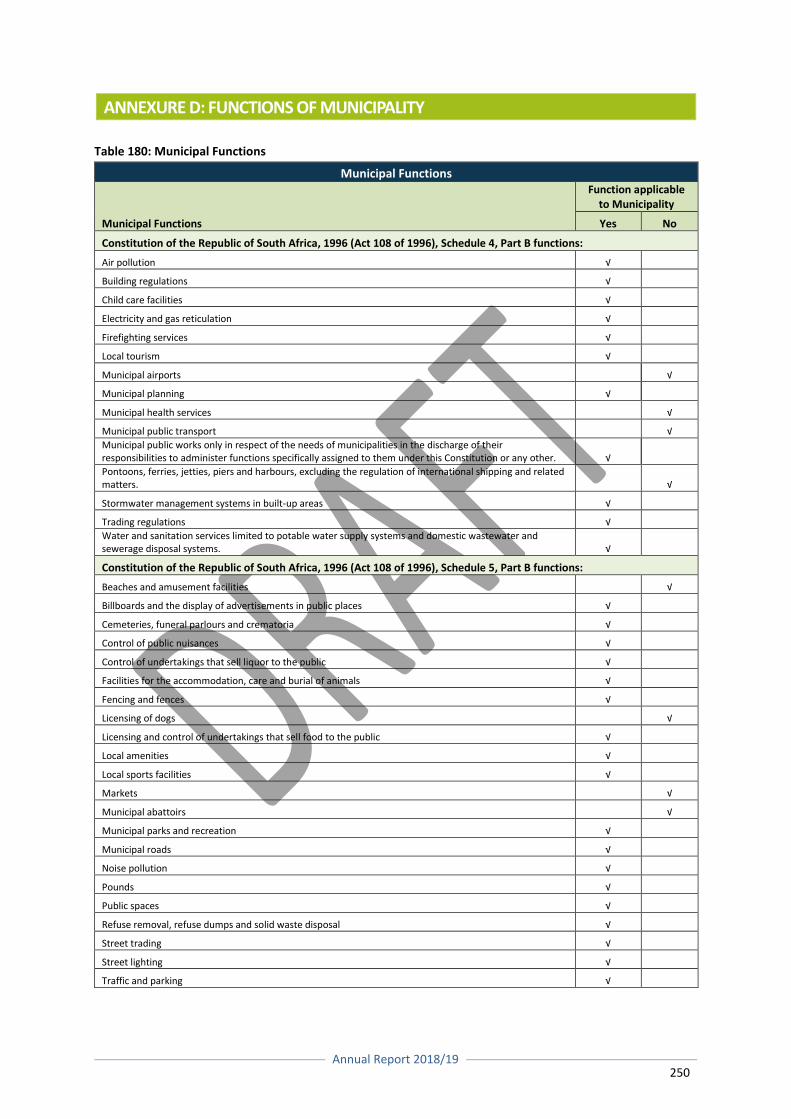
Annual Report 2018/19
250
ANNEXURE D: FUNCTIONS OF MUNICIPALITY
Table 180: Municipal Functions
Municipal Functions
Municipal Functions
Function applicable to Municipality
Yes No
Constitution of the Republic of South Africa, 1996 (Act 108 of 1996), Schedule 4, Part B functions:
Air pollution √
Building regulations √
Child care facilities √
Electricity and gas reticulation √
Firefighting services √
Local tourism √
Municipal airports √
Municipal planning √
Municipal health services √
Municipal public transport √
Municipal public works only in respect of the needs of municipalities in the discharge of their responsibilities to administer functions specifically assigned to them under this Constitution or any other. √
Pontoons, ferries, jetties, piers and harbours, excluding the regulation of international shipping and related matters. √
Stormwater management systems in built-up areas √
Trading regulations √
Water and sanitation services limited to potable water supply systems and domestic wastewater and sewerage disposal systems. √
Constitution of the Republic of South Africa, 1996 (Act 108 of 1996), Schedule 5, Part B functions:
Beaches and amusement facilities √
Billboards and the display of advertisements in public places √
Cemeteries, funeral parlours and crematoria √
Control of public nuisances √
Control of undertakings that sell liquor to the public √
Facilities for the accommodation, care and burial of animals √
Fencing and fences √
Licensing of dogs √
Licensing and control of undertakings that sell food to the public √
Local amenities √
Local sports facilities √
Markets √
Municipal abattoirs √
Municipal parks and recreation √
Municipal roads √
Noise pollution √
Pounds √
Public spaces √
Refuse removal, refuse dumps and solid waste disposal √
Street trading √
Street lighting √
Traffic and parking √
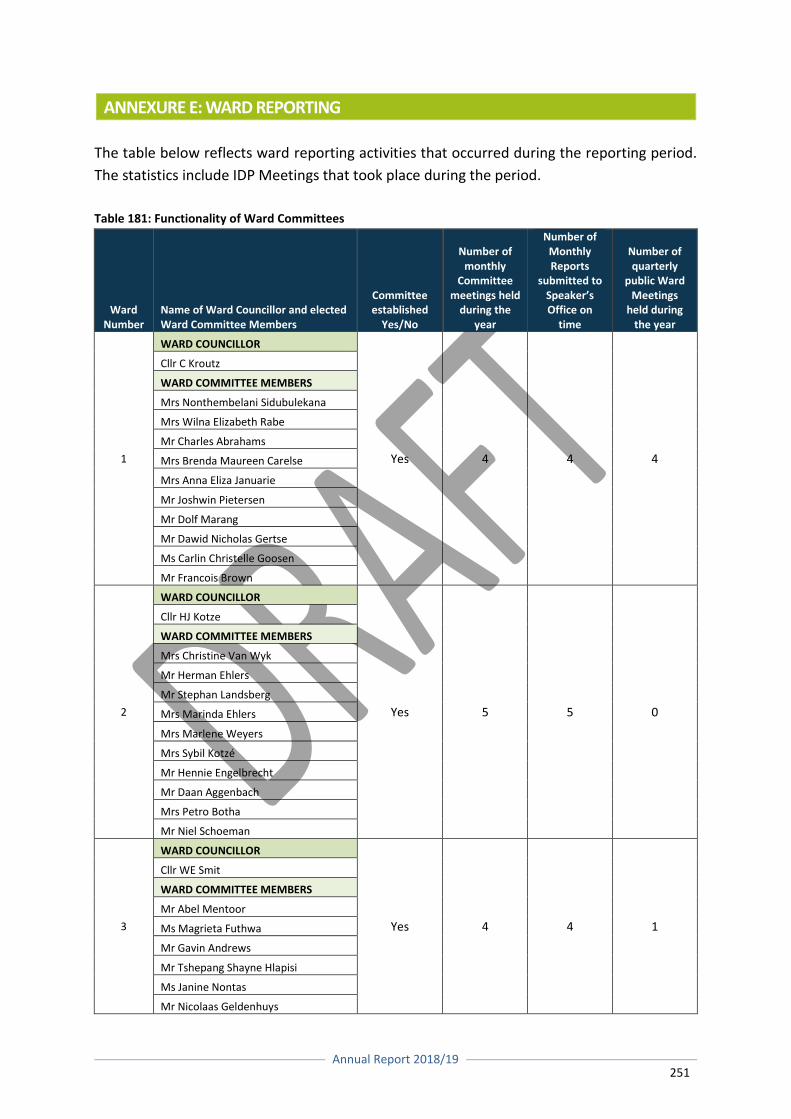
Annual Report 2018/19
251
ANNEXURE E: WARD REPORTING
The table below reflects ward reporting activities that occurred during the reporting period.
The statistics include IDP Meetings that took place during the period.
Table 181: Functionality of Ward Committees
Ward Number
Name of Ward Councillor and elected Ward Committee Members
Committee established
Yes/No
Number of monthly
Committee meetings held
during the year
Number of Monthly Reports
submitted to Speaker’s Office on
time
Number of quarterly
public Ward Meetings
held during the year
1
WARD COUNCILLOR
Yes 4 4 4
Cllr C Kroutz
WARD COMMITTEE MEMBERS
Mrs Nonthembelani Sidubulekana
Mrs Wilna Elizabeth Rabe
Mr Charles Abrahams
Mrs Brenda Maureen Carelse
Mrs Anna Eliza Januarie
Mr Joshwin Pietersen
Mr Dolf Marang
Mr Dawid Nicholas Gertse
Ms Carlin Christelle Goosen
Mr Francois Brown
2
WARD COUNCILLOR
Yes 5 5 0
Cllr HJ Kotze
WARD COMMITTEE MEMBERS
Mrs Christine Van Wyk
Mr Herman Ehlers
Mr Stephan Landsberg
Mrs Marinda Ehlers
Mrs Marlene Weyers
Mrs Sybil Kotzé
Mr Hennie Engelbrecht
Mr Daan Aggenbach
Mrs Petro Botha
Mr Niel Schoeman
3
WARD COUNCILLOR
Yes 4 4 1
Cllr WE Smit
WARD COMMITTEE MEMBERS
Mr Abel Mentoor
Ms Magrieta Futhwa
Mr Gavin Andrews
Mr Tshepang Shayne Hlapisi
Ms Janine Nontas
Mr Nicolaas Geldenhuys
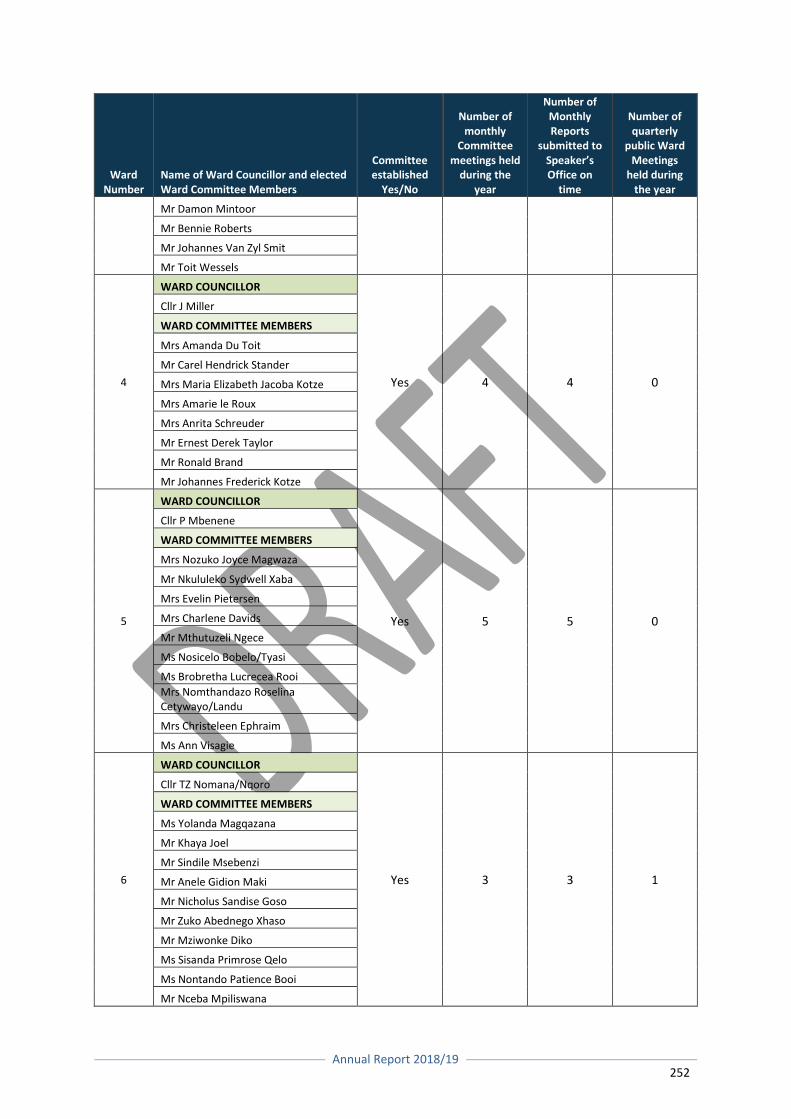
Annual Report 2018/19
252
Ward Number
Name of Ward Councillor and elected Ward Committee Members
Committee established
Yes/No
Number of monthly
Committee meetings held
during the year
Number of Monthly Reports
submitted to Speaker’s Office on
time
Number of quarterly
public Ward Meetings
held during the year
Mr Damon Mintoor
Mr Bennie Roberts
Mr Johannes Van Zyl Smit
Mr Toit Wessels
4
WARD COUNCILLOR
Yes 4 4 0
Cllr J Miller
WARD COMMITTEE MEMBERS
Mrs Amanda Du Toit
Mr Carel Hendrick Stander
Mrs Maria Elizabeth Jacoba Kotze
Mrs Amarie le Roux
Mrs Anrita Schreuder
Mr Ernest Derek Taylor
Mr Ronald Brand
Mr Johannes Frederick Kotze
5
WARD COUNCILLOR
Yes 5 5 0
Cllr P Mbenene
WARD COMMITTEE MEMBERS
Mrs Nozuko Joyce Magwaza
Mr Nkululeko Sydwell Xaba
Mrs Evelin Pietersen
Mrs Charlene Davids
Mr Mthutuzeli Ngece
Ms Nosicelo Bobelo/Tyasi
Ms Brobretha Lucrecea Rooi
Mrs Nomthandazo Roselina Cetywayo/Landu
Mrs Christeleen Ephraim
Ms Ann Visagie
6
WARD COUNCILLOR
Yes 3 3 1
Cllr TZ Nomana/Nqoro
WARD COMMITTEE MEMBERS
Ms Yolanda Magqazana
Mr Khaya Joel
Mr Sindile Msebenzi
Mr Anele Gidion Maki
Mr Nicholus Sandise Goso
Mr Zuko Abednego Xhaso
Mr Mziwonke Diko
Ms Sisanda Primrose Qelo
Ms Nontando Patience Booi
Mr Nceba Mpiliswana

Annual Report 2018/19
253
Ward Number
Name of Ward Councillor and elected Ward Committee Members
Committee established
Yes/No
Number of monthly
Committee meetings held
during the year
Number of Monthly Reports
submitted to Speaker’s Office on
time
Number of quarterly
public Ward Meetings
held during the year
7
WARD COUNCILLOR
Yes 1 1 0
Cllr RB Arnolds
WARD COMMITTEE MEMBERS
Mr Hendry Joseph
Mr Eric Dampies
Mrs Anneline Isaacs
Mrs Saromeo Oliphant
Ms Christina Albertus
Mr Davey Simonse
Mr s Monica Ryan
Mr David Geduld
Ms Bellmordene Robson
Mrs Elmorie Julies
8
WARD COUNCILLOR
Yes 4 4 1
Cllr N Zikhali
WARD COMMITTEE MEMBERS
Ms Nonzoliso Giqwa
Mr Mputumi Pal Foreman
Ms Bulelwa Sylvia Gxowa
Mrs Shiela Witbooi
Mr Sinokolo Melvin Godlo
Ms Nonceba Doreen Mphepeto
Ms NO Johnson
Mr Mbulelo Mcimbi
Ms Ntomboxolo Godongwana
Mr M Ngontsolo
9
WARD COUNCILLOR
Yes 1 1 1
Cllr TC Mangena
WARD COMMITTEE MEMBERS
Ms Esteline Thandiwe Xayimpi
Ms Sandisiwe Cynthia Martins
Mr Vuyo Bulani
Ms Ntasa Adoro
Mrs Nomakhwezi Siko
Mr Mongezi Dlwathi
Ms Nozuko Grace Ngqolobe
Mr Lubabalo Skeyi
Mrs Noncithakalo Tayitayi
Mr Monwabisi Vunguvungu
10
WARD COUNCILLOR
Yes 2 2 3 Cllr C Kearns
WARD COMMITTEE MEMBERS
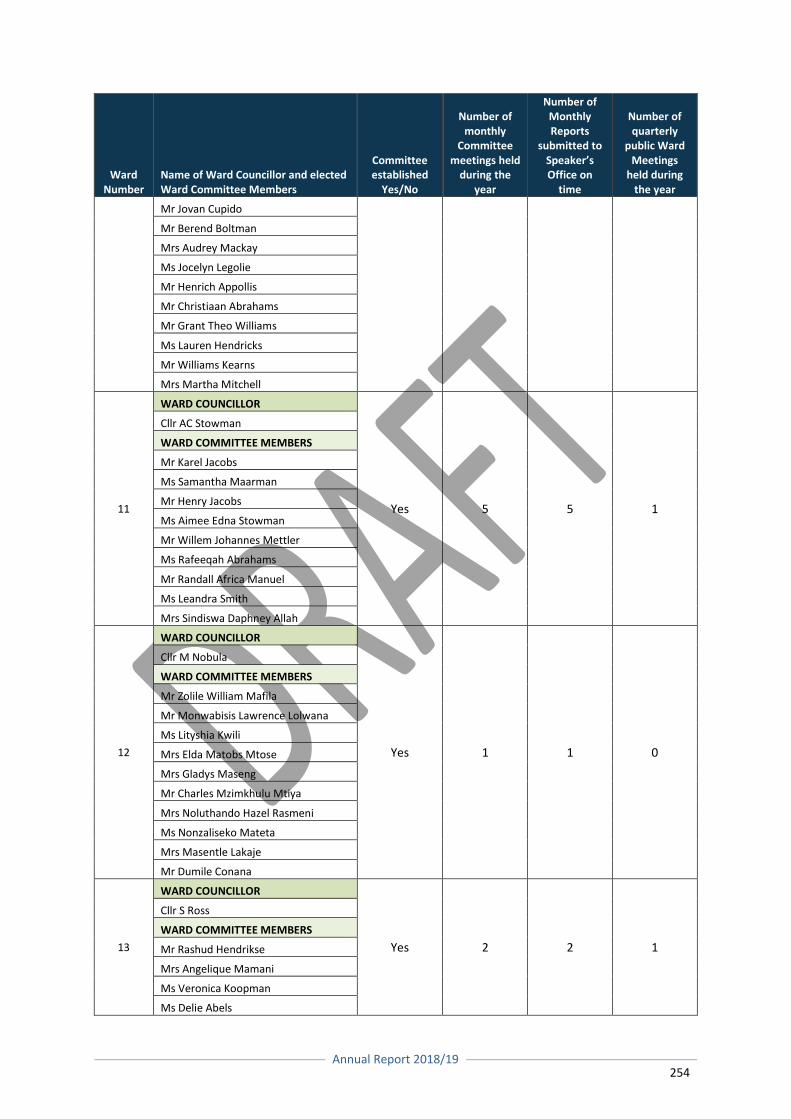
Annual Report 2018/19
254
Ward Number
Name of Ward Councillor and elected Ward Committee Members
Committee established
Yes/No
Number of monthly
Committee meetings held
during the year
Number of Monthly Reports
submitted to Speaker’s Office on
time
Number of quarterly
public Ward Meetings
held during the year
Mr Jovan Cupido
Mr Berend Boltman
Mrs Audrey Mackay
Ms Jocelyn Legolie
Mr Henrich Appollis
Mr Christiaan Abrahams
Mr Grant Theo Williams
Ms Lauren Hendricks
Mr Williams Kearns
Mrs Martha Mitchell
11
WARD COUNCILLOR
Yes 5 5 1
Cllr AC Stowman
WARD COMMITTEE MEMBERS
Mr Karel Jacobs
Ms Samantha Maarman
Mr Henry Jacobs
Ms Aimee Edna Stowman
Mr Willem Johannes Mettler
Ms Rafeeqah Abrahams
Mr Randall Africa Manuel
Ms Leandra Smith
Mrs Sindiswa Daphney Allah
12
WARD COUNCILLOR
Yes 1 1 0
Cllr M Nobula
WARD COMMITTEE MEMBERS
Mr Zolile William Mafila
Mr Monwabisis Lawrence Lolwana
Ms Lityshia Kwili
Mrs Elda Matobs Mtose
Mrs Gladys Maseng
Mr Charles Mzimkhulu Mtiya
Mrs Noluthando Hazel Rasmeni
Ms Nonzaliseko Mateta
Mrs Masentle Lakaje
Mr Dumile Conana
13
WARD COUNCILLOR
Yes 2 2 1
Cllr S Ross
WARD COMMITTEE MEMBERS
Mr Rashud Hendrikse
Mrs Angelique Mamani
Ms Veronica Koopman
Ms Delie Abels
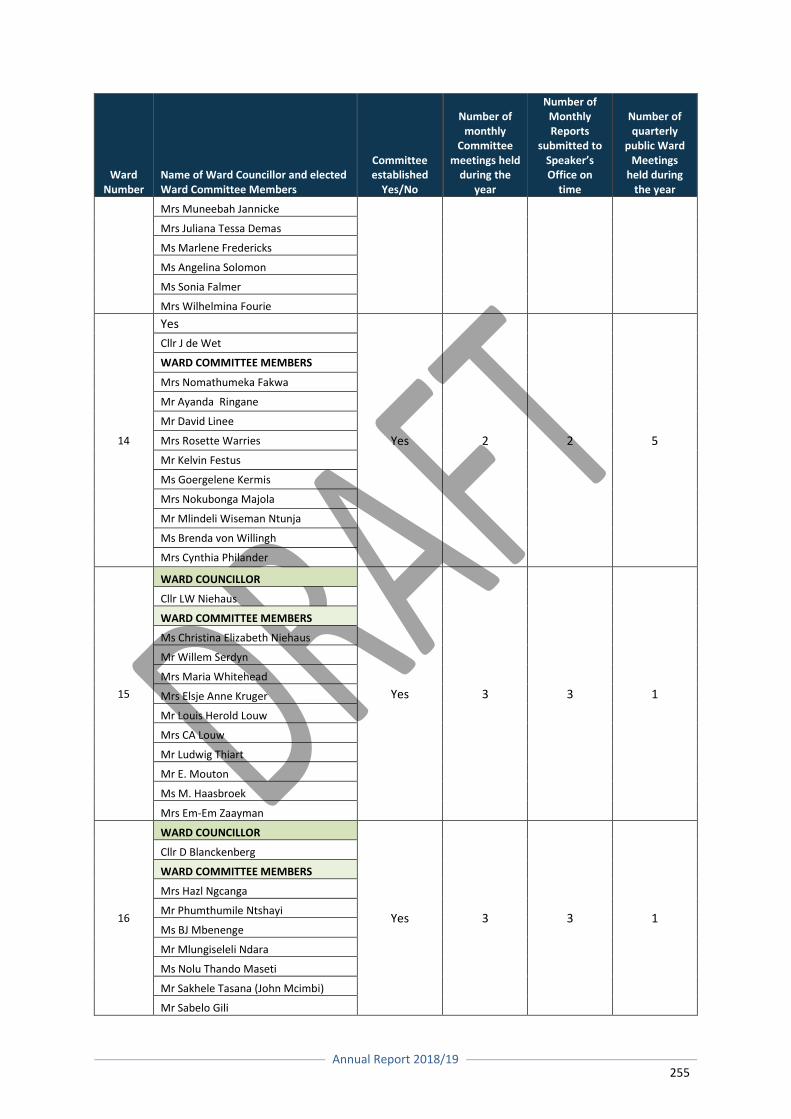
Annual Report 2018/19
255
Ward Number
Name of Ward Councillor and elected Ward Committee Members
Committee established
Yes/No
Number of monthly
Committee meetings held
during the year
Number of Monthly Reports
submitted to Speaker’s Office on
time
Number of quarterly
public Ward Meetings
held during the year
Mrs Muneebah Jannicke
Mrs Juliana Tessa Demas
Ms Marlene Fredericks
Ms Angelina Solomon
Ms Sonia Falmer
Mrs Wilhelmina Fourie
14
Yes
Yes 2 2 5
Cllr J de Wet
WARD COMMITTEE MEMBERS
Mrs Nomathumeka Fakwa
Mr Ayanda Ringane
Mr David Linee
Mrs Rosette Warries
Mr Kelvin Festus
Ms Goergelene Kermis
Mrs Nokubonga Majola
Mr Mlindeli Wiseman Ntunja
Ms Brenda von Willingh
Mrs Cynthia Philander
15
WARD COUNCILLOR
Yes 3 3 1
Cllr LW Niehaus
WARD COMMITTEE MEMBERS
Ms Christina Elizabeth Niehaus
Mr Willem Serdyn
Mrs Maria Whitehead
Mrs Elsje Anne Kruger
Mr Louis Herold Louw
Mrs CA Louw
Mr Ludwig Thiart
Mr E. Mouton
Ms M. Haasbroek
Mrs Em-Em Zaayman
16
WARD COUNCILLOR
Yes 3 3 1
Cllr D Blanckenberg
WARD COMMITTEE MEMBERS
Mrs Hazl Ngcanga
Mr Phumthumile Ntshayi
Ms BJ Mbenenge
Mr Mlungiseleli Ndara
Ms Nolu Thando Maseti
Mr Sakhele Tasana (John Mcimbi)
Mr Sabelo Gili
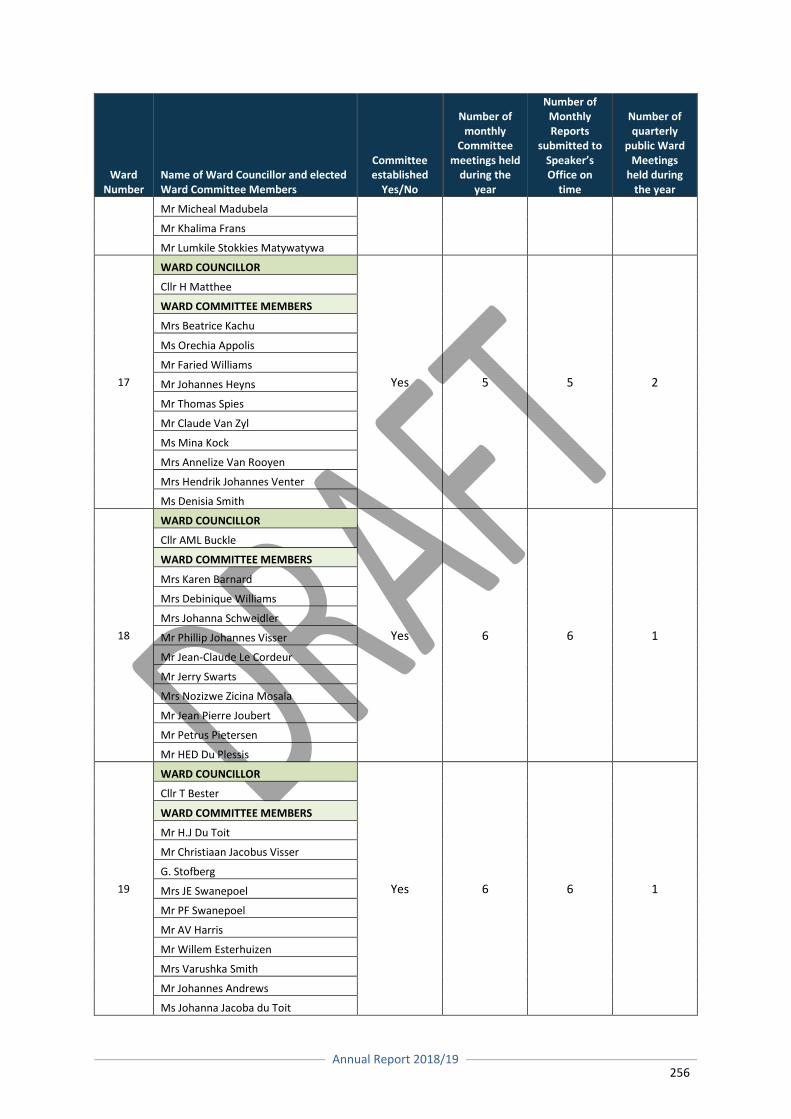
Annual Report 2018/19
256
Ward Number
Name of Ward Councillor and elected Ward Committee Members
Committee established
Yes/No
Number of monthly
Committee meetings held
during the year
Number of Monthly Reports
submitted to Speaker’s Office on
time
Number of quarterly
public Ward Meetings
held during the year
Mr Micheal Madubela
Mr Khalima Frans
Mr Lumkile Stokkies Matywatywa
17
WARD COUNCILLOR
Yes 5 5 2
Cllr H Matthee
WARD COMMITTEE MEMBERS
Mrs Beatrice Kachu
Ms Orechia Appolis
Mr Faried Williams
Mr Johannes Heyns
Mr Thomas Spies
Mr Claude Van Zyl
Ms Mina Kock
Mrs Annelize Van Rooyen
Mrs Hendrik Johannes Venter
Ms Denisia Smith
18
WARD COUNCILLOR
Yes 6 6 1
Cllr AML Buckle
WARD COMMITTEE MEMBERS
Mrs Karen Barnard
Mrs Debinique Williams
Mrs Johanna Schweidler
Mr Phillip Johannes Visser
Mr Jean-Claude Le Cordeur
Mr Jerry Swarts
Mrs Nozizwe Zicina Mosala
Mr Jean Pierre Joubert
Mr Petrus Pietersen
Mr HED Du Plessis
19
WARD COUNCILLOR
Yes 6 6 1
Cllr T Bester
WARD COMMITTEE MEMBERS
Mr H.J Du Toit
Mr Christiaan Jacobus Visser
G. Stofberg
Mrs JE Swanepoel
Mr PF Swanepoel
Mr AV Harris
Mr Willem Esterhuizen
Mrs Varushka Smith
Mr Johannes Andrews
Ms Johanna Jacoba du Toit
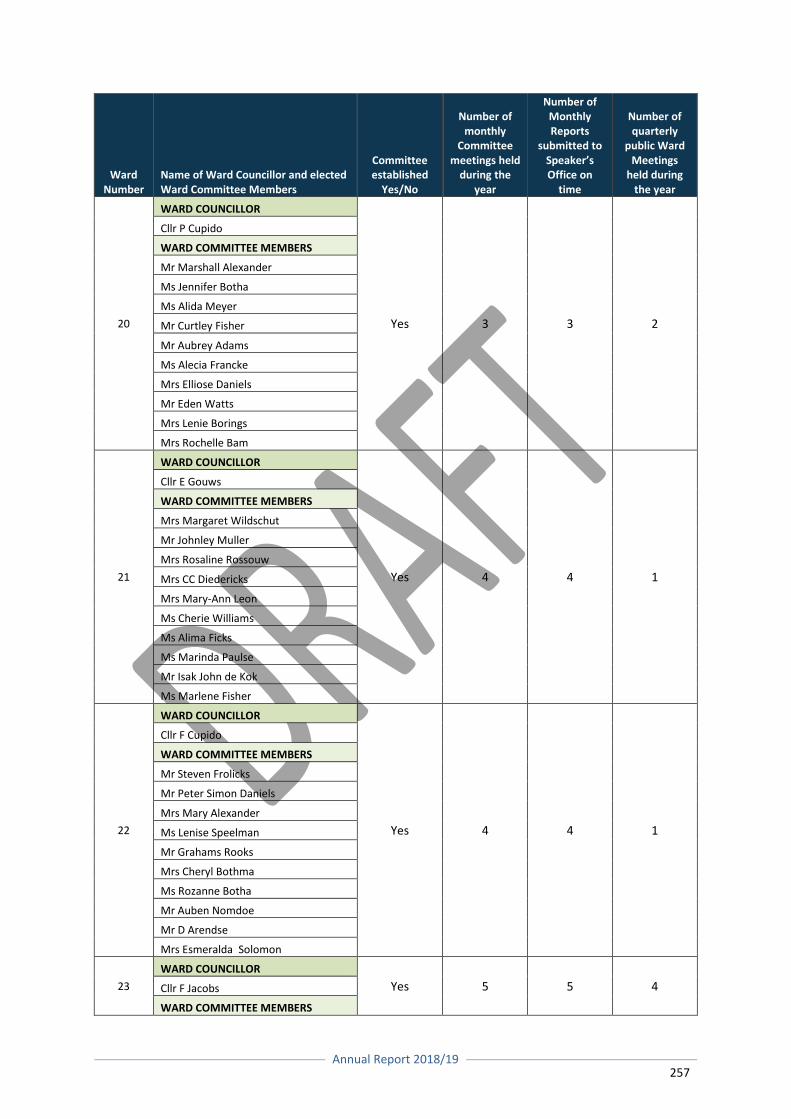
Annual Report 2018/19
257
Ward Number
Name of Ward Councillor and elected Ward Committee Members
Committee established
Yes/No
Number of monthly
Committee meetings held
during the year
Number of Monthly Reports
submitted to Speaker’s Office on
time
Number of quarterly
public Ward Meetings
held during the year
20
WARD COUNCILLOR
Yes 3 3 2
Cllr P Cupido
WARD COMMITTEE MEMBERS
Mr Marshall Alexander
Ms Jennifer Botha
Ms Alida Meyer
Mr Curtley Fisher
Mr Aubrey Adams
Ms Alecia Francke
Mrs Elliose Daniels
Mr Eden Watts
Mrs Lenie Borings
Mrs Rochelle Bam
21
WARD COUNCILLOR
Yes 4 4 1
Cllr E Gouws
WARD COMMITTEE MEMBERS
Mrs Margaret Wildschut
Mr Johnley Muller
Mrs Rosaline Rossouw
Mrs CC Diedericks
Mrs Mary-Ann Leon
Ms Cherie Williams
Ms Alima Ficks
Ms Marinda Paulse
Mr Isak John de Kok
Ms Marlene Fisher
22
WARD COUNCILLOR
Yes 4 4 1
Cllr F Cupido
WARD COMMITTEE MEMBERS
Mr Steven Frolicks
Mr Peter Simon Daniels
Mrs Mary Alexander
Ms Lenise Speelman
Mr Grahams Rooks
Mrs Cheryl Bothma
Ms Rozanne Botha
Mr Auben Nomdoe
Mr D Arendse
Mrs Esmeralda Solomon
23
WARD COUNCILLOR
Yes 5 5 4 Cllr F Jacobs
WARD COMMITTEE MEMBERS
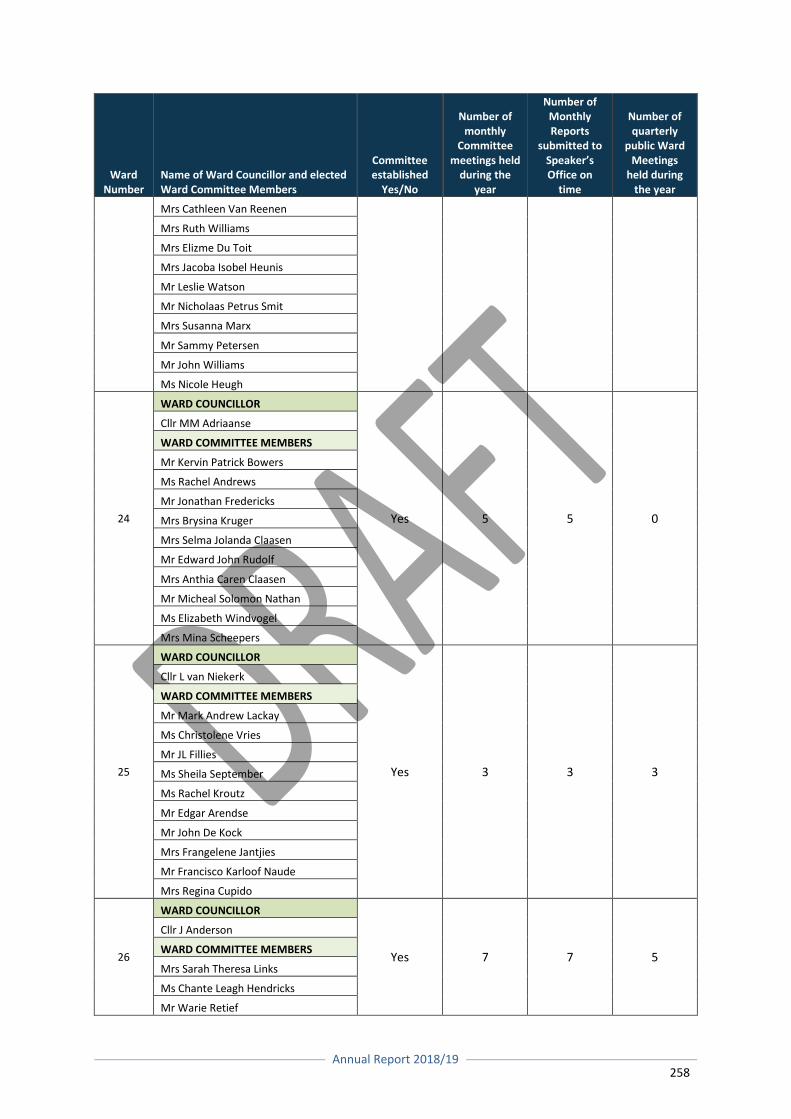
Annual Report 2018/19
258
Ward Number
Name of Ward Councillor and elected Ward Committee Members
Committee established
Yes/No
Number of monthly
Committee meetings held
during the year
Number of Monthly Reports
submitted to Speaker’s Office on
time
Number of quarterly
public Ward Meetings
held during the year
Mrs Cathleen Van Reenen
Mrs Ruth Williams
Mrs Elizme Du Toit
Mrs Jacoba Isobel Heunis
Mr Leslie Watson
Mr Nicholaas Petrus Smit
Mrs Susanna Marx
Mr Sammy Petersen
Mr John Williams
Ms Nicole Heugh
24
WARD COUNCILLOR
Yes 5 5 0
Cllr MM Adriaanse
WARD COMMITTEE MEMBERS
Mr Kervin Patrick Bowers
Ms Rachel Andrews
Mr Jonathan Fredericks
Mrs Brysina Kruger
Mrs Selma Jolanda Claasen
Mr Edward John Rudolf
Mrs Anthia Caren Claasen
Mr Micheal Solomon Nathan
Ms Elizabeth Windvogel
Mrs Mina Scheepers
25
WARD COUNCILLOR
Yes 3 3 3
Cllr L van Niekerk
WARD COMMITTEE MEMBERS
Mr Mark Andrew Lackay
Ms Christolene Vries
Mr JL Fillies
Ms Sheila September
Ms Rachel Kroutz
Mr Edgar Arendse
Mr John De Kock
Mrs Frangelene Jantjies
Mr Francisco Karloof Naude
Mrs Regina Cupido
26
WARD COUNCILLOR
Yes 7 7 5
Cllr J Anderson
WARD COMMITTEE MEMBERS
Mrs Sarah Theresa Links
Ms Chante Leagh Hendricks
Mr Warie Retief

Annual Report 2018/19
259
Ward Number
Name of Ward Councillor and elected Ward Committee Members
Committee established
Yes/No
Number of monthly
Committee meetings held
during the year
Number of Monthly Reports
submitted to Speaker’s Office on
time
Number of quarterly
public Ward Meetings
held during the year
Ms Carmelita Liebenberg
Mrs Catherine Williams
Ms Monique Booysen
Ms Serine Pauline Sheldon
Mrs Du Blanche Krautz
Ms Selma Crotz
Mr Anthony Esau La Douce
27
WARD COUNCILLOR
Yes 4 4 3
Cllr V Booysen
WARD COMMITTEE MEMBERS
Mrs Karin Hendricks
Mr Johannes Daniels
Mr Maans Brown
Ms Fredricka Evelina Philander
Ms Wilhelmina Hendricks
Mrs Magdelena Botha
Mr Karools Isaacs
Mrs Doreen Kilowan
Ms Gwendolene Davids
Mrs Angela Brown
28
WARD COUNCILLOR
Yes 5 5 1
Cllr RH van Nieuwenhuyzen
WARD COMMITTEE MEMBERS
Mr Tom Cowie
Mr Sidney Johannes
Ms Angelique Milly Stevens
Ms Katrina Adams
Mrs Dina Magrieta Johnson
Mr Japie H Arendse
Mr Johannes Muller
Mrs Cecillia Mitchell
Mr John-Hilton Stevens
Mrs Regina Abrahams/Moses
29
WARD COUNCILLOR
Yes 6 6 3
Cllr L Willemse
WARD COMMITTEE MEMBERS
Mr Nicholaas Mettler
Mrs Sonia Appollis
Mr Dawid Mandla Futhwa
Mr Henry Minnaar
Mr Stephen Abrahams
Mr Basil Arendse
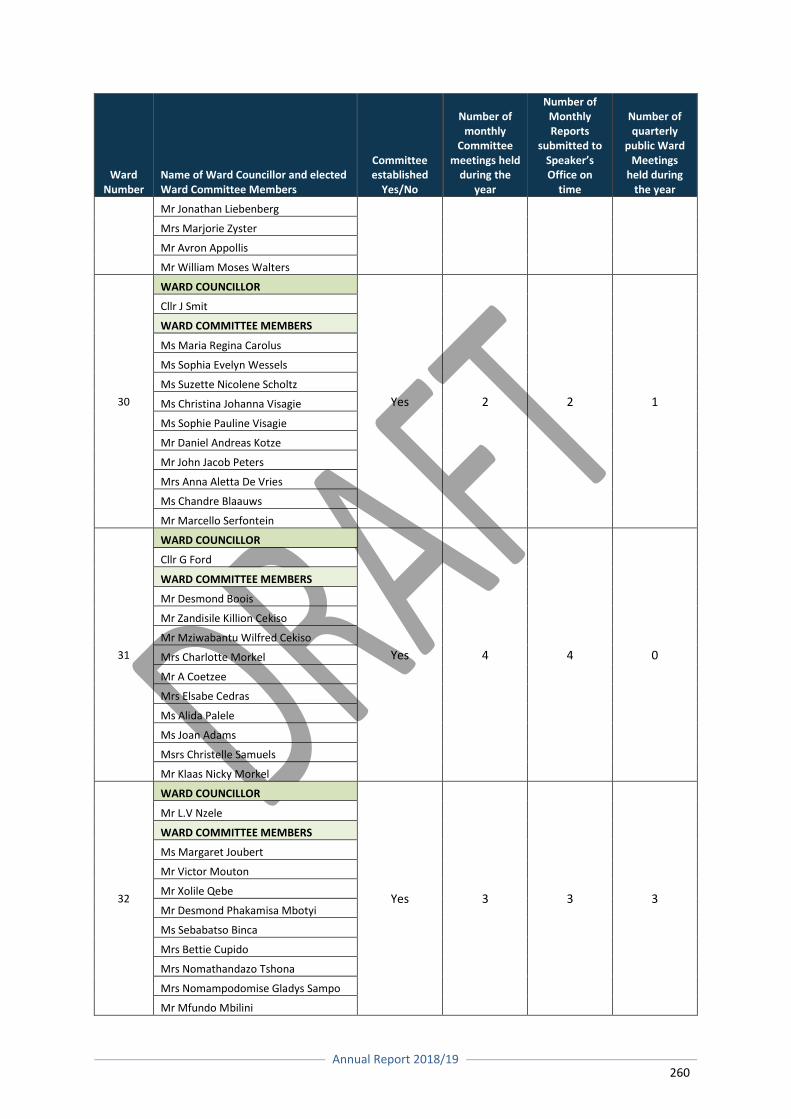
Annual Report 2018/19
260
Ward Number
Name of Ward Councillor and elected Ward Committee Members
Committee established
Yes/No
Number of monthly
Committee meetings held
during the year
Number of Monthly Reports
submitted to Speaker’s Office on
time
Number of quarterly
public Ward Meetings
held during the year
Mr Jonathan Liebenberg
Mrs Marjorie Zyster
Mr Avron Appollis
Mr William Moses Walters
30
WARD COUNCILLOR
Yes 2 2 1
Cllr J Smit
WARD COMMITTEE MEMBERS
Ms Maria Regina Carolus
Ms Sophia Evelyn Wessels
Ms Suzette Nicolene Scholtz
Ms Christina Johanna Visagie
Ms Sophie Pauline Visagie
Mr Daniel Andreas Kotze
Mr John Jacob Peters
Mrs Anna Aletta De Vries
Ms Chandre Blaauws
Mr Marcello Serfontein
31
WARD COUNCILLOR
Yes 4 4 0
Cllr G Ford
WARD COMMITTEE MEMBERS
Mr Desmond Boois
Mr Zandisile Killion Cekiso
Mr Mziwabantu Wilfred Cekiso
Mrs Charlotte Morkel
Mr A Coetzee
Mrs Elsabe Cedras
Ms Alida Palele
Ms Joan Adams
Msrs Christelle Samuels
Mr Klaas Nicky Morkel
32
WARD COUNCILLOR
Yes 3 3 3
Mr L.V Nzele
WARD COMMITTEE MEMBERS
Ms Margaret Joubert
Mr Victor Mouton
Mr Xolile Qebe
Mr Desmond Phakamisa Mbotyi
Ms Sebabatso Binca
Mrs Bettie Cupido
Mrs Nomathandazo Tshona
Mrs Nomampodomise Gladys Sampo
Mr Mfundo Mbilini
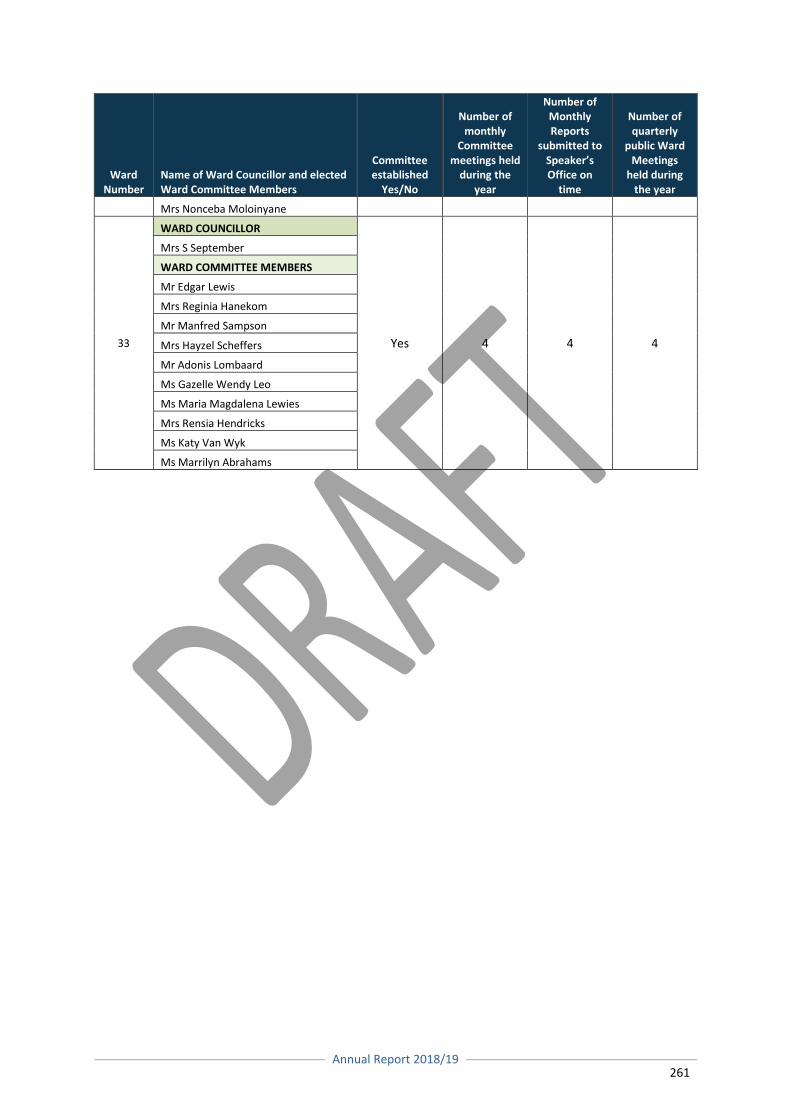
Annual Report 2018/19
261
Ward Number
Name of Ward Councillor and elected Ward Committee Members
Committee established
Yes/No
Number of monthly
Committee meetings held
during the year
Number of Monthly Reports
submitted to Speaker’s Office on
time
Number of quarterly
public Ward Meetings
held during the year
Mrs Nonceba Moloinyane
33
WARD COUNCILLOR
Yes 4 4 4
Mrs S September
WARD COMMITTEE MEMBERS
Mr Edgar Lewis
Mrs Reginia Hanekom
Mr Manfred Sampson
Mrs Hayzel Scheffers
Mr Adonis Lombaard
Ms Gazelle Wendy Leo
Ms Maria Magdalena Lewies
Mrs Rensia Hendricks
Ms Katy Van Wyk
Ms Marrilyn Abrahams
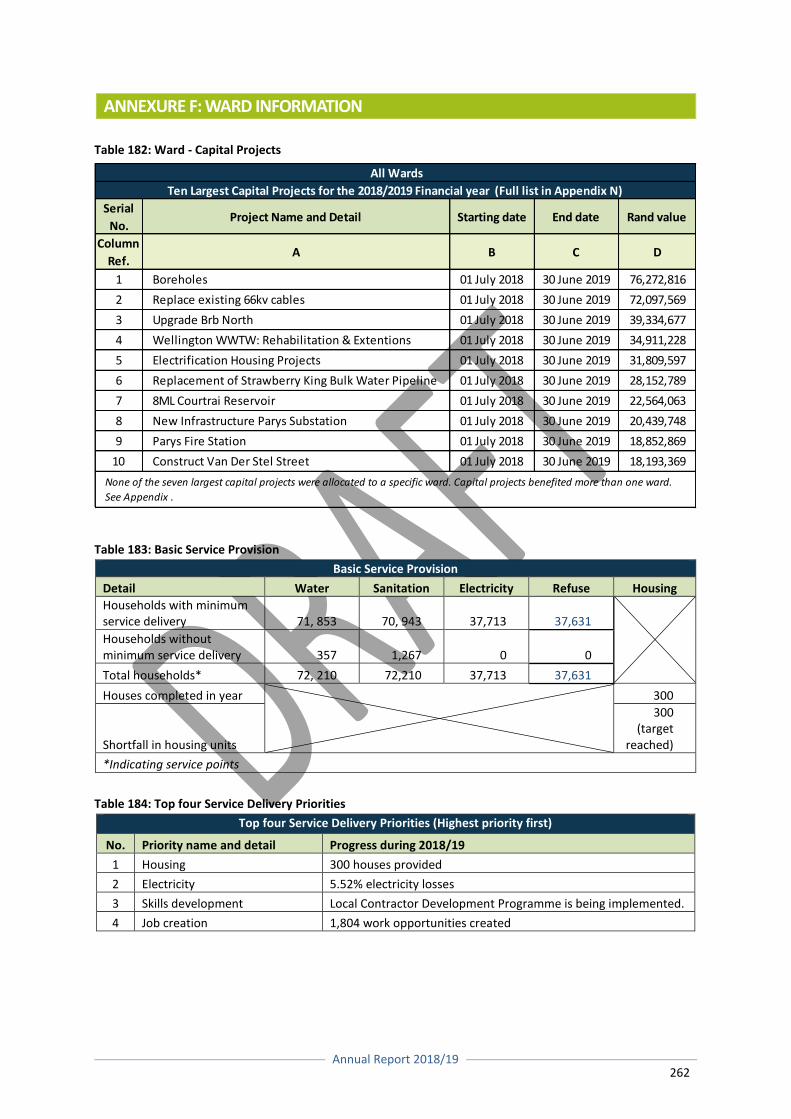
Annual Report 2018/19
262
ANNEXURE F: WARD INFORMATION Table 182: Ward - Capital Projects
Table 183: Basic Service Provision
Basic Service Provision
Detail Water Sanitation Electricity Refuse Housing
Households with minimum service delivery 71, 853 70, 943 37,713 37,631
Households without minimum service delivery 357 1,267 0 0
Total households* 72, 210 72,210 37,713 37,631
Houses completed in year
300
Shortfall in housing units
300 (target
reached)
*Indicating service points
Table 184: Top four Service Delivery Priorities
Top four Service Delivery Priorities (Highest priority first)
No. Priority name and detail Progress during 2018/19
1 Housing 300 houses provided
2 Electricity 5.52% electricity losses
3 Skills development Local Contractor Development Programme is being implemented.
4 Job creation 1,804 work opportunities created
Serial
No.Project Name and Detail Starting date End date Rand value
Column
Ref.A B C D
1 Boreholes 01 July 2018 30 June 2019 76,272,816
2 Replace existing 66kv cables 01 July 2018 30 June 2019 72,097,569
3 Upgrade Brb North 01 July 2018 30 June 2019 39,334,677
4 Wellington WWTW: Rehabilitation & Extentions 01 July 2018 30 June 2019 34,911,228
5 Electrification Housing Projects 01 July 2018 30 June 2019 31,809,597
6 Replacement of Strawberry King Bulk Water Pipeline 01 July 2018 30 June 2019 28,152,789
7 8ML Courtrai Reservoir 01 July 2018 30 June 2019 22,564,063
8 New Infrastructure Parys Substation 01 July 2018 30 June 2019 20,439,748
9 Parys Fire Station 01 July 2018 30 June 2019 18,852,869
10 Construct Van Der Stel Street 01 July 2018 30 June 2019 18,193,369
All Wards
Ten Largest Capital Projects for the 2018/2019 Financial year (Full list in Appendix N)
None of the seven largest capital projects were allocated to a specific ward. Capital projects benefited more than one ward.
See Appendix .
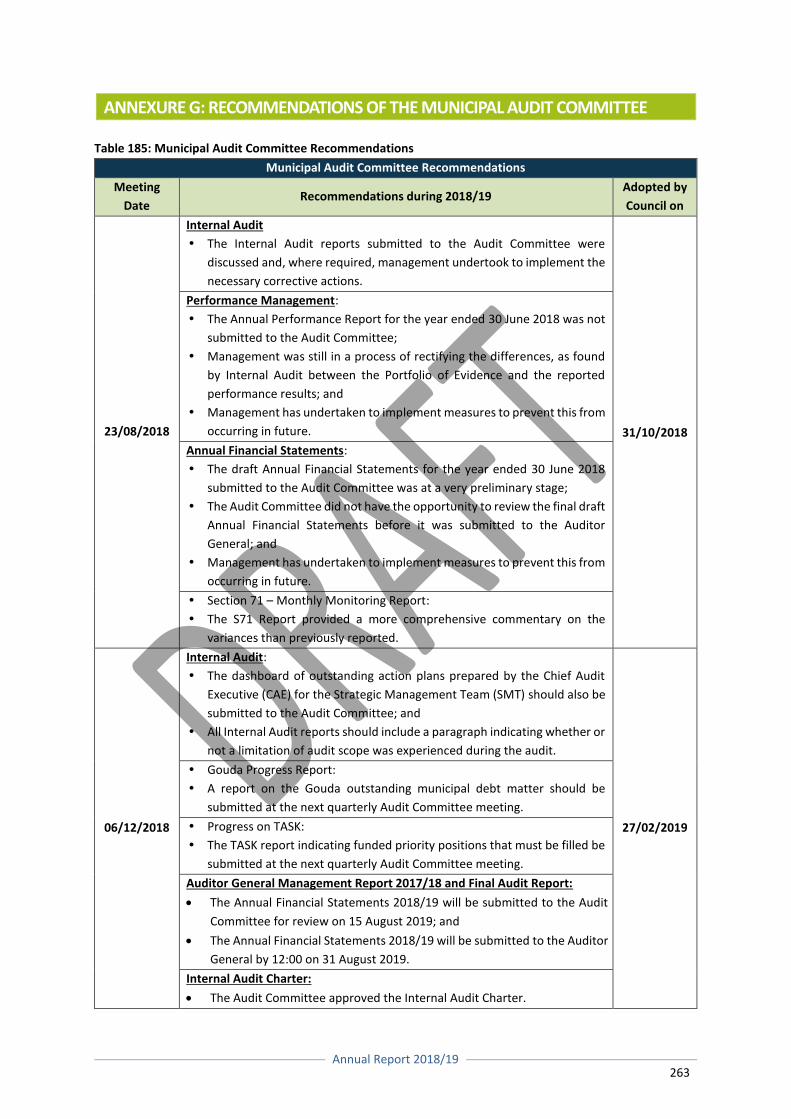
Annual Report 2018/19
263
ANNEXURE G: RECOMMENDATIONS OF THE MUNICIPAL AUDIT COMMITTEE Table 185: Municipal Audit Committee Recommendations
Municipal Audit Committee Recommendations
Meeting
Date Recommendations during 2018/19
Adopted by
Council on
23/08/2018
Internal Audit
The Internal Audit reports submitted to the Audit Committee were
discussed and, where required, management undertook to implement the
necessary corrective actions.
31/10/2018
Performance Management:
The Annual Performance Report for the year ended 30 June 2018 was not
submitted to the Audit Committee;
Management was still in a process of rectifying the differences, as found
by Internal Audit between the Portfolio of Evidence and the reported
performance results; and
Management has undertaken to implement measures to prevent this from
occurring in future.
Annual Financial Statements:
The draft Annual Financial Statements for the year ended 30 June 2018
submitted to the Audit Committee was at a very preliminary stage;
The Audit Committee did not have the opportunity to review the final draft
Annual Financial Statements before it was submitted to the Auditor
General; and
Management has undertaken to implement measures to prevent this from
occurring in future.
Section 71 – Monthly Monitoring Report:
The S71 Report provided a more comprehensive commentary on the
variances than previously reported.
06/12/2018
Internal Audit:
The dashboard of outstanding action plans prepared by the Chief Audit
Executive (CAE) for the Strategic Management Team (SMT) should also be
submitted to the Audit Committee; and
All Internal Audit reports should include a paragraph indicating whether or
not a limitation of audit scope was experienced during the audit.
27/02/2019
Gouda Progress Report:
A report on the Gouda outstanding municipal debt matter should be
submitted at the next quarterly Audit Committee meeting.
Progress on TASK:
The TASK report indicating funded priority positions that must be filled be
submitted at the next quarterly Audit Committee meeting.
Auditor General Management Report 2017/18 and Final Audit Report:
The Annual Financial Statements 2018/19 will be submitted to the Audit
Committee for review on 15 August 2019; and
The Annual Financial Statements 2018/19 will be submitted to the Auditor
General by 12:00 on 31 August 2019.
Internal Audit Charter:
The Audit Committee approved the Internal Audit Charter.
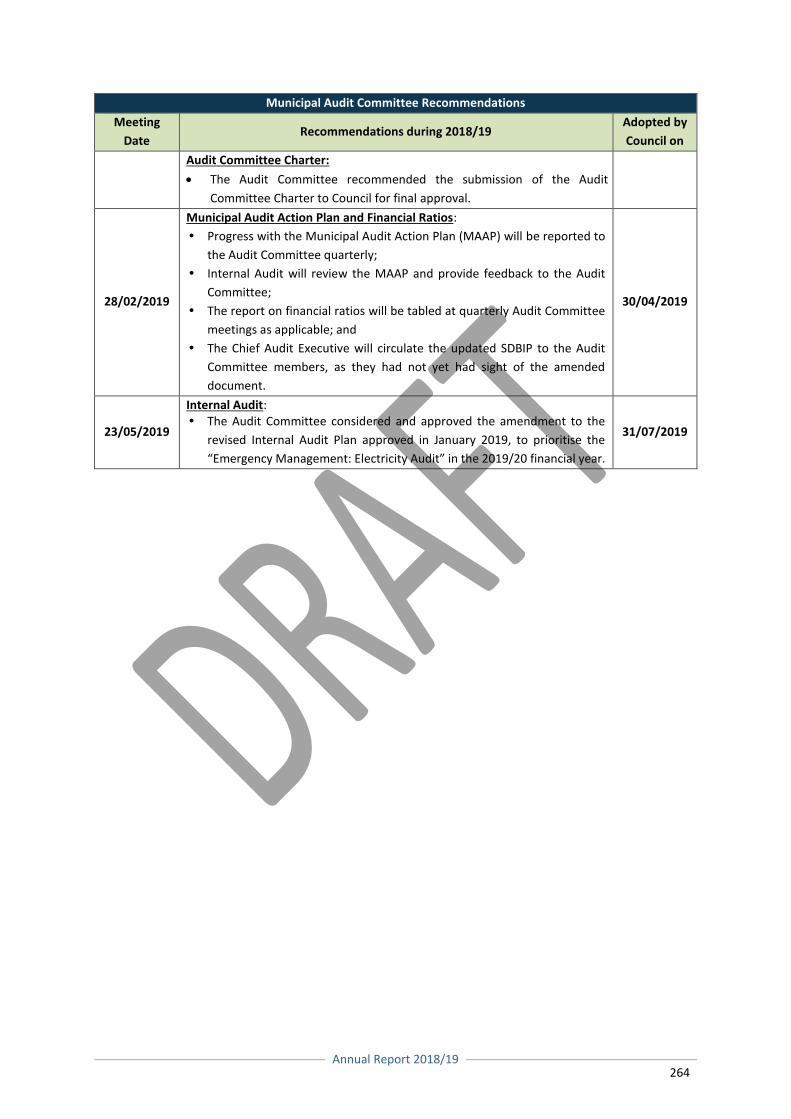
Annual Report 2018/19
264
Municipal Audit Committee Recommendations
Meeting
Date Recommendations during 2018/19
Adopted by
Council on
Audit Committee Charter:
The Audit Committee recommended the submission of the Audit
Committee Charter to Council for final approval.
28/02/2019
Municipal Audit Action Plan and Financial Ratios:
Progress with the Municipal Audit Action Plan (MAAP) will be reported to
the Audit Committee quarterly;
Internal Audit will review the MAAP and provide feedback to the Audit
Committee;
The report on financial ratios will be tabled at quarterly Audit Committee
meetings as applicable; and
The Chief Audit Executive will circulate the updated SDBIP to the Audit
Committee members, as they had not yet had sight of the amended
document.
30/04/2019
23/05/2019
Internal Audit: The Audit Committee considered and approved the amendment to the
revised Internal Audit Plan approved in January 2019, to prioritise the
“Emergency Management: Electricity Audit” in the 2019/20 financial year.
31/07/2019
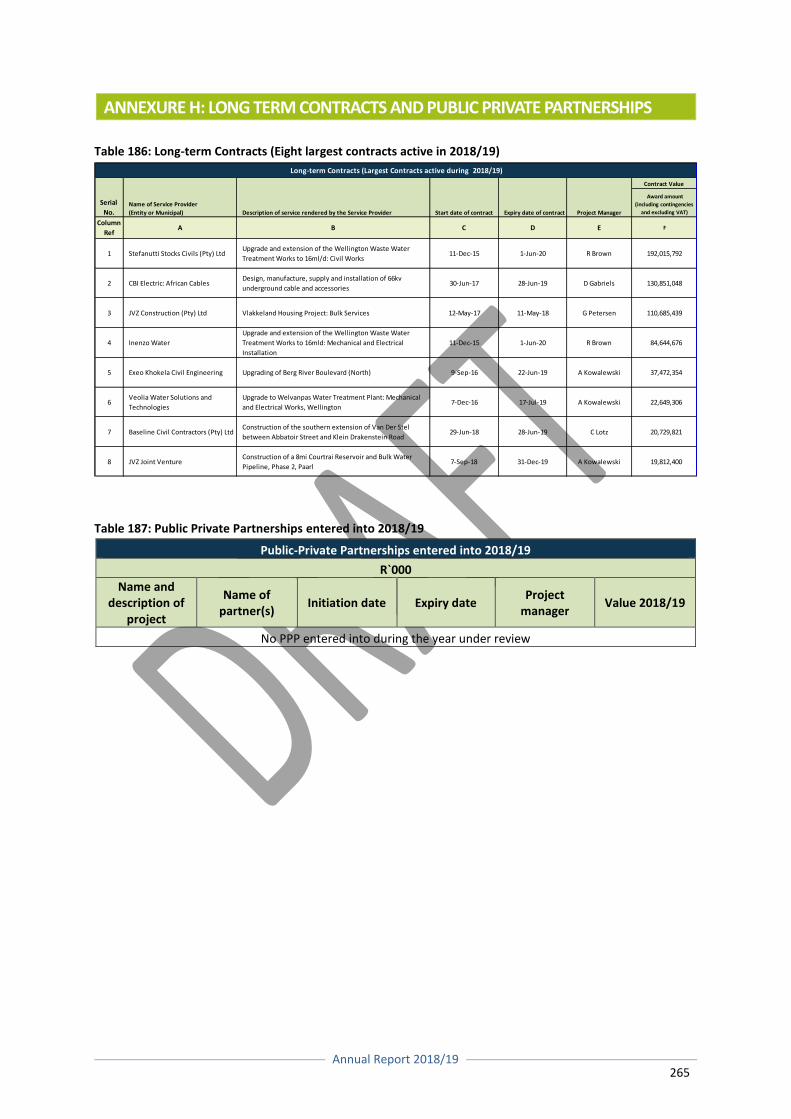
Annual Report 2018/19
265
ANNEXURE H: LONG TERM CONTRACTS AND PUBLIC PRIVATE PARTNERSHIPS
Table 186: Long-term Contracts (Eight largest contracts active in 2018/19)
Table 187: Public Private Partnerships entered into 2018/19
Public-Private Partnerships entered into 2018/19
R`000
Name and description of
project
Name of partner(s)
Initiation date Expiry date Project
manager Value 2018/19
No PPP entered into during the year under review
Contract Value
Award amount
(including contingencies
and excluding VAT)
Column
RefA B C D E F
1 Stefanutti Stocks Civils (Pty) LtdUpgrade and extension of the Wellington Waste Water
Treatment Works to 16ml/d: Civil Works11-Dec-15 1-Jun-20 R Brown 192,015,792
2 CBI Electric: African CablesDesign, manufacture, supply and installation of 66kv
underground cable and accessories30-Jun-17 28-Jun-19 D Gabriels 130,851,048
3 JVZ Construction (Pty) Ltd Vlakkeland Housing Project: Bulk Services 12-May-17 11-May-18 G Petersen 110,685,439
4 Inenzo Water
Upgrade and extension of the Wellington Waste Water
Treatment Works to 16mld: Mechanical and Electrical
Installation
11-Dec-15 1-Jun-20 R Brown 84,644,676
5 Exeo Khokela Civil Engineering Upgrading of Berg River Boulevard (North) 9-Sep-16 22-Jun-19 A Kowalewski 37,472,354
6Veolia Water Solutions and
Technologies
Upgrade to Welvanpas Water Treatment Plant: Mechanical
and Electrical Works, Wellington7-Dec-16 17-Jul-19 A Kowalewski 22,649,306
7 Baseline Civil Contractors (Pty) LtdConstruction of the southern extension of Van Der Stel
between Abbatoir Street and Klein Drakenstein Road29-Jun-18 28-Jun-19 C Lotz 20,729,821
8 JVZ Joint VentureConstruction of a 8mi Courtrai Reservoir and Bulk Water
Pipeline, Phase 2, Paarl7-Sep-18 31-Dec-19 A Kowalewski 19,812,400
Long-term Contracts (Largest Contracts active during 2018/19)
Description of service rendered by the Service Provider Start date of contract Expiry date of contract Project Manager
Name of Service Provider
(Entity or Municipal)
Serial
No.
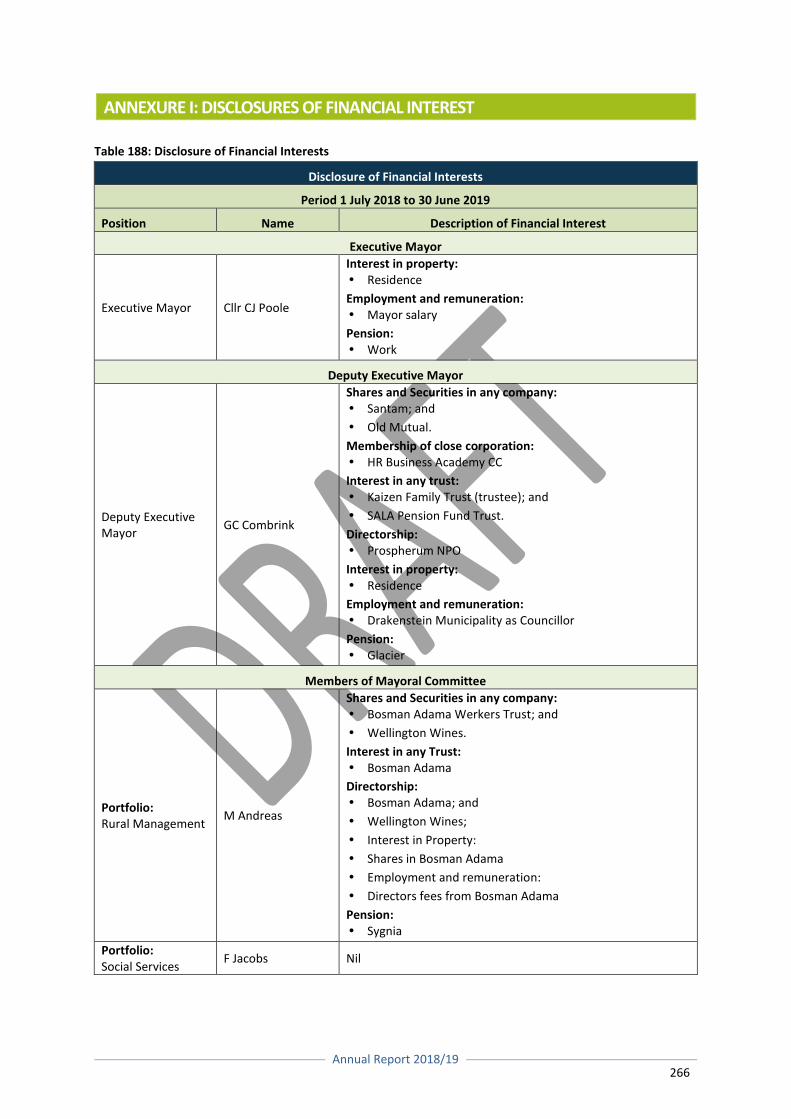
Annual Report 2018/19
266
ANNEXURE I: DISCLOSURES OF FINANCIAL INTEREST
Table 188: Disclosure of Financial Interests
Disclosure of Financial Interests
Period 1 July 2018 to 30 June 2019
Position Name Description of Financial Interest
Executive Mayor
Executive Mayor Cllr CJ Poole
Interest in property: Residence
Employment and remuneration: Mayor salary
Pension: Work
Deputy Executive Mayor
Deputy Executive Mayor
GC Combrink
Shares and Securities in any company: Santam; and
Old Mutual.
Membership of close corporation: HR Business Academy CC
Interest in any trust: Kaizen Family Trust (trustee); and
SALA Pension Fund Trust.
Directorship: Prospherum NPO
Interest in property: Residence
Employment and remuneration: Drakenstein Municipality as Councillor
Pension: Glacier
Members of Mayoral Committee
Portfolio: Rural Management
M Andreas
Shares and Securities in any company: Bosman Adama Werkers Trust; and
Wellington Wines.
Interest in any Trust: Bosman Adama
Directorship: Bosman Adama; and
Wellington Wines;
Interest in Property:
Shares in Bosman Adama
Employment and remuneration:
Directors fees from Bosman Adama
Pension: Sygnia
Portfolio: Social Services
F Jacobs Nil
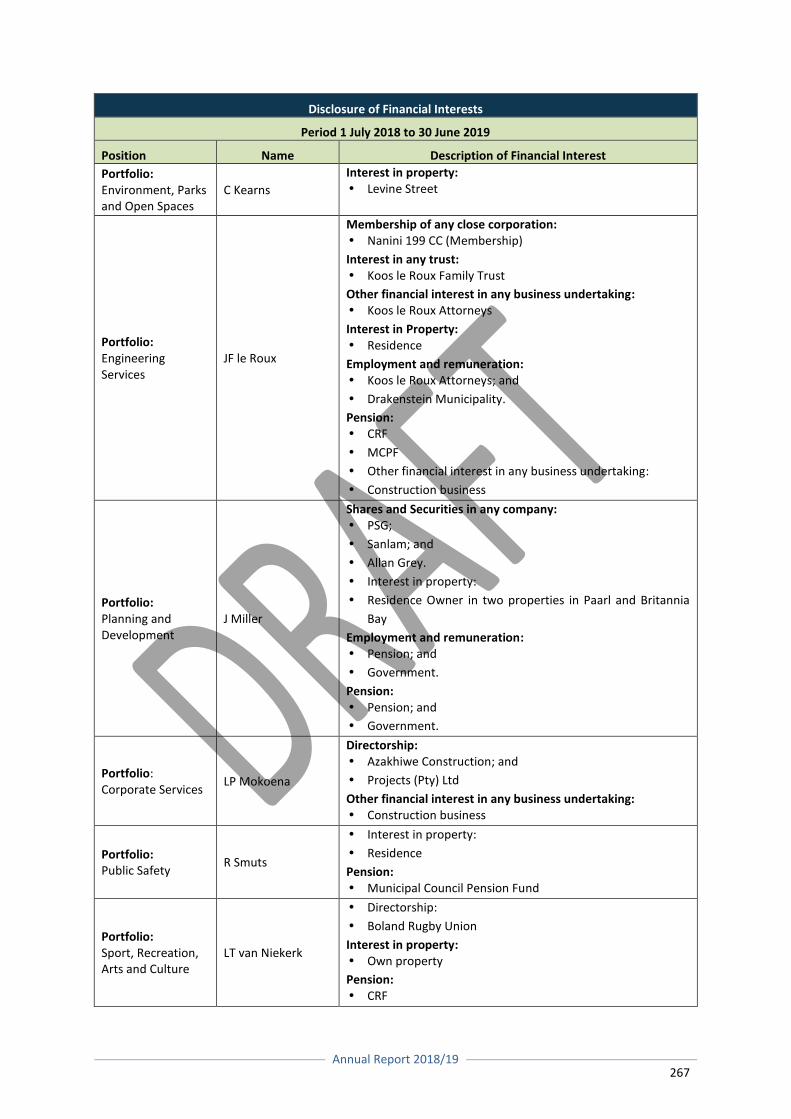
Annual Report 2018/19
267
Disclosure of Financial Interests
Period 1 July 2018 to 30 June 2019
Position Name Description of Financial Interest
Portfolio: Environment, Parks and Open Spaces
C Kearns
Interest in property: Levine Street
Portfolio: Engineering Services
JF le Roux
Membership of any close corporation: Nanini 199 CC (Membership)
Interest in any trust: Koos le Roux Family Trust
Other financial interest in any business undertaking: Koos le Roux Attorneys
Interest in Property: Residence
Employment and remuneration: Koos le Roux Attorneys; and
Drakenstein Municipality.
Pension: CRF
MCPF
Other financial interest in any business undertaking:
Construction business
Portfolio: Planning and Development
J Miller
Shares and Securities in any company: PSG;
Sanlam; and
Allan Grey.
Interest in property:
Residence Owner in two properties in Paarl and Britannia
Bay
Employment and remuneration: Pension; and
Government.
Pension: Pension; and
Government.
Portfolio: Corporate Services
LP Mokoena
Directorship: Azakhiwe Construction; and
Projects (Pty) Ltd
Other financial interest in any business undertaking: Construction business
Portfolio: Public Safety
R Smuts
Interest in property:
Residence
Pension: Municipal Council Pension Fund
Portfolio: Sport, Recreation, Arts and Culture
LT van Niekerk
Directorship:
Boland Rugby Union
Interest in property: Own property
Pension: CRF
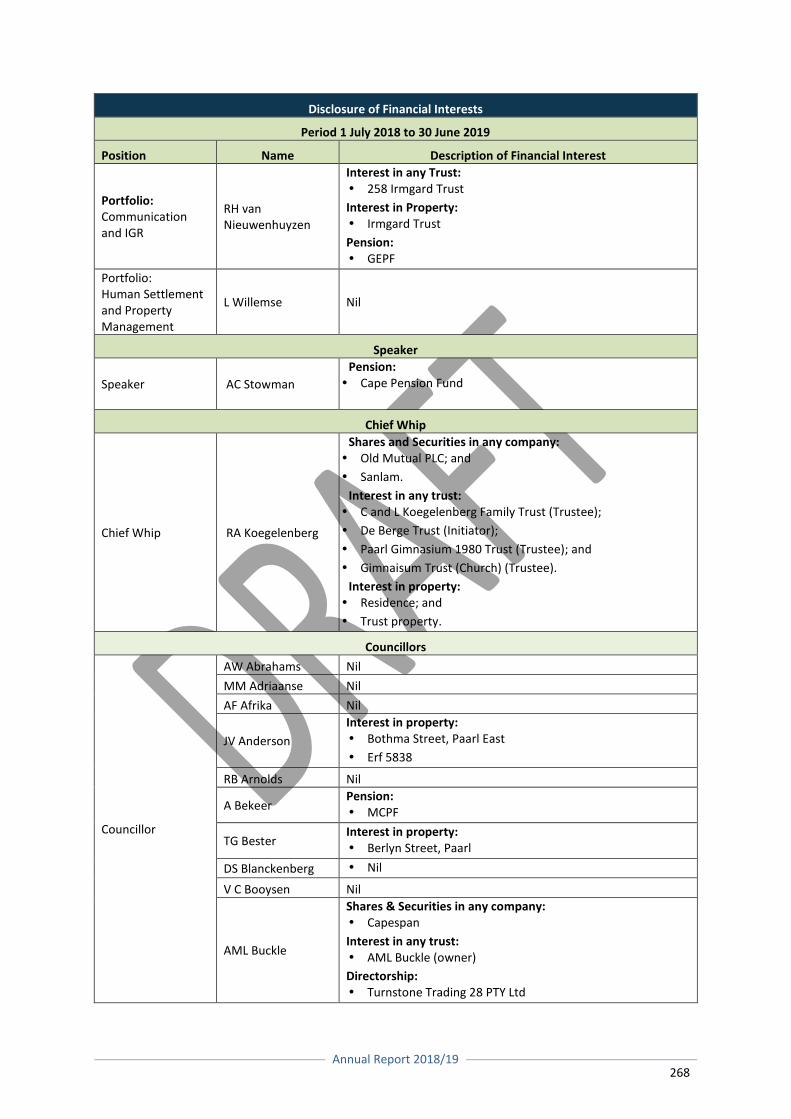
Annual Report 2018/19
268
Disclosure of Financial Interests
Period 1 July 2018 to 30 June 2019
Position Name Description of Financial Interest
Portfolio: Communication and IGR
RH van Nieuwenhuyzen
Interest in any Trust: 258 Irmgard Trust
Interest in Property: Irmgard Trust
Pension: GEPF
Portfolio: Human Settlement and Property Management
L Willemse Nil
Speaker
Speaker AC Stowman
Pension: Cape Pension Fund
Chief Whip
Chief Whip RA Koegelenberg
Shares and Securities in any company: Old Mutual PLC; and
Sanlam.
Interest in any trust: C and L Koegelenberg Family Trust (Trustee);
De Berge Trust (Initiator);
Paarl Gimnasium 1980 Trust (Trustee); and
Gimnaisum Trust (Church) (Trustee).
Interest in property: Residence; and
Trust property.
Councillors
Councillor
AW Abrahams Nil
MM Adriaanse Nil
AF Afrika Nil
JV Anderson
Interest in property: Bothma Street, Paarl East
Erf 5838
RB Arnolds Nil
A Bekeer Pension: MCPF
TG Bester Interest in property: Berlyn Street, Paarl
DS Blanckenberg Nil
V C Booysen Nil
AML Buckle
Shares & Securities in any company: Capespan
Interest in any trust: AML Buckle (owner)
Directorship: Turnstone Trading 28 PTY Ltd
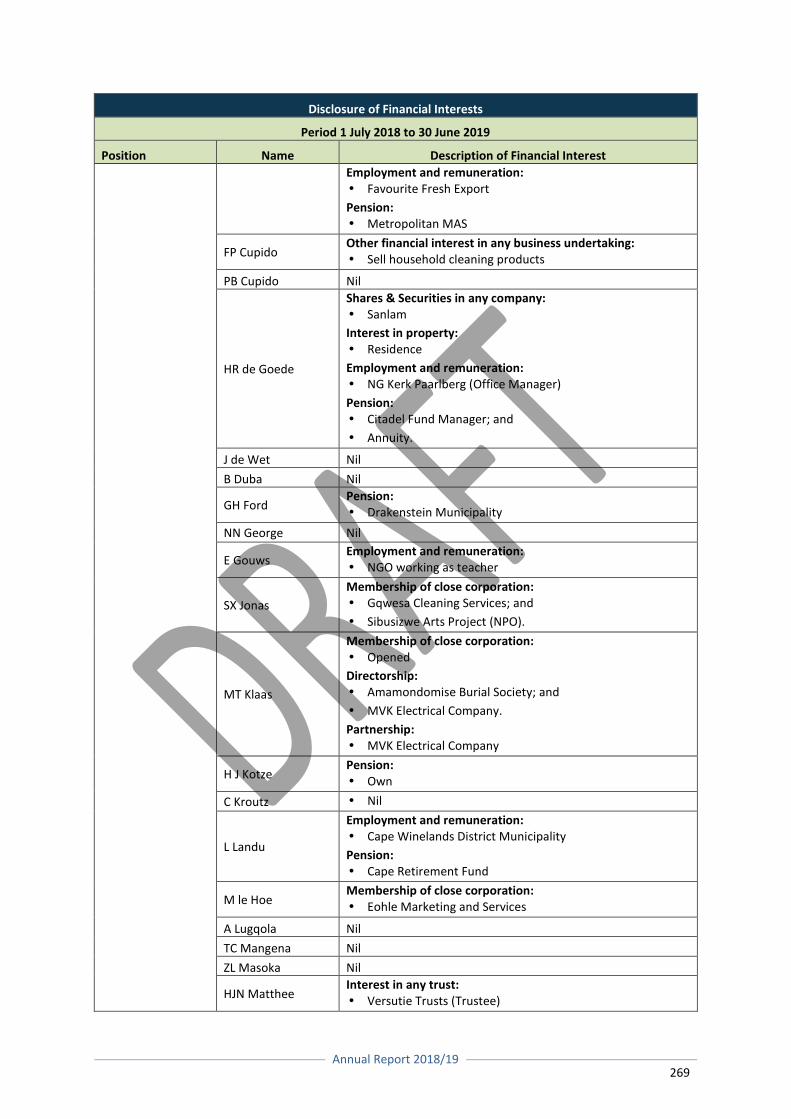
Annual Report 2018/19
269
Disclosure of Financial Interests
Period 1 July 2018 to 30 June 2019
Position Name Description of Financial Interest
Employment and remuneration: Favourite Fresh Export
Pension: Metropolitan MAS
FP Cupido Other financial interest in any business undertaking: Sell household cleaning products
PB Cupido Nil
HR de Goede
Shares & Securities in any company: Sanlam
Interest in property: Residence
Employment and remuneration: NG Kerk Paarlberg (Office Manager)
Pension: Citadel Fund Manager; and
Annuity.
J de Wet Nil
B Duba Nil
GH Ford Pension: Drakenstein Municipality
NN George Nil
E Gouws Employment and remuneration: NGO working as teacher
SX Jonas
Membership of close corporation: Gqwesa Cleaning Services; and
Sibusizwe Arts Project (NPO).
MT Klaas
Membership of close corporation: Opened
Directorship: Amamondomise Burial Society; and
MVK Electrical Company.
Partnership: MVK Electrical Company
H J Kotze Pension: Own
C Kroutz Nil
L Landu
Employment and remuneration: Cape Winelands District Municipality
Pension: Cape Retirement Fund
M le Hoe Membership of close corporation: Eohle Marketing and Services
A Lugqola Nil
TC Mangena Nil
ZL Masoka Nil
HJN Matthee Interest in any trust: Versutie Trusts (Trustee)
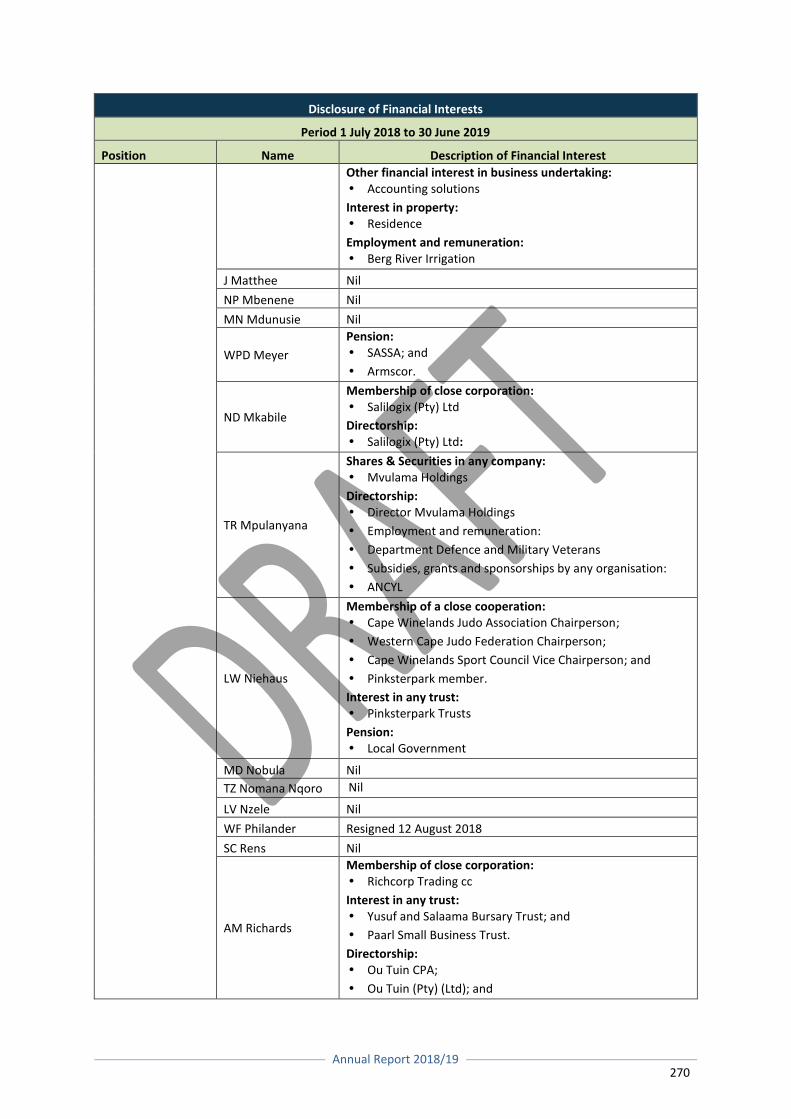
Annual Report 2018/19
270
Disclosure of Financial Interests
Period 1 July 2018 to 30 June 2019
Position Name Description of Financial Interest
Other financial interest in business undertaking: Accounting solutions
Interest in property: Residence
Employment and remuneration: Berg River Irrigation
J Matthee Nil
NP Mbenene Nil
MN Mdunusie Nil
WPD Meyer
Pension: SASSA; and
Armscor.
ND Mkabile
Membership of close corporation: Salilogix (Pty) Ltd
Directorship: Salilogix (Pty) Ltd:
TR Mpulanyana
Shares & Securities in any company: Mvulama Holdings
Directorship: Director Mvulama Holdings
Employment and remuneration:
Department Defence and Military Veterans
Subsidies, grants and sponsorships by any organisation:
ANCYL
LW Niehaus
Membership of a close cooperation: Cape Winelands Judo Association Chairperson;
Western Cape Judo Federation Chairperson;
Cape Winelands Sport Council Vice Chairperson; and
Pinksterpark member.
Interest in any trust: Pinksterpark Trusts
Pension: Local Government
MD Nobula Nil
TZ Nomana Nqoro Nil
LV Nzele Nil
WF Philander Resigned 12 August 2018
SC Rens Nil
AM Richards
Membership of close corporation: Richcorp Trading cc
Interest in any trust: Yusuf and Salaama Bursary Trust; and
Paarl Small Business Trust.
Directorship: Ou Tuin CPA;
Ou Tuin (Pty) (Ltd); and
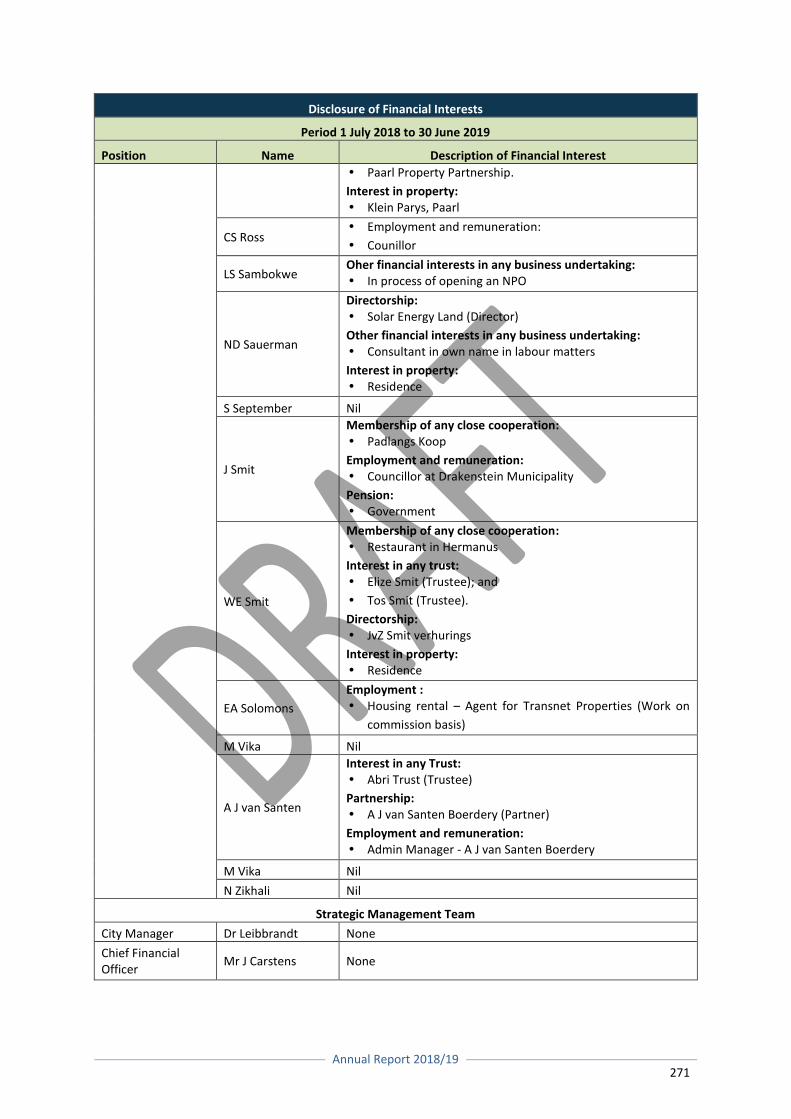
Annual Report 2018/19
271
Disclosure of Financial Interests
Period 1 July 2018 to 30 June 2019
Position Name Description of Financial Interest
Paarl Property Partnership.
Interest in property: Klein Parys, Paarl
CS Ross Employment and remuneration:
Counillor
LS Sambokwe Oher financial interests in any business undertaking: In process of opening an NPO
ND Sauerman
Directorship: Solar Energy Land (Director)
Other financial interests in any business undertaking: Consultant in own name in labour matters
Interest in property: Residence
S September Nil
J Smit
Membership of any close cooperation: Padlangs Koop
Employment and remuneration: Councillor at Drakenstein Municipality
Pension: Government
WE Smit
Membership of any close cooperation: Restaurant in Hermanus
Interest in any trust: Elize Smit (Trustee); and
Tos Smit (Trustee).
Directorship: JvZ Smit verhurings
Interest in property: Residence
EA Solomons
Employment : Housing rental – Agent for Transnet Properties (Work on
commission basis)
M Vika Nil
A J van Santen
Interest in any Trust: Abri Trust (Trustee)
Partnership: A J van Santen Boerdery (Partner)
Employment and remuneration: Admin Manager - A J van Santen Boerdery
M Vika Nil
N Zikhali Nil
Strategic Management Team
City Manager Dr Leibbrandt None
Chief Financial Officer
Mr J Carstens None

Annual Report 2018/19
272
Disclosure of Financial Interests
Period 1 July 2018 to 30 June 2019
Position Name Description of Financial Interest
Executive Director: Corporate Services
Mr S Johaar None
Executive Director: Planning and Development
Ms L Waring None
Executive Director: Community Services
Mr G Boshoff None
Executive Director: Community Services
Mr G Esau None
Executive Director: Engineering Services
Mr D Hattingh
Founder and beneficiary of Capensis Trust;
A trustee of Winelands Village Home Owners Association;
A trustee of Fremco Trust; and
A friend to Grant Mackintosh who is a founder of Emanti
Management.
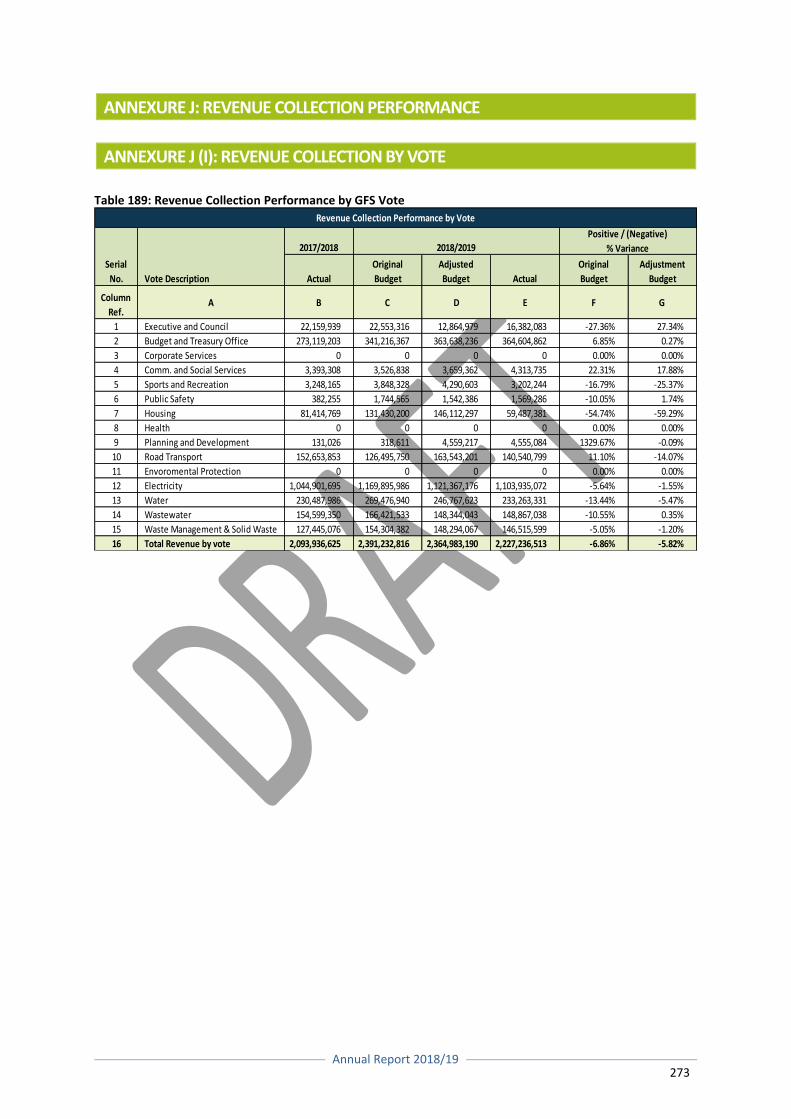
Annual Report 2018/19
273
ANNEXURE J: REVENUE COLLECTION PERFORMANCE
ANNEXURE J (I): REVENUE COLLECTION BY VOTE Table 189: Revenue Collection Performance by GFS Vote
2017/2018
Actual
Original
Budget
Adjusted
Budget Actual
Original
Budget
Adjustment
Budget
Column
Ref.A B C D E F G
1 Executive and Council 22,159,939 22,553,316 12,864,979 16,382,083 -27.36% 27.34%
2 Budget and Treasury Office 273,119,203 341,216,367 363,638,236 364,604,862 6.85% 0.27%
3 Corporate Services 0 0 0 0 0.00% 0.00%
4 Comm. and Social Services 3,393,308 3,526,838 3,659,362 4,313,735 22.31% 17.88%
5 Sports and Recreation 3,248,165 3,848,328 4,290,603 3,202,244 -16.79% -25.37%
6 Public Safety 382,255 1,744,565 1,542,386 1,569,286 -10.05% 1.74%
7 Housing 81,414,769 131,430,200 146,112,297 59,487,381 -54.74% -59.29%
8 Health 0 0 0 0 0.00% 0.00%
9 Planning and Development 131,026 318,611 4,559,217 4,555,084 1329.67% -0.09%
10 Road Transport 152,653,853 126,495,750 163,543,201 140,540,799 11.10% -14.07%
11 Envoromental Protection 0 0 0 0 0.00% 0.00%
12 Electricity 1,044,901,695 1,169,895,986 1,121,367,176 1,103,935,072 -5.64% -1.55%
13 Water 230,487,986 269,476,940 246,767,623 233,263,331 -13.44% -5.47%
14 Wastewater 154,599,350 166,421,533 148,344,043 148,867,038 -10.55% 0.35%
15 Waste Management & Solid Waste 127,445,076 154,304,382 148,294,067 146,515,599 -5.05% -1.20%
16 Total Revenue by vote 2,093,936,625 2,391,232,816 2,364,983,190 2,227,236,513 -6.86% -5.82%
Serial
No. Vote Description
Revenue Collection Performance by Vote
2018/2019
Positive / (Negative)
% Variance
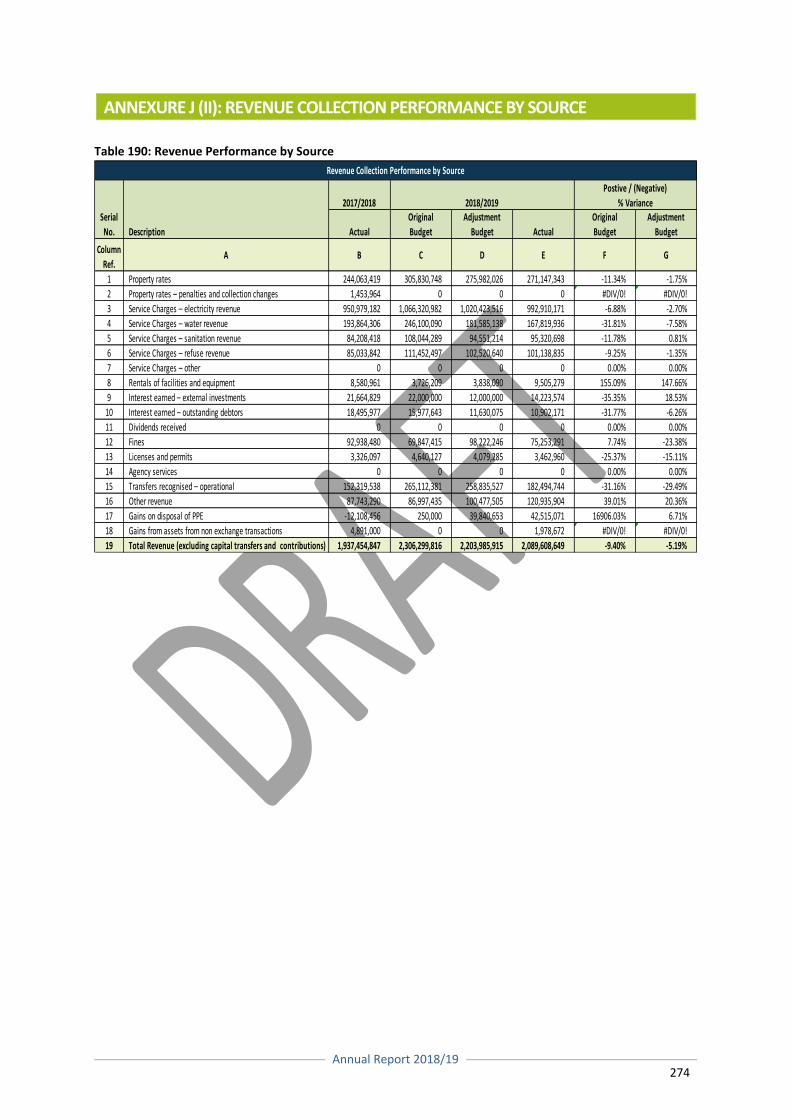
Annual Report 2018/19
274
ANNEXURE J (II): REVENUE COLLECTION PERFORMANCE BY SOURCE
Table 190: Revenue Performance by Source
2017/2018
Actual
Original
Budget
Adjustment
Budget Actual
Original
Budget
Adjustment
Budget
Column
Ref.A B C D E F G
1 Property rates 244,063,419 305,830,748 275,982,026 271,147,343 -11.34% -1.75%
2 Property rates – penalties and collection changes 1,453,964 0 0 0 #DIV/0! #DIV/0!
3 Service Charges – electricity revenue 950,979,182 1,066,320,982 1,020,423,516 992,910,171 -6.88% -2.70%
4 Service Charges – water revenue 193,864,306 246,100,090 181,585,138 167,819,936 -31.81% -7.58%
5 Service Charges – sanitation revenue 84,208,418 108,044,289 94,551,214 95,320,698 -11.78% 0.81%
6 Service Charges – refuse revenue 85,033,842 111,452,497 102,520,640 101,138,835 -9.25% -1.35%
7 Service Charges – other 0 0 0 0 0.00% 0.00%
8 Rentals of facilities and equipment 8,580,961 3,726,209 3,838,090 9,505,279 155.09% 147.66%
9 Interest earned – external investments 21,664,829 22,000,000 12,000,000 14,223,574 -35.35% 18.53%
10 Interest earned – outstanding debtors 18,495,977 15,977,643 11,630,075 10,902,171 -31.77% -6.26%
11 Dividends received 0 0 0 0 0.00% 0.00%
12 Fines 92,938,480 69,847,415 98,222,246 75,253,291 7.74% -23.38%
13 Licenses and permits 3,326,097 4,640,127 4,079,285 3,462,960 -25.37% -15.11%
14 Agency services 0 0 0 0 0.00% 0.00%
15 Transfers recognised – operational 152,319,538 265,112,381 258,835,527 182,494,744 -31.16% -29.49%
16 Other revenue 87,743,290 86,997,435 100,477,505 120,935,904 39.01% 20.36%
17 Gains on disposal of PPE -12,108,456 250,000 39,840,653 42,515,071 16906.03% 6.71%
18 Gains from assets from non exchange transactions 4,891,000 0 0 1,978,672 #DIV/0! #DIV/0!
19 Total Revenue (excluding capital transfers and contributions) 1,937,454,847 2,306,299,816 2,203,985,915 2,089,608,649 -9.40% -5.19%
2018/2019
Postive / (Negative)
% VarianceSerial
No. Description
Revenue Collection Performance by Source
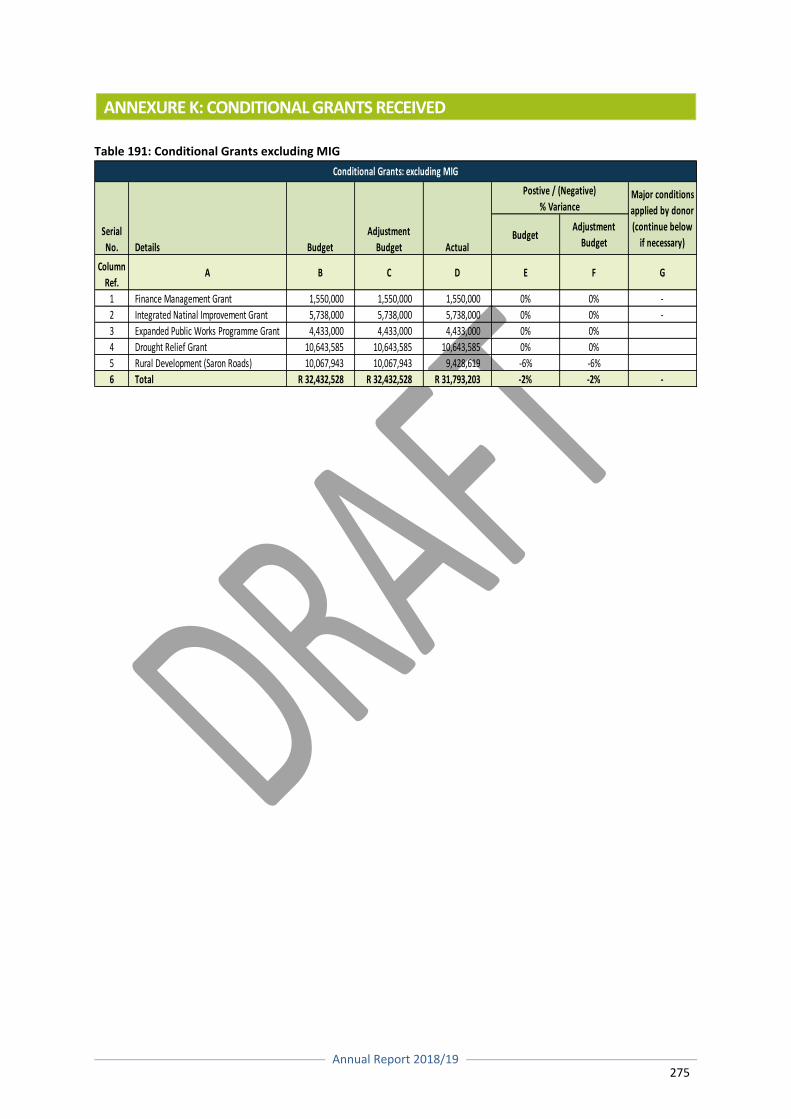
Annual Report 2018/19
275
ANNEXURE K: CONDITIONAL GRANTS RECEIVED
Table 191: Conditional Grants excluding MIG
BudgetAdjustment
Budget
Column
Ref.A B C D E F G
1 Finance Management Grant 1,550,000 1,550,000 1,550,000 0% 0% -
2 Integrated Natinal Improvement Grant 5,738,000 5,738,000 5,738,000 0% 0% -
3 Expanded Public Works Programme Grant 4,433,000 4,433,000 4,433,000 0% 0%
4 Drought Relief Grant 10,643,585 10,643,585 10,643,585 0% 0%
5 Rural Development (Saron Roads) 10,067,943 10,067,943 9,428,619 -6% -6%
6 Total R 32,432,528 R 32,432,528 R 31,793,203 -2% -2% -
Major conditions
applied by donor
(continue below
if necessary)
Conditional Grants: excluding MIG
Serial
No. Details Budget
Adjustment
Budget Actual
Postive / (Negative)
% Variance
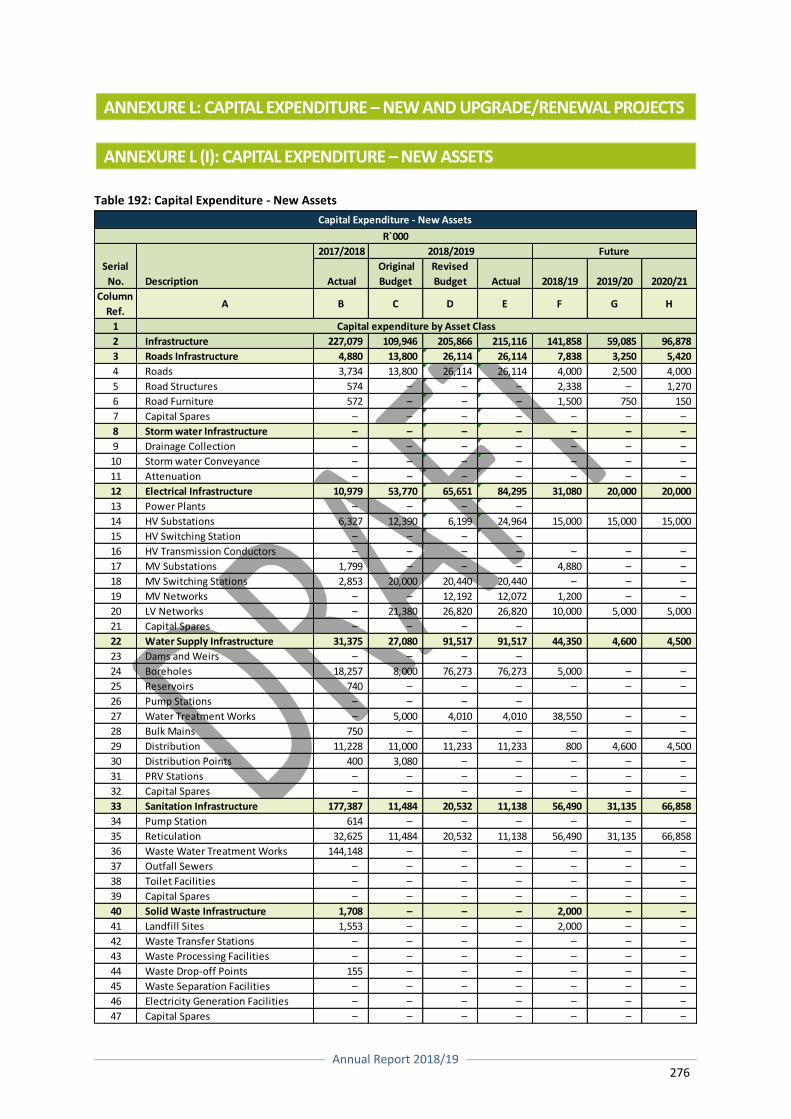
Annual Report 2018/19
276
ANNEXURE L: CAPITAL EXPENDITURE – NEW AND UPGRADE/RENEWAL PROJECTS
ANNEXURE L (I): CAPITAL EXPENDITURE – NEW ASSETS Table 192: Capital Expenditure - New Assets
2017/2018
Actual
Original
Budget
Revised
Budget Actual 2018/19 2019/20 2020/21
Column
Ref.A B C D E F G H
1
2 Infrastructure 227,079 109,946 205,866 215,116 141,858 59,085 96,878
3 Roads Infrastructure 4,880 13,800 26,114 26,114 7,838 3,250 5,420
4 Roads 3,734 13,800 26,114 26,114 4,000 2,500 4,000
5 Road Structures 574 – – – 2,338 – 1,270
6 Road Furniture 572 – – – 1,500 750 150
7 Capital Spares – – – – – – –
8 Storm water Infrastructure – – – – – – –
9 Drainage Collection – – – – – – –
10 Storm water Conveyance – – – – – – –
11 Attenuation – – – – – – –
12 Electrical Infrastructure 10,979 53,770 65,651 84,295 31,080 20,000 20,000
13 Power Plants – – – –
14 HV Substations 6,327 12,390 6,199 24,964 15,000 15,000 15,000
15 HV Switching Station – – – –
16 HV Transmission Conductors – – – – – – –
17 MV Substations 1,799 – – – 4,880 – –
18 MV Switching Stations 2,853 20,000 20,440 20,440 – – –
19 MV Networks – – 12,192 12,072 1,200 – –
20 LV Networks – 21,380 26,820 26,820 10,000 5,000 5,000
21 Capital Spares – – – –
22 Water Supply Infrastructure 31,375 27,080 91,517 91,517 44,350 4,600 4,500
23 Dams and Weirs – – – –
24 Boreholes 18,257 8,000 76,273 76,273 5,000 – –
25 Reservoirs 740 – – – – – –
26 Pump Stations – – – –
27 Water Treatment Works – 5,000 4,010 4,010 38,550 – –
28 Bulk Mains 750 – – – – – –
29 Distribution 11,228 11,000 11,233 11,233 800 4,600 4,500
30 Distribution Points 400 3,080 – – – – –
31 PRV Stations – – – – – – –
32 Capital Spares – – – – – – –
33 Sanitation Infrastructure 177,387 11,484 20,532 11,138 56,490 31,135 66,858
34 Pump Station 614 – – – – – –
35 Reticulation 32,625 11,484 20,532 11,138 56,490 31,135 66,858
36 Waste Water Treatment Works 144,148 – – – – – –
37 Outfall Sewers – – – – – – –
38 Toilet Facilities – – – – – – –
39 Capital Spares – – – – – – –
40 Solid Waste Infrastructure 1,708 – – – 2,000 – –
41 Landfill Sites 1,553 – – – 2,000 – –
42 Waste Transfer Stations – – – – – – –
43 Waste Processing Facilities – – – – – – –
44 Waste Drop-off Points 155 – – – – – –
45 Waste Separation Facilities – – – – – – –
46 Electricity Generation Facilities – – – – – – –
47 Capital Spares – – – – – – –
Serial
No.
Capital Expenditure - New Assets
R`000
Capital expenditure by Asset Class
Description
2018/2019 Future
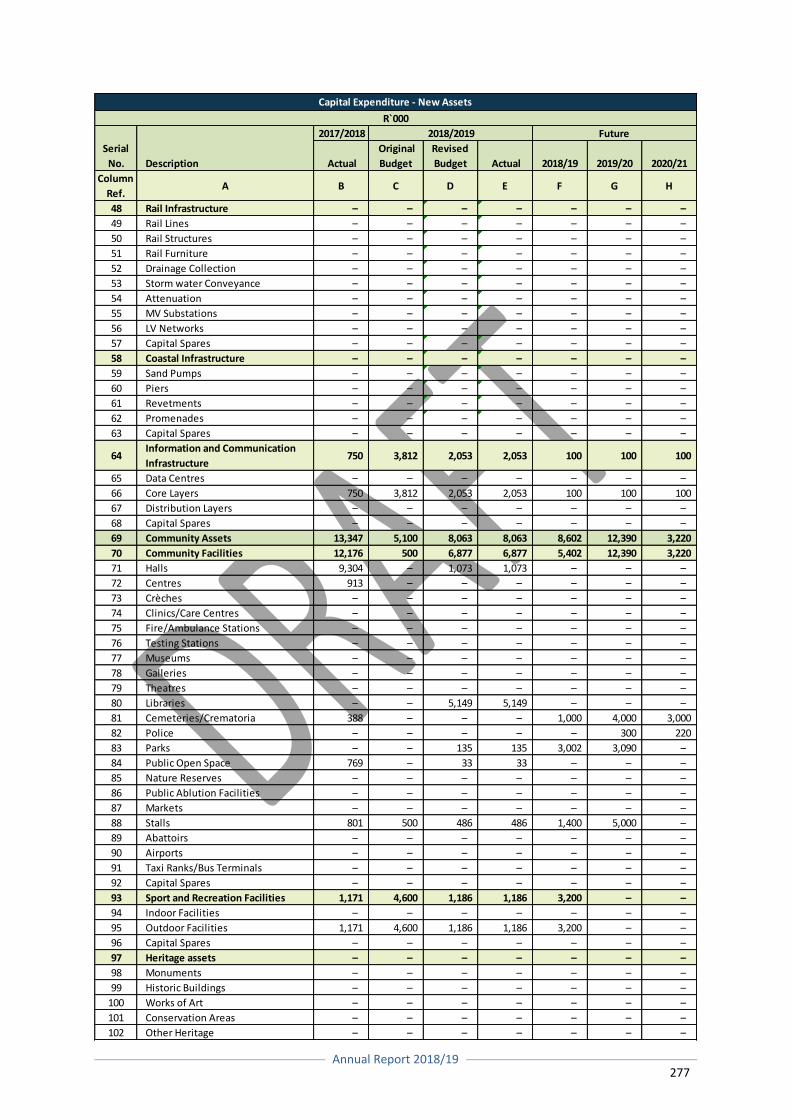
Annual Report 2018/19
277
2017/2018
Actual
Original
Budget
Revised
Budget Actual 2018/19 2019/20 2020/21
Column
Ref.A B C D E F G H
48 Rail Infrastructure – – – – – – –
49 Rail Lines – – – – – – –
50 Rail Structures – – – – – – –
51 Rail Furniture – – – – – – –
52 Drainage Collection – – – – – – –
53 Storm water Conveyance – – – – – – –
54 Attenuation – – – – – – –
55 MV Substations – – – – – – –
56 LV Networks – – – – – – –
57 Capital Spares – – – – – – –
58 Coastal Infrastructure – – – – – – –
59 Sand Pumps – – – – – – –
60 Piers – – – – – – –
61 Revetments – – – – – – –
62 Promenades – – – – – – –
63 Capital Spares – – – – – – –
64Information and Communication
Infrastructure750 3,812 2,053 2,053 100 100 100
65 Data Centres – – – – – – –
66 Core Layers 750 3,812 2,053 2,053 100 100 100
67 Distribution Layers – – – – – – –
68 Capital Spares – – – – – – –
69 Community Assets 13,347 5,100 8,063 8,063 8,602 12,390 3,220
70 Community Facilities 12,176 500 6,877 6,877 5,402 12,390 3,220
71 Halls 9,304 – 1,073 1,073 – – –
72 Centres 913 – – – – – –
73 Crèches – – – – – – –
74 Clinics/Care Centres – – – – – – –
75 Fire/Ambulance Stations – – – – – – –
76 Testing Stations – – – – – – –
77 Museums – – – – – – –
78 Galleries – – – – – – –
79 Theatres – – – – – – –
80 Libraries – – 5,149 5,149 – – –
81 Cemeteries/Crematoria 388 – – – 1,000 4,000 3,000
82 Police – – – – – 300 220
83 Parks – – 135 135 3,002 3,090 –
84 Public Open Space 769 – 33 33 – – –
85 Nature Reserves – – – – – – –
86 Public Ablution Facilities – – – – – – –
87 Markets – – – – – – –
88 Stalls 801 500 486 486 1,400 5,000 –
89 Abattoirs – – – – – – –
90 Airports – – – – – – –
91 Taxi Ranks/Bus Terminals – – – – – – –
92 Capital Spares – – – – – – –
93 Sport and Recreation Facilities 1,171 4,600 1,186 1,186 3,200 – –
94 Indoor Facilities – – – – – – –
95 Outdoor Facilities 1,171 4,600 1,186 1,186 3,200 – –
96 Capital Spares – – – – – – –
97 Heritage assets – – – – – – –
98 Monuments – – – – – – –
99 Historic Buildings – – – – – – –
100 Works of Art – – – – – – –
101 Conservation Areas – – – – – – –
102 Other Heritage – – – – – – –
Serial
No.
Capital Expenditure - New Assets
R`000
Description
2018/2019 Future
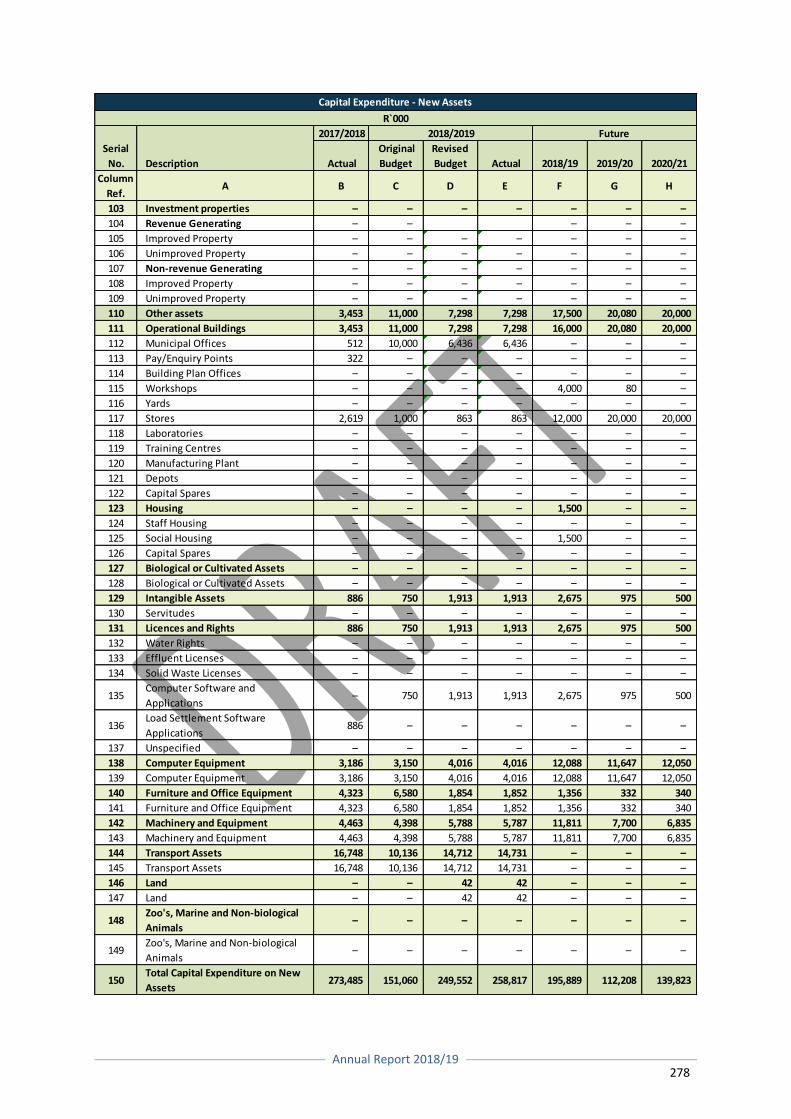
Annual Report 2018/19
278
2017/2018
Actual
Original
Budget
Revised
Budget Actual 2018/19 2019/20 2020/21
Column
Ref.A B C D E F G H
103 Investment properties – – – – – – –
104 Revenue Generating – – – – –
105 Improved Property – – – – – – –
106 Unimproved Property – – – – – – –
107 Non-revenue Generating – – – – – – –
108 Improved Property – – – – – – –
109 Unimproved Property – – – – – – –
110 Other assets 3,453 11,000 7,298 7,298 17,500 20,080 20,000
111 Operational Buildings 3,453 11,000 7,298 7,298 16,000 20,080 20,000
112 Municipal Offices 512 10,000 6,436 6,436 – – –
113 Pay/Enquiry Points 322 – – – – – –
114 Building Plan Offices – – – – – – –
115 Workshops – – – – 4,000 80 –
116 Yards – – – – – – –
117 Stores 2,619 1,000 863 863 12,000 20,000 20,000
118 Laboratories – – – – – – –
119 Training Centres – – – – – – –
120 Manufacturing Plant – – – – – – –
121 Depots – – – – – – –
122 Capital Spares – – – – – – –
123 Housing – – – – 1,500 – –
124 Staff Housing – – – – – – –
125 Social Housing – – – – 1,500 – –
126 Capital Spares – – – – – – –
127 Biological or Cultivated Assets – – – – – – –
128 Biological or Cultivated Assets – – – – – – –
129 Intangible Assets 886 750 1,913 1,913 2,675 975 500
130 Servitudes – – – – – – –
131 Licences and Rights 886 750 1,913 1,913 2,675 975 500
132 Water Rights – – – – – – –
133 Effluent Licenses – – – – – – –
134 Solid Waste Licenses – – – – – – –
135Computer Software and
Applications– 750 1,913 1,913 2,675 975 500
136Load Settlement Software
Applications886 – – – – – –
137 Unspecified – – – – – – –
138 Computer Equipment 3,186 3,150 4,016 4,016 12,088 11,647 12,050
139 Computer Equipment 3,186 3,150 4,016 4,016 12,088 11,647 12,050
140 Furniture and Office Equipment 4,323 6,580 1,854 1,852 1,356 332 340
141 Furniture and Office Equipment 4,323 6,580 1,854 1,852 1,356 332 340
142 Machinery and Equipment 4,463 4,398 5,788 5,787 11,811 7,700 6,835
143 Machinery and Equipment 4,463 4,398 5,788 5,787 11,811 7,700 6,835
144 Transport Assets 16,748 10,136 14,712 14,731 – – –
145 Transport Assets 16,748 10,136 14,712 14,731 – – –
146 Land – – 42 42 – – –
147 Land – – 42 42 – – –
148Zoo's, Marine and Non-biological
Animals– – – – – – –
149Zoo's, Marine and Non-biological
Animals– – – – – – –
150Total Capital Expenditure on New
Assets273,485 151,060 249,552 258,817 195,889 112,208 139,823
Serial
No.
Capital Expenditure - New Assets
R`000
Description
2018/2019 Future
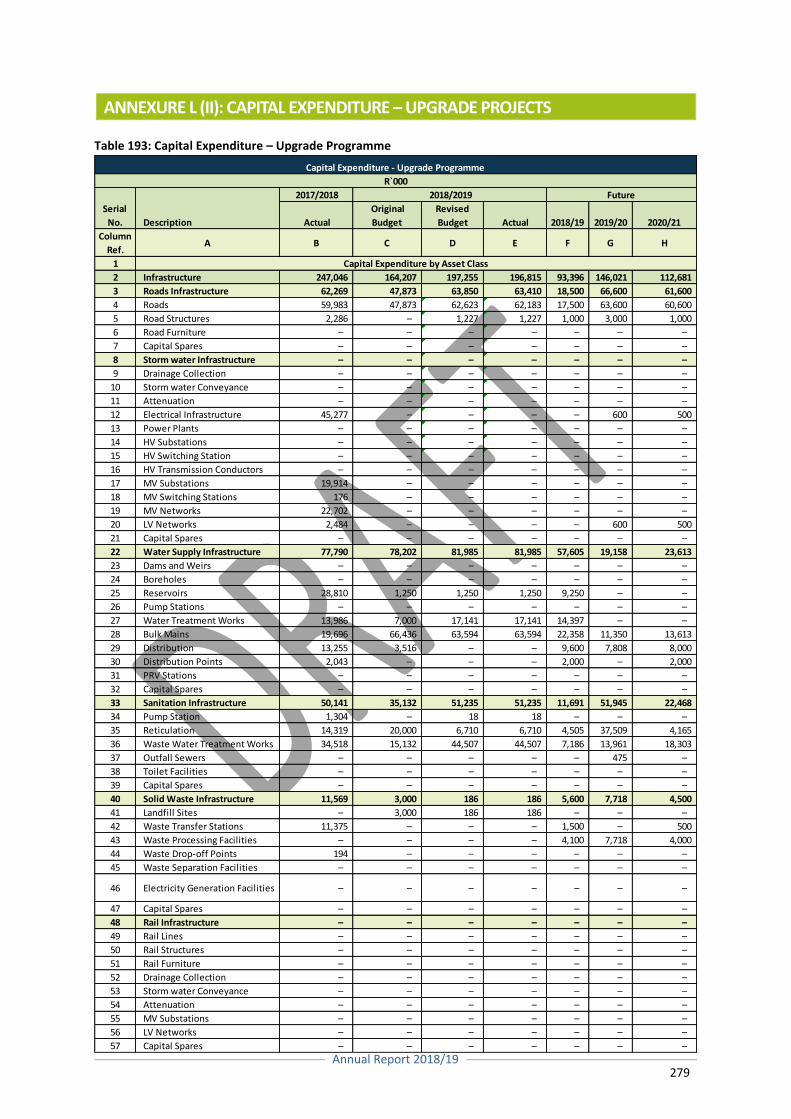
Annual Report 2018/19
279
ANNEXURE L (II): CAPITAL EXPENDITURE – UPGRADE PROJECTS
Table 193: Capital Expenditure – Upgrade Programme
2017/2018
Actual
Original
Budget
Revised
Budget Actual 2018/19 2019/20 2020/21
Column
Ref.A B C D E F G H
1
2 Infrastructure 247,046 164,207 197,255 196,815 93,396 146,021 112,681
3 Roads Infrastructure 62,269 47,873 63,850 63,410 18,500 66,600 61,600
4 Roads 59,983 47,873 62,623 62,183 17,500 63,600 60,600
5 Road Structures 2,286 – 1,227 1,227 1,000 3,000 1,000
6 Road Furniture – – – – – – –
7 Capital Spares – – – – – – –
8 Storm water Infrastructure – – – – – – –
9 Drainage Collection – – – – – – –
10 Storm water Conveyance – – – – – – –
11 Attenuation – – – – – – –
12 Electrical Infrastructure 45,277 – – – – 600 500
13 Power Plants – – – – – – –
14 HV Substations – – – – – – –
15 HV Switching Station – – – – – – –
16 HV Transmission Conductors – – – – – – –
17 MV Substations 19,914 – – – – – –
18 MV Switching Stations 176 – – – – – –
19 MV Networks 22,702 – – – – – –
20 LV Networks 2,484 – – – – 600 500
21 Capital Spares – – – – – – –
22 Water Supply Infrastructure 77,790 78,202 81,985 81,985 57,605 19,158 23,613
23 Dams and Weirs – – – – – – –
24 Boreholes – – – – – – –
25 Reservoirs 28,810 1,250 1,250 1,250 9,250 – –
26 Pump Stations – – – – – – –
27 Water Treatment Works 13,986 7,000 17,141 17,141 14,397 – –
28 Bulk Mains 19,696 66,436 63,594 63,594 22,358 11,350 13,613
29 Distribution 13,255 3,516 – – 9,600 7,808 8,000
30 Distribution Points 2,043 – – – 2,000 – 2,000
31 PRV Stations – – – – – – –
32 Capital Spares – – – – – – –
33 Sanitation Infrastructure 50,141 35,132 51,235 51,235 11,691 51,945 22,468
34 Pump Station 1,304 – 18 18 – – –
35 Reticulation 14,319 20,000 6,710 6,710 4,505 37,509 4,165
36 Waste Water Treatment Works 34,518 15,132 44,507 44,507 7,186 13,961 18,303
37 Outfall Sewers – – – – – 475 –
38 Toilet Facilities – – – – – – –
39 Capital Spares – – – – – – –
40 Solid Waste Infrastructure 11,569 3,000 186 186 5,600 7,718 4,500
41 Landfill Sites – 3,000 186 186 – – –
42 Waste Transfer Stations 11,375 – – – 1,500 – 500
43 Waste Processing Facilities – – – – 4,100 7,718 4,000
44 Waste Drop-off Points 194 – – – – – –
45 Waste Separation Facilities – – – – – – –
46 Electricity Generation Facilities – – – – – – –
47 Capital Spares – – – – – – –
48 Rail Infrastructure – – – – – – –
49 Rail Lines – – – – – – –
50 Rail Structures – – – – – – –
51 Rail Furniture – – – – – – –
52 Drainage Collection – – – – – – –
53 Storm water Conveyance – – – – – – –
54 Attenuation – – – – – – –
55 MV Substations – – – – – – –
56 LV Networks – – – – – – –
57 Capital Spares – – – – – – –
Serial
No.
Capital Expenditure - Upgrade Programme
R`000
Capital Expenditure by Asset Class
Description
2018/2019 Future
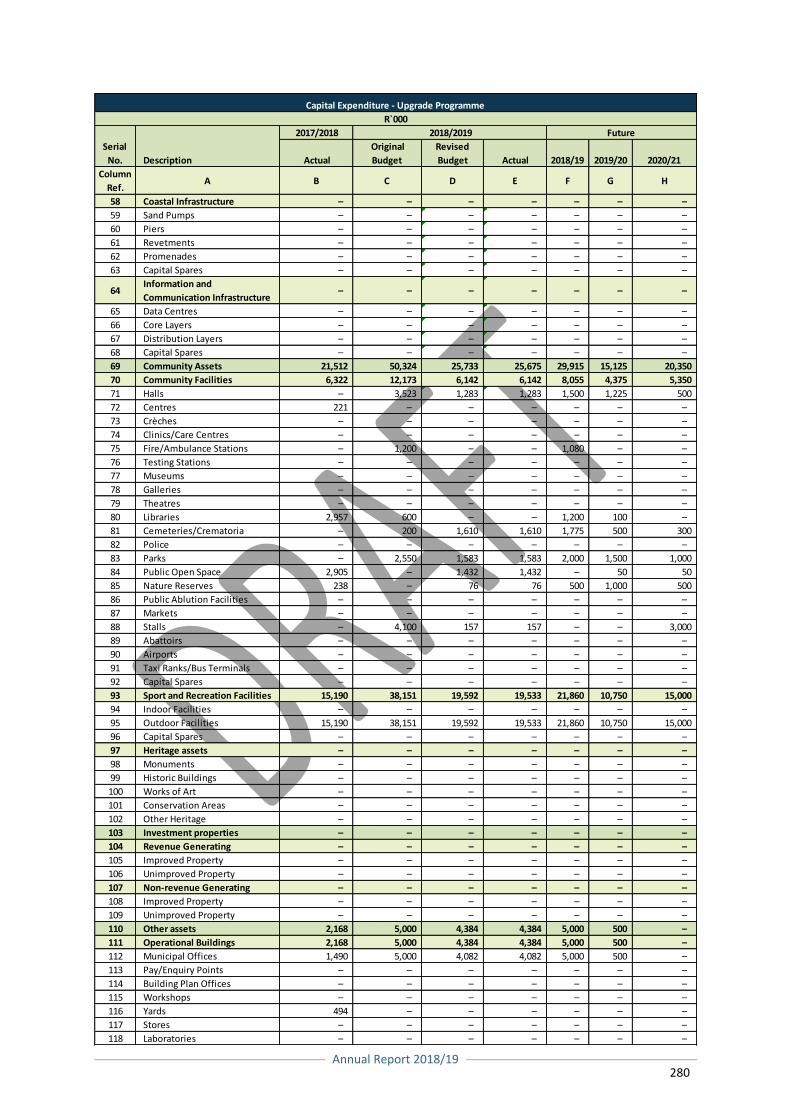
Annual Report 2018/19
280
2017/2018
Actual
Original
Budget
Revised
Budget Actual 2018/19 2019/20 2020/21
Column
Ref.A B C D E F G H
58 Coastal Infrastructure – – – – – – –
59 Sand Pumps – – – – – – –
60 Piers – – – – – – –
61 Revetments – – – – – – –
62 Promenades – – – – – – –
63 Capital Spares – – – – – – –
64Information and
Communication Infrastructure– – – – – – –
65 Data Centres – – – – – – –
66 Core Layers – – – – – – –
67 Distribution Layers – – – – – – –
68 Capital Spares – – – – – – –
69 Community Assets 21,512 50,324 25,733 25,675 29,915 15,125 20,350
70 Community Facilities 6,322 12,173 6,142 6,142 8,055 4,375 5,350
71 Halls – 3,523 1,283 1,283 1,500 1,225 500
72 Centres 221 – – – – – –
73 Crèches – – – – – – –
74 Clinics/Care Centres – – – – – – –
75 Fire/Ambulance Stations – 1,200 – – 1,080 – –
76 Testing Stations – – – – – – –
77 Museums – – – – – – –
78 Galleries – – – – – – –
79 Theatres – – – – – – –
80 Libraries 2,957 600 – – 1,200 100 –
81 Cemeteries/Crematoria – 200 1,610 1,610 1,775 500 300
82 Police – – – – – – –
83 Parks – 2,550 1,583 1,583 2,000 1,500 1,000
84 Public Open Space 2,905 – 1,432 1,432 – 50 50
85 Nature Reserves 238 – 76 76 500 1,000 500
86 Public Ablution Facilities – – – – – – –
87 Markets – – – – – – –
88 Stalls – 4,100 157 157 – – 3,000
89 Abattoirs – – – – – – –
90 Airports – – – – – – –
91 Taxi Ranks/Bus Terminals – – – – – – –
92 Capital Spares – – – – – – –
93 Sport and Recreation Facilities 15,190 38,151 19,592 19,533 21,860 10,750 15,000
94 Indoor Facilities – – – – – – –
95 Outdoor Facilities 15,190 38,151 19,592 19,533 21,860 10,750 15,000
96 Capital Spares – – – – – – –
97 Heritage assets – – – – – – –
98 Monuments – – – – – – –
99 Historic Buildings – – – – – – –
100 Works of Art – – – – – – –
101 Conservation Areas – – – – – – –
102 Other Heritage – – – – – – –
103 Investment properties – – – – – – –
104 Revenue Generating – – – – – – –
105 Improved Property – – – – – – –
106 Unimproved Property – – – – – – –
107 Non-revenue Generating – – – – – – –
108 Improved Property – – – – – – –
109 Unimproved Property – – – – – – –
110 Other assets 2,168 5,000 4,384 4,384 5,000 500 –
111 Operational Buildings 2,168 5,000 4,384 4,384 5,000 500 –
112 Municipal Offices 1,490 5,000 4,082 4,082 5,000 500 –
113 Pay/Enquiry Points – – – – – – –
114 Building Plan Offices – – – – – – –
115 Workshops – – – – – – –
116 Yards 494 – – – – – –
117 Stores – – – – – – –
118 Laboratories – – – – – – –
Serial
No.
Capital Expenditure - Upgrade Programme
R`000
Description
2018/2019 Future
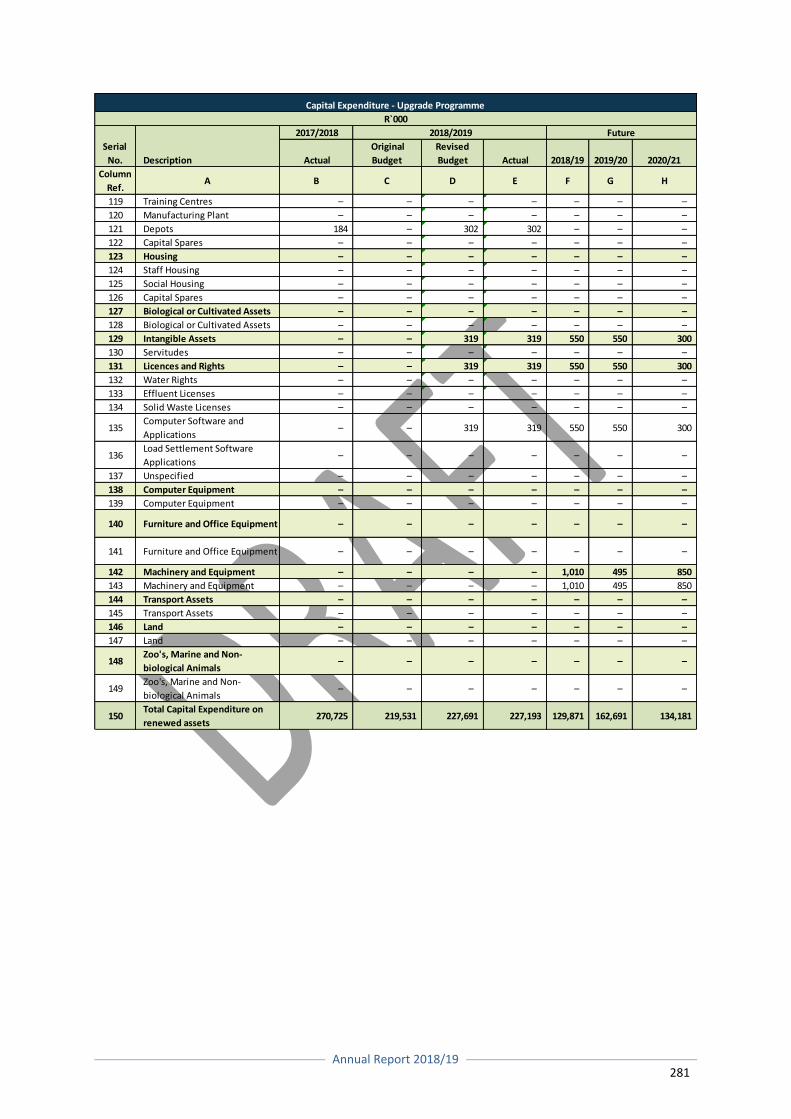
Annual Report 2018/19
281
2017/2018
Actual
Original
Budget
Revised
Budget Actual 2018/19 2019/20 2020/21
Column
Ref.A B C D E F G H
119 Training Centres – – – – – – –
120 Manufacturing Plant – – – – – – –
121 Depots 184 – 302 302 – – –
122 Capital Spares – – – – – – –
123 Housing – – – – – – –
124 Staff Housing – – – – – – –
125 Social Housing – – – – – – –
126 Capital Spares – – – – – – –
127 Biological or Cultivated Assets – – – – – – –
128 Biological or Cultivated Assets – – – – – – –
129 Intangible Assets – – 319 319 550 550 300
130 Servitudes – – – – – – –
131 Licences and Rights – – 319 319 550 550 300
132 Water Rights – – – – – – –
133 Effluent Licenses – – – – – – –
134 Solid Waste Licenses – – – – – – –
135Computer Software and
Applications– – 319 319 550 550 300
136Load Settlement Software
Applications– – – – – – –
137 Unspecified – – – – – – –
138 Computer Equipment – – – – – – –
139 Computer Equipment – – – – – – –
140 Furniture and Office Equipment – – – – – – –
141 Furniture and Office Equipment – – – – – – –
142 Machinery and Equipment – – – – 1,010 495 850
143 Machinery and Equipment – – – – 1,010 495 850
144 Transport Assets – – – – – – –
145 Transport Assets – – – – – – –
146 Land – – – – – – –
147 Land – – – – – – –
148Zoo's, Marine and Non-
biological Animals– – – – – – –
149Zoo's, Marine and Non-
biological Animals– – – – – – –
150Total Capital Expenditure on
renewed assets270,725 219,531 227,691 227,193 129,871 162,691 134,181
Serial
No.
Capital Expenditure - Upgrade Programme
R`000
Description
2018/2019 Future
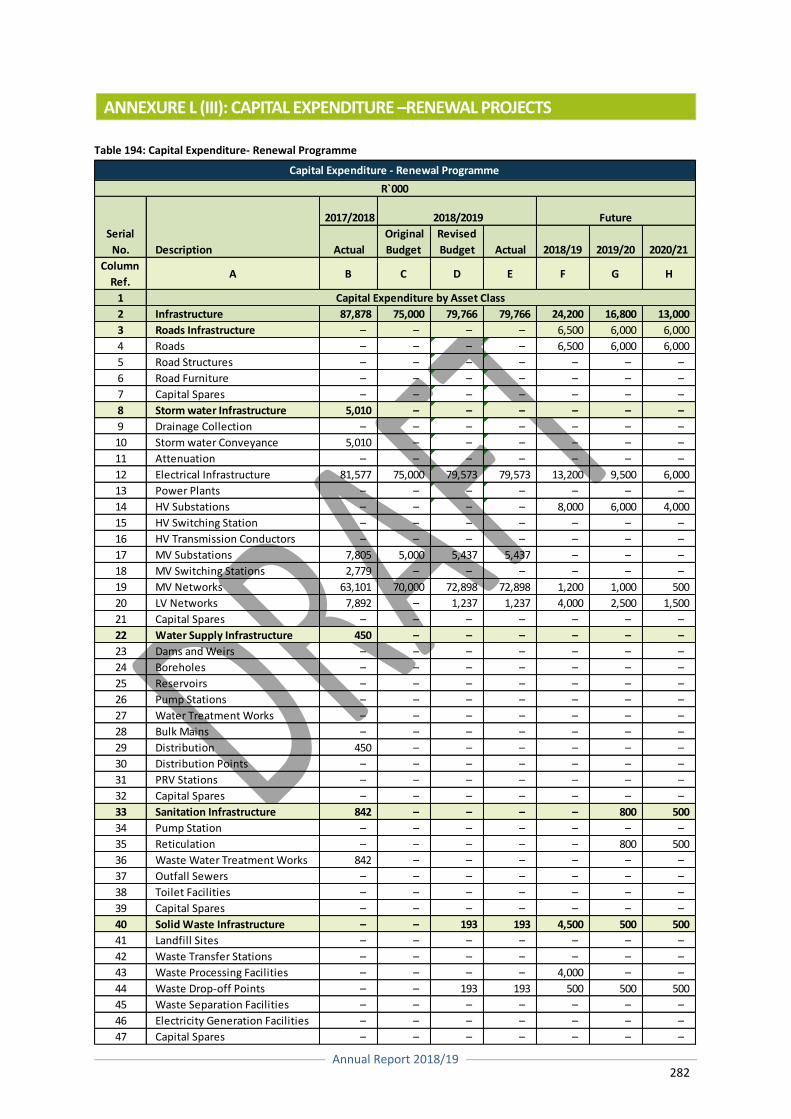
Annual Report 2018/19
282
ANNEXURE L (III): CAPITAL EXPENDITURE –RENEWAL PROJECTS Table 194: Capital Expenditure- Renewal Programme
2017/2018
Actual
Original
Budget
Revised
Budget Actual 2018/19 2019/20 2020/21
Column
Ref.A B C D E F G H
1
2 Infrastructure 87,878 75,000 79,766 79,766 24,200 16,800 13,000
3 Roads Infrastructure – – – – 6,500 6,000 6,000
4 Roads – – – – 6,500 6,000 6,000
5 Road Structures – – – – – – –
6 Road Furniture – – – – – – –
7 Capital Spares – – – – – – –
8 Storm water Infrastructure 5,010 – – – – – –
9 Drainage Collection – – – – – – –
10 Storm water Conveyance 5,010 – – – – – –
11 Attenuation – – – – – – –
12 Electrical Infrastructure 81,577 75,000 79,573 79,573 13,200 9,500 6,000
13 Power Plants – – – – – – –
14 HV Substations – – – – 8,000 6,000 4,000
15 HV Switching Station – – – – – – –
16 HV Transmission Conductors – – – – – – –
17 MV Substations 7,805 5,000 5,437 5,437 – – –
18 MV Switching Stations 2,779 – – – – – –
19 MV Networks 63,101 70,000 72,898 72,898 1,200 1,000 500
20 LV Networks 7,892 – 1,237 1,237 4,000 2,500 1,500
21 Capital Spares – – – – – – –
22 Water Supply Infrastructure 450 – – – – – –
23 Dams and Weirs – – – – – – –
24 Boreholes – – – – – – –
25 Reservoirs – – – – – – –
26 Pump Stations – – – – – – –
27 Water Treatment Works – – – – – – –
28 Bulk Mains – – – – – – –
29 Distribution 450 – – – – – –
30 Distribution Points – – – – – – –
31 PRV Stations – – – – – – –
32 Capital Spares – – – – – – –
33 Sanitation Infrastructure 842 – – – – 800 500
34 Pump Station – – – – – – –
35 Reticulation – – – – – 800 500
36 Waste Water Treatment Works 842 – – – – – –
37 Outfall Sewers – – – – – – –
38 Toilet Facilities – – – – – – –
39 Capital Spares – – – – – – –
40 Solid Waste Infrastructure – – 193 193 4,500 500 500
41 Landfill Sites – – – – – – –
42 Waste Transfer Stations – – – – – – –
43 Waste Processing Facilities – – – – 4,000 – –
44 Waste Drop-off Points – – 193 193 500 500 500
45 Waste Separation Facilities – – – – – – –
46 Electricity Generation Facilities – – – – – – –
47 Capital Spares – – – – – – –
Serial
No.
Capital Expenditure - Renewal Programme
R`000
Capital Expenditure by Asset Class
Description
2018/2019 Future
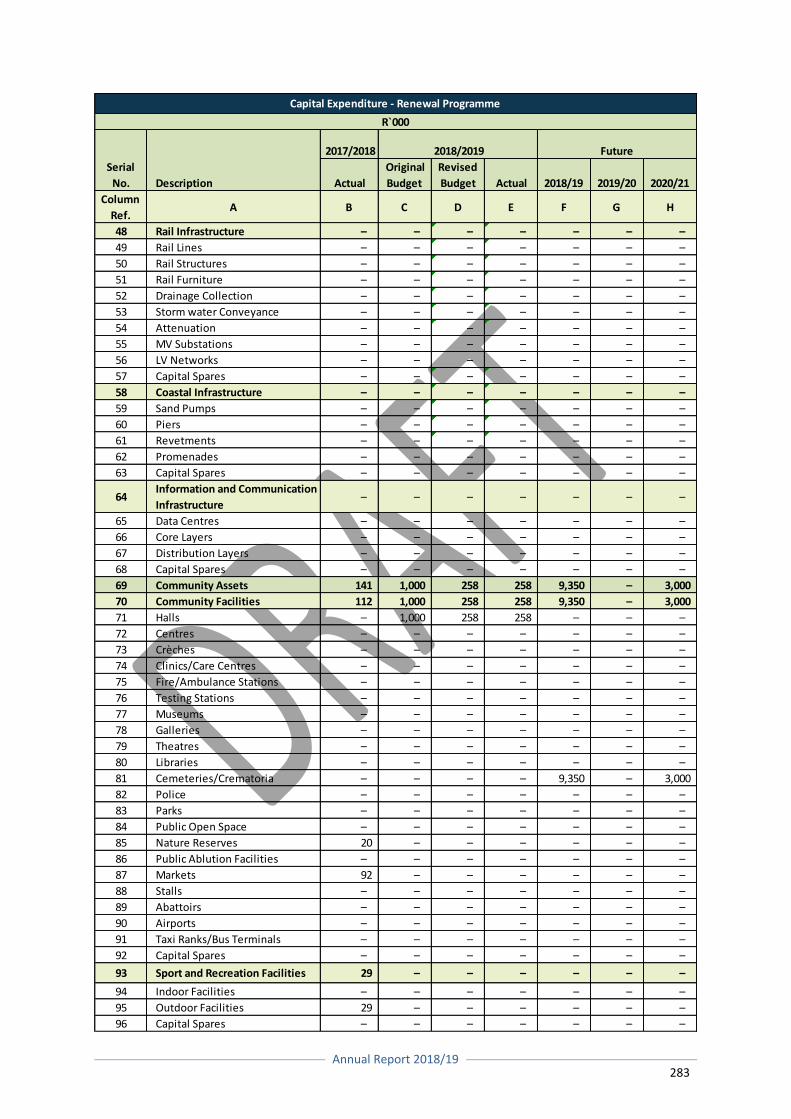
Annual Report 2018/19
283
2017/2018
Actual
Original
Budget
Revised
Budget Actual 2018/19 2019/20 2020/21
Column
Ref.A B C D E F G H
48 Rail Infrastructure – – – – – – –
49 Rail Lines – – – – – – –
50 Rail Structures – – – – – – –
51 Rail Furniture – – – – – – –
52 Drainage Collection – – – – – – –
53 Storm water Conveyance – – – – – – –
54 Attenuation – – – – – – –
55 MV Substations – – – – – – –
56 LV Networks – – – – – – –
57 Capital Spares – – – – – – –
58 Coastal Infrastructure – – – – – – –
59 Sand Pumps – – – – – – –
60 Piers – – – – – – –
61 Revetments – – – – – – –
62 Promenades – – – – – – –
63 Capital Spares – – – – – – –
64Information and Communication
Infrastructure– – – – – – –
65 Data Centres – – – – – – –
66 Core Layers – – – – – – –
67 Distribution Layers – – – – – – –
68 Capital Spares – – – – – – –
69 Community Assets 141 1,000 258 258 9,350 – 3,000
70 Community Facilities 112 1,000 258 258 9,350 – 3,000
71 Halls – 1,000 258 258 – – –
72 Centres – – – – – – –
73 Crèches – – – – – – –
74 Clinics/Care Centres – – – – – – –
75 Fire/Ambulance Stations – – – – – – –
76 Testing Stations – – – – – – –
77 Museums – – – – – – –
78 Galleries – – – – – – –
79 Theatres – – – – – – –
80 Libraries – – – – – – –
81 Cemeteries/Crematoria – – – – 9,350 – 3,000
82 Police – – – – – – –
83 Parks – – – – – – –
84 Public Open Space – – – – – – –
85 Nature Reserves 20 – – – – – –
86 Public Ablution Facilities – – – – – – –
87 Markets 92 – – – – – –
88 Stalls – – – – – – –
89 Abattoirs – – – – – – –
90 Airports – – – – – – –
91 Taxi Ranks/Bus Terminals – – – – – – –
92 Capital Spares – – – – – – –
93 Sport and Recreation Facilities 29 – – – – – –
94 Indoor Facilities – – – – – – –
95 Outdoor Facilities 29 – – – – – –
96 Capital Spares – – – – – – –
Serial
No.
Capital Expenditure - Renewal Programme
R`000
Description
2018/2019 Future
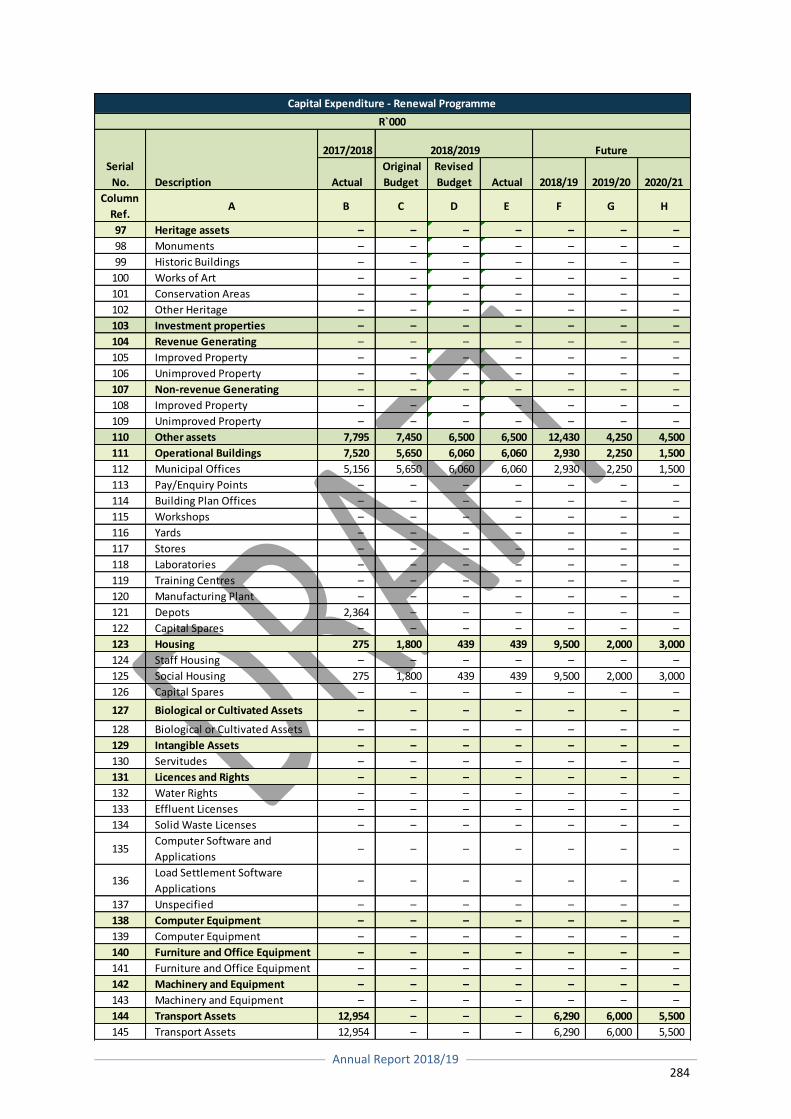
Annual Report 2018/19
284
2017/2018
Actual
Original
Budget
Revised
Budget Actual 2018/19 2019/20 2020/21
Column
Ref.A B C D E F G H
97 Heritage assets – – – – – – –
98 Monuments – – – – – – –
99 Historic Buildings – – – – – – –
100 Works of Art – – – – – – –
101 Conservation Areas – – – – – – –
102 Other Heritage – – – – – – –
103 Investment properties – – – – – – –
104 Revenue Generating – – – – – – –
105 Improved Property – – – – – – –
106 Unimproved Property – – – – – – –
107 Non-revenue Generating – – – – – – –
108 Improved Property – – – – – – –
109 Unimproved Property – – – – – – –
110 Other assets 7,795 7,450 6,500 6,500 12,430 4,250 4,500
111 Operational Buildings 7,520 5,650 6,060 6,060 2,930 2,250 1,500
112 Municipal Offices 5,156 5,650 6,060 6,060 2,930 2,250 1,500
113 Pay/Enquiry Points – – – – – – –
114 Building Plan Offices – – – – – – –
115 Workshops – – – – – – –
116 Yards – – – – – – –
117 Stores – – – – – – –
118 Laboratories – – – – – – –
119 Training Centres – – – – – – –
120 Manufacturing Plant – – – – – – –
121 Depots 2,364 – – – – – –
122 Capital Spares – – – – – – –
123 Housing 275 1,800 439 439 9,500 2,000 3,000
124 Staff Housing – – – – – – –
125 Social Housing 275 1,800 439 439 9,500 2,000 3,000
126 Capital Spares – – – – – – –
127 Biological or Cultivated Assets – – – – – – –
128 Biological or Cultivated Assets – – – – – – –
129 Intangible Assets – – – – – – –
130 Servitudes – – – – – – –
131 Licences and Rights – – – – – – –
132 Water Rights – – – – – – –
133 Effluent Licenses – – – – – – –
134 Solid Waste Licenses – – – – – – –
135Computer Software and
Applications– – – – – – –
136Load Settlement Software
Applications– – – – – – –
137 Unspecified – – – – – – –
138 Computer Equipment – – – – – – –
139 Computer Equipment – – – – – – –
140 Furniture and Office Equipment – – – – – – –
141 Furniture and Office Equipment – – – – – – –
142 Machinery and Equipment – – – – – – –
143 Machinery and Equipment – – – – – – –
144 Transport Assets 12,954 – – – 6,290 6,000 5,500
145 Transport Assets 12,954 – – – 6,290 6,000 5,500
Serial
No.
Capital Expenditure - Renewal Programme
R`000
Description
2018/2019 Future
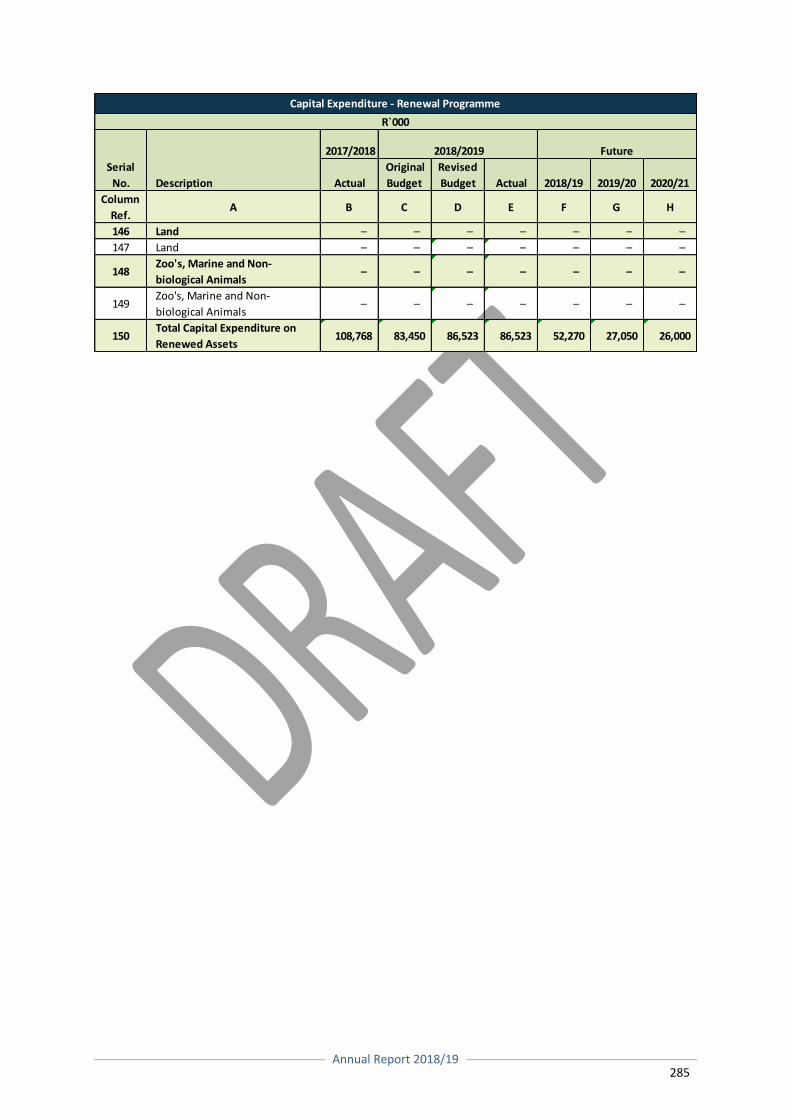
Annual Report 2018/19
285
2017/2018
Actual
Original
Budget
Revised
Budget Actual 2018/19 2019/20 2020/21
Column
Ref.A B C D E F G H
146 Land – – – – – – –
147 Land – – – – – – –
148Zoo's, Marine and Non-
biological Animals– – – – – – –
149Zoo's, Marine and Non-
biological Animals– – – – – – –
150Total Capital Expenditure on
Renewed Assets108,768 83,450 86,523 86,523 52,270 27,050 26,000
Serial
No.
Capital Expenditure - Renewal Programme
R`000
Description
2018/2019 Future
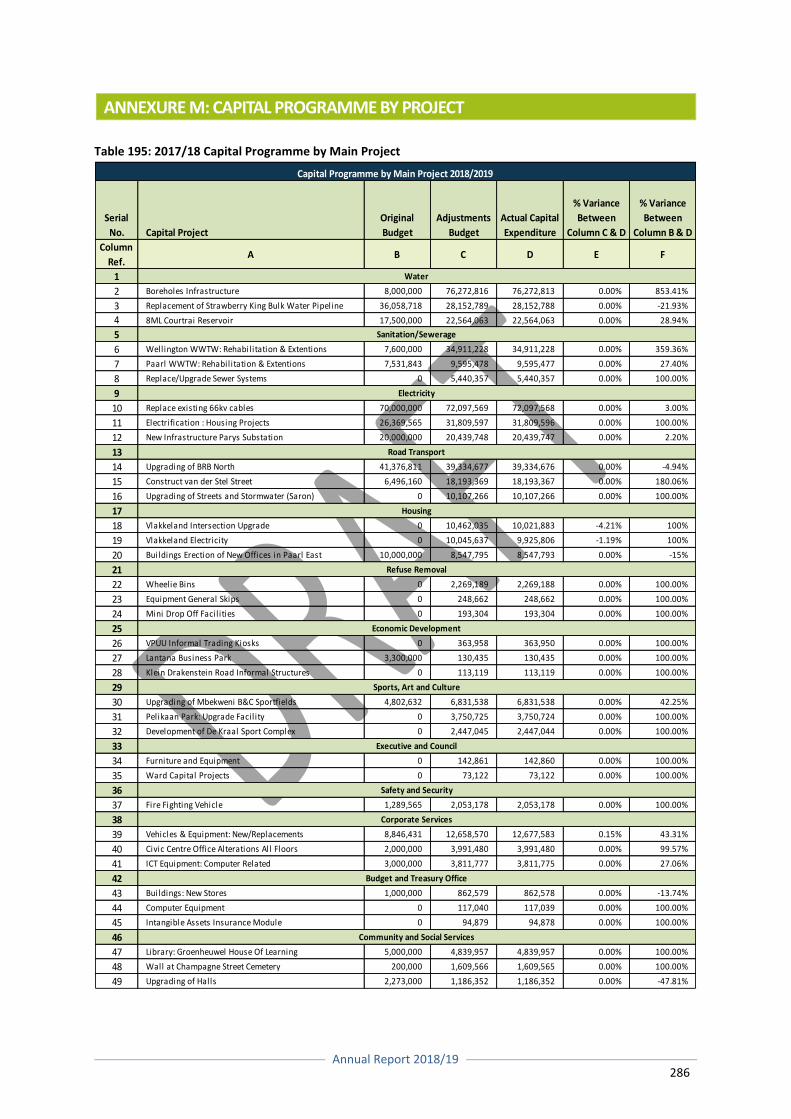
Annual Report 2018/19
286
ANNEXURE M: CAPITAL PROGRAMME BY PROJECT
Table 195: 2017/18 Capital Programme by Main Project
Serial
No. Capital Project
Original
Budget
Adjustments
Budget
Actual Capital
Expenditure
% Variance
Between
Column C & D
% Variance
Between
Column B & D
Column
Ref.A B C D E F
1
2 Boreholes Infrastructure 8,000,000 76,272,816 76,272,813 0.00% 853.41%
3 Replacement of Strawberry King Bulk Water Pipeline 36,058,718 28,152,789 28,152,788 0.00% -21.93%
4 8ML Courtrai Reservoir 17,500,000 22,564,063 22,564,063 0.00% 28.94%
5
6 Wellington WWTW: Rehabilitation & Extentions 7,600,000 34,911,228 34,911,228 0.00% 359.36%
7 Paarl WWTW: Rehabilitation & Extentions 7,531,843 9,595,478 9,595,477 0.00% 27.40%
8 Replace/Upgrade Sewer Systems 0 5,440,357 5,440,357 0.00% 100.00%
9
10 Replace existing 66kv cables 70,000,000 72,097,569 72,097,568 0.00% 3.00%
11 Electrification : Housing Projects 26,369,565 31,809,597 31,809,596 0.00% 100.00%
12 New Infrastructure Parys Substation 20,000,000 20,439,748 20,439,747 0.00% 2.20%
13
14 Upgrading of BRB North 41,376,811 39,334,677 39,334,676 0.00% -4.94%
15 Construct van der Stel Street 6,496,160 18,193,369 18,193,367 0.00% 180.06%
16 Upgrading of Streets and Stormwater (Saron) 0 10,107,266 10,107,266 0.00% 100.00%
17
18 Vlakkeland Intersection Upgrade 0 10,462,035 10,021,883 -4.21% 100%
19 Vlakkeland Electricity 0 10,045,637 9,925,806 -1.19% 100%
20 Buildings Erection of New Offices in Paarl East 10,000,000 8,547,795 8,547,793 0.00% -15%
21
22 Wheelie Bins 0 2,269,189 2,269,188 0.00% 100.00%
23 Equipment General Skips 0 248,662 248,662 0.00% 100.00%
24 Mini Drop Off Facil ities 0 193,304 193,304 0.00% 100.00%
25
26 VPUU Informal Trading Kiosks 0 363,958 363,950 0.00% 100.00%
27 Lantana Business Park 3,300,000 130,435 130,435 0.00% 100.00%
28 Klein Drakenstein Road Informal Structures 0 113,119 113,119 0.00% 100.00%
29
30 Upgrading of Mbekweni B&C Sportfields 4,802,632 6,831,538 6,831,538 0.00% 42.25%
31 Pelikaan Park: Upgrade Facil ity 0 3,750,725 3,750,724 0.00% 100.00%
32 Development of De Kraal Sport Complex 0 2,447,045 2,447,044 0.00% 100.00%
33
34 Furniture and Equipment 0 142,861 142,860 0.00% 100.00%
35 Ward Capital Projects 0 73,122 73,122 0.00% 100.00%
36
37 Fire Fighting Vehicle 1,289,565 2,053,178 2,053,178 0.00% 100.00%
38
39 Vehicles & Equipment: New/Replacements 8,846,431 12,658,570 12,677,583 0.15% 43.31%
40 Civic Centre Office Alterations All Floors 2,000,000 3,991,480 3,991,480 0.00% 99.57%
41 ICT Equipment: Computer Related 3,000,000 3,811,777 3,811,775 0.00% 27.06%
42
43 Buildings: New Stores 1,000,000 862,579 862,578 0.00% -13.74%
44 Computer Equipment 0 117,040 117,039 0.00% 100.00%
45 Intangible Assets Insurance Module 0 94,879 94,878 0.00% 100.00%
46
47 Library: Groenheuwel House Of Learning 5,000,000 4,839,957 4,839,957 0.00% 100.00%
48 Wall at Champagne Street Cemetery 200,000 1,609,566 1,609,565 0.00% 100.00%
49 Upgrading of Halls 2,273,000 1,186,352 1,186,352 0.00% -47.81%
Capital Programme by Main Project 2018/2019
Water
Sanitation/Sewerage
Electricity
Road Transport
Safety and Security
Corporate Services
Budget and Treasury Office
Community and Social Services
Housing
Refuse Removal
Economic Development
Sports, Art and Culture
Executive and Council
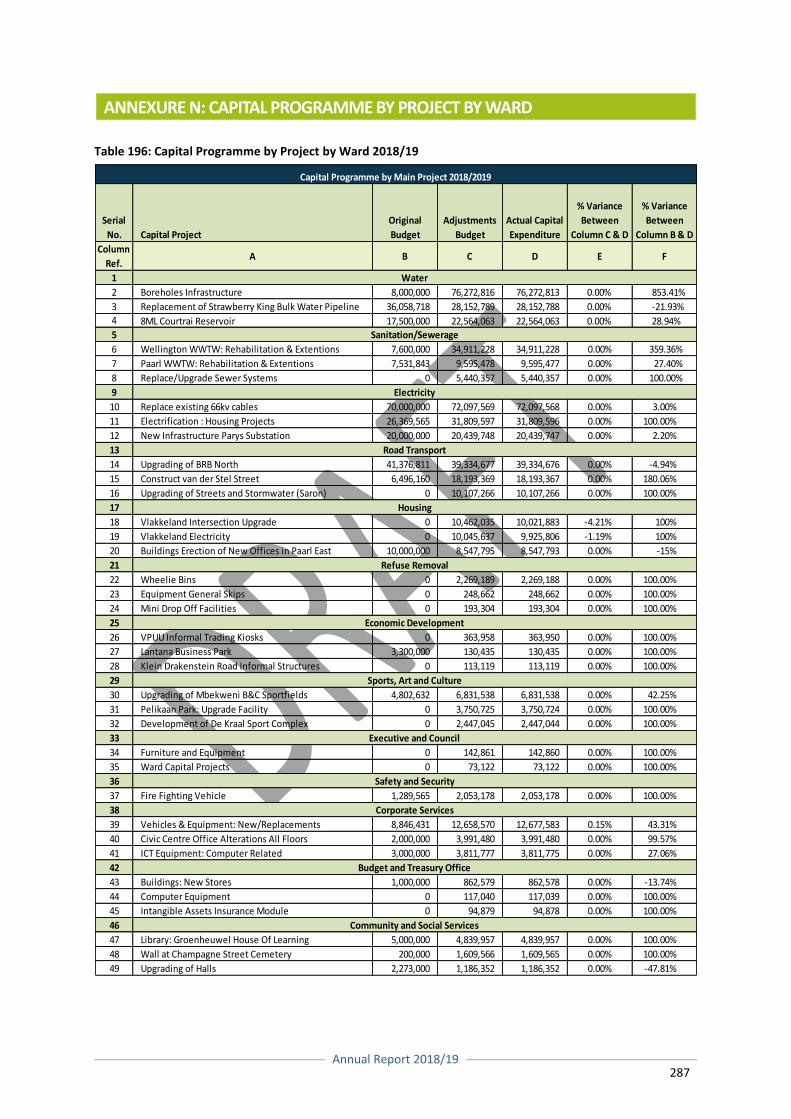
Annual Report 2018/19
287
ANNEXURE N: CAPITAL PROGRAMME BY PROJECT BY WARD
Table 196: Capital Programme by Project by Ward 2018/19
Serial
No. Capital Project
Original
Budget
Adjustments
Budget
Actual Capital
Expenditure
% Variance
Between
Column C & D
% Variance
Between
Column B & D
Column
Ref.A B C D E F
1
2 Boreholes Infrastructure 8,000,000 76,272,816 76,272,813 0.00% 853.41%
3 Replacement of Strawberry King Bulk Water Pipeline 36,058,718 28,152,789 28,152,788 0.00% -21.93%
4 8ML Courtrai Reservoir 17,500,000 22,564,063 22,564,063 0.00% 28.94%
5
6 Wellington WWTW: Rehabilitation & Extentions 7,600,000 34,911,228 34,911,228 0.00% 359.36%
7 Paarl WWTW: Rehabilitation & Extentions 7,531,843 9,595,478 9,595,477 0.00% 27.40%
8 Replace/Upgrade Sewer Systems 0 5,440,357 5,440,357 0.00% 100.00%
9
10 Replace existing 66kv cables 70,000,000 72,097,569 72,097,568 0.00% 3.00%
11 Electrification : Housing Projects 26,369,565 31,809,597 31,809,596 0.00% 100.00%
12 New Infrastructure Parys Substation 20,000,000 20,439,748 20,439,747 0.00% 2.20%
13
14 Upgrading of BRB North 41,376,811 39,334,677 39,334,676 0.00% -4.94%
15 Construct van der Stel Street 6,496,160 18,193,369 18,193,367 0.00% 180.06%
16 Upgrading of Streets and Stormwater (Saron) 0 10,107,266 10,107,266 0.00% 100.00%
17
18 Vlakkeland Intersection Upgrade 0 10,462,035 10,021,883 -4.21% 100%
19 Vlakkeland Electricity 0 10,045,637 9,925,806 -1.19% 100%
20 Buildings Erection of New Offices in Paarl East 10,000,000 8,547,795 8,547,793 0.00% -15%
21
22 Wheelie Bins 0 2,269,189 2,269,188 0.00% 100.00%
23 Equipment General Skips 0 248,662 248,662 0.00% 100.00%
24 Mini Drop Off Facilities 0 193,304 193,304 0.00% 100.00%
25
26 VPUU Informal Trading Kiosks 0 363,958 363,950 0.00% 100.00%
27 Lantana Business Park 3,300,000 130,435 130,435 0.00% 100.00%
28 Klein Drakenstein Road Informal Structures 0 113,119 113,119 0.00% 100.00%
29
30 Upgrading of Mbekweni B&C Sportfields 4,802,632 6,831,538 6,831,538 0.00% 42.25%
31 Pelikaan Park: Upgrade Facility 0 3,750,725 3,750,724 0.00% 100.00%
32 Development of De Kraal Sport Complex 0 2,447,045 2,447,044 0.00% 100.00%
33
34 Furniture and Equipment 0 142,861 142,860 0.00% 100.00%
35 Ward Capital Projects 0 73,122 73,122 0.00% 100.00%
36
37 Fire Fighting Vehicle 1,289,565 2,053,178 2,053,178 0.00% 100.00%
38
39 Vehicles & Equipment: New/Replacements 8,846,431 12,658,570 12,677,583 0.15% 43.31%
40 Civic Centre Office Alterations All Floors 2,000,000 3,991,480 3,991,480 0.00% 99.57%
41 ICT Equipment: Computer Related 3,000,000 3,811,777 3,811,775 0.00% 27.06%
42
43 Buildings: New Stores 1,000,000 862,579 862,578 0.00% -13.74%
44 Computer Equipment 0 117,040 117,039 0.00% 100.00%
45 Intangible Assets Insurance Module 0 94,879 94,878 0.00% 100.00%
46
47 Library: Groenheuwel House Of Learning 5,000,000 4,839,957 4,839,957 0.00% 100.00%
48 Wall at Champagne Street Cemetery 200,000 1,609,566 1,609,565 0.00% 100.00%
49 Upgrading of Halls 2,273,000 1,186,352 1,186,352 0.00% -47.81%
Safety and Security
Corporate Services
Budget and Treasury Office
Community and Social Services
Housing
Refuse Removal
Economic Development
Sports, Art and Culture
Executive and Council
Capital Programme by Main Project 2018/2019
Water
Sanitation/Sewerage
Electricity
Road Transport
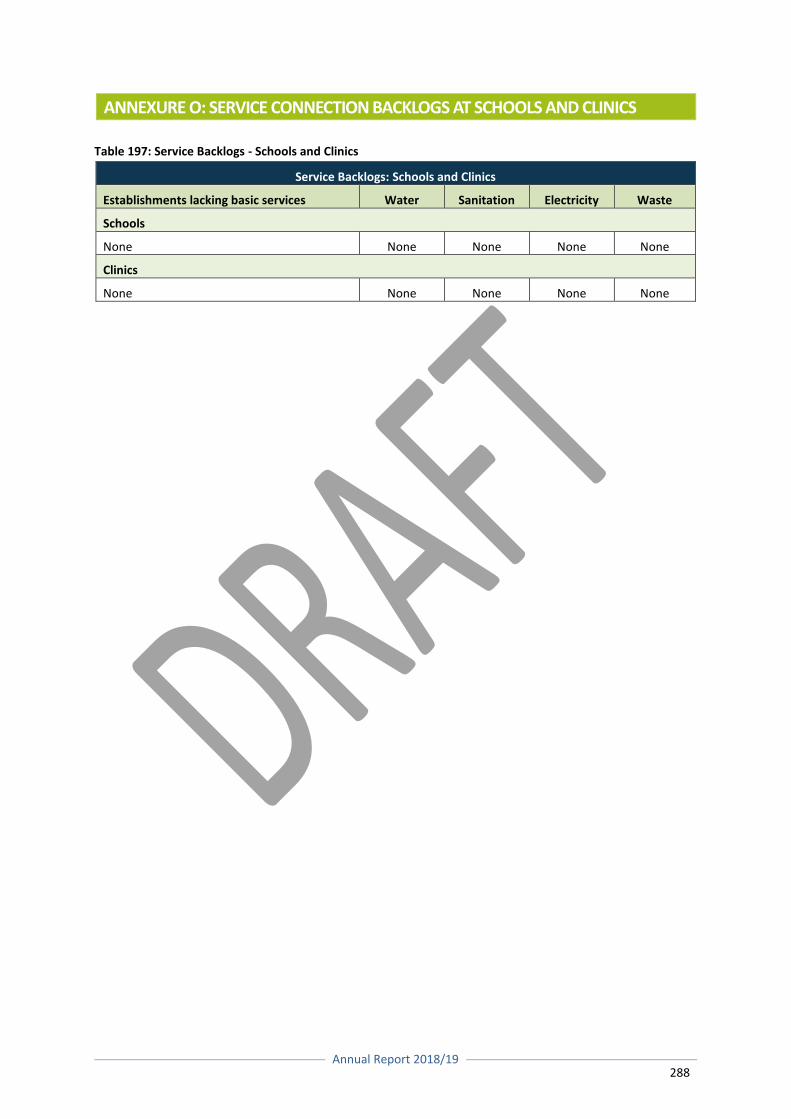
Annual Report 2018/19
288
ANNEXURE O: SERVICE CONNECTION BACKLOGS AT SCHOOLS AND CLINICS
Table 197: Service Backlogs - Schools and Clinics
Service Backlogs: Schools and Clinics
Establishments lacking basic services Water Sanitation Electricity Waste
Schools
None None None None None
Clinics
None None None None None
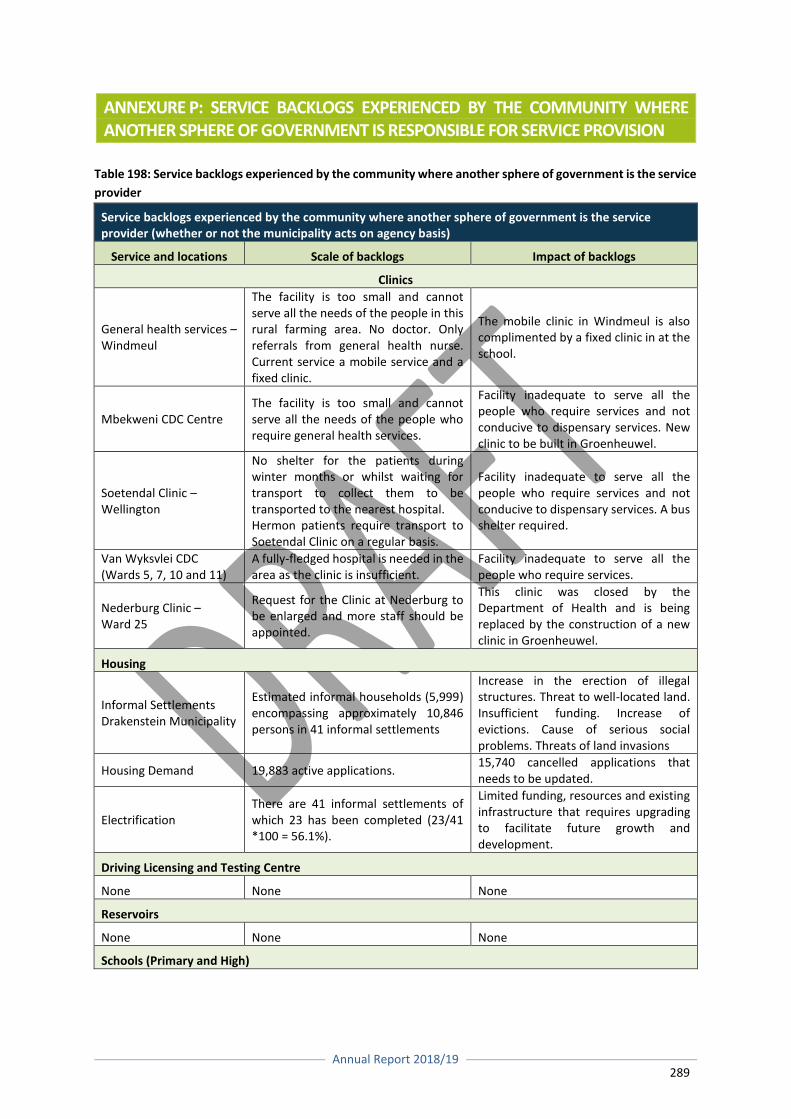
Annual Report 2018/19
289
ANNEXURE P: SERVICE BACKLOGS EXPERIENCED BY THE COMMUNITY WHERE ANOTHER SPHERE OF GOVERNMENT IS RESPONSIBLE FOR SERVICE PROVISION
Table 198: Service backlogs experienced by the community where another sphere of government is the service
provider
Service backlogs experienced by the community where another sphere of government is the service provider (whether or not the municipality acts on agency basis)
Service and locations Scale of backlogs Impact of backlogs
Clinics
General health services – Windmeul
The facility is too small and cannot serve all the needs of the people in this rural farming area. No doctor. Only referrals from general health nurse. Current service a mobile service and a fixed clinic.
The mobile clinic in Windmeul is also complimented by a fixed clinic in at the school.
Mbekweni CDC Centre The facility is too small and cannot serve all the needs of the people who require general health services.
Facility inadequate to serve all the people who require services and not conducive to dispensary services. New clinic to be built in Groenheuwel.
Soetendal Clinic – Wellington
No shelter for the patients during winter months or whilst waiting for transport to collect them to be transported to the nearest hospital. Hermon patients require transport to Soetendal Clinic on a regular basis.
Facility inadequate to serve all the people who require services and not conducive to dispensary services. A bus shelter required.
Van Wyksvlei CDC (Wards 5, 7, 10 and 11)
A fully-fledged hospital is needed in the area as the clinic is insufficient.
Facility inadequate to serve all the people who require services.
Nederburg Clinic – Ward 25
Request for the Clinic at Nederburg to be enlarged and more staff should be appointed.
This clinic was closed by the Department of Health and is being replaced by the construction of a new clinic in Groenheuwel.
Housing
Informal Settlements Drakenstein Municipality
Estimated informal households (5,999) encompassing approximately 10,846 persons in 41 informal settlements
Increase in the erection of illegal structures. Threat to well-located land. Insufficient funding. Increase of evictions. Cause of serious social problems. Threats of land invasions
Housing Demand 19,883 active applications. 15,740 cancelled applications that needs to be updated.
Electrification There are 41 informal settlements of which 23 has been completed (23/41 *100 = 56.1%).
Limited funding, resources and existing infrastructure that requires upgrading to facilitate future growth and development.
Driving Licensing and Testing Centre
None None None
Reservoirs
None None None
Schools (Primary and High)
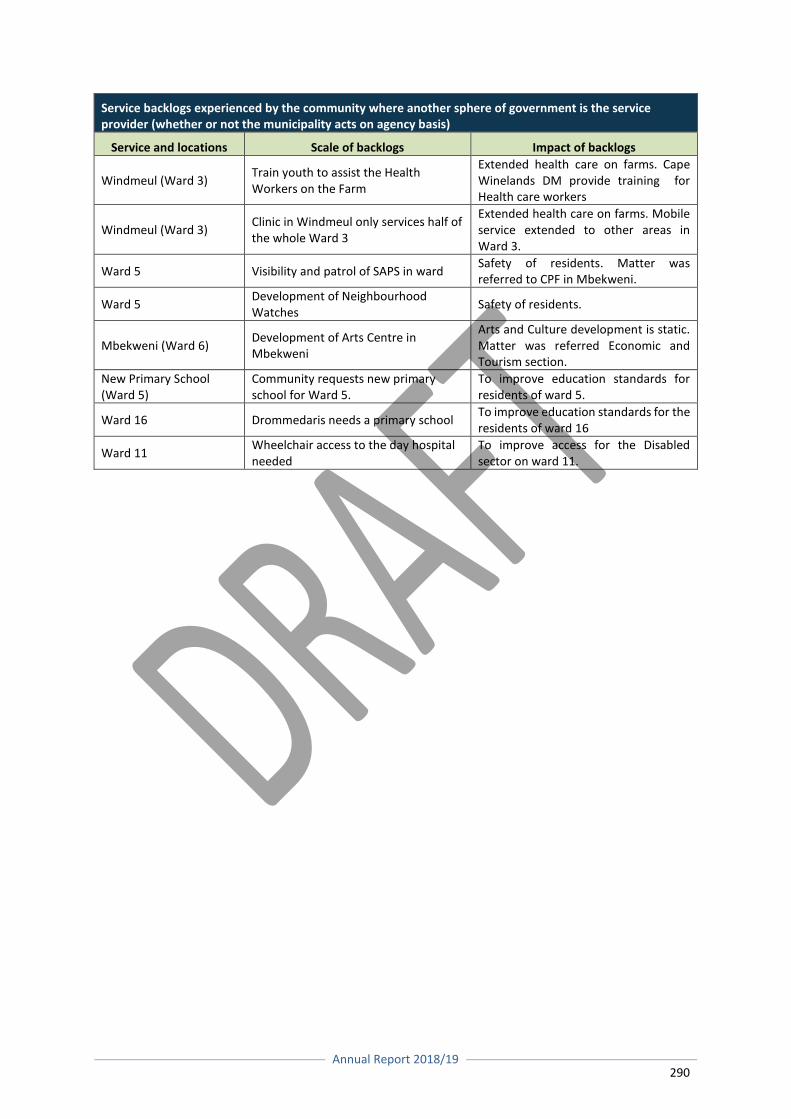
Annual Report 2018/19
290
Service backlogs experienced by the community where another sphere of government is the service provider (whether or not the municipality acts on agency basis)
Service and locations Scale of backlogs Impact of backlogs
Windmeul (Ward 3) Train youth to assist the Health Workers on the Farm
Extended health care on farms. Cape Winelands DM provide training for Health care workers
Windmeul (Ward 3) Clinic in Windmeul only services half of the whole Ward 3
Extended health care on farms. Mobile service extended to other areas in Ward 3.
Ward 5 Visibility and patrol of SAPS in ward Safety of residents. Matter was referred to CPF in Mbekweni.
Ward 5 Development of Neighbourhood Watches
Safety of residents.
Mbekweni (Ward 6) Development of Arts Centre in Mbekweni
Arts and Culture development is static. Matter was referred Economic and Tourism section.
New Primary School (Ward 5)
Community requests new primary school for Ward 5.
To improve education standards for residents of ward 5.
Ward 16 Drommedaris needs a primary school To improve education standards for the residents of ward 16
Ward 11 Wheelchair access to the day hospital needed
To improve access for the Disabled sector on ward 11.
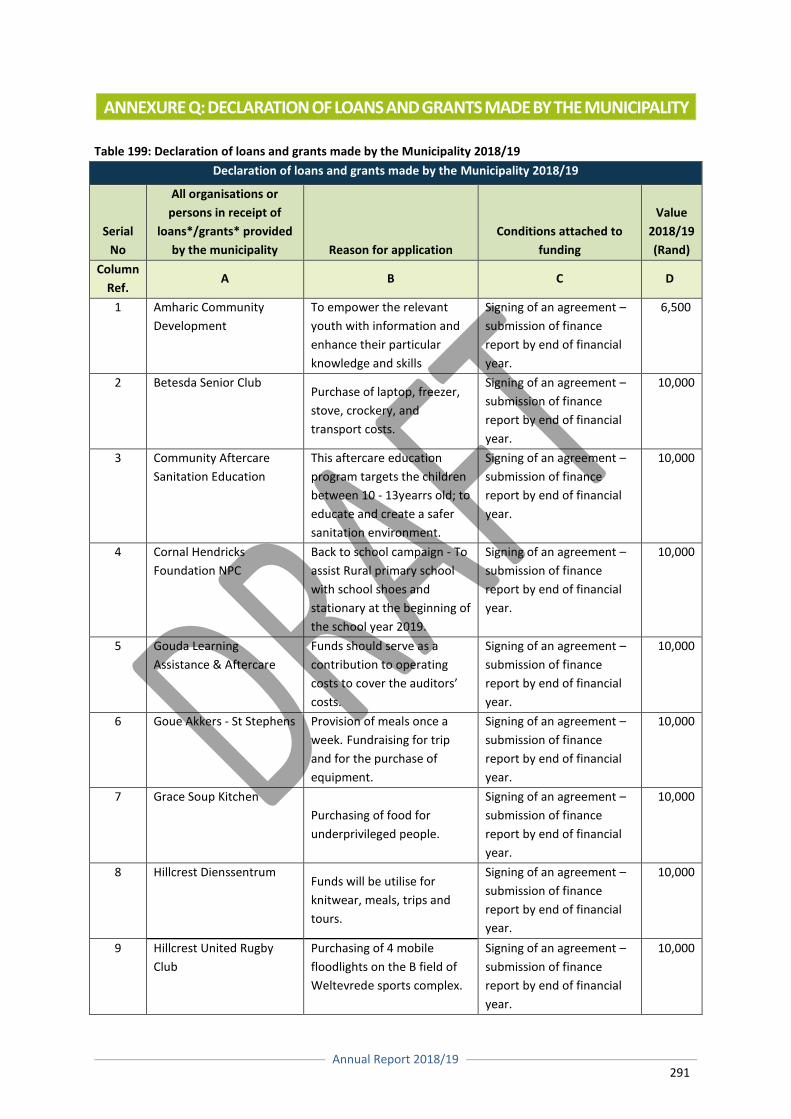
Annual Report 2018/19
291
ANNEXURE Q: DECLARATION OF LOANS AND GRANTS MADE BY THE MUNICIPALITY
Table 199: Declaration of loans and grants made by the Municipality 2018/19
Declaration of loans and grants made by the Municipality 2018/19
Serial
No
All organisations or
persons in receipt of
loans*/grants* provided
by the municipality Reason for application
Conditions attached to
funding
Value
2018/19
(Rand)
Column
Ref. A B C D
1 Amharic Community
Development
To empower the relevant
youth with information and
enhance their particular
knowledge and skills
Signing of an agreement –
submission of finance
report by end of financial
year.
6,500
2 Betesda Senior Club Purchase of laptop, freezer,
stove, crockery, and
transport costs.
Signing of an agreement –
submission of finance
report by end of financial
year.
10,000
3 Community Aftercare
Sanitation Education
This aftercare education
program targets the children
between 10 - 13yearrs old; to
educate and create a safer
sanitation environment.
Signing of an agreement –
submission of finance
report by end of financial
year.
10,000
4 Cornal Hendricks
Foundation NPC
Back to school campaign - To
assist Rural primary school
with school shoes and
stationary at the beginning of
the school year 2019.
Signing of an agreement –
submission of finance
report by end of financial
year.
10,000
5 Gouda Learning
Assistance & Aftercare
Funds should serve as a
contribution to operating
costs to cover the auditors’
costs.
Signing of an agreement –
submission of finance
report by end of financial
year.
10,000
6 Goue Akkers - St Stephens Provision of meals once a
week. Fundraising for trip
and for the purchase of
equipment.
Signing of an agreement –
submission of finance
report by end of financial
year.
10,000
7 Grace Soup Kitchen
Purchasing of food for
underprivileged people.
Signing of an agreement –
submission of finance
report by end of financial
year.
10,000
8 Hillcrest Dienssentrum Funds will be utilise for
knitwear, meals, trips and
tours.
Signing of an agreement –
submission of finance
report by end of financial
year.
10,000
9 Hillcrest United Rugby
Club
Purchasing of 4 mobile
floodlights on the B field of
Weltevrede sports complex.
Signing of an agreement –
submission of finance
report by end of financial
year.
10,000
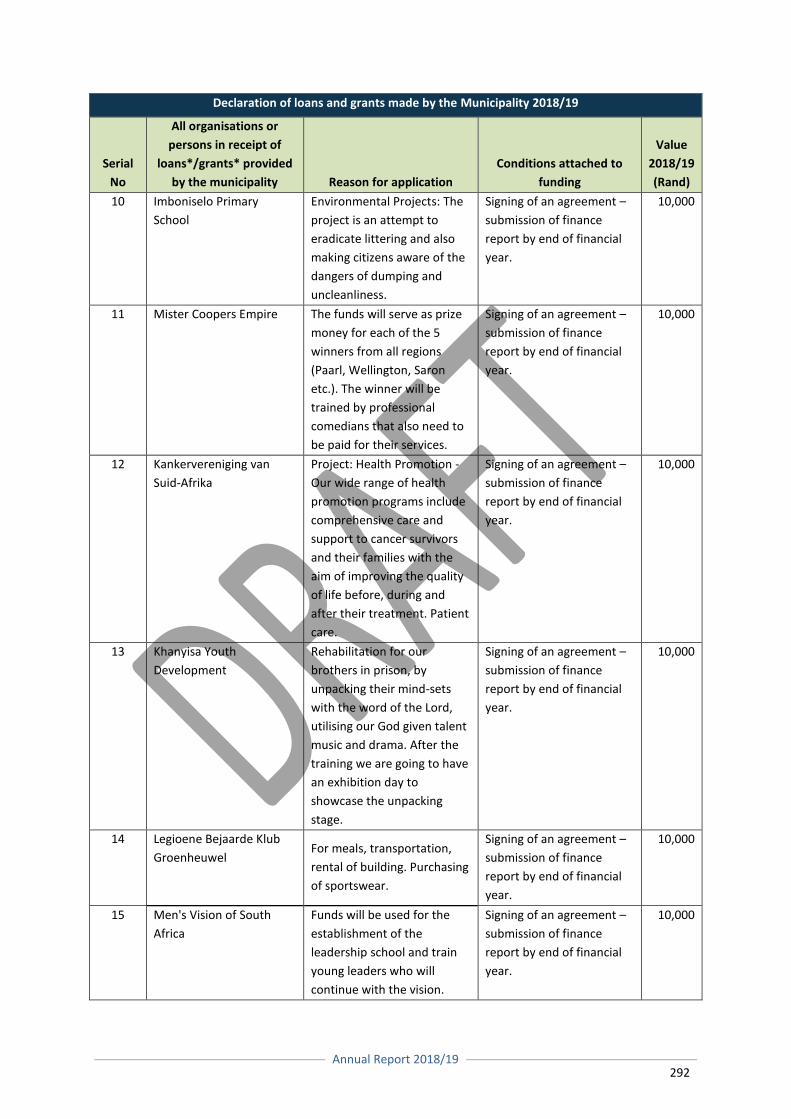
Annual Report 2018/19
292
Declaration of loans and grants made by the Municipality 2018/19
Serial
No
All organisations or
persons in receipt of
loans*/grants* provided
by the municipality Reason for application
Conditions attached to
funding
Value
2018/19
(Rand)
10 Imboniselo Primary
School
Environmental Projects: The
project is an attempt to
eradicate littering and also
making citizens aware of the
dangers of dumping and
uncleanliness.
Signing of an agreement –
submission of finance
report by end of financial
year.
10,000
11 Mister Coopers Empire The funds will serve as prize
money for each of the 5
winners from all regions
(Paarl, Wellington, Saron
etc.). The winner will be
trained by professional
comedians that also need to
be paid for their services.
Signing of an agreement –
submission of finance
report by end of financial
year.
10,000
12 Kankervereniging van
Suid-Afrika
Project: Health Promotion -
Our wide range of health
promotion programs include
comprehensive care and
support to cancer survivors
and their families with the
aim of improving the quality
of life before, during and
after their treatment. Patient
care.
Signing of an agreement –
submission of finance
report by end of financial
year.
10,000
13 Khanyisa Youth
Development
Rehabilitation for our
brothers in prison, by
unpacking their mind-sets
with the word of the Lord,
utilising our God given talent
music and drama. After the
training we are going to have
an exhibition day to
showcase the unpacking
stage.
Signing of an agreement –
submission of finance
report by end of financial
year.
10,000
14 Legioene Bejaarde Klub
Groenheuwel For meals, transportation,
rental of building. Purchasing
of sportswear.
Signing of an agreement –
submission of finance
report by end of financial
year.
10,000
15 Men's Vision of South
Africa
Funds will be used for the
establishment of the
leadership school and train
young leaders who will
continue with the vision.
Signing of an agreement –
submission of finance
report by end of financial
year.
10,000
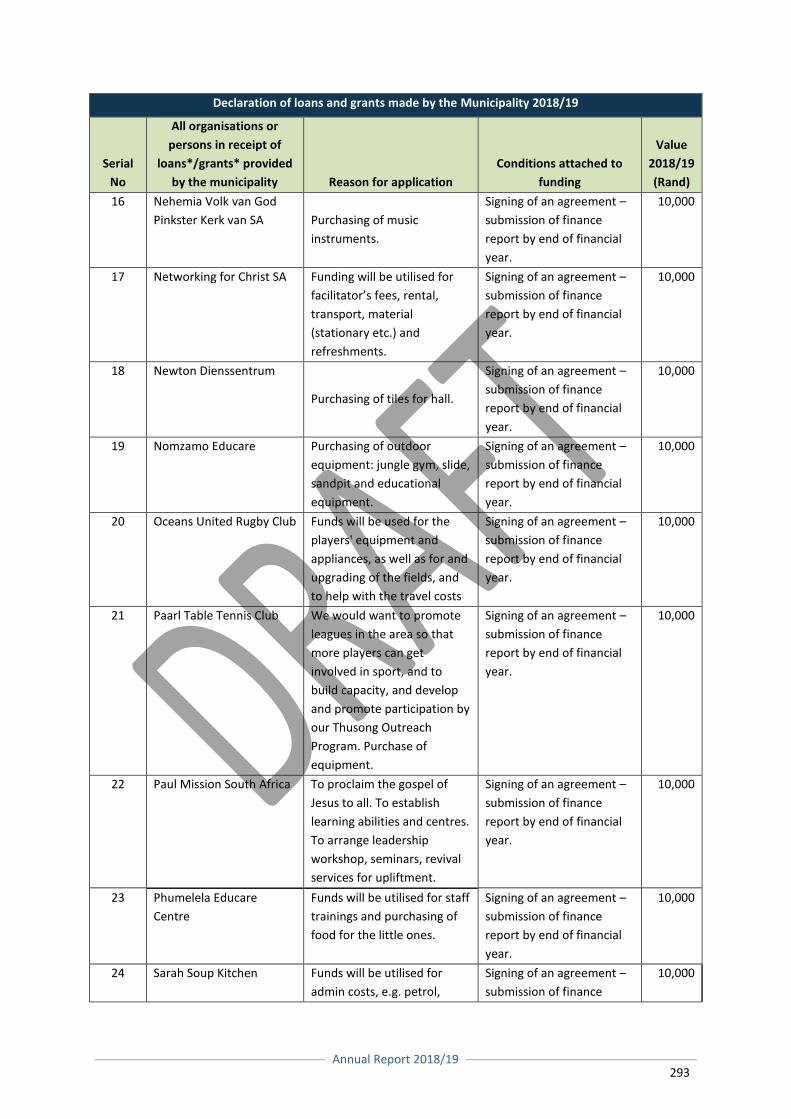
Annual Report 2018/19
293
Declaration of loans and grants made by the Municipality 2018/19
Serial
No
All organisations or
persons in receipt of
loans*/grants* provided
by the municipality Reason for application
Conditions attached to
funding
Value
2018/19
(Rand)
16 Nehemia Volk van God
Pinkster Kerk van SA Purchasing of music
instruments.
Signing of an agreement –
submission of finance
report by end of financial
year.
10,000
17 Networking for Christ SA Funding will be utilised for
facilitator’s fees, rental,
transport, material
(stationary etc.) and
refreshments.
Signing of an agreement –
submission of finance
report by end of financial
year.
10,000
18 Newton Dienssentrum
Purchasing of tiles for hall.
Signing of an agreement –
submission of finance
report by end of financial
year.
10,000
19 Nomzamo Educare Purchasing of outdoor
equipment: jungle gym, slide,
sandpit and educational
equipment.
Signing of an agreement –
submission of finance
report by end of financial
year.
10,000
20 Oceans United Rugby Club Funds will be used for the
players' equipment and
appliances, as well as for and
upgrading of the fields, and
to help with the travel costs
Signing of an agreement –
submission of finance
report by end of financial
year.
10,000
21 Paarl Table Tennis Club We would want to promote
leagues in the area so that
more players can get
involved in sport, and to
build capacity, and develop
and promote participation by
our Thusong Outreach
Program. Purchase of
equipment.
Signing of an agreement –
submission of finance
report by end of financial
year.
10,000
22 Paul Mission South Africa To proclaim the gospel of
Jesus to all. To establish
learning abilities and centres.
To arrange leadership
workshop, seminars, revival
services for upliftment.
Signing of an agreement –
submission of finance
report by end of financial
year.
10,000
23 Phumelela Educare
Centre
Funds will be utilised for staff
trainings and purchasing of
food for the little ones.
Signing of an agreement –
submission of finance
report by end of financial
year.
10,000
24 Sarah Soup Kitchen Funds will be utilised for
admin costs, e.g. petrol,
Signing of an agreement –
submission of finance
10,000
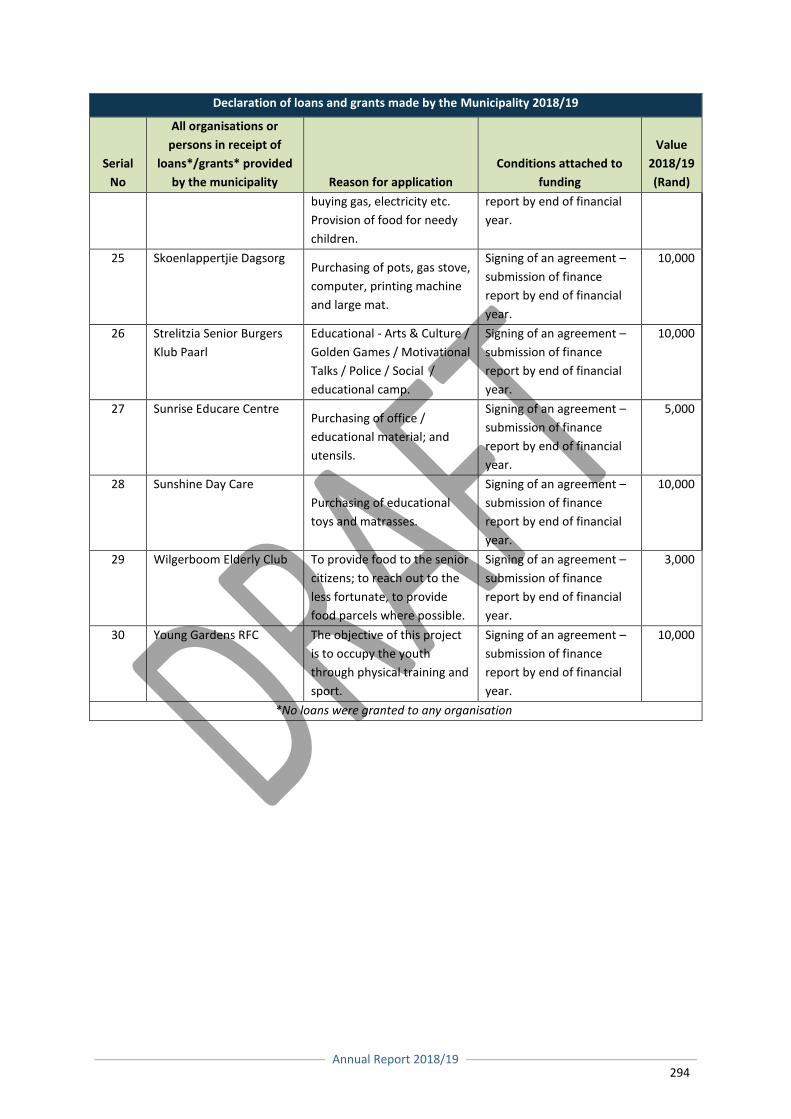
Annual Report 2018/19
294
Declaration of loans and grants made by the Municipality 2018/19
Serial
No
All organisations or
persons in receipt of
loans*/grants* provided
by the municipality Reason for application
Conditions attached to
funding
Value
2018/19
(Rand)
buying gas, electricity etc.
Provision of food for needy
children.
report by end of financial
year.
25 Skoenlappertjie Dagsorg Purchasing of pots, gas stove,
computer, printing machine
and large mat.
Signing of an agreement –
submission of finance
report by end of financial
year.
10,000
26 Strelitzia Senior Burgers
Klub Paarl
Educational - Arts & Culture /
Golden Games / Motivational
Talks / Police / Social /
educational camp.
Signing of an agreement –
submission of finance
report by end of financial
year.
10,000
27 Sunrise Educare Centre Purchasing of office /
educational material; and
utensils.
Signing of an agreement –
submission of finance
report by end of financial
year.
5,000
28 Sunshine Day Care
Purchasing of educational
toys and matrasses.
Signing of an agreement –
submission of finance
report by end of financial
year.
10,000
29 Wilgerboom Elderly Club To provide food to the senior
citizens; to reach out to the
less fortunate, to provide
food parcels where possible.
Signing of an agreement –
submission of finance
report by end of financial
year.
3,000
30 Young Gardens RFC The objective of this project
is to occupy the youth
through physical training and
sport.
Signing of an agreement –
submission of finance
report by end of financial
year.
10,000
*No loans were granted to any organisation
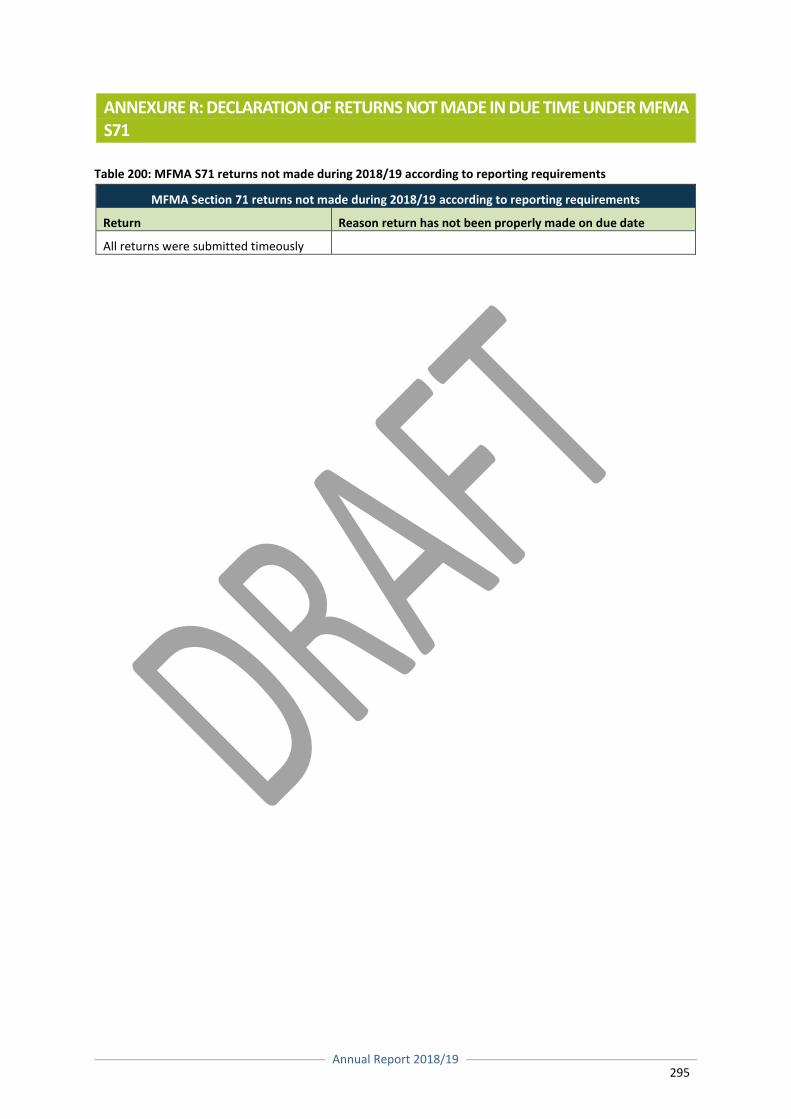
Annual Report 2018/19
295
ANNEXURE R: DECLARATION OF RETURNS NOT MADE IN DUE TIME UNDER MFMA S71
Table 200: MFMA S71 returns not made during 2018/19 according to reporting requirements
MFMA Section 71 returns not made during 2018/19 according to reporting requirements
Return Reason return has not been properly made on due date
All returns were submitted timeously
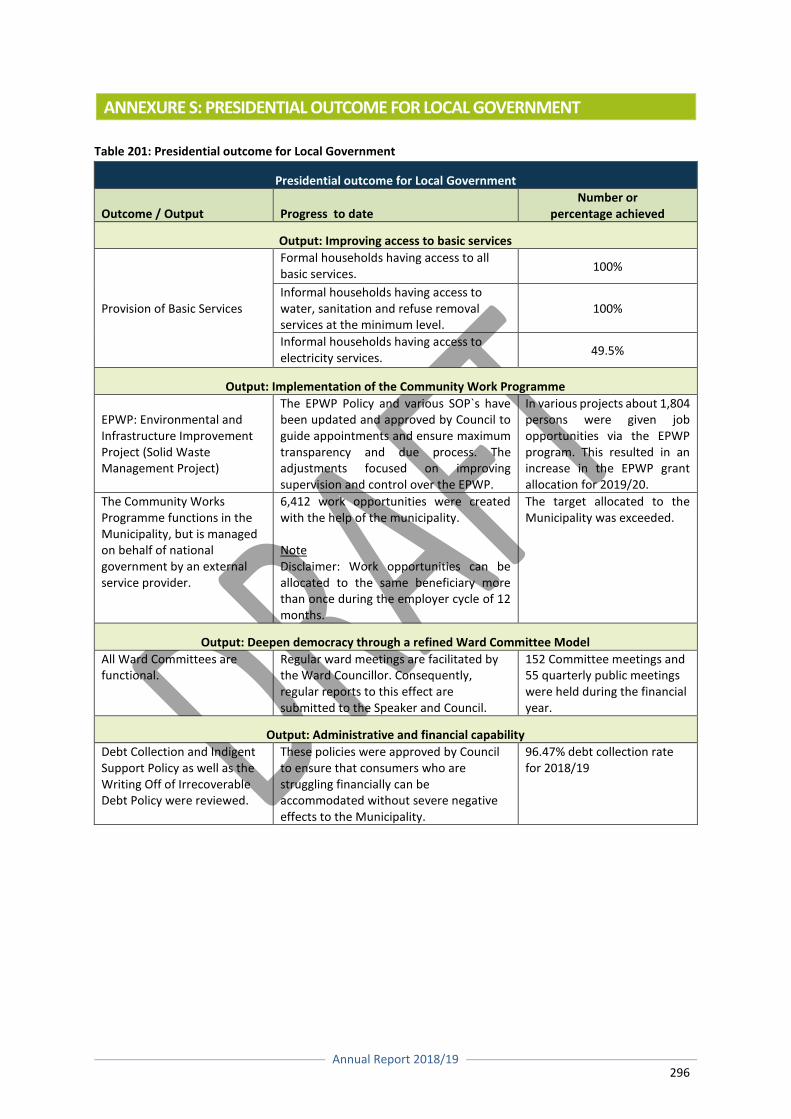
Annual Report 2018/19
296
ANNEXURE S: PRESIDENTIAL OUTCOME FOR LOCAL GOVERNMENT
Table 201: Presidential outcome for Local Government
Presidential outcome for Local Government
Outcome / Output Progress to date Number or
percentage achieved
Output: Improving access to basic services
Provision of Basic Services
Formal households having access to all basic services.
100%
Informal households having access to water, sanitation and refuse removal services at the minimum level.
100%
Informal households having access to electricity services.
49.5%
Output: Implementation of the Community Work Programme
EPWP: Environmental and Infrastructure Improvement Project (Solid Waste Management Project)
The EPWP Policy and various SOP`s have been updated and approved by Council to guide appointments and ensure maximum transparency and due process. The adjustments focused on improving supervision and control over the EPWP.
In various projects about 1,804 persons were given job opportunities via the EPWP program. This resulted in an increase in the EPWP grant allocation for 2019/20.
The Community Works Programme functions in the Municipality, but is managed on behalf of national government by an external service provider.
6,412 work opportunities were created with the help of the municipality. Note Disclaimer: Work opportunities can be allocated to the same beneficiary more than once during the employer cycle of 12 months.
The target allocated to the Municipality was exceeded.
Output: Deepen democracy through a refined Ward Committee Model
All Ward Committees are functional.
Regular ward meetings are facilitated by the Ward Councillor. Consequently, regular reports to this effect are submitted to the Speaker and Council.
152 Committee meetings and 55 quarterly public meetings were held during the financial year.
Output: Administrative and financial capability
Debt Collection and Indigent Support Policy as well as the Writing Off of Irrecoverable Debt Policy were reviewed.
These policies were approved by Council to ensure that consumers who are struggling financially can be accommodated without severe negative effects to the Municipality.
96.47% debt collection rate for 2018/19
Annual Report 2018/19
297
8. VOLUMES
VOLUME I: REPORT OF THE AUDITOR-GENERAL
The report of the Auditor-General to the Western Cape Provincial Parliament and the
Municipal Council on Drakenstein Municipality’s 2018/2019 annual financial statements,
annual performance report, compliance with legislation, other information and internal
control deficiencies now follows on the next eight pages.
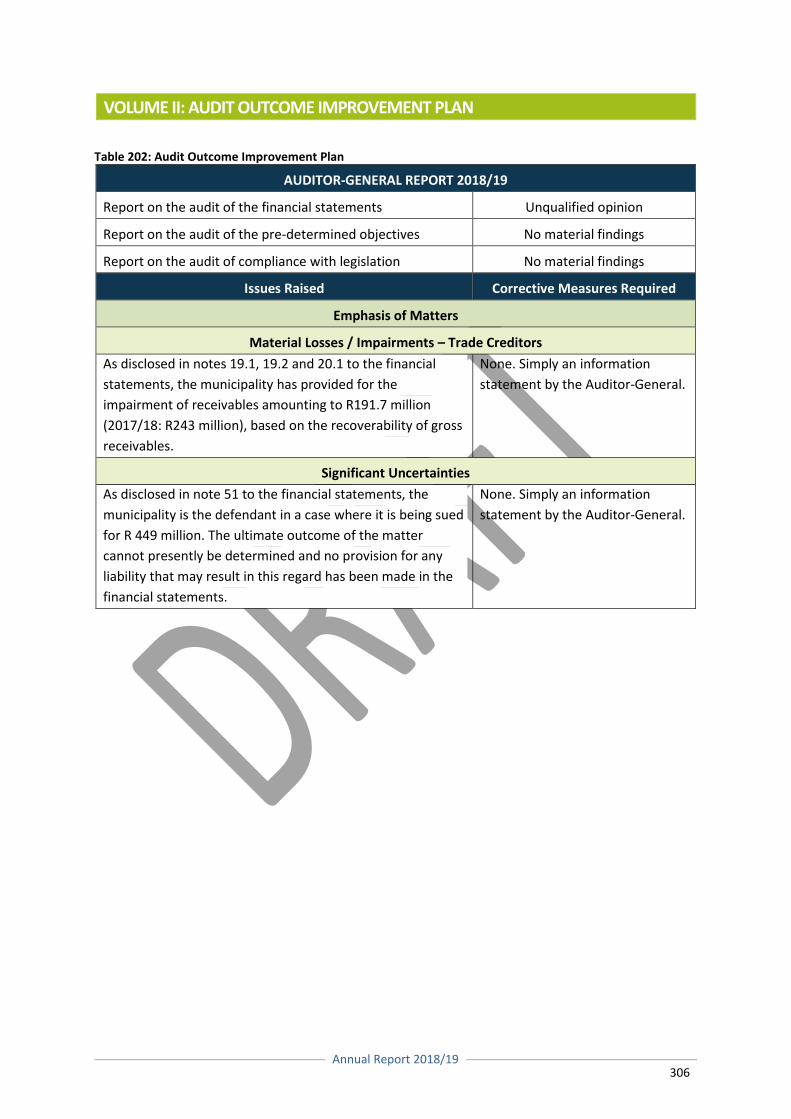
Annual Report 2018/19
306
VOLUME II: AUDIT OUTCOME IMPROVEMENT PLAN
Table 202: Audit Outcome Improvement Plan
AUDITOR-GENERAL REPORT 2018/19
Report on the audit of the financial statements Unqualified opinion
Report on the audit of the pre-determined objectives No material findings
Report on the audit of compliance with legislation No material findings
Issues Raised Corrective Measures Required
Emphasis of Matters
Material Losses / Impairments – Trade Creditors
As disclosed in notes 19.1, 19.2 and 20.1 to the financial
statements, the municipality has provided for the
impairment of receivables amounting to R191.7 million
(2017/18: R243 million), based on the recoverability of gross
receivables.
None. Simply an information
statement by the Auditor-General.
Significant Uncertainties
As disclosed in note 51 to the financial statements, the
municipality is the defendant in a case where it is being sued
for R 449 million. The ultimate outcome of the matter
cannot presently be determined and no provision for any
liability that may result in this regard has been made in the
financial statements.
None. Simply an information
statement by the Auditor-General.
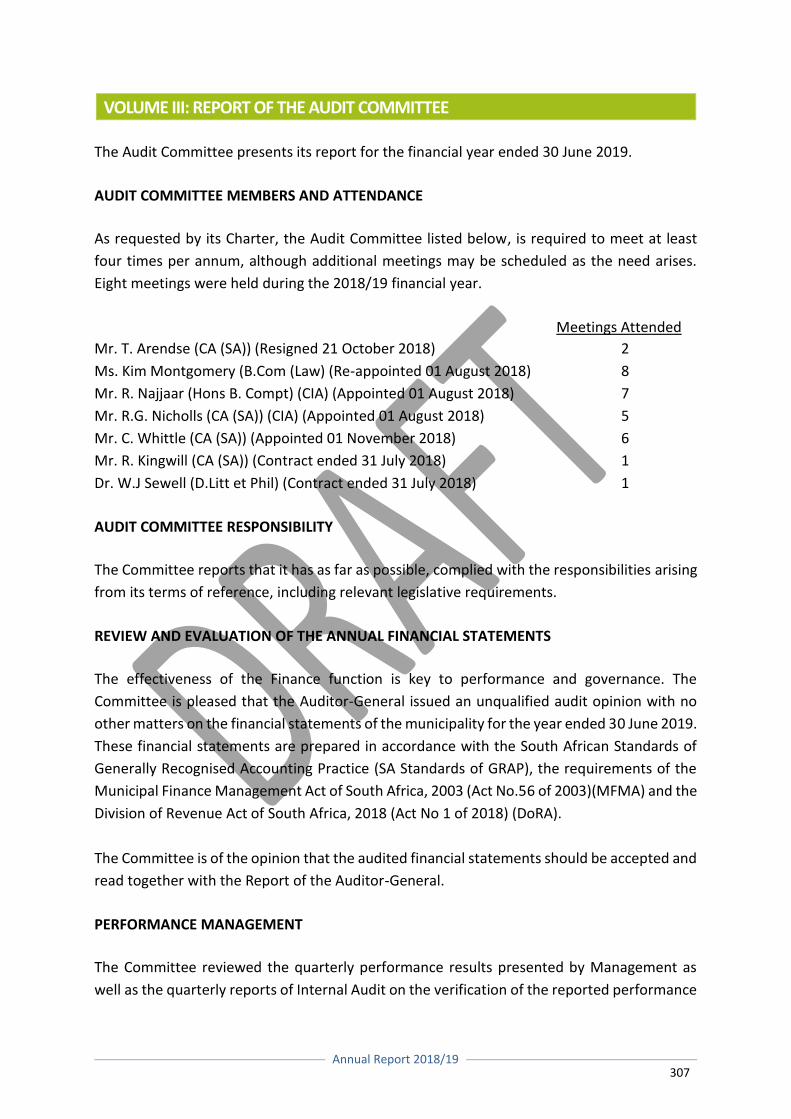
Annual Report 2018/19
307
VOLUME III: REPORT OF THE AUDIT COMMITTEE
The Audit Committee presents its report for the financial year ended 30 June 2019.
AUDIT COMMITTEE MEMBERS AND ATTENDANCE
As requested by its Charter, the Audit Committee listed below, is required to meet at least
four times per annum, although additional meetings may be scheduled as the need arises.
Eight meetings were held during the 2018/19 financial year.
Meetings Attended
Mr. T. Arendse (CA (SA)) (Resigned 21 October 2018) 2
Ms. Kim Montgomery (B.Com (Law) (Re-appointed 01 August 2018) 8
Mr. R. Najjaar (Hons B. Compt) (CIA) (Appointed 01 August 2018) 7
Mr. R.G. Nicholls (CA (SA)) (CIA) (Appointed 01 August 2018) 5
Mr. C. Whittle (CA (SA)) (Appointed 01 November 2018) 6
Mr. R. Kingwill (CA (SA)) (Contract ended 31 July 2018) 1
Dr. W.J Sewell (D.Litt et Phil) (Contract ended 31 July 2018) 1
AUDIT COMMITTEE RESPONSIBILITY
The Committee reports that it has as far as possible, complied with the responsibilities arising
from its terms of reference, including relevant legislative requirements.
REVIEW AND EVALUATION OF THE ANNUAL FINANCIAL STATEMENTS
The effectiveness of the Finance function is key to performance and governance. The
Committee is pleased that the Auditor-General issued an unqualified audit opinion with no
other matters on the financial statements of the municipality for the year ended 30 June 2019.
These financial statements are prepared in accordance with the South African Standards of
Generally Recognised Accounting Practice (SA Standards of GRAP), the requirements of the
Municipal Finance Management Act of South Africa, 2003 (Act No.56 of 2003)(MFMA) and the
Division of Revenue Act of South Africa, 2018 (Act No 1 of 2018) (DoRA).
The Committee is of the opinion that the audited financial statements should be accepted and
read together with the Report of the Auditor-General.
PERFORMANCE MANAGEMENT
The Committee reviewed the quarterly performance results presented by Management as
well as the quarterly reports of Internal Audit on the verification of the reported performance
Annual Report 2018/19
308
results. The Committee noted the success of the effort made by Management to ensure a
credible performance management system and reliable performance results.
This is reflected in the positive outcome of the Auditor-General’s review of the Municipality’s
predetermined objectives. Management is further encouraged to ensure that the business
processes underlying the preparation and presentation of performance information are
further embedded and that management oversight of reported results is strengthened.
INTERNAL CONTROL AND RISK MANAGEMENT
The Committee received quarterly progress reports from Internal Audit on the execution of
the revised operational internal audit plan and the results of the audits conducted. Where
instances of control weakness were reported, Management committed to implementing the
necessary action plans to address the reported control weaknesses. These will be reviewed at
our quarterly meetings.
The Fraud and Risk Management Committee (FARMCO) is responsible for the oversight of risk
governance. The Committee is satisfied that FARMCO dedicates sufficient time to the
governance of risk. FARMCO includes a representative from the Audit Committee. The
Committee is happy to report that the FARMCO structure in the municipality has reached a
mature level of functioning and reliance is placed on its oversight activities.
The Committee reviewed the risk profile of the Municipality when the Internal Audit Plan
priorities were determined. The Committee remains concerned that progress of embedding a
risk management culture in the processes of the Municipality still needs attention. The
Committee also noted the Auditor-General’s report that no significant deficiencies were
identified in internal control.
ASSURANCE PROVIDERS
The Auditor General of South Africa (AGSA) has a constitutional mandate and, as the Supreme
Audit institution of South Africa, exists to strengthen the country’s democracy by enabling
oversight, accountability and governance in the public sector through auditing, thereby
building public confidence. The AGSA, governed by the Public Audit Act, No. 25 of 2004 (PAA),
is legally, financially and operationally independent. The Committee has formally commended
the AGSA audit team on the quality of the external audit undertaken and the manner in which
the engagement between the stakeholders was conducted. Oversight of the Internal Audit
function is delegated to the Committee. The Committee annually reviews the internal audit
charter, which defines the roles and responsibilities of the internal audit function. This charter
ensures that the internal audit function has the necessary skills and resources to effectively
execute the annual internal audit plan. The Chief Audit Executive functions independently
Annual Report 2018/19
309
from management and possesses the necessary competence and skills to perform the
allocated duties. The CAE has unlimited access to the Committee in reporting on the
performance of the duties and functions relating to internal audit. The lines of assurance have
been defined for the municipality and funding has been made available to develop a
Combined Assurance Model from which the process will be formalised and driven.
CONCLUSION
The Audit Committee congratulates the Management team on achieving a clean audit opinion
and wishes the Municipal Council, Executive Mayor and Municipal Management and staff
success in their quest to make Drakenstein a “City of Excellence”.
KIM MONTGOMERY
AUDIT COMMITTEE CHAIRPERSON
Date: 18 December 2019

Annual Report 2018/19
310
VOLUME IV: 2018/2019 ANNUAL AUDITED FINANCIAL STATEMENTS
The audited 2018/2019 annual financial statements will now follow for the next 128 pages.
Drakenstein Municipality received an unqualified audit opinion from the Auditor-General for
the 2018/2019 financial year.
Annual Report 2018/19
439
VOLUME V: 2018/2019 ANNUAL PERFORMANCE REPORT
The audited 2018/2019 annual performance report will now follow for the next 48 pages. No
material findings on the usefulness and reliability of the reported information were raised by
the Auditor-General.
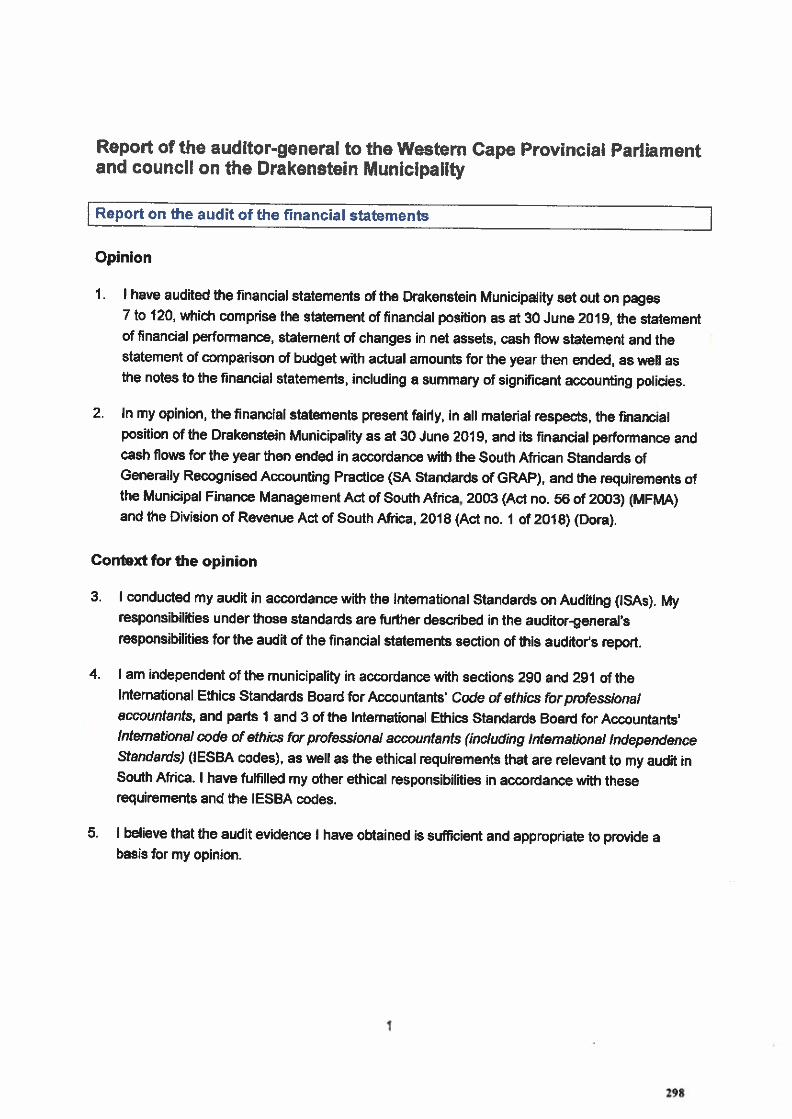
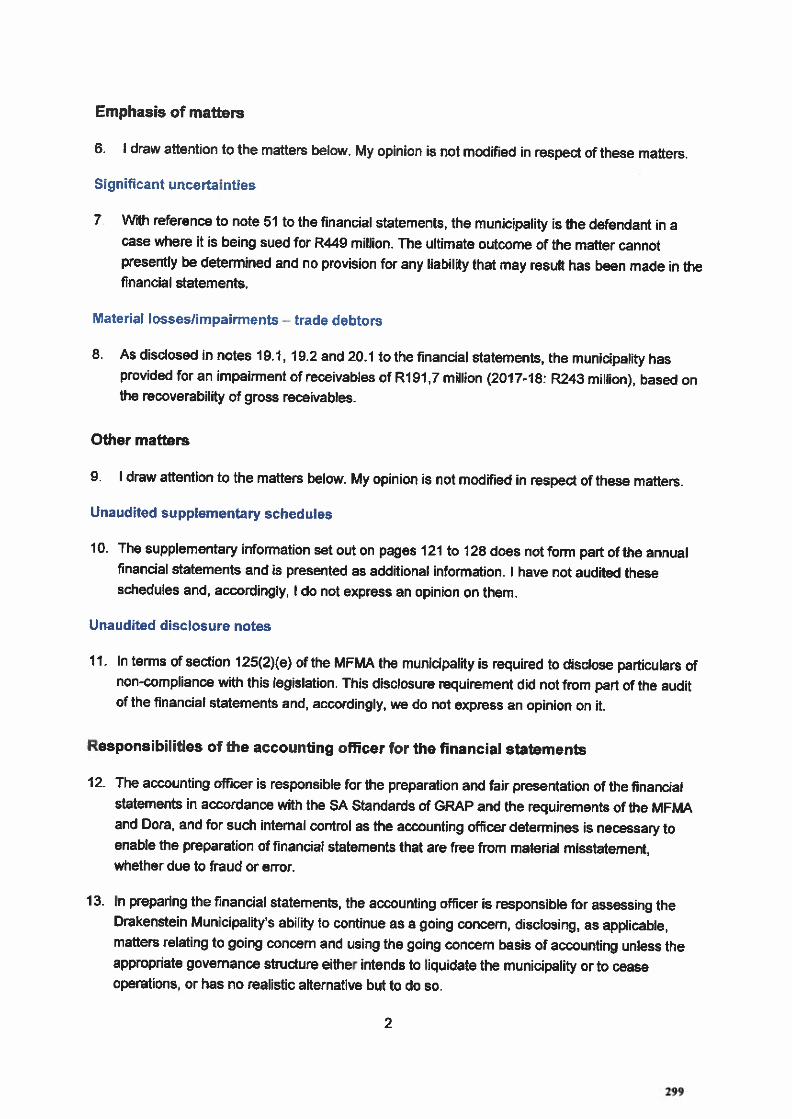
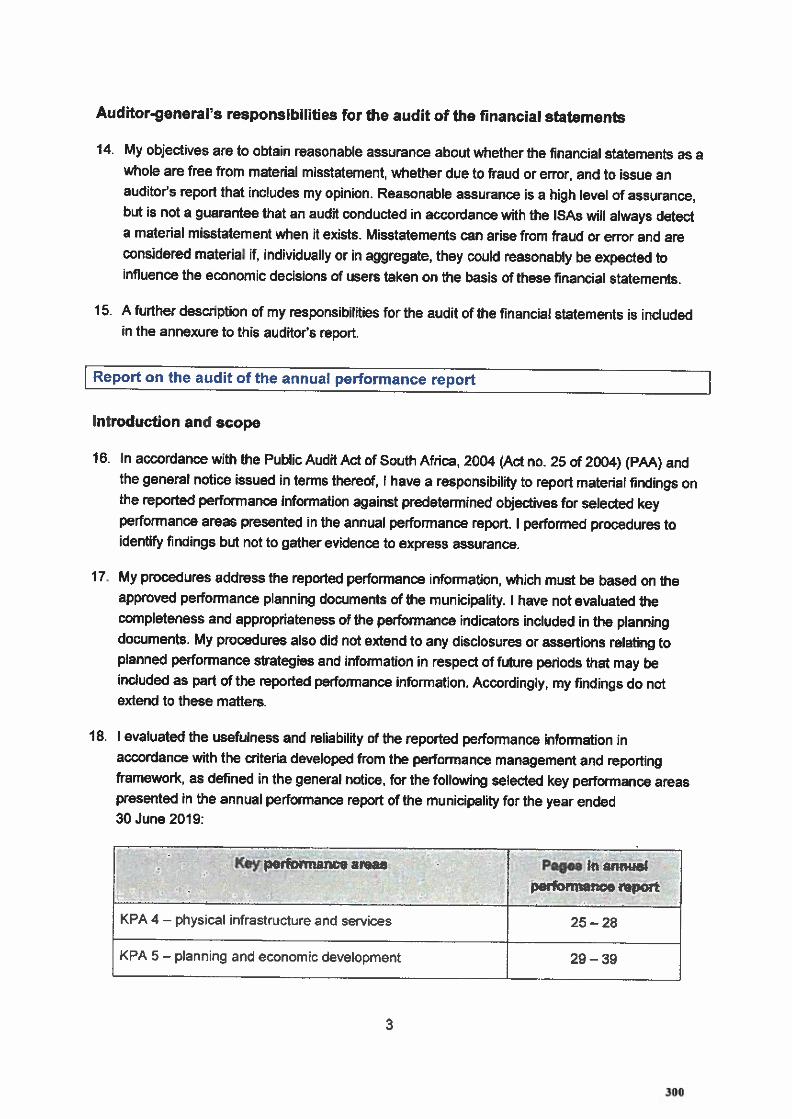
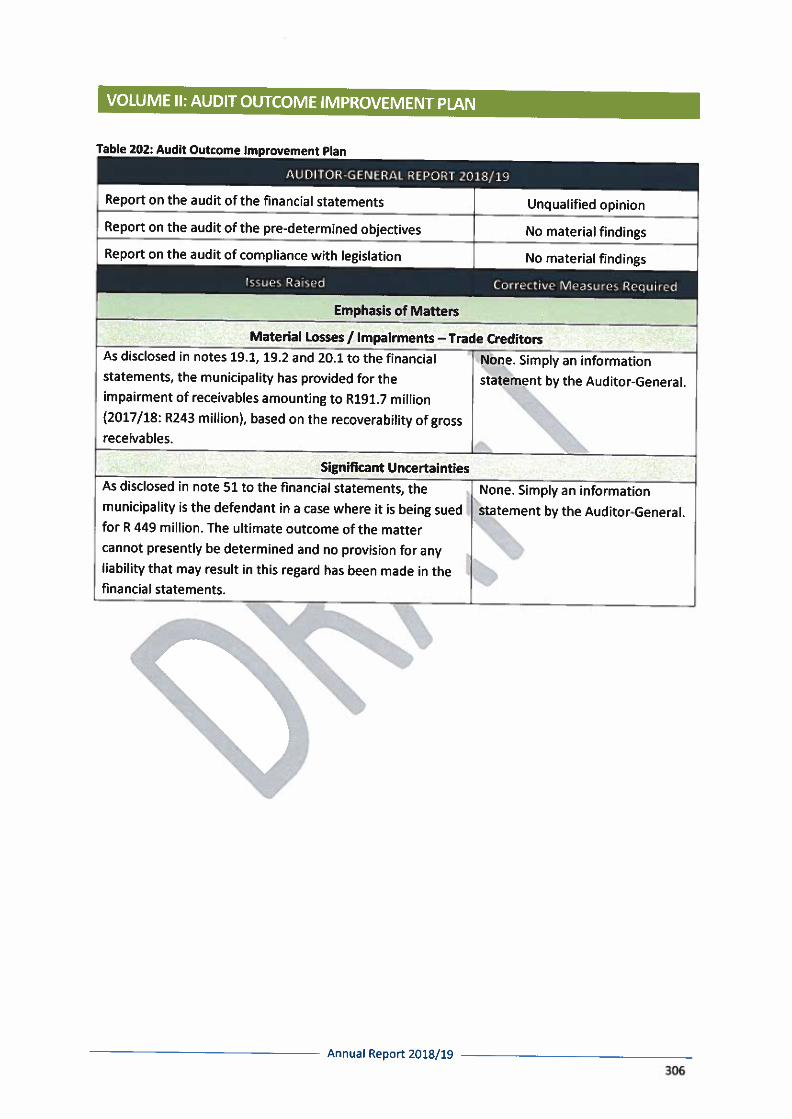
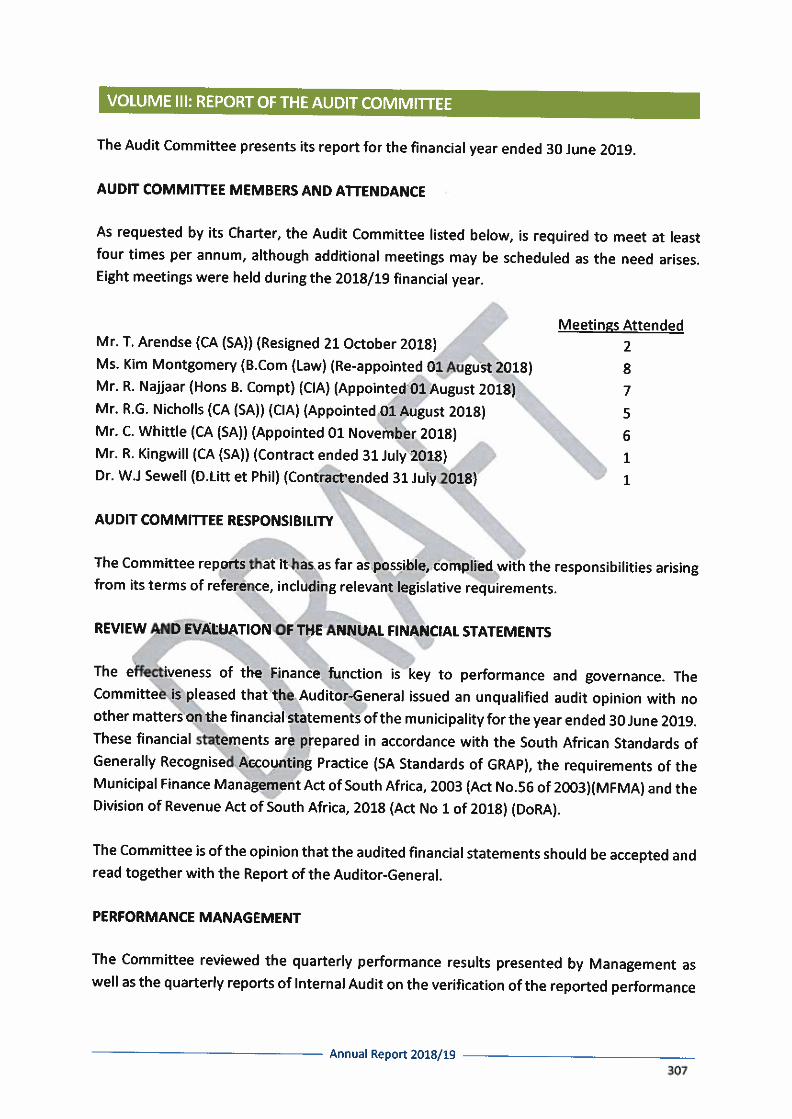
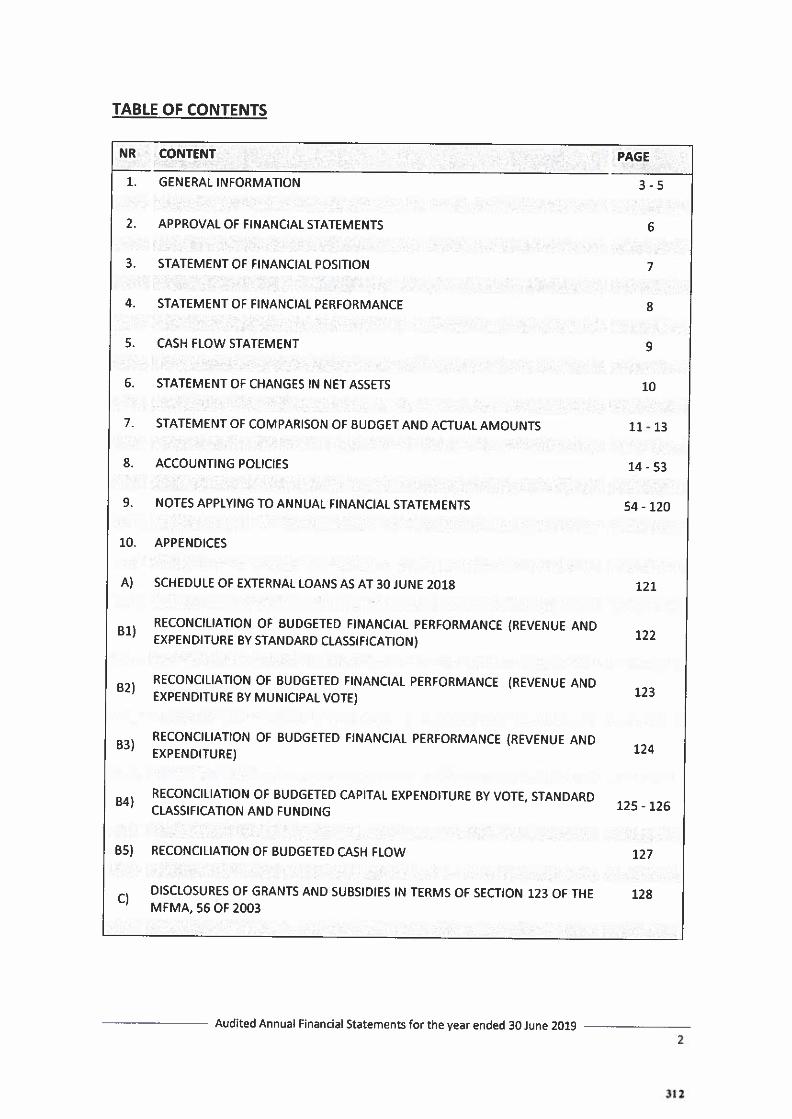
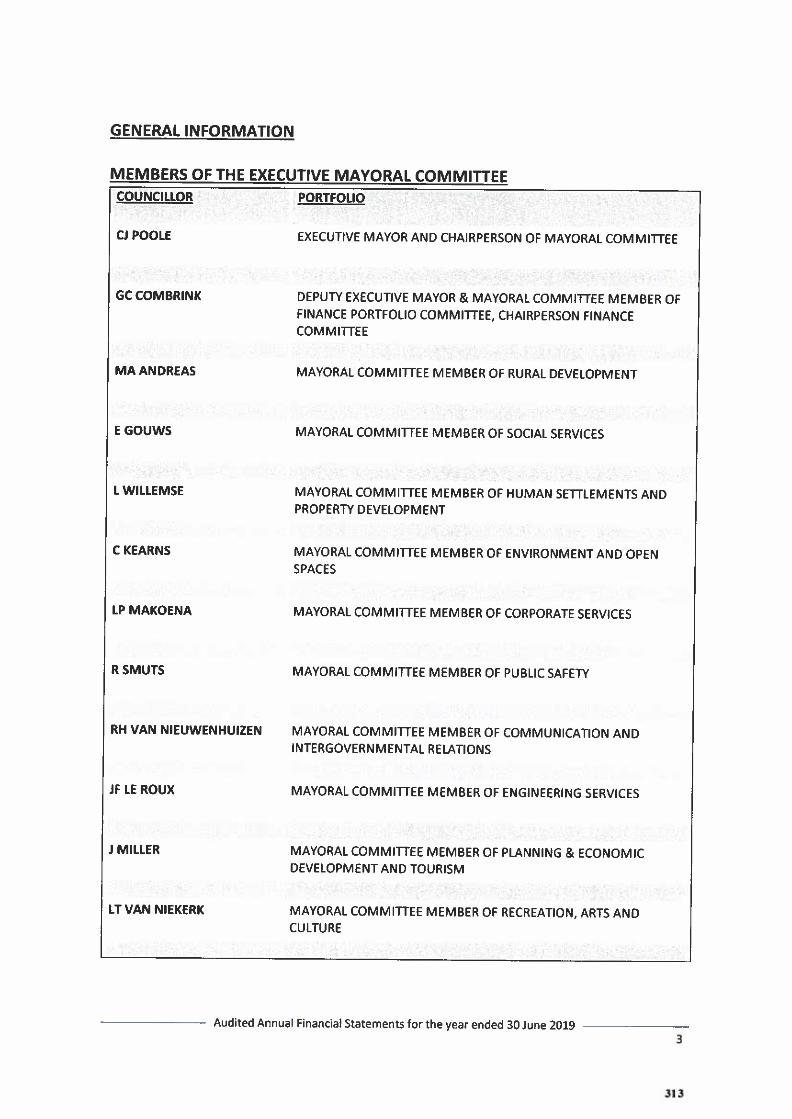
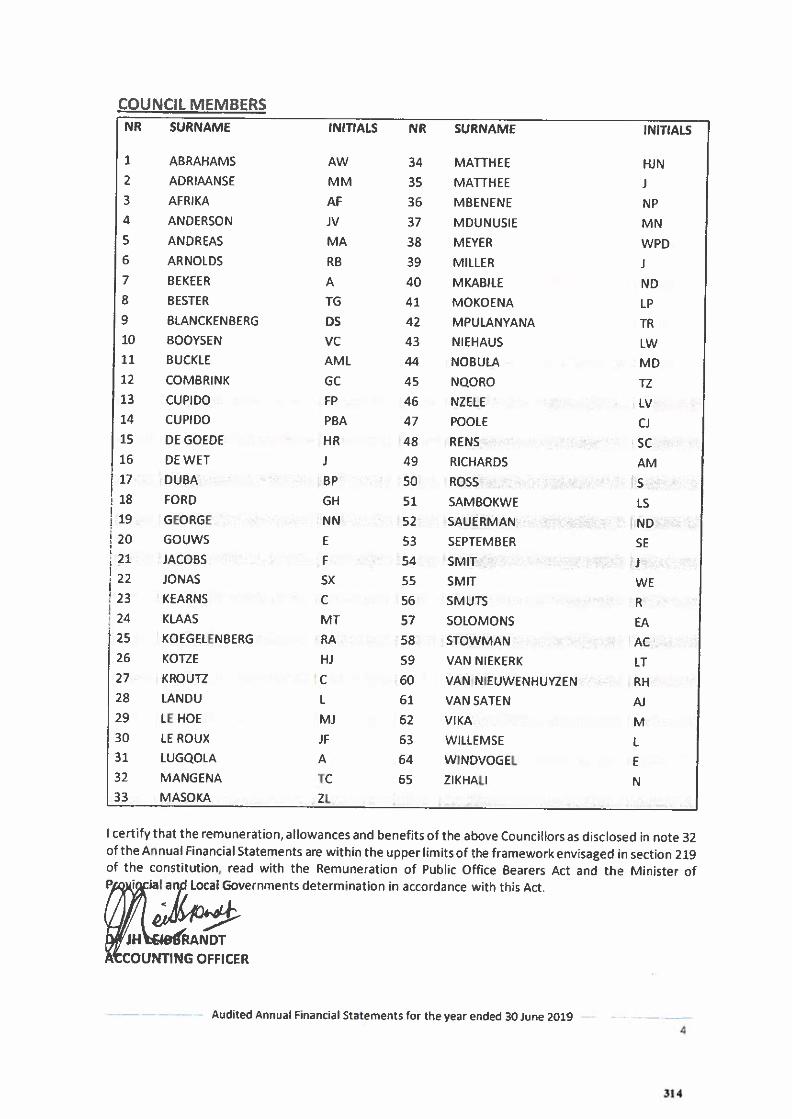
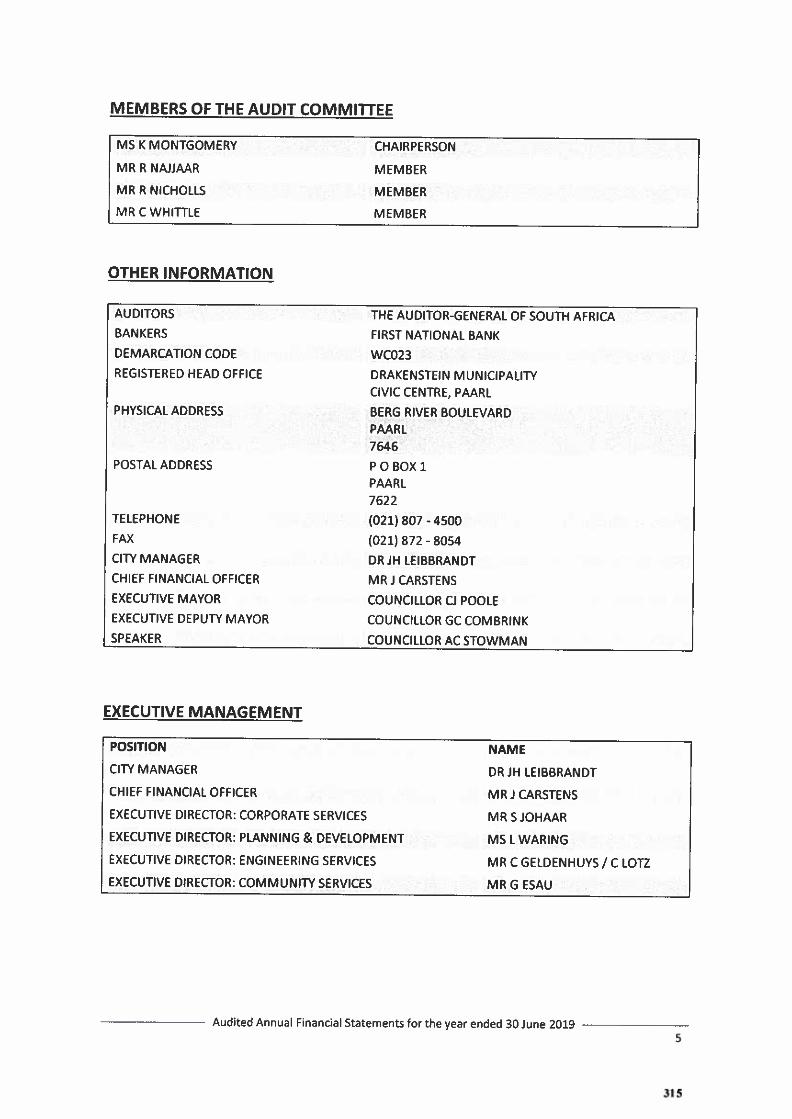
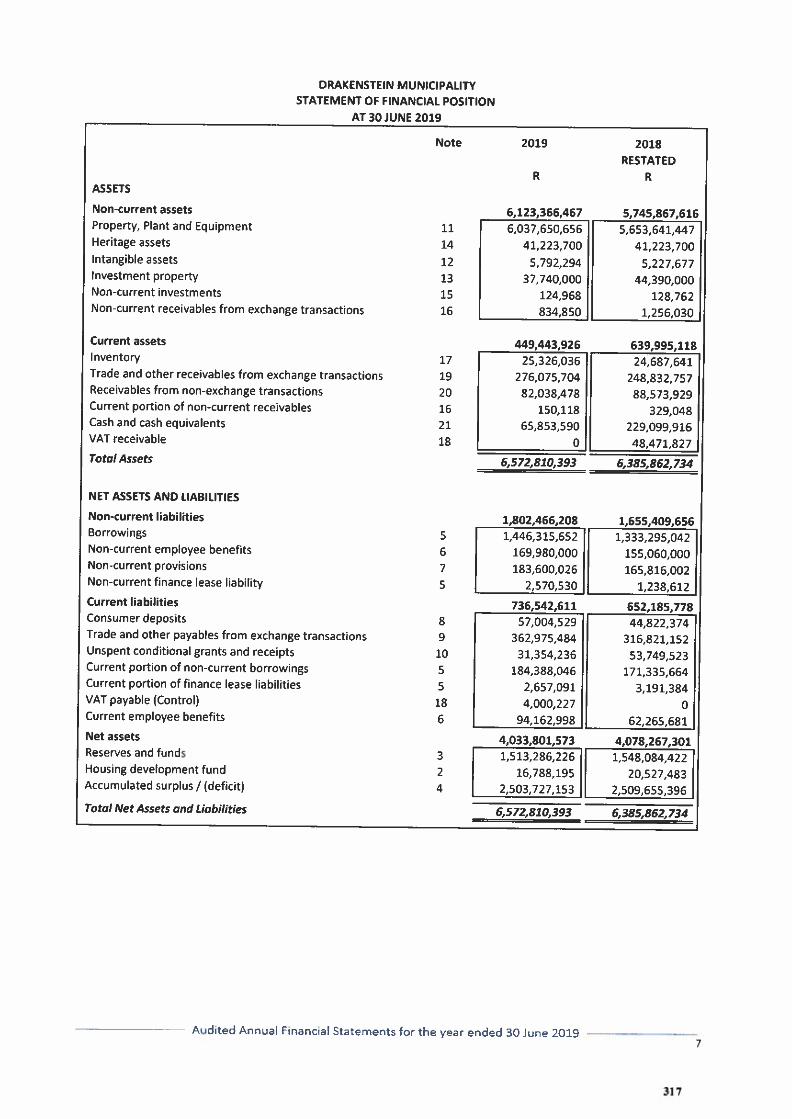
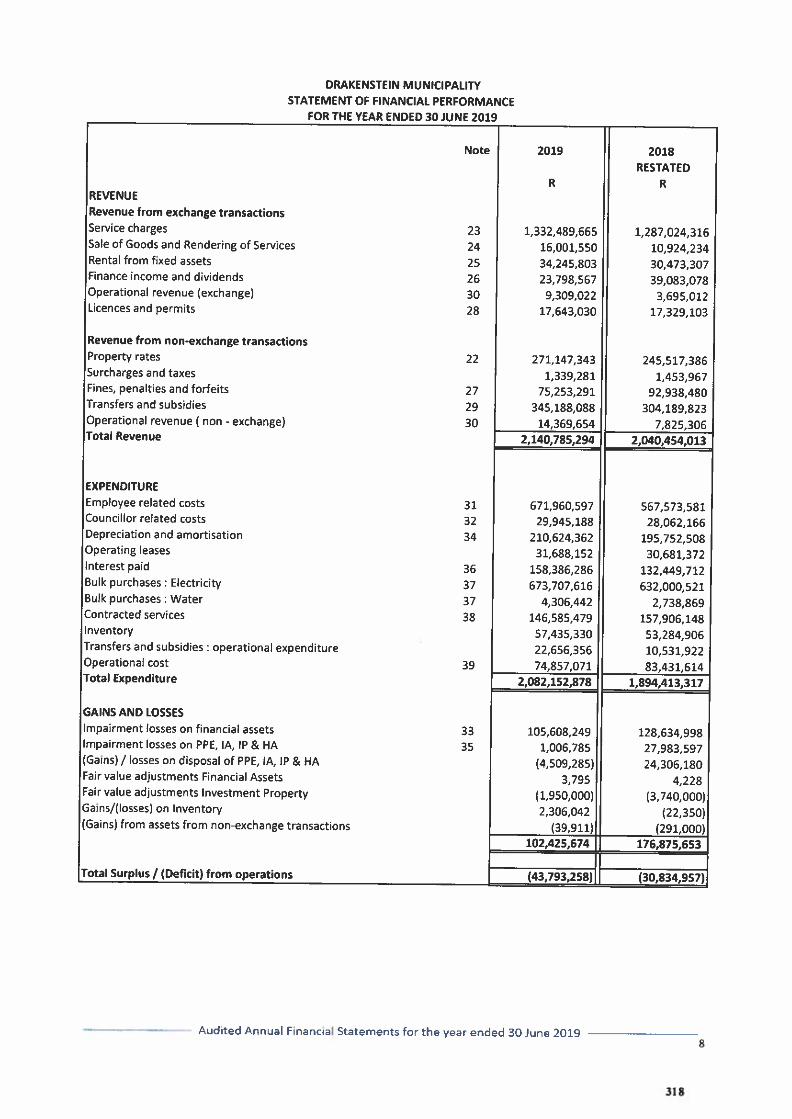
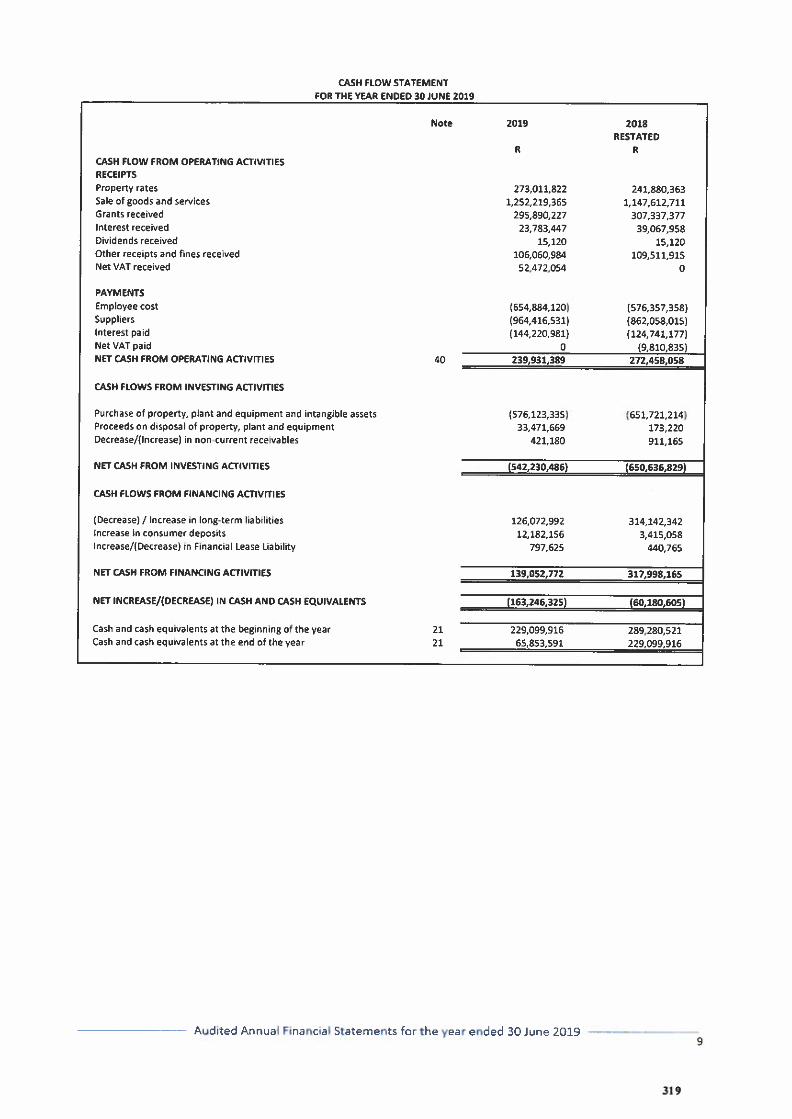
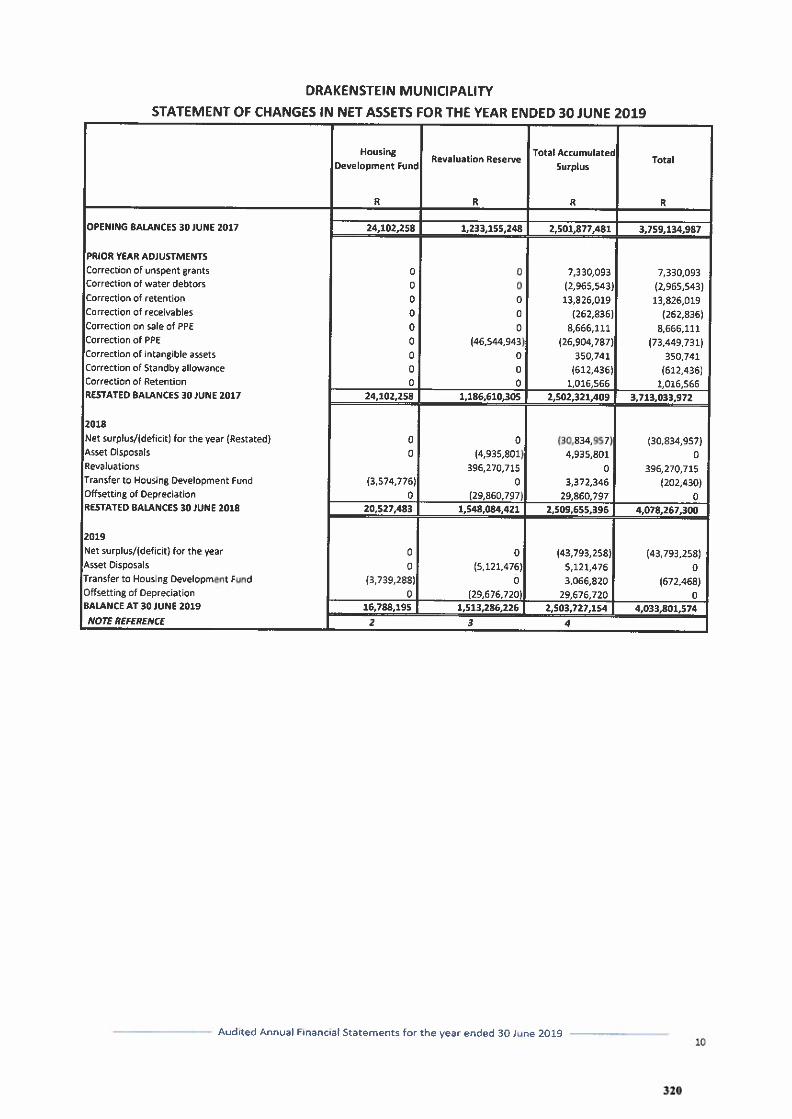
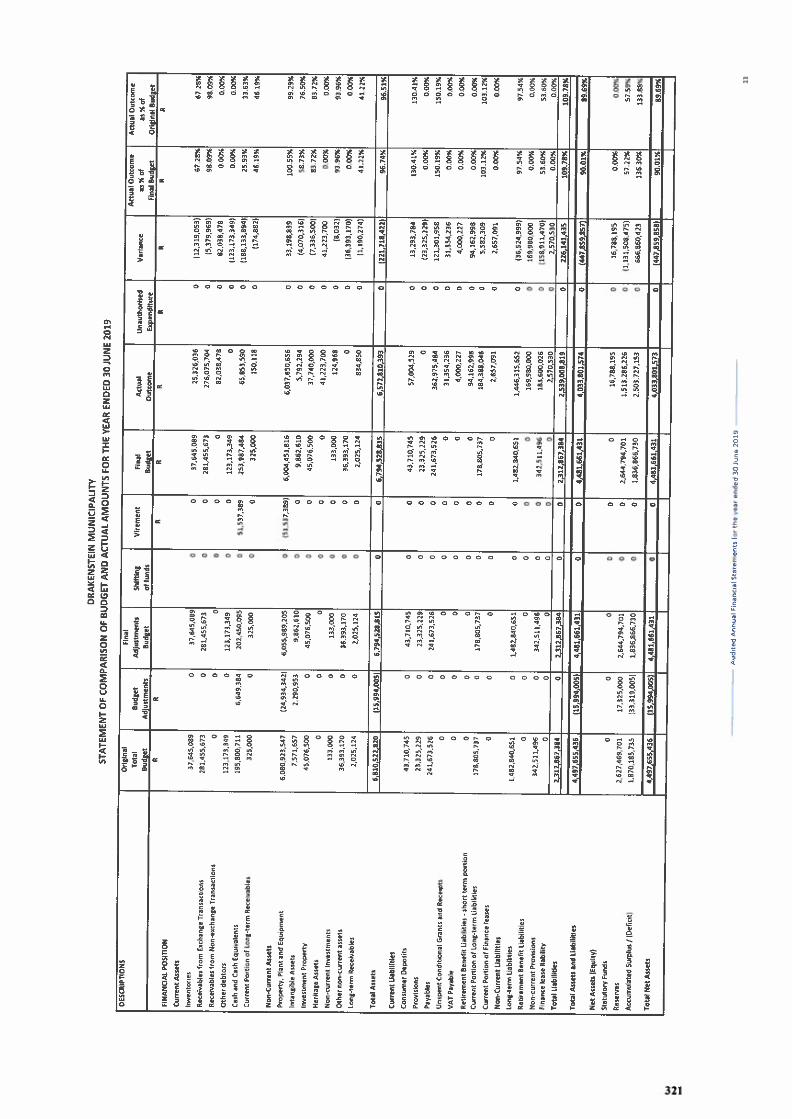
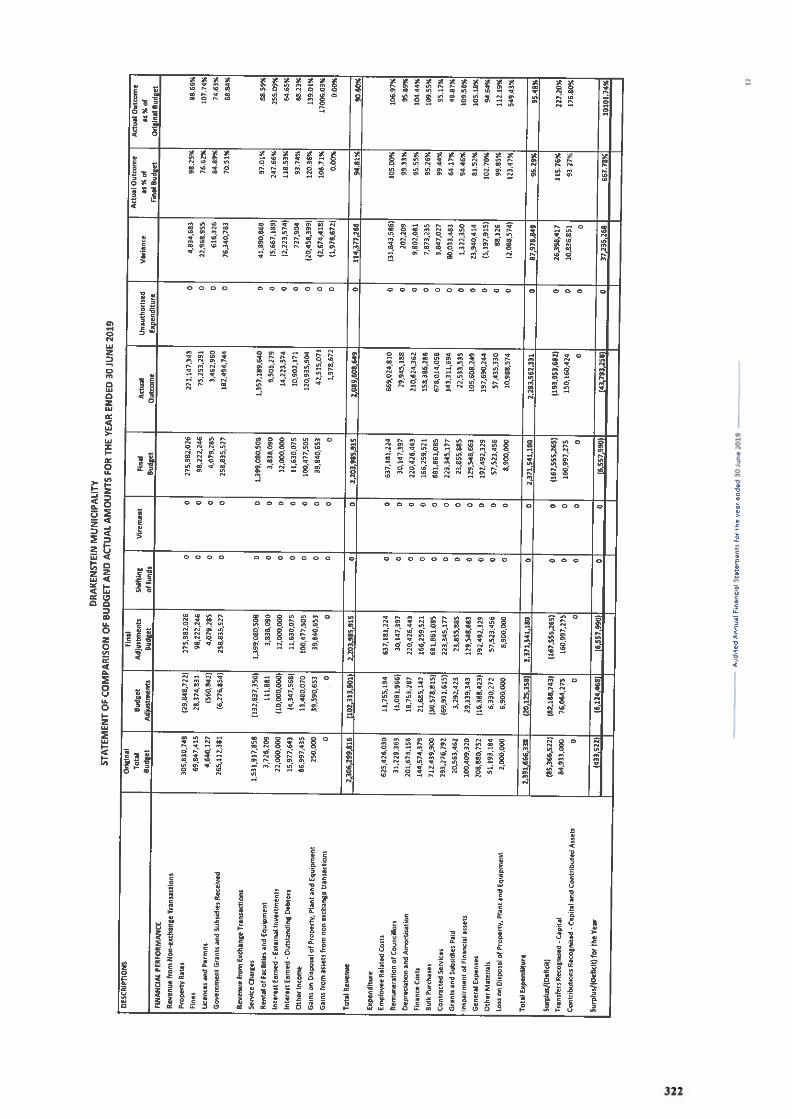
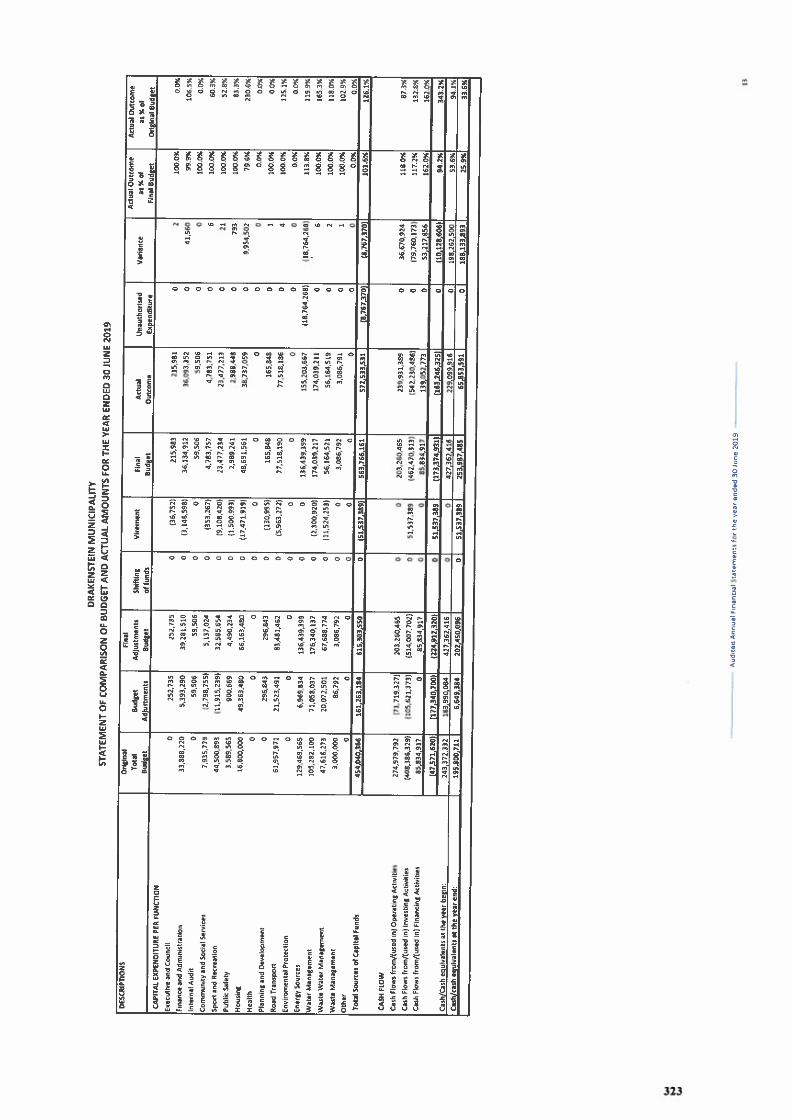
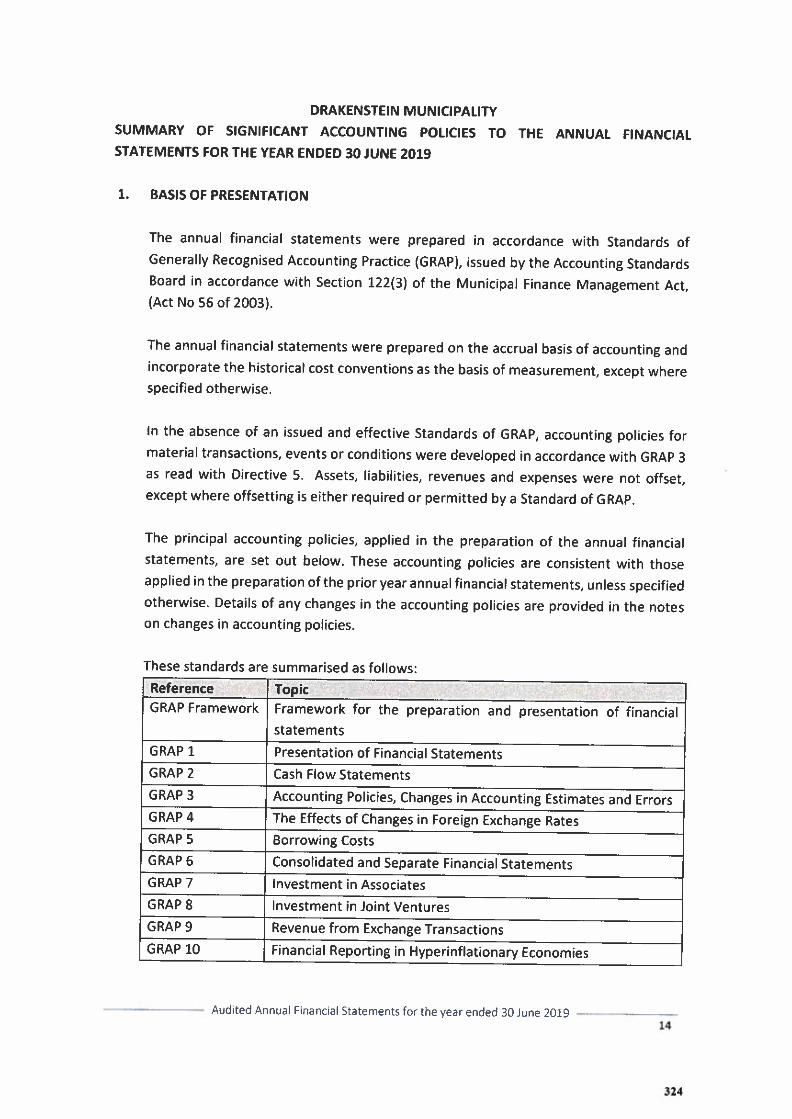
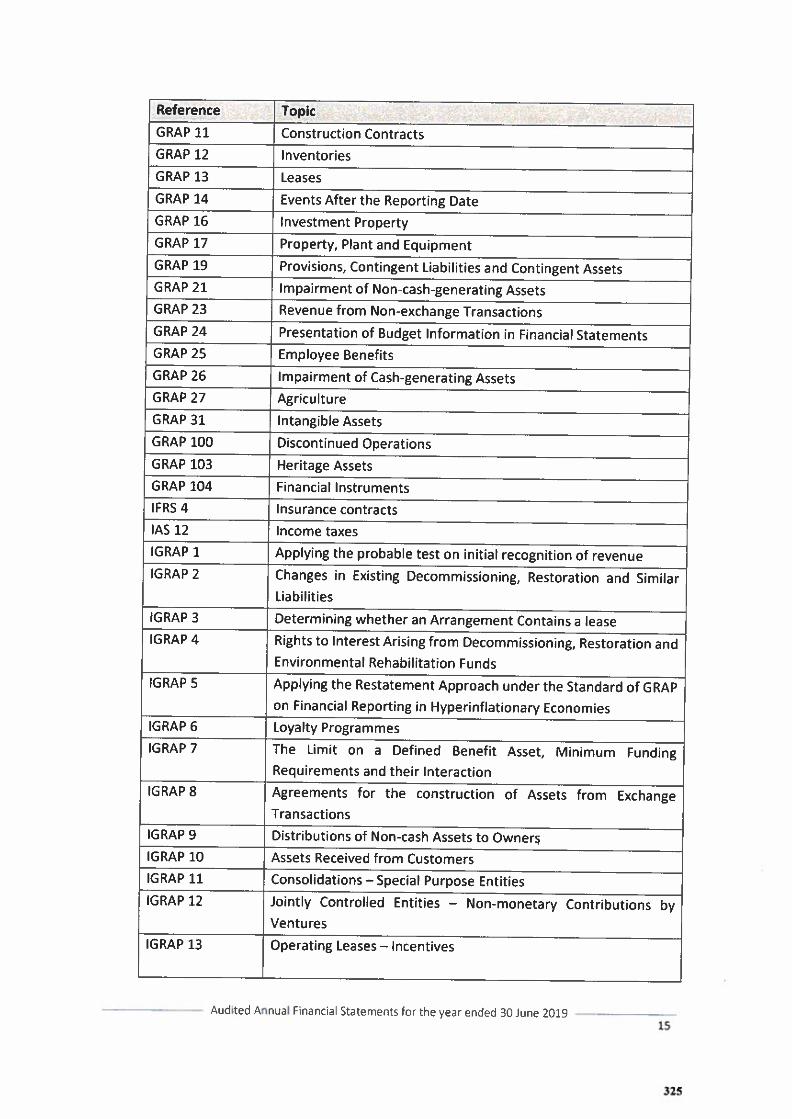
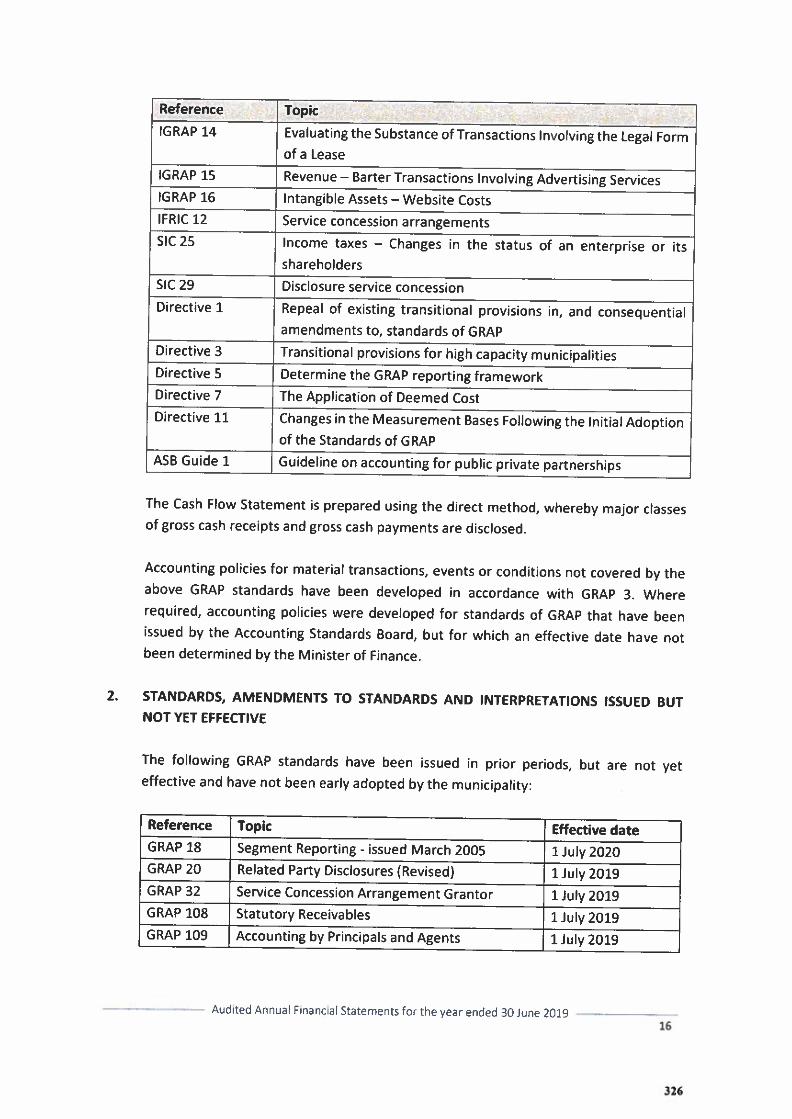
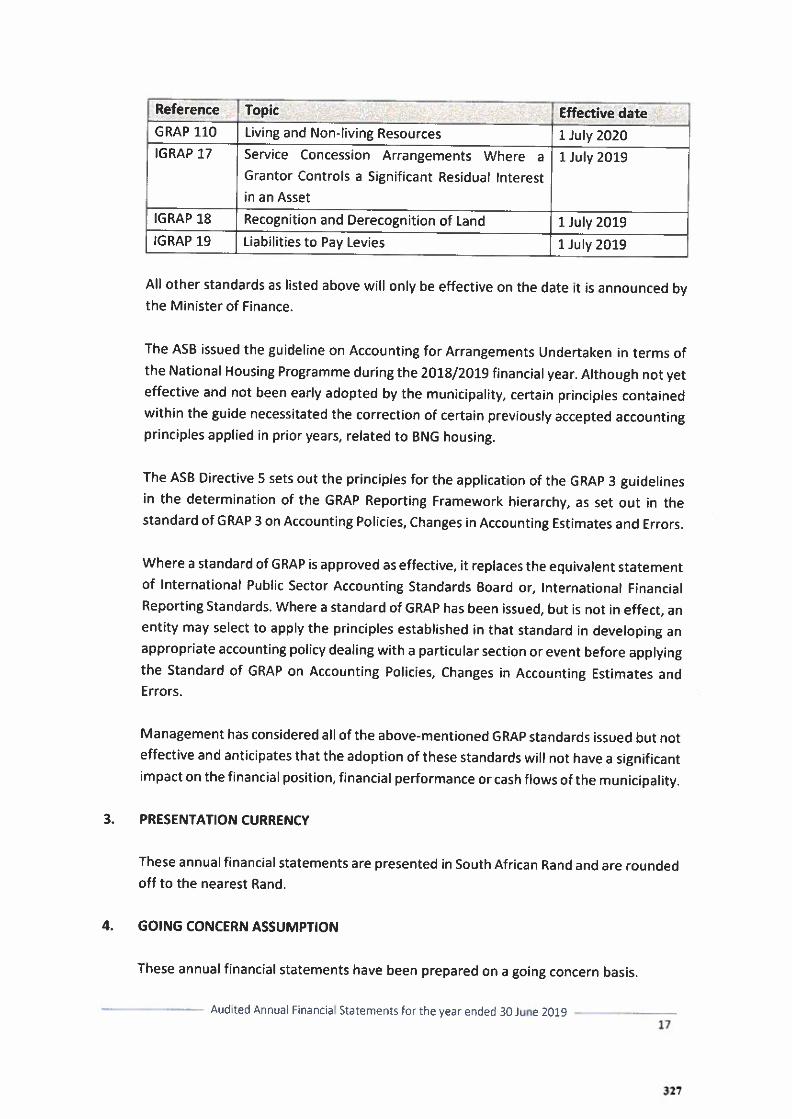
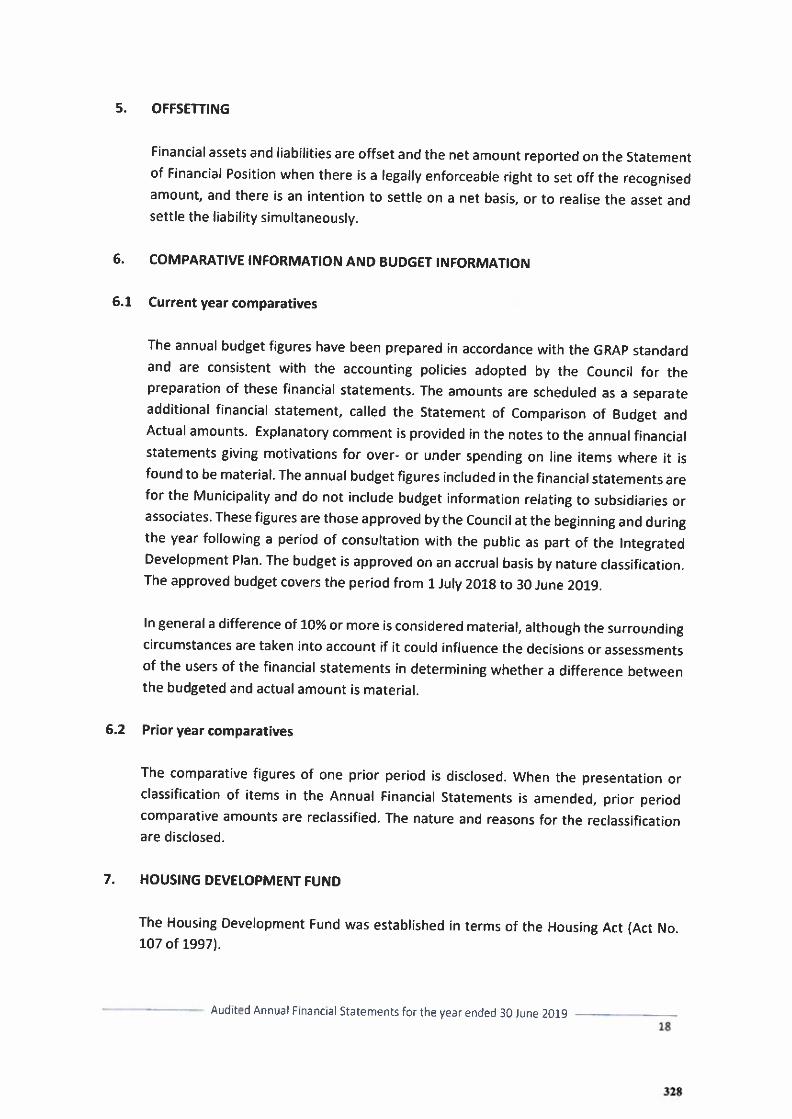
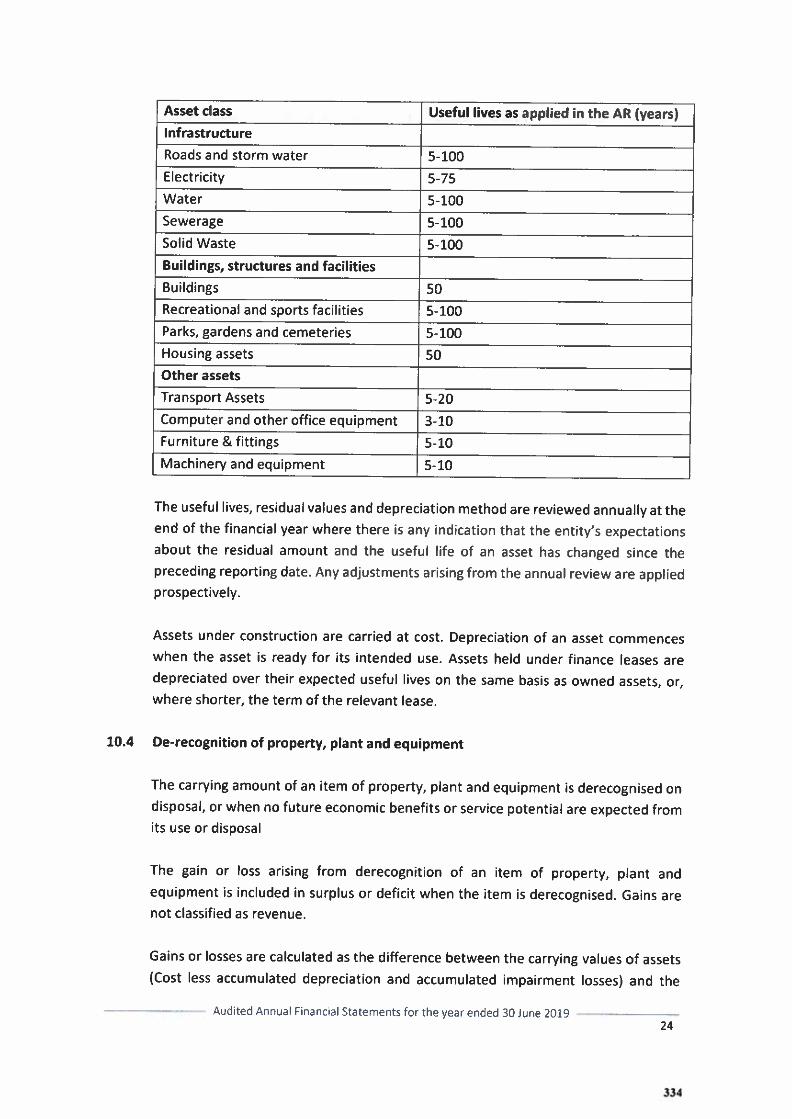
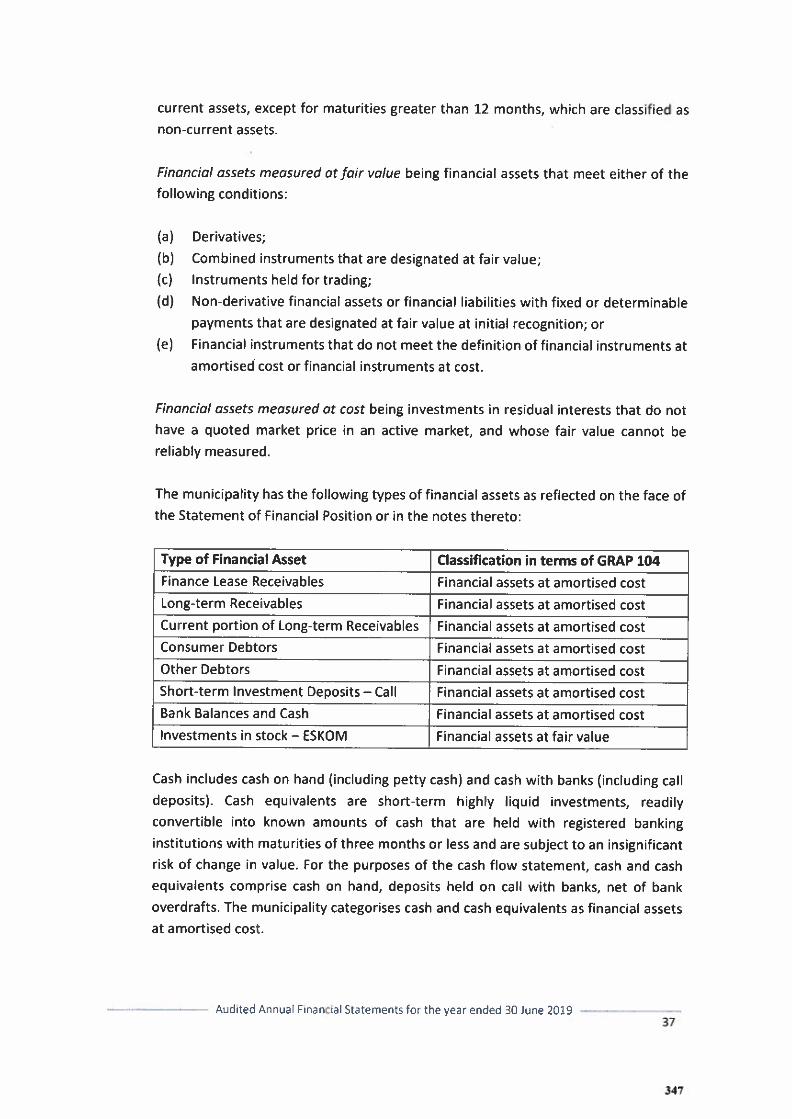
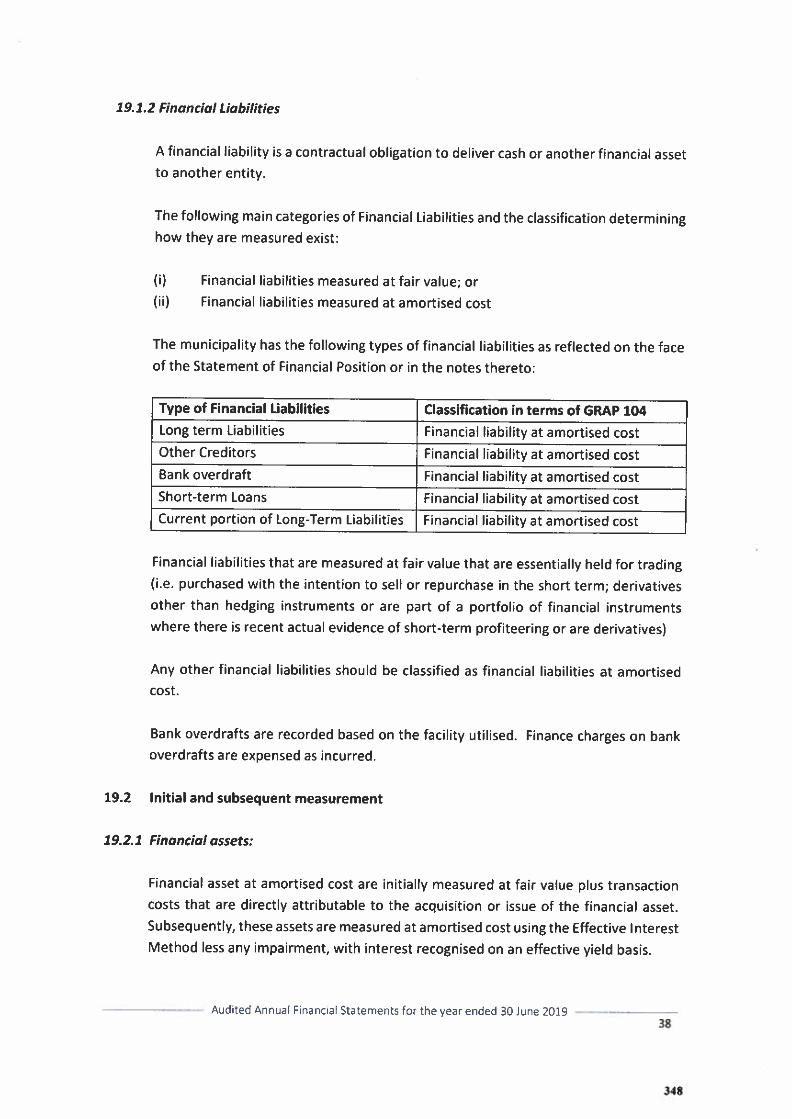

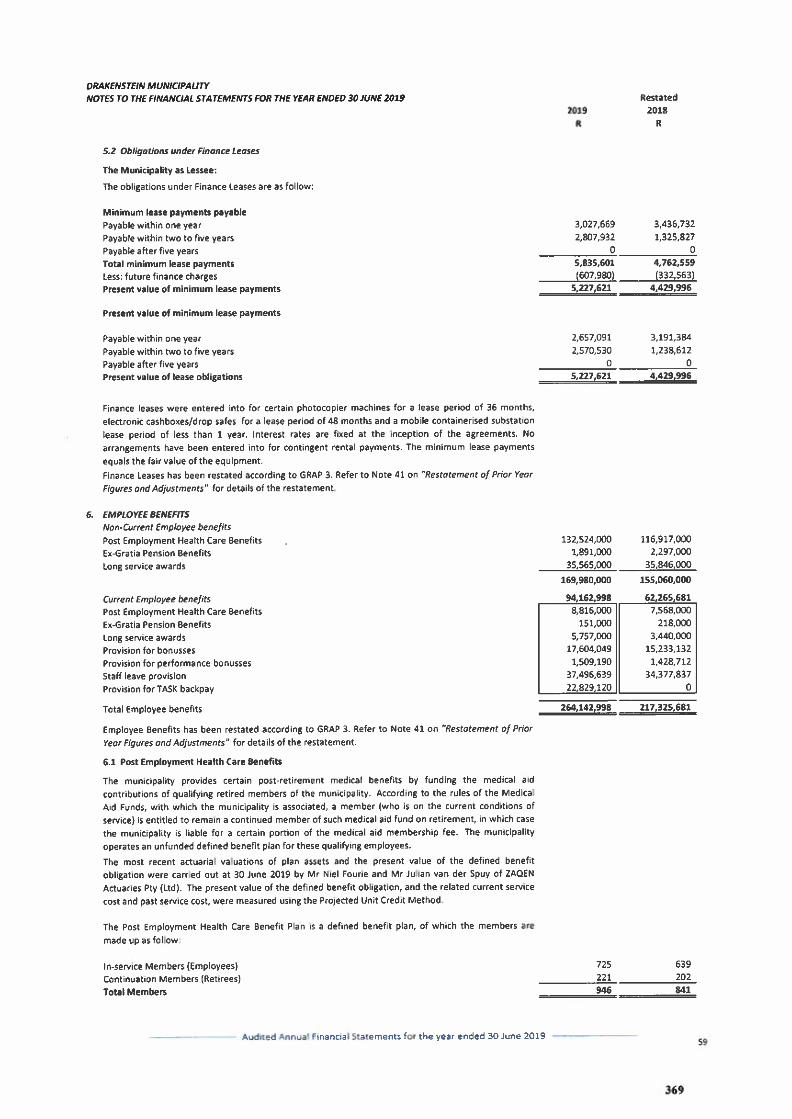
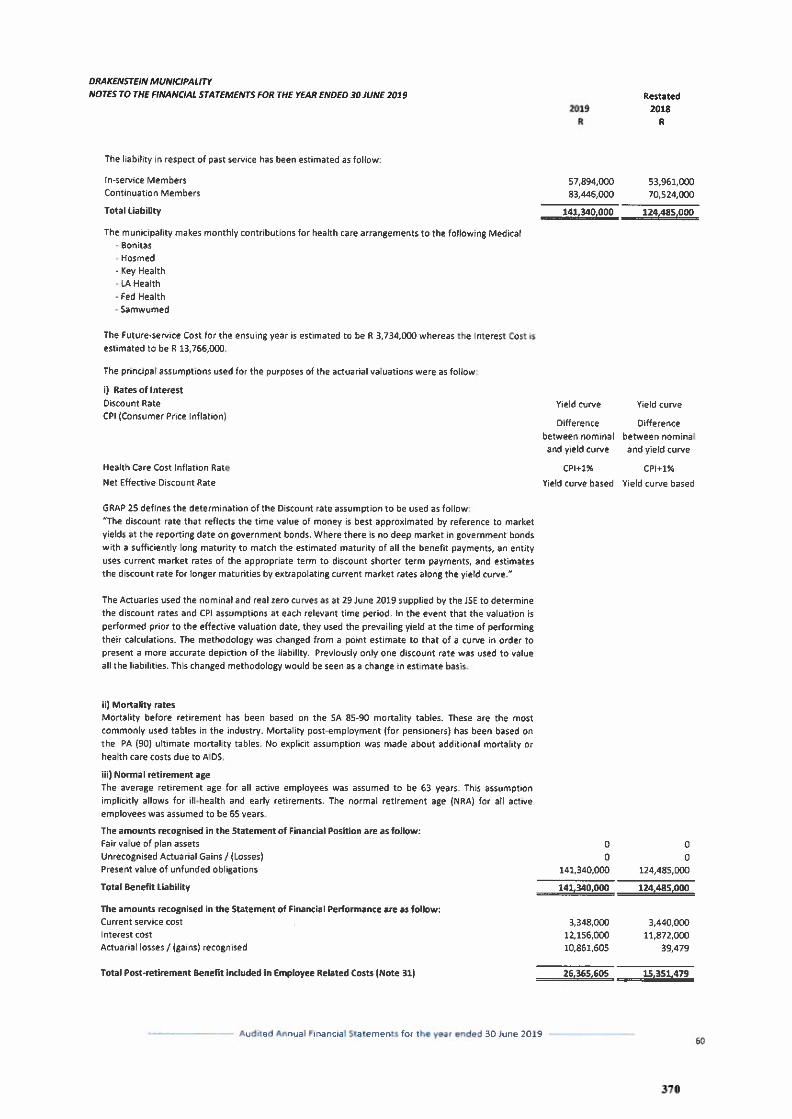
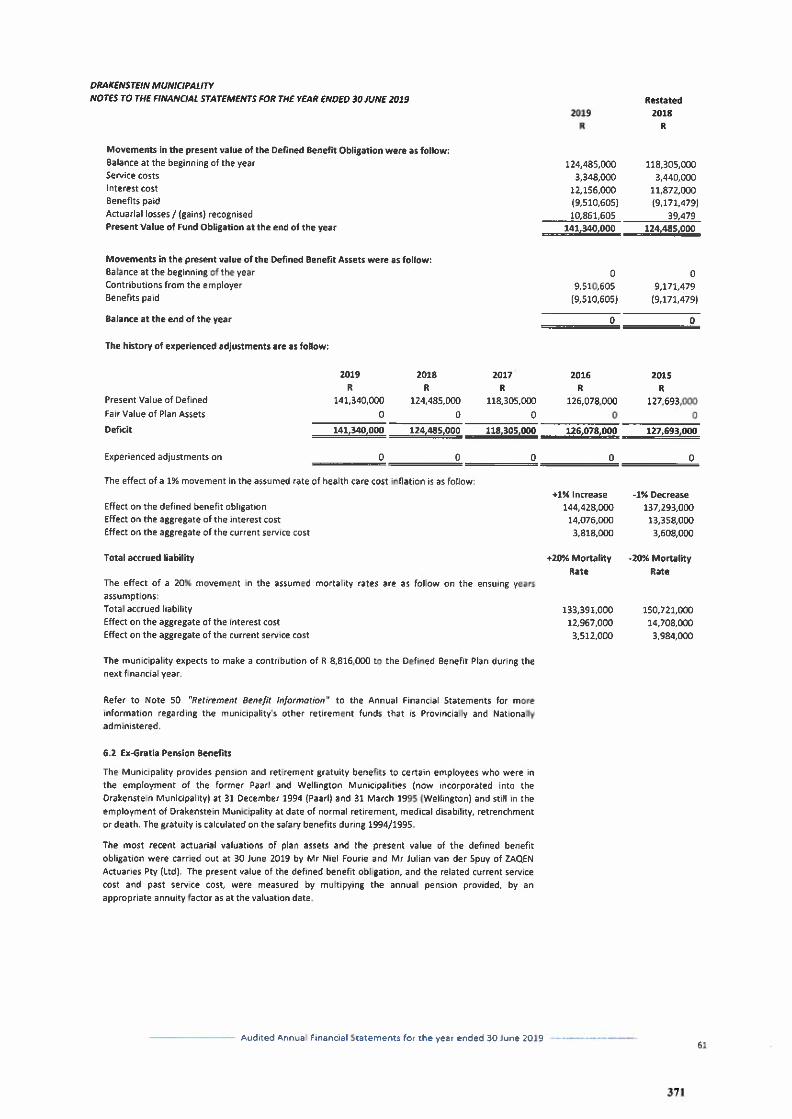
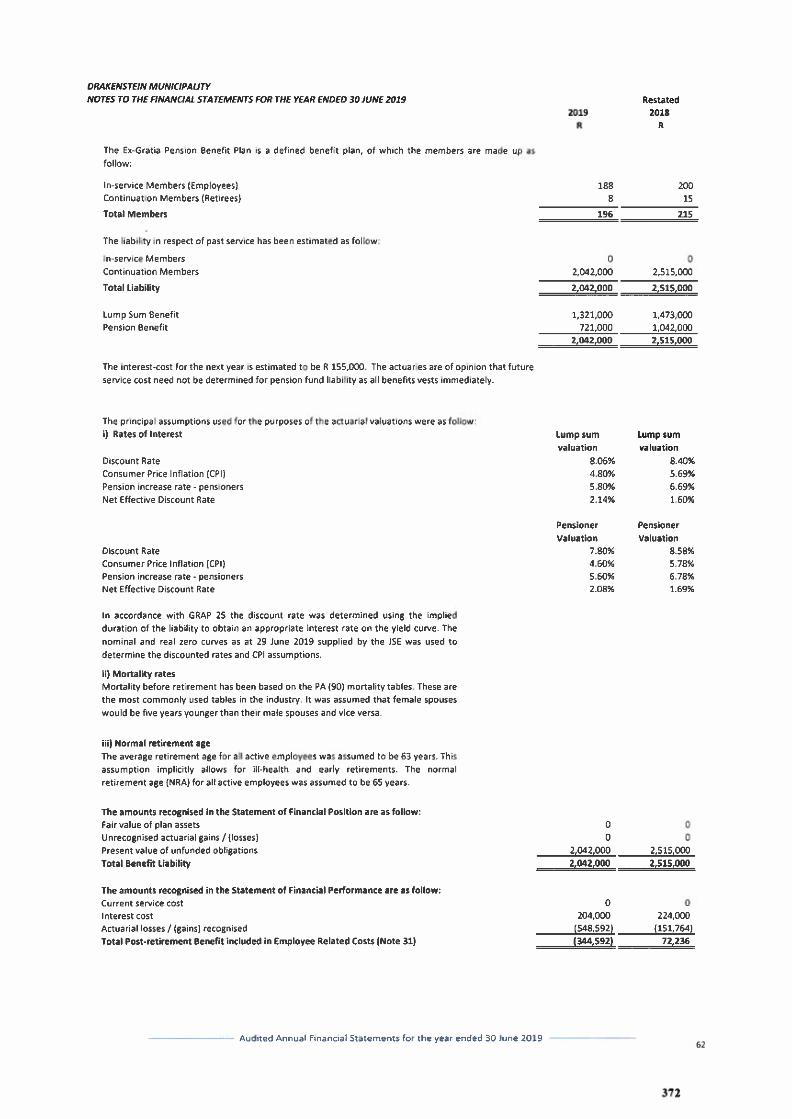
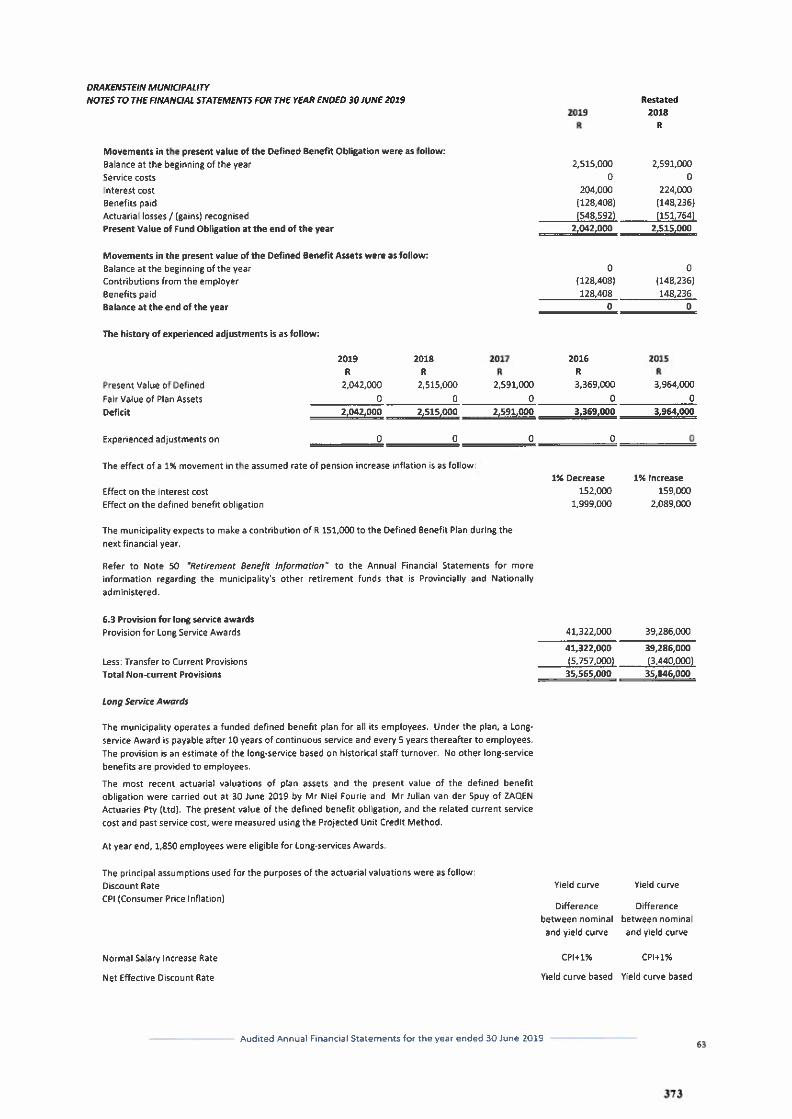
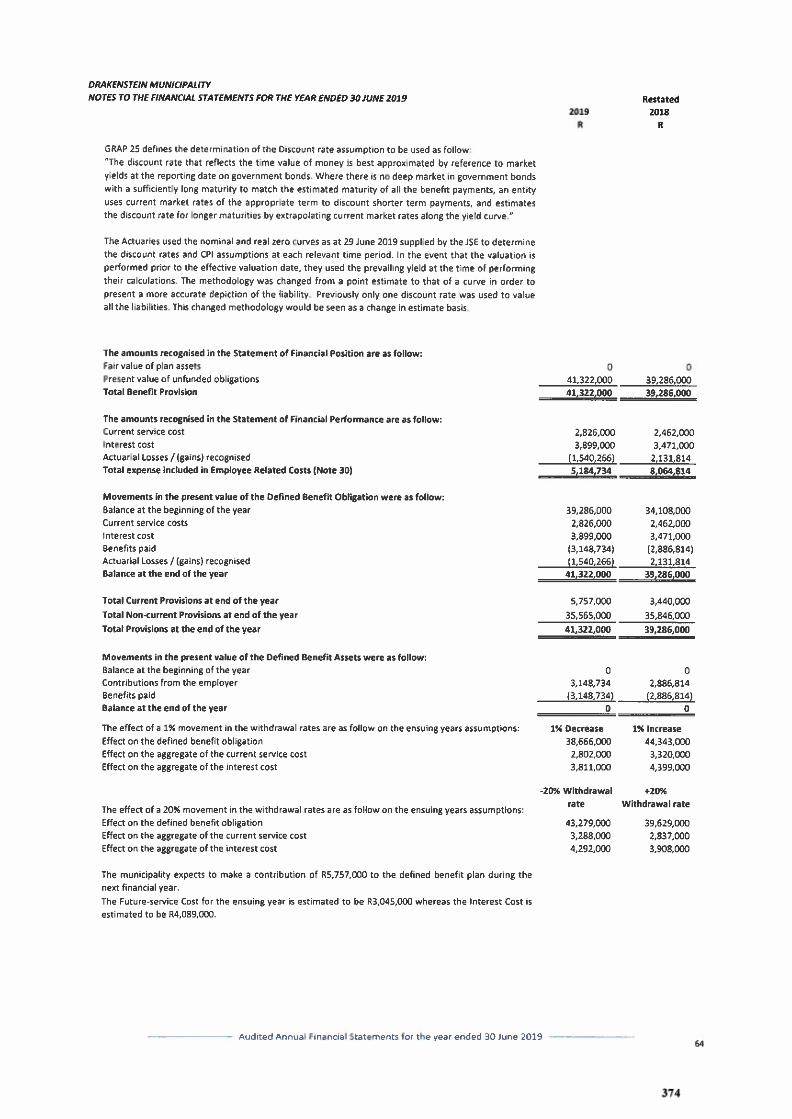
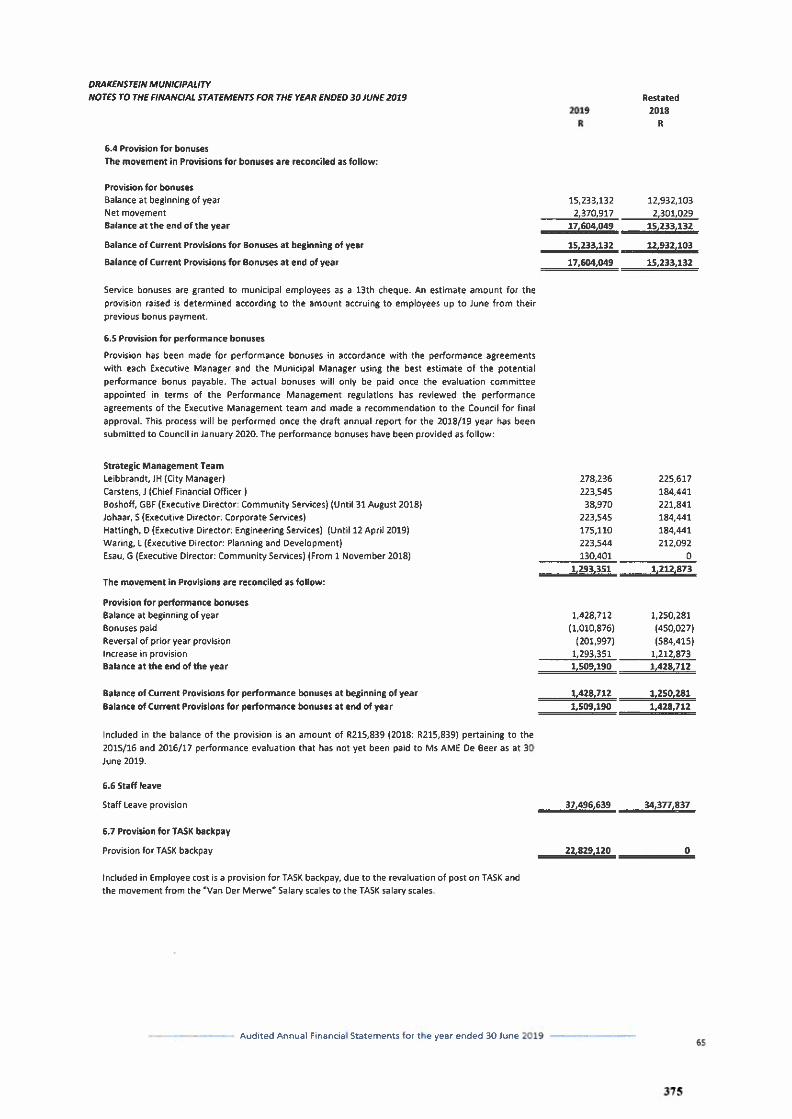
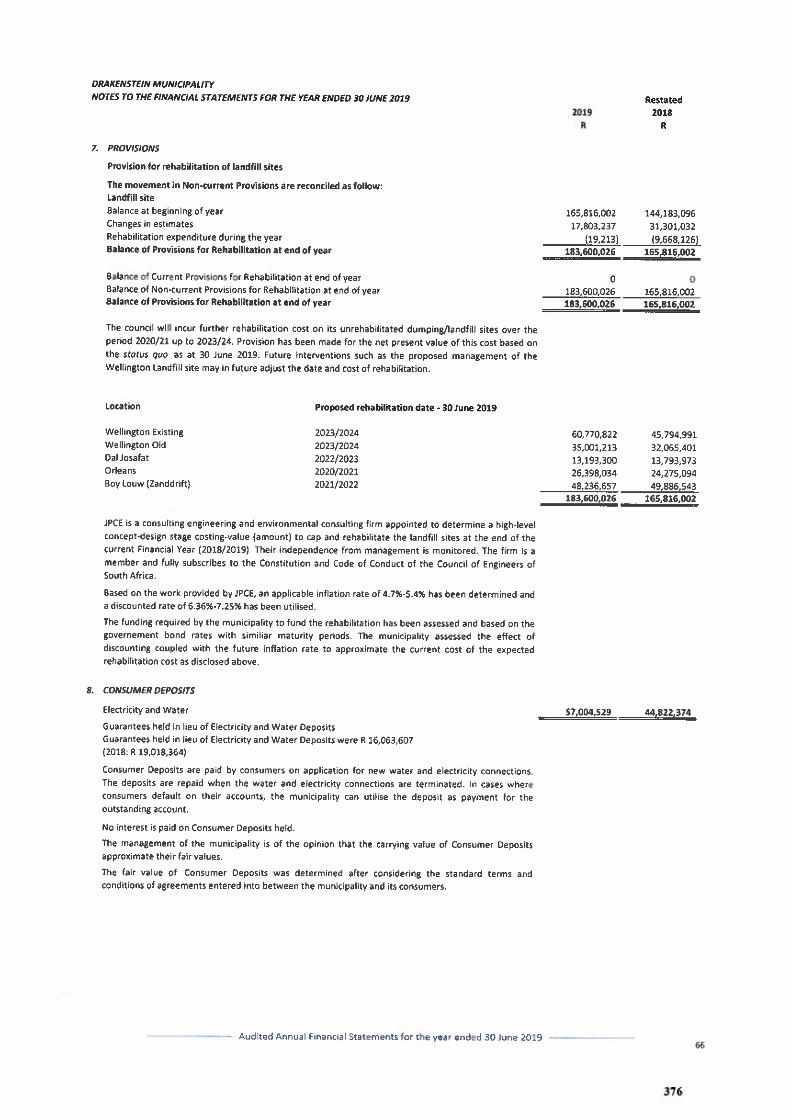
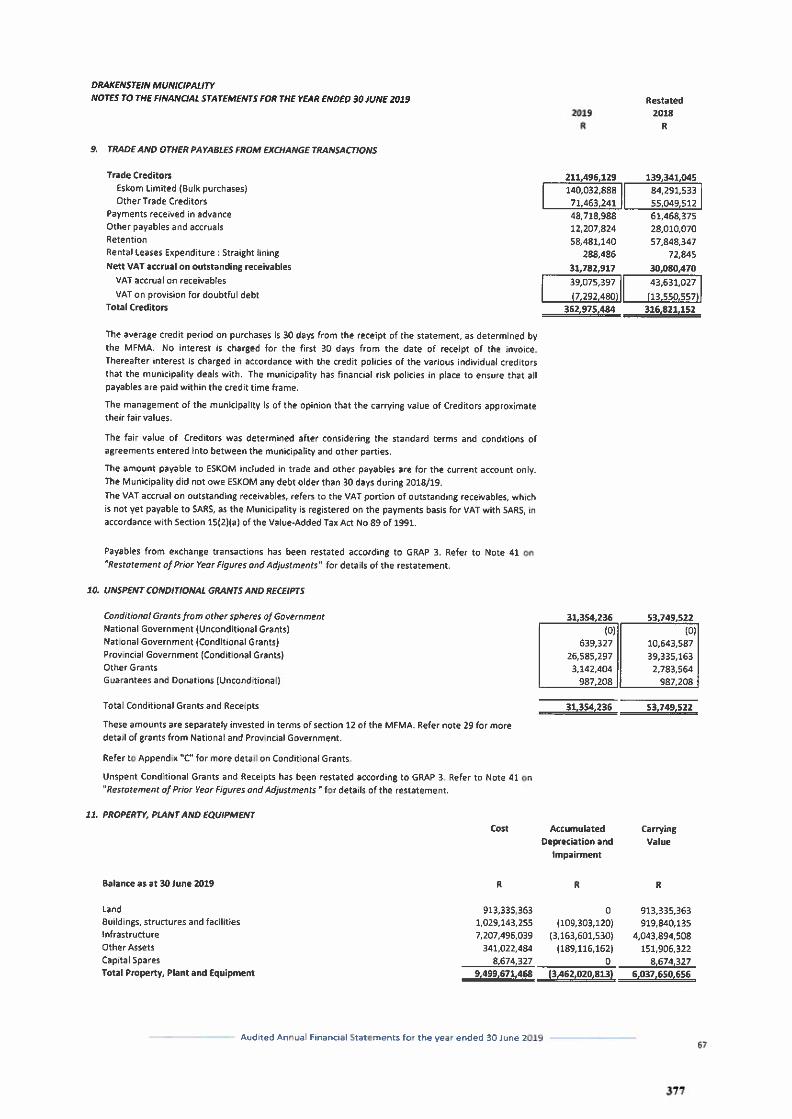
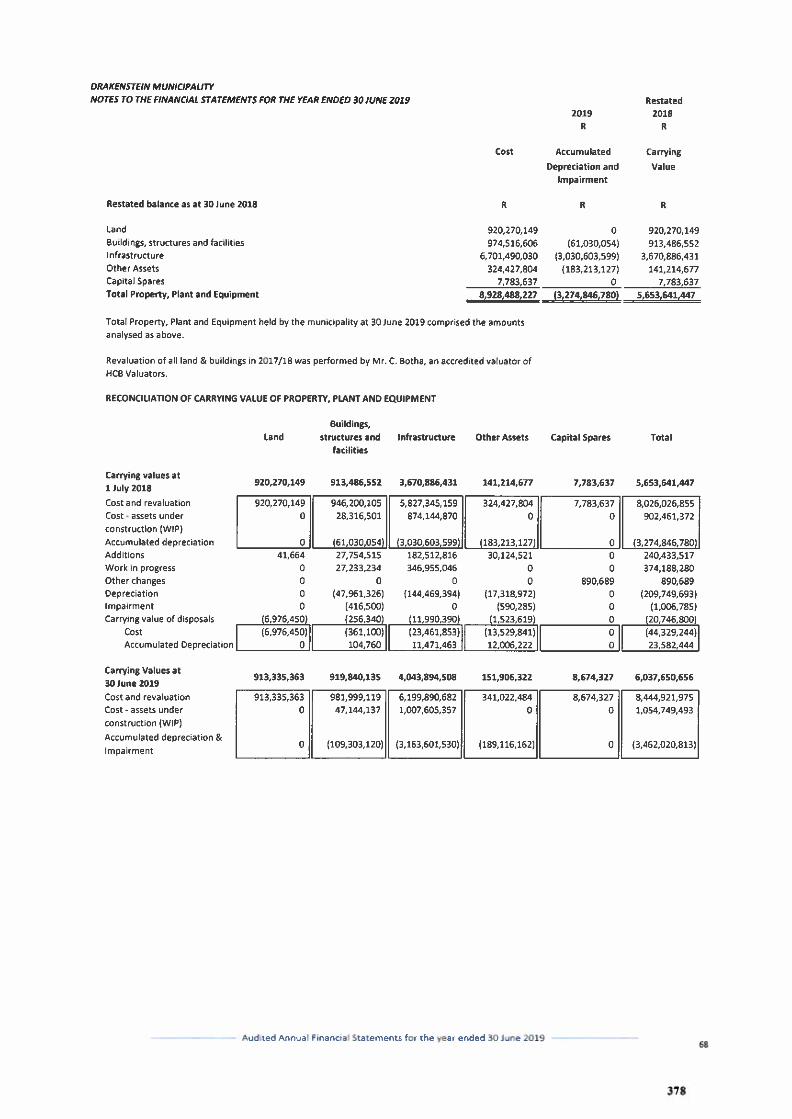
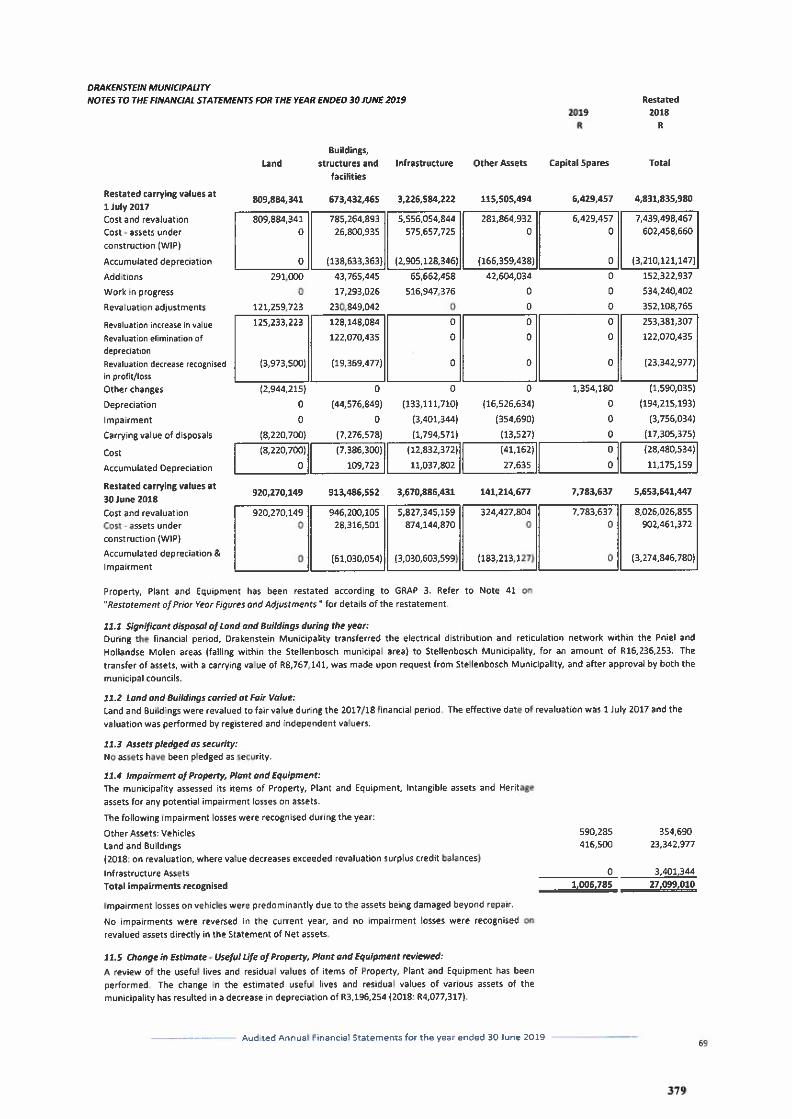
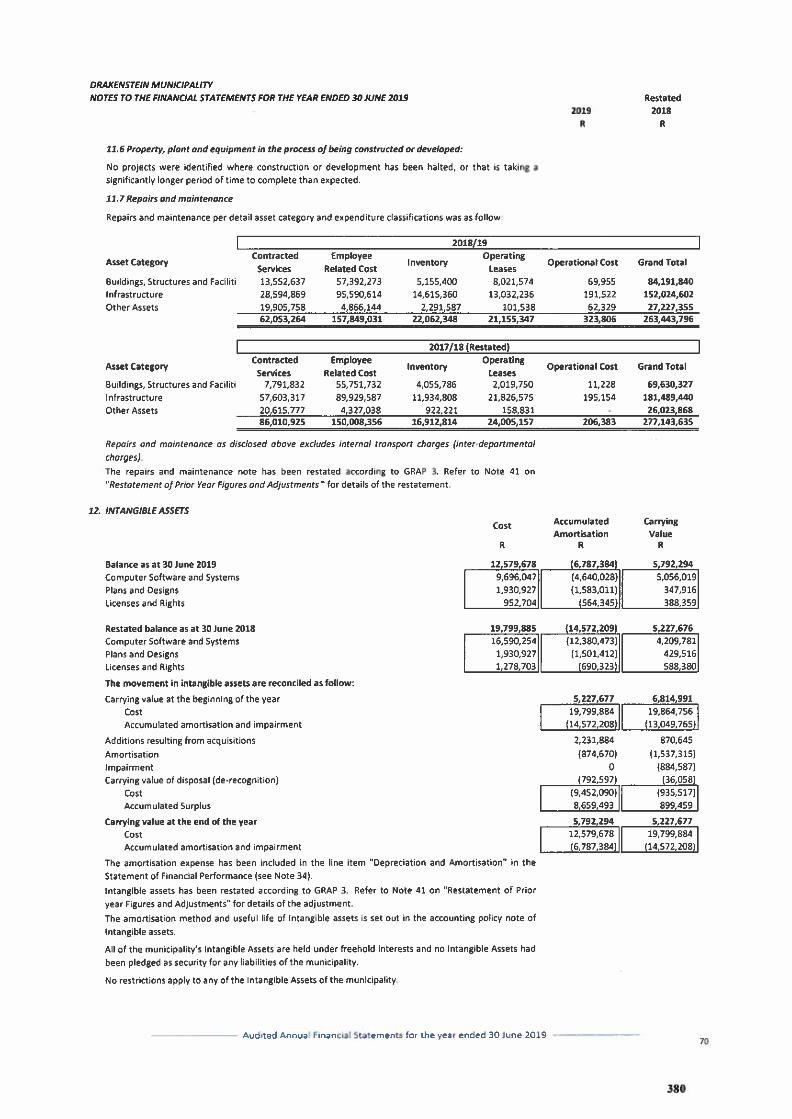
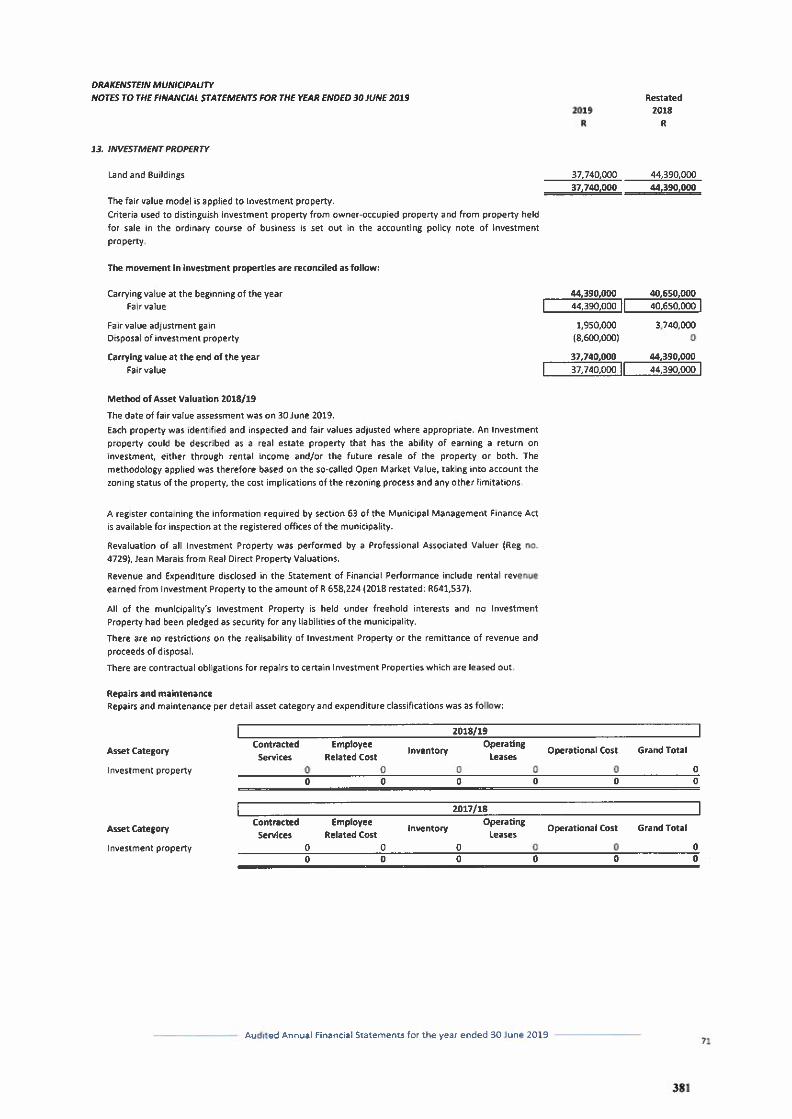
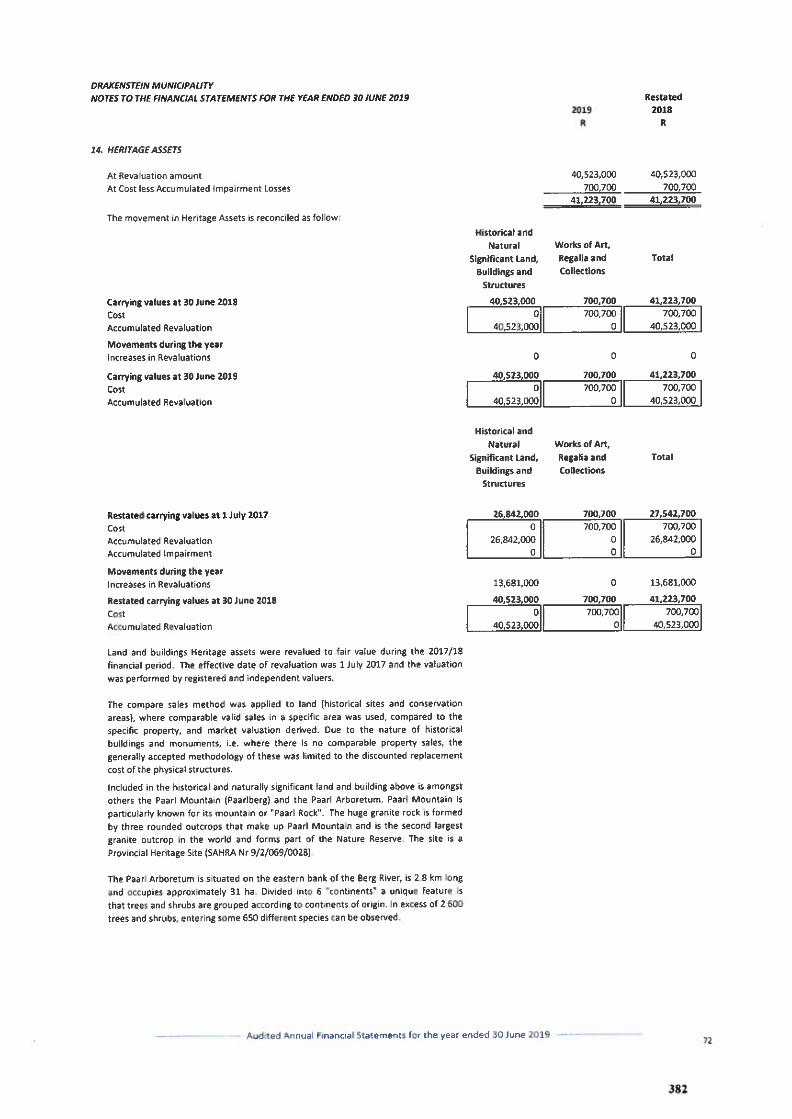
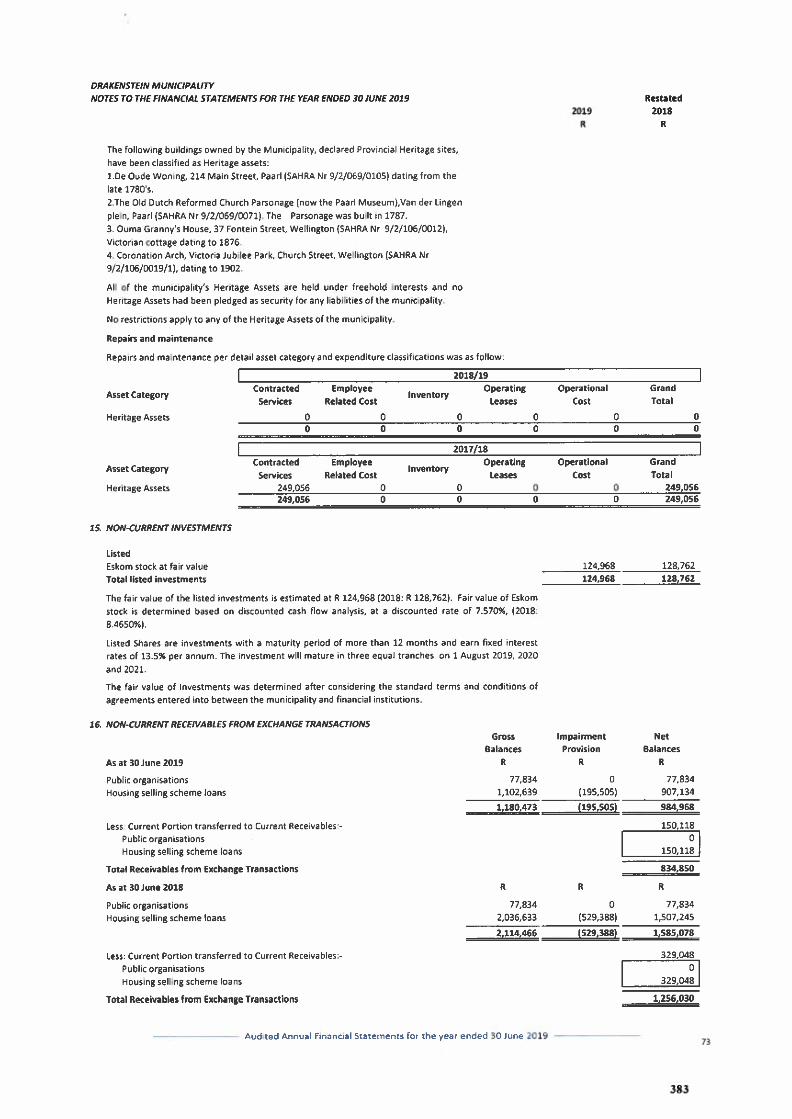
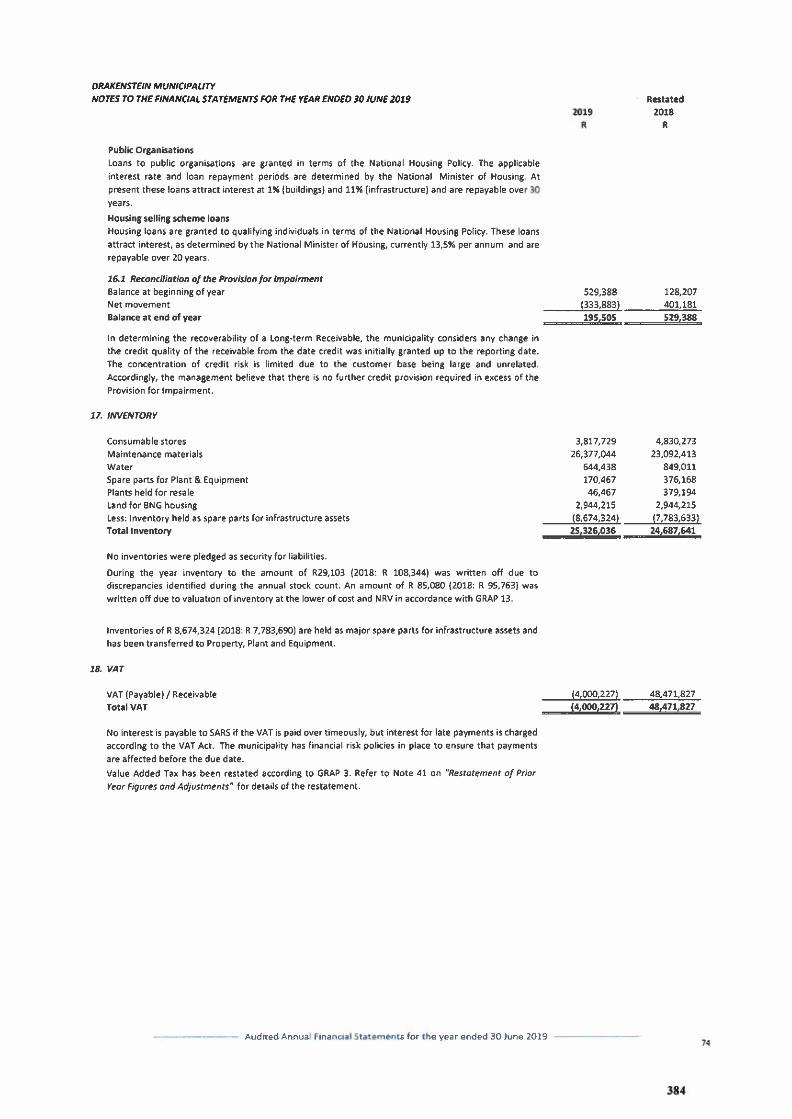
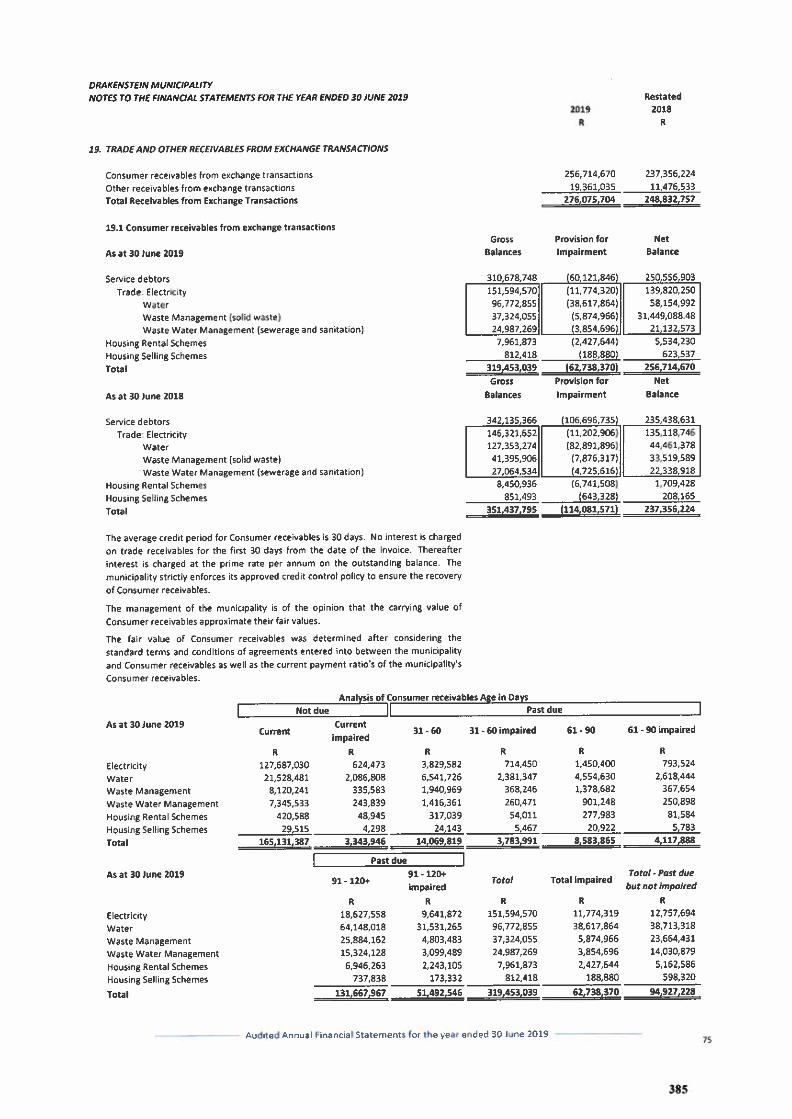
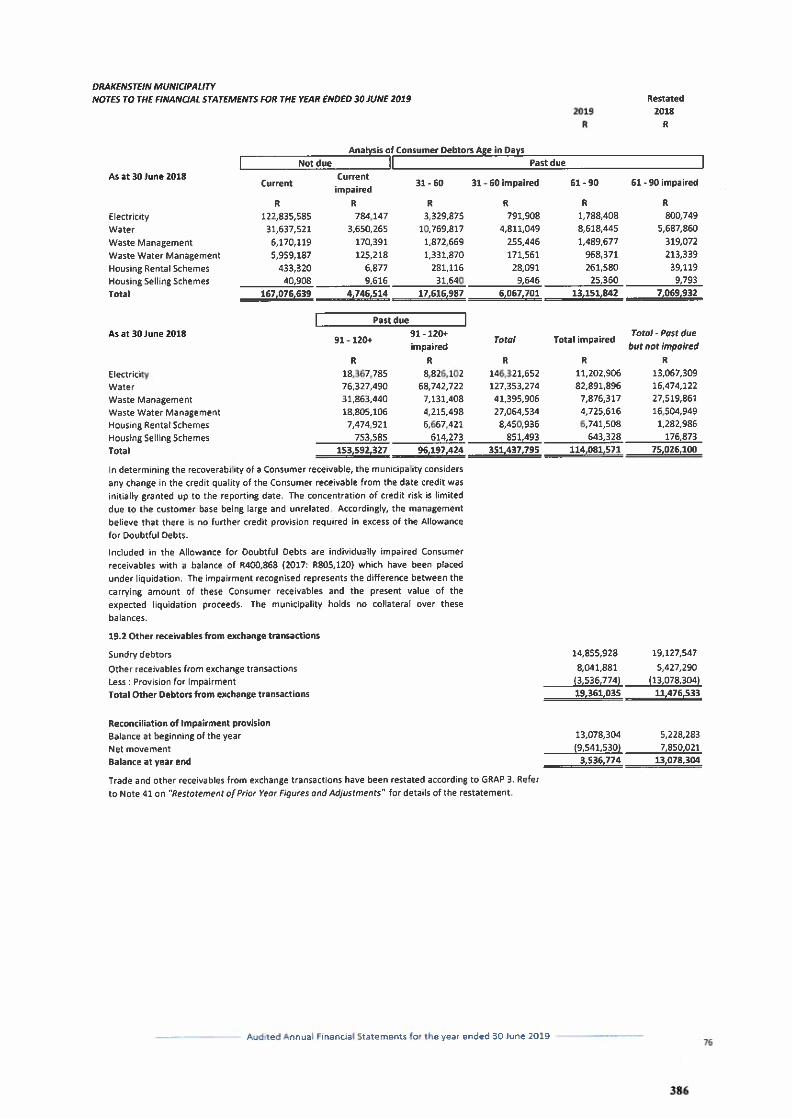
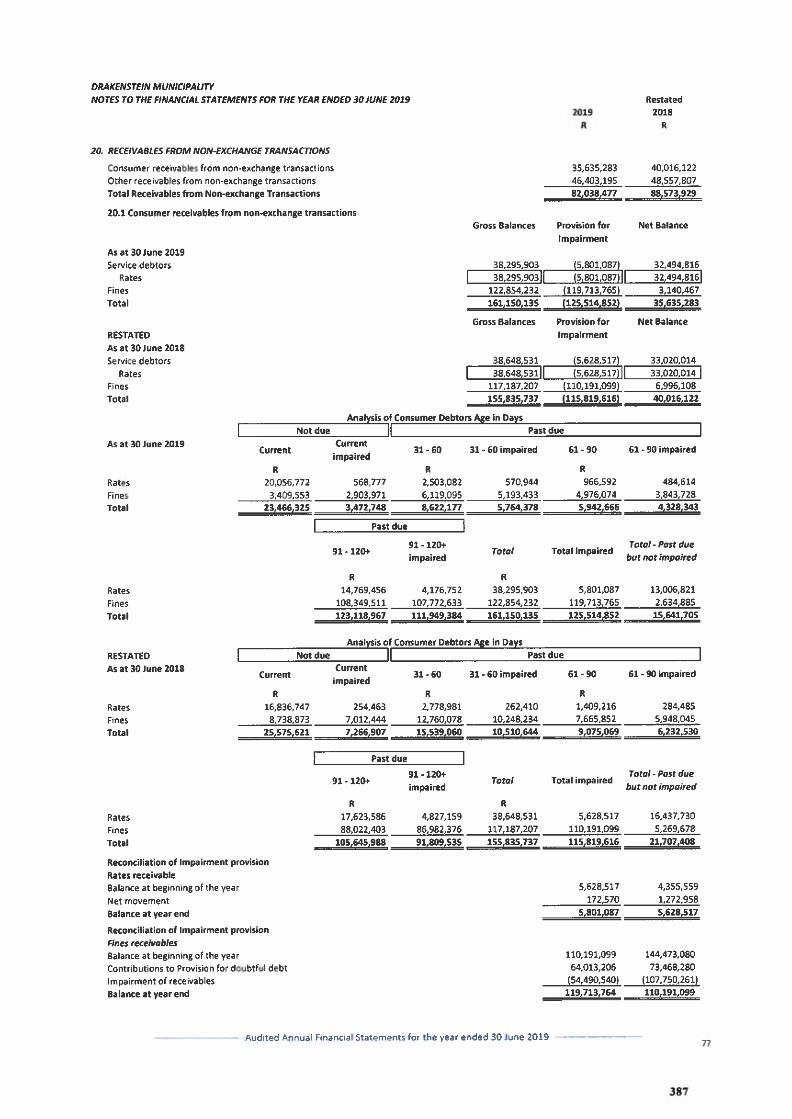
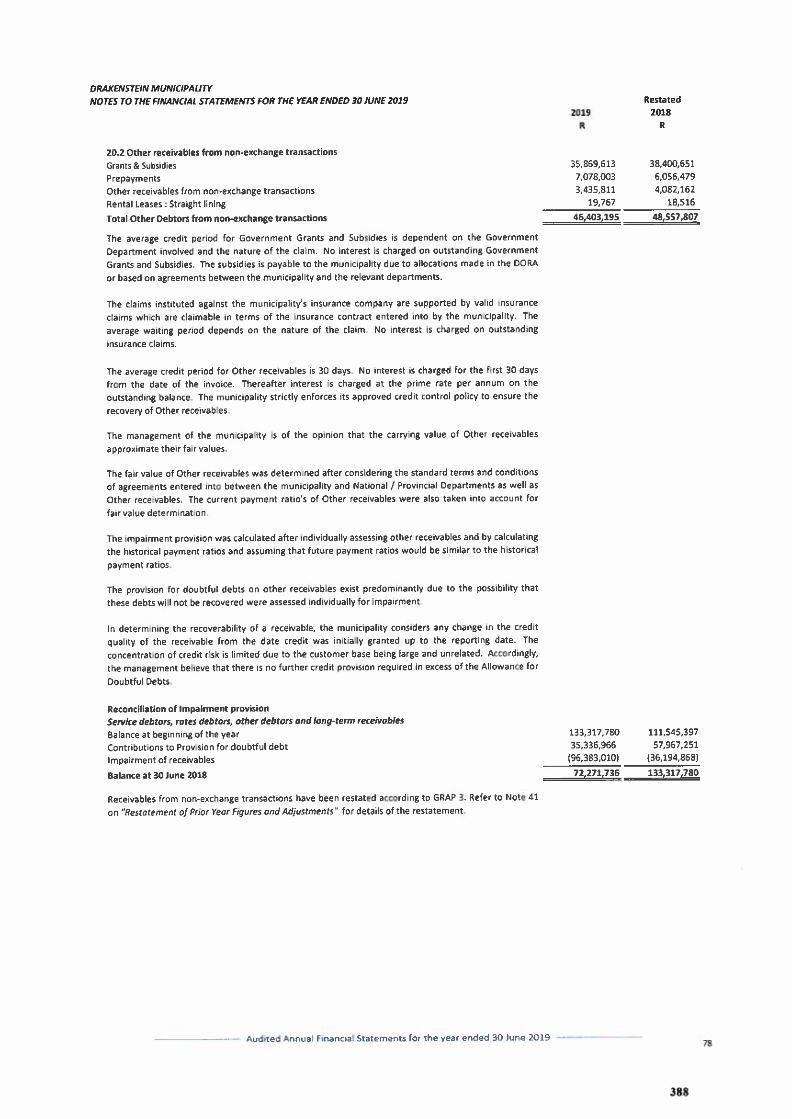
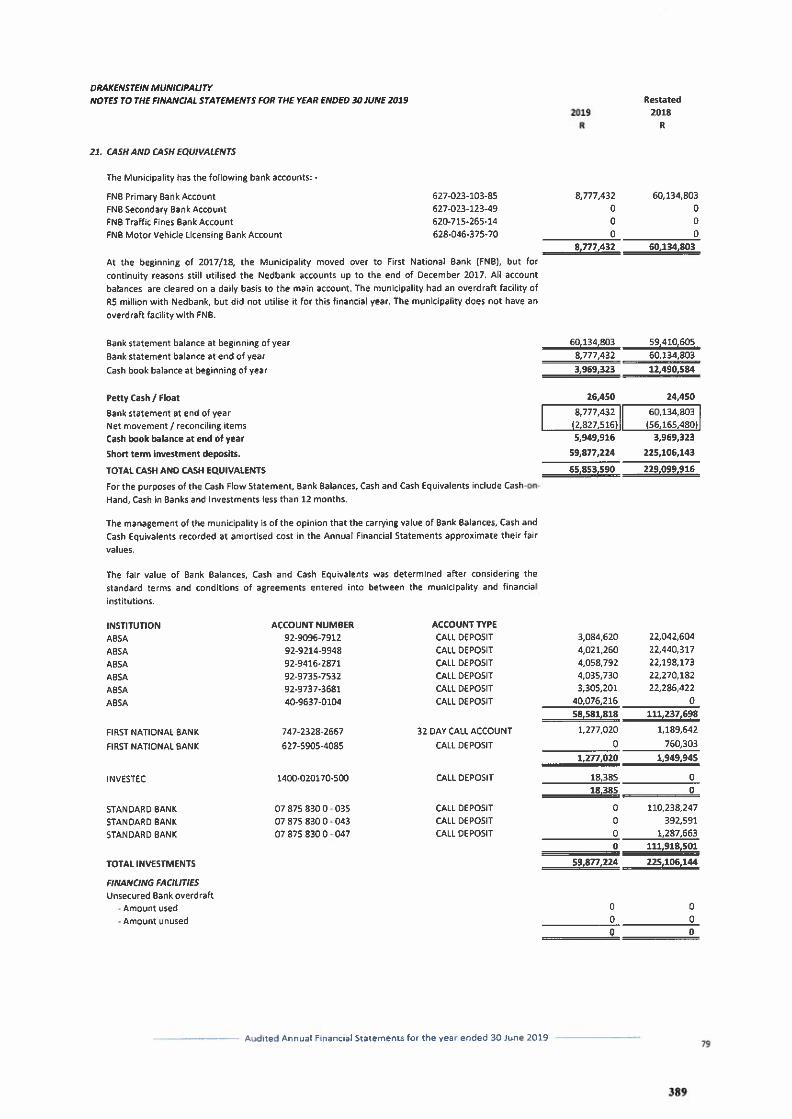
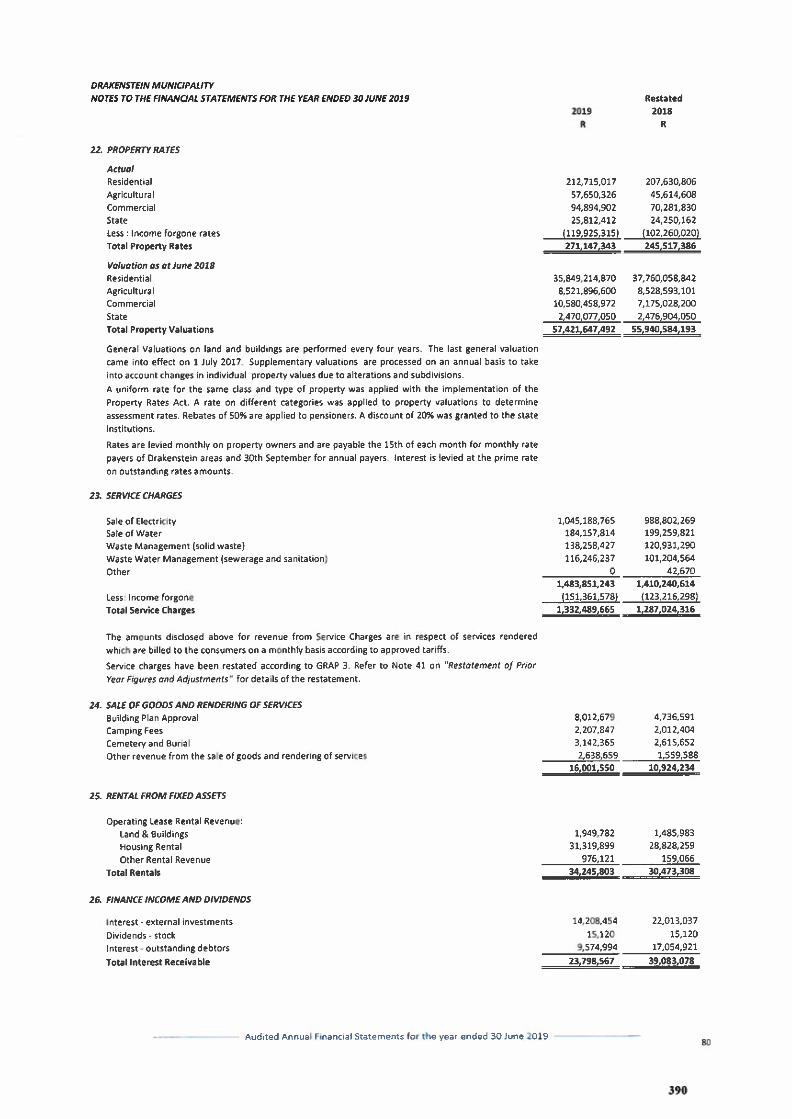
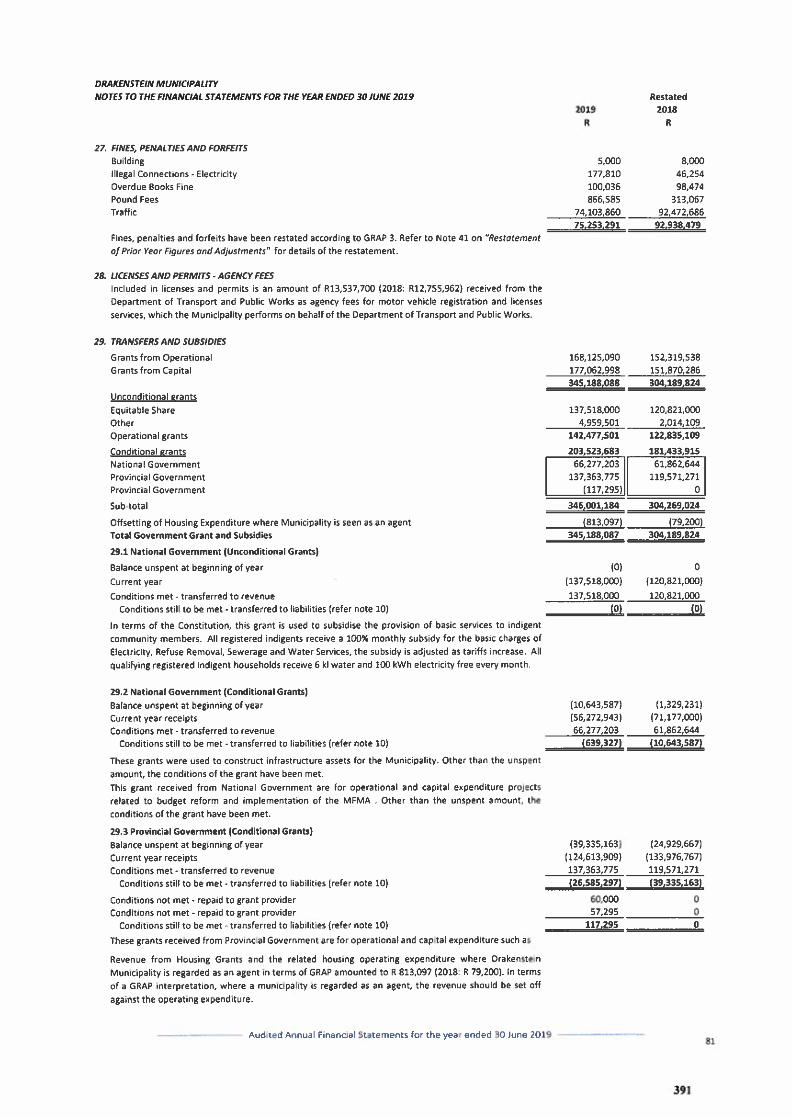
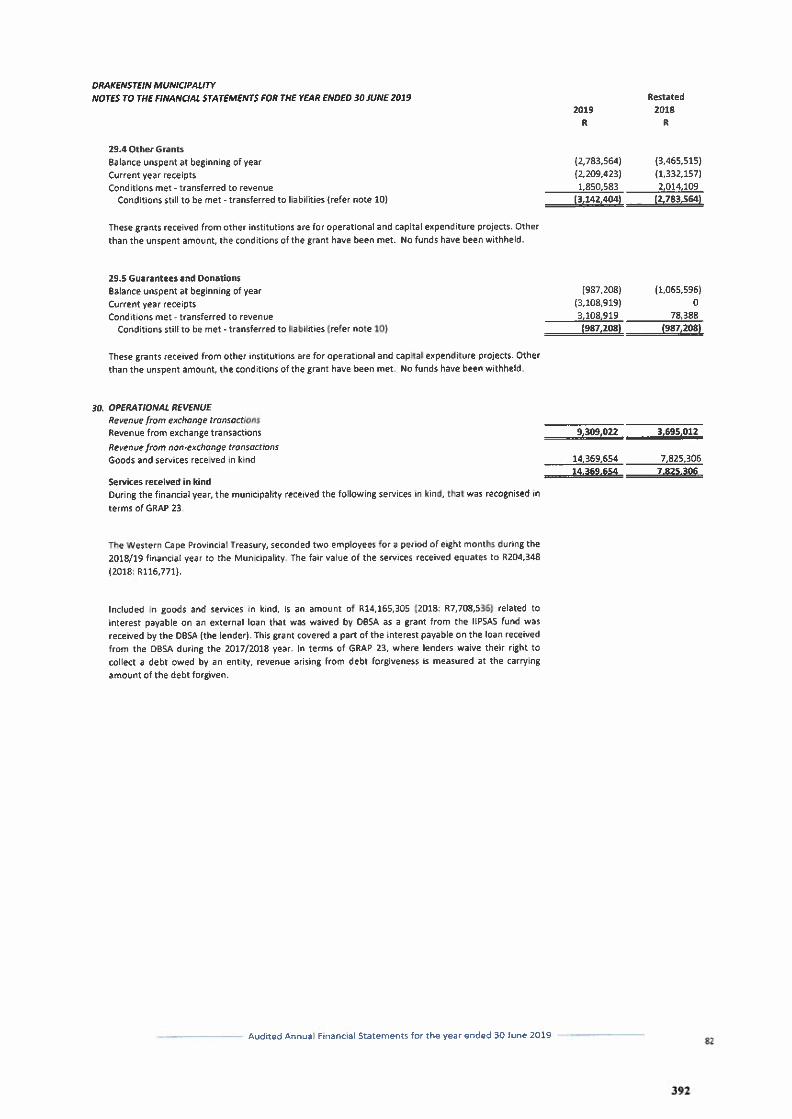
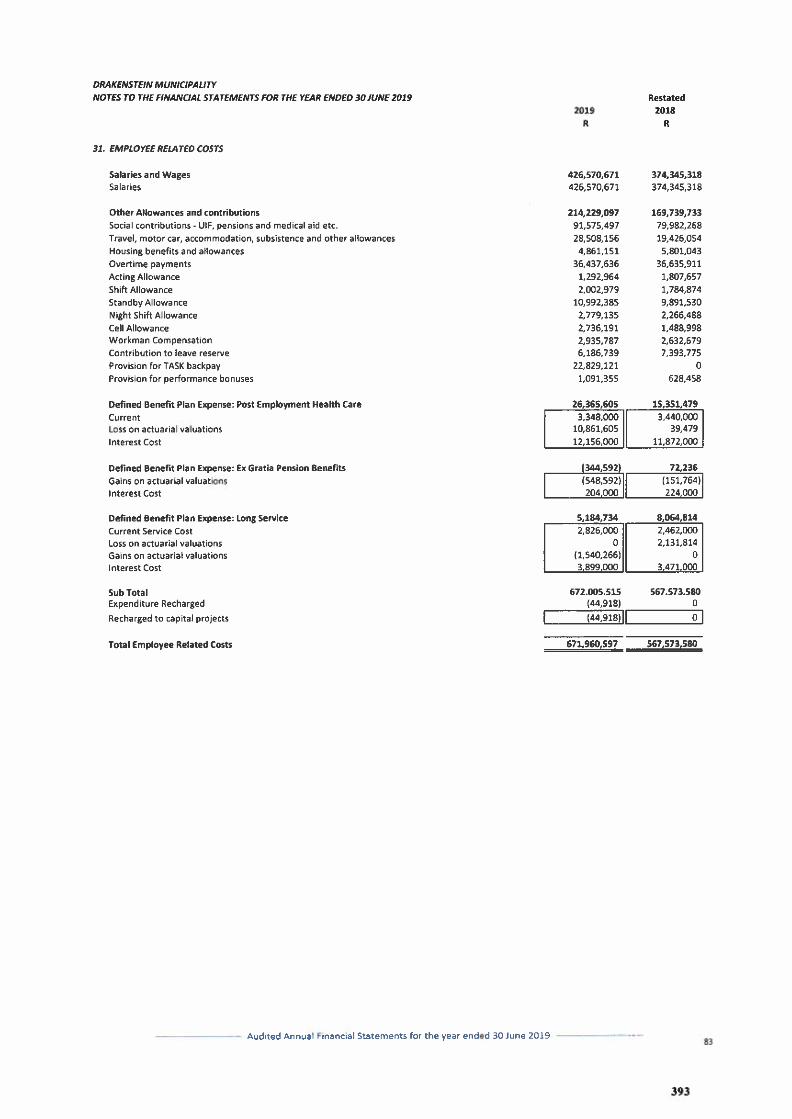
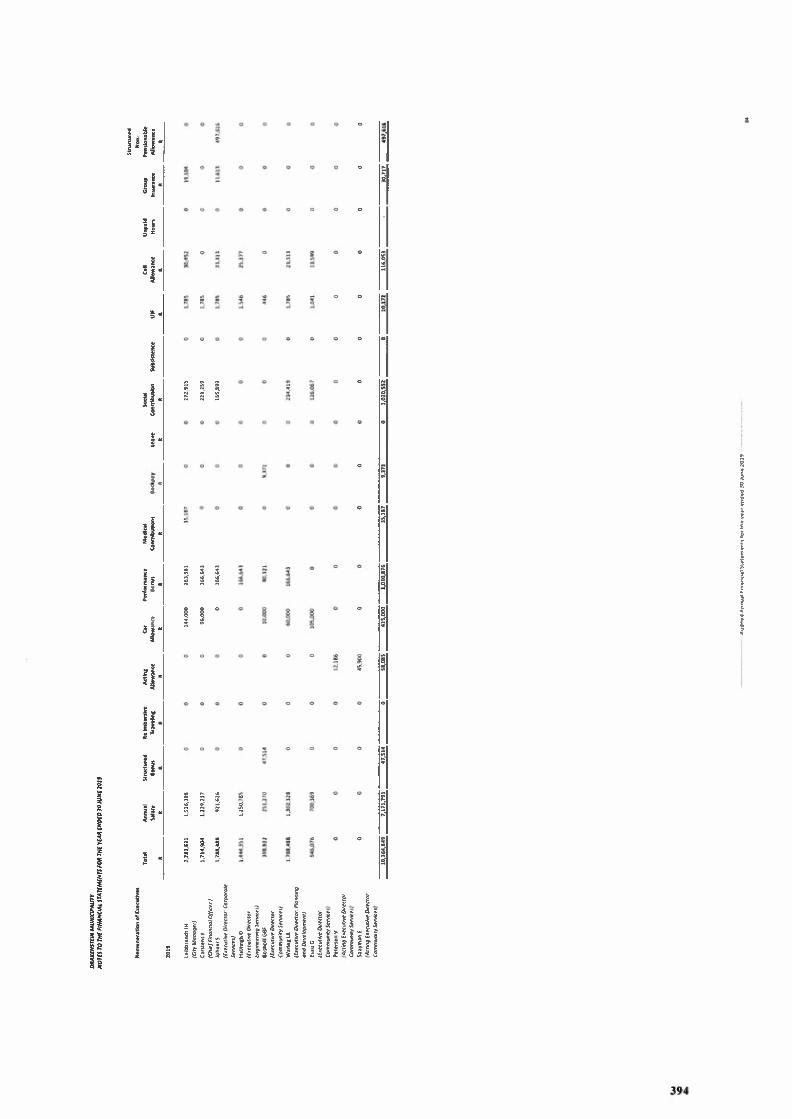
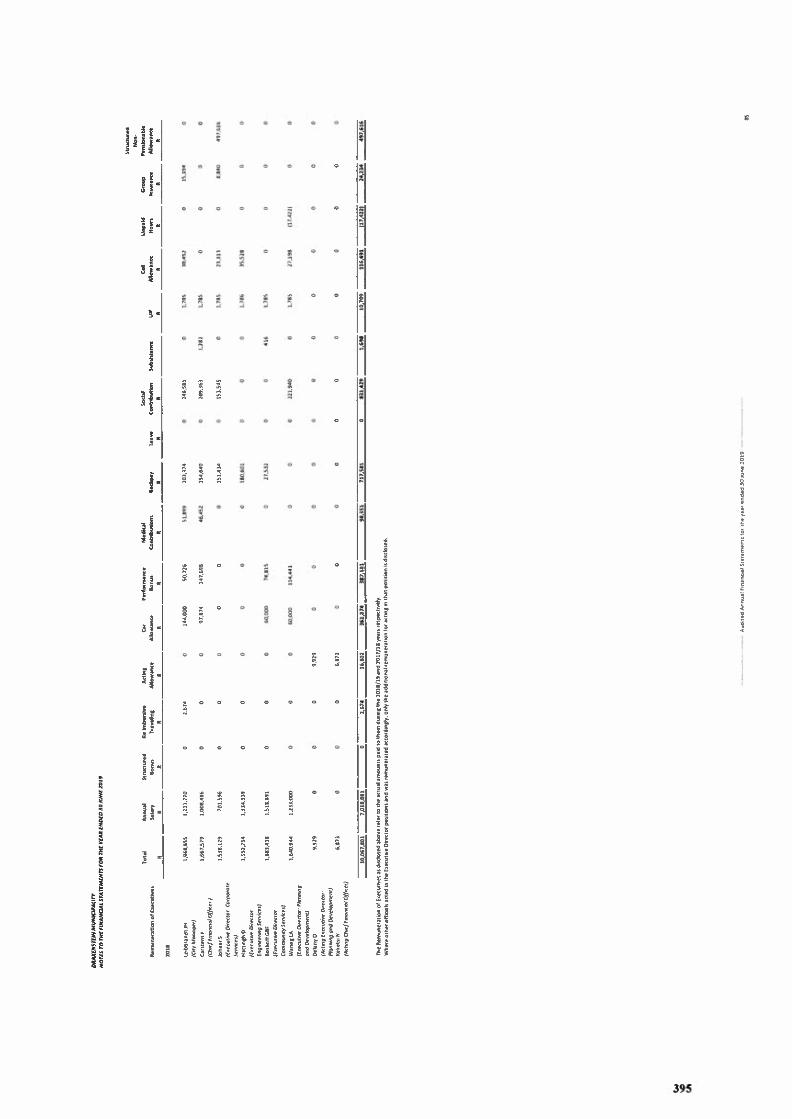
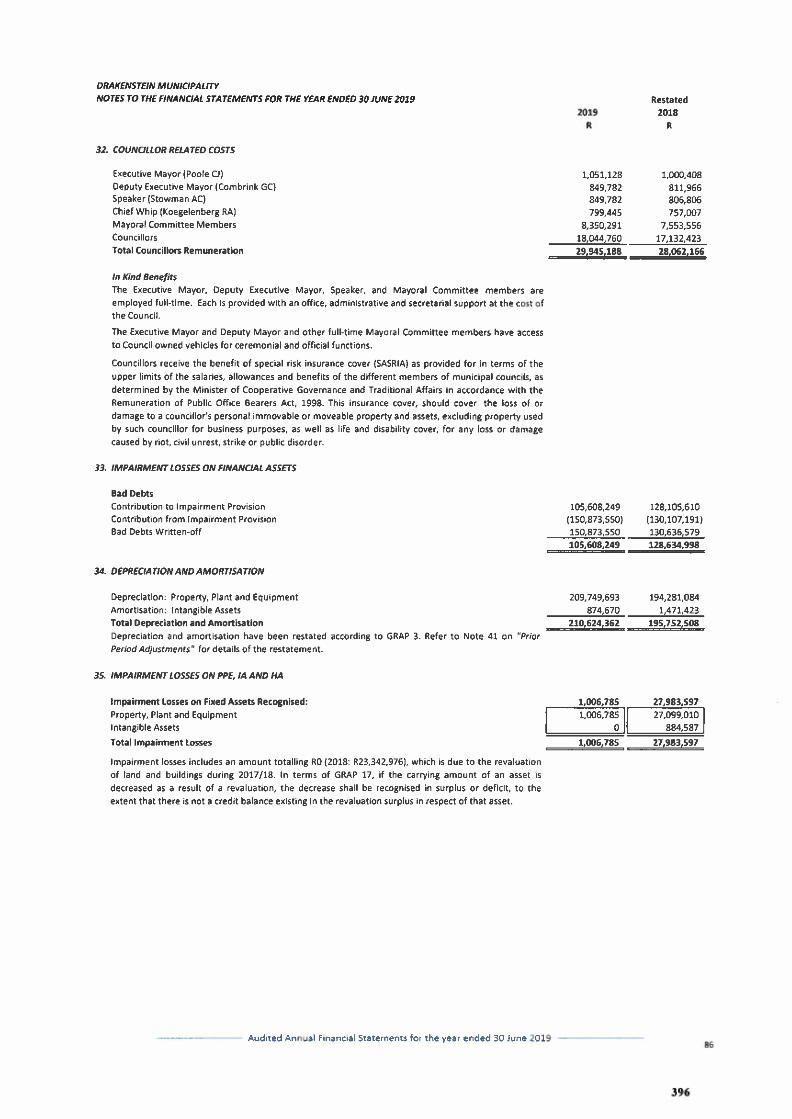
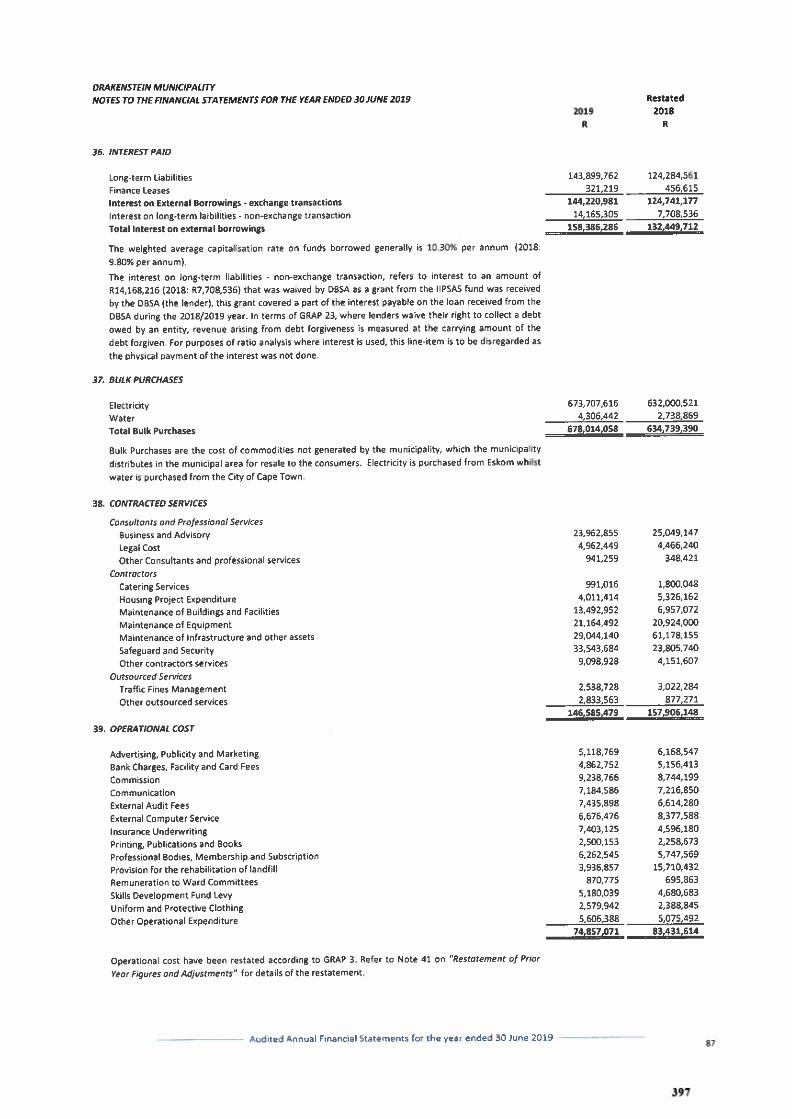
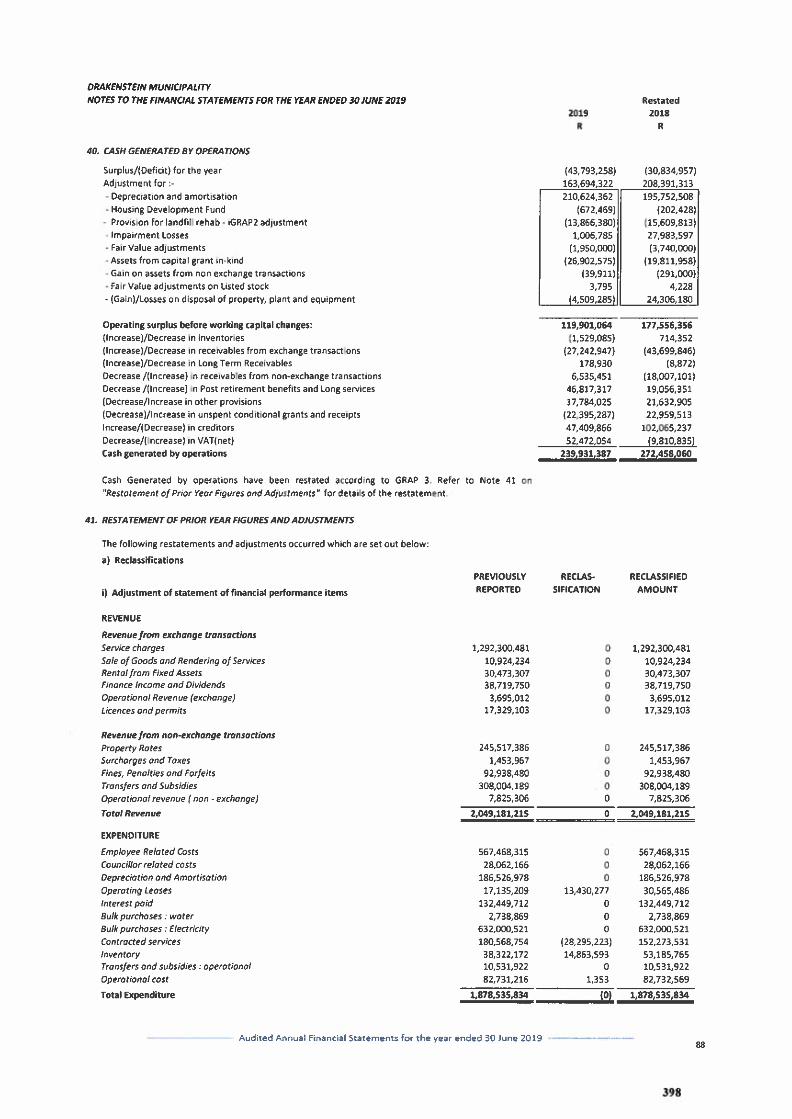
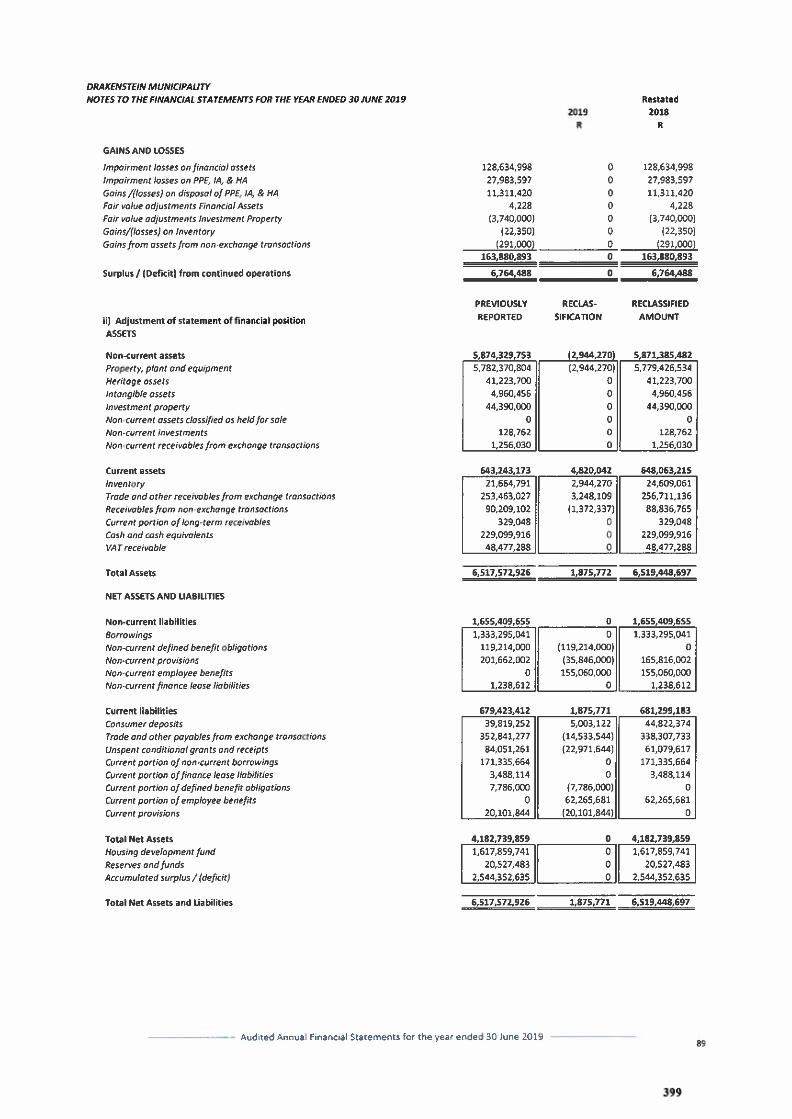
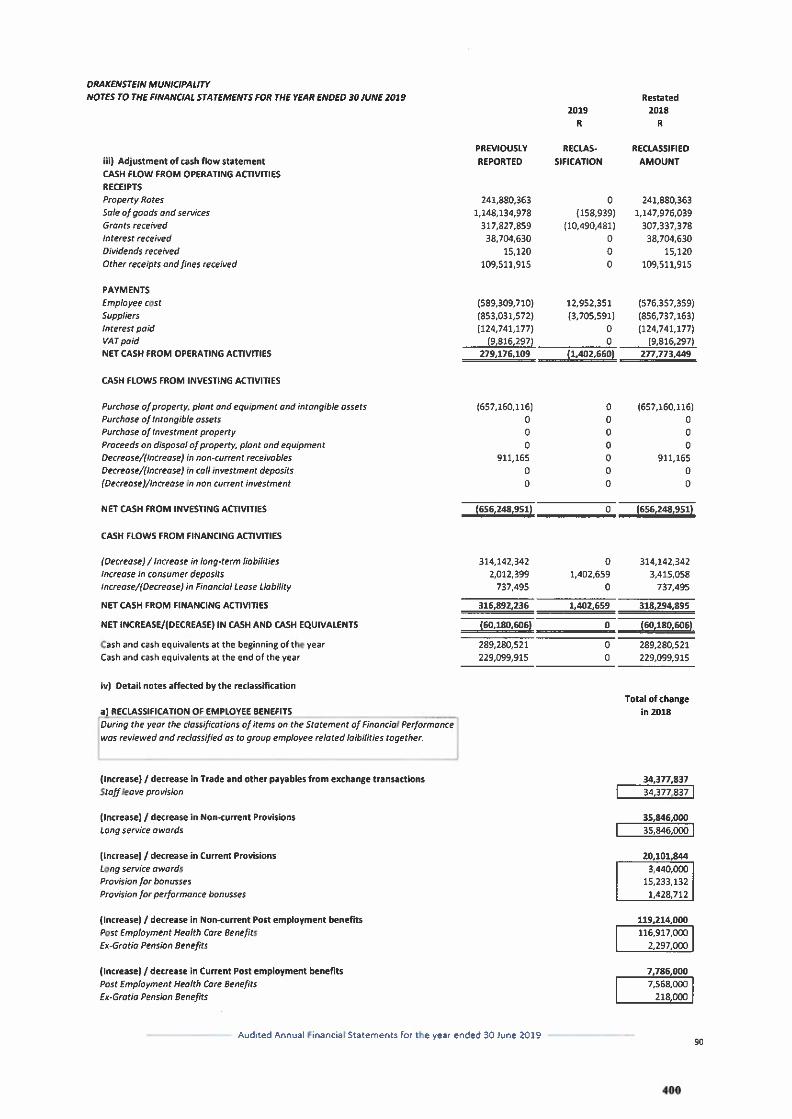
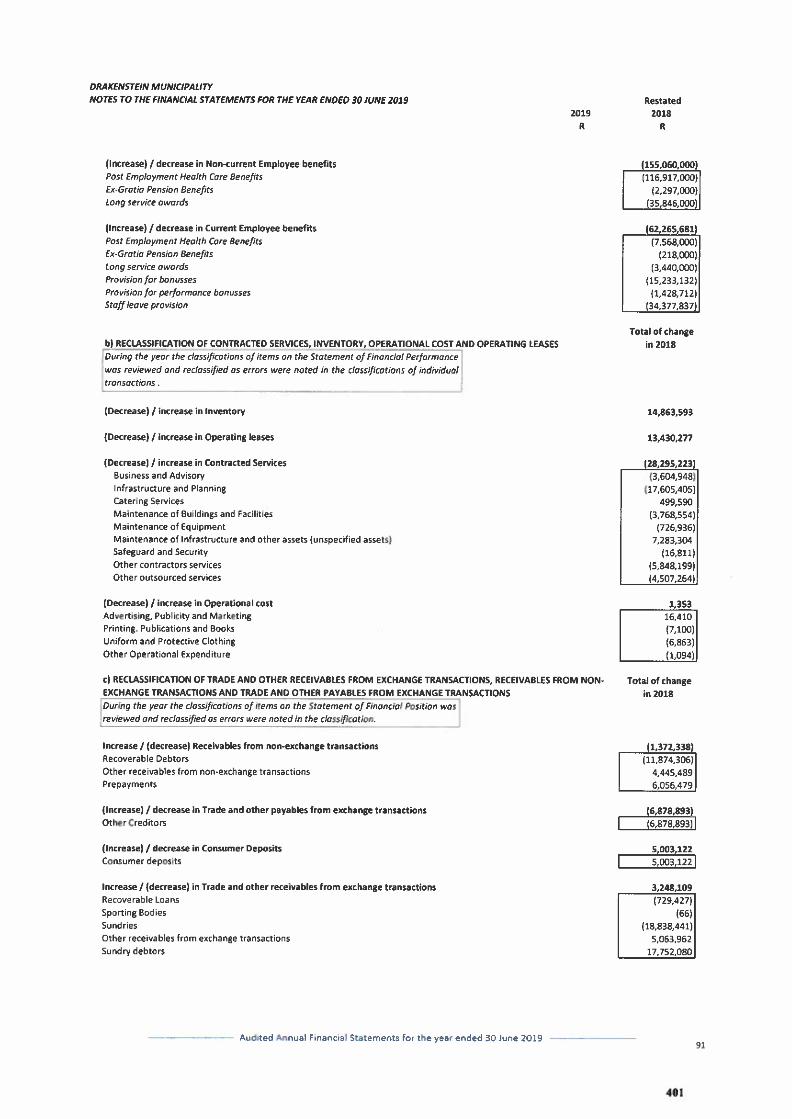
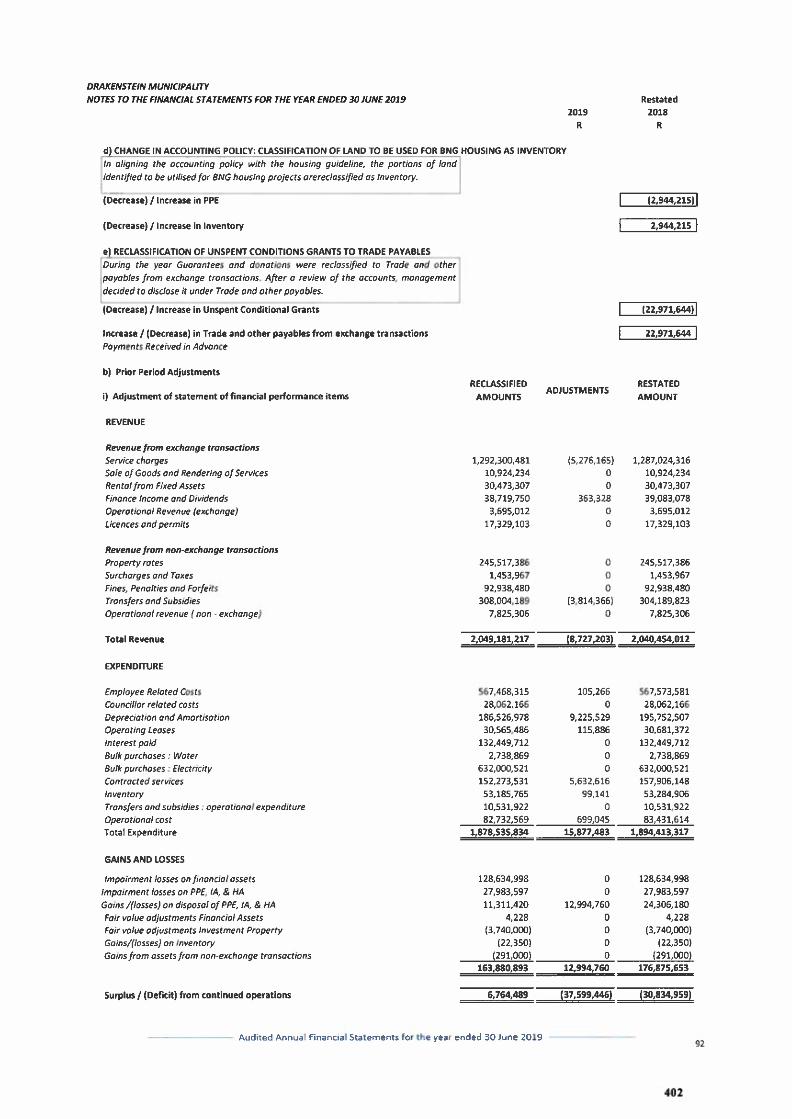
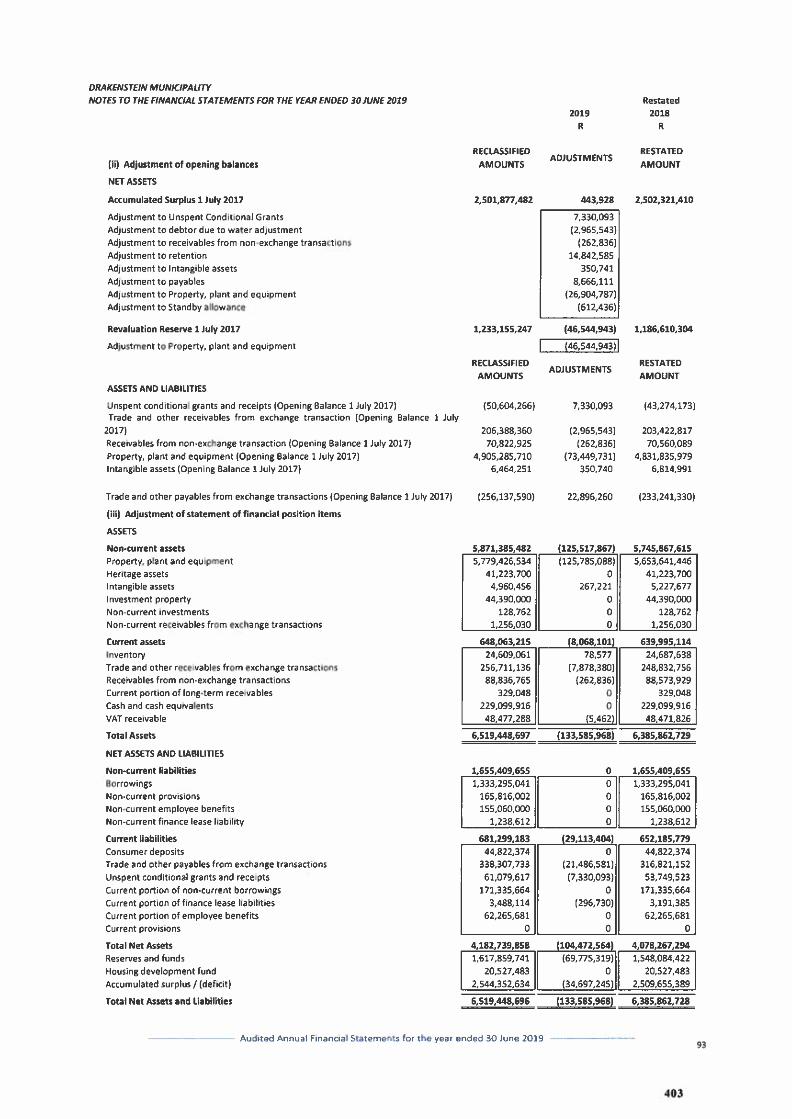
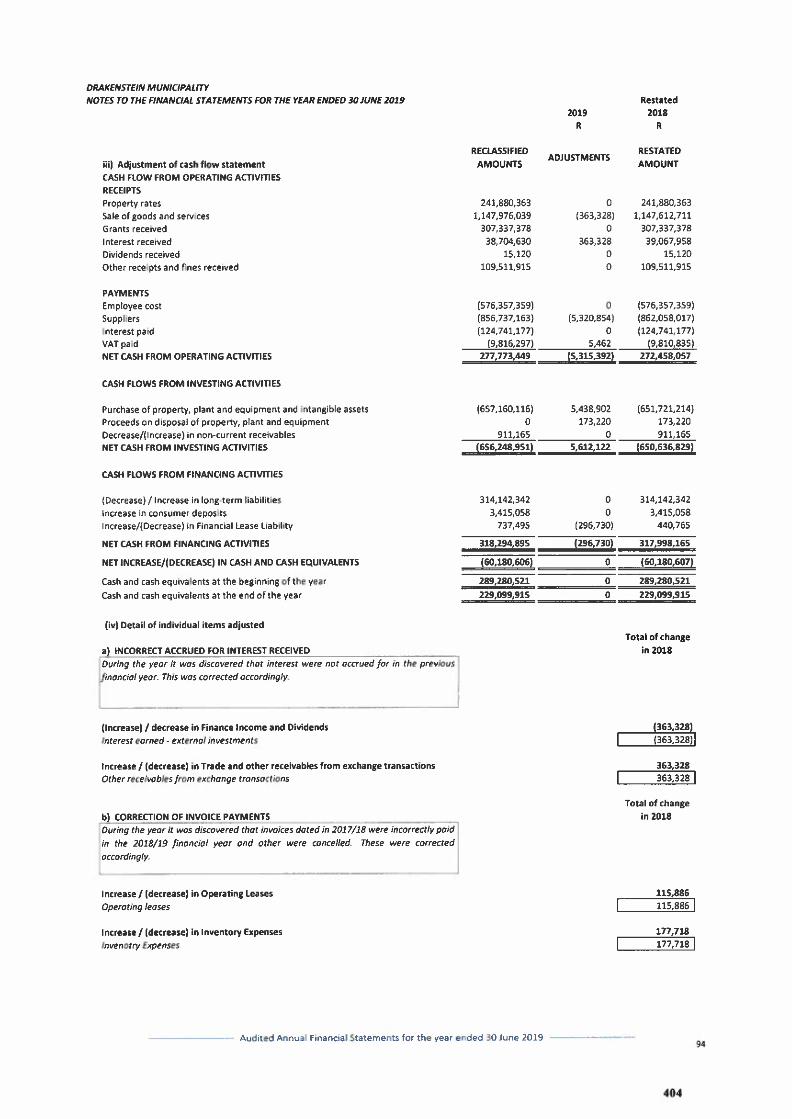
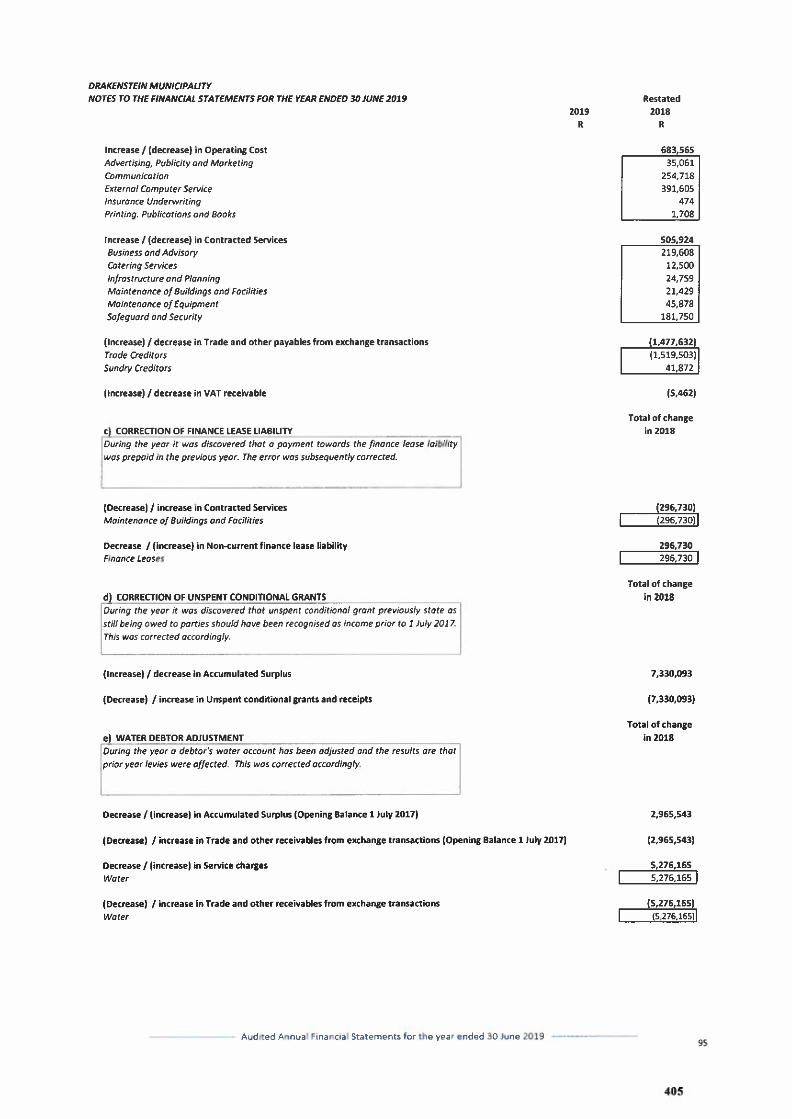
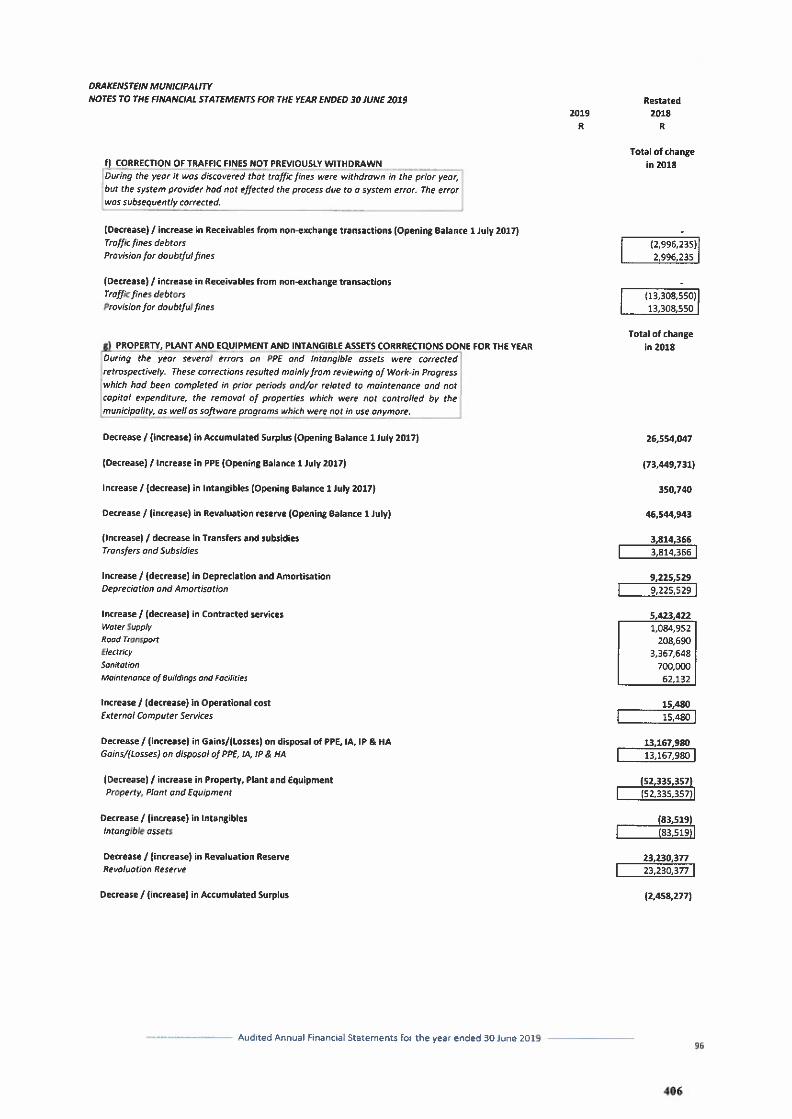
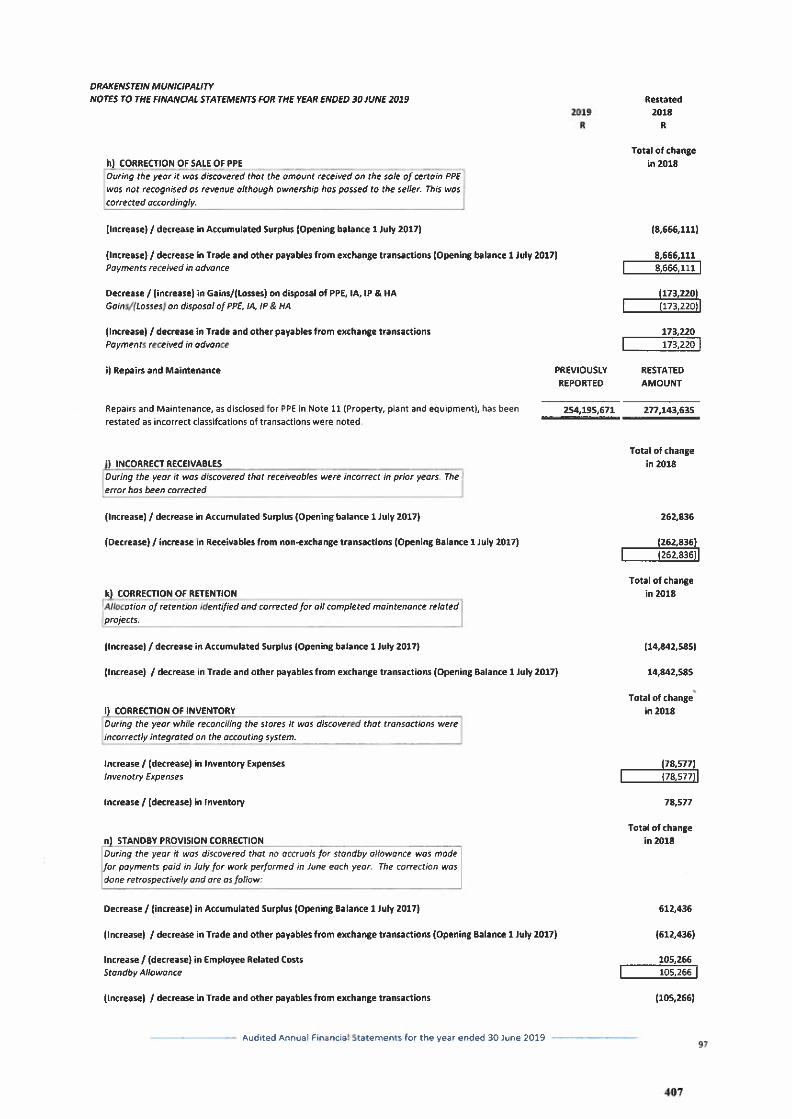
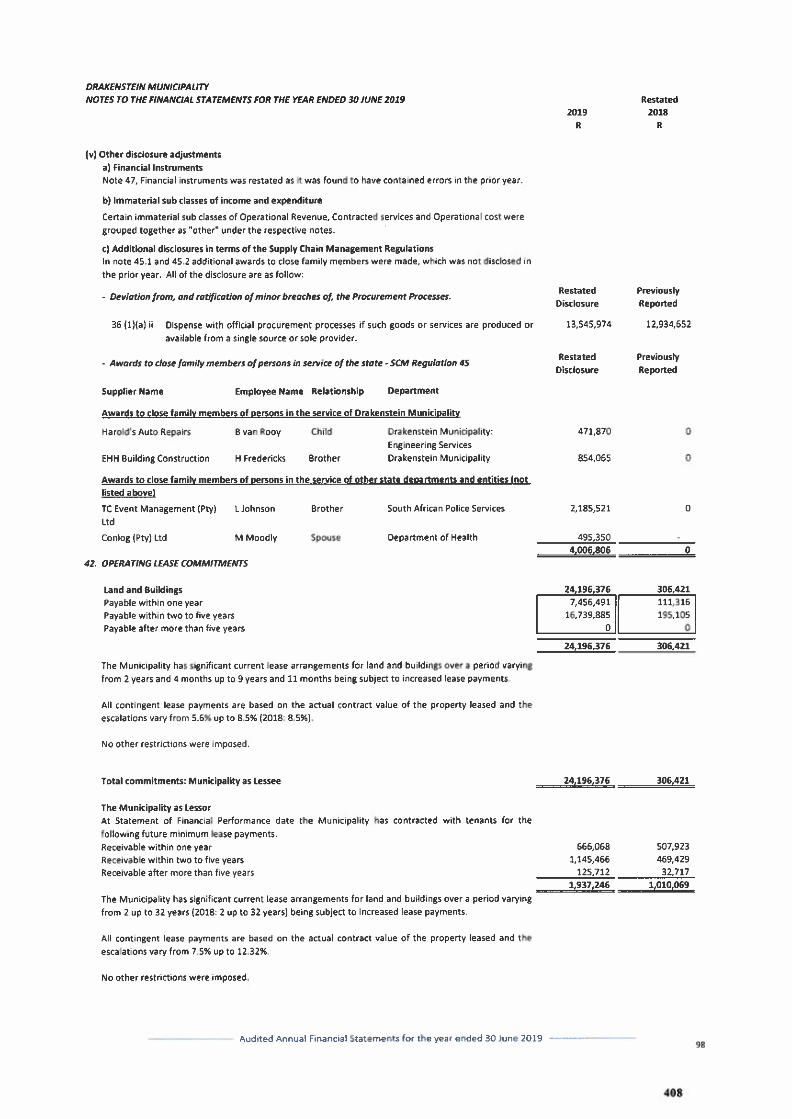
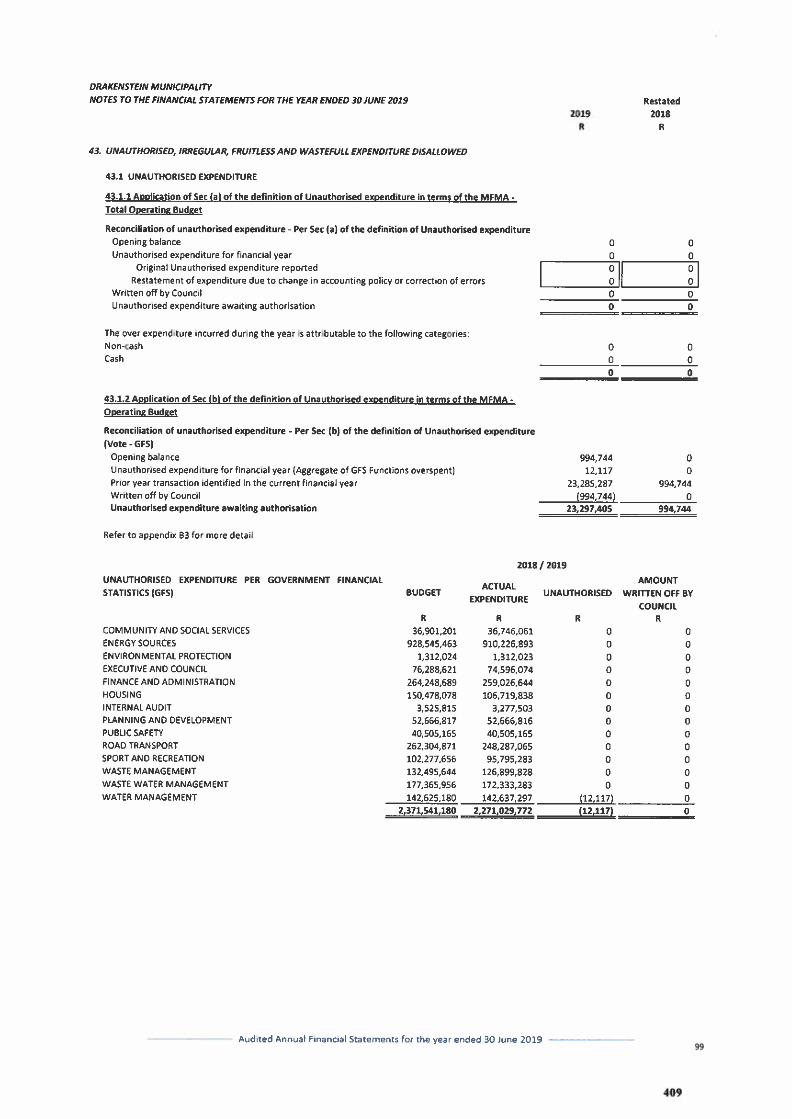
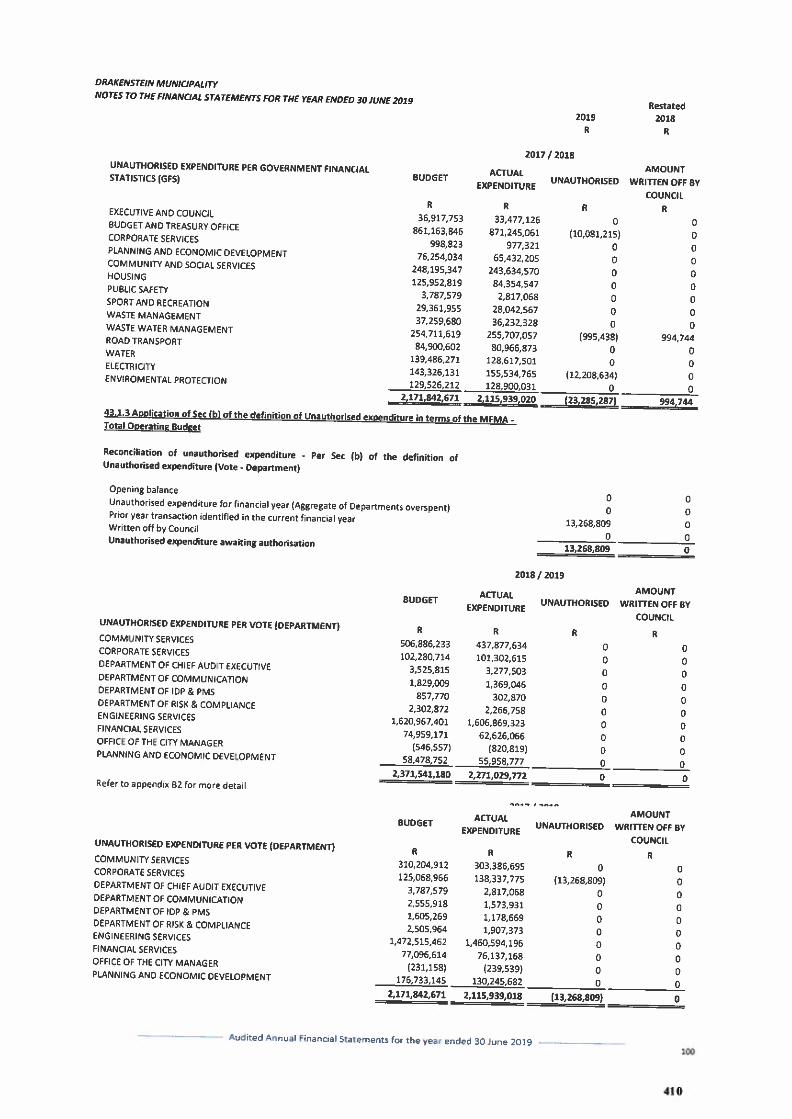
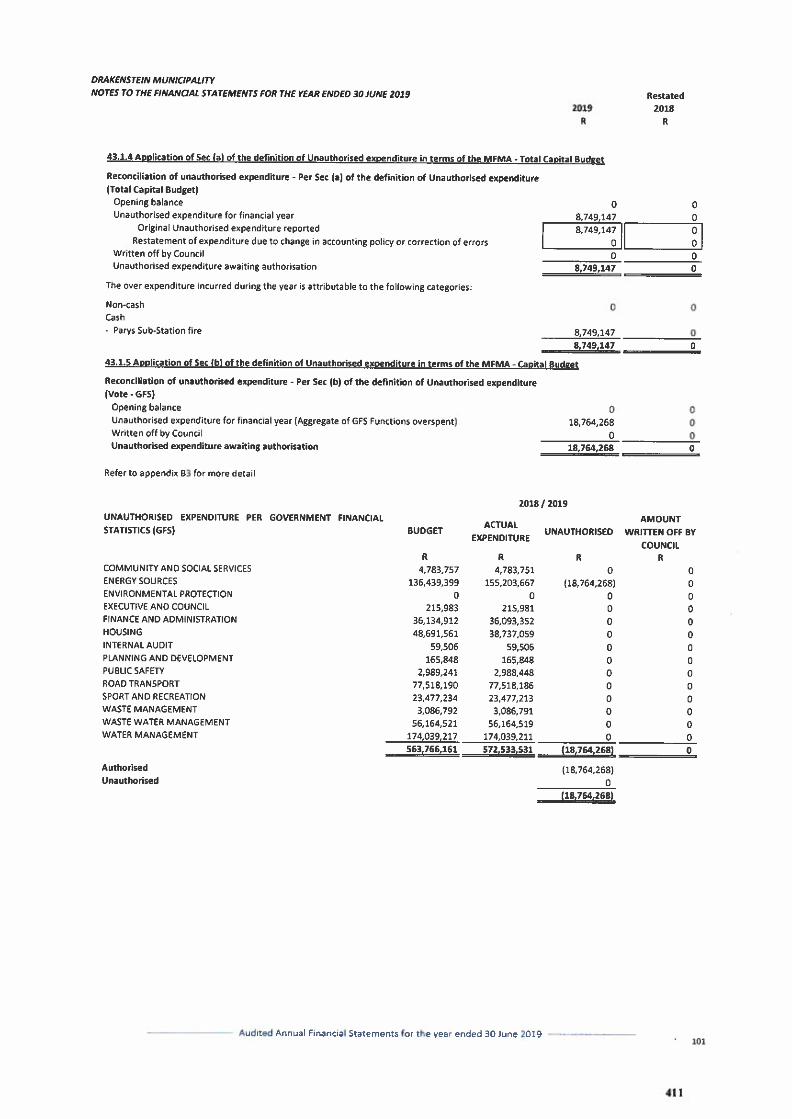
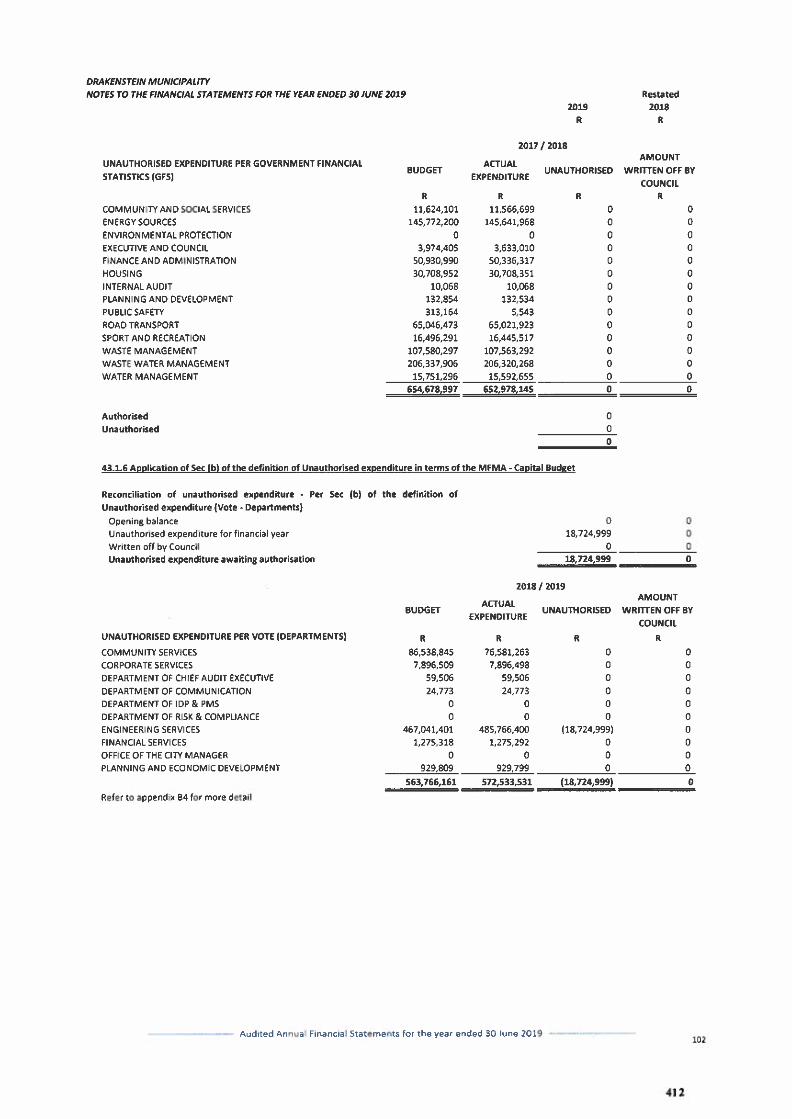
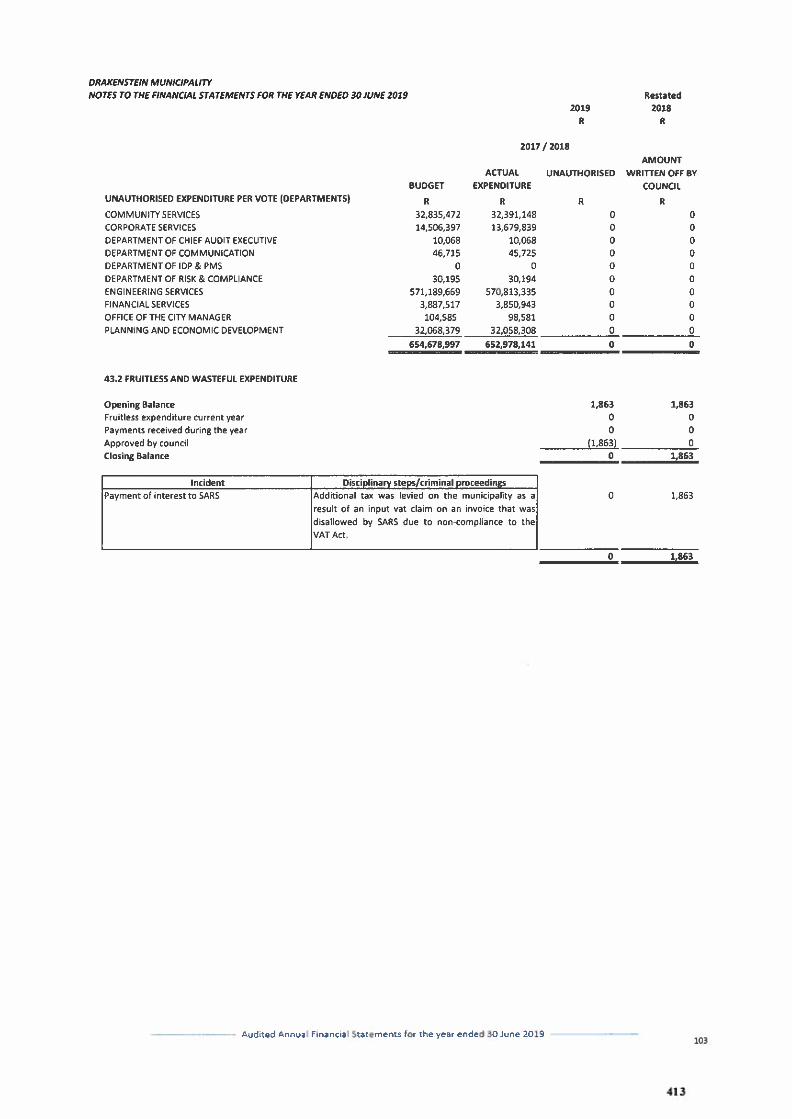
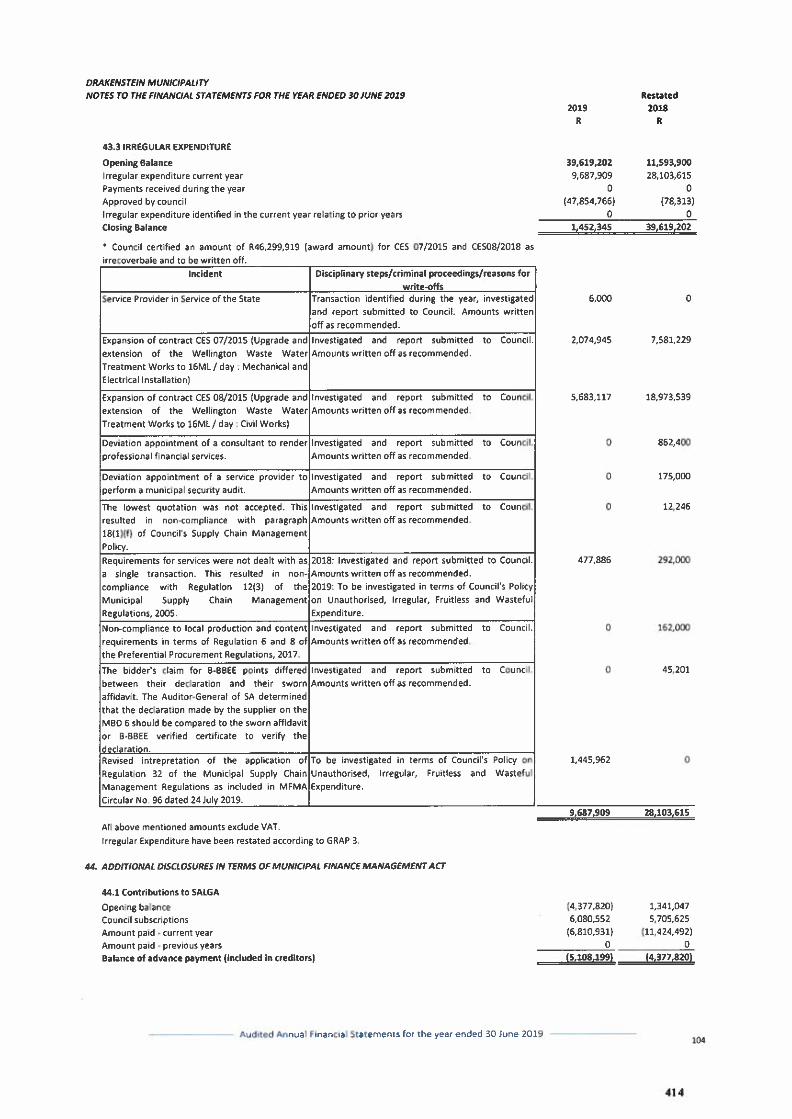
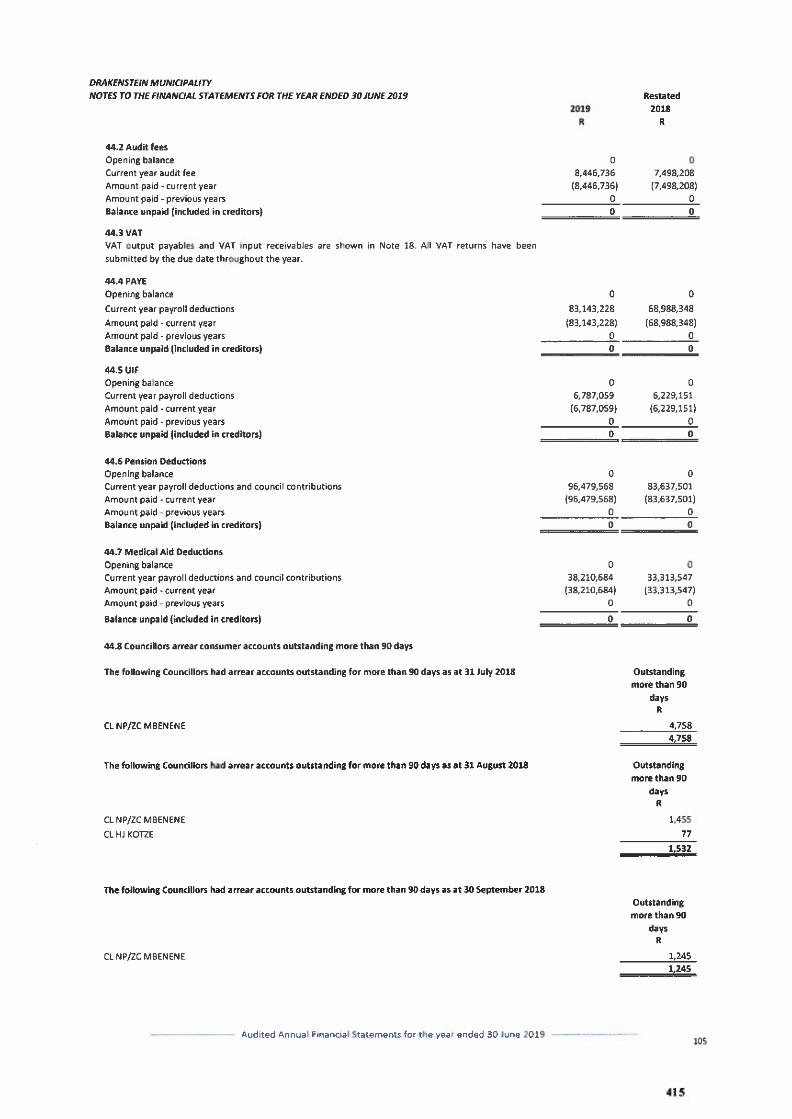
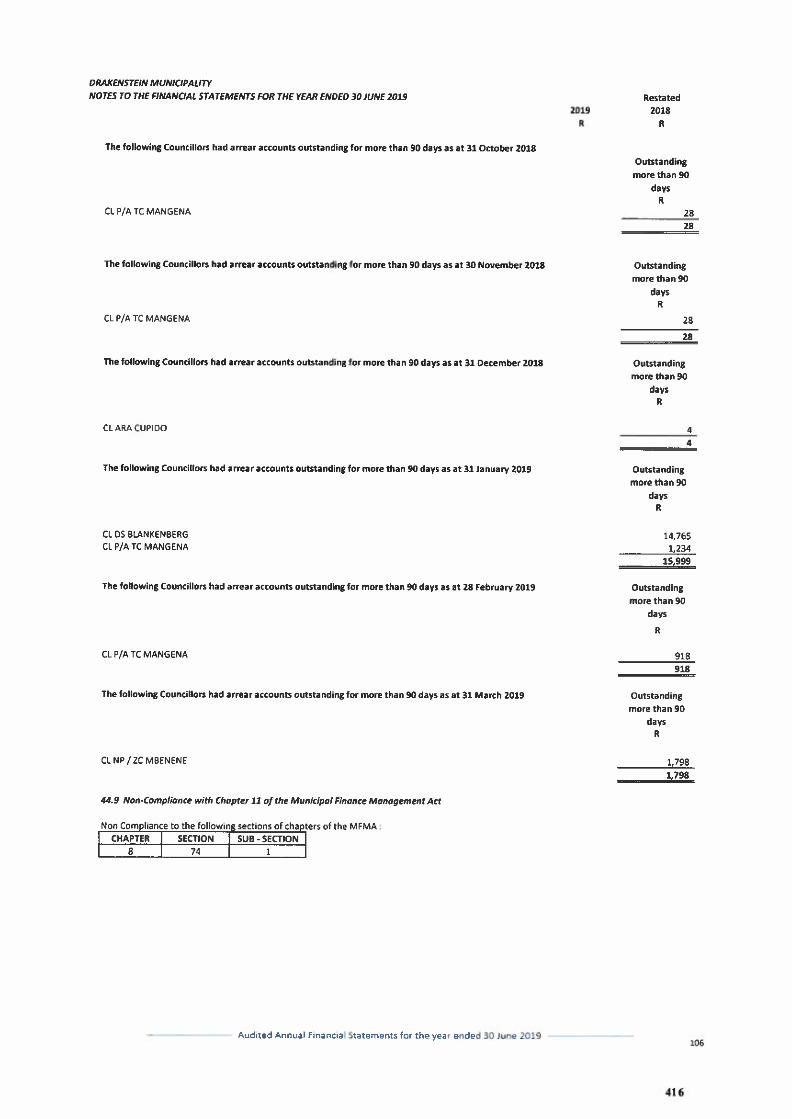
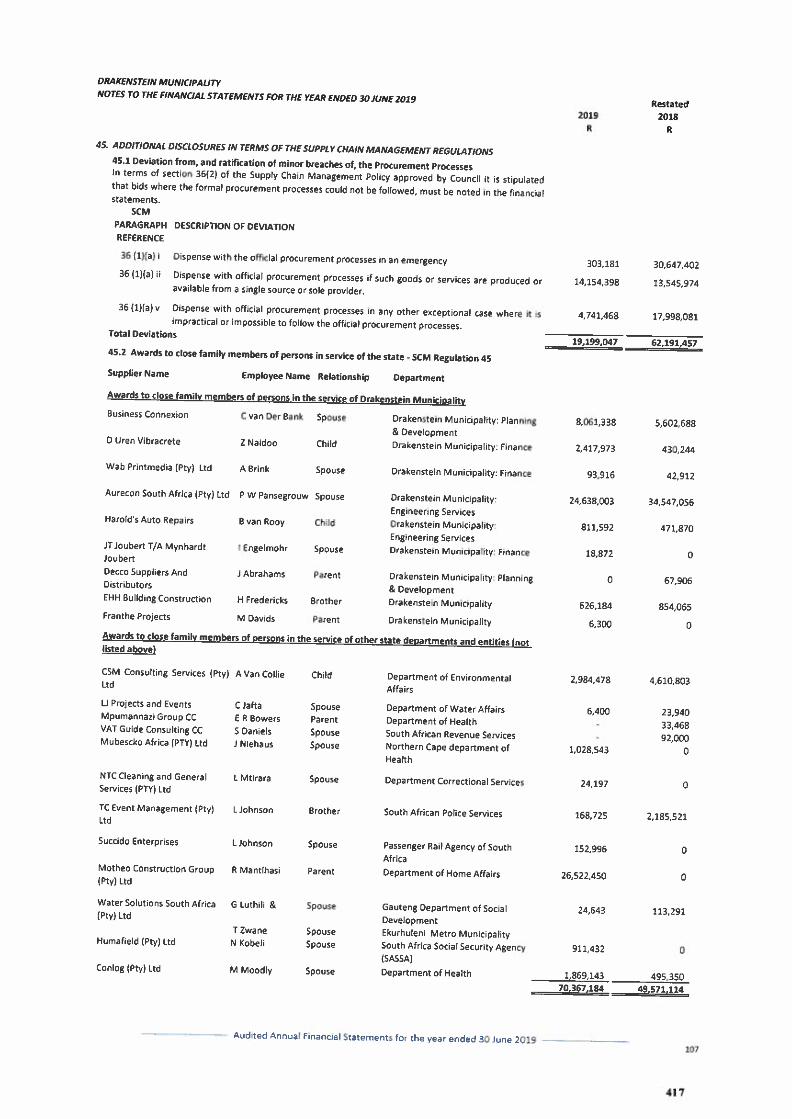
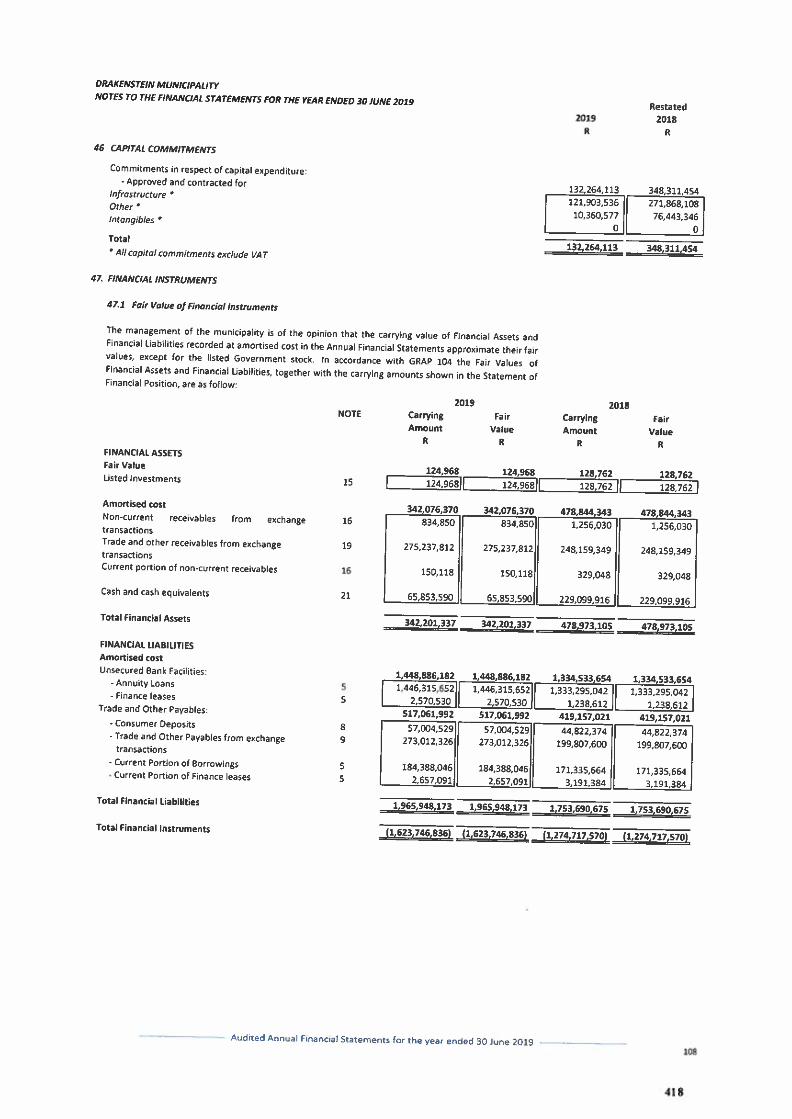
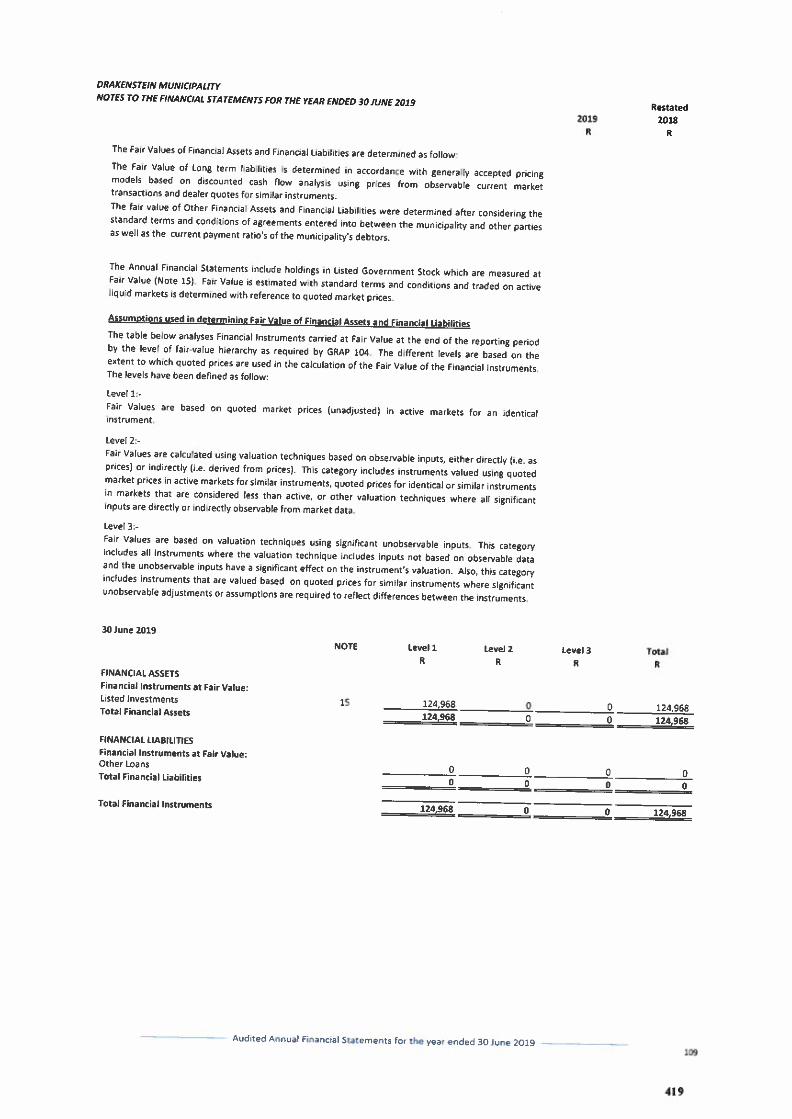
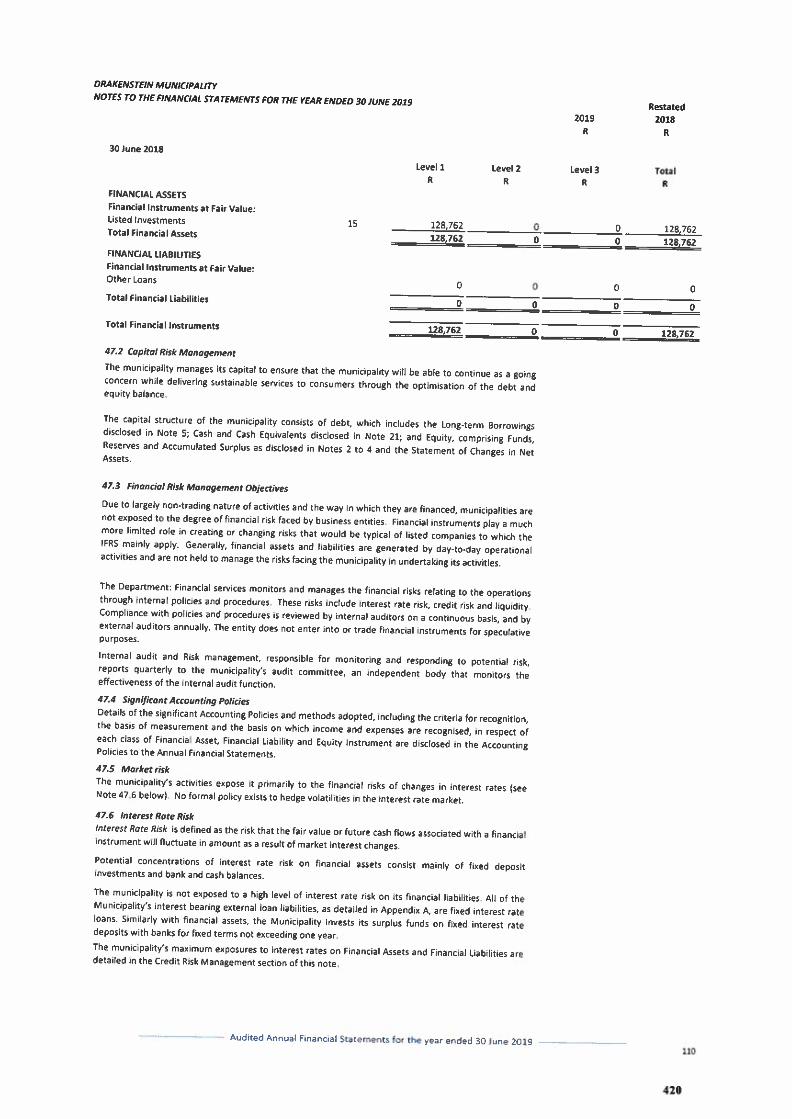
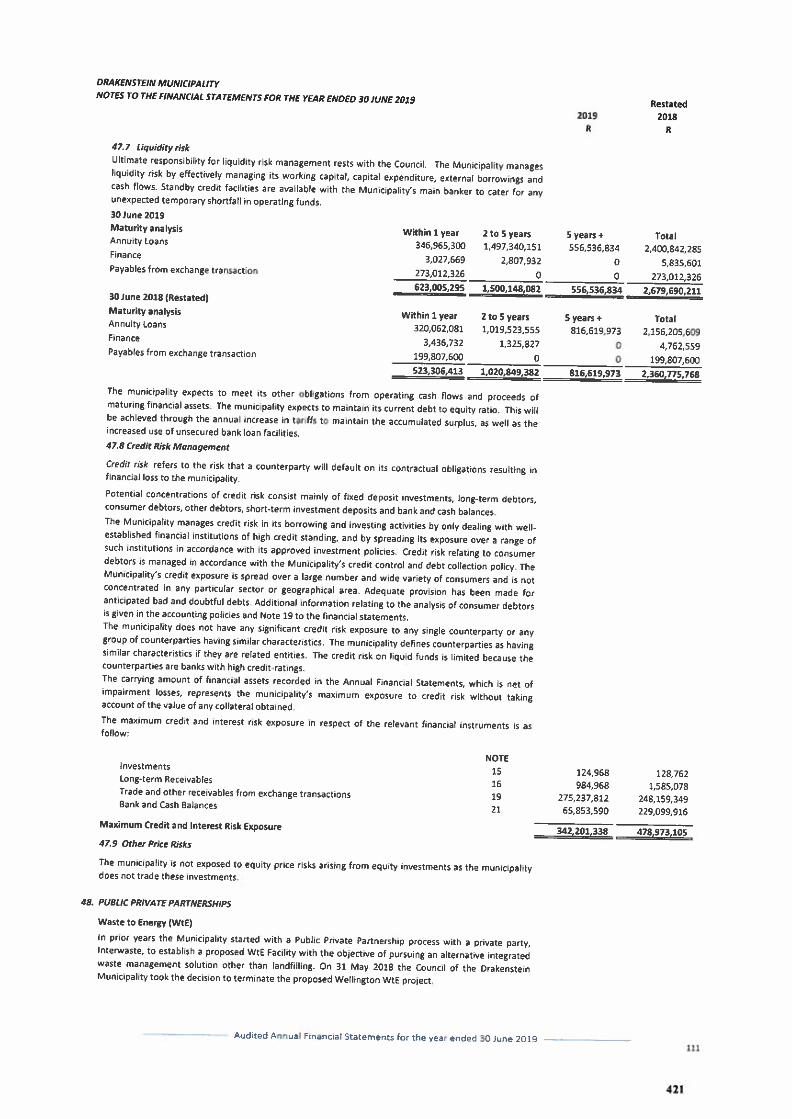
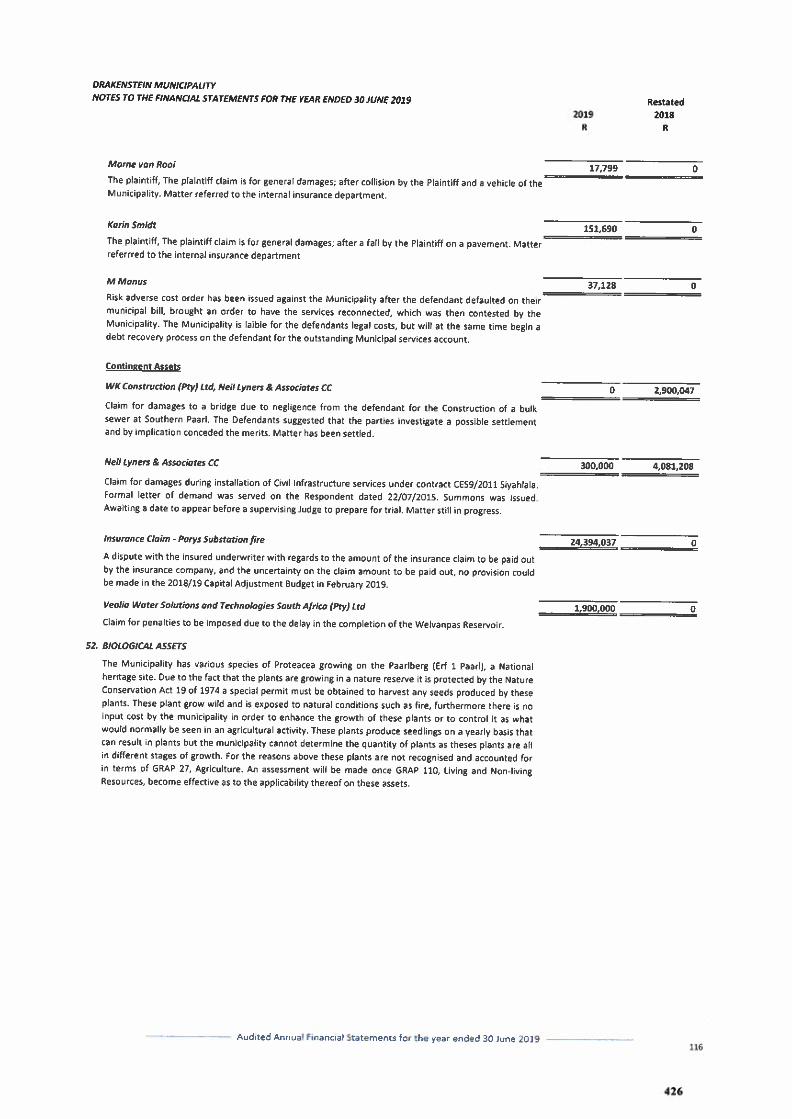
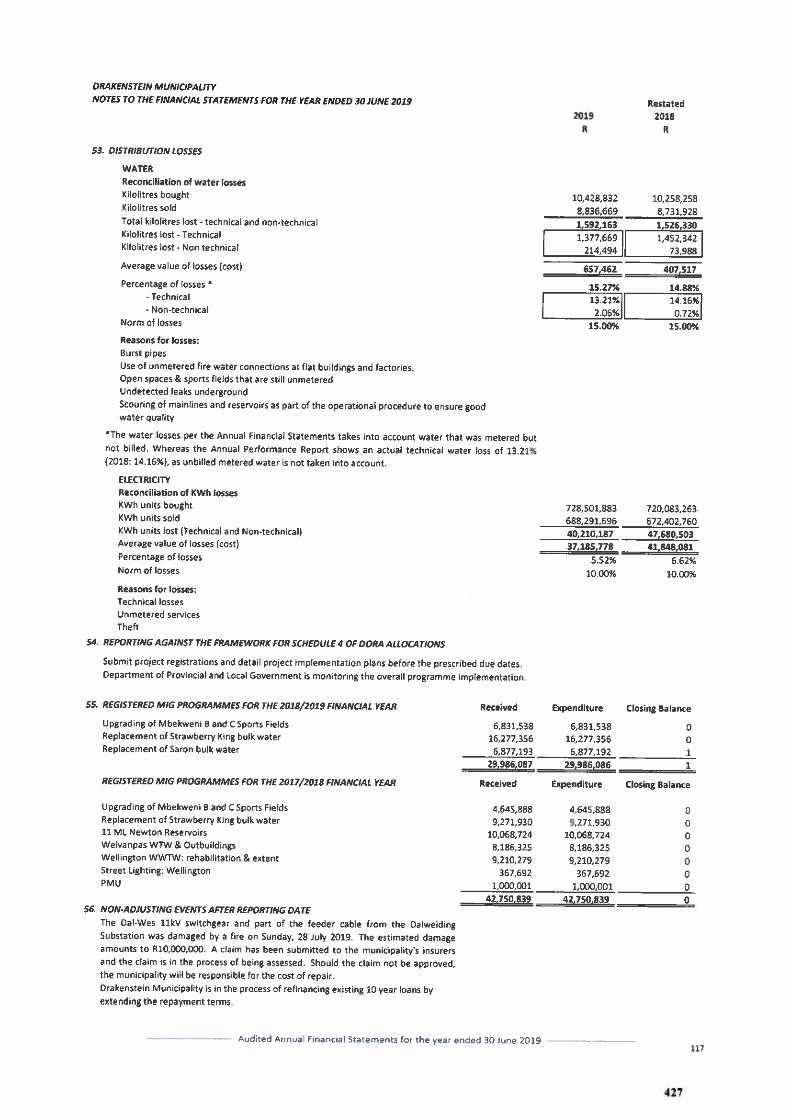
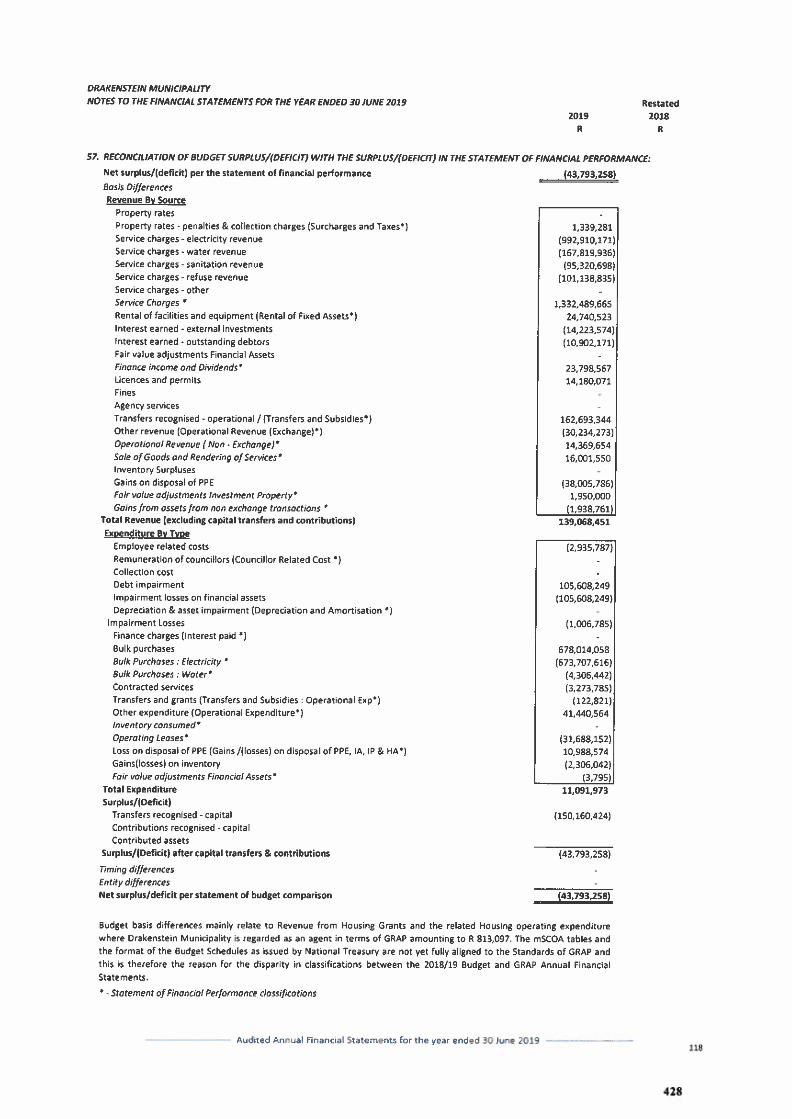
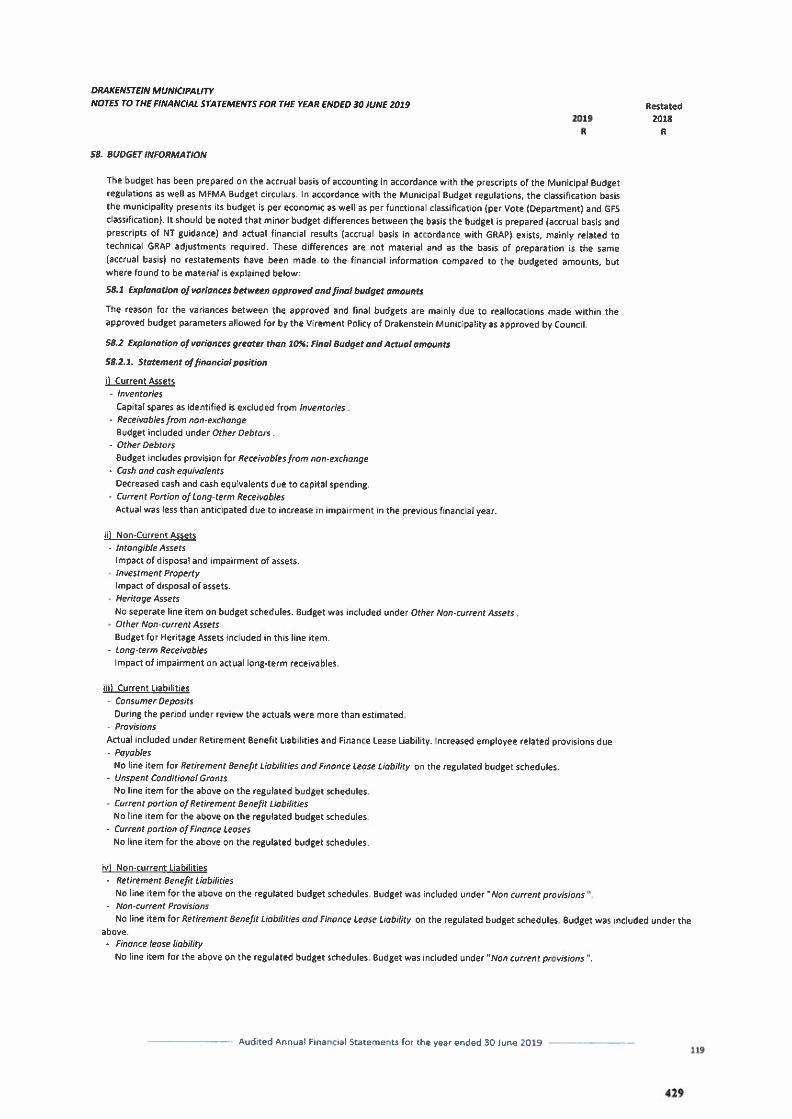
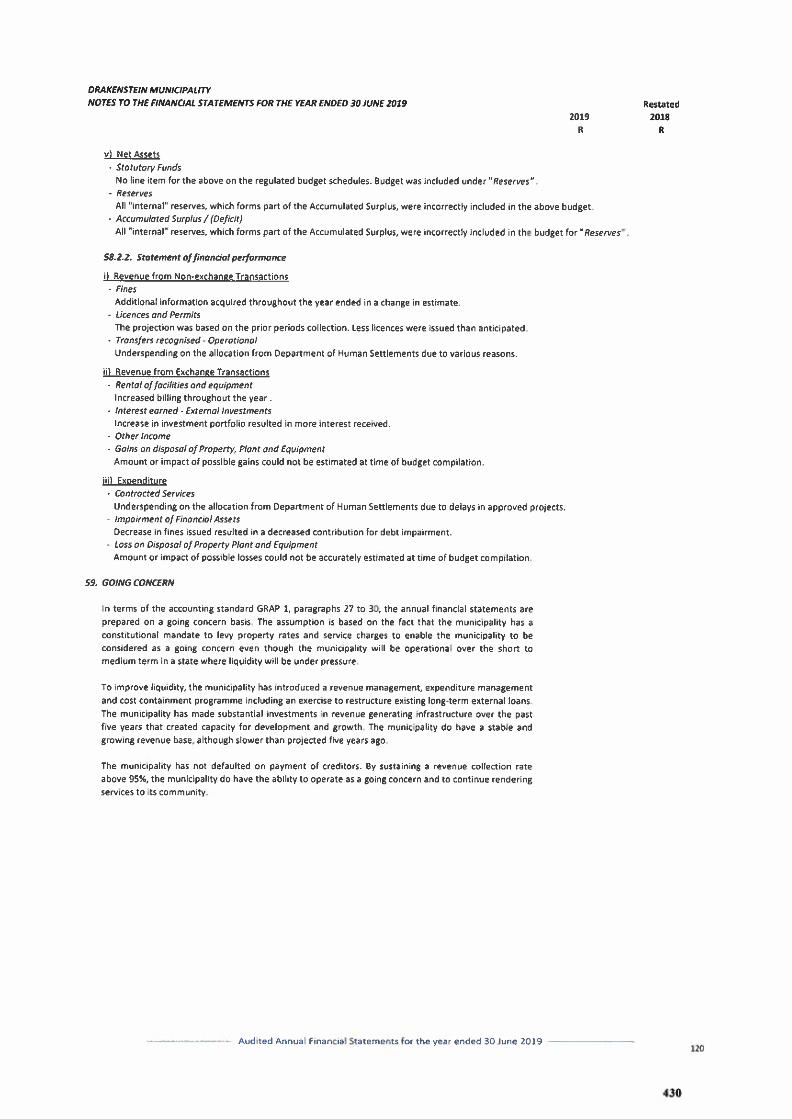
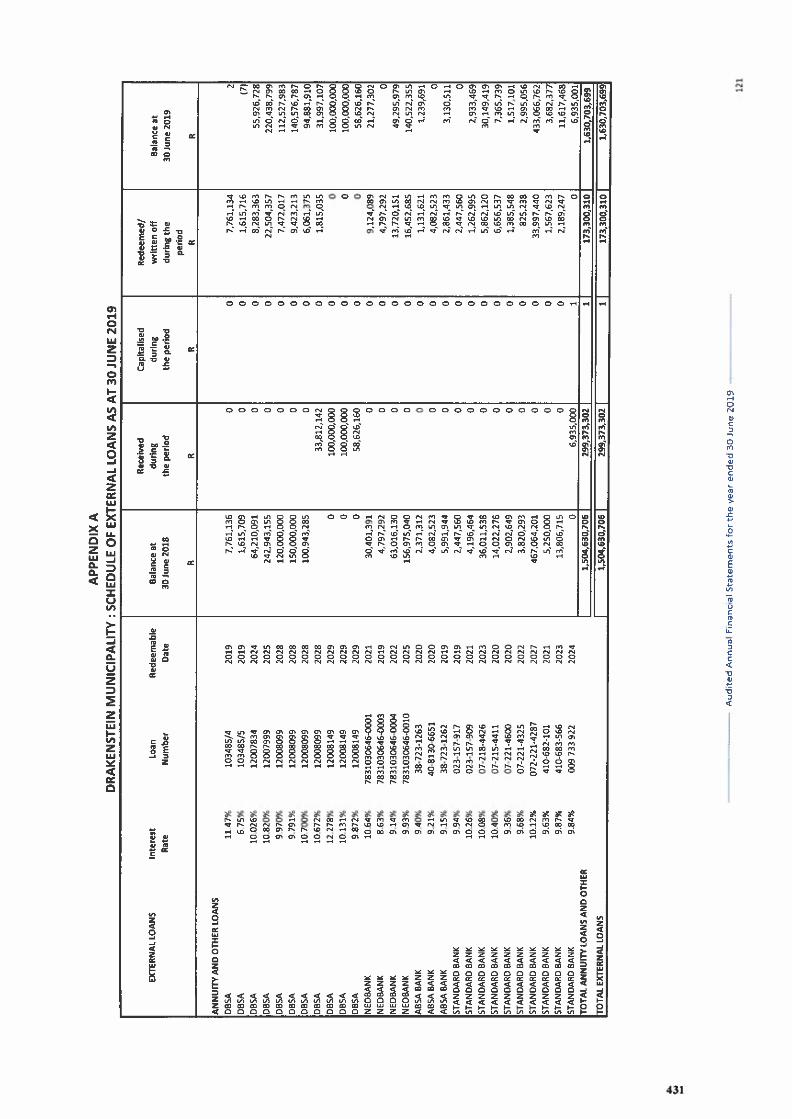
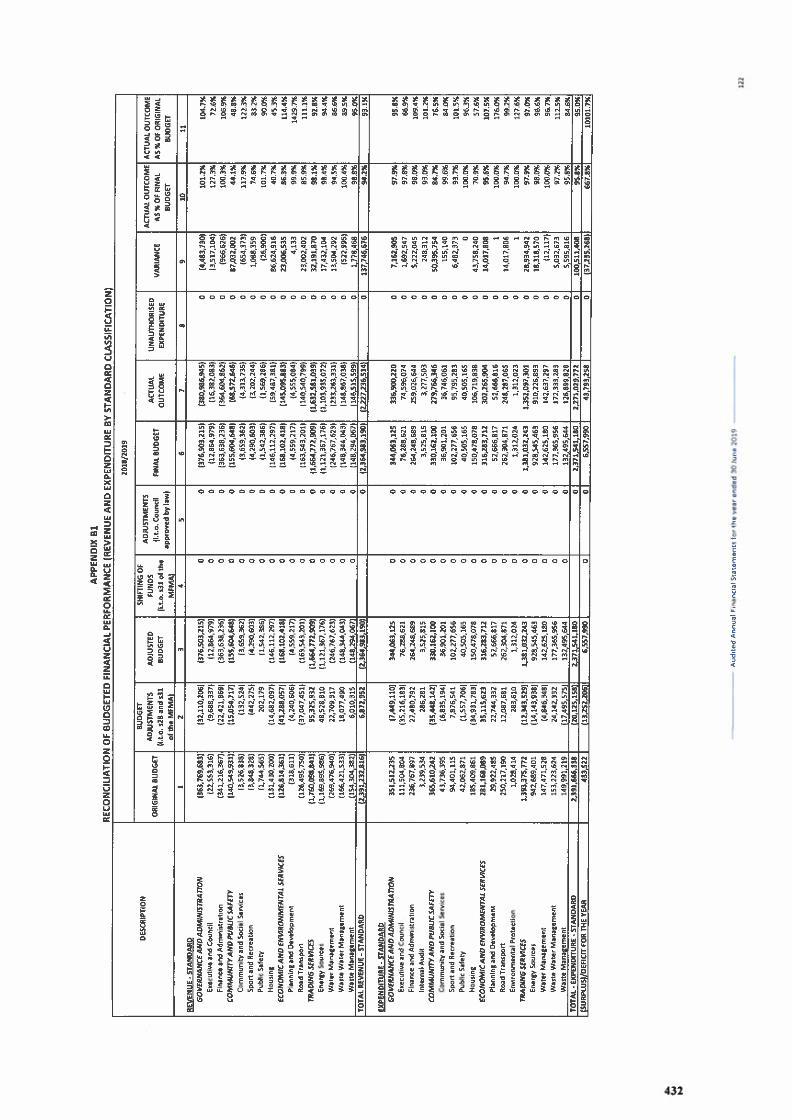
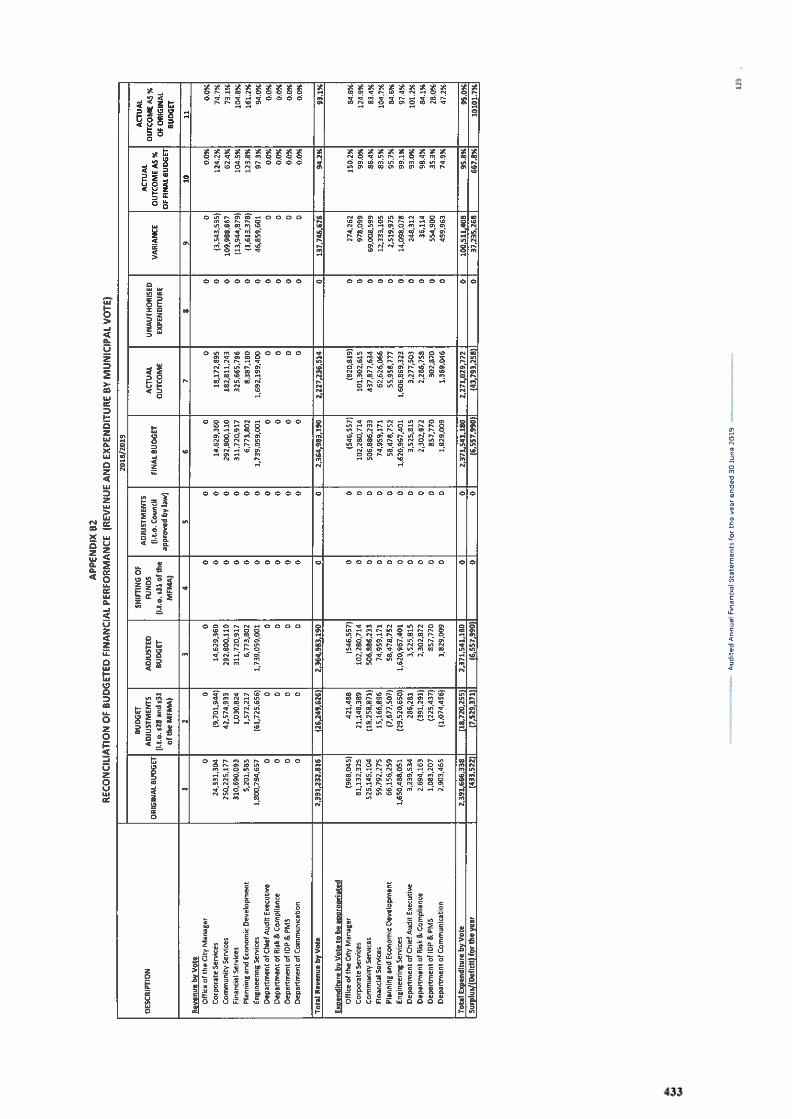
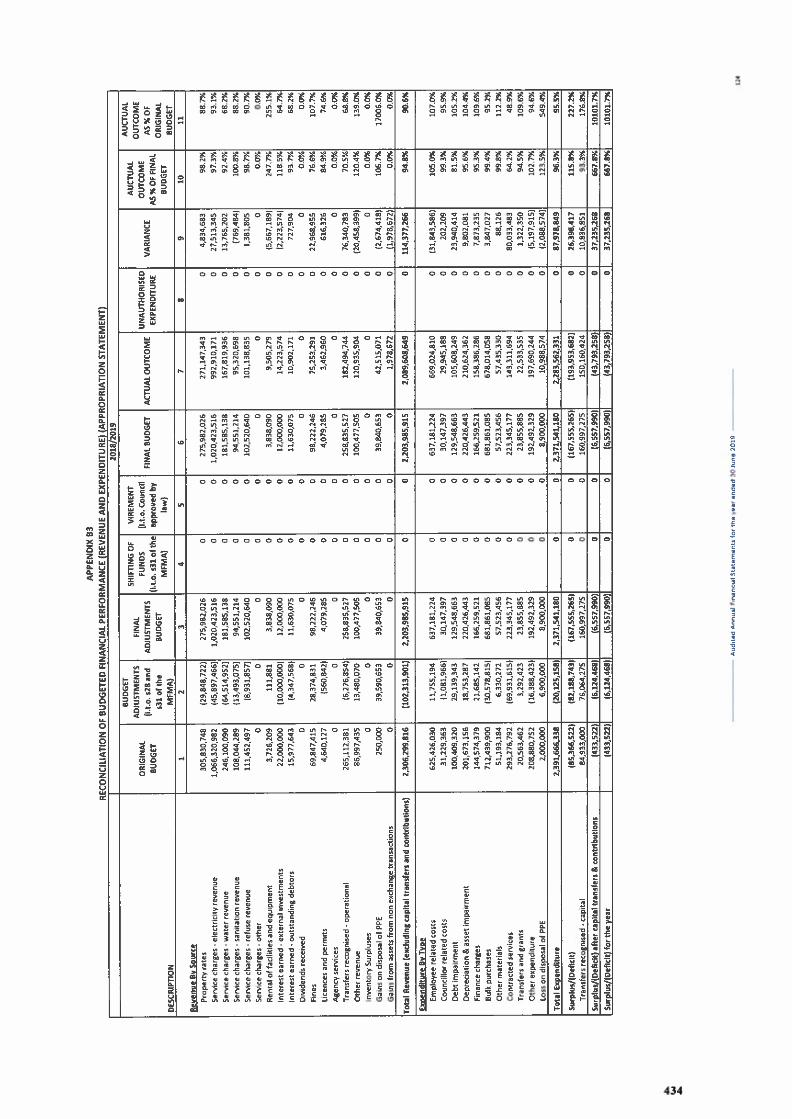
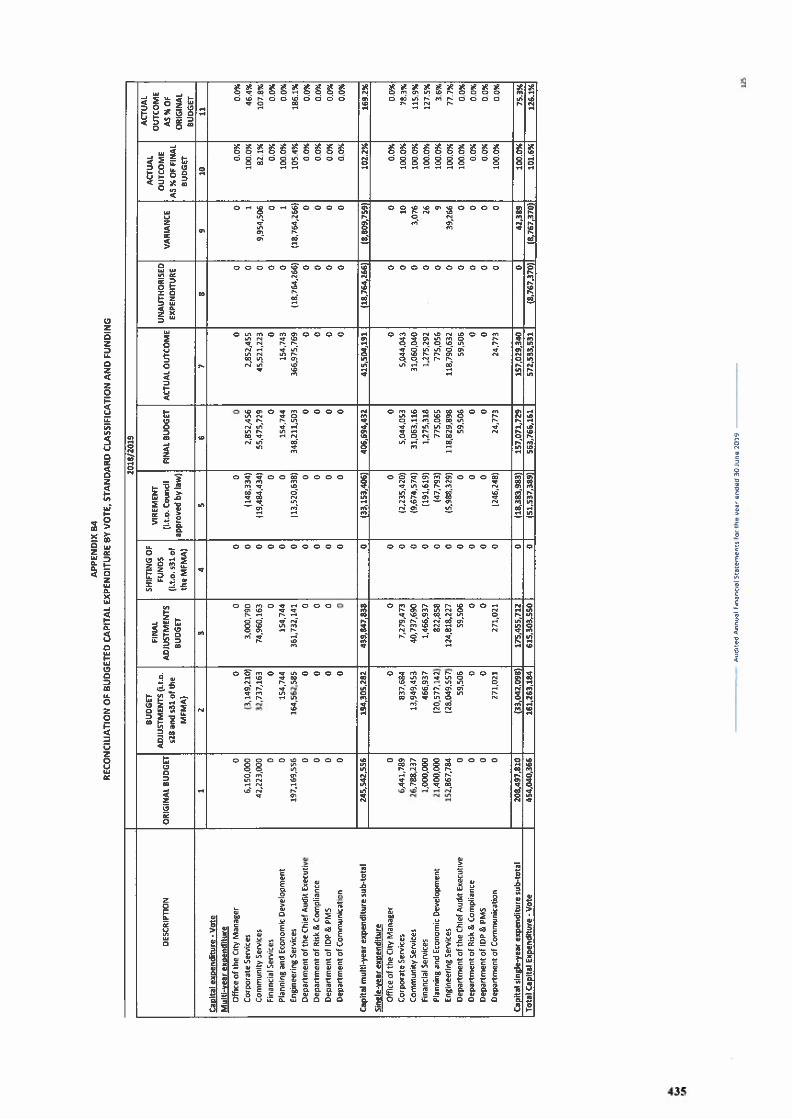
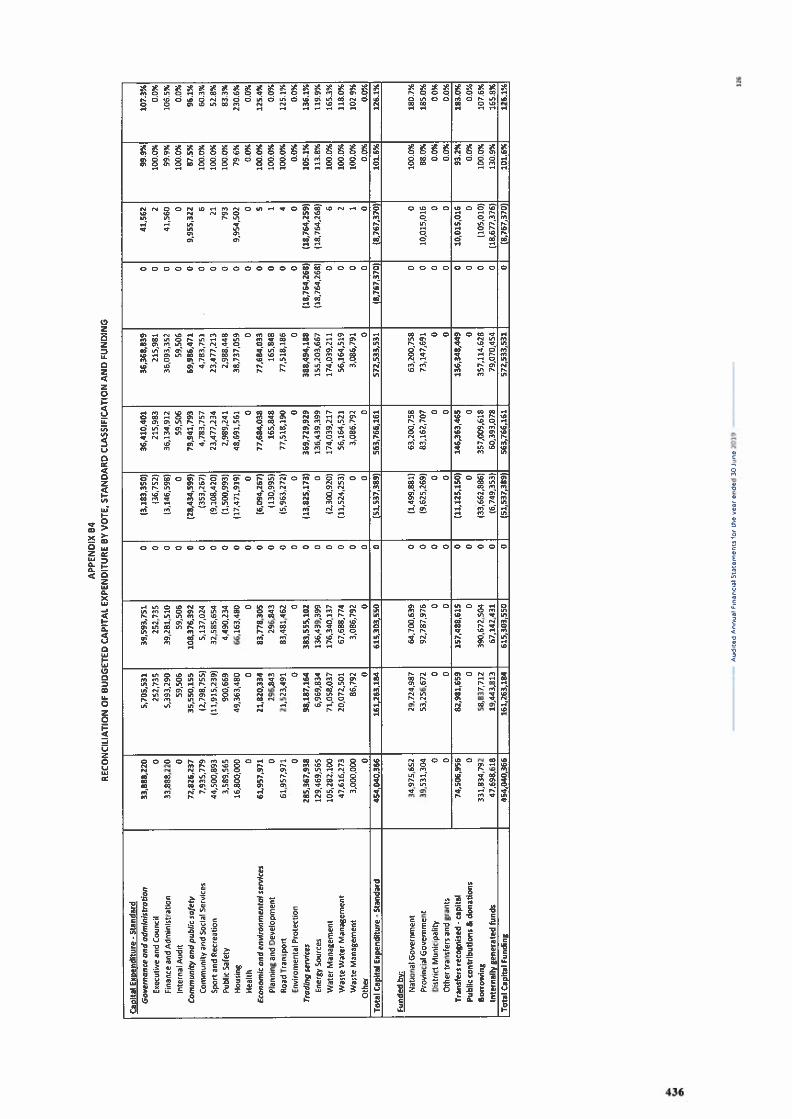
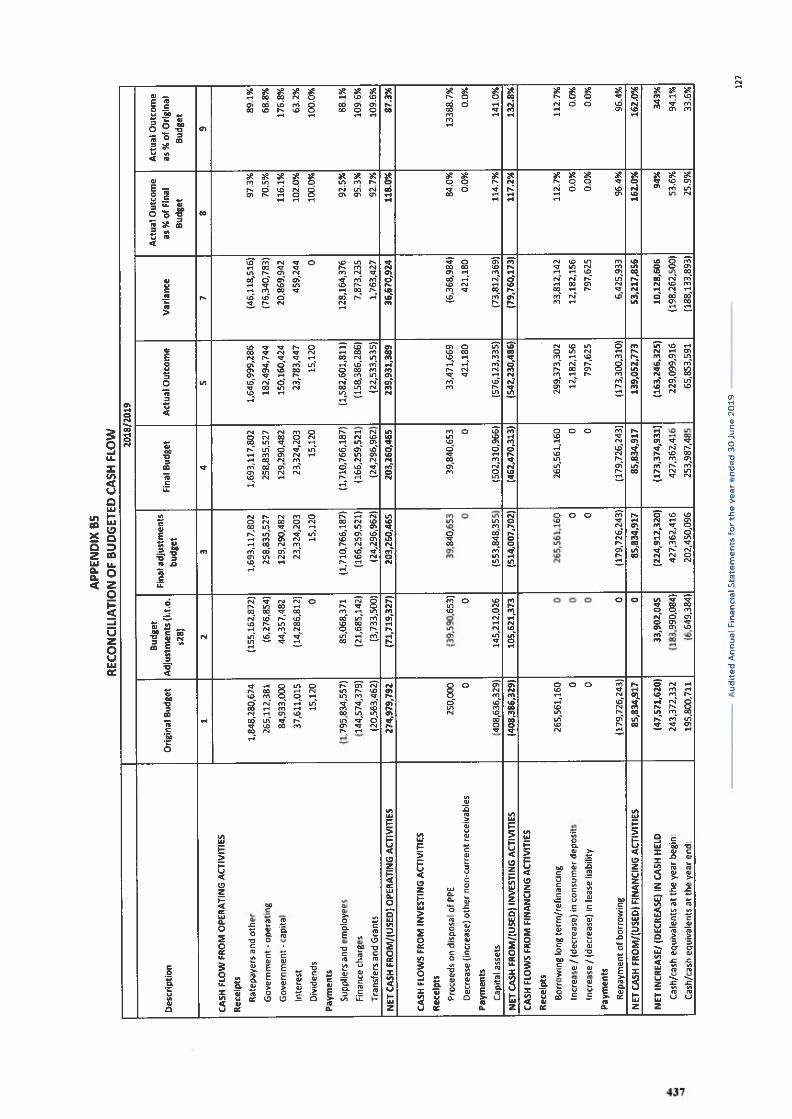
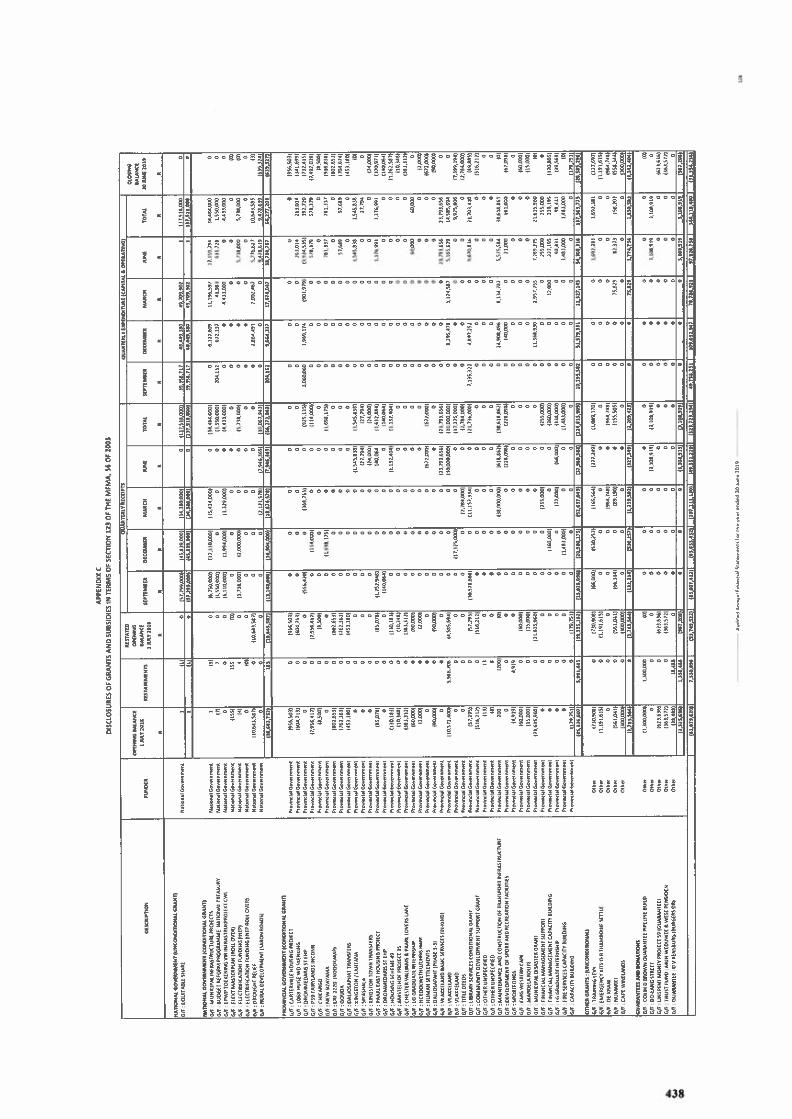
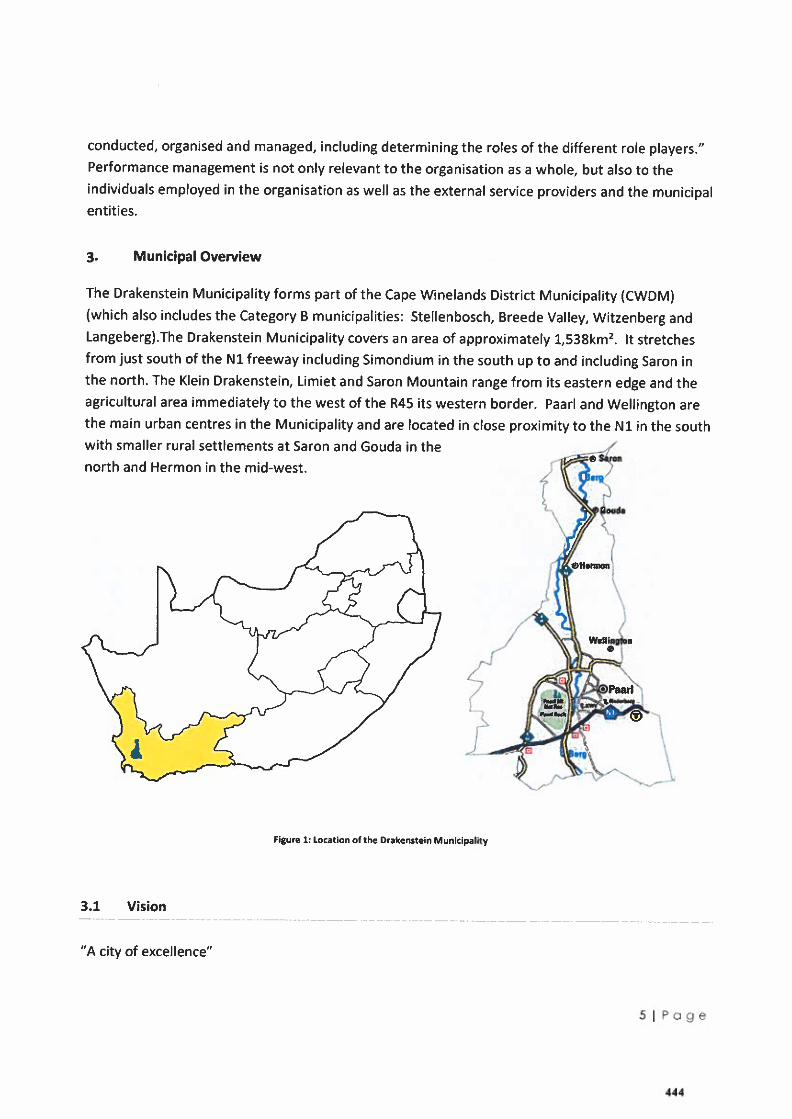
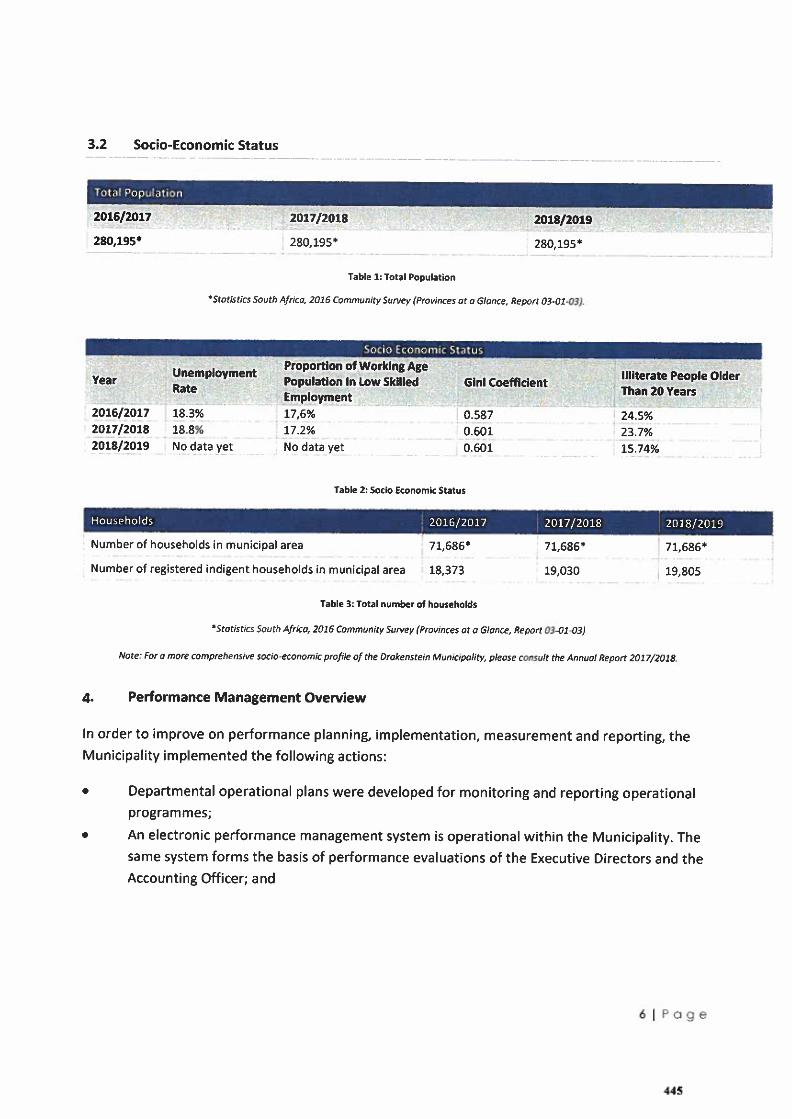
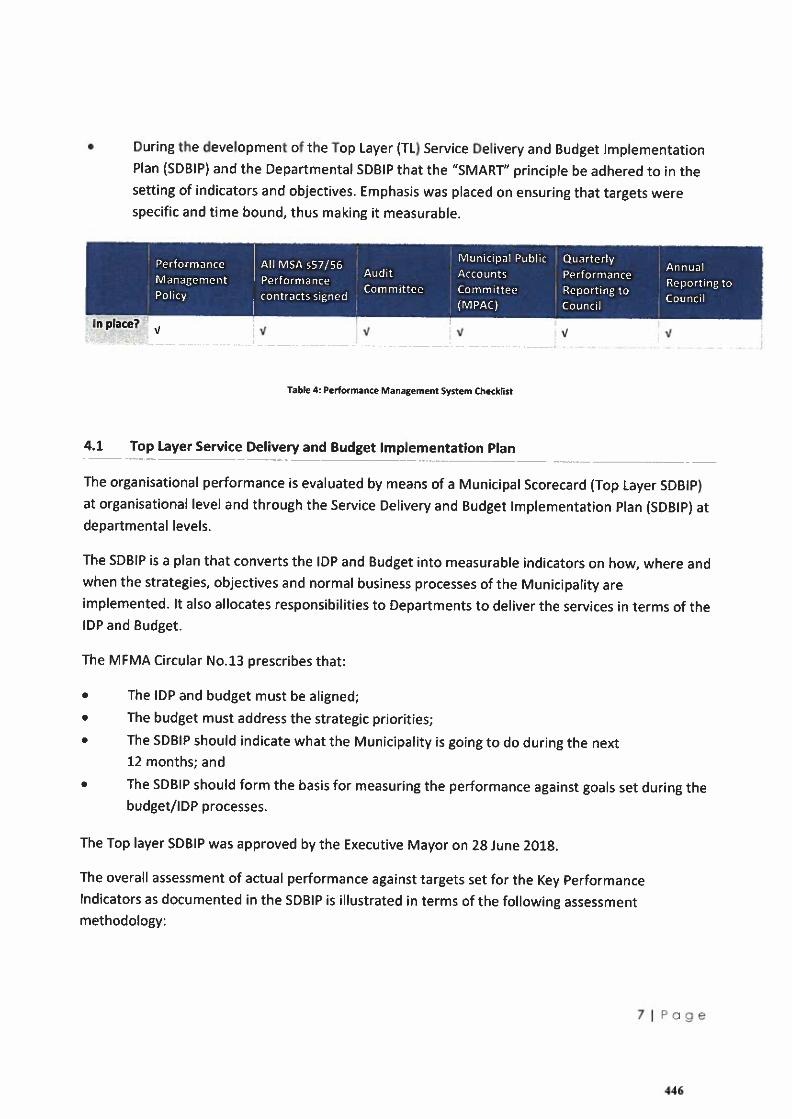
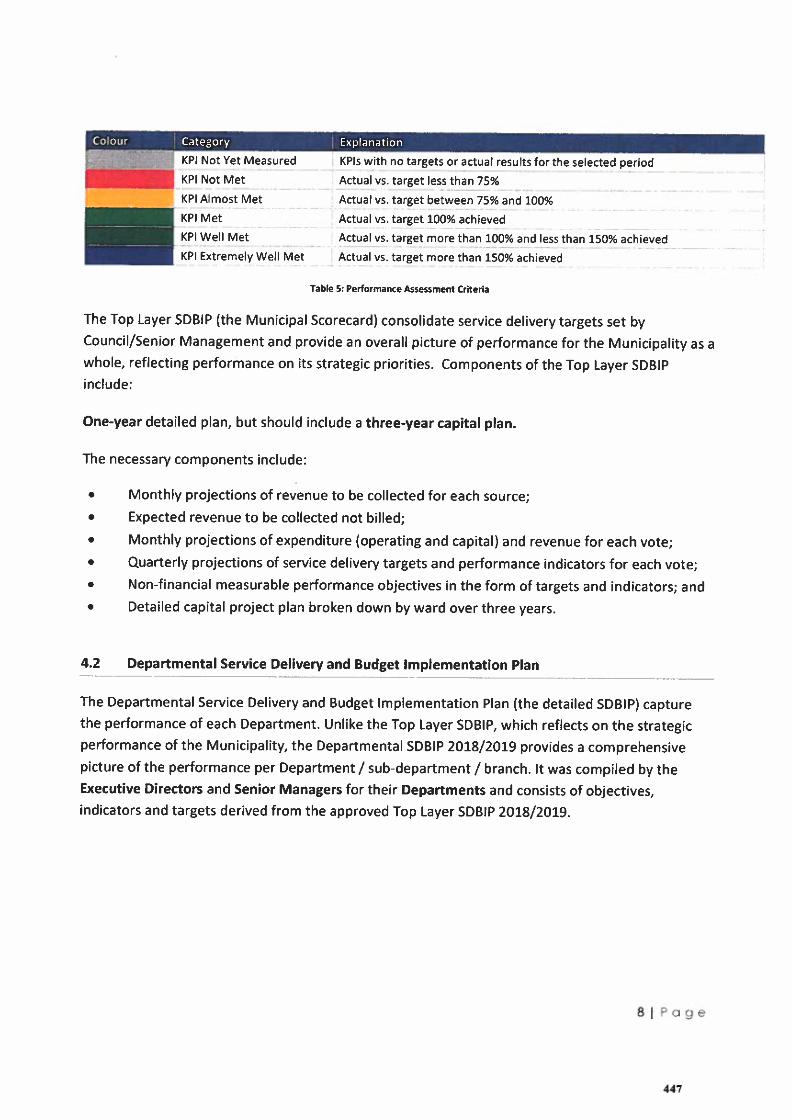
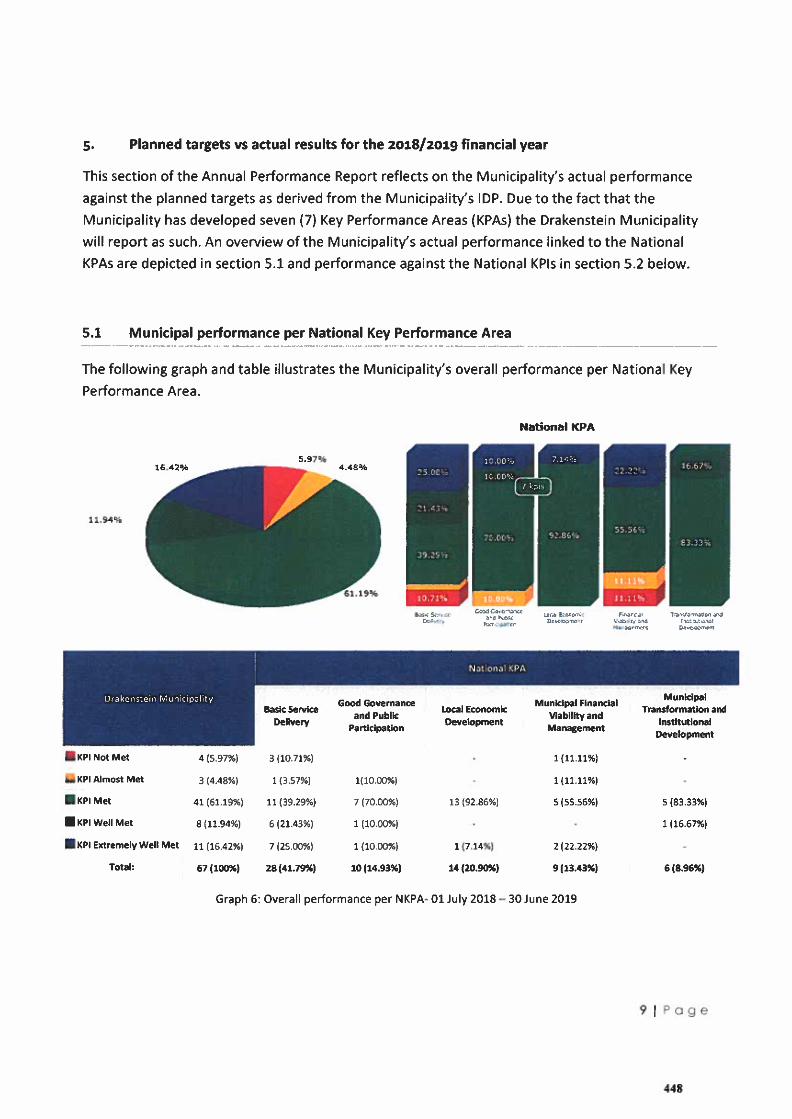
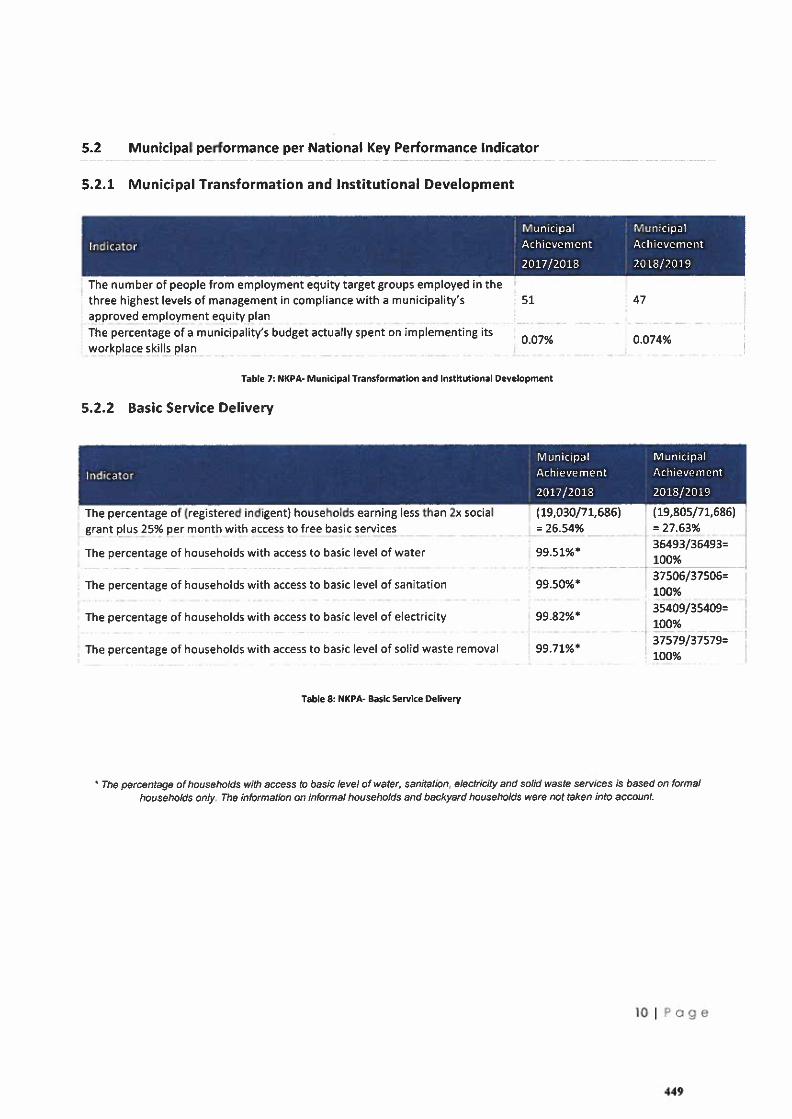
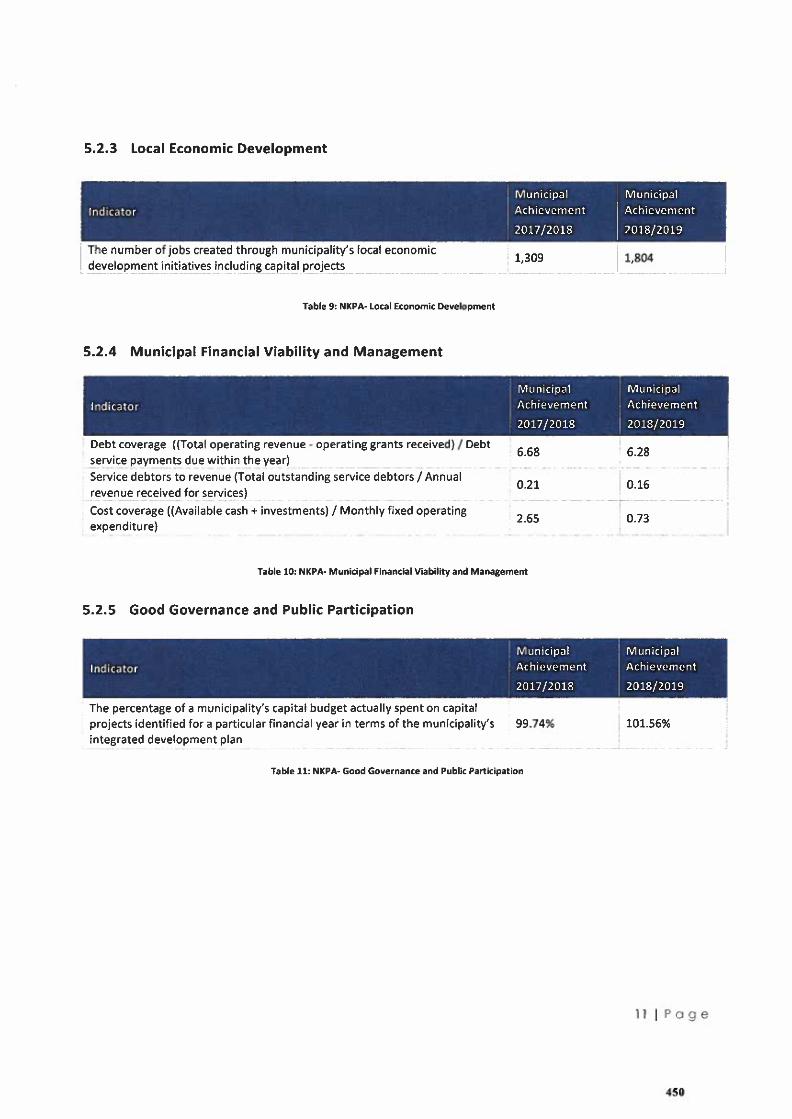
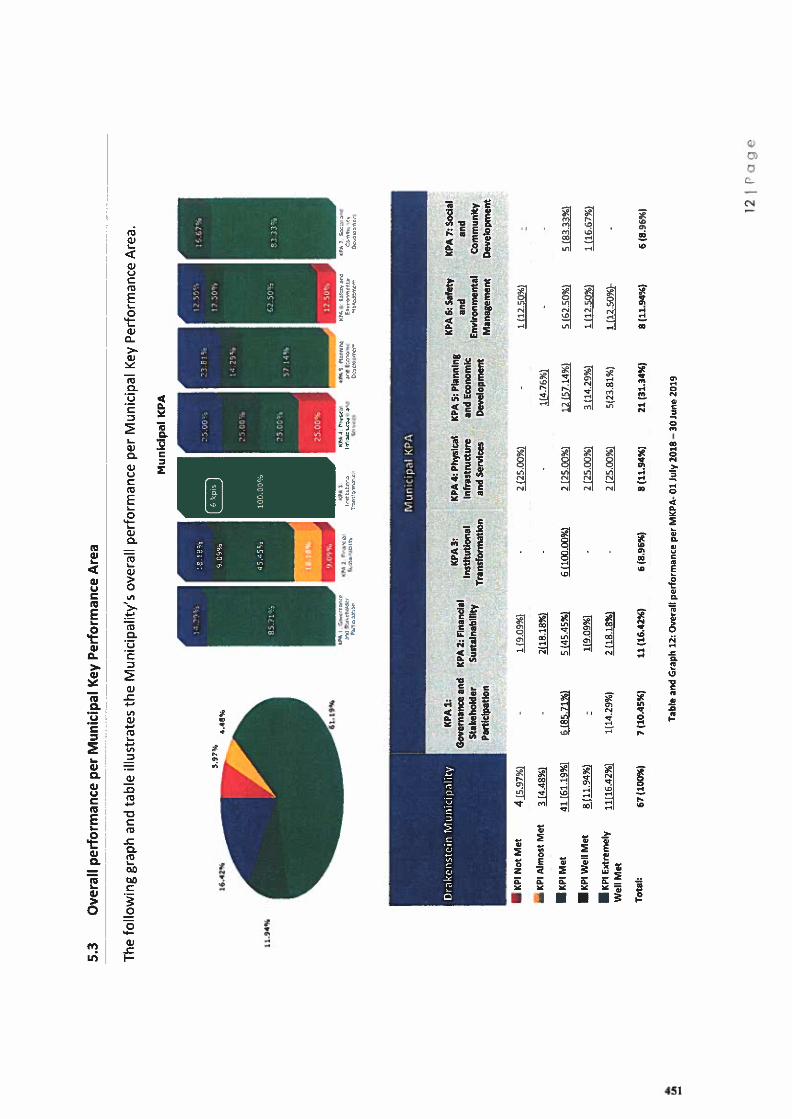
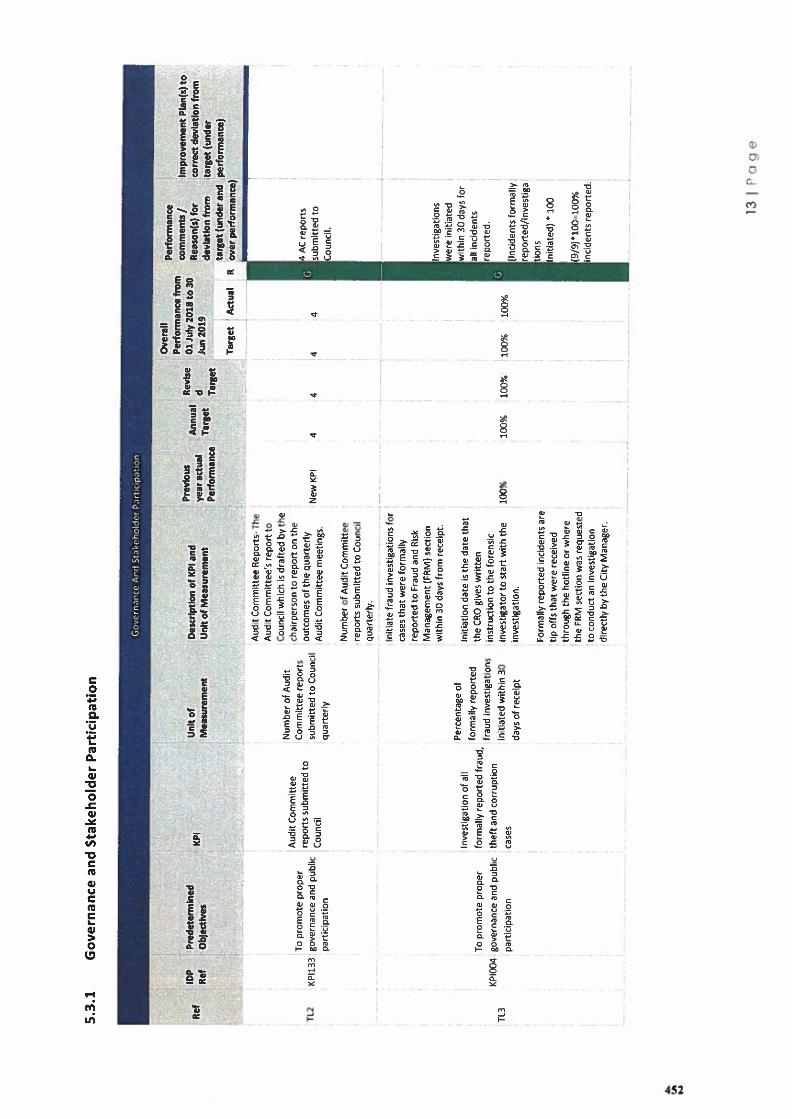
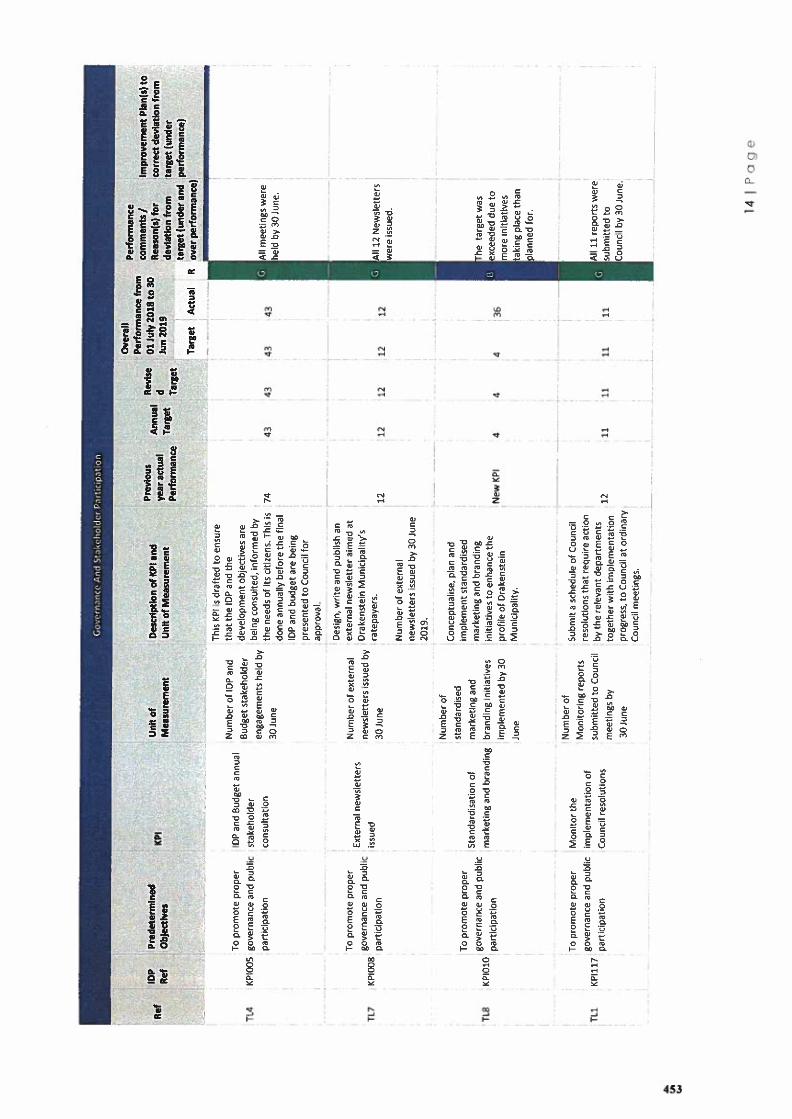
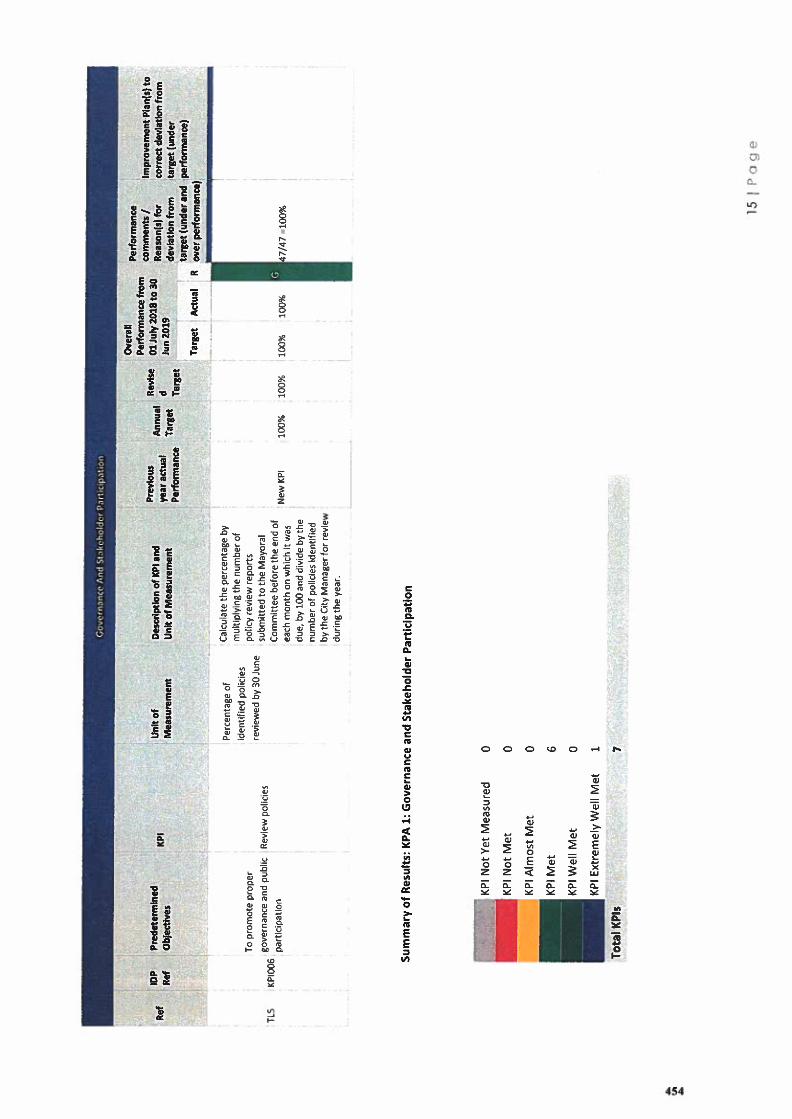
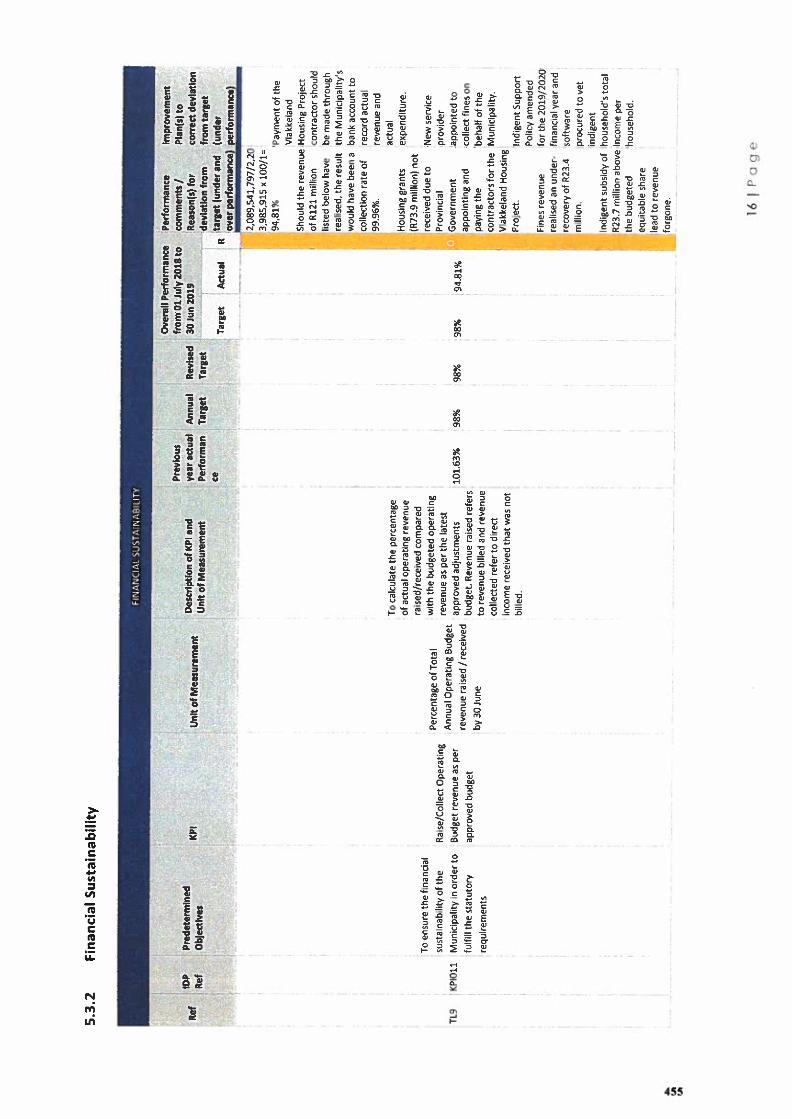
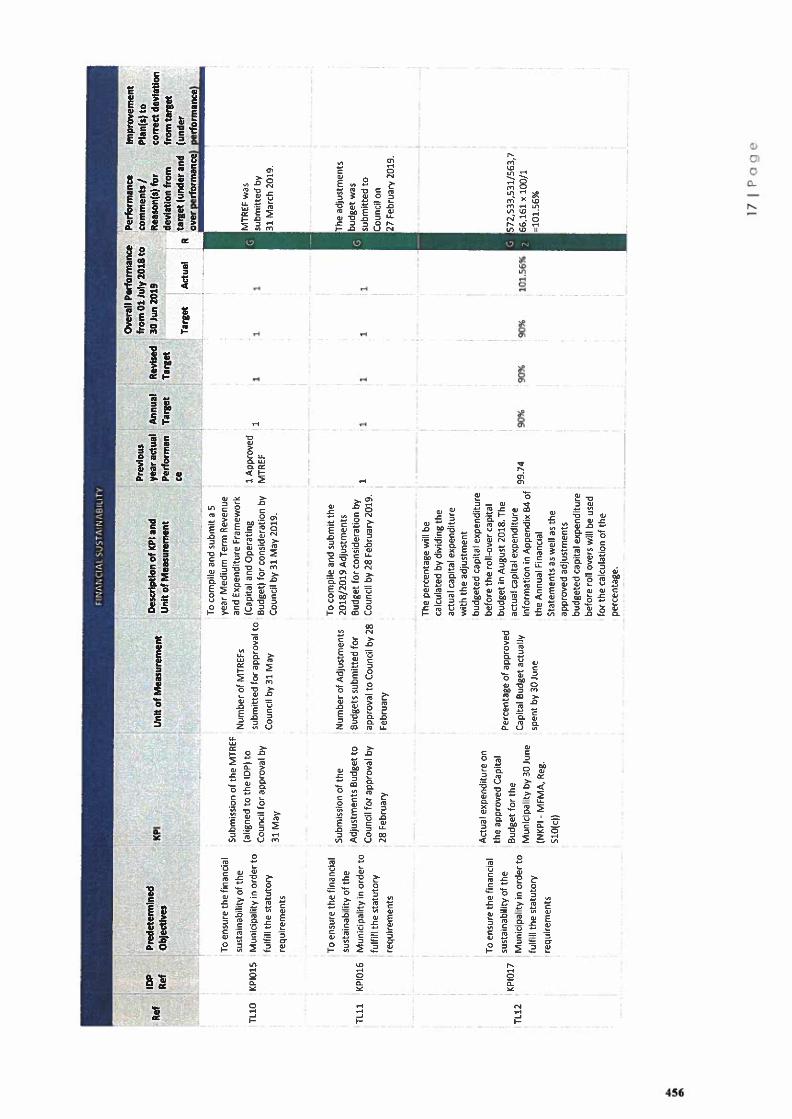
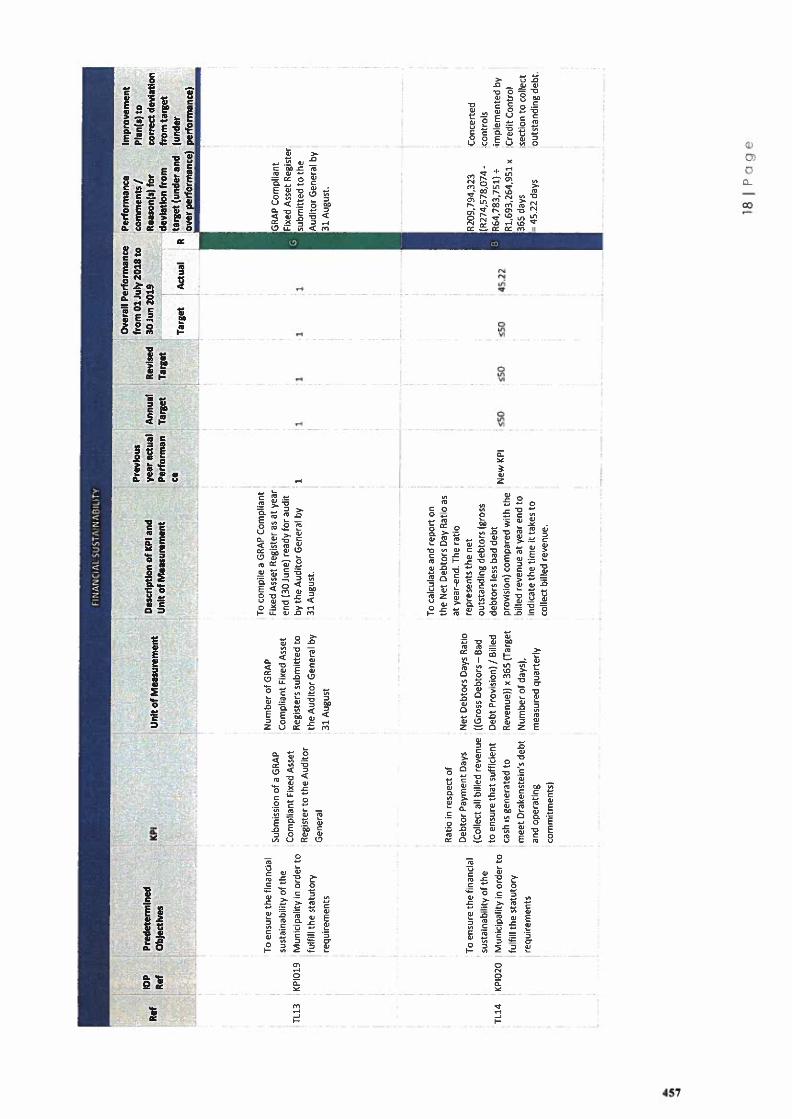
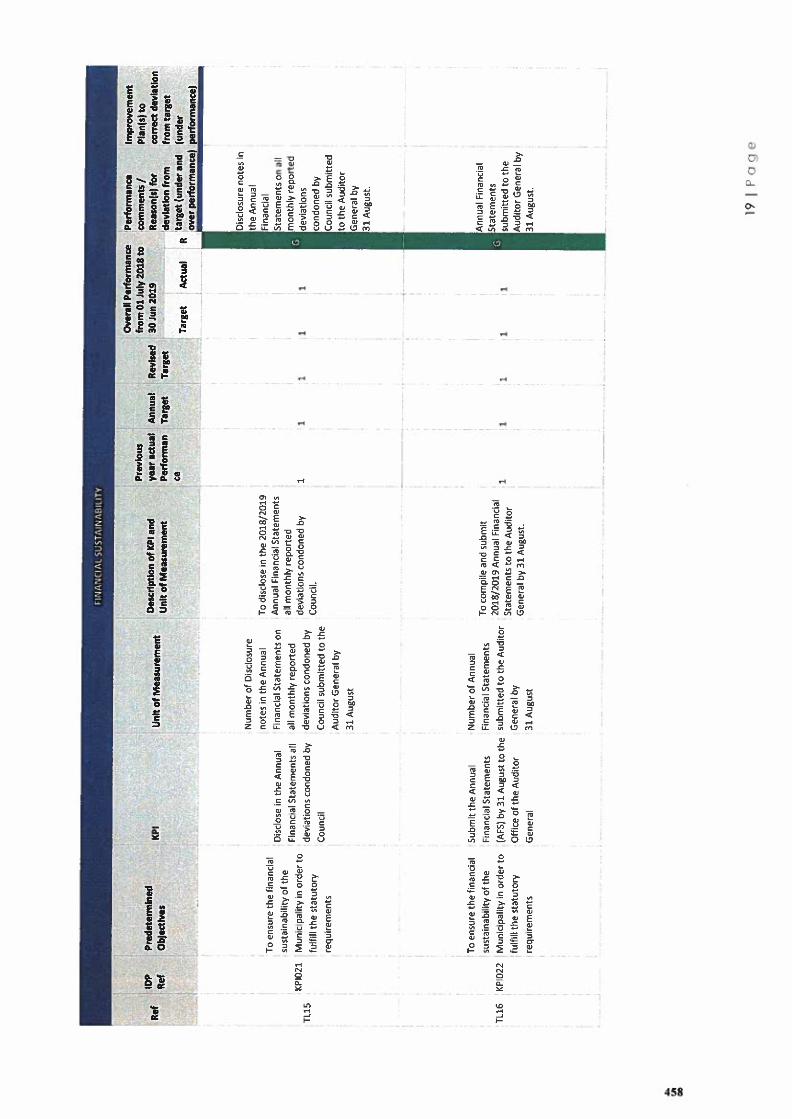
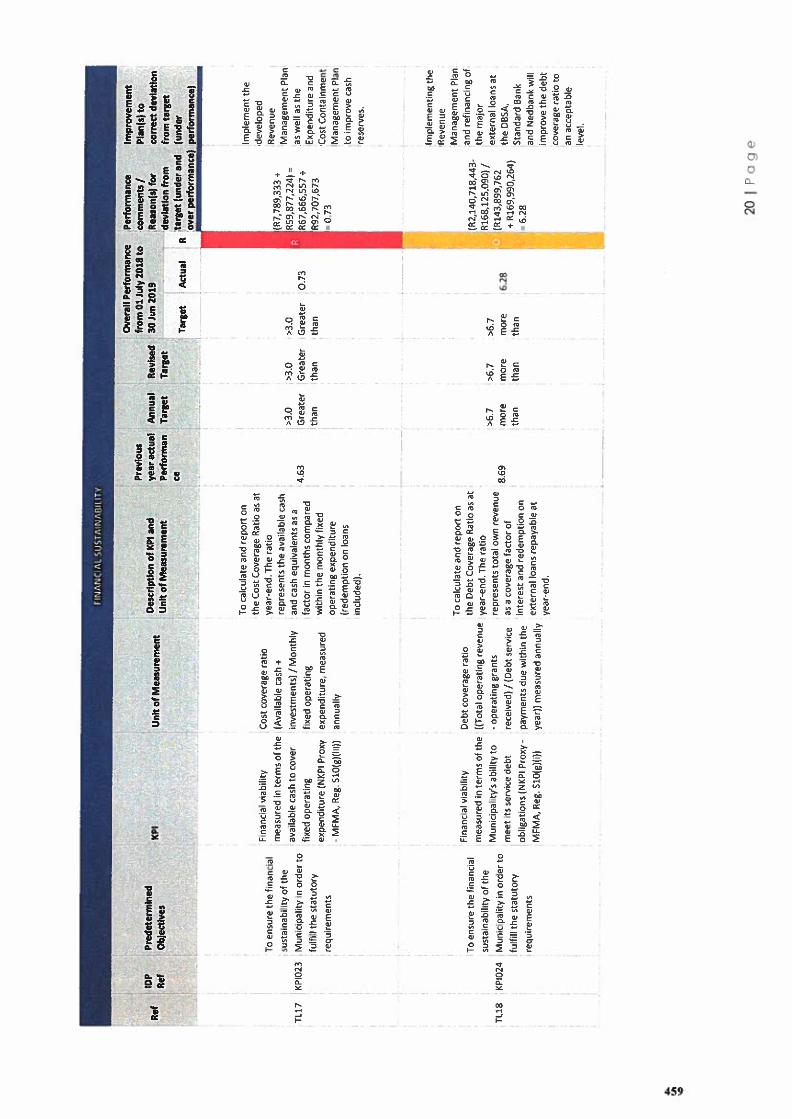
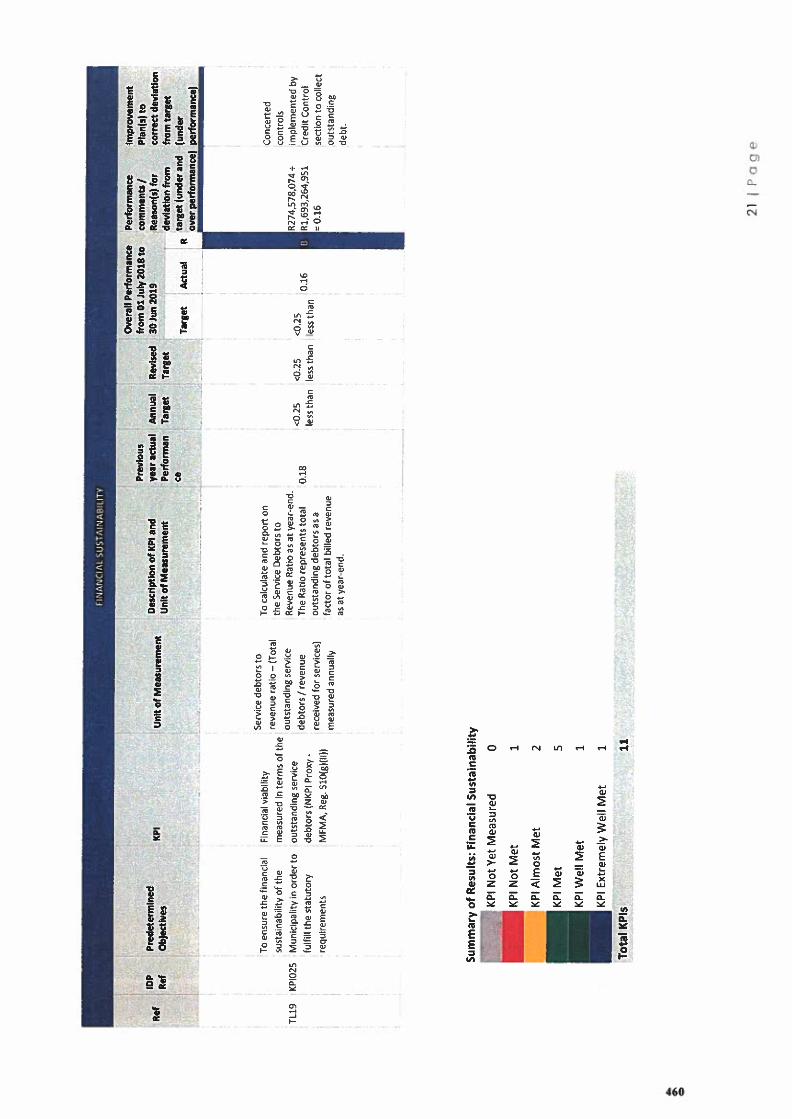
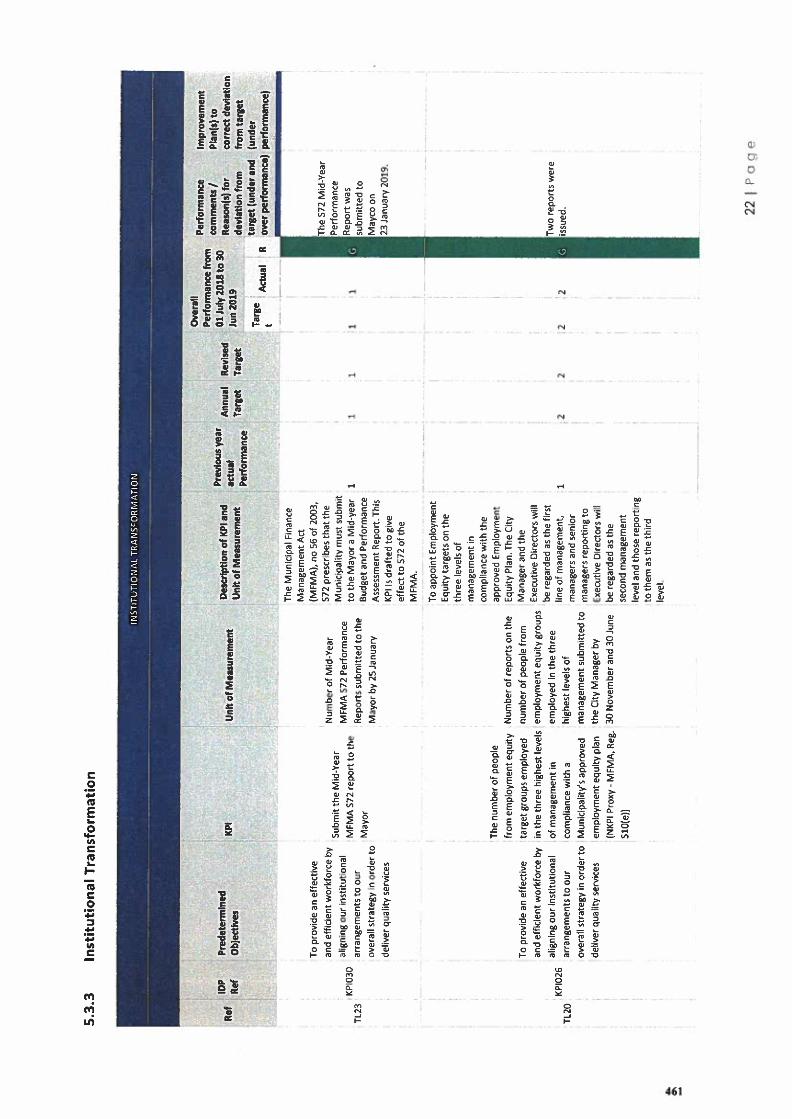
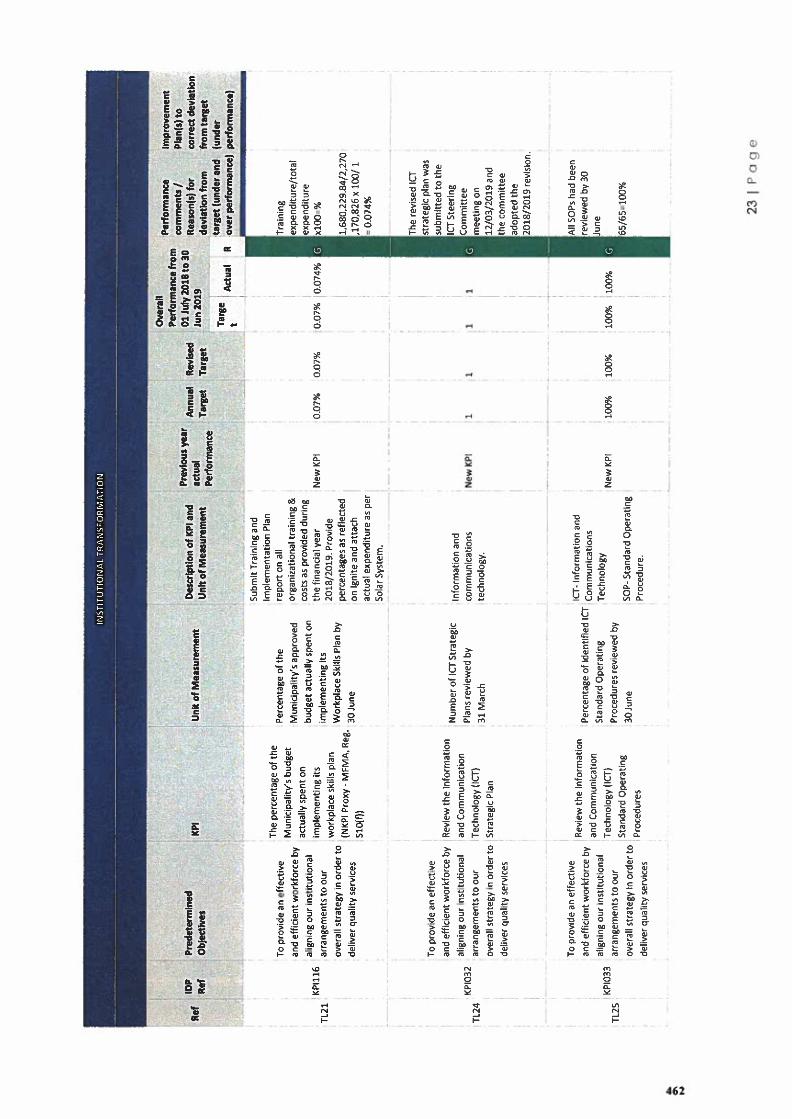
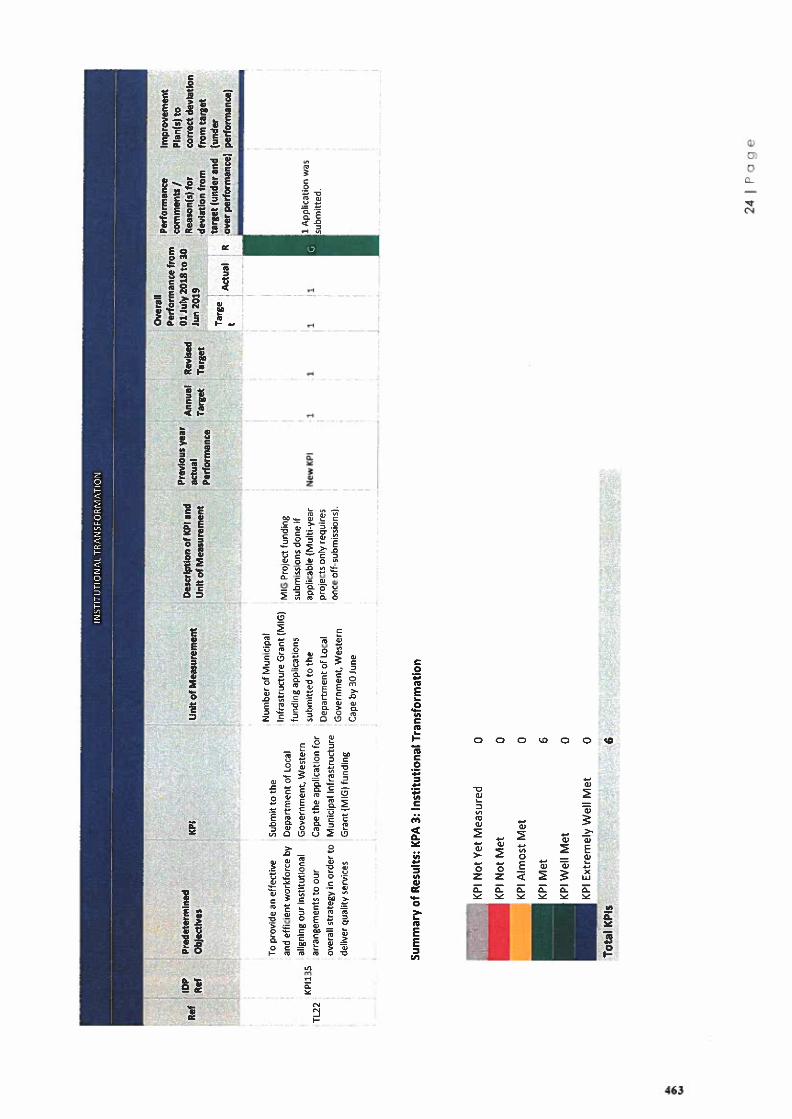
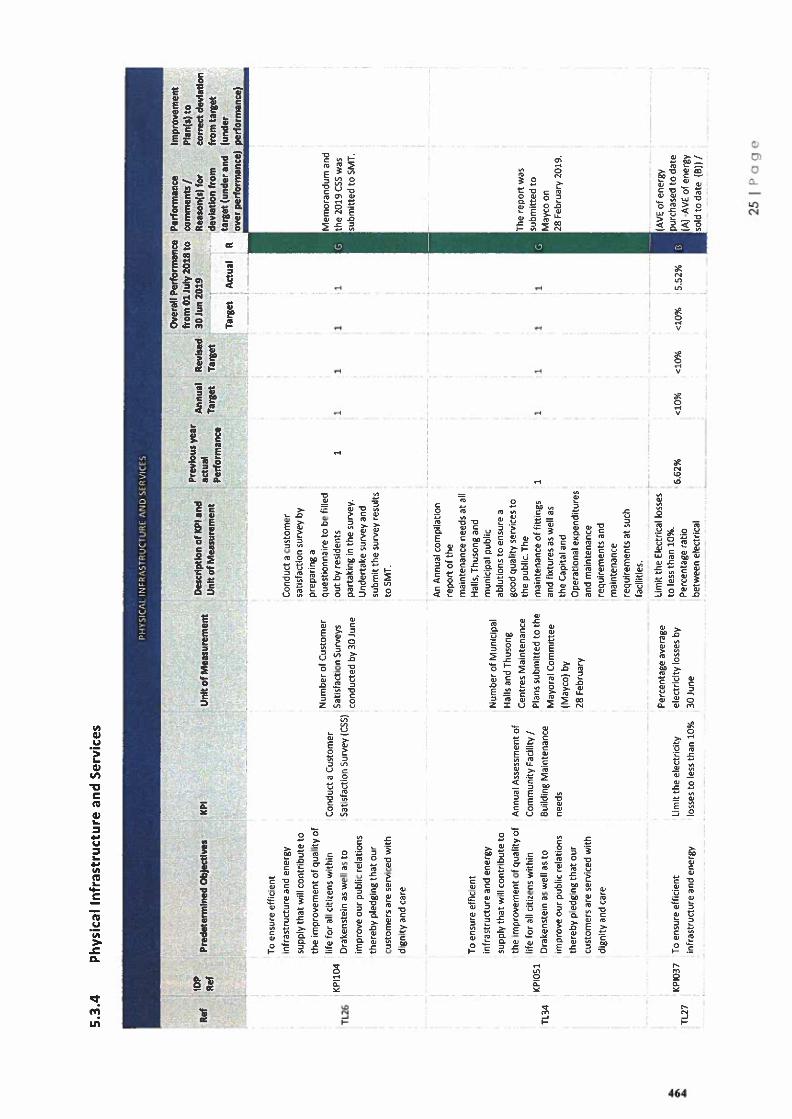
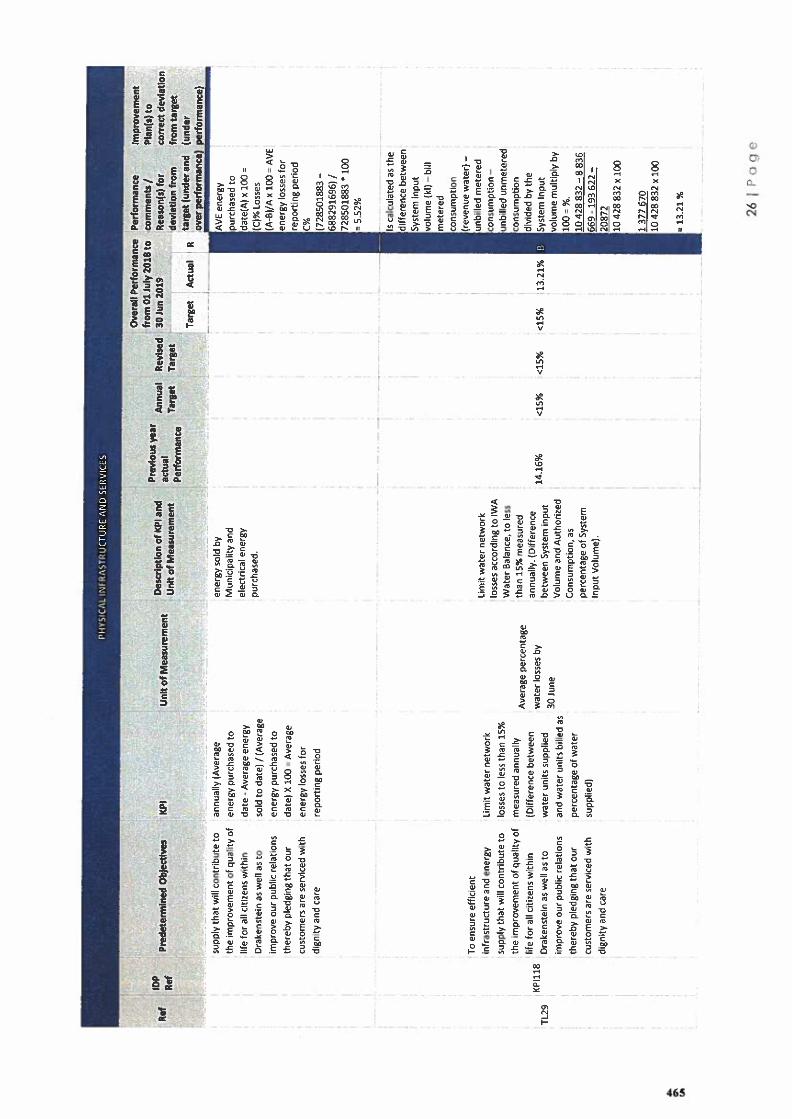
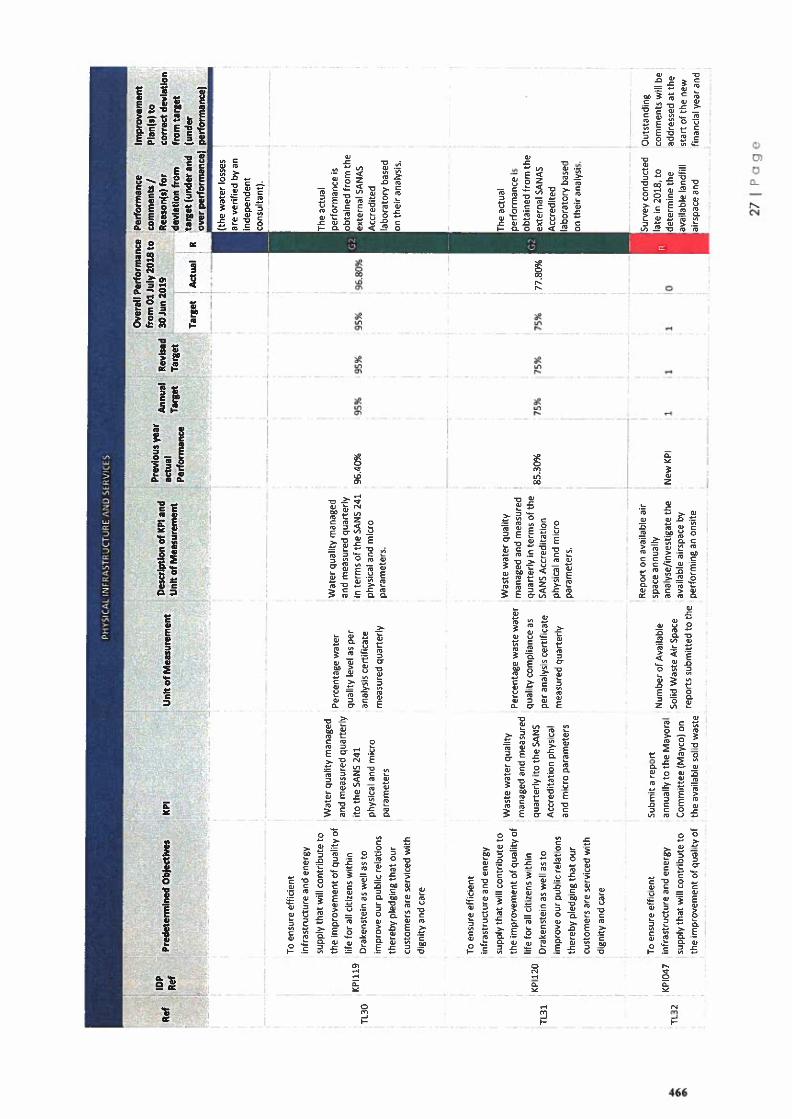
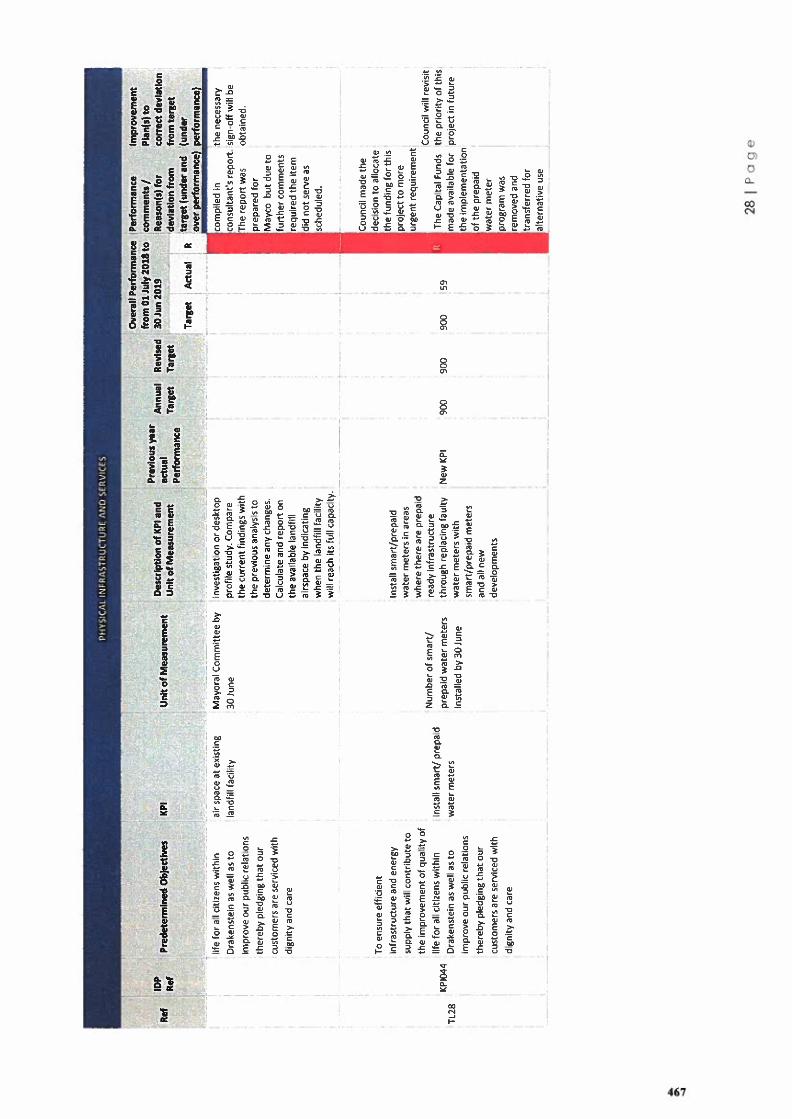
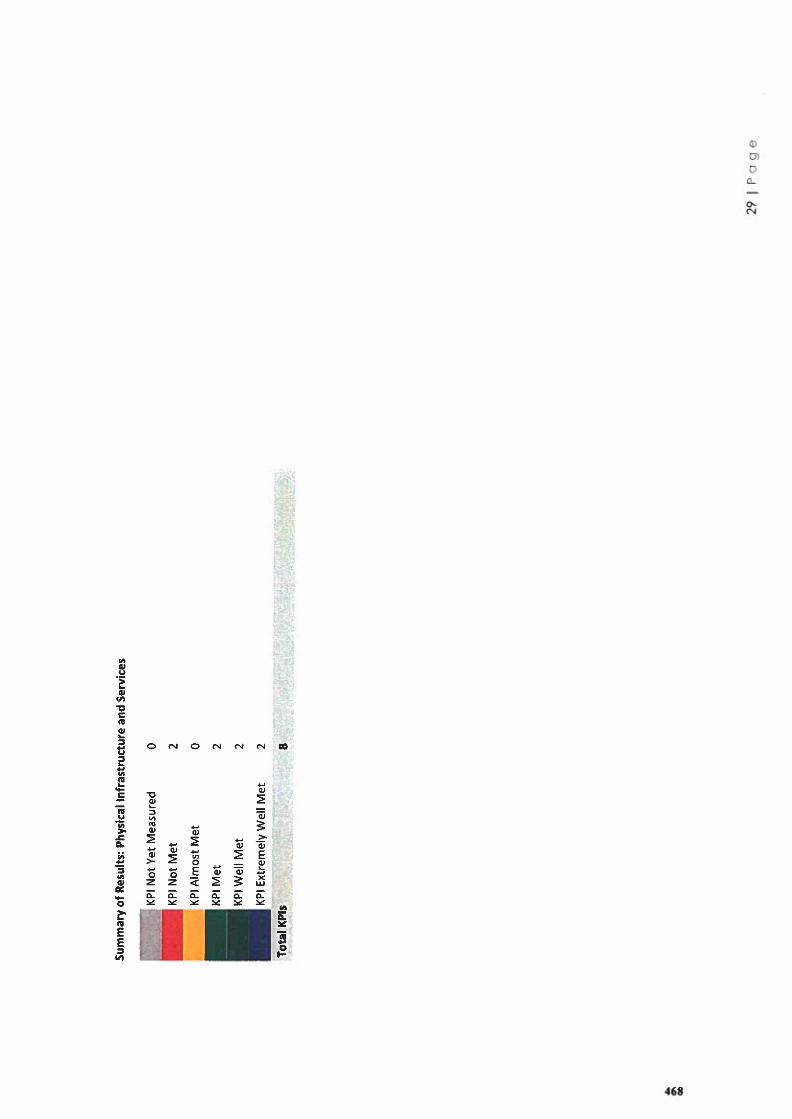
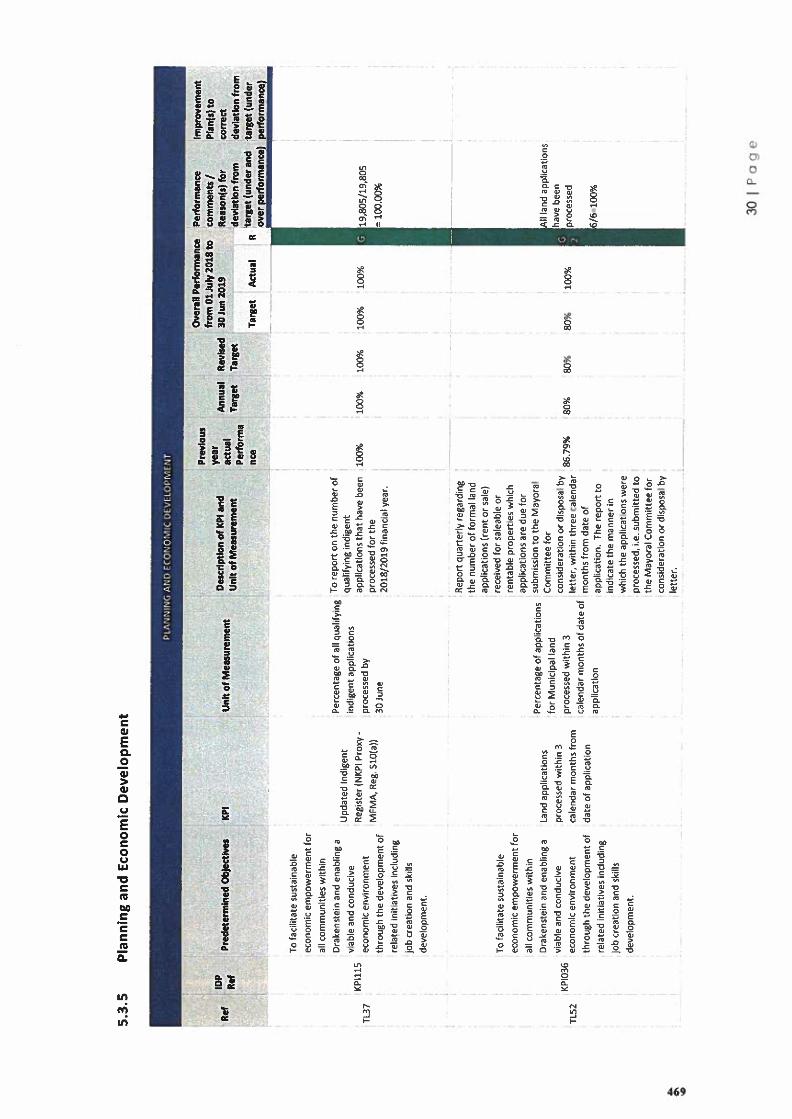
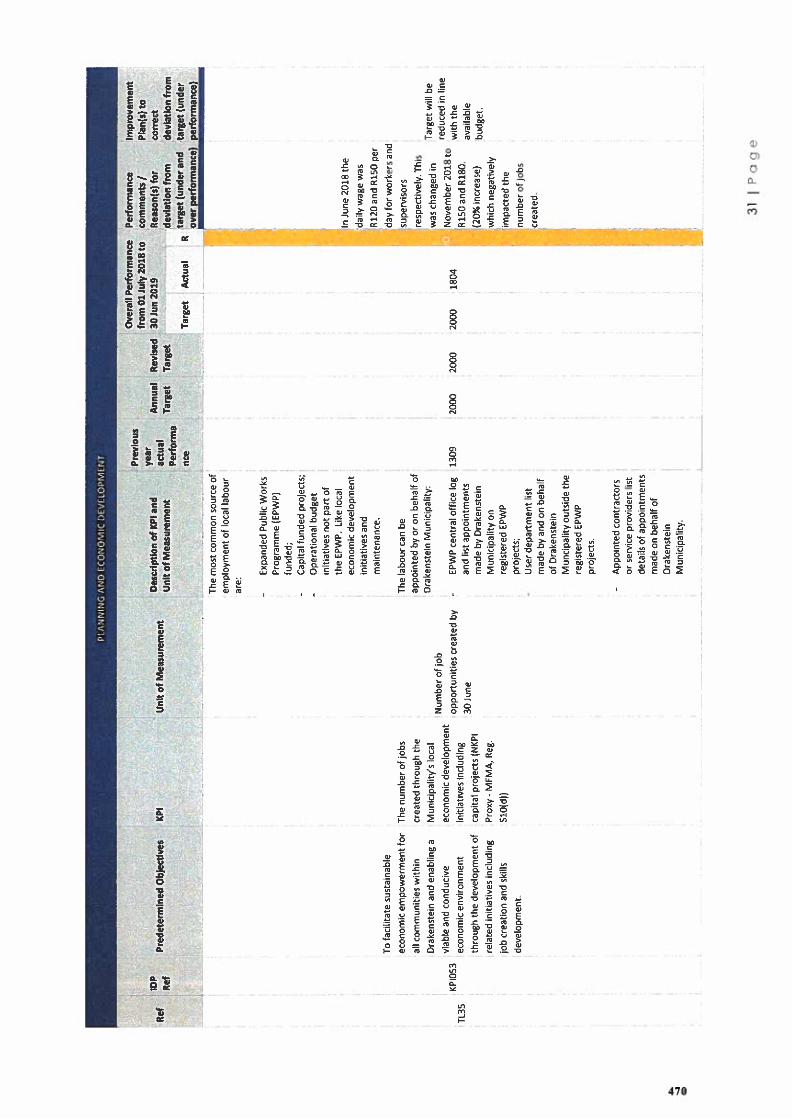
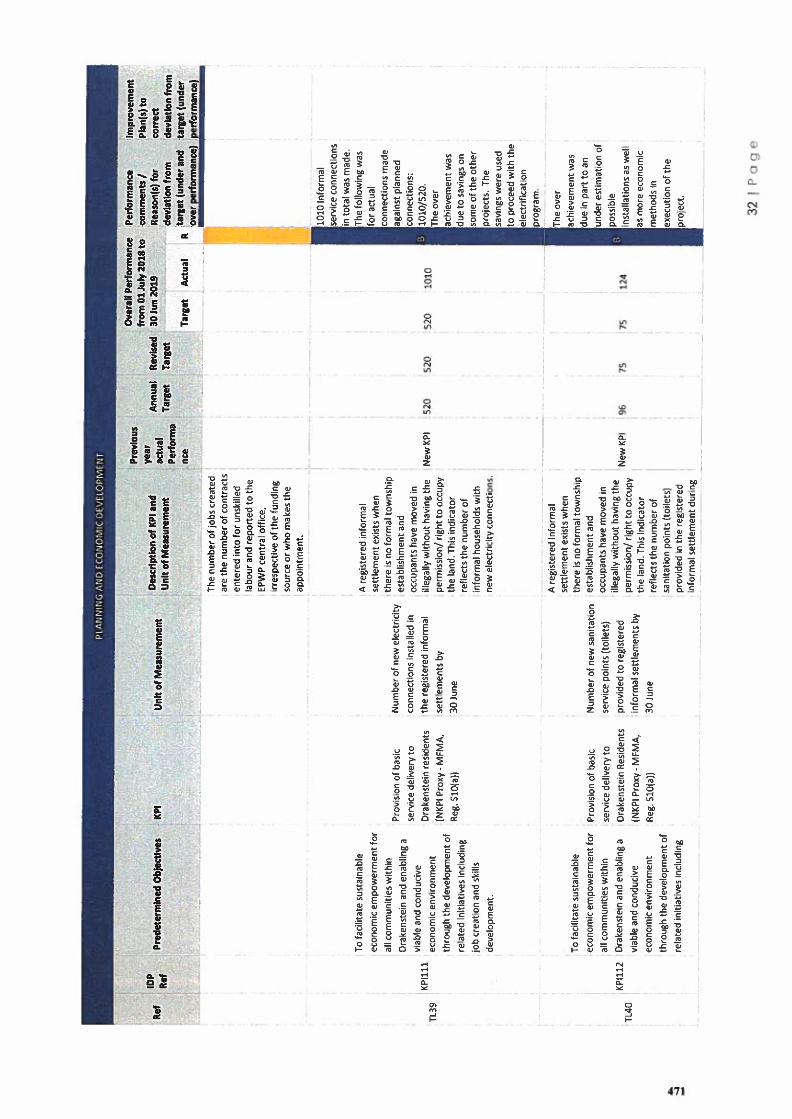
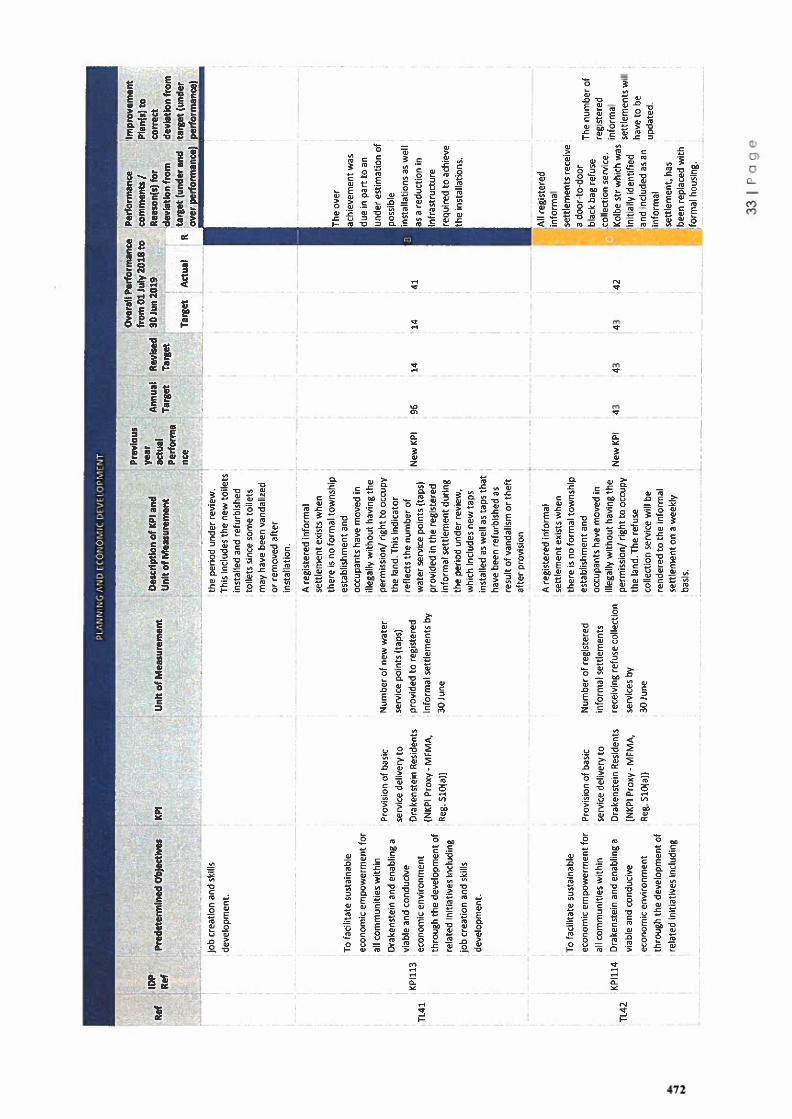
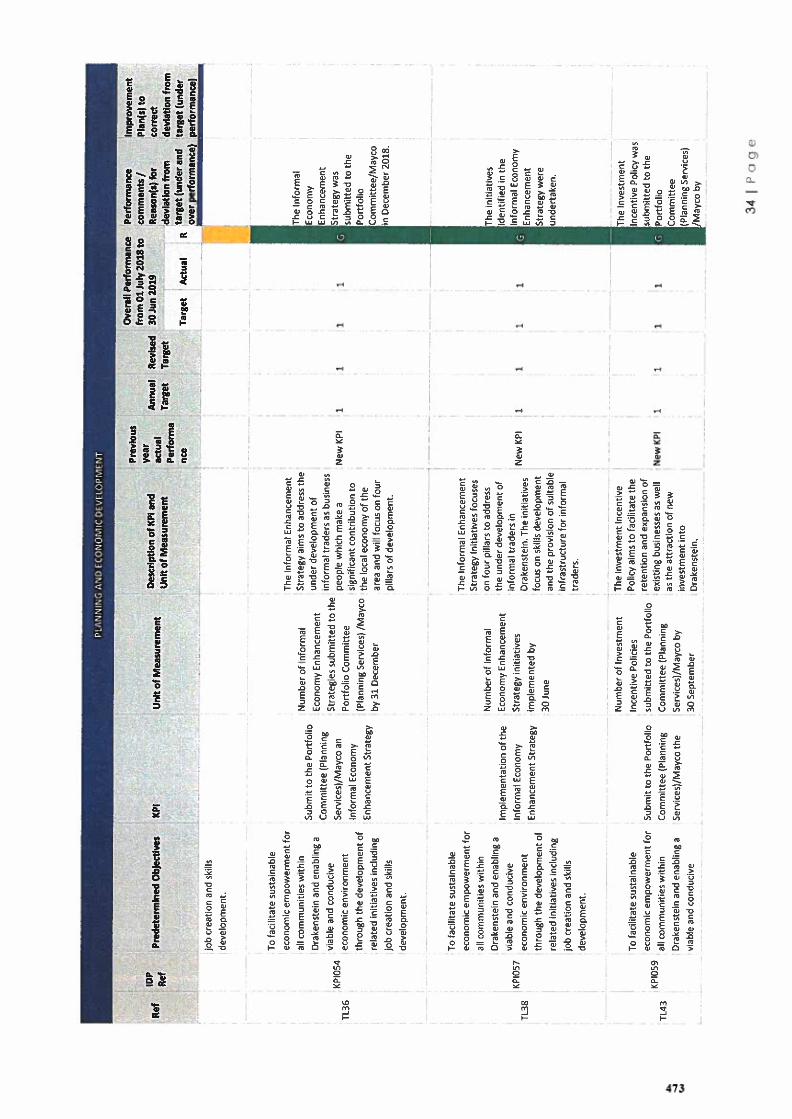
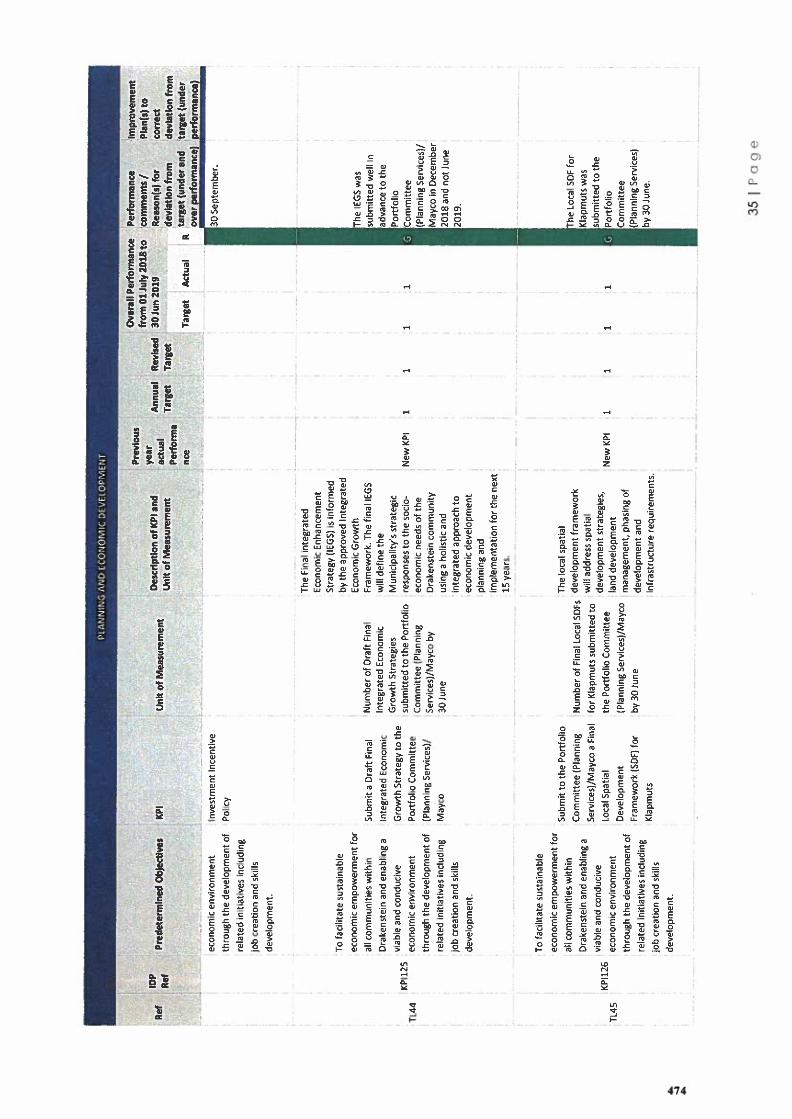
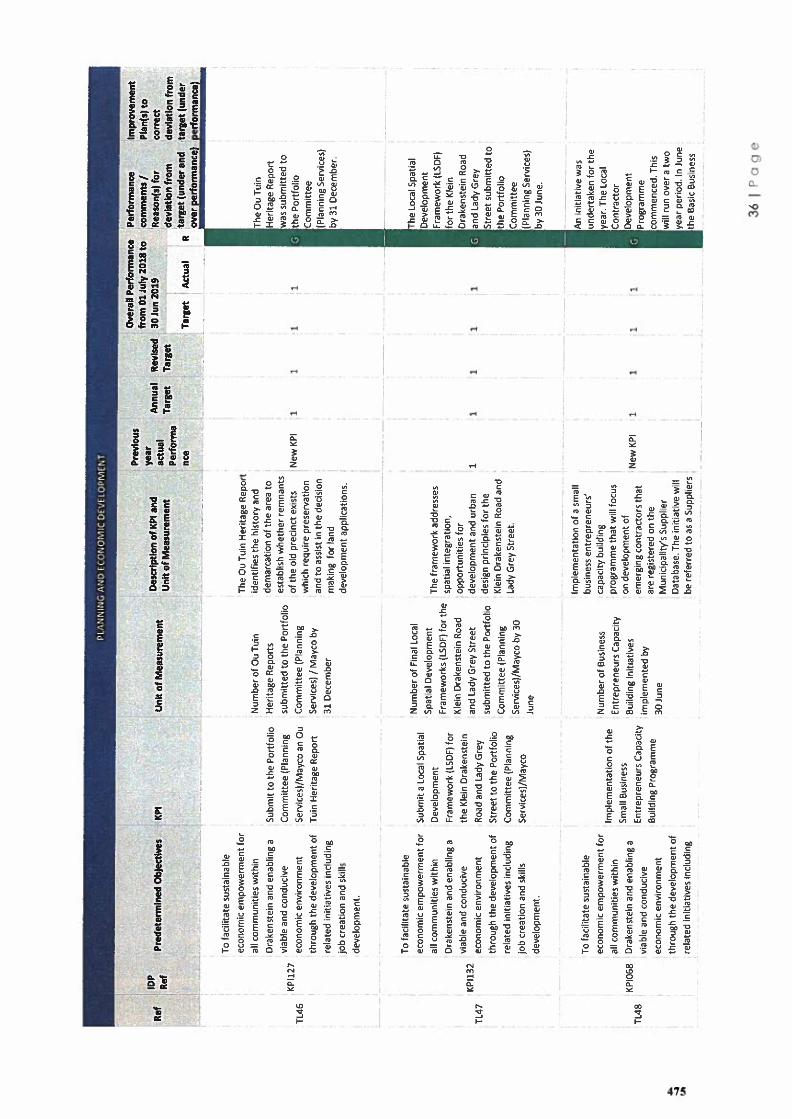
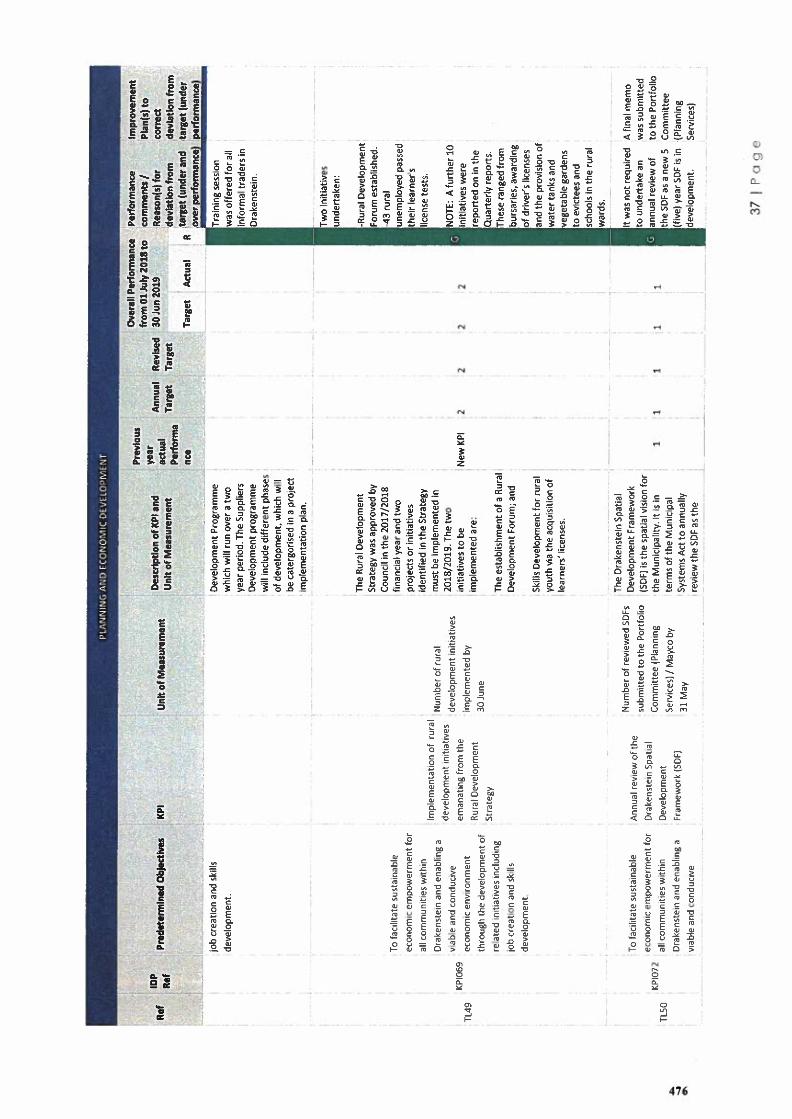
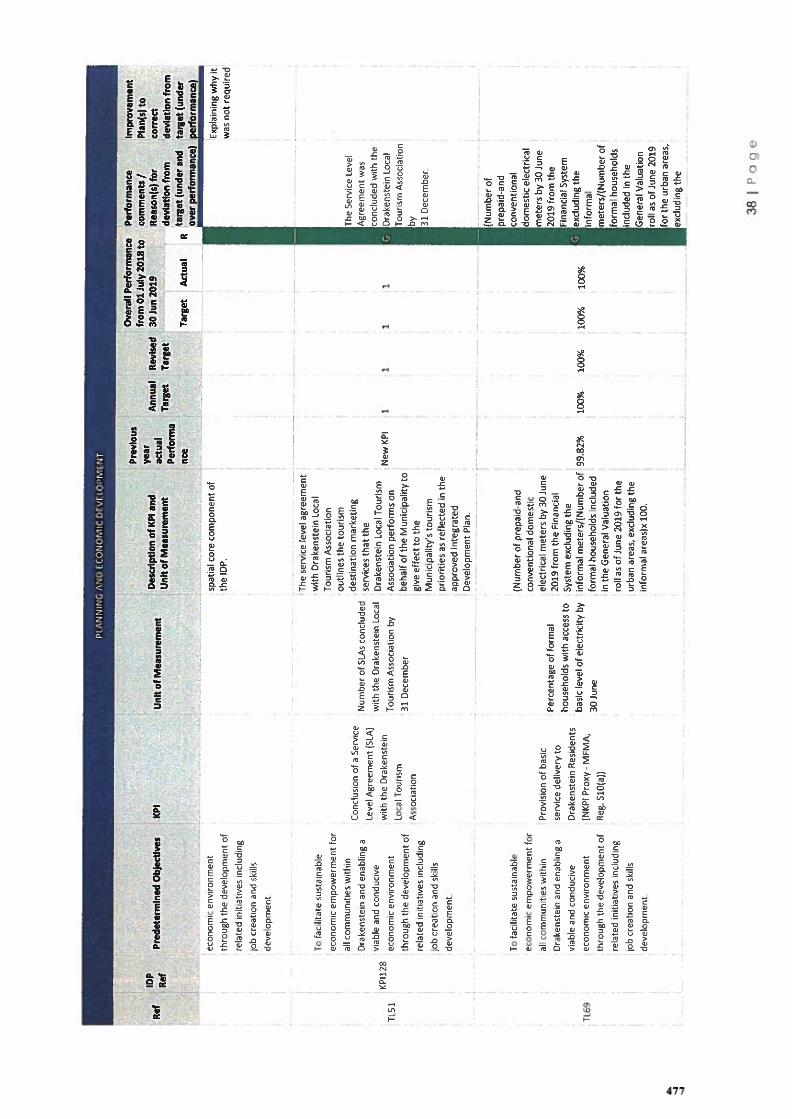
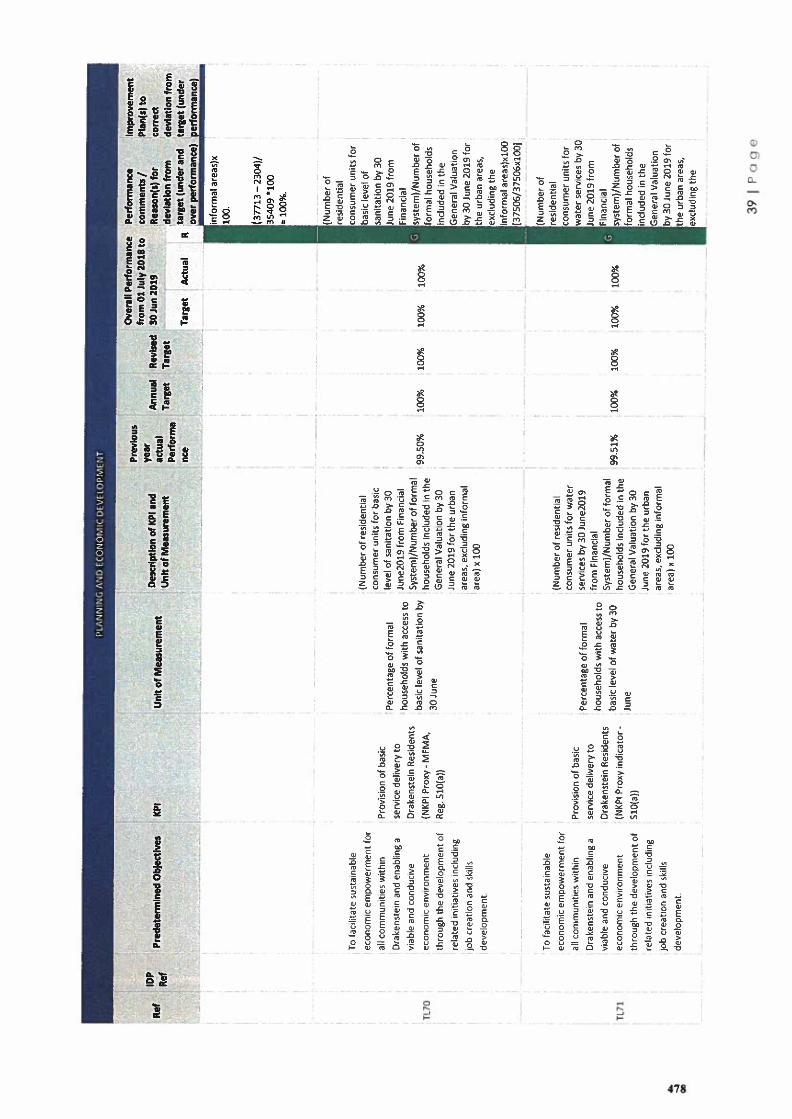
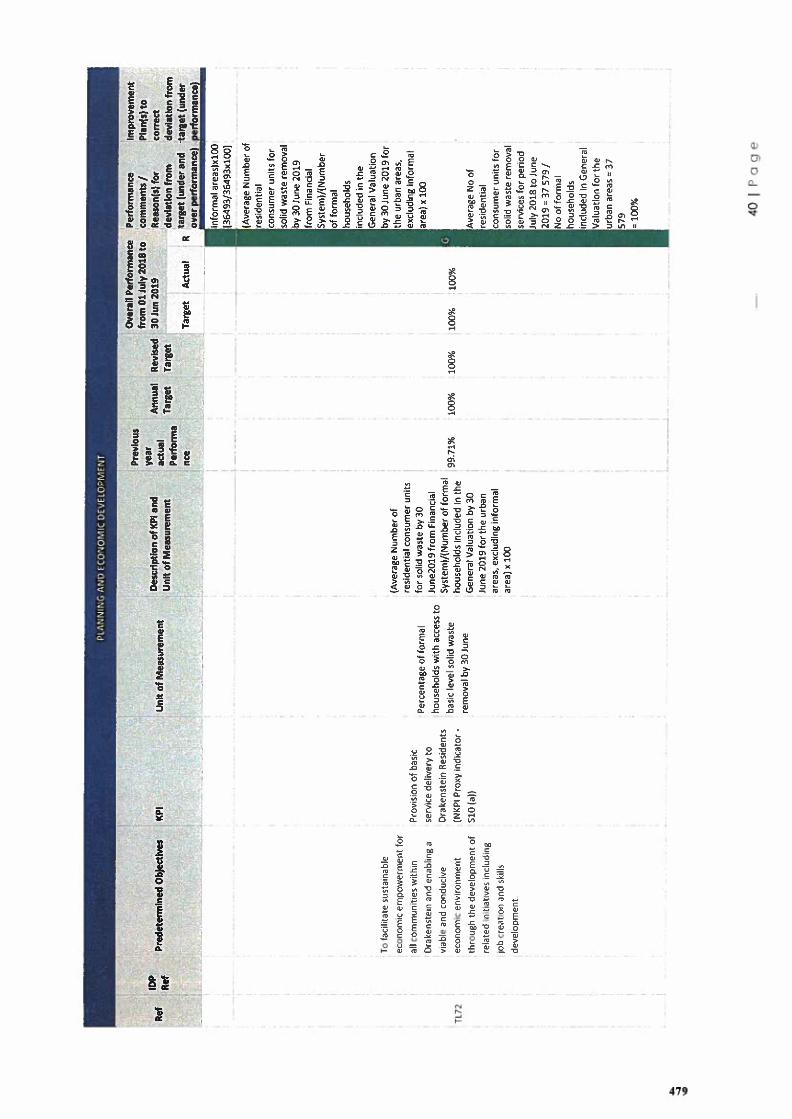
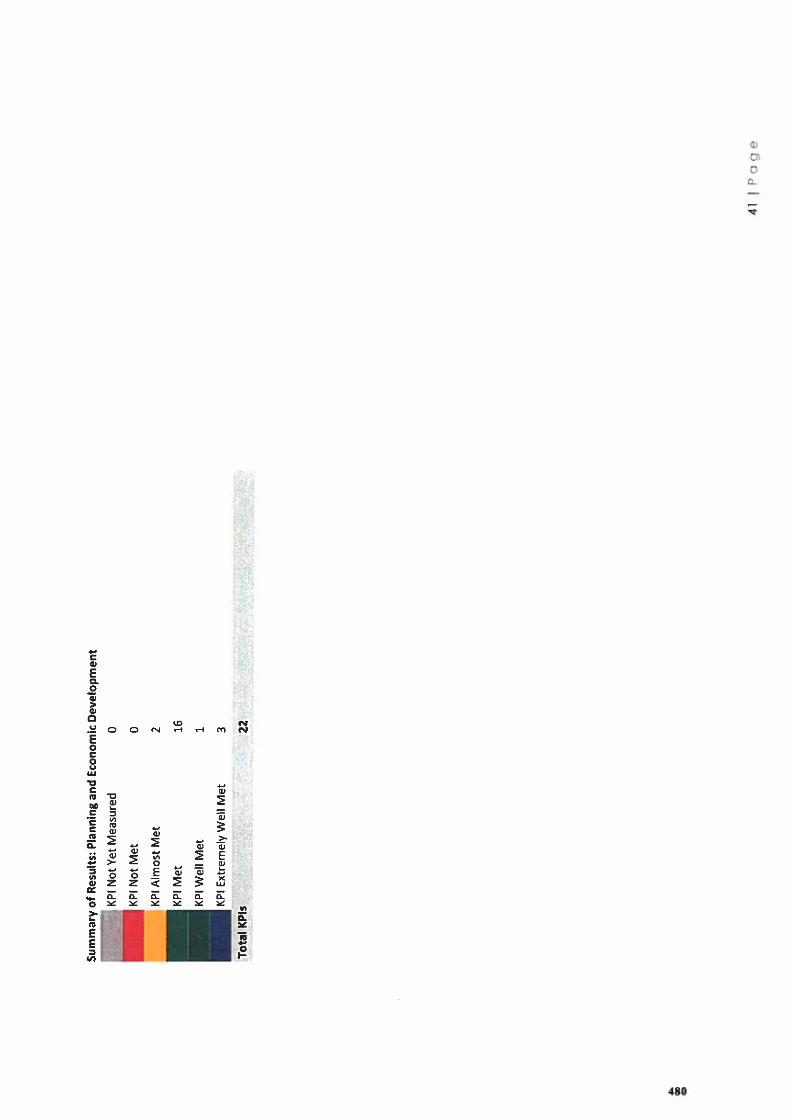
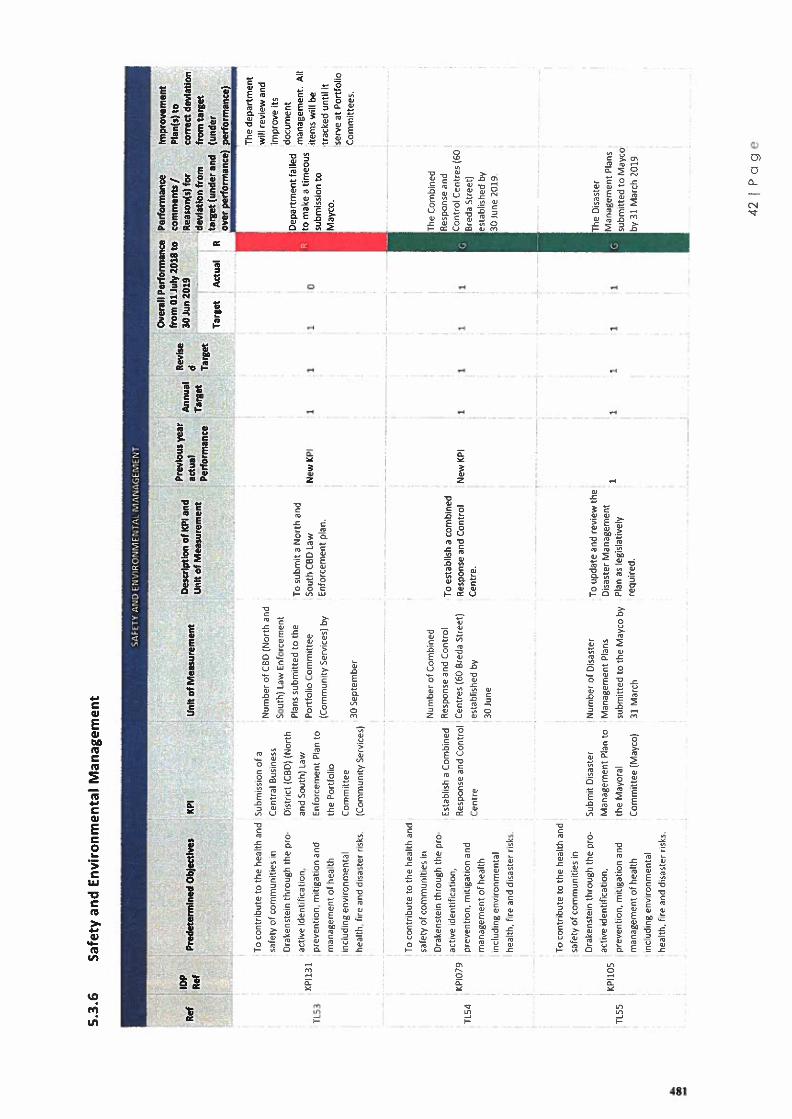
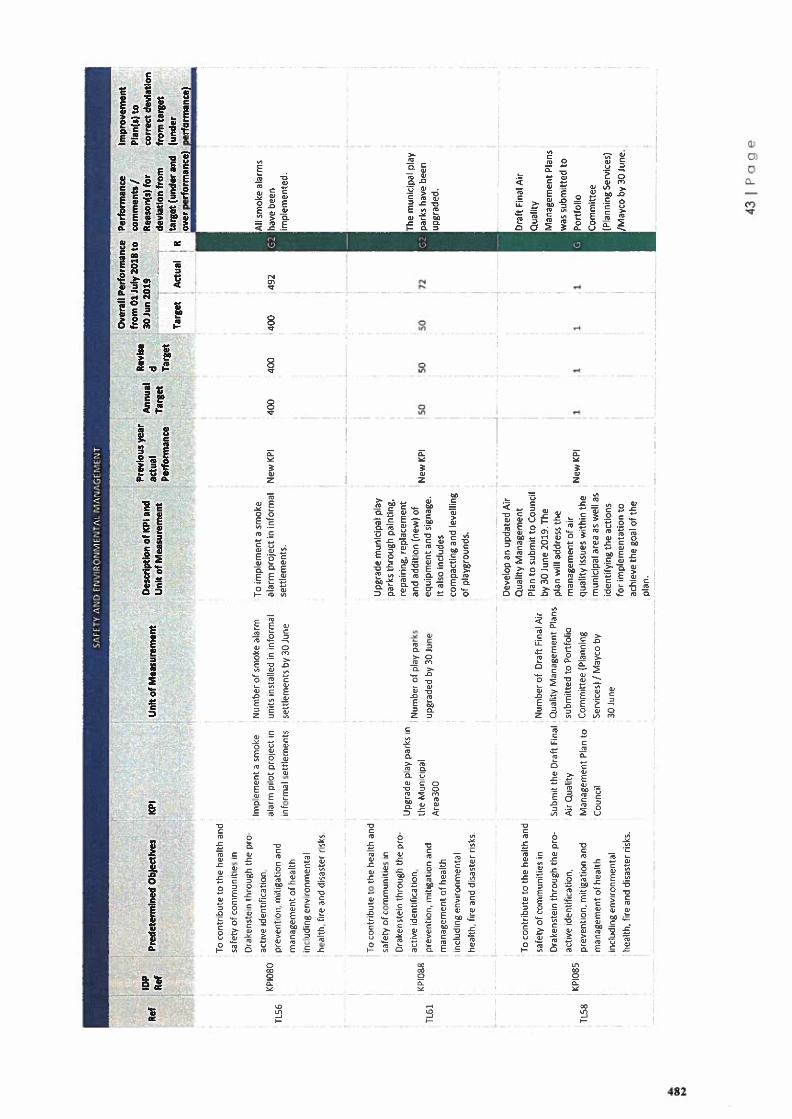
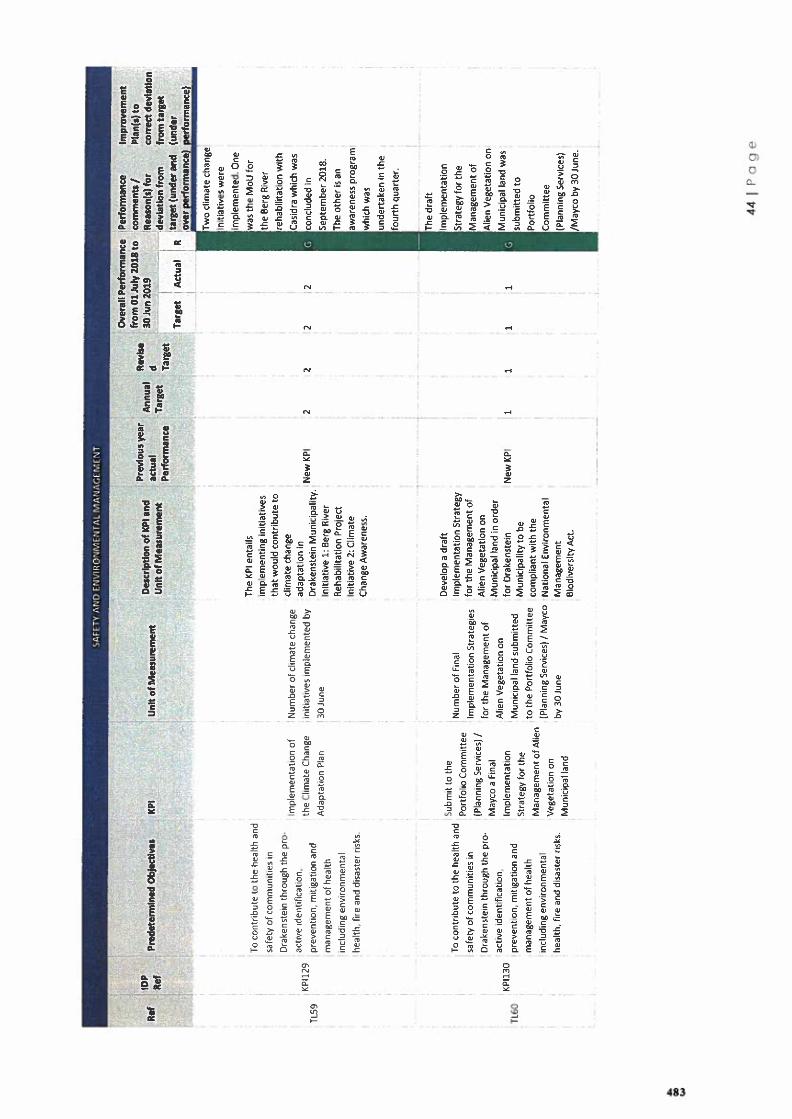
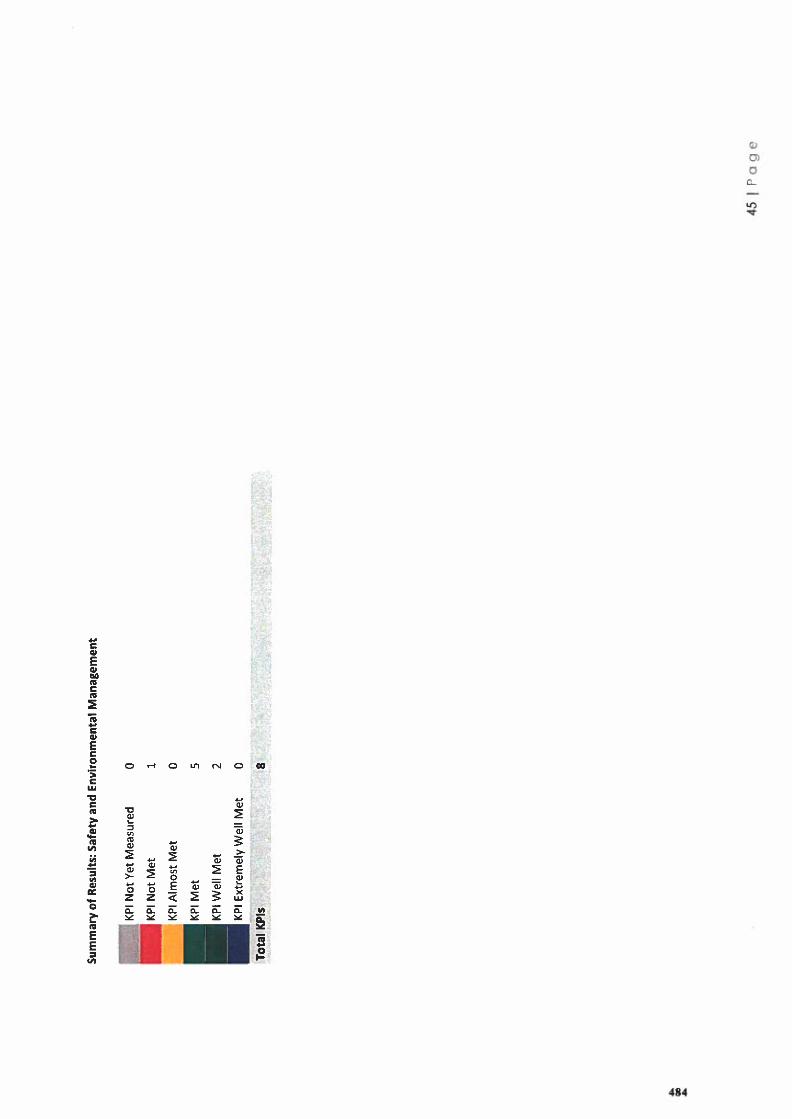
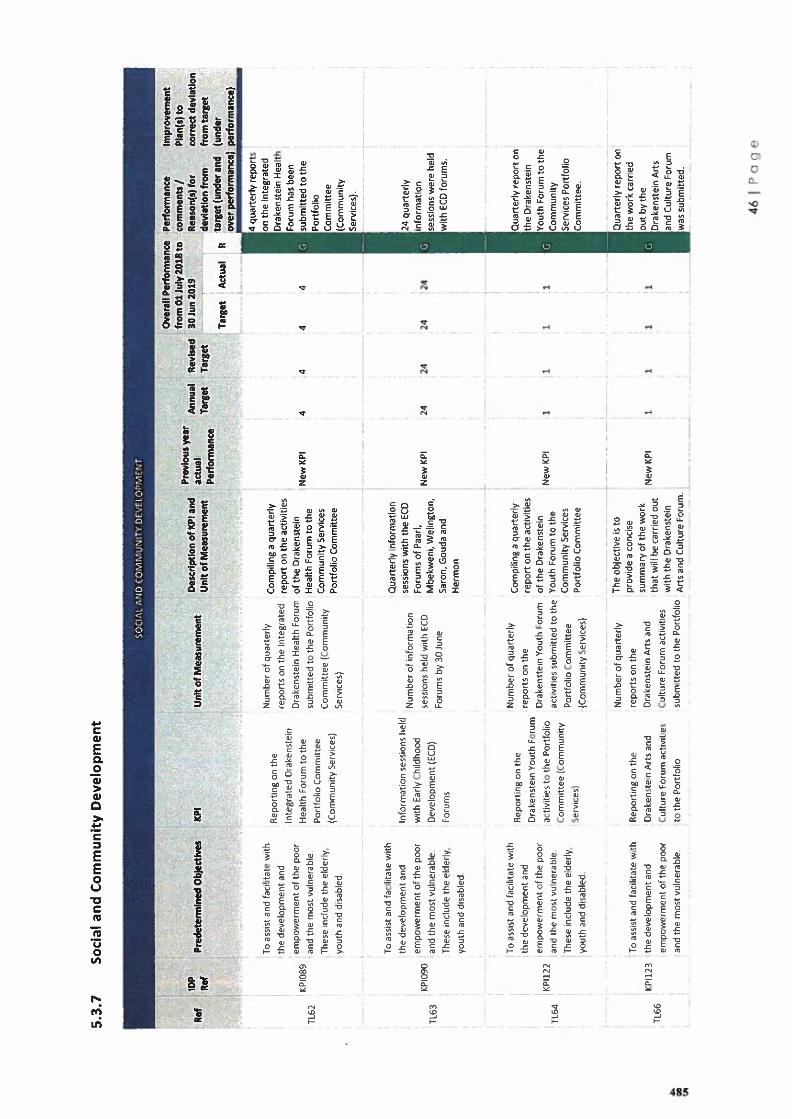
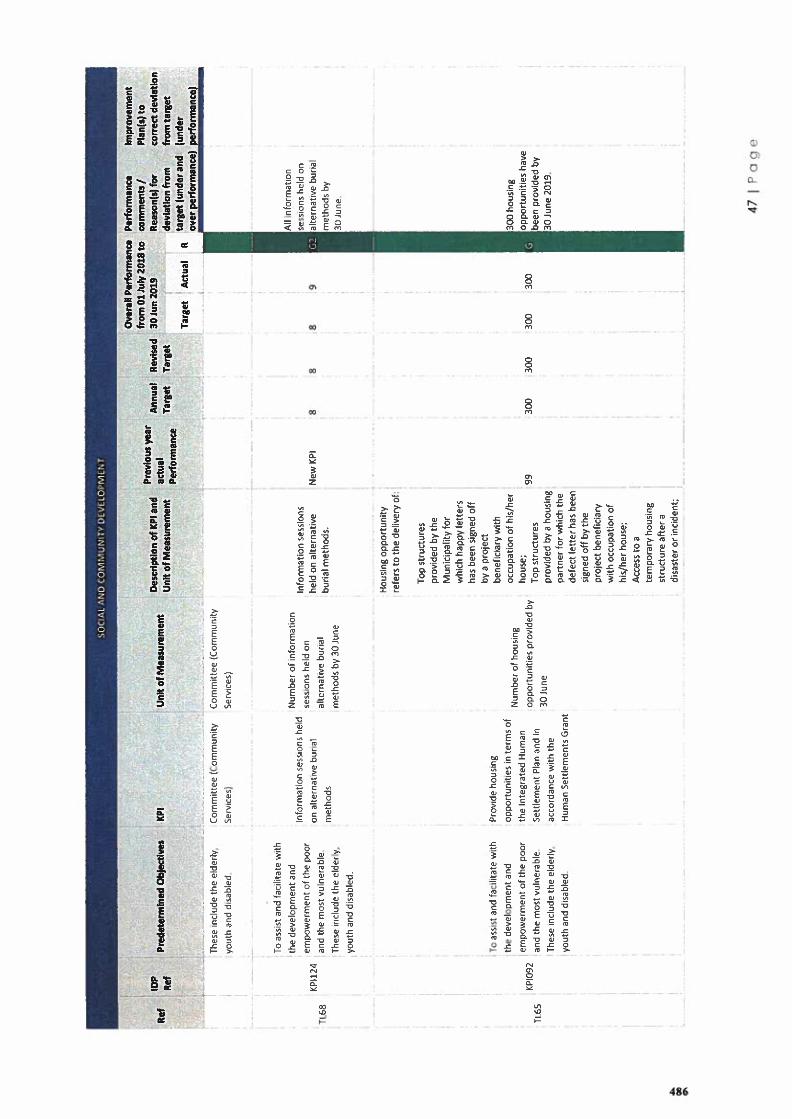
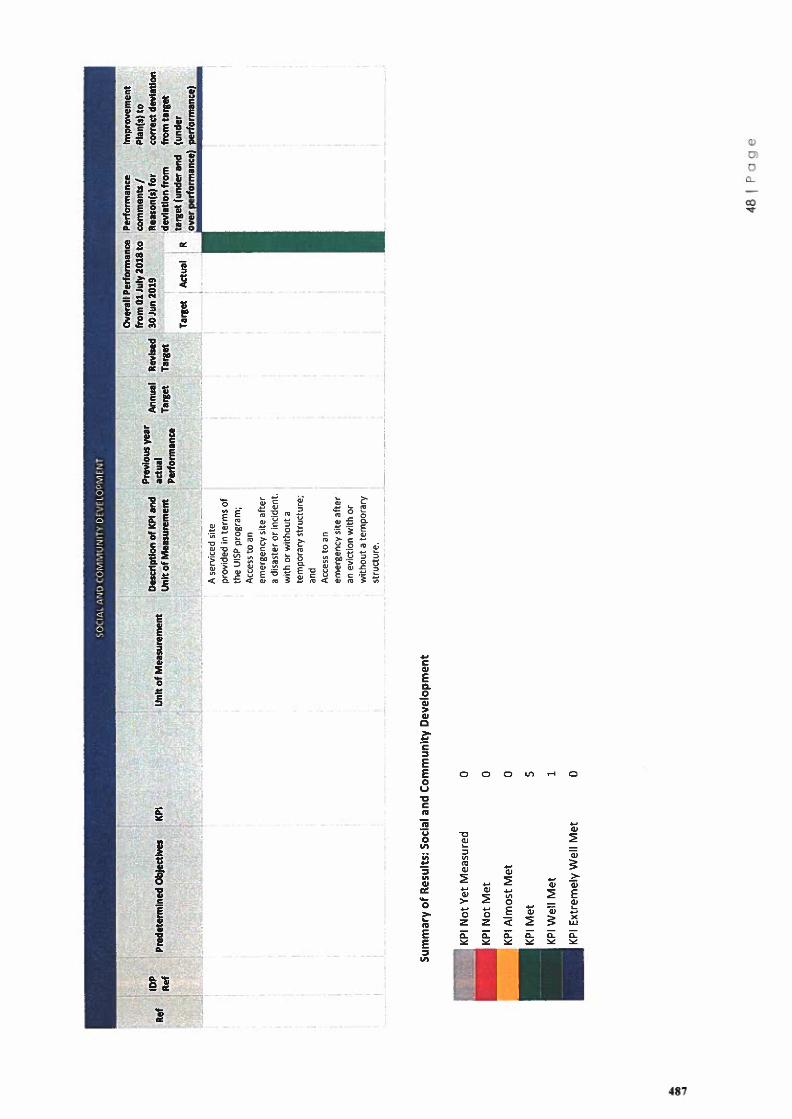
Related Documents