Welcome message from author
This document is posted to help you gain knowledge. Please leave a comment to let me know what you think about it! Share it to your friends and learn new things together.
Transcript


1

2
CONTENTS
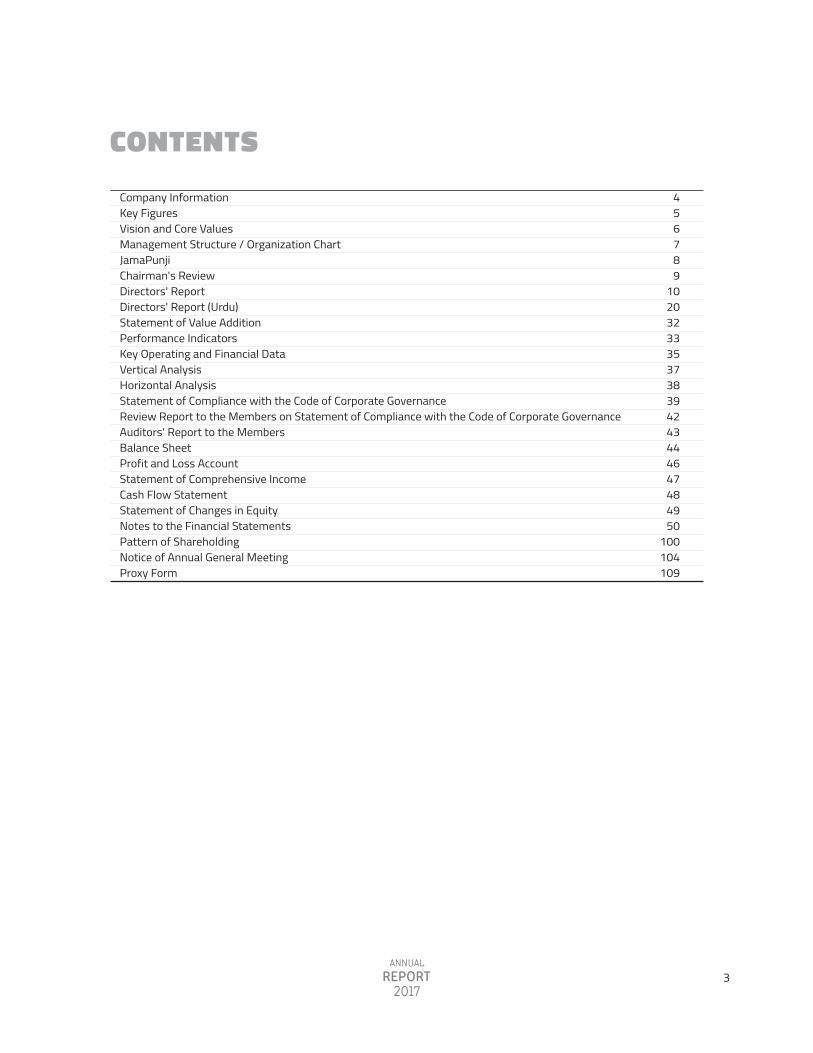
Company Information Key Figures Vision and Core ValuesManagement Structure / Organization ChartJamaPunjiChairman's ReviewDirectors' ReportDirectors' Report (Urdu)Statement of Value AdditionPerformance IndicatorsKey Operating and Financial DataVertical AnalysisHorizontal AnalysisStatement of Compliance with the Code of Corporate GovernanceReview Report to the Members on Statement of Compliance with the Code of Corporate GovernanceAuditors' Report to the MembersBalance SheetProfit and Loss AccountStatement of Comprehensive IncomeCash Flow StatementStatement of Changes in Equity Notes to the Financial Statements Pattern of ShareholdingNotice of Annual General MeetingProxy Form
456789
10203233353738394243444647484950
100104109
3

COMPANY INFORMATION
Board of DirectorsMr. Shaukat ShafiMr. Muhammad Anwar Mr. Ahmad ShafiMr. Amjad Mehmood Mr. Anjum Muhammad SaleemMr. Khalid Bashir Mr. Khurram Mazhar KarimMr. Muhammad Asif (Nominee NIT)
Audit CommitteeMr. Khalid Bashir Mr. Anjum Muhammad SaleemMr. Khurram Mazhar Karim
HR & R CommitteeMr. Khalid BashirMr. Ahmad ShafiMr. Anjum Muhammad Saleem
Chief Financial OfficerMr. Sadiq Saleem
Corporate SecretaryMr. Naseer Ahmad Chaudhary
Head of Internal AuditMr. Muhammad Waqar Iqbal
AuditorsRiaz Ahmed & CompanyChartered Accountants
Legal AdvisorSyed Masroor Ahmad
Stock Exchange ListingThe Crescent Textile Mills Limited is a listed Companyand its shares are traded on Pakistan Stock Exchange.
The Company's shares are quoted in leading dailies under textile composite sector.
ChairmanChief Executive OfficerDirector Director DirectorDirector Director Director
ChairmanMemberMember
ChairmanMemberMember
Advocate
BankersAl Baraka Bank (Pakistan) Limited Allied Bank Limited Habib Bank Limited MCB Bank LimitedNational Bank of Pakistan Standard Chartered Bank (Pakistan) Limited The Bank of PunjabUnited Bank Limited
Mills & Head OfficeSargodha Road, Faisalabad, Pakistan T: + 92-41-111-105-105 F: + 92-41-8786525E: [email protected]
Registered Office45-A, Off: Zafar Ali Road, Gulberg-V, Lahore, Pakistan T: + 92-42-111-245-245 F: + 92-42-111-222-245 E: [email protected]
Share RegistrarCorpTec Associates (Pvt) Ltd.,503 - E, Johar Town,Lahore, PakistanT: +92-42-35170336-37F: +92-42-35170338E: [email protected]
www.ctm.com.pk
4
5
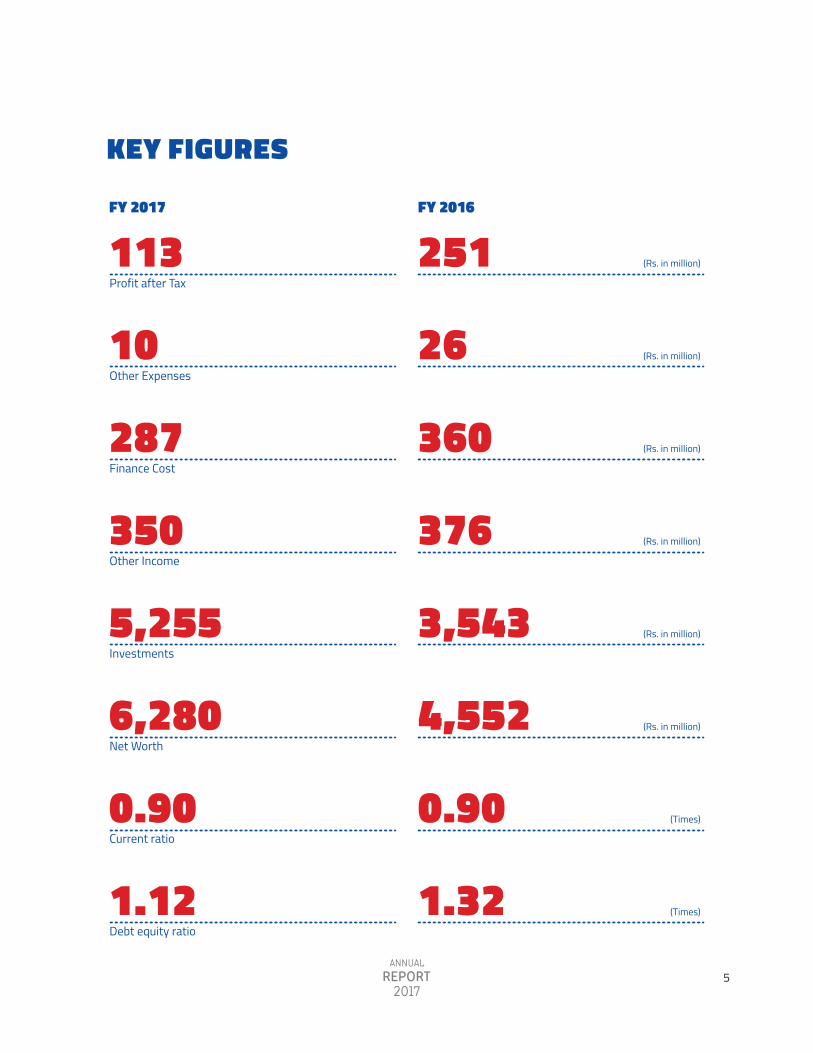
KEY FIGURES
113
10
287
350
5,255
6,280
0.90
1.12
Profit after Tax
Other Expenses
Finance Cost
Other Income
Investments
Net Worth
Current ratio
Debt equity ratio
FY 2017
251
26
360
376
3,543
4,552
0.90
1.32
(Rs. in million)
(Rs. in million)
(Rs. in million)
(Rs. in million)
(Rs. in million)
(Rs. in million)
(Times)
(Times)
FY 2016
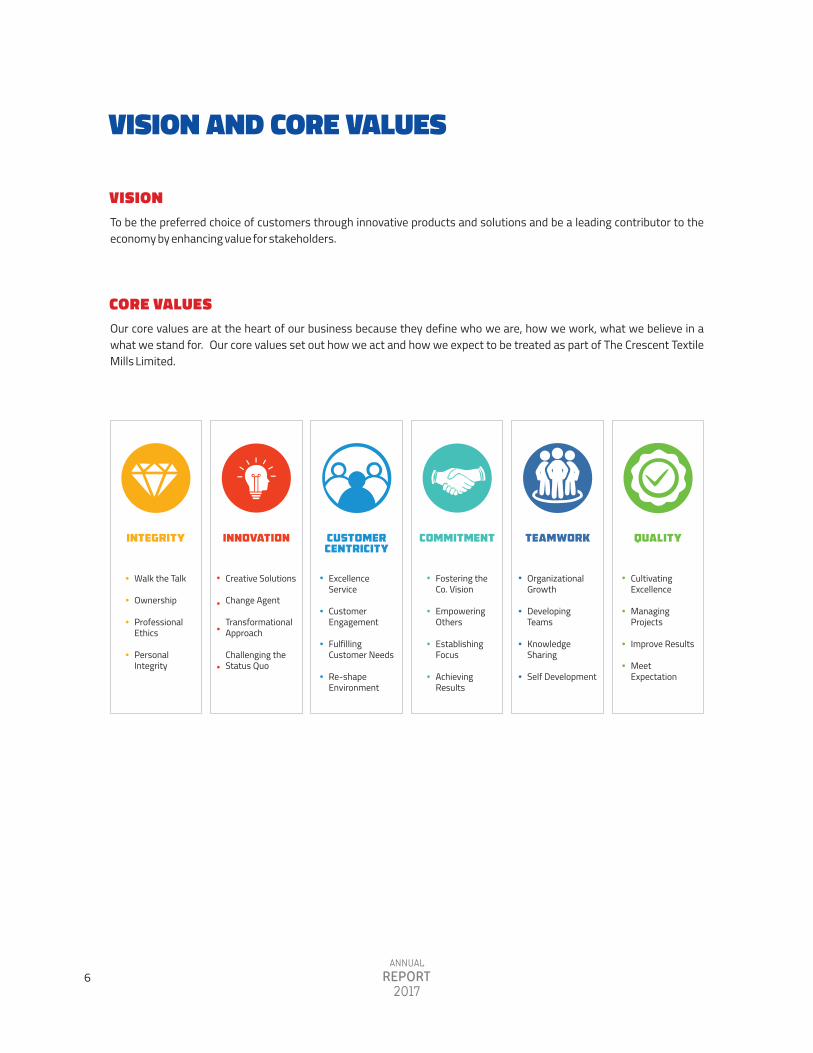
VISION AND CORE VALUES
VISIONTo be the preferred choice of customers through innovative products and solutions and be a leading contributor to the economy by enhancing value for stakeholders.
CORE VALUESOur core values are at the heart of our business because they define who we are, how we work, what we believe in awhat we stand for. Our core values set out how we act and how we expect to be treated as part of The Crescent Textile Mills Limited.
INTEGRITY INNOVATION CUSTOMER CENTRICITY
COMMITMENT TEAMWORK QUALITY
Walk the Talk
Ownership
ProfessionalEthics
PersonalIntegrity
Creative Solutions
Change Agent
TransformationalApproach
Challenging theStatus Quo
ExcellenceService
CustomerEngagement
FulfillingCustomer Needs
Re-shapeEnvironment
Fostering theCo. Vision
EmpoweringOthers
EstablishingFocus
AchievingResults
OrganizationalGrowth
DevelopingTeams
KnowledgeSharing
Self Development
CultivatingExcellence
Managing Projects
Improve Results
MeetExpectation
6
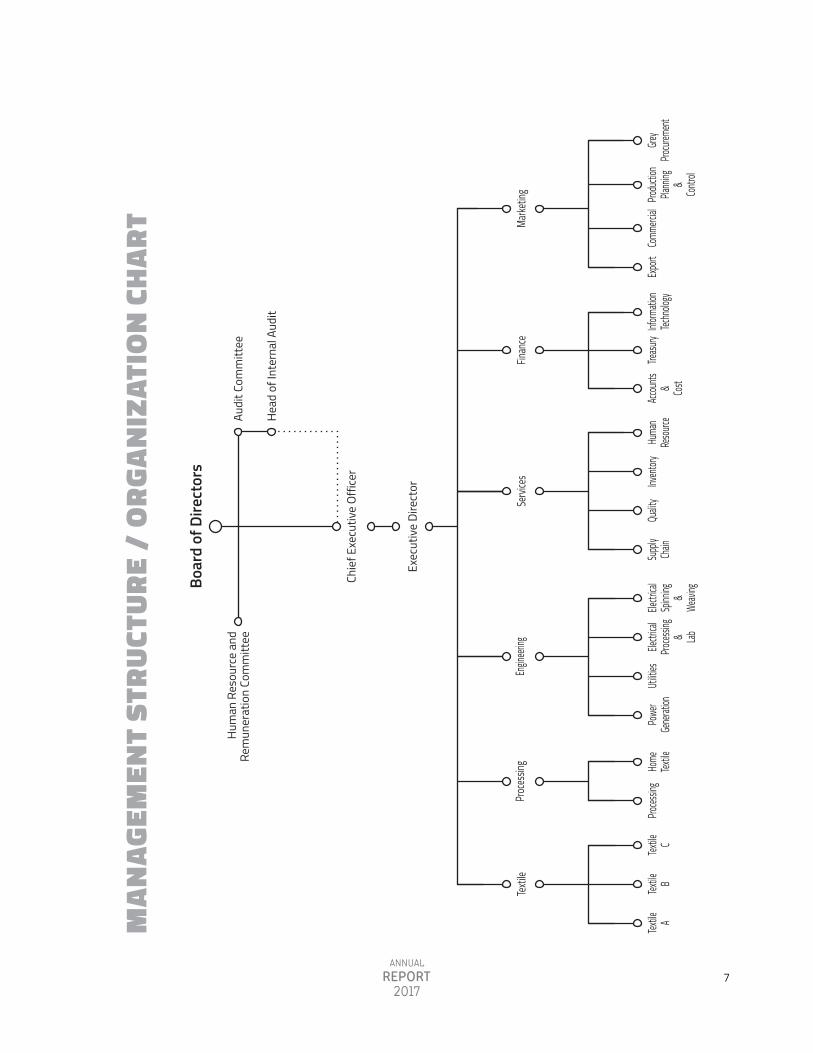
MA
NAG
EMEN
T ST
RUCT
URE
/ O
RGA
NIZ
ATIO
N C
HA
RT
Boar
d of
Dire
ctor
s
Hum
an R
esou
rce
and
Rem
uner
atio
n Co
mm
ittee
Head
of I
nter
nal A
udit
Audi
t Com
mitt
ee
Chie
f Exe
cutiv
e Of
ficer
Exec
utiv
e Di
rect
or
Proc
essin
gTe
xtile
Electr
ical
Proces
sing
& Lab
Electr
ical
Spinn
ing &We
aving
Powe
rGe
nerati
onUti
lities
Proces
sing
Home
Textile
Tex
tile BTex
tile ATex
tile C
Engin
eering
Finan
ce
Inform
ation
Techn
ology
Accoun
ts& Cos
t
Treasu
ry
Marke
ting
Export
Produc
tion
Plann
ing &Con
trol
Comme
rcial
Grey
Procur
ement
Servi
ces Invent
oryHu
man
Resou
rceSu
pply
Chain
Qualit
y
7
8

CHAIRMAN'S REVIEWfor the year ended June 30, 2017
9
On behalf of the Board of Directors It is my pleasure to share with you the performance of company for the year ended June 30, 2017. Performance of the industry remained lackluster throughout the year due demand side weakness of low value added products but rise in exports of high value added goods supported to close the year at level of last year. Contrary to overall performance of the economy where large scale manufacturing sector showed growth, a consistent decline in growth of textile sector was witnessed due host of factors behind falling exports. Even the export package of Rs.180 billion couldn't improve performance of industry throughout the year. Under difficult business environment textile sector continued to suffer due to lower export volumes, an uncompetitive environment in the region, non-release of tax refunds and high cost of carrying out business. Costly raw materials also made it difficult for the manufacturers-cum-exporters to compete with regional exporters and offer their products at competitive prices to buyers. Lower volumes and selling prices put pressure on gross margins of the industry.
In a very competitive and difficult business scenario we are pleased with performance of company as productions, sales volumes and measure to control cost exhibited positively. But it didn't transform into improved profitability as compared to last year mainly due attritions in gross margins. Your company is focused to improve volume and margin of products through cost control, value addition, innovation and strengthening of its assets base.
The management, employees, bankers, vendors and our valuable customers have shown their commitment to remain hand in hand in difficult times to exhibit improved performance. I take this opportunity alongside my Board members to thank all of them who have remained our strength and rendered valuable support and contribution to the company throughout the year.
I would also like to take this opportunity to thank our shareholders for their continued support and trust in the Company. We are confident that with the same support we will perform better and improve our results in future for our mutual benefits.
For and on behalf of the Board of Directors
Shaukat ShafiChairman

DIRECTORS' REPORTfor the year ended June 30, 2017
Directors of your company are pleased to present the Directors' Report along with audited Financial Statements of company and Auditors' Report thereon for the year ended June 30, 2017.
Industry overview Weak fundamentals of the industry weigh on its growth and textile exports for the year remained flat (+0.04% year-on-year basis) at US$ 12.543 billion. Over the years industry has become uncompetitive largely due to increased cost of doing business particularly for higher utilities cost and low capacity utilization. Especially Punjab based industry faced more headwinds as higher LNG prices made it difficult even to compete locally with industry of other provinces. Export package announced by the Prime Minister in January 2017 also failed to stem decline in exports as its implementation remained far from reality. Higher input cost due to increased raw materials prices and minimum wage rate affected its operational viability and gross margins of industry were very thin in the year.
Textile sector which employs more than 40% manpower and contributes 55% ~ 60% towards exports of the country needed particular focus for revival and growth to boost exports of the country. Due to un-conducive business environment slowly and gradually the base of conventional industry was weakening in general as was evident from consistent plunge of Pakistan's share of textile in global market.
Company's performance Sales revenues for the year under review were stable and moderately higher by 2.78% as compared to FY16. Due to slower demand in first half FY17 exports remained lower by 0.96% year-on-year basis but local sales achieved higher growth trajectory mainly of yarn sales as year-on- year basis increase in cotton prices pushed yarn prices
relatively at higher level on comparative basis. Operating profit of company for the year under review went down by 52.44% as compared to FY16 and gross margins across all segments of business suffered due higher input costs. It resulted into decline in overall gross margins; which were down by 27.47% year-on-year basis. Sales volumes of all segments of company except of home textiles during the year were reduced partly due soft export demand and also for installation of machinery imported under BMR and capacities were not fully utilized.
In comparison to FY16 the company managed to attain improved level of production in home textiles but it remained slightly below in spinning, weaving and processing where installation of new machinery and slow demand in first half FY17 had curtailed operating capacity of these segments for some period of time. Cost of production remained high as raw materials prices, purchase rates of semi finished goods and weaving charges went up because of supply constraints in domestic market. Salaries and utilities cost also increased as compared to FY16 due increase in minimum wage rate and increase in LNG and fuel prices on higher international oil prices.
We achieved higher selling prices of our products on year-on-year basis but increase in raw materials prices and other inputs used as semi finished goods outpaced these prices due subdued demand and affected primary margins. Despite substantial decline in gross margins some stability in profit after tax was achieved mainly due accruals of incentives under Prime Minister Package applicable on exports made during January 16, 2017 to June 30, 2017 and to some extent decline in finance cost and tax savings attributable on investment in plant and machinery helped to post the positive results for the year under review.
FY 2017 % 91.6 83.0 93.5 95.5
Capacity 100,272 112 28.800 18.000
Actual 91,841 93 26.937 17.192
Capacity utilizationSegments
Spinning Weaving Processing Home textiles
Set up
Spindles Air jet looms Mln Mtrs (Bleached/ dyed/ print) Mln Mtrs (Made ups)
FY 2016 %
90.2 83.0 94.4 91.5
Capacity 100,272 112 28.800 18.000
Actual 90,440 93 27.200 16.468
10

DIRECTORS' REPORTfor the year ended June 30, 2017
Except value added the performance of other segments was moderately changed in comparison to FY16 mostly in first half FY 2017 as volumes and prices remained
depressed due to weak demand and sluggish market conditions.
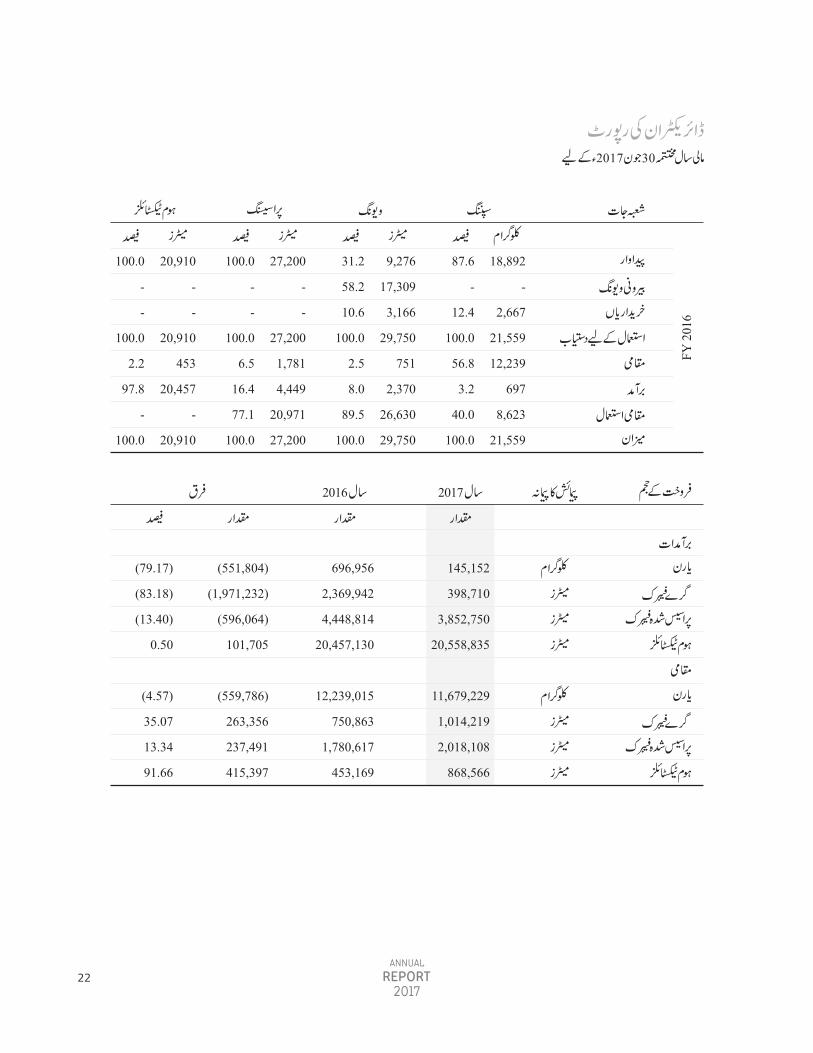
Operational highlights Segment
Production Outside weaving Purchases Available for use Local Export Used in house Ttl. Production Outside weaving Purchases Available for use Local Export Used in house Ttl.
Spinning %
82.1 - 17.9 100.0 55.8 0.7 43.5 100.0 87.6 - 12.4 100.0 56.8 3.2 40.0 100.0
(Kgs) 17,189
- 3,740 20,929 11,679 145 9,104 20,929 18,892
- 2,667 21,559 12,239 697 8,623 21,559
Weaving %
30.6 61.7 7.8 100.0 3.6 1.4 94.9 100.0 31.2 58.2 10.6 100.0 2.5 8.0 89.5 100.0
(Mtrs) 8,541 17,236 2,168 27,944 1,014 399
26,532 27,944 9,276 17,309 3,166 29,750 751 2,370 26,630 29,750
Processing %
100.0 - - 100.0 7.5 14.3 78.2 100.0 100.0 - - 100.0 6.5 16.4 77.1 100.0
(Mtrs) 26,937
- -
26,937 2,018 3,853 21,066 26,937 27,200
- -
27,200 1,781 4,449 20,971 27,200
Home textiles %
100.0 - - 100.0 4.1 95.9 - 100.0 100.0 - - 100.0 2.2 97.8 - 100.0
(Mtrs) 21,427
- -
21,427 869
20,559 -
21,427 20,910
- -
20,910 453
20,457 -
20,910
FY 2
017
FY 2
016
UoM
Kgs Mtrs Mtrs Mtrs
Kgs Mtrs Mtrs Mtrs
Sales volumes
Export: Yarn Grey fabric Processed fabric Home textiles Local: Yarn Grey fabric Processed fabric Home textiles
FY17
145,152 398,710
3,852,750 20,558,835
11,679,229 1,014,219 2,018,108
868,566
FY16
696,956 2,369,942
4,448,814 20,457,130
12,239,015 750,863
1,780,617 453,169
Qty Qty
(551,804) (1,971,232)
(596,064) 101,705
(559,786) 263,356
237,491 415,397
%
(79.17) (83.18)
(13.40) 0.50
(4.57) 35.07 13.34 91.66
Var.Qty
11

DIRECTORS' REPORTfor the year ended June 30, 2017
UoM
Rs./MdRs./KgRs./Kg
Rs./MtrRs./Mtr
Rs./Kg Rs./Mtr Rs./Mtr Rs./Mtr
Rs./Kg Rs./Mtr Rs./Mtr Rs./Mtr
Prices
Purchases: Cotton Polyester Yarn Grey Fabric Weaving chargesSales:Local Yarn Grey fabric Processed fabric Home textiles Export Yarn Grey fabric Processed fabric Home textiles
FY17
6,695117.6130.9208.0
23.8
138.6 106.4
62.9 23.2
129.0 184.4 194.2 254.8
FY16
5,592113.9
99.3198.0
22.3
120.9 88.5 80.2 27.6
110.0 146.5 186.5 255.5
Rs.
1,1033.7
31.610.0
1.5
17.7 17.9
(19.3) (4.4)
19.0 37.9
7.7 (0.7)
%
19.723.25
31.825.056.73
14.64 20.23
(24.06) (15.94)
17.27 25.87
4.13 (0.27)
Var.Unit prices
Selling and distribution cost increased due to higher sea freight charged by shipping lines. Administration cost was higher by 5.91% due increase in salaries, legal charges and other costs on account of increments, fees and consultancy charges paid to lawyers and consultants in appeal cases filed against gas, income tax and other matters respectively. Other charges were higher as electricity, sanitation and sundry cost of residential area increased as compared to FY16. Other operating income and expenses of the company were down as compared to FY16 as income from higher gain on disposal of fixed assets, gain on redemption of preference shares of Shakarganj Limited and higher dividend income from related parties were available in previous year and no
provision was made for Workers' Profit Participation Fund (5% participation fund) as company sustained operational losses during the year under review.
Finance cost and tax expense of the company were down as compared to FY16 due to more use of Export Refinance Part II, reduced exchange loss on use of US$ loans and tax benefits accruing on account of investments in plant and machinery along with higher deferred tax benefit available on losses of local sales made during current year.
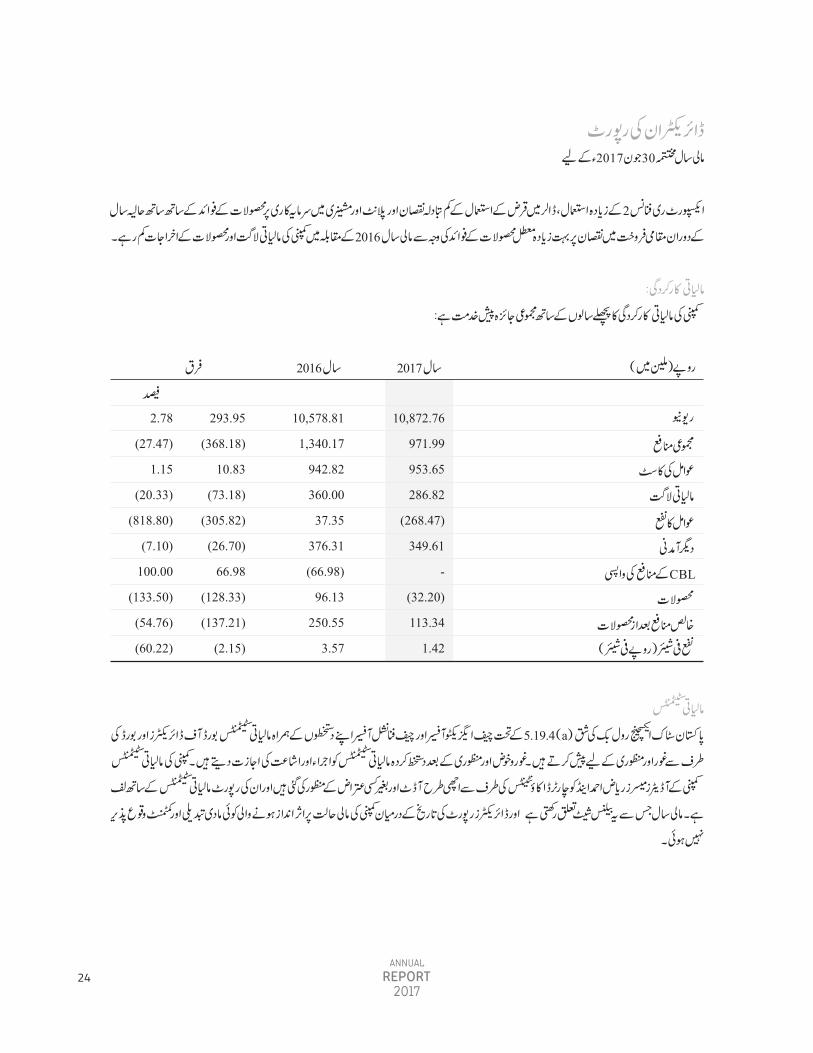
Financial performanceOverall Comparison of the financial performance of company with previous year is as below:
12
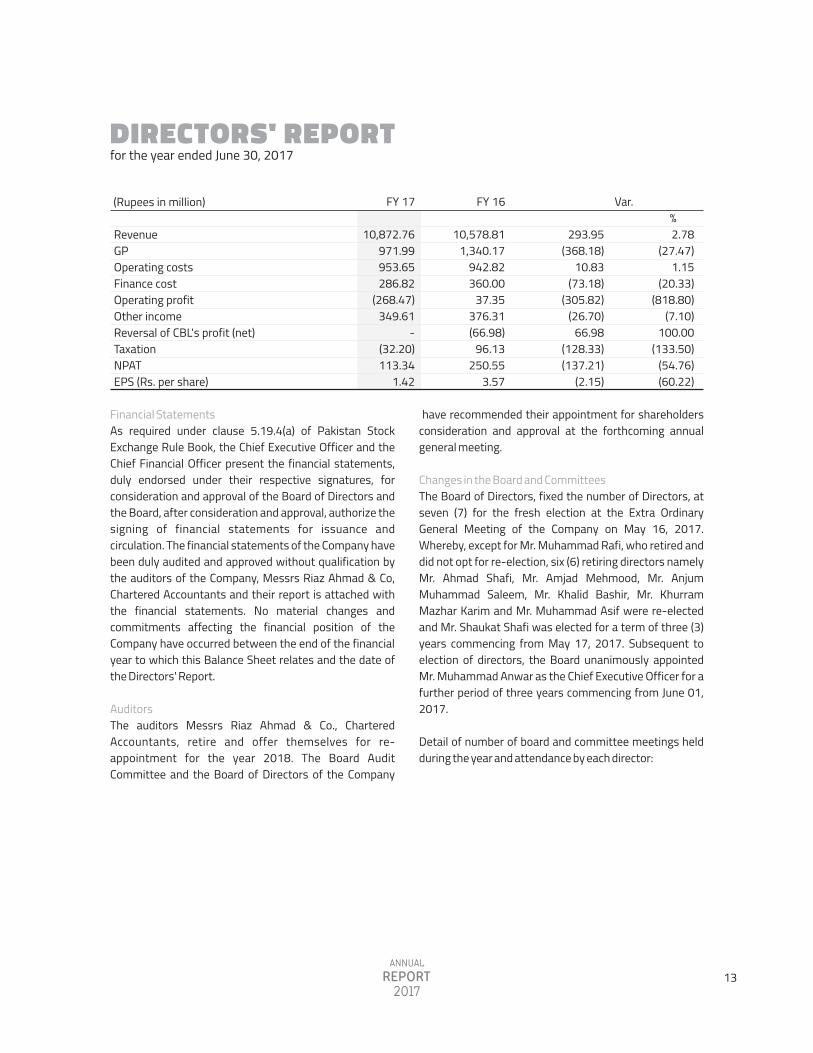
Financial StatementsAs required under clause 5.19.4(a) of Pakistan Stock Exchange Rule Book, the Chief Executive Officer and the Chief Financial Officer present the financial statements, duly endorsed under their respective signatures, for consideration and approval of the Board of Directors and the Board, after consideration and approval, authorize the signing of financial statements for issuance and circulation. The financial statements of the Company have been duly audited and approved without qualification by the auditors of the Company, Messrs Riaz Ahmad & Co, Chartered Accountants and their report is attached with the financial statements. No material changes and commitments affecting the financial position of the Company have occurred between the end of the financial year to which this Balance Sheet relates and the date of the Directors' Report.
AuditorsThe auditors Messrs Riaz Ahmad & Co., Chartered Accountants, retire and offer themselves for re- appointment for the year 2018. The Board Audit Committee and the Board of Directors of the Company
have recommended their appointment for shareholders consideration and approval at the forthcoming annual general meeting.
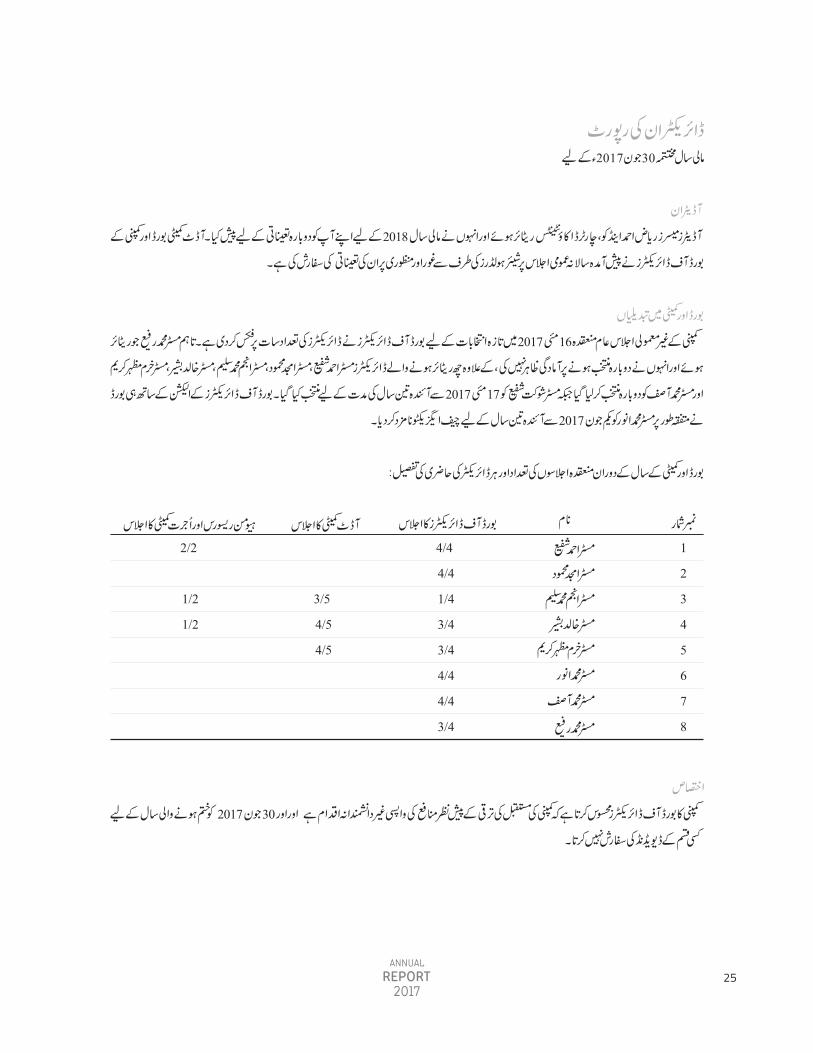
Changes in the Board and Committees The Board of Directors, fixed the number of Directors, at seven (7) for the fresh election at the Extra Ordinary General Meeting of the Company on May 16, 2017. Whereby, except for Mr. Muhammad Rafi, who retired and did not opt for re-election, six (6) retiring directors namely Mr. Ahmad Shafi, Mr. Amjad Mehmood, Mr. Anjum Muhammad Saleem, Mr. Khalid Bashir, Mr. Khurram Mazhar Karim and Mr. Muhammad Asif were re-elected and Mr. Shaukat Shafi was elected for a term of three (3) years commencing from May 17, 2017. Subsequent to election of directors, the Board unanimously appointed Mr. Muhammad Anwar as the Chief Executive Officer for a further period of three years commencing from June 01, 2017.
Detail of number of board and committee meetings held during the year and attendance by each director:
DIRECTORS' REPORTfor the year ended June 30, 2017
Var.FY 17 FY 16 %
(Rupees in million)
Revenue GP Operating costs Finance cost Operating profit Other income Reversal of CBL's profit (net) Taxation NPAT EPS (Rs. per share)
293.95 (368.18) 10.83
(73.18) (305.82)
(26.70) 66.98
(128.33) (137.21)
(2.15)
2.78 (27.47) 1.15
(20.33) (818.80)
(7.10) 100.00
(133.50) (54.76) (60.22)
10,872.76 971.99
953.65 286.82
(268.47) 349.61
- (32.20)
113.34 1.42
10,578.81 1,340.17 942.82 360.00
37.35 376.31 (66.98)
96.13 250.55
3.57
13
AppropriationsThe Board of Directors of the company feel that it is prudent to plough back the profits for future growth of the company and do not recommend any dividend for the year ended June 30, 2017.
Statement on Corporate and Financial Reporting Framework:
a.
b.
c.
d.
Financial statements prepared by company's management present fairly its state of affairs, results of its operations, cash flows and changes in equity;
Proper books of accounts have been maintained;
Appropriate accounting policies have been consistently applied in preparation of financial statements and accounting estimates are based on reasonable and prudent judgment;
International Financial Reporting Standards,
e.
f.
g.
h.
i.
j.
as applicable in Pakistan, have been followed in preparation of financial statements and any departure there from has been adequately disclosed and explained;
System of internal control is sound in design and has been effectively implemented and monitored;
The company has sound potentials to continue as going concern;
There has been no material departure from best practices of corporate governance;
Financial data of the last six years is attached;
Pattern of Shareholding is attached;
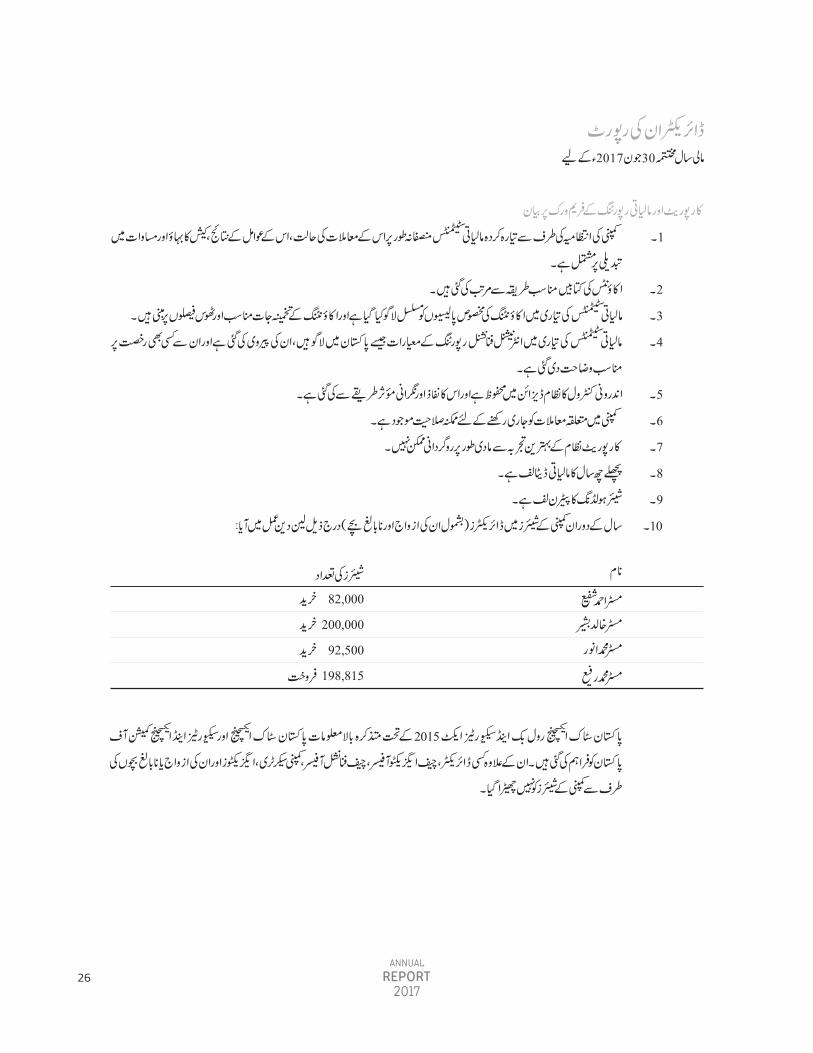
During the year, following transactions undertaken by the directors (including their spouses and minor children) in the shares of the company:
Sr. No.
12345678
Board of Directors'Meeting
4/4 4/4 1/4 3/4 3/4 4/4 4/4 3/4
Audit CommitteeMeeting
3/5 4/5 4/5
HR & R CommitteeMeeting
2/2
1/2 1/2
Name
Mr. Ahmad ShafiMr. Amjad MehmoodMr. Anjum Muhammad SaleemMr. Khalid BashirMr. Khurram Mazhar KarimMr. Muhammad AnwarMr. Muhammad AsifMr. Muhammad Rafi
DIRECTORS' REPORTfor the year ended June 30, 2017
No. of Shares
82,000200,000
92,500198,815
Name
Mr. Ahmad ShafiMr. Khalid BashirMr. Muhammad AnwarMr. Muhammad Rafi
PurchasePurchasePurchaseSale
14
who have been connected to the social uplift of the community development. The collaboration and participation is diversified and extends in providing:
�
�
�
�
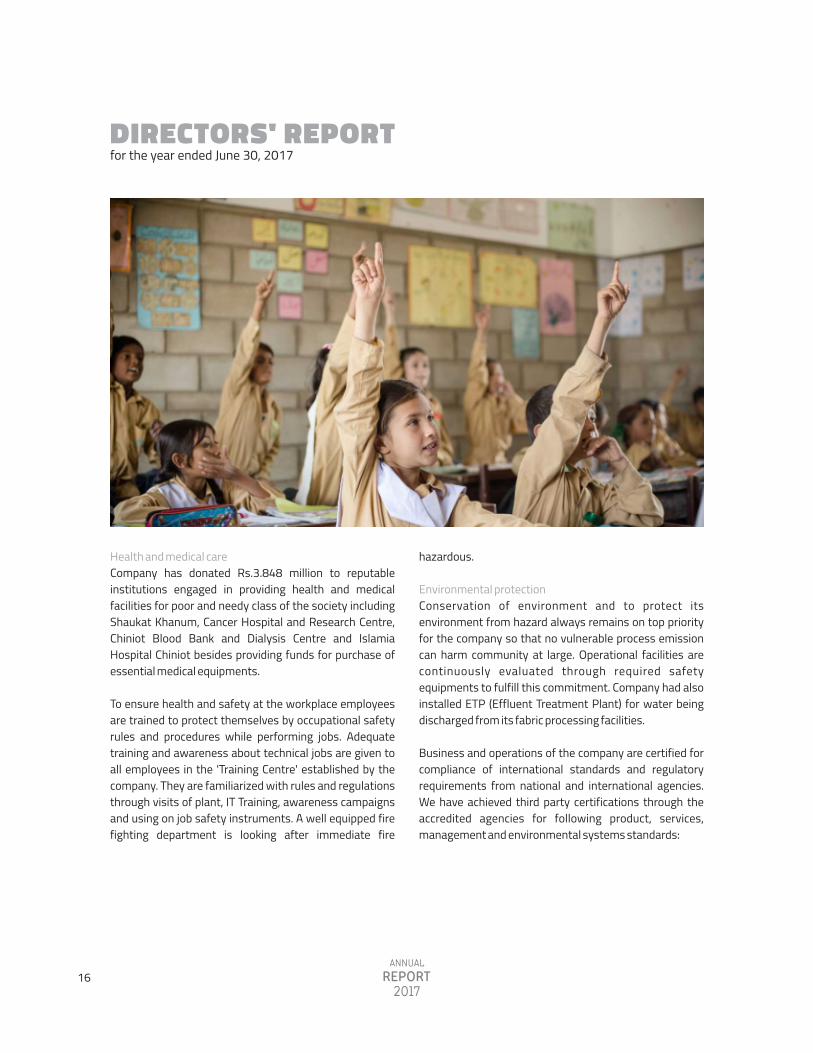
EducationUnder the CSR commitment of the company has been partnering with The Citizen Foundation (TCF), welfare organization working under Government and Non-Government Organisations working for promotion of education in the rural areas. Company has been funding 03 Units primary sections of TCF, already built by company in remote area of Faisalabad, for annual running expense amounting to Rs. 6.0 million. Similarly, company is contributing regularly for educational societies and organizations involved in such noble cause. In addition to cash contribution senior officials have volunteered 280 hours to their structured programs throughout the year.
Education to the underprivileged class of the society to enable them play role of responsible citizen.
health and medical facilities to needy and poor citizens to discharge social and religious obligation.
disaster relief and rehabilitation work for the affected community to aid restoration their normal life.
sports and environmental activities to keep community and environment healthy and hazard free
Corporate Social Responsibility (CSR)Over the year company has demonstrated its enduring commitment to play the role of responsible corporate citizen. Throughout of its more than 6 decades of its sustainable business operations this commitment is reflective an excellent relationship with all the stakeholders including Government, Semi Government agencies, Non-Government Organisations and all those
DIRECTORS' REPORTfor the year ended June 30, 2017
k.
l.
m.
The aforesaid information was also disclosed to Pakistan Stock Exchange (PSX) and Securities and Exchange Commission of Pakistan (SECP) in accordance with the provisions of Pakistan Stock Exchange Rule Book and Securities Act, 2015. Other than that no trading in the shares of the Company was carried out by any Director, the Chief Executive Officer, the Chief Financial Officer, the Company Secretary, Executives and their spouses and minor children.
One director of the Company had already completed Directors' Training Program (DTP) while remaining all directors met the criteria of exemption under code of corporate governance.
Information about outstanding taxes and levies is given in Notes to Accounts; and
Statement of value of investments in respect of employees' retirement plan has been given in Note 38 of the financial statements.
15
Health and medical careCompany has donated Rs.3.848 million to reputable institutions engaged in providing health and medical facilities for poor and needy class of the society including Shaukat Khanum, Cancer Hospital and Research Centre, Chiniot Blood Bank and Dialysis Centre and Islamia Hospital Chiniot besides providing funds for purchase of essential medical equipments.
To ensure health and safety at the workplace employees are trained to protect themselves by occupational safety rules and procedures while performing jobs. Adequate training and awareness about technical jobs are given to all employees in the 'Training Centre' established by the company. They are familiarized with rules and regulations through visits of plant, IT Training, awareness campaigns and using on job safety instruments. A well equipped fire fighting department is looking after immediate fire
hazardous.
Environmental protectionConservation of environment and to protect its environment from hazard always remains on top priority for the company so that no vulnerable process emission can harm community at large. Operational facilities are continuously evaluated through required safety equipments to fulfill this commitment. Company had also installed ETP (Effluent Treatment Plant) for water being discharged from its fabric processing facilities.
Business and operations of the company are certified for compliance of international standards and regulatory requirements from national and international agencies. We have achieved third party certifications through the accredited agencies for following product, services, management and environmental systems standards:
DIRECTORS' REPORTfor the year ended June 30, 2017
16
ISO 9001:2008 Quality Management SystemsISO 14001:2004 Environment Management SystemsOCS 100 Product Standards, Organic Content StandardGOTS Product Standards, Global Organic TextilesOeko-Tex 100 Product Standards for Yarn, Human EcologyOeko-Tex 100 Product Standards for Fabric, Human Ecology Oeko-Tex 100 Product Standards for Home Textiles, Human EcologySA 8000 Social accountability SEDEX Audit Data Bank for sharing with customers SMETA/ETI Code Ethical Trading InitiativeEcolabelling Norway (SWAN) Environmental, Health and Quality requirements
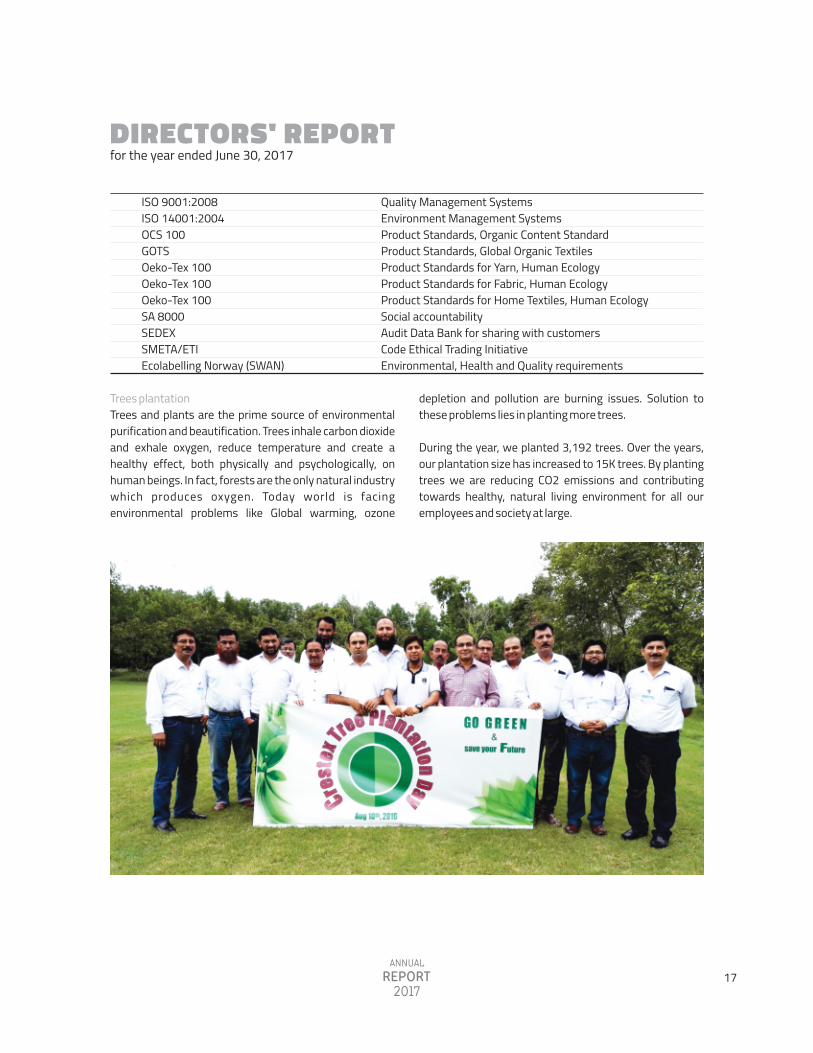
Trees plantationTrees and plants are the prime source of environmental purification and beautification. Trees inhale carbon dioxide and exhale oxygen, reduce temperature and create a healthy effect, both physically and psychologically, on human beings. In fact, forests are the only natural industry which produces oxygen. Today world is facing environmental problems like Global warming, ozone
depletion and pollution are burning issues. Solution to these problems lies in planting more trees.
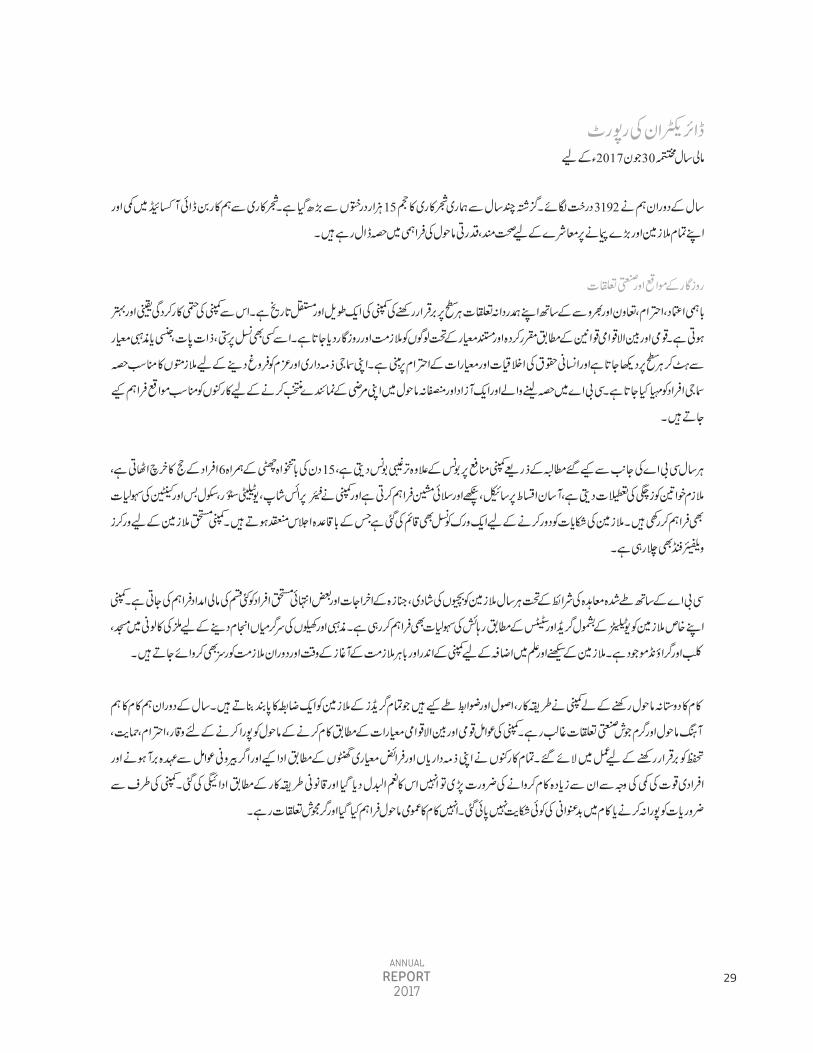
During the year, we planted 3,192 trees. Over the years, our plantation size has increased to 15K trees. By planting trees we are reducing CO2 emissions and contributing towards healthy, natural living environment for all our employees and society at large.
DIRECTORS' REPORTfor the year ended June 30, 2017
17
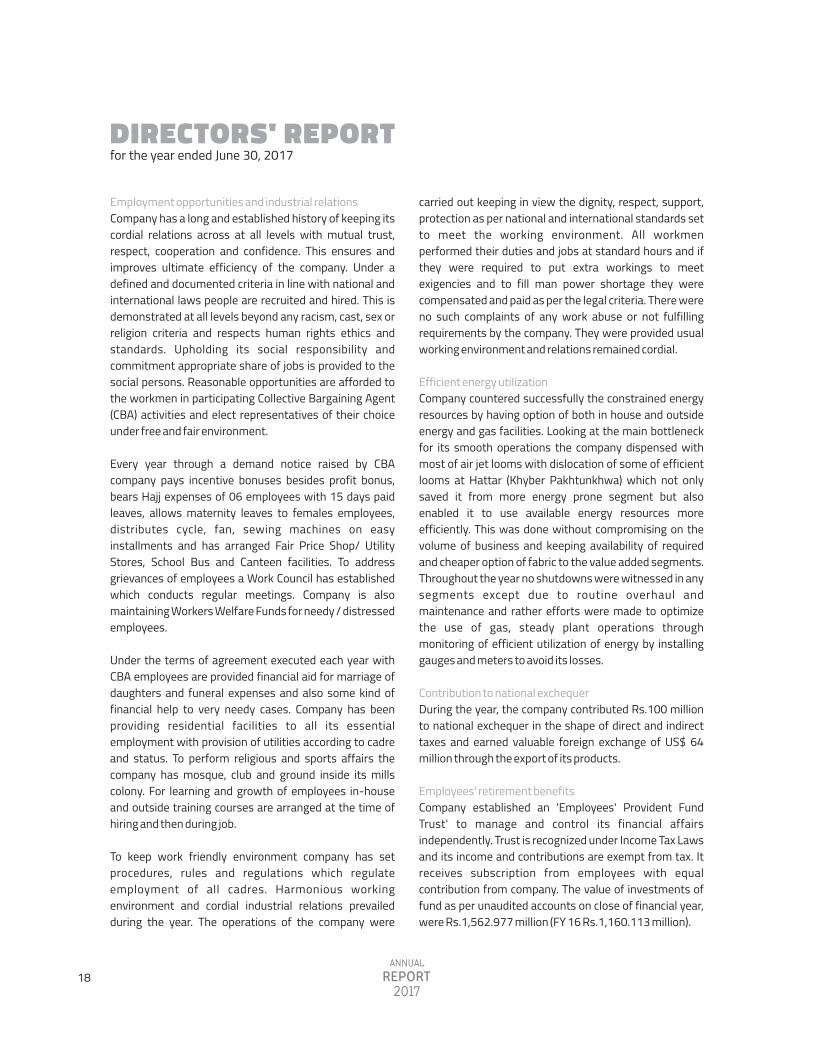
Employment opportunities and industrial relationsCompany has a long and established history of keeping its cordial relations across at all levels with mutual trust, respect, cooperation and confidence. This ensures and improves ultimate efficiency of the company. Under a defined and documented criteria in line with national and international laws people are recruited and hired. This is demonstrated at all levels beyond any racism, cast, sex or religion criteria and respects human rights ethics and standards. Upholding its social responsibility and commitment appropriate share of jobs is provided to the social persons. Reasonable opportunities are afforded to the workmen in participating Collective Bargaining Agent (CBA) activities and elect representatives of their choice under free and fair environment.
Every year through a demand notice raised by CBA company pays incentive bonuses besides profit bonus, bears Hajj expenses of 06 employees with 15 days paid leaves, allows maternity leaves to females employees, distributes cycle, fan, sewing machines on easy installments and has arranged Fair Price Shop/ Utility Stores, School Bus and Canteen facilities. To address grievances of employees a Work Council has established which conducts regular meetings. Company is also maintaining Workers Welfare Funds for needy / distressed employees.
Under the terms of agreement executed each year with CBA employees are provided financial aid for marriage of daughters and funeral expenses and also some kind of financial help to very needy cases. Company has been providing residential facilities to all its essential employment with provision of utilities according to cadre and status. To perform religious and sports affairs the company has mosque, club and ground inside its mills colony. For learning and growth of employees in-house and outside training courses are arranged at the time of hiring and then during job.
To keep work friendly environment company has set procedures, rules and regulations which regulate employment of all cadres. Harmonious working environment and cordial industrial relations prevailed during the year. The operations of the company were
carried out keeping in view the dignity, respect, support, protection as per national and international standards set to meet the working environment. All workmen performed their duties and jobs at standard hours and if they were required to put extra workings to meet exigencies and to fill man power shortage they were compensated and paid as per the legal criteria. There were no such complaints of any work abuse or not fulfilling requirements by the company. They were provided usual working environment and relations remained cordial.
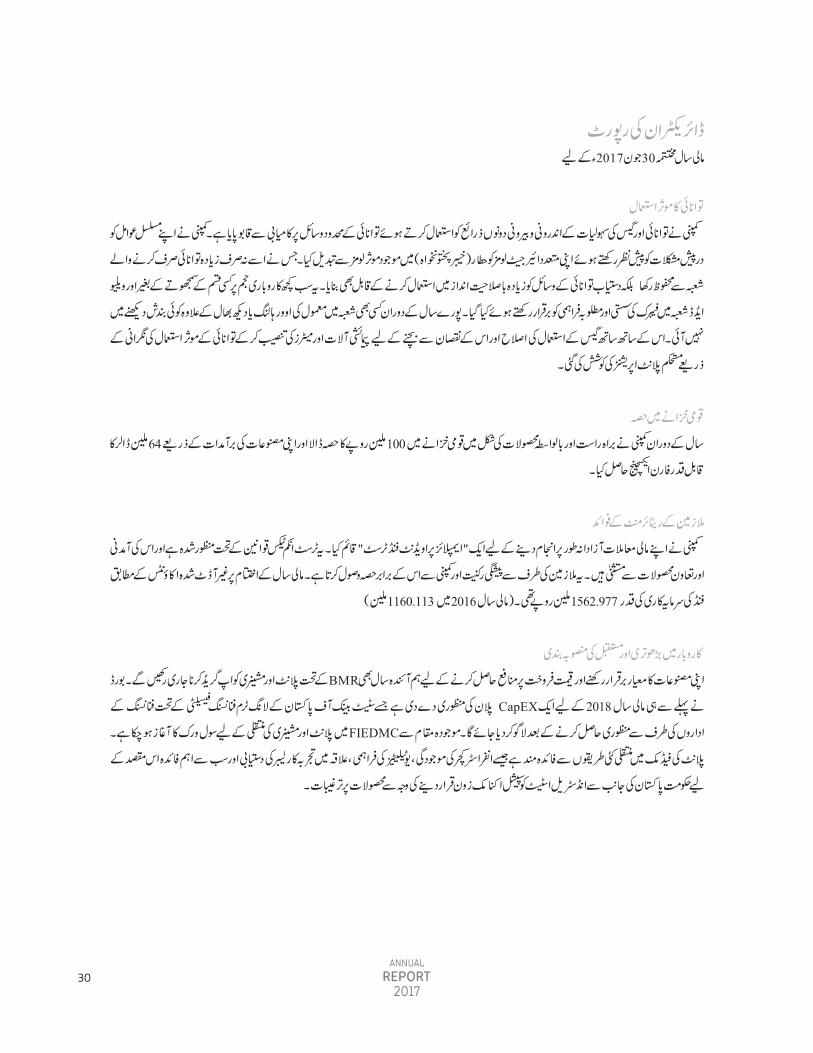
Efficient energy utilizationCompany countered successfully the constrained energy resources by having option of both in house and outside energy and gas facilities. Looking at the main bottleneck for its smooth operations the company dispensed with most of air jet looms with dislocation of some of efficient looms at Hattar (Khyber Pakhtunkhwa) which not only saved it from more energy prone segment but also enabled it to use available energy resources more efficiently. This was done without compromising on the volume of business and keeping availability of required and cheaper option of fabric to the value added segments. Throughout the year no shutdowns were witnessed in any segments except due to routine overhaul and maintenance and rather efforts were made to optimize the use of gas, steady plant operations through monitoring of efficient utilization of energy by installing gauges and meters to avoid its losses.
Contribution to national exchequerDuring the year, the company contributed Rs.100 million to national exchequer in the shape of direct and indirect taxes and earned valuable foreign exchange of US$ 64 million through the export of its products. Employees' retirement benefitsCompany established an 'Employees' Provident Fund Trust' to manage and control its financial affairs independently. Trust is recognized under Income Tax Laws and its income and contributions are exempt from tax. It receives subscription from employees with equal contribution from company. The value of investments of fund as per unaudited accounts on close of financial year, were Rs.1,562.977 million (FY 16 Rs.1,160.113 million).
DIRECTORS' REPORTfor the year ended June 30, 2017
18
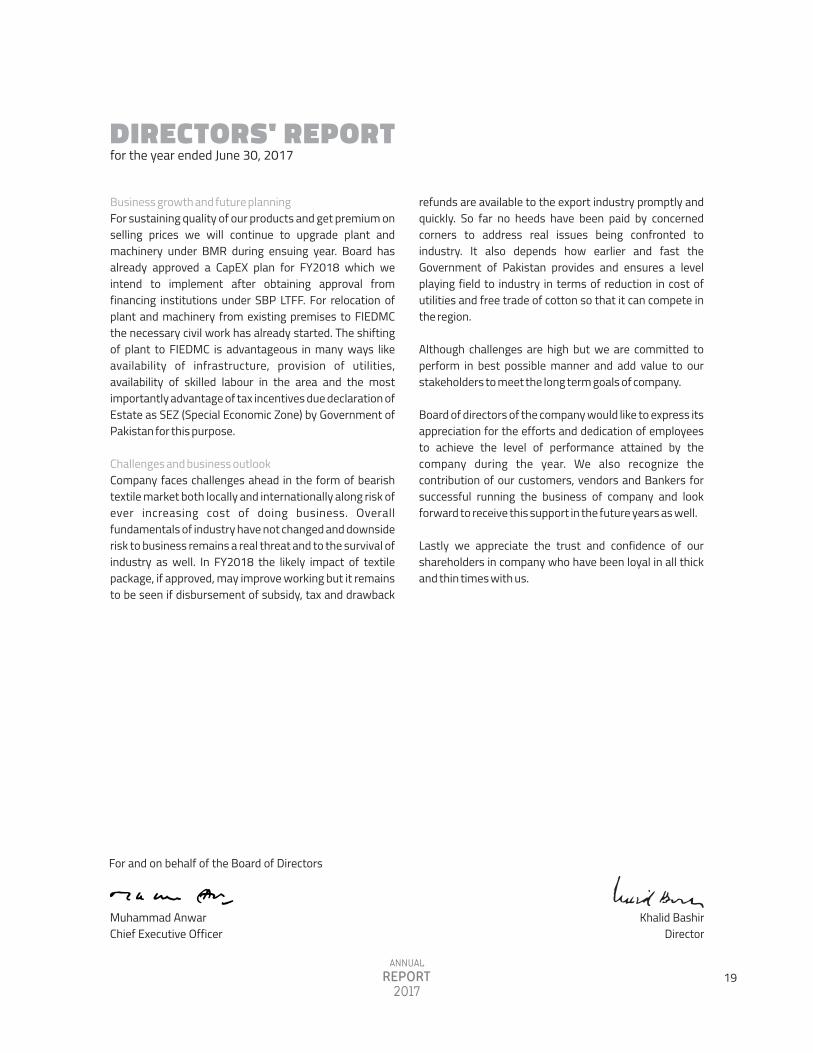
Business growth and future planningFor sustaining quality of our products and get premium on selling prices we will continue to upgrade plant and machinery under BMR during ensuing year. Board has already approved a CapEX plan for FY2018 which we intend to implement after obtaining approval from financing institutions under SBP LTFF. For relocation of plant and machinery from existing premises to FIEDMC the necessary civil work has already started. The shifting of plant to FIEDMC is advantageous in many ways like availability of infrastructure, provision of utilities, availability of skilled labour in the area and the most importantly advantage of tax incentives due declaration of Estate as SEZ (Special Economic Zone) by Government of Pakistan for this purpose.
Challenges and business outlookCompany faces challenges ahead in the form of bearish textile market both locally and internationally along risk of ever increasing cost of doing business. Overall fundamentals of industry have not changed and downside risk to business remains a real threat and to the survival of industry as well. In FY2018 the likely impact of textile package, if approved, may improve working but it remains to be seen if disbursement of subsidy, tax and drawback
refunds are available to the export industry promptly and quickly. So far no heeds have been paid by concerned corners to address real issues being confronted to industry. It also depends how earlier and fast the Government of Pakistan provides and ensures a level playing field to industry in terms of reduction in cost of utilities and free trade of cotton so that it can compete in the region.
Although challenges are high but we are committed to perform in best possible manner and add value to our stakeholders to meet the long term goals of company.
Board of directors of the company would like to express its appreciation for the efforts and dedication of employees to achieve the level of performance attained by the company during the year. We also recognize the contribution of our customers, vendors and Bankers for successful running the business of company and look forward to receive this support in the future years as well.
Lastly we appreciate the trust and confidence of our shareholders in company who have been loyal in all thick and thin times with us.
DIRECTORS' REPORTfor the year ended June 30, 2017
For and on behalf of the Board of Directors
Muhammad AnwarChief Executive Officer
Khalid BashirDirector
19

20
+0.04%

100.0
-
-
100.0
7.5
14.3
78.2
100.0
26,937
-
-
26,937
2,018
3,853
21,066
26,937
21,427
-
-
21,427
869
20,559
-
21,427
100.0
-
-
100.0
4.1
95.9
-
100.0
82.1
-
17.9
100.0
55.8
0.7
43.5
100.0
8,541
17,236
2,168
27,944
1,014
399
26,532
27,944
30.6
61.7
7.8
100.0
3.6
1.4
94.9
100.0
17,189
-
3,740
20,929
11,679
145
9,104
20,929
21
20172016
FY
2017
100,272
112
28.800
18.00
91.6
83.0
93.5
95.5
91,841
93
26.937
17.192
100,272
112
28.800
18.00
90.2
83.0
94.4
91.5
90,440
93
27.200
16.468
22
20,910
-
-
20,910
453
20,457
-
20,910
100.0
-
-
100.0
2.2
97.8
-
100.0
100.0
-
-
100.0
6.5
16.4
77.1
100.0
27,200
-
-
27,200
1,781
4,449
20,971
27,200
9,276
17,309
3,166
29,750
751
2,370
26,630
29,750
31.2
58.2
10.6
100.0
2.5
8.0
89.5
100.0
87.6
-
12.4
100.0
56.8
3.2
40.0
100.0
18,892
-
2,667
21,559
12,239
697
8,623
21,559
FY
201
6
145,152
398,710
3,852,750
20,558,835
11,679,229
1,014,219
2,018,108
868,566
696,956
2,369,942
4,448,814
20,457,130
12,239,015
750,863
1,780,617
453,169
(551,804)
(1,971,232)
(596,064)
101,705
(559,786)
263,356
237,491
415,397
(79.17)
(83.18)
(13.40)
0.50
(4.57)
35.07
13.34
91.66

23
6,695
117.6
130.9
208.0
23.8
138.6
106.4
62.9
23.2
129.0
184.4
194.2
254.8
5,592
113.9
99.3
198.0
22.3
120.9
88.5
80.2
27.6
110.0
146.5
186.5
255.5
1,103
3.7
31.6
10.0
1.5
17.7
17.9
(19.3)
(4.4)
19.0
37.9
7.7
(0.7)
19.72
3.25
31.82
5.05
6.73
14.64
20.23
(24.06)
(15.94)
17.27
25.87
4.13
(0.27)
24
293.95
(368.18)
10.83
(73.18)
(305.82)
(26.70)
66.98
(128.33)
(137.21)
(2.15)
2.78
(27.47)
1.15
(20.33)
(818.80)
(7.10)
100.00
(133.50)
(54.76)
(60.22)
10,872.76
971.99
953.65
286.82
(268.47)
349.61
-
(32.20)
113.34
1.42
10,578.81
1,340.17
942.82
360.00
37.35
376.31
(66.98)
96.13
250.55
3.57
2/2
1/2
1/2
4/4
4/4
1/4
3/4
3/4
4/4
4/4
3/4
3/5
4/5
4/5
1
2
3
4
5
6
7
8
25
26
82,000
200,000
92,500
198,815

27

28
ISO 9001:2008
ISO 14001:2004
OCS 100
GOTS
Oeko-Tex 100 Yarn, Fabric & Home Textile
SA 8000
SEDEX
SMETA/ETI
Ecolabelling Norway (SWAN)
29
30
31
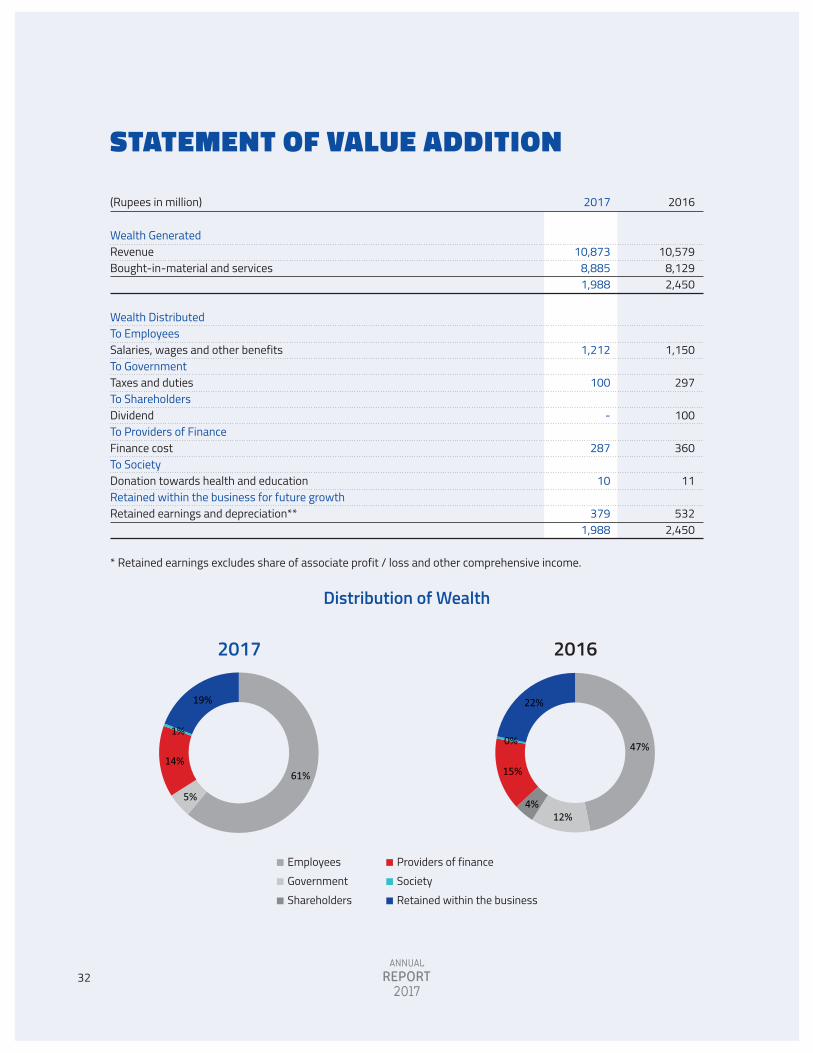
Wealth Generated Revenue Bought-in-material and services
Wealth Distributed To Employees Salaries, wages and other benefits To Government Taxes and duties To Shareholders Dividend To Providers of Finance Finance cost To Society Donation towards health and educationRetained within the business for future growthRetained earnings and depreciation**
2017 2016
10,579 8,129 2,450
1,150
297
100
360
11
532 2,450
10,873 8,885 1,988
1,212
100
-
287
10
379 1,988
(Rupees in million)
* Retained earnings excludes share of associate profit / loss and other comprehensive income.
STATEMENT OF VALUE ADDITION
Distribution of Wealth
EmployeesGovernmentShareholders
Providers of financeSocietyRetained within the business
2017 2016
61%
5%
14%
1%
19%
47%
12%4%
15%
0%
22%
32
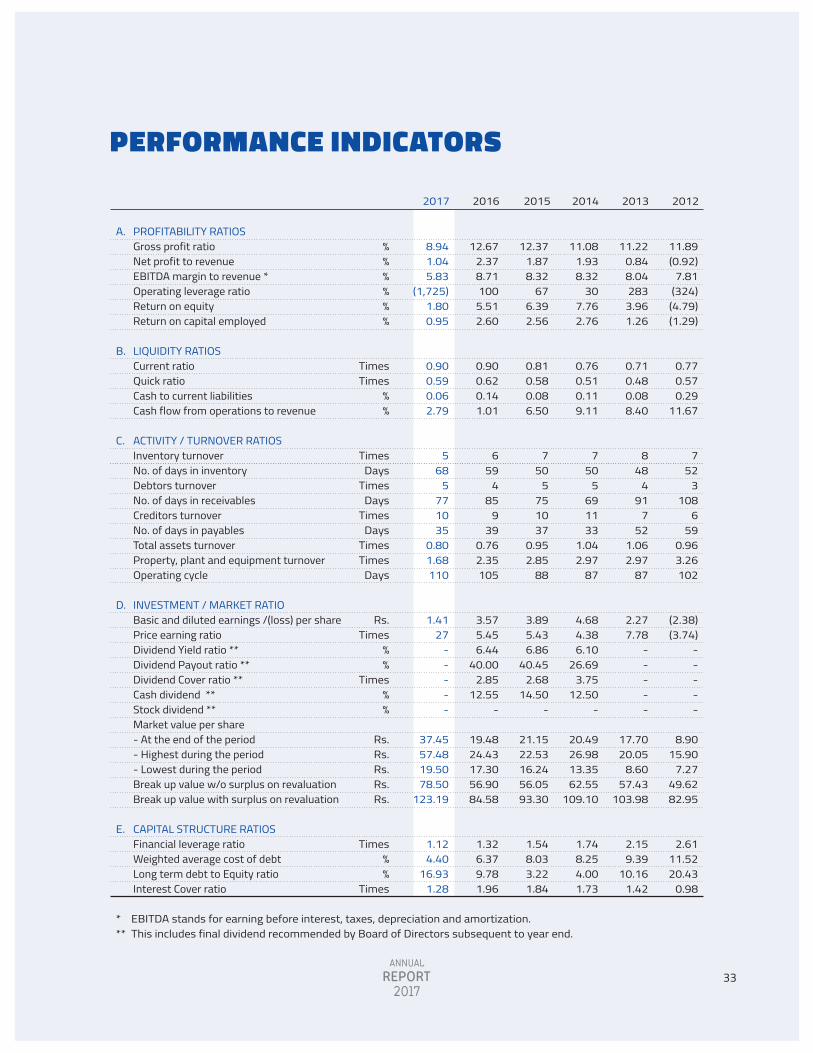
PERFORMANCE INDICATORS
A.
B.
C.
D.
E.
* EBITDA stands for earning before interest, taxes, depreciation and amortization. *** This includes final dividend recommended by Board of Directors subsequent to year end.
2012
11.89 (0.92)
7.81 (324) (4.79) (1.29)
0.77 0.57 0.29
11.67
7 52
3 108
6 59
0.96 3.26 102
(2.38) (3.74)
- - - - -
8.90 15.90
7.27 49.62 82.95
2.61 11.52 20.43
0.98
11.22 0.84 8.04 283 3.96 1.26
0.71 0.48 0.08 8.40
8 48
4 91
7 52
1.06 2.97
87
2.27 7.78
- - - - -
17.70 20.05
8.60 57.43
103.98
2.15 9.39
10.16 1.42
2013
11.08 1.93 8.32
30 7.76 2.76
0.76 0.51 0.11 9.11
7 50
5 69 11 33
1.04 2.97
87
4.68 4.38 6.10
26.69 3.75
12.50 -
20.49 26.98 13.35 62.55
109.10
1.74 8.25 4.00 1.73
2014
12.37 1.87 8.32
67 6.39 2.56
0.81 0.58 0.08 6.50
7 50
5 75 10 37
0.95 2.85
88
3.89 5.43 6.86
40.45 2.68
14.50 -
21.15 22.53 16.24 56.05 93.30
1.54 8.03 3.22 1.84
2015
8.94 1.04 5.83
(1,725) 1.80 0.95
0.90 0.59 0.06 2.79
5 68
5 77 10 35
0.80 1.68 110
1.41 27
- - - - -
37.45 57.48 19.50 78.50
123.19
1.12 4.40
16.93 1.28
2017
12.67 2.37 8.71 100 5.51 2.60
0.90 0.62 0.14 1.01
6 59
4 85
9 39
0.76 2.35 105
3.57 5.45 6.44
40.00 2.85
12.55 -
19.48 24.43 17.30 56.90 84.58
1.32 6.37 9.78 1.96
2016
%%%%%%
TimesTimes
%%
TimesDays
TimesDays
TimesDays
TimesTimes
Days
Rs.Times
%%
Times%%
Rs.Rs.Rs.Rs.Rs.
Times%%
Times
PROFITABILITY RATIOSGross profit ratioNet profit to revenueEBITDA margin to revenue *Operating leverage ratioReturn on equityReturn on capital employed
LIQUIDITY RATIOSCurrent ratioQuick ratioCash to current liabilities Cash flow from operations to revenue
ACTIVITY / TURNOVER RATIOSInventory turnoverNo. of days in inventoryDebtors turnoverNo. of days in receivablesCreditors turnoverNo. of days in payablesTotal assets turnoverProperty, plant and equipment turnoverOperating cycle
INVESTMENT / MARKET RATIOBasic and diluted earnings /(loss) per sharePrice earning ratioDividend Yield ratio **Dividend Payout ratio **Dividend Cover ratio **Cash dividend **Stock dividend **Market value per share - At the end of the period- Highest during the period- Lowest during the periodBreak up value w/o surplus on revaluationBreak up value with surplus on revaluation
CAPITAL STRUCTURE RATIOSFinancial leverage ratioWeighted average cost of debtLong term debt to Equity ratioInterest Cover ratio
33

2012 2013 2014 2015 2016 2017
2012 2013 2014 2015 2016 2017
2012 2013 2014 2015 2016 2017
2012 2013 2014 2015 2016 2017
2013 2014 2015 2016 2017
40
35
30
25
20
15
10
5
0
-5
30
25
20
15
10
5
-5
-10
0
2012
2012 2013 2014 2015 2016 2017
Debtors turnover (times)Earnings per share (Rs.)
34
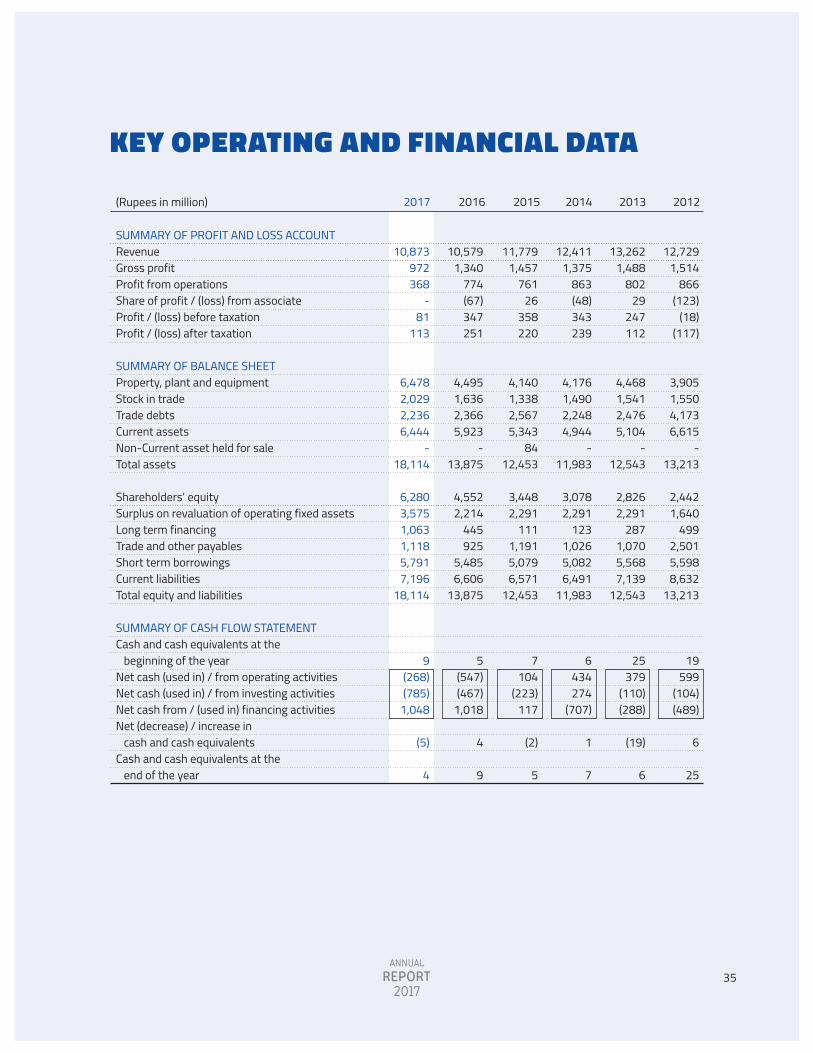
SUMMARY OF PROFIT AND LOSS ACCOUNT RevenueGross profitProfit from operationsShare of profit / (loss) from associateProfit / (loss) before taxation Profit / (loss) after taxation
SUMMARY OF BALANCE SHEET Property, plant and equipmentStock in tradeTrade debtsCurrent assetsNon-Current asset held for saleTotal assets
Shareholders' equitySurplus on revaluation of operating fixed assetsLong term financingTrade and other payablesShort term borrowingsCurrent liabilitiesTotal equity and liabilities
SUMMARY OF CASH FLOW STATEMENTCash and cash equivalents at the beginning of the yearNet cash (used in) / from operating activitiesNet cash (used in) / from investing activitiesNet cash from / (used in) financing activitiesNet (decrease) / increase in cash and cash equivalentsCash and cash equivalents at the end of the year
KEY OPERATING AND FINANCIAL DATA
(Rupees in million)
10,873 972 368
- 81
113
6,478 2,029 2,236
6,444 -
18,114
6,280 3,575 1,063 1,118 5,791
7,196 18,114
9 (268)(785)
1,048
(5)
4
2017 201220132014
12,729 1,514
866 (123)
(18) (117)
3,905 1,550 4,173
6,615 -
13,213
2,442 1,640
499 2,501 5,598
8,632 13,213
19 599
(104)(489)
6
25
13,262 1,488
802 29
247 112
4,468 1,541 2,476 5,104
-12,543
2,826 2,291
287 1,070 5,568 7,139
12,543
25 379
(110)(288)
(19)
6
12,411 1,375
863 (48) 343 239
4,176 1,490 2,248
4,944 -
11,983
3,078 2,291
123 1,026 5,082
6,491 11,983
6 434 274
(707)
1
7
2015
11,779 1,457
761 26
358 220
4,140 1,338 2,567 5,343
84 12,453
3,448 2,291
111 1,191 5,079 6,571
12,453
7 104
(223)117
(2)
5
2016
10,579 1,340
774 (67) 347 251
4,495 1,636 2,366 5,923
- 13,875
4,552 2,214
445 925
5,485 6,606
13,875
5 (547)(467)
1,018
4
9
35

Rs.
in m
illio
n
2012 2013 2014 2015 2016 2017
2012 2013 2014 2015 2016 2017
Rs.
in m
illio
n
Shareholders' equity (Rs. in million)
2012 2013 2014 2015 2016 20170
1,000
2,000
3,000
4,000
5,000
6,000
7,000
-
10
20
30
40
50
60
70
80
90
2012 2013 2014 2015 2016 2017
Gross profit to revenue (%) Net profit to revenue (%)
EBITDA margin to revenue (%)
36

VERTICAL ANALYSIS
BALANCE SHEETProperty, plant and equipmentIntangible assetsInvestment in associateLong term investmentsLong term loans and advancesLong term deposits and prepayments Deferred income tax assetStores, spare parts and loose toolsStock in tradeTrade debtsLoans and advancesShort term deposits and prepaymentsAccrued interestOther receivablesShort term investmentsCash & bank balancesNon-Current asset held for saleTOTAL ASSETS
Issued, subscribed and paid up share capitalReservesShareholders� equitySurplus on revaluation of operating fixed assetsLong term financingLiabilities against assets subject to finance leaseDeferred liabilityTrade and other payablesAccrued mark-up Short term borrowingsCurrent portion of non-current liabilitiesProvision for taxationTOTAL EQUITY AND LIABILITIES
PROFIT AND LOSS ACCOUNTRevenueCost of salesGross profitDistribution costAdministrative expensesOther expensesOther incomeProfit from operationsFinance costShare of profit / (loss) from associateProfit / (loss) before taxationTaxationProfit / (loss) after taxation
for the last six financial years
2017 % 2013 2012 %%2014 %2015 % 2016
4,495 - -
3,449 3 5 -
185 1,636 2,366
469 29
4 1,131
94 9 -
13,875
800 3,752 4,552
2,214 445
- 58
925 60
5,485 66 70
13,875
10,579 9,239 1,340
633 283
26 376 774 360 (67) 347
96 251
6,478 18
- 5,167
2 5 -
192 2,029 2,236
576 62
4 1,253
88 4 -
18,114
800 5,480 6,280
3,575 1,063
- -
1,118 66
5,791 190
31 18,114
10,873 9,901
972 644 300
10 350 368 287
- 81
(32) 113
32.4 - -
24.9 0.0 0.0
- 1.3
11.8 17.1
3.4 0.2 0.0 8.2 0.7 0.1
- 100
5.8 27.0 32.8 16.0
3.2 -
0.4 6.7 0.4
39.5 0.5 0.5
100
100.0 87.3 12.7
6.0 2.7 0.2 3.6 7.3 3.4
(0.6) 3.3 0.9 2.4
35.8 0.1
- 28.5
0.0 0.0
- 1.1
11.2 12.3
3.2 0.3 0.0 6.9 0.5 0.0
- 100
4.4 30.3 34.7 19.7
5.9 - -
6.2 0.4
32.0 1.0 0.2
100
100.0 91.1
8.9 5.9 2.8 0.1 3.2 3.4 2.6
- 0.7
(0.3) 1.0
3,905 4
329 2,287
3 7
63 152
1,550 4,173
267 41
4 353
50 25
-13,213
492 1,950 2,442 1,640
401 98
- 2,501
145 5,598
267 121
13,213
12,729 11,215
1,514 629 200
13 194 866 761
(123) (18)
99 (117)
29.6 0.0 2.5
17.3 0.0 0.1 0.5 1.2
11.7 31.6
2.0 0.3 0.0 2.7 0.4 0.2
- 100
3.7 14.8 18.5 12.4
3.0 0.7
- 18.9
1.1 42.4
2.0 0.9
100
100.0 88.1 11.9
4.9 1.6 0.1 1.5 6.8 6.0
(1.0) (0.1)
0.8 (0.9)
4,468 2
358 2,553
4 7
47 124
1,541 2,476
305 25
5 566
56 6 -
12,543
492 2,334 2,826
2,291 210
77 -
1,070 161
5,568 221 119
12,543
13,262 11,774
1,488 686 187
19 206 802 584
29 247 135 112
35.6 0.0 2.9
20.4 0.0 0.1 0.4 1.0
12.3 19.7
2.4 0.2 0.0 4.5 0.4 0.0
- 100
3.9 18.6 22.5 18.3
1.7 0.6
- 8.5 1.3
44.4 1.8 0.9
100
100.0 88.8 11.2
5.2 1.4 0.1 1.6 6.0 4.4 0.2 1.9 1.0 0.8
4,176 -
311 2,540
3 7 2
157 1,490 2,248
364 21
4 571
82 7 -
11,983
492 2,586 3,078
2,291 79 44
- 1,026
97 5,082
164 122
11,983
12,411 11,036
1,375 611 195
67 361 863 472 (48) 343 104 239
34.8 -
2.6 21.2
0.0 0.1 0.0 1.3
12.4 18.8
3.0 0.2 0.0 4.8 0.7 0.1
- 100
4.1 21.6 25.7 19.1
0.7 0.4
- 8.6 0.8
42.4 1.4 1.0
100
100.0 88.9 11.1
4.9 1.6 0.5 2.9 7.0 3.8
(0.4) 2.8 0.8 1.9
4,140 -
336 2,541
4 5 -
177 1,338 2,567
418 23
5 744
66 5
84 12,453
615 2,833 3,448
2,291 100
11 32
1,191 85
5,079 112 104
12,453
11,779 10,322
1,457 648 234
63 249 761 429
26 358 138 220
33.2 -
2.7 20.4
0.0 0.0
- 1.4
10.7 20.6
3.4 0.2 0.0 6.0 0.5 0.0 0.7
100
4.9 22.7 27.7 18.4
0.8 0.1 0.3 9.6 0.7
40.8 0.9 0.8
100
100.0 87.6 12.4
5.5 2.0 0.5 2.1
6.5 3.6 0.2 3.0 1.2 1.9
%(Rupees in million)
37

HORIZONTAL ANALYSIS
BALANCE SHEETProperty, plant and equipmentIntangible assetsInvestment in associateLong term investmentsLong term loans and advancesLong term deposits and prepayments Deferred income tax assetStores, spare parts and loose toolsStock in tradeTrade debtsLoans and advancesShort term deposits and prepaymentsAccrued interestOther receivablesShort term investmentsCash & bank balancesNon-Current asset held for saleTOTAL ASSETS
Issued, subscribed and paid up share capitalReservesShareholders� equitySurplus on revaluation of operating fixed assetsLong term financingLiabilities against assets subject to finance leaseDeferred liabilityTrade and other payablesAccrued mark-up Short term borrowingsCurrent portion of non-current liabilitiesProvision for taxationTOTAL EQUITY AND LIABILITIES
PROFIT AND LOSS ACCOUNTRevenueCost of salesGross profitDistribution costAdministrative expensesOther expensesOther incomeProfit from operationsFinance costShare of profit / (loss) from associateProfit / (loss) before taxationTaxationProfit / (loss) after taxation
2017 % 2015 % 2013 20122014 % % %2016 %
for the last six financial years
(Rupees in million)
4,495 - -
3,449 3 5 -
185 1,636 2,366
469 29
4 1,131
94 9 -
13,875
800 3,752 4,552 2,214
445 -
58 925
60 5,485
66 70
13,875
10,579 9,239 1,340
633 283
26 376 774 360 (67) 347
96 251
6,478 18
- 5,167
2 5 -
192 2,029 2,236
576 62
4 1,253
88 4 -
18,114
800 5,480 6,280 3,575 1,063
- -
1,118 66
5,791 190
31 18,114
10,873 9,901
972 644 300
10 350 368 287
- 81
(32) 113
8.6 -
(100.0) 35.7
(25.0) - -
4.5 22.3 (7.8) 12.2 26.1
(20.0) 52.0 42.4 80.0
(100.0) 11.4
30.1 32.4 32.0 (3.4)
345.0 (100.0)
81.3 (22.3) (29.4)
8.0 (41.1) (32.7)
11.4
(10.2) (10.5)
(8.0) (2.3) 20.9
(58.7) 51.0
1.7 (16.0)
(357.7) (3.2)
(30.4) 13.8
44.1 100.0
- 49.8
(33.3) - -
3.8 24.0 (5.5) 22.8
113.8 -
10.8 (6.4)
(55.6) -
30.6
- 46.1 38.0 61.5
138.9 -
(100.0) 20.9 10.0
5.6 187.9 (55.7)
30.6
2.8 7.2
(27.5) 1.7 6.0
(61.5) (6.9)
(52.5) (20.3)
(100.0) (76.7)
(133.3) (55.0)
4,176 -
311 2,540
3 7 2
157 1,490 2,248
364 21
4 571
82 7 -
11,983
492 2,586 3,078 2,291
79 44
- 1,026
97 5,082
164 122
11,983
12,411 11,036
1,375 611 195
67 361 863 472 (48) 343 104 239
(6.5) (100.0)
(13.1) (0.5)
(25.0) -
(95.7) 26.6 (3.3) (9.2) 19.3
(16.0) (20.0)
0.9 46.4 16.7
- (4.5)
- 10.8
8.9 -
(62.4) (42.9)
- (4.1)
(39.8) (8.7)
(25.8) 2.5
(4.5)
(6.4) (6.3) (7.6)
(10.9) 4.3
252.6 75.2
7.6 (19.2)
(265.5) 38.9
(23.0) 113.5
3,905 4
329 2,287
3 7
63 152
1,550 4,173
267 41
4 353
50 25
-13,213
492 1,950 2,442 1,640
401 98
- 2,501
145 5,598
267 121
13,213
12,729 11,215
1,514 629 200
13 194 866 761
(123) (18)
99 (117)
(3.2) 100.0 (27.1)
1.4 10.0
177.8 48.8 (5.1) (6.5) 23.0
(13.6) (38.9)
42.6 94.1 33.5 34.9
- 4.7
- (3.5) (2.8) (0.0)
(21.7) 79.4
- 89.7
3.0 (5.7)
(23.8) (19.9)
4.7
(13.8) (16.3)
10.9 (1.9) (1.4)
(68.2) 8.4
31.5 44.4
(15.2) 33.7 (1.0)
3.1
4,468 2
358 2,553
4 7
47 124
1,541 2,476
305 25
5 566
56 6-
12,543
492 2,334 2,826 2,291
210 77
- 1,070
161 5,568
221 119
12,543
13,262 11,774
1,488 686 187
19 206 802 584
29 247 135 112
14.4 (50.0)
8.8 11.6 33.3
- (25.4) (18.4)
(0.6) (40.7)
14.2 (39.0)
25 60.3 12.0
(76.0)-
(5.1)
- 19.7 15.7 39.7
(47.6) (21.4)
- (57.2)
11.0 (0.5)
(17.2) (1.7) (5.1)
4.2 5.0
(1.7) 9.1
(6.5) 46.2
6.2 (7.4)
(23.3) (123.6)
(1,472.2) 36.4
(195.7)
4,140 -
336 2,541
4 5 -
177 1,338 2,567
418 23
5 744
66 5
84 12,453
615 2,833 3,448
2,291 100
11 32
1,191 85
5,079 112 104
12,453
11,779 10,322
1,457 648 234
63 249 761 429
26 358 138 220
(0.9)
8.0 0.0
33.3 (28.6)
(100.0) 12.7
(10.2) 14.2 14.8
9.5 25.0 30.3
(19.5) (28.6) 100.0
3.9
25.0 9.6
12.0 -
26.6 (75.0) 100.0
16.1 (12.4)
(0.1) (31.7) (14.8)
3.9
(5.1) (6.5)
6.0 6.1
20.0 (6.0)
(31.0) (11.8)
(9.2) (154.2)
4.5 32.7 (7.7)
38

STATEMENT OF COMPLIANCEwith Best Practices of Code of Corporate Governance
This statement is being presented to comply with the Code of Corporate Governance contained in chapter 5.19 of Rule Book of Pakistan Stock Exchange Limited (PSX) for the purpose of establishing a framework of good governance, whereby a listed company is managed in compliance with the best Practices of Corporate Governance.
Company has applied the principles contained in the CCG in the following manner:
1 Company encourages representation of independent non-executive directors and directors representing minority interests on its Board of Directors. Since there was no contestant for independent director so shareholders didn't elect. At present Board includes:
CategoryExecutive Directors
Non-Executive Directors
NameMr. Ahmad ShafiMr. Muhammad AnwarMr. Amjad MehmoodMr. Anjum Muhammad SaleemMr. Khalid BashirMr. Khurram Mazhar KarimMr. Muhammad AsifMr. Shaukat Shafi
2
3
4
5
6
7
8
Directors have confirmed that none of them is serving as a Director on more than seven listed companies, including this company (excluding the listed subsidiaries of listed holding companies where applicable).
All the resident directors of the Company are registered as taxpayers and none of them has defaulted in payment of any loan to a banking company, a DFI or an NBFI or, being a Broker of a stock exchange, has been declared as a defaulter by that stock exchange.
No casual vacancy has occurred in the Board during the year.
Company has prepared a 'Code of Conduct' and has ensured that appropriate steps have been taken to disseminate it throughout the company along with its supporting policies and procedures.
Board has developed a vision/mission statement, overall corporate strategy and significant policies of the company. A complete record of particulars of significant policies along with dates on which they were approved or amended has been maintained.
All the powers of the Board have been duly exercised and decisions on material transactions, including appointment and determination of remuneration and terms and conditions of employment of the CEO and other executive and non-executive directors have been taken by the board / shareholders.
Meetings of the Board were presided over by the Chairman and, in his absence, by a director elected by the board for this purpose and the Board met at least once in every quarter. Written notices of the Board meetings, along with agenda and working papers, were circulated at least seven days before the meetings. The minutes of the meetings were appropriately recorded and circulated.
39
9
10
11
12
13
14
15
16
17
18
19
20
21
The Board remained fully compliant with the provision with regard to their training program. Out of total of 8 Directors seven directors are exempt from training as mentioned in proviso to clause 5.19.7 of the Pakistan Stock Exchange Regulations. Other one director has completed his training earlier. Board has approved the terms of appointment and remuneration including terms and conditions of employment of Chief Financial Officer (CFO), Corporate Secretary and Head of Internal Audit as recommended by the Human Resources and Remuneration Committee of the Board.
Directors' report for this year has been prepared in compliance with the requirements of the CCG and fully describes the salient matters required to be disclosed.
Financial Statements of the company were duly endorsed by CEO and CFO before approval of the Board.
Directors, CEO and Executives do not hold any interest in the shares of the company other than that disclosed in the pattern of shareholding.
Company has complied with all corporate and financial reporting requirements of the CCG.
Board has formed an Audit Committee. It comprises three members, all of whom are non-executive Directors including Chairman of the Committee.
Meetings of the audit committee were held at least once in every quarter prior to approval of interim and final results of company and as required by the CCG. The terms of reference of the Committee have been formed and advised to the Committee for compliance.
Board has formed a Human Resource and Remuneration Committee. It comprises three members and two of them are non-executive Directors including the Chairman of the Committee.
Board has set-up an effective internal audit function manned by suitably qualified and experienced personnel who are conversant with policies and procedures of the company.
Statutory auditors of the company have confirmed that they have been given a satisfactory rating under the Quality Control Review program of the ICAP, that they or any of the partners of the firm, their spouses and minor children do not hold shares of the company and that the firm and all its partners are in compliance with International Federation of Accountants (IFAC) guidelines on code of ethics as adopted by the ICAP.
Statutory auditors or the persons associated with them have not been appointed to provide other services except in accordance with the listing regulations and the auditors have confirmed that they have observed IFAC guidelines in this regard.
The 'closed period', prior to the announcement of interim/final results, and business decisions, which may materially affect the market price of company's securities, was determined and intimated to directors, employees and stock exchange(s).
STATEMENT OF COMPLIANCEwith Best Practices of Code of Corporate Governance
40

22
23
24
Material/price sensitive information has been disseminated among all market participants at once through stock exchange(s).
The Company has complied with the requirements relating to maintenance of register of persons having access to inside information by designated senior management officer in a timely manner and maintained proper record including basis for inclusion or exclusion of names of persons from said list.
We confirm that all other material principles enshrined in the CCG have been complied with.
Muhammad AnwarChief Executive Officer
On behalf of the Board
STATEMENT OF COMPLIANCEwith Best Practices of Code of Corporate Governance
41
Khalid BashirDirector

REVIEW REPORT TO THE MEMBERS ONSTATEMENT OF COMPLIANCEwith the Code of Corporate Governance
We have reviewed the enclosed Statement of Compliance with the best practices contained in the Code of Corporate Governance ("the Code") prepared by the Board of Directors of THE CRESCENT TEXTILE MILLS LIMITED ("the Company") for the year ended 30 June 2017 to comply with the requirements of Clause 5.19.24 (b) of the Rule Book of Pakistan Stock Exchange Limited, where the Company is listed.
The responsibility for compliance with the Code is that of the Board of Directors of the Company. Our responsibility is to review, to the extent where such compliance can be objectively verified, whether the statement of compliance reflects the status of the Company's compliance with the provisions of the Code and report if it does not and to highlight any non-compliance with the requirements of the Code. A review is limited primarily to inquiries of the Company personnel and reviews of various documents prepared by the Company to comply with the Code.
As a part of our audit of the financial statements we are required to obtain an understanding of the accounting and internal control systems sufficient to plan the audit and develop an effective audit approach. We are not required to consider whether the Board of Directors' statement on internal control covers all risks and controls or to form an opinion on the effectiveness of such internal controls, the Company's corporate governance procedures and risks.
The Code requires the Company to place before the Audit Committee and upon recommendation of the Audit Committee, place before the Board of Directors for their review and approval its related party transactions distinguishing between transactions carried out on terms equivalent to those that prevail in arm's length transactions and transactions which are not executed at arm's length price and recording proper justification for using such alternate pricing mechanism. We are only required and have ensured compliance of this requirement to the extent of the approval of the related party transactions by the Board of Directors upon recommendation of the Audit Committee. We have not carried out any procedures to determine whether the related party transactions were undertaken at arm's length price or not.
Based on our review, nothing has come to our attention which causes us to believe that the Statement of Compliance does not appropriately reflect the Company's compliance, in all material respects, with the best practices contained in the Code as applicable to the Company for the year ended 30 June 2017.
As stated in paragraph no. 1 of the Statement of Compliance, there is no independent director on the Board of Directors of the Company which is required by rule 5.19.1(b) of the Regulations of Pakistan Stock Exchange Limited.
42
RIAZ AHMAD & COMPANYChartered Accountants
Name of engagement partner:Mubashar MehmoodDate: October 02, 2017Faisalabad

AUDITORS' REPORT TO THE MEMBERS
We have audited the annexed balance sheet of THE CRESCENT TEXTILE MILLS LIMITED ("the Company") as at 30 June 2017 and the related profit and loss account, statement of comprehensive income, cash flow statement and statement of changes in equity together with the notes forming part thereof, for the year then ended and we state that we have obtained all the information and explanations which, to the best of our knowledge and belief, were necessary for the purposes of our audit.
It is the responsibility of the Company's management to establish and maintain a system of internal control, and prepare and present the above said statements in conformity with the approved accounting standards and the requirements of the repealed Companies Ordinance, 1984. Our responsibility is to express an opinion on these statements based on our audit.
We conducted our audit in accordance with the auditing standards as applicable in Pakistan. These standards require that we plan and perform the audit to obtain reasonable assurance about whether the above said statements are free of any material misstatement. An audit includes examining, on a test basis, evidence supporting the amounts and disclosures in the above said statements. An audit also includes assessing the accounting policies and significant estimates made by management, as well as, evaluating the overall presentation of the above said statements. We believe that our audit provides a reasonable basis for our opinion and, after due verification, we report that:
(a) in our opinion, proper books of account have been kept by the Company as required by the repealed Companies Ordinance, 1984;
(b) in our opinion: i) the balance sheet and profit and loss account together with the notes thereon have been drawn up in conformity with the repealed Companies Ordinance, 1984, and are in agreement with the books of account and are further in accordance with accounting policies consistently applied; ii) the expenditure incurred during the year was for the purpose of the Company's business; andiii) the business conducted, investments made and the expenditure incurred during the year were in accordance with the objects of the Company;
(c) in our opinion and to the best of our information and according to the explanations given to us, the balance sheet, profit and loss account, statement of comprehensive income, cash flow statement and statement of changes in equity together with the notes forming part thereof conform with approved accounting standards as applicable in Pakistan, and, give the information required by the repealed Companies Ordinance, 1984, in the manner so required and respectively give a true and fair view of the state of the Company's affairs as at 30 June 2017 and of the profit, its comprehensive income, its cash flows and changes in equity for the year then ended; and
(d) in our opinion, Zakat deductible at source under the Zakat and Ushr Ordinance, 1980 (XVIII of 1980), was deducted by the Company and deposited in the Central Zakat Fund established under Section 7 of that Ordinance.
43
RIAZ AHMAD & COMPANYChartered Accountants
Name of engagement partner:Mubashar MehmoodDate: October 02, 2017Faisalabad

BALANCE SHEET AS AT JUNE 30, 2017
2017 2016Note(Rupees in '000)
Muhammad AnwarChief Executive Officer
44
EQUITY AND LIABILITIES
SHARE CAPITAL AND RESERVESAuthorized share capital100 000 000 (2016: 100 000 000)ordinary shares of Rupees 10 each
Issued, subscribed and paid up share capitalReservesTOTAL EQUITY
Surplus on revaluation of operating fixedassets - net of deferred income tax
LIABILITIES
NON-CURRENT LIABILITIESLong term financing Deferred income tax liability
CURRENT LIABILITIESTrade and other payablesAccrued mark-up Short term borrowingsCurrent portion of non-current liabilitiesProvision for taxation
TOTAL LIABILITIES
CONTINGENCIES AND COMMITMENTS
TOTAL EQUITY AND LIABILITIES
1,000,000
800,000 3,751,934 4,551,934
2,214,012
445,371 58,026
503,397
925,013 59,941
5,484,784 65,745 70,227
6,605,710 7,109,107
13,875,053
1,000,000
800,000 5,480,186 6,280,186
3,575,108
1,063,253 261
1,063,514
1,118,304 65,388
5,790,390 190,376
31,291 7,195,749 8,259,263
18,114,557
34
5
67
89
1011
12
The annexed notes form an integral part of these financial statements.
45
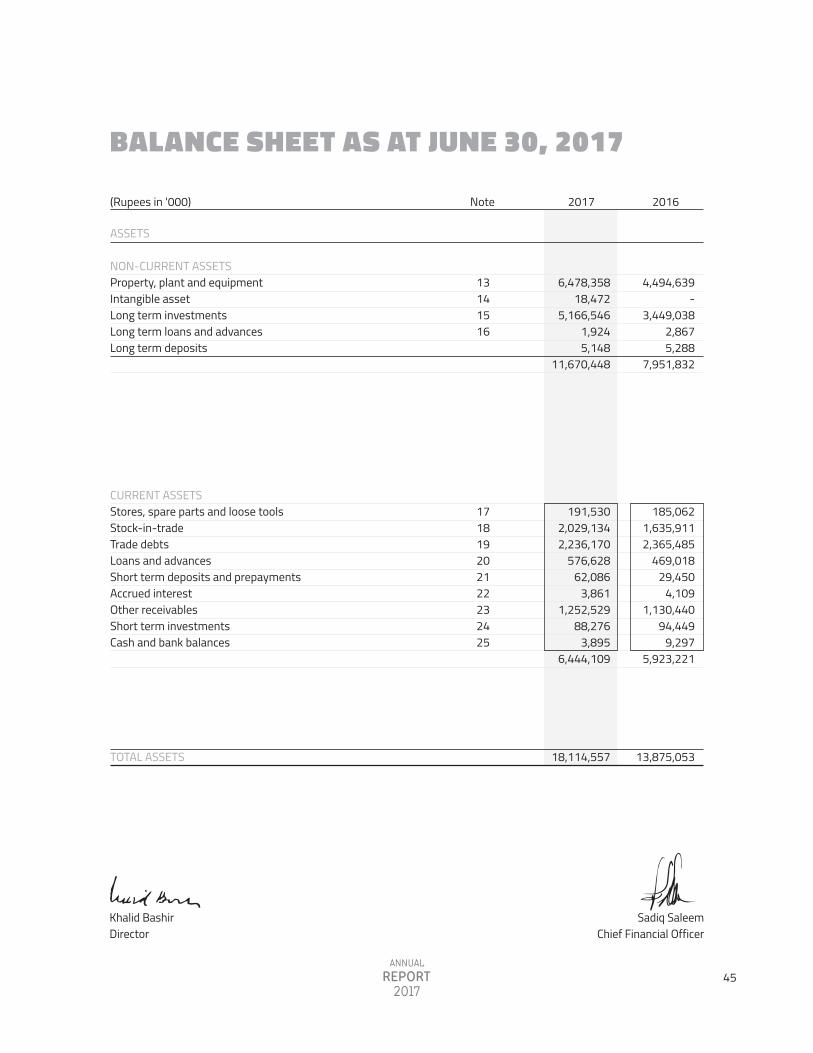
ASSETS NON-CURRENT ASSETS Property, plant and equipmentIntangible assetLong term investmentsLong term loans and advancesLong term deposits CURRENT ASSETS Stores, spare parts and loose tools Stock-in-trade Trade debts Loans and advances Short term deposits and prepayments Accrued interest Other receivables Short term investments Cash and bank balances
TOTAL ASSETS
4,494,639 -
3,449,038 2,867 5,288
7,951,832
185,062 1,635,911 2,365,485
469,018 29,450
4,109 1,130,440
94,449 9,297
5,923,221
13,875,053
13141516
171819 20 21 22 23 24 25
2017 2016Note(Rupees in '000)
6,478,358 18,472
5,166,546 1,924 5,148
11,670,448
191,530 2,029,134 2,236,170
576,628 62,086
3,861 1,252,529
88,276 3,895
6,444,109
18,114,557
BALANCE SHEET AS AT JUNE 30, 2017
Khalid BashirDirector
Sadiq SaleemChief Financial Officer
PROFIT AND LOSS ACCOUNTfor the Year Ended June 30, 2017
2017 2016Note(Rupees in '000)
46
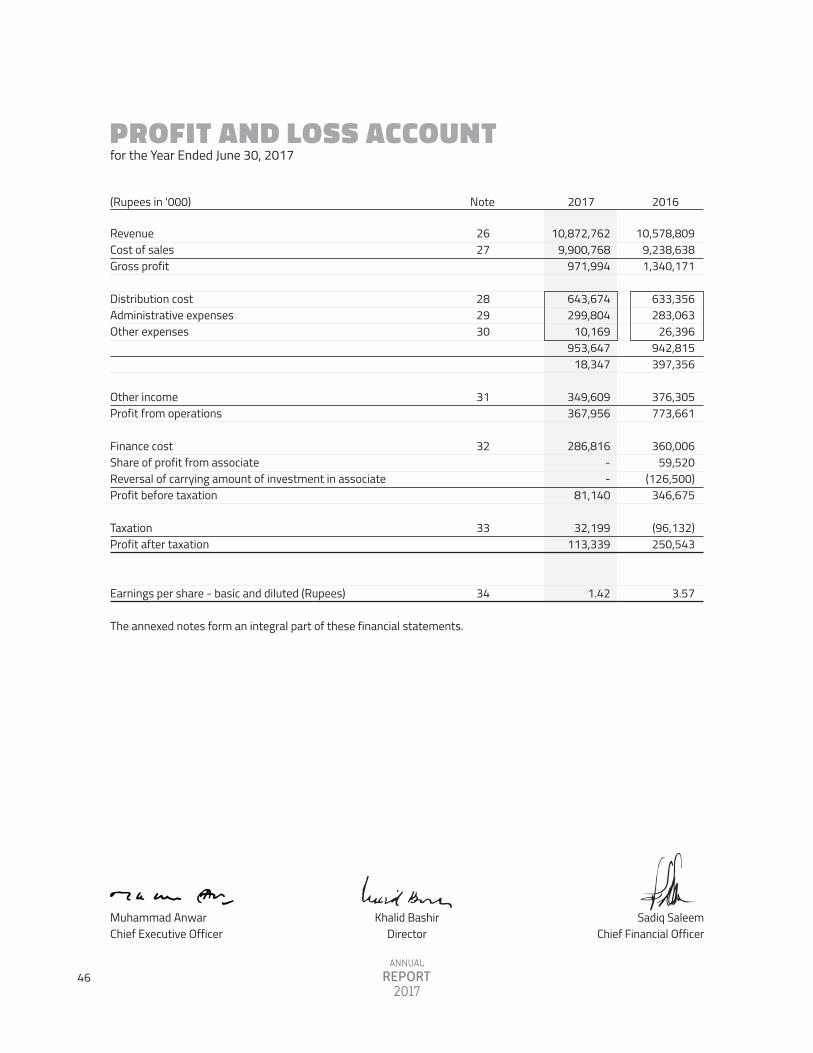
RevenueCost of salesGross profit
Distribution costAdministrative expensesOther expenses
Other incomeProfit from operations
Finance costShare of profit from associateReversal of carrying amount of investment in associateProfit before taxation
TaxationProfit after taxation
Earnings per share - basic and diluted (Rupees)
The annexed notes form an integral part of these financial statements.
10,578,809 9,238,638 1,340,171
633,356283,063 26,396
942,815 397,356
376,305 773,661
360,006 59,520
(126,500) 346,675
(96,132) 250,543
3.57
10,872,762 9,900,768
971,994
643,674299,804
10,169953,647 18,347
349,609 367,956
286,816 - -
81,140
32,199 113,339
1.42
2627
282930
31
32
33
34
Muhammad AnwarChief Executive Officer
Khalid BashirDirector
Sadiq SaleemChief Financial Officer
2017 2016(Rupees in '000)
STATEMENT OF COMPREHENSIVE INCOMEfor the Year Ended June 30, 2017
47
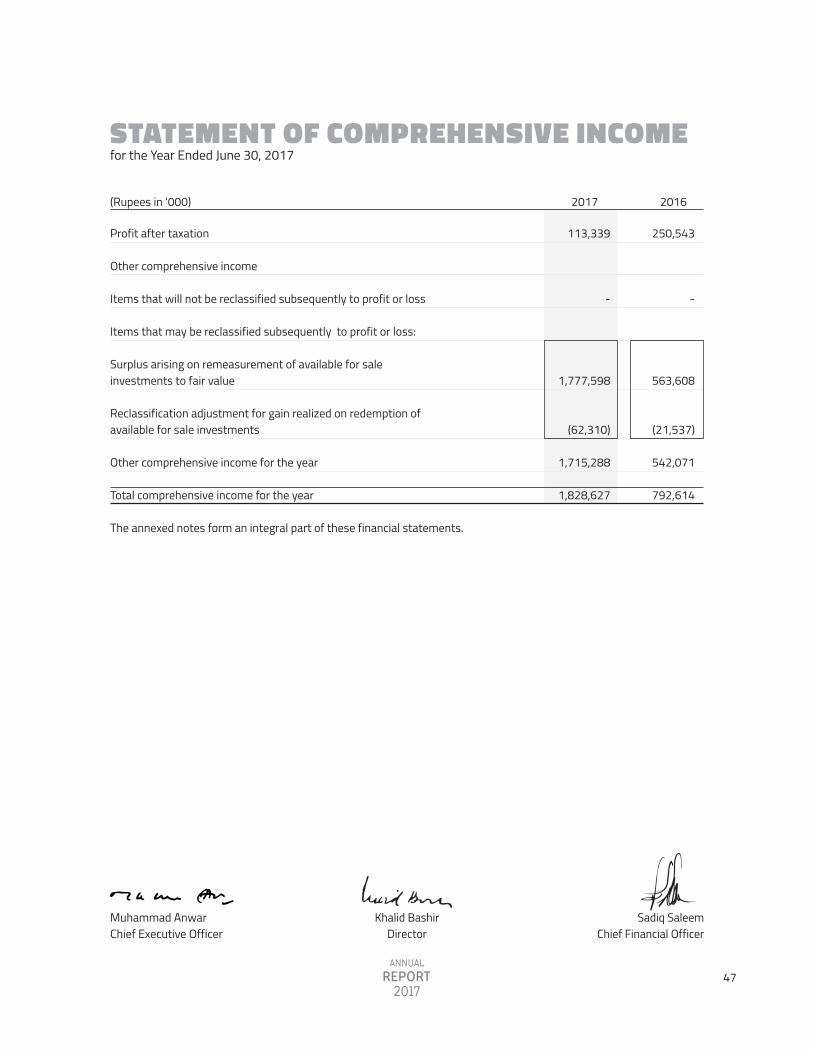
Profit after taxation
Other comprehensive income
Items that will not be reclassified subsequently to profit or loss
Items that may be reclassified subsequently to profit or loss:
Surplus arising on remeasurement of available for saleinvestments to fair value
Reclassification adjustment for gain realized on redemption ofavailable for sale investments
Other comprehensive income for the year
Total comprehensive income for the year
The annexed notes form an integral part of these financial statements.
250,543
-
563,608
(21,537)
542,071
792,614
113,339
-
1,777,598
(62,310)
1,715,288
1,828,627
Muhammad AnwarChief Executive Officer
Khalid BashirDirector
Sadiq SaleemChief Financial Officer

CASH FLOW STATEMENTfor the Year Ended June 30, 2017
CASH FLOWS FROM OPERATING ACTIVITIES
Cash generated from operationsFinance cost paid Income tax paidDividend paid Workers' profit participation fund paidNet decrease in long term loans and advancesNet decrease in long term depositsNet cash used in operating activities
CASH FLOWS FROM INVESTING ACTIVITIESCapital expenditure on property, plant and equipmentCapital expenditure on intangible assetProceeds from sale of property, plant and equipmentProceeds from non-current asset held for saleInvestments madeProceeds from sale of available for sale investmentsDividend receivedNet cash used in investing activities
CASH FLOWS FROM FINANCING ACTIVITIESProceeds from issuance of right sharesProceeds from long term financingRepayment of long term financingRepayment of liabilities against assets subject to finance leaseShort term borrowings - netNet cash from financing activities
Net (decrease) / increase in cash and cash equivalents
Cash and cash equivalents at the beginning of the year
Cash and cash equivalents at the end of the year (Note 25)
The annexed notes form an integral part of these financial statements.
2017 2016
106,451 (384,456) (167,635)
(89,807) (12,152)
797 178
(546,624)
(581,244) -
50,235 144,129
(130,643) 27,461 22,883
(467,179)
323,533 400,111 (79,174) (32,669) 406,104
1,017,905
4,102
5,195
9,297
302,928 (280,534) (177,658)
(99,515) (14,387)
943 140
(268,083)
(920,227) (19,000)
44,483 - -
66,263 43,043
(785,438)
- 808,258 (54,733) (11,012) 305,606
1,048,119
(5,402)
9,297
3,895
35
Note(Rupees in '000)
48
Muhammad AnwarChief Executive Officer
Khalid BashirDirector
Sadiq SaleemChief Financial Officer
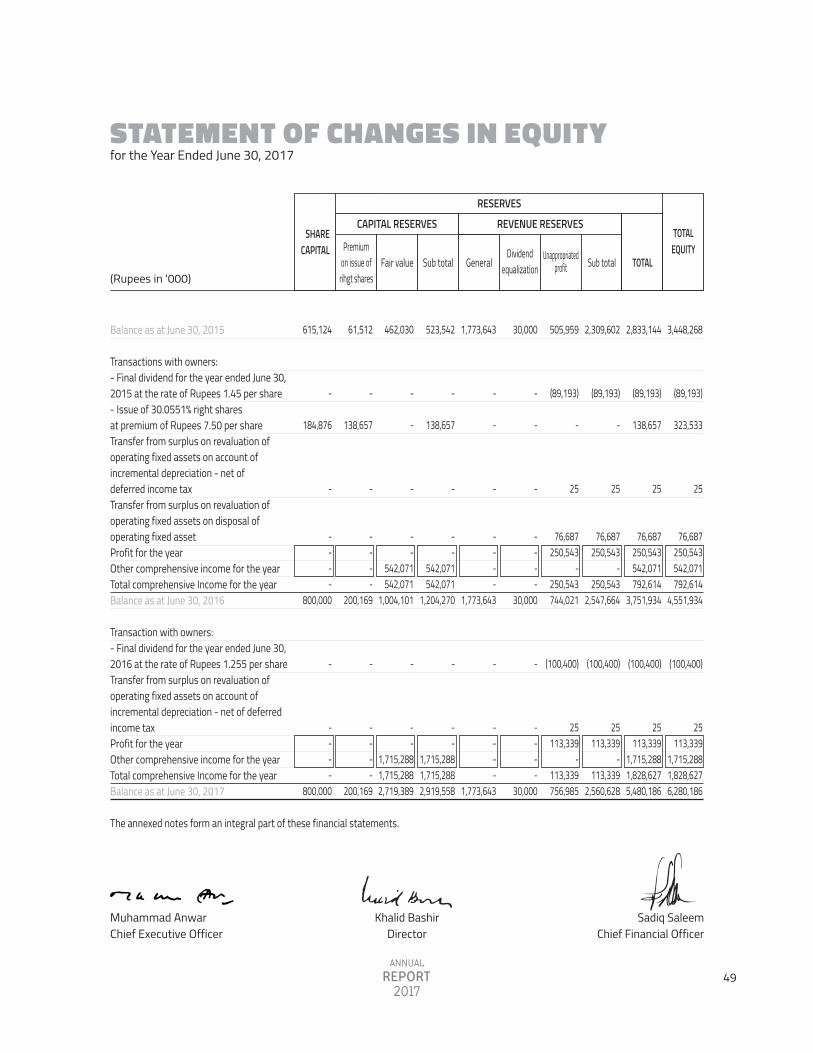
STATEMENT OF CHANGES IN EQUITY for the Year Ended June 30, 2017
49
Fair value GeneralDividend
equalizationUnappropriated
profit Sub total TOTALPremium
on issue ofrihgt shares
SHARECAPITAL
TOTALEQUITY
REVENUE RESERVES
RESERVES
Balance as at June 30, 2015
Transactions with owners:- Final dividend for the year ended June 30,2015 at the rate of Rupees 1.45 per share- Issue of 30.0551% right shares at premium of Rupees 7.50 per shareTransfer from surplus on revaluation ofoperating fixed assets on account ofincremental depreciation - net ofdeferred income taxTransfer from surplus on revaluation ofoperating fixed assets on disposal ofoperating fixed assetProfit for the yearOther comprehensive income for the year Total comprehensive Income for the yearBalance as at June 30, 2016
Transaction with owners:- Final dividend for the year ended June 30,2016 at the rate of Rupees 1.255 per shareTransfer from surplus on revaluation ofoperating fixed assets on account ofincremental depreciation - net of deferredincome taxProfit for the yearOther comprehensive income for the year Total comprehensive Income for the yearBalance as at June 30, 2017
The annexed notes form an integral part of these financial statements.
523,542
-
138,657
-
- -
542,071 542,071
1,204,270
-
- -
1,715,288 1,715,288 2,919,558
1,773,643
-
-
-
- - - -
1,773,643
-
- - - -
1,773,643
30,000
-
-
-
- - - -
30,000
-
- - - -
30,000
505,959
(89,193)
-
25
76,687 250,543
- 250,543 744,021
(100,400)
25 113,339
- 113,339 756,985
2,309,602
(89,193)
-
25
76,687 250,543
- 250,543
2,547,664
(100,400)
25 113,339
- 113,339
2,560,628
2,833,144
(89,193)
138,657
25
76,687 250,543 542,071 792,614
3,751,934
(100,400)
25 113,339
1,715,288 1,828,627 5,480,186
3,448,268
(89,193)
323,533
25
76,687 250,543 542,071 792,614
4,551,934
(100,400)
25 113,339
1,715,288 1,828,627 6,280,186
462,030
-
-
-
- -
542,071 542,071
1,004,101
-
- -
1,715,288 1,715,288 2,719,389
61,512
-
138,657
-
- - - -
200,169
-
- - - -
200,169
615,124
-
184,876
-
- - - -
800,000
-
- - - -
800,000
(Rupees in '000)Sub total
CAPITAL RESERVES
Muhammad AnwarChief Executive Officer
Khalid BashirDirector
Sadiq SaleemChief Financial Officer
NOTES TO THE FINANCIAL STATEMENTS
THE COMPANY AND ITS ACTIVITIESThe Crescent Textile Mills Limited (the Company) is a public limited company incorporated in Pakistan under the Companies Act, 1913 (Now Companies Act, 2017). The registered office of the Company is situated at 45-A, Off: Zafar Ali Road, Gulberg-V, Lahore. Its shares are quoted on Pakistan Stock Exchange Limited. The Company is engaged in the business of textile manufacturing comprising of spinning, combing, weaving, dyeing, bleaching, printing, stitching, buying, selling and otherwise dealing in yarn, cloth and other goods and fabrics made from raw cotton and synthetic fiber(s) and to generate, accumulate, distribute, supply and sale of electricity. The Company also operates a cold storage unit.
SUMMARY OF SIGNIFICANT ACCOUNTING POLICIESThe significant accounting policies applied in the preparation of these financial statements are set out below. These policies have been consistently applied to all years presented, unless otherwise stated:
Basis of preparation
Statement of compliance These financial statements have been prepared in accordance with approved accounting standards as applicable in Pakistan. Approved accounting standards comprise of such International Financial Reporting Standards (IFRS) issued by the International Accounting Standards Board (IASB) and Islamic Financial Accounting Standards (IFAS) issued by the Institute of Chartered Accountants of Pakistan as are notified under the repealed Companies Ordinance, 1984, provisions of and directives issued under the repealed Companies Ordinance, 1984. In case requirements differ, the provisions or directives of the repealed Companies Ordinance, 1984 shall prevail.
The Companies Ordinance, 1984 has been repealed after the enactment of the Companies Act, 2017 on May 30, 2017. Securities and Exchange Commission of Pakistan (SECP) vide its Circular 17 of 2017 and its press release dated July 20, 2017 has clarified that the companies whose financial year closes on or before June 30, 2017 shall prepare their financial statements in accordance with the provisions of the repealed Companies Ordinance, 1984. The Companies Act, 2017 requires enhanced disclosures about Company's operations and has also enhanced the definition of related parties.
Accounting convention These financial statements have been prepared under the historical cost convention, except for the freehold and leasehold land measured at revalued amounts and certain financial instruments carried at fair value.
Critical accounting estimates and judgments The preparation of financial statements in conformity with the approved accounting standards requires the use of certain critical accounting estimates. It also requires the management to exercise its judgment in the process of applying the Company's accounting policies. Estimates and judgments are continually evaluated and are based on historical experience and other factors, including expectations of future events that are believed to be reasonable under the circumstances. The areas where various assumptions and estimates are significant to the Company's financial statements or where judgments were exercised in application of accounting policies are as follows:
Useful lives, patterns of economic benefits and impairments Estimates with respect to residual values and useful lives and pattern of flow of economic benefits are based on the analysis of the management of the Company. Further, the Company reviews the value of assets for possible
1.
2.
2.1
a)
b)
c)
for the Year Ended June 30, 2017
50
NOTES TO THE FINANCIAL STATEMENTS
impairment on annual basis. Any change in the estimates in the future might affect the carrying amount of respective item of property, plant and equipment, with a corresponding effect on the depreciation charge and impairment.
Inventories Net realizable value of inventories is determined with reference to currently prevailing selling prices less estimated expenditure to make sales.
Taxation In making the estimates for income tax currently payable by the Company, the management takes into account the current income tax law and the decisions of appellate authorities on certain issues in the past.
Provision for doubtful debts The Company reviews its receivable balances against any provision required for any doubtful balances on an ongoing basis. The provision is made while taking into consideration expected recoveries, if any.
Amendments to published approved accounting standards that are effective in current year and are relevant to the Company Following amendments to published approved accounting standards are mandatory for the Company's accounting periods beginning on or after July 01, 2016:
IAS 1 (Amendments) 'Presentation of Financial Statements' (effective for annual periods beginning on or after 01 January 2016). Amendments have been made to address perceived impediments to preparers exercising their judgement in presenting their financial reports by making the following changes: clarification that information should not be obscured by aggregating or by providing immaterial information, materiality consideration apply to the all parts of the financial statements, and even when a standard requires a specific disclosure, materiality consideration do apply; clarification that the list of the line items to be presented in these statements can be disaggregated and aggregated as relevant and additional guidance on subtotals in these statements and clarification that an entity's share of other comprehensive income of equity-accounted associates and joint ventures should be presented in aggregate as single line items based on whether or not it will subsequently be reclassified to profit or loss; and additional examples of possible ways of ordering the notes to clarify that understandability and comparability should be considered when determining the order of the notes and to demonstrate that the notes need not be presented in the order so far listed in IAS 1.
IAS 16 (Amendments) 'Property, Plant and Equipment' (effective for annual periods beginning on or after January 01, 2016). The amendments clarify that a depreciation method which is based on revenue, generated by an activity by using an asset is not appropriate for property, plant and equipment; and add guidance that expected future reductions in the selling price of an item that was produced using an asset could indicate the expectation of technological or commercial obsolescence of the asset, which, in turn, might reflect a reduction of the future economic benefits embodied in the asset.
IAS 34 (Amendments) �Interim Financial Reporting� (effective for annual periods beginning on or after January 01, 2016). This amendment clarifies what is meant by the reference in the standard to �information disclosed elsewhere in the interim financial report�. The amendment also amends IAS 34 to require a cross-reference from the interim financial statements to the location of that information.
d)
for the Year Ended June 30, 2017
51

NOTES TO THE FINANCIAL STATEMENTS
IAS 38 (Amendments) 'Intangible Assets' (effective for annual periods beginning on or after January 1, 2016). The amendments introduce severe restrictions on the use of revenue-based amortization for intangible assets. The rebuttable presumption that the use of revenue-based amortization methods for intangible assets is inappropriate can be overcome only when revenue and the consumption of the economic benefits of the intangible assets are highly correlated, or when the intangible asset is expressed as a measure of revenue.
The application of the above amendments does not result in any impact on profit or loss, other comprehensive income and total comprehensive income.
Amendments to published approved accounting standards that are effective in current year but not relevant to the Company There are other amendments to published standards that are mandatory for accounting periods beginning on or after July 01, 2016 but are considered not to be relevant or do not have any significant impact on the Company's financial statements and are therefore not detailed in these financial statements.
Standards, interpretations and amendments to published approved accounting standards that are not yet effective but relevant to the CompanyFollowing standards, interpretations and amendments to existing standards have been published and are mandatory for the Company's accounting periods beginning on or after July 01, 2017 or later periods:
IFRS 9 'Financial Instruments' (effective for annual periods beginning on or after January 01, 2018). A finalized version of IFRS 9 which contains accounting requirements for financial instruments, replacing IAS 39 �Financial Instruments: Recognition and Measurement�. Financial assets are classified by reference to the business model within which they are held and their contractual cash flow characteristics. The 2014 version of IFRS 9 introduces a 'fair value through other comprehensive income' category for certain debt instruments. Financial liabilities are classified in a similar manner as under IAS 39, however there are differences in the requirements applying to the measurement of an entity's own credit risk. The 2014 version of IFRS 9 introduces an 'expected credit loss' model for the measurement of the impairment of financial assets, so it is no longer necessary for a credit event to have occurred before a credit loss is recognized. It introduces a new hedge accounting model that is designed to be more closely aligned with how entities undertake risk management activities when hedging financial and non-financial risk exposures. The requirements for the de-recognition of financial assets and liabilities are carried forward from IAS 39. The management of the Company is in the process of evaluating the impacts of the aforesaid standard on the Company�s financial statements.
IFRS 15 �Revenue from Contracts with Customers� (effective for annual periods beginning on or after January 01, 2018). IFRS 15 provides a single, principles based five-step model to be applied to all contracts with customers. The five steps in the model are: identify the contract with the customer; identify the performance obligations in the contract; determine the transaction price; allocate the transaction price to the performance obligations in the contracts; and recognize revenue when (or as) the entity satisfies a performance obligation. Guidance is provided on topics such as the point in which revenue is recognized, accounting for variable consideration, costs of fulfilling and obtaining a contract and various related matters. New disclosures about revenue are also introduced. IFRS 15 replaces IAS 11 �Construction Contracts�, IAS 18 �Revenue�, IFRIC 13 �Customer Loyalty Programmes�, IFRIC 15 �Agreements for Construction of Real Estate�, IFRIC 18 �Transfer of Assets from Customers� and SIC 31� Revenue-Barter Transactions Involving Advertising Services'. The aforesaid standard is not expected to have a material impact on the Company�s financial statements.
e)
f)
for the Year Ended June 30, 2017
52

NOTES TO THE FINANCIAL STATEMENTS
IFRS 16 �Lease� (effective for annual periods beginning on or after January 01, 2019). IFRS 16 specifies how an entity will recognize, measure, present and disclose leases. The standard provides a single lessee accounting model, requiring lessees to recognize assets and liabilities for all leases unless the lease term is 12 months or less or the underlying asset has a low value. Lessors continue to classify leases as operating or finance, with IFRS 16 approach to lessor accounting substantially unchanged from its predecessor, IAS 17 �Leases�. IFRS 16 replaces IAS 17, IFRIC 4 �Determining Whether an Arrangement Contains a Lease�, SIC-15 �Operating Leases�Incentives� and SIC-27 �Evaluating the Substance of Transactions Involving the Legal Form of a Lease�. The management of the Company is in the process of evaluating the impacts of the aforesaid standard on the Company�s financial statements.
IFRS 15 (Amendments), �Revenue from Contracts with Customers� (effective for annual periods beginning on or after January 01, 2018). Amendments clarify three aspects of the standard (identifying performance obligations, principal versus agent considerations and licensing) and to provide some transition relief for modified contracts and completed contracts. The aforesaid amendments are not expected to have a material impact on the Company�s financial statements.
IAS 7 (Amendments), �Statement of Cash Flows� (effective for annual periods beginning on or after January 01, 2017). Amendments have been made to clarify that entities shall provide disclosures that enable users of financial statements to evaluate changes in liabilities arising from financing activities. The aforesaid amendments will result in certain additional disclosures in the Company�s financial statements.
IAS 12 (Amendments) �Income Tax� (effective for annual periods beginning on or after January 01, 2018). The amendments clarify that the existence of a deductible temporary difference depends solely on a comparison of the carrying amount of an asset and its tax base at the end of the reporting period, and is not affected by possible future changes in the carrying amount or expected manner of recovery of the asset. The amendments further clarify that when calculating deferred tax asset in respect of insufficient taxable temporary differences, the future taxable profit excludes tax deductions resulting from the reversal of those deductible temporary differences. The amendments are not likely to have significant impact on the Company�s financial statements.
IFRIC 22 �Foreign Currency Transactions and Advance Consideration� (effective for annual periods beginning on or after January 01, 2018). IFRIC 22 clarifies which date should be used for translation when a foreign currency transaction involves payment or receipt in advance of the item it relates to. The related item is translated using the exchange rate on the date the advance foreign currency is received or paid and the prepayment or deferred income is recognized. The date of the transaction for the purpose of determining the exchange rate to use on initial recognition of the related asset, expense or income (or part of it) would remain the date on which receipt of payment from advance consideration was recognized. If there are multiple payments or receipts in advance, the entity shall determine a date of the transaction for each payment or receipt of advance consideration. The interpretation is not likely to have a material impact on the Company�s financial statements.
IFRIC 23 �Uncertainty over Income Tax Treatments� (effective for annual periods beginning on or after January 01, 2019). The interpretation addresses the determination of taxable profit (tax loss), tax bases, unused tax losses, unused tax credits and tax rates, when there is uncertainty over income tax treatments under IAS 12 �Income Taxes�. It specifically considers: whether tax treatments should be considered collectively; assumptions for taxation authorities' examinations; the determination of taxable profit (tax loss), tax bases, unused tax losses, unused tax credits and tax rates; and the effect of changes in facts and circumstances. The interpretation is not expected to have a material impact on the Company�s financial statements.
for the Year Ended June 30, 2017
53

NOTES TO THE FINANCIAL STATEMENTS for the Year Ended June 30, 2017
Standards and amendments to published approved accounting standards that are not yet effective and not considered relevant to the CompanyThere are other standards and amendments to published approved accounting standards that are mandatory for accounting periods beginning on or after July 01, 2017 but are considered not to be relevant or do not have any significant impact on the Company's financial statements and are therefore not detailed in these financial statements.
Employees retirement benefit The Company operates a recognized provident fund for all its permanent employees. Equal monthly contributions are made to the fund both by the Company and the employees at the rate of 6.25 percent of the basic salary plus cost of living allowance. Obligation for contributions to defined contribution plan is recognized as an expense in the profit and loss account as and when incurred. Employees are eligible under the scheme on completion of prescribed qualifying period of service.
Liabilities against assets subject to finance lease Leases, where the Company has substantially all the risks and rewards of ownership of assets are classified as finance leases. At inception, finance leases are recorded at the lower of present value of minimum lease payments under the lease agreement and the fair value of the assets. The related rental obligations, net of finance cost, are included in liabilities against assets subject to finance lease. The liabilities are classified as current and non-current depending upon the timing of the payment. Each lease payment is allocated between the liability and finance cost so as to achieve a constant rate on the balance outstanding. The interest element of the rental is charged to profit and loss account over the lease term.
Provisions Provisions are recognized when the Company has a legal or constructive obligation as a result of past events and it is probable that an outflow of resources embodying economic benefits will be required to settle the obligations and a reliable estimate of the amount can be made. Provisions are reviewed at each reporting date and adjusted to reflect the current best estimate.
Dividend and other appropriations Dividend distribution to the Company's shareholders is recognized as a liability in the Company's financial statements in the period in which the dividends are declared and other appropriations are recognized in the period in which these are approved by the Board of Directors.
Taxation
Current Provision for current tax is based on the taxable income for the year determined in accordance with the prevailing law for taxation of income. The charge for current tax is calculated using prevailing tax rates or tax rates expected to apply to the profit for the year, if enacted. The charge for current tax also includes adjustments, where considered necessary, to provision for tax made in previous years arising from assessments framed during the year for such years.
g)
2.2
2.3
2.4
2.5
2.6
54

Deferred Deferred tax is accounted for using the balance sheet liability method in respect of all temporary differences arising from differences between the carrying amount of assets and liabilities in the financial statements and the corresponding tax bases used in the computation of the taxable profit. Deferred tax liabilities are generally recognized for all taxable temporary differences and deferred tax assets to the extent that it is probable that taxable profits will be available against which the deductible temporary differences, unused tax losses and tax credits can be utilized. Deferred tax is calculated at the rates that are expected to apply to the period when the differences reverse based on tax rates that have been enacted or substantively enacted by the balance sheet date. Deferred tax is charged or credited in the profit and loss account, except to the extent that it relates to items recognised in other comprehensive income or directly in equity. In this case, the tax is also recognised in other comprehensive income or directly in equity, respectively.
Property, plant and equipment Operating fixed assets and depreciation
2.7
2.7.1
NOTES TO THE FINANCIAL STATEMENTS for the Year Ended June 30, 2017
Cost / Revalued amount Fixed assets are stated at cost less accumulated depreciation and any identified impairment loss, except freehold land which is stated at revalued amount less any identified impairment loss and leasehold land which is stated at revalued amount less accumulated depreciation and any identified impairment loss. Capital work-in-progress is stated at cost less any identified impairment loss. Cost of operating fixed assets consists of historical cost, borrowing cost pertaining to the erection / construction period of qualifying assets and directly attributable costs of bringing the assets to working condition.
Valuations are performed frequently enough to ensure that the fair value of a revalued asset does not differ materially from its carrying amount.
Subsequent costs are included in the asset's carrying amount or recognized as a separate asset, as appropriate, only when it is probable that future economic benefits associated with the item will flow to the Company and the cost of the item can be measured reliably. All other repair and maintenance costs are charged to profit and loss account during the period in which they are incurred.
Any revaluation surplus is credited to surplus on revaluation of operating fixed assets except to the extent that it reverses a revaluation decrease of the same asset previously recognized in profit and loss account, in which case the increase is recognized in profit and loss account. A revaluation deficit is recognized in profit and loss account, except to the extent that it offsets an existing surplus on the same asset recognized in surplus on revaluation of operating fixed assets.
An annual transfer from surplus on revaluation of operating fixed assets to unappropriated profit is made for the difference between depreciation based on the revalued carrying amount of the assets and depreciation based on the assets original cost. Upon disposal, any revaluation reserve relating to the particular asset being sold is transferred to retained earnings. All transfers from surplus on revaluation of operating fixed assets are net of applicable deferred taxation.
a)
55
Depreciation Depreciation on operating fixed assets is charged from the month in which an asset is acquired while no depreciation is charged for the month in which the asset is disposed of.
Depreciation is charged to profit and loss account on reducing balance method, except leasehold land on which depreciation is charged on straight line method to write off the cost of operating fixed assets over their expected useful lives at the rates mentioned in Note 13.1. The residual values and useful lives are reviewed by the management, at each financial year-end and adjusted if impact on depreciation is significant.
De-recognition An item of property, plant and equipment is de-recognized upon disposal or when no future economic benefits are expected from its use or disposal. Any gain or loss arising on de-recognition of the asset is included in the profit and loss account in the year the asset is de-recognized.
b)
c)
NOTES TO THE FINANCIAL STATEMENTS for the Year Ended June 30, 2017
Assets subject to finance lease These are initially recognized at lower of present value of minimum lease payments under the lease agreements and fair value of assets. Subsequently, these assets are stated at cost less accumulated depreciation and any identified impairment loss. Assets so acquired are depreciated over their expected useful lives. Depreciation of leased assets is charged to profit and loss account.
Depreciation on additions to leased assets is charged from the month in which an asset is acquired while no depreciation is charged for the month in which the asset is disposed of. Assets subject to operating lease Leases, where a significant portion of the risks and rewards of ownership are retained by the lessor are classified as operating leases. Payments made under operating leases (net of any incentives received from the lessor) are charged to profit and loss account on a straight line basis over the lease term.
Non-current assets held for sale Non-current assets classified as held for sale when their carrying amount is to be recovered principally through a sale transaction and a sale is considered highly probable. They are stated at the lower of carrying amount and fair value less costs to sell. Intangible asset Intangible asset represents the cost of computer software acquired and is stated at cost less accumulated amortization and any identified impairment loss.
Amortization is charged to profit and loss account on straight line basis so as to write off the cost of an asset over its estimated useful life. Amortization is charged from the month in which the asset is acquired or capitalized while no amortization is charged for the month in which the asset is disposed of. Intangible asset is amortized over a period of three years. The Company assesses at each balance sheet date whether there is any indication that intangible asset may be impaired. If such indication exists, the carrying amount of such asset is reviewed to assess whether it is recorded in
2.7.2
2.7.3
2.8
2.9
56

excess of its recoverable amount. When carrying value exceeds the respective recoverable amount, asset is written down to its recoverable amount and resulting impairment is recognized in profit and loss account currently. The recoverable amount is the higher of an asset's fair value less cost to sell and value in use. When an impairment loss is recognized, the amortization charge is adjusted in the future periods to allocate the asset's revised carrying amount over its estimated useful life.
Investments Classification of an investment is made on the basis of intended purpose for holding such investment. Management determines the appropriate classification of its investments at the time of purchase and re-evaluates such designation on regular basis.
Investments are initially measured at fair value plus transaction costs directly attributable to acquisition, except for �Investment at fair value through profit or loss� which is initially measured at fair value. The Company assesses at the end of each reporting period whether there is any objective evidence that investments are impaired. If any such evidence exists, the Company applies the provisions of IAS 39 'Financial Instruments: Recognition and Measurement' to all investments, except investment in associate, which is tested for impairment in accordance with the provisions of IAS 36 'Impairment of Assets'.
Investments at fair value through profit or loss Investments classified as held-for-trading and those designated as such are included in this category. Investments are classified as held-for-trading if these are acquired for the purpose of selling in the short term. Gains or losses on investments held-for-trading are recognized in profit and loss account. Held-to-maturity investments Investments with fixed or determinable payments and fixed maturity are classified as held-to-maturity when the Company has the positive intention and ability to hold to maturity. Investments intended to be held for an undefined period are not included in this classification. Other long-term investments that are intended to be held to maturity are subsequently measured at amortized cost. This cost is computed as the amount initially recognized minus principal repayments, plus or minus the cumulative amortization, using the effective interest method, of any difference between the initially recognized amount and the maturity amount. For investments carried at amortized cost, gains and losses are recognized in profit and loss account when the investments are de-recognized or impaired, as well as through the amortization process.
Available for sale investments Investments intended to be held for an indefinite period of time, which may be sold in response to need for liquidity, or changes to interest rates or equity prices are classified as available for sale. After initial recognition, investments which are classified as available for sale are measured at fair value. Gains or losses on available for sale investments are recognized directly in statement of other comprehensive income until the investment is sold, de-recognized or is determined to be impaired, at which time the cumulative gain or loss previously reported in statement of other comprehensive income is included in profit and loss account. These are sub-categorized as under: Quoted For investments that are actively traded in organized capital markets, fair value is determined by reference to
2.10
2.10.1
2.10.2
2.10.3
NOTES TO THE FINANCIAL STATEMENTS for the Year Ended June 30, 2017
57
stock exchange quoted market bids at the close of business on the balance sheet date. Unquoted The investments that do not have a quoted market price in an active market and whose fair value cannot be reliably measured, subsequent to after initial recognition are carried at cost less any identified impairment loss.
Investment in associate An associate is an entity in which the Company has significant influence and which is neither a subsidiary nor a joint venture. Under the equity method, the investment in the associate is carried in the balance sheet at cost plus post-acquisition changes in the Company�s share of net assets of the associate. Goodwill relating to an associate is included in the carrying amount of the investment and is not amortized. The profit and loss account reflects the share of the results of operations of the associate. Where there has been a change recognized directly in the equity of the associate, the Company recognizes its share of any changes and discloses this, when applicable, in the statement of changes in equity.
Inventories Inventories, except for stock in transit and waste materials, are stated at lower of cost and net realizable value. Net realizable value signifies the estimated selling price in the ordinary course of business less the estimated costs of completion and the estimated costs necessary to make a sale. Cost is determined as follows: Stores, spare parts and loose tools Usable stores, spare parts and loose tools are valued principally at moving average cost, while items considered obsolete are carried at nil value. Items-in-transit are stated at invoice amount plus other charges paid thereon. Stock-in-trade Stock of raw materials, except for stock-in-transit, is valued principally at the lower of weighted average cost and net realizable value. Stocks-in-transit are valued at cost comprising invoice value plus other charges paid thereon. Cost of work-in-process and finished goods comprises of cost of direct materials, labour and appropriate manufacturing overheads. Stock of waste materials is stated at net realizable value.
Cash and cash equivalents Cash and cash equivalents comprise cash in hand, cash at banks on current accounts and other short term highly liquid instruments that are readily convertible into known amounts of cash and which are subject to insignificant risk of changes in values. Revenue recognition Revenue is recognized to the extent that it is probable that the economic benefits will flow to the Company and the revenue can be reliably measured. Following specific recognition criteria must also be met before revenue is recognized:
2.10.4
2.11
2.12
2.13
NOTES TO THE FINANCIAL STATEMENTS for the Year Ended June 30, 2017
58
Sale of goods and electricity Revenue from the sale of goods is recognized when the significant risks and rewards of ownership of the goods have passed to the buyer, usually on the delivery of the goods. Related Government grant is recognized when there is reasonable assurance that Company will comply with the conditions attached to it and grant will be received. Revenue from sale of electricity is recognized at the time of transmission. Interest income Revenue is recognized as interest accrues (using the effective interest method that is the rate that exactly discounts estimated future cash receipts through the expected life of the financial instrument to the net carrying amount of the financial asset).
Dividends Dividend on equity instruments is recognized when right to receive the dividend is established. Rental income Revenue is recognized when rent is accrued.
Financial instruments Financial instruments carried on the balance sheet include investments, deposits, trade debts, loans and advances, interest accrued, other receivables, cash and bank balances, long term financing, liabilities against assets subject to finance lease, short-term borrowings, accrued mark-up and trade and other payables etc. Financial assets and liabilities are recognized when the Company becomes a party to the contractual provisions of instrument. Initial recognition is made at fair value plus transaction costs directly attributable to acquisition, except for �financial instruments at fair value through profit or loss� which are initially measured at fair value. Financial assets are de-recognized when the Company loses control of the contractual rights that comprise the financial asset. The Company loses such control if it realizes the rights to benefits specified in contract, the rights expire or the Company surrenders those rights. Financial liabilities are de-recognized when the obligation specified in the contract is discharged, cancelled or expired. Any gain or loss on subsequent measurement (except available for sale investments) and de-recognition is charged to the profit or loss currently. The particular measurement methods adopted are disclosed in the individual policy statements associated with each item.
Borrowings Borrowings are recognized initially at fair value and are subsequently stated at amortized cost. Any difference between the proceeds and the redemption value is recognized in the profit and loss account over the period of the borrowings using the effective interest method.
Trade debts Trade debts originated by the Company are recognized and carried at original invoice amount less an allowance for any uncollectible amounts. Known bad debts are written off and provision is made against debts considered doubtful when collection of the full amount is no longer probable. Loans and receivables Loans and receivables are non-derivative financial assets with fixed or determinable payments that are not quoted in an active market. Such assets are carried at amortized cost using the effective interest method. Gains
2.14
2.15
2.16
2.17
NOTES TO THE FINANCIAL STATEMENTS for the Year Ended June 30, 2017
59

and losses are recognized in profit and loss account when the loans and receivables are de-recognized or impaired, as well as through the amortization process.
Trade and other payables Liabilities for trade and other amounts payable are initially recognized at fair value, which is normally the transaction cost.
Derivative financial instruments The Company uses derivative financial instruments such as forward currency contracts and forward currency swaps to hedge its risks associated with interest rate and foreign currency fluctuations. Such derivative financial instruments are initially recognized at fair value on the date on which a derivative contract is entered into and are subsequently remeasured at fair value. Derivatives are carried as assets when the fair value is positive and as liabilities when the fair value is negative.
Any gains or losses arising from changes in fair value on derivatives during the year that do not qualify for hedge accounting are taken directly to profit and loss account. The fair value of forward currency contracts is calculated by reference to current forward exchange rates for contracts with similar maturity profiles. The fair value of cross currency swap contracts is determined by reference to market values for similar instruments. If the forecast transaction or firm commitment is no longer expected to occur, amounts previously recognized in equity are transferred to profit and loss account. If the hedging instrument expires or is sold, terminated or exercised without replacement or rollover, or if its designation as a hedge is revoked, amounts previously recognized in equity remain in equity until the forecast transaction or firm commitment occurs.
Borrowing cost Interest, mark-up and other charges on long term finances are capitalized up to the date of commissioning of respective qualifying assets acquired out of the proceeds of such long term finances. All other interest, mark-up and other charges are recognized in profit and loss account.
Impairment Financial assets A financial asset is considered to be impaired if objective evidence indicates that one or more events had a negative effect on the estimated future cash flows of that asset. An impairment loss in respect of a financial asset measured at amortized cost is calculated as a difference between its carrying amount and the present value of estimated future cash flows discounted at the original effective interest rate. An impairment loss in respect of available for sale financial asset is calculated with reference to its current fair value. Individually significant financial assets are tested for impairment on an individual basis. The remaining financial assets are assessed collectively in groups that share similar credit risk characteristics.
2.18
2.19
2.20
2.21
a)
NOTES TO THE FINANCIAL STATEMENTS for the Year Ended June 30, 2017
60
NOTES TO THE FINANCIAL STATEMENTS for the Year Ended June 30, 2017
Non-financial assets The carrying amounts of the Company's non-financial assets are reviewed at each balance sheet date to determine whether there is any indication of impairment. If such indication exists, the recoverable amount of such asset is estimated. An impairment loss is recognized wherever the carrying amount of the asset exceeds its recoverable amount. Impairment losses are recognized in profit and loss account. A previously recognized impairment loss is reversed only if there has been a change in the estimates used to determine the asset's recoverable amount since the last impairment loss was recognized. If that is the case, the carrying amount of the asset is increased to its recoverable amount. That increased amount cannot exceed the carrying amount that would have been determined, net of depreciation, had no impairment loss been recognized for the asset in prior years. Such reversal is recognized in profit and loss account.
Off setting Financial assets and financial liabilities are set off and the net amount is reported in the financial statements when there is legal enforceable right to set off and the Company intends either to settle on a net basis or to realize the assets and to settle the liabilities simultaneously.
Foreign currencies These financial statements are presented in Pak Rupees, which is the Company�s functional currency. All monetary assets and liabilities denominated in foreign currencies are translated into Pak Rupees at the rates of exchange prevailing at the balance sheet date, while the transactions in foreign currencies during the year are initially recorded in functional currency at the rates of exchange prevailing at the transaction date. All non-monetary items are translated into Pak Rupees at exchange rates prevailing on the date of transaction or on the date when fair values are determined. Exchange gains and losses are recorded in the profit and loss account.
Segment reporting Segment reporting is based on the operating (business) segments of the Company. An operating segment is a component of the Company that engages in business activities from which it may earn revenues and incur expenses, including revenues and expenses that relate to the transactions with any of the Company's other components. An operating segment's operating results are reviewed regularly by the Chief Executive Officer to make decisions about resources to be allocated to the segment and assess its performance, and for which discrete financial information is available.
Segment results that are reported to the Chief Executive Officer include items directly attributable to a segment as well as those that can be allocated on a reasonable basis. Those income, expenses, assets, liabilities and other balances which cannot be allocated to a particular segment on a reasonable basis are reported as unallocated. The Company has five reportable business segments. Spinning (Producing different quality of yarn using natural and artificial fibres), Weaving (Producing different quality of greige fabric using yarn), Processing and Home Textile (Processing greige fabric for production of printed and dyed fabric and manufacturing of home textile articles), Power Generation (Generating and distributing power) and Cold Storage (Making of ice and warehousing of perishable goods). Transactions among the business segments are recorded at arm's length prices using admissible valuation methods. Inter segment sales and purchases are eliminated from the total.
b)
2.22
2.23
2.24
61

NOTES TO THE FINANCIAL STATEMENTS for the Year Ended June 30, 2017
ISSUED, SUBSCRIBED AND PAID UP SHARE CAPITAL 3.
Ordinary shares of Rupees 10 eachfully paid in cash
Ordinary shares of Rupees 10 eachissued as fully paid bonus shares
505,712
294,288 800,000
505,712
294,288 800,000
2017 2016(Rupees in '000)
50 571 213
29 428 787
80 000 000
50 571 213
29 428 787
80 000 000
2017 2016(Number of Shares)
Ordinary shares of the Company held by related parties: 3.1
7 588 0151 675 8581 104 000
755 985 5 898
11 129 756
7 389 502 -
1 335 000 755 985
5 8989 486 385
The Crescent Textile Mills Limited-Employees Provident Fund-Trustee Crescent Foundation Suraj Cotton Mills Limited Premier Insurance Limited Shakarganj Limited
(Number of Shares) 2017 2016
RESERVES4.
2017 2016(Rupees in '000)
Composition of reserves is as follows: Capital reserve sPremium on issue of right shares (Note 4.1) Fair value reserve (Note 4.2)
Revenue reserves Dividend equalization reserve General reserve Unappropriated profit
200,169 2,719,389 2,919,558
30,000 1,773,643
756,985 2,560,628 5,480,186
200,169 1,004,101 1,204,270
30,000 1,773,643
744,021 2,547,664 3,751,934
This reserve can be utilized by the Company only for the purposes specified in section 81 of the Companies Act, 2017.
This represents the unrealized gain on remeasurement of available for sale investments at fair value and is not available for distribution. This will be transferred to profit and loss account on realization. Reconciliation of fair value reserve is as under:
4.1
4.2
62
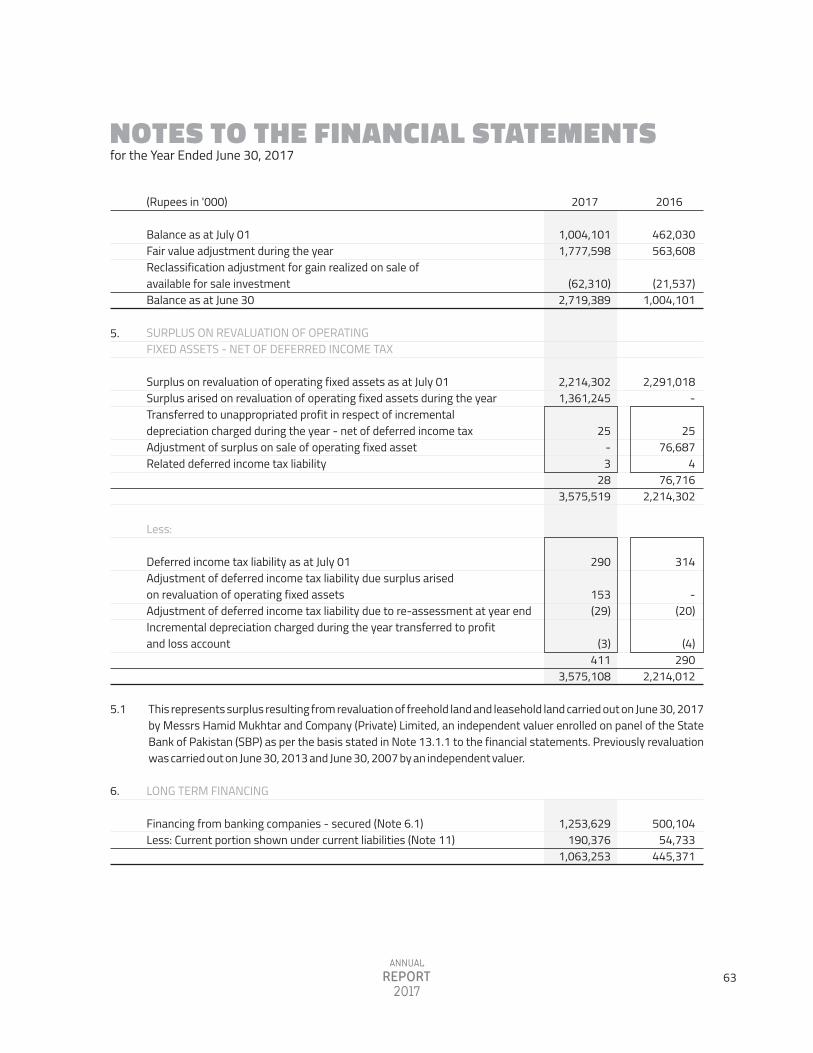
NOTES TO THE FINANCIAL STATEMENTS for the Year Ended June 30, 2017
This represents surplus resulting from revaluation of freehold land and leasehold land carried out on June 30, 2017 by Messrs Hamid Mukhtar and Company (Private) Limited, an independent valuer enrolled on panel of the State Bank of Pakistan (SBP) as per the basis stated in Note 13.1.1 to the financial statements. Previously revaluation was carried out on June 30, 2013 and June 30, 2007 by an independent valuer.
5.1
6.
5.
Balance as at July 01Fair value adjustment during the year Reclassification adjustment for gain realized on sale ofavailable for sale investmentBalance as at June 30
SURPLUS ON REVALUATION OF OPERATING FIXED ASSETS - NET OF DEFERRED INCOME TAX
Surplus on revaluation of operating fixed assets as at July 01 Surplus arised on revaluation of operating fixed assets during the year Transferred to unappropriated profit in respect of incrementaldepreciation charged during the year - net of deferred income tax Adjustment of surplus on sale of operating fixed asset Related deferred income tax liability
Less:
Deferred income tax liability as at July 01 Adjustment of deferred income tax liability due surplus arisedon revaluation of operating fixed assets Adjustment of deferred income tax liability due to re-assessment at year end Incremental depreciation charged during the year transferred to profitand loss account
LONG TERM FINANCING
Financing from banking companies - secured (Note 6.1) Less: Current portion shown under current liabilities (Note 11)
1,004,101 1,777,598
(62,310) 2,719,389
2,214,302 1,361,245
25 - 3
28 3,575,519
290
153 (29)
(3) 411
3,575,108
1,253,629 190,376
1,063,253
462,030 563,608
(21,537)
1,004,101
2,291,018 -
25 76,687
4 76,716
2,214,302
314
- (20)
(4) 290
2,214,012
500,104 54,733
445,371
2017 2016(Rupees in '000)
63
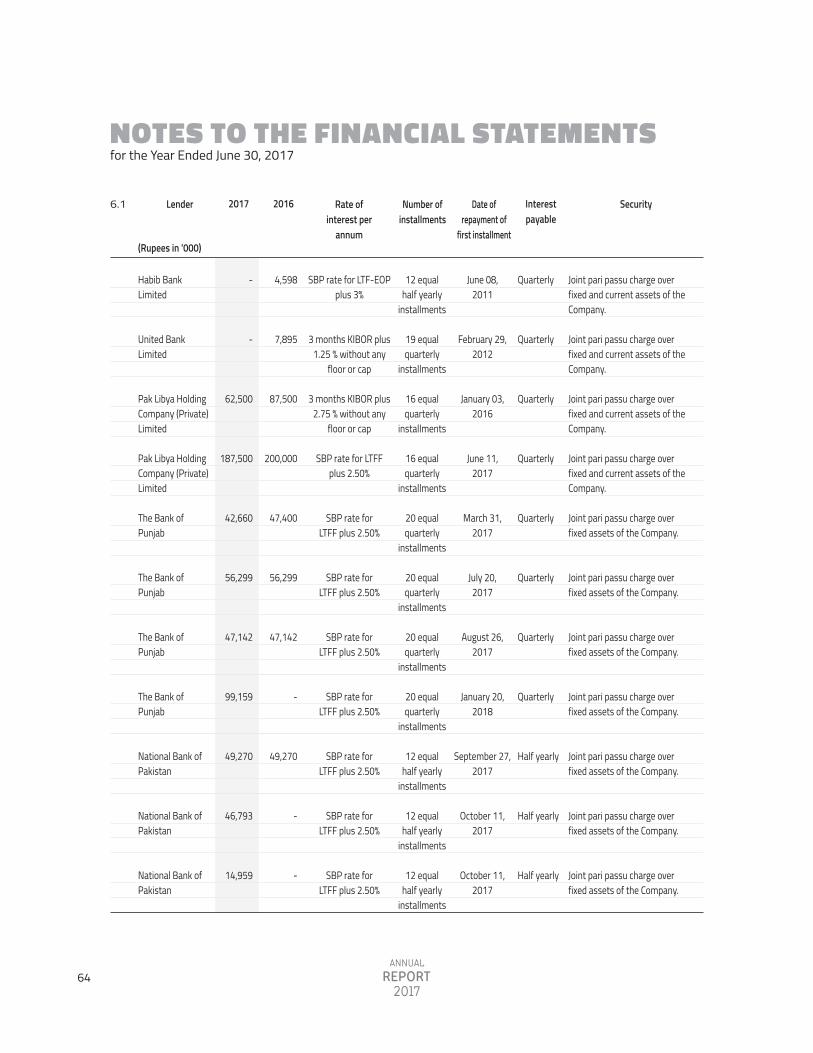
NOTES TO THE FINANCIAL STATEMENTS for the Year Ended June 30, 2017
Habib BankLimited
United BankLimited
Pak Libya HoldingCompany (Private)Limited
Pak Libya HoldingCompany (Private)Limited
The Bank ofPunjab
The Bank ofPunjab
The Bank ofPunjab
The Bank ofPunjab
National Bank ofPakistan
National Bank ofPakistan
National Bank ofPakistan
SBP rate for LTF-EOPplus 3%
3 months KIBOR plus1.25 % without any
floor or cap
3 months KIBOR plus2.75 % without any
floor or cap
SBP rate for LTFFplus 2.50%
SBP rate forLTFF plus 2.50%
SBP rate forLTFF plus 2.50%
SBP rate forLTFF plus 2.50%
SBP rate forLTFF plus 2.50%
SBP rate forLTFF plus 2.50%
SBP rate forLTFF plus 2.50%
SBP rate forLTFF plus 2.50%
-
-
62,500
187,500
42,660
56,299
47,142
99,159
49,270
46,793
14,959
4,598
7,895
87,500
200,000
47,400
56,299
47,142
-
49,270
-
-
12 equalhalf yearly
installments
19 equalquarterly
installments
16 equalquarterly
installments
16 equalquarterly
installments
20 equalquarterly
installments
20 equalquarterly
installments
20 equalquarterly
installments
20 equalquarterly
installments
12 equalhalf yearly
installments
12 equalhalf yearly
installments
12 equalhalf yearly
installments
June 08,2011
February 29,2012
January 03,2016
June 11,2017
March 31,2017
July 20,2017
August 26,2017
January 20,2018
September 27,2017
October 11,2017
October 11,2017
Quarterly
Quarterly
Quarterly
Quarterly
Quarterly
Quarterly
Quarterly
Quarterly
Half yearly
Half yearly
Half yearly
Joint pari passu charge overfixed and current assets of theCompany. Joint pari passu charge overfixed and current assets of theCompany. Joint pari passu charge overfixed and current assets of theCompany. Joint pari passu charge overfixed and current assets of theCompany. Joint pari passu charge overfixed assets of the Company.
Joint pari passu charge overfixed assets of the Company.
Joint pari passu charge overfixed assets of the Company.
Joint pari passu charge overfixed assets of the Company.
Joint pari passu charge overfixed assets of the Company.
Joint pari passu charge overfixed assets of the Company.
Joint pari passu charge overfixed assets of the Company.
6.1 Lender 2017 2016 Rate ofinterest per
annum
Number ofinstallments
Date ofrepayment of
first installment
Interestpayable
Security
(Rupees in '000)
64
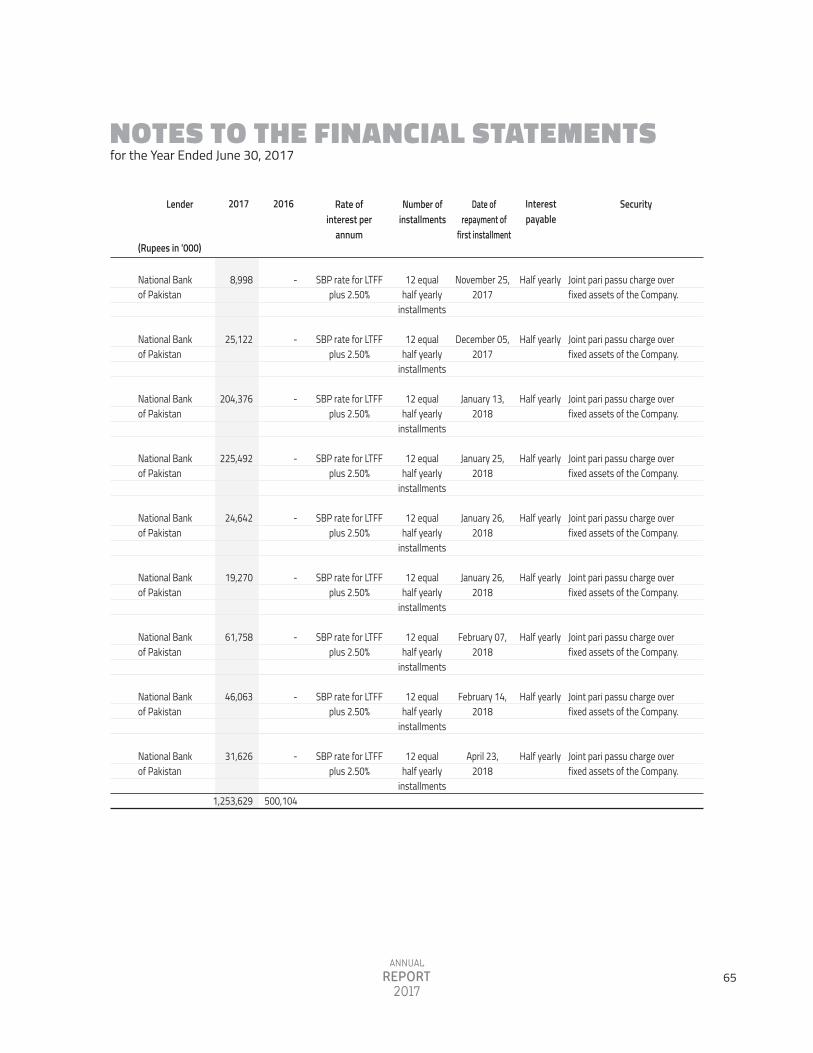
NOTES TO THE FINANCIAL STATEMENTS for the Year Ended June 30, 2017
National Bankof Pakistan
National Bankof Pakistan
National Bankof Pakistan
National Bankof Pakistan
National Bankof Pakistan
National Bankof Pakistan
National Bankof Pakistan
National Bankof Pakistan
National Bankof Pakistan
SBP rate for LTFFplus 2.50%
SBP rate for LTFFplus 2.50%
SBP rate for LTFFplus 2.50%
SBP rate for LTFFplus 2.50%
SBP rate for LTFFplus 2.50%
SBP rate for LTFFplus 2.50%
SBP rate for LTFFplus 2.50%
SBP rate for LTFFplus 2.50%
SBP rate for LTFFplus 2.50%
8,998
25,122
204,376
225,492
24,642
19,270
61,758
46,063
31,626
1,253,629
-
-
-
-
-
-
-
-
-
500,104
12 equalhalf yearly
installments
12 equalhalf yearly
installments
12 equalhalf yearly
installments
12 equalhalf yearly
installments
12 equalhalf yearly
installments
12 equalhalf yearly
installments
12 equalhalf yearly
installments
12 equalhalf yearly
installments
12 equalhalf yearly
installments
November 25,2017
December 05,2017
January 13,2018
January 25,2018
January 26,2018
January 26,2018
February 07,2018
February 14,2018
April 23,2018
Half yearly
Half yearly
Half yearly
Half yearly
Half yearly
Half yearly
Half yearly
Half yearly
Half yearly
Joint pari passu charge overfixed assets of the Company.
Joint pari passu charge overfixed assets of the Company.
Joint pari passu charge overfixed assets of the Company.
Joint pari passu charge overfixed assets of the Company.
Joint pari passu charge overfixed assets of the Company.
Joint pari passu charge overfixed assets of the Company.
Joint pari passu charge overfixed assets of the Company.
Joint pari passu charge overfixed assets of the Company.
Joint pari passu charge overfixed assets of the Company.
Lender 2017 2016 Rate ofinterest per
annum
Number ofinstallments
Date ofrepayment of
first installment
Interestpayable
Security
(Rupees in '000)
65
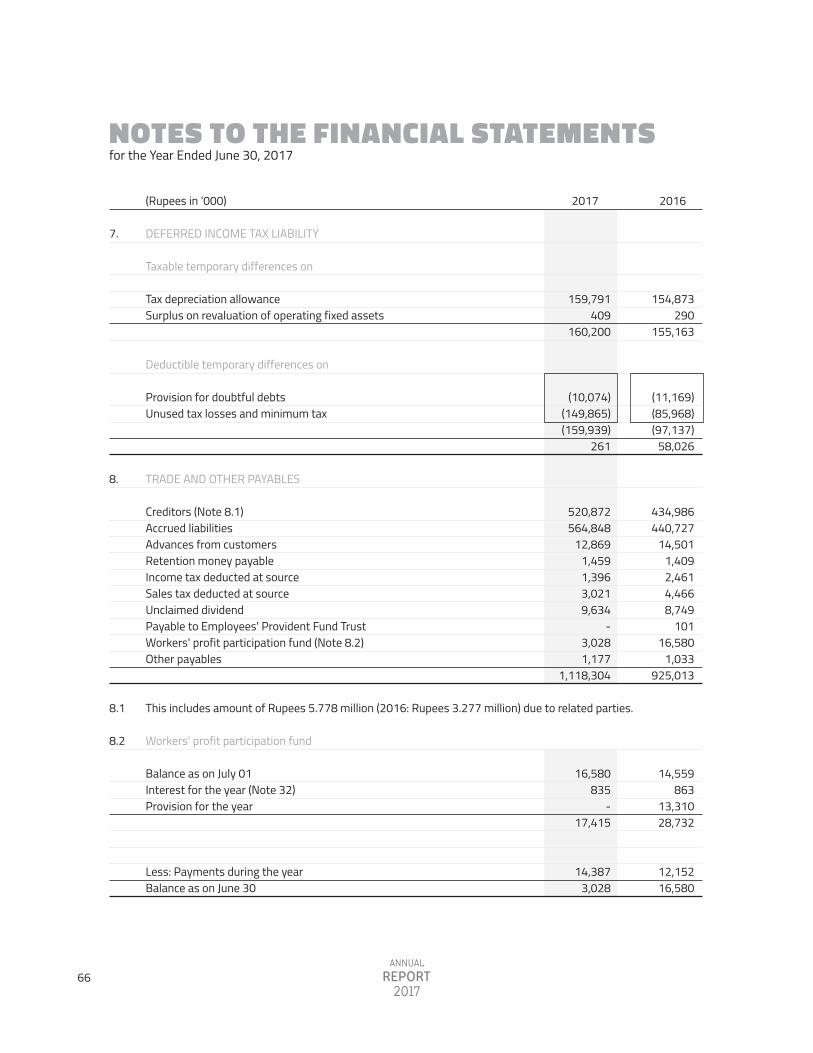
NOTES TO THE FINANCIAL STATEMENTS for the Year Ended June 30, 2017
159,791 409
160,200
(10,074) (149,865) (159,939)
261
520,872 564,848
12,869 1,459 1,396 3,021 9,634
- 3,028 1,177
1,118,304
16,580 835
- 17,415
14,387 3,028
DEFERRED INCOME TAX LIABILITY
Taxable temporary differences on
Tax depreciation allowanceSurplus on revaluation of operating fixed assets
Deductible temporary differences on
Provision for doubtful debtsUnused tax losses and minimum tax
TRADE AND OTHER PAYABLES
Creditors (Note 8.1)Accrued liabilitiesAdvances from customersRetention money payableIncome tax deducted at sourceSales tax deducted at sourceUnclaimed dividend Payable to Employees' Provident Fund TrustWorkers' profit participation fund (Note 8.2)Other payables
This includes amount of Rupees 5.778 million (2016: Rupees 3.277 million) due to related parties.
Workers' profit participation fund
Balance as on July 01Interest for the year (Note 32)Provision for the year
Less: Payments during the yearBalance as on June 30
2017 2016(Rupees in '000)
7.
8.
8.1
8.2
154,873 290
155,163
(11,169) (85,968) (97,137)
58,026
434,986 440,727
14,501 1,409 2,461 4,466 8,749
101 16,580
1,033 925,013
14,559 863
13,310 28,732
12,152 16,580
66

190,376
- 190,376
CURRENT PORTION OF NON-CURRENT LIABILITIES Current portion of long term financing (Note 6) Current portion of liabilities against assets subject to finance lease (Note 11.1)
11.
54,733
11,012 65,745
The finances aggregating to Rupees 1,330 million (2016: Rupees 1,846 million) are obtained from banking companies under mark-up agreements and carry mark up ranging from KIBOR plus 1.50 to 3.00 percent (2016: KIBOR plus 1.75 to 3.00 percent) per annum. Export refinances have been obtained from banking companies under SBP�s refinance scheme on which service charges at the rate of 2.90 to 3.00 percent (2016: 3.40 to 4.50 percent) per annum are payable. These form part of aggregate borrowing limits of Rupees 3,165 million (2016: Rupees 2,116 million).
Short term foreign currency finances amounting to Rupees 2,132 million (2016: Rupees 2,425 million) are available at mark-up ranging from LIBOR plus 0.82 to 2.65 percent (2016: LIBOR plus 1.34 to 2.75 percent) per annum. The aggregate short term finances from banking companies are secured by way of joint pari passu charge over fixed and current assets of the Company.
10.1
10.2
10.3
10.4
The Company retains workers' profit participation fund for its business operations till the date of allocation to workers. Interest is paid at prescribed rate under the Companies Profit (Workers' Participation) Act, 1968 on funds utilized by the Company till the date of allocation to workers.
8.2.1
NOTES TO THE FINANCIAL STATEMENTS for the Year Ended June 30, 2017
2017 2016(Rupees in '000)
ACCRUED MARK-UP
Long term financingLiabilities against assets subject to finance leaseShort term borrowings
SHORT TERM BORROWINGS From banking companies - secured Short term finances (Note 10.1 and Note 10.4) State Bank of Pakistan (SBP) refinance (Note 10.2 and Note 10.4) Short term foreign currency finances (Note 10.3 and Note 10.4)
9.
10.
3,989 13
55,939 59,941
1,209,681 2,115,600 2,159,503 5,484,784
14,597 -
50,791 65,388
877,015 3,105,000 1,808,375 5,790,390
67
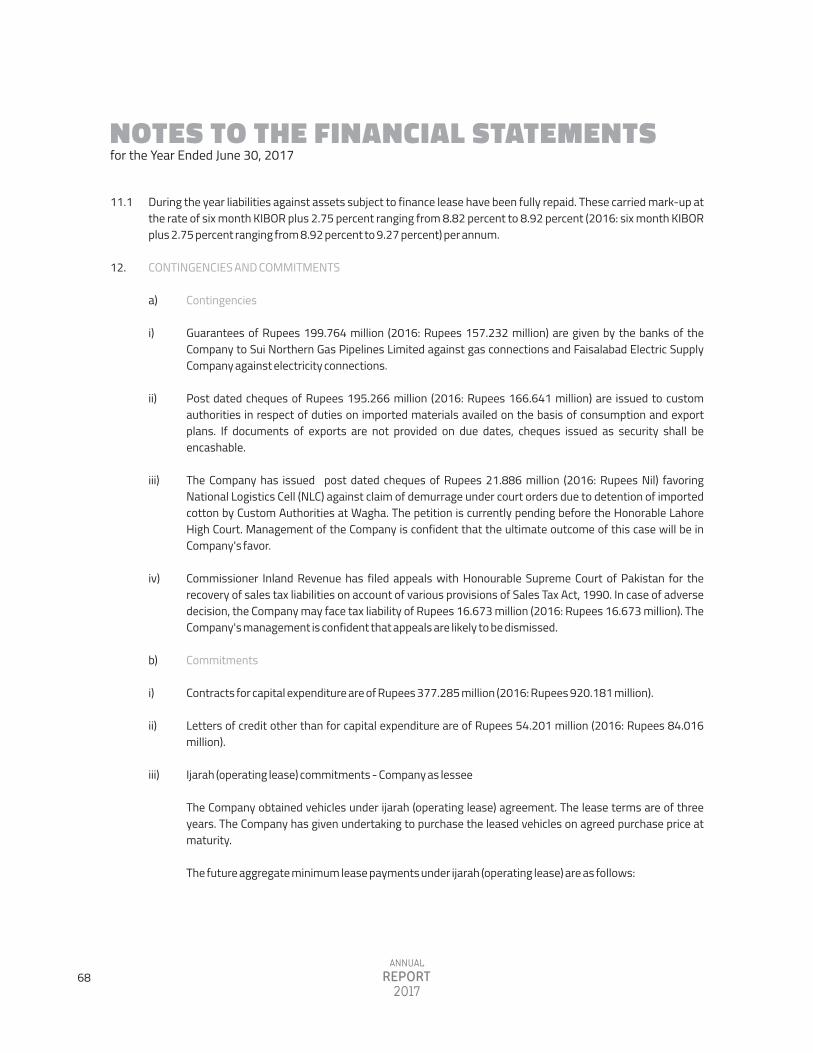
NOTES TO THE FINANCIAL STATEMENTS for the Year Ended June 30, 2017
Contingencies
Guarantees of Rupees 199.764 million (2016: Rupees 157.232 million) are given by the banks of the Company to Sui Northern Gas Pipelines Limited against gas connections and Faisalabad Electric Supply Company against electricity connections. Post dated cheques of Rupees 195.266 million (2016: Rupees 166.641 million) are issued to custom authorities in respect of duties on imported materials availed on the basis of consumption and export plans. If documents of exports are not provided on due dates, cheques issued as security shall be encashable. The Company has issued post dated cheques of Rupees 21.886 million (2016: Rupees Nil) favoring National Logistics Cell (NLC) against claim of demurrage under court orders due to detention of imported cotton by Custom Authorities at Wagha. The petition is currently pending before the Honorable Lahore High Court. Management of the Company is confident that the ultimate outcome of this case will be in Company's favor.
Commissioner Inland Revenue has filed appeals with Honourable Supreme Court of Pakistan for the recovery of sales tax liabilities on account of various provisions of Sales Tax Act, 1990. In case of adverse decision, the Company may face tax liability of Rupees 16.673 million (2016: Rupees 16.673 million). The Company's management is confident that appeals are likely to be dismissed.
Commitments Contracts for capital expenditure are of Rupees 377.285 million (2016: Rupees 920.181 million). Letters of credit other than for capital expenditure are of Rupees 54.201 million (2016: Rupees 84.016 million). Ijarah (operating lease) commitments - Company as lessee The Company obtained vehicles under ijarah (operating lease) agreement. The lease terms are of three years. The Company has given undertaking to purchase the leased vehicles on agreed purchase price at maturity. The future aggregate minimum lease payments under ijarah (operating lease) are as follows:
a)
i)
ii)
iii)
iv)
b)
i)
ii)
iii)
During the year liabilities against assets subject to finance lease have been fully repaid. These carried mark-up at the rate of six month KIBOR plus 2.75 percent ranging from 8.82 percent to 8.92 percent (2016: six month KIBOR plus 2.75 percent ranging from 8.92 percent to 9.27 percent) per annum.
CONTINGENCIES AND COMMITMENTS
11.1
12.
68
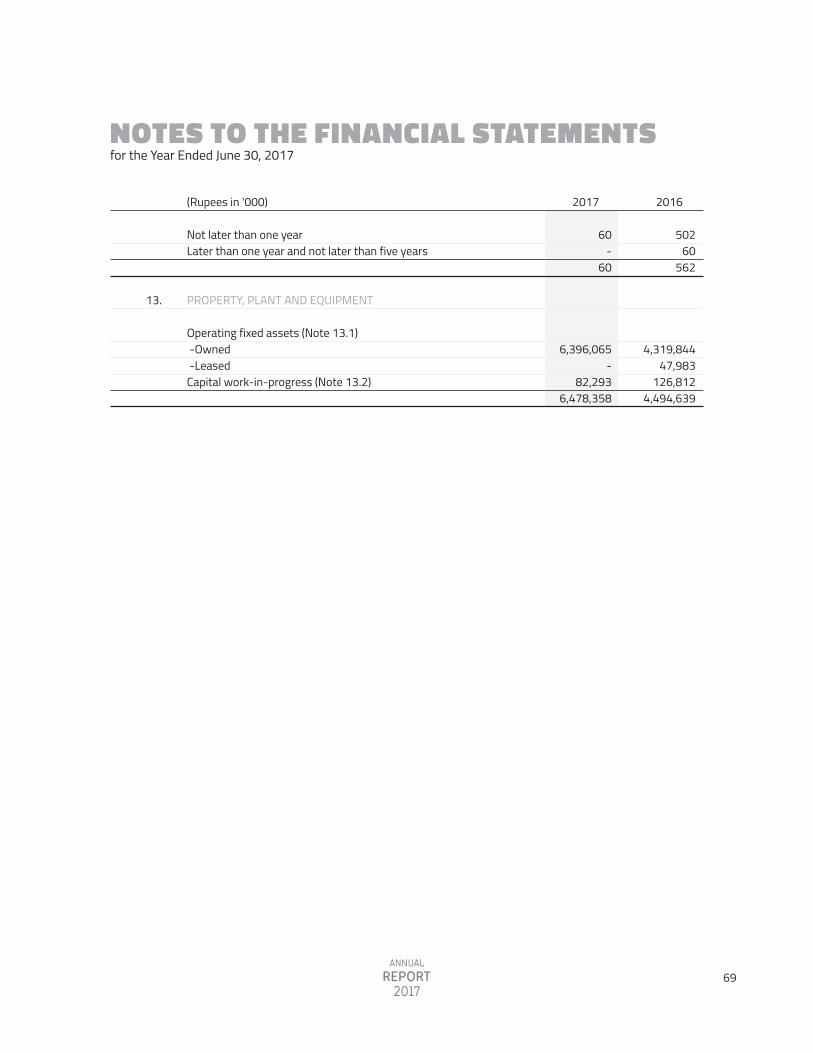
NOTES TO THE FINANCIAL STATEMENTS for the Year Ended June 30, 2017
2017 2016(Rupees in '000)
Not later than one yearLater than one year and not later than five years
PROPERTY, PLANT AND EQUIPMENT
Operating fixed assets (Note 13.1) -Owned -LeasedCapital work-in-progress (Note 13.2)
60-
60
6,396,065 -
82,293 6,478,358
50260
562
4,319,844 47,983
126,812 4,494,639
13.
69
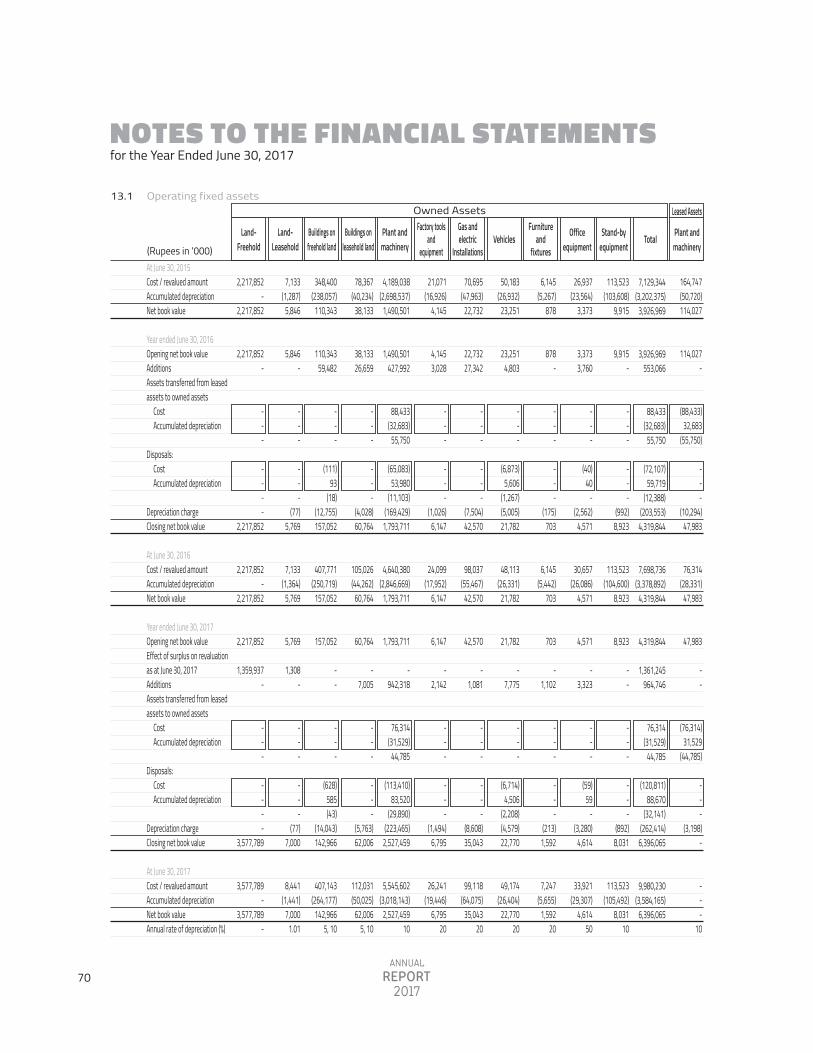
NOTES TO THE FINANCIAL STATEMENTS for the Year Ended June 30, 2017
Operating fixed assets 13.1
Land-Freehold
Land-Leasehold
Buildings onfreehold land
Buildings onleasehold land
Plant andmachinery
Factory toolsand
equipment
Gas andelectric
InstallationsVehicles Stand-by
equipmentTotalOffice
equipment
Furnitureand
fixtures
Plant andmachinery
Leased AssetsOwned Assets
(Rupees in '000)
2,217,852 -
2,217,852
2,217,852 -
- - -
- - - -
2,217,852
2,217,852 -
2,217,852
2,217,852
1,359,937 -
- - -
- - - -
3,577,789
3,577,789 -
3,577,789 -
7,133 (1,287)
5,846
5,846 -
- - -
- - -
(77) 5,769
7,133 (1,364)
5,769
5,769
1,308 -
- - -
- - -
(77) 7,000
8,441 (1,441)
7,000 1.01
348,400 (238,057)
110,343
110,343 59,482
- - -
(111) 93
(18) (12,755) 157,052
407,771 (250,719)
157,052
157,052
- -
- - -
(628) 585 (43)
(14,043) 142,966
407,143 (264,177)
142,966 5, 10
78,367 (40,234)
38,133
38,133 26,659
- - -
- - -
(4,028) 60,764
105,026 (44,262)
60,764
60,764
- 7,005
- - -
- - -
(5,763) 62,006
112,031 (50,025)
62,006 5, 10
4,189,038 (2,698,537)
1,490,501
1,490,501 427,992
88,433 (32,683)
55,750
(65,083) 53,980
(11,103) (169,429)
1,793,711
4,640,380 (2,846,669)
1,793,711
1,793,711
- 942,318
76,314 (31,529)
44,785
(113,410) 83,520
(29,890) (223,465)
2,527,459
5,545,602 (3,018,143)
2,527,459 10
21,071 (16,926)
4,145
4,145 3,028
- - -
- - -
(1,026) 6,147
24,099 (17,952)
6,147
6,147
- 2,142
- - -
- - -
(1,494) 6,795
26,241 (19,446)
6,795 20
70,695 (47,963)
22,732
22,732 27,342
- - -
- - -
(7,504) 42,570
98,037 (55,467)
42,570
42,570
- 1,081
- - -
- - -
(8,608) 35,043
99,118 (64,075)
35,043 20
6,145 (5,267)
878
878 -
- - -
- - -
(175) 703
6,145 (5,442)
703
703
- 1,102
- - -
- - -
(213) 1,592
7,247 (5,655)
1,592 20
26,937 (23,564)
3,373
3,373 3,760
- - -
(40) 40
- (2,562)
4,571
30,657 (26,086)
4,571
4,571
- 3,323
- - -
(59) 59
- (3,280)
4,614
33,921 (29,307)
4,614 50
113,523 (103,608)
9,915
9,915 -
- - -
- - -
(992) 8,923
113,523 (104,600)
8,923
8,923
- -
- - -
- - -
(892) 8,031
113,523 (105,492)
8,031 10
7,129,344 (3,202,375)
3,926,969
3,926,969 553,066
88,433 (32,683)
55,750
(72,107) 59,719
(12,388) (203,553)
4,319,844
7,698,736 (3,378,892)
4,319,844
4,319,844
1,361,245 964,746
76,314 (31,529)
44,785
(120,811) 88,670
(32,141) (262,414)
6,396,065
9,980,230 (3,584,165)
6,396,065
164,747 (50,720) 114,027
114,027 -
(88,433) 32,683
(55,750)
- - -
(10,294) 47,983
76,314 (28,331)
47,983
47,983
- -
(76,314) 31,529
(44,785)
- - -
(3,198) -
- - -
10
50,183 (26,932)
23,251
23,251 4,803
- - -
(6,873) 5,606
(1,267) (5,005) 21,782
48,113 (26,331)
21,782
21,782
- 7,775
- - -
(6,714) 4,506
(2,208) (4,579) 22,770
49,174 (26,404)
22,770 20
At June 30, 2015Cost / revalued amountAccumulated depreciationNet book value
Year ended June 30, 2016Opening net book value AdditionsAssets transferred from leasedassets to owned assets
Cost Accumulated depreciation
Disposals:Cost Accumulated depreciation
Depreciation chargeClosing net book value
At June 30, 2016Cost / revalued amountAccumulated depreciationNet book value
Year ended June 30, 2017Opening net book value Effect of surplus on revaluationas at June 30, 2017AdditionsAssets transferred from leasedassets to owned assets
Cost Accumulated depreciation
Disposals:Cost Accumulated depreciation
Depreciation chargeClosing net book value
At June 30, 2017Cost / revalued amountAccumulated depreciationNet book valueAnnual rate of depreciation (%)
70
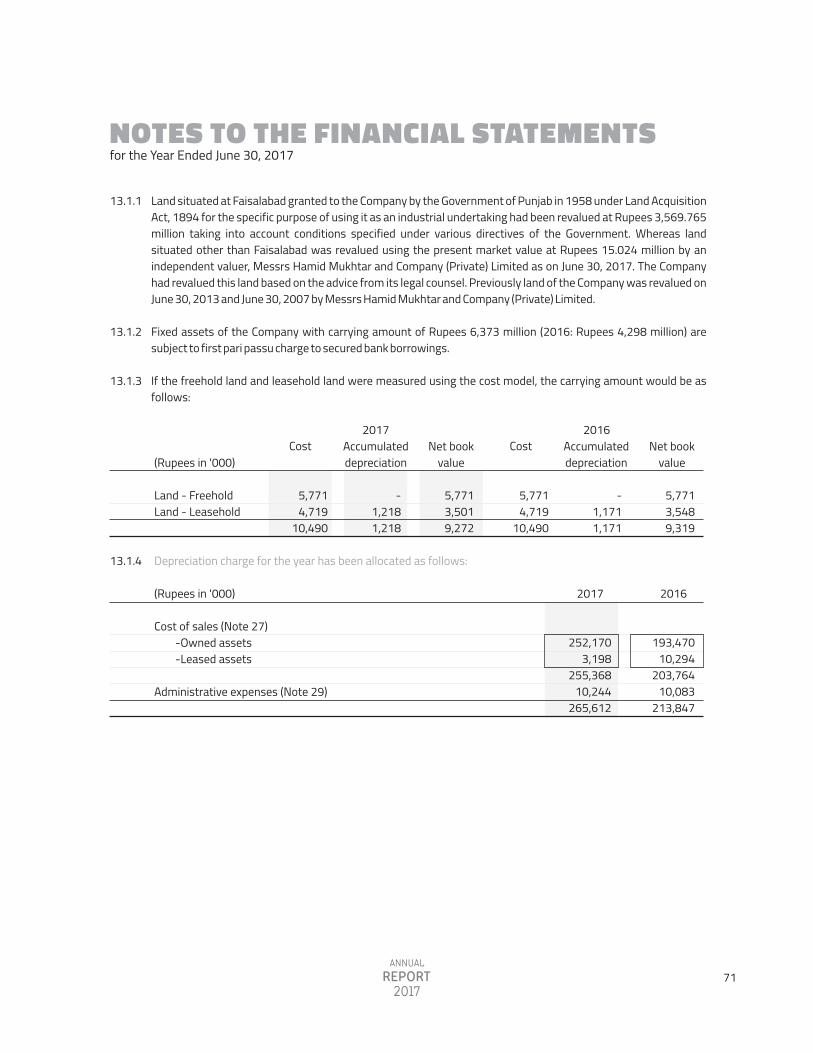
NOTES TO THE FINANCIAL STATEMENTS for the Year Ended June 30, 2017
13.1.1
13.1.2
13.1.3
2017 2016Cost Net book
valueCost Accumulated
depreciation Net book
value(Rupees in '000)
5,771 3,548 9,319
5,771 3,501 9,272
- 1,171 1,171
- 1,218 1,218
5,771 4,719
10,490
5,771 4,719
10,490
Land - Freehold Land - Leasehold
Depreciation charge for the year has been allocated as follows: 13.1.4
2017 2016(Rupees in '000)
252,170 3,198
255,368 10,244
265,612
Cost of sales (Note 27) -Owned assets -Leased assets Administrative expenses (Note 29)
193,470 10,294
203,764 10,083
213,847
Accumulated depreciation
Land situated at Faisalabad granted to the Company by the Government of Punjab in 1958 under Land Acquisition Act, 1894 for the specific purpose of using it as an industrial undertaking had been revalued at Rupees 3,569.765 million taking into account conditions specified under various directives of the Government. Whereas land situated other than Faisalabad was revalued using the present market value at Rupees 15.024 million by an independent valuer, Messrs Hamid Mukhtar and Company (Private) Limited as on June 30, 2017. The Company had revalued this land based on the advice from its legal counsel. Previously land of the Company was revalued on June 30, 2013 and June 30, 2007 by Messrs Hamid Mukhtar and Company (Private) Limited.
Fixed assets of the Company with carrying amount of Rupees 6,373 million (2016: Rupees 4,298 million) are subject to first pari passu charge to secured bank borrowings.
If the freehold land and leasehold land were measured using the cost model, the carrying amount would be as follows:
71

NOTES TO THE FINANCIAL STATEMENTS for the Year Ended June 30, 2017
Detail of operating fixed assets, exceeding the book value of Rupees 50,000 disposed of during the year is as follows: 13.1.5
(Rupees in '000)
Accumulateddepreciation
Net bookvalue
SaleproceedsCostQtyDescription Mode of disposal Particulars of purchasers
Plant and Machinery
Spinning Cards
Comber E-60 withunilapRice Husk Boiler Washing Range Cone Winder
Assembly WindingMachineCone WinderCombers with unilapSingeing MachineTwister Volkmann Compressor with dryerChute Feed
Vehicles
Honda AccordToyota Prius
Aggregate of otheritems of property,plant and equipmentwith individual bookvalues not exceedingRupees 50,000
17
6112
4151111
11
37,032
26,814 12,210 11,621
4,396
3,954
659 3,098 8,422 1,283 1,278
353
111,120
4,222 2,260 6,482
3,209
120,811
34,944
12,282 6,048 8,444 3,641
3,349
566 2,648 7,186 1,087
963 266
81,424
3,532 743
4,275
2,971
88,670
2,088
14,532 6,162 3,177
755
605
93 450
1,236 196 315
87
29,696
690 1,517 2,207
238
32,141
8,500
7,350 6,200 3,825 2,267
1,140 1,117 1,000
800 495 382 175
33,251
2,250 1,625 3,875
7,357
44,483
Negotiation
NegotiationNegotiationNegotiationNegotiation
NegotiationNegotiationNegotiationNegotiationNegotiationNegotiationNegotiation
NegotiationNegotiation
Waqas Rafiq International,Kasur
Ghazi Fabrics, LahoreRC Textile, Faisalabad Mr. Tahir Mahmood, FaisalabadMr. Muhammad Ahmad,Faisalabad
Mr. Khuram Hanif, FaisalabadMr. Javed Tanveer, FaisalabadMr. Adnan Idrees, FaisalabadMr. Tahir Mahmood, FaisalabadMr. Khuram Hanif, FaisalabadMr. Haider Ali, HattarWaqas Rafiq International,Kasur
Mr. Atif Munir, FaisalabadMr. Saif ur Rehman, Faisalabad
72
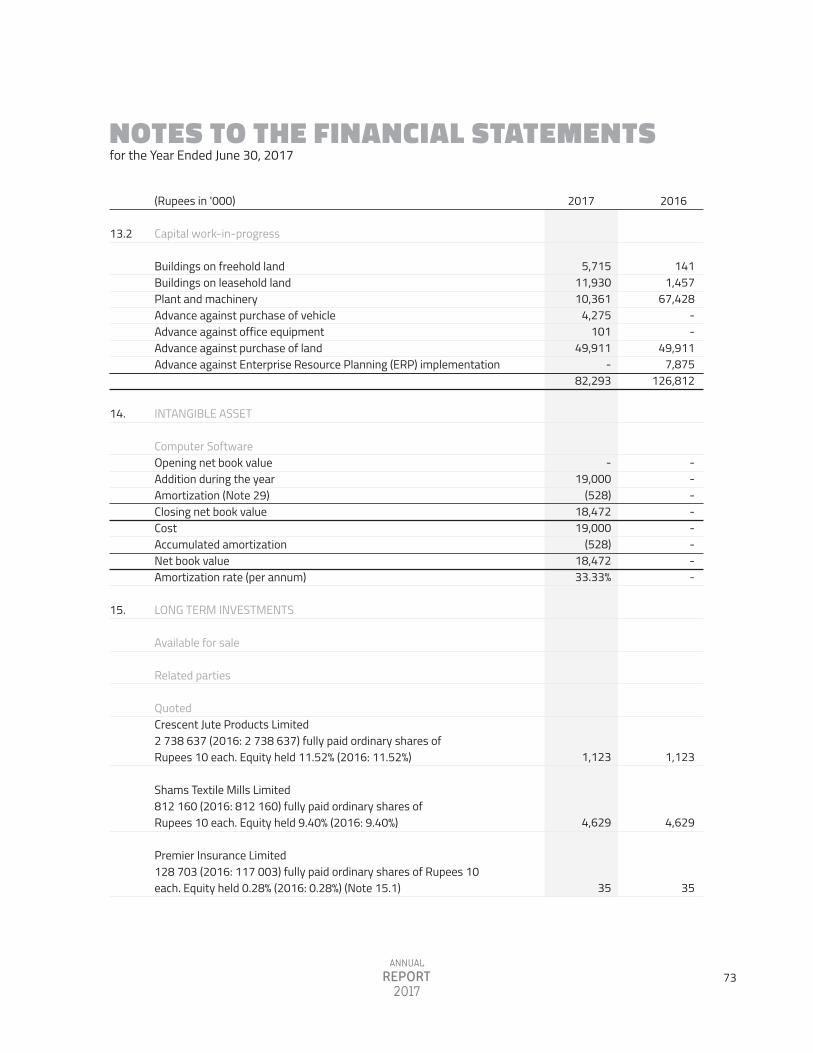
NOTES TO THE FINANCIAL STATEMENTS for the Year Ended June 30, 2017
Capital work-in-progress
Buildings on freehold landBuildings on leasehold landPlant and machineryAdvance against purchase of vehicleAdvance against office equipmentAdvance against purchase of landAdvance against Enterprise Resource Planning (ERP) implementation
INTANGIBLE ASSET
Computer SoftwareOpening net book valueAddition during the yearAmortization (Note 29)Closing net book valueCost Accumulated amortizationNet book valueAmortization rate (per annum)
LONG TERM INVESTMENTS
Available for sale
Related parties
QuotedCrescent Jute Products Limited2 738 637 (2016: 2 738 637) fully paid ordinary shares ofRupees 10 each. Equity held 11.52% (2016: 11.52%)
Shams Textile Mills Limited812 160 (2016: 812 160) fully paid ordinary shares ofRupees 10 each. Equity held 9.40% (2016: 9.40%)
Premier Insurance Limited 128 703 (2016: 117 003) fully paid ordinary shares of Rupees 10 each. Equity held 0.28% (2016: 0.28%) (Note 15.1)
13.2
14.
15.
141 1,457
67,428 - -
49,911 7,875
126,812
--------
1,123
4,629
35
2017 2016(Rupees in '000)
5,715 11,930 10,361
4,275 101
49,911 -
82,293
- 19,000
(528) 18,472 19,000
(528) 18,472 33.33%
1,123
4,629
35
73
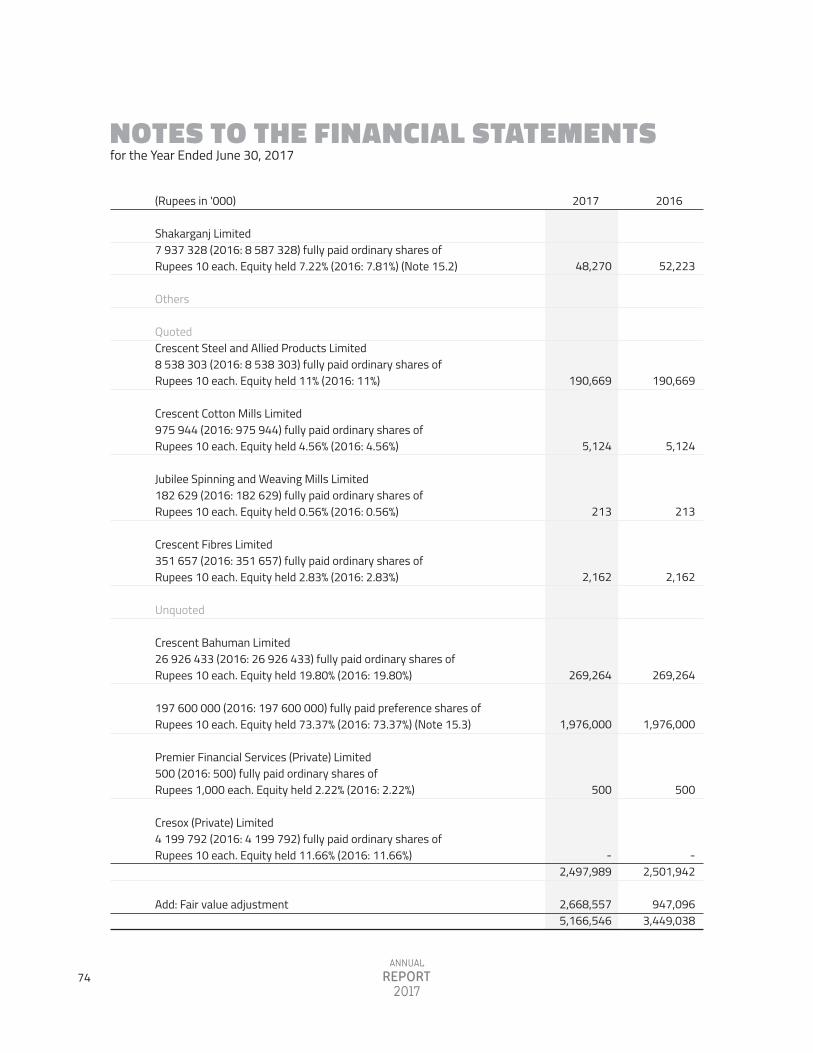
NOTES TO THE FINANCIAL STATEMENTS for the Year Ended June 30, 2017
Shakarganj Limited 7 937 328 (2016: 8 587 328) fully paid ordinary shares of Rupees 10 each. Equity held 7.22% (2016: 7.81%) (Note 15.2)
Others
QuotedCrescent Steel and Allied Products Limited 8 538 303 (2016: 8 538 303) fully paid ordinary shares of Rupees 10 each. Equity held 11% (2016: 11%)
Crescent Cotton Mills Limited 975 944 (2016: 975 944) fully paid ordinary shares ofRupees 10 each. Equity held 4.56% (2016: 4.56%)
Jubilee Spinning and Weaving Mills Limited 182 629 (2016: 182 629) fully paid ordinary shares of Rupees 10 each. Equity held 0.56% (2016: 0.56%)
Crescent Fibres Limited351 657 (2016: 351 657) fully paid ordinary shares of Rupees 10 each. Equity held 2.83% (2016: 2.83%)
Unquoted
Crescent Bahuman Limited26 926 433 (2016: 26 926 433) fully paid ordinary shares of Rupees 10 each. Equity held 19.80% (2016: 19.80%)
197 600 000 (2016: 197 600 000) fully paid preference shares of Rupees 10 each. Equity held 73.37% (2016: 73.37%) (Note 15.3)
Premier Financial Services (Private) Limited500 (2016: 500) fully paid ordinary shares ofRupees 1,000 each. Equity held 2.22% (2016: 2.22%)
Cresox (Private) Limited4 199 792 (2016: 4 199 792) fully paid ordinary shares of Rupees 10 each. Equity held 11.66% (2016: 11.66%)
Add: Fair value adjustment
52,223
190,669
5,124
213
2,162
269,264
1,976,000
500
- 2,501,942
947,096 3,449,038
2017 2016(Rupees in '000)
48,270
190,669
5,124
213
2,162
269,264
1,976,000
500
- 2,497,989
2,668,557 5,166,546
74

NOTES TO THE FINANCIAL STATEMENTS for the Year Ended June 30, 2017
During the year 11 700 bonus shares were received from Premier Insurance Limited.
During the year 650 000 shares of Shakarganj Limited having book value of Rs 3.953 million were sold at fair value of Rs 66.263 million. This represents unlisted non-voting cumulative and participatory preference shares carrying preference dividend at the rate of 5 percent per annum issued by Crescent Bahuman Limited. At the expiry of nine years from the date of issue (October 01, 2010), all outstanding preferences shares along with accumulated dividends, if any, will be converted into non-voting ordinary shares at a price of Rupees 10 per ordinary share.
15.1
15.2
15.3
5,025 3,101 1,924
165,583 25,430
517 191,530
479,595 131,695
1,404,191 13,653
2,029,134
LONG TERM LOANS AND ADVANCES Considered good - secured: Employees Less: Current portion shown under current assets (Note 20)
STORES, SPARE PARTS AND LOOSE TOOLS
Stores (Note 17.1)Spare partsLoose tools
These include stores in transit of Rupees 21.249 million (2016: Rupees 24.752 million).
STOCK-IN-TRADE
Raw materials (Note 18.1)Work-in-processFinished goods (Note 18.2)Waste
6,079 3,212 2,867
157,955 26,826
281 185,062
584,701 107,784 938,090
5,336 1,635,911
16.
These represent interest free loans against household items given to employees and are secured against balance to the credit of employees in the provident fund trust. These are recoverable in equal monthly installments. The fair value adjustment in accordance with the requirements of IAS 39 'Financial Instruments: Recognition and Measurement' arising in respect of staff loans is not considered material and hence not recognized.
16.1
16.2
17.
17.1
18.
Raw materials include stock in transit of Rupees 87.636 million (2016: Rupees 363.937 million).18.1
2017 2016(Rupees in '000)
75

NOTES TO THE FINANCIAL STATEMENTS for the Year Ended June 30, 2017
Finished goods include stock in transit of Rupees 97.134 million (2016: Rupees 62.890 million) and stock with third parties amounting to Rupees 194.903 million (2016: Rupees 176.359 million).
Stock-in-trade of Rupees 13.653 million (2016: Rupees 5.336 million) is being carried at net realizable value.
18.2
18.3
19.
This represents amounts due from Suraj Cotton Mills Limited which were neither past due nor impaired. As at June 30, 2017, trade debts due from other than related parties of Rupees 958.851 million (2016: Rupees 905.148 million) were past due but not impaired. These relate to a number of independent customers from whom there is no recent history of default. The ageing analysis of these trade debts is as follows:
2017 2016(Rupees in '000)
414,823
93 1,821,254 2,236,170
41,203 (41,203)
-
198,736 129,476 630,639 958,851
85 3,101
10,556 3,127
559,759 576,628
TRADE DEBTS
Considered good:Secured (against letters of credit)Unsecured: Related party (Note 19.1) Others (Note 19.2)
Considered doubtful:
Others - unsecuredLess: Provision for doubtful debts
Upto 1 month1 to 6 monthsMore than 6 months
LOANS AND ADVANCES
Considered good:Employees against expensesCurrent portion of long term loans and advances (Note 16)Advances to suppliers Letters of creditIncome tax
407,733
5,649 1,952,103 2,365,485
41,203 (41,203)
-
240,996 92,545
571,607 905,148
85 3,212
12,887 6,107
446,727 469,018
19.1
19.2
As at June 30, 2017, trade debts of Rupees 41.203 million (2016: Rupees 41.203 million) were impaired and provided for. The ageing of these trade debts was more than three years. These trade debts do not include amounts due from related parties.
19.3
20.
76

NOTES TO THE FINANCIAL STATEMENTS for the Year Ended June 30, 2017
Considered doubtful: Advances to suppliers Less: Provision for doubtful loans and advances
SHORT TERM DEPOSITS AND PREPAYMENTS Considered good: Margin deposits Current portion of long term deposits Prepayments
ACCRUED INTEREST This includes interest receivable from Crescent Bahuman Limited on overdue receivable balance.
OTHER RECEIVABLES
Considered good:Due from related parties (Note 23.1)Export rebate and claimsDuty drawbackSales tax and special excise duty refundableDividends receivable (Note 23.2)Miscellaneous
Considered doubtful: Export rebate, sales tax and special excise duty refundable Less: Provision for doubtful other receivables As at July 01 Add: Provision made during the year (Note 30) As at June 30
This represents amounts due from following related parties: Shams Textile Mills Limited Premier Insurance Limited
589 (589)
-
27,529 179
1,742 29,450
525 63,118
- 485,005 580,907
885 1,130,440
43,987
41,744 2,243
43,987 -
- 525 525
21.
22.
23.
23.1
2017 2016(Rupees in '000)
589 (589)
-
61,840 139 107
62,086
77 68,881
173,721 341,442 666,900
1,508 1,252,529
44,308
43,987 321
44,308 -
77 -
77
77
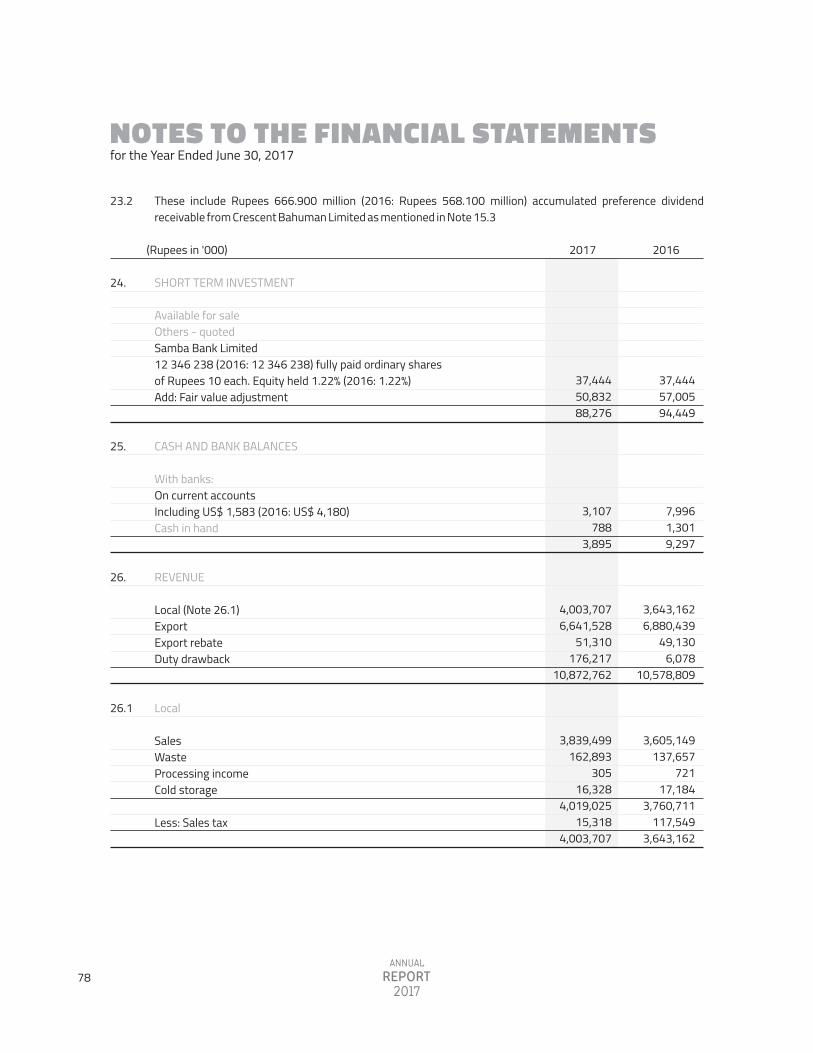
NOTES TO THE FINANCIAL STATEMENTS for the Year Ended June 30, 2017
These include Rupees 666.900 million (2016: Rupees 568.100 million) accumulated preference dividend receivable from Crescent Bahuman Limited as mentioned in Note 15.3
23.2
24.
25.
26.
26.1
37,444 50,832 88,276
3,107 788
3,895
4,003,707 6,641,528
51,310 176,217
10,872,762
3,839,499 162,893
305 16,328
4,019,025 15,318
4,003,707
SHORT TERM INVESTMENT
Available for saleOthers - quotedSamba Bank Limited 12 346 238 (2016: 12 346 238) fully paid ordinary sharesof Rupees 10 each. Equity held 1.22% (2016: 1.22%) Add: Fair value adjustment
CASH AND BANK BALANCES
With banks:On current accounts Including US$ 1,583 (2016: US$ 4,180)Cash in hand
REVENUE
Local (Note 26.1)ExportExport rebateDuty drawback
Local
SalesWasteProcessing incomeCold storage
Less: Sales tax
37,444 57,005 94,449
7,996 1,301 9,297
3,643,162 6,880,439
49,130 6,078
10,578,809
3,605,149 137,657
721 17,184
3,760,711 117,549
3,643,162
2017 2016(Rupees in '000)
78

NOTES TO THE FINANCIAL STATEMENTS for the Year Ended June 30, 2017
2017 2016(Rupees in '000)
COST OF SALES
Raw materials consumed (Note 27.1)Cloth and yarn purchasedStores, spare parts and loose tools consumedPacking materials consumedProcessing and weaving chargesSalaries, wages and other benefits (Note 27.2)Fuel and powerRepair and maintenanceInsuranceDepreciation (Note 13.1.4)Other factory overheads
Work-in-processOpening stockClosing stock
Cost of goods manufacturedFinished goodsOpening stockClosing stock
Cost of sales - purchased for resale
Raw materials consumed
Opening stockAdd: Purchased during the year
Less: Closing stock
3,219,622 1,287,230
622,918 570,888 688,832 918,418
1,112,343 71,772 11,331
203,764 37,958
8,745,076
102,549 (107,784)
(5,235) 8,739,841
1,035,897 (943,426)
92,471 8,832,312
406,326 9,238,638
199,078 3,605,245 3,804,323 (584,701)
3,219,622
27.
27.1
3,561,946 1,848,112
611,356 689,296 799,749 964,009
1,280,308 56,077 11,715
255,368 39,658
10,117,594
107,784 (131,695)
(23,911) 10,093,683
943,426 (1,417,844)
(474,418) 9,619,265
281,503 9,900,768
584,701 3,456,840 4,041,541 (479,595)
3,561,946
Salaries, wages and other benefits include provident fund contribution of Rupees 15.873 million (2016: Rupees 14.896 million) by the Company.
27.2
79
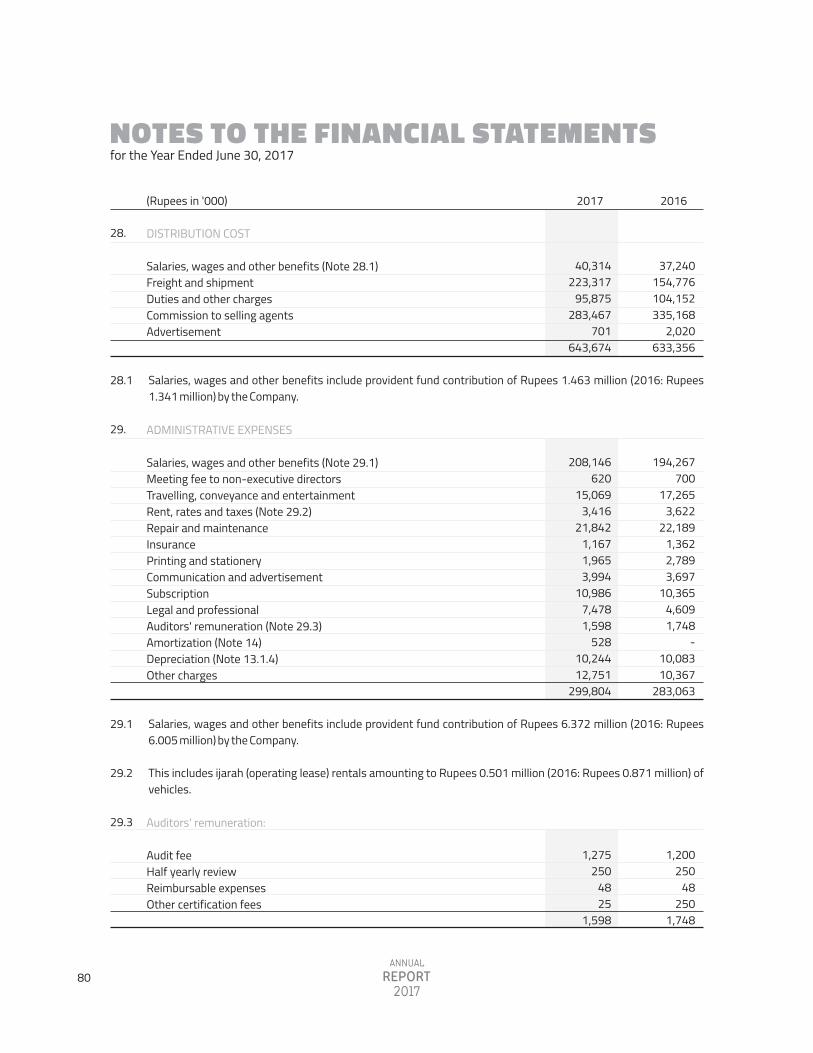
NOTES TO THE FINANCIAL STATEMENTS for the Year Ended June 30, 2017
28.1
29.
2017 2016(Rupees in '000)
DISTRIBUTION COST
Salaries, wages and other benefits (Note 28.1)Freight and shipmentDuties and other chargesCommission to selling agentsAdvertisement
ADMINISTRATIVE EXPENSES
Salaries, wages and other benefits (Note 29.1)Meeting fee to non-executive directorsTravelling, conveyance and entertainmentRent, rates and taxes (Note 29.2)Repair and maintenanceInsurancePrinting and stationeryCommunication and advertisementSubscriptionLegal and professional Auditors' remuneration (Note 29.3)Amortization (Note 14)Depreciation (Note 13.1.4)Other charges
Auditors' remuneration:
Audit feeHalf yearly reviewReimbursable expensesOther certification fees
37,240 154,776 104,152 335,168
2,020 633,356
194,267 700
17,265 3,622
22,189 1,362 2,789 3,697
10,365 4,609 1,748
- 10,083 10,367
283,063
1,200 250
48 250
1,748
28.
Salaries, wages and other benefits include provident fund contribution of Rupees 1.463 million (2016: Rupees 1.341 million) by the Company.
29.1
29.2
29.3
Salaries, wages and other benefits include provident fund contribution of Rupees 6.372 million (2016: Rupees 6.005 million) by the Company.
This includes ijarah (operating lease) rentals amounting to Rupees 0.501 million (2016: Rupees 0.871 million) of vehicles.
40,314 223,317
95,875 283,467
701 643,674
208,146 620
15,069 3,416
21,842 1,167 1,965 3,994
10,986 7,478 1,598
528 10,244 12,751
299,804
1,275 250
48 25
1,598
80
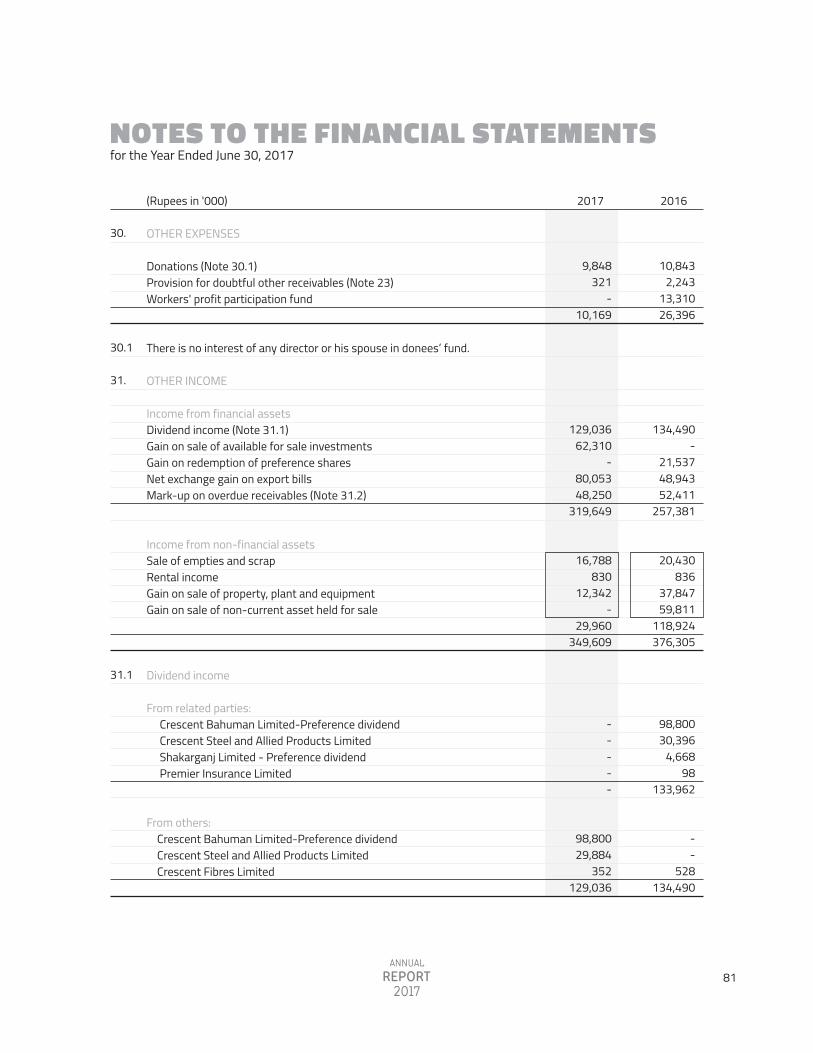
NOTES TO THE FINANCIAL STATEMENTS for the Year Ended June 30, 2017
2017 2016(Rupees in '000)
OTHER EXPENSES
Donations (Note 30.1)Provision for doubtful other receivables (Note 23)Workers' profit participation fund
There is no interest of any director or his spouse in donees� fund.
OTHER INCOME
Income from financial assetsDividend income (Note 31.1)Gain on sale of available for sale investmentsGain on redemption of preference sharesNet exchange gain on export billsMark-up on overdue receivables (Note 31.2)
Income from non-financial assetsSale of empties and scrapRental incomeGain on sale of property, plant and equipmentGain on sale of non-current asset held for sale
Dividend income
From related parties: Crescent Bahuman Limited-Preference dividend Crescent Steel and Allied Products Limited Shakarganj Limited - Preference dividend Premier Insurance Limited
From others: Crescent Bahuman Limited-Preference dividend Crescent Steel and Allied Products Limited Crescent Fibres Limited
10,843 2,243
13,310 26,396
134,490 -
21,537 48,943 52,411
257,381
20,430 836
37,847 59,811
118,924 376,305
98,800 30,396
4,668 98
133,962
- -
528 134,490
30.
30.1
31.
31.1
9,848 321
- 10,169
129,036 62,310
- 80,053 48,250
319,649
16,788 830
12,342 -
29,960 349,609
- - - - -
98,800 29,884
352 129,036
81

NOTES TO THE FINANCIAL STATEMENTS for the Year Ended June 30, 2017
31.1.1
31.2
Crescent Bahuman Limited and Crescent Steel and Allied Products Limited ceased to be the related parties due to elimination of common directorship on June 29, 2016.
This relates to mark-up charged on overdue receivables from Crescent Bahuman Limited.
FINANCE COST
Mark up on: Long term financing Liabilities against assets subject to finance lease Short term borrowingsInterest on workers' profit participation fund (Note 8.2)Bank charges and commission
TAXATION
Charge for the year: Current (Note 33.1) Prior year adjustment
Deferred (Note 33.2)
21,962 2,233
315,253 863
19,695 360,006
70,227 (55)
70,172 25,960 96,132
32.
33.
32.1 Exchange loss on foreign currency loans of the Company amounting to Rupees 1.752 million (2016: Rupees 69.250 million) is adjusted against finance cost.
2017 2016(Rupees in '000)
33.1 Provision for current taxation represents the tax deducted against export sales, minimum tax on local sales, tax on undistributed profits under Section 5A, tax on different heads of other income and tax credit available under the relevant provisions of the Income Tax Ordinance, 2001. Tax losses available as at June 30, 2017 are Rupees 345.964 million (2016: Rupees 182.600 million). Reconciliation of tax expenses and product of accounting profit multiplied by the applicable tax rate is not presented, being impracticable.
59,612 361
214,993 835
11,015 286,816
31,291 (5,601)25,690
(57,889) (32,199)
82
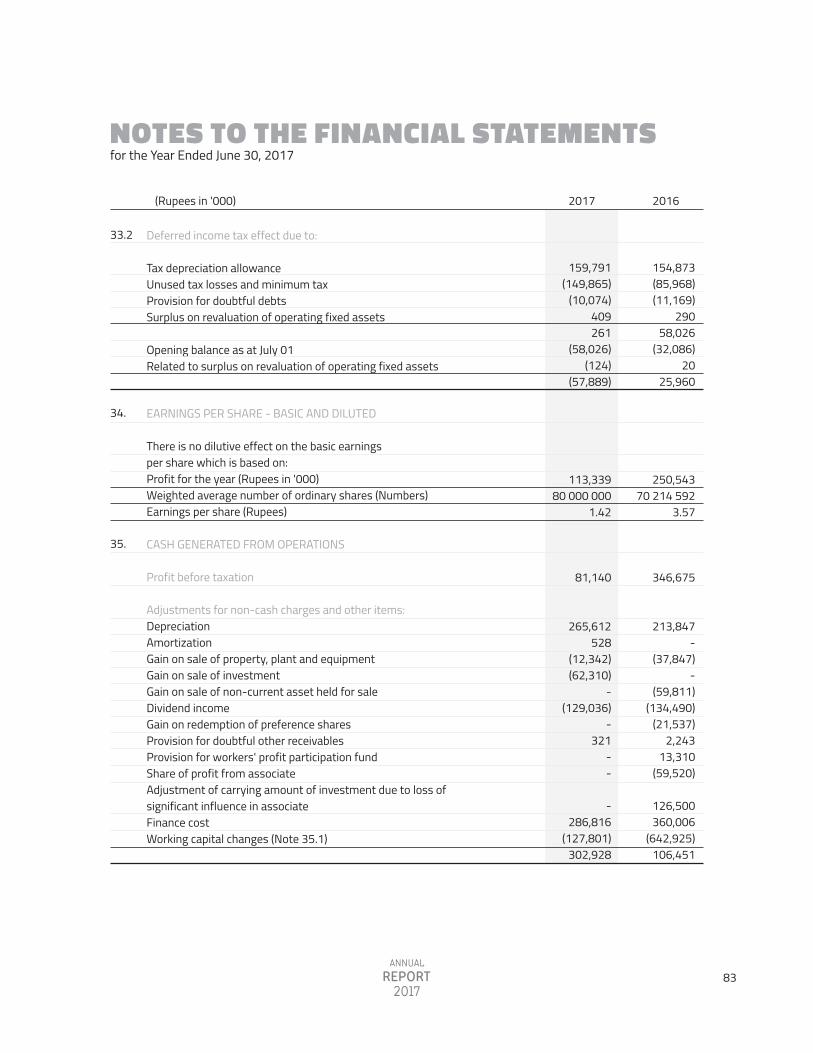
NOTES TO THE FINANCIAL STATEMENTS for the Year Ended June 30, 2017
(Rupees in '000) 20162017
Deferred income tax effect due to:
Tax depreciation allowanceUnused tax losses and minimum taxProvision for doubtful debtsSurplus on revaluation of operating fixed assets
Opening balance as at July 01 Related to surplus on revaluation of operating fixed assets
154,873 (85,968) (11,169)
290 58,026
(32,086) 20
25,960
250,543 70 214 592
3.57
346,675
213,847 -
(37,847) -
(59,811) (134,490)
(21,537) 2,243
13,310 (59,520)
126,500 360,006
(642,925) 106,451
33.2
159,791 (149,865)
(10,074) 409 261
(58,026) (124)
(57,889)
113,339 80 000 000
1.42
81,140
265,612 528
(12,342) (62,310)
- (129,036)
- 321
- -
-
286,816 (127,801)
302,928
EARNINGS PER SHARE - BASIC AND DILUTED There is no dilutive effect on the basic earningsper share which is based on: Profit for the year (Rupees in '000)Weighted average number of ordinary shares (Numbers)Earnings per share (Rupees)
CASH GENERATED FROM OPERATIONS
Profit before taxation
Adjustments for non-cash charges and other items:Depreciation AmortizationGain on sale of property, plant and equipmentGain on sale of investmentGain on sale of non-current asset held for saleDividend incomeGain on redemption of preference sharesProvision for doubtful other receivablesProvision for workers' profit participation fundShare of profit from associateAdjustment of carrying amount of investment due to loss ofsignificant influence in associateFinance costWorking capital changes (Note 35.1)
34.
35.
83
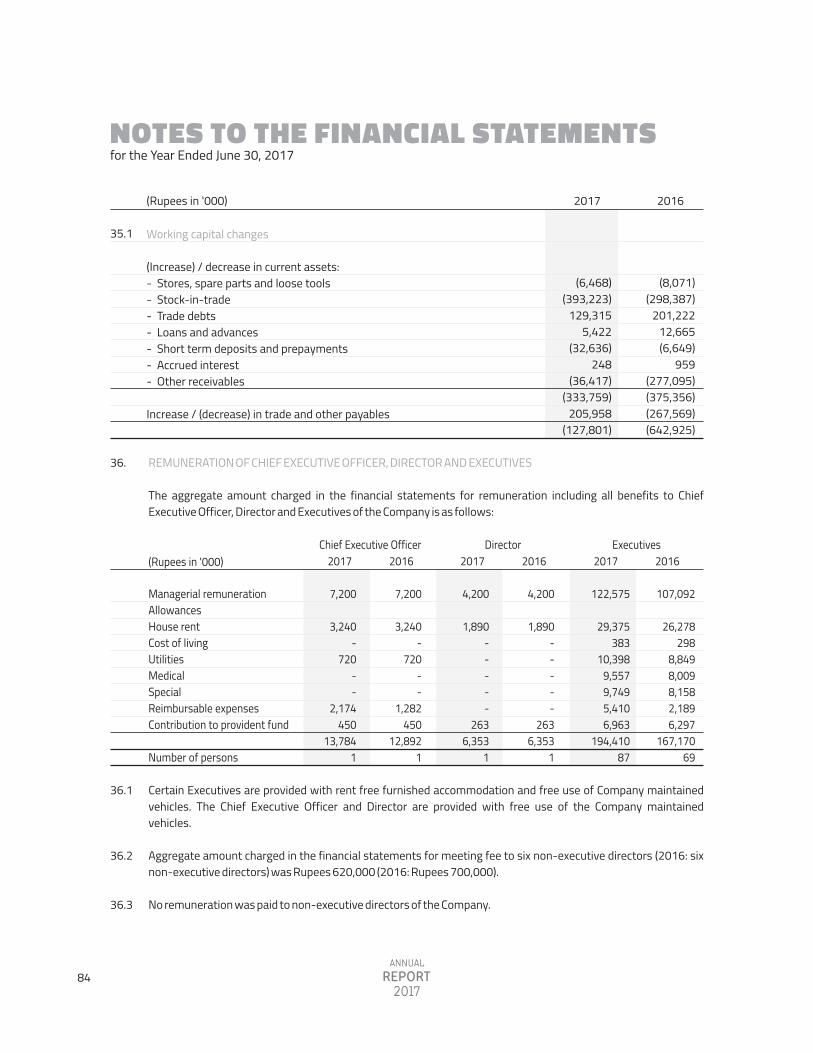
NOTES TO THE FINANCIAL STATEMENTS for the Year Ended June 30, 2017
36.1
36.2
36.3
Certain Executives are provided with rent free furnished accommodation and free use of Company maintained vehicles. The Chief Executive Officer and Director are provided with free use of the Company maintained vehicles.
Aggregate amount charged in the financial statements for meeting fee to six non-executive directors (2016: six non-executive directors) was Rupees 620,000 (2016: Rupees 700,000).
No remuneration was paid to non-executive directors of the Company.
Chief Executive Officer 2017 2016
7,200
3,240 -
720 - -
1,282 450
12,892 1
7,200
3,240 -
720 - -
2,174 450
13,784 1
36. REMUNERATION OF CHIEF EXECUTIVE OFFICER, DIRECTOR AND EXECUTIVES
The aggregate amount charged in the financial statements for remuneration including all benefits to Chief Executive Officer, Director and Executives of the Company is as follows:
Director2017 2016 2017 2016
Executives
122,575
29,375 383
10,398 9,557 9,749 5,410 6,963
194,410 87
107,092
26,278 298
8,849 8,009 8,158 2,189 6,297
167,170 69
4,200
1,890 - - - - -
263 6,353
1
4,200
1,890 - - - - -
263 6,353
1
Managerial remuneration AllowancesHouse rentCost of livingUtilitiesMedicalSpecialReimbursable expensesContribution to provident fund
Number of persons
(Rupees in '000)
2017 2016(Rupees in '000)
Working capital changes
(Increase) / decrease in current assets: - Stores, spare parts and loose tools - Stock-in-trade - Trade debts - Loans and advances - Short term deposits and prepayments - Accrued interest - Other receivables Increase / (decrease) in trade and other payables
(8,071) (298,387)
201,222 12,665 (6,649)
959 (277,095) (375,356) (267,569) (642,925)
35.1
(6,468) (393,223)
129,315 5,422
(32,636) 248
(36,417) (333,759)
205,958 (127,801)
84
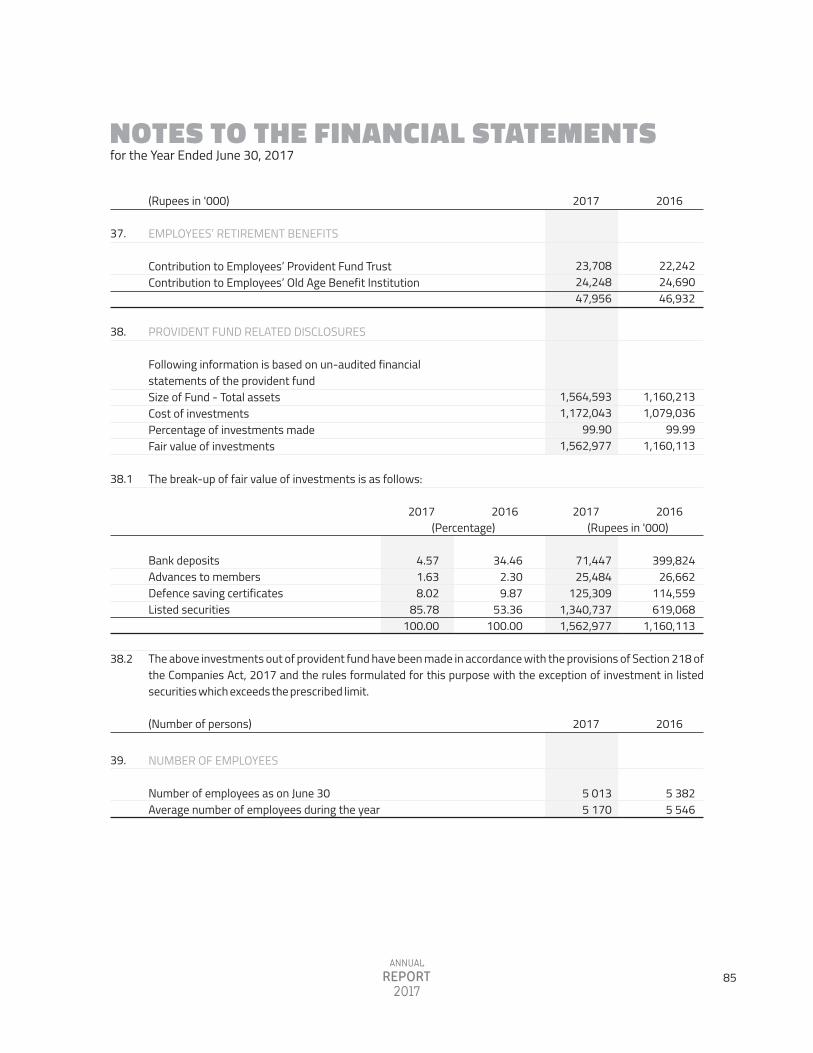
NOTES TO THE FINANCIAL STATEMENTS for the Year Ended June 30, 2017
38.
38.1
2017 2016(Rupees in '000)
23,708 24,248 47,956
1,564,593 1,172,043
99.90 1,562,977
EMPLOYEES� RETIREMENT BENEFITS Contribution to Employees� Provident Fund Trust Contribution to Employees� Old Age Benefit Institution
PROVIDENT FUND RELATED DISCLOSURE S Following information is based on un-audited financialstatements of the provident fundSize of Fund - Total assetsCost of investmentsPercentage of investments madeFair value of investments
The break-up of fair value of investments is as follows:
22,242 24,690 46,932
1,160,213 1,079,036
99.99 1,160,113
37.
39.
5 0135 170
5 3825 546
NUMBER OF EMPLOYEES
Number of employees as on June 30Average number of employees during the year
2017 2016(Number of persons)
71,447 25,484
125,309 1,340,737 1,562,977
399,824 26,662
114,559 619,068
1,160,113
34.46 2.30 9.87
53.36 100.00
4.57 1.63 8.02
85.78 100.00
Bank depositsAdvances to membersDefence saving certificatesListed securities
2017 2016(Percentage)
38.2 The above investments out of provident fund have been made in accordance with the provisions of Section 218 of the Companies Act, 2017 and the rules formulated for this purpose with the exception of investment in listed securities which exceeds the prescribed limit.
2017 2016(Rupees in '000)
85
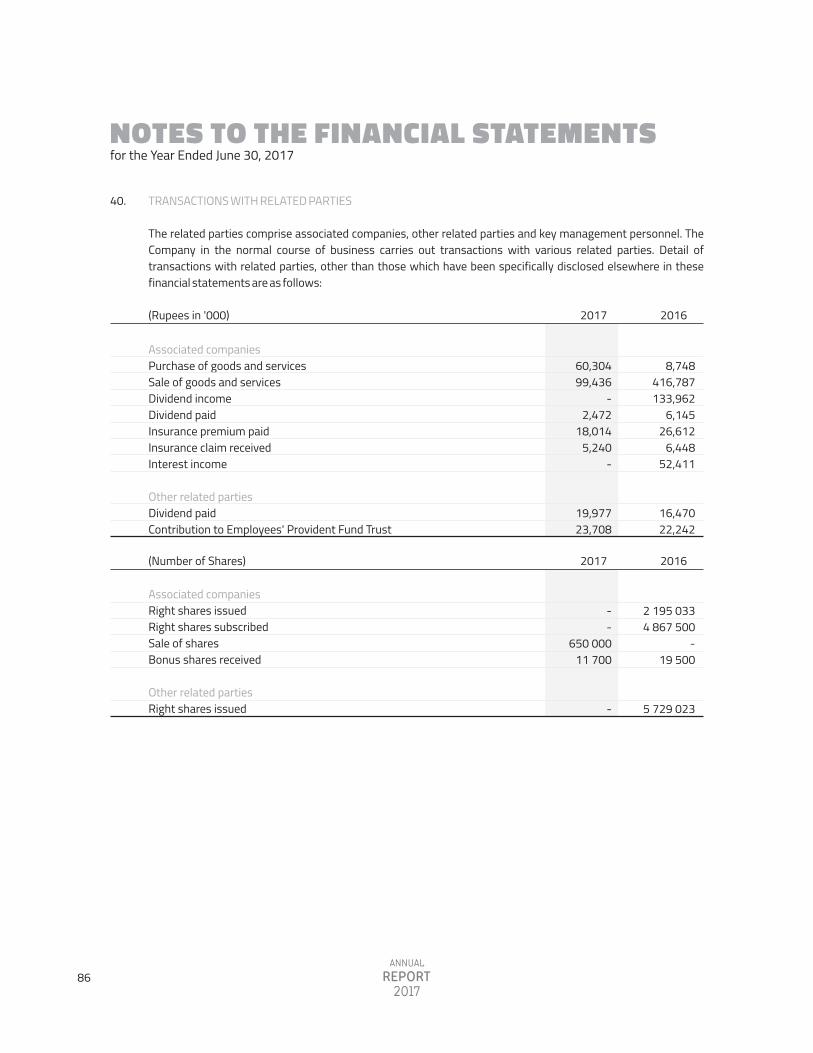
NOTES TO THE FINANCIAL STATEMENTS for the Year Ended June 30, 2017
40. TRANSACTIONS WITH RELATED PARTIES The related parties comprise associated companies, other related parties and key management personnel. The Company in the normal course of business carries out transactions with various related parties. Detail of transactions with related parties, other than those which have been specifically disclosed elsewhere in these financial statements are as follows:
2017 2016(Rupees in '000)
60,304
99,436 -
2,472 18,014
5,240 -
19,977 23,708
8,748
416,787 133,962
6,145 26,612
6,448 52,411
16,470 22,242
Associated companies Purchase of goods and services Sale of goods and services Dividend income Dividend paid Insurance premium paid Insurance claim received Interest income Other related parties Dividend paid Contribution to Employees' Provident Fund Trust
2017 2016(Number of Shares)
-
- 650 000
11 700
-
2 195 033
4 867 500 -
19 500
5 729 023
Associated companies Right shares issued Right shares subscribed Sale of sharesBonus shares received Other related parties Right shares issued
86
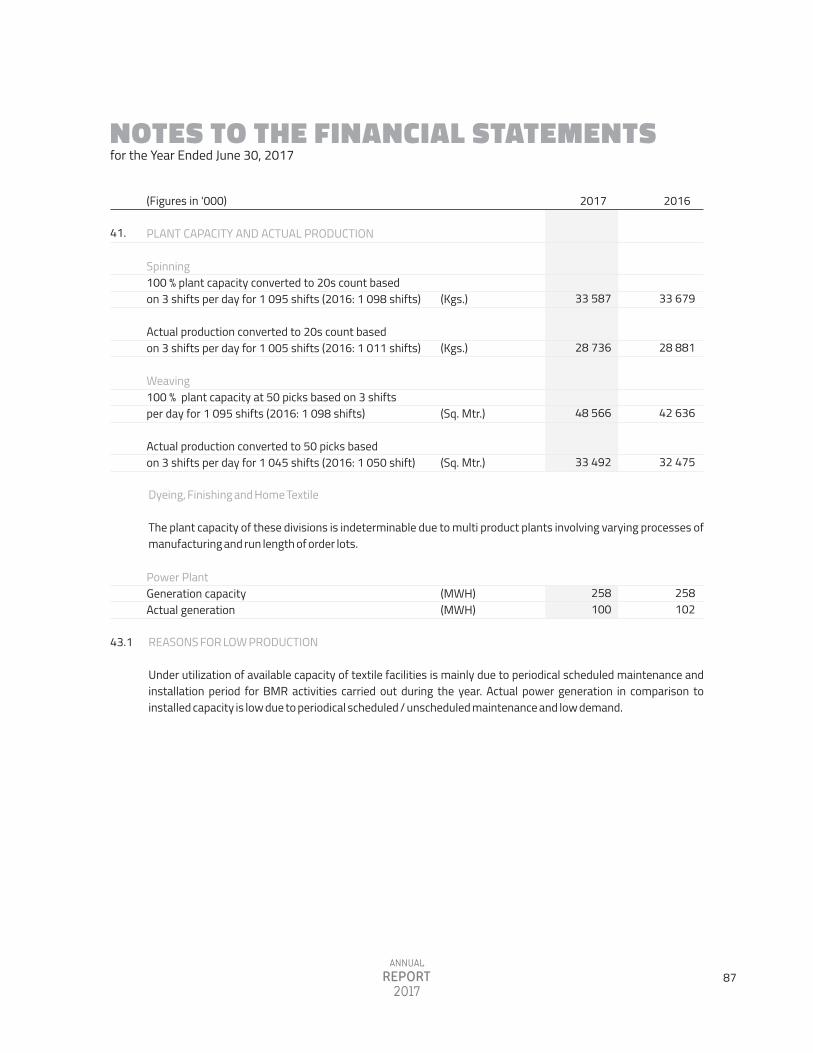
NOTES TO THE FINANCIAL STATEMENTS for the Year Ended June 30, 2017
2017 2016(Figures in '000)
41. PLANT CAPACITY AND ACTUAL PRODUCTION Spinning100 % plant capacity converted to 20s count basedon 3 shifts per day for 1 095 shifts (2016: 1 098 shifts)
Actual production converted to 20s count based on 3 shifts per day for 1 005 shifts (2016: 1 011 shifts)
Weaving100 % plant capacity at 50 picks based on 3 shifts per day for 1 095 shifts (2016: 1 098 shifts) Actual production converted to 50 picks based on 3 shifts per day for 1 045 shifts (2016: 1 050 shift)
Power PlantGeneration capacityActual generation
33 679
28 881
42 636
32 475
258 102
33 587
28 736
48 566
33 492
258 100
Dyeing, Finishing and Home Textile The plant capacity of these divisions is indeterminable due to multi product plants involving varying processes of manufacturing and run length of order lots.
43.1 REASONS FOR LOW PRODUCTION Under utilization of available capacity of textile facilities is mainly due to periodical scheduled maintenance and installation period for BMR activities carried out during the year. Actual power generation in comparison to installed capacity is low due to periodical scheduled / unscheduled maintenance and low demand.
(Kgs.)
(Kgs.)
(Sq. Mtr.)
(Sq. Mtr.)
(MWH)(MWH)
87
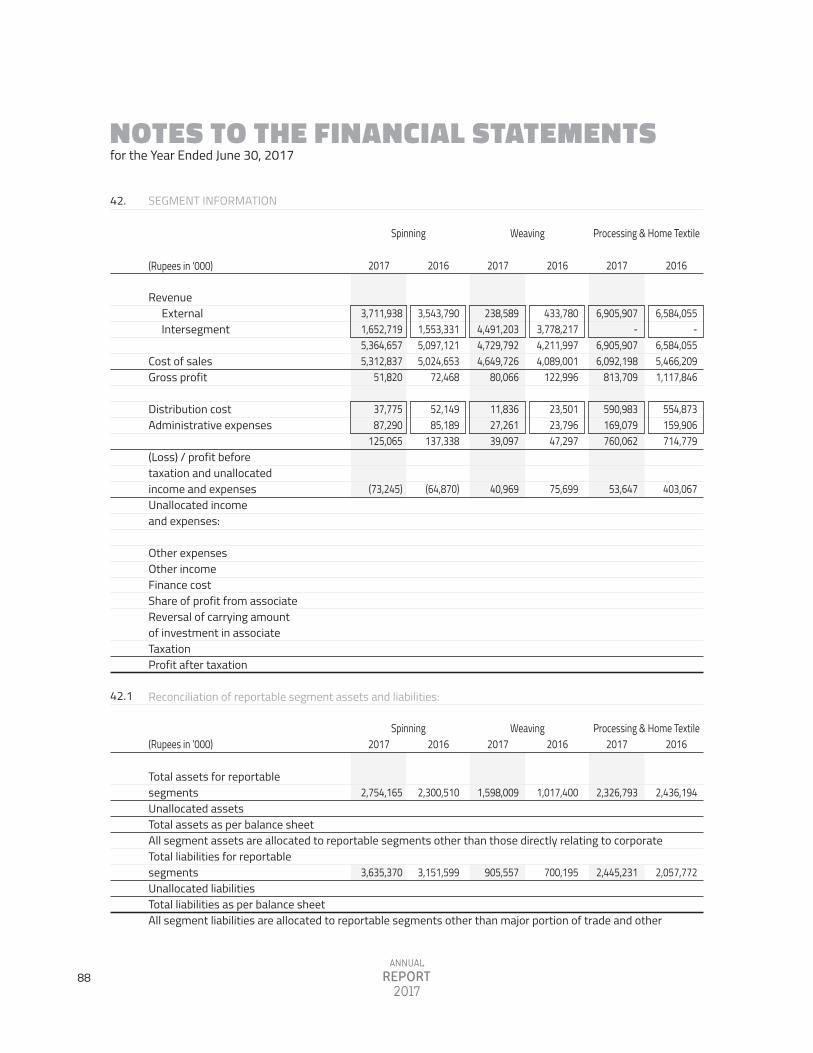
NOTES TO THE FINANCIAL STATEMENTS for the Year Ended June 30, 2017
SEGMENT INFORMATION 42.
2017 2016 2017 2016 2017 2016
Spinning Weaving Processing & Home Textile
(Rupees in '000)
42.1
Revenue External Intersegment
Cost of salesGross profit
Distribution costAdministrative expenses
(Loss) / profit beforetaxation and unallocatedincome and expensesUnallocated income and expenses:
Other expensesOther incomeFinance cost Share of profit from associateReversal of carrying amountof investment in associate TaxationProfit after taxation
Reconciliation of reportable segment assets and liabilities:
Total assets for reportablesegmentsUnallocated assetsTotal assets as per balance sheetAll segment assets are allocated to reportable segments other than those directly relating to corporate Total liabilities for reportablesegmentsUnallocated liabilitiesTotal liabilities as per balance sheetAll segment liabilities are allocated to reportable segments other than major portion of trade and other
433,780 3,778,217 4,211,997 4,089,001
122,996
23,50123,79647,297
75,699
1,017,400
700,195
6,584,055 -
6,584,055 5,466,209 1,117,846
554,873159,906714,779
403,067
2,436,194
2,057,772
3,543,790 1,553,331 5,097,121 5,024,653
72,468
52,14985,189
137,338
(64,870)
2,300,510
3,151,599
Spinning Weaving Processing & Home Textile2017 2016 2017 2016 2017 2016(Rupees in '000)
3,711,938 1,652,719 5,364,657 5,312,837
51,820
37,77587,290
125,065
(73,245)
2,754,165
3,635,370
238,589 4,491,203 4,729,792 4,649,726
80,066
11,83627,26139,097
40,969
1,598,009
905,557
6,905,907 -
6,905,907 6,092,198
813,709
590,983169,079760,062
53,647
2,326,793
2,445,231
88

NOTES TO THE FINANCIAL STATEMENTS for the Year Ended June 30, 2017
Total - CompanyPower Generation Cold Storage Elimination of inter-segment transactions
2017 20162017 2016 2017 2016 20162017
10,578,809 -
10,578,809 9,238,638 1,340,171
633,356283,063916,419
423,752
26,396 376,305 360,006 59,520
(126,500)
(96,132) 250,543
10,872,762 -
10,872,762 9,900,768
971,994
643,674299,804943,478
28,516
10,169 349,609 286,816
-
- 32,199
113,339
- 892,368 892,368 871,562 20,806
2,83313,38016,213
4,593
305,997
146,275
16,328 -
16,328 10,739 5,589
- 838838
4,751
20,216
812
17,184 -
17,184 11,129 6,055
- 792792
5,263
22,779
1,800
- (6,223,916) (6,223,916)
6,223,916 -
- - -
-
6,082,880 7,792,173
13,875,053
6,057,641 1,051,466 7,109,107
- (7,205,593) (7,205,593)
7,205,593 -
- - -
-
6,986,325 11,128,232 18,114,557
7,110,219 1,149,044 8,259,263
Power Generation Cold Storage Total - Company2017 2016 2017 2016 2017 2016
and tax assets.
payables, current and deferred tax liabilities.
- 1,061,671 1,061,671 1,040,861
20,810
3,08015,33618,416
2,394
287,142
123,249
89

NOTES TO THE FINANCIAL STATEMENTS for the Year Ended June 30, 2017
Geographical Information The Company's revenue from external customers by geographical locations is detailed below:
42.2
2017 2016(Rupees in '000)
EuropeAmerica Asia, Africa and AustraliaPakistan
4,886,493 921,912
1,127,242 3,643,162
10,578,809
5,603,042 246,664
1,019,349 4,003,707
10,872,762
All non-current assets of the Company as at reporting date are located and operating in Pakistan.
Revenue from major customers Revenue from two major customers of Processing and Home textile segments of the Company represents Rupees 1,333 million and of Rupees 1,329 million respectively (2016: no major customer of the Company). FINANCIAL RISK MANAGEMENT
Financial risk factors
The Company's activities expose it to a variety of financial risks: market risk (including currency risk, other price risk and interest rate risk), credit risk and liquidity risk. The Company's overall risk management programme focuses on the unpredictability of financial markets and seeks to minimize potential adverse effects on the Company's financial performance. Risk management is carried out by the Company's finance department under policies approved by the Board of Directors (the Board). The Company's finance department evaluates and hedges financial risks. The Board provides principles for overall risk management, as well as policies covering specific areas such as currency risk, other price risk, interest rate risk, credit risk, liquidity risk, use of non-derivative financial instruments and investment of excess liquidity.
42.3
42.4
43.
45.1
Market risk a)
Currency risk Currency risk is the risk that the fair value or future cash flows of a financial instrument will fluctuate because of changes in foreign exchange rates. Currency risk arises mainly from future commercial transactions or receivables and payables that exist due to transactions in foreign currencies.
i)
90
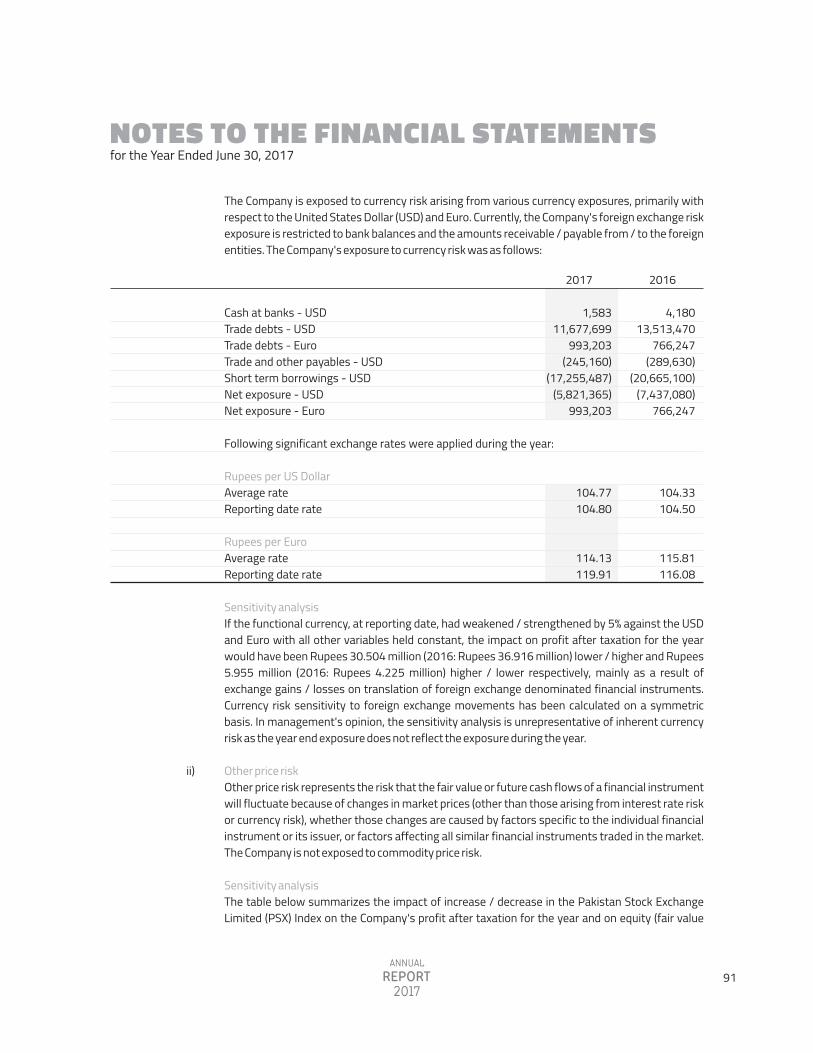
NOTES TO THE FINANCIAL STATEMENTS for the Year Ended June 30, 2017
2017 2016
1,583 11,677,699
993,203 (245,160)
(17,255,487) (5,821,365)
993,203
104.77104.80
114.13119.91
Cash at banks - USDTrade debts - USDTrade debts - EuroTrade and other payables - USDShort term borrowings - USDNet exposure - USDNet exposure - Euro
Following significant exchange rates were applied during the year:
Rupees per US Dollar Average rate Reporting date rate Rupees per Euro Average rate Reporting date rate
4,180 13,513,470
766,247 (289,630)
(20,665,100) (7,437,080)
766,247
104.33104.50
115.81116.08
Sensitivity analysis If the functional currency, at reporting date, had weakened / strengthened by 5% against the USD and Euro with all other variables held constant, the impact on profit after taxation for the year would have been Rupees 30.504 million (2016: Rupees 36.916 million) lower / higher and Rupees 5.955 million (2016: Rupees 4.225 million) higher / lower respectively, mainly as a result of exchange gains / losses on translation of foreign exchange denominated financial instruments. Currency risk sensitivity to foreign exchange movements has been calculated on a symmetric basis. In management's opinion, the sensitivity analysis is unrepresentative of inherent currency risk as the year end exposure does not reflect the exposure during the year. Other price risk Other price risk represents the risk that the fair value or future cash flows of a financial instrument will fluctuate because of changes in market prices (other than those arising from interest rate risk or currency risk), whether those changes are caused by factors specific to the individual financial instrument or its issuer, or factors affecting all similar financial instruments traded in the market. The Company is not exposed to commodity price risk.
Sensitivity analysis The table below summarizes the impact of increase / decrease in the Pakistan Stock Exchange Limited (PSX) Index on the Company's profit after taxation for the year and on equity (fair value
ii)
The Company is exposed to currency risk arising from various currency exposures, primarily with respect to the United States Dollar (USD) and Euro. Currently, the Company's foreign exchange risk exposure is restricted to bank balances and the amounts receivable / payable from / to the foreign entities. The Company's exposure to currency risk was as follows:
91

NOTES TO THE FINANCIAL STATEMENTS for the Year Ended June 30, 2017
2017 2016 2017 2016
Impact on statement of othercomprehensive income (fair value reserve)
Impact on profitafter taxation
150,453 (150,453)
PSX 100 (5% increase)PSX 100 (5% decrease)
64,887 (64,887)
Equity (fair value reserve) would increase / decrease as a result of gains / losses on equity investments classified as available for sale.
Interest rate risk This represents the risk that the fair value or future cash flows of a financial instrument will fluctuate because of changes in market interest rates. The Company's interest rate risk arises from long term financing, liabilities against assets subject to finance lease, short term borrowings and trade debts of CBL. Financial instruments at variable rates expose the Company to cash flow interest rate risk. Financial instruments at fixed rate expose the Company to fair value interest rate risk. At the balance sheet date, the interest rate profile of the Company�s interest bearing financial instruments was:
iii)
--
--
Index
(Rupees in '000)
2017 2016(Rupees in '000)
1,191,1293,105,000
685,070
62,500 -
2,685,390
Fixed rate instruments
Financial liabilities
Long term financingShort term borrowings
Floating rate instruments
Financial assets
Trade debts-CBL
Financial liabilities
Long term financingLiabilities against assets subject to finance leaseShort term borrowings
355,4392,115,600
641,403
144,66511,012
3,369,184
reserve). The analysis is based on the assumption that the equity index had increased / decreased by 5% with all other variables held constant and all the Company's equity instruments moved according to the historical correlation with the index:
92
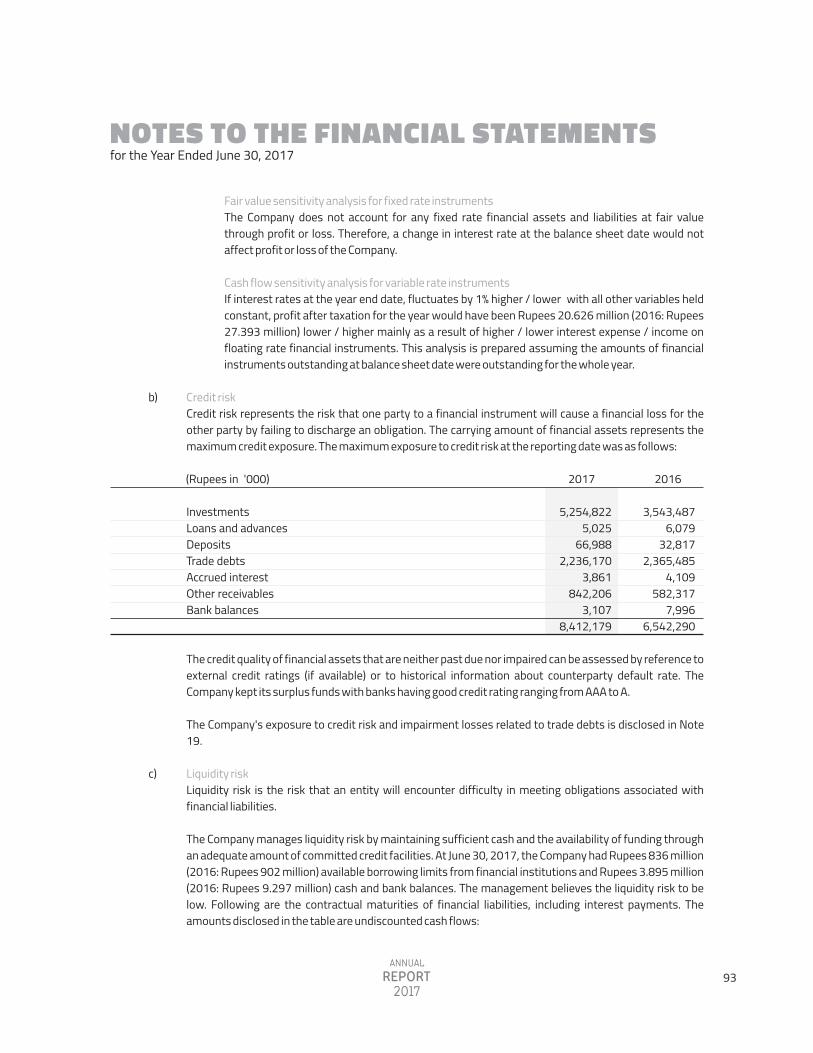
NOTES TO THE FINANCIAL STATEMENTS for the Year Ended June 30, 2017
Fair value sensitivity analysis for fixed rate instruments The Company does not account for any fixed rate financial assets and liabilities at fair value through profit or loss. Therefore, a change in interest rate at the balance sheet date would not affect profit or loss of the Company. Cash flow sensitivity analysis for variable rate instruments If interest rates at the year end date, fluctuates by 1% higher / lower with all other variables held constant, profit after taxation for the year would have been Rupees 20.626 million (2016: Rupees 27.393 million) lower / higher mainly as a result of higher / lower interest expense / income on floating rate financial instruments. This analysis is prepared assuming the amounts of financial instruments outstanding at balance sheet date were outstanding for the whole year.
The credit quality of financial assets that are neither past due nor impaired can be assessed by reference to external credit ratings (if available) or to historical information about counterparty default rate. The Company kept its surplus funds with banks having good credit rating ranging from AAA to A.
The Company's exposure to credit risk and impairment losses related to trade debts is disclosed in Note 19.
Liquidity risk Liquidity risk is the risk that an entity will encounter difficulty in meeting obligations associated with financial liabilities. The Company manages liquidity risk by maintaining sufficient cash and the availability of funding through an adequate amount of committed credit facilities. At June 30, 2017, the Company had Rupees 836 million (2016: Rupees 902 million) available borrowing limits from financial institutions and Rupees 3.895 million (2016: Rupees 9.297 million) cash and bank balances. The management believes the liquidity risk to be low. Following are the contractual maturities of financial liabilities, including interest payments. The amounts disclosed in the table are undiscounted cash flows:
2017 2016(Rupees in '000)
5,254,822 5,025
66,988 2,236,170
3,861 842,206
3,107 8,412,179
3,543,487 6,079
32,817 2,365,485
4,109 582,317
7,996 6,542,290
Investments Loans and advances Deposits Trade debts Accrued interest Other receivables Bank balances
Credit risk Credit risk represents the risk that one party to a financial instrument will cause a financial loss for the other party by failing to discharge an obligation. The carrying amount of financial assets represents the maximum credit exposure. The maximum exposure to credit risk at the reporting date was as follows:
b)
c)
93
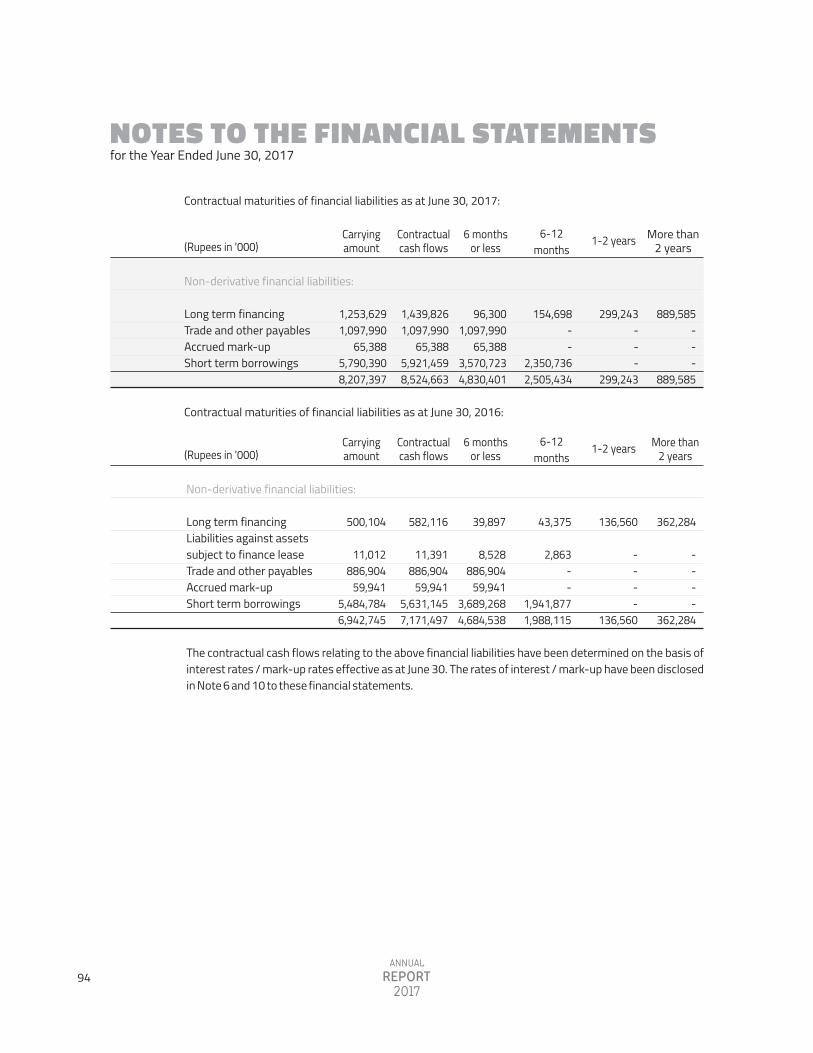
NOTES TO THE FINANCIAL STATEMENTS for the Year Ended June 30, 2017
299,243 - - -
299,243
Non-derivative financial liabilities: Long term financing Trade and other payables Accrued mark-up Short term borrowings
889,585 - - -
889,585
154,698 - -
2,350,736 2,505,434
96,300 1,097,990
65,388 3,570,723 4,830,401
1,439,826 1,097,990
65,388 5,921,459 8,524,663
1,253,629 1,097,990
65,388 5,790,390 8,207,397
1-2 years More than2 years
6-12months
6 monthsor less
Contractualcash flows
Carryingamount(Rupees in '000)
Contractual maturities of financial liabilities as at June 30, 2016:
The contractual cash flows relating to the above financial liabilities have been determined on the basis of interest rates / mark-up rates effective as at June 30. The rates of interest / mark-up have been disclosed in Note 6 and 10 to these financial statements.
1-2 years More than2 years
6-12months
6 monthsor less
Contractualcash flows
Carryingamount(Rupees in '000)
Non-derivative financial liabilities:
Long term financing Liabilities against assetssubject to finance lease Trade and other payables Accrued mark-up Short term borrowings
136,560
- - - -
136,560
43,375
2,863 - -
1,941,877 1,988,115
39,897
8,528
886,904 59,941
3,689,268 4,684,538
582,116
11,391
886,904 59,941
5,631,145 7,171,497
500,104
11,012 886,904
59,941 5,484,784 6,942,745
362,284
- - - -
362,284
Contractual maturities of financial liabilities as at June 30, 2017:
94
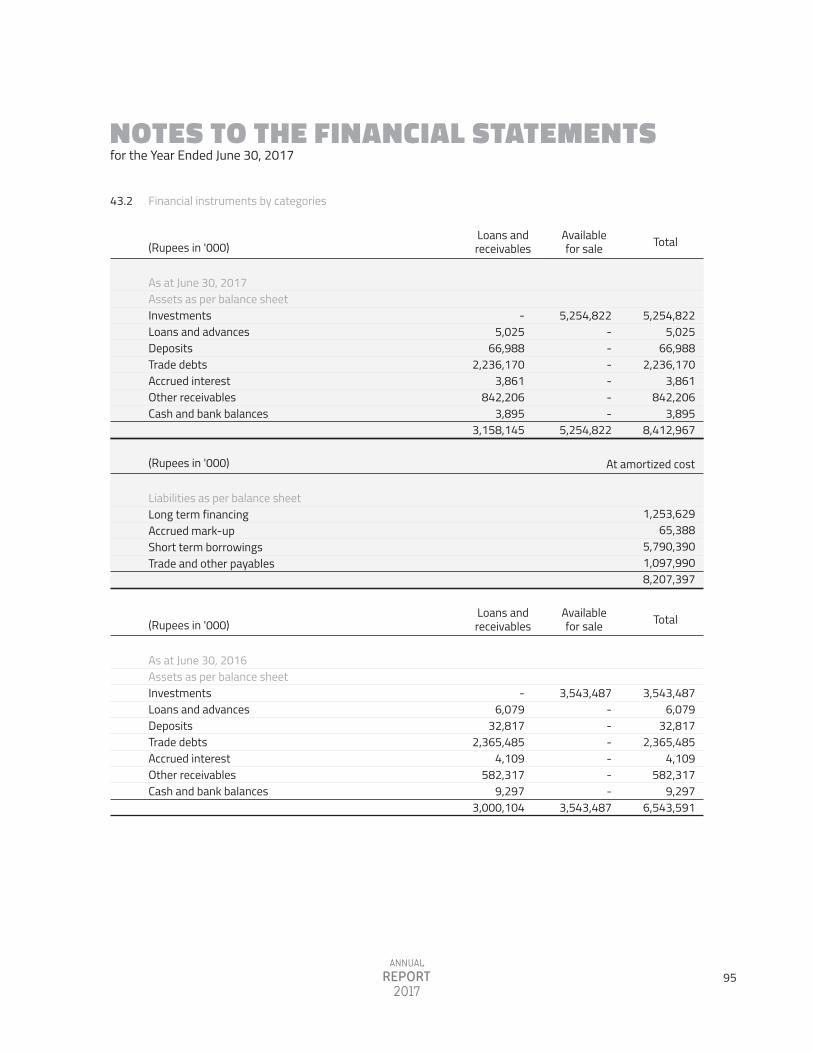
NOTES TO THE FINANCIAL STATEMENTS for the Year Ended June 30, 2017
Financial instruments by categories 43.2
(Rupees in '000)Loans andreceivables
Availablefor sale Total
5,254,822 - - - - - -
5,254,822
5,254,822 5,025
66,988 2,236,170
3,861 842,206
3,895 8,412,967
- 5,025
66,988 2,236,170
3,861 842,206
3,895 3,158,145
As at June 30, 2017Assets as per balance sheet Investments Loans and advances Deposits Trade debts Accrued interest Other receivables Cash and bank balances
(Rupees in '000) At amortized cost
1,253,629 65,388
5,790,390 1,097,990 8,207,397
Liabilities as per balance sheet Long term financing Accrued mark-up Short term borrowings Trade and other payables
(Rupees in '000)Loans andreceivables
Availablefor sale Total
3,543,487 - - - - - -
3,543,487
3,543,487 6,079
32,817 2,365,485
4,109 582,317
9,297 6,543,591
- 6,079
32,817 2,365,485
4,109 582,317
9,297 3,000,104
As at June 30, 2016Assets as per balance sheet Investments Loans and advances Deposits Trade debts Accrued interest Other receivables Cash and bank balances
95

NOTES TO THE FINANCIAL STATEMENTS for the Year Ended June 30, 2017
(Rupees in '000) At amortized cost
500,104 11,012 59,941
5,484,784 886,904
6,942,745
Liabilities as per balance sheet Long term financing Liabilities against assets subject to finance lease Accrued mark-up Short term borrowings Trade and other payables
Offsetting financial assets and financial liabilities
As on balance sheet date, recognized financial instruments are not subject to offsetting as there are no enforceable master netting arrangements and similar agreements.
Capital risk management
The Company's objectives when managing capital are to safeguard the Company's ability to continue as a going concern in order to provide returns for shareholders and benefits for other stakeholders and to maintain an optimal capital structure to reduce the cost of capital. In order to maintain or adjust the capital structure, the Company may adjust the amount of dividends to be paid to shareholders, issue new shares or sell assets to reduce debt. Consistent with others in the industry and the requirements of the lenders, the Company monitors the capital structure on the basis of gearing ratio. This ratio is calculated as borrowings divided by total capital employed. Borrowings represent long term financing and short term borrowings obtained by the Company as referred to in Note 6 and 10 respectively. Total capital employed includes 'total equity' as shown in the balance sheet plus 'borrowings'. The Company's strategy which was unchanged from last year is to maintain a gearing ratio of 50% debt and 50% equity (2016: 50% debt and 50% equity).
43.3
43.4
2017 2016(Rupees in '000)
7,044,019 6,280,186
13,324,205
52.87
5,995,900 4,551,934
10,547,834
56.84
Borrowings Total equity Total capital employed
Gearing ratio (Percentage)
The decrease in the gearing ratio resulted primarily from increase in fair value of investments of the Company.
96
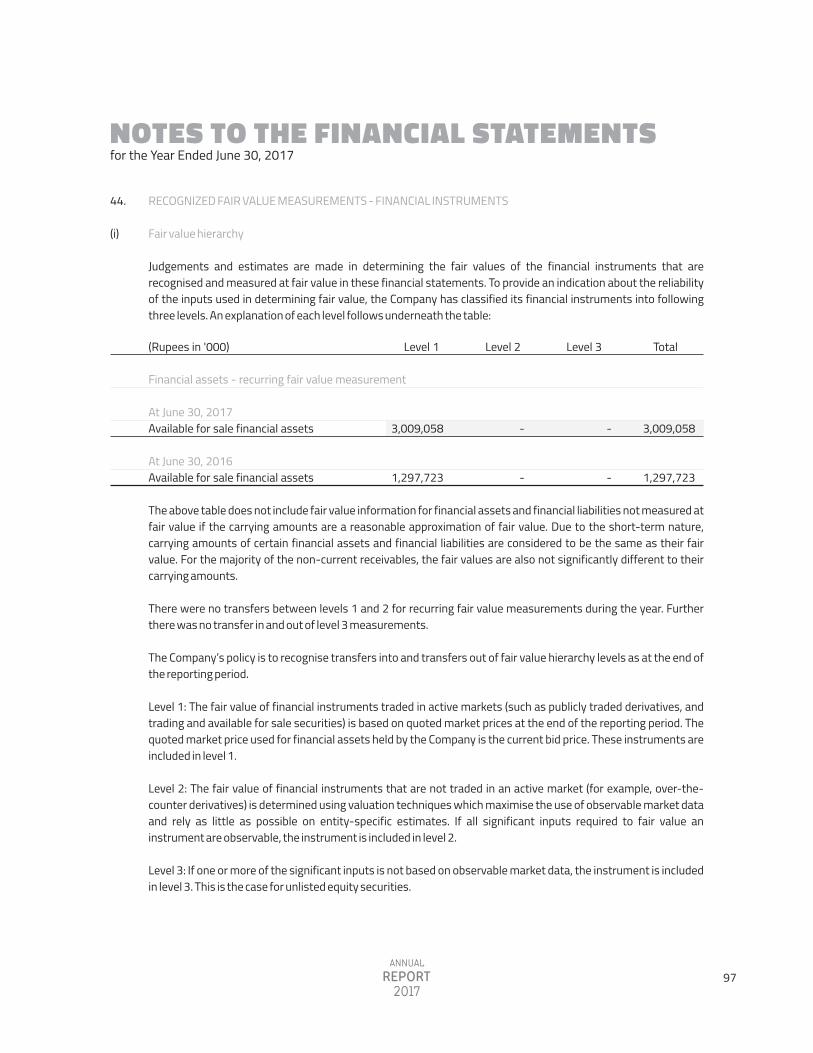
NOTES TO THE FINANCIAL STATEMENTS for the Year Ended June 30, 2017
RECOGNIZED FAIR VALUE MEASUREMENTS - FINANCIAL INSTRUMENTS Fair value hierarchy Judgements and estimates are made in determining the fair values of the financial instruments that are recognised and measured at fair value in these financial statements. To provide an indication about the reliability of the inputs used in determining fair value, the Company has classified its financial instruments into following three levels. An explanation of each level follows underneath the table:
44.
(i)
-
-
3,009,058
1,297,723
-
-
Financial assets - recurring fair value measurement
At June 30, 2017Available for sale financial assets
At June 30, 2016Available for sale financial assets
3,009,058
1,297,723
(Rupees in '000) Level 2 Level 3Level 1 Total
The above table does not include fair value information for financial assets and financial liabilities not measured at fair value if the carrying amounts are a reasonable approximation of fair value. Due to the short-term nature, carrying amounts of certain financial assets and financial liabilities are considered to be the same as their fair value. For the majority of the non-current receivables, the fair values are also not significantly different to their carrying amounts. There were no transfers between levels 1 and 2 for recurring fair value measurements during the year. Further there was no transfer in and out of level 3 measurements.
The Company�s policy is to recognise transfers into and transfers out of fair value hierarchy levels as at the end of the reporting period.
Level 1: The fair value of financial instruments traded in active markets (such as publicly traded derivatives, and trading and available for sale securities) is based on quoted market prices at the end of the reporting period. The quoted market price used for financial assets held by the Company is the current bid price. These instruments are included in level 1. Level 2: The fair value of financial instruments that are not traded in an active market (for example, over-the-counter derivatives) is determined using valuation techniques which maximise the use of observable market data and rely as little as possible on entity-specific estimates. If all significant inputs required to fair value an instrument are observable, the instrument is included in level 2.
Level 3: If one or more of the significant inputs is not based on observable market data, the instrument is included in level 3. This is the case for unlisted equity securities.
97

NOTES TO THE FINANCIAL STATEMENTS for the Year Ended June 30, 2017
The Company�s policy is to recognise transfers into and transfers out of fair value hierarchy levels as at the end of the reporting period. There were no transfers between levels 1 and 2 for recurring fair value measurements during the year. Further, there was no transfer in and out of level 3 measurements.
Valuation techniques used to determine level 2 fair values At the end of each reporting period, the management updates the assessment of the fair value of each property, taking into account the most recent independent valuations. The directors determine a property�s value within a range of reasonable fair value estimates. The best evidence of fair value is current prices in an active market for similar properties. Valuation processes The fair value of freehold and leasehold land has been determined as on June 30, 2017 by Messers Hamid Mukhtar and Company (Private) Limited, an independent valuer enrolled on panel of the State Bank of Pakistan (SBP) as per basis stated in Note 13.1.1 to the financial statements.
DATE OF AUTHORIZATION FOR ISSUE These financial statements were authorized for issue on October 02, 2017 by the Board of Directors of the Company.
(ii)
46.
Valuation techniques used to determine fair values Valuation technique used to value financial instruments includes the use of quoted market prices.
RECOGNIZED FAIR VALUE MEASUREMENTS - NON-FINANCIAL ASSETS
Fair value hierarchy Judgements and estimates are made in determining the fair values of the non-financial assets that are recognised and measured at fair value in the financial statements. To provide an indication about the reliability of the inputs used in determining fair value, the Company has classified its non-financial assets into the following three levels:
(ii)
45.
(i)
- - -
---
3,577,789 7,000
3,584,789
2,217,852 5,769
2,223,621
At June 30, 2017Land - freeholdLand - leasehold
At June 30, 2016Land - freehold Land - leasehold
(Rupees in '000) Level 2 Level 3Level 1 Total
---
- - -
3,577,789 7,000
3,584,789
2,217,852 5,769
2,223,621
98
NOTES TO THE FINANCIAL STATEMENTS for the Year Ended June 30, 2017
CORRESPONDING FIGURES Corresponding figures have been rearranged and reclassified to reflect more appropriate presentation of events and transactions for the purpose of comparison. However, no significant rearrangement and reclassification have been made in these financial statements. GENERAL Figures have been rounded off to the nearest thousand of Rupees unless otherwise stated.
47.
48.
Muhammad AnwarChief Executive Officer
Khalid BashirDirector
99
Sadiq SaleemChief Financial Officer

PATTERN OF SHAREHOLDING - (FORM �34�)as at June 30, 2017
1 1 1 1 1 1 1 1 1 2 1 1 1 1 1 2 1 1 1 1 1 1 2 2 1 1 1 1 1 1 1 1 2 2 3 1 1 1 1 1 1 1 1
522 547 293 557 167 54 52 37 28 13 7 8
23 5 4 6 8 4 4 2 2 9 3 4 1 4 4 4 4 3 3 1 1 2 1 2 2 1 2 3 1 2 1
Shareholders Total
SharesForm to Shareholders
TotalShares
Form to
1 101 501
1,001 5,001
10,001 15,001 20,001 25,001 30,001 35,001 40,001 45,001 50,001 55,001 60,001 65,001 70,001 75,001 85,001 90,001 95,001
100,001 105,001 110,001 115,001 120,001 125,001 130,001 135,001 145,001 150,001 155,001 160,001 165,001 180,001 185,001 190,001 195,001 200,001 210,001 215,001 230,001
235,001 240,001 250,001 255,001 260,001 265,001 280,001 285,001 290,001 295,001 305,001 315,001 330,001 335,001 340,001 345,001 370,001 385,001 390,001 405,001 425,001 445,001 450,001 485,001 495,001 500,001 525,001 540,001 550,001 570,001 605,001 635,001 650,001 665,001 670,001 685,001 690,001 705,001 745,001 755,001 765,001 840,001 895,001
100 500
1,000 5,000
10,000 15,000 20,000 25,000 30,000 35,000 40,000 45,000 50,000 55,000 60,000 65,000 70,000 75,000 80,000 90,000 95,000
100,000 105,000 110,000 115,000 120,000 125,000 130,000 135,000 140,000 150,000 155,000 160,000 165,000 170,000 185,000 190,000 195,000 200,000 205,000 215,000 220,000 235,000
240,000 245,000 255,000 260,000 265,000 270,000 285,000 290,000 295,000 300,000 310,000 320,000 335,000 340,000 345,000 350,000 375,000 390,000 395,000 410,000 430,000 450,000 455,000 490,000 500,000 505,000 530,000 545,000 555,000 575,000 610,000 640,000 655,000 670,000 675,000 690,000 695,000 710,000 750,000 760,000 770,000 845,000 900,000
16,321 166,006 248,016
1,520,516 1,318,563
675,810 941,979 868,137 776,635 419,935 273,080 345,574
1,143,303 264,953 235,500 378,112 546,366 288,082 307,598 175,007 187,199 891,102 307,742 431,305 111,626 471,263 489,331 510,081 530,055 412,038 449,729 150,463 158,198 320,420 165,709 367,500 376,910 193,780 400,000 608,042 210,275 437,146 233,500
240,000 241,888 254,329 256,931 262,867 267,936 280,310 286,426 291,981 595,854 306,279 317,777 333,297 339,543 343,058 698,335 370,500 389,158 391,743 406,096 426,622 450,000 904,444 974,217 500,000 500,611 527,799 542,003 552,157 571,848 609,710 635,905
1,300,550 1,334,013 2,015,184
689,997 690,306 707,805 748,018 755,985 767,324 842,782 897,103
100

as at June 30, 2017
1 1 1 1 1
2,462
1 1 1 1 1
Shareholders Total
SharesForm to Shareholders
TotalShares
Form to
1,330,001 1,385,001 1,590,001 1,675,001 1,720,001
3,600,001 4,355,001 5,925,001 6,850,001 7,385,001
1,335,000 1,390,000 1,595,000 1,680,000 1,725,000
3,605,000 4,360,000 5,930,000 6,855,000 7,390,000
1,335,000 1,389,541 1,594,629 1,677,239 1,724,601
3,603,635 4,359,891 5,929,364 6,855,000 7,389,502
80,000,000
PATTERN OF SHAREHOLDING - (FORM �34�)
101
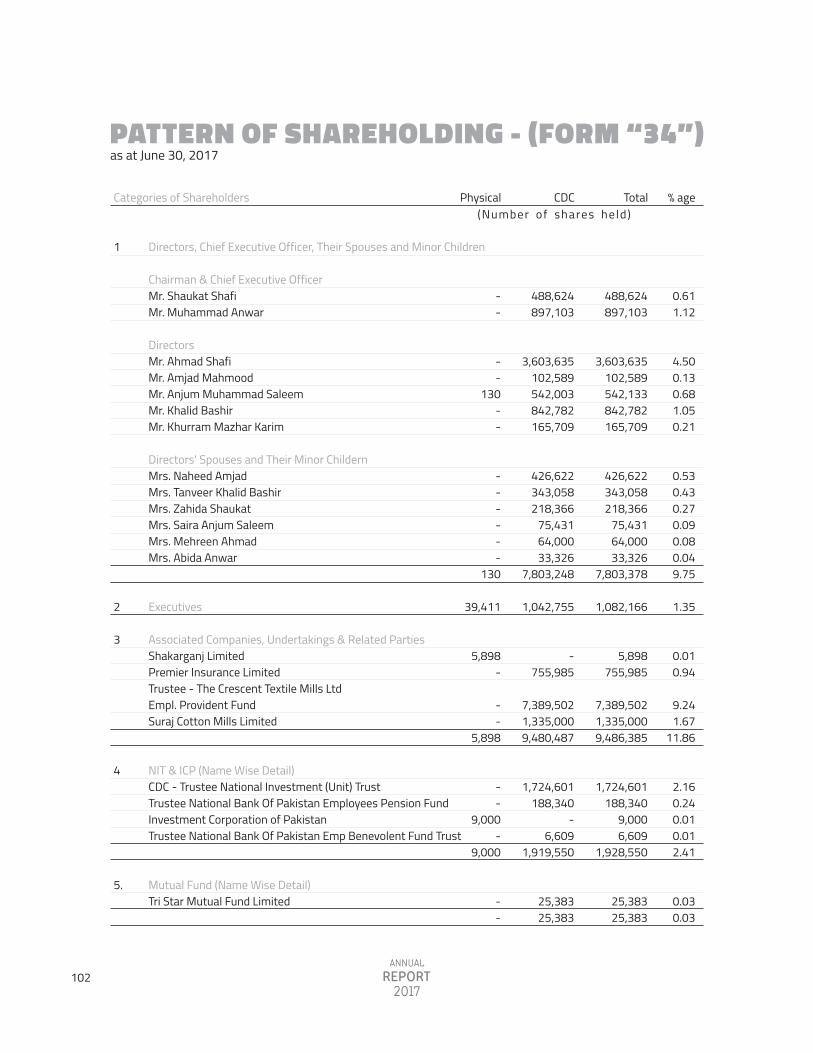
as at June 30, 2017
Categories of Shareholders % ageTotalCDCPhysical
PATTERN OF SHAREHOLDING - (FORM �34�)
Directors, Chief Executive Officer, Their Spouses and Minor Children
Chairman & Chief Executive OfficerMr. Shaukat ShafiMr. Muhammad Anwar
DirectorsMr. Ahmad ShafiMr. Amjad MahmoodMr. Anjum Muhammad SaleemMr. Khalid BashirMr. Khurram Mazhar Karim
Directors' Spouses and Their Minor ChildernMrs. Naheed AmjadMrs. Tanveer Khalid BashirMrs. Zahida ShaukatMrs. Saira Anjum SaleemMrs. Mehreen AhmadMrs. Abida Anwar
Executives
Associated Companies, Undertakings & Related PartiesShakarganj LimitedPremier Insurance LimitedTrustee - The Crescent Textile Mills LtdEmpl. Provident FundSuraj Cotton Mills Limited
NIT & ICP (Name Wise Detail)CDC - Trustee National Investment (Unit) TrustTrustee National Bank Of Pakistan Employees Pension FundInvestment Corporation of PakistanTrustee National Bank Of Pakistan Emp Benevolent Fund Trust
Mutual Fund (Name Wise Detail)Tri Star Mutual Fund Limited
1
2
3
4
5.
488,624 897,103
3,603,635 102,589 542,133 842,782 165,709
426,622 343,058 218,366
75,431 64,000 33,326
7,803,378
1,082,166
5,898 755,985
7,389,502 1,335,000 9,486,385
1,724,601 188,340
9,000 6,609
1,928,550
25,383 25,383
0.61 1.12
4.50 0.13 0.68 1.05 0.21
0.53 0.43 0.27 0.09 0.08 0.04 9.75
1.35
0.01 0.94
9.24 1.67
11.86
2.16 0.24 0.01 0.01 2.41
0.03 0.03
488,624 897,103
3,603,635 102,589 542,003 842,782 165,709
426,622 343,058 218,366
75,431 64,000 33,326
7,803,248
1,042,755
-755,985
7,389,502 1,335,000 9,480,487
1,724,601
188,340 -
6,609 1,919,550
25,383 25,383
--
--
130 --
------
130
39,411
5,898 -
--
5,898
--
9,000-
9,000
--
(Number of shares held)
102
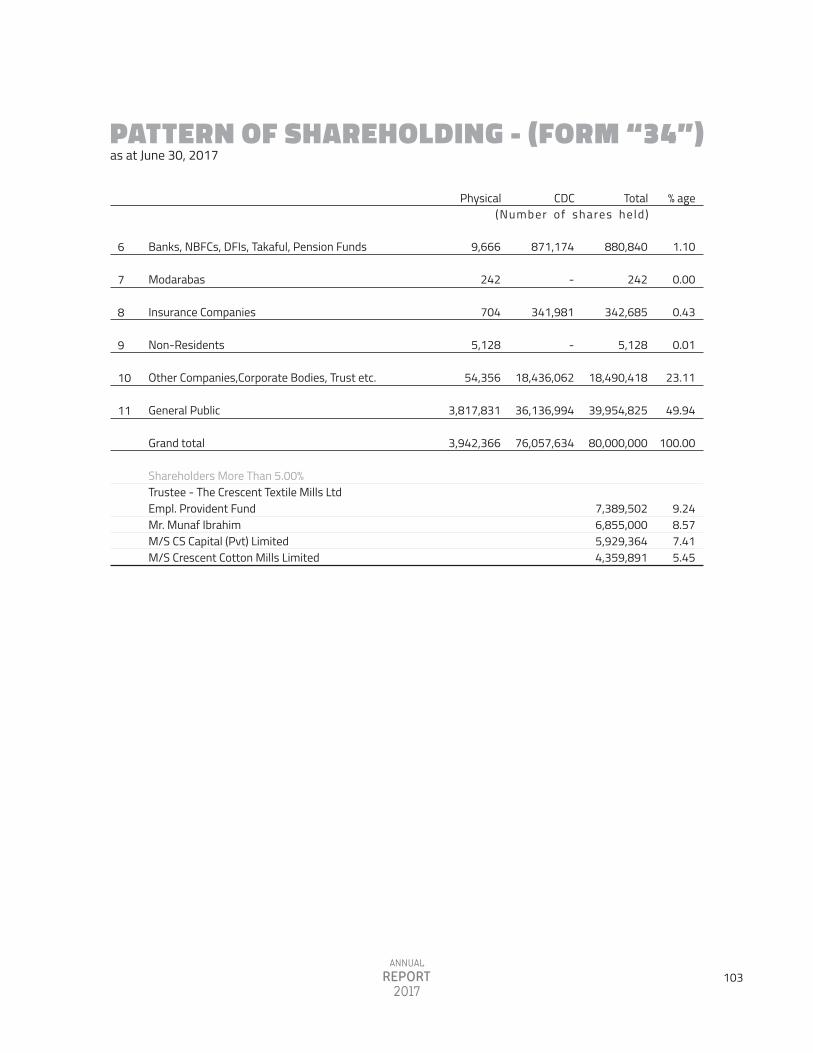
as at June 30, 2017
% ageTotalCDCPhysical
Banks, NBFCs, DFIs, Takaful, Pension Funds
Modarabas
Insurance Companies
Non-Residents
Other Companies,Corporate Bodies, Trust etc.
General Public
Grand total
Shareholders More Than 5.00%Trustee - The Crescent Textile Mills LtdEmpl. Provident FundMr. Munaf IbrahimM/S CS Capital (Pvt) LimitedM/S Crescent Cotton Mills Limited
6
7
8
9
10
11
880,840
242
342,685
5,128
18,490,418
39,954,825
80,000,000
7,389,502 6,855,000 5,929,364 4,359,891
1.10
0.00
0.43
0.01
23.11
49.94
100.00
9.24 8.57 7.41 5.45
871,174
-
341,981
-
18,436,062
36,136,994
76,057,634
9,666
242
704
5,128
54,356
3,817,831
3,942,366
PATTERN OF SHAREHOLDING - (FORM �34�)
(Number of shares held)
103
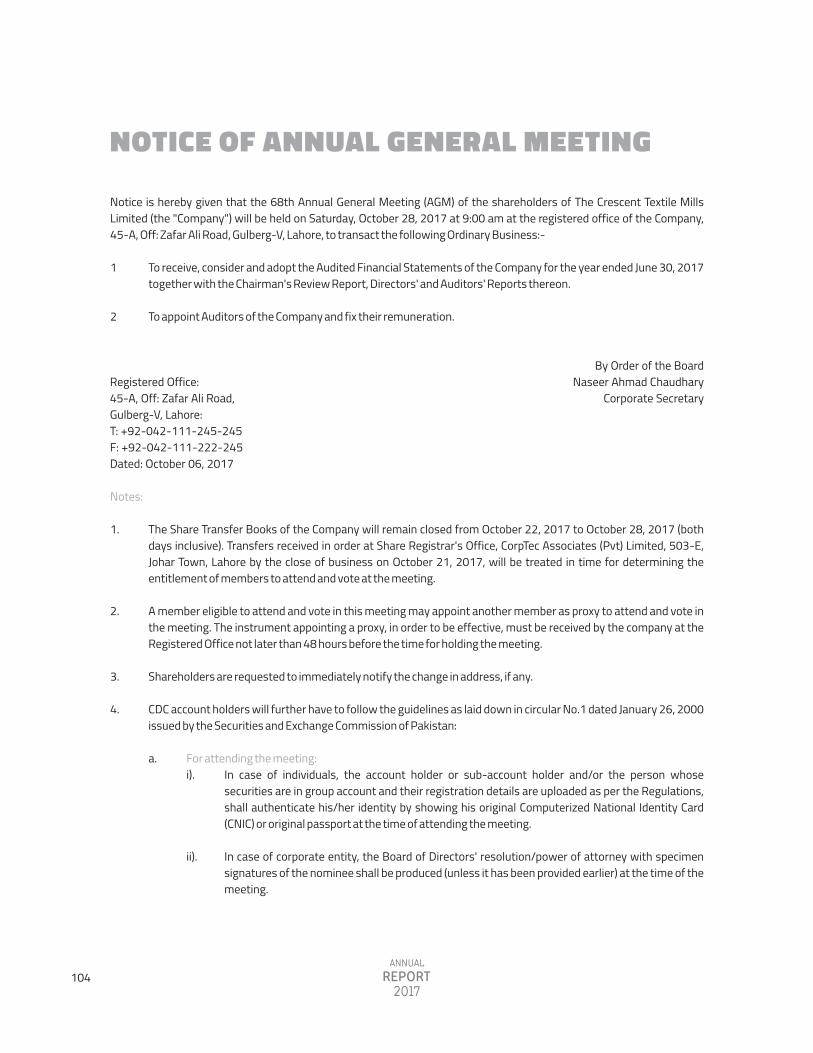
Notice is hereby given that the 68th Annual General Meeting (AGM) of the shareholders of The Crescent Textile Mills Limited (the "Company") will be held on Saturday, October 28, 2017 at 9:00 am at the registered office of the Company, 45-A, Off: Zafar Ali Road, Gulberg-V, Lahore, to transact the following Ordinary Business:-
1
2
Notes:
1.
2.
3.
4.
To receive, consider and adopt the Audited Financial Statements of the Company for the year ended June 30, 2017 together with the Chairman's Review Report, Directors' and Auditors' Reports thereon.
To appoint Auditors of the Company and fix their remuneration.
The Share Transfer Books of the Company will remain closed from October 22, 2017 to October 28, 2017 (both days inclusive). Transfers received in order at Share Registrar's Office, CorpTec Associates (Pvt) Limited, 503-E, Johar Town, Lahore by the close of business on October 21, 2017, will be treated in time for determining the entitlement of members to attend and vote at the meeting.
A member eligible to attend and vote in this meeting may appoint another member as proxy to attend and vote in the meeting. The instrument appointing a proxy, in order to be effective, must be received by the company at the Registered Office not later than 48 hours before the time for holding the meeting.
Shareholders are requested to immediately notify the change in address, if any.
CDC account holders will further have to follow the guidelines as laid down in circular No.1 dated January 26, 2000 issued by the Securities and Exchange Commission of Pakistan:
NOTICE OF ANNUAL GENERAL MEETING
For attending the meeting:i).
ii).
a.In case of individuals, the account holder or sub-account holder and/or the person whose securities are in group account and their registration details are uploaded as per the Regulations, shall authenticate his/her identity by showing his original Computerized National Identity Card (CNIC) or original passport at the time of attending the meeting. In case of corporate entity, the Board of Directors' resolution/power of attorney with specimen signatures of the nominee shall be produced (unless it has been provided earlier) at the time of the meeting.
Registered Office:45-A, Off: Zafar Ali Road, Gulberg-V, Lahore:T: +92-042-111-245-245F: +92-042-111-222-245Dated: October 06, 2017
By Order of the BoardNaseer Ahmad Chaudhary
Corporate Secretary
104
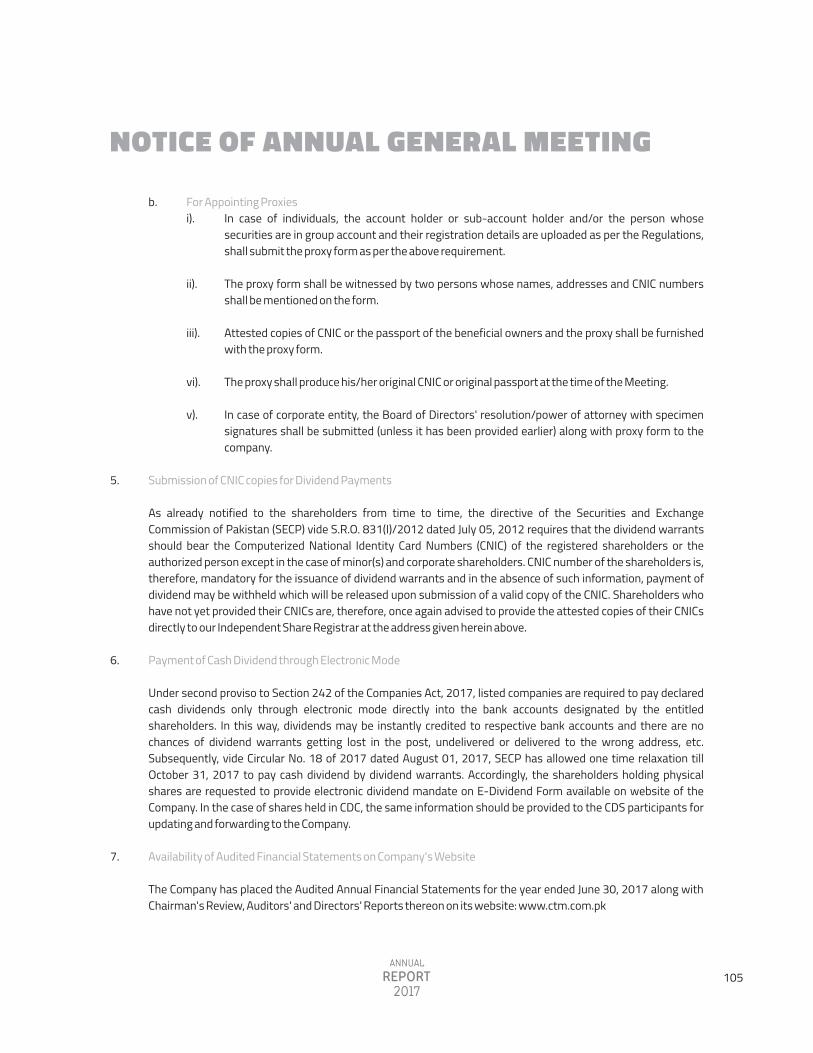
NOTICE OF ANNUAL GENERAL MEETING
For Appointing Proxiesi).
ii).
iii).
vi).
v).
b.In case of individuals, the account holder or sub-account holder and/or the person whose securities are in group account and their registration details are uploaded as per the Regulations, shall submit the proxy form as per the above requirement. The proxy form shall be witnessed by two persons whose names, addresses and CNIC numbers shall be mentioned on the form.
Attested copies of CNIC or the passport of the beneficial owners and the proxy shall be furnished with the proxy form.
The proxy shall produce his/her original CNIC or original passport at the time of the Meeting.
In case of corporate entity, the Board of Directors' resolution/power of attorney with specimen signatures shall be submitted (unless it has been provided earlier) along with proxy form to the company.
5.
6.
7.
Submission of CNIC copies for Dividend Payments
As already notified to the shareholders from time to time, the directive of the Securities and Exchange Commission of Pakistan (SECP) vide S.R.O. 831(I)/2012 dated July 05, 2012 requires that the dividend warrants should bear the Computerized National Identity Card Numbers (CNIC) of the registered shareholders or the authorized person except in the case of minor(s) and corporate shareholders. CNIC number of the shareholders is, therefore, mandatory for the issuance of dividend warrants and in the absence of such information, payment of dividend may be withheld which will be released upon submission of a valid copy of the CNIC. Shareholders who have not yet provided their CNICs are, therefore, once again advised to provide the attested copies of their CNICs directly to our Independent Share Registrar at the address given herein above.
Payment of Cash Dividend through Electronic Mode
Under second proviso to Section 242 of the Companies Act, 2017, listed companies are required to pay declared cash dividends only through electronic mode directly into the bank accounts designated by the entitled shareholders. In this way, dividends may be instantly credited to respective bank accounts and there are no chances of dividend warrants getting lost in the post, undelivered or delivered to the wrong address, etc. Subsequently, vide Circular No. 18 of 2017 dated August 01, 2017, SECP has allowed one time relaxation till October 31, 2017 to pay cash dividend by dividend warrants. Accordingly, the shareholders holding physical shares are requested to provide electronic dividend mandate on E-Dividend Form available on website of the Company. In the case of shares held in CDC, the same information should be provided to the CDS participants for updating and forwarding to the Company.
Availability of Audited Financial Statements on Company's Website
The Company has placed the Audited Annual Financial Statements for the year ended June 30, 2017 along with Chairman's Review, Auditors' and Directors' Reports thereon on its website: www.ctm.com.pk
105
8.
9.
10.
NOTICE OF ANNUAL GENERAL MEETING
Deduction of Income Tax from Dividend @ Revised Rates
Pursuant to the amendment in section 150 of the Income Tax Ordinance, 2001 through Finance Act, 2017, the revised Income Tax Rates on Dividend Income are as follows:
Income Tax Return Filer 15% Income Tax Return Non Filer 20%
Income Tax will be deducted on the basis of Active Tax Payers List posted on the Federal Board of Revenue website. Members seeking exemption from deduction of income tax or are eligible for deduction at reduced tax are requested to provide us valid tax certificate or documentary evidence as the case may be. Members desiring non-deduction of Zakat are also requested to submit a valid declaration for non-deduction of Zakat, if not provided earlier.
The FBR has clarified that shareholders accounts jointly held by filers and Non-filers shall be dealt with separately and in such particular situation, each account holder is to be treated individually as either a filer or a non-filer and tax will be deducted according to his shareholding. If the share is not ascertainable then each account holder will be assumed to hold equal proportion of shares and the deduction will be made accordingly. Therefore, in order to avoid deduction of tax at a higher rate, the joint account holders are requested to provide the below details of their shareholding to the Share Registrar of the Company latest by the AGM date.
Circulation of Financial Statements to the Members
Pursuant to the Securities and Exchange Commission of Pakistan's notification S.R.O 470(I)/2016 dated May 31, 2016, the shareholders of The Crescent Textile Mills Limited in 67th AGM of the Company held on October 31, 2016 had accorded their consent for transmission of annual reports including annual audited accounts, notices of annual general meetings and other information contained therein of the Company through CD or DVD or USB instead of transmitting the same in hard copies. The shareholders who wish to receive hard copy of the aforesaid documents may send to the Company Secretary / Share Registrar, the Standard Request Form available on the website of the Company and the Company will supply hard copies of the aforesaid document to the shareholders on demand, free of cost, within one week of such demand. The shareholders who intends to receive the annual report including the notice of meeting through e-mail are requested to provide their written consent on the Form available on the Company's website: www.ctm.com.pk
Unclaimed Dividend and Bonus Shares
Shareholders, who by any reason, could not claim their dividend or bonus shares or did not collect their physical shares, if any, are advised to contact our Share Registrar M/S CorpTec Associates (Private) Limited, 503-E, Johar Town, Lahore, to collect/enquire about their unclaimed dividend or pending shares, if any. In compliance with Section 244 of the Companies Act, 2017, after having completed the stipulated procedure, all such dividend and shares outstanding for a period of 3 years or more from the date due and payable shall be deposited to the credit of Federal Government in case of unclaimed dividend and in case of shares, shall be delivered to the SECP.
Folio/CDCAccount No.
Name ofshareholder
CNIC Shareholding Totalshares
Principal/joint shareholder
106

11.
NOTICE OF ANNUAL GENERAL MEETING
Video Conference Facility
Pursuant to the provisions of the Companies Act, 2017, the shareholders residing in a city and holding at least 10% of the total paid up share capital may demand the Company to provide the facility of video-link for participating in the meeting. The demand for video-link facility shall be received by the Share Registrar at the address given herein above at least 7 days prior to the date of the meeting on the Standard Request Form available on the Company's website: www.ctm.com.pk
107

108
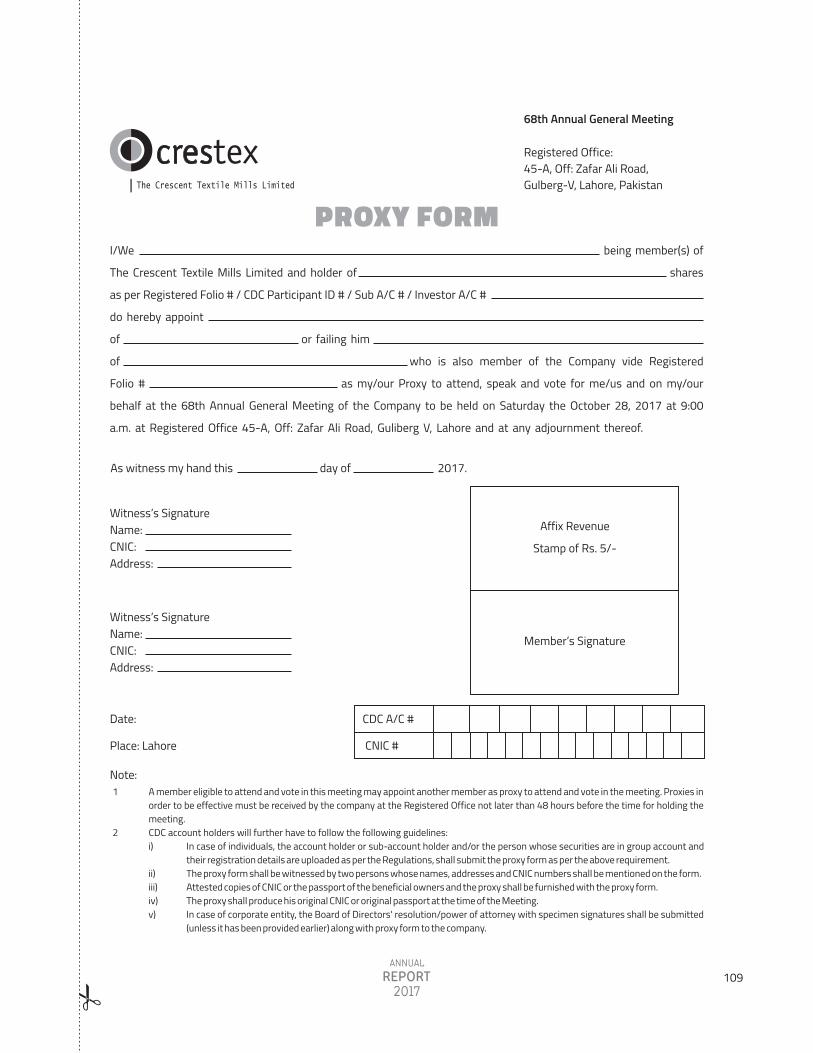
68th Annual General Meeting
Registered Office:45-A, Off: Zafar Ali Road,Gulberg-V, Lahore, Pakistan
PROXY FORM
Affix Revenue
Stamp of Rs. 5/-
Member�s Signature
As witness my hand this day of 2017.
Witness�s SignatureName:CNIC:Address:
Witness�s SignatureName:CNIC:Address:
I/We being member(s) of
The Crescent Textile Mills Limited and holder of shares
as per Registered Folio # / CDC Participant ID # / Sub A/C # / Investor A/C #
do hereby appoint
of or failing him
of who is also member of the Company vide Registered
Folio # as my/our Proxy to attend, speak and vote for me/us and on my/our
behalf at the 68th Annual General Meeting of the Company to be held on Saturday the October 28, 2017 at 9:00
a.m. at Registered Office 45-A, Off: Zafar Ali Road, Guliberg V, Lahore and at any adjournment thereof.
CNIC #
CDC A/C #Date:
Place: Lahore
In case of individuals, the account holder or sub-account holder and/or the person whose securities are in group account and their registration details are uploaded as per the Regulations, shall submit the proxy form as per the above requirement.The proxy form shall be witnessed by two persons whose names, addresses and CNIC numbers shall be mentioned on the form. Attested copies of CNIC or the passport of the beneficial owners and the proxy shall be furnished with the proxy form.The proxy shall produce his original CNIC or original passport at the time of the Meeting. In case of corporate entity, the Board of Directors' resolution/power of attorney with specimen signatures shall be submitted (unless it has been provided earlier) along with proxy form to the company.
i)
ii)iii)iv)v)
A member eligible to attend and vote in this meeting may appoint another member as proxy to attend and vote in the meeting. Proxies in order to be effective must be received by the company at the Registered Office not later than 48 hours before the time for holding the meeting.CDC account holders will further have to follow the following guidelines:
Note:1
2
109

110


111
1
2
45
V
2017 28
V- 45-A
68
2017

112
Related Documents