Annual report including audited financial statements as at 31st December 2016 East Capital (formerly East Capital (Lux)) Société d'investissement à capital variable incorporated in Luxembourg R.C.S. Luxembourg B 121 268

Welcome message from author
This document is posted to help you gain knowledge. Please leave a comment to let me know what you think about it! Share it to your friends and learn new things together.
Transcript
Annual report including audited financial statements as at 31st December 2016
East Capital (formerly East Capital (Lux))
Société d'investissement à capital variable incorporated in Luxembourg R.C.S. Luxembourg B 121 268

No subscription can be received on the basis of this financial report. Subscriptions are only valid if made on the basis of the current prospectus supplemented by the latest annual report and the most recent semi-annual report, if published thereafter.
Contents
East Capital 1
Organisation .................................................................................................................................................... 2
Report on activities by the Board of Directors .................................................................................................. 4
Report of the Réviseur d'Entreprises agréé .......................................................................................................7
Combined statement of net assets .................................................................................................................... 8
Combined statement of operations and other changes in net assets.................................................................. 9
East Capital Russia .......................................................................................................................................... 10 Statement of net assets .................................................................................................................................................................. 10 Statement of operations and other changes in net assets .............................................................................................................. 11 Statistical information .................................................................................................................................................................... 12 Statement of investments and other net assets .............................................................................................................................. 15
East Capital Baltics .......................................................................................................................................... 18 Statement of net assets ...................................................................................................................................................................18 Statement of operations and other changes in net assets .............................................................................................................. 19 Statistical information ................................................................................................................................................................... 20 Statement of investments and other net assets ............................................................................................................................. 22
East Capital Balkans ....................................................................................................................................... 24 Statement of net assets .................................................................................................................................................................. 24 Statement of operations and other changes in net assets ............................................................................................................. 25 Statistical information ................................................................................................................................................................... 26 Statement of investments and other net assets ............................................................................................................................. 28
East Capital Turkey ........................................................................................................................................ 30 Statement of net assets .................................................................................................................................................................. 30 Statement of operations and other changes in net assets .............................................................................................................. 31 Statistical information ................................................................................................................................................................... 32 Statement of investments and other net assets ............................................................................................................................. 35
East Capital Eastern Europe ............................................................................................................................ 37 Statement of net assets .................................................................................................................................................................. 37 Statement of operations and other changes in net assets ............................................................................................................. 38 Statistical information ................................................................................................................................................................... 39 Statement of investments and other net assets ............................................................................................................................. 42
East Capital Emerging Asia ............................................................................................................................. 45 Statement of net assets .................................................................................................................................................................. 45 Statement of operations and other changes in net assets ............................................................................................................. 46 Statistical information ................................................................................................................................................................... 47 Statement of investments and other net assets ............................................................................................................................. 49
East Capital China Environmental .................................................................................................................. 52 Statement of net assets .................................................................................................................................................................. 52 Statement of operations and other changes in net assets ............................................................................................................. 53 Statistical information ................................................................................................................................................................... 54 Statement of investments and other net assets ............................................................................................................................. 55
East Capital Global Frontier Markets .............................................................................................................. 57 Statement of net assets .................................................................................................................................................................. 57 Statement of operations and other changes in net assets ............................................................................................................. 58 Statistical information ................................................................................................................................................................... 59 Statement of investments and other net assets ............................................................................................................................. 62
Notes to the financial statements.................................................................................................................... 65
Additional Information (unaudited)................................................................................................................ 71
Organisation
East Capital 2
Registered Office 11, rue Sainte-Zithe L-2763 Luxembourg Board of Directors Karine Hirn (since 14th June 2016) Partner East Capital Peter Elam Håkansson Chairman and Chief Investment Officer East Capital Paul Carr (until 11th May 2016) Chief Executive Officer East Capital Asset Management S.A., Luxembourg Louise Hedberg Head of Corporate Governance & Sustainability East Capital International AB, Stockholm Albin Rosengren (until 11th May 2016) Partner East Capital Johan Wigh (since 14th June 2016) Partner Advokatfirman Törngren Magnell, Stockholm Jérôme Wigny Partner Elvinger Hoss Prussen, Luxembourg Management Company East Capital Asset Management S.A. 11, rue Sainte-Zithe L-2763 Luxembourg Board of Directors Karine Hirn of the Management Company Partner East Capital Peter Elam Håkansson Chairman and Chief Investment Officer East Capital Albin Rosengren Partner East Capital Paul Carr (since 2nd June 2016) Chief Executive Officer East Capital Asset Management S.A., Luxembourg Johan Wigh (until 11th May 2016) Partner Advokatfirman Törngren Magnell, Stockholm Conducting persons Paul Carr of the Management Company Chief Executive Officer East Capital Asset Management S.A., Luxembourg Magnus Lekander General Counsel East Capital International AB, Stockholm
Organisation (continued)
East Capital 3
Tim Ohlin Risk Manager East Capital Asset Management S.A., Luxembourg Depositary and Paying Agent Skandinaviska Enskilda Banken S.A. in Luxembourg 4, rue Peternelchen L-2370 Howald Central Administration Agent SEB Fund Services S.A. 4, rue Peternelchen L-2370 Howald Administration Agent, Registrar European Fund Administration S.A. and Transfer Agent 2, rue d'Alsace L-1017 Luxembourg Investment Manager East Capital AB, Stockholm (until 1st December 2016) Kungsgatan, 33 Box 1364 SE-111 93 Stockholm Intragroup Investment Advisors East Capital (Dubai) Limited (since 1st December 2016) Office 1701D, 17th floor, North Tower, Emirates Financial Towers PO Box 507035, DIFC, Dubai, United Arab Emirates East Capital Asia Ltd 9/F Wyndham Place 40 - 44 Wyndham Street Central, Hong Kong East Capital (Moscow) LLC 125009, Romanov lane, 4 bldg. 2 Moscow, Russia Auditor KPMG Luxembourg, Société coopérative 39, avenue John F. Kennedy L-1855 Luxembourg Legal Advisers Elvinger Hoss Prussen, Luxembourg 2, place Winston Churchill L-1340 Luxembourg
Report on activities by the Board of Directors
East Capital 4
Market Comment 2016 IN A NUTSHELL Following the highly anticipated first US rate hike in over nine years in December 2015, the year 2016 started with very high volatility. January 2016 was one of the worst ever months for global equity markets, the sell-off being triggered by trade suspension on Chinese onshore stock exchanges due to an ill-advised circuit breaker. Markets recovered however quite quickly, supported by a rebound in commodities prices and subsequently oil producing countries’ higher appetite to invest their petrodollars in emerging markets. As global risk appetite rose, capital started to flow back into emerging markets. In March 2016 investors poured close to 37bn USD into emerging markets stocks and bonds, the highest amount in almost two years. Brexit referendum’s result in June was unexpected and created shock waves across all asset classes. However, once the shock was behind, the UK decision’s effect turned out to be positive on markets as worries about monetary policy tightening globally subsided, investors counting on the fact that economic and political headwinds in the UK and Europe would require central banks’ and governments’ support and a low interest rate environment for a longer time. Another important event in June was the MSCI annual review. The positive decision on Pakistan’s future reclassification from frontier to emerging market was one of the main reasons for the Pakistan market’s strong performance for 2016, up 51.4% for the full year. On the flip side, MSCI decided that the Chinese onshore equity markets’ development, despite ground breaking reforms was still not adequate for A-shares to be included. Over the year, A-shares actually did not recover from the January rout and ended 2016 with a -17.3% return despite an improvement in the overall sentiment towards China throughout the period and the launch of the Shenzhen Connect in December. The rally in commodity prices of oil, nickel, copper, and coal, after a weak start, was another major feature of the whole year of 2016. Many of these commodities such as coal, aluminium and iron ore have been and still are impacted by supply-side reforms in China which reduced the overcapacity situation in some key sectors. The OPEC and non-OPEC members’ agreement on oil production cut in November 2016 was also significant and should guarantee more stable crude oil prices in 2017 compared to recent years. Trump’s election triggered a massive reversal of interest for commodities stocks with implications across all markets, as he pledged during the campaign and the transition period, a loose fiscal policy in order to finance large infrastructure projects. This led in turn to expectations of higher inflation and interest rates. The Fed raised interest rates by 25 basis points in December 2016 and it is generally expected to raise rates by another three-quarter points in 2017 compared to two expected in September 2016.
Among frontier markets, top performing markets are to be found among some oil-producing countries such as Kazakhstan (+62.4%) and other countries that confirmed their reform ambitions such as Vietnam (+17.1%) progressing on the foreign investor limitations or Argentina (+25.3%) under the new presidency. Egypt and Nigeria underwent massive and overdue devaluations of their currencies and were severely underperforming. Among all the markets we invest into, Russia’s development is worth highlighting. Russia made a phenomenal comeback and finished the year with a 61% gain. This is partly explained by a recovery of oil price, but we also saw a number of our key positions reporting remarkably strong numbers, confirming the view that the worst is behind for the Russian economy, supported by a historic low inflation rate and expectations of rate cuts. The Russian government has put more focus on structural reforms and the market also benefited from a compelling dividend story, with already high direct yield expected to increase as discussion on state-controlled listed companies’ dividend payout is ongoing. Investor sentiment turned also more positive on expectations of a better US-Russia dialogue under the new US administration. The second largest market in our Eastern European investment universe, Turkey, had a very volatile year. In the aftermath of the failed state coup in July, the political situation has developed in a negative way and we now see an impact of the Turkish economy, with among others strong pressure on the Lira which lost 14.2% under the year and the equity market, down 6.2% in 2016. In Asia, markets also had an eventful year. Among the noteworthy developments, expectations of CNY depreciation waned during the year despite an actual 7% drop of the Chinese currency versus the USD and strong capital outflows pressure. Taiwan had a good year, up 22.5%. In China, H-shares outperformed A-shares in a significant way, +4.7% vs -17.3%. 2016 was a year of reforms for India. The very important goods and services tax was approved in August and will be implemented in 2017. In November, the government introduced an unprecedented demonetisation reform more probably delaying the earnings recovery but positive for the long-term development of this market, which ended the year more or less flat.
Report on activities by the Board of Directors
East Capital 5
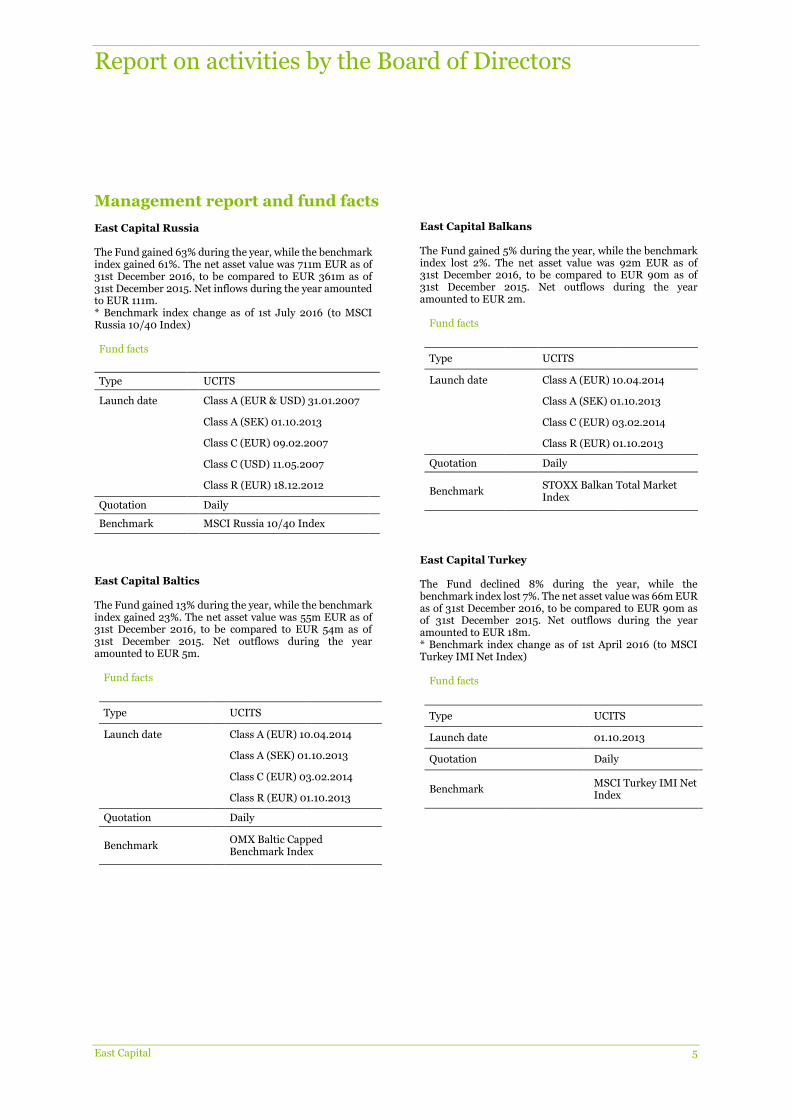
Management report and fund facts East Capital Russia The Fund gained 63% during the year, while the benchmark index gained 61%. The net asset value was 711m EUR as of 31st December 2016, to be compared to EUR 361m as of 31st December 2015. Net inflows during the year amounted to EUR 111m. * Benchmark index change as of 1st July 2016 (to MSCI Russia 10/40 Index) Fund facts
Type UCITS
Launch date Class A (EUR & USD) 31.01.2007
Class A (SEK) 01.10.2013
Class C (EUR) 09.02.2007
Class C (USD) 11.05.2007
Class R (EUR) 18.12.2012
Quotation Daily
Benchmark MSCI Russia 10/40 Index
East Capital Baltics The Fund gained 13% during the year, while the benchmark index gained 23%. The net asset value was 55m EUR as of 31st December 2016, to be compared to EUR 54m as of 31st December 2015. Net outflows during the year amounted to EUR 5m.
Fund facts
Type UCITS
Launch date Class A (EUR) 10.04.2014
Class A (SEK) 01.10.2013
Class C (EUR) 03.02.2014
Class R (EUR) 01.10.2013
Quotation Daily
Benchmark OMX Baltic Capped Benchmark Index
East Capital Balkans The Fund gained 5% during the year, while the benchmark index lost 2%. The net asset value was 92m EUR as of 31st December 2016, to be compared to EUR 90m as of 31st December 2015. Net outflows during the year amounted to EUR 2m.
Fund facts
Type UCITS
Launch date Class A (EUR) 10.04.2014
Class A (SEK) 01.10.2013
Class C (EUR) 03.02.2014
Class R (EUR) 01.10.2013
Quotation Daily
Benchmark STOXX Balkan Total Market Index
East Capital Turkey The Fund declined 8% during the year, while the benchmark index lost 7%. The net asset value was 66m EUR as of 31st December 2016, to be compared to EUR 90m as of 31st December 2015. Net outflows during the year amounted to EUR 18m. * Benchmark index change as of 1st April 2016 (to MSCI Turkey IMI Net Index)
Fund facts
Type UCITS
Launch date 01.10.2013
Quotation Daily
Benchmark MSCI Turkey IMI Net Index
Report on activities by the Board of Directors
East Capital 6
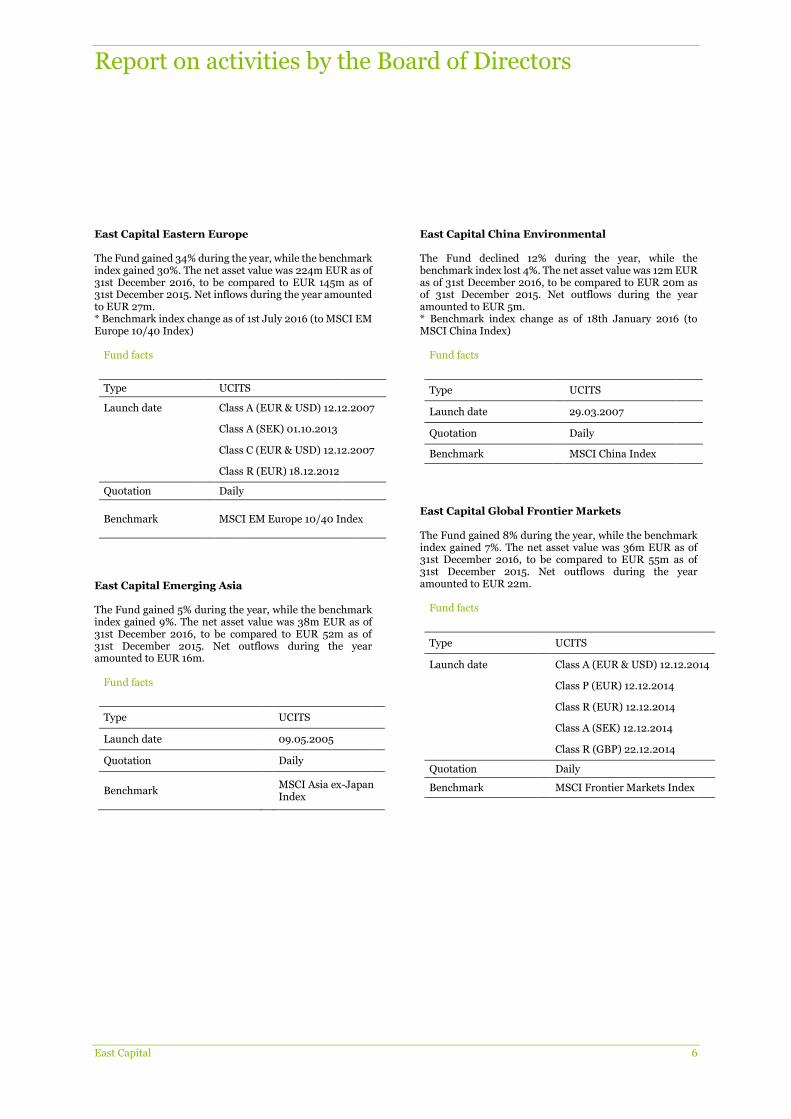
East Capital Eastern Europe The Fund gained 34% during the year, while the benchmark index gained 30%. The net asset value was 224m EUR as of 31st December 2016, to be compared to EUR 145m as of 31st December 2015. Net inflows during the year amounted to EUR 27m. * Benchmark index change as of 1st July 2016 (to MSCI EM Europe 10/40 Index)
Fund facts
Type UCITS
Launch date Class A (EUR & USD) 12.12.2007
Class A (SEK) 01.10.2013
Class C (EUR & USD) 12.12.2007
Class R (EUR) 18.12.2012
Quotation Daily
Benchmark MSCI EM Europe 10/40 Index
East Capital Emerging Asia The Fund gained 5% during the year, while the benchmark index gained 9%. The net asset value was 38m EUR as of 31st December 2016, to be compared to EUR 52m as of 31st December 2015. Net outflows during the year amounted to EUR 16m.
Fund facts
Type UCITS
Launch date 09.05.2005
Quotation Daily
Benchmark MSCI Asia ex-Japan Index
East Capital China Environmental The Fund declined 12% during the year, while the benchmark index lost 4%. The net asset value was 12m EUR as of 31st December 2016, to be compared to EUR 20m as of 31st December 2015. Net outflows during the year amounted to EUR 5m. * Benchmark index change as of 18th January 2016 (to MSCI China Index)
Fund facts
Type UCITS
Launch date 29.03.2007
Quotation Daily
Benchmark MSCI China Index
East Capital Global Frontier Markets The Fund gained 8% during the year, while the benchmark index gained 7%. The net asset value was 36m EUR as of 31st December 2016, to be compared to EUR 55m as of 31st December 2015. Net outflows during the year amounted to EUR 22m.
Fund facts
Type UCITS
Launch date Class A (EUR & USD) 12.12.2014
Class P (EUR) 12.12.2014
Class R (EUR) 12.12.2014
Class A (SEK) 12.12.2014
Class R (GBP) 22.12.2014
Quotation Daily
Benchmark MSCI Frontier Markets Index
Report of the Réviseur d'Entreprises agréé
East Capital 7
KPMG Luxembourg, Société coopérative 39, Avenue John F. Kennedy L-1855 Luxembourg
Tel.: +352 22 51 51 1 Fax: +352 22 51 71 E-mail: [email protected] Internet: www.kpmg.lu
KPMG Luxembourg, Société coopérative, a Luxembourg entity and a member firm of the KPMG network of independent member firms affiliated with KPMG International Cooperative (“KPMG International”),
a Swiss entity.
T.V.A. LU 27351518 R.C.S. Luxembourg B 149133
To the Shareholders of
East Capital We have audited the accompanying financial statements of East Capital (the "Fund") and of each of its sub-funds, which comprise the statement of net assets and the statement of investments and other net assets as at 31st December 2016 and the statement of operations and other changes in net assets for the year then ended, and a summary of significant accounting policies and other explanatory information. Responsibility of the Board of Directors of the Fund for the financial statements The Board of Directors of the Fund is responsible for the preparation and fair presentation of these financial statements in accordance with Luxembourg legal and regulatory requirements relating to the preparation of the financial statements, and for such internal control as the Board of Directors of the Fund determines is necessary to enable the preparation of financial statements that are free from material misstatement, whether due to fraud or error. Responsibility of the Réviseur d'Entreprises agréé Our responsibility is to express an opinion on these financial statements based on our audit. We conducted our audit in accordance with International Standards on Auditing as adopted for Luxembourg by the Commission de Surveillance du Secteur Financier. Those standards require that we comply with ethical requirements and plan and perform the audit to obtain reasonable assurance about whether the financial statements are free from material misstatement. An audit involves performing procedures to obtain audit evidence about the amounts and disclosures in the financial statements. The procedures selected depend on the judgement of the Réviseur d’Entreprises agréé, including the assessment of the risks of material misstatement of the financial statements, whether due to fraud or error. In making those risk assessments, the Réviseur d’Entreprises agréé considers internal control relevant to the entity’s preparation and fair presentation of the financial statements in order to design audit procedures that are appropriate in the circumstances, but not for the purpose of expressing an opinion on the effectiveness of the entity’s internal control. An audit also includes evaluating the appropriateness of accounting policies used and the reasonableness of
accounting estimates made by the Board of Directors of the Fund, as well as evaluating the overall presentation of the financial statements. We believe that the audit evidence we have obtained is sufficient and appropriate to provide a basis for our audit opinion. Opinion In our opinion, the financial statements give a true and fair view of the financial position of East Capital and of each of its sub-funds as of 31st December 2016, and of the results of their operations and changes in their net assets for the year then ended in accordance with Luxembourg legal and regulatory requirements relating to the preparation of the financial statements. Other information The Board of Directors of the Fund is responsible for the other information. The other information comprises the information included in the annual report but does not include the financial statements and our report of Réviseur d’Entreprises agréé thereon. Our opinion on the financial statements does not cover the other information and we do not express any form of assurance conclusion thereon. In connection with our audit of the financial statements, our responsibility is to read the other information and, in doing so, consider whether the other information is materially inconsistent with the financial statements or our knowledge obtained in the audit or otherwise appears to be materially misstated. If, based on the work we have performed, we conclude that there is a material misstatement of this other information, we are required to report this fact. We have nothing to report in this regard. Luxembourg, 25th April 2017 KPMG Luxembourg, Société coopérative Cabinet de révision agréé Pascale Leroy
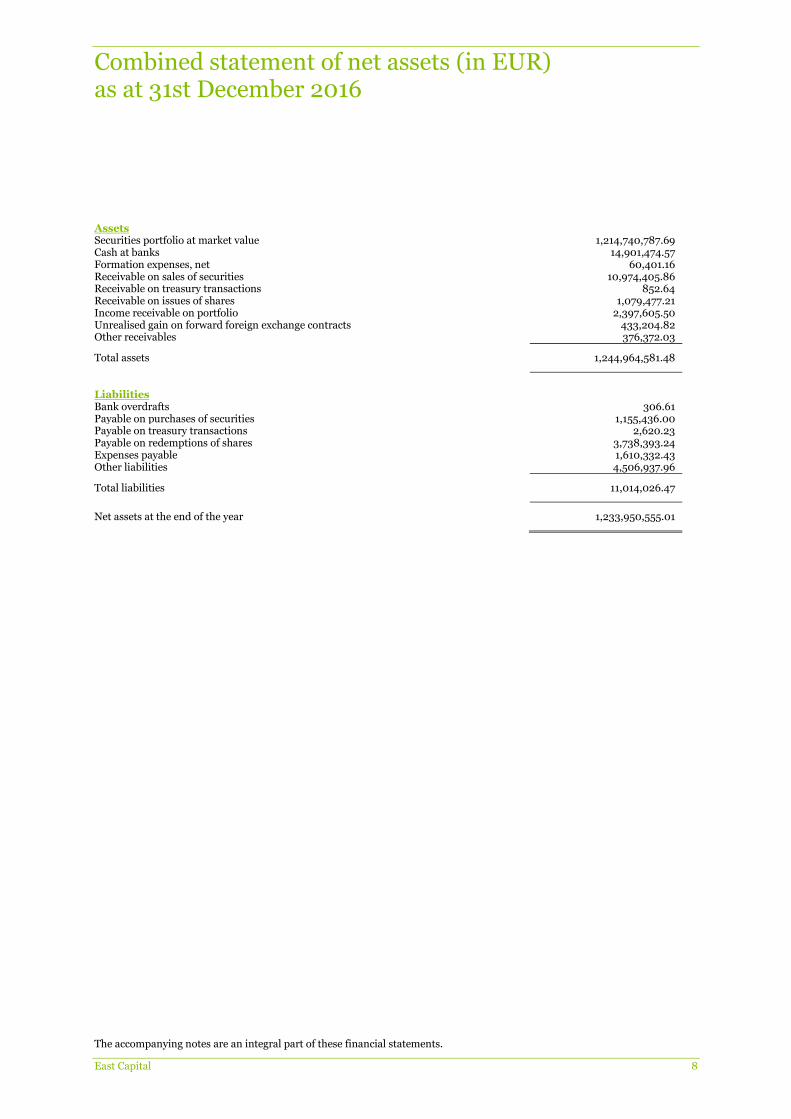
Combined statement of net assets (in EUR) as at 31st December 2016
The accompanying notes are an integral part of these financial statements.
East Capital 8
Assets Securities portfolio at market value 1,214,740,787.69 Cash at banks 14,901,474.57 Formation expenses, net 60,401.16 Receivable on sales of securities 10,974,405.86 Receivable on treasury transactions 852.64 Receivable on issues of shares 1,079,477.21 Income receivable on portfolio 2,397,605.50 Unrealised gain on forward foreign exchange contracts 433,204.82 Other receivables 376,372.03
Total assets 1,244,964,581.48
Liabilities Bank overdrafts 306.61 Payable on purchases of securities 1,155,436.00 Payable on treasury transactions 2,620.23 Payable on redemptions of shares 3,738,393.24 Expenses payable 1,610,332.43 Other liabilities 4,506,937.96
Total liabilities 11,014,026.47
Net assets at the end of the year 1,233,950,555.01

Combined statement of operations and other changes in net assets (in EUR) from 1st January 2016 to 31st December 2016
The accompanying notes are an integral part of these financial statements.
East Capital 9
Income Dividends, net 35,816,246.47 Interest on bank accounts 58,383.55 Other income 1,110,426.10
Total income 36,985,056.12
Expenses Management fees 18,155,356.59 Performance fees 39,845.75 Banking charges and other fees 1,930.71 Transaction fees 2,805,461.51 Flat fee 4,247,917.47 Other administration costs 210,677.85 Subscription duty ("taxe d'abonnement") 463,499.32 Other taxes 774,889.69 Bank interest paid 61,423.16 Other expenses 139,844.25
Total expenses 26,900,846.30
Net investment income 10,084,209.82
Net realised gain/(loss) - on securities portfolio -64,079,909.07 - on foreign exchange -799,579.39
Realised result -54,795,278.64
Net variation of the unrealised gain/(loss) - on securities portfolio 352,631,214.45 - on forward foreign exchange contracts 433,204.82
Result of operations 298,269,140.63
Dividends paid -19,703.21
Subscriptions 425,386,849.78
Redemptions -355,090,963.46
Total changes in net assets 368,545,323.74
Total net assets at the beginning of the year 865,405,231.27
Total net assets at the end of the year 1,233,950,555.01

East Capital Russia
Statement of net assets (in EUR) as at 31st December 2016
The accompanying notes are an integral part of these financial statements.
East Capital 10
Assets Securities portfolio at market value 702,427,449.84 Cash at banks 4,519,224.64 Receivable on sales of securities 9,273,207.85 Receivable on issues of shares 371,562.10 Income receivable on portfolio 1,870,404.50 Other receivables 265,534.80
Total assets 718,727,383.73
Liabilities Payable on treasury transactions 1,226.03 Payable on redemptions of shares 2,940,478.52 Expenses payable 927,729.88 Other liabilities 3,460,522.82
Total liabilities 7,329,957.25
Net assets at the end of the year 711,397,426.48
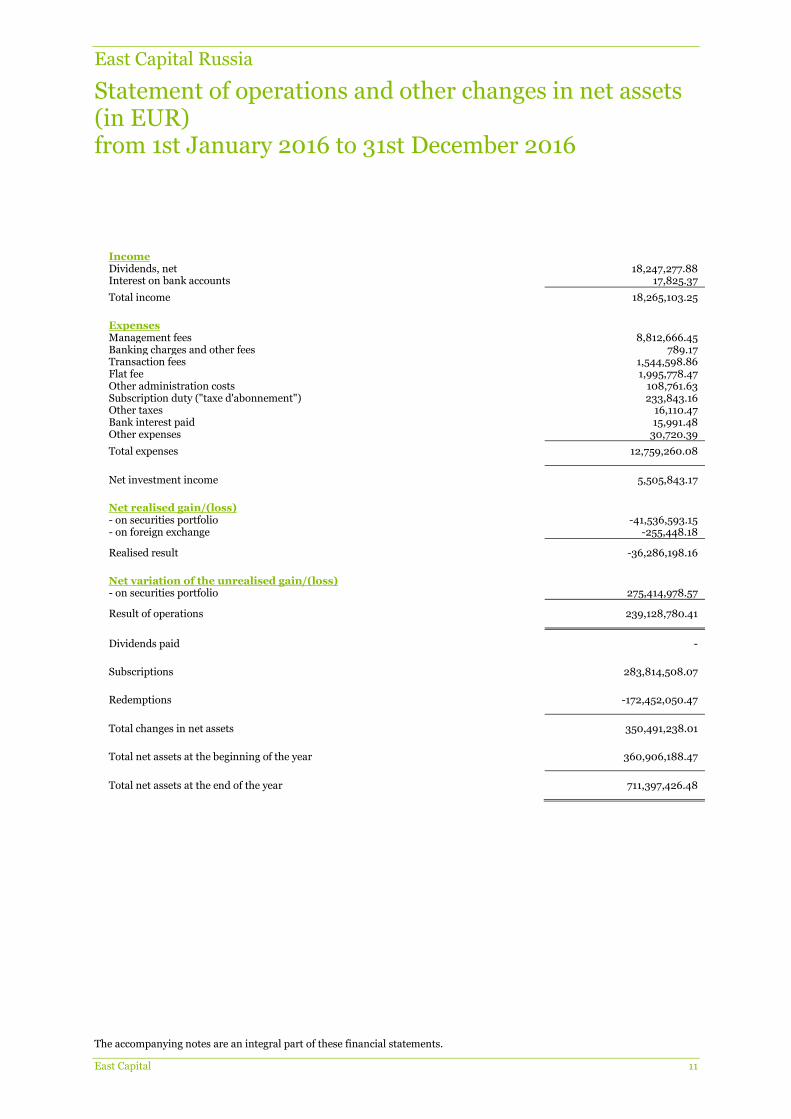
East Capital Russia
Statement of operations and other changes in net assets (in EUR) from 1st January 2016 to 31st December 2016
The accompanying notes are an integral part of these financial statements.
East Capital 11
Income Dividends, net 18,247,277.88 Interest on bank accounts 17,825.37
Total income 18,265,103.25
Expenses Management fees 8,812,666.45 Banking charges and other fees 789.17 Transaction fees 1,544,598.86 Flat fee 1,995,778.47 Other administration costs 108,761.63 Subscription duty ("taxe d'abonnement") 233,843.16 Other taxes 16,110.47 Bank interest paid 15,991.48 Other expenses 30,720.39
Total expenses 12,759,260.08
Net investment income 5,505,843.17
Net realised gain/(loss) - on securities portfolio -41,536,593.15 - on foreign exchange -255,448.18
Realised result -36,286,198.16
Net variation of the unrealised gain/(loss) - on securities portfolio 275,414,978.57
Result of operations 239,128,780.41
Dividends paid -
Subscriptions 283,814,508.07
Redemptions -172,452,050.47
Total changes in net assets 350,491,238.01
Total net assets at the beginning of the year 360,906,188.47
Total net assets at the end of the year 711,397,426.48
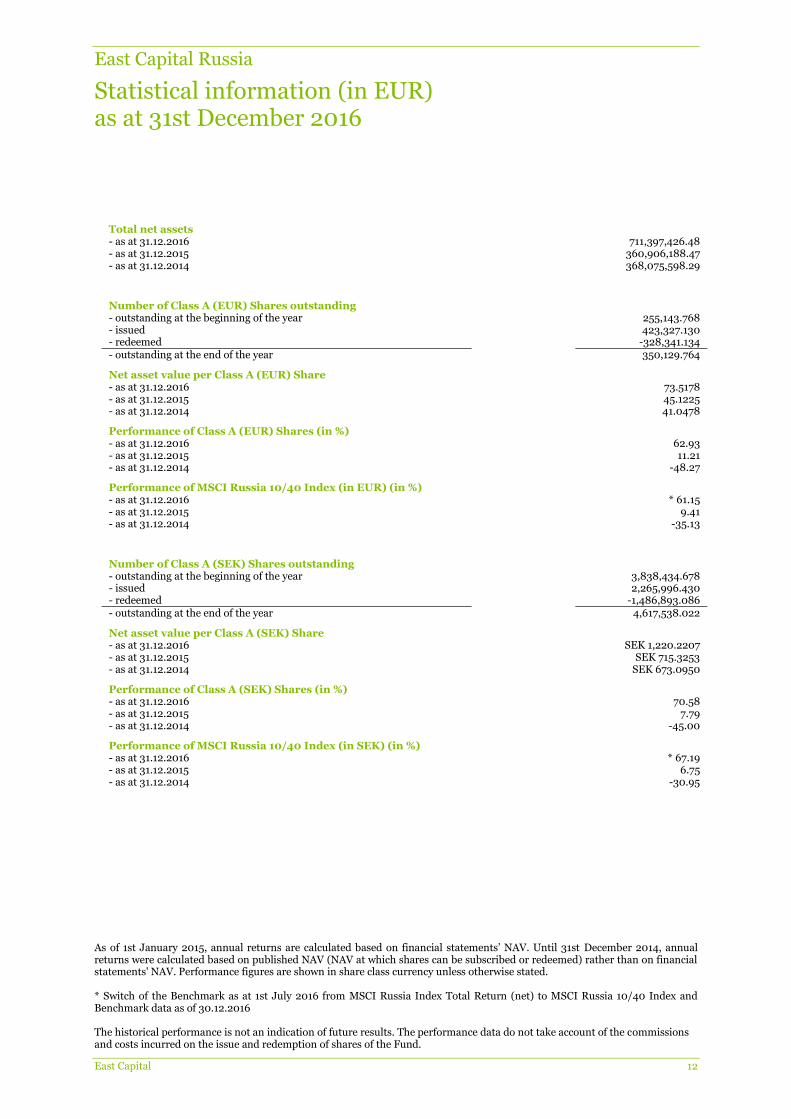
East Capital Russia
Statistical information (in EUR) as at 31st December 2016
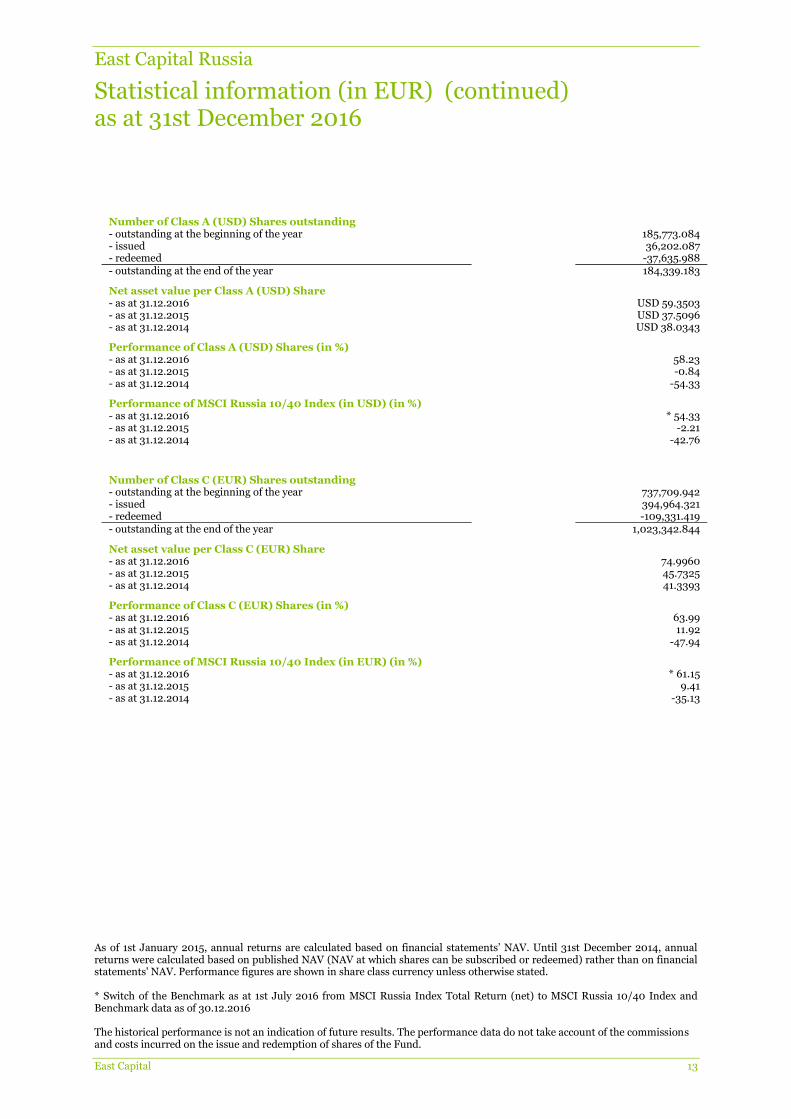
As of 1st January 2015, annual returns are calculated based on financial statements’ NAV. Until 31st December 2014, annual returns were calculated based on published NAV (NAV at which shares can be subscribed or redeemed) rather than on financial statements' NAV. Performance figures are shown in share class currency unless otherwise stated. * Switch of the Benchmark as at 1st July 2016 from MSCI Russia Index Total Return (net) to MSCI Russia 10/40 Index and Benchmark data as of 30.12.2016 The historical performance is not an indication of future results. The performance data do not take account of the commissions and costs incurred on the issue and redemption of shares of the Fund.
East Capital 12
Total net assets
- as at 31.12.2016 711,397,426.48 - as at 31.12.2015 360,906,188.47 - as at 31.12.2014 368,075,598.29
Number of Class A (EUR) Shares outstanding
- outstanding at the beginning of the year 255,143.768 - issued 423,327.130 - redeemed -328,341.134 - outstanding at the end of the year 350,129.764
Net asset value per Class A (EUR) Share - as at 31.12.2016 73.5178 - as at 31.12.2015 45.1225 - as at 31.12.2014 41.0478
Performance of Class A (EUR) Shares (in %) - as at 31.12.2016 62.93 - as at 31.12.2015 11.21 - as at 31.12.2014 -48.27
Performance of MSCI Russia 10/40 Index (in EUR) (in %)
- as at 31.12.2016 * 61.15 - as at 31.12.2015 9.41 - as at 31.12.2014 -35.13
Number of Class A (SEK) Shares outstanding
- outstanding at the beginning of the year 3,838,434.678 - issued 2,265,996.430 - redeemed -1,486,893.086 - outstanding at the end of the year 4,617,538.022
Net asset value per Class A (SEK) Share - as at 31.12.2016 SEK 1,220.2207 - as at 31.12.2015 SEK 715.3253 - as at 31.12.2014 SEK 673.0950
Performance of Class A (SEK) Shares (in %) - as at 31.12.2016 70.58 - as at 31.12.2015 7.79 - as at 31.12.2014 -45.00
Performance of MSCI Russia 10/40 Index (in SEK) (in %)
- as at 31.12.2016 * 67.19 - as at 31.12.2015 6.75 - as at 31.12.2014 -30.95
East Capital Russia
Statistical information (in EUR) (continued) as at 31st December 2016
As of 1st January 2015, annual returns are calculated based on financial statements’ NAV. Until 31st December 2014, annual returns were calculated based on published NAV (NAV at which shares can be subscribed or redeemed) rather than on financial statements' NAV. Performance figures are shown in share class currency unless otherwise stated. * Switch of the Benchmark as at 1st July 2016 from MSCI Russia Index Total Return (net) to MSCI Russia 10/40 Index and Benchmark data as of 30.12.2016 The historical performance is not an indication of future results. The performance data do not take account of the commissions and costs incurred on the issue and redemption of shares of the Fund.
East Capital 13
Number of Class A (USD) Shares outstanding
- outstanding at the beginning of the year 185,773.084 - issued 36,202.087 - redeemed -37,635.988 - outstanding at the end of the year 184,339.183
Net asset value per Class A (USD) Share - as at 31.12.2016 USD 59.3503 - as at 31.12.2015 USD 37.5096 - as at 31.12.2014 USD 38.0343
Performance of Class A (USD) Shares (in %) - as at 31.12.2016 58.23 - as at 31.12.2015 -0.84 - as at 31.12.2014 -54.33
Performance of MSCI Russia 10/40 Index (in USD) (in %)
- as at 31.12.2016 * 54.33 - as at 31.12.2015 -2.21 - as at 31.12.2014 -42.76
Number of Class C (EUR) Shares outstanding
- outstanding at the beginning of the year 737,709.942 - issued 394,964.321 - redeemed -109,331.419 - outstanding at the end of the year 1,023,342.844
Net asset value per Class C (EUR) Share - as at 31.12.2016 74.9960 - as at 31.12.2015 45.7325 - as at 31.12.2014 41.3393
Performance of Class C (EUR) Shares (in %) - as at 31.12.2016 63.99 - as at 31.12.2015 11.92 - as at 31.12.2014 -47.94
Performance of MSCI Russia 10/40 Index (in EUR) (in %)
- as at 31.12.2016 * 61.15 - as at 31.12.2015 9.41 - as at 31.12.2014 -35.13

East Capital Russia
Statistical information (in EUR) (continued) as at 31st December 2016
As of 1st January 2015, annual returns are calculated based on financial statements’ NAV. Until 31st December 2014, annual returns were calculated based on published NAV (NAV at which shares can be subscribed or redeemed) rather than on financial statements' NAV. Performance figures are shown in share class currency unless otherwise stated. * Switch of the Benchmark as at 1st July 2016 from MSCI Russia Index Total Return (net) to MSCI Russia 10/40 Index and Benchmark data as of 30.12.2016 The historical performance is not an indication of future results. The performance data do not take account of the commissions and costs incurred on the issue and redemption of shares of the Fund.
East Capital 14
Number of Class C (USD) Shares outstanding
- outstanding at the beginning of the year 113,699.110 - issued 12,841.209 - redeemed -97,467.633 - outstanding at the end of the year 29,072.686
Net asset value per Class C (USD) Share - as at 31.12.2016 USD 59.6634 - as at 31.12.2015 USD 37.4640 - as at 31.12.2014 USD 37.7475
Performance of Class C (USD) Shares (in %) - as at 31.12.2016 59.26 - as at 31.12.2015 -0.21 - as at 31.12.2014 -54.04
Performance of MSCI Russia 10/40 Index (in USD) (in %)
- as at 31.12.2016 * 54.33 - as at 31.12.2015 -2.21 - as at 31.12.2014 -42.76
Number of Class R (EUR) Shares outstanding
- outstanding at the beginning of the year 936,466.935 - issued 250,276.992 - redeemed -226,874.236 - outstanding at the end of the year 959,869.691
Net asset value per Class R (EUR) Share - as at 31.12.2016 9.6381 - as at 31.12.2015 5.8851 - as at 31.12.2014 5.3272
Performance of Class R (EUR) Shares (in %) - as at 31.12.2016 63.77 - as at 31.12.2015 11.76 - as at 31.12.2014 -48.01
Performance of MSCI Russia 10/40 Index (in EUR) (in %)
- as at 31.12.2016 * 61.15 - as at 31.12.2015 9.41 - as at 31.12.2014 -35.13
East Capital Russia
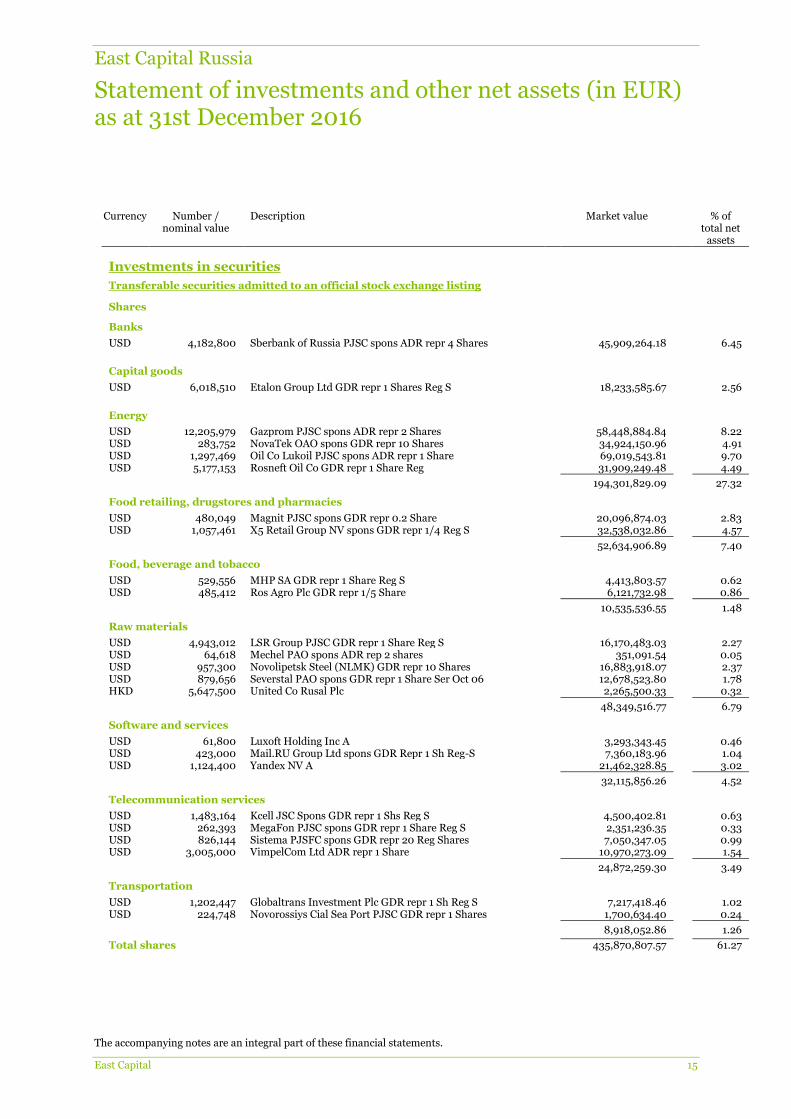
Statement of investments and other net assets (in EUR) as at 31st December 2016
The accompanying notes are an integral part of these financial statements.
East Capital 15
Currency Number / nominal value
Description Market value % of total net
assets
Investments in securities
Transferable securities admitted to an official stock exchange listing
Shares
Banks
USD 4,182,800 Sberbank of Russia PJSC spons ADR repr 4 Shares 45,909,264.18 6.45
Capital goods
USD 6,018,510 Etalon Group Ltd GDR repr 1 Shares Reg S 18,233,585.67 2.56
Energy
USD 12,205,979 Gazprom PJSC spons ADR repr 2 Shares 58,448,884.84 8.22 USD 283,752 NovaTek OAO spons GDR repr 10 Shares 34,924,150.96 4.91 USD 1,297,469 Oil Co Lukoil PJSC spons ADR repr 1 Share 69,019,543.81 9.70 USD 5,177,153 Rosneft Oil Co GDR repr 1 Share Reg 31,909,249.48 4.49
194,301,829.09 27.32
Food retailing, drugstores and pharmacies
USD 480,049 Magnit PJSC spons GDR repr 0.2 Share 20,096,874.03 2.83 USD 1,057,461 X5 Retail Group NV spons GDR repr 1/4 Reg S 32,538,032.86 4.57
52,634,906.89 7.40
Food, beverage and tobacco
USD 529,556 MHP SA GDR repr 1 Share Reg S 4,413,803.57 0.62 USD 485,412 Ros Agro Plc GDR repr 1/5 Share 6,121,732.98 0.86
10,535,536.55 1.48
Raw materials
USD 4,943,012 LSR Group PJSC GDR repr 1 Share Reg S 16,170,483.03 2.27 USD 64,618 Mechel PAO spons ADR rep 2 shares 351,091.54 0.05 USD 957,300 Novolipetsk Steel (NLMK) GDR repr 10 Shares 16,883,918.07 2.37 USD 879,656 Severstal PAO spons GDR repr 1 Share Ser Oct 06 12,678,523.80 1.78 HKD 5,647,500 United Co Rusal Plc 2,265,500.33 0.32
48,349,516.77 6.79
Software and services
USD 61,800 Luxoft Holding Inc A 3,293,343.45 0.46 USD 423,000 Mail.RU Group Ltd spons GDR Repr 1 Sh Reg-S 7,360,183.96 1.04 USD 1,124,400 Yandex NV A 21,462,328.85 3.02
32,115,856.26 4.52
Telecommunication services
USD 1,483,164 Kcell JSC Spons GDR repr 1 Shs Reg S 4,500,402.81 0.63 USD 262,393 MegaFon PJSC spons GDR repr 1 Share Reg S 2,351,236.35 0.33 USD 826,144 Sistema PJSFC spons GDR repr 20 Reg Shares 7,050,347.05 0.99 USD 3,005,000 VimpelCom Ltd ADR repr 1 Share 10,970,273.09 1.54
24,872,259.30 3.49
Transportation
USD 1,202,447 Globaltrans Investment Plc GDR repr 1 Sh Reg S 7,217,418.46 1.02 USD 224,748 Novorossiys Cial Sea Port PJSC GDR repr 1 Shares 1,700,634.40 0.24
8,918,052.86 1.26
Total shares 435,870,807.57 61.27
East Capital Russia
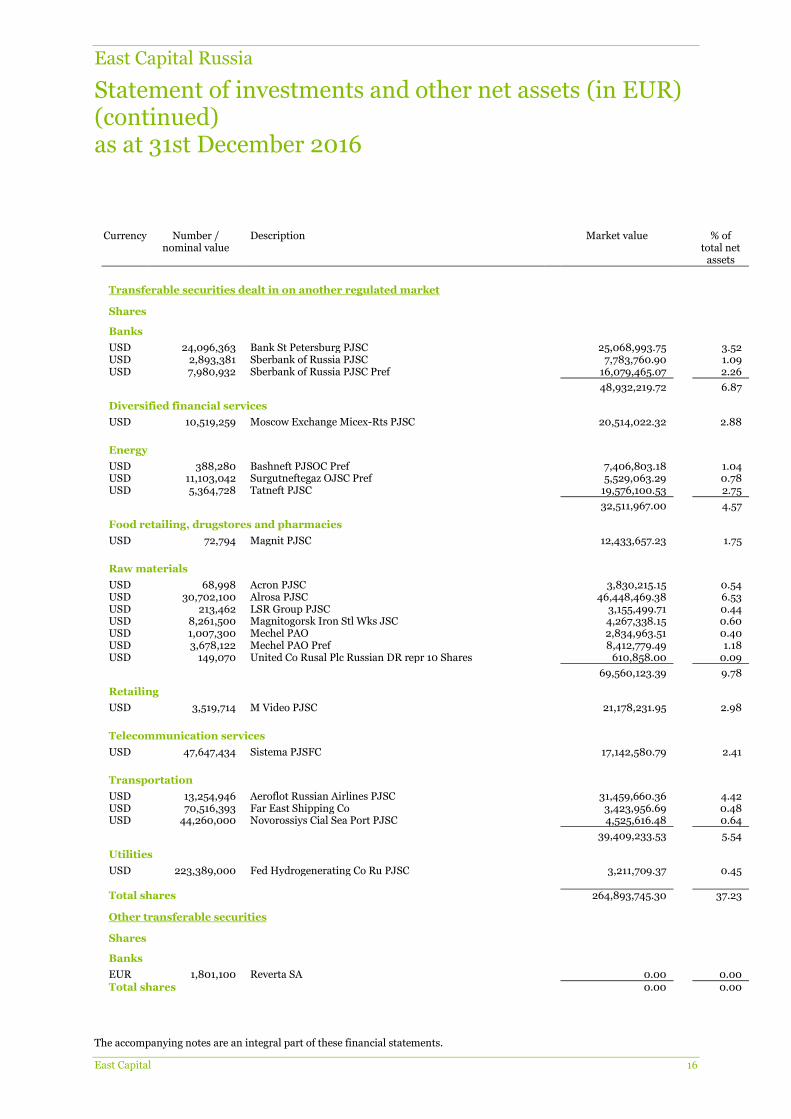
Statement of investments and other net assets (in EUR) (continued) as at 31st December 2016
The accompanying notes are an integral part of these financial statements.
East Capital 16
Currency Number / nominal value
Description Market value % of total net
assets
Transferable securities dealt in on another regulated market
Shares
Banks
USD 24,096,363 Bank St Petersburg PJSC 25,068,993.75 3.52 USD 2,893,381 Sberbank of Russia PJSC 7,783,760.90 1.09 USD 7,980,932 Sberbank of Russia PJSC Pref 16,079,465.07 2.26
48,932,219.72 6.87
Diversified financial services
USD 10,519,259 Moscow Exchange Micex-Rts PJSC 20,514,022.32 2.88
Energy
USD 388,280 Bashneft PJSOC Pref 7,406,803.18 1.04 USD 11,103,042 Surgutneftegaz OJSC Pref 5,529,063.29 0.78 USD 5,364,728 Tatneft PJSC 19,576,100.53 2.75
32,511,967.00 4.57
Food retailing, drugstores and pharmacies
USD 72,794 Magnit PJSC 12,433,657.23 1.75
Raw materials
USD 68,998 Acron PJSC 3,830,215.15 0.54 USD 30,702,100 Alrosa PJSC 46,448,469.38 6.53 USD 213,462 LSR Group PJSC 3,155,499.71 0.44 USD 8,261,500 Magnitogorsk Iron Stl Wks JSC 4,267,338.15 0.60 USD 1,007,300 Mechel PAO 2,834,963.51 0.40 USD 3,678,122 Mechel PAO Pref 8,412,779.49 1.18 USD 149,070 United Co Rusal Plc Russian DR repr 10 Shares 610,858.00 0.09
69,560,123.39 9.78
Retailing
USD 3,519,714 M Video PJSC 21,178,231.95 2.98
Telecommunication services
USD 47,647,434 Sistema PJSFC 17,142,580.79 2.41
Transportation
USD 13,254,946 Aeroflot Russian Airlines PJSC 31,459,660.36 4.42 USD 70,516,393 Far East Shipping Co 3,423,956.69 0.48 USD 44,260,000 Novorossiys Cial Sea Port PJSC 4,525,616.48 0.64
39,409,233.53 5.54
Utilities
USD 223,389,000 Fed Hydrogenerating Co Ru PJSC 3,211,709.37 0.45 Total shares 264,893,745.30 37.23
Other transferable securities
Shares
Banks
EUR 1,801,100 Reverta SA 0.00 0.00 Total shares 0.00 0.00

East Capital Russia
Statement of investments and other net assets (in EUR) (continued) as at 31st December 2016
The accompanying notes are an integral part of these financial statements.
East Capital 17
Currency Number / nominal value
Description Market value % of total net
assets
Closed-ended investment funds
Investment funds
EUR 37,931 East Capital Fin Investors AB Cap 834,482.00 0.12 Total closed-ended investment funds 834,482.00 0.12
Open-ended investment funds
Investment funds (UCI)
Investment funds
USD 512,078.2329 East Capital Bering Ukraine Fd Red P Shares R Master Cap 828,414.97 0.12 Total investment funds (UCI) 828,414.97 0.12
Total investments in securities 702,427,449.84 98.74
Cash at banks 4,519,224.64 0.64
Other net assets/(liabilities) 4,450,752.00 0.62
Total 711,397,426.48 100.00
East Capital Baltics
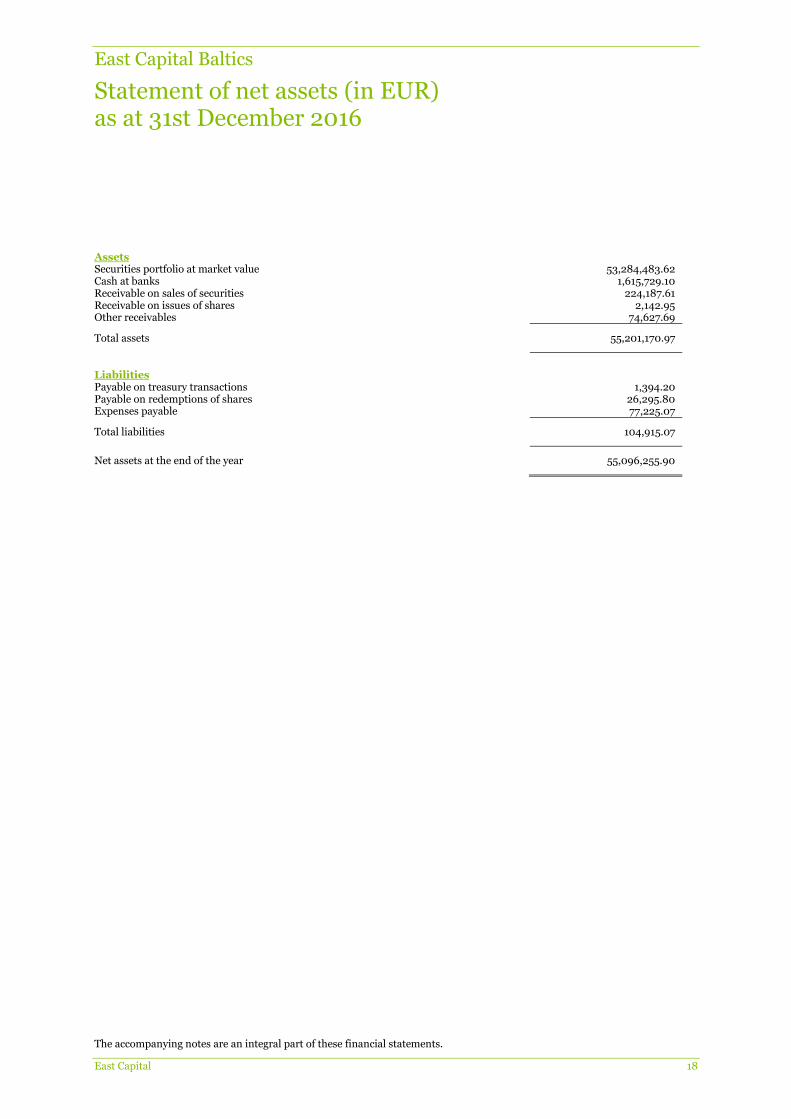
Statement of net assets (in EUR) as at 31st December 2016
The accompanying notes are an integral part of these financial statements.
East Capital 18
Assets Securities portfolio at market value 53,284,483.62 Cash at banks 1,615,729.10 Receivable on sales of securities 224,187.61 Receivable on issues of shares 2,142.95 Other receivables 74,627.69
Total assets 55,201,170.97
Liabilities Payable on treasury transactions 1,394.20 Payable on redemptions of shares 26,295.80 Expenses payable 77,225.07
Total liabilities 104,915.07
Net assets at the end of the year 55,096,255.90
East Capital Baltics
Statement of operations and other changes in net assets (in EUR) from 1st January 2016 to 31st December 2016
The accompanying notes are an integral part of these financial statements.
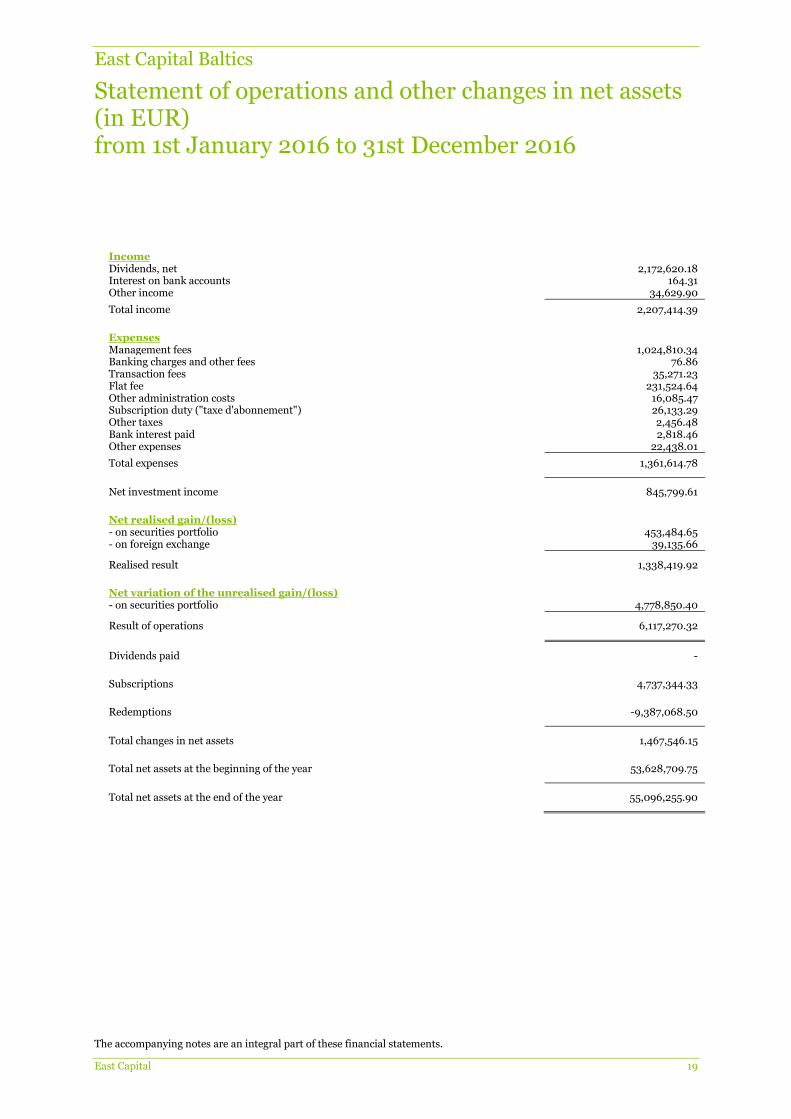
East Capital 19
Income Dividends, net 2,172,620.18 Interest on bank accounts 164.31 Other income 34,629.90
Total income 2,207,414.39
Expenses Management fees 1,024,810.34 Banking charges and other fees 76.86 Transaction fees 35,271.23 Flat fee 231,524.64 Other administration costs 16,085.47 Subscription duty ("taxe d'abonnement") 26,133.29 Other taxes 2,456.48 Bank interest paid 2,818.46 Other expenses 22,438.01
Total expenses 1,361,614.78
Net investment income 845,799.61
Net realised gain/(loss) - on securities portfolio 453,484.65 - on foreign exchange 39,135.66
Realised result 1,338,419.92
Net variation of the unrealised gain/(loss) - on securities portfolio 4,778,850.40
Result of operations 6,117,270.32
Dividends paid -
Subscriptions 4,737,344.33
Redemptions -9,387,068.50
Total changes in net assets 1,467,546.15
Total net assets at the beginning of the year 53,628,709.75
Total net assets at the end of the year 55,096,255.90
East Capital Baltics
Statistical information (in EUR) as at 31st December 2016
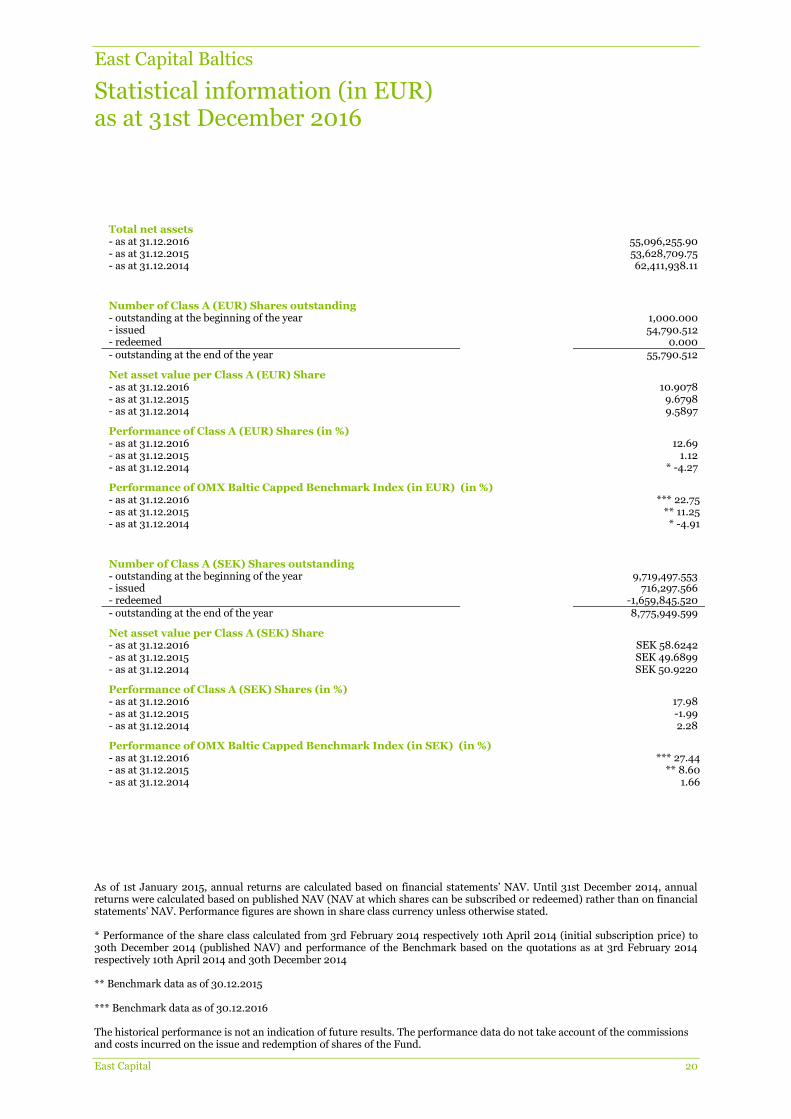
As of 1st January 2015, annual returns are calculated based on financial statements’ NAV. Until 31st December 2014, annual returns were calculated based on published NAV (NAV at which shares can be subscribed or redeemed) rather than on financial statements' NAV. Performance figures are shown in share class currency unless otherwise stated. * Performance of the share class calculated from 3rd February 2014 respectively 10th April 2014 (initial subscription price) to 30th December 2014 (published NAV) and performance of the Benchmark based on the quotations as at 3rd February 2014 respectively 10th April 2014 and 30th December 2014 ** Benchmark data as of 30.12.2015 *** Benchmark data as of 30.12.2016 The historical performance is not an indication of future results. The performance data do not take account of the commissions and costs incurred on the issue and redemption of shares of the Fund.
East Capital 20
Total net assets
- as at 31.12.2016 55,096,255.90 - as at 31.12.2015 53,628,709.75 - as at 31.12.2014 62,411,938.11
Number of Class A (EUR) Shares outstanding
- outstanding at the beginning of the year 1,000.000 - issued 54,790.512 - redeemed 0.000 - outstanding at the end of the year 55,790.512
Net asset value per Class A (EUR) Share - as at 31.12.2016 10.9078 - as at 31.12.2015 9.6798 - as at 31.12.2014 9.5897
Performance of Class A (EUR) Shares (in %) - as at 31.12.2016 12.69 - as at 31.12.2015 1.12 - as at 31.12.2014 * -4.27
Performance of OMX Baltic Capped Benchmark Index (in EUR) (in %)
- as at 31.12.2016 *** 22.75 - as at 31.12.2015 ** 11.25 - as at 31.12.2014 * -4.91
Number of Class A (SEK) Shares outstanding
- outstanding at the beginning of the year 9,719,497.553 - issued 716,297.566 - redeemed -1,659,845.520 - outstanding at the end of the year 8,775,949.599
Net asset value per Class A (SEK) Share - as at 31.12.2016 SEK 58.6242 - as at 31.12.2015 SEK 49.6899 - as at 31.12.2014 SEK 50.9220
Performance of Class A (SEK) Shares (in %) - as at 31.12.2016 17.98 - as at 31.12.2015 -1.99 - as at 31.12.2014 2.28
Performance of OMX Baltic Capped Benchmark Index (in SEK) (in %)
- as at 31.12.2016 *** 27.44 - as at 31.12.2015 ** 8.60 - as at 31.12.2014 1.66
East Capital Baltics
Statistical information (in EUR) (continued) as at 31st December 2016
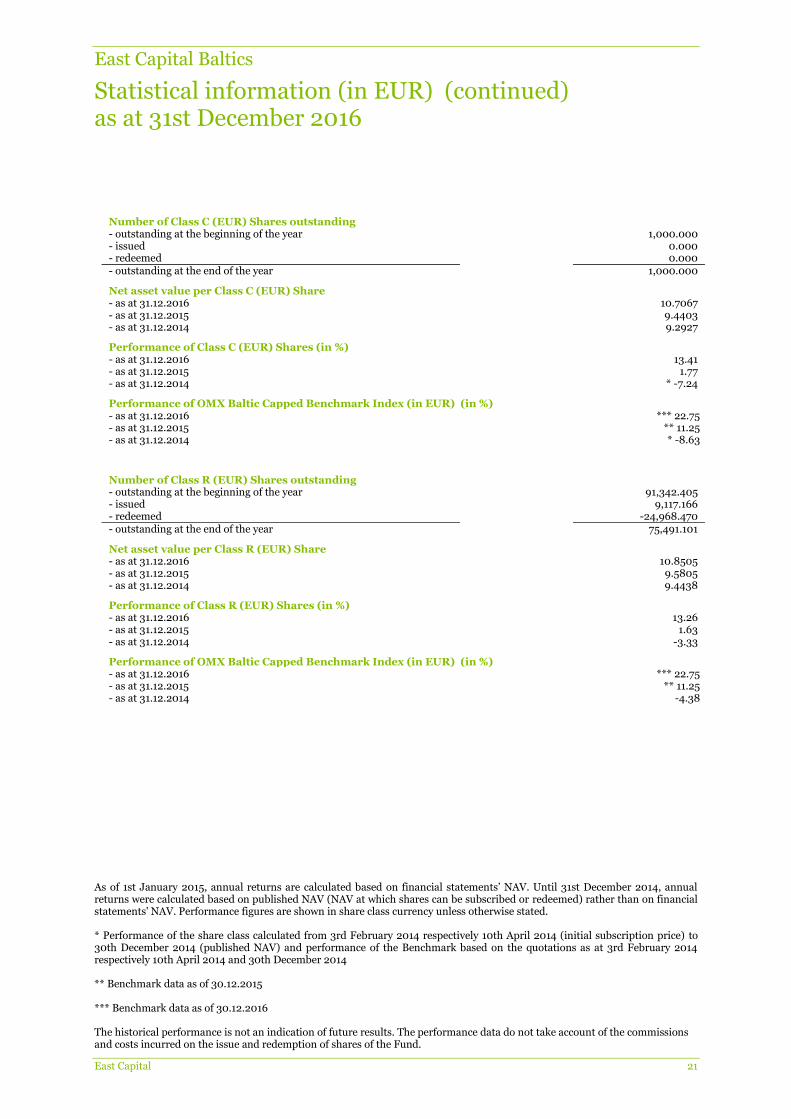
As of 1st January 2015, annual returns are calculated based on financial statements’ NAV. Until 31st December 2014, annual returns were calculated based on published NAV (NAV at which shares can be subscribed or redeemed) rather than on financial statements' NAV. Performance figures are shown in share class currency unless otherwise stated. * Performance of the share class calculated from 3rd February 2014 respectively 10th April 2014 (initial subscription price) to 30th December 2014 (published NAV) and performance of the Benchmark based on the quotations as at 3rd February 2014 respectively 10th April 2014 and 30th December 2014 ** Benchmark data as of 30.12.2015 *** Benchmark data as of 30.12.2016 The historical performance is not an indication of future results. The performance data do not take account of the commissions and costs incurred on the issue and redemption of shares of the Fund.
East Capital 21
Number of Class C (EUR) Shares outstanding
- outstanding at the beginning of the year 1,000.000 - issued 0.000 - redeemed 0.000 - outstanding at the end of the year 1,000.000
Net asset value per Class C (EUR) Share - as at 31.12.2016 10.7067 - as at 31.12.2015 9.4403 - as at 31.12.2014 9.2927
Performance of Class C (EUR) Shares (in %) - as at 31.12.2016 13.41 - as at 31.12.2015 1.77 - as at 31.12.2014 * -7.24
Performance of OMX Baltic Capped Benchmark Index (in EUR) (in %)
- as at 31.12.2016 *** 22.75 - as at 31.12.2015 ** 11.25 - as at 31.12.2014 * -8.63
Number of Class R (EUR) Shares outstanding
- outstanding at the beginning of the year 91,342.405 - issued 9,117.166 - redeemed -24,968.470 - outstanding at the end of the year 75,491.101
Net asset value per Class R (EUR) Share - as at 31.12.2016 10.8505 - as at 31.12.2015 9.5805 - as at 31.12.2014 9.4438
Performance of Class R (EUR) Shares (in %) - as at 31.12.2016 13.26 - as at 31.12.2015 1.63 - as at 31.12.2014 -3.33
Performance of OMX Baltic Capped Benchmark Index (in EUR) (in %)
- as at 31.12.2016 *** 22.75 - as at 31.12.2015 ** 11.25 - as at 31.12.2014 -4.38
East Capital Baltics
Statement of investments and other net assets (in EUR) as at 31st December 2016
The accompanying notes are an integral part of these financial statements.
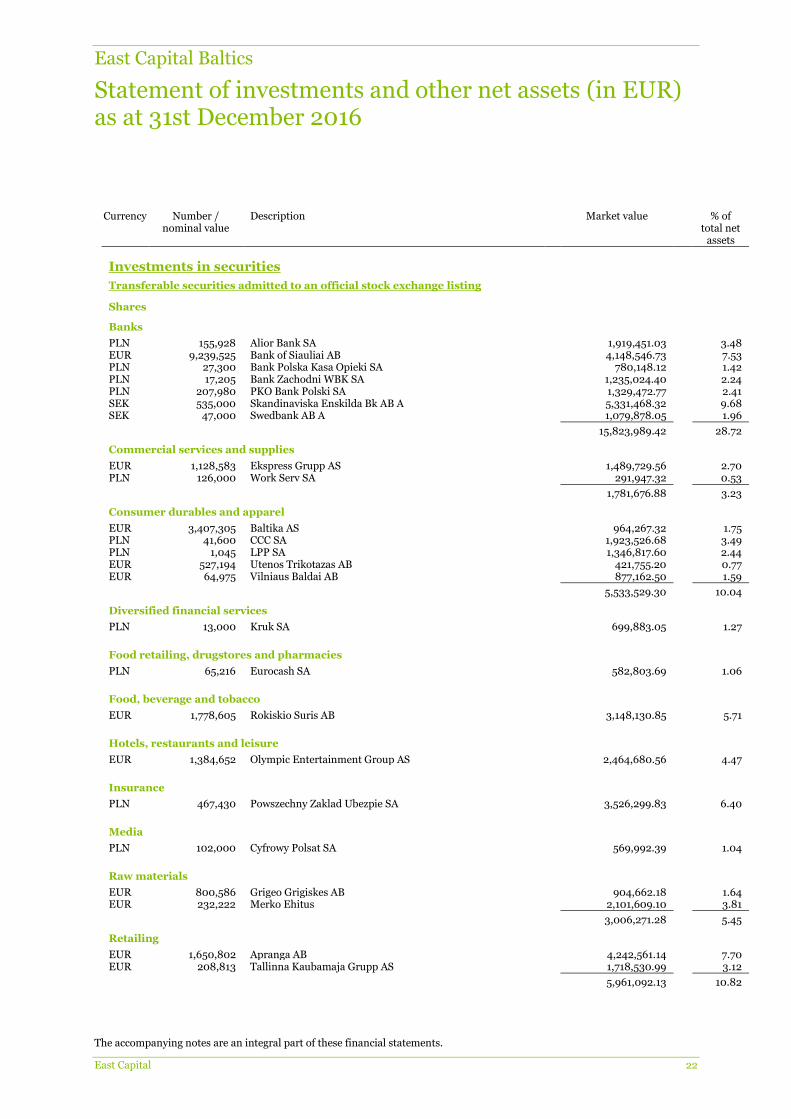
East Capital 22
Currency Number / nominal value
Description Market value % of total net
assets
Investments in securities
Transferable securities admitted to an official stock exchange listing
Shares
Banks
PLN 155,928 Alior Bank SA 1,919,451.03 3.48 EUR 9,239,525 Bank of Siauliai AB 4,148,546.73 7.53 PLN 27,300 Bank Polska Kasa Opieki SA 780,148.12 1.42 PLN 17,205 Bank Zachodni WBK SA 1,235,024.40 2.24 PLN 207,980 PKO Bank Polski SA 1,329,472.77 2.41 SEK 535,000 Skandinaviska Enskilda Bk AB A 5,331,468.32 9.68 SEK 47,000 Swedbank AB A 1,079,878.05 1.96
15,823,989.42 28.72
Commercial services and supplies
EUR 1,128,583 Ekspress Grupp AS 1,489,729.56 2.70 PLN 126,000 Work Serv SA 291,947.32 0.53
1,781,676.88 3.23
Consumer durables and apparel
EUR 3,407,305 Baltika AS 964,267.32 1.75 PLN 41,600 CCC SA 1,923,526.68 3.49 PLN 1,045 LPP SA 1,346,817.60 2.44 EUR 527,194 Utenos Trikotazas AB 421,755.20 0.77 EUR 64,975 Vilniaus Baldai AB 877,162.50 1.59
5,533,529.30 10.04
Diversified financial services
PLN 13,000 Kruk SA 699,883.05 1.27
Food retailing, drugstores and pharmacies
PLN 65,216 Eurocash SA 582,803.69 1.06
Food, beverage and tobacco
EUR 1,778,605 Rokiskio Suris AB 3,148,130.85 5.71
Hotels, restaurants and leisure
EUR 1,384,652 Olympic Entertainment Group AS 2,464,680.56 4.47
Insurance
PLN 467,430 Powszechny Zaklad Ubezpie SA 3,526,299.83 6.40
Media
PLN 102,000 Cyfrowy Polsat SA 569,992.39 1.04
Raw materials
EUR 800,586 Grigeo Grigiskes AB 904,662.18 1.64 EUR 232,222 Merko Ehitus 2,101,609.10 3.81
3,006,271.28 5.45
Retailing
EUR 1,650,802 Apranga AB 4,242,561.14 7.70 EUR 208,813 Tallinna Kaubamaja Grupp AS 1,718,530.99 3.12
5,961,092.13 10.82

East Capital Baltics
Statement of investments and other net assets (in EUR) (continued) as at 31st December 2016
The accompanying notes are an integral part of these financial statements.
East Capital 23
Currency Number / nominal value
Description Market value % of total net
assets
Software and services
PLN 23,000 Asseco Poland SA 281,924.98 0.51 PLN 106,000 CD Projekt SA 1,256,927.26 2.28 PLN 193,520 Wirtualna Polska Hg SA 2,356,266.58 4.28
3,895,118.82 7.07
Telecommunication services
PLN 2,000 Orange Polska SA 2,503.31 0.01 SEK 709,100 Telia Co AB 2,714,902.45 4.93
2,717,405.76 4.94
Transportation
PLN 24,500 Integer.pl SA 190,115.59 0.35 EUR 2,460,952 Tallink Group AS 2,246,849.18 4.08
2,436,964.77 4.43
Utilities
PLN 143,339 Inter RAO Lietuva AB 514,464.29 0.93 EUR 28,487 Tallinna Vesi AS 393,120.60 0.71
907,584.89 1.64
Total shares 53,055,423.62 96.29
Other transferable securities
Closed-ended investment funds
Real estate funds
EUR 881 East Cap Balti Pro Inv AB publ 229,060.00 0.42 Total closed-ended investment funds 229,060.00 0.42
Total investments in securities 53,284,483.62 96.71
Cash at banks 1,615,729.10 2.93
Other net assets/(liabilities) 196,043.18 0.36
Total 55,096,255.90 100.00

East Capital Balkans
Statement of net assets (in EUR) as at 31st December 2016
The accompanying notes are an integral part of these financial statements.
East Capital 24
Assets Securities portfolio at market value 89,970,782.82 Cash at banks 2,281,740.38 Receivable on issues of shares 2,513.39 Income receivable on portfolio 38,851.07
Total assets 92,293,887.66
Liabilities Payable on redemptions of shares 76,769.58 Expenses payable 101,047.73
Total liabilities 177,817.31
Net assets at the end of the year 92,116,070.35

East Capital Balkans
Statement of operations and other changes in net assets (in EUR) from 1st January 2016 to 31st December 2016
The accompanying notes are an integral part of these financial statements.
East Capital 25
Income Dividends, net 4,094,571.94 Interest on bank accounts 6,375.69 Other income 471,611.98
Total income 4,572,559.61
Expenses Management fees 1,647,460.87 Banking charges and other fees 164.28 Transaction fees 116,530.65 Flat fee 374,817.02 Other administration costs 5,091.60 Subscription duty ("taxe d'abonnement") 35,264.43 Other taxes 348,996.61 Bank interest paid 16,988.38 Other expenses 31.79
Total expenses 2,545,345.63
Net investment income 2,027,213.98
Net realised gain/(loss) - on securities portfolio -1,017,214.68 - on foreign exchange -84,595.43
Realised result 925,403.87
Net variation of the unrealised gain/(loss) - on securities portfolio 3,463,115.50
Result of operations 4,388,519.37
Dividends paid -
Subscriptions 20,535,239.90
Redemptions -22,753,214.09
Total changes in net assets 2,170,545.18
Total net assets at the beginning of the year 89,945,525.17
Total net assets at the end of the year 92,116,070.35
East Capital Balkans
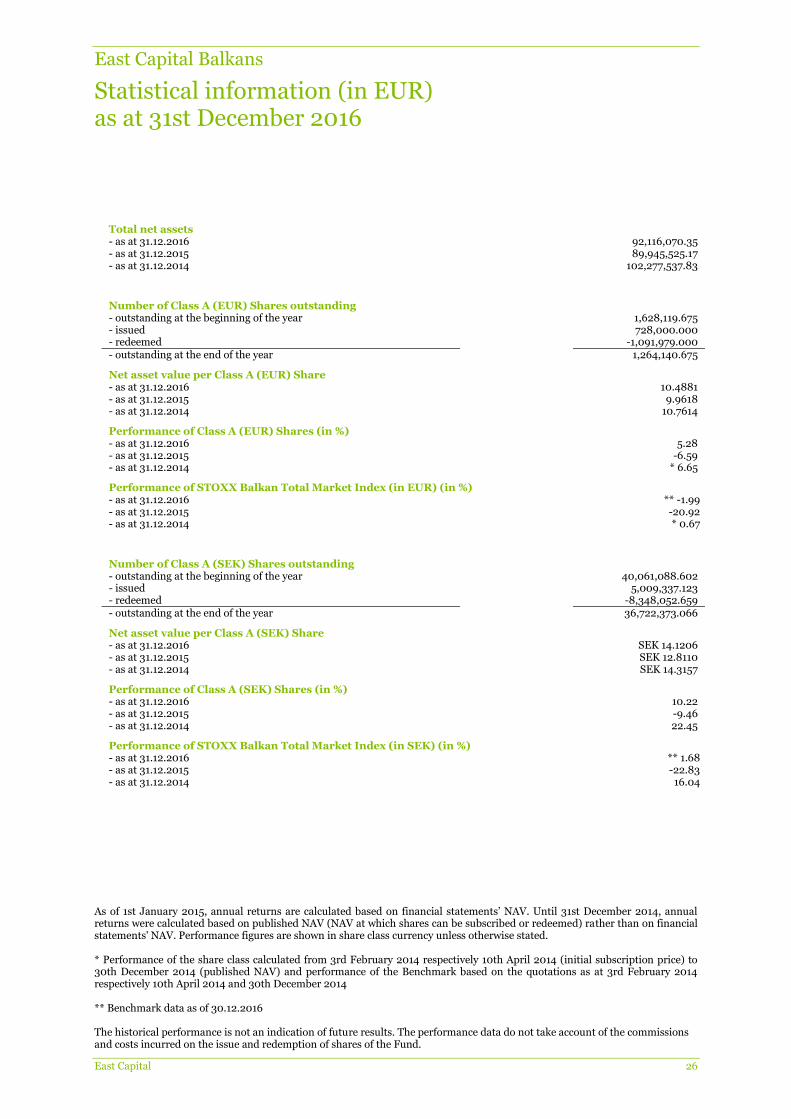
Statistical information (in EUR) as at 31st December 2016
As of 1st January 2015, annual returns are calculated based on financial statements’ NAV. Until 31st December 2014, annual returns were calculated based on published NAV (NAV at which shares can be subscribed or redeemed) rather than on financial statements' NAV. Performance figures are shown in share class currency unless otherwise stated. * Performance of the share class calculated from 3rd February 2014 respectively 10th April 2014 (initial subscription price) to 30th December 2014 (published NAV) and performance of the Benchmark based on the quotations as at 3rd February 2014 respectively 10th April 2014 and 30th December 2014 ** Benchmark data as of 30.12.2016 The historical performance is not an indication of future results. The performance data do not take account of the commissions and costs incurred on the issue and redemption of shares of the Fund.
East Capital 26
Total net assets
- as at 31.12.2016 92,116,070.35 - as at 31.12.2015 89,945,525.17 - as at 31.12.2014 102,277,537.83
Number of Class A (EUR) Shares outstanding
- outstanding at the beginning of the year 1,628,119.675 - issued 728,000.000 - redeemed -1,091,979.000 - outstanding at the end of the year 1,264,140.675
Net asset value per Class A (EUR) Share - as at 31.12.2016 10.4881 - as at 31.12.2015 9.9618 - as at 31.12.2014 10.7614
Performance of Class A (EUR) Shares (in %) - as at 31.12.2016 5.28 - as at 31.12.2015 -6.59 - as at 31.12.2014 * 6.65
Performance of STOXX Balkan Total Market Index (in EUR) (in %)
- as at 31.12.2016 ** -1.99 - as at 31.12.2015 -20.92 - as at 31.12.2014 * 0.67
Number of Class A (SEK) Shares outstanding
- outstanding at the beginning of the year 40,061,088.602 - issued 5,009,337.123 - redeemed -8,348,052.659 - outstanding at the end of the year 36,722,373.066
Net asset value per Class A (SEK) Share - as at 31.12.2016 SEK 14.1206 - as at 31.12.2015 SEK 12.8110 - as at 31.12.2014 SEK 14.3157
Performance of Class A (SEK) Shares (in %) - as at 31.12.2016 10.22 - as at 31.12.2015 -9.46 - as at 31.12.2014 22.45
Performance of STOXX Balkan Total Market Index (in SEK) (in %)
- as at 31.12.2016 ** 1.68 - as at 31.12.2015 -22.83 - as at 31.12.2014 16.04
East Capital Balkans
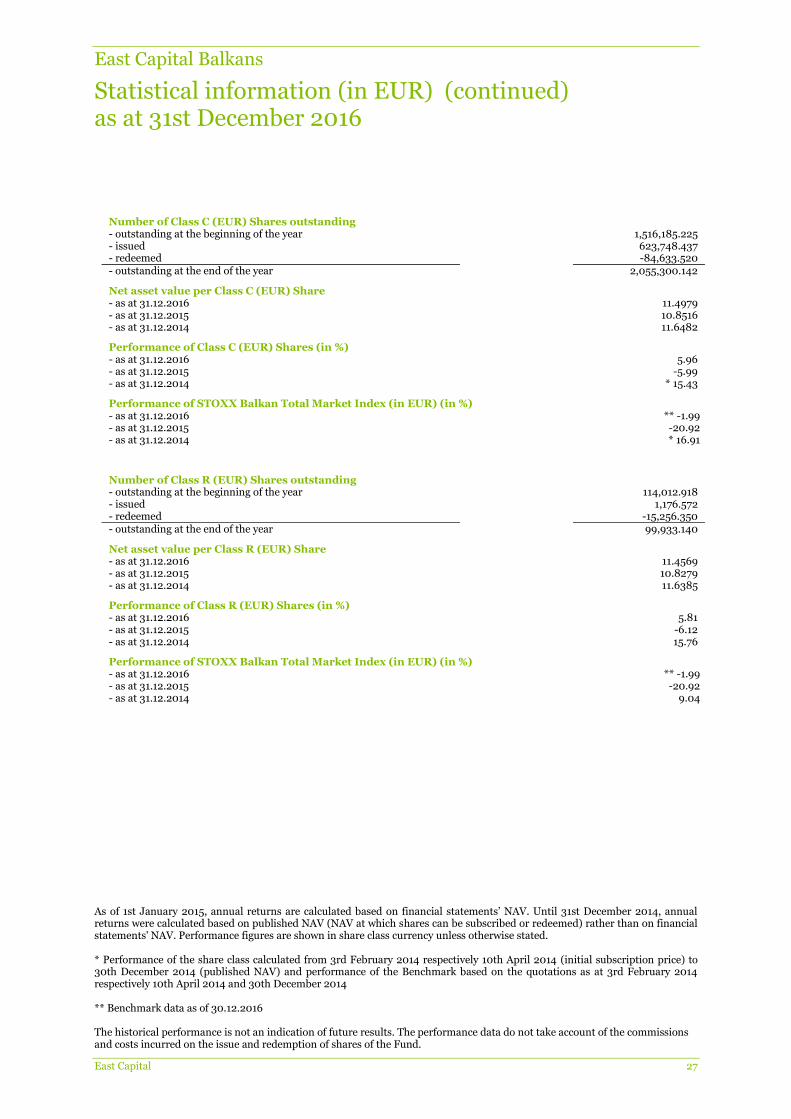
Statistical information (in EUR) (continued) as at 31st December 2016
As of 1st January 2015, annual returns are calculated based on financial statements’ NAV. Until 31st December 2014, annual returns were calculated based on published NAV (NAV at which shares can be subscribed or redeemed) rather than on financial statements' NAV. Performance figures are shown in share class currency unless otherwise stated. * Performance of the share class calculated from 3rd February 2014 respectively 10th April 2014 (initial subscription price) to 30th December 2014 (published NAV) and performance of the Benchmark based on the quotations as at 3rd February 2014 respectively 10th April 2014 and 30th December 2014 ** Benchmark data as of 30.12.2016 The historical performance is not an indication of future results. The performance data do not take account of the commissions and costs incurred on the issue and redemption of shares of the Fund.
East Capital 27
Number of Class C (EUR) Shares outstanding
- outstanding at the beginning of the year 1,516,185.225 - issued 623,748.437 - redeemed -84,633.520 - outstanding at the end of the year 2,055,300.142
Net asset value per Class C (EUR) Share - as at 31.12.2016 11.4979 - as at 31.12.2015 10.8516 - as at 31.12.2014 11.6482
Performance of Class C (EUR) Shares (in %) - as at 31.12.2016 5.96 - as at 31.12.2015 -5.99 - as at 31.12.2014 * 15.43
Performance of STOXX Balkan Total Market Index (in EUR) (in %)
- as at 31.12.2016 ** -1.99 - as at 31.12.2015 -20.92 - as at 31.12.2014 * 16.91
Number of Class R (EUR) Shares outstanding
- outstanding at the beginning of the year 114,012.918 - issued 1,176.572 - redeemed -15,256.350 - outstanding at the end of the year 99,933.140
Net asset value per Class R (EUR) Share - as at 31.12.2016 11.4569 - as at 31.12.2015 10.8279 - as at 31.12.2014 11.6385
Performance of Class R (EUR) Shares (in %) - as at 31.12.2016 5.81 - as at 31.12.2015 -6.12 - as at 31.12.2014 15.76
Performance of STOXX Balkan Total Market Index (in EUR) (in %)
- as at 31.12.2016 ** -1.99 - as at 31.12.2015 -20.92 - as at 31.12.2014 9.04

East Capital Balkans
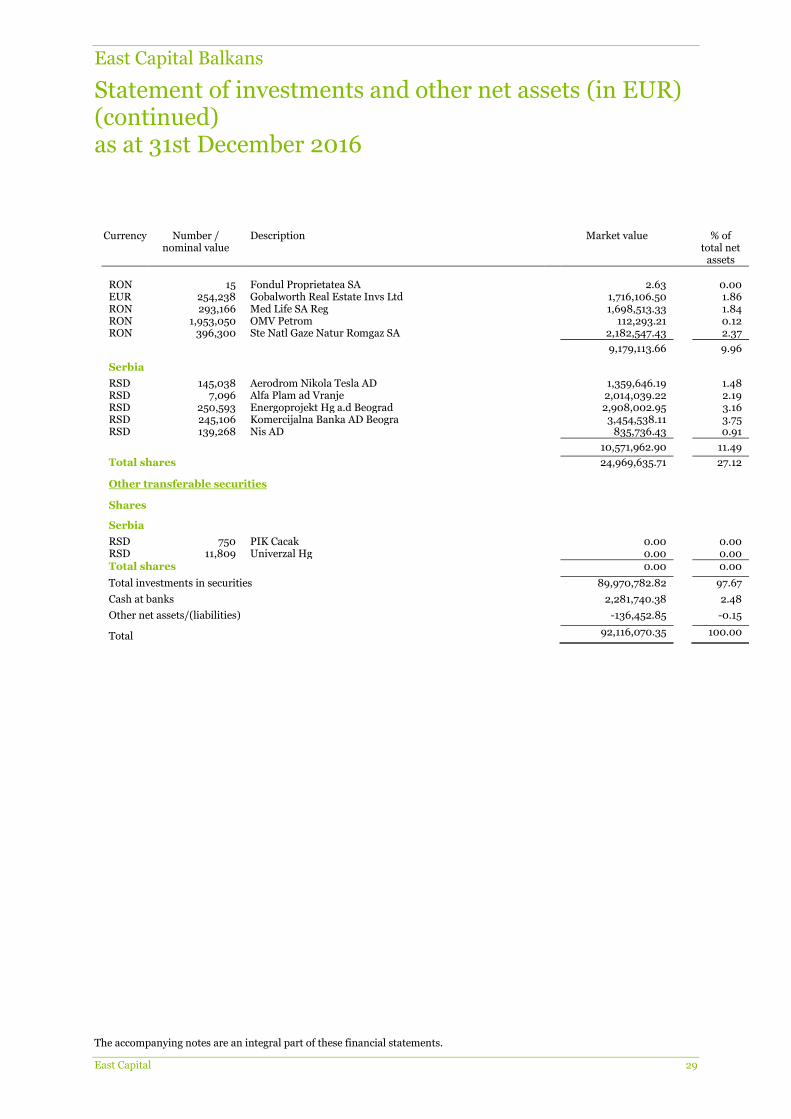
Statement of investments and other net assets (in EUR) as at 31st December 2016
The accompanying notes are an integral part of these financial statements.
East Capital 28
Currency Number / nominal value
Description Market value % of total net
assets
Investments in securities
Transferable securities admitted to an official stock exchange listing
Shares
Austria
EUR 38,988 Erste Group Bank AG 1,084,841.10 1.18 EUR 160,583 Raiffeisen Bank Intl AG 2,790,932.54 3.03
3,875,773.64 4.21
Greece
EUR 373,250 Aegean Airlines SA 2,362,672.50 2.56 EUR 1,412,500 Alpha Bank AE 2,683,750.00 2.91 EUR 6,966,700 Eurobank Ergasias SA 4,493,521.50 4.88 EUR 115,071 Folli Follie Group 2,212,815.33 2.40 EUR 826,534 Fourlis Holding SA Reg 3,372,258.72 3.66 EUR 91,802 Motor Oil (Hellas) Cor Refi SA Reg 1,202,606.20 1.31 EUR 41,000 Titan Cement Co Reg 914,300.00 0.99
17,241,924.25 18.71
Romania
RON 996,210 BRD Gr SG Romanian Bk for Dev 2,607,155.57 2.83 USD 577,727 Fondul Proprietatea SA spons GDR repr 50 Shs Reg S 5,149,472.60 5.59 USD 108,173 OMV Petrom spons GDR repr 150 Shares 937,513.01 1.02
8,694,141.18 9.44
Slovenia
EUR 37,000 Luka Koper 925,000.00 1.00 EUR 19,520 Petrol Ljubljana d.d. 6,344,000.00 6.89 EUR 463,211 Pozavarovalnica Sava d.d. 6,123,649.42 6.65 EUR 15,341 Telekom Slovenia dd 1,090,745.10 1.18 EUR 290,278 Zavarovalnica Triglav d.d. 6,734,449.60 7.31
21,217,844.12 23.03
Turkey
TRY 500,500 Akbank T.A.S. 1,054,863.76 1.15 TRY 7,536 Do & Co AG 473,647.20 0.51 TRY 751,964 Haci Omer Sabanci Holding AS 1,854,401.12 2.01 TRY 427,663 KOC Holding AS 1,590,619.50 1.72 TRY 148,331 Tofas Turk Otomobil Fabrikasi 985,049.75 1.07 TRY 402,417 Turk Hava Yollari AO 543,374.91 0.59 TRY 1,159,432 Turkiye Garanti Bankasi AS Reg 2,381,144.72 2.59 TRY 504,730 Turkiye Halk Bankasi AS 1,270,549.33 1.38 TRY 1,203,000 Turkiye Is Bankasi AS 1,679,503.54 1.82 TRY 67,143 Turkiye Petrol Rafinerileri AS 1,280,302.88 1.39 TRY 731,840 Turkiye Vakiflar Bankasi Tao 858,007.21 0.93
13,971,463.92 15.16
Total shares 65,001,147.11 70.55
Transferable securities dealt in on another regulated market
Shares
Croatia
HRK 34,225 Atlantic Grupa d.d. 4,003,963.42 4.35 HRK 24,205 Podravka DD 1,214,595.73 1.32
5,218,559.15 5.67
Romania
RON 4,112,027 Banca Transilvania SA 2,160,448.66 2.35 RON 203,528 CNTEE Transelectrica SA 1,309,201.90 1.42
East Capital Balkans
Statement of investments and other net assets (in EUR) (continued) as at 31st December 2016
The accompanying notes are an integral part of these financial statements.
East Capital 29
Currency Number / nominal value
Description Market value % of total net
assets RON 15 Fondul Proprietatea SA 2.63 0.00 EUR 254,238 Gobalworth Real Estate Invs Ltd 1,716,106.50 1.86 RON 293,166 Med Life SA Reg 1,698,513.33 1.84 RON 1,953,050 OMV Petrom 112,293.21 0.12 RON 396,300 Ste Natl Gaze Natur Romgaz SA 2,182,547.43 2.37
9,179,113.66 9.96
Serbia
RSD 145,038 Aerodrom Nikola Tesla AD 1,359,646.19 1.48 RSD 7,096 Alfa Plam ad Vranje 2,014,039.22 2.19 RSD 250,593 Energoprojekt Hg a.d Beograd 2,908,002.95 3.16 RSD 245,106 Komercijalna Banka AD Beogra 3,454,538.11 3.75 RSD 139,268 Nis AD 835,736.43 0.91
10,571,962.90 11.49
Total shares 24,969,635.71 27.12
Other transferable securities
Shares
Serbia
RSD 750 PIK Cacak 0.00 0.00 RSD 11,809 Univerzal Hg 0.00 0.00 Total shares 0.00 0.00
Total investments in securities 89,970,782.82 97.67
Cash at banks 2,281,740.38 2.48
Other net assets/(liabilities) -136,452.85 -0.15
Total 92,116,070.35 100.00
East Capital Turkey
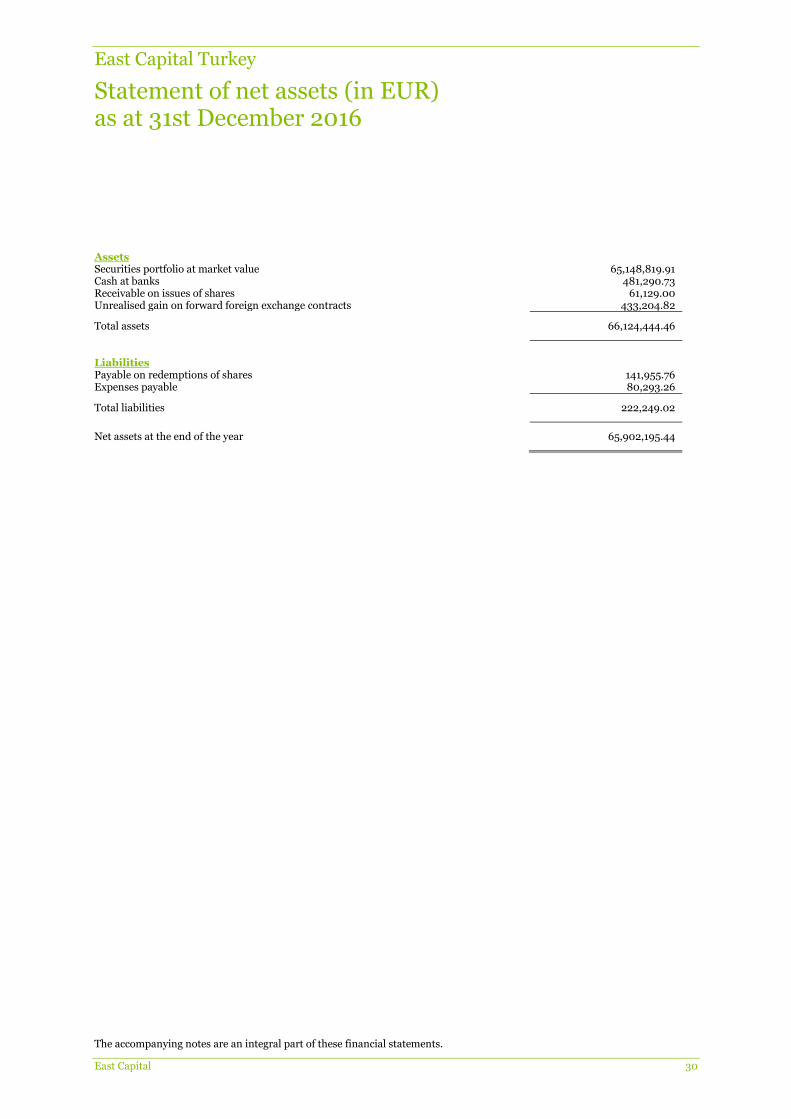
Statement of net assets (in EUR) as at 31st December 2016
The accompanying notes are an integral part of these financial statements.
East Capital 30
Assets Securities portfolio at market value 65,148,819.91 Cash at banks 481,290.73 Receivable on issues of shares 61,129.00 Unrealised gain on forward foreign exchange contracts 433,204.82
Total assets 66,124,444.46
Liabilities Payable on redemptions of shares 141,955.76 Expenses payable 80,293.26
Total liabilities 222,249.02
Net assets at the end of the year 65,902,195.44
East Capital Turkey
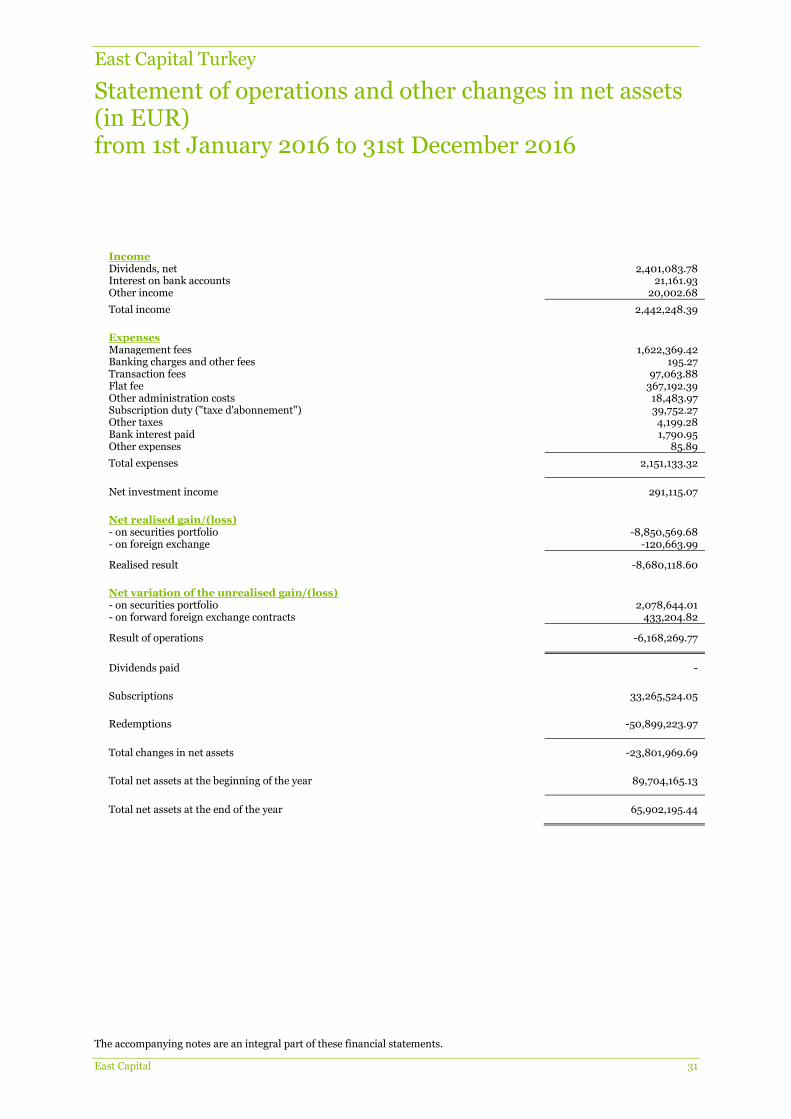
Statement of operations and other changes in net assets (in EUR) from 1st January 2016 to 31st December 2016
The accompanying notes are an integral part of these financial statements.
East Capital 31
Income Dividends, net 2,401,083.78 Interest on bank accounts 21,161.93 Other income 20,002.68
Total income 2,442,248.39
Expenses Management fees 1,622,369.42 Banking charges and other fees 195.27 Transaction fees 97,063.88 Flat fee 367,192.39 Other administration costs 18,483.97 Subscription duty ("taxe d'abonnement") 39,752.27 Other taxes 4,199.28 Bank interest paid 1,790.95 Other expenses 85.89
Total expenses 2,151,133.32
Net investment income 291,115.07
Net realised gain/(loss) - on securities portfolio -8,850,569.68 - on foreign exchange -120,663.99
Realised result -8,680,118.60
Net variation of the unrealised gain/(loss) - on securities portfolio 2,078,644.01 - on forward foreign exchange contracts 433,204.82
Result of operations -6,168,269.77
Dividends paid -
Subscriptions 33,265,524.05
Redemptions -50,899,223.97
Total changes in net assets -23,801,969.69
Total net assets at the beginning of the year 89,704,165.13
Total net assets at the end of the year 65,902,195.44

East Capital Turkey
Statistical information (in EUR) as at 31st December 2016
As of 1st January 2015, annual returns are calculated based on financial statements’ NAV. Until 31st December 2014, annual returns were calculated based on published NAV (NAV at which shares can be subscribed or redeemed) rather than on financial statements' NAV. Performance figures are shown in share class currency unless otherwise stated. * Switch of the Benchmark as at 1st April 2016 from ISE 100 Total Return to MSCI Turkey IMI Net Index and Benchmark data as of 30.12.2016 The historical performance is not an indication of future results. The performance data do not take account of the commissions and costs incurred on the issue and redemption of shares of the Fund.
East Capital 32
Total net assets
- as at 31.12.2016 65,902,195.44 - as at 31.12.2015 89,704,165.13 - as at 31.12.2014 156,000,683.35
Number of Class A (EUR) Shares outstanding
- outstanding at the beginning of the year 1,750.000 - issued 2,912.060 - redeemed -750.000 - outstanding at the end of the year 3,912.060
Net asset value per Class A (EUR) Share - as at 31.12.2016 7.9532 - as at 31.12.2015 8.6010 - as at 31.12.2014 11.1172
Performance of Class A (EUR) Shares (in %) - as at 31.12.2016 -7.53 - as at 31.12.2015 -20.80 - as at 31.12.2014 31.88
Performance of MSCI Turkey IMI Net Index (in EUR) (in %)
- as at 31.12.2016 * -7.04 - as at 31.12.2015 -22.19 - as at 31.12.2014 30.79
Number of Class A (SEK) Shares outstanding
- outstanding at the beginning of the year 97,952,059.417 - issued 38,323,475.272 - redeemed -54,873,116.388 - outstanding at the end of the year 81,402,418.301
Net asset value per Class A (SEK) Share - as at 31.12.2016 SEK 7.5951 - as at 31.12.2015 SEK 7.8452 - as at 31.12.2014 SEK 10.4879
Performance of Class A (SEK) Shares (in %) - as at 31.12.2016 -3.19 - as at 31.12.2015 -23.22 - as at 31.12.2014 40.22
Performance of MSCI Turkey IMI Net Index (in SEK) (in %)
- as at 31.12.2016 * -3.49 - as at 31.12.2015 -24.08 - as at 31.12.2014 39.22
East Capital Turkey
Statistical information (in EUR) (continued) as at 31st December 2016
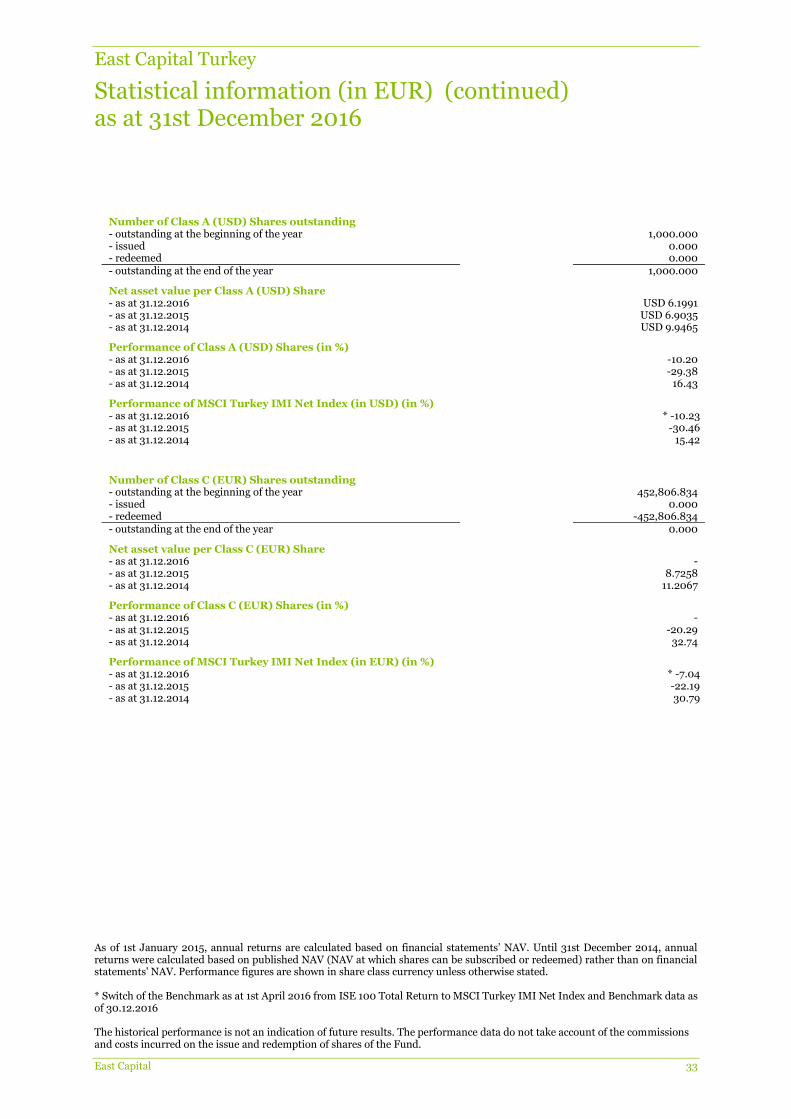
As of 1st January 2015, annual returns are calculated based on financial statements’ NAV. Until 31st December 2014, annual returns were calculated based on published NAV (NAV at which shares can be subscribed or redeemed) rather than on financial statements' NAV. Performance figures are shown in share class currency unless otherwise stated. * Switch of the Benchmark as at 1st April 2016 from ISE 100 Total Return to MSCI Turkey IMI Net Index and Benchmark data as of 30.12.2016 The historical performance is not an indication of future results. The performance data do not take account of the commissions and costs incurred on the issue and redemption of shares of the Fund.
East Capital 33
Number of Class A (USD) Shares outstanding
- outstanding at the beginning of the year 1,000.000 - issued 0.000 - redeemed 0.000 - outstanding at the end of the year 1,000.000
Net asset value per Class A (USD) Share - as at 31.12.2016 USD 6.1991 - as at 31.12.2015 USD 6.9035 - as at 31.12.2014 USD 9.9465
Performance of Class A (USD) Shares (in %) - as at 31.12.2016 -10.20 - as at 31.12.2015 -29.38 - as at 31.12.2014 16.43
Performance of MSCI Turkey IMI Net Index (in USD) (in %)
- as at 31.12.2016 * -10.23 - as at 31.12.2015 -30.46 - as at 31.12.2014 15.42
Number of Class C (EUR) Shares outstanding
- outstanding at the beginning of the year 452,806.834 - issued 0.000 - redeemed -452,806.834 - outstanding at the end of the year 0.000
Net asset value per Class C (EUR) Share - as at 31.12.2016 - - as at 31.12.2015 8.7258 - as at 31.12.2014 11.2067
Performance of Class C (EUR) Shares (in %) - as at 31.12.2016 - - as at 31.12.2015 -20.29 - as at 31.12.2014 32.74
Performance of MSCI Turkey IMI Net Index (in EUR) (in %)
- as at 31.12.2016 * -7.04 - as at 31.12.2015 -22.19 - as at 31.12.2014 30.79

East Capital Turkey
Statistical information (in EUR) (continued) as at 31st December 2016
As of 1st January 2015, annual returns are calculated based on financial statements’ NAV. Until 31st December 2014, annual returns were calculated based on published NAV (NAV at which shares can be subscribed or redeemed) rather than on financial statements' NAV. Performance figures are shown in share class currency unless otherwise stated. * Switch of the Benchmark as at 1st April 2016 from ISE 100 Total Return to MSCI Turkey IMI Net Index and Benchmark data as of 30.12.2016 The historical performance is not an indication of future results. The performance data do not take account of the commissions and costs incurred on the issue and redemption of shares of the Fund.
East Capital 34
Number of Class C (USD) Shares outstanding
- outstanding at the beginning of the year 1,000.000 - issued 0.000 - redeemed 0.000 - outstanding at the end of the year 1,000.000
Net asset value per Class C (USD) Share - as at 31.12.2016 USD 6.4907 - as at 31.12.2015 USD 7.1820 - as at 31.12.2014 USD 10.2811
Performance of Class C (USD) Shares (in %) - as at 31.12.2016 -9.63 - as at 31.12.2015 -28.92 - as at 31.12.2014 20.16
Performance of MSCI Turkey IMI Net Index (in USD) (in %)
- as at 31.12.2016 * -10.23 - as at 31.12.2015 -30.46 - as at 31.12.2014 15.42
Number of Class R (EUR) Shares outstanding
- outstanding at the beginning of the year 209,006.379 - issued 38.694 - redeemed -38,640.220 - outstanding at the end of the year 170,404.853
Net asset value per Class R (EUR) Share - as at 31.12.2016 8.0838 - as at 31.12.2015 8.6982 - as at 31.12.2014 11.1862
Performance of Class R (EUR) Shares (in %) - as at 31.12.2016 -7.06 - as at 31.12.2015 -20.40 - as at 31.12.2014 32.54
Performance of MSCI Turkey IMI Net Index (in EUR) (in %)
- as at 31.12.2016 * -7.04 - as at 31.12.2015 -22.19 - as at 31.12.2014 30.79
East Capital Turkey
Statement of investments and other net assets (in EUR) as at 31st December 2016
The accompanying notes are an integral part of these financial statements.
East Capital 35
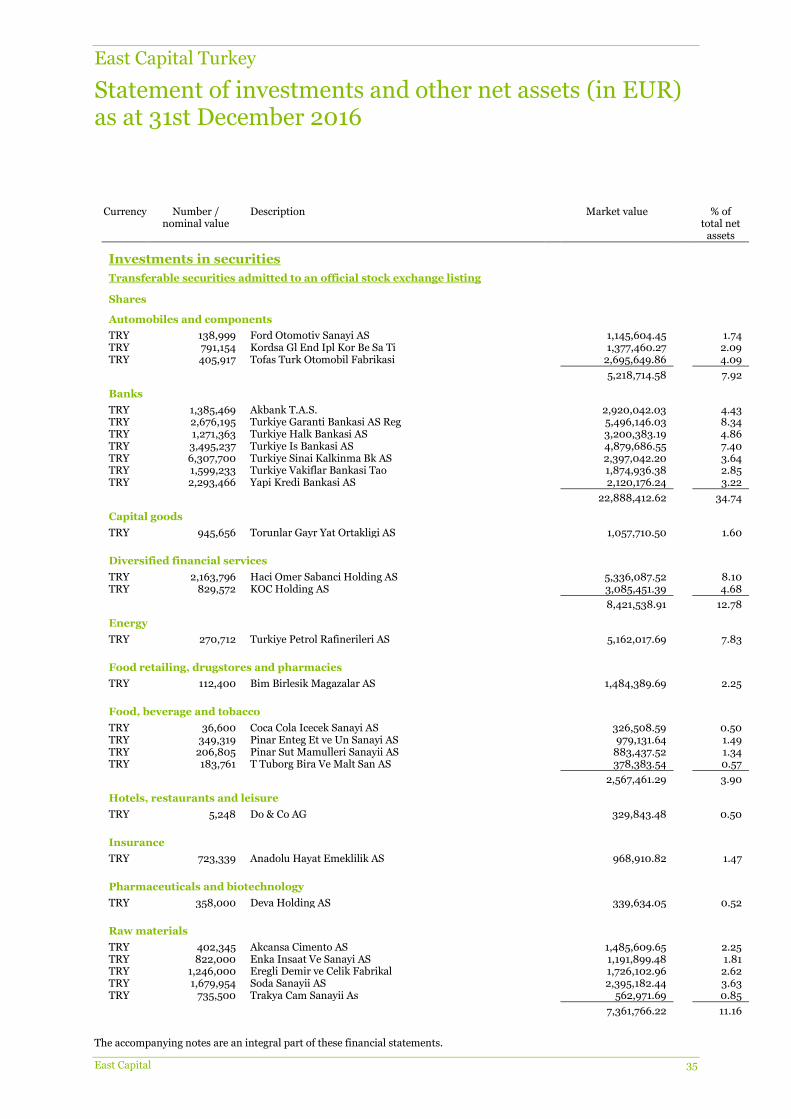
Currency Number / nominal value
Description Market value % of total net
assets
Investments in securities
Transferable securities admitted to an official stock exchange listing
Shares
Automobiles and components
TRY 138,999 Ford Otomotiv Sanayi AS 1,145,604.45 1.74 TRY 791,154 Kordsa Gl End Ipl Kor Be Sa Ti 1,377,460.27 2.09 TRY 405,917 Tofas Turk Otomobil Fabrikasi 2,695,649.86 4.09
5,218,714.58 7.92
Banks
TRY 1,385,469 Akbank T.A.S. 2,920,042.03 4.43 TRY 2,676,195 Turkiye Garanti Bankasi AS Reg 5,496,146.03 8.34 TRY 1,271,363 Turkiye Halk Bankasi AS 3,200,383.19 4.86 TRY 3,495,237 Turkiye Is Bankasi AS 4,879,686.55 7.40 TRY 6,307,700 Turkiye Sinai Kalkinma Bk AS 2,397,042.20 3.64 TRY 1,599,233 Turkiye Vakiflar Bankasi Tao 1,874,936.38 2.85 TRY 2,293,466 Yapi Kredi Bankasi AS 2,120,176.24 3.22
22,888,412.62 34.74
Capital goods
TRY 945,656 Torunlar Gayr Yat Ortakligi AS 1,057,710.50 1.60
Diversified financial services
TRY 2,163,796 Haci Omer Sabanci Holding AS 5,336,087.52 8.10 TRY 829,572 KOC Holding AS 3,085,451.39 4.68
8,421,538.91 12.78
Energy
TRY 270,712 Turkiye Petrol Rafinerileri AS 5,162,017.69 7.83
Food retailing, drugstores and pharmacies
TRY 112,400 Bim Birlesik Magazalar AS 1,484,389.69 2.25
Food, beverage and tobacco
TRY 36,600 Coca Cola Icecek Sanayi AS 326,508.59 0.50 TRY 349,319 Pinar Enteg Et ve Un Sanayi AS 979,131.64 1.49 TRY 206,805 Pinar Sut Mamulleri Sanayii AS 883,437.52 1.34 TRY 183,761 T Tuborg Bira Ve Malt San AS 378,383.54 0.57
2,567,461.29 3.90
Hotels, restaurants and leisure
TRY 5,248 Do & Co AG 329,843.48 0.50
Insurance
TRY 723,339 Anadolu Hayat Emeklilik AS 968,910.82 1.47
Pharmaceuticals and biotechnology
TRY 358,000 Deva Holding AS 339,634.05 0.52
Raw materials
TRY 402,345 Akcansa Cimento AS 1,485,609.65 2.25 TRY 822,000 Enka Insaat Ve Sanayi AS 1,191,899.48 1.81 TRY 1,246,000 Eregli Demir ve Celik Fabrikal 1,726,102.96 2.62 TRY 1,679,954 Soda Sanayii AS 2,395,182.44 3.63 TRY 735,500 Trakya Cam Sanayii As 562,971.69 0.85
7,361,766.22 11.16
East Capital Turkey
Statement of investments and other net assets (in EUR) (continued) as at 31st December 2016
The accompanying notes are an integral part of these financial statements.
East Capital 36
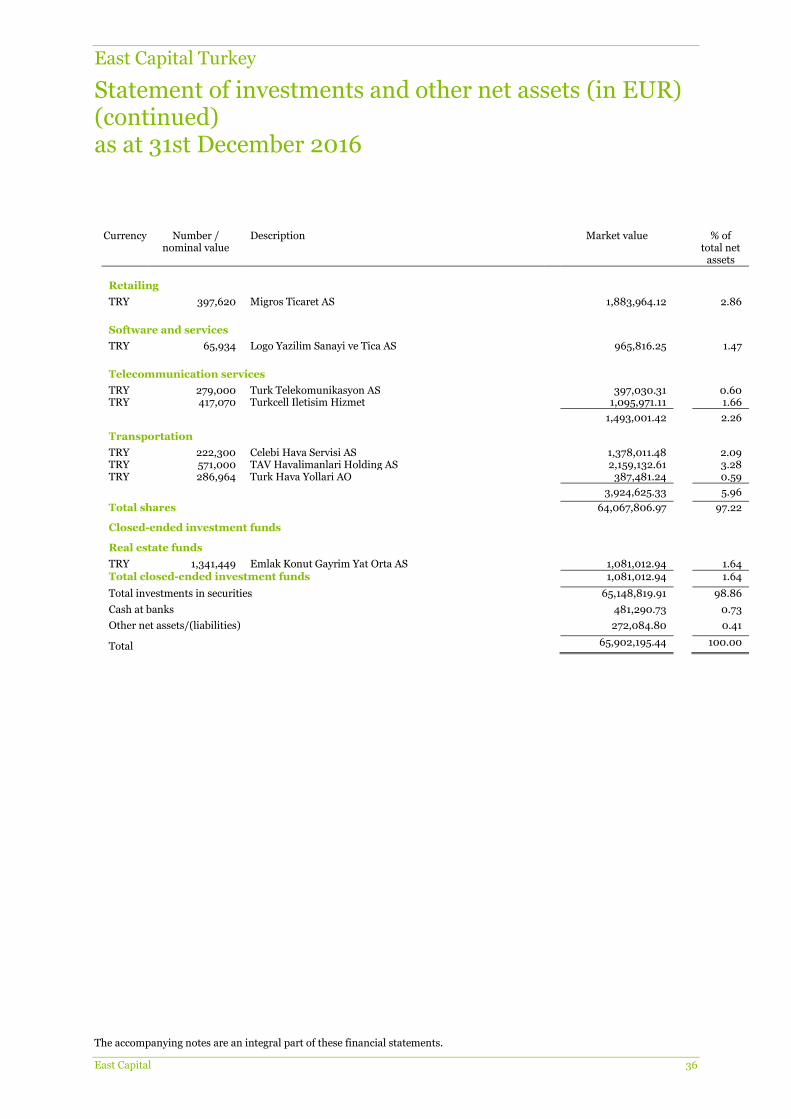
Currency Number / nominal value
Description Market value % of total net
assets
Retailing
TRY 397,620 Migros Ticaret AS 1,883,964.12 2.86
Software and services
TRY 65,934 Logo Yazilim Sanayi ve Tica AS 965,816.25 1.47
Telecommunication services
TRY 279,000 Turk Telekomunikasyon AS 397,030.31 0.60 TRY 417,070 Turkcell Iletisim Hizmet 1,095,971.11 1.66
1,493,001.42 2.26
Transportation
TRY 222,300 Celebi Hava Servisi AS 1,378,011.48 2.09 TRY 571,000 TAV Havalimanlari Holding AS 2,159,132.61 3.28 TRY 286,964 Turk Hava Yollari AO 387,481.24 0.59
3,924,625.33 5.96
Total shares 64,067,806.97 97.22
Closed-ended investment funds
Real estate funds
TRY 1,341,449 Emlak Konut Gayrim Yat Orta AS 1,081,012.94 1.64 Total closed-ended investment funds 1,081,012.94 1.64
Total investments in securities 65,148,819.91 98.86
Cash at banks 481,290.73 0.73
Other net assets/(liabilities) 272,084.80 0.41
Total 65,902,195.44 100.00
East Capital Eastern Europe
Statement of net assets (in EUR) as at 31st December 2016
The accompanying notes are an integral part of these financial statements.
East Capital 37
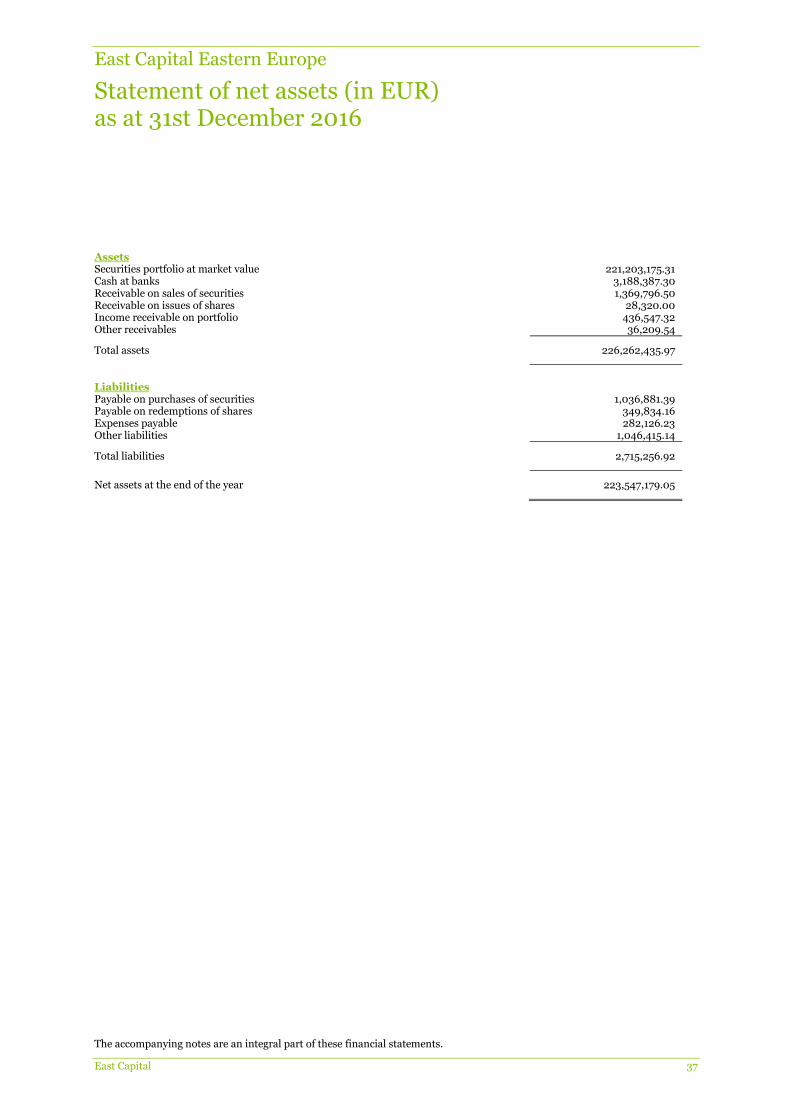
Assets Securities portfolio at market value 221,203,175.31 Cash at banks 3,188,387.30 Receivable on sales of securities 1,369,796.50 Receivable on issues of shares 28,320.00 Income receivable on portfolio 436,547.32 Other receivables 36,209.54
Total assets 226,262,435.97
Liabilities Payable on purchases of securities 1,036,881.39 Payable on redemptions of shares 349,834.16 Expenses payable 282,126.23 Other liabilities 1,046,415.14
Total liabilities 2,715,256.92
Net assets at the end of the year 223,547,179.05

East Capital Eastern Europe
Statement of operations and other changes in net assets (in EUR) from 1st January 2016 to 31st December 2016
The accompanying notes are an integral part of these financial statements.
East Capital 38
Income Dividends, net 5,539,538.36 Interest on bank accounts 11,503.01 Other income 242,811.39
Total income 5,793,852.76
Expenses Management fees 3,226,824.65 Banking charges and other fees 604.41 Transaction fees 326,414.89 Flat fee 729,769.81 Other administration costs 42,087.96 Subscription duty ("taxe d'abonnement") 82,747.53 Other taxes 92,921.51 Bank interest paid 8,950.12 Other expenses 21,642.41
Total expenses 4,531,963.29
Net investment income 1,261,889.47
Net realised gain/(loss) - on securities portfolio -11,035,603.86 - on foreign exchange -62,275.55
Realised result -9,835,989.94
Net variation of the unrealised gain/(loss) - on securities portfolio 61,745,370.58
Result of operations 51,909,380.64
Dividends paid -
Subscriptions 65,590,015.42
Redemptions -39,072,027.84
Total changes in net assets 78,427,368.22
Total net assets at the beginning of the year 145,119,810.83
Total net assets at the end of the year 223,547,179.05
East Capital Eastern Europe
Statistical information (in EUR) as at 31st December 2016
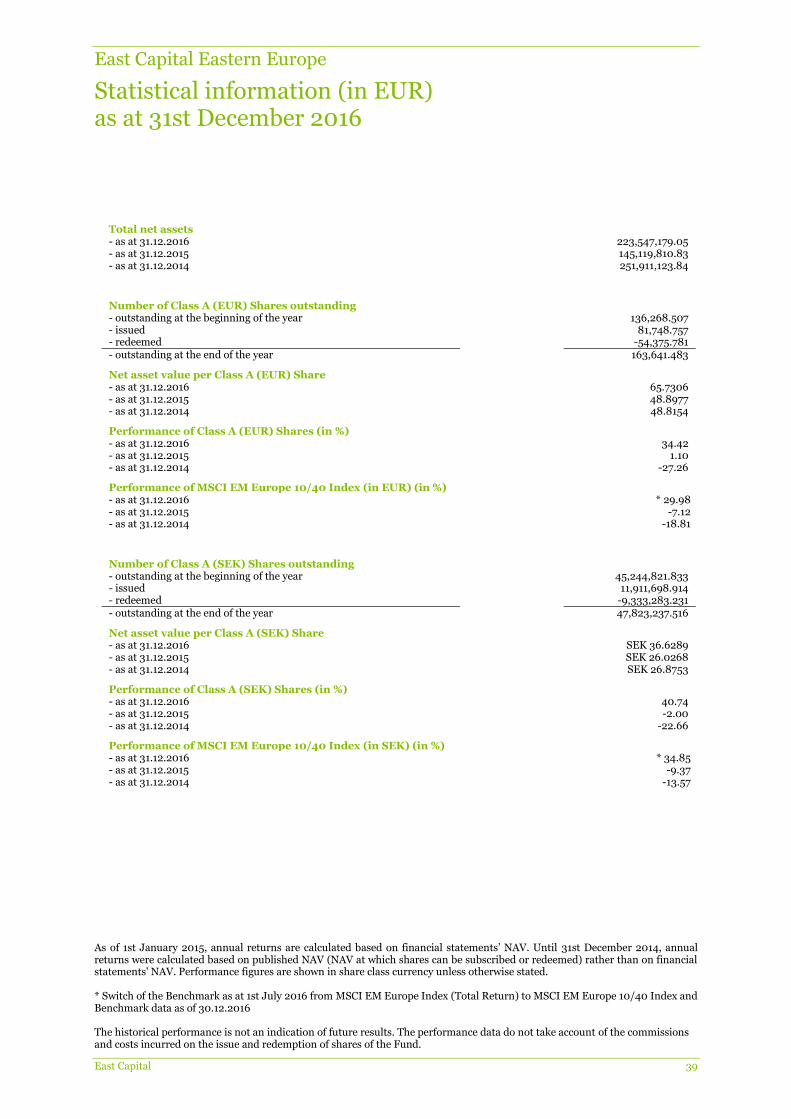
As of 1st January 2015, annual returns are calculated based on financial statements’ NAV. Until 31st December 2014, annual returns were calculated based on published NAV (NAV at which shares can be subscribed or redeemed) rather than on financial statements' NAV. Performance figures are shown in share class currency unless otherwise stated. * Switch of the Benchmark as at 1st July 2016 from MSCI EM Europe Index (Total Return) to MSCI EM Europe 10/40 Index and Benchmark data as of 30.12.2016 The historical performance is not an indication of future results. The performance data do not take account of the commissions and costs incurred on the issue and redemption of shares of the Fund.
East Capital 39
Total net assets
- as at 31.12.2016 223,547,179.05 - as at 31.12.2015 145,119,810.83 - as at 31.12.2014 251,911,123.84
Number of Class A (EUR) Shares outstanding
- outstanding at the beginning of the year 136,268.507 - issued 81,748.757 - redeemed -54,375.781 - outstanding at the end of the year 163,641.483
Net asset value per Class A (EUR) Share - as at 31.12.2016 65.7306 - as at 31.12.2015 48.8977 - as at 31.12.2014 48.8154
Performance of Class A (EUR) Shares (in %) - as at 31.12.2016 34.42 - as at 31.12.2015 1.10 - as at 31.12.2014 -27.26
Performance of MSCI EM Europe 10/40 Index (in EUR) (in %)
- as at 31.12.2016 * 29.98 - as at 31.12.2015 -7.12 - as at 31.12.2014 -18.81
Number of Class A (SEK) Shares outstanding
- outstanding at the beginning of the year 45,244,821.833 - issued 11,911,698.914 - redeemed -9,333,283.231 - outstanding at the end of the year 47,823,237.516
Net asset value per Class A (SEK) Share - as at 31.12.2016 SEK 36.6289 - as at 31.12.2015 SEK 26.0268 - as at 31.12.2014 SEK 26.8753
Performance of Class A (SEK) Shares (in %) - as at 31.12.2016 40.74 - as at 31.12.2015 -2.00 - as at 31.12.2014 -22.66
Performance of MSCI EM Europe 10/40 Index (in SEK) (in %)
- as at 31.12.2016 * 34.85 - as at 31.12.2015 -9.37 - as at 31.12.2014 -13.57

East Capital Eastern Europe
Statistical information (in EUR) (continued) as at 31st December 2016
As of 1st January 2015, annual returns are calculated based on financial statements’ NAV. Until 31st December 2014, annual returns were calculated based on published NAV (NAV at which shares can be subscribed or redeemed) rather than on financial statements' NAV. Performance figures are shown in share class currency unless otherwise stated. * Switch of the Benchmark as at 1st July 2016 from MSCI EM Europe Index (Total Return) to MSCI EM Europe 10/40 Index and Benchmark data as of 30.12.2016 The historical performance is not an indication of future results. The performance data do not take account of the commissions and costs incurred on the issue and redemption of shares of the Fund.
East Capital 40
Number of Class A (USD) Shares outstanding
- outstanding at the beginning of the year 22,052.469 - issued 131,690.000 - redeemed -9,921.617 - outstanding at the end of the year 143,820.852
Net asset value per Class A (USD) Share - as at 31.12.2016 USD 47.6822 - as at 31.12.2015 USD 36.5271 - as at 31.12.2014 USD 40.6458
Performance of Class A (USD) Shares (in %) - as at 31.12.2016 30.54 - as at 31.12.2015 -9.86 - as at 31.12.2014 -35.78
Performance of MSCI EM Europe 10/40 Index (in USD) (in %)
- as at 31.12.2016 * 24.48 - as at 31.12.2015 -16.98 - as at 31.12.2014 -28.34
Number of Class C (EUR) Shares outstanding
- outstanding at the beginning of the year 137,843.647 - issued 283,047.373 - redeemed -117,271.781 - outstanding at the end of the year 303,619.239
Net asset value per Class C (EUR) Share - as at 31.12.2016 69.2237 - as at 31.12.2015 51.1673 - as at 31.12.2014 50.7526
Performance of Class C (EUR) Shares (in %) - as at 31.12.2016 35.29 - as at 31.12.2015 1.75 - as at 31.12.2014 -26.79
Performance of MSCI EM Europe 10/40 Index (in EUR) (in %)
- as at 31.12.2016 * 29.98 - as at 31.12.2015 -7.12 - as at 31.12.2014 -18.81
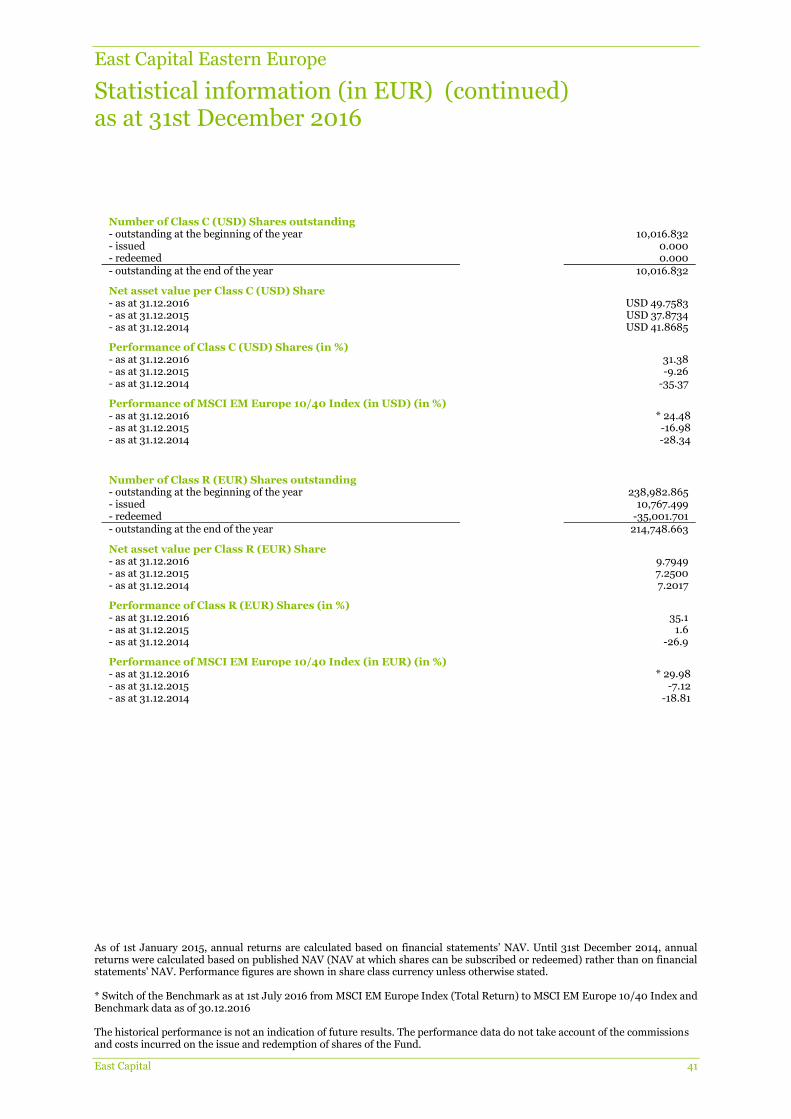
East Capital Eastern Europe
Statistical information (in EUR) (continued) as at 31st December 2016
As of 1st January 2015, annual returns are calculated based on financial statements’ NAV. Until 31st December 2014, annual returns were calculated based on published NAV (NAV at which shares can be subscribed or redeemed) rather than on financial statements' NAV. Performance figures are shown in share class currency unless otherwise stated. * Switch of the Benchmark as at 1st July 2016 from MSCI EM Europe Index (Total Return) to MSCI EM Europe 10/40 Index and Benchmark data as of 30.12.2016 The historical performance is not an indication of future results. The performance data do not take account of the commissions and costs incurred on the issue and redemption of shares of the Fund.
East Capital 41
Number of Class C (USD) Shares outstanding
- outstanding at the beginning of the year 10,016.832 - issued 0.000 - redeemed 0.000 - outstanding at the end of the year 10,016.832
Net asset value per Class C (USD) Share - as at 31.12.2016 USD 49.7583 - as at 31.12.2015 USD 37.8734 - as at 31.12.2014 USD 41.8685
Performance of Class C (USD) Shares (in %) - as at 31.12.2016 31.38 - as at 31.12.2015 -9.26 - as at 31.12.2014 -35.37
Performance of MSCI EM Europe 10/40 Index (in USD) (in %)
- as at 31.12.2016 * 24.48 - as at 31.12.2015 -16.98 - as at 31.12.2014 -28.34
Number of Class R (EUR) Shares outstanding
- outstanding at the beginning of the year 238,982.865 - issued 10,767.499 - redeemed -35,001.701 - outstanding at the end of the year 214,748.663
Net asset value per Class R (EUR) Share - as at 31.12.2016 9.7949 - as at 31.12.2015 7.2500 - as at 31.12.2014 7.2017
Performance of Class R (EUR) Shares (in %) - as at 31.12.2016 35.1 - as at 31.12.2015 1.6 - as at 31.12.2014 -26.9
Performance of MSCI EM Europe 10/40 Index (in EUR) (in %)
- as at 31.12.2016 * 29.98 - as at 31.12.2015 -7.12 - as at 31.12.2014 -18.81
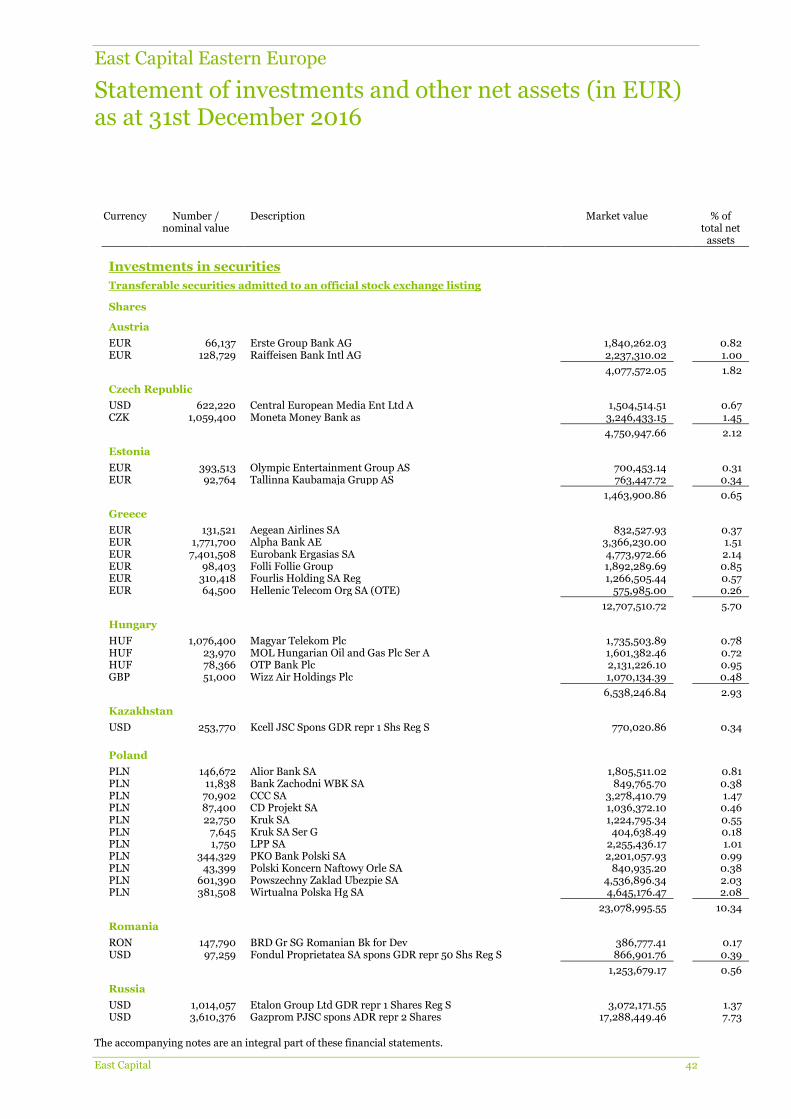
East Capital Eastern Europe
Statement of investments and other net assets (in EUR) as at 31st December 2016
The accompanying notes are an integral part of these financial statements.
East Capital 42
Currency Number / nominal value
Description Market value % of total net
assets
Investments in securities
Transferable securities admitted to an official stock exchange listing
Shares
Austria
EUR 66,137 Erste Group Bank AG 1,840,262.03 0.82 EUR 128,729 Raiffeisen Bank Intl AG 2,237,310.02 1.00
4,077,572.05 1.82
Czech Republic
USD 622,220 Central European Media Ent Ltd A 1,504,514.51 0.67 CZK 1,059,400 Moneta Money Bank as 3,246,433.15 1.45
4,750,947.66 2.12
Estonia
EUR 393,513 Olympic Entertainment Group AS 700,453.14 0.31 EUR 92,764 Tallinna Kaubamaja Grupp AS 763,447.72 0.34
1,463,900.86 0.65
Greece
EUR 131,521 Aegean Airlines SA 832,527.93 0.37 EUR 1,771,700 Alpha Bank AE 3,366,230.00 1.51 EUR 7,401,508 Eurobank Ergasias SA 4,773,972.66 2.14 EUR 98,403 Folli Follie Group 1,892,289.69 0.85 EUR 310,418 Fourlis Holding SA Reg 1,266,505.44 0.57 EUR 64,500 Hellenic Telecom Org SA (OTE) 575,985.00 0.26
12,707,510.72 5.70
Hungary
HUF 1,076,400 Magyar Telekom Plc 1,735,503.89 0.78 HUF 23,970 MOL Hungarian Oil and Gas Plc Ser A 1,601,382.46 0.72 HUF 78,366 OTP Bank Plc 2,131,226.10 0.95 GBP 51,000 Wizz Air Holdings Plc 1,070,134.39 0.48
6,538,246.84 2.93
Kazakhstan
USD 253,770 Kcell JSC Spons GDR repr 1 Shs Reg S 770,020.86 0.34
Poland
PLN 146,672 Alior Bank SA 1,805,511.02 0.81 PLN 11,838 Bank Zachodni WBK SA 849,765.70 0.38 PLN 70,902 CCC SA 3,278,410.79 1.47 PLN 87,400 CD Projekt SA 1,036,372.10 0.46 PLN 22,750 Kruk SA 1,224,795.34 0.55 PLN 7,645 Kruk SA Ser G 404,638.49 0.18 PLN 1,750 LPP SA 2,255,436.17 1.01 PLN 344,329 PKO Bank Polski SA 2,201,057.93 0.99 PLN 43,399 Polski Koncern Naftowy Orle SA 840,935.20 0.38 PLN 601,390 Powszechny Zaklad Ubezpie SA 4,536,896.34 2.03 PLN 381,508 Wirtualna Polska Hg SA 4,645,176.47 2.08
23,078,995.55 10.34
Romania
RON 147,790 BRD Gr SG Romanian Bk for Dev 386,777.41 0.17 USD 97,259 Fondul Proprietatea SA spons GDR repr 50 Shs Reg S 866,901.76 0.39
1,253,679.17 0.56
Russia
USD 1,014,057 Etalon Group Ltd GDR repr 1 Shares Reg S 3,072,171.55 1.37 USD 3,610,376 Gazprom PJSC spons ADR repr 2 Shares 17,288,449.46 7.73
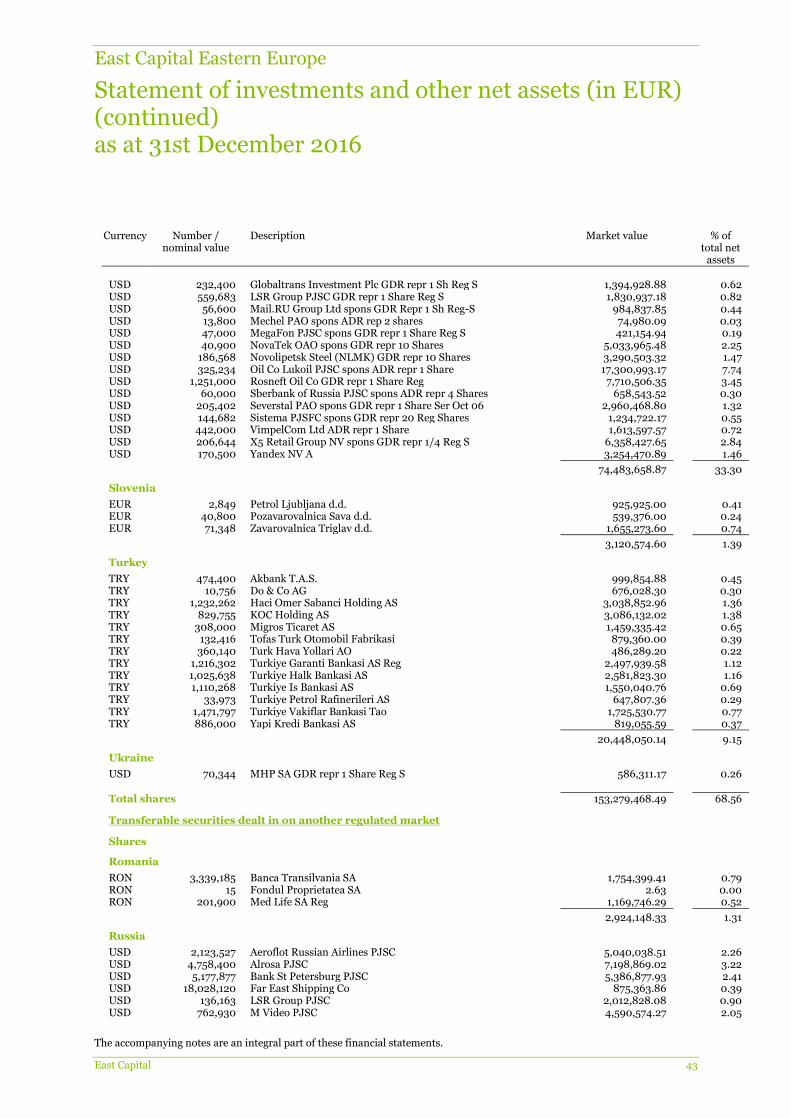
East Capital Eastern Europe
Statement of investments and other net assets (in EUR) (continued) as at 31st December 2016
The accompanying notes are an integral part of these financial statements.
East Capital 43
Currency Number / nominal value
Description Market value % of total net
assets USD 232,400 Globaltrans Investment Plc GDR repr 1 Sh Reg S 1,394,928.88 0.62 USD 559,683 LSR Group PJSC GDR repr 1 Share Reg S 1,830,937.18 0.82 USD 56,600 Mail.RU Group Ltd spons GDR Repr 1 Sh Reg-S 984,837.85 0.44 USD 13,800 Mechel PAO spons ADR rep 2 shares 74,980.09 0.03 USD 47,000 MegaFon PJSC spons GDR repr 1 Share Reg S 421,154.94 0.19 USD 40,900 NovaTek OAO spons GDR repr 10 Shares 5,033,965.48 2.25 USD 186,568 Novolipetsk Steel (NLMK) GDR repr 10 Shares 3,290,503.32 1.47 USD 325,234 Oil Co Lukoil PJSC spons ADR repr 1 Share 17,300,993.17 7.74 USD 1,251,000 Rosneft Oil Co GDR repr 1 Share Reg 7,710,506.35 3.45 USD 60,000 Sberbank of Russia PJSC spons ADR repr 4 Shares 658,543.52 0.30 USD 205,402 Severstal PAO spons GDR repr 1 Share Ser Oct 06 2,960,468.80 1.32 USD 144,682 Sistema PJSFC spons GDR repr 20 Reg Shares 1,234,722.17 0.55 USD 442,000 VimpelCom Ltd ADR repr 1 Share 1,613,597.57 0.72 USD 206,644 X5 Retail Group NV spons GDR repr 1/4 Reg S 6,358,427.65 2.84 USD 170,500 Yandex NV A 3,254,470.89 1.46
74,483,658.87 33.30
Slovenia
EUR 2,849 Petrol Ljubljana d.d. 925,925.00 0.41 EUR 40,800 Pozavarovalnica Sava d.d. 539,376.00 0.24 EUR 71,348 Zavarovalnica Triglav d.d. 1,655,273.60 0.74
3,120,574.60 1.39
Turkey
TRY 474,400 Akbank T.A.S. 999,854.88 0.45 TRY 10,756 Do & Co AG 676,028.30 0.30 TRY 1,232,262 Haci Omer Sabanci Holding AS 3,038,852.96 1.36 TRY 829,755 KOC Holding AS 3,086,132.02 1.38 TRY 308,000 Migros Ticaret AS 1,459,335.42 0.65 TRY 132,416 Tofas Turk Otomobil Fabrikasi 879,360.00 0.39 TRY 360,140 Turk Hava Yollari AO 486,289.20 0.22 TRY 1,216,302 Turkiye Garanti Bankasi AS Reg 2,497,939.58 1.12 TRY 1,025,638 Turkiye Halk Bankasi AS 2,581,823.30 1.16 TRY 1,110,268 Turkiye Is Bankasi AS 1,550,040.76 0.69 TRY 33,973 Turkiye Petrol Rafinerileri AS 647,807.36 0.29 TRY 1,471,797 Turkiye Vakiflar Bankasi Tao 1,725,530.77 0.77 TRY 886,000 Yapi Kredi Bankasi AS 819,055.59 0.37
20,448,050.14 9.15
Ukraine
USD 70,344 MHP SA GDR repr 1 Share Reg S 586,311.17 0.26 Total shares 153,279,468.49 68.56
Transferable securities dealt in on another regulated market
Shares
Romania
RON 3,339,185 Banca Transilvania SA 1,754,399.41 0.79 RON 15 Fondul Proprietatea SA 2.63 0.00 RON 201,900 Med Life SA Reg 1,169,746.29 0.52
2,924,148.33 1.31
Russia
USD 2,123,527 Aeroflot Russian Airlines PJSC 5,040,038.51 2.26 USD 4,758,400 Alrosa PJSC 7,198,869.02 3.22 USD 5,177,877 Bank St Petersburg PJSC 5,386,877.93 2.41 USD 18,028,120 Far East Shipping Co 875,363.86 0.39 USD 136,163 LSR Group PJSC 2,012,828.08 0.90 USD 762,930 M Video PJSC 4,590,574.27 2.05
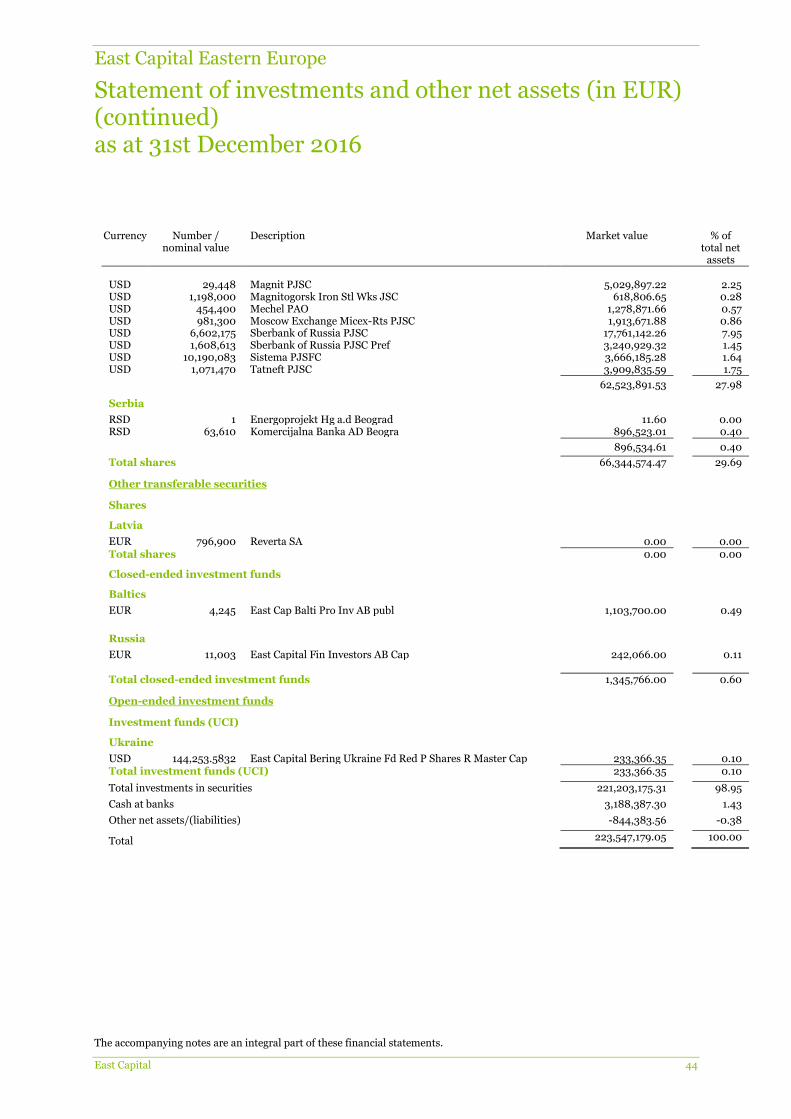
East Capital Eastern Europe
Statement of investments and other net assets (in EUR) (continued) as at 31st December 2016
The accompanying notes are an integral part of these financial statements.
East Capital 44
Currency Number / nominal value
Description Market value % of total net
assets USD 29,448 Magnit PJSC 5,029,897.22 2.25 USD 1,198,000 Magnitogorsk Iron Stl Wks JSC 618,806.65 0.28 USD 454,400 Mechel PAO 1,278,871.66 0.57 USD 981,300 Moscow Exchange Micex-Rts PJSC 1,913,671.88 0.86 USD 6,602,175 Sberbank of Russia PJSC 17,761,142.26 7.95 USD 1,608,613 Sberbank of Russia PJSC Pref 3,240,929.32 1.45 USD 10,190,083 Sistema PJSFC 3,666,185.28 1.64 USD 1,071,470 Tatneft PJSC 3,909,835.59 1.75
62,523,891.53 27.98
Serbia
RSD 1 Energoprojekt Hg a.d Beograd 11.60 0.00 RSD 63,610 Komercijalna Banka AD Beogra 896,523.01 0.40
896,534.61 0.40
Total shares 66,344,574.47 29.69
Other transferable securities
Shares
Latvia
EUR 796,900 Reverta SA 0.00 0.00 Total shares 0.00 0.00
Closed-ended investment funds
Baltics
EUR 4,245 East Cap Balti Pro Inv AB publ 1,103,700.00 0.49
Russia
EUR 11,003 East Capital Fin Investors AB Cap 242,066.00 0.11 Total closed-ended investment funds 1,345,766.00 0.60
Open-ended investment funds
Investment funds (UCI)
Ukraine
USD 144,253.5832 East Capital Bering Ukraine Fd Red P Shares R Master Cap 233,366.35 0.10 Total investment funds (UCI) 233,366.35 0.10
Total investments in securities 221,203,175.31 98.95
Cash at banks 3,188,387.30 1.43
Other net assets/(liabilities) -844,383.56 -0.38
Total 223,547,179.05 100.00
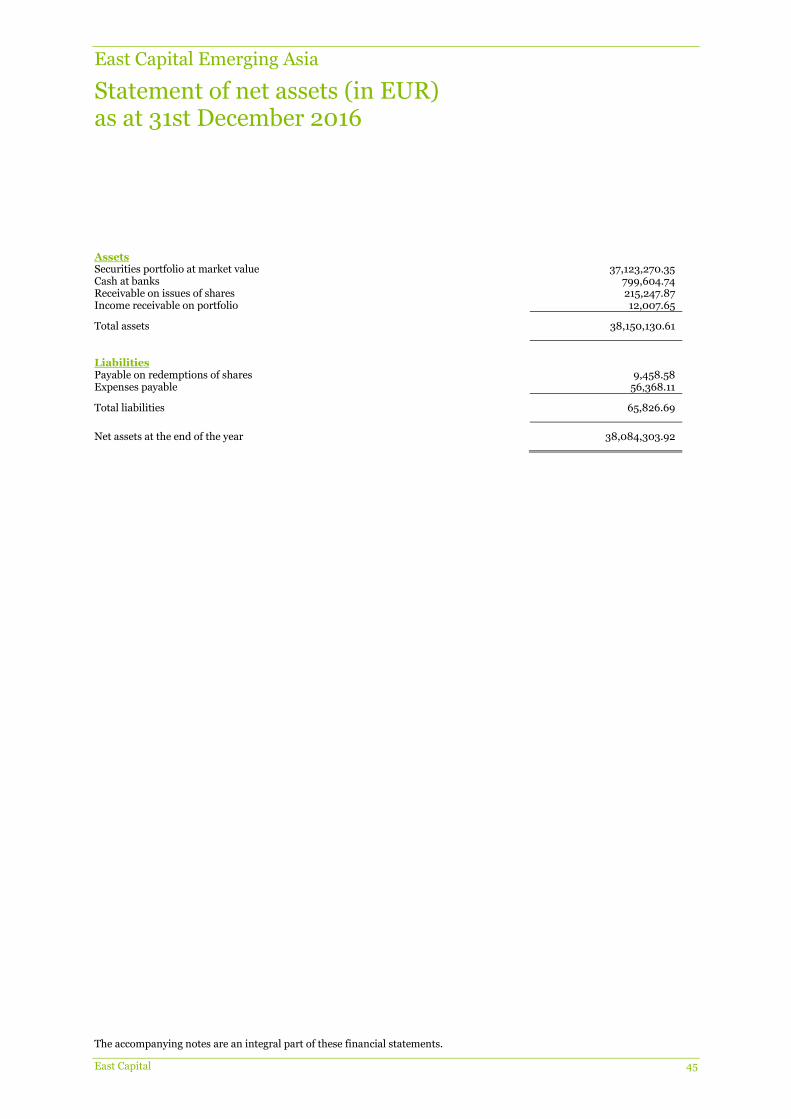
East Capital Emerging Asia
Statement of net assets (in EUR) as at 31st December 2016
The accompanying notes are an integral part of these financial statements.
East Capital 45
Assets Securities portfolio at market value 37,123,270.35 Cash at banks 799,604.74 Receivable on issues of shares 215,247.87 Income receivable on portfolio 12,007.65
Total assets 38,150,130.61
Liabilities Payable on redemptions of shares 9,458.58 Expenses payable 56,368.11
Total liabilities 65,826.69
Net assets at the end of the year 38,084,303.92

East Capital Emerging Asia
Statement of operations and other changes in net assets (in EUR) from 1st January 2016 to 31st December 2016
The accompanying notes are an integral part of these financial statements.
East Capital 46
Income Dividends, net 1,021,322.62 Interest on bank accounts 7.08
Total income 1,021,329.70
Expenses Management fees 711,786.78 Performance fees 14,058.02 Transaction fees 342,689.85 Flat fee 199,380.35 Other administration costs 8,070.24 Subscription duty ("taxe d'abonnement") 18,635.86 Other taxes 205,236.34 Bank interest paid 3,228.95 Other expenses 14,992.10
Total expenses 1,518,078.49
Net investment loss -496,748.79
Net realised gain/(loss) - on securities portfolio 4,275,505.99 - on foreign exchange -210,315.57
Realised result 3,568,441.63
Net variation of the unrealised gain/(loss) - on securities portfolio -654,385.98
Result of operations 2,914,055.65
Dividends paid -19,703.21
Subscriptions 5,544,710.23
Redemptions -22,042,497.65
Total changes in net assets -13,603,434.98
Total net assets at the beginning of the year 51,687,738.90
Total net assets at the end of the year 38,084,303.92

East Capital Emerging Asia
Statistical information (in EUR) as at 31st December 2016
As of 1st January 2015, annual returns are calculated based on financial statements’ NAV. Until 31st December 2014, annual returns were calculated based on published NAV (NAV at which shares can be subscribed or redeemed) rather than on financial statements' NAV. Performance figures are shown in share class currency unless otherwise stated. * Benchmark data as of 30.12.2016 The historical performance is not an indication of future results. The performance data do not take account of the commissions and costs incurred on the issue and redemption of shares of the Fund.
East Capital 47
Total net assets
- as at 31.12.2016 38,084,303.92 - as at 31.12.2015 51,687,738.90 - as at 31.12.2014 63,477,001.25
Number of Class A (EUR) Shares outstanding
- outstanding at the beginning of the year 66,513.976 - issued 1,415.185 - redeemed -8,302.601 - outstanding at the end of the year 59,626.560
Net asset value per Class A (EUR) Share - as at 31.12.2016 283.8590 - as at 31.12.2015 271.3314 - as at 31.12.2014 263.0483
Performance of Class A (EUR) Shares (in %) - as at 31.12.2016 4.62 - as at 31.12.2015 5.91 - as at 31.12.2014 13.91
Performance of MSCI Asia ex-Japan Index (in EUR) (in %)
- as at 31.12.2016 * 9.50 - as at 31.12.2015 2.09 - as at 31.12.2014 18.58
Number of Class A (SEK) Shares outstanding
- outstanding at the beginning of the year 1,302,361.229 - issued 227,997.045 - redeemed -186,264.343 - outstanding at the end of the year 1,344,093.931
Net asset value per Class A (SEK) Share - as at 31.12.2016 SEK 130.6657 - as at 31.12.2015 SEK 119.3009 - as at 31.12.2014 SEK 119.6439
Performance of Class A (SEK) Shares (in %) - as at 31.12.2016 9.53 - as at 31.12.2015 2.65 - as at 31.12.2014 21.10
Performance of MSCI Asia ex-Japan Index (in SEK) (in %)
- as at 31.12.2016 * 13.69 - as at 31.12.2015 -0.39 - as at 31.12.2014 26.23
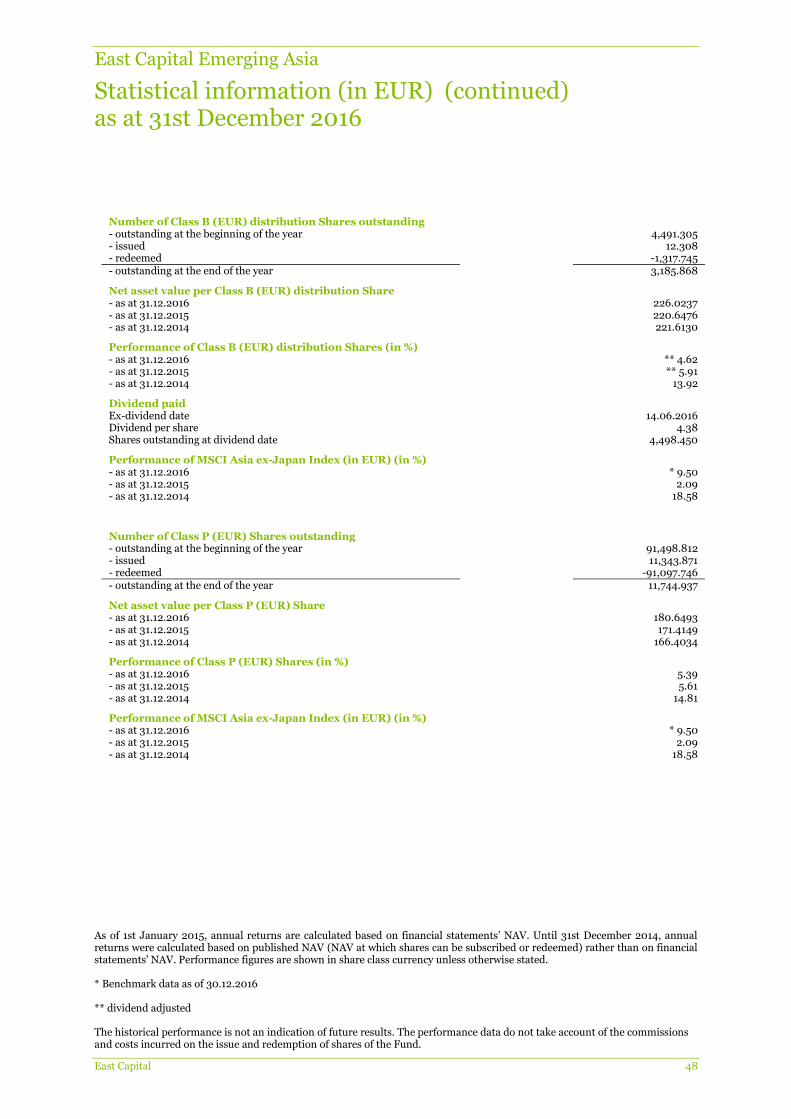
East Capital Emerging Asia
Statistical information (in EUR) (continued) as at 31st December 2016
As of 1st January 2015, annual returns are calculated based on financial statements’ NAV. Until 31st December 2014, annual returns were calculated based on published NAV (NAV at which shares can be subscribed or redeemed) rather than on financial statements' NAV. Performance figures are shown in share class currency unless otherwise stated. * Benchmark data as of 30.12.2016 ** dividend adjusted The historical performance is not an indication of future results. The performance data do not take account of the commissions and costs incurred on the issue and redemption of shares of the Fund.
East Capital 48
Number of Class B (EUR) distribution Shares outstanding
- outstanding at the beginning of the year 4,491.305 - issued 12.308 - redeemed -1,317.745 - outstanding at the end of the year 3,185.868
Net asset value per Class B (EUR) distribution Share - as at 31.12.2016 226.0237 - as at 31.12.2015 220.6476 - as at 31.12.2014 221.6130
Performance of Class B (EUR) distribution Shares (in %) - as at 31.12.2016 ** 4.62 - as at 31.12.2015 ** 5.91 - as at 31.12.2014 13.92
Dividend paid Ex-dividend date 14.06.2016 Dividend per share 4.38 Shares outstanding at dividend date 4,498.450
Performance of MSCI Asia ex-Japan Index (in EUR) (in %)
- as at 31.12.2016 * 9.50 - as at 31.12.2015 2.09 - as at 31.12.2014 18.58
Number of Class P (EUR) Shares outstanding
- outstanding at the beginning of the year 91,498.812 - issued 11,343.871 - redeemed -91,097.746 - outstanding at the end of the year 11,744.937
Net asset value per Class P (EUR) Share - as at 31.12.2016 180.6493 - as at 31.12.2015 171.4149 - as at 31.12.2014 166.4034
Performance of Class P (EUR) Shares (in %) - as at 31.12.2016 5.39 - as at 31.12.2015 5.61 - as at 31.12.2014 14.81
Performance of MSCI Asia ex-Japan Index (in EUR) (in %)
- as at 31.12.2016 * 9.50 - as at 31.12.2015 2.09 - as at 31.12.2014 18.58
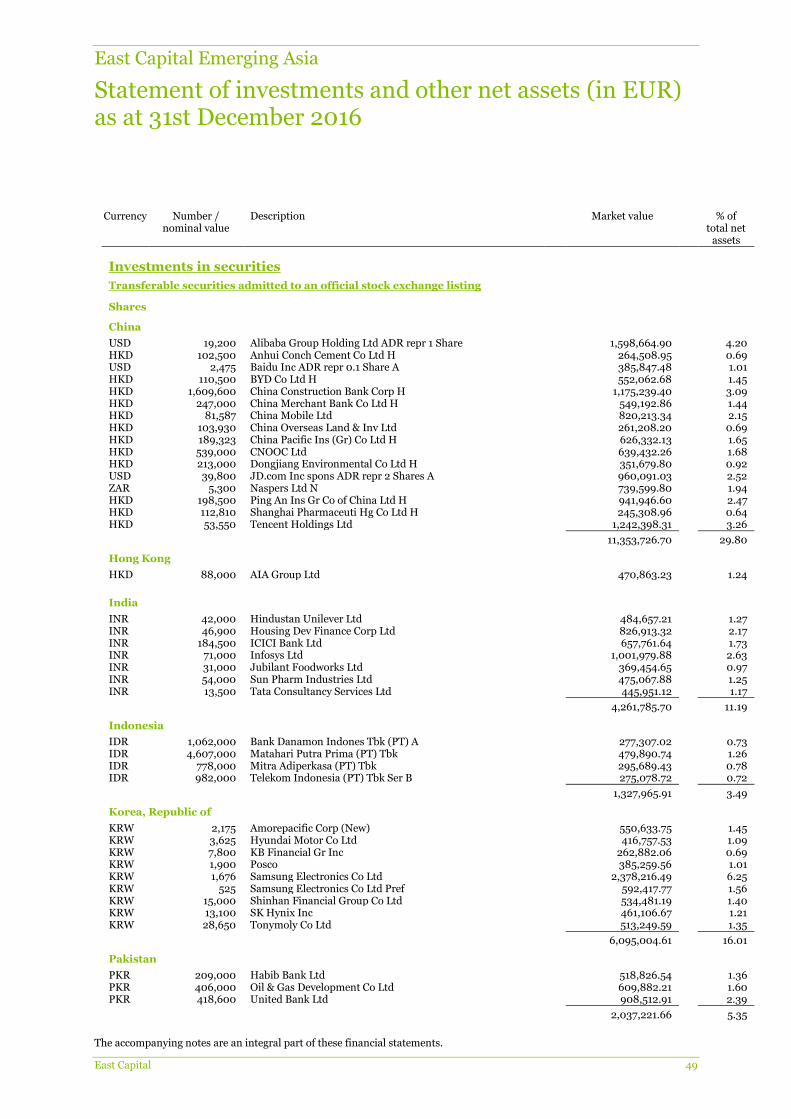
East Capital Emerging Asia
Statement of investments and other net assets (in EUR) as at 31st December 2016
The accompanying notes are an integral part of these financial statements.
East Capital 49
Currency Number / nominal value
Description Market value % of total net
assets
Investments in securities
Transferable securities admitted to an official stock exchange listing
Shares
China
USD 19,200 Alibaba Group Holding Ltd ADR repr 1 Share 1,598,664.90 4.20 HKD 102,500 Anhui Conch Cement Co Ltd H 264,508.95 0.69 USD 2,475 Baidu Inc ADR repr 0.1 Share A 385,847.48 1.01 HKD 110,500 BYD Co Ltd H 552,062.68 1.45 HKD 1,609,600 China Construction Bank Corp H 1,175,239.40 3.09 HKD 247,000 China Merchant Bank Co Ltd H 549,192.86 1.44 HKD 81,587 China Mobile Ltd 820,213.34 2.15 HKD 103,930 China Overseas Land & Inv Ltd 261,208.20 0.69 HKD 189,323 China Pacific Ins (Gr) Co Ltd H 626,332.13 1.65 HKD 539,000 CNOOC Ltd 639,432.26 1.68 HKD 213,000 Dongjiang Environmental Co Ltd H 351,679.80 0.92 USD 39,800 JD.com Inc spons ADR repr 2 Shares A 960,091.03 2.52 ZAR 5,300 Naspers Ltd N 739,599.80 1.94 HKD 198,500 Ping An Ins Gr Co of China Ltd H 941,946.60 2.47 HKD 112,810 Shanghai Pharmaceuti Hg Co Ltd H 245,308.96 0.64 HKD 53,550 Tencent Holdings Ltd 1,242,398.31 3.26
11,353,726.70 29.80
Hong Kong
HKD 88,000 AIA Group Ltd 470,863.23 1.24
India
INR 42,000 Hindustan Unilever Ltd 484,657.21 1.27 INR 46,900 Housing Dev Finance Corp Ltd 826,913.32 2.17 INR 184,500 ICICI Bank Ltd 657,761.64 1.73 INR 71,000 Infosys Ltd 1,001,979.88 2.63 INR 31,000 Jubilant Foodworks Ltd 369,454.65 0.97 INR 54,000 Sun Pharm Industries Ltd 475,067.88 1.25 INR 13,500 Tata Consultancy Services Ltd 445,951.12 1.17
4,261,785.70 11.19
Indonesia
IDR 1,062,000 Bank Danamon Indones Tbk (PT) A 277,307.02 0.73 IDR 4,607,000 Matahari Putra Prima (PT) Tbk 479,890.74 1.26 IDR 778,000 Mitra Adiperkasa (PT) Tbk 295,689.43 0.78 IDR 982,000 Telekom Indonesia (PT) Tbk Ser B 275,078.72 0.72
1,327,965.91 3.49
Korea, Republic of
KRW 2,175 Amorepacific Corp (New) 550,633.75 1.45 KRW 3,625 Hyundai Motor Co Ltd 416,757.53 1.09 KRW 7,800 KB Financial Gr Inc 262,882.06 0.69 KRW 1,900 Posco 385,259.56 1.01 KRW 1,676 Samsung Electronics Co Ltd 2,378,216.49 6.25 KRW 525 Samsung Electronics Co Ltd Pref 592,417.77 1.56 KRW 15,000 Shinhan Financial Group Co Ltd 534,481.19 1.40 KRW 13,100 SK Hynix Inc 461,106.67 1.21 KRW 28,650 Tonymoly Co Ltd 513,249.59 1.35
6,095,004.61 16.01
Pakistan
PKR 209,000 Habib Bank Ltd 518,826.54 1.36 PKR 406,000 Oil & Gas Development Co Ltd 609,882.21 1.60 PKR 418,600 United Bank Ltd 908,512.91 2.39
2,037,221.66 5.35
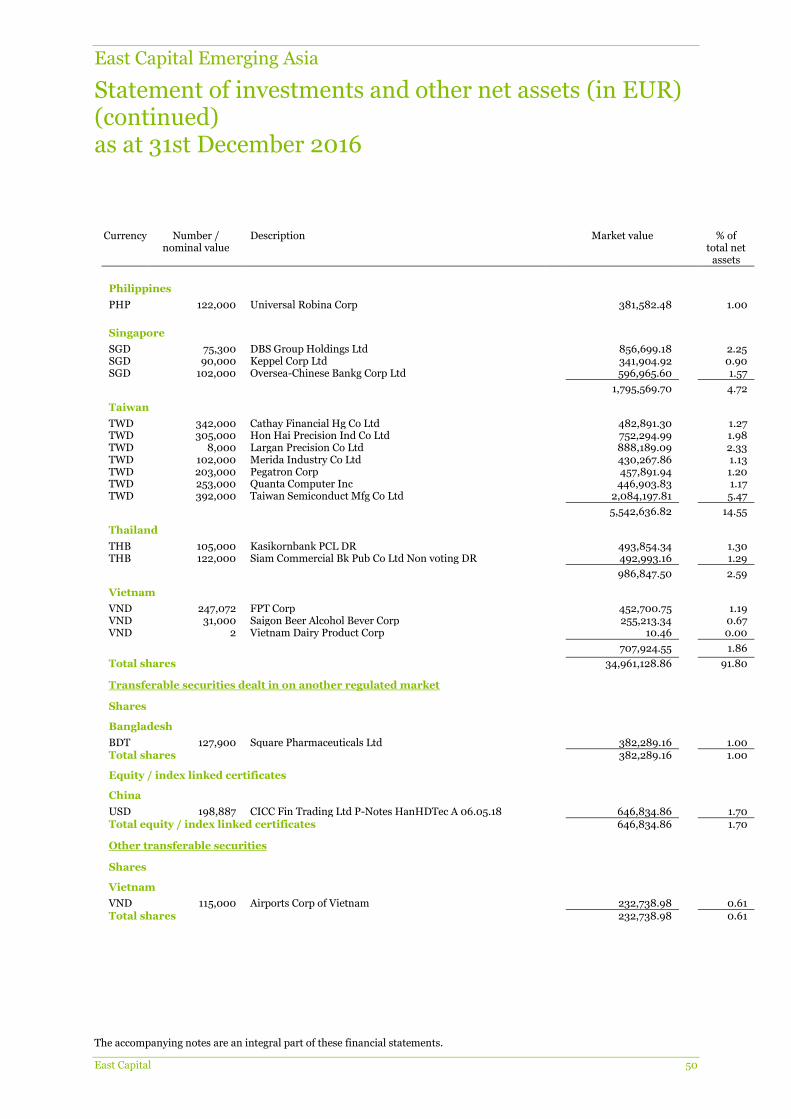
East Capital Emerging Asia
Statement of investments and other net assets (in EUR) (continued) as at 31st December 2016
The accompanying notes are an integral part of these financial statements.
East Capital 50
Currency Number / nominal value
Description Market value % of total net
assets
Philippines
PHP 122,000 Universal Robina Corp 381,582.48 1.00
Singapore
SGD 75,300 DBS Group Holdings Ltd 856,699.18 2.25 SGD 90,000 Keppel Corp Ltd 341,904.92 0.90 SGD 102,000 Oversea-Chinese Bankg Corp Ltd 596,965.60 1.57
1,795,569.70 4.72
Taiwan
TWD 342,000 Cathay Financial Hg Co Ltd 482,891.30 1.27 TWD 305,000 Hon Hai Precision Ind Co Ltd 752,294.99 1.98 TWD 8,000 Largan Precision Co Ltd 888,189.09 2.33 TWD 102,000 Merida Industry Co Ltd 430,267.86 1.13 TWD 203,000 Pegatron Corp 457,891.94 1.20 TWD 253,000 Quanta Computer Inc 446,903.83 1.17 TWD 392,000 Taiwan Semiconduct Mfg Co Ltd 2,084,197.81 5.47
5,542,636.82 14.55
Thailand
THB 105,000 Kasikornbank PCL DR 493,854.34 1.30 THB 122,000 Siam Commercial Bk Pub Co Ltd Non voting DR 492,993.16 1.29
986,847.50 2.59
Vietnam
VND 247,072 FPT Corp 452,700.75 1.19 VND 31,000 Saigon Beer Alcohol Bever Corp 255,213.34 0.67 VND 2 Vietnam Dairy Product Corp 10.46 0.00
707,924.55 1.86
Total shares 34,961,128.86 91.80
Transferable securities dealt in on another regulated market
Shares
Bangladesh
BDT 127,900 Square Pharmaceuticals Ltd 382,289.16 1.00 Total shares 382,289.16 1.00
Equity / index linked certificates
China
USD 198,887 CICC Fin Trading Ltd P-Notes HanHDTec A 06.05.18 646,834.86 1.70 Total equity / index linked certificates 646,834.86 1.70
Other transferable securities
Shares
Vietnam
VND 115,000 Airports Corp of Vietnam 232,738.98 0.61 Total shares 232,738.98 0.61
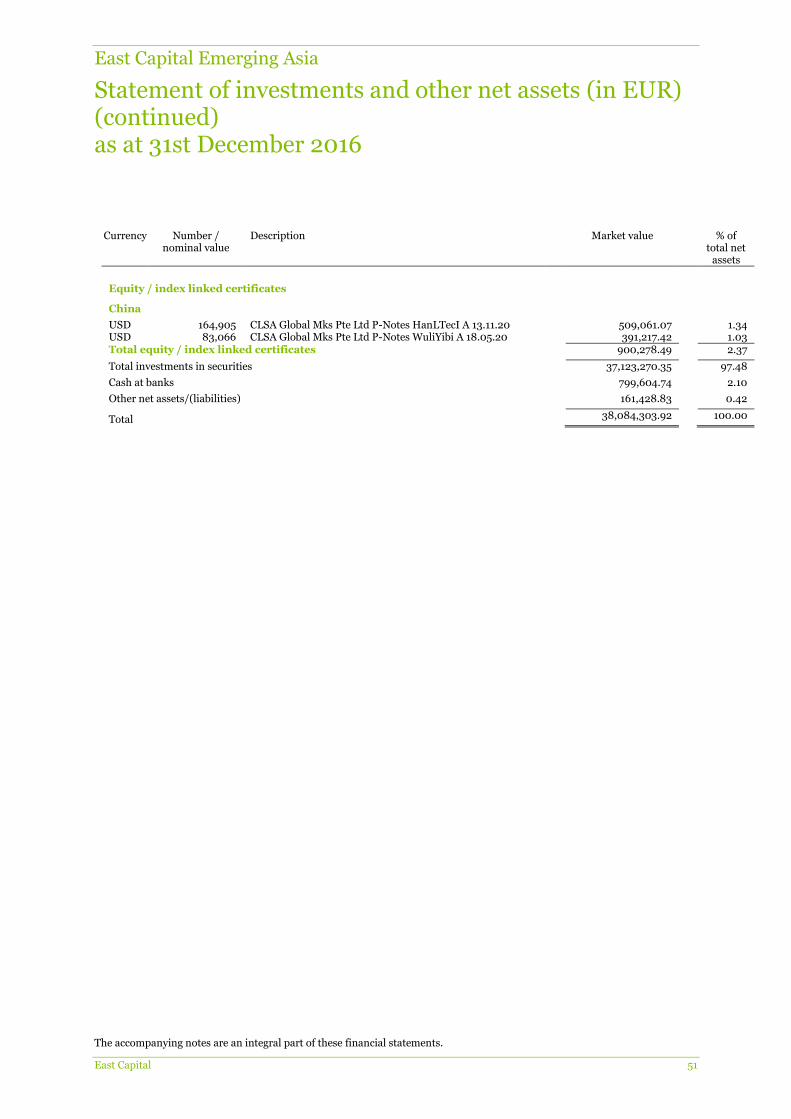
East Capital Emerging Asia
Statement of investments and other net assets (in EUR) (continued) as at 31st December 2016
The accompanying notes are an integral part of these financial statements.
East Capital 51
Currency Number / nominal value
Description Market value % of total net
assets
Equity / index linked certificates
China
USD 164,905 CLSA Global Mks Pte Ltd P-Notes HanLTecI A 13.11.20 509,061.07 1.34 USD 83,066 CLSA Global Mks Pte Ltd P-Notes WuliYibi A 18.05.20 391,217.42 1.03 Total equity / index linked certificates 900,278.49 2.37
Total investments in securities 37,123,270.35 97.48
Cash at banks 799,604.74 2.10
Other net assets/(liabilities) 161,428.83 0.42
Total 38,084,303.92 100.00
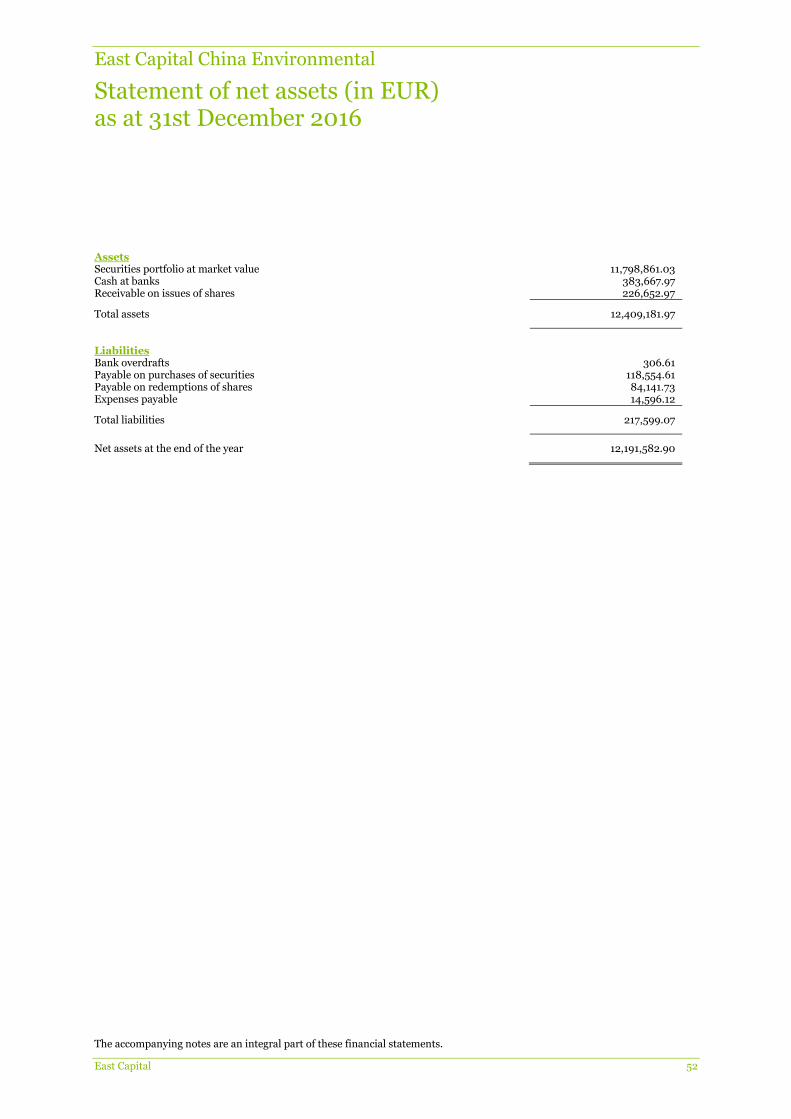
East Capital China Environmental
Statement of net assets (in EUR) as at 31st December 2016
The accompanying notes are an integral part of these financial statements.
East Capital 52
Assets Securities portfolio at market value 11,798,861.03 Cash at banks 383,667.97 Receivable on issues of shares 226,652.97
Total assets 12,409,181.97
Liabilities Bank overdrafts 306.61 Payable on purchases of securities 118,554.61 Payable on redemptions of shares 84,141.73 Expenses payable 14,596.12
Total liabilities 217,599.07
Net assets at the end of the year 12,191,582.90
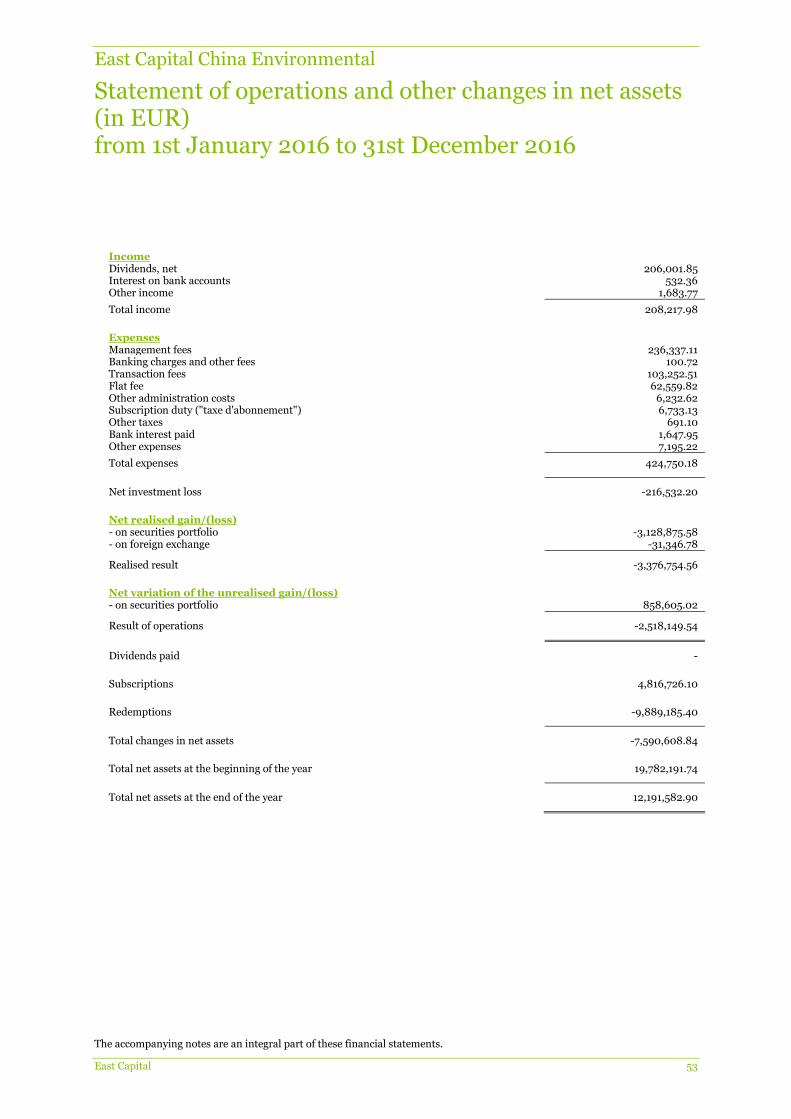
East Capital China Environmental
Statement of operations and other changes in net assets (in EUR) from 1st January 2016 to 31st December 2016
The accompanying notes are an integral part of these financial statements.
East Capital 53
Income Dividends, net 206,001.85 Interest on bank accounts 532.36 Other income 1,683.77
Total income 208,217.98
Expenses Management fees 236,337.11 Banking charges and other fees 100.72 Transaction fees 103,252.51 Flat fee 62,559.82 Other administration costs 6,232.62 Subscription duty ("taxe d'abonnement") 6,733.13 Other taxes 691.10 Bank interest paid 1,647.95 Other expenses 7,195.22
Total expenses 424,750.18
Net investment loss -216,532.20
Net realised gain/(loss) - on securities portfolio -3,128,875.58 - on foreign exchange -31,346.78
Realised result -3,376,754.56
Net variation of the unrealised gain/(loss) - on securities portfolio 858,605.02
Result of operations -2,518,149.54
Dividends paid -
Subscriptions 4,816,726.10
Redemptions -9,889,185.40
Total changes in net assets -7,590,608.84
Total net assets at the beginning of the year 19,782,191.74
Total net assets at the end of the year 12,191,582.90
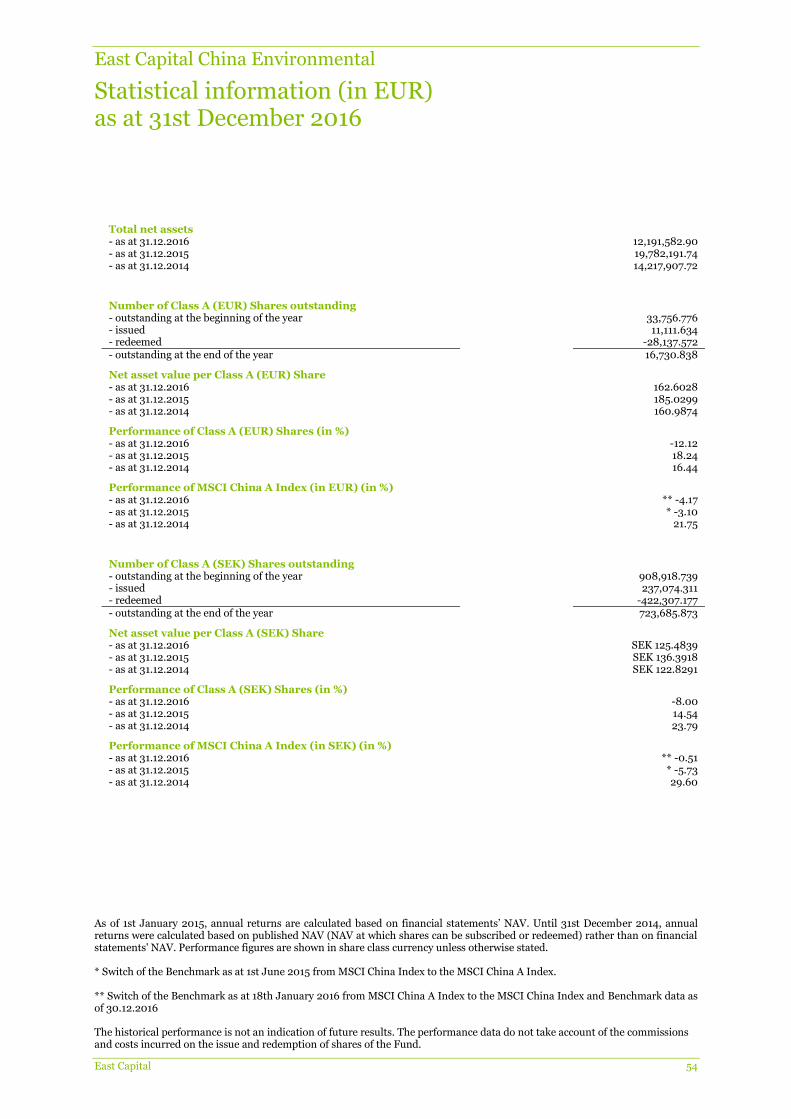
East Capital China Environmental
Statistical information (in EUR) as at 31st December 2016
As of 1st January 2015, annual returns are calculated based on financial statements’ NAV. Until 31st December 2014, annual returns were calculated based on published NAV (NAV at which shares can be subscribed or redeemed) rather than on financial statements' NAV. Performance figures are shown in share class currency unless otherwise stated. * Switch of the Benchmark as at 1st June 2015 from MSCI China Index to the MSCI China A Index. ** Switch of the Benchmark as at 18th January 2016 from MSCI China A Index to the MSCI China Index and Benchmark data as of 30.12.2016 The historical performance is not an indication of future results. The performance data do not take account of the commissions and costs incurred on the issue and redemption of shares of the Fund.
East Capital 54
Total net assets
- as at 31.12.2016 12,191,582.90 - as at 31.12.2015 19,782,191.74 - as at 31.12.2014 14,217,907.72
Number of Class A (EUR) Shares outstanding
- outstanding at the beginning of the year 33,756.776 - issued 11,111.634 - redeemed -28,137.572 - outstanding at the end of the year 16,730.838
Net asset value per Class A (EUR) Share - as at 31.12.2016 162.6028 - as at 31.12.2015 185.0299 - as at 31.12.2014 160.9874
Performance of Class A (EUR) Shares (in %) - as at 31.12.2016 -12.12 - as at 31.12.2015 18.24 - as at 31.12.2014 16.44
Performance of MSCI China A Index (in EUR) (in %)
- as at 31.12.2016 ** -4.17 - as at 31.12.2015 * -3.10 - as at 31.12.2014 21.75
Number of Class A (SEK) Shares outstanding
- outstanding at the beginning of the year 908,918.739 - issued 237,074.311 - redeemed -422,307.177 - outstanding at the end of the year 723,685.873
Net asset value per Class A (SEK) Share - as at 31.12.2016 SEK 125.4839 - as at 31.12.2015 SEK 136.3918 - as at 31.12.2014 SEK 122.8291
Performance of Class A (SEK) Shares (in %) - as at 31.12.2016 -8.00 - as at 31.12.2015 14.54 - as at 31.12.2014 23.79
Performance of MSCI China A Index (in SEK) (in %)
- as at 31.12.2016 ** -0.51 - as at 31.12.2015 * -5.73 - as at 31.12.2014 29.60
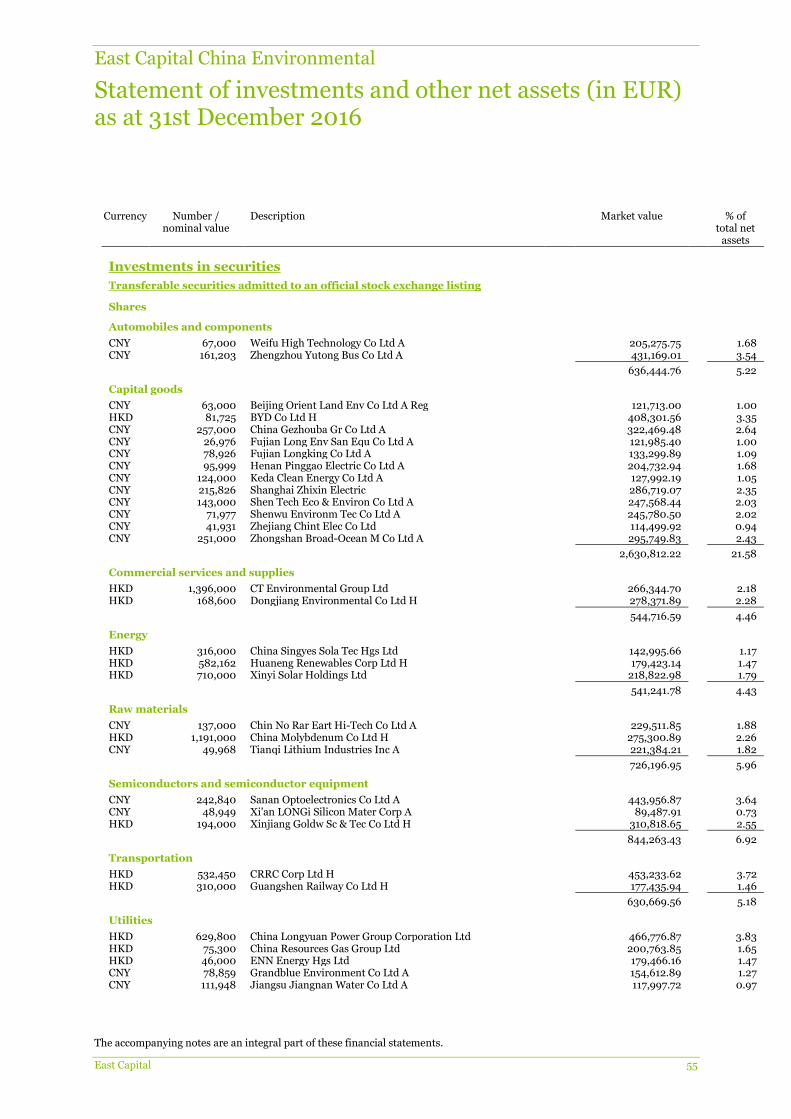
East Capital China Environmental
Statement of investments and other net assets (in EUR) as at 31st December 2016
The accompanying notes are an integral part of these financial statements.
East Capital 55
Currency Number / nominal value
Description Market value % of total net
assets
Investments in securities
Transferable securities admitted to an official stock exchange listing
Shares
Automobiles and components
CNY 67,000 Weifu High Technology Co Ltd A 205,275.75 1.68 CNY 161,203 Zhengzhou Yutong Bus Co Ltd A 431,169.01 3.54
636,444.76 5.22
Capital goods
CNY 63,000 Beijing Orient Land Env Co Ltd A Reg 121,713.00 1.00 HKD 81,725 BYD Co Ltd H 408,301.56 3.35 CNY 257,000 China Gezhouba Gr Co Ltd A 322,469.48 2.64 CNY 26,976 Fujian Long Env San Equ Co Ltd A 121,985.40 1.00 CNY 78,926 Fujian Longking Co Ltd A 133,299.89 1.09 CNY 95,999 Henan Pinggao Electric Co Ltd A 204,732.94 1.68 CNY 124,000 Keda Clean Energy Co Ltd A 127,992.19 1.05 CNY 215,826 Shanghai Zhixin Electric 286,719.07 2.35 CNY 143,000 Shen Tech Eco & Environ Co Ltd A 247,568.44 2.03 CNY 71,977 Shenwu Environm Tec Co Ltd A 245,780.50 2.02 CNY 41,931 Zhejiang Chint Elec Co Ltd 114,499.92 0.94 CNY 251,000 Zhongshan Broad-Ocean M Co Ltd A 295,749.83 2.43
2,630,812.22 21.58
Commercial services and supplies
HKD 1,396,000 CT Environmental Group Ltd 266,344.70 2.18 HKD 168,600 Dongjiang Environmental Co Ltd H 278,371.89 2.28
544,716.59 4.46
Energy
HKD 316,000 China Singyes Sola Tec Hgs Ltd 142,995.66 1.17 HKD 582,162 Huaneng Renewables Corp Ltd H 179,423.14 1.47 HKD 710,000 Xinyi Solar Holdings Ltd 218,822.98 1.79
541,241.78 4.43
Raw materials
CNY 137,000 Chin No Rar Eart Hi-Tech Co Ltd A 229,511.85 1.88 HKD 1,191,000 China Molybdenum Co Ltd H 275,300.89 2.26 CNY 49,968 Tianqi Lithium Industries Inc A 221,384.21 1.82
726,196.95 5.96
Semiconductors and semiconductor equipment
CNY 242,840 Sanan Optoelectronics Co Ltd A 443,956.87 3.64 CNY 48,949 Xi'an LONGi Silicon Mater Corp A 89,487.91 0.73 HKD 194,000 Xinjiang Goldw Sc & Tec Co Ltd H 310,818.65 2.55
844,263.43 6.92
Transportation
HKD 532,450 CRRC Corp Ltd H 453,233.62 3.72 HKD 310,000 Guangshen Railway Co Ltd H 177,435.94 1.46
630,669.56 5.18
Utilities
HKD 629,800 China Longyuan Power Group Corporation Ltd 466,776.87 3.83 HKD 75,300 China Resources Gas Group Ltd 200,763.85 1.65 HKD 46,000 ENN Energy Hgs Ltd 179,466.16 1.47 CNY 78,859 Grandblue Environment Co Ltd A 154,612.89 1.27 CNY 111,948 Jiangsu Jiangnan Water Co Ltd A 117,997.72 0.97

East Capital China Environmental
Statement of investments and other net assets (in EUR) (continued) as at 31st December 2016
The accompanying notes are an integral part of these financial statements.
East Capital 56
Currency Number / nominal value
Description Market value % of total net
assets CNY 95,998 Sichuan Chuantou Energy Co Ltd A 114,030.60 0.93 HKD 532,000 Yunnan Water Investment Co Ltd Reg S 264,813.48 2.17
1,498,461.57 12.29
Total shares 8,052,806.86 66.04
Equity / index linked certificates
Banks
USD 188,400 Cred Suisse (Bahamas) Ltd P-Notes Zhuhai Gree Elec 04.11.18 633,572.87 5.20
Diversified financial services
USD 51,000 Citigroup Gl Mks Hgs Inc P-Notes BeiSDTec A 17.01.17 119,819.15 0.98 USD 19,400 Citigroup Gl Mks Hgs Inc P-Notes BYD A 17.01.17 131,646.99 1.08 USD 78,500 Citigroup Gl Mks Hgs Inc P-Notes ShenzClE A 08.02.18 94,572.72 0.78
346,038.86 2.84
Total equity / index linked certificates 979,611.73 8.04
Transferable securities dealt in on another regulated market
Equity / index linked certificates
Diversified financial services
USD 45,000 CICC Fin Trading Ltd P-Notes GuaChaGr A 03.01.20 122,564.67 1.00 Total equity / index linked certificates 122,564.67 1.00
Other transferable securities
Equity / index linked certificates
Banks
USD 51,910 Credit Suisse Nassau Branch P-Notes Xj Elec A 20.12.18 128,693.11 1.06 USD 17,300 Nomura Bk Intl Plc P-Notes GuBEPTec A 27.04.18 96,247.20 0.79 USD 20,400 UBS AG London P-Notes Beijing GeoEnv Eng&Tec Inc A
08.08.17 87,217.20 0.72
USD 106,946 UBS AG London P-Notes Beijing SPC Env Pro Tec Co A 08.08.17
255,202.59 2.09
USD 91,900 UBS AG London P-Notes FocuPhot A 20.11.17 383,490.27 3.15 USD 73,035 UBS AG London P-Notes SunPoWSu A 20.11.17 105,147.57 0.86
1,055,997.94 8.67
Diversified financial services
USD 182,989 CICC Fin Trading Ltd P-Notes Shenzhen Inovance Tec 29.01.19
508,147.72 4.17
USD 233,252 CLSA Global Mks Pte Ltd P-Notes BeiOrTec A 08.06.20 558,196.49 4.58 USD 168,946 CLSA Global Mks Pte Ltd P-Notes HanLTecI A 13.11.20 521,535.62 4.28
1,587,879.83 13.03
Total equity / index linked certificates 2,643,877.77 21.70
Total investments in securities 11,798,861.03 96.78
Cash at banks 383,667.97 3.15
Bank overdrafts -306.61 0.00
Other net assets/(liabilities) 9,360.51 0.07
Total 12,191,582.90 100.00
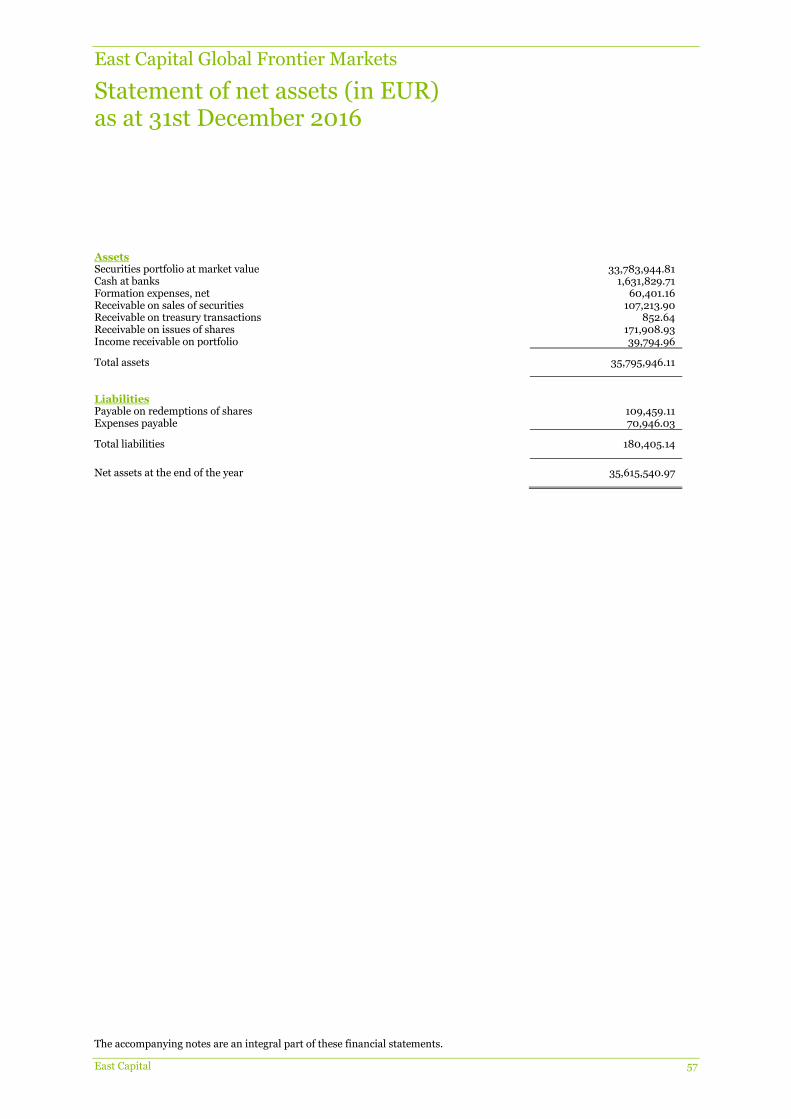
East Capital Global Frontier Markets
Statement of net assets (in EUR) as at 31st December 2016
The accompanying notes are an integral part of these financial statements.
East Capital 57
Assets Securities portfolio at market value 33,783,944.81 Cash at banks 1,631,829.71 Formation expenses, net 60,401.16 Receivable on sales of securities 107,213.90 Receivable on treasury transactions 852.64 Receivable on issues of shares 171,908.93 Income receivable on portfolio 39,794.96
Total assets 35,795,946.11
Liabilities Payable on redemptions of shares 109,459.11 Expenses payable 70,946.03
Total liabilities 180,405.14
Net assets at the end of the year 35,615,540.97

East Capital Global Frontier Markets
Statement of operations and other changes in net assets (in EUR) from 1st January 2016 to 31st December 2016
The accompanying notes are an integral part of these financial statements.
East Capital 58
Income Dividends, net 2,133,829.86 Interest on bank accounts 813.80 Other income 339,686.38
Total income 2,474,330.04
Expenses Management fees 873,100.97 Performance fees 25,787.73 Transaction fees 239,639.64 Flat fee 286,894.97 Other administration costs 5,864.36 Subscription duty ("taxe d'abonnement") 20,389.65 Other taxes 104,277.90 Bank interest paid 10,006.87 Other expenses 42,738.44
Total expenses 1,608,700.53
Net investment income 865,629.51
Net realised gain/(loss) - on securities portfolio -3,240,042.76 - on foreign exchange -74,069.55
Realised result -2,448,482.80
Net variation of the unrealised gain/(loss) - on securities portfolio 4,946,036.35
Result of operations 2,497,553.55
Dividends paid -
Subscriptions 7,082,781.68
Redemptions -28,595,695.54
Total changes in net assets -19,015,360.31
Total net assets at the beginning of the year 54,630,901.28
Total net assets at the end of the year 35,615,540.97
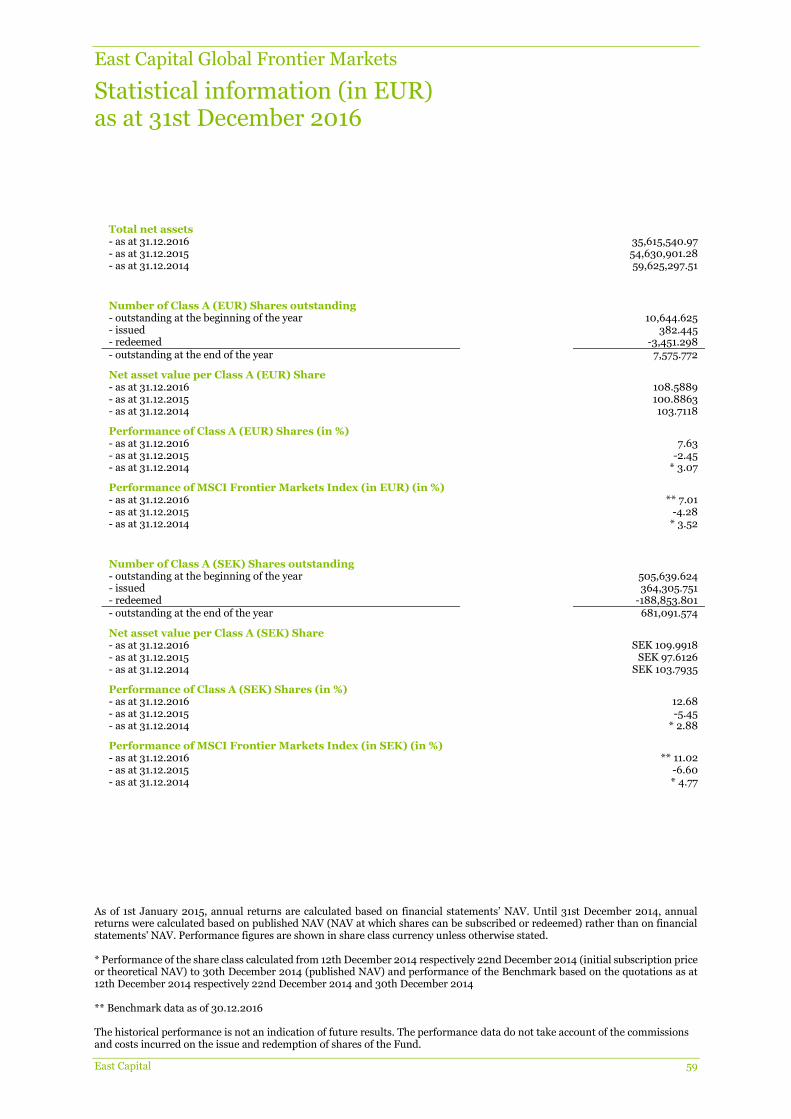
East Capital Global Frontier Markets
Statistical information (in EUR) as at 31st December 2016
As of 1st January 2015, annual returns are calculated based on financial statements’ NAV. Until 31st December 2014, annual returns were calculated based on published NAV (NAV at which shares can be subscribed or redeemed) rather than on financial statements' NAV. Performance figures are shown in share class currency unless otherwise stated. * Performance of the share class calculated from 12th December 2014 respectively 22nd December 2014 (initial subscription price or theoretical NAV) to 30th December 2014 (published NAV) and performance of the Benchmark based on the quotations as at 12th December 2014 respectively 22nd December 2014 and 30th December 2014 ** Benchmark data as of 30.12.2016 The historical performance is not an indication of future results. The performance data do not take account of the commissions and costs incurred on the issue and redemption of shares of the Fund.
East Capital 59
Total net assets
- as at 31.12.2016 35,615,540.97 - as at 31.12.2015 54,630,901.28 - as at 31.12.2014 59,625,297.51
Number of Class A (EUR) Shares outstanding
- outstanding at the beginning of the year 10,644.625 - issued 382.445 - redeemed -3,451.298 - outstanding at the end of the year 7,575.772
Net asset value per Class A (EUR) Share - as at 31.12.2016 108.5889 - as at 31.12.2015 100.8863 - as at 31.12.2014 103.7118
Performance of Class A (EUR) Shares (in %) - as at 31.12.2016 7.63 - as at 31.12.2015 -2.45 - as at 31.12.2014 * 3.07
Performance of MSCI Frontier Markets Index (in EUR) (in %)
- as at 31.12.2016 ** 7.01 - as at 31.12.2015 -4.28 - as at 31.12.2014 * 3.52
Number of Class A (SEK) Shares outstanding
- outstanding at the beginning of the year 505,639.624 - issued 364,305.751 - redeemed -188,853.801 - outstanding at the end of the year 681,091.574
Net asset value per Class A (SEK) Share - as at 31.12.2016 SEK 109.9918 - as at 31.12.2015 SEK 97.6126 - as at 31.12.2014 SEK 103.7935
Performance of Class A (SEK) Shares (in %) - as at 31.12.2016 12.68 - as at 31.12.2015 -5.45 - as at 31.12.2014 * 2.88
Performance of MSCI Frontier Markets Index (in SEK) (in %)
- as at 31.12.2016 ** 11.02 - as at 31.12.2015 -6.60 - as at 31.12.2014 * 4.77
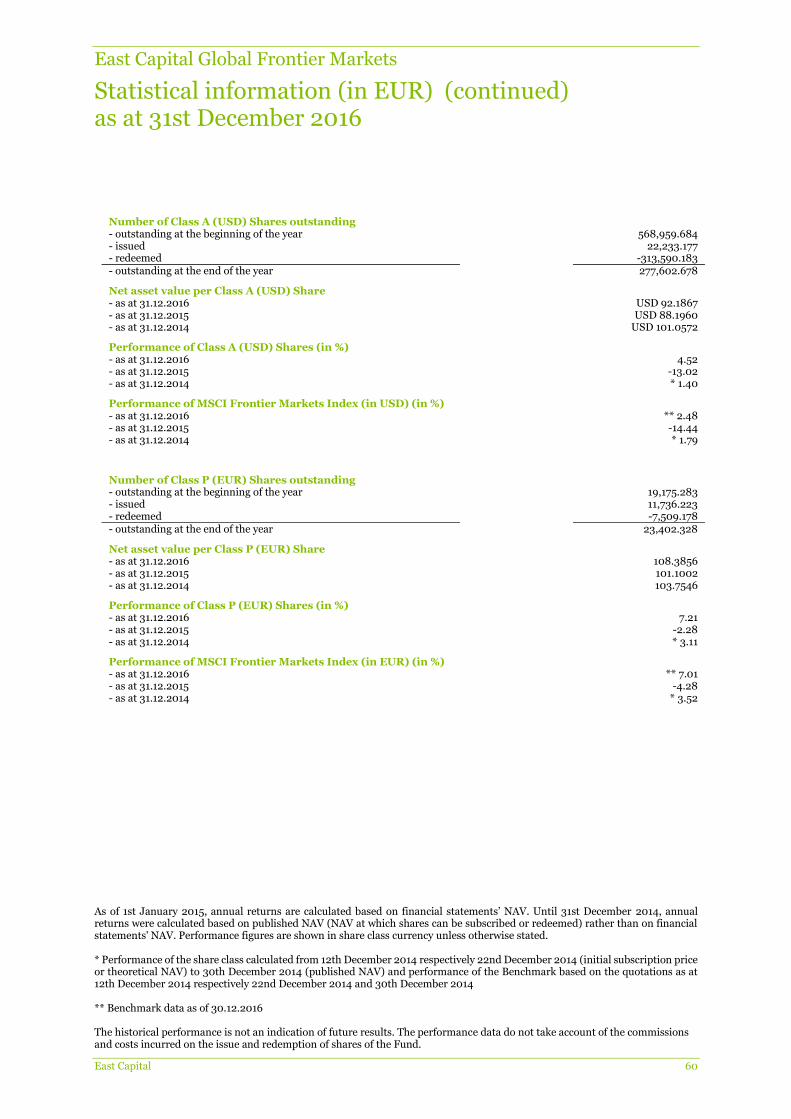
East Capital Global Frontier Markets
Statistical information (in EUR) (continued) as at 31st December 2016
As of 1st January 2015, annual returns are calculated based on financial statements’ NAV. Until 31st December 2014, annual returns were calculated based on published NAV (NAV at which shares can be subscribed or redeemed) rather than on financial statements' NAV. Performance figures are shown in share class currency unless otherwise stated. * Performance of the share class calculated from 12th December 2014 respectively 22nd December 2014 (initial subscription price or theoretical NAV) to 30th December 2014 (published NAV) and performance of the Benchmark based on the quotations as at 12th December 2014 respectively 22nd December 2014 and 30th December 2014 ** Benchmark data as of 30.12.2016 The historical performance is not an indication of future results. The performance data do not take account of the commissions and costs incurred on the issue and redemption of shares of the Fund.
East Capital 60
Number of Class A (USD) Shares outstanding
- outstanding at the beginning of the year 568,959.684 - issued 22,233.177 - redeemed -313,590.183 - outstanding at the end of the year 277,602.678
Net asset value per Class A (USD) Share - as at 31.12.2016 USD 92.1867 - as at 31.12.2015 USD 88.1960 - as at 31.12.2014 USD 101.0572
Performance of Class A (USD) Shares (in %) - as at 31.12.2016 4.52 - as at 31.12.2015 -13.02 - as at 31.12.2014 * 1.40
Performance of MSCI Frontier Markets Index (in USD) (in %)
- as at 31.12.2016 ** 2.48 - as at 31.12.2015 -14.44 - as at 31.12.2014 * 1.79
Number of Class P (EUR) Shares outstanding
- outstanding at the beginning of the year 19,175.283 - issued 11,736.223 - redeemed -7,509.178 - outstanding at the end of the year 23,402.328
Net asset value per Class P (EUR) Share - as at 31.12.2016 108.3856 - as at 31.12.2015 101.1002 - as at 31.12.2014 103.7546
Performance of Class P (EUR) Shares (in %) - as at 31.12.2016 7.21 - as at 31.12.2015 -2.28 - as at 31.12.2014 * 3.11
Performance of MSCI Frontier Markets Index (in EUR) (in %)
- as at 31.12.2016 ** 7.01 - as at 31.12.2015 -4.28 - as at 31.12.2014 * 3.52

East Capital Global Frontier Markets
Statistical information (in EUR) (continued) as at 31st December 2016
As of 1st January 2015, annual returns are calculated based on financial statements’ NAV. Until 31st December 2014, annual returns were calculated based on published NAV (NAV at which shares can be subscribed or redeemed) rather than on financial statements' NAV. Performance figures are shown in share class currency unless otherwise stated. * Performance of the share class calculated from 12th December 2014 respectively 22nd December 2014 (initial subscription price or theoretical NAV) to 30th December 2014 (published NAV) and performance of the Benchmark based on the quotations as at 12th December 2014 respectively 22nd December 2014 and 30th December 2014 ** Benchmark data as of 30.12.2016 The historical performance is not an indication of future results. The performance data do not take account of the commissions and costs incurred on the issue and redemption of shares of the Fund.
East Capital 61
Number of Class R (EUR) Shares outstanding
- outstanding at the beginning of the year 100.000 - issued 0.000 - redeemed 0.000 - outstanding at the end of the year 100.000
Net asset value per Class R (EUR) Share - as at 31.12.2016 109.7290 - as at 31.12.2015 101.4390 - as at 31.12.2014 103.7415
Performance of Class R (EUR) Shares (in %) - as at 31.12.2016 8.17 - as at 31.12.2015 -1.95 - as at 31.12.2014 * 3.10
Performance of MSCI Frontier Markets Index (in EUR) (in %)
- as at 31.12.2016 ** 7.01 - as at 31.12.2015 -4.28 - as at 31.12.2014 * 3.52
Number of Class R (GBP) Shares outstanding
- outstanding at the beginning of the year 100.000 - issued 1,391.996 - redeemed -288.000 - outstanding at the end of the year 1,203.996
Net asset value per Class R (GBP) Share - as at 31.12.2016 GBP 117.6303 - as at 31.12.2015 GBP 93.8904 - as at 31.12.2014 GBP 101.1703
Performance of Class R (GBP) Shares (in %) - as at 31.12.2016 25.28 - as at 31.12.2015 -7.68 - as at 31.12.2014 * 1.70
Performance of MSCI Frontier Markets Index (in GBP) (in %)
- as at 31.12.2016 ** 23.82 - as at 31.12.2015 -9.66 - as at 31.12.2014 * 3.29
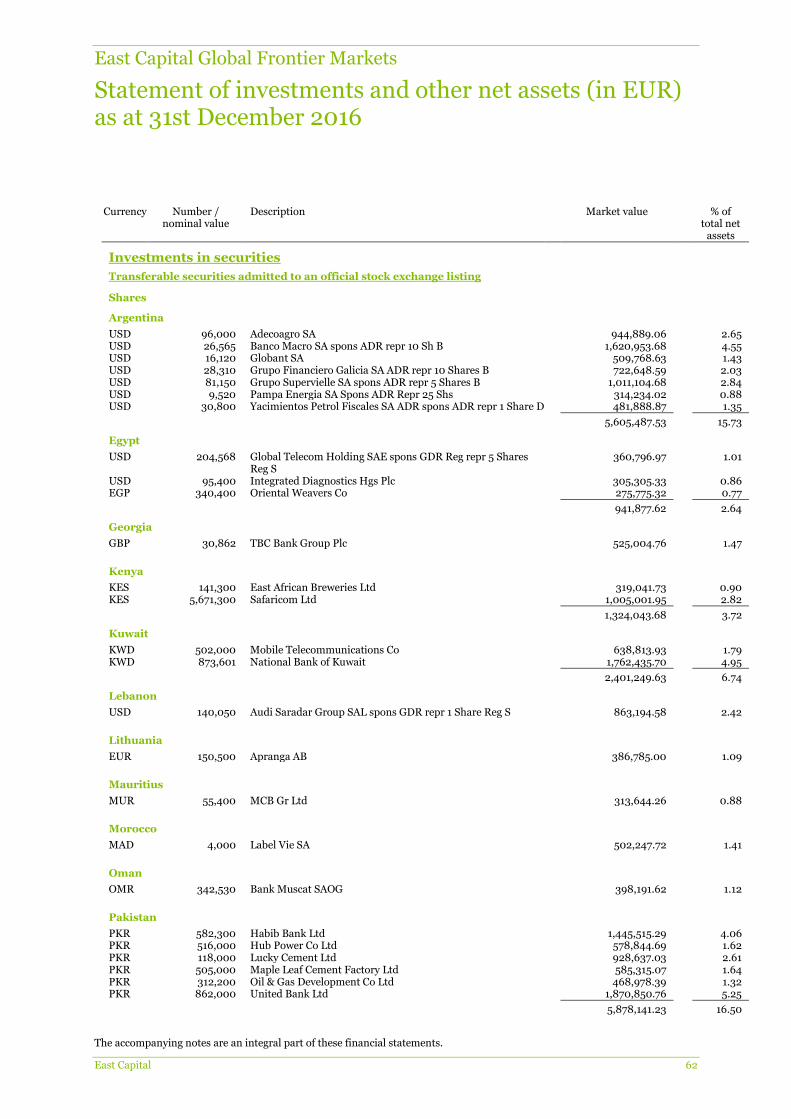
East Capital Global Frontier Markets
Statement of investments and other net assets (in EUR) as at 31st December 2016
The accompanying notes are an integral part of these financial statements.
East Capital 62
Currency Number / nominal value
Description Market value % of total net
assets
Investments in securities
Transferable securities admitted to an official stock exchange listing
Shares
Argentina
USD 96,000 Adecoagro SA 944,889.06 2.65 USD 26,565 Banco Macro SA spons ADR repr 10 Sh B 1,620,953.68 4.55 USD 16,120 Globant SA 509,768.63 1.43 USD 28,310 Grupo Financiero Galicia SA ADR repr 10 Shares B 722,648.59 2.03 USD 81,150 Grupo Supervielle SA spons ADR repr 5 Shares B 1,011,104.68 2.84 USD 9,520 Pampa Energia SA Spons ADR Repr 25 Shs 314,234.02 0.88 USD 30,800 Yacimientos Petrol Fiscales SA ADR spons ADR repr 1 Share D 481,888.87 1.35
5,605,487.53 15.73
Egypt
USD 204,568 Global Telecom Holding SAE spons GDR Reg repr 5 Shares Reg S
360,796.97 1.01
USD 95,400 Integrated Diagnostics Hgs Plc 305,305.33 0.86 EGP 340,400 Oriental Weavers Co 275,775.32 0.77
941,877.62 2.64
Georgia
GBP 30,862 TBC Bank Group Plc 525,004.76 1.47
Kenya
KES 141,300 East African Breweries Ltd 319,041.73 0.90 KES 5,671,300 Safaricom Ltd 1,005,001.95 2.82
1,324,043.68 3.72
Kuwait
KWD 502,000 Mobile Telecommunications Co 638,813.93 1.79 KWD 873,601 National Bank of Kuwait 1,762,435.70 4.95
2,401,249.63 6.74
Lebanon
USD 140,050 Audi Saradar Group SAL spons GDR repr 1 Share Reg S 863,194.58 2.42
Lithuania
EUR 150,500 Apranga AB 386,785.00 1.09
Mauritius
MUR 55,400 MCB Gr Ltd 313,644.26 0.88
Morocco
MAD 4,000 Label Vie SA 502,247.72 1.41
Oman
OMR 342,530 Bank Muscat SAOG 398,191.62 1.12
Pakistan
PKR 582,300 Habib Bank Ltd 1,445,515.29 4.06 PKR 516,000 Hub Power Co Ltd 578,844.69 1.62 PKR 118,000 Lucky Cement Ltd 928,637.03 2.61 PKR 505,000 Maple Leaf Cement Factory Ltd 585,315.07 1.64 PKR 312,200 Oil & Gas Development Co Ltd 468,978.39 1.32 PKR 862,000 United Bank Ltd 1,870,850.76 5.25
5,878,141.23 16.50
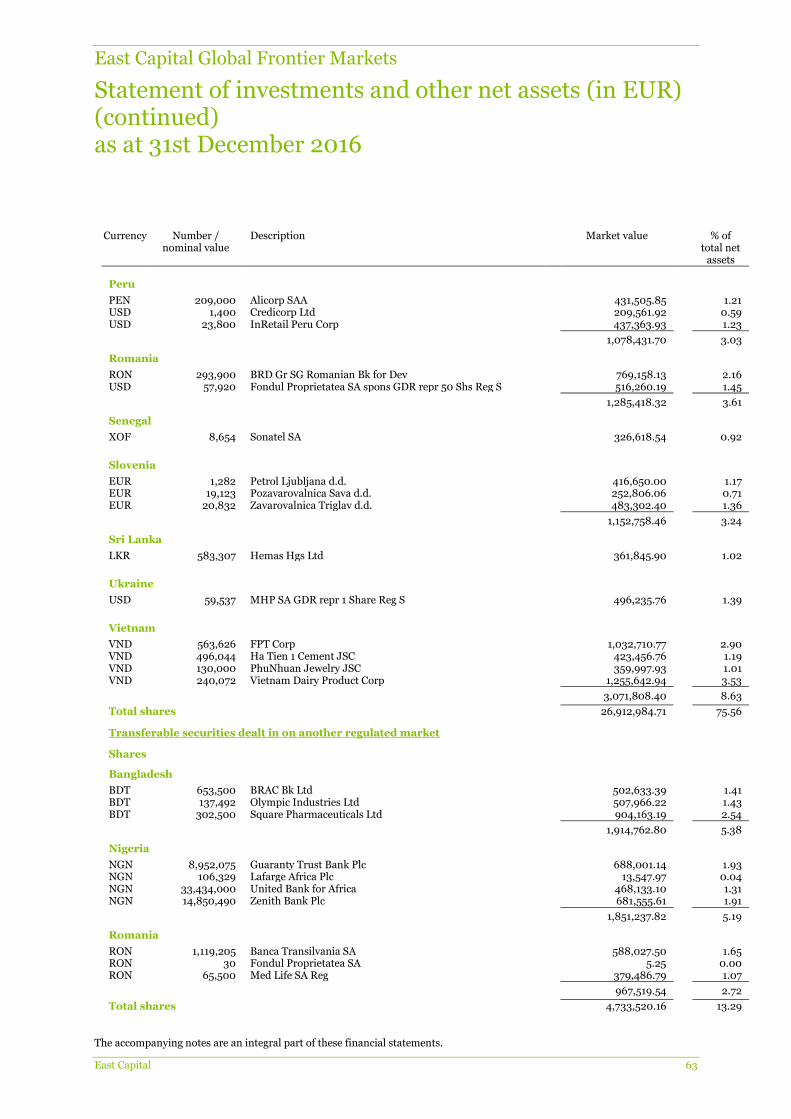
East Capital Global Frontier Markets
Statement of investments and other net assets (in EUR) (continued) as at 31st December 2016
The accompanying notes are an integral part of these financial statements.
East Capital 63
Currency Number / nominal value
Description Market value % of total net
assets
Peru
PEN 209,000 Alicorp SAA 431,505.85 1.21 USD 1,400 Credicorp Ltd 209,561.92 0.59 USD 23,800 InRetail Peru Corp 437,363.93 1.23
1,078,431.70 3.03
Romania
RON 293,900 BRD Gr SG Romanian Bk for Dev 769,158.13 2.16 USD 57,920 Fondul Proprietatea SA spons GDR repr 50 Shs Reg S 516,260.19 1.45
1,285,418.32 3.61
Senegal
XOF 8,654 Sonatel SA 326,618.54 0.92
Slovenia
EUR 1,282 Petrol Ljubljana d.d. 416,650.00 1.17 EUR 19,123 Pozavarovalnica Sava d.d. 252,806.06 0.71 EUR 20,832 Zavarovalnica Triglav d.d. 483,302.40 1.36
1,152,758.46 3.24
Sri Lanka
LKR 583,307 Hemas Hgs Ltd 361,845.90 1.02
Ukraine
USD 59,537 MHP SA GDR repr 1 Share Reg S 496,235.76 1.39
Vietnam
VND 563,626 FPT Corp 1,032,710.77 2.90 VND 496,044 Ha Tien 1 Cement JSC 423,456.76 1.19 VND 130,000 PhuNhuan Jewelry JSC 359,997.93 1.01 VND 240,072 Vietnam Dairy Product Corp 1,255,642.94 3.53
3,071,808.40 8.63
Total shares 26,912,984.71 75.56
Transferable securities dealt in on another regulated market
Shares
Bangladesh
BDT 653,500 BRAC Bk Ltd 502,633.39 1.41 BDT 137,492 Olympic Industries Ltd 507,966.22 1.43 BDT 302,500 Square Pharmaceuticals Ltd 904,163.19 2.54
1,914,762.80 5.38
Nigeria
NGN 8,952,075 Guaranty Trust Bank Plc 688,001.14 1.93 NGN 106,329 Lafarge Africa Plc 13,547.97 0.04 NGN 33,434,000 United Bank for Africa 468,133.10 1.31 NGN 14,850,490 Zenith Bank Plc 681,555.61 1.91
1,851,237.82 5.19
Romania
RON 1,119,205 Banca Transilvania SA 588,027.50 1.65 RON 30 Fondul Proprietatea SA 5.25 0.00 RON 65,500 Med Life SA Reg 379,486.79 1.07
967,519.54 2.72
Total shares 4,733,520.16 13.29
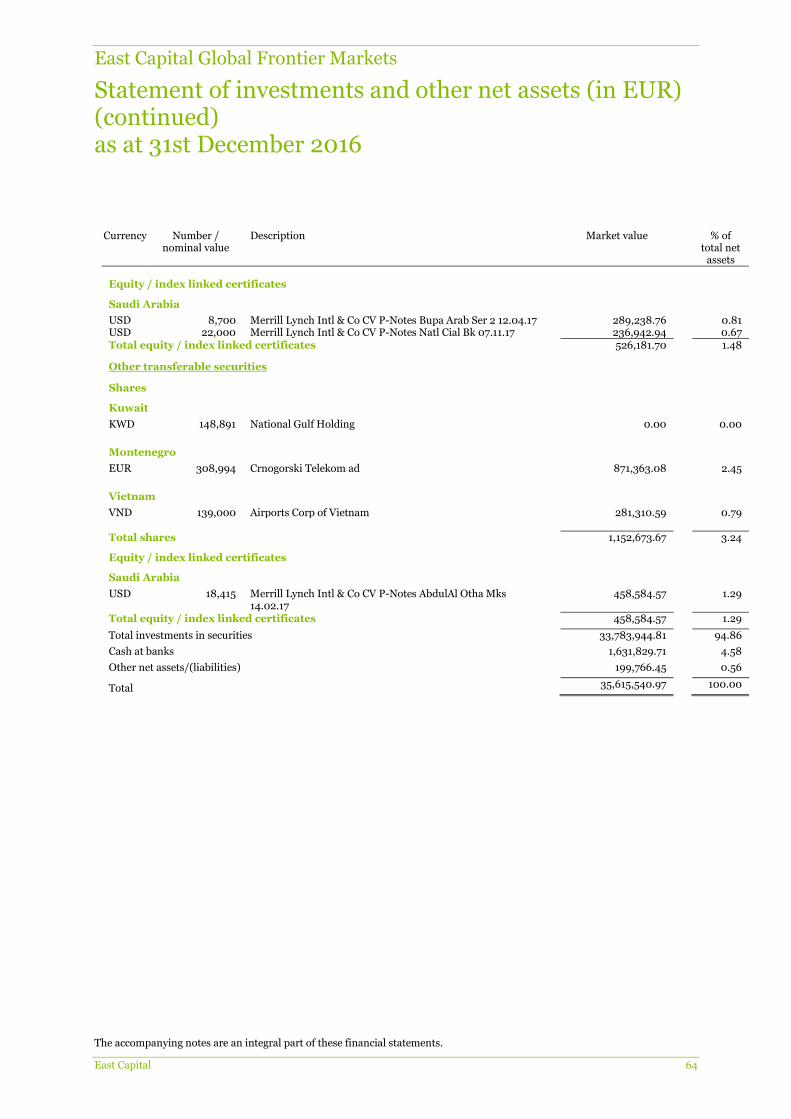
East Capital Global Frontier Markets
Statement of investments and other net assets (in EUR) (continued) as at 31st December 2016
The accompanying notes are an integral part of these financial statements.
East Capital 64
Currency Number / nominal value
Description Market value % of total net
assets
Equity / index linked certificates
Saudi Arabia
USD 8,700 Merrill Lynch Intl & Co CV P-Notes Bupa Arab Ser 2 12.04.17 289,238.76 0.81 USD 22,000 Merrill Lynch Intl & Co CV P-Notes Natl Cial Bk 07.11.17 236,942.94 0.67 Total equity / index linked certificates 526,181.70 1.48
Other transferable securities
Shares
Kuwait
KWD 148,891 National Gulf Holding 0.00 0.00
Montenegro
EUR 308,994 Crnogorski Telekom ad 871,363.08 2.45
Vietnam
VND 139,000 Airports Corp of Vietnam 281,310.59 0.79 Total shares 1,152,673.67 3.24
Equity / index linked certificates
Saudi Arabia
USD 18,415 Merrill Lynch Intl & Co CV P-Notes AbdulAl Otha Mks 14.02.17
458,584.57 1.29
Total equity / index linked certificates 458,584.57 1.29
Total investments in securities 33,783,944.81 94.86
Cash at banks 1,631,829.71 4.58
Other net assets/(liabilities) 199,766.45 0.56
Total 35,615,540.97 100.00

Notes to the financial statements as at 31st December 2016
East Capital 65
Note 1 - General information East Capital (the "Fund") is an open-end investment fund with multiple Sub-Funds ("société d'investissement à capital variable (SICAV) à compartiments multiples"). The Fund qualifies as an Undertaking for Collective Investment in transferable securities under the Council Directive 2009/65/EC as amended and is governed by Part I of the amended Law of 17th December 2010 (the "2010 Law") relating to Undertakings for Collective Investment. The Directive 2014/91/EU of the European Parliament and of the Council of 23rd July 2014 amending the Directive 2009/65/EC had been transposed by the law of 10th May 2016 coming into force on 1st June 2016 and amending the amended 2010 Law. The Fund was incorporated on 13th November 2006 for an unlimited period. Its Articles of Incorporation have been published in the official gazette "Mémorial C, Recueil des Sociétés et Associations du Grand Duché de Luxembourg" on 27th November 2006. As from 1st June 2016, publications are made in the "Recueil électronique des sociétés et associations ("RESA")" through the website of "Registre de Commerce et des Sociétés" of Luxembourg. At the date of the present report, the following Sub-Funds are offered to investors:
- East Capital Russia in EUR - East Capital Baltics in EUR - East Capital Balkans in EUR - East Capital Turkey in EUR - East Capital Eastern Europe in EUR - East Capital Emerging Asia in EUR - East Capital China Environmental in EUR - East Capital Global Frontier Markets in EUR
The extraordinary general meeting of the shareholders, which was held on 11th May 2016, decided to change the name of the Fund from East Capital (Lux) to East Capital. The name was changed with effect as from 1st December 2016. The Board has further decided to change the name of the Sub-Funds as from 1st December 2016, as disclosed in the below table:
Old name New name - East Capital (Lux) - Russian Fund East Capital Russia - East Capital (Lux) - Baltic Fund East Capital Baltics - East Capital (Lux) - Balkan Fund East Capital Balkans - East Capital (Lux) - Turkish Fund East Capital Turkey - East Capital (Lux) - Eastern European Fund East Capital Eastern Europe - East Capital (Lux) - Emerging Asia Fund East Capital Emerging Asia - East Capital (Lux) - China Fund East Capital China Environmental - East Capital (Lux) - Frontier Markets Fund East Capital Global Frontier Markets
The Board of Directors is entitled to create new Sub-Funds. The Board of Directors resolved with effect on 1st October 2013 to create a Master Feeder Structure, as follows:
Feeder (Swedish-domiciled funds) Master (Luxembourg-domiciled funds) East Capital Russia (formerly East Capital Russian Fund)
East Capital Russia (A SEK Class)
East Capital Baltics (formerly East Capital Baltic Fund)
East Capital Baltics (A SEK Class)
East Capital Eastern Europe (formerly East Capital Eastern European Fund)
East Capital Eastern Europe (A SEK Class)
East Capital Balkans (formerly East Capital Balkan Fund)
East Capital Balkans (A SEK Class)
East Capital Turkey (formerly East Capital Turkish Fund)
East Capital Turkey (A SEK Class)
For the Sub-Funds, the following classes of shares may be issued:
- Class A and Class B Shares: these Shares are normally available in EUR, USD, SEK and NOK in accordance with the provisions of the Prospectus and the Appendix I available in the Prospectus, for the Sub-Fund East Capital China Environmental they are also available in RMB;
- Class C and Class D Shares: these Shares are normally available in EUR and USD and are reserved for investments made by investors qualifying as institutional investors within the meaning of the 2010 Law and subject to minimum subscription amounts;
- Class P Shares: these Shares are normally available in EUR, USD and SEK and are reserved for investments made by investors
qualifying as institutional investors within the meaning of the 2010 Law and subject to minimum subscription amounts;
Notes to the financial statements (continued) as at 31st December 2016
East Capital 66
- Class R Shares: these Shares are primarily intended for individual investors in the UK, Swiss and Dutch markets. The Shares are only available to investors who are approved by the Fund, including institutional investors, recognised financial intermediaries or institutions which provide fee-based investment advisory services to underlying investors. These shares are generally available in EUR and GBP;
- Class X Shares: these Shares are only available to institutional investors who are approved by the Fund. Class X Shares are
designed to accommodate an alternative charging structure. No management fee is charged to Class X Shares. Unless a Share Class is identified as a "Distributing Class" or a dividend policy is otherwise specified in the Appendix of the Prospectus, all Share Classes of all Sub-Funds have an accumulation policy and, consequently, no dividends will be paid. The Board of Directors reserves the right to introduce a distribution policy which may vary according to each Sub-Fund and Share Class that is designated as "Distributing Class". The reference currency of the Fund is expressed in EUR. The net asset value of each Class within the Sub-Funds is calculated on any valuation day, being any day that is a business day in Luxembourg and Sweden (except on 24th December) and which is also a day where stock exchanges and regulated markets in countries where the Sub-Fund is materially invested are open for trading. For the Sub-Fund East Capital Global Frontier Markets, the net asset value is only calculated every week from Monday to Thursday. The Fund’s financial year starts on 1st January and ends on 31st December. The Fund publishes an audited Annual Report within 4 months after the end of the business year and an unaudited Semi-annual Report within 2 months after the end of the period to which it refers. Copies of the annual financial statements and semi-annual reports, as well as the current prospectus, copies of the Articles of Incorporation of the Fund may be obtained free of charge at the registered office of the Fund, the Administrative Agent and any distributor or intermediary appointed by the Fund. Note 2 - Significant accounting policies a) Presentation of the financial statements The financial statements of the Fund are established in accordance with the Luxembourg legal and regulatory requirements concerning Undertakings for Collective Investment. b) Valuation The assets of the Fund are valued as follows:
1) The value of any cash in hand or on deposit, bills and demand notes and accounts receivable, prepaid expenses, cash dividends and interest declared or accrued as aforesaid and not yet received are deemed to be the full amount thereof, unless in any case the same is unlikely to be paid or received in full, in which case the value thereof is arrived at after making such discount as the Fund may consider appropriate in such case to reflect the true value thereof.
2) Securities admitted to official listing on an official stock exchange or traded on any other organised market are valued
at the last available reliable price on such stock exchange or market, unless such a price is not deemed to be representative of their fair market value;
3) Securities not listed on stock exchanges or not traded on any regulated market and securities with an official listing for
which the last available price is not representative of a fair market value are valued, prudently and in good faith, on the basis of their estimated sale prices;
4) The financial derivative instruments which are not listed on any official stock exchange or traded on any other organised
market are valued in accordance with market practice;
5) For each Sub-Fund, securities whose value is expressed in a currency other than the reference currency of that Sub-Fund are converted into that reference currency at the average rate between the last available buy/sell rate in Luxembourg or, failing that, in a financial centre which is most representative for those securities.
6) The units/shares of undertakings for collective investment are valued on the basis of the last known net asset value. In
case where an indicative net asset value is available and deemed reliable, such indicative net asset value may be used when deemed to better reflect the value of the undertakings for collective investment.
c) Net realised gain/(loss) on sales of securities The net realised gain/(loss) on sales of securities is determined on the basis of the average cost of securities sold.
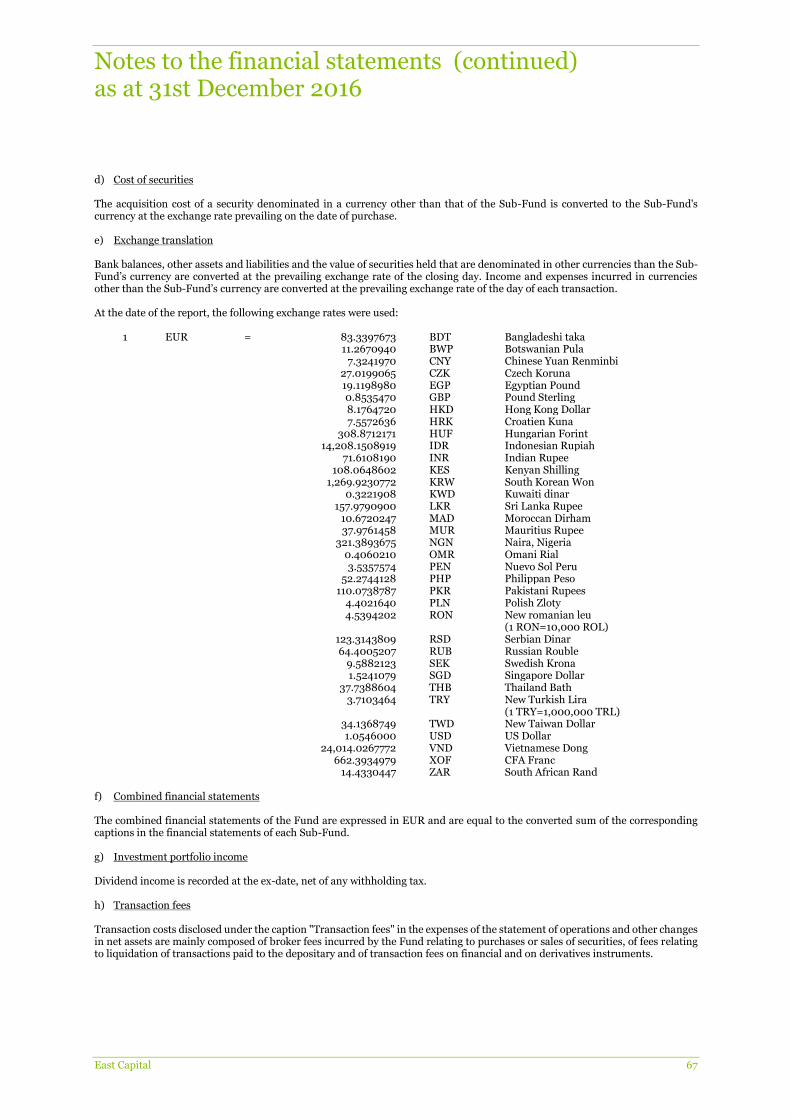
Notes to the financial statements (continued) as at 31st December 2016
East Capital 67
d) Cost of securities The acquisition cost of a security denominated in a currency other than that of the Sub-Fund is converted to the Sub-Fund's currency at the exchange rate prevailing on the date of purchase. e) Exchange translation Bank balances, other assets and liabilities and the value of securities held that are denominated in other currencies than the Sub-Fund’s currency are converted at the prevailing exchange rate of the closing day. Income and expenses incurred in currencies other than the Sub-Fund’s currency are converted at the prevailing exchange rate of the day of each transaction. At the date of the report, the following exchange rates were used:
1 EUR = 83.3397673 BDT Bangladeshi taka 11.2670940 BWP Botswanian Pula 7.3241970 CNY Chinese Yuan Renminbi 27.0199065 CZK Czech Koruna 19.1198980 EGP Egyptian Pound 0.8535470 GBP Pound Sterling 8.1764720 HKD Hong Kong Dollar 7.5572636 HRK Croatien Kuna 308.8712171 HUF Hungarian Forint 14,208.1508919 IDR Indonesian Rupiah 71.6108190 INR Indian Rupee 108.0648602 KES Kenyan Shilling 1,269.9230772 KRW South Korean Won 0.3221908 KWD Kuwaiti dinar 157.9790900 LKR Sri Lanka Rupee 10.6720247 MAD Moroccan Dirham 37.9761458 MUR Mauritius Rupee 321.3893675 NGN Naira, Nigeria 0.4060210 OMR Omani Rial 3.5357574 PEN Nuevo Sol Peru 52.2744128 PHP Philippan Peso 110.0738787 PKR Pakistani Rupees 4.4021640 PLN Polish Zloty 4.5394202 RON New romanian leu
(1 RON=10,000 ROL) 123.3143809 RSD Serbian Dinar 64.4005207 RUB Russian Rouble 9.5882123 SEK Swedish Krona 1.5241079 SGD Singapore Dollar 37.7388604 THB Thailand Bath 3.7103464 TRY New Turkish Lira
(1 TRY=1,000,000 TRL) 34.1368749 TWD New Taiwan Dollar 1.0546000 USD US Dollar 24,014.0267772 VND Vietnamese Dong 662.3934979 XOF CFA Franc 14.4330447 ZAR South African Rand
f) Combined financial statements The combined financial statements of the Fund are expressed in EUR and are equal to the converted sum of the corresponding captions in the financial statements of each Sub-Fund. g) Investment portfolio income Dividend income is recorded at the ex-date, net of any withholding tax. h) Transaction fees Transaction costs disclosed under the caption "Transaction fees" in the expenses of the statement of operations and other changes in net assets are mainly composed of broker fees incurred by the Fund relating to purchases or sales of securities, of fees relating to liquidation of transactions paid to the depositary and of transaction fees on financial and on derivatives instruments.
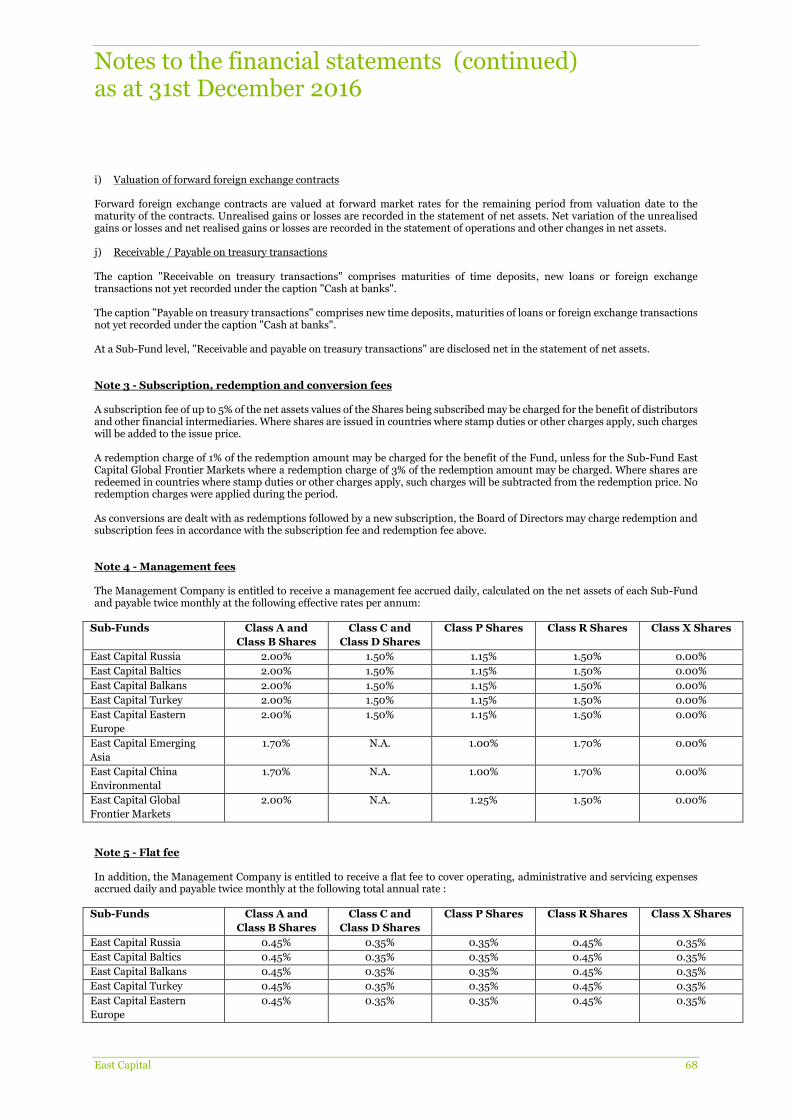
Notes to the financial statements (continued) as at 31st December 2016
East Capital 68
i) Valuation of forward foreign exchange contracts Forward foreign exchange contracts are valued at forward market rates for the remaining period from valuation date to the maturity of the contracts. Unrealised gains or losses are recorded in the statement of net assets. Net variation of the unrealised gains or losses and net realised gains or losses are recorded in the statement of operations and other changes in net assets. j) Receivable / Payable on treasury transactions The caption "Receivable on treasury transactions" comprises maturities of time deposits, new loans or foreign exchange transactions not yet recorded under the caption "Cash at banks". The caption "Payable on treasury transactions" comprises new time deposits, maturities of loans or foreign exchange transactions not yet recorded under the caption "Cash at banks". At a Sub-Fund level, "Receivable and payable on treasury transactions" are disclosed net in the statement of net assets. Note 3 - Subscription, redemption and conversion fees A subscription fee of up to 5% of the net assets values of the Shares being subscribed may be charged for the benefit of distributors and other financial intermediaries. Where shares are issued in countries where stamp duties or other charges apply, such charges will be added to the issue price. A redemption charge of 1% of the redemption amount may be charged for the benefit of the Fund, unless for the Sub-Fund East Capital Global Frontier Markets where a redemption charge of 3% of the redemption amount may be charged. Where shares are redeemed in countries where stamp duties or other charges apply, such charges will be subtracted from the redemption price. No redemption charges were applied during the period. As conversions are dealt with as redemptions followed by a new subscription, the Board of Directors may charge redemption and subscription fees in accordance with the subscription fee and redemption fee above. Note 4 - Management fees The Management Company is entitled to receive a management fee accrued daily, calculated on the net assets of each Sub-Fund and payable twice monthly at the following effective rates per annum:
Sub-Funds Class A and
Class B Shares
Class C and
Class D Shares
Class P Shares Class R Shares Class X Shares
East Capital Russia 2.00% 1.50% 1.15% 1.50% 0.00%
East Capital Baltics 2.00% 1.50% 1.15% 1.50% 0.00%
East Capital Balkans 2.00% 1.50% 1.15% 1.50% 0.00%
East Capital Turkey 2.00% 1.50% 1.15% 1.50% 0.00%
East Capital Eastern
Europe
2.00% 1.50% 1.15% 1.50% 0.00%
East Capital Emerging
Asia
1.70% N.A. 1.00% 1.70% 0.00%
East Capital China
Environmental
1.70% N.A. 1.00% 1.70% 0.00%
East Capital Global
Frontier Markets
2.00% N.A. 1.25% 1.50% 0.00%
Note 5 - Flat fee In addition, the Management Company is entitled to receive a flat fee to cover operating, administrative and servicing expenses accrued daily and payable twice monthly at the following total annual rate :
Sub-Funds Class A and
Class B Shares
Class C and
Class D Shares
Class P Shares Class R Shares Class X Shares
East Capital Russia 0.45% 0.35% 0.35% 0.45% 0.35%
East Capital Baltics 0.45% 0.35% 0.35% 0.45% 0.35%
East Capital Balkans 0.45% 0.35% 0.35% 0.45% 0.35%
East Capital Turkey 0.45% 0.35% 0.35% 0.45% 0.35%
East Capital Eastern
Europe
0.45% 0.35% 0.35% 0.45% 0.35%
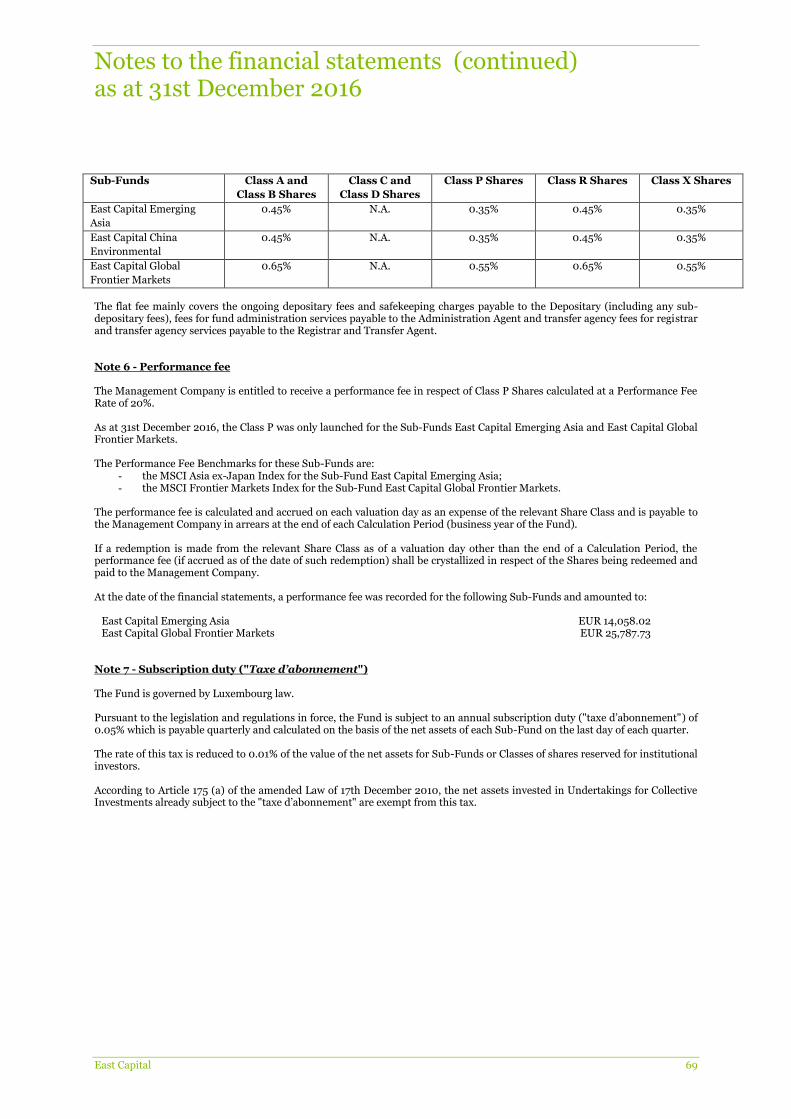
Notes to the financial statements (continued) as at 31st December 2016
East Capital 69
Sub-Funds Class A and
Class B Shares
Class C and
Class D Shares
Class P Shares Class R Shares Class X Shares
East Capital Emerging
Asia
0.45% N.A. 0.35% 0.45% 0.35%
East Capital China
Environmental
0.45% N.A. 0.35% 0.45% 0.35%
East Capital Global
Frontier Markets
0.65% N.A. 0.55% 0.65% 0.55%
The flat fee mainly covers the ongoing depositary fees and safekeeping charges payable to the Depositary (including any sub-depositary fees), fees for fund administration services payable to the Administration Agent and transfer agency fees for registrar and transfer agency services payable to the Registrar and Transfer Agent. Note 6 - Performance fee The Management Company is entitled to receive a performance fee in respect of Class P Shares calculated at a Performance Fee Rate of 20%. As at 31st December 2016, the Class P was only launched for the Sub-Funds East Capital Emerging Asia and East Capital Global Frontier Markets. The Performance Fee Benchmarks for these Sub-Funds are:
- the MSCI Asia ex-Japan Index for the Sub-Fund East Capital Emerging Asia; - the MSCI Frontier Markets Index for the Sub-Fund East Capital Global Frontier Markets.
The performance fee is calculated and accrued on each valuation day as an expense of the relevant Share Class and is payable to the Management Company in arrears at the end of each Calculation Period (business year of the Fund). If a redemption is made from the relevant Share Class as of a valuation day other than the end of a Calculation Period, the performance fee (if accrued as of the date of such redemption) shall be crystallized in respect of the Shares being redeemed and paid to the Management Company. At the date of the financial statements, a performance fee was recorded for the following Sub-Funds and amounted to:
East Capital Emerging Asia EUR 14,058.02 East Capital Global Frontier Markets EUR 25,787.73
Note 7 - Subscription duty ("Taxe d’abonnement") The Fund is governed by Luxembourg law. Pursuant to the legislation and regulations in force, the Fund is subject to an annual subscription duty ("taxe d’abonnement") of 0.05% which is payable quarterly and calculated on the basis of the net assets of each Sub-Fund on the last day of each quarter. The rate of this tax is reduced to 0.01% of the value of the net assets for Sub-Funds or Classes of shares reserved for institutional investors. According to Article 175 (a) of the amended Law of 17th December 2010, the net assets invested in Undertakings for Collective Investments already subject to the "taxe d’abonnement" are exempt from this tax.
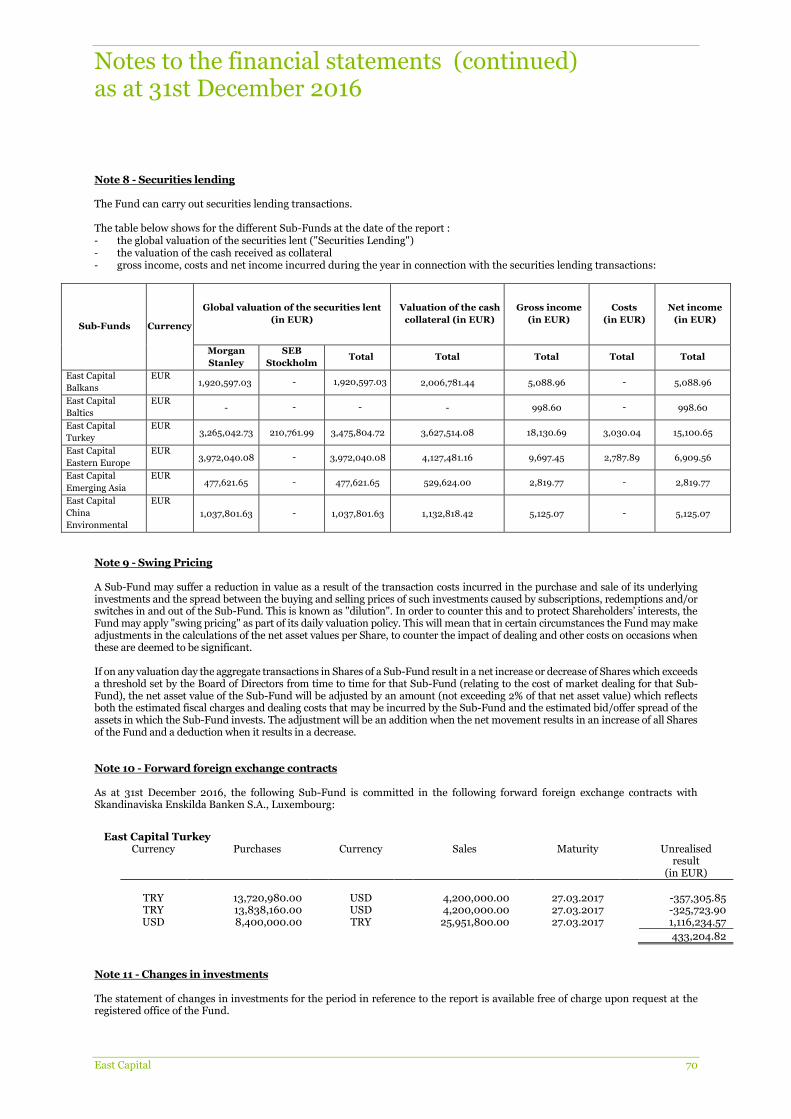
Notes to the financial statements (continued) as at 31st December 2016
East Capital 70
Note 8 - Securities lending The Fund can carry out securities lending transactions. The table below shows for the different Sub-Funds at the date of the report : - the global valuation of the securities lent ("Securities Lending") - the valuation of the cash received as collateral - gross income, costs and net income incurred during the year in connection with the securities lending transactions:
Sub-Funds Currency
Global valuation of the securities lent
(in EUR)
Valuation of the cash
collateral (in EUR)
Gross income
(in EUR)
Costs
(in EUR)
Net income
(in EUR)
Morgan
Stanley
SEB
Stockholm Total Total Total Total Total
East Capital
Balkans
EUR 1,920,597.03 - 1,920,597.03 2,006,781.44 5,088.96 - 5,088.96
East Capital
Baltics
EUR - - - - 998.60 - 998.60
East Capital
Turkey
EUR 3,265,042.73 210,761.99 3,475,804.72 3,627,514.08 18,130.69 3,030.04 15,100.65
East Capital
Eastern Europe
EUR 3,972,040.08 - 3,972,040.08 4,127,481.16 9,697.45 2,787.89 6,909.56
East Capital
Emerging Asia
EUR 477,621.65 - 477,621.65 529,624.00 2,819.77 - 2,819.77
East Capital
China
Environmental
EUR
1,037,801.63 - 1,037,801.63 1,132,818.42 5,125.07 - 5,125.07
Note 9 - Swing Pricing
A Sub-Fund may suffer a reduction in value as a result of the transaction costs incurred in the purchase and sale of its underlying investments and the spread between the buying and selling prices of such investments caused by subscriptions, redemptions and/or switches in and out of the Sub-Fund. This is known as "dilution". In order to counter this and to protect Shareholders’ interests, the Fund may apply "swing pricing" as part of its daily valuation policy. This will mean that in certain circumstances the Fund may make adjustments in the calculations of the net asset values per Share, to counter the impact of dealing and other costs on occasions when these are deemed to be significant. If on any valuation day the aggregate transactions in Shares of a Sub-Fund result in a net increase or decrease of Shares which exceeds a threshold set by the Board of Directors from time to time for that Sub-Fund (relating to the cost of market dealing for that Sub-Fund), the net asset value of the Sub-Fund will be adjusted by an amount (not exceeding 2% of that net asset value) which reflects both the estimated fiscal charges and dealing costs that may be incurred by the Sub-Fund and the estimated bid/offer spread of the assets in which the Sub-Fund invests. The adjustment will be an addition when the net movement results in an increase of all Shares of the Fund and a deduction when it results in a decrease. Note 10 - Forward foreign exchange contracts As at 31st December 2016, the following Sub-Fund is committed in the following forward foreign exchange contracts with Skandinaviska Enskilda Banken S.A., Luxembourg:
East Capital Turkey Currency Purchases Currency Sales Maturity Unrealised
result (in EUR)
TRY 13,720,980.00 USD 4,200,000.00 27.03.2017 -357,305.85 TRY 13,838,160.00 USD 4,200,000.00 27.03.2017 -325,723.90 USD 8,400,000.00 TRY 25,951,800.00 27.03.2017 1,116,234.57 433,204.82
Note 11 - Changes in investments The statement of changes in investments for the period in reference to the report is available free of charge upon request at the registered office of the Fund.

Additional Information (unaudited) as at 31st December 2016
East Capital 71
1 - Risk management As required by Circular CSSF 11/512, the Board of Directors needs to determine the global risk exposure of the Fund either by applying the commitment approach or the VaR approach. In terms of risk management, the Board of Directors decided to adopt the commitment approach as a method of determining the global risk exposure for each Sub-Fund. 2 - Remuneration The total amount of remuneration for the financial year, split into fixed and variable remuneration, paid by the Management Company, East Capital Asset Management S.A. to its staff, number of beneficiaries, and, where relevant, performance fee paid by the Fund is available on demand for Investors and the CSSF at the following address: 11, rue Sainte-Zithe, L-2763 Luxembourg. 3 - Information concerning the transparency of securities financing transactions and of reuse of cash collateral (SFTR regulation EU 2015/2365, hereafter "SFTR") At the date of the financial statements the following Sub-Funds of the Fund are concerned by securities lending transactions in the context of the publication requirements of SFTR.
Ea st Ca pit a l Ba lt ics
(in EUR)
Ea st Ca pit a l Ba lka ns
(in EUR)
Ea st Ca pit a l T u rkey
(in EUR)
Ea st Ca pit a l Ea st ern
Eu rope
(in EUR)
Ea st Ca pit a l Em erging
A sia
(in EUR)
Ea st Ca pit a l Ch ina
Env iron m ent a l
(in EUR)
Global data: assets used for securities lending
secu r it ies len din g in a bsolu te ter m s - 1 ,9 2 0,5 9 7 .03 3 ,4 7 5 ,8 04 .7 2 3 ,9 7 2 ,04 0.08 4 7 7 ,6 2 1 .6 5 1 ,03 7 ,8 01 .6 3
a s a per cen ta g e of fu n d len da ble a ssets of th e Su b-Fu n d 0.00% 2 .1 3 % 5 .3 4 % 1 .8 0% 1 .2 9 % 8 .8 0%
Concentration data
10 la rgest colla t era l issu ers - - - - - -
10 la rgest cou n t erpa rt ies for secu rit ies lending
fir st - Mor g a n Sta n ley Mor g a n Sta n ley Mor g a n Sta n ley Mor g a n Sta n ley Mor g a n Sta n ley
g r oss v olu m es for open tr a des - 1 ,9 2 0,5 9 7 .03 3 ,2 6 5 ,04 2 .7 3 3 ,9 7 2 ,04 0.08 4 7 7 ,6 2 1 .6 5 1 ,03 7 ,8 01 .6 3
secon d - - Ska n din a v iska En skilda Bk
A B - - -
g r oss v olu m es for open tr a des - - 2 1 0,7 6 1 .9 9 - - -
Aggregate transaction data for securities lending
T y pe a nd qu a lit y of t h e colla t era ls receiv ed
secu r it ies colla ter a l - - - - - -
ca sh colla ter a l - 2 ,006 ,7 8 1 .4 4 3 ,6 2 7 ,5 1 4 .08 4 ,1 2 7 ,4 8 1 .1 6 5 2 9 ,6 2 4 .00 1 ,1 3 2 ,8 1 8 .4 2
Colla t era ls cla ssified a ccording t o t h eir residu a l m a t u rit ies
(a bsolu te a m ou n ts)
less th a n 1 da y - - - - - -
fr om 1 da y to 1 w eek (= 7 da y s) - - - - - -
fr om 1 w eek to 1 m on th (= 3 0 da y s) - - - - - -
fr om 1 m on th to 3 m on th s - - - - - -
fr om 3 m on th s to 1 y ea r (= 3 6 5 da y s) - - - - - -
a bov e 1 y ea r - - - - - -
open m a tu r ity - 2 ,006 ,7 8 1 .4 4 3 ,6 2 7 ,5 1 4 .08 4 ,1 2 7 ,4 8 1 .1 6 5 2 9 ,6 2 4 .00 1 ,1 3 2 ,8 1 8 .4 2
Secu rit ies lending cla ssified a ccording t o t h eir residu a l m a t u rit ies
(a bsolu te a m ou n ts)
less th a n 1 da y - - - - - -
fr om 1 da y to 1 w eek (= 7 da y s) - - - - - -
fr om 1 w eek to 1 m on th (= 3 0 da y s) - - - - - -
fr om 1 m on th to 3 m on th s - - - - - -
fr om 3 m on th s to 1 y ea r (= 3 6 5 da y s) - - - - - -
a bov e 1 y ea r - - - - - -
open m a tu r ity - 1 ,9 2 0,5 9 7 .03 3 ,4 7 5 ,8 04 .7 2 3 ,9 7 2 ,04 0.08 4 7 7 ,6 2 1 .6 5 1 ,03 7 ,8 01 .6 3
Cou nt ry (cou n t ries) in wh ich t h e cou nt erpa rt ies a re est a blish ed US US, SE US US US
T y pe of set t lem ent a nd clea ring
tr i-pa r ty - - - - - -
Cen tr a l Cou n ter Pa r ty - - - - - -
bila ter a l - 1 ,9 2 0,5 9 7 .03 3 ,4 7 5 ,8 04 .7 2 3 ,9 7 2 ,04 0.08 4 7 7 ,6 2 1 .6 5 1 ,03 7 ,8 01 .6 3
Da t a on reu se of colla t era l receiv ed
% for eseen in pr ospectu s Pr ospectu s to be u pda ted Pr ospectu s to be u pda ted Pr ospectu s to be u pda ted Pr ospectu s to be u pda ted Pr ospectu s to be u pda ted Pr ospectu s to be u pda ted
colla ter a l r eceiv ed th a t is r eu sed - - - - - -
ca sh colla ter a l r ein v estm en t r etu r n s to th e Su b-Fu n d - - - - - -
Sa fekeeping of colla t era l receiv ed
n u m ber of deposita r ies - 1 1 1 1 1
n a m e of deposita r ies - Skandinavis ka Ens kilda Banken SA
Luxembo urg
Skandinavis ka Ens kilda Banken SA
Luxembo urg
Skandinavis ka Ens kilda Banken SA
Luxembo urg
Skandinavis ka Ens kilda Banken SA
Luxembo urg
Skandinavis ka Ens kilda Banken SA
Luxembo urg
a m ou n ts of a ssets r eceiv ed a s colla ter a l - 2 ,006 ,7 8 1 .4 4 3 ,6 2 7 ,5 1 4 .08 4 ,1 2 7 ,4 8 1 .1 6 5 2 9 ,6 2 4 .00 1 ,1 3 2 ,8 1 8 .4 2
Sa fekeeping of colla t era l gra nt ed
seg r eg a ted a ccou n ts - - - - - -
pooled a ccou n ts - - - - - -
oth er a ccou n ts - - - - - -
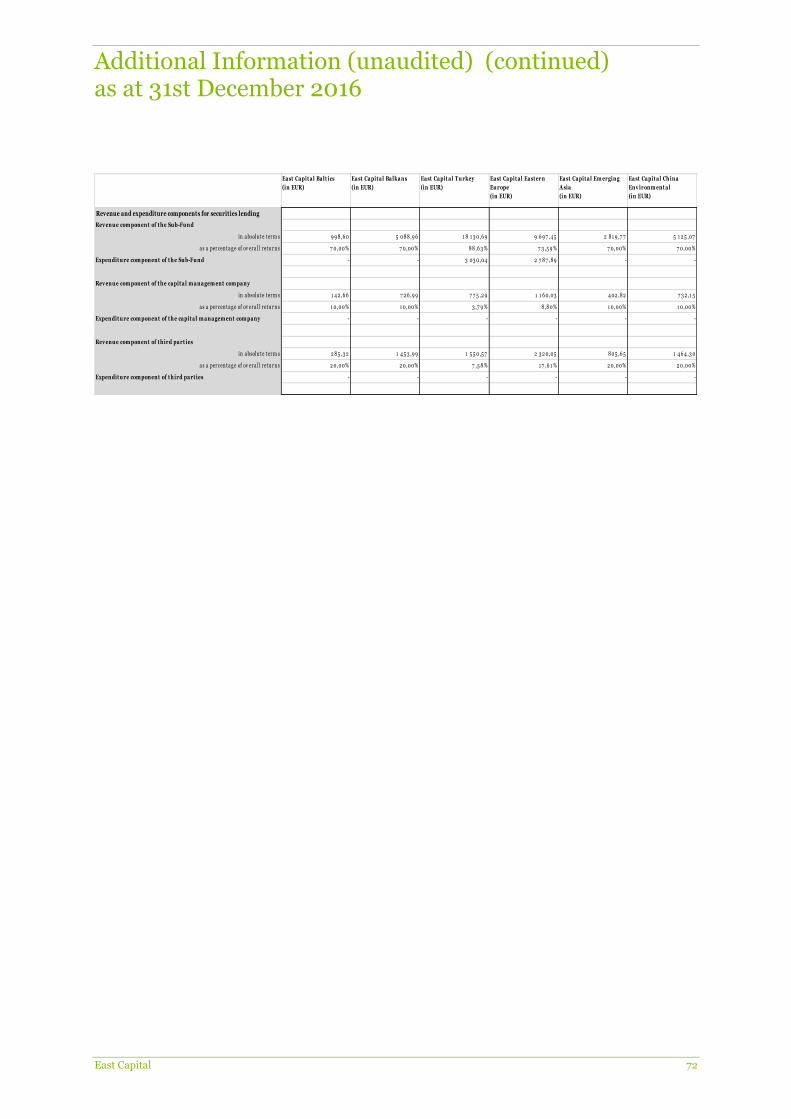
Additional Information (unaudited) (continued) as at 31st December 2016
East Capital 72
Ea st Ca pit a l Ba lt ics
(in EUR)
Ea st Ca pit a l Ba lka ns
(in EUR)
Ea st Ca pit a l T u rkey
(in EUR)
Ea st Ca pit a l Ea st ern
Eu rope
(in EUR)
Ea st Ca pit a l Em erging
A sia
(in EUR)
Ea st Ca pit a l Ch ina
Env ironm ent a l
(in EUR)
Revenue and expenditure components for securities lending
Rev enu e com ponent of t h e Su b-Fu nd
in a bsolu te ter m s 9 9 8 ,6 0 5 08 8 ,9 6 1 8 1 3 0,6 9 9 6 9 7 ,4 5 2 8 1 9 ,7 7 5 1 2 5 ,07
a s a per cen ta g e of ov er a ll r etu r n s 7 0,00% 7 0,00% 8 8 ,6 3 % 7 3 ,5 9 % 7 0,00% 7 0,00%
Expendit u re com ponent of t h e Su b-Fu nd - - 3 03 0,04 2 7 8 7 ,8 9 - -
Rev enu e com ponent of t h e ca pit a l m a na gem ent com pa ny
in a bsolu te ter m s 1 4 2 ,6 6 7 2 6 ,9 9 7 7 5 ,2 9 1 1 6 0,03 4 02 ,8 2 7 3 2 ,1 5
a s a per cen ta g e of ov er a ll r etu r n s 1 0,00% 1 0,00% 3 ,7 9 % 8 ,8 0% 1 0,00% 1 0,00%
Expendit u re com ponent of t h e ca pit a l m a na gem ent com pa ny - - - - - -
Rev enu e com ponent of t h ird pa rt ies
in a bsolu te ter m s 2 8 5 ,3 2 1 4 5 3 ,9 9 1 5 5 0,5 7 2 3 2 0,05 8 05 ,6 5 1 4 6 4 ,3 0
a s a per cen ta g e of ov er a ll r etu r n s 2 0,00% 2 0,00% 7 ,5 8 % 1 7 ,6 1 % 2 0,00% 2 0,00%
Expendit u re com ponent of t h ird pa rt ies - - - - - -

Related Documents