Annual Report December 31, 2018 Global Atlantic Portfolios Global Atlantic BlackRock Allocation Portfolio Global Atlantic BlackRock Disciplined Core Portfolio Global Atlantic BlackRock Disciplined Growth Portfolio Global Atlantic BlackRock Disciplined International Core Portfolio Global Atlantic BlackRock Disciplined Mid Cap Growth Portfolio Global Atlantic BlackRock Disciplined Small Cap Portfolio Global Atlantic BlackRock Disciplined U.S. Core Portfolio Global Atlantic BlackRock Disciplined Value Portfolio Global Atlantic BlackRock High Yield Portfolio Global Atlantic Goldman Sachs Core Fixed Income Portfolio Global Atlantic Goldman Sachs Global Equity Insights Portfolio Global Atlantic Goldman Sachs Large Cap Growth Insights Portfolio Global Atlantic Goldman Sachs Mid Cap Value Insights Portfolio Class I and Class II shares Each a separate series of the Forethought Variable Insurance Trust Distributed by Global Atlantic Distributors, LLC Member FINRA

Welcome message from author
This document is posted to help you gain knowledge. Please leave a comment to let me know what you think about it! Share it to your friends and learn new things together.
Transcript

Annual Report
December 31, 2018
Global Atlantic Portfolios Global Atlantic BlackRock Allocation Portfolio
Global Atlantic BlackRock Disciplined Core Portfolio
Global Atlantic BlackRock Disciplined Growth Portfolio
Global Atlantic BlackRock Disciplined International Core Portfolio
Global Atlantic BlackRock Disciplined Mid Cap Growth Portfolio
Global Atlantic BlackRock Disciplined Small Cap Portfolio
Global Atlantic BlackRock Disciplined U.S. Core Portfolio
Global Atlantic BlackRock Disciplined Value Portfolio
Global Atlantic BlackRock High Yield Portfolio
Global Atlantic Goldman Sachs Core Fixed Income Portfolio
Global Atlantic Goldman Sachs Global Equity Insights Portfolio
Global Atlantic Goldman Sachs Large Cap Growth Insights Portfolio
Global Atlantic Goldman Sachs Mid Cap Value Insights Portfolio
Class I and Class II shares
Each a separate series of the Forethought Variable Insurance Trust Distributed by Global Atlantic Distributors, LLC
Member FINRA


Dear Shareholders/Contract Owners:
The global equity market rally experienced in 2016 and 2017 ended in 2018 as major equity markets turned negative, with many ending the year in correction territory (a decline of greater than 10%) as shown in the graph below. There was a period of relative market calm from May to September, highlighted by generally strong corporate earnings and positive returns, which was preceded and followed by periods of heightened volatility driven by concerns over global trade tensions, rising interest rates, and valuation. During these volatile periods, the markets experienced negative returns and significant daily swings. For example, of the approximately 250 trading days in a given year, the daily range between the high and the low on the S&P 500 exceeded 1% on 110 days in 2018 compared to just 10 in 2017, and exceeded 2% on 36 days in 2018 versus zero in 2017. Furthermore, equity volatility, as measured by the VIX, averaged 21.25 during these periods versus 13.30 in the May to September period and 11.10 in 2017. The fixed income market also experienced periods of volatility, highlighted by the movement in the 10-year U.S. Treasury yield. Beginning 2018 at 2.41%, it rose quickly to 2.95% in February, peaking at 3.25% in November before falling to 2.69% at year end.
With this economic and geopolitical backdrop, the U.S. dollar was one of the only sources of meaningfully positive return in 2018, rising 4.40% (as compared to a decline of -9.87% in 2017). U.S. equity indices fared better than international markets generally, led by the S&P 500 down -4.38% (as compared to up 21.83% in 2017), with the Russell 2000 and S&P MidCap 400 down -11.01% and -11.08%, respectively (as compared to up 14.65% and 16.24%, respectively in 2017). Internationally, the MSCI EAFE and the MSCI Emerging Markets were down -13.79% and -14.58%, respectively (as compared to up 25.03% and 37.28%, respectively in 2017).
After raising interest rates three times in 2017, the U.S. Federal Reserve (the “Fed”) raised rates four times in 2018 and indicated in December that it may raise rates on two more occasions in 2019. Domestic investment grade bonds, as measured by the Bbg Barclays US Agg Bond Index, were essentially flat in 2018 with a return of 0.01% (as compared to up 3.54% in 2017), while the ICE BofAML U.S. High Yield Index fell -2.26% during the year (as compared to up 7.48% in 2017). Commodities, as measured by the S&P GSCI Index, fell -13.82% in 2018 (as compared to up 5.77% in 2017), led by decline of -20.88% in oil (as compared to up 2.06% in 2017) and a decline of -1.94% in gold (as compared to up 12.81% in 2017).
For asset allocation funds, periods of significant fluctuations in volatility and returns meant that asset allocation decisions, and the timing of those decisions, were important drivers of performance in 2018. The following pages contain Management’s discussion of recent Portfolio performance. Thank you for investing in the Global Atlantic Portfolios.
Sincerely,
Eric D. Todd, CFA Cameron Jeffreys, CFA President Senior Vice President Global Atlantic Investment Advisors, LLC Global Atlantic Investment Advisors, LLC
1

Portfolio Benchmark Global Atlantic BlackRock Allocation Portfolio S&P Target Risk® Growth Index Global Atlantic BlackRock Disciplined Core Portfolio S&P 500® Index Global Atlantic BlackRock Disciplined Growth Portfolio Russell 1000® Growth Index Global Atlantic BlackRock Disciplined International Core Portfolio MSCI ACWI ex-USA Index Global Atlantic BlackRock Disciplined Mid Cap Growth Portfolio Russell Midcap® Growth Index Global Atlantic BlackRock Disciplined Small Cap Portfolio Russell 2000® Index Global Atlantic BlackRock Disciplined U.S. Core Portfolio S&P 500® Index Global Atlantic BlackRock Disciplined Value Portfolio Russell 1000® Value Index Global Atlantic BlackRock High Yield Portfolio ICE BofAML U.S. High Yield Master II Index Global Atlantic Goldman Sachs Core Fixed Income Portfolio Bloomberg Barclays US Aggregate Bond Index Global Atlantic Goldman Sachs Global Equity Insights Portfolio MSCI World Standard Index Global Atlantic Goldman Sachs Large Cap Growth Insights Portfolio Russell 1000® Growth Index Global Atlantic Goldman Sachs Mid Cap Value Insights Portfolio Russell Midcap® Value Index
The indices shown are for informational purposes only and are not reflective of any investment. As it is not possible to invest directly in the indices, the data shown does not reflect or compare features of an actual investment, such as its objectives, costs and expenses, liquidity, safety, guarantees or insurance, fluctuation of principal or return, or tax features. Past performance is no guarantee of future results.
This report contains the current opinions of Global Atlantic Investment Advisors, LLC and/or sub-advisers at the time of its publication and should not be considered to be investment advice or a recommendation of any particular security, strategy or investment product. Such opinions are subject to change without notice and securities described herein may no longer be included in, or may at any time be removed from, a Portfolio’s portfolio. This report is distributed for informational purposes only. Information contained herein has been obtained from sources believed to be reliable, but not guaranteed.
Index Definitions:
S&P Target Risk® Growth Index. An index that increases exposure to equities, while also providing limited fixed income exposure to diversify risk.
Bloomberg Barclays US Aggregate Bond Index (“Bbg Barclays US Agg Bond”). An index weighted according to market capitalization and includes, among other categories, Treasury securities, mortgage backed securities, government agency bonds and corporate bonds. To be included in the index, bonds must be rated investment grade by Moody’s and Standard and Poor’s.
ICE BofA ML High Yield Cash Pay MV USI Index (“ICE BofAML U.S. High Yield”). An index that tracks the performance of US dollar denominated, below investment grade corporate debt, currently in a coupon paying period, which is publically issued in the US domestic market.
ICE BofAML U.S. High Yield Master II Index. An unmanaged market value-weighted index comprised of over 2,300 domestic and yankee high-yield bonds, including deferred interest bonds and payment-in-kind securities.
Chicago Board Options Exchange S&P 500 Volatility Index (“VIX”). An index that reflects a market estimate of future volatility, based on the weighted average of the implied volatilities for a wide range of strikes.
MSCI ACWI ex-USA Total Return Index. A free float-adjusted market capitalization index designed to measure the combined equity market performance of developed and emerging market countries, excluding the United States.
MSCI EAFE Total Return Index (“MSCI EAFE”). An index created by Morgan Stanley Capital International (MSCI) that serves as a benchmark of the performance in major developed international equity markets as represented by 21 major MSCI indexes from Europe, Australasia and the Far East.
MSCI Emerging Markets Total Return Index (“MSCI Emerging Markets”). An index created by MSCI that is designed to measure equity market performance in global emerging markets. The index is unmanaged and not available for direct investment. The Emerging Markets Index is a float-adjusted market capitalization index that consists of indices in 24 emerging economies: Brazil, Chile, China, Colombia, Czech Republic, Egypt, Greece, Hungary, India, Indonesia, Korea, Malaysia, Mexico, Pakistan, Peru, Philippines, Poland, Russia, Qatar, South Africa, Taiwan, Thailand, Turkey, and United Arab Emirates.
MSCI World Standard Index. An index that represents large- and mid-cap equity performance across 23 developed markets countries, covering approximately 85% of the free float-adjusted market capitalization in each. The index offers a broad global equity benchmark, without emerging markets exposure.
Russell 1000® Growth Total Return Index. An unmanaged index of common stock prices that measures the performance of those Russell 1000® Index companies with higher price-to-book ratios and higher forecasted growth values.
2

Russell 2000 Total Return Index (“Russell 2000”). An index measuring the performance approximately 2,000 small-cap companies in the Russell 3000 Index, which is made up of 3,000 of the biggest U.S. stocks. The Russell 2000 serves as a benchmark for small-cap stocks in the United States.
Russell 3000 Total Return Index. An index measuring the performance of approximately 3,000 of the largest U.S. companies.
Russell Midcap® Growth Total Return Index. An unmanaged index that consists of the bottom 800 securities of the Russell 1000® Index with greater-than-average growth orientation as ranked by total market capitalization. Securities in this index generally have higher price-to-book and price-to-earnings ratios, lower dividend yields and higher forecasted growth values.
Russell Midcap® Value Total Return Index. An unmanaged index of common stock prices that measures the performance of those Russell Midcap companies with lower price-to-book ratios and lower forecasted growth values.
Russell 1000® Value Total Return Index. An index that measures the performance of large- and mid-capitalization value sectors of the U.S. equity market. It is a subset of the Russell 1000® Index, which measures the performance of the large-capitalization sector of the U.S. equity market.
S&P MidCap 400 Total Return Index (“S&P MidCap 400”). A capitalization-weighted index which measures the performance of the mid-range sector of the U.S. stock market.
S&P 500 Total Return Index (“S&P 500”). A market capitalization weighted price index composed of 500 widely held U.S. common stocks. Frequently used as a measure of U.S. stock market performance.
S&P GSCI Total Return Index (“S&P GSCI”). A broad based, production weighted index meant to be representative of the global commodity market beta. The S&P Goldman Sachs Commodity Index (GSCI) consists of 24 commodity futures on physical commodities across five sectors; energy, agriculture, livestock, industrial metals, and precious metals.
U.S. Dollar Index. An index that indicates the general international value of the U.S. Dollar by averaging the exchange rates between the U.S. Dollar and major world currencies.
2395334.2
3

Table of Contents
Global Atlantic Portfolio Reviews 5 – 33
Financial Statements:
Portfolios of Investments 34 – 161
Statements of Assets and Liabilities 162 – 165
Statements of Operations 166 – 169
Statements of Changes in Net Assets 170 – 176
Financial Highlights 177 – 201
Notes to Financial Statements 202 – 226
Report of Independent Registered Accounting Firm 227
Expense Examples 228 – 229
Supplemental Information 230 - 232
Trustee Table 233 – 235
Privacy Notice 236 - 237
Proxy Voting Policy Back Cover
Portfolio Holdings Back Cover
4

Global Atlantic BlackRock Allocation Portfolio
Portfolio Review (Unaudited)
December 31, 2018
Investment Objective
The Portfolio seeks to provide total return.
Management Review
The Portfolio is sub-advised by BlackRock Investment Management, LLC (“BlackRock”).
How did the Portfolio perform during the period?
During 2018, the Class I shares of Global Atlantic BlackRock Allocation Portfolio outperformed its reference benchmark, the S&P Target Risk® Growth Index. The Portfolio posted a return of -5.14% compared to a benchmark return of -5.69%, a difference of 55 basis points. The following discussion of relative performance pertains to this benchmark.
What factors and allocation decisions influenced the Portfolio’s performance?
The global equity market rally experienced in 2016 and 2017 ended in 2018, as major equity markets turned negative, with many ending the year in correction territory (a decline of greater than 10%). A period of relative market calm from May to September 2018, highlighted by generally strong corporate earnings and positive returns, was surrounded by periods of heightened volatility driven by global trade tensions, rising interest rates, and valuation concerns. From February to March 2018, the S&P 500 and MSCI EAFE indices were down -6.13% and -6.23% respectively, while volatility (as measured by the CBOE Volatility Index (“VIX”)) averaged 20.66 (versus 11.10 in 2017). Market turmoil returned in the fourth quarter, evidenced by declines in the S&P 500 and MSCI EAFE indices of -13.52% and -12.54% respectively, while VIX averaged 20.91. The fixed income market also exhibited periods of volatility, highlighted by the movement in the 10-year U.S. Treasury yield. Starting the year at 2.41%, it rose quickly to 2.95% in February, peaking at 3.25% in November before falling to 2.69% at year end.
The Portfolio’s overweight to equities and the late-year rally in long-duration rates were the primary detractors to performance in 2018. Within equities, an overweight to U.S. large cap equities had a positive contribution to return versus the negative performance of small cap, midcap, and international developed market equities. Although emerging markets equities outperformed through the fourth quarter, they deeply underperformed during the first three quarters of the year. A strategic technology weight was a detractor in the fourth quarter relative to U.S. equities. Within fixed income, BlackRock’s continued preference for credit over rates benefitted the Portfolio overall, although it was a detractor to performance during the market’s flight to safety in the volatile fourth quarter, as was the underweight to duration as the long end of the treasury curve rallied.
How was the Portfolio positioned at period end?
At year end, BlackRock believed the Portfolio remained positioned for continued growth, albeit with higher volatility going forward. BlackRock continues to prefer risk assets and remains overweight equity exposure relative to fixed income. BlackRock remains overweight to the U.S. and underweight Developed Market (DM) equities, believing that growth prospects for the U.S. will continue, and political uncertainty will take a greater toll on non-U.S. developed regions. BlackRock maintains the duration underweight in the Portfolio, although it is more modest with rates resetting lower. BlackRock still anticipates potentially further increases in interest rates over coming quarters, and the Portfolio strategically remains overweight investment grade credit as a result. 2397284.2
5

The Portfolio's performance figures* for the period ended December 31, 2018 as compared to its benchmark:
One Performance
Year Since Inception**
Global Atlantic BlackRock Allocation Portfolio
Class I (5.14%) (2.87%)
Class II (5.33%) (3.12%)
S&P Target Risk® Growth Index (Total Return) (5.69%) (3.20%)
** The Portfolio's inception date is November 1, 2017. The Portfolio commenced operations on November 6, 2017.
Holdings by Asset Class % of Net Assets
Exchange Traded Funds - Equity Funds 59.1%
Exchange Traded Funds - Debt Funds 41.0%
Money Market Fund 0.1%
Other Assets Less Liabilities - Net (0.2)%
100.0%
Please refer to the Portfolio of Investments in this annual report for more information regarding the Portfolio's holdings as of December 31, 2018.
Comparison of the Change in Value of a $10,000 Investment
Global Atlantic BlackRock Allocation Portfolio
Portfolio Review
December 31, 2018 (Unaudited)
*The performance data quoted is historical. Past performance is no guarantee of future results. Current performance may be higher or lower than the
performance data quoted. The principal value and investment return of an investment will fluctuate so that your shares, when redeemed, may be worth more
or less than their original cost. Total returns would have been lower absent fee waivers by the Adviser. The returns shown do not reflect the deduction of
taxes that a shareholder may pay on Portfolio distributions or on the redemption of Portfolio shares, as well as other charges and expenses of the insurance
contract or separate account. The Portfolio's total annual operating expenses, after fee waiver and/or reimbursement, were 0.50% and 0.75% for Class I and
Class II shares, respectively, per the April 27, 2018 prospectus.
The S&P Target Risk®
Growth Index (Total Return) provides increased exposure to equities, while also using some fixed income exposure to dampen risk. It is
not possible to invest directly in an index.
$9,500
$9,700
$9,900
$10,100
$10,300
$10,500
$10,700
Global Atlantic BlackRock Allocation Portfolio - Class I -$9,666
Global Atlantic BlackRock Allocation Portfolio - Class II - $9,638
S&P Target Risk® Growth Index (Total Return) - $9,629
6

Global Atlantic BlackRock Disciplined Core Portfolio
Portfolio Review (Unaudited)
December 31, 2018
Investment Objective
The Portfolio seeks to provide long-term capital appreciation.
Management Review
The Portfolio is sub-advised by BlackRock Investment Management, LLC (“BlackRock”).
How did the Portfolio perform during the period?
During 2018, the Class I shares of Global Atlantic BlackRock Disciplined Core Portfolio underperformed its reference benchmark, the S&P 500 Index. The Portfolio posted a return of -4.75% compared to a benchmark return of -4.38%, a difference of -37 basis points. The following discussion of relative performance pertains to this benchmark.
What factors and allocation decisions influenced the Portfolio’s performance?
The global equity market rally experienced in 2016 and 2017 ended in 2018, as major equity markets turned negative, with many ending the year in correction territory (a decline of greater than 10%). From February to March 2018, the S&P 500 and MSCI EAFE indices were down -6.13% and -6.23% respectively, while volatility (as measured by the CBOE Volatility Index (“VIX”)) averaged 20.66 (versus 11.10 in 2017). A period of relative market calm from May to September 2018, highlighted by generally strong corporate earnings and positive returns, was surrounded by periods of heightened volatility driven by global trade tensions, rising interest rates, and valuation concerns. Market turmoil returned in the fourth quarter, evidenced by declines in the S&P 500 and MSCI EAFE indices of -13.52% and -12.54% respectively, while VIX averaged 20.91.
BlackRock’s Scientific Active Equity (“SAE”) process systematically tracks and ranks the characteristics of companies in order to seek to construct a portfolio that has the best trade-off between returns, risk and costs. The SAE investment model groups the universe of securities based on an analysis of a wide range of factors, such as relative value (“Value”), earnings quality (“Quality”), market sentiment (“Sentiment”), and thematic insights. Value insights seek to incorporate, where appropriate, asset value, sales, earnings and cash flow forecasts over short and long periods. Quality measures aim to assess the sustainability of earnings and the quality of corporate management by investigating company financials as well as other company statements. Sentiment criteria seek to infer information about a company’s value from changes in analysts’ forecasts, linkages between companies, management decisions and the behavior of other market participants in equities and other securities markets. And lastly, thematic insights seek to identify and exploit commonalities among groups of stocks that are believed to drive prices but that currently appear to be less obvious to the market.
Quality based insights outperformed, led by a signal that measures asset efficiency and a signal that identifies persistency and consistency in dividend growth. Value and Sentiment based insights detracted, balancing out the Portfolio’s performance. A signal that captures Sentiment from hedge fund positioning was a main detractor. Historically this signal has added value, but it came under pressure as hedge funds appeared to undergo forced unwinding of positions in the fourth quarter. A fundamental Value signal that uses top-line sales growth as a measure underperformed as well. One standout positive contributor was a signal that captures Sentiment across asset classes. Theme based insights were relatively flat for the twelve-month period.
How was the Portfolio positioned at period end?
At year end, predicted risk estimates were running below longer-term trends following steps to reduce risk as realized volatility moved higher through the final quarter of 2018. In terms of risk budgeting, BlackRock continues to seek to deliver a balanced allocation across fundamental (i.e. Quality, Value), Sentiment and Macro-Thematic signal composites, as well as across trend following and contrarian sources of alpha. BlackRock would expect this allocation to be capable of generating a differentiated source of alpha regardless of whether markets continue to recover or enter a more sustainable down trend over the next 12 months.
2397284.2
7

The Portfolio's performance figures* for the period ended December 31, 2018 as compared to its benchmark:
One Performance
Year Since Inception**
Global Atlantic BlackRock Disciplined Core Portfolio
Class I (4.75%) (0.97%)
Class II (5.06%) (1.33%)
S&P 500® Index (Total Return) (4.38%) (0.44%)
** The Portfolio's inception date is November 1, 2017. The Portfolio commenced operations on November 6, 2017.
Holdings by Asset Class % of Net Assets
Common Stocks 98.3%
Money Market Fund 1.6%
Other Assets Less Liabilities - Net 0.1%
100.0%
Please refer to the Portfolio of Investments in this annual report for more information regarding the Portfolio's holdings as of December 31, 2018.
Derivative exposure is included in "Other Assets Less Liabilities - Net".
Comparison of the Change in Value of a $10,000 Investment
Global Atlantic BlackRock Disciplined Core Portfolio
Portfolio Review (Continued)
December 31, 2018 (Unaudited)
*The performance data quoted is historical. Past performance is no guarantee of future results. Current performance may be higher or lower than the
performance data quoted. The principal value and investment return of an investment will fluctuate so that your shares, when redeemed, may be worth more
or less than their original cost. Total returns would have been lower absent fee waivers by the Adviser. The returns shown do not reflect the deduction of
taxes that a shareholder may pay on Portfolio distributions or on the redemption of Portfolio shares, as well as other charges and expenses of the insurance
contract or separate account. The Portfolio's total annual operating expenses, after fee waiver and/or reimbursement, were 0.48% and 0.73% for Class I and
Class II shares, respectively, per the April 27, 2018 prospectus.
The S&P 500®
Index (Total Return) is a widely accepted, unmanaged index of U.S. stock market performance which does not take into account charges, fees,
and other expenses. Investors cannot invest directly in an index.
$9,887 $9,949
$9,845
$9,000
$9,500
$10,000
$10,500
$11,000
$11,500
Global Atlantic BlackRock Disciplined Core Portfolio - Class I S&P 500® Index (Total Return)
Global Atlantic BlackRock Disciplined Core Portfolio - Class II
8

Global Atlantic BlackRock Disciplined Growth Portfolio
Portfolio Review (Unaudited)
December 31, 2018
Investment Objective
The Portfolio seeks to provide long-term capital appreciation.
Management Review
The Portfolio is sub-advised by BlackRock Investment Management, LLC (“BlackRock”).
How did the Portfolio perform during the period?
During 2018, the Class II shares of Global Atlantic BlackRock Disciplined Growth Portfolio underperformed its reference benchmark, the Russell 1000 Growth Index. The Portfolio posted a return of -2.98% compared to a benchmark return of -1.51%, a difference of -147 basis points. The following discussion of relative performance pertains to this benchmark.
What factors and allocation decisions influenced the Portfolio’s performance?
The global equity market rally experienced in 2016 and 2017 ended in 2018, as major equity markets turned negative, with many ending the year in correction territory (a decline of greater than 10%). A period of relative market calm from May to September 2018, highlighted by generally strong corporate earnings and positive returns, was surrounded by periods of heightened volatility driven by global trade tensions, rising interest rates, and valuation concerns. From February to March 2018, the S&P 500 and MSCI EAFE indices were down -6.13% and -6.23% respectively, while volatility (as measured by the CBOE Volatility Index (“VIX”)) averaged 20.66 (versus 11.10 in 2017). Market turmoil returned in the fourth quarter, evidenced by declines in the S&P 500 and MSCI EAFE indices of -13.52% and -12.54% respectively, while VIX averaged 20.91.
BlackRock’s Scientific Active Equity (“SAE”) process systematically tracks and ranks the characteristics of companies in order to seek to construct a portfolio that has the best trade-off between returns, risk and costs. The SAE investment model groups the universe of securities based on an analysis of a wide range of factors, such as relative value (“Value”), earnings quality (“Quality”), market sentiment (“Sentiment”), and thematic insights. Value insights seek to incorporate, where appropriate, asset value, sales, earnings and cash flow forecasts over short and long periods. Quality measures aim to assess the sustainability of earnings and the quality of corporate management by investigating company financials as well as other company statements. Sentiment criteria seek to infer information about a company’s value from changes in analysts’ forecasts, linkages between companies, management decisions and the behavior of other market participants in equities and other securities markets. And lastly, thematic insights seek to identify and exploit commonalities among groups of stocks that are believed to drive prices but that currently appear to be less obvious to the market.
Sentiment based insights drove the majority of the underperformance, led by a signal that captures sentiment from hedge fund positioning. Historically this signal has added value, but it came under pressure as hedge funds appeared to undergo forced unwinding of positions in the fourth quarter. Theme and Value based insights also underperformed in the twelve-month period. Namely, a signal that captures value by using top-line sales as a fundamental measure detracted.
Quality based insights were slightly additive, but not enough to offset the underperformance by the other signals. A Quality signal that measures asset efficiency stood out as a positive contributor.
How was the Portfolio positioned at period end?
At year end, predicted risk estimates were running below longer-term trends following steps to reduce risk as realized volatility moved higher through the final quarter of 2018. In terms of risk budgeting, BlackRock continues to seek to deliver a balanced allocation across fundamental (i.e. Quality, Value), Sentiment and Macro-Thematic signal composites, as well as across trend following and contrarian sources of alpha. BlackRock would expect this allocation to be capable of generating a differentiated source of alpha regardless of whether markets continue to recover or enter a more sustainable down trend over the next 12 months.
2397284.2
9

The Portfolio's performance figures* for the period ended December 31, 2018 as compared to its benchmark:
One Performance
Year Since Inception**
Global Atlantic BlackRock Disciplined Growth Portfolio
Class II (2.98)% 0.11%
Russell 1000® Growth Index (Total Return) (1.51)% 1.98%
** The Portfolio's inception date is November 1, 2017. The Portfolio commenced operations on November 6, 2017.
Holdings by Asset Class % of Net Assets
Common Stocks 97.9%
Money Market Fund 2.1%
Other Assets Less Liabilities - Net 0.0% ^
100.0%
Please refer to the Portfolio of Investments in this annual report for more information regarding the Portfolio's holdings as of December 31, 2018.
Derivative exposure is included in "Other Assets Less Liabilities - Net".
^ Amount is less than 0.05%
Comparison of the Change in Value of a $10,000 Investment
Global Atlantic BlackRock Disciplined Growth Portfolio
Portfolio Review (Continued)
December 31, 2018 (Unaudited)
*The performance data quoted is historical. Past performance is no guarantee of future results. Current performance may be higher or lower than the
performance data quoted. The principal value and investment return of an investment will fluctuate so that your shares, when redeemed, may be worth more or
less than their original cost. Total returns would have been lower absent fee waivers by the Adviser. The returns shown do not reflect the deduction of taxes that
a shareholder may pay on Portfolio distributions or on the redemption of Portfolio shares, as well as other charges and expenses of the insurance contract or
separate account. The Portfolio's total annual operating expenses, after fee waiver and/or reimbursement, were 0.79% for Class II shares, per the April 27, 2018
prospectus.
The Russell 1000®
Growth Index (Total Return) is an unmanaged index of common stock prices that measures the performance of those Russell 1000®
Index
companies with higher price-to-book ratios and higher forecasted growth values. It is not possible to invest directly in an index.
$10,231 $10,013
$9,500
$10,000
$10,500
$11,000
$11,500
$12,000
$12,500
Russell 1000® Growth Index (Total Return) Global Atlantic BlackRock Disciplined Growth Portfolio - Class II
10

Global Atlantic BlackRock Disciplined International Core Portfolio
Portfolio Review (Unaudited)
December 31, 2018
Investment Objective
The Portfolio seeks to provide long-term capital appreciation.
Management Review
The Portfolio is sub-advised by BlackRock Investment Management, LLC (“BlackRock”).
How did the Portfolio perform during the period?
During 2018, the Class I shares of Global Atlantic BlackRock Disciplined International Core Portfolio underperformed its reference benchmark, the MSCI ACWI ex USA Index. The Portfolio posted a return of -14.80% compared to a benchmark return of -14.20%, a difference of -60 basis points. The following discussion of relative performance pertains to this benchmark.
What factors and allocation decisions influenced the Portfolio’s performance?
The global equity market rally experienced in 2016 and 2017 ended in 2018, as major equity markets turned negative, with many ending the year in correction territory (a decline of greater than 10%). A period of relative market calm from May to September 2018, highlighted by generally strong corporate earnings and positive returns, was surrounded by periods of heightened volatility driven by global trade tensions, rising interest rates, and valuation concerns. From February to March 2018, the S&P 500 and MSCI EAFE indices were down -6.13% and -6.23% respectively, while volatility (as measured by the CBOE Volatility Index (“VIX”)) averaged 20.66 (versus 11.10 in 2017). Market turmoil returned in the fourth quarter, evidenced by declines in the S&P 500 and MSCI EAFE indices of -13.52% and -12.54% respectively, while VIX averaged 20.91.
BlackRock’s Scientific Active Equity (“SAE”) process systematically tracks and ranks the characteristics of companies in order to seek to construct a portfolio that has the best trade-off between returns, risk and costs. The SAE investment model groups the universe of securities based on an analysis of a wide range of factors, such as relative value (“Value”), earnings quality (“Quality”), market sentiment (“Sentiment”), and thematic insights. Value insights seek to incorporate, where appropriate, asset value, sales, earnings and cash flow forecasts over short and long periods. Quality measures aim to assess the sustainability of earnings and the quality of corporate management by investigating company financials as well as other company statements. Sentiment criteria seek to infer information about a company’s value from changes in analysts’ forecasts, linkages between companies, management decisions and the behavior of other market participants in equities and other securities markets. And lastly, thematic insights seek to identify and exploit commonalities among groups of stocks that are believed to drive prices but that currently appear to be less obvious to the market.
The portfolio saw positive contribution from Sentiment and thematic insights, but it was not enough to offset the detraction from Value based insights. A text-learned signal that measures Sentiment from earnings call data was a main contributor in the period. Another machine-learned Sentiment signal that uses a multitude of company specific factors to predict outperformance was a top contributor. Value signals that measure cash flow and sales data detracted from performance. Quality based insights saw marginally positive performance, led by a signal that evaluates a firm’s operating assets.
How was the Portfolio positioned at period end?
At year end, predicted risk estimates were running below longer-term trends following steps to reduce risk as realized volatility moved higher through the final quarter of 2018. In terms of risk budgeting, BlackRock continues to seek to deliver a balanced allocation across fundamental (i.e. Quality, Value), Sentiment and Macro-Thematic signal composites, as well as across trend following and contrarian sources of alpha. BlackRock would expect this allocation to be capable of generating a differentiated source of alpha regardless of whether markets continue to recover or enter a more sustainable down trend over the next 12 months.
Industry risk remains relatively subdued in terms of contribution to overall portfolio risk. Regionally, the Portfolio is underweight the European markets given the geopolitical risk associated with Brexit (Great Britain’s vote to leave the European Union) and weak economic data.
2397284.2
11

The Portfolio's performance figures* for the period ended December 31, 2018 as compared to its benchmark:
One Performance
Year Since Inception**
Global Atlantic BlackRock Disciplined International Core Portfolio
Class I (14.80)% (11.35)%
Class II (14.95)% (11.57)%
MSCI ACWI ex-USA Index (14.20)% (10.37)%
** The Portfolio's inception date is November 1, 2017. The Portfolio commenced operations on November 6, 2017.
Holdings by Asset Class % of Net Assets
Common Stocks 90.9%
Exchange Traded Funds - Equity Funds 6.1%
Money Market Fund 0.0% ^
Other Assets Less Liabilities - Net 3.0%
100.0%
Please refer to the Portfolio of Investments in this annual report for more information regarding the Portfolio's holdings as of December 31, 2018.
Derivative exposure is included in "Other Assets Less Liabilities - Net".
^ Amount is less than 0.05%
Comparison of the Change in Value of a $10,000 Investment
Global Atlantic BlackRock Disciplined International Core Portfolio
Portfolio Review (Continued)
December 31, 2018 (Unaudited)
*The performance data quoted is historical. Past performance is no guarantee of future results. Current performance may be higher or lower than the
performance data quoted. The principal value and investment return of an investment will fluctuate so that your shares, when redeemed, may be worth more
or less than their original cost. Total returns would have been lower absent fee waivers by the Adviser. The returns shown do not reflect the deduction of
taxes that a shareholder may pay on Portfolio distributions or on the redemption of Portfolio shares, as well as other charges and expenses of the insurance
contract or separate account. The Portfolio's total annual operating expenses, after fee waiver and/or reimbursement, were 0.74% and 0.99% for Class I and
Class II shares, respectively, per the April 27, 2018 prospectus.
The MSCI ACWI ex-USA Index is a free float-adjusted market capitalization index designed to measure the combined equity market performance of developed
and emerging market countries, excluding the United States. It is not possible to invest directly in an index.
$8,691 $8,666
$8,803
$8,500
$9,000
$9,500
$10,000
$10,500
Global Atlantic BlackRock Disciplined International Core Portfolio - Class I
Global Atlantic BlackRock Disciplined International Core Portfolio - Class II
MSCI ACWI ex-USA Index
12

Global Atlantic BlackRock Disciplined Mid Cap Growth Portfolio
Portfolio Review (Unaudited)
December 31, 2018
Investment Objective
The Portfolio seeks to provide long-term capital appreciation.
Management Review
The Portfolio is sub-advised by BlackRock Investment Management, LLC (“BlackRock”).
How did the Portfolio perform during the period?
During 2018, the Class I shares of Global Atlantic BlackRock Disciplined Mid Cap Growth Portfolio outperformed its reference benchmark, the Russell Midcap Growth Index. The Portfolio posted a return of -3.07% compared to a benchmark return of -4.75%, a difference of 168 basis points. The following discussion of relative performance pertains to this benchmark.
What factors and allocation decisions influenced the Portfolio’s performance?
The global equity market rally experienced in 2016 and 2017 ended in 2018, as major equity markets turned negative, with many ending the year in correction territory (a decline of greater than 10%). A period of relative market calm from May to September 2018, highlighted by generally strong corporate earnings and positive returns, was surrounded by periods of heightened volatility driven by global trade tensions, rising interest rates, and valuation concerns. From February to March 2018, the S&P 500 and MSCI EAFE indices were down -6.13% and -6.23% respectively, while volatility (as measured by the CBOE Volatility Index (“VIX”)) averaged 20.66 (versus 11.10 in 2017). Market turmoil returned in the fourth quarter, evidenced by declines in the S&P 500 and MSCI EAFE indices of -13.52% and -12.54% respectively, while VIX averaged 20.91.
BlackRock’s Scientific Active Equity (“SAE”) process systematically tracks and ranks the characteristics of companies in order to seek to construct a portfolio that has the best trade-off between returns, risk and costs. The SAE investment model groups the universe of securities based on an analysis of a wide range of factors, such as relative value (“Value”), earnings quality (“Quality”), market sentiment (“Sentiment”), and thematic insights. Value insights seek to incorporate, where appropriate, asset value, sales, earnings and cash flow forecasts over short and long periods. Quality measures aim to assess the sustainability of earnings and the quality of corporate management by investigating company financials as well as other company statements. Sentiment criteria seek to infer information about a company’s value from changes in analysts’ forecasts, linkages between companies, management decisions and the behavior of other market participants in equities and other securities markets. And lastly, thematic insights seek to identify and exploit commonalities among groups of stocks that are believed to drive prices but that currently appear to be less obvious to the market.
Quality, Sentiment, and thematic insights all contributed to the outperformance. A Quality signal that identifies persistency and consistency in dividend growth was a main contributor. Other Quality insights that measure productivity and favor founder-led leadership structures were quite additive. A machine-learned signal that derives Sentiment from conference call data was also a positive contributor.
The Value based insights were relatively flat for the twelve-month period. A notable underperformer was a signal that captures Sentiment from hedge fund positioning. Historically this signal has added value, but it came under pressure as hedge funds appeared to undergo forced unwinding of positions in the fourth quarter.
How was the Portfolio positioned at period end?
At year end, predicted risk estimates were running below longer-term trends following steps to reduce risk as realized volatility moved higher through the final quarter of 2018. In terms of risk budgeting, BlackRock continues to seek to deliver a balanced allocation across fundamental (i.e. Quality, Value), Sentiment and Macro-Thematic signal composites, as well as across trend following and contrarian sources of alpha. BlackRock would expect this allocation to be capable of generating a differentiated source of alpha regardless of whether markets continue to recover or enter a more sustainable down trend over the next 12 months.
2397284.2
13

The Portfolio's performance figures* for the period ended December 31, 2018 as compared to its benchmark:
One Performance
Year Since Inception**
Global Atlantic BlackRock Disciplined Mid Cap Growth Portfolio
Class I (3.07)% 0.28%
Class II (3.35)% 0.03%
Russell Midcap® Growth Index (Total Return) (4.75)% (0.62)%
** The Portfolio's inception date is November 1, 2017. The Portfolio commenced operations on November 6, 2017.
Holdings by Asset Class % of Net Assets
Common Stocks 98.3%
Money Market Fund 1.6%
Other Assets Less Liabilities - Net 0.1%
100.0%
Please refer to the Portfolio of Investments in this annual report for more information regarding the Portfolio's holdings as of December 31, 2018.
Derivative exposure is included in "Other Assets Less Liabilities - Net".
Comparison of the Change in Value of a $10,000 Investment
Global Atlantic BlackRock Disciplined Mid Cap Growth Portfolio
Portfolio Review (Continued)
December 31, 2018 (Unaudited)
*The performance data quoted is historical. Past performance is no guarantee of future results. Current performance may be higher or lower than the
performance data quoted. The principal value and investment return of an investment will fluctuate so that your shares, when redeemed, may be worth more
or less than their original cost. Total returns would have been lower absent fee waivers by the Adviser. The returns shown do not reflect the deduction of
taxes that a shareholder may pay on Portfolio distributions or on the redemption of Portfolio shares, as well as other charges and expenses of the insurance
contract or separate account. The Portfolio's total annual operating expenses, after fee waiver and/or reimbursement, were 0.63% and 0.88% for Class I and
Class II shares, respectively, per the April 27, 2018 prospectus.
The Russell Midcap®
Growth Index (Total Return) is an unmanaged index that consists of the bottom 800 securities of the Russell 1000®
Index with greater-
than-average growth orientation as ranked by total market capitalization. It is not possible to invest directly in an index.
$9,000
$9,500
$10,000
$10,500
$11,000
$11,500
$12,000
$12,500
Global Atlantic BlackRock Disciplined Mid Cap Growth Portfolio - Class I - $10,032
Global Atlantic BlackRock Disciplined Mid Cap Growth Portfolio - Class II - $10,003
Russell Midcap® Growth Index (Total Return) - $9,928
14

Global Atlantic BlackRock Disciplined Small Cap Portfolio
Portfolio Review (Unaudited)
December 31, 2018
Investment Objective
The Portfolio seeks to provide long-term capital appreciation.
Management Review
The Portfolio is sub-advised by BlackRock Investment Management, LLC (“BlackRock”).
How did the Portfolio perform during the period?
During 2018, the Class I shares of Global Atlantic BlackRock Disciplined Small Cap Growth Portfolio outperformed its reference benchmark, the Russell 2000 Index. The Portfolio posted a return of -9.49% compared to a benchmark return of -11.01%, a difference of 152 basis points. The following discussion of relative performance pertains to this benchmark.
What factors and allocation decisions influenced the Portfolio’s performance?
The global equity market rally experienced in 2016 and 2017 ended in 2018, as major equity markets turned negative, with many ending the year in correction territory (a decline of greater than 10%). A period of relative market calm from May to September 2018, highlighted by generally strong corporate earnings and positive returns, was surrounded by periods of heightened volatility driven by global trade tensions, rising interest rates, and valuation concerns. From February to March 2018, the S&P 500 and MSCI EAFE indices were down -6.13% and -6.23% respectively, while volatility (as measured by the CBOE Volatility Index (“VIX”)) averaged 20.66 (versus 11.10 in 2017). Market turmoil returned in the fourth quarter, evidenced by declines in the S&P 500 and MSCI EAFE indices of -13.52% and -12.54% respectively, while VIX averaged 20.91.
BlackRock’s Scientific Active Equity (“SAE”) process systematically tracks and ranks the characteristics of companies in order to seek to construct a portfolio that has the best trade-off between returns, risk and costs. The SAE investment model groups the universe of securities based on an analysis of a wide range of factors, such as relative value (“Value”), earnings quality (“Quality”), market sentiment (“Sentiment”), and thematic insights. Value insights seek to incorporate, where appropriate, asset value, sales, earnings and cash flow forecasts over short and long periods. Quality measures aim to assess the sustainability of earnings and the quality of corporate management by investigating company financials as well as other company statements. Sentiment criteria seek to infer information about a company’s value from changes in analysts’ forecasts, linkages between companies, management decisions and the behavior of other market participants in equities and other securities markets. And lastly, thematic insights seek to identify and exploit commonalities among groups of stocks that are believed to drive prices but that currently appear to be less obvious to the market.
Quality and Sentiment based insight drove the majority of the outperformance for the period. A Quality based insight that seeks to identify stocks with low risk was a main contributor. Another Quality signal that identifies persistency and consistency in dividend growth also outperformed. A Quality insight that favors founder-led leadership structures also added value. A Sentiment insight that evaluates investor flow was largely positive.
Value insights were slightly negative, led by an insight that captures value from top-line sales data. Thematic insights slightly outperformed.
How was the Portfolio positioned at period end?
At year end, predicted risk estimates were running below longer-term trends following steps to reduce risk as realized volatility moved higher through the final quarter of 2018. In terms of risk budgeting, BlackRock continues to seek to deliver a balanced allocation across fundamental (i.e. Quality, Value), Sentiment and Macro-Thematic signal composites, as well as across trend following and contrarian sources of alpha. BlackRock would expect this allocation to be capable of generating a differentiated source of alpha regardless of whether markets continue to recover or enter a more sustainable down trend over the next 12 months.
2397284.2
15

The Portfolio's performance figures* for the period ended December 31, 2018 as compared to its benchmark:
One Performance
Year Since Inception**
Global Atlantic BlackRock Disciplined Small Cap Portfolio
Class I (9.49)% (6.47)%
Class II (9.75)% (6.71)%
Russell 2000® Index (Total Return) (11.01)% (7.09)%
** The Portfolio's inception date is November 1, 2017. The Portfolio commenced operations on November 6, 2017.
Holdings by Asset Class % of Net Assets
Common Stocks 97.6%
Money Market Fund 2.4%
Other Assets Less Liabilities - Net 0.0% ^
100.0%
Please refer to the Portfolio of Investments in this annual report for more information regarding the Portfolio's holdings as of December 31, 2018.
Derivative exposure is included in "Other Assets Less Liabilities - Net".
^ Amount is less than 0.05%
Comparison of the Change in Value of a $10,000 Investment
Global Atlantic BlackRock Disciplined Small Cap Portfolio
Portfolio Review (Continued)
December 31, 2018 (Unaudited)
*The performance data quoted is historical. Past performance is no guarantee of future results. Current performance may be higher or lower than the
performance data quoted. The principal value and investment return of an investment will fluctuate so that your shares, when redeemed, may be worth more
or less than their original cost. Total returns would have been lower absent fee waivers by the Adviser. The returns shown do not reflect the deduction of
taxes that a shareholder may pay on Portfolio distributions or on the redemption of Portfolio shares, as well as other charges and expenses of the insurance
contract or separate account. The Portfolio's total annual operating expenses, after fee waiver and/or reimbursement, were 0.63% and 0.88% for Class I and
Class II shares, respectively, per the April 27, 2018 prospectus.
The Russell 2000®
Index (Total Return) measures the performance of the small-capitalization sector of the U.S. equity market. It is not possible to invest
directly in an index.
$9,000
$9,500
$10,000
$10,500
$11,000
$11,500
$12,000
$12,500
Global Atlantic BlackRock Disciplined Small Cap Portfolio - Class I - $9,250
Global Atlantic BlackRock Disciplined Small Cap Portfolio - Class II - $9,223
Russell 2000® Index (Total Return) - $9,179
16

Global Atlantic BlackRock Disciplined U.S. Core Portfolio
Portfolio Review (Unaudited)
December 31, 2018
Investment Objective
The Portfolio seeks to provide long-term capital appreciation.
Management Review
The Portfolio is sub-advised by BlackRock Investment Management, LLC (“BlackRock”).
How did the Portfolio perform during the period?
During 2018, the Class I shares of Global Atlantic BlackRock Disciplined U.S. Core Portfolio underperformed its reference benchmark, the S&P 500 Index. The Portfolio posted a return of -5.03% compared to a benchmark return of -4.38%, a difference of -65 basis points. The following discussion of relative performance pertains to this benchmark.
What factors and allocation decisions influenced the Portfolio’s performance?
The global equity market rally experienced in 2016 and 2017 ended in 2018, as major equity markets turned negative, with many ending the year in correction territory (a decline of greater than 10%). A period of relative market calm from May to September 2018, highlighted by generally strong corporate earnings and positive returns, was surrounded by periods of heightened volatility driven by global trade tensions, rising interest rates, and valuation concerns. From February to March 2018, the S&P 500 and MSCI EAFE indices were down -6.13% and -6.23% respectively, while volatility (as measured by the CBOE Volatility Index (“VIX”)) averaged 20.66 (versus 11.10 in 2017). Market turmoil returned in the fourth quarter, evidenced by declines in the S&P 500 and MSCI EAFE indices of -13.52% and -12.54% respectively, while VIX averaged 20.91.
BlackRock’s Scientific Active Equity (“SAE”) process systematically tracks and ranks the characteristics of companies in order to seek to construct a portfolio that has the best trade-off between returns, risk and costs. The SAE investment model groups the universe of securities based on an analysis of a wide range of factors, such as relative value (“Value”), earnings quality (“Quality”), market sentiment (“Sentiment”), and thematic insights. Value insights seek to incorporate, where appropriate, asset value, sales, earnings and cash flow forecasts over short and long periods. Quality measures aim to assess the sustainability of earnings and the quality of corporate management by investigating company financials as well as other company statements. Sentiment criteria seek to infer information about a company’s value from changes in analysts’ forecasts, linkages between companies, management decisions and the behavior of other market participants in equities and other securities markets. And lastly, thematic insights seek to identify and exploit commonalities among groups of stocks that are believed to drive prices but that currently appear to be less obvious to the market.
Sentiment based insights drove the majority of the underperformance, led by a signal that captures sentiment from hedge fund positioning. Historically this signal has added value, but it came under pressure as hedge funds appeared to undergo forced unwinding of positions in the fourth quarter. Quality based insights positively contributed, but not enough to offset the detraction from sentiment based insights. A Quality signal that identifies persistency and consistency in dividend growth was a main contributor.
Value and thematic insights were slightly negative for the twelve-month period. Specifically, a signal that captures value by using top-line sales as a fundamental measure detracted.
How was the Portfolio positioned at period end?
At year end, predicted risk estimates were running below longer-term trends following steps to reduce risk as realized volatility moved higher through the final quarter of 2018. In terms of risk budgeting, BlackRock continues to seek to deliver a balanced allocation across fundamental (i.e. Quality, Value), Sentiment and Macro-Thematic signal composites, as well as across trend following and contrarian sources of alpha. BlackRock would expect this allocation to be capable of generating a differentiated source of alpha regardless of whether markets continue to recover or enter a more sustainable down trend over the next 12 months.
2397284.2
17

The Portfolio's performance figures* for the period ended December 31, 2018 as compared to its benchmark:
One Performance
Year Since Inception**
Global Atlantic BlackRock Disciplined U.S. Core Portfolio
Class I (5.03)% (1.05)%
Class II (5.17)% (1.27)%
S&P 500® Index (Total Return) (4.38)% (0.44)%
** The Portfolio's inception date is November 1, 2017. The Portfolio commenced operations on November 6, 2017.
Holdings by Asset Class % of Net Assets
Common Stocks 98.1%
Money Market Fund 1.8%
Other Assets Less Liabilities - Net 0.1%
100.0%
Please refer to the Portfolio of Investments in this annual report for more information regarding the Portfolio's holdings as of December 31, 2018.
Derivative exposure is included in "Other Assets Less Liabilities - Net".
Comparison of the Change in Value of a $10,000 Investment
Global Atlantic BlackRock Disciplined U.S. Core Portfolio
Portfolio Review (Continued)
December 31, 2018 (Unaudited)
*The performance data quoted is historical. Past performance is no guarantee of future results. Current performance may be higher or lower than the
performance data quoted. The principal value and investment return of an investment will fluctuate so that your shares, when redeemed, may be worth more
or less than their original cost. Total returns would have been lower absent fee waivers by the Adviser. The returns shown do not reflect the deduction of
taxes that a shareholder may pay on Portfolio distributions or on the redemption of Portfolio shares, as well as other charges and expenses of the insurance
contract or separate account. The Portfolio's total annual operating expenses, after fee waiver and/or reimbursement, were 0.48% and 0.73% for Class I and
Class II shares, respectively, per the April 27, 2018 prospectus.
The S&P 500®
Index (Total Return) is a widely accepted, unmanaged index of U.S. stock market performance which does not take into account charges, fees,
and other expenses. Investors cannot invest directly in an index.
$9,000
$9,500
$10,000
$10,500
$11,000
$11,500
$12,000
Global Atlantic BlackRock Disciplined U.S. Core Portfolio - Class I -$9,877
Global Atlantic BlackRock Disciplined U.S. Core Portfolio - Class II - $9,853
S&P 500® Index (Total Return) - $9,949
18

Global Atlantic BlackRock Disciplined Value Portfolio
Portfolio Review (Unaudited)
December 31, 2018
Investment Objective
The Portfolio seeks to provide long-term capital appreciation.
Management Review
The Portfolio is sub-advised by BlackRock Investment Management, LLC (“BlackRock”).
How did the Portfolio perform during the period?
During 2018, the Class I shares of Global Atlantic BlackRock Disciplined Value Portfolio outperformed its reference benchmark, the Russell 1000 Value Index. The Portfolio posted a return of -7.97% compared to a benchmark return of -8.27%, a difference of 30 basis points. The following discussion of relative performance pertains to this benchmark.
What factors and allocation decisions influenced the Portfolio’s performance?
The global equity market rally experienced in 2016 and 2017 ended in 2018, as major equity markets turned negative, with many ending the year in correction territory (a decline of greater than 10%). A period of relative market calm from May to September 2018, highlighted by generally strong corporate earnings and positive returns, was surrounded by periods of heightened volatility driven by global trade tensions, rising interest rates, and valuation concerns. From February to March 2018, the S&P 500 and MSCI EAFE indices were down -6.13% and -6.23% respectively, while volatility (as measured by the CBOE Volatility Index (“VIX”)) averaged 20.66 (versus 11.10 in 2017). Market turmoil returned in the fourth quarter, evidenced by declines in the S&P 500 and MSCI EAFE indices of -13.52% and -12.54% respectively, while VIX averaged 20.91.
BlackRock’s Scientific Active Equity (“SAE”) process systematically tracks and ranks the characteristics of companies in order to seek to construct a portfolio that has the best trade-off between returns, risk and costs. The SAE investment model groups the universe of securities based on an analysis of a wide range of factors, such as relative value (“Value”), earnings quality (“Quality”), market sentiment (“Sentiment”), and thematic insights. Value insights seek to incorporate, where appropriate, asset value, sales, earnings and cash flow forecasts over short and long periods. Quality measures aim to assess the sustainability of earnings and the quality of corporate management by investigating company financials as well as other company statements. Sentiment criteria seek to infer information about a company’s value from changes in analysts’ forecasts, linkages between companies, management decisions and the behavior of other market participants in equities and other securities markets. And lastly, thematic insights seek to identify and exploit commonalities among groups of stocks that are believed to drive prices but that currently appear to be less obvious to the market.
Quality based insights drove the majority of the outperformance, led by a signal that identifies persistency and consistency in dividend growth. Another Quality signal that identifies cash flow generation through efficient use of assets was also a main contributor. Sentiment and thematic insights were also slightly additive. Notably, a signal that captures Sentiment across asset classes outperformed. Value based insights were relatively flat for the period.
How was the Portfolio positioned at period end?
At year end, predicted risk estimates were running below longer-term trends following steps to reduce risk as realized volatility moved higher through the final quarter of 2018. In terms of risk budgeting, BlackRock continues to seek to deliver a balanced allocation across fundamental (i.e. Quality, Value), Sentiment and Macro-Thematic signal composites, as well as across trend following and contrarian sources of alpha. BlackRock would expect this allocation to be capable of generating a differentiated source of alpha regardless of whether markets continue to recover or enter a more sustainable down trend over the next 12 months.
2397284.2
19

The Portfolio's performance figures* for the period ended December 31, 2018 as compared to its benchmark:
One Performance
Year Since Inception**
Global Atlantic BlackRock Disciplined Value Portfolio
Class I (7.97)% (3.37)%
Class II (8.16)% (3.47)%
Russell 1000® Value Index (Total Return) (8.27)% (3.76)%
** The Portfolio's inception date is November 1, 2017. The Portfolio commenced operations on November 6, 2017.
Holdings by Asset Class % of Net Assets
Common Stocks 98.2%
Money Market Fund 1.5%
Other Assets Less Liabilities - Net 0.3%
100.0%
Please refer to the Portfolio of Investments in this annual report for more information regarding the Portfolio's holdings as of December 31, 2018.
Derivative exposure is included in "Other Assets Less Liabilities - Net".
Comparison of the Change in Value of a $10,000 Investment
Global Atlantic BlackRock Disciplined Value Portfolio
Portfolio Review (Continued)
December 31, 2018 (Unaudited)
*The performance data quoted is historical. Past performance is no guarantee of future results. Current performance may be higher or lower than the
performance data quoted. The principal value and investment return of an investment will fluctuate so that your shares, when redeemed, may be worth more
or less than their original cost. Total returns would have been lower absent fee waivers by the Adviser. The returns shown do not reflect the deduction of
taxes that a shareholder may pay on Portfolio distributions or on the redemption of Portfolio shares, as well as other charges and expenses of the insurance
contract or separate account. The Portfolio's total annual operating expenses, after fee waiver and/or reimbursement, were 0.54% and 0.79% for Class I and
Class II shares, respectively, per the April 27, 2018 prospectus.
The Russell 1000®
Value Index (Total Return) measures the performance of large- and mid-capitalization value sectors of the U.S. equity market. It is not
possible to invest directly in an index.
$9,000
$9,500
$10,000
$10,500
$11,000
$11,500
Global Atlantic BlackRock Disciplined Value Portfolio - Class I - $9,608
Global Atlantic BlackRock Disciplined Value Portfolio - Class II - $9,596
Russell 1000® Value Index (Total Return) - $9,563
20

Global Atlantic BlackRock High Yield Portfolio
Portfolio Review (Unaudited)
December 31, 2018
Investment Objective
The Portfolio seeks to provide total return.
Management Review
The Portfolio is sub-advised by BlackRock Investment Management, LLC (“BlackRock”).
How did the Portfolio perform during the period?
During 2018, the Class I shares of Global Atlantic BlackRock High Yield Portfolio underperformed its reference benchmark, the ICE BofA ML US High Yield Master II Index. The Portfolio posted a return of -4.32% compared to a benchmark return of -2.25%, a difference of -207 basis points. The following discussion of relative performance pertains to this benchmark.
What factors and allocation decisions influenced the Portfolio’s performance?
The global equity market rally experienced in 2016 and 2017 ended in 2018, as major equity markets turned negative, with many ending the year in correction territory (a decline of greater than 10%). A period of relative market calm from May to September 2018, highlighted by generally strong corporate earnings and positive returns, was surrounded by periods of heightened volatility driven by global trade tensions, rising interest rates, and valuation concerns. From February to March 2018, the S&P 500 and MSCI EAFE indices were down -6.13% and -6.23% respectively, while volatility (as measured by the CBOE Volatility Index (“VIX”)) averaged 20.66 (versus 11.10 in 2017). Market turmoil returned in the fourth quarter, evidenced by declines in the S&P 500 and MSCI EAFE indices of -13.52% and -12.54% respectively, while VIX averaged 20.91.
The fixed income market also exhibited periods of volatility, highlighted by the movement in the 10-year U.S. Treasury yield. Starting the year at 2.41%, it rose quickly to 2.95% in February, peaking at 3.25% in November before falling to 2.69% at year end.
The primary contributor during the period was an underweight to the banking sector, while an underweight to Transportation Services within the Transportation sector also benefited portfolio performance. Security selection within Basic Materials, particularly Metals, was also positive. The primary detractor over the period was security selection within Consumer Non-Cyclicals, particularly within Pharmaceuticals and Tobacco. Another detractor during the period was an overweight to Consumer Cyclicals, particularly within Automotive and Home Construction. Within communications the portfolio was hurt by an overweight to Cable and underweights within Wireless and Wirelines.
The majority of underperformance relative to the benchmark occurred in the first and fourth quarters of the year. First quarter underperformance was primarily driven by two factors; a rally in lower quality bonds given the Portfolio’s higher quality tilt, and the Portfolio’s long duration (versus the benchmark) tilt, which was the result of purchasing new issue and liquid, longer duration high yield bonds. During the fourth quarter, the Portfolio experienced the most underperformance in December amid increased market volatility.
How was the Portfolio positioned at period end?
At year end, the Portfolio was overweight Basics, Capital Goods, Consumer Cyclicals and Consumer Non-Cyclicals. The largest sector underweights were Banking, Transportation, Wireless and Wirelines within Communications and Refining within Energy. 2397284.2
21

The Portfolio's performance figures* for the period ended December 31, 2018 as compared to its benchmark:
One Performance
Year Since Inception**
Global Atlantic BlackRock High Yield Portfolio
Class I (4.32)% (4.39)%
Class II (4.56)% (4.59)%
ICE BofA ML U.S. High Yield Master II Index (2.25)% (1.98)%
** The Portfolio's inception date is November 1, 2017. The Portfolio commenced operations on November 6, 2017.
Holdings by Asset Class % of Net Assets
Corporate Bonds and Notes 98.1%
Money Market Fund 0.3%
Other Assets Less Liabilities - Net 1.6%
100.0%
Please refer to the Portfolio of Investments in this annual report for more information regarding the Portfolio's holdings as of December 31, 2018.
Derivative exposure is included in "Other Assets Less Liabilities - Net".
Comparison of the Change in Value of a $10,000 Investment
Global Atlantic BlackRock High Yield Portfolio
Portfolio Review (Continued)
December 31, 2018 (Unaudited)
*The performance data quoted is historical. Past performance is no guarantee of future results. Current performance may be higher or lower than the
performance data quoted. The principal value and investment return of an investment will fluctuate so that your shares, when redeemed, may be worth more
or less than their original cost. Total returns would have been lower absent fee waivers by the Adviser. The returns shown do not reflect the deduction of
taxes that a shareholder may pay on Portfolio distributions or on the redemption of Portfolio shares, as well as other charges and expenses of the insurance
contract or separate account. The Portfolio's total annual operating expenses, after fee waiver and/or reimbursement, were 0.59% and 0.84% for Class I and
Class II shares, respectively, per the April 27, 2018 prospectus.
The ICE BofA ML U.S. High Yield Master II Index is an unmanaged market value-weighted index comprised of over 2,300 domestic and yankee high-yield
bonds, including deferred interest bonds and payment-in-kind securities. It is not possible to invest directly in an index.
$9,491
$9,769
$9,468
$9,000
$9,500
$10,000
$10,500
Global Atlantic BlackRock High Yield Portfolio - Class I ICE BofA ML U.S. High Yield Master II Index
Global Atlantic BlackRock High Yield Portfolio - Class II
22

Global Atlantic Goldman Sachs Core Fixed Income Portfolio
Portfolio Review (Unaudited)
December 31, 2018
Investment Objective
The Portfolio seeks to provide total return consisting of capital appreciation and income.
Management Review
The Portfolio is sub-advised by Goldman Sachs Asset Management, L.P. (“GSAM”).
How did the Portfolio perform during the period?
During 2018, the Class I shares of Global Atlantic Goldman Sachs Core Fixed Income Portfolio underperformed its reference benchmark, the Bloomberg Barclays U.S. Aggregate Bond Index. The Portfolio posted a return of -0.55% compared to a benchmark return of 0.01%, a difference of -56 basis points. The following discussion of relative performance pertains to this benchmark.
What factors and allocation decisions influenced the Portfolio’s performance?
The global equity market rally experienced in 2016 and 2017 ended in 2018, as major equity markets turned negative, with many ending the year in correction territory (a decline of greater than 10%). A period of relative market calm from May to September 2018, highlighted by generally strong corporate earnings and positive returns, was surrounded by periods of heightened volatility driven by global trade tensions, rising interest rates, and valuation concerns. From February to March 2018, the S&P 500 and MSCI EAFE indices were down -6.13% and -6.23% respectively, while volatility (as measured by the CBOE Volatility Index (“VIX”)) averaged 20.66 (versus 11.10 in 2017). Market turmoil returned in the fourth quarter, evidenced by declines in the S&P 500 and MSCI EAFE indices of -13.52% and -12.54% respectively, while VIX averaged 20.91.
The fixed income market also exhibited periods of volatility, highlighted by the movement in the 10-year U.S. Treasury yield. Starting the year at 2.41%, it rose quickly to 2.95% in February, peaking at 3.25% in November before falling to 2.69% at year end.
The Portfolio’s duration strategy contributed to returns over the period due to a tactical U.S. duration position. The Portfolio’s country relative value strategy slightly contributed to results, driven by long positions in European rates versus short Swedish and UK rates. The Portfolio’s currency strategy detracted from performance, due to long positions in the Swedish krona and the Australian dollar. These losses were partially offset by a short position in the euro. Cross-sector positioning detracted from returns, driven by allocations to corporate credit and collateralized loan obligations (CLOs). An overweight to emerging market sovereign debt further detracted from performance. These losses were partially offset by an underweight positon in agency mortgage-backed securities (MBS) and emerging market corporate debt, as well as exposure to government/swaps.
Overall, the portfolio’s security selection strategies contributed to performance over the period, due to selections of external emerging market debt from Qatar, Kuwait, and the United Arab Emirates. Selections of U.S. government debt further contributed to results. These gains were partially offset by investment-grade utility and financial selections within corporate credit. Within the securitized sector, selections of MBS further detracted from performance.
How was the Portfolio positioned at period end?
At year end, the Portfolio had a tactical position in U.S. duration. The Portfolio was long European rates versus short UK and Australian rates. The Portfolio had an underweight position in agency MBS, commercial mortgage-backed securities (CMBS) and emerging market corporate debt. The portfolio was overweight asset-backed securities (ABS), corporate credit and emerging market sovereign debt.
2397284.2
23

The Portfolio's performance figures* for the period ended December 31, 2018 as compared to its benchmark:
One Performance
Year Since Inception**
Global Atlantic Goldman Sachs Core Fixed Income Portfolio
Class I (0.55)% (0.64)%
Class II (0.60)% (0.69)%
Bloomberg Barclays U.S. Aggregate Bond Index 0.01% 0.30%
** The Portfolio's inception date is November 1, 2017. The Portfolio commenced operations on November 6, 2017.
Holdings by Asset Class % of Net Assets
Corporate Bonds & Notes 39.6%
Mortgage Backed Securities 27.6%
U.S. Treasury Securities 21.9%
Short-Term Investments 16.7%
Asset Backed Securities 8.2%
Municipal Bonds 0.6%
Other Assets Less Liabilities - Net (14.6)%
100.0%
Please refer to the Portfolio of Investments in this annual report for more information regarding the Portfolio's holdings as of December 31, 2018.
Derivative exposure is included in "Other Assets Less Liabilities - Net".
Comparison of the Change in Value of a $10,000 Investment
Global Atlantic Goldman Sachs Core Fixed Income Portfolio
Portfolio Review (Continued)
December 31, 2018 (Unaudited)
*The performance data quoted is historical. Past performance is no guarantee of future results. Current performance may be higher or lower than the performance
data quoted. The principal value and investment return of an investment will fluctuate so that your shares, when redeemed, may be worth more or less than their
original cost. Total returns would have been lower absent fee waivers by the Adviser. The returns shown do not reflect the deduction of taxes that a shareholder
may pay on Portfolio distributions or on the redemption of Portfolio shares, as well as other charges and expenses of the insurance contract or separate account.
The Portfolio's total annual operating expenses, after fee waiver and/or reimbursement, were 0.43% and 0.68% for Class I and Class II shares, respectively, per the
April 27, 2018 prospectus.
The Bloomberg Barclays U.S. Aggregate Bond Index represents an unmanaged diversified portfolio of fixed income securities, including U.S. Treasuries, investment-
grade corporate bonds, and mortgage-backed and asset-backed securities. It is not possible to invest directly in an index.
$9,925 $9,920
$10,035
$9,800
$9,850
$9,900
$9,950
$10,000
$10,050
Global Atlantic Goldman Sachs Core Fixed Income Portfolio - Class I
Global Atlantic Goldman Sachs Core Fixed Income Portfolio - Class II
Bloomberg Barclays U.S. Aggregate Bond Index
24

Global Atlantic Goldman Sachs Global Equity Insights Portfolio
Portfolio Review (Unaudited)
December 31, 2018
Investment Objective
The Portfolio seeks to provide long-term capital appreciation.
Management Review
The Portfolio is sub-advised by Goldman Sachs Asset Management, L.P. (“GSAM”).
How did the Portfolio perform during the period?
During 2018, the Class I shares of Global Atlantic Goldman Sachs Global Equity Insights Portfolio underperformed its reference benchmark, the MSCI World Standard Index. The Portfolio posted a return of -10.20% compared to a benchmark return of -8.71%, a difference of -149 basis points. The following discussion of relative performance pertains to this benchmark.
What factors and allocation decisions influenced the Portfolio’s performance?
The global equity market rally experienced in 2016 and 2017 ended in 2018, as major equity markets turned negative, with many ending the year in correction territory (a decline of greater than 10%). A period of relative market calm from May to September 2018, highlighted by generally strong corporate earnings and positive returns, was surrounded by periods of heightened volatility driven by global trade tensions, rising interest rates, and valuation concerns. From February to March 2018, the S&P 500 and MSCI EAFE indices were down -6.13% and -6.23% respectively, while volatility (as measured by the CBOE Volatility Index (“VIX”)) averaged 20.66 (versus 11.10 in 2017). Market turmoil returned in the fourth quarter, evidenced by declines in the S&P 500 and MSCI EAFE indices of -13.52% and -12.54% respectively, while VIX averaged 20.91.
GSAM’s Insights process uses a quantitative style of management, in combination with a qualitative overlay that emphasizes fundamentally-based stock and country/currency selection, careful portfolio construction and efficient implementation. The Portfolio's investments are selected using fundamental research and a variety of quantitative techniques based on certain investment themes, including, among others, Fundamental Mispricings (“Valuation”), High Quality Business Models (“Quality”), Sentiment Analysis, Market Themes & Trends, and Profitability. Fundamental Mispricings seeks to identify high-quality businesses trading at an attractive price, which GSAM believes leads to strong performance over the long-term. High Quality Business Models seek to identify companies that are generating high-quality revenues with sustainable business models and aligned management incentives. Sentiment Analysis seeks to identify stocks experiencing improvements in their overall market sentiment. Market Themes and Trends seeks to identify companies positively positioned to benefit from themes and trends in the market and macroeconomic environment. The Profitability theme seeks to assess whether a company is earning more than its cost of capital. .
Among investment themes, Profitability was the sole detractor from relative returns over the reporting period. Conversely, Quality contributed the most to returns, followed by Market Trends, Valuation and Sentiment. Among sectors, holdings in the Health Care sector detracted the most from returns. Within the sector, an overweight position in the Pharmaceuticals industry was the largest headwind for performance. Conversely, holdings in the Industrials sector contributed the most to returns. Within Industrials, an underweight position in the Industrial Conglomerates industry was the most beneficial for returns.
At an individual stock level, an underweight position in Microsoft Corp. (0.44% of the Portfolio) detracted the most from returns. The stock did not score highly in GSAM’s Momentum and Quality themes. Momentum as an alternative data source can provide a lens into trends affecting companies globally, while Quality looks at whether companies generate high-quality revenues with sustainable business models and aligned management incentives. Conversely, an underweight position in General Electric Co. (0%) contributed the most to returns. The stock did not score highly in the Quality and Sentiment themes. Sentiment looks at broader market sentiment to gain potential insight into future stock performance respectively.
Among countries, an overweight position in Italy, held primarily for its relatively high risk premia and inexpensive valuations, detracted the most from returns. Conversely, an underweight position in Germany, held primarily for its relatively inexpensive valuations and high risk premia, contributed the most to returns.
25

How was the Portfolio positioned at period end?
As of December 31, 2018, against the MSCI World Standard Index, the Portfolio had its largest overweight position in the Health Care sector, mainly driven by an overweight in the Biotechnology industry. The Portfolio also had an overweight position in the Industrials sector, driven by its positioning in the Airlines industry. Conversely, the Portfolio’s largest underweight position was in the Information Technology sector, which was mainly due to an underweight in the Semiconductor industry. The Portfolio was also underweight in the Consumer Discretionary sector, largely due to its positioning in the Specialty Retail industry.
At a country level, the Portfolio had its largest overweight position in the U.S., primarily for its relatively strong momentum characteristics and supportive macro-economic conditions. The Portfolio held its second largest overweight position in Japan, primarily for its relatively inexpensive valuations, high risk premia and strong momentum characteristics. Conversely, the Portfolio’s largest underweight position was in the U.K, primarily for its relatively weaker momentum characteristics, low risk premia and expensive valuations. The Portfolio held its second largest underweight position in Norway, primarily for its relatively low risk premia.
2397284.2
26

The Portfolio's performance figures* for the period ended December 31, 2018 as compared to its benchmark:
One Performance
Year Since Inception**
Global Atlantic Goldman Sachs Global Equity Insights Portfolio
Class I (10.20)% (6.56)%
Class II (10.47)% (6.87)%
MSCI World Standard Index (Net) (8.71)% (4.89)%
** The Portfolio's inception date is November 1, 2017. The Portfolio commenced operations on November 6, 2017.
Holdings by Asset Class % of Net Assets
Common Stocks 99.8%
Money Market Fund 0.1%
Other Assets Less Liabilities - Net 0.1%
100.0%
Please refer to the Portfolio of Investments in this annual report for more information regarding the Portfolio's holdings as of December 31, 2018.
Comparison of the Change in Value of a $10,000 Investment
Global Atlantic Goldman Sachs Global Equity Insights Portfolio
Portfolio Review (Continued)
December 31, 2018 (Unaudited)
*The performance data quoted is historical. Past performance is no guarantee of future results. Current performance may be higher or lower than the
performance data quoted. The principal value and investment return of an investment will fluctuate so that your shares, when redeemed, may be worth more
or less than their original cost. Total returns would have been lower absent fee waivers by the Adviser. The returns shown do not reflect the deduction of
taxes that a shareholder may pay on Portfolio distributions or on the redemption of Portfolio shares, as well as other charges and expenses of the insurance
contract or separate account. The Portfolio's total annual operating expenses, after fee waiver and/or reimbursement, were 0.72% and 0.97% for Class I and
Class II shares, respectively, per the April 27, 2018 prospectus.
The MSCI World Standard Index (Net) represents large- and mid-cap equity performance across 23 developed markets countries, covering approximately 85%
of the free float-adjusted market capitalization in each. It is not possible to invest directly in an index.
$9,000
$9,500
$10,000
$10,500
$11,000
$11,500
Global Atlantic Goldman Sachs Global Equity Insights Portfolio - Class I - $9,240
Global Atlantic Goldman Sachs Global Equity Insights Portfolio - Class II - $9,204
MSCI World Standard Index (Net) - $9,432
27

Global Atlantic Goldman Sachs Large Cap Growth Insights Portfolio
Portfolio Review (Unaudited)
December 31, 2018
Investment Objective
The Portfolio seeks to provide long-term capital appreciation.
Management Review
The Portfolio is sub-advised by Goldman Sachs Asset Management, L.P. (“GSAM”).
How did the Portfolio perform during the period?
During 2018, the Class I shares of Global Atlantic Goldman Sachs Large Cap Growth Insights Portfolio underperformed its reference benchmark, the Russell 1000 Growth Index. The Portfolio posted a return of -3.89% compared to a benchmark return of -1.51%, a difference of -238 basis points. The following discussion of relative performance pertains to this benchmark.
What factors and allocation decisions influenced the Portfolio’s performance?
The global equity market rally experienced in 2016 and 2017 ended in 2018, as major equity markets turned negative, with many ending the year in correction territory (a decline of greater than 10%). A period of relative market calm from May to September 2018, highlighted by generally strong corporate earnings and positive returns, was surrounded by periods of heightened volatility driven by global trade tensions, rising interest rates, and valuation concerns. From February to March 2018, the S&P 500 and MSCI EAFE indices were down -6.13% and -6.23% respectively, while volatility (as measured by the CBOE Volatility Index (“VIX”)) averaged 20.66 (versus 11.10 in 2017). Market turmoil returned in the fourth quarter, evidenced by declines in the S&P 500 and MSCI EAFE indices of -13.52% and -12.54% respectively, while VIX averaged 20.91.
GSAM’s Insights process uses a quantitative style of management, in combination with a qualitative overlay that emphasizes fundamentally-based stock and country/currency selection, careful portfolio construction and efficient implementation. The Portfolio's investments are selected using fundamental research and a variety of quantitative techniques based on certain investment themes, including, among others, Fundamental Mispricings (“Valuation”), High Quality Business Models (“Quality”), Sentiment Analysis, Market Themes & Trends, and Profitability. Fundamental Mispricings seeks to identify high-quality businesses trading at an attractive price, which GSAM believes leads to strong performance over the long-term. High Quality Business Models seek to identify companies that are generating high-quality revenues with sustainable business models and aligned management incentives. Sentiment Analysis seeks to identify stocks experiencing improvements in their overall market sentiment. Market Themes and Trends seeks to identify companies positively positioned to benefit from themes and trends in the market and macroeconomic environment. The Profitability theme seeks to assess whether a company is earning more than its cost of capital.
Among investment themes, Valuation was the largest detractor from relative returns, followed by Sentiment. Conversely, Quality contributed the most to returns, followed by Market Trends and Profitability. Among sectors, holdings in the Consumer Discretionary sector detracted the most from returns. Within Consumer Discretionary, an overweight position in the Automobiles industry was the largest detractor from results. Conversely, holdings in the Industrials sector contributed the most relative performance. Within Industrials, an underweight position in the Air Freight & Logistics industry was additive for returns.
At an individual stock level, an overweight position in Thor Industries, Inc. (0.62% of the portfolio) detracted the most from returns. The stock scored highly in the Valuation and Sentiment themes. Valuation looks for high-quality businesses at a fair price, while Sentiment analyzes broader market sentiment to gain potential insight into future stock performance, respectively. Conversely, an overweight position in Comcast Corp. (0% - position sold before period end) contributed the most to returns. The stock also scored highly in the Sentiment and Valuation themes.
How was the Portfolio positioned at period end?
As of December 31, 2018, against the Russell 1000 Growth Index, the Portfolio had its largest overweight position in the health care sector, driven by an overweight position in the biotechnology industry. The Portfolio held its second largest
28

overweight position in the materials sector. Within the materials sector, the Portfolio held its largest overweight position in the containers & packaging industry. Conversely, the Portfolio’s largest underweight position was in the consumer staples sector, largely due to an underweight position in the tobacco industry. The Portfolio held its second largest underweight position in the consumer discretionary sector. Within consumer discretionary, the Portfolio held its largest underweight position in the specialty retail industry.
2397284.2
29

The Portfolio's performance figures* for the period ended December 31, 2018 as compared to its benchmark:
One Performance
Year Since Inception**
Global Atlantic Goldman Sachs Large Cap Growth Insights Portfolio
Class I (3.89)% (0.86)%
Class II (4.13)% (1.16)%
Russell 1000® Growth Index (Total Return) (1.51)% 1.98%
** The Portfolio's inception date is November 1, 2017. The Portfolio commenced operations on November 6, 2017.
Holdings by Asset Class % of Net Assets
Common Stocks 100.1%
Money Market Fund 0.0% ^
Other Assets Less Liabilities - Net (0.1)%
100.0%
Please refer to the Portfolio of Investments in this annual report for more information regarding the Portfolio's holdings as of December 31, 2018.
^ Amount is less than 0.05%
Comparison of the Change in Value of a $10,000 Investment
Global Atlantic Goldman Sachs Large Cap Growth Insights Portfolio
Portfolio Review (Continued)
December 31, 2018 (Unaudited)
*The performance data quoted is historical. Past performance is no guarantee of future results. Current performance may be higher or lower than the
performance data quoted. The principal value and investment return of an investment will fluctuate so that your shares, when redeemed, may be worth more
or less than their original cost. Total returns would have been lower absent fee waivers by the Adviser. The returns shown do not reflect the deduction of
taxes that a shareholder may pay on Portfolio distributions or on the redemption of Portfolio shares, as well as other charges and expenses of the insurance
contract or separate account. The Portfolio's total annual operating expenses, after fee waiver and/or reimbursement, were 0.46% and 0.71% for Class I and
Class II shares, respectively, per the April 27, 2018 prospectus.
The Russell 1000®
Growth Index (Total Return) is an unmanaged index of common stock prices that measures the performance of those Russell 1000®
Index
companies with higher price-to-book ratios and higher forecasted growth values. It is not possible to invest directly in an index.
$9,000
$9,500
$10,000
$10,500
$11,000
$11,500
$12,000
$12,500
Global Atlantic Goldman Sachs Large Cap Growth Insights Portfolio - Class I - $9,899
Global Atlantic Goldman Sachs Large Cap Growth Insights Portfolio - Class II - $9,865
Russell 1000® Growth Index (Total Return) - $10,231
30

Global Atlantic Goldman Sachs Mid Cap Value Insights Portfolio
Portfolio Review (Unaudited)
December 31, 2018
Investment Objective
The Portfolio seeks to provide long-term capital appreciation.
Management Review
The Portfolio is sub-advised by Goldman Sachs Asset Management, L.P. (“GSAM”).
How did the Portfolio perform during the period?
During 2018, the Class I shares of Global Atlantic Goldman Sachs Mid Cap Value Insights Portfolio outperformed its reference benchmark, the Russell Midcap Value Index. The Portfolio posted a return of -12.10% compared to a benchmark return of -12.29%, a difference of 19 basis points. The following discussion of relative performance pertains to this benchmark.
What factors and allocation decisions influenced the Portfolio’s performance?
The global equity market rally experienced in 2016 and 2017 ended in 2018, as major equity markets turned negative, with many ending the year in correction territory (a decline of greater than 10%). A period of relative market calm from May to September 2018, highlighted by generally strong corporate earnings and positive returns, was surrounded by periods of heightened volatility driven by global trade tensions, rising interest rates, and valuation concerns. From February to March 2018, the S&P 500 and MSCI EAFE indices were down -6.13% and -6.23% respectively, while volatility (as measured by the CBOE Volatility Index (“VIX”)) averaged 20.66 (versus 11.10 in 2017). Market turmoil returned in the fourth quarter, evidenced by declines in the S&P 500 and MSCI EAFE indices of -13.52% and -12.54% respectively, while VIX averaged 20.91.
GSAM’s Insights process uses a quantitative style of management, in combination with a qualitative overlay that emphasizes fundamentally-based stock and country/currency selection, careful portfolio construction and efficient implementation. The Portfolio's investments are selected using fundamental research and a variety of quantitative techniques based on certain investment themes, including, among others, Fundamental Mispricings (“Valuation”), High Quality Business Models (“Quality”), Sentiment Analysis, Market Themes & Trends, and Profitability. Fundamental Mispricings seeks to identify high-quality businesses trading at an attractive price, which GSAM believes leads to strong performance over the long-term. High Quality Business Models seek to identify companies that are generating high-quality revenues with sustainable business models and aligned management incentives. Sentiment Analysis seeks to identify stocks experiencing improvements in their overall market sentiment. Market Themes and Trends seeks to identify companies positively positioned to benefit from themes and trends in the market and macroeconomic environment. The Profitability theme seeks to assess whether a company is earning more than its cost of capital.
Among investment themes, Market Themes & Trends contributed most to relative, returns followed by Quality, Profitability and Sentiment. Conversely, Valuation was the sole significant detractor from performance. Among sectors, holdings in the Health Care sector contributed the most to returns. Within Health Care, an underweight position in the Health Care Providers & Services industry was the largest contributor. Conversely, holdings in the Financials sector detracted the most from returns. Within Financials, an underweight position in the Banks industry was the biggest detractor.
At an individual stock level, an overweight position in NRG Energy, Inc. (1.02% of the portfolio) contributed the most to returns. The stock scored highly in the Momentum and Quality themes. Momentum looks at alternative data sources that can provide a lens into trends affecting companies globally, while Quality looks at whether companies generate high-quality revenues with sustainable business models and aligned management incentives. Conversely, an overweight position in Thor Industries, Inc. (0.65%) detracted the most from returns. The stock scored highly in the Valuation and Sentiment themes. Valuation looks for high-quality businesses at a fair price, while Sentiment analyzes broader market sentiment to gain potential insight into future stock performance, respectively.
How was the Portfolio positioned at period end?
As of December 31, 2018, against the Russell Mid Cap Value Index, the Portfolio had its largest overweight position in the Health Care sector, driven by an overweight position in the Biotechnology industry. The Portfolio held its second largest
31

overweight position in the Materials sector. Within the Materials sector, the Portfolio held its largest overweight position in the Containers & Packaging industry. Conversely, the Portfolio’s largest underweight position was in the Utilities sector, largely due to an underweight position in the Electric Utilities industry. The Portfolio held its second largest underweight position in the Consumer Discretionary sector. Within Consumer Discretionary, the Portfolio held its largest underweight position in the Textiles & Apparel industry.
2397284.2
32

The Portfolio's performance figures* for the period ended December 31, 2018 as compared to its benchmark:
One Performance
Year Since Inception**
Global Atlantic Goldman Sachs Mid Cap Value Insights Portfolio
Class I (12.10)% (7.19)%
Class II (12.26)% (7.41)%
Russell Midcap® Value Index (Total Return) (12.29)% (7.15)%
** The Portfolio's inception date is November 1, 2017. The Portfolio commenced operations on November 6, 2017.
Holdings by Asset Class % of Net Assets
Common Stocks 99.5%
Money Market Fund 0.4%
Other Assets Less Liabilities - Net 0.1%
100.0%
Please refer to the Portfolio of Investments in this annual report for more information regarding the Portfolio's holdings as of December 31, 2018.
Comparison of the Change in Value of a $10,000 Investment
Global Atlantic Goldman Sachs Mid Cap Value Insights Portfolio
Portfolio Review (Continued)
December 31, 2018 (Unaudited)
*The performance data quoted is historical. Past performance is no guarantee of future results. Current performance may be higher or lower than the
performance data quoted. The principal value and investment return of an investment will fluctuate so that your shares, when redeemed, may be worth more
or less than their original cost. Total returns would have been lower absent fee waivers by the Adviser. The returns shown do not reflect the deduction of
taxes that a shareholder may pay on Portfolio distributions or on the redemption of Portfolio shares, as well as other charges and expenses of the insurance
contract or separate account. The Portfolio's total annual operating expenses, after fee waiver and/or reimbursement, were 0.64% and 0.89% for Class I and
Class II shares, respectively, per the April 27, 2018 prospectus.
The Russell Midcap®
Value Index (Total Return) is an unmanaged index of common stock prices that measures the performance of those Russell Midcap
companies with lower price-to-book ratios and lower forecasted growth values. It is not possible to invest directly in an index.
$9,000
$9,500
$10,000
$10,500
$11,000
$11,500
Global Atlantic Goldman Sachs Mid Cap Value Insights Portfolio - Class I - $9,168
Global Atlantic Goldman Sachs Mid Cap Value Insights Portfolio - Class II - $9,142
Russell Midcap® Value Index (Total Return) - $9,172
33

Shares Value
EXCHANGE TRADED FUNDS - 100.1%
DEBT FUNDS - 41.0% 65,900 iShares iBoxx $ Investment Grade Corporate Bond ETF $ 7,434,838
113,826 iShares Intermediate-Term Corporate Bond ETF 5,966,759
38,938 iShares JP Morgan USD Emerging Markets Bond ETF 4,046,048
235,145 iShares Short Maturity Bond ETF 11,721,978
100,600 iShares U.S. Treasury Bond ETF 2,479,790
31,649,413 EQUITY FUNDS - 59.1%
117,027 iShares Core MSCI EAFE ETF 6,436,485
52,487 iShares Core MSCI Emerging Markets ETF 2,474,762
70,070 iShares Core S&P 500 ETF 17,630,313
13,511 iShares Core S&P Mid-Cap ETF 2,243,637
19,562 iShares Core S&P Small-Cap ETF 1,356,038
61,815 iShares Edge MSCI Min Vol USA ETF 3,239,106
50,724 iShares Edge MSCI USA Momentum Factor ETF 5,084,067
28,250 iShares Global Tech ETF 4,068,848
10,546 iShares S&P 500 Growth ETF 1,588,966
15,392 iShares S&P 500 Value ETF 1,556,745
45,678,967
TOTAL EXCHANGE TRADED FUNDS (Cost $81,826,614) 77,328,380
SHORT-TERM INVESTMENT - 0.1%
MONEY MARKET FUND - 0.1% 86,313 Fidelity Investments Money Market Funds - Government Portfolio, Institutional Class
to yield 2.25% (a) (Cost - $86,313) 86,313
TOTAL INVESTMENTS - 100.2% (Cost - $81,912,927) $ 77,414,693
(146,938)
TOTAL NET ASSETS - 100.0% $ 77,267,755
ETF - Exchange Traded Fund
Global Atlantic BlackRock Allocation PortfolioPORTFOLIO OF INVESTMENTS
December 31, 2018
(a) Money market rate shown represents the rate at December 31, 2018.
OTHER ASSETS LESS LIABILITES - NET - (0.2)%
34See accompanying notes to financial statements.

Shares Value
COMMON STOCKS - 98.3%
ADVERTISING - 0.1%
38,789 Interpublic Group of Cos, Inc. 800,217$
AEROSPACE/DEFENSE - 2.3%
15,425 Boeing Co. 4,974,563
13,257 Embraer SA (ADR) 293,377
903 General Dynamics Corp. 141,961
7,165 Lockheed Martin Corp. 1,876,084
1,550 Northrop Grumman Corp. 379,595
28,031 Raytheon Co. 4,298,554
1 United Technologies Corp. 1
11,964,135
AGRICULTURE - 1.5%
51,249 Altria Group, Inc. 2,531,188
84,216 Archer-Daniels-Midland Co. 3,450,330
31,083 Philip Morris International, Inc. 2,075,101
8,056,619
AIRLINES - 0.5%
17,732 Delta Air Lines, Inc. 884,827
32,771 Southwest Airlines Co. 1,523,196
2,408,023
APPAREL - 1.0%
60,098 NIKE, Inc. 4,455,666
639 Ralph Lauren Corp. 66,111
11,459 VF Corp. 817,485
5,339,262
AUTO MANUFACTURERS - 0.5%
10,555 Ford Motor Co. 80,746
16,950 Honda Motor Co. Ltd. (ADR) 448,328
38,992 PACCAR, Inc. 2,228,003
826 Toyota Motor Corp. (ADR) 95,882
2,852,959
AUTO PARTS & EQUIPMENT - 0.0% **
5,761 BorgWarner, Inc. 200,137
BANKS - 7.2%
411,656 Bank of America Corp. 10,143,204
47,234 BB&T Corp. 2,046,177
64,502 Citigroup, Inc. 3,357,974
52,880 Citizens Financial Group, Inc. 1,572,122
11,620 East West Bancorp, Inc. 505,819
13,386 First Republic Bank 1,163,243
78,607 JP Morgan Chase & Co. 7,673,615
164,581 Morgan Stanley 6,525,637
Global Atlantic BlackRock Disciplined Core Portfolio
PORTFOLIO OF INVESTMENTS
December 31, 2018
35See accompanying notes to financial statements.

Shares Value
BANKS - 7.2% (Continued)
98,406 Wells Fargo & Co. 4,534,548$
37,522,339
BEVERAGES - 1.8%
22,006 Coca-Cola Co. 1,041,984
20,815 Coca-Cola European Partners PLC 954,368
7,205 Constellation Brands, Inc. 1,158,708
7,685 Diageo PLC (ADR) 1,089,733
4,532 Molson Coors Brewing Co. 254,517
18,010 Monster Beverage Corp. * 886,452
33,798 PepsiCo, Inc. 3,734,003
9,119,765
BIOTECHNOLOGY - 2.7%
23,368 Amgen, Inc. 4,549,049
2,821 Biogen, Inc. * 848,895
44,194 Celgene Corp. * 2,832,393
77,704 Gilead Sciences, Inc. 4,860,385
478 Regeneron Pharmaceuticals, Inc. * 178,533
6,198 Vertex Pharmaceuticals, Inc. * 1,027,071
14,296,326
BUILDING MATERIALS - 0.1%
3,662 Vulcan Materials Co. 361,806
CHEMICALS - 1.6%
27,710 Air Products & Chemicals, Inc. 4,434,986
14,392 Celanese Corp. 1,294,848
10,796 Eastman Chemical Co. 789,296
8,610 Huntsman Corp. 166,087
9,739 Linde PLC 1,519,674
1,559 Mosaic Co. 45,538
8,250,429
COMMERCIAL SERVICES - 2.4%
30,078 Automatic Data Processing, Inc. 3,943,827
25,148 Booz Allen Hamilton Holding Corp. 1,133,420
3,652 Ecolab, Inc. 538,122
28,836 H&R Block, Inc. 731,569
16,934 Insperity, Inc. 1,580,958
15,927 PayPal Holdings, Inc. * 1,339,301
9,145 Robert Half International, Inc. 523,094
7,928 S&P Global, Inc. 1,347,284
65,353 Western Union Co. 1,114,922
12,252,497
COMPUTERS - 4.7%
12,030 Accenture PLC 1,696,350
112,175 Apple, Inc. 17,694,485
9,616 Dell Technologies, Inc. Class C* 469,950
Global Atlantic BlackRock Disciplined Core Portfolio
PORTFOLIO OF INVESTMENTS (Continued)
December 31, 2018
36See accompanying notes to financial statements.

Shares Value
COMPUTERS - 4.7% (Continued)
1 EPAM Systems, Inc. * 116$
18,686 Hewlett Packard Enterprise Co. 246,842
97,892 HP, Inc. 2,002,870
16,680 International Business Machines Corp. 1,896,016
21,886 Pure Storage, Inc. * 351,927
24,358,556
COSMETICS/PERSONAL CARE - 0.8%
871 Colgate-Palmolive Co. 51,842
18,852 Estee Lauder Cos, Inc. 2,452,645
19,012 Procter & Gamble Co. 1,747,583
4,252,070
DIVERSIFIED FINANCIAL SERVICES - 4.1%
30,917 American Express Co. 2,947,008
9,716 Capital One Financial Corp. 734,432
96,830 Charles Schwab Corp. 4,021,350
13,203 CME Group, Inc. 2,483,748
1,777 Evercore, Inc. 127,162
9,191 Intercontinental Exchange, Inc. 692,358
29,293 Mastercard, Inc. 5,526,124
13,377 Moelis & Co. 459,901
32,372 Visa, Inc. 4,271,162
21,263,245
ELECTRIC - 2.7%
17,403 Ameren Corp. 1,135,198
16,265 CenterPoint Energy, Inc. 459,161
29,774 CMS Energy Corp. 1,478,279
16,043 Consolidated Edison, Inc. 1,226,648
3,559 DTE Energy Co. 392,558
4,874 Evergy, Inc. 276,697
40,460 OGE Energy Corp. 1,585,627
37,276 Pinnacle West Capital Corp. 3,175,915
41,479 Portland General Electric Co. 1,901,812
7,703 PPL Corp. 218,226
10,296 TechnipFMC PLC 201,596
39,312 Xcel Energy, Inc. 1,936,902
13,988,619
ELECTRICAL COMPONENTS & EQUIPMENT - 0.1%
6,720 AMETEK, Inc. 454,944
ELECTRONICS - 1.3%
15,493 Agilent Technologies, Inc. 1,045,158
14,724 Allegion PLC 1,173,650
15,982 Garmin Ltd. 1,011,980
17,748 Honeywell International, Inc. 2,344,866
PORTFOLIO OF INVESTMENTS (Continued)
Global Atlantic BlackRock Disciplined Core Portfolio
December 31, 2018
37See accompanying notes to financial statements.

Shares Value
ELECTRONICS - 1.3% (Continued)
23,185 National Instruments Corp. 1,052,135$
6,627,789
ENVIRONMENTAL CONTROL - 0.2%
6,213 Republic Services, Inc. 447,895
6,335 Waste Management, Inc. 563,752
1,011,647
FOOD - 1.1%
40,782 Hershey Co. 4,371,015
8,333 Kellogg Co. 475,064
10,289 Kroger Co. 282,948
7,870 Lamb Weston Holdings, Inc. 578,917
1,660 Tyson Foods, Inc. 88,644
5,796,588
GAS - 0.3%
17,067 Atmos Energy Corp. 1,582,452
HAND/MACHINE TOOLS - 0.2%
8,428 Snap-on, Inc. 1,224,504
HEALTHCARE PRODUCTS - 3.0%
24,331 Abbott Laboratories 1,759,861
29,447 Danaher Corp. 3,036,575
2,800 IDEXX Laboratories, Inc. * 520,856
2,610 Intuitive Surgical, Inc. * 1,249,981
4,165 Masimo Corp. 447,196
32,872 Medtronic PLC 2,990,037
1,817 Streris PLC 194,146
26,552 Stryker Corp. 4,162,026
6,107 Thermo Fisher Scientific, Inc. 1,366,686
15,727,364
HEALTHCARE - SERVICES - 2.4%
3,276 Anthem, Inc. 860,376
6,350 Humana, Inc. 1,819,148
4,345 Quest Diagnostics, Inc. 361,808
35,437 UnitedHealth Group, Inc. 8,828,065
2,350 WellCare Health Plans, Inc. * 554,812
12,424,209
HOME FURNISHINGS - 0.0% **
1,316 Sony Corp. (ADR) 63,536
HOUSEHOLD PRODUCTS/WARES - 0.7%
44,956 Church & Dwight Co., Inc. 2,956,307
3,722 Clorox Co. 573,709
3,530,016
Global Atlantic BlackRock Disciplined Core Portfolio
PORTFOLIO OF INVESTMENTS (Continued)
December 31, 2018
38See accompanying notes to financial statements.

Shares Value
INSURANCE - 3.8%
34,214 Allstate Corp. 2,827,103$
13,423 American Financial Group, Inc. 1,215,184
18,831 Arthur J Gallagher & Co. 1,387,845
6,852 Athene Holding Ltd. * 272,915
45,908 Berkshire Hathaway, Inc. * 9,373,495
34,697 Hartford Financial Services Group, Inc. 1,542,282
17,677 Lincoln National Corp. 907,007
1,022 Loews Corp. 46,521
9,999 Progressive Corp. 603,240
3,866 Travelers Cos., Inc. 462,954
46,474 Unum Group 1,365,406
20,003,952
INTERNET - 8.9%
7,465 Alphabet, Inc. - Class A * 7,730,829
6,283 Alphabet, Inc. - Class C * 6,565,484
10,098 Amazon.com, Inc. * 15,166,893
7,311 Baidu, Inc. * (ADR) 1,159,525
413 Booking Holdings, Inc. * 711,359
13,453 CDW Corp. 1,090,366
35,928 Ctrip.com International Ltd. * (ADR) 972,212
64,642 Facebook, Inc. * 8,473,920
6,769 GoDaddy, Inc. * 444,182
4,204 JD.com, Inc. * (ADR) 87,990
8,272 Netflix, Inc. * 2,214,084
2,227 Spotify Technology SA * 252,765
5,886 Twitter, Inc. * 169,164
951 VeriSign, Inc. * 141,024
17,566 Vipshop Holdings Ltd. - ADR * 95,910
18,332 Yelp, Inc. * 641,437
1,787 YY, Inc. * (ADR) 106,970
46,024,114
IRON/STEEL - 0.0% **
1,918 Steel Dynamics, Inc. 57,617
LEISURE - 0.4%
21,004 Carnival Corp. 1,035,497
18,005 Norwegian Cruise Line Holdings Ltd. * 763,232
1,798,729
LODGING - 0.2%
5,682 Extended Stay America, Inc. 88,071
14,266 Hilton Worldwide Holdings, Inc. 1,024,299
1,112,370
MACHINERY - CONSTRUCTION & MINING - 0.2%
7,051 Caterpillar, Inc. 895,971
Global Atlantic BlackRock Disciplined Core Portfolio
PORTFOLIO OF INVESTMENTS (Continued)
December 31, 2018
39See accompanying notes to financial statements.

Shares Value
MACHINERY - DIVERSIFIED - 0.7%
18,848 Rockwell Automation, Inc. 2,836,247$
1,971 Roper Technologies, Inc. 525,311
3,361,558
MEDIA - 2.0%
15,651 AMC Networks, Inc. * 858,927
19,792 CBS Corp. 865,306
105,532 Comcast Corp. 3,593,365
1,148 Discovery, Inc. * 26,496
4,314 Grupo Televisa SAB (ADR) 54,270
16,172 Liberty Media Corp-Liberty SiriusXM - Class A * 595,130
19,562 Liberty Media Corp-Liberty SiriusXM * 723,403
22,795 Twenty-First Century Fox, Inc. - Class A 1,096,895
11,817 Twenty-First Century Fox, Inc. 564,616
36,258 Viacom, Inc. 931,831
10,087 Walt Disney Co. 1,106,040
1,866 World Wrestling Entertainment, Inc. 139,428
10,555,707
MINING - 0.2%
4,129 BHP Billiton Ltd. (ADR) 199,389
18,228 Newmont Mining Corp. 631,600
830,989
MISCELLANEOUS MANUFACTURER - 3.0%
17,329 3M Co. 3,301,868
58,949 Crane Co. 4,254,939
109,712 General Electric Co. 830,520
21,343 Illinois Tool Works, Inc. 2,703,945
37,360 Ingersoll-Rand PLC 3,408,353
5,550 Parker-Hannifin Corp. 827,727
15,327,352
OIL & GAS - 4.2%
54,294 Anadarko Petroleum Corp. 2,380,249
1,774 Cabot Oil & Gas Corp. 39,649
38,531 Chevron Corp. 4,191,787
3,441 Concho Resources, Inc. * 353,700
61,917 ConocoPhillips 3,860,525
7,093 Continental Resources, Inc. * 285,068
2,976 EOG Resources, Inc. 259,537
50,798 Equinor ASA (ADR) 1,075,394
91,179 Exxon Mobil Corp. 6,217,496
4,853 Newfield Exploration Co. * 71,145
12,769 Occidental Petroleum Corp. 783,761
21,746 Phillips 66 1,873,418
2,016 Valero Energy Corp. 151,140
21,542,869
Global Atlantic BlackRock Disciplined Core Portfolio
December 31, 2018
PORTFOLIO OF INVESTMENTS (Continued)
40See accompanying notes to financial statements.

Shares Value
OIL & GAS SERVICES - 0.5%
90,498 Halliburton Co. 2,405,437$
PACKAGING & CONTAINERS - 0.3%
7,493 Packaging Corp. of America 625,366
18,487 WestRock Co. 698,069
1,323,435
PHARMACEUTICALS - 7.2%
46,170 AbbVie, Inc. 4,256,412
20,426 AmerisourceBergen Corp. 1,519,694
59,804 Bristol-Myers Squibb Co. 3,108,612
41,282 Cardinal Health, Inc. 1,841,177
3,352 Cigna Corp. 636,539
17,095 CVS Health Corp. 1,120,064
30,203 Eli Lilly & Co. 3,495,091
69,892 Johnson & Johnson 9,019,563
18,360 McKesson Corp. 2,028,229
89,056 Merck & Co., Inc. 6,804,769
19,189 Pfizer, Inc. 837,600
25,462 Roche Holding AG (ADR) 791,359
22,271 Zoetis, Inc. 1,905,061
37,364,170
PIPELINES - 0.6%
128,853 Kinder Morgan, Inc. 1,981,759
46,213 Williams Cos., Inc. 1,018,997
3,000,756
REAL ESTATE INVESTMENT TRUSTS - 3.1%
94,078 Host Hotels & Resorts, Inc. 1,568,280
32,967 Park Hotels & Resorts, Inc. 856,482
104,522 Prologis, Inc. 6,137,532
62,442 Realty Income Corp. 3,936,344
21,167 Simon Property Group, Inc. 3,555,844
16,054,482
RETAIL - 5.0%
4,216 Best Buy Co., Inc. 223,279
21,379 Costco Wholesale Corp. 4,355,116
8,281 Darden Restaurants, Inc. 826,941
6,285 Domino's Pizza, Inc. 1,558,617
3,714 Dunkin' Brands Group, Inc. 238,142
3,866 Five Below, Inc. * 395,569
624 Genuine Parts Co. 59,916
32,010 Home Depot, Inc. 5,499,958
18,702 McDonald's Corp. 3,320,914
12,549 Penske Automotive Group, Inc. 505,976
7,581 Ross Stores, Inc. 630,738
66,257 Target Corp. 4,378,925
Global Atlantic BlackRock Disciplined Core Portfolio
PORTFOLIO OF INVESTMENTS (Continued)
December 31, 2018
41See accompanying notes to financial statements.

Shares Value
RETAIL - 5.0% (Continued)
45,578 TJX Cos., Inc. 2,039,160$
16,379 Walmart, Inc. 1,525,704
6,195 Yum! Brands, Inc. 569,444
26,128,399
SEMICONDUCTORS - 3.5%
10,981 Analog Devices, Inc. 942,499
44,869 Applied Materials, Inc. 1,469,011
4,228 Broadcom, Inc. 1,075,096
134,897 Intel Corp. 6,330,715
2,173 Maxim Integrated Products, Inc. 110,497
7,517 Mellanox Technologies Ltd. * 694,420
11,780 Micron Technology, Inc. * 373,779
17,402 NVIDIA Corp. 2,323,167
15,959 QUALCOMM, Inc. 908,227
9,094 Skyworks Solutions, Inc. 609,480
25,753 Texas Instruments, Inc. 2,433,659
11,635 Xilinx, Inc. 990,953
18,261,503
SOFTWARE - 7.0%
2,705 Activision Blizzard, Inc. 125,972
5,132 Broadridge Financial Solutions, Inc. 493,955
20,645 Dropbox, Inc. * 421,777
10,307 Electronic Arts, Inc. * 813,325
11,909 Fidelity National Information Services, Inc. 1,221,268
8,339 Intuit, Inc. 1,641,532
180,388 Microsoft Corp. 18,322,009
99,318 Oracle Corp. 4,484,208
2,588 Paychex, Inc. 168,608
42,805 salesforce.com, Inc. * 5,863,001
14,827 Synopsys, Inc. * 1,249,026
11,458 Veeva Systems, Inc. * 1,023,429
3,537 Vmware, Inc. 485,029
36,313,139
TELECOMMUNICATIONS - 3.0%
98,879 AT&T, Inc. 2,822,005
26,894 BCE, Inc. 1,063,120
34,401 China Mobile Ltd. (ADR) 1,651,248
13,980 Ciena Corp. * 474,062
96,293 Cisco Systems, Inc. 4,172,376
5,173 Motorola Solutions, Inc. 595,102
100,814 Telefonaktiebolaget LM Ericsson (ADR) 894,220
3 Telephone & Data Systems, Inc. 98
69,611 Verizon Communications, Inc. 3,913,530
15,585,761
Global Atlantic BlackRock Disciplined Core Portfolio
December 31, 2018
PORTFOLIO OF INVESTMENTS (Continued)
42See accompanying notes to financial statements.

Shares Value
TRANSPORTATION - 0.8%
18,266 Landstar System, Inc. 1,747,508$
16,893 Norfolk Southern Corp. 2,526,179
4,273,687
WATER - 0.4%
21,444 American Water Works Co., Inc. 1,946,472
TOTAL COMMON STOCKS (Cost - $532,849,678) 509,898,522
SHORT-TERM INVESTMENT - 1.6%
MONEY MARKET FUND - 1.6%
8,277,840 Fidelity Investments Money Market Funds - Government Portfolio, Institutional Class
to yield 2.25% (a)(Cost - $8,277,840) 8,277,840$
TOTAL INVESTMENTS - 99.9% (Cost - $541,127,518) 518,176,362$
OTHER ASSETS LESS LIABILITIES - NET - 0.1% 755,990
TOTAL NET ASSETS - 100.0% 518,932,352$
* Non-income producing security.
** Amount is less than 0.05%
ADR - American Depository Receipt
PLC - Public Limited Company
(a) Money market rate shown represents the rate at December 31, 2018.
Description Counterparty Contracts Expiration Date Notional Value
Unrealized
Depreciation
LONG
S&P 500 E-mini Future Goldman Sachs 75 March-19 9,394,500$ (196,158)$
NET UNREALIZED DEPRECIATION ON FUTURES CONTRACTS (196,158)$
FUTURES CONTRACTS
December 31, 2018
PORTFOLIO OF INVESTMENTS (Continued)
Global Atlantic BlackRock Disciplined Core Portfolio
43See accompanying notes to financial statements.

Shares Value
COMMON STOCKS - 97.9%
ADVERTISING - 0.2%
1,506 Interpublic Group of Cos, Inc. 31,069$
AEROSPACE/DEFENSE - 3.3%
829 Boeing Co. 267,352
257 Heico Corp. 16,191
336 Lockheed Martin Corp. 87,978
34 Northrop Grumman Corp. 8,327
936 Raytheon Co. 143,536
1 United Technologies Corp. 81
523,465
AGRICULTURE - 1.0%
2,696 Altria Group, Inc. 133,155
527 Archer-Daniels-Midland Co. 21,591
154,746
AIRLINES - 0.3%
1,024 Southwest Airlines Co. 47,596
APPAREL -1.5%
2,631 NIKE, Inc. 195,062
486 VF Corp. 34,671
229,733
AUTO MANUFACTURERS - 0.4%
860 PACCAR, Inc. 49,140
43 Tesla, Inc. * 14,310
63,450
AUTO PARTS & EQUIPMENT - 0.0% ^
38 Allison Transmission Holdings, Inc. 1,669
52 BorgWarner, Inc. 1,806
3,475
BANKS - 0.9%
2,172 Bank of America Corp. 53,518
73 East West Bancorp, Inc. 3,178
147 First Republic Bank 12,774
1,777 Morgan Stanley 70,458
139,928
BEVERAGES - 2.0%
406 Coca-Cola Co. (The) 19,224
988 Coca-Cola European Partners PLC 45,300
294 Constellation Brands, Inc. 47,281
239 Keurig Dr. Pepper, Inc. 6,128
1,562 Monster Beverage Corp. * 76,882
1,101 PepsiCo., Inc. 121,638
316,453
Global Atlantic BlackRock Disciplined Growth Portfolio
PORTFOLIO OF INVESTMENTS
December 31, 2018
44See accompanying notes to financial statements.

Shares Value
BIOTECHNOLOGY - 4.4%
1,155 Amgen, Inc. 224,844$
215 Biogen, Inc. * 64,698
1,866 Celgene Corp. * 119,592
2,828 Gilead Sciences, Inc. 176,891
293 Incyte Corp. * 18,632
78 Regeneron Pharmaceuticals, Inc. * 29,133
394 Vertex Pharmaceuticals, Inc. * 65,290
699,080
BUILDING MATERIALS - 0.2%
36 Lennox International, Inc. 7,879
235 Vulcan Materials Co. 23,218
31,097
CHEMICALS - 0.9%
263 Air Products & Chemicals, Inc. 42,093
698 Celanese Corp. 62,799
174 Linde PLC 27,151
157 RPM International, Inc. 9,228
141,271
COMMERCIAL SERVICES - 4.5%
1,396 Automatic Data Processing, Inc. 183,044
1,345 Booz Allen Hamilton Holding Corp. 60,619
154 Ecolab, Inc. 22,692
1,288 H&R Block, Inc. 32,677
1,046 Insperity, Inc. 97,655
1,151 PayPal Holdings, Inc. * 96,788
765 Robert Half International, Inc. 43,758
402 S&P Global, Inc. 68,316
536 Square, Inc. * 30,064
621 Total System Services, Inc. 50,481
399 TransUnion 22,663
441 Western Union Co. (The) 7,523
716,280
COMPUTERS - 7.6%
769 Accenture PLC 108,437
6,299 Apple, Inc. 993,604
121 Cognizant Technology Solutions Corp. 7,681
148 Dell Technologies, Inc. Class C * 7,250
234 Fortinet, Inc. * 16,481
398 HP, Inc. 8,143
248 International Business Machines Corp. 28,190
51 NetApp, Inc. 3,043
1,270 Pure Storage, Inc. * 20,422
1,193,251
COSMETICS/PERSONAL CARE - 0.4%
490 Estee Lauder Cos, Inc. 63,749
Global Atlantic BlackRock Disciplined Growth Portfolio
PORTFOLIO OF INVESTMENTS (Continued)
December 31, 2018
45See accompanying notes to financial statements.

Shares Value
DISTRIBUTION/WHOLESALE - 0.0% ^
9 WW Grainger, Inc. 2,541$
DIVERSIFIED FINANCIAL SERVICES - 5.9%
515 American Express Co. 49,090
4,259 Charles Schwab Corp. 176,876
250 CME Group, Inc. 47,030
512 Evercore, Inc. 36,639
276 Intercontinental Exchange, Inc. 20,791
1,512 Mastercard, Inc. 285,239
51 Moelis & Co. 1,753
700 SEI Investments Co. 32,340
574 TD Ameritrade Holding Corp. 28,103
1,964 Visa, Inc. 259,130
936,991
ELECTRIC - 0.3%
409 OGE Energy Corp. 16,029
388 Pinnacle West Capital Corp. 33,058
116 Portland General Electric Co. 5,319
54,406
ELECTRICAL COMPONENTS & EQUIPMENT - 0.1%
82 AMETEK, Inc. 5,551
111 Hubbell, Inc. 11,027
16,578
ELECTRONICS - 1.3%
195 Agilent Technologies, Inc. 13,155
789 Allegion PLC 62,891
533 Garmin Ltd. 33,750
33 Honeywell International, Inc. 4,360
1,990 National Instruments Corp. 90,306
204,462
FOOD - 0.7%
981 Hershey Co. (The) 105,144
96 Lamb Weston Holdings, Inc. 7,062
112,206
GAS - 0.1%
203 Atmos Energy Corp. 18,822
HAND/MACHINE TOOLS - 0.2%
201 Snap-On, Inc. 29,203
PORTFOLIO OF INVESTMENTS (Continued)
December 31, 2018
Global Atlantic BlackRock Disciplined Growth Portfolio
46See accompanying notes to financial statements.

Shares Value
HEALTHCARE PRODUCTS - 2.5%
12 ABIOMED, Inc. * 3,900$
35 Danaher Corp. 3,609
363 Genomic Health, Inc. * 23,381
324 IDEXX Laboratories, Inc. * 60,270
178 Intuitive Surgical, Inc. * 85,248
174 Masimo Corp. * 18,682
175 Steris PLC 18,699
1,153 Stryker Corp. 180,733
394,522
HEALTHCARE - SERVICES - 3.1%
166 Humana, Inc. 47,556
1,656 UnitedHealth Group, Inc. 412,543
109 WellCare Health Plans, Inc. * 25,734
485,833
HOUSEHOLD PRODUCTS/WARES - 0.4%
1,039 Church & Dwight Co., Inc. 68,325
INSURANCE - 1.0%
112 Allstate Corp. 9,255
739 Arthur J. Gallagher & Co. 54,464
174 Berkshire Hathaway, Inc. * 35,527
669 Progressive Corp. (The) 40,361
665 Unum Group 19,538
159,145
INTERNET - 16.7%
376 Alphabet, Inc. - Class A * 392,905
408 Alphabet, Inc. - Class C * 422,529
594 Amazon.com, Inc. * 892,170
40 Booking Holdings, Inc. * 68,897
506 Cargurus, Inc. * 17,067
1,092 CDW Corp. 88,507
3,426 Facebook, Inc. * 449,114
964 GoDaddy, Inc. * 63,258
482 Netflix, Inc. * 129,012
101 Palo Alto Networks, Inc. * 19,023
213 TripAdvisor, Inc. * 11,489
706 Twitter, Inc. * 20,290
291 VeriSign, Inc. * 43,152
794 Yelp, Inc. * 27,782
2,645,195
IRON/STEEL - 0.1%
306 Steel Dynamics, Inc. 9,192
LEISURE TIME - 0.1%
551 Norwegian Cruise Line Holdings Ltd. * 23,357
Global Atlantic BlackRock Disciplined Growth Portfolio
PORTFOLIO OF INVESTMENTS (Continued)
December 31, 2018
47See accompanying notes to financial statements.

Shares Value
LODGING - 0.9%
1,664 Extended Stay America, Inc. 25,792$
1,090 Hilton Worldwide Holdings, Inc. 78,262
321 Marriott International, Inc. 34,848
138,902
MACHINERY - CONSTRUCTION & MINING - 0.2%
307 Caterpillar, Inc. 39,010
MACHINERY - DIVERSIFIED - 1.0%
41 AGCO Corp. 2,282
795 Rockwell Automation, Inc. 119,632
115 Roper Technologies, Inc. 30,650
152,564
MEDIA - 1.2%
1,051 AMC Networks, Inc. * 57,679
886 CBS Corp. 38,736
291 Liberty Media Corp.-Liberty SiriusXM - Class A * 10,709
218 Liberty Media Corp.-Liberty SiriusXM - Class C * 8,062
116 Sinclair Broadcast Group, Inc. 3,055
3,692 Sirius XM Holdings, Inc. 21,081
209 Viacom, Inc. 5,371
245 Walt Disney Co. (The) 26,864
175 World Wrestling Entertainment, Inc. 13,076
184,633
MISCELLANEOUS MANUFACTURING - 3.1%
645 3M Co. 122,898
2,077 Crane Co. 149,918
108 Donaldson Co., Inc. 4,686
780 Illinois Tool Works, Inc. 98,818
1,263 Ingersoll-Rand PLC 115,223
491,543
OFFICE/BUSINESS EQUIPMENT - 0.1%
80 Zebra Technologies Corp. * 12,738
OIL & GAS - 0.5%
1,102 Anadarko Petroleum Corp. 48,312
352 ConocoPhillips 21,947
44 Continental Resources, Inc. * 1,768
72,027
OIL & GAS SERVICES - 0.3%
1,970 Halliburton Co. 52,363
PACKAGING & CONTAINERS - 0.1%
99 Packaging, Corp. of America 8,263
42 WestRock Co. 1,586
9,849
PORTFOLIO OF INVESTMENTS (Continued)
December 31, 2018
Global Atlantic BlackRock Disciplined Growth Portfolio
48See accompanying notes to financial statements.

Shares Value
PHARMACEUTICALS - 4.0%
2,348 AbbVie, Inc. 216,462$
605 AmerisourceBergen Corp. 45,012
1,376 Bristol-Myers Squibb Co. 71,524
842 Cardinal Health, Inc. 37,553
14 Cigna Corp. 2,727
126 DexCom, Inc. * 15,095
791 Eli Lilly & Co. 91,534
416 Johnson & Johnson 53,685
347 McKesson Corp. 38,333
724 Zoetis, Inc. 61,931
633,856
REAL ESTATE INVESTMENT TRUSTS - 2.4%
137 Equity LifeStyle Properties, Inc. 13,307
536 Host Hotels & Resorts, Inc. 8,935
22 Lamar Advertising Co. 1,522
113 Park Hotels & Resorts, Inc. 2,936
2,683 Prologis, Inc. 157,546
1,495 Realty Income Corp. 94,245
595 Simon Property Group, Inc. 99,954
378,445
RETAIL - 6.2%
7 AutoZone, Inc. * 5,868
23 Chipotle Mexican Grill, Inc. * 9,931
733 Costco Wholesale Corp. 149,319
228 Darden Restaurants, Inc. 22,768
340 Domino's Pizza, Inc. 84,317
785 Dunkin' Brands Group, Inc. 50,334
222 Five Below, Inc. * 22,715
1,747 Home Depot, Inc. 300,170
90 Lululemon Athletica, Inc. * 10,945
43 McDonald's, Corp. 7,635
81 O'Reilly Automotive, Inc. * 27,891
569 Ross Stores, Inc. 47,341
44 Starbucks Corp. 2,834
1,653 Target, Corp. 109,247
1,900 TJX Cos, Inc. 85,006
179 Tractor Supply Co. 14,936
21 Ulta Beauty, Inc. * 5,142
281 Yum! Brands, Inc. 25,830
982,229
SEMICONDUCTORS - 3.4%
431 Analog Devices, Inc. 36,993
2,124 Applied Materials, Inc. 69,540
87 Broadcom, Inc. 22,122
69 Cirrus Logic, Inc. * 2,289
PORTFOLIO OF INVESTMENTS (Continued)
December 31, 2018
Global Atlantic BlackRock Disciplined Growth Portfolio
49See accompanying notes to financial statements.

Shares Value
SEMICONDUCTORS - 3.4% (Continued)
535 Intel Corp. 25,108$
178 Maxim Integrated Products, Inc. 9,051
213 Micron Technology, Inc. * 6,758
874 NVIDIA Corp. 116,679
27 NXP Semiconductors NV * 1,979
215 Silicon Laboratories, Inc. * 16,944
380 Skyworks Solutions, Inc. 25,468
1,463 Texas Instruments, Inc. 138,253
765 Xilinx, Inc. 65,155
536,339
SOFTWARE - 12.6%
596 Activision Blizzard, Inc. 27,756
323 Adobe Systems, Inc. * 73,075
52 Athenahealth, Inc. * 6,860
229 Atlassian Corp. PLC * 20,376
359 Box, Inc. * 6,060
428 Broadridge Financial Solutions, Inc. 41,195
941 Dropbox, Inc. * 19,225
662 Electronic Arts, Inc. * 52,238
157 First Data Corp. * 2,655
524 Intuit, Inc. 103,149
9,599 Microsoft Corp. 974,970
169 New Relic, Inc. * 13,684
1,299 Oracle Corp. 58,650
213 Paychex, Inc. 13,877
109 Red Hat, Inc. * 19,145
2,245 Salesforce.com, Inc. * 307,498
191 ServiceNow, Inc. * 34,008
890 Synopsys, Inc. * 74,974
97 Tableau Software, Inc. * 11,640
198 Ultimate Software Group, Inc. (The) * 48,484
618 Veeva Systems, Inc. * 55,200
185 Vmware, Inc. 25,369
1,990,088
TELECOMMUNICATIONS - 0.4%
45 Arista Networks, Inc. * 9,481
756 Ciena Corp. * 25,636
188 Motorola Solutions, Inc. 21,628
56,745
Global Atlantic BlackRock Disciplined Growth Portfolio
PORTFOLIO OF INVESTMENTS (Continued)
December 31, 2018
50See accompanying notes to financial statements.

Shares Value
TRANSPORTATION - 1.4%
230 CH Robinson Worldwide, Inc. 19,341$
156 JB Hunt Transport Services, Inc. 14,514
1,359 Landstar System, Inc. 130,016
207 Norfolk Southern Corp. 30,955
861 Schneider National, Inc. 16,075
118 United Parcel Service, Inc. 11,509
222,410
TOTAL COMMON STOCKS (Cost - $15,797,128) 15,469,162
SHORT-TERM INVESTMENT - 2.1%
MONEY MARKET FUND - 2.1%
328,974 Fidelity Investments Money Market Funds - Government Portfolio, Institutional Class
to yield 2.25% (a)(Cost - $328,974) 328,974
TOTAL INVESTMENTS - 100.0% (Cost - $16,126,102) 15,798,136$
OTHER ASSETS LESS LIABILITIES - NET - 0.0% ^ 8,487
TOTAL NET ASSETS - 100.0% 15,806,623$
* Non-income producing security
^ Represents less than 0.05%
PLC - Public Limited Company
(a) Money market rate shown represents the rate at December 31, 2018.
Description Counterparty Contracts Expiration Date Notional Value
Unrealized
Appreciation
LONG
S&P 500 E-mini Future Goldman Sachs 2 Mar-19 250,520$ 1,682$
NET UNREALIZED APPRECIATION ON FUTURES CONTRACTS 1,682$
FUTURES CONTRACTS
Global Atlantic BlackRock Disciplined Growth Portfolio
PORTFOLIO OF INVESTMENTS (Continued)
December 31, 2018
51See accompanying notes to financial statements.

Shares Value
EXCHANGE TRADED FUNDS - 6.1%
EQUITY FUNDS - 6.1%
109,068 iShares MSCI India ETF 3,636,327$
129,516 iShares MSCI Taiwan ETF 4,095,296
33,652 iShares MSCI Turkey ETF 826,829
TOTAL EQUITY FUNDS (Cost - $9,210,403) 8,558,452
COMMON STOCKS - 90.9%
ADVERTISING - 0.0% +
469 Publicis Groupe SA 26,850
AEROSPACE/DEFENSE - 0.4%
2,696 BAE Systems PLC 15,767
1,224 CAE, Inc. 22,485
14 Dassault Aviation SA 19,365
2,249 MTU Aero Engines AG 407,238
6,624 Rolls-Royce Holdings PLC 70,022
534,877
AGRICULTURE - 1.5%
11,119 British American Tobacco PLC 354,029
78,000 China Agri-Industries Holdings Ltd. * 27,795
1,858 Easy Bio, Inc. * 10,091
28,200 Gudang Garam Tbk. PT 163,969
10,888 Imperial Brands PLC 329,618
34,900 Japan Tobacco, Inc. 832,301
6,900 QL Resources Bhd. 11,371
204,000 Renhe Commercial Holdings Co. Ltd. * 7,035
7,670 Swedish Match AB 302,012
2,038,221
AIRLINES - 0.4%
92,000 China Eastern Airlines Corp. Ltd. 51,233
33,491 International Consolidated Airlines Group SA 264,934
59,282 Qantas Airways Ltd. 241,643
557,810
APPAREL - 1.7%
2,093 adidas AG 436,413
1,386 Burberry Group PLC 30,635
827 Christian Dior SE 315,664
367 Fila Korea Ltd. 17,597
1,412 Kering 664,375
2,149 LVMH Moet Hennessy Louis Vuitton SE 634,302
7,219 Moncler SpA 238,742
155 Puma SE 75,659
200 Zhejiang Semir Garment Co. Ltd. 260
2,413,647
AUTO MANUFACTURERS - 1.8%
40,500 BAIC Motor Corp. Ltd. 21,364
22,000 China First Capital Group Ltd. * 12,504
3,451 Ferrari NV 342,348
18,000 Geely Automobile Holdings Ltd. 31,727
11,400 Honda Motor Co. Ltd. 300,755
1,121 Hyundai Motor Co. 119,052
2,290 Kia Motors Corp. 69,164
13,400 Mitsubishi Motors Corp. 73,525
4,300 Nissan Motor Co. Ltd. 34,501
Global Atlantic BlackRock Disciplined International Core Portfolio
PORTFOLIO OF INVESTMENTS
December 31, 2018
52See accompanying notes to financial statements.

Shares Value
AUTO MANUFACTURERS - 1.8% (Continued)
5,930 Peugeot SA 126,392$
13,500 Sinotruk Hong Kong Ltd. 20,347
700 Suzuki Motor Corp. 35,518
15,000 Toyota Motor Corp. 875,815
32,382 Volvo AB 423,501
2,486,513
AUTO PARTS & EQUIPMENT - 2.0%
4,100 Aisin Seiki Co. Ltd. 142,752
2,864 Cie Generale des Etablissements Michelinn SCA 283,854
2,121 Continental AG 292,773
2,700 Denso Corp. 120,413
8,514 Faurecia 321,863
450 Georg Fischer AG * 359,023
4,503 Hella GmbH Hueck & Co. KgaA 179,137
266 Hyundai Mobis Co. Ltd. 45,295
26,900 JTEKT Corp. 300,592
1,764 Magna International, Inc. 80,037
855 Rheinmetall AG 75,416
2,722 Schaeffler AG 23,207
9,100 Sumitomo Electric Industries Ltd. * 121,261
10,600 Tokai Rika Co. Ltd. * 176,224
7,500 Toyoda Gosei Co. Ltd. 148,681
9,300 Toyota Boshoku Corp. 139,099
2,809,627
BANKS - 12.8%
7,000 ABSA Group Ltd. 78,745
100 Agricultura Bank of China Ltd. 52
465,000 Agricultural Bank of China Ltd 203,714
12,802 Australia & New Zealand Banking Group Ltd. 220,448
128,877 Banco Bilbao Vizcaya Argentaria SA 682,929
9,350 Banco Bradesco SA * 81,661
27,060 Banco Brandesco SA Preference * 269,849
5,300 Banco del Bajio SA 10,291
9,300 Banco do Brasil SA * 111,554
20,600 Banco Santander Brasil SA 226,955
27,600 Bank Central Asia Tbk. PT 49,951
145,100 Bank Mandiri Persero Tbk. PT 74,543
923,000 Bank of China Ltd. 398,467
108,000 Bank of Communications Co. Ltd. 84,283
7,339 Bank of Montreal 479,254
12,207 Bank of Nova Scotia (The) 608,205
303,000 Bank Rakyat Indonesia Persero Tbk. PT 77,014
110,578 Barclays PLC 211,981
4,732 BNP Paribas SA 213,536
22,000 BOC Hong Kong Holdings Ltd. 81,769
4,597 Canadian Imperial Bank of Commerce 342,234
214,000 China CITIC Bank Corp. Ltd. 130,105
693,000 China Construction Bank Corp. 571,795
345,600 China Minsheng Banking Corp. Ltd. 238,365
119,000 Chongqing Rural Commercial Bank Co. Ltd. 63,837
4,202 Commonwealth Bank of Australia 214,145
459 Credicorp Ltd. 101,747
2,232 Credit Agricole SA 24,061
7,800 DBS Group Holdings Ltd. 135,570
Global Atlantic BlackRock Disciplined International Core Portfolio
PORTFOLIO OF INVESTMENTS (Continued)
December 31, 2018
53See accompanying notes to financial statements.

Shares Value
BANKS - 12.8% (Continued)
23,813 DNB ASA 379,918$
7,607 Erste Group Bank AG 252,617
75,901 FirstRand Ltd. 345,921
829 Grupo Elektra SAB de CV * 39,883
19,100 Grupo Financiero Banorte SAB de CV 93,038
3,900 Hachijuni Bank Ltd. (The) 16,032
72,386 HSBC Holdings PLC 596,383
513,000 Industrial & Commercial Bank of China Ltd. 366,272
1,090 Industrial Bank of Korea * 13,725
89,700 Itau Unibanco Holding SA Preference* 821,609
2,100 Kyushu Financial Group, Inc. 7,962
158,893 Lloyds Banking Group PLC 104,927
5,709 Macquarie Group Ltd. 436,679
119,700 Malayan Banking Bhd. 275,172
21,126 Mediobanca Banca di Credito Finanziario SpA 178,132
179,900 Mitsubishi UFJ Financial Group, Inc. 881,996
34,453 National Australia Bank Ltd. 583,816
33,745 Natixis SA 158,893
954 Nedbank Group Ltd. 18,211
8,770 Nordea Bank ABP * 73,774
11,278 OTP Bank Nyrt 453,727
3,700 Oversea-Chinese Banking Corp. Ltd. 30,566
13,000 Postal Savings Bank of China Co. Ltd. 6,858
21,400 Public Bank Bhd. 128,219
55,300 Resona Holdings, Inc. 266,482
17,290 Royal Bank of Canada 1,182,880
43,239 Skandinaviska Enskilda Banken AB 419,912
2,786 Societe Generale SA 88,602
27,737 Standard Bank Group Ltd. 344,779
30,400 Sumitomo Mitsui Financial Group, Inc. 1,009,962
6,700 Sumitomo Mitsui Trust Holdings, Inc. 245,613
21,500 Suruga Bank Ltd. * 79,561
92,700 Thanachart Capital PCL * (NVDR) 141,641
27,148 Toronto-Dominion Bank (The) 1,348,853
25,307 Westpac Banking Corp. 446,116
2,054 Woori Bank * 28,717
17,854,508
BASE METALS - 0.1%
21,573 OZ Minerals Ltd. * 133,649
BEVERAGES - 2.2%
75,000 Ambev SA 297,620
700 Asahi Group Holdings Ltd. 27,237
5,376 Carlsberg A/S 570,381
12,000 China Resources Beer Holdings Co. Ltd. 41,919
32,370 Diageo PLC 1,152,279
1,700 Fraser & Neave Holdings Bhd. * 13,781
18,400 Kirin Holdings Co. Ltd. 385,475
3,228 Pernod Ricard SA 528,790
210 Royal Unibrew A/S 14,444
3,031,926
PORTFOLIO OF INVESTMENTS (Continued)
December 31, 2018
Global Atlantic BlackRock Disciplined International Core Portfolio
54See accompanying notes to financial statements.

Shares Value
BIOTECHNOLOGY- 0.5%
7,500 3SBio, Inc. 9,618$
240 BeiGene Ltd. * (ADR) 33,662
3,326 CSL Ltd. 433,553
416 Genmab AS * 68,027
2,429 H Lundbeck A/S 106,195
34 Medy-Tox, Inc. 17,601
668,656
BUILDING MATERIALS - 1.1%
73,000 BBMG Corp. 23,030
180,400 Cemex SAB DE CV * 87,023
32,000 China Resources Cement Holdings Ltd. 28,815
21,302 Cie de Saint-Gobain 710,208
47,229 CSR Ltd. 93,430
930 HeidelbergCement AG 56,750
1,246 Kingspan Group PLC 53,243
3,800 LIXIL Group Corp. 47,173
6,801 Norbord, Inc. 180,756
1,943 Sika AG 245,585
1,028 Wienerberger AG 21,153
1,547,166
CHEMICALS - 2.7%
2,124 Air Liquide SA 263,322
2,879 Arkema SA 246,703
23,000 Daicel Corp. 237,096
2,300 DIC Corp. 70,647
8,801 Evonik Industries AG 219,327
1,194 Hanwha Chemical Corp. * 21,616
2,500 Hitachi Chemical Co. Ltd. * 37,825
1,600 JSR Corp. 24,135
15,000 Kingboard Laminates Holdings Ltd. 12,377
6,968 Koninklijke DSM NV 569,053
315 LG Chem Ltd. 97,961
729 Linde AG 161,463
63 Lotte Chemical Corp. * 15,640
162 LOTTE Fine Chemical Co. Ltd. * 5,960
4,002 Methanex Corp. 192,394
21,800 Mitsubishi Chemical Holdings Corp. 165,435
1,900 Nitto Dekno Corp. 95,991
1,932 Nutrien Ltd. 90,701
140,000 PTT Global Chemical PCL 306,357
6,700 Shin-Etsu Chemical Co. Ltd. 521,271
2,159 Solvay SA 215,511
19,300 Sumitomo Chemical Co. Ltd. 93,760
1,036 Victrex PLC 30,189
900 Zeon Corp. 8,252
3,702,986
COAL - 0.2%
188,800 Bukit Asam TBK PT * 56,391
103,000 China Coal Energy Co. Ltd. 40,519
46,000 China Shenhua Energy Co. Ltd. 100,821
9,084 Whitehaven Coal Ltd. 27,627
225,358
Global Atlantic BlackRock Disciplined International Core Portfolio
PORTFOLIO OF INVESTMENTS (Continued)
December 31, 2018
55See accompanying notes to financial statements.

Shares Value
COMMERCIAL SERVICES - 0.9%
5,219 Ashtead Group PLC 108,810$
9,821 Atlantia SpA 202,870
10,000 Car, Inc. * 7,446
1,188 Edenred 43,607
5,598 Experian PLC 135,819
48,694 G4S PLC 122,142
620 Intertek Group PLC 37,902
308 Randstad Holding NV 14,115
3,600 Recruit Holdings Co. Ltd. 87,363
7,500 RELX PLC 154,408
7,698 Rentokil Initial PLC 33,060
9,500 Shenzhen International Holdings Ltd. 18,298
500 Toppan Printing Co. Ltd. 7,369
1,654 Wirecard AG 251,094
1,224,303
COMPUTERS - 1.1%
2,110 Atos SE 172,413
100 BOE Technology Group Co. Ltd. 38
2,257 Capgemini SE 223,952
3,731 CGI Group, Inc. * 228,100
1,776 Check Point Software Technologies Ltd. * 182,306
11,053 Computershare Ltd. 133,761
600 Itochu Techno-Solutions Corp. 11,616
256 Jenoptik AG 6,666
42,000 Lenovo Group Ltd. 28,378
5,701 Logitech International S.A. 178,814
13,100 Nihon Unisys Ltd. * 292,650
156 Samsung SDS Co. Ltd. 28,521
204 SK Holdings Co. Ltd. 47,535
86 Teleperformance 13,724
1,548,474
COSMETICS/PERSONAL CARE - 2.3%
318 Amorepacific Corp. 59,707
600 FANCL Corp. * 15,351
2,300 Kao Corp. 170,936
74 LG Household & Health Care Ltd. 73,018
4,903 L'Oreal SA 1,127,699
1,700 Pigeon Corp. 72,825
11,300 Pola Orbis Holdings, Inc. 305,790
400 Shiseido Co. Ltd. 25,127
19,955 Svenska Cellulosa AB SCA 154,673
2,600 Unicharm Corp. 84,340
11,285 Unilever NV (Dutch Certificate) 611,739
8,918 Unilever PLC 466,642
3,167,847
DISTRIBUTION/WHOLESALE - 1.4%
671 Ferguson PLC 42,875
35,836 Inchcape PLC 251,709
20,600 Itochu Corp. 350,546
233 LG Corp. * 14,596
531 LG International Corp. * 7,305
23,800 Marubeni Corp. 167,553
Global Atlantic BlackRock Disciplined International Core Portfolio
PORTFOLIO OF INVESTMENTS (Continued)
December 31, 2018
56See accompanying notes to financial statements.

Shares Value
DISTRIBUTION/WHOLESALE - 1.4% (Continued)
5,000 Mitsubishi Corp. 137,629$
47,300 Mitsui & Co. Ltd. 728,803
432 Posco Daewoo Corp. * 7,046
4,412 Rexel SA 46,905
17,000 Sumitomo Corp. 241,950
1,996,917
DIVERSIFIED FINANCIAL SERVICES - 1.9%
3,997 Aareal Bank AG 123,322
2,128 ASX Ltd. 89,797
3,300 BOC Aviation Ltd. * 24,425
20,000 China International Capital Corp. Ltd. 37,551
32,900 CNPC Capital Co. Ltd. 51,513
84,100 Daiwa Securities Group, Inc. 426,651
3,506 Deutsche Boerse AG 420,628
47,400 Guotai Junan Securities Co. Ltd. 95,898
1,705 Hana Financial Group, Inc. 55,392
7,900 Hitachi Capital Corp. * 166,619
7,900 Hong Kong Exchanges & Clearing Ltd. 228,645
9,806 IG Group Holdings PLC 71,187
3,787 KB Financial Group, Inc. * 157,820
206 Korea Investment Holdings Co. Ltd. * 10,985
13,300 Krungthai Card PLC * (GDR) 12,459
9,333 Man Group PLC 15,809
5,297 Meritz Securities Co. Ltd. * 20,318
1,128 Mirae Asset Daewoo Co. Ltd. * 6,601
12,200 Mitsubishi UFJ Lease & Finance Co. Ltd. * 58,712
8,800 Muangthai Capital PLC (NVDR) 13,243
1,090 NH Investment & Securities Co. Ltd. * 12,748
29,706 Old Mutual Ltd. 46,258
1,245 Samsung Securities Co. Ltd. * 35,147
10,025 Schroders PLC 311,918
2,770 Shinhan Financial Group Co. Ltd. * 98,308
600 Tokyo Century Corp. * 26,414
2,618,368
ELECTRIC - 2.0%
5,415 A2A SpA 9,734
4,829 AGL Energy Ltd. 70,032
47,000 China Power International Development Ltd. 10,685
5,700 Chubu Electric Power Co, Inc. 81,176
8,500 CLP Holdings Ltd. 96,081
124,000 Datang International Power Generation Co. Ltd. 29,142
21,078 E.ON SE 207,870
1,091 EDP Renovaveis SA 9,697
15,126 Endesa SA 348,074
29,675 Engie SA * 424,885
3,599 Fortis, Inc. (Canada) 119,923
8,300 Gulf Energy Development PCL 20,775
8,800 Gulf Energy Development PLC (NVDR) 22,027
3,349 Hera SpA * 10,191
Global Atlantic BlackRock Disciplined International Core Portfolio
PORTFOLIO OF INVESTMENTS (Continued)
December 31, 2018
57See accompanying notes to financial statements.

Shares Value
ELECTRIC - 2.0% (Continued)
19,900 Hokuriku Electric Power Co. * 173,942$
62,000 Huadian Power International Corp. Ltd. 27,954
2,330 Iberdrola SA 18,693
1,686 Korea Electric Power Corp. * 50,015
761 RWE AG 16,498
24,900 Shikoku Electric Power Co., Inc. 301,392
61,500 Tenaga Nasional Bhd. 202,396
78,260 Terna Rete Elettrica Nazionale SpA 443,110
1,470 Uniper SE 37,978
1,480 Verbund AG 63,005
2,795,275
ELECTRICAL COMPONENTS & EQUIPMENT - 0.4%
2,000 Casio Computer Co. Ltd. 23,771
300 Dongfang Electric Corp. Ltd. * 345
296 LS Corp. * 13,025
242 LS Industrial Systems Co. Ltd. * 10,627
500 Mabuchi Motor Co. Ltd. 15,358
5,998 Schneider Electric SE 409,477
25,600 Xinjiang Goldwind Science & Technology Co. Ltd. 22,692
495,295
ELECTRONICS- 0.4%
14,654 Electrocomponents PLC 94,548
3,800 Hoya Corp. 229,112
1,669 LG Display Co. Ltd. * 26,999
100 Murata Manufacturing Co. Ltd. 13,631
729 Samsung Electro-Mechanics Co. Ltd. * 67,621
10,000 Venture Corp. Ltd. 102,348
534,259
ENERGY - ALTERNATE SOURCES - 0.1%
885 Landis+Gyr Group AG 49,511
83 OCI Co. Ltd. * 7,959
36,000 Xinyi Solar Holdings Ltd. * 12,645
70,115
ENGINEERING & CONSTRUCTION - 2.1%
174 Acciona S.A. 14,699
9,753 ACS Actividades de Construccion y Servicios SA 377,176
1,601 Aena SA 248,447
1,604 Bouygues SA 57,465
157,000 China Communications Construction Co. Ltd. 148,390
110,000 China Communications Services Corp. Ltd. 91,042
174,000 China Railway Construction Corp. Ltd. 241,353
178,000 China Railway Group Ltd. 162,100
5,400 Chiyoda Corp. 15,258
7,697 CIMIC Group Ltd. 235,225
197 Daelim Industrial Co. Ltd. * 18,097
1,783 Daewoo Engineering & Construction Co. Ltd. * 8,613
267 Flughafen Zurich AG 44,012
1,800 Grupo Aeroportuario del Centro Norte SAB de CV * 8,572
423 GS Engineering & Construction Corp. * 16,586
4,940 Hochtief AG 664,671
606 Hyundai Engineering & Construction Co. Ltd. * 29,654
3,900 Kandenko Co. Ltd. * 37,928
173,000 Metallurgical Corp of China Ltd. 41,541
1,322 Samsung Engineering Co. Ltd. * 20,852
Global Atlantic BlackRock Disciplined International Core Portfolio
PORTFOLIO OF INVESTMENTS (Continued)
December 31, 2018
58See accompanying notes to financial statements.

Shares Value
ENGINEERING & CONSTRUCTION - 2.1% (Continued)
37,732 Sydney Airport 178,771$
3,586 Vinci SA 295,234
683 WSP Global, Inc. 29,339
2,985,025
ENTERTAINMENT - 0.7%
13,888 Aristocrat Leisure Ltd. 213,533
406,000 Genting Singapore PLC 290,426
2 Kindred Group PLC 18
4,000 Sankyo Co. Ltd. (SDR) 152,395
8,100 Toho Co. Ltd. 293,834
10,828 William Hill PLC 21,375
971,581
FOOD - 3.9%
4,031 A2 Milk Co. Ltd. * 30,138
4,589 Associated British Foods PLC 119,404
52 Barry Callebaut AG 80,759
5,416 Bid Corp. Ltd. 99,773
900 BRF SA * 5,092
70 CJ CheilJedang Corp. 20,734
1,074 Coles Group Ltd. * 8,877
66,000 Dali Foods Group Co. Ltd 48,809
3,143 Danone SA 221,001
16,500 Indofood Sukses Makmur Tbk PT 8,534
40,900 JBS SA 122,307
2,826 Kesko OYJ 152,159
800 Kikkoman Corp. 43,093
30,835 Koninklijke Ahold Delhaize NV 778,123
2,720 Magnit PJSC - GDR 34,626
23,075 Nestle SA 1,867,909
6,200 Nichirei Corp. * 170,943
47 NongShim Co. Ltd 10,720
374 Salmar ASA 18,486
6,900 Seven & i Holdings Co. Ltd. 300,804
25,662 SSP Group PLC 211,591
22,144 Suedzucker AG 285,921
9,136 Tate & Lyle PLC 76,795
21,000 Uni-President China Holdings Ltd. 18,239
8,891 Wesfarmers Ltd. 201,673
156,000 WH Group Ltd. 120,148
113,475 Wm Morrison Supermarkets PLC 308,193
8,448 Woolworths Holdings Ltd. - South Africa * 32,353
1,200 Yamazaki Baking Co. Ltd. 25,222
5,000 Yihai International Holding Ltd. 12,223
5,434,649
FOOD SERVICE - 0.7%
47,311 Compass Group PLC 994,213
FOREST PRODUCTS & PAPER - 0.1%
506 Canfor Corp. * 6,124
26,300 Indah Kiat Pulp & Paper Corp. Tbk PT 21,147
13,000 Pabrik Kertas Tjiwi Kimia Tbk. PT * 10,012
1,178 Smurfit Kappa Group PLC 31,323
3,126 Stora Enso OYJ 36,039
3,300 Suzano Papel E Celulose SA 32,423
Global Atlantic BlackRock Disciplined International Core Portfolio
PORTFOLIO OF INVESTMENTS (Continued)
December 31, 2018
59See accompanying notes to financial statements.

Shares Value
FOREST PRODUCTS & PAPER - 0.1% (Continued)
1,431 UPM-Kymmene OYJ 36,234$
173,302
GAS - 0.6%
55,807 Centrica PLC 95,881
431 Korea Gas Corp. * 18,618
58,086 National Grid PLC 565,343
36,155 Snam SpA 157,842
14,000 Towngas China Co. Ltd. 10,389
848,073
HAND/MACHINE TOOLS - 0.2%
200 Disco Corp. * 23,424
400 DMG Mori Co. Ltd. * 4,524
11,883 Sandvik AB 169,348
20,500 Techtronic Industries Co. Ltd. 108,923
306,219
HEALTHCARE-PRODUCTS - 1.0%
700 Asahi Intecc Co. Ltd. 29,604
5,428 Aspen Pharmacare Holdings Ltd. 50,873
378 Carl Zeiss Meditec AG 29,513
1,903 Cochlear Ltd. 232,534
3,501 GN Store Nord A/S 130,484
24,000 Hengan International Group Co. Ltd. 174,727
9,760 Koninklijke Philips NV * 345,091
386 Sartorius Stedim Biotech 38,544
1,557 Siemens Healthineers AG * 65,046
16,661 Smith & Nephew PLC 310,653
94 Sonova Holding AG 15,314
1,422,383
HEALTHCARE-SERVICES - 0.2%
28,000 Bangkok Dusit Medical Services PCL 21,327
35,000 Evergrande Health Industry Group Ltd. * 46,045
3,669 Fresenius SE & Co. KGaA 177,751
6,000 Genscript Biotech Corp. * 8,093
300 Miraca Holdings, Inc. 6,787
986 NMC Health PLC 34,358
153 Orpea Corp. 15,605
420 SillaJen, Inc. * 27,666
337,632
HOLDING COMPANIES - DIVERSIFIED - 0.5%
194 Aker ASA * 10,351
18,300 Alfa SAB de CV 21,735
16,976 Barloworld Ltd. 135,879
8,000 China Investment Fund International Holdings Co. * 21,458
66 CJ Corp. * 7,187
10 CJ Corp. Preference * 325
21,000 CK Hutchison Holdings Ltd. 201,703
7,100 Keppel Corp. Ltd. 30,786
11,139 Remgro Ltd. 150,797
7,340 San Miguel Corp. 20,519
963 Washington H Soul Pattinson & Co .Ltd. * 16,874
53,000 Wharf Holdings Ltd. 138,096
755,710
HOME BUILDERS - 0.5%
2,397 Bovis Homes Group PLC 26,309
December 31, 2018
Global Atlantic BlackRock Disciplined International Core Portfolio
PORTFOLIO OF INVESTMENTS (Continued)
60See accompanying notes to financial statements.

Shares Value
HOME BUILDERS - 0.5% (Continued)
10,940 Persimmon PLC 268,911$
3,100 Sekisui House Ltd. 45,745
181,006 Taylor Wimpey PLC 314,096
655,061
HOME FURNISHINGS - 0.1%
1,387 LG Electronics, Inc. * 77,442
2,500 Sony Corp. 121,360
198,802
HOUSEHOLD PRODUCTS/WARES - 0.0% +
308 Aekyung Industrial Co. Ltd. * 13,139
INSURANCE - 4.9%
72,800 AIA Group Ltd. 604,392
5,200 Allianz SE 1,041,099
2,323 Assicurazioni Generali SpA 38,771
26,832 Aviva PLC 128,321
5,007 AXA SA 107,939
89,000 China Life Insurance Co. Ltd. 189,155
202,000 China Reinsurance Group Corp. 41,281
671 CNP Assurances 14,206
13,800 Dai-ichi Life Holdings, Inc. 216,091
4,188 Direct Line Insurance Group PLC 16,999
4,233 Great-West Lifeco, Inc. 87,338
1,794 Hanwha Life Insurance Co. Ltd. 6,785
1,500 IRB Brasil Resseguros S/A 32,301
17,800 Japan Post Holdings Co. Ltd. 205,232
95,853 Legal & General Group PLC 282,001
33,998 Manulife Financial Corp. 482,165
50,903 Medibank Pvt Ltd. 92,098
47,411 MMI Holdings Ltd. (South Africa) * 56,458
9,000 MS&AD Insurance Group Holdings, Inc. 256,920
163,000 People's Insurance Co Group of China Ltd. (The) 65,580
72,000 PICC Property & Casualty Co. Ltd. 73,661
48,000 Ping An Insurance Group Co of China Ltd. 423,943
556 Power Corp of Canada 9,986
7,646 Sampo Oyj. 335,724
77 Samsung Fire & Marine Insurance Co. Ltd. * 18,563
300 Samsung Life Insurance Co. Ltd. 21,939
41,276 Sanlam Ltd. 228,976
600 Sompo Holdings, Inc. 20,409
1,972 Storebrand ASA 14,038
7,862 Sun Life Financial, Inc. 260,704
189 Swiss Life Holding AG 72,586
6,081 Swiss Re AG 555,914
289 Talanx AG 9,845
13,600 Tokio Marine Holdings, Inc. 649,042
1,320 Topdanmark A/S 61,269
2,853 Unipol Gruppo SpA * 11,474
368 Zurich Insurance Group AG 109,414
6,842,619
INTERNET- 3.3%
219 58.com, Inc. * 11,872
10,015 Alibaba Group Holding Ltd. * 1,372,756
21,174 Auto Trader Group PLC 122,647
Global Atlantic BlackRock Disciplined International Core Portfolio
PORTFOLIO OF INVESTMENTS (Continued)
December 31, 2018
61See accompanying notes to financial statements.

Shares Value
INTERNET- 3.3% (Continued)
1,748 Baidu, Inc. * (ADR) 277,233$
1,000 China Literature Ltd. * 4,636
300 CyberAgent, Inc. * 11,607
200 en-japan, Inc. * 6,225
368,000 HengTen Networks Group Ltd. * 11,187
2,485 JD.com, Inc. * (ADR) 52,011
264 Kakao Corp. * 24,370
4,390 Moneysupermarket.com Group PLC 15,404
3,358 Naspers Ltd. 675,165
545 NAVER Corp. 59,590
62 NCSoft Corp. 25,921
241 Scout24 AG 11,064
1,299 SINA Corp. (China) * 69,678
46,200 Tencent Holdings Ltd. 1,852,874
318 Wix.com Ltd. * 28,728
7,000 Yahoo Japan Corp. 17,482
209 YY, Inc. * (ADR) 12,511
4,662,961
INVESTMENT COMPANIES - 0.1%
2,515 Investor AB 106,547
11,300 Legend Holdings Corp. 29,587
690 Reinet Investments SCA 10,478
146,612
IRON/STEEL- 0.9%
34,000 Angang Steel Co. Ltd. 23,450
13,498 Anglo American PLC * 302,398
12,052 BlueScope Steel Ltd. 92,991
16,000 China Oriental Group Co. Ltd. 9,523
3,700 Companhia Siderurgica Nacional S.A. * 8,439
1,054 Dongkuk Steel Mill Co. Ltd. * 6,830
13,200 Gerdau SA Preference * 50,474
397 Hyundai Steel Co. * 16,100
42,000 Maanshan Iron & Steel Co. Ltd. 18,507
2,400 Nippon Steel & Sumitomo Metal Corp. 41,398
2,885 Outkumpu OYJ 10,537
766 POSCO 166,820
2,569 Salzgitter AG 75,093
23,631 SSAB AB 81,268
14,400 Usinas Sederurgicas De Minas Gersais SA Preference * 34,256
20,100 Vale SA * 264,491
1,202,575
LEISURE TIME - 0.5%
2,459 BRP, Inc. 63,626
3,829 Carnival PLC 183,507
26,000 China Travel International Investment Hong Kong Ltd. 6,941
1,517 CTS Eventim AG & Co. KGaA 56,499
115,451 Thomas Cook Group PLC 45,229
23,742 TUI AG 340,327
696,129
LODGING - 0.1%
2,839 Crown Resorts Ltd. 23,704
1,513 Melia Hotels International SA 14,200
12,800 Sands China Ltd. 56,076
93,980
Global Atlantic BlackRock Disciplined International Core Portfolio
PORTFOLIO OF INVESTMENTS (Continued)
December 31, 2018
62See accompanying notes to financial statements.

Shares Value
MACHINERY-CONSTRUCTION & MINING - 0.4%
5,302 Doosan Infracore Co. Ltd. * 36,066$
14,200 Hitachi Ltd. 379,931
4,400 Komatsu Ltd. 94,866
55,800 United Tractors Tbk PT 106,177
617,040
MACHINERY- DIVERSIFED - 0.5%
5,000 Amada Holdings Co. Ltd. 45,026
833 Bucher Industries AG 223,418
200 Keyence Corp. 101,499
2,020 Kone OYJ 96,154
15,427 OC Oerlikon Corp. AG * 172,767
204 Toromont Industries Ltd. 8,104
1,438 Valmet OYJ 29,507
676,475
MEDIA - 1.4%
6,306 Altice Europe NV * 12,248
673 Lagardere SCA 16,941
50,685 Mediaset Espana Comunicacion SA 318,094
11,967 Pearson PLC 143,023
20,066 Quebecor, Inc. 422,241
2,018 Thomas Reuters Corp. 97,413
5,500 Tokyo Broadcasting System Holdings, Inc. * 87,226
14,091 Wolters Kluwer NV * 832,146
1,929,332
METAL FABRICATE/HARDWARE - 0.2%
826 Aurubis AG 40,810
12,918 Bodycote PLC 119,526
25,600 China Zhongwang Holdings Ltd. 11,346
4,900 NTN Corp. 14,202
9,743 Sims Metal Management Ltd. 68,865
254,749
MINING - 2.1%
11,405 Anglo American PLC 253,875
2,808 Barrick Gold Corp. 37,891
47,620 BHP Billiton Ltd. 1,147,543
13,118 BHP Billiton PLC 275,934
73,719 Centamin PLC 102,151
20,500 China Hongqiao Group Ltd. 11,652
2,281 Detour Gold Corp. * 19,256
5,229 Evolution Mining Ltd. 13,584
1,613 Franco-Nevada Corp. 113,056
18,156 Glencore PLC 67,370
3,465 Iluka Resources Ltd. 18,588
81,000 Jiangxi Copper Co. Ltd. 95,284
700 Mitsui Mining & Smelting Co. Ltd. 14,528
PORTFOLIO OF INVESTMENTS (Continued)
December 31, 2018
Global Atlantic BlackRock Disciplined International Core Portfolio
63See accompanying notes to financial statements.

Shares Value
MINING - 2.1% (Continued)
40,000 MMG Ltd. * 17,217$
1,133 Pan American Silver Corp. 16,533
27,056 Regis Resources Ltd. 91,999
1,286 Rio Tinto Ltd. 71,042
8,411 Rio Tinto PLC 399,567
40,317 South32 Ltd. 95,084
930 Southern Copper Corp. 28,616
3,240 St. Barbara Ltd. 10,721
810 Teck Resources Ltd. 17,430
15,000 Zhaojin Mining Industry Co. Ltd. 15,231
2,934,152
MISCELLANEOUS MANUFACTURING - 1.2%
4,586 Aalberts Industries NV * 152,294
506 Ansell Ltd. 7,851
42,000 China Railway Signal & Communication Corp. Ltd. 29,397
13,600 FUJIFILM Holdings Corp. 529,299
1,200 Nikon Corp. 17,883
244 POSCO Chemtech Co. Ltd. * 13,930
6,555 Siemens AG 729,703
8,380 Smiths Groups PLC 145,577
12,400 Top Glove Corp. BHD * 16,803
1,642,737
OFFICE/BUSINESS EQUIPMENT - 0.2%
10,700 Canon, Inc. 292,674
3,800 Ricoh Co. Ltd. 37,302
329,976
OIL & GAS - 5.6%
67,888 Beach Energy Ltd. 64,282
83,286 BP PLC 526,070
4,738 Canadian Natural Resources Ltd. 114,270
536,000 China Petroleum & Chemical Corp. 382,693
51,300 China Petroleum & Chemical Corp. * 37,733
245,000 CNOOC Ltd. 378,639
560 DCC PLC 42,686
78,823 Ecopetrol SA 64,442
16,549 Enerplus Corp. 128,679
54,279 Eni SpA 853,051
15,209 Galp Energia SGPS SA 239,842
16,741 Husky Energy, Inc. 172,950
8,606 Imperial Oil Ltd. 217,954
24,100 JXTG Holdings, Inc. 126,678
1,838 Neste Oyj 141,531
677 Novatek PJSC (GDR) 115,767
26,161 Oil Search Ltd. 131,868
5,427 OMV AG 237,298
4,935 Parex Resources, Inc. * 59,077
5,600 Petrobras Distribuidora SA 37,133
418,000 PetroChina Co. Ltd. 260,538
27,000 Petroleo Brasileiro SA * 176,946
December 31, 2018
Global Atlantic BlackRock Disciplined International Core Portfolio
PORTFOLIO OF INVESTMENTS (Continued)
64See accompanying notes to financial statements.

Shares Value
OIL & GAS - 5.6% (Continued)
20,861 Petroleo Brasileiro SA Preference * 122,074$
29,800 PTT Exploration & Production PCL (NVDR) 103,879
194,500 PTT PCL (NVDR) 274,785
9,142 Repsol SA 147,146
27,805 Royal Dutch Shell PLC 817,143
21,418 Royal Dutch Shell PLC 638,305
33,847 Santos Ltd. 130,579
5,561 Saras SPA * 10,750
2,000 Showa Shell Sekiyu KK 28,091
270 SK Innovation Co. Ltd. * 43,435
21,789 Suncor Energy, Inc. 608,299
20,500 Thai Oil PCL * (GDR) 41,711
5,152 Total SA 271,978
2,800 Ultrapar Participacoes SA * 38,434
2,786 Woodside Petroleum Ltd. 61,429
7,848,165
OIL & GAS SERVICES - 0.3%
7,312 Petrofac Ltd. 44,421
18,160 Saipem SPA * 67,780
1,240 SBM Offshore NV 18,321
21,000 Sinopec Engineering Group Co. Ltd. 17,247
8,186 Subsea 7 S.A. 79,675
7,549 TGS NOPEC Geophysical Co. ASA 182,031
2,782 WorleyParsons Ltd. 22,366
431,841
PHARMACEUTICALS - 6.3%
935 Almirall SA 14,290
4,717 Amplifon SpA 75,761
44,200 Astellas Pharma, Inc. 564,611
1,447 AstraZeneca PLC 108,234
2,299 Bausch Health Cos, Inc. * 42,502
4,263 Bayer AG 295,124
174 Celltrion Pharm, Inc. * 9,902
641 Celltrion, Inc. * 127,733
24,000 China Traditional Chinese Medicine Holdings Co. * 13,978
53 Daewoong Pharmaceutical Co. Ltd. 8,954
300 Eisai Co. Ltd. 23,248
51,659 GlaxoSmithKline PLC 981,104
2,112 Grifols SA 55,288
12,000 Guangzhou Baiyunshan Pharmaceutical Holdings Co. 42,992
8,700 Hypera SA 67,791
252 Ipsen SA 32,509
400 Kissei Pharmaceutical Co. Ltd. 10,212
400 Kobayashi Pharmaceutical Co. Ltd. 27,234
16,500 Luye Pharma Group Ltd. * 11,486
6,600 Medipal Holdings Corp. 141,667
1,200 Mitsubishi Tanabe Pharma Corp. 17,292
19,610 Novartis AG 1,671,763
11,888 Novo Nordisk A/S 542,503
7,027 Roche Holding AG 1,735,009
5,045 Sanofi 436,346
3,700 Shionogi & Co. Ltd. 211,482
Global Atlantic BlackRock Disciplined International Core Portfolio
December 31, 2018
PORTFOLIO OF INVESTMENTS (Continued)
65See accompanying notes to financial statements.

Shares Value
PHARMACEUTICALS - 6.3% (Continued)
14,000 SSY Group Ltd. 10,371$
19,600 Takeda Pharmaceutical Co. Ltd. 661,879
1,254 Teva Pharmaceutical Industries Ltd. * 19,682
8,799 Teva Pharmaceutical Industries Ltd. * (ADR) 135,681
6,000 Tong Ren Tang Technologies Co. Ltd. 7,863
8,096 UCB SA 659,878
104 ViroMed Co. Ltd. * 23,674
1,500 Wuxi Biologics Cayman, Inc. * 9,608
8,797,651
PIPELINES - 0.4%
17,031 Enbridge, Inc. 528,836
880 Gibson Energy, Inc. 12,036
598 Inter Pipeline Ltd. 8,468
1,198 TransCanada Corp. 42,761
592,101
PRIVATE EQUITY- 0.1%
5,092 Brookfield Asset Management, Inc. 195,060
REAL ESTATE - 2.0%
159,000 CapitaLand Ltd. 362,795
58,000 China Overseas Land & Investment Ltd. 199,276
22,000 CK Asset Holdings Ltd. 161,010
18,000 Country Garden Holdings Co. Ltd. 21,910
2,300 Daito Trust Construction Co. Ltd. 314,766
950 Fabege AB 12,661
28,000 Future Land Development Holdings Ltd. 19,169
10,500 Greentown China Holdings Ltd. 7,886
10,000 Hang Lung Properties Ltd. 19,057
30,800 Hongkong Land Holdings Ltd. 194,040
12,000 Jiayuan International Group Ltd. 22,193
29,000 Kaisa Group Holdings Ltd. * 9,260
15,500 KWG Property Holding Ltd. 13,720
277 LEG Immobilien AG 28,853
1,800 Leopalace21 Corp. * 7,153
26,000 Logan Property Holdings Co. Ltd. 32,577
10,600 Mitsubishi Estate Co. Ltd. 167,094
164 PSP Swiss Property AG 16,112
58,000 Shanghai Industrial Holdings Ltd. 117,343
38,000 Shenzhen Investment Ltd. 12,571
38,500 Shui On Land Ltd. 8,556
33,000 Sun Hung Kai Properties Ltd. 470,384
99,600 Swire Properties Ltd. 349,837
491 TAG Immobilien AG * 11,175
1,400 Tokyo Tatemono Co. Ltd. 14,547
30,000 Wharf Real Estate Investment Co. Ltd. 179,517
60,000 Yuexiu Property Co. Ltd. 11,035
20,000 Yuzhou Properties Co. Ltd. 8,251
2,792,748
REAL ESTATE INVESTMENT TRUSTS - 1.1%
118,200 Ascendas Real Estate Investment Trust 222,872
5,068 British Land Co. PLC (The) 34,416
339,200 CapitaLand Mall Trust * 562,430
2,010 Dexus 15,028
15,352 Klepierre SA 473,138
Global Atlantic BlackRock Disciplined International Core Portfolio
PORTFOLIO OF INVESTMENTS (Continued)
December 31, 2018
66See accompanying notes to financial statements.

Shares Value
REAL ESTATE INVESTMENT TRUSTS - 1.1% (Continued)
3 Nippon Building Fund, Inc. * 18,894$
36,396 Scentre Group 99,929
17,831 Stockland * 44,187
5,000 Yuexiu Real Estate Investment Trust 3,206
1,474,100
RETAIL - 0.9%
4,000 Alsea SAB de CV 10,407
167,500 Astra International Tbk PT 95,951
2,862 Ceconomy AG 10,293
145,200 Chow Tai Fook Jewellery Group Ltd. 121,103
907 Cie Financiere Richemont SA 57,964
1,174 Clicks Group Ltd. * 15,625
37,100 CP All PCL (NVDR) 78,336
46 E-Mart, Inc. 7,524
258 Galenica AG 11,327
218 Hotel Shilla Co. Ltd. 14,946
4,495 Industria de Diseno Textil SA 114,845
1,594 JD Sports Fashion PLC 7,081
10,500 Li Ning Co. Ltd. * 11,265
22,500 Lifestyle International Holdings Ltd. 34,083
900 Magazine Luiza SA 42,047
535 Samsung C&T Corp. 50,585
17,390 Steinhoff International Holdings NV * 2,079
3,500 Takashimaya Co. Ltd. * 44,789
195,500 Wal-Mart de Mexico SAB de CV 496,152
500 Welcia Holdings Co. Ltd. 22,604
11,000 Zhongsheng Group Holdings Ltd. 21,805
1,270,811
SEMICONDUCTORS - 1.9%
9,200 Advantest Corp. 188,168
1,748 ASML Holding NV 274,077
753 BE Semiconductor Industries NV 15,906
737 Dialog Semiconductor PLC * 18,990
5,000 Hua Hong Semiconductor Ltd. 9,260
10,714 Infineon Technologies AG 212,682
37,617 Samsung Electronics Co. Ltd. 1,304,693
4,018 Samsung Electronics Co. Ltd. (Preference) 114,332
728 Seoul Semiconductor Co. Ltd. 12,625
3,183 SK Hynix, Inc. * 172,586
1,355 STMicroelectronics NV 19,339
2,000 Tokyo Electron Ltd. 228,137
3,200 Ulvac, Inc. * 93,041
2,663,836
SHIPBUILDING - 0.1%
447 Daewoo Shipbuilding & Marine Engineering Co. Ltd. * 13,681
69,400 Yangzijiang Shipbuilding Holdings Ltd. 63,646
77,327
SOFTWARE - 1.6%
184 Adyen NV * 99,922
1,838 Amadeus IT Group SA 127,832
600 Capcom Co. Ltd. 11,878
103 Com2us Corp. 11,908
1,197 Dassault Systemes SE 141,898
29,000 Gree, Inc. 114,980
December 31, 2018
Global Atlantic BlackRock Disciplined International Core Portfolio
PORTFOLIO OF INVESTMENTS (Continued)
67See accompanying notes to financial statements.

Shares Value
SOFTWARE - 1.6% (Continued)
14,000 Kingdee International Software Group Co. Ltd. 12,374$
3,200 Konami Holdings Corp. 140,145
400 Mixi, Inc. 8,393
693 Momo, Inc. * (ADR) 16,459
235 Nemetschek SE 25,722
213 NetEase, Inc. (ADR) 50,134
62 Pearl Abyss Corp. * 11,552
10,924 SAP SE 1,085,562
3,940 Software AG 142,282
802 Temenos Group AG 95,918
12 Tencent Music Entertainment Group * (ADR) 157
1,155 Ubisoft Entertainment SA * 93,057
304 Xero Ltd. * 8,993
2,199,166
TELECOMMUNICATIONS - 4.1%
475,000 America Movil SAB de CV 337,429
6,698 BCE, Inc. 264,476
83,000 China Mobile Ltd. 798,796
360,000 China Telecom Corp. Ltd. 183,923
7,003 Deutsche Telekom AG * 118,641
13,300 Intouch Holdings PCL (NVDR) 19,505
14,000 KDDI Corp. 334,831
126,094 Koninklijke KPN NV 369,010
7 KT Corp. * 187
2,255 LG Uplus Corp. * 35,670
3,800 Megacable Holdings SAB de CV 16,978
3,876 Mobile TeleSystems PJSC (ADR) 27,132
14,400 Nippon Telegraph & Telephone Corp. 588,259
45,401 Nokia OYJ * 261,058
23,100 NTT Docomo, Inc. 520,574
123 Samsung SDI Co. Ltd. * 24,141
200 SK Telecom Co. Ltd. 48,306
371 Sunrise Communications Group AG 32,535
38,438 Telefonaktiebolaget LM Ericsson 337,823
41,655 Telefonica Deutschland Holding AG 162,758
8,061 Telefonica SA 67,628
21,620 Telenor ASA 418,211
81,577 Telstra Corp. Ltd. 163,676
12,300 TIM Participacoes SA 37,607
9,800 Total Access Communication PLC * (NVDR) 13,018
5,928 Vodacom Group Ltd. 54,397
272,317 Vodafone Group PLC 530,293
5,766,862
TOYS/GAMES/HOBBIES - 0.0% +
200 Nintendo Co. Ltd. 53,384
TRANSPORTATION - 1.9%
12,041 Aurizon Holdings Ltd. 36,281
1,347 Canadian National Railway Co. 99,718
2,086 Canadian Pacific Railway Ltd. 369,976
300 Central Japan Railway Co. 63,341
69 CJ Lojostics Corp. * 10,327
26,000 Cosco Shipping Energy Transportation Co. Ltd. 12,984
77,500 Cosco Shipping Holdings Co. Ltd. * 29,201
Global Atlantic BlackRock Disciplined International Core Portfolio
PORTFOLIO OF INVESTMENTS (Continued)
December 31, 2018
68See accompanying notes to financial statements.

Shares Value
TRANSPORTATION - 1.9% (Continued)
461 Deutsche Post AG 12,600$
8,300 East Japan Railway Co. 734,642
8,700 Mitsubishi Logistics Corp. * 198,003
5,200 Nippon Express Co. Ltd. 290,061
22,458 Royal Mail PLC 77,827
1,500 SG Holdings Co. Ltd. 39,156
152,000 Sinotrans Ltd. 66,008
6,408 TFI International, Inc. 165,619
7,200 West Japan Railway Co. 509,312
2,715,056
WATER - 0.3%
6,228 Severn Trent PLC 144,004
14,765 Veolia Environnement SA 303,055
447,059
TOTAL COMMON STOCKS - (Cost -$145,807,251) 126,932,940
SHORT-TERM INVESTMENT - 0.0% +
MONEY MARKET FUND - 0.0% +
36,829
to yield 2.25% (a) (Cost -$36,829) 36,829
TOTAL INVESTMENTS - 97.0% (Cost - $155,054,483) 135,528,221$
OTHER ASSETS LESS LIABILITIES - NET - 3.0% 4,218,293
TOTAL NET ASSETS - 100.0% $ 139,746,514
ADR - American Depositary Receipt
ETF - Exchange Traded Fund
GDR - Global Depositary Receipt
NVDR - Non-voting Depositary Receipt
PLC
SDR -Special Drawing Rights
* Non-income producing security.
+ Represents less than 0.05%.
(a) Money market rate shown represents the rate at December 31, 2018.
Global Atlantic BlackRock Disciplined International Core Portfolio
PORTFOLIO OF INVESTMENTS (Continued)
December 31, 2018
- Public Limited Company
Fidelity Investments Money Market - Government Portfolio, Institutional Class
69See accompanying notes to financial statements.

Description Counterparty Contracts Expiration Date Notional Value
Unrealized
Appreciation/
(Depreciation)
LONG
Euro Stoxx 50 Index Goldman Sachs 36 Mar-19 1,223,903$ (23,644)$
FTSE 100 Index Goldman Sachs 5 Mar-19 424,045 183
MSCI Emerging Market Index Goldman Sachs 14 Mar-19 676,760 (3,320)
Nikkei Index (JPY) Goldman Sachs 11 Mar-19 993,324 (79,387)
S&P/TSX 60 Index Goldman Sachs 2 Mar-19 251,076 (1,393)
SPI 200 Index Goldman Sachs 2 Mar-19 195,747 606
NET UNREALIZED DEPRECIATION ON FUTURES CONTRACTS (106,955)$
FUTURES CONTRACTS
Global Atlantic BlackRock Disciplined International Core Portfolio
PORTFOLIO OF INVESTMENTS (Continued)
December 31, 2018
70See accompanying notes to financial statements.

FORWARD FOREIGN CURRENCY CONTRACTS
Settlement
Date Counterparty
Currency Units to
Receive Unrealized Depreciation
1/2/2019 Morgan Stanley 10,160 USD 91,144 SEK $ (120)
NET UNREALIZED DEPRECIATION ON FORWARD FOREIGN CURRENCY CONTRACTS $ (120)
Global Atlantic BlackRock Disciplined International Core Portfolio
PORTFOLIO OF INVESTMENTS (Continued)
December 31, 2018
In Exchange For
71See accompanying notes to financial statements.

Shares Value
COMMON STOCKS - 98.3%
ADVERTISING - 0.1%
8,306 Interpublic Group of Cos., Inc. 171,353$
AEROSPACE/DEFENSE - 1.7%
1,760 Curtiss-Wright Corp. 179,731
7,801 Harris Corp. 1,050,405
3,003 HEICO Corp. 232,672
9,512 HEICO Corp. - Class A 599,256
1,036 Raytheon Co. 158,871
2,203 Spirit AeroSystems Holdings, Inc. 158,814
1,503 TransDigm Group, Inc. * 511,110
2,890,859
AIRLINES - 0.1%
1,965 Southwest Airlines Co. 91,333
APPAREL - 1.6%
4,643 Capri Holdings Ltd. * 176,063
8,856 Columbia Sportswear Co. 744,701
9,457 Hanesbrands, Inc. 118,496
767 Ralph Lauren Corp. 79,354
5,959 Skechers U.S.A., Inc. * 136,402
3,537 Under Armour, Inc. * 57,193
2,020 Under Armour, Inc. - Class A * 35,693
19,788 VF Corp. 1,411,676
2,759,578
AUTO MANUFACTURERS - 0.2%
5,741 PACCAR, Inc. 328,041
AUTO PARTS & EQUIPMENT - 0.7%
9,794 Allison Transmission Holdings, Inc. 430,055
4,046 Aptiv PLC 249,112
7,106 BorgWarner Inc. 246,862
9,812 Dana, Inc. 133,738
2,864 Tenneco, Inc. 78,445
1,138,212
BANKS - 1.3%
1,090 BOK Financial Corp. 79,930
14,562 East West Bancorp, Inc. 633,884
2,414 First Republic Bank 209,777
11,232 Morgan Stanley 445,349
1,663 Pinnacle Financial Partners, Inc. 76,664
528 Signature Bank 54,284
1,237 SVB Financial Group * 234,931
Global Atlantic BlackRock Disciplined Mid Cap Growth Portfolio
PORTFOLIO OF INVESTMENTS
December 31, 2018
72See accompanying notes to financial statements.

Shares Value
BANKS (Continued) 1.3%
9,520 Synovus Financial Corp. 304,545$
5,436 Western Alliance BanCorp * 214,666
2,254,030
BEVERAGES - 0.6%
15,555 Brown-Forman Corp. - Class B 740,107
9,570 Keurig Dr Pepper, Inc. 245,375
745 Monster Beverage Corp. * 36,669
1,022,151
BIOTECHNOLOGY - 2.9%
2,677 Alnylam Pharmaceuticals, Inc. * 195,180
7,944 BioMarin Pharmaceutical, Inc. * 676,432
193 Bluebird Bio, Inc. * 19,146
6,590 Celgene Corp. * 422,353
7,093 Exact Sciences Corp. * 447,568
20,969 Exelixis, Inc. * 412,460
8,348 Gilead Sciences, Inc. 522,167
15,752 Incyte Corp. * 1,001,670
8,484 Ionis Pharmaceuticals, Inc. * 458,645
144 Loxo Oncology, Inc. * 20,170
1,258 Sage Therapeutics, Inc. * 120,504
6,799 Seattle Genetics, Inc. * 385,231
749 United Therapeutics Corp. * 81,566
851 Vertex Pharmaceuticals, Inc. * 141,019
4,904,111
BUILDING MATERIALS - 1.5%
1,266 Eagle Materials, Inc. 77,264
3,864 Lennox International, Inc. 845,675
3,156 Martin Marietta Materials, Inc. 542,422
2,026 Masco Corp. 59,240
10,400 Vulcan Materials Co. 1,027,520
2,552,121
CHEMICALS - 1.2%
9,451 Axalta Coating Systems Ltd. * 221,342
9,712 Celanese Corp. 873,789
10,026 Chemours Co. 282,934
2,545 FMC Corp. 188,228
3,679 Huntsman Corp. 70,968
523 International Flavors & Fragrances, Inc. 70,223
1,052 Mosaic Co. 30,729
197 NewMarket Corp. 81,182
1,647 RPM International, Inc. 96,811
1,269 Westlake Chemical Corp. 83,970
1,716 WR Grace & Co. 111,385
2,111,561
Global Atlantic BlackRock Disciplined Mid Cap Growth Portfolio
PORTFOLIO OF INVESTMENTS (Continued)
December 31, 2018
73See accompanying notes to financial statements.

Shares Value
COMMERCIAL SERVICES - 8.1%
421 Aaron's, Inc. 17,703$
1,630 Automatic Data Processing, Inc. 213,726
21,800 Booz Allen Hamilton Holding Corp. 982,526
3,082 Bright Horizons Family Solutions, Inc. * 343,489
4,380 Cintas Corp. 735,796
2,756 CoStar Group, Inc. * 929,709
1,190 Deluxe Corp. 45,744
525 Euronet Worldwide, Inc. * 53,750
2,699 FleetCor Technologies, Inc. * 501,258
2,980 Gartner, Inc. * 380,963
1,172 Green Dot Corp. * 93,197
10,986 H&R Block, Inc. 278,715
6,354 Insperity, Inc. 593,209
2,214 MarketAxess Holdings, Inc. 467,840
8,075 Moody's Corp. 1,130,823
2,192 Morningstar, Inc. 240,769
958 Paylocity Holding Corp. * 57,681
14,665 Robert Half International, Inc. 838,838
9,882 Rollins, Inc. 356,722
9,730 ServiceMaster Global Holdings, Inc. * 357,480
20,012 Square, Inc. * 1,122,473
18,880 Total System Services, Inc. 1,534,755
17,547 TransUnion 996,670
4,437 United Rentals, Inc. * 454,926
24,464 Western Union Co. 417,356
4,106 WEX, Inc. * 575,086
13,721,204
COMPUTERS - 2.2%
310 CACI International, Inc. * 44,649
2,746 Dell Technologies, Inc. - Class C * 134,214
4,477 EPAM Systems, Inc. * 519,377
12,323 Fortinet, Inc. * 867,909
18,096 NetApp, Inc. 1,079,788
8,085 Nutanix, Inc. * 336,255
25,867 Pure Storage, Inc. * 415,941
7,391 Teradata Corp. * 283,519
3,681,652
DISTRIBUTION/WHOLESALE - 1.8%
11,760 Copart, Inc. * 561,893
7,512 Fastenal Co. 392,802
6,539 HD Supply Holdings, Inc. * 245,343
6,211 KAR Auction Services, Inc. 296,389
1,428 Pool Corp. 212,272
3,454 Watsco, Inc. 480,590
2,922 WW Grainger, Inc. 825,056
3,014,345
Global Atlantic BlackRock Disciplined Mid Cap Growth Portfolio
PORTFOLIO OF INVESTMENTS (Continued)
December 31, 2018
74See accompanying notes to financial statements.

Shares Value
DIVERSIFIED FINANCIAL SERVICES - 3.2%
3,074 Alliance Data Systems Corp. 461,346$
862 Cboe Global Markets, Inc. 84,329
13,279 Charles Schwab Corp. 551,477
10,312 Discover Financial Services 608,202
8,668 Eaton Vance Corp. 304,940
8,852 Evercore, Inc. 633,449
7,366 Moelis & Co. 253,243
23,475 SEI Investments Co. 1,084,545
14,055 Synchrony Financial 329,730
12,745 T Rowe Price Group, Inc. 1,176,618
5,487,879
ELECTRICAL - 0.1%
254 Pinnacle West Capital Corp. 21,641
3,174 Portland General Electric Co. 145,528
167,169
ELECTRICAL COMPONENTS & EQUIPMENT- 0.6%
7,549 AMETEK, Inc. 511,067
4,557 Hubbell, Inc. 452,692
706 Universal Display Corp. 66,060
1,029,819
ELECTRONICS - 2.9%
3,989 Agilent Technologies, Inc. 269,098
12,024 Allegion PLC 958,433
12,425 Amphenol Corp. 1,006,674
2,139 FLIR Systems, Inc. 93,132
3,795 Garmin Ltd. 240,299
2,573 Gentex Corp. 52,000
1,151 Mettler-Toledo International, Inc. * 650,983
19,203 National Instruments Corp. 871,432
2,889 Resideo Technologies, Inc. * 59,369
3,578 Waters Corp. * 674,990
4,876,410
ENGINERRING & CONSTRUCTION - 0.1%
555 Fluor Corp. 17,871
7,975 frontdoor, Inc. * 212,215
230,086
ENTERTAINMENT - 0.8%
491 Eldorado Resorts, Inc. * 17,779
5,045 Lions Gate Entertainment Corp. - Class A 81,225
4,571 Lions Gate Entertainment Corp. - Class B 68,016
7,565 Live Nation Entertainment, Inc. * 372,576
3,495 Six Flags Entertainment Corp. 194,427
2,869 Vail Resorts, Inc. 604,843
1,338,866
Global Atlantic BlackRock Disciplined Mid Cap Growth Portfolio
PORTFOLIO OF INVESTMENTS (Continued)
December 31, 2018
75See accompanying notes to financial statements.

Shares Value
ENVIRONMENTAL CONTROL - 0.2%
6,479 Clean Harbors, Inc. * 319,739$
1,368 Republic Services, Inc. 98,619
418,358
FOOD - 1.3%
15,843 Hershey Co. 1,698,053
5,584 Kellogg Co. 318,344
717 Lamb Weston Holdings, Inc. 52,743
2,271 Sprouts Farmers Market, Inc. * 53,390
2,122,530
HAND/MACHINE TOOLS - 0.1%
1,594 Snap-on, Inc. 231,592
HEALTHCARE PRODUCTS - 5.3%
2,621 ABIOMED, Inc. * 851,930
3,150 Align Technology, Inc. * 659,705
9,900 Bruker Corp. 294,723
3,250 Cantel Medical Corp. 241,963
11,439 Edwards Lifesciences Corp. * 1,752,112
3,135 Genomic Health, Inc. * 201,925
1,536 Globus Medical, Inc. * 66,478
6,462 Hill-Rom Holdings, Inc. 572,210
8,617 IDEXX Laboratories, Inc. * 1,602,934
8,068 Masimo Corp. * 866,261
7,412 ResMed, Inc. 844,004
3,015 STERIS PLC 322,153
1,747 Stryker Corp. 273,842
4,425 Varian Medical Systems, Inc. * 501,397
9,051,637
HEALTHCARE - SERVICES - 1.7%
10,757 Centene Corp. * 1,240,282
824 Chemed Corp. 233,423
1,918 Encompass Health Corp. 118,341
195 Humana, Inc. 55,864
1,551 Molina Healthcare, Inc. * 180,257
4,427 WellCare Health Plans, Inc. * 1,045,170
2,873,337
HOME BUILDERS - 0.9%
25,397 DR Horton, Inc. 880,260
3,950 Lennar Corp. 154,643
116 NVR, Inc. * 282,691
3,978 Thor Industries, Inc. 206,855
1,524,449
HOME FURNISHINGS - 0.1%
1,018 Roku, Inc. * 31,192
386 Whirlpool Corp. 41,251
72,443
PORTFOLIO OF INVESTMENTS (Continued)
December 31, 2018
Global Atlantic BlackRock Disciplined Mid Cap Growth Portfolio
76See accompanying notes to financial statements.

Shares Value
HOUSEHOLD PRODUCTS/WARES - 1.7%
5,529 Avery Dennison Corp. 496,670$
22,718 Church & Dwight Co., Inc. 1,493,936
5,247 Clorox Co. 808,772
2,799,378
INSURANCE - 0.1%
1,707 Arthur J. Gallagher & Co. 125,806
2,032 Unum Group 59,700
185,506
INTERNET - 6.8%
2,628 Cargurus, Inc. * 88,642
17,448 CDW Corp. 1,414,160
5,430 Expedia Group, Inc. 611,690
2,005 F5 Networks, Inc. * 324,870
5,371 FireEye, Inc. * 87,064
19,689 GoDaddy, Inc. * 1,291,992
4,706 GrubHub, Inc. * 361,468
3,900 InterActiveCorp. * 713,856
919 Match Group, Inc. 39,306
4,246 Okta, Inc. * 270,895
6,513 Palo Alto Networks, Inc. * 1,226,724
6,904 RingCentral, Inc. * 569,166
12,854 Snap, Inc. * 70,826
698 Stitch Fix, Inc. * 11,929
7,738 TripAdvisor, Inc. * 417,388
3,891 Twilio, Inc. * 347,466
44,689 Twitter, Inc. * 1,284,362
9,437 VeriSign, Inc. * 1,399,413
3,008 Wayfair, Inc. * 270,961
6,926 Yelp, Inc. * 242,341
6,240 Zendesk, Inc. * 364,229
4,124 Zillow Group, Inc. * 130,236
751 Zillow Group, Inc. - Class A * 23,601
11,562,585
IRON/STEEL - 0.1%
5,921 Steel Dynamics, Inc. 177,867
LEISURE - 0.3%
3,907 Norwegian Cruise Line Holdings Ltd. * 165,618
777 Planet Fitness, Inc. * 41,663
4,077 Polaris Industries, Inc. 312,624
519,905
LODGING - 1.8%
7,201 Boyd Gaming Corp. 149,637
21,754 Extended Stay America, Inc. 337,187
21,959 Hilton Worldwide Holdings, Inc. 1,576,656
1,834 Wyndham Destinations, Inc. 65,731
Global Atlantic BlackRock Disciplined Mid Cap Growth Portfolio
PORTFOLIO OF INVESTMENTS (Continued)
December 31, 2018
77See accompanying notes to financial statements.

Shares Value
LODGING (Continued) - 1.8%
7,679 Wyndham Hotels & Resorts, Inc. 348,396$
4,992 Wynn Resorts Ltd. 493,759
2,971,366
MACHINERY - DIVERSIFIED - 2.4%
4,055 AGCO Corp. 225,742
2,213 Cognex Corp. 85,577
1,098 Cummins, Inc. 146,737
15,586 Graco, Inc. 652,274
3,740 IDEX Corp. 472,212
12,392 Rockwell Automation, Inc. 1,864,748
1,551 Roper Technologies, Inc. 413,373
4,215 Xylem, Inc. 281,225
4,141,888
MEDIA - 1.7%
8,233 AMC Networks, Inc. * 451,827
25,587 CBS Corp. 1,118,664
3,376 FactSet Research Systems, Inc. 675,639
320 Liberty Media Corp-Liberty SiriusXM - Class A * 11,776
3,288 Liberty Media Corp-Liberty SiriusXM - Class C * 121,590
2,212 Sinclair Broadcast Group, Inc. 58,264
76,752 Sirius XM Holdings, Inc. 438,254
1,748 World Wrestling Entertainment, Inc. 130,611
3,006,625
MISCELLANEOUS MANUFACTURER - 2.7%
19,294 Crane Co. 1,392,641
8,061 Donaldson Co., Inc. 349,767
2,202 Hexcel Corp. 126,263
1,625 Illinois Tool Works, Inc. 205,871
16,981 Ingersoll-Rand PLC 1,549,177
2,270 ITT, Inc. 109,573
3,681 Parker-Hannifin Corp. 548,984
6,733 Textron, Inc. 309,651
4,591,927
OFFICE/BUSINESS EQUIPMENT - 0.4%
4,413 Zebra Technologies Corp. * 702,682
OIL & GAS - 0.9%
7,336 Anadarko Petroleum Corp. 321,610
16,952 Antero Resources Corp. * 159,179
19,853 Cabot Oil & Gas Corp. 443,715
1,988 Concho Resources, Inc. * 204,347
6,732 Continental Resources, Inc. * 270,559
4,479 Nabors Industries Ltd. 8,958
4,692 Newfield Exploration Co. * 68,785
2,403 Parsley Energy, Inc. * 38,400
Global Atlantic BlackRock Disciplined Mid Cap Growth Portfolio
PORTFOLIO OF INVESTMENTS (Continued)
December 31, 2018
78See accompanying notes to financial statements.

Shares Value
OIL & GAS (Continued) - 0.9%
940 Whiting Petroleum Corp. * 21,329$
1,536,882
OIL & GAS SERVICES - 0.1%
5,086 Halliburton Co. 135,186
PACKAGING & CONTAINERS - 0.5%
9,182 Packaging Corp. of America 766,330
1,585 Westrock Co. 59,850
826,180
PHARMACEUTICALS - 2.9%
1,185 AbbVie, Inc. 109,245
1,101 Agios Pharmaceuticals, Inc. * 50,767
5,609 Alkermes PLC * 165,522
15,348 AmerisourceBergen Corp. 1,141,891
5,775 Cardinal Health, Inc. 257,565
6,309 DexCom, Inc. * 755,818
1,138 Herbalife Nutrition Ltd. * 67,085
4,601 Jazz Pharmaceuticals PLC * 570,340
2,548 McKesson Corp. 281,478
8,546 Nektar Therapeutics * 280,907
5,935 Neurocrine Biosciences, Inc. * 423,818
3,539 PRA Health Sciences, Inc. * 325,446
2,990 Sarepta Therapeutics, Inc. * 326,299
2,421 TESARO, Inc. * 179,759
4,935,940
PIPELINES - 0.4%
9,874 Cheniere Energy, Inc. * 584,442
1,679 Kinder Morgan, Inc. 25,823
1,523 Plains GP Holdings LP 30,612
640,877
REAL ESTATE - 0.1%
1,866 CBRE Group, Inc. * 74,715
REAL ESTATE INVESTMENT TRUSTS - 2.4%
2,676 CoreSite Realty Corp. 233,427
8,266 Equity LifeStyle Properties, Inc. 802,877
3,894 Extra Space Storage, Inc. 352,329
1,266 Host Hotels & Resorts, Inc. 21,104
6,297 Lamar Advertising Co. 435,626
11,228 Prologis, Inc. 659,308
6,401 Realty Income Corp. 403,519
6,696 SBA Communications Corp. * 1,084,015
3,992,205
RETAIL - 8.4%
1,750 Advance Auto Parts, Inc. 275,555
2,725 AutoNation, Inc. * 97,283
Global Atlantic BlackRock Disciplined Mid Cap Growth Portfolio
PORTFOLIO OF INVESTMENTS (Continued)
December 31, 2018
79See accompanying notes to financial statements.

Shares Value
RETAIL (Continued) - 8.4%
1,356 AutoZone, Inc. * 1,136,789$
3,772 Best Buy Co., Inc. 199,765
1,353 BJ's Wholesale Club Holdings, Inc. * 29,982
4,024 Burlington Stores, Inc. * 654,584
1,403 CarMax, Inc. * 88,010
1,466 Chipotle Mexican Grill, Inc. * 633,004
4,559 Darden Restaurants, Inc. 455,262
11,121 Dollar General Corp. 1,201,958
4,349 Domino's Pizza Inc. 1,078,509
8,543 Dunkin' Brands Group, Inc. 547,777
1,566 Five Below, Inc. * 160,233
7,336 Lululemon Athletica Inc. * 892,131
6,188 Michaels Cos., Inc. * 83,786
7,038 Nordstrom Inc. 328,041
4,946 O'Reilly Automotive Inc. * 1,703,056
3,545 Penske Automotive Group Inc. 142,934
25,219 Ross Stores Inc. 2,098,221
10,889 Target Corp. 719,654
7,898 Tractor Supply Co. 659,009
3,470 Ulta Beauty Inc. * 849,595
3,692 Urban Outfitters Inc. * 122,574
6,207 Wendy's Co. 96,891
316 Williams-Sonoma Inc. 15,942
14,270,545
SEMICONDUCTORS - 5.4%
49,618 Advanced Micro Devices, Inc. * 915,948
5,872 Analog Devices, Inc. 503,994
11,266 Applied Materials, Inc. 368,849
5,208 Cirrus Logic, Inc. * 172,801
7,506 KLA-Tencor Corp. 671,712
10,780 Lam Research Corp. 1,467,913
1 Marvell Technology Group Ltd. 16
27,730 Maxim Integrated Products, Inc. 1,410,071
820 MKS Instruments, Inc. 52,980
102 NVIDIA Corp. 13,617
33,406 ON Semiconductor Corp. * 551,533
5,649 Silicon Laboratories, Inc. * 445,198
11,367 Skyworks Solutions, Inc. 761,816
2,644 Teradyne, Inc. 82,969
19,758 Xilinx, Inc. 1,682,789
9,102,206
SHIPBUILDING - 0.3%
2,496 Huntington Ingalls Industries, Inc. 475,014
SOFTWARE - 14.7%
9,483 Akamai Technologies, Inc. * 579,222
Global Atlantic BlackRock Disciplined Mid Cap Growth Portfolio
PORTFOLIO OF INVESTMENTS (Continued)
December 31, 2018
80See accompanying notes to financial statements.

Shares Value
SOFTWARE (Continued) - 14.7%
1,735 ANSYS, Inc. * 248,001$
2,559 athenahealth, Inc. * 337,609
7,617 Atlassian Corp. PLC * 677,761
9,007 Autodesk, Inc. * 1,158,390
10,457 Black Knight, Inc. * 471,192
10,078 Box, Inc. * 170,117
10,662 Broadridge Financial Solutions, Inc. 1,026,218
22,736 Cadence Design Systems, Inc. * 988,561
11,152 CDK Global, Inc. 533,958
9,055 Cerner Corp. * 474,844
7,726 Citrix Systems, Inc. 791,606
4,359 DocuSign, Inc. * 174,709
8,409 Dropbox, Inc. * 171,796
735 Electronic Arts, Inc. * 57,999
3,349 Fidelity National Information Services, Inc. 343,440
45,037 First Data Corp. * 761,576
11,695 Fiserv, Inc. * 859,466
557 HubSpot, Inc. * 70,032
370 Intuit, Inc. 72,835
2,094 Jack Henry & Associates, Inc. 264,933
8,698 Manhattan Associates, Inc. * 368,534
1,038 MSCI, Inc. 153,032
3,020 New Relic, Inc. * 244,529
19,464 Paychex, Inc. 1,268,080
2,338 Paycom Software, Inc. * 286,288
1,028 Pegasystems, Inc. 49,169
2,276 Pivotal Software, Inc. * 37,213
5,430 PTC, Inc. * 450,147
3,721 RealPage, Inc. * 179,315
11,321 Red Hat, Inc. * 1,988,420
4,282 salesforce.com, Inc. * 586,506
12,218 ServiceNow, Inc. * 2,175,415
7,383 Splunk, Inc. * 774,108
13,740 SS&C Technologies Holdings, Inc. 619,811
8,756 Synopsys, Inc. * 737,605
5,977 Tableau Software, Inc. * 717,240
2,481 Take-Two Interactive Software, Inc. * 255,394
715 Tyler Technologies, Inc. * 132,861
4,178 Ultimate Software Group, Inc. * 1,023,067
12,962 Veeva Systems, Inc. * 1,157,766
88 Vmware, Inc. 12,067
8,604 Workday, Inc. * 1,373,887
24,824,719
TELECOMMUNICATIONS - 1.1%
4,103 Arista Networks, Inc. * 864,502
6,484 Ciena Corp. * 219,872
PORTFOLIO OF INVESTMENTS (Continued)
December 31, 2018
Global Atlantic BlackRock Disciplined Mid Cap Growth Portfolio
81See accompanying notes to financial statements.

Shares Value
TELECOMMUNICATIONS (Continued) - 1.1%
1,866 LogMeIn, Inc. 152,210$
5,384 Motorola Solutions, Inc. 619,375
3,571 Zayo Group Holdings, Inc. * 81,562
1,937,521
TRANSPORTATION - 1.8%
8,697 CH Robinson Worldwide, Inc. 731,331
3,892 Expeditors International of Washington, Inc. 265,006
5,954 JB Hunt Transport Services, Inc. 553,960
11,030 Landstar System, Inc. 1,055,240
15,254 Schneider National, Inc. 284,790
3,979 XPO Logistics, Inc. * 226,962
3,117,289
TOTAL COMMON STOCKS (Cost - $172,734,861) 166,594,134
SHORT-TERM INVESTMENT - 1.6%
MONEY MARKET FUND - 1.6%
2,610,777 Fidelity Investments Money Market Funds - Government Portfolio, Institutional Class
to yield 2.25% (a)(Cost - $2,610,777) 2,610,777
TOTAL INVESTMENTS - 99.9% (Cost - $175,345,638) 169,204,911$
OTHER ASSETS LESS LIABILITIES - NET - 0.1% 233,190
TOTAL NET ASSETS - 100.0% 169,438,101$
* Non-Income producing security.
PLC - Public Limited Company
(a) Money market rate shown represents the rate at December 31, 2018.
Description Counterparty Contracts Expiration Date Notional Value
Unrealized
Depreciation
LONG
S&P 500 E-mini Future Goldman Sachs 23 Mar-19 2,880,980$ (86,945)$
NET UNREALIZED DEPRECIATION ON FUTURES CONTRACTS (86,945)$
FUTURES CONTRACTS
Global Atlantic BlackRock Disciplined Mid Cap Growth Portfolio
PORTFOLIO OF INVESTMENTS (Continued)
December 31, 2018
82See accompanying notes to financial statements.

Shares Value
COMMON STOCKS - 97.6%
ADVERTISING - 0.3%
407 Trade Desk, Inc. * 47,236$
AEROSPACE/DEFENSE - 1.1%
433 Aerojet Rocketdyne Holdings, Inc. * 15,255
438 Curtiss-Wright, Corp. 44,729
515 Esterline Technologies, Corp. * 62,547
545 MSA Safety, Inc. 51,376
173,907
AGRICULTURE - 0.0% ^
1,865 Vector Group Ltd. 18,146
AIRLINES - 0.3%
923 Hawaiian Holdings, Inc. 24,376
225 SkyWest, Inc. 10,006
263 Spirit Airlines, Inc. * 15,233
49,615
APPAREL - 1.3%
318 Columbia Sportswear Co. 26,741
1,821 Crocs, Inc. * 47,310
455 Deckers Outdoor Corp. * 58,217
415 Oxford Industries, Inc. 29,482
1,352 Wolverine World Wide, Inc. 43,114
204,864
AUTO MANUFACTURERS - 0.1%
458 Navistar International Corp. * 11,885
AUTO PARTS & EQUIPMENT - 0.9%
383 Altra Industrial Motion Corp. 9,632
174 Cooper-Standard Holdings, Inc. * 10,809
2,773 Dana, Inc. 37,796
1,114 Meritor, Inc. * 18,838
865 Modine Manufacturing Co. * 9,351
1,530 Tenneco, Inc. 41,907
732 Tower International, Inc. 17,421
145,754
BANKS - 8.8%
1,637 Bank of Commerce Holdings 17,942
183 Banner Corp. 9,787
284 BOK Financial Corp. 20,826
4,679 Boston Private Financial Holdings, Inc. 49,457
2,030 Cadence BanCorp 34,063
330 Carolina Financial Corp. 9,765
2,312 Cathay General Bancorp 77,521
Global Atlantic BlackRock Disciplined Small Cap Portfolio
PORTFOLIO OF INVESTMENTS
December 31, 2018
83See accompanying notes to financial statements.

Shares Value
BANKS (Continued) - 8.8%
79 Eagle Bancorp, Inc. * 3,848$
759 FCB Financial Holdings, Inc. * 25,487
3,140 First Commonwealth Financial Corp. 37,931
406 First Horizon National Corp. 5,343
1,239 First of Long Island Corp. 24,718
1,971 Flagstar Bancorp, Inc. * 52,034
1,395 Glacier Bancorp, Inc. 55,270
302 Guaranty Bancorp 6,267
1,990 Hanmi Financial Corp. 39,203
1,449 Heritage Commerce Corp. 16,432
2,097 Home BancShares, Inc. 34,265
455 HomeStreet, Inc. * 9,660
3,938 Hope Bancorp, Inc. 46,705
3,186 Independent Bank Corp. 66,970
404 International Bancshares Corp. 13,898
2,417 Lakeland Financial Corp. 97,067
3,085 LCNB Corp. 46,738
1,051 MBT Financial Corp. 9,774
745 Merchants Bancorp 14,870
567 National Bank Holdings Corp. 17,503
502 Preferred Bank 21,762
1,047 QCR Holdings, Inc. 33,598
510 Republic Bancorp, Inc. * 19,747
1,015 Republic First Bancorp, Inc. 6,060
2,046 Sandy Spring Bancorp, Inc. 64,122
520 Shore Bancshares, Inc. 7,561
797 Sierra Bancorp 19,152
1,284 SmartFinancial, Inc. * 23,459
621 South State Corp. 37,229
37 Sterling Bancorp, Inc. 257
541 TriCo Bancshares 18,280
3,832 TriState Capital Holdings, Inc. * 74,571
667 United Bankshares, Inc. 20,750
4,616 United Community Banks, Inc. 99,059
191 Walker & Dunlop, Inc. 8,261
1,154 West Bancorporation, Inc. 22,030
1,717 Wintrust Financial Corp. 114,161
1,433,403
BIOTECHNOLOGY - 3.2%
4,507 Achillion Pharmaceuticals, Inc. * 7,166
1,093 Alder Biopharmaceuticals, Inc. * 11,203
807 AMAG Pharmaceuticals, Inc. * 12,258
875 Amicus Therapeutics, Inc. * 8,383
2,190 Ardelyx, Inc. * 3,920
December 31, 2018
Global Atlantic BlackRock Disciplined Small Cap Portfolio
PORTFOLIO OF INVESTMENTS (Continued)
84See accompanying notes to financial statements.

Shares Value
BIOTECHNOLOGY (Continued) - 3.2%
510 Assembly Biosciences, Inc. * 11,536$
298 Atara Biotherapeutics, Inc. * 10,353
152 Blueprint Medicines Corp. * 8,194
1,099 Calithera Biosciences, Inc. * 4,407
429 Cambrex Corp. * 16,199
1,062 ChemoCentryx, Inc. * 11,586
905 CytomX Therapeutics, Inc. * 13,666
313 Editas Medicine, Inc. * 7,121
510 Emergent BioSolutions, Inc. * 30,233
2,668 Enzo Biochem, Inc. * 7,417
382 Exact Sciences Corp. * 24,104
337 FibroGen, Inc. * 15,596
216 Five Prime Therapeutics, Inc. * 2,009
1,472 Halozyme Therapeutics, Inc. * 21,535
107 Intercept Pharmaceuticals, Inc. * 10,785
269 Ligand Pharmaceuticals, Inc. * 36,503
270 Loxo Oncology, Inc. * 37,819
1,069 Medicines Co. * 20,461
807 Myriad Genetics, Inc. * 23,459
3,592 Nymox Pharmaceutical Corp. * 4,706
2,915 PDL BioPharma, Inc. * 8,454
648 Prothena Corp. PLC * 6,674
165 Puma Biotechnology, Inc. * 3,358
382 REGENXBIO, Inc. * 16,025
720 Retrophin, Inc. * 16,294
248 Sage Therapeutics, Inc. * 23,756
1,095 Sangamo Therapeutics, Inc. * 12,571
225 Spark Therapeutics, Inc. * 8,807
474 Spectrum Pharmaceuticals, Inc. * 4,148
258 Ultragenyx Pharmaceutical, Inc. * 11,218
3,484 Veracyte, Inc. * 43,826
2,433 ZIOPHARM Oncology, Inc. * 4,550
520,300
BUILDING MATERIALS - 1.6%
402 Boise Cascade Co. 9,588
2,392 Builders FirstSource, Inc. * 26,097
515 Continental Building Products, Inc. * 13,107
1,005 Griffon Corp. 10,502
178 JELD-WEN Holding, Inc. * 2,529
782 Louisiana-Pacific Corp. 17,376
5,394 LSI Industries, Inc. 17,099
540 Patrick Industries, Inc. * 15,989
828 PGT Innovations, Inc. * 13,124
716 Summit Materials, Inc. * 8,878
Global Atlantic BlackRock Disciplined Small Cap Portfolio
PORTFOLIO OF INVESTMENTS (Continued)
December 31, 2018
85See accompanying notes to financial statements.

Shares Value
BUILDING MATERIALS (Continued) - 1.6%
1,054 Trex Co., Inc. * 62,565$
2,616 Universal Forest Products, Inc. 67,911
264,765
CHEMICALS - 1.9%
490 AdvanSix, Inc. * 11,927
1,297 Ferro Corp. * 20,337
718 GCP Applied Technologies, Inc. * 17,627
1,075 HB Fuller Co. 45,870
587 Ingevity Corp. * 49,126
1,131 Innospec, Inc. 69,851
824 Koppers Holdings, Inc. * 14,041
306 Kraton Corp. * 6,683
1,298 PolyOne Corp. 37,123
418 Stepan Co. 30,931
303,516
COAL - 0.2%
1,027 Peabody Energy Corp. 31,303
COMMERCIAL SERVICES - 5.1%
649 Aaron's, Inc. 27,290
575 AMN Healthcare Services, Inc. * 32,580
1,145 ASGN, Inc. * 62,403
279 Avis Budget Group, Inc. * 6,272
1,122 Care.com, Inc. * 21,666
1,179 Carriage Services, Inc. 18,275
390 Cimpress NV * 40,334
383 CorVel Corp. * 23,639
640 CRA International, Inc. 27,232
125 Forrester Research, Inc. 5,588
176 Grand Canyon Education, Inc. * 16,921
659 Green Dot Corp. * 52,404
370 HealthEquity, Inc. * 22,071
981 Insperity, Inc. 91,586
604 Kelly Services, Inc. 12,370
1,894 Kforce, Inc. 58,562
1,414 Korn/Ferry International 55,910
687 Laureate Education, Inc. * 10,470
1,242 LiveRamp Holdings, Inc. * 47,978
1,092 Matthews International Corp. 44,357
80 Medifast, Inc. 10,002
282 National Research Corp. 10,755
267 Nutrisystem, Inc. 11,716
616 Paylocity Holding Corp. * 37,089
762 Quad/Graphics, Inc. 9,388
Global Atlantic BlackRock Disciplined Small Cap Portfolio
PORTFOLIO OF INVESTMENTS (Continued)
December 31, 2018
86See accompanying notes to financial statements.

Shares Value
COMMERCIAL SERVICES - 5.1% (Continued)
393 Sotheby's * 15,618$
690 SP Plus Corp. * 20,383
262 Strategic Education, Inc. 29,716
301 Weight Watchers International, Inc. * 11,600
834,175
COMPUTERS - 1.9%
35 CACI International, Inc. * 5,041
571 EPAM Systems, Inc. * 66,242
507 Insight Enterprises, Inc. * 20,660
376 Lumentum Holdings, Inc. * 15,796
1,132 Mitek Systems, Inc. * 12,237
671 NetScout Systems, Inc. * 15,856
648 Nutanix, Inc. * 26,950
1,696 Pure Storage, Inc. * 27,272
332 Qualys, Inc. * 24,814
651 Rapid7, Inc. * 20,285
748 Varonis Systems, Inc. * 39,569
511 Virtusa Corp. * 21,763
382 Vocera Communications, Inc. * 15,032
311,517
COSMETICS/PERSONAL CARE - 0.3%
759 Inter Parfums, Inc. 49,768
DISTRIBUTION/WHOLESALE - 0.9%
1,573 Core-Mark Holding Co, Inc. 36,572
1,503 Essendant, Inc. 18,908
321 Fossil Group, Inc. * 5,049
453 H&E Equipment Services, Inc. 9,250
303 Nexeo Solutions, Inc. * 2,603
1,922 ScanSource, Inc. * 66,078
457 Systemax, Inc. 10,918
149,378
DIVERSIFIED FINANCIAL SERVICES - 1.6%
2,067 BrightSphere Investment Group PLC 22,076
982 Enova International, Inc. * 19,110
86 Evercore, Inc. 6,154
446 Federal Agricultural Mortgage Corp. 26,956
2,425 Ladenburg Thalmann Financial Services, Inc. 5,650
3,331 LendingClub Corp. * 8,761
31 LendingTree, Inc. * 6,807
13,134 Medley Management, Inc. 50,697
1,278 Moelis & Co. 43,938
98 Mr. Cooper Group, Inc. * 1,144
368 Piper Jaffray Cos 24,229
Global Atlantic BlackRock Disciplined Small Cap Portfolio
PORTFOLIO OF INVESTMENTS (Continued)
December 31, 2018
87See accompanying notes to financial statements.

Shares Value
DIVERSIFIED FINANCIAL SERVICES - 1.6% (Continued)
321 Stifel Financial Corp. 13,296$
689 WageWorks, Inc. * 18,713
297 Westwood Holdings Group, Inc. 10,098
257,629
ELECTRIC - 2.7%
604 Avista Corp. 25,658
906 Black Hills Corp. 56,879
1,517 Clearway Energy, Inc. 26,168
3,338 Clearway Energy, Inc. - Class A 56,479
2,363 IDACORP, Inc. 219,901
1,131 PNM Resources, Inc. 46,473
760 Vistra Energy Corp. * 17,396
448,954
ELECTRICAL COMPONENTS & EQUIPMENT- 0.8%
398 EnerSys 30,889
1,593 Generac Holdings, Inc. * 79,172
147 Littelfuse, Inc. 25,208
135,269
ELECTRONICS - 3.7%
625 Advanced Energy Industries, Inc. * 26,831
2,312 AVX Corp. 35,258
1,453 Brady Corp. 63,147
627 Control4 Corp. * 11,035
6,967 Fitbit, Inc. * 34,626
2,043 GoPro, Inc. * 8,662
951 OSI Systems, Inc. * 69,708
644 Stoneridge, Inc. * 15,875
918 SYNNEX Corp. 74,211
467 Tech Data Corp. * 38,205
3,747 Vishay Intertechnology, Inc. 67,483
531 Vishay Precision Group, Inc. * 16,052
1,298 Watts Water Technologies, Inc. 83,760
848 Woodward, Inc. 62,998
607,851
ENERGY - ALTERNATE SOURCES- 0.2%
4,224 Pacific Ethanol, Inc. * 3,637
649 Renewable Energy Group, Inc. * 16,679
128 REX American Resources Corp. * 8,718
29,034
ENGINEERING & CONSTRUCTION - 1.1%
1,153 Comfort Systems USA, Inc. 50,363
545 EMCOR Group, Inc. 32,531
1,082 MasTec, Inc. * 43,886
694 MYR Group, Inc. * 19,550
Global Atlantic BlackRock Disciplined Small Cap Portfolio
PORTFOLIO OF INVESTMENTS (Continued)
December 31, 2018
88See accompanying notes to financial statements.

Shares Value
ENGINEERING & CONSTRUCTION - 1.1% (Continued)
973 Primoris Services Corp. 18,613$
275 TopBuild Corp. * 12,375
177,318
ENTERTAINMENT - 0.9%
652 AMC Entertainment Holdings, Inc. 8,007
473 Eldorado Resorts, Inc. * 17,127
1,642 IMAX Corp. * 30,886
310 Marriott Vacations Worldwide Corp. 21,858
205 Penn National Gaming, Inc. * 3,860
461 Scientific Games Corp. * 8,243
2,418 SeaWorld Entertainment, Inc. * 53,414
143,395
ENVIRONMENTAL CONTROL - 0.0% ^
291 Tetra Tech, Inc. 15,065
FOOD - 1.2%
200 Calavo Growers, Inc. 14,592
545 Chefs' Warehouse, Inc. * 17,429
3,512 Dean Foods Co. 13,381
5 J&J Snack Foods Corp. 723
417 John B Sanfilippo & Son, Inc. 23,210
2,467 Performance Food Group Co. * 79,610
128 Sanderson Farms, Inc. 12,709
4,322 Smart & Final Stores, Inc. * 20,486
790 United Natural Foods, Inc. * 8,366
190,506
FOREST PRODUCTS & PAPER - 0.2%
1,045 Schweitzer-Mauduit International, Inc. 26,177
GAS - 0.8%
780 Chesapeake Utilities Corp. 63,414
778 Southwest Gas Holdings, Inc. 59,517
122,931
HAND/MACHINE TOOLS - 0.2%
202 Kennametal, Inc. 6,723
2,019 Milacron Holdings Corp. * 24,006
30,729
HEALTHCARE PRODUCTS - 4.8%
3,283 Accuray, Inc. * 11,195
1,266 AtriCure, Inc. * 38,740
27 Atrion Corp. 20,009
641 Cantel Medical Corp. 47,722
680 CONMED Corp. 43,656
619 Genomic Health, Inc. * 39,870
Global Atlantic BlackRock Disciplined Small Cap Portfolio
PORTFOLIO OF INVESTMENTS (Continued)
December 31, 2018
89See accompanying notes to financial statements.

Shares Value
HEALTHCARE PRODUCTS (Continued) - 4.8%
882 Globus Medical, Inc. * 38,173$
359 Haemonetics Corp. * 35,918
215 ICU Medical, Inc. * 49,370
306 Inogen, Inc. * 37,996
583 Insulet Corp. * 46,244
157 Integer Holdings Corp. * 11,973
628 Intersect ENT, Inc. * 17,697
251 LivaNova PLC * 22,959
506 Luminex Corp. 11,694
987 Masimo Corp. * 105,974
246 Merit Medical Systems, Inc. * 13,729
1,095 MiMedx Group, Inc. * 1,960
230 Nevro Corp. * 8,945
551 Novocure Ltd. * 18,447
1,722 NxStage Medical, Inc. * 49,284
350 Penumbra, Inc. * 42,770
209 Repligen Corp. * 11,023
203 STAAR Surgical Co. * 6,478
321 Surmodics, Inc. * 15,170
264 Tandem Diabetes Care, Inc. * 10,024
1,104 Wright Medical Group NV * 30,051
787,071
HEALTHCARE - SERVICES - 2.4%
684 American Renal Associates Holdings, Inc. * 7,880
1,713 Catalent, Inc. * 53,411
147 Chemed Corp. 41,642
743 Encompass Health Corp. 45,843
768 Ensign Group, Inc. 29,791
2,135 Invitae Corp. * 23,613
592 LHC Group, Inc. * 55,577
845 Medpace Holdings, Inc. * 44,726
181 Molina Healthcare, Inc. * 21,036
689 Natera, Inc. * 9,618
123 National HealthCare Corp. 9,649
991 Select Medical Holdings Corp. * 15,212
674 Syneos Health, Inc. * 26,522
410 Tenet Healthcare Corp. * 7,027
159 Tivity Health, Inc. * 3,945
395,492
HOME BUILDERS - 1.2%
1,085 Beazer Homes USA, Inc. * 10,286
303 Century Communities, Inc. * 5,230
291 LCI Industries 19,439
2,701 MDC Holdings, Inc. 75,925
Global Atlantic BlackRock Disciplined Small Cap Portfolio
PORTFOLIO OF INVESTMENTS (Continued)
December 31, 2018
90See accompanying notes to financial statements.
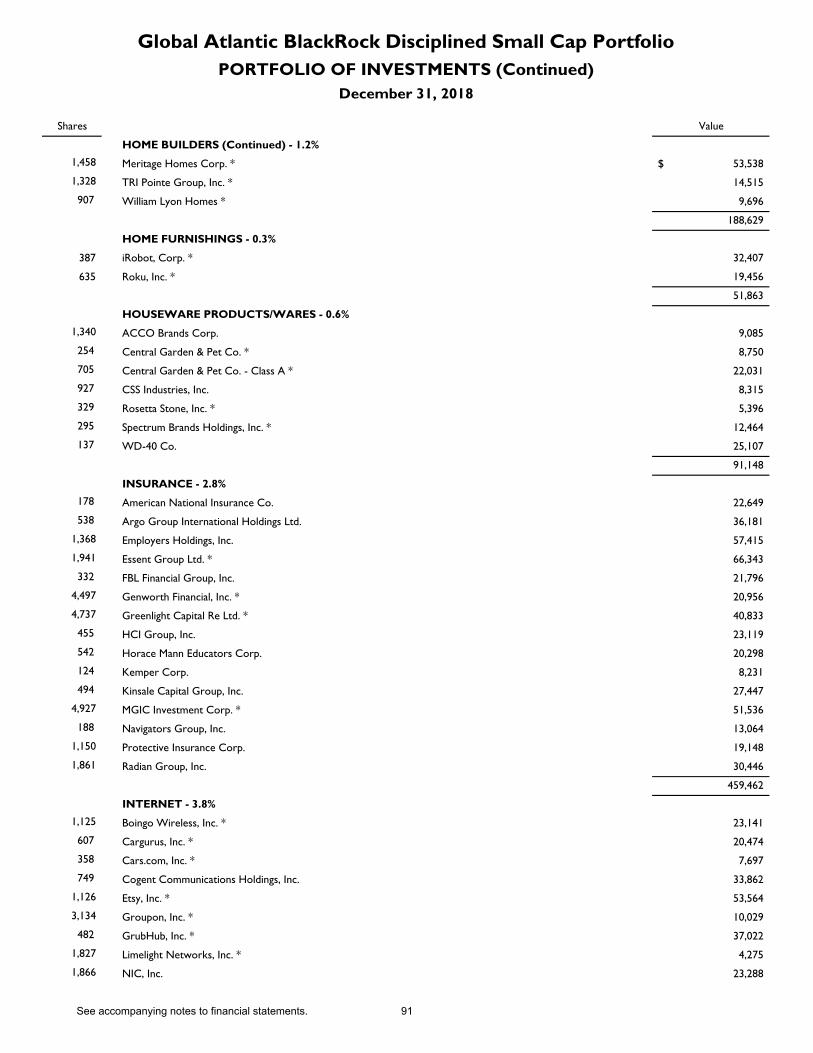
Shares Value
HOME BUILDERS (Continued) - 1.2%
1,458 Meritage Homes Corp. * 53,538$
1,328 TRI Pointe Group, Inc. * 14,515
907 William Lyon Homes * 9,696
188,629
HOME FURNISHINGS - 0.3%
387 iRobot, Corp. * 32,407
635 Roku, Inc. * 19,456
51,863
HOUSEWARE PRODUCTS/WARES - 0.6%
1,340 ACCO Brands Corp. 9,085
254 Central Garden & Pet Co. * 8,750
705 Central Garden & Pet Co. - Class A * 22,031
927 CSS Industries, Inc. 8,315
329 Rosetta Stone, Inc. * 5,396
295 Spectrum Brands Holdings, Inc. * 12,464
137 WD-40 Co. 25,107
91,148
INSURANCE - 2.8%
178 American National Insurance Co. 22,649
538 Argo Group International Holdings Ltd. 36,181
1,368 Employers Holdings, Inc. 57,415
1,941 Essent Group Ltd. * 66,343
332 FBL Financial Group, Inc. 21,796
4,497 Genworth Financial, Inc. * 20,956
4,737 Greenlight Capital Re Ltd. * 40,833
455 HCI Group, Inc. 23,119
542 Horace Mann Educators Corp. 20,298
124 Kemper Corp. 8,231
494 Kinsale Capital Group, Inc. 27,447
4,927 MGIC Investment Corp. * 51,536
188 Navigators Group, Inc. 13,064
1,150 Protective Insurance Corp. 19,148
1,861 Radian Group, Inc. 30,446
459,462
INTERNET - 3.8%
1,125 Boingo Wireless, Inc. * 23,141
607 Cargurus, Inc. * 20,474
358 Cars.com, Inc. * 7,697
749 Cogent Communications Holdings, Inc. 33,862
1,126 Etsy, Inc. * 53,564
3,134 Groupon, Inc. * 10,029
482 GrubHub, Inc. * 37,022
1,827 Limelight Networks, Inc. * 4,275
1,866 NIC, Inc. 23,288
Global Atlantic BlackRock Disciplined Small Cap Portfolio
PORTFOLIO OF INVESTMENTS (Continued)
December 31, 2018
91See accompanying notes to financial statements.
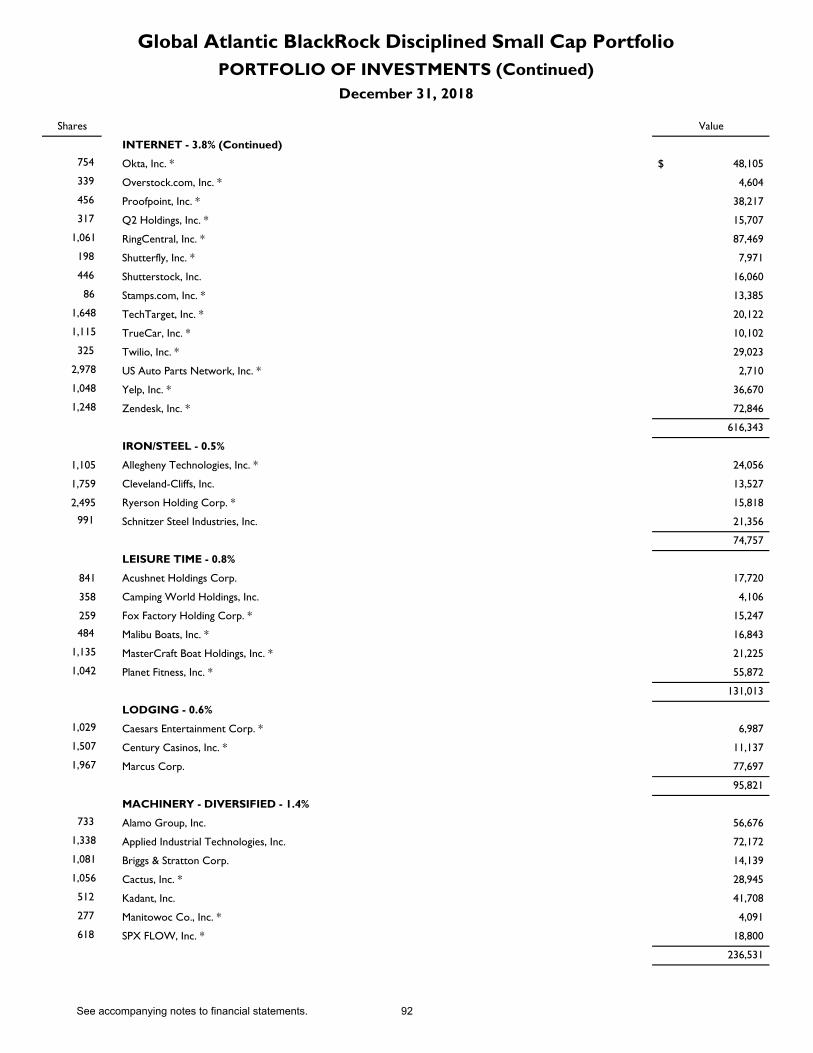
Shares Value
INTERNET - 3.8% (Continued)
754 Okta, Inc. * 48,105$
339 Overstock.com, Inc. * 4,604
456 Proofpoint, Inc. * 38,217
317 Q2 Holdings, Inc. * 15,707
1,061 RingCentral, Inc. * 87,469
198 Shutterfly, Inc. * 7,971
446 Shutterstock, Inc. 16,060
86 Stamps.com, Inc. * 13,385
1,648 TechTarget, Inc. * 20,122
1,115 TrueCar, Inc. * 10,102
325 Twilio, Inc. * 29,023
2,978 US Auto Parts Network, Inc. * 2,710
1,048 Yelp, Inc. * 36,670
1,248 Zendesk, Inc. * 72,846
616,343
IRON/STEEL - 0.5%
1,105 Allegheny Technologies, Inc. * 24,056
1,759 Cleveland-Cliffs, Inc. 13,527
2,495 Ryerson Holding Corp. * 15,818
991 Schnitzer Steel Industries, Inc. 21,356
74,757
LEISURE TIME - 0.8%
841 Acushnet Holdings Corp. 17,720
358 Camping World Holdings, Inc. 4,106
259 Fox Factory Holding Corp. * 15,247
484 Malibu Boats, Inc. * 16,843
1,135 MasterCraft Boat Holdings, Inc. * 21,225
1,042 Planet Fitness, Inc. * 55,872
131,013
LODGING - 0.6%
1,029 Caesars Entertainment Corp. * 6,987
1,507 Century Casinos, Inc. * 11,137
1,967 Marcus Corp. 77,697
95,821
MACHINERY - DIVERSIFIED - 1.4%
733 Alamo Group, Inc. 56,676
1,338 Applied Industrial Technologies, Inc. 72,172
1,081 Briggs & Stratton Corp. 14,139
1,056 Cactus, Inc. * 28,945
512 Kadant, Inc. 41,708
277 Manitowoc Co., Inc. * 4,091
618 SPX FLOW, Inc. * 18,800
236,531
Global Atlantic BlackRock Disciplined Small Cap Portfolio
PORTFOLIO OF INVESTMENTS (Continued)
December 31, 2018
92See accompanying notes to financial statements.

Shares Value
MEDIA - 0.9%
1,456 Entercom Communications Corp. 8,314$
4,818 Entravision Communications Corp. 14,020
2,003 Gray Television, Inc. * 29,524
222 Meredith Corp. 11,531
666 MSG Networks, Inc. * 15,691
190 Nexstar Media Group, Inc. 14,942
314 Sinclair Broadcast Group, Inc. 8,271
1,921 Townsquare Media, Inc. 7,838
480 World Wrestling Entertainment, Inc. 35,866
145,997
METAL FABRICATE/HARDWARE - 0.8%
570 CIRCOR International, Inc. * 12,141
3,607 Rexnord Corp. * 82,781
1,088 TimkenSteel Corp. * 9,509
975 Worthington Industries, Inc. 33,969
138,400
MINING - 0.3%
6,536 Hecla Mining Co. 15,425
248 Kaiser Aluminum Corp. 22,144
320 Materion Corp. 14,397
51,966
MISCELLANEOUS MANUFACTURER - 1.3%
230 Ambarella, Inc. * 8,045
618 Axon Enterprise, Inc. * 27,038
311 EnPro Industries, Inc. 18,691
816 ESCO Technologies, Inc. 53,815
393 Harsco Corp. * 7,805
34 Hillenbrand, Inc. 1,290
142 John Bean Technologies Corp. 10,197
128 Proto Labs, Inc. * 14,437
366 Raven Industries, Inc. 13,246
430 Standex International Corp. 28,887
523 Trinseo SA 23,943
207,394
OFFICE FURNISHINGS - 0.3%
2,204 Interface, Inc. 31,407
1,019 Kimball International, Inc. 14,460
45,867
OIL & GAS - 1.8%
475 Carrizo Oil & Gas, Inc. * 5,363
854 CVR Energy, Inc. 29,446
550 Delek US Holdings, Inc. 17,881
3,248 Denbury Resources, Inc. * 5,554
3,289 Eclipse Resources Corp. * 3,453
Global Atlantic BlackRock Disciplined Small Cap Portfolio
PORTFOLIO OF INVESTMENTS (Continued)
December 31, 2018
93See accompanying notes to financial statements.

Shares Value
OIL & GAS - 1.8% (Continued)
5,928 Ensco PLC 21,104$
5,122 Evolution Petroleum Corp. 34,932
2,629 Gulfport Energy Corp. * 17,220
1,404 HighPoint Resources Corp. * 3,496
1,933 Matador Resources Co. * 30,019
7,271 Noble Corp. PLC * 19,050
1,907 Oasis Petroleum, Inc. * 10,546
124 Parker Drilling Co. * 42
342 PDC Energy, Inc. * 10,178
360 Penn Virginia Corp. * 19,462
1,116 Rowan Cos PLC * 9,363
874 SandRidge Energy, Inc. * 6,651
8,102 Southwestern Energy Co. * 27,628
3,839 SRC Energy, Inc. * 18,043
1,458 Ultra Petroleum Corp. * 1,108
290,539
OIL & GAS SERVICES - 0.9%
2,783 Archrock, Inc. 20,845
394 Basic Energy Services, Inc. * 1,513
656 C&J Energy Services, Inc. * 8,856
273 Dril-Quip, Inc. * 8,198
949 Exterran Corp. * 16,797
1,688 FTS International, Inc. * 12,002
190 KLX Energy Services Holdings, Inc. * 4,456
676 McDermott International, Inc. * 4,421
607 MRC Global, Inc. * 7,424
1,382 Oil States International, Inc. * 19,735
680 PHI, Inc. * 1,258
3,545 Pioneer Energy Services Corp. * 4,360
1,973 ProPetro Holding Corp. * 24,307
1,992 Superior Energy Services, Inc. * 6,673
2,699 TETRA Technologies, Inc. * 4,534
510 US Silica Holdings, Inc. 5,192
150,571
PACKAGING & CONTAINERS - 0.0% ^
417 Greif, Inc. 15,475
PHARMACEUTICALS - 4.3%
777 Aimmune Therapeutics, Inc. * 18,586
2,123 Akebia Therapeutics, Inc. * 11,740
3,496 Array BioPharma, Inc. * 49,818
637 BioSpecifics Technologies Corp. * 38,602
4,959 Chimerix, Inc. * 12,745
707 Clovis Oncology, Inc. * 12,698
Global Atlantic BlackRock Disciplined Small Cap Portfolio
PORTFOLIO OF INVESTMENTS (Continued)
December 31, 2018
94See accompanying notes to financial statements.

Shares Value
PHARMACEUTICALS - 4.3% (Continued)
2,367 Conatus Pharmaceuticals, Inc. * 4,095$
855 Concert Pharmaceuticals, Inc. * 10,730
1,331 Corcept Therapeutics, Inc. * 17,782
1,614 Corvus Pharmaceuticals, Inc. * 5,923
1,799 Dermira, Inc. * 12,935
635 Diplomat Pharmacy, Inc. * 8,547
473 Enanta Pharmaceuticals, Inc. * 33,503
798 Endo International PLC * 5,825
785 Global Blood Therapeutics, Inc. * 32,224
642 Heron Therapeutics, Inc. * 16,653
1,612 Horizon Pharma PLC * 31,498
1,900 Ironwood Pharmaceuticals, Inc. * 19,684
2,084 Mallinckrodt PLC * 32,927
420 Nektar Therapeutics * 13,805
1,252 Owens & Minor, Inc. 7,925
263 Pacira Pharmaceuticals, Inc. * 11,314
987 Phibro Animal Health Corp. 31,742
302 Portola Pharmaceuticals, Inc. * 5,895
318 PRA Health Sciences, Inc. * 29,243
839 Prestige Brands Holdings, Inc. * 25,908
1,333 Ra Pharmaceuticals, Inc. * 24,261
995 Revance Therapeutics, Inc. * 20,029
185 Sarepta Therapeutics, Inc. * 20,189
3,816 Seres Therapeutics, Inc. * 17,248
247 Supernus Pharmaceuticals, Inc. * 8,205
395 USANA Health Sciences, Inc. * 46,503
1,504 Vanda Pharmaceuticals, Inc. * 39,300
661 Xencor, Inc. * 23,902
207 Zogenix, Inc. * 7,547
709,531
PRIVATE EQUITY - 0.3%
2,496 Kennedy-Wilson Holdings, Inc. 45,352
REAL ESTATE - 0.5%
432 Marcus & Millichap, Inc. * 14,831
1,446 McGrath RentCorp 74,440
89,271
REAL ESTATE INVESTMENT TRUSTS - 8.2%
3,916 Arbor Realty Trust, Inc. 39,434
937 Ares Commercial Real Estate Corp. 12,218
1,494 CareTrust REIT, Inc. 27,579
3,198 CatchMark Timber Trust, Inc. 22,706
7,553 Cedar Realty Trust, Inc. 23,716
2,378 Chatham Lodging Trust 42,043
December 31, 2018
Global Atlantic BlackRock Disciplined Small Cap Portfolio
PORTFOLIO OF INVESTMENTS (Continued)
95See accompanying notes to financial statements.

Shares Value
REAL ESTATE INVESTMENT TRUSTS (Continued) - 8.2%
5,618 DiamondRock Hospitality Co. 51,011$
4,866 Easterly Government Properties, Inc. 76,299
1,045 EastGroup Properties, Inc. 95,858
5,838 First Industrial Realty Trust, Inc. 168,485
2,539 Four Corners Property Trust, Inc. 66,522
1,374 Franklin Street Properties Corp. 8,560
326 GEO Group, Inc. 6,422
1,444 Global Net Lease, Inc. 25,443
4,208 Hersha Hospitality Trust 73,808
4,360 Invesco Mortgage Capital, Inc. 63,133
3,509 Kite Realty Group Trust 49,442
2,848 Ladder Capital Corp. 44,059
1,647 National Storage Affiliates Trust 43,580
877 Pennsylvania Real Estate Investment Trust 5,209
3,098 Preferred Apartment Communities, Inc. 43,558
167 PS Business Parks, Inc. 21,877
363 QTS Realty Trust, Inc. 13,449
1,841 Redwood Trust, Inc. 27,744
1,539 Retail Opportunity Investments Corp. 24,439
1,391 Rexford Industrial Realty, Inc. 40,993
404 Ryman Hospitality Properties, Inc. 26,943
3,373 STAG Industrial, Inc. 83,920
1,954 Sunstone Hotel Investors, Inc. 25,422
1,630 Terreno Realty Corp. 57,327
1,498 TPG RE Finance Trust, Inc. 27,383
1,338,582
RETAIL - 5.2%
1,907 American Eagle Outfitters, Inc. 36,862
277 America's Car-Mart, Inc. * 20,069
1,533 Asbury Automotive Group, Inc. * 102,190
303 Bassett Furniture Industries, Inc. 6,072
576 Beacon Roofing Supply, Inc. * 18,271
405 Big Lots, Inc. 11,713
1,173 BJ's Restaurants, Inc. 59,319
1,473 Bloomin' Brands, Inc. 26,352
1,364 BMC Stock Holdings, Inc. * 21,115
149 Brinker International, Inc. 6,553
1,672 Carrols Restaurant Group, Inc. * 16,452
1,182 Cato Corp. 16,867
742 Cheesecake Factory, Inc. 32,284
2,489 Chico's FAS, Inc. 13,988
173 Children's Place, Inc. 15,586
856 Citi Trends, Inc. 17,454
305 Dillard's, Inc. 18,395
Global Atlantic BlackRock Disciplined Small Cap Portfolio
PORTFOLIO OF INVESTMENTS (Continued)
December 31, 2018
96See accompanying notes to financial statements.

Shares Value
RETAIL - 5.2% (Continued)
1,414 Express, Inc. * 7,226$
638 Five Below, Inc. * 65,280
206 Group 1 Automotive, Inc. 10,860
435 Lithia Motors, Inc. 33,204
393 Ollie's Bargain Outlet Holdings, Inc. * 26,138
1,124 Party City Holdco, Inc. * 11,218
345 PC Connection, Inc. 10,257
201 RH * 24,084
965 Rush Enterprises, Inc. 33,273
2,203 Sonic Automotive, Inc. 30,313
2,283 Texas Roadhouse, Inc. 136,295
1,048 Zumiez, Inc. * 20,090
847,780
SAVINGS & LOANS - 2.2%
1,068 First Defiance Financial Corp. 26,177
2,732 First Financial Northwest, Inc. 42,264
2,835 Meridian Bancorp, Inc. 40,597
1,479 People's United Financial, Inc. 21,342
3,391 Riverview Bancorp, Inc. 24,686
4,730 TFS Financial Corp. 76,295
1,721 United Community Financial Corp. 15,231
4,157 Washington Federal, Inc. 111,033
357,625
SEMICONDUCTORS - 1.9%
510 Alpha & Omega Semiconductor Ltd. * 5,197
2,345 Amkor Technology, Inc. * 15,383
976 Brooks Automation, Inc. 25,552
218 Cabot Microelectronics Corp. 20,786
693 Cirrus Logic, Inc. * 22,994
460 Cohu, Inc. 7,392
229 Cree, Inc. * 9,795
940 Diodes, Inc. * 30,324
2,074 Entegris, Inc. 57,854
1,216 Integrated Device Technology, Inc. * 58,891
150 Power Integrations, Inc. 9,147
372 Semtech Corp. * 17,064
454 Synaptics, Inc. * 16,893
858 Ultra Clean Holdings, Inc. * 7,267
304,539
SOFTWARE - 4.1%
2,129 Allscripts Healthcare Solutions, Inc. * 20,524
420 Appfolio, Inc. * 24,872
218 Benefitfocus, Inc. * 9,967
460 Bottomline Technologies de, Inc. * 22,080
Global Atlantic BlackRock Disciplined Small Cap Portfolio
PORTFOLIO OF INVESTMENTS (Continued)
December 31, 2018
97See accompanying notes to financial statements.

Shares Value
SOFTWARE (Continued) - 4.1%
942 Box, Inc. * 15,901$
1,258 Cloudera, Inc. * 13,913
699 Cornerstone OnDemand, Inc. * 35,251
309 CSG Systems International, Inc. 9,817
183 Fair Isaac, Corp. * 34,221
666 Five9, Inc. * 29,118
1,675 GreenSky, Inc. * 16,030
1,400 Hortonworks, Inc. * 20,188
231 HubSpot, Inc. * 29,044
1,963 InnerWorkings, Inc. * 7,342
358 Instructure, Inc. * 13,429
847 LivePerson, Inc. * 15,974
770 Medidata Solutions, Inc. * 51,913
569 MicroStrategy, Inc. * 72,690
391 MINDBODY, Inc. * 14,232
603 New Relic, Inc. * 48,825
595 Omnicell, Inc. * 36,438
788 Progress Software Corp. 27,966
794 SendGrid, Inc. * 34,277
250 SPS Commerce, Inc. * 20,595
1,765 TiVo Corp. 16,609
636 Workiva, Inc. * 22,826
512 Yext, Inc. * 7,603
671,645
STOREAGE/WAREHOUSING - 0.0% ^
228 Mobile Mini, Inc. 7,239
TELECOMMUNICATIONS - 2.4%
6,098 A10 Networks, Inc. * 38,052
5,464 Aerohive Networks, Inc. * 17,813
988 Calix, Inc. * 9,633
2,561 Ciena Corp. * 86,844
1,334 Consolidated Communications Holdings, Inc. 13,180
1,813 Extreme Networks, Inc. * 11,059
1,411 Finisar Corp. * 30,478
4,635 Infinera Corp. * 18,494
1,528 Iridium Communications, Inc. * 28,192
277 NETGEAR, Inc. * 14,412
958 Ooma, Inc. * 13,297
2,061 Plantronics, Inc. 68,219
306 Ubiquiti Networks, Inc. 30,419
1,506 Vonage Holdings Corp. * 13,147
393,239
TRANSPORTATION - 1.2%
245 Atlas Air Worldwide Holdings, Inc. * 10,337
Global Atlantic BlackRock Disciplined Small Cap Portfolio
PORTFOLIO OF INVESTMENTS (Continued)
December 31, 2018
98See accompanying notes to financial statements.

Shares Value
TRANSPORTATION (Continued) - 1.2%
283 Covenant Transportation Group, Inc. * 5,434$
810 Hub Group, Inc. * 30,027
588 Knight-Swift Transportation Holdings, Inc. 14,741
2,720 Marten Transport Ltd. 44,037
584 Matson, Inc. 18,700
8,692 Nordic American Tankers Ltd. 17,384
220 Saia, Inc. * 12,280
16,995 Scorpio Tankers, Inc. 29,911
561 Werner Enterprises, Inc. 16,571
199,422
TRUCKING & LEASING - 0.3%
167 GATX Corp. 11,825
850 Greenbrier Cos, Inc. 33,609
45,434
WATER - 0.2%
601 SJW Group 33,428
TOTAL COMMON STOCKS (Cost - $18,183,298) 15,951,816
SHORT-TERM INVESTMENT - 2.4%
MONEY MARKET FUND - 2.4%
392,228 Fidelity Investments Money Market Funds - Government Portfolio, Institutional Class
to yield 2.25% (a)(Cost - $392,228) 392,228
TOTAL INVESTMENTS - 100.0% (Cost - $18,575,526) 16,344,044$
OTHER ASSETS LESS LIABILITIES - NET - 0.0% ^ 1,625
TOTAL NET ASSETS - 100.0% 16,345,669$
* Non-income producing security.
^ Represents less than 0.05%
PLC - Public Limited Company
REIT - Real Estate Investment Trust
(a) Money market rate shown represents the rate at December 31, 2018.
Description Counterparty Contracts Expiration Date Notional Value
Unrealized
Depreciation
LONG
E-mini Russell 2000 Future Goldman Sachs 6 Mar-19 404,700$ (9,801)$
NET UNREALIZED DEPRECIATION ON FUTURES CONTRACTS (9,801)$
FUTURES CONTRACTS
Global Atlantic BlackRock Disciplined Small Cap Portfolio
PORTFOLIO OF INVESTMENTS (Continued)
December 31, 2018
99See accompanying notes to financial statements.

Shares Value
COMMON STOCKS - 98.1 %
ADVERTISING - 0.2 %
1,723 Interpublic Group of Cos, Inc. 35,545$
AEROSPACE/DEFENSE - 2.3 %
682 Boeing Co. 219,945
353 Lockheed Martin Corp. 92,430
50 Northrop Grumman Corp. 12,245
1,215 Raytheon Co. 186,320
510,940
AGRICULTURE - 1.7 %
2,257 Altria Group, Inc. 111,473
3,649 Archer-Daniels-Midland Co. 149,500
1,569 Phillip Morris International, Inc. 104,746
365,719
AIRLINES - 0.4 %
435 Delta Air Lines, Inc. 21,707
1,506 Southwest Airlines, Co. 69,999
91,706
APPAREL - 1.0 %
2,657 NIKE, Inc. 196,990
408 VF Corp. 29,107
226,097
AUTO MANUFACTURERS - 0.7 %
1,607 Ford Motor Co. 12,294
566 General Motors Co. 18,933
2,004 PACCAR, Inc. 114,509
145,736
AUTO PARTS & EQUIPMENT - 0.0 % ^
283 BorgWarner, Inc. 9,831
BANKS - 7.2 %
17,286 Bank of America Corp. 425,927
2,530 BB&T Corp. 109,600
2,549 Citigroup, Inc. 132,701
1,937 Citizens Financial Group, Inc. 57,587
66 Cullen/Frost Bankers, Inc. 5,804
928 East West Bancorp, Inc. 40,396
258 First Republic Bank 22,420
3,220 JPMorgan Chase & Co. 314,336
6,654 Morgan Stanley 263,831
4,400 Wells Fargo & Co. 202,752
1,575,354
BEVERAGES - 1.7 %
516 Coca-Cola Co. 24,433
1,317 Coca-Cola European Partners PLC 60,384
293 Constellation Brands, Inc. 47,120
193 Molson Coors Brewing Co. 10,839
Global Atlantic BlackRock Disciplined U.S. Core Portfolio
PORTFOLIO OF INVESTMENTS
December 31, 2018
100See accompanying notes to financial statements.

Shares Value
BEVERAGES (Continued) - 1.7 %
1,188 Monster Beverage Corp. * 58,473$
1,539 PepsiCo, Inc. 170,029
371,278
BIOTECHNOLOGY - 2.9 %
1,019 Amgen, Inc. 198,369
108 Biogen, Inc. * 32,499
1,948 Celgene Corp. * 124,847
3,388 Gilead Sciences, Inc. 211,919
57 Incyte Corp. * 3,625
41 Regeneron Pharmaceuticals, Inc. * 15,314
262 Vertex Pharmaceuticals, Inc. * 43,416
629,989
BUILDING MATERIALS - 0.0 % ^
41 Vulcan Materials Co. 4,051
CHEMICALS - 1.5 %
1,092 Air Products & Chemicals, Inc. 174,775
552 Celanese Corp. 49,663
571 Eastman Chemical Co. 41,746
972 Huntsman Corp. 18,750
285 Linde PLC 44,471
329,405
COMMERCIAL SERVICES - 2.4 %
1,315 Automatic Data Processing, Inc. 172,423
811 Booz Allen Hamilton Holding Corp. 36,552
272 Ecolab, Inc. 40,079
1,107 H&R Block, Inc. 28,085
856 Insperity, Inc. 79,916
641 PayPal Holdings, Inc. 53,902
535 Robert Half International, Inc. 30,602
193 S&P Global, Inc. 32,798
194 Total System Services, Inc. 15,770
2,521 Western Union Co. 43,008
533,135
COMPUTERS - 4.8 %
757 Accenture PLC 106,745
4,676 Apple, Inc. 737,592
146 Cognizant Technology Solutions Corp. 9,268
114 Dell Technologies, Inc. - Class C * 5,572
1,340 Hewlett Packard Enterprise Co. 17,701
3,597 HP, Inc. 73,595
793 International Business Machines Corp. 90,140
924 Pure Storage, Inc. * 14,858
1,055,471
COSMETICS/PERSONAL CARE - 0.7 %
723 Estee Lauder Cos, Inc. 94,062
596 Proctor & Gamble Co. 54,784
148,846
Global Atlantic BlackRock Disciplined U.S. Core Portfolio
PORTFOLIO OF INVESTMENTS (Continued)
December 31, 2018
101See accompanying notes to financial statements.

Shares Value
DIVERSIFIED FINANCIAL SERVICES - 4.0 %
1,043 American Express Co. 99,419$
368 Capital One Financial Corp. 27,817
4,223 Charles Schwab Corp. 175,381
569 CME Group, Inc. 107,040
384 Evercore, Inc. 27,479
624 Intercontinental Exchange, Inc. 47,006
1,047 Mastercard, Inc. 197,517
230 SEI Investments Co. 10,626
36 T Rowe Price Group, Inc. 3,324
124 TD Ameritrade Holding Corp. 6,071
1,272 Visa, Inc. 167,828
869,508
ELECTRIC - 2.6 %
969 Ameren Corp. 63,208
975 CMS Energy Corp. 48,409
465 Consolidated Edison, Inc. 35,554
272 DTE Energy Co. 30,002
392 IDACORP, Inc. 36,480
1,886 OGE Energy Corp. 73,912
1,676 Pinnacle West Capital Corp. 142,795
1,355 Portland General Electric Co. 62,127
1,369 Xcel Energy, Inc. 67,451
559,938
ELECTRICAL COMPONENTS & EQUIPMENT - 0.0 % ^
44 AMETEK, Inc. 2,979
39 Hubbell, Inc. 3,874
6,853
ELECTRONICS - 1.4 %
536 Agilent Technologies, Inc. 36,159
761 Allegion PLC 60,659
872 Garmin Ltd. 55,215
579 Honeywell International, Inc. 76,497
34 Keysight Technologies, Inc. * 2,111
1,569 National Instruments Corp. 71,201
301,842
ENVIRONMENTAL CONTROL - 0.1 %
130 Republic Services, Inc. 9,372
148 Waste Connections, Inc. 10,989
104 Waste Management, Inc. 9,255
29,616
FOOD - 1.1 %
1,645 Hershey Co. 176,311
99 Hormel Foods Corp. 4,225
192 Kellogg Co. 10,946
393 Kroger Co. 10,808
297 Lamb Weston Holdings, Inc. 21,847
246 Tyson Foods, Inc. 13,136
237,273
Global Atlantic BlackRock Disciplined U.S. Core Portfolio
PORTFOLIO OF INVESTMENTS (Continued)
December 31, 2018
102See accompanying notes to financial statements.

Shares Value
GAS - 0.4 %
916 Atmos Energy Corp. 84,932$
HAND/MACHINE TOOLS - 0.2 %
322 Snap-on, Inc. 46,783
HEALTHCARE PRODUCTS - 3.0 %
857 Abbott Laboratories 61,987
1,099 Danaher Corp. 113,329
139 IDEXX Laboratories, Inc. * 25,857
103 Intuitive Surgical, Inc. * 49,329
1,472 Medtronic PLC 133,893
178 STERIS PLC 19,019
1,228 Stryker Corp. 192,489
274 Thermo Fisher Scientific, Inc. 61,318
657,221
HEALTHCARE - SERVICES - 2.4%
123 Anthem, Inc. 32,303
168 Humana, Inc. 48,129
228 Quest Diagnostics, Inc. 18,986
1,652 UnitedHealth Group, Inc. 411,546
84 WellCare Health Plans, Inc. * 19,832
530,796
HOUSEHOLD PRODUCTS/WARES - 0.8 %
2,080 Church & Dwight Co., Inc. 136,781
184 Clorox Co. 28,362
165,143
INSURANCE - 3.9 %
1,308 Allstate Corp. 108,080
498 American Financial Group, Inc. 45,084
858 Arthur J. Gallagher & Co. 63,235
2,018 Berkshire Hathaway, Inc. * 412,035
1,251 Hartford Financial Services Group, Inc. 55,607
1,017 Lincoln National Corp. 52,182
649 Loews Corp. 29,542
313 Progressive Corp. 18,883
92 Travelers Cos, Inc. 11,017
2,252 Unum Group 66,164
861,829
INTERNET -8.7 %
284 Alphabet, Inc. - Class A * 296,769
315 Alphabet, Inc. - Class C * 326,217
435 Amazon.com, Inc. * 653,357
31 Booking Holdings, Inc. * 53,395
239 Cargurus, Inc. * 8,061
793 CDW Corp. 64,273
2,774 Facebook, Inc. * 363,644
272 GoDaddy, Inc. * 17,849
Global Atlantic BlackRock Disciplined U.S. Core Portfolio
PORTFOLIO OF INVESTMENTS (Continued)
December 31, 2018
103See accompanying notes to financial statements.

Shares Value
INTERNET (Continued) - 8.7 %
350 Netflix, Inc. * 93,681$
136 Twitter, Inc. * 3,909
697 Yelp, Inc. * 24,388
1,905,543
IRON/STEEL - 0.0 % ^
607 Steel Dynamics, Inc. 18,234
LEISURE - 0.3 %
646 Carnival Corp. 31,848
626 Norwegian Cruise Line Holdings Ltd. * 26,536
58,384
LODGING - 0.3 %
1,062 Extended Stay America, Inc. 16,461
616 Hilton Worldwide Holdings, Inc. 44,229
90 Marriott International, Inc. 9,770
70,460
MACHINERY - CONSTRUCTION & MINING - 0.2 %
274 Caterpillar, Inc. 34,817
MACHINERY - DIVERSIFIED - 0.7 %
890 Rockwell Automation, Inc. 133,927
54 Roper Technologies, Inc. 14,392
148,319
MEDIA - 2.1 %
997 AMC Networks, Inc. * 54,715
920 CBS Corp. 40,222
4,896 Comcast Corp. 166,709
518 Liberty Media Corp. - Liberty SiriusXM - Class A * 19,062
382 Liberty Media Corp. - Liberty SiriusXM - Class C * 14,126
97 Sinclair Broadcast Group, Inc. 2,555
993 Twenty-First Century Fox, Inc. - Class A 47,783
499 Twenty-First Century Fox, Inc. - Class B 23,842
120 Viacom, Inc. - Class A 3,337
1,460 Viacom, Inc. - Class B 37,522
540 Walt Disney Co. 59,211
469,084
MINING - 0.2 %
1,132 Newmont Mining Corp. 39,224
MISCELLANEOUS MANUFACTURER - 2.8 %
759 3M Co. 144,620
2,450 Crane Co. 176,841
5,198 General Electric Co. 39,349
867 Illinois Tool Works, Inc. 109,840
1,418 Ingersoll-Rand PLC 129,364
91 Parker-Hannifin Corp. 13,572
613,586
Global Atlantic BlackRock Disciplined U.S. Core Portfolio
PORTFOLIO OF INVESTMENTS (Continued)
December 31, 2018
104See accompanying notes to financial statements.

Shares Value
OIL & GAS - 4.0 %
2,257 Anadarko Petroleum Corp. 98,947$
171 Antero Resources Corp. * 1,606
1,708 Chevron Corp. 185,813
169 Concho Resources, Inc. * 17,372
2,492 ConocoPhillips 155,376
405 Continental Resources, Inc. * 16,277
218 EOG Resources, Inc. 19,012
4,281 Exxon Mobil Corp. 291,921
205 Newfield Exploration Co. * 3,005
656 Occidental Petroleum Corp. 40,265
530 Phillips 66 45,660
166 Valero Energy Corp. 12,445
887,699
OIL & GAS SERVICES - 0.5 %
3,743 Halliburton Co. 99,489
PACKAGING & CONTAINERS - 0.2 %
1,219 Westrock Co. 46,029
PHARMACEUTICALS - 7.2 %
1,993 AbbVie, Inc. 183,735
816 AmerisourceBergen Corp. 60,710
2,576 Bristol-Myers Squibb Co. 133,900
1,984 Cardinal Health, Inc. 88,486
142 Cigna Corp. 27,043
836 CVS Health Corp. 54,775
1,323 Eli Lilly & Co. 153,098
3,407 Johnson & Johnson 439,673
774 McKesson Corp. 85,504
3,546 Merck & Co., Inc. 270,950
481 Pfizer, Inc. 20,996
584 Zoetis, Inc. 49,955
1,568,825
PIPELINES - 0.7 %
6,524 Kinder Morgan, Inc. 100,339
606 TechnipFMC PLC * 11,865
1,921 Williams Cos, Inc. 42,358
154,562
REAL ESTATE INVESTMENT TRUSTS - 3.1 %
3,140 Host Hotels & Resorts, Inc. 52,344
1,627 Park Hotels & Resorts, Inc. 42,269
4,447 Prologis, Inc. 261,128
2,726 Realty Income Corp. 171,847
856 Simon Property Group, Inc. 143,799
671,387
Global Atlantic BlackRock Disciplined U.S. Core Portfolio
PORTFOLIO OF INVESTMENTS (Continued)
December 31, 2018
105See accompanying notes to financial statements.

Shares Value
RETAIL - 5.0 %
910 Costco Wholesale Corp. 185,376$
253 Darden Restaurants, Inc. 25,265
248 Domino's Pizza, Inc. 61,502
199 Dunkin' Brands Group, Inc. 12,760
155 Five Below, Inc. * 15,860
114 Genuine Parts Co. 10,946
1,427 Home Depot, Inc. 245,187
778 McDonald's Corp. 138,149
10 O'Reilly Automotive ,Inc. * 3,443
146 Penske Automotive Group, Inc. 5,887
425 Ross Stores, Inc. 35,360
2,860 Target Corp. 189,017
1,796 TJX Cos, Inc. 80,353
666 Walmart, Inc. 62,038
297 Yum! Brands, Inc. 27,300
1,098,443
SEMICONDUCTORS - 3.5 %
648 Analog Devices, Inc. 55,618
1,589 Applied Materials, Inc. 52,024
187 Broadcom Ltd. 47,550
255 Cirrus Logic, Inc. * 8,461
5,894 Intel Corp. 276,605
281 Micron Technology, Inc. * 8,916
666 NVIDIA Corp. 88,911
696 QUALCOMM, Inc. 39,609
87 Silicon Laboratories, Inc. * 6,856
500 Skyworks Solutions, Inc. 33,510
1,249 Texas Instruments, Inc. 118,031
420 Xilinx, Inc. 35,771
771,862
SOFTWARE - 7.1 %
243 Activision Blizzard, Inc. 11,317
27 Adobe Systems, Inc. * 6,108
287 Broadridge Financial Solutions, Inc. 27,624
922 Dropbox, Inc. * 18,836
543 Electronic Arts, Inc. * 42,848
266 Fidelity National Information Services, Inc. 27,278
409 Intuit, Inc. 80,512
7,679 Microsoft Corp. 779,956
4,392 Oracle Corp. 198,299
275 Paychex, Inc. 17,916
1,923 salesforce.com, Inc. * 263,393
706 Synopsys, Inc. * 59,473
337 Veeva Systems, Inc. * 30,101
27 VMware, Inc. 3,703
1,567,364
TELECOMMUNICATIONS - 2.7 %
5,220 AT&T, Inc. 148,979
Global Atlantic BlackRock Disciplined U.S. Core Portfolio
PORTFOLIO OF INVESTMENTS (Continued)
December 31, 2018
106See accompanying notes to financial statements.
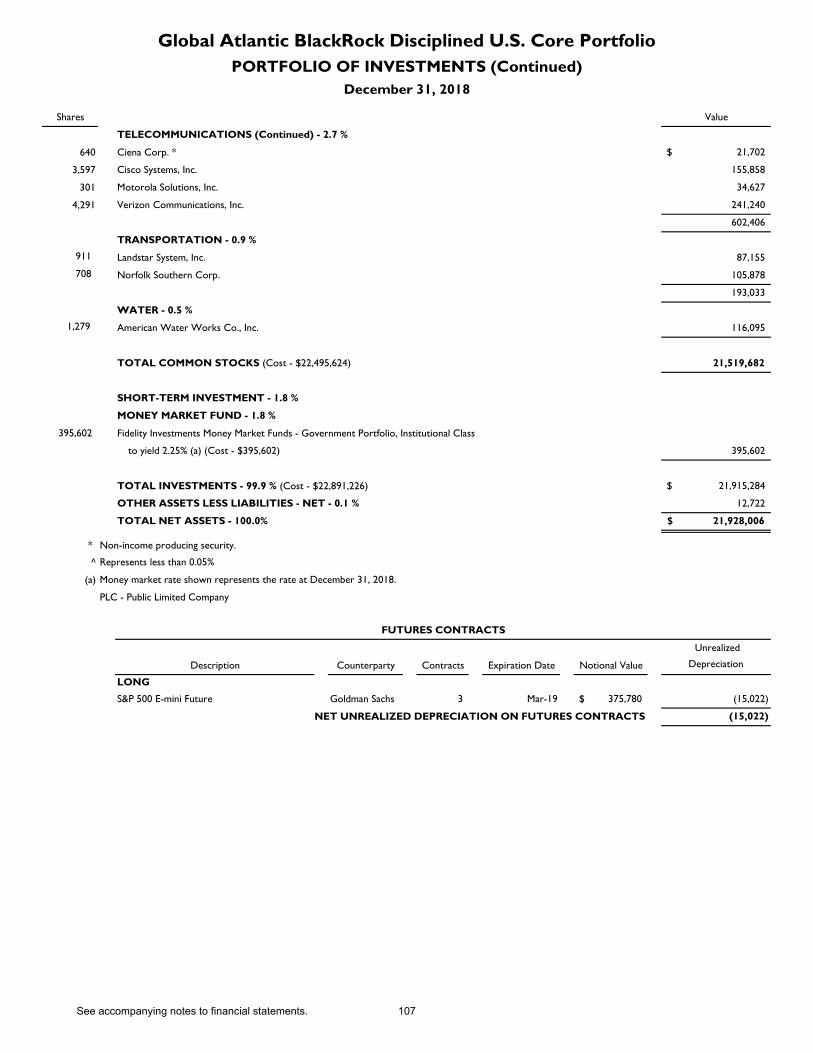
Shares Value
TELECOMMUNICATIONS (Continued) - 2.7 %
640 Ciena Corp. * 21,702$
3,597 Cisco Systems, Inc. 155,858
301 Motorola Solutions, Inc. 34,627
4,291 Verizon Communications, Inc. 241,240
602,406
TRANSPORTATION - 0.9 %
911 Landstar System, Inc. 87,155
708 Norfolk Southern Corp. 105,878
193,033
WATER - 0.5 %
1,279 American Water Works Co., Inc. 116,095
TOTAL COMMON STOCKS (Cost - $22,495,624) 21,519,682
SHORT-TERM INVESTMENT - 1.8 %
MONEY MARKET FUND - 1.8 %
395,602
to yield 2.25% (a) (Cost - $395,602) 395,602
TOTAL INVESTMENTS - 99.9 % (Cost - $22,891,226) 21,915,284$
OTHER ASSETS LESS LIABILITIES - NET - 0.1 % 12,722
TOTAL NET ASSETS - 100.0% 21,928,006$
* Non-income producing security.
^ Represents less than 0.05%
(a) Money market rate shown represents the rate at December 31, 2018.
PLC - Public Limited Company
Description Counterparty Contracts Expiration Date Notional Value
Unrealized
Depreciation
LONG
S&P 500 E-mini Future Goldman Sachs 3 Mar-19 375,780$ (15,022)
NET UNREALIZED DEPRECIATION ON FUTURES CONTRACTS (15,022)
FUTURES CONTRACTS
Global Atlantic BlackRock Disciplined U.S. Core Portfolio
PORTFOLIO OF INVESTMENTS (Continued)
December 31, 2018
Fidelity Investments Money Market Funds - Government Portfolio, Institutional Class
107See accompanying notes to financial statements.

Shares Value
COMMON STOCKS - 98.2 %
ADVERTISING - 0.2 %
24,255 Interpublic Group of Cos, Inc. 500,381$
AEROSPACE/DEFENSE - 1.1 %
2,265 Curtiss-Wright Corp. 231,302
896 General Dynamics Corp. 140,860
1,148 Lockheed Martin Corp. 300,592
11,667 Raytheon Co. 1,789,134
2,865 United Technologies Corp. 305,012
2,766,900
AGRICULTURE - 1.8 %
3,223 Altria Group, Inc. 159,184
53,822 Archer-Daniels-Midland Co. 2,205,087
32,034 Philip Morris International, Inc. 2,138,590
4,502,861
AIRLINES - 0.5 %
762 Alaska Air Group, Inc. 46,368
12,819 Delta Air Lines, Inc. 639,668
15,406 Southwest Airlines Co. 716,071
1,402,107
APPAREL - 0.4 %
10,891 NIKE, Inc. 807,459
1,095 Ralph Lauren Corp. 113,289
3,139 VF Corp. 223,936
1,144,684
AUTO MANUFACTURERS - 1.1 %
77,955 Ford Motor Co. 596,356
23,165 General Motors Co. 774,869
23,624 PACCAR, Inc. 1,349,875
2,721,100
AUTO PARTS & EQUIPMENT - 0.1%
6,546 BorgWarner, Inc. 227,408
3,320 Dana, Inc. 45,252
272,660
BANKS - 12.8 %
280,791 Bank of America Corp. 6,918,690
43,211 BB&T Corp. 1,871,901
54,585 Citigroup, Inc. 2,841,695
47,151 Citizens Financial Group, Inc. 1,401,799
5,642 Cullen/Frost Bankers, Inc. 496,157
15,896 East West Bancorp, Inc. 691,953
30,317 First Horizon National Corp. 398,972
12,406 First Republic Bank 1,078,081
1,739 Goldman Sachs Group, Inc. 290,500
40,857 Huntington Bancshares, Inc. 487,015
68,797 JPMorgan Chase & Co. 6,715,963
16,999 KeyCorp 251,245
Global Atlantic BlackRock Disciplined Value Portfolio
PORTFOLIO OF INVESTMENTS
December 31, 2018
108See accompanying notes to financial statements.

Shares Value
BANKS (Continued) - 12.8 %
93,660 Morgan Stanley 3,713,619$
15,434 Synovus Financial Corp. 493,734
16,431 US Bancorp 750,897
93,528 Wells Fargo & Co. 4,309,770
1,950 Western Alliance Bancorp * 77,006
32,788,997
BEVERAGES - 0.5 %
10,460 Coca-Cola European Partners PLC 479,591
652 Constellation Brands, Inc. 104,855
6,100 Molson Coors Brewing Co. 342,576
792 Monster Beverage Corp. * 38,982
3,219 PepsiCo, Inc. 355,635
1,321,639
BIOTECHNOLOGY - 1.4 %
3,999 Amgen, Inc. 778,485
13,909 Celgene Corp. * 891,428
32,014 Gilead Sciences, Inc. 2,002,476
3,672,389
BUILDING MATERIALS - 0.0 % ^
294 Vulcan Materials Co. 29,047
CHEMICALS - 2.1 %
17,298 Air Products & Chemicals, Inc. 2,768,545
7,328 Celanese Corp. 659,300
14,618 Eastman Chemical Co. 1,068,722
20,499 Huntsman Corp. 395,426
2,056 Linde PLC 320,818
4,297 Mosaic Co. 125,515
2,546 Olin Corp. 51,200
463 RPM International, Inc. 27,215
5,416,741
COMMERCIAL SERVICES - 1.4 %
5,397 Automatic Data Processing, Inc. 707,655
9,967 Booz Allen Hamilton Holding Corp. 449,213
4,099 Deluxe Corp. 157,566
3,199 Ecolab, Inc. 471,373
11,726 H&R Block, Inc. 297,489
7,648 Insperity, Inc. 714,017
851 ManpowerGroup, Inc. 55,145
2,064 Robert Half International, Inc. 118,061
33,802 Western Union Co. 576,662
3,547,181
COMPUTERS - 1.0 %
1,605 Amdocs Ltd. 94,021
5,525 Dell Technologies, Inc. - Class C * 270,008
39,827 Hewlett Packard Enterprise Co. 526,115
55,834 HP, Inc. 1,142,364
Global Atlantic BlackRock Disciplined Value Portfolio
PORTFOLIO OF INVESTMENTS (Continued)
December 31, 2018
109See accompanying notes to financial statements.

Shares Value
COMPUTERS (Continued) - 1.0 %
2,426 International Business Machines Corp. 275,763$
8,638 Pure Storage, Inc. * 138,899
2,447,170
COSMETICS/PERSONAL CARE - 1.5 %
8,274 Colgate-Palmolive Co. 492,468
4,752 Estee Lauder Cos, Inc. 618,235
29,250 Proctor & Gamble Co. 2,688,660
3,799,363
DIVERSIFIED FINANCIAL SERVICES - 2.9 %
21,618 Ally Financial, Inc. 489,864
7,729 American Express, Co. 736,728
15,652 Capital One Financial Corp. 1,183,135
32,876 Charles Schwab Corp. 1,365,340
8,481 CME Group, Inc. 1,595,446
2,435 Discover Financial Services 143,616
1,886 Evercore. Inc. 134,962
2,598 Intercontinental Exchange, Inc. 195,707
25,747 Invesco Ltd. 431,005
14,745 Legg Mason, Inc. 376,145
9,537 Moelis & Co. 327,882
4,816 SEI Investments Co. 222,499
4,886 Synchrony Financial 114,626
7,316,955
ELECTRIC - 5.3 %
5,995 Alliant Energy Corp. 253,289
10,596 Ameren Corp. 691,177
12,539 CenterPoint Energy, Inc. 353,976
20,894 CMS Energy Corp. 1,037,387
23,770 Consolidated Edison, Inc. 1,817,454
5,935 Dominion Energy, Inc. 424,115
7,090 DTE Energy Co. 782,027
9,416 Evergy, Inc. 534,546
4,925 Eversource Energy 320,322
5,817 IDACORP, Inc. 541,330
30,726 OGE Energy Corp. 1,204,152
26,235 Pinnacle West Capital Corp. 2,235,222
25,738 Portland General Electric Co. 1,180,087
18,631 PPL Corp. 527,816
520 Public Service Enterprise Group, Inc. 27,066
3,601 WEC Energy Group, Inc. 249,405
24,983 Xcel Energy, Inc. 1,230,912
13,410,283
ELECTRICAL COMPONENTS & EQUIPMENT - 0.2 %
6,321 AMETEK, Inc. 427,932
1,226 Hubbell, Inc. 121,791
549,723
PORTFOLIO OF INVESTMENTS (Continued)
December 31, 2018
Global Atlantic BlackRock Disciplined Value Portfolio
110See accompanying notes to financial statements.

Shares Value
ELECTRONICS - 1.2 %
8,463 ADT, Inc. 50,863$
7,923 Agilent Technologies, Inc. 534,486
5,613 Allegion PLC 447,412
2,254 Corning, Inc. 68,093
12,368 Garmin Ltd. 783,142
2,653 Honeywell International, Inc. 350,514
1,058 Keysight Technologies, Inc. * 65,681
19,307 National Instruments Corp. 876,152
3,176,343
ENTERTAINMENT - 0.0 % ^
1,738 Cinemark Holdings, Inc. 62,220
ENVIRONMENTAL CONTROL - 0.2 %
5,452 Clean Harbors, Inc. * 269,056
3,773 Republic Services, Inc. 271,996
1,167 Waste Connections, Inc. 86,650
627,702
FOOD - 1.8 %
22,393 Hershey Co. 2,400,082
6,198 Hormel Foods Corp. 264,531
9,034 Kellogg Co. 515,028
14,473 Kroger Co. 398,008
4,912 Lamb Weston Holdings, Inc. 361,327
10,689 Tyson Foods, Inc. 570,792
4,509,768
GAS - 0.6 %
11,741 Atmos Energy Corp. 1,088,626
9,934 UGI Corp. 529,978
1,618,604
HAND/MACHINE TOOLS - 0.3 %
4,607 Snap-on, Inc. 669,351
HEALTHCARE PRODUCTS - 3.9 %
27,587 Abbott Laboratories 1,995,368
19,987 Danaher Corp. 2,061,059
1,677 Masimo Corp. * 180,059
30,179 Medtronic PLC 2,745,082
4,751 STERIS PLC 507,644
9,543 Stryker Corp. 1,495,865
4,499 Thermo Fisher Scientific, Inc. 1,006,831
9,991,908
HEALTHCARE - SERVICES - 1.2 %
3,900 Anthem, Inc. 1,024,257
1,570 Humana, Inc. 449,774
6,442 Quest Diagnostics, Inc. 536,425
3,917 UnitedHealth Group, Inc. 975,803
Global Atlantic BlackRock Disciplined Value Portfolio
PORTFOLIO OF INVESTMENTS (Continued)
December 31, 2018
111See accompanying notes to financial statements.

Shares Value
HEALTHCARE - SERVICES (Continued) - 1.2 %
529 WellCare Health Plans, Inc. * 124,892$
3,111,151
HOME BUILDERS - 0.1 %
2,255 DR Horton, Inc. 78,158
HOME FURNISHINGS - 0.1 %
2,817 Whirlpool Corp. 301,053
HOUSEHOLD PRODUCTS/WARES - 0.6 %
24,100 Church & Dwight Co., Inc. 1,584,816
423 Clorox, Co. 65,201
1,650,017
INSURANCE - 6.9 %
2,353 Aflac, Inc. 107,203
23,510 Allstate Corp. 1,942,631
11,166 American Financial Group, Inc. 1,010,858
12,392 Arthur J. Gallagher & Co. 913,290
9,272 Athene Holding Ltd. * 369,304
19,165 AXA Equitable Holdings, Inc. 318,714
35,155 Berkshire Hathaway, Inc. * 7,177,948
2,470 Chubb Ltd. 319,075
1,058 CNA Financial Corp. 46,711
7,030 CNO Financial Group, Inc. 104,606
2,583 Essent Group Ltd. * 88,287
2,359 Fidelity National Financial, Inc. 74,167
2,635 First American Financial Corp. 117,626
1,396 Hanover Insurance Group, Inc. 163,011
27,574 Hartford Financial Services Group, Inc. 1,225,664
17,660 Lincoln National Corp. 906,135
22,331 Loews Corp. 1,016,507
5,470 Travelers Cos, Inc. 655,033
32,047 Unum Group 941,540
17,498,310
INTERNET - 0.3 %
5,593 CDW Corp. 453,313
475 Facebook, Inc. * 62,268
7,510 Yelp, Inc. * 262,774
778,355
IRON/STEEL - 0.3 %
7,381 Reliance Steel & Aluminum Co. 525,306
9,806 Steel Dynamics, Inc. 294,572
819,878
LEISURE TIME - 0.4 %
11,961 Carnival Corp. 589,677
9,638 Norwegian Cruise Line Holdings Ltd. * 408,555
998,232
December 31, 2018
Global Atlantic BlackRock Disciplined Value Portfolio
PORTFOLIO OF INVESTMENTS (Continued)
112See accompanying notes to financial statements.

Shares Value
LODGING - 0.1 %
13,395 Extended Stay America, Inc. 207,623$
664 Las Vegas Sands Corp. 34,561
242,184
MACHINERY - DIVERSIFIED - 0.6 %
7,154 Rockwell Automation, Inc. 1,076,534
1,511 Roper Technologies, Inc. 402,712
1,479,246
MEDIA - 2.8 %
7,443 AMC Networks, Inc. * 408,472
7,051 CBS Corp. 308,270
90,674 Comcast Corp. 3,087,450
13,304 Liberty Media Corp-Liberty SiriusXM - Class A * 489,587
20,391 Liberty Media Corp-Liberty SiriusXM - Class C * 754,059
1,039 Sinclair Broadcast Group, Inc. 27,367
1,858 Tribune Media Co. 84,316
16,437 Twenty-First Century Fox, Inc. - Class A 790,948
8,479 Twenty-First Century Fox, Inc. - Class C 405,127
3,260 Viacom, Inc. - Class A 90,661
24,336 Viacom, Inc. - Class C 625,435
7,071,692
MINING - 0.4 %
28,698 Newmont Mining Corp. 994,386
MISCELLANEOUS MANUFACTURER - 2.9 %
3,445 3M Co. 656,410
34,804 Crane Co. 2,512,153
164,676 General Electric Co. 1,246,597
6,898 Illinois Tool Works, Inc. 873,908
16,586 Ingersoll-Rand PLC 1,513,141
3,342 Parker-Hannifin Corp. 498,426
7,300,635
OIL & GAS - 7.5 %
31,408 Anadarko Petroleum Corp. 1,376,927
25,122 Antero Resources Corp. * 235,896
8,868 Apache Corp. 232,785
38,153 Chevron Corp. 4,150,665
3,644 Concho Resources, Inc. * 374,567
41,632 ConocoPhillips 2,595,755
8,769 Continental Resources, Inc. * 352,426
7,065 EOG Resources, Inc. 616,139
88,845 Exxon Mobil Corp. 6,058,341
3,552 Helmerich & Payne, Inc. 170,283
10,932 Marathon Oil Corp. 156,765
37,964 Nabors Industries Ltd. 75,928
2,687 Newfield Exploration Co. * 39,391
16,494 Occidental Petroleum Corp. 1,012,402
PORTFOLIO OF INVESTMENTS (Continued)
December 31, 2018
Global Atlantic BlackRock Disciplined Value Portfolio
113See accompanying notes to financial statements.

Shares Value
OIL & GAS (Continued) - 7.5 %
14,046 Phillips 66 1,210,063$
6,663 Valero Energy Corp. 499,525
3,879 Whiting Petroleum Corp. * 88,013
19,245,871
OIL & GAS SERVICES - 0.5 %
37,938 Halliburton Co. 1,008,392
484 Schlumberger Ltd. 17,463
13,267 TechnipFMC PLC * 259,768
1,285,623
PACKAGING & CONTAINERS - 0.5 %
1,387 Bemis Co, Inc. 63,663
3,195 Packaging Corp. of America 266,655
22,752 Westrock Co. 859,116
1,189,434
PHARMACEUTICALS - 9.1 %
5,038 AbbVie, Inc. 464,453
3,186 Allergan PLC 425,841
9,214 AmerisourceBergen Corp. 685,522
27,971 Bristol-Myers Squibb Co. 1,453,933
26,628 Cardinal Health, Inc. 1,187,609
2,916 Cigna Corp. 553,794
19,883 CVS Health Corp. 1,302,734
12,241 Eli Lilly & Co. 1,416,529
1,443 Herbalife Nutrition Ltd. * 85,065
52,531 Johnson & Johnson 6,779,126
10,219 McKesson Corp. 1,128,893
62,342 Merk & Co., Inc. 4,763,552
64,441 Pfizer, Inc. 2,812,850
1,672 Zoetis, Inc. 143,021
23,202,922
PIPELINES - 1.0 %
105,612 Kinder Morgan, Inc. 1,624,313
3,271 Plains GP Holdings LP 65,747
40,439 Williams Cos, Inc. 891,680
2,581,740
REAL ESTATE INVESTMENT TRUSTS - 4.9 %
5,605 Apartment Investment & Management Co. 245,947
4,227 Apple Hospitality REIT, Inc. 60,277
54,396 Brandywine Realty Trust 700,077
3,487 Equity LifeStyle Properties, Inc. 338,692
3,752 First Industrial Realty Trust, Inc. 108,283
21,106 Highwoods Properties, Inc. 816,591
60,250 Host Hotels & Resorts, Inc. 1,004,368
8,854 Outfront Media, Inc. 160,434
48,843 Park Hotels & Resorts, Inc. 1,268,941
58,846 Prologis, Inc. 3,455,437
43,345 Realty Income Corp. 2,732,469
Global Atlantic BlackRock Disciplined Value Portfolio
PORTFOLIO OF INVESTMENTS (Continued)
December 31, 2018
114See accompanying notes to financial statements.

Shares Value
REAL ESTATE INVESTMENT TRUSTS (Continued) - 4.9 %
8,182 Simon Property Group, Inc. 1,374,494$
2,479 SL Green Realty Corp. 196,039
11,730 Sunstone Hotel Investors, Inc. 152,607
3 Weingarten Realty Investors 74
12,614,730
RETAIL - 3.8 %
4,581 Costco Wholesale Corp. 933,196
3,426 Darden Restaurants, Inc. 342,120
1,677 Dick's Sporting Goods, Inc. 52,322
2,409 Domino's Pizza, Inc. 597,408
550 Dunkin' Brands Group, Inc. 35,266
685 Five Below, Inc. * 70,089
822 Foot Locker, Inc. 43,730
2,283 Genuine Parts Co. 219,214
10,636 McDonald's Corp. 1,888,635
10,874 Penske Automotive Group, Inc. 438,440
406 Ross Stores, Inc. 33,779
37,673 Target Corp. 2,489,809
989 TJX Cos. Inc. 44,248
24,414 Walmart, Inc. 2,274,164
1,360 Yum! Brands, Inc. 125,011
9,587,431
SEMICONDUCTORS - 3.2 %
9,359 Analog Devices, Inc. 803,283
4,530 Applied Materials, Inc. 148,312
291 Broadcom, Inc. 73,995
4,485 CirrusLogic, Inc. * 148,812
108,830 Intel Corp. 5,107,392
3,143 Maxim Integrated Products, Inc. 159,822
19,691 QUALCOMM, Inc. 1,120,615
3,202 Silicon Laboratories, Inc. * 252,350
6,005 Skyworks Solutions, Inc. 402,455
442 Xilinx, Inc. 37,645
8,254,681
SOFTWARE - 2.1 %
1 Broadridge Financial Solutions, Inc. 96
7,052 Dropbox, Inc. * 144,072
1,363 Electronic Arts, Inc. * 107,554
6,731 Fidelity National Information Services, Inc. 690,264
64,997 Oracle Corp. 2,934,615
4,826 salesforce.com, Inc. * 661,017
6,466 Synopsys, Inc. * 544,696
3,255 Veeva Systems, Inc. * 290,737
5,373,051
TELECOMMUNICATIONS - 5.3 %
133,522 AT&T, Inc. 3,810,718
1,667 CenturyLink, Inc. 25,255
Global Atlantic BlackRock Disciplined Value Portfolio
PORTFOLIO OF INVESTMENTS (Continued)
December 31, 2018
115See accompanying notes to financial statements.

Shares Value
TELECOMMUNICATIONS (Continued) - 5.3 %
5,143 Ciena Corp. * 174,399$
84,579 Cisco Systems, Inc. 3,664,808
8,507 CommScope Holding Co, Inc. * 139,430
5,683 Juniper Networks, Inc. 152,930
4,746 Motorola Solutions, Inc. 545,980
9,290 Telephone & Data Systems, Inc. 302,297
85,440 Verizon Communications, Inc. 4,803,436
13,619,253
TRANSPORTATION - 0.7 %
6,554 Landstar System, Inc. 627,021
6,957 Norfolk Southern Corp. 1,040,350
1,667,371
WATER - 0.6 %
16,746 American Water Works Co., Inc. 1,520,034
TOTAL COMMON STOCKS (Cost - $266,876,569) 250,731,515
SHORT-TERM INVESTMENT - 1.5 %
MONEY MARKET FUND - 1.5 %
3,888,739 Fidelity Investments Money Market Funds - Government Portfolio, Institutional Class
to yield 2.25% (a)(Cost - $3,888,739) 3,888,739
TOTAL INVESTMENTS - 99.7 % (Cost - $270,765,308) 254,620,254$
OTHER ASSETS LESS LIABILITIES - NET - 0.3 % 681,596
TOTAL NET ASSETS - 100.0 % 255,301,850$
* Non-income producing security.
^ Represents less than 0.05%
(a) Money market rate shown represents the rate at December 31, 2018.
LP - Limited Partnerships
PLC - Public Limited Company
Description Counterparty Contracts Expiration Date Notional Value
Unrealized
Depreciation
LONG
S&P 500 E-mini Future Goldman Sachs 40 Mar-19 5,010,400$ (106,752)$
NET UNREALIZED DEPRECIATION ON FUTURES CONTRACTS (106,752)
FUTURES CONTRACTS
Global Atlantic BlackRock Disciplined Value Portfolio
PORTFOLIO OF INVESTMENTS (Continued)
December 31, 2018
116See accompanying notes to financial statements.

Principal Amount Coupon Rate (%) Maturity Value
CORPORATE BONDS & NOTES - 98.1%
AEROSPACE/DEFENSE - 1.3%
60,000$ BBA US Holdings, Inc. (a) 5.38 5/1/2026 56,849$
200,000 Bombardier, Inc. (a) 8.75 12/1/2021 206,000
40,000 Kratos Defense & Security Solutions, Inc. (a) 6.50 11/30/2025 40,700
250,000 TransDigm, Inc. 6.38 6/15/2026 232,500
200,000 TransDigm, Inc. 6.50 7/15/2024 194,500
200,000 TransDigm UK Holdings PLC (a) 6.88 5/15/2026 190,500
921,049
AGRICULTURE - 1.0%
400,000 Pyxus International, Inc. 9.88 7/15/2021 303,000
450,000 Vector Group, Ltd. (a) 6.13 2/1/2025 382,500
685,500
APPAREL - 0.1%
100,000 Levi Strauss & Co. 5.00 5/1/2025 97,750
AUTO MANUFACTURERS - 0.9%
200,000 Allison Transmission, Inc. (a) 4.75 10/1/2027 178,000
250,000 BCD Acquisition, Inc. (a) 9.63 9/15/2023 256,875
150,000 Jaguar Land Rover Automotive PLC (a) 5.63 2/1/2023 139,125
50,000 JB Poindexter & Co., Inc. (a) 7.13 4/15/2026 46,750
620,750
AUTO PARTS & EQUIPMENT - 1.6%
100,000 American Axle & Manufacturing, Inc. 6.25 4/1/2025 91,000
100,000 Cooper-Standard Automotive, Inc. (a) 5.63 11/15/2026 88,000
400,000 Dana Financing Luxembourg Sarl (a) 5.75 4/15/2025 373,000
200,000 IHO Verwaltungs GmbH (a,b) 4.75 9/15/2026 173,500
50,000 Tenneco, Inc. 5.00 7/15/2026 38,462
400,000 Titan International, Inc. 6.50 11/30/2023 358,000
1,121,962
BANKS - 0.5%
100,000 CIT Group, Inc. 5.00 8/15/2022 98,625
120,000 Freedom Mortgage Corp. (a) 8.25 4/15/2025 102,600
150,000 Provident Funding Associates LP / PFG Finance Corp. (a) 6.38 6/15/2025 135,000
336,225
BUILDING MATERIALS - 0.6%
100,000 Griffon Corp. 5.25 3/1/2022 90,500
50,000 PGT Escrow Issuer, Inc. (a) 6.75 8/1/2026 49,250
105,000 NCI Building Systems, Inc. 8.00 4/15/2026 96,075
100,000 Standard Industries, Inc. (a) 5.38 11/15/2024 93,875
100,000 Summit Materials LLC / Summit Materials Finance Corp. (a) 5.13 6/1/2025 91,000
420,700
CHEMICALS - 3.0%
100,000 Cornerstone Chemical Co. (a) 6.75 8/15/2024 87,750
100,000 CVR Partners LP / CVR Nitrogen Finance Corp. (a) 9.25 6/15/2023 104,000
300,000 Hexion, Inc. (a) 10.38 2/1/2022 239,250
200,000 INEOS Group Holdings SA (a) 5.63 8/1/2024 177,200
25,000 Ingevity Corp. (a) 4.50 2/1/2026 22,625
350,000 NOVA Chemicals Corp. (a) 4.88 6/1/2024 315,875
240,000 Nufarm Australia Ltd. / Nufarm Americas, Inc. (a) 5.75 4/30/2026 218,760
200,000 OCI NV (a) 6.63 4/15/2023 196,500
100,000 Rain CII Carbon LLC / CII Carbon Corp. (a) 7.25 4/1/2025 90,500
100,000 Rayonier AM Products, Inc. (a) 5.50 6/1/2024 88,250
400,000 TPC Group, Inc. (a) 8.75 12/15/2020 380,000
75,000 Tronox Finance PLC (a) 5.75 10/1/2025 60,750
100,000 Valvoline, Inc. 4.38 8/15/2025 92,000
2,073,460
COAL - 0.6%
100,000 Foresight Energy LLC / Foresight Energy Finance Corp. (a) 11.50 4/1/2023 85,000
200,000 Peabody Energy Corp. (a) 6.00 3/31/2022 194,000
125,000 SunCoke Energy Partners LP / SunCoke Energy Partners Finance Corp. (a) 7.50 6/15/2025 118,438
397,438
Global Atlantic BlackRock High Yield Portfolio
PORTFOLIO OF INVESTMENTS
December 31, 2018
117See accompanying notes to financial statements.

Principal Amount Coupon Rate (%) Maturity Value
COMMERCIAL SERVICES - 2.8%
100,000$ APX Group, Inc. 7.63 9/1/2023 80,750$
100,000 Brink's Co. (The) (a) 4.63 10/15/2027 91,000
125,000 Graham Holdings Co. (a) 5.75 6/1/2026 125,313
50,000 Hertz Corp. (The) 6.25 10/15/2022 42,375
250,000 Hertz Corp. (The) (a) 7.63 6/1/2022 235,625
200,000 Jaguar Holding Co. II / Pharmaceutical Product Development LLC (a) 6.38 8/1/2023 191,400
162,000 Prime Security Services Borrower LLC / Prime Finance Inc. (a) 9.25 5/15/2023 167,063
45,000 Refinitiv US Holdings, Inc. (a) 6.25 5/15/2026 43,425
40,000 Refinitiv US Holdings, Inc. (a) 8.25 11/15/2026 36,550
100,000 RR Donnelley & Sons Co. 6.50 11/15/2023 98,000
100,000 Service Corp. International 4.63 12/15/2027 94,000
350,000 ServiceMaster Co LLC (The) (a) 5.13 11/15/2024 330,750
125,000 Sotheby's (a) 4.88 12/15/2025 113,125
100,000 Team Health Holdings, Inc. (a) 6.38 2/1/2025 81,625
200,000 United Rentals North America, Inc. 4.88 1/15/2028 175,500
50,000 Verscend Escrow Corp. (a) 9.75 8/15/2026 47,000
1,953,501
COMPUTERS - 1.4%
35,000 Banff Merger Sub, Inc. (a) 9.75 9/1/2026 32,025
500,000 Dell International LLC / EMC Corp. (a) 7.13 6/15/2024 508,750
500,000 Exela Intermediate LLC / Exela Finance, Inc. (a) 10.00 7/15/2023 477,500
1,018,275
COSMETICS/PERSONAL CARE - 0.3%
200,000 Avon International Operations, Inc. (a) 7.88 8/15/2022 197,000
DISTRIBUTION/WHOLESALE - 0.4%
100,000 Core & Main LP (a) 6.13 8/15/2025 88,000
50,000 HD Supply, Inc. (a) 5.38 10/15/2026 48,500
84,000 KAR Auction Services, Inc. (a) 5.13 6/1/2025 75,810
100,000 LKQ Corp. 4.75 5/15/2023 94,000
306,310
DIVERSIFIED FINANCIAL SERVICES - 3.8%
500,000 Ally Financial, Inc. 5.13 9/30/2024 496,250
200,000 Ally Financial, Inc. 5.75 11/20/2025 199,000
200,000 goeasy Ltd. (a) 7.88 11/1/2022 202,500
110,000 Intrepid Aviation Group Holdings LLC/Intrepid Finance Co. (a) 8.50 8/15/2021 108,888
200,000 Jefferies Finance LLC / JFIN Co-Issuer Corp. (a) 7.25 8/15/2024 185,000
300,000 Ladder Capital Finance Holdings LLLP / Ladder Capital Finance Corp. (a) 5.25 10/1/2025 267,750
25,000 LPL Holdings, Inc. (a) 5.75 9/15/2025 23,438
40,000 Nationstar Mortgage Holdings, Inc. (a) 8.13 7/15/2023 39,000
300,000 Nationstar Mortgage LLC / Nationstar Capital Corp. 6.50 7/1/2021 292,500
100,000 Navient Corp. 5.50 1/25/2023 87,500
100,000 Navient Corp. 6.75 6/15/2026 83,000
230,000 NFP Corp. (a) 6.88 7/15/2025 205,850
100,000 Quicken Loans, Inc. (a) 5.75 5/1/2025 93,500
105,000 Springleaf Finance Corp. 6.88 3/15/2025 93,975
100,000 Tempo Acquisition LLC / Tempo Acquisition Finance Corp. (a) 6.75 6/1/2025 92,500
185,000 Travelport Corporate Finance PLC (a) 6.00 3/15/2026 186,850
2,657,501
ELECTRIC - 1.9%
180,000 Calpine Corp. (a) 5.25 6/1/2026 164,250
100,000 Calpine Corp. 5.38 1/15/2023 93,750
200,000 Clearway Energy Operating LLC 5.00 9/15/2026 179,500
80,000 Clearway Energy Operating LLC (a) 5.75 10/15/2025 76,400
200,000 Drax Finco PLC (a) 6.63 11/1/2025 196,500
80,000 NRG Energy, Inc. 5.75 1/15/2028 76,800
350,000 NRG Energy, Inc. 6.63 1/15/2027 352,625
100,000 NRG Energy, Inc. 7.25 5/15/2026 103,750
100,000 Talen Energy Supply LLC 6.50 6/1/2025 71,000
1,314,575
Global Atlantic BlackRock High Yield Portfolio
PORTFOLIO OF INVESTMENTS (Continued)
December 31, 2018
118See accompanying notes to financial statements.

Principal Amount Coupon Rate (%) Maturity Value
ELECTRICAL COMPONENTS & EQUIPMENT - 0.9%
80,000$ Energizer Gamma Acquisition, Inc. (a) 6.38 7/15/2026 73,400$
400,000 Energizer Holdings, Inc. (a) 5.50 6/15/2025 361,000
200,000 WESCO Distribution, Inc. 5.38 6/15/2024 188,500
622,900
ELECTRONICS - 0.1%
45,000 Itron, Inc. (a) 5.00 1/15/2026 41,175
ENGINEEERING & CONSTRUCTION - 0.9%
229,000 AECOM 5.88 10/15/2024 225,565
300,000 Brand Industrial Services, Inc. (a) 8.50 7/15/2025 255,750
45,000 Frontdoor, Inc. (a) 6.75 8/15/2026 42,750
90,000 New Enterprise Stone & Lime Co., Inc. (a) 6.25 3/15/2026 81,900
35,000 TopBuild Corp. (a) 5.63 5/1/2026 32,025
637,990
ENTERTAINMENT - 2.0%
25,000 Boyne USA, Inc. (a) 7.25 5/1/2025 25,812
400,000 Churchill Downs, Inc. (a) 4.75 1/15/2028 361,880
25,000 Downstream Development Authority of the Quapaw Tribe of Oklahoma (a) 10.50 2/15/2023 24,625
100,000 Eldorado Resorts, Inc. 6.00 4/1/2025 96,464
25,000 Eldorado Resorts, Inc. (a) 6.00 9/15/2026 23,625
200,000 Cirsa Finance International SARL 7.88 12/20/2023 197,560
200,000 Live Nation Entertainment, Inc. (a) 4.88 11/1/2024 190,000
200,000 Merlin Entertainments PLC (a) 5.75 6/15/2026 197,500
100,000 Mohegan Gaming & Entertainment (a) 7.88 10/15/2024 93,375
100,000 Six Flags Entertainment Corp. (a) 4.88 7/31/2024 94,250
45,000 Stars Group Holdings BV / Stars Group US Co-Borrower LLC (a) 7.00 7/15/2026 43,763
40,000 WMG Acquisition Corp. (a) 5.50 4/15/2026 38,200
1,387,054
ENVIRONMENTAL CONTROL - 0.8%
200,000 Advanced Disposal Services, Inc. (a) 5.63 11/15/2024 195,500
205,000 GFL Environmental, Inc. (a) 5.38 3/1/2023 179,375
110,000 Tervita Escrow Corp. (a) 7.63 12/1/2021 104,775
65,000 Waste Pro USA, Inc. (a) 5.50 2/15/2026 59,800
539,450
FOOD - 1.3%
200,000 Albertsons Cos. LLC / Safeway, Inc. / New Albertson's LP / Albertson's LLC 6.63 6/15/2024 185,500
100,000 Lamb Weston Holdings,Inc. (a) 4.88 11/1/2026 96,000
150,000 Pilgrim's Pride Corp. (a) 5.75 3/15/2025 140,625
200,000 Post Holdings, Inc. (a) 5.50 3/1/2025 191,962
200,000 Post Holdings, Inc. (a) 5.75 3/1/2027 187,500
200,000 Simmons Foods, Inc. (a) 5.75 11/1/2024 142,000
943,587
FOREST PRODUCTS & PAPER - 0.3%
25,000 Cascades, Inc. (a) 5.50 7/15/2022 24,375
200,000 Clearwater Paper Corp. (a) 5.38 2/1/2025 180,500
204,875
GAS - 1.4%
200,000 AmeriGas Partners LP / AmeriGas Finance Corp. 5.63 5/20/2024 189,000
400,000 AmeriGas Partners LP / AmeriGas Finance Corp. 5.50 5/20/2025 366,000
400,000 AmeriGas Partners LP / AmeriGas Finance Corp. 5.75 5/20/2027 354,000
50,000 Superior Plus LP / Superior General Partner, Inc. (a) 7.00 7/15/2026 48,250
957,250
HEALTHCARE PRODUCTS - 2.7%
100,000 Avantor, Inc. (a) 6.00 10/1/2024 98,250
200,000 Hill-Rom Holdings, Inc. (a) 5.75 9/1/2023 200,000
300,000 Hologic, Inc. (a) 4.38 10/15/2025 279,000
200,000 Kinetic Concepts, Inc. / KCI USA, Inc. (a) 7.88 2/15/2021 202,500
300,000 Mallinckrodt International Finance SA/Mallinckrodt CB LLC (a) 5.75 8/1/2022 258,000
350,000 Mallinckrodt International Finance SA/Mallinckrodt CB LLC (a) 5.63 10/15/2023 266,000
Global Atlantic BlackRock High Yield Portfolio
PORTFOLIO OF INVESTMENTS (Continued)
December 31, 2018
119See accompanying notes to financial statements.

Principal Amount Coupon Rate (%) Maturity Value
HEALTHCARE PRODUCTS - 2.7% (Continued)
200,000$ Ortho-Clinical Diagnostics, Inc. / Ortho-Clinical Diagnostics SA (a) 6.63 5/15/2022 180,000$
450,000 Teleflex, Inc. 4.63 11/15/2027 417,375
1,901,125
HEALTHCARE SERVICES - 5.3%
100,000 Centene Corp. 4.75 1/15/2025 95,500
120,000 Centene Corp. (a) 5.38 6/1/2026 116,700
200,000 CHS/Community Health Systems, Inc. 6.25 3/31/2023 181,760
500,000 Encompass Health Corp. 5.75 11/1/2024 495,000
120,000 Envision Healthcare Corp. (a) 8.75 10/15/2026 103,800
400,000 HCA, Inc. 5.25 6/15/2026 397,000
600,000 HCA, Inc. 5.38 2/1/2025 585,000
105,000 HCA, Inc. 5.38 9/1/2026 102,112
115,000 HCA, Inc. 5.63 9/1/2028 110,975
650,000 HCA, Inc. 5.88 2/15/2026 646,750
175,000 Molina Healthcare, Inc. 5.38 11/15/2022 168,875
100,000 MPH Acquisition Holdings LLC (a) 7.13 6/1/2024 93,250
100,000 RegionalCare Hospital Partners Holdings, Inc. (a) 8.25 5/1/2023 101,000
100,000 Tenet Healthcare Corp. 4.63 7/15/2024 93,000
100,000 Tenet Healthcare Corp. 5.13 5/1/2025 93,250
100,000 WellCare Health Plans, Inc. 5.25 4/1/2025 96,250
170,000 WellCare Health Plans, Inc. (a) 5.38 8/15/2026 164,050
100,000 West Street Merger Sub, Inc. (a) 6.38 9/1/2025 88,500
3,732,772
HOME BUILDERS - 2.5%
250,000 Beazer Homes USA, Inc. 5.88 10/15/2027 197,500
200,000 Century Communities, Inc. 5.88 7/15/2025 176,000
100,000 K Hovnanian Enterprises, Inc. (a) 10.00 7/15/2022 87,500
100,000 Lennar Corp. 4.75 11/29/2027 90,250
100,000 Mattamy Group Corp. (a) 6.88 12/15/2023 93,375
400,000 PulteGroup, Inc. 5.00 1/15/2027 362,000
200,000 PulteGroup, Inc. 5.50 3/1/2026 192,500
300,000 Toll Brothers Finance Corp. 4.88 3/15/2027 271,500
200,000 TRI Pointe Group, Inc. / TRI Pointe Homes, Inc. 5.88 6/15/2024 178,500
90,000 William Lyon Homes, Inc. 6.00 9/1/2023 81,000
30,000 Williams Scotsman International, Inc. (a) 6.88 8/15/2023 28,800
1,758,925
HOUSEWARES - 0.1%
100,000 Scotts Miracle-Gro Co. 6.00 10/15/2023 99,500
INSURANCE - 0.5%
100,000 AssuredPartners, Inc. (a) 7.00 8/15/2025 90,220
100,000 CNO Financial Group, Inc. 5.25 5/30/2025 95,250
120,000 Fidelity & Guaranty Life Holdings, Inc. (a) 5.50 5/1/2025 114,635
100,000 Radian Group, Inc. 4.50 10/1/2024 90,625
390,730
INTERNET - 3.7%
305,000 Cogent Communications Group, Inc. (a) 5.38 3/1/2022 302,713
150,000 Match Group, Inc. (a) 5.00 12/15/2027 137,625
400,000 Netflix, Inc. 4.38 11/15/2026 363,000
200,000 Netflix, Inc. (a) 5.88 11/15/2028 194,340
600,000 VeriSign, Inc. 4.75 7/15/2027 562,680
200,000 VeriSign, Inc. 5.25 4/1/2025 198,000
400,000 Zayo Group LLC / Zayo Capital Inc. (a) 5.75 1/15/2027 357,000
500,000 Zayo Group LLC / Zayo Capital Inc. 6.00 4/1/2023 473,805
2,589,163
IRON/STEEL - 3.4%
200,000 AK Steel Corp. 6.38 10/15/2025 154,000
200,000 AK Steel Corp. 7.50 7/15/2023 198,500
100,000 Allegheny Technologies, Inc. 5.95 1/15/2021 98,000
400,000 Allegheny Technologies, Inc. 7.88 8/15/2023 408,000
400,000 Big River Steel LLC / BRS Finance Corp. (a) 7.25 9/1/2025 397,000
Global Atlantic BlackRock High Yield Portfolio
PORTFOLIO OF INVESTMENTS (Continued)
December 31, 2018
120See accompanying notes to financial statements.

Principal Amount Coupon Rate (%) Maturity Value
IRON/STEEL - 3.4% (Continued)
470,000$ Cleveland-Cliffs, Inc. 5.75 3/1/2025 423,000$
200,000 Commercial Metals Co. 5.38 7/15/2027 179,000
75,000 Commercial Metals Co. (a) 5.75 4/15/2026 69,563
500,000 United States Steel Corp. 6.88 8/15/2025 457,500
2,384,563
LEISURE TIME - 0.4%
200,000 Carlson Travel, Inc. (a) 6.75 12/15/2023 192,750
25,000 Silversea Cruise Finance Ltd. (a) 7.25 2/1/2025 26,430
100,000 Viking Cruises Ltd. (a) 5.88 9/15/2027 93,250
312,430
LODGING - 1.4%
75,000 Boyd Gaming Corp. 6.00 8/15/2026 70,125
100,000 Hilton Domestic Operating Co., Inc. 4.25 9/1/2024 94,500
45,000 Hilton Domestic Operating Co., Inc. (a) 5.13 5/1/2026 43,200
400,000 Hilton Worldwide Finance LLC / Hilton Worldwide Finance Corp. 4.88 4/1/2027 375,000
100,000 Jack Ohio Finance LLC / Jack Ohio Finance 1 Corp. (a) 6.75 11/15/2021 101,000
50,000 Station Casinos LLC (a) 5.00 10/1/2025 45,250
100,000 Wyndham Hotels & Resorts, Inc. (a) 5.38 4/15/2026 96,000
200,000 Wynn Las Vegas LLC / Wynn Las Vegas Capital Corp. (a) 5.50 3/1/2025 186,500
1,011,575
MACHINERY - DIVERSIFIED - 0.3%
140,000 Cleaver-Brooks, Inc. (a) 7.88 3/1/2023 135,100
35,000 Mueller Water Products, Inc. (a) 5.50 6/15/2026 33,950
35,000 RBS Global Inc / Rexnord LLC (a) 4.88 12/15/2025 31,763
50,000 Stevens Holding Co., Inc. (a) 6.13 10/1/2026 49,250
250,063
MEDIA - 8.7%
200,000 Altice Financing SA (a) 6.63 2/15/2023 192,000
200,000 Altice Financing SA (a) 7.50 5/15/2026 182,500
300,000 Altice Financing SA (France) (a) 7.38 5/1/2026 275,250
200,000 Altice Luxembourg SA (a) 7.75 5/15/2022 182,000
200,000 Cablevision Systems Corp. 5.88 9/15/2022 196,500
200,000 CCO Holdings LLC / CCO Holdings Capital Corp. (a) 5.50 5/1/2026 192,250
200,000 CCO Holdings LLC / CCO Holdings Capital Corp. (a) 5.13 5/1/2027 186,280
100,000 CCO Holdings LLC / CCO Holdings Capital Corp. (a) 5.00 2/1/2028 92,000
150,000 Cengage Learning, Inc. (a) 9.50 6/15/2024 102,000
200,000 CSC Holdings LLC (a) 5.13 12/15/2021 196,000
500,000 CSC Holdings LLC 5.25 6/1/2024 458,125
200,000 CSC Holdings LLC (a) 5.38 2/1/2028 183,936
200,000 CSC Holdings LLC (a) 5.50 5/15/2026 188,500
100,000 DISH DBS Corp. 5.88 7/15/2022 92,000
500,000 DISH DBS Corp. 5.88 11/15/2024 402,500
200,000 DISH DBS Corp. 6.75 6/1/2021 197,940
300,000 DISH DBS Corp. 7.75 7/1/2026 248,250
315,000 Gray Escrow, Inc. (a) 7.00 5/15/2027 306,549
171,000 Gray Television Inc. (a) 5.88 7/15/2026 159,423
100,000 Midcontinent Communications / Midcontinent Finance Corp. (a) 6.88 8/15/2023 102,500
100,000 Radiate Holdco LLC / Radiate Finance Inc. (a) 6.63 2/15/2025 86,500
70,000 Radiate Holdco LLC / Radiate Finance Inc. (a) 6.88 2/15/2023 63,525
200,000 Sirius XM Radio, Inc. (a) 3.88 8/1/2022 190,000
700,000 Sirius XM Radio, Inc. (a) 5.00 8/1/2027 639,625
200,000 Univision Communications. Inc. (a) 5.13 2/15/2025 175,500
200,000 Univision Communications. Inc. (a) 5.13 5/15/2023 179,500
400,000 UPC Holding BV (a) 5.50 1/15/2028 359,000
200,000 Virgin Media Finance PLC (a) 6.00 10/15/2024 192,100
150,000 Ziggo BV (a) 5.50 1/15/2027 134,250
6,156,503
December 31, 2018
Global Atlantic BlackRock High Yield Portfolio
PORTFOLIO OF INVESTMENTS (Continued)
121See accompanying notes to financial statements.

Principal Amount Coupon Rate (%) Maturity Value
METAL FABRICATE/HARDWARE - 0.4%
100,000$ Grinding Media, Inc. / Moly-Cop AltaSteel Ltd. (a) 7.38 12/15/2023 96,750$
100,000 Novelis Corp. (a) 5.88 9/30/2026 88,500
100,000 Novelis Corp. (a) 6.25 8/15/2024 94,000
279,250
MINING - 1.4%
500,000 Freeport-McMoRan, Inc. 3.55 3/1/2022 473,125
200,000 Freeport-McMoRan, Inc. 6.88 2/15/2023 206,250
87,000 Hi-Crush Partners LP (a) 9.50 8/1/2026 63,945
250,000 Northwest Acquisitions ULC / Dominion Finco, Inc. (a) 7.13 11/1/2022 246,950
990,270
MISCELLANEOUS MANUFACTURING - 0.1%
50,000 LSB Industries, Inc. (a) 9.63 5/1/2023 50,750
OFFICE/BUSINESS EQUIPMENT - 0.5%
200,000 CDW LLC / CDW Finance Corp. 5.00 9/1/2025 191,500
200,000 CDW LLC / CDW Finance Corp. 5.50 12/1/2024 197,500
389,000
OIL & GAS - 8.4%
95,000 Berry Petroleum Co. LLC (a) 7.00 2/15/2026 85,500
750,000 California Resources Corp. (a) 8.00 12/15/2022 508,125
80,000 Chaparral Energy, Inc. (a) 8.75 7/15/2023 57,200
110,000 Chesapeake Energy Corp. 7.00 10/1/2024 95,150
120,000 Chesapeake Energy Corp. 7.50 10/1/2026 102,600
125,000 Comstock Escrow Corp. (a) 9.75 8/15/2026 105,625
55,000 Covey Park Energy LLC / Covey Park Finance Corp. (a) 7.50 5/15/2025 47,300
500,000 CVR Refining LLC / Coffeyville Finance, Inc. 6.50 11/1/2022 492,500
30,000 Denbury Resources, Inc. (a) 7.50 2/15/2024 24,150
500,000 Denbury Resources, Inc. (a) 9.00 5/15/2021 465,000
265,000 Ensco PLC 7.75 2/1/2026 196,100
300,000 EP Energy LLC / Everest Acquisition Finance, Inc. (a) 8.00 11/29/2024 223,500
225,000 EP Energy LLC / Everest Acquisition Finance, Inc. (a) 7.75 5/15/2026 199,125
65,000 Extraction Oil & Gas,Inc. (a) 5.63 2/1/2026 47,450
200,000 Gulfport Energy Corp. 6.38 1/15/2026 173,000
70,000 Hess Infrastructure Partners LP / Hess Infrastructure Partners Finance Corp. (a) 5.63 2/15/2026 67,725
80,000 Hilcorp Energy I LP / Hilcorp Finance Co. (a) 6.25 11/1/2028 70,400
105,000 Indigo Natural Resources LLC (a) 6.88 2/15/2026 90,300
35,000 Jagged Peak Energy LLC (a) 5.88 5/1/2026 32,550
30,000 Jones Energy Holdings LLC / Jones Energy Finance Corp. (a) 9.25 3/15/2023 26,100
55,000 Matador Resources Co. 5.88 9/15/2026 50,600
100,000 Moss Creek Resources Holdings, Inc. (a) 7.50 1/15/2026 86,500
200,000 Murphy Oil Corp. 5.75 8/15/2025 186,818
100,000 Newfield Exploration Co. 5.38 1/1/2026 98,000
80,000 Noble Holding International Ltd. (a) 7.88 2/1/2026 68,200
80,000 Northern Oil and Gas, Inc. (b) 9.50 5/15/2023 77,000
85,000 Oasis Petroleum, Inc. (a) 6.25 5/1/2026 71,400
70,000 Parkland Fuel Corp. (a) 6.00 4/1/2026 65,625
500,000 PBF Holding Co. LLC / PBF Finance Corp. 7.25 6/15/2025 470,000
30,000 PDC Energy, Inc. 5.75 5/15/2026 26,700
250,000 Precision Drilling Corp. (a) 7.13 1/15/2026 215,000
100,000 Precision Drilling Corp. 7.75 12/15/2023 92,125
125,000 QEP Resources, Inc. 5.63 3/1/2026 103,750
100,000 Rowan Cos, Inc. 7.38 6/15/2025 80,250
105,000 Shelf Drilling Holdings Ltd. (a) 8.25 2/15/2025 89,775
25,000 SM Energy Co. 6.63 1/15/2027 22,125
300,000 Southwestern Energy Co. 6.20 1/23/2025 268,125
200,000 Sunoco LP / Sunoco Finance Corp. 5.50 2/15/2026 189,500
35,000 TransoceanGuardian Ltd. (a) 5.88 1/15/2024 33,512
25,000 Transocean Pontus Ltd. (a) 6.13 8/1/2025 24,125
200,000 Vine Oil & Gas LP / Vine Oil & Gas Finance Corp. (a) 9.75 4/15/2023 160,000
130,000 W&T Offshore, Inc. (a) 9.75 11/1/2023 113,750
70,000 Whiting Petroleum Corp. 6.63 1/15/2026 60,025
Global Atlantic BlackRock High Yield Portfolio
PORTFOLIO OF INVESTMENTS (Continued)
December 31, 2018
122See accompanying notes to financial statements.

Principal Amount Coupon Rate (%) Maturity Value
OIL & GAS - 8.4% (Continued)
55,000$ WildHorse Resource Development Corp. 6.88 2/1/2025 51,975$
100,000 WPX Energy, Inc. 8.25 8/1/2023 104,500
5,918,780
OIL & GAS SERVICES - 1.1%
65,000 Apergy Corp. 6.38 5/1/2026 63,050
45,000 Bristow Group, Inc. (a) 8.75 3/1/2023 32,175
125,000 CSI Compressco LP / CSI Compressco Finance, Inc. (a) 7.50 4/1/2025 116,250
397,000 McDermott Technology Americas, Inc. / McDermott Technology US, Inc. (a) 10.63 5/1/2024 334,969
35,000 Nine Energy Service, Inc. (a) 8.75 11/1/2023 33,250
85,000 USA Compression Partners LP / USA Compression Finance Corp. (a) 6.88 4/1/2026 81,600
200,000 Weatherford International Ltd. 9.88 2/15/2024 122,000
783,294
PACKAGING & CONTAINERS - 3.2%
500,000 ARD Finance SA (b) 7.13 9/15/2023 448,750
500,000 Ardagh Packaging Finance PLC / Ardagh Holdings USA, Inc. (a) 7.25 5/15/2024 498,750
100,000 BWAY Holding Co. (a) 5.50 4/15/2024 94,000
100,000 BWAY Holding Co. (a) 7.25 4/15/2025 89,750
200,000 Crown Americas LLC / Crown Americas Capital Corp. V 4.25 9/30/2026 179,500
100,000 Plastipak Holdings, Inc. (a) 6.25 10/15/2025 88,500
500,000 Reynolds Group Issuer, Inc. / Reynolds Group Issuer LLC / Reynolds Group Issuer (a) 5.13 7/15/2023 476,250
400,000 Silgan Holdings, Inc. 4.75 3/15/2025 373,000
2,248,500
PHARMARCEUTICALS - 3.0%
60,000 Bausch Health Cos, Inc. (a) 5.50 11/1/2025 55,950
300,000 Bausch Health Cos, Inc. (a) 5.88 5/15/2023 277,500
600,000 Bausch Health Cos, Inc. (a) 6.13 4/15/2025 523,500
250,000 Bausch Health Cos, Inc. (a) 7.00 3/15/2024 252,500
355,000 Bausch Health Cos, Inc. (a) 9.00 12/15/2025 333,970
300,000 Endo Finance LLC (a) 5.75 1/15/2022 249,750
500,000 Endo Doc/Endo Finance LLC/Endo Finco, Inc. 6.00 7/15/2023 381,250
60,000 Valeant Pharmaceuticals International 8.50 1/31/2027 58,200
2,132,620
PIPELINES - 2.1%
220,000 American Midstream Partners LP / American Midstream Finance Corp. (a) 9.50 12/15/2021 206,800
300,000 Cheniere Corpus Christi Holdings LLC 5.13 6/30/2027 283,215
100,000 Cheniere Corpus Christi Holdings LLC 5.88 3/31/2025 99,500
100,000 Cheniere Energy Partners LP 5.25 10/1/2025 93,250
105,000 Cheniere Energy Partners LP (a) 5.63 10/1/2026 98,175
100,000 Crestwood Midstream Partners LP / Crestwood Midstream Finance Corp. 5.75 4/1/2025 92,750
80,000 DCP Midstream Operating LP 5.38 7/15/2025 78,200
100,000 Genesis Energy LP / Genesis Energy Finance Corp. 6.50 10/1/2025 88,000
200,000 Holly Energy Partners LP / Holly Energy Finance Corp. (a) 6.00 8/1/2024 196,000
200,000 Targa Resources Partners LP / Targa Resources Partners Finance Corp. 5.00 1/15/2028 181,000
70,000 Targa Resources Partners LP / Targa Resources Partners Finance Corp. (a) 5.88 4/15/2026 68,075
1,484,965
PRIVATE EQUITY - 0.8%
200,000 Icahn Enterprises LP / Icahn Enterprises Finance Corp. 6.25 2/1/2022 197,500
400,000 Icahn Enterprises LP / Icahn Enterprises Finance Corp. 6.38 12/15/2025 385,000
582,500
REAL ESTATE - 0.3%
175,000 Hunt Cos, Inc. (a) 6.25 2/15/2026 149,520
100,000 Kennedy-Wilson, Inc. 5.88 4/1/2024 93,500
243,020
REAL ESTATE INVESTMENT TRUSTS - 2.4%
300,000 CoreCivic, Inc. 4.75 10/15/2027 248,250
600,000 Iron Mountain, Inc. (a) 4.88 9/15/2027 523,500
400,000 MPT Operating Partnership LP / MPT Finance Corp. 5.00 10/15/2027 365,750
100,000 SBA Communications Corp. 4.00 10/1/2022 95,250
100,000 SBA Communications Corp. 4.88 9/1/2024 94,000
PORTFOLIO OF INVESTMENTS (Continued)
December 31, 2018
Global Atlantic BlackRock High Yield Portfolio
123See accompanying notes to financial statements.

Principal Amount Coupon Rate (%) Maturity Value
REAL ESTATE INVESTMENT TRUSTS - 2.4% (Continued)
145,000$ Starwood Property Trust, Inc. 4.75 3/15/2025 130,500$
250,000 Uniti Group LP / Uniti Group Finance, Inc. / CSL Capital LLC (a) 6.00 4/15/2023 226,250
1,683,500
RETAIL - 3.8%
400,000 New Red Finance, Inc. (a) 4.63 1/15/2022 387,000
500,000 New Red Finance, Inc. (a) 5.00 10/15/2025 460,000
400,000 Golden Nugget, Inc. (a) 8.75 10/1/2025 384,000
140,000 IRB Holding Corp. (a) 6.75 2/15/2026 122,500
100,000 KFC Holding Co./Pizza Hut Holdings LLC/Taco Bell of America LLC (a) 5.25 6/1/2026 96,750
200,000 KFC Holding Co./Pizza Hut Holdings LLC/Taco Bell of America LLC (a) 4.75 6/1/2027 186,000
200,000 L Brands, Inc. 6.88 11/1/2035 167,040
100,000 PetSmart, Inc. (a) 5.88 6/1/2025 72,250
100,000 QVC, Inc. 4.45 2/15/2025 92,156
300,000 QVC, Inc. 5.13 7/2/2022 303,169
200,000 Sally Holdings LLC / Sally Capital, Inc. 5.63 12/1/2025 184,000
200,000 Suburban Propane Partners LP/Suburban Energy Finance Corp. 5.50 6/1/2024 186,000
2,640,865
SEMICONDUCTORS - 0.5%
200,000 Entegris, Inc. (a) 4.63 2/10/2026 184,000
160,000 Qorvo, Inc. (a) 5.50 7/15/2026 152,800
336,800
SOFTWARE - 2.7%
25,000 ACI Worldwide, Inc. (a) 5.75 8/15/2026 24,562
100,000 Camelot Finance SA (a) 7.88 10/15/2024 96,500
50,000 CDK Global, Inc. 5.88 6/15/2026 50,202
60,000 Fair Isaac Corp. (a) 5.25 5/15/2026 58,050
200,000 First Data Corp. (a) 5.00 1/15/2024 192,500
200,000 First Data Corp. (a) 5.38 8/15/2023 196,500
200,000 First Data Corp. (a) 5.75 1/15/2024 195,000
200,000 IQVIA, Inc. (a) 5.00 10/15/2026 191,000
145,000 MSCI, Inc. (a) 5.38 5/15/2027 141,919
100,000 PTC, Inc. 6.00 5/15/2024 100,500
200,000 Rackspace Hosting, Inc. (a) 8.63 11/15/2024 156,000
150,000 Riverbed Technology, Inc. (a) 8.88 3/1/2023 110,437
350,000 Solera LLC / Solera Finance, Inc. (a) 10.50 3/1/2024 372,750
1,885,920
STORAGE/WAREHOUSING - 0.3%
200,000 Algeco Global Finance PLC (a) 8.00 2/15/2023 186,500
TELECOMMUNICATIONS - 7.8%
200,000 C&W Senior Financing Plc. (a) 7.50 10/15/2026 192,250
300,000 CenturyLink, Inc. 5.63 4/1/2025 264,000
500,000 CenturyLink, Inc. 5.80 3/15/2022 481,250
100,000 CenturyLink, Inc. 7.50 4/1/2024 96,500
200,000 CenturyLink, Inc. 7.60 9/15/2039 158,000
100,000 CommScope, Inc. (a) 5.50 6/15/2024 91,500
200,000 DKT Finance ApS (a) 9.38 6/17/2023 204,500
300,000 Frontier Communications Corp. 11.00 9/15/2025 186,735
200,000 Frontier Communications Corp. 6.88 1/15/2025 101,500
195,000 Frontier Communications Corp. (a) 8.50 4/1/2026 170,625
400,000 Hughes Satellite Systems Corp. 5.25 8/1/2026 366,500
150,000 Hughes Satellite Systems Corp. 6.63 8/1/2026 137,437
40,000 Intelsat Connect Finance SA (a) 9.50 2/15/2023 34,400
200,000 Intelsat Jackson Holdings SA 5.50 8/1/2023 174,000
200,000 Intelsat Jackson Holdings SA (a) 8.00 2/15/2024 206,000
170,000 Intelsat Jackson Holdings SA (a) 8.50 10/15/2024 164,900
200,000 Nokia OYJ 4.38 6/12/2027 186,000
100,000 Sprint Capital Corp. 6.88 11/15/2028 94,500
300,000 Sprint Communications, Inc. 6.00 11/15/2022 294,399
300,000 Sprint Corp. 7.13 6/15/2024 297,102
200,000 Sprint Corp. 7.25 9/15/2021 204,700
Global Atlantic BlackRock High Yield Portfolio
PORTFOLIO OF INVESTMENTS (Continued)
December 31, 2018
124See accompanying notes to financial statements.

Principal Amount Coupon Rate (%) Maturity Value
TELECOMMUNICATIONS - 7.8% (Continued)
200,000$ Sprint Corp. 7.63 2/15/2025 200,000$
50,000 Sprint Corp. 7.63 3/1/2026 49,375
400,000 Sprint Corp. 7.88 9/15/2023 410,500
100,000 Telesat Canada / Telesat LLC (a) 8.88 11/15/2024 104,000
40,000 T-Mobile USA, Inc. 4.50 2/1/2026 36,700
150,000 T-Mobile USA, Inc. 4.75 2/1/2028 135,750
200,000 T-Mobile USA, Inc. 6.38 3/1/2025 202,000
200,000 T-Mobile USA, Inc. 6.50 1/15/2026 204,000
5,449,123
TEXTILES - 0.2%
155,000 Eagle Intermediate Global Holding BV/Ruyi US Finance LLC (a) 7.50 5/1/2025 145,002
TRANSPORTATION - 0.7%
100,000 Teekay Offshore Partners LP/Teekay Offshore Finance Corp. (a) 8.50 7/15/2023 97,000
368,000 XPO Logistics, Inc. (a) 6.50 6/15/2022 364,780
461,780
TRUCKING & LEASING - 1.5%
50,000 Avolon Holdings Funding Ltd. (a) 5.13 10/1/2023 47,750
145,000 Fortress Transportation & Infrastructure Investors LLC (a) 6.75 3/15/2022 145,363
85,000 Fortress Transportation & Infrastructure Investors LLC (a) 6.50 10/1/2025 79,475
400,000 Park Aerospace Holdings Ltd. (a) 5.25 8/15/2022 387,000
400,000 Park Aerospace Holdings Ltd. (a) 5.50 2/15/2024 386,000
1,045,588
TOTAL CORPORATE BONDS & NOTES (Cost - $75,336,548) 68,981,653
SHORT-TERM INVESTMENT - 0.3%
Shares MONEY MARKET FUND - 0.3%
232,331 Fidelity Investments Money Market Funds - Government Portfolio, Institutional Class
to yield 2.25% (c) (Cost - $232,331) 232,331
TOTAL INVESTMENTS - 98.4% (Cost - $75,568,879) 69,213,984$
OTHER ASSETS LESS LIABILITIES - NET - 1.6% 1,111,949
TOTAL NET ASSETS - 100.0% 70,325,933$
^ - Represents less than 0.05%
LP - Limited Partnership
PLC - Public Limited Company
REITS - Real Estate Investment Trusts
(b) PIK - Pay-in-kind security.
Global Atlantic BlackRock High Yield Portfolio
PORTFOLIO OF INVESTMENTS (Continued)
December 31, 2018
(c) Money market rate shown represents the rate at December 31, 2018.
(a) 144(a) - Security was purchased pursuant to Rule 144a under the Securities Act of 1933 and may not be resold subject to that rule, except to qualified institutional buyers. As of December 31, 2018,
these securities amounted to $39,012,916 or 55.5% of net assets.
125See accompanying notes to financial statements.

Description
Number of
Contracts Expiration Date Counterparty Notional Amount
Unrealized
Appreciation/
Depreciation
SHORT
U.S. 10 Year Ultra Bond Future 6 March 2019 Goldman Sachs 780,469$ (25,219)$
U.S. 10 Year Note Future 21 March 2019 Goldman Sachs 2,562,328 (60,737)
(85,956)
LONG
U.S. Long Bond Future 5 March 2019 Goldman Sachs 730,000 33,672
U.S. Ultra Bond Future 1 March 2019 Goldman Sachs 160,656 8,316
U.S. 5 Year Ultra Note Future 9 March 2019 Goldman Sachs 1,032,188 17,334
U.S. 2 Year Note Future 16 March 2019 Goldman Sachs 3,397,000 23,250
82,572
TOTAL NET UNREALIZED DEPRECIATION OF FUTURES CONTRACTS (3,384)$
Global Atlantic BlackRock High Yield Portfolio
PORTFOLIO OF INVESTMENTS (Continued)
December 31, 2018
FUTURES CONTRACTS
126See accompanying notes to financial statements.

Principal
Amount Coupon Rate (%) Maturity Value
ASSET BACKED SECURITIES - 8.2%
500,000$ ACIS CLO 2014-4 Ltd. 3 Month US LIBOR + 1.42 (a,b) 3.96 5/1/2026 499,250$
1,500,000 Assurant CLO 2018-1 Ltd. 3 Month US LIBOR + 1.04 (a,b) 3.51 4/20/2031 1,483,711
400,000 Catamaran CLO 2013-1 AR 3 Month US LIBOR + 0.85 (a,b) 3.36 1/27/2028 393,632
350,000 CBAM 2018-5 Ltd. 3 Month US LIBOR + 1.02 (a,b) 3.47 4/17/2031 345,824
116,652 Harben Finance 2017-1 PLC 3 Month BP LIBOR + 0.80 (b) 1.69 8/20/2056 149,323
890,908 Kentucky Higher Education Student Loan 2013-2 Corp. 1 Month US LIBOR + 0.60 (b) 2.95 9/1/2028 887,812
310,605 London Wall Mortgage Capital 2017-FL1 PLC 3 Month BP LIBOR + 0.85 (b) 1.74 11/15/2049 394,520
250,000 Madison Park Funding 2018-30 Ltd. 3 Month US LIBOR + 0.75 (a,b) 3.19 4/15/2029 243,813
550,000 OCP CLO 2015-10 Ltd. 3 Month US LIBOR + 0.82 (a,b) 3.33 10/26/2027 544,411
382,260 Pennsylvania Higher Education 2012-1 PLC 1 Month US LIBOR + 0.55 (a,b) 3.06 5/25/2057 381,740
549,542 Ripon Mortgages 1X PLC 3 Month BP LIBOR + 0.80 (b) 1.69 8/20/2056 699,730
44,224 Scholar Funding 2010-A Trust 3 Month US LIBOR + 0.75 (a,b) 3.26 10/28/2041 43,659
1,550,000 TICP CLO 2018-10 Ltd. 3 Month US LIBOR + 1.00 (a,b) 3.47 4/20/2031 1,506,586
TOTAL ASSET BACKED SECURITIES (Cost - $7,742,287) 7,574,011
CORPORATE BONDS & NOTES - 39.6%
AEROSPACE/DEFENSE - 1.6%
150,000 Boeing Co. (The) 2.60 10/30/2025 142,314
100,000 Boeing Co. (The) 3.45 11/1/2028 98,905
150,000 General Dynamics Corp. 2.88 5/11/2020 150,103
125,000 General Dynamics Corp. 3 Month US LIBOR + 0.29 (b) 2.91 5/11/2020 124,834
300,000 Lockheed Martin Corp. 3.55 1/15/2026 297,687
125,000 Northrop Grumman Corp. 2.93 1/15/2025 118,611
300,000 Northrop Grumman Corp. 3.25 1/15/2028 279,900
50,000 Northrop Grumman Corp. 4.75 6/1/2043 50,547
50,000 United Technologies Corp. 3 Month US LIBOR + 0.65 (b) 3.28 8/16/2021 49,812
50,000 United Technologies Corp. 3.35 8/16/2021 49,865
150,000 United Technologies Corp. 3.95 8/16/2025 148,838
1,511,416
AGRICULTURE - 0.4%
200,000 Reynolds American, Inc. 3.25 6/12/2020 198,772
175,000 Reynolds American, Inc. 4.45 6/12/2025 168,741
367,513
AUTO MANUFACTURERS - 0.3%
200,000 Ford Motor Credit Co. LLC 5.88 8/2/2021 205,114
75,000 General Motors Financial Co., Inc. 2.40 5/9/2019 74,718
279,832
BANKS - 12.1%
200,000 Banco Santander SA 4.25 4/11/2027 186,860
200,000 Banco Santander SA 4.38 4/12/2028 186,745
175,000 Bank of America Corp. 3.25 10/21/2027 161,988
133,000 Bank of America Corp. 3 Month US LIBOR + 1.04 (b) 3.42 12/20/2028 124,242
225,000 Bank of America Corp. 3 Month US LIBOR + 0.94 (b) 3.86 7/23/2024 224,464
149,000 Bank of America Corp. 4.00 4/1/2024 149,826
25,000 Bank of America Corp. 4.18 11/25/2027 24,029
125,000 Bank of America Corp. 3 Month US LIBOR + 1.31 (b) 4.27 7/23/2029 124,413
100,000 Bank of America Corp. 6.11 1/29/2037 109,904
175,000 Bank of New York Mellon Corp. (The) 3.30 8/23/2029 163,709
225,000 Barclays PLC 3 Month US LIBOR + 1.40 (b) 4.61 2/15/2023 223,101
300,000 BNP Paribas SA (a) 3.50 3/1/2023 290,854
255,000 BPCE SA 2.65 2/3/2021 249,994
250,000 BPCE SA (a) 4.00 9/12/2023 245,606
250,000 Citibank NA 3.05 5/1/2020 249,683
200,000 Citigroup, Inc. 2.70 10/27/2022 192,790
Global Atlantic Goldman Sachs Core Fixed Income Portfolio
PORTFOLIO OF INVESTMENTS
December 31, 2018
127See accompanying notes to financial statements.

Principal
Amount Coupon Rate (%) Maturity Value
BANKS - 12.1% (Continued)
200,000$ Citigroup, Inc. 3.40 5/1/2026 188,124$
100,000 Citigroup, Inc. 4.13 7/25/2028 93,845
75,000 Citigroup, Inc. 4.60 3/9/2026 74,021
250,000 Cooperatieve Rabobank UA/NY 3 Month US LIBOR + 0.43 (b) 2.94 4/26/2021 248,748
250,000 Credit Suisse Group Funding Guernsey Ltd. 2.75 3/26/2020 247,303
255,000 Credit Suisse Group Funding Guernsey Ltd. 4.55 4/17/2026 252,472
325,000 Deutsche Bank AG 2.70 7/13/2020 316,107
250,000 HSBC Bank USA NA 4.88 8/24/2020 256,145
150,000 Huntington Bancshares, Inc. 4.00 5/15/2025 150,784
200,000 JPMorgan Chase & Co. 2.95 10/1/2026 184,706
275,000 JPMorgan Chase & Co. 3.25 9/23/2022 272,816
225,000 JPMorgan Chase & Co. 3.30 4/1/2026 214,275
325,000 JPMorgan Chase & Co. 3 Month US LIBOR + 0.95 (b) 3.51 1/23/2029 307,744
450,000 JPMorgan Chase & Co. 3 Month US LIBOR + 1.00 (b) 4.02 12/5/2024 453,581
1,400,000 KFW 1.25 9/30/2019 1,385,767
275,000 Lloyds Bank PLC 3 Month US LIBOR + 0.49 (b) 3.08 5/7/2021 272,228
400,000 Mizuho Financial Group, Inc. 2.60 9/11/2022 386,889
400,000 Morgan Stanley 3.63 1/20/2027 380,159
400,000 Morgan Stanley 3.70 10/23/2024 393,356
125,000 Morgan Stanley 3 Month US LIBOR + 0.85 (b) 3.74 4/24/2024 123,936
250,000 PNC Bank NA 4.05 7/26/2028 251,134
150,000 Royal Bank of Canada 3 Month US LIBOR + 0.39 (b) 2.91 4/30/2021 148,742
150,000 Royal Bank of Canada 3.20 4/30/2021 149,985
300,000 Royal Bank of Scotland Group PLC 3 Month US LIBOR + 1.55 (b) 4.52 6/25/2024 294,369
375,000 Standard Chartered PLC 3 Month US LIBOR + 1.15 (a,b) 4.25 1/20/2023 371,234
250,000 Sumitomo Mitsui Banking Corp. 2.45 1/16/2020 248,010
200,000 UBS AG (a) 2.20 6/8/2020 196,750
325,000 Wells Fargo & Co. 3.00 10/23/2026 300,860
125,000 Wells Fargo & Co. 3.55 9/29/2025 121,109
11,193,407
BEVERAGES - 1.3%
200,000 Anheuser-Busch Cos. LLC/Anheuser-Busch InBev Worldwid, Inc. (a) 4.70 2/1/2036 185,480
175,000 Anheuser-Busch Cos. LLC/Anheuser-Busch InBev Worldwid, Inc. (a) 4.90 2/1/2046 162,292
175,000 Anheuser-Busch InBev Finance, Inc. 3.30 2/1/2023 170,161
100,000 Anheuser-Busch InBev Worldwide, Inc. 4.00 4/13/2028 95,653
175,000 Constellation Brands, Inc. 3 Month US LIBOR + 0.70 (b) 3.21 11/15/2021 172,904
75,000 Constellation Brands, Inc. 4.40 11/15/2025 75,148
125,000 Keurig Dr. Pepper, Inc. (a) 4.06 5/25/2023 124,567
200,000 Molson Coors Brewing Co. 3.00 7/15/2026 178,119
1,164,324
BIOTECHNOLOGY - 0.4%
175,000 Amgen, Inc. 3.13 5/1/2025 167,440
200,000 Gilead Sciences, Inc. 5.65 12/1/2041 220,958
388,398
CHEMICALS - 0.5%
125,000 DowDuPont, Inc. 4.21 11/15/2023 127,769
100,000 DowDuPont, Inc. 4.49 11/15/2025 102,958
75,000 DowDuPont, Inc. 4.73 11/15/2028 77,430
125,000 Sherwin-Williams Co. (The) 4.50 6/1/2047 112,721
420,878
COMMERCIAL SERVICES - 0.1%
26,000 Ecolab, Inc. 3.95 12/1/2047 24,362
50,000 S&P Global, Inc. 2.95 1/22/2027 47,034
71,396
Global Atlantic Goldman Sachs Core Fixed Income Portfolio
PORTFOLIO OF INVESTMENTS (Continued)
December 31, 2018
128See accompanying notes to financial statements.

Principal
Amount Coupon Rate (%) Maturity Value
COMPUTERS - 0.9%
200,000$ Apple, Inc. 2.45 8/4/2026 184,846$
175,000 Apple, Inc. 2.75 1/13/2025 168,745
175,000 Apple, Inc. 3.25 2/23/2026 170,822
50,000 Apple, Inc. 4.65 2/23/2046 52,927
225,000 Dell International LLC / EMC Corp. (a) 5.45 6/15/2023 228,969
806,309
DIVERSIFIED FINANCIAL SERVICES - 1.0%
175,000 American Express Co. 3.63 12/5/2024 171,076
125,000 Nuveen LLC (a) 4.00 11/1/2028 128,803
90,000 Synchrony Financial 4.50 7/23/2025 82,070
575,000 Visa, Inc. 3.15 12/14/2025 565,047
946,996
ELECTRIC - 1.5%
50,000 Alliant Energy Finance LLC (a) 3.75 6/15/2023 50,308
175,000 Arizona Public Service Co. 2.95 9/15/2027 165,721
100,000 Berkshire Hathaway Energy Co. 3.25 4/15/2028 95,127
74,000 Berkshire Hathaway Energy Co. 6.13 4/1/2036 88,579
25,000 Duke Energy Carolinas LLC 3.95 3/15/2048 23,855
200,000 Duke Energy Corp. 3.15 8/15/2027 186,703
175,000 Entergy Corp. 2.95 9/1/2026 161,451
25,000 Pacific Gas & Electric Co. 4.00 12/1/2046 18,855
50,000 Sempra Energy 3 Month US LIBOR + 0.50 (b) 2.94 1/15/2021 49,160
125,000 Sempra Energy 3.40 2/1/2028 114,212
125,000 Southern California Edison Co. 4.05 3/15/2042 117,187
350,000 Southern Co. (The) 3.25 7/1/2026 327,864
1,399,022
FOOD - 0.6%
100,000 Conagra Brands, Inc. 5.40 11/1/2048 92,097
375,000 General Mills, Inc. 3 Month US LIBOR + 0.54 (b) 2.98 4/16/2021 369,183
125,000 Tyson Foods, Inc. 3.90 9/28/2023 124,826
586,106
GAS - 0.5%
400,000 NiSource, Inc. 3.49 5/15/2027 381,698
125,000 NiSource, Inc. (a) 3.65 6/15/2023 125,212
506,910
HAND/MACHINE TOOLS - 0.1%
125,000 Stanley Black & Decker, Inc. 4.25 11/15/2028 128,580
HEALTHCARE-PRODUCTS - 0.2%
200,000 Thermo Fisher Scientific, Inc. 3.65 12/15/2025 197,061
HEALTHCARE-SERVICES - 0.4%
225,000 Sutter Health 4.09 8/15/2048 214,858
125,000 UnitedHealth Group, Inc. 4.75 7/15/2045 132,250
347,108
INSURANCE - 1.2%
200,000 AIA Group Ltd. (a) 3.20 3/11/2025 192,627
175,000 American International Group, Inc. 3.90 4/1/2026 168,362
75,000 American International Group, Inc. 4.20 4/1/2028 72,252
150,000 Arch Capital Finance LLC 5.03 12/15/2046 156,636
50,000 Great-West Lifeco, Inc. (a) 4.05 5/17/2028 50,859
275,000 MetLife, Inc. 3.60 11/13/2025 271,397
75,000 Principal Financial Group, Inc. 3.10 11/15/2026 70,037
100,000 Prudential Financial, Inc. 3.88 3/27/2028 100,495
50,000 XLIT Ltd. 4.45 3/31/2025 49,689
1,132,354
Global Atlantic Goldman Sachs Core Fixed Income Portfolio
PORTFOLIO OF INVESTMENTS (Continued)
December 31, 2018
129See accompanying notes to financial statements.

Principal
Amount Coupon Rate (%) Maturity Value
INTERNET - 0.7%
100,000$ Amazon.com, Inc. 3.15 8/22/2027 96,548$
75,000 Amazon.com, Inc. 3.88 8/22/2037 72,432
475,000 Amazon.com, Inc. 5.20 12/3/2025 521,782
690,762
LODGING - 0.1%
100,000 Marriott International, Inc. 2.30 1/15/2022 96,139
MACHINERY-DIVERSIFIED - 0.1%
125,000 Roper Technologies, Inc. 4.20 9/15/2028 123,755
MEDIA - 1.3%
200,000 21st Century Fox America, Inc. 3.70 9/15/2024 201,841
25,000 21st Century Fox America, Inc. 6.15 3/1/2037 30,665
425,000 Comcast Corp. 3.70 4/15/2024 427,595
350,000 Comcast Corp. 4.15 10/15/2028 355,401
200,000 Comcast Corp. 4.25 10/15/2030 202,262
1,217,764
MINING - 0.3%
250,000 Glencore Funding LLC (a) 4.63 4/29/2024 247,810
OIL & GAS - 1.8%
25,000 BP Capital Markets America, Inc. 3.22 4/14/2024 24,477
100,000 BP Capital Markets America, Inc. 4.23 11/6/2028 102,876
175,000 BP Capital Markets PLC 3.72 11/28/2028 172,298
200,000 Canadian Natural Resources Ltd. 3.85 6/1/2027 188,664
75,000 Concho Resources, Inc. 4.30 8/15/2028 73,365
75,000 Marathon Petroleum Corp. 3.63 9/15/2024 72,978
50,000 Marathon Petroleum Corp. (a) 3.80 4/1/2028 46,922
80,000 Petroleos Mexicanos 6.50 3/13/2027 75,200
150,000 Phillips 66 Co. 3.90 3/15/2028 144,898
125,000 Pioneer Natural Resources Co. 3.95 7/15/2022 125,371
375,000 Shell International Finance BV 3.88 11/13/2028 385,369
150,000 Shell International Finance BV 4.55 8/12/2043 155,915
75,000 Valero Energy Corp. 4.35 6/1/2028 74,300
1,642,633
OIL & GAS SERVICES - 0.1%
75,000 Halliburton Co. 3.80 11/15/2025 72,674
PHARMACEUTICALS - 2.3%
200,000 AbbVie, Inc. 3.38 11/14/2021 199,812
125,000 AbbVie, Inc. 3.75 11/14/2023 124,368
350,000 Bayer US Finance LLC (a) 4.25 12/15/2025 340,641
600,000 Bayer US Finance LLC (a) 4.38 12/15/2028 572,851
400,000 Cigna Corp. (a) 3.75 7/15/2023 398,668
125,000 CVS Health Corp. 3.88 7/20/2025 121,813
125,000 CVS Health Corp. 4.78 3/25/2038 119,782
50,000 CVS Health Corp. 5.05 3/25/2048 48,630
125,000 CVS Health Corp. 5.13 7/20/2045 121,676
100,000 McKesson Corp. 2.85 3/15/2023 96,594
2,144,835
Global Atlantic Goldman Sachs Core Fixed Income Portfolio
PORTFOLIO OF INVESTMENTS (Continued)
December 31, 2018
130See accompanying notes to financial statements.

Principal
Amount Coupon Rate (%) Maturity Value
PIPELINES - 2.0%
175,000$ Energy Transfer Operating LP 4.20 9/15/2023 172,470$
25,000 Energy Transfer Operating LP 4.95 6/15/2028 24,460
50,000 Energy Transfer Operating LP 5.30 4/15/2047 44,069
25,000 Energy Transfer Operating LP 6.00 6/15/2048 24,345
300,000 Enterprise Products Operating LLC 3.70 2/15/2026 295,588
25,000 Kinder Morgan Energy Partners LP 5.40 9/1/2044 23,897
175,000 Magellan Midstream Partners LP 5.00 3/1/2026 182,924
125,000 MPLX LP 4.50 4/15/2038 109,168
25,000 MPLX LP 4.70 4/15/2048 21,713
50,000 MPLX LP 4.80 2/15/2029 49,877
100,000 MPLX LP 5.50 2/15/2049 97,271
150,000 ONEOK, Inc. 4.55 7/15/2028 148,050
100,000 Sabine Pass Liquefaction LLC 5.63 4/15/2023 105,358
275,000 Sabine Pass Liquefaction LLC 5.63 3/1/2025 285,576
100,000 Sunoco Logistics Partners Operations LP 5.40 10/1/2047 90,621
175,000 Williams Partners LP 4.00 9/15/2025 168,973
1,844,360
REAL ESTATE INVESTMENT TRUSTS - 1.0%
175,000 American Tower Corp. 3.38 10/15/2026 162,805
100,000 Crown Castle International Corp. 3.15 7/15/2023 96,128
75,000 Crown Castle International Corp. 3.65 9/1/2027 69,528
75,000 CubeSmart LP 4.38 12/15/2023 76,712
75,000 Duke Realty LP 4.00 9/15/2028 74,450
150,000 Federal Realty Investment Trust 3.25 7/15/2027 142,118
100,000 Kilroy Realty LP 4.75 12/15/2028 101,849
150,000 VEREIT Operating Partnership LP 4.63 11/1/2025 150,280
75,000 VEREIT Operating Partnership LP 4.88 6/1/2026 74,968
948,838
RETAIL - 0.6%
50,000 Alimentation Couche-Tard, Inc. (a) 3.55 7/26/2027 46,684
75,000 Dollar Tree, Inc. 4.00 5/15/2025 72,102
125,000 Dollar Tree, Inc. 4.20 5/15/2028 118,400
100,000 Home Depot, Inc. (The) 3.90 12/6/2028 102,426
150,000 Starbucks Corp. 3.80 8/15/2025 148,338
75,000 Walmart, Inc. 4.05 6/29/2048 74,626
562,576
SEMICONDUCTORS - 0.5%
175,000 Broadcom Corp. / Broadcom Cayman Finance Ltd. 3.13 1/15/2025 157,983
200,000 Broadcom Corp. / Broadcom Cayman Finance Ltd. 3.63 1/15/2024 189,220
75,000 Microchip Technology, Inc. (a) 3.92 6/1/2021 74,399
75,000 NVIDIA Corp. 3.20 9/16/2026 71,134
492,736
SOFTWARE - 0.7%
75,000 Fidelity National Information Services, Inc. 3.00 8/15/2026 68,998
50,000 Fiserv, Inc. 3.80 10/1/2023 50,311
100,000 Fiserv, Inc. 4.20 10/1/2028 99,800
150,000 Microsoft Corp. 3.70 8/8/2046 143,697
125,000 Oracle Corp. 3.25 11/15/2027 120,560
125,000 Oracle Corp. 4.00 7/15/2046 116,636
600,002
December 31, 2018
Global Atlantic Goldman Sachs Core Fixed Income Portfolio
PORTFOLIO OF INVESTMENTS (Continued)
131See accompanying notes to financial statements.

Principal
Amount Coupon Rate (%) Maturity Value
SOVEREIGN - 2.4%
440,000$ Abu Dhabi Government International Bond 3.13 10/11/2027 420,218$
200,000 Indonesia Government International Bond 4.35 1/8/2027 197,762
670,000 Kuwait Government International Bond (a) 3.50 3/20/2027 666,210
520,000 Perusahaan Penerbit SBSN Indonesia III 4.55 3/29/2026 515,580
200,000 Qatar Government International Bond (a) 4.50 4/23/2028 208,750
200,000 Qatar Government International Bond (a) 5.10 4/23/2048 210,050
2,218,570
TELECOMMUNICATIONS - 2.3%
100,000 AT&T, Inc. 3.20 3/1/2022 98,646
100,000 AT&T, Inc. 3.40 5/15/2025 94,165
225,000 AT&T, Inc. 3.60 2/17/2023 223,606
150,000 AT&T, Inc. 4.25 3/1/2027 146,754
125,000 AT&T, Inc. 5.25 3/1/2037 122,778
200,000 British Telecommunications PLC 5.13 12/4/2028 201,126
175,000 Cisco Systems, Inc. 2.50 9/20/2026 163,132
25,000 Verizon Communications, Inc. 2.63 8/15/2026 22,666
25,000 Verizon Communications, Inc. 3.50 11/1/2024 24,657
488,000 Verizon Communications, Inc. 4.33 9/21/2028 490,006
100,000 Verizon Communications, Inc. 5.01 4/15/2049 99,640
200,000 Verizon Communications, Inc. 5.25 3/16/2037 208,333
275,000 Vodafone Group PLC 3.75 1/16/2024 271,049
2,166,558
TRANSPORTATION - 0.3%
75,000 Burlington Northern Santa Fe LLC 3.25 6/15/2027 73,411
150,000 Burlington Northern Santa Fe LLC 4.15 4/1/2045 145,429
25,000 FedEx Corp. 3.40 2/15/2028 23,712
242,552
TOTAL CORPORATE BONDS & NOTES (Cost - $37,545,417) 36,760,174
MUNICIPAL BONDS - 0.6%
25,000 New Jersey Turnpike Authority 7.10 1/1/2041 34,152
175,000 State of California 7.60 11/1/2040 254,836
325,000 State of Illinois 5.10 6/1/2033 309,865
TOTAL MUNICIPAL BONDS (Cost - $616,998) 598,853
MORTGAGE BACKED SECURITIES - 27.6%
789,385 Fannie Mae Pool 4.50 6/1/2031 825,257
11,000,000 Fannie Mae Pool TBA +^ 4.50 6/25/2044 11,390,157
1,000,000 Ginnie Mae Pool TBA +^ 4.50 7/20/2044 1,034,531
951,148 Ginnie Mae Pool 4.50 2/20/2048 987,015
2,999,702 Ginnie Mae Pool 4.50 6/20/2048 3,107,048
1,992,270 Ginnie Mae Pool 4.50 10/20/2048 2,062,778
1,996,072 Ginnie Mae Pool 4.50 11/20/2048 2,067,326
2,000,000 Ginnie Mae Pool 4.50 12/20/2048 2,070,968
2,000,000 Ginnie Mae Pool TBA +^ 5.00 11/20/2040 2,080,625
TOTAL MORTGAGE BACKED SECURITIES (Cost - $25,471,766) 25,625,705
Global Atlantic Goldman Sachs Core Fixed Income Portfolio
PORTFOLIO OF INVESTMENTS (Continued)
December 31, 2018
132See accompanying notes to financial statements.

Principal
Amount Coupon Rate (%) Maturity Value
U.S. TREASURY SECURITIES - 21.9%
390,000$ United States Treasury Bond 2.88 11/15/2046 379,199$
4,930,000 United States Treasury Bond 3.00 5/15/2047 4,908,816
660,000 United States Treasury Inflation Indexed Note 0.75 7/15/2028 650,812
7,360,000 United States Treasury Note 2.13 9/30/2024 7,192,100
200,000 United States Treasury Note 2.88 8/15/2028 203,094
1,340,000 United States Treasury Note 2.25 2/15/2027 1,301,161
5,580,000 United States Treasury Note 2.75 6/30/2025 5,636,236
20,271,418
SHORT-TERM INVESTMENTS - 16.7%
CERTIFICATE OF DEPOSIT - 0.9%
800,000 Landesbk Baden-Wurtt NY 2.50 1/8/2019 800,005
COMMERCIAL PAPER - 1.2%
286,000 Bell CDA 2.79 1/22/2019 285,520
500,000 VW Credit, Inc. 2.73 1/7/2019 499,738
350,000 VW Credit, Inc. 3.17 3/20/2019 347,614
1,132,872
Shares
MONEY MARKET FUND - 14.6%
13,521,964 Fidelity Investments Money Market - Government Portfolio, Institutional Class to yield 2.25% (c) 13,521,964
TOTAL SHORT-TERM INVESTMENTS (Cost - $15,455,199) 15,454,841
TOTAL INVESTMENTS - 114.6% (Cost - $106,779,589) 106,285,002$
OTHER ASSETS LESS LIABILITIES - NET - (14.6)% (13,525,445)
TOTAL NET ASSETS - 100.0% 92,759,557$
LIBOR - London Interbank Offered Rate
LP - Limited Partnership
REITS - Real Estate Investments Trusts
TBA - To Be Announced Security
^ Delayed delivery
+ All or a portion of these TBAs are subject to dollar-roll transactions.
(a)
(b) Variable Rate Security - interest rate subject to periodic change.
Benchmark Rate
1 Month US LIBOR 2.51%
3 Month US LIBOR 2.81%
3 Month GBP LIBOR 0.91%
(c) Money market rate shown represents the rate at December 31, 2018.
(d) Zero coupon.
144(a) - Security was purchased pursuant to Rule 144a under the Securities Act of 1933 and may not be resold subject to that rule, except to qualified institutional buyers. As of
December 31, 2018, these securities amounted to $9,942,962 or 10.7% of net assets.
TOTAL U.S. TREASURY SECURITIES (Cost - $19,947,922)
Global Atlantic Goldman Sachs Core Fixed Income Portfolio
PORTFOLIO OF INVESTMENTS (Continued)
December 31, 2018
133See accompanying notes to financial statements.

Description
Number of
Contracts Expiration Date Counterparty Notional Amount
Unrealized Appreciation/
(Depreciation)
SHORT
Euro 3 Month Future 11 Dec-19 Morgan Stanley 3,151,523$ (1,875)$
Euro 90 Day Future 3 Jun-19 Morgan Stanley 729,863 (1,413)
Euro 90 Day Future 2 Sep-19 Morgan Stanley 486,700 (700)
Euro 90 Day Future 77 Dec-19 Morgan Stanley 18,739,875 (56,274)
Euro 90 Day Future 7 Dec-20 Morgan Stanley 1,706,775 (9,250)
Euro BTP Future 1 Mar-19 Morgan Stanley 146,117 (4,603)
Euro Oat Future 5 Mar-19 Morgan Stanley 861,935 772
Long Gilt Future 1 Mar-19 Morgan Stanley 156,869 (1,271)
U.S. 10 Year Note Future 67 Mar-19 Morgan Stanley 8,175,047 (195,957)
U.S. 10 Year Ultra Future 16 Mar-19 Morgan Stanley 2,081,250 (64,434)
U.S. Ultra Bond Future 4 Mar-19 Morgan Stanley 642,625 (7,912)
(342,917)
LONG
Euro-Bobl Future 7 Mar-19 Morgan Stanley 1,060,432 2,834
Euro-Bond Future 6 Mar-19 Morgan Stanley 1,121,705 5,245
U.S. 2 Year Note Future 73 Mar-19 Morgan Stanley 15,498,813 104,656
U.S. 5 Year Note Future 42 Mar-19 Morgan Stanley 4,816,875 75,029
U.S. Long Bond Future 53 Mar-19 Morgan Stanley 7,738,000 329,770
517,534
TOTAL NET UNREALIZED APPRECIATION OF FUTURES CONTRACTS 174,617$
Global Atlantic Goldman Sachs Core Fixed Income Portfolio
PORTFOLIO OF INVESTMENTS (Continued)
December 31, 2018
FUTURES CONTRACTS
134See accompanying notes to financial statements.

Counterparty Floating Rate Index
Pay/Receive
Floating Rate Fixed Rate
Expiration
Date
Notional
Amount Value
Premiums
Paid/
(Received)
Unrealized
Appreciation/
(Depreciation)
Merrill Lynch 3 Month EUR LIBOR* Receive -0.10% 1/16/2021 1,650,000$ 5,571$ -$ 5,571$
Morgan Stanley 3 Month EUR LIBOR* Pay -0.09% 11/22/2020 3,970,000 5,327 - 5,327
Danske Bank A/S 3 Month STIBOR* Pay 0.05% 1/16/2021 14,090,000 (71) - (71)
Barclays Bank PLC 3 Month STIBOR* Receive 0.50% 12/16/2021 28,320,000 (29,317) - (29,317)
Barclays Bank PLC 3 Month STIBOR* Receive 0.50% 3/20/2023 8,230,000 (576) - (576)
Danske Bank A/S 3 Month STIBOR* Pay 0.75% 3/20/2024 21,040,000 (3,486) - (3,486)
NatWest Markets PLC 3 Month STIBOR* Pay 1.05% 7/8/2028 600,000 2,850 - 2,850
Deutsche Bank 3 Month STIBOR* Pay 1.10% 8/1/2023 720,000 1,417 - 1,417
Deutsche Bank 3 Month STIBOR* Receive 1.15% 12/18/2028 130,000 (26) - (26)
Morgan Stanley 3 Month STIBOR* Receive 1.25% 3/20/2029 1,780,000 (626) - (626)
Citibank NA 3 Month USD LIBOR* Receive 2.50% 3/20/2021 3,350,000 (17,581) - (17,581)
Citibank NA 3 Month USD LIBOR* Receive 2.75% 3/20/2024 1,860,000 (18,101) - (18,101)
NatWest Markets PLC 3 Month USD LIBOR* Pay 3.00% 3/20/2029 160,000 2,932 - 2,932
Citibank NA 3 Month USD LIBOR* Pay 3.50% 11/8/2048 210,000 6,815 - 6,815
Citibank NA 6 Month EUR LIBOR** Pay 0.35% 12/16/2021 3,460,000 49,804 - 49,804
Barclays Bank PLC 6 Month EUR LIBOR** Receive 0.67% 3/8/2023 970,000 7,133 - 7,133
JPMorgan 6 Month EUR LIBOR** Pay 0.50% 3/20/2023 1,040,000 4,555 - 4,555
Morgan Stanley 6 Month EUR LIBOR** Receive 0.50% 3/20/2024 4,230,000 21,190 - 21,190
Citibank NA 6 Month EUR LIBOR** Pay 0.60% 9/28/2022 1,750,000 15,106 - 15,106
Deutsche Bank 6 Month EUR LIBOR** Pay 1.00% 3/20/2029 540,000 3,816 - 3,816
JPMorgan 6 Month EUR LIBOR** Receive 1.90% 3/8/2028 380,000 (892) - (892)
Citibank NA 6 Month JPY LIBOR**
Pay 1.00% 3/20/2049 17,060,000 (5,110) - (5,110)
Morgan Stanley 6 Month NOK LIBOR **
Pay 2.00% 3/20/2024 2,050,000 (888) - (888)
Credit Suisse Canadian Dollar Offerred Rate** Pay 2.50% 3/20/2021 840,000 2,947 - 2,947
Royal Bank of Canada Canadian Dollar Offerred Rate** Receive 2.50% 3/20/2024 1,450,000 10,258 - 10,258
Australia New Zealand Banking Group NZD 3 Month Bank Bill Benchmark Rate* Pay 2.25% 3/20/2021 2,490,000 4,592 - 4,592
Deutsche Bank NZD 3 Month Bank Bill Benchmark Rate* Pay 2.75% 3/20/2024 1,960,000 13,969 - 13,969
-$ 81,608$
Counterparty Index
Buy/Sell
Protection
Fixed Rate
Received
Fixed Rate
Paid
Expiration
Date
Notional
Amount Value
Premiums
Paid/
(Received)
Unrealized
Appreciation/
(Depreciation)
Credit Suisse
North American Investment Grade CDX Index
Version 30#
Sell 1.00% -
12/20/2023 1,890,000$ (10,765)$ -$ (10,765)$
Deutsche Bank ITRAXX Europe Series 29^ Buy - 1.00% 12/20/2023 455,000 717 - 717
-$ (10,048)$
-$ 71,560$
* Pays quarterly.
**Pays semiannually.
# The underlying holdings of version 30 of this index can be found at http://www.markit.com/Company/Files/DownloadFiles?CMSID=cfbb780d206d4b2a8a92a4d358b1f949.
^ The underlying holdings of Series 29 this index can be found at http://www.markit.com/Company/Files/DownloadFiles?CMSID=d482583edb58464697a2003002728c53.
Benchmark Rate
3 Month EUR LIBOR -0.36%
3 Month GBP LIBOR 0.91%
3 Month STIBOR -0.13%
3 Month USD LIBOR 2.81%
6 Month EUR EURIBOR -0.24%
6 Month JPY LIBOR 0.00%
6 Month NOK LIBOR 1.41%
Canadian Dollar Offered Rate 2.31%
NZD 3 Month Bank Bill Benchmark Rate 1.97%
Global Atlantic Goldman Sachs Core Fixed Income Portfolio
INTEREST RATE SWAPS
CREDIT DEFAULT SWAPS*
PORTFOLIO OF INVESTMENTS (Continued)
December 31, 2018
135See accompanying notes to financial statements.

Forward Foreign Currency Contracts
Settlement
Date Counterparty
Currency Units to
Receive
Unrealized Appreciation/
(Depreciation)
1/17/2019 Morgan Stanley 115,171 GBP 148,319 USD (1,529)$
1/17/2019 Morgan Stanley 1,419,757 USD 1,109,216 GBP 6,016
2/8/2019 Morgan Stanley 159,493 EUR 182,380 USD 519
2/8/2019 Morgan Stanley 49,840 EUR 56,866 USD 288
2/8/2019 Morgan Stanley 362,299 USD 314,610 EUR 1,520
3/20/2019 Morgan Stanley 89,000 AUD 64,946 USD (2,207)
3/20/2019 Morgan Stanley 425,318 AUD 308,468 USD (8,649)
3/20/2019 Morgan Stanley 96,995 AUD 71,000 USD (2,625)
3/20/2019 Morgan Stanley 215,193 AUD 159,055 USD (7,359)
3/20/2019 Morgan Stanley 194,012 AUD 143,274 USD (6,509)
3/20/2019 Morgan Stanley 98,219 AUD 71,066 USD (1,829)
3/20/2019 Morgan Stanley 197,960 AUD 125,009 EUR (4,283)
3/20/2019 Morgan Stanley 40,039 AUD 3,122,402 JPY (411)
3/20/2019 Morgan Stanley 98,041 AUD 103,123 NZD (131)
3/20/2019 Morgan Stanley 47,794 CAD 36,004 USD (948)
3/20/2019 Morgan Stanley 94,134 CAD 71,016 USD (1,971)
3/20/2019 Morgan Stanley 56,424 CAD 42,146 USD (760)
3/20/2019 Morgan Stanley 94,600 CAD 70,995 USD (1,607)
3/20/2019 Morgan Stanley 282,785 CAD 212,992 USD (5,575)
3/20/2019 Morgan Stanley 190,379 CAD 141,988 USD (2,349)
3/20/2019 Morgan Stanley 87,815 CAD 65,325 USD (915)
3/20/2019 Morgan Stanley 42,580 CAD 31,338 USD (106)
3/20/2019 Morgan Stanley 38,175 CAD 39,291 AUD 303
3/20/2019 Morgan Stanley 95,689 CAD 62,966 EUR (2,260)
3/20/2019 Morgan Stanley 282,850 CAD 187,507 EUR (8,273)
3/20/2019 Morgan Stanley 96,074 CAD 62,938 EUR (1,947)
3/20/2019 Morgan Stanley 95,703 CAD 63,023 EUR (2,315)
3/20/2019 Morgan Stanley 38,183 CAD 3,184,118 JPY (1,196)
3/20/2019 Morgan Stanley 685,572 CHF 608,969 EUR (172)
3/20/2019 Morgan Stanley 62,941 EUR 72,243 USD 175
3/20/2019 Morgan Stanley 1,076,226 EUR 1,235,481 USD 2,781
3/20/2019 Morgan Stanley 62,378 EUR 71,727 USD 43
3/20/2019 Morgan Stanley 125,025 EUR 193,072 CAD 2,235
3/20/2019 Morgan Stanley 125,594 EUR 142,666 CHF (852)
3/20/2019 Morgan Stanley 61,957 EUR 69,994 CHF (231)
3/20/2019 Morgan Stanley 63,034 EUR 57,008 GBP (351)
3/20/2019 Morgan Stanley 47,145 EUR 460,073 NOK 932
Global Atlantic Goldman Sachs Core Fixed Income Portfolio
PORTFOLIO OF INVESTMENTS (Continued)
December 31, 2018
In Exchange For
136See accompanying notes to financial statements.

Forward Foreign Currency Contracts
Settlement
Date Counterparty
Currency Units to
Receive
Unrealized Appreciation
(Depreciation)
3/20/2019 Morgan Stanley 24,449 EUR 238,848 NOK 453$
3/20/2019 Morgan Stanley 28,017 EUR 277,886 NOK 35
3/20/2019 Morgan Stanley 28,971 EUR 297,450 SEK (425)
3/20/2019 Morgan Stanley 62,027 EUR 629,246 SEK (47)
3/20/2019 Morgan Stanley 24,611 GBP 31,421 USD 41
3/20/2019 Morgan Stanley 295,740 GBP 379,021 USD (960)
3/20/2019 Morgan Stanley 56,027 GBP 71,639 USD (17)
3/20/2019 Morgan Stanley 56,356 GBP 63,055 EUR (506)
3/20/2019 Morgan Stanley 56,445 GBP 61,968 EUR 859
3/20/2019 Morgan Stanley 24,625 GBP 27,224 EUR 158
3/20/2019 Morgan Stanley 7,945,164 JPY 71,020 USD 1,846
3/20/2019 Morgan Stanley 7,952,264 JPY 71,037 USD 1,894
3/20/2019 Morgan Stanley 15,946,515 JPY 142,036 USD 4,211
3/20/2019 Morgan Stanley 15,987,263 JPY 141,935 USD 4,686
3/20/2019 Morgan Stanley 15,851,045 JPY 142,042 USD 3,330
3/20/2019 Morgan Stanley 23,612,700 JPY 186,000 EUR 2,551
3/20/2019 Morgan Stanley 241,703 NOK 28,548 USD (540)
3/20/2019 Morgan Stanley 620,375 NOK 70,988 USD 899
3/20/2019 Morgan Stanley 698,920 NOK 71,682 EUR (1,487)
3/20/2019 Morgan Stanley 1,216,416 NOK 125,047 EUR (2,920)
3/20/2019 Morgan Stanley 610,269 NOK 62,950 EUR (1,712)
3/20/2019 Morgan Stanley 1,949,591 NOK 199,981 EUR (4,179)
3/20/2019 Morgan Stanley 616,152 NOK 63,057 EUR (1,154)
3/20/2019 Morgan Stanley 617,303 NOK 62,935 EUR (880)
3/20/2019 Morgan Stanley 618,372 NOK 62,979 EUR (807)
3/20/2019 Morgan Stanley 626,284 NOK 63,057 EUR 21
3/20/2019 Morgan Stanley 616,584 NOK 61,974 EUR 142
3/20/2019 Morgan Stanley 1,243,697 NOK 124,995 EUR 300
3/20/2019 Morgan Stanley 245,466 NOK 24,694 EUR 32
3/20/2019 Morgan Stanley 618,394 NOK 62,006 EUR 316
3/20/2019 Morgan Stanley 620,806 NOK 61,973 EUR 632
3/20/2019 Morgan Stanley 106,406 NZD 73,119 USD (1,672)
3/20/2019 Morgan Stanley 103,004 NZD 71,325 USD (2,163)
3/20/2019 Morgan Stanley 107,262 NZD 73,918 USD (1,897)
3/20/2019 Morgan Stanley 103,060 NZD 70,886 USD (1,686)
3/20/2019 Morgan Stanley 103,059 NZD 70,144 USD (945)
3/20/2019 Morgan Stanley 105,329 NZD 61,990 EUR (600)
December 31, 2018
In Exchange For
Global Atlantic Goldman Sachs Core Fixed Income Portfolio
PORTFOLIO OF INVESTMENTS (Continued)
137See accompanying notes to financial statements.

Forward Foreign Currency Contracts
Settlement
Date Counterparty
Currency Units to
Receive
Unrealized Appreciation
(Depreciation)
3/20/2019 Morgan Stanley 1,424,669 SEK 138,731 EUR 2,065$
3/20/2019 Morgan Stanley 1,242,359 SEK 121,343 EUR 1,381
3/20/2019 Morgan Stanley 641,230 SEK 62,044 EUR 1,387
3/20/2019 Morgan Stanley 636,195 SEK 61,983 EUR 886
3/20/2019 Morgan Stanley 143,696 USD 196,044 AUD 5,499
3/20/2019 Morgan Stanley 142,478 USD 193,050 AUD 6,391
3/20/2019 Morgan Stanley 141,662 USD 193,929 AUD 4,956
3/20/2019 Morgan Stanley 71,156 USD 98,969 AUD 1,390
3/20/2019 Morgan Stanley 104,062 USD 138,371 CAD 2,570
3/20/2019 Morgan Stanley 141,986 USD 188,437 CAD 3,772
3/20/2019 Morgan Stanley 537,998 USD 714,636 CAD 13,828
3/20/2019 Morgan Stanley 41,915 USD 55,192 CAD 1,433
3/20/2019 Morgan Stanley 71,063 USD 93,657 CAD 2,367
3/20/2019 Morgan Stanley 143,609 USD 124,944 EUR (147)
3/20/2019 Morgan Stanley 142,930 USD 124,997 EUR (887)
3/20/2019 Morgan Stanley 142,552 USD 124,961 EUR (1,223)
3/20/2019 Morgan Stanley 71,497 USD 61,967 EUR 201
3/20/2019 Morgan Stanley 71,576 USD 62,055 EUR 178
3/20/2019 Morgan Stanley 71,002 USD 56,053 GBP (654)
3/20/2019 Morgan Stanley 71,238 USD 55,994 GBP (343)
3/20/2019 Morgan Stanley 70,960 USD 7,983,227 JPY (2,255)
3/20/2019 Morgan Stanley 70,952 USD 7,976,652 JPY (2,203)
3/20/2019 Morgan Stanley 70,963 USD 7,929,918 JPY (1,763)
3/20/2019 Morgan Stanley 240,516 USD 26,897,847 JPY (6,167)
3/20/2019 Morgan Stanley 71,036 USD 7,885,281 JPY (1,281)
3/20/2019 Morgan Stanley 71,008 USD 7,838,973 JPY (884)
3/20/2019 Morgan Stanley 71,052 USD 7,831,076 JPY (768)
3/20/2019 Morgan Stanley 907,338 USD 1,331,871 NZD 13,049
3/20/2019 Morgan Stanley 71,061 USD 626,657 SEK (57)
3/20/2019 Morgan Stanley 31,381 USD 279,024 SEK (285)
NET UNREALIZED DEPRECIATION ON FORWARD FOREIGN CURRENCY CONTRACTS (12,303)$
In Exchange For
Global Atlantic Goldman Sachs Core Fixed Income Portfolio
PORTFOLIO OF INVESTMENTS (Continued)
December 31, 2018
138See accompanying notes to financial statements.

Shares Value
COMMON STOCKS - 99.8 %
AEROSPACE/DEFENSE - 1.7 %
1,039 Boeing Co. 335,078$
6,000 CAE, Inc. 110,221
617 Kongsberg Gruppen ASA 8,379
453,678
AGRICULTURE - 1.6 %
5,586 Imperial Brands PLC 169,108
2,606 Philip Morris International, Inc. 173,977
2,710 Swedish Match AB 106,708
449,793
AIRLINES - 2.7 %
1,315 American Airlines Group, Inc. 42,225
2,798 Delta Air Lines, Inc. 139,620
4,292 Deutsche Lufthansa AG 96,656
427 International Consolidated Airlines Group SA 3,378
14,421 International Consolidated Airlines Group SA 113,506
38,671 Qantas Airways Ltd. 157,629
511 Southwest Airlines Co. 23,751
1,826 United Continental Holdings, Inc. * 152,891
729,656
APPAREL - 1.2 %
667 adidas AG 139,077
405 Kering SA 190,561
329,638
AUTO MANUFACTURERS - 2.0 %
5,259 Fiat Chrysler Automobiles NV * 76,242
5,946 General Motors Co. 198,894
4,146 Peugeot SA 88,368
900 Toyota Motor Corp. 52,549
10,681 Volvo AB 139,689
555,742
AUTO PARTS & EQUIPMENT - 0.2 %
744 Allison Transmission Holdings, Inc. 32,669
132 Continental AG 18,221
653 Goodyear Tire & Rubber Co. 13,328
64,218
BANKS - 7.2 %
5,798 ABN AMRO Group NV 136,139
26,963 Banco Bilbao Vizcaya Argentaria SA 142,879
5,240 Bank of America Corp. 129,114
Global Atlantic Goldman Sachs Global Equity Insights Portfolio
PORTFOLIO OF INVESTMENTS
December 31, 2018
139See accompanying notes to financial statements.

Shares Value
BANKS (Continued) - 7.2 %
4,546 Citigroup, Inc. 236,665$
4,961 Citizens Financial Group, Inc. 147,491
2,228 Comerica, Inc. 153,041
91 Erste Group Bank AG 3,022
26 First Citizens BancShares, Inc. 9,803
11,974 Lloyds Banking Group PLC 7,907
923 Macquarie Group Ltd. 70,600
7,500 Mitsubishi UFJ Financial Group, Inc. 36,770
106,600 Mizuho Financial Group, Inc. 165,465
2,703 PacWest Bancorp 89,956
5,600 Sumitomo Mitsui Financial Group, Inc. 186,046
747 SVB Financial Group * 141,870
952 Synovus Financial Corp. 30,454
400 Toronto-Dominion Bank 19,874
3,181 Western Alliance Bancorp * 125,618
3,497 Zions Bancorp NA 142,468
1,975,182
BEVERAGES - 0.6 %
18,140 Coca-Cola Amatil Ltd. 104,591
300 Cott Corp. 4,176
881 Monster Beverage Corp. * 43,363
152,130
BIOTECHNOLOGY - 2.3 %
461 Alexion Pharmaceuticals, Inc. * 44,883
884 Amgen, Inc. 172,088
566 Biogen, Inc. * 170,321
539 Gilead Sciences, Inc. 33,714
1,287 Vertex Pharmaceuticals, Inc. * 213,269
634,275
BUILDING MATERIALS - 0.0 % ^
100 AGC, Inc. 3,126
CHEMICALS - 2.9 %
462 Air Liquide SA 57,276
57 Arkema SA 4,884
347 Axalta Coating Systems Ltd. * 8,127
210 BASF SE * 14,500
3,595 CF Industries Holdings, Inc. 156,418
2,177 Covestro AG 107,459
656 Huntsman Corp. 12,654
1,616 Koninklijke DSM NV 131,973
Global Atlantic Goldman Sachs Global Equity Insights Portfolio
PORTFOLIO OF INVESTMENTS (Continued)
December 31, 2018
140See accompanying notes to financial statements.

Shares Value
CHEMICALS - 2.9 % (Continued)
17,300 Mitsubishi Chemical Holdings Corp. 131,285$
443 Sherwin-Williams Co. 174,303
156 Victrex PLC 4,546
803,425
COMMERCIAL SERVICES - 2.5 %
200 Benesse Holdings, Inc. 5,100
46 Bright Horizons Family Solutions, Inc. * 5,127
696 Experian PLC 16,886
1,937 Intertek Group PLC 118,414
679 ManpowerGroup, Inc. 43,999
2,825 PayPal Holdings, Inc. * 237,554
80 Randstad NV 3,666
1,171 S&P Global, Inc. 199,000
422 Wirecard AG 64,064
693,810
COMPUTERS - 4.0 %
4,198 Apple, Inc. 662,193
2,724 Fortinet, Inc. * 191,851
1,939 International Business Machines Corp. 220,406
200 NET One Systems Co., Ltd. * 3,526
200 Nomura Research Institute Ltd. 7,428
37 Teleperformance 5,905
353 Teradata Corp. * 13,541
1,104,850
COSMETICS/PERSONAL CARE - 0.3 %
765 Colgate-Palmolive Co. 45,533
690 Unilever PLC - ADR 36,053
81,586
DISTRIBUTION/WHOLESALE - 0.6 %
400 Mitsui & Co. Ltd. 6,163
9,300 Sumitomo Corp 132,361
496 WESCO International, Inc. * 23,808
162,332
DIVERSIFIED FINANCIAL SERVICES - 1.8 %
500 AEON Financial Service Co. Ltd. 8,905
6,405 Ally Financial, Inc. 145,137
2,300 Hong Kong Exchanges & Clearing Ltd. 66,567
2,300 Ichinen Holdings Co., Ltd. * 24,108
2,600 Japan Exchange Group, Inc. 42,158
5,900 ORIX Corp. 86,337
December 31, 2018
PORTFOLIO OF INVESTMENTS (Continued)
Global Atlantic Goldman Sachs Global Equity Insights Portfolio
141See accompanying notes to financial statements.

Shares Value
DIVERSIFIED FINANCIAL SERVICES - 1.8 % (Continued)
1,382 Synchrony Financial 32,422$
636 Visa, Inc. 83,914
489,548
ELECTRIC - 3.1 %
2,449 Ameren Corp. 159,748
758 American Electric Power Co., Inc. 56,653
369 CenterPoint Energy, Inc. 10,417
1,500 CLP Holdings Ltd. 16,955
4,037 CMS Energy Corp. 200,437
1,456 DTE Energy Co. 160,597
4,835 Exelon Corp. 218,059
900 Kansai Electric Power Co,, Inc. 13,535
400 Shikoku Electric Power Co., Inc. 4,842
1,900 TransAlta Corp. 7,776
849,019
ELECTRICAL COMPONENTS & EQUIPMENT - 0.6 %
2,586 Schneider Electric SE 176,543
ELECTRONICS - 1.1 %
1,994 Agilent Technologies, Inc. 134,515
86 FLIR Systems, Inc. 3,744
473 Honeywell International, Inc. 62,493
343 Keysight Technologies, Inc. * 21,293
1,400 Kyocera Corp. 70,284
454 National Instruments Corp. 20,603
312,932
ENGINEERING & CONSTRUCTION - 0.3 %
2,882 AECOM * 76,373
ENTERTAINMENT - 0.4 %
1,826 Cinemark Holdings, Inc. 65,371
3,300 Sega Sammy Holdings, Inc. 46,200
111,571
FOOD - 4.7 %
713 Austevoll Seafood ASA 8,794
5,852 Coles Group Ltd. * 48,367
5,103 Conagra Brands, Inc. 109,000
8,800 Empire Co., Ltd. 185,755
334 Ingredion, Inc. 30,528
7,509 Koninklijke Ahold Delhaize NV 189,490
1,395 Kroger Co. 38,363
Global Atlantic Goldman Sachs Global Equity Insights Portfolio
PORTFOLIO OF INVESTMENTS (Continued)
December 31, 2018
142See accompanying notes to financial statements.

Shares Value
FOOD (Continued) - 4.7 %
289 Lamb Weston Holdings, Inc. 21,259$
288 Mowi ASA 6,077
400 Miyoshi Oil & Fat Co. Ltd. * 3,821
309 Mondelez International, Inc. 12,369
3,100 Seven & i Holdings Co. Ltd. 135,144
2,754 Tyson Foods, Inc. 147,064
1,392 US Foods Holding Corp. * 44,043
5,541 Wesfarmers Ltd. 125,686
8,879 Woolworths Group Ltd. 183,899
1,289,659
FOREST PRODUCTS & PAPER - 0.3 %
1,872 International Paper Co. 75,554
GAS - 0.4 %
4,000 Osaka Gas Co, Ltd. 73,244
522 UGI Corp. 27,849
101,093
HEALTHCARE - PRODUCTS - 2.6 %
363 ABIOMED, Inc. * 117,990
1,230 Boston Scientific Corp. * 43,468
2,600 Create Medic Co. Ltd. * 23,508
47 Hill-Rom Holdings, Inc. 4,162
770 IDEXX Laboratories, Inc. * 143,235
149 Lonza Group AG 38,497
2,856 Medtronic PLC 259,782
710 Zimmer Biomet Holdings, Inc. 73,641
704,283
HEALTHCARE - SERVICES - 0.8 %
419 Fresenius Medical Care AG & Co. KGaA 27,129
1,321 HCA Healthcare, Inc. 164,398
202 Universal Health Services, Inc. 23,545
215,072
HOME BUILDERS - 1.1 %
623 DR Horton, Inc. 21,593
5,818 PulteGroup, Inc. 151,210
2,237 Thor Industries, Inc. 116,324
289,127
HOME FURNISHINGS - 0.1 %
544 Dolby Laboratories, Inc. 33,641
Global Atlantic Goldman Sachs Global Equity Insights Portfolio
PORTFOLIO OF INVESTMENTS (Continued)
December 31, 2018
143See accompanying notes to financial statements.
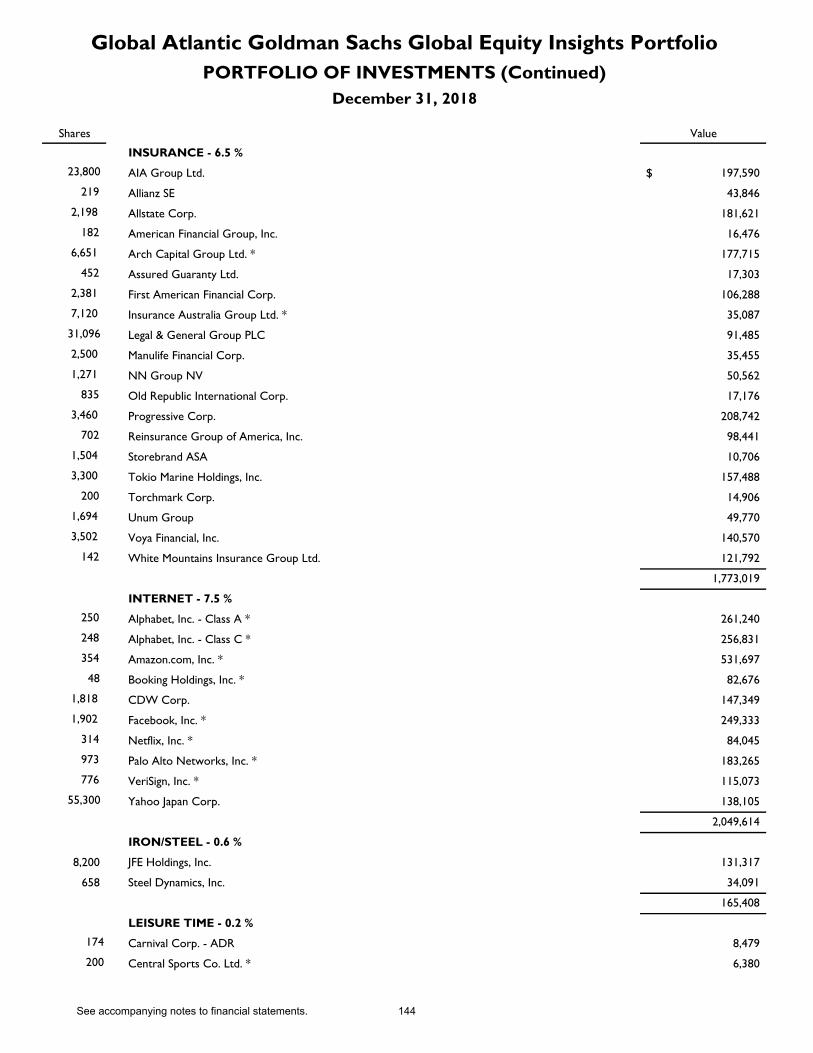
Shares Value
INSURANCE - 6.5 %
23,800 AIA Group Ltd. 197,590$
219 Allianz SE 43,846
2,198 Allstate Corp. 181,621
182 American Financial Group, Inc. 16,476
6,651 Arch Capital Group Ltd. * 177,715
452 Assured Guaranty Ltd. 17,303
2,381 First American Financial Corp. 106,288
7,120 Insurance Australia Group Ltd. * 35,087
31,096 Legal & General Group PLC 91,485
2,500 Manulife Financial Corp. 35,455
1,271 NN Group NV 50,562
835 Old Republic International Corp. 17,176
3,460 Progressive Corp. 208,742
702 Reinsurance Group of America, Inc. 98,441
1,504 Storebrand ASA 10,706
3,300 Tokio Marine Holdings, Inc. 157,488
200 Torchmark Corp. 14,906
1,694 Unum Group 49,770
3,502 Voya Financial, Inc. 140,570
142 White Mountains Insurance Group Ltd. 121,792
1,773,019
INTERNET - 7.5 %
250 Alphabet, Inc. - Class A * 261,240
248 Alphabet, Inc. - Class C * 256,831
354 Amazon.com, Inc. * 531,697
48 Booking Holdings, Inc. * 82,676
1,818 CDW Corp. 147,349
1,902 Facebook, Inc. * 249,333
314 Netflix, Inc. * 84,045
973 Palo Alto Networks, Inc. * 183,265
776 VeriSign, Inc. * 115,073
55,300 Yahoo Japan Corp. 138,105
2,049,614
IRON/STEEL - 0.6 %
8,200 JFE Holdings, Inc. 131,317
658 Steel Dynamics, Inc. 34,091
165,408
LEISURE TIME - 0.2 %
174 Carnival Corp. - ADR 8,479
200 Central Sports Co. Ltd. * 6,380
December 31, 2018
Global Atlantic Goldman Sachs Global Equity Insights Portfolio
PORTFOLIO OF INVESTMENTS (Continued)
144See accompanying notes to financial statements.

Shares Value
LEISURE TIME (Continued) - 0.2 %
2,500 Yamaha Motor Co. Ltd. 49,196$
64,055
LODGING - 0.0 % ^
1,070 Crown Resorts Ltd. 8,934
MACHINERY - CONSTRUCTION & MINING - 0.7 %
167 Caterpillar, Inc. 21,221
6,000 Hitachi Ltd. 160,534
181,755
MACHINERY - DIVERSIFIED - 0.2 %
400 Makino Milling Machine Co. Ltd. 14,182
1,300 Sumitomo Heavy Industries Ltd. 38,805
52,987
MEDIA - 3.6 %
9,345 Comcast Corp. 318,197
9,362 News Corp. 106,259
15,179 Pearson PLC 181,411
6,320 Viacom, Inc. 162,424
5,032 Vivendi SA 122,410
1,622 Wolters Kluwer NV * 95,787
986,488
MINING - 0.7 %
2,225 BHP Billiton Ltd. 46,802
6,937 Freeport-McMoRan, Inc. 71,520
1,600 Kirkland Lake Gold Ltd. 41,705
471 Rio Tinto PLC - ADR 22,834
182,861
MISCELLANEOUS MANUFACTURER - 1.0 %
409 Illinois Tool Works, Inc. 51,816
455 Ingersoll-Rand PLC 41,510
1,038 Parker-Hannifin Corp. 154,807
732 Textron, Inc. 33,665
281,798
OIL & GAS - 7.3 %
6,774 BP PLC - ADR 256,870
261 Chevron Corp. 28,394
631 CNX Resources Corp. * 7,206
3,425 ConocoPhillips 213,549
2,939 DNO ASA * 4,260
16,114 Eni SpA 253,248
9,065 Galp Energia SGPS SA 142,953
Global Atlantic Goldman Sachs Global Equity Insights Portfolio
PORTFOLIO OF INVESTMENTS (Continued)
December 31, 2018
145See accompanying notes to financial statements.

Shares Value
OIL & GAS (Continued) - 7.3 %
2,462 HollyFrontier Corp. 125,857$
4,800 JXTG Holdings, Inc. 25,230
2,651 Marathon Petroleum Corp. 156,436
1,951 OMV AG 85,308
2,310 Phillips 66 199,007
1,582 Royal Dutch Shell PLC 46,492
924 Royal Dutch Shell PLC 27,537
6,100 Suncor Energy, Inc. 170,298
3,674 TechnipFMC PLC * 71,937
534 TOTAL SA 28,190
2,132 Valero Energy Corp. 159,836
2,002,608
OIL & GAS SERVICES - 0.0 % ^
482 TGS NOPEC Geophysical Co. ASA 11,623
PACKAGING & CONTAINERS - 0.6 %
480 Berry Global Group, Inc. * 22,814
3,921 WestRock Co. 148,057
170,871
PHARMACEUTICALS - 7.7 %
3,160 AbbVie, Inc. 291,320
1,223 Allergan PLC 163,466
5,700 Astellas Pharma, Inc. 72,812
4,239 Bristol-Myers Squibb Co 220,343
126 Grifols SA 3,298
3,539 Johnson & Johnson 456,708
5,259 Mylan NV * 144,097
3,515 Novo Nordisk A/S 160,405
426 Roche Holding AG 105,182
3,000 Santen Pharmaceutical Co. Ltd. 43,367
2,600 Shionogi & Co, Ltd. 148,609
52 Siegfried Holding AG 17,724
1,700 Takeda Pharmaceutical Co. Ltd. 57,408
2,594 Zoetis, Inc. 221,891
2,106,630
REAL ESTATE INVESTMENT TRUSTS - 2.6 %
4,917 American Homes 4 Rent 97,602
526 American Tower Corp. 83,208
1,140 Apartment Investment & Management Co. 50,023
3,179 Duke Realty Corp. 82,336
379 Hospitality Properties Trust 9,051
Global Atlantic Goldman Sachs Global Equity Insights Portfolio
PORTFOLIO OF INVESTMENTS (Continued)
December 31, 2018
146See accompanying notes to financial statements.

Shares Value
REAL ESTATE INVESTMENT TRUSTS (Continued) - 2.6 %
10,200 Host Hotels & Resorts, Inc. 170,034$
14 Japan Retail Fund Investment Corp. 28,009
8,111 Kimco Realty Corp. 118,826
646 Lamar Advertising Co. 44,690
548 Spirit Realty Capital, Inc. 19,317
232 Sun Communities, Inc. 23,597
726,693
RETAIL - 3.2 %
182 AutoZone, Inc. * 152,578
1,382 Best Buy Co, Inc. 73,191
252 Chipotle Mexican Grill, Inc. * 108,811
863 Darden Restaurants, Inc. 86,179
400 Marui Group Co. Ltd. 7,777
400 Matsumotokiyoshi Holdings Co. Ltd. 12,268
25 O'Reilly Automotive, Inc. * 8,608
1,500 Takashimaya Co. Ltd. * 19,195
2,293 Target Corp. 151,544
2,002 Walmart, Inc. 186,486
370 Yum China Holdings, Inc. 12,406
748 Yum! Brands, Inc. 68,756
887,799
SEMICONDUCTORS - 1.1 %
5,186 Applied Materials, Inc. 169,790
2,120 Infineon Technologies AG 42,084
157 KLA-Tencor Corp. 14,050
2,809 Micron Technology, Inc. * 89,130
315,054
SOFTWARE - 4.1 %
939 Adobe Systems, Inc. * 212,439
341 Black Knight, Inc. * 15,365
2,026 Citrix Systems, Inc. 207,584
1,049 Fidelity National Information Services, Inc. 107,575
973 Intuit, Inc. 191,535
1,400 Konami Holdings Corp. 61,313
211 Lectra 4,385
1,185 Microsoft Corp. 120,360
66 MSCI, Inc. 9,730
790 ServiceNow, Inc. * 140,660
56 Splunk, Inc. * 5,872
227 Temenos AG 27,149
400 TIS, Inc. * 15,768
Global Atlantic Goldman Sachs Global Equity Insights Portfolio
PORTFOLIO OF INVESTMENTS (Continued)
December 31, 2018
147See accompanying notes to financial statements.

Shares Value
SOFTWARE (Continued) - 4.1 %
42 Ubisoft Entertainment SA * 3,384$
1,123,119
TELECOMMUNICATIONS - 2.2 %
927 AT&T, Inc. 26,457
326 EchoStar Corp. * 11,971
2,771 Juniper Networks, Inc. 74,568
2,500 Nippon Telegraph & Telephone Corp. 102,128
20,497 Telefonaktiebolaget LM Ericsson 180,144
3,987 Telefonica SA 33,449
1,329 Telenor ASA 25,708
368 Telephone & Data Systems, Inc. 11,975
2,333 Verizon Communications, Inc. 131,161
597,561
TRANSPORTATION - 2.9 %
5,430 Aurizon Holdings Ltd. 16,361
600 Canadian Pacific Railway Ltd. 106,417
800 Central Japan Railway Co. 168,910
1,878 CSX Corp. 116,680
1,800 East Japan Railway Co. 159,320
923 Norfolk Southern Corp. 138,025
651 Union Pacific Corp. 89,990
795,703
TOTAL COMMON STOCKS (Cost - $30,158,944) 27,402,436
SHORT-TERM INVESTMENT - 0.1 %
MONEY MARKET FUND - 0.1 %
7,087 Fidelity Investments Money Market Funds - Government Portfolio, Institutional Class
to yield 2.25% (a)(Cost - $7,087) 7,087
TOTAL INVESTMENTS - 99.9 % (Cost - $30,166,031) 27,409,523$
OTHER ASSETS LESS LIABILITIES - NET - 0.1 % 35,150
TOTAL NET ASSETS - 100.0 % 27,444,673$
* Non-income producing security.
^ Represents less than 0.05%
(a) Money market rate shown represents the rate at December 31, 2018.
ADR - American Depository Receipt
PLC - Public Limited Company
PORTFOLIO OF INVESTMENTS (Continued)
December 31, 2018
Global Atlantic Goldman Sachs Global Equity Insights Portfolio
148See accompanying notes to financial statements.

Shares Value
COMMON STOCKS - 100.1%
ADVERTISING - 0.1%
2,293 Omnicom Group, Inc. 167,938$
AEROSPACE/DEFENSE - 3.0%
5,723 Boeing Co. 1,845,668
4,461 Harris Corp. 600,673
2,446,341
AIRLINES - 2.4%
12,733 Delta Air Lines, Inc. 635,377
14,804 Southwest Airlines Co. 688,090
7,001 United Continental Holdings, Inc. * 586,194
1,909,661
AUTO PARTS & EQUIPMENT - 0.8%
15,077 Allison Transmission Holdings, Inc. 662,031
BANKS - 1.9%
9,404 Comerica, Inc. 645,961
2,460 East West Bancorp, Inc. 107,084
2,380 SVB Financial Group * 452,010
1,103 Synovus Financial Corp 35,285
6,595 Western Alliance Bancorp * 260,437
1,704 Zions Bancorp NA 69,421
1,570,198
BEVERAGES - 2.2%
3,817 Coca-Cola Co. 180,735
4,666 Constellation Brands, Inc. 750,386
13,644 Monster Beverage Corp. * 671,558
1,574 PepsiCo, Inc. 173,896
1,776,575
BIOTECHNOLOGY - 5.6%
2,292 Alexion Pharmaceuticals, Inc. * 223,149
7,615 Amgen, Inc. 1,482,412
2,659 Biogen, Inc. * 800,146
12,604 Gilead Sciences, Inc. 788,380
4,772 Incyte Corp. * 303,451
5,533 Vertex Pharmaceuticals, Inc. * 916,873
4,514,411
BUILDING MATERIALS - 0.6%
2,212 Lennox International, Inc. 484,118
Global Atlantic Goldman Sachs Large Cap Growth Insights Portfolio
PORTFOLIO OF INVESTMENTS
December 31, 2018
149See accompanying notes to financial statements.

Shares Value
CHEMICALS - 1.7%
9,749 Axalta Coating Systems Ltd. * 228,322$
7,513 CF Industries Holdings, Inc. 326,891
1,994 Sherwin-Williams Co. 784,559
1,339,772
COMMERCIAL SERVICES - 3.5%
621 Bright Horizons Family Solutions, Inc. * 69,210
2,237 H&R Block, Inc. 56,753
15,806 PayPal Holdings, Inc. * 1,329,127
7,865 Robert Half International, Inc. 449,878
1,408 S&P Global, Inc. 239,276
4,144 Verisk Analytics, Inc. * 451,862
1,532 WEX, Inc. * 214,572
2,810,678
COMPUTERS - 9.0%
35,730 Apple, Inc. 5,636,050
1,277 EPAM Systems, Inc. * 148,145
9,703 Fortinet, Inc. * 683,382
6,250 International Business Machines Corp. 710,438
3,384 Teradata Corp. * 129,810
7,307,825
DISTRIBUTION/WHOLESALE - 0.3%
966 WW Grainger, Inc. 272,760
DIVERSIFIED FINANCIAL SERVICES - 3.1%
5,269 Charles Schwab Corp. 218,822
1,007 Discover Financial Services 59,393
8,945 E*TRADE Financial Corp. 392,507
2,304 Mastercard, Inc. 434,650
10,586 Visa, Inc. 1,396,717
2,502,089
ELECTRIC - 0.7%
11,416 CMS Energy Corp. 566,804
ELECTRONICS - 1.3%
3,339 Agilent Technologies, Inc. 225,249
5,475 Honeywell International, Inc. 723,357
1,735 National Instruments Corp. 78,734
1,027,340
Global Atlantic Goldman Sachs Large Cap Growth Insights Portfolio
PORTFOLIO OF INVESTMENTS (Continued)
December 31, 2018
150See accompanying notes to financial statements.

Shares Value
ENTERTAINMENT - 0.5%
1,443 Madison Square Garden Co. * 386,291$
ENVIRONMENTAL CONTROL - 0.8%
8,468 Republic Services, Inc. 610,458
FOOD - 1.7%
6,937 Conagra Brands, Inc. 148,174
2,427 General Mills, Inc. 94,507
1,947 Ingredion, Inc. 177,956
6,107 Tyson Foods, Inc. 326,114
20,001 US Foods Holding Corp. * 632,832
1,379,583
FOREST PRODUCTS & PAPER - 0.3%
5,807 International Paper Co. 234,371
HEALTHCARE PRODUCTS - 3.1%
2,001 ABIOMED, Inc. * 650,405
4,199 Boston Scientific Corp. * 148,393
4,765 Hill-Rom Holdings, Inc. 421,941
3,888 IDEXX Laboratories, Inc. * 723,246
446 Intuitive Surgical, Inc. * 213,598
1,134 Medtronic PLC 103,149
1,562 Varian Medical Systems, Inc. * 176,990
565 Zimmer Biomet Holdings, Inc. 58,602
2,496,324
HEALTHCARE - SERVICES - 2.2%
6,371 HCA Healthcare, Inc. 792,871
1,115 Molina Healthcare, Inc. * 129,585
3,540 UnitedHealth Group, Inc. 881,885
1,804,341
HOME BUILDERS - 1.8%
4,284 DR Horton, Inc. 148,483
157 NVR, Inc. * 382,607
16,035 PulteGroup, Inc. 416,750
9,725 Thor Industries, Inc. 505,700
1,453,540
INSURANCE - 1.9%
2,817 Arch Capital Group Ltd. * 75,270
14,667 Progressive Corp. 884,860
Global Atlantic Goldman Sachs Large Cap Growth Insights Portfolio
December 31, 2018
PORTFOLIO OF INVESTMENTS (Continued)
151See accompanying notes to financial statements.

Shares Value
INSURANCE (Continued) - 1.9%
14,538 Voya Financial, Inc. 583,555$
1,543,685
INTERNET - 18.3%
2,095 Alphabet, Inc. - Class A * 2,189,191
2,132 Alphabet, Inc. - Class C * 2,207,921
2,913 Amazon.com, Inc. * 4,375,239
334 Booking Holdings, Inc. * 575,288
7,345 CDW Corp. 595,312
16,662 Facebook, Inc. * 2,184,222
5,238 GoDaddy, Inc. * 343,718
2,915 Netflix, Inc. * 780,229
4,086 Palo Alto Networks, Inc. * 769,598
1,484 RingCentral, Inc. * 122,341
4,639 Twitter, Inc. * 133,325
3,823 VeriSign, Inc. * 566,913
14,843,297
IRON/STEEL - 0.0% ^
775 Steel Dynamics, Inc. 23,281
LODGING - 0.4%
4,230 Hilton Worldwide Holdings, Inc. 303,714
1,686 Wyndham Destinations, Inc. 60,426
364,140
MACHINERY - CONSTRUCTION & MINING - 0.4%
2,349 Caterpillar, Inc. 298,487
MACHINERY - DIVERSIFIED - 0.1%
958 Cummins, Inc. 128,026
MEDIA - 0.4%
322 Cable One, Inc. 264,072
3,493 News Corp. 39,646
303,718
MISCELLANEOUS MANUFACTURER - 1.7%
2,930 AO Smith Corp. 125,111
3,672 Ingersoll-Rand PLC 334,997
4,095 Parker-Hannifin Corp. 610,728
6,786 Textron, Inc. 312,088
1,382,924
Global Atlantic Goldman Sachs Large Cap Growth Insights Portfolio
PORTFOLIO OF INVESTMENTS (Continued)
December 31, 2018
152See accompanying notes to financial statements.

Shares Value
OFFICE/BUSINESS EQUIPMENT - 0.1%
1,004 Zebra Technologies Corp. * 159,866$
OIL & GAS - 1.7%
2,689 ConocoPhillips 167,659
3,604 HollyFrontier Corp. 184,236
970 PBF Energy, Inc. 31,690
6,648 Phillips 66 572,725
11,310 TechnipFMC PLC * 221,450
2,387 Valero Energy Corp. 178,953
1,356,713
PACKAGING & CONTAINERS - 1.6%
11,806 Berry Global Group, Inc. * 561,139
3,737 Sealed Air Corp. 130,197
15,500 WestRock Co. 585,280
1,276,616
PHARMACEUTICALS - 5.5%
15,065 AbbVie, Inc. 1,388,842
2,786 Allergan PLC 372,377
8,264 Bristol-Myers Squibb Co. 429,563
7,833 Johnson & Johnson 1,010,849
10,455 Mylan NV * 286,467
924 Neurocrine Biosciences, Inc. * 65,983
10,772 Zoetis, Inc. 921,437
4,475,518
REAL ESTATE INVESTMENT TRUSTS - 1.5%
3,951 Alexandria Real Estate Equities, Inc. 455,313
5,885 Kimco Realty Corp. 86,215
9,576 Lamar Advertising Co. 662,468
1,203,996
RETAIL - 4.5%
898 AutoZone, Inc. * 752,829
6,034 Best Buy Co, Inc. 319,561
974 Chipotle Mexican Grill, Inc. * 420,563
6,439 Darden Restaurants, Inc. 642,999
1,971 Dollar Tree, Inc. * 178,021
3,202 Home Depot, Inc. 550,168
4,324 Michaels Cos, Inc. * 58,547
1,248 Ulta Beauty, Inc. * 305,560
13,621 Wendy's Co. 212,624
December 31, 2018
Global Atlantic Goldman Sachs Large Cap Growth Insights Portfolio
PORTFOLIO OF INVESTMENTS (Continued)
153See accompanying notes to financial statements.

Shares Value
RETAIL (Continued) - 4.5%
7,361 Yum China Holdings, Inc. 246,814$
3,687,686
SEMICONDUCTORS - 2.3%
26,388 Applied Materials, Inc. 863,943
12,512 Micron Technology, Inc. * 397,006
8,374 NXP Semiconductors NV 613,647
1,874,596
SOFTWARE - 12.4%
3,305 Adobe, Inc. * 747,723
14,997 Black Knight, Inc. * 675,765
8,602 Cadence Design Systems, Inc. * 374,015
7,018 Citrix Systems, Inc. 719,064
5,814 Fidelity National Information Services, Inc. 596,226
4,415 Intuit, Inc. 869,093
42,745 Microsoft Corp. 4,341,610
4,938 MSCI, Inc. 728,009
2,568 ServiceNow, Inc. * 457,232
3,784 Splunk, Inc. * 396,752
1,467 Tableau Software, Inc. * 176,040
10,081,529
TRANSPORTATION - 0.7%
3,713 CSX Corp. 230,689
177 Union Pacific Corp. 24,467
5,259 XPO Logistics, Inc. * 299,972
555,128
TOTAL COMMON STOCKS (Cost - $84,802,813) 81,282,655
SHORT-TERM INVESTMENT - 0.0% ^
MONEY MARKET FUND - 0.0% ^
20,700 Fidelity Investments Money Market Funds - Government Portfolio, Institutional Class
to yield 2.25% (a)(Cost - $20,700) 20,700
TOTAL INVESTMENTS - 100.1% (Cost - $84,823,513) 81,303,355$
OTHER ASSETS LESS LIABILITIES - NET - (0.1)% (118,171)
TOTAL NET ASSETS - 100.0% 81,185,184$
* Non-income producing security.
^ Represents less than 0.05%
PLC - Public Limited Company
(a) Money market rate shown represents the rate at December 31, 2018.
PORTFOLIO OF INVESTMENTS (Continued)
December 31, 2018
Global Atlantic Goldman Sachs Large Cap Growth Insights Portfolio
154See accompanying notes to financial statements.

Shares Value
COMMON STOCKS - 99.5%
ADVERTISING - 0.2%
3,486 Omnicom Group, Inc. 255,315$
AEROSPACE/DEFENSE - 1.3%
2,903 Boeing Co. 936,218
3,222 Teledyne Technologies, Inc. * 667,180
1,603,398
AIRLINES - 3.5%
10,884 Alaska Air Group, Inc. 662,291
23,067 American Airlines Group, Inc. 740,681
6,598 Copa Holdings SA 519,329
3,458 Delta Air Lines, Inc. 172,554
36,844 JetBlue Airways Corp. * 591,715
1,093 Southwest Airlines Co. 50,803
19,171 United Continental Holdings, Inc. * 1,605,188
4,342,561
AUTO PARTS & EQUIPMENT - 0.4%
22,446 Goodyear Tire & Rubber Co. 458,123
BANKS - 7.4%
44,829 Citizens Financial Group, Inc. 1,332,766
19,361 Comerica, Inc. 1,329,907
9,760 East West Bancorp, Inc. 424,853
1,496 First Citizens BancShares, Inc. 564,067
22,494 First Hawaiian, Inc. 506,340
27,067 PacWest Bancorp 900,790
18,092 Popular, Inc. 854,304
3,004 SVB Financial Group * 570,520
14,735 Synovus Financial Corp. 471,373
6,082 Texas Capital Bancshares, Inc. * 310,729
19,656 Western Alliance Bancorp * 776,215
29,159 Zions Bancorp NA 1,187,938
9,229,802
BIOTECHNOLOGY - 1.6%
2,539 Amgen, Inc. 494,267
544 Biogen, Inc. * 163,700
3,998 Gilead Sciences, Inc. 250,075
2,509 Incyte Corp. * 159,547
5,658 Vertex Pharmaceuticals, Inc. * 937,587
2,005,176
Global Atlantic Goldman Sachs Mid Cap Value Insights PortfolioPORTFOLIO OF INVESTMENTS
December 31, 2018
155See accompanying notes to financial statements.

Shares Value
BUILDING MATERIALS - 0.1%
393 Lennox International, Inc. 86,012$
CHEMICALS - 2.5%
2,274 Ashland Global Holdings, Inc. 161,363
26,373 Axalta Coating Systems Ltd. * 617,656
29,995 CF Industries Holdings, Inc. 1,305,082
26,443 Huntsman Corp. 510,085
13,428 Mosaic Co. 392,232
267 Sherwin-Williams Co. 105,054
3,091,472
COMMERCIAL SERVICES - 1.8%
3,036 Bright Horizons Family Solutions, Inc. * 338,362
388 Graham Holdings Co. 248,545
20,415 H&R Block, Inc. 517,929
15,393 ManpowerGroup, Inc. 997,466
1,514 PayPal Holdings, Inc. * 127,312
2,229,614
COMPUTERS - 0.9% 3,355 Fortinet, Inc. * 236,293
6,706 Teradata Corp. * 257,242
15,449 Western Digital Corp. 571,150
1,064,685
DISTRIBUTION/WHOLESALE - 0.7% 19,352 WESCO International, Inc. * 928,896
DIVERSIFIED FINANCIAL SERVICES - 2.1% 53,613 Ally Financial, Inc. 1,214,871
22,162 BGC Partners, Inc. 114,578
13,845 E*TRADE Financial Corp. 607,519
26,729 Synchrony Financial 627,062
2,564,030
ELECTRIC - 8.8%
25,493 AES Corp. 368,629
21,867 Ameren Corp. 1,426,384
34,647 CenterPoint Energy, Inc. 978,085
27,540 CMS Energy Corp. 1,367,361
14,093 DTE Energy Co. 1,554,458
31,964 NRG Energy, Inc. 1,265,774
30,078 OGE Energy Corp. 1,178,757
17,991 PG&E Corp. * 427,286
Global Atlantic Goldman Sachs Mid Cap Value Insights PortfolioPORTFOLIO OF INVESTMENTS (Continued)
December 31, 2018
156See accompanying notes to financial statements.

Shares Value
ELECTRIC (Continued) - 8.8%
55,126 PPL Corp. 1,561,720$
10,030 Vistra Energy Corp. * 229,587
5,445 WEC Energy Group, Inc. 377,121
4,737 Xcel Energy, Inc. 233,392
10,968,554
ELECTRICAL COMPONENTS & EQUIPMENT - 0.2%
3,692 AMETEK, Inc. 249,948
ELECTRONICS - 2.6%
20,553 Agilent Technologies, Inc. 1,386,505
12,320 FLIR Systems, Inc. 536,413
14,539 Keysight Technologies, Inc. * 902,581
6,500 National Instruments Corp. 294,970
5,676 nVent Electric PLC 127,483
3,247,952
ENGINEERING COMPONENTS & EQUIPMENT - 0.9%
35,796 AECOM * 948,594
4,861 Fluor Corp 156,524
1,105,118
ENTERTAINMENT - 1.1%
28,494 Cinemark Holdings, Inc. 1,020,085
1,482 Madison Square Garden Co. * 396,731
1,416,816
ENVIRONMENTAL CONTROL - 1.6%
15,694 Pentair PLC 592,919
20,060 Republic Services, Inc. 1,446,125
2,039,044
FOOD - 3.8%
40,097 Conagra Brands, Inc. 856,472
12,134 Ingredion, Inc. 1,109,048
2,122 Kroger Co. 58,355
6,935 Lamb Weston Holdings, Inc. 510,139
22,754 Tyson Foods, Inc. 1,215,064
30,583 US Foods Holding Corp. * 967,646
4,716,724
FOREST PRODUCTS & PAPER - 1.1%
34,789 International Paper Co. 1,404,084
GAS - 1.0%
22,545 UGI Corp. 1,202,776
Global Atlantic Goldman Sachs Mid Cap Value Insights PortfolioPORTFOLIO OF INVESTMENTS (Continued)
December 31, 2018
157See accompanying notes to financial statements.

Shares Value
HEALTHCARE PRODUCTS - 2.4%
1,668 ABIOMED, Inc. * 542,167$
11,117 Hill-Rom Holdings, Inc. 984,410
4,983 IDEXX Laboratories, Inc. * 926,938
4,745 Zimmer Biomet Holdings, Inc. 492,151
2,945,666
HEALTHCARE - SERVICES - 1.3%
7,198 HCA Healthcare, Inc. 895,791
5,734 Universal Health Services, Inc. 668,355
1,564,146
HOME BUILDERS - 1.9%
11,698 DR Horton, Inc. 405,453
42,975 PulteGroup, Inc. 1,116,920
15,523 Thor Industries, Inc. 807,196
2,329,569
HOME FURNISHINGS - 0.6%
10,336 Dolby Laboratories, Inc. 639,178
1,177 Whirlpool Corp. 125,786
764,964
INSURANCE - 8.9%
6,679 American Financial Group, Inc. 604,650
47,230 Arch Capital Group Ltd. * 1,261,986
27,649 Assured Guaranty Ltd. 1,058,404
17,777 Athene Holding Ltd. * 708,058
23,925 First American Financial Corp. 1,068,012
35,737 Old Republic International Corp. 735,110
15,795 Progressive Corp. 952,912
2,215 Reinsurance Group of America, Inc. 310,609
15,534 Torchmark Corp. 1,157,749
26,308 Unum Group 772,929
27,708 Voya Financial, Inc. 1,112,199
1,218 White Mountains Insurance Group Ltd. 1,044,666
3,492 WR Berkley Corp. 258,094
11,045,378
INTERNET - 0.7%
4,285 Palo Alto Networks, Inc. * 807,080
IRON/STEEL - 1.1%
16,417 Nucor Corp. 850,565 19,174 Steel Dynamics, Inc. 575,987
1,426,552
Global Atlantic Goldman Sachs Mid Cap Value Insights PortfolioPORTFOLIO OF INVESTMENTS (Continued)
December 31, 2018
158See accompanying notes to financial statements.

Shares Value
MACHINERY - DIVERSIFIED - 0.5%
5,497 AGCO Corp. 306,018$ 2,453 Cummins, Inc. 327,819
633,837
MEDIA - 1.7%
83,989 News Corp. 953,275
43,852 Viacom, Inc. 1,126,996
2,080,271
MINING - 0.5%
65,760 Freeport-McMoRan, Inc. 677,986
MISCELLANEOUS MANUFACTURER - 2.3%
10,946 Ingersoll-Rand PLC 998,604
9,681 Parker-Hannifin Corp. 1,443,824
9,058 Textron, Inc. 416,577
2,859,005
OIL & GAS - 5.7%
55,452 CNX Resources Corp. * 633,262
14,313 ConocoPhillips 892,416
7,096 Continental Resources, Inc. * 285,188
28,592 Devon Energy Corp. 644,464
8,051 EQT Corp. 152,083
11,772 Helmerich & Payne, Inc. 564,350
20,967 HollyFrontier Corp. 1,071,833
5,088 Marathon Oil Corp. 72,962
23,417 PBF Energy, Inc. 765,033
10,314 Phillips 66 888,551
10,536 Valero Energy Corp. 789,884
14,870 Whiting Petroleum Corp. * 337,400
7,097,426
PACKAGING & CONTAINERS - 2.4%
22,895 Berry Global Group, Inc. * 1,088,199
27,298 Owens-Illinois, Inc. * 470,618
5,462 Sealed Air Corp. 190,296
32,024 WestRock Co. 1,209,226
2,958,339
PHARMACEUTICALS - 2.6%
9,088 AbbVie, Inc. 837,823
5,847 Allergan PLC 781,510
46,604 Mylan NV * 1,276,950
4,200 Zoetis, Inc. 359,268
3,255,551
PORTFOLIO OF INVESTMENTS (Continued)Global Atlantic Goldman Sachs Mid Cap Value Insights Portfolio
December 31, 2018
159See accompanying notes to financial statements.

Shares Value
PIPELINES - 0.6% 2,379 Cheniere Energy, Inc. * 140,813$
26,697 TechnipFMC PLC * 522,727
4,176 Williams Cos, Inc. 92,081
755,621
REAL ESTATE INVESTMENT TRUSTS - 15.4% 6,962 Alexandria Real Estate Equities, Inc. 802,301
42,727 American Homes 4 Rent 848,131
25,993 Apartment Investment & Management Co. 1,140,573
36,130 Apple Hospitality REIT, Inc. 515,214
74,768 Brandywine Realty Trust 962,264
42,105 Brixmor Property Group, Inc. 618,522
12,996 Brookfield Property REIT, Inc. 209,236
13,512 Camden Property Trust 1,189,732
20,761 Columbia Property Trust, Inc. 401,725
16,725 Douglas Emmett, Inc. 570,824
46,699 Duke Realty Corp. 1,209,504
70,062 Empire State Realty Trust, Inc. 996,982
5,342 EPR Properties 342,048
21,062 Healthcare Trust of America, Inc. 533,079
1,437 Highwoods Properties, Inc. 55,598
43,035 Hospitality Properties Trust 1,027,676
78,623 Host Hotels & Resorts, Inc. 1,310,645
73,280 Kimco Realty Corp. 1,073,552
13,658 Lamar Advertising Co. 944,860
55,096 Paramount Group, Inc. 692,006
80,096 Retail Properties of America, Inc. 869,042
30,470 Senior Housing Properties Trust 357,108
33,032 Spirit Realty Capital, Inc. 1,164,378
9,507 STORE Capital Corp. 269,143
7,997 Sun Communities, Inc. 813,375
820 UDR, Inc. 32,488
17,397 VEREIT, Inc. 124,389
19,074,395
RETAIL - 3.6% 1,219 AutoZone, Inc. * 1,021,936
10,672 Best Buy Co, Inc. 565,189
111 Chipotle Mexican Grill, Inc. * 47,929
9,398 Darden Restaurants, Inc. 938,484
Global Atlantic Goldman Sachs Mid Cap Value Insights PortfolioPORTFOLIO OF INVESTMENTS (Continued)
December 31, 2018
160See accompanying notes to financial statements.

Shares Value
RETAIL (Continued) - 3.6% 3,995 Dick's Sporting Goods, Inc. 124,644$
8,550 Dollar Tree, Inc. * 772,236
4,951 Foot Locker, Inc. 263,393
4,869 Michaels Cos, Inc. * 65,926
4,352 Tapestry, Inc. 146,880
16,035 Yum China Holdings, Inc. 537,654
4,484,271 SEMICONDUCTORS - 0.5%
2,689 Applied Materials, Inc. 88,038
6,738 NXP Semiconductors NV 493,761
581,799
SOFTWARE - 1.0% 1,893 Citrix Systems, Inc. 193,957
10,657 Fidelity National Information Services, Inc. 1,092,875
1,286,832
TELECOMMUNICATIONS - 2.2%
31,264 CommScope Holding Co., Inc. * 512,417
20,860 EchoStar Corp. * 765,979
31,741 Juniper Networks, Inc. 854,150
17,679 Telephone & Data Systems, Inc. 575,273
2,707,819
TOTAL COMMON STOCKS (Cost - $138,340,803) 123,546,607
SHORT-TERM INVESTMENT - 0.4%
MONEY MARKET FUND - 0.4%
533,909 Fidelity Investments Money Market Funds - Government Portfolio, Institutional Class
to yield 2.25% (a)(Cost - $533,909) 533,909
TOTAL INVESTMENTS - 99.9% (Cost - $138,874,712) 124,080,516$
OTHER ASSETS LESS LIABILITIES - NET - 0.1% 83,445
TOTAL NET ASSETS - 100.0% 124,163,961$
* Non-income producing security.
(a) Money market rate shown represents the rate at December 31, 2018.
PLC - Public Limited Company
REIT - Real Estate Investment Trust
PORTFOLIO OF INVESTMENTS (Continued)December 31, 2018
Global Atlantic Goldman Sachs Mid Cap Value Insights Portfolio
161See accompanying notes to financial statements.

Global Atlantic Portfolios
Statements of Assets and LiabilitiesDecember 31, 2018
Global Atlantic Global Atlantic Global Atlantic Global Atlantic BlackRock
BlackRock Allocation BlackRock Disciplined BlackRock Disciplined Disciplined International
Assets: Portfolio Core Portfolio Growth Portfolio Core Portfolio
Investments in securities, at cost 81,912,927$ 541,127,518$ 16,126,102$ 155,054,483$
Investments in securities, at value 77,414,693$ 518,176,362$ 15,798,136$ 135,528,221$
Foreign Cash (cost: $-, $-, $- and $3,590,612, respectively) - - - 3,603,826
Deposits with broker + - 729,220 14,238 497,674
Unrealized appreciation on futures contracts - - 1,682 -
Receivable for securities sold - 5,671,206 - -
Interest and dividends receivable 24,683 855,247 18,132 436,603
Total Assets 77,439,376 525,432,035 15,832,188 140,066,324
Liabilities:
Unrealized depreciation on futures contracts - 196,158 - 106,955
Unrealized depreciation on forward foreign exchange
contracts - - - 120
Payable for Portfolio shares redeemed 149,269 239,329 14,689 124,328
Payable for securities purchased - 5,850,289 - -
Accrued distribution (12b-1) fees 3,026 7,114 3,504 8,887
Accrued investment advisory fees - net 11,353 159,808 4,414 65,747
Administrative service fees payable 5,986 32,769 2,466 10,207
Accrued expenses and other liabilities 1,987 14,216 492 3,566
Total Liabilities 171,621 6,499,683 25,565 319,810
Net Assets 77,267,755$ 518,932,352$ 15,806,623$ 139,746,514$
Net Assets:
Paid in capital 80,429,682$ 543,844,008$ 15,662,212$ 165,601,965$
Accumulated earnings (loss) (3,161,927) (24,911,656) 144,411 (25,855,451)
Net Assets 77,267,755 518,932,352 15,806,623 139,746,514
Class I Shares:
Net assets 63,461,579$ 486,490,713$ -$ 98,694,189$
Total shares outstanding at end of period
($0 par value, unlimited shares authorized) 6,600,132 49,960,921 - 11,608,441
Net asset value, offering and redemption
price per share
(Net assets ÷ Total shares of beneficial
interest outstanding) 9.62$ 9.74$ -$ 8.50$
Class II Shares:
Net assets 13,806,176$ 32,441,639$ 15,806,623$ 41,052,325$
Total shares outstanding at end of period
($0 par value, unlimited shares authorized) 1,437,269 3,336,107 1,604,893 4,835,273
Net asset value, offering and redemption
price per share
(Net assets ÷ Total shares of beneficial
interest outstanding) 9.61$ 9.72$ 9.85$ 8.49$
+ Collateral for futures contracts and foreign currency contracts.
162See accompanying notes to financial statements.

Global Atlantic Portfolios
Statements of Assets and Liabilities (Continued) December 31, 2018
Global Atlantic BlackRock Global Atlantic BlackRock Global Atlantic BlackRock Global Atlantic
Disciplined Mid Cap Disciplined Small Cap Disciplined U.S. Core BlackRock Disciplined
Assets: Growth Portfolio Portfolio Portfolio Value Portfolio
Investments in securities, at cost 175,345,638$ 18,575,526$ 22,891,226$ 270,765,308
Investments in securities, at value 169,204,911$ 16,344,044$ 21,915,284$ 254,620,254
Cash 37,478 - 3,161 -
Deposits with broker + 254,839 36,231 37,902 379,228
Receivable for securities sold 1,808,569 - - 3,065,250
Interest and dividends receivable 101,146 20,529 31,676 498,273
Total Assets 171,406,943 16,400,804 21,988,023 258,563,005
Liabilities:
Unrealized depreciation on futures contracts 86,945 9,801 15,022 106,752
Payable for Portfolio shares redeemed 96,705 34,848 35,424 349,667
Payable for securities purchased 1,686,975 - - 2,682,352
Accrued investment advisory fees - net 72,794 5,858 5,303 97,005
Accrued distribution (12b-1) fees 9,466 1,670 670 1,684
Administrative service fees payable 11,645 2,483 2,776 17,024
Accrued expenses and other liabilities 4,312 475 822 6,671
Total Liabilities 1,968,842 55,135 60,017 3,261,155
Net Assets 169,438,101$ 16,345,669$ 21,928,006$ 255,301,850
Net Assets:
Paid in capital 175,453,937$ 18,045,321$ 22,759,105$ 272,513,480
Accumulated loss (6,015,836) (1,699,652) (831,099) (17,211,630)
Net Assets 169,438,101$ 16,345,669$ 21,928,006$ 255,301,850$
Class I Shares:
Net assets 126,148,590$ 8,812,685$ 18,963,392$ 248,141,407
Total shares outstanding at end of period
($0 par value, unlimited shares authorized) 12,731,789 959,352 1,963,277 26,418,672
Net asset value, offering and redemption
price per share
(Net assets ÷ Total shares of beneficial
interest outstanding) 9.91$ 9.19$ 9.66$ 9.39
Class II Shares:
Net assets 43,289,511$ 7,532,984$ 2,964,614$ 7,160,443
Total shares outstanding at end of period
($0 par value, unlimited shares authorized) 4,371,094 820,758 307,292 761,916
Net asset value, offering and redemption
price per share
(Net assets ÷ Total shares of beneficial
interest outstanding) 9.90$ 9.18$ 9.65$ 9.40
+ Collateral for futures contracts and foreign currency contracts.
163See accompanying notes to financial statements.

Global Atlantic Portfolios
Statements of Assets and Liabilities (Continued)
December 31, 2018
Global Atlantic Global Atlantic Goldman Global Atlantic Goldman Global Atlantic Goldman
BlackRock High Sachs Core Fixed Sachs Global Equity Sachs Large Cap Growth
Assets: Yield Portfolio Income Portfolio Insights Portfolio Insights Portfolio
Investments in securities, at cost 75,568,879$ 106,779,589$ 30,166,031$ 84,823,513$
Investments in securities, at value 69,213,984$ 106,285,002$ 27,409,523$ 81,303,355$
Cash - - - 6,140
Foreign cash (Cost: $0, $19,660, $21,864, and $0, respectively) - 18,667 22,025 -
Deposits with broker + 17,386 79,200 - -
Unrealized appreciation on futures contracts - 174,617 - -
Unrealized appreciation on swap contracts - 71,560 - -
Interest and dividends receivable 1,252,997 553,446 40,966 38,007
Receivable for Portfolio shares sold - 38,432 - -
Receivable for securities sold - 11,291,563 - -
Due from broker - 23,566 - -
Total Assets 70,484,367 118,536,053 27,472,514 81,347,502
Liabilities:
Unrealized depreciation on futures contracts 3,384 - - -
Unrealized depreciation on forward
foreign currency contracts - 12,303 - -
Payable for securities purchased - 25,733,399 - -
Payable for portfolio shares redeemed 118,584 - 7,582 130,351
Accrued investment advisory fees - net 28,529 21,297 13,308 22,826
Accrued distribution (12b-1) fees 237 - 2,660 714
Administrative service fees payable 5,842 7,074 3,283 6,355
Accrued expenses and other liabilities 1,858 2,423 1,008 2,072
Total Liabilities 158,434 25,776,496 27,841 162,318
Net Assets 70,325,933$ 92,759,557$ 27,444,673$ 81,185,184$
Net Assets:
Paid in capital 74,232,224$ 92,099,989$ 30,675,102$ 83,403,609$
Accumulated earnings (loss) (3,906,291) 659,568 (3,230,429) (2,218,425)
Net Assets 70,325,933$ 92,759,557$ 27,444,673$ 81,185,184$
Class I Shares:
Net assets 69,255,380$ 92,759,547$ 15,290,209$ 77,929,795$
Total shares outstanding at end of period
($0 par value, unlimited shares authorized) 7,342,847 9,347,348 1,678,773 7,988,051
Net asset value, offering and redemption
price per share
(Net assets ÷ Total shares of beneficial
interest outstanding) 9.43$ 9.92$ 9.11$ 9.76$
Class II Shares:
Net assets 1,070,553$ 10$ 12,154,464$ 3,255,389$
Total shares outstanding at end of period
($0 par value, unlimited shares authorized) 113,783 1 1,336,536 334,213
Net asset value, offering and redemption
price per share
(Net assets ÷ Total shares of beneficial
interest outstanding) 9.41$ 9.92$ (a) 9.09$ 9.74$
(a) NAV may not recalculate due to rounding of net assets.
+ Collateral for forward foreign currency contracts and futures contracts.
164See accompanying notes to financial statements.

Global Atlantic Portfolios
Statements of Assets and Liabilities (Continued)
December 31, 2018
Global Atlantic Goldman
Sachs Mid Cap Value
Assets: Insights Portfolio
Investments in securities, at cost 138,874,712$
Investments in securities, at value 124,080,516$
Interest and dividends receivable 251,120
Receivable for Portfolio shares sold 892
Total Assets 124,332,528
Liabilities:
Payable for Portfolio shares redeemed 85,048
Accrued investment advisory fees - net 54,622
Accrued distribution (12b-1) fees 16,563
Administrative service fees payable 9,074
Accrued expenses and other liabilities 3,260
Total Liabilities 168,567
Net Assets 124,163,961$
Net Assets:
Paid in capital 138,249,058$
Accumulated loss (14,085,097)
Net Assets 124,163,961$
Class I Shares:
Net assets 49,080,085$
Total shares outstanding at end of period
($0 par value, unlimited shares authorized) 5,403,335
Net asset value, offering and redemption
price per share
(Net assets ÷ Total shares of beneficial
interest outstanding) 9.08$
Class II Shares:
Net assets 75,083,876$
Total shares outstanding at end of period
($0 par value, unlimited shares authorized) 8,281,596
Net asset value, offering and redemption
price per share
(Net assets ÷ Total shares of beneficial
interest outstanding) 9.07$
165See accompanying notes to financial statements.

Global Atlantic Portfolios
Statements of Operations
For the Year Ended December 31, 2018
Global Atlantic Global Atlantic Global Atlantic Global Atlantic BlackRock
BlackRock Allocation BlackRock Disciplined BlackRock Disciplined Disciplined International
Portfolio Core Portfolio Growth Portfolio Core Portfolio
Investment Income:
Dividend income 2,069,334$ 10,966,724$ * 296,578$ ** 4,383,822$ ***
Interest income 1,741 152,807 5,474 40,336
Total Investment Income 2,071,075 11,119,531 302,052 4,424,158
Expenses:
Investment advisory fees 189,924 2,180,588 88,514 871,857
Distribution fees (12b-1) - Class II Shares 36,019 94,485 49,174 99,045
Administrative service fees 60,897 374,588 14,860 94,762
Legal fees 17,175 140,690 3,866 37,010
Trustees fees 9,256 40,404 2,201 10,285
Custody fees - 524 5 84
Miscellaneous Expense 24 167 5 43
Total Expenses 313,295 2,831,446 158,625 1,113,086
Expenses waived (8,542) (50,540) (3,754) (9,810)
Net Expenses 304,753 2,780,906 154,871 1,103,276
Net Investment Income 1,766,322 8,338,625 147,181 3,320,882
Net Realized and Unrealized Gain/(Loss) on
Investments, Futures Contracts, Forward Foreign
Currency Contracts, Foreign Currency Translations
and Payments From Affiliate
Net realized gain/(loss) on:
Investments (239,566) (6,173,071) 446,713 (6,435,168)
Futures contracts - 2,028,327 (18,646) (292,932)
Futures commissions - (12,997) (280) (2,321)
Foreign currency translations - 335 - (166,168)
Forward foreign currency contracts (249,954) - - 171,649
Payments from affiliate 876 53,961 - 118,147
(488,644) (4,103,445) 427,787 (6,606,793)
Net change in unrealized depreciation on:
Investments (5,694,631) (31,887,582) (794,194) (21,069,202)
Futures contracts - (223,173) 682 (112,589)
Foreign currency translations 3,940 (940) - (9,829)
Forward foreign currency contracts 67,076 - - (120)
(5,623,615) (32,111,695) (793,512) (21,191,740)
Net Realized and Unrealized Loss on
Investments, Futures Contracts, Forward Foreign
Currency Contracts, Foreign Currency Translations
and Payments From Affiliate (6,112,259) (36,215,140) (365,725) (27,798,533)
Net Decrease in Net Assets
Resulting from Operations (4,345,937)$ (27,876,515)$ (218,544)$ (24,477,651)$
* Foreign Taxes Withheld $21,771
** Foreign Taxes Withheld $2
*** Foreign Taxes Withheld $519,683
166See accompanying notes to financial statements.

Global Atlantic Portfolios
Statements of Operations (Continued)
For the Year Ended December 31, 2018
Global Atlantic BlackRock Global Atlantic BlackRock Global Atlantic BlackRock Global Atlantic
Disciplined Mid Cap Disciplined Small Cap Disciplined U.S. Core BlackRock Disciplined
Growth Portfolio Portfolio Portfolio Value Portfolio
Investment Income:
Dividend income 2,949,788$ * 242,339$ ** 484,516$ 7,353,203$ ***
Interest income 49,233 8,093 8,119 70,215
Total Investment Income 2,999,021 250,432 492,635 7,423,418
Expenses:
Investment advisory fees 1,014,177 103,173 98,118 1,353,298
Distribution fees (12b-1) - Class II Shares 112,467 19,890 7,188 22,421
Administrative service fees 124,893 14,350 18,504 203,498
Legal fees 46,609 4,563 5,898 69,492
Trustees fees 12,974 1,450 2,145 22,569
Miscellaneous Expense 54 5 7 83
Total Expenses 1,311,174 143,431 131,860 1,671,361
Expenses waived (35,854) (3,138) (3,915) (25,935)
Net Expenses 1,275,320 140,293 127,945 1,645,426
Net Investment Income 1,723,701 110,139 364,690 5,777,992
Net Realized and Unrealized Gain/(Loss) on
Investments, Futures Contracts, Foreign Currency
Translations and Payments from Affiliate
Net realized gain (loss) on:
Investments (834,342) 514,437 89,385 (2,457,618)
Futures contracts 864,911 (58,115) (35,565) (80,828)
Futures commissions (4,120) (754) (297) (2,051)
Foreign currency translations 2 (439) (2) 5
Payments from affiliate 19,123 1,987 678 1,058
45,574 457,116 54,199 (2,539,434)
Net change in unrealized depreciation on:
Investments (8,449,340) (2,433,537) (1,573,017) (24,997,951)
Futures contracts (99,025) (9,043) (15,075) (153,788)
(8,548,365) (2,442,580) (1,588,092) (25,151,739)
Net Realized and Unrealized Loss on
Investments, Futures Contracts, Foreign
Currency Translations and Payments From Affiliate (8,502,791) (1,985,464) (1,533,893) (27,691,173)
Net Decrease in Net Assets
Resulting from Operations (6,779,090)$ (1,875,325)$ (1,169,203)$ (21,913,181)$
* Foreign Taxes Withheld $468
** Foreign Taxes Withheld $26
*** Foreign Taxes Withheld $418
167See accompanying notes to financial statements.

Global Atlantic Portfolios
Statements of Operations (Continued)
For the Year Ended December 31, 2018
Global Atlantic Global Atlantic Goldman Global Atlantic Goldman Global Atlantic Goldman
BlackRock High Sachs Core Fixed Sachs Global Equity Sachs Large Cap Growth
Yield Portfolio Income Portfolio Insights Portfolio Insights Portfolio
Investment Income:
Dividend income 1,433$ -$ 651,054$ * 1,183,704$
Interest income 4,697,500 2,539,507 917 10,957
Total Investment Income 4,698,933 2,539,507 651,971 1,194,661
Expenses:
Investment advisory fees 403,013 292,910 198,698 347,010
Distribution fees (12b-1) - Class II Shares 3,054 - 31,902 7,199
Administrative service fees 55,910 59,217 22,875 65,086
Legal fees 15,786 22,797 8,121 22,156
Trustees fees 8,957 6,091 2,060 6,924
Custody fees 16 2,888 547 -
Miscellaneous Expense 22 27 9 26
Total Expenses 486,758 383,930 264,212 448,401
Expenses waived (8,365) (9,926) (4,573) (9,822)
Net Expenses 478,393 374,004 259,639 438,579
Net Investment Income 4,220,540 2,165,503 392,332 756,082
Net Realized and Unrealized Gain/(Loss) on Investments,
Futures Contracts, Swap Contracts, Foreign Currency
Translations, Forward Foreign Currrency Contracts and
Payments from Affiliate
Net realized gain/(loss) on:
Investments (1,815,310) (827,549) (515,979) 1,090,119
Futures contracts 82,704 (360,638) - 438
Futures commissions (958) (11,393) - -
Payments from affiliate - 695 3,240 461
Swap Contracts - 47,381 - -
Forward foreign currency contracts - 138,625 - -
Foreign currency translations - (216,220) (24,835) -
(1,733,564) (1,229,099) (537,574) 1,091,018
Net change in unrealized depreciation on:
Investments (5,856,633) (463,555) (3,308,265) (5,347,626)
Futures contracts (19,929) 191,546 - -
Swap contracts - 71,560 - -
Forward foreign currency contracts - 14,511 - -
Foreign currency translations - (548) (3,415) -
(5,876,562) (186,486) (3,311,680) (5,347,626)
Net Realized and Unrealized Loss on
Investments, Futures Contracts,
Swap Contracts, Foreign Currency Translations,
Forward Foreign Currency Contracts and Payments
From Affiliate (7,610,126) (1,415,585) (3,849,254) (4,256,608)
Net Increase/(Decrease) in Net Assets
Resulting from Operations (3,389,586)$ 749,918$ (3,456,922)$ (3,500,526)$
* Foreign Taxes Withheld $42,849.
168See accompanying notes to financial statements.

Global Atlantic Portfolios
Statements of Operations (Continued)
For the Year Ended December 31, 2018
Global Atlantic Goldman
Sachs Mid Cap Value
Insights Portfolio
Investment Income:
Dividend income 2,781,380$ *
Interest income 18,563
Total Investment Income 2,799,943
Expenses:
Investment advisory fees 750,608
Distribution fees (12b-1) - Class II Shares 188,780
Administrative service fees 92,574
Legal fees 34,684
Trustees fees 9,580
Miscellaneous expense 40
Total Expenses 1,076,266
Expenses waived (12,865)
Net Expenses 1,063,401
Net Investment Income 1,736,542
Net Realized and Unrealized Gain (Loss) on Investments,
Futures Contracts and Payments From Affiliate
Net Realized Gain (Loss) on:
Investments 349,347
Futures contracts (605,880)
Futures commissions (1,458)
Payments from affiliate 5,673
(252,318)
Net change in unrealized depreciation on:
Investments (16,219,628)
(16,219,628)
Net Realized and Unrealized Loss on Investments,
Futures Contracts and Payments from Affiliate (16,471,946)
Net Decrease in Net Assets
Resulting from Operations (14,735,404)$
* Foreign Taxes Withheld $357.
169See accompanying notes to financial statements.

Global Atlantic Portfolios
Statements of Changes in Net Assets
Year ended Period ended Year ended Period ended
December 31, December 31, December 31, December 31,
2018 2017 * 2018 2017 *
Increase/(Decrease) in Net Assets:
From Operations:
Net investment income 1,766,322$ 492,081$ 8,338,625$ 626,358$
Net realized gain/(loss) on investments, futures contracts,
forward foreign currency contracts, foreign currency
translations and payments from affiliate (488,644) (72,175) (4,103,445) 1,636,161
Net change in unrealized appreciation (depreciation) on
investments, futures contracts, forward foreign
currency contracts and foreign currency translations (5,623,615) 1,125,381 (32,111,695) 8,963,755
Net increase (decrease) in net assets
resulting from operations (4,345,937) 1,545,287 (27,876,515) 11,226,274
From Distributions to Shareholders:
Total distributions paid ** (361,277) - (8,261,415) -
Total distributions to shareholders (361,277) - (8,261,415) -
From Shares of Beneficial Interest:
Proceeds from shares sold
Class 1 4,710,096 75,524,306 275,178,625 311,998,253
Class II 8,539,942 9,050,156 5,280,712 36,742,558
Reinvestment of distributions
Class 1 319,042 - 7,813,964 -
Class 2 42,236 - 447,452 -
Cost of shares redeemed
Class 1 (12,957,720) (1,794,566) (78,346,434) (6,968,659)
Class II (2,903,952) (99,858) (7,914,091) (388,372)
Net increase (decrease) in net assets from share
transactions of beneficial interest (2,250,356) 82,680,038 202,460,228 341,383,780
Total increase (decrease) in net assets (6,957,570) 84,225,325 166,322,298 352,610,054
Net Assets:
Beginning of period 84,225,325 - 352,610,054 -
End of period *** 77,267,755$ 84,225,325$ 518,932,352$ 352,610,054$
Share Activity:
Class 1
Shares Sold 458,954 7,557,486 26,048,710 31,127,893
Shares Reinvested 32,456 - 761,595 -
Shares Redeemed (1,270,339) (178,425) (7,300,038) (677,239)
Net increase (decrease) in shares of beneficial
interest outstanding (778,929) 7,379,061 19,510,267 30,450,654
Share Activity:
Class II
Shares Sold 831,755 896,907 489,813 3,575,334
Shares Reinvested 4,301 - 43,654 -
Shares Redeemed (285,815) (9,879) (735,161) (37,533)
Net increase (decrease) in shares of beneficial
interest outstanding 550,241 887,028 (201,694) 3,537,801
* The Portfolio's inception date is November 1, 2017. The Portfolio commenced operations on November 6, 2017.
** Distributions from net investment income and net realized capital gains are combined for the year ended December 31, 2018. See "New Accounting Pronouncements"
in the Notes To Financial Statements for more information. No distributions were paid during the period ended December 31, 2017.
*** Net Assets - End of period include distribution in excess of net investment income of $410,263 and $626,325 as of December 31, 2017 for Global Atlantic BlackRock
Allocation Portfolio and Global Atlantic BlackRock Disciplined Core Portfolio, respectively.
Global Atlantic BlackRock Global Atlantic BlackRock
Allocation Portfolio Disciplined Core Portfolio
170See accompanying notes to financial statements.

Global Atlantic Portfolios
Statements of Changes in Net Assets
Year ended Period ended Year ended Period ended
December 31, December 31, December 31, December 31,
2018 2017 * 2018 2017 *
Increase/(Decrease) in Net Assets:
From Operations:
Net investment income 147,181$ 35,461$ 3,320,882$ 182,389$
Net realized gain (loss) on investments, futures contracts,
forward foreign currency contracts and payments from
affiliate 427,787 143,379 (6,606,793) 19,116
Net change in unrealized appreciation (depreciation) on
investments, futures contracts, foreign currency
translations and forward foreign currency contracts (793,512) 467,228 (21,191,740) 1,555,794
Net increase (decrease) in net assets
resulting from operations (218,544) 646,068 (24,477,651) 1,757,299
From Distributions to Shareholders:
Total distributions paid ** (283,113) - (3,135,099) -
Total distributions to shareholders (283,113) - (3,135,099) -
From Shares of Beneficial Interest:
Proceeds from shares sold
Class I - - 60,436,711 67,121,000
Class II 701,973 20,598,578 47,547,508 5,062,115
Reinvestment of distributions
Class 1 - - 2,260,346 -
Class 2 283,113 - 874,754 -
Cost of shares redeemed
Class I - - (11,619,140) (1,676,131)
Class II (5,210,960) (710,492) (4,308,815) (96,383)
Net increase (decrease) in net assets from share
transactions of beneficial interest (4,225,874) 19,888,086 95,191,364 70,410,601
Total increase (decrease) in net assets (4,727,531) 20,534,154 67,578,614 72,167,900
Net Assets:
Beginning of period 20,534,154 - 72,167,900 -
End of period *** 15,806,623$ 20,534,154$ 139,746,514$ 72,167,900$
Share Activity:
Class I
Shares Sold - - 5,956,019 6,744,358
Shares Reinvested - - 259,512 -
Shares Redeemed - - (1,184,435) (167,013)
Net increase in shares of beneficial
interest outstanding - - 5,031,096 6,577,345
Share Activity:
Class II
Shares Sold 63,002 2,059,777 4,680,473 509,672
Shares Reinvested 27,118 - 100,546 -
Shares Redeemed (475,123) (69,881) (445,806) (9,612)
Net increase (decrease) in shares of beneficial
interest outstanding (385,003) 1,989,896 4,335,213 500,060
* The Portfolio's inception date is November 1, 2017. The Portfolio commenced operations on November 6, 2017.
** Distributions from net investment income and net realized capital gains are combined for the year ended December 31, 2018. See "New Accounting Pronouncements"
in the Notes To Financial Statements for more information. No distributions were paid during the period ended December 31, 2017.
*** Net Assets - End of period include distribution in excess of net investment income of $35,450 and $178,881 as of December 31, 2017 for Global Atlantic BlackRock
Disciplined Growth Portfolio and Global Atlantic BlackRock Disciplined International Core Portfolio, respectively.
Global Atlantic BlackRock Global Atlantic BlackRock Disciplined
Disciplined Growth Portfolio International Core Portfolio
171See accompanying notes to financial statements.

Global Atlantic Portfolios
Statements of Changes in Net Assets
Year ended Period ended Year ended Period ended
December 31, December 31, December 31, December 31,
2018 2017 * 2018 2017 *
Increase/(Decrease) in Net Assets:
From Operations:
Net investment income 1,723,701$ 100,714$ 110,139$ 17,274$
Net realized gain on investments, futures contracts,
foreign currency translations and payments from affiliate45,574 466,926 457,116 61,623
Net change in unrealized appreciation (depreciation) on
investments and futures contracts (8,548,365) 2,320,693 (2,442,580) 201,297
Net increase (decrease) in net assets
resulting from operations (6,779,090) 2,888,333 (1,875,325) 280,194
From Distributions to Shareholders:
Total distributions paid ** (2,125,079) - (104,521) -
Total distributions to shareholders (2,125,079) - (104,521) -
From Shares of Beneficial Interest:
Proceeds from shares sold
Class I 60,544,967 92,925,853 154,274 11,512,090
Class II 34,653,907 17,899,858 5,930,065 4,076,758
Reinvestment of distributions
Class 1 1,648,223 - 65,101 -
Class 2 476,857 - 39,420 -
Cost of shares redeemed
Class I (23,194,442) (2,095,171) (1,925,214) (307,907)
Class II (7,045,289) (360,826) (1,470,068) (29,198)
Net increase in net assets from share
transactions of beneficial interest 67,084,223 108,369,714 2,793,578 15,251,743
Total increase in net assets 58,180,054 111,258,047 813,732 15,531,937
Net Assets:
Beginning of period 111,258,047 - 15,531,937 -
End of period *** 169,438,101$ 111,258,047$ 16,345,669$ 15,531,937$
Share Activity:
Class I
Shares Sold 5,651,636 9,234,622 14,058 1,151,343
Shares Reinvested 160,177 - 6,523 -
Shares Redeemed (2,110,745) (203,901) (182,058) (30,514)
Net increase (decrease) in shares of beneficial
interest outstanding 3,701,068 9,030,721 (161,477) 1,120,829
Share Activity:
Class II
Shares Sold 3,246,172 1,755,442 556,716 401,660
Shares Reinvested 46,342 - 3,950 -
Shares Redeemed (641,559) (35,303) (138,711) (2,857)
Net increase in shares of beneficial
interest outstanding 2,650,955 1,720,139 421,955 398,803
* The Portfolio's inception date is November 1, 2017. The Portfolio commenced operations on November 6, 2017.
** Distributions from net investment income and net realized capital gains are combined for the year ended December 31, 2018. See "New Accounting Pronouncements"
in the Notes To Financial Statements for more information. No distributions were paid during the period ended December 31, 2017.
*** Net Assets - End of period include distribution in excess of net investment income of $100,681 and $17,274 as of December 31, 2017 for Global Atlantic BlackRock
Disciplined Mid Cap Growth Portfolio and Global Atlantic BlackRock Disciplined Small Cap Portfolio, respectively.
Global Atlantic BlackRock Global Atlantic BlackRock
Disciplined Mid Cap Growth Portfolio Disciplined Small Cap Portfolio
172See accompanying notes to financial statements.
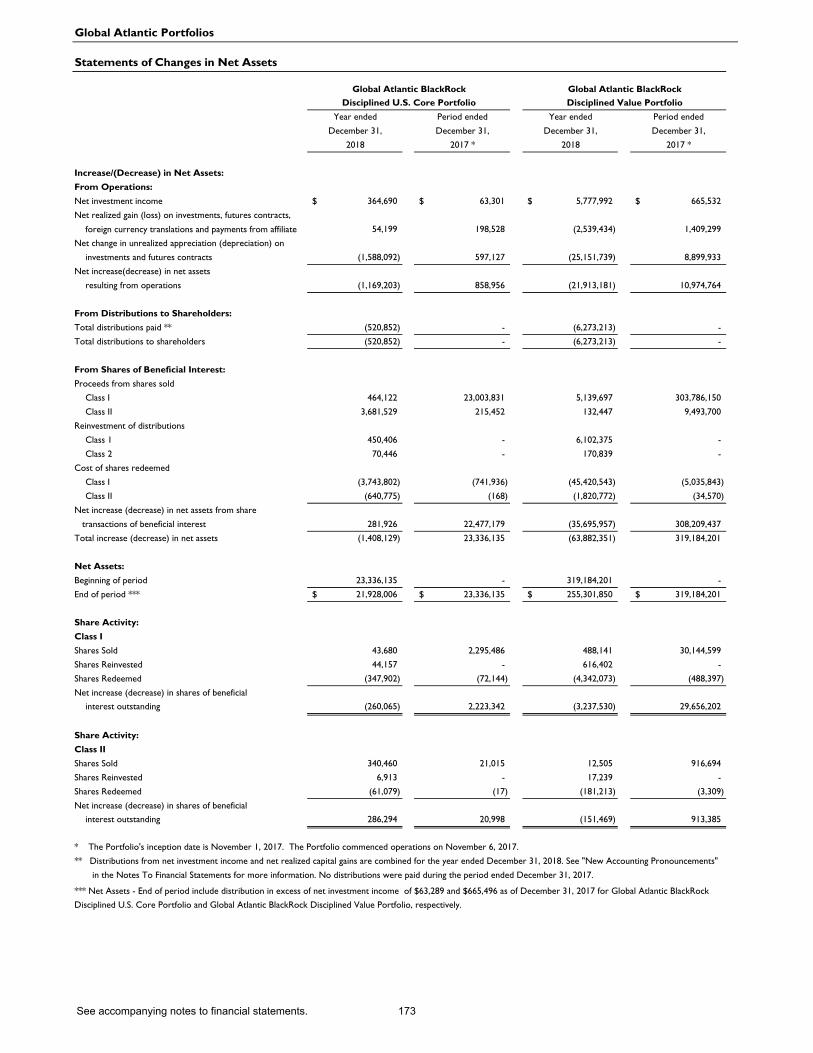
Global Atlantic Portfolios
Statements of Changes in Net Assets
Year ended Period ended Year ended Period ended
December 31, December 31, December 31, December 31,
2018 2017 * 2018 2017 *
Increase/(Decrease) in Net Assets:
From Operations:
Net investment income 364,690$ 63,301$ 5,777,992$ 665,532$
Net realized gain (loss) on investments, futures contracts,
foreign currency translations and payments from affiliate 54,199 198,528 (2,539,434) 1,409,299
Net change in unrealized appreciation (depreciation) on
investments and futures contracts (1,588,092) 597,127 (25,151,739) 8,899,933
Net increase(decrease) in net assets
resulting from operations (1,169,203) 858,956 (21,913,181) 10,974,764
From Distributions to Shareholders:
Total distributions paid ** (520,852) - (6,273,213) -
Total distributions to shareholders (520,852) - (6,273,213) -
From Shares of Beneficial Interest:
Proceeds from shares sold
Class I 464,122 23,003,831 5,139,697 303,786,150
Class II 3,681,529 215,452 132,447 9,493,700
Reinvestment of distributions
Class 1 450,406 - 6,102,375 -
Class 2 70,446 - 170,839 -
Cost of shares redeemed
Class I (3,743,802) (741,936) (45,420,543) (5,035,843)
Class II (640,775) (168) (1,820,772) (34,570)
Net increase (decrease) in net assets from share
transactions of beneficial interest 281,926 22,477,179 (35,695,957) 308,209,437
Total increase (decrease) in net assets (1,408,129) 23,336,135 (63,882,351) 319,184,201
Net Assets:
Beginning of period 23,336,135 - 319,184,201 -
End of period *** 21,928,006$ 23,336,135$ 255,301,850$ 319,184,201$
Share Activity:
Class I
Shares Sold 43,680 2,295,486 488,141 30,144,599
Shares Reinvested 44,157 - 616,402 -
Shares Redeemed (347,902) (72,144) (4,342,073) (488,397)
Net increase (decrease) in shares of beneficial
interest outstanding (260,065) 2,223,342 (3,237,530) 29,656,202
Share Activity:
Class II
Shares Sold 340,460 21,015 12,505 916,694
Shares Reinvested 6,913 - 17,239 -
Shares Redeemed (61,079) (17) (181,213) (3,309)
Net increase (decrease) in shares of beneficial
interest outstanding 286,294 20,998 (151,469) 913,385
* The Portfolio's inception date is November 1, 2017. The Portfolio commenced operations on November 6, 2017.
** Distributions from net investment income and net realized capital gains are combined for the year ended December 31, 2018. See "New Accounting Pronouncements"
in the Notes To Financial Statements for more information. No distributions were paid during the period ended December 31, 2017.
*** Net Assets - End of period include distribution in excess of net investment income of $63,289 and $665,496 as of December 31, 2017 for Global Atlantic BlackRock
Disciplined U.S. Core Portfolio and Global Atlantic BlackRock Disciplined Value Portfolio, respectively.
Global Atlantic BlackRock Global Atlantic BlackRock
Disciplined U.S. Core Portfolio Disciplined Value Portfolio
173See accompanying notes to financial statements.

Global Atlantic Portfolios
Statements of Changes in Net Assets
Year ended Period ended Year ended Period ended
December 31, December 31, December 31, December 31,
2018 2017 * 2018 2017 *
Increase/(Decrease) in Net Assets:
From Operations:
Net investment income 4,220,540$ 475,457$ 2,165,503$ 76,330$
Net realized loss on investments, futures contracts,
swap contracts, payments from affiliate, foreign currency
translations and forward foreign currency contracts (1,733,564) (27,418) (1,229,099) (44,627)
Net change in unrealized depreciation on
investments, futures contracts, forward foreign
currency contracts, foreign currency translations and
swap contracts (5,876,562) (481,717) (186,486) (74,969)
Net increase (decrease) in net assets
resulting from operations (3,389,586) (33,678) 749,918 (43,266)
From Distributions to Shareholders:
Total distributions paid ** (483,027) - (47,084) -
Total distributions to shareholders (483,027) - (47,084) -
From Shares of Beneficial Interest:
Proceeds from shares sold
Class I 8,510,950 87,802,702 71,228,815 35,878,977
Class II 43,566 1,456,499 - 10
Reinvestment of distributions
Class 1 475,788 - 47,084 -
Class 2 7,239 - - -
Cost of shares redeemed
Class I (18,991,102) (4,692,905) (14,478,734) (576,163)
Class II (322,915) (57,598) - -
Net increase (decrease) in net assets from share
transactions of beneficial interest (10,276,474) 84,508,698 56,797,165 35,302,824
Total increase (decrease) in net assets (14,149,087) 84,475,020 57,499,999 35,259,558
Net Assets:
Beginning of period 84,475,020 - 35,259,558 -
End of period *** 70,325,933$ 84,475,020$ 92,759,557$ 35,259,558$
Share Activity:
Class I
Shares Sold 861,033 8,846,295 7,289,283 3,589,454
Shares Reinvested 48,649 - 4,829 -
Shares Redeemed (1,938,480) (474,650) (1,478,494) (57,724)
Net increase (decrease) in shares of beneficial
interest outstanding (1,028,798) 8,371,645 5,815,618 3,531,730
Share Activity:
Class II
Shares Sold 4,390 147,418 - 1
Shares Reinvested 742 - - -
Shares Redeemed (32,950) (5,817) - -
Net increase (decrease) in shares of beneficial
interest outstanding (27,818) 141,601 - 1
* The Portfolio's inception date is November 1, 2017. The Portfolio commenced operations on November 6, 2017.
** Distributions from net investment income and net realized capital gains are combined for the year ended December 31, 2018. See "New Acounting Pronouncements"
in the Notes To Financial Statements for more information. No distributions were paid during the period ended December 31, 2017.
*** Net Assets - End of period included distribution in excess of net investment income of $475,457 and $73,481 as of December 31, 2017 for Global Atlantic BlackRock High Yield
Portfolio and Global Atlantic Goldman Sachs Core Fixed Income Portfolio, respectively.
Global Atlantic BlackRock Global Atlantic Goldman Sachs
High Yield Portfolio Core Fixed Income Portfolio
174See accompanying notes to financial statements.

Global Atlantic Portfolios
Statements of Changes in Net Assets
Year ended Period ended Year ended Period ended
December 31, December 31, December 31, December 31,
2018 2017 * 2018 2017 *
Increase/(Decrease) in Net Assets:
From Operations:
Net investment income 392,332$ 36,615$ 756,082$ 181,650$
Net realized gain (loss) on investments, foreign currency
translations, payments from affiliate and futures contracts (537,574) 41,964 1,091,018 498,104
Net change in unrealized appreciation (depreciation) on
investments and foreign currency translations (3,311,680) 554,824 (5,347,626) 1,827,468
Net increase (decrease) in net assets
resulting from operations (3,456,922) 633,403 (3,500,526) 2,507,222
From Distributions to Shareholders:
Total distributions paid ** (406,910) - (1,225,121) -
Total distributions to shareholders (406,910) - (1,225,121) -
From Shares of Beneficial Interest:
Proceeds from shares sold
Class I 762,193 19,993,673 11,264,824 84,849,029
Class II 11,946,181 4,500,102 4,150,216 18,286
Reinvestment of distributions
Class 1 239,600 - 1,181,346 -
Class 2 167,310 - 43,775 -
Cost of shares redeemed
Class I (3,663,162) (642,326) (15,403,543) (2,177,891)
Class II (2,600,439) (28,030) (522,157) (276)
Net increase in net assets from share
transactions of beneficial interest 6,851,683 23,823,419 714,461 82,689,148
Total increase (decrease) in net assets 2,987,851 24,456,822 (4,011,186) 85,196,370
Net Assets:
Beginning of period 24,456,822 - 85,196,370 -
End of period *** 27,444,673$ 24,456,822$ 81,185,184$ 85,196,370$
Share Activity:
Class I
Shares Sold 71,956 1,999,307 1,025,070 8,484,786
Shares Reinvested 24,881 - 115,141 -
Shares Redeemed (354,007) (63,364) (1,423,308) (213,638)
Net increase (decrease) in shares of beneficial
interest outstanding (257,170) 1,935,943 (283,097) 8,271,148
Share Activity:
Class II
Shares Sold 1,129,288 444,520 376,728 1,829
Shares Reinvested 17,392 - 4,271 -
Shares Redeemed (251,916) (2,748) (48,588) (27)
Net increase in shares of beneficial
interest outstanding 894,764 441,772 332,411 1,802
* The Portfolio's inception date is November 1, 2017. The Portfolio commenced operations on November 6, 2017.
** Distributions from net investment income and net realized capital gains are combined for the year ended December 31, 2018. See "New Acounting Pronouncements"
in the Notes To Financial Statements for more information. No distributions were paid during the period ended December 31, 2017.
*** Net Assets - End of period included distribution in excess of net investment income of $27,190 and $179,717 as of December 31, 2017 for Global Atlantic Goldman Sachs Global Equity Insights
Portfolio and Global Atlantic Goldman Sachs Large Cap Growth Insights Portfolio, respectively.
Global Atlantic Goldman Sachs Global Atlantic Goldman Sachs
Global Equity Insights Portfolio Large Cap Growth Insights Portfolio
175See accompanying notes to financial statements.

Global Atlantic Portfolios
Statements of Changes in Net Assets
Year ended Period ended
December 31, December 31,
2018 2017 *
Increase/(Decrease) in Net Assets:
From Operations:
Net investment income 1,736,542$ 200,949$
Net realized gain (loss) on investments, futures contracts and payments from affiliate (252,318) 181,778
Net change in unrealized appreciation (depreciation) on investments (16,219,628) 1,425,432
Net increase (decrease) in net assets
resulting from operations (14,735,404) 1,808,159
From Distributions to Shareholders:
Total distributions paid ** (1,157,852) -
Total distributions to shareholders (1,157,852) -
From Shares of Beneficial Interest:
Proceeds from shares sold
Class I 608,534 66,563,971
Class II 79,279,639 13,478,826
Reinvestment of distributions
Class 1 516,181 -
Class 2 641,671 -
Cost of shares redeemed
Class I (11,691,655) (1,157,852)
Class II (9,860,791) (129,466)
Net increase in net assets from share
transactions of beneficial interest 59,493,579 78,755,479
Total increase in net assets 43,600,323 80,563,638
Net Assets:
Beginning of period 80,563,638 -
End of period *** 124,163,961$ 80,563,638$
Share Activity:
Class I
Shares Sold 58,962 6,534,241
Shares Reinvested 53,380 -
Shares Redeemed (1,130,804) (112,444)
Net increase (decrease) in shares of
beneficial interest outstanding (1,018,462) 6,421,797
Share Activity:
Class II
Shares Sold 7,862,414 1,315,623
Shares Reinvested 66,494 -
Shares Redeemed (950,389) (12,546)
Net increase in shares of beneficial
interest outstanding 6,978,519 1,303,077
* The Portfolio's inception date is November 1, 2017. The Portfolio commenced operations on November 6, 2017.
** Distributions from net investment income and net realized capital gains are combined for the year ended December 31, 2018. See "New Acounting Pronouncements"
in the Notes To Financial Statements for more information. No distributions were paid during the period ended December 31, 2017.
*** Net Assets - End of period included distribution in excess of net investment income of $179,651 as of December 31, 2017.
Global Atlantic Goldman Sachs
Mid Cap Value Insights Portfolio
176See accompanying notes to financial statements.

Global Atlantic Portfolios
Financial Highlights
Global Atlantic BlackRock Allocation Portfolio
Selected data based on a share outstanding throughout each period indicated.
Year ended Period Ended
December 31, December 31,
2018 2017 (a)
Net asset value, beginning of period 10.19$ 10.00$
Income from investment operations:
Net investment income (b,c) 0.21 0.06
Net realized and unrealized gain (loss)
on investments (0.73) 0.13
Total income (loss) from
investment operations (0.52) 0.19
Less distributions from:
Net investment income (0.05) -
Net realized gain (0.00) (j) -
Total distributions from net investment
income and net realized gains (0.05) -
Net asset value, end of period 9.62$ 10.19$
Total return (d, i) (5.14)% 1.90%
Ratios and Supplemental Data:
Net assets, end of period (in 000's) 63,462$ 75,191$ (g)
Ratio of net expenses to
average net assets (e) 0.31% 0.31% (g)
Ratio of gross expenses to
average net assets (e,f,) 0.32% 0.32% (g)
Ratio of net investment income to
average net assets (c,e) 2.06% 4.15% (g)
Portfolio turnover rate 54% 2% (h)
(a) Global Atlantic BlackRock Allocation Portfolio inception date is November 1, 2017. Commenced operations on November 6, 2017.
(b)
(c)
(d)
(e) Does not include the expenses of the investment companies in which the Portfolio invests.
(f) Represents the ratio of expenses to average net assets absent fee waivers and/or expense reimbursements by the Adviser.
(g) Not annualized.Annualized.
(h) Not annualized.
(i)
(j) Less than $0.005 per share
For the period ended December 31, 2017 and the year ended December 31, 2018, the Portfolio received reimbursements from a related party. The reimbursements had no impact
on the Portfolio's total return.
Class I Shares
Net investment income has been calculated using the average shares method, which more appropriately presents the per share data for the period.
Recognition of net investment income by the Portfolio is affected by the timing of the declaration of dividends by the underlying investment companies in which the Portfolio invests.
Total returns are historical and assume changes in share price and reinvestment of dividends and capital gains distributions. Total return does not reflect the deduction of taxes that
a shareholder may pay on Portfolio distributions or on the redemption of Portfolio shares, as well as other charges and expenses of the insurance contract or separate account.
Total returns for periods of less than one year are not annualized. Total returns would have been lower absent fee waivers by the Adviser.
177See accompanying notes to financial statements.

Global Atlantic Portfolios
Financial Highlights
Global Atlantic BlackRock Allocation Portfolio
Selected data based on a share outstanding throughout each period indicated.
Year ended Period Ended
December 31, December 31,
2018 2017 (a)
Net asset value, beginning of period 10.18$ 10.00$
Income from investment operations:
Net investment income (b,c) 0.20 0.14
Net realized and unrealized gain (loss)
on investments (0.74) 0.04
Total income (loss) from
investment operations (0.54) 0.18
Less distributions from:
Net investment income (0.03) -
Net realized gain (0.00) (j) -
Total distributions from net investment
income and net realized gains (0.03) -
Net asset value, end of period 9.61$ 10.18$
Total return (d, i) (5.33)% 1.80%
Ratios and Supplemental Data:
Net assets, end of period (in 000's) 13,806$ 9,034$ (g)
Ratio of net expenses to
average net assets (e) 0.56% 0.56% (g)
Ratio of gross expenses to
average net assets (e,f,) 0.57% 0.56% (g)
Ratio of net investment income to
average net assets (c,e) 1.99% 9.11% (g)
Portfolio turnover rate 54% 2% (h)
(a) Global Atlantic BlackRock Allocation Portfolio inception date is November 1, 2017. Commenced operations on November 6, 2017.
(b)
(c)
(d)
(e) Does not include the expenses of the investment companies in which the Portfolio invests.
(f) Represents the ratio of expenses to average net assets absent fee waivers and/or expense reimbursements by the Adviser.
(g) Not annualized.Annualized.
(h) Not annualized.
(i)
(j) Less than $0.005 per share
For the period ended December 31, 2017 and the year ended December 31, 2018, the Portfolio received reimbursements from a related party. The reimbursements had no impact
on the Portfolio's total return.
Class II Shares
Net investment income has been calculated using the average shares method, which more appropriately presents the per share data for the period.
Recognition of net investment income by the Portfolio is affected by the timing of the declaration of dividends by the underlying investment companies in which the Portfolio invests.
Total returns are historical and assume changes in share price and reinvestment of dividends and capital gains distributions. Total return does not reflect the deduction of taxes that
a shareholder may pay on Portfolio distributions or on the redemption of Portfolio shares, as well as other charges and expenses of the insurance contract or separate account.
Total returns for periods of less than one year are not annualized. Total returns would have been lower absent fee waivers by the Adviser.
178See accompanying notes to financial statements.

Global Atlantic Portfolios
Financial Highlights
Global Atlantic BlackRock Disciplined Core Portfolio
Selected data based on a share outstanding throughout each period indicated.
Year ended Period Ended
December 31, December 31,
2018 2017 (a)
Net asset value, beginning of period 10.38$ 10.00$
Income from investment operations:
Net investment income (b) 0.16 0.03
Net realized and unrealized gain (loss)
on investments (0.64) 0.35
Total income (loss) from
investment operations (0.48) 0.38
Less distributions from:
Net investment income (0.12) -
Net realized gain (0.04) -
Total distributions from net investment
income and net realized gains (0.16) -
Net asset value, end of period 9.74$ 10.38$
Total return (c,g) (4.75)% 3.80%
Ratios and Supplemental Data:
Net assets, end of period (in 000's) 486,491$ 315,936$
Ratio of net expenses to
average net assets 0.48% 0.48% (d)
Ratio of gross expenses to
average net assets (e) 0.49% 0.48% (d)
Ratio of net investment income to
average net assets 1.51% 1.67% (d)
Portfolio turnover rate 156% 18% (f)
(a) Global Atlantic BlackRock Disciplined Core Portfolio inception date is November 1, 2017. Commenced operations on November 6, 2017.
(b)
(c)
(d) Annualized.
(e) Represents the ratio of expenses to average net assets absent fee waivers and/or expense reimbursements by the Adviser.
(f) Not annualized.
(g)
Class I Shares
Net investment income has been calculated using the average shares method, which more appropriately presents the per share data for the period.
Total returns are historical and assume changes in share price and reinvestment of dividends and capital gains distributions. Total return does not reflect the deduction of taxes
that a shareholder may pay on Portfolio distributions or on the redemption of Portfolio shares, as well as other charges and expenses of the insurance contract or separate
account. Total returns for periods of less than one year are not annualized. Total returns would have been lower absent fee waivers by the adviser.
For the period ended December 31, 2017 and the year ended December 31, 2018, the Portfolio received reimbursements from a related party. The reimbursements had no
impact on the Portfolio's total return.
179See accompanying notes to financial statements.

Global Atlantic Portfolios
Financial Highlights
Global Atlantic BlackRock Disciplined Core Portfolio
Selected data based on a share outstanding throughout each period indicated.
Year ended Period Ended
December 31, December 31,
2018 2017 (a)
Net asset value, beginning of period 10.37$ 10.00$
Income from investment operations:
Net investment income (b) 0.13 0.02
Net realized and unrealized gain (loss)
on investments (0.65) 0.35
Total income (loss) from
investment operations (0.52) 0.37
Less distributions from:
Net investment income (0.09) -
Net realized gain (0.04) -
Total distributions from net investment
income and net realized gains (0.13) -
Net asset value, end of period 9.72$ 10.37$
Total return (c,g) (5.06)% 3.70%
Ratios and Supplemental Data:
Net assets, end of period (in 000's) 32,442$ 36,674$
Ratio of net expenses to
average net assets 0.73% 0.72% (d)
Ratio of gross expenses to
average net assets (e) 0.74% 0.72% (d)
Ratio of net investment income to
average net assets 1.24% 1.00% (d)
Portfolio turnover rate 156% 18% (f)
(a) Global Atlantic BlackRock Disciplined Core Portfolio inception date is November 1, 2017. Commenced operations on November 6, 2017.
(b)
(c)
(d) Annualized.
(e) Represents the ratio of expenses to average net assets absent fee waivers and/or expense reimbursements by the Adviser.
(f) Not annualized.
(g)
Class II Shares
Net investment income has been calculated using the average shares method, which more appropriately presents the per share data for the period.
Total returns are historical and assume changes in share price and reinvestment of dividends and capital gains distributions. Total return does not reflect the deduction of taxes
that a shareholder may pay on Portfolio distributions or on the redemption of Portfolio shares, as well as other charges and expenses of the insurance contract or separate
account. Total returns for periods of less than one year are not annualized. Total returns would have been lower absent fee waivers by the Adviser.
For the period ended December 31, 2017 and the year ended December 31, 2018, the Portfolio received reimbursements from a related party. The reimbursements had no
impact on the Portfolio's total return.
180See accompanying notes to financial statements.

Global Atlantic Portfolios
Financial Highlights
Global Atlantic BlackRock Disciplined Growth Portfolio
Selected data based on a share outstanding throughout each period indicated.
Year ended Period Ended
December 31, December 31,
2018 2017 (a)
Net asset value, beginning of period 10.32$ 10.00$
Income from investment operations:
Net investment income (b) 0.08 0.02
Net realized and unrealized gain (loss)
on investments (0.38) 0.30
Total income (loss) from
investment operations (0.30) 0.32
Less distributions from:
Net investment income (0.08) -
Net realized gain (0.09) -
Total distributions from net investment
income and net realized gains (0.17) -
Net asset value, end of period 9.85 10.32
Total return (c) (2.98)% 3.20% (g)
Ratios and Supplemental Data:
Net assets, end of period (in 000's) 15,807$ 20,534$
Ratio of net expenses to
average net assets 0.79% 0.79% (d)
Ratio of gross expenses to
average net assets (e) 0.81% 0.80% (d)
Ratio of net investment income to
average net assets 0.75% 1.14% (d)
Portfolio turnover rate 156% 23% (f)
(a) Global Atlantic BlackRock Disciplined Growth Portfolio inception date is November 1, 2017. Commenced operations on November 6, 2017.
(b)
(c)
(d) Annualized.
(e) Does not include the expenses of the investment companies in which the Portfolio invests.Represents the ratio of expenses to average net assets absent fee waivers and/or expense reimbursements by the Adviser.
(f) Not annualized.
(g)
Class II Shares
Net investment income has been calculated using the average shares method, which more appropriately presents the per share data for the period.
Total returns are historical and assume changes in share price and reinvestment of dividends and capital gains distributions. Total return does not reflect the deduction of taxes that
a shareholder may pay on Portfolio distributions or on the redemption of Portfolio shares, as well as other charges and expenses of the insurance contract or separate account.
Total returns for periods of less than one year are not annualized. Total returns would have been lower absent fee waivers by the Adviser.
For the period ended December 31, 2017, the Portfolio received reimbursements from a related party. The reimbursements had no impact on the Portfolio's total return.
181See accompanying notes to financial statements.

Global Atlantic Portfolios
Financial Highlights
Global Atlantic BlackRock Disciplined International Core Portfolio
Selected data based on a share outstanding throughout each period indicated.
Year ended Period Ended
December 31, December 31,
2018 2017 (a)
Net asset value, beginning of period 10.20$ 10.00$
Income from investment operations:
Net investment income (b,c) 0.23 0.03
Net realized and unrealized gain (loss)
on investments (1.74) 0.17
Total income (loss) from
investment operations (1.51) 0.20
Less distributions from:
Net investment income (0.19) -
net realized gain 0.00 -
Total distributions from net investment
income and net realized gains (0.19) -
Net asset value, end of period 8.50$ 10.20$
Total return (d) (14.80)% (j) 2.00% (i)
Ratios and Supplemental Data:
Net assets, end of period (in 000's) 98,694$ 67,071$
Ratio of net expenses to
average net assets (e) 0.69% 0.69% (g)
Ratio of gross expenses to
average net assets (e,f) 0.70% 0.69% (g)
Ratio of net investment income to
average net assets (c,e) 2.30% 1.99% (g)
Portfolio turnover rate 67% 4% (h)
(a) Global Atlantic BlackRock Disciplined International Core Portfolio inception date is November 1, 2017. Commenced operations on November 6, 2017.
(b)
(c)
(d)
(e) Does not include the expenses of the investment companies in which the Portfolio invests.
(f) Represents the ratio of expenses to average net assets absent fee waivers and/or expense reimbursements by the Adviser.
(g) Annualized.
(h) Not annualized.
(i) For the period ended December 31, 2017, 0.13% of the Portfolio's total return consisted of a reimbursement from an affiliate. Excluding this item, total return would have been 1.87%.
(j) For the year ended December 31, 2018, 0.10% of the Portfolio's total return consisted of a reimbursement from an affiliate. Excluding this item, total return would have been (14.90)%.
Class I Shares
Net investment income has been calculated using the average shares method, which more appropriately presents the per share data for the period.
Recognition of net investment income by the Portfolio is affected by the timing of the declaration of dividends by the underlying investment companies in which the Portfolio invests.
Total returns are historical and assume changes in share price and reinvestment of dividends and capital gains distributions. Total return does not reflect the deduction of taxes that a
shareholder may pay on Portfolio distributions or on the redemption of Portfolio shares, as well as other charges and expenses of the insurance contract or separate account. Total
returns for periods of less than one year are not annualized. Total returns would have been lower absent fee waivers by the Adviser.
182See accompanying notes to financial statements.

Global Atlantic Portfolios
Financial Highlights
Global Atlantic BlackRock Disciplined International Core Portfolio
Selected data based on a share outstanding throughout each period indicated.
Year ended Period Ended
December 31, December 31,
2018 2017 (a)
Net asset value, beginning of period 10.19$ 10.00$
Income from investment operations:
Net investment income (b,c) 0.22 0.05
Net realized and unrealized gain (loss)
on investments (1.74) 0.14
Total income (loss) from
investment operations (1.52) 0.19
Less distributions from:
Net investment income (0.18) -
net realized gain 0.00 -
Total distributions from net investment
income and net realized gains (0.18) -$
Net asset value, end of period 8.49$ 10.19$
Total return (d) (14.95)% (j) 1.90% (i)
Ratios and Supplemental Data:
Net assets, end of period (in 000's) 41,052$ 5,097$
Ratio of net expenses to
average net assets (e) 0.94% 0.93% (g)
Ratio of gross expenses to
average net assets (e,f) 0.95% 0.93% (g)
Ratio of net investment income to
average net assets (c,e) 2.23% 3.34% (g)
Portfolio turnover rate 67% 4% (h)
(a) Global Atlantic BlackRock Disciplined International Core Portfolio inception date is November 1, 2017. Commenced operations on November 6, 2017.
(b)
(c)
(d)
(e) Does not include the expenses of the investment companies in which the Portfolio invests.
(f) Represents the ratio of expenses to average net assets absent fee waivers and/or expense reimbursements by the Adviser.
(g) Annualized.
(h) Not annualized.
(i) For the period ended December 31, 2017, the Portfolio received a reimbursement from a related party. This reimbursement had no impact on the Portfolio's total return.
(j) For the year ended December 31, 2018, 0.10% of the Portfolio's total return consisted of a reimbursement from an affiliate. Excluding this item, total return would have been (15.05)%.
Class II Shares
Recognition of net investment income by the Portfolio is affected by the timing of the declaration of dividends by the underlying investment companies in which the Portfolio invests.
Total returns are historical and assume changes in share price and reinvestment of dividends and capital gains distributions. Total return does not reflect the deduction of taxes that a
shareholder may pay on Portfolio distributions or on the redemption of Portfolio shares, as well as other charges and expenses of the insurance contract or separate account. Total
returns for periods of less than one year are not annualized. Total returns would have been lower absent fee waivers by the Adviser.
Net investment income has been calculated using the average shares method, which more appropriately presents the per share data for the period.
183See accompanying notes to financial statements.

Global Atlantic Portfolios
Financial Highlights
Global Atlantic BlackRock Disciplined Mid Cap Growth Portfolio
Selected data based on a share outstanding throughout each period indicated.
Year ended Period Ended
December 31, December 31,
2018 2017 (a)
Net asset value, beginning of period 10.35$ 10.00$
Income from investment operations:
Net investment income (b) 0.11 0.01
Net realized and unrealized gain (loss)
on investments (0.43) 0.34
Total income (loss) from
investment operations (0.32) 0.35
Less distributions from:
Net investment income (0.09) -
net realized gain (0.03) -
Total distributions from net investment
income and net realized gains (0.12) -$
Net asset value, end of period 9.91$ 10.35$
Total return (c,g) (3.07)% 3.50%
Ratios and Supplemental Data:
Net assets, end of period (in 000's) 126,149$ 93,457$
Ratio of net expenses to
average net assets 0.63% 0.63% (d)
Ratio of gross expenses to
average net assets (e) 0.65% 0.64% (d)
Ratio of net investment income to
average net assets 0.99% 0.79% (d)
Portfolio turnover rate 168% 26% (f)
(a) Global Atlantic BlackRock Disciplined Mid Cap Growth Portfolio inception date is November 1, 2017. Commenced operations on November 6, 2017.
(b)
(c)
(d) Annualized.
(e) Represents the ratio of expenses to average net assets absent fee waivers and/or expense reimbursements by the Adviser.
(f) Not annualized.
(g)
Class I Shares
Net investment income has been calculated using the average shares method, which more appropriately presents the per share data for the period.
Total returns are historical and assume changes in share price and reinvestment of dividends and capital gains distributions. Total return does not reflect the deduction of taxes that
a shareholder may pay on Portfolio distributions or on the redemption of Portfolio shares, as well as other charges and expenses of the insurance contract or separate account.
Total returns for periods of less than one year are not annualized. Total returns would have been lower absent fee waivers by the Adviser.
For the period ended December 31, 2017 and the year ended December 31, 2018, the Portfolio received reimbursements from a related party. The reimbursements had no impact
on the Portfolio's total return.
184See accompanying notes to financial statements.

Global Atlantic Portfolios
Financial Highlights
Global Atlantic BlackRock Disciplined Mid Cap Growth Portfolio
Selected data based on a share outstanding throughout each period indicated.
Year ended Period Ended
December 31, December 31,
2018 2017 (a)
Net asset value, beginning of period 10.35$ 10.00$
Income from investment operations:
Net investment income (b) 0.08 0.01
Net realized and unrealized gain (loss)
on investments (0.43) 0.34
Total income (loss) from
investment operations (0.35) 0.35
Less distributions from:
Net investment income (0.07) -
net realized gain (0.03) -
Total distributions from net investment
income and net realized gains (0.10) -$
Net asset value, end of period 9.90$ 10.35$
Total return (c,g) (3.35)% 3.50%
Ratios and Supplemental Data:
Net assets, end of period (in 000's) 43,290$ 17,801$
Ratio of net expenses to
average net assets 0.88% 0.88% (d)
Ratio of gross expenses to
average net assets (e) 0.90% 0.89% (d)
Ratio of net investment income to
average net assets 0.77% 0.41% (d)
Portfolio turnover rate 168% 26% (f)
(a) Global Atlantic BlackRock Disciplined Mid Cap Growth Portfolio inception date is November 1, 2017. Commenced operations on November 6, 2017.
(b)
(c)
(d) Annualized.
(e) Represents the ratio of expenses to average net assets absent fee waivers and/or expense reimbursements by the Adviser.
(f) Not annualized.
(g)
Class II Shares
Net investment income has been calculated using the average shares method, which more appropriately presents the per share data for the period.
Total returns are historical and assume changes in share price and reinvestment of dividends and capital gains distributions. Total return does not reflect the deduction of taxes that
a shareholder may pay on Portfolio distributions or on the redemption of Portfolio shares, as well as other charges and expenses of the insurance contract or separate account.
Total returns for periods of less than one year are not annualized. Total returns would have been lower absent fee waivers by the Adviser.
For the period ended December 31, 2017 and the year ended December 31, 2018, the Portfolio received reimbursements from a related party. The reimbursements had no impact
on the Portfolio's total return.
185See accompanying notes to financial statements.

Global Atlantic Portfolios
Financial Highlights
Global Atlantic BlackRock Disciplined Small Cap Portfolio
Selected data based on a share outstanding throughout each period indicated.
Year ended Period Ended
December 31, December 31,
2018 2017 (a)
Net asset value, beginning of period 10.22$ 10.00$
Income from investment operations:
Net investment income (b) 0.07 0.01
Net realized and unrealized gain (loss)
on investments (1.04) 0.21
Total income from
investment operations (0.97) 0.22
Less distributions from:
Net investment income (0.03) -
Net realized gain (0.03) -
Total distributions from net investment
income and net realized gains (0.06) -$
Net asset value, end of period 9.19$ 10.22$
Total return (c,g) (9.49)% 2.20%
Ratios and Supplemental Data:
Net assets, end of period (in 000's) 8,813$ 11,457$
Ratio of net expenses to
average net assets 0.63% 0.63% (d)
Ratio of gross expenses to
average net assets (e) 0.65% 0.64% (d)
Ratio of net investment income to
average net assets 0.67% 0.89% (d)
Portfolio turnover rate 40% 15% (f)
(a) Global Atlantic BlackRock Disciplined Small Cap Portfolio inception date is November 1, 2017. Commenced operations on November 6, 2017.
(b)
(c)
(d) Annualized.
(e) Represents the ratio of expenses to average net assets absent fee waivers and/or expense reimbursements by the Adviser.
(f) Not annualized.
(g)
Class I Shares
Net investment income has been calculated using the average shares method, which more appropriately presents the per share data for the period.
Total returns are historical and assume changes in share price and reinvestment of dividends and capital gains distributions. Total return does not reflect the deduction of taxes that
a shareholder may pay on Portfolio distributions or on the redemption of Portfolio shares, as well as other charges and expenses of the insurance contract or separate account.
Total returns for periods of less than one year are not annualized. Total returns would have been lower absent fee waivers by the Adviser.
For the period ended December 31, 2017 and the year ended December 31, 2018, the Portfolio received reimbursements from a related party. The reimbursements had no
impact on the Portfolio's total return.
186See accompanying notes to financial statements.

Global Atlantic Portfolios
Financial Highlights
Global Atlantic BlackRock Disciplined Small Cap Portfolio
Selected data based on a share outstanding throughout each period indicated.
Year ended Period Ended
December 31, December 31,
2018 2017 (a)
Net asset value, beginning of period 10.22$ 10.00$
Income from investment operations:
Net investment income (b) 0.05 0.01
Net realized and unrealized gain (loss)
on investments (1.05) 0.21
Total income (loss) from
investment operations (1.00) 0.22
Less distributions from:
Net investment income (0.01) -
Net realized gain (0.03) -
Total distributions from net investment
income and net realized gains (0.04) -$
Net asset value, end of period 9.18$ 10.22$
Total return (c,g) (9.75)% 2.20%
Ratios and Supplemental Data:
Net assets, end of period (in 000's) 7,533$ 4,075$
Ratio of net expenses to
average net assets 0.88% 0.87% (d)
Ratio of gross expenses to
average net assets (e) 0.90% 0.87% (d)
Ratio of net investment income to
average net assets 0.44% 0.75% (d)
Portfolio turnover rate 40% 15% (f)
(a) Global Atlantic BlackRock Disciplined Small Cap Portfolio inception date is November 1, 2017. Commenced operations on November 6, 2017.
(b)
(c)
(d) Annualized.
(e) Represents the ratio of expenses to average net assets absent fee waivers and/or expense reimbursements by the Adviser.
(f) Not annualized.
(g)
Class II Shares
Net investment income has been calculated using the average shares method, which more appropriately presents the per share data for the period.
Total returns are historical and assume changes in share price and reinvestment of dividends and capital gains distributions. Total return does not reflect the deduction of taxes that
a shareholder may pay on Portfolio distributions or on the redemption of Portfolio shares, as well as other charges and expenses of the insurance contract or separate account.
Total returns for periods of less than one year are not annualized. Total returns would have been lower absent fee waivers by the Adviser.
For the period ended December 31, 2017 and the year ended December 31, 2018, the Portfolio received reimbursements from a related party. The reimbursements had no
impact on the Portfolio's total return.
187See accompanying notes to financial statements.

Global Atlantic Portfolios
Financial Highlights
Global Atlantic BlackRock Disciplined U.S. Core Portfolio
Selected data based on a share outstanding throughout each period indicated.
Year ended Period Ended
December 31, December 31,
2018 2017 (a)
Net asset value, beginning of period 10.40$ 10.00$
Income from investment operations:
Net investment income (b) 0.16 0.03
Net realized and unrealized gain (loss)
on investments (0.67) 0.37
Total income (loss) from
investment operations (0.51) 0.40
Less distributions from:
Net investment income (0.14) -
net realized gain (0.09) -
Total distributions from net investment
income and net realized gains (0.23) -
Net asset value, end of period 9.66$ 10.40$
Total return (c,g) (5.03)% 4.00%
Ratios and Supplemental Data:
Net assets, end of period (in 000's) 18,963$ 23,118$
Ratio of net expenses to
average net assets 0.48% 0.48% (d)
Ratio of gross expenses to
average net assets (e) 0.50% 0.49% (d)
Ratio of net investment income to
average net assets 1.48% 1.88% (d)
Portfolio turnover rate 172% 24% (f)
(a) Global Atlantic BlackRock Disciplined U.S. Core Portfolio inception date is November 1, 2017. Commenced operations on November 6, 2017.
(b)
(c)
(d) Annualized.
(e) Represents the ratio of expenses to average net assets absent fee waivers and/or expense reimbursements by the Adviser.
(f) Not annualized.
(g)
Class I Shares
Net investment income has been calculated using the average shares method, which more appropriately presents the per share data for the period.
Total returns are historical and assume changes in share price and reinvestment of dividends and capital gains distributions. Total return does not reflect the deduction of taxes
that a shareholder may pay on Portfolio distributions or on the redemption of Portfolio shares, as well as other charges and expenses of the insurance contract or separate
account. Total returns for periods of less than one year are not annualized. Total returns would have been lower absent fee waivers by the Adviser.
For the period ended December 31, 2017 and the year ended December 31, 2018, the Portfolio received reimbursements from a related party. The reimbursements had no
impact on the Portfolio's total return.
188See accompanying notes to financial statements.

Global Atlantic Portfolios
Financial Highlights
Global Atlantic BlackRock Disciplined U.S. Core Portfolio
Selected data based on a share outstanding throughout each period indicated.
Year ended Period Ended
December 31, December 31,
2018 2017 (a)
Net asset value, beginning of period 10.39$ 10.00$
Income from investment operations:
Net investment income (b) 0.14 0.02
Net realized and unrealized gain (loss)
on investments (0.67) 0.37
Total income (loss) from
investment operations (0.53) 0.39
Less distributions from:
Net investment income (0.12) -
net realized gain (0.09) -
Total distributions from net investment
income and net realized gains (0.21) -$
Net asset value, end of period 9.65$ 10.39$
Total return (c,g) (5.17)% 3.90%
Ratios and Supplemental Data:
Net assets, end of period (in 000's) 2,965$ 218$
Ratio of net expenses to
average net assets 0.73% 0.72% (d)
Ratio of gross expenses to
average net assets (e) 0.75% 0.72% (d)
Ratio of net investment income to
average net assets 1.25% 0.98% (d)
Portfolio turnover rate 172% 24% (f)
(a) Global Atlantic BlackRock Disciplined U.S. Core Portfolio inception date is November 1, 2017. Commenced operations on November 6, 2017.
(b)
(c)
(d) Annualized.
(e) Represents the ratio of expenses to average net assets absent fee waivers and/or expense reimbursements by the Adviser.
(f) Not annualized.
(g)
Class II Shares
Net investment income has been calculated using the average shares method, which more appropriately presents the per share data for the period.
Total returns are historical and assume changes in share price and reinvestment of dividends and capital gains distributions. Total return does not reflect the deduction of taxes
that a shareholder may pay on Portfolio distributions or on the redemption of Portfolio shares, as well as other charges and expenses of the insurance contract or separate
account. Total returns for periods of less than one year are not annualized. Total returns would have been lower absent fee waivers by the Adviser.
For the period ended December 31, 2017 and the year ended December 31, 2018, the Portfolio received reimbursements from a related party. The reimbursements had no
impact on the Portfolio's total return.
189See accompanying notes to financial statements.

Global Atlantic Portfolios
Financial Highlights
Global Atlantic BlackRock Disciplined Value Portfolio
Selected data based on a share outstanding throughout the period indicated.
Year ended Period Ended
December 31, December 31,
2018 2017 (a)
Net asset value, beginning of period 10.44$ 10.00$
Income from investment operations:
Net investment income (b) 0.20 0.03
Net realized and unrealized gain (loss)
on investments (1.02) 0.41
Total income (loss) from
investment operations (0.82) 0.44
Less distributions from:
Net investment income (0.16) -
Net realized gain (0.07) -
Total distributions from net investment
income and net realized gains (0.23) -
Net asset value, end of period 9.39$ 10.44$
Total return (c,g) (7.97)% 4.40%
Ratios and Supplemental Data:
Net assets, end of period (in 000's) 248,141$ 309,640$
Ratio of net expenses to
average net assets 0.54% 0.54% (d)
Ratio of gross expenses to
average net assets (e) 0.55% 0.54% (d)
Ratio of net investment income to
average net assets 1.93% 1.99% (d)
Portfolio turnover rate 140% 17% (f)
(a) Global Atlantic BlackRock Disciplined Value Portfolio inception date is November 1, 2017. Commenced operations on November 6, 2017.
(b)
(c)
(d) Annualized.
(e) Represents the ratio of expenses to average net assets absent fee waivers and/or expense reimbursements by the Adviser.
(f) Not annualized.
(g)
Class I Shares
Net investment income has been calculated using the average shares method, which more appropriately presents the per share data for the
Total returns are historical and assume changes in share price and reinvestment of dividends and capital gains distributions. Total return does not reflect the deduction of taxes that a
shareholder may pay on Portfolio distributions or on the redemption of Portfolio shares, as well as other charges and expenses of the insurance contract or separate account. Total
returns for periods of less than one year are not annualized. Total returns would have been lower absent fees waived by the adviser.
For the period ended December 31, 2017 and the year ended December 31, 2018, the Portfolio received reimbursements from a related party. The reimbursements had no impact
on the Portfolio's total return.
190See accompanying notes to financial statements.

Global Atlantic Portfolios
Financial Highlights
Global Atlantic BlackRock Disciplined Value Portfolio
Selected data based on a share outstanding throughout the period indicated.
Year ended Period Ended
December 31, December 31,
2018 2017 (a)
Net asset value, beginning of period 10.45$ 10.00$
Income from investment operations:
Net investment income (b) 0.18 0.02
Net realized and unrealized gain (loss)
on investments (1.02) 0.43
Total income (loss) from
investment operations (0.84) 0.45
Less distributions from:
Net investment income (0.14) -
Net realized gain (0.07) -
Total distributions from net investment
income and net realized gains (0.21) -
Net asset value, end of period 9.40$ 10.45$
Total return (c,g) (8.16)% 4.50%
Ratios and Supplemental Data:
Net assets, end of period (in 000's) 7,160$ 9,545$
Ratio of net expenses to
average net assets 0.79% 0.78% (d)
Ratio of gross expenses to
average net assets (e) 0.80% 0.78% (d)
Ratio of net investment income to
average net assets 1.68% 1.34% (d)
Portfolio turnover rate 140% 17% (f)
(a) Global Atlantic BlackRock Disciplined Value Portfolio inception date is November 1, 2017. Commenced operations on November 6, 2017.
(b)
(c)
(d) Annualized.
(e) Represents the ratio of expenses to average net assets absent fee waivers and/or expense reimbursements by the Adviser.
(f) Not annualized.
(g)
Net investment income has been calculated using the average shares method, which more appropriately presents the per share data for the
Class II Shares
Total returns are historical and assume changes in share price and reinvestment of dividends and capital gains distributions. Total return does not reflect the deduction of taxes that a
shareholder may pay on Portfolio distributions or on the redemption of Portfolio shares, as well as other charges and expenses of the insurance contract or separate account. Total
returns for periods of less than one year are not annualized. Total returns would have been lower absent fees waived by the Adviser.
For the period ended December 31, 2017 and the year ended December 31, 2018, the Portfolio received reimbursements from a related party. The reimbursements had no impact
on the Portfolio's total return.
191See accompanying notes to financial statements.

Global Atlantic Portfolios
Financial Highlights
Global Atlantic BlackRock High Yield Portfolio
Selected data based on a share outstanding throughout the period indicated.
Year Ended Period Ended
December 31, December 31,
2018 2017 (a)
Net asset value, beginning of period 9.92$ 10.00$
Income from investment operations:
Net investment income (b) 0.52 0.07
Net realized and unrealized loss
on investments (0.95) (0.15)
Total loss from
investment operations (0.43) (0.08)
Less distributions from:
Net investment income (0.06)
Net realized gain -
Total distributions from net investment
income and net realized gains (0.06)
Net asset value, end of period 9.43$ 9.92$
Total return (c) (4.32)% (0.80)% (g)
Ratios and Supplemental Data:
Net assets, end of period (in 000's) 69,255$ 83,070$
Ratio of net expenses to
average net assets 0.59% 0.59% (d)
Ratio of gross expenses to
average net assets (e) 0.60% 0.59% (d)
Ratio of net investment income to
average net assets 5.24% 4.54% (d)
Portfolio turnover rate 36% 3% (f)
(a) Global Atlantic BlackRock High Yield Portfolio inception date is November 1, 2017. Commenced operations on November 6, 2017.
(b)
(c)
(d) Annualized.
(e)
(f) Not annualized.
(g) For the period ended December 31, 2017, the Portfolio received a reimbursement from a related party. This reimbursement had no impact on the Portfolio's total return.
Class I Shares
Represents the ratio of expenses to average net assets absent fee waivers and/or expense reimbursements by the Adviser.
Total returns are historical and assume changes in share price and reinvestment of dividends and capital gains distributions. Total return does not reflect the deduction of taxes
that a shareholder may pay on Portfolio distributions or on the redemption of Portfolio shares, as well as other charges and expenses of the insurance contract or separate
account. Total returns for periods of less than one year are not annualized. Total returns would have been lower absent fee waivers by the Adviser.
Net investment income has been calculated using the average shares method, which more appropriately presents the per share data for the period.
192See accompanying notes to financial statements.

Global Atlantic Portfolios
Financial Highlights
Global Atlantic BlackRock High Yield Portfolio
Selected data based on a share outstanding throughout the period indicated.
Year Ended Period Ended
December 31, December 31,
2018 2017 (a)
Net asset value, beginning of period 9.92$ 10.00$
Income from investment operations:
Net investment income (b) 0.49 0.07
Net realized and unrealized loss
on investments (0.94) (0.15)
Total loss from
investment operations (0.45) (0.08)
Less distributions from:
Net investment income (0.06)
Net realized gain -
Total distributions from net investment
income and net realized gains (0.06)
Net asset value, end of period 9.41$ 9.92$
Total return (c) (4.56)% (0.80)% (g)
Ratios and Supplemental Data:
Net assets, end of period (in 000's) 1,071$ 1,405$
Ratio of net expenses to
average net assets 0.84% 0.83% (d)
Ratio of gross expenses to
average net assets (e) 0.85% 0.83% (d)
Ratio of net investment income to
average net assets () 4.99% 4.31% (d)
Portfolio turnover rate 36% 3% (f)
(a) Global Atlantic BlackRock High Yield Portfolio inception date is November 1, 2017. Commenced operations on November 6, 2017.
(b)
(c)
(d) Annualized.
(e)
(f) Not annualized.
(g)
Class II Shares
Represents the ratio of expenses to average net assets absent fee waivers and/or expense reimbursements by the Adviser.
For the period ended December 31, 2017, the Portfolio received a reimbursement from a related party. This reimbursement had no impact on the Portfolio's total return.
Total returns are historical and assume changes in share price and reinvestment of dividends and capital gains distributions. Total return does not reflect the deduction of taxes
that a shareholder may pay on Portfolio distributions or on the redemption of Portfolio shares, as well as other charges and expenses of the insurance contract or separate
account. Total returns for periods of less than one year are not annualized. Total returns would have been lower absent fee waivers by the Adviser.
Net investment income has been calculated using the average shares method, which more appropriately presents the per share data for the period.
193See accompanying notes to financial statements.

Global Atlantic Portfolios
Financial Highlights
Global Atlantic Goldman Sachs Core Fixed Income Portfolio
Selected data based on a share outstanding throughout the period indicated.
Year Ended Period Ended
December 31, December 31,
2018 2017 (a)
Net asset value, beginning of period 9.98$ 10.00$
Income from investment operations:
Net investment income (b) 0.25 0.03
Net realized and unrealized loss
on investments (0.31) (0.05)
Total loss from
investment operations (0.06) (0.02)
Less distributions from:
Net investment income (0.00) (h) -
Total distributions from net investment
income and net realized gains (0.00) -
Net asset value, end of period 9.92$ 9.98$
Total return (c,g) (0.55)% (0.20)%
Ratios and Supplemental Data:
Net assets, end of period (in 000's) 92,760$ 35,260$
Ratio of net expenses to
average net assets 0.43% 0.43% (d)
Ratio of gross expenses to
average net assets (e) 0.44% 0.44% (d)
Ratio of net investment income to
average net assets 2.51% 1.64% (d)
Portfolio turnover rate 248% (i) 69% (f)
(a) Global Atlantic Goldman Sachs Core Fixed Income Portfolio inception date is November 1, 2017. Commenced operations on November 6, 2017.
(b)
(c)
(d) Annualized.
(e)
(f) Not annualized.
(g)
(h) Represents less than $0.005 per share.
(i) The portfolio turnover rate excludes mortgage dollar roll transactions for the year ended December 31, 2018. If these were included in the calculation, the portfolio turnover
would be 486%. See Note 3 in the accompanying notes to financial statements.
For the period ended December 31, 2017 and the year ended December 31, 2018, the Portfolio received a reimbursement from a related party. This reimbursement had no
impact on the Portfolio's total return.
Represents the ratio of expenses to average net assets absent fee waivers and/or expense reimbursements by the Adviser.
Class I Shares
Net investment income has been calculated using the average shares method, which more appropriately presents the per share data for the period.
Total returns are historical and assume changes in share price and reinvestment of dividends and capital gains distributions. Total return does not reflect the deduction of taxes
that a shareholder may pay on Portfolio distributions or on the redemption of Portfolio shares, as well as other charges and expenses of the insurance contract or separate
account. Total returns for periods of less than one year are not annualized. Total returns would have been lower absent fee waivers by the Adviser.
194See accompanying notes to financial statements.

Global Atlantic Portfolios
Financial Highlights
Global Atlantic Goldman Sachs Core Fixed Income Portfolio
Selected data based on a share outstanding throughout the period indicated.
Year Ended Period Ended
December 31, December 31,
2018 2017 (a)
Net asset value, beginning of period 9.98$ 10.00$
Income from investment operations:
Net realized and unrealized loss
on investments (0.06) (0.02)
Total loss from
investment operations (0.06) (0.02)
Less distributions from:
Net investment income (0.00) (h) -
Net asset value, end of period 9.92$ 9.98$
Total return (b,g) (0.60)% (0.20)%
Ratios and Supplemental Data:
Net assets, end of period (in 000's) (f) 10$ 10$
Ratio of net expenses to
average net assets (d) 0.68% 0.68% (c)
Ratio of gross expenses to
average net assets 0.68% 0.68% (c)
Ratio of net investment income to
average net assets 0.00% 0.00% (c)
Portfolio turnover rate 248% (i) 69% (e)
(a) Global Atlantic Goldman Sachs Core Fixed Income Portfolio inception date is November 1, 2017. Commenced operations on November 6, 2017.
(b)
(c) Annualized.
(d)
(e) Not annualized.
(f) Represents actual net assets.
(g)
(h) Represents less than $0.005 per share.
(i) The portfolio turnover rate excludes mortgage dollar roll transactions for the year ended December 31, 2018. If these were included in the calculation, the portfolio turnover
would be 486%. See Note 3 in the accompanying notes to financial statements.
Class II Shares
For the period ended December 31, 2017 and the year ended December 31, 2018, the Portfolio received a reimbursement from a related party. This reimbursement had no
impact on the Portfolio's total return.
Represents the ratio of expenses to average net assets per the April 27, 2018 prospectus and does not represent the operating expense for the period.
Total returns are historical and assume changes in share price and reinvestment of dividends and capital gains distributions. Total return does not reflect the deduction of taxes
that a shareholder may pay on Portfolio distributions or on the redemption of Portfolio shares, as well as other charges and expenses of the insurance contract or separate
account. Total returns for periods of less than one year are not annualized. Total returns would have been lower absent fee waivers by the Adviser.
195See accompanying notes to financial statements.

Global Atlantic Portfolios
Financial Highlights
Global Atlantic Goldman Sachs Global Equity Insights Portfolio
Selected data based on a share outstanding throughout each period indicated.
Year Ended Period Ended
December 31, December 31,
2018 2017 (a)
Net asset value, beginning of period 10.29$ 10.00$
Income from investment operations:
Net investment income (b) 0.14 0.02
Net realized and unrealized gain (loss)
on investments (1.18) 0.27
Total income (loss) from
investment operations (1.04) 0.29
Less distributions from:
Net investment income (0.12) -
net realized gain (0.02) -
Total distributions from net investment
income and net realized gains (0.14) -
Net asset value, end of period 9.11$ 10.29$
Total return (c,g) (10.20)% 2.90%
Ratios and Supplemental Data:
Net assets, end of period (in 000's) 15,290$ 19,915$
Ratio of net expenses to
average net assets 0.72% 0.72% (d)
Ratio of gross expenses to
average net assets (e) 0.74% 0.73% (d)
Ratio of net investment income to
average net assets 1.32% 1.15% (d)
Portfolio turnover rate 138% 11% (f)
(a) Global Atlantic Goldman Sachs Global Equity Insights Portfolio inception date is November 1, 2017. Commenced operations on November 6, 2017.
(b)
(c)
(d) Annualized.
(e) Represents the ratio of expenses to average net assets absent fee waivers and/or expense reimbursements by the Adviser.
(f) Not annualized.
(g)
Class I Shares
Net investment income has been calculated using the average shares method, which more appropriately presents the per share data for the period.
Total returns are historical and assume changes in share price and reinvestment of dividends and capital gains distributions. Total return does not reflect the deduction of taxes that a
shareholder may pay on Portfolio distributions or on the redemption of Portfolio shares, as well as other charges and expenses of the insurance contract or separate account. Total
returns for periods of less than one year are not annualized. Total returns would have been lower absent fee waivers by the Adviser.
For the period ended December 31, 2017 and the year ended December 31, 2018, the Portfolio received reimbursements from a related party. The reimbursements had no impact on
the Portfolio's total return.
196See accompanying notes to financial statements.

Global Atlantic Portfolios
Financial Highlights
Global Atlantic Goldman Sachs Global Equity Insights Portfolio
Selected data based on a share outstanding throughout each period indicated.
Year Ended Period Ended
December 31, December 31,
2018 2017 (a)
Net asset value, beginning of period 10.28$ 10.00$
Income from investment operations:
Net investment income (b) 0.12 0.01
Net realized and unrealized gain (loss)
on investments (1.19) 0.27
Total income (loss) from
investment operations (1.07) 0.28
Less distributions from:
Net investment income (0.10) -
net realized gain (0.02) -
Total distributions from net investment
income and net realized gains (0.12) -
Net asset value, end of period 9.09$ 10.28$
Total return (c,g) (10.47)% 2.80%
Ratios and Supplemental Data:
Net assets, end of period (in 000's) 12,154$ 4,542$
Ratio of net expenses to
average net assets 0.97% 0.96% (d)
Ratio of gross expenses to
average net assets (e) 0.99% 0.96% (d)
Ratio of net investment income to
average net assets 1.12% 0.74% (d)
Portfolio turnover rate 138% 11% (f)
(a) Global Atlantic Goldman Sachs Global Equity Insights Portfolio inception date is November 1, 2017. Commenced operations on November 6, 2017.
(b)
(c)
(d) Annualized.
(e) Represents the ratio of expenses to average net assets absent fee waivers and/or expense reimbursements by the Adviser.
(f) Not annualized.
(g)
Net investment income has been calculated using the average shares method, which more appropriately presents the per share data for the period.
Total returns are historical and assume changes in share price and reinvestment of dividends and capital gains distributions. Total return does not reflect the deduction of taxes that a
shareholder may pay on Portfolio distributions or on the redemption of Portfolio shares, as well as other charges and expenses of the insurance contract or separate account. Total
returns for periods of less than one year are not annualized. Total returns would have been lower absent fee waivers by the Adviser.
Class II Shares
For the period ended December 31, 2017 and the year ended December 31, 2018, the Portfolio received reimbursements from a related party. The reimbursements had no impact on
the Portfolio's total return.
197See accompanying notes to financial statements.

Global Atlantic Portfolios
Financial Highlights
Global Atlantic Goldman Sachs Large Cap Growth Insights Portfolio
Selected data based on a share outstanding throughout each period indicated.
Year Ended Period Ended
December 31, December 31,
2018 2017 (a)
Net asset value, beginning of period 10.30$ 10.00$
Income from investment operations:
Net investment income (b) 0.09 0.02
Net realized and unrealized gain (loss)
on investments (0.48) 0.28
Total income (loss) from
investment operations (0.39) 0.30
Less distributions from:
Net investment income (0.09) -
net realized gain (0.06) -
Total distributions from net investment
income and net realized gains (0.15) -
Net asset value, end of period 9.76$ 10.30$
Total return (c,g) (3.89)% 3.00%
Ratios and Supplemental Data:
Net assets, end of period (in 000's) 77,930$ 85,178$
Ratio of net expenses to
average net assets 0.46% 0.46% (d)
Ratio of gross expenses to
average net assets (e) 0.47% 0.47% (d)
Ratio of net investment income to
average net assets 0.81% 1.41% (d)
Portfolio turnover rate 192% 21% (f)
(a) Global Atlantic Goldman Sachs Large Cap Growth Insights Portfolio inception date is November 1, 2017. Commenced operations on November 6, 2017.
(b)
(c)
(d) Annualized.
(e) Represents the ratio of expenses to average net assets absent fee waivers and/or expense reimbursements by the Adviser.
(f) Not annualized.
(g)
Class I Shares
Net investment income has been calculated using the average shares method, which more appropriately presents the per share data for the period.
Total returns are historical and assume changes in share price and reinvestment of dividends and capital gains distributions. Total return does not reflect the deduction of taxes that a
shareholder may pay on Portfolio distributions or on the redemption of Portfolio shares, as well as other charges and expenses of the insurance contract or separate account. Total
returns for periods of less than one year are not annualized. Total returns would have been lower absent fee waivers by the Adviser.
For the period ended December 31, 2017 and the year ended December 31, 2018, the Portfolio received reimbursements from a related party. The reimbursements had no impact on
the Portfolio's total return.
198See accompanying notes to financial statements.

Global Atlantic Portfolios
Financial Highlights
Global Atlantic Goldman Sachs Large Cap Growth Insights Portfolio
Selected data based on a share outstanding throughout the period indicated.
Year Ended Period Ended
December 31, December 31,
2018 2017 (a)
Net asset value, beginning of period 10.29$ 10.00$
Income from investment operations:
Net investment income (b) 0.06 0.02
Net realized and unrealized gain (loss)
on investments (0.48) 0.27
Total income (loss) from
investment operations (0.42) 0.29
Less distributions from:
Net investment income (0.07) -
net realized gain (0.06) -
Total distributions from net investment
income and net realized gains (0.13) -
Net asset value, end of period 9.74$ 10.29$
Total return (c,g) (4.13)% 2.90%
Ratios and Supplemental Data:
Net assets, end of period (in 000's) 3,255$ 19$
Ratio of net expenses to
average net assets 0.71% 0.71% (d)
Ratio of gross expenses to
average net assets (e) 0.72% 0.72% (d)
Ratio of net investment income to
average net assets 0.57% 1.16% (d)
Portfolio turnover rate 192% 21% (f)
(a) Global Atlantic Goldman Sachs Large Cap Growth Insights Portfolio inception date is November 1, 2017. Commenced operations on November 6, 2017.
(b)
(c)
(d) Annualized.
(e) Represents the ratio of expenses to average net assets absent fee waivers and/or expense reimbursements by the Adviser.
(f) Not annualized.
(g)
Class II Shares
Net investment income has been calculated using the average shares method, which more appropriately presents the per share data for the period.
Total returns are historical and assume changes in share price and reinvestment of dividends and capital gains distributions. Total return does not reflect the deduction of taxes that a
shareholder may pay on Portfolio distributions or on the redemption of Portfolio shares, as well as other charges and expenses of the insurance contract or separate account. Total
returns for periods of less than one year are not annualized. Total returns would have been lower absent fee waivers by the Adviser.
For the period ended December 31, 2017 and the year ended December 31, 2018, the Portfolio received reimbursements from a related party. The reimbursements had no impact on
the Portfolio's total return.
199See accompanying notes to financial statements.

Global Atlantic Portfolios
Financial Highlights
Global Atlantic Goldman Sachs Mid Cap Value Insights Portfolio
Selected data based on a share outstanding throughout the period indicated.
Year Ended Period Ended
December 31, December 31,
2018 2017 (a)
Net asset value, beginning of period 10.43$ 10.00$
Income from investment operations:
Net investment income (b) 0.14 0.04
Net realized and unrealized gain (loss)
on investments (1.39) 0.39
Total income (loss) from
investment operations (1.25) 0.43
Less distributions from:
Net investment income (0.08) -
Net realized gain (0.02) -
Total distributions from net investment
income and net realized gains (0.10) -
Net asset value, end of period 9.08$ 10.43$
Total return (c,g) (12.10)% 4.30%
Ratios and Supplemental Data:
Net assets, end of period (in 000's) 49,080$ 66,982$
Ratio of net expenses to
average net assets 0.64% 0.64% (d)
Ratio of gross expenses to
average net assets (e) 0.65% 0.64% (d)
Ratio of net investment income to
average net assets 1.33% 2.56% (d)
Portfolio turnover rate 205% 12% (f)
(a) Global Atlantic Goldman Sachs Mid Cap Value Insights Portfolio inception date is November 1, 2017. Commenced operations on November 6, 2017.
(b)
(c)
(d) Annualized.
(e) Represents the ratio of expenses to average net assets absent fee waivers and/or expense reimbursements by the Adviser.
(f) Not annualized.
(g) For the period ended December 31, 2017 and the year ended December 31, 2018, the Portfolio received reimbursements from a related party. The reimbursements had no impact on
the Portfolio's total return.
Net investment income has been calculated using the average shares method, which more appropriately presents the per share data for the period.
Class I Shares
Total returns are historical and assume changes in share price and reinvestment of dividends and capital gains distributions. Total return does not reflect the deduction of taxes that a
shareholder may pay on Portfolio distributions or on the redemption of Portfolio shares, as well as other charges and expenses of the insurance contract or separate account. Total
returns for periods of less than one year are not annualized. Total returns would have been lower absent fee waivers by the Adviser.
200See accompanying notes to financial statements.

Global Atlantic Portfolios
Financial Highlights
Global Atlantic Goldman Sachs Mid Cap Value Insights Portfolio
Selected data based on a share outstanding throughout the period indicated.
Year Ended Period Ended
December 31, December 31,
2018 2017 (a)
Net asset value, beginning of period 10.42$ 10.00$
Income from investment operations:
Net investment income (b) 0.13 0.04
Net realized and unrealized gain (loss)
on investments (1.40) 0.38
Total income (loss) from
investment operations (1.27) 0.42
Less distributions from:
Net investment income (0.06) -
Net realized gain (0.02) -
Total distributions from net investment
income and net realized gains (0.08) -
Net asset value, end of period 9.07$ 10.42$
Total return (c,g) (12.26)% 4.20%
Ratios and Supplemental Data:
Net assets, end of period (in 000's) 75,084$ 13,581$
Ratio of net expenses to
average net assets 0.89% 0.88% (d)
Ratio of gross expenses to
average net assets (e) 0.90% 0.88% (d)
Ratio of net investment income to
average net assets 1.22% 2.69% (d)
Portfolio turnover rate 205% 12% (f)
(a) Global Atlantic Goldman Sachs Mid Cap Value Insights Portfolio inception date is November 1, 2017. Commenced operations on November 6, 2017.
(b)
(c)
(d) Annualized.
(e) Represents the ratio of expenses to average net assets absent fee waivers and/or expense reimbursements by the Adviser.
(f) Not annualized.
(g) For the period ended December 31, 2017 and the year ended December 31, 2018, the Portfolio received reimbursements from a related party. The reimbursements had no impact on
the Portfolio's total return.
Class II Shares
Net investment income has been calculated using the average shares method, which more appropriately presents the per share data for the period.
Total returns are historical and assume changes in share price and reinvestment of dividends and capital gains distributions. Total return does not reflect the deduction of taxes that a
shareholder may pay on Portfolio distributions or on the redemption of Portfolio shares, as well as other charges and expenses of the insurance contract or separate account. Total
returns for periods of less than one year are not annualized. Total returns would have been lower absent fee waivers by the Adviser.
201See accompanying notes to financial statements.

Global Atlantic Portfolios
NOTES TO FINANCIAL STATEMENTS December 31, 2018
1. ORGANIZATION
The Global Atlantic Portfolios (each, a “Portfolio” and collectively, the “Portfolios”) are comprised of twenty-five different
actively managed portfolios, thirteen of which are discussed in this report. Each Portfolio is a series of shares of beneficial
interest of Forethought Variable Insurance Trust (the “Trust”), a statutory trust organized under the laws of the State of
Delaware, and registered under the Investment Company Act of 1940, as amended (the "1940 Act"), as an open-end
management investment company.
Portfolio Name Commencement Date * Investment Objective
Global Atlantic BlackRock Allocation
Portfolio
November 6, 2017 Total return.
Global Atlantic BlackRock Disciplined
Core Portfolio
November 6, 2017 Long-term capital appreciation.
Global Atlantic BlackRock Disciplined
Growth Portfolio
November 6, 2017 Long-term capital appreciation.
Global Atlantic BlackRock Disciplined
International Core Portfolio
November 6, 2017 Long-term capital appreciation.
Global Atlantic BlackRock Disciplined
Mid Cap Growth Portfolio
November 6, 2017 Long-term capital appreciation.
Global Atlantic BlackRock Disciplined
Small Cap Portfolio
November 6, 2017 Long-term capital appreciation.
Global Atlantic BlackRock Disciplined
U.S. Core Portfolio
November 6, 2017 Long-term capital appreciation.
Global Atlantic BlackRock Disciplined
Value Portfolio
November 6, 2017 Long-term capital appreciation.
Global Atlantic BlackRock High Yield
Portfolio
November 6, 2017 Total return.
Global Atlantic Goldman Sachs Core
Fixed Income Portfolio
November 6, 2017 Total return consisting of capital
appreciation and income.
Global Atlantic Goldman Sachs Global
Equity Insights Portfolio
November 6, 2017 Long-term capital appreciation.
Global Atlantic Goldman Sachs Large Cap
Growth Insights Portfolio
November 6, 2017 Long-term capital appreciation.
Global Atlantic Goldman Sachs Mid Cap
Value Insights Portfolio
November 6, 2017 Long-term capital appreciation.
* The Portfolios’ inception date is November 1, 2017. The Portfolios commenced operations on November 6, 2017.
The Global Atlantic BlackRock Allocation Portfolio is a non-diversified series of the Trust; all other Portfolios are diversified.
Certain of the Portfolios operate as “fund of funds.” A “fund of funds” typically invests in multiple underlying funds and the
level of its interest in any particular underlying fund may fluctuate. The Portfolios are intended to be funding vehicles for
variable annuity and variable life insurance contracts offered by separate accounts of insurance companies. The assets of
each Portfolio are segregated and a shareholder's interest is limited to the Portfolio in which shares are held. Each Portfolio
pays its own expenses.
The Portfolios currently offer Class I and Class II shares at net asset value, except the Global Atlantic BlackRock Disciplined
Growth Portfolio, which only offers Class II shares. All classes of shares have equal voting privileges except that each class
has exclusive voting rights with respect to its service and/or distribution plans. Each Portfolio’s income, expenses (other
than class specific distribution fees) and realized and unrealized gains and losses are allocated proportionately each day
based upon the relative net assets of each class.
References herein to a Portfolio’s investment in a particular instrument include direct investments and indirect investments
through investment companies such as open-end funds (mutual funds), exchange-traded funds and closed-end funds, as
applicable.
202

Global Atlantic Portfolios
NOTES TO FINANCIAL STATEMENTS (Continued) December 31, 2018
2. SIGNIFICANT ACCOUNTING POLICIES
The following is a summary of significant accounting policies followed by the Portfolios in preparation of their financial
statements. The policies are in conformity with U.S. generally accepted accounting principles (“GAAP”). The preparation
of the financial statements requires management to make estimates and assumptions that affect the reported amounts of
assets and liabilities and disclosure of contingent assets and liabilities at the date of the financial statements and the reported
amounts of income and expenses for the period. Actual results could differ from those estimates. Each Portfolio is an
investment company and accordingly follows the investment company accounting and reporting guidance of the Financial
Accounting Standards Board (FASB) Accounting Standard Codification Topic 946 "Financial Services – Investment
Companies".
Securities Valuation – Securities listed on an exchange are valued at the last reported sale price at the close of the
regular trading session of the primary exchange on the business day the value is being determined, or in the case of securities
listed on NASDAQ at the NASDAQ Official Closing Price. In the absence of a sale such securities shall be valued at the
mean between the current bid and ask prices on the day of valuation. Futures and future options are valued at the final
settle price or, in the absence of a settle price, at the last sale price on the day of valuation. Short-term debt obligations
having 60 days or less remaining until maturity, at time of purchase, may be valued at amortized cost to the extent it is
determined that amortized cost approximates fair value. Investments in open-end investment companies are valued at net
asset value, as discussed in more detail below.
Valuation of Investment Companies - The Portfolios may invest in one or more portfolios of open-end investment
companies (the “Underlying Fund” or “Underlying Funds”). Each Underlying Fund is valued at its respective net asset values
as reported by such investment company. Each Underlying Fund values securities in its portfolio for which market quotations
are readily available at their market values (generally the last reported sale price) and all other securities and assets at their
fair value based on the methods established by each Underlying Fund’s board(s) of trustees.
Exchange-Traded Funds – The Portfolios may invest in passive exchange-traded funds (“ETFs”). An ETF is a type of
index fund that is bought and sold on a securities exchange. An ETF trades like common stock and represents a fixed
portfolio of securities designed to track the performance and dividend yield of a particular domestic or foreign market
index. A Portfolio may purchase an ETF to temporarily gain exposure to a portion of the U.S. or a foreign market while
awaiting an opportunity to purchase securities directly. The risks of owning an ETF generally reflect the risks of owning the
underlying securities it is designed to track, although the lack of liquidity in an ETF could result in it being more volatile than
the underlying securities, which may result in a Portfolio paying significantly more or receiving significantly less for ETF
shares than the value of the relevant underlying securities. Additionally, an ETF has fees and expenses that increase the cost
of investing in the ETF versus the costs of owning the underlying securities directly.
Illiquid Securities - The Portfolios may hold securities, such as private placements, interests in commodity pools, other
non-traded securities or temporarily illiquid securities, for which market quotations are not readily available or are
determined to be unreliable. These securities will be valued at their fair market value as determined using the valuation
procedures approved by the Board of Trustees (the “Board”). The Board has delegated execution of these procedures to
a Fair Value Committee composed of one or more representatives from each of the (i) Trust, (ii) administrator, and (iii)
Global Atlantic Investment Advisors, LLC (the “Adviser”) and/or Sub-Adviser. The Fair Value Committee may also include
the Trust’s Chief Compliance Officer and may enlist third party consultants or advisers (such as an accounting firm or fair
value pricing specialist) on an as-needed basis to assist in determining a security-specific fair value or valuation method. The
Board reviews and approves the execution of this process and the resultant fair value prices at least quarterly to assure the
process produces reliable results.
203

Global Atlantic Portfolios
NOTES TO FINANCIAL STATEMENTS (Continued) December 31, 2018
Fair Value Committee and Valuation Process – The Fair Value Committee is composed of one or more
representatives from each of the (i) Trust, (ii) administrator, and (iii) Adviser and/or Sub-Adviser. The applicable investments
are valued collectively via inputs from each of these groups. For example, fair value determinations are required for the
following securities: (i) securities for which market quotations are not readily available on a particular business day (including
without limitation securities for which there is a short and temporary lapse in the provision of a price by the regular pricing
source); (ii) securities for which, in the opinion of the Adviser or relevant Sub-Adviser, the prices or values available do not
represent the fair value of the instrument (factors which may cause the Adviser or Sub-Adviser to make such a judgment
include, but are not limited to, the following: the availability of only a bid price or an ask price; the spread between bid and
ask prices; the frequency of sales; the thinness of the market; the size of reported trades; and actions of the securities
markets or regulators, such as the suspension or limitation of trading); (iii) securities determined to be illiquid; (iv) securities
with respect to which an event that will affect the value thereof has occurred (a “significant event”) subsequent to the
determination of the closing price reported on the principal exchange on which the securities are traded, but prior to the
relevant Portfolio’s calculation of its net asset value (“NAV”); and (v) mutual funds that do not provide timely NAV
information. Specifically, interests in commodity pools or managed futures pools are valued on a daily basis by reference to
the closing market prices of each futures contract or other asset held by a pool, as adjusted for pool expenses. Restricted
or illiquid securities, such as private placements or non-traded securities are valued via inputs from the Adviser or Sub-
Adviser valuation based upon the current bid for the security from two or more independent dealers or other parties
reasonably familiar with the facts and circumstances of the security (who should take into consideration all relevant factors
as may be appropriate under the circumstances). If the Adviser or Sub-Adviser is unable to obtain a current bid from such
independent dealers or other independent parties, the fair value team shall determine the fair value of restricted or illiquid
securities using the following factors: (i) the type of security; (ii) the cost at date of purchase; (iii) the size and nature of the
Portfolio’s holdings; (iv) the discount from market value of unrestricted securities of the same class at the time of purchase
and subsequent thereto; (v) information as to any transactions or offers with respect to the security; (vi) the nature and
duration of restrictions on disposition of the security and the existence of any registration rights, as well as any estimation
of the cost of registration or otherwise qualifying the security for public sale, including commissions; (vii) how the yield of
the security compares to similar securities of companies of similar or equal creditworthiness; (viii) the level of recent trades
of similar or comparable securities; (ix) the liquidity characteristics of the security; (x) current market conditions; (xi) the
market value of any securities into which the security is convertible or exchangeable; (xii) the security’s embedded option
values; and (xiii) information about the financial condition of the issuer and its prospects.
Each Portfolio utilizes various methods to measure the fair value of all of its investments on a recurring basis. GAAP
establishes a hierarchy that prioritizes inputs to valuation methods. The three levels of input are:
Level 1 – Unadjusted quoted prices in active markets for identical assets and liabilities that the Portfolio has the ability to
access.
Level 2 – Observable inputs other than quoted prices included in Level 1 that are observable for the asset or liability,
either directly or indirectly. These inputs may include quoted prices for the identical instrument in an inactive market, prices
for similar instruments, interest rates, prepayment speeds, credit risk, yield curves, default rates and similar data.
Level 3 – Unobservable inputs for the asset or liability, to the extent relevant observable inputs are not available,
representing the Portfolio’s own assumptions about the assumptions a market participant would use in valuing the asset or
liability, and would be based on the best information available.
The availability of observable inputs can vary from security to security and is affected by a wide variety of factors, including,
for example, the type of security, whether the security is new and not yet established in the marketplace, the liquidity of
markets, and other characteristics particular to the security. To the extent that valuation is based on models or inputs that
are less observable or unobservable in the market, the determination of fair value requires more judgment. Accordingly,
the degree of judgment exercised in determining fair value is greatest for instruments categorized in Level 3.
The inputs used to measure fair value may fall into different levels of the fair value hierarchy. In such cases, for disclosure
purposes, the level in the fair value hierarchy within which the fair value measurement falls in its entirety is determined
based on the lowest level input that is significant to the fair value measurement in its entirety.
204

Global Atlantic Portfolios
NOTES TO FINANCIAL STATEMENTS (Continued) December 31, 2018
The inputs or methodology used for valuing securities are not necessarily an indication of the risk associated with investing
in those securities. The following tables summarize the inputs used as of December 31, 2018 for each Portfolio’s
investments measured at fair value:
Global Atlantic BlackRock Allocation Portfolio
Assets Level 1 Level 2 Level 3 Total
Exchange Traded Funds 77,328,380$ -$ -$ 77,328,380$
Short-Term Investment 86,313 - - 86,313
Total 77,414,693$ -$ -$ 77,414,693$
Global Atlantic BlackRock Disciplined Core Portfolio
Assets Level 1 Level 2 Level 3 Total
Common Stocks 509,898,522$ -$ -$ 509,898,522$
Short-Term Investment 8,277,840 - - 8,277,840
Total 518,176,362$ -$ -$ 518,176,362$
Liabilities Level 1 Level 2 Level 3 Total
Futures Contract * 196,158$ -$ -$ 196,158$
Total 196,158$ -$ -$ 196,158$
Global Atlantic BlackRock Disciplined Growth Portfolio
Assets Level 1 Level 2 Level 3 Total
Common Stocks 15,469,162$ -$ -$ 15,469,162$
Short-Term Investment 328,974 - - 328,974
Futures Contract * 1,682 - - 1,682
Total 15,799,818$ -$ -$ 15,799,818$
Global Atlantic BlackRock Disciplined International Core Portfolio
Assets Level 1 Level 2 Level 3 Total
Common Stocks 126,932,940$ -$ -$ 126,932,940$
Exchange Traded Funds 8,558,452 - - 8,558,452
Short-Term Investment 36,829 - - 36,829
Total 135,528,221$ -$ -$ 135,528,221$
Liabilities Level 1 Level 2 Level 3 Total
Futures Contracts * 106,955$ -$ -$ 106,955$
Forward Foreign Exchange Contracts - 120 - 120
Total 106,955$ 120$ -$ 107,075$
Global Atlantic BlackRock Disciplined Mid Cap Growth Portfolio
Assets Level 1 Level 2 Level 3 Total
Common Stocks 166,594,134$ -$ -$ 166,594,134$
Short-Term Investment 2,610,777 - - 2,610,777
Total 169,204,911$ -$ -$ 169,204,911$
Liabilities Level 1 Level 2 Level 3 Total
Futures Contracts* 86,945$ -$ -$ 86,945$
Total 86,945$ -$ -$ 86,945$ 205

Global Atlantic Portfolios
NOTES TO FINANCIAL STATEMENTS (Continued) December 31, 2018
Global Atlantic BlackRock Disciplined Small Cap Portfolio
Assets Level 1 Level 2 Level 3 Total
Common Stocks 15,951,816$ -$ -$ 15,951,816$
Short-Term Investment 392,228 - - 392,228
Total 16,344,044$ -$ -$ 16,344,044$
Liabilities Level 1 Level 2 Level 3 Total
Futures Contract * 9,801$ -$ -$ 9,801$
Total 9,801$ -$ -$ 9,801$
Global Atlantic BlackRock Disciplined U.S. Core Portfolio
Assets Level 1 Level 2 Level 3 Total
Common Stocks 21,519,682$ -$ -$ 21,519,682$
Short-Term Investment 395,602 - - 395,602
Total 21,915,284$ -$ -$ 21,915,284$
Liabilities Level 1 Level 2 Level 3 Total
Futures Contracts * 15,022$ -$ -$ 15,022$
Total 15,022$ -$ -$ 15,022$
Global Atlantic BlackRock Disciplined Value Portfolio
Assets Level 1 Level 2 Level 3 Total
Common Stocks 250,731,515$ -$ -$ 250,731,515$
Short-Term Investment 3,888,739 - - 3,888,739
Total 254,620,254$ -$ -$ 254,620,254$
Liabilities Level 1 Level 2 Level 3 Total
Futures Contracts * 106,752$ -$ -$ 106,752$
Total 106,752$ -$ -$ 106,752$
Global Atlantic BlackRock High Yield Portfolio
Assets Level 1 Level 2 Level 3 Total
Corporate Bonds & Notes -$ 68,981,653$ -$ 68,981,653$
Short-Term Investment 232,331 - - 232,331
Total 232,331$ 68,981,653$ -$ 69,213,984$
Liabilities Level 1 Level 2 Level 3 Total
Futures Contracts * 3,384$ -$ -$ 3,384$
Total 3,384$ -$ -$ 3,384$
206
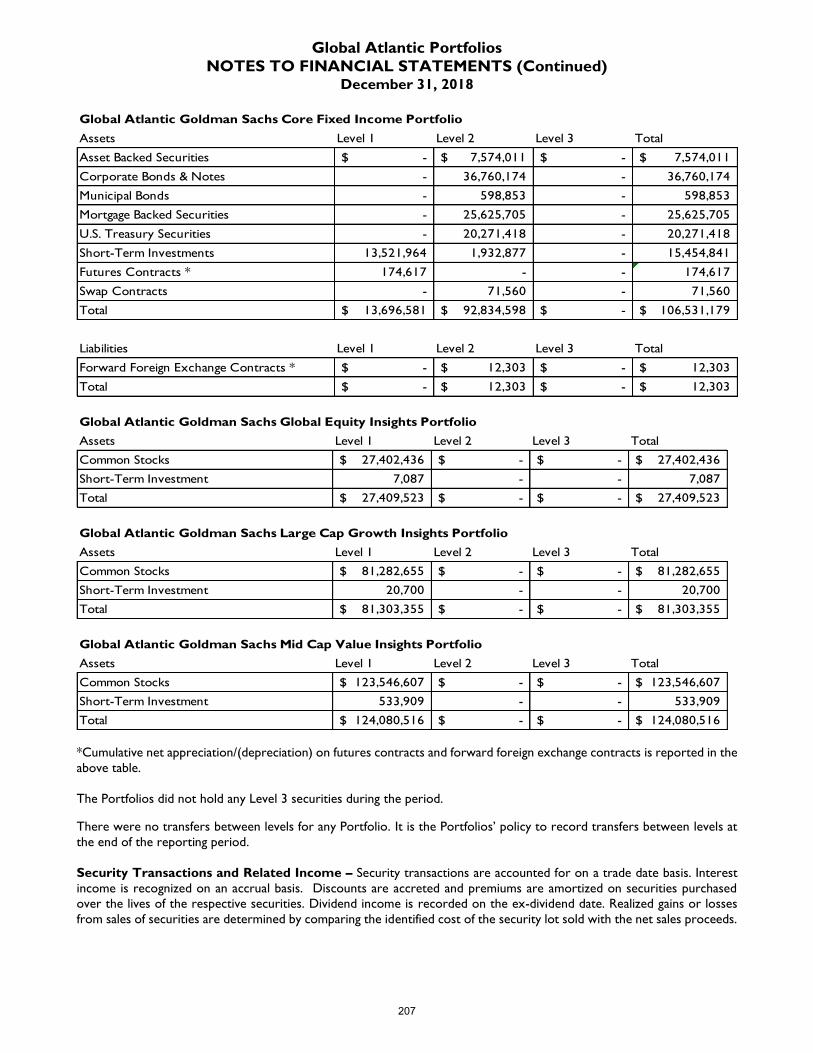
Global Atlantic Portfolios
NOTES TO FINANCIAL STATEMENTS (Continued) December 31, 2018
Global Atlantic Goldman Sachs Core Fixed Income Portfolio
Assets Level 1 Level 2 Level 3 Total
Asset Backed Securities -$ 7,574,011$ -$ 7,574,011$
Corporate Bonds & Notes - 36,760,174 - 36,760,174
Municipal Bonds - 598,853 - 598,853
Mortgage Backed Securities - 25,625,705 - 25,625,705
U.S. Treasury Securities - 20,271,418 - 20,271,418
Short-Term Investments 13,521,964 1,932,877 - 15,454,841
Futures Contracts * 174,617 - - 174,617
Swap Contracts - 71,560 - 71,560
Total 13,696,581$ 92,834,598$ -$ 106,531,179$
Liabilities Level 1 Level 2 Level 3 Total
Forward Foreign Exchange Contracts * -$ 12,303$ -$ 12,303$
Total -$ 12,303$ -$ 12,303$
Global Atlantic Goldman Sachs Global Equity Insights Portfolio
Assets Level 1 Level 2 Level 3 Total
Common Stocks 27,402,436$ -$ -$ 27,402,436$
Short-Term Investment 7,087 - - 7,087
Total 27,409,523$ -$ -$ 27,409,523$
Global Atlantic Goldman Sachs Large Cap Growth Insights Portfolio
Assets Level 1 Level 2 Level 3 Total
Common Stocks 81,282,655$ -$ -$ 81,282,655$
Short-Term Investment 20,700 - - 20,700
Total 81,303,355$ -$ -$ 81,303,355$
Global Atlantic Goldman Sachs Mid Cap Value Insights Portfolio
Assets Level 1 Level 2 Level 3 Total
Common Stocks 123,546,607$ -$ -$ 123,546,607$
Short-Term Investment 533,909 - - 533,909
Total 124,080,516$ -$ -$ 124,080,516$
*Cumulative net appreciation/(depreciation) on futures contracts and forward foreign exchange contracts is reported in the
above table.
The Portfolios did not hold any Level 3 securities during the period.
There were no transfers between levels for any Portfolio. It is the Portfolios’ policy to record transfers between levels at
the end of the reporting period.
Security Transactions and Related Income – Security transactions are accounted for on a trade date basis. Interest
income is recognized on an accrual basis. Discounts are accreted and premiums are amortized on securities purchased
over the lives of the respective securities. Dividend income is recorded on the ex-dividend date. Realized gains or losses
from sales of securities are determined by comparing the identified cost of the security lot sold with the net sales proceeds.
207

Global Atlantic Portfolios
NOTES TO FINANCIAL STATEMENTS (Continued) December 31, 2018
Dividends and Distributions to Shareholders – Dividends from net investment income and distributions from net
realized capital gains, if any, are declared and paid annually. Dividends and distributions to shareholders are recorded on
ex-date and are determined in accordance with Federal income tax regulations, which may differ from GAAP. These
“book/tax” differences are considered either temporary (e.g., deferred losses, capital loss carryforwards) or permanent in
nature. To the extent these differences are permanent in nature, such amounts are reclassified within the composition of
net assets based on their Federal tax-basis treatment; temporary differences do not require reclassification. These
reclassifications have no effect on net assets, results from operations or net asset values per share of the Portfolios.
Cash and Cash Equivalents – Cash and cash equivalents include cash and overnight investments in interest-bearing
demand deposits with a financial institution with original maturities of three months or less. The Portfolios maintain deposits
with a financial institution which are generally an amount that is in excess of federally insured limits.
Federal Income Tax – It is each Portfolio’s policy to qualify as a regulated investment company by complying with the
provisions of the Internal Revenue Code that are applicable to regulated investment companies and to distribute
substantially all of their taxable income and net realized gains to shareholders. Therefore, no Federal income tax provision
is required.
Each Portfolio will recognize the tax benefits of uncertain tax positions only where the position is “more likely than not”
to be sustained assuming examination by tax authorities. Management has analyzed each Portfolio’s tax positions, and has
concluded that no liability for unrecognized tax benefits should be recorded related to uncertain tax positions taken on
returns filed for the open tax year December 31, 2017, or expected to be taken in each Portfolio’s December 31, 2018 tax
returns. Each Portfolio identified its major tax jurisdictions as U.S. Federal and foreign jurisdictions where the Portfolios
make significant investments; however, the Portfolios are not aware of any tax positions for which it is reasonably possible
that the total amounts of unrecognized tax benefits will change materially in the next twelve months. Foreign Currency Translation - The accounting records of the Portfolios are maintained in U.S. dollars. Foreign
currencies, as well as investment securities and other assets and liabilities denominated in foreign currencies, are translated
into U.S. dollars using exchange rates deemed appropriate by the investment adviser. Purchases and sales of securities,
income receipts and expense payments are translated into U.S. dollars on the respective dates of such transactions.
Net realized gains and losses on foreign currency transactions represent net gains and losses from currency realized between
the trade and settlement dates on securities transactions and the difference between income accrued versus income
received. The effects of changes in foreign currency exchange rates on investments in securities are included with the net
realized and unrealized gain or loss on investments.
Forward Foreign Currency Contracts - As foreign securities are purchased, a Portfolio may enter into forward
currency exchange contracts in order to hedge against foreign currency exchange rate risks. A forward involves an obligation
to purchase or sell a specific currency at a future date, which may be any fixed number of days from the date of the contract
agreed upon by the parties, at a price set at the time of the contract. The market value of the contract fluctuates with
changes in currency exchange rates. The contract is marked-to-market daily and the change in market value is recorded
by the Portfolio as an unrealized gain or loss. As foreign securities are sold, a portion of the contract is generally closed
and the Portfolio records a realized gain or loss equal to the difference between the value of the contract at the time it was
opened and the value at the time it was closed. Realized gains and losses from contract transactions are included as a
component of net realized gains/(losses) from forward foreign currency contracts in the Statements of Operations.
For the year ended December 31, 2018, realized gains/(losses) and the change in unrealized appreciation/(depreciation) on
forward foreign currency contracts subject to currency risk, as disclosed in the Statements of Operations, is as follows:
Realized Gain/(Loss)
Change in Unrealized
Appreciation/
Depreciation
Global Atlantic BlackRock Allocation Portfolio (249,954)$ 67,076$
Global Atlantic BlackRock Disciplined International Core Portfolio 171,649 (120)
Global Atlantic Goldman Sachs Core Fixed Income Portfolio 138,625 14,511
208

Global Atlantic Portfolios
NOTES TO FINANCIAL STATEMENTS (Continued) December 31, 2018
Futures Contracts – The Portfolios are subject to equity price risk in the normal course of pursuing their investment
objectives. The Portfolios may sell futures contracts to hedge against market risk, foreign currency exchange rate risks, and
to reduce return volatility. Futures are standardized, exchange-traded contracts that provide for the future sale by one
party and purchase by another party of a specified amount of a specific financial instrument (e.g., units of a securities index)
for a specified price, date, time and place designated at the time the contract is made. Brokerage fees are incurred when a
futures contract is bought or sold and initial and variation margin deposits must be maintained. Entering into a contract to
buy is commonly referred to as buying or purchasing a contract or holding a long position. Entering into a contract to sell
is commonly referred to as selling a contract or holding a short position. The Portfolios may also buy or sell hedge
instruments based on one or more market indices in an attempt to maintain the Portfolios’ volatility at a targeted level.
Initial margin deposits required upon entering into futures contracts are satisfied by the segregation of specific securities or
cash as collateral for the account of the broker (the Portfolio’s agent in acquiring the futures position). During the period
the futures contracts are open, changes in the value of the contracts are recognized as unrealized gains or losses by “marking
to market” on a daily basis to reflect the market value of the contracts at the end of each day’s trading. Variation margin
payments are received or made depending upon whether unrealized gains or losses are incurred. When the contracts are
closed, a Portfolio recognizes a realized gain or loss equal to the difference between the proceeds from, or cost of, the
closing transaction and the Portfolio’s basis in the contract. If a Portfolio were unable to liquidate a futures contract and/or
enter into an offsetting closing transaction, the Portfolio would continue to be subject to market risk with respect to the
value of the contracts and continue to be required to maintain the margin deposits on the futures contracts. Each Portfolio
segregates liquid securities having a value at least equal to the amount of the current obligation under any open futures
contract. These amounts are disclosed on the Statements of Assets and Liabilities as Deposits with Brokers when
applicable. Risks may exceed amounts recognized in the Statements of Assets and Liabilities. With futures, there is minimal
counterparty credit risk to a Portfolio since futures are exchange traded and the exchange’s clearinghouse, as counterparty
to all exchange traded futures, guarantees the futures against default.
For the year ended December 31, 2018, realized gains/(losses) and the change in unrealized appreciation (depreciation) on
futures contracts, as disclosed in the Statements of Operations, is as follows:
Risk Type Realized Gain/(Loss)
Change in
Unrealized
Appreciation/
(Depreciation)
Global Atlantic BlackRock Disciplined Core Portfolio Equity 2,028,327$ (223,173)$
Global Atlantic BlackRock Disciplined Growth Portfolio Equity (18,646) 682
Global Atlantic BlackRock Disciplined International Core Portfolio Equity (292,932) (112,589)
Global Atlantic BlackRock Disciplined Mid Cap Growth Portfolio Equity 864,911 (99,025)
Global Atlantic BlackRock Disciplined Small Cap Portfolio Equity (58,115) (9,043)
Global Atlantic BlackRock Disciplined U.S. Core Portfolio Equity (35,565) (15,075)
Global Atlantic BlackRock Disciplined Value Portfolio Equity (80,828) (153,788)
Global Atlantic BlackRock High Yield Portfolio Interest Rate 82,704 (19,929)
Global Atlantic Goldman Sachs Core Fixed Income Portfolio Interest Rate (360,638) 191,546
Global Atlantic Goldman Sachs Large Cap Growth Insights Portfolio Equity 438 -
Global Atlantic Goldman Sachs Mid Cap Value Insights Portfolio Equity (605,880) -
Swap Agreements – The Global Atlantic Goldman Sachs Core Fixed Income Portfolio is subject to equity price risk
and/or interest rate risk in the normal course of pursuing its investment objective. The Portfolio may enter into various
swap transactions for investment purposes or to manage interest rate, equity, foreign exchange (currency), or credit risk.
These are two-party contracts entered into primarily to exchange the returns (or differentials in rates of returns) earned
or realized on particular pre-determined investments or instruments. In a standard over-the-counter ("OTC") swap, two
parties agree to exchange the returns, differentials in rates of return or some other amount earned or realized on the
"notional amount" (i.e., the return or increase in value of a particular dollar amount invested in a “basket” of securities,
representing a particular index or industry sectors) of predetermined investments or instruments.
209

Global Atlantic Portfolios
NOTES TO FINANCIAL STATEMENTS (Continued) December 31, 2018
Certain Portfolios may enter into credit default swaps (“CDS”). CDS are two-party contracts that transfer credit exposure
between the parties. One party (the “buyer”) receives credit protection and the other party (the “seller”) takes on credit
risk. The buyer typically makes predetermined periodic payments to the seller in exchange for the seller’s commitment to
purchase the underlying reference obligation if a defined credit event occurs, such as a default, bankruptcy or failure to pay
interest or principal on a reference debt instrument, with respect to a specified issuer or one of the reference issuers in a
CDS portfolio. If the defined credit event occurs, the seller must pay the agreed-upon value of a reference obligation to
the counterparty or perform pursuant to the agreement. The buyer must then surrender the reference obligation to the
seller. As a seller of credit protection in a CDS, a Portfolio would be liable for the notional amount of the swap.
The swaps in which a Portfolio may invest may be centrally-cleared or bi-laterally traded. The gross returns to be exchanged
or “swapped” between the parties are calculated with respect to a notional amount. Changes in the value of swap
agreements are recognized as unrealized gains or losses in the Statement of Operations by “marking to market” on a daily
basis to reflect the value of the swap agreement at the end of each trading day. Payments received or paid at the beginning
of a swap agreement are reflected as such on the Statement of Assets and Liabilities and may be referred to as upfront
payments. A Portfolio amortizes upfront payments and/or accrues for the fixed payment stream on swap agreements on a
daily basis with the net amount recorded as a component of unrealized gain or loss on the Statement of Operations.
Realized gains and losses from the decrease in notional value of the swap are recognized on trade date. A liquidation
payment received or made at the termination of the swap agreement is recorded as a realized gain or loss on the Statement
of Operations. A Portfolio segregates cash or liquid securities having a value at least equal to the amount of its current
obligation under any swap transaction. Swap agreements involve, to varying degrees, lack of liquidity and elements of credit,
market and counterparty risk in excess of amounts recognized on the Statement of Assets and Liabilities. Each Portfolio’s
maximum risk of loss from the counterparty credit risk is the discounted net value of the cash flow to be received from the
counterparty over the contract’s remaining life, to be the extent that amount is positive.
Swaps may involve greater risks than direct investments in securities because swaps may be leveraged and, when traded in
the OTC markets, are subject to counterparty risk, credit risk and pricing risk, each of which individually and collectively,
may have a considerable impact on the performance of a Portfolio. CDS in particular may involve greater risks than investing
in a referenced instrument directly. Swaps, especially those that are not exchange-traded, may also be considered illiquid.
It may not be possible for a Portfolio to liquidate a swap position at an advantageous time or price, which may result in
significant losses. Although central clearing and exchange-trading of swaps may decrease counterparty risk and increase
market liquidity, exchange-trading and clearing does not make the contracts risk free, but rather, the primary credit risk on
such contracts is the creditworthiness of the clearing broker or the clearinghouse.
The Portfolios use cash and certain securities as collateral to swap agreements as indicated on the Portfolio of Investments
and Statements of Assets and Liabilities. Such collateral is held for the benefit of the counterparty in a segregated account
to prevent non-payment by the Portfolios. If the counterparty defaults, a Portfolio may seek return of this collateral and
incur certain costs exercising their rights to the collateral.
For the year ended December 31, 2018, the change in unrealized appreciation/(depreciation) on swap contracts for the
Global Atlantic Goldman Sachs Core Fixed Income Portfolio was $71,560. For the year ended December 31, 2018, the
Global Atlantic Goldman Sachs Core Fixed Income Portfolio had realized gains of $47,381 from swap contracts.
210

Global Atlantic Portfolios
NOTES TO FINANCIAL STATEMENTS (Continued) December 31, 2018
Offsetting of Financial Assets/Liabilities and Derivative Assets/Liabilities
The following tables present certain of the Portfolios’ asset/liability derivatives available for offset under a master netting
arrangement net of collateral pledged as of December 31, 2018.
Global Atlantic BlackRock Disciplined Core Portfolio
Liabilities
Description
Gross
Amounts of
Recognized
Liabilities
Gross Amounts
Offset in the
Statement of Assets
& Liabilities
Net Amounts of
Liabilities Presented in
the Statement of Assets
& Liabilities
Financial
Instruments
Cash
Collateral
Pledged Net Amount
Futures Contracts 196,158$ (1) -$ (1) 196,158$ -$ 196,158$ (2) -$
Total 196,158$ -$ 196,158$ -$ 196,158$ -$
Gross Amounts Not Offset
in the Statement of Assets &
Liabilities
(1) Gross unrealized depreciation as presented in the Portfolio of Investments.
(2) The amount is limited to the net derivative balance and, accordingly, does not include excess collateral pledged of $533,062.
Global Atlantic BlackRock Disciplined Growth Portfolio
Assets
Description
Gross Amounts
of Recognized
Assets
Gross Amounts
Offset in the
Statement of Assets
& Liabilities
Net Amounts of Assets
Presented in the
Statement of Assets &
Liabilities
Financial
Instruments
Cash
Collateral
Pledged Net Amount
Futures Contracts 1,682$ (1) -$ (1) 1,682$ -$ -$ (2) -$
Total 1,682$ -$ 1,682$ -$ -$ -$
Gross Amounts Not
Offset in the Statement of
Assets & Liabilities
(1) Gross unrealized appreciation as presented in the Portfolio of Investments.
(2) The amount is limited to the net derivative balance and, accordingly, does not include collateral pledged of $14,238.
Global Atlantic BlackRock Disciplined International Core Portfolio
Liabilities
Description
Gross Amounts
of Recognized
Liabilities
Gross Amounts
Offset in the
Statement of Assets
& Liabilities
Net Amounts of
Liabilities Presented in
the Statement of Assets
& Liabilities
Financial
Instruments
Cash
Collateral
Pledged Net Amount
Futures Contracts 106,955$ (1) -$ (1) 106,955$ -$ 106,955$ (2) -$
Forward Foreign
Currency Contracts 120 (1) - (1) 120 - 120 (2) -
Total 107,075$ -$ 107,075$ -$ 107,075$ -$
Gross Amounts Not Offset
in the Statement of Assets
& Liabilities
(1) Gross unrealized depreciation as presented in the Portfolio of Investments.
(2) The amount is limited to the net derivative balance and, accordingly, does not include excess collateral pledged of $390,599.
211

Global Atlantic Portfolios
NOTES TO FINANCIAL STATEMENTS (Continued) December 31, 2018
Global Atlantic BlackRock Disciplined Mid Cap Growth Portfolio
Liabilities
Description
Gross Amounts
of Recognized
Liabilities
Gross Amounts
Offset in the
Statement of Assets
& Liabilities
Net Amounts of
Liabilities Presented in
the Statement of Assets
& Liabilities
Financial
Instruments
Cash
Collateral
Pledged Net Amount
Futures Contracts 86,945$ (1) -$ (1) 86,945$ -$ 86,945$ (2) -$
Total 86,945$ -$ 86,945$ -$ 86,945$ -$
Gross Amounts Not Offset
in the Statement of Assets &
Liabilities
(1) Gross unrealized depreciation as presented in the Portfolio of Investments.
(2) The amount is limited to the net derivative balance and, accordingly, does not include excess collateral pledged of $167,894.
Global Atlantic BlackRock Disciplined Small Cap Portfolio
Liabilities
Description
Gross Amounts
of Recognized
Liabilities
Gross Amounts
Offset in the
Statement of Assets
& Liabilities
Net Amounts of
Liabilities Presented in
the Statement of Assets
& Liabilities
Financial
Instruments
Cash
Collateral
Pledged Net Amount
Futures Contracts 9,801$ (1) -$ (1) 9,801$ -$ 9,801$ (2) -$
Total 9,801$ -$ 9,801$ -$ 9,801$ -$
Gross Amounts Not Offset
in the Statement of Assets &
Liabilities
(1) Gross unrealized depreciation as presented in the Portfolio of Investments.
(2) The amount is limited to the net derivative balance and, accordingly, does not include excess collateral pledged of $26,430.
Global Atlantic BlackRock Disciplined U.S. Core Portfolio
Liabilities
Description
Gross Amounts
of Recognized
Liabilities
Gross Amounts
Offset in the
Statement of Assets
& Liabilities
Net Amounts of
Liabilities Presented in
the Statement of Assets
& Liabilities
Financial
Instruments
Cash
Collateral
Pledged Net Amount
Futures Contracts 15,022$ (1) -$ (1) 15,022$ -$ 15,022$ (2) -$
Total 15,022$ -$ 15,022$ -$ 15,022$ -$
Gross Amounts Not Offset
in the Statement of Assets &
Liabilities
(1) Gross unrealized depreciation as presented in the Portfolio of Investments.
(2) The amount is limited to the net derivative balance and, accordingly, does not include excess collateral pledged of $22,880.
212

Global Atlantic Portfolios
NOTES TO FINANCIAL STATEMENTS (Continued) December 31, 2018
Global Atlantic BlackRock Disciplined Value Portfolio
Liabilities
Description
Gross Amounts
of Recognized
Liabilities
Gross Amounts
Offset in the
Statement of Assets
& Liabilities
Net Amounts of
Liabilities Presented in
the Statement of Assets
& Liabilities
Financial
Instruments
Cash
Collateral
Pledged Net Amount
Futures Contracts 106,752$ (1) -$ (1) 106,752$ -$ 106,752$ (2) -$
Total 106,752$ -$ 106,752$ -$ 106,752$ -$
Gross Amounts Not Offset
in the Statement of Assets &
Liabilities
(1) Gross unrealized appreciation and depreciation as presented in the Portfolio of Investments.
(2) The amount is limited to the net derivative balance and, accordingly, does not include excess collateral pledged of $272,476.
Global Atlantic BlackRock High Yield Portfolio
Liabilities
Description
Gross Amounts
of Recognized
Liabilities
Gross Amounts
Offset in the
Statement of Assets
& Liabilities
Net Amounts of
Liabilities Presented in
the Statement of Assets
& Liabilities
Financial
Instruments
Cash
Collateral
Pledged Net Amount
Futures Contracts 85,956$ (1) (82,572)$ (1) 3,384$ -$ 3,384$ (2) -$
Total 85,956$ (82,572)$ 3,384$ -$ 3,384$ -$
Gross Amounts Not Offset
in the Statement of Assets &
Liabilities
(1) Gross unrealized appreciation and depreciation as presented in the Portfolio of Investments.
(2) The amount is limited to the net derivative balance and, accordingly, does not include excess collateral pledged of $14,002.
213

Global Atlantic Portfolios
NOTES TO FINANCIAL STATEMENTS (Continued) December 31, 2018
Global Atlantic Goldman Sachs Core Fixed Income Portfolio
Assets
Description
Gross Amounts
of Recognized
Assets
Gross Amounts
Offset in the
Statement of Assets
& Liabilities
Net Amounts of Assets
Presented in the
Statement of Assets &
Liabilities
Financial
Instruments
Cash
Collateral
Pledged Net Amount
Futures Contracts 518,306$ (1) (343,689)$ (1) 174,617$ -$ -$ (2) -$
Swap Contracts 158,999 (87,439) 71,560 - - -
Total 677,305$ (431,128)$ 246,177$ -$ -$ -$
Liabilities
Description
Gross Amounts
of Recognized
Liabilities
Gross Amounts
Offset in the
Statement of Assets
& Liabilities
Net Amounts of
Liabilities Presented in
the Statement of Assets
& Liabilities
Financial
Instruments
Cash
Collateral
Pledged Net Amount
Forward Exchange
Contracts 125,418$ (1) (113,115)$ (1) 12,303$ -$ 12,303$ (2) -$
Total 125,418$ (113,115)$ 12,303$ -$ 12,303$ -$
Gross Amounts Not Offset
in the Statement of Assets &
Liabilities
Gross Amounts Not Offset
in the Statement of Assets &
Liabilities
(1) Gross unrealized appreciation and depreciation as presented in the Portfolio of Investments.
(2) The amount is limited to the net derivative balance and, accordingly, does not include collateral pledged of $79,200 for swap contracts.
Impact of Derivatives on the Statements of Assets and Liabilities and Statements of Operations
The following is a summary of the location of derivative investments on the Global Atlantic Goldman Sachs Core Fixed
Income Portfolio’s Statement of Assets and Liabilities as of December 31, 2018:
Location on the Statements of Assets and Liabilities
Derivatives Investment Type Liability Derivatives
Interest Rate Contracts
Currency Contracts
Unrealized appreciation on futures contracts and swap
contracts
Unrealized depreciation on forward foreign currency
contracts
The following table sets forth the fair value of the Global Atlantic Goldman Sachs Core Fixed Income Portfolio’s derivative
contracts by primary risk exposure as of December 31, 2018:
Global Atlantic Goldman Sachs Core Fixed Income Portfolio
Equity Interest Rate Currency
Total as of
December 31, 2018
Futures Contracts -$ 174,617$ -$ 174,617$
Swap Contracts - 71,560 - 71,560
Forward Foreign Currency Contracts - - (12,303) (12,303)
Total -$ 246,177$ (12,303)$ 233,874$
Derivatives Investment Fair Value
214

Global Atlantic Portfolios
NOTES TO FINANCIAL STATEMENTS (Continued) December 31, 2018
The following is a summary of the location of derivative investments on the Global Atlantic Goldman Sachs Core Fixed
Income Portfolio’s Statement of Operations for the year ended December 31, 2018:
Derivative Investment Type Location of Gain/(Loss) on Derivatives
Futures Contracts Net realized loss on:
Futures contracts
Net change in unrealized appreciation on:
Futures contracts
Currency Contracts
Net realized loss on:
Forward foreign currency contracts
Net change in unrealized appreciation on:
Forward foreign currency contracts
Swap Contracts
Net realized gain on:
Swap contracts
Net change in unrealized appreciation on:
Swap contracts
The following is a summary of the Global Atlantic Goldman Sachs Core Fixed Income Portfolio’s realized and unrealized
gain/(loss) on derivative investments recognized in the Statement of Operations categorized by primary risk exposure for
the year ended December 31, 2018:
Equity Interest Rate Currency
Total as of
December 31, 2018
Futures Contracts -$ 191,546$ -$ 191,546$
Swap Contracts - 71,560 - 71,560
Forward Foreign Currency Contracts - - 14,511 14,511
Total -$ 263,106$ 14,511$ 277,617$
Equity Interest Rate Currency
Total as of
December 31, 2018
Futures Contracts -$ (360,638)$ -$ (360,638)$
Swap Contracts - 47,381 - 47,381
Forward Foreign Currency Contracts - - (216,220) (216,220)
Total -$ (313,257)$ (216,220)$ (529,477)$
Realized gain/(loss) on derivatives recognized in the Statement of Operations
Net change in unrealized appreciation on derivatives recognized in the
Statement of Operations
The notional value of the derivative instruments outstanding as of December 31, 2018, as disclosed in the Portfolios of
Investments, and the amounts of realized and changes in unrealized gains and losses on derivative instruments during the
period as disclosed above and within in the Statements of Operations serve as indicators of the volume of derivative activity
for the Portfolios.
215

Global Atlantic Portfolios
NOTES TO FINANCIAL STATEMENTS (Continued) December 31, 2018
Short Sales - A Portfolio may make short sales of securities: (i) to offset potential declines in long positions in similar
securities; (ii) to increase the flexibility of the Portfolio; (iii) for investment return; (iv) as part of a risk arbitrage strategy;
and (v) as part of its overall portfolio management strategies involving the use of derivative instruments. A short sale is a
transaction in which the Portfolio sells a security it does not own or have the right to acquire (or that it owns but does not
wish to deliver) in anticipation that the market price of that security will decline.
When a Portfolio makes a short sale, the broker-dealer through which the short sale is made must borrow the security
sold short and deliver it to the party purchasing the security. The Portfolio is required to make a margin deposit in
connection with such short sales; the Portfolio may have to pay a fee to borrow particular securities and will often be
obligated to pay over any dividends and accrued interest on borrowed securities.
If the price of the security sold short increases between the time of the short sale and the time a Portfolio covers its short
position, the Portfolio will incur a loss; conversely, if the price declines, the Portfolio will realize a capital gain. Any gain will
be decreased, and any loss increased, by the transaction costs described above. The successful use of short selling may be
adversely affected by imperfect correlation between movements in the price of the security sold short and the securities
being hedged.
To the extent a Portfolio sells securities short, it will provide collateral to the broker-dealer and (except in the case of
short sales “against the box”) will maintain additional asset coverage in the form of cash, U.S. government securities or
other liquid securities with its custodian in a segregated account in an amount at least equal to the difference between the
current market value of the securities sold short and any amounts required to be deposited as collateral with the selling
broker (not including the proceeds of the short sale). A Portfolio does not intend to enter into short sales (other than
short sales “against the box”) if immediately after such sales the aggregate of the value of all collateral plus the amount in
such segregated account exceeds 10% of the value of the Portfolio’s net assets. This percentage may be varied by action of
the Board of Trustees. A short sale is “against the box” to the extent a Portfolio contemporaneously owns, or has the right
to obtain at no added cost, securities identical to those sold short.
When-Issued and Delayed-Delivery Transactions - The Portfolios may engage in when-issued or delayed-delivery
transactions. The Portfolios record when-issued securities on the trade date and maintain security positions such that
sufficient liquid assets will be available to make payment for the securities purchased. Securities purchased on a when-issued
or delayed-delivery basis are marked to market daily and begin earning interest on the settlement date. Losses may occur
on these transactions due to changes in market conditions or the failure of counterparties to perform under the contract.
Real Estate Investment Trusts – Certain Portfolios may invest in real estate investment trusts (“REITs”). REITs are
pooled investment vehicles that own, and typically operate, income-producing real estate. If a REIT meets certain
requirements, including distributing to shareholders substantially all of its taxable income (other than net capital gains), then
it is not taxed on the income distributed to shareholders. REITs are subject to management fees and other expenses, and
so a Portfolio that invests in REITs will bear its proportionate share of the costs of the REITs’ operations. Along with the
risks common to different types of real estate-related securities, such as loss to casualty or condemnation, increases in
property taxes and operating expenses, zoning law amendments, changes in interest rates, overbuilding and increased
competition, variations in market value, and possible environmental liabilities, REITs involve additional risk factors. These
include poor performance by the REIT’s manager, changes to the tax laws, and failure by the REIT to qualify for tax free
distribution of income or exemption under the 1940 Act. In addition, REITs are not diversified and are heavily dependent
on cash flow.
Distributions from a Portfolio’s investments in REITs may be characterized as ordinary income, a net capital gain or a return
of capital. The Portfolios record distributions that represent a net capital gain as a realized gain and distributions that
represent a return of capital as a reduction of the cost of investment. REITs report information on the source of their
distributions annually in the following calendar year. As a result, a Portfolio estimates the source of REIT distributions for
accounting purposes and then makes adjustments when the actual source information is reported by the REIT. These
estimates are based on the most recent REIT distribution information available.
216

Global Atlantic Portfolios
NOTES TO FINANCIAL STATEMENTS (Continued) December 31, 2018
Credit Risk - There is a risk that security issuers will not make interest and/or principal payments on their securities. In
addition, the credit quality of securities may be lowered if an issuer's financial condition changes. Lower credit quality will
lead to greater volatility in the price of a security and in shares of a Portfolio or an underlying fund. Lower credit quality
also will affect liquidity and make it difficult to sell the security. This means that, compared to issuers of higher rated
securities, issuers of lower rated securities are less likely to have the capacity to pay interest and repay principal when due
in the event of adverse business, financial or economic conditions and/or may be in default or not current in the payment
of interest or principal. Default, or the market's perception that an issuer is likely to default, tends to reduce the value and
liquidity of fixed income securities, thereby reducing the value of your investment in Portfolio shares. In addition, default
may cause a Portfolio to directly or indirectly incur expenses in seeking recovery of principal or interest.
A Portfolio could lose money on a debt security if an issuer or borrower is unable or fails to meet its obligations, including
failing to make interest payments and/or to repay principal when due. Changes in an issuer's financial strength, the market's
perception of the issuer's financial strength or in a security's credit rating, which reflects a third party's assessment of the
credit risk presented by a particular issuer, may affect debt securities' value. A Portfolio may incur substantial losses on debt
securities that are inaccurately perceived to present a different amount of credit risk by the market, the Sub-Adviser or the
rating agencies than such securities actually do.
Derivatives Risk – The use of derivatives is a highly specialized activity that involves investment techniques and risks
different from those associated with investments in more traditional securities and instruments. The use of derivatives may
increase costs, reduce a Portfolio’s returns and/or increase volatility. Volatility is defined as the characteristic of a security,
an index or a market to fluctuate significantly in price within a short time period. Many types of derivatives are also subject
to counterparty risk, which is the risk that the other party in the transaction will not fulfill its contractual obligation. A risk
of a Portfolio's use of derivatives is that the fluctuations in their values may not correlate perfectly with, and may be more
sensitive to market events than, the overall securities markets. The possible lack of a liquid secondary market for derivatives
and the resulting inability to sell or otherwise close-out a derivatives position at an advantageous time or price could expose
a Portfolio to losses and could make derivatives more difficult to value accurately. Derivatives typically give rise to a form
of leverage and may expose a Portfolio to greater risk and increase its costs. The Dodd-Frank Wall Street Reform and
Consumer Protection Act (the "Dodd-Frank Act") and related regulatory developments require the clearing and exchange-
trading of many standardized over-the-counter ("OTC") derivative instruments deemed to be "swaps." The Commodity
Futures Trading Commission ("CFTC") has implemented mandatory exchange-trading and clearing requirements under the
Dodd-Frank Act and the CFTC continues to approve contracts for central clearing. Uncleared swaps are subject to margin
requirements that are being implemented on a phase-in basis. The regulation of the derivatives markets has increased over
the past several years, and there can be no assurance that any new governmental regulation will not adversely affect a
Portfolio's ability to achieve its investment result.
Market Risk - The market prices of securities may go up or down, sometimes rapidly or unpredictably, due to general
market conditions, such as real or perceived adverse economic or political conditions, inflation, changes in interest rates or
currency rates, limited dealer capacity, lack of liquidity in the markets or adverse investor sentiment. Each Portfolio has
exposure to instruments that may be more volatile and carry more risk than some other forms of investment. Adverse
market conditions may be prolonged and may not have the same impact on all types of securities. Market prices of securities
also may go down due to events or conditions that affect particular sectors, industries or issuers. When market prices fall,
the value of your investment will go down.
A Portfolio may experience a substantial or complete loss on any individual security. Since the global financial crisis that
began in 2008, the U.S. and many foreign economies continue to experience its after-effects, which have resulted, and may
continue to result, in slower growth and an unusually high degree of volatility in the financial markets, both domestic and
foreign. In response to the financial crisis, the U.S. government and the Federal Reserve, as well as certain foreign
governments and their central banks have taken steps to support financial markets, including by keeping interest rates at
historically low levels. The Federal Reserve has since reduced its market support activities and has recently started raising
interest rates. Further reduction or withdrawal of Federal Reserve or other U.S. or non-U.S. governmental support could
negatively affect the markets generally and increase market volatility. These and other changes in market conditions could
reduce the value and liquidity of the securities in which a Portfolio invests. This environment could make identifying
investment risks and opportunities especially difficult.
217

Global Atlantic Portfolios
NOTES TO FINANCIAL STATEMENTS (Continued) December 31, 2018
Policy and legislative changes in the U.S. and abroad affect many aspects of financial regulation and may, in some cases,
contribute to decreased liquidity and increased volatility in the financial markets. Economies and financial markets around
the world are becoming increasingly interconnected. As a result, whether or not a Portfolio has exposure to securities of
issuers located in or with significant exposure to countries experiencing economic and financial difficulties, the value and
liquidity of the Portfolio's investments may be negatively affected.
In addition, market prices of securities in broad market segments may be adversely affected by a prominent issuer having
experienced losses or by the lack of earnings or such an issuer’s failure to meet the market’s expectations with respect to
new products or services, or even by factors wholly unrelated to the value or condition of the issuer, such as changes in
interest rates. An increase in interest rates or other adverse conditions (e.g., inflation/deflation, increased selling of fixed-
income investments across other pooled investment vehicles or accounts, changes in investor perception or changes in
government intervention in the markets) may lead to increased redemptions and increased portfolio turnover, which could
reduce liquidity for certain Portfolio investments, adversely affect values of portfolio holdings and increase a Portfolio’s
costs. If dealer capacity in fixed-income markets is insufficient for market conditions, this has the potential to further inhibit
liquidity and increase volatility in the fixed-income markets.
Quantitative Investing Risk – Investments selected using quantitative analysis or "models" may perform differently than
expected as a result of the factors used in the models, the weight placed on each factor, changes from the factors' historical
trends, and technical issues in the construction and implementation of the models (including, for example, data problems
and/or software issues). In addition, investments selected using models may react differently to issuer, political, market, and
economic developments from the market as a whole or securities selected using only fundamental analysis. There is no
guarantee that the use of quantitative analysis will result in effective investment decisions for a Portfolio. Additionally,
commonality of holdings across quantitative money managers may amplify losses.
Expenses – Expenses of the Trust that are directly identifiable to a specific Portfolio are charged to that Portfolio.
Expenses, which are not readily identifiable to a specific Portfolio, are allocated in such a manner as deemed equitable,
taking into consideration the nature and type of expense and the relative sizes of the Portfolios in the Trust.
Indemnification – The Trust indemnifies its officers and Trustees for certain liabilities that may arise from the performance
of their duties to the Trust. Additionally, in the normal course of business, the Portfolios enter into contracts that contain
a variety of representations and warranties and which provide general indemnities. Each Portfolio’s maximum exposure
under these arrangements is unknown, as this would involve future claims that may be made against the Portfolios that have
not yet occurred. However, the Portfolios expect the risk of loss due to these warranties and indemnities to be remote. 3. INVESTMENT TRANSACTIONS
For the year ended December 31, 2018, cost of purchases and proceeds from sales of portfolio securities, other than short-
term investments, were as follows:
Portfolio Purchases Sales
Global Atlantic BlackRock Allocation Portfolio $ 46,136,207 $47,111,538
Global Atlantic BlackRock Disciplined Core Portfolio 1,034,284,475 833,797,245
Global Atlantic BlackRock Disciplined Growth Portfolio 29,862,329 34,118,481
Global Atlantic BlackRock Disciplined International Core Portfolio 183,506,145 90,813,608
Global Atlantic BlackRock Disciplined Mid Cap Growth Portfolio 360,726,502 294,415,175
Global Atlantic BlackRock Disciplined Small Cap Portfolio 10,286,264 7,299,268
Global Atlantic BlackRock Disciplined U.S. Core Portfolio 42,192,541 42,261,694
Global Atlantic BlackRock Disciplined Value Portfolio 413,772,735 449,650,900
Global Atlantic BlackRock High Yield Portfolio 28,360,009 34,078,843
218

Global Atlantic Portfolios
NOTES TO FINANCIAL STATEMENTS (Continued) December 31, 2018
Portfolio Purchases Sales
Global Atlantic Goldman Sachs Core Fixed Income Portfolio $445,089,359 $384,015,533
Global Atlantic Goldman Sachs Global Equity Insights Portfolio 49,700,079 42,769,715
Global Atlantic Goldman Sachs Large Cap Growth Insights Portfolio 177,401,848 177,061,075
Global Atlantic Goldman Sachs Mid Cap Value Insights Portfolio 327,057,679 267,681,488
The aggregate amount of purchases and sales listed above are inclusive of the cost of purchases and proceeds from sales of
mortgage dollar roll transactions. The amount of these transactions is listed below.
Portfolio Purchases Sales
Global Atlantic Goldman Sachs Core Fixed Income Portfolio $224,516,992 $210,080,078
4. INVESTMENT ADVISORY AGREEMENT AND TRANSACTIONS WITH RELATED PARTIES
The Adviser serves as the Portfolios’ investment adviser. The Adviser has engaged the following sub-advisers for the
Portfolios:
Portfolio Sub-Adviser
Global Atlantic BlackRock Allocation Portfolio BlackRock Investment Management, LLC
Global Atlantic BlackRock Disciplined Core Portfolio BlackRock Investment Management, LLC
Global Atlantic BlackRock Disciplined Growth Portfolio BlackRock Investment Management, LLC
Global Atlantic BlackRock Disciplined International Core Portfolio BlackRock Investment Management, LLC
Global Atlantic BlackRock Disciplined Mid Cap Growth Portfolio BlackRock Investment Management, LLC
Global Atlantic BlackRock Disciplined Small Cap Portfolio BlackRock Investment Management, LLC
Global Atlantic BlackRock Disciplined U.S. Core Portfolio BlackRock Investment Management, LLC
Global Atlantic BlackRock Disciplined Value Portfolio BlackRock Investment Management, LLC
Global Atlantic BlackRock High Yield Portfolio BlackRock Investment Management, LLC
Global Atlantic Goldman Sachs Core Fixed Income Portfolio Goldman Sachs Asset Management, L.P.
Global Atlantic Goldman Sachs Global Equity Insights Portfolio Goldman Sachs Asset Management, L.P.
Global Atlantic Goldman Sachs Large Cap Growth Insights Portfolio Goldman Sachs Asset Management, L.P.
Global Atlantic Goldman Sachs Mid Cap Value Insights Portfolio Goldman Sachs Asset Management, L.P.
The Portfolios have employed Gemini Fund Services, LLC (“GFS”) to provide administration, fund accounting and transfer
agent services. GFS provides a Principal Financial Officer to the Trust.
Pursuant to an Investment Advisory Agreement with the Trust, on behalf of the Portfolios, the Adviser, under the oversight
of the Board, directs the daily investment operations of the Portfolios and supervises the performance of administrative and
professional services provided by others. As compensation for its services and the related expenses borne by the Adviser,
the Portfolios pay the Adviser an advisory fee, computed on average daily net assets and accrued daily and paid monthly.
219

Global Atlantic Portfolios
NOTES TO FINANCIAL STATEMENTS (Continued) December 31, 2018
The following chart details the annual advisory fee for each Portfolio.
Portfolio Advisory Fee* Global Atlantic BlackRock Allocation Portfolio 0.22% of the first $1 billion 0.21% of the next $1 billion 0.20% over $2 billion Global Atlantic BlackRock Disciplined Core Portfolio 0.39% of the first $1 billion
0.37% of the next $1 billion
0.35% over $2 billion
Global Atlantic BlackRock Disciplined Growth Portfolio 0.45% of the first $1 billion
0.43% of the next $1 billion
0.41% over $2 billion
Global Atlantic BlackRock Disciplined International Core Portfolio 0.60% of the first $1 billion
0.58% of the next $1 billion
0.56% over $2 billion
Global Atlantic BlackRock Disciplined Mid Cap Growth Portfolio 0.55% of the first $1 billion
0.53% of the next $1 billion
0.51% over $2 billion
Global Atlantic BlackRock Disciplined Small Cap Portfolio 0.54% of the first $1 billion
0.52% of the next $1 billion
0.50% over $2 billion
Global Atlantic BlackRock Disciplined U.S. Core Portfolio 0.39% of the first $1 billion
0.37% of the next $1 billion
0.35% over $2 billion
Global Atlantic BlackRock Disciplined Value Portfolio 0.45% of the first $1 billion
0.43% of the next $1 billion
0.41% over $2 billion
Global Atlantic BlackRock High Yield Portfolio 0.50% of the first $1 billion
0.48% of the next $1 billion
0.46% over $2 billion
Global Atlantic Goldman Sachs Core Fixed Income Portfolio 0.34% of the first $250 million
0.32% of the next $250 million
0.26% over $500 million
Global Atlantic Goldman Sachs Global Equity Insights Portfolio 0.63% of the first $250 million
0.61% of the next $250 million
0.58% of the next $500 million
0.55% over $1 billion
220

Global Atlantic Portfolios
NOTES TO FINANCIAL STATEMENTS (Continued) December 31, 2018
Portfolio Advisory Fee* Global Atlantic Goldman Sachs Large Cap Growth Insights Portfolio 0.37% of the first $250 million
0.35% of the next $250 million
0.34% of the next $500 million
0.32% over $1 billion
Global Atlantic Goldman Sachs Mid Cap Value Insights Portfolio 0.55% of the first $250 million
0.53% of the next $250 million
0.51% of the next $500 million
0.48% over $1 billion
* Calculated daily based on the average daily net assets.
With respect to each Portfolio, the Adviser has contractually agreed to waive its fees and to reimburse expenses, at least
until the expiration dates listed below, to ensure that total annual portfolio operating expenses after fee waiver and/or
reimbursement (exclusive of any front-end or contingent deferred loads, brokerage fees and commissions, acquired fund
fees and expenses, borrowing costs (such as interest and dividend expense on securities sold short), taxes and extraordinary
expenses, such as litigation) will not exceed the average daily net asset percentages attributable to the Portfolio’s shares
listed below (“Waiver Agreement”). The expense reimbursement is subject to possible recoupment from the Portfolio in
future years on a rolling three year basis (within the three years after the fees have been waived or reimbursed) if such
recoupment can be achieved within the lesser of the expense limits listed below and any expense limits applicable at the
time of recoupment. The agreements may be terminated only by the Portfolio's Board of Trustees, on 60 days’ written
notice to the Adviser.
Portfolio Class I Class II Expiration Date
Global Atlantic BlackRock Allocation Portfolio 0.31% 0.56% April 30, 2020
Global Atlantic BlackRock Disciplined Core Portfolio 0.48% 0.73% April 30, 2020
Global Atlantic BlackRock Disciplined Growth Portfolio 0.54% 0.79% April 30, 2020
Global Atlantic BlackRock Disciplined International Core Portfolio 0.69% 0.94% April 30, 2020
Global Atlantic BlackRock Disciplined Mid Cap Growth Portfolio 0.63% 0.88% April 30, 2020
Global Atlantic BlackRock Disciplined Small Cap Portfolio 0.63% 0.88% April 30, 2020
Global Atlantic BlackRock Disciplined U.S. Core Portfolio 0.48% 0.73% April 30, 2020
Global Atlantic BlackRock Disciplined Value Portfolio 0.54% 0.79% April 30, 2020
Global Atlantic BlackRock High Yield Portfolio 0.59% 0.84% April 30, 2020
Global Atlantic Goldman Sachs Core Fixed Income Portfolio 0.43% 0.68% April 30, 2020
Global Atlantic Goldman Sachs Global Equity Insights Portfolio 0.72% 0.97% April 30, 2020
Global Atlantic Goldman Sachs Large Cap Growth Insights Portfolio 0.46% 0.71% April 30, 2020
Global Atlantic Goldman Sachs Mid Cap Value Insights Portfolio 0.64% 0.89% April 30, 2020
Portfolio Expense Limitation
221

Global Atlantic Portfolios
NOTES TO FINANCIAL STATEMENTS (Continued) December 31, 2018
For the year ended December 31, 2018, the Adviser waived fees as follows:
Portfolio Waiver
Global Atlantic BlackRock Allocation Portfolio 8,542$
Global Atlantic BlackRock Disciplined Core Portfolio 50,540$
Global Atlantic BlackRock Disciplined Growth Portfolio 3,754$
Global Atlantic BlackRock Disciplined International Core Portfolio 9,810$
Global Atlantic BlackRock Disciplined Mid Cap Growth Portfolio 35,854$
Global Atlantic BlackRock Disciplined Small Cap Portfolio 3,138$
Global Atlantic BlackRock Disciplined U.S. Core Portfolio 3,915$
Global Atlantic BlackRock Disciplined Value Portfolio 25,935$
Global Atlantic BlackRock High Yield Portfolio 8,365$
Global Atlantic Goldman Sachs Core Fixed Income Portfolio 9,926$
Global Atlantic Goldman Sachs Global Equity Insights Portfolio 4,573$
Global Atlantic Goldman Sachs Large Cap Growth Insights Portfolio 9,822$
Global Atlantic Goldman Sachs Mid Cap Value Insights Portfolio 12,865$
If the Adviser waives any fee or reimburses any expense pursuant to the Waiver Agreement, and the Portfolio’s operating
expenses are subsequently less than the expense limitation, the Adviser shall be entitled to reimbursement by the Portfolio
for such waived fees or reimbursed expenses provided that such reimbursement does not cause the Portfolio's expenses
to exceed the amount of the expense limitation. If Portfolio operating expenses subsequently exceed the expense limitation,
the reimbursements shall be suspended.
The Adviser may recapture the following amounts by the following dates:
Portfolio December 31, 2020 December 31, 2021
Global Atlantic BlackRock Allocation Portfolio 853$ 8,542$
Global Atlantic BlackRock Disciplined Core Portfolio -$ 50,540$
Global Atlantic BlackRock Disciplined Growth Portfolio 310$ 3,754$
Global Atlantic BlackRock Disciplined International Core Portfolio 190$ 9,810$
Global Atlantic BlackRock Disciplined Mid Cap Growth Portfolio 1,748$ 35,854$
Global Atlantic BlackRock Disciplined Small Cap Portfolio 119$ 3,138$
Global Atlantic BlackRock Disciplined U.S. Core Portfolio 307$ 3,915$
Global Atlantic BlackRock Disciplined Value Portfolio -$ 25,935$
Global Atlantic BlackRock High Yield Portfolio 191$ 8,365$
Global Atlantic Goldman Sachs Core Fixed Income Portfolio 378$ 9,926$
Global Atlantic Goldman Sachs Global Equity Insights Portfolio 225$ 4,573$
Global Atlantic Goldman Sachs Large Cap Growth Insights Portfolio 1,279$ 9,822$
Global Atlantic Goldman Sachs Mid Cap Value Insights Portfolio -$ 12,865$
On May 23, 2017, the U.S. Securities and Exchange Commission (“SEC”) granted an order allowing Commonwealth Annuity
and Life Insurance Company (“Commonwealth”) to substitute certain variable investment options in which subaccounts of
its Separate Accounts invest with the Portfolios included in this report.
222

Global Atlantic Portfolios
NOTES TO FINANCIAL STATEMENTS (Continued) December 31, 2018
As a condition of this order, the SEC required that Commonwealth or an affiliate thereof (other than the Trust) pay all
expenses and transaction costs of the substitutions, including legal and accounting expenses, any applicable brokerage
expenses and other fees and expenses so that no fees or charges were assessed to the affected contract owners to effect
the substitutions. Please refer to the “payments from affiliate” line item on each Portfolio’s Statement of Operations for
additional details.
The Trust, on behalf of the Portfolios, has adopted a distribution and shareholder servicing plan (the “Plan”) pursuant to
Rule 12b-1 under the 1940 Act for Class II shares. The fee charged under the Plan is calculated at an annual rate of 0.25%
of the average daily net assets attributable to each Portfolio’s Class II shares and, for the year ended December 31, 2018,
was paid to Northern Lights Distributors, LLC (”Northern Lights”), to provide compensation for ongoing distribution-
related activities or services and/or maintenance of the Portfolios’ shareholder accounts, not otherwise required to be
provided by the Adviser. Northern Lights is an affiliate of GFS. Effective on or about January 1, 2019, Global Atlantic
Distributors, LLC (“GAD”) became the principal underwriter (distributor) for the Portfolios and Northern Lights no longer
serves as the Portfolios’ principal underwriter. GAD is an affiliate of the Adviser.
Pursuant to the terms of an administrative servicing agreement with GFS, each Portfolio pays GFS, an annual asset based
fee, which is calculated and applied monthly, adjusted upward for any Portfolios with less than $5 million in assets, and
subject to an annual minimum fee based on the number of Portfolios in the Trust. In consideration of its receipt of the
annual fee, GFS pays all operational expenses of the Portfolios with the exception of legal counsel fees, Trustee fees, certain
expenses related to Board meetings and costs associated with the preparation and filing of Forms N-PORT and N-CEN.
Certain extraordinary expenses such as expenses incurred in connection with any merger, reorganization or litigation would
be borne by the Portfolios.
For the year ended December 31, 2018, the Trustees received fees as follows:
Portfolio Fees Received
Global Atlantic BlackRock Allocation Portfolio 9,256$
Global Atlantic BlackRock Disciplined Core Portfolio 40,404$
Global Atlantic BlackRock Disciplined Growth Portfolio 2,201$
Global Atlantic BlackRock Disciplined International Core Portfolio 10,285$
Global Atlantic BlackRock Disciplined Mid Cap Growth Portfolio 12,974$
Global Atlantic BlackRock Disciplined Small Cap Portfolio 1,450$
Global Atlantic BlackRock Disciplined U.S. Core Portfolio 2,145$
Global Atlantic BlackRock Disciplined Value Portfolio 22,569$
Global Atlantic BlackRock High Yield Portfolio 8,957$
Global Atlantic Goldman Sachs Core Fixed Income Portfolio 6,091$
Global Atlantic Goldman Sachs Global Equity Insights Portfolio 2,060$
Global Atlantic Goldman Sachs Large Cap Growth Insights Portfolio 6,924$
Global Atlantic Goldman Sachs Mid Cap Value Insights Portfolio 9,580$
Certain affiliates of Northern Lights and GFS provide ancillary services to the Portfolios as follows:
Blu Giant, LLC (“Blu Giant”) – Blu Giant, an affiliate of GFS and Northern Lights, provides EDGAR conversion and filing
services as well as print management services for the Portfolios on an ad-hoc basis. For the provision of these services,
Blu Giant receives customary fees from GFS under the administrative servicing agreement.
223

Global Atlantic Portfolios
NOTES TO FINANCIAL STATEMENTS (Continued) December 31, 2018
5. CONTROL OWNERSHIP
The beneficial ownership, either directly or indirectly, of more than 25% of the voting securities of a Portfolio creates a
presumption of the control of the Portfolio, under section 2(a)(9) of the 1940 Act. As of December 31, 2018,
Commonwealth Annuity and Life Insurance Company owned 100% of the voting securities of each Portfolio. The Trust has
no knowledge as to whether all or any portion of the shares owned of record are also owned beneficially.
Shareholder Concentration Risk — Commonwealth Annuity and Life Insurance Company, certain accounts, or the
Adviser’s affiliates may from time to time own (beneficially or of record) or control a significant percentage of a Portfolio’s
shares. Redemptions by these entities of their holdings in a Portfolio may impact the Portfolio’s liquidity and NAV. These
redemptions may also force a Portfolio to sell securities.
6. AGGREGATE UNREALIZED APPRECIATION AND DEPRECIATION – TAX BASIS
Gross Gross Net Unrealized
Tax Unrealized Unrealized Appreciation/
Cost Appreciation Depreciation (Depreciation)
Global Atlantic BlackRock Allocation Portfolio 82,078,163$ 49,133$ (4,712,603)$ (4,663,470)$
Global Atlantic BlackRock Disciplined Core Portfolio 544,245,169 18,124,154 (44,389,119) (26,264,965)
Global Atlantic BlackRock Disciplined Growth Portfolio 16,220,735 831,594 (1,252,511) (420,917)
Global Atlantic BlackRock Disciplined International Core Portfolio 156,007,228 1,661,929 (22,247,771) (20,585,842)
Global Atlantic BlackRock Disciplined Mid Cap Growth Portfolio 175,921,549 10,627,586 (17,431,169) (6,803,583)
Global Atlantic BlackRock Disciplined Small Cap Portfolio 18,563,385 1,301,023 (3,530,165) (2,229,142)
Global Atlantic BlackRock Disciplined U.S. Core Portfolio 23,044,412 798,547 (1,942,698) (1,144,151)
Global Atlantic BlackRock Disciplined Value Portfolio 272,444,244 8,572,567 (26,503,309) (17,930,742)
Global Atlantic BlackRock High Yield Portfolio 75,576,429 40,317 (6,406,146) (6,365,829)
Global Atlantic Goldman Sachs Core Fixed Income Portfolio 107,147,726 620,029 (1,197,881) (577,852)
Global Atlantic Goldman Sachs Global Equity Insights Portfolio 30,206,440 617,829 (3,414,746) (2,796,917)
Global Atlantic Goldman Sachs Large Cap Growth Insights Portfolio 85,167,444 3,271,146 (7,135,235) (3,864,089)
Global Atlantic Goldman Sachs Mid Cap Value Insights Portfolio 139,945,842 2,015,705 (17,881,031) (15,865,326)
7. DISTRIBUTIONS TO SHAREHOLDERS AND TAX COMPONENTS OF CAPITAL
The tax character of fund distributions paid for the year ended December 31, 2018 was as follows:
For fiscal year ended Ordinary Long-Term Return of
12/31/2018 Income Capital Gains Capital Total
Global Atlantic BlackRock Allocation Portfolio 361,277$ $ - -$ -$ 361,277$
Global Atlantic BlackRock Disciplined Core Portfolio 7,952,766 308,649 - 8,261,415
Global Atlantic BlackRock Disciplined Growth Portfolio 263,078 - 20,035 - 283,113
Global Atlantic BlackRock Disciplined International Core Portfolio 3,135,099 - - 3,135,099
Global Atlantic BlackRock Disciplined Mid Cap Growth Portfolio 2,025,737 99,342 - 2,125,079
Global Atlantic BlackRock Disciplined Small Cap Portfolio 93,096 11,425 - 104,521
Global Atlantic BlackRock Disciplined U.S. Core Portfolio 498,157 22,695 - 520,852
Global Atlantic BlackRock Disciplined Value Portfolio 5,978,801 294,412 - 6,273,213
Global Atlantic BlackRock High Yield Portfolio 476,776 6,251 - 483,027
Global Atlantic Goldman Sachs Core Fixed Income Portfolio 47,084 - - 47,084
Global Atlantic Goldman Sachs Global Equity Insights Portfolio 362,130 44,780 - 406,910
Global Atlantic Goldman Sachs Large Cap Growth Insights Portfolio 1,222,604 2,517 - 1,225,121
Global Atlantic Goldman Sachs Mid Cap Value Insights Portfolio 1,136,829 21,023 - 1,157,852
There were no fund distributions for the period ended December 31, 2017.
224

Global Atlantic Portfolios
NOTES TO FINANCIAL STATEMENTS (Continued) December 31, 2018
As of December 31, 2018, the components of accumulated earnings/(deficit) on a tax basis were as follows:
Undistributed Undistributed Post October Loss Capital Loss Other Unrealized Total
Ordinary Long-Term and Carry Book/Tax Appreciation/ Accumulated
Income Capital Gains Late Year Loss Forwards Differences (Depreciation) Earnings/(Deficits)
Global Atlantic BlackRock Allocation Portfolio 1,578,456$ -$ -$ (76,913)$ -$ (4,663,470)$ (3,161,927)$
Global Atlantic BlackRock Disciplined Core Portfolio 2,642,419 - - (1,288,484) - (26,265,591) (24,911,656)
Global Atlantic BlackRock Disciplined Growth Portfolio 536,061 29,267 - - - (420,917) 144,411
Global Atlantic BlackRock Disciplined International Core Portfolio 511,658 - - (5,778,538) - (20,588,571) (25,855,451)
Global Atlantic BlackRock Disciplined Mid Cap Growth Portfolio 402,171 385,576 - - - (6,803,583) (6,015,836)
Global Atlantic BlackRock Disciplined Small Cap Portfolio 529,490 - - - - (2,229,142) (1,699,652)
Global Atlantic BlackRock Disciplined U.S. Core Portfolio 313,052 - - - - (1,144,151) (831,099)
Global Atlantic BlackRock Disciplined Value Portfolio 1,876,308 - - (1,157,196) - (17,930,742) (17,211,630)
Global Atlantic BlackRock High Yield Portfolio 4,219,221 - - (1,759,683) - (6,365,829) (3,906,291)
Global Atlantic Goldman Sachs Core Fixed Income Portfolio 2,191,473 - - (953,311) - (578,594) 659,568
Global Atlantic Goldman Sachs Global Equity Insights Portfolio 42,788 - - (475,952) - (2,797,265) (3,230,429)
Global Atlantic Goldman Sachs Large Cap Growth Insights Portfolio 1,615,049 30,615 - - - (3,864,089) (2,218,425)
Global Atlantic Goldman Sachs Mid Cap Value Insights Portfolio 1,780,229 - - - - (15,865,326) (14,085,097)
The difference between book basis and tax basis unrealized appreciation (depreciation), undistributed ordinary income
(loss) and accumulated net realized gain (loss) from investments is primarily attributable to the tax deferral of losses on
wash sales, return of capital distributions from C-Corporations and the mark-to-market on passive foreign investment
companies, open 1256 options and futures contracts, forward foreign currency contracts and swaps. The unrealized
appreciation (depreciation) in the table above includes unrealized foreign currency gains (losses) of ($626), ($2,729), ($742),
and ($348) for BlackRock Disciplined Core Portfolio, BlackRock Disciplined International Core Portfolio, Goldman Sachs
Core Fixed Income Portfolio, and Goldman Sachs Global Equity Insights Portfolio, respectively.
At December 31, 2018, the Portfolios had capital loss carry forwards for federal income tax purposes available to offset
future capital gains as follows:
Non-Expiring Non-Expiring
Short-Term Long-Term Total
Global Atlantic BlackRock Allocation Portfolio 57,097$ 19,816$ 76,913$
Global Atlantic BlackRock Disciplined Core Portfolio 1,288,484 - 1,288,484
Global Atlantic BlackRock Disciplined Growth Portfolio - - -
Global Atlantic BlackRock Disciplined International Core Portfolio 5,124,632 653,906 5,778,538
Global Atlantic BlackRock Disciplined Mid Cap Growth Portfolio - - -
Global Atlantic BlackRock Disciplined Small Cap Portfolio - - -
Global Atlantic BlackRock Disciplined U.S. Core Portfolio - - -
Global Atlantic BlackRock Disciplined Value Portfolio 1,087,455 69,741 1,157,196
Global Atlantic BlackRock High Yield Portfolio 1,628,868 130,815 1,759,683
Global Atlantic Goldman Sachs Core Fixed Income Portfolio 796,660 156,651 953,311
Global Atlantic Goldman Sachs Global Equity Insights Portfolio 435,227 40,725 475,952
Global Atlantic Goldman Sachs Large Cap Growth Insights Portfolio - - -
Global Atlantic Goldman Sachs Mid Cap Value Insights Portfolio - - -
8. NEW ACCOUNTING PRONOUNCEMENTS
In August 2018, the Securities and Exchange Commission adopted amendments to certain disclosure requirements under
Regulation S-X to conform to US GAAP, including: (i) an amendment to require presentation of the total, rather than the
components, of distributable earnings on the Statement of Assets and Liabilities; and (ii) an amendment to require
presentation of the total, rather than the components, of distributions to shareholders, except for tax return of capital
distributions, if any, on the Statement of Changes in Net Assets. The amendments also removed the requirement for
parenthetical disclosure of undistributed net investment income on the Statement of Changes in Net Assets. These
amendments have been adapted effective with these financial statements.
225

Global Atlantic Portfolios
NOTES TO FINANCIAL STATEMENTS (Continued) December 31, 2018
In August 2018, the FASB issued Accounting Standards Update (“ASU”) No. 2018-13, which changes certain fair value
measurement disclosure requirements. The new ASU, in addition to other modifications and additions, removes the
requirement to disclose the amount and reasons for transfers between Level 1 and Level 2 of the fair value hierarchy, and
the policy for the timing of transfers between levels. For investment companies, the amendments are effective for financial
statements issued for fiscal years beginning after December 15, 2019, and interim periods within those fiscal years. Early
adoption is allowed. At this time, management is evaluating the implications of the ASU and any impact on the financial
statement disclosures.
9. SUBSEQUENT EVENTS
Subsequent events after the date of the Statement of Assets and Liabilities have been evaluated through the date the financial
statements were issued. Management has determined that no events or transactions occurred requiring adjustment or
disclosure in the financial statements, other than the following.
Effective February 1, 2019, NorthStar Financial Services Group, LLC, the parent company of Gemini Fund Services, LLC
(“GFS”) sold its interest in the Gemini Companies to a third party private equity firm that contemporaneously acquired
Ultimus Fund Solutions, LLC (an independent mutual fund administration firm) and its affiliates (collectively, the “Ultimus
Companies”). As a result of these separate transactions, the Gemini Companies and the Ultimus Companies are now
indirectly owned through a common parent entity, The Ultimus Group, LLC.
226

Report of Independent Registered Public Accounting Firm
To the Board of Trustees of Forethought Variable Interest Trust and the Shareholders of Each of the Separate Series of Forethought Variable Insurance Trust Opinion on the Financial Statements We have audited the accompanying statements of assets and liabilities, including the portfolios of investments, of Global Atlantic BlackRock Allocation Portfolio, Global Atlantic BlackRock Disciplined Core Portfolio, Global Atlantic BlackRock Disciplined Growth Portfolio, Global Atlantic BlackRock Disciplined International Core Portfolio, Global Atlantic BlackRock Disciplined Mid Cap Growth Portfolio, Global Atlantic BlackRock Disciplined Small Cap Portfolio, Global Atlantic BlackRock Disciplined U.S. Core Portfolio, Global Atlantic BlackRock Disciplined Value Portfolio, Global Atlantic BlackRock High Yield Portfolio, Global Atlantic Goldman Sachs Core Fixed Income Portfolio, Global Atlantic Goldman Sachs Global Equity Insights Portfolio, Global Atlantic Goldman Sachs Large Cap Growth Insights Portfolio, and Global Atlantic Goldman Sachs Mid Cap Value Insights Portfolio (collectively, the Portfolios), each a separate series of the Forethought Variable Insurance Trust, as of December 31, 2018, the related statements of operations for the year then ended, and the statements of changes in net assets and financial highlights for the year then ended and for the period from November 6, 2017 (commencement of operations) through December 31, 2017, including the related notes (collectively, the financial statements). In our opinion, the financial statements present fairly, in all material respects, the financial position of each of the Portfolios as of December 31, 2018, the results of their operations for the year then ended, and changes in their net assets and the financial highlights for the year then ended and for the period from November 6, 2017 (commencement of operations) through December 31, 2017, in conformity with accounting principles generally accepted in the United States of America. Basis for Opinion These financial statements are the responsibility of each of the Portfolios’ management. Our responsibility is to express an opinion on the Portfolios’ financial statements based on our audits. We are a public accounting firm registered with the Public Company Accounting Oversight Board (United States) (PCAOB) and are required to be independent with respect to the Portfolios in accordance with the U.S. federal securities laws and the applicable rules and regulations of the Securities and Exchange Commission and the PCAOB. We conducted our audits in accordance with the standards of the PCAOB. Those standards require that we plan and perform the audits to obtain reasonable assurance about whether the financial statements are free of material misstatement, whether due to error or fraud. The Portfolios are not required to have, nor were we engaged to perform, an audit of internal control over financial reporting. As part of our audits, we are required to obtain an understanding of internal control over financial reporting but not for the purpose of expressing an opinion on the effectiveness of the Portfolios’ internal control over financial reporting. Accordingly, we express no such opinion. Our audits included performing procedures to assess the risks of material misstatement of the financial statements, whether due to error or fraud, and performing procedures that respond to those risks. Such procedures included examining, on a test basis, evidence regarding the amounts and disclosures in the financial statements. Our audits also included evaluating the accounting principles used and significant estimates made by management, as well as evaluating the overall presentation of the financial statements. Our procedures included confirmation of investments owned as of December 31, 2018, by correspondence with the custodians and brokers or by other appropriate auditing procedures where replies from brokers were not received. We believe that our audits provide a reasonable basis for our opinion. /s/ RSM US LLP We have served as the auditor for one or more Forethought Variance Insurance Trust investment companies since 2013. Denver, Colorado February 25, 2019
227

Global Atlantic Portfolios
EXPENSE EXAMPLES
December 31, 2018 (Unaudited)
As a shareholder of the Portfolios, you incur ongoing costs, including management fees; distribution and/or service
(12b-1) fees; and other Portfolio expenses. This example is intended to help you understand your ongoing costs (in
dollars) of investing in each Portfolio and to compare these costs with the ongoing costs of investing in other mutual
funds.
The example is based on an investment of $1,000 invested at the beginning of the period and held for the entire period
from July 1, 2018 through December 31, 2018.
Actual Expenses
The “Actual” expenses set of columns in the table below provides information about actual account values and actual
expenses. You may use the information below together with the amount you invested, to estimate the expenses that you
paid over the period. Simply divide your account value by $1,000 (for example, an $8,600 account value divided by $1,000
= 8.6), then multiply the result by the number in the table under the heading entitled “Expenses Paid During Period” to
estimate the expenses you paid on your account during this period.
Hypothetical Example for Comparison Purposes
The “Hypothetical” expenses set of columns in the table below provides information about hypothetical account values
and hypothetical expenses based on each Portfolio’s actual expense ratio and an assumed rate of return of 5% per year
before expenses, which is not the Portfolio’s actual return. The hypothetical account values and expenses may not be
used to estimate the actual ending account balances or expenses you paid for the period. You may use this information to
compare this 5% hypothetical example for a specific Portfolio with the 5% hypothetical examples that appear in the
shareholder reports of other funds.
Please note that the expenses shown in the table are meant to highlight your ongoing costs only and do not reflect any
transactional costs, such as sales charges (loads), or redemption fees or other expenses charged by your insurance
contract or separate account. Therefore, the Hypothetical columns of the table are useful in comparing ongoing costs
only, and will not help you determine the relative total costs of owning different funds. In addition, if these transactional
costs were included, your costs would have been higher.
Actual
Hypothetical
(5% return before
expenses)
Class I Shares
Portfolio’s
Annualized
Expense Ratio
Beginning
Account Value
7-1-18
Ending
Account
Value
12-31-18
Expenses
Paid
During
Period*
Ending
Account
Value
12-31-18
Expenses
Paid
During
Period*
Global Atlantic BlackRock
Allocation Portfolio 0.31% $1,000.00 $949.50 $1.52 $1,023.64 $1.58
Global Atlantic BlackRock
Disciplined Core Portfolio 0.48% $1,000.00 $924.00 $2.33 $1,022.79 $2.45
Global Atlantic BlackRock
Disciplined International Core
Portfolio 0.69% $1,000.00 $881.40 $3.27 $1,021.73 $3.52
Global Atlantic BlackRock
Disciplined Mid Cap Growth
Portfolio 0.63% $1,000.00 $908.70 $3.03 $1,022.03 $3.21
Global Atlantic BlackRock
Disciplined Small Cap Portfolio 0.63% $1,000.00 $837.90 $2.92 $1,022.03 $3.21
* Expenses are equal to the Portfolio’s annualized expense ratio, multiplied by the number of days in the period (184) divided by the number of
days in the fiscal year (365).
228

Global Atlantic Portfolios
EXPENSE EXAMPLES (Continued)
December 31, 2018 (Unaudited)
Actual
Hypothetical
(5% return before
expenses)
Class I Shares
Portfolio’s
Annualized
Expense Ratio
Beginning
Account
Value
7-1-18
Ending
Account
Value
12-31-18
Expenses
Paid
During
Period*
Ending
Account
Value
12-31-18
Expenses
Paid
During
Period*
Global Atlantic BlackRock Disciplined
U.S. Core Portfolio 0.48% $1,000.00 $924.00 $2.33 $1,022.79 $2.45
Global Atlantic BlackRock Disciplined
Value Portfolio 0.54% $1,000.00 $931.00 $2.63 $1,022.48 $2.75
Global Atlantic BlackRock High Yield
Portfolio 0.59% $1,000.00 $968.50 $2.93 $1,022.23 $3.01
Global Atlantic Goldman Sachs Core
Fixed Income Portfolio 0.43% $1,000.00 $1,010.70 $2.18 $1,023.04 $2.19
Global Atlantic Goldman Sachs Global
Equity Insights Portfolio 0.72% $1,000.00 $882.60 $3.42 $1,021.58 $3.67
Global Atlantic Goldman Sachs Large
Cap Growth Insights Portfolio 0.46% $1,000.00 $901.60 $2.20 $1,022.89 $2.35
Global Atlantic Goldman Sachs Mid Cap
Value Insights Portfolio 0.64% $1,000.00 $879.80 $3.03 $1,021.98 $3.26
Class II Shares
Portfolio’s
Annualized
Expense Ratio
Beginning
Account
Value
7-1-18
Ending
Account
Value
12-31-18
Expenses
Paid
During
Period*
Ending
Account
Value
12-31-18
Expenses
Paid
During
Period*
Global Atlantic BlackRock Allocation
Portfolio 0.56% $1,000.00 $947.70 $2.75 $1,022.38 $2.85
Global Atlantic BlackRock Disciplined
Core Portfolio 0.73% $1,000.00 $922.70 $3.54 $1,021.53 $3.72
Global Atlantic BlackRock Disciplined
Growth Portfolio 0.79% $1,000.00 $905.30 $3.79 $1,021.22 $4.02
Global Atlantic BlackRock Disciplined
International Core Portfolio 0.94% $1,000.00 $879.80 $4.45 $1,020.47 $4.79
Global Atlantic BlackRock Disciplined
Mid Cap Growth Portfolio 0.88% $1,000.00 $906.90 $4.23 $1,020.77 $4.48
Global Atlantic BlackRock Disciplined
Small Cap Portfolio 0.88% $1,000.00 $836.20 $4.07 $1,020.77 $4.48
Global Atlantic BlackRock Disciplined
U.S. Core Portfolio 0.73% $1,000.00 $922.50 $3.54 $1,021.53 $3.72
Global Atlantic BlackRock Disciplined
Value Portfolio 0.79% $1,000.00 $929.90 $3.84 $1,021.22 $4.02
Global Atlantic BlackRock High Yield
Portfolio 0.84% $1,000.00 $967.10 $4.16 $1,020.97 $4.28
Global Atlantic Goldman Sachs
Core Fixed Income Portfolio 0.68% $1,000.00 $1,010.20 $3.45 $1,021.78 $3.47
Global Atlantic Goldman Sachs
Global Equity Insights Portfolio 0.97% $1,000.00 $880.80 $4.60 $1,020.32 $4.94
Global Atlantic Goldman Sachs
Large Cap Growth Insights Portfolio 0.71% $1,000.00 $900.10 $3.40 $1,021.63 $3.62
Global Atlantic Goldman Sachs
Mid Cap Value Insights Portfolio 0.89% $1,000.00 $879.00 $4.22 $1,020.72 $4.53
* Expenses are equal to the Portfolio’s annualized expense ratio, multiplied by the number of days in the period (184) divided by the number of
days in the fiscal year (365).
229

Global Atlantic Portfolios
SUPPLEMENTAL INFORMATION
December 31, 2018 (Unaudited)
Approval of Renewal of Investment Advisory Agreement and Sub-Advisory Agreements for Global Atlantic
BlackRock Allocation Portfolio, Global Atlantic BlackRock Disciplined Core Portfolio, Global Atlantic
BlackRock Disciplined Growth Portfolio, Global Atlantic BlackRock Disciplined International Core
Portfolio, Global Atlantic BlackRock Disciplined Mid Cap Growth Portfolio, Global Atlantic BlackRock
Disciplined Small Cap Portfolio, Global Atlantic BlackRock Disciplined U.S. Core Portfolio, Global
Atlantic BlackRock Disciplined Value Portfolio, Global Atlantic BlackRock High Yield Portfolio, Global
Atlantic Goldman Sachs Core Fixed Income Portfolio, Global Atlantic Goldman Sachs Global Equity
Insights Portfolio, Global Atlantic Goldman Sachs Large Cap Growth Insights Portfolio and Global
Atlantic Goldman Sachs Mid Cap Value Insights Portfolio.
At an in-person meeting held on November 12, 2018, the Board of Trustees (the “Trustees” or the
“Board”) of Forethought Variable Insurance Trust (the “Trust”), including a majority of the Trustees who
are not “interested persons,” as that term is defined in the Investment Company Act of 1940, as amended
(the “Independent Trustees”), considered the renewal of: (i) an investment advisory agreement between
Global Atlantic Investment Advisors, LLC (the “Adviser”) and the Trust, on behalf of Global Atlantic
BlackRock Allocation Portfolio (“GA BlackRock Allocation”), Global Atlantic BlackRock Disciplined
Core Portfolio (“GA BlackRock Core”), Global Atlantic BlackRock Disciplined Growth Portfolio (“GA
BlackRock Growth”), Global Atlantic BlackRock Disciplined International Core Portfolio (“GA
BlackRock International”), Global Atlantic BlackRock Disciplined Mid Cap Growth Portfolio (“GA
BlackRock Mid Cap Growth”), Global Atlantic BlackRock Disciplined Small Cap Portfolio (“GA
BlackRock Small Cap”), Global Atlantic BlackRock Disciplined U.S. Core Portfolio (“GA BlackRock U.S.
Core”), Global Atlantic BlackRock Disciplined Value Portfolio (“GA BlackRock Value”), Global Atlantic
BlackRock High Yield Portfolio (“GA BlackRock High Yield”), Global Atlantic Goldman Sachs Core
Fixed Income Portfolio (“GA Goldman Core Fixed”), Global Atlantic Goldman Sachs Global Equity
Insights Portfolio (“GA Goldman Global Equity”), Global Atlantic Goldman Sachs Large Cap Growth
Insights Portfolio (“GA Goldman Large Cap”) and Global Atlantic Goldman Sachs Mid Cap Value Insights
Portfolio (“GA Goldman Mid Cap”) (each a “Fund” and collectively the “Funds”) (the “Advisory
Agreement”); (ii) a sub-advisory agreement between the Adviser, the Trust, on behalf of GA BlackRock
Allocation, GA BlackRock International, GA BlackRock Growth, GA Blackrock Value, GA BlackRock
Mid Cap Growth, GA BlackRock Small Cap, GA BlackRock Core, GA BlackRock U.S. Core and GA
BlackRock High Yield, and BlackRock Investment Management, LLC (“BIM”) (the “BIM Sub-Advisory
Agreement”); and (iii) a sub-advisory agreement between the Adviser, the Trust, on behalf of GA Goldman
Core Fixed, GA Goldman Global Equity, GA Goldman Large Cap and GA Goldman Mid Cap, and
Goldman Sachs Asset Management, L.P. (“GSAM” and together with BIM, the “Sub-Advisers”) (the
“GSAM Sub-Advisory Agreement” and collectively with the BIM Sub-Advisory Agreement, the “Sub-
Advisory Agreements”).
To discuss and review the materials relating to the proposed renewal of the Advisory Agreement
and Sub-Advisory Agreements in advance of the November 12, 2018 meeting, the Independent Trustees
met in person on October 31, 2018 with independent counsel to the Independent Trustees (“Independent
Counsel”) with representatives of the Adviser in attendance and counsel to the Trust (“Trust Counsel”)
participating telephonically.
Prior to the meetings, the Trustees requested, received and reviewed written responses from the
Adviser and the Sub-Advisers to questions posed to the Adviser and the Sub-Advisers by counsel, on behalf
of the Trustees. Following the meeting on October 31, 2018, the Independent Trustees requested additional
information on certain items and the Adviser responded to those items and made certain updates, which
were discussed during the meeting on November 12, 2018. The Trustees also received a memorandum from
Independent Counsel describing the legal standards for their consideration of the approval of the Advisory
230

Global Atlantic Portfolios
SUPPLEMENTAL INFORMATION (Continued)
December 31, 2018 (Unaudited)
and Sub-Advisory Agreements. During the meetings, the Board and the Adviser discussed information
relating to the Board’s consideration of the Gartenberg factors with respect to each Fund. The Trustees also
reviewed comparative information relating to advisory fees and total expenses and received in-person
presentations concerning the services provided under the Advisory and Sub-Advisory Agreements from
personnel of the Adviser at the November 12, 2018 Board meeting. Prior to voting on the renewal of the
Advisory and Sub-Advisory Agreements, the Independent Trustees met in executive session with
Independent Counsel present.
The Trustees relied upon the advice of counsel and their own business judgment in determining the
material factors to be considered in evaluating the Advisory and Sub-Advisory Agreements and the weight
to be given to each such factor. The conclusions reached by the Trustees were based on a comprehensive
evaluation of all of the information provided and were not the result of any one factor. Moreover, each
Trustee may have afforded different weight to the various factors in reaching his or her conclusions with
respect to the Advisory and Sub-Advisory Agreements.
Nature, Extent, and Quality of Services. The Trustees requested and considered information
regarding the nature, extent, and quality of services provided by the Adviser and each Sub-Adviser, as well
as their expertise, resources, and capabilities. The Trustees considered, among other things, the terms of the
Investment Advisory and Sub-Advisory Agreements and the range of services provided by the Adviser and
each Sub-Adviser. The Trustees also considered the financial industry experience as well as portfolio
management, compliance, and operations experience of the Adviser’s and Sub-Advisers’ personnel. The
Trustees reviewed the Adviser’s practices for monitoring compliance with each Fund’s investment
limitations, noting that such practices continue to be adequate. The Trustees also considered information
and representations regarding the financial condition of the Adviser and the Sub-Advisers related to their
ongoing ability to provide services specified under the Investment Advisory Agreement and Sub-Advisory
Agreements, respectively. Based on their analysis of the data presented, the Trustees concluded that they
were generally satisfied with the nature and quality of the services being provided under the Investment
Advisory and Sub-Advisory Agreements.
Performance. The Trustees requested and reviewed specific information regarding the investment
performance of each Fund as compared to the performance of its benchmark index and peer group for the
1-year and since inception periods. The Board noted that GA BlackRock High Yield and GA Goldman
Large Cap had underperformed their respective benchmarks for the 1-year and since-inception periods. The
Trustees discussed with the Adviser the steps being taken to improve the Funds’ performance. The Trustees
concluded that they were generally satisfied with the Adviser’s and the Sub-Advisers’ investment
performance to date.
Fees and Expenses. The Trustees reviewed the Funds’ fees and expenses, including the fees paid
to the Adviser and the Sub-Advisers. The Trustees reviewed reports describing both the advisory fees
charged by the Adviser and the total net expense ratios of each Fund in comparison to those of peer groups
selected by the Adviser that were comprised of similarly situated funds. The Trustees also reviewed
information provided by GSAM as to fees it charged to other clients. The Trustees were not provided with
information regarding fees BIM charges to other clients, but noted the representations of the Adviser that
the fee arrangement with each Sub-Adviser, including BIM, were negotiated by the Adviser on an arm’s
length basis. The Trustees considered the complexity of certain managed risk strategies. The Trustees also
considered the “spread” between the advisory and sub-advisory fees at various asset levels. The Trustees
noted the ongoing efforts of the Adviser to reduce expenses charged to shareholders by voluntarily waiving
certain fees payable to the Adviser. The Trustees also considered that the Adviser had agreed to limit each
Fund’s total annual operating expenses by waiving a portion of its advisory fee and/or reimbursing a Fund
231

Global Atlantic Portfolios
SUPPLEMENTAL INFORMATION (Continued)
December 31, 2018 (Unaudited)
to the extent that its expenses exceed a specified amount. Based on their review, the Trustees concluded
that the advisory fee charged to each Fund and the sub-advisory fee paid by the Adviser to each Sub-Adviser
were not unreasonable in light of the services provided to each respective Fund.
Profitability. The Trustees reviewed information regarding the Adviser’s cost to provide
investment advisory and related services to each Fund and the Adviser’s profitability, both overall and with
respect to each Fund. The Trustees also reviewed information about the profitability to the Adviser and its
affiliates from all services provided to each Fund and all aspects of their relationship with each Fund. The
Trustees concluded that the profitability levels for the Adviser were not excessive. The Trustees were not
provided with information regarding the Sub-Advisers’ profitability with respect to managing each relevant
Fund. The Trustees considered, however, the information provided by the Sub-Advisers, as applicable,
regarding fees charged to other clients, the Funds’ advisory and sub-advisory fees and the Funds’ total
expense ratios relative to their peer groups.
Economies of Scale. The Trustees considered information regarding the Adviser’s and Sub-
Advisers’ realization of economies of scale with respect to each Fund and whether the fee levels reflect
these economies of scale for the benefit of each Fund’s shareholders. The Trustees noted the breakpoints in
the advisory fee schedule for each Fund which reduce fee rates as the Fund assets grow over time. The
Trustees considered the expense limitations and/or fee waivers that reduce each relevant Fund’s overall
expenses at all asset levels. Based on this information, the Trustees concluded that they were satisfied with
the extent to which economies of scale, if any, would be shared for the benefit of each Fund’s shareholders
based on currently available information and the effective advisory fee and expense ratios for each Fund
and its current and reasonably anticipated asset levels. The Trustees noted, however, that they would
continue to monitor each Fund’s growth and consider any additional opportunities to realize benefits from
economies of scale for shareholders in the future.
Other Benefits. The Trustees considered other benefits to the Adviser and its affiliates from their
relationships with the Funds, including the role of the Funds in supporting the variable insurance products
offered by Forethought Life Insurance Company (“FLIC”) and Commonwealth Annuity and Life Insurance
Company (“CWA”) and the fact that FLIC and CWA or their affiliates receive 12b-1 fees from the Funds.
The Trustees also considered other benefits to the Sub-Advisers and their affiliates from their relationships
with the Funds, noting that BIM and GSAM may receive soft dollar benefits in connection with their sub-
advisory relationships with the Funds to which each serves as Sub-Adviser.
Conclusion. Having requested and received such information from the Adviser and Sub-Advisers
as the Trustees believed to be reasonably necessary to evaluate the terms of the Advisory and Sub-Advisory
Agreements, and as assisted by the advice of counsel, the Trustees, including the Independent Trustees
voting separately, unanimously concluded that renewing the Advisory and Sub-Advisory Agreements was
in the best interests of each Fund and its shareholders. They noted that in considering the Advisory and
Sub-Advisory Agreements, the Independent Trustees did not identify any one factor as all important.
Moreover, each Trustee may have afforded different weight to the various factors in reaching a conclusion
with respect to the Advisory and Sub-Advisory Agreements.
232

Global Atlantic Portfolios
SUPPLEMENTAL INFORMATION (Continued)
December 31, 2018 (Unaudited)
Trustees and Officers
The Trustees and officers of the Trust, together with information as to their principal business occupations during the
past five years and other information, are shown below. Unless otherwise noted, the address of each Trustee and
Officer is c/o Global Atlantic Investment Advisors, LLC, 10 West Market Street, Suite 2300, Indianapolis, Indiana
46204.
Independent Trustees
Name, Address
and Age
Position/
Term of Office1
Principal Occupation During the Past Five
Years
Number of
Portfolios in
Fund Complex
Overseen by
Trustee
Other Directorships
held by Trustee
During the Past Five
Years
Mark Garbin
Year of Birth:
1951
Trustee since 2013 Managing Principal, Coherent Capital
Management LLC (since 2007). 25 Altegris KKR
Commitments Fund
(since 2014); Oak
Hill Advisors
Mortgage Strategies
Fund (Offshore)
(2014–2017); Two
Roads Shared Trust
(since 2012);
Northern Lights
Fund Trust (since
2013); Northern
Lights Variable
Trust (since 2013). Mitchell E. Appel
Year of Birth:
1970
Trustee since 2013 President, Value Line Funds (since 2008);
Chief Financial Officer (since 2008),
President (since 2009), EULAV Securities
LLC; President (since 2009), Treasurer
(since 2011), EULAV Asset Management.
25 Value Line Funds
(since 2010);
EULAV Asset
Management (since
2010). Joseph E. Breslin
Year of Birth:
1953
Trustee since 2013 Counsel, White Oak Global Advisors, LLC
(asset management firm) (since 2016);
Counsel, Common fund (asset management
firm) (2014–2016); Consultant, Investment
Managers (since 2009).
25 Kinetics Mutual
Funds, Inc. (since
2000); Kinetics
Portfolios
Trust (since
2000); Northern
Lights Fund Trust
IV (since 2015);
BlueArc Multi-
Strategy Fund
(2014–2017);
Hatteras
Trust (2004–2016).
233

Global Atlantic Portfolios
SUPPLEMENTAL INFORMATION (Continued)
December 31, 2018 (Unaudited)
Interested Trustees and Officers of the Trust
Name, Address
and Age
Position/
Term of Office1
Principal Occupation During the Past Five
Years
Number of
Portfolios in
Fund Complex
Overseen by
Trustee
Other Directorships
held by Trustee
During the Past Five
Years
Robert M. Arena, Jr.
Year of Birth: 19682
Trustee and
President/Chief
Executive Officer
since 2013
Co-President, Head of Life and Retirement,
Global Atlantic Financial Group Limited
(since 2017), Director, Managing Director,
Co-President and Head of Life and
Retirement, Global Atlantic Financial
Company (since 2017, 2014, 2017 and
2016, respectively); Director, Co-President,
Head of Life and Retirement, Global
Atlantic (Fin) Company (since 2017);
Director and Executive Vice President of
Commonwealth Annuity and Life Insurance
Company (since 2017); Director and
President, Forethought Life Insurance
Company (since 2016); Director and Chief
Executive Officer of Accordia Life and
Annuity Company (since 2017); Member
and Chairman of the Board of Managers,
Global Atlantic Investment Advisors, LLC
(since 2016); Member of Board of
Managers and President, Global Atlantic
Distributors, LLC (since 2013); Executive
Vice President, Forethought Financial
Group, Inc. (2013–2014); President,
Forethought Annuity, Forethought
Financial Group, Inc. (2013-
2015); Director and Co-President, Hartford
Securities Distribution Company, Inc.
(2010–2013); Executive Vice President,
Global Annuity, The Hartford (2010–2013).
25 None
April Galda
Year of Birth
19783
Trustee since 2018 Managing Director—Head of Enterprise
Operations of Global Atlantic Financial
Company (since 2018); Managing Director
of Commonwealth Annuity and Life
Insurance Company, Forethought Life
Insurance Company, Forethought National
Life Insurance Company, Accordia Life
and Annuity Company and First Allmerica
Financial Life Insurance Company (since
2018); Senior Vice President of Global
Atlantic Financial Group Limited and
Global Atlantic Financial Life Limited
(since 2017); Senior Vice President of
Commonwealth Re Midco Limited
(April 2013-Feb. 2015 and since
Oct. 2015); Co-Chief Executive Officer of
Global Atlantic Re Limited (2015-2018);
Managing Director of Global Atlantic
Financial Company (May 2013-Feb. 2015
and Nov. 2015-Jan. 2016); Senior Vice
25 None
234

Global Atlantic Portfolios
SUPPLEMENTAL INFORMATION (Continued)
December 31, 2018 (Unaudited)
Name, Address
and Age
Position/
Term of Office1
Principal Occupation During the Past Five
Years
Number of
Portfolios in
Fund Complex
Overseen by
Trustee
Other Directorships
held by Trustee
During the Past Five
Years
President of Global Atlantic Re Limited
(2014-2015); Chief Operating Officer of
Ariel Re (2012-2015).
Deborah Schunder
Year of Birth: 1967
Vice President
since 2014 Vice President, Investment Product
Management, Forethought Life Insurance
Company and Vice President, Global
Atlantic Investment Advisors, LLC (since
2013); Director of Investment Management,
Forethought Life Insurance Company
(2013–2013).
N/A N/A
Laura Szalyga
Year of Birth: 1978
Treasurer/Chief
Financial Officer
since 2013
Vice President, Gemini Fund Services, LLC
(since 2015); Assistant Vice President,
Gemini Fund Services, LLC (2011–2014).
N/A N/A
Sarah M. Patterson
Year of Birth: 1976
Secretary/Chief
Legal Officer
since 2013
Senior Vice President, Associate General
Counsel and Assistant Secretary, Global
Atlantic Financial Group Limited (since
2014) and Forethought Financial Group,
Inc. (since 2013); Secretary, Global
Atlantic Investment Advisors, LLC (since
2016); Assistant Secretary, Global Atlantic
Distributors, LLC (since 2016).
N/A N/A
David Capalbo
Year of Birth: 1968
Chief Compliance
Officer since 2018
Chief Compliance Officer of Forethought
Variable Insurance Trust (since 2018);
Chief Compliance Officer of Global
Atlantic Investment Advisors LLC (since
2018); Assistant Vice President and Senior
Compliance Officer of Global Atlantic
Financial Group (since 2016); and Senior
Director of Asset Management Compliance
of Columbia Threadneedle Investments
(2006 — 2016).
N/A N/A
Elizabeth Constant
Year of Birth: 1976
Assistant Secretary
since 2017
Assistant Vice President, Legal Counsel of
Global Atlantic Financial Group (since
2016); Associate Counsel, Global Atlantic
Financial Group (2014–2016); Paralegal,
Senior Paralegal, and Legal Specialist, The
Hartford (2006–2013).
N/A N/A
1 The term of office for each Trustee and officer listed above will continue indefinitely until the individual resigns or is removed. 2 Mr. Arena is an interested person of the Trust because he is an officer of Global Atlantic Financial Group Limited. 3 Ms. Galda is an interested person of the Trust because she is a Managing Director of Global Atlantic Financial Company.
The Fund’s Statement of Additional Information includes additional information about the Trustees and is available free of charge, upon request, by calling toll-free at 1-877-881-7735.
235

PRIVACY NOTICE
FACTS WHAT DOES FORETHOUGHT VARIABLE INSURANCE TRUST DO WITH YOUR PERSONAL INFORMATION?
Why? Financial companies choose how they share your personal information. Federal law gives consumers the right to limit some, but not all sharing. Federal law also requires us to tell you how we collect, share, and protect your personal information. Please read this notice carefully to understand what we do.
What? The types of personal information we collect and share depends on the product or service that you have with us. This information can include:
Social Security number and wire transfer instructions account transactions and transaction history investment experience and purchase history
When you are no longer our customer, we continue to share your information as described in this notice.
How? All financial companies need to share customers' personal information to run their everyday business. In the section below, we list the reasons financial companies can share their customers' personal information; the reasons Forethought Variable Insurance Trust chooses to share; and whether you can limit this sharing.
Reasons we can share your personal information:
Does Forethought Variable Insurance Trust
share information?
Can you limit this sharing?
For our everyday business purposes - such as to process your transactions, maintain your account(s), respond to court orders and legal investigations, or report to credit bureaus.
YES NO
For our marketing purposes - to offer our products and services to you.
NO We don't share
For joint marketing with other financial companies. NO We don't share
For our affiliates' everyday business purposes - information about your transactions and records.
NO We don't share
For our affiliates' everyday business purposes - information about your credit worthiness.
NO We don't share
For nonaffiliates to market to you NO We don't share
236

QUESTIONS? Call 1-402-493-4603
What we do : How does Forethought Variable Insurance Trust protect my personal information?
To protect your personal information from unauthorized access and use, we use security measures that comply with federal law. These measures include computer safeguards and secured files and buildings. Our service providers are held accountable for adhering to strict policies and procedures to prevent any misuse of your nonpublic personal information.
How does Forethought Variable Insurance Trust collect my personal information?
We collect your personal information, for example, when you open an account or deposit money direct us to buy securities or direct us to sell your securities seek advice about your investments
We also collect your personal information from others, such as credit bureaus, affiliates, or other companies.
Why can't I limit all sharing?
Federal law gives you the right to limit only: sharing for affiliates' everyday business purposes –
information about your creditworthiness. affiliates from using your information to market to you. sharing for nonaffiliates to market to you.
State laws and individual companies may give you additional rights to limit sharing.
Definitions Affiliates Companies related by common ownership or control. They can be
financial and nonfinancial companies. Forethought Variable Insurance Trust has no affiliates.
Nonaffiliates Companies not related by common ownership or control. They can be financial and nonfinancial companies.
Forethought Variable Insurance Trust does not share with nonaffiliates so they can market to you.
Joint marketing A formal agreement between nonaffiliated financial companies that together market financial products or services to you.
Forethought Variable Insurance Trust does not jointly market.
237

PROXY VOTING POLICY
Information regarding how the Portfolios voted proxies relating to portfolio securities for the most recent twelve month period ended June 30 (disclosed on Form N-PX) as well as information regarding the policies and procedures that the Portfolios use to determine how to vote proxies (disclosed in the Portfolios’ Statement of Additional Information) is available without charge, upon request, by calling 1-877-881-7735 or by referring to the Securities and Exchange Commission’s (“SEC”) website at http://www.sec.gov.
PORTFOLIO HOLDINGS
Each Portfolio files its complete schedule of portfolio holdings with the SEC for the first and third quarters of each fiscal year on Form N-Q. The Portfolios’ Form N-Qs are available: (i) on the SEC’s website at http://www.sec.gov; (ii) on the Portfolios’ website at www.geminifund.com/GlobalAtlanticDocuments; and (iii) may be reviewed and copied at the SEC’s Public Reference Room in Washington, DC. Information on the operation of the Public Reference Room may be obtained by calling 1-800-SEC-0330.
INVESTMENT ADVISER ADMINISTRATOR Global Atlantic Investment Advisors, LLC Gemini Fund Services, LLC 10 West Market Street, Suite 2300 80 Arkay Drive, Suite 110 Indianapolis, IN 46204 Hauppauge, NY 11788
INVESTMENT SUB-ADVISERS
BlackRock Investment Management, LLC Goldman Sachs Asset Management, L.P. 1 University Square 200 West Street Princeton, NJ 08536 New York, NY 10282
Related Documents