ANNUAL REPORT Fiscal 2009

Welcome message from author
This document is posted to help you gain knowledge. Please leave a comment to let me know what you think about it! Share it to your friends and learn new things together.
Transcript
ANNUAL REPORT Fiscal 2009
1
3/80 3/81 3/82 3/83 3/84 3/85 3/86 3/87 3/88 3/89 3/90 3/91 3/92 3/93 3/94 3/95 3/96 3/97 3/98 3/99 3/00 3/01 3/02 3/03 3/04 3/05 3/06 12/06 12/0812/0912/07
20
40
60
80
100
120
140
160(Billions of yen)
2
4
6
8
10
12
14
16
18
20(Billions of yen)
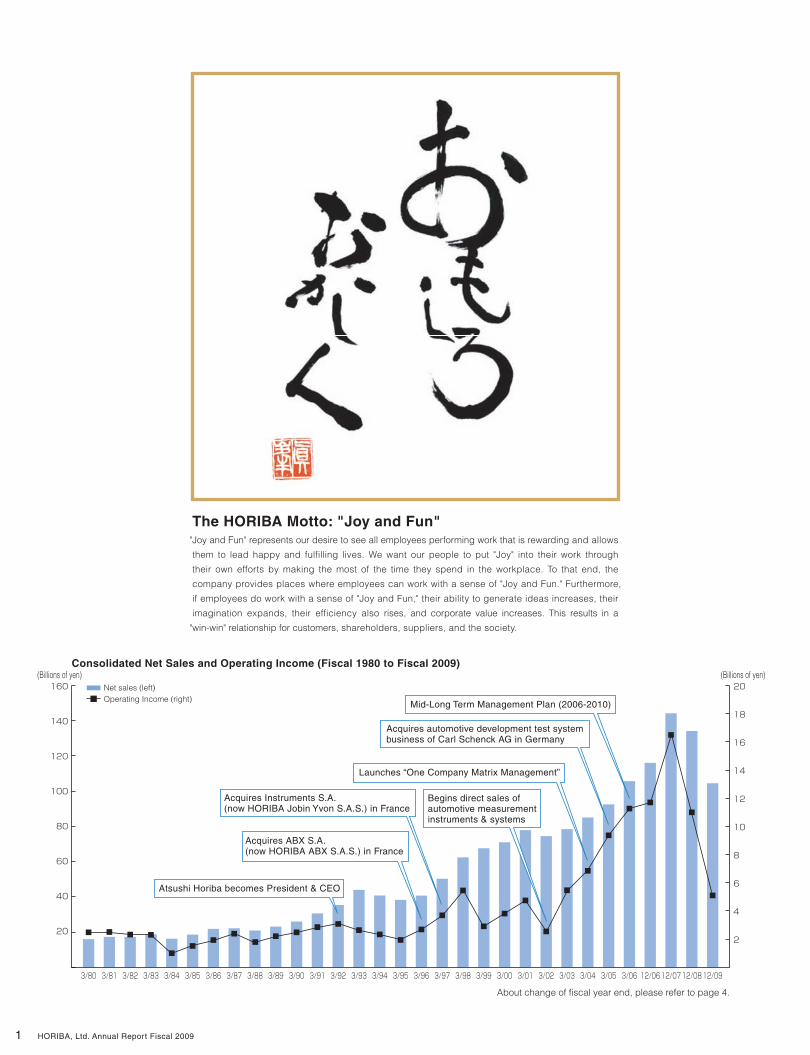
Atsushi Horiba becomes President & CEO
Acquires ABX S.A. (now HORIBA ABX S.A.S.) in France
Begins direct sales of automotive measurement instruments & systems
Launches “One Company Matrix Management”
Acquires automotive development test system business of Carl Schenck AG in Germany
Mid-Long Term Management Plan (2006-2010)
Acquires Instruments S.A. (now HORIBA Jobin Yvon S.A.S.) in France
Net sales (left)Operating Income (right)
About change of fiscal year end, please refer to page 4.
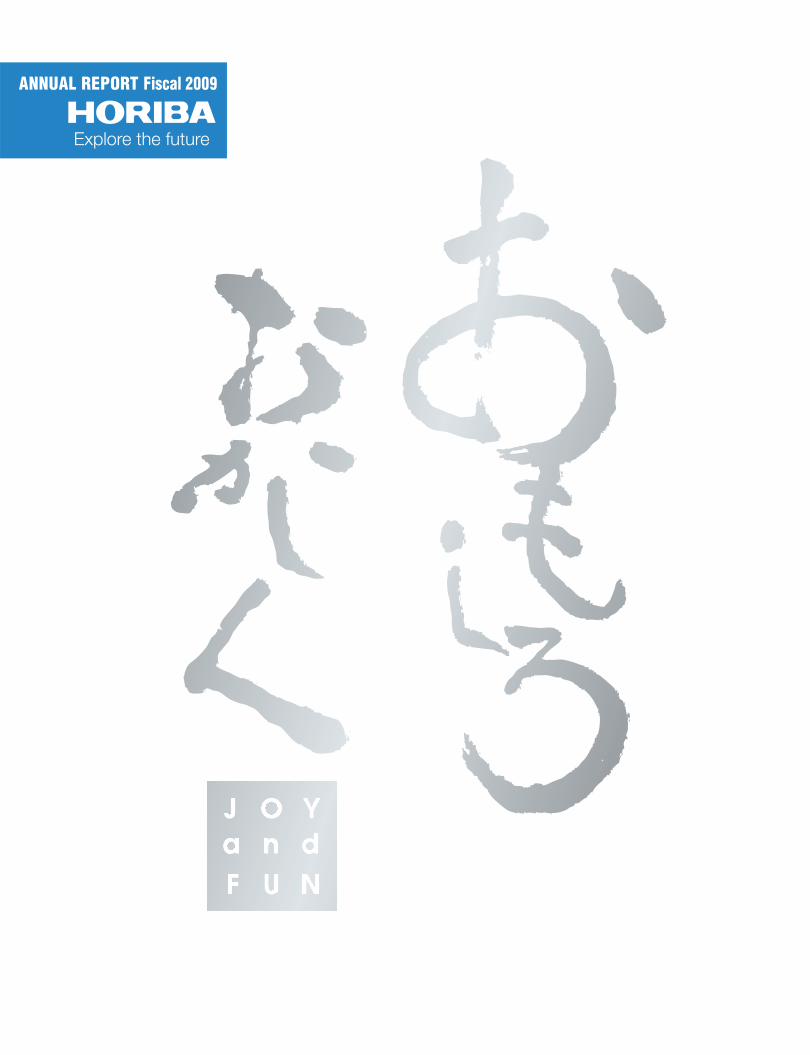
"Joy and Fun" represents our desire to see all employees performing work that is rewarding and allows
them to lead happy and fulfilling lives. We want our people to put "Joy" into their work through
their own efforts by making the most of the time they spend in the workplace. To that end, the
company provides places where employees can work with a sense of "Joy and Fun." Furthermore,
if employees do work with a sense of "Joy and Fun," their ability to generate ideas increases, their
imagination expands, their efficiency also rises, and corporate value increases. This results in a
"win-win" relationship for customers, shareholders, suppliers, and the society.
The HORIBA Motto: "Joy and Fun"
Consolidated Net Sales and Operating Income (Fiscal 1980 to Fiscal 2009)
HORIBA, Ltd. Annual Report Fiscal 2009
2
Significant R&D in new materials is required to develop high performance lithium ion batteries for electric automobiles and improve photovoltaic cells for harnessing clean energy. HORIBA’s exhaust emissions and test systems, from the Automotive Test Systems segment, are widely used to develop advanced automotive power trains, while its leading-edge scientific analyzers, from the Analytical Instruments & Systems segment, aid the quest for better battery materials.
Everything beginswith measurement
To realize a sustainable society
necessarily starts with analysis.
We also contribute, in a variety of ways,
toward advancements in next-gen energy.
[The quest for better second generation batteries and clean energy]
HORIBA, Ltd. Annual Report Fiscal 2009
3
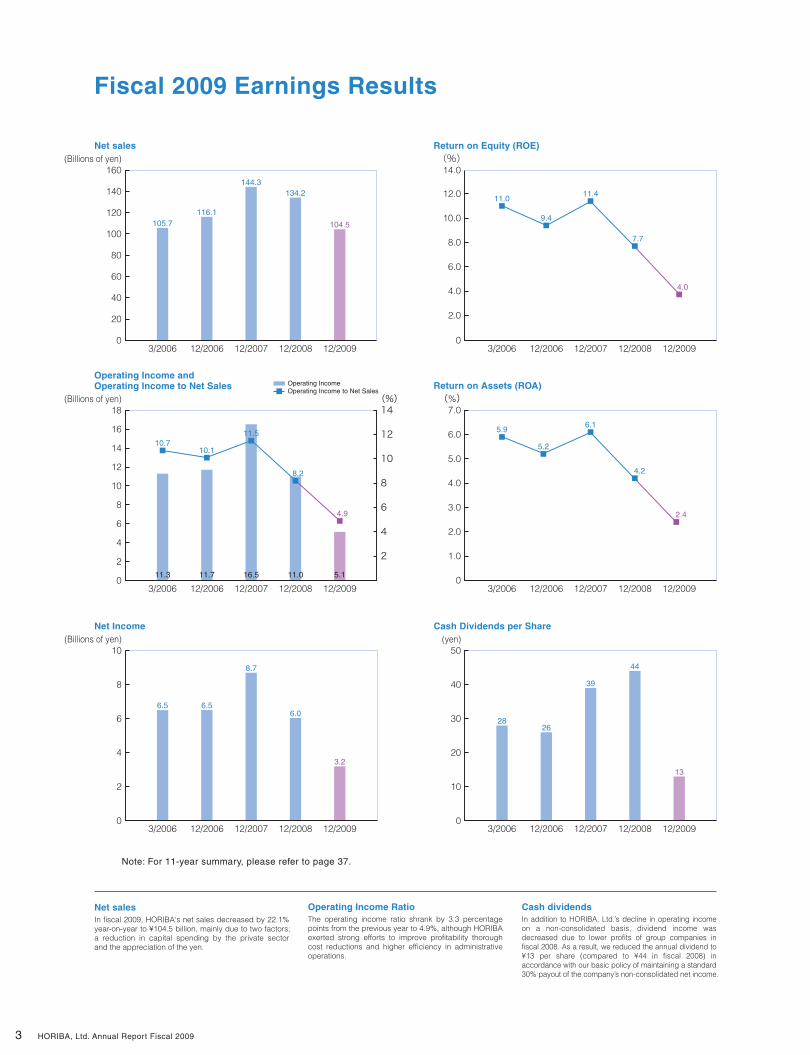
Fiscal 2009 Earnings Results
Net Income Cash Dividends per Share
20
0
40
60
80
100
120
140
160
105.7
3/2006 12/2006 12/2007 12/2008 12/2009 3/2006 12/2006 12/2007 12/2008 12/2009
3/2006 12/2006 12/2007 12/2008 12/2009 3/2006 12/2006 12/2007 12/2008 12/2009
3/2006 12/2006 12/2007 12/2008 12/2009 3/2006 12/2006 12/2007 12/2008 12/2009
116.1
144.3134.2
104.5
(Billions of yen)
0
2
4
6
8
10
6.5 6.5
Note: For 11-year summary, please refer to page 37.
8.7
6.0
3.2
(yen)
0
10
20
30
40
50
2826
39
44
13
Operating Income and Operating Income to Net Sales
10.710.1
(Billions of yen)
2
0
4
6
8
10
12
14
18(%)14
12
10
8
6
4
2
16
Operating IncomeOperating Income to Net Sales
11.5
8.2
4.9
11.3 11.7 16.5 11.0 5.1
Return on Assets (ROA)(%)
0
3.0
2.0
1.0
4.0
5.0
6.0
7.0
5.9
5.2
6.1
4.2
2.4
11.0
9.4
11.4
7.7
Return on Equity (ROE)(%)
4.0
2.0
0
6.0
8.0
10.0
12.0
14.0
4.0
HORIBA, Ltd. Annual Report Fiscal 2009
(Billions of yen)
In fiscal 2009, HORIBA‘s net sales decreased by 22.1% year-on-year to ¥104.5 billion, mainly due to two factors; a reduction in capital spending by the private sector and the appreciation of the yen.
Net sales
Net sales
The operating income ratio shrank by 3.3 percentage points from the previous year to 4.9%, although HORIBA exerted strong efforts to improve profitability thorough cost reductions and higher efficiency in administrative operations.
Operating Income RatioIn addition to HORIBA, Ltd.’s decline in operating income on a non-consolidated basis, dividend income was decreased due to lower profits of group companies in fiscal 2008. As a result, we reduced the annual dividend to ¥13 per share (compared to ¥44 in fiscal 2008) in accordance with our basic policy of maintaining a standard 30% payout of the company’s non-consolidated net income.
Cash dividends
4
Table of Contents
Corporate Philosophy and History
Fiscal 2009 Earnings Results
To Our Stakeholders
Growth through M&A Activities
HORIBA at a Glance
Automotive Test Systems
Analytical Instruments & Systems
Medical-Diagnostic Instruments & Systems
Semiconductor Instruments & Systems
Evolution in “One Company” Management
One Company Matrix Management
Progress in Well-Balanced Management
Organizational Restructuring of Group Companies
Value Creation Based on Invisible Values
Globalization of Human Resources
HORIBA’s R&D Activities and Intellectual Property
Human Resources
Technology
Governance
CSR
Eleven-Year Summary
Financial Section
Corporate Philosophy
Corporate Data
1
3
5
9
13
15
17
19
21
25
27
33
35
37
41
73
74
Change of Fiscal Year-End Disclaimer Regarding Future Plans and ForecastsHORIBA changed its fiscal year-end from March 20 to December 31, effective from fiscal 2006. As a result of this change, the following irregular fiscal periods were recorded: Fiscal 2006 for HORIBA, Ltd. and HORIBA Advanced Techno Co., Ltd. comprised the 9 months and 11 days from March 21, 2006 to December 31, 2006; and fiscal 2006 for HORIBA STEC, Co., Ltd. comprised the 9 months from April 1, 2006 to December 31, 2006. As the fiscal year-end of other consolidated HORIBA subsidiaries was already December 31, the length of their 2006 fiscal periods remained unchanged at 12 months.
This annual report contains certain statements describing HORIBA’s future plans, strategies, and performance forecasts. These statements reflect management’s assumptions and beliefs based on currently available information. Therefore, actual performance may differ significantly from the forecasts due to various factors in the operating environment.
HORIBA, Ltd. Annual Report Fiscal 2009
5
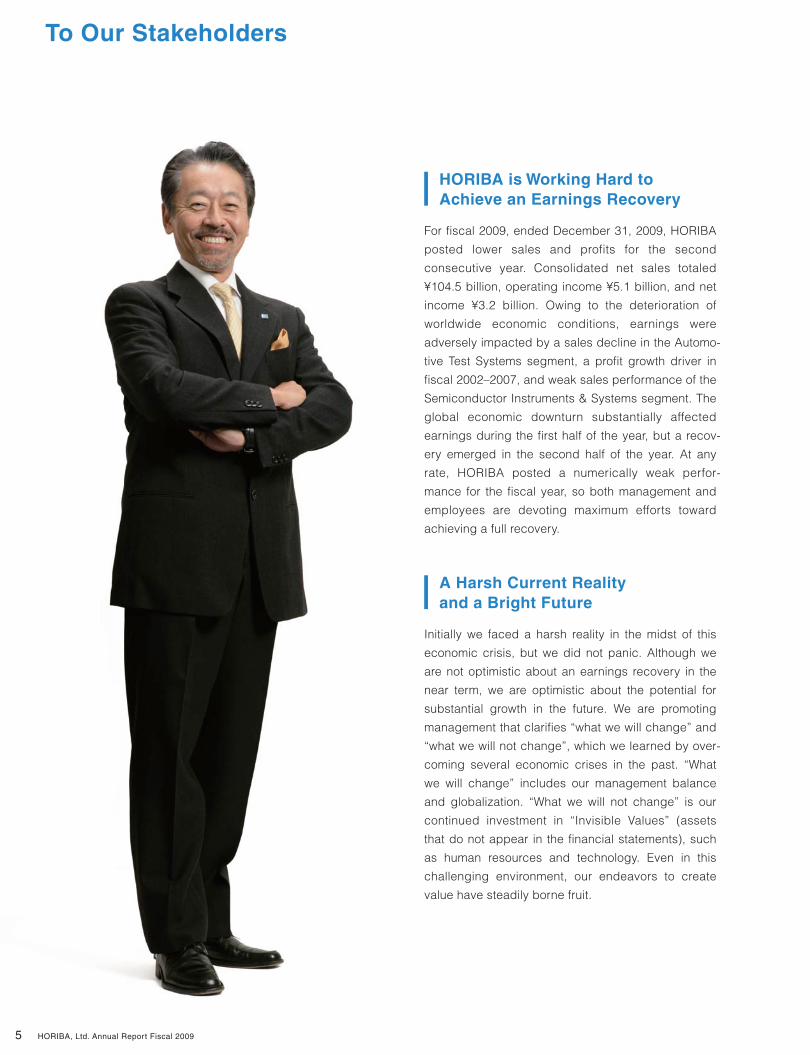
To Our Stakeholders
HORIBA is Working Hard to Achieve an Earnings Recovery
For fiscal 2009, ended December 31, 2009, HORIBA
posted lower sales and profits for the second
consecutive year. Consolidated net sales totaled
¥104.5 billion, operating income ¥5.1 billion, and net
income ¥3.2 billion. Owing to the deterioration of
worldwide economic conditions, earnings were
adversely impacted by a sales decline in the Automo-
tive Test Systems segment, a profit growth driver in
fiscal 2002–2007, and weak sales performance of the
Semiconductor Instruments & Systems segment. The
global economic downturn substantially affected
earnings during the first half of the year, but a recov-
ery emerged in the second half of the year. At any
rate, HORIBA posted a numerically weak perfor-
mance for the fiscal year, so both management and
employees are devoting maximum efforts toward
achieving a full recovery.
A Harsh Current Reality and a Bright Future
Initially we faced a harsh reality in the midst of this
economic crisis, but we did not panic. Although we
are not optimistic about an earnings recovery in the
near term, we are optimistic about the potential for
substantial growth in the future. We are promoting
management that clarifies “what we will change” and
“what we will not change”, which we learned by over-
coming several economic crises in the past. “What
we will change” includes our management balance
and globalization. “What we will not change” is our
continued investment in “Invisible Values” (assets
that do not appear in the financial statements), such
as human resources and technology. Even in this
challenging environment, our endeavors to create
value have steadily borne fruit.
HORIBA, Ltd. Annual Report Fiscal 2009
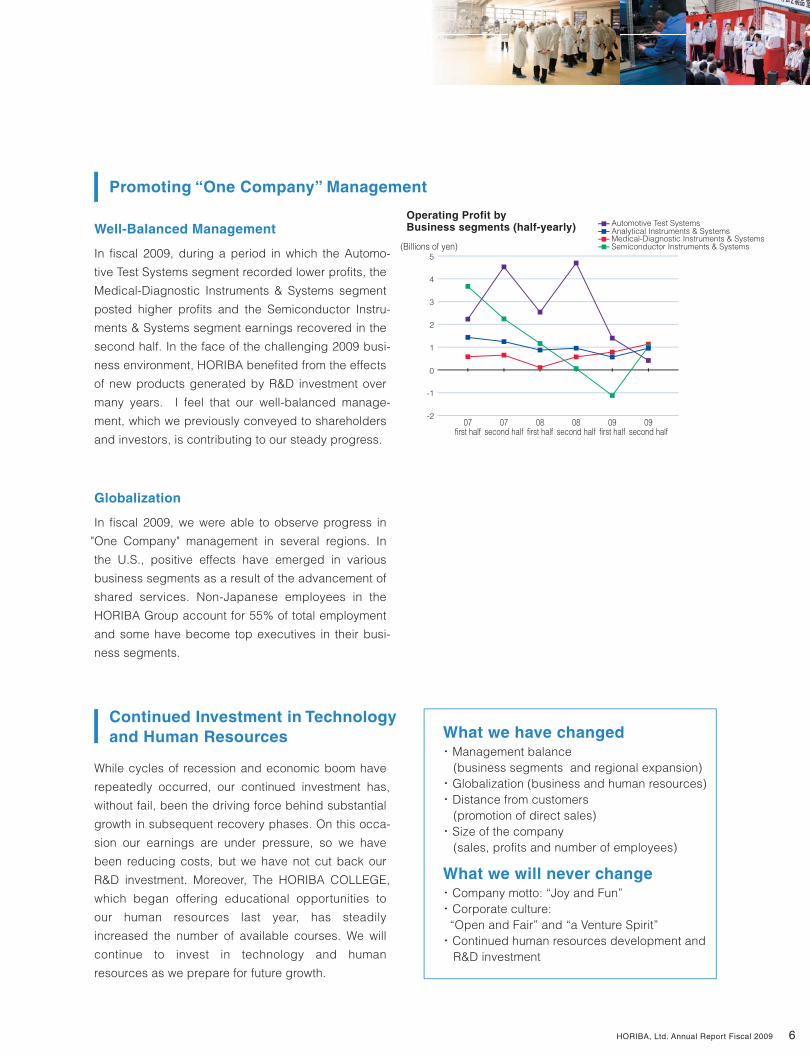
In fiscal 2009, during a period in which the Automo-
tive Test Systems segment recorded lower profits, the
Medical-Diagnostic Instruments & Systems segment
posted higher profits and the Semiconductor Instru-
ments & Systems segment earnings recovered in the
second half. In the face of the challenging 2009 busi-
ness environment, HORIBA benefited from the effects
of new products generated by R&D investment over
many years. I feel that our well-balanced manage-
ment, which we previously conveyed to shareholders
and investors, is contributing to our steady progress.
6
Continued Investment in Technology and Human Resources
While cycles of recession and economic boom have
repeatedly occurred, our continued investment has,
without fail, been the driving force behind substantial
growth in subsequent recovery phases. On this occa-
sion our earnings are under pressure, so we have
been reducing costs, but we have not cut back our
R&D investment. Moreover, The HORIBA COLLEGE,
which began offering educational opportunities to
our human resources last year, has steadily
increased the number of available courses. We will
continue to invest in technology and human
resources as we prepare for future growth.
Promoting “One Company” Management
What we have changed・ Management balance (business segments and regional expansion)・ Globalization (business and human resources)・ Distance from customers (promotion of direct sales)・ Size of the company (sales, profits and number of employees)
What we will never change・ Company motto: “Joy and Fun”・ Corporate culture: “Open and Fair” and “a Venture Spirit”・ Continued human resources development and R&D investment
Operating Profit by Business segments (half-yearly)
(Billions of yen)
-2
-1
0
3
2
1
4
5
07first half
07second half
08first half
08second half
09first half
09second half
Automotive Test SystemsAnalytical Instruments & SystemsMedical-Diagnostic Instruments & SystemsSemiconductor Instruments & Systems
Well-Balanced Management
In fiscal 2009, we were able to observe progress in
"One Company" management in several regions. In
the U.S., positive effects have emerged in various
business segments as a result of the advancement of
shared services. Non-Japanese employees in the
HORIBA Group account for 55% of total employment
and some have become top executives in their busi-
ness segments.
Globalization
HORIBA, Ltd. Annual Report Fiscal 2009
7
Quality Growth
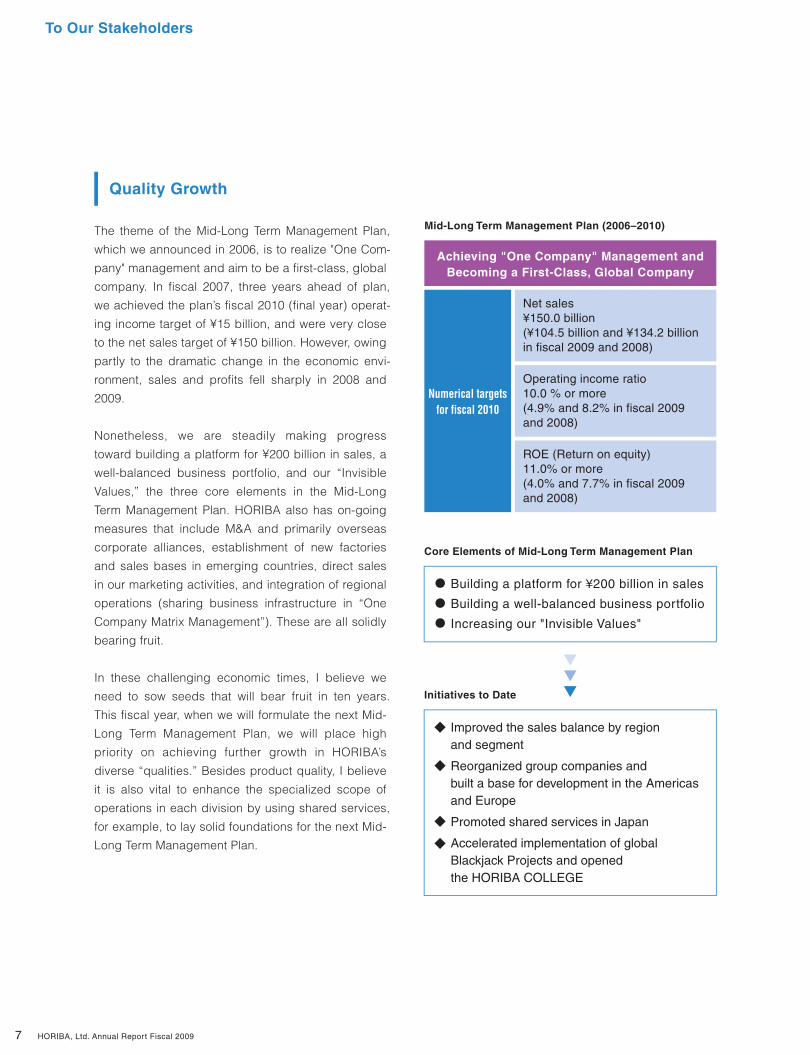
Mid-Long Term Management Plan (2006–2010)
Numerical targetsfor fiscal 2010
Operating income ratio10.0 % or more (4.9% and 8.2% in fiscal 2009 and 2008)
ROE (Return on equity)11.0% or more (4.0% and 7.7% in fiscal 2009 and 2008)
Achieving "One Company" Management andBecoming a First-Class, Global Company
Initiatives to Date
HORIBA, Ltd. Annual Report Fiscal 2009
The theme of the Mid-Long Term Management Plan,
which we announced in 2006, is to realize "One Com-
pany" management and aim to be a first-class, global
company. In fiscal 2007, three years ahead of plan,
we achieved the plan’s fiscal 2010 (final year) operat-
ing income target of ¥15 billion, and were very close
to the net sales target of ¥150 billion. However, owing
partly to the dramatic change in the economic envi-
ronment, sales and profits fell sharply in 2008 and
2009.
Nonetheless, we are steadily making progress
toward building a platform for ¥200 billion in sales, a
well-balanced business portfolio, and our “Invisible
Values,” the three core elements in the Mid-Long
Term Management Plan. HORIBA also has on-going
measures that include M&A and primarily overseas
corporate alliances, establishment of new factories
and sales bases in emerging countries, direct sales
in our marketing activities, and integration of regional
operations (sharing business infrastructure in “One
Company Matrix Management”). These are all solidly
bearing fruit.
In these challenging economic times, I believe we
need to sow seeds that will bear fruit in ten years.
This fiscal year, when we will formulate the next Mid-
Long Term Management Plan, we will place high
priority on achieving further growth in HORIBA’s
diverse “qualities.” Besides product quality, I believe
it is also vital to enhance the specialized scope of
operations in each division by using shared services,
for example, to lay solid foundations for the next Mid-
Long Term Management Plan.
To Our Stakeholders
Net sales¥150.0 billion (¥104.5 billion and ¥134.2 billion in fiscal 2009 and 2008)
Core Elements of Mid-Long Term Management Plan
• Building a platform for ¥200 billion in sales
• Building a well-balanced business portfolio
• Increasing our "Invisible Values"
Improved the sales balance by regionand segment
Reorganized group companies andbuilt a base for development in the Americas and Europe
Promoted shared services in Japan
Accelerated implementation of globalBlackjack Projects and openedthe HORIBA COLLEGE
Since its founding 57 years ago, HORIBA has consis-
tently focused on a unique corporate culture symbol-
ized by the company motto “Joy and Fun.” This
corporate culture cultivates “Invisible Values,” such
as human resources and unique technologies that
are valued worldwide. We ultimately deliver these
“Invisible Values” to customers in the form of real
“products” that create corporate value and earnings.
Through economic booms and recessions, we will
continue to pursue management objectives aimed at
the enhancement of our “Invisible Values.”
Our headquarters are located in Japan, but HORIBA
is not simply another Japanese entity that conducts
business around the world. Rather, our objective is to
be a first-class, global company that understands the
culture, customs, and values of the countries and
regions where we do business, and conducts busi-
ness in harmony with the local area and its employ-
ees. In April 2009, we took specific measures to
implement this policy by appointing three non-
Japanese employees from our foreign operations to
be corporate officers of HORIBA, Ltd. And, in 2010,
we welcomed a person with management experience
in a global blue chip company as an excecutive
corporate officer who brings very valuable strengths
to HORIBA. By implementing management based on
this corporate philosophy, I firmly believe that, as a
global company, our actions will ensure sustained
growth and receive a fair market valuation from inves-
tors around the world.
The future of the global economy is unclear. However,
instead of being complacent, running away from risk,
or blindly stepping on the brake, we intend to pursue
management strategies which turn risk into opportu-
nity by correctly ascertaining situations and boldly
acting.
I sincerely hope that all our stakeholders understand
and agree with our management policies and will
continue to support us for many years to come.
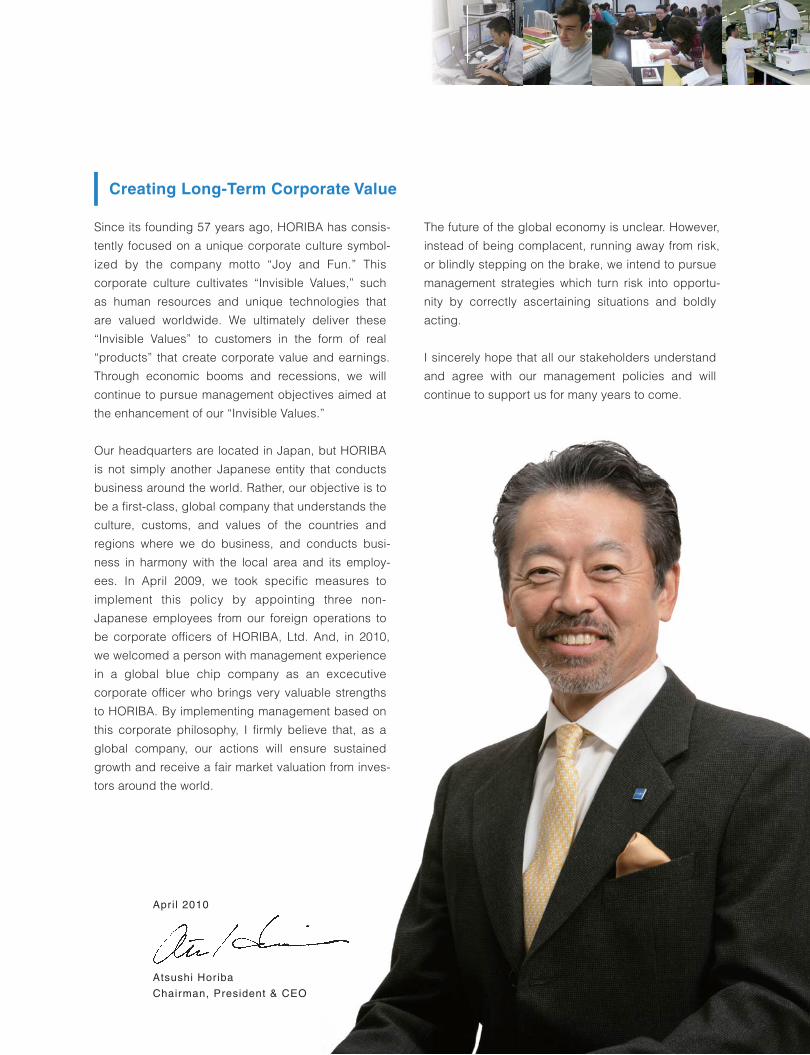
Creating Long-Term Corporate Value
April 2010
Atsushi Horiba
Chairman, President & CEO
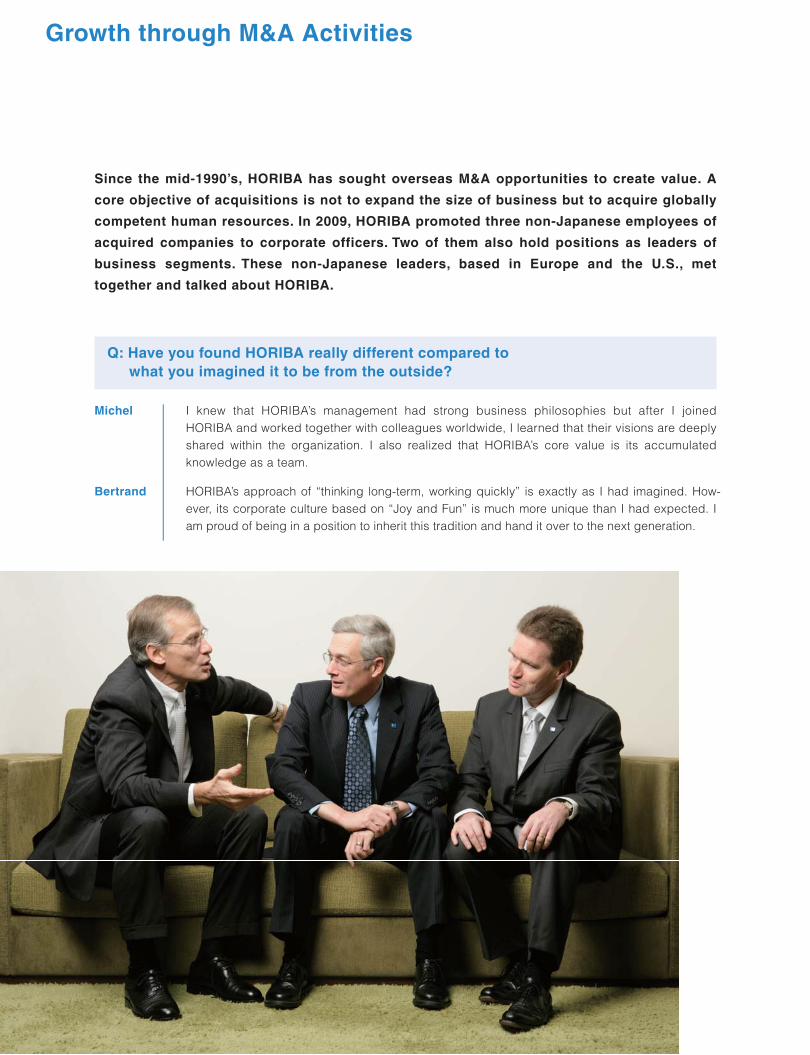
Since the mid-1990’s, HORIBA has sought overseas M&A opportunities to create value. A
core objective of acquisitions is not to expand the size of business but to acquire globally
competent human resources. In 2009, HORIBA promoted three non-Japanese employees of
acquired companies to corporate officers. Two of them also hold positions as leaders of
business segments. These non-Japanese leaders, based in Europe and the U.S., met
together and talked about HORIBA.
Q: Have you found HORIBA really different compared to what you imagined it to be from the outside?
Michel
Bertrand
Growth through M&A Activities
I knew that HORIBA’s management had strong business philosophies but after I joined HORIBA and worked together with colleagues worldwide, I learned that their visions are deeply shared within the organization. I also realized that HORIBA’s core value is its accumulated knowledge as a team.
HORIBA’s approach of “thinking long-term, working quickly” is exactly as I had imagined. How-ever, its corporate culture based on “Joy and Fun” is much more unique than I had expected. I am proud of being in a position to inherit this tradition and hand it over to the next generation.
10
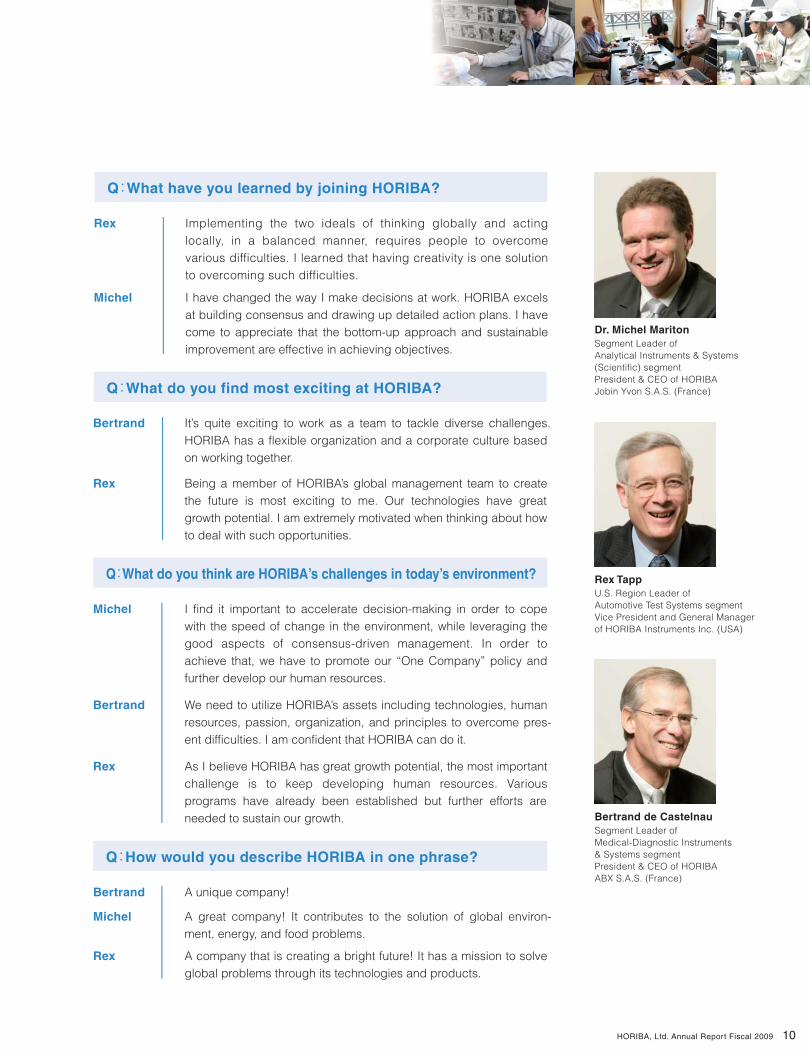
Dr. Michel MaritonSegment Leader of Analytical Instruments & Systems (Scientific) segmentPresident & CEO of HORIBA Jobin Yvon S.A.S. (France)
Bertrand de CastelnauSegment Leader of Medical-Diagnostic Instruments & Systems segmentPresident & CEO of HORIBA ABX S.A.S. (France)
Rex TappU.S. Region Leader of Automotive Test Systems segmentVice President and General Manager of HORIBA Instruments Inc. (USA)
Rex
Michel
Implementing the two ideals of thinking globally and acting locally, in a balanced manner, requires people to overcome various difficulties. I learned that having creativity is one solution to overcoming such difficulties.
I have changed the way I make decisions at work. HORIBA excels at building consensus and drawing up detailed action plans. I have come to appreciate that the bottom-up approach and sustainable improvement are effective in achieving objectives.
Q:What have you learned by joining HORIBA?
Bertrand
Rex
It’s quite exciting to work as a team to tackle diverse challenges. HORIBA has a flexible organization and a corporate culture based on working together.
Being a member of HORIBA’s global management team to create the future is most exciting to me. Our technologies have great growth potential. I am extremely motivated when thinking about how to deal with such opportunities.
Q:What do you find most exciting at HORIBA?
Michel
Bertrand
Rex
I find it important to accelerate decision-making in order to cope with the speed of change in the environment, while leveraging the good aspects of consensus-driven management. In order to achieve that, we have to promote our “One Company” policy and further develop our human resources.
We need to utilize HORIBA’s assets including technologies, human resources, passion, organization, and principles to overcome pres-ent difficulties. I am confident that HORIBA can do it.
As I believe HORIBA has great growth potential, the most important challenge is to keep developing human resources. Various programs have already been established but further efforts are needed to sustain our growth.
Q:What do you think are HORIBA’s challenges in today’s environment?
Bertrand A unique company!
Michel A great company! It contributes to the solution of global environ-ment, energy, and food problems.
Rex A company that is creating a bright future! It has a mission to solve global problems through its technologies and products.
Q:How would you describe HORIBA in one phrase?
HORIBA, Ltd. Annual Report Fiscal 2009
11
0
60
40
20
80
120
100104.5
140
104.5
Europe
AsiaJapan
Americas
Acquisition of some overseas companies and operations since the mid-1990’s has enabled HORIBA to reduce dependence on its sales and profit from the Japanese market and emission measurement systems. The result has achieved a better balance. We find that the current strong yen and difficult economic conditions are presenting good M&A opportunities. In particular, we think that there are great opportunities in the medical-diagnostic area and in new energy or materials technologies areas, where we wish to grow in the medium to long-term. By region, the U.S. market is where HORIBA’s market share remains low despite its large size as a maker of analytical instruments & systems.
M&A Targets
HORIBA’s Policies on M&A
M&A Characteristics
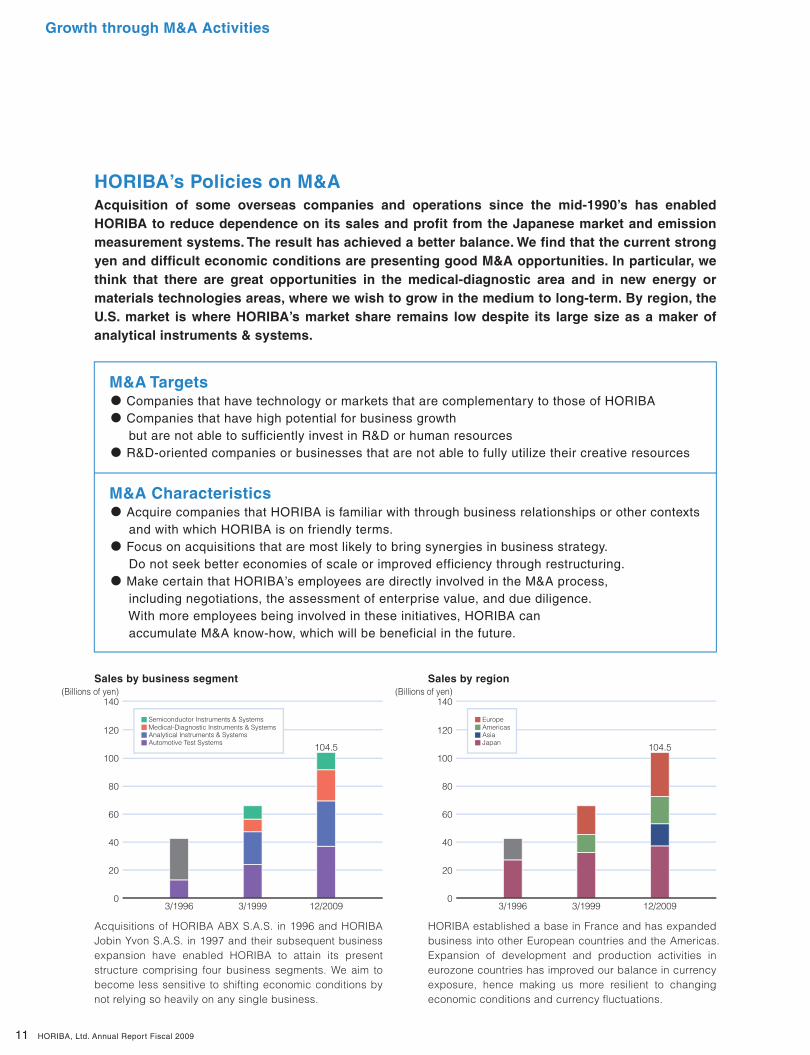
Sales by business segment Sales by region
Growth through M&A Activities
• Companies that have technology or markets that are complementary to those of HORIBA
• Companies that have high potential for business growth but are not able to sufficiently invest in R&D or human resources
• R&D-oriented companies or businesses that are not able to fully utilize their creative resources
• Acquire companies that HORIBA is familiar with through business relationships or other contexts and with which HORIBA is on friendly terms.
• Focus on acquisitions that are most likely to bring synergies in business strategy. Do not seek better economies of scale or improved efficiency through restructuring.
• Make certain that HORIBA’s employees are directly involved in the M&A process, including negotiations, the assessment of enterprise value, and due diligence. With more employees being involved in these initiatives, HORIBA can accumulate M&A know-how, which will be beneficial in the future.
Acquisitions of HORIBA ABX S.A.S. in 1996 and HORIBA Jobin Yvon S.A.S. in 1997 and their subsequent business expansion have enabled HORIBA to attain its present structure comprising four business segments. We aim to become less sensitive to shifting economic conditions by not relying so heavily on any single business.
HORIBA established a base in France and has expanded business into other European countries and the Americas. Expansion of development and production activities in eurozone countries has improved our balance in currency exposure, hence making us more resilient to changing economic conditions and currency fluctuations.
3/1996 3/1999 12/2009 3/1996 3/1999 12/2009
(Billions of yen)
0
60
40
20
80
120
100
140(Billions of yen)
Automotive Test SystemsAnalytical Instruments & SystemsMedical-Diagnostic Instruments & SystemsSemiconductor Instruments & Systems
HORIBA, Ltd. Annual Report Fiscal 2009
12/2006 12/2007 12/2008 12/2009
12
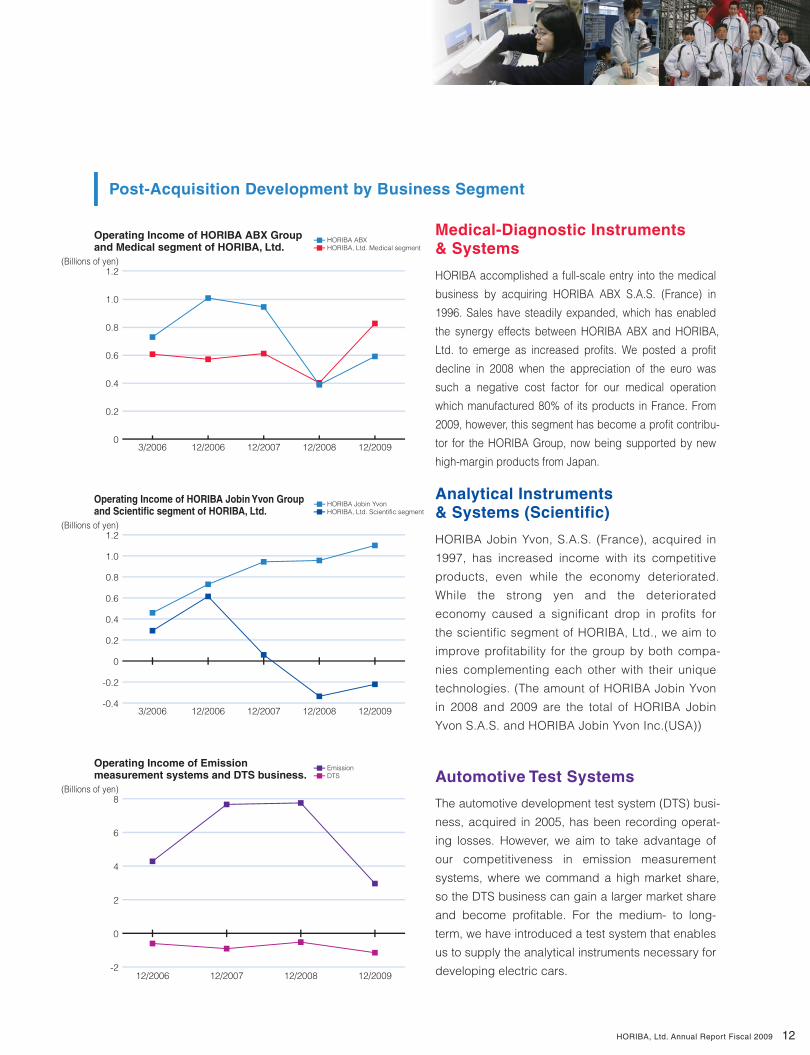
Operating Income of HORIBA ABX Group and Medical segment of HORIBA, Ltd.
0
0.6
0.4
0.2
0.8
1.2
1.0
HORIBA ABX HORIBA, Ltd. Medical segment
Operating Income of HORIBA Jobin Yvon Group and Scientific segment of HORIBA, Ltd.
0
0.6
0.4
0.2
-0.2
-0.4
0.8
1.2
1.0
HORIBA Jobin Yvon HORIBA, Ltd. Scientific segment
Operating Income of Emission measurement systems and DTS business.
(Billions of yen)
-2
4
2
0
6
8
Emission DTS
Post-Acquisition Development by Business Segment
Medical-Diagnostic Instruments & Systems
Analytical Instruments & Systems (Scientific)
Automotive Test Systems
3/2006 12/2006 12/2007 12/2008 12/2009
3/2006 12/2006 12/2007 12/2008 12/2009
(Billions of yen)
(Billions of yen)
HORIBA accomplished a full-scale entry into the medical
business by acquiring HORIBA ABX S.A.S. (France) in
1996. Sales have steadily expanded, which has enabled
the synergy effects between HORIBA ABX and HORIBA,
Ltd. to emerge as increased profits. We posted a profit
decline in 2008 when the appreciation of the euro was
such a negative cost factor for our medical operation
which manufactured 80% of its products in France. From
2009, however, this segment has become a profit contribu-
tor for the HORIBA Group, now being supported by new
high-margin products from Japan.
HORIBA Jobin Yvon, S.A.S. (France), acquired in
1997, has increased income with its competitive
products, even while the economy deteriorated.
While the strong yen and the deteriorated
economy caused a significant drop in profits for
the scientific segment of HORIBA, Ltd., we aim to
improve profitability for the group by both compa-
nies complementing each other with their unique
technologies. (The amount of HORIBA Jobin Yvon
in 2008 and 2009 are the total of HORIBA Jobin
Yvon S.A.S. and HORIBA Jobin Yvon Inc.(USA))
The automotive development test system (DTS) busi-
ness, acquired in 2005, has been recording operat-
ing losses. However, we aim to take advantage of
our competitiveness in emission measurement
systems, where we command a high market share,
so the DTS business can gain a larger market share
and become profitable. For the medium- to long-
term, we have introduced a test system that enables
us to supply the analytical instruments necessary for
developing electric cars.
HORIBA, Ltd. Annual Report Fiscal 2009
13
Emission measurement systems, automotive emission analyzers, on-board emission measurement systems, driveline test systems, engine test systems, brake test systems, and drive recorders
Automobile, truck and motorcycle manufacturers; automotive component manufacturers, multi-purpose motor manufacturers, government regulatory agencies, oil companies, automotive maintenance and repair centers
Development of new gas, diesel and hybrid powertrains, vehicle certification and QC, in-use vehicle inspections
The global automotive industry’s shifting investments for research and development
Principal products
Major customers
Product applications
Risk factor
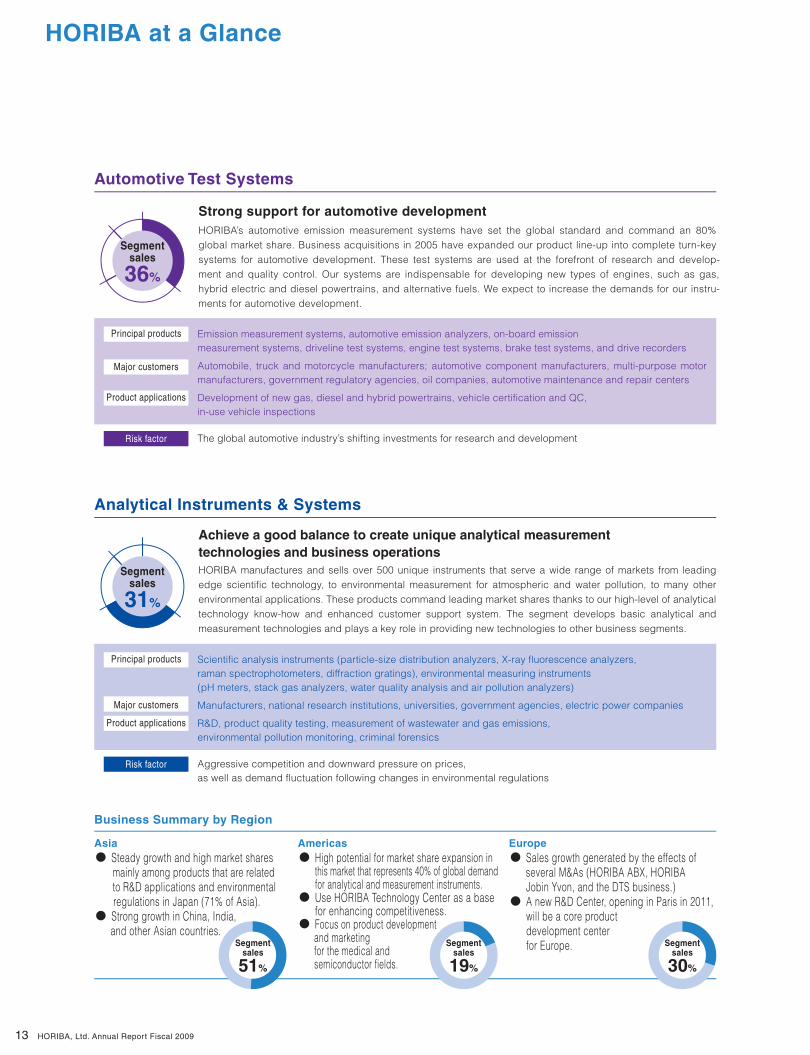
Automotive Test Systems
Strong support for automotive development
Analytical Instruments & Systems
Business Summary by Region
Asia
HORIBA’s automotive emission measurement systems have set the global standard and command an 80% global market share. Business acquisitions in 2005 have expanded our product line-up into complete turn-key systems for automotive development. These test systems are used at the forefront of research and develop-ment and quality control. Our systems are indispensable for developing new types of engines, such as gas, hybrid electric and diesel powertrains, and alternative fuels. We expect to increase the demands for our instru-ments for automotive development.
Scientific analysis instruments (particle-size distribution analyzers, X-ray fluorescence analyzers, raman spectrophotometers, diffraction gratings), environmental measuring instruments (pH meters, stack gas analyzers, water quality analysis and air pollution analyzers)
Manufacturers, national research institutions, universities, government agencies, electric power companies
R&D, product quality testing, measurement of wastewater and gas emissions, environmental pollution monitoring, criminal forensics
Aggressive competition and downward pressure on prices, as well as demand fluctuation following changes in environmental regulations
Principal products
Major customers
Product applications
Risk factor
Achieve a good balance to create unique analytical measurement technologies and business operationsHORIBA manufactures and sells over 500 unique instruments that serve a wide range of markets from leading edge scientific technology, to environmental measurement for atmospheric and water pollution, to many other environmental applications. These products command leading market shares thanks to our high-level of analytical technology know-how and enhanced customer support system. The segment develops basic analytical and measurement technologies and plays a key role in providing new technologies to other business segments.
• Steady growth and high market shares mainly among products that are related to R&D applications and environmental regulations in Japan (71% of Asia).
• Strong growth in China, India, and other Asian countries.
Americas
• High potential for market share expansion in this market that represents 40% of global demand for analytical and measurement instruments.• Use HORIBA Technology Center as a base for enhancing competitiveness.• Focus on product development and marketing for the medical and semiconductor fields.
Europe
• Sales growth generated by the effects of several M&As (HORIBA ABX, HORIBA Jobin Yvon, and the DTS business.)
• A new R&D Center, opening in Paris in 2011, will be a core product development center for Europe.
HORIBA at a Glance
HORIBA, Ltd. Annual Report Fiscal 2009
Segmentsales
36%
Segmentsales
51%
Segmentsales
19%
Segmentsales
30%
Segmentsales
31%
14
Medical-Diagnostic Instruments & Systems
Impact of changes in the external environment
HORIBA’s earnings are expected to be primarily affected by the following external factors:
Semiconductor Instruments & Systems
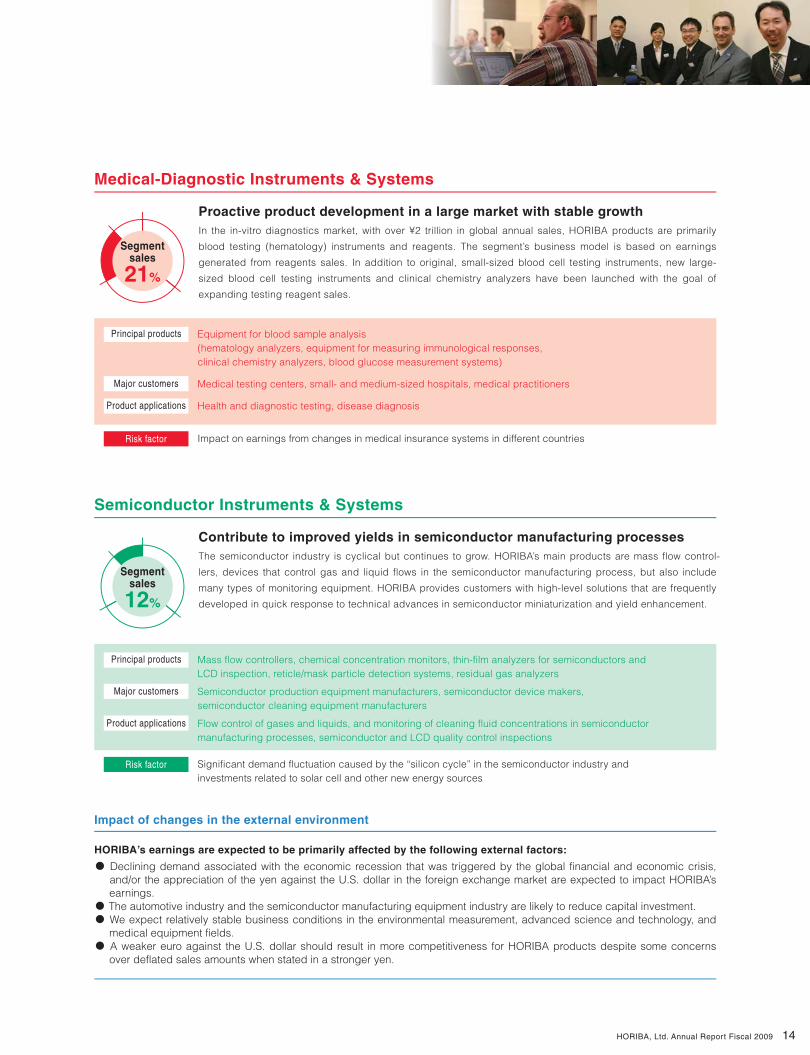
Equipment for blood sample analysis (hematology analyzers, equipment for measuring immunological responses, clinical chemistry analyzers, blood glucose measurement systems)
Medical testing centers, small- and medium-sized hospitals, medical practitioners
Health and diagnostic testing, disease diagnosis
Impact on earnings from changes in medical insurance systems in different countries
Principal products
Major customers
Product applications
Risk factor
Proactive product development in a large market with stable growthIn the in-vitro diagnostics market, with over ¥2 trillion in global annual sales, HORIBA products are primarily
blood testing (hematology) instruments and reagents. The segment’s business model is based on earnings
generated from reagents sales. In addition to original, small-sized blood cell testing instruments, new large-
sized blood cell testing instruments and clinical chemistry analyzers have been launched with the goal of
expanding testing reagent sales.
Mass flow controllers, chemical concentration monitors, thin-film analyzers for semiconductors and LCD inspection, reticle/mask particle detection systems, residual gas analyzers
Semiconductor production equipment manufacturers, semiconductor device makers, semiconductor cleaning equipment manufacturers
Flow control of gases and liquids, and monitoring of cleaning fluid concentrations in semiconductor manufacturing processes, semiconductor and LCD quality control inspections
Significant demand fluctuation caused by the “silicon cycle” in the semiconductor industry and investments related to solar cell and other new energy sources
Principal products
Major customers
Product applications
Risk factor
Contribute to improved yields in semiconductor manufacturing processesThe semiconductor industry is cyclical but continues to grow. HORIBA’s main products are mass flow control-
lers, devices that control gas and liquid flows in the semiconductor manufacturing process, but also include
many types of monitoring equipment. HORIBA provides customers with high-level solutions that are frequently
developed in quick response to technical advances in semiconductor miniaturization and yield enhancement.
• Declining demand associated with the economic recession that was triggered by the global financial and economic crisis, and/or the appreciation of the yen against the U.S. dollar in the foreign exchange market are expected to impact HORIBA’s earnings.
• The automotive industry and the semiconductor manufacturing equipment industry are likely to reduce capital investment.
• We expect relatively stable business conditions in the environmental measurement, advanced science and technology, and medical equipment fields.
• A weaker euro against the U.S. dollar should result in more competitiveness for HORIBA products despite some concerns over deflated sales amounts when stated in a stronger yen.
HORIBA, Ltd. Annual Report Fiscal 2009
Segmentsales
21%
Segmentsales
12%
Emission measurementsystems
15
Net Sales and Operating Income Ratio
3/01 3/02 3/03 3/04 3/05 3/06 12/06 12/07
20
18
16
14
12
10
8
6
4
2
0
Net Sales Operating Income Ratio
12/08 12/09
Note: For the fiscal year ended December 31, 2006, the accounting term for HORIBA was 9 months and 11 days as a result of a change in its fiscal year-end from March 20 to December 31 (see page 4 for details.)
(%)
0
60
50
40
30
20
10
(Billions of yen)
0
10
20
30
40
50
60
70
80
90
100
Sales Breakdown
Engines
DrivelinesVehicles
Other
(%)
DTSbusiness
EURO4EURO5EURO6
US EPA Bin5Japan 2009
EURO4
EURO5
Japan 2005
Japan 2009EURO6
US EPA Bin5
Wind tunnel balances testsBrake tests
Motor measurement
Battery measurement
Driving management systems and drive recorders
Emission measurementsystems
EURO3
EURO3
Automotive Test Systems
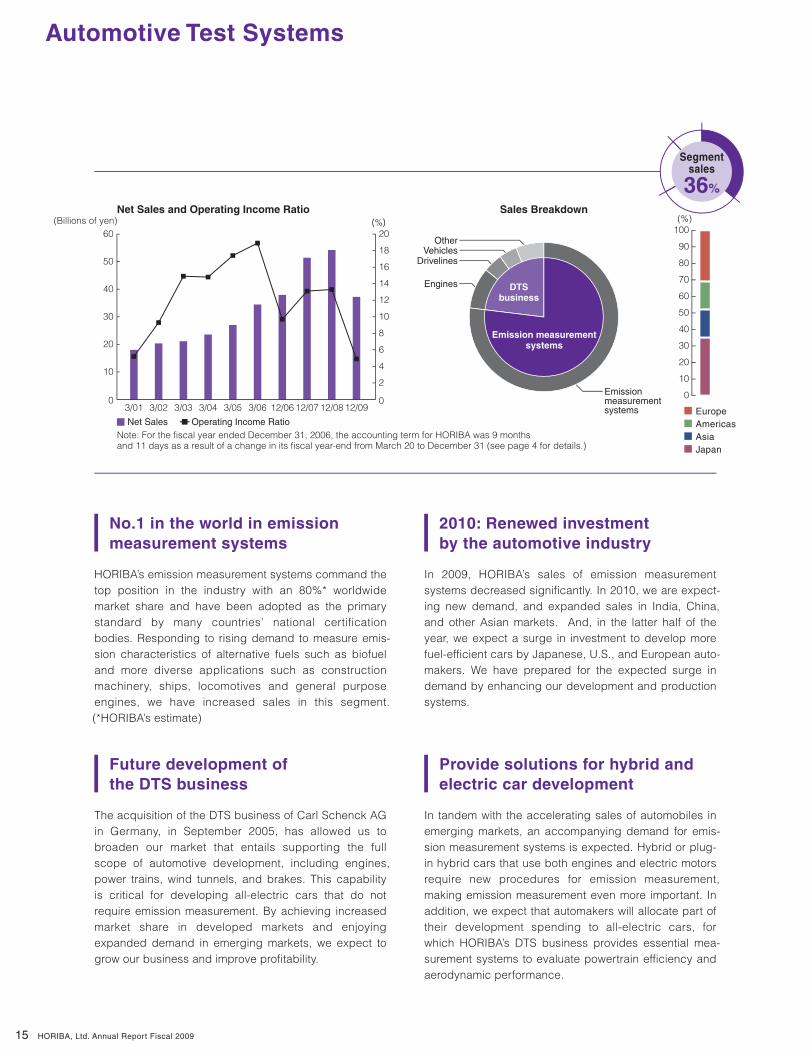
No.1 in the world in emission measurement systems
HORIBA’s emission measurement systems command the top position in the industry with an 80%* worldwide market share and have been adopted as the primary standard by many countries’ national certification bodies. Responding to rising demand to measure emis-sion characteristics of alternative fuels such as biofuel and more diverse applications such as construction machinery, ships, locomotives and general purpose engines, we have increased sales in this segment. (*HORIBA’s estimate)
2010: Renewed investment by the automotive industry
In 2009, HORIBA’s sales of emission measurement systems decreased significantly. In 2010, we are expect-ing new demand, and expanded sales in India, China, and other Asian markets. And, in the latter half of the year, we expect a surge in investment to develop more fuel-efficient cars by Japanese, U.S., and European auto-makers. We have prepared for the expected surge in demand by enhancing our development and production systems.
Future development of the DTS business
The acquisition of the DTS business of Carl Schenck AG in Germany, in September 2005, has allowed us to broaden our market that entails supporting the full scope of automotive development, including engines, power trains, wind tunnels, and brakes. This capability is critical for developing all-electric cars that do not require emission measurement. By achieving increased market share in developed markets and enjoying expanded demand in emerging markets, we expect to grow our business and improve profitability.
Provide solutions for hybrid and electric car development
In tandem with the accelerating sales of automobiles in emerging markets, an accompanying demand for emis-sion measurement systems is expected. Hybrid or plug-in hybrid cars that use both engines and electric motors require new procedures for emission measurement, making emission measurement even more important. In addition, we expect that automakers will allocate part of their development spending to all-electric cars, for which HORIBA’s DTS business provides essential mea-surement systems to evaluate powertrain efficiency and aerodynamic performance.
EuropeAmericasAsiaJapan
Segmentsales
36%
HORIBA, Ltd. Annual Report Fiscal 2009
Share
16
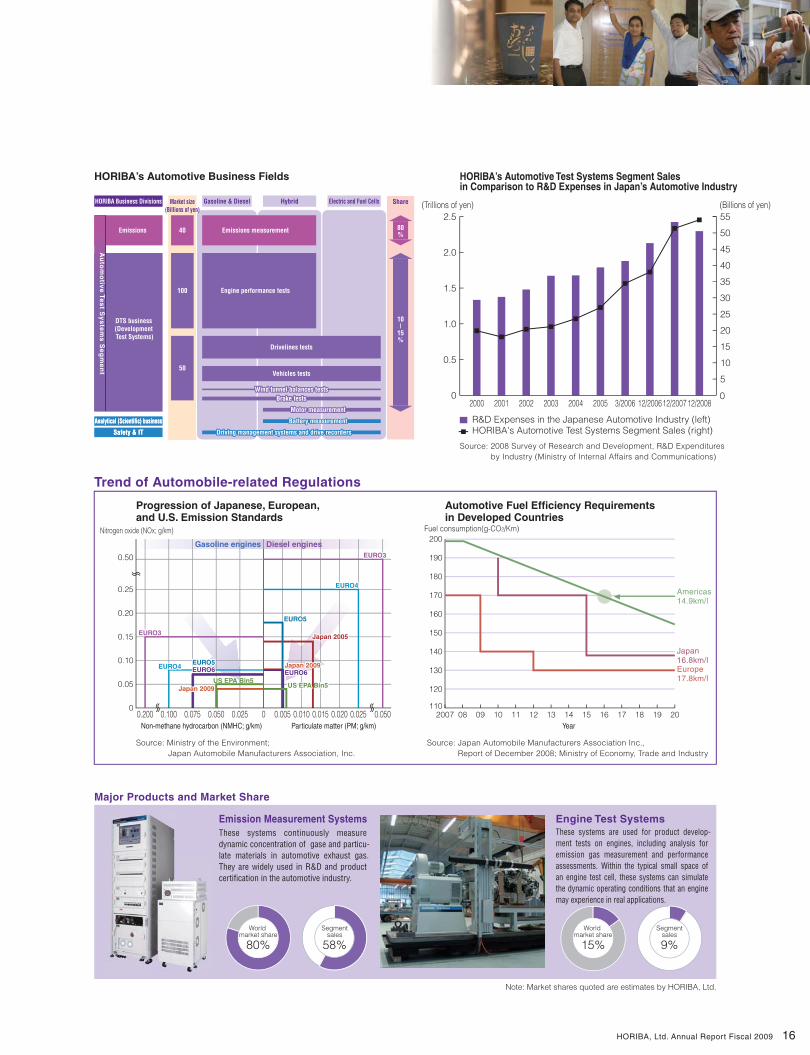
HORIBA’s Automotive Business Fields HORIBA’s Automotive Test Systems Segment Sales in Comparison to R&D Expenses in Japan’s Automotive Industry
Progression of Japanese, European, and U.S. Emission Standards
Trend of Automobile-related Regulations
Automotive Fuel Efficiency Requirements in Developed Countries
Major Products and Market Share
Note: Market shares quoted are estimates by HORIBA, Ltd.
World market share
80%
R&D Expenses in the Japanese Automotive Industry (left)HORIBA's Automotive Test Systems Segment Sales (right)
Source: 2008 Survey of Research and Development, R&D Expenditures by Industry (Ministry of Internal Affairs and Communications)
Source: Japan Automobile Manufacturers Association Inc., Report of December 2008; Ministry of Economy, Trade and Industry
Source: Ministry of the Environment; Japan Automobile Manufacturers Association, Inc.
2000 2001 2002 2003 2004 2005 3/2006 12/200612/200712/2008
(Trillions of yen) (Billions of yen)
0
0.5
1.0
1.5
2.0
2.5
0
5
10
15
20
25
30
40
35
45
50
55
0.1000.200 0.075 0.050 0.025 0.005 0.010 0.015 0.020 0.0500.0250Particulate matter (PM; g/km)Non-methane hydrocarbon (NMHC; g/km)
0
0.05
0.10
0.15
0.20
0.25
0.50
Nitrogen oxide (NOx; g/km) Fuel consumption(g-CO2/Km)
EURO4EURO4EURO5EURO5EURO6EURO6
US EPA Bin5US EPA Bin5Japan Japan 20092009
EURO4EURO5EURO6
US EPA Bin5Japan 2009
EURO4EURO4
EURO5EURO5
Japan Japan 20052005
Japan Japan 20092009EURO6EURO6
US EPA Bin5US EPA Bin5
EURO4
EURO5
Japan 2005
Japan 2009EURO6
US EPA Bin5
200
190
180
170
160
150
140
130
120
1102007 08 09 10 11 12 13 14
Year15 16 17 18 19 20
Gasoline engines Diesel engines
HORIBA Business Divisions
Emissions
DTS business (Development Test Systems)
Gasoline & Diesel Hybrid Electric and Fuel Cells
Emissions measurement
Engine performance tests
Vehicles tests
Wind tunnel balances testsWind tunnel balances testsWind tunnel balances testsBrake testsBrake testsBrake tests
Motor measurementMotor measurementMotor measurement
Battery measurementBattery measurementBattery measurement
Driving management systems and drive recordersDriving management systems and drive recordersDriving management systems and drive recorders
Drivelines tests
Segmentsales
58%
Safety & ITSafety & IT
Analytical (Scientific) businessAnalytical (Scientific) business
EURO3EURO3EURO3
EURO3EURO3EURO3
Europe17.8km/l
Japan16.8km/l
Americas14.9km/l
40 80%
10|
15%
100
50
HORIBA, Ltd. Annual Report Fiscal 2009
Au
tom
otiv
e T
es
t Sy
ste
ms
Se
gm
en
t
Market size(Billions of yen)
These systems are used for product develop-ment tests on engines, including analysis for emission gas measurement and performance assessments. Within the typical small space of an engine test cell, these systems can simulate the dynamic operating conditions that an engine may experience in real applications.
Engine Test SystemsThese systems continuously measure dynamic concentration of gase and particu-late materials in automotive exhaust gas. They are widely used in R&D and product certification in the automotive industry.
Emission Measurement Systems
World market share
15%
Segmentsales
9%
17
0
10
20
30
40
50
60
70
80
90
100(%)
8
7
6
5
4
3
2
1
0Opticalcomponents
Molecular & Microanalysis
Elemental analysis
Emission gas measurement
Other
Water quality analysis
Air pollutionOther
0
45
35
40
30
25
20
15
10
5
(Billions of yen)
Segmentsales
31%
Scientific
Process &Environment
Analytical Instruments & Systems
Net Sales and Operating Income Ratio
Net Sales Operating Income RatioNote: For the fiscal year ended December 31, 2006, the accounting term for HORIBA was 9 months and 11 days as a result of a change in its fiscal year-end from March 20 to December 31 (see page 4 for details.)
3/01 3/02 3/03 3/04 3/05 3/06 12/06 12/07 12/08 12/09
9(%)
Sales Breakdown
EuropeAmericasAsiaJapan
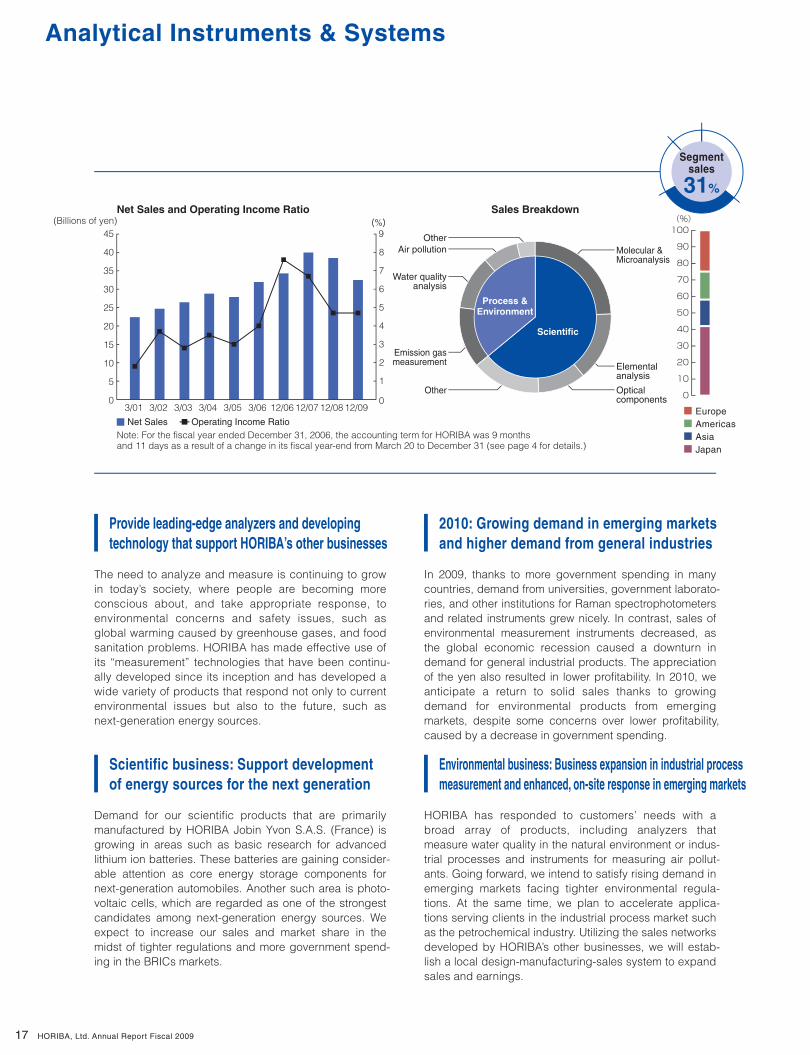
Provide leading-edge analyzers and developing technology that support HORIBA’s other businesses
The need to analyze and measure is continuing to grow in today’s society, where people are becoming more conscious about, and take appropriate response, to environmental concerns and safety issues, such as global warming caused by greenhouse gases, and food sanitation problems. HORIBA has made effective use of its “measurement” technologies that have been continu-ally developed since its inception and has developed a wide variety of products that respond not only to current environmental issues but also to the future, such as next-generation energy sources.
2010: Growing demand in emerging markets and higher demand from general industries
In 2009, thanks to more government spending in many countries, demand from universities, government laborato-ries, and other institutions for Raman spectrophotometers and related instruments grew nicely. In contrast, sales of environmental measurement instruments decreased, as the global economic recession caused a downturn in demand for general industrial products. The appreciation of the yen also resulted in lower profitability. In 2010, we anticipate a return to solid sales thanks to growing demand for environmental products from emerging markets, despite some concerns over lower profitability, caused by a decrease in government spending.
Scientific business: Support development of energy sources for the next generation
Demand for our scientific products that are primarily manufactured by HORIBA Jobin Yvon S.A.S. (France) is growing in areas such as basic research for advanced lithium ion batteries. These batteries are gaining consider-able attention as core energy storage components for next-generation automobiles. Another such area is photo-voltaic cells, which are regarded as one of the strongest candidates among next-generation energy sources. We expect to increase our sales and market share in the midst of tighter regulations and more government spend-ing in the BRICs markets.
Environmental business: Business expansion in industrial process measurement and enhanced, on-site response in emerging markets
HORIBA has responded to customers’ needs with a broad array of products, including analyzers that measure water quality in the natural environment or indus-trial processes and instruments for measuring air pollut-ants. Going forward, we intend to satisfy rising demand in emerging markets facing tighter environmental regula-tions. At the same time, we plan to accelerate applica-tions serving clients in the industrial process market such as the petrochemical industry. Utilizing the sales networks developed by HORIBA’s other businesses, we will estab-lish a local design-manufacturing-sales system to expand sales and earnings.
HORIBA, Ltd. Annual Report Fiscal 2009
18
Major Products and Market Share
Note: Market shares quoted are estimates by HORIBA, Ltd.
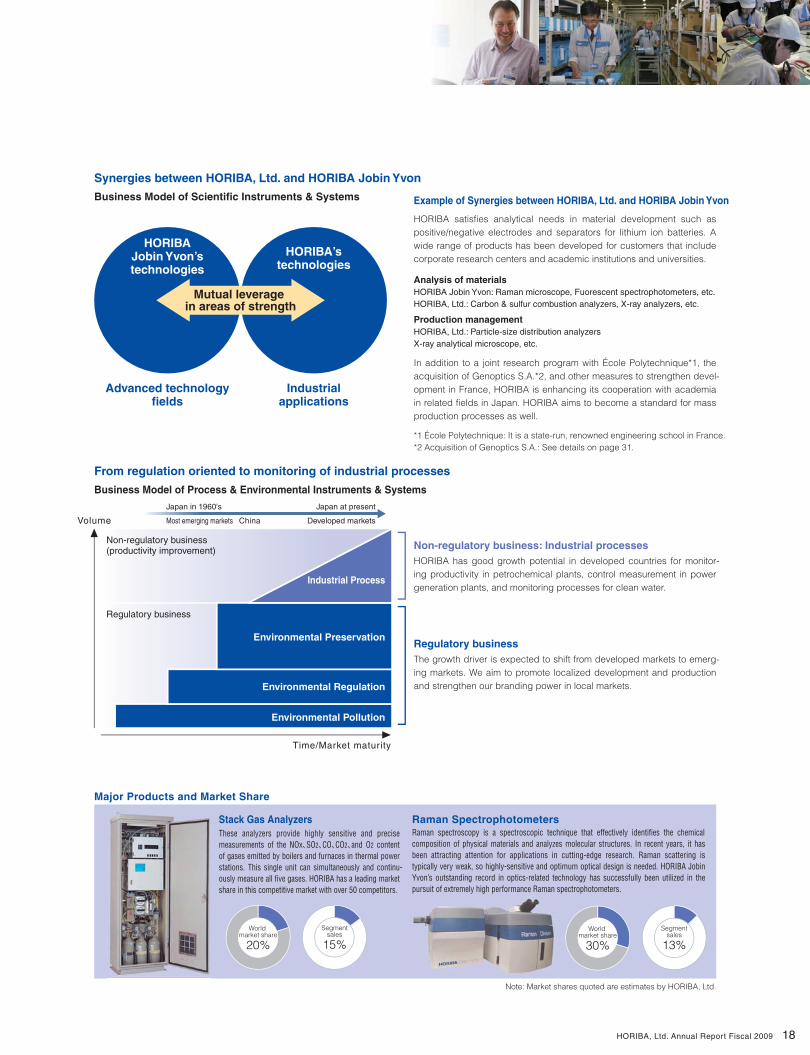
Synergies between HORIBA, Ltd. and HORIBA Jobin Yvon
Example of Synergies between HORIBA, Ltd. and HORIBA Jobin YvonBusiness Model of Scientific Instruments & Systems
From regulation oriented to monitoring of industrial processes
Business Model of Process & Environmental Instruments & Systems
Analysis of materialsHORIBA Jobin Yvon: Raman microscope, Fuorescent spectrophotometers, etc. HORIBA, Ltd.: Carbon & sulfur combustion analyzers, X-ray analyzers, etc.
Production managementHORIBA, Ltd.: Particle-size distribution analyzers X-ray analytical microscope, etc.
Non-regulatory business: Industrial processes
Time/Market maturity
Non-regulatory business (productivity improvement)
Regulatory business
Japan in 1960's
Most emerging markets
Japan at present
Developed marketsChina
Environmental Pollution
Environmental Regulation
Environmental Preservation
Industrial Process
*1 École Polytechnique: It is a state-run, renowned engineering school in France.*2 Acquisition of Genoptics S.A.: See details on page 31.
Volume
World market share
20%
Segmentsales
15%
HORIBA satisfies analytical needs in material development such as positive/negative electrodes and separators for lithium ion batteries. A wide range of products has been developed for customers that include corporate research centers and academic institutions and universities.
In addition to a joint research program with École Polytechnique*1, the acquisition of Genoptics S.A.*2, and other measures to strengthen devel-opment in France, HORIBA is enhancing its cooperation with academia in related fields in Japan. HORIBA aims to become a standard for mass production processes as well.
HORIBA has good growth potential in developed countries for monitor-ing productivity in petrochemical plants, control measurement in power generation plants, and monitoring processes for clean water.
Regulatory businessThe growth driver is expected to shift from developed markets to emerg-ing markets. We aim to promote localized development and production and strengthen our branding power in local markets.
HORIBAJobin Yvon’stechnologies
Advanced technologyfields
Industrialapplications
HORIBA’stechnologies
Mutual leverage in areas of strength
Raman spectroscopy is a spectroscopic technique that effectively identifies the chemical composition of physical materials and analyzes molecular structures. In recent years, it has been attracting attention for applications in cutting-edge research. Raman scattering is typically very weak, so highly-sensitive and optimum optical design is needed. HORIBA Jobin Yvon’s outstanding record in optics-related technology has successfully been utilized in the pursuit of extremely high performance Raman spectrophotometers.
Raman SpectrophotometersThese analyzers provide highly sensitive and precise measurements of the NOx、SO2、CO、CO2、and O2 content of gases emitted by boilers and furnaces in thermal power stations. This single unit can simultaneously and continu-ously measure all five gases. HORIBA has a leading market share in this competitive market with over 50 competitors.
Stack Gas Analyzers
World market share
30%
Segmentsales
13%
HORIBA, Ltd. Annual Report Fiscal 2009
Medical-diagnostic
instruments
Testing reagents
Other
19
0
10
20
30
40
50
60
70
80
90
100
Sales Breakdown(%)
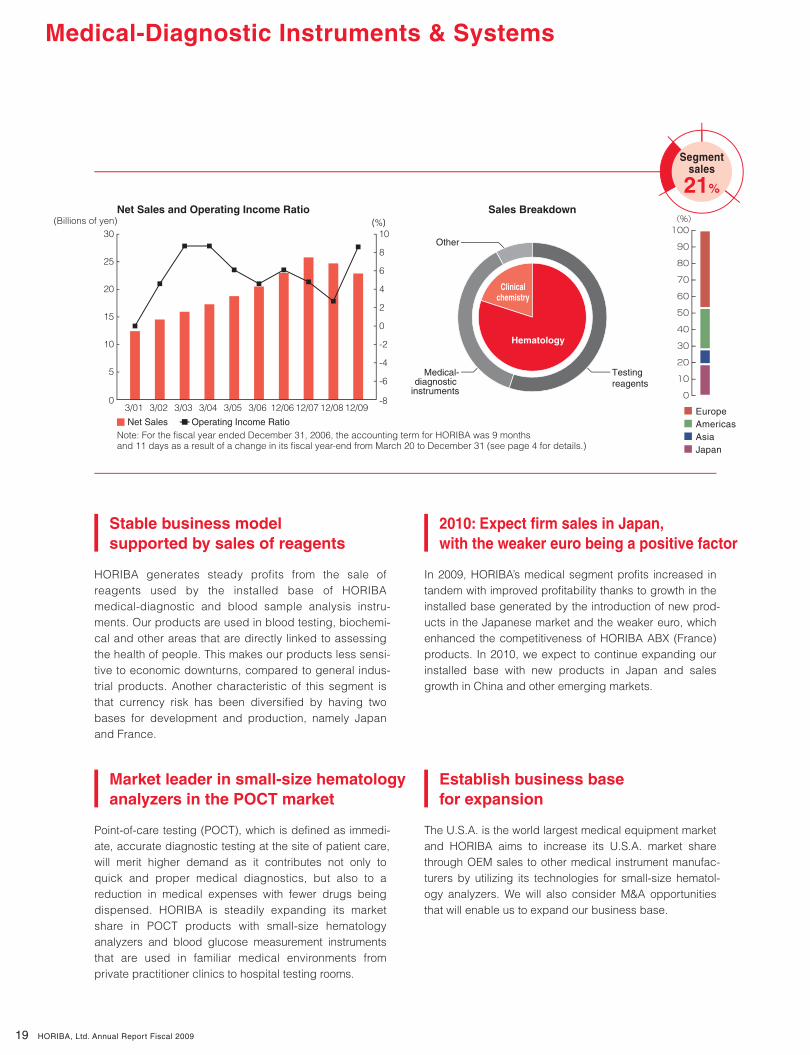
Medical-Diagnostic Instruments & Systems
8
6
4
2
0
-2
-4
-6
-80
30
25
20
15
10
5
Segmentsales
21%
Hematology
Clinicalchemistry
(Billions of yen)Net Sales and Operating Income Ratio
Net Sales Operating Income RatioNote: For the fiscal year ended December 31, 2006, the accounting term for HORIBA was 9 months and 11 days as a result of a change in its fiscal year-end from March 20 to December 31 (see page 4 for details.)
3/01 3/02 3/03 3/04 3/05 3/06 12/06 12/07 12/08 12/09
10(%)
EuropeAmericasAsiaJapan
Stable business model supported by sales of reagents
HORIBA generates steady profits from the sale of reagents used by the installed base of HORIBA medical-diagnostic and blood sample analysis instru-ments. Our products are used in blood testing, biochemi-cal and other areas that are directly linked to assessing the health of people. This makes our products less sensi-tive to economic downturns, compared to general indus-trial products. Another characteristic of this segment is that currency risk has been diversified by having two bases for development and production, namely Japan and France.
2010: Expect firm sales in Japan, with the weaker euro being a positive factor
In 2009, HORIBA’s medical segment profits increased in tandem with improved profitability thanks to growth in the installed base generated by the introduction of new prod-ucts in the Japanese market and the weaker euro, which enhanced the competitiveness of HORIBA ABX (France) products. In 2010, we expect to continue expanding our installed base with new products in Japan and sales growth in China and other emerging markets.
Market leader in small-size hematology analyzers in the POCT market
Point-of-care testing (POCT), which is defined as immedi-ate, accurate diagnostic testing at the site of patient care, will merit higher demand as it contributes not only to quick and proper medical diagnostics, but also to a reduction in medical expenses with fewer drugs being dispensed. HORIBA is steadily expanding its market share in POCT products with small-size hematology analyzers and blood glucose measurement instruments that are used in familiar medical environments from private practitioner clinics to hospital testing rooms.
Establish business base for expansion
The U.S.A. is the world largest medical equipment market and HORIBA aims to increase its U.S.A. market share through OEM sales to other medical instrument manufac-turers by utilizing its technologies for small-size hematol-ogy analyzers. We will also consider M&A opportunities that will enable us to expand our business base.
Francedevelopment and production
(hardware and reagents)
Japandevelopment and production
(hardware and reagents)
Brazildevelopment and production
(reagents)
U.S.A.sales
HORIBA, Ltd. Annual Report Fiscal 2009
20
Major Products and Market Share
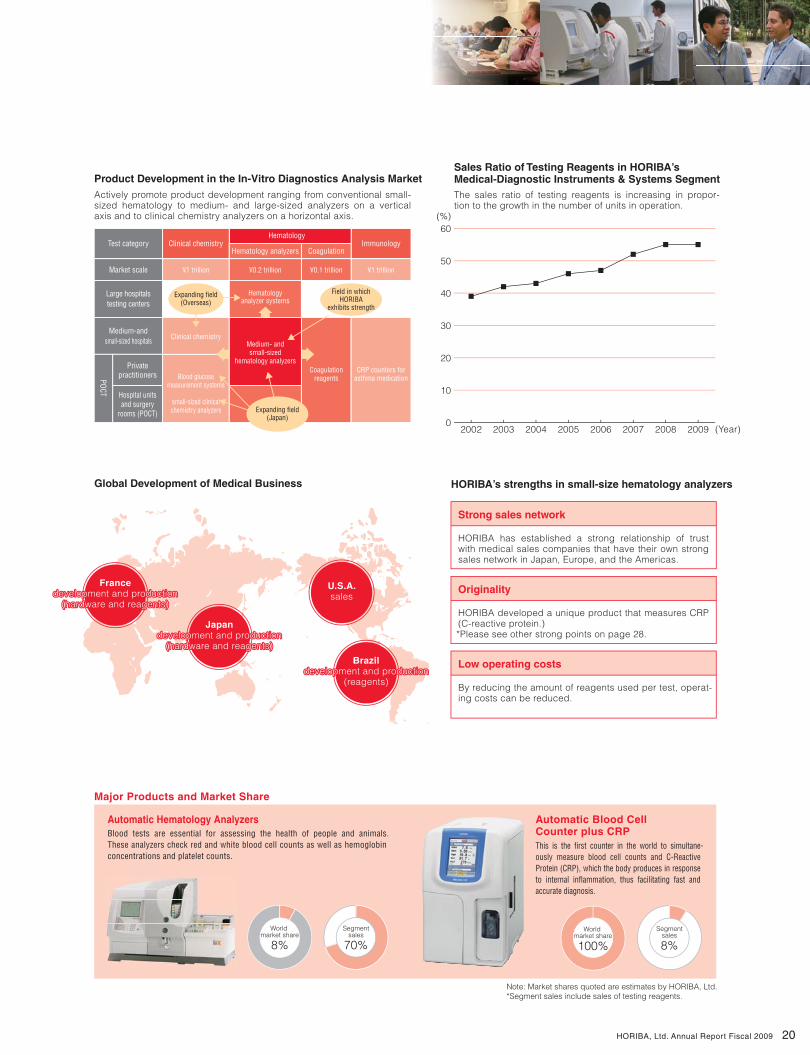
Product Development in the In-Vitro Diagnostics Analysis MarketSales Ratio of Testing Reagents in HORIBA’s Medical-Diagnostic Instruments & Systems Segment
Global Development of Medical Business HORIBA’s strengths in small-size hematology analyzers
Originality
Test category Clinical chemistryHematology
Immunology
¥1 trillion
Coagulation
¥0.1 trillion
Hematology analyzers
¥0.2 trillion ¥1 trillionMarket scale
Large hospitalstesting centers
Medium-andsmall-sized hospitals
Privatepractitioners
Hospital unitsand surgery
rooms (POCT)
Hematologyanalyzer systems
Clinical chemistry
Blood glucosemeasurement systems
small-sized clinicalchemistry analyzers
Coagulationreagents
CRP counters forasthma medication
Medium- andsmall-sized
hematology analyzers
Field in whichHORIBA
exhibits strength
Expanding field(Overseas)
Expanding field(Japan)
2002 2003 2004 2005 2006 20070
60
50
40
30
20
10
2009 (Year)2008
(%)
Actively promote product development ranging from conventional small-sized hematology to medium- and large-sized analyzers on a vertical axis and to clinical chemistry analyzers on a horizontal axis.
The sales ratio of testing reagents is increasing in propor-tion to the growth in the number of units in operation.
HORIBA developed a unique product that measures CRP (C-reactive protein.) *Please see other strong points on page 28.
Low operating costs
By reducing the amount of reagents used per test, operat-ing costs can be reduced.
Strong sales network
HORIBA has established a strong relationship of trust with medical sales companies that have their own strong sales network in Japan, Europe, and the Americas.
POCT
Francedevelopment and production
(hardware and reagents)
Francedevelopment and production
(hardware and reagents)
Francedevelopment and production
(hardware and reagents)
Japandevelopment and production
(hardware and reagents)
Japandevelopment and production
(hardware and reagents)
Japandevelopment and production
(hardware and reagents)
Brazildevelopment and production
(reagents)
Brazildevelopment and production
(reagents)
Brazildevelopment and production
(reagents)
U.S.A.sales
U.S.A.sales
U.S.A.sales
This is the first counter in the world to simultane-ously measure blood cell counts and C-Reactive Protein (CRP), which the body produces in response to internal inflammation, thus facilitating fast and accurate diagnosis.
Automatic Blood Cell Counter plus CRPBlood tests are essential for assessing the health of people and animals.
These analyzers check red and white blood cell counts as well as hemoglobin concentrations and platelet counts.
Automatic Hematology Analyzers
World market share
8%World
market share
100%
Segmentsales
70%
Segmentsales
8%
Note: Market shares quoted are estimates by HORIBA, Ltd.*Segment sales include sales of testing reagents.
HORIBA, Ltd. Annual Report Fiscal 2009
Mass flow controllers
Wet processmonitor
Dry process monitor
Other
21
0
10
20
30
40
50
60
70
80
90
100
Sales Breakdown(%)
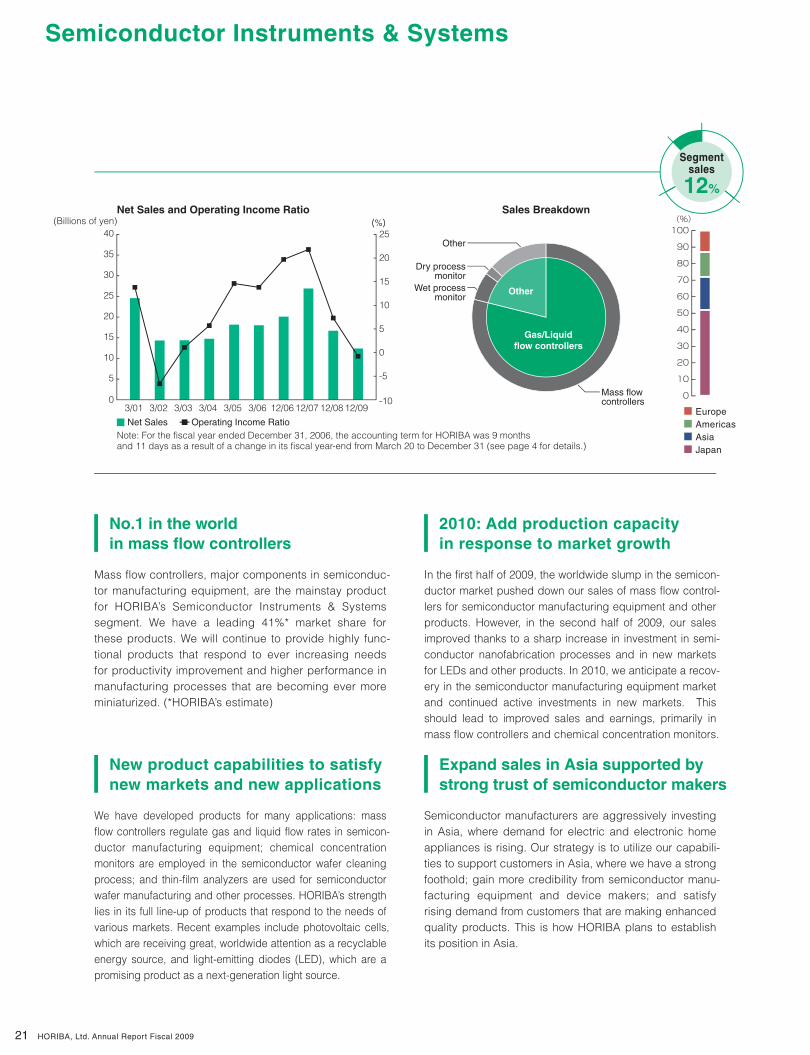
Semiconductor Instruments & Systems
25
20
15
10
5
0
-5
-100
30
25
35
40
20
15
10
5
Gas/Liquidflow controllers
Other
Net Sales and Operating Income Ratio
Net Sales Operating Income RatioNote: For the fiscal year ended December 31, 2006, the accounting term for HORIBA was 9 months and 11 days as a result of a change in its fiscal year-end from March 20 to December 31 (see page 4 for details.)
(Billions of yen)
3/01 3/02 3/03 3/04 3/05 3/06 12/06 12/07 12/08 12/09
(%)
Segmentsales
12%
EuropeAmericasAsiaJapan
No.1 in the world in mass flow controllers
Mass flow controllers, major components in semiconduc-tor manufacturing equipment, are the mainstay product for HORIBA’s Semiconductor Instruments & Systems segment. We have a leading 41%* market share for these products. We will continue to provide highly func-tional products that respond to ever increasing needs for productivity improvement and higher performance in manufacturing processes that are becoming ever more miniaturized. (*HORIBA’s estimate)
2010: Add production capacity in response to market growth
In the first half of 2009, the worldwide slump in the semicon-ductor market pushed down our sales of mass flow control-lers for semiconductor manufacturing equipment and other products. However, in the second half of 2009, our sales improved thanks to a sharp increase in investment in semi-conductor nanofabrication processes and in new markets for LEDs and other products. In 2010, we anticipate a recov-ery in the semiconductor manufacturing equipment market and continued active investments in new markets. This should lead to improved sales and earnings, primarily in mass flow controllers and chemical concentration monitors.
New product capabilities to satisfy new markets and new applications
We have developed products for many applications: mass flow controllers regulate gas and liquid flow rates in semicon-ductor manufacturing equipment; chemical concentration monitors are employed in the semiconductor wafer cleaning process; and thin-film analyzers are used for semiconductor wafer manufacturing and other processes. HORIBA’s strength lies in its full line-up of products that respond to the needs of various markets. Recent examples include photovoltaic cells, which are receiving great, worldwide attention as a recyclable energy source, and light-emitting diodes (LED), which are a promising product as a next-generation light source.
Expand sales in Asia supported by strong trust of semiconductor makers
Semiconductor manufacturers are aggressively investing in Asia, where demand for electric and electronic home appliances is rising. Our strategy is to utilize our capabili-ties to support customers in Asia, where we have a strong foothold; gain more credibility from semiconductor manu-facturing equipment and device makers; and satisfy rising demand from customers that are making enhanced quality products. This is how HORIBA plans to establish its position in Asia.
HORIBA, Ltd. Annual Report Fiscal 2009
22
Major Products and Market Share
Note: Market shares quoted are estimates by HORIBA, Ltd.
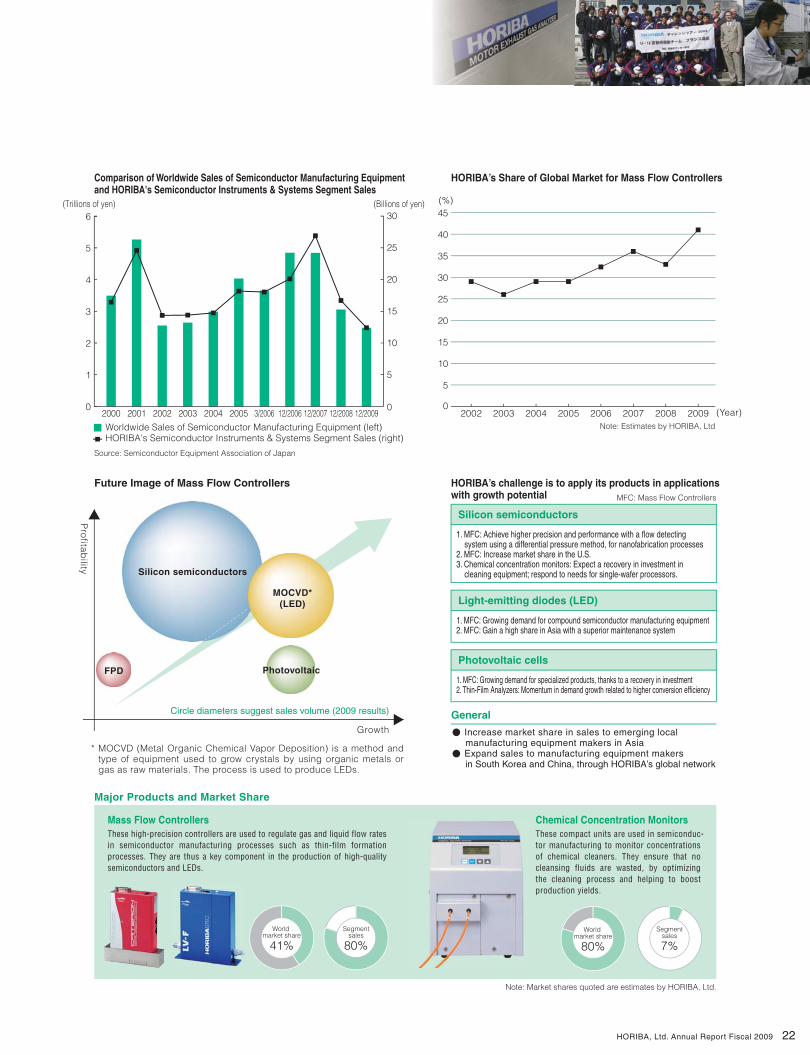
HORIBA’s challenge is to apply its products in applications with growth potential
Silicon semiconductors
1. MFC: Achieve higher precision and performance with a flow detecting system using a differential pressure method, for nanofabrication processes 2. MFC: Increase market share in the U.S.3. Chemical concentration monitors: Expect a recovery in investment in cleaning equipment; respond to needs for single-wafer processors.
Light-emitting diodes (LED)
1. MFC: Growing demand for compound semiconductor manufacturing equipment2. MFC: Gain a high share in Asia with a superior maintenance system
Photovoltaic cells
1. MFC: Growing demand for specialized products, thanks to a recovery in investment2. Thin-Film Analyzers: Momentum in demand growth related to higher conversion efficiency
General
Comparison of Worldwide Sales of Semiconductor Manufacturing Equipment and HORIBA's Semiconductor Instruments & Systems Segment Sales
2000 2001 2002 2003 2004 2005 3/2006 12/2006Worldwide Sales of Semiconductor Manufacturing Equipment (left)HORIBA's Semiconductor Instruments & Systems Segment Sales (right)
Source: Semiconductor Equipment Association of Japan
12/2007 12/2008 12/2009
(Trillions of yen) (Billions of yen)
0
1
2
3
4
5
6
0
5
10
15
20
30
25
Future Image of Mass Flow Controllers
Growth
Circle diameters suggest sales volume (2009 results)
HORIBA’s Share of Global Market for Mass Flow Controllers
Note: Estimates by HORIBA, Ltd
(%)
0
45
40
35
30
25
20
15
10
5
(Year)2002 2003 2004 2005 2006 2007 20092008
* MOCVD (Metal Organic Chemical Vapor Deposition) is a method and type of equipment used to grow crystals by using organic metals or gas as raw materials. The process is used to produce LEDs.
Pro
fitab
ility• Increase market share in sales to emerging local manufacturing equipment makers in Asia
• Expand sales to manufacturing equipment makers in South Korea and China, through HORIBA’s global network
MFC: Mass Flow Controllers
These high-precision controllers are used to regulate gas and liquid flow rates in semiconductor manufacturing processes such as thin-film formation processes. They are thus a key component in the production of high-quality semiconductors and LEDs.
Mass Flow ControllersThese compact units are used in semiconduc-tor manufacturing to monitor concentrations of chemical cleaners. They ensure that no cleansing fluids are wasted, by optimizing the cleaning process and helping to boost production yields.
Chemical Concentration Monitors
World market share
41%
HORIBA, Ltd. Annual Report Fiscal 2009
Segmentsales
80%World
market share
80%
Segmentsales
7%
Silicon semiconductors
MOCVD*(LED)
PhotovoltaicFPD
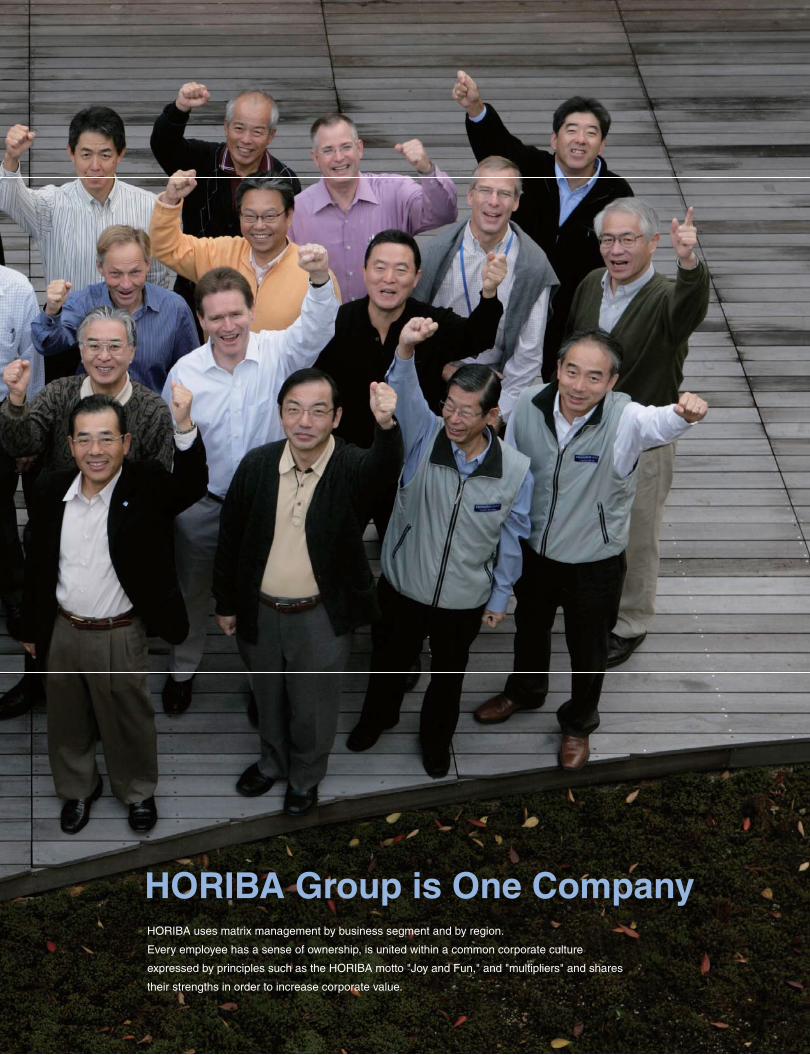
HORIBA Group is One CompanyHORIBA uses matrix management by business segment and by region.
Every employee has a sense of ownership, is united within a common corporate culture
expressed by principles such as the HORIBA motto "Joy and Fun," and "multipliers" and shares
their strengths in order to increase corporate value.
25
Evolution in “One Company” Management
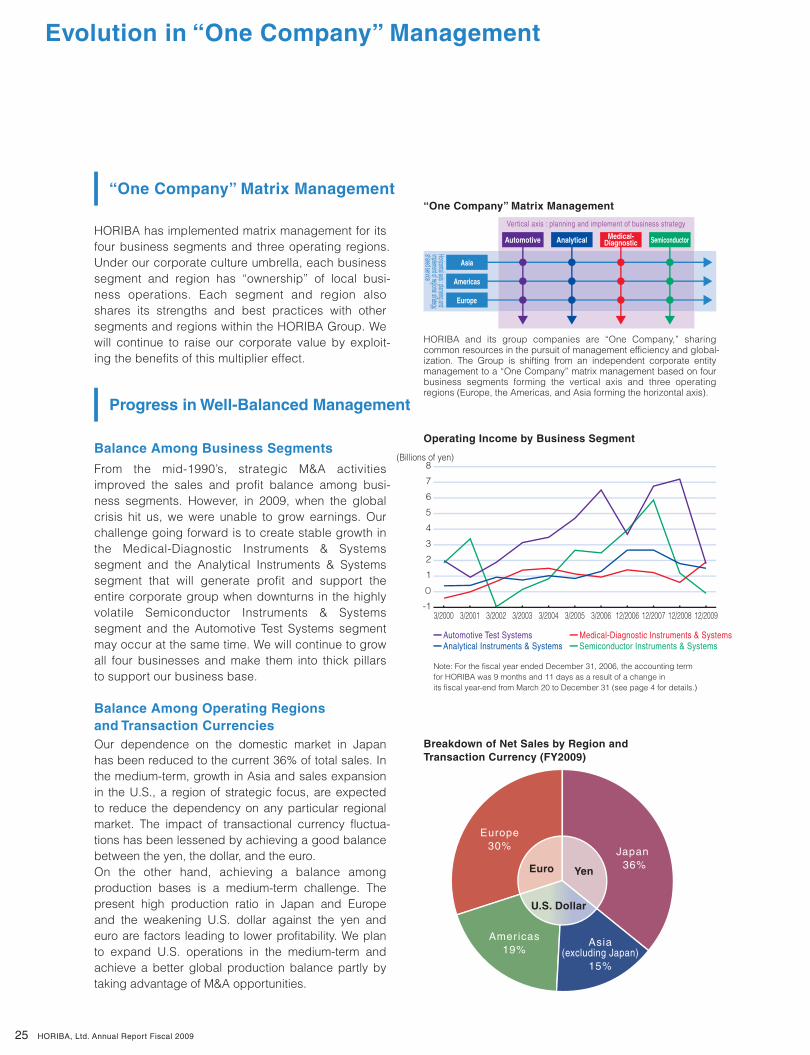
“One Company” Matrix Management
HORIBA has implemented matrix management for its four business segments and three operating regions. Under our corporate culture umbrella, each business segment and region has “ownership” of local busi-ness operations. Each segment and region also shares its strengths and best practices with other segments and regions within the HORIBA Group. We will continue to raise our corporate value by exploit-ing the benefits of this multiplier effect.
Progress in Well-Balanced Management
“One Company” Matrix Management
Vertical axis : planning and implement of business strategy
Horizontal axis : planning and implement of regional strategy, shared service
Automotive Analytical Medical-Diagnostic Semiconductor
Europe
Americas
Asia
Operating Income by Business Segment
Breakdown of Net Sales by Region and Transaction Currency (FY2009)
Automotive Test SystemsAnalytical Instruments & Systems
Medical-Diagnostic Instruments & SystemsSemiconductor Instruments & Systems
3/2000 3/2001 3/2002 3/2003 3/2004 3/2005 3/2006 12/2006 12/200812/2007 12/2009
7
(Billions of yen) 8
6
5
4
3
2
1
0
-1
HORIBA and its group companies are “One Company,” sharing common resources in the pursuit of management efficiency and global-ization. The Group is shifting from an independent corporate entity management to a “One Company” matrix management based on four business segments forming the vertical axis and three operating regions (Europe, the Americas, and Asia forming the horizontal axis).
Japan 36%Yen
U.S. Dollar
Euro
Asia(excluding Japan)
15%
Americas19%
Europe30%
HORIBA, Ltd. Annual Report Fiscal 2009
From the mid-1990’s, strategic M&A activities improved the sales and profit balance among busi-ness segments. However, in 2009, when the global crisis hit us, we were unable to grow earnings. Our challenge going forward is to create stable growth in the Medical-Diagnostic Instruments & Systems segment and the Analytical Instruments & Systems segment that will generate profit and support the entire corporate group when downturns in the highly volatile Semiconductor Instruments & Systems segment and the Automotive Test Systems segment may occur at the same time. We will continue to grow all four businesses and make them into thick pillars to support our business base.
Balance Among Business Segments
Our dependence on the domestic market in Japan has been reduced to the current 36% of total sales. In the medium-term, growth in Asia and sales expansion in the U.S., a region of strategic focus, are expected to reduce the dependency on any particular regional market. The impact of transactional currency fluctua-tions has been lessened by achieving a good balance between the yen, the dollar, and the euro.On the other hand, achieving a balance among production bases is a medium-term challenge. The present high production ratio in Japan and Europe and the weakening U.S. dollar against the yen and euro are factors leading to lower profitability. We plan to expand U.S. operations in the medium-term and achieve a better global production balance partly by taking advantage of M&A opportunities.
Balance Among Operating Regions and Transaction Currencies
Note: For the fiscal year ended December 31, 2006, the accounting term for HORIBA was 9 months and 11 days as a result of a change in its fiscal year-end from March 20 to December 31 (see page 4 for details.)
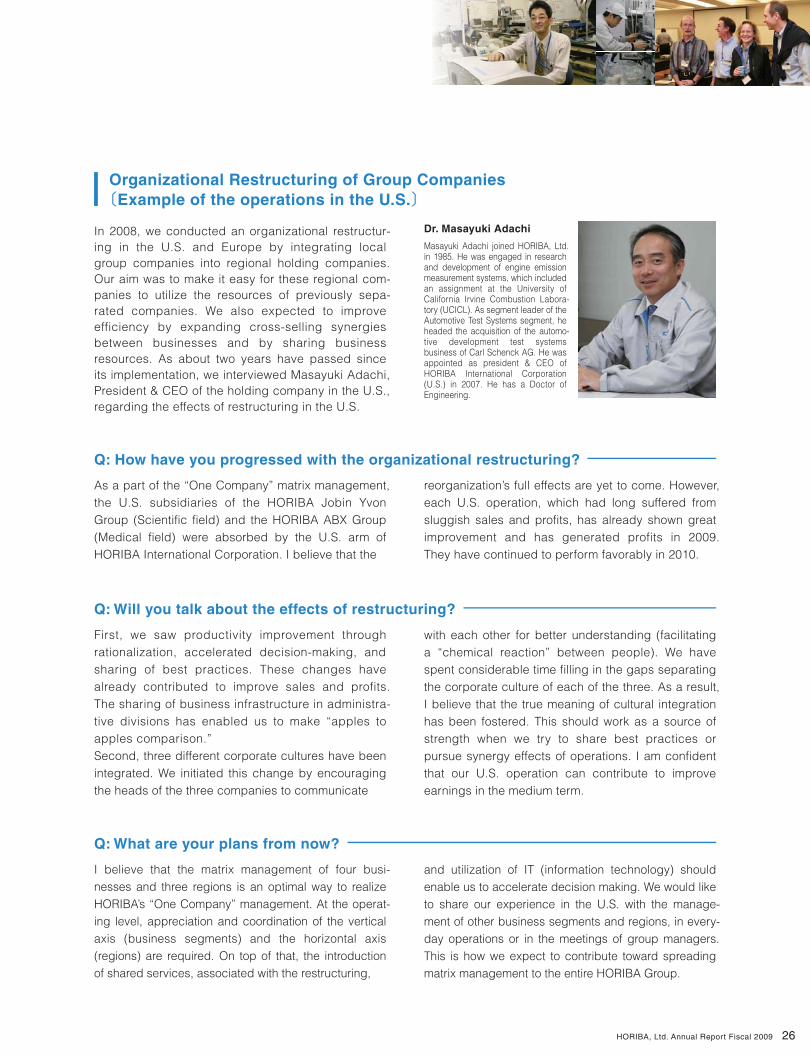
In 2008, we conducted an organizational restructur-ing in the U.S. and Europe by integrating local group companies into regional holding companies. Our aim was to make it easy for these regional com-panies to utilize the resources of previously sepa-rated companies. We also expected to improve efficiency by expanding cross-selling synergies between businesses and by sharing business resources. As about two years have passed since its implementation, we interviewed Masayuki Adachi, President & CEO of the holding company in the U.S., regarding the effects of restructuring in the U.S.
Organizational Restructuring of Group Companies〔Example of the operations in the U.S.〕
Dr. Masayuki Adachi
Masayuki Adachi joined HORIBA, Ltd. in 1985. He was engaged in research and development of engine emission measurement systems, which included an assignment at the University of California Irvine Combustion Labora-tory (UCICL). As segment leader of the Automotive Test Systems segment, he headed the acquisition of the automo-tive development test systems business of Carl Schenck AG. He was appointed as president & CEO of HORIBA International Corporation (U.S.) in 2007. He has a Doctor of Engineering.
26
Q: How have you progressed with the organizational restructuring?
As a part of the “One Company” matrix management, the U.S. subsidiaries of the HORIBA Jobin Yvon Group (Scientific field) and the HORIBA ABX Group (Medical field) were absorbed by the U.S. arm of HORIBA International Corporation. I believe that the
reorganization’s full effects are yet to come. However, each U.S. operation, which had long suffered from sluggish sales and profits, has already shown great improvement and has generated profits in 2009. They have continued to perform favorably in 2010.
Q: Will you talk about the effects of restructuring?
First, we saw productivity improvement through rationalization, accelerated decision-making, and sharing of best practices. These changes have already contributed to improve sales and profits. The sharing of business infrastructure in administra-tive divisions has enabled us to make “apples to apples comparison.” Second, three different corporate cultures have been integrated. We initiated this change by encouraging the heads of the three companies to communicate
with each other for better understanding (facilitating a “chemical reaction” between people). We have spent considerable time filling in the gaps separating the corporate culture of each of the three. As a result, I believe that the true meaning of cultural integration has been fostered. This should work as a source of strength when we try to share best practices or pursue synergy effects of operations. I am confident that our U.S. operation can contribute to improve earnings in the medium term.
Q: What are your plans from now?
I believe that the matrix management of four busi-nesses and three regions is an optimal way to realize HORIBA’s “One Company” management. At the operat-ing level, appreciation and coordination of the vertical axis (business segments) and the horizontal axis (regions) are required. On top of that, the introduction of shared services, associated with the restructuring,
and utilization of IT (information technology) should enable us to accelerate decision making. We would like to share our experience in the U.S. with the manage-ment of other business segments and regions, in every-day operations or in the meetings of group managers. This is how we expect to contribute toward spreading matrix management to the entire HORIBA Group.
HORIBA, Ltd. Annual Report Fiscal 2009
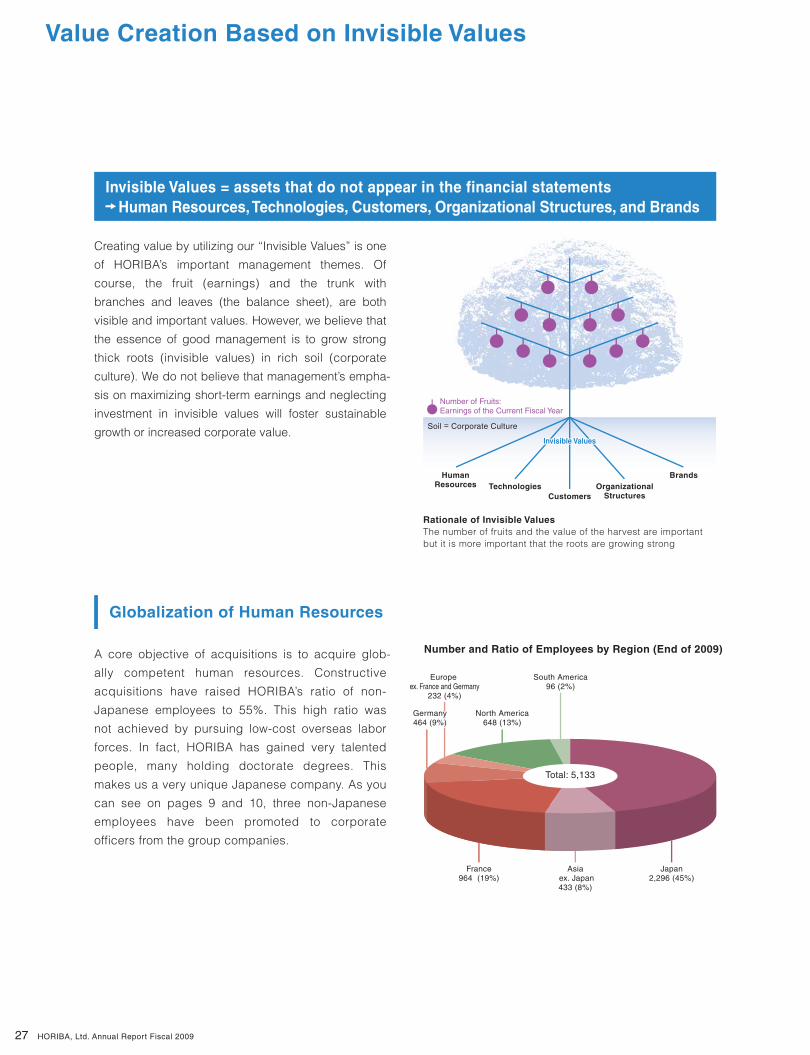
Japan2,296 (45%)
France964 (19%)
Europe ex. France and Germany
232 (4%)
North America648 (13%)
South America96 (2%)
Asia ex. Japan433 (8%)
27
Invisible Values = assets that do not appear in the financial statements Human Resources, Technologies, Customers, Organizational Structures, and Brands
Creating value by utilizing our “Invisible Values” is one
of HORIBA’s important management themes. Of
course, the fruit (earnings) and the trunk with
branches and leaves (the balance sheet), are both
visible and important values. However, we believe that
the essence of good management is to grow strong
thick roots (invisible values) in rich soil (corporate
culture). We do not believe that management’s empha-
sis on maximizing short-term earnings and neglecting
investment in invisible values will foster sustainable
growth or increased corporate value.
Number and Ratio of Employees by Region (End of 2009)
Rationale of Invisible ValuesThe number of fruits and the value of the harvest are important but it is more important that the roots are growing strong
HumanResources Technologies
CustomersOrganizational
Structures
Brands
Number of Fruits: Earnings of the Current Fiscal Year
Soil = Corporate Culture
Total: 5,133
Invisible ValuesInvisible ValuesInvisible Values
Germany464 (9%)Germany464 (9%)Germany464 (9%)
Value Creation Based on Invisible Values
Globalization of Human Resources
A core objective of acquisitions is to acquire glob-
ally competent human resources. Constructive
acquisitions have raised HORIBA’s ratio of non-
Japanese employees to 55%. This high ratio was
not achieved by pursuing low-cost overseas labor
forces. In fact, HORIBA has gained very talented
people, many holding doctorate degrees. This
makes us a very unique Japanese company. As you
can see on pages 9 and 10, three non-Japanese
employees have been promoted to corporate
officers from the group companies.
HORIBA, Ltd. Annual Report Fiscal 2009
<Measurement Method>Whole blood immunology
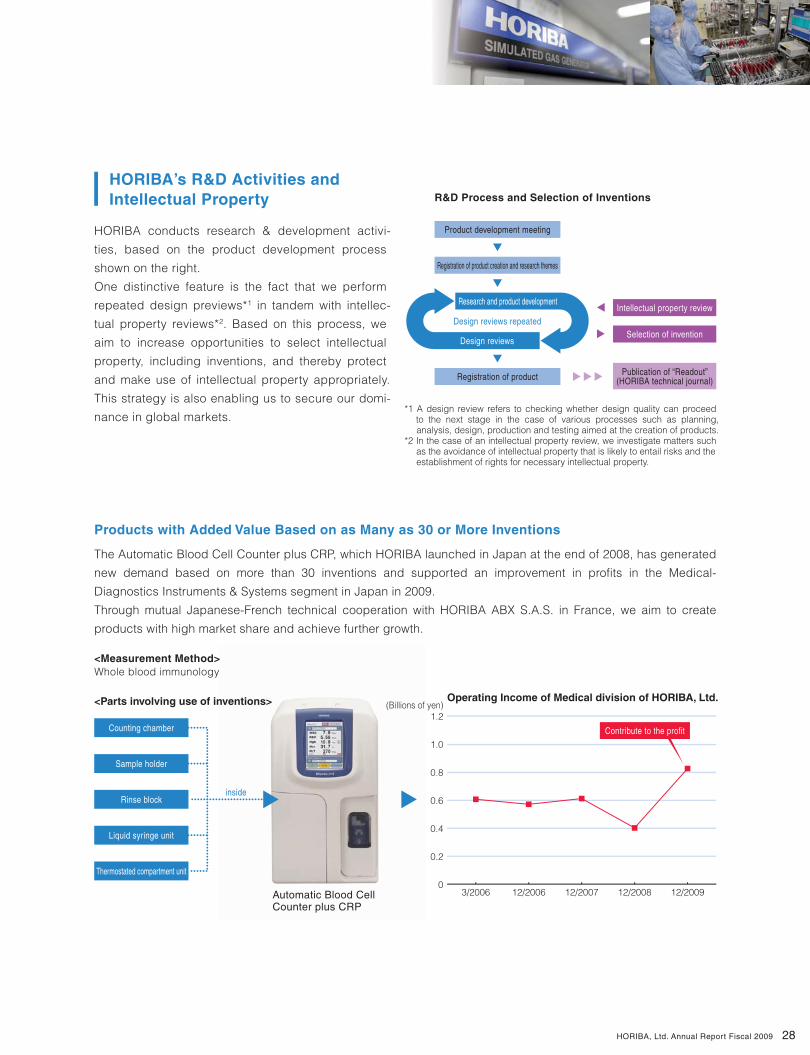
R&D Process and Selection of Inventions
Automatic Blood Cell Counter plus CRP
28
*1 A design review refers to checking whether design quality can proceed to the next stage in the case of various processes such as planning, analysis, design, production and testing aimed at the creation of products.*2 In the case of an intellectual property review, we investigate matters such as the avoidance of intellectual property that is likely to entail risks and the establishment of rights for necessary intellectual property.
Operating Income of Medical division of HORIBA, Ltd.(Billions of yen)
0
0.6
0.4
0.2
0.8
1.2
1.0
3/2006 12/2006 12/2007 12/2008 12/2009
Product development meeting
Registration of product creation and research themes
Selection of invention
Publication of “Readout”(HORIBA technical journal)Registration of product
Design reviews repeated
<Parts involving use of inventions>
Research and product development
Design reviews
Intellectual property review
Contribute to the profitCounting chamber
inside
Sample holder
Rinse block
Liquid syringe unit
Thermostated compartment unit
Invisible Values
Germany464 (9%)
HORIBA conducts research & development activi-
ties, based on the product development process
shown on the right.
One distinctive feature is the fact that we perform
repeated design previews*1 in tandem with intellec-
tual property reviews*2. Based on this process, we
aim to increase opportunities to select intellectual
property, including inventions, and thereby protect
and make use of intellectual property appropriately.
This strategy is also enabling us to secure our domi-
nance in global markets.
HORIBA’s R&D Activities and Intellectual Property
The Automatic Blood Cell Counter plus CRP, which HORIBA launched in Japan at the end of 2008, has generated
new demand based on more than 30 inventions and supported an improvement in profits in the Medical-
Diagnostics Instruments & Systems segment in Japan in 2009.
Through mutual Japanese-French technical cooperation with HORIBA ABX S.A.S. in France, we aim to create
products with high market share and achieve further growth.
Products with Added Value Based on as Many as 30 or More Inventions
HORIBA, Ltd. Annual Report Fiscal 2009
29
Value Creation Based on Invisible Values: Human Resources
Financial Results Briefing for Employees
The internal IR event held in 2009
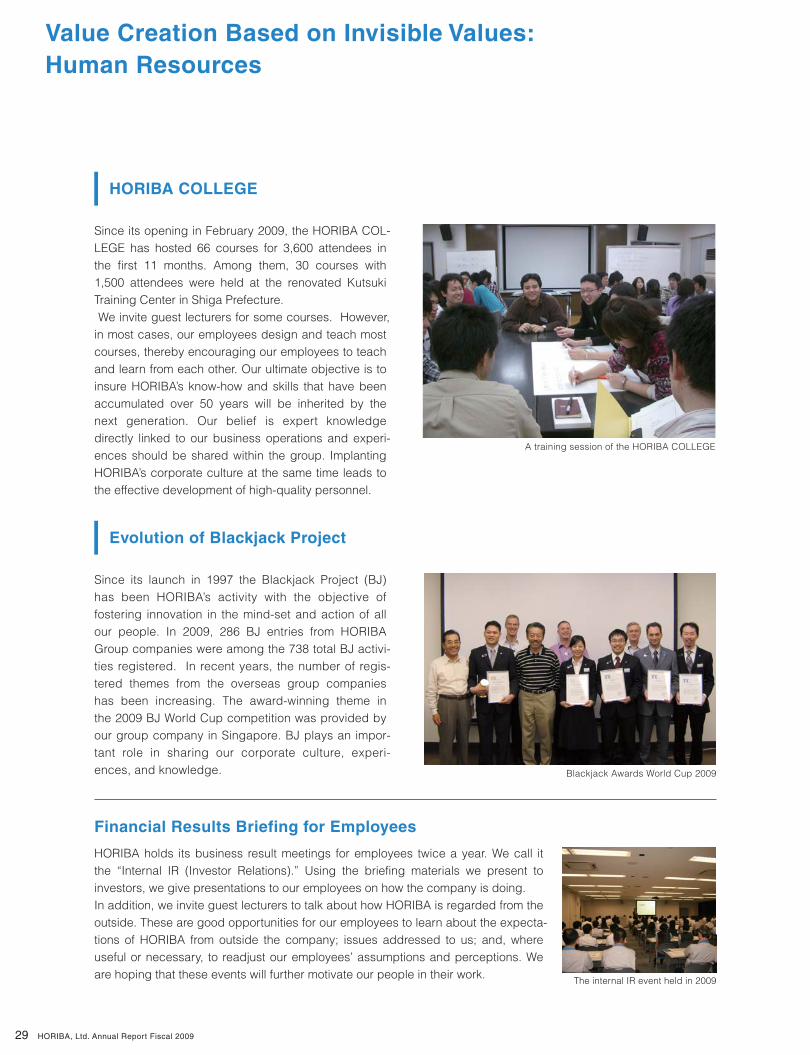
A training session of the HORIBA COLLEGE
Blackjack Awards World Cup 2009
Evolution of Blackjack Project
Since its launch in 1997 the Blackjack Project (BJ) has been HORIBA’s activity with the objective of fostering innovation in the mind-set and action of all our people. In 2009, 286 BJ entries from HORIBA Group companies were among the 738 total BJ activi-ties registered. In recent years, the number of regis-tered themes from the overseas group companies has been increasing. The award-winning theme in the 2009 BJ World Cup competition was provided by our group company in Singapore. BJ plays an impor-tant role in sharing our corporate culture, experi-ences, and knowledge.
HORIBA holds its business result meetings for employees twice a year. We call it the “Internal IR (Investor Relations).” Using the briefing materials we present to investors, we give presentations to our employees on how the company is doing. In addition, we invite guest lecturers to talk about how HORIBA is regarded from the outside. These are good opportunities for our employees to learn about the expecta-tions of HORIBA from outside the company; issues addressed to us; and, where useful or necessary, to readjust our employees’ assumptions and perceptions. We are hoping that these events will further motivate our people in their work.
HORIBA COLLEGE
Since its opening in February 2009, the HORIBA COL-LEGE has hosted 66 courses for 3,600 attendees in the first 11 months. Among them, 30 courses with 1,500 attendees were held at the renovated Kutsuki Training Center in Shiga Prefecture. We invite guest lecturers for some courses. However, in most cases, our employees design and teach most courses, thereby encouraging our employees to teach and learn from each other. Our ultimate objective is to insure HORIBA’s know-how and skills that have been accumulated over 50 years will be inherited by the next generation. Our belief is expert knowledge directly linked to our business operations and experi-ences should be shared within the group. Implanting HORIBA’s corporate culture at the same time leads to the effective development of high-quality personnel.
HORIBA, Ltd. Annual Report Fiscal 2009
31
Value Creation Based on Invisible Values: Technology
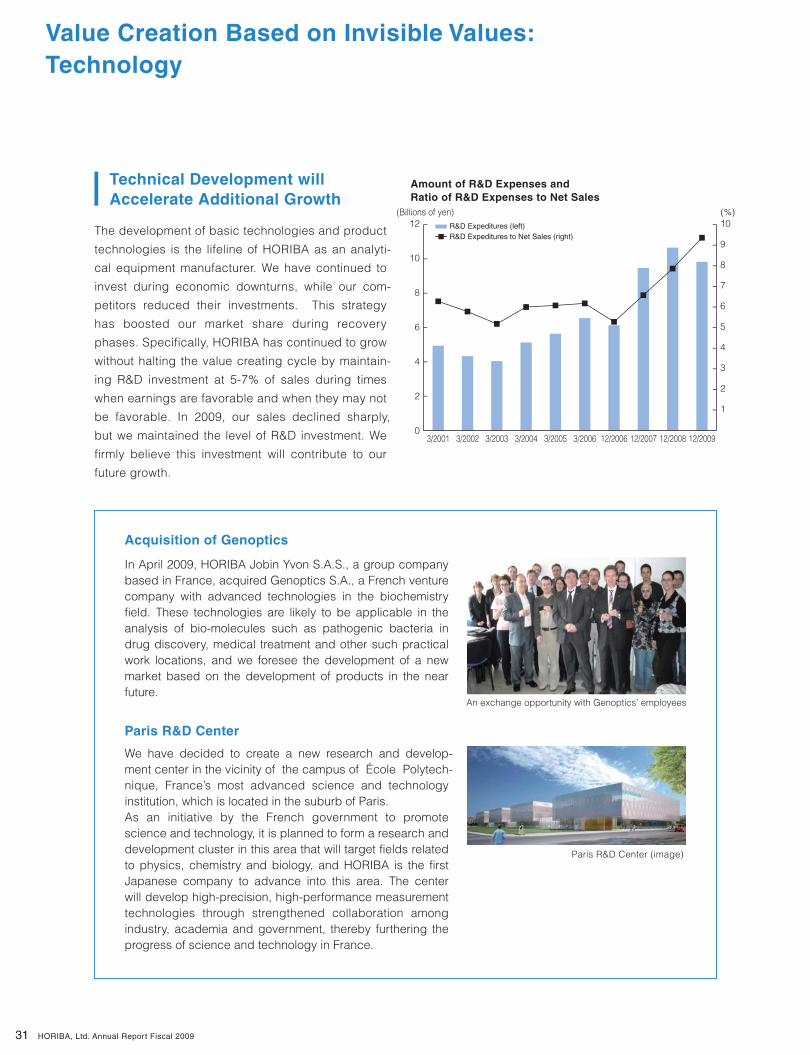
Amount of R&D Expenses and Ratio of R&D Expenses to Net Sales
3/2001 3/2002 3/2003 3/2004 3/2005 3/2006 12/2006 12/2007
(%)
7
6
8
9
10
5
4
(Billions of yen)
8
6
10
12
4
2
3
2
1
012/2008 12/2009
R&D Expeditures (left)R&D Expeditures to Net Sales (right)
The development of basic technologies and product
technologies is the lifeline of HORIBA as an analyti-
cal equipment manufacturer. We have continued to
invest during economic downturns, while our com-
petitors reduced their investments. This strategy
has boosted our market share during recovery
phases. Specifically, HORIBA has continued to grow
without halting the value creating cycle by maintain-
ing R&D investment at 5-7% of sales during times
when earnings are favorable and when they may not
be favorable. In 2009, our sales declined sharply,
but we maintained the level of R&D investment. We
firmly believe this investment will contribute to our
future growth.
Technical Development will Accelerate Additional Growth
In April 2009, HORIBA Jobin Yvon S.A.S., a group company based in France, acquired Genoptics S.A., a French venture company with advanced technologies in the biochemistry field. These technologies are likely to be applicable in the analysis of bio-molecules such as pathogenic bacteria in drug discovery, medical treatment and other such practical work locations, and we foresee the development of a new market based on the development of products in the near future.
Acquisition of Genoptics
We have decided to create a new research and develop-ment center in the vicinity of the campus of École Polytech-nique, France’s most advanced science and technology institution, which is located in the suburb of Paris. As an initiative by the French government to promote science and technology, it is planned to form a research and development cluster in this area that will target fields related to physics, chemistry and biology, and HORIBA is the first Japanese company to advance into this area. The center will develop high-precision, high-performance measurement technologies through strengthened collaboration among industry, academia and government, thereby furthering the progress of science and technology in France.
Paris R&D Center
An exchange opportunity with Genoptics’ employees
Paris R&D Center (image)
HORIBA, Ltd. Annual Report Fiscal 2009
Semiconductor Automotive Analytical Medical-Diagnostic
Application of Basic Technologies
Technology to measure and instantly control the flow of gases
Technology for real-time analysis of elements in gases
Technology for analysis of visible light
Technology to measure particle diameter and size distribution
Gas Flow Control Infrared Measurement
Spectroscopic Analysis Particle-Size Distribution Analysis
“Raising Efficiency” is the Main Theme
Improving investment efficiency is a major theme at HORIBA. In 2009, we produced “Getway (HORIBA R&D Action
Guide),” a booklet that summarizes the outcome of activities in the development stage. The primary aim is to speed
up development and pursue high quality. For each development project, we are attempting to revise its develop-
ment process based on the recognition that the process flow is integrated from design to sales and service. Even
during economic downturns, we will maintain R&D investment, and by further accelerating development, we aim to
launch high-quality products in the market and expand our market share during periods of demand recovery.
Enabling Integrated Proposals at a Group Level
The ability to propose solutions from several fields
in relation to one technical trend is a HORIBA
strength. We have accumulated many practical
accomplishments by responding to application
needs in a wide variety of industries. For example,
raising the efficiency of electric cars, our experts in
mechatronics in the automotive segment are able to
propose systems test solutions, while our specialists
in the scientific field can propose solutions for
battery material analysis. We regard a high degree
of flexibility, namely our technical applications capa-
bility, as a unique strength of HORIBA to create
great opportunities.
HORIBA allocates its development resources by focusing on core analytical and measurement technologies. The company efficiently applies these core technologies to new product development in four business segments, each with different markets.
Dr. Kozo IshidaExecutive Vice President
Kozo Ishida joined HORIBA, Ltd. in 1970 and has been engaged in the development of gas analyzers. He was appointed as President of HORIBA Europe GmbH in 1985. In 1988, he was appointed as a Director of HORIBA, Ltd. He was appointed as Executive Vice President in 2002. While still serving as an adviser in some industry-academia-government research projects, he teaches graduate students as a visiting profes-sor of Doshisha University. He has a Doctor of Engineering.
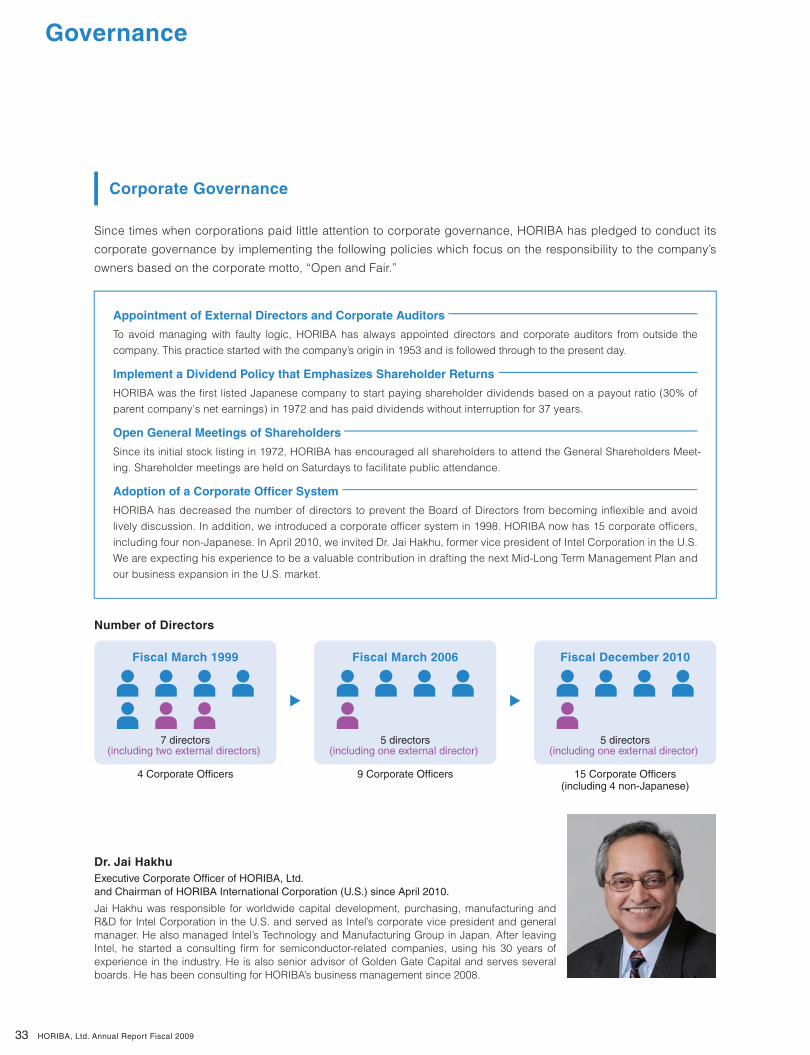
33
Governance
To avoid managing with faulty logic, HORIBA has always appointed directors and corporate auditors from outside the
company. This practice started with the company’s origin in 1953 and is followed through to the present day.
Appointment of External Directors and Corporate Auditors
HORIBA was the first listed Japanese company to start paying shareholder dividends based on a payout ratio (30% of
parent company's net earnings) in 1972 and has paid dividends without interruption for 37 years.
Implement a Dividend Policy that Emphasizes Shareholder Returns
Since its initial stock listing in 1972, HORIBA has encouraged all shareholders to attend the General Shareholders Meet-
ing. Shareholder meetings are held on Saturdays to facilitate public attendance.
Open General Meetings of Shareholders
HORIBA has decreased the number of directors to prevent the Board of Directors from becoming inflexible and avoid
lively discussion. In addition, we introduced a corporate officer system in 1998. HORIBA now has 15 corporate officers,
including four non-Japanese. In April 2010, we invited Dr. Jai Hakhu, former vice president of Intel Corporation in the U.S.
We are expecting his experience to be a valuable contribution in drafting the next Mid-Long Term Management Plan and
our business expansion in the U.S. market.
Adoption of a Corporate Officer System
Dr. Jai HakhuExecutive Corporate Officer of HORIBA, Ltd. and Chairman of HORIBA International Corporation (U.S.) since April 2010.
Number of Directors
Jai Hakhu was responsible for worldwide capital development, purchasing, manufacturing and R&D for Intel Corporation in the U.S. and served as Intel’s corporate vice president and general manager. He also managed Intel’s Technology and Manufacturing Group in Japan. After leaving Intel, he started a consulting firm for semiconductor-related companies, using his 30 years of experience in the industry. He is also senior advisor of Golden Gate Capital and serves several boards. He has been consulting for HORIBA’s business management since 2008.
Fiscal March 1999
4 Corporate Officers 9 Corporate Officers 15 Corporate Officers(including 4 non-Japanese)
Fiscal March 2006
5 directors(including one external director)
7 directors(including two external directors)
Fiscal December 2010
5 directors(including one external director)
HORIBA, Ltd. Annual Report Fiscal 2009
Corporate Governance
Since times when corporations paid little attention to corporate governance, HORIBA has pledged to conduct its
corporate governance by implementing the following policies which focus on the responsibility to the company’s
owners based on the corporate motto, “Open and Fair.”
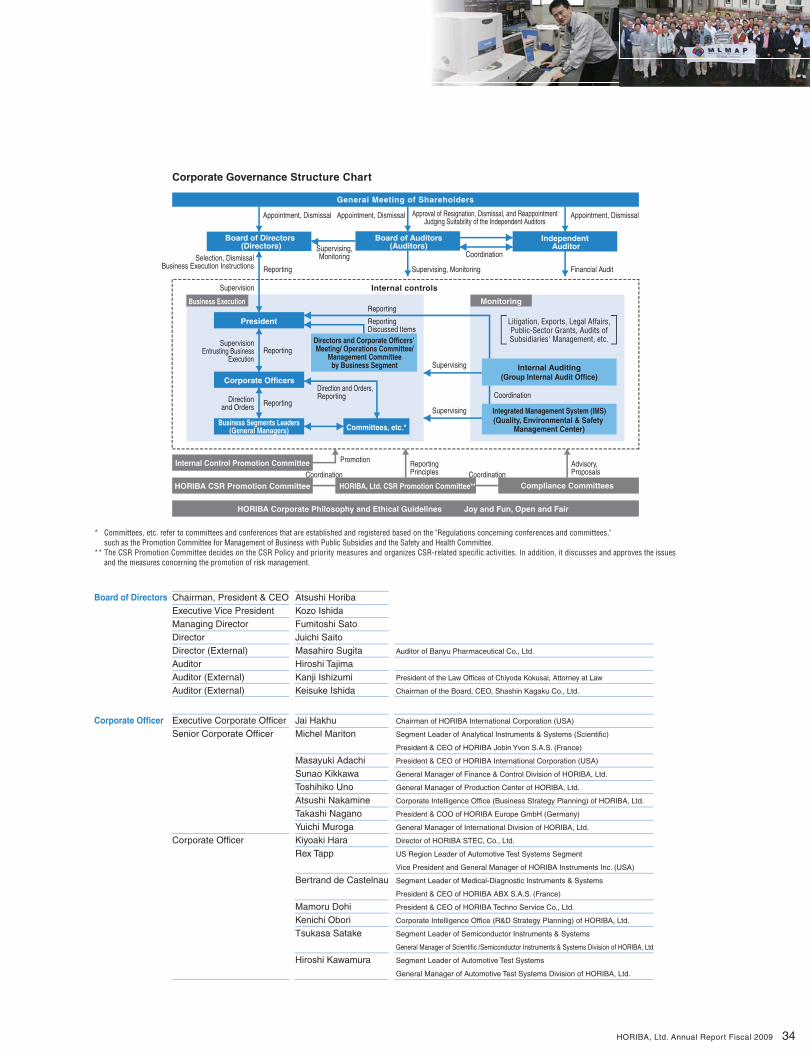
Board of Directors
Executive Corporate Officer Jai Hakhu Chairman of HORIBA International Corporation (USA)
Senior Corporate Officer Michel Mariton Segment Leader of Analytical Instruments & Systems (Scientific)
President & CEO of HORIBA Jobin Yvon S.A.S. (France)
Masayuki Adachi President & CEO of HORIBA International Corporation (USA)
Sunao Kikkawa General Manager of Finance & Control Division of HORIBA, Ltd.
Toshihiko Uno General Manager of Production Center of HORIBA, Ltd.
Atsushi Nakamine Corporate Intelligence Office (Business Strategy Planning) of HORIBA, Ltd.
Takashi Nagano President & COO of HORIBA Europe GmbH (Germany)
Yuichi Muroga General Manager of International Division of HORIBA, Ltd.
Corporate Officer Kiyoaki Hara Director of HORIBA STEC, Co., Ltd.
Rex Tapp US Region Leader of Automotive Test Systems Segment
Vice President and General Manager of HORIBA Instruments Inc. (USA)
Bertrand de Castelnau Segment Leader of Medical-Diagnostic Instruments & Systems
President & CEO of HORIBA ABX S.A.S. (France)
Mamoru Dohi President & CEO of HORIBA Techno Service Co., Ltd.
Kenichi Obori Corporate Intelligence Office (R&D Strategy Planning) of HORIBA, Ltd.
Tsukasa Satake Segment Leader of Semiconductor Instruments & Systems
General Manager of Scientific /Semiconductor Instruments & Systems Division of HORIBA, Ltd
Hiroshi Kawamura Segment Leader of Automotive Test Systems
General Manager of Automotive Test Systems Division of HORIBA, Ltd.
Corporate Officer
34
Board of Directors (Directors)
Board of Auditors(Auditors)
President
Committees, etc.*
Corporate Officers
Business Segments Leaders(General Managers)
HORIBA CSR Promotion Committee
Internal Control Promotion Committee
HORIBA, Ltd. CSR Promotion Committee** Compliance Committees
Directors and Corporate Officers’ Meeting/ Operations Committee/
Management Committeeby Business Segment
Business Execution Monitoring
Internal controls
General Meeting of Shareholders
Integrated Management System (IMS)(Quality, Environmental & Safety
Management Center)
Independent Auditor
HORIBA Corporate Philosophy and Ethical Guidelines Joy and Fun, Open and Fair
Internal Auditing(Group Internal Audit Office)
Appointment, Dismissal Appointment, Dismissal
Coordination
Appointment, Dismissal
Supervising,Monitoring
Supervising, Monitoring Financial Audit
Supervision
Reporting
Supervising
Supervising
Coordination
CoordinationCoordinationReportingPrinciples
Promotion Advisory,Proposals
Reporting Discussed Items
Reporting
Reporting
ReportingDirectionand Orders
* Committees, etc. refer to committees and conferences that are established and registered based on the "Regulations concerning conferences and committees," such as the Promotion Committee for Management of Business with Public Subsidies and the Safety and Health Committee.** The CSR Promotion Committee decides on the CSR Policy and priority measures and organizes CSR-related specific activities. In addition, it discusses and approves the issues and the measures concerning the promotion of risk management.
Approval of Resignation, Dismissal, and ReappointmentJudging Suitability of the Independent Auditors
Selection, DismissalBusiness Execution Instructions
SupervisionEntrusting Business
Execution
Corporate Governance Structure Chart
Direction and Orders,Reporting
Litigation, Exports, Legal Affairs, Public-Sector Grants, Audits of Subsidiaries' Management, etc.
HORIBA, Ltd. Annual Report Fiscal 2009
Chairman, President & CEO Atsushi HoribaExecutive Vice President Kozo IshidaManaging Director Fumitoshi SatoDirector Juichi SaitoDirector (External) Masahiro Sugita Auditor of Banyu Pharmaceutical Co., Ltd.
Auditor Hiroshi TajimaAuditor (External) Kanji Ishizumi President of the Law Offices of Chiyoda Kokusai, Attorney at Law
Auditor (External) Keisuke Ishida Chairman of the Board, CEO, Shashin Kagaku Co., Ltd.
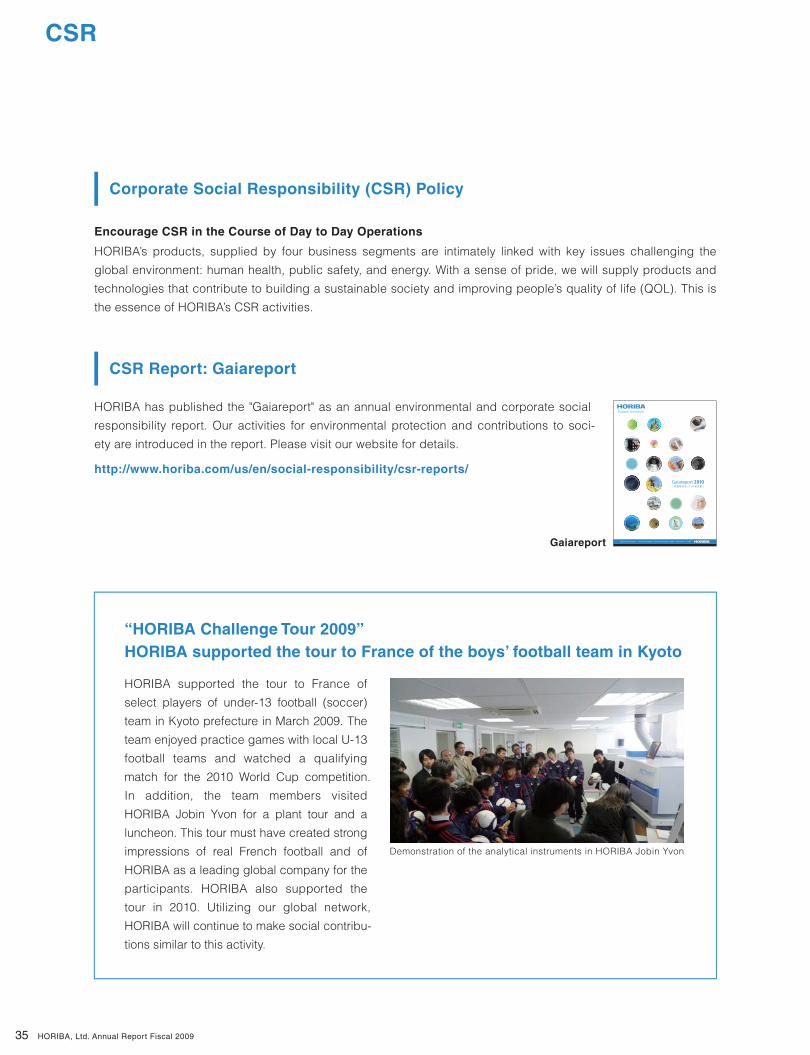
35
CSR
Corporate Social Responsibility (CSR) Policy
Encourage CSR in the Course of Day to Day Operations
HORIBA’s products, supplied by four business segments are intimately linked with key issues challenging the
global environment: human health, public safety, and energy. With a sense of pride, we will supply products and
technologies that contribute to building a sustainable society and improving people’s quality of life (QOL). This is
the essence of HORIBA’s CSR activities.
HORIBA supported the tour to France of
select players of under-13 football (soccer)
team in Kyoto prefecture in March 2009. The
team enjoyed practice games with local U-13
football teams and watched a qualifying
match for the 2010 World Cup competition.
In addition, the team members visited
HORIBA Jobin Yvon for a plant tour and a
luncheon. This tour must have created strong
impressions of real French football and of
HORIBA as a leading global company for the
participants. HORIBA also supported the
tour in 2010. Utilizing our global network,
HORIBA will continue to make social contribu-
tions similar to this activity.
CSR Report: Gaiareport
“HORIBA Challenge Tour 2009” HORIBA supported the tour to France of the boys’ football team in Kyoto
HORIBA has published the "Gaiareport" as an annual environmental and corporate social
responsibility report. Our activities for environmental protection and contributions to soci-
ety are introduced in the report. Please visit our website for details.
http://www.horiba.com/us/en/social-responsibility/csr-reports/
Demonstration of the analytical instruments in HORIBA Jobin Yvon
Gaiareport
Gaiareport 2010[ 堀場製作所 /CSR報告書 ]
HORIBA, Ltd. Annual Report Fiscal 2009
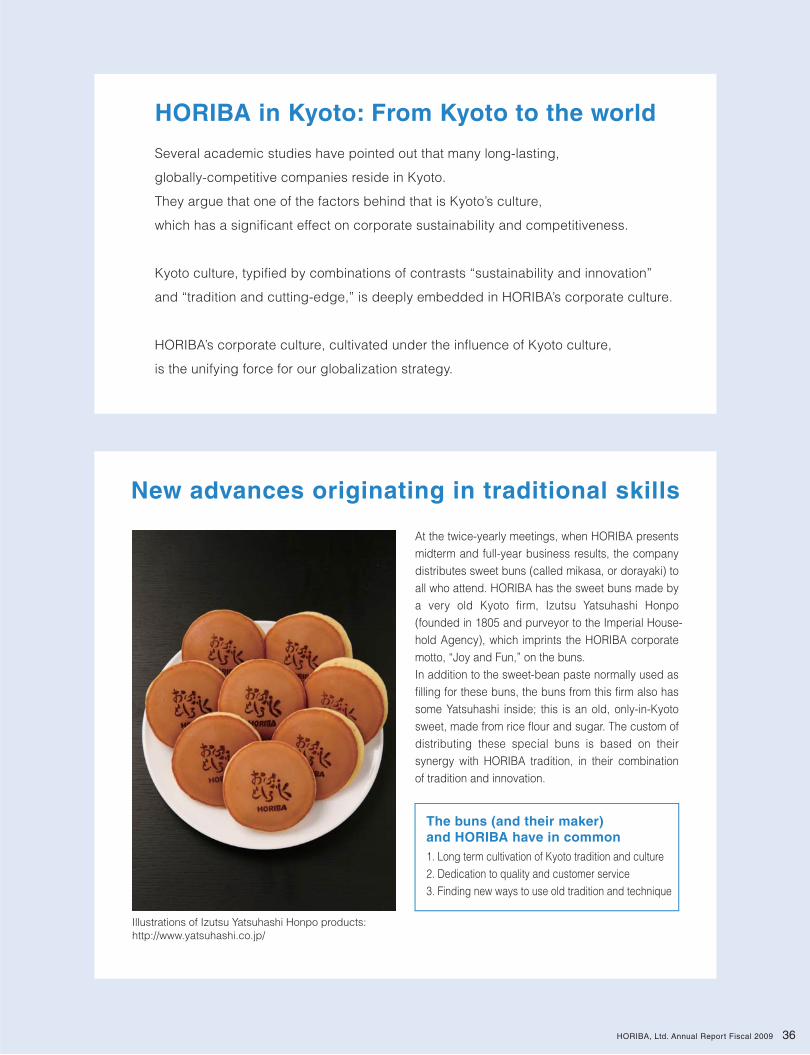
36
HORIBA in Kyoto: From Kyoto to the world
Several academic studies have pointed out that many long-lasting,
globally-competitive companies reside in Kyoto.
They argue that one of the factors behind that is Kyoto’s culture,
which has a significant effect on corporate sustainability and competitiveness.
Kyoto culture, typified by combinations of contrasts “sustainability and innovation”
and “tradition and cutting-edge,” is deeply embedded in HORIBA’s corporate culture.
HORIBA’s corporate culture, cultivated under the influence of Kyoto culture,
is the unifying force for our globalization strategy.
Illustrations of Izutsu Yatsuhashi Honpo products: http://www.yatsuhashi.co.jp/
The buns (and their maker) and HORIBA have in common1. Long term cultivation of Kyoto tradition and culture2. Dedication to quality and customer service3. Finding new ways to use old tradition and technique
New advances originating in traditional skills
At the twice-yearly meetings, when HORIBA presents midterm and full-year business results, the company distributes sweet buns (called mikasa, or dorayaki) to all who attend. HORIBA has the sweet buns made by a very old Kyoto firm, Izutsu Yatsuhashi Honpo (founded in 1805 and purveyor to the Imperial House-hold Agency), which imprints the HORIBA corporate motto, “Joy and Fun,” on the buns.In addition to the sweet-bean paste normally used as filling for these buns, the buns from this firm also has some Yatsuhashi inside; this is an old, only-in-Kyoto sweet, made from rice flour and sugar. The custom of distributing these special buns is based on their synergy with HORIBA tradition, in their combination of tradition and innovation.
HORIBA, Ltd. Annual Report Fiscal 2009
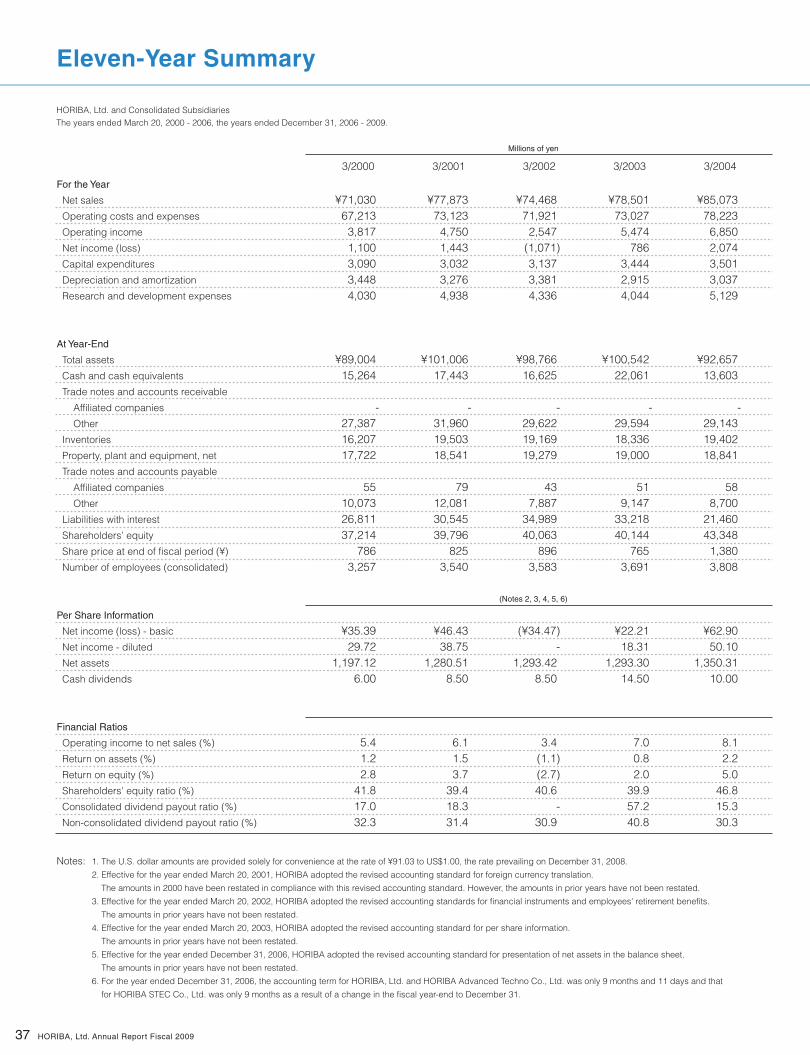
37
Eleven-Year Summary
¥71,030 67,213
3,817 1,100 3,090 3,448 4,030
¥89,004 15,264
-27,387 16,207 17,722
55 10,073 26,811 37,214
786 3,257
¥35.39 29.72
1,197.12 6.00
5.4 1.2 2.8
41.8 17.0 32.3
¥77,873 73,123
4,750 1,443 3,032 3,276 4,938
¥101,006 17,443
-31,960 19,503 18,541
79 12,081 30,545
39,796 825
3,540
¥46.43 38.75
1,280.51 8.50
6.1 1.5 3.7
39.4 18.3 31.4
3/2000 3/2001
¥74,468 71,921
2,547 (1,071)3,137 3,381 4,336
¥98,766 16,625
-29,622 19,169 19,279
43 7,887
34,989 40,063
896 3,583
(¥34.47)-
1,293.42 8.50
3.4 (1.1)(2.7)40.6
-30.9
3/2002
¥78,501 73,027
5,474 786
3,444 2,915 4,044
¥100,542 22,061
-29,594 18,336 19,000
51 9,147
33,218 40,144
765 3,691
¥22.21 18.31
1,293.30 14.50
7.0 0.8 2.0
39.9 57.2 40.8
¥85,073 78,223
6,850 2,074 3,501 3,037 5,129
¥92,657 13,603
-29,143 19,402 18,841
58 8,700
21,460 43,348
1,380 3,808
¥62.90 50.10
1,350.31 10.00
8.1 2.2 5.0
46.8 15.3 30.3
3/2003 3/2004
HORIBA, Ltd. and Consolidated SubsidiariesThe years ended March 20, 2000 - 2006, the years ended December 31, 2006 - 2009.
For the Year
Net sales
Operating costs and expenses
Operating income
Net income (loss)
Capital expenditures
Depreciation and amortization
Research and development expenses
At Year-End
Total assets
Cash and cash equivalents
Trade notes and accounts receivable
Affiliated companies
Other
Inventories
Property, plant and equipment, net
Trade notes and accounts payable
Affiliated companies
Other
Liabilities with interest
Shareholders’ equity
Share price at end of fiscal period (¥)
Number of employees (consolidated)
Per Share Information
Net income (loss) - basic
Net income - diluted
Net assets
Cash dividends
Financial Ratios
Operating income to net sales (%)
Return on assets (%)
Return on equity (%)
Shareholders' equity ratio (%)
Consolidated dividend payout ratio (%)
Non-consolidated dividend payout ratio (%)
Millions of yen
(Notes 2, 3, 4, 5, 6)
Notes: 1. The U.S. dollar amounts are provided solely for convenience at the rate of ¥91.03 to US$1.00, the rate prevailing on December 31, 2008.
2. Effective for the year ended March 20, 2001, HORIBA adopted the revised accounting standard for foreign currency translation.
The amounts in 2000 have been restated in compliance with this revised accounting standard. However, the amounts in prior years have not been restated.
3. Effective for the year ended March 20, 2002, HORIBA adopted the revised accounting standards for financial instruments and employees' retirement benefits.
The amounts in prior years have not been restated.
4. Effective for the year ended March 20, 2003, HORIBA adopted the revised accounting standard for per share information.
The amounts in prior years have not been restated.
5. Effective for the year ended December 31, 2006, HORIBA adopted the revised accounting standard for presentation of net assets in the balance sheet.
The amounts in prior years have not been restated.
6. For the year ended December 31, 2006, the accounting term for HORIBA, Ltd. and HORIBA Advanced Techno Co., Ltd. was only 9 months and 11 days and that
for HORIBA STEC Co., Ltd. was only 9 months as a result of a change in the fiscal year-end to December 31.
HORIBA, Ltd. Annual Report Fiscal 2009
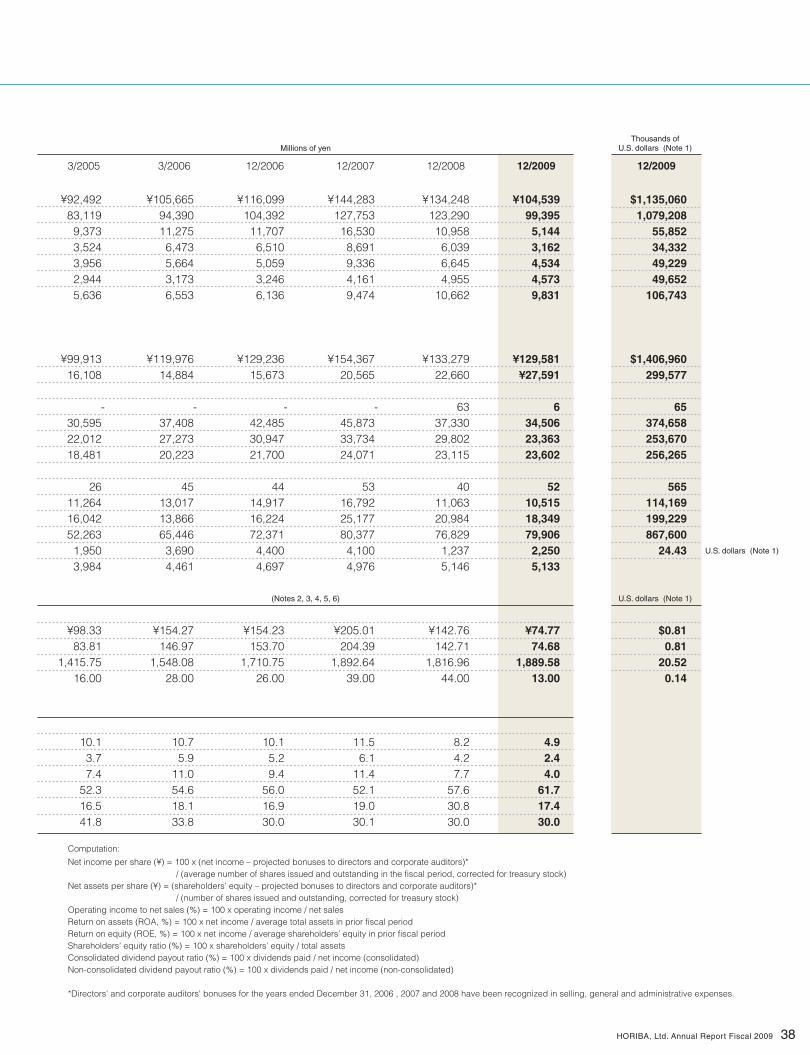
38
¥92,492 83,119 9,373 3,524 3,956 2,944 5,636
¥99,913 16,108
-30,595 22,012 18,481
26 11,264 16,042 52,263 1,950 3,984
¥98.33 83.81
1,415.75 16.00
10.1 3.7 7.4
52.3 16.5 41.8
¥116,099 104,392 11,707 6,510 5,059 3,246 6,136
¥129,236 15,673
-42,485 30,947 21,700
44 14,917 16,224 72,371 4,400 4,697
¥154.23 153.70
1,710.75 26.00
10.1 5.2 9.4
56.0 16.9 30.0
$1,135,060 1,079,208
55,852 34,332 49,229 49,652
106,743
$1,406,960 299,577
65 374,658 253,670 256,265
565 114,169 199,229 867,600
24.43
$0.81 0.81
20.52 0.14
3/2005 12/2006
¥144,283 127,753 16,530 8,691 9,336 4,161 9,474
¥154,367 20,565
-45,873 33,734 24,071
53 16,792 25,177 80,377 4,100 4,976
¥205.01 204.39
1,892.64 39.00
11.5 6.1
11.4 52.1 19.0 30.1
12/2007
¥134,248 123,290
10,958 6,039 6,645 4,955
10,662
¥133,279 22,660
63 37,330 29,802 23,115
40 11,063 20,984 76,829
1,237 5,146
¥142.76 142.71
1,816.96 44.00
8.2 4.2 7.7
57.6 30.8 30.0
12/2008
¥104,539 99,395
5,144 3,162 4,534 4,573 9,831
¥129,581 ¥27,591
6 34,506 23,363 23,602
52 10,515 18,349 79,906
2,250 5,133
¥74.77 74.68
1,889.58 13.00
4.9 2.4 4.0
61.7 17.4 30.0
12/2009
¥105,665 94,390 11,275 6,473 5,664 3,173 6,553
¥119,976 14,884
-37,408 27,273 20,223
45 13,017 13,866 65,446 3,690 4,461
¥154.27 146.97
1,548.08 28.00
10.7 5.9
11.0 54.6 18.1 33.8
3/2006 12/2009
Millions of yenThousands of
U.S. dollars (Note 1)
(Notes 2, 3, 4, 5, 6) U.S. dollars (Note 1)
U.S. dollars (Note 1)
Computation:
Net income per share (¥) = 100 x (net income – projected bonuses to directors and corporate auditors)* / (average number of shares issued and outstanding in the fiscal period, corrected for treasury stock) Net assets per share (¥) = (shareholders’ equity – projected bonuses to directors and corporate auditors)* / (number of shares issued and outstanding, corrected for treasury stock)Operating income to net sales (%) = 100 x operating income / net salesReturn on assets (ROA, %) = 100 x net income / average total assets in prior fiscal periodReturn on equity (ROE, %) = 100 x net income / average shareholders’ equity in prior fiscal periodShareholders’ equity ratio (%) = 100 x shareholders’ equity / total assetsConsolidated dividend payout ratio (%) = 100 x dividends paid / net income (consolidated)Non-consolidated dividend payout ratio (%) = 100 x dividends paid / net income (non-consolidated)
*Directors' and corporate auditors' bonuses for the years ended December 31, 2006 , 2007 and 2008 have been recognized in selling, general and administrative expenses.
HORIBA, Ltd. Annual Report Fiscal 2009
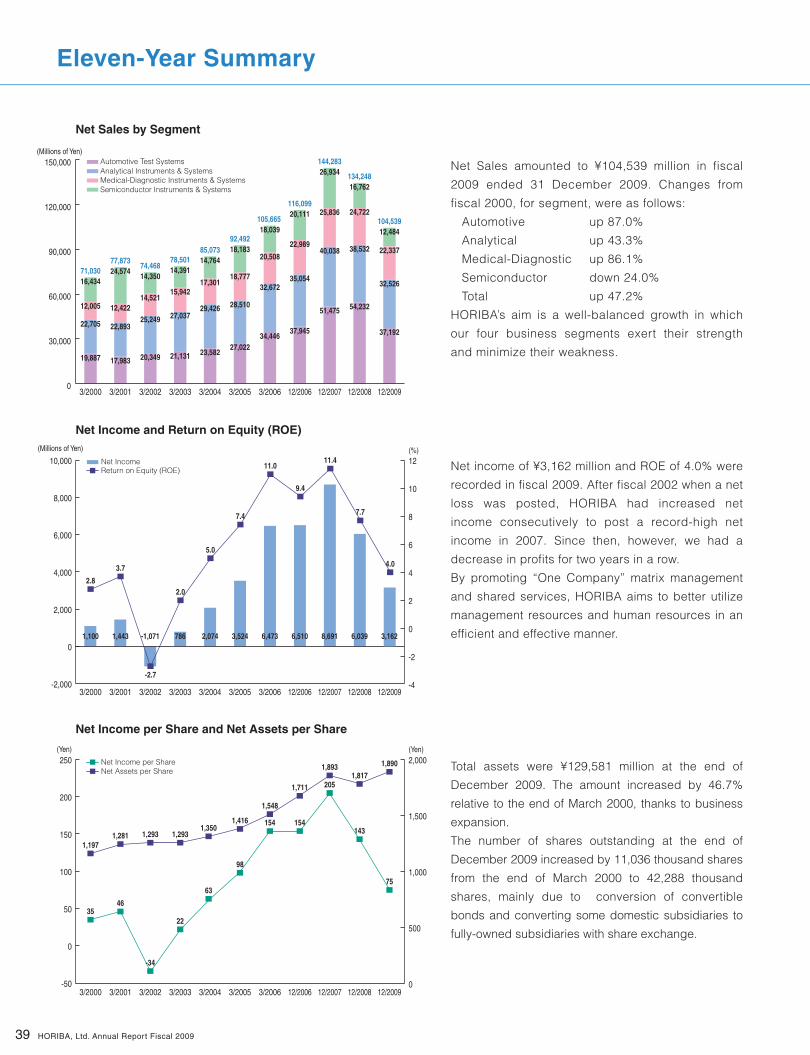
104,53912,484
22,337
32,526
37,192
39
Eleven-Year Summary
71,03077,873
74,46878,501
(%)
(Yen)
2.8
3.7
-2.7
2.0
5.0
7.4
11.0
9.4
11.4
7.7
16,43424,574
14,35014,391
15,942
27,037
21,131
14,521
25,249
20,349
12,422
22,893
17,983
12,005
22,705
19,887
14,764
17,301
85,07392,492
105,665
23,58227,022
34,446
32,672
20,508
18,039
116,099
37,945
35,054
22,989
20,111
28,510
18,777
18,183
29,426 51,475
40,038
25,836
144,283
134,24826,934
16,762
24,722
38,532
54,232
-4
-2
0
2
4
6
8
10
12
786 2,074 3,524 6,473 6,510 8,691 6,0391,100 1,443 -1,071
0
500
1,000
1,500
2,000
1,1971,281 1,293 1,293
1,3501,416
1,548
1,711
1,8931,817
3546
-34
22
63
98
154 154
205
143
4.0
3,162
1,890
75
0
30,000
60,000
90,000
120,000
150,000(Millions of Yen)
Net Sales by Segment
Automotive Test SystemsAnalytical Instruments & SystemsMedical-Diagnostic Instruments & SystemsSemiconductor Instruments & Systems
3/2000 3/2001 3/2002 3/2003 3/2004 3/2005 3/2006 12/2006 12/2007 12/2008 12/2009
3/2000 3/2001 3/2002 3/2003 3/2004 3/2005 3/2006 12/2006 12/2007 12/2008 12/2009
3/2000 3/2001 3/2002 3/2003 3/2004 3/2005 3/2006 12/2006 12/2007 12/2008 12/2009
Net Income and Return on Equity (ROE)
-2,000
0
2,000
4,000
6,000
8,000
10,000
(Millions of Yen)
Net IncomeReturn on Equity (ROE)
Net Income per Share and Net Assets per Share
-50
0
50
100
150
200
250(Yen)
Net Assets per ShareNet Income per Share
HORIBA, Ltd. Annual Report Fiscal 2009
Net Sales amounted to ¥104,539 million in fiscal
2009 ended 31 December 2009. Changes from
fiscal 2000, for segment, were as follows:
Automotive up 87.0%
Analytical up 43.3%
Medical-Diagnostic up 86.1%
Semiconductor down 24.0%
Total up 47.2%
HORIBA’s aim is a well-balanced growth in which
our four business segments exert their strength
and minimize their weakness.
Net income of ¥3,162 million and ROE of 4.0% were
recorded in fiscal 2009. After fiscal 2002 when a net
loss was posted, HORIBA had increased net
income consecutively to post a record-high net
income in 2007. Since then, however, we had a
decrease in profits for two years in a row.
By promoting “One Company” matrix management
and shared services, HORIBA aims to better utilize
management resources and human resources in an
efficient and effective manner.
Total assets were ¥129,581 million at the end of
December 2009. The amount increased by 46.7%
relative to the end of March 2000, thanks to business
expansion.
The number of shares outstanding at the end of
December 2009 increased by 11,036 thousand shares
from the end of March 2000 to 42,288 thousand
shares, mainly due to conversion of convertible
bonds and converting some domestic subsidiaries to
fully-owned subsidiaries with share exchange.
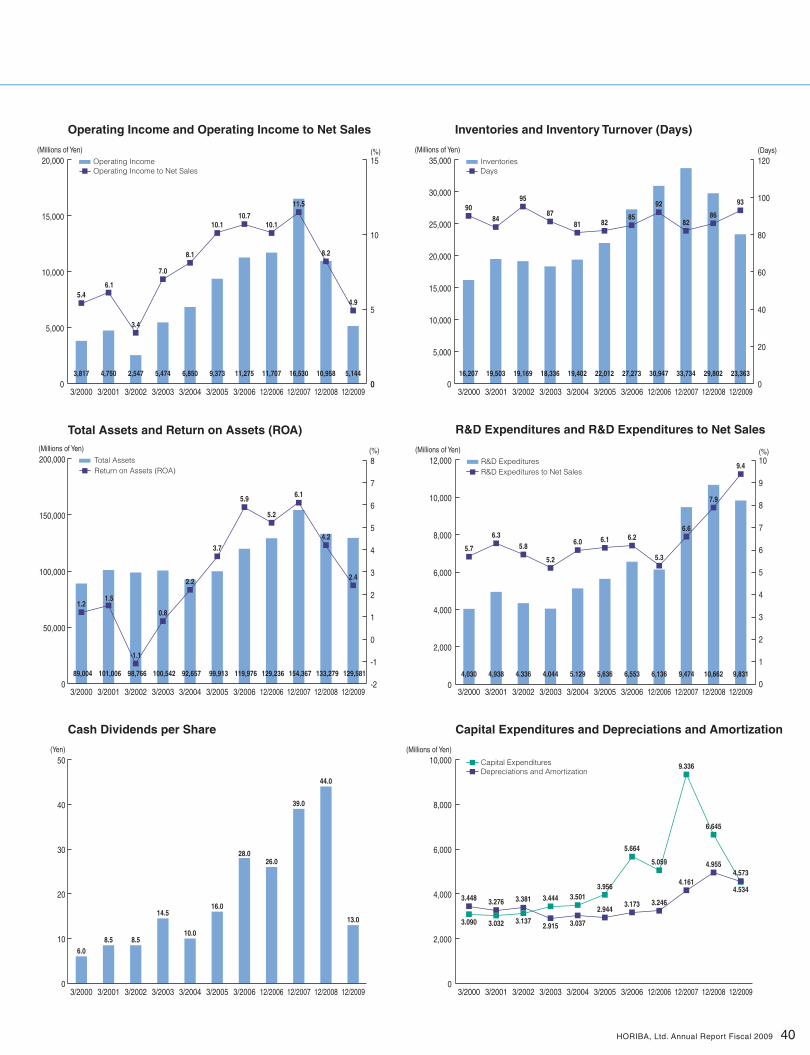
4.534
40
(%)
(%)
(Days)InventoriesDays
(%)
6.08.5 8.5
14.5
10.0
16.0
28.026.0
39.0
44.0
5.46.1
3.4
7.0
8.1
5
10
15
5,474 6,850 9,373 11,275 11,707 16,530 10,9583,817 4,750 2,547
10.110.7
10.1
11.5
8.2
-2
-1
0
1
2
3
4
5
6
7
8
100,542 92,657 99,913 119,976 129,236 154,367 133,27989,004 101,006 98,766
9084
95
8781 82
1.21.5
-1.1
0.8
2.2
3.7
5.9
5.2
6.1
4.2
18,336 19,402 22,012 27,273 30,947 33,734 29,80216,207 19,503 19,169
0
20
40
60
80
100
120
85
92
8286
4.044 5.129 5,636 6,553 6,136 9,474 10,6624,030 4,938 4.336
0
3.448 3.276 3.381 3.444 3.5013.956
5.664
5.059
9.336
6.645
2.9443.173 3.246
4.161
4.955
13.0
5,144
4.9
129,581
2.4
23,363
93
9,831
4.573
3.090 3.032 3.1372.915 3.037
5.2
6.0 6.1 6.2
5.3
6.6
0
1
2
3
4
5
6
7
8
9
10
5.7
6.35.8
7.9
9.4
Operating Income and Operating Income to Net Sales
0
5,000
10,000
15,000
20,000(Millions of Yen)
Operating IncomeOperating Income to Net Sales
Total Assets and Return on Assets (ROA)
0
50,000
100,000
150,000
200,000(Millions of Yen)
Total AssetsReturn on Assets (ROA)
Cash Dividends per Share
0
10
20
30
40
50(Yen)
Inventories and Inventory Turnover (Days)
0
5,000
10,000
15,000
20,000
25,000
30,000
35,000(Millions of Yen)
R&D Expenditures and R&D Expenditures to Net Sales
0
2,000
4,000
6,000
8,000
10,000
12,000(Millions of Yen)
R&D ExpedituresR&D Expeditures to Net Sales
Capital Expenditures and Depreciations and Amortization
0
2,000
4,000
6,000
8,000
10,000(Millions of Yen)
Depreciations and AmortizationCapital Expenditures
3/2000 3/2001 3/2002 3/2003 3/2004 3/2005 3/2006 12/2006 12/2007 12/2008 12/2009
3/2000 3/2001 3/2002 3/2003 3/2004 3/2005 3/2006 12/2006 12/2007 12/2008 12/2009
3/2000 3/2001 3/2002 3/2003 3/2004 3/2005 3/2006 12/2006 12/2007 12/2008 12/2009
3/2000 3/2001 3/2002 3/2003 3/2004 3/2005 3/2006 12/2006 12/2007 12/2008 12/2009
3/2000 3/2001 3/2002 3/2003 3/2004 3/2005 3/2006 12/2006 12/2007 12/2008 12/2009
3/2000 3/2001 3/2002 3/2003 3/2004 3/2005 3/2006 12/2006 12/2007 12/2008 12/2009
HORIBA, Ltd. Annual Report Fiscal 2009
HORIBA, Ltd. and Consolidated Subsidiaries | Consolidated Financial Review
41 HORIBA, Ltd. Annual Report Fiscal 2009
During the fiscal year under review, the global economy
weakened significantly in developed countries during the early
stage of the year, in the midst of the expanding financial crisis
that was triggered in the fall of 2008. Due to the implementation
of various governments’ economic stimulative measures,
however, the economy has been picking up since the spring of
2009. In Japan, the slowdown in overseas economies and the
appreciation of the yen caused significant deterioration in the
economy in the fall of 2008. However, because of various
economic measures taken in Japan and overseas and progress in
inventory adjustment, the economy has been gradually improving
since mid-2009. Nevertheless, private-sector capital investment
has remained depressed since a significant drop in the first half
of 2009, as corporate earnings have stayed at a low level. The
Japanese yen also strengthened throughout the year. The
average exchange rate for 2009 was 93.65 yen against the U.S.
dollar and 130.35 yen against the Euro, representing an
appreciation of about 10% and 17%, respectively.
The operating results of HORIBA, Ltd. (“the Company”) and
its consolidated subsidiaries (together “HORIBA Group” or
“HORIBA” as a consolidated group) in the analytical and testing
instrument market were affected by cutbacks in capital
expenditures and R&D investment mainly in the automotive and
semiconductor industries, which experienced a downturn in
business in the first half of 2009. In addition, selling prices
continued to decline due to the strengthening of the yen and the
effects of intensified competition. Since then, the market has
begun to pick up as a result of economic stimulative measures
implemented by governments of various countries and a recovery
in capital expenditures for memory products and LEDs from the
second half of 2009.
In this environment, HORIBA Group made exerted efforts to
improve profitability through thorough cost reduction. The Group
also made progress in introducing shared services in
administrative divisions and improved efficiency while enhancing
its expertise. Recognizing “human resources” as the most
important assets that do not appear in the financial statements,
the HORIBA Group has focused on developing its “human
resources” and has continued investing in internal training
programs called HORIBA COLLEGE at Kutsuki Training Center,
which was expanded in February 2009. Moreover, the Biwako
Plant in Shiga Prefecture, upon its completion in May 2010, began
operating as a distribution base and a manufacturing base of
large-sized products, thereby preparing the Group for further
cost reduction, efficiency enhancement, and demand growth.
Despite our efforts, the consolidated sales, operating income
and net income of HORIBA decreased from a year ago, due
mostly to the decline in demand and the strengthened yen.
Net Sales
In the fiscal year under review, consolidated net sales decreased
by \29,709 million, or 22.1%, year on year to \104,539 million.
Business Segments
Automotive Test Systems
Sales in the Automotive Test Systems segment amounted to
\37,192 million, down 31.4% year on year. Business results were
depressed by a cutback in capital spending and R&D investment
by auto manufacturers and the appreciation of the yen. Although
sales of emission measurement systems, a core product, were
steady in China, India, and other Asian countries, segment sales
declined significantly due to a decline in demand in Japan and
Europe and the appreciation of the yen. By geographic region*2,
sales decreased by 22.9% in Japan and other Asian countries,
32.6% in the Americas and 40.0% in Europe.
Analytical Instruments & Systems
Sales in the Analytical Instruments & Systems amounted to
\32,526 million, down 15.6% year on year. Analytical instruments
and systems for analysis of cutting-edge materials that are
developed and manufactured in France performed strongly in the
U.S. and Japan, supported by supplementary budgets and other
factors. In contrast, the Company saw a significant decline in
demand for environmental analytical instruments and systems
stemming from a decline in capital expenditures in the private
sector associated with the economic downturn. Overseas sales
in Japanese yen was reduced by the currency’s appreciation. By
geographic region*2, sales decreased by 15.1% in Japan and other
Asian countries, 9.6% in the Americas and 19.8% in Europe.
Medical-Diagnostic Instruments & Systems
Sales in the Medical-Diagnostic Instruments & Systems segment
decreased by 9.6% year on year to \22,337 million. Significant
appreciation of the yen, compared to the previous year, reduced
overseas sales value, representing approximately 80% of total
sales. Nevertheless, robust domestic sales of hematology
analyzers, which were launched at the end of 2008, were robust
throughout the year. By geographic region*2, sales increased by
12.7% in Japan and other Asian countries and 18.0% in the
Americas, but decreased by 18.1% in Europe.
Semiconductor Instruments & Systems
Sales in the Semiconductor Instruments & Systems segment
amounted to \12,484 million, down 25.5% year on year. The
sluggish worldwide semiconductor market in the first half of the
year caused a significant drop in sales of mass flow controllers
for semiconductor and solar cell manufacturing equipment, but
sales recovered in the second half of the year. Similarly, sales of
chemical concentration monitors used in semiconductor cleaning
equipment and thin-film analyzers were sluggish. By geographic
region*2, sales decreased by 27.4% in Japan and other Asian
countries and 33.1% in the Americas, but increased by 2.8% in
Europe.
*2 Geographic segmentation is based on the region where sales
occur.
The average foreign exchange rate applied in book closings was
\93.65 to the U.S. dollar, compared with \103.48 for the previous
year, and \130.35 to the euro, compared with \152.65 for the
previous year. Using the exchange rates for the previous year,
consolidated sales for the year under review would have been
\113,929 million. Thus, \9,390 million in decreased sales can be
attributed to the appreciation of the yen.
Cost of Sales, SG&A Expenses, and Operating Income
Consolidated cost of sales decreased by \15,960 million to
\58,714 million. The cost of sales ratio decreased by 0.6
percentage points from a year ago to 56.2%, mainly due to a low
capacity utilization of the plants that stemmed from a decline in
production volume and the appreciation of the yen. Excluding
\4,653 million from fluctuations in foreign exchange rates,
however, the actual decrease in cost was \11,307 million rather
than the nominal decrease of \15,960 million.
Selling, general and administrative (SG&A) expenses
decreased by \7,935 million from a year ago to \40,681 million
thanks to the effects of thorough cost cutting efforts. The ratio
to net sales, however, worsened by 2.7 percentage points to
38.9% due to a decrease in sales. Excluding \3,546 million from
fluctuations in foreign exchange rates, however, the actual
decrease in SG&A expenses was \4,389 million rather than the
nominal decrease of \7,935 million.
As a result, consolidated operating income decreased by
\5,814 million, or 53.1%, year on year to \5,144 million. The
operating income ratio was 4.9%, down 3.3 percentage points from
8.2% in the previous year.
Business Segments
Automotive Test Systems
Operating income in the Automotive Test Systems segment
decreased by 75.0% to \1,810 million. In addition to a substantial
drop in demand associated with a cutback in capital spending and
R&D investment by auto manufacturers, the segment was
affected by margin deterioration in Europe caused by the
automotive development test systems (DTS) acquired from
Germany’s Carl Schenck AG in 2005.
Analytical Instruments & Systems
Segment operating income in the Analytical Instruments &
Systems decreased by 16.8% to \1,520 million due to a
substantial drop in demand associated with a cutback in
private-sector capital spending because of the weak economy.
Medical-Diagnostic Instruments & Systems
In the Medical-Diagnostic Instruments & Systems segment,
operating income surged by 182.1% to \1,913 million thanks to
steady sales in Japan.
Semiconductor Instruments & Systems
The Semiconductor Instruments & Systems segment recorded
operating loss of \99 million (compared to operating income of
\1,222 million in the previous year.) It was affected by a
significant sales decline stemming from a downturn in the global
semiconductor market.
Net Income
Other income (expenses) improved by \226 million from the
previous year to a loss of \751 million, due mainly to
improvement in foreign exchange gains, despite a \472 million
loss on valuation of inventories in accordance with changes in
accounting policies and other losses. Nevertheless, because of
the deterioration in operating income, pretax income decreased
by \5,588 million, or 56.0%, to \4,393 million, and net income
decreased by \2,877 million, or 47.6%, to \3,162 million.
Financial Position
As of December 31, 2009, total consolidated assets were
\129,581 million, down \3,698 million from December 31, 2008.
The main factors contributing to the reduction of total assets
were a decline in sales, which reduced trade notes and accounts
receivable by \2,881 million, and a cutback in inventory, which
reduced goods and manufactured products by \2,299 million,
work-in-process by \1,993 million and raw materials and supplies
42HORIBA, Ltd. Annual Report Fiscal 2009
43 HORIBA, Ltd. Annual Report Fiscal 2009
HORIBA, Ltd. and Consolidated Subsidiaries | Consolidated Financial Review
by \2,147 million.
Total consolidated liabilities declined to \49,604 million, down
\6,833 million from a year ago, due mainly to a decrease of \2,234
million in short-term loans payable associated with a reduction in
working capital and a decline of \1,960 million in accounts
payable – other.
Total consolidated net assets amounted to \79,977 million, up
\3,135 million from a year ago, due mainly to an increase of
\1,556 million in retained earnings and an increase of \1,044
million in foreign currency translation adjustments.
Cash Flows
Cash Flow from Operating Activities
Net cash provided by operating activities amounted to \13,712
million, compared to \ 7,522 million provided in the previous year.
Attributable factors were a decrease of \6,744 million in
inventories and a decrease of \3,576 million in trade notes and
accounts receivable, in addition to \4,393 million in income before
income taxes despite income taxes paid of \2,664 million.
Cash Flow from Investing Activities
Net cash provided by investment activities totaled \4,192 million,
compared to \491 million used in the previous year. Payments
amounted to \3,941 million for the purchase of property, plant
and equipment and \488 million for the purchase of intangibles.
Cash Flow from Financing Activities
Net cash used in financing activities amounted to \4,722 million,
compared to \3,943 million used in the previous year. This was
mainly attributable to a decrease of \2,157 million in short-term
borrowings, cash dividends paid of \1,482 million, and repayment
of long-term debt of \873 million.
As a result, there was a net increase of \4,931 million in cash and
cash equivalents to \27,591 million as of December 31, 2009.
Dividend Policy
HORIBA’s basic policy regarding dividends is to maintain its
standard payout ratio in which the total dividend payment is equal
to 30% of the nonconsolidated net income of the Company. In
some cases, a portion of extraordinary gains and/or losses may
be excluded from the calculation of the payout ratio. The
Company receives a certain proportion of the net income of each
group company as a dividend. Thus, although dividend payments
to shareholders are computed based on the nonconsolidated net
income of the Company, they are in effect made on consolidated
earnings. In addition, the Company intends to appropriate internal
reserves for retained earnings as working capital for business
expansion, capital expenditure and investment in research and
development, with the aim of improving corporate value in the
medium to long term.
Major Risks
1. Business Risks
(1) Risks Associated with International Business Activities
HORIBA conducts business activities in many countries around
the world, including the U.S and countries in Europe and Asia.
Major risks associated with the entry into these overseas
markets and conducting business there include sudden shifts in
economic conditions or in product supply and demand, sudden
changes in retail prices due to competition, changes in laws,
regulations and tax systems and social disruptions such as
terrorism or war. These risks could affect HORIBA’s financial
position and business results.
To protect against fluctuations in foreign currency exchange
rates, HORIBA promotes local production and supply. HORIBA
also employs foreign exchange forward contracts within the limits
of its balance of foreign currency denominated receivables and
payables to import and export transactions to minimize foreign
exchange risks. However, fluctuations in foreign exchange rates
could still have an impact when financial statements prepared in
local currencies are translated into Japanese yen for the
consolidated financial statements, and a major change in foreign
exchange rates beyond our estimates could affect our financial
condition and business performance.
(2) Changes in Performance or Financial Position Associated
with Acquisitions or Alliances
HORIBA has actively promoted corporate acquisitions and
alliances to enhance the efficiency and effectiveness of its
business operations. HORIBA conducts complete and diligent
investigations when making acquisitions and forming alliances in
order to avoid any negative impact on earnings and cash flows.
However, it is possible that HORIBA’s financial condition and
business performance could be affected if an acquisition or
alliance did not proceed in accordance with initial plans.
(3) Repairs of Facilities Following Natural Disasters and
Associated Delays in Delivery, etc.
HORIBA produces products in Japan, Europe (France and
Germany), the U.S., Asia (China and South Korea) and other
locations. In the case of a major earthquake or other natural
44HORIBA, Ltd. Annual Report Fiscal 2009
disaster, HORIBA may incur substantial costs for repair of
manufacturing facilities, etc., or losses may be incurred due to
delays in shipments or other factors. Under such circumstances,
there would be a possibility of a significant impact on HORIBA’s
financial condition and business performance.
(4) Risks Associated with Contracts and Transactions
HORIBA enters into various contracts with customers, suppliers
and other stakeholders and conducts its business activities
based on these contracts. Nevertheless, there is a possibility of
claims arising for damages due to different views of performance
or a different understanding of business terms between the
parties. It is possible that such claims could have a significant
impact on HORIBA’s financial condition and business
performance.
(5) Other Business Risks
In addition to the above mentioned risks, there are risks
associated with the breakdown or malfunction of information
systems and regulations in the environmental area. These risks
could affect HORIBA’s financial position and business results.
2. Risks Associated with Development and Production
(1) Compensation for Product Liability
HORIBA conducts optimum quality control for its products and
services and strives to maintain the highest standards of
reliability. Nevertheless, there is always the possibility of recalls
or litigation arising from unforeseen defects. HORIBA carries
insurance for product liability, but there can be no guarantee that
this insurance would cover the full amount of any unforeseen
damages. Such circumstances could have an affect on
HORIBA’s financial condition and business performance.
(2) Delays in Development of New Products
HORIBA’s business field, measuring instruments, is extremely
specialized and requires high levels of technical capability.
HORIBA, therefore, invests large sums in product development.
However, it is possible that expected returns of this investment
will not be realized due to unforeseen circumstances.
(3) Risks Concerning Intellectual Property Rights
HORIBA possesses a wide range of intellectual property rights
related to the products it manufactures, including patents,
trademarks and expertise, which give it superiority in terms of
competitiveness. HORIBA exercises all possible caution
regarding the management and protection of these intellectual
property rights. However, in the case of infringement by a third
party, it is possible that HORIBA will be unable to attain its
expected earnings. There is also a possibility of disputes over
intellectual property rights with other companies. Such
disputes could significantly affect HORIBA’s financial condition
and business performance.
(4) Risks Associated with Fluctuations in Raw Material Prices
HORIBA takes into account the risk of fluctuations in purchasing
prices and makes arrangements such as advance purchasing to
manage this risk when it is deemed necessary. However, it may
require some time for an increase in purchasing prices to be
passed on and reflected in selling prices. Such circumstances
could significantly affect Horiba’s financial condition and
business performance.
3. Financial Risks
(1) Shifts in the Market Price of Securities and Other Assets
HORIBA holds shares in its major alliance partners and other
companies as part of its technology and business strategies for
the future. Currently, HORIBA’s acquisitions and sales of
investment securities are carefully inspected by the Board of
Directors. Market prices of the shares are reported to top
management on a timely basis, and the purpose for holding the
investment securities is properly reviewed. If declines in the
market price or profitability of land, building or other assets
occurred in the future, there could be a negative impact on the
financial condition and business performance of HORIBA by
application of impairment accounting.
(2) Reversal of Deferred Tax Assets Resulting From Changes in
Systems or Accounting Policies
HORIBA considers the deferred tax assets recorded at the end
of the current period under review to be fully recoverable with
future earnings (taxable income), but it is possible that a reversal
of a portion of these assets will be required as a result of
systemic changes.
4. Risks by Business Segment
HORIBA consists of four business segments: Automotive Test
Systems, Analytical Instruments & Systems, Medical-Diagnostic
Instruments & Systems, Semiconductor Instruments & Systems.
HORIBA can achieve balanced growth by overcoming each
segment’s weakness with complementary strengths among all
the business segments. Nevertheless, each business segment
carries risks associated with fluctuations in its respective
45 HORIBA, Ltd. Annual Report Fiscal 2009
HORIBA, Ltd. and Consolidated Subsidiaries | Consolidated Financial Review
operations.
(1) Automotive Test Systems
Emission measurement systems, the main products of the
Automotive Test Systems segment, are used by automobile
manufacturers, automotive component manufacturers and
government agencies, and the setting of legal limits on exhaust
emissions affects demand. It is possible, therefore, that the
financial condition and business performance of HORIBA will be
significantly affected by future regulations. Furthermore, capital
expenditures related to shifts in the automation of automotive
test systems could have a significant impact on HORIBA’s
financial condition and business performance.
(2) Analytical Instruments & Systems
Scientific analysis instruments in the Analytical Instruments &
Systems segment are used for R&D and product quality testing,
and there are risks that demand may be affected by the R&D
budgets of government agencies and the R&D investments and
production of private enterprises. In addition, demand for
environmental measuring instruments such as analyzers for air
pollution and water quality may be affected by changes in
environmental regulations and have a significant impact on
HORIBA’s financial condition and business performance.
(3) Medical-Diagnostic Instruments & Systems
The main products in the Medical-Diagnostic Instruments &
Systems segment are hematology analyzers, which target the
market for small- and medium-sized equipment used by small-
and medium-sized hospitals and medical practitioners. Price
competition for these products that is beyond our expectations
could have a significant impact on HORIBA’s financial condition
and business performance.
(4) Semiconductor Instruments & Systems
The main products in this segment are fluid control products for
semiconductor manufacturing processes and products that
support R&D and quality testing by semiconductor manufacturers.
To minimize fluctuations in the semiconductor market, HORIBA
makes efforts to shorten lead time and quickly respond to
customers’ needs. Nevertheless, sharp fluctuations in the
semiconductor market and the investments of semiconductor
manufacturers could affect the financial condition and business
performance of HORIBA.
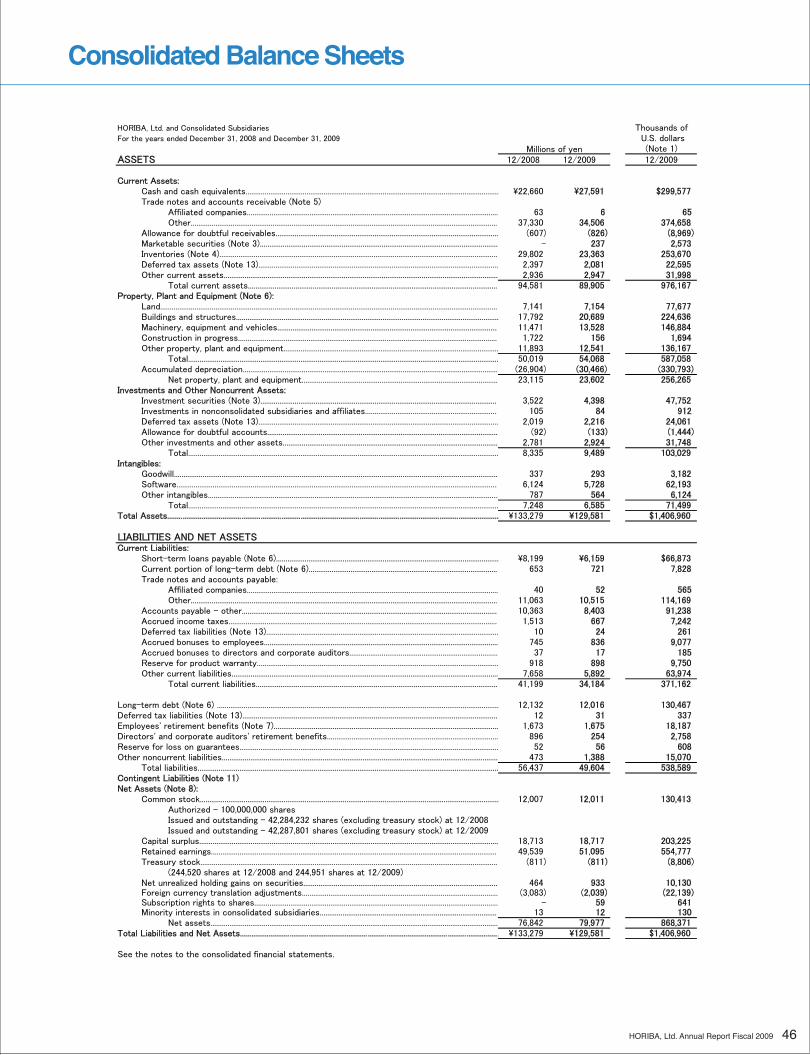
46HORIBA, Ltd. Annual Report Fiscal 2009
Consolidated Balance Sheets
Consolidated Balance SheetsHORIBA, Ltd. and Consolidated Subsidiaries Thousands ofFor the years ended December 31, 2008 and December 31, 2009 U.S. dollars
Millions of yen (Note 1)ASSETS 12/2008 12/2009 12/2009
Current Assets:Cash and cash equivalents..................................................................................................................................... \22,660 \27,591 $299,577Trade notes and accounts receivable (Note 5)
Affiliated companies.................................................................................................................................... 63 6 65Other................................................................................................................................................................. 37,330 34,506 374,658
Allowance for doubtful receivables..................................................................................................................... (607) (826) (8,969)Marketable securities (Note 3)............................................................................................................................. - 237 2,573Inventories (Note 4).................................................................................................................................................. 29,802 23,363 253,670Deferred tax assets (Note 13).............................................................................................................................. 2,397 2,081 22,595Other current assets................................................................................................................................................ 2,936 2,947 31,998
Total current assets................................................................................................................................... 94,581 89,905 976,167Property, Plant and Equipment (Note 6):
Land................................................................................................................................................................................. 7,141 7,154 77,677Buildings and structures.......................................................................................................................................... 17,792 20,689 224,636Machinery, equipment and vehicles.................................................................................................................... 11,471 13,528 146,884Construction in progress......................................................................................................................................... 1,722 156 1,694Other property, plant and equipment................................................................................................................. 11,893 12,541 136,167
Total................................................................................................................................................................... 50,019 54,068 587,058Accumulated depreciation...................................................................................................................................... (26,904) (30,466) (330,793)
Net property, plant and equipment....................................................................................................... 23,115 23,602 256,265Investments and Other Noncurrent Assets:
Investment securities (Note 3)............................................................................................................................. 3,522 4,398 47,752Investments in nonconsolidated subsidiaries and affiliates...................................................................... 105 84 912Deferred tax assets (Note 13).............................................................................................................................. 2,019 2,216 24,061Allowance for doubtful accounts......................................................................................................................... (92) (133) (1,444)Other investments and other assets................................................................................................................. 2,781 2,924 31,748
Total................................................................................................................................................................... 8,335 9,489 103,029Intangibles:
Goodwill.......................................................................................................................................................................... 337 293 3,182Software......................................................................................................................................................................... 6,124 5,728 62,193Other intangibles........................................................................................................................................................ 787 564 6,124
Total................................................................................................................................................................... 7,248 6,585 71,499Total Assets.............................................................................................................................................................................. \133,279 \129,581 $1,406,960
LIABILITIES AND NET ASSETSCurrent Liabilities:
Short-term loans payable (Note 6)..................................................................................................................... \8,199 \6,159 $66,873Current portion of long-term debt (Note 6)................................................................................................... 653 721 7,828Trade notes and accounts payable:
Affiliated companies.................................................................................................................................... 40 52 565Other................................................................................................................................................................. 11,063 10,515 114,169
Accounts payable - other....................................................................................................................................... 10,363 8,403 91,238Accrued income taxes.............................................................................................................................................. 1,513 667 7,242Deferred tax liabilities (Note 13).......................................................................................................................... 10 24 261Accrued bonuses to employees........................................................................................................................... 745 836 9,077Accrued bonuses to directors and corporate auditors.............................................................................. 37 17 185Reserve for product warranty............................................................................................................................... 918 898 9,750Other current liabilities............................................................................................................................................ 7,658 5,892 63,974
Total current liabilities............................................................................................................................... 41,199 34,184 371,162
Long-term debt (Note 6) .................................................................................................................................................... 12,132 12,016 130,467Deferred tax liabilities (Note 13)...................................................................................................................................... 12 31 337Employees' retirement benefits (Note 7)...................................................................................................................... 1,673 1,675 18,187Directors' and corporate auditors' retirement benefits.......................................................................................... 896 254 2,758Reserve for loss on guarantees........................................................................................................................................ 52 56 608Other noncurrent liabilities................................................................................................................................................. 473 1,388 15,070
Total liabilities.............................................................................................................................................................. 56,437 49,604 538,589Contingent Liabilities (Note 11)Net Assets (Note 8):
Common stock............................................................................................................................................................. 12,007 12,011 130,413Authorized - 100,000,000 sharesIssued and outstanding - 42,284,232 shares (excluding treasury stock) at 12/2008Issued and outstanding - 42,287,801 shares (excluding treasury stock) at 12/2009
Capital surplus............................................................................................................................................................. 18,713 18,717 203,225Retained earnings....................................................................................................................................................... 49,539 51,095 554,777Treasury stock............................................................................................................................................................ (811) (811) (8,806)
(244,520 shares at 12/2008 and 244,951 shares at 12/2009)Net unrealized holding gains on securities...................................................................................................... 464 933 10,130Foreign currency translation adjustments....................................................................................................... (3,083) (2,039) (22,139)Subscription rights to shares................................................................................................................................ - 59 641Minority interests in consolidated subsidiaries.............................................................................................. 13 12 130
Net assets....................................................................................................................................................... 76,842 79,977 868,371Total Liabilities and Net Assets........................................................................................................................................ \133,279 \129,581 $1,406,960
See the notes to the consolidated financial statements.
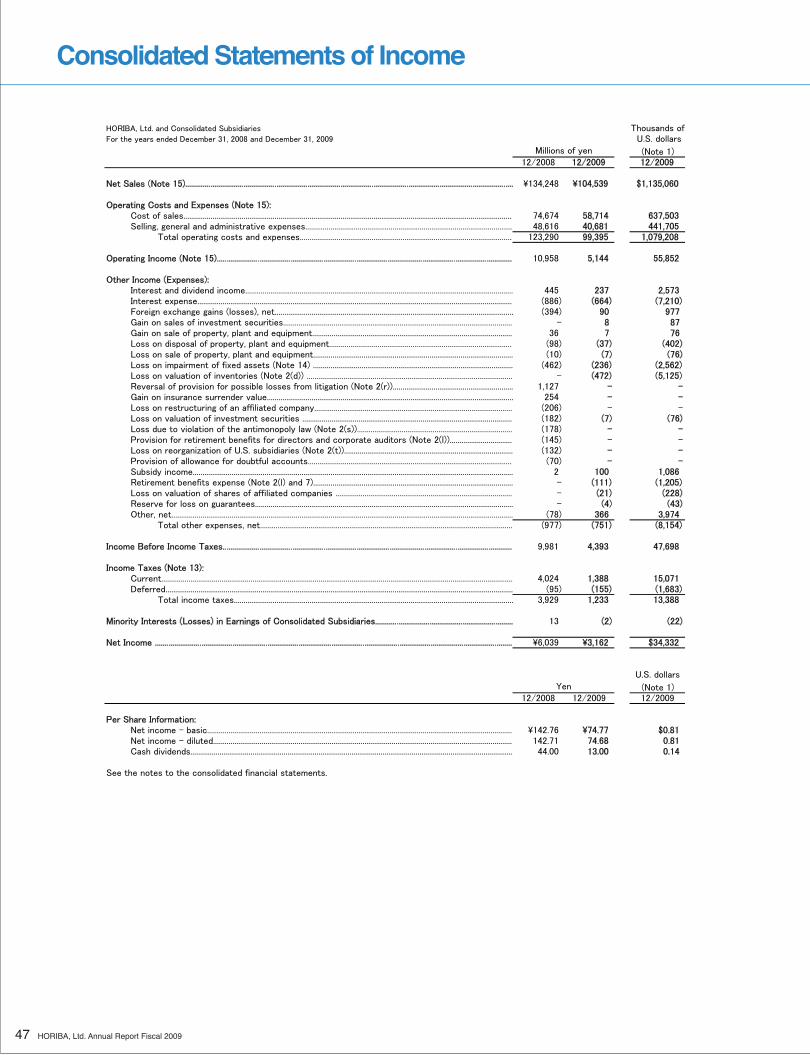
47 HORIBA, Ltd. Annual Report Fiscal 2009
Consolidated Statements of Income
Consolidated Statements of IncomeHORIBA, Ltd. and Consolidated Subsidiaries Thousands ofFor the years ended December 31, 2008 and December 31, 2009 U.S. dollars
(Note 1)12/2008 12/2009 12/2009
Net Sales (Note 15)......................................................................................................................................................................... \134,248 \104,539 $1,135,060
Operating Costs and Expenses (Note 15):Cost of sales.......................................................................................................................................................................... 74,674 58,714 637,503Selling, general and administrative expenses........................................................................................................... 48,616 40,681 441,705
Total operating costs and expenses.............................................................................................................. 123,290 99,395 1,079,208
Operating Income (Note 15)........................................................................................................................................................ 10,958 5,144 55,852
Other Income (Expenses):Interest and dividend income.......................................................................................................................................... 445 237 2,573Interest expense.................................................................................................................................................................. (886) (664) (7,210)Foreign exchange gains (losses), net........................................................................................................................... (394) 90 977Gain on sales of investment securities...................................................................................................................... - 8 87Gain on sale of property, plant and equipment....................................................................................................... 36 7 76Loss on disposal of property, plant and equipment.............................................................................................. (98) (37) (402)Loss on sale of property, plant and equipment....................................................................................................... (10) (7) (76)Loss on impairment of fixed assets (Note 14) ....................................................................................................... (462) (236) (2,562)Loss on valuation of inventories (Note 2(d)) .......................................................................................................... - (472) (5,125)Reversal of provision for possible losses from litigation (Note 2(r)).............................................................. 1,127 - -Gain on insurance surrender value............................................................................................................................... 254 - -Loss on restructuring of an affiliated company...................................................................................................... (206) - -Loss on valuation of investment securities ............................................................................................................ (182) (7) (76)Loss due to violation of the antimonopoly law (Note 2(s))................................................................................ (178) - -Provision for retirement benefits for directors and corporate auditors (Note 2(l))................................ (145) - -Loss on reorganization of U.S. subsidiaries (Note 2(t))....................................................................................... (132) - -Provision of allowance for doubtful accounts......................................................................................................... (70) - -Subsidy income..................................................................................................................................................................... 2 100 1,086Retirement benefits expense (Note 2(l) and 7)....................................................................................................... - (111) (1,205)Loss on valuation of shares of affiliated companies ........................................................................................... - (21) (228)Reserve for loss on guarantees..................................................................................................................................... - (4) (43)Other, net................................................................................................................................................................................ (78) 366 3,974
Total other expenses, net.................................................................................................................................. (977) (751) (8,154)
Income Before Income Taxes..................................................................................................................................................... 9,981 4,393 47,698
Income Taxes (Note 13):Current..................................................................................................................................................................................... 4,024 1,388 15,071Deferred................................................................................................................................................................................... (95) (155) (1,683)
Total income taxes................................................................................................................................................ 3,929 1,233 13,388
Minority Interests (Losses) in Earnings of Consolidated Subsidiaries....................................................................... 13 (2) (22)
Net Income ........................................................................................................................................................................................ \6,039 \3,162 $34,332
U.S. dollars
(Note 1)12/2008 12/2009 12/2009
Per Share Information:Net income - basic............................................................................................................................................................. \142.76 \74.77 $0.81Net income - diluted.......................................................................................................................................................... 142.71 74.68 0.81Cash dividends...................................................................................................................................................................... 44.00 13.00 0.14
See the notes to the consolidated financial statements.
Millions of yen
Yen
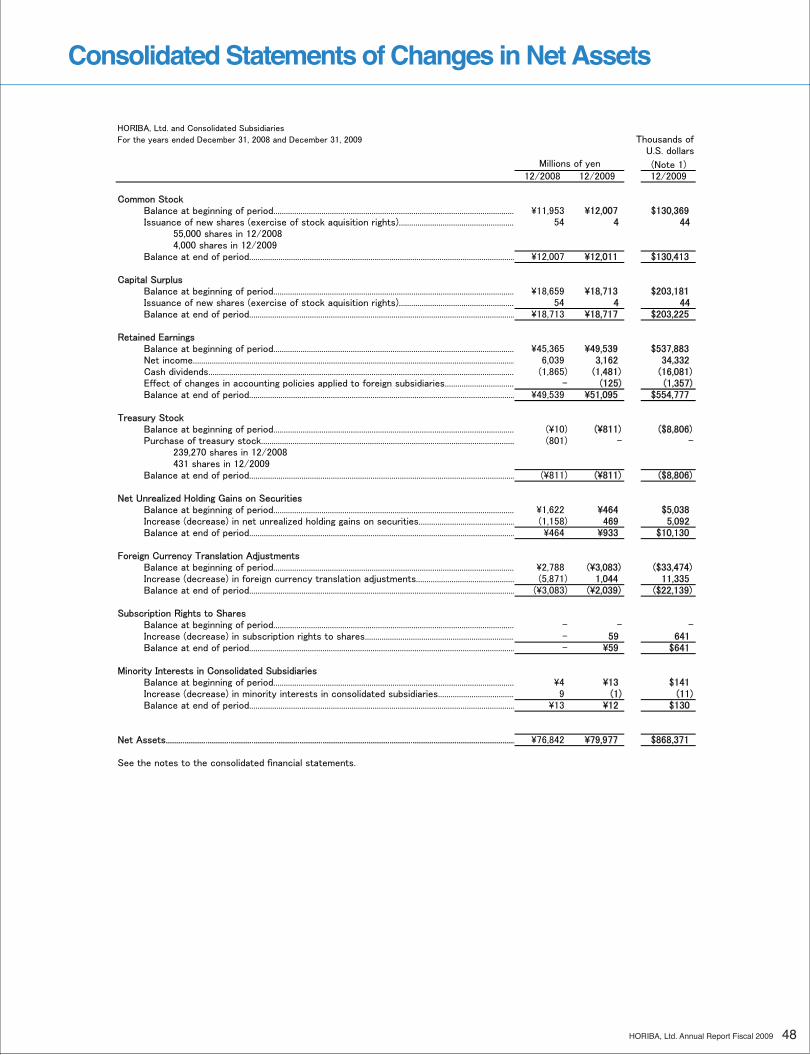
48HORIBA, Ltd. Annual Report Fiscal 2009
Consolidated Statements of Changes in Net Assets
Consolidated Statements of Changes in Net AssetsHORIBA, Ltd. and Consolidated Subsidiaries
For the years ended December 31, 2008 and December 31, 2009 Thousands of U.S. dollars
(Note 1)12/2008 12/2009 12/2009
Common StockBalance at beginning of period................................................................................................................... \11,953 \12,007 $130,369Issuance of new shares (exercise of stock aquisition rights)....................................................... 54 4 44
55,000 shares in 12/20084,000 shares in 12/2009
Balance at end of period............................................................................................................................... \12,007 \12,011 $130,413
Capital SurplusBalance at beginning of period................................................................................................................... \18,659 \18,713 $203,181Issuance of new shares (exercise of stock aquisition rights)....................................................... 54 4 44Balance at end of period............................................................................................................................... \18,713 \18,717 $203,225
Retained EarningsBalance at beginning of period................................................................................................................... \45,365 \49,539 $537,883Net income.......................................................................................................................................................... 6,039 3,162 34,332Cash dividends.................................................................................................................................................. (1,865) (1,481) (16,081)Effect of changes in accounting policies applied to foreign subsidiaries................................. - (125) (1,357)Balance at end of period............................................................................................................................... \49,539 \51,095 $554,777
Treasury StockBalance at beginning of period................................................................................................................... (\10) (\811) ($8,806)Purchase of treasury stock......................................................................................................................... (801) - -
239,270 shares in 12/2008431 shares in 12/2009
Balance at end of period............................................................................................................................... (\811) (\811) ($8,806)
Net Unrealized Holding Gains on SecuritiesBalance at beginning of period................................................................................................................... \1,622 \464 $5,038Increase (decrease) in net unrealized holding gains on securities.............................................. (1,158) 469 5,092Balance at end of period............................................................................................................................... \464 \933 $10,130
Foreign Currency Translation Adjustments Balance at beginning of period................................................................................................................... \2,788 (\3,083) ($33,474)Increase (decrease) in foreign currency translation adjustments............................................... (5,871) 1,044 11,335Balance at end of period............................................................................................................................... (\3,083) (\2,039) ($22,139)
Subscription Rights to SharesBalance at beginning of period................................................................................................................... - - -Increase (decrease) in subscription rights to shares........................................................................ - 59 641Balance at end of period............................................................................................................................... - \59 $641
Minority Interests in Consolidated SubsidiariesBalance at beginning of period................................................................................................................... \4 \13 $141Increase (decrease) in minority interests in consolidated subsidiaries..................................... 9 (1) (11)Balance at end of period............................................................................................................................... \13 \12 $130
Net Assets....................................................................................................................................................................... \76,842 \79,977 $868,371
See the notes to the consolidated financial statements.
Millions of yen
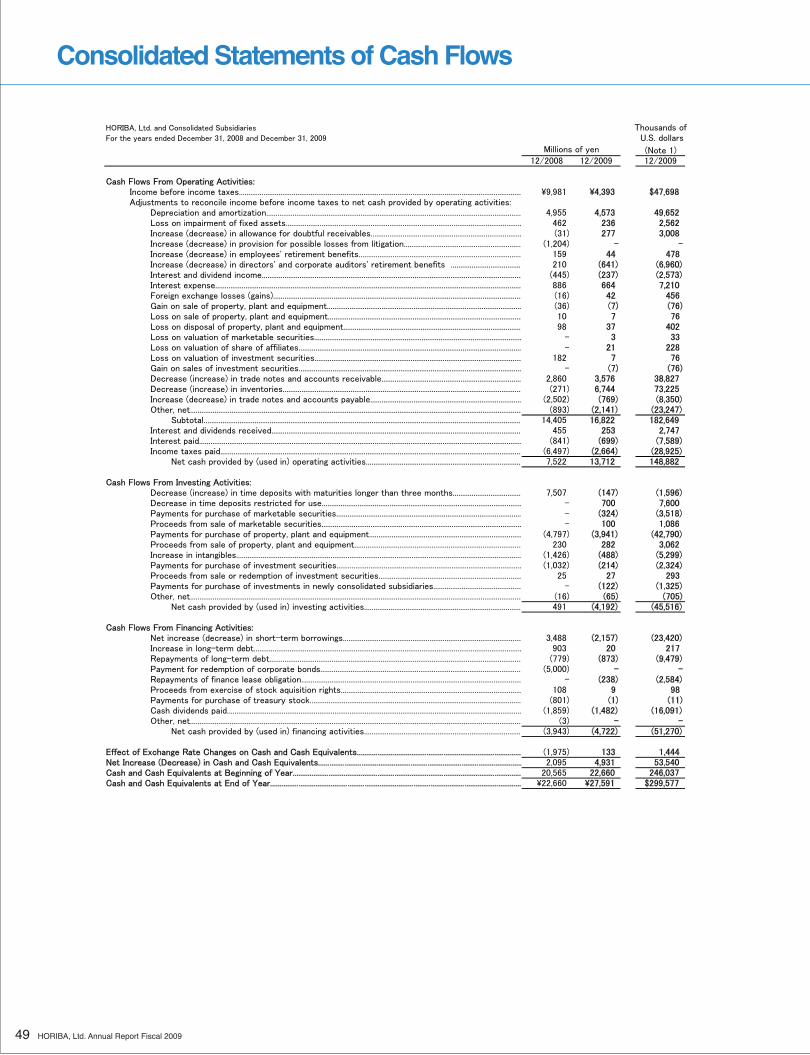
49 HORIBA, Ltd. Annual Report Fiscal 2009
Consolidated Statements of Cash Flows
Consolidated Statements of Cash FlowsHORIBA, Ltd. and Consolidated Subsidiaries Thousands ofFor the years ended December 31, 2008 and December 31, 2009 U.S. dollars
(Note 1)12/2008 12/2009 12/2009
Cash Flows From Operating Activities:Income before income taxes...................................................................................................................................................... \9,981 \4,393 $47,698Adjustments to reconcile income before income taxes to net cash provided by operating activities:
Depreciation and amortization....................................................................................................................................... 4,955 4,573 49,652Loss on impairment of fixed assets............................................................................................................................. 462 236 2,562Increase (decrease) in allowance for doubtful receivables................................................................................ (31) 277 3,008Increase (decrease) in provision for possible losses from litigation.............................................................. (1,204) - -Increase (decrease) in employees' retirement benefits...................................................................................... 159 44 478Increase (decrease) in directors' and corporate auditors' retirement benefits ...................................... 210 (641) (6,960)Interest and dividend income.......................................................................................................................................... (445) (237) (2,573)Interest expense.................................................................................................................................................................. 886 664 7,210Foreign exchange losses (gains).................................................................................................................................... (16) 42 456Gain on sale of property, plant and equipment....................................................................................................... (36) (7) (76)Loss on sale of property, plant and equipment....................................................................................................... 10 7 76Loss on disposal of property, plant and equipment.............................................................................................. 98 37 402Loss on valuation of marketable securities.............................................................................................................. - 3 33Loss on valuation of share of affiliates...................................................................................................................... - 21 228Loss on valuation of investment securities.............................................................................................................. 182 7 76Gain on sales of investment securities...................................................................................................................... - (7) (76)Decrease (increase) in trade notes and accounts receivable.......................................................................... 2,860 3,576 38,827Decrease (increase) in inventories............................................................................................................................... (271) 6,744 73,225Increase (decrease) in trade notes and accounts payable................................................................................ (2,502) (769) (8,350)Other, net................................................................................................................................................................................ (893) (2,141) (23,247)
Subtotal......................................................................................................................................................................... 14,405 16,822 182,649Interest and dividends received..................................................................................................................................... 455 253 2,747Interest paid........................................................................................................................................................................... (841) (699) (7,589)Income taxes paid................................................................................................................................................................ (6,497) (2,664) (28,925)
Net cash provided by (used in) operating activities................................................................................... 7,522 13,712 148,882
Cash Flows From Investing Activities:Decrease (increase) in time deposits with maturities longer than three months..................................... 7,507 (147) (1,596)Decrease in time deposits restricted for use.......................................................................................................... - 700 7,600Payments for purchase of marketable securities.................................................................................................. - (324) (3,518)Proceeds from sale of marketable securities.......................................................................................................... - 100 1,086Payments for purchase of property, plant and equipment................................................................................. (4,797) (3,941) (42,790)Proceeds from sale of property, plant and equipment......................................................................................... 230 282 3,062Increase in intangibles....................................................................................................................................................... (1,426) (488) (5,299)Payments for purchase of investment securities.................................................................................................. (1,032) (214) (2,324)Proceeds from sale or redemption of investment securities............................................................................ 25 27 293Payments for purchase of investments in newly consolidated subsidiaries............................................... - (122) (1,325)Other, net................................................................................................................................................................................ (16) (65) (705)
Net cash provided by (used in) investing activities................................................................................... 491 (4,192) (45,516)
Cash Flows From Financing Activities:Net increase (decrease) in short-term borrowings............................................................................................... 3,488 (2,157) (23,420)Increase in long-term debt.............................................................................................................................................. 903 20 217Repayments of long-term debt...................................................................................................................................... (779) (873) (9,479)Payment for redemption of corporate bonds........................................................................................................... (5,000) - -Repayments of finance lease obligation..................................................................................................................... - (238) (2,584)Proceeds from exercise of stock aquisition rights................................................................................................ 108 9 98Payments for purchase of treasury stock................................................................................................................ (801) (1) (11)Cash dividends paid............................................................................................................................................................ (1,859) (1,482) (16,091)Other, net................................................................................................................................................................................ (3) - -
Net cash provided by (used in) financing activities.................................................................................... (3,943) (4,722) (51,270)
Effect of Exchange Rate Changes on Cash and Cash Equivalents....................................................................................... (1,975) 133 1,444Net Increase (Decrease) in Cash and Cash Equivalents............................................................................................................ 2,095 4,931 53,540Cash and Cash Equivalents at Beginning of Year......................................................................................................................... 20,565 22,660 246,037Cash and Cash Equivalents at End of Year..................................................................................................................................... \22,660 \27,591 $299,577
Millions of yen
50HORIBA, Ltd. Annual Report Fiscal 2009
HORIBA, Ltd. and Consolidated Subsidiaries | Notes to Consolidated Financial Statements
1. Basis of presenting consolidated financial statements
The accompanying consolidated financial statements of HORIBA, Ltd.
(“the Company”) have been prepared in accordance with the provisions
set forth in the Japanese Financial Instruments and Exchange Law and
its related accounting regulations and in conformity with accounting
principles generally accepted in Japan (“Japanese GAAP”), which are
different in certain respects as to application and disclosure
requirements from International Financial Reporting Standards.
Prior to the year ended December 31, 2009, the accounts of overseas
subsidiaries were based on their accounting records maintained in
conformity with generally accepted accounting principles prevailing in the
respective countries of domicile. From the fiscal year ended December
31, 2009, the “Practical Solution on Unification of Accounting Policies
Applied to Foreign Subsidiaries for Consolidated Financial Statements”
(Practical Issue Task Force of the ASBJ No. 18; issued on May 17, 2006)
was adopted, and necessary adjustments in preparing the consolidated
financial statements were made. The adoption of the new standard had
the effect of increasing operating income by 158 million yen ($1,716
thousand) and reducing income before income taxes by 20 million yen
($217 thousand) compared to the amounts that would have been
recorded with the previous method. The accompanying consolidated
financial statements have been restructured and translated into English
(with some expanded descriptions) from the consolidated financial
statements of the Company prepared in accordance with Japanese
GAAP and filed with the appropriate Local Finance Bureau of the
Ministry of Finance as required by the Japanese Financial Instruments
and Exchange Law. Some supplementary information included in the
statutory Japanese language consolidated financial statements, but not
required for fair presentation, is not presented in the accompanying
consolidated financial statements.
The translation of the Japanese yen amounts into U.S. dollar amounts
is included solely for the convenience of readers outside Japan, using the
prevailing exchange rate at December 31, 2009, which was \92.10 to
U.S.$1.00. The translations should not be construed as representations
that the Japanese yen amounts have been, could have been, or could in
the future be converted into U.S. dollars at this or any other rate of
exchange.
Certain prior year amounts have been reclassified to conform to the
current year’s presentation.
2. Summary of significant accounting policies
(a) Principles of consolidation
The consolidated financial statements include the accounts of the
Company and 36 (40 in the year ended December 31, 2008) of its
subsidiaries (“HORIBA” as a consolidated group). In the year ended
December 31, 2009, one company became a subsidiary of the Company
as a result of a share acquisition, four subsidiaries were absorbed by
another subsidiary of the Company and another subsidiary was
liquidated.
The accompanying consolidated financial statements include the
accounts of the Company and significant companies over which the
Company has control through majority voting rights or certain other
conditions evidencing control by the Company. Significant intercompany
transactions and accounts have been eliminated in consolidation. In the
elimination of investments in subsidiaries, the assets and liabilities of the
subsidiaries, including the portions attributable to minority shareholders,
are evaluated using the fair value at the time the Company acquired
control of the respective subsidiary. Acquisition costs that are in excess
of the net assets of acquired subsidiaries and affiliates and that cannot
be assigned to specific individual accounts are amortized on a
straight-line basis over five years.
December 31 is the year-end of the consolidated subsidiaries and
matches that of the consolidated financial statements for the year ended
December 31, 2008 and 2009.
One of the Company’s subsidiaries is not included in the consolidated
accounts as the effect on total assets, sales, income and retained
earnings would have been immaterial.
The Company has six affiliated companies. For one of the six affiliates,
the equity method was applied. Investments in five affiliates (generally
20%-50% ownership) over which the Company has the ability to exercise
significant influence over operating and financial policies and one
nonconsolidated subsidiary were accounted for on a cost basis, not by
the equity method, as the effect on income and retained earnings was
immaterial.
(b) Cash and cash equivalents
Cash and cash equivalents include cash on hand, readily available bank
deposits, and short-term highly liquid investments that are readily
convertible into cash, have insignificant risk of change in value and have
original maturities of three months or less from date of purchase.
(c) Securities
Available-for-sale securities with available fair market values are stated
at fair market value. Unrealized gains and losses on securities are
reported, net of applicable income taxes, as a separate component of net
assets. Realized gains and losses on the sale of such securities are
computed using moving average cost. Available-for-sale securities with
no available fair market value are stated mainly at moving average cost.
(d) Inventories
Inventories are valued by the cost method. Cost is principally determined
by the weighted average method for merchandise, finished goods and
work-in-process and by the moving average method for raw materials
and supplies.
Effective January 1, 2008, the Company and certain of its domestic
51 HORIBA, Ltd. Annual Report Fiscal 2009
HORIBA, Ltd. and Consolidated Subsidiaries | Notes to Consolidated Financial Statements
subsidiaries reclassified loss on disposal of inventories and loss on
write-down of inventories from other expenses as cost of sales in
connection with changes in management and organizational structure to
cope with the increased number of the titles related to publications and
the necessities of cost management.
For the year ended December 31, 2008, operating income was \135
million less than it would have been without the adoption of the new
method. However, this change did not have any impact on the results of
income before income taxes.
Effective January 1, 2009, the Company and its consolidated domestic
subsidiaries have adopted the “Accounting Standards for Measurement
of Inventories” (ASBJ Statement No. 9; issued on July 5, 2006), and
standards for inventory valuation have been changed from the
conventional cost method to the cost method (writing down book values
based on decreasing profitability with regard to the values on the balance
sheet). The adoption of the new standard reduced operating income by
543 million yen ($5,896 thousand) and income before income taxes by
1,015 million yen ($11,021 thousand) compared to the amounts that
would have been recorded with the previous method.
(e) Property, plant and equipment and depreciation (except for leases)
Property, plant and equipment are stated at cost. Depreciation is
computed by the straight-line method or the declining balance method
over the estimated useful life of the asset.
Buildings acquired after April 1, 1998 and the EPR system (server, etc)
included in “Other property, plant and equipment” are depreciated by
the straight-line method. Other property, plant and equipment are
depreciated by the Company and domestic subsidiaries by the declining
balance method and by overseas subsidiaries by the straight-line method.
Estimated useful lives of assets are principally as follows:
Buildings and structures - 5 to 60 years
Machinery, equipment and vehicles - 2 to 18 years
Effective January 1, 2008, the Company and its domestic subsidiaries
have adopted the method of depreciation for tangible fixed assets
acquired on or after April 1, 2007 provided by the revised Corporate Tax
Law, following the completion of its fixed assets management system.
For the year ended December 31, 2008, operating income and income
before income taxes were \124 million less, respectively, than they would
have been without the adoption of the new method.
In addition, the Company and its domestic subsidiaries have adopted
the revised Corporation Tax Law and changed the method of
depreciation for tangible fixed assets acquired on or before March 31,
2007. Accordingly, the difference between the residual value of such an
asset under the amended Japanese Tax Law and the value equivalent to
5% of its acquisition cost, as computed by the previous Corporation Tax
Law, is depreciated over a period of five years starting from the year
following the year in which the value of the asset falls to 5% of its
acquisition cost. The difference is amortized by the straight-line method
and is included in depreciation expense. For the year ended December
31, 2008, operating income and income before income taxes were \55
million less, respectively, than they would have been without the adoption
of the new method.
In accordance with the revised Corporate Tax Law of Japan, the
Company and its consolidated domestic subsidiaries reviewed the
estimated useful lives of machinery and equipment. As a result, the
estimated useful lives of some machinery and equipment were changed.
This change had the effect of reducing operating income and income
before income taxes by 36 million yen ($391 thousand) each for the year
ended December 31, 2009.
(f) Software
Amortization of computer software used by HORIBA is computed on the
straight-line method over the estimated useful life of 5 to 10 years.
(g) Leases
With regard to leased assets under finance leases other than those that
are deemed to transfer ownership of the leased property to the lessee,
the lease term is deemed to be the useful life, and depreciation is
computed by the straight-line method over the lease term with zero
residual value. Financial leases other than those that are deemed to
transfer ownership of the leased property to the lessee and which
commenced in fiscal years beginning prior to January 1, 2009, continue
to be accounted for in a similar way to operating leases.
The leased assets under finance leases other than those that are
deemed to transfer ownership of the leased property to the lessees are
accounted for in the similar way to operating leases. However, the
“Accounting Standard for Lease Transactions” (ASBJ Statement No.
13; originally issued by the Corporate Accounting Council on June 17,
1993 and revised by the ASBJ on March 30, 2007) and the “Guidance on
Accounting Standard for Lease Transactions” (ASBJ Guidance No. 16;
issued by the Japanese Institute of Certified Public Accountants on
January 18, 1994 and revised by the ASBJ on March 30, 2007) became
applicable to fiscal years beginning on or after April 1, 2008. HORIBA
adopted this accounting standard and practical guideline starting from
January 1, 2009, and the leases were accounted for by the method used
for ordinary sales transactions. The above changes had no impact on
operating income or income before income taxes for the year ended
December 31, 2009.
(h) Allowance for doubtful receivables
The Company and its domestic subsidiaries provide for doubtful
accounts principally at an amount computed based on the actual ratio of
bad debts in the past plus the estimated uncollectible amounts of certain
individual receivables. The overseas subsidiaries provide for doubtful
accounts based on estimates by management.
52HORIBA, Ltd. Annual Report Fiscal 2009
(i) Accrued bonuses to employees
Accrued bonuses to employees are provided for the expected payment
of employee bonuses for the current fiscal year to those employees
serving at the end of the fiscal year.
(j) Accrued bonuses to directors and corporate auditors
The Company’s domestic subsidiaries provide for accrued bonuses to
directors and corporate auditors for the expected payment of director
and corporate auditor bonuses for the current fiscal year to those
directors and corporate auditors serving at the end of the fiscal year.
(k) Reserve for product warranty
The reserve for product warranty is provided for accrued warranty
expenses for products of the Company and certain subsidiaries. The
provision is determined by predetermined standards, which are based on
actual product warranty records, and takes into account individual cases.
(l) Retirement benefits and pension plans
The Company and some consolidated subsidiaries provide for
employees’ severance and retirement benefits based on estimated
amounts of projected benefit obligation and the fair value of plan assets.
Actuarial gains or losses are recognized in expenses using the
straight-line method over a fixed term of years (5 years), which is within
the average of the estimated remaining service years, commencing with
the following period. In the Company and some domestic consolidated
subsidiaries, prior service costs are recognized in expenses using the
straight-line method over a fixed term of years (10 years), which is within
the average of the estimated remaining service years, commencing in the
period they arise. In some consolidated subsidiaries, they are expensed
as incurred.
Effective January 1, 2009, at one domestic consolidated subsidiary,
the method for calculating projected benefit obligation has changed from
the simplified method to the “rule method” to more accurately account
for retirement benefits. The difference resulting from the change from
the simplified method to the “rule method” has been recorded as other
expenses of 111 million yen ($1,205 thousand) in “Retirement benefits
expense” for the year ended December 31, 2009. This change had no
impact on operating income, but it reduced income before income taxes
by 111 million yen ($1,205 thousand) for the year ended December 31,
2009 compared to the amount that would have been recorded with the
previous method.
(m) Retirement benefits for the directors and corporate auditors
Retirement benefits for directors and corporate auditors are provided for
at an amount based upon internal rules at the balance sheet date.
Following a resolution by the Board of Directors meeting held on
February 17, 2009 to abolish the retirement benefits plan for directors
and corporate auditors, the Company resolved at the shareholders
meeting held on March 28, 2009 to pay retirement benefits to directors
and corporate auditors on their termination (the actual payment will be
made when a director or auditor retires from his post.)
As a result, an additional allowance for retirement benefits for
directors and corporate auditors, in a certain percentage of the
increment of the retirement allowance corresponding to the term served,
was recognized as provision for retirement benefits for the directors and
corporate auditors in other expenses for the year ended December 31,
2008. The allowance for directors’ and corporate auditors’ retirement
benefits was fully reversed, and the resulting unpaid amount of 655
million yen ($7,112 thousand), was included in “Other noncurrent
liabilities” for the year ended December 31, 2009.
(n) Reserve for loss on guarantees
A reserve for loss on guarantees was provided in an estimated amount in
relation to an affiliated company after consideration of the Company’s
financial position, etc.
(o) Foreign currency translation
Short-term and long-term receivables and payables in foreign currencies
are translated into Japanese yen based on exchange rates at the
balance sheet date.
Balance sheet accounts of consolidated foreign subsidiaries are
translated into Japanese yen at the balance sheet date, except for
shareholders’ equity accounts, which are translated at historical rates.
Revenue and expense accounts of consolidated foreign subsidiaries are
translated into Japanese yen at average annual exchange rates.
Differences arising from the application of the process stated above are
separately presented in the consolidated financial statements in “Foreign
currency translation adjustments” and “Minority interests” in net assets.
(p) Derivatives and hedge accounting
Derivative financial instruments are stated at fair value, and changes in
the fair value are recognized as gains or losses unless the derivative
financial instruments are used for hedging purposes. HORIBA uses
foreign currency exchange contracts to manage risk related to its
importing and exporting activities. The use of foreign currency exchange
contracts is limited to the amounts of HORIBA’s foreign currency
denominated receivables and payables. HORIBA also uses interest rate
swap contracts to avoid the risk of rising interest rates. Contracts are
entered into and controlled by the finance department, which reports
results to the Director. Transactions involving derivative contracts are
limited to highly rated banking institutions, and HORIBA considers that
there are no material credit risks associated with them.
Prior to the year ended December 31, 2007, in cases in which a foreign
exchange forward contract met certain hedging criteria, the hedged item
was stated at the forward exchange rate. Hedge effectiveness was
evaluated by verifying the currency type, term and identity of the hedged
item and the hedging instrument. Effective January 1, 2008, the
Company and its domestic subsidiaries changed this accounting method
for such hedging activities. This change was made as the policy for
53 HORIBA, Ltd. Annual Report Fiscal 2009
HORIBA, Ltd. and Consolidated Subsidiaries | Notes to Consolidated Financial Statements
foreign currency management was revised. Under the new policy, foreign
currency forward contracts used to hedge foreign exchange exposure
are measured at fair value, and payables and receivables in foreign
currency are translated at the exchange rates in effect at the balance
sheet date. Any change in fair value is charged to earnings. This new
policy did not have any impact on operating income and did not have a
material impact on income before income taxes.
(q) Research and development expenses
Research and development expenses are charged to income when
incurred. Research and development expenses charged to income for
the years ended December 31, 2008, and December 31, 2009, were
\10,662 million and \9,831 million ($106,743 thousand), respectively.
(r) Provision for possible losses from litigation
A lawsuit was filed by Micronics Japan Co., Ltd. against the Company
seeking compensation for damages related to an agreement to develop
and commercialize liquid-crystal related testing equipment (\933 million
plus damages for delay in payment).
On December 25, 2008, the Tokyo High Court ruled in favor of the
Company. As a result, the Company recorded other income of \1,127
million for the year ended December 31, 2008, as reversal of the
provision for possible losses from litigation after subtracting attorneys’
fees and other related costs from the provision of the \1,204 million for
possible losses from litigation that was established when the Tokyo
District Court initially ruled against the Company on May 22, 2007.
(s) Losses due to violation of the antimonopoly law
In connection with the Company’s violation of the Antimonopoly Law in
bidding to supply air pollution analyzers to public entities, the Japan Fair
Trade Commission issued a restraining order and imposed a fine on the
Company on November 12, 2008. The amount of \178 million, which a
represented fine of \37 million and the estimated amount of damages for
breach of contract and other costs, were recognized as loss due to
violation of the antimonopoly law in other expenses for the year ended
December 31, 2008.
(t) Loss on reorganization of U.S. subsidiaries
For the year ended December 31, 2008, HORIBA recorded a loss on the
reorganization of U.S. subsidiaries in the amount of \132 million as other
expenses. This loss consisted of a reserve for product warranty of \62
million and loss on the write-down of inventories of \70 million.
(u) Income taxes
Income taxes comprise corporate tax, enterprise tax, and prefectural and
municipal inhabitants taxes.
HORIBA recognizes the tax effects of loss carryforwards and the
temporary differences between the carrying amounts of assets and
liabilities for tax and financial reporting. The provision for current income
tax is computed based on the pretax income included in the consolidated
statements of income.
The asset and liability approach is used to recognize deferred tax
assets and liabilities for the expected future tax consequences of
temporary differences between the carrying amounts of assets and
liabilities for financial reporting purposes and the amounts used for
income tax purposes.
(v) Per share information
The computations of net income per share are based on the weighted
average number of shares of common stock outstanding during each
period. The weighted average number of shares of common stock used
in the computation for the years ended December 31, 2008 and
December 31, 2009 were 42,304 thousand and 42,286 thousand,
respectively. Diluted net income per share of common stock assumes
full conversion of dilutive convertible bonds at the beginning of the year
or at the later date of issuance, with an applicable adjustment for related
interest expense, net of tax and dilutive stock option plans. The weighted
average number of shares used in the computation for the years ended
December 31, 2008 and December 31, 2009 were 42,319 thousand and
42,340 thousand, respectively.
Cash dividends per share shown in the consolidated statements of
income represent actual amounts applicable to earnings in the respective
fiscal year, including dividends to be paid after the end of the period.
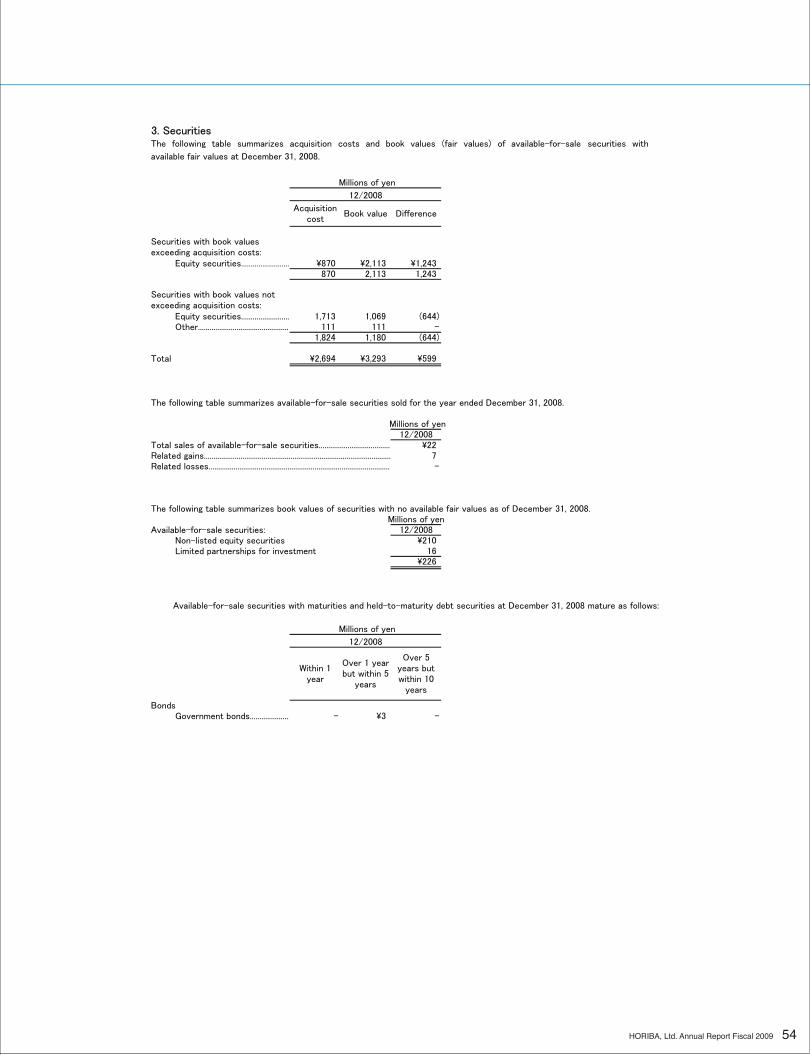
54HORIBA, Ltd. Annual Report Fiscal 2009
3. Securities
Millions of yen
12/2008
Equity securities......................... \870 \2,113 \1,243870 2,113 1,243
Equity securities......................... 1,713 1,069 (644)Other................................................ 111 111 -
1,824 1,180 (644)
Total \2,694 \3,293 \599
Millions of yen12/2008
Total sales of available-for-sale securities..................................... \22Related gains................................................................................................. 7Related losses.............................................................................................. -
Millions of yenAvailable-for-sale securities: 12/2008
Non-listed equity securities \210Limited partnerships for investment 16
\226
BondsGovernment bonds..................... - \3 -
The following table summarizes book values of securities with no available fair values as of December 31, 2008.
Acquisitioncost
DifferenceBook value
Securities with book valuesexceeding acquisition costs:
available fair values at December 31, 2008.
The following table summarizes acquisition costs and book values (fair values) of available-for-sale securities with
Securities with book values notexceeding acquisition costs:
The following table summarizes available-for-sale securities sold for the year ended December 31, 2008.
Available-for-sale securities with maturities and held-to-maturity debt securities at December 31, 2008 mature as follows:
Over 1 yearbut within 5
years
Over 5years butwithin 10
years
Millions of yen
12/2008
Within 1year
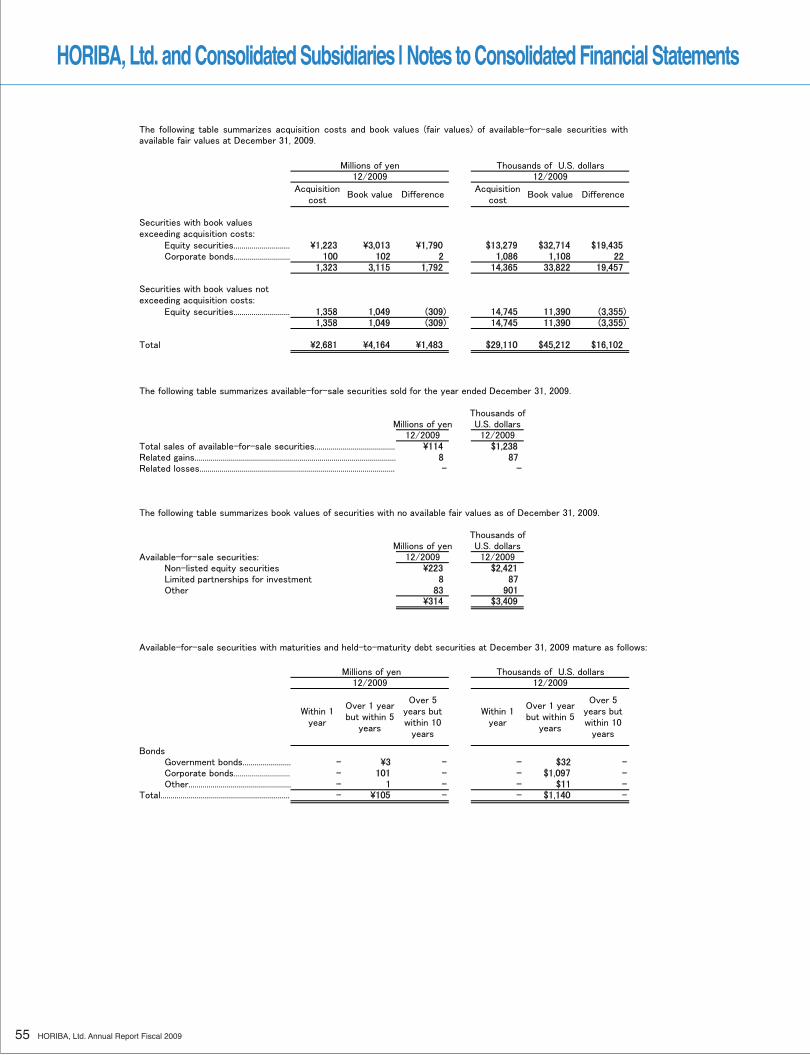
55 HORIBA, Ltd. Annual Report Fiscal 2009
HORIBA, Ltd. and Consolidated Subsidiaries | Notes to Consolidated Financial Statements
Millions of yen Thousands of U.S. dollars12/2009 12/2009
Equity securities............................ \1,223 \3,013 \1,790 $13,279 $32,714 $19,435Corporate bonds............................ 100 102 2 1,086 1,108 22
1,323 3,115 1,792 14,365 33,822 19,457
Equity securities............................ 1,358 1,049 (309) 14,745 11,390 (3,355)1,358 1,049 (309) 14,745 11,390 (3,355)
Total \2,681 \4,164 \1,483 $29,110 $45,212 $16,102
Thousands ofMillions of yen U.S. dollars
12/2009 12/2009Total sales of available-for-sale securities........................................ \114 $1,238Related gains.................................................................................................... 8 87Related losses.................................................................................................. - -
The following table summarizes book values of securities with no available fair values as of December 31, 2009.
Thousands ofMillions of yen U.S. dollars
Available-for-sale securities: 12/2009 12/2009Non-listed equity securities \223 $2,421Limited partnerships for investment 8 87Other 83 901
\314 $3,409
Available-for-sale securities with maturities and held-to-maturity debt securities at December 31, 2009 mature as follows:
BondsGovernment bonds........................ - \3 - - $32 -Corporate bonds............................ - 101 - - $1,097 -Other................................................... - 1 - - $11 -
Total................................................................. - \105 - - $1,140 -
Within 1year
The following table summarizes available-for-sale securities sold for the year ended December 31, 2009.
Thousands of U.S. dollars Millions of yen
Over 5years butwithin 10
years
Over 5years butwithin 10
years
12/2009
Within 1year
Over 1 yearbut within 5
years
Over 1 yearbut within 5
years
12/2009
The following table summarizes acquisition costs and book values (fair values) of available-for-sale securities with
Securities with book values notexceeding acquisition costs:
Securities with book valuesexceeding acquisition costs:
Book valueBook value DifferenceAcquisition
costAcquisition
cost
available fair values at December 31, 2009.
Difference
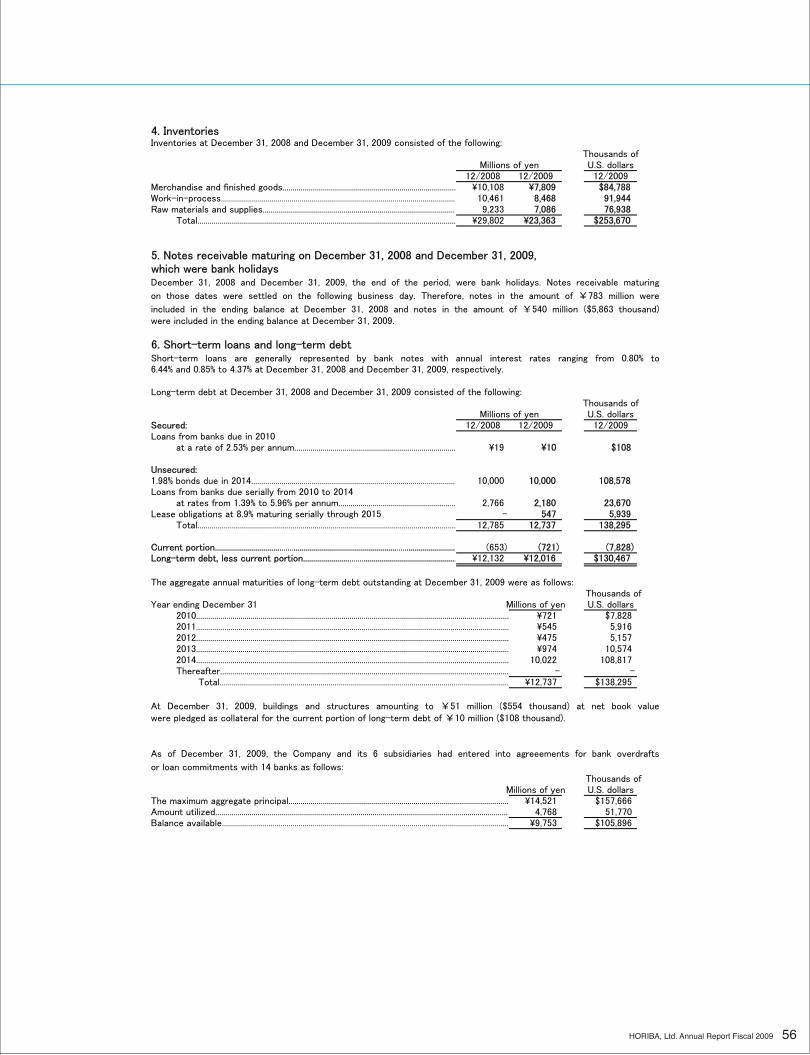
56HORIBA, Ltd. Annual Report Fiscal 2009
4. Inventories
Thousands ofU.S. dollars
12/2008 12/2009 12/2009Merchandise and finished goods...................................................................................... \10,108 \7,809 $84,788Work-in-process..................................................................................................................... 10,461 8,468 91,944Raw materials and supplies................................................................................................ 9,233 7,086 76,938
Total................................................................................................................................ \29,802 \23,363 $253,670
5. Notes receivable maturing on December 31, 2008 and December 31, 2009, which were bank holidays
were included in the ending balance at December 31, 2009.
6. Short-term loans and long-term debt
Thousands ofU.S. dollars
Secured: 12/2008 12/2009 12/2009Loans from banks due in 2010
at a rate of 2.53% per annum................................................................................ \19 \10 $108
Unsecured:1.98% bonds due in 2014...................................................................................................... 10,000 10,000 108,578Loans from banks due serially from 2010 to 2014
at rates from 1.39% to 5.96% per annum.......................................................... 2,766 2,180 23,670Lease obligations at 8.9% maturing serially through 2015 - 547 5,939
Total................................................................................................................................ 12,785 12,737 138,295
Current portion....................................................................................................................... (653) (721) (7,828)Long-term debt, less current portion............................................................................ \12,132 \12,016 $130,467
Thousands ofYear ending December 31 Millions of yen U.S. dollars
2010........................................................................................................................................................... \721 $7,8282011........................................................................................................................................................... \545 5,9162012........................................................................................................................................................... \475 5,1572013........................................................................................................................................................... \974 10,5742014........................................................................................................................................................... 10,022 108,817Thereafter............................................................................................................................................... - -
Total............................................................................................................................................... \12,737 $138,295
Thousands ofMillions of yen U.S. dollars
The maximum aggregate principal............................................................................................................. \14,521 $157,666Amount utilized.................................................................................................................................................. 4,768 51,770Balance available.............................................................................................................................................. \9,753 $105,896
were pledged as collateral for the current portion of long-term debt of ¥10 million ($108 thousand).
included in the ending balance at December 31, 2008 and notes in the amount of ¥540 million ($5,863 thousand)
December 31, 2008 and December 31, 2009, the end of the period, were bank holidays. Notes receivable maturing
6.44% and 0.85% to 4.37% at December 31, 2008 and December 31, 2009, respectively.
At December 31, 2009, buildings and structures amounting to ¥51 million ($554 thousand) at net book value
Short-term loans are generally represented by bank notes with annual interest rates ranging from 0.80% to
The aggregate annual maturities of long-term debt outstanding at December 31, 2009 were as follows:
or loan commitments with 14 banks as follows:
As of December 31, 2009, the Company and its 6 subsidiaries had entered into agreeements for bank overdrafts
Inventories at December 31, 2008 and December 31, 2009 consisted of the following:
Millions of yen
Long-term debt at December 31, 2008 and December 31, 2009 consisted of the following:
Millions of yen
on those dates were settled on the following business day. Therefore, notes in the amount of ¥783 million were
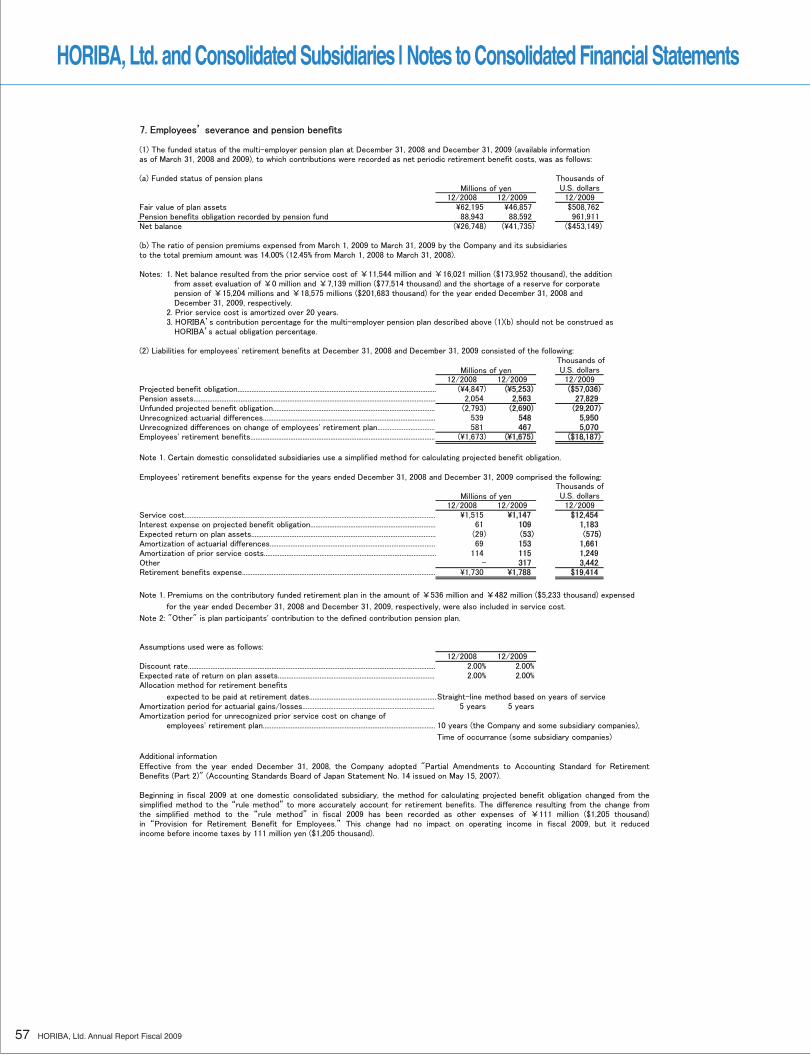
57 HORIBA, Ltd. Annual Report Fiscal 2009
HORIBA, Ltd. and Consolidated Subsidiaries | Notes to Consolidated Financial Statements
7. Employees’ severance and pension benefits
(1) The funded status of the multi-employer pension plan at December 31, 2008 and December 31, 2009 (available information as of March 31, 2008 and 2009), to which contributions were recorded as net periodic retirement benefit costs, was as follows:
(a) Funded status of pension plans Thousands ofMillions of yen U.S. dollars
12/2008 12/2009 12/2009Fair value of plan assets \62,195 \46,857 $508,762Pension benefits obligation recorded by pension fund 88,943 88,592 961,911Net balance (\26,748) (\41,735) ($453,149)
(b) The ratio of pension premiums expensed from March 1, 2009 to March 31, 2009 by the Company and its subsidiaries to the total premium amount was 14.00% (12.45% from March 1, 2008 to March 31, 2008).
Notes: 1. Net balance resulted from the prior service cost of ¥11,544 million and ¥16,021 million ($173,952 thousand), the addition from asset evaluation of ¥0 million and ¥7,139 million ($77,514 thousand) and the shortage of a reserve for corporate pension of ¥15,204 millions and ¥18,575 millions ($201,683 thousand) for the year ended December 31, 2008 and December 31, 2009, respectively.2. Prior service cost is amortized over 20 years.3. HORIBA’s contribution percentage for the multi-employer pension plan described above (1)(b) should not be construed as HORIBA’s actual obligation percentage.
(2) Liabilities for employees' retirement benefits at December 31, 2008 and December 31, 2009 consisted of the following: Thousands of
Millions of yen U.S. dollars12/2008 12/2009 12/2009
Projected benefit obligation.................................................................................................................. (\4,847) (\5,253) ($57,036)Pension assets........................................................................................................................................... 2,054 2,563 27,829Unfunded projected benefit obligation............................................................................................. (2,793) (2,690) (29,207)Unrecognized actuarial differences................................................................................................... 539 548 5,950Unrecognized differences on change of employees' retirement plan................................. 581 467 5,070Employees' retirement benefits.......................................................................................................... (\1,673) (\1,675) ($18,187)
Note 1. Certain domestic consolidated subsidiaries use a simplified method for calculating projected benefit obligation.
Employees' retirement benefits expense for the years ended December 31, 2008 and December 31, 2009 comprised the following:Thousands of
Millions of yen U.S. dollars12/2008 12/2009 12/2009
Service cost................................................................................................................................................ \1,515 \1,147 $12,454Interest expense on projected benefit obligation........................................................................ 61 109 1,183Expected return on plan assets.......................................................................................................... (29) (53) (575)Amortization of actuarial differences............................................................................................... 69 153 1,661Amortization of prior service costs................................................................................................... 114 115 1,249Other - 317 3,442Retirement benefits expense............................................................................................................... \1,730 \1,788 $19,414
Note 1. Premiums on the contributory funded retirement plan in the amount of ¥536 million and ¥482 million ($5,233 thousand) expensed
for the year ended December 31, 2008 and December 31, 2009, respectively, were also included in service cost.
Note 2: "Other" is plan participants' contribution to the defined contribution pension plan.
Assumptions used were as follows:12/2008 12/2009
Discount rate.............................................................................................................................................. 2.00% 2.00%Expected rate of return on plan assets........................................................................................... 2.00% 2.00%Allocation method for retirement benefits
expected to be paid at retirement dates.........................................................................Straight-line method based on years of serviceAmortization period for actuarial gains/losses............................................................................ 5 years 5 yearsAmortization period for unrecognized prior service cost on change of
employees' retirement plan................................................................................................... 10 years (the Company and some subsidiary companies),
Time of occurrance (some subsidiary companies)
Additional information
Benefits (Part 2)" (Accounting Standards Board of Japan Statement No. 14 issued on May 15, 2007).
income before income taxes by 111 million yen ($1,205 thousand).
Beginning in fiscal 2009 at one domestic consolidated subsidiary, the method for calculating projected benefit obligation changed from thesimplified method to the “rule method” to more accurately account for retirement benefits. The difference resulting from the change fromthe simplified method to the “rule method” in fiscal 2009 has been recorded as other expenses of ¥111 million ($1,205 thousand)in “Provision for Retirement Benefit for Employees.” This change had no impact on operating income in fiscal 2009, but it reduced
Effective from the year ended December 31, 2008, the Company adopted "Partial Amendments to Accounting Standard for Retirement
58HORIBA, Ltd. Annual Report Fiscal 2009
8. Net assets
paid-in capital, which is included in capital surplus.
paid-in capital equaled 25% of common stock.
generally require a resolution of the shareholders' meeting.
of the Company in accordance with Japanese laws and regulations.
The Japanese Corporate Law ("the Law") became effective on May 1, 2006, replacing the Japanese Commercial Code ("the Code"). The Law
is generally applicable to events and transactions occurring after April 30, 2006 and for fiscal years ending after that date. Under Japanese
laws and regulations, the entire amount paid for new shares is required to be designated as common stock. However, a company may,
by a resolution of the Board of Directors, designate an amount not exceeding one-half of the price of the new shares as additional
the shareholders' meeting or could be capitalized by a resolution of the Board of Directors. Under the Law, both of these appropriations
Additional paid-in capital and legal earnings reserve may not be distributed as dividends. Under the Code, however, on condition that
Under the Law, in cases where a dividend distribution of surplus is made, the smaller of an amount equal to 10% of the dividend or
the excess, if any, of 25% of common stock over the total of additional paid-in capital and legal earnings reserve must be set aside
as additional paid-in capital or legal earnings reserve. Legal earnings reserve is included in retained earnings in the accompanying
consolidated balance sheets. Under the Code, companies were required to set aside an amount equal to at least 10% of the aggregate
At the Board of Directors' meeting held on February 15, 2010, the Board of Directors approved cash dividends amounting to ¥296 million
($3,214 thousand). Such appropriations have not been accrued in the consolidated financial statements as of December 31, 2009. Such
appropriations are recognized in the period in which they are approved by the Board of Directors.
the total amount of legal earnings reserve and additional paid-in capital remained equal to or greater than 25% of common stock,
they were available for distribution by resolution of the shareholders' meeting. Under the Law, all additional paid-in capital and all legal
earnings reserve may be transferred to other capital surplus and retained earnings, respectively, which are potentially available for dividends.
The maximum amount that the Company can distribute as dividends is calculated based on the nonconsolidated financial statements
amount of cash dividends and other cash appropriations as legal earnings reserve until the total legal earnings reserve and additional
Under the Code, legal earnings reserve and additional paid-in capital could be used to eliminate or reduce a deficit by a resolution of
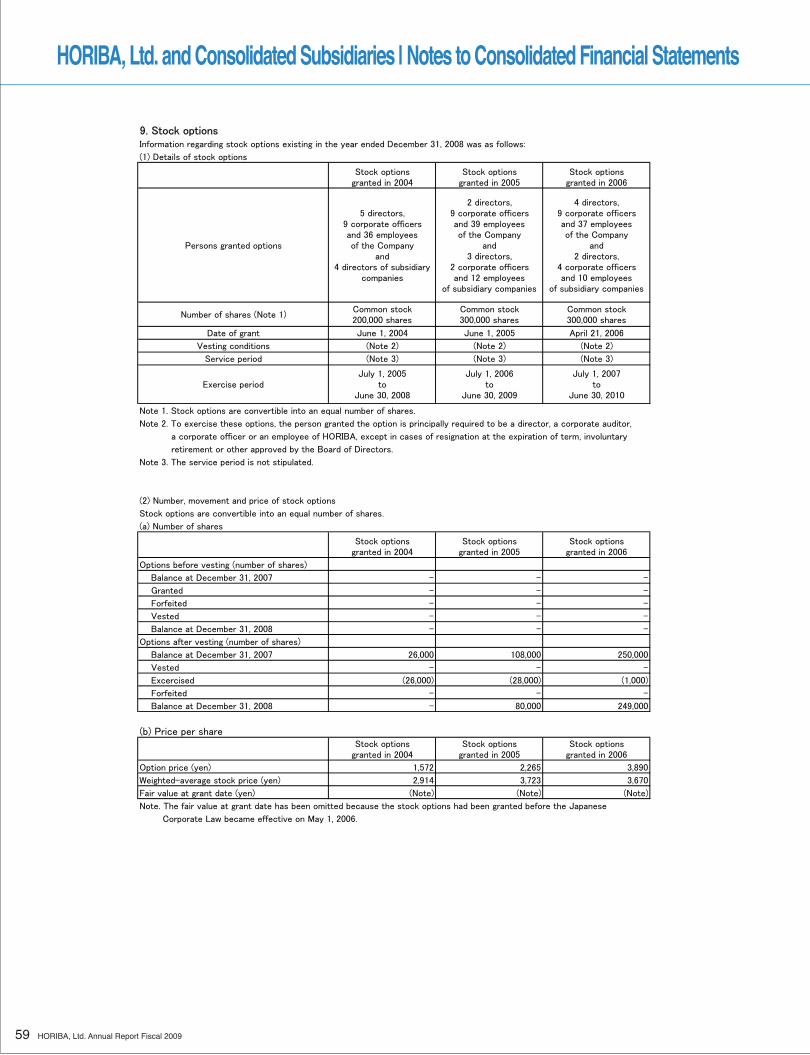
59 HORIBA, Ltd. Annual Report Fiscal 2009
HORIBA, Ltd. and Consolidated Subsidiaries | Notes to Consolidated Financial Statements
9. Stock options Information regarding stock options existing in the year ended December 31, 2008 was as follows:
(1) Details of stock options
Stock optionsgranted in 2004
Stock optionsgranted in 2005
Stock optionsgranted in 2006
Persons granted options
5 directors,9 corporate officersand 36 employeesof the Company
and4 directors of subsidiary
companies
2 directors,9 corporate officersand 39 employeesof the Company
and3 directors,
2 corporate officersand 12 employees
of subsidiary companies
4 directors,9 corporate officersand 37 employeesof the Company
and2 directors,
4 corporate officersand 10 employees
of subsidiary companies
Number of shares (Note 1)Common stock200,000 shares
Common stock300,000 shares
Common stock300,000 shares
Date of grant June 1, 2004 June 1, 2005 April 21, 2006
Vesting conditions (Note 2) (Note 2) (Note 2)
Service period (Note 3) (Note 3) (Note 3)
Exercise periodJuly 1, 2005
toJune 30, 2008
July 1, 2006to
June 30, 2009
July 1, 2007to
June 30, 2010
Note 1. Stock options are convertible into an equal number of shares.
Note 2. To exercise these options, the person granted the option is principally required to be a director, a corporate auditor,
a corporate officer or an employee of HORIBA, except in cases of resignation at the expiration of term, involuntary
retirement or other approved by the Board of Directors.
Note 3. The service period is not stipulated.
(2) Number, movement and price of stock options
Stock options are convertible into an equal number of shares.
(a) Number of shares
Stock optionsgranted in 2004
Stock optionsgranted in 2005
Stock optionsgranted in 2006
Options before vesting (number of shares)
Balance at December 31, 2007 - - -
Granted - - -
Forfeited - - -
Vested - - -
Balance at December 31, 2008 - - -
Options after vesting (number of shares)
Balance at December 31, 2007 26,000 108,000 250,000
Vested - - -
Excercised (26,000) (28,000) (1,000)
Forfeited - - -
Balance at December 31, 2008 - 80,000 249,000
(b) Price per shareStock options
granted in 2004Stock options
granted in 2005Stock options
granted in 2006
Option price (yen) 1,572 2,265 3,890
Weighted-average stock price (yen) 2,914 3,723 3,670
Fair value at grant date (yen) (Note) (Note) (Note)
Note. The fair value at grant date has been omitted because the stock options had been granted before the Japanese
Corporate Law became effective on May 1, 2006.
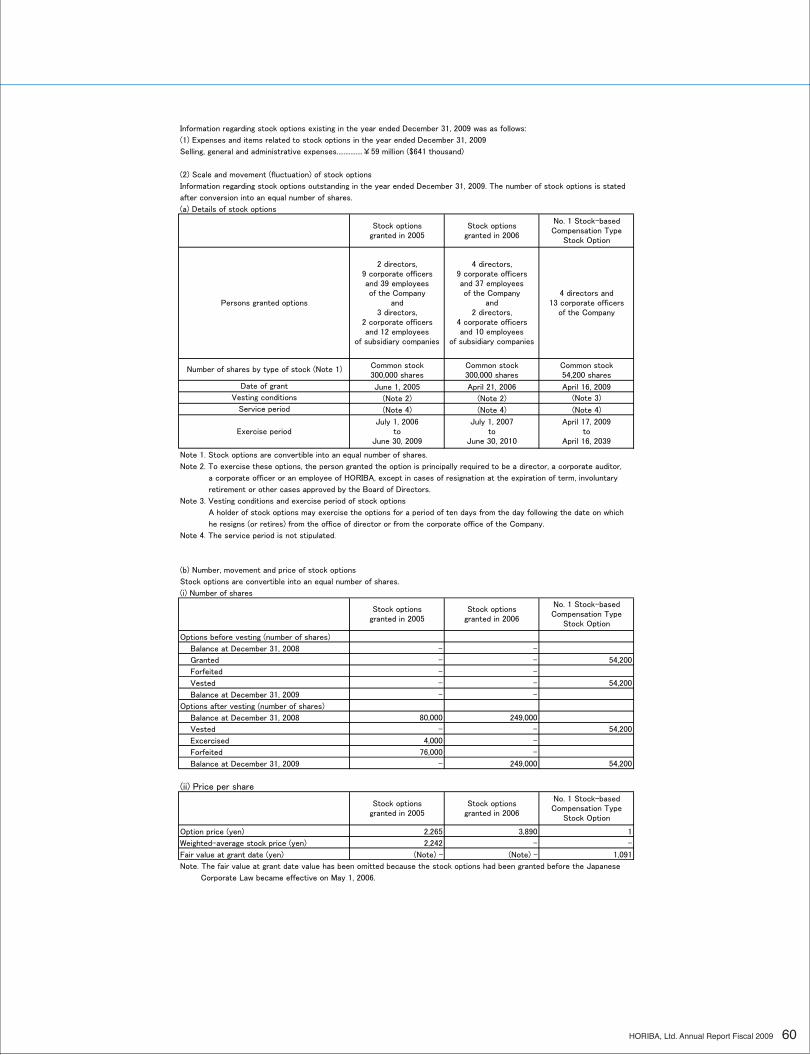
60HORIBA, Ltd. Annual Report Fiscal 2009
Information regarding stock options existing in the year ended December 31, 2009 was as follows:
(1) Expenses and items related to stock options in the year ended December 31, 2009
Selling, general and administrative expenses...............¥59 million ($641 thousand)
(2) Scale and movement (fluctuation) of stock options
Information regarding stock options outstanding in the year ended December 31, 2009. The number of stock options is stated
after conversion into an equal number of shares.
(a) Details of stock options
Note 1. Stock options are convertible into an equal number of shares.
Note 2. To exercise these options, the person granted the option is principally required to be a director, a corporate auditor,
a corporate officer or an employee of HORIBA, except in cases of resignation at the expiration of term, involuntary
retirement or other cases approved by the Board of Directors.
Note 3. Vesting conditions and exercise period of stock options
A holder of stock options may exercise the options for a period of ten days from the day following the date on which
he resigns (or retires) from the office of director or from the corporate office of the Company.
Note 4. The service period is not stipulated.
(b) Number, movement and price of stock options
Stock options are convertible into an equal number of shares.
(i) Number of shares
Options before vesting (number of shares)
Balance at December 31, 2008
Balance at December 31, 2009
Options after vesting (number of shares)
Balance at December 31, 2008
Balance at December 31, 2009
(ii) Price per share
Option price (yen)
Note. The fair value at grant date value has been omitted because the stock options had been granted before the Japanese
Corporate Law became effective on May 1, 2006.
Weighted-average stock price (yen) 2,242 -
Fair value at grant date (yen) (Note) - (Note) - 1,091
2,265 3,890 1
-
Stock optionsgranted in 2005
Stock optionsgranted in 2006
No. 1 Stock-basedCompensation Type
Stock Option
No. 1 Stock-basedCompensation Type
Stock Option
4 directors and13 corporate officers
of the Company
Stock optionsgranted in 2005
Stock optionsgranted in 2006
Persons granted options
2 directors,9 corporate officersand 39 employeesof the Company
and3 directors,
2 corporate officersand 12 employees
of subsidiary companies
4 directors,9 corporate officersand 37 employeesof the Company
and2 directors,
4 corporate officersand 10 employees
of subsidiary companies
Common stock54,200 shares
Date of grant June 1, 2005 April 21, 2006 April 16, 2009
Number of shares by type of stock (Note 1) Common stock300,000 shares
Common stock300,000 shares
(Note 3)
Service period (Note 4) (Note 4) (Note 4)
Vesting conditions (Note 2) (Note 2)
April 17, 2009to
April 16, 2039
Stock optionsgranted in 2005
Stock optionsgranted in 2006
No. 1 Stock-basedCompensation Type
Stock Option
Exercise periodJuly 1, 2006
toJune 30, 2009
July 1, 2007to
June 30, 2010
-
- -
Vested - -
54,200
Forfeited - -
Granted -
54,200
- -
-
80,000 249,000
Forfeited 76,000 -
54,200
Excercised 4,000 -
Vested -
- 249,000 54,200
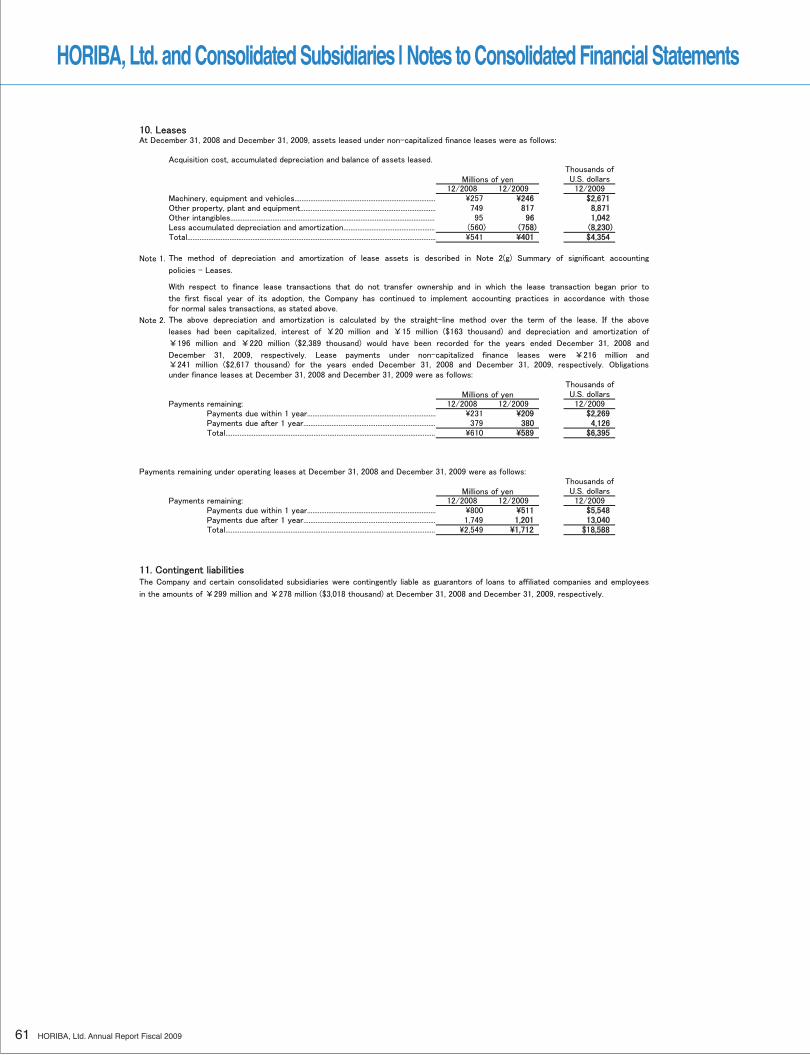
61 HORIBA, Ltd. Annual Report Fiscal 2009
HORIBA, Ltd. and Consolidated Subsidiaries | Notes to Consolidated Financial Statements
10. LeasesAt December 31, 2008 and December 31, 2009, assets leased under non-capitalized finance leases were as follows:
Acquisition cost, accumulated depreciation and balance of assets leased.Thousands of
Millions of yen U.S. dollars12/2008 12/2009 12/2009
Machinery, equipment and vehicles................................................................................ \257 \246 $2,671Other property, plant and equipment............................................................................. 749 817 8,871Other intangibles..................................................................................................................... 95 96 1,042Less accumulated depreciation and amortization.................................................... (560) (758) (8,230)Total............................................................................................................................................. \541 \401 $4,354
Note 1.
policies – Leases.
for normal sales transactions, as stated above.
Note 2.
under finance leases at December 31, 2008 and December 31, 2009 were as follows:Thousands of
Millions of yen U.S. dollarsPayments remaining: 12/2008 12/2009 12/2009
Payments due within 1 year......................................................................... \231 \209 $2,269Payments due after 1 year........................................................................... 379 380 4,126Total....................................................................................................................... \610 \589 $6,395
Payments remaining under operating leases at December 31, 2008 and December 31, 2009 were as follows:Thousands of
Millions of yen U.S. dollarsPayments remaining: 12/2008 12/2009 12/2009
Payments due within 1 year......................................................................... \800 \511 $5,548Payments due after 1 year........................................................................... 1,749 1,201 13,040Total....................................................................................................................... \2,549 \1,712 $18,588
11. Contingent liabilitiesThe Company and certain consolidated subsidiaries were contingently liable as guarantors of loans to affiliated companies and employees
in the amounts of ¥299 million and ¥278 million ($3,018 thousand) at December 31, 2008 and December 31, 2009, respectively.
The method of depreciation and amortization of lease assets is described in Note 2(g) Summary of significant accounting
With respect to finance lease transactions that do not transfer ownership and in which the lease transaction began prior to
the first fiscal year of its adoption, the Company has continued to implement accounting practices in accordance with those
The above depreciation and amortization is calculated by the straight-line method over the term of the lease. If the above
leases had been capitalized, interest of ¥20 million and ¥15 million ($163 thousand) and depreciation and amortization of
¥196 million and ¥220 million ($2,389 thousand) would have been recorded for the years ended December 31, 2008 and
December 31, 2009, respectively. Lease payments under non-capitalized finance leases were ¥216 million and¥241 million ($2,617 thousand) for the years ended December 31, 2008 and December 31, 2009, respectively. Obligations
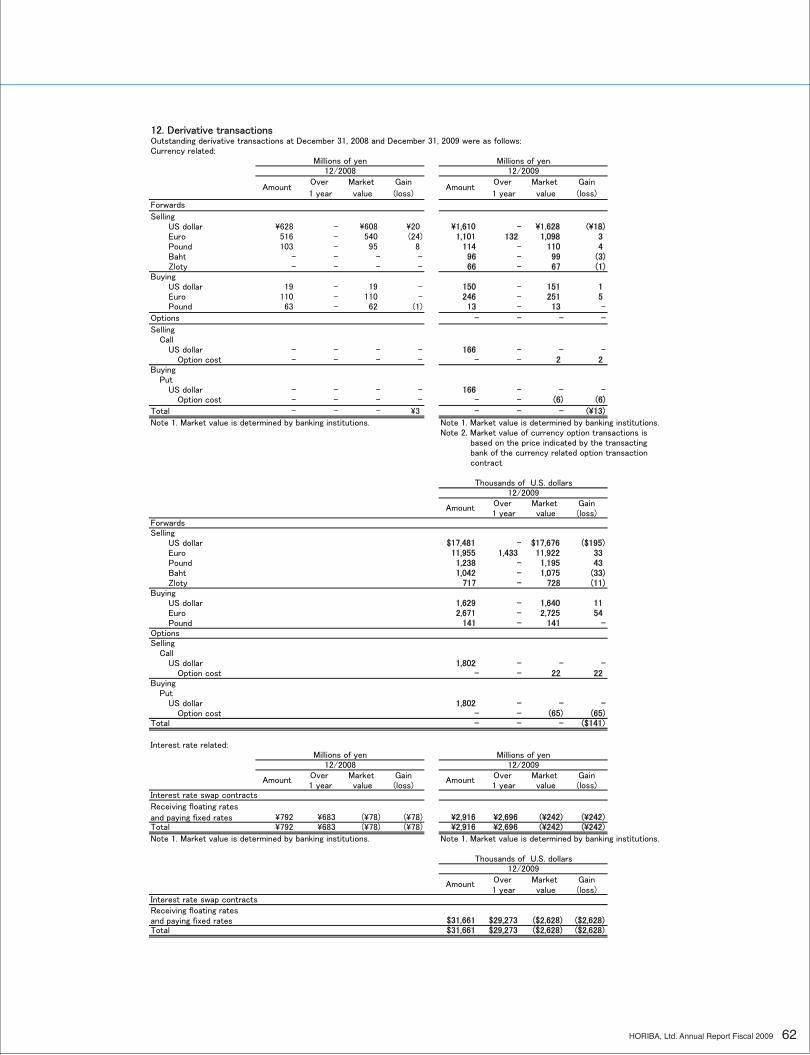
62HORIBA, Ltd. Annual Report Fiscal 2009
12. Derivative transactionsOutstanding derivative transactions at December 31, 2008 and December 31, 2009 were as follows:Currency related:
Millions of yen Millions of yen12/2008 12/2009
Over Market Gain Over Market Gain
1 year value (loss) 1 year value (loss)
Forwards
SellingUS dollar \628 - \608 \20 \1,610 - \1,628 (\18)Euro 516 - 540 (24) 1,101 132 1,098 3Pound 103 - 95 8 114 - 110 4Baht - - - - 96 - 99 (3)Zloty - - - - 66 - 67 (1)
BuyingUS dollar 19 - 19 - 150 - 151 1Euro 110 - 110 - 246 - 251 5Pound 63 - 62 (1) 13 - 13 -
Options - - - -
SellingCall
US dollar - - - - 166 - - -Option cost - - - - - - 2 2
BuyingPut
US dollar - - - - 166 - - -Option cost - - - - - - (6) (6)
Total - - - \3 - - - (\13)
Note 1. Market value is determined by banking institutions. Note 1. Market value is determined by banking institutions.Note 2. Market value of currency option transactions is based on the price indicated by the transacting bank of the currency related option transaction contract.
Thousands of U.S. dollars12/2009
Over Market Gain 1 year value (loss)
ForwardsSelling
US dollar $17,481 - $17,676 ($195)Euro 11,955 1,433 11,922 33Pound 1,238 - 1,195 43Baht 1,042 - 1,075 (33)Zloty 717 - 728 (11)
BuyingUS dollar 1,629 - 1,640 11Euro 2,671 - 2,725 54Pound 141 - 141 -
OptionsSelling
CallUS dollar 1,802 - - -
Option cost - - 22 22Buying
PutUS dollar 1,802 - - -
Option cost - - (65) (65)Total - - - ($141)
Interest rate related:Millions of yen Millions of yen
12/2008 12/2009Over Market Gain Over Market Gain
1 year value (loss) 1 year value (loss)Interest rate swap contracts
Receiving floating ratesand paying fixed rates \792 \683 (\78) (\78) \2,916 \2,696 (\242) (\242)Total \792 \683 (\78) (\78) \2,916 \2,696 (\242) (\242)
Note 1. Market value is determined by banking institutions. Note 1. Market value is determined by banking institutions.
Thousands of U.S. dollars12/2009
Over Market Gain 1 year value (loss)
Interest rate swap contractsReceiving floating ratesand paying fixed rates $31,661 $29,273 ($2,628) ($2,628)Total $31,661 $29,273 ($2,628) ($2,628)
Amount
Amount Amount
Amount
Amount Amount
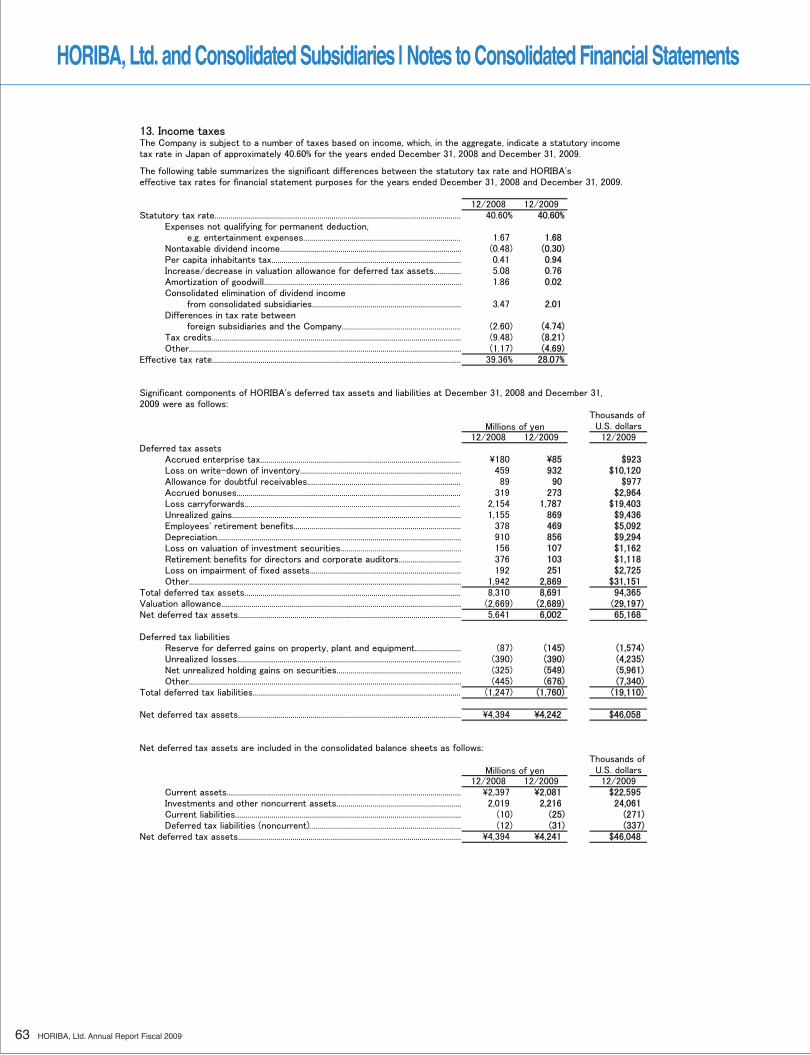
63 HORIBA, Ltd. Annual Report Fiscal 2009
HORIBA, Ltd. and Consolidated Subsidiaries | Notes to Consolidated Financial Statements
13. Income taxesThe Company is subject to a number of taxes based on income, which, in the aggregate, indicate a statutory incometax rate in Japan of approximately 40.60% for the years ended December 31, 2008 and December 31, 2009.
The following table summarizes the significant differences between the statutory tax rate and HORIBA'seffective tax rates for financial statement purposes for the years ended December 31, 2008 and December 31, 2009.
12/2008 12/2009Statutory tax rate.......................................................................................................................... 40.60% 40.60%
Expenses not qualifying for permanent deduction, e.g. entertainment expenses............................................................................... 1.67 1.68
Nontaxable dividend income.......................................................................................... (0.48) (0.30)Per capita inhabitants tax.............................................................................................. 0.41 0.94Increase/decrease in valuation allowance for deferred tax assets.............. 5.08 0.76Amortization of goodwill.................................................................................................. 1.86 0.02Consolidated elimination of dividend income
from consolidated subsidiaries.......................................................................... 3.47 2.01Differences in tax rate between
foreign subsidiaries and the Company........................................................... (2.60) (4.74)Tax credits............................................................................................................................ (9.48) (8.21)Other....................................................................................................................................... (1.17) (4.69)
Effective tax rate............................................................................................................................ 39.36% 28.07%
Significant components of HORIBA's deferred tax assets and liabilities at December 31, 2008 and December 31, 2009 were as follows:
Thousands of Millions of yen U.S. dollars
12/2008 12/2009 12/2009Deferred tax assets
Accrued enterprise tax.................................................................................................... \180 \85 $923Loss on write-down of inventory................................................................................ 459 932 $10,120Allowance for doubtful receivables............................................................................. 89 90 $977Accrued bonuses................................................................................................................ 319 273 $2,964Loss carryforwards............................................................................................................ 2,154 1,787 $19,403Unrealized gains.................................................................................................................. 1,155 869 $9,436Employees' retirement benefits................................................................................... 378 469 $5,092Depreciation......................................................................................................................... 910 856 $9,294Loss on valuation of investment securities............................................................ 156 107 $1,162Retirement benefits for directors and corporate auditors............................... 376 103 $1,118Loss on impairment of fixed assets........................................................................... 192 251 $2,725Other....................................................................................................................................... 1,942 2,869 $31,151
Total deferred tax assets............................................................................................................ 8,310 8,691 94,365Valuation allowance....................................................................................................................... (2,669) (2,689) (29,197)Net deferred tax assets............................................................................................................... 5,641 6,002 65,168
Deferred tax liabilitiesReserve for deferred gains on property, plant and equipment....................... (87) (145) (1,574)Unrealized losses............................................................................................................... (390) (390) (4,235)Net unrealized holding gains on securities.............................................................. (325) (549) (5,961)Other....................................................................................................................................... (445) (676) (7,340)
Total deferred tax liabilities........................................................................................................ (1,247) (1,760) (19,110)
Net deferred tax assets............................................................................................................... \4,394 \4,242 $46,058
Net deferred tax assets are included in the consolidated balance sheets as follows:Thousands of
Millions of yen U.S. dollars12/2008 12/2009 12/2009
Current assets.................................................................................................................... \2,397 \2,081 $22,595Investments and other noncurrent assets.............................................................. 2,019 2,216 24,061Current liabilities................................................................................................................ (10) (25) (271)Deferred tax liabilities (noncurrent)........................................................................... (12) (31) (337)
Net deferred tax assets............................................................................................................... \4,394 \4,241 $46,048
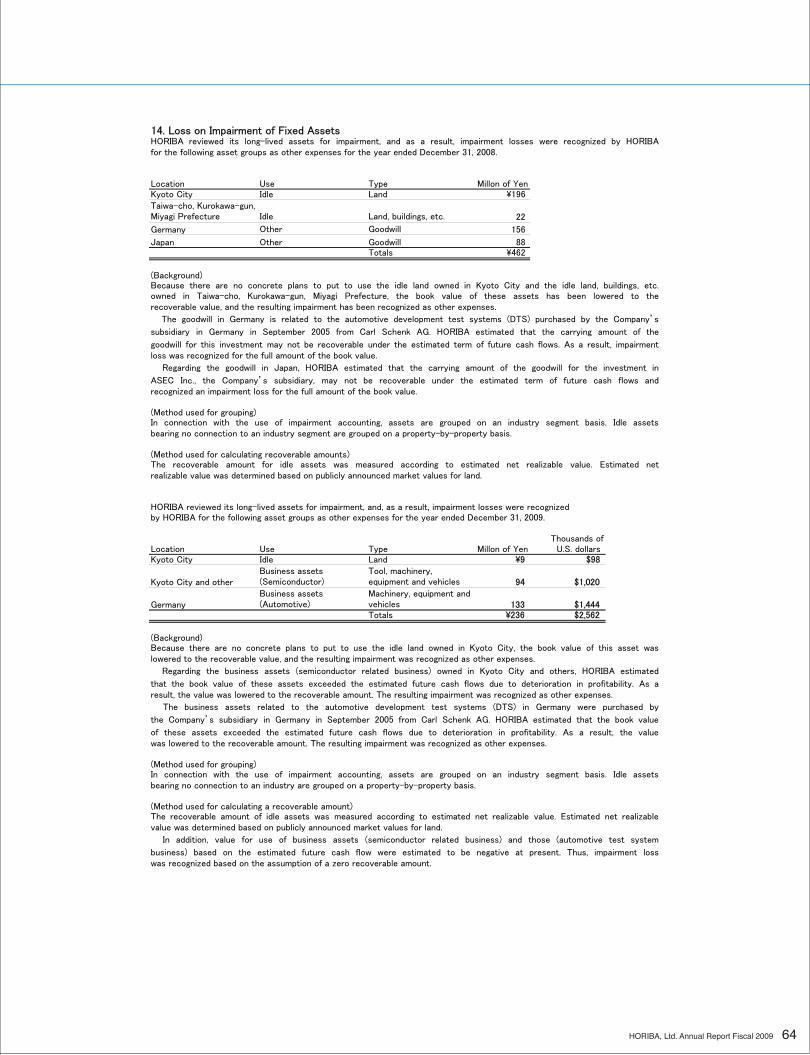
64HORIBA, Ltd. Annual Report Fiscal 2009
14. Loss on Impairment of Fixed Assets
for the following asset groups as other expenses for the year ended December 31, 2008.
Location Use Type Millon of YenKyoto City Idle Land \196
22
Germany 156
Japan Other Goodwill 88Totals \462
(Background)
recoverable value, and the resulting impairment has been recognized as other expenses.
loss was recognized for the full amount of the book value.
recognized an impairment loss for the full amount of the book value.
(Method used for grouping)
bearing no connection to an industry segment are grouped on a property-by-property basis.
(Method used for calculating recoverable amounts)
realizable value was determined based on publicly announced market values for land.
HORIBA reviewed its long-lived assets for impairment, and, as a result, impairment losses were recognized by HORIBA for the following asset groups as other expenses for the year ended December 31, 2009.
Thousands of Location Use Type Millon of Yen U.S. dollarsKyoto City Idle Land \9 $98
Kyoto City and other 94 $1,020
Germany 133 $1,444Totals \236 $2,562
(Background)
lowered to the recoverable value, and the resulting impairment was recognized as other expenses.
result, the value was lowered to the recoverable amount. The resulting impairment was recognized as other expenses.
was lowered to the recoverable amount. The resulting impairment was recognized as other expenses.
(Method used for grouping)
bearing no connection to an industry are grouped on a property-by-property basis.
(Method used for calculating a recoverable amount)
value was determined based on publicly announced market values for land.
was recognized based on the assumption of a zero recoverable amount.
HORIBA reviewed its long-lived assets for impairment, and as a result, impairment losses were recognized by HORIBA
Because there are no concrete plans to put to use the idle land owned in Kyoto City and the idle land, buildings, etc.owned in Taiwa-cho, Kurokawa-gun, Miyagi Prefecture, the book value of these assets has been lowered to the
The goodwill in Germany is related to the automotive development test systems (DTS) purchased by the Company’s
Taiwa-cho, Kurokawa-gun,Miyagi Prefecture Idle Land, buildings, etc.
Other Goodwill
subsidiary in Germany in September 2005 from Carl Schenk AG. HORIBA estimated that the carrying amount of the
goodwill for this investment may not be recoverable under the estimated term of future cash flows. As a result, impairment
Regarding the goodwill in Japan, HORIBA estimated that the carrying amount of the goodwill for the investment in
ASEC Inc., the Company’s subsidiary, may not be recoverable under the estimated term of future cash flows and
In connection with the use of impairment accounting, assets are grouped on an industry segment basis. Idle assets
The recoverable amount for idle assets was measured according to estimated net realizable value. Estimated net
Because there are no concrete plans to put to use the idle land owned in Kyoto City, the book value of this asset was
Regarding the business assets (semiconductor related business) owned in Kyoto City and others, HORIBA estimated
Business assets(Semiconductor)
Business assets(Automotive)
Tool, machinery,equipment and vehicles
Machinery, equipment andvehicles
that the book value of these assets exceeded the estimated future cash flows due to deterioration in profitability. As a
The business assets related to the automotive development test systems (DTS) in Germany were purchased by
the Company’s subsidiary in Germany in September 2005 from Carl Schenk AG. HORIBA estimated that the book value
of these assets exceeded the estimated future cash flows due to deterioration in profitability. As a result, the value
In connection with the use of impairment accounting, assets are grouped on an industry segment basis. Idle assets
The recoverable amount of idle assets was measured according to estimated net realizable value. Estimated net realizable
In addition, value for use of business assets (semiconductor related business) and those (automotive test system
business) based on the estimated future cash flow were estimated to be negative at present. Thus, impairment loss
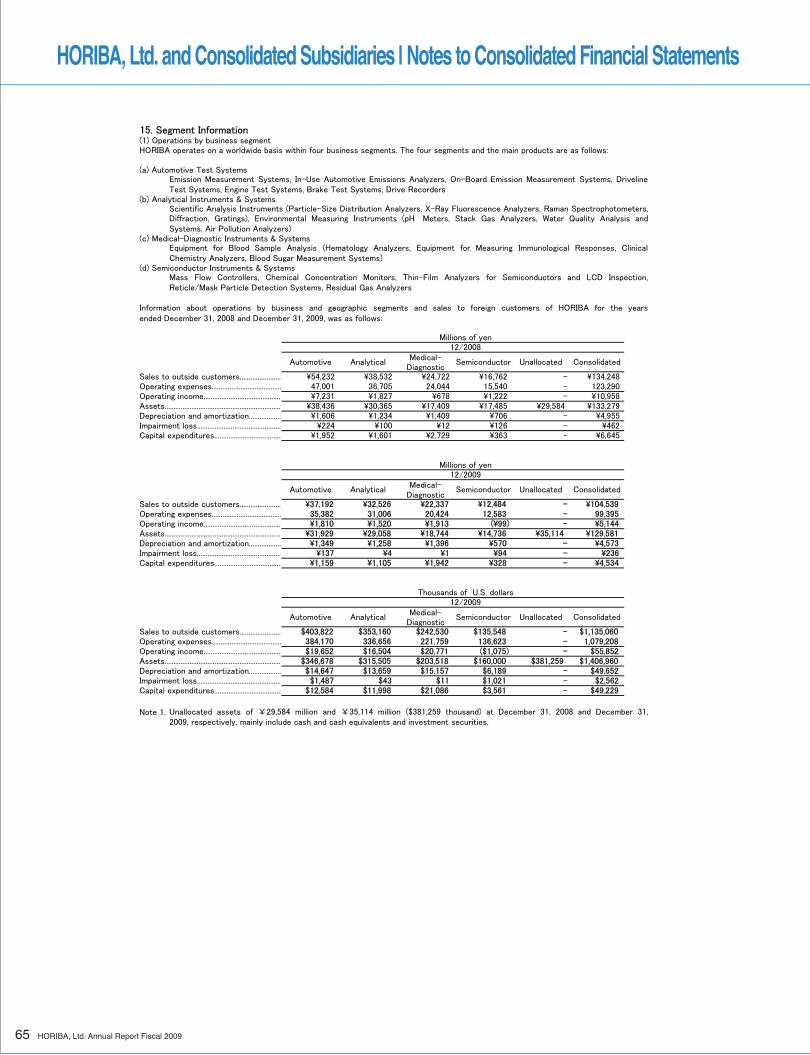
65 HORIBA, Ltd. Annual Report Fiscal 2009
HORIBA, Ltd. and Consolidated Subsidiaries | Notes to Consolidated Financial Statements
15. Segment Information(1) Operations by business segment
(a) Automotive Test Systems
Test Systems, Engine Test Systems, Brake Test Systems, Drive Recorders(b) Analytical Instruments & Systems
Systems, Air Pollution Analyzers) (c) Medical-Diagnostic Instruments & Systems
Chemistry Analyzers, Blood Sugar Measurement Systems)(d) Semiconductor Instruments & Systems
Reticle/Mask Particle Detection Systems, Residual Gas Analyzers
ended December 31, 2008 and December 31, 2009, was as follows:
Millions of yen12/2008
Medical-Diagnostic
Sales to outside customers....................... \54,232 \38,532 \24,722 \16,762 - \134,248Operating expenses....................................... 47,001 36,705 24,044 15,540 - 123,290Operating income............................................ \7,231 \1,827 \678 \1,222 - \10,958Assets................................................................. \38,436 \30,365 \17,409 \17,485 \29,584 \133,279Depreciation and amortization.................. \1,606 \1,234 \1,409 \706 - \4,955Impairment loss............................................... \224 \100 \12 \126 - \462Capital expenditures...................................... \1,952 \1,601 \2,729 \363 - \6,645
Millions of yen12/2009
Medical-Diagnostic
Sales to outside customers....................... \37,192 \32,526 \22,337 \12,484 - \104,539Operating expenses....................................... 35,382 31,006 20,424 12,583 - 99,395Operating income............................................ \1,810 \1,520 \1,913 (\99) - \5,144Assets................................................................. \31,929 \29,058 \18,744 \14,736 \35,114 \129,581Depreciation and amortization.................. \1,349 \1,258 \1,396 \570 - \4,573Impairment loss............................................... \137 \4 \1 \94 - \236Capital expenditures...................................... \1,159 \1,105 \1,942 \328 - \4,534
Thousands of U.S. dollars12/2009
Medical-Diagnostic
Sales to outside customers....................... $403,822 $353,160 $242,530 $135,548 - $1,135,060Operating expenses....................................... 384,170 336,656 221,759 136,623 - 1,079,208Operating income............................................ $19,652 $16,504 $20,771 ($1,075) - $55,852Assets................................................................. $346,678 $315,505 $203,518 $160,000 $381,259 $1,406,960Depreciation and amortization.................. $14,647 $13,659 $15,157 $6,189 - $49,652Impairment loss............................................... $1,487 $43 $11 $1,021 - $2,562Capital expenditures...................................... $12,584 $11,998 $21,086 $3,561 - $49,229
Note 1. 2009, respectively, mainly include cash and cash equivalents and investment securities.
Analytical Semiconductor
HORIBA operates on a worldwide basis within four business segments. The four segments and the main products are as follows:
Emission Measurement Systems, In-Use Automotive Emissions Analyzers, On-Board Emission Measurement Systems, Driveline
Diffraction, Gratings), Environmental Measuring Instruments (pH Meters, Stack Gas Analyzers, Water Quality Analysis and
Equipment for Blood Sample Analysis (Hematology Analyzers, Equipment for Measuring Immunological Responses, Clinical
Mass Flow Controllers, Chemical Concentration Monitors, Thin-Film Analyzers for Semiconductors and LCD Inspection,
Information about operations by business and geographic segments and sales to foreign customers of HORIBA for the years
Scientific Analysis Instruments (Particle-Size Distribution Analyzers, X-Ray Fluorescence Analyzers, Raman Spectrophotometers,
Unallocated assets of ¥29,584 million and ¥35,114 million ($381,259 thousand) at December 31, 2008 and December 31,
Automotive Analytical Semiconductor Unallocated Consolidated
Automotive Unallocated Consolidated
Automotive Analytical Semiconductor Unallocated Consolidated
66HORIBA, Ltd. Annual Report Fiscal 2009
Note 2.
Note 3.
As stated in Note 2(d), Summary of significant accounting policies - Inventories, the Company and some of its consolidatedsubsidiaries in Japan reclassified loss on disposal and write-down of inventories from other expenses to cost of sales. As aresult, in comparison to the amounts that would have been recorded with previous accounting method, operating expensesincreased ¥20 million for Automotive Test Systems, ¥69 million for Analytical Instruments & Systems, ¥20 million forMedical-Diagnostic Instruments & Systems, and ¥26 million for Semiconductor Instruments & Systems, while operatingincome recorded a decrease of the same amount.
As stated in Note 2(d), Summary of significant accounting policies - inventories, the “Accounting Standards forMeasurement of Inventories” (ASBJ Statement No. 9; issued on July 5, 2006) has been adopted since fiscal 2009. Theadoption of the new standard had the effect of increasing operating income of the Medical-Diagnostic Instruments &Systems by ¥0 million ($0 thousand) and reducing operating income of the Automotive Test Systems by ¥12 million ($130thousand), the Analytical Instruments & Systems by ¥342 million ($3,714 thousand), and the Semiconductor Instruments &Systems by ¥189 million ($2,052 thousand) compared to the amounts that would have been recorded under the previousmethod.
As stated in Note 1 Basis of presenting consolidated financial statements, the “Practical Solution on Unification ofAccounting Policies Applied to Foreign Subsidiaries for Consolidated Financial Statements” (Practical Issue Task Force ofthe ASBJ No. 18; issued on May 17, 2006) was adopted, commencing in fiscal 2009. The adoption of the new standard hadthe effect of increasing operating income of the Automotive Test Systems by ¥183 million ($1,987 thousand), and reducingoperating income of the Analytical Instruments & Systems by ¥9 million ($98 thousand), and the Medical-DiagnosticInstruments & Systems by ¥14 million ($152 thousand), and the Semiconductor Instruments & Systems by ¥2 million ($21thousand) compared to the amounts that would have been recorded under the previous method.
As stated in Note 2(e), Summary of significant accounting policies - Property, plant and equipment and depreciation(except for leases), the Company and its consolidated domestic subsidiaries reviewed the estimated useful lives of somemachinery and equipment, commencing in fiscal 2009, in accordance with the revised Corporate Tax Law of Japan. Thischange had the effect of reducing operating income of the Automotive Test Systems by ¥14 million ($152 thousand), theAnalytical Instruments & Systems by ¥8 million ($87 thousand), the Medical-Diagnostic Instruments & Systems by ¥1million ($11 thousand), and the Semiconductor Instruments & Systems by ¥13 million ($141 thousand) compared to theamounts that would have been recorded under the previous method.
As stated in Note 2(e) Summary of significant accounting policies - Property, plant and equipment and depreciation, theCompany and its consolidated subsidiaries in Japan adopted the method of depreciation for tangible fixed assets acquiredon or after April 1, 2007, in accordance with the method prescribed by the revised Corporate Tax Law. As a result of thischange, in comparison to amounts that would have been recorded with the previous accounting method, operating expensesincreased ¥46 million for Automotive Test Systems, ¥43 million for Analytical Instruments & Systems, ¥6 million forMedical-Diagnostic Instruments & Systems, and ¥29 million for Semiconductor Instruments & Systems, while operatingincome recorded a decrease of the same amount.
In addition, the Company and its consolidated subsidiaries in Japan adopted the revised Corporate Tax Law and changedthe method of depreciation for tangible fixed assets acquired on or before March 31, 2007. According to the revised law,the difference between the residual value of such an asset under the amended Japanese Tax Law and an amountequivalent to 5% of value at acquisition, as computed by the previous Corporate Tax Law, is depreciated over a period offive years using the average method and is included in depreciation expenses starting from the year following the year inwhich the value of the asset falls to 5% of its acquisition cost. As a result, in comparison to the amounts that would havebeen recorded with previous accounting method, operating expenses increased ¥23 million for Automotive Test Systems,¥21 million for Analytical Instruments & Systems, ¥3 million for Medical-Diagnostic Instruments & Systems, and ¥8million for Semiconductor Instruments & Systems, while operating income recorded a decrease of the same amount.
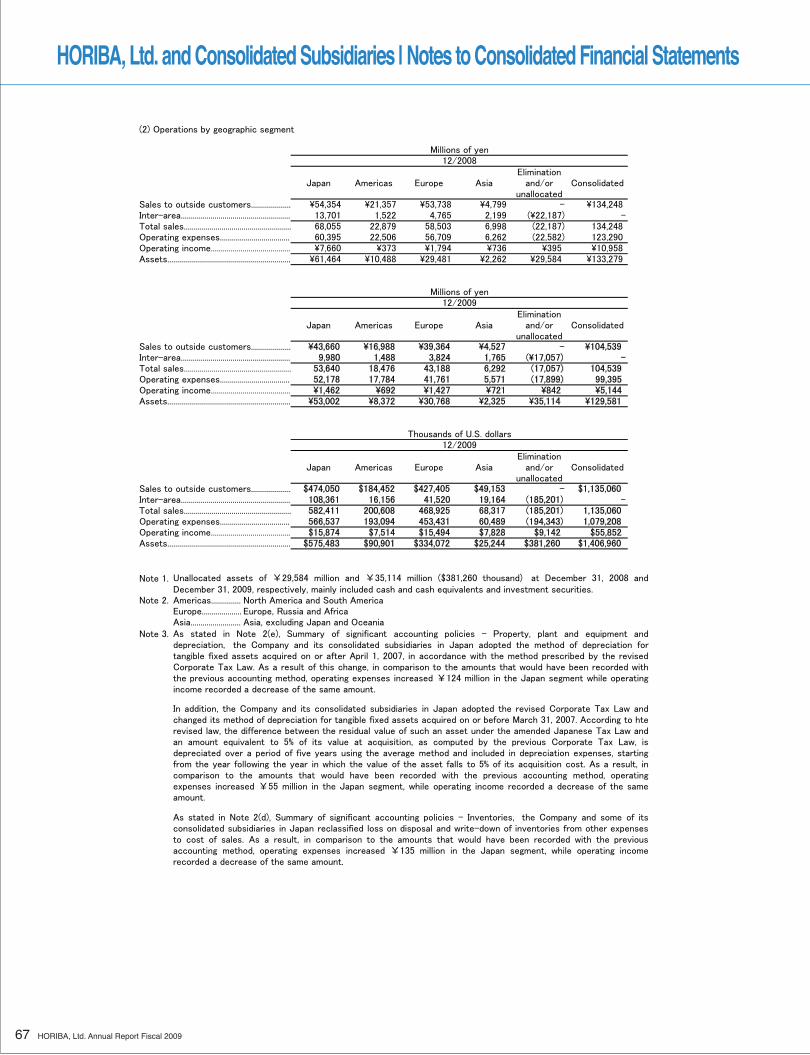
67 HORIBA, Ltd. Annual Report Fiscal 2009
HORIBA, Ltd. and Consolidated Subsidiaries | Notes to Consolidated Financial Statements
(2) Operations by geographic segment
Millions of yen12/2008
EliminationJapan Americas Europe Asia and/or Consolidated
unallocatedSales to outside customers.................... \54,354 \21,357 \53,738 \4,799 - \134,248Inter-area....................................................... 13,701 1,522 4,765 2,199 (\22,187) -Total sales...................................................... 68,055 22,879 58,503 6,998 (22,187) 134,248Operating expenses.................................... 60,395 22,506 56,709 6,262 (22,582) 123,290Operating income........................................ \7,660 \373 \1,794 \736 \395 \10,958Assets.............................................................. \61,464 \10,488 \29,481 \2,262 \29,584 \133,279
EliminationJapan Americas Europe Asia and/or Consolidated
unallocatedSales to outside customers.................... \43,660 \16,988 \39,364 \4,527 - \104,539Inter-area....................................................... 9,980 1,488 3,824 1,765 (\17,057) -Total sales...................................................... 53,640 18,476 43,188 6,292 (17,057) 104,539Operating expenses.................................... 52,178 17,784 41,761 5,571 (17,899) 99,395Operating income........................................ \1,462 \692 \1,427 \721 \842 \5,144Assets.............................................................. \53,002 \8,372 \30,768 \2,325 \35,114 \129,581
EliminationJapan Americas Europe Asia and/or Consolidated
unallocatedSales to outside customers.................... $474,050 $184,452 $427,405 $49,153 - $1,135,060Inter-area....................................................... 108,361 16,156 41,520 19,164 (185,201) -Total sales...................................................... 582,411 200,608 468,925 68,317 (185,201) 1,135,060Operating expenses.................................... 566,537 193,094 453,431 60,489 (194,343) 1,079,208Operating income........................................ $15,874 $7,514 $15,494 $7,828 $9,142 $55,852Assets.............................................................. $575,483 $90,901 $334,072 $25,244 $381,260 $1,406,960
Note 1. December 31, 2009, respectively, mainly included cash and cash equivalents and investment securities.Note 2. Americas............... North America and South America
Europe.................... Europe, Russia and AfricaAsia..........................Asia, excluding Japan and Oceania
Note 3.
Millions of yen12/2009
Thousands of U.S. dollars12/2009
Unallocated assets of ¥29,584 million and ¥35,114 million ($381,260 thousand) at December 31, 2008 and
As stated in Note 2(e), Summary of significant accounting policies - Property, plant and equipment anddepreciation, the Company and its consolidated subsidiaries in Japan adopted the method of depreciation fortangible fixed assets acquired on or after April 1, 2007, in accordance with the method prescribed by the revisedCorporate Tax Law. As a result of this change, in comparison to the amounts that would have been recorded withthe previous accounting method, operating expenses increased ¥124 million in the Japan segment while operatingincome recorded a decrease of the same amount.
In addition, the Company and its consolidated subsidiaries in Japan adopted the revised Corporate Tax Law andchanged its method of depreciation for tangible fixed assets acquired on or before March 31, 2007. According to hterevised law, the difference between the residual value of such an asset under the amended Japanese Tax Law andan amount equivalent to 5% of its value at acquisition, as computed by the previous Corporate Tax Law, isdepreciated over a period of five years using the average method and included in depreciation expenses, startingfrom the year following the year in which the value of the asset falls to 5% of its acquisition cost. As a result, incomparison to the amounts that would have been recorded with the previous accounting method, operatingexpenses increased ¥55 million in the Japan segment, while operating income recorded a decrease of the sameamount.
As stated in Note 2(d), Summary of significant accounting policies - Inventories, the Company and some of itsconsolidated subsidiaries in Japan reclassified loss on disposal and write-down of inventories from other expensesto cost of sales. As a result, in comparison to the amounts that would have been recorded with the previousaccounting method, operating expenses increased ¥135 million in the Japan segment, while operating incomerecorded a decrease of the same amount.
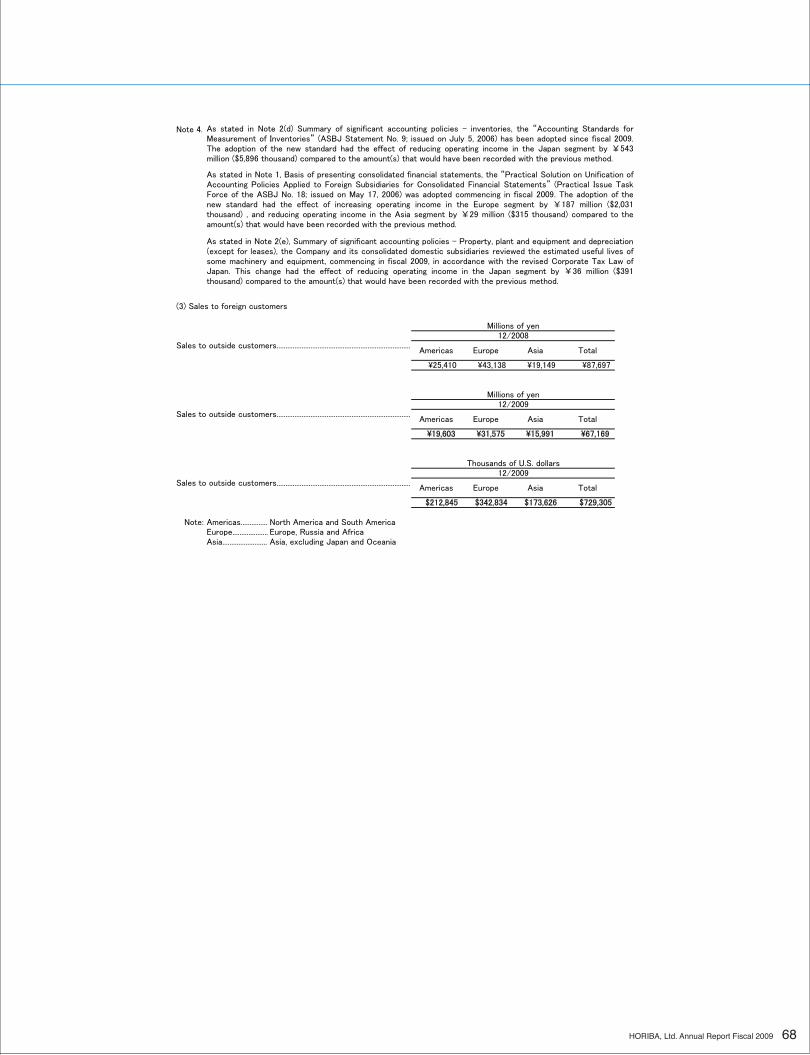
68HORIBA, Ltd. Annual Report Fiscal 2009
Note 4.
(3) Sales to foreign customers
Sales to outside customers...........................................................................
\25,410 \43,138 \19,149 \87,697
Sales to outside customers...........................................................................
\19,603 \31,575 \15,991 \67,169
Sales to outside customers...........................................................................
$212,845 $342,834 $173,626 $729,305
Note: Americas............... North America and South AmericaEurope.................... Europe, Russia and AfricaAsia..........................Asia, excluding Japan and Oceania
12/2009
Millions of yen
As stated in Note 2(d) Summary of significant accounting policies - inventories, the “Accounting Standards forMeasurement of Inventories” (ASBJ Statement No. 9; issued on July 5, 2006) has been adopted since fiscal 2009.The adoption of the new standard had the effect of reducing operating income in the Japan segment by ¥543million ($5,896 thousand) compared to the amount(s) that would have been recorded with the previous method.
As stated in Note 1, Basis of presenting consolidated financial statements, the “Practical Solution on Unification ofAccounting Policies Applied to Foreign Subsidiaries for Consolidated Financial Statements” (Practical Issue TaskForce of the ASBJ No. 18; issued on May 17, 2006) was adopted commencing in fiscal 2009. The adoption of thenew standard had the effect of increasing operating income in the Europe segment by ¥187 million ($2,031thousand) , and reducing operating income in the Asia segment by ¥29 million ($315 thousand) compared to theamount(s) that would have been recorded with the previous method.
As stated in Note 2(e), Summary of significant accounting policies - Property, plant and equipment and depreciation(except for leases), the Company and its consolidated domestic subsidiaries reviewed the estimated useful lives ofsome machinery and equipment, commencing in fiscal 2009, in accordance with the revised Corporate Tax Law ofJapan. This change had the effect of reducing operating income in the Japan segment by ¥36 million ($391thousand) compared to the amount(s) that would have been recorded with the previous method.
Europe Asia Total
Thousands of U.S. dollars
12/2009
Millions of yen12/2008
Americas Europe Asia Total
Americas
Americas Europe Asia Total
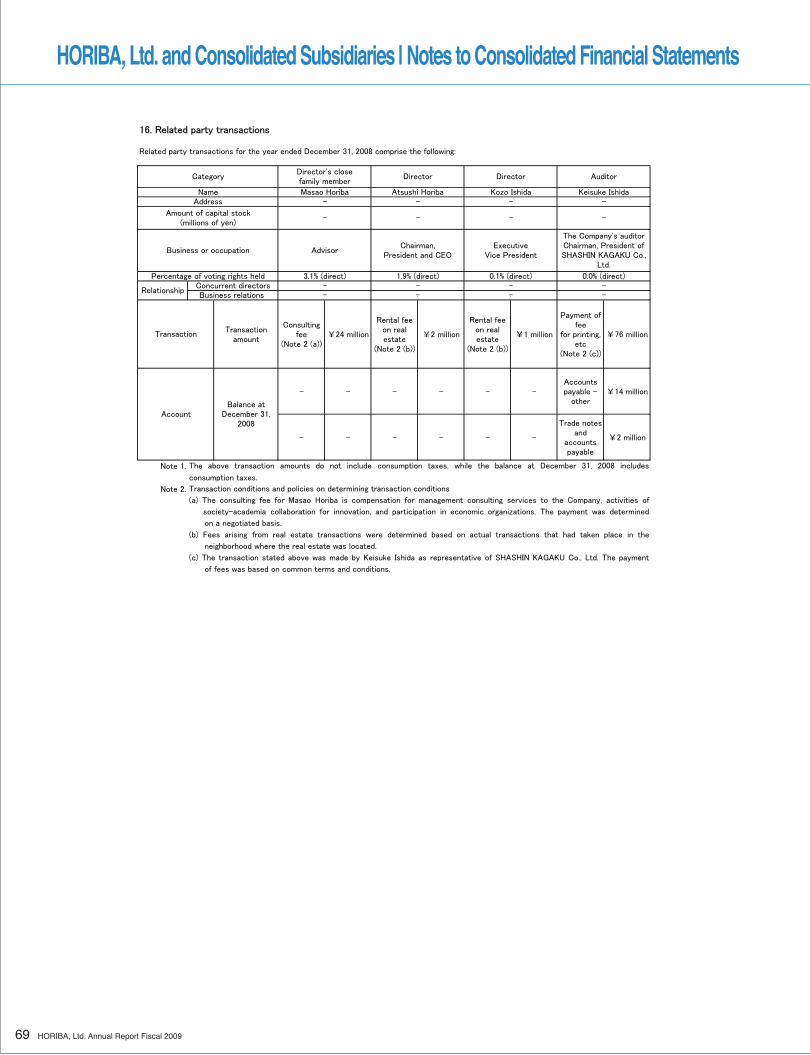
69 HORIBA, Ltd. Annual Report Fiscal 2009
HORIBA, Ltd. and Consolidated Subsidiaries | Notes to Consolidated Financial Statements
16. Related party transactions
Related party transactions for the year ended December 31, 2008 comprise the following:
Transactionamount
Consultingfee
(Note 2 (a))¥24 million
Rental feeon realestate
(Note 2 (b))
¥2 million
Rental feeon realestate
(Note 2 (b))
¥1 million
Payment offee
for printing,etc
(Note 2 (c))
¥76 million
- - - - - -Accountspayable -
other¥14 million
- - - - - -
Trade notesand
accountspayable
¥2 million
Note 1.
consumption taxes.
Note 2.
(b) Fees arising from real estate transactions were determined based on actual transactions that had taken place in the
Transaction conditions and policies on determining transaction conditions
(a) The consulting fee for Masao Horiba is compensation for management consulting services to the Company, activities of
society-academia collaboration for innovation, and participation in economic organizations. The payment was determined
on a negotiated basis.
Transaction
AccountBalance at
December 31,2008
The above transaction amounts do not include consumption taxes, while the balance at December 31, 2008 includes
neighborhood where the real estate was located.
(c) The transaction stated above was made by Keisuke Ishida as representative of SHASHIN KAGAKU Co., Ltd. The payment
of fees was based on common terms and conditions.
Auditor
Name Masao Horiba Atsushi Horiba Kozo Ishida Keisuke Ishida
CategoryDirector's closefamily member
Director Director
-
-
Address - - -
Amount of capital stock(millions of yen)
- - -
The Company's auditorChairman, President ofSHASHIN KAGAKU Co.,
Ltd.
Percentage of voting rights held 3.1% (direct) 1.9% (direct) 0.1% (direct) 0.0% (direct)
Business or occupation AdvisorChairman,
President and CEOExecutive
Vice President
RelationshipConcurrent directors - - - -Business relations - - - -
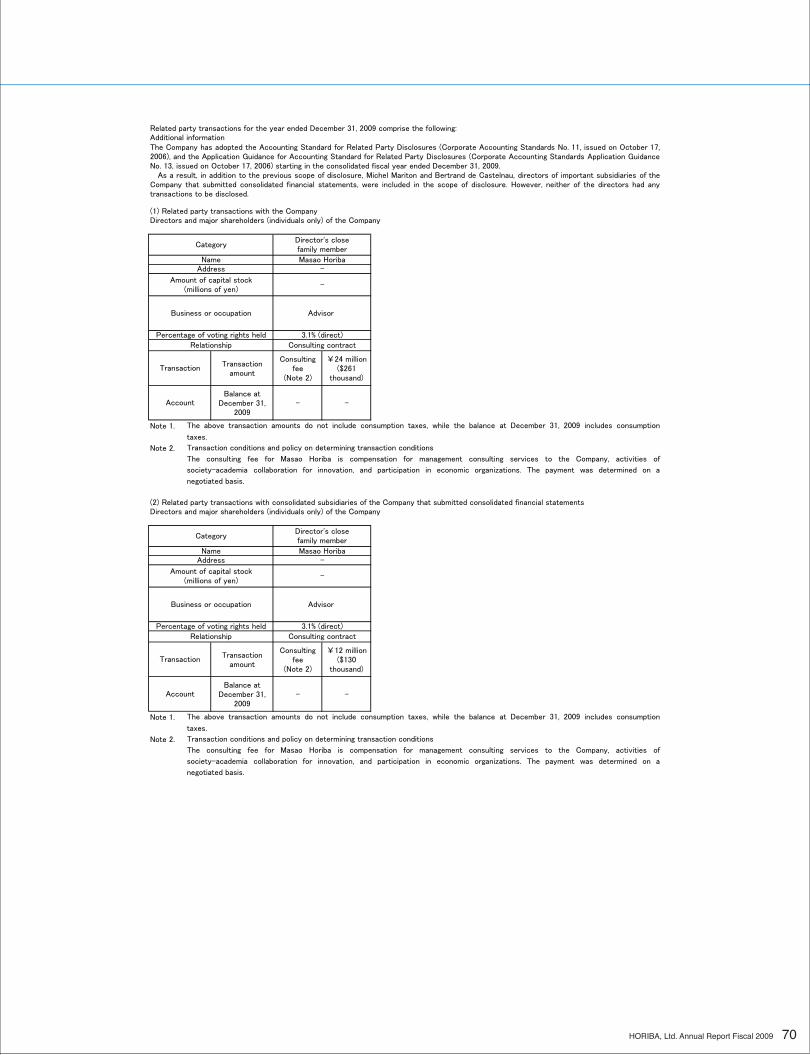
70HORIBA, Ltd. Annual Report Fiscal 2009
Related party transactions for the year ended December 31, 2009 comprise the following:Additional information
(1) Related party transactions with the Company Directors and major shareholders (individuals only) of the Company
Transactionamount
Consultingfee
(Note 2)
¥24 million($261
thousand)
Balance atDecember 31,
2009- -
Note 1.
taxes.
Note 2.
(2) Related party transactions with consolidated subsidiaries of the Company that submitted consolidated financial statementsDirectors and major shareholders (individuals only) of the Company
Transactionamount
Consultingfee
(Note 2)
¥12 million($130
thousand)
Balance atDecember 31,
2009- -
Note 1.
taxes.
Note 2.
negotiated basis.
Transaction conditions and policy on determining transaction conditions
The consulting fee for Masao Horiba is compensation for management consulting services to the Company, activities of
The consulting fee for Masao Horiba is compensation for management consulting services to the Company, activities of
society-academia collaboration for innovation, and participation in economic organizations. The payment was determined on a
negotiated basis.
Name Masao Horiba
CategoryDirector's closefamily member
Address -
Percentage of voting rights held 3.1% (direct)
Business or occupation Advisor
Amount of capital stock(millions of yen)
-
Account
society-academia collaboration for innovation, and participation in economic organizations. The payment was determined on a
3.1% (direct)Consulting contract
The above transaction amounts do not include consumption taxes, while the balance at December 31, 2009 includes consumption
Transaction
Advisor
Relationship Consulting contract
Transaction
Account
The above transaction amounts do not include consumption taxes, while the balance at December 31, 2009 includes consumption
Transaction conditions and policy on determining transaction conditions
Director's closefamily member
Masao Horiba-
-
Category
The Company has adopted the Accounting Standard for Related Party Disclosures (Corporate Accounting Standards No. 11, issued on October 17,2006), and the Application Guidance for Accounting Standard for Related Party Disclosures (Corporate Accounting Standards Application GuidanceNo. 13, issued on October 17, 2006) starting in the consolidated fiscal year ended December 31, 2009.
As a result, in addition to the previous scope of disclosure, Michel Mariton and Bertrand de Castelnau, directors of important subsidiaries of theCompany that submitted consolidated financial statements, were included in the scope of disclosure. However, neither of the directors had anytransactions to be disclosed.
Relationship
NameAddress
Amount of capital stock(millions of yen)
Business or occupation
Percentage of voting rights held
71 HORIBA, Ltd. Annual Report Fiscal 2009
HORIBA, Ltd. and Consolidated Subsidiaries | Notes to Consolidated Financial Statements
17. Subsequent eventsCash dividends
¥296 million ($3,214 thousand) to shareholders of record at December 31, 2009.
18. Other informationLitigationA lawsuit was filed by Micronics Japan Co., Ltd. against the Company seeking compensation for damages related to an agreement to develop andcommercialize liquid-crystal related testing equipment (¥933 million and damages for delay in payment), but the Company won the case in theTokyo High Court on December 25, 2008. Subsequently, Micronics Japan appealed the case to a higher court, but the Supreme Court dismissed thecase on November 24, 2009, resulting in a final victory for the Company.
On February 15, 2010, the Company's Board of Directors resolved to pay cash dividends of ¥7 ($0.08) per share, aggregating
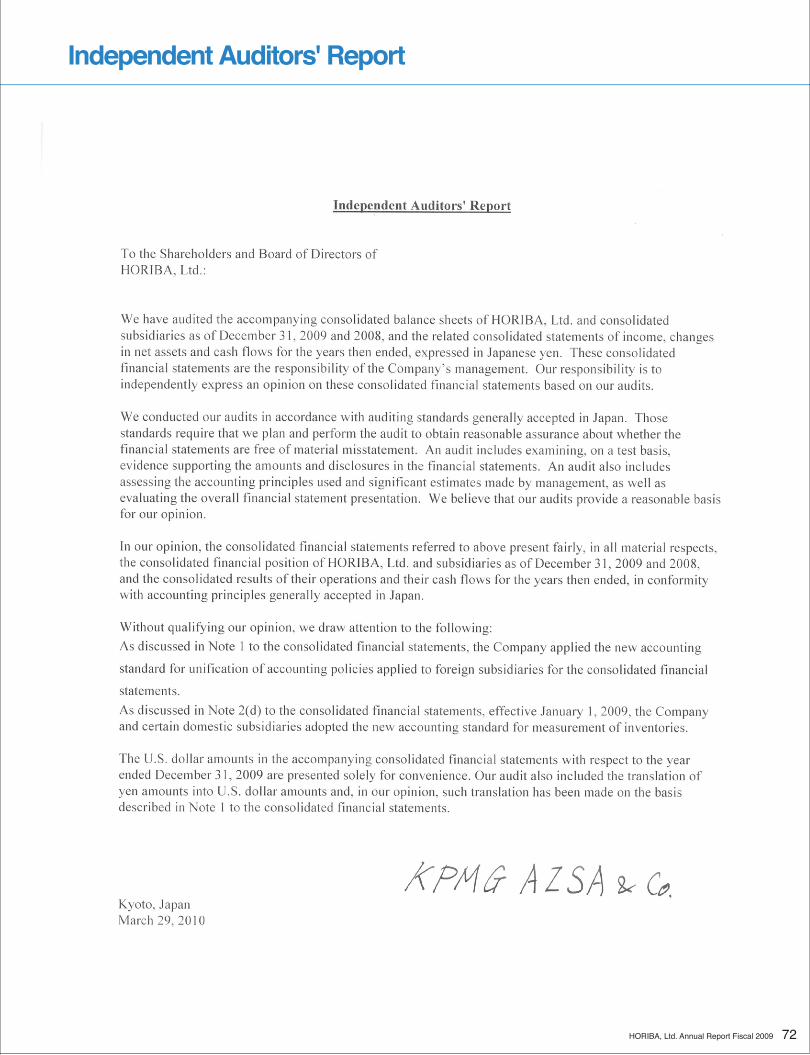
72HORIBA, Ltd. Annual Report Fiscal 2009
Independent Auditors' Report
Corporate Philosophy
73
HORIBA’s company motto “Joy and Fun”Originates from the belief that if we take interest and pride in the work that occupies most of the active time in our lives,
in the place where we spend the large part of each day, then as a result our satisfaction with life will increase, and we
will be able to enjoy our lives even more. Taking interest and pride in our work leads us to “Joy and Fun.”
Business OperationsWe, at the HORIBA, apply our most advanced analytical
technologies to provide highly original analytical and
measuring products and equipment in such fields as
engine emissions, scientific analysis, industrial and
process control, environment monitoring, semi-conductor
process control, medical and health-care, and biotechnol-
ogy, thereby contributing to the progress of science and
technology, improvement in the quality, development and
benefit of human health. We are engaging in the new
businesses for derivative and peripheral products aim to
develop scientific technology and improve the life of the
community, while at the same time minimizing the impact
on the environment.
We strictly abide by all environmental protection laws
and regulations in our business activities. In addition, all
HORIBA group companies are required to attain the
highest levels of quality for establishing, developing, and
maintaining environmental systems, including implement-
ing internal control standards that minimize the impact
that our business activities have on the environment.
We strive to deliver higher value-added products and
services in the shortest possible time to customers all
over the world, combining the functions and specialties
of development, production, sales, and services from
globally located points throughout the world. Further-
more, we aim to be the leader in the global market in the
fields and product segments in which we operate, to
meet all customers’ needs consistently, and to effectively
maximize our limited resources through a policy of selec-
tive investment.
Customer ResponsivenessWe maintain a philosophy of pursuing technology to the
ultimate degree in both the fundamental and applied
technology fields, supplying products that continuously
satisfy customers’ requirements. We are committed to
offering top-quality, highly reliable products and services
with a consistent level of excellence throughout the world.
We are obliged to observe the highest standards for
establishing, developing, and maintaining quality control
systems. To provide products and services to customers
in the fastest delivery time possible, we have adopted
the slogan “Ultra-Quick Supplier” for all our activities.
This slogan encompasses not only production lead times
but also development, marketing and sales, service, and
control functions.
Responsibility to Shareholdersand InvestorsOur basic policy is to calculate annual dividends on an
allocated rate of net income. Important information
regarding management and business operations are
fully disclosed on a regular basis to shareholders and
potential investors. A timely responsive management
control system should be maintained by HORIBA group
companies to ensure that company objectives are met,
profit generated and the information disclosed repre-
sents the true performance of the company as well as its
management.
EmployeesWe are proud of the entrepreneurial spirit that led to the
creation of HORIBA group companies. Each employee is
made aware of this heritage, and we actively encourage
ideas and innovations from individual employees.
HORIBA promotes an open and fair business environ-
ment that allows all employees to achieve their individual
goals and maximize their potential. To further each
employee’s personal and professional growth, we encour-
age thinking from a global perspective and have estab-
lished a global personnel development program and
performance evaluation system. We value employees
who challenge their personal abilities and recognize
their own accomplishments.
HORIBA, Ltd. Annual Report Fiscal 2009
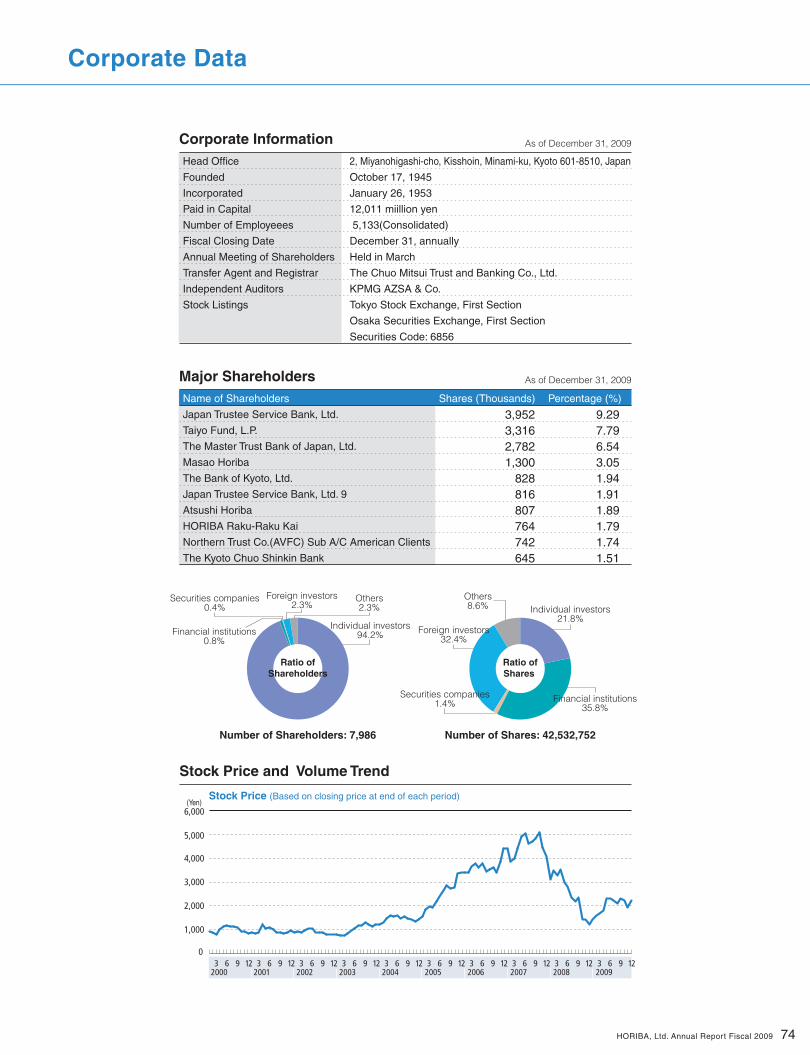
Individual investors94.2%
Others2.3%
Securities companies0.4%
Financial institutions0.8%
Corporate Data
Head Office 2, Miyanohigashi-cho, Kisshoin, Minami-ku, Kyoto 601-8510, Japan
Founded October 17, 1945
Incorporated January 26, 1953
Paid in Capital 12,011 miillion yen
Number of Employeees 5,133(Consolidated)
Fiscal Closing Date December 31, annually
Annual Meeting of Shareholders Held in March
Transfer Agent and Registrar The Chuo Mitsui Trust and Banking Co., Ltd.
Independent Auditors KPMG AZSA & Co.
Stock Listings Tokyo Stock Exchange, First Section
Osaka Securities Exchange, First Section
Securities Code: 6856
Name of Shareholders Shares (Thousands) Percentage (%)
Japan Trustee Service Bank, Ltd.
Taiyo Fund, L.P.
The Master Trust Bank of Japan, Ltd.
Masao Horiba
The Bank of Kyoto, Ltd.
Japan Trustee Service Bank, Ltd. 9
Atsushi Horiba
HORIBA Raku-Raku Kai
Northern Trust Co.(AVFC) Sub A/C American Clients
The Kyoto Chuo Shinkin Bank
Corporate Information As of December 31, 2009
As of December 31, 2009Major Shareholders
3,9523,3162,7821,300
828816807764742645
9.297.796.543.051.941.911.891.791.741.51
Stock Price and Volume Trend
(Yen)Stock Price (Based on closing price at end of each period)
Number of Shareholders: 7,986 Number of Shares: 42,532,752
Foreign investors2.3%
0
1,000
2,000
3,000
4,000
5,000
6,000
2000 20013 9 3 9 3 9 3 9 3 9 3 9 3 9 3 9 3 9126 126 126 126 126 126 126 12 126 6
2002 2003 2004 2005 2006 2007 20083 9 1262009
74
Ratio ofShareholders
Ratio ofShares
HORIBA, Ltd. Annual Report Fiscal 2009
Individual investors21.8%
Others8.6%
Foreign investors32.4%
Securities companies1.4% Financial institutions
35.8%

HORIBA, Ltd.
2, Miyanohigashi-cho, Kisshoin, Minami-ku, Kyoto 601-8510, JapanPhone : +81-75-313-8121 Fax : +81-75-312-7389E-mail : [email protected] : http://www.horiba.com
Related Documents