Annual Report Essay Altered States: A Perspective on 75 Years of State Income Growth Ohio Board of Regents April 23, 2007

Annual Report Essay Altered States: A Perspective on 75 Years of State Income Growth Ohio Board of Regents April 23, 2007.
Jan 04, 2016
Welcome message from author
This document is posted to help you gain knowledge. Please leave a comment to let me know what you think about it! Share it to your friends and learn new things together.
Transcript
Annual Report Essay
Altered States: A Perspective on 75 Years of State Income Growth
Ohio Board of RegentsApril 23, 2007
IN THE ANNUAL REPORT WE ASK:
• Why do residents of some states have higher incomes than residents of other states?
• Why have these income differences persisted for the past 75 years?

BASED ON A LONG-TERM RESEARCH PROJECT
• An early initiative of our Regional Issues Program
• Paul Bauer, Scott Shane (of Case), and myself
• State Growth Empirics (Federal Reserve Bank of Cleveland Working Paper 06-06)


New York$9,703
Mississippi$1,882
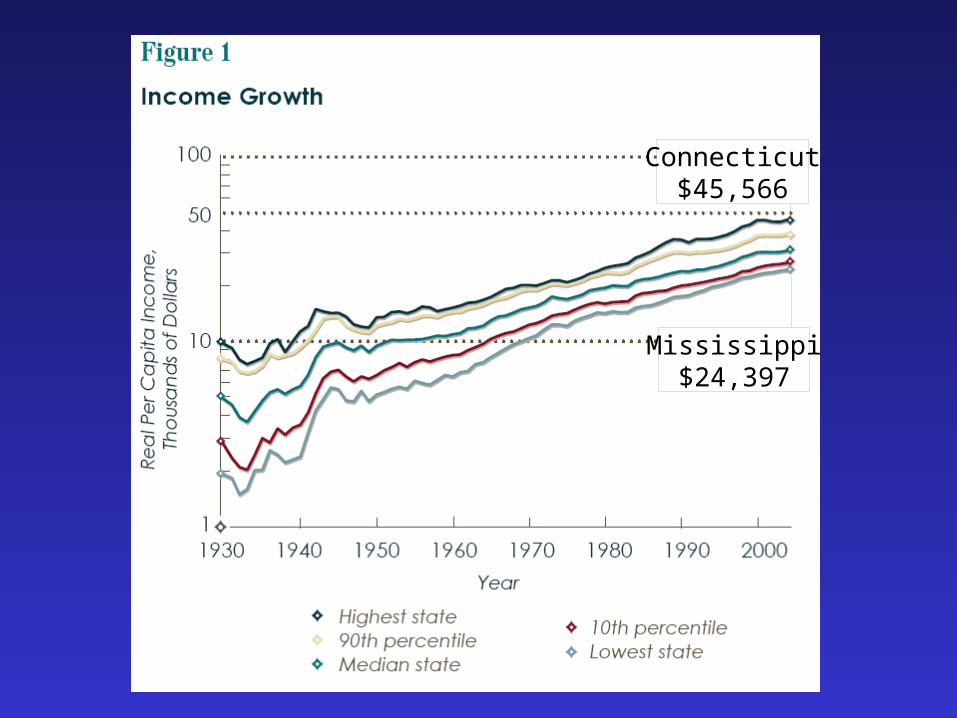
Connecticut$45,566
Mississippi$24,397


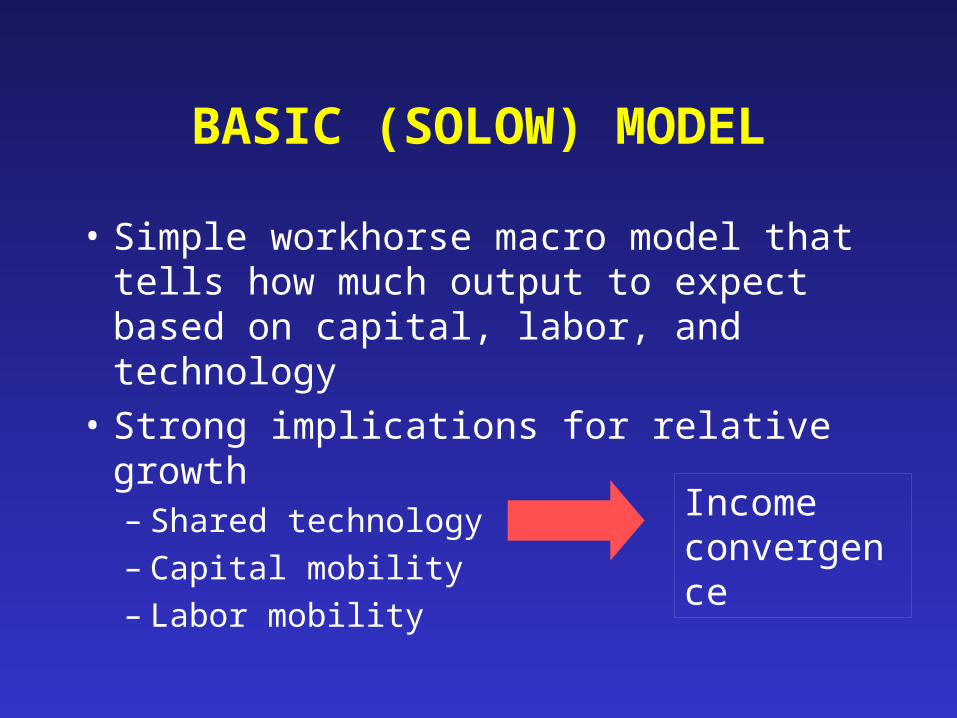
BASIC (SOLOW) MODEL
• Simple workhorse macro model that tells how much output to expect based on capital, labor, and technology
BASIC (SOLOW) MODEL
• Simple workhorse macro model that tells how much output to expect based on capital, labor, and technology
• Strong implications for relative growth– Shared technology– Capital mobility– Labor mobility
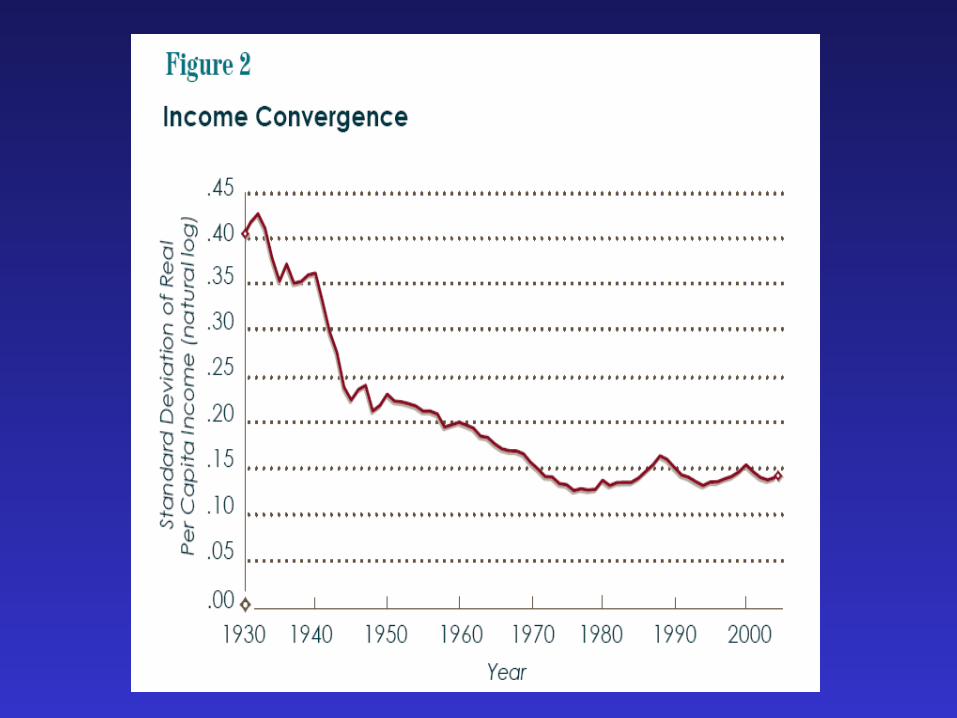
Income convergence
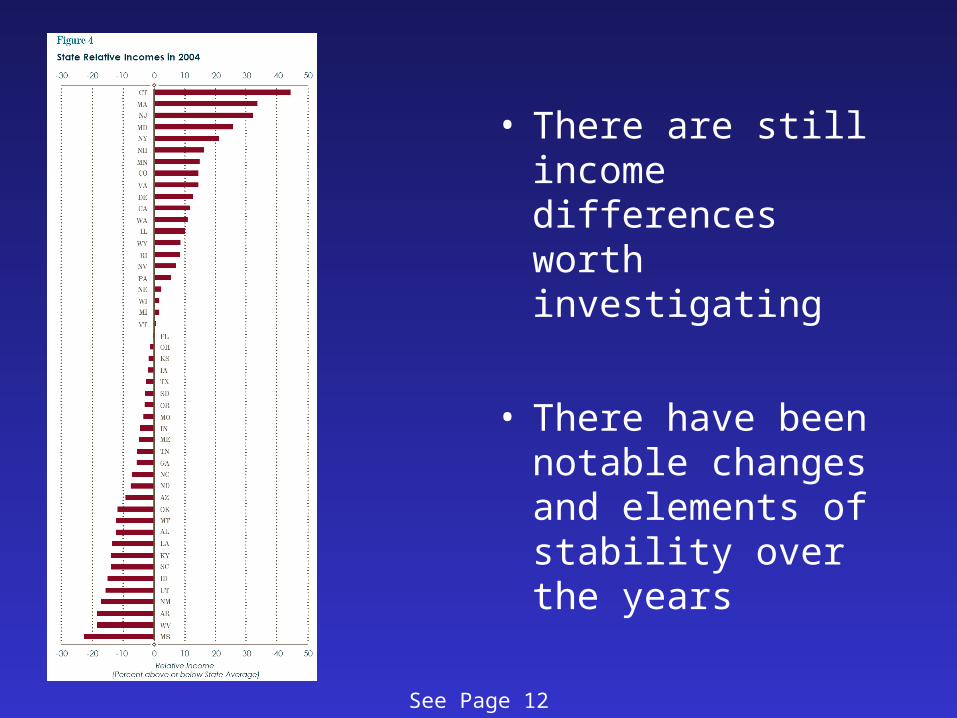
• There are still income differences worth investigating
• There have been notable changes and elements of stability over the years
See Page 12
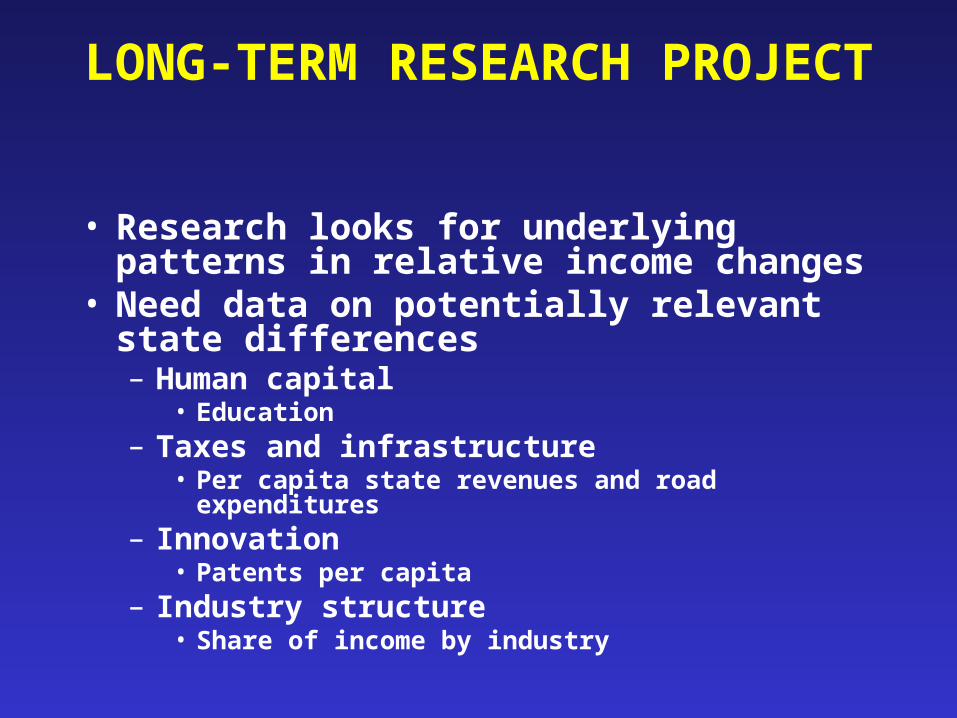
LONG-TERM RESEARCH PROJECT
• Research looks for underlying patterns in relative income changes
• Need data on potentially relevant state differences– Human capital
• Education– Taxes and infrastructure
• Per capita state revenues and road expenditures – Innovation
• Patents per capita– Industry structure
• Share of income by industry
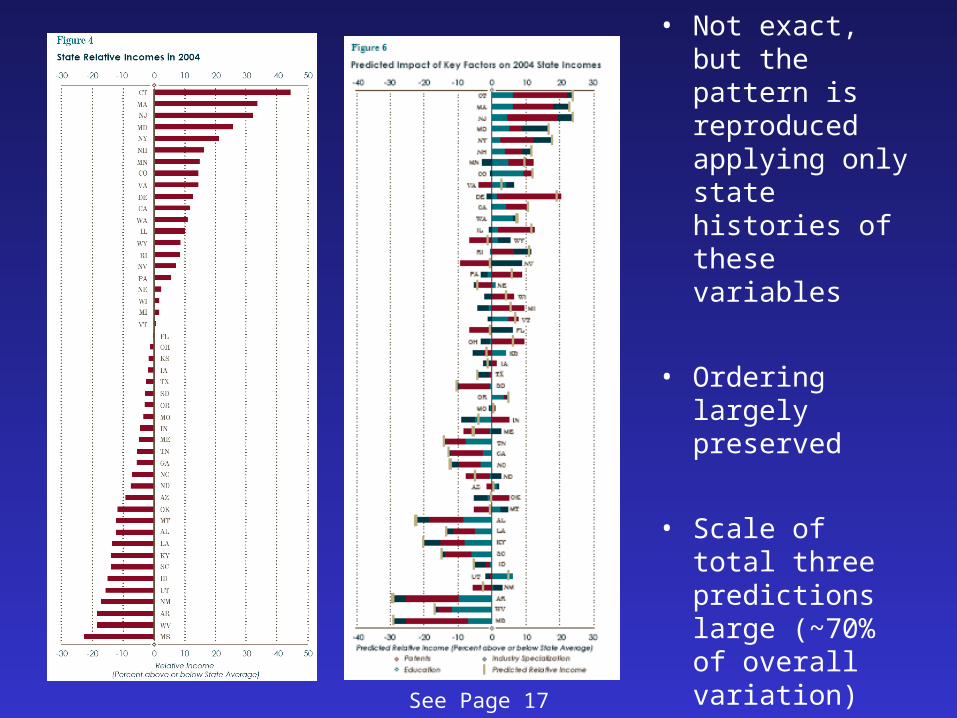
See Page 17
• Not exact, but the pattern is reproduced applying only state histories of these variables
• Ordering largely preserved
• Scale of total three predictions large (~70% of overall variation)
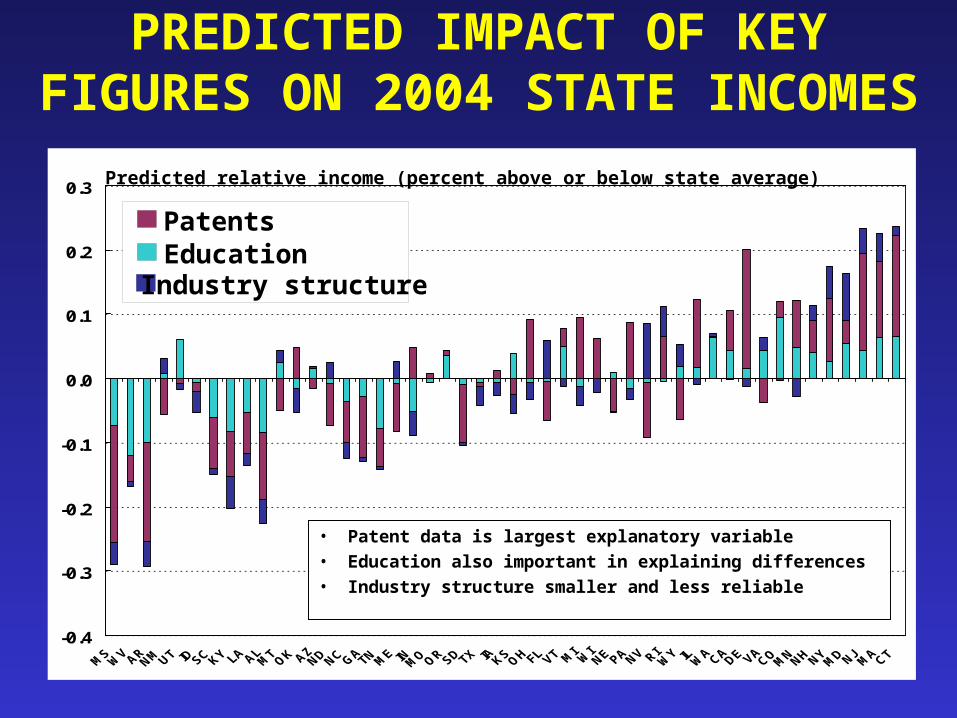
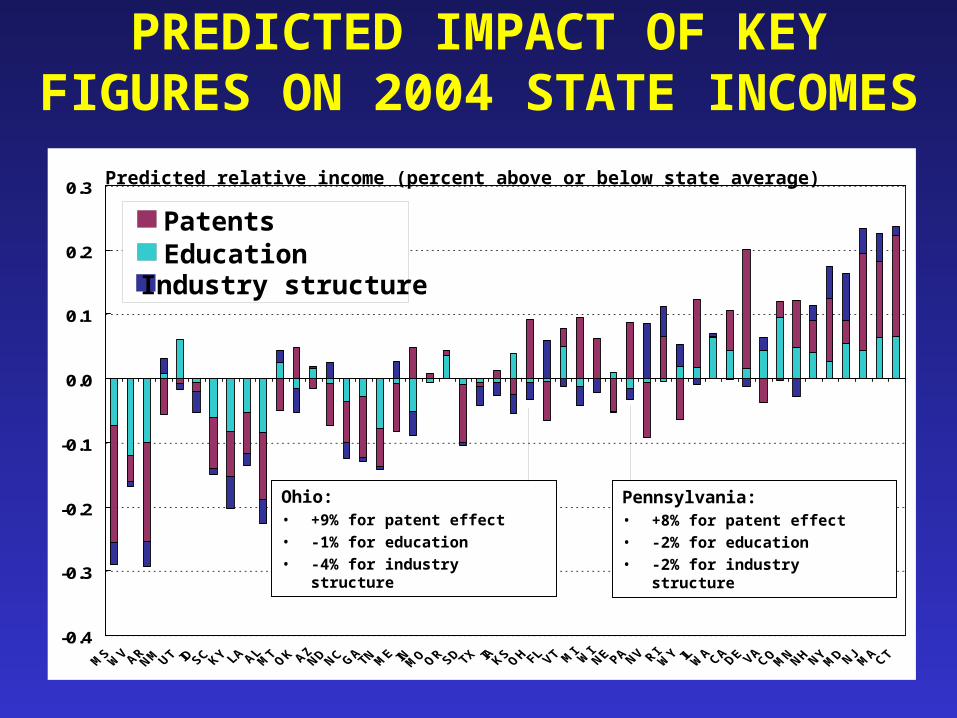
PREDICTED IMPACT OF KEY FIGURES ON 2004 STATE INCOMES
-0.4
-0.3
-0.2
-0.1
0.0
0.1
0.2
0.3
• Patent data is largest explanatory variable• Education also important in explaining differences• Industry structure smaller and less reliable
Predicted relative income (percent above or below state average)
PatentsEducationIndustry structure
PREDICTED IMPACT OF KEY FIGURES ON 2004 STATE INCOMES
-0.4
-0.3
-0.2
-0.1
0.0
0.1
0.2
0.3 Predicted relative income (percent above or below state average)
PatentsEducationIndustry structure
Ohio:• +9% for patent effect
• -1% for education
• -4% for industry structure
Pennsylvania:• +8% for patent effect
• -2% for education
• -2% for industry structure

LESSONS FOR THE STATES
• We do not study specific policies that might be implemented and thus have no specific recommendations
• However, it is evident that over a span of 75 years the most reliable indicators of relative income levels and growth are knowledge variables
• Economic development efforts should not ignore either education or innovation

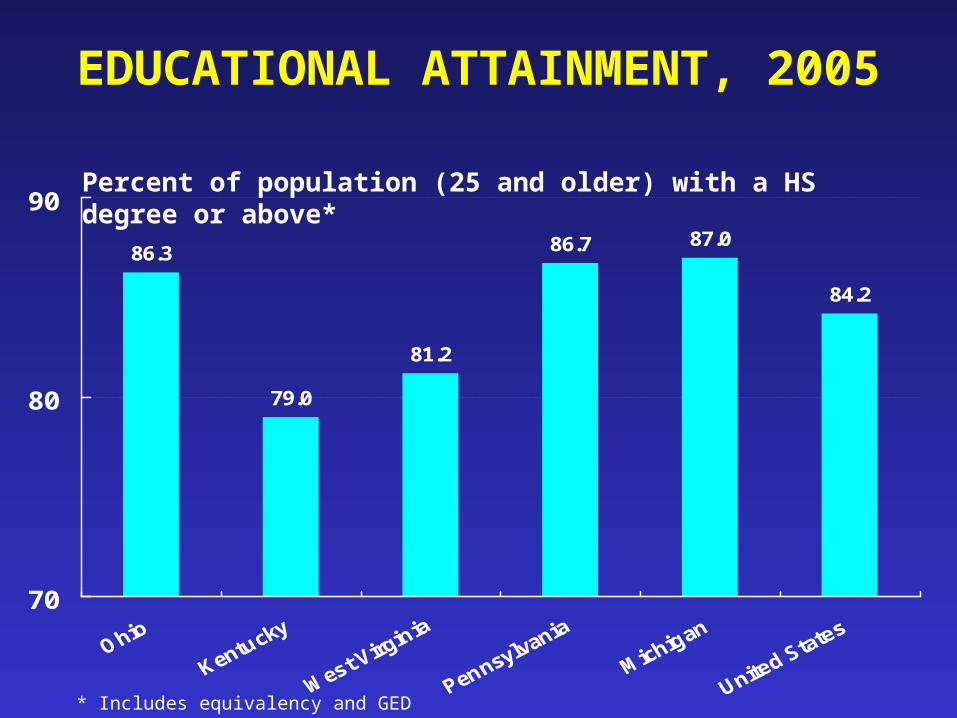
86.3
79.0
81.2
86.7 87.0
84.2
70
80
90
EDUCATIONAL ATTAINMENT, 2005
Percent of population (25 and older) with a HS degree or above*
* Includes equivalency and GED
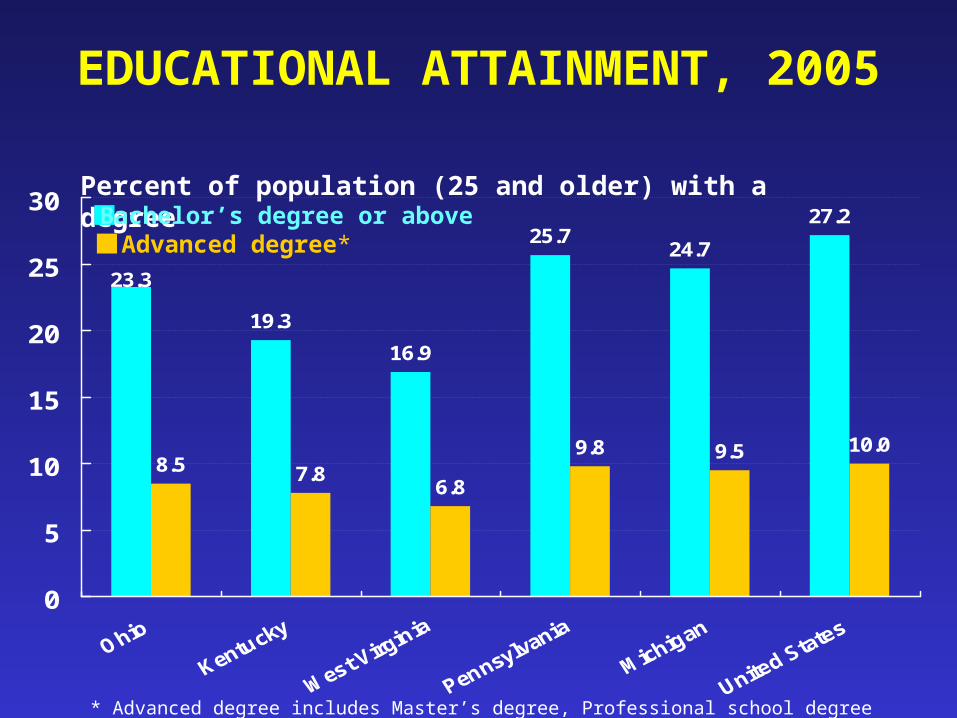
19.3
16.9
25.724.7
27.2
8.5 7.86.8
9.8 9.5 10.0
23.3
0
5
10
15
20
25
30
EDUCATIONAL ATTAINMENT, 2005
Percent of population (25 and older) with a degreeBachelor’s degree or aboveAdvanced degree*
* Advanced degree includes Master’s degree, Professional school degree and Doctorate degree
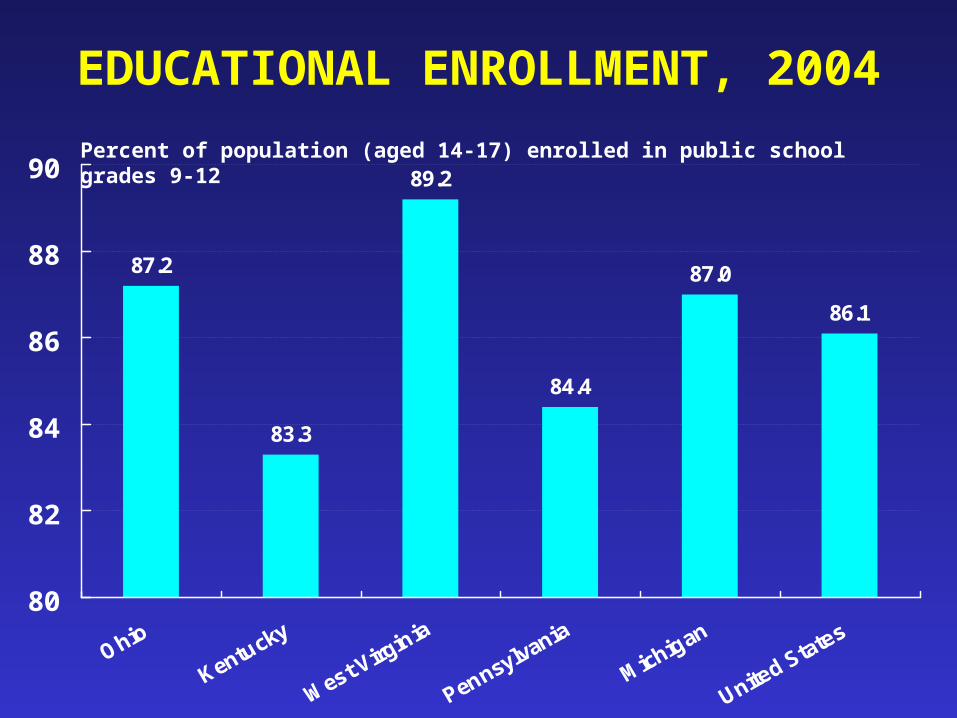
87.2
83.3
89.2
84.4
87.0
86.1
80
82
84
86
88
90
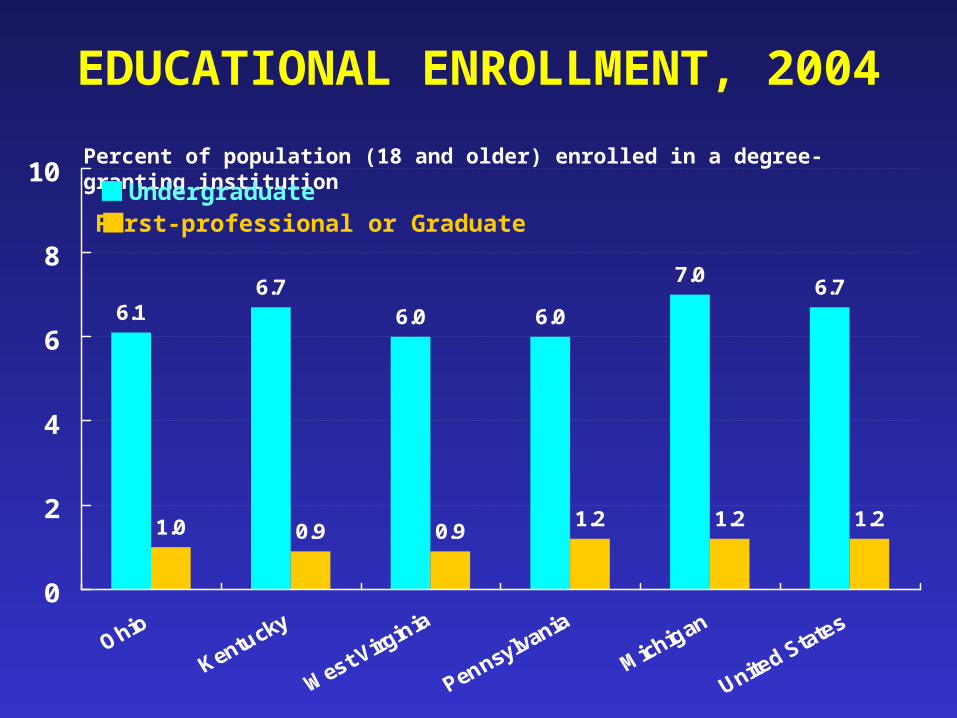
EDUCATIONAL ENROLLMENT, 2004
Percent of population (aged 14-17) enrolled in public school grades 9-12
6.16.7
6.0 6.0
7.06.7
1.0 0.9 0.91.2 1.2 1.2
0
2
4
6
8
10
EDUCATIONAL ENROLLMENT, 2004
Percent of population (18 and older) enrolled in a degree-granting institution
UndergraduateFirst-professional or Graduate
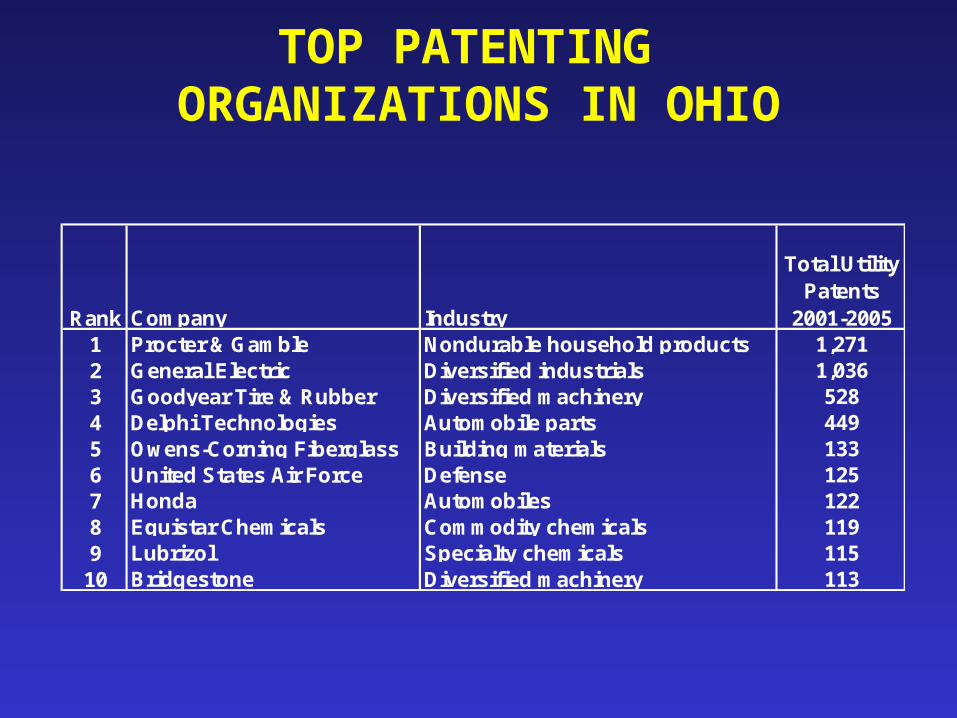
TOP PATENTING ORGANIZATIONS IN OHIO
Rank Company Industry
Total Utility Patents
2001-20051 Procter & Gamble Nondurable household products 1,2712 General Electric Diversified industrials 1,0363 Goodyear Tire & Rubber Diversified machinery 5284 Delphi Technologies Automobile parts 4495 Owens-Corning Fiberglass Building materials 1336 United States Air Force Defense 1257 Honda Automobiles 1228 Equistar Chemicals Commodity chemicals 1199 Lubrizol Specialty chemicals 115
10 Bridgestone Diversified machinery 113
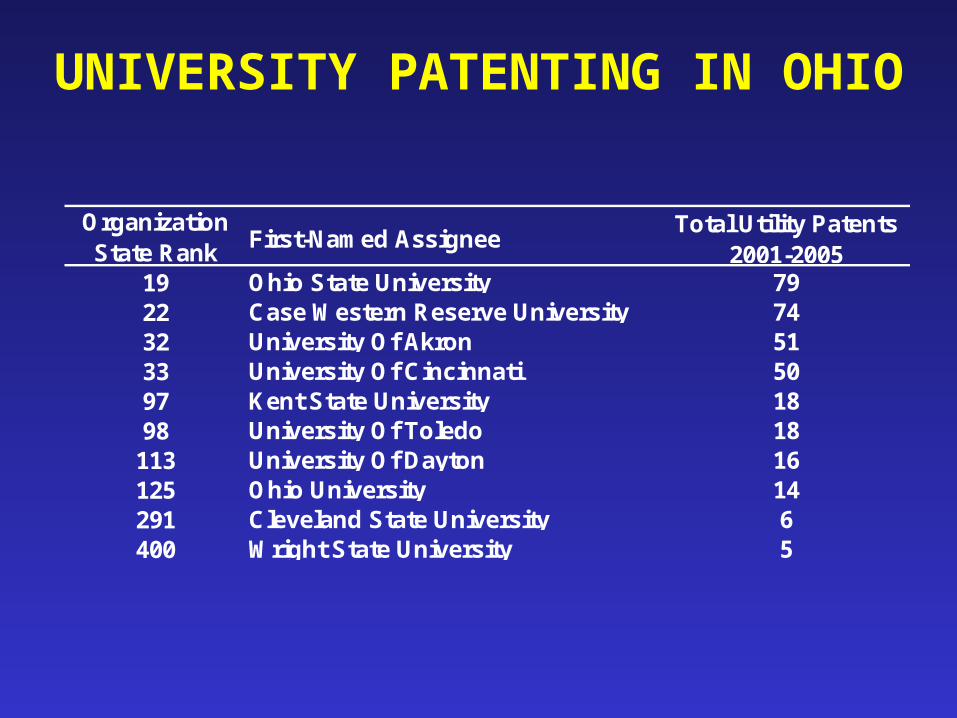
UNIVERSITY PATENTING IN OHIO
Organization State Rank
First-Named AssigneeTotal Utility Patents
2001-200519 Ohio State University 7922 Case Western Reserve University 7432 University Of Akron 5133 University Of Cincinnati 5097 Kent State University 1898 University Of Toledo 18113 University Of Dayton 16125 Ohio University 14291 Cleveland State University 6400 Wright State University 5

ISSUES FOR OHIO
• Economic development efforts should not ignore either education or innovation
• Education attainment lower in Ohio– Is it due to enrollments or attraction?
• Patent activity focused on wide-range of businesses– Is there a greater role for universities?

Annual Report Essay
Altered States: A Perspective on 75 Years of State Income Growth
Ohio Board of RegentsApril 23, 2007
Related Documents