FOR THE FINANCIAL YEAR ENDED 30 JUNE 2020 BOOKLET 2 ANNUAL REPORTS

Welcome message from author
This document is posted to help you gain knowledge. Please leave a comment to let me know what you think about it! Share it to your friends and learn new things together.
Transcript

FOR THE FINANCIAL YEAR ENDED 30 JUNE 2020BOOKLET 2
ANNUAL REPORTS

i
ANNUAL REPORTS FOR THE FINANCIAL YEAR ENDED JUNE 2020
THE SCHEMES LISTED IN BOOKLET 2 ARE NOTED BELOW.
Refer to page
Statements of Financial
Position
Statements of Comprehensive
Income
Statements of Changes
in Equity
Statements of Cash
Flows
Active Growth Trust 7 44 81 100
ANZ Equity Imputation Trust 7 44 81 100
ANZ Equity Trust No 1 7 44 81 100
ANZ Fixed Interest Trust 7 44 81 100
ANZ OA - Pendal Core Hedged Global Shares Trust 8 45 81 101
ANZ OA Arrowstreet Global Equity (Hedged) Trust 8 45 81 101
ANZ OA Colonial First State Imputation Trust 8 45 81 101
ANZ OA Investors Mutual Australian Share Trust 8 45 81 101
ANZ OA Magellan Global Trust 9 46 82 102
ANZ OA OnePath Active Growth Trust 9 46 82 102
ANZ OA OnePath Australian Share Trust 9 46 82 102
ANZ OA OnePath Balanced Trust 9 46 82 102
ANZ OA OnePath Blue Chip Imputation Trust 10 47 82 103
ANZ OA OnePath Conservative Trust 10 47 82 103
ANZ OA OnePath Diversified Fixed Interest Trust 10 47 82 103
ANZ OA OnePath Global Emerging Markets Share Trust 10 47 82 103
ANZ OA OnePath High Growth Trust 11 48 83 104
ANZ OA OnePath Income Trust 11 48 83 104
ANZ OA OnePath Managed Growth Trust 11 48 83 104
Refer to page
Statements of Financial
Position
Statements of Comprehensive
Income
Statements of Changes
in Equity
Statements of Cash
Flows
ANZ OA OnePath Property Securities Trust 11 48 83 104
ANZ OA OnePath Select Leaders Trust 12 49 83 105
ANZ OA OnePath Sustainable Investments – Australian Share Trust 12 49 83 105
ANZ OA OnePath Tax Effective Income Trust 12 49 83 105
ANZ OA OptiMix Australian Fixed Interest Trust 12 49 83 105
ANZ OA OptiMix Australian Share Trust 13 50 84 106
ANZ OA OptiMix Conservative Trust 13 50 84 106
ANZ OA OptiMix Global Share Trust 13 50 84 106
ANZ OA OptiMix Global Smaller Companies Share Trust 13 50 84 106
ANZ OA OptiMix Growth Trust 14 51 84 107
ANZ OA OptiMix High Growth Trust 14 51 84 107
ANZ OA OptiMix Moderate Trust 14 51 84 107
ANZ OA OptiMix Property Securities Trust 14 51 84 107
ANZ OA Perpetual Australian Share Trust 15 52 85 108
ANZ OA Schroder Australian Equity Trust 15 52 85 108
ANZ OA SG Hiscock Property Trust 15 52 85 108
ANZ OA UBS Diversified Fixed Income Trust 15 52 85 108
ANZ OneAnswer – BR Scientific Australian Equity Trust 16 53 85 109
ANZ OneAnswer – BR Scientific International Equity Trust 16 53 85 109

ii
ANNUAL REPORTS FOR THE FINANCIAL YEAR ENDED JUNE 2020 (CONTINUED)
Refer to page
Statements of Financial
Position
Statements of Comprehensive
Income
Statements of Changes
in Equity
Statements of Cash
Flows
ANZ Private International Fixed Interest Fund 16 53 85 109
ANZ Property Securities Trust 16 53 85 109
Australian Share Trust 17 54 86 110
Balanced Trust 17 54 86 110
Blue Chip Imputation Trust 17 54 86 110
Emerging Companies Trust 17 54 86 110
Global Share Trust 18 55 86 111
Heine Property Securities Fund 18 55 86 111
High Growth Trust 18 55 86 111
OneAnswer – Altrinsic Global Equities Trust 18 55 86 111
OneAnswer – Antipodes Global (Long Only) Trust 19 56 87 112
OneAnswer – Arrowstreet Global Equity (Hedged) Trust 19 56 87 112
OneAnswer – Ausbil Australian Emerging Leaders Trust 19 56 87 112
OneAnswer – Bennelong Australian Equities Trust 19 56 87 112
OneAnswer – Bentham Global Income Trust 20 57 87 113
OneAnswer – BlackRock Scientific Australian Equity Trust 20 57 87 113
OneAnswer – Blackrock Tactical Growth Trust 20 57 87 113
OneAnswer – BR Scientific Diversified Growth Trust 20 57 87 113
OneAnswer – BR Scientific International Equity Trust 21 58 88 114
Refer to page
Statements of Financial
Position
Statements of Comprehensive
Income
Statements of Changes
in Equity
Statements of Cash
Flows
OneAnswer – Colonial First State Global Credit Income Trust 21 58 88 114
OneAnswer – Colonial First State Global Listed Infrastructure Trust 21 58 88 114
OneAnswer – Colonial First State Imputation Trust 21 58 88 114
OneAnswer – Fidelity Australian Equities Trust 22 59 88 115
OneAnswer – Greencape Broadcap Trust 22 59 88 115
OneAnswer – Investors Mutual Australian Share Trust 22 59 88 115
OneAnswer – Janus Henderson Global Fixed Interest Total Return Trust 22 59 88 115
OneAnswer – Kapstream Absolute Return Income Trust 23 60 89 116
OneAnswer – Magellan Global Trust 23 60 89 116
OneAnswer – Merlon Australian Share Income Trust 23 60 89 116
OneAnswer – MFS Global Equity Trust 23 60 89 116
OneAnswer – Nikko AM Australian Shares Trust 24 61 89 117
OneAnswer – OnePath Global Property Securities Index Trust 24 61 89 117
OneAnswer – Pendal Australian Share Trust 24 61 89 117
OneAnswer – Pendal Core Hedged Global Shares Trust 24 61 89 117
OneAnswer – Pendal Monthly Income Plus Trust 25 62 90 118
OneAnswer – Pendal Smaller Companies Trust 25 62 90 118

iii
ANNUAL REPORTS FOR THE FINANCIAL YEAR ENDED JUNE 2020 (CONTINUED)
Refer to page
Statements of Financial
Position
Statements of Comprehensive
Income
Statements of Changes
in Equity
Statements of Cash
Flows
OneAnswer – Perennial Value Shares Trust 25 62 90 118
OneAnswer – Perpetual Australian Share Trust 25 62 90 118
OneAnswer – Perpetual Balanced Growth Trust 26 63 90 119
OneAnswer – Perpetual Conservative Growth Trust 26 63 90 119
OneAnswer – Perpetual Ethical SRI Trust 26 63 90 119
OneAnswer – Platinum Asia Trust 26 63 90 119
OneAnswer – Platinum International Trust 27 64 91 120
OneAnswer – RARE Infastructure Value Trust 27 64 91 120
OneAnswer – Schroder Australian Equity Trust 27 64 91 120
OneAnswer – Schroder Balanced Trust 27 64 91 120
OneAnswer – Schroder Fixed Income Trust 28 65 91 121
OneAnswer – Schroder Real Return Trust 28 65 91 121
OneAnswer – SG Hiscock Property Trust 28 65 91 121
OneAnswer – Stewart Investors Worldwide Sustainability Trust 28 65 91 121
OneAnswer – T. Rowe Price Global Equity Trust 29 66 92 122
OneAnswer – T.Rowe Price Dynamic Global Bond Trust 29 66 92 122
OneAnswer – UBS Balanced Trust 29 66 92 122
OneAnswer – UBS Defensive Trust 29 66 92 122
Refer to page
Statements of Financial
Position
Statements of Comprehensive
Income
Statements of Changes
in Equity
Statements of Cash
Flows
OneAnswer – UBS Diversified Fixed Income Trust 30 67 92 123
OneAnswer – Vanguard Australian Shares Index Trust 30 67 92 123
OneAnswer – Vanguard Balanced Index Trust 30 67 92 123
OneAnswer – Vanguard Conservative Index Trust 30 67 92 123
OneAnswer – Vanguard Diversified Bond Index Trust 31 68 93 124
OneAnswer – Vanguard Growth Index Trust 31 68 93 124
OneAnswer – Vanguard High Growth Index Trust 31 68 93 124
OneAnswer – Vanguard International Shares Index (Hedged) Trust 31 68 93 124
OneAnswer – Vanguard International Shares Index Trust 32 69 93 125
OneAnswer – Vanguard Property Securities Index Trust 32 69 93 125
OneAnswer – Walter Scott Global Equity (Hedged) Trust 32 69 93 125
OnePath Alternatives Growth Fund 32 69 93 125
OnePath Capital Guaranteed Trust 33 70 94 126
OnePath Capital Stable Trust 33 70 94 126
OnePath Diversified Credit Trust 33 70 94 126
OnePath Diversified Fixed Interest Trust 33 70 94 126
OnePath Geared Australian Shares Index Trust 34 71 94 127
iv
ANNUAL REPORTS FOR THE FINANCIAL YEAR ENDED JUNE 2020 (CONTINUED)
Refer to page
Statements of Financial
Position
Statements of Comprehensive
Income
Statements of Changes
in Equity
Statements of Cash
Flows
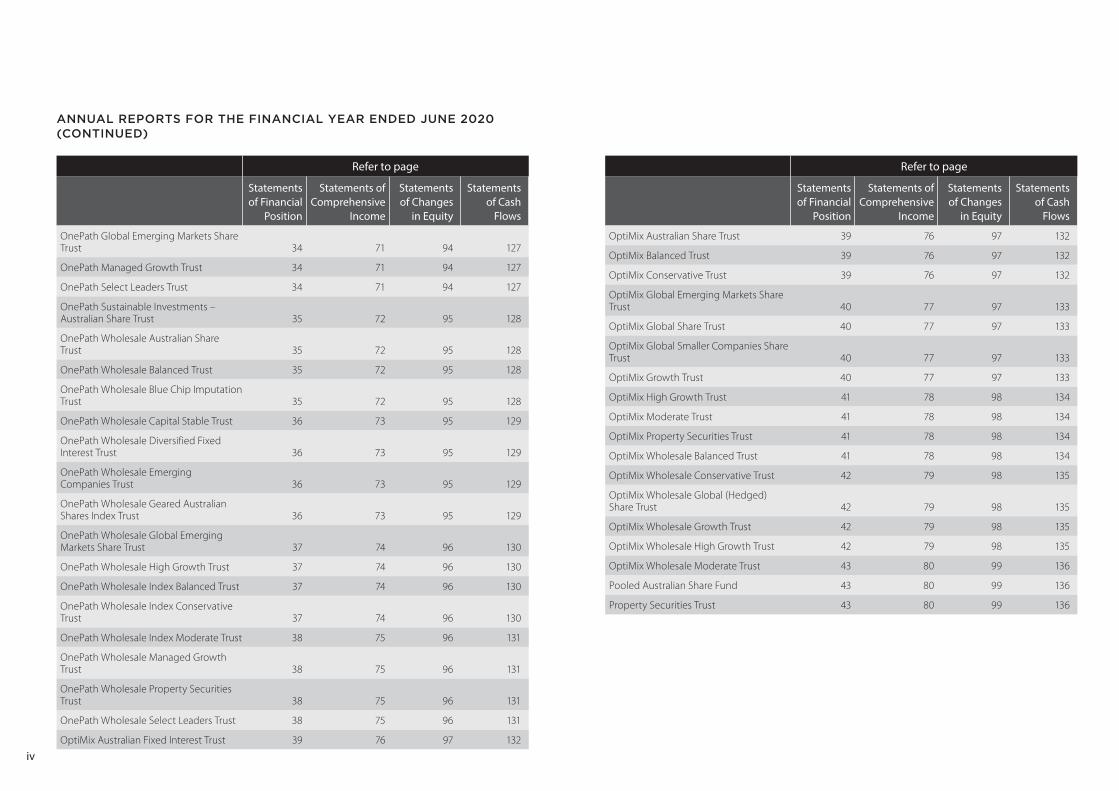
OnePath Global Emerging Markets Share Trust 34 71 94 127
OnePath Managed Growth Trust 34 71 94 127
OnePath Select Leaders Trust 34 71 94 127
OnePath Sustainable Investments – Australian Share Trust 35 72 95 128
OnePath Wholesale Australian Share Trust 35 72 95 128
OnePath Wholesale Balanced Trust 35 72 95 128
OnePath Wholesale Blue Chip Imputation Trust 35 72 95 128
OnePath Wholesale Capital Stable Trust 36 73 95 129
OnePath Wholesale Diversified Fixed Interest Trust 36 73 95 129
OnePath Wholesale Emerging Companies Trust 36 73 95 129
OnePath Wholesale Geared Australian Shares Index Trust 36 73 95 129
OnePath Wholesale Global Emerging Markets Share Trust 37 74 96 130
OnePath Wholesale High Growth Trust 37 74 96 130
OnePath Wholesale Index Balanced Trust 37 74 96 130
OnePath Wholesale Index Conservative Trust 37 74 96 130
OnePath Wholesale Index Moderate Trust 38 75 96 131
OnePath Wholesale Managed Growth Trust 38 75 96 131
OnePath Wholesale Property Securities Trust 38 75 96 131
OnePath Wholesale Select Leaders Trust 38 75 96 131
OptiMix Australian Fixed Interest Trust 39 76 97 132
Refer to page
Statements of Financial
Position
Statements of Comprehensive
Income
Statements of Changes
in Equity
Statements of Cash
Flows
OptiMix Australian Share Trust 39 76 97 132
OptiMix Balanced Trust 39 76 97 132
OptiMix Conservative Trust 39 76 97 132
OptiMix Global Emerging Markets Share Trust 40 77 97 133
OptiMix Global Share Trust 40 77 97 133
OptiMix Global Smaller Companies Share Trust 40 77 97 133
OptiMix Growth Trust 40 77 97 133
OptiMix High Growth Trust 41 78 98 134
OptiMix Moderate Trust 41 78 98 134
OptiMix Property Securities Trust 41 78 98 134
OptiMix Wholesale Balanced Trust 41 78 98 134
OptiMix Wholesale Conservative Trust 42 79 98 135
OptiMix Wholesale Global (Hedged) Share Trust 42 79 98 135
OptiMix Wholesale Growth Trust 42 79 98 135
OptiMix Wholesale High Growth Trust 42 79 98 135
OptiMix Wholesale Moderate Trust 43 80 99 136
Pooled Australian Share Fund 43 80 99 136
Property Securities Trust 43 80 99 136

Contents of Annual Report
2
Directors' Report ......................................................................................................................................................................................................................................................... 3 Financial Report ......................................................................................................................................................................................................................................................... 7
Financial Statements ............................................................................................................................................................................................................................................... 7 Statements of Financial Position ............................................................................................................................................................................................................................ 7 Statements of Comprehensive Income ................................................................................................................................................................................................................... 44 Statements of Changes in Equity ......................................................................................................................................................................................................................... 81 Statements of Cash Flows ................................................................................................................................................................................................................................100
Notes to the Financial Statements ............................................................................................................................................................................................................................137 1. Reporting entity ..........................................................................................................................................................................................................................................137 2. Basis of preparation .....................................................................................................................................................................................................................................137 3. Significant accounting policies .........................................................................................................................................................................................................................138 4. Net assets attributable to unitholders .................................................................................................................................................................................................................142 5. Receivables ...............................................................................................................................................................................................................................................155 6. Financial assets and liabilities .........................................................................................................................................................................................................................168 7. Payables ..................................................................................................................................................................................................................................................205 8. Reconciliation of cash flows from operating activities ..............................................................................................................................................................................................217 9. Financial risk management .............................................................................................................................................................................................................................236 10. Auditor's remuneration ................................................................................................................................................................................................................................352 11. Related parties..........................................................................................................................................................................................................................................361 12. Investment assets and liabilities of unconsolidated structured entities ........................................................................................................................................................................401 13. Custodian ................................................................................................................................................................................................................................................420 14. Commitments and contingencies ....................................................................................................................................................................................................................420 15. Significant events during the financial period ......................................................................................................................................................................................................420 16. Likely developments and expected results of operations ........................................................................................................................................................................................421 17. Events subsequent to reporting date ................................................................................................................................................................................................................421
Directors' Declaration ...........................................................................................................................................................................................................................................422 Independent Auditor's Report .......................................................................................................................................................................................................................................424 Lead Auditor's Independence Declaration ........................................................................................................................................................................................................................427

Directors' Report for the financial year ended 30 June 2020
3
The Directors of OnePath Funds Management Limited (OPFM), the Responsible Entity of the following Managed Investment Schemes (the 'Schemes'), present their report together with the financial report of the Schemes for the financial year ended 30 June 2020, and the report of the auditor of the Schemes.
1. Active Growth Trust 2. ANZ Equity Imputation Trust 3. ANZ Equity Trust No 1 4. ANZ Fixed Interest Trust 5. ANZ OA - Pendal Core Hedged Global Shares Trust 6. ANZ OA Arrowstreet Global Equity (Hedged) Trust 7. ANZ OA Colonial First State Imputation Trust 8. ANZ OA Investors Mutual Australian Share Trust 9. ANZ OA Magellan Global Trust 10. ANZ OA OnePath Active Growth Trust 11. ANZ OA OnePath Australian Share Trust 12. ANZ OA OnePath Balanced Trust 13. ANZ OA OnePath Blue Chip Imputation Trust 14. ANZ OA OnePath Conservative Trust 15. ANZ OA OnePath Diversified Fixed Interest Trust 16. ANZ OA OnePath Global Emerging Markets Share Trust 17. ANZ OA OnePath High Growth Trust 18. ANZ OA OnePath Income Trust 19. ANZ OA OnePath Managed Growth Trust 20. ANZ OA OnePath Property Securities Trust 21. ANZ OA OnePath Select Leaders Trust 22. ANZ OA OnePath Sustainable Investments - Australian Share Trust 23. ANZ OA OnePath Tax Effective Income Trust 24. ANZ OA OptiMix Australian Fixed Interest Trust 25. ANZ OA OptiMix Australian Share Trust 26. ANZ OA OptiMix Conservative Trust 27. ANZ OA OptiMix Global Share Trust 28. ANZ OA OptiMix Global Smaller Companies Share Trust 29. ANZ OA OptiMix Growth Trust 30. ANZ OA OptiMix High Growth Trust 31. ANZ OA OptiMix Moderate Trust 32. ANZ OA OptiMix Property Securities Trust 33. ANZ OA Perpetual Australian Share Trust 34. ANZ OA Schroder Australian Equity Trust 35. ANZ OA SG Hiscock Property Trust 36. ANZ OA UBS Diversified Fixed Income Trust 37. ANZ OneAnswer - BR Scientific Australian Equity Trust 38. ANZ OneAnswer - BR Scientific International Equity Trust 39. ANZ Private International Fixed Interest Fund 40. ANZ Property Securities Trust 41. Australian Share Trust 42. Balanced Trust 43. Blue Chip Imputation Trust
44. Emerging Companies Trust 45. Global Share Trust 46. Heine Property Securities Fund 47. High Growth Trust 48. OneAnswer - Altrinsic Global Equities Trust 49. OneAnswer - Antipodes Global (Long Only) Trust 50. OneAnswer - Arrowstreet Global Equity (Hedged) Trust 51. OneAnswer - Ausbil Australian Emerging Leaders Trust 52. OneAnswer - Bennelong Australian Equities Trust 53. OneAnswer - Bentham Global Income Trust 54. OneAnswer - BlackRock Scientific Australian Equity Trust 55. OneAnswer - Blackrock Tactical Growth Trust 56. OneAnswer - BR Scientific Diversified Growth Trust 57. OneAnswer - BR Scientific International Equity Trust 58. OneAnswer - Colonial First State Global Credit Income Trust 59. OneAnswer - Colonial First State Global Listed Infrastructure Trust 60. OneAnswer - Colonial First State Imputation Trust 61. OneAnswer - Fidelity Australian Equities Trust 62. OneAnswer - Greencape Broadcap Trust 63. OneAnswer - Investors Mutual Australian Share Trust 64. OneAnswer - Janus Henderson Global Fixed Interest Total Return Trust 65. OneAnswer - Kapstream Absolute Return Income Trust 66. OneAnswer - Magellan Global Trust 67. OneAnswer - Merlon Australian Share Income Trust 68. OneAnswer - MFS Global Equity Trust 69. OneAnswer - Nikko AM Australian Shares Trust 70. OneAnswer - OnePath Global Property Securities Index Trust 71. OneAnswer - Pendal Australian Share Trust 72. OneAnswer - Pendal Core Hedged Global Shares Trust 73. OneAnswer - Pendal Monthly Income Plus Trust 74. OneAnswer - Pendal Smaller Companies Trust 75. OneAnswer - Perennial Value Shares Trust 76. OneAnswer - Perpetual Australian Share Trust 77. OneAnswer - Perpetual Balanced Growth Trust 78. OneAnswer - Perpetual Conservative Growth Trust 79. OneAnswer - Perpetual Ethical SRI Trust 80. OneAnswer - Platinum Asia Trust 81. OneAnswer - Platinum International Trust 82. OneAnswer - RARE Infastructure Value Trust 83. OneAnswer - Schroder Australian Equity Trust 84. OneAnswer - Schroder Balanced Trust 85. OneAnswer - Schroder Fixed Income Trust 86. OneAnswer - Schroder Real Return Trust 87. OneAnswer - SG Hiscock Property Trust 88. OneAnswer - Stewart Investors Worldwide Sustainability Trust 89. OneAnswer - T. Rowe Price Global Equity Trust 90. OneAnswer - T.Rowe Price Dynamic Global Bond Trust 91. OneAnswer - UBS Balanced Trust

Directors' Report for the financial year ended 30 June 2020
4
92. OneAnswer - UBS Defensive Trust 93. OneAnswer - UBS Diversified Fixed Income Trust 94. OneAnswer - Vanguard Australian Shares Index Trust 95. OneAnswer - Vanguard Balanced Index Trust 96. OneAnswer - Vanguard Conservative Index Trust 97. OneAnswer - Vanguard Diversified Bond Index Trust 98. OneAnswer - Vanguard Growth Index Trust 99. OneAnswer - Vanguard High Growth Index Trust 100. OneAnswer - Vanguard International Shares Index (Hedged) Trust 101. OneAnswer - Vanguard International Shares Index Trust 102. OneAnswer - Vanguard Property Securities Index Trust 103. OneAnswer - Walter Scott Global Equity (Hedged) Trust 104. OnePath Alternatives Growth Fund 105. OnePath Capital Guaranteed Trust 106. OnePath Capital Stable Trust 107. OnePath Diversified Credit Trust 108. OnePath Diversified Fixed Interest Trust 109. OnePath Geared Australian Shares Index Trust 110. OnePath Global Emerging Markets Share Trust 111. OnePath Managed Growth Trust 112. OnePath Select Leaders Trust 113. OnePath Sustainable Investments - Australian Share Trust 114. OnePath Wholesale Australian Share Trust 115. OnePath Wholesale Balanced Trust 116. OnePath Wholesale Blue Chip Imputation Trust 117. OnePath Wholesale Capital Stable Trust 118. OnePath Wholesale Diversified Fixed Interest Trust 119. OnePath Wholesale Emerging Companies Trust 120. OnePath Wholesale Geared Australian Shares Index Trust 121. OnePath Wholesale Global Emerging Markets Share Trust 122. OnePath Wholesale High Growth Trust 123. OnePath Wholesale Index Balanced Trust 124. OnePath Wholesale Index Conservative Trust 125. OnePath Wholesale Index Moderate Trust 126. OnePath Wholesale Managed Growth Trust 127. OnePath Wholesale Property Securities Trust 128. OnePath Wholesale Select Leaders Trust 129. OptiMix Australian Fixed Interest Trust 130. OptiMix Australian Share Trust 131. OptiMix Balanced Trust 132. OptiMix Conservative Trust 133. OptiMix Global Emerging Markets Share Trust 134. OptiMix Global Share Trust 135. OptiMix Global Smaller Companies Share Trust 136. OptiMix Growth Trust 137. OptiMix High Growth Trust 138. OptiMix Moderate Trust
139. OptiMix Property Securities Trust 140. OptiMix Wholesale Balanced Trust 141. OptiMix Wholesale Conservative Trust 142. OptiMix Wholesale Global (Hedged) Share Trust 143. OptiMix Wholesale Growth Trust 144. OptiMix Wholesale High Growth Trust 145. OptiMix Wholesale Moderate Trust 146. Pooled Australian Share Fund 147. Property Securities Trust
Responsible Entity
The Responsible Entity of the Schemes is OnePath Funds Management Limited. As at reporting date, the registered office and principal place of business of the Responsible Entity and the Schemes is Level 6, 161 Collins Street, Melbourne, VIC 3000.
The Directors of OnePath Funds Management Limited during or since the end of the financial year are:
Principal activities
The Schemes are registered Managed Investment Schemes domiciled in Australia.
The investment activities of the Schemes continued to be in accordance with the investment policies of the Schemes, as outlined in the Product Disclosure Statements (PDSs) or investment mandates, and investments in each class of asset were maintained within the stated asset allocation ranges. The key asset categories are cash, derivatives and unit trusts.
The Schemes did not have any employees during the year.
Review of operations and results
The Schemes continue to invest in accordance with target asset allocations as set out in the governing documents of the Schemes and in accordance with the provisions of each Scheme's Constitution.
The results of operations of the Schemes are disclosed in the Statements of Comprehensive Income.
Position Held Date Appointed Date Resigned
S J Chapman Independent Non-Executive Director, Chairman Appointed 1 August 2011 Resigned 31 January
2020A H Chonowitz Independent Non-Executive Director Appointed 1 March 2015 Resigned 31 July 2019M A Da Silva Executive Director Appointed 31 January 2020
L M Fricke Independent Non-Executive Director Appointed 7 September 2017 Resigned 31 January 2020
P G Mullin Independent Executive Director Appointed 1 March 2015 Resigned 31 January 2020
J Selak Independent Non-Executive Director, Chairman Appointed 31 January 2020
M A Somerville Independent Non-Executive Director Appointed 31 January 2020
Name
Directors' Report for the financial year ended 30 June 2020
5
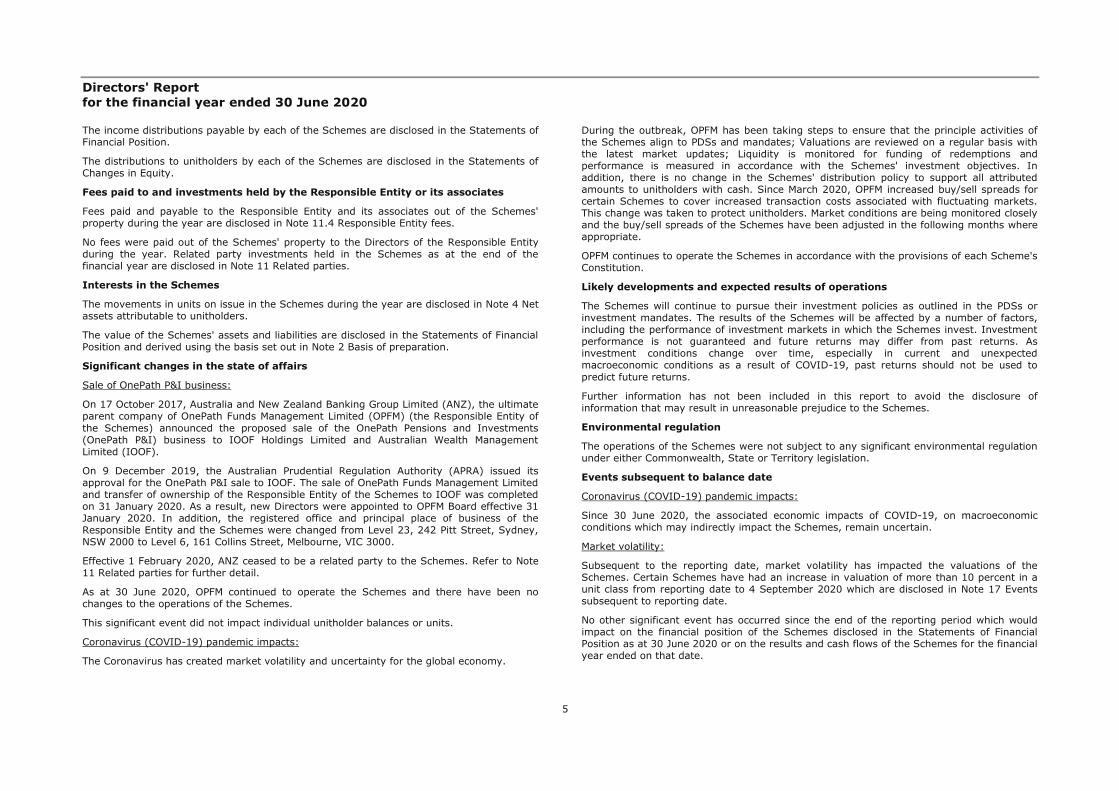
The income distributions payable by each of the Schemes are disclosed in the Statements of Financial Position.
The distributions to unitholders by each of the Schemes are disclosed in the Statements of Changes in Equity.
Fees paid to and investments held by the Responsible Entity or its associates
Fees paid and payable to the Responsible Entity and its associates out of the Schemes' property during the year are disclosed in Note 11.4 Responsible Entity fees.
No fees were paid out of the Schemes' property to the Directors of the Responsible Entity during the year. Related party investments held in the Schemes as at the end of the financial year are disclosed in Note 11 Related parties.
Interests in the Schemes
The movements in units on issue in the Schemes during the year are disclosed in Note 4 Net assets attributable to unitholders.
The value of the Schemes' assets and liabilities are disclosed in the Statements of Financial Position and derived using the basis set out in Note 2 Basis of preparation.
Significant changes in the state of affairs
Sale of OnePath P&I business:
On 17 October 2017, Australia and New Zealand Banking Group Limited (ANZ), the ultimate parent company of OnePath Funds Management Limited (OPFM) (the Responsible Entity of the Schemes) announced the proposed sale of the OnePath Pensions and Investments (OnePath P&I) business to IOOF Holdings Limited and Australian Wealth Management Limited (IOOF).
On 9 December 2019, the Australian Prudential Regulation Authority (APRA) issued its approval for the OnePath P&I sale to IOOF. The sale of OnePath Funds Management Limited and transfer of ownership of the Responsible Entity of the Schemes to IOOF was completed on 31 January 2020. As a result, new Directors were appointed to OPFM Board effective 31 January 2020. In addition, the registered office and principal place of business of the Responsible Entity and the Schemes were changed from Level 23, 242 Pitt Street, Sydney, NSW 2000 to Level 6, 161 Collins Street, Melbourne, VIC 3000.
Effective 1 February 2020, ANZ ceased to be a related party to the Schemes. Refer to Note 11 Related parties for further detail.
As at 30 June 2020, OPFM continued to operate the Schemes and there have been no changes to the operations of the Schemes.
This significant event did not impact individual unitholder balances or units.
Coronavirus (COVID-19) pandemic impacts:
The Coronavirus has created market volatility and uncertainty for the global economy.
During the outbreak, OPFM has been taking steps to ensure that the principle activities of the Schemes align to PDSs and mandates; Valuations are reviewed on a regular basis with the latest market updates; Liquidity is monitored for funding of redemptions and performance is measured in accordance with the Schemes' investment objectives. In addition, there is no change in the Schemes' distribution policy to support all attributed amounts to unitholders with cash. Since March 2020, OPFM increased buy/sell spreads for certain Schemes to cover increased transaction costs associated with fluctuating markets. This change was taken to protect unitholders. Market conditions are being monitored closely and the buy/sell spreads of the Schemes have been adjusted in the following months where appropriate.
OPFM continues to operate the Schemes in accordance with the provisions of each Scheme's Constitution.
Likely developments and expected results of operations
The Schemes will continue to pursue their investment policies as outlined in the PDSs or investment mandates. The results of the Schemes will be affected by a number of factors, including the performance of investment markets in which the Schemes invest. Investment performance is not guaranteed and future returns may differ from past returns. As investment conditions change over time, especially in current and unexpected macroeconomic conditions as a result of COVID-19, past returns should not be used to predict future returns.
Further information has not been included in this report to avoid the disclosure of information that may result in unreasonable prejudice to the Schemes.
Environmental regulation
The operations of the Schemes were not subject to any significant environmental regulation under either Commonwealth, State or Territory legislation.
Events subsequent to balance date
Coronavirus (COVID-19) pandemic impacts:
Since 30 June 2020, the associated economic impacts of COVID-19, on macroeconomic conditions which may indirectly impact the Schemes, remain uncertain.
Market volatility:
Subsequent to the reporting date, market volatility has impacted the valuations of the Schemes. Certain Schemes have had an increase in valuation of more than 10 percent in a unit class from reporting date to 4 September 2020 which are disclosed in Note 17 Events subsequent to reporting date.
No other significant event has occurred since the end of the reporting period which would impact on the financial position of the Schemes disclosed in the Statements of Financial Position as at 30 June 2020 or on the results and cash flows of the Schemes for the financial year ended on that date.

Directors' Report for the financial year ended 30 June 2020
6
Indemnities and insurance premiums for officers and auditor
Indemnification:
Under the Schemes' Constitutions, the Responsible Entity, including its officers and employees, is generally indemnified out of the Schemes' assets for any loss, damage, expense or other liability incurred by it in properly performing or exercising any of its powers, duties or rights in relation to the Schemes.
The Responsible Entity has not indemnified any auditor of the Schemes.
Insurance premiums:
No insurance premiums are paid out of the assets of the Schemes in relation to insurance cover for the Responsible Entity, its officers and employees or the auditor of the Schemes.
True and fair view
The financial statements have been prepared in accordance with applicable accounting standards to give a true and fair view of the state of affairs of the Schemes at the reporting date.
Lead auditor's independence declaration
The lead auditor's independence declaration is set out on pages 427 and 428 and forms part of the Directors' Report for the financial year ended 30 June 2020.
This report is made in accordance with a resolution of the Directors of OnePath Funds Management Limited.
John SelakDirector
Melbourne
7 September 2020

Financial Report Financial Statements - Statements of Financial Position as at 30 June 2020
7
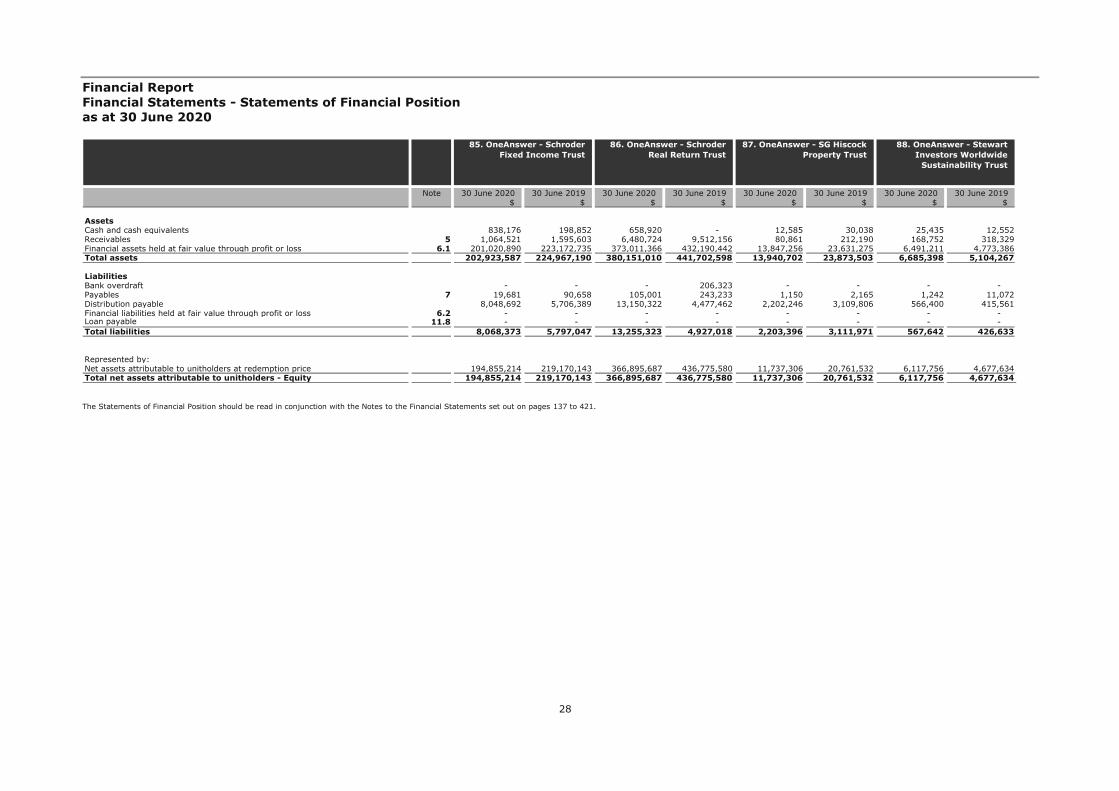
The Statements of Financial Position should be read in conjunction with the Notes to the Financial Statements set out on pages 137 to 421.
Note 30 June 2020 30 June 2019 30 June 2020 30 June 2019 30 June 2020 30 June 2019 30 June 2020 30 June 2019$ $ $ $ $ $ $ $
AssetsCash and cash equivalents 160,724 218,981 28,474 35,534 111,651 76,893 19,997 23,766Receivables 5 3,359,617 2,416,846 121,575 133,694 170,121 551,315 92,329 70,693Financial assets held at fair value through profit or loss 6.1 42,623,323 52,726,106 7,843,436 9,742,797 35,246,760 37,747,196 5,608,219 5,951,206Total assets 46,143,664 55,361,933 7,993,485 9,912,025 35,528,532 38,375,404 5,720,545 6,045,665
LiabilitiesBank overdraft - - - - - - - - Payables 7 86,936 68,060 7,365 9,213 4,287 5,167 4,408 4,839Distribution payable 1,053,394 487,125 99,542 101,070 218,806 613,986 144,239 104,618Financial liabilities held at fair value through profit or loss 6.2 - - - - - - - - Loan payable 11.8 - - - - - - - - Total liabilities 1,140,330 555,185 106,907 110,283 223,093 619,153 148,647 109,457
- - - - Represented by: - - - - Net assets attributable to unitholders at redemption price 45,003,334 54,806,748 7,886,578 9,801,742 35,305,439 37,756,251 5,571,898 5,936,208Total net assets attributable to unitholders - Equity 45,003,334 54,806,748 7,886,578 9,801,742 35,305,439 37,756,251 5,571,898 5,936,208
3. ANZ Equity Trust No 1 4. ANZ Fixed Interest Trust 1. Active Growth Trust 2. ANZ Equity Imputation Trust

Financial Report Financial Statements - Statements of Financial Position as at 30 June 2020
8
The Statements of Financial Position should be read in conjunction with the Notes to the Financial Statements set out on pages 137 to 421.
Note 30 June 2020 30 June 2019 30 June 2020 30 June 2019 30 June 2020 30 June 2019 30 June 2020 30 June 2019$ $ $ $ $ $ $ $
AssetsCash and cash equivalents 46,401 36,356 - 47,681 479,920 121,794 184,126 138,023Receivables 5 1,220,715 2,571 5,709,514 6,406,247 1,144,011 3,368,866 4,755,323 8,345,278Financial assets held at fair value through profit or loss 6.1 11,852,875 18,000,933 260,036,584 347,753,107 132,625,644 158,357,251 46,884,640 55,288,387Total assets 13,119,991 18,039,860 265,746,098 354,207,035 134,249,575 161,847,911 51,824,089 63,771,688
LiabilitiesBank overdraft - - 19,455 - - - - - Payables 7 1,769 2,452 95,267 179,168 9,382 52,084 2,971 4,128Distribution payable 1,558,748 563,457 4,913,074 2,494,281 4,294,218 5,839,915 5,327,696 11,769,547Financial liabilities held at fair value through profit or loss 6.2 - - - - - - - - Loan payable 11.8 - - - - - - - - Total liabilities 1,560,517 565,909 5,027,796 2,673,449 4,303,600 5,891,999 5,330,667 11,773,675
- - - - Represented by: - - - - Net assets attributable to unitholders at redemption price 11,559,474 17,473,951 260,718,302 351,533,586 129,945,975 155,955,912 46,493,422 51,998,013Total net assets attributable to unitholders - Equity 11,559,474 17,473,951 260,718,302 351,533,586 129,945,975 155,955,912 46,493,422 51,998,013
7. ANZ OA Colonial First State Imputation Trust
8. ANZ OA Investors Mutual Australian Share Trust
5. ANZ OA - Pendal Core Hedged Global Shares Trust
6. ANZ OA Arrowstreet Global Equity (Hedged) Trust

Financial Report Financial Statements - Statements of Financial Position as at 30 June 2020
9
The Statements of Financial Position should be read in conjunction with the Notes to the Financial Statements set out on pages 137 to 421.
Note 30 June 2020 30 June 2019 30 June 2020 30 June 2019 30 June 2020 30 June 2019 30 June 2020 30 June 2019$ $ $ $ $ $ $ $
AssetsCash and cash equivalents 856,474 448,404 316,172 203,114 235,181 252,293 80,458 53,175Receivables 5 14,955,127 4,376,724 2,885,613 1,994,535 362,886 1,244,734 1,572,287 876,660Financial assets held at fair value through profit or loss 6.1 102,098,184 84,365,759 48,175,687 59,735,590 70,765,319 83,550,961 22,072,240 26,208,621Total assets 117,909,785 89,190,887 51,377,472 61,933,239 71,363,386 85,047,988 23,724,985 27,138,456
LiabilitiesBank overdraft - - - - - - - - Payables 7 5,439 4,279 28,795 30,924 22,252 26,644 50,155 61,780Distribution payable 15,240,030 4,700,533 3,667,142 2,612,231 1,718,558 2,363,624 494,881 101,694Financial liabilities held at fair value through profit or loss 6.2 - - 16,674 17,314 - - - - Loan payable 11.8 - - - - - - - - Total liabilities 15,245,469 4,704,812 3,712,611 2,660,469 1,740,810 2,390,268 545,036 163,474
- - - - Represented by: - - - - Net assets attributable to unitholders at redemption price 102,664,316 84,486,075 47,664,861 59,272,770 69,622,576 82,657,720 23,179,949 26,974,982Total net assets attributable to unitholders - Equity 102,664,316 84,486,075 47,664,861 59,272,770 69,622,576 82,657,720 23,179,949 26,974,982
11. ANZ OA OnePath Australian Share Trust
12. ANZ OA OnePath Balanced Trust
9. ANZ OA Magellan Global Trust
10. ANZ OA OnePath Active Growth Trust
Financial Report Financial Statements - Statements of Financial Position as at 30 June 2020
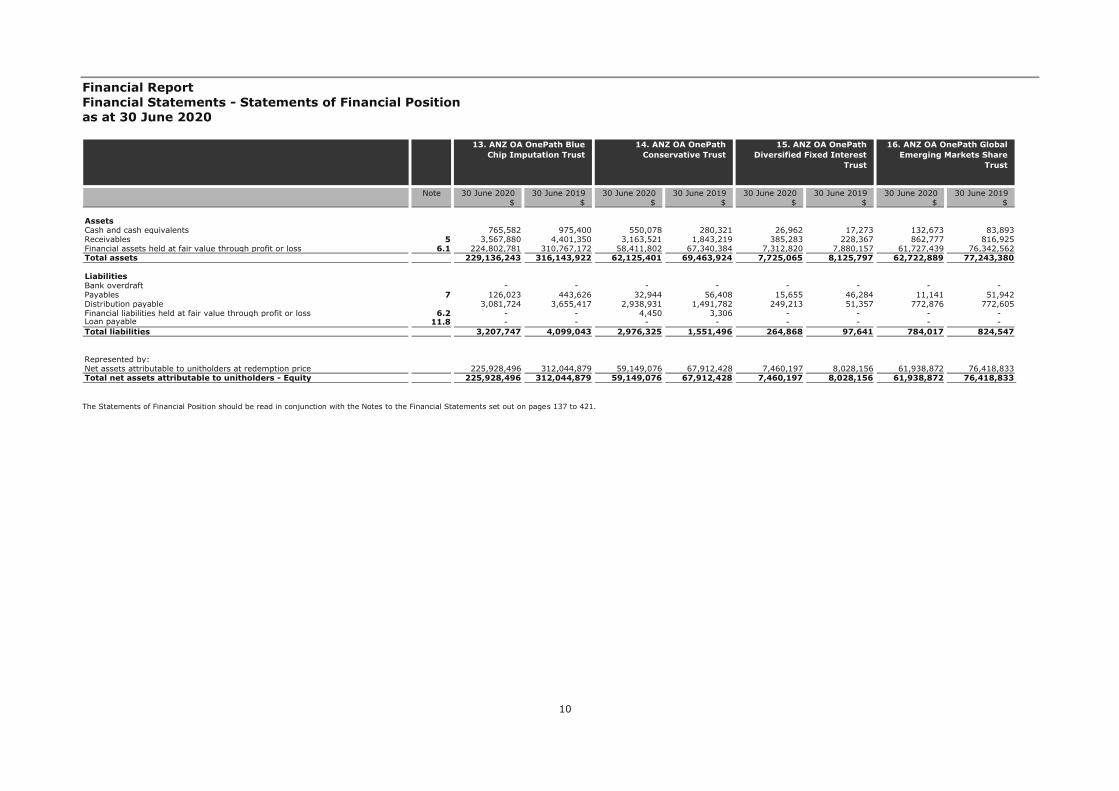
10
The Statements of Financial Position should be read in conjunction with the Notes to the Financial Statements set out on pages 137 to 421.
Note 30 June 2020 30 June 2019 30 June 2020 30 June 2019 30 June 2020 30 June 2019 30 June 2020 30 June 2019$ $ $ $ $ $ $ $
AssetsCash and cash equivalents 765,582 975,400 550,078 280,321 26,962 17,273 132,673 83,893Receivables 5 3,567,880 4,401,350 3,163,521 1,843,219 385,283 228,367 862,777 816,925Financial assets held at fair value through profit or loss 6.1 224,802,781 310,767,172 58,411,802 67,340,384 7,312,820 7,880,157 61,727,439 76,342,562Total assets 229,136,243 316,143,922 62,125,401 69,463,924 7,725,065 8,125,797 62,722,889 77,243,380
LiabilitiesBank overdraft - - - - - - - - Payables 7 126,023 443,626 32,944 56,408 15,655 46,284 11,141 51,942Distribution payable 3,081,724 3,655,417 2,938,931 1,491,782 249,213 51,357 772,876 772,605Financial liabilities held at fair value through profit or loss 6.2 - - 4,450 3,306 - - - - Loan payable 11.8 - - - - - - - - Total liabilities 3,207,747 4,099,043 2,976,325 1,551,496 264,868 97,641 784,017 824,547
- - - - Represented by: - - - - Net assets attributable to unitholders at redemption price 225,928,496 312,044,879 59,149,076 67,912,428 7,460,197 8,028,156 61,938,872 76,418,833Total net assets attributable to unitholders - Equity 225,928,496 312,044,879 59,149,076 67,912,428 7,460,197 8,028,156 61,938,872 76,418,833
15. ANZ OA OnePath Diversified Fixed Interest
Trust
16. ANZ OA OnePath Global Emerging Markets Share
Trust
13. ANZ OA OnePath Blue Chip Imputation Trust
14. ANZ OA OnePath Conservative Trust

Financial Report Financial Statements - Statements of Financial Position as at 30 June 2020
11
The Statements of Financial Position should be read in conjunction with the Notes to the Financial Statements set out on pages 137 to 421.
Note 30 June 2020 30 June 2019 30 June 2020 30 June 2019 30 June 2020 30 June 2019 30 June 2020 30 June 2019$ $ $ $ $ $ $ $
AssetsCash and cash equivalents 60,313 45,838 82,894 21,358 291,780 191,463 276,141 343,241Receivables 5 1,418,418 1,466,701 259,064 181,214 5,276,878 4,437,447 1,901,702 1,032,930Financial assets held at fair value through profit or loss 6.1 16,587,439 21,416,357 7,788,449 9,814,743 77,488,096 90,965,043 102,622,474 164,903,989Total assets 18,066,170 22,928,896 8,130,407 10,017,315 83,056,754 95,593,953 104,800,317 166,280,160
LiabilitiesBank overdraft - - - - - - - - Payables 7 1,147 1,162 12,072 15,700 33,270 36,596 7,637 72,443Distribution payable 1,794,478 1,923,647 84,078 3,802 2,146,730 1,155,329 9,501,673 13,827,523Financial liabilities held at fair value through profit or loss 6.2 - - - - - - - - Loan payable 11.8 - - - - - - - - Total liabilities 1,795,625 1,924,809 96,150 19,502 2,180,000 1,191,925 9,509,310 13,899,966
- - - - Represented by: - - - - Net assets attributable to unitholders at redemption price 16,270,545 21,004,087 8,034,257 9,997,813 80,876,754 94,402,028 95,291,007 152,380,194Total net assets attributable to unitholders - Equity 16,270,545 21,004,087 8,034,257 9,997,813 80,876,754 94,402,028 95,291,007 152,380,194
19. ANZ OA OnePath Managed Growth Trust
20. ANZ OA OnePath Property Securities Trust
17. ANZ OA OnePath High Growth Trust
18. ANZ OA OnePath Income Trust
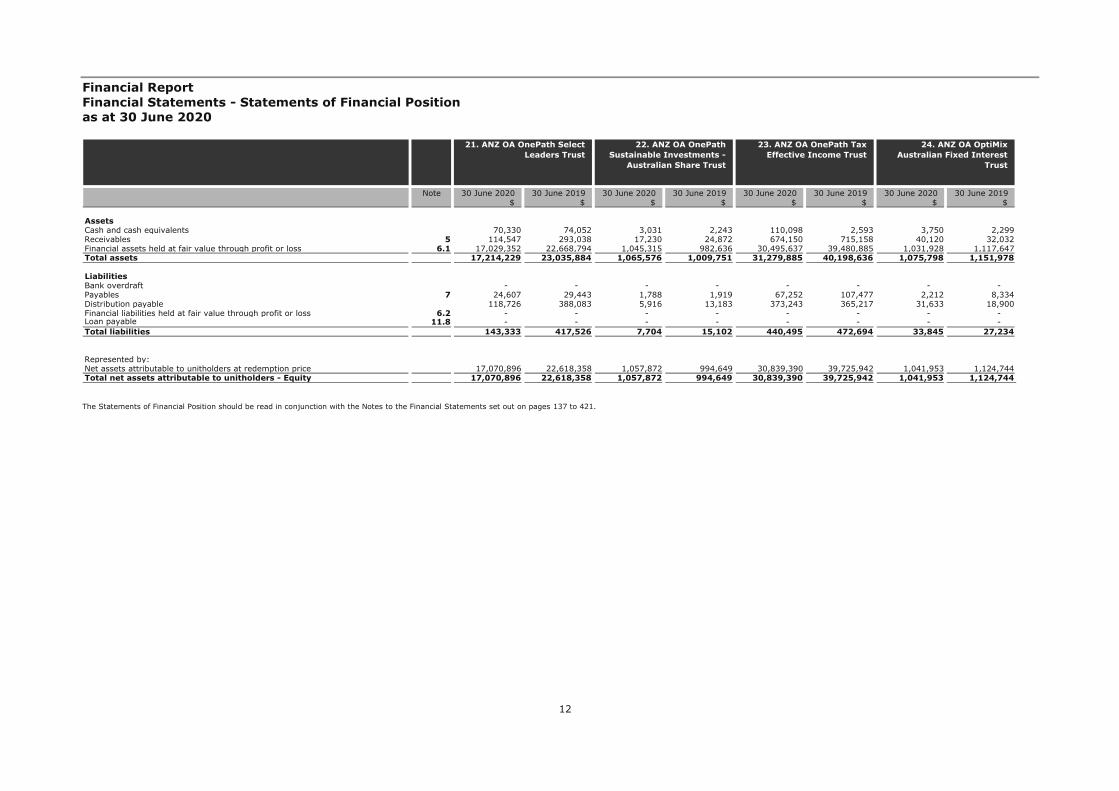
Financial Report Financial Statements - Statements of Financial Position as at 30 June 2020
12
The Statements of Financial Position should be read in conjunction with the Notes to the Financial Statements set out on pages 137 to 421.
Note 30 June 2020 30 June 2019 30 June 2020 30 June 2019 30 June 2020 30 June 2019 30 June 2020 30 June 2019$ $ $ $ $ $ $ $
AssetsCash and cash equivalents 70,330 74,052 3,031 2,243 110,098 2,593 3,750 2,299Receivables 5 114,547 293,038 17,230 24,872 674,150 715,158 40,120 32,032Financial assets held at fair value through profit or loss 6.1 17,029,352 22,668,794 1,045,315 982,636 30,495,637 39,480,885 1,031,928 1,117,647Total assets 17,214,229 23,035,884 1,065,576 1,009,751 31,279,885 40,198,636 1,075,798 1,151,978
LiabilitiesBank overdraft - - - - - - - - Payables 7 24,607 29,443 1,788 1,919 67,252 107,477 2,212 8,334Distribution payable 118,726 388,083 5,916 13,183 373,243 365,217 31,633 18,900Financial liabilities held at fair value through profit or loss 6.2 - - - - - - - - Loan payable 11.8 - - - - - - - - Total liabilities 143,333 417,526 7,704 15,102 440,495 472,694 33,845 27,234
- - - - Represented by: - - - - Net assets attributable to unitholders at redemption price 17,070,896 22,618,358 1,057,872 994,649 30,839,390 39,725,942 1,041,953 1,124,744Total net assets attributable to unitholders - Equity 17,070,896 22,618,358 1,057,872 994,649 30,839,390 39,725,942 1,041,953 1,124,744
23. ANZ OA OnePath Tax Effective Income Trust
24. ANZ OA OptiMix Australian Fixed Interest
Trust
21. ANZ OA OnePath Select Leaders Trust
22. ANZ OA OnePath Sustainable Investments -
Australian Share Trust
Financial Report Financial Statements - Statements of Financial Position as at 30 June 2020
13
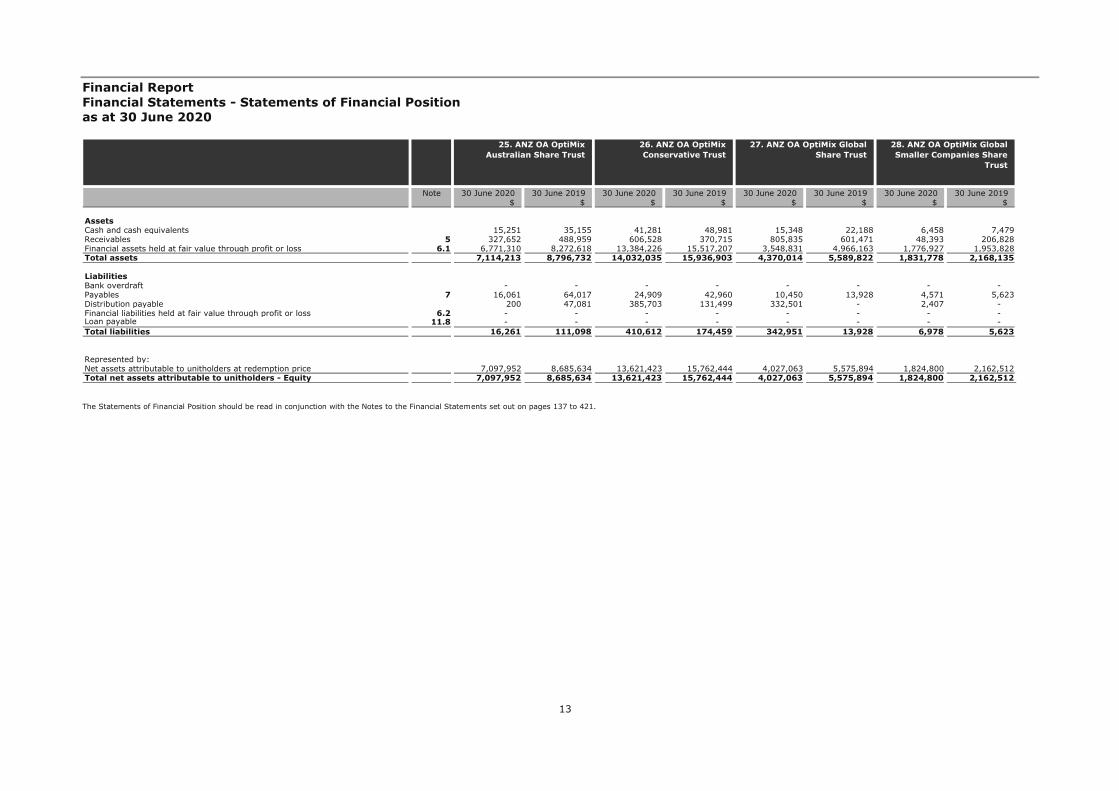
The Statements of Financial Position should be read in conjunction with the Notes to the Financial Statements set out on pages 137 to 421.
Note 30 June 2020 30 June 2019 30 June 2020 30 June 2019 30 June 2020 30 June 2019 30 June 2020 30 June 2019$ $ $ $ $ $ $ $
AssetsCash and cash equivalents 15,251 35,155 41,281 48,981 15,348 22,188 6,458 7,479Receivables 5 327,652 488,959 606,528 370,715 805,835 601,471 48,393 206,828Financial assets held at fair value through profit or loss 6.1 6,771,310 8,272,618 13,384,226 15,517,207 3,548,831 4,966,163 1,776,927 1,953,828Total assets 7,114,213 8,796,732 14,032,035 15,936,903 4,370,014 5,589,822 1,831,778 2,168,135
LiabilitiesBank overdraft - - - - - - - - Payables 7 16,061 64,017 24,909 42,960 10,450 13,928 4,571 5,623Distribution payable 200 47,081 385,703 131,499 332,501 - 2,407 - Financial liabilities held at fair value through profit or loss 6.2 - - - - - - - - Loan payable 11.8 - - - - - - - - Total liabilities 16,261 111,098 410,612 174,459 342,951 13,928 6,978 5,623
- - - - Represented by: - - - - Net assets attributable to unitholders at redemption price 7,097,952 8,685,634 13,621,423 15,762,444 4,027,063 5,575,894 1,824,800 2,162,512Total net assets attributable to unitholders - Equity 7,097,952 8,685,634 13,621,423 15,762,444 4,027,063 5,575,894 1,824,800 2,162,512
27. ANZ OA OptiMix Global Share Trust
28. ANZ OA OptiMix Global Smaller Companies Share
Trust
25. ANZ OA OptiMix Australian Share Trust
26. ANZ OA OptiMix Conservative Trust

Financial Report Financial Statements - Statements of Financial Position as at 30 June 2020
14
The Statements of Financial Position should be read in conjunction with the Notes to the Financial Statements set out on pages 137 to 421.
Note 30 June 2020 30 June 2019 30 June 2020 30 June 2019 30 June 2020 30 June 2019 30 June 2020 30 June 2019$ $ $ $ $ $ $ $
AssetsCash and cash equivalents 72,097 81,630 19,252 38,179 62,049 55,282 7,563 9,700Receivables 5 1,737,386 797,131 699,113 588,723 691,355 392,933 42,124 36,590Financial assets held at fair value through profit or loss 6.1 20,938,174 26,467,865 8,147,572 9,648,711 16,993,270 20,621,436 2,060,637 3,141,515Total assets 22,747,657 27,346,626 8,865,937 10,275,613 17,746,674 21,069,651 2,110,324 3,187,805
LiabilitiesBank overdraft - - - - - - - - Payables 7 48,829 60,751 18,303 21,690 35,768 44,134 4,904 7,599Distribution payable 307,599 154,609 93,753 70,091 433,947 84,037 10,923 1,655Financial liabilities held at fair value through profit or loss 6.2 - - - - - - - - Loan payable 11.8 - - - - - - - - Total liabilities 356,428 215,360 112,056 91,781 469,715 128,171 15,827 9,254
- - - - Represented by: - - - - Net assets attributable to unitholders at redemption price 22,391,229 27,131,266 8,753,881 10,183,832 17,276,959 20,941,480 2,094,497 3,178,551Total net assets attributable to unitholders - Equity 22,391,229 27,131,266 8,753,881 10,183,832 17,276,959 20,941,480 2,094,497 3,178,551
31. ANZ OA OptiMix Moderate Trust
32. ANZ OA OptiMix Property Securities Trust
29. ANZ OA OptiMix Growth Trust
30. ANZ OA OptiMix High Growth Trust

Financial Report Financial Statements - Statements of Financial Position as at 30 June 2020
15
The Statements of Financial Position should be read in conjunction with the Notes to the Financial Statements set out on pages 137 to 421.
Note 30 June 2020 30 June 2019 30 June 2020 30 June 2019 30 June 2020 30 June 2019 30 June 2020 30 June 2019$ $ $ $ $ $ $ $
AssetsCash and cash equivalents 804,917 858,396 265,409 269,459 36,468 26,206 7,148 8,790Receivables 5 4,432,895 13,688,843 9,548,251 20,194,748 1,994,235 2,832,850 39,901 33,393Financial assets held at fair value through profit or loss 6.1 251,552,684 331,472,475 65,554,771 120,683,040 10,607,371 18,839,259 1,997,695 2,157,470Total assets 256,790,496 346,019,714 75,368,431 141,147,247 12,638,074 21,698,315 2,044,744 2,199,653
LiabilitiesBank overdraft - - - - - - - - Payables 7 38,614 102,056 10,495 75,855 2,225 3,455 1,648 1,830Distribution payable 4,155,908 13,300,338 6,609,221 28,514,319 2,404,160 3,752,655 23,358 23,949Financial liabilities held at fair value through profit or loss 6.2 - - - - - - - - Loan payable 11.8 - - - - - - - - Total liabilities 4,194,522 13,402,394 6,619,716 28,590,174 2,406,385 3,756,110 25,006 25,779
- - - - Represented by: - - - - Net assets attributable to unitholders at redemption price 252,595,974 332,617,320 68,748,715 112,557,073 10,231,689 17,942,205 2,019,738 2,173,874Total net assets attributable to unitholders - Equity 252,595,974 332,617,320 68,748,715 112,557,073 10,231,689 17,942,205 2,019,738 2,173,874
35. ANZ OA SG Hiscock Property Trust
36. ANZ OA UBS Diversified Fixed Income Trust
33. ANZ OA Perpetual Australian Share Trust
34. ANZ OA Schroder Australian Equity Trust

Financial Report Financial Statements - Statements of Financial Position as at 30 June 2020
16
The Statements of Financial Position should be read in conjunction with the Notes to the Financial Statements set out on pages 137 to 421.
Note 30 June 2020 30 June 2019 30 June 2020 30 June 2019 30 June 2020 30 June 2019 30 June 2020 30 June 2019$ $ $ $ $ $ $ $
AssetsCash and cash equivalents 47,318 7,168 58,206 - 3,285,361 6,772,942 166,785 225,148Receivables 5 88,668 325,146 114,219 192,609 10,609,591 3,167,248 5,563,525 8,391,594Financial assets held at fair value through profit or loss 6.1 13,753,913 18,186,667 11,019,513 13,050,626 242,092,453 179,130,192 55,352,653 91,818,508Total assets 13,889,899 18,518,981 11,191,938 13,243,235 255,987,405 189,070,382 61,082,963 100,435,250
LiabilitiesBank overdraft - - - 24,109 - - - - Payables 7 3,516 19,114 2,714 2,286 64,769 - 17,868 31,760Distribution payable 1,526,826 1,805,642 1,156,061 916,777 11,844,740 3,024,145 12,275,304 12,739,322Financial liabilities held at fair value through profit or loss 6.2 - - - - - - - - Loan payable 11.8 - - - - - - - - Total liabilities 1,530,342 1,824,756 1,158,775 943,172 11,909,509 3,024,145 12,293,172 12,771,082
- - - - Represented by: - - - - Net assets attributable to unitholders at redemption price 12,359,557 16,694,225 10,033,163 12,300,063 244,077,896 186,046,237 48,789,791 87,664,168Total net assets attributable to unitholders - Equity 12,359,557 16,694,225 10,033,163 12,300,063 244,077,896 186,046,237 48,789,791 87,664,168
39. ANZ Private International Fixed Interest Fund
40. ANZ Property Securities Trust
37. ANZ OneAnswer - BR Scientific Australian Equity
Trust
38. ANZ OneAnswer - BR Scientific International
Equity Trust

Financial Report Financial Statements - Statements of Financial Position as at 30 June 2020
17
The Statements of Financial Position should be read in conjunction with the Notes to the Financial Statements set out on pages 137 to 421.
Note 30 June 2020 30 June 2019 30 June 2020 30 June 2019 30 June 2020 30 June 2019 30 June 2020 30 June 2019$ $ $ $ $ $ $ $
AssetsCash and cash equivalents 298,005 208,342 203,492 244,295 259,217 352,569 639,382 700,461Receivables 5 598,042 1,967,448 4,610,696 2,474,294 1,164,399 1,385,071 35,684,477 32,076,003Financial assets held at fair value through profit or loss 6.1 121,539,187 133,793,644 66,780,685 78,867,189 73,765,226 98,888,834 190,383,807 256,294,820Total assets 122,435,234 135,969,434 71,594,873 81,585,778 75,188,842 100,626,474 226,707,666 289,071,284
LiabilitiesBank overdraft - - - - - - - - Payables 7 22,931 54,590 31,990 38,011 87,005 124,743 117,594 289,584Distribution payable 538,384 1,865,986 4,076,243 4,795,587 881,301 960,537 48,759,946 44,401,180Financial liabilities held at fair value through profit or loss 6.2 - - - - - - - - Loan payable 11.8 - - - - - - - - Total liabilities 561,315 1,920,576 4,108,233 4,833,598 968,306 1,085,280 48,877,540 44,690,764
- - - - Represented by: - - - - Net assets attributable to unitholders at redemption price 121,873,919 134,048,858 67,486,640 76,752,180 74,220,536 99,541,194 177,830,126 244,380,520Total net assets attributable to unitholders - Equity 121,873,919 134,048,858 67,486,640 76,752,180 74,220,536 99,541,194 177,830,126 244,380,520
43. Blue Chip Imputation Trust
44. Emerging Companies Trust
41. Australian Share Trust 42. Balanced Trust

Financial Report Financial Statements - Statements of Financial Position as at 30 June 2020
18
The Statements of Financial Position should be read in conjunction with the Notes to the Financial Statements set out on pages 137 to 421.
Note 30 June 2020 30 June 2019 30 June 2020 30 June 2019 30 June 2020 30 June 2019 30 June 2020 30 June 2019$ $ $ $ $ $ $ $
AssetsCash and cash equivalents 525,409 168,390 24,045 29,390 4,984 3,123 - - Receivables 5 1,156,003 1,305,027 624,435 798,602 114,601 103,962 726,835 1,555,799Financial assets held at fair value through profit or loss 6.1 182,252,782 180,658,575 6,219,043 8,751,466 1,298,367 1,471,943 8,371,197 16,184,016Total assets 183,934,194 182,131,992 6,867,523 9,579,458 1,417,952 1,579,028 9,098,032 17,739,815
LiabilitiesBank overdraft - - - - - - 39,855 4,847Payables 7 11,451 21,302 11,037 15,510 2,754 3,130 754 582Distribution payable 1,110,760 1,273,281 95,090 8,703 105,791 14,831 1,180,882 1,836,831Financial liabilities held at fair value through profit or loss 6.2 - - - - - - - - Loan payable 11.8 - - - - - - - - Total liabilities 1,122,211 1,294,583 106,127 24,213 108,545 17,961 1,221,491 1,842,260
- - - - Represented by: - - - - Net assets attributable to unitholders at redemption price 182,811,983 180,837,409 6,761,396 9,555,245 1,309,407 1,561,067 7,876,541 15,897,555Total net assets attributable to unitholders - Equity 182,811,983 180,837,409 6,761,396 9,555,245 1,309,407 1,561,067 7,876,541 15,897,555
47. High Growth Trust 48. OneAnswer - Altrinsic Global Equities Trust
45. Global Share Trust 46. Heine Property Securities Fund

Financial Report Financial Statements - Statements of Financial Position as at 30 June 2020
19
The Statements of Financial Position should be read in conjunction with the Notes to the Financial Statements set out on pages 137 to 421.
Note 30 June 2020 30 June 2019 30 June 2020 30 June 2019 30 June 2020 30 June 2019 30 June 2020 30 June 2019$ $ $ $ $ $ $ $
AssetsCash and cash equivalents 146,409 - 33,713 41,153 177,853 - 212,043 354,006Receivables 5 1,519,766 4,861,697 187,644 100,685 153,031 1,490,544 7,221,610 2,469,451Financial assets held at fair value through profit or loss 6.1 68,997,583 85,380,637 9,302,599 11,801,221 63,741,288 82,884,595 92,634,254 99,649,962Total assets 70,663,758 90,242,334 9,523,956 11,943,059 64,072,172 84,375,139 100,067,907 102,473,419
LiabilitiesBank overdraft - 155,545 - - - 155,506 - - Payables 7 11,823 83,562 6,360 25,489 11,241 41,649 11,029 5,721Distribution payable 927 781,285 109,640 39,850 4,305,378 3,399,447 10,119,437 3,705,383Financial liabilities held at fair value through profit or loss 6.2 - - - - - - - - Loan payable 11.8 - - - - - - - - Total liabilities 12,750 1,020,392 116,000 65,339 4,316,619 3,596,602 10,130,466 3,711,104
- - - - Represented by: - - - - Net assets attributable to unitholders at redemption price 70,651,008 89,221,942 9,407,956 11,877,720 59,755,553 80,778,537 89,937,441 98,762,315Total net assets attributable to unitholders - Equity 70,651,008 89,221,942 9,407,956 11,877,720 59,755,553 80,778,537 89,937,441 98,762,315
51. OneAnswer - Ausbil Australian Emerging Leaders
Trust
52. OneAnswer - Bennelong Australian Equities Trust
49. OneAnswer - Antipodes Global (Long Only) Trust
50. OneAnswer - Arrowstreet Global Equity (Hedged) Trust

Financial Report Financial Statements - Statements of Financial Position as at 30 June 2020
20
The Statements of Financial Position should be read in conjunction with the Notes to the Financial Statements set out on pages 137 to 421.
Note 30 June 2020 30 June 2019 30 June 2020 30 June 2019 30 June 2020 30 June 2019 30 June 2020 30 June 2019$ $ $ $ $ $ $ $
AssetsCash and cash equivalents - - 725 3,479 234,361 - 154,217 - Receivables 5 601,778 613,527 31,490 57,913 2,860,571 4,941,627 201,176 1,508,183Financial assets held at fair value through profit or loss 6.1 58,578,184 74,292,085 3,049,074 3,095,501 39,790,929 49,249,173 35,299,964 41,325,517Total assets 59,179,962 74,905,612 3,081,289 3,156,893 42,885,861 54,190,800 35,655,357 42,833,700
LiabilitiesBank overdraft 26,019 225,383 - - - 70,234 - 481,176Payables 7 9,243 80,679 4,453 4,064 6,314 8,295 40,807 11,880Distribution payable 620,455 590,730 3,818 36,693 3,095,406 5,298,186 3,936,617 2,833,960Financial liabilities held at fair value through profit or loss 6.2 - - - - - - - - Loan payable 11.8 - - - - - - - - Total liabilities 655,717 896,792 8,271 40,757 3,101,720 5,376,715 3,977,424 3,327,016
- - - - Represented by: - - - - Net assets attributable to unitholders at redemption price 58,524,245 74,008,820 3,073,018 3,116,136 39,784,141 48,814,085 31,677,933 39,506,684Total net assets attributable to unitholders - Equity 58,524,245 74,008,820 3,073,018 3,116,136 39,784,141 48,814,085 31,677,933 39,506,684
55. OneAnswer - Blackrock Tactical Growth Trust
56. OneAnswer - BR Scientific Diversified Growth
Trust
53. OneAnswer - Bentham Global Income Trust
54. OneAnswer - BlackRock Scientific Australian Equity
Trust

Financial Report Financial Statements - Statements of Financial Position as at 30 June 2020
21
The Statements of Financial Position should be read in conjunction with the Notes to the Financial Statements set out on pages 137 to 421.
Note 30 June 2020 30 June 2019 30 June 2020 30 June 2019 30 June 2020 30 June 2019 30 June 2020 30 June 2019$ $ $ $ $ $ $ $
AssetsCash and cash equivalents - - 101,025 - 666,438 812,629 14,371 22,182Receivables 5 32,411 29,964 20,893 490,850 10,206,288 1,991,292 135,074 205,357Financial assets held at fair value through profit or loss 6.1 2,186,471 2,276,753 34,903,027 43,380,113 146,085,304 154,993,077 3,946,885 5,312,950Total assets 2,218,882 2,306,717 35,024,945 43,870,963 156,958,030 157,796,998 4,096,330 5,540,489
LiabilitiesBank overdraft 2,097 1,502 - 264,966 - - - - Payables 7 3,175 2,677 4,417 25,072 29,665 61,922 6,287 25,332Distribution payable 5,787 6,988 34,489 126,827 10,142,672 1,866,849 - - Financial liabilities held at fair value through profit or loss 6.2 - - - - - - - - Loan payable 11.8 - - - - - - - - Total liabilities 11,059 11,167 38,906 416,865 10,172,337 1,928,771 6,287 25,332
- - - - Represented by: - - - - Net assets attributable to unitholders at redemption price 2,207,823 2,295,550 34,986,039 43,454,098 146,785,693 155,868,227 4,090,043 5,515,157Total net assets attributable to unitholders - Equity 2,207,823 2,295,550 34,986,039 43,454,098 146,785,693 155,868,227 4,090,043 5,515,157
59. OneAnswer - Colonial First State Global Listed
Infrastructure Trust
60. OneAnswer - Colonial First State Imputation Trust
57. OneAnswer - BR Scientific International
Equity Trust
58. OneAnswer - Colonial First State Global Credit
Income Trust

Financial Report Financial Statements - Statements of Financial Position as at 30 June 2020
22
The Statements of Financial Position should be read in conjunction with the Notes to the Financial Statements set out on pages 137 to 421.
Note 30 June 2020 30 June 2019 30 June 2020 30 June 2019 30 June 2020 30 June 2019 30 June 2020 30 June 2019$ $ $ $ $ $ $ $
AssetsCash and cash equivalents 951,460 86,043 173,800 165,733 586,698 - 57,230 - Receivables 5 12,857,145 5,020,250 320,191 2,407,497 7,270,562 11,077,423 176,097 9,958Financial assets held at fair value through profit or loss 6.1 248,552,688 325,844,885 73,445,405 75,295,359 144,832,815 175,504,636 3,885,108 3,849,484Total assets 262,361,293 330,951,178 73,939,396 77,868,589 152,690,075 186,582,059 4,118,435 3,859,442
LiabilitiesBank overdraft - - - - - 158,262 - 5,054Payables 7 54,444 173,516 6,191 10,956 17,252 84,221 611 603Distribution payable 34,429,683 9,728,697 214,884 2,373,922 13,928,637 24,215,600 168,431 3,334Financial liabilities held at fair value through profit or loss 6.2 - - - - - - - - Loan payable 11.8 - - - - - - - - Total liabilities 34,484,127 9,902,213 221,075 2,384,878 13,945,889 24,458,083 169,042 8,991
- - - - Represented by: - - - - Net assets attributable to unitholders at redemption price 227,877,166 321,048,965 73,718,321 75,483,711 138,744,186 162,123,976 3,949,393 3,850,451Total net assets attributable to unitholders - Equity 227,877,166 321,048,965 73,718,321 75,483,711 138,744,186 162,123,976 3,949,393 3,850,451
63. OneAnswer - Investors Mutual Australian Share
Trust
64. OneAnswer - Janus Henderson Global Fixed
Interest Total Return Trust
61. OneAnswer - Fidelity Australian Equities Trust
62. OneAnswer - Greencape Broadcap Trust

Financial Report Financial Statements - Statements of Financial Position as at 30 June 2020
23
The Statements of Financial Position should be read in conjunction with the Notes to the Financial Statements set out on pages 137 to 421.
Note 30 June 2020 30 June 2019 30 June 2020 30 June 2019 30 June 2020 30 June 2019 30 June 2020 30 June 2019$ $ $ $ $ $ $ $
AssetsCash and cash equivalents 969,748 - 1,183,492 570,538 142,005 14,636 827,776 - Receivables 5 4,603,672 5,449,652 9,565,833 8,602,499 241,170 459,006 47,571,608 55,721,339Financial assets held at fair value through profit or loss 6.1 557,245,710 644,353,913 229,183,689 175,157,485 53,715,517 74,170,426 382,134,573 477,948,035Total assets 562,819,130 649,803,565 239,933,014 184,330,522 54,098,692 74,644,068 430,533,957 533,669,374
LiabilitiesBank overdraft - 4,630 - - - - - 791,726Payables 7 166,716 223,565 27,143 88,418 22,863 45,818 107,215 391,170Distribution payable 4,544,689 3,547,324 30,393,831 8,856,487 219,423 285,229 102,187,550 76,412,341Financial liabilities held at fair value through profit or loss 6.2 - - - - - - - - Loan payable 11.8 - - - - - - - - Total liabilities 4,711,405 3,775,519 30,420,974 8,944,905 242,286 331,047 102,294,765 77,595,237
- - - - Represented by: - - - - Net assets attributable to unitholders at redemption price 558,107,725 646,028,046 209,512,040 175,385,617 53,856,406 74,313,021 328,239,192 456,074,137Total net assets attributable to unitholders - Equity 558,107,725 646,028,046 209,512,040 175,385,617 53,856,406 74,313,021 328,239,192 456,074,137
67. OneAnswer - Merlon Australian Share Income
Trust
68. OneAnswer - MFS Global Equity Trust
65. OneAnswer - Kapstream Absolute Return Income
Trust
66. OneAnswer - Magellan Global Trust
Financial Report Financial Statements - Statements of Financial Position as at 30 June 2020
24
The Statements of Financial Position should be read in conjunction with the Notes to the Financial Statements set out on pages 137 to 421.
Note 30 June 2020 30 June 2019 30 June 2020 30 June 2019 30 June 2020 30 June 2019 30 June 2020 30 June 2019$ $ $ $ $ $ $ $
AssetsCash and cash equivalents 35,992 95,051 259,544 377,855 167,100 64,301 111,276 96,866Receivables 5 493,378 1,670,133 3,851,954 2,063,444 131,332 543,841 4,072,681 2,067Financial assets held at fair value through profit or loss 6.1 10,044,408 20,094,695 189,091,305 257,344,745 32,708,970 40,173,527 33,432,092 50,129,069Total assets 10,573,778 21,859,879 193,202,803 259,786,044 33,007,402 40,781,669 37,616,049 50,228,002
LiabilitiesBank overdraft - - - - - - - - Payables 7 6,872 1,403 68,906 146,193 4,585 5,928 2,079 66,168Distribution payable 269,828 1,621,880 3,824,780 2,296,709 689,232 1,260,468 3,478,446 667Financial liabilities held at fair value through profit or loss 6.2 - - - - - - - - Loan payable 11.8 - - - - - - - - Total liabilities 276,700 1,623,283 3,893,686 2,442,902 693,817 1,266,396 3,480,525 66,835
- - - - Represented by: - - - - Net assets attributable to unitholders at redemption price 10,297,078 20,236,596 189,309,117 257,343,142 32,313,585 39,515,273 34,135,524 50,161,167Total net assets attributable to unitholders - Equity 10,297,078 20,236,596 189,309,117 257,343,142 32,313,585 39,515,273 34,135,524 50,161,167
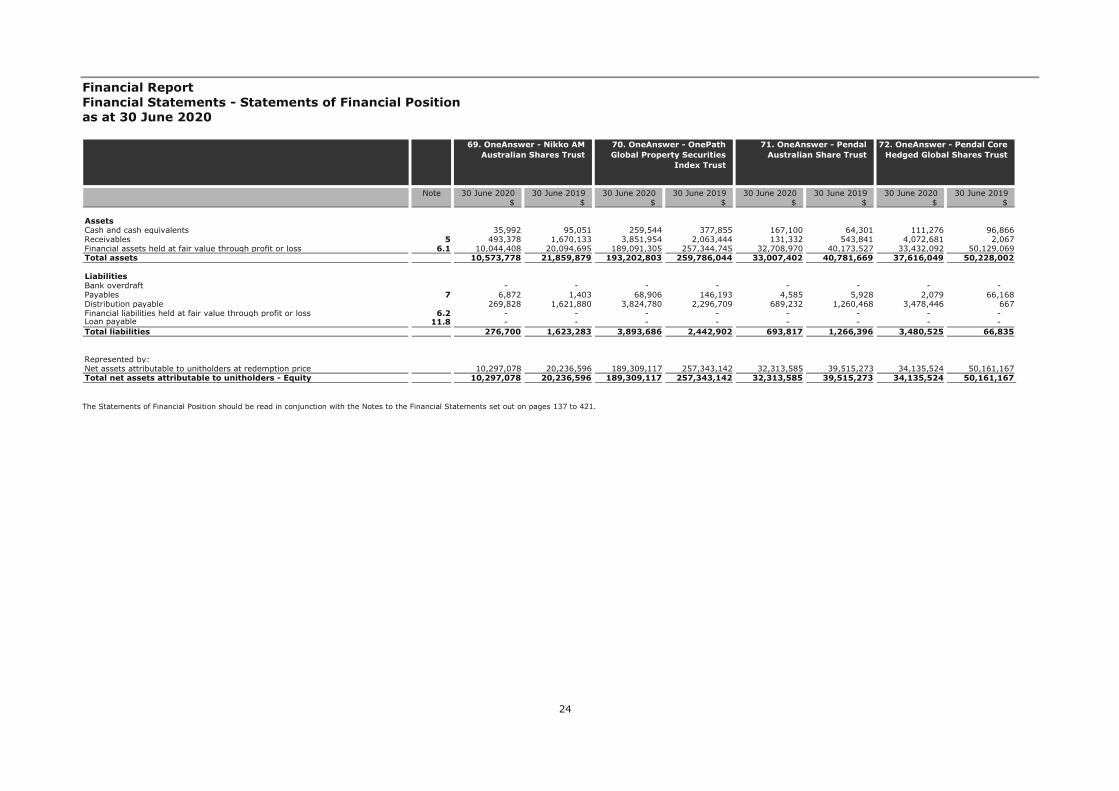
71. OneAnswer - Pendal Australian Share Trust
72. OneAnswer - Pendal Core Hedged Global Shares Trust
69. OneAnswer - Nikko AM Australian Shares Trust
70. OneAnswer - OnePath Global Property Securities
Index Trust
Financial Report Financial Statements - Statements of Financial Position as at 30 June 2020
25
The Statements of Financial Position should be read in conjunction with the Notes to the Financial Statements set out on pages 137 to 421.
Note 30 June 2020 30 June 2019 30 June 2020 30 June 2019 30 June 2020 30 June 2019 30 June 2020 30 June 2019$ $ $ $ $ $ $ $
AssetsCash and cash equivalents 37,294 21,232 590,120 295,984 321,585 223,312 31,010 93,722Receivables 5 274,222 112,427 15,899 5,838,960 758,522 2,614,579 274,948 938,070Financial assets held at fair value through profit or loss 6.1 18,844,119 14,528,614 88,181,468 98,525,543 82,829,790 115,038,664 14,874,556 22,316,964Total assets 19,155,635 14,662,273 88,787,487 104,660,487 83,909,897 117,876,555 15,180,514 23,348,756
LiabilitiesBank overdraft - - - - - - - - Payables 7 1,993 1,738 38,012 77,142 14,436 106,639 24,677 166,873Distribution payable 339,435 124,860 1,145,751 6,202,402 7,182,009 10,682,554 99,606 680,339Financial liabilities held at fair value through profit or loss 6.2 - - - - - - - - Loan payable 11.8 - - - - - - - - Total liabilities 341,428 126,598 1,183,763 6,279,544 7,196,445 10,789,193 124,283 847,212
- - - - Represented by: - - - - Net assets attributable to unitholders at redemption price 18,814,207 14,535,675 87,603,724 98,380,943 76,713,452 107,087,362 15,056,231 22,501,544Total net assets attributable to unitholders - Equity 18,814,207 14,535,675 87,603,724 98,380,943 76,713,452 107,087,362 15,056,231 22,501,544
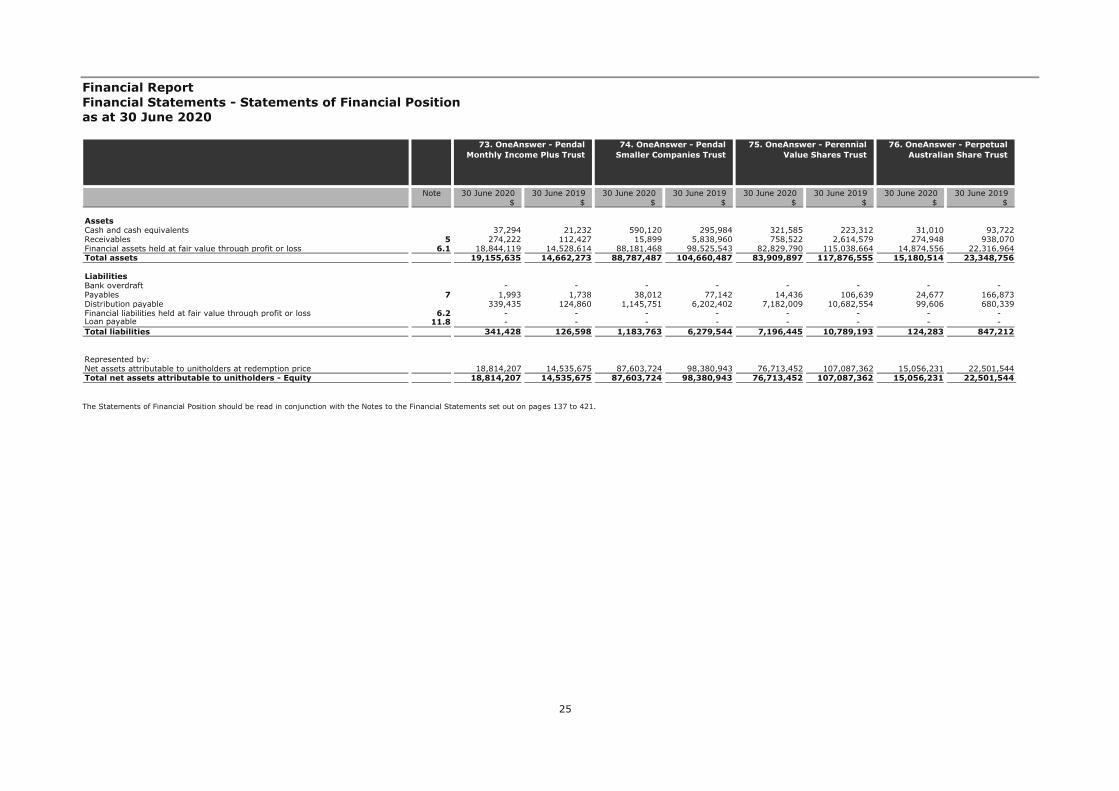
75. OneAnswer - Perennial Value Shares Trust
76. OneAnswer - Perpetual Australian Share Trust
73. OneAnswer - Pendal Monthly Income Plus Trust
74. OneAnswer - Pendal Smaller Companies Trust

Financial Report Financial Statements - Statements of Financial Position as at 30 June 2020
26
The Statements of Financial Position should be read in conjunction with the Notes to the Financial Statements set out on pages 137 to 421.
Note 30 June 2020 30 June 2019 30 June 2020 30 June 2019 30 June 2020 30 June 2019 30 June 2020 30 June 2019$ $ $ $ $ $ $ $
AssetsCash and cash equivalents 254,414 - 337,337 98,353 11,166 18,293 89,277 - Receivables 5 7,522,816 12,436,707 4,038,765 4,368,789 96,668 78,606 2,346,240 1,580,204Financial assets held at fair value through profit or loss 6.1 105,023,009 141,166,162 119,013,521 134,157,924 5,048,232 4,506,358 24,391,293 26,688,121Total assets 112,800,239 153,602,869 123,389,623 138,625,066 5,156,066 4,603,257 26,826,810 28,268,325
LiabilitiesBank overdraft - 72,126 - - - - - 101,719Payables 7 11,225 60,730 66,388 55,520 1,110 1,094 2,505 3,169Distribution payable 6,380,843 19,372,958 5,342,627 5,107,122 89,618 71,473 1,970,509 1,809,599Financial liabilities held at fair value through profit or loss 6.2 - - - - - - - - Loan payable 11.8 - - - - - - - - Total liabilities 6,392,068 19,505,814 5,409,015 5,162,642 90,728 72,567 1,973,014 1,914,487
- - - - Represented by: - - - - Net assets attributable to unitholders at redemption price 106,408,171 134,097,055 117,980,608 133,462,424 5,065,338 4,530,690 24,853,796 26,353,838Total net assets attributable to unitholders - Equity 106,408,171 134,097,055 117,980,608 133,462,424 5,065,338 4,530,690 24,853,796 26,353,838
79. OneAnswer - Perpetual Ethical SRI Trust
80. OneAnswer - Platinum Asia Trust
77. OneAnswer - Perpetual Balanced Growth Trust
78. OneAnswer - Perpetual Conservative Growth Trust
Financial Report Financial Statements - Statements of Financial Position as at 30 June 2020
27
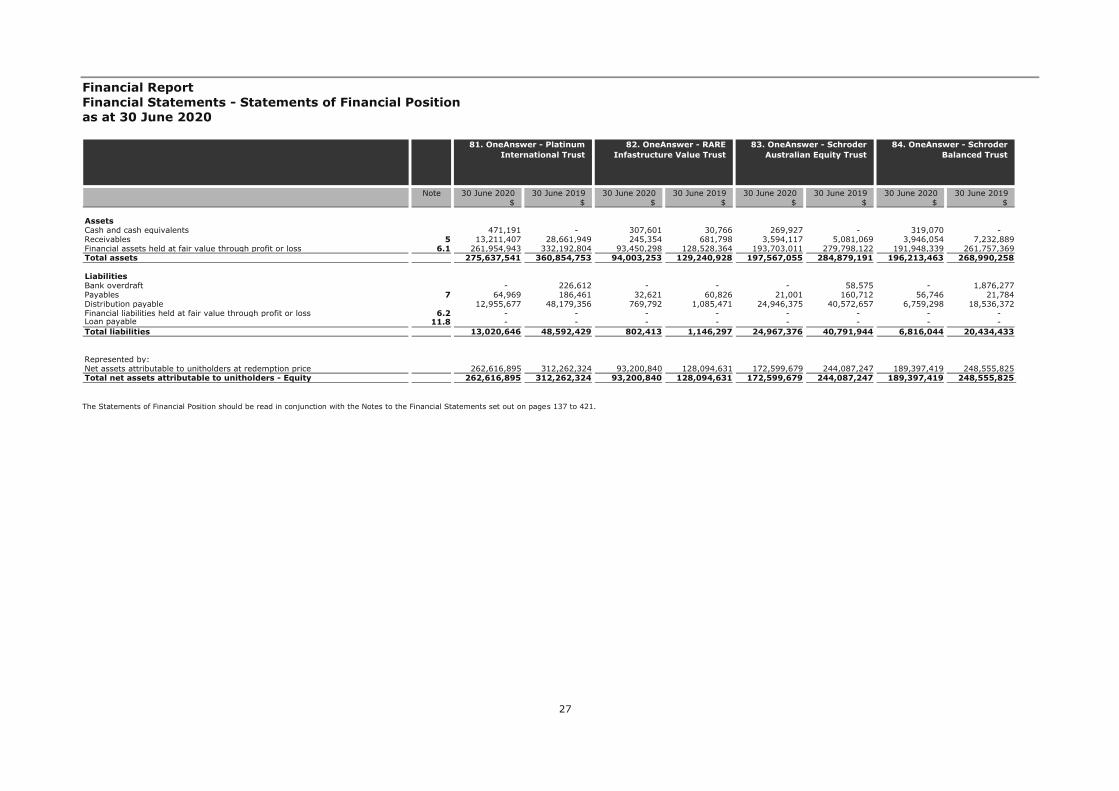
The Statements of Financial Position should be read in conjunction with the Notes to the Financial Statements set out on pages 137 to 421.
Note 30 June 2020 30 June 2019 30 June 2020 30 June 2019 30 June 2020 30 June 2019 30 June 2020 30 June 2019$ $ $ $ $ $ $ $
AssetsCash and cash equivalents 471,191 - 307,601 30,766 269,927 - 319,070 - Receivables 5 13,211,407 28,661,949 245,354 681,798 3,594,117 5,081,069 3,946,054 7,232,889Financial assets held at fair value through profit or loss 6.1 261,954,943 332,192,804 93,450,298 128,528,364 193,703,011 279,798,122 191,948,339 261,757,369Total assets 275,637,541 360,854,753 94,003,253 129,240,928 197,567,055 284,879,191 196,213,463 268,990,258
LiabilitiesBank overdraft - 226,612 - - - 58,575 - 1,876,277Payables 7 64,969 186,461 32,621 60,826 21,001 160,712 56,746 21,784Distribution payable 12,955,677 48,179,356 769,792 1,085,471 24,946,375 40,572,657 6,759,298 18,536,372Financial liabilities held at fair value through profit or loss 6.2 - - - - - - - - Loan payable 11.8 - - - - - - - - Total liabilities 13,020,646 48,592,429 802,413 1,146,297 24,967,376 40,791,944 6,816,044 20,434,433
- - - - Represented by: - - - - Net assets attributable to unitholders at redemption price 262,616,895 312,262,324 93,200,840 128,094,631 172,599,679 244,087,247 189,397,419 248,555,825Total net assets attributable to unitholders - Equity 262,616,895 312,262,324 93,200,840 128,094,631 172,599,679 244,087,247 189,397,419 248,555,825
83. OneAnswer - Schroder Australian Equity Trust
84. OneAnswer - Schroder Balanced Trust
81. OneAnswer - Platinum International Trust
82. OneAnswer - RARE Infastructure Value Trust
Financial Report Financial Statements - Statements of Financial Position as at 30 June 2020
28
The Statements of Financial Position should be read in conjunction with the Notes to the Financial Statements set out on pages 137 to 421.
Note 30 June 2020 30 June 2019 30 June 2020 30 June 2019 30 June 2020 30 June 2019 30 June 2020 30 June 2019$ $ $ $ $ $ $ $
AssetsCash and cash equivalents 838,176 198,852 658,920 - 12,585 30,038 25,435 12,552Receivables 5 1,064,521 1,595,603 6,480,724 9,512,156 80,861 212,190 168,752 318,329Financial assets held at fair value through profit or loss 6.1 201,020,890 223,172,735 373,011,366 432,190,442 13,847,256 23,631,275 6,491,211 4,773,386Total assets 202,923,587 224,967,190 380,151,010 441,702,598 13,940,702 23,873,503 6,685,398 5,104,267
LiabilitiesBank overdraft - - - 206,323 - - - - Payables 7 19,681 90,658 105,001 243,233 1,150 2,165 1,242 11,072Distribution payable 8,048,692 5,706,389 13,150,322 4,477,462 2,202,246 3,109,806 566,400 415,561Financial liabilities held at fair value through profit or loss 6.2 - - - - - - - - Loan payable 11.8 - - - - - - - - Total liabilities 8,068,373 5,797,047 13,255,323 4,927,018 2,203,396 3,111,971 567,642 426,633
- - - - Represented by: - - - - Net assets attributable to unitholders at redemption price 194,855,214 219,170,143 366,895,687 436,775,580 11,737,306 20,761,532 6,117,756 4,677,634Total net assets attributable to unitholders - Equity 194,855,214 219,170,143 366,895,687 436,775,580 11,737,306 20,761,532 6,117,756 4,677,634
87. OneAnswer - SG Hiscock Property Trust
88. OneAnswer - Stewart Investors Worldwide
Sustainability Trust
85. OneAnswer - Schroder Fixed Income Trust
86. OneAnswer - Schroder Real Return Trust

Financial Report Financial Statements - Statements of Financial Position as at 30 June 2020
29
The Statements of Financial Position should be read in conjunction with the Notes to the Financial Statements set out on pages 137 to 421.
Note 30 June 2020 30 June 2019 30 June 2020 30 June 2019 30 June 2020 30 June 2019 30 June 2020 30 June 2019$ $ $ $ $ $ $ $
AssetsCash and cash equivalents 271,365 71,424 694,525 212,225 190,050 - - - Receivables 5 5,761,402 3,793,378 105,350 184,353 2,904,843 2,057,978 811,501 494,264Financial assets held at fair value through profit or loss 6.1 43,262,484 34,909,218 65,147,937 47,250,428 57,130,856 72,683,109 21,671,027 24,300,838Total assets 49,295,251 38,774,020 65,947,812 47,647,006 60,225,749 74,741,087 22,482,528 24,795,102
LiabilitiesBank overdraft - - - - - 151,197 122,024 36,566Payables 7 4,680 37,468 6,296 10,740 6,215 7,790 3,277 4,174Distribution payable 7,100,937 4,458,054 102,569 159,043 4,700,732 3,773,152 1,583,012 1,591,319Financial liabilities held at fair value through profit or loss 6.2 - - - - - - - - Loan payable 11.8 - - - - - - - - Total liabilities 7,105,617 4,495,522 108,865 169,783 4,706,947 3,932,139 1,708,313 1,632,059
- - - - Represented by: - - - - Net assets attributable to unitholders at redemption price 42,189,634 34,278,498 65,838,947 47,477,223 55,518,802 70,808,948 20,774,215 23,163,043Total net assets attributable to unitholders - Equity 42,189,634 34,278,498 65,838,947 47,477,223 55,518,802 70,808,948 20,774,215 23,163,043
91. OneAnswer - UBS Balanced Trust
92. OneAnswer - UBS Defensive Trust
89. OneAnswer - T. Rowe Price Global Equity Trust
90. OneAnswer - T.Rowe Price Dynamic Global Bond
Trust

Financial Report Financial Statements - Statements of Financial Position as at 30 June 2020
30
The Statements of Financial Position should be read in conjunction with the Notes to the Financial Statements set out on pages 137 to 421.
Note 30 June 2020 30 June 2019 30 June 2020 30 June 2019 30 June 2020 30 June 2019 30 June 2020 30 June 2019$ $ $ $ $ $ $ $
AssetsCash and cash equivalents 295,456 - 1,915,230 3,897,995 479,272 559,417 1,266,294 89,996Receivables 5 2,014,781 1,801,191 14,833,441 25,244,712 110,695,102 68,423,017 36,774,043 17,103,484Financial assets held at fair value through profit or loss 6.1 108,159,690 101,917,334 914,062,176 1,124,538,876 2,010,517,895 2,288,834,458 777,447,403 813,750,674Total assets 110,469,927 103,718,525 930,810,847 1,153,681,583 2,121,692,269 2,357,816,892 815,487,740 830,944,154
LiabilitiesBank overdraft - 169,056 - - - - - - Payables 7 39,906 15,763 269,115 740,916 864,077 1,983,790 135,265 206,766Distribution payable 2,036,975 1,373,743 42,073,015 42,048,575 180,824,427 88,691,752 51,288,735 23,162,041Financial liabilities held at fair value through profit or loss 6.2 - - - - - - - - Loan payable 11.8 - - - - - - - - Total liabilities 2,076,881 1,558,562 42,342,130 42,789,491 181,688,504 90,675,542 51,424,000 23,368,807
- - - - Represented by: - - - - Net assets attributable to unitholders at redemption price 108,393,046 102,159,963 888,468,717 1,110,892,092 1,940,003,765 2,267,141,350 764,063,740 807,575,347Total net assets attributable to unitholders - Equity 108,393,046 102,159,963 888,468,717 1,110,892,092 1,940,003,765 2,267,141,350 764,063,740 807,575,347
95. OneAnswer - Vanguard Balanced Index Trust
96. OneAnswer - Vanguard Conservative Index Trust
93. OneAnswer - UBS Diversified Fixed Income
Trust
94. OneAnswer - Vanguard Australian Shares Index
Trust

Financial Report Financial Statements - Statements of Financial Position as at 30 June 2020
31
The Statements of Financial Position should be read in conjunction with the Notes to the Financial Statements set out on pages 137 to 421.
Note 30 June 2020 30 June 2019 30 June 2020 30 June 2019 30 June 2020 30 June 2019 30 June 2020 30 June 2019$ $ $ $ $ $ $ $
AssetsCash and cash equivalents 54,235 29,901 1,067,352 2,420,269 99,374 87,626 338,776 409,092Receivables 5 4,790,789 1,173,624 54,087,828 41,278,279 20,418,102 17,834,142 10,770,066 4,499,750Financial assets held at fair value through profit or loss 6.1 98,749,115 103,572,662 937,940,607 1,085,971,520 337,972,637 387,536,402 88,005,004 106,054,519Total assets 103,594,139 104,776,187 993,095,787 1,129,670,068 358,490,113 405,458,170 99,113,846 110,963,361
LiabilitiesBank overdraft - - - - - - - - Payables 7 16,306 20,424 119,229 185,362 224,286 118,319 20,800 95,501Distribution payable 4,616,758 302,050 91,289,081 52,758,009 32,576,423 23,078,668 13,821,592 6,638,640Financial liabilities held at fair value through profit or loss 6.2 - - - - - - - - Loan payable 11.8 - - - - - - - - Total liabilities 4,633,064 322,474 91,408,310 52,943,371 32,800,709 23,196,987 13,842,392 6,734,141
- - - - Represented by: - - - - Net assets attributable to unitholders at redemption price 98,961,075 104,453,713 901,687,477 1,076,726,697 325,689,404 382,261,183 85,271,454 104,229,220Total net assets attributable to unitholders - Equity 98,961,075 104,453,713 901,687,477 1,076,726,697 325,689,404 382,261,183 85,271,454 104,229,220
99. OneAnswer - Vanguard High Growth Index Trust
100. OneAnswer - Vanguard International Shares Index
(Hedged) Trust
97. OneAnswer - Vanguard Diversified Bond Index Trust
98. OneAnswer - Vanguard Growth Index Trust

Financial Report Financial Statements - Statements of Financial Position as at 30 June 2020
32
The Statements of Financial Position should be read in conjunction with the Notes to the Financial Statements set out on pages 137 to 421.
Note 30 June 2020 30 June 2019 30 June 2020 30 June 2019 30 June 2020 30 June 2019 30 June 2020 30 June 2019$ $ $ $ $ $ $ $
AssetsCash and cash equivalents 1,775,082 3,087,074 278,545 155,623 98,461 7,079 2,300,941 1,489,681Receivables 5 70,546,732 74,669,018 6,321,227 3,860,974 2,967,645 3,520,651 3,294,740 338,880Financial assets held at fair value through profit or loss 6.1 708,453,166 812,165,658 116,231,519 174,940,766 33,756,490 39,683,468 178,485,608 201,011,122Total assets 780,774,980 889,921,750 122,831,291 178,957,363 36,822,596 43,211,198 184,081,289 202,839,683
LiabilitiesBank overdraft - - - - - - - - Payables 7 216,761 768,298 24,574 184,563 2,589 3,154 134,086 153,965Distribution payable 103,715,864 83,300,573 9,264,604 4,830,316 3,241,172 4,053,519 3,222,521 583,968Financial liabilities held at fair value through profit or loss 6.2 - - - - - - - - Loan payable 11.8 - - - - - - - - Total liabilities 103,932,625 84,068,871 9,289,178 5,014,879 3,243,761 4,056,673 3,356,607 737,933
- - - - Represented by: - - - - Net assets attributable to unitholders at redemption price 676,842,355 805,852,879 113,542,113 173,942,484 33,578,835 39,154,525 180,724,682 202,101,750Total net assets attributable to unitholders - Equity 676,842,355 805,852,879 113,542,113 173,942,484 33,578,835 39,154,525 180,724,682 202,101,750
103. OneAnswer - Walter Scott Global Equity (Hedged)
Trust
104. OnePath Alternatives Growth Fund
101. OneAnswer - Vanguard International Shares Index
Trust
102. OneAnswer - Vanguard Property Securities Index
Trust

Financial Report Financial Statements - Statements of Financial Position as at 30 June 2020
33
The Statements of Financial Position should be read in conjunction with the Notes to the Financial Statements set out on pages 137 to 421.
Note 30 June 2020 30 June 2019 30 June 2020 30 June 2019 30 June 2020 30 June 2019 30 June 2020 30 June 2019$ $ $ $ $ $ $ $
AssetsCash and cash equivalents 15,442,990 7,161,596 16,641 22,393 2,872 1,884 47,477 47,064Receivables 5 22,771,495 20,120,225 252,189 181,172 7,366 793 657,270 337,065Financial assets held at fair value through profit or loss 6.1 612,630,838 746,184,527 4,482,782 5,399,186 811,181 941,238 12,770,904 15,304,713Total assets 650,845,323 773,466,348 4,751,612 5,602,751 821,419 943,915 13,475,651 15,688,842
LiabilitiesBank overdraft - - - - - - - - Payables 7 80,425 160,469 4,989 6,105 1,458 1,766 9,915 23,067Distribution payable 39,842,850 27,136,403 95,132 24,438 616 - 470,376 201,255Financial liabilities held at fair value through profit or loss 6.2 6,617 87,888 - - - - - - Loan payable 11.8 - - - - - - - - Total liabilities 39,929,892 27,384,760 100,121 30,543 2,074 1,766 480,291 224,322
- - - - Represented by: - - - - Net assets attributable to unitholders at redemption price 610,915,431 746,081,588 4,651,491 5,572,208 819,345 942,149 12,995,360 15,464,520Total net assets attributable to unitholders - Equity 610,915,431 746,081,588 4,651,491 5,572,208 819,345 942,149 12,995,360 15,464,520
107. OnePath Diversified Credit Trust
108. OnePath Diversified Fixed Interest Trust
105. OnePath Capital Guaranteed Trust
106. OnePath Capital Stable Trust

Financial Report Financial Statements - Statements of Financial Position as at 30 June 2020
34
The Statements of Financial Position should be read in conjunction with the Notes to the Financial Statements set out on pages 137 to 421.
Note 30 June 2020 30 June 2019 30 June 2020 30 June 2019 30 June 2020 30 June 2019 30 June 2020 30 June 2019$ $ $ $ $ $ $ $
AssetsCash and cash equivalents 56,792 55,607 98,236 64,515 2,620 2,154 9,587 11,511Receivables 5 315,004 505,764 449,163 391,675 47,891 52,807 18,106 48,483Financial assets held at fair value through profit or loss 6.1 4,314,319 5,649,466 32,795,327 35,114,150 695,877 1,071,041 2,694,026 3,766,029Total assets 4,686,115 6,210,837 33,342,726 35,570,340 746,388 1,126,002 2,721,719 3,826,023
LiabilitiesBank overdraft - - - - - - - - Payables 7 10,327 72,514 5,437 28,803 1,561 2,329 5,503 51,260Distribution payable 133,120 303,821 421,106 354,710 9,988 6,773 1,240 39,896Financial liabilities held at fair value through profit or loss 6.2 - - - - - - - - Loan payable 11.8 - - - - - - - - Total liabilities 143,447 376,335 426,543 383,513 11,549 9,102 6,743 91,156
- - - - Represented by: - - - - Net assets attributable to unitholders at redemption price 4,542,668 5,834,502 32,916,183 35,186,827 734,839 1,116,900 2,714,976 3,734,867Total net assets attributable to unitholders - Equity 4,542,668 5,834,502 32,916,183 35,186,827 734,839 1,116,900 2,714,976 3,734,867
111. OnePath Managed Growth Trust
112. OnePath Select Leaders Trust
109. OnePath Geared Australian Shares Index
Trust
110. OnePath Global Emerging Markets Share
Trust

Financial Report Financial Statements - Statements of Financial Position as at 30 June 2020
35
The Statements of Financial Position should be read in conjunction with the Notes to the Financial Statements set out on pages 137 to 421.
Note 30 June 2020 30 June 2019 30 June 2020 30 June 2019 30 June 2020 30 June 2019 30 June 2020 30 June 2019$ $ $ $ $ $ $ $
AssetsCash and cash equivalents 3,673 7,386 375,000 650,730 5,043,867 1,942,441 21,941 49,617Receivables 5 29,048 44,546 832,144 3,443,578 22,748,510 15,512,729 100,022 217,692Financial assets held at fair value through profit or loss 6.1 1,758,791 1,789,003 173,759,499 236,050,603 391,515,129 488,549,552 6,580,866 16,197,980Total assets 1,791,512 1,840,935 174,966,643 240,144,911 419,307,506 506,004,722 6,702,829 16,465,289
LiabilitiesBank overdraft - - - - - - - - Payables 7 1,352 1,383 24,978 58,832 126,186 209,784 5,023 12,844Distribution payable 67,624 35,970 7,370,359 12,702,931 26,903,354 15,155,876 86,310 175,604Financial liabilities held at fair value through profit or loss 6.2 - - - - 100,572 208,476 - - Loan payable 11.8 - - - - - - - - Total liabilities 68,976 37,353 7,395,337 12,761,763 27,130,112 15,574,136 91,333 188,448
- - - - Represented by: - - - - Net assets attributable to unitholders at redemption price 1,722,536 1,803,582 167,571,306 227,383,148 392,177,394 490,430,586 6,611,496 16,276,841Total net assets attributable to unitholders - Equity 1,722,536 1,803,582 167,571,306 227,383,148 392,177,394 490,430,586 6,611,496 16,276,841
115. OnePath Wholesale Balanced Trust
116. OnePath Wholesale Blue Chip Imputation Trust
113. OnePath Sustainable Investments - Australian
Share Trust
114. OnePath Wholesale Australian Share Trust

Financial Report Financial Statements - Statements of Financial Position as at 30 June 2020
36
The Statements of Financial Position should be read in conjunction with the Notes to the Financial Statements set out on pages 137 to 421.
Note 30 June 2020 30 June 2019 30 June 2020 30 June 2019 30 June 2020 30 June 2019 30 June 2020 30 June 2019$ $ $ $ $ $ $ $
AssetsCash and cash equivalents 2,099,784 4,285,002 - 143,509 183,115 149,666 2,877,913 273,078Receivables 5 11,347,012 9,028,005 20,321,619 10,665,934 14,047,490 11,736,478 1,577,668 2,453,292Financial assets held at fair value through profit or loss 6.1 350,458,466 424,158,029 529,109,297 616,407,564 49,804,966 63,069,273 90,543,175 110,752,684Total assets 363,905,262 437,471,036 549,430,916 627,217,007 64,035,571 74,955,417 94,998,756 113,479,054
LiabilitiesBank overdraft - - 53,300 - - - - - Payables 7 5,213 9,731 164,084 618,571 28,019 36,098 40,532 96,029Distribution payable 19,209,433 13,696,904 26,398,355 12,890,653 16,023,384 6,497,799 2,956,313 4,370,135Financial liabilities held at fair value through profit or loss 6.2 3,308 13,303 - - - - - - Loan payable 11.8 - - - - - - 47,539,000 57,049,000Total liabilities 19,217,954 13,719,938 26,615,739 13,509,224 16,051,403 6,533,897 50,535,845 61,515,164
- - - - Represented by: - - - - Net assets attributable to unitholders at redemption price 344,687,308 423,751,098 522,815,177 613,707,783 47,984,168 68,421,520 44,462,911 51,963,890Total net assets attributable to unitholders - Equity 344,687,308 423,751,098 522,815,177 613,707,783 47,984,168 68,421,520 44,462,911 51,963,890
119. OnePath Wholesale Emerging Companies Trust
120. OnePath Wholesale Geared Australian Shares
Index Trust
117. OnePath Wholesale Capital Stable Trust
118. OnePath Wholesale Diversified Fixed Interest
Trust

Financial Report Financial Statements - Statements of Financial Position as at 30 June 2020
37
The Statements of Financial Position should be read in conjunction with the Notes to the Financial Statements set out on pages 137 to 421.
Note 30 June 2020 30 June 2019 30 June 2020 30 June 2019 30 June 2020 30 June 2019 30 June 2020 30 June 2019$ $ $ $ $ $ $ $
AssetsCash and cash equivalents 51,503 47,801 744,160 540,662 - - 25,117 - Receivables 5 154,551 159,256 2,188,492 1,855,074 1,032,273 662,109 241,756 186,254Financial assets held at fair value through profit or loss 6.1 11,260,272 13,126,514 35,292,323 44,207,346 21,364,406 24,953,562 7,101,151 8,523,080Total assets 11,466,326 13,333,571 38,224,975 46,603,082 22,396,679 25,615,671 7,368,024 8,709,334
LiabilitiesBank overdraft - - - - - - - - Payables 7 14,601 20,370 14,631 22,297 - - - - Distribution payable 106,824 96,303 3,006,785 2,980,836 2,299,743 1,359,623 511,112 367,282Financial liabilities held at fair value through profit or loss 6.2 - - 6,665 14,365 - - - - Loan payable 11.8 - - - - - - - - Total liabilities 121,425 116,673 3,028,081 3,017,498 2,299,743 1,359,623 511,112 367,282
- - - - Represented by: - - - - Net assets attributable to unitholders at redemption price 11,344,901 13,216,898 35,196,894 43,585,584 20,096,936 24,256,048 6,856,912 8,342,052Total net assets attributable to unitholders - Equity 11,344,901 13,216,898 35,196,894 43,585,584 20,096,936 24,256,048 6,856,912 8,342,052
123. OnePath Wholesale Index Balanced Trust
124. OnePath Wholesale Index Conservative Trust
121. OnePath Wholesale Global Emerging Markets
Share Trust
122. OnePath Wholesale High Growth Trust

Financial Report Financial Statements - Statements of Financial Position as at 30 June 2020
38
The Statements of Financial Position should be read in conjunction with the Notes to the Financial Statements set out on pages 137 to 421.
Note 30 June 2020 30 June 2019 30 June 2020 30 June 2019 30 June 2020 30 June 2019 30 June 2020 30 June 2019$ $ $ $ $ $ $ $
AssetsCash and cash equivalents - 2,683 12,472,146 4,988,859 6,410 8,188 153,691 358,286Receivables 5 192,857 141,038 50,572,633 36,024,067 161,917 221,932 456,043 1,230,727Financial assets held at fair value through profit or loss 6.1 4,405,698 5,589,484 844,474,266 1,039,947,203 1,616,825 2,438,026 75,923,872 99,981,237Total assets 4,598,555 5,733,205 907,519,045 1,080,960,129 1,785,152 2,668,146 76,533,606 101,570,250
LiabilitiesBank overdraft - - - - - - - - Payables 7 - - 403,317 774,558 1,323 13,356 4,400 6,266Distribution payable 424,952 357,516 57,382,330 49,729,156 28,602 9,347 2,919,563 2,776,622Financial liabilities held at fair value through profit or loss 6.2 - - 358,130 455,927 - - - - Loan payable 11.8 - - - - - - - - Total liabilities 424,952 357,516 58,143,777 50,959,641 29,925 22,703 2,923,963 2,782,888
- - - - Represented by: - - - - Net assets attributable to unitholders at redemption price 4,173,603 5,375,689 849,375,268 1,030,000,488 1,755,227 2,645,443 73,609,643 98,787,362Total net assets attributable to unitholders - Equity 4,173,603 5,375,689 849,375,268 1,030,000,488 1,755,227 2,645,443 73,609,643 98,787,362
127. OnePath Wholesale Property Securities Trust
128. OnePath Wholesale Select Leaders Trust
125. OnePath Wholesale Index Moderate Trust
126. OnePath Wholesale Managed Growth Trust

Financial Report Financial Statements - Statements of Financial Position as at 30 June 2020
39
The Statements of Financial Position should be read in conjunction with the Notes to the Financial Statements set out on pages 137 to 421.
Note 30 June 2020 30 June 2019 30 June 2020 30 June 2019 30 June 2020 30 June 2019 30 June 2020 30 June 2019$ $ $ $ $ $ $ $
AssetsCash and cash equivalents 12,336 14,933 35,499 41,463 120,979 65,021 33,582 35,846Receivables 5 128,185 92,003 470,799 770,544 2,634,814 1,905,866 415,117 258,011Financial assets held at fair value through profit or loss 6.1 3,394,919 3,621,203 9,637,438 12,974,442 31,984,483 39,630,718 9,178,950 11,682,999Total assets 3,535,440 3,728,139 10,143,736 13,786,449 34,740,276 41,601,605 9,627,649 11,976,856
LiabilitiesBank overdraft - - - - - - - - Payables 7 4,461 5,207 22,499 31,322 72,721 103,652 21,014 26,775Distribution payable 113,646 71,782 397 76,344 668,811 215,706 221,318 53,284Financial liabilities held at fair value through profit or loss 6.2 - - - - - - - - Loan payable 11.8 - - - - - - - - Total liabilities 118,107 76,989 22,896 107,666 741,532 319,358 242,332 80,059
- - - - Represented by: - - - - Net assets attributable to unitholders at redemption price 3,417,333 3,651,150 10,120,840 13,678,783 33,998,744 41,282,247 9,385,317 11,896,797Total net assets attributable to unitholders - Equity 3,417,333 3,651,150 10,120,840 13,678,783 33,998,744 41,282,247 9,385,317 11,896,797
131. OptiMix Balanced Trust 132. OptiMix Conservative Trust
129. OptiMix Australian Fixed Interest Trust
130. OptiMix Australian Share Trust

Financial Report Financial Statements - Statements of Financial Position as at 30 June 2020
40
The Statements of Financial Position should be read in conjunction with the Notes to the Financial Statements set out on pages 137 to 421.
Note 30 June 2020 30 June 2019 30 June 2020 30 June 2019 30 June 2020 30 June 2019 30 June 2020 30 June 2019$ $ $ $ $ $ $ $
AssetsCash and cash equivalents 11,518 12,755 18,858 33,435 9,511 20,560 39,013 54,365Receivables 5 224,261 169,687 1,007,049 724,581 71,554 302,534 845,843 398,967Financial assets held at fair value through profit or loss 6.1 3,029,913 3,210,108 4,442,200 5,991,994 2,657,558 2,899,477 10,210,530 13,459,587Total assets 3,265,692 3,392,550 5,468,107 6,750,010 2,738,623 3,222,571 11,095,386 13,912,919
LiabilitiesBank overdraft - - - - - - - - Payables 7 6,305 6,610 12,342 15,491 5,577 52,531 25,104 32,147Distribution payable 139,992 229,149 771,172 758,614 3,441 18,037 142,153 71,710Financial liabilities held at fair value through profit or loss 6.2 - - - - - - - - Loan payable 11.8 - - - - - - - - Total liabilities 146,297 235,759 783,514 774,105 9,018 70,568 167,257 103,857
- - - - Represented by: - - - - Net assets attributable to unitholders at redemption price 3,119,395 3,156,791 4,684,593 5,975,905 2,729,605 3,152,003 10,928,129 13,809,062Total net assets attributable to unitholders - Equity 3,119,395 3,156,791 4,684,593 5,975,905 2,729,605 3,152,003 10,928,129 13,809,062
135. OptiMix Global Smaller Companies Share Trust
136. OptiMix Growth Trust 133. OptiMix Global Emerging Markets Share
Trust
134. OptiMix Global Share Trust
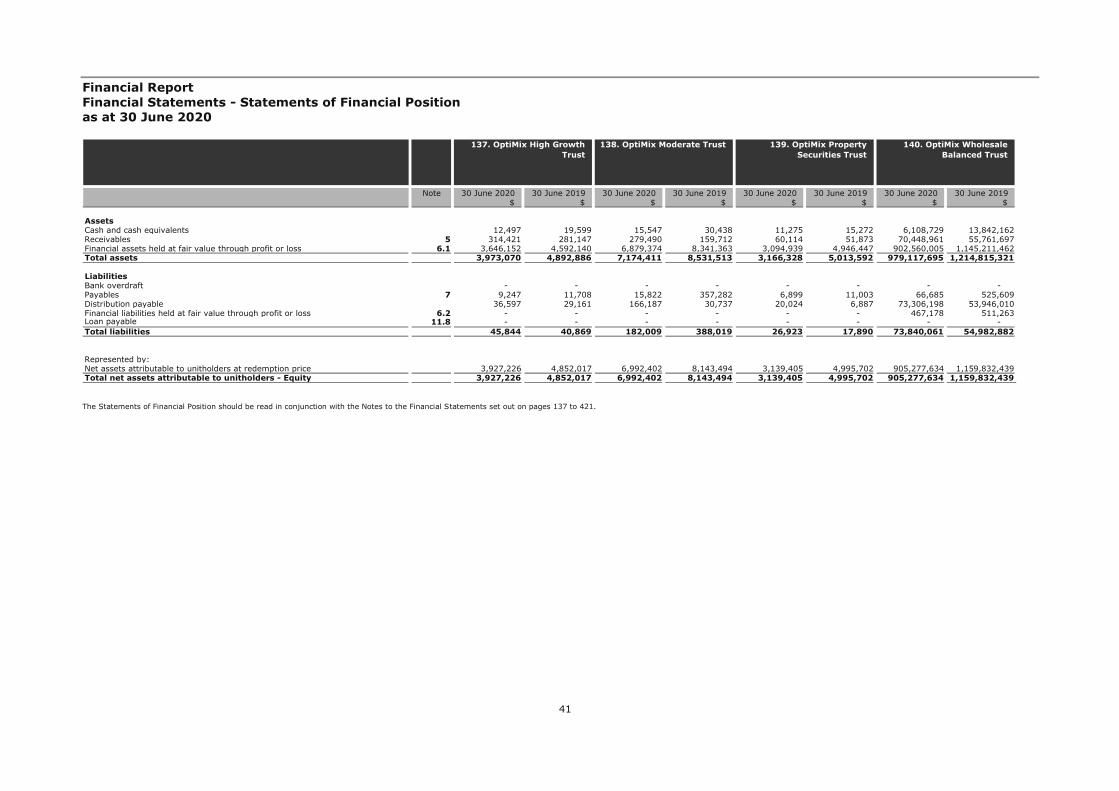
Financial Report Financial Statements - Statements of Financial Position as at 30 June 2020
41
The Statements of Financial Position should be read in conjunction with the Notes to the Financial Statements set out on pages 137 to 421.
Note 30 June 2020 30 June 2019 30 June 2020 30 June 2019 30 June 2020 30 June 2019 30 June 2020 30 June 2019$ $ $ $ $ $ $ $
AssetsCash and cash equivalents 12,497 19,599 15,547 30,438 11,275 15,272 6,108,729 13,842,162Receivables 5 314,421 281,147 279,490 159,712 60,114 51,873 70,448,961 55,761,697Financial assets held at fair value through profit or loss 6.1 3,646,152 4,592,140 6,879,374 8,341,363 3,094,939 4,946,447 902,560,005 1,145,211,462Total assets 3,973,070 4,892,886 7,174,411 8,531,513 3,166,328 5,013,592 979,117,695 1,214,815,321
LiabilitiesBank overdraft - - - - - - - - Payables 7 9,247 11,708 15,822 357,282 6,899 11,003 66,685 525,609Distribution payable 36,597 29,161 166,187 30,737 20,024 6,887 73,306,198 53,946,010Financial liabilities held at fair value through profit or loss 6.2 - - - - - - 467,178 511,263Loan payable 11.8 - - - - - - - - Total liabilities 45,844 40,869 182,009 388,019 26,923 17,890 73,840,061 54,982,882
- - - - Represented by: - - - - Net assets attributable to unitholders at redemption price 3,927,226 4,852,017 6,992,402 8,143,494 3,139,405 4,995,702 905,277,634 1,159,832,439Total net assets attributable to unitholders - Equity 3,927,226 4,852,017 6,992,402 8,143,494 3,139,405 4,995,702 905,277,634 1,159,832,439
139. OptiMix Property Securities Trust
140. OptiMix Wholesale Balanced Trust
137. OptiMix High Growth Trust
138. OptiMix Moderate Trust
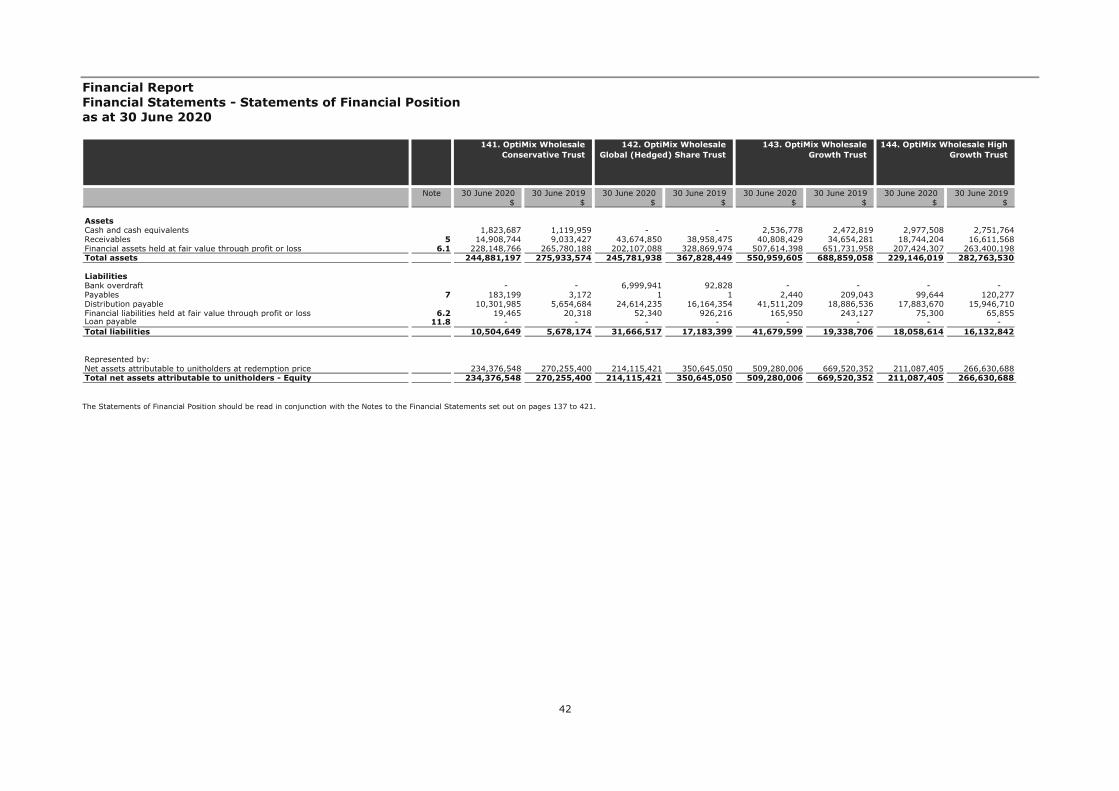
Financial Report Financial Statements - Statements of Financial Position as at 30 June 2020
42
The Statements of Financial Position should be read in conjunction with the Notes to the Financial Statements set out on pages 137 to 421.
Note 30 June 2020 30 June 2019 30 June 2020 30 June 2019 30 June 2020 30 June 2019 30 June 2020 30 June 2019$ $ $ $ $ $ $ $
AssetsCash and cash equivalents 1,823,687 1,119,959 - - 2,536,778 2,472,819 2,977,508 2,751,764Receivables 5 14,908,744 9,033,427 43,674,850 38,958,475 40,808,429 34,654,281 18,744,204 16,611,568Financial assets held at fair value through profit or loss 6.1 228,148,766 265,780,188 202,107,088 328,869,974 507,614,398 651,731,958 207,424,307 263,400,198Total assets 244,881,197 275,933,574 245,781,938 367,828,449 550,959,605 688,859,058 229,146,019 282,763,530
LiabilitiesBank overdraft - - 6,999,941 92,828 - - - - Payables 7 183,199 3,172 1 1 2,440 209,043 99,644 120,277Distribution payable 10,301,985 5,654,684 24,614,235 16,164,354 41,511,209 18,886,536 17,883,670 15,946,710Financial liabilities held at fair value through profit or loss 6.2 19,465 20,318 52,340 926,216 165,950 243,127 75,300 65,855Loan payable 11.8 - - - - - - - - Total liabilities 10,504,649 5,678,174 31,666,517 17,183,399 41,679,599 19,338,706 18,058,614 16,132,842
- - - - Represented by: - - - - Net assets attributable to unitholders at redemption price 234,376,548 270,255,400 214,115,421 350,645,050 509,280,006 669,520,352 211,087,405 266,630,688Total net assets attributable to unitholders - Equity 234,376,548 270,255,400 214,115,421 350,645,050 509,280,006 669,520,352 211,087,405 266,630,688
143. OptiMix Wholesale Growth Trust
144. OptiMix Wholesale High Growth Trust
141. OptiMix Wholesale Conservative Trust
142. OptiMix Wholesale Global (Hedged) Share Trust
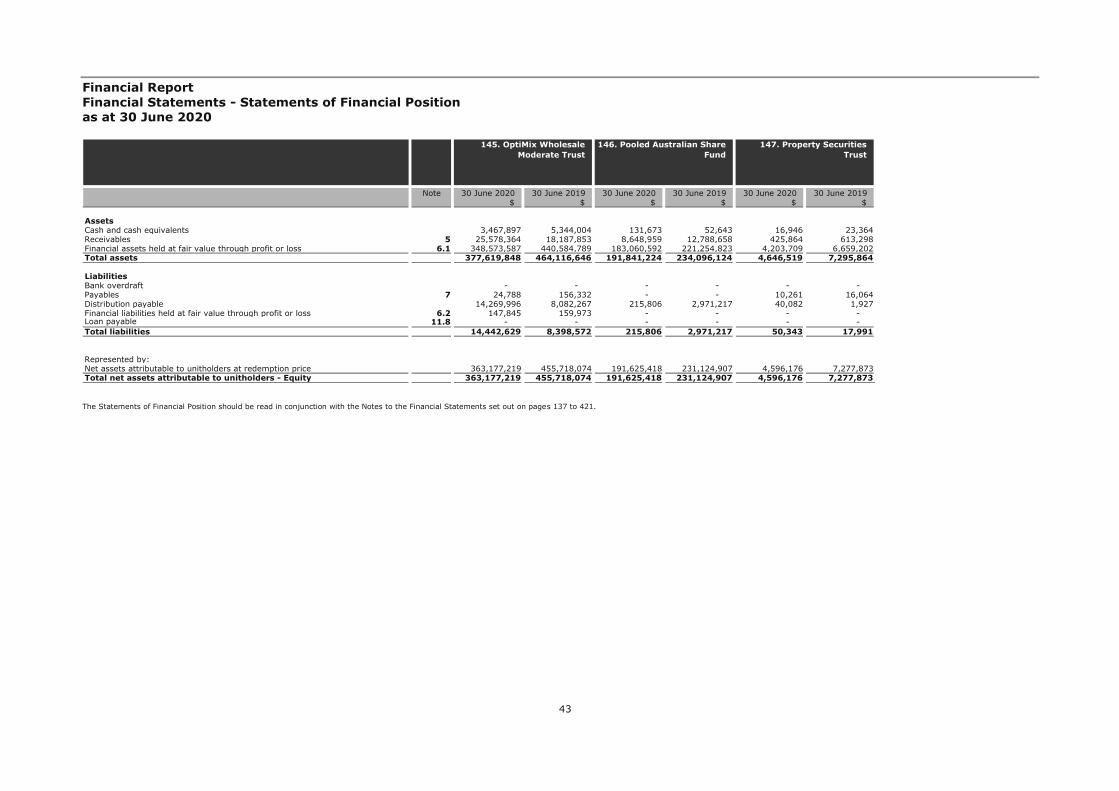
Financial Report Financial Statements - Statements of Financial Position as at 30 June 2020
43
The Statements of Financial Position should be read in conjunction with the Notes to the Financial Statements set out on pages 137 to 421.
Note 30 June 2020 30 June 2019 30 June 2020 30 June 2019 30 June 2020 30 June 2019$ $ $ $ $ $
AssetsCash and cash equivalents 3,467,897 5,344,004 131,673 52,643 16,946 23,364Receivables 5 25,578,364 18,187,853 8,648,959 12,788,658 425,864 613,298Financial assets held at fair value through profit or loss 6.1 348,573,587 440,584,789 183,060,592 221,254,823 4,203,709 6,659,202Total assets 377,619,848 464,116,646 191,841,224 234,096,124 4,646,519 7,295,864
LiabilitiesBank overdraft - - - - - - Payables 7 24,788 156,332 - - 10,261 16,064Distribution payable 14,269,996 8,082,267 215,806 2,971,217 40,082 1,927Financial liabilities held at fair value through profit or loss 6.2 147,845 159,973 - - - - Loan payable 11.8 - - - - - - Total liabilities 14,442,629 8,398,572 215,806 2,971,217 50,343 17,991
- - - Represented by: - - - Net assets attributable to unitholders at redemption price 363,177,219 455,718,074 191,625,418 231,124,907 4,596,176 7,277,873Total net assets attributable to unitholders - Equity 363,177,219 455,718,074 191,625,418 231,124,907 4,596,176 7,277,873
147. Property Securities Trust
145. OptiMix Wholesale Moderate Trust
146. Pooled Australian Share Fund

Financial Report Financial Statements - Statements of Comprehensive Income for the financial year ended 30 June 2020
44
The Statements of Comprehensive Income should be read in conjunction with the Notes to the Financial Statements set out on pages 137 to 421.
Note 30 June 2020 30 June 2019 30 June 2020 30 June 2019 30 June 2020 30 June 2019 30 June 2020 30 June 2019$ $ $ $ $ $ $ $
Investment incomeInterest income 324 1,069 73 180 225 563 39 132Unit trust distribution income 4,151,807 3,272,295 502,810 553,673 1,485,880 1,795,794 272,458 271,653Net change in fair value of investments (5,240,033) 887,874 (1,710,166) (189,911) (3,916,526) 1,386,042 (68,493) 295,102Other income 287 - - - - - - - Net investment income/(loss) (1,087,615) 4,161,238 (1,207,283) 363,942 (2,430,421) 3,182,399 204,004 566,887
ExpensesResponsible Entity fees 11.4 738,810 816,304 105,574 114,298 58,164 62,405 57,648 61,945Interest expense - - - - - - - - Other expenses - - - - - - - - Loan interest expense - - - - - - - - Operating expenses before finance costs 738,810 816,304 105,574 114,298 58,164 62,405 57,648 61,945
Profit/(loss) from operating activities (1,826,425) 3,344,934 (1,312,857) 249,644 (2,488,585) 3,119,994 146,356 504,942- - - - - - - -
Profit/(loss) for the financial year/Total comprehensive income (1,826,425) 3,344,934 (1,312,857) 249,644 (2,488,585) 3,119,994 146,356 504,942
3. ANZ Equity Trust No 1 1. Active Growth Trust 2. ANZ Equity Imputation Trust
4. ANZ Fixed Interest Trust

Financial Report Financial Statements - Statements of Comprehensive Income for the financial year ended 30 June 2020
45
The Statements of Comprehensive Income should be read in conjunction with the Notes to the Financial Statements set out on pages 137 to 421.
Note 30 June 2020 30 June 2019 30 June 2020 30 June 2019 30 June 2020 30 June 2019 30 June 2020 30 June 2019$ $ $ $ $ $ $ $
Investment incomeInterest income 107 409 1,499 3,879 858 2,526 472 1,345Unit trust distribution income 1,219,266 243 6,378,158 5,179,290 7,950,203 11,690,078 5,859,657 9,557,707Net change in fair value of investments (2,634,148) (326,144) (12,232,487) 22,094,317 (12,383,157) 2,499,143 (12,741,004) (4,334,490)Other income - - 63 - 14 - 11 - Net investment income/(loss) (1,414,775) (325,492) (5,852,767) 27,277,486 (4,432,082) 14,191,747 (6,880,864) 5,224,562
ExpensesResponsible Entity fees 11.4 25,995 32,948 201,930 244,556 129,840 151,449 42,808 50,802Interest expense - - 2 2,554 1 - - - Other expenses - - - - - - - - Loan interest expense - - - - - - - - Operating expenses before finance costs 25,995 32,948 201,932 247,110 129,841 151,449 42,808 50,802
Profit/(loss) from operating activities (1,440,770) (358,440) (6,054,699) 27,030,376 (4,561,923) 14,040,298 (6,923,672) 5,173,760- - - - - - - -
Profit/(loss) for the financial year/Total comprehensive income (1,440,770) (358,440) (6,054,699) 27,030,376 (4,561,923) 14,040,298 (6,923,672) 5,173,760
7. ANZ OA Colonial First State Imputation Trust
5. ANZ OA - Pendal Core Hedged Global Shares Trust
6. ANZ OA Arrowstreet Global Equity (Hedged) Trust
8. ANZ OA Investors Mutual Australian Share Trust

Financial Report Financial Statements - Statements of Comprehensive Income for the financial year ended 30 June 2020
46
The Statements of Comprehensive Income should be read in conjunction with the Notes to the Financial Statements set out on pages 137 to 421.
Note 30 June 2020 30 June 2019 30 June 2020 30 June 2019 30 June 2020 30 June 2019 30 June 2020 30 June 2019$ $ $ $ $ $ $ $
Investment incomeInterest income 1,041 2,164 2,395 6,515 570 1,651 179 728Unit trust distribution income 14,950,641 4,372,117 3,564,070 2,897,107 3,088,104 4,102,343 1,876,562 1,269,797Net change in fair value of investments (7,051,102) 10,347,209 (4,762,499) 1,767,873 (7,993,829) 2,834,797 (2,097,044) 860,346Other income - - 98 - 3 - 48 - Net investment income/(loss) 7,900,580 14,721,490 (1,195,936) 4,671,495 (4,905,152) 6,938,791 (220,255) 2,130,871
ExpensesResponsible Entity fees 11.4 63,442 48,065 106,638 120,740 302,830 326,210 674,012 753,723Interest expense - - 728 7,729 - - - - Other expenses - - 381 281 - - - - Loan interest expense - - - - - - - - Operating expenses before finance costs 63,442 48,065 107,747 128,750 302,830 326,210 674,012 753,723
Profit/(loss) from operating activities 7,837,138 14,673,425 (1,303,683) 4,542,745 (5,207,982) 6,612,581 (894,267) 1,377,148- - - - - - - -
Profit/(loss) for the financial year/Total comprehensive income 7,837,138 14,673,425 (1,303,683) 4,542,745 (5,207,982) 6,612,581 (894,267) 1,377,148
11. ANZ OA OnePath Australian Share Trust
9. ANZ OA Magellan Global Trust
10. ANZ OA OnePath Active Growth Trust
12. ANZ OA OnePath Balanced Trust

Financial Report Financial Statements - Statements of Comprehensive Income for the financial year ended 30 June 2020
47
The Statements of Comprehensive Income should be read in conjunction with the Notes to the Financial Statements set out on pages 137 to 421.
Note 30 June 2020 30 June 2019 30 June 2020 30 June 2019 30 June 2020 30 June 2019 30 June 2020 30 June 2019$ $ $ $ $ $ $ $
Investment incomeInterest income 1,741 6,205 2,184 7,975 74 426 498 1,884Unit trust distribution income 14,929,893 18,439,116 3,701,719 2,468,749 499,663 391,607 2,286,217 1,648,506Net change in fair value of investments (49,002,387) (6,846,041) (3,161,227) 2,508,459 (228,969) 585,920 (5,450,426) 3,751,426Other income 32 - 143 - - - 50 - Net investment income/(loss) (34,070,721) 11,599,280 542,819 4,985,183 270,768 977,953 (3,163,661) 5,401,816
ExpensesResponsible Entity fees 11.4 1,876,717 2,150,761 440,677 497,448 208,253 224,505 159,657 175,945Interest expense 2 - 157 9,498 - - - - Other expenses - - 254 102 - - - - Loan interest expense - - - - - - - - Operating expenses before finance costs 1,876,719 2,150,761 441,088 507,048 208,253 224,505 159,657 175,945
Profit/(loss) from operating activities (35,947,440) 9,448,519 101,731 4,478,135 62,515 753,448 (3,323,318) 5,225,871- - - - - - - -
Profit/(loss) for the financial year/Total comprehensive income (35,947,440) 9,448,519 101,731 4,478,135 62,515 753,448 (3,323,318) 5,225,871
15. ANZ OA OnePath Diversified Fixed Interest
Trust
13. ANZ OA OnePath Blue Chip Imputation Trust
14. ANZ OA OnePath Conservative Trust
16. ANZ OA OnePath Global Emerging Markets Share
Trust

Financial Report Financial Statements - Statements of Comprehensive Income for the financial year ended 30 June 2020
48
The Statements of Comprehensive Income should be read in conjunction with the Notes to the Financial Statements set out on pages 137 to 421.
Note 30 June 2020 30 June 2019 30 June 2020 30 June 2019 30 June 2020 30 June 2019 30 June 2020 30 June 2019$ $ $ $ $ $ $ $
Investment incomeInterest income 148 520 280 769 618 5,904 984 3,210Unit trust distribution income 1,804,483 1,959,357 410,162 324,433 6,657,464 9,123,756 6,834,903 5,834,411Net change in fair value of investments (2,616,578) (97,268) (352,682) 393,413 (8,610,272) (822,350) (42,802,513) 1,809,495Other income - - 5 2 8 - 41 - Net investment income/(loss) (811,947) 1,862,609 57,765 718,617 (1,952,182) 8,307,310 (35,966,585) 7,647,116
ExpensesResponsible Entity fees 11.4 13,656 14,182 166,959 210,685 430,164 451,035 127,425 155,575Interest expense - - 41 22 - - - - Other expenses - - - - - - - - Loan interest expense - - - - - - - - Operating expenses before finance costs 13,656 14,182 167,000 210,707 430,164 451,035 127,425 155,575
Profit/(loss) from operating activities (825,603) 1,848,427 (109,235) 507,910 (2,382,346) 7,856,275 (36,094,010) 7,491,541- - - - - - - -
Profit/(loss) for the financial year/Total comprehensive income (825,603) 1,848,427 (109,235) 507,910 (2,382,346) 7,856,275 (36,094,010) 7,491,541
19. ANZ OA OnePath Managed Growth Trust
17. ANZ OA OnePath High Growth Trust
18. ANZ OA OnePath Income Trust
20. ANZ OA OnePath Property Securities Trust

Financial Report Financial Statements - Statements of Comprehensive Income for the financial year ended 30 June 2020
49
The Statements of Comprehensive Income should be read in conjunction with the Notes to the Financial Statements set out on pages 137 to 421.
Note 30 June 2020 30 June 2019 30 June 2020 30 June 2019 30 June 2020 30 June 2019 30 June 2020 30 June 2019$ $ $ $ $ $ $ $
Investment incomeInterest income 132 660 8 23 238 770 8 34Unit trust distribution income 789,515 1,353,697 38,117 50,151 1,861,899 1,934,375 75,786 66,273Net change in fair value of investments (2,083,362) (139,771) (92,358) 82,767 (5,361,669) 2,179,863 (28,940) 61,139Other income 40 - - - 47 - 10 - Net investment income/(loss) (1,293,675) 1,214,586 (54,233) 132,941 (3,499,485) 4,115,008 46,864 127,446
ExpensesResponsible Entity fees 11.4 264,170 313,961 22,701 21,283 966,791 1,071,606 29,250 38,073Interest expense - - - - - - - - Other expenses - - - - - - - - Loan interest expense - - - - - - - - Operating expenses before finance costs 264,170 313,961 22,701 21,283 966,791 1,071,606 29,250 38,073
Profit/(loss) from operating activities (1,557,845) 900,625 (76,934) 111,658 (4,466,276) 3,043,402 17,614 89,373- - - - - - - -
Profit/(loss) for the financial year/Total comprehensive income (1,557,845) 900,625 (76,934) 111,658 (4,466,276) 3,043,402 17,614 89,373
23. ANZ OA OnePath Tax Effective Income Trust
21. ANZ OA OnePath Select Leaders Trust
22. ANZ OA OnePath Sustainable Investments -
Australian Share Trust
24. ANZ OA OptiMix Australian Fixed Interest
Trust

Financial Report Financial Statements - Statements of Comprehensive Income for the financial year ended 30 June 2020
50
The Statements of Comprehensive Income should be read in conjunction with the Notes to the Financial Statements set out on pages 137 to 421.
Note 30 June 2020 30 June 2019 30 June 2020 30 June 2019 30 June 2020 30 June 2019 30 June 2020 30 June 2019$ $ $ $ $ $ $ $
Investment incomeInterest income 56 185 107 371 36 125 16 57Unit trust distribution income 590,902 864,812 775,451 523,610 864,546 665,127 64,910 227,757Net change in fair value of investments (1,274,494) (314,047) (707,611) 595,483 (728,485) 19,365 (69,177) (164,864)Other income 24 - 11 - 20 - 2 - Net investment income/(loss) (683,512) 550,950 67,958 1,119,464 136,117 684,617 (4,249) 62,950
ExpensesResponsible Entity fees 11.4 225,669 259,275 330,158 368,776 153,943 171,435 61,581 75,655Interest expense - - - - - - - - Other expenses - - - - - - - - Loan interest expense - - - - - - - - Operating expenses before finance costs 225,669 259,275 330,158 368,776 153,943 171,435 61,581 75,655
Profit/(loss) from operating activities (909,181) 291,675 (262,200) 750,688 (17,826) 513,182 (65,830) (12,705)- - - - - - - -
Profit/(loss) for the financial year/Total comprehensive income (909,181) 291,675 (262,200) 750,688 (17,826) 513,182 (65,830) (12,705)
27. ANZ OA OptiMix Global Share Trust
25. ANZ OA OptiMix Australian Share Trust
26. ANZ OA OptiMix Conservative Trust
28. ANZ OA OptiMix Global Smaller Companies Share
Trust

Financial Report Financial Statements - Statements of Comprehensive Income for the financial year ended 30 June 2020
51
The Statements of Comprehensive Income should be read in conjunction with the Notes to the Financial Statements set out on pages 137 to 421.
Note 30 June 2020 30 June 2019 30 June 2020 30 June 2019 30 June 2020 30 June 2019 30 June 2020 30 June 2019$ $ $ $ $ $ $ $
Investment incomeInterest income 175 685 77 240 145 441 20 65Unit trust distribution income 2,127,713 1,241,859 868,738 780,110 952,785 652,341 112,396 105,013Net change in fair value of investments (3,140,070) 753,271 (1,416,469) (31,548) (1,273,941) 855,723 (737,282) 300,755Other income 100 - 36 - 57 - - - Net investment income/(loss) (1,012,082) 1,995,815 (547,618) 748,802 (320,954) 1,508,505 (624,866) 405,833
ExpensesResponsible Entity fees 11.4 685,872 758,198 253,021 274,844 498,881 558,253 77,542 92,946Interest expense - - - - - - - - Other expenses - - - - - - - - Loan interest expense - - - - - - - - Operating expenses before finance costs 685,872 758,198 253,021 274,844 498,881 558,253 77,542 92,946
Profit/(loss) from operating activities (1,697,954) 1,237,617 (800,639) 473,958 (819,835) 950,252 (702,408) 312,887- - - - - - - -
Profit/(loss) for the financial year/Total comprehensive income (1,697,954) 1,237,617 (800,639) 473,958 (819,835) 950,252 (702,408) 312,887
31. ANZ OA OptiMix Moderate Trust
29. ANZ OA OptiMix Growth Trust
30. ANZ OA OptiMix High Growth Trust
32. ANZ OA OptiMix Property Securities Trust

Financial Report Financial Statements - Statements of Comprehensive Income for the financial year ended 30 June 2020
52
The Statements of Comprehensive Income should be read in conjunction with the Notes to the Financial Statements set out on pages 137 to 421.
Note 30 June 2020 30 June 2019 30 June 2020 30 June 2019 30 June 2020 30 June 2019 30 June 2020 30 June 2019$ $ $ $ $ $ $ $
Investment incomeInterest income 1,797 4,198 807 3,036 125 467 16 810Unit trust distribution income 9,974,299 20,270,578 11,280,889 22,276,021 2,559,668 3,403,398 73,027 1,014,373Net change in fair value of investments (40,900,624) (1,190,670) (22,229,766) (9,830,417) (7,096,429) (2,670,357) 6,954 524,954Other income 38 - - - 22 - 3 - Net investment income/(loss) (30,924,490) 19,084,106 (10,948,070) 12,448,640 (4,536,614) 733,508 80,000 1,540,137
ExpensesResponsible Entity fees 11.4 540,018 627,783 154,801 187,637 35,220 45,060 23,432 30,489Interest expense 2 - 1 - - - - - Other expenses - - - - - - - - Loan interest expense - - - - - - - - Operating expenses before finance costs 540,020 627,783 154,802 187,637 35,220 45,060 23,432 30,489
Profit/(loss) from operating activities (31,464,510) 18,456,323 (11,102,872) 12,261,003 (4,571,834) 688,448 56,568 1,509,648- - - - - - - -
Profit/(loss) for the financial year/Total comprehensive income (31,464,510) 18,456,323 (11,102,872) 12,261,003 (4,571,834) 688,448 56,568 1,509,648
35. ANZ OA SG Hiscock Property Trust
33. ANZ OA Perpetual Australian Share Trust
34. ANZ OA Schroder Australian Equity Trust
36. ANZ OA UBS Diversified Fixed Income Trust

Financial Report Financial Statements - Statements of Comprehensive Income for the financial year ended 30 June 2020
53
The Statements of Comprehensive Income should be read in conjunction with the Notes to the Financial Statements set out on pages 137 to 421.
Note 30 June 2020 30 June 2019 30 June 2020 30 June 2019 30 June 2020 30 June 2019 30 June 2020 30 June 2019$ $ $ $ $ $ $ $
Investment incomeInterest income 94 199 64 240 23,010 29,460 595 2,076Unit trust distribution income 377,121 750,552 187,940 190,775 12,732,796 4,046,809 8,461,516 11,252,811Net change in fair value of investments (1,450,139) 1,218,022 406,472 1,216,759 (4,331,472) 7,121,139 (29,756,876) (6,629,466)Other income 24 - - - 335,746 147,259 - - Net investment income/(loss) (1,072,900) 1,968,773 594,476 1,407,774 8,760,080 11,344,667 (21,294,765) 4,625,421
ExpensesResponsible Entity fees 11.4 46,971 48,826 33,975 26,755 - - 284,497 335,320Interest expense - 50 - - 2,826 - - - Other expenses - - - - - 3,928 - - Loan interest expense - - - - - - - - Operating expenses before finance costs 46,971 48,876 33,975 26,755 2,826 3,928 284,497 335,320
Profit/(loss) from operating activities (1,119,871) 1,919,897 560,501 1,381,019 8,757,254 11,340,739 (21,579,262) 4,290,101- - - - - - - -
Profit/(loss) for the financial year/Total comprehensive income (1,119,871) 1,919,897 560,501 1,381,019 8,757,254 11,340,739 (21,579,262) 4,290,101
39. ANZ Private International Fixed Interest Fund
37. ANZ OneAnswer - BR Scientific Australian Equity
Trust
38. ANZ OneAnswer - BR Scientific International
Equity Trust
40. ANZ Property Securities Trust

Financial Report Financial Statements - Statements of Comprehensive Income for the financial year ended 30 June 2020
54
The Statements of Comprehensive Income should be read in conjunction with the Notes to the Financial Statements set out on pages 137 to 421.
Note 30 June 2020 30 June 2019 30 June 2020 30 June 2019 30 June 2020 30 June 2019 30 June 2020 30 June 2019$ $ $ $ $ $ $ $
Investment incomeInterest income 805 2,012 505 2,249 568 2,153 1,543 5,063Unit trust distribution income 5,188,857 6,403,108 5,692,896 3,913,877 4,793,876 6,274,987 39,726,251 37,011,200Net change in fair value of investments (13,517,589) 4,839,513 (6,342,307) 2,689,785 (15,953,356) (3,424,694) (44,447,173) (24,347,647)Other income 56 - 41 - 116,814 - 23 - Net investment income/(loss) (8,327,871) 11,244,633 (648,865) 6,605,911 (11,042,098) 2,852,446 (4,719,356) 12,668,616
ExpensesResponsible Entity fees 11.4 323,712 393,266 430,660 501,115 1,273,744 1,512,842 1,544,347 1,732,930Interest expense 1 - - - 1 - 1 - Other expenses - - - - - - - - Loan interest expense - - - - - - - - Operating expenses before finance costs 323,713 393,266 430,660 501,115 1,273,745 1,512,842 1,544,348 1,732,930
Profit/(loss) from operating activities (8,651,584) 10,851,367 (1,079,525) 6,104,796 (12,315,843) 1,339,604 (6,263,704) 10,935,686- - - - - - - -
Profit/(loss) for the financial year/Total comprehensive income (8,651,584) 10,851,367 (1,079,525) 6,104,796 (12,315,843) 1,339,604 (6,263,704) 10,935,686
43. Blue Chip Imputation Trust
41. Australian Share Trust 42. Balanced Trust 44. Emerging Companies Trust

Financial Report Financial Statements - Statements of Comprehensive Income for the financial year ended 30 June 2020
55
The Statements of Comprehensive Income should be read in conjunction with the Notes to the Financial Statements set out on pages 137 to 421.
Note 30 June 2020 30 June 2019 30 June 2020 30 June 2019 30 June 2020 30 June 2019 30 June 2020 30 June 2019$ $ $ $ $ $ $ $
Investment incomeInterest income 1,342 3,304 53 182 15 79 76 392Unit trust distribution income 1,973,492 2,375,693 930,312 1,072,815 140,432 159,179 655,366 1,518,532Net change in fair value of investments 15,436,084 25,165,901 (3,229,645) (631,350) (208,106) (42,116) (422,639) 214,120Other income 20 - - - - - - - Net investment income/(loss) 17,410,938 27,544,898 (2,299,280) 441,647 (67,659) 117,142 232,803 1,733,044
ExpensesResponsible Entity fees 11.4 145,868 130,225 173,369 187,203 37,436 40,547 9,104 8,744Interest expense 1 - - - - - 3 - Other expenses - - - - - - - - Loan interest expense - - - - - - - - Operating expenses before finance costs 145,869 130,225 173,369 187,203 37,436 40,547 9,107 8,744
Profit/(loss) from operating activities 17,265,069 27,414,673 (2,472,649) 254,444 (105,095) 76,595 223,696 1,724,300- - - - - - - -
Profit/(loss) for the financial year/Total comprehensive income 17,265,069 27,414,673 (2,472,649) 254,444 (105,095) 76,595 223,696 1,724,300
47. High Growth Trust 45. Global Share Trust 46. Heine Property Securities Fund
48. OneAnswer - Altrinsic Global Equities Trust
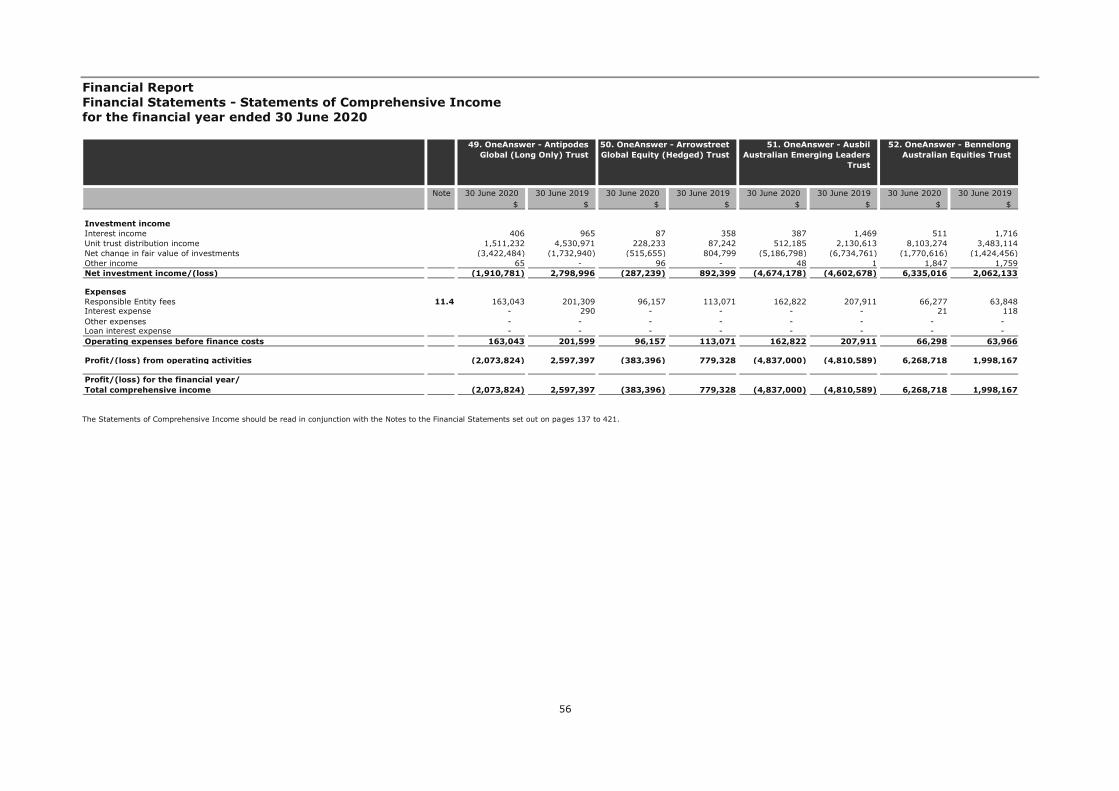
Financial Report Financial Statements - Statements of Comprehensive Income for the financial year ended 30 June 2020
56
The Statements of Comprehensive Income should be read in conjunction with the Notes to the Financial Statements set out on pages 137 to 421.
Note 30 June 2020 30 June 2019 30 June 2020 30 June 2019 30 June 2020 30 June 2019 30 June 2020 30 June 2019$ $ $ $ $ $ $ $
Investment incomeInterest income 406 965 87 358 387 1,469 511 1,716Unit trust distribution income 1,511,232 4,530,971 228,233 87,242 512,185 2,130,613 8,103,274 3,483,114Net change in fair value of investments (3,422,484) (1,732,940) (515,655) 804,799 (5,186,798) (6,734,761) (1,770,616) (1,424,456)Other income 65 - 96 - 48 1 1,847 1,759Net investment income/(loss) (1,910,781) 2,798,996 (287,239) 892,399 (4,674,178) (4,602,678) 6,335,016 2,062,133
ExpensesResponsible Entity fees 11.4 163,043 201,309 96,157 113,071 162,822 207,911 66,277 63,848Interest expense - 290 - - - - 21 118Other expenses - - - - - - - - Loan interest expense - - - - - - - - Operating expenses before finance costs 163,043 201,599 96,157 113,071 162,822 207,911 66,298 63,966
Profit/(loss) from operating activities (2,073,824) 2,597,397 (383,396) 779,328 (4,837,000) (4,810,589) 6,268,718 1,998,167- - - - - - - -
Profit/(loss) for the financial year/Total comprehensive income (2,073,824) 2,597,397 (383,396) 779,328 (4,837,000) (4,810,589) 6,268,718 1,998,167
51. OneAnswer - Ausbil Australian Emerging Leaders
Trust
49. OneAnswer - Antipodes Global (Long Only) Trust
50. OneAnswer - Arrowstreet Global Equity (Hedged) Trust
52. OneAnswer - Bennelong Australian Equities Trust
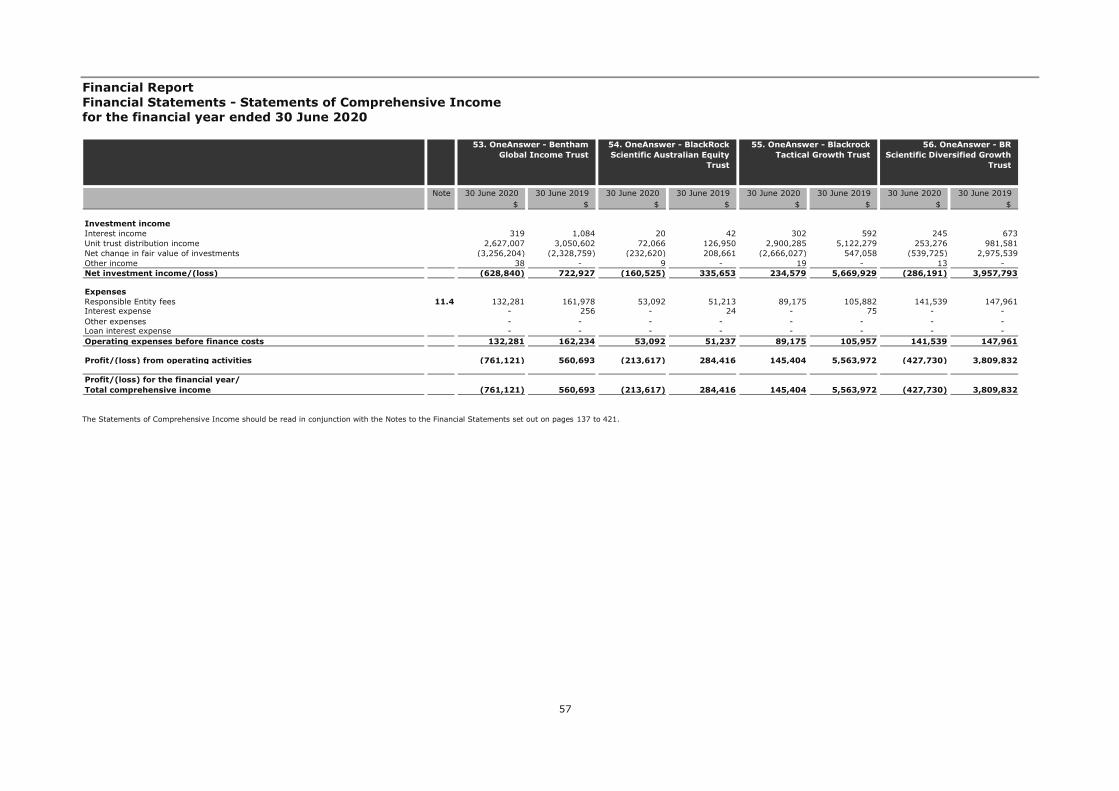
Financial Report Financial Statements - Statements of Comprehensive Income for the financial year ended 30 June 2020
57
The Statements of Comprehensive Income should be read in conjunction with the Notes to the Financial Statements set out on pages 137 to 421.
Note 30 June 2020 30 June 2019 30 June 2020 30 June 2019 30 June 2020 30 June 2019 30 June 2020 30 June 2019$ $ $ $ $ $ $ $
Investment incomeInterest income 319 1,084 20 42 302 592 245 673Unit trust distribution income 2,627,007 3,050,602 72,066 126,950 2,900,285 5,122,279 253,276 981,581Net change in fair value of investments (3,256,204) (2,328,759) (232,620) 208,661 (2,666,027) 547,058 (539,725) 2,975,539Other income 38 - 9 - 19 - 13 - Net investment income/(loss) (628,840) 722,927 (160,525) 335,653 234,579 5,669,929 (286,191) 3,957,793
ExpensesResponsible Entity fees 11.4 132,281 161,978 53,092 51,213 89,175 105,882 141,539 147,961Interest expense - 256 - 24 - 75 - - Other expenses - - - - - - - - Loan interest expense - - - - - - - - Operating expenses before finance costs 132,281 162,234 53,092 51,237 89,175 105,957 141,539 147,961
Profit/(loss) from operating activities (761,121) 560,693 (213,617) 284,416 145,404 5,563,972 (427,730) 3,809,832- - - - - - - -
Profit/(loss) for the financial year/Total comprehensive income (761,121) 560,693 (213,617) 284,416 145,404 5,563,972 (427,730) 3,809,832
55. OneAnswer - Blackrock Tactical Growth Trust
53. OneAnswer - Bentham Global Income Trust
54. OneAnswer - BlackRock Scientific Australian Equity
Trust
56. OneAnswer - BR Scientific Diversified Growth
Trust

Financial Report Financial Statements - Statements of Comprehensive Income for the financial year ended 30 June 2020
58
The Statements of Comprehensive Income should be read in conjunction with the Notes to the Financial Statements set out on pages 137 to 421.
Note 30 June 2020 30 June 2019 30 June 2020 30 June 2019 30 June 2020 30 June 2019 30 June 2020 30 June 2019$ $ $ $ $ $ $ $
Investment incomeInterest income 11 33 259 809 1,874 3,561 34 950Unit trust distribution income 36,415 33,814 402,174 634,885 12,012,990 3,204,169 357,468 2,448,063Net change in fair value of investments 71,210 226,385 (852,611) 646,692 (23,228,297) 14,664,123 (429,119) (4,380,444)Other income 20 - 20 - - - 48 - Net investment income/(loss) 107,656 260,232 (450,158) 1,282,386 (11,213,433) 17,871,853 (71,569) (1,931,431)
ExpensesResponsible Entity fees 11.4 39,734 36,439 59,450 71,915 154,909 109,707 93,202 112,096Interest expense 1 10 - - 1 - - - Other expenses - - - - - - - - Loan interest expense - - - - - - - - Operating expenses before finance costs 39,735 36,449 59,450 71,915 154,910 109,707 93,202 112,096
Profit/(loss) from operating activities 67,921 223,783 (509,608) 1,210,471 (11,368,343) 17,762,146 (164,771) (2,043,527)- - - - - - - -
Profit/(loss) for the financial year/Total comprehensive income 67,921 223,783 (509,608) 1,210,471 (11,368,343) 17,762,146 (164,771) (2,043,527)
59. OneAnswer - Colonial First State Global Listed
Infrastructure Trust
57. OneAnswer - BR Scientific International
Equity Trust
58. OneAnswer - Colonial First State Global Credit
Income Trust
60. OneAnswer - Colonial First State Imputation Trust

Financial Report Financial Statements - Statements of Comprehensive Income for the financial year ended 30 June 2020
59
The Statements of Comprehensive Income should be read in conjunction with the Notes to the Financial Statements set out on pages 137 to 421.
Note 30 June 2020 30 June 2019 30 June 2020 30 June 2019 30 June 2020 30 June 2019 30 June 2020 30 June 2019$ $ $ $ $ $ $ $
Investment incomeInterest income 1,265 8,646 553 1,788 1,315 1,995 29 38Unit trust distribution income 18,083,425 11,239,029 938,630 3,445,190 10,442,713 14,106,735 281,094 32,443Net change in fair value of investments (35,559,008) 16,538,125 1,270,211 2,518,521 (30,366,475) 1,216,866 (69,931) 172,672Other income 19 - - - 12 - 1 - Net investment income/(loss) (17,474,299) 27,785,800 2,209,394 5,965,499 (19,922,435) 15,325,596 211,193 205,153
ExpensesResponsible Entity fees 11.4 379,314 424,248 48,156 37,883 245,520 277,709 7,527 9,759Interest expense 1 - - - 1 624 - 162Other expenses - - - - - - - - Loan interest expense - - - - - - - - Operating expenses before finance costs 379,315 424,248 48,156 37,883 245,521 278,333 7,527 9,921
Profit/(loss) from operating activities (17,853,614) 27,361,552 2,161,238 5,927,616 (20,167,956) 15,047,263 203,666 195,232- - - - - - - -
Profit/(loss) for the financial year/Total comprehensive income (17,853,614) 27,361,552 2,161,238 5,927,616 (20,167,956) 15,047,263 203,666 195,232
63. OneAnswer - Investors Mutual Australian Share
Trust
61. OneAnswer - Fidelity Australian Equities Trust
62. OneAnswer - Greencape Broadcap Trust
64. OneAnswer - Janus Henderson Global Fixed
Interest Total Return Trust

Financial Report Financial Statements - Statements of Comprehensive Income for the financial year ended 30 June 2020
60
The Statements of Comprehensive Income should be read in conjunction with the Notes to the Financial Statements set out on pages 137 to 421.
Note 30 June 2020 30 June 2019 30 June 2020 30 June 2019 30 June 2020 30 June 2019 30 June 2020 30 June 2019$ $ $ $ $ $ $ $
Investment incomeInterest income 3,160 11,089 2,118 4,545 355 952 2,665 10,078Unit trust distribution income 11,529,538 17,805,524 9,554,628 8,577,661 3,551,288 4,457,813 47,557,673 52,896,814Net change in fair value of investments (8,475,564) 5,046,486 6,675,449 21,384,829 (7,994,210) (1,265,162) (42,632,655) 30,895,210Other income 41 - 50 - 13 - 15 - Net investment income/(loss) 3,057,175 22,863,099 16,232,245 29,967,035 (4,442,554) 3,193,603 4,927,698 83,802,102
ExpensesResponsible Entity fees 11.4 672,857 612,901 263,496 219,142 73,120 100,542 658,270 693,163Interest expense 3 - 1 - - 142 3 - Other expenses - - - - - - - - Loan interest expense - - - - - - - - Operating expenses before finance costs 672,860 612,901 263,497 219,142 73,120 100,684 658,273 693,163
Profit/(loss) from operating activities 2,384,315 22,250,198 15,968,748 29,747,893 (4,515,674) 3,092,919 4,269,425 83,108,939- - - - - - - -
Profit/(loss) for the financial year/Total comprehensive income 2,384,315 22,250,198 15,968,748 29,747,893 (4,515,674) 3,092,919 4,269,425 83,108,939
67. OneAnswer - Merlon Australian Share Income
Trust
65. OneAnswer - Kapstream Absolute Return Income
Trust
66. OneAnswer - Magellan Global Trust
68. OneAnswer - MFS Global Equity Trust

Financial Report Financial Statements - Statements of Comprehensive Income for the financial year ended 30 June 2020
61
The Statements of Comprehensive Income should be read in conjunction with the Notes to the Financial Statements set out on pages 137 to 421.
Note 30 June 2020 30 June 2019 30 June 2020 30 June 2019 30 June 2020 30 June 2019 30 June 2020 30 June 2019$ $ $ $ $ $ $ $
Investment incomeInterest income 108 497 2,692 5,981 253 795 262 696Unit trust distribution income 741,981 1,973,028 3,822,426 2,082,244 1,891,486 1,663,806 4,071,398 - Net change in fair value of investments (3,248,791) (1,913,727) (39,744,273) 18,987,278 (4,233,849) 1,210,142 (8,211,536) (855,053)Other income - - 76 - 4 - 17 - Net investment income/(loss) (2,506,702) 59,798 (35,919,079) 21,075,503 (2,342,106) 2,874,743 (4,139,859) (854,357)
ExpensesResponsible Entity fees 11.4 14,581 13,901 462,796 515,561 64,419 65,976 29,754 39,967Interest expense 4 - - 15 - 92 - 72Other expenses - - - - - - - - Loan interest expense - - - - - - - - Operating expenses before finance costs 14,585 13,901 462,796 515,576 64,419 66,068 29,754 40,039
Profit/(loss) from operating activities (2,521,287) 45,897 (36,381,875) 20,559,927 (2,406,525) 2,808,675 (4,169,613) (894,396)- - - - - - - -
Profit/(loss) for the financial year/Total comprehensive income (2,521,287) 45,897 (36,381,875) 20,559,927 (2,406,525) 2,808,675 (4,169,613) (894,396)
71. OneAnswer - Pendal Australian Share Trust
69. OneAnswer - Nikko AM Australian Shares Trust
70. OneAnswer - OnePath Global Property Securities
Index Trust
72. OneAnswer - Pendal Core Hedged Global Shares Trust

Financial Report Financial Statements - Statements of Comprehensive Income for the financial year ended 30 June 2020
62
The Statements of Comprehensive Income should be read in conjunction with the Notes to the Financial Statements set out on pages 137 to 421.
Note 30 June 2020 30 June 2019 30 June 2020 30 June 2019 30 June 2020 30 June 2019 30 June 2020 30 June 2019$ $ $ $ $ $ $ $
Investment incomeInterest income 145 292 702 2,356 621 1,670 123 1,327Unit trust distribution income 580,945 424,145 1,681,173 6,641,028 2,571,646 5,281,370 592,217 2,336,481Net change in fair value of investments (576,228) 389,992 (4,344,989) (11,221,073) (12,537,603) (534,863) (2,409,822) (2,266,648)Other income 11 - 29 - 87 - 59 - Net investment income/(loss) 4,873 814,429 (2,663,085) (4,577,689) (9,965,249) 4,748,177 (1,817,423) 71,160
ExpensesResponsible Entity fees 11.4 21,425 19,422 272,175 349,066 215,654 286,183 361,644 480,782Interest expense - - - - - - - - Other expenses - - - - - - - - Loan interest expense - - - - - - - - Operating expenses before finance costs 21,425 19,422 272,175 349,066 215,654 286,183 361,644 480,782
Profit/(loss) from operating activities (16,552) 795,007 (2,935,260) (4,926,755) (10,180,903) 4,461,994 (2,179,067) (409,622)- - - - - - - -
Profit/(loss) for the financial year/Total comprehensive income (16,552) 795,007 (2,935,260) (4,926,755) (10,180,903) 4,461,994 (2,179,067) (409,622)
75. OneAnswer - Perennial Value Shares Trust
73. OneAnswer - Pendal Monthly Income Plus Trust
74. OneAnswer - Pendal Smaller Companies Trust
76. OneAnswer - Perpetual Australian Share Trust

Financial Report Financial Statements - Statements of Comprehensive Income for the financial year ended 30 June 2020
63
The Statements of Comprehensive Income should be read in conjunction with the Notes to the Financial Statements set out on pages 137 to 421.
Note 30 June 2020 30 June 2019 30 June 2020 30 June 2019 30 June 2020 30 June 2019 30 June 2020 30 June 2019$ $ $ $ $ $ $ $
Investment incomeInterest income 763 2,072 941 2,789 41 93 188 454Unit trust distribution income 7,515,064 13,195,829 4,841,847 6,011,016 188,225 204,645 2,345,783 1,420,584Net change in fair value of investments (10,408,506) (603,438) (4,177,800) 3,489,109 (706,026) (363,689) 1,321,897 (1,064,700)Other income 40 - 17 - - - - - Net investment income/(loss) (2,892,639) 12,594,463 665,005 9,502,914 (517,760) (158,951) 3,667,868 356,338
ExpensesResponsible Entity fees 11.4 156,430 205,682 476,922 441,873 14,292 15,607 34,660 40,865Interest expense 1 72 1 25 - 3 - - Other expenses - - - - - - - - Loan interest expense - - - - - - - - Operating expenses before finance costs 156,431 205,754 476,923 441,898 14,292 15,610 34,660 40,865
Profit/(loss) from operating activities (3,049,070) 12,388,709 188,082 9,061,016 (532,052) (174,561) 3,633,208 315,473- - - - - - - -
Profit/(loss) for the financial year/Total comprehensive income (3,049,070) 12,388,709 188,082 9,061,016 (532,052) (174,561) 3,633,208 315,473
79. OneAnswer - Perpetual Ethical SRI Trust
77. OneAnswer - Perpetual Balanced Growth Trust
78. OneAnswer - Perpetual Conservative Growth Trust
80. OneAnswer - Platinum Asia Trust

Financial Report Financial Statements - Statements of Comprehensive Income for the financial year ended 30 June 2020
64
The Statements of Comprehensive Income should be read in conjunction with the Notes to the Financial Statements set out on pages 137 to 421.
Note 30 June 2020 30 June 2019 30 June 2020 30 June 2019 30 June 2020 30 June 2019 30 June 2020 30 June 2019$ $ $ $ $ $ $ $
Investment incomeInterest income 1,654 4,689 629 1,905 1,322 3,684 1,334 3,088Unit trust distribution income 12,554,263 27,202,546 3,965,341 5,234,968 7,040,784 8,450,224 7,216,680 9,489,377Net change in fair value of investments (23,119,259) (23,383,816) (9,310,267) 9,791,170 (33,132,297) 16,404,198 (9,193,879) 9,706,956Other income 118 - 14 - 78 - 9 - Net investment income/(loss) (10,563,224) 3,823,419 (5,344,283) 15,028,043 (26,090,113) 24,858,106 (1,975,856) 19,199,421
ExpensesResponsible Entity fees 11.4 569,298 717,307 156,258 191,498 253,019 309,432 251,359 286,128Interest expense 2 478 1 - 1 50 1 118Other expenses - - - - - - - - Loan interest expense - - - - - - - - Operating expenses before finance costs 569,300 717,785 156,259 191,498 253,020 309,482 251,360 286,246
Profit/(loss) from operating activities (11,132,524) 3,105,634 (5,500,542) 14,836,545 (26,343,133) 24,548,624 (2,227,216) 18,913,175- - - - - - - -
Profit/(loss) for the financial year/Total comprehensive income (11,132,524) 3,105,634 (5,500,542) 14,836,545 (26,343,133) 24,548,624 (2,227,216) 18,913,175
83. OneAnswer - Schroder Australian Equity Trust
81. OneAnswer - Platinum International Trust
82. OneAnswer - RARE Infastructure Value Trust
84. OneAnswer - Schroder Balanced Trust

Financial Report Financial Statements - Statements of Comprehensive Income for the financial year ended 30 June 2020
65
The Statements of Comprehensive Income should be read in conjunction with the Notes to the Financial Statements set out on pages 137 to 421.
Note 30 June 2020 30 June 2019 30 June 2020 30 June 2019 30 June 2020 30 June 2019 30 June 2020 30 June 2019$ $ $ $ $ $ $ $
Investment incomeInterest income 1,502 2,641 2,325 5,364 106 322 53 126Unit trust distribution income 4,295,824 4,605,542 13,478,623 15,134,439 662,144 842,923 547,828 350,514Net change in fair value of investments 4,677,453 15,228,193 (10,765,012) 5,670,167 (5,663,638) (34,126) (156,604) 211,686Other income 86 - 14 - 17 - 2 - Net investment income/(loss) 8,974,865 19,836,376 2,715,950 20,809,970 (5,001,371) 809,119 391,279 562,326
ExpensesResponsible Entity fees 11.4 254,263 291,611 381,364 418,863 19,906 29,881 13,277 12,569Interest expense 1 92 2 439 - 112 - - Other expenses - - - - - - - - Loan interest expense - - - - - - - - Operating expenses before finance costs 254,264 291,703 381,366 419,302 19,906 29,993 13,277 12,569
Profit/(loss) from operating activities 8,720,601 19,544,673 2,334,584 20,390,668 (5,021,277) 779,126 378,002 549,757- - - - - - - -
Profit/(loss) for the financial year/Total comprehensive income 8,720,601 19,544,673 2,334,584 20,390,668 (5,021,277) 779,126 378,002 549,757
87. OneAnswer - SG Hiscock Property Trust
85. OneAnswer - Schroder Fixed Income Trust
86. OneAnswer - Schroder Real Return Trust
88. OneAnswer - Stewart Investors Worldwide
Sustainability Trust

Financial Report Financial Statements - Statements of Comprehensive Income for the financial year ended 30 June 2020
66
The Statements of Comprehensive Income should be read in conjunction with the Notes to the Financial Statements set out on pages 137 to 421.
Note 30 June 2020 30 June 2019 30 June 2020 30 June 2019 30 June 2020 30 June 2019 30 June 2020 30 June 2019$ $ $ $ $ $ $ $
Investment incomeInterest income 393 754 575 1,062 399 986 166 194Unit trust distribution income 5,760,002 3,758,630 470,706 489,926 3,424,939 1,942,285 789,028 659,122Net change in fair value of investments 2,168,744 392,763 2,386,488 85,371 (5,215,653) 1,232,111 (979,941) 919,639Other income 5 - - - 19 - 24 - Net investment income/(loss) 7,929,144 4,152,147 2,857,769 576,359 (1,790,296) 3,175,382 (190,723) 1,578,955
ExpensesResponsible Entity fees 11.4 55,048 43,061 47,788 33,060 86,903 101,582 53,811 59,973Interest expense - - - - - 32 23 241Other expenses - - - - - - - - Loan interest expense - - - - - - - - Operating expenses before finance costs 55,048 43,061 47,788 33,060 86,903 101,614 53,834 60,214
Profit/(loss) from operating activities 7,874,096 4,109,086 2,809,981 543,299 (1,877,199) 3,073,768 (244,557) 1,518,741- - - - - - - -
Profit/(loss) for the financial year/Total comprehensive income 7,874,096 4,109,086 2,809,981 543,299 (1,877,199) 3,073,768 (244,557) 1,518,741
91. OneAnswer - UBS Balanced Trust
89. OneAnswer - T. Rowe Price Global Equity Trust
90. OneAnswer - T.Rowe Price Dynamic Global Bond
Trust
92. OneAnswer - UBS Defensive Trust

Financial Report Financial Statements - Statements of Comprehensive Income for the financial year ended 30 June 2020
67
The Statements of Comprehensive Income should be read in conjunction with the Notes to the Financial Statements set out on pages 137 to 421.
Note 30 June 2020 30 June 2019 30 June 2020 30 June 2019 30 June 2020 30 June 2019 30 June 2020 30 June 2019$ $ $ $ $ $ $ $
Investment incomeInterest income 874 1,250 6,214 17,678 9,226 14,472 5,398 7,860Unit trust distribution income 3,609,709 3,817,840 50,517,052 73,170,204 126,142,564 88,278,279 41,056,534 22,994,722Net change in fair value of investments 181,719 3,641,710 (126,452,719) 45,244,033 (82,228,868) 113,993,324 (19,362,068) 41,742,674Other income 58 - 53 - 23 - 68 - Net investment income/(loss) 3,792,360 7,460,800 (75,929,400) 118,431,915 43,922,945 202,286,075 21,699,932 64,745,256
ExpensesResponsible Entity fees 11.4 137,449 161,956 1,909,198 2,027,127 3,237,287 3,259,333 1,560,874 1,488,858Interest expense - - 7 - 486 1,183 157 458Other expenses - - - - - - 169 - Loan interest expense - - - - - - - - Operating expenses before finance costs 137,449 161,956 1,909,205 2,027,127 3,237,773 3,260,516 1,561,200 1,489,316
Profit/(loss) from operating activities 3,654,911 7,298,844 (77,838,605) 116,404,788 40,685,172 199,025,559 20,138,732 63,255,940- - - - - - - -
Profit/(loss) for the financial year/Total comprehensive income 3,654,911 7,298,844 (77,838,605) 116,404,788 40,685,172 199,025,559 20,138,732 63,255,940
95. OneAnswer - Vanguard Balanced Index Trust
93. OneAnswer - UBS Diversified Fixed Income
Trust
94. OneAnswer - Vanguard Australian Shares Index
Trust
96. OneAnswer - Vanguard Conservative Index Trust
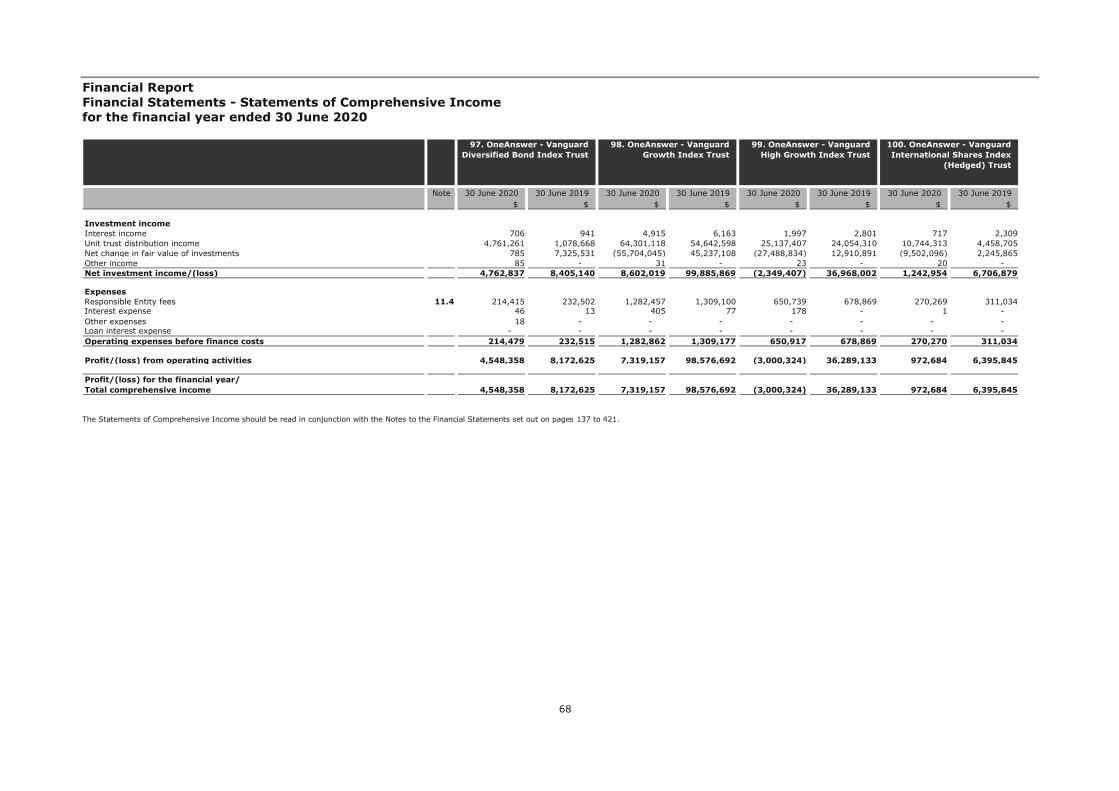
Financial Report Financial Statements - Statements of Comprehensive Income for the financial year ended 30 June 2020
68
The Statements of Comprehensive Income should be read in conjunction with the Notes to the Financial Statements set out on pages 137 to 421.
Note 30 June 2020 30 June 2019 30 June 2020 30 June 2019 30 June 2020 30 June 2019 30 June 2020 30 June 2019$ $ $ $ $ $ $ $
Investment incomeInterest income 706 941 4,915 6,163 1,997 2,801 717 2,309Unit trust distribution income 4,761,261 1,078,668 64,301,118 54,642,598 25,137,407 24,054,310 10,744,313 4,458,705Net change in fair value of investments 785 7,325,531 (55,704,045) 45,237,108 (27,488,834) 12,910,891 (9,502,096) 2,245,865Other income 85 - 31 - 23 - 20 - Net investment income/(loss) 4,762,837 8,405,140 8,602,019 99,885,869 (2,349,407) 36,968,002 1,242,954 6,706,879
ExpensesResponsible Entity fees 11.4 214,415 232,502 1,282,457 1,309,100 650,739 678,869 270,269 311,034Interest expense 46 13 405 77 178 - 1 - Other expenses 18 - - - - - - - Loan interest expense - - - - - - - - Operating expenses before finance costs 214,479 232,515 1,282,862 1,309,177 650,917 678,869 270,270 311,034
Profit/(loss) from operating activities 4,548,358 8,172,625 7,319,157 98,576,692 (3,000,324) 36,289,133 972,684 6,395,845- - - - - - - -
Profit/(loss) for the financial year/Total comprehensive income 4,548,358 8,172,625 7,319,157 98,576,692 (3,000,324) 36,289,133 972,684 6,395,845
99. OneAnswer - Vanguard High Growth Index Trust
97. OneAnswer - Vanguard Diversified Bond Index Trust
98. OneAnswer - Vanguard Growth Index Trust
100. OneAnswer - Vanguard International Shares Index
(Hedged) Trust

Financial Report Financial Statements - Statements of Comprehensive Income for the financial year ended 30 June 2020
69
The Statements of Comprehensive Income should be read in conjunction with the Notes to the Financial Statements set out on pages 137 to 421.
Note 30 June 2020 30 June 2019 30 June 2020 30 June 2019 30 June 2020 30 June 2019 30 June 2020 30 June 2019$ $ $ $ $ $ $ $
Investment incomeInterest income 1,447 9,308 575 1,594 221 748 12,911 60,075Unit trust distribution income 70,515,885 74,430,309 11,011,436 7,766,644 2,967,625 3,434,608 4,949,150 2,309,123Net change in fair value of investments (21,436,135) 26,456,685 (43,605,612) 23,105,116 (2,499,718) 2,098,332 (2,424,233) (2,526,121)Other income 31 - 11 - 3 - 64 - Net investment income/(loss) 49,081,228 100,896,302 (32,593,590) 30,873,354 468,131 5,533,688 2,537,892 (156,923)
ExpensesResponsible Entity fees 11.4 1,422,182 1,486,964 316,347 359,279 33,404 43,029 263,582 292,336Interest expense 131 - 1 - - - 4 - Other expenses - - - - - - - - Loan interest expense - - - - - - - - Operating expenses before finance costs 1,422,313 1,486,964 316,348 359,279 33,404 43,029 263,586 292,336
Profit/(loss) from operating activities 47,658,915 99,409,338 (32,909,938) 30,514,075 434,727 5,490,659 2,274,306 (449,259)- - - - - - - -
Profit/(loss) for the financial year/Total comprehensive income 47,658,915 99,409,338 (32,909,938) 30,514,075 434,727 5,490,659 2,274,306 (449,259)
103. OneAnswer - Walter Scott Global Equity (Hedged)
Trust
101. OneAnswer - Vanguard International Shares Index
Trust
102. OneAnswer - Vanguard Property Securities Index
Trust
104. OnePath Alternatives Growth Fund

Financial Report Financial Statements - Statements of Comprehensive Income for the financial year ended 30 June 2020
70
The Statements of Comprehensive Income should be read in conjunction with the Notes to the Financial Statements set out on pages 137 to 421.
Note 30 June 2020 30 June 2019 30 June 2020 30 June 2019 30 June 2020 30 June 2019 30 June 2020 30 June 2019$ $ $ $ $ $ $ $
Investment incomeInterest income 25,772 84,955 37 122 6 27 110 464Unit trust distribution income 38,191,897 31,899,414 330,217 295,767 12,449 11,298 870,740 659,139Net change in fair value of investments (38,222,542) 19,385,962 (268,301) 77,519 (3,318) 23,122 (391,113) 868,492Other income 12 7 58 - 1 - 28 - Net investment income/(loss) (4,861) 51,370,338 62,011 373,408 9,138 34,447 479,765 1,528,095
ExpensesResponsible Entity fees 11.4 - - 68,203 85,857 19,470 23,911 137,242 161,180Interest expense 9,997 47,628 - - - - - - Other expenses 7,338 8,942 - - - - - - Loan interest expense - - - - - - - - Operating expenses before finance costs 17,335 56,570 68,203 85,857 19,470 23,911 137,242 161,180
Profit/(loss) from operating activities (22,196) 51,313,768 (6,192) 287,551 (10,332) 10,536 342,523 1,366,915- - - - - - - -
Profit/(loss) for the financial year/Total comprehensive income (22,196) 51,313,768 (6,192) 287,551 (10,332) 10,536 342,523 1,366,915
107. OnePath Diversified Credit Trust
105. OnePath Capital Guaranteed Trust
106. OnePath Capital Stable Trust
108. OnePath Diversified Fixed Interest Trust

Financial Report Financial Statements - Statements of Comprehensive Income for the financial year ended 30 June 2020
71
The Statements of Comprehensive Income should be read in conjunction with the Notes to the Financial Statements set out on pages 137 to 421.
Note 30 June 2020 30 June 2019 30 June 2020 30 June 2019 30 June 2020 30 June 2019 30 June 2020 30 June 2019$ $ $ $ $ $ $ $
Investment incomeInterest income 53 185 216 502 8 328 24 430Unit trust distribution income 290,338 475,956 1,162,210 740,255 62,118 329,885 131,839 702,415Net change in fair value of investments (1,210,642) 480,707 (2,762,322) 1,677,905 (88,223) (102,749) (351,945) (1,418,712)Other income 21 - 35 - 8 - 27 - Net investment income/(loss) (920,230) 956,848 (1,599,861) 2,418,662 (26,089) 227,464 (220,055) (715,867)
ExpensesResponsible Entity fees 11.4 157,273 172,343 77,375 95,064 24,759 33,872 83,236 105,662Interest expense - - - - - - - - Other expenses - - - - - - - - Loan interest expense - - - - - - - - Operating expenses before finance costs 157,273 172,343 77,375 95,064 24,759 33,872 83,236 105,662
Profit/(loss) from operating activities (1,077,503) 784,505 (1,677,236) 2,323,598 (50,848) 193,592 (303,291) (821,529)- - - - - - - -
Profit/(loss) for the financial year/Total comprehensive income (1,077,503) 784,505 (1,677,236) 2,323,598 (50,848) 193,592 (303,291) (821,529)
111. OnePath Managed Growth Trust
109. OnePath Geared Australian Shares Index
Trust
110. OnePath Global Emerging Markets Share
Trust
112. OnePath Select Leaders Trust

Financial Report Financial Statements - Statements of Comprehensive Income for the financial year ended 30 June 2020
72
The Statements of Comprehensive Income should be read in conjunction with the Notes to the Financial Statements set out on pages 137 to 421.
Note 30 June 2020 30 June 2019 30 June 2020 30 June 2019 30 June 2020 30 June 2019 30 June 2020 30 June 2019$ $ $ $ $ $ $ $
Investment incomeInterest income 15 66 1,381 5,078 16,861 127,003 95 404Unit trust distribution income 75,773 115,945 8,010,622 12,253,812 27,450,068 20,835,333 644,646 965,543Net change in fair value of investments (150,485) 117,797 (20,874,516) 6,335,394 (30,638,608) 17,301,013 (1,156,958) (363,709)Other income 2 - - - 31 1,903 - - Net investment income/(loss) (74,695) 233,808 (12,862,513) 18,594,284 (3,171,648) 38,265,252 (512,217) 602,238
ExpensesResponsible Entity fees 11.4 17,139 17,841 160,555 201,135 275,442 342,084 115,113 166,625Interest expense - - 1 - 11,973 176,148 - - Other expenses - - - - 6,040 7,827 - - Loan interest expense - - - - - - - - Operating expenses before finance costs 17,139 17,841 160,556 201,135 293,455 526,059 115,113 166,625
Profit/(loss) from operating activities (91,834) 215,967 (13,023,069) 18,393,149 (3,465,103) 37,739,193 (627,330) 435,613- - - - - - - -
Profit/(loss) for the financial year/Total comprehensive income (91,834) 215,967 (13,023,069) 18,393,149 (3,465,103) 37,739,193 (627,330) 435,613
115. OnePath Wholesale Balanced Trust
113. OnePath Sustainable Investments - Australian
Share Trust
114. OnePath Wholesale Australian Share Trust
116. OnePath Wholesale Blue Chip Imputation Trust

Financial Report Financial Statements - Statements of Comprehensive Income for the financial year ended 30 June 2020
73
The Statements of Comprehensive Income should be read in conjunction with the Notes to the Financial Statements set out on pages 137 to 421.
Note 30 June 2020 30 June 2019 30 June 2020 30 June 2019 30 June 2020 30 June 2019 30 June 2020 30 June 2019$ $ $ $ $ $ $ $
Investment incomeInterest income 12,978 76,421 - - 512 2,091 2,838 2,780Unit trust distribution income 20,013,755 16,107,900 30,269,212 19,626,609 14,812,898 12,735,251 4,961,105 7,112,801Net change in fair value of investments (14,683,814) 11,922,418 (10,198,244) 27,577,108 (15,983,545) (9,277,991) (13,874,871) 3,534,851Other income 743 18 15 - 17,223 - - - Net investment income/(loss) 5,343,662 28,106,757 20,070,983 47,203,717 (1,152,912) 3,459,351 (8,910,928) 10,650,432
ExpensesResponsible Entity fees 11.4 68,473 103,447 1,138,631 1,166,123 305,330 327,497 2,744 3,034Interest expense 4,793 60,875 - - - - 111 - Other expenses 2,587 2,872 - - - - 89,968 91,699Loan interest expense - - - - - - 909,831 1,448,566Operating expenses before finance costs 75,853 167,194 1,138,631 1,166,123 305,330 327,497 1,002,654 1,543,299
Profit/(loss) from operating activities 5,267,809 27,939,563 18,932,352 46,037,594 (1,458,242) 3,131,854 (9,913,582) 9,107,133- - - - - - - -
Profit/(loss) for the financial year/Total comprehensive income 5,267,809 27,939,563 18,932,352 46,037,594 (1,458,242) 3,131,854 (9,913,582) 9,107,133
119. OnePath Wholesale Emerging Companies Trust
117. OnePath Wholesale Capital Stable Trust
118. OnePath Wholesale Diversified Fixed Interest
Trust
120. OnePath Wholesale Geared Australian Shares
Index Trust
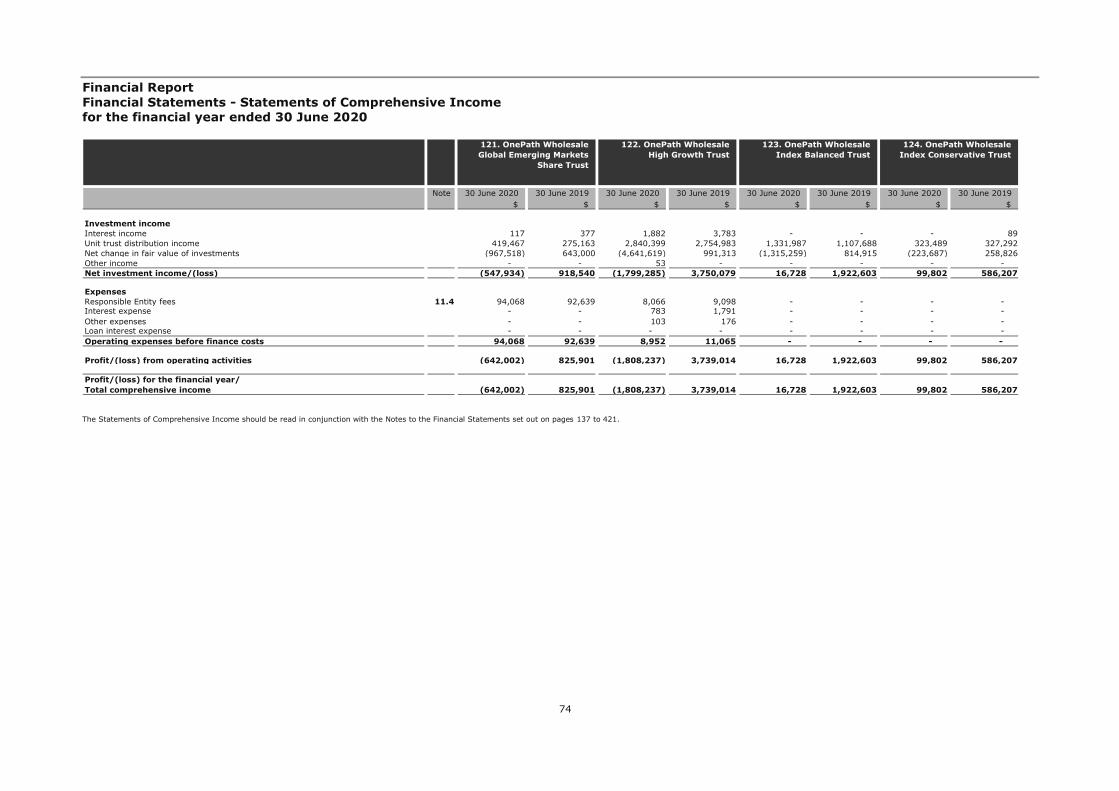
Financial Report Financial Statements - Statements of Comprehensive Income for the financial year ended 30 June 2020
74
The Statements of Comprehensive Income should be read in conjunction with the Notes to the Financial Statements set out on pages 137 to 421.
Note 30 June 2020 30 June 2019 30 June 2020 30 June 2019 30 June 2020 30 June 2019 30 June 2020 30 June 2019$ $ $ $ $ $ $ $
Investment incomeInterest income 117 377 1,882 3,783 - - - 89Unit trust distribution income 419,467 275,163 2,840,399 2,754,983 1,331,987 1,107,688 323,489 327,292Net change in fair value of investments (967,518) 643,000 (4,641,619) 991,313 (1,315,259) 814,915 (223,687) 258,826Other income - - 53 - - - - - Net investment income/(loss) (547,934) 918,540 (1,799,285) 3,750,079 16,728 1,922,603 99,802 586,207
ExpensesResponsible Entity fees 11.4 94,068 92,639 8,066 9,098 - - - - Interest expense - - 783 1,791 - - - - Other expenses - - 103 176 - - - - Loan interest expense - - - - - - - - Operating expenses before finance costs 94,068 92,639 8,952 11,065 - - - -
Profit/(loss) from operating activities (642,002) 825,901 (1,808,237) 3,739,014 16,728 1,922,603 99,802 586,207- - - - - - - -
Profit/(loss) for the financial year/Total comprehensive income (642,002) 825,901 (1,808,237) 3,739,014 16,728 1,922,603 99,802 586,207
123. OnePath Wholesale Index Balanced Trust
121. OnePath Wholesale Global Emerging Markets
Share Trust
122. OnePath Wholesale High Growth Trust
124. OnePath Wholesale Index Conservative Trust

Financial Report Financial Statements - Statements of Comprehensive Income for the financial year ended 30 June 2020
75
The Statements of Comprehensive Income should be read in conjunction with the Notes to the Financial Statements set out on pages 137 to 421.
Note 30 June 2020 30 June 2019 30 June 2020 30 June 2019 30 June 2020 30 June 2019 30 June 2020 30 June 2019$ $ $ $ $ $ $ $
Investment incomeInterest income - - 32,684 197,826 18 60 576 1,566Unit trust distribution income 252,727 241,713 61,916,042 50,361,730 243,490 301,008 3,496,765 4,206,206Net change in fair value of investments (231,215) 167,180 (82,814,283) 30,026,232 (838,440) (175,583) (9,163,716) 5,289,516Other income - - 4,035 - - - - - Net investment income/(loss) 21,512 408,893 (20,861,522) 80,585,788 (594,932) 125,485 (5,666,375) 9,497,288
ExpensesResponsible Entity fees 11.4 - - 206,480 245,553 21,254 26,305 65,254 83,513Interest expense - - 34,214 279,821 - - 1 - Other expenses - - 14,243 74,438 - - - - Loan interest expense - - - - - - - - Operating expenses before finance costs - - 254,937 599,812 21,254 26,305 65,255 83,513
Profit/(loss) from operating activities 21,512 408,893 (21,116,459) 79,985,976 (616,186) 99,180 (5,731,630) 9,413,775- - - - - - - -
Profit/(loss) for the financial year/Total comprehensive income 21,512 408,893 (21,116,459) 79,985,976 (616,186) 99,180 (5,731,630) 9,413,775
127. OnePath Wholesale Property Securities Trust
125. OnePath Wholesale Index Moderate Trust
126. OnePath Wholesale Managed Growth Trust
128. OnePath Wholesale Select Leaders Trust
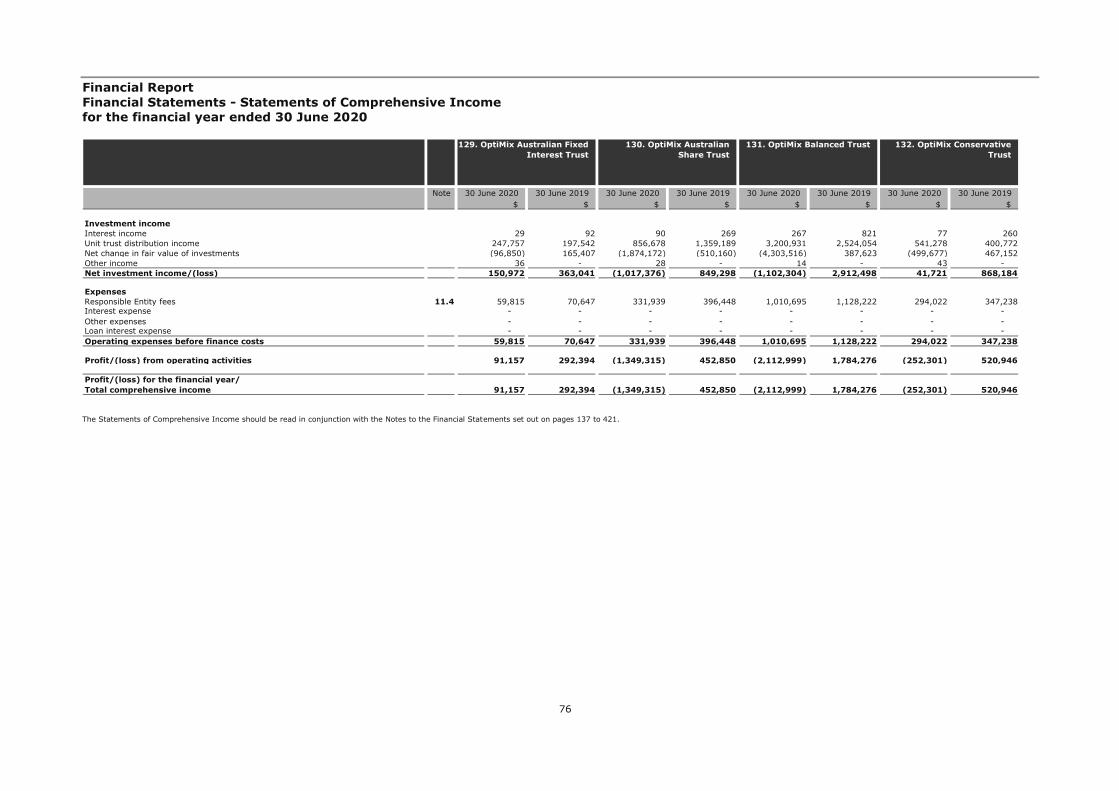
Financial Report Financial Statements - Statements of Comprehensive Income for the financial year ended 30 June 2020
76
The Statements of Comprehensive Income should be read in conjunction with the Notes to the Financial Statements set out on pages 137 to 421.
Note 30 June 2020 30 June 2019 30 June 2020 30 June 2019 30 June 2020 30 June 2019 30 June 2020 30 June 2019$ $ $ $ $ $ $ $
Investment incomeInterest income 29 92 90 269 267 821 77 260Unit trust distribution income 247,757 197,542 856,678 1,359,189 3,200,931 2,524,054 541,278 400,772Net change in fair value of investments (96,850) 165,407 (1,874,172) (510,160) (4,303,516) 387,623 (499,677) 467,152Other income 36 - 28 - 14 - 43 - Net investment income/(loss) 150,972 363,041 (1,017,376) 849,298 (1,102,304) 2,912,498 41,721 868,184
ExpensesResponsible Entity fees 11.4 59,815 70,647 331,939 396,448 1,010,695 1,128,222 294,022 347,238Interest expense - - - - - - - - Other expenses - - - - - - - - Loan interest expense - - - - - - - - Operating expenses before finance costs 59,815 70,647 331,939 396,448 1,010,695 1,128,222 294,022 347,238
Profit/(loss) from operating activities 91,157 292,394 (1,349,315) 452,850 (2,112,999) 1,784,276 (252,301) 520,946- - - - - - - -
Profit/(loss) for the financial year/Total comprehensive income 91,157 292,394 (1,349,315) 452,850 (2,112,999) 1,784,276 (252,301) 520,946
131. OptiMix Balanced Trust 129. OptiMix Australian Fixed Interest Trust
130. OptiMix Australian Share Trust
132. OptiMix Conservative Trust

Financial Report Financial Statements - Statements of Comprehensive Income for the financial year ended 30 June 2020
77
The Statements of Comprehensive Income should be read in conjunction with the Notes to the Financial Statements set out on pages 137 to 421.
Note 30 June 2020 30 June 2019 30 June 2020 30 June 2019 30 June 2020 30 June 2019 30 June 2020 30 June 2019$ $ $ $ $ $ $ $
Investment incomeInterest income 29 92 46 149 25 92 94 278Unit trust distribution income 219,816 168,706 1,078,293 804,716 95,848 337,492 1,037,858 621,748Net change in fair value of investments (388,497) 149,941 (1,012,527) 33,285 (112,286) (254,744) (1,508,918) 385,035Other income 18 - 24 - 21 - 4 - Net investment income/(loss) (168,634) 318,739 65,836 838,150 (16,392) 82,840 (470,962) 1,007,061
ExpensesResponsible Entity fees 11.4 77,725 88,869 173,029 197,073 73,781 94,526 350,733 390,574Interest expense - - - - - - - - Other expenses - - - - - - - - Loan interest expense - - - - - - - - Operating expenses before finance costs 77,725 88,869 173,029 197,073 73,781 94,526 350,733 390,574
Profit/(loss) from operating activities (246,359) 229,870 (107,193) 641,077 (90,173) (11,686) (821,695) 616,487- - - - - - - -
Profit/(loss) for the financial year/Total comprehensive income (246,359) 229,870 (107,193) 641,077 (90,173) (11,686) (821,695) 616,487
135. OptiMix Global Smaller Companies Share Trust
133. OptiMix Global Emerging Markets Share
Trust
134. OptiMix Global Share Trust
136. OptiMix Growth Trust

Financial Report Financial Statements - Statements of Comprehensive Income for the financial year ended 30 June 2020
78
The Statements of Comprehensive Income should be read in conjunction with the Notes to the Financial Statements set out on pages 137 to 421.
Note 30 June 2020 30 June 2019 30 June 2020 30 June 2019 30 June 2020 30 June 2019 30 June 2020 30 June 2019$ $ $ $ $ $ $ $
Investment incomeInterest income 32 132 49 192 31 104 34,742 228,974Unit trust distribution income 387,519 396,797 383,732 268,973 170,422 163,823 85,262,650 74,226,468Net change in fair value of investments (619,040) 17,854 (511,468) 359,261 (1,129,045) 476,850 (116,795,772) 11,771,212Other income 5 - 42 - 50 - 80 94Net investment income/(loss) (231,484) 414,783 (127,645) 628,426 (958,542) 640,777 (31,498,300) 86,226,748
ExpensesResponsible Entity fees 11.4 126,119 175,557 216,265 256,361 109,146 133,965 92,066 112,218Interest expense - - - - - - 34,919 348,577Other expenses - - - - - - 15,298 13,083Loan interest expense - - - - - - - - Operating expenses before finance costs 126,119 175,557 216,265 256,361 109,146 133,965 142,283 473,878
Profit/(loss) from operating activities (357,603) 239,226 (343,910) 372,065 (1,067,688) 506,812 (31,640,583) 85,752,870- - - - - - - -
Profit/(loss) for the financial year/Total comprehensive income (357,603) 239,226 (343,910) 372,065 (1,067,688) 506,812 (31,640,583) 85,752,870
139. OptiMix Property Securities Trust
137. OptiMix High Growth Trust
138. OptiMix Moderate Trust 140. OptiMix Wholesale Balanced Trust

Financial Report Financial Statements - Statements of Comprehensive Income for the financial year ended 30 June 2020
79
The Statements of Comprehensive Income should be read in conjunction with the Notes to the Financial Statements set out on pages 137 to 421.
Note 30 June 2020 30 June 2019 30 June 2020 30 June 2019 30 June 2020 30 June 2019 30 June 2020 30 June 2019$ $ $ $ $ $ $ $
Investment incomeInterest income 7,520 16,374 3,242 10,889 18,292 99,734 7,710 34,427Unit trust distribution income 17,976,970 12,628,247 47,515,614 43,165,231 49,960,665 46,908,284 22,882,965 22,302,572Net change in fair value of investments (16,965,997) 7,007,869 (60,165,194) (20,279,829) (75,424,733) 3,835,628 (37,052,112) (853,366)Other income 20 11 - - 882 28 7 13Net investment income/(loss) 1,018,513 19,652,501 (12,646,338) 22,896,291 (25,444,894) 50,843,674 (14,161,430) 21,483,646
ExpensesResponsible Entity fees 11.4 30,672 45,960 3 3 34,746 40,184 15,463 20,173Interest expense 2,389 13,038 - 3,890 13,408 160,400 5,770 52,550Other expenses 1,706 971 - - 5,883 5,036 1,388 1,917Loan interest expense - - - - - - - - Operating expenses before finance costs 34,767 59,969 3 3,893 54,037 205,620 22,621 74,640
Profit/(loss) from operating activities 983,746 19,592,532 (12,646,341) 22,892,398 (25,498,931) 50,638,054 (14,184,051) 21,409,006- - - - - - - -
Profit/(loss) for the financial year/Total comprehensive income 983,746 19,592,532 (12,646,341) 22,892,398 (25,498,931) 50,638,054 (14,184,051) 21,409,006
143. OptiMix Wholesale Growth Trust
141. OptiMix Wholesale Conservative Trust
142. OptiMix Wholesale Global (Hedged) Share Trust
144. OptiMix Wholesale High Growth Trust
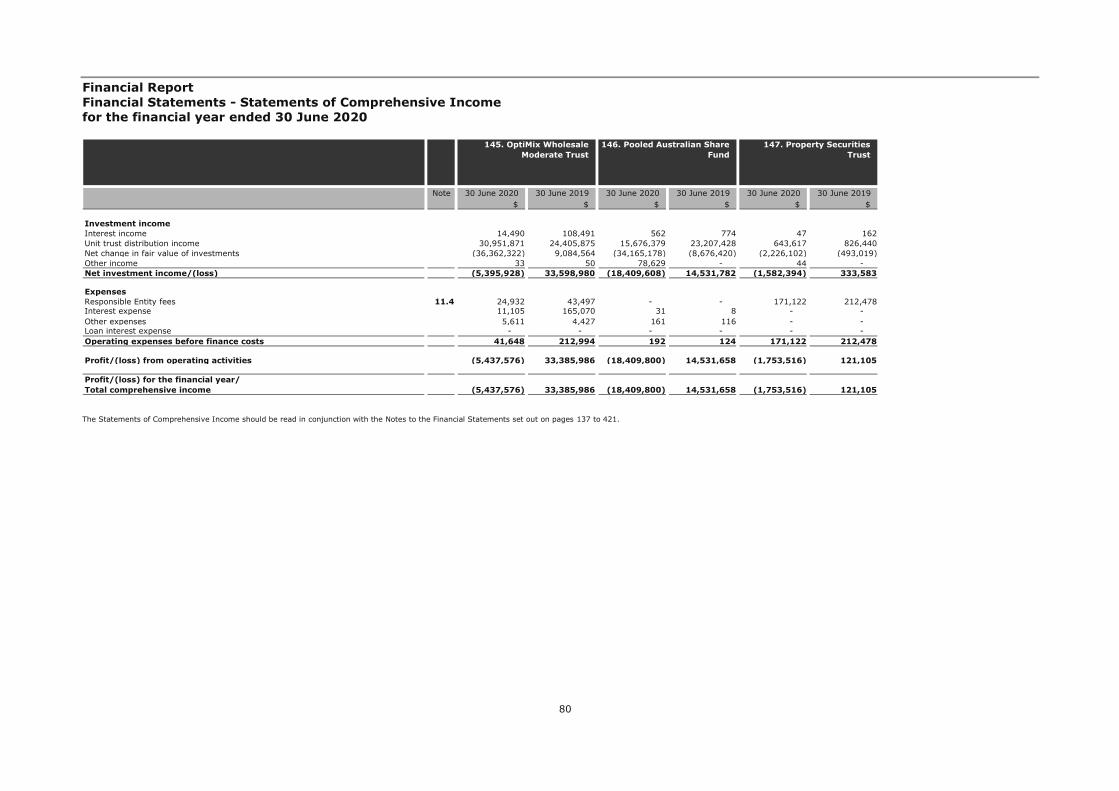
Financial Report Financial Statements - Statements of Comprehensive Income for the financial year ended 30 June 2020
80
The Statements of Comprehensive Income should be read in conjunction with the Notes to the Financial Statements set out on pages 137 to 421.
Note 30 June 2020 30 June 2019 30 June 2020 30 June 2019 30 June 2020 30 June 2019$ $ $ $ $ $
Investment incomeInterest income 14,490 108,491 562 774 47 162Unit trust distribution income 30,951,871 24,405,875 15,676,379 23,207,428 643,617 826,440Net change in fair value of investments (36,362,322) 9,084,564 (34,165,178) (8,676,420) (2,226,102) (493,019)Other income 33 50 78,629 - 44 - Net investment income/(loss) (5,395,928) 33,598,980 (18,409,608) 14,531,782 (1,582,394) 333,583
ExpensesResponsible Entity fees 11.4 24,932 43,497 - - 171,122 212,478Interest expense 11,105 165,070 31 8 - - Other expenses 5,611 4,427 161 116 - - Loan interest expense - - - - - - Operating expenses before finance costs 41,648 212,994 192 124 171,122 212,478
Profit/(loss) from operating activities (5,437,576) 33,385,986 (18,409,800) 14,531,658 (1,753,516) 121,105- - - - - -
Profit/(loss) for the financial year/Total comprehensive income (5,437,576) 33,385,986 (18,409,800) 14,531,658 (1,753,516) 121,105
147. Property Securities Trust
145. OptiMix Wholesale Moderate Trust
146. Pooled Australian Share Fund
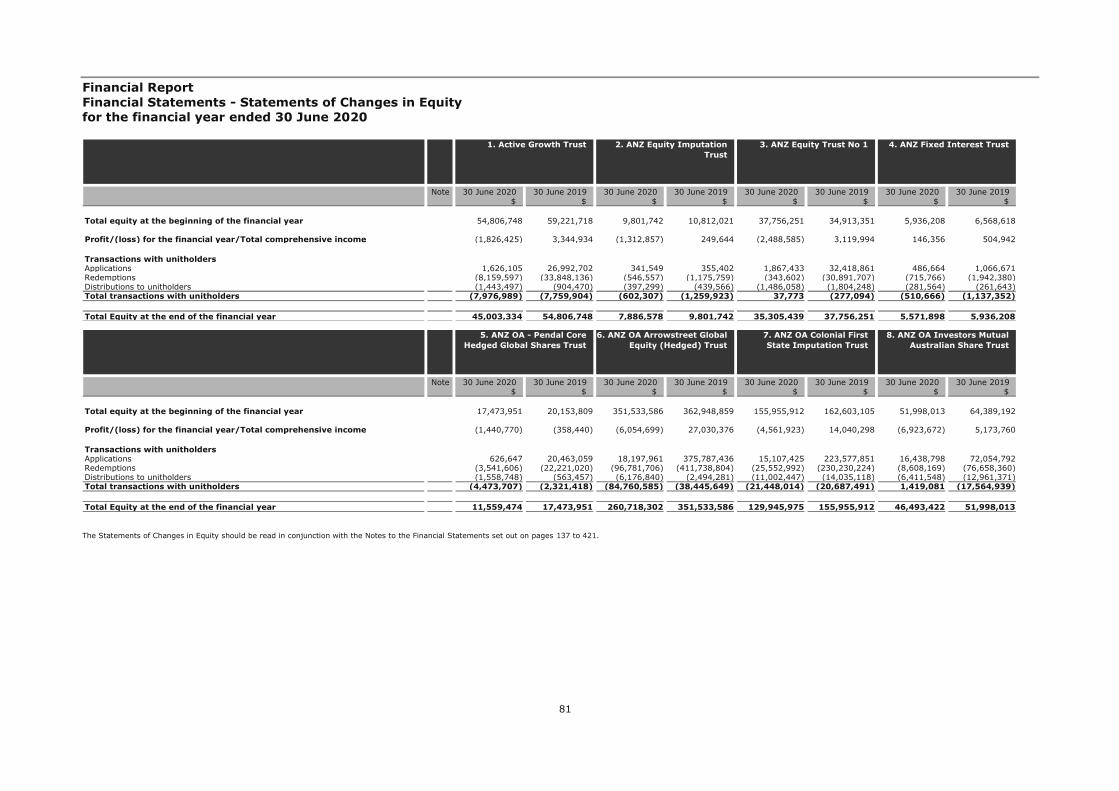
Financial Report Financial Statements - Statements of Changes in Equity for the financial year ended 30 June 2020
81
The Statements of Changes in Equity should be read in conjunction with the Notes to the Financial Statements set out on pages 137 to 421.
Note 30 June 2020 30 June 2019 30 June 2020 30 June 2019 30 June 2020 30 June 2019 30 June 2020 30 June 2019$ $ $ $ $ $ $ $
Total equity at the beginning of the financial year 54,806,748 59,221,718 9,801,742 10,812,021 37,756,251 34,913,351 5,936,208 6,568,618
Profit/(loss) for the financial year/Total comprehensive income (1,826,425) 3,344,934 (1,312,857) 249,644 (2,488,585) 3,119,994 146,356 504,942
Transactions with unitholdersApplications 1,626,105 26,992,702 341,549 355,402 1,867,433 32,418,861 486,664 1,066,671Redemptions (8,159,597) (33,848,136) (546,557) (1,175,759) (343,602) (30,891,707) (715,766) (1,942,380)Distributions to unitholders (1,443,497) (904,470) (397,299) (439,566) (1,486,058) (1,804,248) (281,564) (261,643)Total transactions with unitholders (7,976,989) (7,759,904) (602,307) (1,259,923) 37,773 (277,094) (510,666) (1,137,352)
Total Equity at the end of the financial year 45,003,334 54,806,748 7,886,578 9,801,742 35,305,439 37,756,251 5,571,898 5,936,208
1. Active Growth Trust 2. ANZ Equity Imputation Trust
3. ANZ Equity Trust No 1 4. ANZ Fixed Interest Trust
Note 30 June 2020 30 June 2019 30 June 2020 30 June 2019 30 June 2020 30 June 2019 30 June 2020 30 June 2019$ $ $ $ $ $ $ $
Total equity at the beginning of the financial year 17,473,951 20,153,809 351,533,586 362,948,859 155,955,912 162,603,105 51,998,013 64,389,192
Profit/(loss) for the financial year/Total comprehensive income (1,440,770) (358,440) (6,054,699) 27,030,376 (4,561,923) 14,040,298 (6,923,672) 5,173,760
Transactions with unitholdersApplications 626,647 20,463,059 18,197,961 375,787,436 15,107,425 223,577,851 16,438,798 72,054,792Redemptions (3,541,606) (22,221,020) (96,781,706) (411,738,804) (25,552,992) (230,230,224) (8,608,169) (76,658,360)Distributions to unitholders (1,558,748) (563,457) (6,176,840) (2,494,281) (11,002,447) (14,035,118) (6,411,548) (12,961,371)Total transactions with unitholders (4,473,707) (2,321,418) (84,760,585) (38,445,649) (21,448,014) (20,687,491) 1,419,081 (17,564,939)
Total Equity at the end of the financial year 11,559,474 17,473,951 260,718,302 351,533,586 129,945,975 155,955,912 46,493,422 51,998,013
5. ANZ OA - Pendal Core Hedged Global Shares Trust
6. ANZ OA Arrowstreet Global Equity (Hedged) Trust
7. ANZ OA Colonial First State Imputation Trust
8. ANZ OA Investors Mutual Australian Share Trust
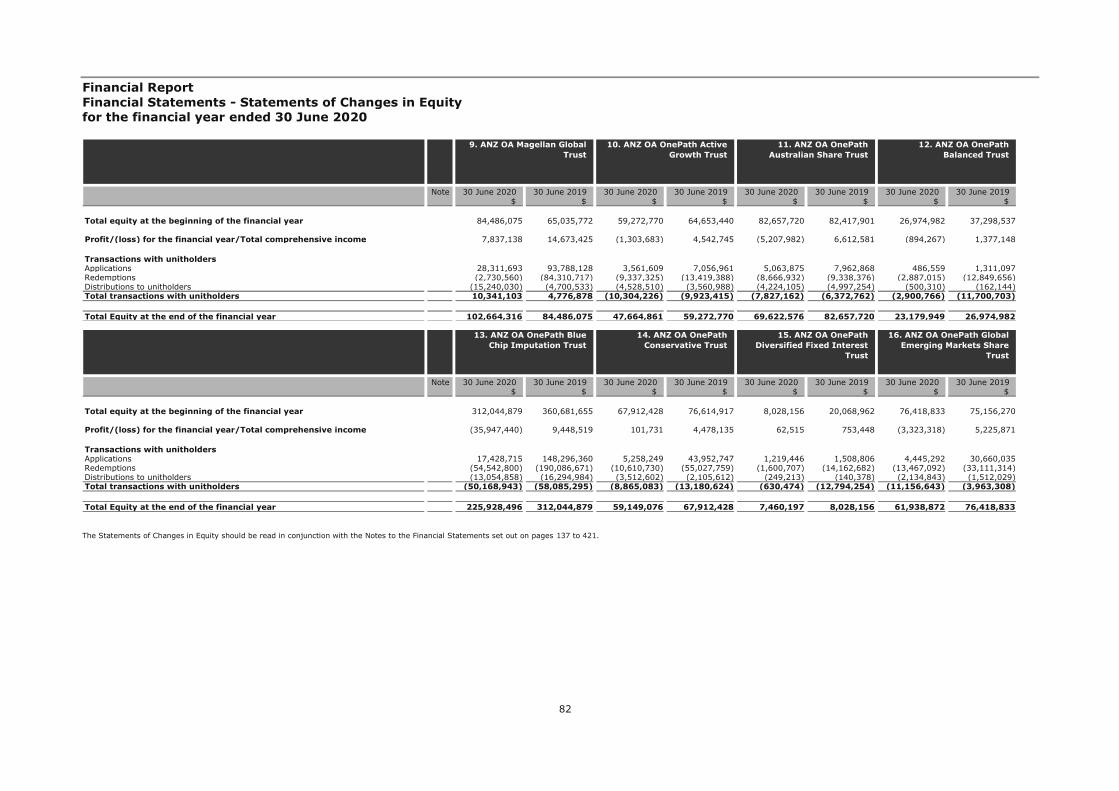
Financial Report Financial Statements - Statements of Changes in Equity for the financial year ended 30 June 2020
82
The Statements of Changes in Equity should be read in conjunction with the Notes to the Financial Statements set out on pages 137 to 421.
Note 30 June 2020 30 June 2019 30 June 2020 30 June 2019 30 June 2020 30 June 2019 30 June 2020 30 June 2019$ $ $ $ $ $ $ $
Total equity at the beginning of the financial year 84,486,075 65,035,772 59,272,770 64,653,440 82,657,720 82,417,901 26,974,982 37,298,537
Profit/(loss) for the financial year/Total comprehensive income 7,837,138 14,673,425 (1,303,683) 4,542,745 (5,207,982) 6,612,581 (894,267) 1,377,148
Transactions with unitholdersApplications 28,311,693 93,788,128 3,561,609 7,056,961 5,063,875 7,962,868 486,559 1,311,097Redemptions (2,730,560) (84,310,717) (9,337,325) (13,419,388) (8,666,932) (9,338,376) (2,887,015) (12,849,656)Distributions to unitholders (15,240,030) (4,700,533) (4,528,510) (3,560,988) (4,224,105) (4,997,254) (500,310) (162,144)Total transactions with unitholders 10,341,103 4,776,878 (10,304,226) (9,923,415) (7,827,162) (6,372,762) (2,900,766) (11,700,703)
Total Equity at the end of the financial year 102,664,316 84,486,075 47,664,861 59,272,770 69,622,576 82,657,720 23,179,949 26,974,982
9. ANZ OA Magellan Global Trust
10. ANZ OA OnePath Active Growth Trust
11. ANZ OA OnePath Australian Share Trust
12. ANZ OA OnePath Balanced Trust
Note 30 June 2020 30 June 2019 30 June 2020 30 June 2019 30 June 2020 30 June 2019 30 June 2020 30 June 2019$ $ $ $ $ $ $ $
Total equity at the beginning of the financial year 312,044,879 360,681,655 67,912,428 76,614,917 8,028,156 20,068,962 76,418,833 75,156,270
Profit/(loss) for the financial year/Total comprehensive income (35,947,440) 9,448,519 101,731 4,478,135 62,515 753,448 (3,323,318) 5,225,871
Transactions with unitholdersApplications 17,428,715 148,296,360 5,258,249 43,952,747 1,219,446 1,508,806 4,445,292 30,660,035Redemptions (54,542,800) (190,086,671) (10,610,730) (55,027,759) (1,600,707) (14,162,682) (13,467,092) (33,111,314)Distributions to unitholders (13,054,858) (16,294,984) (3,512,602) (2,105,612) (249,213) (140,378) (2,134,843) (1,512,029)Total transactions with unitholders (50,168,943) (58,085,295) (8,865,083) (13,180,624) (630,474) (12,794,254) (11,156,643) (3,963,308)
Total Equity at the end of the financial year 225,928,496 312,044,879 59,149,076 67,912,428 7,460,197 8,028,156 61,938,872 76,418,833
13. ANZ OA OnePath Blue Chip Imputation Trust
14. ANZ OA OnePath Conservative Trust
15. ANZ OA OnePath Diversified Fixed Interest
Trust
16. ANZ OA OnePath Global Emerging Markets Share
Trust
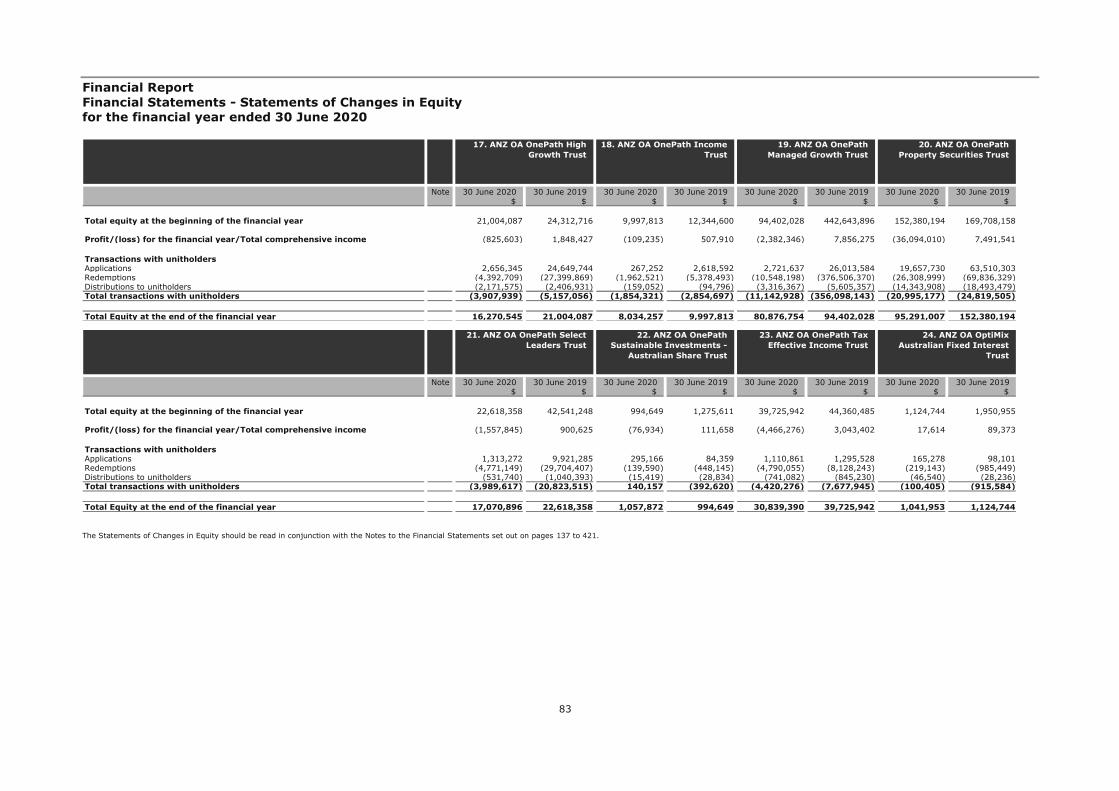
Financial Report Financial Statements - Statements of Changes in Equity for the financial year ended 30 June 2020
83
The Statements of Changes in Equity should be read in conjunction with the Notes to the Financial Statements set out on pages 137 to 421.
Note 30 June 2020 30 June 2019 30 June 2020 30 June 2019 30 June 2020 30 June 2019 30 June 2020 30 June 2019$ $ $ $ $ $ $ $
Total equity at the beginning of the financial year 21,004,087 24,312,716 9,997,813 12,344,600 94,402,028 442,643,896 152,380,194 169,708,158
Profit/(loss) for the financial year/Total comprehensive income (825,603) 1,848,427 (109,235) 507,910 (2,382,346) 7,856,275 (36,094,010) 7,491,541
Transactions with unitholdersApplications 2,656,345 24,649,744 267,252 2,618,592 2,721,637 26,013,584 19,657,730 63,510,303Redemptions (4,392,709) (27,399,869) (1,962,521) (5,378,493) (10,548,198) (376,506,370) (26,308,999) (69,836,329)Distributions to unitholders (2,171,575) (2,406,931) (159,052) (94,796) (3,316,367) (5,605,357) (14,343,908) (18,493,479)Total transactions with unitholders (3,907,939) (5,157,056) (1,854,321) (2,854,697) (11,142,928) (356,098,143) (20,995,177) (24,819,505)
Total Equity at the end of the financial year 16,270,545 21,004,087 8,034,257 9,997,813 80,876,754 94,402,028 95,291,007 152,380,194
17. ANZ OA OnePath High Growth Trust
18. ANZ OA OnePath Income Trust
19. ANZ OA OnePath Managed Growth Trust
20. ANZ OA OnePath Property Securities Trust
Note 30 June 2020 30 June 2019 30 June 2020 30 June 2019 30 June 2020 30 June 2019 30 June 2020 30 June 2019$ $ $ $ $ $ $ $
Total equity at the beginning of the financial year 22,618,358 42,541,248 994,649 1,275,611 39,725,942 44,360,485 1,124,744 1,950,955
Profit/(loss) for the financial year/Total comprehensive income (1,557,845) 900,625 (76,934) 111,658 (4,466,276) 3,043,402 17,614 89,373
Transactions with unitholdersApplications 1,313,272 9,921,285 295,166 84,359 1,110,861 1,295,528 165,278 98,101Redemptions (4,771,149) (29,704,407) (139,590) (448,145) (4,790,055) (8,128,243) (219,143) (985,449)Distributions to unitholders (531,740) (1,040,393) (15,419) (28,834) (741,082) (845,230) (46,540) (28,236)Total transactions with unitholders (3,989,617) (20,823,515) 140,157 (392,620) (4,420,276) (7,677,945) (100,405) (915,584)
Total Equity at the end of the financial year 17,070,896 22,618,358 1,057,872 994,649 30,839,390 39,725,942 1,041,953 1,124,744
21. ANZ OA OnePath Select Leaders Trust
22. ANZ OA OnePath Sustainable Investments -
Australian Share Trust
23. ANZ OA OnePath Tax Effective Income Trust
24. ANZ OA OptiMix Australian Fixed Interest
Trust
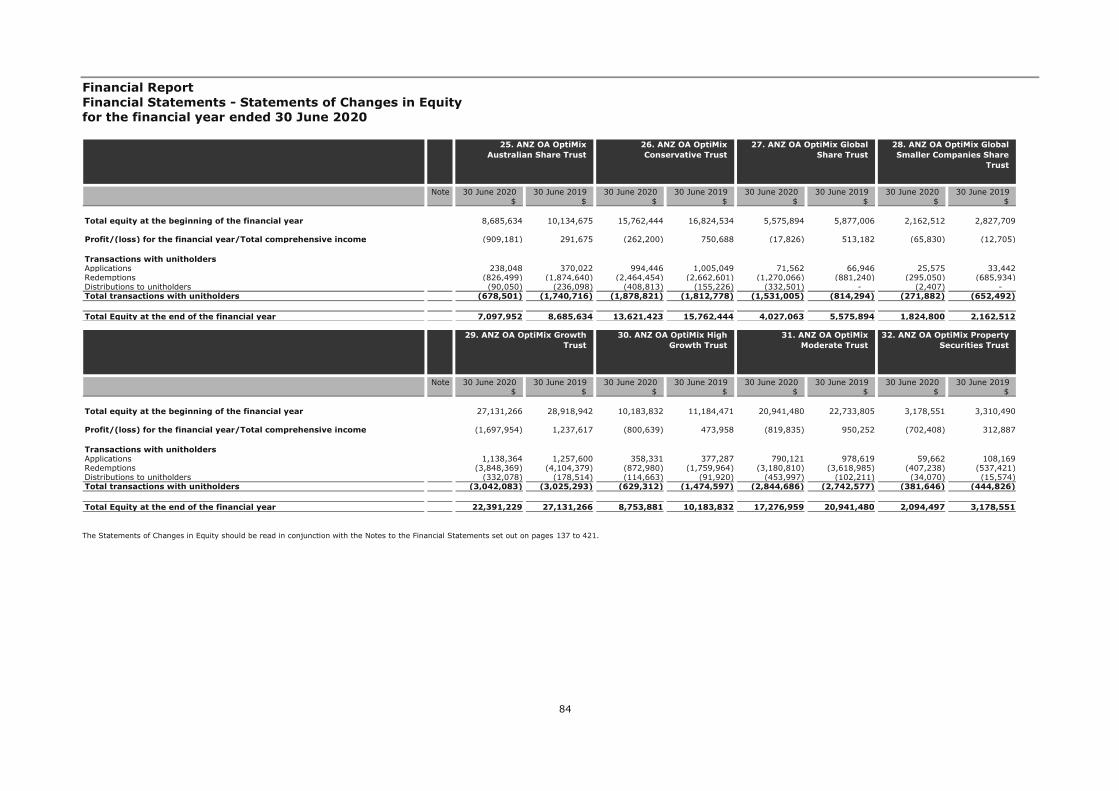
Financial Report Financial Statements - Statements of Changes in Equity for the financial year ended 30 June 2020
84
The Statements of Changes in Equity should be read in conjunction with the Notes to the Financial Statements set out on pages 137 to 421.
Note 30 June 2020 30 June 2019 30 June 2020 30 June 2019 30 June 2020 30 June 2019 30 June 2020 30 June 2019$ $ $ $ $ $ $ $
Total equity at the beginning of the financial year 8,685,634 10,134,675 15,762,444 16,824,534 5,575,894 5,877,006 2,162,512 2,827,709
Profit/(loss) for the financial year/Total comprehensive income (909,181) 291,675 (262,200) 750,688 (17,826) 513,182 (65,830) (12,705)
Transactions with unitholdersApplications 238,048 370,022 994,446 1,005,049 71,562 66,946 25,575 33,442Redemptions (826,499) (1,874,640) (2,464,454) (2,662,601) (1,270,066) (881,240) (295,050) (685,934)Distributions to unitholders (90,050) (236,098) (408,813) (155,226) (332,501) - (2,407) - Total transactions with unitholders (678,501) (1,740,716) (1,878,821) (1,812,778) (1,531,005) (814,294) (271,882) (652,492)
Total Equity at the end of the financial year 7,097,952 8,685,634 13,621,423 15,762,444 4,027,063 5,575,894 1,824,800 2,162,512
25. ANZ OA OptiMix Australian Share Trust
26. ANZ OA OptiMix Conservative Trust
27. ANZ OA OptiMix Global Share Trust
28. ANZ OA OptiMix Global Smaller Companies Share
Trust
Note 30 June 2020 30 June 2019 30 June 2020 30 June 2019 30 June 2020 30 June 2019 30 June 2020 30 June 2019$ $ $ $ $ $ $ $
Total equity at the beginning of the financial year 27,131,266 28,918,942 10,183,832 11,184,471 20,941,480 22,733,805 3,178,551 3,310,490
Profit/(loss) for the financial year/Total comprehensive income (1,697,954) 1,237,617 (800,639) 473,958 (819,835) 950,252 (702,408) 312,887
Transactions with unitholdersApplications 1,138,364 1,257,600 358,331 377,287 790,121 978,619 59,662 108,169Redemptions (3,848,369) (4,104,379) (872,980) (1,759,964) (3,180,810) (3,618,985) (407,238) (537,421)Distributions to unitholders (332,078) (178,514) (114,663) (91,920) (453,997) (102,211) (34,070) (15,574)Total transactions with unitholders (3,042,083) (3,025,293) (629,312) (1,474,597) (2,844,686) (2,742,577) (381,646) (444,826)
Total Equity at the end of the financial year 22,391,229 27,131,266 8,753,881 10,183,832 17,276,959 20,941,480 2,094,497 3,178,551
29. ANZ OA OptiMix Growth Trust
30. ANZ OA OptiMix High Growth Trust
31. ANZ OA OptiMix Moderate Trust
32. ANZ OA OptiMix Property Securities Trust

Financial Report Financial Statements - Statements of Changes in Equity for the financial year ended 30 June 2020
85
The Statements of Changes in Equity should be read in conjunction with the Notes to the Financial Statements set out on pages 137 to 421.
Note 30 June 2020 30 June 2019 30 June 2020 30 June 2019 30 June 2020 30 June 2019 30 June 2020 30 June 2019$ $ $ $ $ $ $ $
Total equity at the beginning of the financial year 332,617,320 382,687,194 112,557,073 146,617,764 17,942,205 26,506,139 2,173,874 60,038,200
Profit/(loss) for the financial year/Total comprehensive income (31,464,510) 18,456,323 (11,102,872) 12,261,003 (4,571,834) 688,448 56,568 1,509,648
Transactions with unitholdersApplications 26,605,249 357,027,922 34,344,487 168,355,699 4,559,499 20,804,247 242,185 4,948,891Redemptions (65,725,650) (405,907,052) (58,784,312) (184,136,992) (4,755,083) (25,753,120) (405,250) (63,337,548)Distributions to unitholders (9,436,435) (19,647,067) (8,265,661) (30,540,401) (2,943,098) (4,303,509) (47,639) (985,317)Total transactions with unitholders (48,556,836) (68,526,197) (32,705,486) (46,321,694) (3,138,682) (9,252,382) (210,704) (59,373,974)
Total Equity at the end of the financial year 252,595,974 332,617,320 68,748,715 112,557,073 10,231,689 17,942,205 2,019,738 2,173,874
33. ANZ OA Perpetual Australian Share Trust
34. ANZ OA Schroder Australian Equity Trust
35. ANZ OA SG Hiscock Property Trust
36. ANZ OA UBS Diversified Fixed Income Trust
Note 30 June 2020 30 June 2019 30 June 2020 30 June 2019 30 June 2020 30 June 2019 30 June 2020 30 June 2019$ $ $ $ $ $ $ $
Total equity at the beginning of the financial year 16,694,225 18,803,085 12,300,063 11,860,098 186,046,237 153,235,953 87,664,168 111,942,460
Profit/(loss) for the financial year/Total comprehensive income (1,119,871) 1,919,897 560,501 1,381,019 8,757,254 11,340,739 (21,579,262) 4,290,101
Transactions with unitholdersApplications 2,927,896 18,828,604 1,903,316 14,423,435 166,939,436 42,932,250 15,938,241 93,368,876Redemptions (4,349,964) (20,624,848) (3,507,105) (14,401,438) (104,191,531) (16,272,086) (18,264,103) (106,549,333)Distributions to unitholders (1,792,729) (2,232,513) (1,223,612) (963,051) (13,473,500) (5,190,619) (14,969,253) (15,387,936)Total transactions with unitholders (3,214,797) (4,028,757) (2,827,401) (941,054) 49,274,405 21,469,545 (17,295,115) (28,568,393)
Total Equity at the end of the financial year 12,359,557 16,694,225 10,033,163 12,300,063 244,077,896 186,046,237 48,789,791 87,664,168
37. ANZ OneAnswer - BR Scientific Australian Equity
Trust
38. ANZ OneAnswer - BR Scientific International
Equity Trust
39. ANZ Private International Fixed Interest Fund
40. ANZ Property Securities Trust

Financial Report Financial Statements - Statements of Changes in Equity for the financial year ended 30 June 2020
86
The Statements of Changes in Equity should be read in conjunction with the Notes to the Financial Statements set out on pages 137 to 421.
Note 30 June 2020 30 June 2019 30 June 2020 30 June 2019 30 June 2020 30 June 2019 30 June 2020 30 June 2019$ $ $ $ $ $ $ $
Total equity at the beginning of the financial year 134,048,858 127,525,768 76,752,180 132,169,915 99,541,194 131,712,614 244,380,520 281,249,828
Profit/(loss) for the financial year/Total comprehensive income (8,651,584) 10,851,367 (1,079,525) 6,104,796 (12,315,843) 1,339,604 (6,263,704) 10,935,686
Transactions with unitholdersApplications 7,127,686 117,094,302 5,882,776 8,029,655 4,131,777 51,267,809 47,704,371 176,703,334Redemptions (5,772,343) (115,434,589) (9,119,350) (63,557,005) (13,499,236) (80,014,360) (56,996,300) (176,887,550)Distributions to unitholders (4,878,698) (5,987,990) (4,949,441) (5,995,181) (3,637,356) (4,764,473) (50,994,761) (47,620,778)Total transactions with unitholders (3,523,355) (4,328,277) (8,186,015) (61,522,531) (13,004,815) (33,511,024) (60,286,690) (47,804,994)
Total Equity at the end of the financial year 121,873,919 134,048,858 67,486,640 76,752,180 74,220,536 99,541,194 177,830,126 244,380,520
41. Australian Share Trust 42. Balanced Trust 43. Blue Chip Imputation Trust
44. Emerging Companies Trust
Note 30 June 2020 30 June 2019 30 June 2020 30 June 2019 30 June 2020 30 June 2019 30 June 2020 30 June 2019$ $ $ $ $ $ $ $
Total equity at the beginning of the financial year 180,837,409 169,431,046 9,555,245 10,320,050 1,561,067 3,474,143 15,897,555 16,704,861
Profit/(loss) for the financial year/Total comprehensive income 17,265,069 27,414,673 (2,472,649) 254,444 (105,095) 76,595 223,696 1,724,300
Transactions with unitholdersApplications 9,523,662 155,485,096 152,984 280,794 157,213 353,785 2,962,313 19,839,122Redemptions (22,900,403) (169,182,533) (216,177) (1,152,818) (194,214) (2,300,344) (10,026,141) (20,533,897)Distributions to unitholders (1,913,754) (2,310,873) (258,007) (147,225) (109,564) (43,112) (1,180,882) (1,836,831)Total transactions with unitholders (15,290,495) (16,008,310) (321,200) (1,019,249) (146,565) (1,989,671) (8,244,710) (2,531,606)
Total Equity at the end of the financial year 182,811,983 180,837,409 6,761,396 9,555,245 1,309,407 1,561,067 7,876,541 15,897,555
45. Global Share Trust 46. Heine Property Securities Fund
47. High Growth Trust 48. OneAnswer - Altrinsic Global Equities Trust

Financial Report Financial Statements - Statements of Changes in Equity for the financial year ended 30 June 2020
87
The Statements of Changes in Equity should be read in conjunction with the Notes to the Financial Statements set out on pages 137 to 421.
Note 30 June 2020 30 June 2019 30 June 2020 30 June 2019 30 June 2020 30 June 2019 30 June 2020 30 June 2019$ $ $ $ $ $ $ $
Total equity at the beginning of the financial year 89,221,942 102,087,370 11,877,720 16,411,442 80,778,537 80,932,450 98,762,315 97,155,360
Profit/(loss) for the financial year/Total comprehensive income (2,073,824) 2,597,397 (383,396) 779,328 (4,837,000) (4,810,589) 6,268,718 1,998,167
Transactions with unitholdersApplications 2,197,332 83,060,677 621,279 6,656,989 5,837,088 94,825,019 13,623,694 112,268,083Redemptions (18,693,515) (97,742,217) (2,575,885) (11,930,189) (17,399,170) (85,949,400) (17,746,446) (107,966,919)Distributions to unitholders (927) (781,285) (131,762) (39,850) (4,623,902) (4,218,943) (10,970,840) (4,692,376)Total transactions with unitholders (16,497,110) (15,462,825) (2,086,368) (5,313,050) (16,185,984) 4,656,676 (15,093,592) (391,212)
Total Equity at the end of the financial year 70,651,008 89,221,942 9,407,956 11,877,720 59,755,553 80,778,537 89,937,441 98,762,315
49. OneAnswer - Antipodes Global (Long Only) Trust
50. OneAnswer - Arrowstreet Global Equity (Hedged) Trust
51. OneAnswer - Ausbil Australian Emerging Leaders
Trust
52. OneAnswer - Bennelong Australian Equities Trust
Note 30 June 2020 30 June 2019 30 June 2020 30 June 2019 30 June 2020 30 June 2019 30 June 2020 30 June 2019$ $ $ $ $ $ $ $
Total equity at the beginning of the financial year 74,008,820 79,186,715 3,116,136 3,438,561 48,814,085 54,427,803 39,506,684 40,907,995
Profit/(loss) for the financial year/Total comprehensive income (761,121) 560,693 (213,617) 284,416 145,404 5,563,972 (427,730) 3,809,832
Transactions with unitholdersApplications 6,161,138 76,954,557 684,322 672,566 6,806,459 59,567,562 7,361,853 39,384,098Redemptions (18,192,327) (79,449,564) (484,827) (1,202,632) (12,845,209) (65,013,415) (10,779,492) (41,683,044)Distributions to unitholders (2,692,265) (3,243,581) (28,996) (76,775) (3,136,598) (5,731,837) (3,983,382) (2,912,197)Total transactions with unitholders (14,723,454) (5,738,588) 170,499 (606,841) (9,175,348) (11,177,690) (7,401,021) (5,211,143)
Total Equity at the end of the financial year 58,524,245 74,008,820 3,073,018 3,116,136 39,784,141 48,814,085 31,677,933 39,506,684
53. OneAnswer - Bentham Global Income Trust
54. OneAnswer - BlackRock Scientific Australian Equity
Trust
55. OneAnswer - Blackrock Tactical Growth Trust
56. OneAnswer - BR Scientific Diversified Growth
Trust

Financial Report Financial Statements - Statements of Changes in Equity for the financial year ended 30 June 2020
88
The Statements of Changes in Equity should be read in conjunction with the Notes to the Financial Statements set out on pages 137 to 421.
Note 30 June 2020 30 June 2019 30 June 2020 30 June 2019 30 June 2020 30 June 2019 30 June 2020 30 June 2019$ $ $ $ $ $ $ $
Total equity at the beginning of the financial year 2,295,550 2,587,309 43,454,098 47,751,997 155,868,227 50,692,954 5,515,157 74,884,259
Profit/(loss) for the financial year/Total comprehensive income 67,921 223,783 (509,608) 1,210,471 (11,368,343) 17,762,146 (164,771) (2,043,527)
Transactions with unitholdersApplications 220,579 380,446 3,321,768 42,396,011 27,509,544 219,071,749 185,759 6,777,148Redemptions (367,393) (887,025) (10,893,377) (47,318,453) (13,342,234) (128,560,768) (1,311,923) (71,937,699)Distributions to unitholders (8,834) (8,963) (386,842) (585,928) (11,881,501) (3,097,854) (134,179) (2,165,024)Total transactions with unitholders (155,648) (515,542) (7,958,451) (5,508,370) 2,285,809 87,413,127 (1,260,343) (67,325,575)
Total Equity at the end of the financial year 2,207,823 2,295,550 34,986,039 43,454,098 146,785,693 155,868,227 4,090,043 5,515,157
57. OneAnswer - BR Scientific International
Equity Trust
58. OneAnswer - Colonial First State Global Credit
Income Trust
59. OneAnswer - Colonial First State Global Listed
Infrastructure Trust
60. OneAnswer - Colonial First State Imputation Trust
Note 30 June 2020 30 June 2019 30 June 2020 30 June 2019 30 June 2020 30 June 2019 30 June 2020 30 June 2019$ $ $ $ $ $ $ $
Total equity at the beginning of the financial year 321,048,965 302,233,452 75,483,711 32,050,326 162,123,976 198,142,892 3,850,451 5,389,845
Profit/(loss) for the financial year/Total comprehensive income (17,853,614) 27,361,552 2,161,238 5,927,616 (20,167,956) 15,047,263 203,666 195,232
Transactions with unitholdersApplications 29,131,384 310,809,824 13,281,831 106,400,152 39,532,797 128,348,584 846,843 3,754,089Redemptions (64,826,714) (303,057,014) (16,072,300) (65,486,378) (25,741,945) (151,747,545) (677,973) (5,456,044)Distributions to unitholders (39,622,855) (16,298,849) (1,136,159) (3,408,005) (17,002,686) (27,667,218) (273,594) (32,671)Total transactions with unitholders (75,318,185) (8,546,039) (3,926,628) 37,505,769 (3,211,834) (51,066,179) (104,724) (1,734,626)
Total Equity at the end of the financial year 227,877,166 321,048,965 73,718,321 75,483,711 138,744,186 162,123,976 3,949,393 3,850,451
61. OneAnswer - Fidelity Australian Equities Trust
62. OneAnswer - Greencape Broadcap Trust
63. OneAnswer - Investors Mutual Australian Share
Trust
64. OneAnswer - Janus Henderson Global Fixed
Interest Total Return Trust
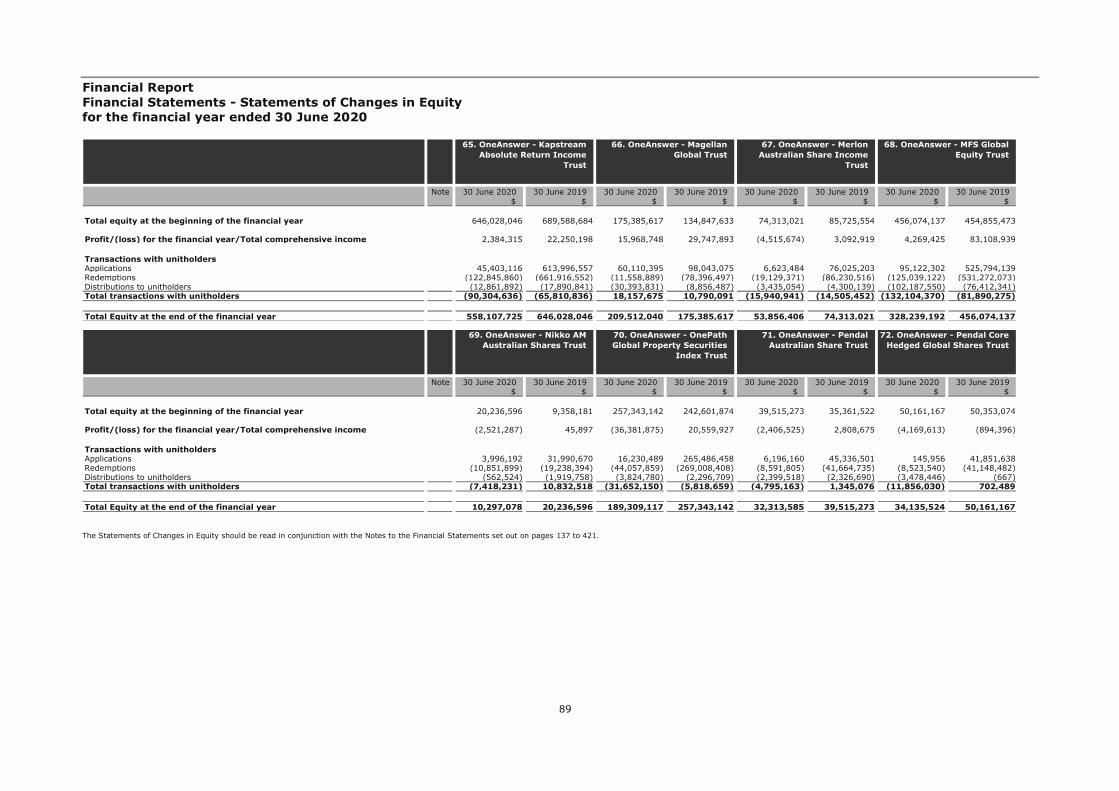
Financial Report Financial Statements - Statements of Changes in Equity for the financial year ended 30 June 2020
89
The Statements of Changes in Equity should be read in conjunction with the Notes to the Financial Statements set out on pages 137 to 421.
Note 30 June 2020 30 June 2019 30 June 2020 30 June 2019 30 June 2020 30 June 2019 30 June 2020 30 June 2019$ $ $ $ $ $ $ $
Total equity at the beginning of the financial year 646,028,046 689,588,684 175,385,617 134,847,633 74,313,021 85,725,554 456,074,137 454,855,473
Profit/(loss) for the financial year/Total comprehensive income 2,384,315 22,250,198 15,968,748 29,747,893 (4,515,674) 3,092,919 4,269,425 83,108,939
Transactions with unitholdersApplications 45,403,116 613,996,557 60,110,395 98,043,075 6,623,484 76,025,203 95,122,302 525,794,139Redemptions (122,845,860) (661,916,552) (11,558,889) (78,396,497) (19,129,371) (86,230,516) (125,039,122) (531,272,073)Distributions to unitholders (12,861,892) (17,890,841) (30,393,831) (8,856,487) (3,435,054) (4,300,139) (102,187,550) (76,412,341)Total transactions with unitholders (90,304,636) (65,810,836) 18,157,675 10,790,091 (15,940,941) (14,505,452) (132,104,370) (81,890,275)
Total Equity at the end of the financial year 558,107,725 646,028,046 209,512,040 175,385,617 53,856,406 74,313,021 328,239,192 456,074,137
65. OneAnswer - Kapstream Absolute Return Income
Trust
66. OneAnswer - Magellan Global Trust
67. OneAnswer - Merlon Australian Share Income
Trust
68. OneAnswer - MFS Global Equity Trust
Note 30 June 2020 30 June 2019 30 June 2020 30 June 2019 30 June 2020 30 June 2019 30 June 2020 30 June 2019$ $ $ $ $ $ $ $
Total equity at the beginning of the financial year 20,236,596 9,358,181 257,343,142 242,601,874 39,515,273 35,361,522 50,161,167 50,353,074
Profit/(loss) for the financial year/Total comprehensive income (2,521,287) 45,897 (36,381,875) 20,559,927 (2,406,525) 2,808,675 (4,169,613) (894,396)
Transactions with unitholdersApplications 3,996,192 31,990,670 16,230,489 265,486,458 6,196,160 45,336,501 145,956 41,851,638Redemptions (10,851,899) (19,238,394) (44,057,859) (269,008,408) (8,591,805) (41,664,735) (8,523,540) (41,148,482)Distributions to unitholders (562,524) (1,919,758) (3,824,780) (2,296,709) (2,399,518) (2,326,690) (3,478,446) (667)Total transactions with unitholders (7,418,231) 10,832,518 (31,652,150) (5,818,659) (4,795,163) 1,345,076 (11,856,030) 702,489
Total Equity at the end of the financial year 10,297,078 20,236,596 189,309,117 257,343,142 32,313,585 39,515,273 34,135,524 50,161,167
69. OneAnswer - Nikko AM Australian Shares Trust
70. OneAnswer - OnePath Global Property Securities
Index Trust
71. OneAnswer - Pendal Australian Share Trust
72. OneAnswer - Pendal Core Hedged Global Shares Trust

Financial Report Financial Statements - Statements of Changes in Equity for the financial year ended 30 June 2020
90
The Statements of Changes in Equity should be read in conjunction with the Notes to the Financial Statements set out on pages 137 to 421.
Note 30 June 2020 30 June 2019 30 June 2020 30 June 2019 30 June 2020 30 June 2019 30 June 2020 30 June 2019$ $ $ $ $ $ $ $
Total equity at the beginning of the financial year 14,535,675 12,029,481 98,380,943 103,698,343 107,087,362 132,952,164 22,501,544 91,181,986
Profit/(loss) for the financial year/Total comprehensive income (16,552) 795,007 (2,935,260) (4,926,755) (10,180,903) 4,461,994 (2,179,067) (409,622)
Transactions with unitholdersApplications 8,071,164 16,820,924 11,530,879 109,617,618 13,993,983 114,511,382 1,365,240 3,906,304Redemptions (3,146,738) (14,690,581) (17,710,459) (103,116,840) (25,300,515) (131,587,586) (6,400,704) (70,320,158)Distributions to unitholders (629,342) (419,156) (1,662,379) (6,891,423) (8,886,475) (13,250,592) (230,782) (1,856,966)Total transactions with unitholders 4,295,084 1,711,187 (7,841,959) (390,645) (20,193,007) (30,326,796) (5,266,246) (68,270,820)
Total Equity at the end of the financial year 18,814,207 14,535,675 87,603,724 98,380,943 76,713,452 107,087,362 15,056,231 22,501,544
73. OneAnswer - Pendal Monthly Income Plus Trust
74. OneAnswer - Pendal Smaller Companies Trust
75. OneAnswer - Perennial Value Shares Trust
76. OneAnswer - Perpetual Australian Share Trust
Note 30 June 2020 30 June 2019 30 June 2020 30 June 2019 30 June 2020 30 June 2019 30 June 2020 30 June 2019$ $ $ $ $ $ $ $
Total equity at the beginning of the financial year 134,097,055 195,985,497 133,462,424 126,772,039 4,530,690 6,891,567 26,353,838 24,435,058
Profit/(loss) for the financial year/Total comprehensive income (3,049,070) 12,388,709 188,082 9,061,016 (532,052) (174,561) 3,633,208 315,473
Transactions with unitholdersApplications 20,946,764 175,428,245 18,073,573 131,771,991 2,660,018 5,548,802 4,126,133 35,452,640Redemptions (39,203,646) (229,096,155) (27,735,194) (127,663,594) (1,419,339) (7,546,439) (7,288,874) (32,039,734)Distributions to unitholders (6,382,932) (20,609,241) (6,008,277) (6,479,028) (173,979) (188,679) (1,970,509) (1,809,599)Total transactions with unitholders (24,639,814) (74,277,151) (15,669,898) (2,370,631) 1,066,700 (2,186,316) (5,133,250) 1,603,307
Total Equity at the end of the financial year 106,408,171 134,097,055 117,980,608 133,462,424 5,065,338 4,530,690 24,853,796 26,353,838
77. OneAnswer - Perpetual Balanced Growth Trust
78. OneAnswer - Perpetual Conservative Growth Trust
79. OneAnswer - Perpetual Ethical SRI Trust
80. OneAnswer - Platinum Asia Trust
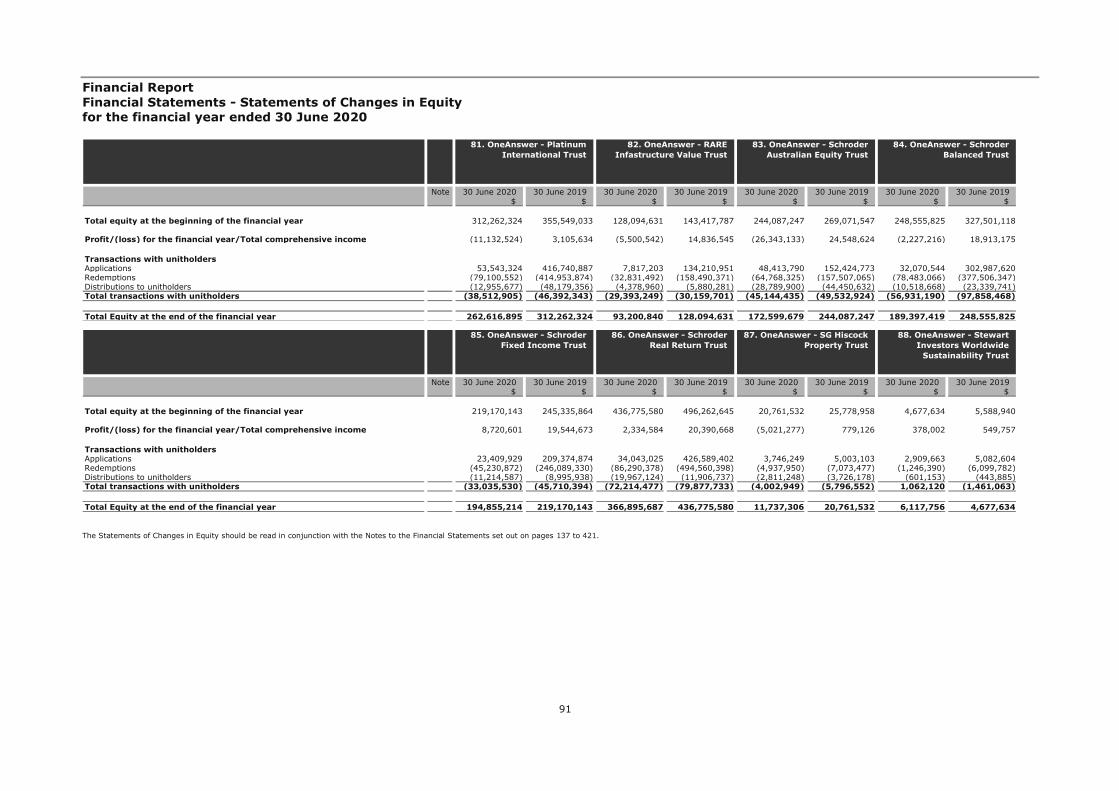
Financial Report Financial Statements - Statements of Changes in Equity for the financial year ended 30 June 2020
91
The Statements of Changes in Equity should be read in conjunction with the Notes to the Financial Statements set out on pages 137 to 421.
Note 30 June 2020 30 June 2019 30 June 2020 30 June 2019 30 June 2020 30 June 2019 30 June 2020 30 June 2019$ $ $ $ $ $ $ $
Total equity at the beginning of the financial year 312,262,324 355,549,033 128,094,631 143,417,787 244,087,247 269,071,547 248,555,825 327,501,118
Profit/(loss) for the financial year/Total comprehensive income (11,132,524) 3,105,634 (5,500,542) 14,836,545 (26,343,133) 24,548,624 (2,227,216) 18,913,175
Transactions with unitholdersApplications 53,543,324 416,740,887 7,817,203 134,210,951 48,413,790 152,424,773 32,070,544 302,987,620Redemptions (79,100,552) (414,953,874) (32,831,492) (158,490,371) (64,768,325) (157,507,065) (78,483,066) (377,506,347)Distributions to unitholders (12,955,677) (48,179,356) (4,378,960) (5,880,281) (28,789,900) (44,450,632) (10,518,668) (23,339,741)Total transactions with unitholders (38,512,905) (46,392,343) (29,393,249) (30,159,701) (45,144,435) (49,532,924) (56,931,190) (97,858,468)
Total Equity at the end of the financial year 262,616,895 312,262,324 93,200,840 128,094,631 172,599,679 244,087,247 189,397,419 248,555,825
81. OneAnswer - Platinum International Trust
82. OneAnswer - RARE Infastructure Value Trust
83. OneAnswer - Schroder Australian Equity Trust
84. OneAnswer - Schroder Balanced Trust
Note 30 June 2020 30 June 2019 30 June 2020 30 June 2019 30 June 2020 30 June 2019 30 June 2020 30 June 2019$ $ $ $ $ $ $ $
Total equity at the beginning of the financial year 219,170,143 245,335,864 436,775,580 496,262,645 20,761,532 25,778,958 4,677,634 5,588,940
Profit/(loss) for the financial year/Total comprehensive income 8,720,601 19,544,673 2,334,584 20,390,668 (5,021,277) 779,126 378,002 549,757
Transactions with unitholdersApplications 23,409,929 209,374,874 34,043,025 426,589,402 3,746,249 5,003,103 2,909,663 5,082,604Redemptions (45,230,872) (246,089,330) (86,290,378) (494,560,398) (4,937,950) (7,073,477) (1,246,390) (6,099,782)Distributions to unitholders (11,214,587) (8,995,938) (19,967,124) (11,906,737) (2,811,248) (3,726,178) (601,153) (443,885)Total transactions with unitholders (33,035,530) (45,710,394) (72,214,477) (79,877,733) (4,002,949) (5,796,552) 1,062,120 (1,461,063)
Total Equity at the end of the financial year 194,855,214 219,170,143 366,895,687 436,775,580 11,737,306 20,761,532 6,117,756 4,677,634
85. OneAnswer - Schroder Fixed Income Trust
86. OneAnswer - Schroder Real Return Trust
87. OneAnswer - SG Hiscock Property Trust
88. OneAnswer - Stewart Investors Worldwide
Sustainability Trust

Financial Report Financial Statements - Statements of Changes in Equity for the financial year ended 30 June 2020
92
The Statements of Changes in Equity should be read in conjunction with the Notes to the Financial Statements set out on pages 137 to 421.
Note 30 June 2020 30 June 2019 30 June 2020 30 June 2019 30 June 2020 30 June 2019 30 June 2020 30 June 2019$ $ $ $ $ $ $ $
Total equity at the beginning of the financial year 34,278,498 18,110,458 47,477,223 19,088,821 70,808,948 82,164,626 23,163,043 30,431,631
Profit/(loss) for the financial year/Total comprehensive income 7,874,096 4,109,086 2,809,981 543,299 (1,877,199) 3,073,768 (244,557) 1,518,741
Transactions with unitholdersApplications 13,590,108 50,232,067 20,389,623 68,429,084 5,160,342 74,803,925 7,644,919 25,898,323Redemptions (6,452,131) (33,715,059) (4,386,908) (40,113,023) (13,377,017) (85,212,992) (8,042,722) (32,854,826)Distributions to unitholders (7,100,937) (4,458,054) (450,972) (470,958) (5,196,272) (4,020,379) (1,746,468) (1,830,826)Total transactions with unitholders 37,040 12,058,954 15,551,743 27,845,103 (13,412,947) (14,429,446) (2,144,271) (8,787,329)
Total Equity at the end of the financial year 42,189,634 34,278,498 65,838,947 47,477,223 55,518,802 70,808,948 20,774,215 23,163,043
89. OneAnswer - T. Rowe Price Global Equity Trust
90. OneAnswer - T.Rowe Price Dynamic Global Bond
Trust
91. OneAnswer - UBS Balanced Trust
92. OneAnswer - UBS Defensive Trust
Note 30 June 2020 30 June 2019 30 June 2020 30 June 2019 30 June 2020 30 June 2019 30 June 2020 30 June 2019$ $ $ $ $ $ $ $
Total equity at the beginning of the financial year 102,159,963 108,895,708 1,110,892,092 1,096,531,365 2,267,141,350 2,283,162,975 807,575,347 838,323,643
Profit/(loss) for the financial year/Total comprehensive income 3,654,911 7,298,844 (77,838,605) 116,404,788 40,685,172 199,025,559 20,138,732 63,255,940
Transactions with unitholdersApplications 19,003,042 152,201,919 128,771,163 1,075,429,140 273,538,572 2,243,133,655 121,056,922 764,587,556Redemptions (12,844,839) (162,565,255) (196,868,014) (1,088,897,696) (434,046,868) (2,336,729,779) (125,498,232) (825,935,386)Distributions to unitholders (3,580,031) (3,671,253) (76,487,919) (88,575,505) (207,314,461) (121,451,060) (59,209,029) (32,656,406)Total transactions with unitholders 2,578,172 (14,034,589) (144,584,770) (102,044,061) (367,822,757) (215,047,184) (63,650,339) (94,004,236)
Total Equity at the end of the financial year 108,393,046 102,159,963 888,468,717 1,110,892,092 1,940,003,765 2,267,141,350 764,063,740 807,575,347
93. OneAnswer - UBS Diversified Fixed Income
Trust
94. OneAnswer - Vanguard Australian Shares Index
Trust
95. OneAnswer - Vanguard Balanced Index Trust
96. OneAnswer - Vanguard Conservative Index Trust

Financial Report Financial Statements - Statements of Changes in Equity for the financial year ended 30 June 2020
93
The Statements of Changes in Equity should be read in conjunction with the Notes to the Financial Statements set out on pages 137 to 421.
Note 30 June 2020 30 June 2019 30 June 2020 30 June 2019 30 June 2020 30 June 2019 30 June 2020 30 June 2019$ $ $ $ $ $ $ $
Total equity at the beginning of the financial year 104,453,713 120,948,860 1,076,726,697 1,078,547,962 382,261,183 383,253,681 104,229,220 111,585,445
Profit/(loss) for the financial year/Total comprehensive income 4,548,358 8,172,625 7,319,157 98,576,692 (3,000,324) 36,289,133 972,684 6,395,845
Transactions with unitholdersApplications 16,274,037 107,785,045 118,932,115 1,102,501,108 40,148,387 382,853,044 10,968,435 105,222,593Redemptions (21,072,096) (131,511,470) (194,676,599) (1,130,805,086) (54,762,959) (389,000,756) (17,076,748) (112,334,568)Distributions to unitholders (5,242,937) (941,347) (106,613,893) (72,093,979) (38,956,883) (31,133,919) (13,822,137) (6,640,095)Total transactions with unitholders (10,040,996) (24,667,772) (182,358,377) (100,397,957) (53,571,455) (37,281,631) (19,930,450) (13,752,070)
Total Equity at the end of the financial year 98,961,075 104,453,713 901,687,477 1,076,726,697 325,689,404 382,261,183 85,271,454 104,229,220
97. OneAnswer - Vanguard Diversified Bond Index Trust
98. OneAnswer - Vanguard Growth Index Trust
99. OneAnswer - Vanguard High Growth Index Trust
100. OneAnswer - Vanguard International Shares Index
(Hedged) Trust
Note 30 June 2020 30 June 2019 30 June 2020 30 June 2019 30 June 2020 30 June 2019 30 June 2020 30 June 2019$ $ $ $ $ $ $ $
Total equity at the beginning of the financial year 805,852,879 854,565,032 173,942,484 171,320,409 39,154,525 37,799,570 202,101,750 230,406,124
Profit/(loss) for the financial year/Total comprehensive income 47,658,915 99,409,338 (32,909,938) 30,514,075 434,727 5,490,659 2,274,306 (449,259)
Transactions with unitholdersApplications 133,786,014 839,162,858 15,779,567 167,832,800 5,821,066 46,503,042 16,928,726 191,835,868Redemptions (197,093,852) (892,786,758) (29,542,862) (187,190,508) (8,590,311) (46,585,227) (36,052,826) (217,518,814)Distributions to unitholders (113,361,601) (94,497,591) (13,727,138) (8,534,292) (3,241,172) (4,053,519) (4,527,274) (2,172,169)Total transactions with unitholders (176,669,439) (148,121,491) (27,490,433) (27,892,000) (6,010,417) (4,135,704) (23,651,374) (27,855,115)
Total Equity at the end of the financial year 676,842,355 805,852,879 113,542,113 173,942,484 33,578,835 39,154,525 180,724,682 202,101,750
101. OneAnswer - Vanguard International Shares Index
Trust
102. OneAnswer - Vanguard Property Securities Index
Trust
103. OneAnswer - Walter Scott Global Equity (Hedged)
Trust
104. OnePath Alternatives Growth Fund
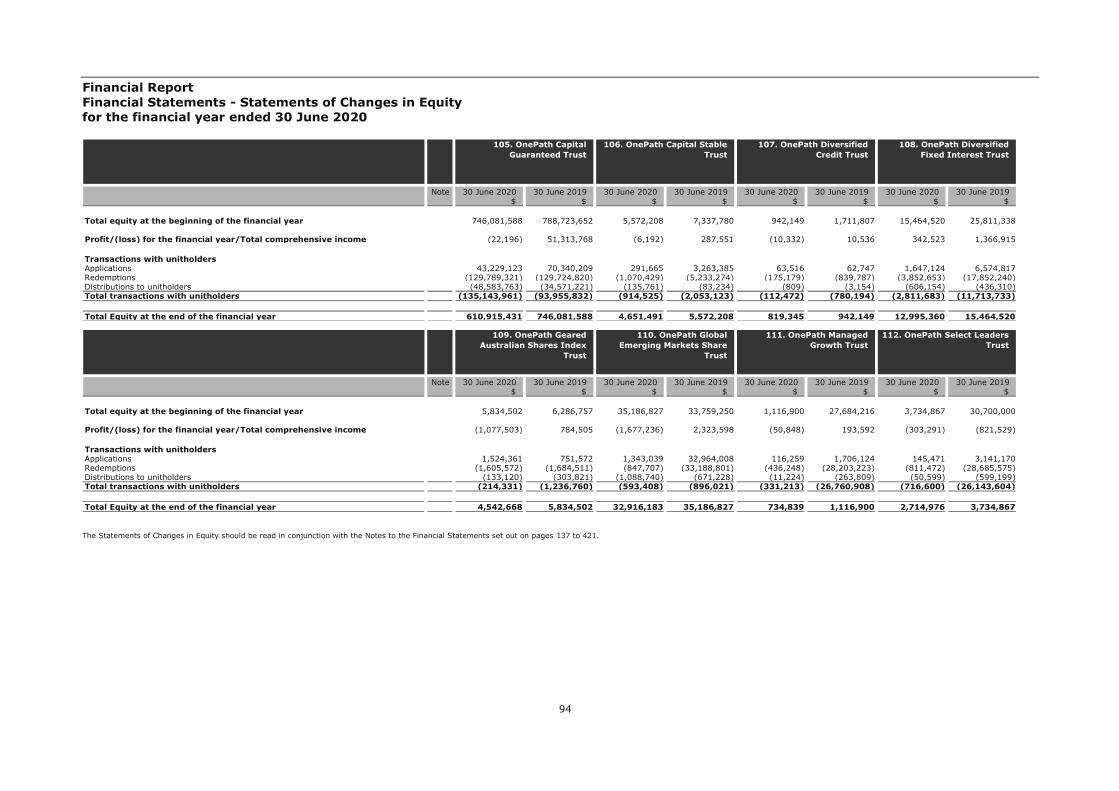
Financial Report Financial Statements - Statements of Changes in Equity for the financial year ended 30 June 2020
94
The Statements of Changes in Equity should be read in conjunction with the Notes to the Financial Statements set out on pages 137 to 421.
Note 30 June 2020 30 June 2019 30 June 2020 30 June 2019 30 June 2020 30 June 2019 30 June 2020 30 June 2019$ $ $ $ $ $ $ $
Total equity at the beginning of the financial year 746,081,588 788,723,652 5,572,208 7,337,780 942,149 1,711,807 15,464,520 25,811,338
Profit/(loss) for the financial year/Total comprehensive income (22,196) 51,313,768 (6,192) 287,551 (10,332) 10,536 342,523 1,366,915
Transactions with unitholdersApplications 43,229,123 70,340,209 291,665 3,263,385 63,516 62,747 1,647,124 6,574,817Redemptions (129,789,321) (129,724,820) (1,070,429) (5,233,274) (175,179) (839,787) (3,852,653) (17,852,240)Distributions to unitholders (48,583,763) (34,571,221) (135,761) (83,234) (809) (3,154) (606,154) (436,310)Total transactions with unitholders (135,143,961) (93,955,832) (914,525) (2,053,123) (112,472) (780,194) (2,811,683) (11,713,733)
Total Equity at the end of the financial year 610,915,431 746,081,588 4,651,491 5,572,208 819,345 942,149 12,995,360 15,464,520
105. OnePath Capital Guaranteed Trust
106. OnePath Capital Stable Trust
107. OnePath Diversified Credit Trust
108. OnePath Diversified Fixed Interest Trust
Note 30 June 2020 30 June 2019 30 June 2020 30 June 2019 30 June 2020 30 June 2019 30 June 2020 30 June 2019$ $ $ $ $ $ $ $
Total equity at the beginning of the financial year 5,834,502 6,286,757 35,186,827 33,759,250 1,116,900 27,684,216 3,734,867 30,700,000
Profit/(loss) for the financial year/Total comprehensive income (1,077,503) 784,505 (1,677,236) 2,323,598 (50,848) 193,592 (303,291) (821,529)
Transactions with unitholdersApplications 1,524,361 751,572 1,343,039 32,964,008 116,259 1,706,124 145,471 3,141,170Redemptions (1,605,572) (1,684,511) (847,707) (33,188,801) (436,248) (28,203,223) (811,472) (28,685,575)Distributions to unitholders (133,120) (303,821) (1,088,740) (671,228) (11,224) (263,809) (50,599) (599,199)Total transactions with unitholders (214,331) (1,236,760) (593,408) (896,021) (331,213) (26,760,908) (716,600) (26,143,604)
Total Equity at the end of the financial year 4,542,668 5,834,502 32,916,183 35,186,827 734,839 1,116,900 2,714,976 3,734,867
109. OnePath Geared Australian Shares Index
Trust
110. OnePath Global Emerging Markets Share
Trust
111. OnePath Managed Growth Trust
112. OnePath Select Leaders Trust
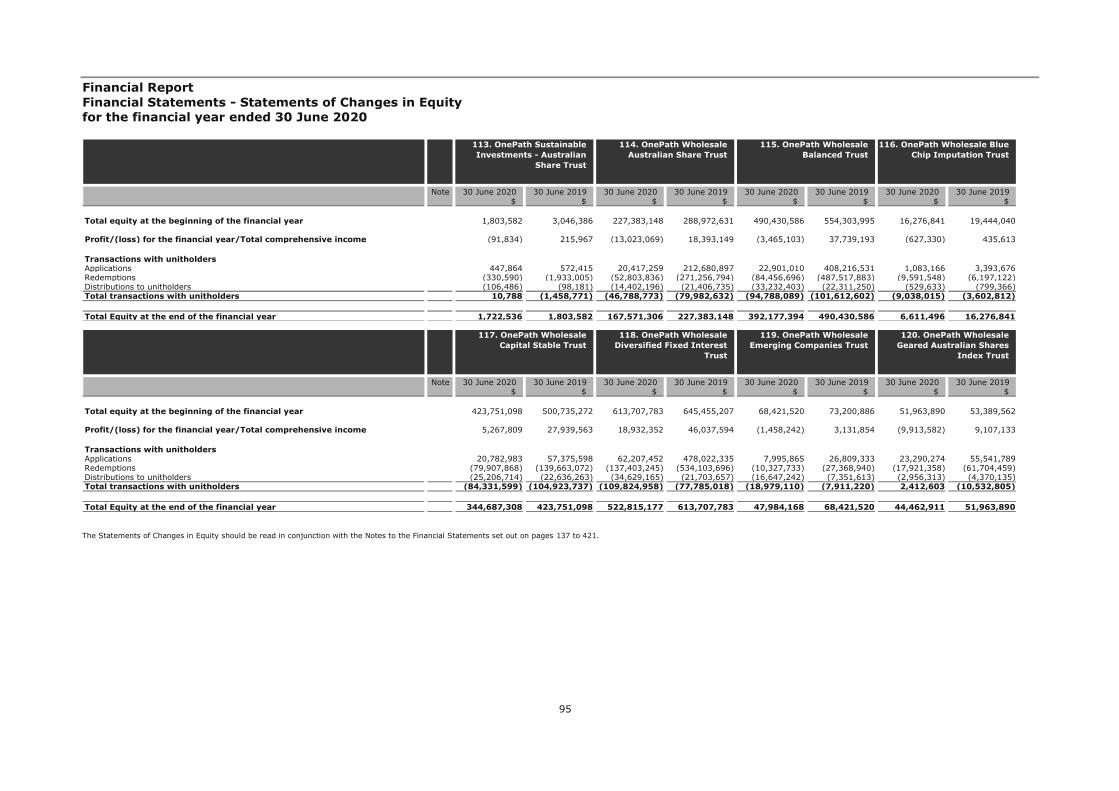
Financial Report Financial Statements - Statements of Changes in Equity for the financial year ended 30 June 2020
95
The Statements of Changes in Equity should be read in conjunction with the Notes to the Financial Statements set out on pages 137 to 421.
Note 30 June 2020 30 June 2019 30 June 2020 30 June 2019 30 June 2020 30 June 2019 30 June 2020 30 June 2019$ $ $ $ $ $ $ $
Total equity at the beginning of the financial year 1,803,582 3,046,386 227,383,148 288,972,631 490,430,586 554,303,995 16,276,841 19,444,040
Profit/(loss) for the financial year/Total comprehensive income (91,834) 215,967 (13,023,069) 18,393,149 (3,465,103) 37,739,193 (627,330) 435,613
Transactions with unitholdersApplications 447,864 572,415 20,417,259 212,680,897 22,901,010 408,216,531 1,083,166 3,393,676Redemptions (330,590) (1,933,005) (52,803,836) (271,256,794) (84,456,696) (487,517,883) (9,591,548) (6,197,122)Distributions to unitholders (106,486) (98,181) (14,402,196) (21,406,735) (33,232,403) (22,311,250) (529,633) (799,366)Total transactions with unitholders 10,788 (1,458,771) (46,788,773) (79,982,632) (94,788,089) (101,612,602) (9,038,015) (3,602,812)
Total Equity at the end of the financial year 1,722,536 1,803,582 167,571,306 227,383,148 392,177,394 490,430,586 6,611,496 16,276,841
113. OnePath Sustainable Investments - Australian
Share Trust
114. OnePath Wholesale Australian Share Trust
115. OnePath Wholesale Balanced Trust
116. OnePath Wholesale Blue Chip Imputation Trust
Note 30 June 2020 30 June 2019 30 June 2020 30 June 2019 30 June 2020 30 June 2019 30 June 2020 30 June 2019$ $ $ $ $ $ $ $
Total equity at the beginning of the financial year 423,751,098 500,735,272 613,707,783 645,455,207 68,421,520 73,200,886 51,963,890 53,389,562
Profit/(loss) for the financial year/Total comprehensive income 5,267,809 27,939,563 18,932,352 46,037,594 (1,458,242) 3,131,854 (9,913,582) 9,107,133
Transactions with unitholdersApplications 20,782,983 57,375,598 62,207,452 478,022,335 7,995,865 26,809,333 23,290,274 55,541,789Redemptions (79,907,868) (139,663,072) (137,403,245) (534,103,696) (10,327,733) (27,368,940) (17,921,358) (61,704,459)Distributions to unitholders (25,206,714) (22,636,263) (34,629,165) (21,703,657) (16,647,242) (7,351,613) (2,956,313) (4,370,135)Total transactions with unitholders (84,331,599) (104,923,737) (109,824,958) (77,785,018) (18,979,110) (7,911,220) 2,412,603 (10,532,805)
Total Equity at the end of the financial year 344,687,308 423,751,098 522,815,177 613,707,783 47,984,168 68,421,520 44,462,911 51,963,890
117. OnePath Wholesale Capital Stable Trust
118. OnePath Wholesale Diversified Fixed Interest
Trust
119. OnePath Wholesale Emerging Companies Trust
120. OnePath Wholesale Geared Australian Shares
Index Trust

Financial Report Financial Statements - Statements of Changes in Equity for the financial year ended 30 June 2020
96
The Statements of Changes in Equity should be read in conjunction with the Notes to the Financial Statements set out on pages 137 to 421.
Note 30 June 2020 30 June 2019 30 June 2020 30 June 2019 30 June 2020 30 June 2019 30 June 2020 30 June 2019$ $ $ $ $ $ $ $
Total equity at the beginning of the financial year 13,216,898 11,328,092 43,585,584 46,770,747 24,256,048 25,926,167 8,342,052 8,628,752
Profit/(loss) for the financial year/Total comprehensive income (642,002) 825,901 (1,808,237) 3,739,014 16,728 1,922,603 99,802 586,207
Transactions with unitholdersApplications 1,300,774 5,568,071 4,806,591 27,647,335 2,816,714 28,027,749 535,423 9,858,880Redemptions (2,205,262) (4,322,229) (7,584,752) (30,614,607) (4,300,365) (29,720,415) (1,482,251) (10,174,051)Distributions to unitholders (325,507) (182,937) (3,802,292) (3,956,905) (2,692,189) (1,900,056) (638,114) (557,736)Total transactions with unitholders (1,229,995) 1,062,905 (6,580,453) (6,924,177) (4,175,840) (3,592,722) (1,584,942) (872,907)
Total Equity at the end of the financial year 11,344,901 13,216,898 35,196,894 43,585,584 20,096,936 24,256,048 6,856,912 8,342,052
121. OnePath Wholesale Global Emerging Markets
Share Trust
122. OnePath Wholesale High Growth Trust
123. OnePath Wholesale Index Balanced Trust
124. OnePath Wholesale Index Conservative Trust
Note 30 June 2020 30 June 2019 30 June 2020 30 June 2019 30 June 2020 30 June 2019 30 June 2020 30 June 2019$ $ $ $ $ $ $ $
Total equity at the beginning of the financial year 5,375,689 7,147,795 1,030,000,488 1,139,311,847 2,645,443 2,947,807 98,787,362 75,281,565
Profit/(loss) for the financial year/Total comprehensive income 21,512 408,893 (21,116,459) 79,985,976 (616,186) 99,180 (5,731,630) 9,413,775
Transactions with unitholdersApplications 443,535 6,544,645 67,530,616 1,231,074,140 74,760 145,902 6,980,458 126,320,477Redemptions (1,156,162) (8,239,169) (154,122,916) (1,352,172,969) (256,272) (477,715) (20,513,314) (106,535,086)Distributions to unitholders (510,971) (486,475) (72,916,461) (68,198,506) (92,518) (69,731) (5,913,233) (5,693,369)Total transactions with unitholders (1,223,598) (2,180,999) (159,508,761) (189,297,335) (274,030) (401,544) (19,446,089) 14,092,022
Total Equity at the end of the financial year 4,173,603 5,375,689 849,375,268 1,030,000,488 1,755,227 2,645,443 73,609,643 98,787,362
125. OnePath Wholesale Index Moderate Trust
126. OnePath Wholesale Managed Growth Trust
127. OnePath Wholesale Property Securities Trust
128. OnePath Wholesale Select Leaders Trust
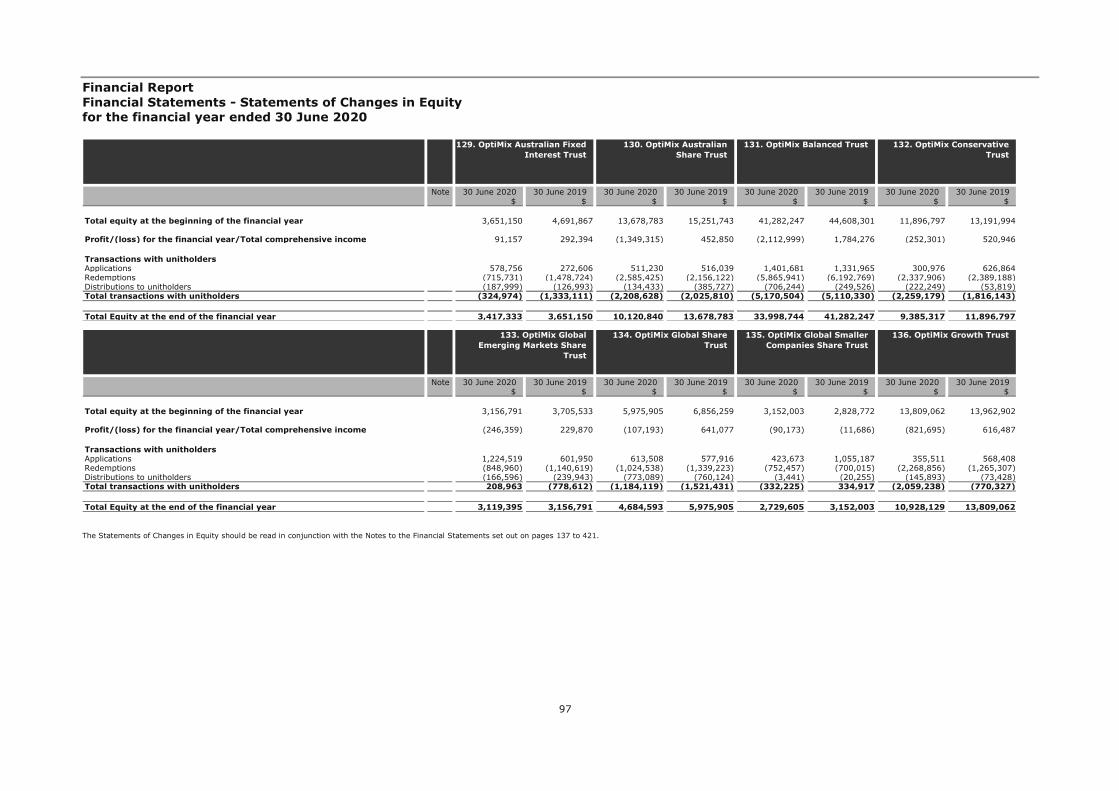
Financial Report Financial Statements - Statements of Changes in Equity for the financial year ended 30 June 2020
97
The Statements of Changes in Equity should be read in conjunction with the Notes to the Financial Statements set out on pages 137 to 421.
Note 30 June 2020 30 June 2019 30 June 2020 30 June 2019 30 June 2020 30 June 2019 30 June 2020 30 June 2019$ $ $ $ $ $ $ $
Total equity at the beginning of the financial year 3,651,150 4,691,867 13,678,783 15,251,743 41,282,247 44,608,301 11,896,797 13,191,994
Profit/(loss) for the financial year/Total comprehensive income 91,157 292,394 (1,349,315) 452,850 (2,112,999) 1,784,276 (252,301) 520,946
Transactions with unitholdersApplications 578,756 272,606 511,230 516,039 1,401,681 1,331,965 300,976 626,864Redemptions (715,731) (1,478,724) (2,585,425) (2,156,122) (5,865,941) (6,192,769) (2,337,906) (2,389,188)Distributions to unitholders (187,999) (126,993) (134,433) (385,727) (706,244) (249,526) (222,249) (53,819)Total transactions with unitholders (324,974) (1,333,111) (2,208,628) (2,025,810) (5,170,504) (5,110,330) (2,259,179) (1,816,143)
Total Equity at the end of the financial year 3,417,333 3,651,150 10,120,840 13,678,783 33,998,744 41,282,247 9,385,317 11,896,797
129. OptiMix Australian Fixed Interest Trust
130. OptiMix Australian Share Trust
131. OptiMix Balanced Trust 132. OptiMix Conservative Trust
Note 30 June 2020 30 June 2019 30 June 2020 30 June 2019 30 June 2020 30 June 2019 30 June 2020 30 June 2019$ $ $ $ $ $ $ $
Total equity at the beginning of the financial year 3,156,791 3,705,533 5,975,905 6,856,259 3,152,003 2,828,772 13,809,062 13,962,902
Profit/(loss) for the financial year/Total comprehensive income (246,359) 229,870 (107,193) 641,077 (90,173) (11,686) (821,695) 616,487
Transactions with unitholdersApplications 1,224,519 601,950 613,508 577,916 423,673 1,055,187 355,511 568,408Redemptions (848,960) (1,140,619) (1,024,538) (1,339,223) (752,457) (700,015) (2,268,856) (1,265,307)Distributions to unitholders (166,596) (239,943) (773,089) (760,124) (3,441) (20,255) (145,893) (73,428)Total transactions with unitholders 208,963 (778,612) (1,184,119) (1,521,431) (332,225) 334,917 (2,059,238) (770,327)
Total Equity at the end of the financial year 3,119,395 3,156,791 4,684,593 5,975,905 2,729,605 3,152,003 10,928,129 13,809,062
133. OptiMix Global Emerging Markets Share
Trust
134. OptiMix Global Share Trust
135. OptiMix Global Smaller Companies Share Trust
136. OptiMix Growth Trust

Financial Report Financial Statements - Statements of Changes in Equity for the financial year ended 30 June 2020
98
The Statements of Changes in Equity should be read in conjunction with the Notes to the Financial Statements set out on pages 137 to 421.
Note 30 June 2020 30 June 2019 30 June 2020 30 June 2019 30 June 2020 30 June 2019 30 June 2020 30 June 2019$ $ $ $ $ $ $ $
Total equity at the beginning of the financial year 4,852,017 6,609,375 8,143,494 10,034,645 4,995,702 5,158,637 1,159,832,439 1,273,712,706
Profit/(loss) for the financial year/Total comprehensive income (357,603) 239,226 (343,910) 372,065 (1,067,688) 506,812 (31,640,583) 85,752,870
Transactions with unitholdersApplications 99,309 221,360 360,368 312,734 176,537 173,072 77,133,504 1,223,860,735Redemptions (628,315) (2,187,873) (1,000,056) (2,544,568) (905,899) (807,095) (209,454,099) (1,349,895,502)Distributions to unitholders (38,182) (30,071) (167,494) (31,382) (59,247) (35,724) (90,593,627) (73,598,370)Total transactions with unitholders (567,188) (1,996,584) (807,182) (2,263,216) (788,609) (669,747) (222,914,222) (199,633,137)
Total Equity at the end of the financial year 3,927,226 4,852,017 6,992,402 8,143,494 3,139,405 4,995,702 905,277,634 1,159,832,439
137. OptiMix High Growth Trust
138. OptiMix Moderate Trust 139. OptiMix Property Securities Trust
140. OptiMix Wholesale Balanced Trust
Note 30 June 2020 30 June 2019 30 June 2020 30 June 2019 30 June 2020 30 June 2019 30 June 2020 30 June 2019$ $ $ $ $ $ $ $
Total equity at the beginning of the financial year 270,255,400 299,846,584 350,645,050 320,797,440 669,520,352 763,486,220 266,630,688 285,030,057
Profit/(loss) for the financial year/Total comprehensive income 983,746 19,592,532 (12,646,341) 22,892,398 (25,498,931) 50,638,054 (14,184,051) 21,409,006
Transactions with unitholdersApplications 41,087,381 256,145,021 77,311,254 138,450,216 31,558,149 614,272,881 21,436,703 292,471,362Redemptions (64,284,412) (296,200,924) (176,580,307) (115,330,650) (114,484,941) (727,473,625) (40,141,008) (310,711,646)Distributions to unitholders (13,665,567) (9,127,813) (24,614,235) (16,164,354) (51,814,623) (31,403,178) (22,654,927) (21,568,091)Total transactions with unitholders (36,862,598) (49,183,716) (123,883,288) 6,955,212 (134,741,415) (144,603,922) (41,359,232) (39,808,375)
Total Equity at the end of the financial year 234,376,548 270,255,400 214,115,421 350,645,050 509,280,006 669,520,352 211,087,405 266,630,688
141. OptiMix Wholesale Conservative Trust
142. OptiMix Wholesale Global (Hedged) Share Trust
143. OptiMix Wholesale Growth Trust
144. OptiMix Wholesale High Growth Trust
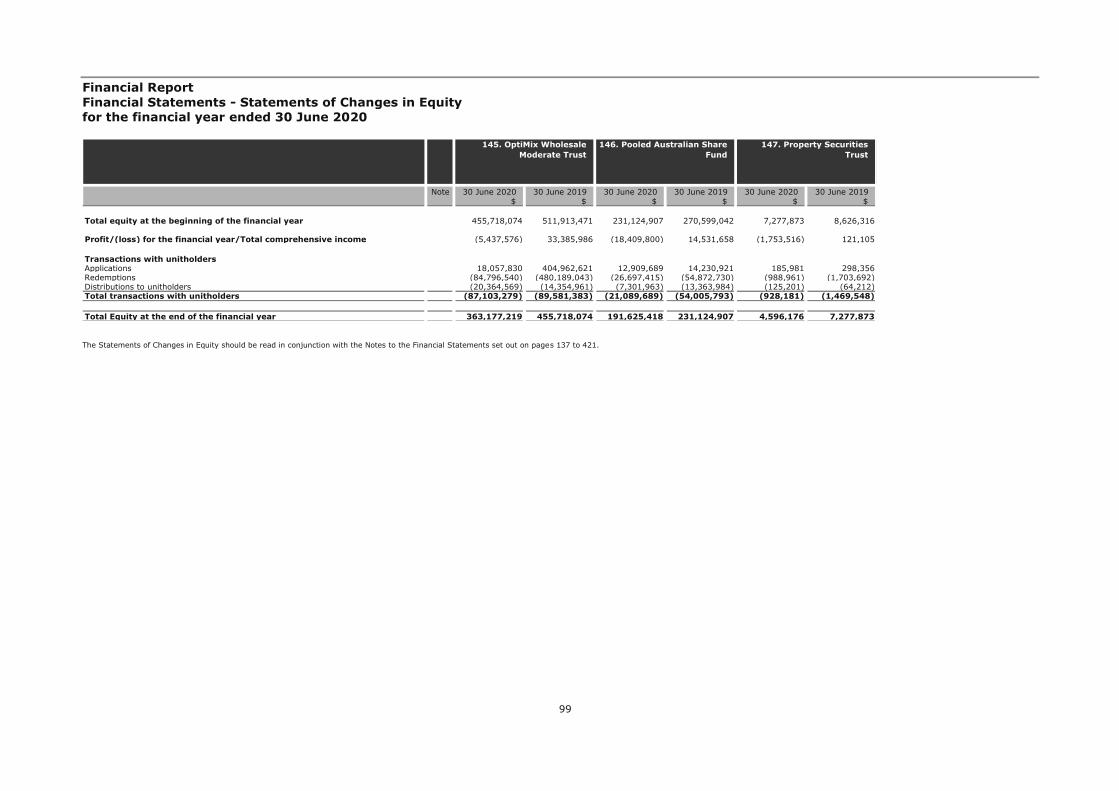
Financial Report Financial Statements - Statements of Changes in Equity for the financial year ended 30 June 2020
99
The Statements of Changes in Equity should be read in conjunction with the Notes to the Financial Statements set out on pages 137 to 421.
Note 30 June 2020 30 June 2019 30 June 2020 30 June 2019 30 June 2020 30 June 2019$ $ $ $ $ $
Total equity at the beginning of the financial year 455,718,074 511,913,471 231,124,907 270,599,042 7,277,873 8,626,316
Profit/(loss) for the financial year/Total comprehensive income (5,437,576) 33,385,986 (18,409,800) 14,531,658 (1,753,516) 121,105
Transactions with unitholdersApplications 18,057,830 404,962,621 12,909,689 14,230,921 185,981 298,356Redemptions (84,796,540) (480,189,043) (26,697,415) (54,872,730) (988,961) (1,703,692)Distributions to unitholders (20,364,569) (14,354,961) (7,301,963) (13,363,984) (125,201) (64,212)Total transactions with unitholders (87,103,279) (89,581,383) (21,089,689) (54,005,793) (928,181) (1,469,548)
Total Equity at the end of the financial year 363,177,219 455,718,074 191,625,418 231,124,907 4,596,176 7,277,873
145. OptiMix Wholesale Moderate Trust
146. Pooled Australian Share Fund
147. Property Securities Trust

Financial Report Financial Statements - Statements of Cash Flows for the financial year ended 30 June 2020
100
The Statements of Cash Flows should be read in conjunction with the Notes to the Financial Statements set out on pages 137 to 421.
Note 30 June 2020 30 June 2019 30 June 2020 30 June 2019 30 June 2020 30 June 2019 30 June 2020 30 June 2019$ $ $ $ $ $ $ $
Cash flows from operating activities:Interest received 386 1,140 83 191 247 594 46 146Unit trust distribution received - - - - - - - - Other income received 287 - - - - - - - Realised foreign exchange gains/(losses) - - - - - - - - Interest paid - - - - - - - - Operating expenses paid (744,321) (840,077) (107,029) (121,814) (58,844) (66,800) (58,098) (65,364)Proceeds from sale of investments 8,061,900 9,038,925 703,721 1,390,605 450,762 582,362 855,789 1,245,270Purchase of investments - - - - - - (330,461) (86,967)Net cash flows from/(used in) operating activities 8 7,318,252 8,199,988 596,775 1,268,982 392,165 516,156 467,276 1,093,085
Cash flows from financing activities:Proceeds from issue of units 675,976 496,595 36,227 4,238 13,527 2,574 346,254 84,014Payments for redemption of units (8,026,120) (8,575,320) (546,557) (1,175,759) (324,755) (450,340) (715,766) (1,094,950)Drawdown/(prepayment) of loan - - - - - - - - Distributions paid (26,365) (69,436) (93,505) (112,215) (46,179) (55,948) (101,533) (102,437)Net cash flows from/(used in) financing activities (7,376,509) (8,148,161) (603,835) (1,283,736) (357,407) (503,714) (471,045) (1,113,373)
- - - - Net increase/(decrease) in cash and cash equivalents (58,257) 51,827 (7,060) (14,754) 34,758 12,442 (3,769) (20,288)Effect of exchange rate fluctuations on cash and cash equivalents - - - - - - - - Cash and cash equivalents at the beginning of the financial year 218,981 167,154 35,534 50,288 76,893 64,451 23,766 44,054Cash and cash equivalents at the end of the financial year 160,724 218,981 28,474 35,534 111,651 76,893 19,997 23,766
1. Active Growth Trust 2. ANZ Equity Imputation Trust
3. ANZ Equity Trust No 1 4. ANZ Fixed Interest Trust

Financial Report Financial Statements - Statements of Cash Flows for the financial year ended 30 June 2020
101
The Statements of Cash Flows should be read in conjunction with the Notes to the Financial Statements set out on pages 137 to 421.
Note 30 June 2020 30 June 2019 30 June 2020 30 June 2019 30 June 2020 30 June 2019 30 June 2020 30 June 2019$ $ $ $ $ $ $ $
Cash flows from operating activities:Interest received 121 432 1,681 3,564 969 2,477 526 1,446Unit trust distribution received - - - - - - - - Other income received - - 64 - 15 - 12 - Realised foreign exchange gains/(losses) - - - - - - - - Interest paid - - (2) (3,493) (1) - - - Operating expenses paid (25,819) (35,227) (194,157) (262,262) (130,476) (157,929) (42,528) (53,178)Proceeds from sale of investments 3,514,159 4,257,638 82,415,715 86,475,161 24,931,694 25,355,346 6,829,469 13,480,074Purchase of investments - (90,983) - - (1,423,614) (2,243,678) (1,718,606) - Net cash flows from/(used in) operating activities 8 3,488,461 4,131,860 82,223,301 86,212,970 23,378,587 22,956,216 5,068,873 13,428,342
Cash flows from financing activities:Proceeds from issue of units 16,288 262,858 4,996,384 7,535,268 2,098,799 3,150,026 2,138,402 555,920Payments for redemption of units (3,491,898) (4,366,320) (87,259,194) (92,333,518) (25,029,989) (26,286,923) (7,045,745) (13,913,639)Drawdown/(prepayment) of loan - - - - - - - - Distributions paid (2,806) (26,288) (27,627) (689,912) (89,271) (115,260) (115,427) (73,519)Net cash flows from/(used in) financing activities (3,478,416) (4,129,750) (82,290,437) (85,488,162) (23,020,461) (23,252,157) (5,022,770) (13,431,238)
- - - - Net increase/(decrease) in cash and cash equivalents 10,045 2,110 (67,136) 724,808 358,126 (295,941) 46,103 (2,896)Effect of exchange rate fluctuations on cash and cash equivalents - - - - - - - - Cash and cash equivalents at the beginning of the financial year 36,356 34,246 47,681 (677,127) 121,794 417,735 138,023 140,919Cash and cash equivalents at the end of the financial year 46,401 36,356 (19,455) 47,681 479,920 121,794 184,126 138,023
5. ANZ OA - Pendal Core Hedged Global Shares Trust
6. ANZ OA Arrowstreet Global Equity (Hedged) Trust
7. ANZ OA Colonial First State Imputation Trust
8. ANZ OA Investors Mutual Australian Share Trust

Financial Report Financial Statements - Statements of Cash Flows for the financial year ended 30 June 2020
102
The Statements of Cash Flows should be read in conjunction with the Notes to the Financial Statements set out on pages 137 to 421.
Note 30 June 2020 30 June 2019 30 June 2020 30 June 2019 30 June 2020 30 June 2019 30 June 2020 30 June 2019$ $ $ $ $ $ $ $
Cash flows from operating activities:Interest received 1,145 2,068 2,611 6,380 639 1,799 201 816Unit trust distribution received - - - - - - - - Other income received - - 95 2 2 - 50 - Realised foreign exchange gains/(losses) - - 11,384 (15,328) - - - - Interest paid - - (728) (7,729) - - - - Operating expenses paid (62,265) (50,287) (107,746) (126,228) (303,411) (334,407) (675,585) (777,696)Proceeds from sale of investments 1,031,600 1,297,412 14,068,261 13,841,889 8,757,886 9,614,393 3,213,196 6,405,469Purchase of investments (21,443,010) (4,542,629) (4,611,504) (2,837,550) - - - - Net cash flows from/(used in) operating activities 8 (20,472,530) (3,293,436) 9,362,373 10,861,436 8,455,116 9,281,785 2,537,862 5,628,589
Cash flows from financing activities:Proceeds from issue of units 22,529,447 5,496,906 88,397 150,539 245,893 156,170 395,993 377,250Payments for redemption of units (1,647,549) (1,925,072) (9,328,739) (10,922,961) (8,666,932) (9,338,376) (2,890,015) (5,955,067)Drawdown/(prepayment) of loan - - - - - - - - Distributions paid (1,298) (9,458) (8,973) (13,865) (51,189) (133,861) (16,557) (121,221)Net cash flows from/(used in) financing activities 20,880,600 3,562,376 (9,249,315) (10,786,287) (8,472,228) (9,316,067) (2,510,579) (5,699,038)
- - - - Net increase/(decrease) in cash and cash equivalents 408,070 268,940 113,058 75,149 (17,112) (34,282) 27,283 (70,449)Effect of exchange rate fluctuations on cash and cash equivalents - - - - - - - - Cash and cash equivalents at the beginning of the financial year 448,404 179,464 203,114 127,965 252,293 286,575 53,175 123,624Cash and cash equivalents at the end of the financial year 856,474 448,404 316,172 203,114 235,181 252,293 80,458 53,175
9. ANZ OA Magellan Global Trust
10. ANZ OA OnePath Active Growth Trust
11. ANZ OA OnePath Australian Share Trust
12. ANZ OA OnePath Balanced Trust

Financial Report Financial Statements - Statements of Cash Flows for the financial year ended 30 June 2020
103
The Statements of Cash Flows should be read in conjunction with the Notes to the Financial Statements set out on pages 137 to 421.
Note 30 June 2020 30 June 2019 30 June 2020 30 June 2019 30 June 2020 30 June 2019 30 June 2020 30 June 2019$ $ $ $ $ $ $ $
Cash flows from operating activities:Interest received 2,007 6,629 2,337 8,102 80 464 531 2,049Unit trust distribution received - - - - - - - - Other income received 32 - 142 1 - - 51 - Realised foreign exchange gains/(losses) - - (2,412) (33,683) - - - - Interest paid (2) - (157) (9,498) - - - - Operating expenses paid (1,865,541) (2,203,535) (436,948) (516,453) (186,578) (252,017) (159,550) (183,548)Proceeds from sale of investments 52,665,990 62,417,491 13,531,909 18,347,209 1,308,299 2,140,105 11,780,971 6,631,306Purchase of investments - (1,320,511) (5,390,337) (4,816,568) (674,664) (237,263) (379,461) (2,618,713)Net cash flows from/(used in) operating activities 8 50,802,486 58,900,074 7,704,534 12,979,110 447,137 1,651,289 11,242,542 3,831,094
Cash flows from financing activities:Proceeds from issue of units 3,285,896 5,665,680 3,015,731 2,860,936 1,197,599 953,961 2,234,250 5,854,870Payments for redemption of units (53,944,564) (64,012,351) (10,388,497) (15,630,221) (1,630,121) (2,631,161) (13,421,715) (9,840,024)Drawdown/(prepayment) of loan - - - - - - - - Distributions paid (353,636) (509,780) (62,011) (45,109) (4,926) (11,857) (6,297) (676)Net cash flows from/(used in) financing activities (51,012,304) (58,856,451) (7,434,777) (12,814,394) (437,448) (1,689,057) (11,193,762) (3,985,830)
- - - - Net increase/(decrease) in cash and cash equivalents (209,818) 43,623 269,757 164,716 9,689 (37,768) 48,780 (154,736)Effect of exchange rate fluctuations on cash and cash equivalents - - - - - - - - Cash and cash equivalents at the beginning of the financial year 975,400 931,777 280,321 115,605 17,273 55,041 83,893 238,629Cash and cash equivalents at the end of the financial year 765,582 975,400 550,078 280,321 26,962 17,273 132,673 83,893
13. ANZ OA OnePath Blue Chip Imputation Trust
14. ANZ OA OnePath Conservative Trust
15. ANZ OA OnePath Diversified Fixed Interest
Trust
16. ANZ OA OnePath Global Emerging Markets Share
Trust

Financial Report Financial Statements - Statements of Cash Flows for the financial year ended 30 June 2020
104
The Statements of Cash Flows should be read in conjunction with the Notes to the Financial Statements set out on pages 137 to 421.
Note 30 June 2020 30 June 2019 30 June 2020 30 June 2019 30 June 2020 30 June 2019 30 June 2020 30 June 2019$ $ $ $ $ $ $ $
Cash flows from operating activities:Interest received 166 553 320 791 700 6,691 1,089 3,449Unit trust distribution received - - - - - - - - Other income received - - 5 1 7 - 41 - Realised foreign exchange gains/(losses) - - - - - - - - Interest paid - - (41) (22) - - - - Operating expenses paid (13,773) (14,869) (166,934) (219,970) (430,159) (466,454) (128,027) (161,568)Proceeds from sale of investments 4,379,915 5,400,285 2,840,731 3,944,280 10,680,208 62,721,012 25,440,923 28,675,115Purchase of investments (314,725) (211,905) (838,500) (810,000) - - - - Net cash flows from/(used in) operating activities 8 4,051,583 5,174,064 1,835,581 2,915,080 10,250,756 62,261,249 25,314,026 28,516,996
Cash flows from financing activities:Proceeds from issue of units 356,948 288,198 203,864 156,280 404,606 730,760 941,645 720,704Payments for redemption of units (4,392,709) (5,459,252) (1,962,521) (3,022,960) (10,547,110) (62,858,214) (26,235,307) (29,086,815)Drawdown/(prepayment) of loan - - - - - - - - Distributions paid (1,347) (621) (15,388) (44,790) (7,935) (70,108) (87,464) (108,254)Net cash flows from/(used in) financing activities (4,037,108) (5,171,675) (1,774,045) (2,911,470) (10,150,439) (62,197,562) (25,381,126) (28,474,365)
- - - - Net increase/(decrease) in cash and cash equivalents 14,475 2,389 61,536 3,610 100,317 63,687 (67,100) 42,631Effect of exchange rate fluctuations on cash and cash equivalents - - - - - - - - Cash and cash equivalents at the beginning of the financial year 45,838 43,449 21,358 17,748 191,463 127,776 343,241 300,610Cash and cash equivalents at the end of the financial year 60,313 45,838 82,894 21,358 291,780 191,463 276,141 343,241
17. ANZ OA OnePath High Growth Trust
18. ANZ OA OnePath Income Trust
19. ANZ OA OnePath Managed Growth Trust
20. ANZ OA OnePath Property Securities Trust
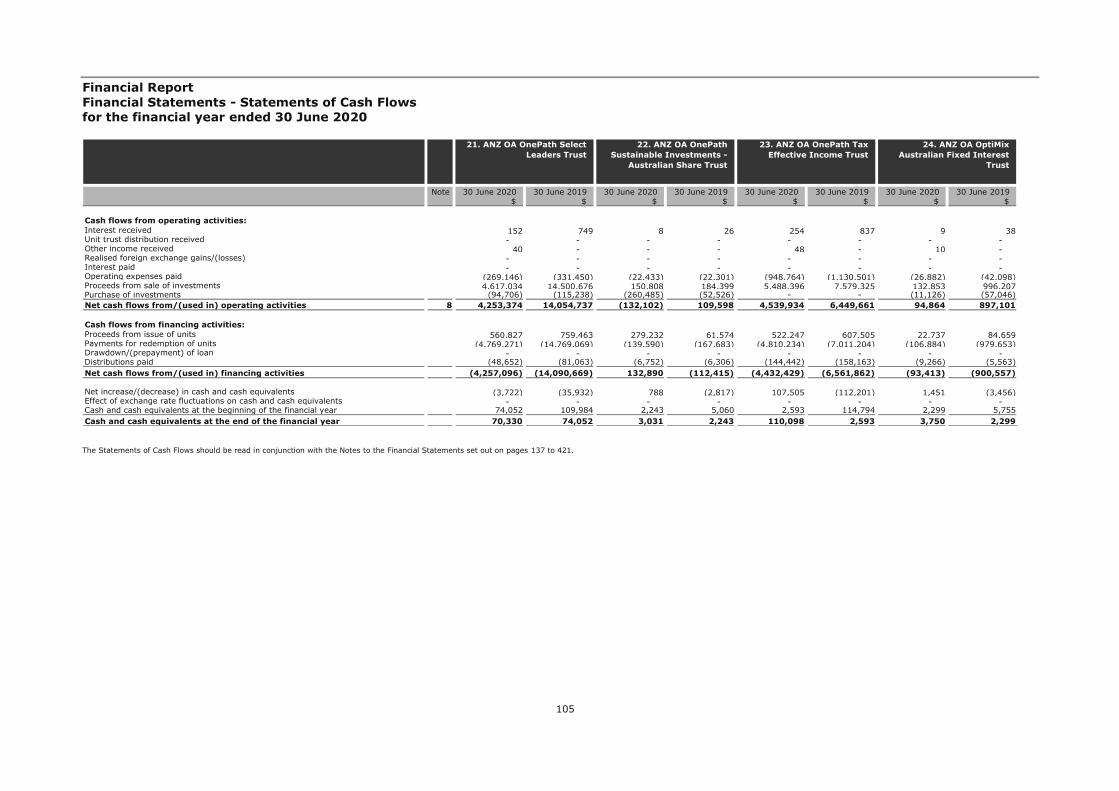
Financial Report Financial Statements - Statements of Cash Flows for the financial year ended 30 June 2020
105
The Statements of Cash Flows should be read in conjunction with the Notes to the Financial Statements set out on pages 137 to 421.
Note 30 June 2020 30 June 2019 30 June 2020 30 June 2019 30 June 2020 30 June 2019 30 June 2020 30 June 2019$ $ $ $ $ $ $ $
Cash flows from operating activities:Interest received 152 749 8 26 254 837 9 38Unit trust distribution received - - - - - - - - Other income received 40 - - - 48 - 10 - Realised foreign exchange gains/(losses) - - - - - - - - Interest paid - - - - - - - - Operating expenses paid (269,146) (331,450) (22,433) (22,301) (948,764) (1,130,501) (26,882) (42,098)Proceeds from sale of investments 4,617,034 14,500,676 150,808 184,399 5,488,396 7,579,325 132,853 996,207Purchase of investments (94,706) (115,238) (260,485) (52,526) - - (11,126) (57,046)Net cash flows from/(used in) operating activities 8 4,253,374 14,054,737 (132,102) 109,598 4,539,934 6,449,661 94,864 897,101
Cash flows from financing activities:Proceeds from issue of units 560,827 759,463 279,232 61,574 522,247 607,505 22,737 84,659Payments for redemption of units (4,769,271) (14,769,069) (139,590) (167,683) (4,810,234) (7,011,204) (106,884) (979,653)Drawdown/(prepayment) of loan - - - - - - - - Distributions paid (48,652) (81,063) (6,752) (6,306) (144,442) (158,163) (9,266) (5,563)Net cash flows from/(used in) financing activities (4,257,096) (14,090,669) 132,890 (112,415) (4,432,429) (6,561,862) (93,413) (900,557)
- - - - Net increase/(decrease) in cash and cash equivalents (3,722) (35,932) 788 (2,817) 107,505 (112,201) 1,451 (3,456)Effect of exchange rate fluctuations on cash and cash equivalents - - - - - - - - Cash and cash equivalents at the beginning of the financial year 74,052 109,984 2,243 5,060 2,593 114,794 2,299 5,755Cash and cash equivalents at the end of the financial year 70,330 74,052 3,031 2,243 110,098 2,593 3,750 2,299
21. ANZ OA OnePath Select Leaders Trust
22. ANZ OA OnePath Sustainable Investments -
Australian Share Trust
23. ANZ OA OnePath Tax Effective Income Trust
24. ANZ OA OptiMix Australian Fixed Interest
Trust

Financial Report Financial Statements - Statements of Cash Flows for the financial year ended 30 June 2020
106
The Statements of Cash Flows should be read in conjunction with the Notes to the Financial Statements set out on pages 137 to 421.
Note 30 June 2020 30 June 2019 30 June 2020 30 June 2019 30 June 2020 30 June 2019 30 June 2020 30 June 2019$ $ $ $ $ $ $ $
Cash flows from operating activities:Interest received 65 197 123 391 42 132 19 61Unit trust distribution received - - - - - - - - Other income received 23 - 10 - 20 - 2 - Realised foreign exchange gains/(losses) - - - - - - - - Interest paid - - - - - - - - Operating expenses paid (227,257) (270,626) (307,346) (406,160) (156,252) (178,209) (61,828) (80,189)Proceeds from sale of investments 975,957 2,047,259 2,336,820 2,450,760 1,347,854 1,002,654 330,261 732,921Purchase of investments - (59,842) (399,243) (291,388) - - - - Net cash flows from/(used in) operating activities 8 748,788 1,716,988 1,630,364 1,753,603 1,191,664 824,577 268,454 652,793
Cash flows from financing activities:Proceeds from issue of units 122,502 171,622 870,148 923,220 71,562 66,946 25,575 33,442Payments for redemption of units (869,809) (1,844,925) (2,477,901) (2,649,154) (1,270,066) (881,240) (295,050) (685,934)Drawdown/(prepayment) of loan - - - - - - - - Distributions paid (21,385) (35,774) (30,311) (36,218) - - - - Net cash flows from/(used in) financing activities (768,692) (1,709,077) (1,638,064) (1,762,152) (1,198,504) (814,294) (269,475) (652,492)
- - - - Net increase/(decrease) in cash and cash equivalents (19,904) 7,911 (7,700) (8,549) (6,840) 10,283 (1,021) 301Effect of exchange rate fluctuations on cash and cash equivalents - - - - - - - - Cash and cash equivalents at the beginning of the financial year 35,155 27,244 48,981 57,530 22,188 11,905 7,479 7,178Cash and cash equivalents at the end of the financial year 15,251 35,155 41,281 48,981 15,348 22,188 6,458 7,479
25. ANZ OA OptiMix Australian Share Trust
26. ANZ OA OptiMix Conservative Trust
27. ANZ OA OptiMix Global Share Trust
28. ANZ OA OptiMix Global Smaller Companies Share
Trust

Financial Report Financial Statements - Statements of Cash Flows for the financial year ended 30 June 2020
107
The Statements of Cash Flows should be read in conjunction with the Notes to the Financial Statements set out on pages 137 to 421.
Note 30 June 2020 30 June 2019 30 June 2020 30 June 2019 30 June 2020 30 June 2019 30 June 2020 30 June 2019$ $ $ $ $ $ $ $
Cash flows from operating activities:Interest received 198 711 93 255 161 472 23 70Unit trust distribution received - - - - - - - - Other income received 100 - 36 - 57 - - - Realised foreign exchange gains/(losses) - - - - - - - - Interest paid - - - - - - - - Operating expenses paid (678,177) (796,679) (255,176) (286,001) (504,116) (580,690) (77,875) (97,204)Proceeds from sale of investments 3,862,862 4,136,087 840,270 1,797,091 3,173,727 3,857,219 448,093 613,325Purchase of investments (305,423) (143,229) - - (168,286) (309,035) - - Net cash flows from/(used in) operating activities 8 2,879,560 3,196,890 585,223 1,511,345 2,501,543 2,967,966 370,241 516,191
Cash flows from financing activities:Proceeds from issue of units 967,477 974,870 271,492 284,539 695,170 769,380 39,059 36,211Payments for redemption of units (3,848,369) (4,104,379) (872,980) (1,759,964) (3,180,810) (3,669,221) (407,238) (537,421)Drawdown/(prepayment) of loan - - - - - - - - Distributions paid (8,201) (15,998) (2,662) (2,953) (9,136) (35,419) (4,199) (14,319)Net cash flows from/(used in) financing activities (2,889,093) (3,145,507) (604,150) (1,478,378) (2,494,776) (2,935,260) (372,378) (515,529)
- - - - Net increase/(decrease) in cash and cash equivalents (9,533) 51,383 (18,927) 32,967 6,767 32,706 (2,137) 662Effect of exchange rate fluctuations on cash and cash equivalents - - - - - - - - Cash and cash equivalents at the beginning of the financial year 81,630 30,247 38,179 5,212 55,282 22,576 9,700 9,038Cash and cash equivalents at the end of the financial year 72,097 81,630 19,252 38,179 62,049 55,282 7,563 9,700
29. ANZ OA OptiMix Growth Trust
30. ANZ OA OptiMix High Growth Trust
31. ANZ OA OptiMix Moderate Trust
32. ANZ OA OptiMix Property Securities Trust

Financial Report Financial Statements - Statements of Cash Flows for the financial year ended 30 June 2020
108
The Statements of Cash Flows should be read in conjunction with the Notes to the Financial Statements set out on pages 137 to 421.
Note 30 June 2020 30 June 2019 30 June 2020 30 June 2019 30 June 2020 30 June 2019 30 June 2020 30 June 2019$ $ $ $ $ $ $ $
Cash flows from operating activities:Interest received 2,116 4,267 950 3,197 141 508 18 972Unit trust distribution received - - - - - - - - Other income received 38 - - - 23 - 3 - Realised foreign exchange gains/(losses) - - - - - - - - Interest paid (2) - (1) - - - - - Operating expenses paid (540,317) (649,247) (152,436) (196,892) (35,306) (47,875) (20,903) (31,322)Proceeds from sale of investments 61,377,023 65,938,873 56,135,855 43,103,717 4,579,054 5,889,252 402,947 8,449,051Purchase of investments (3,183,797) (3,650,307) (1,338,635) (1,993,713) (46,473) - (172,412) (334,443)Net cash flows from/(used in) operating activities 8 57,655,061 61,643,586 54,645,733 40,916,309 4,497,439 5,841,885 209,653 8,084,258
Cash flows from financing activities:Proceeds from issue of units 5,056,860 6,922,631 2,110,064 3,400,107 138,302 114,688 196,791 461,771Payments for redemption of units (62,646,165) (68,367,026) (56,499,048) (44,150,875) (4,574,276) (5,972,482) (405,250) (8,654,449)Drawdown/(prepayment) of loan - - - - - - - - Distributions paid (119,235) (55,433) (260,799) (155,590) (51,203) (11,696) (2,836) (5,205)Net cash flows from/(used in) financing activities (57,708,540) (61,499,828) (54,649,783) (40,906,358) (4,487,177) (5,869,490) (211,295) (8,197,883)
- - - - Net increase/(decrease) in cash and cash equivalents (53,479) 143,758 (4,050) 9,951 10,262 (27,605) (1,642) (113,625)Effect of exchange rate fluctuations on cash and cash equivalents - - - - - - - - Cash and cash equivalents at the beginning of the financial year 858,396 714,638 269,459 259,508 26,206 53,811 8,790 122,415Cash and cash equivalents at the end of the financial year 804,917 858,396 265,409 269,459 36,468 26,206 7,148 8,790
33. ANZ OA Perpetual Australian Share Trust
34. ANZ OA Schroder Australian Equity Trust
35. ANZ OA SG Hiscock Property Trust
36. ANZ OA UBS Diversified Fixed Income Trust

Financial Report Financial Statements - Statements of Cash Flows for the financial year ended 30 June 2020
109
The Statements of Cash Flows should be read in conjunction with the Notes to the Financial Statements set out on pages 137 to 421.
Note 30 June 2020 30 June 2019 30 June 2020 30 June 2019 30 June 2020 30 June 2019 30 June 2020 30 June 2019$ $ $ $ $ $ $ $
Cash flows from operating activities:Interest received 106 178 73 224 25,836 28,050 677 2,236Unit trust distribution received - - - - - - - - Other income received 25 - - - 335,746 147,260 - - Realised foreign exchange gains/(losses) - - - - - - - - Interest paid - (121) - (2) (2,826) - - - Operating expenses paid (46,779) (53,024) (33,457) (28,246) - (5,641) (281,146) (346,141)Proceeds from sale of investments 3,988,052 4,568,890 3,111,396 2,084,991 88,540,001 8,970,312 18,369,902 19,360,389Purchase of investments (392,188) (297,835) (407,580) (1,028,922) (151,088,000) (26,510,000) (384,490) - Net cash flows from/(used in) operating activities 8 3,549,216 4,218,088 2,670,432 1,028,045 (62,189,243) (17,370,019) 17,704,943 19,016,484
Cash flows from financing activities:Proceeds from issue of units 801,390 683,482 801,002 1,486,705 167,481,329 42,390,357 805,722 712,849Payments for redemption of units (4,232,784) (4,864,442) (3,379,629) (2,487,333) (104,126,762) (16,287,279) (18,016,465) (19,618,392)Drawdown/(prepayment) of loan - - - - - - - - Distributions paid (77,672) (109,436) (9,490) (10,279) (4,652,905) (3,935,892) (552,563) (143,192)Net cash flows from/(used in) financing activities (3,509,066) (4,290,396) (2,588,117) (1,010,907) 58,701,662 22,167,186 (17,763,306) (19,048,735)
- - - - Net increase/(decrease) in cash and cash equivalents 40,150 (72,308) 82,315 17,138 (3,487,581) 4,797,167 (58,363) (32,251)Effect of exchange rate fluctuations on cash and cash equivalents - - - - - - - - Cash and cash equivalents at the beginning of the financial year 7,168 79,476 (24,109) (41,247) 6,772,942 1,975,775 225,148 257,399Cash and cash equivalents at the end of the financial year 47,318 7,168 58,206 (24,109) 3,285,361 6,772,942 166,785 225,148
37. ANZ OneAnswer - BR Scientific Australian Equity
Trust
38. ANZ OneAnswer - BR Scientific International
Equity Trust
39. ANZ Private International Fixed Interest Fund
40. ANZ Property Securities Trust

Financial Report Financial Statements - Statements of Cash Flows for the financial year ended 30 June 2020
110
The Statements of Cash Flows should be read in conjunction with the Notes to the Financial Statements set out on pages 137 to 421.
Note 30 June 2020 30 June 2019 30 June 2020 30 June 2019 30 June 2020 30 June 2019 30 June 2020 30 June 2019$ $ $ $ $ $ $ $
Cash flows from operating activities:Interest received 899 2,098 566 2,503 658 2,328 1,760 5,575Unit trust distribution received - - - - - - - - Other income received 58 - 42 - 116,815 - 22 - Realised foreign exchange gains/(losses) - - - - - - - - Interest paid (1) - - - (1) - (1) - Operating expenses paid (328,186) (405,030) (434,521) (519,127) (1,292,250) (1,552,942) (1,547,515) (1,790,820)Proceeds from sale of investments 5,667,688 4,840,887 9,297,718 31,706,200 14,171,884 19,845,346 57,450,873 33,915,624Purchase of investments (375,388) (559,247) - (1,152,379) - (374,057) - - Net cash flows from/(used in) operating activities 8 4,965,070 3,878,708 8,863,805 30,037,197 12,997,106 17,920,675 55,905,139 32,130,379
Cash flows from financing activities:Proceeds from issue of units 903,084 247,710 447,444 2,100,351 790,130 1,365,503 2,606,162 2,687,777Payments for redemption of units (5,715,167) (3,974,613) (9,119,350) (31,961,594) (13,505,743) (18,591,985) (56,598,664) (34,325,565)Drawdown/(prepayment) of loan - - - - - - - - Distributions paid (63,324) (67,313) (232,702) (159,977) (374,845) (490,267) (1,973,716) (1,365,832)Net cash flows from/(used in) financing activities (4,875,407) (3,794,216) (8,904,608) (30,021,220) (13,090,458) (17,716,749) (55,966,218) (33,003,620)
- - - - Net increase/(decrease) in cash and cash equivalents 89,663 84,492 (40,803) 15,977 (93,352) 203,926 (61,079) (873,241)Effect of exchange rate fluctuations on cash and cash equivalents - - - - - - - - Cash and cash equivalents at the beginning of the financial year 208,342 123,850 244,295 228,318 352,569 148,643 700,461 1,573,702Cash and cash equivalents at the end of the financial year 298,005 208,342 203,492 244,295 259,217 352,569 639,382 700,461
41. Australian Share Trust 42. Balanced Trust 43. Blue Chip Imputation Trust
44. Emerging Companies Trust

Financial Report Financial Statements - Statements of Cash Flows for the financial year ended 30 June 2020
111
The Statements of Cash Flows should be read in conjunction with the Notes to the Financial Statements set out on pages 137 to 421.
Note 30 June 2020 30 June 2019 30 June 2020 30 June 2019 30 June 2020 30 June 2019 30 June 2020 30 June 2019$ $ $ $ $ $ $ $
Cash flows from operating activities:Interest received 1,428 3,453 62 197 17 98 97 414Unit trust distribution received - - - - - - - - Other income received 19 - - - - - - - Realised foreign exchange gains/(losses) - - - - - - - - Interest paid (1) - - - - - (3) - Operating expenses paid (145,825) (135,000) (177,527) (194,761) (36,967) (43,150) (8,579) (10,527)Proceeds from sale of investments 19,194,095 17,668,012 406,933 748,902 120,779 312,043 9,056,294 3,072,448Purchase of investments (3,229,738) (1,312,610) - - (24,026) (32,848) (182,158) (1,081,711)Net cash flows from/(used in) operating activities 8 15,819,978 16,223,855 229,468 554,338 59,803 236,143 8,865,651 1,980,624
Cash flows from financing activities:Proceeds from issue of units 7,083,935 3,996,525 30,310 3,577 61,593 61,258 652,719 1,819,551Payments for redemption of units (22,546,550) (20,390,396) (216,177) (458,088) (115,272) (301,642) (9,522,073) (3,828,845)Drawdown/(prepayment) of loan - - - - - - - - Distributions paid (344) (301) (48,946) (107,909) (4,263) (25,575) (31,305) (22,730)Net cash flows from/(used in) financing activities (15,462,959) (16,394,172) (234,813) (562,420) (57,942) (265,959) (8,900,659) (2,032,024)
- - - - Net increase/(decrease) in cash and cash equivalents 357,019 (170,317) (5,345) (8,082) 1,861 (29,816) (35,008) (51,400)Effect of exchange rate fluctuations on cash and cash equivalents - - - - - - - - Cash and cash equivalents at the beginning of the financial year 168,390 338,707 29,390 37,472 3,123 32,939 (4,847) 46,553Cash and cash equivalents at the end of the financial year 525,409 168,390 24,045 29,390 4,984 3,123 (39,855) (4,847)
45. Global Share Trust 46. Heine Property Securities Fund
47. High Growth Trust 48. OneAnswer - Altrinsic Global Equities Trust

Financial Report Financial Statements - Statements of Cash Flows for the financial year ended 30 June 2020
112
The Statements of Cash Flows should be read in conjunction with the Notes to the Financial Statements set out on pages 137 to 421.
Note 30 June 2020 30 June 2019 30 June 2020 30 June 2019 30 June 2020 30 June 2019 30 June 2020 30 June 2019$ $ $ $ $ $ $ $
Cash flows from operating activities:Interest received 438 897 101 403 416 1,484 566 1,586Unit trust distribution received - - - - - - - - Other income received 65 - 96 - 48 1 1,849 1,757Realised foreign exchange gains/(losses) - - - - - - - - Interest paid - (392) - - - - (21) (261)Operating expenses paid (163,494) (209,719) (91,763) (120,712) (162,419) (218,664) (65,376) (68,796)Proceeds from sale of investments 17,777,352 17,596,491 2,468,808 1,223,040 15,957,750 7,975,149 13,079,362 9,707,381Purchase of investments - (1,497,425) (351,264) (383,860) (179,130) (2,424,701) (4,484,129) (9,640,646)Net cash flows from/(used in) operating activities 8 17,614,361 15,889,852 2,025,978 718,871 15,616,665 5,333,269 8,532,251 1,021
Cash flows from financing activities:Proceeds from issue of units 493,941 2,929,695 559,138 912,867 844,454 5,025,727 7,916,229 15,599,361Payments for redemption of units (17,805,231) (18,893,743) (2,592,442) (1,606,166) (16,064,787) (10,288,093) (16,564,282) (15,140,997)Drawdown/(prepayment) of loan - - - - - - - - Distributions paid (1,117) (1,628) (114) (3,960) (62,973) (299,461) (26,161) (19,150)Net cash flows from/(used in) financing activities (17,312,407) (15,965,676) (2,033,418) (697,259) (15,283,306) (5,561,827) (8,674,214) 439,214
- - - - Net increase/(decrease) in cash and cash equivalents 301,954 (75,824) (7,440) 21,612 333,359 (228,558) (141,963) 440,235Effect of exchange rate fluctuations on cash and cash equivalents - - - - - - - - Cash and cash equivalents at the beginning of the financial year (155,545) (79,721) 41,153 19,541 (155,506) 73,052 354,006 (86,229)Cash and cash equivalents at the end of the financial year 146,409 (155,545) 33,713 41,153 177,853 (155,506) 212,043 354,006
49. OneAnswer - Antipodes Global (Long Only) Trust
50. OneAnswer - Arrowstreet Global Equity (Hedged) Trust
51. OneAnswer - Ausbil Australian Emerging Leaders
Trust
52. OneAnswer - Bennelong Australian Equities Trust

Financial Report Financial Statements - Statements of Cash Flows for the financial year ended 30 June 2020
113
The Statements of Cash Flows should be read in conjunction with the Notes to the Financial Statements set out on pages 137 to 421.
Note 30 June 2020 30 June 2019 30 June 2020 30 June 2019 30 June 2020 30 June 2019 30 June 2020 30 June 2019$ $ $ $ $ $ $ $
Cash flows from operating activities:Interest received 339 1,144 22 45 321 548 224 760Unit trust distribution received - - - - - - - - Other income received 38 - 9 - 17 - 14 - Realised foreign exchange gains/(losses) - - - - - - - - Interest paid - (256) - (24) - (91) - - Operating expenses paid (127,737) (174,168) (52,694) (54,029) (88,374) (111,215) (140,702) (151,847)Proceeds from sale of investments 15,437,109 9,052,000 477,680 695,398 11,771,676 14,425,806 9,322,593 5,799,756Purchase of investments (348,548) (3,315,404) (565,325) (45,025) (917) (353,071) (2,285,071) (728,678)Net cash flows from/(used in) operating activities 8 14,961,201 5,563,316 (140,308) 596,365 11,682,723 13,961,977 6,897,058 4,919,991
Cash flows from financing activities:Proceeds from issue of units 2,148,171 7,865,556 625,277 107,848 1,237,515 919,362 3,504,587 1,902,459Payments for redemption of units (16,866,168) (13,619,024) (473,840) (688,532) (12,517,065) (14,639,285) (9,732,813) (7,179,359)Drawdown/(prepayment) of loan - - - - - - - - Distributions paid (43,840) (65,289) (13,883) (11,796) (98,578) (154,436) (33,439) (55,384)Net cash flows from/(used in) financing activities (14,761,837) (5,818,757) 137,554 (592,480) (11,378,128) (13,874,359) (6,261,665) (5,332,284)
- - - - Net increase/(decrease) in cash and cash equivalents 199,364 (255,441) (2,754) 3,885 304,595 87,618 635,393 (412,293)Effect of exchange rate fluctuations on cash and cash equivalents - - - - - - - - Cash and cash equivalents at the beginning of the financial year (225,383) 30,058 3,479 (406) (70,234) (157,852) (481,176) (68,883)Cash and cash equivalents at the end of the financial year (26,019) (225,383) 725 3,479 234,361 (70,234) 154,217 (481,176)
53. OneAnswer - Bentham Global Income Trust
54. OneAnswer - BlackRock Scientific Australian Equity
Trust
55. OneAnswer - Blackrock Tactical Growth Trust
56. OneAnswer - BR Scientific Diversified Growth
Trust

Financial Report Financial Statements - Statements of Cash Flows for the financial year ended 30 June 2020
114
The Statements of Cash Flows should be read in conjunction with the Notes to the Financial Statements set out on pages 137 to 421.
Note 30 June 2020 30 June 2019 30 June 2020 30 June 2019 30 June 2020 30 June 2019 30 June 2020 30 June 2019$ $ $ $ $ $ $ $
Cash flows from operating activities:Interest received 13 36 262 959 2,127 3,395 40 1,105Unit trust distribution received - - - - - - - - Other income received 20 - 20 - - - 49 - Realised foreign exchange gains/(losses) - - - - - - - - Interest paid (1) (10) - - (1) - - - Operating expenses paid (39,175) (38,872) (58,312) (78,699) (152,186) (111,055) (93,906) (116,175)Proceeds from sale of investments 370,842 641,527 9,426,234 6,393,841 316,823 - 1,399,803 7,305,317Purchase of investments (175,569) (91,429) (931,424) (357,989) (10,888,917) (87,049,911) (36,659) (71,517)Net cash flows from/(used in) operating activities 8 156,130 511,252 8,436,780 5,958,112 (10,722,154) (87,157,571) 1,269,327 7,118,730
Cash flows from financing activities:Proceeds from issue of units 208,913 98,705 2,218,063 1,858,012 17,473,907 90,197,378 76,280 358,133Payments for redemption of units (364,542) (612,878) (10,286,298) (8,029,706) (6,880,792) (2,844,224) (1,328,518) (7,532,675)Drawdown/(prepayment) of loan - - - - - - - - Distributions paid (1,096) (850) (2,554) (19,668) (17,152) (18,014) (24,900) (77,583)Net cash flows from/(used in) financing activities (156,725) (515,023) (8,070,789) (6,191,362) 10,575,963 87,335,140 (1,277,138) (7,252,125)
- - - - Net increase/(decrease) in cash and cash equivalents (595) (3,771) 365,991 (233,250) (146,191) 177,569 (7,811) (133,395)Effect of exchange rate fluctuations on cash and cash equivalents - - - - - - - - Cash and cash equivalents at the beginning of the financial year (1,502) 2,269 (264,966) (31,716) 812,629 635,060 22,182 155,577Cash and cash equivalents at the end of the financial year (2,097) (1,502) 101,025 (264,966) 666,438 812,629 14,371 22,182
57. OneAnswer - BR Scientific International
Equity Trust
58. OneAnswer - Colonial First State Global Credit
Income Trust
59. OneAnswer - Colonial First State Global Listed
Infrastructure Trust
60. OneAnswer - Colonial First State Imputation Trust

Financial Report Financial Statements - Statements of Cash Flows for the financial year ended 30 June 2020
115
The Statements of Cash Flows should be read in conjunction with the Notes to the Financial Statements set out on pages 137 to 421.
Note 30 June 2020 30 June 2019 30 June 2020 30 June 2019 30 June 2020 30 June 2019 30 June 2020 30 June 2019$ $ $ $ $ $ $ $
Cash flows from operating activities:Interest received 1,376 9,411 639 1,752 1,399 1,813 30 48Unit trust distribution received - - - - - - - - Other income received 19 - - - 12 - 3 - Realised foreign exchange gains/(losses) - - - - - - - - Interest paid (1) - - - (1) (731) - (162)Operating expenses paid (377,118) (444,199) (46,552) (39,213) (230,940) (304,031) (7,350) (10,875)Proceeds from sale of investments 52,643,474 13,921,113 10,534,424 119,194 20,633,628 42,740,602 587,753 1,981,991Purchase of investments (779,154) (12,597,597) (4,404,033) (37,635,274) (6,074,650) (913,293) (578,525) (244,811)Net cash flows from/(used in) operating activities 8 51,488,596 888,728 6,084,478 (37,553,541) 14,329,448 41,524,360 1,911 1,726,191
Cash flows from financing activities:Proceeds from issue of units 5,581,791 22,926,850 8,120,469 39,254,492 10,244,538 4,380,430 737,823 367,918Payments for redemption of units (56,089,914) (24,648,538) (14,188,079) (1,667,001) (23,496,997) (46,374,073) (675,190) (2,114,268)Drawdown/(prepayment) of loan - - - - - - - - Distributions paid (115,056) (60,916) (8,801) (14,219) (332,029) (194,701) (2,260) (318)Net cash flows from/(used in) financing activities (50,623,179) (1,782,604) (6,076,411) 37,573,272 (13,584,488) (42,188,344) 60,373 (1,746,668)
- - - - Net increase/(decrease) in cash and cash equivalents 865,417 (893,876) 8,067 19,731 744,960 (663,984) 62,284 (20,477)Effect of exchange rate fluctuations on cash and cash equivalents - - - - - - - - Cash and cash equivalents at the beginning of the financial year 86,043 979,919 165,733 146,002 (158,262) 505,722 (5,054) 15,423Cash and cash equivalents at the end of the financial year 951,460 86,043 173,800 165,733 586,698 (158,262) 57,230 (5,054)
61. OneAnswer - Fidelity Australian Equities Trust
62. OneAnswer - Greencape Broadcap Trust
63. OneAnswer - Investors Mutual Australian Share
Trust
64. OneAnswer - Janus Henderson Global Fixed
Interest Total Return Trust

Financial Report Financial Statements - Statements of Cash Flows for the financial year ended 30 June 2020
116
The Statements of Cash Flows should be read in conjunction with the Notes to the Financial Statements set out on pages 137 to 421.
Note 30 June 2020 30 June 2019 30 June 2020 30 June 2019 30 June 2020 30 June 2019 30 June 2020 30 June 2019$ $ $ $ $ $ $ $
Cash flows from operating activities:Interest received 3,471 11,895 2,346 4,419 416 963 2,839 10,926Unit trust distribution received - - - - - - - - Other income received 42 - 51 - 13 - 16 - Realised foreign exchange gains/(losses) - - - - - - - - Interest paid (3) - (1) - - (142) (3) - Operating expenses paid (656,949) (656,486) (259,799) (225,035) (72,273) (109,235) (654,781) (720,082)Proceeds from sale of investments 90,861,481 67,761,086 3,144,959 2,075,928 16,954,016 15,582,543 108,728,544 50,497,165Purchase of investments - - (41,918,053) (10,365,328) (727,427) (1,080,131) - - Net cash flows from/(used in) operating activities 8 90,208,042 67,116,495 (39,030,497) (8,510,016) 16,154,745 14,393,998 108,076,615 49,788,009
Cash flows from financing activities:Proceeds from issue of units 15,309,548 17,679,068 49,329,760 15,513,061 1,629,758 2,675,067 8,023,566 12,358,244Payments for redemption of units (104,436,238) (85,552,412) (9,605,501) (6,680,101) (17,597,082) (17,161,799) (113,477,287) (63,758,425)Drawdown/(prepayment) of loan - - - - - - - - Distributions paid (106,974) (209,684) (80,808) (123,114) (60,052) (67,444) (1,003,392) (543,492)Net cash flows from/(used in) financing activities (89,233,664) (68,083,028) 39,643,451 8,709,846 (16,027,376) (14,554,176) (106,457,113) (51,943,673)
- - - - Net increase/(decrease) in cash and cash equivalents 974,378 (966,533) 612,954 199,830 127,369 (160,178) 1,619,502 (2,155,664)Effect of exchange rate fluctuations on cash and cash equivalents - - - - - - - - Cash and cash equivalents at the beginning of the financial year (4,630) 961,903 570,538 370,708 14,636 174,814 (791,726) 1,363,938Cash and cash equivalents at the end of the financial year 969,748 (4,630) 1,183,492 570,538 142,005 14,636 827,776 (791,726)
65. OneAnswer - Kapstream Absolute Return Income
Trust
66. OneAnswer - Magellan Global Trust
67. OneAnswer - Merlon Australian Share Income
Trust
68. OneAnswer - MFS Global Equity Trust

Financial Report Financial Statements - Statements of Cash Flows for the financial year ended 30 June 2020
117
The Statements of Cash Flows should be read in conjunction with the Notes to the Financial Statements set out on pages 137 to 421.
Note 30 June 2020 30 June 2019 30 June 2020 30 June 2019 30 June 2020 30 June 2019 30 June 2020 30 June 2019$ $ $ $ $ $ $ $
Cash flows from operating activities:Interest received 148 479 2,694 6,069 302 790 292 769Unit trust distribution received - - - 116,252 - - - - Other income received - - 76 - 3 - 18 - Realised foreign exchange gains/(losses) - - - 1,234 - - - - Interest paid (4) - - (15) - (92) - (72)Operating expenses paid (14,191) (14,388) (461,702) (534,238) (64,260) (68,952) (29,802) (42,770)Proceeds from sale of investments 9,699,410 413,405 31,811,762 25,129,715 6,734,732 6,252,779 8,485,441 9,561,558Purchase of investments (979,584) (11,764,076) (1,333,228) (1,231,707) (1,201,497) (3,361,636) - (201,126)Net cash flows from/(used in) operating activities 8 8,705,779 (11,364,580) 30,019,602 23,487,310 5,469,280 2,822,889 8,455,949 9,318,359
Cash flows from financing activities:Proceeds from issue of units 1,652,183 12,508,730 8,050,180 7,176,611 2,299,126 5,159,923 145,334 153,605Payments for redemption of units (10,405,827) (1,084,642) (38,156,869) (31,496,715) (7,646,321) (7,968,941) (8,586,873) (9,625,638)Drawdown/(prepayment) of loan - - - - - - - - Distributions paid (11,194) (3,850) (31,224) (288,265) (19,286) (49,027) - (71,860)Net cash flows from/(used in) financing activities (8,764,838) 11,420,238 (30,137,913) (24,608,369) (5,366,481) (2,858,045) (8,441,539) (9,543,893)
- - - - Net increase/(decrease) in cash and cash equivalents (59,059) 55,658 (118,311) (1,121,059) 102,799 (35,156) 14,410 (225,534)Effect of exchange rate fluctuations on cash and cash equivalents - - - (1,326) - - - - Cash and cash equivalents at the beginning of the financial year 95,051 39,393 377,855 1,500,240 64,301 99,457 96,866 322,400Cash and cash equivalents at the end of the financial year 35,992 95,051 259,544 377,855 167,100 64,301 111,276 96,866
69. OneAnswer - Nikko AM Australian Shares Trust
70. OneAnswer - OnePath Global Property Securities
Index Trust
71. OneAnswer - Pendal Australian Share Trust
72. OneAnswer - Pendal Core Hedged Global Shares Trust

Financial Report Financial Statements - Statements of Cash Flows for the financial year ended 30 June 2020
118
The Statements of Cash Flows should be read in conjunction with the Notes to the Financial Statements set out on pages 137 to 421.
Note 30 June 2020 30 June 2019 30 June 2020 30 June 2019 30 June 2020 30 June 2019 30 June 2020 30 June 2019$ $ $ $ $ $ $ $
Cash flows from operating activities:Interest received 161 296 764 2,438 706 1,691 148 1,502Unit trust distribution received - - - - - - - - Other income received 11 - 30 - 87 - 58 - Realised foreign exchange gains/(losses) - - - - - - - - Interest paid - - - - - - - - Operating expenses paid (21,170) (22,283) (269,069) (368,303) (216,465) (299,844) (366,535) (497,491)Proceeds from sale of investments 2,077,498 2,040,319 13,768,955 14,717,305 24,059,764 28,818,962 6,638,472 20,403,347Purchase of investments (6,550,097) (3,632,525) (282,137) (510,513) - (813,633) (359,427) (499,820)Net cash flows from/(used in) operating activities 8 (4,493,597) (1,614,193) 13,218,543 13,840,927 23,844,092 27,707,176 5,912,716 19,407,538
Cash flows from financing activities:Proceeds from issue of units 7,597,390 4,566,394 3,947,321 5,888,004 905,134 1,597,345 670,924 1,133,149Payments for redemption of units (3,083,274) (2,948,094) (16,700,786) (18,782,524) (24,333,302) (29,132,206) (6,529,128) (20,666,535)Drawdown/(prepayment) of loan - - - - - - - - Distributions paid (4,457) (7,408) (170,942) (585,083) (317,651) (223,175) (117,224) (43,109)Net cash flows from/(used in) financing activities 4,509,659 1,610,892 (12,924,407) (13,479,603) (23,745,819) (27,758,036) (5,975,428) (19,576,495)
- - - - Net increase/(decrease) in cash and cash equivalents 16,062 (3,301) 294,136 361,324 98,273 (50,860) (62,712) (168,957)Effect of exchange rate fluctuations on cash and cash equivalents - - - - - - - - Cash and cash equivalents at the beginning of the financial year 21,232 24,533 295,984 (65,340) 223,312 274,172 93,722 262,679Cash and cash equivalents at the end of the financial year 37,294 21,232 590,120 295,984 321,585 223,312 31,010 93,722
73. OneAnswer - Pendal Monthly Income Plus Trust
74. OneAnswer - Pendal Smaller Companies Trust
75. OneAnswer - Perennial Value Shares Trust
76. OneAnswer - Perpetual Australian Share Trust

Financial Report Financial Statements - Statements of Cash Flows for the financial year ended 30 June 2020
119
The Statements of Cash Flows should be read in conjunction with the Notes to the Financial Statements set out on pages 137 to 421.
Note 30 June 2020 30 June 2019 30 June 2020 30 June 2019 30 June 2020 30 June 2019 30 June 2020 30 June 2019$ $ $ $ $ $ $ $
Cash flows from operating activities:Interest received 887 2,209 1,092 2,684 47 126 188 536Unit trust distribution received - - - - - - - - Other income received 39 - 16 - - - - - Realised foreign exchange gains/(losses) - - - - - - - - Interest paid (1) (72) (1) (25) - (3) - - Operating expenses paid (156,830) (215,998) (490,214) (447,207) (14,365) (17,362) (34,109) (44,972)Proceeds from sale of investments 38,150,718 68,631,596 17,827,794 10,194,893 1,148,728 3,507,856 5,912,671 3,858,058Purchase of investments - - (1,679,856) (8,425,642) (2,226,382) (698,028) (715,448) (1,099,435)Net cash flows from/(used in) operating activities 8 37,994,813 68,417,735 15,658,831 1,324,703 (1,091,972) 2,792,589 5,163,302 2,714,187
Cash flows from financing activities:Proceeds from issue of units 852,983 2,203,200 9,022,931 19,325,546 2,353,592 890,209 1,819,585 1,522,562Payments for redemption of units (38,316,811) (70,792,261) (24,378,858) (20,307,369) (1,265,836) (3,764,046) (6,778,063) (4,350,427)Drawdown/(prepayment) of loan - - - - - - - - Distributions paid (204,445) (102,611) (63,920) (47,208) (2,911) (60,935) (13,828) (79,057)Net cash flows from/(used in) financing activities (37,668,273) (68,691,672) (15,419,847) (1,029,031) 1,084,845 (2,934,772) (4,972,306) (2,906,922)
- - - - Net increase/(decrease) in cash and cash equivalents 326,540 (273,937) 238,984 295,672 (7,127) (142,183) 190,996 (192,735)Effect of exchange rate fluctuations on cash and cash equivalents - - - - - - - - Cash and cash equivalents at the beginning of the financial year (72,126) 201,811 98,353 (197,319) 18,293 160,476 (101,719) 91,016Cash and cash equivalents at the end of the financial year 254,414 (72,126) 337,337 98,353 11,166 18,293 89,277 (101,719)
77. OneAnswer - Perpetual Balanced Growth Trust
78. OneAnswer - Perpetual Conservative Growth Trust
79. OneAnswer - Perpetual Ethical SRI Trust
80. OneAnswer - Platinum Asia Trust

Financial Report Financial Statements - Statements of Cash Flows for the financial year ended 30 June 2020
120
The Statements of Cash Flows should be read in conjunction with the Notes to the Financial Statements set out on pages 137 to 421.
Note 30 June 2020 30 June 2019 30 June 2020 30 June 2019 30 June 2020 30 June 2019 30 June 2020 30 June 2019$ $ $ $ $ $ $ $
Cash flows from operating activities:Interest received 1,838 4,448 721 1,938 1,466 3,862 1,335 3,081Unit trust distribution received - - - - - - - - Other income received 119 - 15 - 77 - 8 - Realised foreign exchange gains/(losses) - - - - - - - - Interest paid (2) (478) (1) - (1) (50) (1) (118)Operating expenses paid (570,533) (752,938) (158,446) (200,739) (253,138) (323,025) (253,607) (301,573)Proceeds from sale of investments 75,076,475 70,157,300 30,127,479 33,972,110 62,376,324 46,079,656 71,188,989 98,632,897Purchase of investments - - - - (920,310) (1,147,324) - - Net cash flows from/(used in) operating activities 8 74,507,897 69,408,332 29,969,768 33,773,309 61,204,418 44,613,119 70,936,724 98,334,287
Cash flows from financing activities:Proceeds from issue of units 1,968,220 4,005,137 1,035,918 1,930,969 3,318,219 4,898,464 3,841,425 2,435,718Payments for redemption of units (75,141,773) (72,309,395) (30,682,433) (35,921,018) (63,660,596) (49,716,824) (72,377,217) (102,388,501)Drawdown/(prepayment) of loan - - - - - - - - Distributions paid (636,541) (1,081,026) (46,418) (88,770) (533,539) (450,159) (205,585) (186,032)Net cash flows from/(used in) financing activities (73,810,094) (69,385,284) (29,692,933) (34,078,819) (60,875,916) (45,268,519) (68,741,377) (100,138,815)
- - - - Net increase/(decrease) in cash and cash equivalents 697,803 23,048 276,835 (305,510) 328,502 (655,400) 2,195,347 (1,804,528)Effect of exchange rate fluctuations on cash and cash equivalents - - - - - - - - Cash and cash equivalents at the beginning of the financial year (226,612) (249,660) 30,766 336,276 (58,575) 596,825 (1,876,277) (71,749)Cash and cash equivalents at the end of the financial year 471,191 (226,612) 307,601 30,766 269,927 (58,575) 319,070 (1,876,277)
81. OneAnswer - Platinum International Trust
82. OneAnswer - RARE Infastructure Value Trust
83. OneAnswer - Schroder Australian Equity Trust
84. OneAnswer - Schroder Balanced Trust
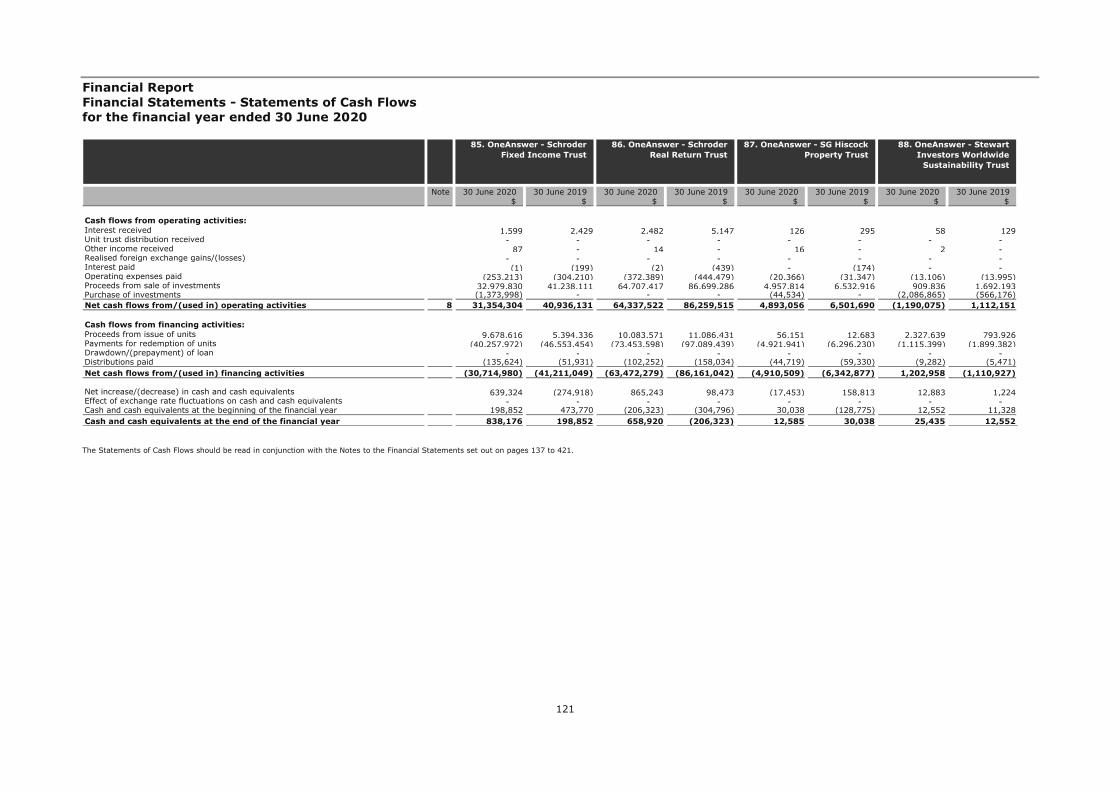
Financial Report Financial Statements - Statements of Cash Flows for the financial year ended 30 June 2020
121
The Statements of Cash Flows should be read in conjunction with the Notes to the Financial Statements set out on pages 137 to 421.
Note 30 June 2020 30 June 2019 30 June 2020 30 June 2019 30 June 2020 30 June 2019 30 June 2020 30 June 2019$ $ $ $ $ $ $ $
Cash flows from operating activities:Interest received 1,599 2,429 2,482 5,147 126 295 58 129Unit trust distribution received - - - - - - - - Other income received 87 - 14 - 16 - 2 - Realised foreign exchange gains/(losses) - - - - - - - - Interest paid (1) (199) (2) (439) - (174) - - Operating expenses paid (253,213) (304,210) (372,389) (444,479) (20,366) (31,347) (13,106) (13,995)Proceeds from sale of investments 32,979,830 41,238,111 64,707,417 86,699,286 4,957,814 6,532,916 909,836 1,692,193Purchase of investments (1,373,998) - - - (44,534) - (2,086,865) (566,176)Net cash flows from/(used in) operating activities 8 31,354,304 40,936,131 64,337,522 86,259,515 4,893,056 6,501,690 (1,190,075) 1,112,151
Cash flows from financing activities:Proceeds from issue of units 9,678,616 5,394,336 10,083,571 11,086,431 56,151 12,683 2,327,639 793,926Payments for redemption of units (40,257,972) (46,553,454) (73,453,598) (97,089,439) (4,921,941) (6,296,230) (1,115,399) (1,899,382)Drawdown/(prepayment) of loan - - - - - - - - Distributions paid (135,624) (51,931) (102,252) (158,034) (44,719) (59,330) (9,282) (5,471)Net cash flows from/(used in) financing activities (30,714,980) (41,211,049) (63,472,279) (86,161,042) (4,910,509) (6,342,877) 1,202,958 (1,110,927)
- - - - Net increase/(decrease) in cash and cash equivalents 639,324 (274,918) 865,243 98,473 (17,453) 158,813 12,883 1,224Effect of exchange rate fluctuations on cash and cash equivalents - - - - - - - - Cash and cash equivalents at the beginning of the financial year 198,852 473,770 (206,323) (304,796) 30,038 (128,775) 12,552 11,328Cash and cash equivalents at the end of the financial year 838,176 198,852 658,920 (206,323) 12,585 30,038 25,435 12,552
85. OneAnswer - Schroder Fixed Income Trust
86. OneAnswer - Schroder Real Return Trust
87. OneAnswer - SG Hiscock Property Trust
88. OneAnswer - Stewart Investors Worldwide
Sustainability Trust

Financial Report Financial Statements - Statements of Cash Flows for the financial year ended 30 June 2020
122
The Statements of Cash Flows should be read in conjunction with the Notes to the Financial Statements set out on pages 137 to 421.
Note 30 June 2020 30 June 2019 30 June 2020 30 June 2019 30 June 2020 30 June 2019 30 June 2020 30 June 2019$ $ $ $ $ $ $ $
Cash flows from operating activities:Interest received 419 748 607 1,053 425 988 184 170Unit trust distribution received - - - - - - - - Other income received 4 - - - 19 - 25 - Realised foreign exchange gains/(losses) - - - - - - - - Interest paid - - - - - (32) (23) (296)Operating expenses paid (54,514) (44,369) (45,800) (33,863) (88,274) (106,341) (54,919) (63,298)Proceeds from sale of investments 3,130,896 1,387,370 352,683 - 13,194,917 14,306,145 6,989,690 9,261,631Purchase of investments (5,556,787) (16,148,069) (15,335,482) (27,793,674) (280,423) - (4,867,837) (405,911)Net cash flows from/(used in) operating activities 8 (2,479,982) (14,804,320) (15,027,992) (27,826,484) 12,826,664 14,200,760 2,067,120 8,792,296
Cash flows from financing activities:Proceeds from issue of units 7,579,660 18,073,719 18,814,779 28,985,768 744,495 460,358 5,858,614 752,044Payments for redemption of units (4,808,734) (3,219,938) (3,303,171) (1,158,301) (13,190,895) (14,852,130) (7,988,387) (9,357,006)Drawdown/(prepayment) of loan - - - - - - - - Distributions paid (91,003) (48,384) (1,316) (1,165) (39,017) (45,410) (22,805) (31,484)Net cash flows from/(used in) financing activities 2,679,923 14,805,397 15,510,292 27,826,302 (12,485,417) (14,437,182) (2,152,578) (8,636,446)
- - - - Net increase/(decrease) in cash and cash equivalents 199,941 1,077 482,300 (182) 341,247 (236,422) (85,458) 155,850Effect of exchange rate fluctuations on cash and cash equivalents - - - - - - - - Cash and cash equivalents at the beginning of the financial year 71,424 70,347 212,225 212,407 (151,197) 85,225 (36,566) (192,416)Cash and cash equivalents at the end of the financial year 271,365 71,424 694,525 212,225 190,050 (151,197) (122,024) (36,566)
89. OneAnswer - T. Rowe Price Global Equity Trust
90. OneAnswer - T.Rowe Price Dynamic Global Bond
Trust
91. OneAnswer - UBS Balanced Trust
92. OneAnswer - UBS Defensive Trust

Financial Report Financial Statements - Statements of Cash Flows for the financial year ended 30 June 2020
123
The Statements of Cash Flows should be read in conjunction with the Notes to the Financial Statements set out on pages 137 to 421.
Note 30 June 2020 30 June 2019 30 June 2020 30 June 2019 30 June 2020 30 June 2019 30 June 2020 30 June 2019$ $ $ $ $ $ $ $
Cash flows from operating activities:Interest received 896 1,234 7,137 18,661 9,712 15,655 5,556 8,318Unit trust distribution received - - - - - - - - Other income received 57 - 53 - 23 - 67 - Realised foreign exchange gains/(losses) - - - - - - - - Interest paid - - (7) - (486) (1,183) (157) (458)Operating expenses paid (136,174) (171,177) (1,912,412) (2,107,785) (3,222,419) (3,368,947) (1,545,683) (1,532,035)Proceeds from sale of investments 6,586,222 15,182,767 144,664,401 101,213,791 621,046,132 319,450,784 172,246,033 139,815,336Purchase of investments (9,254,918) - - (14,511,939) (341,732,179) (153,567,000) (133,998,365) (53,525,850)Net cash flows from/(used in) operating activities 8 (2,803,917) 15,012,824 142,759,172 84,612,728 276,100,783 162,529,309 36,707,451 84,765,311
Cash flows from financing activities:Proceeds from issue of units 13,859,985 1,652,436 22,271,772 43,187,352 54,503,255 56,471,388 55,154,773 36,861,462Payments for redemption of units (10,564,519) (16,777,764) (166,212,241) (125,524,311) (329,838,486) (219,883,044) (90,376,205) (122,172,319)Drawdown/(prepayment) of loan - - - - - - - - Distributions paid (27,037) (60,138) (801,468) (705,861) (845,697) (365,627) (309,721) (197,877)Net cash flows from/(used in) financing activities 3,268,429 (15,185,466) (144,741,937) (83,042,820) (276,180,928) (163,777,283) (35,531,153) (85,508,734)
- - - - Net increase/(decrease) in cash and cash equivalents 464,512 (172,642) (1,982,765) 1,569,908 (80,145) (1,247,974) 1,176,298 (743,423)Effect of exchange rate fluctuations on cash and cash equivalents - - - - - - - - Cash and cash equivalents at the beginning of the financial year (169,056) 3,586 3,897,995 2,328,087 559,417 1,807,391 89,996 833,419Cash and cash equivalents at the end of the financial year 295,456 (169,056) 1,915,230 3,897,995 479,272 559,417 1,266,294 89,996
93. OneAnswer - UBS Diversified Fixed Income
Trust
94. OneAnswer - Vanguard Australian Shares Index
Trust
95. OneAnswer - Vanguard Balanced Index Trust
96. OneAnswer - Vanguard Conservative Index Trust

Financial Report Financial Statements - Statements of Cash Flows for the financial year ended 30 June 2020
124
The Statements of Cash Flows should be read in conjunction with the Notes to the Financial Statements set out on pages 137 to 421.
Note 30 June 2020 30 June 2019 30 June 2020 30 June 2019 30 June 2020 30 June 2019 30 June 2020 30 June 2019$ $ $ $ $ $ $ $
Cash flows from operating activities:Interest received 752 954 5,320 6,240 2,175 2,734 841 2,337Unit trust distribution received - - - - - - - - Other income received 85 - 32 - 22 - 19 - Realised foreign exchange gains/(losses) - - - - - - - - Interest paid (46) (13) (405) (77) (178) - (1) - Operating expenses paid (214,006) (245,381) (1,275,538) (1,346,080) (645,927) (711,622) (271,301) (324,678)Proceeds from sale of investments 14,315,001 32,773,999 288,535,711 147,347,090 80,343,398 46,892,147 13,303,098 11,314,315Purchase of investments (8,412,000) (7,216,000) (145,048,037) (75,817,072) (35,789,669) (23,589,850) (296,974) (100,000)Net cash flows from/(used in) operating activities 8 5,689,786 25,313,559 142,217,083 70,190,101 43,909,821 22,593,409 12,735,682 10,891,974
Cash flows from financing activities:Proceeds from issue of units 13,355,982 10,937,401 18,644,423 31,326,904 6,648,260 11,769,984 3,668,110 3,523,414Payments for redemption of units (19,017,520) (36,254,153) (161,893,288) (99,297,357) (50,401,971) (34,363,849) (16,402,289) (14,000,067)Drawdown/(prepayment) of loan - - - - - - - - Distributions paid (3,914) (10,777) (321,135) (112,050) (144,362) (58,212) (71,819) (34,015)Net cash flows from/(used in) financing activities (5,665,452) (25,327,529) (143,570,000) (68,082,503) (43,898,073) (22,652,077) (12,805,998) (10,510,668)
- - - - Net increase/(decrease) in cash and cash equivalents 24,334 (13,970) (1,352,917) 2,107,598 11,748 (58,668) (70,316) 381,306Effect of exchange rate fluctuations on cash and cash equivalents - - - - - - - - Cash and cash equivalents at the beginning of the financial year 29,901 43,871 2,420,269 312,671 87,626 146,294 409,092 27,786Cash and cash equivalents at the end of the financial year 54,235 29,901 1,067,352 2,420,269 99,374 87,626 338,776 409,092
97. OneAnswer - Vanguard Diversified Bond Index Trust
98. OneAnswer - Vanguard Growth Index Trust
99. OneAnswer - Vanguard High Growth Index Trust
100. OneAnswer - Vanguard International Shares Index
(Hedged) Trust

Financial Report Financial Statements - Statements of Cash Flows for the financial year ended 30 June 2020
125
The Statements of Cash Flows should be read in conjunction with the Notes to the Financial Statements set out on pages 137 to 421.
Note 30 June 2020 30 June 2019 30 June 2020 30 June 2019 30 June 2020 30 June 2019 30 June 2020 30 June 2019$ $ $ $ $ $ $ $
Cash flows from operating activities:Interest received 1,744 9,597 620 1,779 239 710 13,915 61,430Unit trust distribution received - - - - - - - - Other income received 32 - 9 - 2 - 65 - Realised foreign exchange gains/(losses) - - - - - - - - Interest paid (131) - (1) - - (68) (4) - Operating expenses paid (1,413,743) (1,546,883) (322,793) (370,211) (32,640) (46,810) (260,981) (308,240)Proceeds from sale of investments 156,706,666 85,279,444 25,270,440 27,524,451 7,262,902 4,814,620 32,000,000 63,999,999Purchase of investments - (405,524) (1,687,885) - (316,357) (498,772) (10,000,000) (29,000,000)Net cash flows from/(used in) operating activities 8 155,294,568 83,336,634 23,260,390 27,156,019 6,914,146 4,269,680 21,752,995 34,753,189
Cash flows from financing activities:Proceeds from issue of units 17,037,900 22,139,969 4,414,852 3,023,568 1,067,645 1,478,518 10,340,128 12,929,461Payments for redemption of units (172,702,057) (103,011,525) (27,476,138) (30,068,018) (7,868,563) (5,624,368) (31,121,927) (49,036,216)Drawdown/(prepayment) of loan - - - - - - - - Distributions paid (942,403) (176,932) (76,182) (62,182) (21,846) (19,649) (159,936) (996,900)Net cash flows from/(used in) financing activities (156,606,560) (81,048,488) (23,137,468) (27,106,632) (6,822,764) (4,165,499) (20,941,735) (37,103,655)
- - - - Net increase/(decrease) in cash and cash equivalents (1,311,992) 2,288,146 122,922 49,387 91,382 104,181 811,260 (2,350,466)Effect of exchange rate fluctuations on cash and cash equivalents - - - - - - - - Cash and cash equivalents at the beginning of the financial year 3,087,074 798,928 155,623 106,236 7,079 (97,102) 1,489,681 3,840,147Cash and cash equivalents at the end of the financial year 1,775,082 3,087,074 278,545 155,623 98,461 7,079 2,300,941 1,489,681
101. OneAnswer - Vanguard International Shares Index
Trust
102. OneAnswer - Vanguard Property Securities Index
Trust
103. OneAnswer - Walter Scott Global Equity (Hedged)
Trust
104. OnePath Alternatives Growth Fund
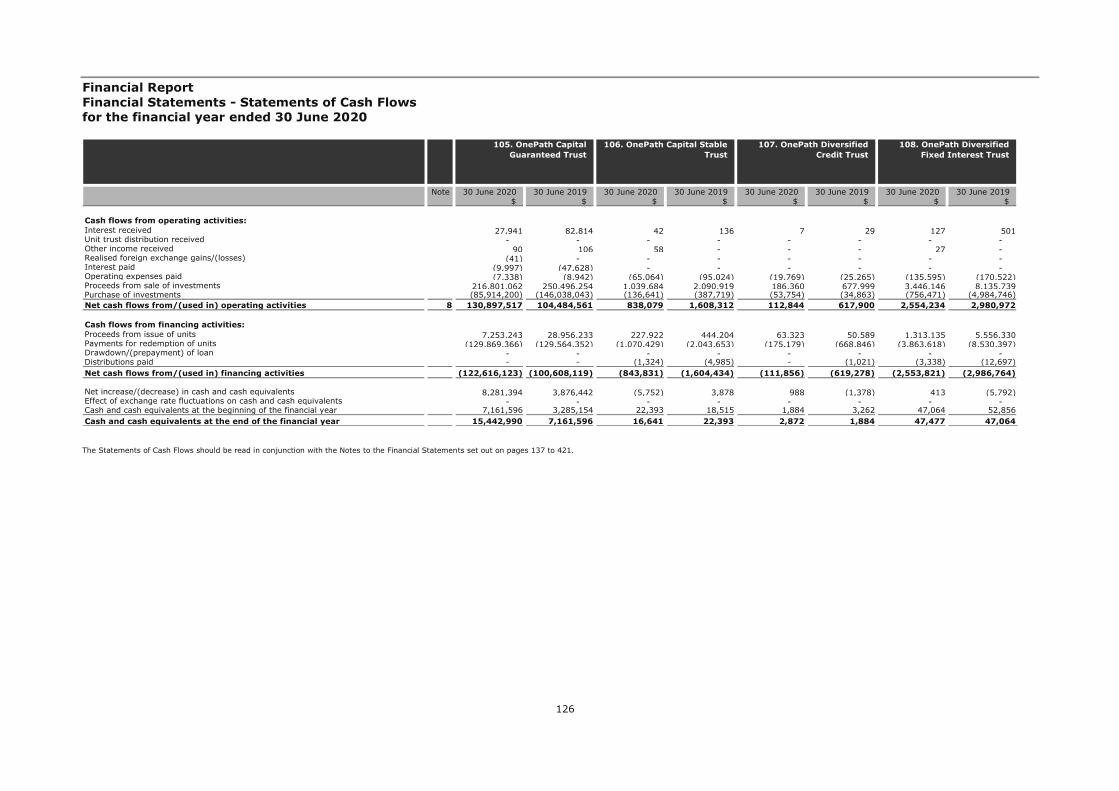
Financial Report Financial Statements - Statements of Cash Flows for the financial year ended 30 June 2020
126
The Statements of Cash Flows should be read in conjunction with the Notes to the Financial Statements set out on pages 137 to 421.
Note 30 June 2020 30 June 2019 30 June 2020 30 June 2019 30 June 2020 30 June 2019 30 June 2020 30 June 2019$ $ $ $ $ $ $ $
Cash flows from operating activities:Interest received 27,941 82,814 42 136 7 29 127 501Unit trust distribution received - - - - - - - - Other income received 90 106 58 - - - 27 - Realised foreign exchange gains/(losses) (41) - - - - - - - Interest paid (9,997) (47,628) - - - - - - Operating expenses paid (7,338) (8,942) (65,064) (95,024) (19,769) (25,265) (135,595) (170,522)Proceeds from sale of investments 216,801,062 250,496,254 1,039,684 2,090,919 186,360 677,999 3,446,146 8,135,739Purchase of investments (85,914,200) (146,038,043) (136,641) (387,719) (53,754) (34,863) (756,471) (4,984,746)Net cash flows from/(used in) operating activities 8 130,897,517 104,484,561 838,079 1,608,312 112,844 617,900 2,554,234 2,980,972
Cash flows from financing activities:Proceeds from issue of units 7,253,243 28,956,233 227,922 444,204 63,323 50,589 1,313,135 5,556,330Payments for redemption of units (129,869,366) (129,564,352) (1,070,429) (2,043,653) (175,179) (668,846) (3,863,618) (8,530,397)Drawdown/(prepayment) of loan - - - - - - - - Distributions paid - - (1,324) (4,985) - (1,021) (3,338) (12,697)Net cash flows from/(used in) financing activities (122,616,123) (100,608,119) (843,831) (1,604,434) (111,856) (619,278) (2,553,821) (2,986,764)
- - - - Net increase/(decrease) in cash and cash equivalents 8,281,394 3,876,442 (5,752) 3,878 988 (1,378) 413 (5,792)Effect of exchange rate fluctuations on cash and cash equivalents - - - - - - - - Cash and cash equivalents at the beginning of the financial year 7,161,596 3,285,154 22,393 18,515 1,884 3,262 47,064 52,856Cash and cash equivalents at the end of the financial year 15,442,990 7,161,596 16,641 22,393 2,872 1,884 47,477 47,064
105. OnePath Capital Guaranteed Trust
106. OnePath Capital Stable Trust
107. OnePath Diversified Credit Trust
108. OnePath Diversified Fixed Interest Trust

Financial Report Financial Statements - Statements of Cash Flows for the financial year ended 30 June 2020
127
The Statements of Cash Flows should be read in conjunction with the Notes to the Financial Statements set out on pages 137 to 421.
Note 30 June 2020 30 June 2019 30 June 2020 30 June 2019 30 June 2020 30 June 2019 30 June 2020 30 June 2019$ $ $ $ $ $ $ $
Cash flows from operating activities:Interest received 64 207 232 546 10 368 28 510Unit trust distribution received - - - - - - - - Other income received 22 - 36 - 7 - 27 - Realised foreign exchange gains/(losses) - - - - - - - - Interest paid - - - - - - - - Operating expenses paid (169,399) (172,767) (78,098) (100,422) (25,314) (36,458) (85,414) (110,372)Proceeds from sale of investments 1,503,077 1,591,285 660,110 1,001,455 308,431 678,222 898,535 10,416,992Purchase of investments (902,616) (409,138) - - (4,827) (48,573) (16,465) (24,516)Net cash flows from/(used in) operating activities 8 431,148 1,009,587 582,280 901,579 278,307 593,559 796,711 10,282,614
Cash flows from financing activities:Proceeds from issue of units 1,274,765 580,198 63,745 85,264 27,484 39,637 70,784 114,544Payments for redemption of units (1,660,247) (1,629,836) (608,848) (965,275) (305,091) (655,592) (854,834) (10,421,113)Drawdown/(prepayment) of loan - - - - - - - - Distributions paid (44,481) (16,309) (3,456) - (234) (4,725) (14,585) (21,167)Net cash flows from/(used in) financing activities (429,963) (1,065,947) (548,559) (880,011) (277,841) (620,680) (798,635) (10,327,736)
- - - - Net increase/(decrease) in cash and cash equivalents 1,185 (56,360) 33,721 21,568 466 (27,121) (1,924) (45,122)Effect of exchange rate fluctuations on cash and cash equivalents - - - - - - - - Cash and cash equivalents at the beginning of the financial year 55,607 111,967 64,515 42,947 2,154 29,275 11,511 56,633Cash and cash equivalents at the end of the financial year 56,792 55,607 98,236 64,515 2,620 2,154 9,587 11,511
109. OnePath Geared Australian Shares Index
Trust
110. OnePath Global Emerging Markets Share
Trust
111. OnePath Managed Growth Trust
112. OnePath Select Leaders Trust
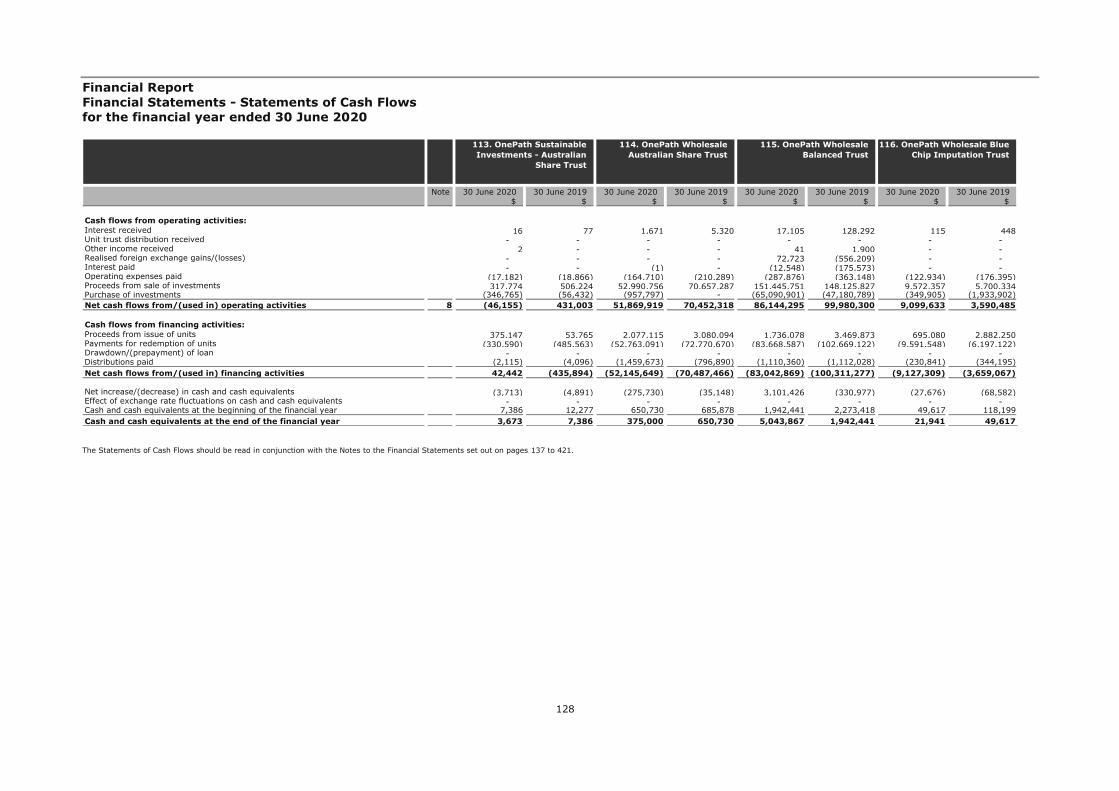
Financial Report Financial Statements - Statements of Cash Flows for the financial year ended 30 June 2020
128
The Statements of Cash Flows should be read in conjunction with the Notes to the Financial Statements set out on pages 137 to 421.
Note 30 June 2020 30 June 2019 30 June 2020 30 June 2019 30 June 2020 30 June 2019 30 June 2020 30 June 2019$ $ $ $ $ $ $ $
Cash flows from operating activities:Interest received 16 77 1,671 5,320 17,105 128,292 115 448Unit trust distribution received - - - - - - - - Other income received 2 - - - 41 1,900 - - Realised foreign exchange gains/(losses) - - - - 72,723 (556,209) - - Interest paid - - (1) - (12,548) (175,573) - - Operating expenses paid (17,182) (18,866) (164,710) (210,289) (287,876) (363,148) (122,934) (176,395)Proceeds from sale of investments 317,774 506,224 52,990,756 70,657,287 151,445,751 148,125,827 9,572,357 5,700,334Purchase of investments (346,765) (56,432) (957,797) - (65,090,901) (47,180,789) (349,905) (1,933,902)Net cash flows from/(used in) operating activities 8 (46,155) 431,003 51,869,919 70,452,318 86,144,295 99,980,300 9,099,633 3,590,485
Cash flows from financing activities:Proceeds from issue of units 375,147 53,765 2,077,115 3,080,094 1,736,078 3,469,873 695,080 2,882,250Payments for redemption of units (330,590) (485,563) (52,763,091) (72,770,670) (83,668,587) (102,669,122) (9,591,548) (6,197,122)Drawdown/(prepayment) of loan - - - - - - - - Distributions paid (2,115) (4,096) (1,459,673) (796,890) (1,110,360) (1,112,028) (230,841) (344,195)Net cash flows from/(used in) financing activities 42,442 (435,894) (52,145,649) (70,487,466) (83,042,869) (100,311,277) (9,127,309) (3,659,067)
- - - - Net increase/(decrease) in cash and cash equivalents (3,713) (4,891) (275,730) (35,148) 3,101,426 (330,977) (27,676) (68,582)Effect of exchange rate fluctuations on cash and cash equivalents - - - - - - - - Cash and cash equivalents at the beginning of the financial year 7,386 12,277 650,730 685,878 1,942,441 2,273,418 49,617 118,199Cash and cash equivalents at the end of the financial year 3,673 7,386 375,000 650,730 5,043,867 1,942,441 21,941 49,617
113. OnePath Sustainable Investments - Australian
Share Trust
114. OnePath Wholesale Australian Share Trust
115. OnePath Wholesale Balanced Trust
116. OnePath Wholesale Blue Chip Imputation Trust

Financial Report Financial Statements - Statements of Cash Flows for the financial year ended 30 June 2020
129
The Statements of Cash Flows should be read in conjunction with the Notes to the Financial Statements set out on pages 137 to 421. † Operating expenses paid include long term loan interest paid.
Note 30 June 2020 30 June 2019 30 June 2020 30 June 2019 30 June 2020 30 June 2019 30 June 2020 30 June 2019$ $ $ $ $ $ $ $
Cash flows from operating activities:Interest received 15,783 74,105 - - 569 2,245 2,567 2,915Unit trust distribution received - - - - - - - - Other income received 775 27 16 - 17,223 - - - Realised foreign exchange gains/(losses) - (1) - - - - - - Interest paid (4,793) (60,875) - - - - (111) - Operating expenses paid (72,794) (113,525) (1,146,331) (1,193,181) (310,402) (339,312) (1,058,095) (1,571,213)Proceeds from sale of investments 96,566,701 173,355,549 104,583,588 86,858,325 10,518,357 3,062,777 108,032,211 58,104,001Purchase of investments (19,868,830) (65,793,375) (7,566,022) (9,394,814) (733,393) (1,003,130) (95,860,518) (48,435,000)Net cash flows from/(used in) operating activities 8 76,636,842 107,461,905 95,871,251 76,270,330 9,492,354 1,722,580 11,116,054 8,100,703
Cash flows from financing activities:Proceeds from issue of units 1,480,024 1,376,267 36,110,053 38,870,246 3,996,020 4,801,154 18,633,417 8,176,803Payments for redemption of units (79,910,858) (104,740,216) (127,885,850) (111,360,512) (10,220,989) (6,251,521) (17,624,385) (17,274,009)Drawdown/(prepayment) of loan - - - - - - (9,510,000) 1,168,000Distributions paid (391,226) (479,847) (4,292,263) (3,831,175) (3,233,936) (506,003) (10,251) (7,522)Net cash flows from/(used in) financing activities (78,822,060) (103,843,796) (96,068,060) (76,321,441) (9,458,905) (1,956,370) (8,511,219) (7,936,728)
- - - - Net increase/(decrease) in cash and cash equivalents (2,185,218) 3,618,109 (196,809) (51,111) 33,449 (233,790) 2,604,835 163,975Effect of exchange rate fluctuations on cash and cash equivalents - - - - - - - - Cash and cash equivalents at the beginning of the financial year 4,285,002 666,893 143,509 194,620 149,666 383,456 273,078 109,103Cash and cash equivalents at the end of the financial year 2,099,784 4,285,002 (53,300) 143,509 183,115 149,666 2,877,913 273,078
117. OnePath Wholesale Capital Stable Trust
118. OnePath Wholesale Diversified Fixed Interest
Trust
119. OnePath Wholesale Emerging Companies Trust
120. OnePath Wholesale Geared Australian Shares
Index Trust†

Financial Report Financial Statements - Statements of Cash Flows for the financial year ended 30 June 2020
130
The Statements of Cash Flows should be read in conjunction with the Notes to the Financial Statements set out on pages 137 to 421.
Note 30 June 2020 30 June 2019 30 June 2020 30 June 2019 30 June 2020 30 June 2019 30 June 2020 30 June 2019$ $ $ $ $ $ $ $
Cash flows from operating activities:Interest received 127 412 2,194 3,539 - - - 89Unit trust distribution received - - - - - - - - Other income received - - 55 - - - - - Realised foreign exchange gains/(losses) - - 3,833 (11,714) - - - - Interest paid - - (783) (1,791) - - - - Operating expenses paid (95,520) (97,312) (8,311) (9,846) - - - - Proceeds from sale of investments 1,747,665 468,095 8,878,124 9,652,230 10,644,662 7,549,195 3,569,586 2,161,080Purchase of investments (437,779) (1,462,084) (2,117,110) (1,851,249) (7,408,942) (4,421,513) (2,103,357) (1,441,745)Net cash flows from/(used in) operating activities 8 1,214,493 (1,090,889) 6,758,002 7,781,169 3,235,720 3,127,682 1,466,229 719,424
Cash flows from financing activities:Proceeds from issue of units 1,186,884 2,077,643 895,283 705,540 309,325 248,104 41,139 515,924Payments for redemption of units (2,193,887) (922,528) (7,425,810) (8,093,372) (3,545,045) (3,375,786) (1,482,251) (1,235,348)Drawdown/(prepayment) of loan - - - - - - - - Distributions paid (203,788) (108,872) (23,977) (44,073) - - - - Net cash flows from/(used in) financing activities (1,210,791) 1,046,243 (6,554,504) (7,431,905) (3,235,720) (3,127,682) (1,441,112) (719,424)
- - - - Net increase/(decrease) in cash and cash equivalents 3,702 (44,646) 203,498 349,264 - - 25,117 - Effect of exchange rate fluctuations on cash and cash equivalents - - - - - - - - Cash and cash equivalents at the beginning of the financial year 47,801 92,447 540,662 191,398 - - - - Cash and cash equivalents at the end of the financial year 51,503 47,801 744,160 540,662 - - 25,117 -
121. OnePath Wholesale Global Emerging Markets
Share Trust
122. OnePath Wholesale High Growth Trust
123. OnePath Wholesale Index Balanced Trust
124. OnePath Wholesale Index Conservative Trust
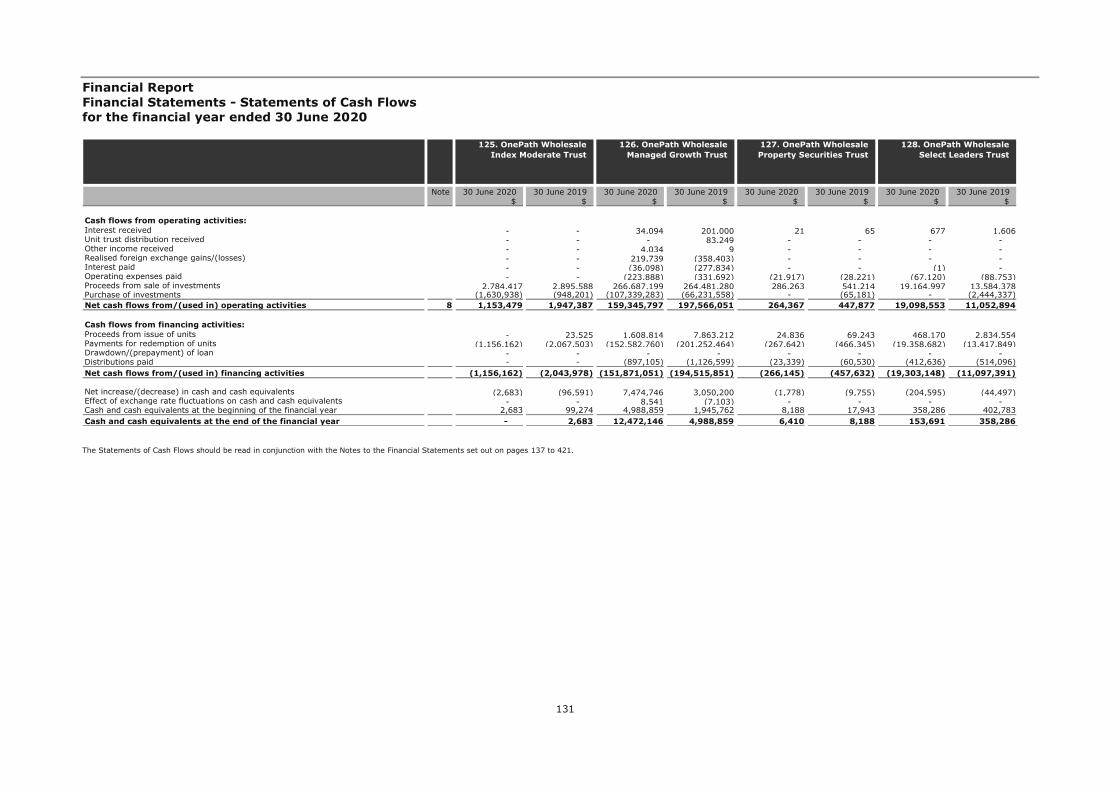
Financial Report Financial Statements - Statements of Cash Flows for the financial year ended 30 June 2020
131
The Statements of Cash Flows should be read in conjunction with the Notes to the Financial Statements set out on pages 137 to 421.
Note 30 June 2020 30 June 2019 30 June 2020 30 June 2019 30 June 2020 30 June 2019 30 June 2020 30 June 2019$ $ $ $ $ $ $ $
Cash flows from operating activities:Interest received - - 34,094 201,000 21 65 677 1,606Unit trust distribution received - - - 83,249 - - - - Other income received - - 4,034 9 - - - - Realised foreign exchange gains/(losses) - - 219,739 (358,403) - - - - Interest paid - - (36,098) (277,834) - - (1) - Operating expenses paid - - (223,888) (331,692) (21,917) (28,221) (67,120) (88,753)Proceeds from sale of investments 2,784,417 2,895,588 266,687,199 264,481,280 286,263 541,214 19,164,997 13,584,378Purchase of investments (1,630,938) (948,201) (107,339,283) (66,231,558) - (65,181) - (2,444,337)Net cash flows from/(used in) operating activities 8 1,153,479 1,947,387 159,345,797 197,566,051 264,367 447,877 19,098,553 11,052,894
Cash flows from financing activities:Proceeds from issue of units - 23,525 1,608,814 7,863,212 24,836 69,243 468,170 2,834,554Payments for redemption of units (1,156,162) (2,067,503) (152,582,760) (201,252,464) (267,642) (466,345) (19,358,682) (13,417,849)Drawdown/(prepayment) of loan - - - - - - - - Distributions paid - - (897,105) (1,126,599) (23,339) (60,530) (412,636) (514,096)Net cash flows from/(used in) financing activities (1,156,162) (2,043,978) (151,871,051) (194,515,851) (266,145) (457,632) (19,303,148) (11,097,391)
- - - - Net increase/(decrease) in cash and cash equivalents (2,683) (96,591) 7,474,746 3,050,200 (1,778) (9,755) (204,595) (44,497)Effect of exchange rate fluctuations on cash and cash equivalents - - 8,541 (7,103) - - - - Cash and cash equivalents at the beginning of the financial year 2,683 99,274 4,988,859 1,945,762 8,188 17,943 358,286 402,783Cash and cash equivalents at the end of the financial year - 2,683 12,472,146 4,988,859 6,410 8,188 153,691 358,286
125. OnePath Wholesale Index Moderate Trust
126. OnePath Wholesale Managed Growth Trust
127. OnePath Wholesale Property Securities Trust
128. OnePath Wholesale Select Leaders Trust
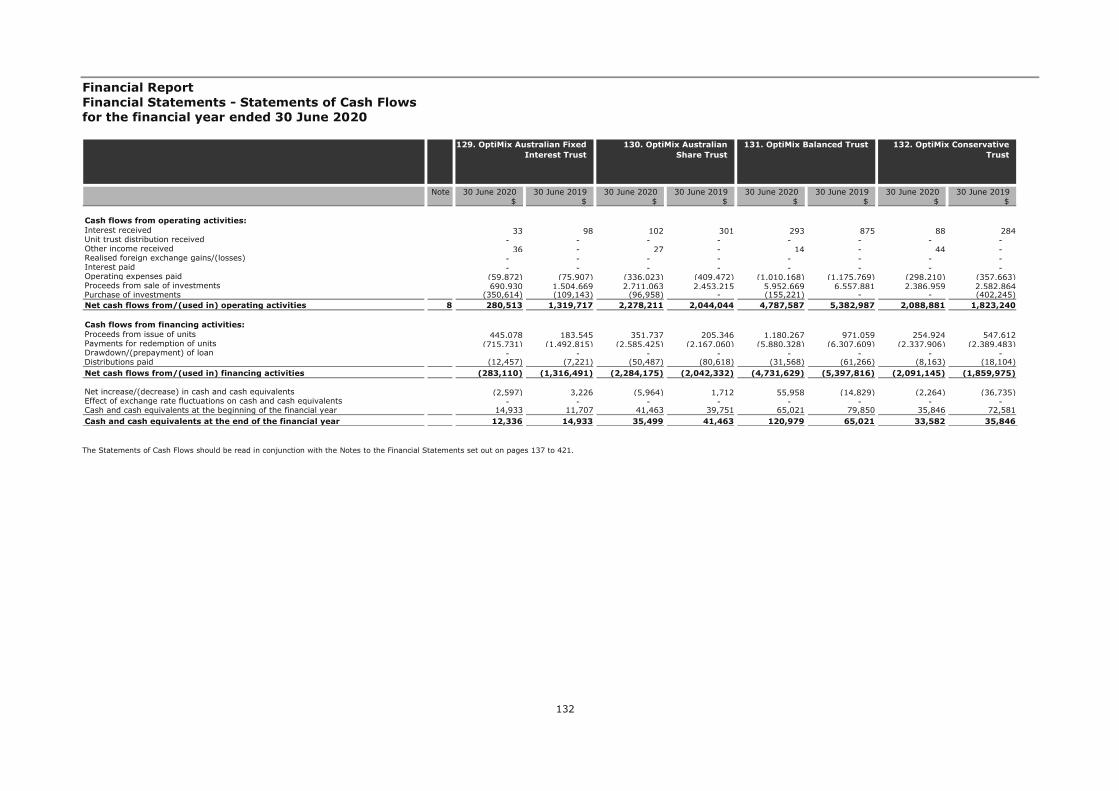
Financial Report Financial Statements - Statements of Cash Flows for the financial year ended 30 June 2020
132
The Statements of Cash Flows should be read in conjunction with the Notes to the Financial Statements set out on pages 137 to 421.
Note 30 June 2020 30 June 2019 30 June 2020 30 June 2019 30 June 2020 30 June 2019 30 June 2020 30 June 2019$ $ $ $ $ $ $ $
Cash flows from operating activities:Interest received 33 98 102 301 293 875 88 284Unit trust distribution received - - - - - - - - Other income received 36 - 27 - 14 - 44 - Realised foreign exchange gains/(losses) - - - - - - - - Interest paid - - - - - - - - Operating expenses paid (59,872) (75,907) (336,023) (409,472) (1,010,168) (1,175,769) (298,210) (357,663)Proceeds from sale of investments 690,930 1,504,669 2,711,063 2,453,215 5,952,669 6,557,881 2,386,959 2,582,864Purchase of investments (350,614) (109,143) (96,958) - (155,221) - - (402,245)Net cash flows from/(used in) operating activities 8 280,513 1,319,717 2,278,211 2,044,044 4,787,587 5,382,987 2,088,881 1,823,240
Cash flows from financing activities:Proceeds from issue of units 445,078 183,545 351,737 205,346 1,180,267 971,059 254,924 547,612Payments for redemption of units (715,731) (1,492,815) (2,585,425) (2,167,060) (5,880,328) (6,307,609) (2,337,906) (2,389,483)Drawdown/(prepayment) of loan - - - - - - - - Distributions paid (12,457) (7,221) (50,487) (80,618) (31,568) (61,266) (8,163) (18,104)Net cash flows from/(used in) financing activities (283,110) (1,316,491) (2,284,175) (2,042,332) (4,731,629) (5,397,816) (2,091,145) (1,859,975)
- - - - Net increase/(decrease) in cash and cash equivalents (2,597) 3,226 (5,964) 1,712 55,958 (14,829) (2,264) (36,735)Effect of exchange rate fluctuations on cash and cash equivalents - - - - - - - - Cash and cash equivalents at the beginning of the financial year 14,933 11,707 41,463 39,751 65,021 79,850 35,846 72,581Cash and cash equivalents at the end of the financial year 12,336 14,933 35,499 41,463 120,979 65,021 33,582 35,846
129. OptiMix Australian Fixed Interest Trust
130. OptiMix Australian Share Trust
131. OptiMix Balanced Trust 132. OptiMix Conservative Trust

Financial Report Financial Statements - Statements of Cash Flows for the financial year ended 30 June 2020
133
The Statements of Cash Flows should be read in conjunction with the Notes to the Financial Statements set out on pages 137 to 421.
Note 30 June 2020 30 June 2019 30 June 2020 30 June 2019 30 June 2020 30 June 2019 30 June 2020 30 June 2019$ $ $ $ $ $ $ $
Cash flows from operating activities:Interest received 32 101 54 169 29 115 106 294Unit trust distribution received - - - - - - - - Other income received 18 - 23 - 21 - 5 - Realised foreign exchange gains/(losses) - - - - - - - - Interest paid - - - - - - - - Operating expenses paid (78,359) (94,073) (174,533) (204,164) (75,087) (98,969) (352,265) (403,153)Proceeds from sale of investments 640,428 1,029,876 1,331,440 1,671,353 756,382 723,899 2,371,582 1,319,960Purchase of investments (680,025) (383,137) - (100,632) (297,505) (249,055) (46,085) (66,868)Net cash flows from/(used in) operating activities 8 (117,906) 552,767 1,156,984 1,366,726 383,840 375,990 1,973,343 850,233
Cash flows from financing activities:Proceeds from issue of units 1,005,927 578,594 74,637 95,645 403,912 247,811 288,554 454,445Payments for redemption of units (848,360) (1,146,176) (1,024,538) (1,339,223) (798,055) (671,114) (2,268,856) (1,265,307)Drawdown/(prepayment) of loan - - - - - - - - Distributions paid (40,898) (2,211) (221,660) (152,417) (746) (51,134) (8,393) (14,954)Net cash flows from/(used in) financing activities 116,669 (569,793) (1,171,561) (1,395,995) (394,889) (474,437) (1,988,695) (825,816)
- - - - Net increase/(decrease) in cash and cash equivalents (1,237) (17,026) (14,577) (29,269) (11,049) (98,447) (15,352) 24,417Effect of exchange rate fluctuations on cash and cash equivalents - - - - - - - - Cash and cash equivalents at the beginning of the financial year 12,755 29,781 33,435 62,704 20,560 119,007 54,365 29,948Cash and cash equivalents at the end of the financial year 11,518 12,755 18,858 33,435 9,511 20,560 39,013 54,365
133. OptiMix Global Emerging Markets Share
Trust
134. OptiMix Global Share Trust
135. OptiMix Global Smaller Companies Share Trust
136. OptiMix Growth Trust
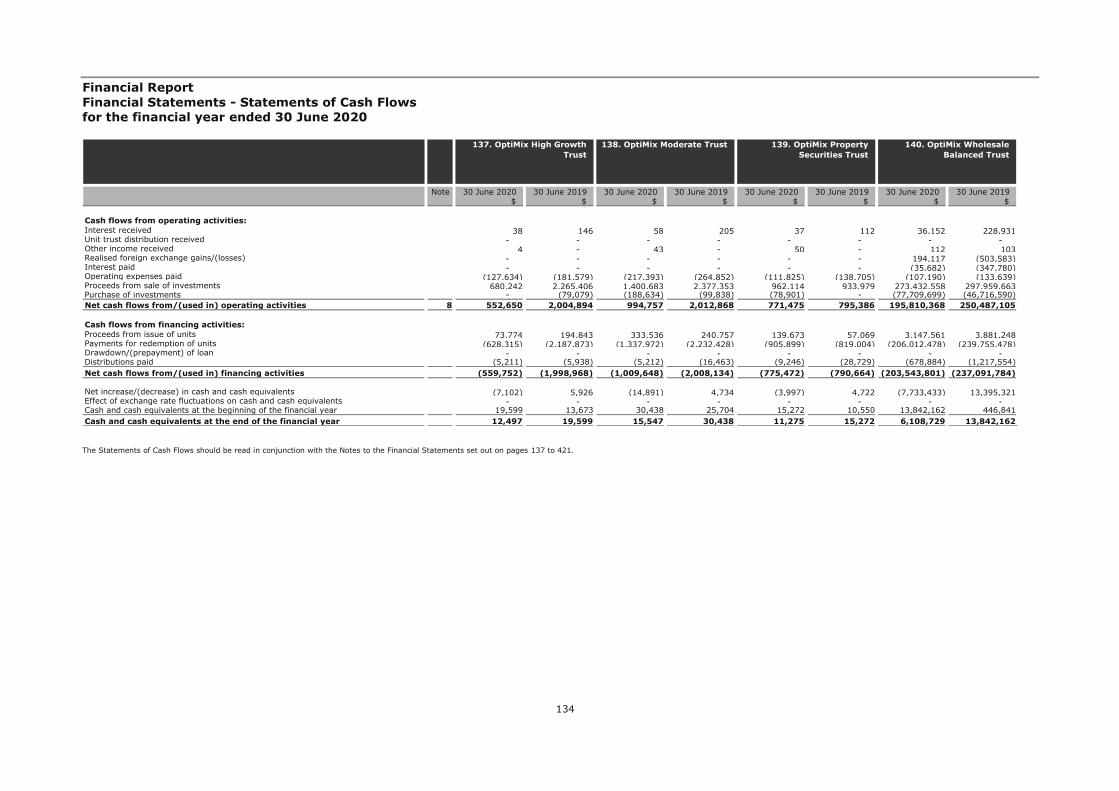
Financial Report Financial Statements - Statements of Cash Flows for the financial year ended 30 June 2020
134
The Statements of Cash Flows should be read in conjunction with the Notes to the Financial Statements set out on pages 137 to 421.
Note 30 June 2020 30 June 2019 30 June 2020 30 June 2019 30 June 2020 30 June 2019 30 June 2020 30 June 2019$ $ $ $ $ $ $ $
Cash flows from operating activities:Interest received 38 146 58 205 37 112 36,152 228,931Unit trust distribution received - - - - - - - - Other income received 4 - 43 - 50 - 112 103Realised foreign exchange gains/(losses) - - - - - - 194,117 (503,583)Interest paid - - - - - - (35,682) (347,780)Operating expenses paid (127,634) (181,579) (217,393) (264,852) (111,825) (138,705) (107,190) (133,639)Proceeds from sale of investments 680,242 2,265,406 1,400,683 2,377,353 962,114 933,979 273,432,558 297,959,663Purchase of investments - (79,079) (188,634) (99,838) (78,901) - (77,709,699) (46,716,590)Net cash flows from/(used in) operating activities 8 552,650 2,004,894 994,757 2,012,868 771,475 795,386 195,810,368 250,487,105
Cash flows from financing activities:Proceeds from issue of units 73,774 194,843 333,536 240,757 139,673 57,069 3,147,561 3,881,248Payments for redemption of units (628,315) (2,187,873) (1,337,972) (2,232,428) (905,899) (819,004) (206,012,478) (239,755,478)Drawdown/(prepayment) of loan - - - - - - - - Distributions paid (5,211) (5,938) (5,212) (16,463) (9,246) (28,729) (678,884) (1,217,554)Net cash flows from/(used in) financing activities (559,752) (1,998,968) (1,009,648) (2,008,134) (775,472) (790,664) (203,543,801) (237,091,784)
- - - - Net increase/(decrease) in cash and cash equivalents (7,102) 5,926 (14,891) 4,734 (3,997) 4,722 (7,733,433) 13,395,321Effect of exchange rate fluctuations on cash and cash equivalents - - - - - - - - Cash and cash equivalents at the beginning of the financial year 19,599 13,673 30,438 25,704 15,272 10,550 13,842,162 446,841Cash and cash equivalents at the end of the financial year 12,497 19,599 15,547 30,438 11,275 15,272 6,108,729 13,842,162
137. OptiMix High Growth Trust
138. OptiMix Moderate Trust 139. OptiMix Property Securities Trust
140. OptiMix Wholesale Balanced Trust
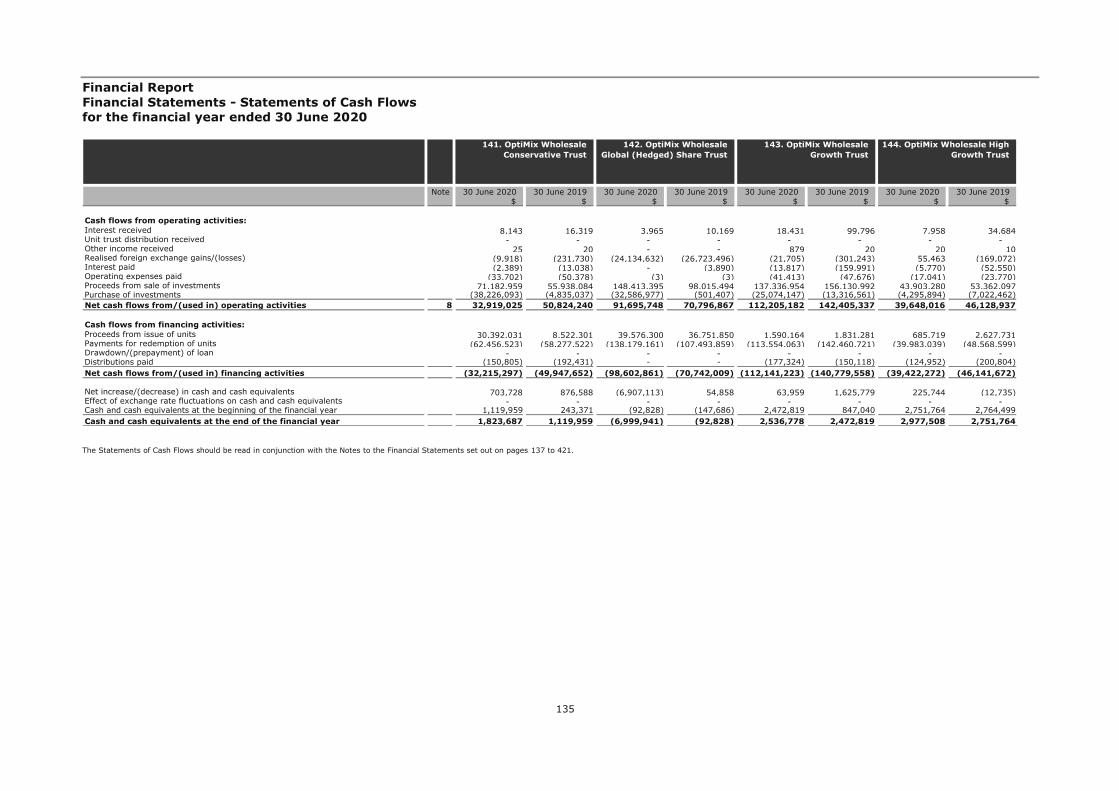
Financial Report Financial Statements - Statements of Cash Flows for the financial year ended 30 June 2020
135
The Statements of Cash Flows should be read in conjunction with the Notes to the Financial Statements set out on pages 137 to 421.
Note 30 June 2020 30 June 2019 30 June 2020 30 June 2019 30 June 2020 30 June 2019 30 June 2020 30 June 2019$ $ $ $ $ $ $ $
Cash flows from operating activities:Interest received 8,143 16,319 3,965 10,169 18,431 99,796 7,958 34,684Unit trust distribution received - - - - - - - - Other income received 25 20 - - 879 20 20 10Realised foreign exchange gains/(losses) (9,918) (231,730) (24,134,632) (26,723,496) (21,705) (301,243) 55,463 (169,072)Interest paid (2,389) (13,038) - (3,890) (13,817) (159,991) (5,770) (52,550)Operating expenses paid (33,702) (50,378) (3) (3) (41,413) (47,676) (17,041) (23,770)Proceeds from sale of investments 71,182,959 55,938,084 148,413,395 98,015,494 137,336,954 156,130,992 43,903,280 53,362,097Purchase of investments (38,226,093) (4,835,037) (32,586,977) (501,407) (25,074,147) (13,316,561) (4,295,894) (7,022,462)Net cash flows from/(used in) operating activities 8 32,919,025 50,824,240 91,695,748 70,796,867 112,205,182 142,405,337 39,648,016 46,128,937
Cash flows from financing activities:Proceeds from issue of units 30,392,031 8,522,301 39,576,300 36,751,850 1,590,164 1,831,281 685,719 2,627,731Payments for redemption of units (62,456,523) (58,277,522) (138,179,161) (107,493,859) (113,554,063) (142,460,721) (39,983,039) (48,568,599)Drawdown/(prepayment) of loan - - - - - - - - Distributions paid (150,805) (192,431) - - (177,324) (150,118) (124,952) (200,804)Net cash flows from/(used in) financing activities (32,215,297) (49,947,652) (98,602,861) (70,742,009) (112,141,223) (140,779,558) (39,422,272) (46,141,672)
- - - - Net increase/(decrease) in cash and cash equivalents 703,728 876,588 (6,907,113) 54,858 63,959 1,625,779 225,744 (12,735)Effect of exchange rate fluctuations on cash and cash equivalents - - - - - - - - Cash and cash equivalents at the beginning of the financial year 1,119,959 243,371 (92,828) (147,686) 2,472,819 847,040 2,751,764 2,764,499Cash and cash equivalents at the end of the financial year 1,823,687 1,119,959 (6,999,941) (92,828) 2,536,778 2,472,819 2,977,508 2,751,764
141. OptiMix Wholesale Conservative Trust
142. OptiMix Wholesale Global (Hedged) Share Trust
143. OptiMix Wholesale Growth Trust
144. OptiMix Wholesale High Growth Trust

Financial Report Financial Statements - Statements of Cash Flows for the financial year ended 30 June 2020
136
The Statements of Cash Flows should be read in conjunction with the Notes to the Financial Statements set out on pages 137 to 421.
Note 30 June 2020 30 June 2019 30 June 2020 30 June 2019 30 June 2020 30 June 2019$ $ $ $ $ $
Cash flows from operating activities:Interest received 14,759 109,917 593 782 56 176Unit trust distribution received - - - - - - Other income received 49 49 78,629 - 43 - Realised foreign exchange gains/(losses) 34,862 (545,460) - - - - Interest paid (11,534) (164,641) (31) (8) - - Operating expenses paid (32,087) (50,700) (161) (116) (174,704) (222,552)Proceeds from sale of investments 115,776,274 129,257,772 26,697,415 54,822,731 1,058,213 1,869,264Purchase of investments (36,742,880) (30,686,451) (2,852,315) (350,000) - - Net cash flows from/(used in) operating activities 8 79,039,443 97,920,486 23,924,130 54,473,389 883,608 1,646,888
Cash flows from financing activities:Proceeds from issue of units 2,179,040 10,177,674 2,852,315 399,999 122,641 124,515Payments for redemption of units (82,987,388) (102,786,016) (26,697,415) (54,872,730) (988,961) (1,703,692)Drawdown/(prepayment) of loan - - - - - - Distributions paid (107,202) (160,919) - - (23,706) (72,460)Net cash flows from/(used in) financing activities (80,915,550) (92,769,261) (23,845,100) (54,472,731) (890,026) (1,651,637)
- - - Net increase/(decrease) in cash and cash equivalents (1,876,107) 5,151,225 79,030 658 (6,418) (4,749)Effect of exchange rate fluctuations on cash and cash equivalents - - - - - - Cash and cash equivalents at the beginning of the financial year 5,344,004 192,779 52,643 51,985 23,364 28,113Cash and cash equivalents at the end of the financial year 3,467,897 5,344,004 131,673 52,643 16,946 23,364
145. OptiMix Wholesale Moderate Trust
146. Pooled Australian Share Fund
147. Property Securities Trust
Financial Report Notes to the Financial Statements for the financial year ended 30 June 2020
137
1. Reporting entity
The Schemes included in these financial statements are registered Managed Investment Schemes under the Corporations Act 2001. The financial statements of the Schemes are for the financial year ended 30 June 2020.
2. Basis of preparation
2.1 Statement of compliance
The financial statements are general purpose financial statements which have been prepared in accordance with Australian Accounting Standards adopted by the Australian Accounting Standards Board (AASB) and the Corporations Act 2001. The financial statements of the Schemes comply with International Financial Reporting Standards (IFRS) and interpretations adopted by the International Accounting Standards Board (IASB).
The financial statements were approved by the Board of Directors of the Responsible Entity on 7 September 2020.
2.2 Basis of measurement
The financial statements have been prepared on the historical cost basis except for:
financial instruments held at fair value through profit or loss, which are measured at fair value; and financial liabilities, other than those held at fair value through profit or loss, which are measured at amortised cost.
2.3 Functional and presentation currency
The financial statements are presented in Australian dollars, which is the Schemes' functional currency.
2.4 Use of estimates and judgements
The preparation of the financial statements which are in conformity with IFRS, requires management to make judgements, estimates and assumptions that affect the application of accounting policies and the reported amounts of assets, liabilities, income and expenses and the disclosure of contingent assets and liabilities. The estimates and associated assumptions can refer to historical experience and various other factors that are believed to be reasonable using market participant assumptions in the current market environment based on what is known and knowable at the measurement date. The results of which forms the basis of making the judgement about carrying values of assets and liabilities that are not readily apparent from other sources. Actual results may differ from estimates.
Estimates and underlying assumptions are reviewed on an ongoing basis. Revisions to accounting estimates are recognised in the period in which the estimates are revised and in any future periods affected.
The dynamic and evolving nature of COVID-19, limited recent experience of the economic and financial impacts of such a pandemic, may result in the application of future judgement within those identified areas. Refer to Note 15 Significant events during the financial period for further detail.
Note 9.5 Valuation of financial instruments contains information about the estimation of fair values of financial instruments.
The Schemes have been re-assessed as at 30 June 2020 and continued to meet the definition of the investment entities under the definition of AASB 10 Consolidated Financial Statements as the following criteria are met:
The Schemes obtain and manage funds for the purpose of providing investors of the Schemes with investment management services; The Schemes have committed to their investors that their business purposes are to invest funds solely for return from capital appreciation and investment income; and The Schemes measure and evaluate the performance of their investments on a fair value basis.
2.5 Going concern
The financial statements have been prepared on a going concern basis.
Financial Report Notes to the Financial Statements for the financial year ended 30 June 2020
138
2.6 Changes in accounting policies
There were no changes in the accounting policies of the Schemes during the financial year.
3. Significant accounting policies
The accounting policies set out below have been applied consistently to all periods presented in these financial statements.
The Schemes have not early adopted any accounting standard.
3.1 Foreign currency translation
Foreign currency transactions are translated to Australian dollars at the rates of exchange prevailing at the dates of the transactions. Assets and liabilities denominated in foreign currencies are translated at the rates of exchange prevailing at the reporting date. Unrealised foreign exchange gains or losses, arising in translation of assets and liabilities denominated in foreign currencies at reporting date, are recognised as part of the 'Net change in fair value of investments' in the Statements of Comprehensive Income. Realised gains and losses on amounts denominated in foreign currencies are also brought to account as part of 'Net change in fair value of investments' in the Statements of Comprehensive Income and as 'Realised foreign exchange gains/(losses)' in the Statements of Cash Flows.
3.2 Financial instruments
3.2.1 Recognition and initial measurement
Financial assets and liabilities held at fair value through profit or loss are recognised initially on the trade date at which the Schemes become a party to the contractual provisions of the instrument. Other financial assets and liabilities are recognised on the due date they originated.
Financial assets and financial liabilities held at fair value through the profit or loss are measured initially at fair value, with transaction costs recognised in the Statements of Comprehensive Income. Financial assets or liabilities not held at fair value through profit or loss are measured initially at fair value plus transaction costs that are directly attributable to its acquisition or issue.
3.2.2 Derecognition
The Schemes derecognise financial assets when the contractual rights to the cash flows from the financial assets expire or they transfer the financial assets and the transfer qualifies for derecognition in accordance with AASB 9 Financial Instruments.
A financial liability is derecognised when the obligation specified in the contract is discharged, cancelled or expired.
When there is objective evidence that the Schemes will not be able to collect all amounts due according to the original terms of the receivable, the Schemes will write off the amount by reducing the carrying amount directly in the Statements of Financial Position and also recognise a loss or other expense in the Statements of Comprehensive Income.
3.2.3 Classification
Financial assets and financial liabilities held at fair value through profit or loss are those that meet the definition of held for trading in AASB 9 Financial Instruments. These include investments in unlisted unit trusts and derivatives.
Financial assets measured at amortised cost include cash and cash equivalents. Financial liabilities measured at amortised cost include balances due to brokers, accounts payable and loan payable.
3.2.4 Measurement
Subsequent to initial recognition, all instruments classified at fair value through profit or loss are measured at fair value with changes in their fair value recognised in the Statements of Comprehensive Income.
Financial liabilities other than those at fair value through profit or loss, are measured at amortised cost using the effective interest rate method.
Refer to Note 9.5 Valuation of financial instruments for additional disclosures.

Financial Report Notes to the Financial Statements for the financial year ended 30 June 2020
139
3.2.5 Fair value measurement principles
The Schemes have adopted AASB 13 Fair Value Measurement and as a result the Schemes have adopted the definition of fair value, as set out below.
Fair value is the price that would be received to sell an asset or paid to transfer a liability in an orderly transaction between market participants at the measurement date in the principal, or in its absence, the most advantageous market to which the Schemes have access at that date. The fair value of a liability reflects its non - performance risk.
The prices used to value investments include, but are not limited to:
independent prices obtained for each security; quoted 'bid' prices on long securities and quoted 'ask' prices on securities sold short; and redemption prices published by the relevant Responsible Entity, for investments into unlisted unit trusts.
When applicable, the Schemes measure the fair value of an instrument using the quoted prices in an active market for that instrument. A market is regarded as active if transactions for the asset or liability take place with sufficient frequency and volume to provide pricing information on an ongoing basis.
When there is no quoted price in an active market, the Schemes use valuation techniques that maximise the use of relevant observable inputs and minimise the use of unobservable inputs. The chosen valuation technique incorporates all the factors that market participants would take into account in pricing a transaction.
3.2.6 Offsetting
Financial assets and liabilities are offset and the net amount presented in the Statements of Financial Position when, and only when, the Schemes have a legal right to offset the amounts and they intend either to settle on a net basis or realise the asset and settle the liability simultaneously.
Refer to Note 9.2.7 Offsetting financial assets and financial liabilities for additional disclosures.
Income and expenses are presented on a net basis only when permitted under AASBs, e.g. for gains and losses arising from a group of similar transactions, such as gains and losses from financial instruments held at fair value through profit or loss.
3.2.7 Derivative financial instruments
The Schemes use derivative financial instruments to hedge their exposure to credit, interest rate, foreign exchange and price risks arising from investment activities. In accordance with their investment strategy, the Schemes hold or issue derivative financial instruments for hedging purposes.
Derivative financial instruments are recognised initially at cost. Subsequent to initial recognition, derivative financial instruments are stated at fair value. The gain or loss on remeasurement to fair value is recognised immediately in the Statements of Comprehensive Income. The Schemes do not apply hedge accounting.
3.3 Net assets attributable to unitholders
Units are redeemable at the unitholders' option, however, applications and redemptions may be suspended by the Responsible Entity if it is in the best interests of the unitholders. The units can be put back to the Schemes at any time for cash based on the redemption price. The fair value of redeemable units is measured at the redemption amount that is payable (based on the redemption unit price) at the end of the reporting period if unitholders exercised their right to redeem units from the Schemes.
3.4 Terms and conditions of units
The Schemes included in these financial statements have between one and three classes of units.
Each unit issued within each class confers upon the unitholders an equal interest in the relevant class and is of equal value. The rights, obligations and restrictions attached to each unit in each class are identical in all respects. The classes in the Schemes differ in terms of the Responsible Entity fees charged.
A unit does not confer any interest in any particular asset or investment of the Schemes. Unitholders have various rights under the applicable Constitution and the Corporations Act 2001, including the right to have their units redeemed, receive income distributions and attend and vote at meetings of unitholders.

Financial Report Notes to the Financial Statements for the financial year ended 30 June 2020
140
3.5 Cash and cash equivalents
For the purpose of presentation in the Statements of Cash Flows, cash and cash equivalents may include cash at bank, deposits held at call with financial institutions, other short term, highly liquid investments with original maturities of three months or less from the date of acquisition that are readily convertible to known amounts of cash which are subject to an insignificant risk of changes in value, and bank overdrafts. Bank overdrafts are shown in current liabilities on the Statement of Financial Position but are included within cash and cash equivalents for cash flow purposes.
3.6 Interest
Interest income from financial assets at amortised cost is recognised on a time-proportionate basis using the effective interest method and includes interest from cash and cash equivalents.
Interest from financial assets at fair value through profit or loss is determined based on the contractual coupon interest rate and includes interest from debt securities.
3.7 Distribution income
Income distributions from private equity investments and unlisted unit trusts are recognised in the Statements of Comprehensive Income on an entitlement basis.
3.8 Expenses
All expenses, including Responsible Entity fees, are recognised in the Statements of Comprehensive Income on an accruals basis.
Interest expense is interest accrued on overdraft balances held during the financial year.
Loan interest expenses is interest accrued on long term loans.
3.9 Foreign exchange gains and losses
Foreign exchange gains and losses on financial assets and financial liabilities held at fair value through profit or loss are recognised together with other changes in the fair value. Included in the profit or loss line item are net foreign exchange gains or losses on monetary financial assets and financial liabilities other than those classified at fair value through profit or loss.
3.10 Distribution and taxation
Under the Attribution Managed Investment Trust ("AMIT") tax regime, the Schemes are not subject to income tax as taxable income (including assessable realised capital gains) is attributed in full to the unitholders. The Schemes fully attribute their taxable income which is calculated in accordance with the Schemes' Constitutions and applicable taxation legislation, to the unitholders on a fair and reasonable basis consistent with their rights. A Scheme could invest into a unit trust managed by an external fund manager who opted to distribute a portion of attributable income in cash due to AMIT election. The Responsible Entity’s distribution policy is to support all attributed amounts to unitholders with cash.
Financial instruments held at fair value may include unrealised capital gains or losses. Unrealised gains or losses that are recognised as 'profit or loss from operating activities' are transferred to net assets attributable to unitholders and are not assessable and do not impact distributions until realised.
3.11 Finance costs
Equity transactions, including distributions to unitholders have been disclosed in the Statements of Changes in Equity for the financial year ended 30 June 2020. Distributions paid are included in cash flows from financing activities in the Statements of Cash Flows.
3.12 Receivables
Receivables are measured at transaction price and may include amounts for unsettled sales, accrued income and other receivables such as Reduced Input Tax Credits (RITC).
Unsettled sales are amounts due from brokers for securities sold that have not been received at reporting date. Trades are recorded on trade date, and normally settle within three business days. Accrued income may include amounts for dividends, trust distributions, interest income and compensation income. Amounts are generally received within 30 days of being recorded as receivables. RITC is the amount of Goods and Service Tax (GST) recoverable from the Australian Taxation Office (ATO).
Financial Report Notes to the Financial Statements for the financial year ended 30 June 2020
141
3.13 Payables
Payables may include amounts for unsettled purchases, accrued expenses and other payables such as GST.
Unsettled purchases are amounts due to brokers for securities purchased that have not been paid at reporting date. Trades are recorded on trade date and normally settle within three business days. Accrued expenses include Responsible Entity fees payable.
3.14 Profit/(loss) for the financial year
Profit/(loss) for the financial year is disclosed in the Statements of Comprehensive Income. Equity transactions, including distributions to unitholders have been disclosed in the Statements of Changes in Equity.
3.15 Goods and services tax
Expenses incurred by the Schemes are recognised net of the amount of GST recoverable from the ATO as Reduced Input Tax Credit.
Payables are stated with the amount of GST included. The net amount of GST recoverable from the ATO is included in receivables in the Statements of Financial Position. Cash flows relating to GST are included in the Statements of Cash Flows on a gross basis.
3.16 Loan payable
A revolving debt facility is classified as "Loan payable" and measured at amortised cost.
3.17 New standards and interpretations not yet adopted
A number of new standards, amendments to standards and interpretations are effective for annual periods beginning after 1 July 2020, and have not been early adopted by the Schemes in preparing these financial statements. None of these are expected to have a material effect on the Schemes' financial statements.

Financial Report Notes to the Financial Statements for the financial year ended 30 June 2020
142
4. Net assets attributable to unitholders
The Schemes consider their net assets attributable to unitholders as equity as each Scheme had made an irrevocable choice to be an Attribution Managed Investment Trust ("AMIT"). The Schemes are therefore no longer contractually obligated to pay distributions. Under AASB 132 Financial Instruments: Presentation, puttable financial instruments are classified as equity where the following criteria are met:
the puttable financial instrument entitles the holder to a pro-rata share of net assets in the event of the Schemes' liquidation; the puttable financial instrument is in the class of instruments that is subordinate to all other classes of instruments and class features are identical; the puttable financial instrument does not include any contractual obligations to deliver cash or another financial asset, or to exchange financial instruments with another entity under potentially unfavourable conditions to the Schemes, and it is not a contract settled in the Schemes' own equity instruments; and the total expected cash flows attributable to the puttable financial instrument over the life are based substantially on the profit or loss.
The Schemes' units are classified as equity as they satisfied all the above criteria. The amount of net assets attributable to unitholders can change significantly on a daily basis as the Schemes are subject to daily applications and redemptions at the discretion of unitholders. Daily applications and redemptions are reviewed relative to the liquidity of the Schemes' underlying assets on a daily basis by the Responsible Entity. Under the terms of each Scheme's Constitution, the Responsible Entity has the discretion to reject an application for units and to defer or adjust a redemption of units if the exercise of such discretion is in the best interests of unitholders.
Movements in the number of units attributable to unitholders equity, of the Schemes during the year are as follows:
30 June 2020 30 June 2019 30 June 2020 30 June 2019 30 June 2020 30 June 2019 30 June 2020 30 June 2019Units Units Units Units Units Units Units Units
Opening balance 35,523,909 40,120,586 9,716,662 10,542,276 26,150,303 24,936,659 4,939,183 5,706,796
Applications 1,044,011 17,707,642 345,753 367,275 1,357,376 24,578,754 442,006 1,008,873Redemptions (5,191,800) (22,304,319) (578,465) (1,192,889) (201,674) (23,365,110) (622,836) (1,776,486)
Closing balance 31,376,120 35,523,909 9,483,950 9,716,662 27,306,005 26,150,303 4,758,353 4,939,183
4. ANZ Fixed Interest Trust 1. Active Growth Trust 2. ANZ Equity Imputation Trust
3. ANZ Equity Trust No 1
30 June 2020 30 June 2019 30 June 2020 30 June 2019 30 June 2020 30 June 2019 30 June 2020 30 June 2019Units Units Units Units Units Units Units Units
Opening balance 16,501,007 18,170,273 216,920,821 239,640,118 148,278,562 154,806,115 47,814,236 51,373,466
Applications 580,764 18,150,479 11,261,986 230,411,766 14,754,887 220,051,555 15,279,568 56,843,170Redemptions (3,383,896) (19,819,745) (60,374,130) (253,131,063) (24,961,426) (226,579,108) (8,006,389) (60,402,400)
Closing balance 13,697,875 16,501,007 167,808,677 216,920,821 138,072,023 148,278,562 55,087,415 47,814,236
8. ANZ OA Investors Mutual Australian Share Trust
5. ANZ OA - Pendal Core Hedged Global Shares Trust
6. ANZ OA Arrowstreet Global Equity (Hedged) Trust
7. ANZ OA Colonial First State Imputation Trust
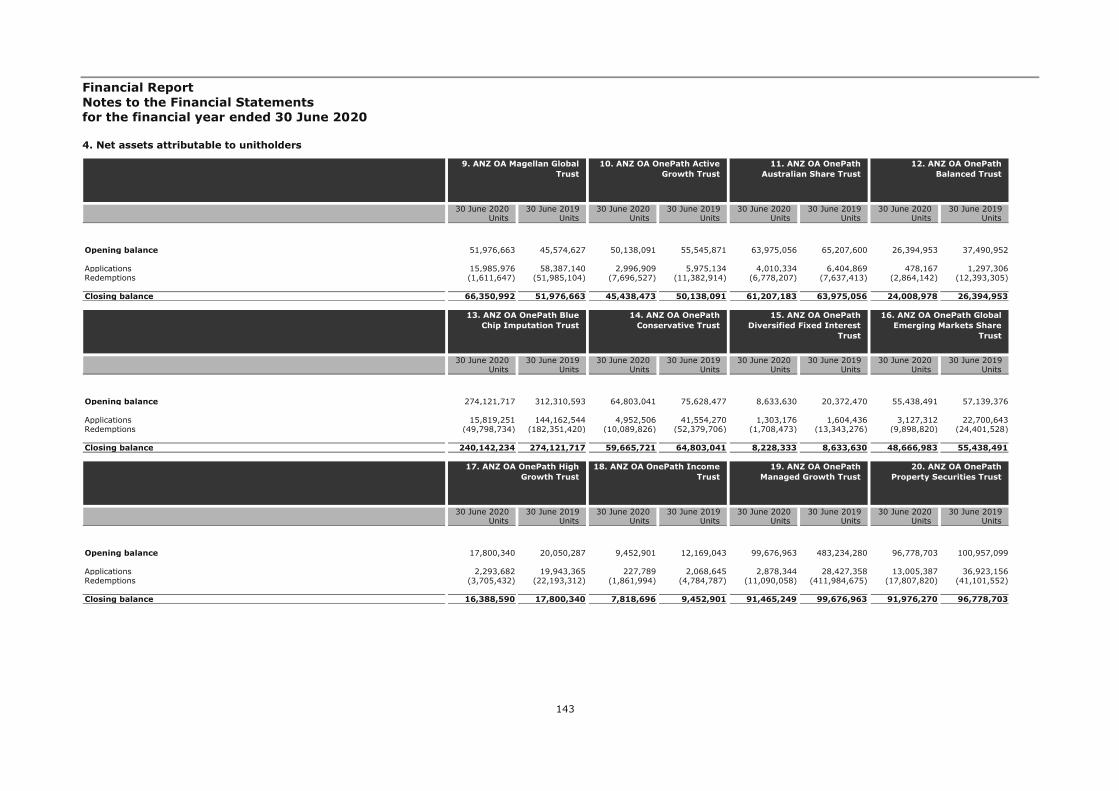
Financial Report Notes to the Financial Statements for the financial year ended 30 June 2020
143
4. Net assets attributable to unitholders
30 June 2020 30 June 2019 30 June 2020 30 June 2019 30 June 2020 30 June 2019 30 June 2020 30 June 2019Units Units Units Units Units Units Units Units
Opening balance 51,976,663 45,574,627 50,138,091 55,545,871 63,975,056 65,207,600 26,394,953 37,490,952
Applications 15,985,976 58,387,140 2,996,909 5,975,134 4,010,334 6,404,869 478,167 1,297,306Redemptions (1,611,647) (51,985,104) (7,696,527) (11,382,914) (6,778,207) (7,637,413) (2,864,142) (12,393,305)
Closing balance 66,350,992 51,976,663 45,438,473 50,138,091 61,207,183 63,975,056 24,008,978 26,394,953
12. ANZ OA OnePath Balanced Trust
9. ANZ OA Magellan Global Trust
10. ANZ OA OnePath Active Growth Trust
11. ANZ OA OnePath Australian Share Trust
30 June 2020 30 June 2019 30 June 2020 30 June 2019 30 June 2020 30 June 2019 30 June 2020 30 June 2019Units Units Units Units Units Units Units Units
Opening balance 274,121,717 312,310,593 64,803,041 75,628,477 8,633,630 20,372,470 55,438,491 57,139,376
Applications 15,819,251 144,162,544 4,952,506 41,554,270 1,303,176 1,604,436 3,127,312 22,700,643Redemptions (49,798,734) (182,351,420) (10,089,826) (52,379,706) (1,708,473) (13,343,276) (9,898,820) (24,401,528)
Closing balance 240,142,234 274,121,717 59,665,721 64,803,041 8,228,333 8,633,630 48,666,983 55,438,491
16. ANZ OA OnePath Global Emerging Markets Share
Trust
13. ANZ OA OnePath Blue Chip Imputation Trust
14. ANZ OA OnePath Conservative Trust
15. ANZ OA OnePath Diversified Fixed Interest
Trust
30 June 2020 30 June 2019 30 June 2020 30 June 2019 30 June 2020 30 June 2019 30 June 2020 30 June 2019Units Units Units Units Units Units Units Units
Opening balance 17,800,340 20,050,287 9,452,901 12,169,043 99,676,963 483,234,280 96,778,703 100,957,099
Applications 2,293,682 19,943,365 227,789 2,068,645 2,878,344 28,427,358 13,005,387 36,923,156Redemptions (3,705,432) (22,193,312) (1,861,994) (4,784,787) (11,090,058) (411,984,675) (17,807,820) (41,101,552)
Closing balance 16,388,590 17,800,340 7,818,696 9,452,901 91,465,249 99,676,963 91,976,270 96,778,703
20. ANZ OA OnePath Property Securities Trust
17. ANZ OA OnePath High Growth Trust
18. ANZ OA OnePath Income Trust
19. ANZ OA OnePath Managed Growth Trust
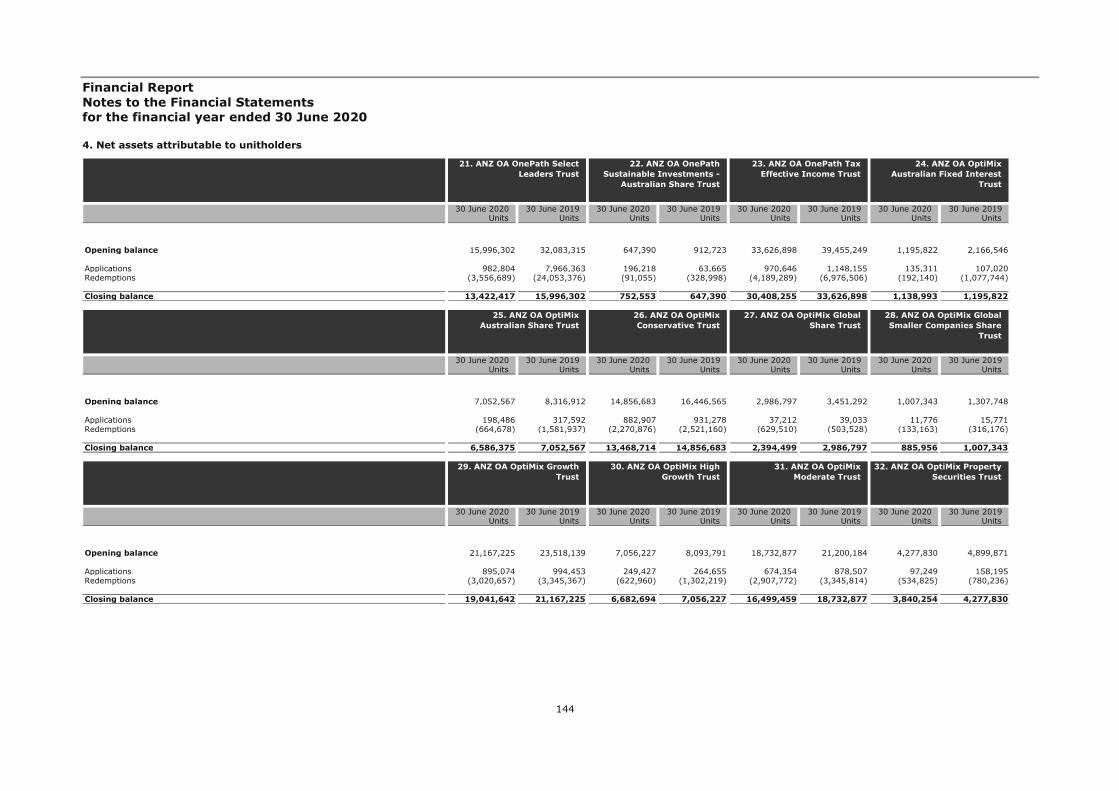
Financial Report Notes to the Financial Statements for the financial year ended 30 June 2020
144
4. Net assets attributable to unitholders
30 June 2020 30 June 2019 30 June 2020 30 June 2019 30 June 2020 30 June 2019 30 June 2020 30 June 2019Units Units Units Units Units Units Units Units
Opening balance 15,996,302 32,083,315 647,390 912,723 33,626,898 39,455,249 1,195,822 2,166,546
Applications 982,804 7,966,363 196,218 63,665 970,646 1,148,155 135,311 107,020Redemptions (3,556,689) (24,053,376) (91,055) (328,998) (4,189,289) (6,976,506) (192,140) (1,077,744)
Closing balance 13,422,417 15,996,302 752,553 647,390 30,408,255 33,626,898 1,138,993 1,195,822
24. ANZ OA OptiMix Australian Fixed Interest
Trust
21. ANZ OA OnePath Select Leaders Trust
22. ANZ OA OnePath Sustainable Investments -
Australian Share Trust
23. ANZ OA OnePath Tax Effective Income Trust
30 June 2020 30 June 2019 30 June 2020 30 June 2019 30 June 2020 30 June 2019 30 June 2020 30 June 2019Units Units Units Units Units Units Units Units
Opening balance 7,052,567 8,316,912 14,856,683 16,446,565 2,986,797 3,451,292 1,007,343 1,307,748
Applications 198,486 317,592 882,907 931,278 37,212 39,033 11,776 15,771Redemptions (664,678) (1,581,937) (2,270,876) (2,521,160) (629,510) (503,528) (133,163) (316,176)
Closing balance 6,586,375 7,052,567 13,468,714 14,856,683 2,394,499 2,986,797 885,956 1,007,343
28. ANZ OA OptiMix Global Smaller Companies Share
Trust
25. ANZ OA OptiMix Australian Share Trust
26. ANZ OA OptiMix Conservative Trust
27. ANZ OA OptiMix Global Share Trust
30 June 2020 30 June 2019 30 June 2020 30 June 2019 30 June 2020 30 June 2019 30 June 2020 30 June 2019Units Units Units Units Units Units Units Units
Opening balance 21,167,225 23,518,139 7,056,227 8,093,791 18,732,877 21,200,184 4,277,830 4,899,871
Applications 895,074 994,453 249,427 264,655 674,354 878,507 97,249 158,195Redemptions (3,020,657) (3,345,367) (622,960) (1,302,219) (2,907,772) (3,345,814) (534,825) (780,236)
Closing balance 19,041,642 21,167,225 6,682,694 7,056,227 16,499,459 18,732,877 3,840,254 4,277,830
32. ANZ OA OptiMix Property Securities Trust
29. ANZ OA OptiMix Growth Trust
30. ANZ OA OptiMix High Growth Trust
31. ANZ OA OptiMix Moderate Trust

Financial Report Notes to the Financial Statements for the financial year ended 30 June 2020
145
4. Net assets attributable to unitholders
30 June 2020 30 June 2019 30 June 2020 30 June 2019 30 June 2020 30 June 2019 30 June 2020 30 June 2019Units Units Units Units Units Units Units Units
Opening balance 386,127,526 441,881,643 105,657,252 117,999,252 13,150,186 16,249,385 2,320,662 63,443,087
Applications 31,668,224 430,379,567 32,119,195 132,527,577 3,285,088 11,341,843 267,366 5,211,817Redemptions (80,511,601) (486,133,684) (56,684,693) (144,869,577) (3,399,108) (14,441,042) (437,007) (66,334,242)
Closing balance 337,284,149 386,127,526 81,091,754 105,657,252 13,036,166 13,150,186 2,151,021 2,320,662
36. ANZ OA UBS Diversified Fixed Income Trust
33. ANZ OA Perpetual Australian Share Trust
34. ANZ OA Schroder Australian Equity Trust
35. ANZ OA SG Hiscock Property Trust
30 June 2020 30 June 2019 30 June 2020 30 June 2019 30 June 2020 30 June 2019 30 June 2020 30 June 2019Units Units Units Units Units Units Units Units
Opening balance 14,084,091 15,789,689 8,645,366 8,566,767 204,482,292 175,956,411 64,859,175 73,007,302
Applications 2,443,739 14,867,196 1,287,077 9,506,552 179,712,730 46,947,345 11,408,531 50,545,224Redemptions (3,565,391) (16,572,794) (2,318,061) (9,427,953) (112,622,106) (18,421,464) (12,941,292) (58,693,351)
Closing balance 12,962,439 14,084,091 7,614,382 8,645,366 271,572,916 204,482,292 63,326,414 64,859,175
40. ANZ Property Securities Trust
37. ANZ OneAnswer - BR Scientific Australian Equity
Trust
38. ANZ OneAnswer - BR Scientific International
Equity Trust
39. ANZ Private International Fixed Interest Fund
30 June 2020 30 June 2019 30 June 2020 30 June 2019 30 June 2020 30 June 2019 30 June 2020 30 June 2019Units Units Units Units Units Units Units Units
Opening balance 94,321,454 92,862,070 70,095,915 119,791,903 71,522,133 95,368,021 134,415,092 134,184,555
Applications 5,280,444 88,373,433 5,333,917 7,215,034 3,288,647 45,932,955 27,218,616 96,545,967Redemptions (4,115,537) (86,914,049) (8,487,824) (56,911,022) (10,184,917) (69,778,843) (33,969,745) (96,315,430)
Closing balance 95,486,361 94,321,454 66,942,008 70,095,915 64,625,863 71,522,133 127,663,963 134,415,092
44. Emerging Companies Trust
41. Australian Share Trust 42. Balanced Trust 43. Blue Chip Imputation Trust

Financial Report Notes to the Financial Statements for the financial year ended 30 June 2020
146
4. Net assets attributable to unitholders
30 June 2020 30 June 2019 30 June 2020 30 June 2019 30 June 2020 30 June 2019 30 June 2020 30 June 2019Units Units Units Units Units Units Units Units
Opening balance 59,138,809 63,980,131 7,517,719 8,048,778 1,591,590 2,992,771 16,803,771 17,408,457
Applications 2,929,782 53,182,193 142,569 220,469 128,798 306,044 3,039,919 19,533,979Redemptions (7,084,773) (58,023,515) (166,867) (751,528) (175,063) (1,707,225) (10,013,385) (20,138,665)
Closing balance 54,983,818 59,138,809 7,493,421 7,517,719 1,545,325 1,591,590 9,830,305 16,803,771
48. OneAnswer - Altrinsic Global Equities Trust
45. Global Share Trust 46. Heine Property Securities Fund
47. High Growth Trust
30 June 2020 30 June 2019 30 June 2020 30 June 2019 30 June 2020 30 June 2019 30 June 2020 30 June 2019Units Units Units Units Units Units Units Units
Opening balance 187,901,313 222,832,444 7,635,666 10,267,897 74,451,407 67,012,892 78,091,889 74,808,065
Applications 4,604,349 158,493,488 356,422 3,352,455 5,506,272 85,238,985 10,618,157 89,523,158Redemptions (37,654,349) (193,424,619) (1,848,826) (5,984,686) (16,366,023) (77,800,470) (13,478,344) (86,239,334)
Closing balance 154,851,313 187,901,313 6,143,262 7,635,666 63,591,656 74,451,407 75,231,702 78,091,889
52. OneAnswer - Bennelong Australian Equities Trust
49. OneAnswer - Antipodes Global (Long Only) Trust
50. OneAnswer - Arrowstreet Global Equity (Hedged) Trust
51. OneAnswer - Ausbil Australian Emerging Leaders
Trust
30 June 2020 30 June 2019 30 June 2020 30 June 2019 30 June 2020 30 June 2019 30 June 2020 30 June 2019Units Units Units Units Units Units Units Units
Opening balance 67,504,626 69,503,118 2,850,307 3,422,315 53,617,601 59,102,669 29,735,297 31,128,968
Applications 5,691,353 68,591,254 698,193 516,618 7,344,591 61,900,500 5,572,728 27,568,767Redemptions (17,085,512) (70,589,746) (485,382) (1,088,626) (14,045,379) (67,385,568) (8,026,806) (28,962,438)
Closing balance 56,110,467 67,504,626 3,063,118 2,850,307 46,916,813 53,617,601 27,281,219 29,735,297
56. OneAnswer - BR Scientific Diversified Growth
Trust
53. OneAnswer - Bentham Global Income Trust
54. OneAnswer - BlackRock Scientific Australian Equity
Trust
55. OneAnswer - Blackrock Tactical Growth Trust

Financial Report Notes to the Financial Statements for the financial year ended 30 June 2020
147
4. Net assets attributable to unitholders
30 June 2020 30 June 2019 30 June 2020 30 June 2019 30 June 2020 30 June 2019 30 June 2020 30 June 2019Units Units Units Units Units Units Units Units
Opening balance 1,125,721 1,406,908 46,591,860 51,622,403 150,905,228 54,671,024 6,874,483 71,146,151
Applications 102,807 153,079 3,551,885 44,916,260 26,924,652 224,424,858 238,137 6,670,324Redemptions (172,369) (434,266) (11,999,165) (49,946,803) (13,083,786) (128,190,654) (1,606,535) (70,941,992)
Closing balance 1,056,159 1,125,721 38,144,580 46,591,860 164,746,094 150,905,228 5,506,085 6,874,483
60. OneAnswer - Colonial First State Imputation Trust
57. OneAnswer - BR Scientific International
Equity Trust
58. OneAnswer - Colonial First State Global Credit
Income Trust
59. OneAnswer - Colonial First State Global Listed
Infrastructure Trust
30 June 2020 30 June 2019 30 June 2020 30 June 2019 30 June 2020 30 June 2019 30 June 2020 30 June 2019Units Units Units Units Units Units Units Units
Opening balance 202,700,152 197,131,372 70,553,847 30,611,115 121,661,589 137,366,993 3,846,728 5,599,643
Applications 18,837,774 207,801,742 12,380,077 103,031,581 30,413,400 87,907,014 816,769 3,942,773Redemptions (41,552,507) (202,232,962) (14,770,225) (63,088,849) (19,682,104) (103,612,418) (681,097) (5,695,688)
Closing balance 179,985,419 202,700,152 68,163,699 70,553,847 132,392,885 121,661,589 3,982,400 3,846,728
64. OneAnswer - Janus Henderson Global Fixed
Interest Total Return Trust
61. OneAnswer - Fidelity Australian Equities Trust
62. OneAnswer - Greencape Broadcap Trust
63. OneAnswer - Investors Mutual Australian Share
Trust
30 June 2020 30 June 2019 30 June 2020 30 June 2019 30 June 2020 30 June 2019 30 June 2020 30 June 2019Units Units Units Units Units Units Units Units
Opening balance 570,530,541 613,029,853 130,830,562 115,059,354 83,012,350 94,555,347 261,984,944 263,387,786
Applications 41,443,003 528,132,997 41,419,030 73,831,544 7,859,916 84,888,440 53,371,824 269,435,397Redemptions (109,143,299) (570,632,309) (8,850,150) (58,060,336) (22,085,475) (96,431,437) (68,953,353) (270,838,239)
Closing balance 502,830,245 570,530,541 163,399,442 130,830,562 68,786,791 83,012,350 246,403,415 261,984,944
68. OneAnswer - MFS Global Equity Trust
65. OneAnswer - Kapstream Absolute Return Income
Trust
66. OneAnswer - Magellan Global Trust
67. OneAnswer - Merlon Australian Share Income
Trust

Financial Report Notes to the Financial Statements for the financial year ended 30 June 2020
148
4. Net assets attributable to unitholders
30 June 2020 30 June 2019 30 June 2020 30 June 2019 30 June 2020 30 June 2019 30 June 2020 30 June 2019Units Units Units Units Units Units Units Units
Opening balance 23,181,223 9,481,913 194,049,589 196,823,410 42,277,073 38,408,659 51,268,458 50,814,175
Applications 4,599,033 34,898,838 14,387,220 187,360,437 6,885,419 50,860,084 150,556 42,083,458Redemptions (13,215,207) (21,199,528) (34,267,556) (190,134,258) (9,439,673) (46,991,670) (8,962,415) (41,629,175)
Closing balance 14,565,049 23,181,223 174,169,253 194,049,589 39,722,819 42,277,073 42,456,599 51,268,458
72. OneAnswer - Pendal Core Hedged Global Shares Trust
69. OneAnswer - Nikko AM Australian Shares Trust
70. OneAnswer - OnePath Global Property Securities
Index Trust
71. OneAnswer - Pendal Australian Share Trust
30 June 2020 30 June 2019 30 June 2020 30 June 2019 30 June 2020 30 June 2019 30 June 2020 30 June 2019Units Units Units Units Units Units Units Units
Opening balance 13,854,763 11,853,355 95,166,561 90,497,180 118,785,377 137,220,725 22,094,834 100,934,039
Applications 7,611,805 16,281,310 11,377,163 94,626,960 15,527,208 119,798,203 1,332,525 4,451,547Redemptions (2,913,682) (14,279,902) (17,408,087) (89,957,579) (28,844,773) (138,233,551) (6,364,329) (83,290,752)
Closing balance 18,552,886 13,854,763 89,135,637 95,166,561 105,467,812 118,785,377 17,063,030 22,094,834
76. OneAnswer - Perpetual Australian Share Trust
73. OneAnswer - Pendal Monthly Income Plus Trust
74. OneAnswer - Pendal Smaller Companies Trust
75. OneAnswer - Perennial Value Shares Trust
30 June 2020 30 June 2019 30 June 2020 30 June 2019 30 June 2020 30 June 2019 30 June 2020 30 June 2019Units Units Units Units Units Units Units Units
Opening balance 143,679,657 195,805,947 126,101,463 121,645,580 4,819,159 7,035,758 28,532,259 25,196,121
Applications 22,210,200 170,535,049 17,066,471 123,655,167 2,816,534 5,836,988 4,219,578 35,259,799Redemptions (42,382,707) (222,661,339) (26,603,052) (119,199,284) (1,509,370) (8,053,587) (7,506,937) (31,923,661)
Closing balance 123,507,150 143,679,657 116,564,882 126,101,463 6,126,323 4,819,159 25,244,900 28,532,259
80. OneAnswer - Platinum Asia Trust
77. OneAnswer - Perpetual Balanced Growth Trust
78. OneAnswer - Perpetual Conservative Growth Trust
79. OneAnswer - Perpetual Ethical SRI Trust

Financial Report Notes to the Financial Statements for the financial year ended 30 June 2020
149
4. Net assets attributable to unitholders
30 June 2020 30 June 2019 30 June 2020 30 June 2019 30 June 2020 30 June 2019 30 June 2020 30 June 2019Units Units Units Units Units Units Units Units
Opening balance 342,214,051 343,977,793 104,308,347 124,909,121 209,259,249 212,921,500 252,993,969 325,568,099
Applications 57,607,233 387,594,532 6,644,150 111,960,295 41,529,483 117,854,282 32,199,852 294,318,580Redemptions (85,100,610) (389,358,274) (26,945,867) (132,561,069) (57,642,317) (121,516,533) (80,660,455) (366,892,710)
Closing balance 314,720,674 342,214,051 84,006,630 104,308,347 193,146,415 209,259,249 204,533,366 252,993,969
84. OneAnswer - Schroder Balanced Trust
81. OneAnswer - Platinum International Trust
82. OneAnswer - RARE Infastructure Value Trust
83. OneAnswer - Schroder Australian Equity Trust
30 June 2020 30 June 2019 30 June 2020 30 June 2019 30 June 2020 30 June 2019 30 June 2020 30 June 2019Units Units Units Units Units Units Units Units
Opening balance 209,085,678 244,853,898 440,835,873 511,216,507 17,178,278 18,879,106 4,005,683 4,956,052
Applications 22,037,275 201,668,546 34,198,658 433,832,250 3,077,450 3,591,858 2,381,108 4,040,623Redemptions (42,565,019) (237,436,766) (87,315,820) (504,212,884) (4,383,930) (5,292,686) (987,747) (4,990,992)
Closing balance 188,557,934 209,085,678 387,718,711 440,835,873 15,871,798 17,178,278 5,399,044 4,005,683
88. OneAnswer - Stewart Investors Worldwide
Sustainability Trust
85. OneAnswer - Schroder Fixed Income Trust
86. OneAnswer - Schroder Real Return Trust
87. OneAnswer - SG Hiscock Property Trust
30 June 2020 30 June 2019 30 June 2020 30 June 2019 30 June 2020 30 June 2019 30 June 2020 30 June 2019Units Units Units Units Units Units Units Units
Opening balance 24,200,504 12,763,190 47,983,299 19,397,895 55,183,744 63,037,097 21,884,678 28,107,668
Applications 9,173,318 33,272,452 20,495,221 69,589,767 3,904,943 55,846,525 7,144,037 23,526,683Redemptions (4,258,954) (21,835,138) (4,444,077) (41,004,363) (10,442,644) (63,699,878) (7,738,302) (29,749,673)
Closing balance 29,114,868 24,200,504 64,034,443 47,983,299 48,646,043 55,183,744 21,290,413 21,884,678
92. OneAnswer - UBS Defensive Trust
89. OneAnswer - T. Rowe Price Global Equity Trust
90. OneAnswer - T.Rowe Price Dynamic Global Bond
Trust
91. OneAnswer - UBS Balanced Trust
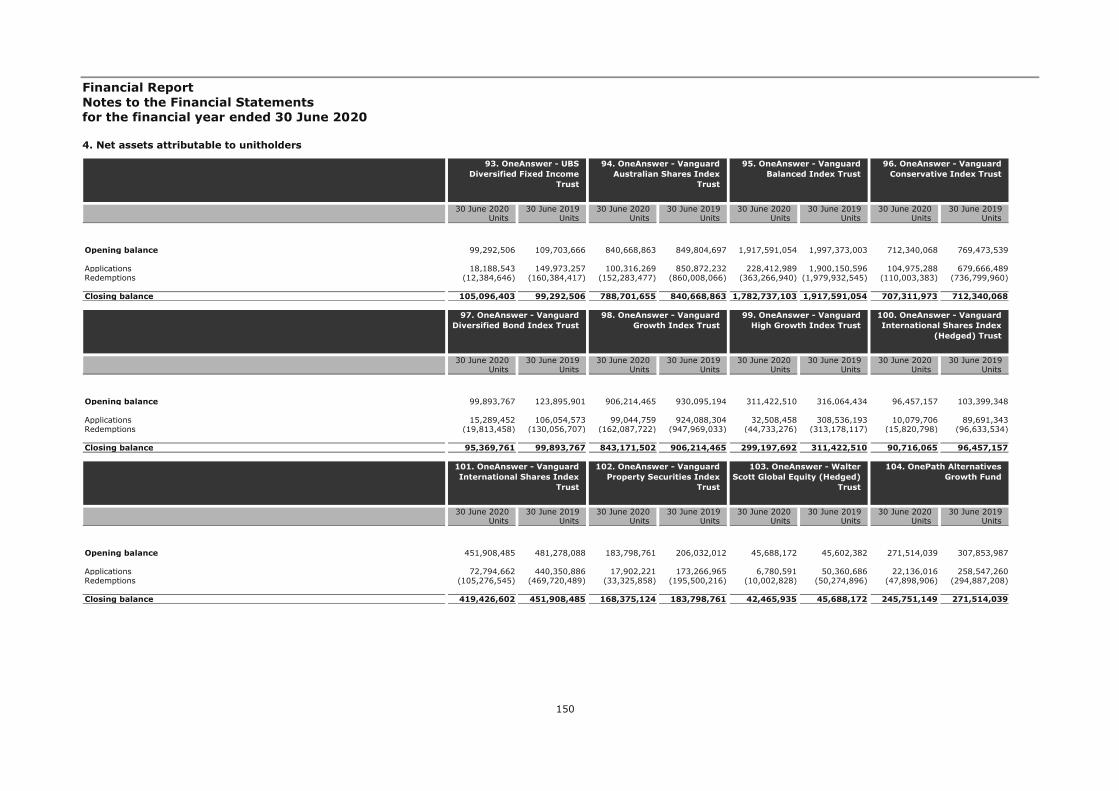
Financial Report Notes to the Financial Statements for the financial year ended 30 June 2020
150
4. Net assets attributable to unitholders
30 June 2020 30 June 2019 30 June 2020 30 June 2019 30 June 2020 30 June 2019 30 June 2020 30 June 2019Units Units Units Units Units Units Units Units
Opening balance 99,292,506 109,703,666 840,668,863 849,804,697 1,917,591,054 1,997,373,003 712,340,068 769,473,539
Applications 18,188,543 149,973,257 100,316,269 850,872,232 228,412,989 1,900,150,596 104,975,288 679,666,489Redemptions (12,384,646) (160,384,417) (152,283,477) (860,008,066) (363,266,940) (1,979,932,545) (110,003,383) (736,799,960)
Closing balance 105,096,403 99,292,506 788,701,655 840,668,863 1,782,737,103 1,917,591,054 707,311,973 712,340,068
96. OneAnswer - Vanguard Conservative Index Trust
93. OneAnswer - UBS Diversified Fixed Income
Trust
94. OneAnswer - Vanguard Australian Shares Index
Trust
95. OneAnswer - Vanguard Balanced Index Trust
30 June 2020 30 June 2019 30 June 2020 30 June 2019 30 June 2020 30 June 2019 30 June 2020 30 June 2019Units Units Units Units Units Units Units Units
Opening balance 99,893,767 123,895,901 906,214,465 930,095,194 311,422,510 316,064,434 96,457,157 103,399,348
Applications 15,289,452 106,054,573 99,044,759 924,088,304 32,508,458 308,536,193 10,079,706 89,691,343Redemptions (19,813,458) (130,056,707) (162,087,722) (947,969,033) (44,733,276) (313,178,117) (15,820,798) (96,633,534)
Closing balance 95,369,761 99,893,767 843,171,502 906,214,465 299,197,692 311,422,510 90,716,065 96,457,157
100. OneAnswer - Vanguard International Shares Index
(Hedged) Trust
97. OneAnswer - Vanguard Diversified Bond Index Trust
98. OneAnswer - Vanguard Growth Index Trust
99. OneAnswer - Vanguard High Growth Index Trust
30 June 2020 30 June 2019 30 June 2020 30 June 2019 30 June 2020 30 June 2019 30 June 2020 30 June 2019Units Units Units Units Units Units Units Units
Opening balance 451,908,485 481,278,088 183,798,761 206,032,012 45,688,172 45,602,382 271,514,039 307,853,987
Applications 72,794,662 440,350,886 17,902,221 173,266,965 6,780,591 50,360,686 22,136,016 258,547,260Redemptions (105,276,545) (469,720,489) (33,325,858) (195,500,216) (10,002,828) (50,274,896) (47,898,906) (294,887,208)
Closing balance 419,426,602 451,908,485 168,375,124 183,798,761 42,465,935 45,688,172 245,751,149 271,514,039
104. OnePath Alternatives Growth Fund
101. OneAnswer - Vanguard International Shares Index
Trust
102. OneAnswer - Vanguard Property Securities Index
Trust
103. OneAnswer - Walter Scott Global Equity (Hedged)
Trust

Financial Report Notes to the Financial Statements for the financial year ended 30 June 2020
151
4. Net assets attributable to unitholders
30 June 2020 30 June 2019 30 June 2020 30 June 2019 30 June 2020 30 June 2019 30 June 2020 30 June 2019Units Units Units Units Units Units Units Units
Opening balance 626,313,233 676,386,910 5,501,902 7,515,826 964,160 1,670,385 15,404,162 26,348,727
Applications 36,061,474 59,790,708 288,192 3,136,537 54,175 57,582 1,718,087 7,202,135Redemptions (109,058,642) (109,864,385) (1,065,251) (5,150,461) (171,980) (763,807) (3,924,470) (18,146,700)
Closing balance 553,316,065 626,313,233 4,724,843 5,501,902 846,355 964,160 13,197,779 15,404,162
108. OnePath Diversified Fixed Interest Trust
105. OnePath Capital Guaranteed Trust
106. OnePath Capital Stable Trust
107. OnePath Diversified Credit Trust
30 June 2020 30 June 2019 30 June 2020 30 June 2019 30 June 2020 30 June 2019 30 June 2020 30 June 2019Units Units Units Units Units Units Units Units
Opening balance 8,348,899 9,816,845 27,418,922 27,886,656 2,044,046 86,058,084 2,281,392 24,512,539
Applications 1,887,148 1,063,819 1,002,231 24,601,578 320,893 5,321,718 88,828 2,645,086Redemptions (2,380,791) (2,531,765) (838,997) (25,069,312) (975,775) (89,335,756) (517,596) (24,876,233)
Closing balance 7,855,256 8,348,899 27,582,156 27,418,922 1,389,164 2,044,046 1,852,624 2,281,392
112. OnePath Select Leaders Trust
109. OnePath Geared Australian Shares Index
Trust
110. OnePath Global Emerging Markets Share
Trust
111. OnePath Managed Growth Trust
30 June 2020 30 June 2019 30 June 2020 30 June 2019 30 June 2020 30 June 2019 30 June 2020 30 June 2019Units Units Units Units Units Units Units Units
Opening balance 1,471,932 2,677,428 162,931,162 206,103,427 449,423,646 522,279,769 17,391,164 20,444,263
Applications 347,847 504,239 15,036,838 160,405,264 20,988,387 377,248,935 1,153,957 3,641,596Redemptions (257,841) (1,709,735) (39,324,819) (203,577,529) (77,838,936) (450,105,058) (9,985,930) (6,694,695)
Closing balance 1,561,938 1,471,932 138,643,181 162,931,162 392,573,097 449,423,646 8,559,191 17,391,164
116. OnePath Wholesale Blue Chip Imputation Trust
113. OnePath Sustainable Investments - Australian
Share Trust
114. OnePath Wholesale Australian Share Trust
115. OnePath Wholesale Balanced Trust
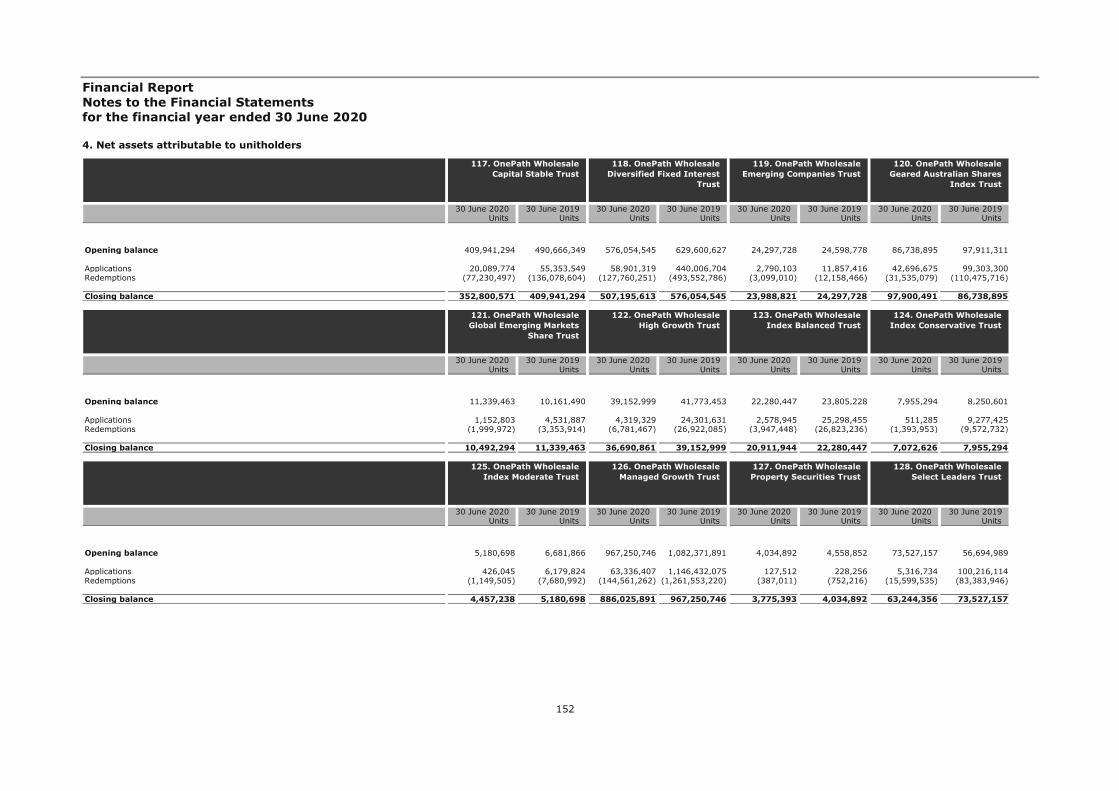
Financial Report Notes to the Financial Statements for the financial year ended 30 June 2020
152
4. Net assets attributable to unitholders
30 June 2020 30 June 2019 30 June 2020 30 June 2019 30 June 2020 30 June 2019 30 June 2020 30 June 2019Units Units Units Units Units Units Units Units
Opening balance 409,941,294 490,666,349 576,054,545 629,600,627 24,297,728 24,598,778 86,738,895 97,911,311
Applications 20,089,774 55,353,549 58,901,319 440,006,704 2,790,103 11,857,416 42,696,675 99,303,300Redemptions (77,230,497) (136,078,604) (127,760,251) (493,552,786) (3,099,010) (12,158,466) (31,535,079) (110,475,716)
Closing balance 352,800,571 409,941,294 507,195,613 576,054,545 23,988,821 24,297,728 97,900,491 86,738,895
120. OnePath Wholesale Geared Australian Shares
Index Trust
117. OnePath Wholesale Capital Stable Trust
118. OnePath Wholesale Diversified Fixed Interest
Trust
119. OnePath Wholesale Emerging Companies Trust
30 June 2020 30 June 2019 30 June 2020 30 June 2019 30 June 2020 30 June 2019 30 June 2020 30 June 2019Units Units Units Units Units Units Units Units
Opening balance 11,339,463 10,161,490 39,152,999 41,773,453 22,280,447 23,805,228 7,955,294 8,250,601
Applications 1,152,803 4,531,887 4,319,329 24,301,631 2,578,945 25,298,455 511,285 9,277,425Redemptions (1,999,972) (3,353,914) (6,781,467) (26,922,085) (3,947,448) (26,823,236) (1,393,953) (9,572,732)
Closing balance 10,492,294 11,339,463 36,690,861 39,152,999 20,911,944 22,280,447 7,072,626 7,955,294
124. OnePath Wholesale Index Conservative Trust
121. OnePath Wholesale Global Emerging Markets
Share Trust
122. OnePath Wholesale High Growth Trust
123. OnePath Wholesale Index Balanced Trust
30 June 2020 30 June 2019 30 June 2020 30 June 2019 30 June 2020 30 June 2019 30 June 2020 30 June 2019Units Units Units Units Units Units Units Units
Opening balance 5,180,698 6,681,866 967,250,746 1,082,371,891 4,034,892 4,558,852 73,527,157 56,694,989
Applications 426,045 6,179,824 63,336,407 1,146,432,075 127,512 228,256 5,316,734 100,216,114Redemptions (1,149,505) (7,680,992) (144,561,262) (1,261,553,220) (387,011) (752,216) (15,599,535) (83,383,946)
Closing balance 4,457,238 5,180,698 886,025,891 967,250,746 3,775,393 4,034,892 63,244,356 73,527,157
128. OnePath Wholesale Select Leaders Trust
125. OnePath Wholesale Index Moderate Trust
126. OnePath Wholesale Managed Growth Trust
127. OnePath Wholesale Property Securities Trust

Financial Report Notes to the Financial Statements for the financial year ended 30 June 2020
153
4. Net assets attributable to unitholders
30 June 2020 30 June 2019 30 June 2020 30 June 2019 30 June 2020 30 June 2019 30 June 2020 30 June 2019Units Units Units Units Units Units Units Units
Opening balance 3,803,778 5,101,513 12,281,165 13,833,495 37,627,457 42,328,782 11,594,126 13,356,433
Applications 597,651 291,267 482,506 491,403 1,236,208 1,219,260 295,089 633,597Redemptions (744,409) (1,589,002) (2,380,440) (2,043,733) (5,385,027) (5,920,585) (2,294,246) (2,395,904)
Closing balance 3,657,020 3,803,778 10,383,231 12,281,165 33,478,638 37,627,457 9,594,969 11,594,126
132. OptiMix Conservative Trust
129. OptiMix Australian Fixed Interest Trust
130. OptiMix Australian Share Trust
131. OptiMix Balanced Trust
30 June 2020 30 June 2019 30 June 2020 30 June 2019 30 June 2020 30 June 2019 30 June 2020 30 June 2019Units Units Units Units Units Units Units Units
Opening balance 3,385,818 4,197,681 5,858,189 6,577,622 2,362,625 2,128,160 12,286,758 12,935,466
Applications 1,179,977 561,073 579,960 539,421 285,062 770,202 327,651 529,222Redemptions (884,721) (1,372,936) (1,007,949) (1,258,854) (589,591) (535,737) (2,008,733) (1,177,930)
Closing balance 3,681,074 3,385,818 5,430,200 5,858,189 2,058,096 2,362,625 10,605,676 12,286,758
136. OptiMix Growth Trust 133. OptiMix Global Emerging Markets Share
Trust
134. OptiMix Global Share Trust
135. OptiMix Global Smaller Companies Share Trust
30 June 2020 30 June 2019 30 June 2020 30 June 2019 30 June 2020 30 June 2019 30 June 2020 30 June 2019Units Units Units Units Units Units Units Units
Opening balance 4,765,379 6,765,072 7,273,970 9,330,657 6,134,271 6,881,420 1,122,500,731 1,247,738,704
Applications 100,678 229,502 324,070 295,367 162,268 214,336 74,392,221 1,176,977,597Redemptions (611,737) (2,229,195) (918,968) (2,352,054) (1,081,913) (961,485) (202,576,575) (1,302,215,570)
Closing balance 4,254,320 4,765,379 6,679,072 7,273,970 5,214,626 6,134,271 994,316,377 1,122,500,731
140. OptiMix Wholesale Balanced Trust
137. OptiMix High Growth Trust
138. OptiMix Moderate Trust 139. OptiMix Property Securities Trust
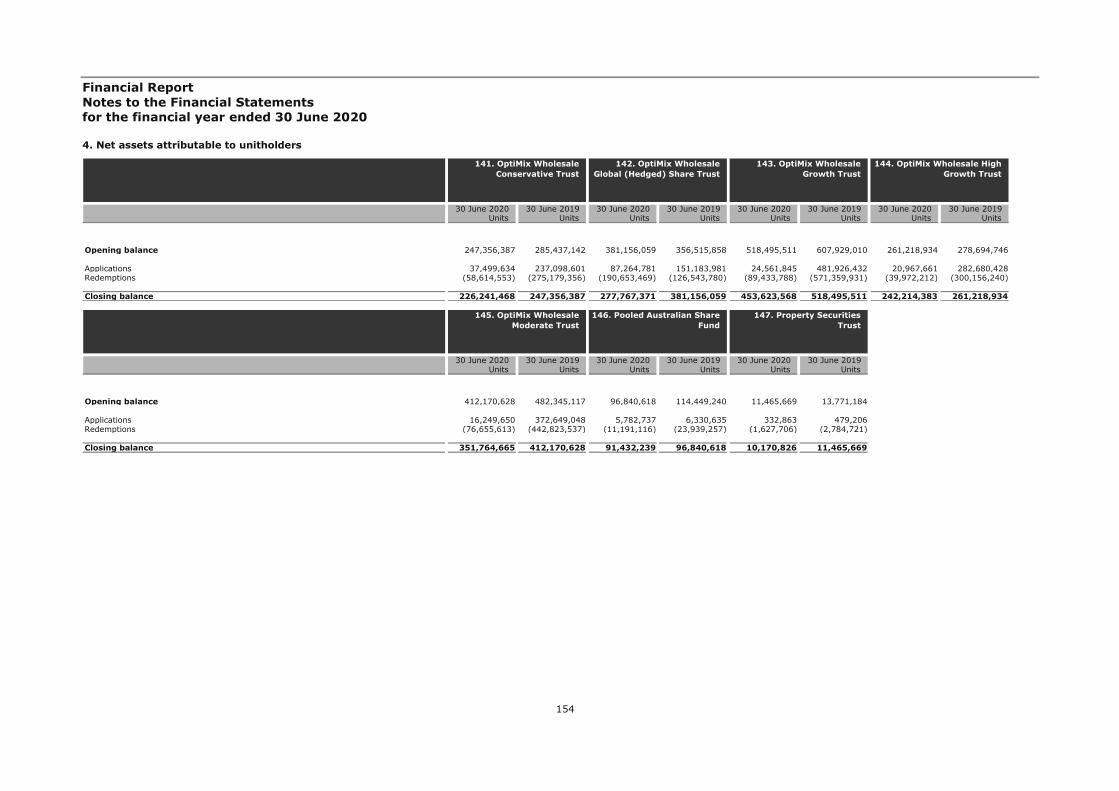
Financial Report Notes to the Financial Statements for the financial year ended 30 June 2020
154
4. Net assets attributable to unitholders
30 June 2020 30 June 2019 30 June 2020 30 June 2019 30 June 2020 30 June 2019 30 June 2020 30 June 2019Units Units Units Units Units Units Units Units
Opening balance 247,356,387 285,437,142 381,156,059 356,515,858 518,495,511 607,929,010 261,218,934 278,694,746
Applications 37,499,634 237,098,601 87,264,781 151,183,981 24,561,845 481,926,432 20,967,661 282,680,428Redemptions (58,614,553) (275,179,356) (190,653,469) (126,543,780) (89,433,788) (571,359,931) (39,972,212) (300,156,240)
Closing balance 226,241,468 247,356,387 277,767,371 381,156,059 453,623,568 518,495,511 242,214,383 261,218,934
144. OptiMix Wholesale High Growth Trust
141. OptiMix Wholesale Conservative Trust
142. OptiMix Wholesale Global (Hedged) Share Trust
143. OptiMix Wholesale Growth Trust
30 June 2020 30 June 2019 30 June 2020 30 June 2019 30 June 2020 30 June 2019Units Units Units Units Units Units
Opening balance 412,170,628 482,345,117 96,840,618 114,449,240 11,465,669 13,771,184
Applications 16,249,650 372,649,048 5,782,737 6,330,635 332,863 479,206Redemptions (76,655,613) (442,823,537) (11,191,116) (23,939,257) (1,627,706) (2,784,721)
Closing balance 351,764,665 412,170,628 91,432,239 96,840,618 10,170,826 11,465,669
145. OptiMix Wholesale Moderate Trust
146. Pooled Australian Share Fund
147. Property Securities Trust
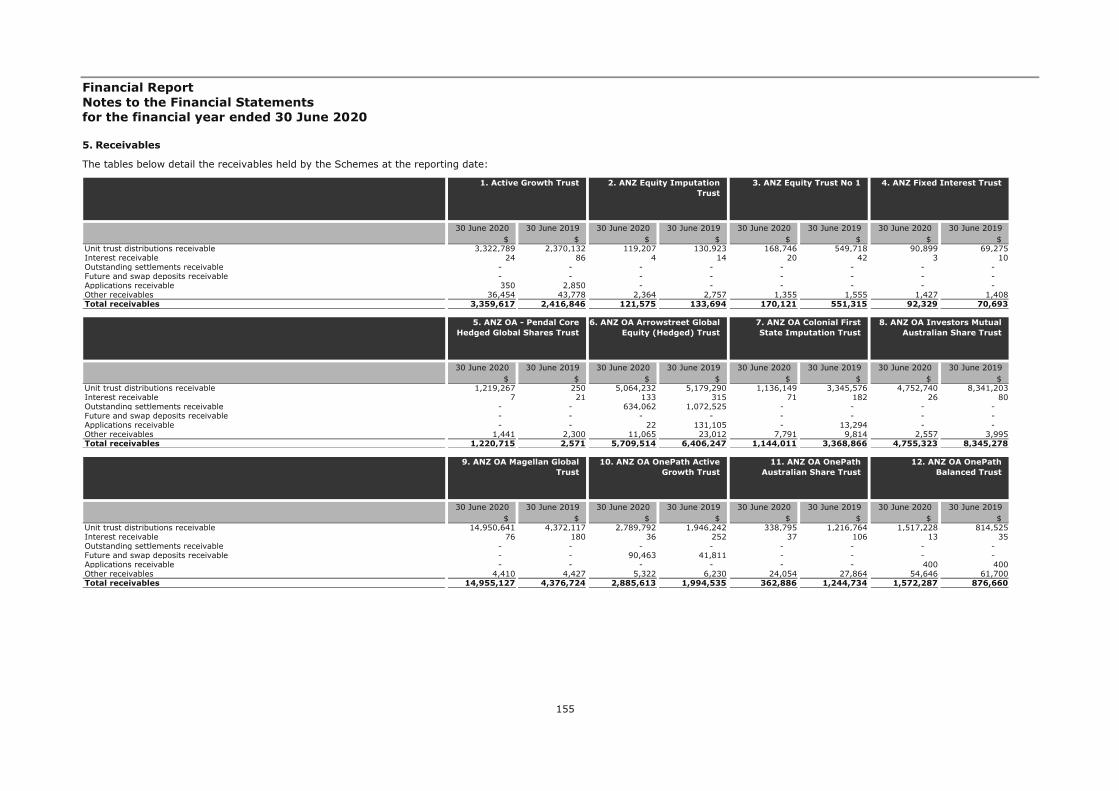
Financial Report Notes to the Financial Statements for the financial year ended 30 June 2020
155
5. Receivables
The tables below detail the receivables held by the Schemes at the reporting date:
30 June 2020 30 June 2019 30 June 2020 30 June 2019 30 June 2020 30 June 2019 30 June 2020 30 June 2019$ $ $ $ $ $ $ $
Unit trust distributions receivable 3,322,789 2,370,132 119,207 130,923 168,746 549,718 90,899 69,275Interest receivable 24 86 4 14 20 42 3 10Outstanding settlements receivable - - - - - - - - Future and swap deposits receivable - - - - - - - - Applications receivable 350 2,850 - - - - - - Other receivables 36,454 43,778 2,364 2,757 1,355 1,555 1,427 1,408Total receivables 3,359,617 2,416,846 121,575 133,694 170,121 551,315 92,329 70,693
1. Active Growth Trust 2. ANZ Equity Imputation Trust
3. ANZ Equity Trust No 1 4. ANZ Fixed Interest Trust
30 June 2020 30 June 2019 30 June 2020 30 June 2019 30 June 2020 30 June 2019 30 June 2020 30 June 2019$ $ $ $ $ $ $ $
Unit trust distributions receivable 1,219,267 250 5,064,232 5,179,290 1,136,149 3,345,576 4,752,740 8,341,203Interest receivable 7 21 133 315 71 182 26 80Outstanding settlements receivable - - 634,062 1,072,525 - - - - Future and swap deposits receivable - - - - - - - - Applications receivable - - 22 131,105 - 13,294 - - Other receivables 1,441 2,300 11,065 23,012 7,791 9,814 2,557 3,995Total receivables 1,220,715 2,571 5,709,514 6,406,247 1,144,011 3,368,866 4,755,323 8,345,278
5. ANZ OA - Pendal Core Hedged Global Shares Trust
6. ANZ OA Arrowstreet Global Equity (Hedged) Trust
7. ANZ OA Colonial First State Imputation Trust
8. ANZ OA Investors Mutual Australian Share Trust
30 June 2020 30 June 2019 30 June 2020 30 June 2019 30 June 2020 30 June 2019 30 June 2020 30 June 2019$ $ $ $ $ $ $ $
Unit trust distributions receivable 14,950,641 4,372,117 2,789,792 1,946,242 338,795 1,216,764 1,517,228 814,525Interest receivable 76 180 36 252 37 106 13 35Outstanding settlements receivable - - - - - - - - Future and swap deposits receivable - - 90,463 41,811 - - - - Applications receivable - - - - - - 400 400Other receivables 4,410 4,427 5,322 6,230 24,054 27,864 54,646 61,700Total receivables 14,955,127 4,376,724 2,885,613 1,994,535 362,886 1,244,734 1,572,287 876,660
9. ANZ OA Magellan Global Trust
10. ANZ OA OnePath Active Growth Trust
11. ANZ OA OnePath Australian Share Trust
12. ANZ OA OnePath Balanced Trust

Financial Report Notes to the Financial Statements for the financial year ended 30 June 2020
156
5. Receivables
30 June 2020 30 June 2019 30 June 2020 30 June 2019 30 June 2020 30 June 2019 30 June 2020 30 June 2019$ $ $ $ $ $ $ $
Unit trust distributions receivable 3,437,771 4,211,864 3,106,773 1,800,995 373,907 169,511 857,535 808,131Interest receivable 116 382 50 203 4 10 36 69Outstanding settlements receivable - - - - - - - - Future and swap deposits receivable - - 25,280 - - - - - Applications receivable - - - - - 24,584 - - Other receivables 129,993 189,104 31,418 42,021 11,372 34,262 5,206 8,725Total receivables 3,567,880 4,401,350 3,163,521 1,843,219 385,283 228,367 862,777 816,925
13. ANZ OA OnePath Blue Chip Imputation Trust
14. ANZ OA OnePath Conservative Trust
15. ANZ OA OnePath Diversified Fixed Interest
Trust
16. ANZ OA OnePath Global Emerging Markets Share
Trust
30 June 2020 30 June 2019 30 June 2020 30 June 2019 30 June 2020 30 June 2019 30 June 2020 30 June 2019$ $ $ $ $ $ $ $
Unit trust distributions receivable 1,417,900 1,466,267 244,530 162,987 5,240,095 4,396,164 1,897,835 1,024,853Interest receivable 11 29 10 50 47 129 76 181Outstanding settlements receivable - - - - - - - - Future and swap deposits receivable - - 2 2 - - - - Applications receivable - - - - - - - - Other receivables 507 405 14,522 18,175 36,736 41,154 3,791 7,896Total receivables 1,418,418 1,466,701 259,064 181,214 5,276,878 4,437,447 1,901,702 1,032,930
17. ANZ OA OnePath High Growth Trust
18. ANZ OA OnePath Income Trust
19. ANZ OA OnePath Managed Growth Trust
20. ANZ OA OnePath Property Securities Trust
30 June 2020 30 June 2019 30 June 2020 30 June 2019 30 June 2020 30 June 2019 30 June 2020 30 June 2019$ $ $ $ $ $ $ $
Unit trust distributions receivable 102,278 279,011 16,819 24,062 627,516 630,434 38,816 28,033Interest receivable 10 30 1 1 18 34 1 2Outstanding settlements receivable - - - - - - - - Future and swap deposits receivable - - - - - - - - Applications receivable - - - - - - - - Other receivables 12,259 13,997 410 809 46,616 84,690 1,303 3,997Total receivables 114,547 293,038 17,230 24,872 674,150 715,158 40,120 32,032
21. ANZ OA OnePath Select Leaders Trust
22. ANZ OA OnePath Sustainable Investments -
Australian Share Trust
23. ANZ OA OnePath Tax Effective Income Trust
24. ANZ OA OptiMix Australian Fixed Interest
Trust
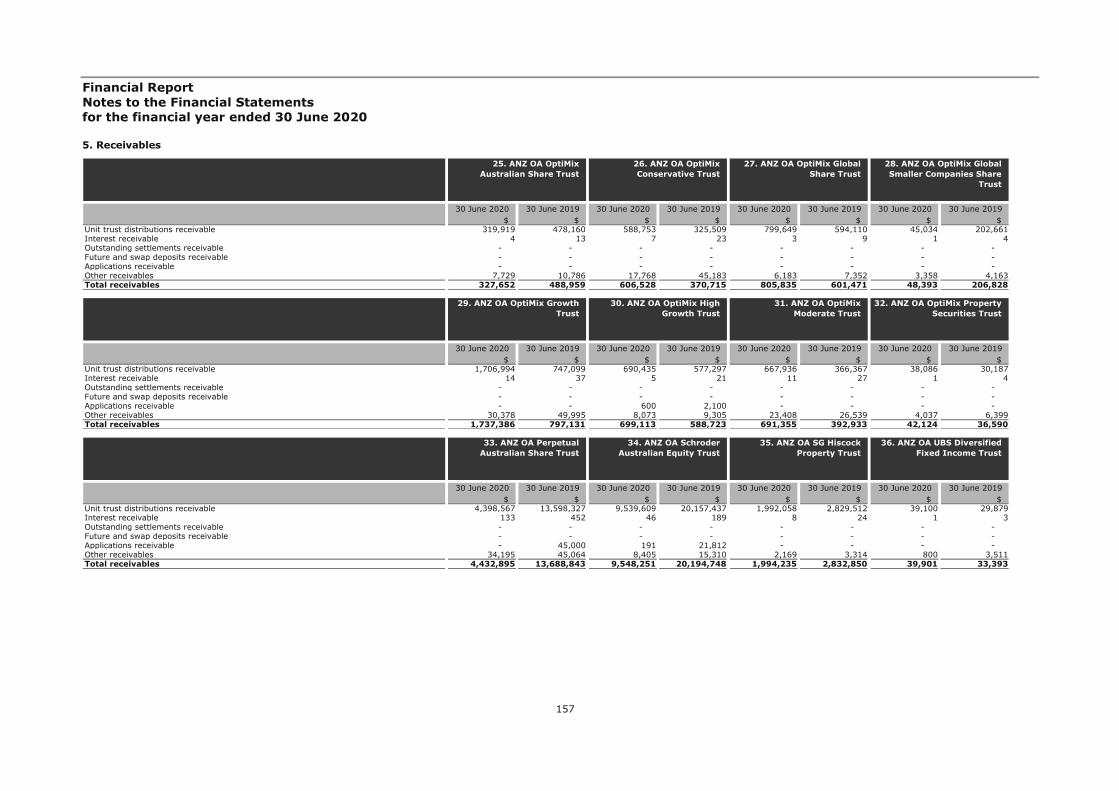
Financial Report Notes to the Financial Statements for the financial year ended 30 June 2020
157
5. Receivables
30 June 2020 30 June 2019 30 June 2020 30 June 2019 30 June 2020 30 June 2019 30 June 2020 30 June 2019$ $ $ $ $ $ $ $
Unit trust distributions receivable 319,919 478,160 588,753 325,509 799,649 594,110 45,034 202,661Interest receivable 4 13 7 23 3 9 1 4Outstanding settlements receivable - - - - - - - - Future and swap deposits receivable - - - - - - - - Applications receivable - - - - - - - - Other receivables 7,729 10,786 17,768 45,183 6,183 7,352 3,358 4,163Total receivables 327,652 488,959 606,528 370,715 805,835 601,471 48,393 206,828
25. ANZ OA OptiMix Australian Share Trust
26. ANZ OA OptiMix Conservative Trust
27. ANZ OA OptiMix Global Share Trust
28. ANZ OA OptiMix Global Smaller Companies Share
Trust
30 June 2020 30 June 2019 30 June 2020 30 June 2019 30 June 2020 30 June 2019 30 June 2020 30 June 2019$ $ $ $ $ $ $ $
Unit trust distributions receivable 1,706,994 747,099 690,435 577,297 667,936 366,367 38,086 30,187Interest receivable 14 37 5 21 11 27 1 4Outstanding settlements receivable - - - - - - - - Future and swap deposits receivable - - - - - - - - Applications receivable - - 600 2,100 - - - - Other receivables 30,378 49,995 8,073 9,305 23,408 26,539 4,037 6,399Total receivables 1,737,386 797,131 699,113 588,723 691,355 392,933 42,124 36,590
29. ANZ OA OptiMix Growth Trust
30. ANZ OA OptiMix High Growth Trust
31. ANZ OA OptiMix Moderate Trust
32. ANZ OA OptiMix Property Securities Trust
30 June 2020 30 June 2019 30 June 2020 30 June 2019 30 June 2020 30 June 2019 30 June 2020 30 June 2019$ $ $ $ $ $ $ $
Unit trust distributions receivable 4,398,567 13,598,327 9,539,609 20,157,437 1,992,058 2,829,512 39,100 29,879Interest receivable 133 452 46 189 8 24 1 3Outstanding settlements receivable - - - - - - - - Future and swap deposits receivable - - - - - - - - Applications receivable - 45,000 191 21,812 - - - - Other receivables 34,195 45,064 8,405 15,310 2,169 3,314 800 3,511Total receivables 4,432,895 13,688,843 9,548,251 20,194,748 1,994,235 2,832,850 39,901 33,393
33. ANZ OA Perpetual Australian Share Trust
34. ANZ OA Schroder Australian Equity Trust
35. ANZ OA SG Hiscock Property Trust
36. ANZ OA UBS Diversified Fixed Income Trust

Financial Report Notes to the Financial Statements for the financial year ended 30 June 2020
158
5. Receivables
30 June 2020 30 June 2019 30 June 2020 30 June 2019 30 June 2020 30 June 2019 30 June 2020 30 June 2019$ $ $ $ $ $ $ $
Unit trust distributions receivable 86,629 292,746 111,567 139,499 10,609,270 2,622,208 5,542,931 8,357,848Interest receivable 9 21 7 16 321 3,147 36 118Outstanding settlements receivable - 30,011 - 50,359 - - - - Future and swap deposits receivable - - - - - - - - Applications receivable - - - - - 541,893 - - Other receivables 2,030 2,368 2,645 2,735 - - 20,558 33,628Total receivables 88,668 325,146 114,219 192,609 10,609,591 3,167,248 5,563,525 8,391,594
37. ANZ OneAnswer - BR Scientific Australian Equity
Trust
38. ANZ OneAnswer - BR Scientific International
Equity Trust
39. ANZ Private International Fixed Interest Fund
40. ANZ Property Securities Trust
30 June 2020 30 June 2019 30 June 2020 30 June 2019 30 June 2020 30 June 2019 30 June 2020 30 June 2019$ $ $ $ $ $ $ $
Unit trust distributions receivable 581,879 1,948,454 4,590,450 2,451,075 1,121,105 1,328,861 35,612,523 31,873,305Interest receivable 68 162 41 102 43 133 123 340Outstanding settlements receivable - - - - - - - - Future and swap deposits receivable - - - - - - - - Applications receivable 642 600 350 1,101 600 700 719 108,732Other receivables 15,453 18,232 19,855 22,016 42,651 55,377 71,112 93,626Total receivables 598,042 1,967,448 4,610,696 2,474,294 1,164,399 1,385,071 35,684,477 32,076,003
41. Australian Share Trust 42. Balanced Trust 43. Blue Chip Imputation Trust
44. Emerging Companies Trust
30 June 2020 30 June 2019 30 June 2020 30 June 2019 30 June 2020 30 June 2019 30 June 2020 30 June 2019$ $ $ $ $ $ $ $
Unit trust distributions receivable 1,148,763 1,297,751 622,766 796,609 110,984 100,777 655,366 1,518,532Interest receivable 111 197 4 13 1 3 5 26Outstanding settlements receivable - - - - - - 71,464 36,888Future and swap deposits receivable - - - - - - - - Applications receivable - - - - 1,279 - - - Other receivables 7,129 7,079 1,665 1,980 2,337 3,182 - 353Total receivables 1,156,003 1,305,027 624,435 798,602 114,601 103,962 726,835 1,555,799
45. Global Share Trust 46. Heine Property Securities Fund
47. High Growth Trust 48. OneAnswer - Altrinsic Global Equities Trust

Financial Report Notes to the Financial Statements for the financial year ended 30 June 2020
159
5. Receivables
30 June 2020 30 June 2019 30 June 2020 30 June 2019 30 June 2020 30 June 2019 30 June 2020 30 June 2019$ $ $ $ $ $ $ $
Unit trust distributions receivable 1,511,232 4,530,971 180,897 87,241 149,789 1,204,123 7,221,535 2,468,402Interest receivable 36 68 5 19 36 65 75 130Outstanding settlements receivable - 285,811 - - - 255,592 - - Future and swap deposits receivable - - - - - - - - Applications receivable 333 34,457 500 217 100 22,600 - - Other receivables 8,165 10,390 6,242 13,208 3,106 8,164 - 919Total receivables 1,519,766 4,861,697 187,644 100,685 153,031 1,490,544 7,221,610 2,469,451
49. OneAnswer - Antipodes Global (Long Only) Trust
50. OneAnswer - Arrowstreet Global Equity (Hedged) Trust
51. OneAnswer - Ausbil Australian Emerging Leaders
Trust
52. OneAnswer - Bennelong Australian Equities Trust
30 June 2020 30 June 2019 30 June 2020 30 June 2019 30 June 2020 30 June 2019 30 June 2020 30 June 2019$ $ $ $ $ $ $ $
Unit trust distributions receivable 432,490 247,827 19,205 49,828 2,857,394 4,645,273 196,491 886,369Interest receivable 26 46 2 4 25 44 22 1Outstanding settlements receivable 167,263 355,783 10,163 6,022 - 290,378 - 608,540Future and swap deposits receivable - - - - - - - - Applications receivable - - 100 30 - - - 7,500Other receivables 1,999 9,871 2,020 2,029 3,152 5,932 4,663 5,773Total receivables 601,778 613,527 31,490 57,913 2,860,571 4,941,627 201,176 1,508,183
53. OneAnswer - Bentham Global Income Trust
54. OneAnswer - BlackRock Scientific Australian Equity
Trust
55. OneAnswer - Blackrock Tactical Growth Trust
56. OneAnswer - BR Scientific Diversified Growth
Trust
30 June 2020 30 June 2019 30 June 2020 30 June 2019 30 June 2020 30 June 2019 30 June 2020 30 June 2019$ $ $ $ $ $ $ $
Unit trust distributions receivable 22,136 24,242 19,963 136,078 10,197,424 1,932,864 131,518 200,248Interest receivable 1 3 20 23 104 357 2 8Outstanding settlements receivable 9,756 5,016 - 352,046 - - - - Future and swap deposits receivable - - - - - - - - Applications receivable - - - - 3,130 50,344 200 - Other receivables 518 703 910 2,703 5,630 7,727 3,354 5,101Total receivables 32,411 29,964 20,893 490,850 10,206,288 1,991,292 135,074 205,357
57. OneAnswer - BR Scientific International
Equity Trust
58. OneAnswer - Colonial First State Global Credit
Income Trust
59. OneAnswer - Colonial First State Global Listed
Infrastructure Trust
60. OneAnswer - Colonial First State Imputation Trust

Financial Report Notes to the Financial Statements for the financial year ended 30 June 2020
160
5. Receivables
30 June 2020 30 June 2019 30 June 2020 30 June 2019 30 June 2020 30 June 2019 30 June 2020 30 June 2019$ $ $ $ $ $ $ $
Unit trust distributions receivable 12,850,267 4,362,709 1 2,388,485 7,236,004 10,515,627 175,734 - Interest receivable 211 322 48 134 98 182 3 4Outstanding settlements receivable - 535,264 316,888 - - 531,296 - 9,423Future and swap deposits receivable - - - - - - - - Applications receivable 247 104,060 3,254 18,200 24,697 - - - Other receivables 6,420 17,895 - 678 9,763 30,318 360 531Total receivables 12,857,145 5,020,250 320,191 2,407,497 7,270,562 11,077,423 176,097 9,958
61. OneAnswer - Fidelity Australian Equities Trust
62. OneAnswer - Greencape Broadcap Trust
63. OneAnswer - Investors Mutual Australian Share
Trust
64. OneAnswer - Janus Henderson Global Fixed
Interest Total Return Trust
30 June 2020 30 June 2019 30 June 2020 30 June 2019 30 June 2020 30 June 2019 30 June 2020 30 June 2019$ $ $ $ $ $ $ $
Unit trust distributions receivable 2,718,907 3,038,210 9,554,629 8,577,662 240,099 329,787 47,557,674 52,896,814Interest receivable 294 605 170 398 26 87 225 399Outstanding settlements receivable 1,861,687 2,241,688 - - - 124,914 - 2,650,924Future and swap deposits receivable - - - - - - - - Applications receivable 1,443 137,434 6,169 17,854 - - 961 145,468Other receivables 21,341 31,715 4,865 6,585 1,045 4,218 12,748 27,734Total receivables 4,603,672 5,449,652 9,565,833 8,602,499 241,170 459,006 47,571,608 55,721,339
65. OneAnswer - Kapstream Absolute Return Income
Trust
66. OneAnswer - Magellan Global Trust
67. OneAnswer - Merlon Australian Share Income
Trust
68. OneAnswer - MFS Global Equity Trust
30 June 2020 30 June 2019 30 June 2020 30 June 2019 30 June 2020 30 June 2019 30 June 2020 30 June 2019$ $ $ $ $ $ $ $
Unit trust distributions receivable 440,581 1,669,721 3,822,418 1,969,481 130,541 541,582 4,071,398 - Interest receivable 6 46 - - 21 70 21 51Outstanding settlements receivable 52,791 - 161 39 - - - - Future and swap deposits receivable - - - - - - - - Applications receivable - - 1,062 53,668 50 50 30 75Other receivables - 366 28,313 40,256 720 2,139 1,232 1,941Total receivables 493,378 1,670,133 3,851,954 2,063,444 131,332 543,841 4,072,681 2,067
69. OneAnswer - Nikko AM Australian Shares Trust
70. OneAnswer - OnePath Global Property Securities
Index Trust
71. OneAnswer - Pendal Australian Share Trust
72. OneAnswer - Pendal Core Hedged Global Shares Trust

Financial Report Notes to the Financial Statements for the financial year ended 30 June 2020
161
5. Receivables
30 June 2020 30 June 2019 30 June 2020 30 June 2019 30 June 2020 30 June 2019 30 June 2020 30 June 2019$ $ $ $ $ $ $ $
Unit trust distributions receivable 274,212 112,401 - 5,806,559 746,204 2,563,051 259,351 913,593Interest receivable 10 26 76 138 50 135 8 33Outstanding settlements receivable - - - - - - - - Future and swap deposits receivable - - - - - - - - Applications receivable - - 3,981 10,822 536 33,493 200 175Other receivables - - 11,842 21,441 11,732 17,900 15,389 24,269Total receivables 274,222 112,427 15,899 5,838,960 758,522 2,614,579 274,948 938,070
73. OneAnswer - Pendal Monthly Income Plus Trust
74. OneAnswer - Pendal Smaller Companies Trust
75. OneAnswer - Perennial Value Shares Trust
76. OneAnswer - Perpetual Australian Share Trust
30 June 2020 30 June 2019 30 June 2020 30 June 2019 30 June 2020 30 June 2019 30 June 2020 30 June 2019$ $ $ $ $ $ $ $
Unit trust distributions receivable 7,513,232 11,882,622 4,017,976 4,357,464 96,576 78,597 2,345,783 1,420,584Interest receivable 58 182 69 220 3 9 16 16Outstanding settlements receivable - 531,617 - - - - - 157,914Future and swap deposits receivable - - - - - - - - Applications receivable - 9,266 - - - - - 34Other receivables 9,526 13,020 20,720 11,105 89 - 441 1,656Total receivables 7,522,816 12,436,707 4,038,765 4,368,789 96,668 78,606 2,346,240 1,580,204
77. OneAnswer - Perpetual Balanced Growth Trust
78. OneAnswer - Perpetual Conservative Growth Trust
79. OneAnswer - Perpetual Ethical SRI Trust
80. OneAnswer - Platinum Asia Trust
30 June 2020 30 June 2019 30 June 2020 30 June 2019 30 June 2020 30 June 2019 30 June 2020 30 June 2019$ $ $ $ $ $ $ $
Unit trust distributions receivable 12,554,263 27,202,546 243,843 306,429 3,057,498 4,416,271 3,327,027 4,537,001Interest receivable 142 326 51 143 107 251 103 104Outstanding settlements receivable 633,955 1,389,282 - 331,753 531,441 625,084 535,478 2,682,662Future and swap deposits receivable - - - - - - - - Applications receivable 5,217 39,622 - 40,500 402 26,952 70,000 - Other receivables 17,830 30,173 1,460 2,973 4,669 12,511 13,446 13,122Total receivables 13,211,407 28,661,949 245,354 681,798 3,594,117 5,081,069 3,946,054 7,232,889
81. OneAnswer - Platinum International Trust
82. OneAnswer - RARE Infastructure Value Trust
83. OneAnswer - Schroder Australian Equity Trust
84. OneAnswer - Schroder Balanced Trust
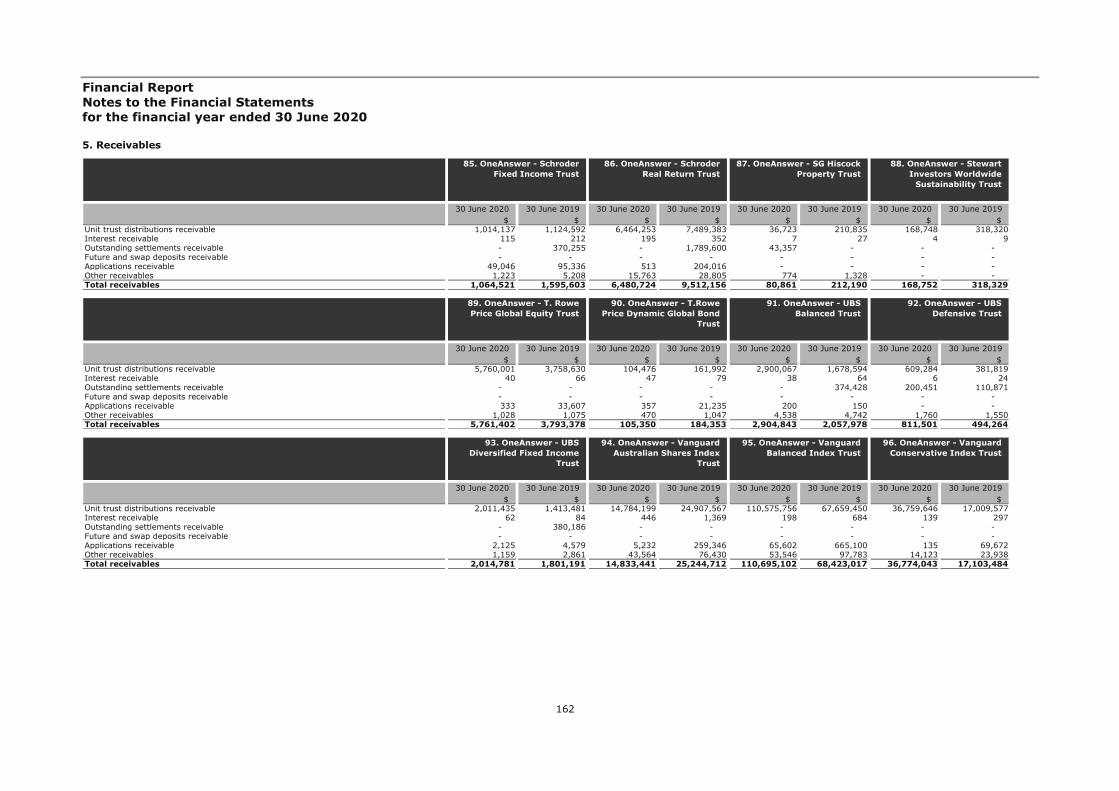
Financial Report Notes to the Financial Statements for the financial year ended 30 June 2020
162
5. Receivables
30 June 2020 30 June 2019 30 June 2020 30 June 2019 30 June 2020 30 June 2019 30 June 2020 30 June 2019$ $ $ $ $ $ $ $
Unit trust distributions receivable 1,014,137 1,124,592 6,464,253 7,489,383 36,723 210,835 168,748 318,320Interest receivable 115 212 195 352 7 27 4 9Outstanding settlements receivable - 370,255 - 1,789,600 43,357 - - - Future and swap deposits receivable - - - - - - - - Applications receivable 49,046 95,336 513 204,016 - - - - Other receivables 1,223 5,208 15,763 28,805 774 1,328 - - Total receivables 1,064,521 1,595,603 6,480,724 9,512,156 80,861 212,190 168,752 318,329
85. OneAnswer - Schroder Fixed Income Trust
86. OneAnswer - Schroder Real Return Trust
87. OneAnswer - SG Hiscock Property Trust
88. OneAnswer - Stewart Investors Worldwide
Sustainability Trust
30 June 2020 30 June 2019 30 June 2020 30 June 2019 30 June 2020 30 June 2019 30 June 2020 30 June 2019$ $ $ $ $ $ $ $
Unit trust distributions receivable 5,760,001 3,758,630 104,476 161,992 2,900,067 1,678,594 609,284 381,819Interest receivable 40 66 47 79 38 64 6 24Outstanding settlements receivable - - - - - 374,428 200,451 110,871Future and swap deposits receivable - - - - - - - - Applications receivable 333 33,607 357 21,235 200 150 - - Other receivables 1,028 1,075 470 1,047 4,538 4,742 1,760 1,550Total receivables 5,761,402 3,793,378 105,350 184,353 2,904,843 2,057,978 811,501 494,264
89. OneAnswer - T. Rowe Price Global Equity Trust
90. OneAnswer - T.Rowe Price Dynamic Global Bond
Trust
91. OneAnswer - UBS Balanced Trust
92. OneAnswer - UBS Defensive Trust
30 June 2020 30 June 2019 30 June 2020 30 June 2019 30 June 2020 30 June 2019 30 June 2020 30 June 2019$ $ $ $ $ $ $ $
Unit trust distributions receivable 2,011,435 1,413,481 14,784,199 24,907,567 110,575,756 67,659,450 36,759,646 17,009,577Interest receivable 62 84 446 1,369 198 684 139 297Outstanding settlements receivable - 380,186 - - - - - - Future and swap deposits receivable - - - - - - - - Applications receivable 2,125 4,579 5,232 259,346 65,602 665,100 135 69,672Other receivables 1,159 2,861 43,564 76,430 53,546 97,783 14,123 23,938Total receivables 2,014,781 1,801,191 14,833,441 25,244,712 110,695,102 68,423,017 36,774,043 17,103,484
93. OneAnswer - UBS Diversified Fixed Income
Trust
94. OneAnswer - Vanguard Australian Shares Index
Trust
95. OneAnswer - Vanguard Balanced Index Trust
96. OneAnswer - Vanguard Conservative Index Trust

Financial Report Notes to the Financial Statements for the financial year ended 30 June 2020
163
5. Receivables
30 June 2020 30 June 2019 30 June 2020 30 June 2019 30 June 2020 30 June 2019 30 June 2020 30 June 2019$ $ $ $ $ $ $ $
Unit trust distributions receivable 4,761,261 1,078,669 54,068,773 40,928,461 20,404,874 17,746,265 10,744,313 4,458,705Interest receivable 15 61 130 535 49 227 65 189Outstanding settlements receivable - - - - - - - - Future and swap deposits receivable - - - - - - - - Applications receivable 28,138 92,494 2,595 317,861 850 61,000 14,020 27,183Other receivables 1,375 2,400 16,330 31,422 12,329 26,650 11,668 13,673Total receivables 4,790,789 1,173,624 54,087,828 41,278,279 20,418,102 17,834,142 10,770,066 4,499,750
97. OneAnswer - Vanguard Diversified Bond Index Trust
98. OneAnswer - Vanguard Growth Index Trust
99. OneAnswer - Vanguard High Growth Index Trust
100. OneAnswer - Vanguard International Shares Index
(Hedged) Trust
30 June 2020 30 June 2019 30 June 2020 30 June 2019 30 June 2020 30 June 2019 30 June 2020 30 June 2019$ $ $ $ $ $ $ $
Unit trust distributions receivable 70,515,885 74,430,309 6,315,275 3,782,759 2,967,625 3,434,608 3,239,401 188,970Interest receivable 273 570 55 100 20 38 504 1,508Outstanding settlements receivable - - - - - 84,677 - - Future and swap deposits receivable - - - - - - - - Applications receivable 5,279 187,257 250 69,134 - - 49,250 137,225Other receivables 25,295 50,882 5,647 8,981 - 1,328 5,585 11,177Total receivables 70,546,732 74,669,018 6,321,227 3,860,974 2,967,645 3,520,651 3,294,740 338,880
101. OneAnswer - Vanguard International Shares Index
Trust
102. OneAnswer - Vanguard Property Securities Index
Trust
103. OneAnswer - Walter Scott Global Equity (Hedged)
Trust
104. OnePath Alternatives Growth Fund
30 June 2020 30 June 2019 30 June 2020 30 June 2019 30 June 2020 30 June 2019 30 June 2020 30 June 2019$ $ $ $ $ $ $ $
Unit trust distributions receivable 22,595,424 19,362,714 249,876 174,599 6,582 - 652,981 329,220Interest receivable 2,399 4,568 3 8 1 2 7 24Outstanding settlements receivable - - - - - - - - Future and swap deposits receivable 67,681 745,438 - - - - - - Applications receivable 105,978 7,414 - - - - 320 26Other receivables 13 91 2,310 6,565 783 791 3,962 7,795Total receivables 22,771,495 20,120,225 252,189 181,172 7,366 793 657,270 337,065
105. OnePath Capital Guaranteed Trust
106. OnePath Capital Stable Trust
107. OnePath Diversified Credit Trust
108. OnePath Diversified Fixed Interest Trust
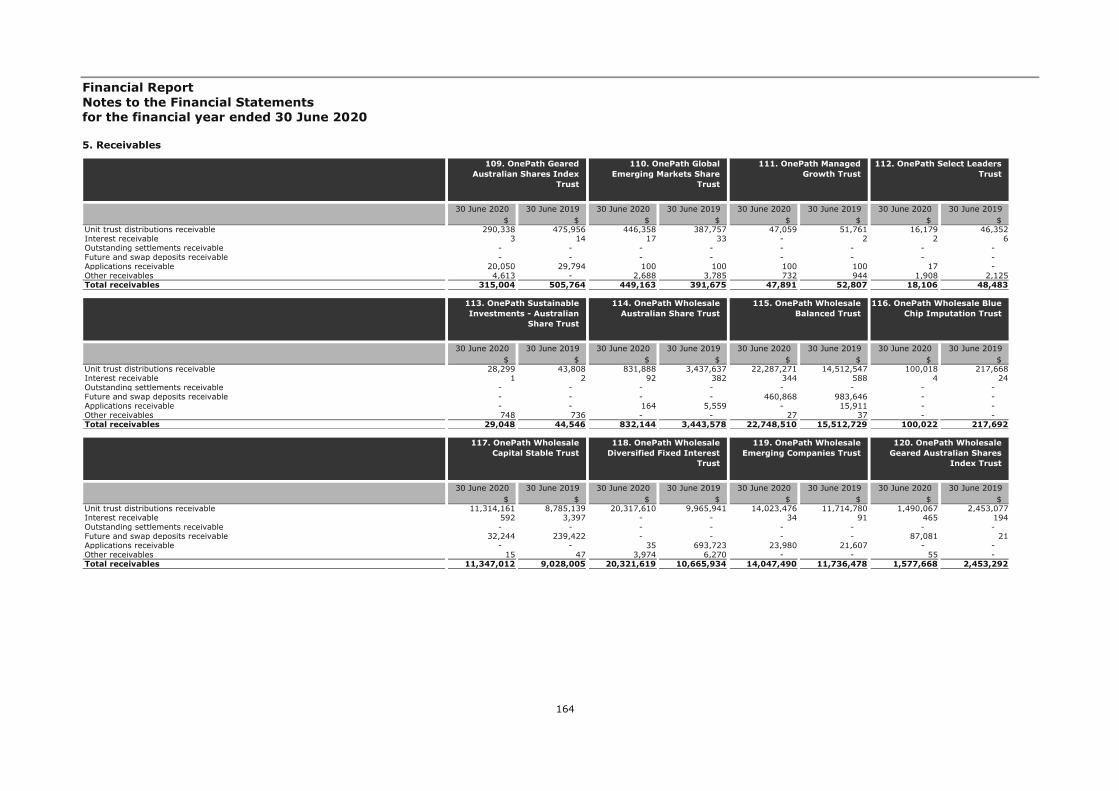
Financial Report Notes to the Financial Statements for the financial year ended 30 June 2020
164
5. Receivables
30 June 2020 30 June 2019 30 June 2020 30 June 2019 30 June 2020 30 June 2019 30 June 2020 30 June 2019$ $ $ $ $ $ $ $
Unit trust distributions receivable 290,338 475,956 446,358 387,757 47,059 51,761 16,179 46,352Interest receivable 3 14 17 33 - 2 2 6Outstanding settlements receivable - - - - - - - - Future and swap deposits receivable - - - - - - - - Applications receivable 20,050 29,794 100 100 100 100 17 - Other receivables 4,613 - 2,688 3,785 732 944 1,908 2,125Total receivables 315,004 505,764 449,163 391,675 47,891 52,807 18,106 48,483
109. OnePath Geared Australian Shares Index
Trust
110. OnePath Global Emerging Markets Share
Trust
111. OnePath Managed Growth Trust
112. OnePath Select Leaders Trust
30 June 2020 30 June 2019 30 June 2020 30 June 2019 30 June 2020 30 June 2019 30 June 2020 30 June 2019$ $ $ $ $ $ $ $
Unit trust distributions receivable 28,299 43,808 831,888 3,437,637 22,287,271 14,512,547 100,018 217,668Interest receivable 1 2 92 382 344 588 4 24Outstanding settlements receivable - - - - - - - - Future and swap deposits receivable - - - - 460,868 983,646 - - Applications receivable - - 164 5,559 - 15,911 - - Other receivables 748 736 - - 27 37 - - Total receivables 29,048 44,546 832,144 3,443,578 22,748,510 15,512,729 100,022 217,692
113. OnePath Sustainable Investments - Australian
Share Trust
114. OnePath Wholesale Australian Share Trust
115. OnePath Wholesale Balanced Trust
116. OnePath Wholesale Blue Chip Imputation Trust
30 June 2020 30 June 2019 30 June 2020 30 June 2019 30 June 2020 30 June 2019 30 June 2020 30 June 2019$ $ $ $ $ $ $ $
Unit trust distributions receivable 11,314,161 8,785,139 20,317,610 9,965,941 14,023,476 11,714,780 1,490,067 2,453,077Interest receivable 592 3,397 - - 34 91 465 194Outstanding settlements receivable - - - - - - - - Future and swap deposits receivable 32,244 239,422 - - - - 87,081 21Applications receivable - - 35 693,723 23,980 21,607 - - Other receivables 15 47 3,974 6,270 - - 55 - Total receivables 11,347,012 9,028,005 20,321,619 10,665,934 14,047,490 11,736,478 1,577,668 2,453,292
117. OnePath Wholesale Capital Stable Trust
118. OnePath Wholesale Diversified Fixed Interest
Trust
119. OnePath Wholesale Emerging Companies Trust
120. OnePath Wholesale Geared Australian Shares
Index Trust

Financial Report Notes to the Financial Statements for the financial year ended 30 June 2020
165
5. Receivables
30 June 2020 30 June 2019 30 June 2020 30 June 2019 30 June 2020 30 June 2019 30 June 2020 30 June 2019$ $ $ $ $ $ $ $
Unit trust distributions receivable 153,257 144,952 2,153,368 1,832,975 1,032,273 662,109 241,756 186,254Interest receivable 6 16 94 406 - - - - Outstanding settlements receivable - - - - - - - - Future and swap deposits receivable - - 35,027 21,688 - - - - Applications receivable 1,288 14,288 - - - - - - Other receivables - - 3 5 - - - - Total receivables 154,551 159,256 2,188,492 1,855,074 1,032,273 662,109 241,756 186,254
121. OnePath Wholesale Global Emerging Markets
Share Trust
122. OnePath Wholesale High Growth Trust
123. OnePath Wholesale Index Balanced Trust
124. OnePath Wholesale Index Conservative Trust
30 June 2020 30 June 2019 30 June 2020 30 June 2019 30 June 2020 30 June 2019 30 June 2020 30 June 2019$ $ $ $ $ $ $ $
Unit trust distributions receivable 192,857 141,038 48,879,777 34,021,326 161,916 221,928 456,000 1,230,583Interest receivable - - 122 1,532 1 4 43 144Outstanding settlements receivable - - - - - - - - Future and swap deposits receivable - - 1,692,268 2,000,540 - - - - Applications receivable - - 415 620 - - - - Other receivables - - 51 49 - - - - Total receivables 192,857 141,038 50,572,633 36,024,067 161,917 221,932 456,043 1,230,727
125. OnePath Wholesale Index Moderate Trust
126. OnePath Wholesale Managed Growth Trust
127. OnePath Wholesale Property Securities Trust
128. OnePath Wholesale Select Leaders Trust
30 June 2020 30 June 2019 30 June 2020 30 June 2019 30 June 2020 30 June 2019 30 June 2020 30 June 2019$ $ $ $ $ $ $ $
Unit trust distributions receivable 127,701 90,826 455,333 749,928 2,590,517 1,844,315 403,769 245,078Interest receivable 2 6 6 18 21 47 5 16Outstanding settlements receivable - - - - - - - - Future and swap deposits receivable - - - - - - - - Applications receivable - - - 400 850 1,007 - - Other receivables 482 1,171 15,460 20,198 43,426 60,497 11,343 12,917Total receivables 128,185 92,003 470,799 770,544 2,634,814 1,905,866 415,117 258,011
129. OptiMix Australian Fixed Interest Trust
130. OptiMix Australian Share Trust
131. OptiMix Balanced Trust 132. OptiMix Conservative Trust
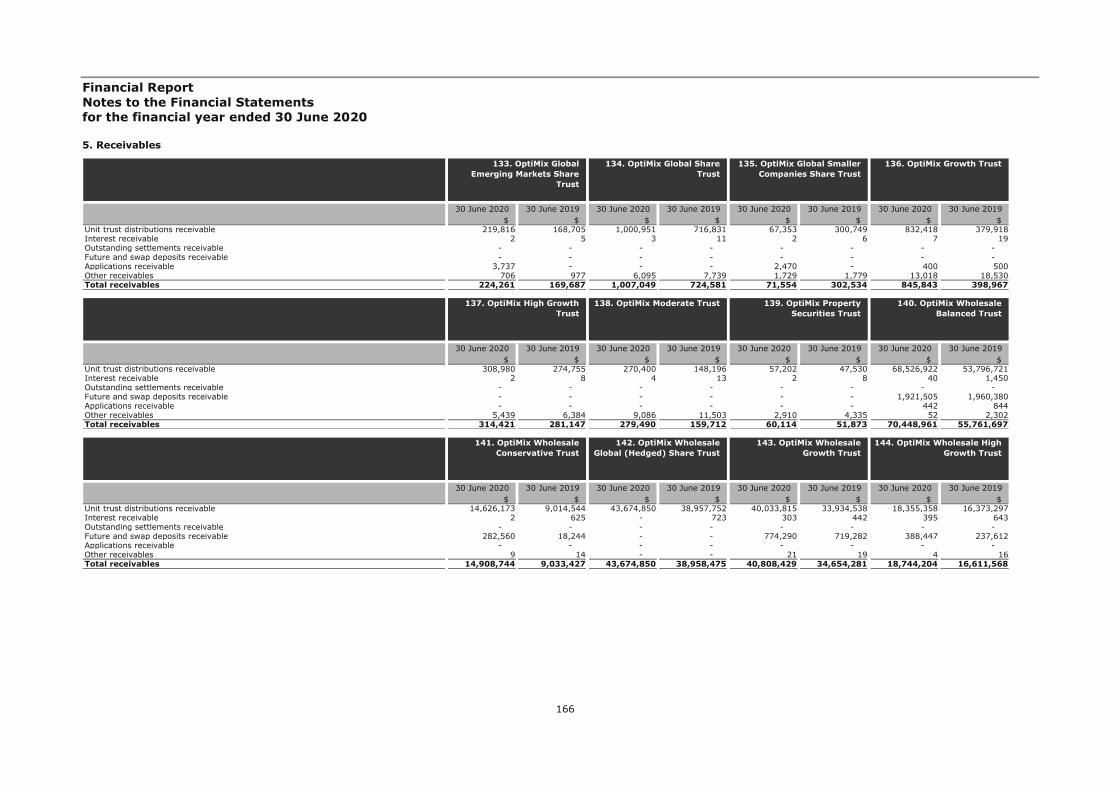
Financial Report Notes to the Financial Statements for the financial year ended 30 June 2020
166
5. Receivables
30 June 2020 30 June 2019 30 June 2020 30 June 2019 30 June 2020 30 June 2019 30 June 2020 30 June 2019$ $ $ $ $ $ $ $
Unit trust distributions receivable 219,816 168,705 1,000,951 716,831 67,353 300,749 832,418 379,918Interest receivable 2 5 3 11 2 6 7 19Outstanding settlements receivable - - - - - - - - Future and swap deposits receivable - - - - - - - - Applications receivable 3,737 - - - 2,470 - 400 500Other receivables 706 977 6,095 7,739 1,729 1,779 13,018 18,530Total receivables 224,261 169,687 1,007,049 724,581 71,554 302,534 845,843 398,967
133. OptiMix Global Emerging Markets Share
Trust
134. OptiMix Global Share Trust
135. OptiMix Global Smaller Companies Share Trust
136. OptiMix Growth Trust
30 June 2020 30 June 2019 30 June 2020 30 June 2019 30 June 2020 30 June 2019 30 June 2020 30 June 2019$ $ $ $ $ $ $ $
Unit trust distributions receivable 308,980 274,755 270,400 148,196 57,202 47,530 68,526,922 53,796,721Interest receivable 2 8 4 13 2 8 40 1,450Outstanding settlements receivable - - - - - - - - Future and swap deposits receivable - - - - - - 1,921,505 1,960,380Applications receivable - - - - - - 442 844Other receivables 5,439 6,384 9,086 11,503 2,910 4,335 52 2,302Total receivables 314,421 281,147 279,490 159,712 60,114 51,873 70,448,961 55,761,697
137. OptiMix High Growth Trust
138. OptiMix Moderate Trust 139. OptiMix Property Securities Trust
140. OptiMix Wholesale Balanced Trust
30 June 2020 30 June 2019 30 June 2020 30 June 2019 30 June 2020 30 June 2019 30 June 2020 30 June 2019$ $ $ $ $ $ $ $
Unit trust distributions receivable 14,626,173 9,014,544 43,674,850 38,957,752 40,033,815 33,934,538 18,355,358 16,373,297Interest receivable 2 625 - 723 303 442 395 643Outstanding settlements receivable - - - - - - - - Future and swap deposits receivable 282,560 18,244 - - 774,290 719,282 388,447 237,612Applications receivable - - - - - - - - Other receivables 9 14 - - 21 19 4 16Total receivables 14,908,744 9,033,427 43,674,850 38,958,475 40,808,429 34,654,281 18,744,204 16,611,568
141. OptiMix Wholesale Conservative Trust
142. OptiMix Wholesale Global (Hedged) Share Trust
143. OptiMix Wholesale Growth Trust
144. OptiMix Wholesale High Growth Trust
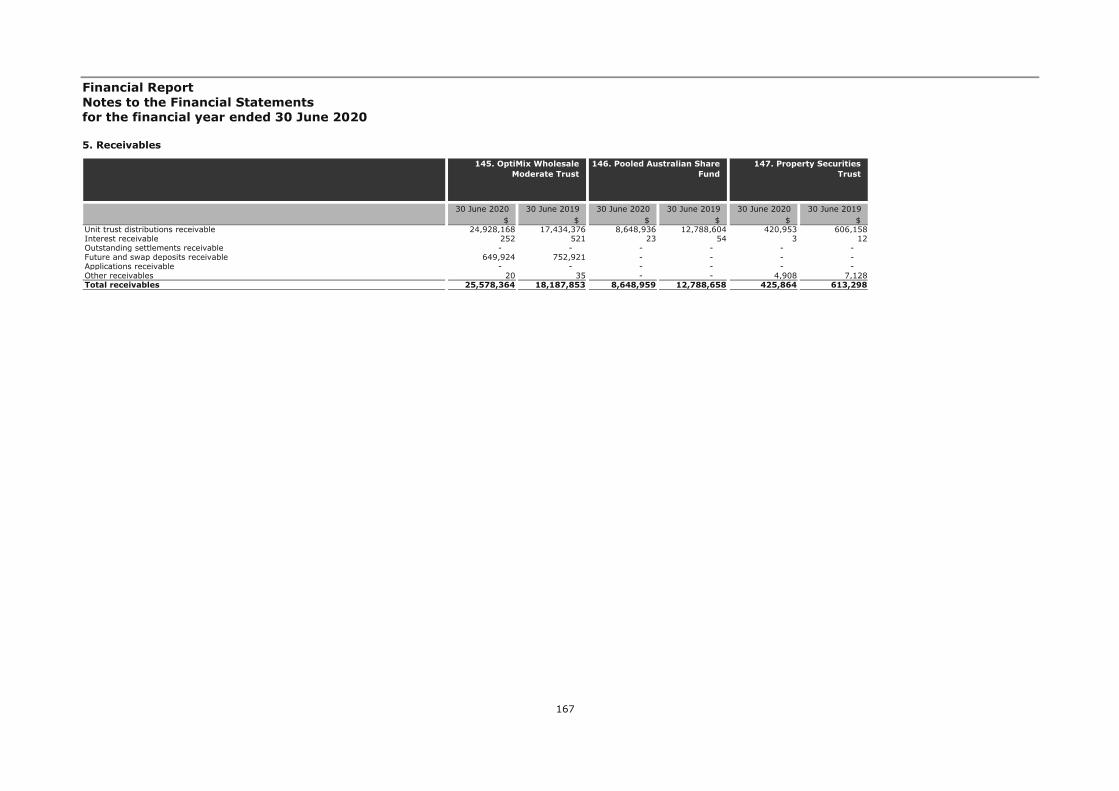
Financial Report Notes to the Financial Statements for the financial year ended 30 June 2020
167
5. Receivables
30 June 2020 30 June 2019 30 June 2020 30 June 2019 30 June 2020 30 June 2019$ $ $ $ $ $
Unit trust distributions receivable 24,928,168 17,434,376 8,648,936 12,788,604 420,953 606,158Interest receivable 252 521 23 54 3 12Outstanding settlements receivable - - - - - - Future and swap deposits receivable 649,924 752,921 - - - - Applications receivable - - - - - - Other receivables 20 35 - - 4,908 7,128Total receivables 25,578,364 18,187,853 8,648,959 12,788,658 425,864 613,298
145. OptiMix Wholesale Moderate Trust
146. Pooled Australian Share Fund
147. Property Securities Trust
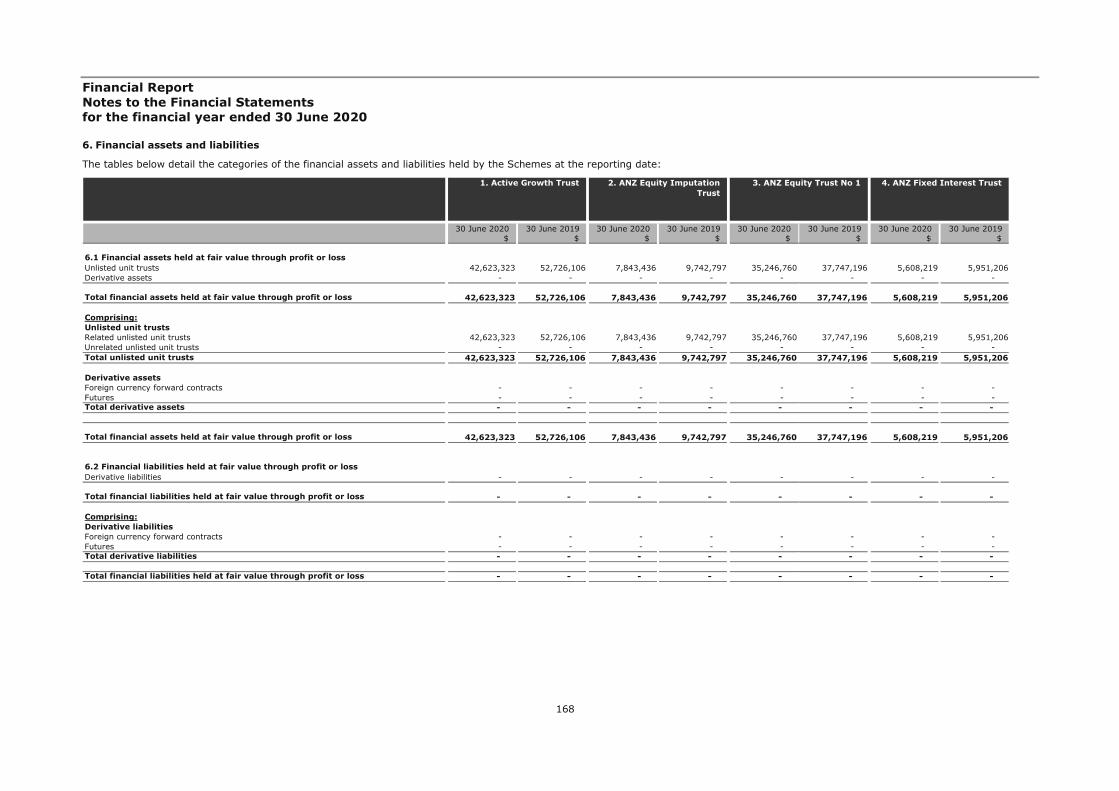
Financial Report Notes to the Financial Statements for the financial year ended 30 June 2020
168
6. Financial assets and liabilities
The tables below detail the categories of the financial assets and liabilities held by the Schemes at the reporting date:
30 June 2020 30 June 2019 30 June 2020 30 June 2019 30 June 2020 30 June 2019 30 June 2020 30 June 2019$ $ $ $ $ $ $ $
6.1 Financial assets held at fair value through profit or lossUnlisted unit trusts 42,623,323 52,726,106 7,843,436 9,742,797 35,246,760 37,747,196 5,608,219 5,951,206Derivative assets - - - - - - - -
Total financial assets held at fair value through profit or loss 42,623,323 52,726,106 7,843,436 9,742,797 35,246,760 37,747,196 5,608,219 5,951,206
Comprising:Unlisted unit trustsRelated unlisted unit trusts 42,623,323 52,726,106 7,843,436 9,742,797 35,246,760 37,747,196 5,608,219 5,951,206Unrelated unlisted unit trusts - - - - - - - - Total unlisted unit trusts 42,623,323 52,726,106 7,843,436 9,742,797 35,246,760 37,747,196 5,608,219 5,951,206
Derivative assetsForeign currency forward contracts - - - - - - - - Futures - - - - - - - - Total derivative assets - - - - - - - -
Total financial assets held at fair value through profit or loss 42,623,323 52,726,106 7,843,436 9,742,797 35,246,760 37,747,196 5,608,219 5,951,206
6.2 Financial liabilities held at fair value through profit or lossDerivative liabilities - - - - - - - -
Total financial liabilities held at fair value through profit or loss - - - - - - - -
Comprising:Derivative liabilitiesForeign currency forward contracts - - - - - - - - Futures - - - - - - - - Total derivative liabilities - - - - - - - -
Total financial liabilities held at fair value through profit or loss - - - - - - - -
4. ANZ Fixed Interest Trust 1. Active Growth Trust 2. ANZ Equity Imputation Trust
3. ANZ Equity Trust No 1
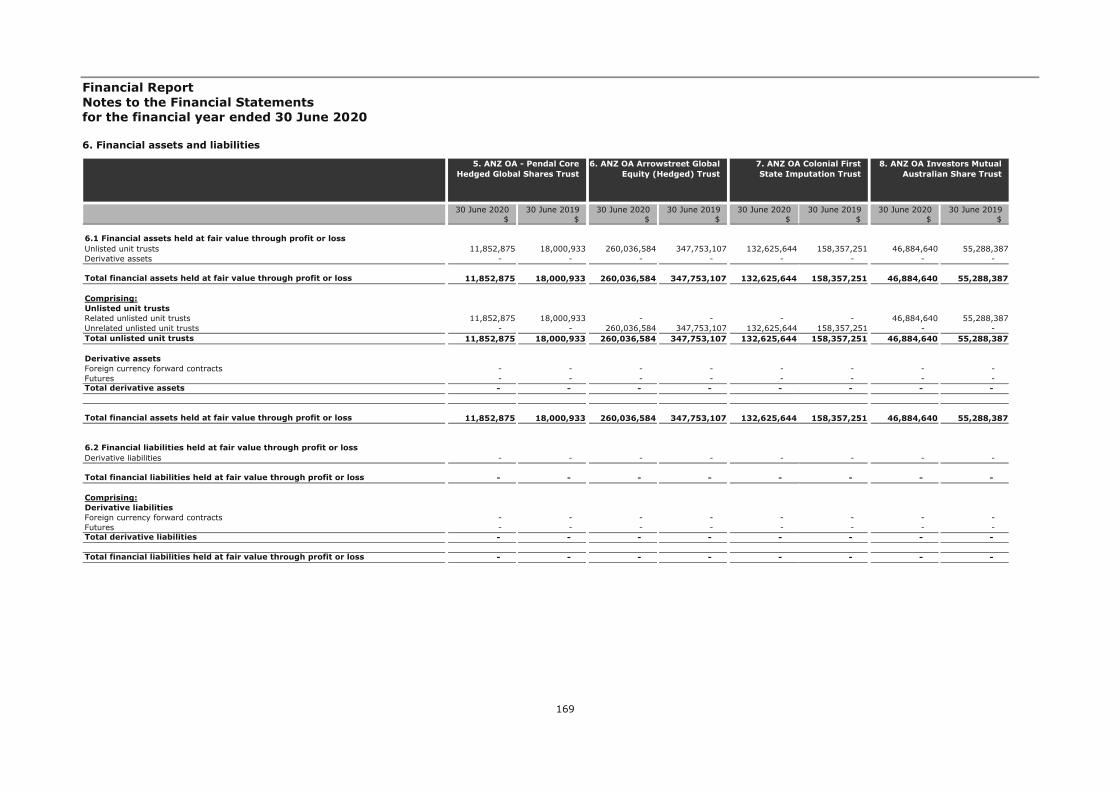
Financial Report Notes to the Financial Statements for the financial year ended 30 June 2020
169
6. Financial assets and liabilities
30 June 2020 30 June 2019 30 June 2020 30 June 2019 30 June 2020 30 June 2019 30 June 2020 30 June 2019$ $ $ $ $ $ $ $
6.1 Financial assets held at fair value through profit or lossUnlisted unit trusts 11,852,875 18,000,933 260,036,584 347,753,107 132,625,644 158,357,251 46,884,640 55,288,387Derivative assets - - - - - - - -
Total financial assets held at fair value through profit or loss 11,852,875 18,000,933 260,036,584 347,753,107 132,625,644 158,357,251 46,884,640 55,288,387
Comprising:Unlisted unit trustsRelated unlisted unit trusts 11,852,875 18,000,933 - - - - 46,884,640 55,288,387Unrelated unlisted unit trusts - - 260,036,584 347,753,107 132,625,644 158,357,251 - - Total unlisted unit trusts 11,852,875 18,000,933 260,036,584 347,753,107 132,625,644 158,357,251 46,884,640 55,288,387
Derivative assetsForeign currency forward contracts - - - - - - - - Futures - - - - - - - - Total derivative assets - - - - - - - -
Total financial assets held at fair value through profit or loss 11,852,875 18,000,933 260,036,584 347,753,107 132,625,644 158,357,251 46,884,640 55,288,387
6.2 Financial liabilities held at fair value through profit or lossDerivative liabilities - - - - - - - -
Total financial liabilities held at fair value through profit or loss - - - - - - - -
Comprising:Derivative liabilitiesForeign currency forward contracts - - - - - - - - Futures - - - - - - - - Total derivative liabilities - - - - - - - -
Total financial liabilities held at fair value through profit or loss - - - - - - - -
8. ANZ OA Investors Mutual Australian Share Trust
5. ANZ OA - Pendal Core Hedged Global Shares Trust
6. ANZ OA Arrowstreet Global Equity (Hedged) Trust
7. ANZ OA Colonial First State Imputation Trust
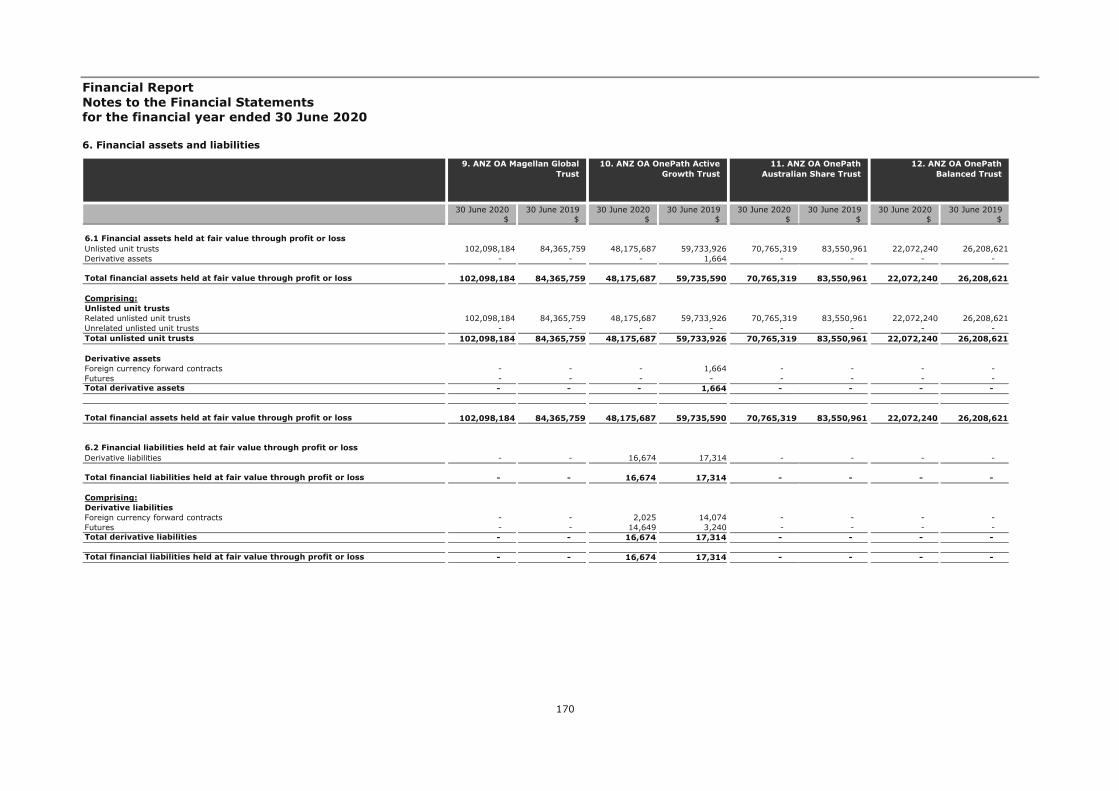
Financial Report Notes to the Financial Statements for the financial year ended 30 June 2020
170
6. Financial assets and liabilities
30 June 2020 30 June 2019 30 June 2020 30 June 2019 30 June 2020 30 June 2019 30 June 2020 30 June 2019$ $ $ $ $ $ $ $
6.1 Financial assets held at fair value through profit or lossUnlisted unit trusts 102,098,184 84,365,759 48,175,687 59,733,926 70,765,319 83,550,961 22,072,240 26,208,621Derivative assets - - - 1,664 - - - -
Total financial assets held at fair value through profit or loss 102,098,184 84,365,759 48,175,687 59,735,590 70,765,319 83,550,961 22,072,240 26,208,621
Comprising:Unlisted unit trustsRelated unlisted unit trusts 102,098,184 84,365,759 48,175,687 59,733,926 70,765,319 83,550,961 22,072,240 26,208,621Unrelated unlisted unit trusts - - - - - - - - Total unlisted unit trusts 102,098,184 84,365,759 48,175,687 59,733,926 70,765,319 83,550,961 22,072,240 26,208,621
Derivative assetsForeign currency forward contracts - - - 1,664 - - - - Futures - - - - - - - - Total derivative assets - - - 1,664 - - - -
Total financial assets held at fair value through profit or loss 102,098,184 84,365,759 48,175,687 59,735,590 70,765,319 83,550,961 22,072,240 26,208,621
6.2 Financial liabilities held at fair value through profit or lossDerivative liabilities - - 16,674 17,314 - - - -
Total financial liabilities held at fair value through profit or loss - - 16,674 17,314 - - - -
Comprising:Derivative liabilitiesForeign currency forward contracts - - 2,025 14,074 - - - - Futures - - 14,649 3,240 - - - - Total derivative liabilities - - 16,674 17,314 - - - -
Total financial liabilities held at fair value through profit or loss - - 16,674 17,314 - - - -
12. ANZ OA OnePath Balanced Trust
9. ANZ OA Magellan Global Trust
10. ANZ OA OnePath Active Growth Trust
11. ANZ OA OnePath Australian Share Trust

Financial Report Notes to the Financial Statements for the financial year ended 30 June 2020
171
6. Financial assets and liabilities
30 June 2020 30 June 2019 30 June 2020 30 June 2019 30 June 2020 30 June 2019 30 June 2020 30 June 2019$ $ $ $ $ $ $ $
6.1 Financial assets held at fair value through profit or lossUnlisted unit trusts 224,802,781 310,767,172 58,411,802 67,340,384 7,312,820 7,880,157 61,727,439 76,342,562Derivative assets - - - - - - - -
Total financial assets held at fair value through profit or loss 224,802,781 310,767,172 58,411,802 67,340,384 7,312,820 7,880,157 61,727,439 76,342,562
Comprising:Unlisted unit trustsRelated unlisted unit trusts 224,802,781 310,767,172 58,411,802 67,340,384 7,312,820 7,880,157 61,727,439 76,342,562Unrelated unlisted unit trusts - - - - - - - - Total unlisted unit trusts 224,802,781 310,767,172 58,411,802 67,340,384 7,312,820 7,880,157 61,727,439 76,342,562
Derivative assetsForeign currency forward contracts - - - - - - - - Futures - - - - - - - - Total derivative assets - - - - - - - -
Total financial assets held at fair value through profit or loss 224,802,781 310,767,172 58,411,802 67,340,384 7,312,820 7,880,157 61,727,439 76,342,562
6.2 Financial liabilities held at fair value through profit or lossDerivative liabilities - - 4,450 3,306 - - - -
Total financial liabilities held at fair value through profit or loss - - 4,450 3,306 - - - -
Comprising:Derivative liabilitiesForeign currency forward contracts - - - 3,306 - - - - Futures - - 4,450 - - - - - Total derivative liabilities - - 4,450 3,306 - - - -
Total financial liabilities held at fair value through profit or loss - - 4,450 3,306 - - - -
16. ANZ OA OnePath Global Emerging Markets Share
Trust
13. ANZ OA OnePath Blue Chip Imputation Trust
14. ANZ OA OnePath Conservative Trust
15. ANZ OA OnePath Diversified Fixed Interest
Trust
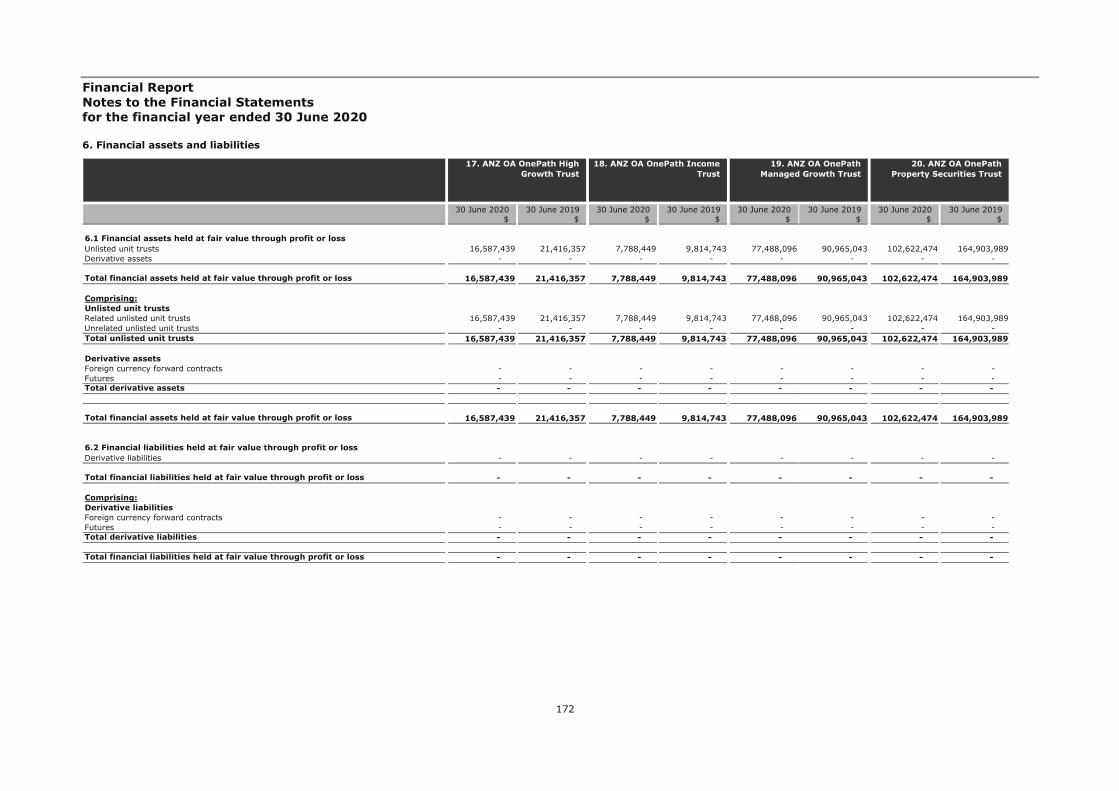
Financial Report Notes to the Financial Statements for the financial year ended 30 June 2020
172
6. Financial assets and liabilities
30 June 2020 30 June 2019 30 June 2020 30 June 2019 30 June 2020 30 June 2019 30 June 2020 30 June 2019$ $ $ $ $ $ $ $
6.1 Financial assets held at fair value through profit or lossUnlisted unit trusts 16,587,439 21,416,357 7,788,449 9,814,743 77,488,096 90,965,043 102,622,474 164,903,989Derivative assets - - - - - - - -
Total financial assets held at fair value through profit or loss 16,587,439 21,416,357 7,788,449 9,814,743 77,488,096 90,965,043 102,622,474 164,903,989
Comprising:Unlisted unit trustsRelated unlisted unit trusts 16,587,439 21,416,357 7,788,449 9,814,743 77,488,096 90,965,043 102,622,474 164,903,989Unrelated unlisted unit trusts - - - - - - - - Total unlisted unit trusts 16,587,439 21,416,357 7,788,449 9,814,743 77,488,096 90,965,043 102,622,474 164,903,989
Derivative assetsForeign currency forward contracts - - - - - - - - Futures - - - - - - - - Total derivative assets - - - - - - - -
Total financial assets held at fair value through profit or loss 16,587,439 21,416,357 7,788,449 9,814,743 77,488,096 90,965,043 102,622,474 164,903,989
6.2 Financial liabilities held at fair value through profit or lossDerivative liabilities - - - - - - - -
Total financial liabilities held at fair value through profit or loss - - - - - - - -
Comprising:Derivative liabilitiesForeign currency forward contracts - - - - - - - - Futures - - - - - - - - Total derivative liabilities - - - - - - - -
Total financial liabilities held at fair value through profit or loss - - - - - - - -
20. ANZ OA OnePath Property Securities Trust
17. ANZ OA OnePath High Growth Trust
18. ANZ OA OnePath Income Trust
19. ANZ OA OnePath Managed Growth Trust

Financial Report Notes to the Financial Statements for the financial year ended 30 June 2020
173
6. Financial assets and liabilities
30 June 2020 30 June 2019 30 June 2020 30 June 2019 30 June 2020 30 June 2019 30 June 2020 30 June 2019$ $ $ $ $ $ $ $
6.1 Financial assets held at fair value through profit or lossUnlisted unit trusts 17,029,352 22,668,794 1,045,315 982,636 30,495,637 39,480,885 1,031,928 1,117,647Derivative assets - - - - - - - -
Total financial assets held at fair value through profit or loss 17,029,352 22,668,794 1,045,315 982,636 30,495,637 39,480,885 1,031,928 1,117,647
Comprising:Unlisted unit trustsRelated unlisted unit trusts 17,029,352 22,668,794 1,045,315 982,636 30,495,637 39,480,885 1,031,928 1,117,647Unrelated unlisted unit trusts - - - - - - - - Total unlisted unit trusts 17,029,352 22,668,794 1,045,315 982,636 30,495,637 39,480,885 1,031,928 1,117,647
Derivative assetsForeign currency forward contracts - - - - - - - - Futures - - - - - - - - Total derivative assets - - - - - - - -
Total financial assets held at fair value through profit or loss 17,029,352 22,668,794 1,045,315 982,636 30,495,637 39,480,885 1,031,928 1,117,647
6.2 Financial liabilities held at fair value through profit or lossDerivative liabilities - - - - - - - -
Total financial liabilities held at fair value through profit or loss - - - - - - - -
Comprising:Derivative liabilitiesForeign currency forward contracts - - - - - - - - Futures - - - - - - - - Total derivative liabilities - - - - - - - -
Total financial liabilities held at fair value through profit or loss - - - - - - - -
24. ANZ OA OptiMix Australian Fixed Interest
Trust
21. ANZ OA OnePath Select Leaders Trust
22. ANZ OA OnePath Sustainable Investments -
Australian Share Trust
23. ANZ OA OnePath Tax Effective Income Trust

Financial Report Notes to the Financial Statements for the financial year ended 30 June 2020
174
6. Financial assets and liabilities
30 June 2020 30 June 2019 30 June 2020 30 June 2019 30 June 2020 30 June 2019 30 June 2020 30 June 2019$ $ $ $ $ $ $ $
6.1 Financial assets held at fair value through profit or lossUnlisted unit trusts 6,771,310 8,272,618 13,384,226 15,517,207 3,548,831 4,966,163 1,776,927 1,953,828Derivative assets - - - - - - - -
Total financial assets held at fair value through profit or loss 6,771,310 8,272,618 13,384,226 15,517,207 3,548,831 4,966,163 1,776,927 1,953,828
Comprising:Unlisted unit trustsRelated unlisted unit trusts 6,771,310 8,272,618 13,384,226 15,517,207 3,548,831 4,966,163 1,776,927 1,953,828Unrelated unlisted unit trusts - - - - - - - - Total unlisted unit trusts 6,771,310 8,272,618 13,384,226 15,517,207 3,548,831 4,966,163 1,776,927 1,953,828
Derivative assetsForeign currency forward contracts - - - - - - - - Futures - - - - - - - - Total derivative assets - - - - - - - -
Total financial assets held at fair value through profit or loss 6,771,310 8,272,618 13,384,226 15,517,207 3,548,831 4,966,163 1,776,927 1,953,828
6.2 Financial liabilities held at fair value through profit or lossDerivative liabilities - - - - - - - -
Total financial liabilities held at fair value through profit or loss - - - - - - - -
Comprising:Derivative liabilitiesForeign currency forward contracts - - - - - - - - Futures - - - - - - - - Total derivative liabilities - - - - - - - -
Total financial liabilities held at fair value through profit or loss - - - - - - - -
28. ANZ OA OptiMix Global Smaller Companies Share
Trust
25. ANZ OA OptiMix Australian Share Trust
26. ANZ OA OptiMix Conservative Trust
27. ANZ OA OptiMix Global Share Trust

Financial Report Notes to the Financial Statements for the financial year ended 30 June 2020
175
6. Financial assets and liabilities
30 June 2020 30 June 2019 30 June 2020 30 June 2019 30 June 2020 30 June 2019 30 June 2020 30 June 2019$ $ $ $ $ $ $ $
6.1 Financial assets held at fair value through profit or lossUnlisted unit trusts 20,938,174 26,467,865 8,147,572 9,648,711 16,993,270 20,621,436 2,060,637 3,141,515Derivative assets - - - - - - - -
Total financial assets held at fair value through profit or loss 20,938,174 26,467,865 8,147,572 9,648,711 16,993,270 20,621,436 2,060,637 3,141,515
Comprising:Unlisted unit trustsRelated unlisted unit trusts 20,938,174 26,467,865 8,147,572 9,648,711 16,993,270 20,621,436 2,060,637 3,141,515Unrelated unlisted unit trusts - - - - - - - - Total unlisted unit trusts 20,938,174 26,467,865 8,147,572 9,648,711 16,993,270 20,621,436 2,060,637 3,141,515
Derivative assetsForeign currency forward contracts - - - - - - - - Futures - - - - - - - - Total derivative assets - - - - - - - -
Total financial assets held at fair value through profit or loss 20,938,174 26,467,865 8,147,572 9,648,711 16,993,270 20,621,436 2,060,637 3,141,515
6.2 Financial liabilities held at fair value through profit or lossDerivative liabilities - - - - - - - -
Total financial liabilities held at fair value through profit or loss - - - - - - - -
Comprising:Derivative liabilitiesForeign currency forward contracts - - - - - - - - Futures - - - - - - - - Total derivative liabilities - - - - - - - -
Total financial liabilities held at fair value through profit or loss - - - - - - - -
32. ANZ OA OptiMix Property Securities Trust
29. ANZ OA OptiMix Growth Trust
30. ANZ OA OptiMix High Growth Trust
31. ANZ OA OptiMix Moderate Trust

Financial Report Notes to the Financial Statements for the financial year ended 30 June 2020
176
6. Financial assets and liabilities
30 June 2020 30 June 2019 30 June 2020 30 June 2019 30 June 2020 30 June 2019 30 June 2020 30 June 2019$ $ $ $ $ $ $ $
6.1 Financial assets held at fair value through profit or lossUnlisted unit trusts 251,552,684 331,472,475 65,554,771 120,683,040 10,607,371 18,839,259 1,997,695 2,157,470Derivative assets - - - - - - - -
Total financial assets held at fair value through profit or loss 251,552,684 331,472,475 65,554,771 120,683,040 10,607,371 18,839,259 1,997,695 2,157,470
Comprising:Unlisted unit trustsRelated unlisted unit trusts - - 65,554,771 120,683,040 10,607,371 18,839,259 1,997,695 2,157,470Unrelated unlisted unit trusts 251,552,684 331,472,475 - - - - - - Total unlisted unit trusts 251,552,684 331,472,475 65,554,771 120,683,040 10,607,371 18,839,259 1,997,695 2,157,470
Derivative assetsForeign currency forward contracts - - - - - - - - Futures - - - - - - - - Total derivative assets - - - - - - - -
Total financial assets held at fair value through profit or loss 251,552,684 331,472,475 65,554,771 120,683,040 10,607,371 18,839,259 1,997,695 2,157,470
6.2 Financial liabilities held at fair value through profit or lossDerivative liabilities - - - - - - - -
Total financial liabilities held at fair value through profit or loss - - - - - - - -
Comprising:Derivative liabilitiesForeign currency forward contracts - - - - - - - - Futures - - - - - - - - Total derivative liabilities - - - - - - - -
Total financial liabilities held at fair value through profit or loss - - - - - - - -
36. ANZ OA UBS Diversified Fixed Income Trust
33. ANZ OA Perpetual Australian Share Trust
34. ANZ OA Schroder Australian Equity Trust
35. ANZ OA SG Hiscock Property Trust

Financial Report Notes to the Financial Statements for the financial year ended 30 June 2020
177
6. Financial assets and liabilities
30 June 2020 30 June 2019 30 June 2020 30 June 2019 30 June 2020 30 June 2019 30 June 2020 30 June 2019$ $ $ $ $ $ $ $
6.1 Financial assets held at fair value through profit or lossUnlisted unit trusts 13,753,913 18,186,667 11,019,513 13,050,626 242,092,453 179,130,192 55,352,653 91,818,508Derivative assets - - - - - - - -
Total financial assets held at fair value through profit or loss 13,753,913 18,186,667 11,019,513 13,050,626 242,092,453 179,130,192 55,352,653 91,818,508
Comprising:Unlisted unit trustsRelated unlisted unit trusts - - - - 118,311,396 88,703,689 55,352,653 91,818,508Unrelated unlisted unit trusts 13,753,913 18,186,667 11,019,513 13,050,626 123,781,057 90,426,503 - - Total unlisted unit trusts 13,753,913 18,186,667 11,019,513 13,050,626 242,092,453 179,130,192 55,352,653 91,818,508
Derivative assetsForeign currency forward contracts - - - - - - - - Futures - - - - - - - - Total derivative assets - - - - - - - -
Total financial assets held at fair value through profit or loss 13,753,913 18,186,667 11,019,513 13,050,626 242,092,453 179,130,192 55,352,653 91,818,508
6.2 Financial liabilities held at fair value through profit or lossDerivative liabilities - - - - - - - -
Total financial liabilities held at fair value through profit or loss - - - - - - - -
Comprising:Derivative liabilitiesForeign currency forward contracts - - - - - - - - Futures - - - - - - - - Total derivative liabilities - - - - - - - -
Total financial liabilities held at fair value through profit or loss - - - - - - - -
40. ANZ Property Securities Trust
37. ANZ OneAnswer - BR Scientific Australian Equity
Trust
38. ANZ OneAnswer - BR Scientific International
Equity Trust
39. ANZ Private International Fixed Interest Fund

Financial Report Notes to the Financial Statements for the financial year ended 30 June 2020
178
6. Financial assets and liabilities
30 June 2020 30 June 2019 30 June 2020 30 June 2019 30 June 2020 30 June 2019 30 June 2020 30 June 2019$ $ $ $ $ $ $ $
6.1 Financial assets held at fair value through profit or lossUnlisted unit trusts 121,539,187 133,793,644 66,780,685 78,867,189 73,765,226 98,888,834 190,383,807 256,294,820Derivative assets - - - - - - - -
Total financial assets held at fair value through profit or loss 121,539,187 133,793,644 66,780,685 78,867,189 73,765,226 98,888,834 190,383,807 256,294,820
Comprising:Unlisted unit trustsRelated unlisted unit trusts 121,539,187 133,793,644 66,780,685 78,867,189 73,765,226 98,888,834 190,383,807 256,294,820Unrelated unlisted unit trusts - - - - - - - - Total unlisted unit trusts 121,539,187 133,793,644 66,780,685 78,867,189 73,765,226 98,888,834 190,383,807 256,294,820
Derivative assetsForeign currency forward contracts - - - - - - - - Futures - - - - - - - - Total derivative assets - - - - - - - -
Total financial assets held at fair value through profit or loss 121,539,187 133,793,644 66,780,685 78,867,189 73,765,226 98,888,834 190,383,807 256,294,820
6.2 Financial liabilities held at fair value through profit or lossDerivative liabilities - - - - - - - -
Total financial liabilities held at fair value through profit or loss - - - - - - - -
Comprising:Derivative liabilitiesForeign currency forward contracts - - - - - - - - Futures - - - - - - - - Total derivative liabilities - - - - - - - -
Total financial liabilities held at fair value through profit or loss - - - - - - - -
44. Emerging Companies Trust
41. Australian Share Trust 42. Balanced Trust 43. Blue Chip Imputation Trust
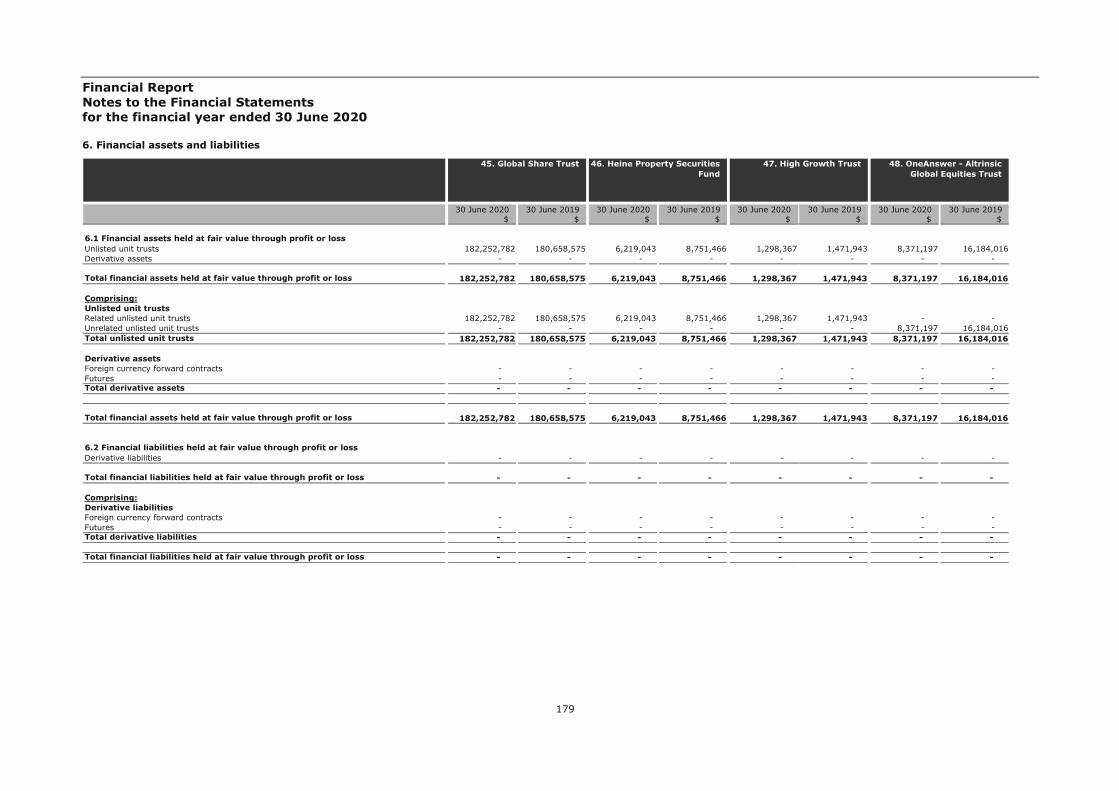
Financial Report Notes to the Financial Statements for the financial year ended 30 June 2020
179
6. Financial assets and liabilities
30 June 2020 30 June 2019 30 June 2020 30 June 2019 30 June 2020 30 June 2019 30 June 2020 30 June 2019$ $ $ $ $ $ $ $
6.1 Financial assets held at fair value through profit or lossUnlisted unit trusts 182,252,782 180,658,575 6,219,043 8,751,466 1,298,367 1,471,943 8,371,197 16,184,016Derivative assets - - - - - - - -
Total financial assets held at fair value through profit or loss 182,252,782 180,658,575 6,219,043 8,751,466 1,298,367 1,471,943 8,371,197 16,184,016
Comprising:Unlisted unit trustsRelated unlisted unit trusts 182,252,782 180,658,575 6,219,043 8,751,466 1,298,367 1,471,943 - - Unrelated unlisted unit trusts - - - - - - 8,371,197 16,184,016Total unlisted unit trusts 182,252,782 180,658,575 6,219,043 8,751,466 1,298,367 1,471,943 8,371,197 16,184,016
Derivative assetsForeign currency forward contracts - - - - - - - - Futures - - - - - - - - Total derivative assets - - - - - - - -
Total financial assets held at fair value through profit or loss 182,252,782 180,658,575 6,219,043 8,751,466 1,298,367 1,471,943 8,371,197 16,184,016
6.2 Financial liabilities held at fair value through profit or lossDerivative liabilities - - - - - - - -
Total financial liabilities held at fair value through profit or loss - - - - - - - -
Comprising:Derivative liabilitiesForeign currency forward contracts - - - - - - - - Futures - - - - - - - - Total derivative liabilities - - - - - - - -
Total financial liabilities held at fair value through profit or loss - - - - - - - -
48. OneAnswer - Altrinsic Global Equities Trust
45. Global Share Trust 46. Heine Property Securities Fund
47. High Growth Trust

Financial Report Notes to the Financial Statements for the financial year ended 30 June 2020
180
6. Financial assets and liabilities
30 June 2020 30 June 2019 30 June 2020 30 June 2019 30 June 2020 30 June 2019 30 June 2020 30 June 2019$ $ $ $ $ $ $ $
6.1 Financial assets held at fair value through profit or lossUnlisted unit trusts 68,997,583 85,380,637 9,302,599 11,801,221 63,741,288 82,884,595 92,634,254 99,649,962Derivative assets - - - - - - - -
Total financial assets held at fair value through profit or loss 68,997,583 85,380,637 9,302,599 11,801,221 63,741,288 82,884,595 92,634,254 99,649,962
Comprising:Unlisted unit trustsRelated unlisted unit trusts - - 9,302,599 11,801,221 - - - - Unrelated unlisted unit trusts 68,997,583 85,380,637 - - 63,741,288 82,884,595 92,634,254 99,649,962Total unlisted unit trusts 68,997,583 85,380,637 9,302,599 11,801,221 63,741,288 82,884,595 92,634,254 99,649,962
Derivative assetsForeign currency forward contracts - - - - - - - - Futures - - - - - - - - Total derivative assets - - - - - - - -
Total financial assets held at fair value through profit or loss 68,997,583 85,380,637 9,302,599 11,801,221 63,741,288 82,884,595 92,634,254 99,649,962
6.2 Financial liabilities held at fair value through profit or lossDerivative liabilities - - - - - - - -
Total financial liabilities held at fair value through profit or loss - - - - - - - -
Comprising:Derivative liabilitiesForeign currency forward contracts - - - - - - - - Futures - - - - - - - - Total derivative liabilities - - - - - - - -
Total financial liabilities held at fair value through profit or loss - - - - - - - -
52. OneAnswer - Bennelong Australian Equities Trust
49. OneAnswer - Antipodes Global (Long Only) Trust
50. OneAnswer - Arrowstreet Global Equity (Hedged) Trust
51. OneAnswer - Ausbil Australian Emerging Leaders
Trust

Financial Report Notes to the Financial Statements for the financial year ended 30 June 2020
181
6. Financial assets and liabilities
30 June 2020 30 June 2019 30 June 2020 30 June 2019 30 June 2020 30 June 2019 30 June 2020 30 June 2019$ $ $ $ $ $ $ $
6.1 Financial assets held at fair value through profit or lossUnlisted unit trusts 58,578,184 74,292,085 3,049,074 3,095,501 39,790,929 49,249,173 35,299,964 41,325,517Derivative assets - - - - - - - -
Total financial assets held at fair value through profit or loss 58,578,184 74,292,085 3,049,074 3,095,501 39,790,929 49,249,173 35,299,964 41,325,517
Comprising:Unlisted unit trustsRelated unlisted unit trusts - - - - - - - - Unrelated unlisted unit trusts 58,578,184 74,292,085 3,049,074 3,095,501 39,790,929 49,249,173 35,299,964 41,325,517Total unlisted unit trusts 58,578,184 74,292,085 3,049,074 3,095,501 39,790,929 49,249,173 35,299,964 41,325,517
Derivative assetsForeign currency forward contracts - - - - - - - - Futures - - - - - - - - Total derivative assets - - - - - - - -
Total financial assets held at fair value through profit or loss 58,578,184 74,292,085 3,049,074 3,095,501 39,790,929 49,249,173 35,299,964 41,325,517
6.2 Financial liabilities held at fair value through profit or lossDerivative liabilities - - - - - - - -
Total financial liabilities held at fair value through profit or loss - - - - - - - -
Comprising:Derivative liabilitiesForeign currency forward contracts - - - - - - - - Futures - - - - - - - - Total derivative liabilities - - - - - - - -
Total financial liabilities held at fair value through profit or loss - - - - - - - -
56. OneAnswer - BR Scientific Diversified Growth
Trust
53. OneAnswer - Bentham Global Income Trust
54. OneAnswer - BlackRock Scientific Australian Equity
Trust
55. OneAnswer - Blackrock Tactical Growth Trust

Financial Report Notes to the Financial Statements for the financial year ended 30 June 2020
182
6. Financial assets and liabilities
30 June 2020 30 June 2019 30 June 2020 30 June 2019 30 June 2020 30 June 2019 30 June 2020 30 June 2019$ $ $ $ $ $ $ $
6.1 Financial assets held at fair value through profit or lossUnlisted unit trusts 2,186,471 2,276,753 34,903,027 43,380,113 146,085,304 154,993,077 3,946,885 5,312,950Derivative assets - - - - - - - -
Total financial assets held at fair value through profit or loss 2,186,471 2,276,753 34,903,027 43,380,113 146,085,304 154,993,077 3,946,885 5,312,950
Comprising:Unlisted unit trustsRelated unlisted unit trusts - - - - - - 3,946,885 5,312,950Unrelated unlisted unit trusts 2,186,471 2,276,753 34,903,027 43,380,113 146,085,304 154,993,077 - - Total unlisted unit trusts 2,186,471 2,276,753 34,903,027 43,380,113 146,085,304 154,993,077 3,946,885 5,312,950
Derivative assetsForeign currency forward contracts - - - - - - - - Futures - - - - - - - - Total derivative assets - - - - - - - -
Total financial assets held at fair value through profit or loss 2,186,471 2,276,753 34,903,027 43,380,113 146,085,304 154,993,077 3,946,885 5,312,950
6.2 Financial liabilities held at fair value through profit or lossDerivative liabilities - - - - - - - -
Total financial liabilities held at fair value through profit or loss - - - - - - - -
Comprising:Derivative liabilitiesForeign currency forward contracts - - - - - - - - Futures - - - - - - - - Total derivative liabilities - - - - - - - -
Total financial liabilities held at fair value through profit or loss - - - - - - - -
60. OneAnswer - Colonial First State Imputation Trust
57. OneAnswer - BR Scientific International
Equity Trust
58. OneAnswer - Colonial First State Global Credit
Income Trust
59. OneAnswer - Colonial First State Global Listed
Infrastructure Trust
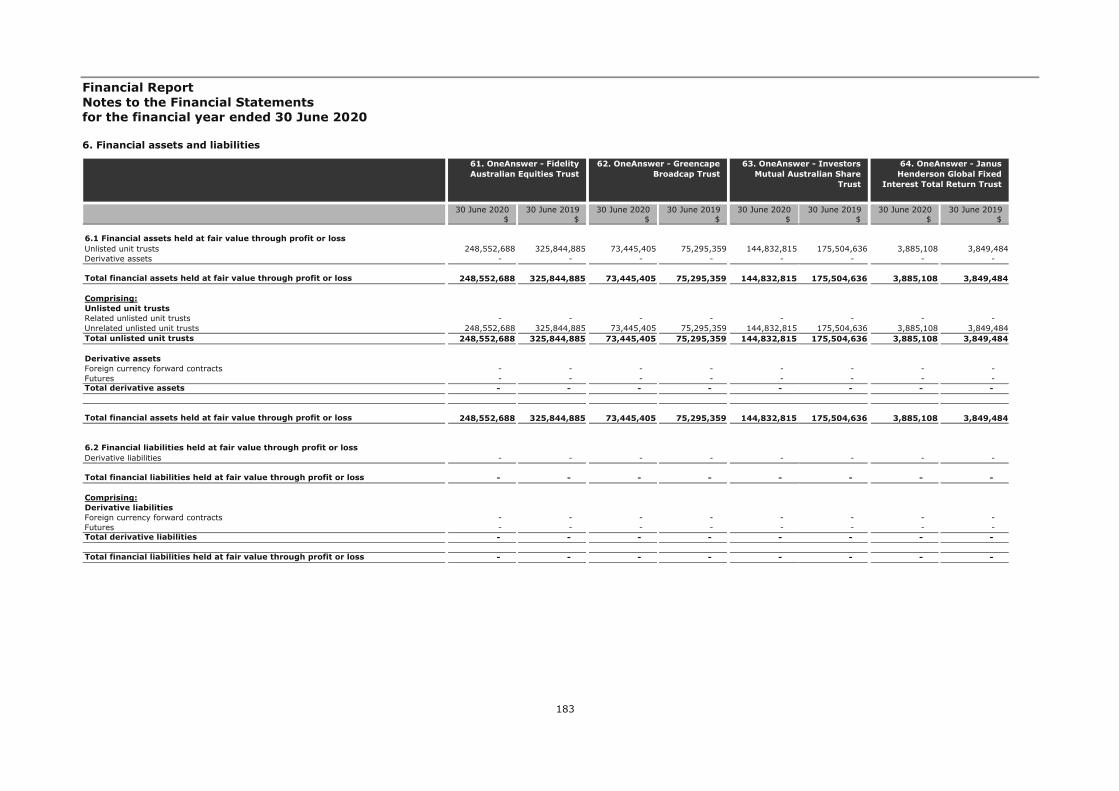
Financial Report Notes to the Financial Statements for the financial year ended 30 June 2020
183
6. Financial assets and liabilities
30 June 2020 30 June 2019 30 June 2020 30 June 2019 30 June 2020 30 June 2019 30 June 2020 30 June 2019$ $ $ $ $ $ $ $
6.1 Financial assets held at fair value through profit or lossUnlisted unit trusts 248,552,688 325,844,885 73,445,405 75,295,359 144,832,815 175,504,636 3,885,108 3,849,484Derivative assets - - - - - - - -
Total financial assets held at fair value through profit or loss 248,552,688 325,844,885 73,445,405 75,295,359 144,832,815 175,504,636 3,885,108 3,849,484
Comprising:Unlisted unit trustsRelated unlisted unit trusts - - - - - - - - Unrelated unlisted unit trusts 248,552,688 325,844,885 73,445,405 75,295,359 144,832,815 175,504,636 3,885,108 3,849,484Total unlisted unit trusts 248,552,688 325,844,885 73,445,405 75,295,359 144,832,815 175,504,636 3,885,108 3,849,484
Derivative assetsForeign currency forward contracts - - - - - - - - Futures - - - - - - - - Total derivative assets - - - - - - - -
Total financial assets held at fair value through profit or loss 248,552,688 325,844,885 73,445,405 75,295,359 144,832,815 175,504,636 3,885,108 3,849,484
6.2 Financial liabilities held at fair value through profit or lossDerivative liabilities - - - - - - - -
Total financial liabilities held at fair value through profit or loss - - - - - - - -
Comprising:Derivative liabilitiesForeign currency forward contracts - - - - - - - - Futures - - - - - - - - Total derivative liabilities - - - - - - - -
Total financial liabilities held at fair value through profit or loss - - - - - - - -
64. OneAnswer - Janus Henderson Global Fixed
Interest Total Return Trust
61. OneAnswer - Fidelity Australian Equities Trust
62. OneAnswer - Greencape Broadcap Trust
63. OneAnswer - Investors Mutual Australian Share
Trust

Financial Report Notes to the Financial Statements for the financial year ended 30 June 2020
184
6. Financial assets and liabilities
30 June 2020 30 June 2019 30 June 2020 30 June 2019 30 June 2020 30 June 2019 30 June 2020 30 June 2019$ $ $ $ $ $ $ $
6.1 Financial assets held at fair value through profit or lossUnlisted unit trusts 557,245,710 644,353,913 229,183,689 175,157,485 53,715,517 74,170,426 382,134,573 477,948,035Derivative assets - - - - - - - -
Total financial assets held at fair value through profit or loss 557,245,710 644,353,913 229,183,689 175,157,485 53,715,517 74,170,426 382,134,573 477,948,035
Comprising:Unlisted unit trustsRelated unlisted unit trusts - - - - - - - - Unrelated unlisted unit trusts 557,245,710 644,353,913 229,183,689 175,157,485 53,715,517 74,170,426 382,134,573 477,948,035Total unlisted unit trusts 557,245,710 644,353,913 229,183,689 175,157,485 53,715,517 74,170,426 382,134,573 477,948,035
Derivative assetsForeign currency forward contracts - - - - - - - - Futures - - - - - - - - Total derivative assets - - - - - - - -
Total financial assets held at fair value through profit or loss 557,245,710 644,353,913 229,183,689 175,157,485 53,715,517 74,170,426 382,134,573 477,948,035
6.2 Financial liabilities held at fair value through profit or lossDerivative liabilities - - - - - - - -
Total financial liabilities held at fair value through profit or loss - - - - - - - -
Comprising:Derivative liabilitiesForeign currency forward contracts - - - - - - - - Futures - - - - - - - - Total derivative liabilities - - - - - - - -
Total financial liabilities held at fair value through profit or loss - - - - - - - -
68. OneAnswer - MFS Global Equity Trust
65. OneAnswer - Kapstream Absolute Return Income
Trust
66. OneAnswer - Magellan Global Trust
67. OneAnswer - Merlon Australian Share Income
Trust

Financial Report Notes to the Financial Statements for the financial year ended 30 June 2020
185
6. Financial assets and liabilities
30 June 2020 30 June 2019 30 June 2020 30 June 2019 30 June 2020 30 June 2019 30 June 2020 30 June 2019$ $ $ $ $ $ $ $
6.1 Financial assets held at fair value through profit or lossUnlisted unit trusts 10,044,408 20,094,695 189,091,305 257,344,745 32,708,970 40,173,527 33,432,092 50,129,069Derivative assets - - - - - - - -
Total financial assets held at fair value through profit or loss 10,044,408 20,094,695 189,091,305 257,344,745 32,708,970 40,173,527 33,432,092 50,129,069
Comprising:Unlisted unit trustsRelated unlisted unit trusts - - 189,091,305 257,344,745 - - - - Unrelated unlisted unit trusts 10,044,408 20,094,695 - - 32,708,970 40,173,527 33,432,092 50,129,069Total unlisted unit trusts 10,044,408 20,094,695 189,091,305 257,344,745 32,708,970 40,173,527 33,432,092 50,129,069
Derivative assetsForeign currency forward contracts - - - - - - - - Futures - - - - - - - - Total derivative assets - - - - - - - -
Total financial assets held at fair value through profit or loss 10,044,408 20,094,695 189,091,305 257,344,745 32,708,970 40,173,527 33,432,092 50,129,069
6.2 Financial liabilities held at fair value through profit or lossDerivative liabilities - - - - - - - -
Total financial liabilities held at fair value through profit or loss - - - - - - - -
Comprising:Derivative liabilitiesForeign currency forward contracts - - - - - - - - Futures - - - - - - - - Total derivative liabilities - - - - - - - -
Total financial liabilities held at fair value through profit or loss - - - - - - - -
72. OneAnswer - Pendal Core Hedged Global Shares Trust
69. OneAnswer - Nikko AM Australian Shares Trust
70. OneAnswer - OnePath Global Property Securities
Index Trust
71. OneAnswer - Pendal Australian Share Trust

Financial Report Notes to the Financial Statements for the financial year ended 30 June 2020
186
6. Financial assets and liabilities
30 June 2020 30 June 2019 30 June 2020 30 June 2019 30 June 2020 30 June 2019 30 June 2020 30 June 2019$ $ $ $ $ $ $ $
6.1 Financial assets held at fair value through profit or lossUnlisted unit trusts 18,844,119 14,528,614 88,181,468 98,525,543 82,829,790 115,038,664 14,874,556 22,316,964Derivative assets - - - - - - - -
Total financial assets held at fair value through profit or loss 18,844,119 14,528,614 88,181,468 98,525,543 82,829,790 115,038,664 14,874,556 22,316,964
Comprising:Unlisted unit trustsRelated unlisted unit trusts - - - - - - 14,874,556 22,316,964Unrelated unlisted unit trusts 18,844,119 14,528,614 88,181,468 98,525,543 82,829,790 115,038,664 - - Total unlisted unit trusts 18,844,119 14,528,614 88,181,468 98,525,543 82,829,790 115,038,664 14,874,556 22,316,964
Derivative assetsForeign currency forward contracts - - - - - - - - Futures - - - - - - - - Total derivative assets - - - - - - - -
Total financial assets held at fair value through profit or loss 18,844,119 14,528,614 88,181,468 98,525,543 82,829,790 115,038,664 14,874,556 22,316,964
6.2 Financial liabilities held at fair value through profit or lossDerivative liabilities - - - - - - - -
Total financial liabilities held at fair value through profit or loss - - - - - - - -
Comprising:Derivative liabilitiesForeign currency forward contracts - - - - - - - - Futures - - - - - - - - Total derivative liabilities - - - - - - - -
Total financial liabilities held at fair value through profit or loss - - - - - - - -
76. OneAnswer - Perpetual Australian Share Trust
73. OneAnswer - Pendal Monthly Income Plus Trust
74. OneAnswer - Pendal Smaller Companies Trust
75. OneAnswer - Perennial Value Shares Trust

Financial Report Notes to the Financial Statements for the financial year ended 30 June 2020
187
6. Financial assets and liabilities
30 June 2020 30 June 2019 30 June 2020 30 June 2019 30 June 2020 30 June 2019 30 June 2020 30 June 2019$ $ $ $ $ $ $ $
6.1 Financial assets held at fair value through profit or lossUnlisted unit trusts 105,023,009 141,166,162 119,013,521 134,157,924 5,048,232 4,506,358 24,391,293 26,688,121Derivative assets - - - - - - - -
Total financial assets held at fair value through profit or loss 105,023,009 141,166,162 119,013,521 134,157,924 5,048,232 4,506,358 24,391,293 26,688,121
Comprising:Unlisted unit trustsRelated unlisted unit trusts - - - - - - - - Unrelated unlisted unit trusts 105,023,009 141,166,162 119,013,521 134,157,924 5,048,232 4,506,358 24,391,293 26,688,121Total unlisted unit trusts 105,023,009 141,166,162 119,013,521 134,157,924 5,048,232 4,506,358 24,391,293 26,688,121
Derivative assetsForeign currency forward contracts - - - - - - - - Futures - - - - - - - - Total derivative assets - - - - - - - -
Total financial assets held at fair value through profit or loss 105,023,009 141,166,162 119,013,521 134,157,924 5,048,232 4,506,358 24,391,293 26,688,121
6.2 Financial liabilities held at fair value through profit or lossDerivative liabilities - - - - - - - -
Total financial liabilities held at fair value through profit or loss - - - - - - - -
Comprising:Derivative liabilitiesForeign currency forward contracts - - - - - - - - Futures - - - - - - - - Total derivative liabilities - - - - - - - -
Total financial liabilities held at fair value through profit or loss - - - - - - - -
80. OneAnswer - Platinum Asia Trust
77. OneAnswer - Perpetual Balanced Growth Trust
78. OneAnswer - Perpetual Conservative Growth Trust
79. OneAnswer - Perpetual Ethical SRI Trust

Financial Report Notes to the Financial Statements for the financial year ended 30 June 2020
188
6. Financial assets and liabilities
30 June 2020 30 June 2019 30 June 2020 30 June 2019 30 June 2020 30 June 2019 30 June 2020 30 June 2019$ $ $ $ $ $ $ $
6.1 Financial assets held at fair value through profit or lossUnlisted unit trusts 261,954,943 332,192,804 93,450,298 128,528,364 193,703,011 279,798,122 191,948,339 261,757,369Derivative assets - - - - - - - -
Total financial assets held at fair value through profit or loss 261,954,943 332,192,804 93,450,298 128,528,364 193,703,011 279,798,122 191,948,339 261,757,369
Comprising:Unlisted unit trustsRelated unlisted unit trusts - - - - - - - - Unrelated unlisted unit trusts 261,954,943 332,192,804 93,450,298 128,528,364 193,703,011 279,798,122 191,948,339 261,757,369Total unlisted unit trusts 261,954,943 332,192,804 93,450,298 128,528,364 193,703,011 279,798,122 191,948,339 261,757,369
Derivative assetsForeign currency forward contracts - - - - - - - - Futures - - - - - - - - Total derivative assets - - - - - - - -
Total financial assets held at fair value through profit or loss 261,954,943 332,192,804 93,450,298 128,528,364 193,703,011 279,798,122 191,948,339 261,757,369
6.2 Financial liabilities held at fair value through profit or lossDerivative liabilities - - - - - - - -
Total financial liabilities held at fair value through profit or loss - - - - - - - -
Comprising:Derivative liabilitiesForeign currency forward contracts - - - - - - - - Futures - - - - - - - - Total derivative liabilities - - - - - - - -
Total financial liabilities held at fair value through profit or loss - - - - - - - -
84. OneAnswer - Schroder Balanced Trust
81. OneAnswer - Platinum International Trust
82. OneAnswer - RARE Infastructure Value Trust
83. OneAnswer - Schroder Australian Equity Trust

Financial Report Notes to the Financial Statements for the financial year ended 30 June 2020
189
6. Financial assets and liabilities
30 June 2020 30 June 2019 30 June 2020 30 June 2019 30 June 2020 30 June 2019 30 June 2020 30 June 2019$ $ $ $ $ $ $ $
6.1 Financial assets held at fair value through profit or lossUnlisted unit trusts 201,020,890 223,172,735 373,011,366 432,190,442 13,847,256 23,631,275 6,491,211 4,773,386Derivative assets - - - - - - - -
Total financial assets held at fair value through profit or loss 201,020,890 223,172,735 373,011,366 432,190,442 13,847,256 23,631,275 6,491,211 4,773,386
Comprising:Unlisted unit trustsRelated unlisted unit trusts - - - - - - - - Unrelated unlisted unit trusts 201,020,890 223,172,735 373,011,366 432,190,442 13,847,256 23,631,275 6,491,211 4,773,386Total unlisted unit trusts 201,020,890 223,172,735 373,011,366 432,190,442 13,847,256 23,631,275 6,491,211 4,773,386
Derivative assetsForeign currency forward contracts - - - - - - - - Futures - - - - - - - - Total derivative assets - - - - - - - -
Total financial assets held at fair value through profit or loss 201,020,890 223,172,735 373,011,366 432,190,442 13,847,256 23,631,275 6,491,211 4,773,386
6.2 Financial liabilities held at fair value through profit or lossDerivative liabilities - - - - - - - -
Total financial liabilities held at fair value through profit or loss - - - - - - - -
Comprising:Derivative liabilitiesForeign currency forward contracts - - - - - - - - Futures - - - - - - - - Total derivative liabilities - - - - - - - -
Total financial liabilities held at fair value through profit or loss - - - - - - - -
88. OneAnswer - Stewart Investors Worldwide
Sustainability Trust
85. OneAnswer - Schroder Fixed Income Trust
86. OneAnswer - Schroder Real Return Trust
87. OneAnswer - SG Hiscock Property Trust

Financial Report Notes to the Financial Statements for the financial year ended 30 June 2020
190
6. Financial assets and liabilities
30 June 2020 30 June 2019 30 June 2020 30 June 2019 30 June 2020 30 June 2019 30 June 2020 30 June 2019$ $ $ $ $ $ $ $
6.1 Financial assets held at fair value through profit or lossUnlisted unit trusts 43,262,484 34,909,218 65,147,937 47,250,428 57,130,856 72,683,109 21,671,027 24,300,838Derivative assets - - - - - - - -
Total financial assets held at fair value through profit or loss 43,262,484 34,909,218 65,147,937 47,250,428 57,130,856 72,683,109 21,671,027 24,300,838
Comprising:Unlisted unit trustsRelated unlisted unit trusts - - - - - - - - Unrelated unlisted unit trusts 43,262,484 34,909,218 65,147,937 47,250,428 57,130,856 72,683,109 21,671,027 24,300,838Total unlisted unit trusts 43,262,484 34,909,218 65,147,937 47,250,428 57,130,856 72,683,109 21,671,027 24,300,838
Derivative assetsForeign currency forward contracts - - - - - - - - Futures - - - - - - - - Total derivative assets - - - - - - - -
Total financial assets held at fair value through profit or loss 43,262,484 34,909,218 65,147,937 47,250,428 57,130,856 72,683,109 21,671,027 24,300,838
6.2 Financial liabilities held at fair value through profit or lossDerivative liabilities - - - - - - - -
Total financial liabilities held at fair value through profit or loss - - - - - - - -
Comprising:Derivative liabilitiesForeign currency forward contracts - - - - - - - - Futures - - - - - - - - Total derivative liabilities - - - - - - - -
Total financial liabilities held at fair value through profit or loss - - - - - - - -
92. OneAnswer - UBS Defensive Trust
89. OneAnswer - T. Rowe Price Global Equity Trust
90. OneAnswer - T.Rowe Price Dynamic Global Bond
Trust
91. OneAnswer - UBS Balanced Trust

Financial Report Notes to the Financial Statements for the financial year ended 30 June 2020
191
6. Financial assets and liabilities
30 June 2020 30 June 2019 30 June 2020 30 June 2019 30 June 2020 30 June 2019 30 June 2020 30 June 2019$ $ $ $ $ $ $ $
6.1 Financial assets held at fair value through profit or lossUnlisted unit trusts 108,159,690 101,917,334 914,062,176 1,124,538,876 2,010,517,895 2,288,834,458 777,447,403 813,750,674Derivative assets - - - - - - - -
Total financial assets held at fair value through profit or loss 108,159,690 101,917,334 914,062,176 1,124,538,876 2,010,517,895 2,288,834,458 777,447,403 813,750,674
Comprising:Unlisted unit trustsRelated unlisted unit trusts - - 914,062,176 1,124,538,876 2,010,517,895 2,288,834,458 777,447,403 813,750,674Unrelated unlisted unit trusts 108,159,690 101,917,334 - - - - - - Total unlisted unit trusts 108,159,690 101,917,334 914,062,176 1,124,538,876 2,010,517,895 2,288,834,458 777,447,403 813,750,674
Derivative assetsForeign currency forward contracts - - - - - - - - Futures - - - - - - - - Total derivative assets - - - - - - - -
Total financial assets held at fair value through profit or loss 108,159,690 101,917,334 914,062,176 1,124,538,876 2,010,517,895 2,288,834,458 777,447,403 813,750,674
6.2 Financial liabilities held at fair value through profit or lossDerivative liabilities - - - - - - - -
Total financial liabilities held at fair value through profit or loss - - - - - - - -
Comprising:Derivative liabilitiesForeign currency forward contracts - - - - - - - - Futures - - - - - - - - Total derivative liabilities - - - - - - - -
Total financial liabilities held at fair value through profit or loss - - - - - - - -
96. OneAnswer - Vanguard Conservative Index Trust
93. OneAnswer - UBS Diversified Fixed Income
Trust
94. OneAnswer - Vanguard Australian Shares Index
Trust
95. OneAnswer - Vanguard Balanced Index Trust

Financial Report Notes to the Financial Statements for the financial year ended 30 June 2020
192
6. Financial assets and liabilities
30 June 2020 30 June 2019 30 June 2020 30 June 2019 30 June 2020 30 June 2019 30 June 2020 30 June 2019$ $ $ $ $ $ $ $
6.1 Financial assets held at fair value through profit or lossUnlisted unit trusts 98,749,115 103,572,662 937,940,607 1,085,971,520 337,972,637 387,536,402 88,005,004 106,054,519Derivative assets - - - - - - - -
Total financial assets held at fair value through profit or loss 98,749,115 103,572,662 937,940,607 1,085,971,520 337,972,637 387,536,402 88,005,004 106,054,519
Comprising:Unlisted unit trustsRelated unlisted unit trusts 98,749,115 103,572,662 937,940,607 1,085,971,520 337,972,637 387,536,402 88,005,004 106,054,519Unrelated unlisted unit trusts - - - - - - - - Total unlisted unit trusts 98,749,115 103,572,662 937,940,607 1,085,971,520 337,972,637 387,536,402 88,005,004 106,054,519
Derivative assetsForeign currency forward contracts - - - - - - - - Futures - - - - - - - - Total derivative assets - - - - - - - -
Total financial assets held at fair value through profit or loss 98,749,115 103,572,662 937,940,607 1,085,971,520 337,972,637 387,536,402 88,005,004 106,054,519
6.2 Financial liabilities held at fair value through profit or lossDerivative liabilities - - - - - - - -
Total financial liabilities held at fair value through profit or loss - - - - - - - -
Comprising:Derivative liabilitiesForeign currency forward contracts - - - - - - - - Futures - - - - - - - - Total derivative liabilities - - - - - - - -
Total financial liabilities held at fair value through profit or loss - - - - - - - -
100. OneAnswer - Vanguard International Shares Index
(Hedged) Trust
97. OneAnswer - Vanguard Diversified Bond Index Trust
98. OneAnswer - Vanguard Growth Index Trust
99. OneAnswer - Vanguard High Growth Index Trust

Financial Report Notes to the Financial Statements for the financial year ended 30 June 2020
193
6. Financial assets and liabilities
30 June 2020 30 June 2019 30 June 2020 30 June 2019 30 June 2020 30 June 2019 30 June 2020 30 June 2019$ $ $ $ $ $ $ $
6.1 Financial assets held at fair value through profit or lossUnlisted unit trusts 708,453,166 812,165,658 116,231,519 174,940,766 33,756,490 39,683,468 178,485,608 201,011,122Derivative assets - - - - - - - -
Total financial assets held at fair value through profit or loss 708,453,166 812,165,658 116,231,519 174,940,766 33,756,490 39,683,468 178,485,608 201,011,122
Comprising:Unlisted unit trustsRelated unlisted unit trusts 708,453,166 812,165,658 116,231,519 174,940,766 - - - - Unrelated unlisted unit trusts - - - - 33,756,490 39,683,468 178,485,608 201,011,122Total unlisted unit trusts 708,453,166 812,165,658 116,231,519 174,940,766 33,756,490 39,683,468 178,485,608 201,011,122
Derivative assetsForeign currency forward contracts - - - - - - - - Futures - - - - - - - - Total derivative assets - - - - - - - -
Total financial assets held at fair value through profit or loss 708,453,166 812,165,658 116,231,519 174,940,766 33,756,490 39,683,468 178,485,608 201,011,122
6.2 Financial liabilities held at fair value through profit or lossDerivative liabilities - - - - - - - -
Total financial liabilities held at fair value through profit or loss - - - - - - - -
Comprising:Derivative liabilitiesForeign currency forward contracts - - - - - - - - Futures - - - - - - - - Total derivative liabilities - - - - - - - -
Total financial liabilities held at fair value through profit or loss - - - - - - - -
104. OnePath Alternatives Growth Fund
101. OneAnswer - Vanguard International Shares Index
Trust
102. OneAnswer - Vanguard Property Securities Index
Trust
103. OneAnswer - Walter Scott Global Equity (Hedged)
Trust

Financial Report Notes to the Financial Statements for the financial year ended 30 June 2020
194
6. Financial assets and liabilities
30 June 2020 30 June 2019 30 June 2020 30 June 2019 30 June 2020 30 June 2019 30 June 2020 30 June 2019$ $ $ $ $ $ $ $
6.1 Financial assets held at fair value through profit or lossUnlisted unit trusts 612,630,198 746,184,527 4,482,782 5,399,186 811,181 941,238 12,770,904 15,304,713Derivative assets 640 - - - - - - -
Total financial assets held at fair value through profit or loss 612,630,838 746,184,527 4,482,782 5,399,186 811,181 941,238 12,770,904 15,304,713
Comprising:Unlisted unit trustsRelated unlisted unit trusts 612,630,198 746,184,527 4,482,782 5,399,186 811,181 941,238 12,770,904 15,304,713Unrelated unlisted unit trusts - - - - - - - - Total unlisted unit trusts 612,630,198 746,184,527 4,482,782 5,399,186 811,181 941,238 12,770,904 15,304,713
Derivative assetsForeign currency forward contracts - - - - - - - - Futures 640 - - - - - - - Total derivative assets 640 - - - - - - -
Total financial assets held at fair value through profit or loss 612,630,838 746,184,527 4,482,782 5,399,186 811,181 941,238 12,770,904 15,304,713
6.2 Financial liabilities held at fair value through profit or lossDerivative liabilities 6,617 87,888 - - - - - -
Total financial liabilities held at fair value through profit or loss 6,617 87,888 - - - - - -
Comprising:Derivative liabilitiesForeign currency forward contracts - - - - - - - - Futures 6,617 87,888 - - - - - - Total derivative liabilities 6,617 87,888 - - - - - -
Total financial liabilities held at fair value through profit or loss 6,617 87,888 - - - - - -
108. OnePath Diversified Fixed Interest Trust
105. OnePath Capital Guaranteed Trust
106. OnePath Capital Stable Trust
107. OnePath Diversified Credit Trust

Financial Report Notes to the Financial Statements for the financial year ended 30 June 2020
195
6. Financial assets and liabilities
30 June 2020 30 June 2019 30 June 2020 30 June 2019 30 June 2020 30 June 2019 30 June 2020 30 June 2019$ $ $ $ $ $ $ $
6.1 Financial assets held at fair value through profit or lossUnlisted unit trusts 4,314,319 5,649,466 32,795,327 35,114,150 695,877 1,071,041 2,694,026 3,766,029Derivative assets - - - - - - - -
Total financial assets held at fair value through profit or loss 4,314,319 5,649,466 32,795,327 35,114,150 695,877 1,071,041 2,694,026 3,766,029
Comprising:Unlisted unit trustsRelated unlisted unit trusts 4,314,319 5,649,466 32,795,327 35,114,150 695,877 1,071,041 2,694,026 3,766,029Unrelated unlisted unit trusts - - - - - - - - Total unlisted unit trusts 4,314,319 5,649,466 32,795,327 35,114,150 695,877 1,071,041 2,694,026 3,766,029
Derivative assetsForeign currency forward contracts - - - - - - - - Futures - - - - - - - - Total derivative assets - - - - - - - -
Total financial assets held at fair value through profit or loss 4,314,319 5,649,466 32,795,327 35,114,150 695,877 1,071,041 2,694,026 3,766,029
6.2 Financial liabilities held at fair value through profit or lossDerivative liabilities - - - - - - - -
Total financial liabilities held at fair value through profit or loss - - - - - - - -
Comprising:Derivative liabilitiesForeign currency forward contracts - - - - - - - - Futures - - - - - - - - Total derivative liabilities - - - - - - - -
Total financial liabilities held at fair value through profit or loss - - - - - - - -
112. OnePath Select Leaders Trust
109. OnePath Geared Australian Shares Index
Trust
110. OnePath Global Emerging Markets Share
Trust
111. OnePath Managed Growth Trust
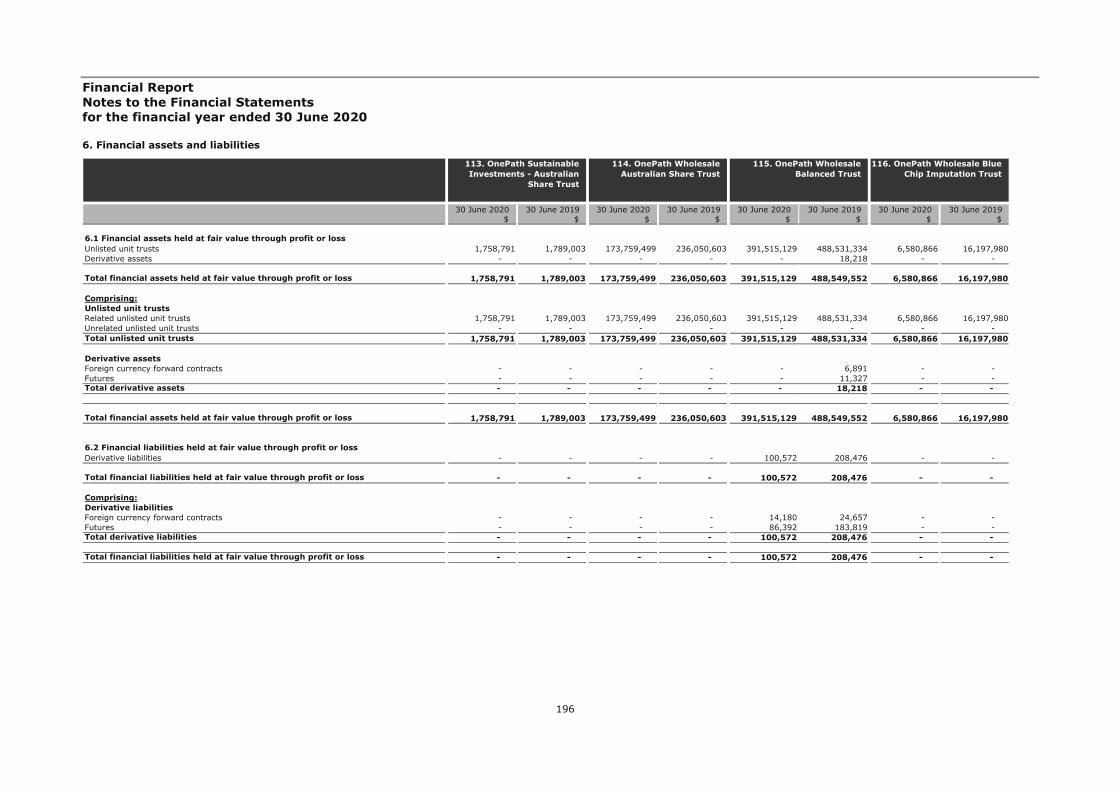
Financial Report Notes to the Financial Statements for the financial year ended 30 June 2020
196
6. Financial assets and liabilities
30 June 2020 30 June 2019 30 June 2020 30 June 2019 30 June 2020 30 June 2019 30 June 2020 30 June 2019$ $ $ $ $ $ $ $
6.1 Financial assets held at fair value through profit or lossUnlisted unit trusts 1,758,791 1,789,003 173,759,499 236,050,603 391,515,129 488,531,334 6,580,866 16,197,980Derivative assets - - - - - 18,218 - -
Total financial assets held at fair value through profit or loss 1,758,791 1,789,003 173,759,499 236,050,603 391,515,129 488,549,552 6,580,866 16,197,980
Comprising:Unlisted unit trustsRelated unlisted unit trusts 1,758,791 1,789,003 173,759,499 236,050,603 391,515,129 488,531,334 6,580,866 16,197,980Unrelated unlisted unit trusts - - - - - - - - Total unlisted unit trusts 1,758,791 1,789,003 173,759,499 236,050,603 391,515,129 488,531,334 6,580,866 16,197,980
Derivative assetsForeign currency forward contracts - - - - - 6,891 - - Futures - - - - - 11,327 - - Total derivative assets - - - - - 18,218 - -
Total financial assets held at fair value through profit or loss 1,758,791 1,789,003 173,759,499 236,050,603 391,515,129 488,549,552 6,580,866 16,197,980
6.2 Financial liabilities held at fair value through profit or lossDerivative liabilities - - - - 100,572 208,476 - -
Total financial liabilities held at fair value through profit or loss - - - - 100,572 208,476 - -
Comprising:Derivative liabilitiesForeign currency forward contracts - - - - 14,180 24,657 - - Futures - - - - 86,392 183,819 - - Total derivative liabilities - - - - 100,572 208,476 - -
Total financial liabilities held at fair value through profit or loss - - - - 100,572 208,476 - -
116. OnePath Wholesale Blue Chip Imputation Trust
113. OnePath Sustainable Investments - Australian
Share Trust
114. OnePath Wholesale Australian Share Trust
115. OnePath Wholesale Balanced Trust

Financial Report Notes to the Financial Statements for the financial year ended 30 June 2020
197
6. Financial assets and liabilities
30 June 2020 30 June 2019 30 June 2020 30 June 2019 30 June 2020 30 June 2019 30 June 2020 30 June 2019$ $ $ $ $ $ $ $
6.1 Financial assets held at fair value through profit or lossUnlisted unit trusts 350,458,187 424,158,029 529,109,297 616,407,564 49,804,966 63,069,273 90,527,600 110,752,684Derivative assets 279 - - - - - 15,575 -
Total financial assets held at fair value through profit or loss 350,458,466 424,158,029 529,109,297 616,407,564 49,804,966 63,069,273 90,543,175 110,752,684
Comprising:Unlisted unit trustsRelated unlisted unit trusts 350,458,187 424,158,029 529,109,297 616,407,564 49,804,966 63,069,273 90,527,600 110,752,684Unrelated unlisted unit trusts - - - - - - - - Total unlisted unit trusts 350,458,187 424,158,029 529,109,297 616,407,564 49,804,966 63,069,273 90,527,600 110,752,684
Derivative assetsForeign currency forward contracts - - - - - - - - Futures 279 - - - - - 15,575 - Total derivative assets 279 - - - - - 15,575 -
Total financial assets held at fair value through profit or loss 350,458,466 424,158,029 529,109,297 616,407,564 49,804,966 63,069,273 90,543,175 110,752,684
6.2 Financial liabilities held at fair value through profit or lossDerivative liabilities 3,308 13,303 - - - - - -
Total financial liabilities held at fair value through profit or loss 3,308 13,303 - - - - - -
Comprising:Derivative liabilitiesForeign currency forward contracts - - - - - - - - Futures 3,308 13,303 - - - - - - Total derivative liabilities 3,308 13,303 - - - - - -
Total financial liabilities held at fair value through profit or loss 3,308 13,303 - - - - - -
120. OnePath Wholesale Geared Australian Shares
Index Trust
117. OnePath Wholesale Capital Stable Trust
118. OnePath Wholesale Diversified Fixed Interest
Trust
119. OnePath Wholesale Emerging Companies Trust

Financial Report Notes to the Financial Statements for the financial year ended 30 June 2020
198
6. Financial assets and liabilities
30 June 2020 30 June 2019 30 June 2020 30 June 2019 30 June 2020 30 June 2019 30 June 2020 30 June 2019$ $ $ $ $ $ $ $
6.1 Financial assets held at fair value through profit or lossUnlisted unit trusts 11,260,272 13,126,514 35,292,323 44,205,682 21,364,406 24,953,562 7,101,151 8,523,080Derivative assets - - - 1,664 - - - -
Total financial assets held at fair value through profit or loss 11,260,272 13,126,514 35,292,323 44,207,346 21,364,406 24,953,562 7,101,151 8,523,080
Comprising:Unlisted unit trustsRelated unlisted unit trusts 11,260,272 13,126,514 35,292,323 44,205,682 21,364,406 24,953,562 7,101,151 8,523,080Unrelated unlisted unit trusts - - - - - - - - Total unlisted unit trusts 11,260,272 13,126,514 35,292,323 44,205,682 21,364,406 24,953,562 7,101,151 8,523,080
Derivative assetsForeign currency forward contracts - - - 1,664 - - - - Futures - - - - - - - - Total derivative assets - - - 1,664 - - - -
Total financial assets held at fair value through profit or loss 11,260,272 13,126,514 35,292,323 44,207,346 21,364,406 24,953,562 7,101,151 8,523,080
6.2 Financial liabilities held at fair value through profit or lossDerivative liabilities - - 6,665 14,365 - - - -
Total financial liabilities held at fair value through profit or loss - - 6,665 14,365 - - - -
Comprising:Derivative liabilitiesForeign currency forward contracts - - 1,349 14,365 - - - - Futures - - 5,316 - - - - - Total derivative liabilities - - 6,665 14,365 - - - -
Total financial liabilities held at fair value through profit or loss - - 6,665 14,365 - - - -
124. OnePath Wholesale Index Conservative Trust
121. OnePath Wholesale Global Emerging Markets
Share Trust
122. OnePath Wholesale High Growth Trust
123. OnePath Wholesale Index Balanced Trust

Financial Report Notes to the Financial Statements for the financial year ended 30 June 2020
199
6. Financial assets and liabilities
30 June 2020 30 June 2019 30 June 2020 30 June 2019 30 June 2020 30 June 2019 30 June 2020 30 June 2019$ $ $ $ $ $ $ $
6.1 Financial assets held at fair value through profit or lossUnlisted unit trusts 4,405,698 5,589,484 844,474,266 1,039,856,397 1,616,825 2,438,026 75,923,872 99,981,237Derivative assets - - - 90,806 - - - -
Total financial assets held at fair value through profit or loss 4,405,698 5,589,484 844,474,266 1,039,947,203 1,616,825 2,438,026 75,923,872 99,981,237
Comprising:Unlisted unit trustsRelated unlisted unit trusts 4,405,698 5,589,484 843,547,935 1,039,230,692 1,616,825 2,438,026 75,923,872 99,981,237Unrelated unlisted unit trusts - - 926,331 625,705 - - - - Total unlisted unit trusts 4,405,698 5,589,484 844,474,266 1,039,856,397 1,616,825 2,438,026 75,923,872 99,981,237
Derivative assetsForeign currency forward contracts - - - 27,873 - - - - Futures - - - 62,933 - - - - Total derivative assets - - - 90,806 - - - -
Total financial assets held at fair value through profit or loss 4,405,698 5,589,484 844,474,266 1,039,947,203 1,616,825 2,438,026 75,923,872 99,981,237
6.2 Financial liabilities held at fair value through profit or lossDerivative liabilities - - 358,130 455,927 - - - -
Total financial liabilities held at fair value through profit or loss - - 358,130 455,927 - - - -
Comprising:Derivative liabilitiesForeign currency forward contracts - - 50,636 159,563 - - - - Futures - - 307,494 296,364 - - - - Total derivative liabilities - - 358,130 455,927 - - - -
Total financial liabilities held at fair value through profit or loss - - 358,130 455,927 - - - -
128. OnePath Wholesale Select Leaders Trust
125. OnePath Wholesale Index Moderate Trust
126. OnePath Wholesale Managed Growth Trust
127. OnePath Wholesale Property Securities Trust

Financial Report Notes to the Financial Statements for the financial year ended 30 June 2020
200
6. Financial assets and liabilities
30 June 2020 30 June 2019 30 June 2020 30 June 2019 30 June 2020 30 June 2019 30 June 2020 30 June 2019$ $ $ $ $ $ $ $
6.1 Financial assets held at fair value through profit or lossUnlisted unit trusts 3,394,919 3,621,203 9,637,438 12,974,442 31,984,483 39,630,718 9,178,950 11,682,999Derivative assets - - - - - - - -
Total financial assets held at fair value through profit or loss 3,394,919 3,621,203 9,637,438 12,974,442 31,984,483 39,630,718 9,178,950 11,682,999
Comprising:Unlisted unit trustsRelated unlisted unit trusts 3,394,919 3,621,203 9,637,438 12,974,442 31,984,483 39,630,718 9,178,950 11,682,999Unrelated unlisted unit trusts - - - - - - - - Total unlisted unit trusts 3,394,919 3,621,203 9,637,438 12,974,442 31,984,483 39,630,718 9,178,950 11,682,999
Derivative assetsForeign currency forward contracts - - - - - - - - Futures - - - - - - - - Total derivative assets - - - - - - - -
Total financial assets held at fair value through profit or loss 3,394,919 3,621,203 9,637,438 12,974,442 31,984,483 39,630,718 9,178,950 11,682,999
6.2 Financial liabilities held at fair value through profit or lossDerivative liabilities - - - - - - - -
Total financial liabilities held at fair value through profit or loss - - - - - - - -
Comprising:Derivative liabilitiesForeign currency forward contracts - - - - - - - - Futures - - - - - - - - Total derivative liabilities - - - - - - - -
Total financial liabilities held at fair value through profit or loss - - - - - - - -
132. OptiMix Conservative Trust
129. OptiMix Australian Fixed Interest Trust
130. OptiMix Australian Share Trust
131. OptiMix Balanced Trust

Financial Report Notes to the Financial Statements for the financial year ended 30 June 2020
201
6. Financial assets and liabilities
30 June 2020 30 June 2019 30 June 2020 30 June 2019 30 June 2020 30 June 2019 30 June 2020 30 June 2019$ $ $ $ $ $ $ $
6.1 Financial assets held at fair value through profit or lossUnlisted unit trusts 3,029,913 3,210,108 4,442,200 5,991,994 2,657,558 2,899,477 10,210,530 13,459,587Derivative assets - - - - - - - -
Total financial assets held at fair value through profit or loss 3,029,913 3,210,108 4,442,200 5,991,994 2,657,558 2,899,477 10,210,530 13,459,587
Comprising:Unlisted unit trustsRelated unlisted unit trusts 3,029,913 3,210,108 4,442,200 5,991,994 2,657,558 2,899,477 10,210,530 13,459,587Unrelated unlisted unit trusts - - - - - - - - Total unlisted unit trusts 3,029,913 3,210,108 4,442,200 5,991,994 2,657,558 2,899,477 10,210,530 13,459,587
Derivative assetsForeign currency forward contracts - - - - - - - - Futures - - - - - - - - Total derivative assets - - - - - - - -
Total financial assets held at fair value through profit or loss 3,029,913 3,210,108 4,442,200 5,991,994 2,657,558 2,899,477 10,210,530 13,459,587
6.2 Financial liabilities held at fair value through profit or lossDerivative liabilities - - - - - - - -
Total financial liabilities held at fair value through profit or loss - - - - - - - -
Comprising:Derivative liabilitiesForeign currency forward contracts - - - - - - - - Futures - - - - - - - - Total derivative liabilities - - - - - - - -
Total financial liabilities held at fair value through profit or loss - - - - - - - -
136. OptiMix Growth Trust 133. OptiMix Global Emerging Markets Share
Trust
134. OptiMix Global Share Trust
135. OptiMix Global Smaller Companies Share Trust
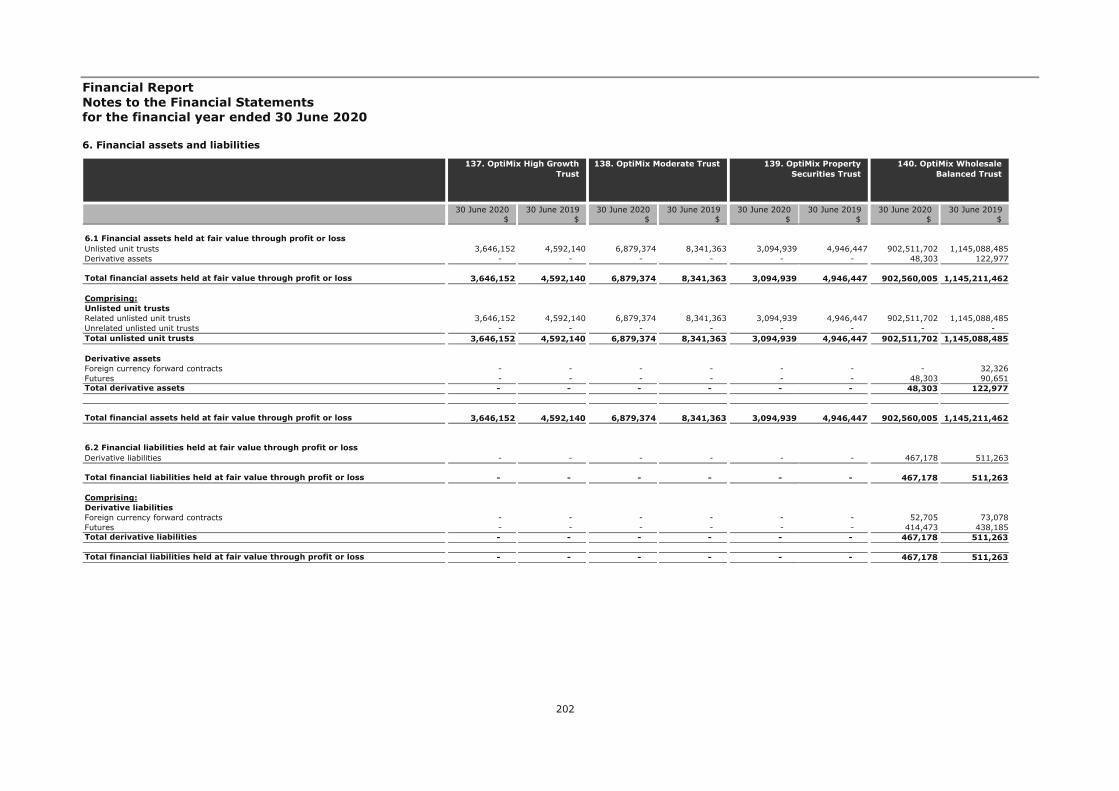
Financial Report Notes to the Financial Statements for the financial year ended 30 June 2020
202
6. Financial assets and liabilities
30 June 2020 30 June 2019 30 June 2020 30 June 2019 30 June 2020 30 June 2019 30 June 2020 30 June 2019$ $ $ $ $ $ $ $
6.1 Financial assets held at fair value through profit or lossUnlisted unit trusts 3,646,152 4,592,140 6,879,374 8,341,363 3,094,939 4,946,447 902,511,702 1,145,088,485Derivative assets - - - - - - 48,303 122,977
Total financial assets held at fair value through profit or loss 3,646,152 4,592,140 6,879,374 8,341,363 3,094,939 4,946,447 902,560,005 1,145,211,462
Comprising:Unlisted unit trustsRelated unlisted unit trusts 3,646,152 4,592,140 6,879,374 8,341,363 3,094,939 4,946,447 902,511,702 1,145,088,485Unrelated unlisted unit trusts - - - - - - - - Total unlisted unit trusts 3,646,152 4,592,140 6,879,374 8,341,363 3,094,939 4,946,447 902,511,702 1,145,088,485
Derivative assetsForeign currency forward contracts - - - - - - - 32,326Futures - - - - - - 48,303 90,651Total derivative assets - - - - - - 48,303 122,977
Total financial assets held at fair value through profit or loss 3,646,152 4,592,140 6,879,374 8,341,363 3,094,939 4,946,447 902,560,005 1,145,211,462
6.2 Financial liabilities held at fair value through profit or lossDerivative liabilities - - - - - - 467,178 511,263
Total financial liabilities held at fair value through profit or loss - - - - - - 467,178 511,263
Comprising:Derivative liabilitiesForeign currency forward contracts - - - - - - 52,705 73,078Futures - - - - - - 414,473 438,185Total derivative liabilities - - - - - - 467,178 511,263
Total financial liabilities held at fair value through profit or loss - - - - - - 467,178 511,263
140. OptiMix Wholesale Balanced Trust
137. OptiMix High Growth Trust
138. OptiMix Moderate Trust 139. OptiMix Property Securities Trust
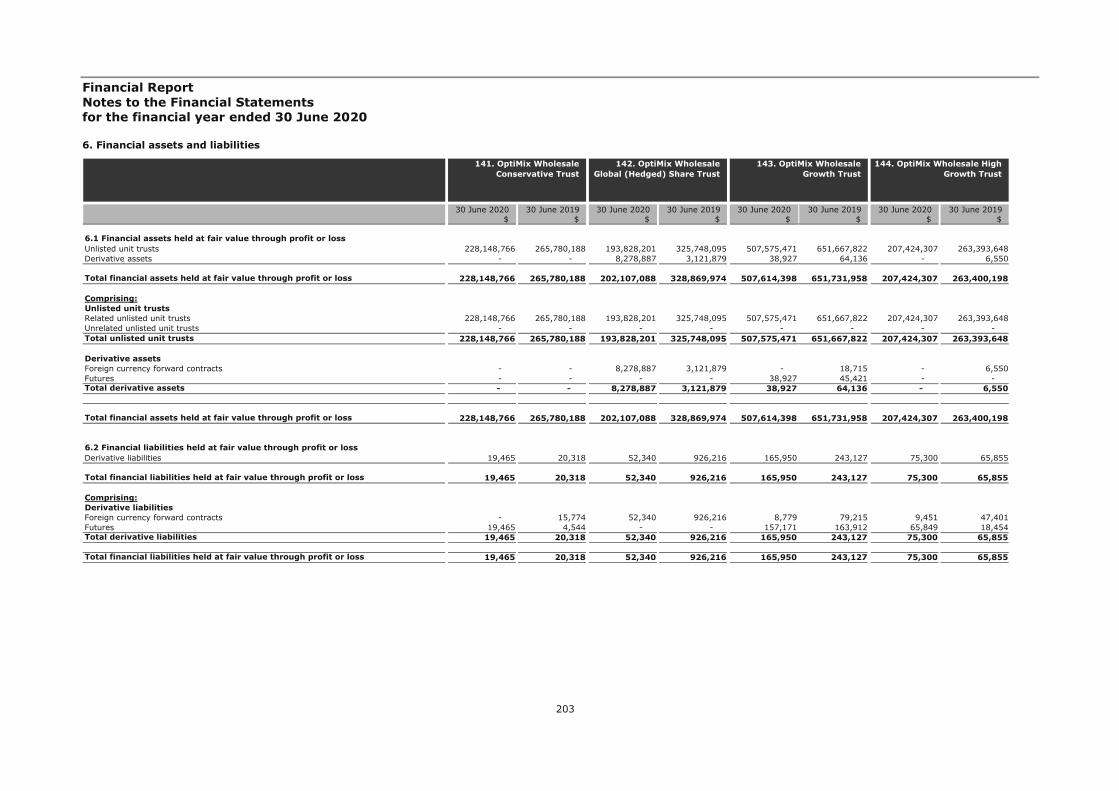
Financial Report Notes to the Financial Statements for the financial year ended 30 June 2020
203
6. Financial assets and liabilities
30 June 2020 30 June 2019 30 June 2020 30 June 2019 30 June 2020 30 June 2019 30 June 2020 30 June 2019$ $ $ $ $ $ $ $
6.1 Financial assets held at fair value through profit or lossUnlisted unit trusts 228,148,766 265,780,188 193,828,201 325,748,095 507,575,471 651,667,822 207,424,307 263,393,648Derivative assets - - 8,278,887 3,121,879 38,927 64,136 - 6,550
Total financial assets held at fair value through profit or loss 228,148,766 265,780,188 202,107,088 328,869,974 507,614,398 651,731,958 207,424,307 263,400,198
Comprising:Unlisted unit trustsRelated unlisted unit trusts 228,148,766 265,780,188 193,828,201 325,748,095 507,575,471 651,667,822 207,424,307 263,393,648Unrelated unlisted unit trusts - - - - - - - - Total unlisted unit trusts 228,148,766 265,780,188 193,828,201 325,748,095 507,575,471 651,667,822 207,424,307 263,393,648
Derivative assetsForeign currency forward contracts - - 8,278,887 3,121,879 - 18,715 - 6,550Futures - - - - 38,927 45,421 - - Total derivative assets - - 8,278,887 3,121,879 38,927 64,136 - 6,550
Total financial assets held at fair value through profit or loss 228,148,766 265,780,188 202,107,088 328,869,974 507,614,398 651,731,958 207,424,307 263,400,198
6.2 Financial liabilities held at fair value through profit or lossDerivative liabilities 19,465 20,318 52,340 926,216 165,950 243,127 75,300 65,855
Total financial liabilities held at fair value through profit or loss 19,465 20,318 52,340 926,216 165,950 243,127 75,300 65,855
Comprising:Derivative liabilitiesForeign currency forward contracts - 15,774 52,340 926,216 8,779 79,215 9,451 47,401Futures 19,465 4,544 - - 157,171 163,912 65,849 18,454Total derivative liabilities 19,465 20,318 52,340 926,216 165,950 243,127 75,300 65,855
Total financial liabilities held at fair value through profit or loss 19,465 20,318 52,340 926,216 165,950 243,127 75,300 65,855
144. OptiMix Wholesale High Growth Trust
141. OptiMix Wholesale Conservative Trust
142. OptiMix Wholesale Global (Hedged) Share Trust
143. OptiMix Wholesale Growth Trust

Financial Report Notes to the Financial Statements for the financial year ended 30 June 2020
204
6. Financial assets and liabilities
30 June 2020 30 June 2019 30 June 2020 30 June 2019 30 June 2020 30 June 2019$ $ $ $ $ $
6.1 Financial assets held at fair value through profit or lossUnlisted unit trusts 348,542,571 440,564,326 183,060,592 221,254,823 4,203,709 6,659,202Derivative assets 31,016 20,463 - - - -
Total financial assets held at fair value through profit or loss 348,573,587 440,584,789 183,060,592 221,254,823 4,203,709 6,659,202
Comprising:Unlisted unit trustsRelated unlisted unit trusts 348,542,571 440,564,326 183,060,592 221,254,823 4,203,709 6,659,202Unrelated unlisted unit trusts - - - - - - Total unlisted unit trusts 348,542,571 440,564,326 183,060,592 221,254,823 4,203,709 6,659,202
Derivative assetsForeign currency forward contracts - 11,580 - - - - Futures 31,016 8,883 - - - - Total derivative assets 31,016 20,463 - - - -
Total financial assets held at fair value through profit or loss 348,573,587 440,584,789 183,060,592 221,254,823 4,203,709 6,659,202
6.2 Financial liabilities held at fair value through profit or lossDerivative liabilities 147,845 159,973 - - - -
Total financial liabilities held at fair value through profit or loss 147,845 159,973 - - - -
Comprising:Derivative liabilitiesForeign currency forward contracts 15,527 - - - - - Futures 132,318 159,973 - - - - Total derivative liabilities 147,845 159,973 - - - -
Total financial liabilities held at fair value through profit or loss 147,845 159,973 - - - -
145. OptiMix Wholesale Moderate Trust
146. Pooled Australian Share Fund
147. Property Securities Trust
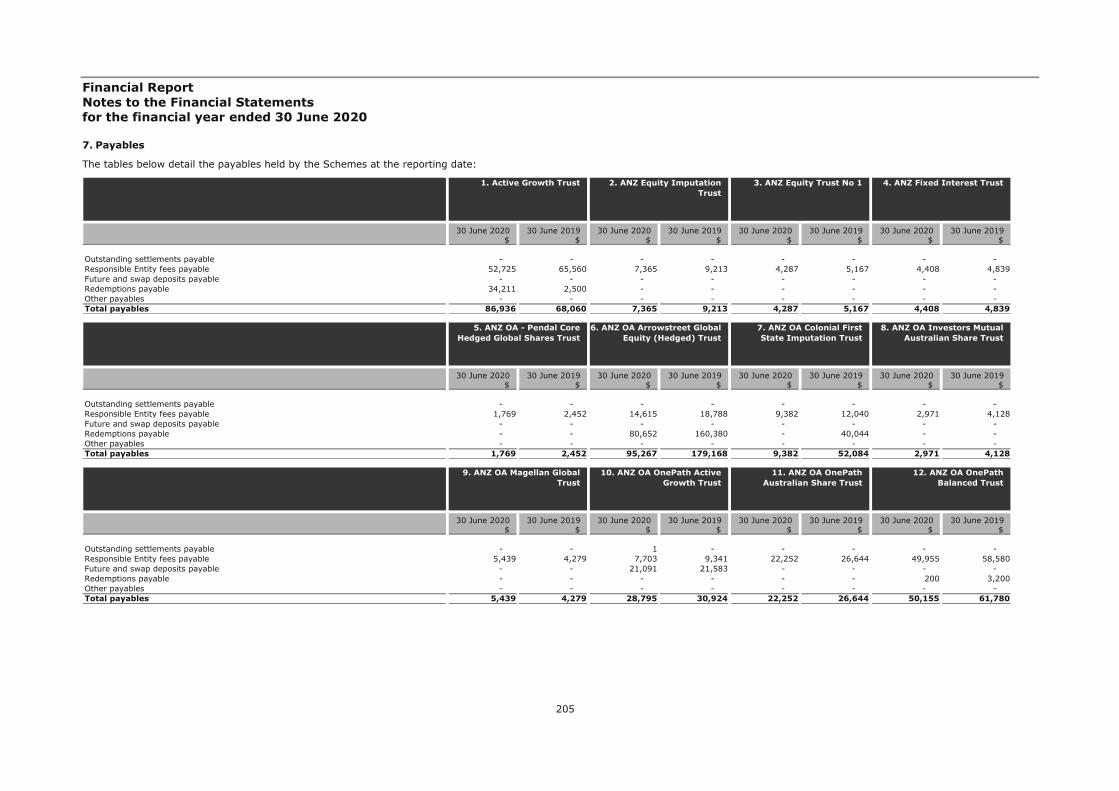
Financial Report Notes to the Financial Statements for the financial year ended 30 June 2020
205
7. Payables
The tables below detail the payables held by the Schemes at the reporting date:
30 June 2020 30 June 2019 30 June 2020 30 June 2019 30 June 2020 30 June 2019 30 June 2020 30 June 2019$ $ $ $ $ $ $ $
Outstanding settlements payable - - - - - - - - Responsible Entity fees payable 52,725 65,560 7,365 9,213 4,287 5,167 4,408 4,839Future and swap deposits payable - - - - - - - - Redemptions payable 34,211 2,500 - - - - - - Other payables - - - - - - - - Total payables 86,936 68,060 7,365 9,213 4,287 5,167 4,408 4,839
1. Active Growth Trust 2. ANZ Equity Imputation Trust
3. ANZ Equity Trust No 1 4. ANZ Fixed Interest Trust
30 June 2020 30 June 2019 30 June 2020 30 June 2019 30 June 2020 30 June 2019 30 June 2020 30 June 2019$ $ $ $ $ $ $ $
Outstanding settlements payable - - - - - - - - Responsible Entity fees payable 1,769 2,452 14,615 18,788 9,382 12,040 2,971 4,128Future and swap deposits payable - - - - - - - - Redemptions payable - - 80,652 160,380 - 40,044 - - Other payables - - - - - - - - Total payables 1,769 2,452 95,267 179,168 9,382 52,084 2,971 4,128
5. ANZ OA - Pendal Core Hedged Global Shares Trust
6. ANZ OA Arrowstreet Global Equity (Hedged) Trust
7. ANZ OA Colonial First State Imputation Trust
8. ANZ OA Investors Mutual Australian Share Trust
30 June 2020 30 June 2019 30 June 2020 30 June 2019 30 June 2020 30 June 2019 30 June 2020 30 June 2019$ $ $ $ $ $ $ $
Outstanding settlements payable - - 1 - - - - - Responsible Entity fees payable 5,439 4,279 7,703 9,341 22,252 26,644 49,955 58,580Future and swap deposits payable - - 21,091 21,583 - - - - Redemptions payable - - - - - - 200 3,200Other payables - - - - - - - - Total payables 5,439 4,279 28,795 30,924 22,252 26,644 50,155 61,780
9. ANZ OA Magellan Global Trust
10. ANZ OA OnePath Active Growth Trust
11. ANZ OA OnePath Australian Share Trust
12. ANZ OA OnePath Balanced Trust

Financial Report Notes to the Financial Statements for the financial year ended 30 June 2020
206
7. Payables
30 June 2020 30 June 2019 30 June 2020 30 June 2019 30 June 2020 30 June 2019 30 June 2020 30 June 2019$ $ $ $ $ $ $ $
Outstanding settlements payable - - 1 1 - - - - Responsible Entity fees payable 126,023 173,958 32,343 38,964 15,655 16,870 11,141 14,552Future and swap deposits payable - - - - - - - - Redemptions payable - 269,668 600 17,443 - 29,414 - 37,390Other payables - - - - - - - - Total payables 126,023 443,626 32,944 56,408 15,655 46,284 11,141 51,942
13. ANZ OA OnePath Blue Chip Imputation Trust
14. ANZ OA OnePath Conservative Trust
15. ANZ OA OnePath Diversified Fixed Interest
Trust
16. ANZ OA OnePath Global Emerging Markets Share
Trust
30 June 2020 30 June 2019 30 June 2020 30 June 2019 30 June 2020 30 June 2019 30 June 2020 30 June 2019$ $ $ $ $ $ $ $
Outstanding settlements payable - - - - - - - - Responsible Entity fees payable 1,147 1,162 12,072 15,700 32,182 36,596 7,637 12,344Future and swap deposits payable - - - - - - - - Redemptions payable - - - - 1,088 - - 60,099Other payables - - - - - - - - Total payables 1,147 1,162 12,072 15,700 33,270 36,596 7,637 72,443
17. ANZ OA OnePath High Growth Trust
18. ANZ OA OnePath Income Trust
19. ANZ OA OnePath Managed Growth Trust
20. ANZ OA OnePath Property Securities Trust
30 June 2020 30 June 2019 30 June 2020 30 June 2019 30 June 2020 30 June 2019 30 June 2020 30 June 2019$ $ $ $ $ $ $ $
Outstanding settlements payable - - - - - - - - Responsible Entity fees payable 18,037 24,751 1,788 1,919 67,252 87,298 2,212 2,538Future and swap deposits payable - - - - - - - - Redemptions payable 6,570 4,692 - - - 20,179 - 5,796Other payables - - - - - - - - Total payables 24,607 29,443 1,788 1,919 67,252 107,477 2,212 8,334
21. ANZ OA OnePath Select Leaders Trust
22. ANZ OA OnePath Sustainable Investments -
Australian Share Trust
23. ANZ OA OnePath Tax Effective Income Trust
24. ANZ OA OptiMix Australian Fixed Interest
Trust
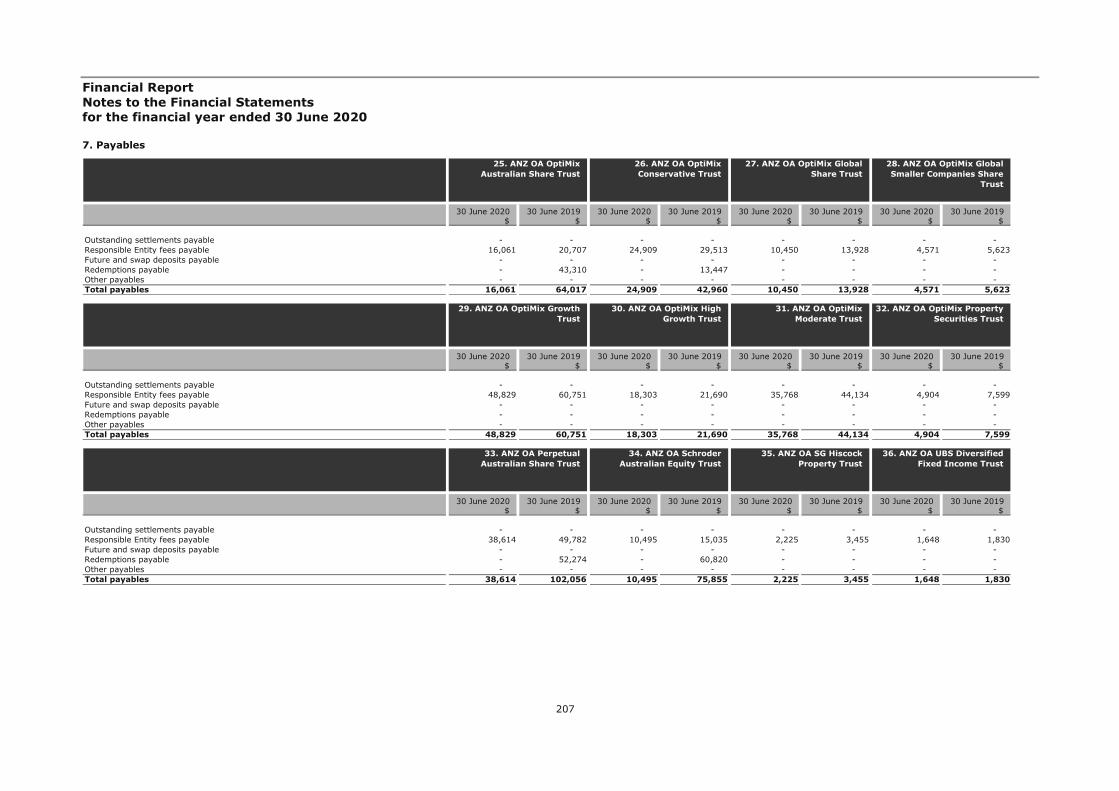
Financial Report Notes to the Financial Statements for the financial year ended 30 June 2020
207
7. Payables
30 June 2020 30 June 2019 30 June 2020 30 June 2019 30 June 2020 30 June 2019 30 June 2020 30 June 2019$ $ $ $ $ $ $ $
Outstanding settlements payable - - - - - - - - Responsible Entity fees payable 16,061 20,707 24,909 29,513 10,450 13,928 4,571 5,623Future and swap deposits payable - - - - - - - - Redemptions payable - 43,310 - 13,447 - - - - Other payables - - - - - - - - Total payables 16,061 64,017 24,909 42,960 10,450 13,928 4,571 5,623
25. ANZ OA OptiMix Australian Share Trust
26. ANZ OA OptiMix Conservative Trust
27. ANZ OA OptiMix Global Share Trust
28. ANZ OA OptiMix Global Smaller Companies Share
Trust
30 June 2020 30 June 2019 30 June 2020 30 June 2019 30 June 2020 30 June 2019 30 June 2020 30 June 2019$ $ $ $ $ $ $ $
Outstanding settlements payable - - - - - - - - Responsible Entity fees payable 48,829 60,751 18,303 21,690 35,768 44,134 4,904 7,599Future and swap deposits payable - - - - - - - - Redemptions payable - - - - - - - - Other payables - - - - - - - - Total payables 48,829 60,751 18,303 21,690 35,768 44,134 4,904 7,599
29. ANZ OA OptiMix Growth Trust
30. ANZ OA OptiMix High Growth Trust
31. ANZ OA OptiMix Moderate Trust
32. ANZ OA OptiMix Property Securities Trust
30 June 2020 30 June 2019 30 June 2020 30 June 2019 30 June 2020 30 June 2019 30 June 2020 30 June 2019$ $ $ $ $ $ $ $
Outstanding settlements payable - - - - - - - - Responsible Entity fees payable 38,614 49,782 10,495 15,035 2,225 3,455 1,648 1,830Future and swap deposits payable - - - - - - - - Redemptions payable - 52,274 - 60,820 - - - - Other payables - - - - - - - - Total payables 38,614 102,056 10,495 75,855 2,225 3,455 1,648 1,830
33. ANZ OA Perpetual Australian Share Trust
34. ANZ OA Schroder Australian Equity Trust
35. ANZ OA SG Hiscock Property Trust
36. ANZ OA UBS Diversified Fixed Income Trust
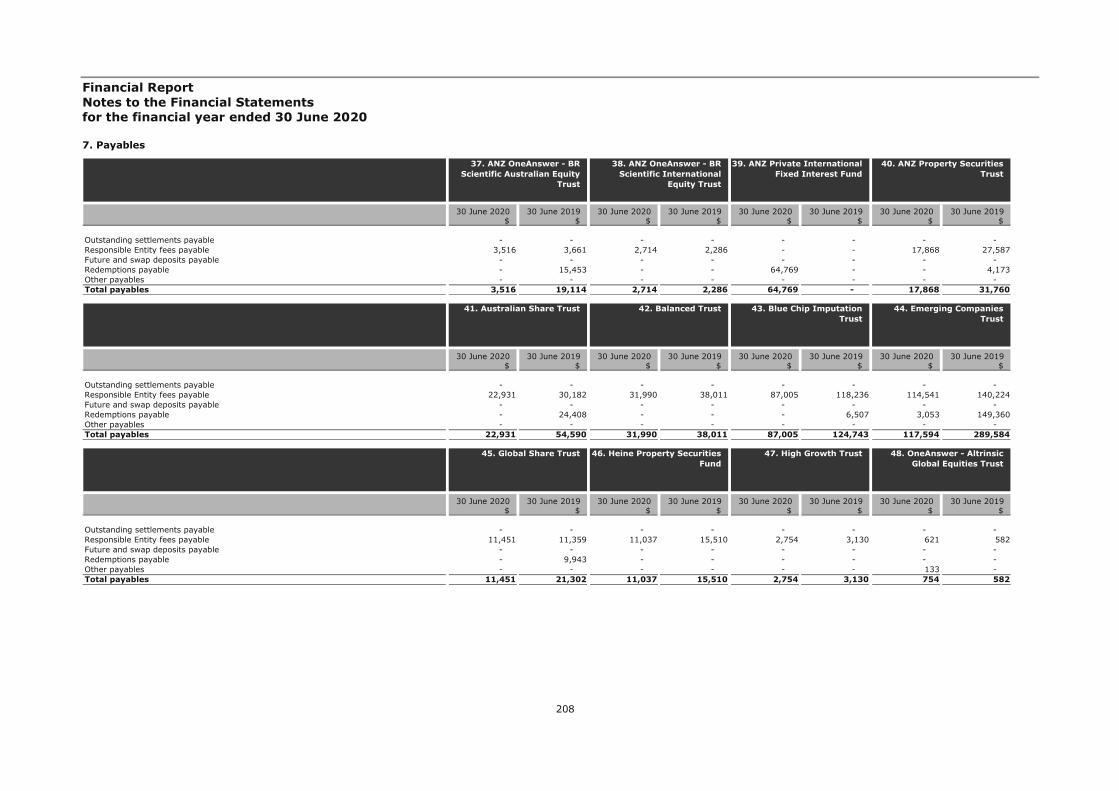
Financial Report Notes to the Financial Statements for the financial year ended 30 June 2020
208
7. Payables
30 June 2020 30 June 2019 30 June 2020 30 June 2019 30 June 2020 30 June 2019 30 June 2020 30 June 2019$ $ $ $ $ $ $ $
Outstanding settlements payable - - - - - - - - Responsible Entity fees payable 3,516 3,661 2,714 2,286 - - 17,868 27,587Future and swap deposits payable - - - - - - - - Redemptions payable - 15,453 - - 64,769 - - 4,173Other payables - - - - - - - - Total payables 3,516 19,114 2,714 2,286 64,769 - 17,868 31,760
37. ANZ OneAnswer - BR Scientific Australian Equity
Trust
38. ANZ OneAnswer - BR Scientific International
Equity Trust
39. ANZ Private International Fixed Interest Fund
40. ANZ Property Securities Trust
30 June 2020 30 June 2019 30 June 2020 30 June 2019 30 June 2020 30 June 2019 30 June 2020 30 June 2019$ $ $ $ $ $ $ $
Outstanding settlements payable - - - - - - - - Responsible Entity fees payable 22,931 30,182 31,990 38,011 87,005 118,236 114,541 140,224Future and swap deposits payable - - - - - - - - Redemptions payable - 24,408 - - - 6,507 3,053 149,360Other payables - - - - - - - - Total payables 22,931 54,590 31,990 38,011 87,005 124,743 117,594 289,584
41. Australian Share Trust 42. Balanced Trust 43. Blue Chip Imputation Trust
44. Emerging Companies Trust
30 June 2020 30 June 2019 30 June 2020 30 June 2019 30 June 2020 30 June 2019 30 June 2020 30 June 2019$ $ $ $ $ $ $ $
Outstanding settlements payable - - - - - - - - Responsible Entity fees payable 11,451 11,359 11,037 15,510 2,754 3,130 621 582Future and swap deposits payable - - - - - - - - Redemptions payable - 9,943 - - - - - - Other payables - - - - - - 133 - Total payables 11,451 21,302 11,037 15,510 2,754 3,130 754 582
45. Global Share Trust 46. Heine Property Securities Fund
47. High Growth Trust 48. OneAnswer - Altrinsic Global Equities Trust
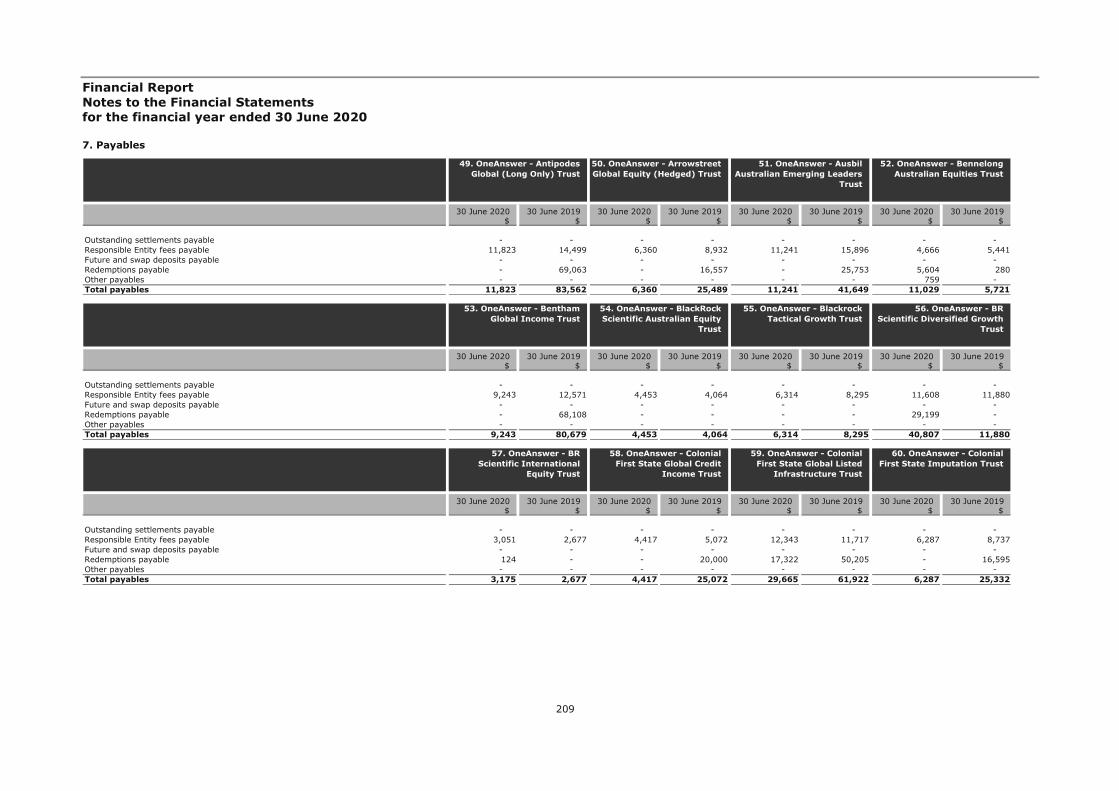
Financial Report Notes to the Financial Statements for the financial year ended 30 June 2020
209
7. Payables
30 June 2020 30 June 2019 30 June 2020 30 June 2019 30 June 2020 30 June 2019 30 June 2020 30 June 2019$ $ $ $ $ $ $ $
Outstanding settlements payable - - - - - - - - Responsible Entity fees payable 11,823 14,499 6,360 8,932 11,241 15,896 4,666 5,441Future and swap deposits payable - - - - - - - - Redemptions payable - 69,063 - 16,557 - 25,753 5,604 280Other payables - - - - - - 759 - Total payables 11,823 83,562 6,360 25,489 11,241 41,649 11,029 5,721
49. OneAnswer - Antipodes Global (Long Only) Trust
50. OneAnswer - Arrowstreet Global Equity (Hedged) Trust
51. OneAnswer - Ausbil Australian Emerging Leaders
Trust
52. OneAnswer - Bennelong Australian Equities Trust
30 June 2020 30 June 2019 30 June 2020 30 June 2019 30 June 2020 30 June 2019 30 June 2020 30 June 2019$ $ $ $ $ $ $ $
Outstanding settlements payable - - - - - - - - Responsible Entity fees payable 9,243 12,571 4,453 4,064 6,314 8,295 11,608 11,880Future and swap deposits payable - - - - - - - - Redemptions payable - 68,108 - - - - 29,199 - Other payables - - - - - - - - Total payables 9,243 80,679 4,453 4,064 6,314 8,295 40,807 11,880
53. OneAnswer - Bentham Global Income Trust
54. OneAnswer - BlackRock Scientific Australian Equity
Trust
55. OneAnswer - Blackrock Tactical Growth Trust
56. OneAnswer - BR Scientific Diversified Growth
Trust
30 June 2020 30 June 2019 30 June 2020 30 June 2019 30 June 2020 30 June 2019 30 June 2020 30 June 2019$ $ $ $ $ $ $ $
Outstanding settlements payable - - - - - - - - Responsible Entity fees payable 3,051 2,677 4,417 5,072 12,343 11,717 6,287 8,737Future and swap deposits payable - - - - - - - - Redemptions payable 124 - - 20,000 17,322 50,205 - 16,595Other payables - - - - - - - - Total payables 3,175 2,677 4,417 25,072 29,665 61,922 6,287 25,332
57. OneAnswer - BR Scientific International
Equity Trust
58. OneAnswer - Colonial First State Global Credit
Income Trust
59. OneAnswer - Colonial First State Global Listed
Infrastructure Trust
60. OneAnswer - Colonial First State Imputation Trust

Financial Report Notes to the Financial Statements for the financial year ended 30 June 2020
210
7. Payables
30 June 2020 30 June 2019 30 June 2020 30 June 2019 30 June 2020 30 June 2019 30 June 2020 30 June 2019$ $ $ $ $ $ $ $
Outstanding settlements payable - - - - - - - - Responsible Entity fees payable 26,130 35,409 3,871 3,665 17,252 23,227 611 603Future and swap deposits payable - - - - - - - - Redemptions payable 28,314 138,107 1,600 7,291 - 60,994 - - Other payables - - 720 - - - - - Total payables 54,444 173,516 6,191 10,956 17,252 84,221 611 603
61. OneAnswer - Fidelity Australian Equities Trust
62. OneAnswer - Greencape Broadcap Trust
63. OneAnswer - Investors Mutual Australian Share
Trust
64. OneAnswer - Janus Henderson Global Fixed
Interest Total Return Trust
30 June 2020 30 June 2019 30 June 2020 30 June 2019 30 June 2020 30 June 2019 30 June 2020 30 June 2019$ $ $ $ $ $ $ $
Outstanding settlements payable - - - - - - - - Responsible Entity fees payable 53,351 47,816 21,604 19,626 4,992 7,318 46,891 58,387Future and swap deposits payable - - - - - - - - Redemptions payable 113,365 175,749 5,539 68,792 17,871 38,500 60,324 332,783Other payables - - - - - - - - Total payables 166,716 223,565 27,143 88,418 22,863 45,818 107,215 391,170
65. OneAnswer - Kapstream Absolute Return Income
Trust
66. OneAnswer - Magellan Global Trust
67. OneAnswer - Merlon Australian Share Income
Trust
68. OneAnswer - MFS Global Equity Trust
30 June 2020 30 June 2019 30 June 2020 30 June 2019 30 June 2020 30 June 2019 30 June 2020 30 June 2019$ $ $ $ $ $ $ $
Outstanding settlements payable - - - - - - - - Responsible Entity fees payable 740 1,403 31,114 41,961 4,585 5,846 2,079 2,835Future and swap deposits payable - - - - - - - - Redemptions payable 5,445 - 37,792 104,232 - 82 - 63,333Other payables 687 - - - - - - - Total payables 6,872 1,403 68,906 146,193 4,585 5,928 2,079 66,168
69. OneAnswer - Nikko AM Australian Shares Trust
70. OneAnswer - OnePath Global Property Securities
Index Trust
71. OneAnswer - Pendal Australian Share Trust
72. OneAnswer - Pendal Core Hedged Global Shares Trust
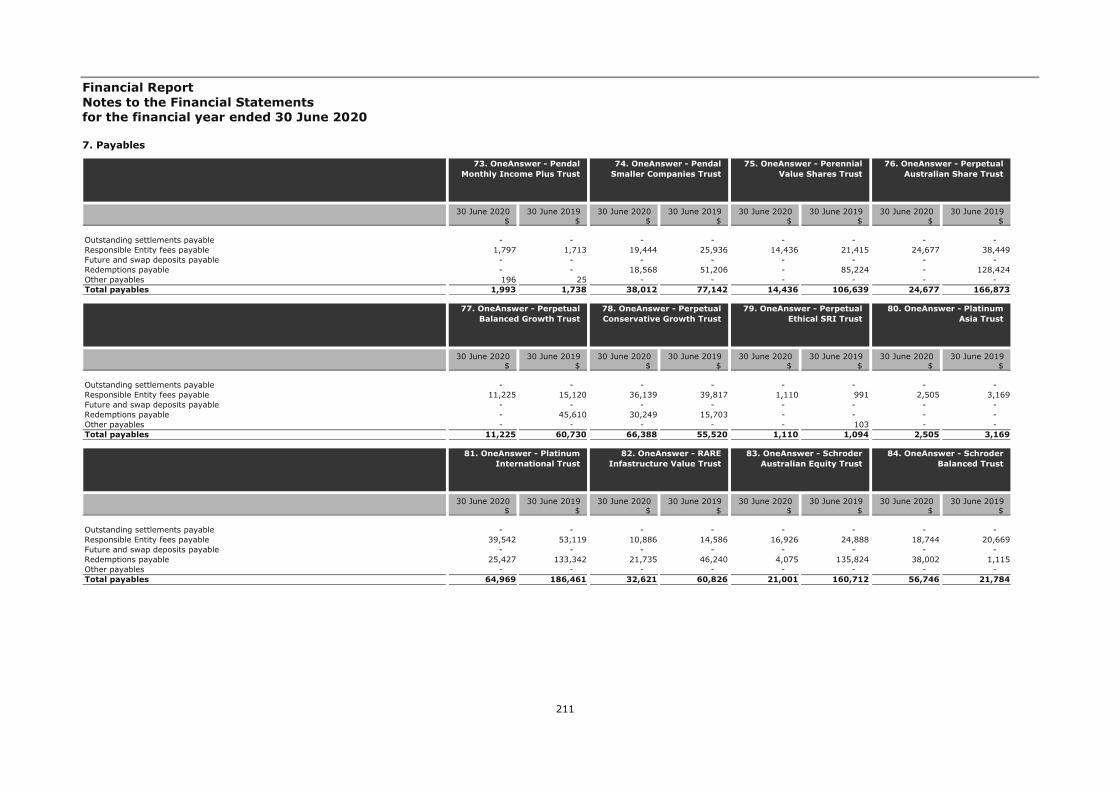
Financial Report Notes to the Financial Statements for the financial year ended 30 June 2020
211
7. Payables
30 June 2020 30 June 2019 30 June 2020 30 June 2019 30 June 2020 30 June 2019 30 June 2020 30 June 2019$ $ $ $ $ $ $ $
Outstanding settlements payable - - - - - - - - Responsible Entity fees payable 1,797 1,713 19,444 25,936 14,436 21,415 24,677 38,449Future and swap deposits payable - - - - - - - - Redemptions payable - - 18,568 51,206 - 85,224 - 128,424Other payables 196 25 - - - - - - Total payables 1,993 1,738 38,012 77,142 14,436 106,639 24,677 166,873
73. OneAnswer - Pendal Monthly Income Plus Trust
74. OneAnswer - Pendal Smaller Companies Trust
75. OneAnswer - Perennial Value Shares Trust
76. OneAnswer - Perpetual Australian Share Trust
30 June 2020 30 June 2019 30 June 2020 30 June 2019 30 June 2020 30 June 2019 30 June 2020 30 June 2019$ $ $ $ $ $ $ $
Outstanding settlements payable - - - - - - - - Responsible Entity fees payable 11,225 15,120 36,139 39,817 1,110 991 2,505 3,169Future and swap deposits payable - - - - - - - - Redemptions payable - 45,610 30,249 15,703 - - - - Other payables - - - - - 103 - - Total payables 11,225 60,730 66,388 55,520 1,110 1,094 2,505 3,169
77. OneAnswer - Perpetual Balanced Growth Trust
78. OneAnswer - Perpetual Conservative Growth Trust
79. OneAnswer - Perpetual Ethical SRI Trust
80. OneAnswer - Platinum Asia Trust
30 June 2020 30 June 2019 30 June 2020 30 June 2019 30 June 2020 30 June 2019 30 June 2020 30 June 2019$ $ $ $ $ $ $ $
Outstanding settlements payable - - - - - - - - Responsible Entity fees payable 39,542 53,119 10,886 14,586 16,926 24,888 18,744 20,669Future and swap deposits payable - - - - - - - - Redemptions payable 25,427 133,342 21,735 46,240 4,075 135,824 38,002 1,115Other payables - - - - - - - - Total payables 64,969 186,461 32,621 60,826 21,001 160,712 56,746 21,784
81. OneAnswer - Platinum International Trust
82. OneAnswer - RARE Infastructure Value Trust
83. OneAnswer - Schroder Australian Equity Trust
84. OneAnswer - Schroder Balanced Trust
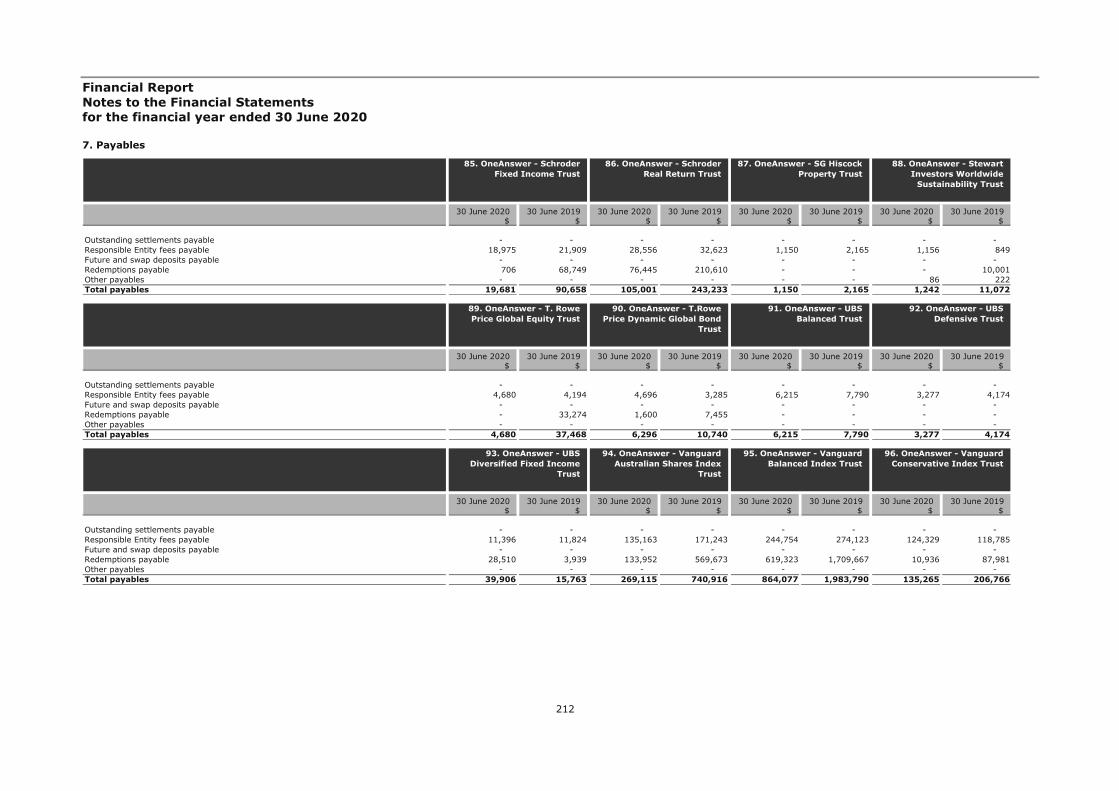
Financial Report Notes to the Financial Statements for the financial year ended 30 June 2020
212
7. Payables
30 June 2020 30 June 2019 30 June 2020 30 June 2019 30 June 2020 30 June 2019 30 June 2020 30 June 2019$ $ $ $ $ $ $ $
Outstanding settlements payable - - - - - - - - Responsible Entity fees payable 18,975 21,909 28,556 32,623 1,150 2,165 1,156 849Future and swap deposits payable - - - - - - - - Redemptions payable 706 68,749 76,445 210,610 - - - 10,001Other payables - - - - - - 86 222Total payables 19,681 90,658 105,001 243,233 1,150 2,165 1,242 11,072
85. OneAnswer - Schroder Fixed Income Trust
86. OneAnswer - Schroder Real Return Trust
87. OneAnswer - SG Hiscock Property Trust
88. OneAnswer - Stewart Investors Worldwide
Sustainability Trust
30 June 2020 30 June 2019 30 June 2020 30 June 2019 30 June 2020 30 June 2019 30 June 2020 30 June 2019$ $ $ $ $ $ $ $
Outstanding settlements payable - - - - - - - - Responsible Entity fees payable 4,680 4,194 4,696 3,285 6,215 7,790 3,277 4,174Future and swap deposits payable - - - - - - - - Redemptions payable - 33,274 1,600 7,455 - - - - Other payables - - - - - - - - Total payables 4,680 37,468 6,296 10,740 6,215 7,790 3,277 4,174
89. OneAnswer - T. Rowe Price Global Equity Trust
90. OneAnswer - T.Rowe Price Dynamic Global Bond
Trust
91. OneAnswer - UBS Balanced Trust
92. OneAnswer - UBS Defensive Trust
30 June 2020 30 June 2019 30 June 2020 30 June 2019 30 June 2020 30 June 2019 30 June 2020 30 June 2019$ $ $ $ $ $ $ $
Outstanding settlements payable - - - - - - - - Responsible Entity fees payable 11,396 11,824 135,163 171,243 244,754 274,123 124,329 118,785Future and swap deposits payable - - - - - - - - Redemptions payable 28,510 3,939 133,952 569,673 619,323 1,709,667 10,936 87,981Other payables - - - - - - - - Total payables 39,906 15,763 269,115 740,916 864,077 1,983,790 135,265 206,766
93. OneAnswer - UBS Diversified Fixed Income
Trust
94. OneAnswer - Vanguard Australian Shares Index
Trust
95. OneAnswer - Vanguard Balanced Index Trust
96. OneAnswer - Vanguard Conservative Index Trust

Financial Report Notes to the Financial Statements for the financial year ended 30 June 2020
213
7. Payables
30 June 2020 30 June 2019 30 June 2020 30 June 2019 30 June 2020 30 June 2019 30 June 2020 30 June 2019$ $ $ $ $ $ $ $
Outstanding settlements payable - - - - - - - - Responsible Entity fees payable 16,306 16,904 98,460 106,632 47,897 57,407 20,800 23,838Future and swap deposits payable - - - - - - - - Redemptions payable - 3,520 20,769 78,730 176,389 60,912 - 71,663Other payables - - - - - - - - Total payables 16,306 20,424 119,229 185,362 224,286 118,319 20,800 95,501
97. OneAnswer - Vanguard Diversified Bond Index Trust
98. OneAnswer - Vanguard Growth Index Trust
99. OneAnswer - Vanguard High Growth Index Trust
100. OneAnswer - Vanguard International Shares Index
(Hedged) Trust
30 June 2020 30 June 2019 30 June 2020 30 June 2019 30 June 2020 30 June 2019 30 June 2020 30 June 2019$ $ $ $ $ $ $ $
Outstanding settlements payable - - - - - - - - Responsible Entity fees payable 104,551 121,698 20,567 30,349 2,329 3,154 20,056 23,046Future and swap deposits payable - - - - - - - - Redemptions payable 112,210 646,600 4,007 154,214 - - 114,030 130,919Other payables - - - - 260 - - - Total payables 216,761 768,298 24,574 184,563 2,589 3,154 134,086 153,965
101. OneAnswer - Vanguard International Shares Index
Trust
102. OneAnswer - Vanguard Property Securities Index
Trust
103. OneAnswer - Walter Scott Global Equity (Hedged)
Trust
104. OnePath Alternatives Growth Fund
30 June 2020 30 June 2019 30 June 2020 30 June 2019 30 June 2020 30 June 2019 30 June 2020 30 June 2019$ $ $ $ $ $ $ $
Outstanding settlements payable 2 1 - - - - - - Responsible Entity fees payable - - 4,989 6,105 1,458 1,766 9,915 12,102Future and swap deposits payable - - - - - - - - Redemptions payable 80,423 160,468 - - - - - 10,965Other payables - - - - - - - - Total payables 80,425 160,469 4,989 6,105 1,458 1,766 9,915 23,067
105. OnePath Capital Guaranteed Trust
106. OnePath Capital Stable Trust
107. OnePath Diversified Credit Trust
108. OnePath Diversified Fixed Interest Trust
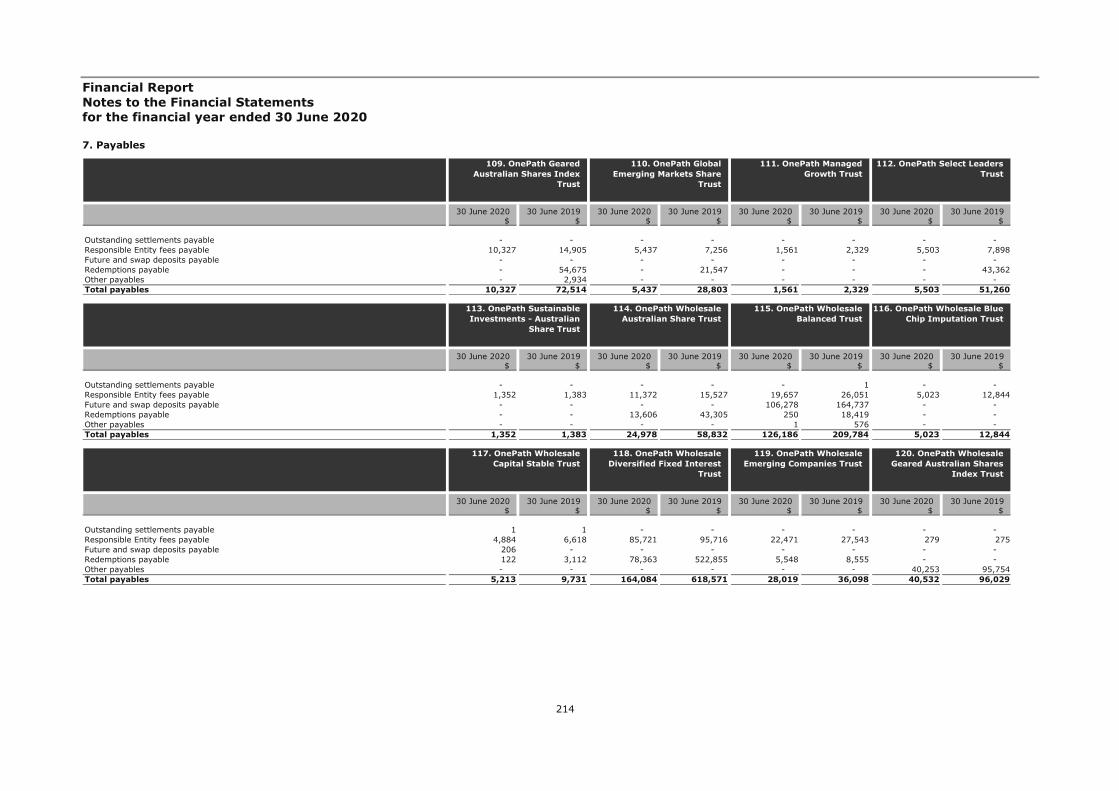
Financial Report Notes to the Financial Statements for the financial year ended 30 June 2020
214
7. Payables
30 June 2020 30 June 2019 30 June 2020 30 June 2019 30 June 2020 30 June 2019 30 June 2020 30 June 2019$ $ $ $ $ $ $ $
Outstanding settlements payable - - - - - - - - Responsible Entity fees payable 10,327 14,905 5,437 7,256 1,561 2,329 5,503 7,898Future and swap deposits payable - - - - - - - - Redemptions payable - 54,675 - 21,547 - - - 43,362Other payables - 2,934 - - - - - - Total payables 10,327 72,514 5,437 28,803 1,561 2,329 5,503 51,260
109. OnePath Geared Australian Shares Index
Trust
110. OnePath Global Emerging Markets Share
Trust
111. OnePath Managed Growth Trust
112. OnePath Select Leaders Trust
30 June 2020 30 June 2019 30 June 2020 30 June 2019 30 June 2020 30 June 2019 30 June 2020 30 June 2019$ $ $ $ $ $ $ $
Outstanding settlements payable - - - - - 1 - - Responsible Entity fees payable 1,352 1,383 11,372 15,527 19,657 26,051 5,023 12,844Future and swap deposits payable - - - - 106,278 164,737 - - Redemptions payable - - 13,606 43,305 250 18,419 - - Other payables - - - - 1 576 - - Total payables 1,352 1,383 24,978 58,832 126,186 209,784 5,023 12,844
113. OnePath Sustainable Investments - Australian
Share Trust
114. OnePath Wholesale Australian Share Trust
115. OnePath Wholesale Balanced Trust
116. OnePath Wholesale Blue Chip Imputation Trust
30 June 2020 30 June 2019 30 June 2020 30 June 2019 30 June 2020 30 June 2019 30 June 2020 30 June 2019$ $ $ $ $ $ $ $
Outstanding settlements payable 1 1 - - - - - - Responsible Entity fees payable 4,884 6,618 85,721 95,716 22,471 27,543 279 275Future and swap deposits payable 206 - - - - - - - Redemptions payable 122 3,112 78,363 522,855 5,548 8,555 - - Other payables - - - - - - 40,253 95,754Total payables 5,213 9,731 164,084 618,571 28,019 36,098 40,532 96,029
117. OnePath Wholesale Capital Stable Trust
118. OnePath Wholesale Diversified Fixed Interest
Trust
119. OnePath Wholesale Emerging Companies Trust
120. OnePath Wholesale Geared Australian Shares
Index Trust
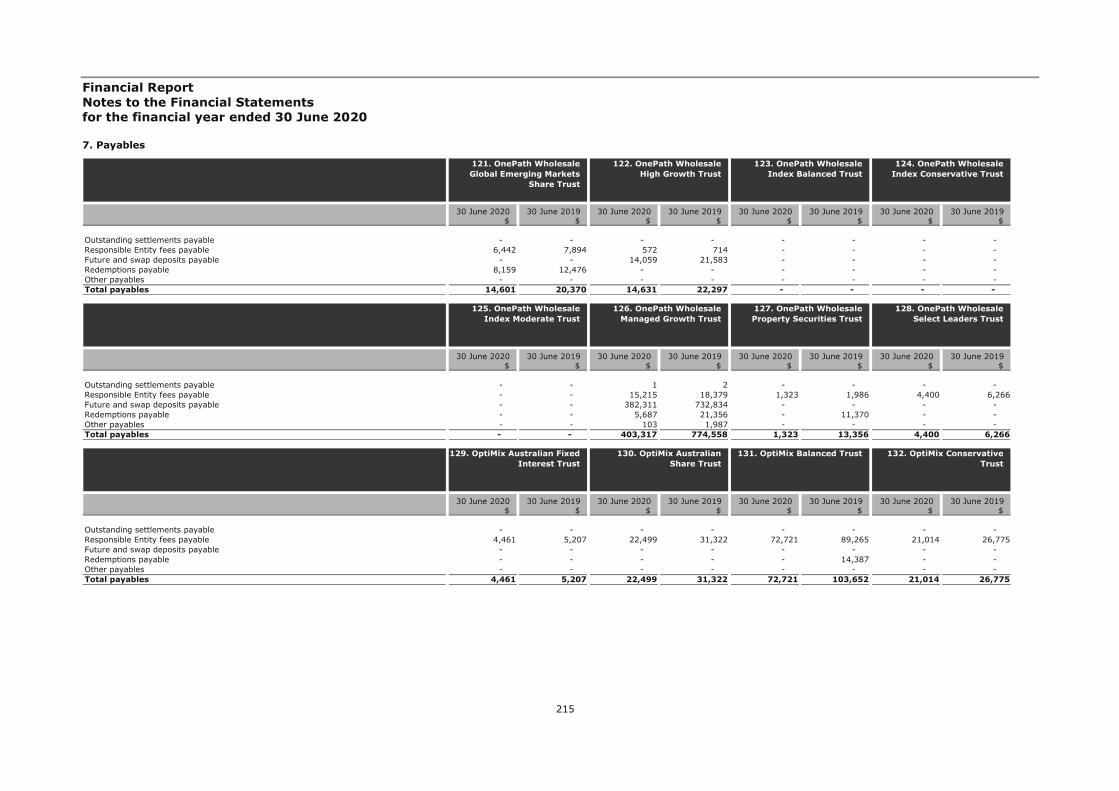
Financial Report Notes to the Financial Statements for the financial year ended 30 June 2020
215
7. Payables
30 June 2020 30 June 2019 30 June 2020 30 June 2019 30 June 2020 30 June 2019 30 June 2020 30 June 2019$ $ $ $ $ $ $ $
Outstanding settlements payable - - - - - - - - Responsible Entity fees payable 6,442 7,894 572 714 - - - - Future and swap deposits payable - - 14,059 21,583 - - - - Redemptions payable 8,159 12,476 - - - - - - Other payables - - - - - - - - Total payables 14,601 20,370 14,631 22,297 - - - -
121. OnePath Wholesale Global Emerging Markets
Share Trust
122. OnePath Wholesale High Growth Trust
123. OnePath Wholesale Index Balanced Trust
124. OnePath Wholesale Index Conservative Trust
30 June 2020 30 June 2019 30 June 2020 30 June 2019 30 June 2020 30 June 2019 30 June 2020 30 June 2019$ $ $ $ $ $ $ $
Outstanding settlements payable - - 1 2 - - - - Responsible Entity fees payable - - 15,215 18,379 1,323 1,986 4,400 6,266Future and swap deposits payable - - 382,311 732,834 - - - - Redemptions payable - - 5,687 21,356 - 11,370 - - Other payables - - 103 1,987 - - - - Total payables - - 403,317 774,558 1,323 13,356 4,400 6,266
125. OnePath Wholesale Index Moderate Trust
126. OnePath Wholesale Managed Growth Trust
127. OnePath Wholesale Property Securities Trust
128. OnePath Wholesale Select Leaders Trust
30 June 2020 30 June 2019 30 June 2020 30 June 2019 30 June 2020 30 June 2019 30 June 2020 30 June 2019$ $ $ $ $ $ $ $
Outstanding settlements payable - - - - - - - - Responsible Entity fees payable 4,461 5,207 22,499 31,322 72,721 89,265 21,014 26,775Future and swap deposits payable - - - - - - - - Redemptions payable - - - - - 14,387 - - Other payables - - - - - - - - Total payables 4,461 5,207 22,499 31,322 72,721 103,652 21,014 26,775
129. OptiMix Australian Fixed Interest Trust
130. OptiMix Australian Share Trust
131. OptiMix Balanced Trust 132. OptiMix Conservative Trust

Financial Report Notes to the Financial Statements for the financial year ended 30 June 2020
216
7. Payables
30 June 2020 30 June 2019 30 June 2020 30 June 2019 30 June 2020 30 June 2019 30 June 2020 30 June 2019$ $ $ $ $ $ $ $
Outstanding settlements payable - - - - - - - - Responsible Entity fees payable 5,705 6,610 12,342 15,491 5,577 6,933 25,104 32,147Future and swap deposits payable - - - - - - - - Redemptions payable 600 - - - - 45,598 - - Other payables - - - - - - - - Total payables 6,305 6,610 12,342 15,491 5,577 52,531 25,104 32,147
133. OptiMix Global Emerging Markets Share
Trust
134. OptiMix Global Share Trust
135. OptiMix Global Smaller Companies Share Trust
136. OptiMix Growth Trust
30 June 2020 30 June 2019 30 June 2020 30 June 2019 30 June 2020 30 June 2019 30 June 2020 30 June 2019$ $ $ $ $ $ $ $
Outstanding settlements payable - - - - - - 1 1Responsible Entity fees payable 9,247 11,708 15,822 19,366 6,899 11,003 6,514 8,558Future and swap deposits payable - - - - - - - 465,948Redemptions payable - - - 337,916 - - 60,136 50,305Other payables - - - - - - 34 797Total payables 9,247 11,708 15,822 357,282 6,899 11,003 66,685 525,609
137. OptiMix High Growth Trust
138. OptiMix Moderate Trust 139. OptiMix Property Securities Trust
140. OptiMix Wholesale Balanced Trust
30 June 2020 30 June 2019 30 June 2020 30 June 2019 30 June 2020 30 June 2019 30 June 2020 30 June 2019$ $ $ $ $ $ $ $
Outstanding settlements payable 1 1 - - 1 - - - Responsible Entity fees payable 1,847 3,171 - - 2,439 3,223 1,177 1,366Future and swap deposits payable 181,351 - - - - 180,929 98,467 118,911Redemptions payable - - - - - 24,481 - - Other payables - - 1 1 - 410 - - Total payables 183,199 3,172 1 1 2,440 209,043 99,644 120,277
141. OptiMix Wholesale Conservative Trust
142. OptiMix Wholesale Global (Hedged) Share Trust
143. OptiMix Wholesale Growth Trust
144. OptiMix Wholesale High Growth Trust

Financial Report Notes to the Financial Statements for the financial year ended 30 June 2020
217
7. Payables
8. Reconciliation of cash flows from operating activities
The tables below detail the reconciliation of cash flows from operating activities for the year as follows:
† In prior year, the Scheme had in-specie transfers as a result of asset restructuring by OnePath Life Limited redemption.
30 June 2020 30 June 2019 30 June 2020 30 June 2019 30 June 2020 30 June 2019$ $ $ $ $ $
Outstanding settlements payable - - - - - - Responsible Entity fees payable 1,465 3,008 - - 10,261 16,064Future and swap deposits payable 23,323 152,895 - - - - Redemptions payable - - - - - - Other payables - 429 - - - - Total payables 24,788 156,332 - - 10,261 16,064
145. OptiMix Wholesale Moderate Trust
146. Pooled Australian Share Fund
147. Property Securities Trust
30 June 2020 30 June 2019 30 June 2020 30 June 2019 30 June 2020 30 June 2019 30 June 2020 30 June 2019$ $ $ $ $ $ $ $
8.1 Profit/(Loss) from operating activities (1,826,425) 3,344,934 (1,312,857) 249,644 (2,488,585) 3,119,994 146,356 504,942Adjustments for net realised and unrealised (gains)/losses on:Change in fair value of investments 5,240,033 (887,874) 1,710,166 189,911 3,916,526 (1,386,042) 68,493 (295,102)Realised foreign exchange gains/(losses) - - - - - - - - Changes in operating assets and liabilities:Proceeds from sale of investments 8,061,900 9,038,925 703,721 1,390,605 450,762 582,362 855,789 1,245,270Purchase of investments - - - - - - (330,461) (86,967)Net change in receivables (945,271) 714,611 12,119 23,355 381,194 1,330,825 (21,636) (10,591)Net change in payables (12,835) (7,650) (1,848) (4,759) (880) (2,840) (431) (2,012)Income reinvested (3,199,150) (4,002,958) (514,526) (579,774) (1,866,852) (3,128,143) (250,834) (262,455)Net cash flows from/(used in) operating activities 7,318,252 8,199,988 596,775 1,268,982 392,165 516,156 467,276 1,093,085
8.2 Non-cash financing activitiesDistributions reinvested by unitholders in additional scheme units 850,863 1,223,791 305,322 351,164 1,835,059 1,974,920 140,410 135,227Trust income reinvested 3,199,150 4,002,958 514,526 579,774 1,866,852 3,128,143 250,834 262,455Other non-cash activities (in-specie assets purchase) - - - - - - - - Other non-cash activities (in-specie assets sale) - - - - - - - - Other non-cash activities (in-specie applications) (101,766) (25,270,316) - - (18,847) (30,441,367) - (847,430)Other non-cash activities (in-specie redemptions) 101,766 25,270,316 - - 18,847 30,441,367 - 847,430
1. Active Growth Trust† 2. ANZ Equity Imputation Trust
3. ANZ Equity Trust No 1† 4. ANZ Fixed Interest Trust†

Financial Report Notes to the Financial Statements for the financial year ended 30 June 2020
218
8. Reconciliation of cash flows from operating activities
† In prior year, the Scheme had in-specie transfers as a result of asset restructuring by OnePath Life Limited redemption.
30 June 2020 30 June 2019 30 June 2020 30 June 2019 30 June 2020 30 June 2019 30 June 2020 30 June 2019$ $ $ $ $ $ $ $
8.1 Profit/(Loss) from operating activities (1,440,770) (358,440) (6,054,699) 27,030,376 (4,561,923) 14,040,298 (6,923,672) 5,173,760Adjustments for net realised and unrealised (gains)/losses on:Change in fair value of investments 2,634,148 326,144 12,232,487 (22,094,317) 12,383,157 (2,499,143) 12,741,004 4,334,490Realised foreign exchange gains/(losses) - - - - - - - - Changes in operating assets and liabilities:Proceeds from sale of investments 3,514,159 4,257,638 82,415,715 86,475,161 24,931,694 25,355,346 6,829,469 13,480,074Purchase of investments - (90,983) - - (1,423,614) (2,243,678) (1,718,606) - Net change in receivables (1,218,144) 3,841,877 127,187 36,377,223 2,211,561 2,875,672 3,589,955 (3,131,842)Net change in payables (683) (1,449) (4,173) (6,828) (2,658) (2,934) (1,157) (1,473)Income reinvested (249) (3,842,927) (6,493,216) (41,568,645) (10,159,630) (14,569,345) (9,448,120) (6,426,667)Net cash flows from/(used in) operating activities 3,488,461 4,131,860 82,223,301 86,212,970 23,378,587 22,956,216 5,068,873 13,428,342
8.2 Non-cash financing activitiesDistributions reinvested by unitholders in additional scheme units 560,651 2,345,501 3,730,420 48,833,000 12,458,873 16,511,824 12,737,972 8,754,151Trust income reinvested 249 3,842,927 6,493,216 41,568,645 10,159,630 14,569,345 9,448,120 6,426,667Other non-cash activities (in-specie assets purchase) - - - - - - - - Other non-cash activities (in-specie assets sale) - - - - - - - - Other non-cash activities (in-specie applications) (49,708) (17,854,700) (9,602,240) (319,307,803) (563,047) (203,903,257) (1,562,424) (62,744,721)Other non-cash activities (in-specie redemptions) 49,708 17,854,700 9,602,240 319,307,803 563,047 203,903,257 1,562,424 62,744,721
5. ANZ OA - Pendal Core Hedged Global Shares Trust†
6. ANZ OA Arrowstreet Global Equity (Hedged) Trust†
7. ANZ OA Colonial First State Imputation Trust†
8. ANZ OA Investors Mutual Australian Share Trust†
30 June 2020 30 June 2019 30 June 2020 30 June 2019 30 June 2020 30 June 2019 30 June 2020 30 June 2019$ $ $ $ $ $ $ $
8.1 Profit/(Loss) from operating activities 7,837,138 14,673,425 (1,303,683) 4,542,745 (5,207,982) 6,612,581 (894,267) 1,377,148Adjustments for net realised and unrealised (gains)/losses on:Change in fair value of investments 7,051,102 (10,347,209) 4,762,499 (1,767,873) 7,993,829 (2,834,797) 2,097,044 (860,346)Realised foreign exchange gains/(losses) - - 11,384 (15,328) - - - - Changes in operating assets and liabilities:Proceeds from sale of investments 1,031,600 1,297,412 14,068,261 13,841,889 8,757,886 9,614,393 3,213,196 6,405,469Purchase of investments (21,443,010) (4,542,629) (4,611,504) (2,837,550) - - - - Net change in receivables (10,578,403) 1,046,169 (842,426) 1,101,215 881,848 3,389,229 (695,627) 110,918Net change in payables 1,160 (410) (1,638) (3,250) (4,392) (3,704) (8,625) (11,063)Income reinvested (4,372,117) (5,420,194) (2,720,520) (4,000,412) (3,966,073) (7,495,917) (1,173,859) (1,393,537)Net cash flows from/(used in) operating activities (20,472,530) (3,293,436) 9,362,373 10,861,436 8,455,116 9,281,785 2,537,862 5,628,589
8.2 Non-cash financing activitiesDistributions reinvested by unitholders in additional scheme units 4,699,235 5,905,577 3,464,626 4,409,995 4,817,982 7,806,698 90,566 917,559Trust income reinvested 4,372,117 5,420,194 2,720,520 4,000,412 3,966,073 7,495,917 1,173,859 1,393,537Other non-cash activities (in-specie assets purchase) - - 470,763 862,885 - - - - Other non-cash activities (in-specie assets sale) - - (470,763) (862,885) - - - (6,875,101)Other non-cash activities (in-specie applications) (1,083,011) (82,385,645) (8,586) (2,496,427) - - - (16,288)Other non-cash activities (in-specie redemptions) 1,083,011 82,385,645 8,586 2,496,427 - - - 6,891,389
9. ANZ OA Magellan Global Trust†
10. ANZ OA OnePath Active Growth Trust†
11. ANZ OA OnePath Australian Share Trust
12. ANZ OA OnePath Balanced Trust
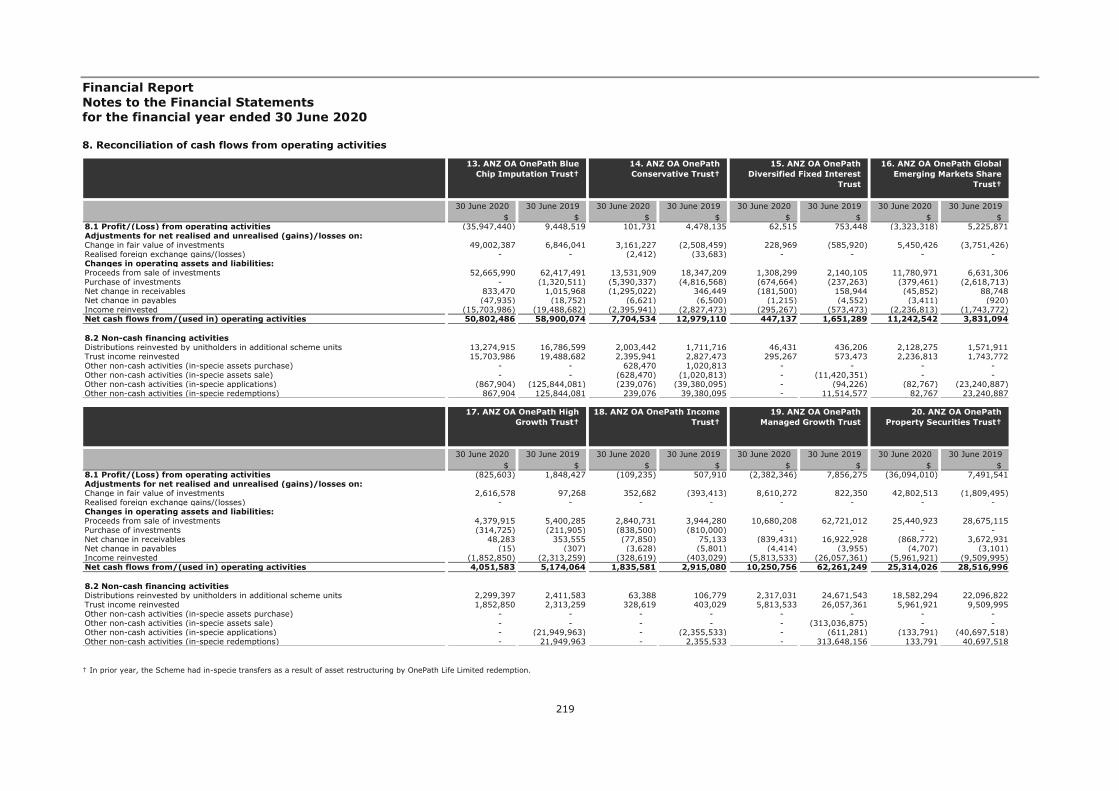
Financial Report Notes to the Financial Statements for the financial year ended 30 June 2020
219
8. Reconciliation of cash flows from operating activities
† In prior year, the Scheme had in-specie transfers as a result of asset restructuring by OnePath Life Limited redemption.
30 June 2020 30 June 2019 30 June 2020 30 June 2019 30 June 2020 30 June 2019 30 June 2020 30 June 2019$ $ $ $ $ $ $ $
8.1 Profit/(Loss) from operating activities (35,947,440) 9,448,519 101,731 4,478,135 62,515 753,448 (3,323,318) 5,225,871Adjustments for net realised and unrealised (gains)/losses on:Change in fair value of investments 49,002,387 6,846,041 3,161,227 (2,508,459) 228,969 (585,920) 5,450,426 (3,751,426)Realised foreign exchange gains/(losses) - - (2,412) (33,683) - - - - Changes in operating assets and liabilities:Proceeds from sale of investments 52,665,990 62,417,491 13,531,909 18,347,209 1,308,299 2,140,105 11,780,971 6,631,306Purchase of investments - (1,320,511) (5,390,337) (4,816,568) (674,664) (237,263) (379,461) (2,618,713)Net change in receivables 833,470 1,015,968 (1,295,022) 346,449 (181,500) 158,944 (45,852) 88,748Net change in payables (47,935) (18,752) (6,621) (6,500) (1,215) (4,552) (3,411) (920)Income reinvested (15,703,986) (19,488,682) (2,395,941) (2,827,473) (295,267) (573,473) (2,236,813) (1,743,772)Net cash flows from/(used in) operating activities 50,802,486 58,900,074 7,704,534 12,979,110 447,137 1,651,289 11,242,542 3,831,094
8.2 Non-cash financing activitiesDistributions reinvested by unitholders in additional scheme units 13,274,915 16,786,599 2,003,442 1,711,716 46,431 436,206 2,128,275 1,571,911Trust income reinvested 15,703,986 19,488,682 2,395,941 2,827,473 295,267 573,473 2,236,813 1,743,772Other non-cash activities (in-specie assets purchase) - - 628,470 1,020,813 - - - - Other non-cash activities (in-specie assets sale) - - (628,470) (1,020,813) - (11,420,351) - - Other non-cash activities (in-specie applications) (867,904) (125,844,081) (239,076) (39,380,095) - (94,226) (82,767) (23,240,887)Other non-cash activities (in-specie redemptions) 867,904 125,844,081 239,076 39,380,095 - 11,514,577 82,767 23,240,887
13. ANZ OA OnePath Blue Chip Imputation Trust†
14. ANZ OA OnePath Conservative Trust†
15. ANZ OA OnePath Diversified Fixed Interest
Trust
16. ANZ OA OnePath Global Emerging Markets Share
Trust†
30 June 2020 30 June 2019 30 June 2020 30 June 2019 30 June 2020 30 June 2019 30 June 2020 30 June 2019$ $ $ $ $ $ $ $
8.1 Profit/(Loss) from operating activities (825,603) 1,848,427 (109,235) 507,910 (2,382,346) 7,856,275 (36,094,010) 7,491,541Adjustments for net realised and unrealised (gains)/losses on:Change in fair value of investments 2,616,578 97,268 352,682 (393,413) 8,610,272 822,350 42,802,513 (1,809,495)Realised foreign exchange gains/(losses) - - - - - - - - Changes in operating assets and liabilities:Proceeds from sale of investments 4,379,915 5,400,285 2,840,731 3,944,280 10,680,208 62,721,012 25,440,923 28,675,115Purchase of investments (314,725) (211,905) (838,500) (810,000) - - - - Net change in receivables 48,283 353,555 (77,850) 75,133 (839,431) 16,922,928 (868,772) 3,672,931Net change in payables (15) (307) (3,628) (5,801) (4,414) (3,955) (4,707) (3,101)Income reinvested (1,852,850) (2,313,259) (328,619) (403,029) (5,813,533) (26,057,361) (5,961,921) (9,509,995)Net cash flows from/(used in) operating activities 4,051,583 5,174,064 1,835,581 2,915,080 10,250,756 62,261,249 25,314,026 28,516,996
8.2 Non-cash financing activitiesDistributions reinvested by unitholders in additional scheme units 2,299,397 2,411,583 63,388 106,779 2,317,031 24,671,543 18,582,294 22,096,822Trust income reinvested 1,852,850 2,313,259 328,619 403,029 5,813,533 26,057,361 5,961,921 9,509,995Other non-cash activities (in-specie assets purchase) - - - - - - - - Other non-cash activities (in-specie assets sale) - - - - - (313,036,875) - - Other non-cash activities (in-specie applications) - (21,949,963) - (2,355,533) - (611,281) (133,791) (40,697,518)Other non-cash activities (in-specie redemptions) - 21,949,963 - 2,355,533 - 313,648,156 133,791 40,697,518
17. ANZ OA OnePath High Growth Trust†
18. ANZ OA OnePath Income Trust†
19. ANZ OA OnePath Managed Growth Trust
20. ANZ OA OnePath Property Securities Trust†

Financial Report Notes to the Financial Statements for the financial year ended 30 June 2020
220
8. Reconciliation of cash flows from operating activities
† In prior year, the Scheme had in-specie transfers as a result of asset restructuring by OnePath Life Limited redemption.
30 June 2020 30 June 2019 30 June 2020 30 June 2019 30 June 2020 30 June 2019 30 June 2020 30 June 2019$ $ $ $ $ $ $ $
8.1 Profit/(Loss) from operating activities (1,557,845) 900,625 (76,934) 111,658 (4,466,276) 3,043,402 17,614 89,373Adjustments for net realised and unrealised (gains)/losses on:Change in fair value of investments 2,083,362 139,771 92,358 (82,767) 5,361,669 (2,179,863) 28,940 (61,139)Realised foreign exchange gains/(losses) - - - - - - - - Changes in operating assets and liabilities:Proceeds from sale of investments 4,617,034 14,500,676 150,808 184,399 5,488,396 7,579,325 132,853 996,207Purchase of investments (94,706) (115,238) (260,485) (52,526) - - (11,126) (57,046)Net change in receivables 178,491 1,479,343 7,642 4,182 41,008 (77,356) (8,088) (935)Net change in payables (6,714) (7,588) (131) (289) (20,046) (9,077) (326) (2,549)Income reinvested (966,248) (2,842,852) (45,360) (55,059) (1,864,817) (1,906,770) (65,003) (66,810)Net cash flows from/(used in) operating activities 4,253,374 14,054,737 (132,102) 109,598 4,539,934 6,449,661 94,864 897,101
8.2 Non-cash financing activitiesDistributions reinvested by unitholders in additional scheme units 752,445 2,166,348 15,934 25,385 588,614 685,832 24,541 13,442Trust income reinvested 966,248 2,842,852 45,360 55,059 1,864,817 1,906,770 65,003 66,810Other non-cash activities (in-specie assets purchase) - - - - - - 118,000 - Other non-cash activities (in-specie assets sale) - (7,934,872) - (280,462) - (1,113,726) (118,055) - Other non-cash activities (in-specie applications) - (6,995,774) - - - (2,191) (118,000) - Other non-cash activities (in-specie redemptions) - 14,930,646 - 280,462 - 1,115,917 118,055 -
21. ANZ OA OnePath Select Leaders Trust†
22. ANZ OA OnePath Sustainable Investments -
Australian Share Trust
23. ANZ OA OnePath Tax Effective Income Trust
24. ANZ OA OptiMix Australian Fixed Interest
Trust
30 June 2020 30 June 2019 30 June 2020 30 June 2019 30 June 2020 30 June 2019 30 June 2020 30 June 2019$ $ $ $ $ $ $ $
8.1 Profit/(Loss) from operating activities (909,181) 291,675 (262,200) 750,688 (17,826) 513,182 (65,830) (12,705)Adjustments for net realised and unrealised (gains)/losses on:Change in fair value of investments 1,274,494 314,047 707,611 (595,483) 728,485 (19,365) 69,177 164,864Realised foreign exchange gains/(losses) - - - - - - - - Changes in operating assets and liabilities:Proceeds from sale of investments 975,957 2,047,259 2,336,820 2,450,760 1,347,854 1,002,654 330,261 732,921Purchase of investments - (59,842) (399,243) (291,388) - - - - Net change in receivables 161,307 246,125 (235,813) (8,115) (204,364) (210,095) 158,435 532,739Net change in payables (4,646) (4,618) (4,604) (3,573) (3,478) (2,391) (1,052) (2,804)Income reinvested (749,143) (1,117,658) (512,207) (549,286) (659,007) (459,408) (222,537) (762,222)Net cash flows from/(used in) operating activities 748,788 1,716,988 1,630,364 1,753,603 1,191,664 824,577 268,454 652,793
8.2 Non-cash financing activitiesDistributions reinvested by unitholders in additional scheme units 115,546 198,400 124,298 174,060 - - - - Trust income reinvested 749,143 1,117,658 512,207 549,286 659,007 459,408 222,537 762,222Other non-cash activities (in-specie assets purchase) - - - - - - - - Other non-cash activities (in-specie assets sale) - - - - - - - - Other non-cash activities (in-specie applications) - - - - - - - - Other non-cash activities (in-specie redemptions) - - - - - - - -
25. ANZ OA OptiMix Australian Share Trust
26. ANZ OA OptiMix Conservative Trust
27. ANZ OA OptiMix Global Share Trust
28. ANZ OA OptiMix Global Smaller Companies Share
Trust

Financial Report Notes to the Financial Statements for the financial year ended 30 June 2020
221
8. Reconciliation of cash flows from operating activities
† In prior year, the Scheme had in-specie transfers as a result of asset restructuring by OnePath Life Limited redemption.
30 June 2020 30 June 2019 30 June 2020 30 June 2019 30 June 2020 30 June 2019 30 June 2020 30 June 2019$ $ $ $ $ $ $ $
8.1 Profit/(Loss) from operating activities (1,697,954) 1,237,617 (800,639) 473,958 (819,835) 950,252 (702,408) 312,887Adjustments for net realised and unrealised (gains)/losses on:Change in fair value of investments 3,140,070 (753,271) 1,416,469 31,548 1,273,941 (855,723) 737,282 (300,755)Realised foreign exchange gains/(losses) - - - - - - - - Changes in operating assets and liabilities:Proceeds from sale of investments 3,862,862 4,136,087 840,270 1,797,091 3,173,727 3,857,219 448,093 613,325Purchase of investments (305,423) (143,229) - - (168,286) (309,035) - - Net change in receivables (940,255) (211,850) (111,890) 233,646 (298,422) 114,499 (5,534) 54,373Net change in payables (11,922) (7,153) (3,387) (4,448) (8,366) (6,682) (2,695) (1,798)Income reinvested (1,167,818) (1,061,311) (755,600) (1,020,450) (651,216) (782,564) (104,497) (161,841)Net cash flows from/(used in) operating activities 2,879,560 3,196,890 585,223 1,511,345 2,501,543 2,967,966 370,241 516,191
8.2 Non-cash financing activitiesDistributions reinvested by unitholders in additional scheme units 170,887 282,830 88,339 92,748 94,951 209,239 20,603 71,958Trust income reinvested 1,167,818 1,061,311 755,600 1,020,450 651,216 782,564 104,497 161,841Other non-cash activities (in-specie assets purchase) - - - - - - - - Other non-cash activities (in-specie assets sale) - - - - - - - - Other non-cash activities (in-specie applications) - - - - - - - - Other non-cash activities (in-specie redemptions) - - - - - - - -
29. ANZ OA OptiMix Growth Trust
30. ANZ OA OptiMix High Growth Trust
31. ANZ OA OptiMix Moderate Trust
32. ANZ OA OptiMix Property Securities Trust
30 June 2020 30 June 2019 30 June 2020 30 June 2019 30 June 2020 30 June 2019 30 June 2020 30 June 2019$ $ $ $ $ $ $ $
8.1 Profit/(Loss) from operating activities (31,464,510) 18,456,323 (11,102,872) 12,261,003 (4,571,834) 688,448 56,568 1,509,648Adjustments for net realised and unrealised (gains)/losses on:Change in fair value of investments 40,900,624 1,190,670 22,229,766 9,830,417 7,096,429 2,670,357 (6,954) (524,954)Realised foreign exchange gains/(losses) - - - - - - - - Changes in operating assets and liabilities:Proceeds from sale of investments 61,377,023 65,938,873 56,135,855 43,103,717 4,579,054 5,889,252 402,947 8,449,051Purchase of investments (3,183,797) (3,650,307) (1,338,635) (1,993,713) (46,473) - (172,412) (334,443)Net change in receivables 9,210,948 (5,902,884) 10,624,876 123,470 838,615 497,350 (6,508) 1,379,335Net change in payables (11,168) (7,256) (4,540) (3,031) (1,230) (2,139) (182) (2,276)Income reinvested (19,174,059) (14,381,833) (21,898,717) (22,405,554) (3,397,122) (3,901,383) (63,806) (2,392,103)Net cash flows from/(used in) operating activities 57,655,061 61,643,586 54,645,733 40,916,309 4,497,439 5,841,885 209,653 8,084,258
8.2 Non-cash financing activitiesDistributions reinvested by unitholders in additional scheme units 18,461,630 12,563,154 29,909,960 24,992,058 4,240,390 899,911 45,394 2,318,156Trust income reinvested 19,174,059 14,381,833 21,898,717 22,405,554 3,397,122 3,901,383 63,806 2,392,103Other non-cash activities (in-specie assets purchase) - - - - - - - - Other non-cash activities (in-specie assets sale) - - - - - - - (52,514,135)Other non-cash activities (in-specie applications) (3,131,759) (337,497,137) (2,346,084) (139,941,913) (180,807) (19,789,648) - (2,168,964)Other non-cash activities (in-specie redemptions) 3,131,759 337,497,137 2,346,084 139,941,913 180,807 19,789,648 - 54,683,099
33. ANZ OA Perpetual Australian Share Trust†
34. ANZ OA Schroder Australian Equity Trust†
35. ANZ OA SG Hiscock Property Trust†
36. ANZ OA UBS Diversified Fixed Income Trust†
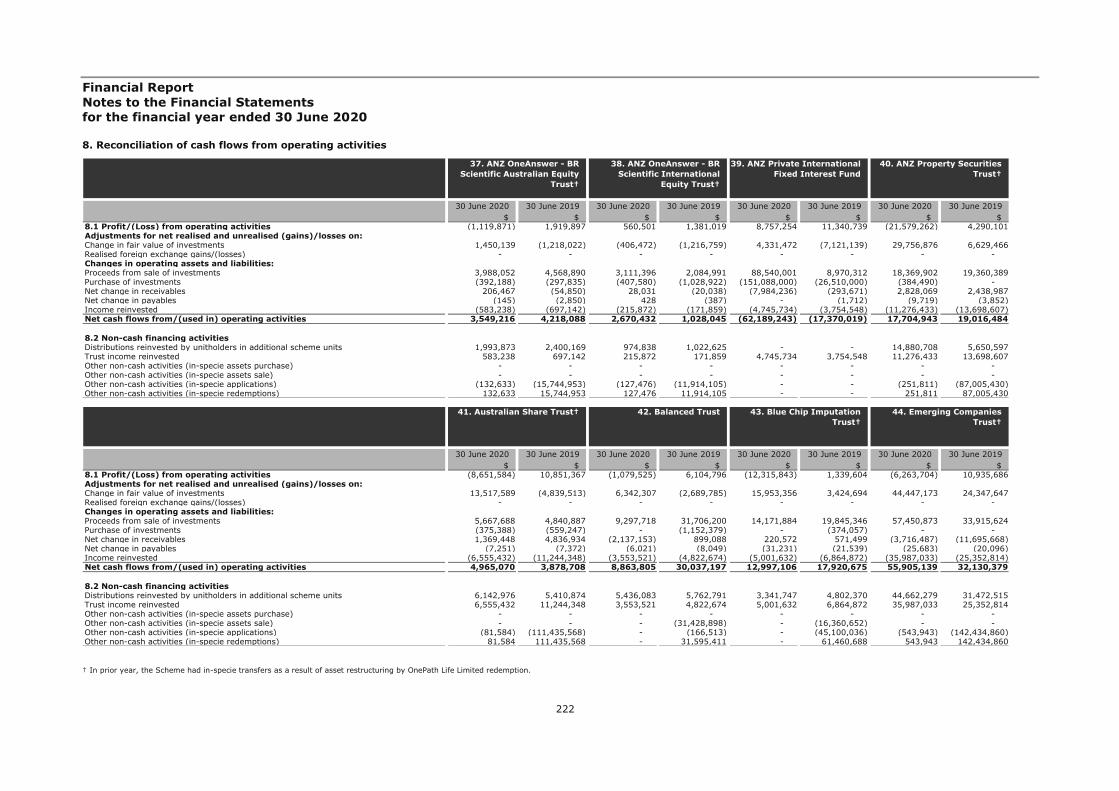
Financial Report Notes to the Financial Statements for the financial year ended 30 June 2020
222
8. Reconciliation of cash flows from operating activities
† In prior year, the Scheme had in-specie transfers as a result of asset restructuring by OnePath Life Limited redemption.
30 June 2020 30 June 2019 30 June 2020 30 June 2019 30 June 2020 30 June 2019 30 June 2020 30 June 2019$ $ $ $ $ $ $ $
8.1 Profit/(Loss) from operating activities (1,119,871) 1,919,897 560,501 1,381,019 8,757,254 11,340,739 (21,579,262) 4,290,101Adjustments for net realised and unrealised (gains)/losses on:Change in fair value of investments 1,450,139 (1,218,022) (406,472) (1,216,759) 4,331,472 (7,121,139) 29,756,876 6,629,466Realised foreign exchange gains/(losses) - - - - - - - - Changes in operating assets and liabilities:Proceeds from sale of investments 3,988,052 4,568,890 3,111,396 2,084,991 88,540,001 8,970,312 18,369,902 19,360,389Purchase of investments (392,188) (297,835) (407,580) (1,028,922) (151,088,000) (26,510,000) (384,490) - Net change in receivables 206,467 (54,850) 28,031 (20,038) (7,984,236) (293,671) 2,828,069 2,438,987Net change in payables (145) (2,850) 428 (387) - (1,712) (9,719) (3,852)Income reinvested (583,238) (697,142) (215,872) (171,859) (4,745,734) (3,754,548) (11,276,433) (13,698,607)Net cash flows from/(used in) operating activities 3,549,216 4,218,088 2,670,432 1,028,045 (62,189,243) (17,370,019) 17,704,943 19,016,484
8.2 Non-cash financing activitiesDistributions reinvested by unitholders in additional scheme units 1,993,873 2,400,169 974,838 1,022,625 - - 14,880,708 5,650,597Trust income reinvested 583,238 697,142 215,872 171,859 4,745,734 3,754,548 11,276,433 13,698,607Other non-cash activities (in-specie assets purchase) - - - - - - - - Other non-cash activities (in-specie assets sale) - - - - - - - - Other non-cash activities (in-specie applications) (132,633) (15,744,953) (127,476) (11,914,105) - - (251,811) (87,005,430)Other non-cash activities (in-specie redemptions) 132,633 15,744,953 127,476 11,914,105 - - 251,811 87,005,430
37. ANZ OneAnswer - BR Scientific Australian Equity
Trust†
38. ANZ OneAnswer - BR Scientific International
Equity Trust†
39. ANZ Private International Fixed Interest Fund
40. ANZ Property Securities Trust†
30 June 2020 30 June 2019 30 June 2020 30 June 2019 30 June 2020 30 June 2019 30 June 2020 30 June 2019$ $ $ $ $ $ $ $
8.1 Profit/(Loss) from operating activities (8,651,584) 10,851,367 (1,079,525) 6,104,796 (12,315,843) 1,339,604 (6,263,704) 10,935,686Adjustments for net realised and unrealised (gains)/losses on:Change in fair value of investments 13,517,589 (4,839,513) 6,342,307 (2,689,785) 15,953,356 3,424,694 44,447,173 24,347,647Realised foreign exchange gains/(losses) - - - - - - - - Changes in operating assets and liabilities:Proceeds from sale of investments 5,667,688 4,840,887 9,297,718 31,706,200 14,171,884 19,845,346 57,450,873 33,915,624Purchase of investments (375,388) (559,247) - (1,152,379) - (374,057) - - Net change in receivables 1,369,448 4,836,934 (2,137,153) 899,088 220,572 571,499 (3,716,487) (11,695,668)Net change in payables (7,251) (7,372) (6,021) (8,049) (31,231) (21,539) (25,683) (20,096)Income reinvested (6,555,432) (11,244,348) (3,553,521) (4,822,674) (5,001,632) (6,864,872) (35,987,033) (25,352,814)Net cash flows from/(used in) operating activities 4,965,070 3,878,708 8,863,805 30,037,197 12,997,106 17,920,675 55,905,139 32,130,379
8.2 Non-cash financing activitiesDistributions reinvested by unitholders in additional scheme units 6,142,976 5,410,874 5,436,083 5,762,791 3,341,747 4,802,370 44,662,279 31,472,515Trust income reinvested 6,555,432 11,244,348 3,553,521 4,822,674 5,001,632 6,864,872 35,987,033 25,352,814Other non-cash activities (in-specie assets purchase) - - - - - - - - Other non-cash activities (in-specie assets sale) - - - (31,428,898) - (16,360,652) - - Other non-cash activities (in-specie applications) (81,584) (111,435,568) - (166,513) - (45,100,036) (543,943) (142,434,860)Other non-cash activities (in-specie redemptions) 81,584 111,435,568 - 31,595,411 - 61,460,688 543,943 142,434,860
41. Australian Share Trust† 42. Balanced Trust 43. Blue Chip Imputation Trust†
44. Emerging Companies Trust†

Financial Report Notes to the Financial Statements for the financial year ended 30 June 2020
223
8. Reconciliation of cash flows from operating activities
† In prior year, the Scheme had in-specie transfers as a result of asset restructuring by OnePath Life Limited redemption.
30 June 2020 30 June 2019 30 June 2020 30 June 2019 30 June 2020 30 June 2019 30 June 2020 30 June 2019$ $ $ $ $ $ $ $
8.1 Profit/(Loss) from operating activities 17,265,069 27,414,673 (2,472,649) 254,444 (105,095) 76,595 223,696 1,724,300Adjustments for net realised and unrealised (gains)/losses on:Change in fair value of investments (15,436,084) (25,165,901) 3,229,645 631,350 208,106 42,116 422,639 (214,120)Realised foreign exchange gains/(losses) - - - - - - - - Changes in operating assets and liabilities:Proceeds from sale of investments 19,194,095 17,668,012 406,933 748,902 120,779 312,043 9,056,294 3,072,448Purchase of investments (3,229,738) (1,312,610) - - (24,026) (32,848) (182,158) (1,081,711)Net change in receivables 149,024 414,954 174,167 193,312 (9,360) 156,994 863,540 (348,697)Net change in payables 92 (468) (4,473) (5,578) (376) (1,065) 172 (1,430)Income reinvested (2,122,480) (2,794,805) (1,104,155) (1,268,092) (130,225) (317,692) (1,518,532) (1,170,166)Net cash flows from/(used in) operating activities 15,819,978 16,223,855 229,468 554,338 59,803 236,143 8,865,651 1,980,624
8.2 Non-cash financing activitiesDistributions reinvested by unitholders in additional scheme units 2,075,931 2,704,274 122,674 277,217 14,341 292,527 1,805,526 1,314,519Trust income reinvested 2,122,480 2,794,805 1,104,155 1,268,092 130,225 317,692 1,518,532 1,170,166Other non-cash activities (in-specie assets purchase) - - - - 80,000 - - - Other non-cash activities (in-specie assets sale) - - - (694,730) (78,942) (1,998,702) - - Other non-cash activities (in-specie applications) (363,796) (148,784,297) - - (80,000) - (504,068) (16,705,052)Other non-cash activities (in-specie redemptions) 363,796 148,784,297 - 694,730 78,942 1,998,702 504,068 16,705,052
45. Global Share Trust† 46. Heine Property Securities Fund
47. High Growth Trust 48. OneAnswer - Altrinsic Global Equities Trust†
30 June 2020 30 June 2019 30 June 2020 30 June 2019 30 June 2020 30 June 2019 30 June 2020 30 June 2019$ $ $ $ $ $ $ $
8.1 Profit/(Loss) from operating activities (2,073,824) 2,597,397 (383,396) 779,328 (4,837,000) (4,810,589) 6,268,718 1,998,167Adjustments for net realised and unrealised (gains)/losses on:Change in fair value of investments 3,422,484 1,732,940 515,655 (804,799) 5,186,798 6,734,761 1,770,616 1,424,456Realised foreign exchange gains/(losses) - - - - - - - - Changes in operating assets and liabilities:Proceeds from sale of investments 17,777,352 17,596,491 2,468,808 1,223,040 15,957,750 7,975,149 13,079,362 9,707,381Purchase of investments - (1,497,425) (351,264) (383,860) (179,130) (2,424,701) (4,484,129) (9,640,646)Net change in receivables 3,021,996 8,673,079 (86,676) 1,901,120 1,059,421 8,538,287 (4,752,159) (827,167)Net change in payables (2,676) (5,847) (2,572) (1,875) (4,655) (6,454) (16) (4,174)Income reinvested (4,530,971) (13,206,783) (134,577) (1,994,083) (1,566,519) (10,673,184) (3,350,141) (2,656,996)Net cash flows from/(used in) operating activities 17,614,361 15,889,852 2,025,978 718,871 15,616,665 5,333,269 8,532,251 1,021
8.2 Non-cash financing activitiesDistributions reinvested by unitholders in additional scheme units 780,168 1,304,282 61,858 205,121 3,654,998 14,179,286 4,530,625 3,841,612Trust income reinvested 4,530,971 13,206,783 134,577 1,994,083 1,566,519 10,673,184 3,350,141 2,656,996Other non-cash activities (in-specie assets purchase) - - - - - - - - Other non-cash activities (in-specie assets sale) - - - (4,768,582) - - - - Other non-cash activities (in-specie applications) (957,347) (78,792,920) - (5,538,884) (1,360,136) (75,639,108) (1,176,840) (92,827,225)Other non-cash activities (in-specie redemptions) 957,347 78,792,920 - 10,307,466 1,360,136 75,639,108 1,176,840 92,827,225
49. OneAnswer - Antipodes Global (Long Only) Trust†
50. OneAnswer - Arrowstreet Global Equity (Hedged)
Trust†
51. OneAnswer - Ausbil Australian Emerging Leaders
Trust†
52. OneAnswer - Bennelong Australian Equities Trust†

Financial Report Notes to the Financial Statements for the financial year ended 30 June 2020
224
8. Reconciliation of cash flows from operating activities
† In prior year, the Scheme had in-specie transfers as a result of asset restructuring by OnePath Life Limited redemption.
30 June 2020 30 June 2019 30 June 2020 30 June 2019 30 June 2020 30 June 2019 30 June 2020 30 June 2019$ $ $ $ $ $ $ $
8.1 Profit/(Loss) from operating activities (761,121) 560,693 (213,617) 284,416 145,404 5,563,972 (427,730) 3,809,832Adjustments for net realised and unrealised (gains)/losses on:Change in fair value of investments 3,256,204 2,328,759 232,620 (208,661) 2,666,027 (547,058) 539,725 (2,975,539)Realised foreign exchange gains/(losses) - - - - - - - - Changes in operating assets and liabilities:Proceeds from sale of investments 15,437,109 9,052,000 477,680 695,398 11,771,676 14,425,806 9,322,593 5,799,756Purchase of investments (348,548) (3,315,404) (565,325) (45,025) (917) (353,071) (2,285,071) (728,678)Net change in receivables (176,771) 459,418 30,634 (11,064) 1,790,678 1,236,149 690,967 484,244Net change in payables (3,328) (2,385) 389 (1,801) (1,981) (3,121) (272) (2,136)Income reinvested (2,442,344) (3,519,765) (102,689) (116,898) (4,688,164) (6,360,700) (943,154) (1,467,488)Net cash flows from/(used in) operating activities 14,961,201 5,563,316 (140,308) 596,365 11,682,723 13,961,977 6,897,058 4,919,991
8.2 Non-cash financing activitiesDistributions reinvested by unitholders in additional scheme units 2,618,700 3,351,070 47,988 50,618 5,240,800 8,274,070 2,847,286 2,970,454Trust income reinvested 2,442,344 3,519,765 102,689 116,898 4,688,164 6,360,700 943,154 1,467,488Other non-cash activities (in-specie assets purchase) - - - - - - - - Other non-cash activities (in-specie assets sale) - - - - - - - - Other non-cash activities (in-specie applications) (1,394,267) (65,762,908) (10,987) (514,100) (328,144) (50,374,130) (1,017,480) (34,503,685)Other non-cash activities (in-specie redemptions) 1,394,267 65,762,908 10,987 514,100 328,144 50,374,130 1,017,480 34,503,685
53. OneAnswer - Bentham Global Income Trust†
54. OneAnswer - BlackRock Scientific Australian Equity
Trust†
55. OneAnswer - Blackrock Tactical Growth Trust†
56. OneAnswer - BR Scientific Diversified Growth
Trust†
30 June 2020 30 June 2019 30 June 2020 30 June 2019 30 June 2020 30 June 2019 30 June 2020 30 June 2019$ $ $ $ $ $ $ $
8.1 Profit/(Loss) from operating activities 67,921 223,783 (509,608) 1,210,471 (11,368,343) 17,762,146 (164,771) (2,043,527)Adjustments for net realised and unrealised (gains)/losses on:Change in fair value of investments (71,210) (226,385) 852,611 (646,692) 23,228,297 (14,664,123) 429,119 4,380,444Realised foreign exchange gains/(losses) - - - - - - - - Changes in operating assets and liabilities:Proceeds from sale of investments 370,842 641,527 9,426,234 6,393,841 316,823 - 1,399,803 7,305,317Purchase of investments (175,569) (91,429) (931,424) (357,989) (10,888,917) (87,049,911) (36,659) (71,517)Net change in receivables 2,293 (547) 117,911 753,890 (8,262,210) 93,834 70,483 3,699,281Net change in payables 374 (1,730) (655) (4,081) 626 6,266 (2,450) (3,351)Income reinvested (38,521) (33,967) (518,289) (1,391,328) (3,748,430) (3,305,783) (426,198) (6,147,917)Net cash flows from/(used in) operating activities 156,130 511,252 8,436,780 5,958,112 (10,722,154) (87,157,571) 1,269,327 7,118,730
8.2 Non-cash financing activitiesDistributions reinvested by unitholders in additional scheme units 8,939 7,594 476,626 1,323,680 3,588,526 3,236,882 109,279 6,142,043Trust income reinvested 38,521 33,967 518,289 1,391,328 3,748,430 3,305,783 426,198 6,147,917Other non-cash activities (in-specie assets purchase) - - - - - - - - Other non-cash activities (in-specie assets sale) - - - - - - - (64,111,457)Other non-cash activities (in-specie applications) (2,727) (274,147) (627,079) (39,286,628) (6,494,325) (125,666,339) - (276,972)Other non-cash activities (in-specie redemptions) 2,727 274,147 627,079 39,286,628 6,494,325 125,666,339 - 64,388,429
57. OneAnswer - BR Scientific International
Equity Trust†
58. OneAnswer - Colonial First State Global Credit
Income Trust†
59. OneAnswer - Colonial First State Global Listed
Infrastructure Trust†
60. OneAnswer - Colonial First State Imputation Trust
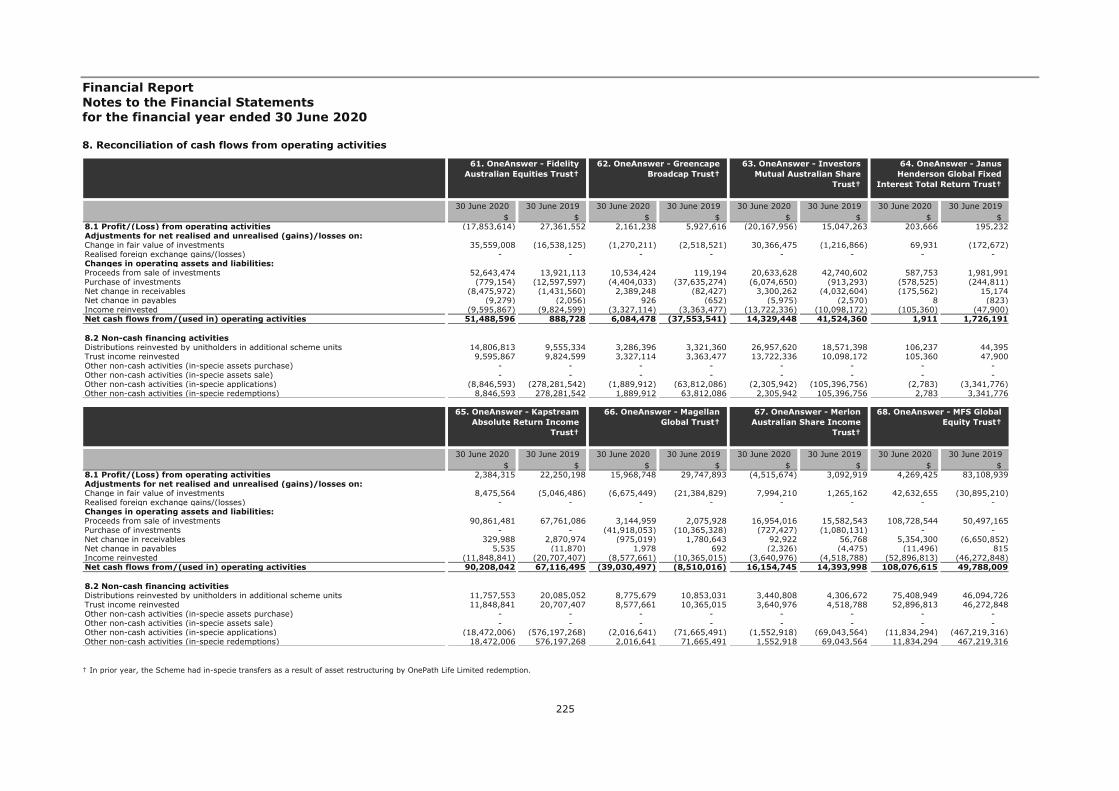
Financial Report Notes to the Financial Statements for the financial year ended 30 June 2020
225
8. Reconciliation of cash flows from operating activities
† In prior year, the Scheme had in-specie transfers as a result of asset restructuring by OnePath Life Limited redemption.
30 June 2020 30 June 2019 30 June 2020 30 June 2019 30 June 2020 30 June 2019 30 June 2020 30 June 2019$ $ $ $ $ $ $ $
8.1 Profit/(Loss) from operating activities (17,853,614) 27,361,552 2,161,238 5,927,616 (20,167,956) 15,047,263 203,666 195,232Adjustments for net realised and unrealised (gains)/losses on:Change in fair value of investments 35,559,008 (16,538,125) (1,270,211) (2,518,521) 30,366,475 (1,216,866) 69,931 (172,672)Realised foreign exchange gains/(losses) - - - - - - - - Changes in operating assets and liabilities:Proceeds from sale of investments 52,643,474 13,921,113 10,534,424 119,194 20,633,628 42,740,602 587,753 1,981,991Purchase of investments (779,154) (12,597,597) (4,404,033) (37,635,274) (6,074,650) (913,293) (578,525) (244,811)Net change in receivables (8,475,972) (1,431,560) 2,389,248 (82,427) 3,300,262 (4,032,604) (175,562) 15,174Net change in payables (9,279) (2,056) 926 (652) (5,975) (2,570) 8 (823)Income reinvested (9,595,867) (9,824,599) (3,327,114) (3,363,477) (13,722,336) (10,098,172) (105,360) (47,900)Net cash flows from/(used in) operating activities 51,488,596 888,728 6,084,478 (37,553,541) 14,329,448 41,524,360 1,911 1,726,191
8.2 Non-cash financing activitiesDistributions reinvested by unitholders in additional scheme units 14,806,813 9,555,334 3,286,396 3,321,360 26,957,620 18,571,398 106,237 44,395Trust income reinvested 9,595,867 9,824,599 3,327,114 3,363,477 13,722,336 10,098,172 105,360 47,900Other non-cash activities (in-specie assets purchase) - - - - - - - - Other non-cash activities (in-specie assets sale) - - - - - - - - Other non-cash activities (in-specie applications) (8,846,593) (278,281,542) (1,889,912) (63,812,086) (2,305,942) (105,396,756) (2,783) (3,341,776)Other non-cash activities (in-specie redemptions) 8,846,593 278,281,542 1,889,912 63,812,086 2,305,942 105,396,756 2,783 3,341,776
61. OneAnswer - Fidelity Australian Equities Trust†
62. OneAnswer - Greencape Broadcap Trust†
63. OneAnswer - Investors Mutual Australian Share
Trust†
64. OneAnswer - Janus Henderson Global Fixed
Interest Total Return Trust†
30 June 2020 30 June 2019 30 June 2020 30 June 2019 30 June 2020 30 June 2019 30 June 2020 30 June 2019$ $ $ $ $ $ $ $
8.1 Profit/(Loss) from operating activities 2,384,315 22,250,198 15,968,748 29,747,893 (4,515,674) 3,092,919 4,269,425 83,108,939Adjustments for net realised and unrealised (gains)/losses on:Change in fair value of investments 8,475,564 (5,046,486) (6,675,449) (21,384,829) 7,994,210 1,265,162 42,632,655 (30,895,210)Realised foreign exchange gains/(losses) - - - - - - - - Changes in operating assets and liabilities:Proceeds from sale of investments 90,861,481 67,761,086 3,144,959 2,075,928 16,954,016 15,582,543 108,728,544 50,497,165Purchase of investments - - (41,918,053) (10,365,328) (727,427) (1,080,131) - - Net change in receivables 329,988 2,870,974 (975,019) 1,780,643 92,922 56,768 5,354,300 (6,650,852)Net change in payables 5,535 (11,870) 1,978 692 (2,326) (4,475) (11,496) 815Income reinvested (11,848,841) (20,707,407) (8,577,661) (10,365,015) (3,640,976) (4,518,788) (52,896,813) (46,272,848)Net cash flows from/(used in) operating activities 90,208,042 67,116,495 (39,030,497) (8,510,016) 16,154,745 14,393,998 108,076,615 49,788,009
8.2 Non-cash financing activitiesDistributions reinvested by unitholders in additional scheme units 11,757,553 20,085,052 8,775,679 10,853,031 3,440,808 4,306,672 75,408,949 46,094,726Trust income reinvested 11,848,841 20,707,407 8,577,661 10,365,015 3,640,976 4,518,788 52,896,813 46,272,848Other non-cash activities (in-specie assets purchase) - - - - - - - - Other non-cash activities (in-specie assets sale) - - - - - - - - Other non-cash activities (in-specie applications) (18,472,006) (576,197,268) (2,016,641) (71,665,491) (1,552,918) (69,043,564) (11,834,294) (467,219,316)Other non-cash activities (in-specie redemptions) 18,472,006 576,197,268 2,016,641 71,665,491 1,552,918 69,043,564 11,834,294 467,219,316
65. OneAnswer - Kapstream Absolute Return Income
Trust†
66. OneAnswer - Magellan Global Trust†
67. OneAnswer - Merlon Australian Share Income
Trust†
68. OneAnswer - MFS Global Equity Trust†
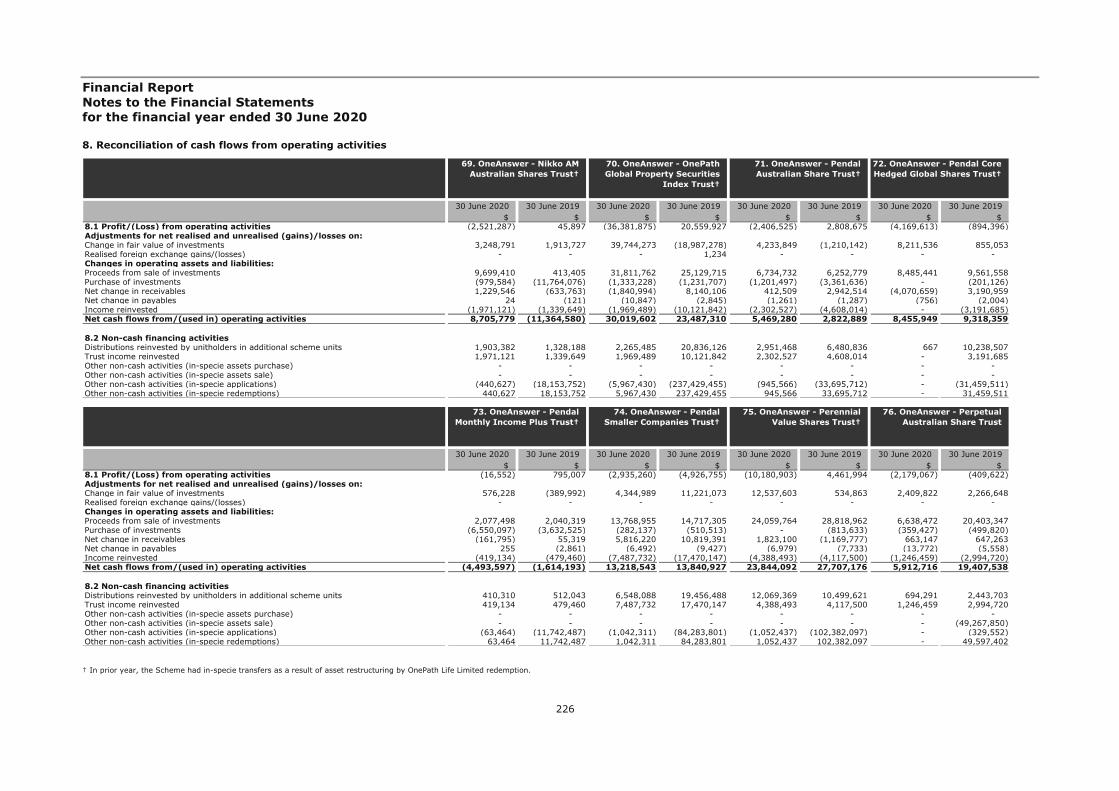
Financial Report Notes to the Financial Statements for the financial year ended 30 June 2020
226
8. Reconciliation of cash flows from operating activities
† In prior year, the Scheme had in-specie transfers as a result of asset restructuring by OnePath Life Limited redemption.
30 June 2020 30 June 2019 30 June 2020 30 June 2019 30 June 2020 30 June 2019 30 June 2020 30 June 2019$ $ $ $ $ $ $ $
8.1 Profit/(Loss) from operating activities (2,521,287) 45,897 (36,381,875) 20,559,927 (2,406,525) 2,808,675 (4,169,613) (894,396)Adjustments for net realised and unrealised (gains)/losses on:Change in fair value of investments 3,248,791 1,913,727 39,744,273 (18,987,278) 4,233,849 (1,210,142) 8,211,536 855,053Realised foreign exchange gains/(losses) - - - 1,234 - - - - Changes in operating assets and liabilities:Proceeds from sale of investments 9,699,410 413,405 31,811,762 25,129,715 6,734,732 6,252,779 8,485,441 9,561,558Purchase of investments (979,584) (11,764,076) (1,333,228) (1,231,707) (1,201,497) (3,361,636) - (201,126)Net change in receivables 1,229,546 (633,763) (1,840,994) 8,140,106 412,509 2,942,514 (4,070,659) 3,190,959Net change in payables 24 (121) (10,847) (2,845) (1,261) (1,287) (756) (2,004)Income reinvested (1,971,121) (1,339,649) (1,969,489) (10,121,842) (2,302,527) (4,608,014) - (3,191,685)Net cash flows from/(used in) operating activities 8,705,779 (11,364,580) 30,019,602 23,487,310 5,469,280 2,822,889 8,455,949 9,318,359
8.2 Non-cash financing activitiesDistributions reinvested by unitholders in additional scheme units 1,903,382 1,328,188 2,265,485 20,836,126 2,951,468 6,480,836 667 10,238,507Trust income reinvested 1,971,121 1,339,649 1,969,489 10,121,842 2,302,527 4,608,014 - 3,191,685Other non-cash activities (in-specie assets purchase) - - - - - - - - Other non-cash activities (in-specie assets sale) - - - - - - - - Other non-cash activities (in-specie applications) (440,627) (18,153,752) (5,967,430) (237,429,455) (945,566) (33,695,712) - (31,459,511)Other non-cash activities (in-specie redemptions) 440,627 18,153,752 5,967,430 237,429,455 945,566 33,695,712 - 31,459,511
69. OneAnswer - Nikko AM Australian Shares Trust†
70. OneAnswer - OnePath Global Property Securities
Index Trust†
71. OneAnswer - Pendal Australian Share Trust†
72. OneAnswer - Pendal Core Hedged Global Shares Trust†
30 June 2020 30 June 2019 30 June 2020 30 June 2019 30 June 2020 30 June 2019 30 June 2020 30 June 2019$ $ $ $ $ $ $ $
8.1 Profit/(Loss) from operating activities (16,552) 795,007 (2,935,260) (4,926,755) (10,180,903) 4,461,994 (2,179,067) (409,622)Adjustments for net realised and unrealised (gains)/losses on:Change in fair value of investments 576,228 (389,992) 4,344,989 11,221,073 12,537,603 534,863 2,409,822 2,266,648Realised foreign exchange gains/(losses) - - - - - - - - Changes in operating assets and liabilities:Proceeds from sale of investments 2,077,498 2,040,319 13,768,955 14,717,305 24,059,764 28,818,962 6,638,472 20,403,347Purchase of investments (6,550,097) (3,632,525) (282,137) (510,513) - (813,633) (359,427) (499,820)Net change in receivables (161,795) 55,319 5,816,220 10,819,391 1,823,100 (1,169,777) 663,147 647,263Net change in payables 255 (2,861) (6,492) (9,427) (6,979) (7,733) (13,772) (5,558)Income reinvested (419,134) (479,460) (7,487,732) (17,470,147) (4,388,493) (4,117,500) (1,246,459) (2,994,720)Net cash flows from/(used in) operating activities (4,493,597) (1,614,193) 13,218,543 13,840,927 23,844,092 27,707,176 5,912,716 19,407,538
8.2 Non-cash financing activitiesDistributions reinvested by unitholders in additional scheme units 410,310 512,043 6,548,088 19,456,488 12,069,369 10,499,621 694,291 2,443,703Trust income reinvested 419,134 479,460 7,487,732 17,470,147 4,388,493 4,117,500 1,246,459 2,994,720Other non-cash activities (in-specie assets purchase) - - - - - - - - Other non-cash activities (in-specie assets sale) - - - - - - - (49,267,850)Other non-cash activities (in-specie applications) (63,464) (11,742,487) (1,042,311) (84,283,801) (1,052,437) (102,382,097) - (329,552)Other non-cash activities (in-specie redemptions) 63,464 11,742,487 1,042,311 84,283,801 1,052,437 102,382,097 - 49,597,402
73. OneAnswer - Pendal Monthly Income Plus Trust†
74. OneAnswer - Pendal Smaller Companies Trust†
75. OneAnswer - Perennial Value Shares Trust†
76. OneAnswer - Perpetual Australian Share Trust

Financial Report Notes to the Financial Statements for the financial year ended 30 June 2020
227
8. Reconciliation of cash flows from operating activities
† In prior year, the Scheme had in-specie transfers as a result of asset restructuring by OnePath Life Limited redemption.
30 June 2020 30 June 2019 30 June 2020 30 June 2019 30 June 2020 30 June 2019 30 June 2020 30 June 2019$ $ $ $ $ $ $ $
8.1 Profit/(Loss) from operating activities (3,049,070) 12,388,709 188,082 9,061,016 (532,052) (174,561) 3,633,208 315,473Adjustments for net realised and unrealised (gains)/losses on:Change in fair value of investments 10,408,506 603,438 4,177,800 (3,489,109) 706,026 363,689 (1,321,897) 1,064,700Realised foreign exchange gains/(losses) - - - - - - - - Changes in operating assets and liabilities:Proceeds from sale of investments 38,150,718 68,631,596 17,827,794 10,194,893 1,148,728 3,507,856 5,912,671 3,858,058Purchase of investments - - (1,679,856) (8,425,642) (2,226,382) (698,028) (715,448) (1,099,435)Net change in receivables 4,373,008 (463,515) 330,024 (1,642,586) (18,062) 211,392 (923,984) 4,423,483Net change in payables (3,895) (4,605) (3,678) 5,077 16 (1,755) (664) (2,451)Income reinvested (11,884,454) (12,737,888) (5,181,335) (4,378,946) (170,246) (416,004) (1,420,584) (5,845,641)Net cash flows from/(used in) operating activities 37,994,813 68,417,735 15,658,831 1,324,703 (1,091,972) 2,792,589 5,163,302 2,714,187
8.2 Non-cash financing activitiesDistributions reinvested by unitholders in additional scheme units 19,170,602 14,957,160 5,708,852 5,330,080 152,923 844,321 1,795,771 6,240,750Trust income reinvested 11,884,454 12,737,888 5,181,335 4,378,946 170,246 416,004 1,420,584 5,845,641Other non-cash activities (in-specie assets purchase) - - - - - - - - Other non-cash activities (in-specie assets sale) - - - - - - - - Other non-cash activities (in-specie applications) (932,445) (158,258,719) (3,341,790) (107,340,522) (153,503) (3,814,272) (510,811) (27,689,307)Other non-cash activities (in-specie redemptions) 932,445 158,258,719 3,341,790 107,340,522 153,503 3,814,272 510,811 27,689,307
77. OneAnswer - Perpetual Balanced Growth Trust†
78. OneAnswer - Perpetual Conservative Growth Trust†
79. OneAnswer - Perpetual Ethical SRI Trust†
80. OneAnswer - Platinum Asia Trust†
30 June 2020 30 June 2019 30 June 2020 30 June 2019 30 June 2020 30 June 2019 30 June 2020 30 June 2019$ $ $ $ $ $ $ $
8.1 Profit/(Loss) from operating activities (11,132,524) 3,105,634 (5,500,542) 14,836,545 (26,343,133) 24,548,624 (2,227,216) 18,913,175Adjustments for net realised and unrealised (gains)/losses on:Change in fair value of investments 23,119,259 23,383,816 9,310,267 (9,791,170) 33,132,297 (16,404,198) 9,193,879 (9,706,956)Realised foreign exchange gains/(losses) - - - - - - - - Changes in operating assets and liabilities:Proceeds from sale of investments 75,076,475 70,157,300 30,127,479 33,972,110 62,376,324 46,079,656 71,188,989 98,632,897Purchase of investments - - - - (920,310) (1,147,324) - - Net change in receivables 14,660,810 18,294,252 64,191 4,489,207 1,366,759 312,723 1,209,651 1,377,646Net change in payables (13,577) (19,126) (3,700) (6,268) (7,962) (4,494) (1,925) (7,159)Income reinvested (27,202,546) (45,513,544) (4,027,927) (9,727,115) (8,399,557) (8,771,868) (8,426,654) (10,875,316)Net cash flows from/(used in) operating activities 74,507,897 69,408,332 29,969,768 33,773,309 61,204,418 44,613,119 70,936,724 98,334,287
8.2 Non-cash financing activitiesDistributions reinvested by unitholders in additional scheme units 47,542,815 70,182,032 4,648,221 9,647,779 43,882,643 39,817,370 22,090,157 25,438,671Trust income reinvested 27,202,546 45,513,544 4,027,927 9,727,115 8,399,557 8,771,868 8,426,654 10,875,316Other non-cash activities (in-specie assets purchase) - - - - - - - - Other non-cash activities (in-specie assets sale) - - - - - - - - Other non-cash activities (in-specie applications) (4,066,694) (342,536,669) (2,173,564) (122,591,968) (1,239,478) (107,683,304) (6,068,962) (275,116,731)Other non-cash activities (in-specie redemptions) 4,066,694 342,536,669 2,173,564 122,591,968 1,239,478 107,683,304 6,068,962 275,116,731
81. OneAnswer - Platinum International Trust†
82. OneAnswer - RARE Infastructure Value Trust†
83. OneAnswer - Schroder Australian Equity Trust†
84. OneAnswer - Schroder Balanced Trust†

Financial Report Notes to the Financial Statements for the financial year ended 30 June 2020
228
8. Reconciliation of cash flows from operating activities
† In prior year, the Scheme had in-specie transfers as a result of asset restructuring by OnePath Life Limited redemption.
30 June 2020 30 June 2019 30 June 2020 30 June 2019 30 June 2020 30 June 2019 30 June 2020 30 June 2019$ $ $ $ $ $ $ $
8.1 Profit/(Loss) from operating activities 8,720,601 19,544,673 2,334,584 20,390,668 (5,021,277) 779,126 378,002 549,757Adjustments for net realised and unrealised (gains)/losses on:Change in fair value of investments (4,677,453) (15,228,193) 10,765,012 (5,670,167) 5,663,638 34,126 156,604 (211,686)Realised foreign exchange gains/(losses) - - - - - - - - Changes in operating assets and liabilities:Proceeds from sale of investments 32,979,830 41,238,111 64,707,417 86,699,286 4,957,814 6,532,916 909,836 1,692,193Purchase of investments (1,373,998) - - - (44,534) - (2,086,865) (566,176)Net change in receivables 114,537 101,818 1,038,329 1,110,232 174,686 200,546 149,577 37,971Net change in payables (2,934) (7,498) (4,067) (6,413) (1,015) (1,433) 171 (1,426)Income reinvested (4,406,279) (4,712,780) (14,503,753) (16,264,091) (836,256) (1,043,591) (697,400) (388,482)Net cash flows from/(used in) operating activities 31,354,304 40,936,131 64,337,522 86,259,515 4,893,056 6,501,690 (1,190,075) 1,112,151
8.2 Non-cash financing activitiesDistributions reinvested by unitholders in additional scheme units 8,736,660 4,428,365 11,192,012 18,013,517 3,674,089 4,201,789 441,032 100,679Trust income reinvested 4,406,279 4,712,780 14,503,753 16,264,091 836,256 1,043,591 697,400 388,482Other non-cash activities (in-specie assets purchase) - - - - - - - - Other non-cash activities (in-specie assets sale) - - - - - - - - Other non-cash activities (in-specie applications) (5,040,943) (199,531,796) (12,970,945) (397,333,893) (16,009) (788,631) (140,992) (4,190,399)Other non-cash activities (in-specie redemptions) 5,040,943 199,531,796 12,970,945 397,333,893 16,009 788,631 140,992 4,190,399
85. OneAnswer - Schroder Fixed Income Trust†
86. OneAnswer - Schroder Real Return Trust†
87. OneAnswer - SG Hiscock Property Trust†
88. OneAnswer - Stewart Investors Worldwide Sustainability Trust†
30 June 2020 30 June 2019 30 June 2020 30 June 2019 30 June 2020 30 June 2019 30 June 2020 30 June 2019$ $ $ $ $ $ $ $
8.1 Profit/(Loss) from operating activities 7,874,096 4,109,086 2,809,981 543,299 (1,877,199) 3,073,768 (244,557) 1,518,741Adjustments for net realised and unrealised (gains)/losses on:Change in fair value of investments (2,168,744) (392,763) (2,386,488) (85,371) 5,215,653 (1,232,111) 979,941 (919,639)Realised foreign exchange gains/(losses) - - - - - - - - Changes in operating assets and liabilities:Proceeds from sale of investments 3,130,896 1,387,370 352,683 - 13,194,917 14,306,145 6,989,690 9,261,631Purchase of investments (5,556,787) (16,148,069) (15,335,482) (27,793,674) (280,423) - (4,867,837) (405,911)Net change in receivables (2,001,298) (2,337,156) 58,125 (15,086) (1,221,243) (247,309) (227,657) 13,522Net change in payables 486 (507) 1,411 244 (1,575) (2,772) (897) (3,710)Income reinvested (3,758,631) (1,422,281) (528,222) (475,896) (2,203,466) (1,696,961) (561,563) (672,338)Net cash flows from/(used in) operating activities (2,479,982) (14,804,320) (15,027,992) (27,826,484) 12,826,664 14,200,760 2,067,120 8,792,296
8.2 Non-cash financing activitiesDistributions reinvested by unitholders in additional scheme units 4,367,051 1,663,436 506,130 480,800 4,229,675 3,982,705 1,731,970 1,872,616Trust income reinvested 3,758,631 1,422,281 528,222 475,896 2,203,466 1,696,961 561,563 672,338Other non-cash activities (in-specie assets purchase) - - - - - - - - Other non-cash activities (in-specie assets sale) - - - - - - - - Other non-cash activities (in-specie applications) (1,676,671) (30,461,847) (1,089,592) (38,947,267) (186,122) (70,360,862) (54,335) (23,497,820)Other non-cash activities (in-specie redemptions) 1,676,671 30,461,847 1,089,592 38,947,267 186,122 70,360,862 54,335 23,497,820
89. OneAnswer - T. Rowe Price Global Equity Trust†
90. OneAnswer - T.Rowe Price Dynamic Global Bond
Trust†
91. OneAnswer - UBS Balanced Trust†
92. OneAnswer - UBS Defensive Trust†

Financial Report Notes to the Financial Statements for the financial year ended 30 June 2020
229
8. Reconciliation of cash flows from operating activities
† In prior year, the Scheme had in-specie transfers as a result of asset restructuring by OnePath Life Limited redemption.
30 June 2020 30 June 2019 30 June 2020 30 June 2019 30 June 2020 30 June 2019 30 June 2020 30 June 2019$ $ $ $ $ $ $ $
8.1 Profit/(Loss) from operating activities 3,654,911 7,298,844 (77,838,605) 116,404,788 40,685,172 199,025,559 20,138,732 63,255,940Adjustments for net realised and unrealised (gains)/losses on:Change in fair value of investments (181,719) (3,641,710) 126,452,719 (45,244,033) 82,228,868 (113,993,324) 19,362,068 (41,742,674)Realised foreign exchange gains/(losses) - - - - - - - - Changes in operating assets and liabilities:Proceeds from sale of investments 6,586,222 15,182,767 144,664,401 101,213,791 621,046,132 319,450,784 172,246,033 139,815,336Purchase of investments (9,254,918) - - (14,511,939) (341,732,179) (153,567,000) (133,998,365) (53,525,850)Net change in receivables (596,230) 1,079,979 10,157,157 (7,007,962) (42,871,583) (10,697,209) (19,740,096) 2,424,363Net change in payables (428) (6,360) (36,080) (4,228) (29,369) (11,831) 5,544 (19,239)Income reinvested (3,011,755) (4,900,696) (60,640,420) (66,237,689) (83,226,258) (77,677,670) (21,306,465) (25,442,565)Net cash flows from/(used in) operating activities (2,803,917) 15,012,824 142,759,172 84,612,728 276,100,783 162,529,309 36,707,451 84,765,311
8.2 Non-cash financing activitiesDistributions reinvested by unitholders in additional scheme units 2,889,762 4,751,051 75,662,011 69,121,068 114,336,089 70,885,829 30,772,614 24,153,023Trust income reinvested 3,011,755 4,900,696 60,640,420 66,237,689 83,226,258 77,677,670 21,306,465 25,442,565Other non-cash activities (in-specie assets purchase) - - - - 14,000,000 - 5,000,000 - Other non-cash activities (in-specie assets sale) - - - - (14,000,000) - (5,000,000) - Other non-cash activities (in-specie applications) (2,255,749) (145,800,692) (31,091,494) (962,904,358) (105,298,726) (2,115,146,617) (35,199,072) (703,680,266)Other non-cash activities (in-specie redemptions) 2,255,749 145,800,692 31,091,494 962,904,358 105,298,726 2,115,146,617 35,199,072 703,680,266
93. OneAnswer - UBS Diversified Fixed Income
Trust†
94. OneAnswer - Vanguard Australian Shares Index
Trust†
95. OneAnswer - Vanguard Balanced Index Trust†
96. OneAnswer - Vanguard Conservative Index Trust†
30 June 2020 30 June 2019 30 June 2020 30 June 2019 30 June 2020 30 June 2019 30 June 2020 30 June 2019$ $ $ $ $ $ $ $
8.1 Profit/(Loss) from operating activities 4,548,358 8,172,625 7,319,157 98,576,692 (3,000,324) 36,289,133 972,684 6,395,845Adjustments for net realised and unrealised (gains)/losses on:Change in fair value of investments (785) (7,325,531) 55,704,045 (45,237,108) 27,488,834 (12,910,891) 9,502,096 (2,245,865)Realised foreign exchange gains/(losses) - - - - - - - - Changes in operating assets and liabilities:Proceeds from sale of investments 14,315,001 32,773,999 288,535,711 147,347,090 80,343,398 46,892,147 13,303,098 11,314,315Purchase of investments (8,412,000) (7,216,000) (145,048,037) (75,817,072) (35,789,669) (23,589,850) (296,974) (100,000)Net change in receivables (3,681,521) 2,104,971 (13,124,815) (14,619,416) (2,644,110) (8,613,504) (6,283,479) (1,850,190)Net change in payables (598) (10,479) (8,172) (5,558) (9,510) (6,103) (3,038) (5,560)Income reinvested (1,078,669) (3,186,026) (51,160,806) (40,054,527) (22,478,798) (15,467,523) (4,458,705) (2,616,571)Net cash flows from/(used in) operating activities 5,689,786 25,313,559 142,217,083 70,190,101 43,909,821 22,593,409 12,735,682 10,891,974
8.2 Non-cash financing activitiesDistributions reinvested by unitholders in additional scheme units 924,315 1,501,353 67,761,686 39,490,842 29,314,766 16,447,272 6,567,366 3,398,154Trust income reinvested 1,078,669 3,186,026 51,160,806 40,054,527 22,478,798 15,467,523 4,458,705 2,616,571Other non-cash activities (in-specie assets purchase) - - 5,150,000 581,337 1,650,000 826,774 - - Other non-cash activities (in-specie assets sale) - - (5,150,000) (581,337) (1,650,000) (826,774) - - Other non-cash activities (in-specie applications) (2,058,096) (95,253,797) (32,841,272) (1,031,429,212) (4,245,511) (354,576,508) (746,122) (98,283,760)Other non-cash activities (in-specie redemptions) 2,058,096 95,253,797 32,841,272 1,031,429,212 4,245,511 354,576,508 746,122 98,283,760
97. OneAnswer - Vanguard Diversified Bond Index
Trust†
98. OneAnswer - Vanguard Growth Index Trust†
99. OneAnswer - Vanguard High Growth Index Trust†
100. OneAnswer - Vanguard International Shares Index
(Hedged) Trust†
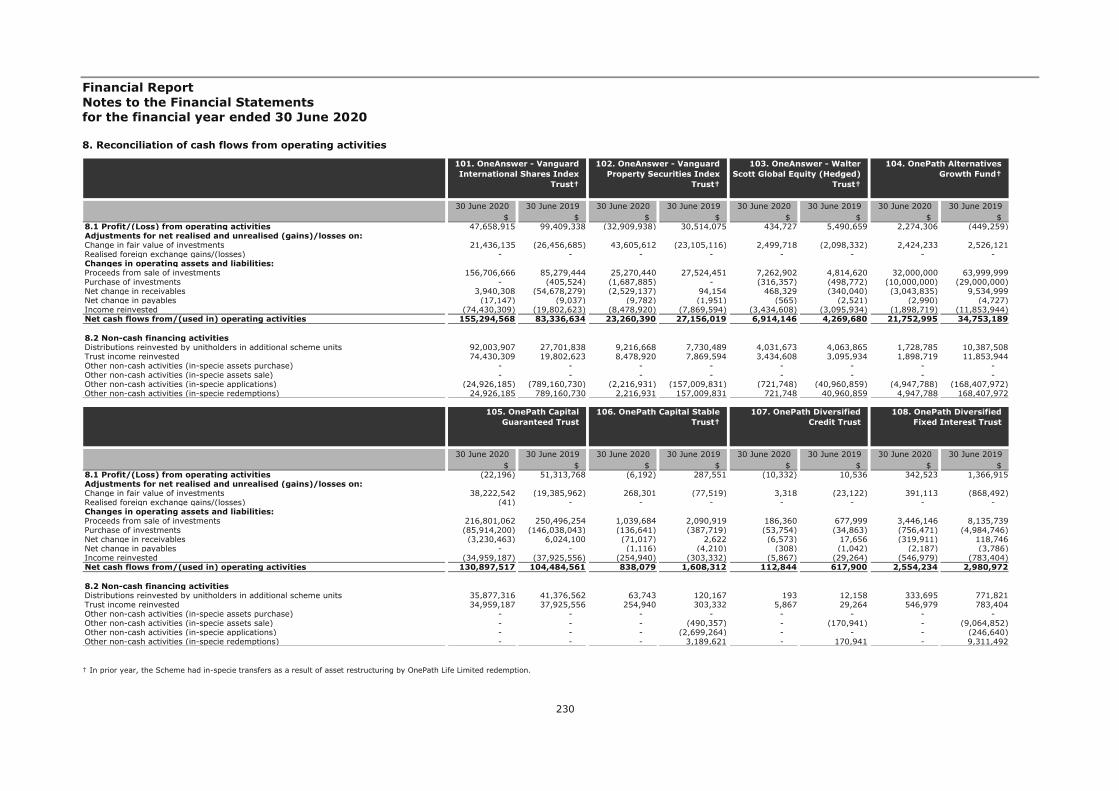
Financial Report Notes to the Financial Statements for the financial year ended 30 June 2020
230
8. Reconciliation of cash flows from operating activities
† In prior year, the Scheme had in-specie transfers as a result of asset restructuring by OnePath Life Limited redemption.
30 June 2020 30 June 2019 30 June 2020 30 June 2019 30 June 2020 30 June 2019 30 June 2020 30 June 2019$ $ $ $ $ $ $ $
8.1 Profit/(Loss) from operating activities 47,658,915 99,409,338 (32,909,938) 30,514,075 434,727 5,490,659 2,274,306 (449,259)Adjustments for net realised and unrealised (gains)/losses on:Change in fair value of investments 21,436,135 (26,456,685) 43,605,612 (23,105,116) 2,499,718 (2,098,332) 2,424,233 2,526,121Realised foreign exchange gains/(losses) - - - - - - - - Changes in operating assets and liabilities:Proceeds from sale of investments 156,706,666 85,279,444 25,270,440 27,524,451 7,262,902 4,814,620 32,000,000 63,999,999Purchase of investments - (405,524) (1,687,885) - (316,357) (498,772) (10,000,000) (29,000,000)Net change in receivables 3,940,308 (54,678,279) (2,529,137) 94,154 468,329 (340,040) (3,043,835) 9,534,999Net change in payables (17,147) (9,037) (9,782) (1,951) (565) (2,521) (2,990) (4,727)Income reinvested (74,430,309) (19,802,623) (8,478,920) (7,869,594) (3,434,608) (3,095,934) (1,898,719) (11,853,944)Net cash flows from/(used in) operating activities 155,294,568 83,336,634 23,260,390 27,156,019 6,914,146 4,269,680 21,752,995 34,753,189
8.2 Non-cash financing activitiesDistributions reinvested by unitholders in additional scheme units 92,003,907 27,701,838 9,216,668 7,730,489 4,031,673 4,063,865 1,728,785 10,387,508Trust income reinvested 74,430,309 19,802,623 8,478,920 7,869,594 3,434,608 3,095,934 1,898,719 11,853,944Other non-cash activities (in-specie assets purchase) - - - - - - - - Other non-cash activities (in-specie assets sale) - - - - - - - - Other non-cash activities (in-specie applications) (24,926,185) (789,160,730) (2,216,931) (157,009,831) (721,748) (40,960,859) (4,947,788) (168,407,972)Other non-cash activities (in-specie redemptions) 24,926,185 789,160,730 2,216,931 157,009,831 721,748 40,960,859 4,947,788 168,407,972
101. OneAnswer - Vanguard International Shares Index
Trust†
102. OneAnswer - Vanguard Property Securities Index
Trust†
103. OneAnswer - Walter Scott Global Equity (Hedged)
Trust†
104. OnePath Alternatives Growth Fund†
30 June 2020 30 June 2019 30 June 2020 30 June 2019 30 June 2020 30 June 2019 30 June 2020 30 June 2019$ $ $ $ $ $ $ $
8.1 Profit/(Loss) from operating activities (22,196) 51,313,768 (6,192) 287,551 (10,332) 10,536 342,523 1,366,915Adjustments for net realised and unrealised (gains)/losses on:Change in fair value of investments 38,222,542 (19,385,962) 268,301 (77,519) 3,318 (23,122) 391,113 (868,492)Realised foreign exchange gains/(losses) (41) - - - - - - - Changes in operating assets and liabilities:Proceeds from sale of investments 216,801,062 250,496,254 1,039,684 2,090,919 186,360 677,999 3,446,146 8,135,739Purchase of investments (85,914,200) (146,038,043) (136,641) (387,719) (53,754) (34,863) (756,471) (4,984,746)Net change in receivables (3,230,463) 6,024,100 (71,017) 2,622 (6,573) 17,656 (319,911) 118,746Net change in payables - - (1,116) (4,210) (308) (1,042) (2,187) (3,786)Income reinvested (34,959,187) (37,925,556) (254,940) (303,332) (5,867) (29,264) (546,979) (783,404)Net cash flows from/(used in) operating activities 130,897,517 104,484,561 838,079 1,608,312 112,844 617,900 2,554,234 2,980,972
8.2 Non-cash financing activitiesDistributions reinvested by unitholders in additional scheme units 35,877,316 41,376,562 63,743 120,167 193 12,158 333,695 771,821Trust income reinvested 34,959,187 37,925,556 254,940 303,332 5,867 29,264 546,979 783,404Other non-cash activities (in-specie assets purchase) - - - - - - - - Other non-cash activities (in-specie assets sale) - - - (490,357) - (170,941) - (9,064,852)Other non-cash activities (in-specie applications) - - - (2,699,264) - - - (246,640)Other non-cash activities (in-specie redemptions) - - - 3,189,621 - 170,941 - 9,311,492
105. OnePath Capital Guaranteed Trust
106. OnePath Capital Stable Trust†
107. OnePath Diversified Credit Trust
108. OnePath Diversified Fixed Interest Trust
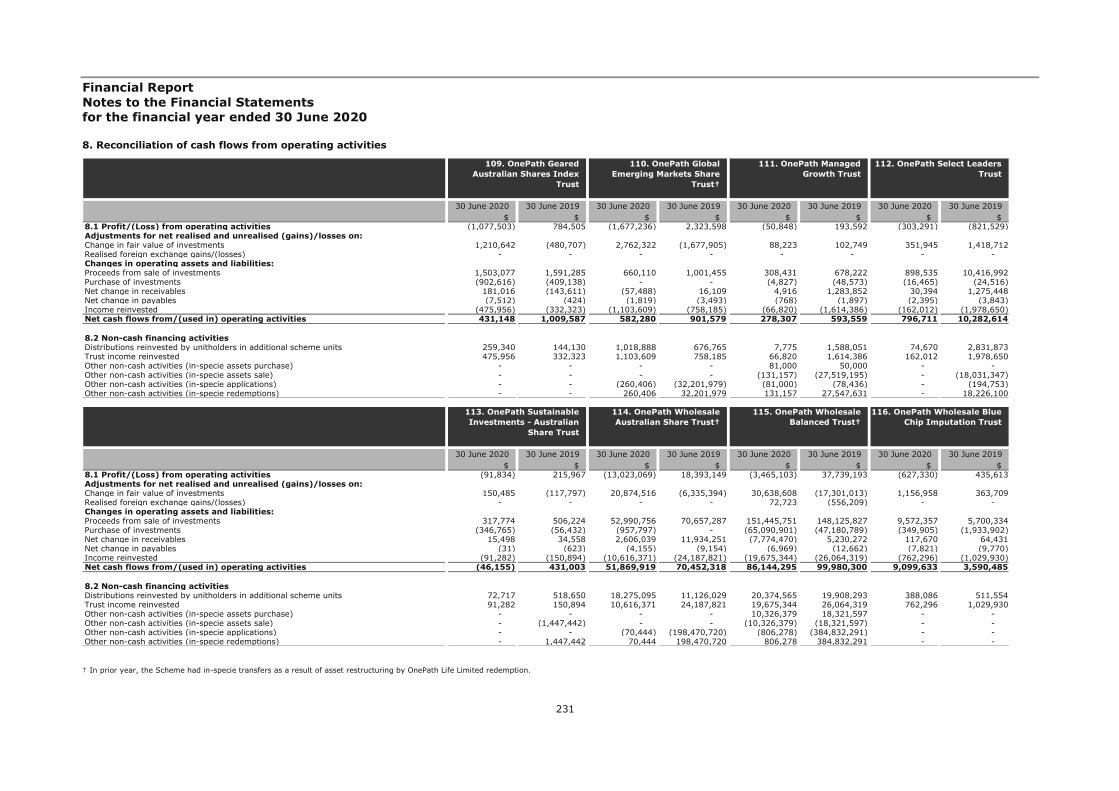
Financial Report Notes to the Financial Statements for the financial year ended 30 June 2020
231
8. Reconciliation of cash flows from operating activities
† In prior year, the Scheme had in-specie transfers as a result of asset restructuring by OnePath Life Limited redemption.
30 June 2020 30 June 2019 30 June 2020 30 June 2019 30 June 2020 30 June 2019 30 June 2020 30 June 2019$ $ $ $ $ $ $ $
8.1 Profit/(Loss) from operating activities (1,077,503) 784,505 (1,677,236) 2,323,598 (50,848) 193,592 (303,291) (821,529)Adjustments for net realised and unrealised (gains)/losses on:Change in fair value of investments 1,210,642 (480,707) 2,762,322 (1,677,905) 88,223 102,749 351,945 1,418,712Realised foreign exchange gains/(losses) - - - - - - - - Changes in operating assets and liabilities:Proceeds from sale of investments 1,503,077 1,591,285 660,110 1,001,455 308,431 678,222 898,535 10,416,992Purchase of investments (902,616) (409,138) - - (4,827) (48,573) (16,465) (24,516)Net change in receivables 181,016 (143,611) (57,488) 16,109 4,916 1,283,852 30,394 1,275,448Net change in payables (7,512) (424) (1,819) (3,493) (768) (1,897) (2,395) (3,843)Income reinvested (475,956) (332,323) (1,103,609) (758,185) (66,820) (1,614,386) (162,012) (1,978,650)Net cash flows from/(used in) operating activities 431,148 1,009,587 582,280 901,579 278,307 593,559 796,711 10,282,614
8.2 Non-cash financing activitiesDistributions reinvested by unitholders in additional scheme units 259,340 144,130 1,018,888 676,765 7,775 1,588,051 74,670 2,831,873Trust income reinvested 475,956 332,323 1,103,609 758,185 66,820 1,614,386 162,012 1,978,650Other non-cash activities (in-specie assets purchase) - - - - 81,000 50,000 - - Other non-cash activities (in-specie assets sale) - - - - (131,157) (27,519,195) - (18,031,347)Other non-cash activities (in-specie applications) - - (260,406) (32,201,979) (81,000) (78,436) - (194,753)Other non-cash activities (in-specie redemptions) - - 260,406 32,201,979 131,157 27,547,631 - 18,226,100
109. OnePath Geared Australian Shares Index
Trust
110. OnePath Global Emerging Markets Share
Trust†
111. OnePath Managed Growth Trust
112. OnePath Select Leaders Trust
30 June 2020 30 June 2019 30 June 2020 30 June 2019 30 June 2020 30 June 2019 30 June 2020 30 June 2019$ $ $ $ $ $ $ $
8.1 Profit/(Loss) from operating activities (91,834) 215,967 (13,023,069) 18,393,149 (3,465,103) 37,739,193 (627,330) 435,613Adjustments for net realised and unrealised (gains)/losses on:Change in fair value of investments 150,485 (117,797) 20,874,516 (6,335,394) 30,638,608 (17,301,013) 1,156,958 363,709Realised foreign exchange gains/(losses) - - - - 72,723 (556,209) - - Changes in operating assets and liabilities:Proceeds from sale of investments 317,774 506,224 52,990,756 70,657,287 151,445,751 148,125,827 9,572,357 5,700,334Purchase of investments (346,765) (56,432) (957,797) - (65,090,901) (47,180,789) (349,905) (1,933,902)Net change in receivables 15,498 34,558 2,606,039 11,934,251 (7,774,470) 5,230,272 117,670 64,431Net change in payables (31) (623) (4,155) (9,154) (6,969) (12,662) (7,821) (9,770)Income reinvested (91,282) (150,894) (10,616,371) (24,187,821) (19,675,344) (26,064,319) (762,296) (1,029,930)Net cash flows from/(used in) operating activities (46,155) 431,003 51,869,919 70,452,318 86,144,295 99,980,300 9,099,633 3,590,485
8.2 Non-cash financing activitiesDistributions reinvested by unitholders in additional scheme units 72,717 518,650 18,275,095 11,126,029 20,374,565 19,908,293 388,086 511,554Trust income reinvested 91,282 150,894 10,616,371 24,187,821 19,675,344 26,064,319 762,296 1,029,930Other non-cash activities (in-specie assets purchase) - - - - 10,326,379 18,321,597 - - Other non-cash activities (in-specie assets sale) - (1,447,442) - - (10,326,379) (18,321,597) - - Other non-cash activities (in-specie applications) - - (70,444) (198,470,720) (806,278) (384,832,291) - - Other non-cash activities (in-specie redemptions) - 1,447,442 70,444 198,470,720 806,278 384,832,291 - -
113. OnePath Sustainable Investments - Australian
Share Trust
114. OnePath Wholesale Australian Share Trust†
115. OnePath Wholesale Balanced Trust†
116. OnePath Wholesale Blue Chip Imputation Trust
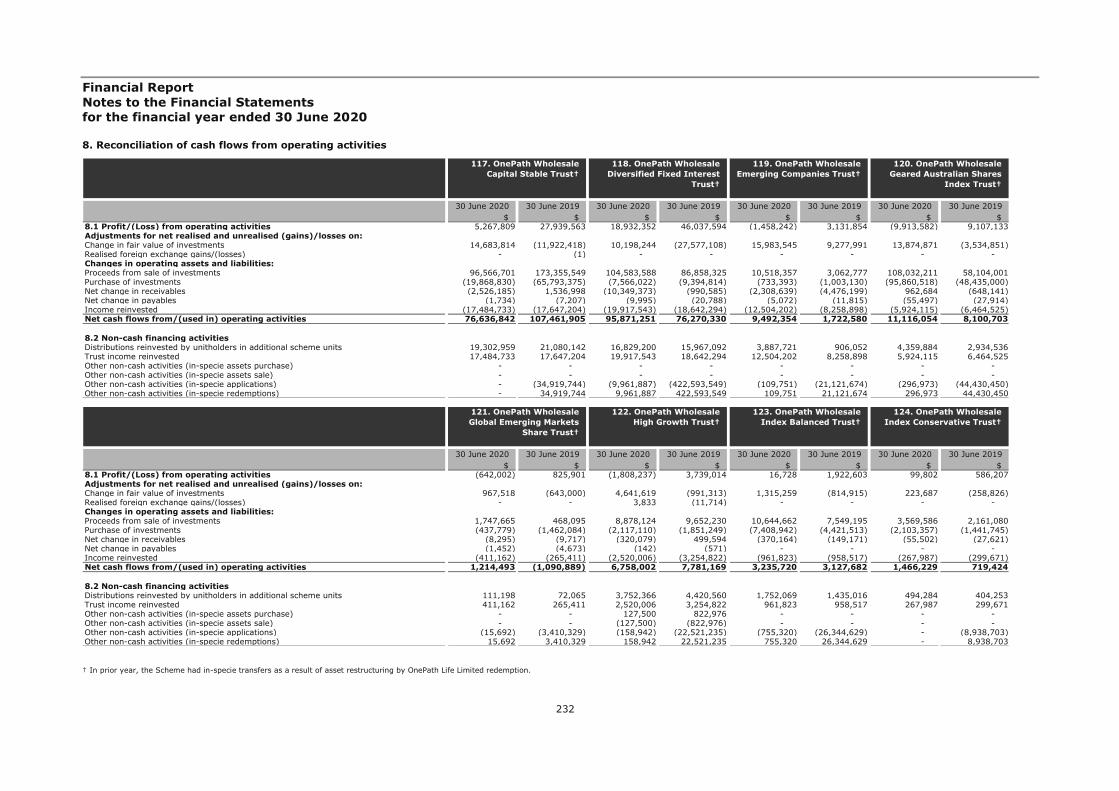
Financial Report Notes to the Financial Statements for the financial year ended 30 June 2020
232
8. Reconciliation of cash flows from operating activities
† In prior year, the Scheme had in-specie transfers as a result of asset restructuring by OnePath Life Limited redemption.
30 June 2020 30 June 2019 30 June 2020 30 June 2019 30 June 2020 30 June 2019 30 June 2020 30 June 2019$ $ $ $ $ $ $ $
8.1 Profit/(Loss) from operating activities 5,267,809 27,939,563 18,932,352 46,037,594 (1,458,242) 3,131,854 (9,913,582) 9,107,133Adjustments for net realised and unrealised (gains)/losses on:Change in fair value of investments 14,683,814 (11,922,418) 10,198,244 (27,577,108) 15,983,545 9,277,991 13,874,871 (3,534,851)Realised foreign exchange gains/(losses) - (1) - - - - - - Changes in operating assets and liabilities:Proceeds from sale of investments 96,566,701 173,355,549 104,583,588 86,858,325 10,518,357 3,062,777 108,032,211 58,104,001Purchase of investments (19,868,830) (65,793,375) (7,566,022) (9,394,814) (733,393) (1,003,130) (95,860,518) (48,435,000)Net change in receivables (2,526,185) 1,536,998 (10,349,373) (990,585) (2,308,639) (4,476,199) 962,684 (648,141)Net change in payables (1,734) (7,207) (9,995) (20,788) (5,072) (11,815) (55,497) (27,914)Income reinvested (17,484,733) (17,647,204) (19,917,543) (18,642,294) (12,504,202) (8,258,898) (5,924,115) (6,464,525)Net cash flows from/(used in) operating activities 76,636,842 107,461,905 95,871,251 76,270,330 9,492,354 1,722,580 11,116,054 8,100,703
8.2 Non-cash financing activitiesDistributions reinvested by unitholders in additional scheme units 19,302,959 21,080,142 16,829,200 15,967,092 3,887,721 906,052 4,359,884 2,934,536Trust income reinvested 17,484,733 17,647,204 19,917,543 18,642,294 12,504,202 8,258,898 5,924,115 6,464,525Other non-cash activities (in-specie assets purchase) - - - - - - - - Other non-cash activities (in-specie assets sale) - - - - - - - - Other non-cash activities (in-specie applications) - (34,919,744) (9,961,887) (422,593,549) (109,751) (21,121,674) (296,973) (44,430,450)Other non-cash activities (in-specie redemptions) - 34,919,744 9,961,887 422,593,549 109,751 21,121,674 296,973 44,430,450
117. OnePath Wholesale Capital Stable Trust†
118. OnePath Wholesale Diversified Fixed Interest
Trust†
119. OnePath Wholesale Emerging Companies Trust†
120. OnePath Wholesale Geared Australian Shares
Index Trust†
30 June 2020 30 June 2019 30 June 2020 30 June 2019 30 June 2020 30 June 2019 30 June 2020 30 June 2019$ $ $ $ $ $ $ $
8.1 Profit/(Loss) from operating activities (642,002) 825,901 (1,808,237) 3,739,014 16,728 1,922,603 99,802 586,207Adjustments for net realised and unrealised (gains)/losses on:Change in fair value of investments 967,518 (643,000) 4,641,619 (991,313) 1,315,259 (814,915) 223,687 (258,826)Realised foreign exchange gains/(losses) - - 3,833 (11,714) - - - - Changes in operating assets and liabilities:Proceeds from sale of investments 1,747,665 468,095 8,878,124 9,652,230 10,644,662 7,549,195 3,569,586 2,161,080Purchase of investments (437,779) (1,462,084) (2,117,110) (1,851,249) (7,408,942) (4,421,513) (2,103,357) (1,441,745)Net change in receivables (8,295) (9,717) (320,079) 499,594 (370,164) (149,171) (55,502) (27,621)Net change in payables (1,452) (4,673) (142) (571) - - - - Income reinvested (411,162) (265,411) (2,520,006) (3,254,822) (961,823) (958,517) (267,987) (299,671)Net cash flows from/(used in) operating activities 1,214,493 (1,090,889) 6,758,002 7,781,169 3,235,720 3,127,682 1,466,229 719,424
8.2 Non-cash financing activitiesDistributions reinvested by unitholders in additional scheme units 111,198 72,065 3,752,366 4,420,560 1,752,069 1,435,016 494,284 404,253Trust income reinvested 411,162 265,411 2,520,006 3,254,822 961,823 958,517 267,987 299,671Other non-cash activities (in-specie assets purchase) - - 127,500 822,976 - - - - Other non-cash activities (in-specie assets sale) - - (127,500) (822,976) - - - - Other non-cash activities (in-specie applications) (15,692) (3,410,329) (158,942) (22,521,235) (755,320) (26,344,629) - (8,938,703)Other non-cash activities (in-specie redemptions) 15,692 3,410,329 158,942 22,521,235 755,320 26,344,629 - 8,938,703
121. OnePath Wholesale Global Emerging Markets
Share Trust†
122. OnePath Wholesale High Growth Trust†
123. OnePath Wholesale Index Balanced Trust†
124. OnePath Wholesale Index Conservative Trust†

Financial Report Notes to the Financial Statements for the financial year ended 30 June 2020
233
8. Reconciliation of cash flows from operating activities
† In prior year, the Scheme had in-specie transfers as a result of asset restructuring by OnePath Life Limited redemption.
30 June 2020 30 June 2019 30 June 2020 30 June 2019 30 June 2020 30 June 2019 30 June 2020 30 June 2019$ $ $ $ $ $ $ $
8.1 Profit/(Loss) from operating activities 21,512 408,893 (21,116,459) 79,985,976 (616,186) 99,180 (5,731,630) 9,413,775Adjustments for net realised and unrealised (gains)/losses on:Change in fair value of investments 231,215 (167,180) 82,814,283 (30,026,232) 838,440 175,583 9,163,716 (5,289,516)Realised foreign exchange gains/(losses) - - 219,739 (358,403) - - - - Changes in operating assets and liabilities:Proceeds from sale of investments 2,784,417 2,895,588 266,687,199 264,481,280 286,263 541,214 19,164,997 13,584,378Purchase of investments (1,630,938) (948,201) (107,339,283) (66,231,558) - (65,181) - (2,444,337)Net change in receivables (51,819) (687) (14,857,043) 13,147,391 60,015 61,116 774,684 1,855,525Net change in payables - - (5,048) (9,715) (663) (1,916) (1,866) (5,240)Income reinvested (200,908) (241,026) (47,057,591) (63,422,688) (303,502) (362,119) (4,271,348) (6,061,691)Net cash flows from/(used in) operating activities 1,153,479 1,947,387 159,345,797 197,566,051 264,367 447,877 19,098,553 11,052,894
8.2 Non-cash financing activitiesDistributions reinvested by unitholders in additional scheme units 443,535 349,454 64,366,182 72,314,014 49,924 76,659 5,357,656 4,390,195Trust income reinvested 200,908 241,026 47,057,591 63,422,688 303,502 362,119 4,271,348 6,061,691Other non-cash activities (in-specie assets purchase) - - 19,871,000 26,122,198 - - - 25,966,219Other non-cash activities (in-specie assets sale) - - (19,871,000) (26,122,198) - - - - Other non-cash activities (in-specie applications) - (6,171,666) (1,555,825) (1,150,899,149) - - (1,154,632) (119,095,728)Other non-cash activities (in-specie redemptions) - 6,171,666 1,555,825 1,150,899,149 - - 1,154,632 93,129,509
125. OnePath Wholesale Index Moderate Trust†
126. OnePath Wholesale Managed Growth Trust†
127. OnePath Wholesale Property Securities Trust
128. OnePath Wholesale Select Leaders Trust†
30 June 2020 30 June 2019 30 June 2020 30 June 2019 30 June 2020 30 June 2019 30 June 2020 30 June 2019$ $ $ $ $ $ $ $
8.1 Profit/(Loss) from operating activities 91,157 292,394 (1,349,315) 452,850 (2,112,999) 1,784,276 (252,301) 520,946Adjustments for net realised and unrealised (gains)/losses on:Change in fair value of investments 96,850 (165,407) 1,874,172 510,160 4,303,516 (387,623) 499,677 (467,152)Realised foreign exchange gains/(losses) - - - - - - - - Changes in operating assets and liabilities:Proceeds from sale of investments 690,930 1,504,669 2,711,063 2,453,215 5,952,669 6,557,881 2,386,959 2,582,864Purchase of investments (350,614) (109,143) (96,958) - (155,221) - - (402,245)Net change in receivables (36,182) (22,740) 299,345 342,153 (729,105) 1,143,642 (157,106) 24,349Net change in payables (746) (4,089) (8,823) (5,162) (16,544) (11,191) (5,761) (4,405)Income reinvested (210,882) (175,967) (1,151,273) (1,709,172) (2,454,729) (3,703,998) (382,587) (431,117)Net cash flows from/(used in) operating activities 280,513 1,319,717 2,278,211 2,044,044 4,787,587 5,382,987 2,088,881 1,823,240
8.2 Non-cash financing activitiesDistributions reinvested by unitholders in additional scheme units 133,678 89,061 159,893 310,693 221,571 360,906 46,052 99,252Trust income reinvested 210,882 175,967 1,151,273 1,709,172 2,454,729 3,703,998 382,587 431,117Other non-cash activities (in-specie assets purchase) - - - - - - - - Other non-cash activities (in-specie assets sale) - - - - - - - - Other non-cash activities (in-specie applications) - - - - - - - - Other non-cash activities (in-specie redemptions) - - - - - - - -
129. OptiMix Australian Fixed Interest Trust
130. OptiMix Australian Share Trust
131. OptiMix Balanced Trust 132. OptiMix Conservative Trust

Financial Report Notes to the Financial Statements for the financial year ended 30 June 2020
234
8. Reconciliation of cash flows from operating activities
† In prior year, the Scheme had in-specie transfers as a result of asset restructuring by OnePath Life Limited redemption.
30 June 2020 30 June 2019 30 June 2020 30 June 2019 30 June 2020 30 June 2019 30 June 2020 30 June 2019$ $ $ $ $ $ $ $
8.1 Profit/(Loss) from operating activities (246,359) 229,870 (107,193) 641,077 (90,173) (11,686) (821,695) 616,487Adjustments for net realised and unrealised (gains)/losses on:Change in fair value of investments 388,497 (149,941) 1,012,527 (33,285) 112,286 254,744 1,508,918 (385,035)Realised foreign exchange gains/(losses) - - - - - - - - Changes in operating assets and liabilities:Proceeds from sale of investments 640,428 1,029,876 1,331,440 1,671,353 756,382 723,899 2,371,582 1,319,960Purchase of investments (680,025) (383,137) - (100,632) (297,505) (249,055) (46,085) (66,868)Net change in receivables (50,837) 433,121 (282,468) (228,461) 233,450 634,589 (446,976) (116,498)Net change in payables (905) (4,227) (3,149) (3,774) (1,356) (2,918) (7,043) (2,803)Income reinvested (168,705) (602,795) (794,173) (579,552) (329,244) (973,583) (585,358) (515,010)Net cash flows from/(used in) operating activities (117,906) 552,767 1,156,984 1,366,726 383,840 375,990 1,973,343 850,233
8.2 Non-cash financing activitiesDistributions reinvested by unitholders in additional scheme units 214,855 23,356 538,871 482,921 17,291 839,622 67,057 113,563Trust income reinvested 168,705 602,795 794,173 579,552 329,244 973,583 585,358 515,010Other non-cash activities (in-specie assets purchase) - - - - - - - - Other non-cash activities (in-specie assets sale) - - - - - - - - Other non-cash activities (in-specie applications) - - - - - - - - Other non-cash activities (in-specie redemptions) - - - - - - - -
133. OptiMix Global Emerging Markets Share
Trust
134. OptiMix Global Share Trust
135. OptiMix Global Smaller Companies Share Trust
136. OptiMix Growth Trust
30 June 2020 30 June 2019 30 June 2020 30 June 2019 30 June 2020 30 June 2019 30 June 2020 30 June 2019$ $ $ $ $ $ $ $
8.1 Profit/(Loss) from operating activities (357,603) 239,226 (343,910) 372,065 (1,067,688) 506,812 (31,640,583) 85,752,870Adjustments for net realised and unrealised (gains)/losses on:Change in fair value of investments 619,040 (17,854) 511,468 (359,261) 1,129,045 (476,850) 116,795,772 (11,771,212)Realised foreign exchange gains/(losses) - - - - - - 194,117 (503,583)Changes in operating assets and liabilities:Proceeds from sale of investments 680,242 2,265,406 1,400,683 2,377,353 962,114 933,979 273,432,558 297,959,663Purchase of investments - (79,079) (188,634) (99,838) (78,901) - (77,709,699) (46,716,590)Net change in receivables (33,274) 206,670 (119,778) 67,486 (8,241) 86,160 (14,726,541) 38,495,404Net change in payables (2,461) (6,000) (3,544) (5,519) (4,104) (2,278) (2,807) (5,323)Income reinvested (353,294) (603,475) (261,528) (339,418) (160,750) (252,437) (70,532,449) (112,724,124)Net cash flows from/(used in) operating activities 552,650 2,004,894 994,757 2,012,868 771,475 795,386 195,810,368 250,487,105
8.2 Non-cash financing activitiesDistributions reinvested by unitholders in additional scheme units 25,535 26,517 26,832 71,977 36,864 116,003 70,554,555 109,888,924Trust income reinvested 353,294 603,475 261,528 339,418 160,750 252,437 70,532,449 112,724,124Other non-cash activities (in-specie assets purchase) - - - - - - 20,093,600 26,225,001Other non-cash activities (in-specie assets sale) - - - - - - (20,093,600) (26,225,001)Other non-cash activities (in-specie applications) - - - - - - (3,431,790) (1,110,089,719)Other non-cash activities (in-specie redemptions) - - - - - - 3,431,790 1,110,089,719
137. OptiMix High Growth Trust
138. OptiMix Moderate Trust 139. OptiMix Property Securities Trust
140. OptiMix Wholesale Balanced Trust†

Financial Report Notes to the Financial Statements for the financial year ended 30 June 2020
235
8. Reconciliation of cash flows from operating activities
† In prior year, the Scheme had in-specie transfers as a result of asset restructuring by OnePath Life Limited redemption.
30 June 2020 30 June 2019 30 June 2020 30 June 2019 30 June 2020 30 June 2019 30 June 2020 30 June 2019$ $ $ $ $ $ $ $
8.1 Profit/(Loss) from operating activities 983,746 19,592,532 (12,646,341) 22,892,398 (25,498,931) 50,638,054 (14,184,051) 21,409,006Adjustments for net realised and unrealised (gains)/losses on:Change in fair value of investments 16,965,997 (7,007,869) 60,165,194 20,279,829 75,424,733 (3,835,628) 37,052,112 853,366Realised foreign exchange gains/(losses) (9,918) (231,730) (24,134,632) (26,723,496) (21,705) (301,243) 55,463 (169,072)Changes in operating assets and liabilities:Proceeds from sale of investments 71,182,959 55,938,084 148,413,395 98,015,494 137,336,954 156,130,992 43,903,280 53,362,097Purchase of investments (38,226,093) (4,835,037) (32,586,977) (501,407) (25,074,147) (13,316,561) (4,295,894) (7,022,462)Net change in receivables (5,611,001) 1,757,186 (4,716,375) (15,705,667) (6,099,140) 24,968,903 (1,981,801) 9,531,592Net change in payables (1,324) (3,446) - - (1,194) (2,046) (189) (1,679)Income reinvested (12,365,341) (14,385,480) (42,798,516) (27,460,284) (43,861,388) (71,877,134) (20,900,904) (31,833,911)Net cash flows from/(used in) operating activities 32,919,025 50,824,240 91,695,748 70,796,867 112,205,182 142,405,337 39,648,016 46,128,937
8.2 Non-cash financing activitiesDistributions reinvested by unitholders in additional scheme units 8,867,461 9,636,897 16,164,354 23,999,861 29,012,626 27,453,177 20,593,015 27,700,584Trust income reinvested 12,365,341 14,385,480 42,798,516 27,460,284 43,861,388 71,877,134 20,900,904 31,833,911Other non-cash activities (in-specie assets purchase) 3,072,665 6,921,670 20,844,600 76,341,926 7,718,581 10,257,251 2,700,900 5,715,974Other non-cash activities (in-specie assets sale) (3,072,665) (6,921,670) (37,675,146) (6,480,212) (7,718,581) (10,257,251) (2,700,900) (5,715,974)Other non-cash activities (in-specie applications) (1,827,889) (237,985,823) (21,570,600) (77,698,505) (955,359) (584,988,423) (157,969) (262,143,047)Other non-cash activities (in-specie redemptions) 1,827,889 237,985,823 38,401,146 7,836,791 955,359 584,988,423 157,969 262,143,047
141. OptiMix Wholesale Conservative Trust†
142. OptiMix Wholesale Global (Hedged) Share Trust
143. OptiMix Wholesale Growth Trust†
144. OptiMix Wholesale High Growth Trust†
30 June 2020 30 June 2019 30 June 2020 30 June 2019 30 June 2020 30 June 2019$ $ $ $ $ $
8.1 Profit/(Loss) from operating activities (5,437,576) 33,385,986 (18,409,800) 14,531,658 (1,753,516) 121,105Adjustments for net realised and unrealised (gains)/losses on:Change in fair value of investments 36,362,322 (9,084,564) 34,165,178 8,676,420 2,226,102 493,019Realised foreign exchange gains/(losses) 34,862 (545,460) - - - - Changes in operating assets and liabilities:Proceeds from sale of investments 115,776,274 129,257,772 26,697,415 54,822,731 1,058,213 1,869,264Purchase of investments (36,742,880) (30,686,451) (2,852,315) (350,000) - - Net change in receivables (7,493,508) 8,570,467 4,139,699 6,871,401 187,434 216,076Net change in payables (1,972) (2,347) - - (5,803) (4,845)Income reinvested (23,458,079) (32,974,917) (19,816,047) (30,078,821) (828,822) (1,047,731)Net cash flows from/(used in) operating activities 79,039,443 97,920,486 23,924,130 54,473,389 883,608 1,646,888
8.2 Non-cash financing activitiesDistributions reinvested by unitholders in additional scheme units 14,069,638 17,381,920 10,057,374 13,830,922 63,340 173,841Trust income reinvested 23,458,079 32,974,917 19,816,047 30,078,821 828,822 1,047,731Other non-cash activities (in-specie assets purchase) 8,099,000 16,274,405 - - - - Other non-cash activities (in-specie assets sale) (8,099,000) (16,274,405) - - - - Other non-cash activities (in-specie applications) (1,809,152) (377,403,027) - - - - Other non-cash activities (in-specie redemptions) 1,809,152 377,403,027 - - - -
145. OptiMix Wholesale Moderate Trust†
146. Pooled Australian Share Fund
147. Property Securities Trust
Financial Report Notes to the Financial Statements for the financial year ended 30 June 2020
236
9. Financial risk management
9.1 Introduction and overview
The Schemes are exposed to a variety of financial risks from investments in financial instruments. These risks include:
credit risk liquidity risk market risk
This note presents information about the Schemes' exposure to each of the above risks, the Schemes' objectives, policies and processes for measuring and managing risks, and the Schemes' management of unitholder funds.
9.1.1 Risk management framework
The Schemes maintain positions in a variety of derivative and non-derivative financial instruments in accordance with the PDSs or investment mandates. During the year the Schemes' investment portfolios comprise cash, derivatives and unit trusts.
The Schemes' investment managers have been given a discretionary authority to manage the assets in line with the Schemes' investment objectives. Compliance with the target asset allocations and the composition of the portfolio is monitored on a daily basis. In instances where the portfolio has diverged from target asset allocations, the investment managers are obliged to take action to rebalance the portfolio in line with the established targets, within prescribed time limits.
9.2 Credit risk
Credit risk is the risk that a counterparty to a financial instrument will fail to discharge an obligation or commitment that it has entered into with the Schemes, resulting in a financial loss to the Schemes. It arises from derivative instruments and cash and cash equivalents.
9.2.1 Management of credit risk
The Schemes' policy over credit risk is to minimise its exposure to counterparties with higher risk of default by dealing only with counterparties meeting the credit standards set out in the Schemes' PDSs and by taking collateral. Credit risk is further minimised by managing the assets of the Schemes within credit rating limits.
Credit risk is monitored by the investment managers in accordance with the policies and procedures in place, including assessing the credit rating and quality of interest bearing instruments relative to their price and yield.
9.2.2 Derivative financial instruments
The Schemes may enter into two types of derivative transactions: exchange-traded derivatives and over-the-counter (OTC) derivatives. Credit risk arising from exchange-traded derivatives is mitigated by margin requirements. OTC derivatives expose the Schemes to the risk that the counterparties to the derivative financial instruments might default on their obligations to the Schemes.
Derivative financial instruments are transacted with counterparties on arm's length basis and within predetermined limits.
The fair value of the over-the-counter derivative assets held by the Schemes is disclosed in Note 9.2.6 Credit risk exposure.
9.2.3 Cash and cash equivalents
The Schemes' cash and cash equivalents are held mainly by Australia and New Zealand Banking Group Limited (ANZ) or JPMorgan Chase Bank, N.A. (Sydney Branch). The credit rating of these banking institutions as determined by Standard & Poor's are A-1+ (2019: A-1+) and A-1 (2019: A-1), respectively, as at reporting date. Maximum credit risk exposure from cash and cash equivalents is represented by the carrying amount on the Statements of Financial Position.
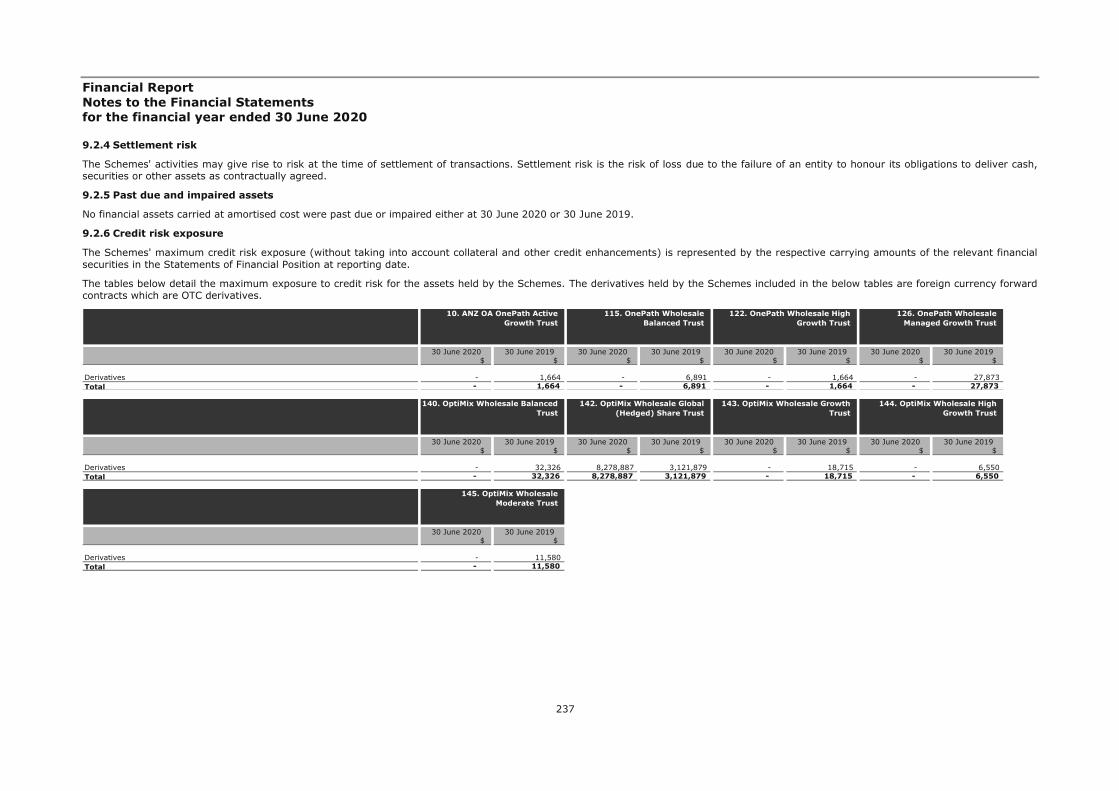
Financial Report Notes to the Financial Statements for the financial year ended 30 June 2020
237
9.2.4 Settlement risk
The Schemes' activities may give rise to risk at the time of settlement of transactions. Settlement risk is the risk of loss due to the failure of an entity to honour its obligations to deliver cash, securities or other assets as contractually agreed.
9.2.5 Past due and impaired assets
No financial assets carried at amortised cost were past due or impaired either at 30 June 2020 or 30 June 2019.
9.2.6 Credit risk exposure
The Schemes' maximum credit risk exposure (without taking into account collateral and other credit enhancements) is represented by the respective carrying amounts of the relevant financial securities in the Statements of Financial Position at reporting date.
The tables below detail the maximum exposure to credit risk for the assets held by the Schemes. The derivatives held by the Schemes included in the below tables are foreign currency forward contracts which are OTC derivatives.
30 June 2020 30 June 2019 30 June 2020 30 June 2019 30 June 2020 30 June 2019 30 June 2020 30 June 2019$ $ $ $ $ $ $ $
Derivatives - 1,664 - 6,891 - 1,664 - 27,873 Total - 1,664 - 6,891 - 1,664 - 27,873
115. OnePath Wholesale Balanced Trust
122. OnePath Wholesale High Growth Trust
126. OnePath Wholesale Managed Growth Trust
10. ANZ OA OnePath Active Growth Trust
30 June 2020 30 June 2019 30 June 2020 30 June 2019 30 June 2020 30 June 2019 30 June 2020 30 June 2019$ $ $ $ $ $ $ $
Derivatives - 32,326 8,278,887 3,121,879 - 18,715 - 6,550 Total - 32,326 8,278,887 3,121,879 - 18,715 - 6,550
142. OptiMix Wholesale Global (Hedged) Share Trust
143. OptiMix Wholesale Growth Trust
144. OptiMix Wholesale High Growth Trust
140. OptiMix Wholesale Balanced Trust
30 June 2020 30 June 2019$ $
Derivatives - 11,580 Total - 11,580
145. OptiMix Wholesale Moderate Trust
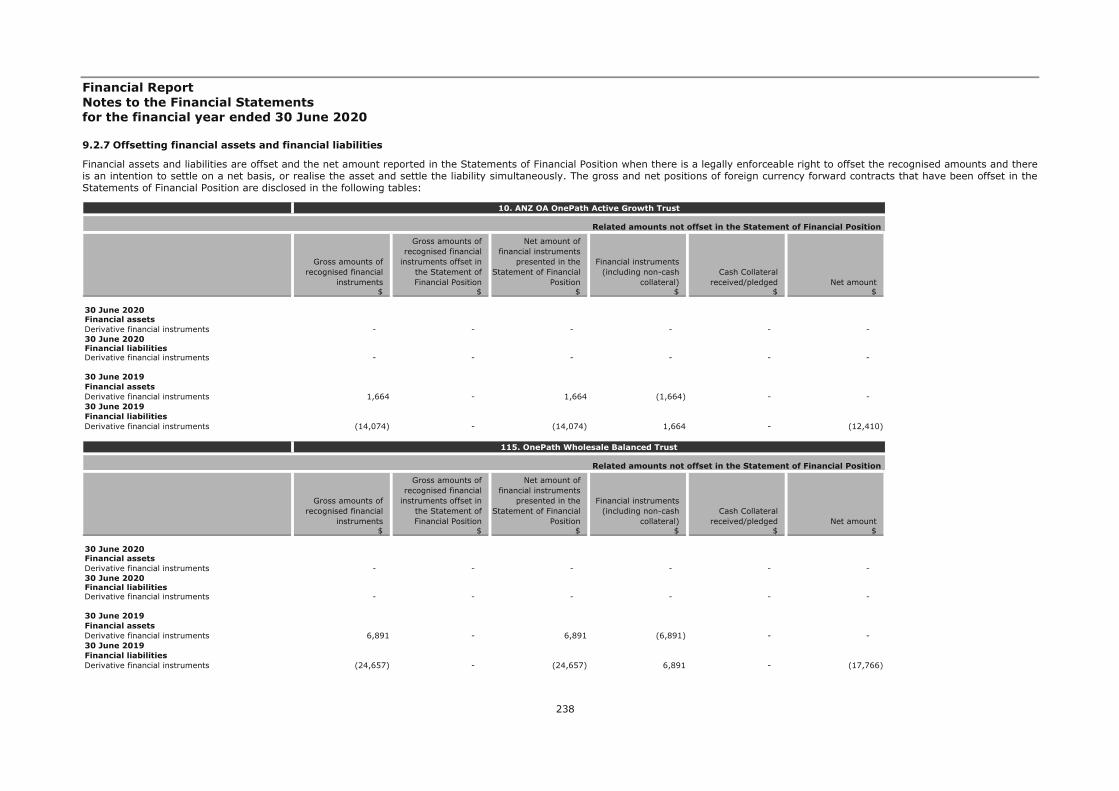
Financial Report Notes to the Financial Statements for the financial year ended 30 June 2020
238
9.2.7 Offsetting financial assets and financial liabilities
Financial assets and liabilities are offset and the net amount reported in the Statements of Financial Position when there is a legally enforceable right to offset the recognised amounts and there is an intention to settle on a net basis, or realise the asset and settle the liability simultaneously. The gross and net positions of foreign currency forward contracts that have been offset in the Statements of Financial Position are disclosed in the following tables:
10. ANZ OA OnePath Active Growth Trust
$ $ $ $ $ $
30 June 2020Financial assetsDerivative financial instruments - - - - - - 30 June 2020Financial liabilitiesDerivative financial instruments - - - - - -
30 June 2019Financial assetsDerivative financial instruments 1,664 - 1,664 (1,664) - - 30 June 2019Financial liabilitiesDerivative financial instruments (14,074) - (14,074) 1,664 - (12,410)
Net amount
Related amounts not offset in the Statement of Financial Position
Gross amounts of recognised financial
instruments
Gross amounts of recognised financial
instruments offset in the Statement of Financial Position
Net amount of financial instruments
presented in the Statement of Financial
Position
Financial instruments (including non-cash
collateral)Cash Collateral
received/pledged
115. OnePath Wholesale Balanced Trust
$ $ $ $ $ $
30 June 2020Financial assetsDerivative financial instruments - - - - - - 30 June 2020Financial liabilitiesDerivative financial instruments - - - - - -
30 June 2019Financial assetsDerivative financial instruments 6,891 - 6,891 (6,891) - - 30 June 2019Financial liabilitiesDerivative financial instruments (24,657) - (24,657) 6,891 - (17,766)
Net amount
Related amounts not offset in the Statement of Financial Position
Gross amounts of recognised financial
instruments
Gross amounts of recognised financial
instruments offset in the Statement of Financial Position
Net amount of financial instruments
presented in the Statement of Financial
Position
Financial instruments (including non-cash
collateral)Cash Collateral
received/pledged

Financial Report Notes to the Financial Statements for the financial year ended 30 June 2020
239
9.2.7 Offsetting financial assets and financial liabilities
122. OnePath Wholesale High Growth Trust
$ $ $ $ $ $
30 June 2020Financial assetsDerivative financial instruments - - - - - - 30 June 2020Financial liabilitiesDerivative financial instruments - - - - - -
30 June 2019Financial assetsDerivative financial instruments 1,664 - 1,664 (1,664) - - 30 June 2019Financial liabilitiesDerivative financial instruments (14,365) - (14,365) 1,664 - (12,701)
Net amount
Related amounts not offset in the Statement of Financial Position
Gross amounts of recognised financial
instruments
Gross amounts of recognised financial
instruments offset in the Statement of Financial Position
Net amount of financial instruments
presented in the Statement of Financial
Position
Financial instruments (including non-cash
collateral)Cash Collateral
received/pledged
126. OnePath Wholesale Managed Growth Trust
$ $ $ $ $ $
30 June 2020Financial assetsDerivative financial instruments - - - - - - 30 June 2020Financial liabilitiesDerivative financial instruments - - - - - -
30 June 2019Financial assetsDerivative financial instruments 27,873 - 27,873 (27,873) - - 30 June 2019Financial liabilitiesDerivative financial instruments (159,563) - (159,563) 27,873 - (131,690)
Net amount
Related amounts not offset in the Statement of Financial Position
Gross amounts of recognised financial
instruments
Gross amounts of recognised financial
instruments offset in the Statement of Financial Position
Net amount of financial instruments
presented in the Statement of Financial
Position
Financial instruments (including non-cash
collateral)Cash Collateral
received/pledged

Financial Report Notes to the Financial Statements for the financial year ended 30 June 2020
240
9.2.7 Offsetting financial assets and financial liabilities
140. OptiMix Wholesale Balanced Trust
$ $ $ $ $ $
30 June 2020Financial assetsDerivative financial instruments - - - - - - 30 June 2020Financial liabilitiesDerivative financial instruments - - - - - -
30 June 2019Financial assetsDerivative financial instruments 32,326 - 32,326 (32,326) - - 30 June 2019Financial liabilitiesDerivative financial instruments (73,078) - (73,078) 32,326 - (40,752)
Net amount
Related amounts not offset in the Statement of Financial Position
Gross amounts of recognised financial
instruments
Gross amounts of recognised financial
instruments offset in the Statement of Financial Position
Net amount of financial instruments
presented in the Statement of Financial
Position
Financial instruments (including non-cash
collateral)Cash Collateral
received/pledged
142. OptiMix Wholesale Global (Hedged) Share Trust
$ $ $ $ $ $
30 June 2020Financial assetsDerivative financial instruments 8,278,887 - 8,278,887 (52,340) - 8,226,54730 June 2020Financial liabilitiesDerivative financial instruments (52,340) - (52,340) 52,340 - -
30 June 2019Financial assetsDerivative financial instruments 3,121,879 - 3,121,879 (926,216) - 2,195,66330 June 2019Financial liabilitiesDerivative financial instruments (926,216) - (926,216) 926,216 - -
Net amount
Related amounts not offset in the Statement of Financial Position
Gross amounts of recognised financial
instruments
Gross amounts of recognised financial
instruments offset in the Statement of Financial Position
Net amount of financial instruments
presented in the Statement of Financial
Position
Financial instruments (including non-cash
collateral)Cash Collateral
received/pledged
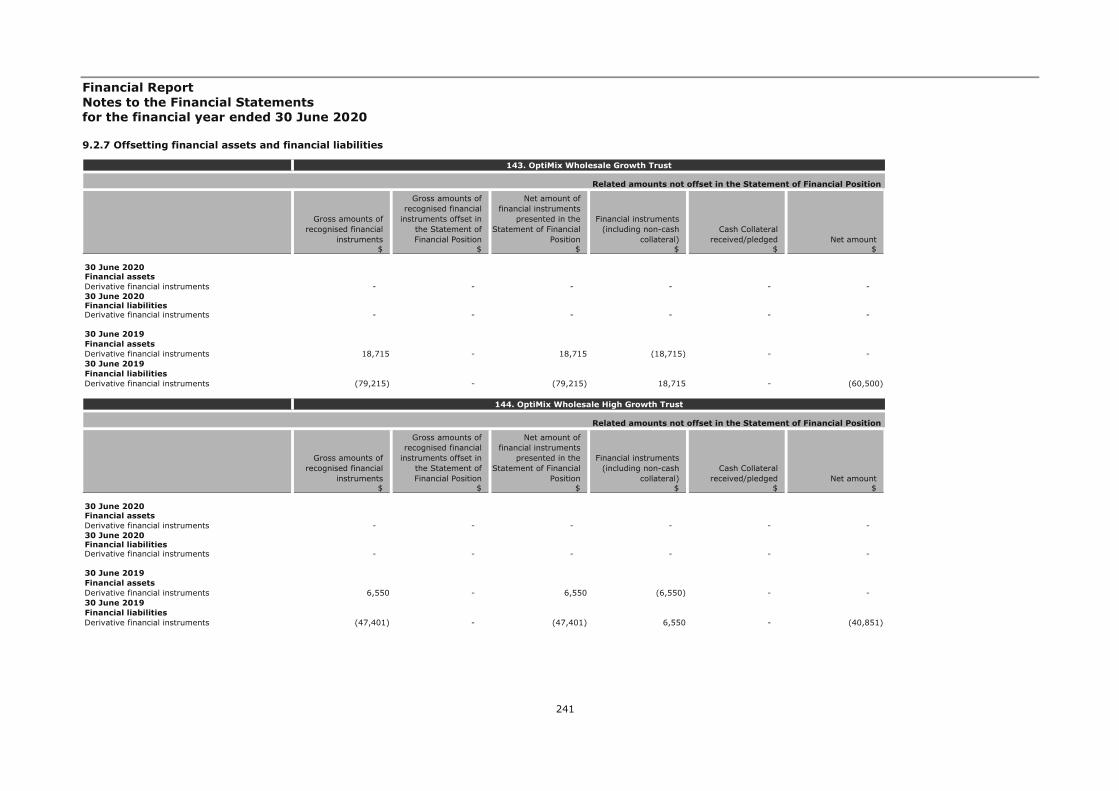
Financial Report Notes to the Financial Statements for the financial year ended 30 June 2020
241
9.2.7 Offsetting financial assets and financial liabilities
143. OptiMix Wholesale Growth Trust
$ $ $ $ $ $
30 June 2020Financial assetsDerivative financial instruments - - - - - - 30 June 2020Financial liabilitiesDerivative financial instruments - - - - - -
30 June 2019Financial assetsDerivative financial instruments 18,715 - 18,715 (18,715) - - 30 June 2019Financial liabilitiesDerivative financial instruments (79,215) - (79,215) 18,715 - (60,500)
Net amount
Related amounts not offset in the Statement of Financial Position
Gross amounts of recognised financial
instruments
Gross amounts of recognised financial
instruments offset in the Statement of Financial Position
Net amount of financial instruments
presented in the Statement of Financial
Position
Financial instruments (including non-cash
collateral)Cash Collateral
received/pledged
144. OptiMix Wholesale High Growth Trust
$ $ $ $ $ $
30 June 2020Financial assetsDerivative financial instruments - - - - - - 30 June 2020Financial liabilitiesDerivative financial instruments - - - - - -
30 June 2019Financial assetsDerivative financial instruments 6,550 - 6,550 (6,550) - - 30 June 2019Financial liabilitiesDerivative financial instruments (47,401) - (47,401) 6,550 - (40,851)
Net amount
Related amounts not offset in the Statement of Financial Position
Gross amounts of recognised financial
instruments
Gross amounts of recognised financial
instruments offset in the Statement of Financial Position
Net amount of financial instruments
presented in the Statement of Financial
Position
Financial instruments (including non-cash
collateral)Cash Collateral
received/pledged
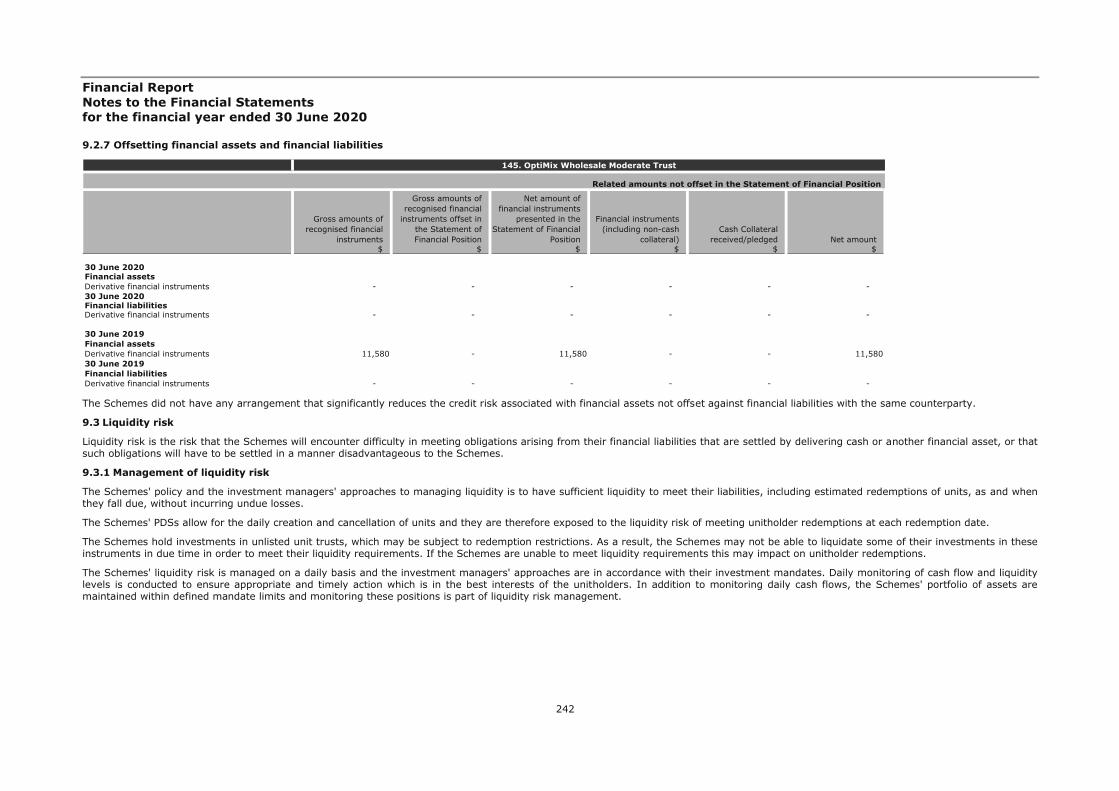
Financial Report Notes to the Financial Statements for the financial year ended 30 June 2020
242
9.2.7 Offsetting financial assets and financial liabilities
The Schemes did not have any arrangement that significantly reduces the credit risk associated with financial assets not offset against financial liabilities with the same counterparty.
9.3 Liquidity risk
Liquidity risk is the risk that the Schemes will encounter difficulty in meeting obligations arising from their financial liabilities that are settled by delivering cash or another financial asset, or that such obligations will have to be settled in a manner disadvantageous to the Schemes.
9.3.1 Management of liquidity risk
The Schemes' policy and the investment managers' approaches to managing liquidity is to have sufficient liquidity to meet their liabilities, including estimated redemptions of units, as and when they fall due, without incurring undue losses.
The Schemes' PDSs allow for the daily creation and cancellation of units and they are therefore exposed to the liquidity risk of meeting unitholder redemptions at each redemption date.
The Schemes hold investments in unlisted unit trusts, which may be subject to redemption restrictions. As a result, the Schemes may not be able to liquidate some of their investments in these instruments in due time in order to meet their liquidity requirements. If the Schemes are unable to meet liquidity requirements this may impact on unitholder redemptions.
The Schemes' liquidity risk is managed on a daily basis and the investment managers' approaches are in accordance with their investment mandates. Daily monitoring of cash flow and liquidity levels is conducted to ensure appropriate and timely action which is in the best interests of the unitholders. In addition to monitoring daily cash flows, the Schemes' portfolio of assets are maintained within defined mandate limits and monitoring these positions is part of liquidity risk management.
145. OptiMix Wholesale Moderate Trust
$ $ $ $ $ $
30 June 2020Financial assetsDerivative financial instruments - - - - - - 30 June 2020Financial liabilitiesDerivative financial instruments - - - - - -
30 June 2019Financial assetsDerivative financial instruments 11,580 - 11,580 - - 11,58030 June 2019Financial liabilitiesDerivative financial instruments - - - - - -
Net amount
Related amounts not offset in the Statement of Financial Position
Gross amounts of recognised financial
instruments
Gross amounts of recognised financial
instruments offset in the Statement of Financial Position
Net amount of financial instruments
presented in the Statement of Financial
Position
Financial instruments (including non-cash
collateral)Cash Collateral
received/pledged
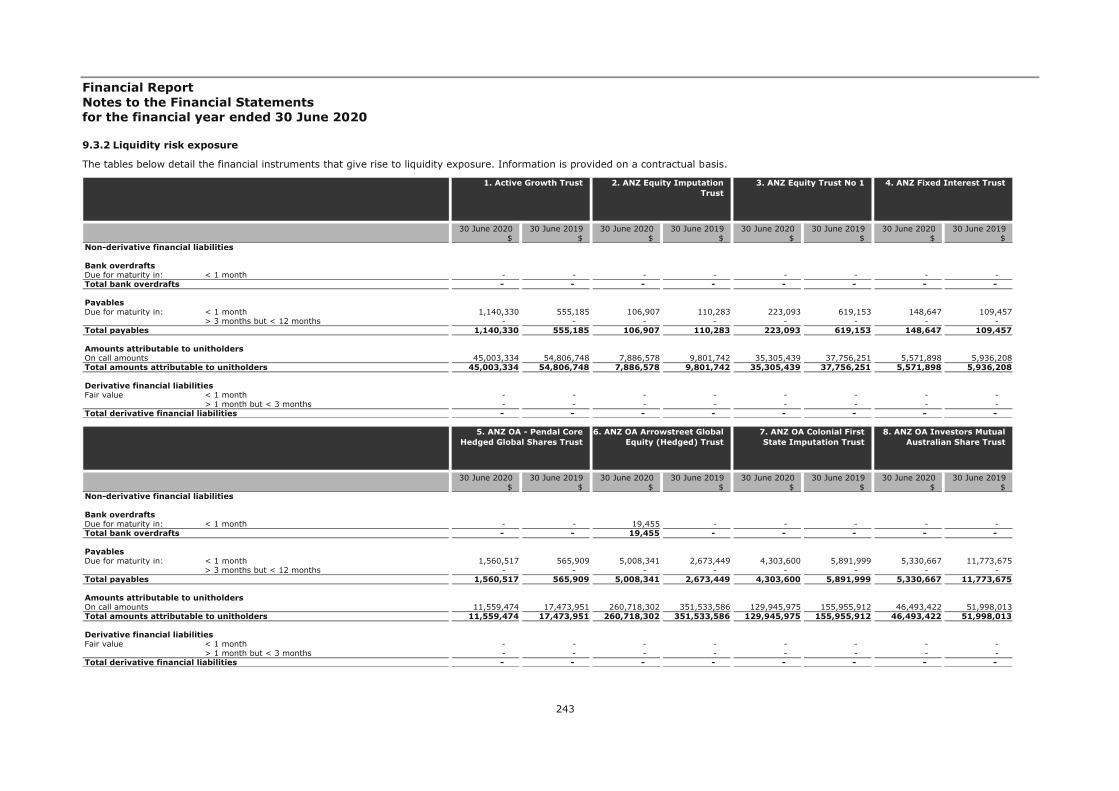
Financial Report Notes to the Financial Statements for the financial year ended 30 June 2020
243
9.3.2 Liquidity risk exposure
The tables below detail the financial instruments that give rise to liquidity exposure. Information is provided on a contractual basis.
30 June 2020 30 June 2019 30 June 2020 30 June 2019 30 June 2020 30 June 2019 30 June 2020 30 June 2019$ $ $ $ $ $ $ $
Non-derivative financial liabilities
Bank overdraftsDue for maturity in: < 1 month - - - - - - - - Total bank overdrafts - - - - - - - -
PayablesDue for maturity in: < 1 month 1,140,330 555,185 106,907 110,283 223,093 619,153 148,647 109,457
> 3 months but < 12 months - - - - - - - - Total payables 1,140,330 555,185 106,907 110,283 223,093 619,153 148,647 109,457
Amounts attributable to unitholdersOn call amounts 45,003,334 54,806,748 7,886,578 9,801,742 35,305,439 37,756,251 5,571,898 5,936,208Total amounts attributable to unitholders 45,003,334 54,806,748 7,886,578 9,801,742 35,305,439 37,756,251 5,571,898 5,936,208
Derivative financial liabilitiesFair value < 1 month - - - - - - - -
> 1 month but < 3 months - - - - - - - - Total derivative financial liabilities - - - - - - - -
3. ANZ Equity Trust No 1 4. ANZ Fixed Interest Trust 1. Active Growth Trust 2. ANZ Equity Imputation Trust
30 June 2020 30 June 2019 30 June 2020 30 June 2019 30 June 2020 30 June 2019 30 June 2020 30 June 2019$ $ $ $ $ $ $ $
Non-derivative financial liabilities
Bank overdraftsDue for maturity in: < 1 month - - 19,455 - - - - - Total bank overdrafts - - 19,455 - - - - -
PayablesDue for maturity in: < 1 month 1,560,517 565,909 5,008,341 2,673,449 4,303,600 5,891,999 5,330,667 11,773,675
> 3 months but < 12 months - - - - - - - - Total payables 1,560,517 565,909 5,008,341 2,673,449 4,303,600 5,891,999 5,330,667 11,773,675
Amounts attributable to unitholdersOn call amounts 11,559,474 17,473,951 260,718,302 351,533,586 129,945,975 155,955,912 46,493,422 51,998,013Total amounts attributable to unitholders 11,559,474 17,473,951 260,718,302 351,533,586 129,945,975 155,955,912 46,493,422 51,998,013
Derivative financial liabilitiesFair value < 1 month - - - - - - - -
> 1 month but < 3 months - - - - - - - - Total derivative financial liabilities - - - - - - - -
7. ANZ OA Colonial First State Imputation Trust
8. ANZ OA Investors Mutual Australian Share Trust
5. ANZ OA - Pendal Core Hedged Global Shares Trust
6. ANZ OA Arrowstreet Global Equity (Hedged) Trust
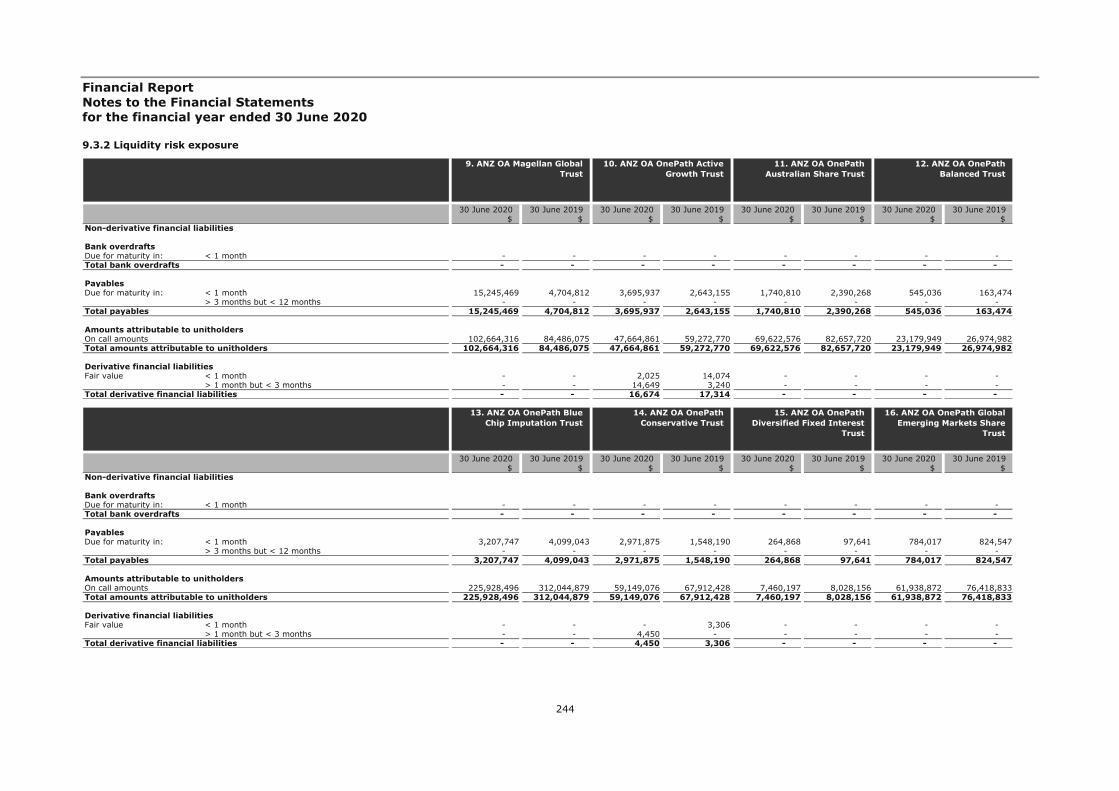
Financial Report Notes to the Financial Statements for the financial year ended 30 June 2020
244
9.3.2 Liquidity risk exposure
30 June 2020 30 June 2019 30 June 2020 30 June 2019 30 June 2020 30 June 2019 30 June 2020 30 June 2019$ $ $ $ $ $ $ $
Non-derivative financial liabilities
Bank overdraftsDue for maturity in: < 1 month - - - - - - - - Total bank overdrafts - - - - - - - -
PayablesDue for maturity in: < 1 month 15,245,469 4,704,812 3,695,937 2,643,155 1,740,810 2,390,268 545,036 163,474
> 3 months but < 12 months - - - - - - - - Total payables 15,245,469 4,704,812 3,695,937 2,643,155 1,740,810 2,390,268 545,036 163,474
Amounts attributable to unitholdersOn call amounts 102,664,316 84,486,075 47,664,861 59,272,770 69,622,576 82,657,720 23,179,949 26,974,982Total amounts attributable to unitholders 102,664,316 84,486,075 47,664,861 59,272,770 69,622,576 82,657,720 23,179,949 26,974,982
Derivative financial liabilitiesFair value < 1 month - - 2,025 14,074 - - - -
> 1 month but < 3 months - - 14,649 3,240 - - - - Total derivative financial liabilities - - 16,674 17,314 - - - -
11. ANZ OA OnePath Australian Share Trust
12. ANZ OA OnePath Balanced Trust
9. ANZ OA Magellan Global Trust
10. ANZ OA OnePath Active Growth Trust
30 June 2020 30 June 2019 30 June 2020 30 June 2019 30 June 2020 30 June 2019 30 June 2020 30 June 2019$ $ $ $ $ $ $ $
Non-derivative financial liabilities
Bank overdraftsDue for maturity in: < 1 month - - - - - - - - Total bank overdrafts - - - - - - - -
PayablesDue for maturity in: < 1 month 3,207,747 4,099,043 2,971,875 1,548,190 264,868 97,641 784,017 824,547
> 3 months but < 12 months - - - - - - - - Total payables 3,207,747 4,099,043 2,971,875 1,548,190 264,868 97,641 784,017 824,547
Amounts attributable to unitholdersOn call amounts 225,928,496 312,044,879 59,149,076 67,912,428 7,460,197 8,028,156 61,938,872 76,418,833Total amounts attributable to unitholders 225,928,496 312,044,879 59,149,076 67,912,428 7,460,197 8,028,156 61,938,872 76,418,833
Derivative financial liabilitiesFair value < 1 month - - - 3,306 - - - -
> 1 month but < 3 months - - 4,450 - - - - - Total derivative financial liabilities - - 4,450 3,306 - - - -
15. ANZ OA OnePath Diversified Fixed Interest
Trust
16. ANZ OA OnePath Global Emerging Markets Share
Trust
13. ANZ OA OnePath Blue Chip Imputation Trust
14. ANZ OA OnePath Conservative Trust

Financial Report Notes to the Financial Statements for the financial year ended 30 June 2020
245
9.3.2 Liquidity risk exposure
30 June 2020 30 June 2019 30 June 2020 30 June 2019 30 June 2020 30 June 2019 30 June 2020 30 June 2019$ $ $ $ $ $ $ $
Non-derivative financial liabilities
Bank overdraftsDue for maturity in: < 1 month - - - - - - - - Total bank overdrafts - - - - - - - -
PayablesDue for maturity in: < 1 month 1,795,625 1,924,809 96,150 19,502 2,180,000 1,191,925 9,509,310 13,899,966
> 3 months but < 12 months - - - - - - - - Total payables 1,795,625 1,924,809 96,150 19,502 2,180,000 1,191,925 9,509,310 13,899,966
Amounts attributable to unitholdersOn call amounts 16,270,545 21,004,087 8,034,257 9,997,813 80,876,754 94,402,028 95,291,007 152,380,194Total amounts attributable to unitholders 16,270,545 21,004,087 8,034,257 9,997,813 80,876,754 94,402,028 95,291,007 152,380,194
Derivative financial liabilitiesFair value < 1 month - - - - - - - -
> 1 month but < 3 months - - - - - - - - Total derivative financial liabilities - - - - - - - -
19. ANZ OA OnePath Managed Growth Trust
20. ANZ OA OnePath Property Securities Trust
17. ANZ OA OnePath High Growth Trust
18. ANZ OA OnePath Income Trust
30 June 2020 30 June 2019 30 June 2020 30 June 2019 30 June 2020 30 June 2019 30 June 2020 30 June 2019$ $ $ $ $ $ $ $
Non-derivative financial liabilities
Bank overdraftsDue for maturity in: < 1 month - - - - - - - - Total bank overdrafts - - - - - - - -
PayablesDue for maturity in: < 1 month 143,333 417,526 7,704 15,102 440,495 472,694 33,845 27,234
> 3 months but < 12 months - - - - - - - - Total payables 143,333 417,526 7,704 15,102 440,495 472,694 33,845 27,234
Amounts attributable to unitholdersOn call amounts 17,070,896 22,618,358 1,057,872 994,649 30,839,390 39,725,942 1,041,953 1,124,744Total amounts attributable to unitholders 17,070,896 22,618,358 1,057,872 994,649 30,839,390 39,725,942 1,041,953 1,124,744
Derivative financial liabilitiesFair value < 1 month - - - - - - - -
> 1 month but < 3 months - - - - - - - - Total derivative financial liabilities - - - - - - - -
23. ANZ OA OnePath Tax Effective Income Trust
24. ANZ OA OptiMix Australian Fixed Interest
Trust
21. ANZ OA OnePath Select Leaders Trust
22. ANZ OA OnePath Sustainable Investments -
Australian Share Trust
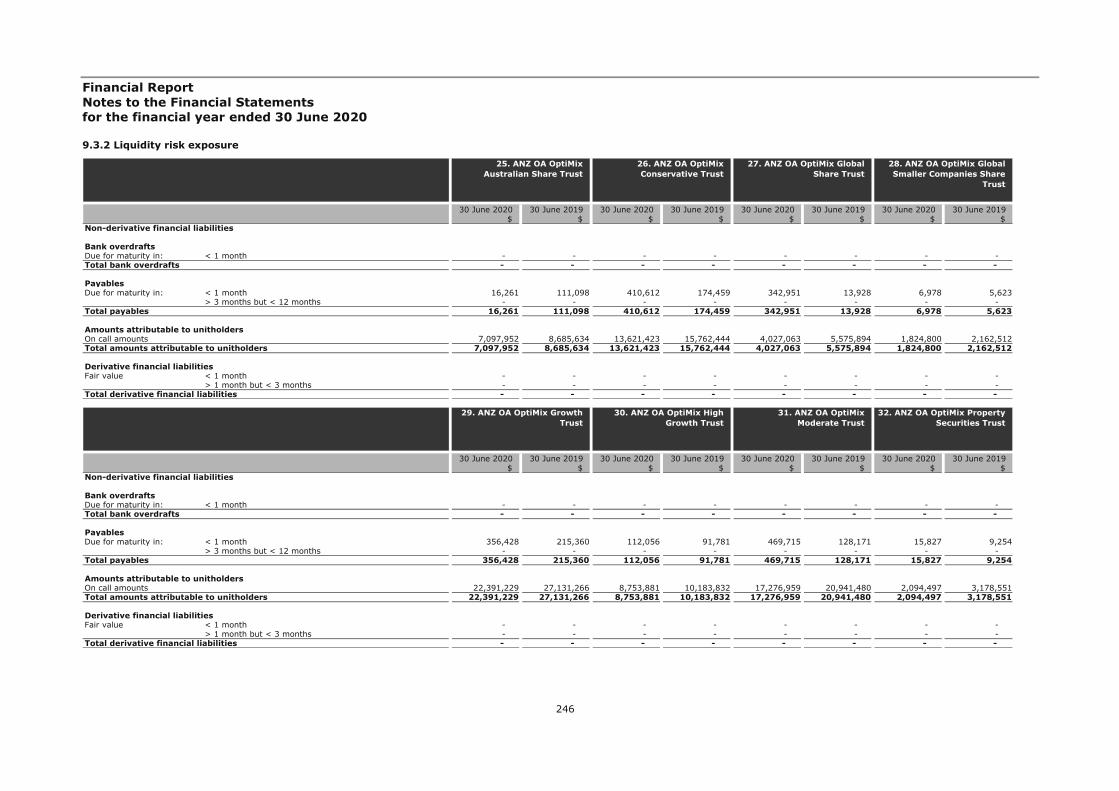
Financial Report Notes to the Financial Statements for the financial year ended 30 June 2020
246
9.3.2 Liquidity risk exposure
30 June 2020 30 June 2019 30 June 2020 30 June 2019 30 June 2020 30 June 2019 30 June 2020 30 June 2019$ $ $ $ $ $ $ $
Non-derivative financial liabilities
Bank overdraftsDue for maturity in: < 1 month - - - - - - - - Total bank overdrafts - - - - - - - -
PayablesDue for maturity in: < 1 month 16,261 111,098 410,612 174,459 342,951 13,928 6,978 5,623
> 3 months but < 12 months - - - - - - - - Total payables 16,261 111,098 410,612 174,459 342,951 13,928 6,978 5,623
Amounts attributable to unitholdersOn call amounts 7,097,952 8,685,634 13,621,423 15,762,444 4,027,063 5,575,894 1,824,800 2,162,512Total amounts attributable to unitholders 7,097,952 8,685,634 13,621,423 15,762,444 4,027,063 5,575,894 1,824,800 2,162,512
Derivative financial liabilitiesFair value < 1 month - - - - - - - -
> 1 month but < 3 months - - - - - - - - Total derivative financial liabilities - - - - - - - -
27. ANZ OA OptiMix Global Share Trust
28. ANZ OA OptiMix Global Smaller Companies Share
Trust
25. ANZ OA OptiMix Australian Share Trust
26. ANZ OA OptiMix Conservative Trust
30 June 2020 30 June 2019 30 June 2020 30 June 2019 30 June 2020 30 June 2019 30 June 2020 30 June 2019$ $ $ $ $ $ $ $
Non-derivative financial liabilities
Bank overdraftsDue for maturity in: < 1 month - - - - - - - - Total bank overdrafts - - - - - - - -
PayablesDue for maturity in: < 1 month 356,428 215,360 112,056 91,781 469,715 128,171 15,827 9,254
> 3 months but < 12 months - - - - - - - - Total payables 356,428 215,360 112,056 91,781 469,715 128,171 15,827 9,254
Amounts attributable to unitholdersOn call amounts 22,391,229 27,131,266 8,753,881 10,183,832 17,276,959 20,941,480 2,094,497 3,178,551Total amounts attributable to unitholders 22,391,229 27,131,266 8,753,881 10,183,832 17,276,959 20,941,480 2,094,497 3,178,551
Derivative financial liabilitiesFair value < 1 month - - - - - - - -
> 1 month but < 3 months - - - - - - - - Total derivative financial liabilities - - - - - - - -
31. ANZ OA OptiMix Moderate Trust
32. ANZ OA OptiMix Property Securities Trust
29. ANZ OA OptiMix Growth Trust
30. ANZ OA OptiMix High Growth Trust
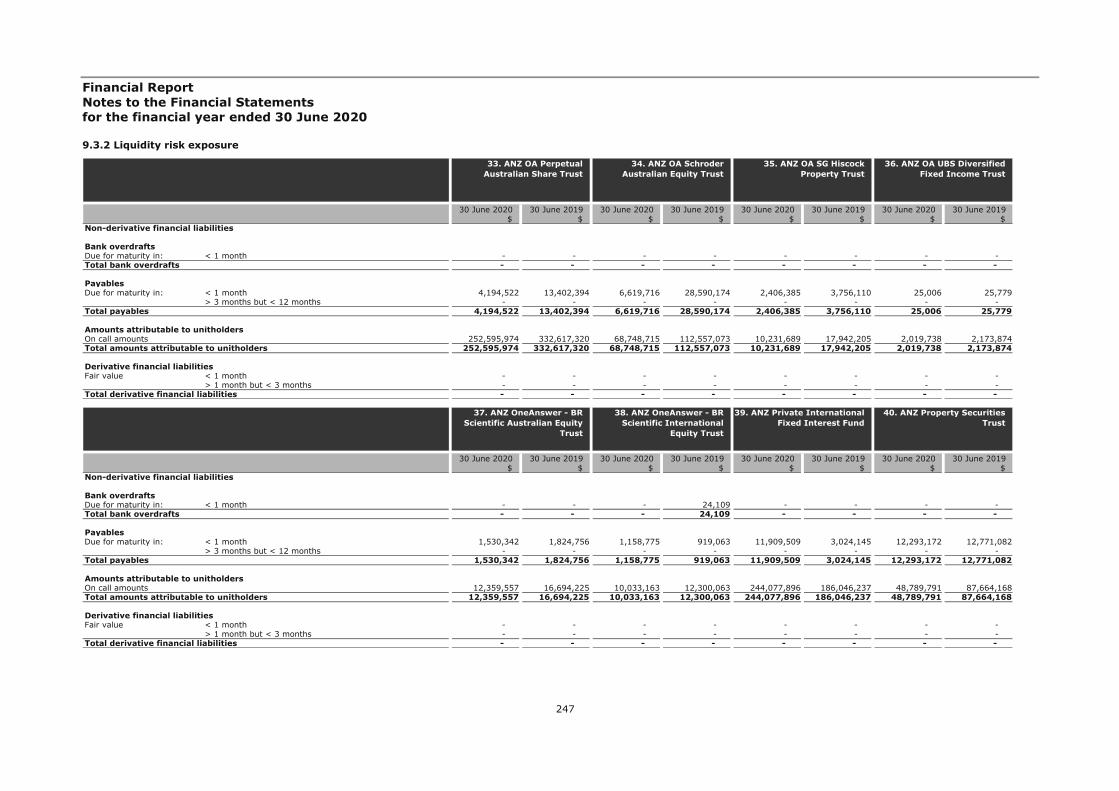
Financial Report Notes to the Financial Statements for the financial year ended 30 June 2020
247
9.3.2 Liquidity risk exposure
30 June 2020 30 June 2019 30 June 2020 30 June 2019 30 June 2020 30 June 2019 30 June 2020 30 June 2019$ $ $ $ $ $ $ $
Non-derivative financial liabilities
Bank overdraftsDue for maturity in: < 1 month - - - - - - - - Total bank overdrafts - - - - - - - -
PayablesDue for maturity in: < 1 month 4,194,522 13,402,394 6,619,716 28,590,174 2,406,385 3,756,110 25,006 25,779
> 3 months but < 12 months - - - - - - - - Total payables 4,194,522 13,402,394 6,619,716 28,590,174 2,406,385 3,756,110 25,006 25,779
Amounts attributable to unitholdersOn call amounts 252,595,974 332,617,320 68,748,715 112,557,073 10,231,689 17,942,205 2,019,738 2,173,874Total amounts attributable to unitholders 252,595,974 332,617,320 68,748,715 112,557,073 10,231,689 17,942,205 2,019,738 2,173,874
Derivative financial liabilitiesFair value < 1 month - - - - - - - -
> 1 month but < 3 months - - - - - - - - Total derivative financial liabilities - - - - - - - -
35. ANZ OA SG Hiscock Property Trust
36. ANZ OA UBS Diversified Fixed Income Trust
33. ANZ OA Perpetual Australian Share Trust
34. ANZ OA Schroder Australian Equity Trust
30 June 2020 30 June 2019 30 June 2020 30 June 2019 30 June 2020 30 June 2019 30 June 2020 30 June 2019$ $ $ $ $ $ $ $
Non-derivative financial liabilities
Bank overdraftsDue for maturity in: < 1 month - - - 24,109 - - - - Total bank overdrafts - - - 24,109 - - - -
PayablesDue for maturity in: < 1 month 1,530,342 1,824,756 1,158,775 919,063 11,909,509 3,024,145 12,293,172 12,771,082
> 3 months but < 12 months - - - - - - - - Total payables 1,530,342 1,824,756 1,158,775 919,063 11,909,509 3,024,145 12,293,172 12,771,082
Amounts attributable to unitholdersOn call amounts 12,359,557 16,694,225 10,033,163 12,300,063 244,077,896 186,046,237 48,789,791 87,664,168Total amounts attributable to unitholders 12,359,557 16,694,225 10,033,163 12,300,063 244,077,896 186,046,237 48,789,791 87,664,168
Derivative financial liabilitiesFair value < 1 month - - - - - - - -
> 1 month but < 3 months - - - - - - - - Total derivative financial liabilities - - - - - - - -
39. ANZ Private International Fixed Interest Fund
40. ANZ Property Securities Trust
37. ANZ OneAnswer - BR Scientific Australian Equity
Trust
38. ANZ OneAnswer - BR Scientific International
Equity Trust
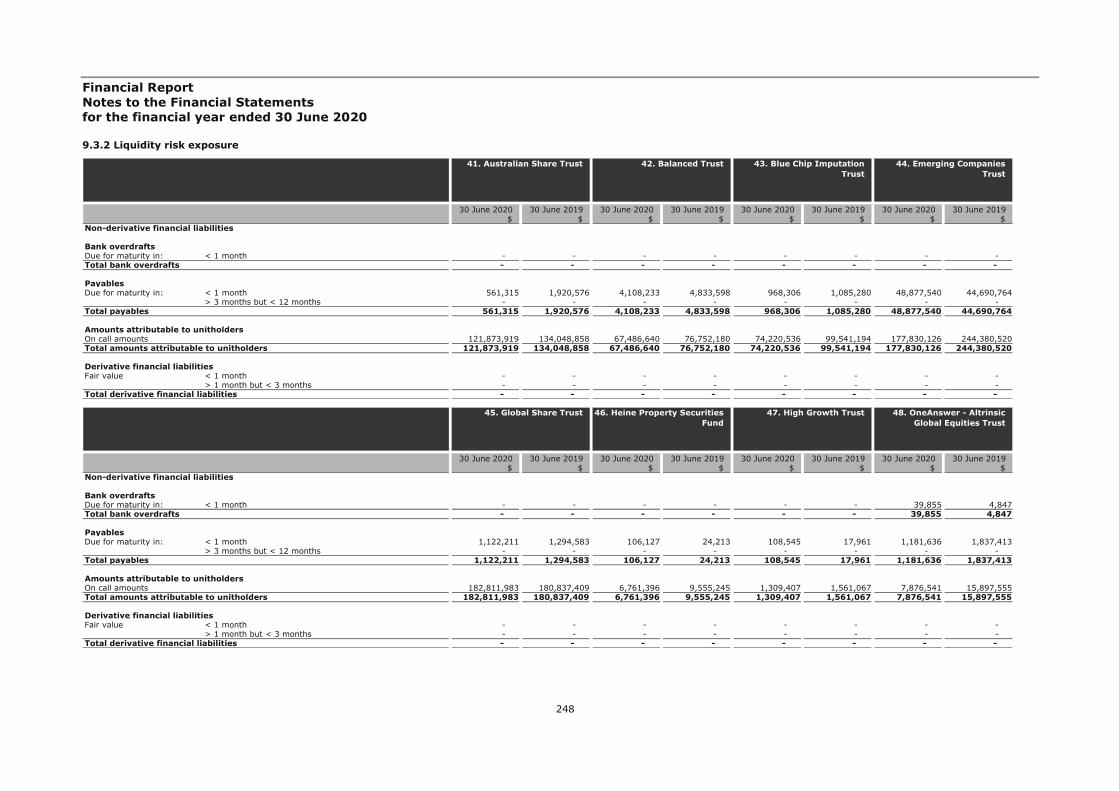
Financial Report Notes to the Financial Statements for the financial year ended 30 June 2020
248
9.3.2 Liquidity risk exposure
30 June 2020 30 June 2019 30 June 2020 30 June 2019 30 June 2020 30 June 2019 30 June 2020 30 June 2019$ $ $ $ $ $ $ $
Non-derivative financial liabilities
Bank overdraftsDue for maturity in: < 1 month - - - - - - - - Total bank overdrafts - - - - - - - -
PayablesDue for maturity in: < 1 month 561,315 1,920,576 4,108,233 4,833,598 968,306 1,085,280 48,877,540 44,690,764
> 3 months but < 12 months - - - - - - - - Total payables 561,315 1,920,576 4,108,233 4,833,598 968,306 1,085,280 48,877,540 44,690,764
Amounts attributable to unitholdersOn call amounts 121,873,919 134,048,858 67,486,640 76,752,180 74,220,536 99,541,194 177,830,126 244,380,520Total amounts attributable to unitholders 121,873,919 134,048,858 67,486,640 76,752,180 74,220,536 99,541,194 177,830,126 244,380,520
Derivative financial liabilitiesFair value < 1 month - - - - - - - -
> 1 month but < 3 months - - - - - - - - Total derivative financial liabilities - - - - - - - -
43. Blue Chip Imputation Trust
44. Emerging Companies Trust
41. Australian Share Trust 42. Balanced Trust
30 June 2020 30 June 2019 30 June 2020 30 June 2019 30 June 2020 30 June 2019 30 June 2020 30 June 2019$ $ $ $ $ $ $ $
Non-derivative financial liabilities
Bank overdraftsDue for maturity in: < 1 month - - - - - - 39,855 4,847Total bank overdrafts - - - - - - 39,855 4,847
PayablesDue for maturity in: < 1 month 1,122,211 1,294,583 106,127 24,213 108,545 17,961 1,181,636 1,837,413
> 3 months but < 12 months - - - - - - - - Total payables 1,122,211 1,294,583 106,127 24,213 108,545 17,961 1,181,636 1,837,413
Amounts attributable to unitholdersOn call amounts 182,811,983 180,837,409 6,761,396 9,555,245 1,309,407 1,561,067 7,876,541 15,897,555Total amounts attributable to unitholders 182,811,983 180,837,409 6,761,396 9,555,245 1,309,407 1,561,067 7,876,541 15,897,555
Derivative financial liabilitiesFair value < 1 month - - - - - - - -
> 1 month but < 3 months - - - - - - - - Total derivative financial liabilities - - - - - - - -
47. High Growth Trust 48. OneAnswer - Altrinsic Global Equities Trust
45. Global Share Trust 46. Heine Property Securities Fund

Financial Report Notes to the Financial Statements for the financial year ended 30 June 2020
249
9.3.2 Liquidity risk exposure
30 June 2020 30 June 2019 30 June 2020 30 June 2019 30 June 2020 30 June 2019 30 June 2020 30 June 2019$ $ $ $ $ $ $ $
Non-derivative financial liabilities
Bank overdraftsDue for maturity in: < 1 month - 155,545 - - - 155,506 - - Total bank overdrafts - 155,545 - - - 155,506 - -
PayablesDue for maturity in: < 1 month 12,750 864,847 116,000 65,339 4,316,619 3,441,096 10,130,466 3,711,104
> 3 months but < 12 months - - - - - - - - Total payables 12,750 864,847 116,000 65,339 4,316,619 3,441,096 10,130,466 3,711,104
Amounts attributable to unitholdersOn call amounts 70,651,008 89,221,942 9,407,956 11,877,720 59,755,553 80,778,537 89,937,441 98,762,315Total amounts attributable to unitholders 70,651,008 89,221,942 9,407,956 11,877,720 59,755,553 80,778,537 89,937,441 98,762,315
Derivative financial liabilitiesFair value < 1 month - - - - - - - -
> 1 month but < 3 months - - - - - - - - Total derivative financial liabilities - - - - - - - -
51. OneAnswer - Ausbil Australian Emerging Leaders
Trust
52. OneAnswer - Bennelong Australian Equities Trust
49. OneAnswer - Antipodes Global (Long Only) Trust
50. OneAnswer - Arrowstreet Global Equity (Hedged) Trust
30 June 2020 30 June 2019 30 June 2020 30 June 2019 30 June 2020 30 June 2019 30 June 2020 30 June 2019$ $ $ $ $ $ $ $
Non-derivative financial liabilities
Bank overdraftsDue for maturity in: < 1 month 26,019 225,383 - - - 70,234 - 481,176Total bank overdrafts 26,019 225,383 - - - 70,234 - 481,176
PayablesDue for maturity in: < 1 month 629,698 671,409 8,271 40,757 3,101,720 5,306,481 3,977,424 2,845,840
> 3 months but < 12 months - - - - - - - - Total payables 629,698 671,409 8,271 40,757 3,101,720 5,306,481 3,977,424 2,845,840
Amounts attributable to unitholdersOn call amounts 58,524,245 74,008,820 3,073,018 3,116,136 39,784,141 48,814,085 31,677,933 39,506,684Total amounts attributable to unitholders 58,524,245 74,008,820 3,073,018 3,116,136 39,784,141 48,814,085 31,677,933 39,506,684
Derivative financial liabilitiesFair value < 1 month - - - - - - - -
> 1 month but < 3 months - - - - - - - - Total derivative financial liabilities - - - - - - - -
55. OneAnswer - Blackrock Tactical Growth Trust
56. OneAnswer - BR Scientific Diversified Growth
Trust
53. OneAnswer - Bentham Global Income Trust
54. OneAnswer - BlackRock Scientific Australian Equity
Trust
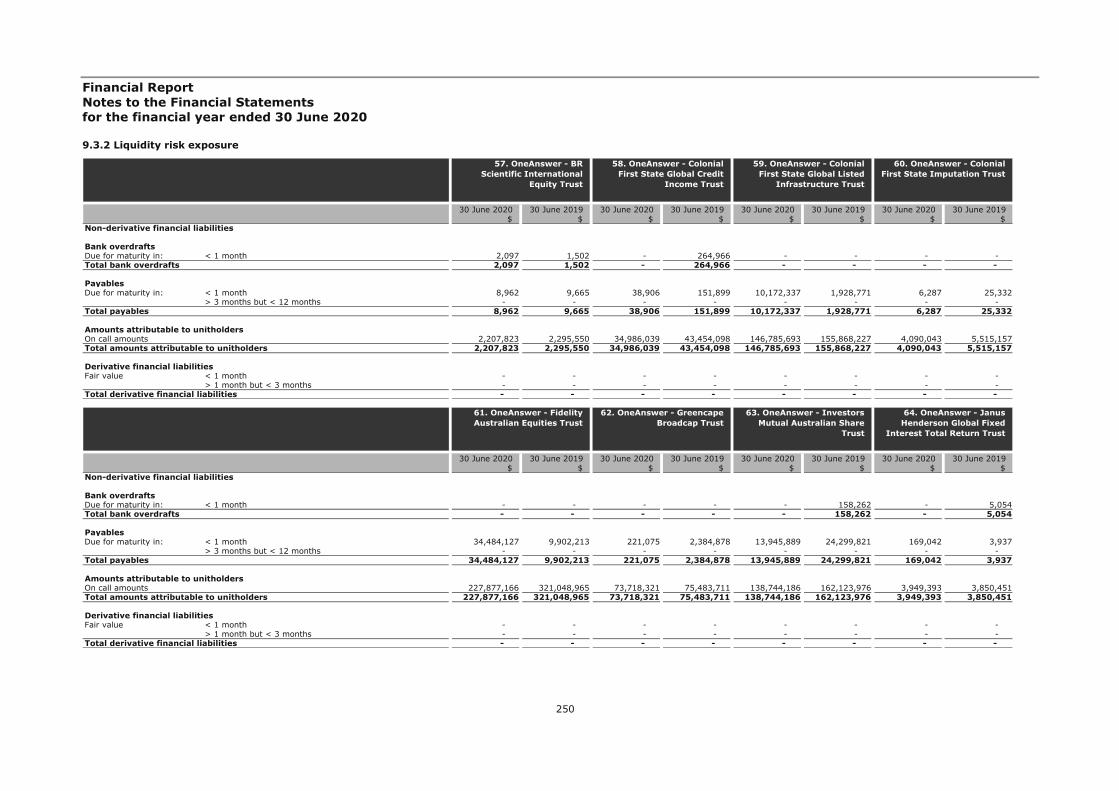
Financial Report Notes to the Financial Statements for the financial year ended 30 June 2020
250
9.3.2 Liquidity risk exposure
30 June 2020 30 June 2019 30 June 2020 30 June 2019 30 June 2020 30 June 2019 30 June 2020 30 June 2019$ $ $ $ $ $ $ $
Non-derivative financial liabilities
Bank overdraftsDue for maturity in: < 1 month 2,097 1,502 - 264,966 - - - - Total bank overdrafts 2,097 1,502 - 264,966 - - - -
PayablesDue for maturity in: < 1 month 8,962 9,665 38,906 151,899 10,172,337 1,928,771 6,287 25,332
> 3 months but < 12 months - - - - - - - - Total payables 8,962 9,665 38,906 151,899 10,172,337 1,928,771 6,287 25,332
Amounts attributable to unitholdersOn call amounts 2,207,823 2,295,550 34,986,039 43,454,098 146,785,693 155,868,227 4,090,043 5,515,157Total amounts attributable to unitholders 2,207,823 2,295,550 34,986,039 43,454,098 146,785,693 155,868,227 4,090,043 5,515,157
Derivative financial liabilitiesFair value < 1 month - - - - - - - -
> 1 month but < 3 months - - - - - - - - Total derivative financial liabilities - - - - - - - -
59. OneAnswer - Colonial First State Global Listed
Infrastructure Trust
60. OneAnswer - Colonial First State Imputation Trust
57. OneAnswer - BR Scientific International
Equity Trust
58. OneAnswer - Colonial First State Global Credit
Income Trust
30 June 2020 30 June 2019 30 June 2020 30 June 2019 30 June 2020 30 June 2019 30 June 2020 30 June 2019$ $ $ $ $ $ $ $
Non-derivative financial liabilities
Bank overdraftsDue for maturity in: < 1 month - - - - - 158,262 - 5,054Total bank overdrafts - - - - - 158,262 - 5,054
PayablesDue for maturity in: < 1 month 34,484,127 9,902,213 221,075 2,384,878 13,945,889 24,299,821 169,042 3,937
> 3 months but < 12 months - - - - - - - - Total payables 34,484,127 9,902,213 221,075 2,384,878 13,945,889 24,299,821 169,042 3,937
Amounts attributable to unitholdersOn call amounts 227,877,166 321,048,965 73,718,321 75,483,711 138,744,186 162,123,976 3,949,393 3,850,451Total amounts attributable to unitholders 227,877,166 321,048,965 73,718,321 75,483,711 138,744,186 162,123,976 3,949,393 3,850,451
Derivative financial liabilitiesFair value < 1 month - - - - - - - -
> 1 month but < 3 months - - - - - - - - Total derivative financial liabilities - - - - - - - -
63. OneAnswer - Investors Mutual Australian Share
Trust
64. OneAnswer - Janus Henderson Global Fixed
Interest Total Return Trust
61. OneAnswer - Fidelity Australian Equities Trust
62. OneAnswer - Greencape Broadcap Trust

Financial Report Notes to the Financial Statements for the financial year ended 30 June 2020
251
9.3.2 Liquidity risk exposure
30 June 2020 30 June 2019 30 June 2020 30 June 2019 30 June 2020 30 June 2019 30 June 2020 30 June 2019$ $ $ $ $ $ $ $
Non-derivative financial liabilities
Bank overdraftsDue for maturity in: < 1 month - 4,630 - - - - - 791,726Total bank overdrafts - 4,630 - - - - - 791,726
PayablesDue for maturity in: < 1 month 4,711,405 3,770,889 30,420,974 8,944,905 242,286 331,047 102,294,765 76,803,511
> 3 months but < 12 months - - - - - - - - Total payables 4,711,405 3,770,889 30,420,974 8,944,905 242,286 331,047 102,294,765 76,803,511
Amounts attributable to unitholdersOn call amounts 558,107,725 646,028,046 209,512,040 175,385,617 53,856,406 74,313,021 328,239,192 456,074,137Total amounts attributable to unitholders 558,107,725 646,028,046 209,512,040 175,385,617 53,856,406 74,313,021 328,239,192 456,074,137
Derivative financial liabilitiesFair value < 1 month - - - - - - - -
> 1 month but < 3 months - - - - - - - - Total derivative financial liabilities - - - - - - - -
67. OneAnswer - Merlon Australian Share Income
Trust
68. OneAnswer - MFS Global Equity Trust
65. OneAnswer - Kapstream Absolute Return Income
Trust
66. OneAnswer - Magellan Global Trust
30 June 2020 30 June 2019 30 June 2020 30 June 2019 30 June 2020 30 June 2019 30 June 2020 30 June 2019$ $ $ $ $ $ $ $
Non-derivative financial liabilities
Bank overdraftsDue for maturity in: < 1 month - - - - - - - - Total bank overdrafts - - - - - - - -
PayablesDue for maturity in: < 1 month 276,700 1,623,283 3,893,686 2,442,902 693,817 1,266,396 3,480,525 66,835
> 3 months but < 12 months - - - - - - - - Total payables 276,700 1,623,283 3,893,686 2,442,902 693,817 1,266,396 3,480,525 66,835
Amounts attributable to unitholdersOn call amounts 10,297,078 20,236,596 189,309,117 257,343,142 32,313,585 39,515,273 34,135,524 50,161,167Total amounts attributable to unitholders 10,297,078 20,236,596 189,309,117 257,343,142 32,313,585 39,515,273 34,135,524 50,161,167
Derivative financial liabilitiesFair value < 1 month - - - - - - - -
> 1 month but < 3 months - - - - - - - - Total derivative financial liabilities - - - - - - - -
71. OneAnswer - Pendal Australian Share Trust
72. OneAnswer - Pendal Core Hedged Global Shares Trust
69. OneAnswer - Nikko AM Australian Shares Trust
70. OneAnswer - OnePath Global Property Securities
Index Trust
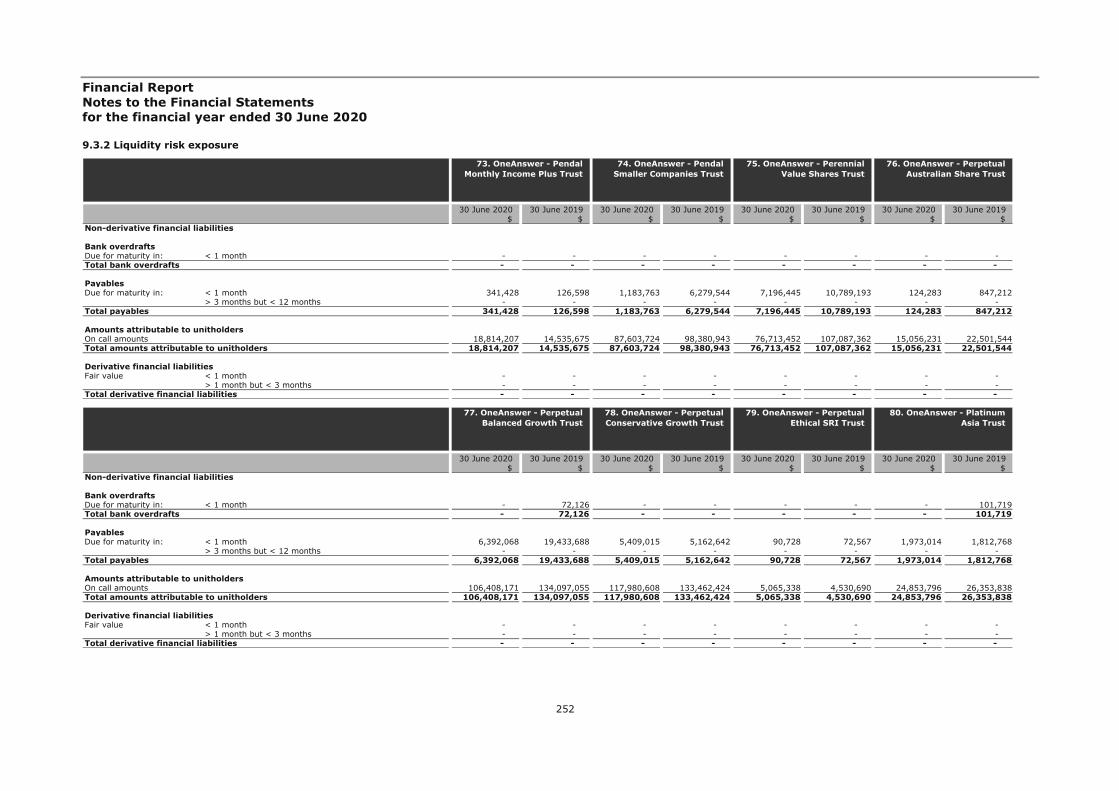
Financial Report Notes to the Financial Statements for the financial year ended 30 June 2020
252
9.3.2 Liquidity risk exposure
30 June 2020 30 June 2019 30 June 2020 30 June 2019 30 June 2020 30 June 2019 30 June 2020 30 June 2019$ $ $ $ $ $ $ $
Non-derivative financial liabilities
Bank overdraftsDue for maturity in: < 1 month - - - - - - - - Total bank overdrafts - - - - - - - -
PayablesDue for maturity in: < 1 month 341,428 126,598 1,183,763 6,279,544 7,196,445 10,789,193 124,283 847,212
> 3 months but < 12 months - - - - - - - - Total payables 341,428 126,598 1,183,763 6,279,544 7,196,445 10,789,193 124,283 847,212
Amounts attributable to unitholdersOn call amounts 18,814,207 14,535,675 87,603,724 98,380,943 76,713,452 107,087,362 15,056,231 22,501,544Total amounts attributable to unitholders 18,814,207 14,535,675 87,603,724 98,380,943 76,713,452 107,087,362 15,056,231 22,501,544
Derivative financial liabilitiesFair value < 1 month - - - - - - - -
> 1 month but < 3 months - - - - - - - - Total derivative financial liabilities - - - - - - - -
75. OneAnswer - Perennial Value Shares Trust
76. OneAnswer - Perpetual Australian Share Trust
73. OneAnswer - Pendal Monthly Income Plus Trust
74. OneAnswer - Pendal Smaller Companies Trust
30 June 2020 30 June 2019 30 June 2020 30 June 2019 30 June 2020 30 June 2019 30 June 2020 30 June 2019$ $ $ $ $ $ $ $
Non-derivative financial liabilities
Bank overdraftsDue for maturity in: < 1 month - 72,126 - - - - - 101,719Total bank overdrafts - 72,126 - - - - - 101,719
PayablesDue for maturity in: < 1 month 6,392,068 19,433,688 5,409,015 5,162,642 90,728 72,567 1,973,014 1,812,768
> 3 months but < 12 months - - - - - - - - Total payables 6,392,068 19,433,688 5,409,015 5,162,642 90,728 72,567 1,973,014 1,812,768
Amounts attributable to unitholdersOn call amounts 106,408,171 134,097,055 117,980,608 133,462,424 5,065,338 4,530,690 24,853,796 26,353,838Total amounts attributable to unitholders 106,408,171 134,097,055 117,980,608 133,462,424 5,065,338 4,530,690 24,853,796 26,353,838
Derivative financial liabilitiesFair value < 1 month - - - - - - - -
> 1 month but < 3 months - - - - - - - - Total derivative financial liabilities - - - - - - - -
79. OneAnswer - Perpetual Ethical SRI Trust
80. OneAnswer - Platinum Asia Trust
77. OneAnswer - Perpetual Balanced Growth Trust
78. OneAnswer - Perpetual Conservative Growth Trust

Financial Report Notes to the Financial Statements for the financial year ended 30 June 2020
253
9.3.2 Liquidity risk exposure
30 June 2020 30 June 2019 30 June 2020 30 June 2019 30 June 2020 30 June 2019 30 June 2020 30 June 2019$ $ $ $ $ $ $ $
Non-derivative financial liabilities
Bank overdraftsDue for maturity in: < 1 month - 226,612 - - - 58,575 - 1,876,277Total bank overdrafts - 226,612 - - - 58,575 - 1,876,277
PayablesDue for maturity in: < 1 month 13,020,646 48,365,817 802,413 1,146,297 24,967,376 40,733,369 6,816,044 18,558,156
> 3 months but < 12 months - - - - - - - - Total payables 13,020,646 48,365,817 802,413 1,146,297 24,967,376 40,733,369 6,816,044 18,558,156
Amounts attributable to unitholdersOn call amounts 262,616,895 312,262,324 93,200,840 128,094,631 172,599,679 244,087,247 189,397,419 248,555,825Total amounts attributable to unitholders 262,616,895 312,262,324 93,200,840 128,094,631 172,599,679 244,087,247 189,397,419 248,555,825
Derivative financial liabilitiesFair value < 1 month - - - - - - - -
> 1 month but < 3 months - - - - - - - - Total derivative financial liabilities - - - - - - - -
83. OneAnswer - Schroder Australian Equity Trust
84. OneAnswer - Schroder Balanced Trust
81. OneAnswer - Platinum International Trust
82. OneAnswer - RARE Infastructure Value Trust
30 June 2020 30 June 2019 30 June 2020 30 June 2019 30 June 2020 30 June 2019 30 June 2020 30 June 2019$ $ $ $ $ $ $ $
Non-derivative financial liabilities
Bank overdraftsDue for maturity in: < 1 month - - - 206,323 - - - - Total bank overdrafts - - - 206,323 - - - -
PayablesDue for maturity in: < 1 month 8,068,373 5,797,047 13,255,323 4,720,695 2,203,396 3,111,971 567,642 426,633
> 3 months but < 12 months - - - - - - - - Total payables 8,068,373 5,797,047 13,255,323 4,720,695 2,203,396 3,111,971 567,642 426,633
Amounts attributable to unitholdersOn call amounts 194,855,214 219,170,143 366,895,687 436,775,580 11,737,306 20,761,532 6,117,756 4,677,634Total amounts attributable to unitholders 194,855,214 219,170,143 366,895,687 436,775,580 11,737,306 20,761,532 6,117,756 4,677,634
Derivative financial liabilitiesFair value < 1 month - - - - - - - -
> 1 month but < 3 months - - - - - - - - Total derivative financial liabilities - - - - - - - -
87. OneAnswer - SG Hiscock Property Trust
88. OneAnswer - Stewart Investors Worldwide
Sustainability Trust
85. OneAnswer - Schroder Fixed Income Trust
86. OneAnswer - Schroder Real Return Trust

Financial Report Notes to the Financial Statements for the financial year ended 30 June 2020
254
9.3.2 Liquidity risk exposure
30 June 2020 30 June 2019 30 June 2020 30 June 2019 30 June 2020 30 June 2019 30 June 2020 30 June 2019$ $ $ $ $ $ $ $
Non-derivative financial liabilities
Bank overdraftsDue for maturity in: < 1 month - - - - - 151,197 122,024 36,566Total bank overdrafts - - - - - 151,197 122,024 36,566
PayablesDue for maturity in: < 1 month 7,105,617 4,495,522 108,865 169,783 4,706,947 3,780,942 1,586,289 1,595,493
> 3 months but < 12 months - - - - - - - - Total payables 7,105,617 4,495,522 108,865 169,783 4,706,947 3,780,942 1,586,289 1,595,493
Amounts attributable to unitholdersOn call amounts 42,189,634 34,278,498 65,838,947 47,477,223 55,518,802 70,808,948 20,774,215 23,163,043Total amounts attributable to unitholders 42,189,634 34,278,498 65,838,947 47,477,223 55,518,802 70,808,948 20,774,215 23,163,043
Derivative financial liabilitiesFair value < 1 month - - - - - - - -
> 1 month but < 3 months - - - - - - - - Total derivative financial liabilities - - - - - - - -
91. OneAnswer - UBS Balanced Trust
92. OneAnswer - UBS Defensive Trust
89. OneAnswer - T. Rowe Price Global Equity Trust
90. OneAnswer - T.Rowe Price Dynamic Global Bond
Trust
30 June 2020 30 June 2019 30 June 2020 30 June 2019 30 June 2020 30 June 2019 30 June 2020 30 June 2019$ $ $ $ $ $ $ $
Non-derivative financial liabilities
Bank overdraftsDue for maturity in: < 1 month - 169,056 - - - - - - Total bank overdrafts - 169,056 - - - - - -
PayablesDue for maturity in: < 1 month 2,076,881 1,389,506 42,342,130 42,789,491 181,688,504 90,675,542 51,424,000 23,368,807
> 3 months but < 12 months - - - - - - - - Total payables 2,076,881 1,389,506 42,342,130 42,789,491 181,688,504 90,675,542 51,424,000 23,368,807
Amounts attributable to unitholdersOn call amounts 108,393,046 102,159,963 888,468,717 1,110,892,092 1,940,003,765 2,267,141,350 764,063,740 807,575,347Total amounts attributable to unitholders 108,393,046 102,159,963 888,468,717 1,110,892,092 1,940,003,765 2,267,141,350 764,063,740 807,575,347
Derivative financial liabilitiesFair value < 1 month - - - - - - - -
> 1 month but < 3 months - - - - - - - - Total derivative financial liabilities - - - - - - - -
95. OneAnswer - Vanguard Balanced Index Trust
96. OneAnswer - Vanguard Conservative Index Trust
93. OneAnswer - UBS Diversified Fixed Income
Trust
94. OneAnswer - Vanguard Australian Shares Index
Trust

Financial Report Notes to the Financial Statements for the financial year ended 30 June 2020
255
9.3.2 Liquidity risk exposure
30 June 2020 30 June 2019 30 June 2020 30 June 2019 30 June 2020 30 June 2019 30 June 2020 30 June 2019$ $ $ $ $ $ $ $
Non-derivative financial liabilities
Bank overdraftsDue for maturity in: < 1 month - - - - - - - - Total bank overdrafts - - - - - - - -
PayablesDue for maturity in: < 1 month 4,633,064 322,474 91,408,310 52,943,371 32,800,709 23,196,987 13,842,392 6,734,141
> 3 months but < 12 months - - - - - - - - Total payables 4,633,064 322,474 91,408,310 52,943,371 32,800,709 23,196,987 13,842,392 6,734,141
Amounts attributable to unitholdersOn call amounts 98,961,075 104,453,713 901,687,477 1,076,726,697 325,689,404 382,261,183 85,271,454 104,229,220Total amounts attributable to unitholders 98,961,075 104,453,713 901,687,477 1,076,726,697 325,689,404 382,261,183 85,271,454 104,229,220
Derivative financial liabilitiesFair value < 1 month - - - - - - - -
> 1 month but < 3 months - - - - - - - - Total derivative financial liabilities - - - - - - - -
99. OneAnswer - Vanguard High Growth Index Trust
100. OneAnswer - Vanguard International Shares Index
(Hedged) Trust
97. OneAnswer - Vanguard Diversified Bond Index Trust
98. OneAnswer - Vanguard Growth Index Trust
30 June 2020 30 June 2019 30 June 2020 30 June 2019 30 June 2020 30 June 2019 30 June 2020 30 June 2019$ $ $ $ $ $ $ $
Non-derivative financial liabilities
Bank overdraftsDue for maturity in: < 1 month - - - - - - - - Total bank overdrafts - - - - - - - -
PayablesDue for maturity in: < 1 month 103,932,625 84,068,871 9,289,178 5,014,879 3,243,761 4,056,673 3,356,607 737,933
> 3 months but < 12 months - - - - - - - - Total payables 103,932,625 84,068,871 9,289,178 5,014,879 3,243,761 4,056,673 3,356,607 737,933
Amounts attributable to unitholdersOn call amounts 676,842,355 805,852,879 113,542,113 173,942,484 33,578,835 39,154,525 180,724,682 202,101,750Total amounts attributable to unitholders 676,842,355 805,852,879 113,542,113 173,942,484 33,578,835 39,154,525 180,724,682 202,101,750
Derivative financial liabilitiesFair value < 1 month - - - - - - - -
> 1 month but < 3 months - - - - - - - - Total derivative financial liabilities - - - - - - - -
103. OneAnswer - Walter Scott Global Equity (Hedged)
Trust
104. OnePath Alternatives Growth Fund
101. OneAnswer - Vanguard International Shares Index
Trust
102. OneAnswer - Vanguard Property Securities Index
Trust

Financial Report Notes to the Financial Statements for the financial year ended 30 June 2020
256
9.3.2 Liquidity risk exposure
30 June 2020 30 June 2019 30 June 2020 30 June 2019 30 June 2020 30 June 2019 30 June 2020 30 June 2019$ $ $ $ $ $ $ $
Non-derivative financial liabilities
Bank overdraftsDue for maturity in: < 1 month - - - - - - - - Total bank overdrafts - - - - - - - -
PayablesDue for maturity in: < 1 month 39,923,275 27,296,872 100,121 30,543 2,074 1,766 480,291 224,322
> 3 months but < 12 months - - - - - - - - Total payables 39,923,275 27,296,872 100,121 30,543 2,074 1,766 480,291 224,322
Amounts attributable to unitholdersOn call amounts 610,915,431 746,081,588 4,651,491 5,572,208 819,345 942,149 12,995,360 15,464,520Total amounts attributable to unitholders 610,915,431 746,081,588 4,651,491 5,572,208 819,345 942,149 12,995,360 15,464,520
Derivative financial liabilitiesFair value < 1 month - - - - - - - -
> 1 month but < 3 months 6,617 87,888 - - - - - - Total derivative financial liabilities 6,617 87,888 - - - - - -
107. OnePath Diversified Credit Trust
108. OnePath Diversified Fixed Interest Trust
105. OnePath Capital Guaranteed Trust
106. OnePath Capital Stable Trust
30 June 2020 30 June 2019 30 June 2020 30 June 2019 30 June 2020 30 June 2019 30 June 2020 30 June 2019$ $ $ $ $ $ $ $
Non-derivative financial liabilities
Bank overdraftsDue for maturity in: < 1 month - - - - - - - - Total bank overdrafts - - - - - - - -
PayablesDue for maturity in: < 1 month 143,447 376,335 426,543 383,513 11,549 9,102 6,743 91,156
> 3 months but < 12 months - - - - - - - - Total payables 143,447 376,335 426,543 383,513 11,549 9,102 6,743 91,156
Amounts attributable to unitholdersOn call amounts 4,542,668 5,834,502 32,916,183 35,186,827 734,839 1,116,900 2,714,976 3,734,867Total amounts attributable to unitholders 4,542,668 5,834,502 32,916,183 35,186,827 734,839 1,116,900 2,714,976 3,734,867
Derivative financial liabilitiesFair value < 1 month - - - - - - - -
> 1 month but < 3 months - - - - - - - - Total derivative financial liabilities - - - - - - - -
111. OnePath Managed Growth Trust
112. OnePath Select Leaders Trust
109. OnePath Geared Australian Shares Index
Trust
110. OnePath Global Emerging Markets Share
Trust

Financial Report Notes to the Financial Statements for the financial year ended 30 June 2020
257
9.3.2 Liquidity risk exposure
† OnePath Wholesale Geared Australian Shares Index Trust holds a revolving debt facility (2020: $75 million and 2019: $75 million) and the drawn amount of this facility has been classified as Payables. Refer to Note 11.8 Loans held with Australia and New
Zealand Banking Group Limited for more details of the revolving debt facility.
30 June 2020 30 June 2019 30 June 2020 30 June 2019 30 June 2020 30 June 2019 30 June 2020 30 June 2019$ $ $ $ $ $ $ $
Non-derivative financial liabilities
Bank overdraftsDue for maturity in: < 1 month - - - - - - - - Total bank overdrafts - - - - - - - -
PayablesDue for maturity in: < 1 month 68,976 37,353 7,395,337 12,761,763 27,029,540 15,365,660 91,333 188,448
> 3 months but < 12 months - - - - - - - - Total payables 68,976 37,353 7,395,337 12,761,763 27,029,540 15,365,660 91,333 188,448
Amounts attributable to unitholdersOn call amounts 1,722,536 1,803,582 167,571,306 227,383,148 392,177,394 490,430,586 6,611,496 16,276,841Total amounts attributable to unitholders 1,722,536 1,803,582 167,571,306 227,383,148 392,177,394 490,430,586 6,611,496 16,276,841
Derivative financial liabilitiesFair value < 1 month - - - - 14,180 24,657 - -
> 1 month but < 3 months - - - - 86,392 183,819 - - Total derivative financial liabilities - - - - 100,572 208,476 - -
115. OnePath Wholesale Balanced Trust
116. OnePath Wholesale Blue Chip Imputation Trust
113. OnePath Sustainable Investments - Australian
Share Trust
114. OnePath Wholesale Australian Share Trust
30 June 2020 30 June 2019 30 June 2020 30 June 2019 30 June 2020 30 June 2019 30 June 2020 30 June 2019$ $ $ $ $ $ $ $
Non-derivative financial liabilities
Bank overdraftsDue for maturity in: < 1 month - - 53,300 - - - - - Total bank overdrafts - - 53,300 - - - - -
PayablesDue for maturity in: < 1 month 19,214,646 13,706,635 26,562,439 13,509,224 16,051,403 6,533,897 2,996,845 4,466,164
> 3 months but < 12 months - - - - - - 47,539,000 57,049,000Total payables 19,214,646 13,706,635 26,562,439 13,509,224 16,051,403 6,533,897 50,535,845 61,515,164
Amounts attributable to unitholdersOn call amounts 344,687,308 423,751,098 522,815,177 613,707,783 47,984,168 68,421,520 44,462,911 51,963,890Total amounts attributable to unitholders 344,687,308 423,751,098 522,815,177 613,707,783 47,984,168 68,421,520 44,462,911 51,963,890
Derivative financial liabilitiesFair value < 1 month - - - - - - - -
> 1 month but < 3 months 3,308 13,303 - - - - - - Total derivative financial liabilities 3,308 13,303 - - - - - -
119. OnePath Wholesale Emerging Companies Trust
120. OnePath Wholesale Geared Australian Shares
Index Trust†
117. OnePath Wholesale Capital Stable Trust
118. OnePath Wholesale Diversified Fixed Interest
Trust

Financial Report Notes to the Financial Statements for the financial year ended 30 June 2020
258
9.3.2 Liquidity risk exposure
30 June 2020 30 June 2019 30 June 2020 30 June 2019 30 June 2020 30 June 2019 30 June 2020 30 June 2019$ $ $ $ $ $ $ $
Non-derivative financial liabilities
Bank overdraftsDue for maturity in: < 1 month - - - - - - - - Total bank overdrafts - - - - - - - -
PayablesDue for maturity in: < 1 month 121,425 116,673 3,021,416 3,003,133 2,299,743 1,359,623 511,112 367,282
> 3 months but < 12 months - - - - - - - - Total payables 121,425 116,673 3,021,416 3,003,133 2,299,743 1,359,623 511,112 367,282
Amounts attributable to unitholdersOn call amounts 11,344,901 13,216,898 35,196,894 43,585,584 20,096,936 24,256,048 6,856,912 8,342,052Total amounts attributable to unitholders 11,344,901 13,216,898 35,196,894 43,585,584 20,096,936 24,256,048 6,856,912 8,342,052
Derivative financial liabilitiesFair value < 1 month - - 1,349 14,365 - - - -
> 1 month but < 3 months - - 5,316 - - - - - Total derivative financial liabilities - - 6,665 14,365 - - - -
123. OnePath Wholesale Index Balanced Trust
124. OnePath Wholesale Index Conservative Trust
121. OnePath Wholesale Global Emerging Markets
Share Trust
122. OnePath Wholesale High Growth Trust
30 June 2020 30 June 2019 30 June 2020 30 June 2019 30 June 2020 30 June 2019 30 June 2020 30 June 2019$ $ $ $ $ $ $ $
Non-derivative financial liabilities
Bank overdraftsDue for maturity in: < 1 month - - - - - - - - Total bank overdrafts - - - - - - - -
PayablesDue for maturity in: < 1 month 424,952 357,516 57,785,647 50,503,714 29,925 22,703 2,923,963 2,782,888
> 3 months but < 12 months - - - - - - - - Total payables 424,952 357,516 57,785,647 50,503,714 29,925 22,703 2,923,963 2,782,888
Amounts attributable to unitholdersOn call amounts 4,173,603 5,375,689 849,375,268 1,030,000,488 1,755,227 2,645,443 73,609,643 98,787,362Total amounts attributable to unitholders 4,173,603 5,375,689 849,375,268 1,030,000,488 1,755,227 2,645,443 73,609,643 98,787,362
Derivative financial liabilitiesFair value < 1 month - - 50,636 159,563 - - - -
> 1 month but < 3 months - - 307,494 296,364 - - - - Total derivative financial liabilities - - 358,130 455,927 - - - -
127. OnePath Wholesale Property Securities Trust
128. OnePath Wholesale Select Leaders Trust
125. OnePath Wholesale Index Moderate Trust
126. OnePath Wholesale Managed Growth Trust

Financial Report Notes to the Financial Statements for the financial year ended 30 June 2020
259
9.3.2 Liquidity risk exposure
30 June 2020 30 June 2019 30 June 2020 30 June 2019 30 June 2020 30 June 2019 30 June 2020 30 June 2019$ $ $ $ $ $ $ $
Non-derivative financial liabilities
Bank overdraftsDue for maturity in: < 1 month - - - - - - - - Total bank overdrafts - - - - - - - -
PayablesDue for maturity in: < 1 month 118,107 76,989 22,896 107,666 741,532 319,358 242,332 80,059
> 3 months but < 12 months - - - - - - - - Total payables 118,107 76,989 22,896 107,666 741,532 319,358 242,332 80,059
Amounts attributable to unitholdersOn call amounts 3,417,333 3,651,150 10,120,840 13,678,783 33,998,744 41,282,247 9,385,317 11,896,797Total amounts attributable to unitholders 3,417,333 3,651,150 10,120,840 13,678,783 33,998,744 41,282,247 9,385,317 11,896,797
Derivative financial liabilitiesFair value < 1 month - - - - - - - -
> 1 month but < 3 months - - - - - - - - Total derivative financial liabilities - - - - - - - -
131. OptiMix Balanced Trust 132. OptiMix Conservative Trust
129. OptiMix Australian Fixed Interest Trust
130. OptiMix Australian Share Trust
30 June 2020 30 June 2019 30 June 2020 30 June 2019 30 June 2020 30 June 2019 30 June 2020 30 June 2019$ $ $ $ $ $ $ $
Non-derivative financial liabilities
Bank overdraftsDue for maturity in: < 1 month - - - - - - - - Total bank overdrafts - - - - - - - -
PayablesDue for maturity in: < 1 month 146,297 235,759 783,514 774,105 9,018 70,568 167,257 103,857
> 3 months but < 12 months - - - - - - - - Total payables 146,297 235,759 783,514 774,105 9,018 70,568 167,257 103,857
Amounts attributable to unitholdersOn call amounts 3,119,395 3,156,791 4,684,593 5,975,905 2,729,605 3,152,003 10,928,129 13,809,062Total amounts attributable to unitholders 3,119,395 3,156,791 4,684,593 5,975,905 2,729,605 3,152,003 10,928,129 13,809,062
Derivative financial liabilitiesFair value < 1 month - - - - - - - -
> 1 month but < 3 months - - - - - - - - Total derivative financial liabilities - - - - - - - -
135. OptiMix Global Smaller Companies Share Trust
136. OptiMix Growth Trust 133. OptiMix Global Emerging Markets Share
Trust
134. OptiMix Global Share Trust
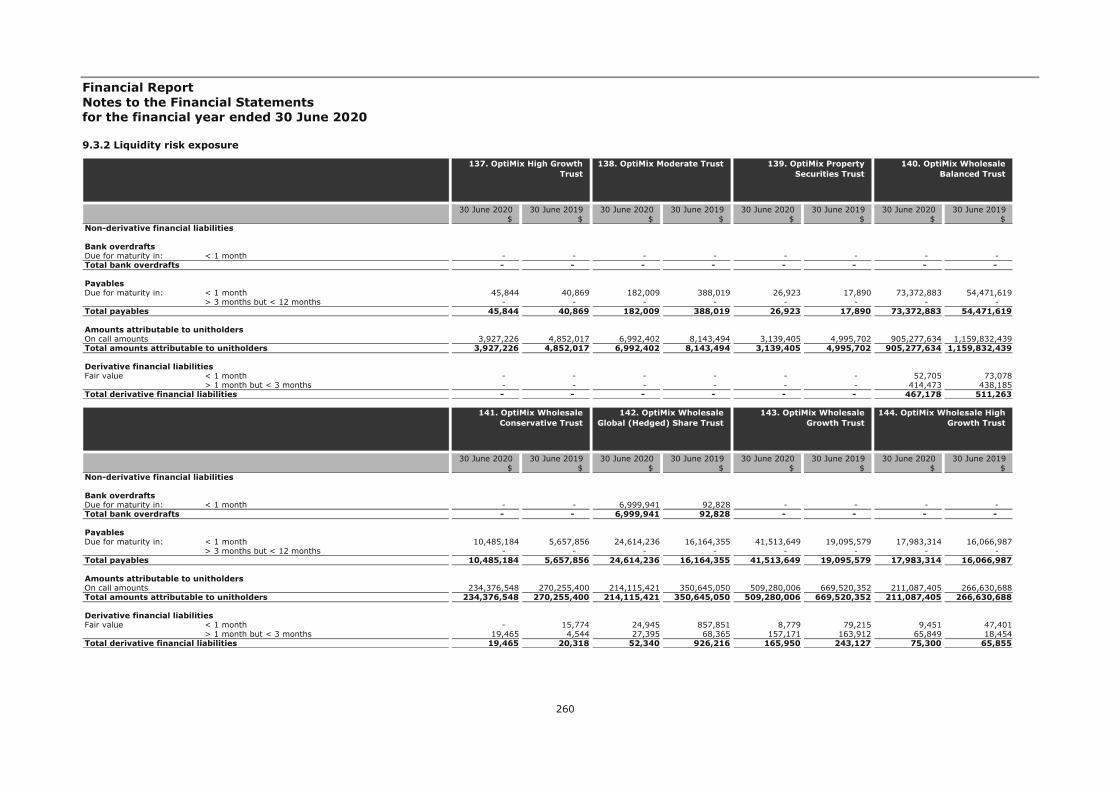
Financial Report Notes to the Financial Statements for the financial year ended 30 June 2020
260
9.3.2 Liquidity risk exposure
30 June 2020 30 June 2019 30 June 2020 30 June 2019 30 June 2020 30 June 2019 30 June 2020 30 June 2019$ $ $ $ $ $ $ $
Non-derivative financial liabilities
Bank overdraftsDue for maturity in: < 1 month - - - - - - - - Total bank overdrafts - - - - - - - -
PayablesDue for maturity in: < 1 month 45,844 40,869 182,009 388,019 26,923 17,890 73,372,883 54,471,619
> 3 months but < 12 months - - - - - - - - Total payables 45,844 40,869 182,009 388,019 26,923 17,890 73,372,883 54,471,619
Amounts attributable to unitholdersOn call amounts 3,927,226 4,852,017 6,992,402 8,143,494 3,139,405 4,995,702 905,277,634 1,159,832,439Total amounts attributable to unitholders 3,927,226 4,852,017 6,992,402 8,143,494 3,139,405 4,995,702 905,277,634 1,159,832,439
Derivative financial liabilitiesFair value < 1 month - - - - - - 52,705 73,078
> 1 month but < 3 months - - - - - - 414,473 438,185Total derivative financial liabilities - - - - - - 467,178 511,263
139. OptiMix Property Securities Trust
140. OptiMix Wholesale Balanced Trust
137. OptiMix High Growth Trust
138. OptiMix Moderate Trust
30 June 2020 30 June 2019 30 June 2020 30 June 2019 30 June 2020 30 June 2019 30 June 2020 30 June 2019$ $ $ $ $ $ $ $
Non-derivative financial liabilities
Bank overdraftsDue for maturity in: < 1 month - - 6,999,941 92,828 - - - - Total bank overdrafts - - 6,999,941 92,828 - - - -
PayablesDue for maturity in: < 1 month 10,485,184 5,657,856 24,614,236 16,164,355 41,513,649 19,095,579 17,983,314 16,066,987
> 3 months but < 12 months - - - - - - - - Total payables 10,485,184 5,657,856 24,614,236 16,164,355 41,513,649 19,095,579 17,983,314 16,066,987
Amounts attributable to unitholdersOn call amounts 234,376,548 270,255,400 214,115,421 350,645,050 509,280,006 669,520,352 211,087,405 266,630,688Total amounts attributable to unitholders 234,376,548 270,255,400 214,115,421 350,645,050 509,280,006 669,520,352 211,087,405 266,630,688
Derivative financial liabilitiesFair value < 1 month - 15,774 24,945 857,851 8,779 79,215 9,451 47,401
> 1 month but < 3 months 19,465 4,544 27,395 68,365 157,171 163,912 65,849 18,454Total derivative financial liabilities 19,465 20,318 52,340 926,216 165,950 243,127 75,300 65,855
143. OptiMix Wholesale Growth Trust
144. OptiMix Wholesale High Growth Trust
141. OptiMix Wholesale Conservative Trust
142. OptiMix Wholesale Global (Hedged) Share Trust
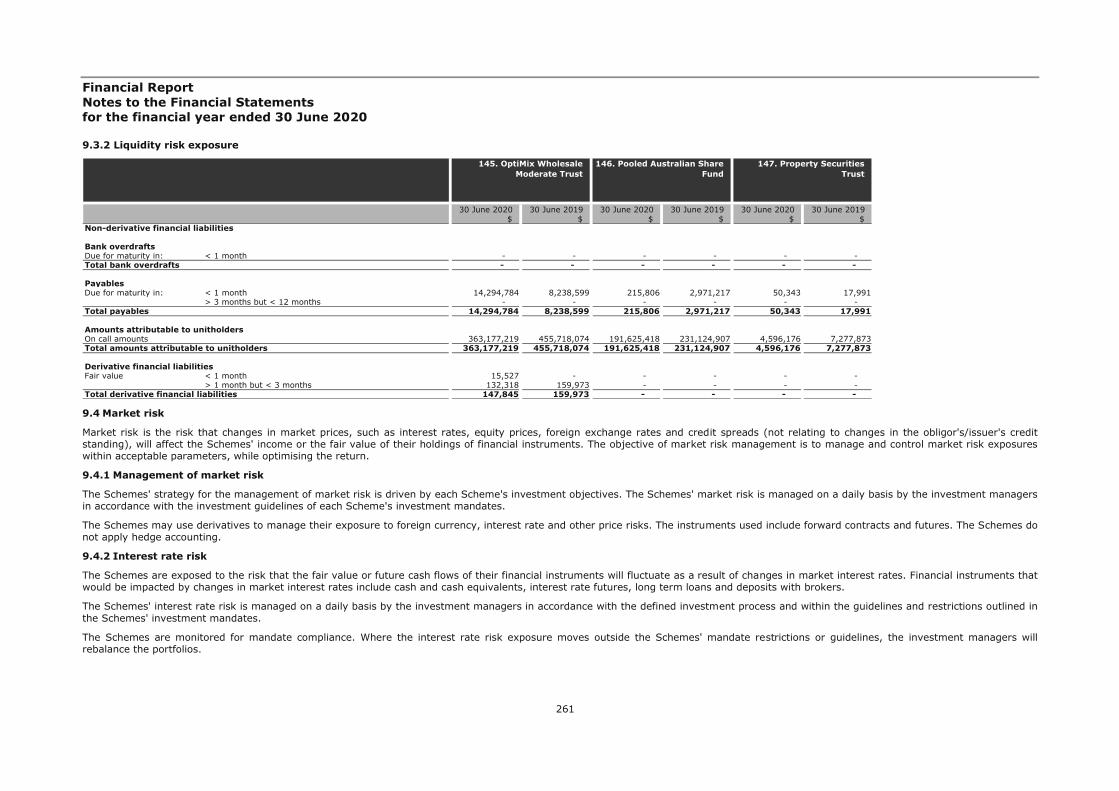
Financial Report Notes to the Financial Statements for the financial year ended 30 June 2020
261
9.3.2 Liquidity risk exposure
9.4 Market risk
Market risk is the risk that changes in market prices, such as interest rates, equity prices, foreign exchange rates and credit spreads (not relating to changes in the obligor's/issuer's credit standing), will affect the Schemes' income or the fair value of their holdings of financial instruments. The objective of market risk management is to manage and control market risk exposures within acceptable parameters, while optimising the return.
9.4.1 Management of market risk
The Schemes' strategy for the management of market risk is driven by each Scheme's investment objectives. The Schemes' market risk is managed on a daily basis by the investment managers in accordance with the investment guidelines of each Scheme's investment mandates.
The Schemes may use derivatives to manage their exposure to foreign currency, interest rate and other price risks. The instruments used include forward contracts and futures. The Schemes do not apply hedge accounting.
9.4.2 Interest rate risk
The Schemes are exposed to the risk that the fair value or future cash flows of their financial instruments will fluctuate as a result of changes in market interest rates. Financial instruments that would be impacted by changes in market interest rates include cash and cash equivalents, interest rate futures, long term loans and deposits with brokers.
The Schemes' interest rate risk is managed on a daily basis by the investment managers in accordance with the defined investment process and within the guidelines and restrictions outlined in the Schemes' investment mandates.
The Schemes are monitored for mandate compliance. Where the interest rate risk exposure moves outside the Schemes' mandate restrictions or guidelines, the investment managers will rebalance the portfolios.
30 June 2020 30 June 2019 30 June 2020 30 June 2019 30 June 2020 30 June 2019$ $ $ $ $ $
Non-derivative financial liabilities
Bank overdraftsDue for maturity in: < 1 month - - - - - - Total bank overdrafts - - - - - -
PayablesDue for maturity in: < 1 month 14,294,784 8,238,599 215,806 2,971,217 50,343 17,991
> 3 months but < 12 months - - - - - - Total payables 14,294,784 8,238,599 215,806 2,971,217 50,343 17,991
Amounts attributable to unitholdersOn call amounts 363,177,219 455,718,074 191,625,418 231,124,907 4,596,176 7,277,873Total amounts attributable to unitholders 363,177,219 455,718,074 191,625,418 231,124,907 4,596,176 7,277,873
Derivative financial liabilitiesFair value < 1 month 15,527 - - - - -
> 1 month but < 3 months 132,318 159,973 - - - - Total derivative financial liabilities 147,845 159,973 - - - -
147. Property Securities Trust
145. OptiMix Wholesale Moderate Trust
146. Pooled Australian Share Fund

Financial Report Notes to the Financial Statements for the financial year ended 30 June 2020
262
9.4.3 Exposure and sensitivity analysis - interest rate risk
Direct interest rate risk exposure at the reporting date is disclosed in Note 9.4.4 Interest rate risk exposure and sensitivity analysis.
A sensitivity analysis reflects how 'Net assets attributable to unitholders' and 'Profit/(loss) for the financial year/Total comprehensive income' would have been affected by changes in the relevant risk at the end of the reporting period. Management have determined that a fluctuation in interest rates of 100 basis points is reasonably possible, considering the economic environment in which the Schemes operate.
The tables at Note 9.4.4 Interest rate risk exposure and sensitivity analysis set out the effect on the Schemes' 'Net assets attributable to unitholders' and 'Change in net assets attributable to unitholders/Total comprehensive income' of a reasonably possible increase or reduction of 100 basis points in interest rates at 30 June 2020 (2019: 50 basis points).
9.4.4 Interest rate risk exposure and sensitivity analysis
The tables below detail the assets and liabilities exposed to, and sensitivity analysis on, interest rate risk.
Fixed interest rate Floating interest rate Total Fixed interest rate Floating interest rate Total Fixed interest rate Floating interest rate Total Fixed interest rate Floating interest rate Total $ $ $ $ $ $ $ $ $ $ $ $
30 June 2020Financial assetsCash and cash equivalents - 160,724 160,724 - 28,474 28,474 - 111,651 111,651 - 19,997 19,997Future and swap deposits - - - - - - - - - - - - Financial assets held at fair value through profit or loss - - - - - - - - - - - - Financial liabilitiesBank overdraft - - - - - - - - - - - - Future and swap payable - - - - - - - - - - - - Loan payable - - - - - - - - - - - - Financial liabilities held at fair value through profit or loss - - - - - - - - - - - - Net exposure - 160,724 160,724 - 28,474 28,474 - 111,651 111,651 - 19,997 19,997
30 June 2019Financial assetsCash and cash equivalents - 218,981 218,981 - 35,534 35,534 - 76,893 76,893 - 23,766 23,766Future and swap deposits - - - - - - - - - - - - Financial assets held at fair value through profit or loss - - - - - - - - - - - - Financial liabilitiesBank overdraft - - - - - - - - - - - - Future and swap payable - - - - - - - - - - - - Loan payable - - - - - - - - - - - - Financial liabilities held at fair value through profit or loss - - - - - - - - - - - - Net exposure - 218,981 218,981 - 35,534 35,534 - 76,893 76,893 - 23,766 23,766
Sensitivity analysis 2020 2019 2020 2019 2020 2019 2020 2019$ $ $ $ $ $ $ $
Impact on Profit/loss from operating activities and Net assets attributable to unitholders
Interest rate risk - increase of 100bps (2019: 50bps) 1,607 1,095 285 178 1,117 384 200 119Interest rate risk - decrease of 100bps (2019: 50bps) (1,607) (1,095) (285) (178) (1,117) (384) (200) (119)
1. Active Growth Trust 2. ANZ Equity Imputation Trust 3. ANZ Equity Trust No 1 4. ANZ Fixed Interest Trust

Financial Report Notes to the Financial Statements for the financial year ended 30 June 2020
263
9.4.4 Interest rate risk exposure and sensitivity analysis
Fixed interest rate Floating interest rate Total Fixed interest rate Floating interest rate Total Fixed interest rate Floating interest rate Total Fixed interest rate Floating interest rate Total $ $ $ $ $ $ $ $ $ $ $ $
30 June 2020Financial assetsCash and cash equivalents - 46,401 46,401 - - - - 479,920 479,920 - 184,126 184,126Future and swap deposits - - - - - - - - - - - - Financial assets held at fair value through profit or loss - - - - - - - - - - - - Financial liabilitiesBank overdraft - - - - (19,455) (19,455) - - - - - - Future and swap payable - - - - - - - - - - - - Loan payable - - - - - - - - - - - - Financial liabilities held at fair value through profit or loss - - - - - - - - - - - - Net exposure - 46,401 46,401 - (19,455) (19,455) - 479,920 479,920 - 184,126 184,126
30 June 2019Financial assetsCash and cash equivalents - 36,356 36,356 - 47,681 47,681 - 121,794 121,794 - 138,023 138,023Future and swap deposits - - - - - - - - - - - - Financial assets held at fair value through profit or loss - - - - - - - - - - - - Financial liabilitiesBank overdraft - - - - - - - - - - - - Future and swap payable - - - - - - - - - - - - Loan payable - - - - - - - - - - - - Financial liabilities held at fair value through profit or loss - - - - - - - - - - - - Net exposure - 36,356 36,356 - 47,681 47,681 - 121,794 121,794 - 138,023 138,023
Sensitivity analysis 2020 2019 2020 2019 2020 2019 2020 2019$ $ $ $ $ $ $ $
Impact on Profit/loss from operating activities and Net assets attributable to unitholders
Interest rate risk - increase of 100bps (2019: 50bps) 464 182 (195) 238 4,799 609 1,841 690Interest rate risk - decrease of 100bps (2019: 50bps) (464) (182) 195 (238) (4,799) (609) (1,841) (690)
5. ANZ OA - Pendal Core Hedged Global Shares Trust
6. ANZ OA Arrowstreet Global Equity (Hedged) Trust
7. ANZ OA Colonial First State Imputation Trust 8. ANZ OA Investors Mutual Australian Share Trust

Financial Report Notes to the Financial Statements for the financial year ended 30 June 2020
264
9.4.4 Interest rate risk exposure and sensitivity analysis
Fixed interest rate Floating interest rate Total Fixed interest rate Floating interest rate Total Fixed interest rate Floating interest rate Total Fixed interest rate Floating interest rate Total $ $ $ $ $ $ $ $ $ $ $ $
30 June 2020Financial assetsCash and cash equivalents - 856,474 856,474 - 316,172 316,172 - 235,181 235,181 - 80,458 80,458Future and swap deposits - - - - 90,463 90,463 - - - - - - Financial assets held at fair value through profit or loss - - - - - - - - - - - - Financial liabilitiesBank overdraft - - - - - - - - - - - - Future and swap payable - - - - (21,091) (21,091) - - - - - - Loan payable - - - - - - - - - - - - Financial liabilities held at fair value through profit or loss - - - - - - - - - - - - Net exposure - 856,474 856,474 - 385,544 385,544 - 235,181 235,181 - 80,458 80,458
30 June 2019Financial assetsCash and cash equivalents - 448,404 448,404 - 203,114 203,114 - 252,293 252,293 - 53,175 53,175Future and swap deposits - - - - 41,811 41,811 - - - - - - Financial assets held at fair value through profit or loss - - - - - - - - - - - - Financial liabilitiesBank overdraft - - - - - - - - - - - - Future and swap payable - - - - (21,583) (21,583) - - - - - - Loan payable - - - - - - - - - - - - Financial liabilities held at fair value through profit or loss - - - - - - - - - - - - Net exposure - 448,404 448,404 - 223,342 223,342 - 252,293 252,293 - 53,175 53,175
Sensitivity analysis 2020 2019 2020 2019 2020 2019 2020 2019$ $ $ $ $ $ $ $
Impact on Profit/loss from operating activities and Net assets attributable to unitholders
Interest rate risk - increase of 100bps (2019: 50bps) 8,565 2,242 3,855 1,117 2,352 1,261 805 266Interest rate risk - decrease of 100bps (2019: 50bps) (8,565) (2,242) (3,855) (1,117) (2,352) (1,261) (805) (266)
9. ANZ OA Magellan Global Trust 10. ANZ OA OnePath Active Growth Trust 11. ANZ OA OnePath Australian Share Trust 12. ANZ OA OnePath Balanced Trust
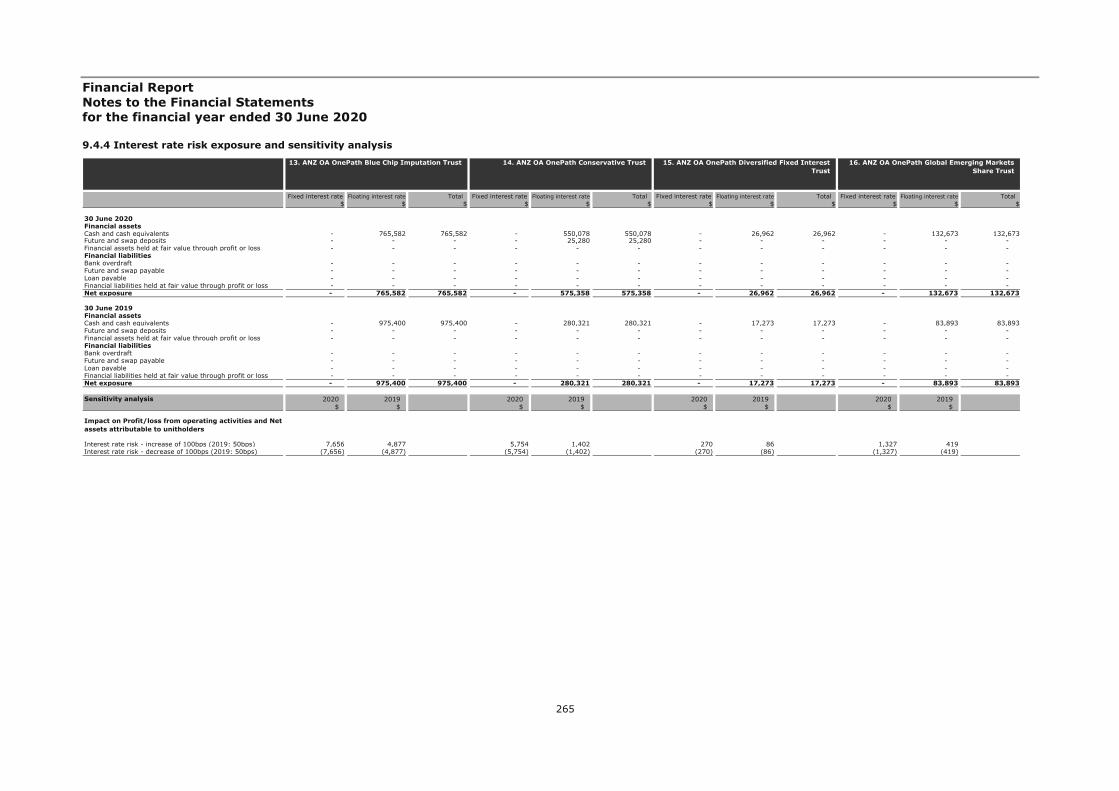
Financial Report Notes to the Financial Statements for the financial year ended 30 June 2020
265
9.4.4 Interest rate risk exposure and sensitivity analysis
Fixed interest rate Floating interest rate Total Fixed interest rate Floating interest rate Total Fixed interest rate Floating interest rate Total Fixed interest rate Floating interest rate Total $ $ $ $ $ $ $ $ $ $ $ $
30 June 2020Financial assetsCash and cash equivalents - 765,582 765,582 - 550,078 550,078 - 26,962 26,962 - 132,673 132,673Future and swap deposits - - - - 25,280 25,280 - - - - - - Financial assets held at fair value through profit or loss - - - - - - - - - - - - Financial liabilitiesBank overdraft - - - - - - - - - - - - Future and swap payable - - - - - - - - - - - - Loan payable - - - - - - - - - - - - Financial liabilities held at fair value through profit or loss - - - - - - - - - - - - Net exposure - 765,582 765,582 - 575,358 575,358 - 26,962 26,962 - 132,673 132,673
30 June 2019Financial assetsCash and cash equivalents - 975,400 975,400 - 280,321 280,321 - 17,273 17,273 - 83,893 83,893Future and swap deposits - - - - - - - - - - - - Financial assets held at fair value through profit or loss - - - - - - - - - - - - Financial liabilitiesBank overdraft - - - - - - - - - - - - Future and swap payable - - - - - - - - - - - - Loan payable - - - - - - - - - - - - Financial liabilities held at fair value through profit or loss - - - - - - - - - - - - Net exposure - 975,400 975,400 - 280,321 280,321 - 17,273 17,273 - 83,893 83,893
Sensitivity analysis 2020 2019 2020 2019 2020 2019 2020 2019$ $ $ $ $ $ $ $
Impact on Profit/loss from operating activities and Net assets attributable to unitholders
Interest rate risk - increase of 100bps (2019: 50bps) 7,656 4,877 5,754 1,402 270 86 1,327 419Interest rate risk - decrease of 100bps (2019: 50bps) (7,656) (4,877) (5,754) (1,402) (270) (86) (1,327) (419)
13. ANZ OA OnePath Blue Chip Imputation Trust 14. ANZ OA OnePath Conservative Trust 15. ANZ OA OnePath Diversified Fixed Interest Trust
16. ANZ OA OnePath Global Emerging Markets Share Trust

Financial Report Notes to the Financial Statements for the financial year ended 30 June 2020
266
9.4.4 Interest rate risk exposure and sensitivity analysis
Fixed interest rate Floating interest rate Total Fixed interest rate Floating interest rate Total Fixed interest rate Floating interest rate Total Fixed interest rate Floating interest rate Total $ $ $ $ $ $ $ $ $ $ $ $
30 June 2020Financial assetsCash and cash equivalents - 60,313 60,313 - 82,894 82,894 - 291,780 291,780 - 276,141 276,141Future and swap deposits - - - - 2 2 - - - - - - Financial assets held at fair value through profit or loss - - - - - - - - - - - - Financial liabilitiesBank overdraft - - - - - - - - - - - - Future and swap payable - - - - - - - - - - - - Loan payable - - - - - - - - - - - - Financial liabilities held at fair value through profit or loss - - - - - - - - - - - - Net exposure - 60,313 60,313 - 82,896 82,896 - 291,780 291,780 - 276,141 276,141
30 June 2019Financial assetsCash and cash equivalents - 45,838 45,838 - 21,358 21,358 - 191,463 191,463 - 343,241 343,241Future and swap deposits - - - - 2 2 - - - - - - Financial assets held at fair value through profit or loss - - - - - - - - - - - - Financial liabilitiesBank overdraft - - - - - - - - - - - - Future and swap payable - - - - - - - - - - - - Loan payable - - - - - - - - - - - - Financial liabilities held at fair value through profit or loss - - - - - - - - - - - - Net exposure - 45,838 45,838 - 21,360 21,360 - 191,463 191,463 - 343,241 343,241
Sensitivity analysis 2020 2019 2020 2019 2020 2019 2020 2019$ $ $ $ $ $ $ $
Impact on Profit/loss from operating activities and Net assets attributable to unitholders
Interest rate risk - increase of 100bps (2019: 50bps) 603 229 829 107 2,918 957 2,761 1,716Interest rate risk - decrease of 100bps (2019: 50bps) (603) (229) (829) (107) (2,918) (957) (2,761) (1,716)
17. ANZ OA OnePath High Growth Trust 18. ANZ OA OnePath Income Trust 19. ANZ OA OnePath Managed Growth Trust 20. ANZ OA OnePath Property Securities Trust

Financial Report Notes to the Financial Statements for the financial year ended 30 June 2020
267
9.4.4 Interest rate risk exposure and sensitivity analysis
Fixed interest rate Floating interest rate Total Fixed interest rate Floating interest rate Total Fixed interest rate Floating interest rate Total Fixed interest rate Floating interest rate Total $ $ $ $ $ $ $ $ $ $ $ $
30 June 2020Financial assetsCash and cash equivalents - 70,330 70,330 - 3,031 3,031 - 110,098 110,098 - 3,750 3,750Future and swap deposits - - - - - - - - - - - - Financial assets held at fair value through profit or loss - - - - - - - - - - - - Financial liabilitiesBank overdraft - - - - - - - - - - - - Future and swap payable - - - - - - - - - - - - Loan payable - - - - - - - - - - - - Financial liabilities held at fair value through profit or loss - - - - - - - - - - - - Net exposure - 70,330 70,330 - 3,031 3,031 - 110,098 110,098 - 3,750 3,750
30 June 2019Financial assetsCash and cash equivalents - 74,052 74,052 - 2,243 2,243 - 2,593 2,593 - 2,299 2,299Future and swap deposits - - - - - - - - - - - - Financial assets held at fair value through profit or loss - - - - - - - - - - - - Financial liabilitiesBank overdraft - - - - - - - - - - - - Future and swap payable - - - - - - - - - - - - Loan payable - - - - - - - - - - - - Financial liabilities held at fair value through profit or loss - - - - - - - - - - - - Net exposure - 74,052 74,052 - 2,243 2,243 - 2,593 2,593 - 2,299 2,299
Sensitivity analysis 2020 2019 2020 2019 2020 2019 2020 2019$ $ $ $ $ $ $ $
Impact on Profit/loss from operating activities and Net assets attributable to unitholders
Interest rate risk - increase of 100bps (2019: 50bps) 703 370 30 11 1,101 13 37 11Interest rate risk - decrease of 100bps (2019: 50bps) (703) (370) (30) (11) (1,101) (13) (37) (11)
21. ANZ OA OnePath Select Leaders Trust 22. ANZ OA OnePath Sustainable Investments - Australian Share Trust
23. ANZ OA OnePath Tax Effective Income Trust 24. ANZ OA OptiMix Australian Fixed Interest Trust

Financial Report Notes to the Financial Statements for the financial year ended 30 June 2020
268
9.4.4 Interest rate risk exposure and sensitivity analysis
Fixed interest rate Floating interest rate Total Fixed interest rate Floating interest rate Total Fixed interest rate Floating interest rate Total Fixed interest rate Floating interest rate Total $ $ $ $ $ $ $ $ $ $ $ $
30 June 2020Financial assetsCash and cash equivalents - 15,251 15,251 - 41,281 41,281 - 15,348 15,348 - 6,458 6,458Future and swap deposits - - - - - - - - - - - - Financial assets held at fair value through profit or loss - - - - - - - - - - - - Financial liabilitiesBank overdraft - - - - - - - - - - - - Future and swap payable - - - - - - - - - - - - Loan payable - - - - - - - - - - - - Financial liabilities held at fair value through profit or loss - - - - - - - - - - - - Net exposure - 15,251 15,251 - 41,281 41,281 - 15,348 15,348 - 6,458 6,458
30 June 2019Financial assetsCash and cash equivalents - 35,155 35,155 - 48,981 48,981 - 22,188 22,188 - 7,479 7,479Future and swap deposits - - - - - - - - - - - - Financial assets held at fair value through profit or loss - - - - - - - - - - - - Financial liabilitiesBank overdraft - - - - - - - - - - - - Future and swap payable - - - - - - - - - - - - Loan payable - - - - - - - - - - - - Financial liabilities held at fair value through profit or loss - - - - - - - - - - - - Net exposure - 35,155 35,155 - 48,981 48,981 - 22,188 22,188 - 7,479 7,479
Sensitivity analysis 2020 2019 2020 2019 2020 2019 2020 2019$ $ $ $ $ $ $ $
Impact on Profit/loss from operating activities and Net assets attributable to unitholders
Interest rate risk - increase of 100bps (2019: 50bps) 153 176 413 245 153 111 65 37Interest rate risk - decrease of 100bps (2019: 50bps) (153) (176) (413) (245) (153) (111) (65) (37)
25. ANZ OA OptiMix Australian Share Trust 26. ANZ OA OptiMix Conservative Trust 27. ANZ OA OptiMix Global Share Trust 28. ANZ OA OptiMix Global Smaller Companies Share Trust

Financial Report Notes to the Financial Statements for the financial year ended 30 June 2020
269
9.4.4 Interest rate risk exposure and sensitivity analysis
Fixed interest rate Floating interest rate Total Fixed interest rate Floating interest rate Total Fixed interest rate Floating interest rate Total Fixed interest rate Floating interest rate Total $ $ $ $ $ $ $ $ $ $ $ $
30 June 2020Financial assetsCash and cash equivalents - 72,097 72,097 - 19,252 19,252 - 62,049 62,049 - 7,563 7,563Future and swap deposits - - - - - - - - - - - - Financial assets held at fair value through profit or loss - - - - - - - - - - - - Financial liabilitiesBank overdraft - - - - - - - - - - - - Future and swap payable - - - - - - - - - - - - Loan payable - - - - - - - - - - - - Financial liabilities held at fair value through profit or loss - - - - - - - - - - - - Net exposure - 72,097 72,097 - 19,252 19,252 - 62,049 62,049 - 7,563 7,563
30 June 2019Financial assetsCash and cash equivalents - 81,630 81,630 - 38,179 38,179 - 55,282 55,282 - 9,700 9,700Future and swap deposits - - - - - - - - - - - - Financial assets held at fair value through profit or loss - - - - - - - - - - - - Financial liabilitiesBank overdraft - - - - - - - - - - - - Future and swap payable - - - - - - - - - - - - Loan payable - - - - - - - - - - - - Financial liabilities held at fair value through profit or loss - - - - - - - - - - - - Net exposure - 81,630 81,630 - 38,179 38,179 - 55,282 55,282 - 9,700 9,700
Sensitivity analysis 2020 2019 2020 2019 2020 2019 2020 2019$ $ $ $ $ $ $ $
Impact on Profit/loss from operating activities and Net assets attributable to unitholders
Interest rate risk - increase of 100bps (2019: 50bps) 721 408 193 191 620 276 76 49Interest rate risk - decrease of 100bps (2019: 50bps) (721) (408) (193) (191) (620) (276) (76) (49)
29. ANZ OA OptiMix Growth Trust 30. ANZ OA OptiMix High Growth Trust 31. ANZ OA OptiMix Moderate Trust 32. ANZ OA OptiMix Property Securities Trust

Financial Report Notes to the Financial Statements for the financial year ended 30 June 2020
270
9.4.4 Interest rate risk exposure and sensitivity analysis
Fixed interest rate Floating interest rate Total Fixed interest rate Floating interest rate Total Fixed interest rate Floating interest rate Total Fixed interest rate Floating interest rate Total $ $ $ $ $ $ $ $ $ $ $ $
30 June 2020Financial assetsCash and cash equivalents - 804,917 804,917 - 265,409 265,409 - 36,468 36,468 - 7,148 7,148Future and swap deposits - - - - - - - - - - - - Financial assets held at fair value through profit or loss - - - - - - - - - - - - Financial liabilitiesBank overdraft - - - - - - - - - - - - Future and swap payable - - - - - - - - - - - - Loan payable - - - - - - - - - - - - Financial liabilities held at fair value through profit or loss - - - - - - - - - - - - Net exposure - 804,917 804,917 - 265,409 265,409 - 36,468 36,468 - 7,148 7,148
30 June 2019Financial assetsCash and cash equivalents - 858,396 858,396 - 269,459 269,459 - 26,206 26,206 - 8,790 8,790Future and swap deposits - - - - - - - - - - - - Financial assets held at fair value through profit or loss - - - - - - - - - - - - Financial liabilitiesBank overdraft - - - - - - - - - - - - Future and swap payable - - - - - - - - - - - - Loan payable - - - - - - - - - - - - Financial liabilities held at fair value through profit or loss - - - - - - - - - - - - Net exposure - 858,396 858,396 - 269,459 269,459 - 26,206 26,206 - 8,790 8,790
Sensitivity analysis 2020 2019 2020 2019 2020 2019 2020 2019$ $ $ $ $ $ $ $
Impact on Profit/loss from operating activities and Net assets attributable to unitholders
Interest rate risk - increase of 100bps (2019: 50bps) 8,049 4,292 2,654 1,347 365 131 71 44Interest rate risk - decrease of 100bps (2019: 50bps) (8,049) (4,292) (2,654) (1,347) (365) (131) (71) (44)
33. ANZ OA Perpetual Australian Share Trust 34. ANZ OA Schroder Australian Equity Trust 35. ANZ OA SG Hiscock Property Trust 36. ANZ OA UBS Diversified Fixed Income Trust

Financial Report Notes to the Financial Statements for the financial year ended 30 June 2020
271
9.4.4 Interest rate risk exposure and sensitivity analysis
Fixed interest rate Floating interest rate Total Fixed interest rate Floating interest rate Total Fixed interest rate Floating interest rate Total Fixed interest rate Floating interest rate Total $ $ $ $ $ $ $ $ $ $ $ $
30 June 2020Financial assetsCash and cash equivalents - 47,318 47,318 - 58,206 58,206 - 3,285,361 3,285,361 - 166,785 166,785Future and swap deposits - - - - - - - - - - - - Financial assets held at fair value through profit or loss - - - - - - - - - - - - Financial liabilitiesBank overdraft - - - - - - - - - - - - Future and swap payable - - - - - - - - - - - - Loan payable - - - - - - - - - - - - Financial liabilities held at fair value through profit or loss - - - - - - - - - - - - Net exposure - 47,318 47,318 - 58,206 58,206 - 3,285,361 3,285,361 - 166,785 166,785
30 June 2019Financial assetsCash and cash equivalents - 7,168 7,168 - - - - 6,772,942 6,772,942 - 225,148 225,148Future and swap deposits - - - - - - - - - - - - Financial assets held at fair value through profit or loss - - - - - - - - - - - - Financial liabilitiesBank overdraft - - - - (24,109) (24,109) - - - - - - Future and swap payable - - - - - - - - - - - - Loan payable - - - - - - - - - - - - Financial liabilities held at fair value through profit or loss - - - - - - - - - - - - Net exposure - 7,168 7,168 - (24,109) (24,109) - 6,772,942 6,772,942 - 225,148 225,148
Sensitivity analysis 2020 2019 2020 2019 2020 2019 2020 2019$ $ $ $ $ $ $ $
Impact on Profit/loss from operating activities and Net assets attributable to unitholders
Interest rate risk - increase of 100bps (2019: 50bps) 473 36 582 (121) 32,854 33,865 1,668 1,126Interest rate risk - decrease of 100bps (2019: 50bps) (473) (36) (582) 121 (32,854) (33,865) (1,668) (1,126)
37. ANZ OneAnswer - BR Scientific Australian Equity Trust
38. ANZ OneAnswer - BR Scientific International Equity Trust
39. ANZ Private International Fixed Interest Fund
40. ANZ Property Securities Trust

Financial Report Notes to the Financial Statements for the financial year ended 30 June 2020
272
9.4.4 Interest rate risk exposure and sensitivity analysis
Fixed interest rate Floating interest rate Total Fixed interest rate Floating interest rate Total Fixed interest rate Floating interest rate Total Fixed interest rate Floating interest rate Total $ $ $ $ $ $ $ $ $ $ $ $
30 June 2020Financial assetsCash and cash equivalents - 298,005 298,005 - 203,492 203,492 - 259,217 259,217 - 639,382 639,382Future and swap deposits - - - - - - - - - - - - Financial assets held at fair value through profit or loss - - - - - - - - - - - - Financial liabilitiesBank overdraft - - - - - - - - - - - - Future and swap payable - - - - - - - - - - - - Loan payable - - - - - - - - - - - - Financial liabilities held at fair value through profit or loss - - - - - - - - - - - - Net exposure - 298,005 298,005 - 203,492 203,492 - 259,217 259,217 - 639,382 639,382
30 June 2019Financial assetsCash and cash equivalents - 208,342 208,342 - 244,295 244,295 - 352,569 352,569 - 700,461 700,461Future and swap deposits - - - - - - - - - - - - Financial assets held at fair value through profit or loss - - - - - - - - - - - - Financial liabilitiesBank overdraft - - - - - - - - - - - - Future and swap payable - - - - - - - - - - - - Loan payable - - - - - - - - - - - - Financial liabilities held at fair value through profit or loss - - - - - - - - - - - - Net exposure - 208,342 208,342 - 244,295 244,295 - 352,569 352,569 - 700,461 700,461
Sensitivity analysis 2020 2019 2020 2019 2020 2019 2020 2019$ $ $ $ $ $ $ $
Impact on Profit/loss from operating activities and Net assets attributable to unitholders
Interest rate risk - increase of 100bps (2019: 50bps) 2,980 1,042 2,035 1,221 2,592 1,763 6,394 3,502Interest rate risk - decrease of 100bps (2019: 50bps) (2,980) (1,042) (2,035) (1,221) (2,592) (1,763) (6,394) (3,502)
41. Australian Share Trust 42. Balanced Trust 43. Blue Chip Imputation Trust 44. Emerging Companies Trust

Financial Report Notes to the Financial Statements for the financial year ended 30 June 2020
273
9.4.4 Interest rate risk exposure and sensitivity analysis
Fixed interest rate Floating interest rate Total Fixed interest rate Floating interest rate Total Fixed interest rate Floating interest rate Total Fixed interest rate Floating interest rate Total $ $ $ $ $ $ $ $ $ $ $ $
30 June 2020Financial assetsCash and cash equivalents - 525,409 525,409 - 24,045 24,045 - 4,984 4,984 - - - Future and swap deposits - - - - - - - - - - - - Financial assets held at fair value through profit or loss - - - - - - - - - - - - Financial liabilitiesBank overdraft - - - - - - - - - - (39,855) (39,855)Future and swap payable - - - - - - - - - - - - Loan payable - - - - - - - - - - - - Financial liabilities held at fair value through profit or loss - - - - - - - - - - - - Net exposure - 525,409 525,409 - 24,045 24,045 - 4,984 4,984 - (39,855) (39,855)
30 June 2019Financial assetsCash and cash equivalents - 168,390 168,390 - 29,390 29,390 - 3,123 3,123 - - - Future and swap deposits - - - - - - - - - - - - Financial assets held at fair value through profit or loss - - - - - - - - - - - - Financial liabilitiesBank overdraft - - - - - - - - - - (4,847) (4,847)Future and swap payable - - - - - - - - - - - - Loan payable - - - - - - - - - - - - Financial liabilities held at fair value through profit or loss - - - - - - - - - - - - Net exposure - 168,390 168,390 - 29,390 29,390 - 3,123 3,123 - (4,847) (4,847)
Sensitivity analysis 2020 2019 2020 2019 2020 2019 2020 2019$ $ $ $ $ $ $ $
Impact on Profit/loss from operating activities and Net assets attributable to unitholders
Interest rate risk - increase of 100bps (2019: 50bps) 5,254 842 240 147 50 16 (399) (24)Interest rate risk - decrease of 100bps (2019: 50bps) (5,254) (842) (240) (147) (50) (16) 399 24
45. Global Share Trust 46. Heine Property Securities Fund 47. High Growth Trust 48. OneAnswer - Altrinsic Global Equities Trust

Financial Report Notes to the Financial Statements for the financial year ended 30 June 2020
274
9.4.4 Interest rate risk exposure and sensitivity analysis
Fixed interest rate Floating interest rate Total Fixed interest rate Floating interest rate Total Fixed interest rate Floating interest rate Total Fixed interest rate Floating interest rate Total $ $ $ $ $ $ $ $ $ $ $ $
30 June 2020Financial assetsCash and cash equivalents - 146,409 146,409 - 33,713 33,713 - 177,853 177,853 - 212,043 212,043Future and swap deposits - - - - - - - - - - - - Financial assets held at fair value through profit or loss - - - - - - - - - - - - Financial liabilitiesBank overdraft - - - - - - - - - - - - Future and swap payable - - - - - - - - - - - - Loan payable - - - - - - - - - - - - Financial liabilities held at fair value through profit or loss - - - - - - - - - - - - Net exposure - 146,409 146,409 - 33,713 33,713 - 177,853 177,853 - 212,043 212,043
30 June 2019Financial assetsCash and cash equivalents - - - - 41,153 41,153 - - - - 354,006 354,006Future and swap deposits - - - - - - - - - - - - Financial assets held at fair value through profit or loss - - - - - - - - - - - - Financial liabilitiesBank overdraft - (155,545) (155,545) - - - - (155,506) (155,506) - - - Future and swap payable - - - - - - - - - - - - Loan payable - - - - - - - - - - - - Financial liabilities held at fair value through profit or loss - - - - - - - - - - - - Net exposure - (155,545) (155,545) - 41,153 41,153 - (155,506) (155,506) - 354,006 354,006
Sensitivity analysis 2020 2019 2020 2019 2020 2019 2020 2019$ $ $ $ $ $ $ $
Impact on Profit/loss from operating activities and Net assets attributable to unitholders
Interest rate risk - increase of 100bps (2019: 50bps) 1,464 (778) 337 206 1,779 (778) 2,120 1,770Interest rate risk - decrease of 100bps (2019: 50bps) (1,464) 778 (337) (206) (1,779) 778 (2,120) (1,770)
49. OneAnswer - Antipodes Global (Long Only) Trust
50. OneAnswer - Arrowstreet Global Equity (Hedged) Trust
51. OneAnswer - Ausbil Australian Emerging Leaders Trust
52. OneAnswer - Bennelong Australian Equities Trust

Financial Report Notes to the Financial Statements for the financial year ended 30 June 2020
275
9.4.4 Interest rate risk exposure and sensitivity analysis
Fixed interest rate Floating interest rate Total Fixed interest rate Floating interest rate Total Fixed interest rate Floating interest rate Total Fixed interest rate Floating interest rate Total $ $ $ $ $ $ $ $ $ $ $ $
30 June 2020Financial assetsCash and cash equivalents - - - - 725 725 - 234,361 234,361 - 154,217 154,217Future and swap deposits - - - - - - - - - - - - Financial assets held at fair value through profit or loss - - - - - - - - - - - - Financial liabilitiesBank overdraft - (26,019) (26,019) - - - - - - - - - Future and swap payable - - - - - - - - - - - - Loan payable - - - - - - - - - - - - Financial liabilities held at fair value through profit or loss - - - - - - - - - - - - Net exposure - (26,019) (26,019) - 725 725 - 234,361 234,361 - 154,217 154,217
30 June 2019Financial assetsCash and cash equivalents - - - - 3,479 3,479 - - - - - - Future and swap deposits - - - - - - - - - - - - Financial assets held at fair value through profit or loss - - - - - - - - - - - - Financial liabilitiesBank overdraft - (225,383) (225,383) - - - - (70,234) (70,234) - (481,176) (481,176)Future and swap payable - - - - - - - - - - - - Loan payable - - - - - - - - - - - - Financial liabilities held at fair value through profit or loss - - - - - - - - - - - - Net exposure - (225,383) (225,383) - 3,479 3,479 - (70,234) (70,234) - (481,176) (481,176)
Sensitivity analysis 2020 2019 2020 2019 2020 2019 2020 2019$ $ $ $ $ $ $ $
Impact on Profit/loss from operating activities and Net assets attributable to unitholders
Interest rate risk - increase of 100bps (2019: 50bps) (260) (1,127) 7 17 2,344 (351) 1,542 (2,406)Interest rate risk - decrease of 100bps (2019: 50bps) 260 1,127 (7) (17) (2,344) 351 (1,542) 2,406
53. OneAnswer - Bentham Global Income Trust 54. OneAnswer - BlackRock Scientific Australian Equity Trust
55. OneAnswer - Blackrock Tactical Growth Trust 56. OneAnswer - BR Scientific Diversified Growth Trust
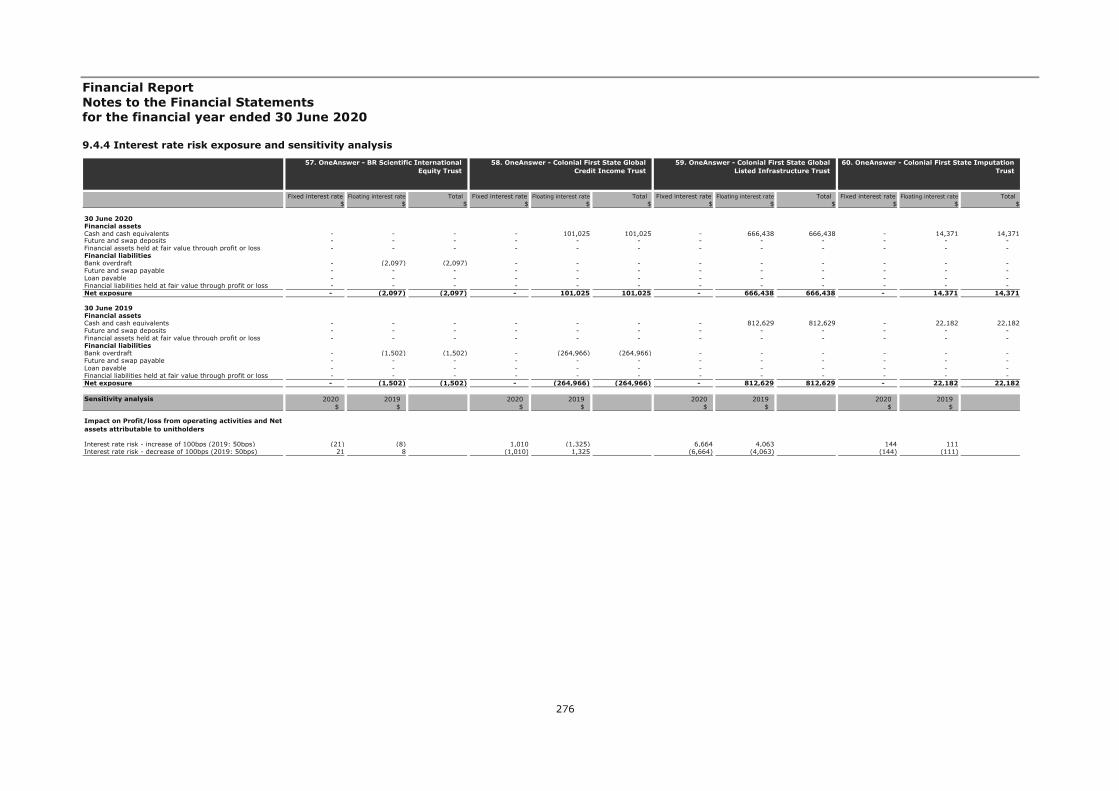
Financial Report Notes to the Financial Statements for the financial year ended 30 June 2020
276
9.4.4 Interest rate risk exposure and sensitivity analysis
Fixed interest rate Floating interest rate Total Fixed interest rate Floating interest rate Total Fixed interest rate Floating interest rate Total Fixed interest rate Floating interest rate Total $ $ $ $ $ $ $ $ $ $ $ $
30 June 2020Financial assetsCash and cash equivalents - - - - 101,025 101,025 - 666,438 666,438 - 14,371 14,371Future and swap deposits - - - - - - - - - - - - Financial assets held at fair value through profit or loss - - - - - - - - - - - - Financial liabilitiesBank overdraft - (2,097) (2,097) - - - - - - - - - Future and swap payable - - - - - - - - - - - - Loan payable - - - - - - - - - - - - Financial liabilities held at fair value through profit or loss - - - - - - - - - - - - Net exposure - (2,097) (2,097) - 101,025 101,025 - 666,438 666,438 - 14,371 14,371
30 June 2019Financial assetsCash and cash equivalents - - - - - - - 812,629 812,629 - 22,182 22,182Future and swap deposits - - - - - - - - - - - - Financial assets held at fair value through profit or loss - - - - - - - - - - - - Financial liabilitiesBank overdraft - (1,502) (1,502) - (264,966) (264,966) - - - - - - Future and swap payable - - - - - - - - - - - - Loan payable - - - - - - - - - - - - Financial liabilities held at fair value through profit or loss - - - - - - - - - - - - Net exposure - (1,502) (1,502) - (264,966) (264,966) - 812,629 812,629 - 22,182 22,182
Sensitivity analysis 2020 2019 2020 2019 2020 2019 2020 2019$ $ $ $ $ $ $ $
Impact on Profit/loss from operating activities and Net assets attributable to unitholders
Interest rate risk - increase of 100bps (2019: 50bps) (21) (8) 1,010 (1,325) 6,664 4,063 144 111Interest rate risk - decrease of 100bps (2019: 50bps) 21 8 (1,010) 1,325 (6,664) (4,063) (144) (111)
57. OneAnswer - BR Scientific International Equity Trust
58. OneAnswer - Colonial First State Global Credit Income Trust
59. OneAnswer - Colonial First State Global Listed Infrastructure Trust
60. OneAnswer - Colonial First State Imputation Trust

Financial Report Notes to the Financial Statements for the financial year ended 30 June 2020
277
9.4.4 Interest rate risk exposure and sensitivity analysis
Fixed interest rate Floating interest rate Total Fixed interest rate Floating interest rate Total Fixed interest rate Floating interest rate Total Fixed interest rate Floating interest rate Total $ $ $ $ $ $ $ $ $ $ $ $
30 June 2020Financial assetsCash and cash equivalents - 951,460 951,460 - 173,800 173,800 - 586,698 586,698 - 57,230 57,230Future and swap deposits - - - - - - - - - - - - Financial assets held at fair value through profit or loss - - - - - - - - - - - - Financial liabilitiesBank overdraft - - - - - - - - - - - - Future and swap payable - - - - - - - - - - - - Loan payable - - - - - - - - - - - - Financial liabilities held at fair value through profit or loss - - - - - - - - - - - - Net exposure - 951,460 951,460 - 173,800 173,800 - 586,698 586,698 - 57,230 57,230
30 June 2019Financial assetsCash and cash equivalents - 86,043 86,043 - 165,733 165,733 - - - - - - Future and swap deposits - - - - - - - - - - - - Financial assets held at fair value through profit or loss - - - - - - - - - - - - Financial liabilitiesBank overdraft - - - - - - - (158,262) (158,262) - (5,054) (5,054)Future and swap payable - - - - - - - - - - - - Loan payable - - - - - - - - - - - - Financial liabilities held at fair value through profit or loss - - - - - - - - - - - - Net exposure - 86,043 86,043 - 165,733 165,733 - (158,262) (158,262) - (5,054) (5,054)
Sensitivity analysis 2020 2019 2020 2019 2020 2019 2020 2019$ $ $ $ $ $ $ $
Impact on Profit/loss from operating activities and Net assets attributable to unitholders
Interest rate risk - increase of 100bps (2019: 50bps) 9,515 430 1,738 829 5,867 (791) 572 (25)Interest rate risk - decrease of 100bps (2019: 50bps) (9,515) (430) (1,738) (829) (5,867) 791 (572) 25
61. OneAnswer - Fidelity Australian Equities Trust
62. OneAnswer - Greencape Broadcap Trust 63. OneAnswer - Investors Mutual Australian Share Trust
64. OneAnswer - Janus Henderson Global Fixed Interest Total Return Trust

Financial Report Notes to the Financial Statements for the financial year ended 30 June 2020
278
9.4.4 Interest rate risk exposure and sensitivity analysis
Fixed interest rate Floating interest rate Total Fixed interest rate Floating interest rate Total Fixed interest rate Floating interest rate Total Fixed interest rate Floating interest rate Total $ $ $ $ $ $ $ $ $ $ $ $
30 June 2020Financial assetsCash and cash equivalents - 969,748 969,748 - 1,183,492 1,183,492 - 142,005 142,005 - 827,776 827,776Future and swap deposits - - - - - - - - - - - - Financial assets held at fair value through profit or loss - - - - - - - - - - - - Financial liabilitiesBank overdraft - - - - - - - - - - - - Future and swap payable - - - - - - - - - - - - Loan payable - - - - - - - - - - - - Financial liabilities held at fair value through profit or loss - - - - - - - - - - - - Net exposure - 969,748 969,748 - 1,183,492 1,183,492 - 142,005 142,005 - 827,776 827,776
30 June 2019Financial assetsCash and cash equivalents - - - - 570,538 570,538 - 14,636 14,636 - - - Future and swap deposits - - - - - - - - - - - - Financial assets held at fair value through profit or loss - - - - - - - - - - - - Financial liabilitiesBank overdraft - (4,630) (4,630) - - - - - - - (791,726) (791,726)Future and swap payable - - - - - - - - - - - - Loan payable - - - - - - - - - - - - Financial liabilities held at fair value through profit or loss - - - - - - - - - - - - Net exposure - (4,630) (4,630) - 570,538 570,538 - 14,636 14,636 - (791,726) (791,726)
Sensitivity analysis 2020 2019 2020 2019 2020 2019 2020 2019$ $ $ $ $ $ $ $
Impact on Profit/loss from operating activities and Net assets attributable to unitholders
Interest rate risk - increase of 100bps (2019: 50bps) 9,697 (23) 11,835 2,853 1,420 73 8,278 (3,959)Interest rate risk - decrease of 100bps (2019: 50bps) (9,697) 23 (11,835) (2,853) (1,420) (73) (8,278) 3,959
65. OneAnswer - Kapstream Absolute Return Income Trust
66. OneAnswer - Magellan Global Trust 67. OneAnswer - Merlon Australian Share Income Trust
68. OneAnswer - MFS Global Equity Trust

Financial Report Notes to the Financial Statements for the financial year ended 30 June 2020
279
9.4.4 Interest rate risk exposure and sensitivity analysis
Fixed interest rate Floating interest rate Total Fixed interest rate Floating interest rate Total Fixed interest rate Floating interest rate Total Fixed interest rate Floating interest rate Total $ $ $ $ $ $ $ $ $ $ $ $
30 June 2020Financial assetsCash and cash equivalents - 35,992 35,992 - 259,544 259,544 - 167,100 167,100 - 111,276 111,276Future and swap deposits - - - - - - - - - - - - Financial assets held at fair value through profit or loss - - - - - - - - - - - - Financial liabilitiesBank overdraft - - - - - - - - - - - - Future and swap payable - - - - - - - - - - - - Loan payable - - - - - - - - - - - - Financial liabilities held at fair value through profit or loss - - - - - - - - - - - - Net exposure - 35,992 35,992 - 259,544 259,544 - 167,100 167,100 - 111,276 111,276
30 June 2019Financial assetsCash and cash equivalents - 95,051 95,051 - 377,855 377,855 - 64,301 64,301 - 96,866 96,866Future and swap deposits - - - - - - - - - - - - Financial assets held at fair value through profit or loss - - - - - - - - - - - - Financial liabilitiesBank overdraft - - - - - - - - - - - - Future and swap payable - - - - - - - - - - - - Loan payable - - - - - - - - - - - - Financial liabilities held at fair value through profit or loss - - - - - - - - - - - - Net exposure - 95,051 95,051 - 377,855 377,855 - 64,301 64,301 - 96,866 96,866
Sensitivity analysis 2020 2019 2020 2019 2020 2019 2020 2019$ $ $ $ $ $ $ $
Impact on Profit/loss from operating activities and Net assets attributable to unitholders
Interest rate risk - increase of 100bps (2019: 50bps) 360 475 2,595 1,889 1,671 322 1,113 484Interest rate risk - decrease of 100bps (2019: 50bps) (360) (475) (2,595) (1,889) (1,671) (322) (1,113) (484)
69. OneAnswer - Nikko AM Australian Shares Trust
70. OneAnswer - OnePath Global Property Securities Index Trust
71. OneAnswer - Pendal Australian Share Trust 72. OneAnswer - Pendal Core Hedged Global Shares Trust
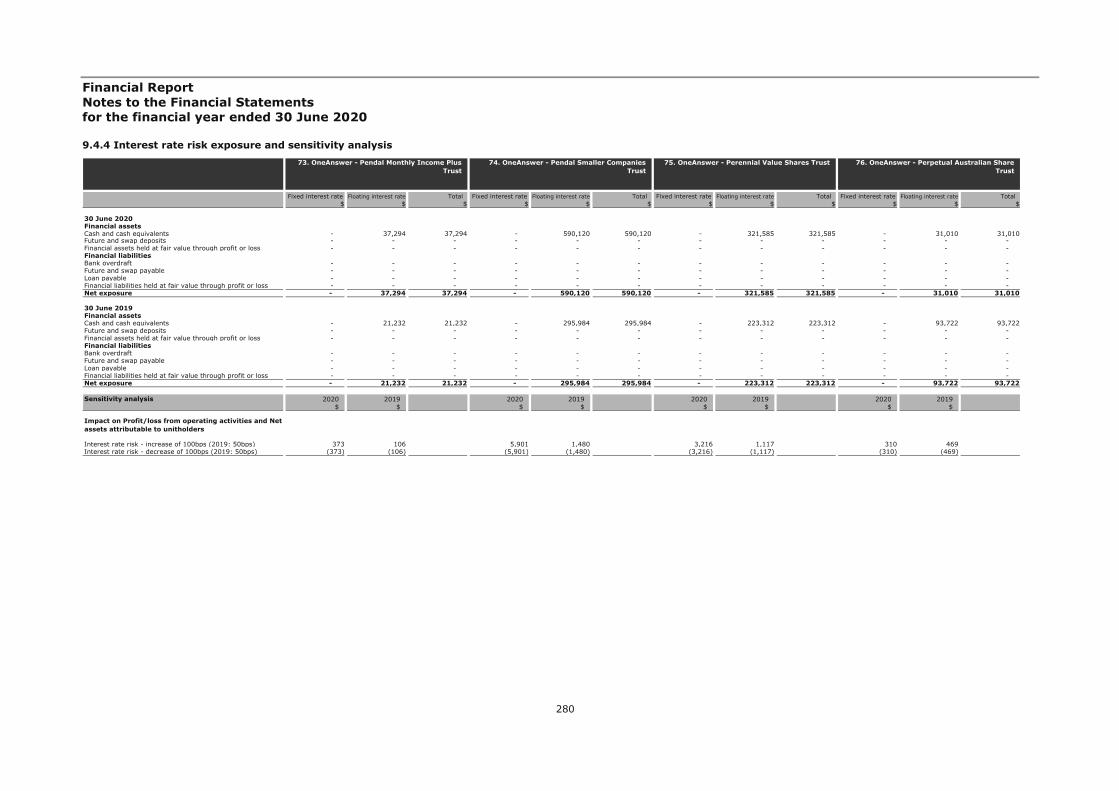
Financial Report Notes to the Financial Statements for the financial year ended 30 June 2020
280
9.4.4 Interest rate risk exposure and sensitivity analysis
Fixed interest rate Floating interest rate Total Fixed interest rate Floating interest rate Total Fixed interest rate Floating interest rate Total Fixed interest rate Floating interest rate Total $ $ $ $ $ $ $ $ $ $ $ $
30 June 2020Financial assetsCash and cash equivalents - 37,294 37,294 - 590,120 590,120 - 321,585 321,585 - 31,010 31,010Future and swap deposits - - - - - - - - - - - - Financial assets held at fair value through profit or loss - - - - - - - - - - - - Financial liabilitiesBank overdraft - - - - - - - - - - - - Future and swap payable - - - - - - - - - - - - Loan payable - - - - - - - - - - - - Financial liabilities held at fair value through profit or loss - - - - - - - - - - - - Net exposure - 37,294 37,294 - 590,120 590,120 - 321,585 321,585 - 31,010 31,010
30 June 2019Financial assetsCash and cash equivalents - 21,232 21,232 - 295,984 295,984 - 223,312 223,312 - 93,722 93,722Future and swap deposits - - - - - - - - - - - - Financial assets held at fair value through profit or loss - - - - - - - - - - - - Financial liabilitiesBank overdraft - - - - - - - - - - - - Future and swap payable - - - - - - - - - - - - Loan payable - - - - - - - - - - - - Financial liabilities held at fair value through profit or loss - - - - - - - - - - - - Net exposure - 21,232 21,232 - 295,984 295,984 - 223,312 223,312 - 93,722 93,722
Sensitivity analysis 2020 2019 2020 2019 2020 2019 2020 2019$ $ $ $ $ $ $ $
Impact on Profit/loss from operating activities and Net assets attributable to unitholders
Interest rate risk - increase of 100bps (2019: 50bps) 373 106 5,901 1,480 3,216 1,117 310 469Interest rate risk - decrease of 100bps (2019: 50bps) (373) (106) (5,901) (1,480) (3,216) (1,117) (310) (469)
73. OneAnswer - Pendal Monthly Income Plus Trust
74. OneAnswer - Pendal Smaller Companies Trust
75. OneAnswer - Perennial Value Shares Trust 76. OneAnswer - Perpetual Australian Share Trust

Financial Report Notes to the Financial Statements for the financial year ended 30 June 2020
281
9.4.4 Interest rate risk exposure and sensitivity analysis
Fixed interest rate Floating interest rate Total Fixed interest rate Floating interest rate Total Fixed interest rate Floating interest rate Total Fixed interest rate Floating interest rate Total $ $ $ $ $ $ $ $ $ $ $ $
30 June 2020Financial assetsCash and cash equivalents - 254,414 254,414 - 337,337 337,337 - 11,166 11,166 - 89,277 89,277Future and swap deposits - - - - - - - - - - - - Financial assets held at fair value through profit or loss - - - - - - - - - - - - Financial liabilitiesBank overdraft - - - - - - - - - - - - Future and swap payable - - - - - - - - - - - - Loan payable - - - - - - - - - - - - Financial liabilities held at fair value through profit or loss - - - - - - - - - - - - Net exposure - 254,414 254,414 - 337,337 337,337 - 11,166 11,166 - 89,277 89,277
30 June 2019Financial assetsCash and cash equivalents - - - - 98,353 98,353 - 18,293 18,293 - - - Future and swap deposits - - - - - - - - - - - - Financial assets held at fair value through profit or loss - - - - - - - - - - - - Financial liabilitiesBank overdraft - (72,126) (72,126) - - - - - - - (101,719) (101,719)Future and swap payable - - - - - - - - - - - - Loan payable - - - - - - - - - - - - Financial liabilities held at fair value through profit or loss - - - - - - - - - - - - Net exposure - (72,126) (72,126) - 98,353 98,353 - 18,293 18,293 - (101,719) (101,719)
Sensitivity analysis 2020 2019 2020 2019 2020 2019 2020 2019$ $ $ $ $ $ $ $
Impact on Profit/loss from operating activities and Net assets attributable to unitholders
Interest rate risk - increase of 100bps (2019: 50bps) 2,544 (361) 3,373 492 112 91 893 (509)Interest rate risk - decrease of 100bps (2019: 50bps) (2,544) 361 (3,373) (492) (112) (91) (893) 509
77. OneAnswer - Perpetual Balanced Growth Trust
78. OneAnswer - Perpetual Conservative Growth Trust
79. OneAnswer - Perpetual Ethical SRI Trust 80. OneAnswer - Platinum Asia Trust

Financial Report Notes to the Financial Statements for the financial year ended 30 June 2020
282
9.4.4 Interest rate risk exposure and sensitivity analysis
Fixed interest rate Floating interest rate Total Fixed interest rate Floating interest rate Total Fixed interest rate Floating interest rate Total Fixed interest rate Floating interest rate Total $ $ $ $ $ $ $ $ $ $ $ $
30 June 2020Financial assetsCash and cash equivalents - 471,191 471,191 - 307,601 307,601 - 269,927 269,927 - 319,070 319,070Future and swap deposits - - - - - - - - - - - - Financial assets held at fair value through profit or loss - - - - - - - - - - - - Financial liabilitiesBank overdraft - - - - - - - - - - - - Future and swap payable - - - - - - - - - - - - Loan payable - - - - - - - - - - - - Financial liabilities held at fair value through profit or loss - - - - - - - - - - - - Net exposure - 471,191 471,191 - 307,601 307,601 - 269,927 269,927 - 319,070 319,070
30 June 2019Financial assetsCash and cash equivalents - - - - 30,766 30,766 - - - - - - Future and swap deposits - - - - - - - - - - - - Financial assets held at fair value through profit or loss - - - - - - - - - - - - Financial liabilitiesBank overdraft - (226,612) (226,612) - - - - (58,575) (58,575) - (1,876,277) (1,876,277)Future and swap payable - - - - - - - - - - - - Loan payable - - - - - - - - - - - - Financial liabilities held at fair value through profit or loss - - - - - - - - - - - - Net exposure - (226,612) (226,612) - 30,766 30,766 - (58,575) (58,575) - (1,876,277) (1,876,277)
Sensitivity analysis 2020 2019 2020 2019 2020 2019 2020 2019$ $ $ $ $ $ $ $
Impact on Profit/loss from operating activities and Net assets attributable to unitholders
Interest rate risk - increase of 100bps (2019: 50bps) 4,712 (1,133) 3,076 154 2,699 (293) 3,191 (9,381)Interest rate risk - decrease of 100bps (2019: 50bps) (4,712) 1,133 (3,076) (154) (2,699) 293 (3,191) 9,381
81. OneAnswer - Platinum International Trust 82. OneAnswer - RARE Infastructure Value Trust 83. OneAnswer - Schroder Australian Equity Trust
84. OneAnswer - Schroder Balanced Trust

Financial Report Notes to the Financial Statements for the financial year ended 30 June 2020
283
9.4.4 Interest rate risk exposure and sensitivity analysis
Fixed interest rate Floating interest rate Total Fixed interest rate Floating interest rate Total Fixed interest rate Floating interest rate Total Fixed interest rate Floating interest rate Total $ $ $ $ $ $ $ $ $ $ $ $
30 June 2020Financial assetsCash and cash equivalents - 838,176 838,176 - 658,920 658,920 - 12,585 12,585 - 25,435 25,435Future and swap deposits - - - - - - - - - - - - Financial assets held at fair value through profit or loss - - - - - - - - - - - - Financial liabilitiesBank overdraft - - - - - - - - - - - - Future and swap payable - - - - - - - - - - - - Loan payable - - - - - - - - - - - - Financial liabilities held at fair value through profit or loss - - - - - - - - - - - - Net exposure - 838,176 838,176 - 658,920 658,920 - 12,585 12,585 - 25,435 25,435
30 June 2019Financial assetsCash and cash equivalents - 198,852 198,852 - - - - 30,038 30,038 - 12,552 12,552Future and swap deposits - - - - - - - - - - - - Financial assets held at fair value through profit or loss - - - - - - - - - - - - Financial liabilitiesBank overdraft - - - - (206,323) (206,323) - - - - - - Future and swap payable - - - - - - - - - - - - Loan payable - - - - - - - - - - - - Financial liabilities held at fair value through profit or loss - - - - - - - - - - - - Net exposure - 198,852 198,852 - (206,323) (206,323) - 30,038 30,038 - 12,552 12,552
Sensitivity analysis 2020 2019 2020 2019 2020 2019 2020 2019$ $ $ $ $ $ $ $
Impact on Profit/loss from operating activities and Net assets attributable to unitholders
Interest rate risk - increase of 100bps (2019: 50bps) 8,382 994 6,589 (1,032) 126 150 254 63Interest rate risk - decrease of 100bps (2019: 50bps) (8,382) (994) (6,589) 1,032 (126) (150) (254) (63)
85. OneAnswer - Schroder Fixed Income Trust 86. OneAnswer - Schroder Real Return Trust 87. OneAnswer - SG Hiscock Property Trust 88. OneAnswer - Stewart Investors Worldwide Sustainability Trust

Financial Report Notes to the Financial Statements for the financial year ended 30 June 2020
284
9.4.4 Interest rate risk exposure and sensitivity analysis
Fixed interest rate Floating interest rate Total Fixed interest rate Floating interest rate Total Fixed interest rate Floating interest rate Total Fixed interest rate Floating interest rate Total $ $ $ $ $ $ $ $ $ $ $ $
30 June 2020Financial assetsCash and cash equivalents - 271,365 271,365 - 694,525 694,525 - 190,050 190,050 - - - Future and swap deposits - - - - - - - - - - - - Financial assets held at fair value through profit or loss - - - - - - - - - - - - Financial liabilitiesBank overdraft - - - - - - - - - - (122,024) (122,024)Future and swap payable - - - - - - - - - - - - Loan payable - - - - - - - - - - - - Financial liabilities held at fair value through profit or loss - - - - - - - - - - - - Net exposure - 271,365 271,365 - 694,525 694,525 - 190,050 190,050 - (122,024) (122,024)
30 June 2019Financial assetsCash and cash equivalents - 71,424 71,424 - 212,225 212,225 - - - - - - Future and swap deposits - - - - - - - - - - - - Financial assets held at fair value through profit or loss - - - - - - - - - - - - Financial liabilitiesBank overdraft - - - - - - - (151,197) (151,197) - (36,566) (36,566)Future and swap payable - - - - - - - - - - - - Loan payable - - - - - - - - - - - - Financial liabilities held at fair value through profit or loss - - - - - - - - - - - - Net exposure - 71,424 71,424 - 212,225 212,225 - (151,197) (151,197) - (36,566) (36,566)
Sensitivity analysis 2020 2019 2020 2019 2020 2019 2020 2019$ $ $ $ $ $ $ $
Impact on Profit/loss from operating activities and Net assets attributable to unitholders
Interest rate risk - increase of 100bps (2019: 50bps) 2,714 357 6,945 1,061 1,901 (756) (1,220) (183)Interest rate risk - decrease of 100bps (2019: 50bps) (2,714) (357) (6,945) (1,061) (1,901) 756 1,220 183
89. OneAnswer - T. Rowe Price Global Equity Trust
90. OneAnswer - T.Rowe Price Dynamic Global Bond Trust
91. OneAnswer - UBS Balanced Trust 92. OneAnswer - UBS Defensive Trust

Financial Report Notes to the Financial Statements for the financial year ended 30 June 2020
285
9.4.4 Interest rate risk exposure and sensitivity analysis
Fixed interest rate Floating interest rate Total Fixed interest rate Floating interest rate Total Fixed interest rate Floating interest rate Total Fixed interest rate Floating interest rate Total $ $ $ $ $ $ $ $ $ $ $ $
30 June 2020Financial assetsCash and cash equivalents - 295,456 295,456 - 1,915,230 1,915,230 - 479,272 479,272 - 1,266,294 1,266,294Future and swap deposits - - - - - - - - - - - - Financial assets held at fair value through profit or loss - - - - - - - - - - - - Financial liabilitiesBank overdraft - - - - - - - - - - - - Future and swap payable - - - - - - - - - - - - Loan payable - - - - - - - - - - - - Financial liabilities held at fair value through profit or loss - - - - - - - - - - - - Net exposure - 295,456 295,456 - 1,915,230 1,915,230 - 479,272 479,272 - 1,266,294 1,266,294
30 June 2019Financial assetsCash and cash equivalents - - - - 3,897,995 3,897,995 - 559,417 559,417 - 89,996 89,996Future and swap deposits - - - - - - - - - - - - Financial assets held at fair value through profit or loss - - - - - - - - - - - - Financial liabilitiesBank overdraft - (169,056) (169,056) - - - - - - - - - Future and swap payable - - - - - - - - - - - - Loan payable - - - - - - - - - - - - Financial liabilities held at fair value through profit or loss - - - - - - - - - - - - Net exposure - (169,056) (169,056) - 3,897,995 3,897,995 - 559,417 559,417 - 89,996 89,996
Sensitivity analysis 2020 2019 2020 2019 2020 2019 2020 2019$ $ $ $ $ $ $ $
Impact on Profit/loss from operating activities and Net assets attributable to unitholders
Interest rate risk - increase of 100bps (2019: 50bps) 2,955 (845) 19,152 19,490 4,793 2,797 12,663 450Interest rate risk - decrease of 100bps (2019: 50bps) (2,955) 845 (19,152) (19,490) (4,793) (2,797) (12,663) (450)
93. OneAnswer - UBS Diversified Fixed Income Trust
94. OneAnswer - Vanguard Australian Shares Index Trust
95. OneAnswer - Vanguard Balanced Index Trust 96. OneAnswer - Vanguard Conservative Index Trust

Financial Report Notes to the Financial Statements for the financial year ended 30 June 2020
286
9.4.4 Interest rate risk exposure and sensitivity analysis
Fixed interest rate Floating interest rate Total Fixed interest rate Floating interest rate Total Fixed interest rate Floating interest rate Total Fixed interest rate Floating interest rate Total $ $ $ $ $ $ $ $ $ $ $ $
30 June 2020Financial assetsCash and cash equivalents - 54,235 54,235 - 1,067,352 1,067,352 - 99,374 99,374 - 338,776 338,776Future and swap deposits - - - - - - - - - - - - Financial assets held at fair value through profit or loss - - - - - - - - - - - - Financial liabilitiesBank overdraft - - - - - - - - - - - - Future and swap payable - - - - - - - - - - - - Loan payable - - - - - - - - - - - - Financial liabilities held at fair value through profit or loss - - - - - - - - - - - - Net exposure - 54,235 54,235 - 1,067,352 1,067,352 - 99,374 99,374 - 338,776 338,776
30 June 2019Financial assetsCash and cash equivalents - 29,901 29,901 - 2,420,269 2,420,269 - 87,626 87,626 - 409,092 409,092Future and swap deposits - - - - - - - - - - - - Financial assets held at fair value through profit or loss - - - - - - - - - - - - Financial liabilitiesBank overdraft - - - - - - - - - - - - Future and swap payable - - - - - - - - - - - - Loan payable - - - - - - - - - - - - Financial liabilities held at fair value through profit or loss - - - - - - - - - - - - Net exposure - 29,901 29,901 - 2,420,269 2,420,269 - 87,626 87,626 - 409,092 409,092
Sensitivity analysis 2020 2019 2020 2019 2020 2019 2020 2019$ $ $ $ $ $ $ $
Impact on Profit/loss from operating activities and Net assets attributable to unitholders
Interest rate risk - increase of 100bps (2019: 50bps) 542 150 10,674 12,101 994 438 3,388 2,045Interest rate risk - decrease of 100bps (2019: 50bps) (542) (150) (10,674) (12,101) (994) (438) (3,388) (2,045)
97. OneAnswer - Vanguard Diversified Bond Index Trust
98. OneAnswer - Vanguard Growth Index Trust 99. OneAnswer - Vanguard High Growth Index Trust
100. OneAnswer - Vanguard International Shares Index (Hedged) Trust

Financial Report Notes to the Financial Statements for the financial year ended 30 June 2020
287
9.4.4 Interest rate risk exposure and sensitivity analysis
Fixed interest rate Floating interest rate Total Fixed interest rate Floating interest rate Total Fixed interest rate Floating interest rate Total Fixed interest rate Floating interest rate Total $ $ $ $ $ $ $ $ $ $ $ $
30 June 2020Financial assetsCash and cash equivalents - 1,775,082 1,775,082 - 278,545 278,545 - 98,461 98,461 - 2,300,941 2,300,941Future and swap deposits - - - - - - - - - - - - Financial assets held at fair value through profit or loss - - - - - - - - - - - - Financial liabilitiesBank overdraft - - - - - - - - - - - - Future and swap payable - - - - - - - - - - - - Loan payable - - - - - - - - - - - - Financial liabilities held at fair value through profit or loss - - - - - - - - - - - - Net exposure - 1,775,082 1,775,082 - 278,545 278,545 - 98,461 98,461 - 2,300,941 2,300,941
30 June 2019Financial assetsCash and cash equivalents - 3,087,074 3,087,074 - 155,623 155,623 - 7,079 7,079 - 1,489,681 1,489,681Future and swap deposits - - - - - - - - - - - - Financial assets held at fair value through profit or loss - - - - - - - - - - - - Financial liabilitiesBank overdraft - - - - - - - - - - - - Future and swap payable - - - - - - - - - - - - Loan payable - - - - - - - - - - - - Financial liabilities held at fair value through profit or loss - - - - - - - - - - - - Net exposure - 3,087,074 3,087,074 - 155,623 155,623 - 7,079 7,079 - 1,489,681 1,489,681
Sensitivity analysis 2020 2019 2020 2019 2020 2019 2020 2019$ $ $ $ $ $ $ $
Impact on Profit/loss from operating activities and Net assets attributable to unitholders
Interest rate risk - increase of 100bps (2019: 50bps) 17,751 15,435 2,785 778 985 35 23,009 7,448Interest rate risk - decrease of 100bps (2019: 50bps) (17,751) (15,435) (2,785) (778) (985) (35) (23,009) (7,448)
101. OneAnswer - Vanguard International Shares Index Trust
102. OneAnswer - Vanguard Property Securities Index Trust
103. OneAnswer - Walter Scott Global Equity (Hedged) Trust
104. OnePath Alternatives Growth Fund

Financial Report Notes to the Financial Statements for the financial year ended 30 June 2020
288
9.4.4 Interest rate risk exposure and sensitivity analysis
Fixed interest rate Floating interest rate Total Fixed interest rate Floating interest rate Total Fixed interest rate Floating interest rate Total Fixed interest rate Floating interest rate Total $ $ $ $ $ $ $ $ $ $ $ $
30 June 2020Financial assetsCash and cash equivalents - 15,442,990 15,442,990 - 16,641 16,641 - 2,872 2,872 - 47,477 47,477Future and swap deposits - 67,681 67,681 - - - - - - - - - Financial assets held at fair value through profit or loss - 640 640 - - - - - - - - - Financial liabilitiesBank overdraft - - - - - - - - - - - - Future and swap payable - - - - - - - - - - - - Loan payable - - - - - - - - - - - - Financial liabilities held at fair value through profit or loss - (6,617) (6,617) - - - - - - - - - Net exposure - 15,504,694 15,504,694 - 16,641 16,641 - 2,872 2,872 - 47,477 47,477
30 June 2019Financial assetsCash and cash equivalents - 7,161,596 7,161,596 - 22,393 22,393 - 1,884 1,884 - 47,064 47,064Future and swap deposits - 745,438 745,438 - - - - - - - - - Financial assets held at fair value through profit or loss - - - - - - - - - - - - Financial liabilitiesBank overdraft - - - - - - - - - - - - Future and swap payable - - - - - - - - - - - - Loan payable - - - - - - - - - - - - Financial liabilities held at fair value through profit or loss - - - - - - - - - - - - Net exposure - 7,907,034 7,907,034 - 22,393 22,393 - 1,884 1,884 - 47,064 47,064
Sensitivity analysis 2020 2019 2020 2019 2020 2019 2020 2019$ $ $ $ $ $ $ $
Impact on Profit/loss from operating activities and Net assets attributable to unitholders
Interest rate risk - increase of 100bps (2019: 50bps) 395,917 39,535 166 112 29 9 475 235Interest rate risk - decrease of 100bps (2019: 50bps) (303,178) (39,535) (166) (112) (29) (9) (475) (235)
105. OnePath Capital Guaranteed Trust 106. OnePath Capital Stable Trust 107. OnePath Diversified Credit Trust 108. OnePath Diversified Fixed Interest Trust

Financial Report Notes to the Financial Statements for the financial year ended 30 June 2020
289
9.4.4 Interest rate risk exposure and sensitivity analysis
Fixed interest rate Floating interest rate Total Fixed interest rate Floating interest rate Total Fixed interest rate Floating interest rate Total Fixed interest rate Floating interest rate Total $ $ $ $ $ $ $ $ $ $ $ $
30 June 2020Financial assetsCash and cash equivalents - 56,792 56,792 - 98,236 98,236 - 2,620 2,620 - 9,587 9,587Future and swap deposits - - - - - - - - - - - - Financial assets held at fair value through profit or loss - - - - - - - - - - - - Financial liabilitiesBank overdraft - - - - - - - - - - - - Future and swap payable - - - - - - - - - - - - Loan payable - - - - - - - - - - - - Financial liabilities held at fair value through profit or loss - - - - - - - - - - - - Net exposure - 56,792 56,792 - 98,236 98,236 - 2,620 2,620 - 9,587 9,587
30 June 2019Financial assetsCash and cash equivalents - 55,607 55,607 - 64,515 64,515 - 2,154 2,154 - 11,511 11,511Future and swap deposits - - - - - - - - - - - - Financial assets held at fair value through profit or loss - - - - - - - - - - - - Financial liabilitiesBank overdraft - - - - - - - - - - - - Future and swap payable - - - - - - - - - - - - Loan payable - - - - - - - - - - - - Financial liabilities held at fair value through profit or loss - - - - - - - - - - - - Net exposure - 55,607 55,607 - 64,515 64,515 - 2,154 2,154 - 11,511 11,511
Sensitivity analysis 2020 2019 2020 2019 2020 2019 2020 2019$ $ $ $ $ $ $ $
Impact on Profit/loss from operating activities and Net assets attributable to unitholders
Interest rate risk - increase of 100bps (2019: 50bps) 568 278 982 323 26 11 96 58Interest rate risk - decrease of 100bps (2019: 50bps) (568) (278) (982) (323) (26) (11) (96) (58)
109. OnePath Geared Australian Shares Index Trust
110. OnePath Global Emerging Markets Share Trust
111. OnePath Managed Growth Trust 112. OnePath Select Leaders Trust
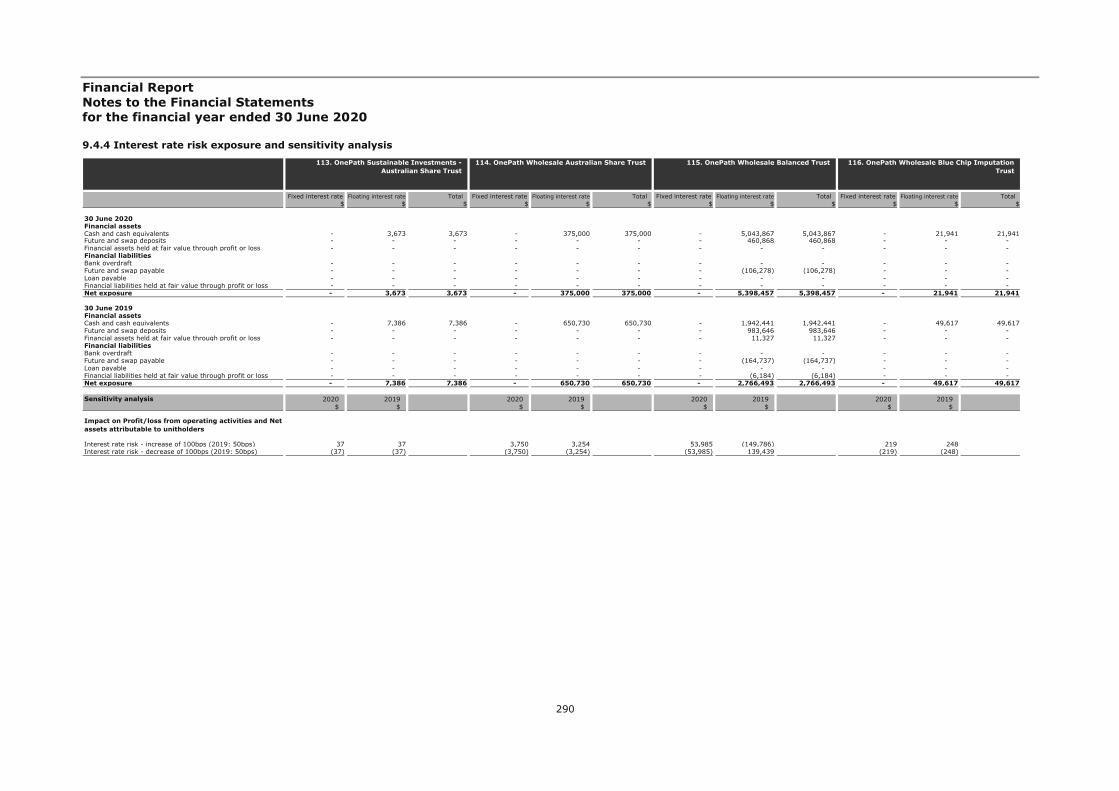
Financial Report Notes to the Financial Statements for the financial year ended 30 June 2020
290
9.4.4 Interest rate risk exposure and sensitivity analysis
Fixed interest rate Floating interest rate Total Fixed interest rate Floating interest rate Total Fixed interest rate Floating interest rate Total Fixed interest rate Floating interest rate Total $ $ $ $ $ $ $ $ $ $ $ $
30 June 2020Financial assetsCash and cash equivalents - 3,673 3,673 - 375,000 375,000 - 5,043,867 5,043,867 - 21,941 21,941Future and swap deposits - - - - - - - 460,868 460,868 - - - Financial assets held at fair value through profit or loss - - - - - - - - - - - - Financial liabilitiesBank overdraft - - - - - - - - - - - - Future and swap payable - - - - - - - (106,278) (106,278) - - - Loan payable - - - - - - - - - - - - Financial liabilities held at fair value through profit or loss - - - - - - - - - - - - Net exposure - 3,673 3,673 - 375,000 375,000 - 5,398,457 5,398,457 - 21,941 21,941
30 June 2019Financial assetsCash and cash equivalents - 7,386 7,386 - 650,730 650,730 - 1,942,441 1,942,441 - 49,617 49,617Future and swap deposits - - - - - - - 983,646 983,646 - - - Financial assets held at fair value through profit or loss - - - - - - - 11,327 11,327 - - - Financial liabilitiesBank overdraft - - - - - - - - - - - - Future and swap payable - - - - - - - (164,737) (164,737) - - - Loan payable - - - - - - - - - - - - Financial liabilities held at fair value through profit or loss - - - - - - - (6,184) (6,184) - - - Net exposure - 7,386 7,386 - 650,730 650,730 - 2,766,493 2,766,493 - 49,617 49,617
Sensitivity analysis 2020 2019 2020 2019 2020 2019 2020 2019$ $ $ $ $ $ $ $
Impact on Profit/loss from operating activities and Net assets attributable to unitholders
Interest rate risk - increase of 100bps (2019: 50bps) 37 37 3,750 3,254 53,985 (149,786) 219 248Interest rate risk - decrease of 100bps (2019: 50bps) (37) (37) (3,750) (3,254) (53,985) 139,439 (219) (248)
113. OnePath Sustainable Investments - Australian Share Trust
114. OnePath Wholesale Australian Share Trust 115. OnePath Wholesale Balanced Trust 116. OnePath Wholesale Blue Chip Imputation Trust

Financial Report Notes to the Financial Statements for the financial year ended 30 June 2020
291
9.4.4 Interest rate risk exposure and sensitivity analysis
Fixed interest rate Floating interest rate Total Fixed interest rate Floating interest rate Total Fixed interest rate Floating interest rate Total Fixed interest rate Floating interest rate Total $ $ $ $ $ $ $ $ $ $ $ $
30 June 2020Financial assetsCash and cash equivalents - 2,099,784 2,099,784 - - - - 183,115 183,115 - 2,877,913 2,877,913Future and swap deposits - 32,244 32,244 - - - - - - - 87,081 87,081Financial assets held at fair value through profit or loss - 279 279 - - - - - - - - - Financial liabilitiesBank overdraft - - - - (53,300) (53,300) - - - - - - Future and swap payable - (206) (206) - - - - - - - - - Loan payable - - - - - - - - - - (47,539,000) (47,539,000)Financial liabilities held at fair value through profit or loss - (3,308) (3,308) - - - - - - - - - Net exposure - 2,128,793 2,128,793 - (53,300) (53,300) - 183,115 183,115 - (44,574,006) (44,574,006)
30 June 2019Financial assetsCash and cash equivalents - 4,285,002 4,285,002 - 143,509 143,509 - 149,666 149,666 - 273,078 273,078Future and swap deposits - 239,422 239,422 - - - - - - - 21 21Financial assets held at fair value through profit or loss - - - - - - - - - - - - Financial liabilitiesBank overdraft - - - - - - - - - - - - Future and swap payable - - - - - - - - - - - - Loan payable - - - - - - - - - - (57,049,000) (57,049,000)Financial liabilities held at fair value through profit or loss - - - - - - - - - - - - Net exposure - 4,524,424 4,524,424 - 143,509 143,509 - 149,666 149,666 - (56,775,901) (56,775,901)
Sensitivity analysis 2020 2019 2020 2019 2020 2019 2020 2019$ $ $ $ $ $ $ $
Impact on Profit/loss from operating activities and Net assets attributable to unitholders
Interest rate risk - increase of 100bps (2019: 50bps) 133,653 22,622 (533) 718 1,831 748 (445,740) (283,880)Interest rate risk - decrease of 100bps (2019: 50bps) (93,044) (22,622) 533 (718) (1,831) (748) 445,740 283,880
117. OnePath Wholesale Capital Stable Trust 118. OnePath Wholesale Diversified Fixed Interest Trust
119. OnePath Wholesale Emerging Companies Trust
120. OnePath Wholesale Geared Australian Shares Index Trust
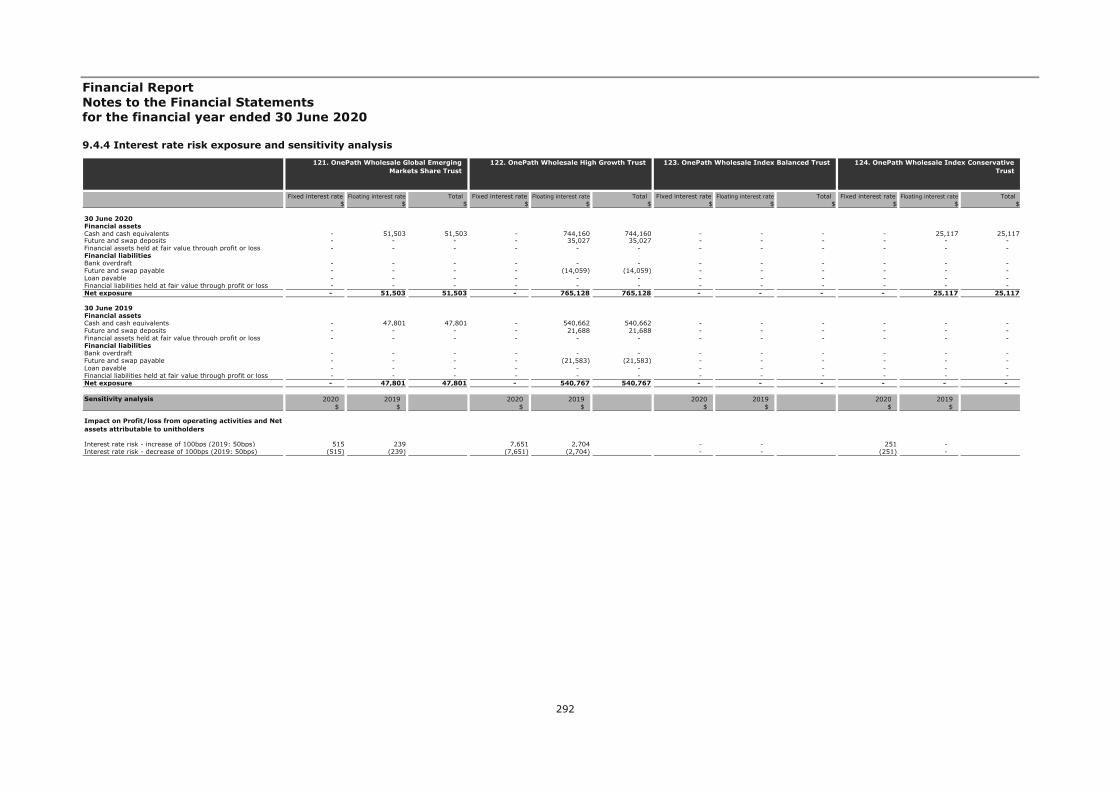
Financial Report Notes to the Financial Statements for the financial year ended 30 June 2020
292
9.4.4 Interest rate risk exposure and sensitivity analysis
Fixed interest rate Floating interest rate Total Fixed interest rate Floating interest rate Total Fixed interest rate Floating interest rate Total Fixed interest rate Floating interest rate Total $ $ $ $ $ $ $ $ $ $ $ $
30 June 2020Financial assetsCash and cash equivalents - 51,503 51,503 - 744,160 744,160 - - - - 25,117 25,117Future and swap deposits - - - - 35,027 35,027 - - - - - - Financial assets held at fair value through profit or loss - - - - - - - - - - - - Financial liabilitiesBank overdraft - - - - - - - - - - - - Future and swap payable - - - - (14,059) (14,059) - - - - - - Loan payable - - - - - - - - - - - - Financial liabilities held at fair value through profit or loss - - - - - - - - - - - - Net exposure - 51,503 51,503 - 765,128 765,128 - - - - 25,117 25,117
30 June 2019Financial assetsCash and cash equivalents - 47,801 47,801 - 540,662 540,662 - - - - - - Future and swap deposits - - - - 21,688 21,688 - - - - - - Financial assets held at fair value through profit or loss - - - - - - - - - - - - Financial liabilitiesBank overdraft - - - - - - - - - - - - Future and swap payable - - - - (21,583) (21,583) - - - - - - Loan payable - - - - - - - - - - - - Financial liabilities held at fair value through profit or loss - - - - - - - - - - - - Net exposure - 47,801 47,801 - 540,767 540,767 - - - - - -
Sensitivity analysis 2020 2019 2020 2019 2020 2019 2020 2019$ $ $ $ $ $ $ $
Impact on Profit/loss from operating activities and Net assets attributable to unitholders
Interest rate risk - increase of 100bps (2019: 50bps) 515 239 7,651 2,704 - - 251 - Interest rate risk - decrease of 100bps (2019: 50bps) (515) (239) (7,651) (2,704) - - (251) -
121. OnePath Wholesale Global Emerging Markets Share Trust
122. OnePath Wholesale High Growth Trust 123. OnePath Wholesale Index Balanced Trust 124. OnePath Wholesale Index Conservative Trust

Financial Report Notes to the Financial Statements for the financial year ended 30 June 2020
293
9.4.4 Interest rate risk exposure and sensitivity analysis
Fixed interest rate Floating interest rate Total Fixed interest rate Floating interest rate Total Fixed interest rate Floating interest rate Total Fixed interest rate Floating interest rate Total $ $ $ $ $ $ $ $ $ $ $ $
30 June 2020Financial assetsCash and cash equivalents - - - - 12,472,146 12,472,146 - 6,410 6,410 - 153,691 153,691Future and swap deposits - - - - 1,692,268 1,692,268 - - - - - - Financial assets held at fair value through profit or loss - - - - - - - - - - - - Financial liabilitiesBank overdraft - - - - - - - - - - - - Future and swap payable - - - - (382,311) (382,311) - - - - - - Loan payable - - - - - - - - - - - - Financial liabilities held at fair value through profit or loss - - - - - - - - - - - - Net exposure - - - - 13,782,103 13,782,103 - 6,410 6,410 - 153,691 153,691
30 June 2019Financial assetsCash and cash equivalents - 2,683 2,683 - 4,988,859 4,988,859 - 8,188 8,188 - 358,286 358,286Future and swap deposits - - - - 2,000,540 2,000,540 - - - - - - Financial assets held at fair value through profit or loss - - - - 62,933 62,933 - - - - - - Financial liabilitiesBank overdraft - - - - - - - - - - - - Future and swap payable - - - - (732,834) (732,834) - - - - - - Loan payable - - - - - - - - - - - - Financial liabilities held at fair value through profit or loss - - - - (4,861) (4,861) - - - - - - Net exposure - 2,683 2,683 - 6,314,637 6,314,637 - 8,188 8,188 - 358,286 358,286
Sensitivity analysis 2020 2019 2020 2019 2020 2019 2020 2019$ $ $ $ $ $ $ $
Impact on Profit/loss from operating activities and Net assets attributable to unitholders
Interest rate risk - increase of 100bps (2019: 50bps) - 13 137,821 (403,263) 64 41 1,537 1,791Interest rate risk - decrease of 100bps (2019: 50bps) - (13) (137,821) 386,258 (64) (41) (1,537) (1,791)
125. OnePath Wholesale Index Moderate Trust 126. OnePath Wholesale Managed Growth Trust 127. OnePath Wholesale Property Securities Trust
128. OnePath Wholesale Select Leaders Trust

Financial Report Notes to the Financial Statements for the financial year ended 30 June 2020
294
9.4.4 Interest rate risk exposure and sensitivity analysis
Fixed interest rate Floating interest rate Total Fixed interest rate Floating interest rate Total Fixed interest rate Floating interest rate Total Fixed interest rate Floating interest rate Total $ $ $ $ $ $ $ $ $ $ $ $
30 June 2020Financial assetsCash and cash equivalents - 12,336 12,336 - 35,499 35,499 - 120,979 120,979 - 33,582 33,582Future and swap deposits - - - - - - - - - - - - Financial assets held at fair value through profit or loss - - - - - - - - - - - - Financial liabilitiesBank overdraft - - - - - - - - - - - - Future and swap payable - - - - - - - - - - - - Loan payable - - - - - - - - - - - - Financial liabilities held at fair value through profit or loss - - - - - - - - - - - - Net exposure - 12,336 12,336 - 35,499 35,499 - 120,979 120,979 - 33,582 33,582
30 June 2019Financial assetsCash and cash equivalents - 14,933 14,933 - 41,463 41,463 - 65,021 65,021 - 35,846 35,846Future and swap deposits - - - - - - - - - - - - Financial assets held at fair value through profit or loss - - - - - - - - - - - - Financial liabilitiesBank overdraft - - - - - - - - - - - - Future and swap payable - - - - - - - - - - - - Loan payable - - - - - - - - - - - - Financial liabilities held at fair value through profit or loss - - - - - - - - - - - - Net exposure - 14,933 14,933 - 41,463 41,463 - 65,021 65,021 - 35,846 35,846
Sensitivity analysis 2020 2019 2020 2019 2020 2019 2020 2019$ $ $ $ $ $ $ $
Impact on Profit/loss from operating activities and Net assets attributable to unitholders
Interest rate risk - increase of 100bps (2019: 50bps) 123 75 355 207 1,210 325 336 179Interest rate risk - decrease of 100bps (2019: 50bps) (123) (75) (355) (207) (1,210) (325) (336) (179)
129. OptiMix Australian Fixed Interest Trust 130. OptiMix Australian Share Trust 131. OptiMix Balanced Trust 132. OptiMix Conservative Trust

Financial Report Notes to the Financial Statements for the financial year ended 30 June 2020
295
9.4.4 Interest rate risk exposure and sensitivity analysis
Fixed interest rate Floating interest rate Total Fixed interest rate Floating interest rate Total Fixed interest rate Floating interest rate Total Fixed interest rate Floating interest rate Total $ $ $ $ $ $ $ $ $ $ $ $
30 June 2020Financial assetsCash and cash equivalents - 11,518 11,518 - 18,858 18,858 - 9,511 9,511 - 39,013 39,013Future and swap deposits - - - - - - - - - - - - Financial assets held at fair value through profit or loss - - - - - - - - - - - - Financial liabilitiesBank overdraft - - - - - - - - - - - - Future and swap payable - - - - - - - - - - - - Loan payable - - - - - - - - - - - - Financial liabilities held at fair value through profit or loss - - - - - - - - - - - - Net exposure - 11,518 11,518 - 18,858 18,858 - 9,511 9,511 - 39,013 39,013
30 June 2019Financial assetsCash and cash equivalents - 12,755 12,755 - 33,435 33,435 - 20,560 20,560 - 54,365 54,365Future and swap deposits - - - - - - - - - - - - Financial assets held at fair value through profit or loss - - - - - - - - - - - - Financial liabilitiesBank overdraft - - - - - - - - - - - - Future and swap payable - - - - - - - - - - - - Loan payable - - - - - - - - - - - - Financial liabilities held at fair value through profit or loss - - - - - - - - - - - - Net exposure - 12,755 12,755 - 33,435 33,435 - 20,560 20,560 - 54,365 54,365
Sensitivity analysis 2020 2019 2020 2019 2020 2019 2020 2019$ $ $ $ $ $ $ $
Impact on Profit/loss from operating activities and Net assets attributable to unitholders
Interest rate risk - increase of 100bps (2019: 50bps) 115 64 189 167 95 103 390 272Interest rate risk - decrease of 100bps (2019: 50bps) (115) (64) (189) (167) (95) (103) (390) (272)
133. OptiMix Global Emerging Markets Share Trust
134. OptiMix Global Share Trust 135. OptiMix Global Smaller Companies Share Trust
136. OptiMix Growth Trust

Financial Report Notes to the Financial Statements for the financial year ended 30 June 2020
296
9.4.4 Interest rate risk exposure and sensitivity analysis
Fixed interest rate Floating interest rate Total Fixed interest rate Floating interest rate Total Fixed interest rate Floating interest rate Total Fixed interest rate Floating interest rate Total $ $ $ $ $ $ $ $ $ $ $ $
30 June 2020Financial assetsCash and cash equivalents - 12,497 12,497 - 15,547 15,547 - 11,275 11,275 - 6,108,729 6,108,729Future and swap deposits - - - - - - - - - - 1,921,505 1,921,505Financial assets held at fair value through profit or loss - - - - - - - - - - 48,303 48,303Financial liabilitiesBank overdraft - - - - - - - - - - - - Future and swap payable - - - - - - - - - - - - Loan payable - - - - - - - - - - - - Financial liabilities held at fair value through profit or loss - - - - - - - - - - - - Net exposure - 12,497 12,497 - 15,547 15,547 - 11,275 11,275 - 8,078,537 8,078,537
30 June 2019Financial assetsCash and cash equivalents - 19,599 19,599 - 30,438 30,438 - 15,272 15,272 - 13,842,162 13,842,162Future and swap deposits - - - - - - - - - - 1,960,380 1,960,380Financial assets held at fair value through profit or loss - - - - - - - - - - 90,651 90,651Financial liabilitiesBank overdraft - - - - - - - - - - - - Future and swap payable - - - - - - - - - - (465,948) (465,948)Loan payable - - - - - - - - - - - - Financial liabilities held at fair value through profit or loss - - - - - - - - - - (370) (370)Net exposure - 19,599 19,599 - 30,438 30,438 - 15,272 15,272 - 15,426,875 15,426,875
Sensitivity analysis 2020 2019 2020 2019 2020 2019 2020 2019$ $ $ $ $ $ $ $
Impact on Profit/loss from operating activities and Net assets attributable to unitholders
Interest rate risk - increase of 100bps (2019: 50bps) 125 98 155 152 113 76 (427,111) (539,666)Interest rate risk - decrease of 100bps (2019: 50bps) (125) (98) (155) (152) (113) (76) 250,558 526,944
137. OptiMix High Growth Trust 138. OptiMix Moderate Trust 139. OptiMix Property Securities Trust 140. OptiMix Wholesale Balanced Trust

Financial Report Notes to the Financial Statements for the financial year ended 30 June 2020
297
9.4.4 Interest rate risk exposure and sensitivity analysis
Fixed interest rate Floating interest rate Total Fixed interest rate Floating interest rate Total Fixed interest rate Floating interest rate Total Fixed interest rate Floating interest rate Total $ $ $ $ $ $ $ $ $ $ $ $
30 June 2020Financial assetsCash and cash equivalents - 1,823,687 1,823,687 - - - - 2,536,778 2,536,778 - 2,977,508 2,977,508Future and swap deposits - 282,560 282,560 - - - - 774,290 774,290 - 388,447 388,447Financial assets held at fair value through profit or loss - - - - - - - 38,927 38,927 - - - Financial liabilitiesBank overdraft - - - - (6,999,941) (6,999,941) - - - - - - Future and swap payable - (181,351) (181,351) - - - - - - - (98,467) (98,467)Loan payable - - - - - - - - - - - - Financial liabilities held at fair value through profit or loss - - - - - - - - - - - - Net exposure - 1,924,896 1,924,896 - (6,999,941) (6,999,941) - 3,349,995 3,349,995 - 3,267,488 3,267,488
30 June 2019Financial assetsCash and cash equivalents - 1,119,959 1,119,959 - - - - 2,472,819 2,472,819 - 2,751,764 2,751,764Future and swap deposits - 18,244 18,244 - - - - 719,282 719,282 - 237,612 237,612Financial assets held at fair value through profit or loss - - - - - - - 45,421 45,421 - - - Financial liabilitiesBank overdraft - - - - (92,828) (92,828) - - - - - - Future and swap payable - - - - - - - (180,929) (180,929) - (118,911) (118,911)Loan payable - - - - - - - - - - - - Financial liabilities held at fair value through profit or loss - (4,544) (4,544) - - - - (159) (159) - - - Net exposure - 1,133,659 1,133,659 - (92,828) (92,828) - 3,056,434 3,056,434 - 2,870,465 2,870,465
Sensitivity analysis 2020 2019 2020 2019 2020 2019 2020 2019$ $ $ $ $ $ $ $
Impact on Profit/loss from operating activities and Net assets attributable to unitholders
Interest rate risk - increase of 100bps (2019: 50bps) 19,249 41,716 (69,999) (464) (243,178) (217,344) 32,675 14,352Interest rate risk - decrease of 100bps (2019: 50bps) (19,249) (42,879) 69,999 464 129,085 205,191 (32,675) (14,352)
141. OptiMix Wholesale Conservative Trust 142. OptiMix Wholesale Global (Hedged) Share Trust
143. OptiMix Wholesale Growth Trust 144. OptiMix Wholesale High Growth Trust
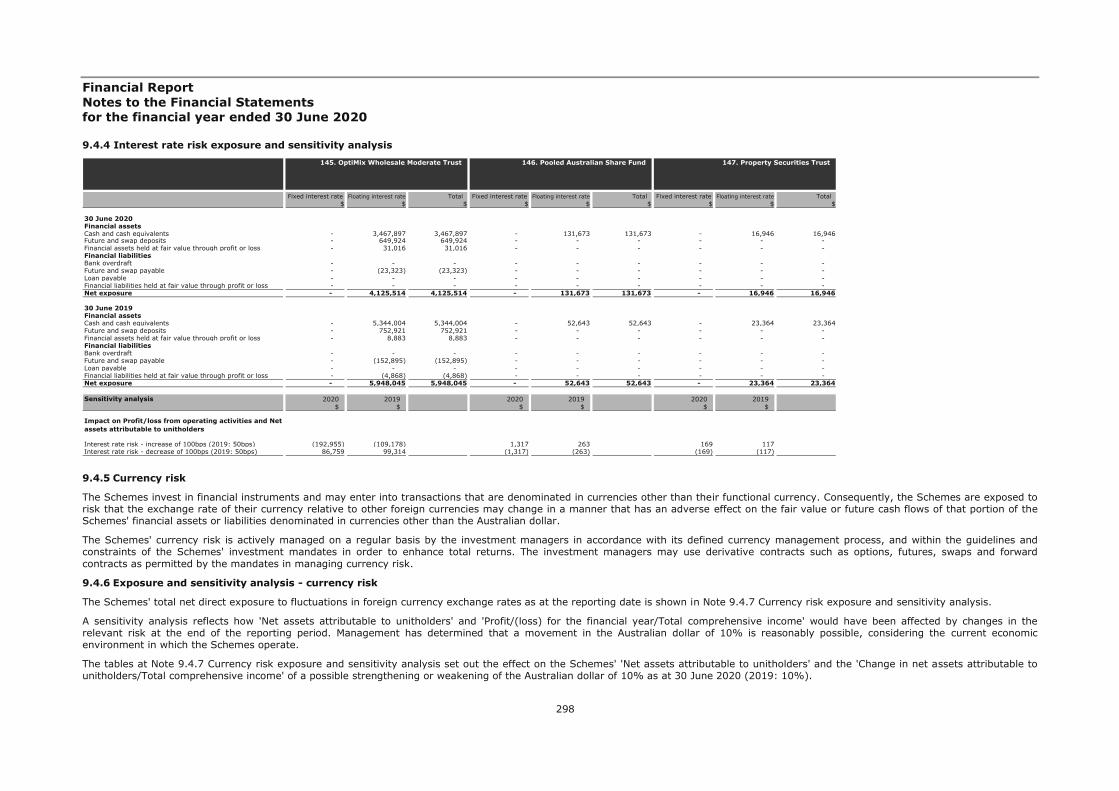
Financial Report Notes to the Financial Statements for the financial year ended 30 June 2020
298
9.4.4 Interest rate risk exposure and sensitivity analysis
9.4.5 Currency risk
The Schemes invest in financial instruments and may enter into transactions that are denominated in currencies other than their functional currency. Consequently, the Schemes are exposed to risk that the exchange rate of their currency relative to other foreign currencies may change in a manner that has an adverse effect on the fair value or future cash flows of that portion of the Schemes' financial assets or liabilities denominated in currencies other than the Australian dollar.
The Schemes' currency risk is actively managed on a regular basis by the investment managers in accordance with its defined currency management process, and within the guidelines and constraints of the Schemes' investment mandates in order to enhance total returns. The investment managers may use derivative contracts such as options, futures, swaps and forward contracts as permitted by the mandates in managing currency risk.
9.4.6 Exposure and sensitivity analysis - currency risk
The Schemes' total net direct exposure to fluctuations in foreign currency exchange rates as at the reporting date is shown in Note 9.4.7 Currency risk exposure and sensitivity analysis.
A sensitivity analysis reflects how 'Net assets attributable to unitholders' and 'Profit/(loss) for the financial year/Total comprehensive income' would have been affected by changes in the relevant risk at the end of the reporting period. Management has determined that a movement in the Australian dollar of 10% is reasonably possible, considering the current economic environment in which the Schemes operate.
The tables at Note 9.4.7 Currency risk exposure and sensitivity analysis set out the effect on the Schemes' 'Net assets attributable to unitholders' and the 'Change in net assets attributable to unitholders/Total comprehensive income' of a possible strengthening or weakening of the Australian dollar of 10% as at 30 June 2020 (2019: 10%).
Fixed interest rate Floating interest rate Total Fixed interest rate Floating interest rate Total Fixed interest rate Floating interest rate Total $ $ $ $ $ $ $ $ $
30 June 2020Financial assetsCash and cash equivalents - 3,467,897 3,467,897 - 131,673 131,673 - 16,946 16,946Future and swap deposits - 649,924 649,924 - - - - - - Financial assets held at fair value through profit or loss - 31,016 31,016 - - - - - - Financial liabilitiesBank overdraft - - - - - - - - - Future and swap payable - (23,323) (23,323) - - - - - - Loan payable - - - - - - - - - Financial liabilities held at fair value through profit or loss - - - - - - - - - Net exposure - 4,125,514 4,125,514 - 131,673 131,673 - 16,946 16,946
30 June 2019Financial assetsCash and cash equivalents - 5,344,004 5,344,004 - 52,643 52,643 - 23,364 23,364Future and swap deposits - 752,921 752,921 - - - - - - Financial assets held at fair value through profit or loss - 8,883 8,883 - - - - - - Financial liabilitiesBank overdraft - - - - - - - - - Future and swap payable - (152,895) (152,895) - - - - - - Loan payable - - - - - - - - - Financial liabilities held at fair value through profit or loss - (4,868) (4,868) - - - - - - Net exposure - 5,948,045 5,948,045 - 52,643 52,643 - 23,364 23,364
Sensitivity analysis 2020 2019 2020 2019 2020 2019$ $ $ $ $ $
Impact on Profit/loss from operating activities and Net assets attributable to unitholders
Interest rate risk - increase of 100bps (2019: 50bps) (192,955) (109,178) 1,317 263 169 117Interest rate risk - decrease of 100bps (2019: 50bps) 86,759 99,314 (1,317) (263) (169) (117)
145. OptiMix Wholesale Moderate Trust 146. Pooled Australian Share Fund 147. Property Securities Trust
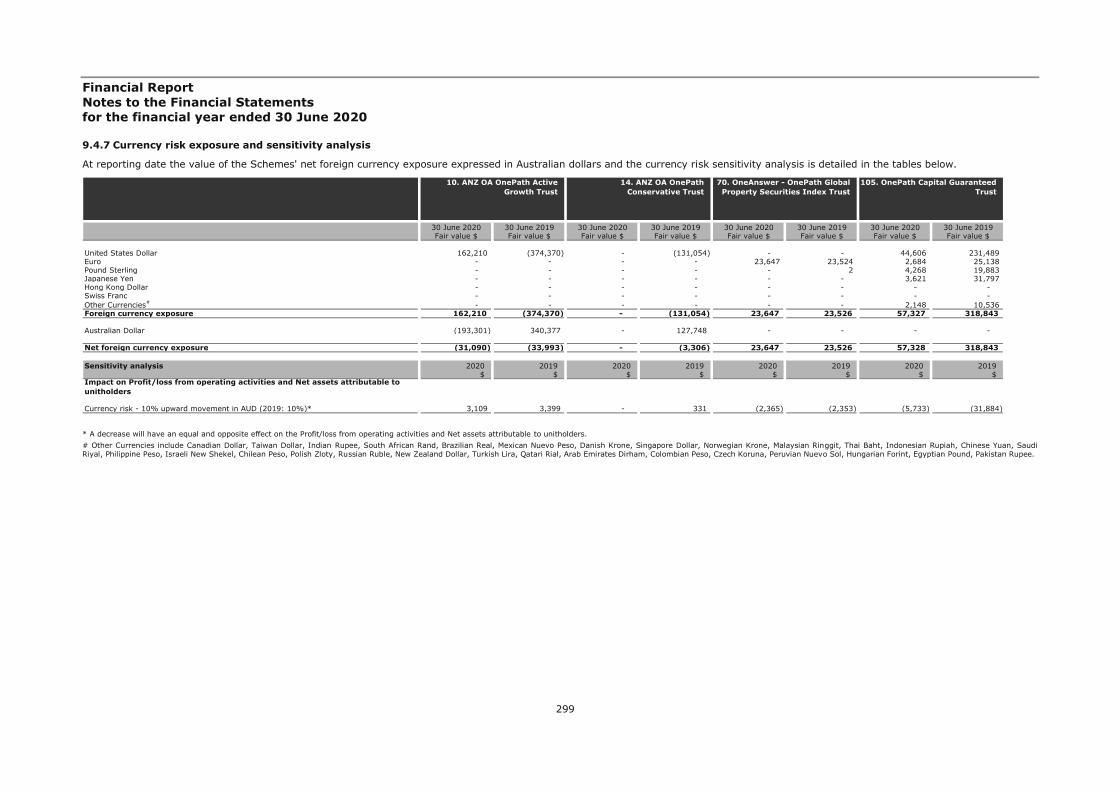
Financial Report Notes to the Financial Statements for the financial year ended 30 June 2020
299
9.4.7 Currency risk exposure and sensitivity analysis
At reporting date the value of the Schemes' net foreign currency exposure expressed in Australian dollars and the currency risk sensitivity analysis is detailed in the tables below.
* A decrease will have an equal and opposite effect on the Profit/loss from operating activities and Net assets attributable to unitholders. # Other Currencies include Canadian Dollar, Taiwan Dollar, Indian Rupee, South African Rand, Brazilian Real, Mexican Nuevo Peso, Danish Krone, Singapore Dollar, Norwegian Krone, Malaysian Ringgit, Thai Baht, Indonesian Rupiah, Chinese Yuan, Saudi Riyal, Philippine Peso, Israeli New Shekel, Chilean Peso, Polish Zloty, Russian Ruble, New Zealand Dollar, Turkish Lira, Qatari Rial, Arab Emirates Dirham, Colombian Peso, Czech Koruna, Peruvian Nuevo Sol, Hungarian Forint, Egyptian Pound, Pakistan Rupee.
30 June 2020 30 June 2019 30 June 2020 30 June 2019 30 June 2020 30 June 2019 30 June 2020 30 June 2019Fair value $ Fair value $ Fair value $ Fair value $ Fair value $ Fair value $ Fair value $ Fair value $
United States Dollar 162,210 (374,370) - (131,054) - - 44,606 231,489 Euro - - - - 23,647 23,524 2,684 25,138 Pound Sterling - - - - - 2 4,268 19,883 Japanese Yen - - - - - - 3,621 31,797 Hong Kong Dollar - - - - - - - - Swiss Franc - - - - - - - - Other Currencies# - - - - - - 2,148 10,536 Foreign currency exposure 162,210 (374,370) - (131,054) 23,647 23,526 57,327 318,843
Australian Dollar (193,301) 340,377 - 127,748 - - - -
Net foreign currency exposure (31,090) (33,993) - (3,306) 23,647 23,526 57,328 318,843
Sensitivity analysis 2020 2019 2020 2019 2020 2019 2020 2019$ $ $ $ $ $ $ $
Impact on Profit/loss from operating activities and Net assets attributable to unitholders
Currency risk - 10% upward movement in AUD (2019: 10%)* 3,109 3,399 - 331 (2,365) (2,353) (5,733) (31,884)
14. ANZ OA OnePath Conservative Trust
70. OneAnswer - OnePath Global Property Securities Index Trust
105. OnePath Capital Guaranteed Trust
10. ANZ OA OnePath Active Growth Trust
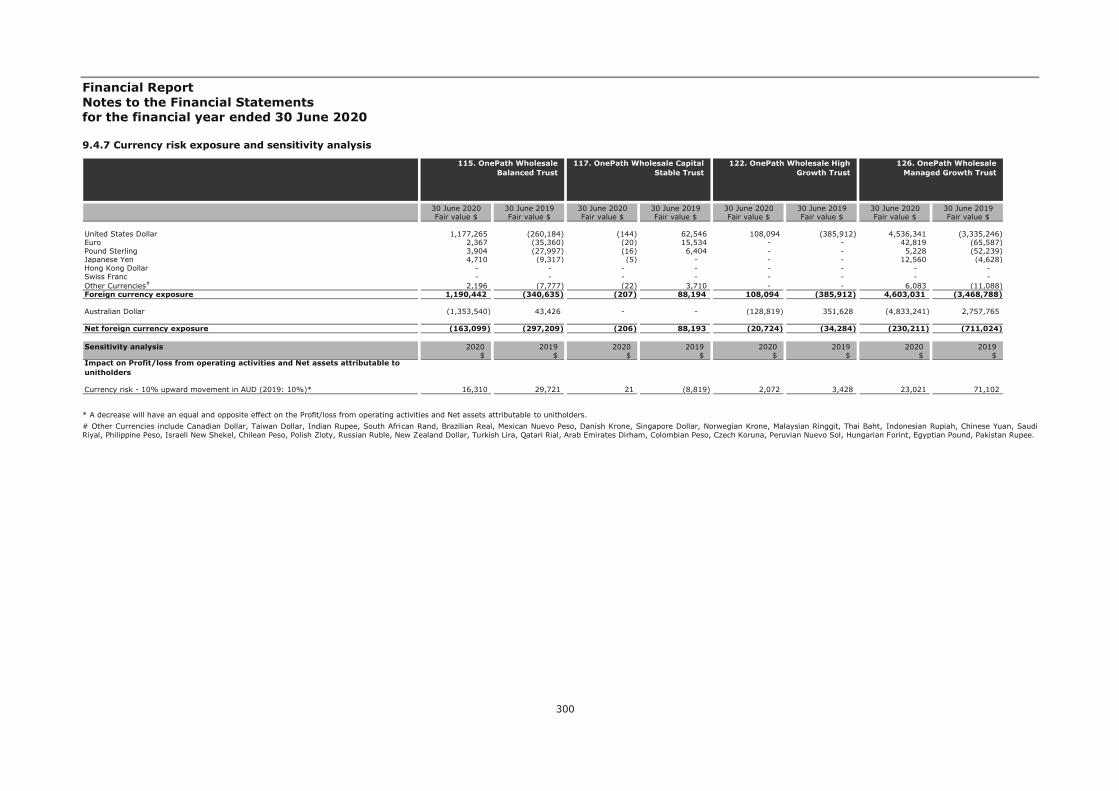
Financial Report Notes to the Financial Statements for the financial year ended 30 June 2020
300
9.4.7 Currency risk exposure and sensitivity analysis
* A decrease will have an equal and opposite effect on the Profit/loss from operating activities and Net assets attributable to unitholders. # Other Currencies include Canadian Dollar, Taiwan Dollar, Indian Rupee, South African Rand, Brazilian Real, Mexican Nuevo Peso, Danish Krone, Singapore Dollar, Norwegian Krone, Malaysian Ringgit, Thai Baht, Indonesian Rupiah, Chinese Yuan, Saudi Riyal, Philippine Peso, Israeli New Shekel, Chilean Peso, Polish Zloty, Russian Ruble, New Zealand Dollar, Turkish Lira, Qatari Rial, Arab Emirates Dirham, Colombian Peso, Czech Koruna, Peruvian Nuevo Sol, Hungarian Forint, Egyptian Pound, Pakistan Rupee.
30 June 2020 30 June 2019 30 June 2020 30 June 2019 30 June 2020 30 June 2019 30 June 2020 30 June 2019Fair value $ Fair value $ Fair value $ Fair value $ Fair value $ Fair value $ Fair value $ Fair value $
United States Dollar 1,177,265 (260,184) (144) 62,546 108,094 (385,912) 4,536,341 (3,335,246) Euro 2,367 (35,360) (20) 15,534 - - 42,819 (65,587) Pound Sterling 3,904 (27,997) (16) 6,404 - - 5,228 (52,239) Japanese Yen 4,710 (9,317) (5) - - - 12,560 (4,628) Hong Kong Dollar - - - - - - - - Swiss Franc - - - - - - - - Other Currencies# 2,196 (7,777) (22) 3,710 - - 6,083 (11,088) Foreign currency exposure 1,190,442 (340,635) (207) 88,194 108,094 (385,912) 4,603,031 (3,468,788)
Australian Dollar (1,353,540) 43,426 - - (128,819) 351,628 (4,833,241) 2,757,765
Net foreign currency exposure (163,099) (297,209) (206) 88,193 (20,724) (34,284) (230,211) (711,024)
Sensitivity analysis 2020 2019 2020 2019 2020 2019 2020 2019$ $ $ $ $ $ $ $
Impact on Profit/loss from operating activities and Net assets attributable to unitholders
Currency risk - 10% upward movement in AUD (2019: 10%)* 16,310 29,721 21 (8,819) 2,072 3,428 23,021 71,102
117. OnePath Wholesale Capital Stable Trust
122. OnePath Wholesale High Growth Trust
126. OnePath Wholesale Managed Growth Trust
115. OnePath Wholesale Balanced Trust

Financial Report Notes to the Financial Statements for the financial year ended 30 June 2020
301
9.4.7 Currency risk exposure and sensitivity analysis
* A decrease will have an equal and opposite effect on the Profit/loss from operating activities and Net assets attributable to unitholders. # Other Currencies include Canadian Dollar, Taiwan Dollar, Indian Rupee, South African Rand, Brazilian Real, Mexican Nuevo Peso, Danish Krone, Singapore Dollar, Norwegian Krone, Malaysian Ringgit, Thai Baht, Indonesian Rupiah, Chinese Yuan, Saudi Riyal, Philippine Peso, Israeli New Shekel, Chilean Peso, Polish Zloty, Russian Ruble, New Zealand Dollar, Turkish Lira, Qatari Rial, Arab Emirates Dirham, Colombian Peso, Czech Koruna, Peruvian Nuevo Sol, Hungarian Forint, Egyptian Pound, Pakistan Rupee.
30 June 2020 30 June 2019 30 June 2020 30 June 2019 30 June 2020 30 June 2019 30 June 2020 30 June 2019Fair value $ Fair value $ Fair value $ Fair value $ Fair value $ Fair value $ Fair value $ Fair value $
United States Dollar 4,795,557 1,525,421 161,706 (625,320) 162,667,283 234,857,224 873,331 (545,807) Euro 241,920 (30,038) 62,274 - 29,705,198 46,172,358 69,775 46,094 Pound Sterling 74,648 (33,178) 17,659 1 11,250,624 21,189,254 34,087 2,550 Japanese Yen 44,886 11,119 38,713 - 20,001,639 30,167,198 14,857 (2,813) Hong Kong Dollar - - - - 2,676,992 5,100,941 - - Swiss Franc - - - - 8,056,038 11,511,015 - - Other Currencies# 36,416 (13,915) 2,210 - 9,075,393 14,941,270 2,210 (1,621) Foreign currency exposure 5,193,427 1,459,409 282,562 (625,319) 243,433,167 363,939,260 994,260 (501,597)
Australian Dollar (5,030,754) (2,248,896) - 609,545 (235,206,620) (361,743,595) (837,975) 210,105
Net foreign currency exposure 162,673 (789,488) 282,561 (15,774) 8,226,547 2,195,663 156,285 (291,492)
Sensitivity analysis 2020 2019 2020 2019 2020 2019 2020 2019$ $ $ $ $ $ $ $
Impact on Profit/loss from operating activities and Net assets attributable to unitholders
Currency risk - 10% upward movement in AUD (2019: 10%)* (16,267) 78,949 (28,256) 1,577 (822,655) (219,566) (15,629) 29,149
141. OptiMix Wholesale Conservative Trust
142. OptiMix Wholesale Global (Hedged) Share Trust
143. OptiMix Wholesale Growth Trust
140. OptiMix Wholesale Balanced Trust
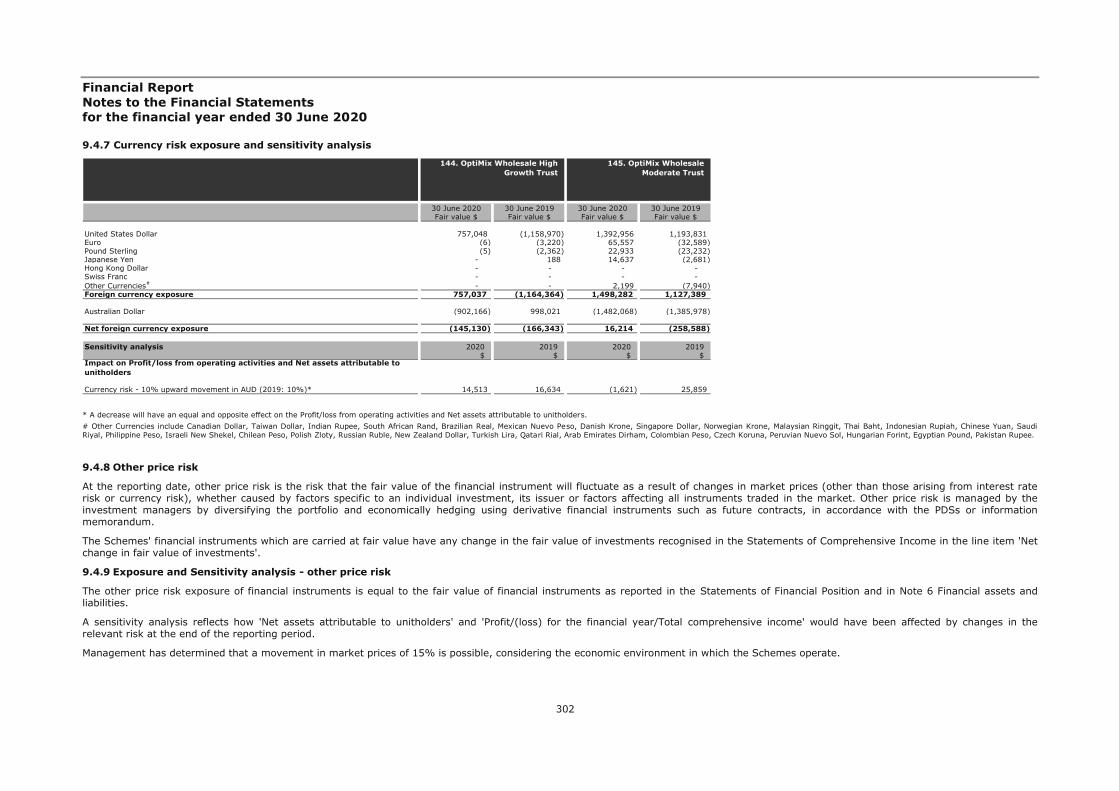
Financial Report Notes to the Financial Statements for the financial year ended 30 June 2020
302
9.4.7 Currency risk exposure and sensitivity analysis
* A decrease will have an equal and opposite effect on the Profit/loss from operating activities and Net assets attributable to unitholders. # Other Currencies include Canadian Dollar, Taiwan Dollar, Indian Rupee, South African Rand, Brazilian Real, Mexican Nuevo Peso, Danish Krone, Singapore Dollar, Norwegian Krone, Malaysian Ringgit, Thai Baht, Indonesian Rupiah, Chinese Yuan, Saudi Riyal, Philippine Peso, Israeli New Shekel, Chilean Peso, Polish Zloty, Russian Ruble, New Zealand Dollar, Turkish Lira, Qatari Rial, Arab Emirates Dirham, Colombian Peso, Czech Koruna, Peruvian Nuevo Sol, Hungarian Forint, Egyptian Pound, Pakistan Rupee.
9.4.8 Other price risk
At the reporting date, other price risk is the risk that the fair value of the financial instrument will fluctuate as a result of changes in market prices (other than those arising from interest rate risk or currency risk), whether caused by factors specific to an individual investment, its issuer or factors affecting all instruments traded in the market. Other price risk is managed by the investment managers by diversifying the portfolio and economically hedging using derivative financial instruments such as future contracts, in accordance with the PDSs or information memorandum.
The Schemes' financial instruments which are carried at fair value have any change in the fair value of investments recognised in the Statements of Comprehensive Income in the line item 'Net change in fair value of investments'.
9.4.9 Exposure and Sensitivity analysis - other price risk
The other price risk exposure of financial instruments is equal to the fair value of financial instruments as reported in the Statements of Financial Position and in Note 6 Financial assets and liabilities.
A sensitivity analysis reflects how 'Net assets attributable to unitholders' and 'Profit/(loss) for the financial year/Total comprehensive income' would have been affected by changes in the relevant risk at the end of the reporting period.
Management has determined that a movement in market prices of 15% is possible, considering the economic environment in which the Schemes operate.
30 June 2020 30 June 2019 30 June 2020 30 June 2019Fair value $ Fair value $ Fair value $ Fair value $
United States Dollar 757,048 (1,158,970) 1,392,956 1,193,831 Euro (6) (3,220) 65,557 (32,589) Pound Sterling (5) (2,362) 22,933 (23,232) Japanese Yen - 188 14,637 (2,681) Hong Kong Dollar - - - - Swiss Franc - - - - Other Currencies# - - 2,199 (7,940) Foreign currency exposure 757,037 (1,164,364) 1,498,282 1,127,389
Australian Dollar (902,166) 998,021 (1,482,068) (1,385,978)
Net foreign currency exposure (145,130) (166,343) 16,214 (258,588)
Sensitivity analysis 2020 2019 2020 2019$ $ $ $
Impact on Profit/loss from operating activities and Net assets attributable to unitholders
Currency risk - 10% upward movement in AUD (2019: 10%)* 14,513 16,634 (1,621) 25,859
145. OptiMix Wholesale Moderate Trust
144. OptiMix Wholesale High Growth Trust
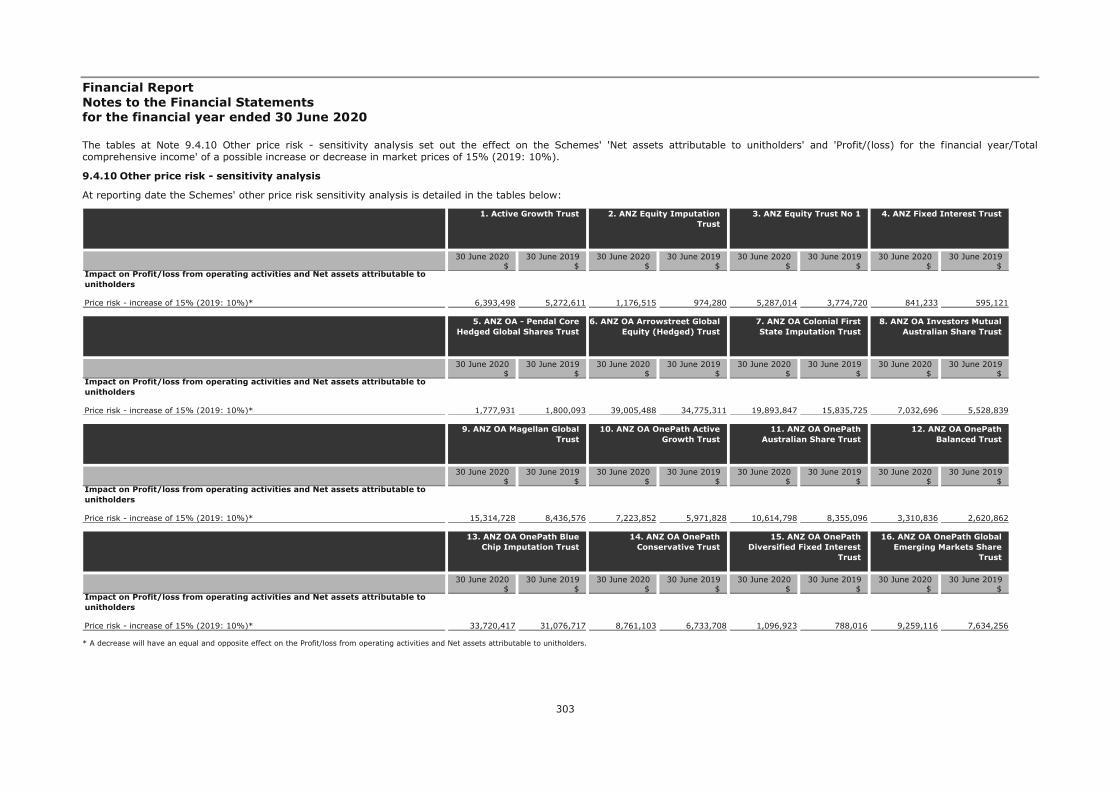
Financial Report Notes to the Financial Statements for the financial year ended 30 June 2020
303
The tables at Note 9.4.10 Other price risk - sensitivity analysis set out the effect on the Schemes' 'Net assets attributable to unitholders' and 'Profit/(loss) for the financial year/Total comprehensive income' of a possible increase or decrease in market prices of 15% (2019: 10%).
9.4.10 Other price risk - sensitivity analysis
At reporting date the Schemes' other price risk sensitivity analysis is detailed in the tables below:
* A decrease will have an equal and opposite effect on the Profit/loss from operating activities and Net assets attributable to unitholders.
30 June 2020 30 June 2019 30 June 2020 30 June 2019 30 June 2020 30 June 2019 30 June 2020 30 June 2019$ $ $ $ $ $ $ $
Impact on Profit/loss from operating activities and Net assets attributable to unitholders
Price risk - increase of 15% (2019: 10%)* 6,393,498 5,272,611 1,176,515 974,280 5,287,014 3,774,720 841,233 595,121
1. Active Growth Trust 2. ANZ Equity Imputation Trust
3. ANZ Equity Trust No 1 4. ANZ Fixed Interest Trust
30 June 2020 30 June 2019 30 June 2020 30 June 2019 30 June 2020 30 June 2019 30 June 2020 30 June 2019$ $ $ $ $ $ $ $
Impact on Profit/loss from operating activities and Net assets attributable to unitholders
Price risk - increase of 15% (2019: 10%)* 1,777,931 1,800,093 39,005,488 34,775,311 19,893,847 15,835,725 7,032,696 5,528,839
5. ANZ OA - Pendal Core Hedged Global Shares Trust
6. ANZ OA Arrowstreet Global Equity (Hedged) Trust
7. ANZ OA Colonial First State Imputation Trust
8. ANZ OA Investors Mutual Australian Share Trust
30 June 2020 30 June 2019 30 June 2020 30 June 2019 30 June 2020 30 June 2019 30 June 2020 30 June 2019$ $ $ $ $ $ $ $
Impact on Profit/loss from operating activities and Net assets attributable to unitholders
Price risk - increase of 15% (2019: 10%)* 15,314,728 8,436,576 7,223,852 5,971,828 10,614,798 8,355,096 3,310,836 2,620,862
9. ANZ OA Magellan Global Trust
10. ANZ OA OnePath Active Growth Trust
11. ANZ OA OnePath Australian Share Trust
12. ANZ OA OnePath Balanced Trust
30 June 2020 30 June 2019 30 June 2020 30 June 2019 30 June 2020 30 June 2019 30 June 2020 30 June 2019$ $ $ $ $ $ $ $
Impact on Profit/loss from operating activities and Net assets attributable to unitholders
Price risk - increase of 15% (2019: 10%)* 33,720,417 31,076,717 8,761,103 6,733,708 1,096,923 788,016 9,259,116 7,634,256
13. ANZ OA OnePath Blue Chip Imputation Trust
14. ANZ OA OnePath Conservative Trust
15. ANZ OA OnePath Diversified Fixed Interest
Trust
16. ANZ OA OnePath Global Emerging Markets Share
Trust
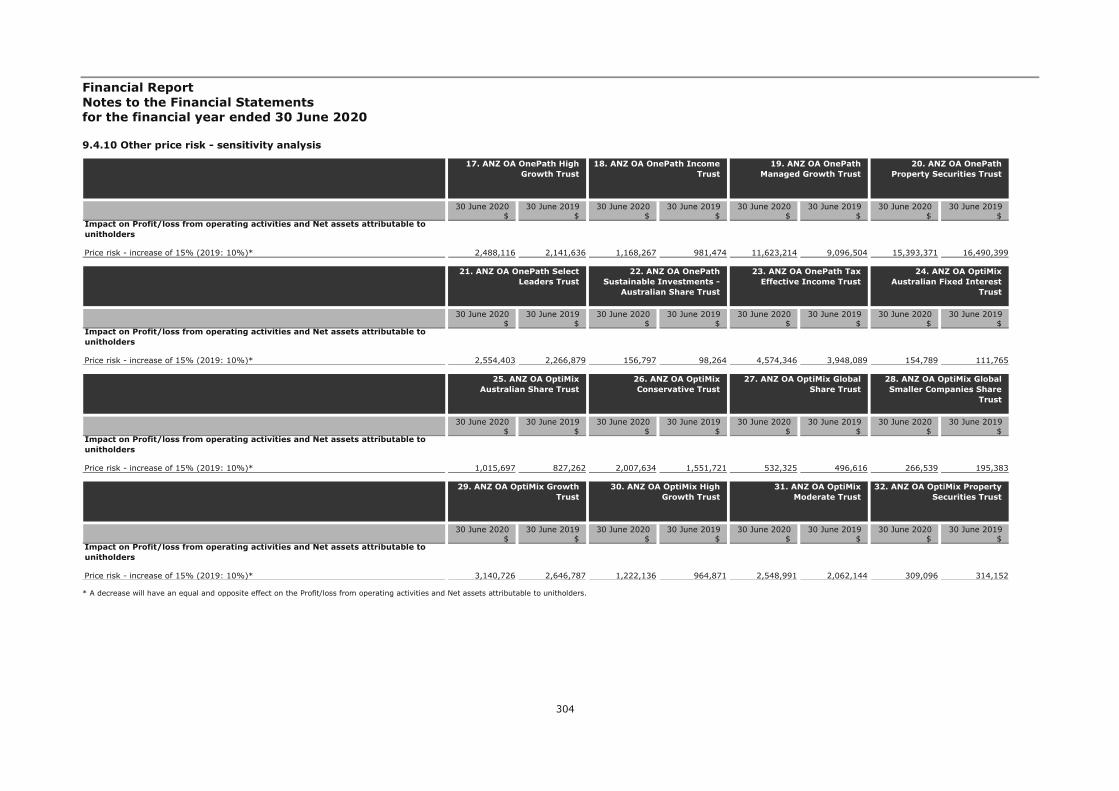
Financial Report Notes to the Financial Statements for the financial year ended 30 June 2020
304
9.4.10 Other price risk - sensitivity analysis
* A decrease will have an equal and opposite effect on the Profit/loss from operating activities and Net assets attributable to unitholders.
30 June 2020 30 June 2019 30 June 2020 30 June 2019 30 June 2020 30 June 2019 30 June 2020 30 June 2019$ $ $ $ $ $ $ $
Impact on Profit/loss from operating activities and Net assets attributable to unitholders
Price risk - increase of 15% (2019: 10%)* 2,488,116 2,141,636 1,168,267 981,474 11,623,214 9,096,504 15,393,371 16,490,399
17. ANZ OA OnePath High Growth Trust
18. ANZ OA OnePath Income Trust
19. ANZ OA OnePath Managed Growth Trust
20. ANZ OA OnePath Property Securities Trust
30 June 2020 30 June 2019 30 June 2020 30 June 2019 30 June 2020 30 June 2019 30 June 2020 30 June 2019$ $ $ $ $ $ $ $
Impact on Profit/loss from operating activities and Net assets attributable to unitholders
Price risk - increase of 15% (2019: 10%)* 2,554,403 2,266,879 156,797 98,264 4,574,346 3,948,089 154,789 111,765
21. ANZ OA OnePath Select Leaders Trust
22. ANZ OA OnePath Sustainable Investments -
Australian Share Trust
23. ANZ OA OnePath Tax Effective Income Trust
24. ANZ OA OptiMix Australian Fixed Interest
Trust
30 June 2020 30 June 2019 30 June 2020 30 June 2019 30 June 2020 30 June 2019 30 June 2020 30 June 2019$ $ $ $ $ $ $ $
Impact on Profit/loss from operating activities and Net assets attributable to unitholders
Price risk - increase of 15% (2019: 10%)* 1,015,697 827,262 2,007,634 1,551,721 532,325 496,616 266,539 195,383
25. ANZ OA OptiMix Australian Share Trust
26. ANZ OA OptiMix Conservative Trust
27. ANZ OA OptiMix Global Share Trust
28. ANZ OA OptiMix Global Smaller Companies Share
Trust
30 June 2020 30 June 2019 30 June 2020 30 June 2019 30 June 2020 30 June 2019 30 June 2020 30 June 2019$ $ $ $ $ $ $ $
Impact on Profit/loss from operating activities and Net assets attributable to unitholders
Price risk - increase of 15% (2019: 10%)* 3,140,726 2,646,787 1,222,136 964,871 2,548,991 2,062,144 309,096 314,152
29. ANZ OA OptiMix Growth Trust
30. ANZ OA OptiMix High Growth Trust
31. ANZ OA OptiMix Moderate Trust
32. ANZ OA OptiMix Property Securities Trust

Financial Report Notes to the Financial Statements for the financial year ended 30 June 2020
305
9.4.10 Other price risk - sensitivity analysis
* A decrease will have an equal and opposite effect on the Profit/loss from operating activities and Net assets attributable to unitholders.
30 June 2020 30 June 2019 30 June 2020 30 June 2019 30 June 2020 30 June 2019 30 June 2020 30 June 2019$ $ $ $ $ $ $ $
Impact on Profit/loss from operating activities and Net assets attributable to unitholders
Price risk - increase of 15% (2019: 10%)* 37,732,903 33,147,248 9,833,216 12,068,304 1,591,106 1,883,926 299,654 215,747
33. ANZ OA Perpetual Australian Share Trust
34. ANZ OA Schroder Australian Equity Trust
35. ANZ OA SG Hiscock Property Trust
36. ANZ OA UBS Diversified Fixed Income Trust
30 June 2020 30 June 2019 30 June 2020 30 June 2019 30 June 2020 30 June 2019 30 June 2020 30 June 2019$ $ $ $ $ $ $ $
Impact on Profit/loss from operating activities and Net assets attributable to unitholders
Price risk - increase of 15% (2019: 10%)* 2,063,087 1,818,667 1,652,927 1,305,063 36,313,868 17,913,019 8,302,898 9,181,851
37. ANZ OneAnswer - BR Scientific Australian Equity
Trust
38. ANZ OneAnswer - BR Scientific International
Equity Trust
39. ANZ Private International Fixed Interest Fund
40. ANZ Property Securities Trust
30 June 2020 30 June 2019 30 June 2020 30 June 2019 30 June 2020 30 June 2019 30 June 2020 30 June 2019$ $ $ $ $ $ $ $
Impact on Profit/loss from operating activities and Net assets attributable to unitholders
Price risk - increase of 15% (2019: 10%)* 18,230,878 13,379,364 10,017,103 7,886,719 11,064,784 9,888,883 28,557,571 25,629,482
41. Australian Share Trust 42. Balanced Trust 43. Blue Chip Imputation Trust
44. Emerging Companies Trust
30 June 2020 30 June 2019 30 June 2020 30 June 2019 30 June 2020 30 June 2019 30 June 2020 30 June 2019$ $ $ $ $ $ $ $
Impact on Profit/loss from operating activities and Net assets attributable to unitholders
Price risk - increase of 15% (2019: 10%)* 27,337,917 18,065,858 932,856 875,147 194,755 147,194 1,255,680 1,618,402
45. Global Share Trust 46. Heine Property Securities Fund
47. High Growth Trust 48. OneAnswer - Altrinsic Global Equities Trust
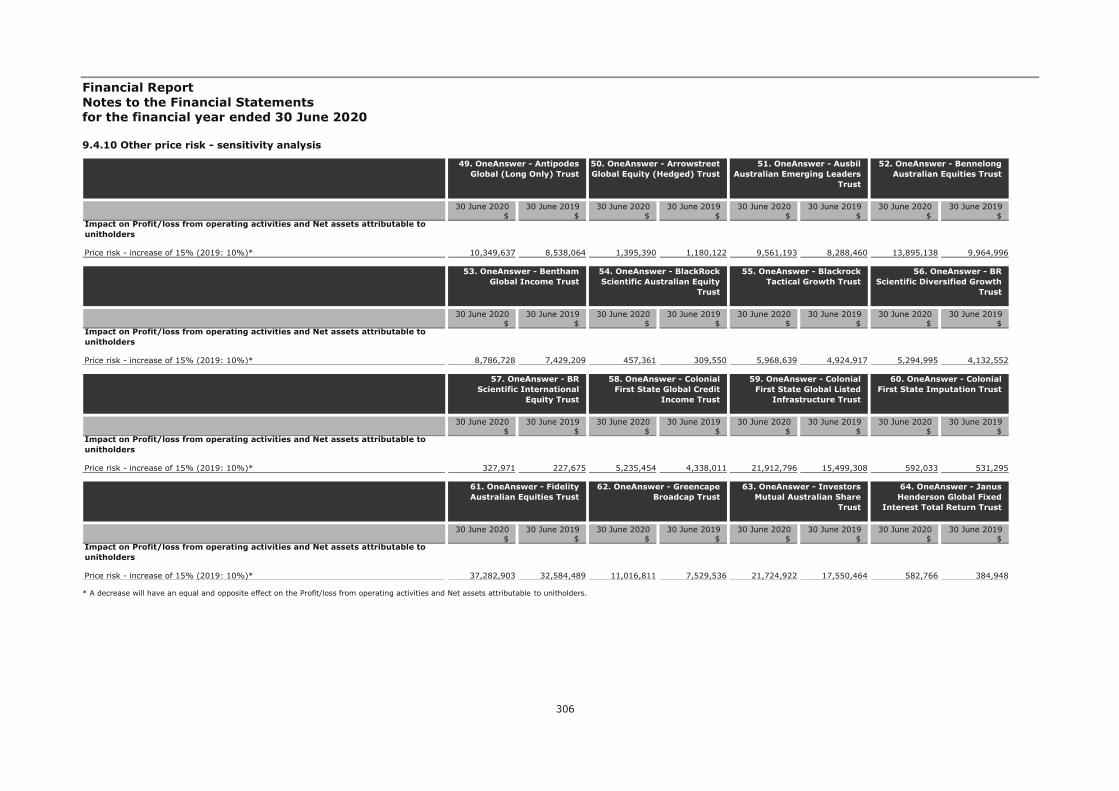
Financial Report Notes to the Financial Statements for the financial year ended 30 June 2020
306
9.4.10 Other price risk - sensitivity analysis
* A decrease will have an equal and opposite effect on the Profit/loss from operating activities and Net assets attributable to unitholders.
30 June 2020 30 June 2019 30 June 2020 30 June 2019 30 June 2020 30 June 2019 30 June 2020 30 June 2019$ $ $ $ $ $ $ $
Impact on Profit/loss from operating activities and Net assets attributable to unitholders
Price risk - increase of 15% (2019: 10%)* 10,349,637 8,538,064 1,395,390 1,180,122 9,561,193 8,288,460 13,895,138 9,964,996
49. OneAnswer - Antipodes Global (Long Only) Trust
50. OneAnswer - Arrowstreet Global Equity (Hedged) Trust
51. OneAnswer - Ausbil Australian Emerging Leaders
Trust
52. OneAnswer - Bennelong Australian Equities Trust
30 June 2020 30 June 2019 30 June 2020 30 June 2019 30 June 2020 30 June 2019 30 June 2020 30 June 2019$ $ $ $ $ $ $ $
Impact on Profit/loss from operating activities and Net assets attributable to unitholders
Price risk - increase of 15% (2019: 10%)* 8,786,728 7,429,209 457,361 309,550 5,968,639 4,924,917 5,294,995 4,132,552
53. OneAnswer - Bentham Global Income Trust
54. OneAnswer - BlackRock Scientific Australian Equity
Trust
55. OneAnswer - Blackrock Tactical Growth Trust
56. OneAnswer - BR Scientific Diversified Growth
Trust
30 June 2020 30 June 2019 30 June 2020 30 June 2019 30 June 2020 30 June 2019 30 June 2020 30 June 2019$ $ $ $ $ $ $ $
Impact on Profit/loss from operating activities and Net assets attributable to unitholders
Price risk - increase of 15% (2019: 10%)* 327,971 227,675 5,235,454 4,338,011 21,912,796 15,499,308 592,033 531,295
57. OneAnswer - BR Scientific International
Equity Trust
58. OneAnswer - Colonial First State Global Credit
Income Trust
59. OneAnswer - Colonial First State Global Listed
Infrastructure Trust
60. OneAnswer - Colonial First State Imputation Trust
30 June 2020 30 June 2019 30 June 2020 30 June 2019 30 June 2020 30 June 2019 30 June 2020 30 June 2019$ $ $ $ $ $ $ $
Impact on Profit/loss from operating activities and Net assets attributable to unitholders
Price risk - increase of 15% (2019: 10%)* 37,282,903 32,584,489 11,016,811 7,529,536 21,724,922 17,550,464 582,766 384,948
61. OneAnswer - Fidelity Australian Equities Trust
62. OneAnswer - Greencape Broadcap Trust
63. OneAnswer - Investors Mutual Australian Share
Trust
64. OneAnswer - Janus Henderson Global Fixed
Interest Total Return Trust

Financial Report Notes to the Financial Statements for the financial year ended 30 June 2020
307
9.4.10 Other price risk - sensitivity analysis
* A decrease will have an equal and opposite effect on the Profit/loss from operating activities and Net assets attributable to unitholders.
30 June 2020 30 June 2019 30 June 2020 30 June 2019 30 June 2020 30 June 2019 30 June 2020 30 June 2019$ $ $ $ $ $ $ $
Impact on Profit/loss from operating activities and Net assets attributable to unitholders
Price risk - increase of 15% (2019: 10%)* 83,586,857 64,435,391 34,377,553 17,515,749 8,057,328 7,417,043 57,320,186 47,794,804
65. OneAnswer - Kapstream Absolute Return Income
Trust
66. OneAnswer - Magellan Global Trust
67. OneAnswer - Merlon Australian Share Income
Trust
68. OneAnswer - MFS Global Equity Trust
30 June 2020 30 June 2019 30 June 2020 30 June 2019 30 June 2020 30 June 2019 30 June 2020 30 June 2019$ $ $ $ $ $ $ $
Impact on Profit/loss from operating activities and Net assets attributable to unitholders
Price risk - increase of 15% (2019: 10%)* 1,506,661 2,009,470 28,363,696 25,734,475 4,906,346 4,017,353 5,014,814 5,012,907
69. OneAnswer - Nikko AM Australian Shares Trust
70. OneAnswer - OnePath Global Property Securities
Index Trust
71. OneAnswer - Pendal Australian Share Trust
72. OneAnswer - Pendal Core Hedged Global Shares Trust
30 June 2020 30 June 2019 30 June 2020 30 June 2019 30 June 2020 30 June 2019 30 June 2020 30 June 2019$ $ $ $ $ $ $ $
Impact on Profit/loss from operating activities and Net assets attributable to unitholders
Price risk - increase of 15% (2019: 10%)* 2,826,618 1,452,861 13,227,220 9,852,554 12,424,469 11,503,866 2,231,183 2,231,696
73. OneAnswer - Pendal Monthly Income Plus Trust
74. OneAnswer - Pendal Smaller Companies Trust
75. OneAnswer - Perennial Value Shares Trust
76. OneAnswer - Perpetual Australian Share Trust
30 June 2020 30 June 2019 30 June 2020 30 June 2019 30 June 2020 30 June 2019 30 June 2020 30 June 2019$ $ $ $ $ $ $ $
Impact on Profit/loss from operating activities and Net assets attributable to unitholders
Price risk - increase of 15% (2019: 10%)* 15,753,451 14,116,616 17,852,028 13,415,792 757,235 450,636 3,658,694 2,668,812
77. OneAnswer - Perpetual Balanced Growth Trust
78. OneAnswer - Perpetual Conservative Growth Trust
79. OneAnswer - Perpetual Ethical SRI Trust
80. OneAnswer - Platinum Asia Trust

Financial Report Notes to the Financial Statements for the financial year ended 30 June 2020
308
9.4.10 Other price risk - sensitivity analysis
* A decrease will have an equal and opposite effect on the Profit/loss from operating activities and Net assets attributable to unitholders.
30 June 2020 30 June 2019 30 June 2020 30 June 2019 30 June 2020 30 June 2019 30 June 2020 30 June 2019$ $ $ $ $ $ $ $
Impact on Profit/loss from operating activities and Net assets attributable to unitholders
Price risk - increase of 15% (2019: 10%)* 39,293,241 33,219,280 14,017,545 12,852,836 29,055,452 27,979,812 28,792,251 26,175,737
81. OneAnswer - Platinum International Trust
82. OneAnswer - RARE Infastructure Value Trust
83. OneAnswer - Schroder Australian Equity Trust
84. OneAnswer - Schroder Balanced Trust
30 June 2020 30 June 2019 30 June 2020 30 June 2019 30 June 2020 30 June 2019 30 June 2020 30 June 2019$ $ $ $ $ $ $ $
Impact on Profit/loss from operating activities and Net assets attributable to unitholders
Price risk - increase of 15% (2019: 10%)* 30,153,134 22,317,274 55,951,705 43,219,044 2,077,088 2,363,128 973,682 477,339
85. OneAnswer - Schroder Fixed Income Trust
86. OneAnswer - Schroder Real Return Trust
87. OneAnswer - SG Hiscock Property Trust
88. OneAnswer - Stewart Investors Worldwide
Sustainability Trust
30 June 2020 30 June 2019 30 June 2020 30 June 2019 30 June 2020 30 June 2019 30 June 2020 30 June 2019$ $ $ $ $ $ $ $
Impact on Profit/loss from operating activities and Net assets attributable to unitholders
Price risk - increase of 15% (2019: 10%)* 6,489,373 3,490,922 9,772,191 4,725,043 8,569,628 7,268,311 3,250,654 2,430,084
89. OneAnswer - T. Rowe Price Global Equity Trust
90. OneAnswer - T.Rowe Price Dynamic Global Bond
Trust
91. OneAnswer - UBS Balanced Trust
92. OneAnswer - UBS Defensive Trust
30 June 2020 30 June 2019 30 June 2020 30 June 2019 30 June 2020 30 June 2019 30 June 2020 30 June 2019$ $ $ $ $ $ $ $
Impact on Profit/loss from operating activities and Net assets attributable to unitholders
Price risk - increase of 15% (2019: 10%)* 16,223,954 10,191,733 137,109,326 112,453,888 301,577,684 228,883,446 116,617,110 81,375,067
93. OneAnswer - UBS Diversified Fixed Income
Trust
94. OneAnswer - Vanguard Australian Shares Index
Trust
95. OneAnswer - Vanguard Balanced Index Trust
96. OneAnswer - Vanguard Conservative Index Trust

Financial Report Notes to the Financial Statements for the financial year ended 30 June 2020
309
9.4.10 Other price risk - sensitivity analysis
* A decrease will have an equal and opposite effect on the Profit/loss from operating activities and Net assets attributable to unitholders.
30 June 2020 30 June 2019 30 June 2020 30 June 2019 30 June 2020 30 June 2019 30 June 2020 30 June 2019$ $ $ $ $ $ $ $
Impact on Profit/loss from operating activities and Net assets attributable to unitholders
Price risk - increase of 15% (2019: 10%)* 14,812,367 10,357,266 140,691,091 108,597,152 50,695,896 38,753,640 13,200,751 10,605,452
97. OneAnswer - Vanguard Diversified Bond Index Trust
98. OneAnswer - Vanguard Growth Index Trust
99. OneAnswer - Vanguard High Growth Index Trust
100. OneAnswer - Vanguard International Shares Index
(Hedged) Trust
30 June 2020 30 June 2019 30 June 2020 30 June 2019 30 June 2020 30 June 2019 30 June 2020 30 June 2019$ $ $ $ $ $ $ $
Impact on Profit/loss from operating activities and Net assets attributable to unitholders
Price risk - increase of 15% (2019: 10%)* 106,267,975 81,216,566 17,434,728 17,494,077 5,063,474 3,968,347 26,772,841 20,101,112
101. OneAnswer - Vanguard International Shares Index
Trust
102. OneAnswer - Vanguard Property Securities Index
Trust
103. OneAnswer - Walter Scott Global Equity (Hedged)
Trust
104. OnePath Alternatives Growth Fund
30 June 2020 30 June 2019 30 June 2020 30 June 2019 30 June 2020 30 June 2019 30 June 2020 30 June 2019$ $ $ $ $ $ $ $
Impact on Profit/loss from operating activities and Net assets attributable to unitholders
Price risk - increase of 15% (2019: 10%)* 91,893,633 74,609,664 672,417 539,919 121,677 94,124 1,915,636 1,530,471
105. OnePath Capital Guaranteed Trust
106. OnePath Capital Stable Trust
107. OnePath Diversified Credit Trust
108. OnePath Diversified Fixed Interest Trust
30 June 2020 30 June 2019 30 June 2020 30 June 2019 30 June 2020 30 June 2019 30 June 2020 30 June 2019$ $ $ $ $ $ $ $
Impact on Profit/loss from operating activities and Net assets attributable to unitholders
Price risk - increase of 15% (2019: 10%)* 647,148 564,947 4,919,299 3,511,415 104,382 107,104 404,104 376,603
109. OnePath Geared Australian Shares Index
Trust
110. OnePath Global Emerging Markets Share
Trust
111. OnePath Managed Growth Trust
112. OnePath Select Leaders Trust
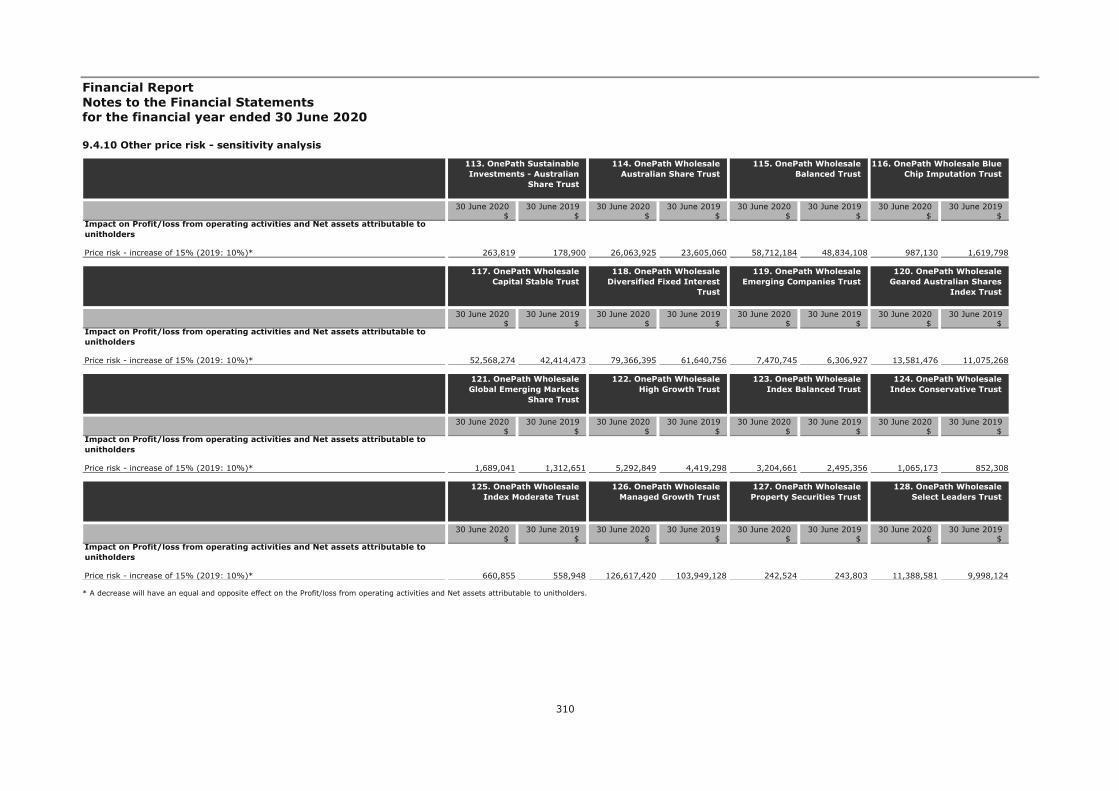
Financial Report Notes to the Financial Statements for the financial year ended 30 June 2020
310
9.4.10 Other price risk - sensitivity analysis
* A decrease will have an equal and opposite effect on the Profit/loss from operating activities and Net assets attributable to unitholders.
30 June 2020 30 June 2019 30 June 2020 30 June 2019 30 June 2020 30 June 2019 30 June 2020 30 June 2019$ $ $ $ $ $ $ $
Impact on Profit/loss from operating activities and Net assets attributable to unitholders
Price risk - increase of 15% (2019: 10%)* 263,819 178,900 26,063,925 23,605,060 58,712,184 48,834,108 987,130 1,619,798
113. OnePath Sustainable Investments - Australian
Share Trust
114. OnePath Wholesale Australian Share Trust
115. OnePath Wholesale Balanced Trust
116. OnePath Wholesale Blue Chip Imputation Trust
30 June 2020 30 June 2019 30 June 2020 30 June 2019 30 June 2020 30 June 2019 30 June 2020 30 June 2019$ $ $ $ $ $ $ $
Impact on Profit/loss from operating activities and Net assets attributable to unitholders
Price risk - increase of 15% (2019: 10%)* 52,568,274 42,414,473 79,366,395 61,640,756 7,470,745 6,306,927 13,581,476 11,075,268
117. OnePath Wholesale Capital Stable Trust
118. OnePath Wholesale Diversified Fixed Interest
Trust
119. OnePath Wholesale Emerging Companies Trust
120. OnePath Wholesale Geared Australian Shares
Index Trust
30 June 2020 30 June 2019 30 June 2020 30 June 2019 30 June 2020 30 June 2019 30 June 2020 30 June 2019$ $ $ $ $ $ $ $
Impact on Profit/loss from operating activities and Net assets attributable to unitholders
Price risk - increase of 15% (2019: 10%)* 1,689,041 1,312,651 5,292,849 4,419,298 3,204,661 2,495,356 1,065,173 852,308
121. OnePath Wholesale Global Emerging Markets
Share Trust
122. OnePath Wholesale High Growth Trust
123. OnePath Wholesale Index Balanced Trust
124. OnePath Wholesale Index Conservative Trust
30 June 2020 30 June 2019 30 June 2020 30 June 2019 30 June 2020 30 June 2019 30 June 2020 30 June 2019$ $ $ $ $ $ $ $
Impact on Profit/loss from operating activities and Net assets attributable to unitholders
Price risk - increase of 15% (2019: 10%)* 660,855 558,948 126,617,420 103,949,128 242,524 243,803 11,388,581 9,998,124
125. OnePath Wholesale Index Moderate Trust
126. OnePath Wholesale Managed Growth Trust
127. OnePath Wholesale Property Securities Trust
128. OnePath Wholesale Select Leaders Trust

Financial Report Notes to the Financial Statements for the financial year ended 30 June 2020
311
9.4.10 Other price risk - sensitivity analysis
* A decrease will have an equal and opposite effect on the Profit/loss from operating activities and Net assets attributable to unitholders.
30 June 2020 30 June 2019 30 June 2020 30 June 2019 30 June 2020 30 June 2019 30 June 2020 30 June 2019$ $ $ $ $ $ $ $
Impact on Profit/loss from operating activities and Net assets attributable to unitholders
Price risk - increase of 15% (2019: 10%)* 509,238 362,120 1,445,616 1,297,444 4,797,672 3,963,072 1,376,843 1,168,300
129. OptiMix Australian Fixed Interest Trust
130. OptiMix Australian Share Trust
131. OptiMix Balanced Trust 132. OptiMix Conservative Trust
30 June 2020 30 June 2019 30 June 2020 30 June 2019 30 June 2020 30 June 2019 30 June 2020 30 June 2019$ $ $ $ $ $ $ $
Impact on Profit/loss from operating activities and Net assets attributable to unitholders
Price risk - increase of 15% (2019: 10%)* 454,487 321,011 666,330 599,199 398,634 289,948 1,531,580 1,345,959
133. OptiMix Global Emerging Markets Share
Trust
134. OptiMix Global Share Trust
135. OptiMix Global Smaller Companies Share Trust
136. OptiMix Growth Trust
30 June 2020 30 June 2019 30 June 2020 30 June 2019 30 June 2020 30 June 2019 30 June 2020 30 June 2019$ $ $ $ $ $ $ $
Impact on Profit/loss from operating activities and Net assets attributable to unitholders
Price risk - increase of 15% (2019: 10%)* 546,923 459,214 1,031,906 834,136 464,241 494,645 135,313,924 114,470,020
137. OptiMix High Growth Trust
138. OptiMix Moderate Trust 139. OptiMix Property Securities Trust
140. OptiMix Wholesale Balanced Trust
30 June 2020 30 June 2019 30 June 2020 30 June 2019 30 June 2020 30 June 2019 30 June 2020 30 June 2019$ $ $ $ $ $ $ $
Impact on Profit/loss from operating activities and Net assets attributable to unitholders
Price risk - increase of 15% (2019: 10%)* 34,219,395 26,575,987 30,308,212 32,794,376 76,117,267 65,148,883 31,102,351 26,333,434
141. OptiMix Wholesale Conservative Trust
142. OptiMix Wholesale Global (Hedged) Share Trust
143. OptiMix Wholesale Growth Trust
144. OptiMix Wholesale High Growth Trust
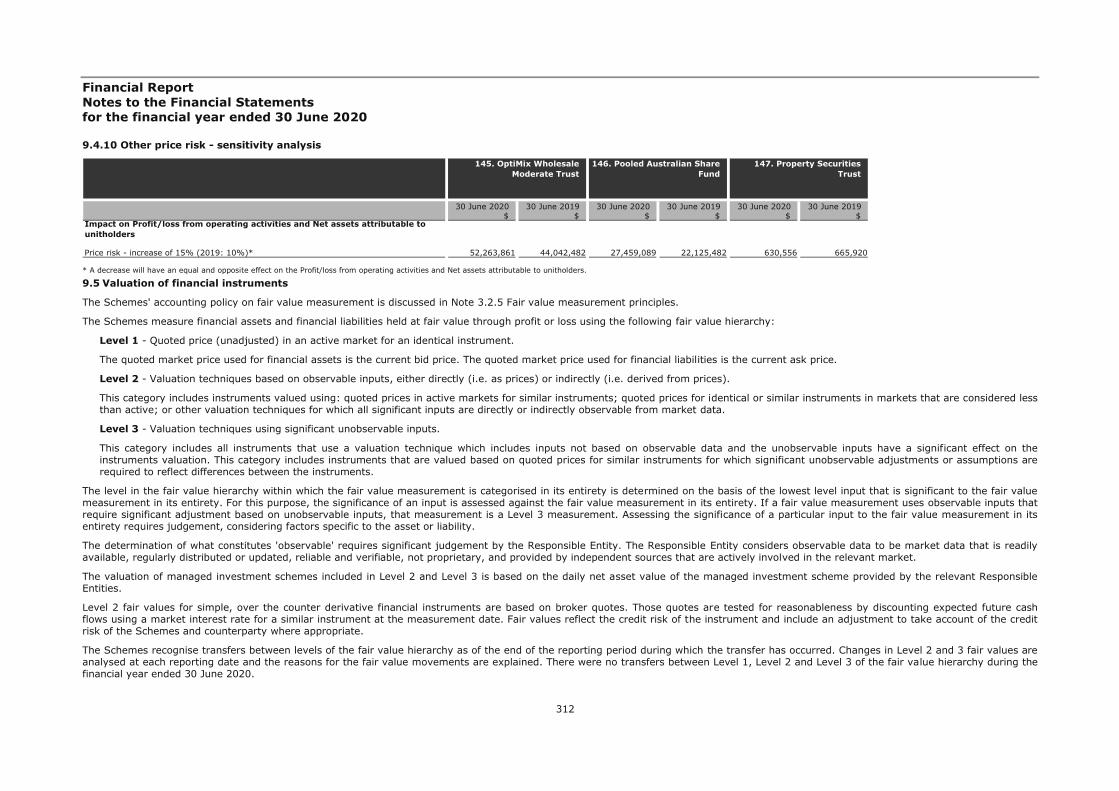
Financial Report Notes to the Financial Statements for the financial year ended 30 June 2020
312
9.4.10 Other price risk - sensitivity analysis
* A decrease will have an equal and opposite effect on the Profit/loss from operating activities and Net assets attributable to unitholders.
9.5 Valuation of financial instruments
The Schemes' accounting policy on fair value measurement is discussed in Note 3.2.5 Fair value measurement principles.
The Schemes measure financial assets and financial liabilities held at fair value through profit or loss using the following fair value hierarchy:
Level 1 - Quoted price (unadjusted) in an active market for an identical instrument.
The quoted market price used for financial assets is the current bid price. The quoted market price used for financial liabilities is the current ask price.
Level 2 - Valuation techniques based on observable inputs, either directly (i.e. as prices) or indirectly (i.e. derived from prices).
This category includes instruments valued using: quoted prices in active markets for similar instruments; quoted prices for identical or similar instruments in markets that are considered less than active; or other valuation techniques for which all significant inputs are directly or indirectly observable from market data.
Level 3 - Valuation techniques using significant unobservable inputs.
This category includes all instruments that use a valuation technique which includes inputs not based on observable data and the unobservable inputs have a significant effect on the instruments valuation. This category includes instruments that are valued based on quoted prices for similar instruments for which significant unobservable adjustments or assumptions are required to reflect differences between the instruments.
The level in the fair value hierarchy within which the fair value measurement is categorised in its entirety is determined on the basis of the lowest level input that is significant to the fair value measurement in its entirety. For this purpose, the significance of an input is assessed against the fair value measurement in its entirety. If a fair value measurement uses observable inputs that require significant adjustment based on unobservable inputs, that measurement is a Level 3 measurement. Assessing the significance of a particular input to the fair value measurement in its entirety requires judgement, considering factors specific to the asset or liability.
The determination of what constitutes 'observable' requires significant judgement by the Responsible Entity. The Responsible Entity considers observable data to be market data that is readily available, regularly distributed or updated, reliable and verifiable, not proprietary, and provided by independent sources that are actively involved in the relevant market.
The valuation of managed investment schemes included in Level 2 and Level 3 is based on the daily net asset value of the managed investment scheme provided by the relevant Responsible Entities.
Level 2 fair values for simple, over the counter derivative financial instruments are based on broker quotes. Those quotes are tested for reasonableness by discounting expected future cash flows using a market interest rate for a similar instrument at the measurement date. Fair values reflect the credit risk of the instrument and include an adjustment to take account of the credit risk of the Schemes and counterparty where appropriate.
The Schemes recognise transfers between levels of the fair value hierarchy as of the end of the reporting period during which the transfer has occurred. Changes in Level 2 and 3 fair values are analysed at each reporting date and the reasons for the fair value movements are explained. There were no transfers between Level 1, Level 2 and Level 3 of the fair value hierarchy during the financial year ended 30 June 2020.
30 June 2020 30 June 2019 30 June 2020 30 June 2019 30 June 2020 30 June 2019$ $ $ $ $ $
Impact on Profit/loss from operating activities and Net assets attributable to unitholders
Price risk - increase of 15% (2019: 10%)* 52,263,861 44,042,482 27,459,089 22,125,482 630,556 665,920
145. OptiMix Wholesale Moderate Trust
146. Pooled Australian Share Fund
147. Property Securities Trust
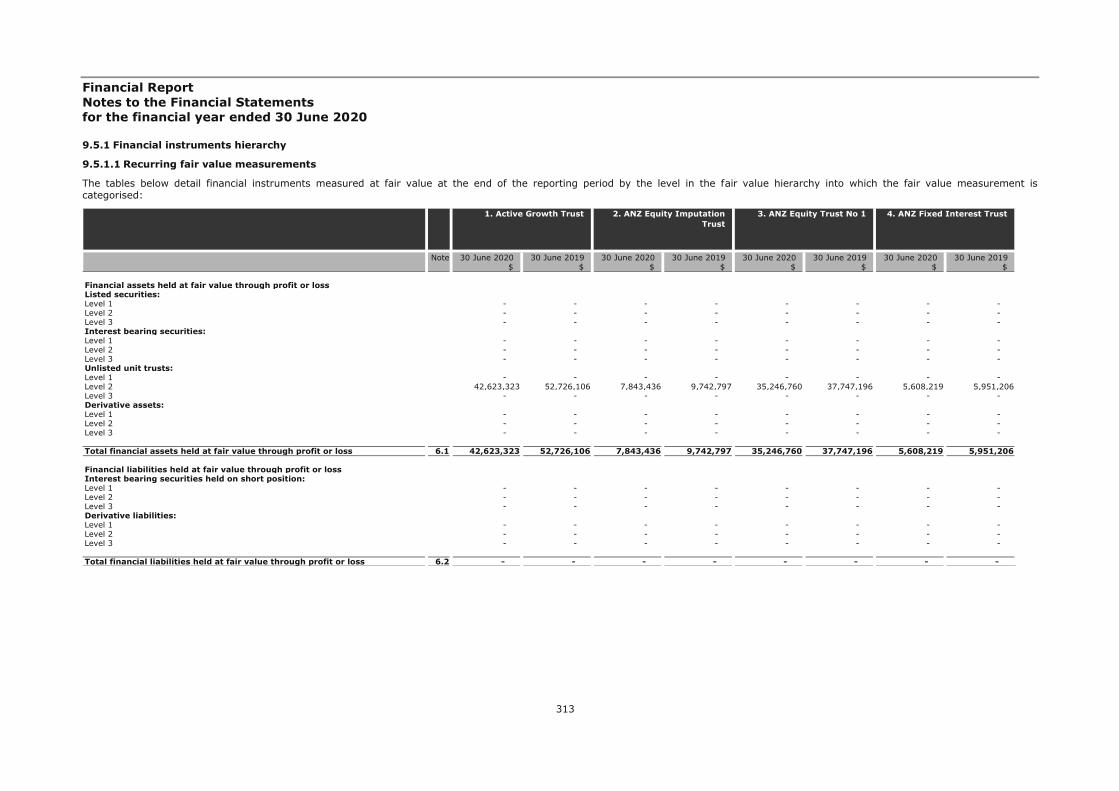
Financial Report Notes to the Financial Statements for the financial year ended 30 June 2020
313
9.5.1 Financial instruments hierarchy
9.5.1.1 Recurring fair value measurements
The tables below detail financial instruments measured at fair value at the end of the reporting period by the level in the fair value hierarchy into which the fair value measurement is categorised:
Note 30 June 2020 30 June 2019 30 June 2020 30 June 2019 30 June 2020 30 June 2019 30 June 2020 30 June 2019$ $ $ $ $ $ $ $
Financial assets held at fair value through profit or lossListed securities: Level 1 - - - - - - - - Level 2 - - - - - - - - Level 3 - - - - - - - - Interest bearing securities: Level 1 - - - - - - - - Level 2 - - - - - - - - Level 3 - - - - - - - - Unlisted unit trusts: Level 1 - - - - - - - - Level 2 42,623,323 52,726,106 7,843,436 9,742,797 35,246,760 37,747,196 5,608,219 5,951,206Level 3 - - - - - - - - Derivative assets: Level 1 - - - - - - - - Level 2 - - - - - - - - Level 3 - - - - - - - -
Total financial assets held at fair value through profit or loss 6.1 42,623,323 52,726,106 7,843,436 9,742,797 35,246,760 37,747,196 5,608,219 5,951,206
Financial liabilities held at fair value through profit or lossInterest bearing securities held on short position:Level 1 - - - - - - - - Level 2 - - - - - - - - Level 3 - - - - - - - - Derivative liabilities:Level 1 - - - - - - - - Level 2 - - - - - - - - Level 3 - - - - - - - -
Total financial liabilities held at fair value through profit or loss 6.2 - - - - - - - -
3. ANZ Equity Trust No 1 4. ANZ Fixed Interest Trust 1. Active Growth Trust 2. ANZ Equity Imputation Trust

Financial Report Notes to the Financial Statements for the financial year ended 30 June 2020
314
9.5.1.1 Recurring fair value measurements
Note 30 June 2020 30 June 2019 30 June 2020 30 June 2019 30 June 2020 30 June 2019 30 June 2020 30 June 2019$ $ $ $ $ $ $ $
Financial assets held at fair value through profit or lossListed securities: Level 1 - - - - - - - - Level 2 - - - - - - - - Level 3 - - - - - - - - Interest bearing securities: Level 1 - - - - - - - - Level 2 - - - - - - - - Level 3 - - - - - - - - Unlisted unit trusts: Level 1 - - - - - - - - Level 2 11,852,875 18,000,933 260,036,584 347,753,107 132,625,644 158,357,251 46,884,640 55,288,387Level 3 - - - - - - - - Derivative assets: Level 1 - - - - - - - - Level 2 - - - - - - - - Level 3 - - - - - - - -
Total financial assets held at fair value through profit or loss 6.1 11,852,875 18,000,933 260,036,584 347,753,107 132,625,644 158,357,251 46,884,640 55,288,387
Financial liabilities held at fair value through profit or lossInterest bearing securities held on short position:Level 1 - - - - - - - - Level 2 - - - - - - - - Level 3 - - - - - - - - Derivative liabilities:Level 1 - - - - - - - - Level 2 - - - - - - - - Level 3 - - - - - - - -
Total financial liabilities held at fair value through profit or loss 6.2 - - - - - - - -
7. ANZ OA Colonial First State Imputation Trust
8. ANZ OA Investors Mutual Australian Share Trust
5. ANZ OA - Pendal Core Hedged Global Shares Trust
6. ANZ OA Arrowstreet Global Equity (Hedged) Trust

Financial Report Notes to the Financial Statements for the financial year ended 30 June 2020
315
9.5.1.1 Recurring fair value measurements
Note 30 June 2020 30 June 2019 30 June 2020 30 June 2019 30 June 2020 30 June 2019 30 June 2020 30 June 2019$ $ $ $ $ $ $ $
Financial assets held at fair value through profit or lossListed securities: Level 1 - - - - - - - - Level 2 - - - - - - - - Level 3 - - - - - - - - Interest bearing securities: Level 1 - - - - - - - - Level 2 - - - - - - - - Level 3 - - - - - - - - Unlisted unit trusts: Level 1 - - - - - - - - Level 2 102,098,184 84,365,759 48,175,687 59,733,926 70,765,319 83,550,961 22,072,240 26,208,621Level 3 - - - - - - - - Derivative assets: Level 1 - - - - - - - - Level 2 - - - 1,664 - - - - Level 3 - - - - - - - -
Total financial assets held at fair value through profit or loss 6.1 102,098,184 84,365,759 48,175,687 59,735,590 70,765,319 83,550,961 22,072,240 26,208,621
Financial liabilities held at fair value through profit or lossInterest bearing securities held on short position:Level 1 - - - - - - - - Level 2 - - - - - - - - Level 3 - - - - - - - - Derivative liabilities:Level 1 - - 14,649 3,240 - - - - Level 2 - - 2,025 14,074 - - - - Level 3 - - - - - - - -
Total financial liabilities held at fair value through profit or loss 6.2 - - 16,674 17,314 - - - -
11. ANZ OA OnePath Australian Share Trust
12. ANZ OA OnePath Balanced Trust
9. ANZ OA Magellan Global Trust
10. ANZ OA OnePath Active Growth Trust

Financial Report Notes to the Financial Statements for the financial year ended 30 June 2020
316
9.5.1.1 Recurring fair value measurements
Note 30 June 2020 30 June 2019 30 June 2020 30 June 2019 30 June 2020 30 June 2019 30 June 2020 30 June 2019$ $ $ $ $ $ $ $
Financial assets held at fair value through profit or lossListed securities: Level 1 - - - - - - - - Level 2 - - - - - - - - Level 3 - - - - - - - - Interest bearing securities: Level 1 - - - - - - - - Level 2 - - - - - - - - Level 3 - - - - - - - - Unlisted unit trusts: Level 1 - - - - - - - - Level 2 224,802,781 310,767,172 58,411,802 67,340,384 7,312,820 7,880,157 61,727,439 76,342,562Level 3 - - - - - - - - Derivative assets: Level 1 - - - - - - - - Level 2 - - - - - - - - Level 3 - - - - - - - -
Total financial assets held at fair value through profit or loss 6.1 224,802,781 310,767,172 58,411,802 67,340,384 7,312,820 7,880,157 61,727,439 76,342,562
Financial liabilities held at fair value through profit or lossInterest bearing securities held on short position:Level 1 - - - - - - - - Level 2 - - - - - - - - Level 3 - - - - - - - - Derivative liabilities:Level 1 - - 4,450 - - - - - Level 2 - - - 3,306 - - - - Level 3 - - - - - - - -
Total financial liabilities held at fair value through profit or loss 6.2 - - 4,450 3,306 - - - -
15. ANZ OA OnePath Diversified Fixed Interest
Trust
16. ANZ OA OnePath Global Emerging Markets Share
Trust
13. ANZ OA OnePath Blue Chip Imputation Trust
14. ANZ OA OnePath Conservative Trust

Financial Report Notes to the Financial Statements for the financial year ended 30 June 2020
317
9.5.1.1 Recurring fair value measurements
Note 30 June 2020 30 June 2019 30 June 2020 30 June 2019 30 June 2020 30 June 2019 30 June 2020 30 June 2019$ $ $ $ $ $ $ $
Financial assets held at fair value through profit or lossListed securities: Level 1 - - - - - - - - Level 2 - - - - - - - - Level 3 - - - - - - - - Interest bearing securities: Level 1 - - - - - - - - Level 2 - - - - - - - - Level 3 - - - - - - - - Unlisted unit trusts: Level 1 - - - - - - - - Level 2 16,587,439 21,416,357 7,788,449 9,814,743 77,488,096 90,965,043 102,622,474 164,903,989Level 3 - - - - - - - - Derivative assets: Level 1 - - - - - - - - Level 2 - - - - - - - - Level 3 - - - - - - - -
Total financial assets held at fair value through profit or loss 6.1 16,587,439 21,416,357 7,788,449 9,814,743 77,488,096 90,965,043 102,622,474 164,903,989
Financial liabilities held at fair value through profit or lossInterest bearing securities held on short position:Level 1 - - - - - - - - Level 2 - - - - - - - - Level 3 - - - - - - - - Derivative liabilities:Level 1 - - - - - - - - Level 2 - - - - - - - - Level 3 - - - - - - - -
Total financial liabilities held at fair value through profit or loss 6.2 - - - - - - - -
19. ANZ OA OnePath Managed Growth Trust
20. ANZ OA OnePath Property Securities Trust
17. ANZ OA OnePath High Growth Trust
18. ANZ OA OnePath Income Trust

Financial Report Notes to the Financial Statements for the financial year ended 30 June 2020
318
9.5.1.1 Recurring fair value measurements
Note 30 June 2020 30 June 2019 30 June 2020 30 June 2019 30 June 2020 30 June 2019 30 June 2020 30 June 2019$ $ $ $ $ $ $ $
Financial assets held at fair value through profit or lossListed securities: Level 1 - - - - - - - - Level 2 - - - - - - - - Level 3 - - - - - - - - Interest bearing securities: Level 1 - - - - - - - - Level 2 - - - - - - - - Level 3 - - - - - - - - Unlisted unit trusts: Level 1 - - - - - - - - Level 2 17,029,352 22,668,794 1,045,315 982,636 30,495,637 39,480,885 1,031,928 1,117,647Level 3 - - - - - - - - Derivative assets: Level 1 - - - - - - - - Level 2 - - - - - - - - Level 3 - - - - - - - -
Total financial assets held at fair value through profit or loss 6.1 17,029,352 22,668,794 1,045,315 982,636 30,495,637 39,480,885 1,031,928 1,117,647
Financial liabilities held at fair value through profit or lossInterest bearing securities held on short position:Level 1 - - - - - - - - Level 2 - - - - - - - - Level 3 - - - - - - - - Derivative liabilities:Level 1 - - - - - - - - Level 2 - - - - - - - - Level 3 - - - - - - - -
Total financial liabilities held at fair value through profit or loss 6.2 - - - - - - - -
23. ANZ OA OnePath Tax Effective Income Trust
24. ANZ OA OptiMix Australian Fixed Interest
Trust
21. ANZ OA OnePath Select Leaders Trust
22. ANZ OA OnePath Sustainable Investments -
Australian Share Trust

Financial Report Notes to the Financial Statements for the financial year ended 30 June 2020
319
9.5.1.1 Recurring fair value measurements
Note 30 June 2020 30 June 2019 30 June 2020 30 June 2019 30 June 2020 30 June 2019 30 June 2020 30 June 2019$ $ $ $ $ $ $ $
Financial assets held at fair value through profit or lossListed securities: Level 1 - - - - - - - - Level 2 - - - - - - - - Level 3 - - - - - - - - Interest bearing securities: Level 1 - - - - - - - - Level 2 - - - - - - - - Level 3 - - - - - - - - Unlisted unit trusts: Level 1 - - - - - - - - Level 2 6,771,310 8,272,618 13,384,226 15,517,207 3,548,831 4,966,163 1,776,927 1,953,828Level 3 - - - - - - - - Derivative assets: Level 1 - - - - - - - - Level 2 - - - - - - - - Level 3 - - - - - - - -
Total financial assets held at fair value through profit or loss 6.1 6,771,310 8,272,618 13,384,226 15,517,207 3,548,831 4,966,163 1,776,927 1,953,828
Financial liabilities held at fair value through profit or lossInterest bearing securities held on short position:Level 1 - - - - - - - - Level 2 - - - - - - - - Level 3 - - - - - - - - Derivative liabilities:Level 1 - - - - - - - - Level 2 - - - - - - - - Level 3 - - - - - - - -
Total financial liabilities held at fair value through profit or loss 6.2 - - - - - - - -
27. ANZ OA OptiMix Global Share Trust
28. ANZ OA OptiMix Global Smaller Companies Share
Trust
25. ANZ OA OptiMix Australian Share Trust
26. ANZ OA OptiMix Conservative Trust

Financial Report Notes to the Financial Statements for the financial year ended 30 June 2020
320
9.5.1.1 Recurring fair value measurements
Note 30 June 2020 30 June 2019 30 June 2020 30 June 2019 30 June 2020 30 June 2019 30 June 2020 30 June 2019$ $ $ $ $ $ $ $
Financial assets held at fair value through profit or lossListed securities: Level 1 - - - - - - - - Level 2 - - - - - - - - Level 3 - - - - - - - - Interest bearing securities: Level 1 - - - - - - - - Level 2 - - - - - - - - Level 3 - - - - - - - - Unlisted unit trusts: Level 1 - - - - - - - - Level 2 20,938,174 26,467,865 8,147,572 9,648,711 16,993,270 20,621,436 2,060,637 3,141,515Level 3 - - - - - - - - Derivative assets: Level 1 - - - - - - - - Level 2 - - - - - - - - Level 3 - - - - - - - -
Total financial assets held at fair value through profit or loss 6.1 20,938,174 26,467,865 8,147,572 9,648,711 16,993,270 20,621,436 2,060,637 3,141,515
Financial liabilities held at fair value through profit or lossInterest bearing securities held on short position:Level 1 - - - - - - - - Level 2 - - - - - - - - Level 3 - - - - - - - - Derivative liabilities:Level 1 - - - - - - - - Level 2 - - - - - - - - Level 3 - - - - - - - -
Total financial liabilities held at fair value through profit or loss 6.2 - - - - - - - -
31. ANZ OA OptiMix Moderate Trust
32. ANZ OA OptiMix Property Securities Trust
29. ANZ OA OptiMix Growth Trust
30. ANZ OA OptiMix High Growth Trust

Financial Report Notes to the Financial Statements for the financial year ended 30 June 2020
321
9.5.1.1 Recurring fair value measurements
Note 30 June 2020 30 June 2019 30 June 2020 30 June 2019 30 June 2020 30 June 2019 30 June 2020 30 June 2019$ $ $ $ $ $ $ $
Financial assets held at fair value through profit or lossListed securities: Level 1 - - - - - - - - Level 2 - - - - - - - - Level 3 - - - - - - - - Interest bearing securities: Level 1 - - - - - - - - Level 2 - - - - - - - - Level 3 - - - - - - - - Unlisted unit trusts: Level 1 - - - - - - - - Level 2 251,552,684 331,472,475 65,554,771 120,683,040 10,607,371 18,839,259 1,997,695 2,157,470Level 3 - - - - - - - - Derivative assets: Level 1 - - - - - - - - Level 2 - - - - - - - - Level 3 - - - - - - - -
Total financial assets held at fair value through profit or loss 6.1 251,552,684 331,472,475 65,554,771 120,683,040 10,607,371 18,839,259 1,997,695 2,157,470
Financial liabilities held at fair value through profit or lossInterest bearing securities held on short position:Level 1 - - - - - - - - Level 2 - - - - - - - - Level 3 - - - - - - - - Derivative liabilities:Level 1 - - - - - - - - Level 2 - - - - - - - - Level 3 - - - - - - - -
Total financial liabilities held at fair value through profit or loss 6.2 - - - - - - - -
35. ANZ OA SG Hiscock Property Trust
36. ANZ OA UBS Diversified Fixed Income Trust
33. ANZ OA Perpetual Australian Share Trust
34. ANZ OA Schroder Australian Equity Trust

Financial Report Notes to the Financial Statements for the financial year ended 30 June 2020
322
9.5.1.1 Recurring fair value measurements
Note 30 June 2020 30 June 2019 30 June 2020 30 June 2019 30 June 2020 30 June 2019 30 June 2020 30 June 2019$ $ $ $ $ $ $ $
Financial assets held at fair value through profit or lossListed securities: Level 1 - - - - - - - - Level 2 - - - - - - - - Level 3 - - - - - - - - Interest bearing securities: Level 1 - - - - - - - - Level 2 - - - - - - - - Level 3 - - - - - - - - Unlisted unit trusts: Level 1 - - - - - - - - Level 2 13,753,913 18,186,667 11,019,513 13,050,626 242,092,453 179,130,192 55,352,653 91,818,508Level 3 - - - - - - - - Derivative assets: Level 1 - - - - - - - - Level 2 - - - - - - - - Level 3 - - - - - - - -
Total financial assets held at fair value through profit or loss 6.1 13,753,913 18,186,667 11,019,513 13,050,626 242,092,453 179,130,192 55,352,653 91,818,508
Financial liabilities held at fair value through profit or lossInterest bearing securities held on short position:Level 1 - - - - - - - - Level 2 - - - - - - - - Level 3 - - - - - - - - Derivative liabilities:Level 1 - - - - - - - - Level 2 - - - - - - - - Level 3 - - - - - - - -
Total financial liabilities held at fair value through profit or loss 6.2 - - - - - - - -
39. ANZ Private International Fixed Interest Fund
40. ANZ Property Securities Trust
37. ANZ OneAnswer - BR Scientific Australian Equity
Trust
38. ANZ OneAnswer - BR Scientific International
Equity Trust

Financial Report Notes to the Financial Statements for the financial year ended 30 June 2020
323
9.5.1.1 Recurring fair value measurements
Note 30 June 2020 30 June 2019 30 June 2020 30 June 2019 30 June 2020 30 June 2019 30 June 2020 30 June 2019$ $ $ $ $ $ $ $
Financial assets held at fair value through profit or lossListed securities: Level 1 - - - - - - - - Level 2 - - - - - - - - Level 3 - - - - - - - - Interest bearing securities: Level 1 - - - - - - - - Level 2 - - - - - - - - Level 3 - - - - - - - - Unlisted unit trusts: Level 1 - - - - - - - - Level 2 121,539,187 133,793,644 66,780,685 78,867,189 73,765,226 98,888,834 190,383,807 256,294,820Level 3 - - - - - - - - Derivative assets: Level 1 - - - - - - - - Level 2 - - - - - - - - Level 3 - - - - - - - -
Total financial assets held at fair value through profit or loss 6.1 121,539,187 133,793,644 66,780,685 78,867,189 73,765,226 98,888,834 190,383,807 256,294,820
Financial liabilities held at fair value through profit or lossInterest bearing securities held on short position:Level 1 - - - - - - - - Level 2 - - - - - - - - Level 3 - - - - - - - - Derivative liabilities:Level 1 - - - - - - - - Level 2 - - - - - - - - Level 3 - - - - - - - -
Total financial liabilities held at fair value through profit or loss 6.2 - - - - - - - -
43. Blue Chip Imputation Trust
44. Emerging Companies Trust
41. Australian Share Trust 42. Balanced Trust

Financial Report Notes to the Financial Statements for the financial year ended 30 June 2020
324
9.5.1.1 Recurring fair value measurements
Note 30 June 2020 30 June 2019 30 June 2020 30 June 2019 30 June 2020 30 June 2019 30 June 2020 30 June 2019$ $ $ $ $ $ $ $
Financial assets held at fair value through profit or lossListed securities: Level 1 - - - - - - - - Level 2 - - - - - - - - Level 3 - - - - - - - - Interest bearing securities: Level 1 - - - - - - - - Level 2 - - - - - - - - Level 3 - - - - - - - - Unlisted unit trusts: Level 1 - - - - - - - - Level 2 182,252,782 180,658,575 6,219,043 8,751,466 1,298,367 1,471,943 8,371,197 16,184,016Level 3 - - - - - - - - Derivative assets: Level 1 - - - - - - - - Level 2 - - - - - - - - Level 3 - - - - - - - -
Total financial assets held at fair value through profit or loss 6.1 182,252,782 180,658,575 6,219,043 8,751,466 1,298,367 1,471,943 8,371,197 16,184,016
Financial liabilities held at fair value through profit or lossInterest bearing securities held on short position:Level 1 - - - - - - - - Level 2 - - - - - - - - Level 3 - - - - - - - - Derivative liabilities:Level 1 - - - - - - - - Level 2 - - - - - - - - Level 3 - - - - - - - -
Total financial liabilities held at fair value through profit or loss 6.2 - - - - - - - -
47. High Growth Trust 48. OneAnswer - Altrinsic Global Equities Trust
45. Global Share Trust 46. Heine Property Securities Fund

Financial Report Notes to the Financial Statements for the financial year ended 30 June 2020
325
9.5.1.1 Recurring fair value measurements
Note 30 June 2020 30 June 2019 30 June 2020 30 June 2019 30 June 2020 30 June 2019 30 June 2020 30 June 2019$ $ $ $ $ $ $ $
Financial assets held at fair value through profit or lossListed securities: Level 1 - - - - - - - - Level 2 - - - - - - - - Level 3 - - - - - - - - Interest bearing securities: Level 1 - - - - - - - - Level 2 - - - - - - - - Level 3 - - - - - - - - Unlisted unit trusts: Level 1 - - - - - - - - Level 2 68,997,583 85,380,637 9,302,599 11,801,221 63,741,288 82,884,595 92,634,254 99,649,962Level 3 - - - - - - - - Derivative assets: Level 1 - - - - - - - - Level 2 - - - - - - - - Level 3 - - - - - - - -
Total financial assets held at fair value through profit or loss 6.1 68,997,583 85,380,637 9,302,599 11,801,221 63,741,288 82,884,595 92,634,254 99,649,962
Financial liabilities held at fair value through profit or lossInterest bearing securities held on short position:Level 1 - - - - - - - - Level 2 - - - - - - - - Level 3 - - - - - - - - Derivative liabilities:Level 1 - - - - - - - - Level 2 - - - - - - - - Level 3 - - - - - - - -
Total financial liabilities held at fair value through profit or loss 6.2 - - - - - - - -
51. OneAnswer - Ausbil Australian Emerging Leaders
Trust
52. OneAnswer - Bennelong Australian Equities Trust
49. OneAnswer - Antipodes Global (Long Only) Trust
50. OneAnswer - Arrowstreet Global Equity (Hedged) Trust

Financial Report Notes to the Financial Statements for the financial year ended 30 June 2020
326
9.5.1.1 Recurring fair value measurements
Note 30 June 2020 30 June 2019 30 June 2020 30 June 2019 30 June 2020 30 June 2019 30 June 2020 30 June 2019$ $ $ $ $ $ $ $
Financial assets held at fair value through profit or lossListed securities: Level 1 - - - - - - - - Level 2 - - - - - - - - Level 3 - - - - - - - - Interest bearing securities: Level 1 - - - - - - - - Level 2 - - - - - - - - Level 3 - - - - - - - - Unlisted unit trusts: Level 1 - - - - - - - - Level 2 58,578,184 74,292,085 3,049,074 3,095,501 39,790,929 49,249,173 35,299,964 41,325,517Level 3 - - - - - - - - Derivative assets: Level 1 - - - - - - - - Level 2 - - - - - - - - Level 3 - - - - - - - -
Total financial assets held at fair value through profit or loss 6.1 58,578,184 74,292,085 3,049,074 3,095,501 39,790,929 49,249,173 35,299,964 41,325,517
Financial liabilities held at fair value through profit or lossInterest bearing securities held on short position:Level 1 - - - - - - - - Level 2 - - - - - - - - Level 3 - - - - - - - - Derivative liabilities:Level 1 - - - - - - - - Level 2 - - - - - - - - Level 3 - - - - - - - -
Total financial liabilities held at fair value through profit or loss 6.2 - - - - - - - -
55. OneAnswer - Blackrock Tactical Growth Trust
56. OneAnswer - BR Scientific Diversified Growth
Trust
53. OneAnswer - Bentham Global Income Trust
54. OneAnswer - BlackRock Scientific Australian Equity
Trust

Financial Report Notes to the Financial Statements for the financial year ended 30 June 2020
327
9.5.1.1 Recurring fair value measurements
Note 30 June 2020 30 June 2019 30 June 2020 30 June 2019 30 June 2020 30 June 2019 30 June 2020 30 June 2019$ $ $ $ $ $ $ $
Financial assets held at fair value through profit or lossListed securities: Level 1 - - - - - - - - Level 2 - - - - - - - - Level 3 - - - - - - - - Interest bearing securities: Level 1 - - - - - - - - Level 2 - - - - - - - - Level 3 - - - - - - - - Unlisted unit trusts: Level 1 - - - - - - - - Level 2 2,186,471 2,276,753 34,903,027 43,380,113 146,085,304 154,993,077 3,946,885 5,312,950Level 3 - - - - - - - - Derivative assets: Level 1 - - - - - - - - Level 2 - - - - - - - - Level 3 - - - - - - - -
Total financial assets held at fair value through profit or loss 6.1 2,186,471 2,276,753 34,903,027 43,380,113 146,085,304 154,993,077 3,946,885 5,312,950
Financial liabilities held at fair value through profit or lossInterest bearing securities held on short position:Level 1 - - - - - - - - Level 2 - - - - - - - - Level 3 - - - - - - - - Derivative liabilities:Level 1 - - - - - - - - Level 2 - - - - - - - - Level 3 - - - - - - - -
Total financial liabilities held at fair value through profit or loss 6.2 - - - - - - - -
59. OneAnswer - Colonial First State Global Listed
Infrastructure Trust
60. OneAnswer - Colonial First State Imputation Trust
57. OneAnswer - BR Scientific International
Equity Trust
58. OneAnswer - Colonial First State Global Credit
Income Trust

Financial Report Notes to the Financial Statements for the financial year ended 30 June 2020
328
9.5.1.1 Recurring fair value measurements
Note 30 June 2020 30 June 2019 30 June 2020 30 June 2019 30 June 2020 30 June 2019 30 June 2020 30 June 2019$ $ $ $ $ $ $ $
Financial assets held at fair value through profit or lossListed securities: Level 1 - - - - - - - - Level 2 - - - - - - - - Level 3 - - - - - - - - Interest bearing securities: Level 1 - - - - - - - - Level 2 - - - - - - - - Level 3 - - - - - - - - Unlisted unit trusts: Level 1 - - - - - - - - Level 2 248,552,688 325,844,885 73,445,405 75,295,359 144,832,815 175,504,636 3,885,108 3,849,484Level 3 - - - - - - - - Derivative assets: Level 1 - - - - - - - - Level 2 - - - - - - - - Level 3 - - - - - - - -
Total financial assets held at fair value through profit or loss 6.1 248,552,688 325,844,885 73,445,405 75,295,359 144,832,815 175,504,636 3,885,108 3,849,484
Financial liabilities held at fair value through profit or lossInterest bearing securities held on short position:Level 1 - - - - - - - - Level 2 - - - - - - - - Level 3 - - - - - - - - Derivative liabilities:Level 1 - - - - - - - - Level 2 - - - - - - - - Level 3 - - - - - - - -
Total financial liabilities held at fair value through profit or loss 6.2 - - - - - - - -
63. OneAnswer - Investors Mutual Australian Share
Trust
64. OneAnswer - Janus Henderson Global Fixed
Interest Total Return Trust
61. OneAnswer - Fidelity Australian Equities Trust
62. OneAnswer - Greencape Broadcap Trust
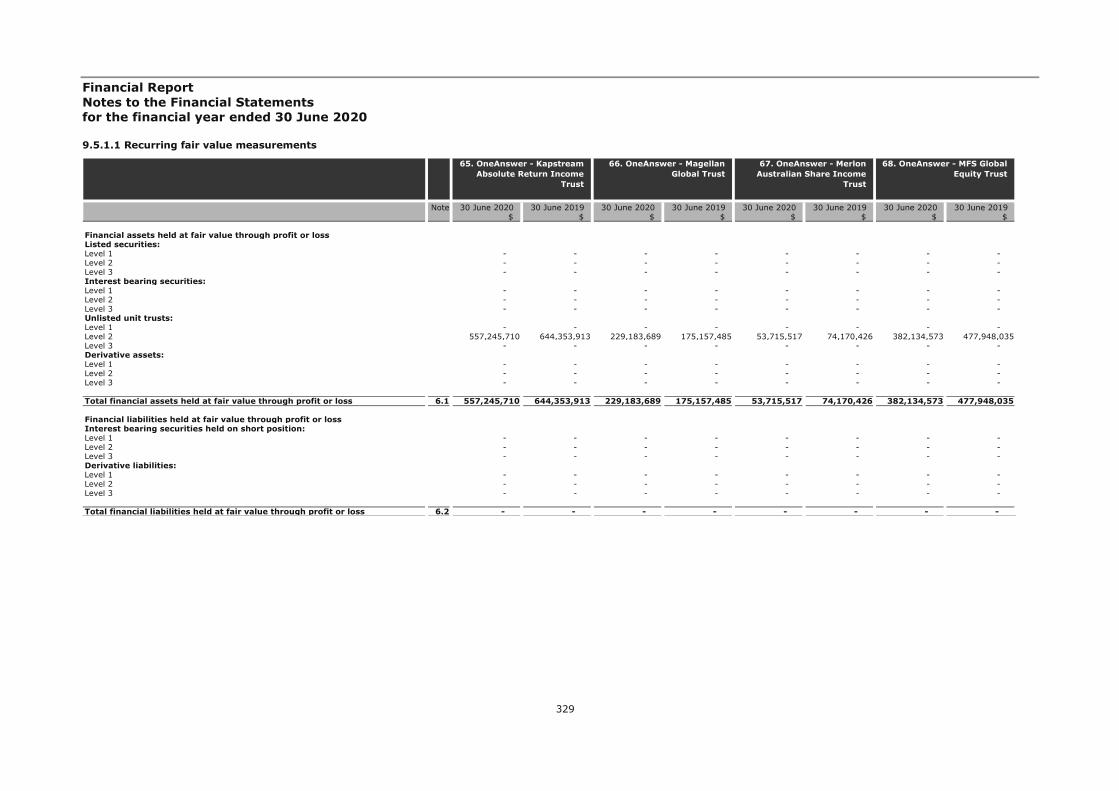
Financial Report Notes to the Financial Statements for the financial year ended 30 June 2020
329
9.5.1.1 Recurring fair value measurements
Note 30 June 2020 30 June 2019 30 June 2020 30 June 2019 30 June 2020 30 June 2019 30 June 2020 30 June 2019$ $ $ $ $ $ $ $
Financial assets held at fair value through profit or lossListed securities: Level 1 - - - - - - - - Level 2 - - - - - - - - Level 3 - - - - - - - - Interest bearing securities: Level 1 - - - - - - - - Level 2 - - - - - - - - Level 3 - - - - - - - - Unlisted unit trusts: Level 1 - - - - - - - - Level 2 557,245,710 644,353,913 229,183,689 175,157,485 53,715,517 74,170,426 382,134,573 477,948,035Level 3 - - - - - - - - Derivative assets: Level 1 - - - - - - - - Level 2 - - - - - - - - Level 3 - - - - - - - -
Total financial assets held at fair value through profit or loss 6.1 557,245,710 644,353,913 229,183,689 175,157,485 53,715,517 74,170,426 382,134,573 477,948,035
Financial liabilities held at fair value through profit or lossInterest bearing securities held on short position:Level 1 - - - - - - - - Level 2 - - - - - - - - Level 3 - - - - - - - - Derivative liabilities:Level 1 - - - - - - - - Level 2 - - - - - - - - Level 3 - - - - - - - -
Total financial liabilities held at fair value through profit or loss 6.2 - - - - - - - -
67. OneAnswer - Merlon Australian Share Income
Trust
68. OneAnswer - MFS Global Equity Trust
65. OneAnswer - Kapstream Absolute Return Income
Trust
66. OneAnswer - Magellan Global Trust

Financial Report Notes to the Financial Statements for the financial year ended 30 June 2020
330
9.5.1.1 Recurring fair value measurements
Note 30 June 2020 30 June 2019 30 June 2020 30 June 2019 30 June 2020 30 June 2019 30 June 2020 30 June 2019$ $ $ $ $ $ $ $
Financial assets held at fair value through profit or lossListed securities: Level 1 - - - - - - - - Level 2 - - - - - - - - Level 3 - - - - - - - - Interest bearing securities: Level 1 - - - - - - - - Level 2 - - - - - - - - Level 3 - - - - - - - - Unlisted unit trusts: Level 1 - - - - - - - - Level 2 10,044,408 20,094,695 189,091,305 257,344,745 32,708,970 40,173,527 33,432,092 50,129,069Level 3 - - - - - - - - Derivative assets: Level 1 - - - - - - - - Level 2 - - - - - - - - Level 3 - - - - - - - -
Total financial assets held at fair value through profit or loss 6.1 10,044,408 20,094,695 189,091,305 257,344,745 32,708,970 40,173,527 33,432,092 50,129,069
Financial liabilities held at fair value through profit or lossInterest bearing securities held on short position:Level 1 - - - - - - - - Level 2 - - - - - - - - Level 3 - - - - - - - - Derivative liabilities:Level 1 - - - - - - - - Level 2 - - - - - - - - Level 3 - - - - - - - -
Total financial liabilities held at fair value through profit or loss 6.2 - - - - - - - -
71. OneAnswer - Pendal Australian Share Trust
72. OneAnswer - Pendal Core Hedged Global Shares Trust
69. OneAnswer - Nikko AM Australian Shares Trust
70. OneAnswer - OnePath Global Property Securities
Index Trust

Financial Report Notes to the Financial Statements for the financial year ended 30 June 2020
331
9.5.1.1 Recurring fair value measurements
Note 30 June 2020 30 June 2019 30 June 2020 30 June 2019 30 June 2020 30 June 2019 30 June 2020 30 June 2019$ $ $ $ $ $ $ $
Financial assets held at fair value through profit or lossListed securities: Level 1 - - - - - - - - Level 2 - - - - - - - - Level 3 - - - - - - - - Interest bearing securities: Level 1 - - - - - - - - Level 2 - - - - - - - - Level 3 - - - - - - - - Unlisted unit trusts: Level 1 - - - - - - - - Level 2 18,844,119 14,528,614 88,181,468 98,525,543 82,829,790 115,038,664 14,874,556 22,316,964Level 3 - - - - - - - - Derivative assets: Level 1 - - - - - - - - Level 2 - - - - - - - - Level 3 - - - - - - - -
Total financial assets held at fair value through profit or loss 6.1 18,844,119 14,528,614 88,181,468 98,525,543 82,829,790 115,038,664 14,874,556 22,316,964
Financial liabilities held at fair value through profit or lossInterest bearing securities held on short position:Level 1 - - - - - - - - Level 2 - - - - - - - - Level 3 - - - - - - - - Derivative liabilities:Level 1 - - - - - - - - Level 2 - - - - - - - - Level 3 - - - - - - - -
Total financial liabilities held at fair value through profit or loss 6.2 - - - - - - - -
75. OneAnswer - Perennial Value Shares Trust
76. OneAnswer - Perpetual Australian Share Trust
73. OneAnswer - Pendal Monthly Income Plus Trust
74. OneAnswer - Pendal Smaller Companies Trust

Financial Report Notes to the Financial Statements for the financial year ended 30 June 2020
332
9.5.1.1 Recurring fair value measurements
Note 30 June 2020 30 June 2019 30 June 2020 30 June 2019 30 June 2020 30 June 2019 30 June 2020 30 June 2019$ $ $ $ $ $ $ $
Financial assets held at fair value through profit or lossListed securities: Level 1 - - - - - - - - Level 2 - - - - - - - - Level 3 - - - - - - - - Interest bearing securities: Level 1 - - - - - - - - Level 2 - - - - - - - - Level 3 - - - - - - - - Unlisted unit trusts: Level 1 - - - - - - - - Level 2 105,023,009 141,166,162 119,013,521 134,157,924 5,048,232 4,506,358 24,391,293 26,688,121Level 3 - - - - - - - - Derivative assets: Level 1 - - - - - - - - Level 2 - - - - - - - - Level 3 - - - - - - - -
Total financial assets held at fair value through profit or loss 6.1 105,023,009 141,166,162 119,013,521 134,157,924 5,048,232 4,506,358 24,391,293 26,688,121
Financial liabilities held at fair value through profit or lossInterest bearing securities held on short position:Level 1 - - - - - - - - Level 2 - - - - - - - - Level 3 - - - - - - - - Derivative liabilities:Level 1 - - - - - - - - Level 2 - - - - - - - - Level 3 - - - - - - - -
Total financial liabilities held at fair value through profit or loss 6.2 - - - - - - - -
79. OneAnswer - Perpetual Ethical SRI Trust
80. OneAnswer - Platinum Asia Trust
77. OneAnswer - Perpetual Balanced Growth Trust
78. OneAnswer - Perpetual Conservative Growth Trust

Financial Report Notes to the Financial Statements for the financial year ended 30 June 2020
333
9.5.1.1 Recurring fair value measurements
Note 30 June 2020 30 June 2019 30 June 2020 30 June 2019 30 June 2020 30 June 2019 30 June 2020 30 June 2019$ $ $ $ $ $ $ $
Financial assets held at fair value through profit or lossListed securities: Level 1 - - - - - - - - Level 2 - - - - - - - - Level 3 - - - - - - - - Interest bearing securities: Level 1 - - - - - - - - Level 2 - - - - - - - - Level 3 - - - - - - - - Unlisted unit trusts: Level 1 - - - - - - - - Level 2 261,954,943 332,192,804 93,450,298 128,528,364 193,703,011 279,798,122 191,948,339 261,757,369Level 3 - - - - - - - - Derivative assets: Level 1 - - - - - - - - Level 2 - - - - - - - - Level 3 - - - - - - - -
Total financial assets held at fair value through profit or loss 6.1 261,954,943 332,192,804 93,450,298 128,528,364 193,703,011 279,798,122 191,948,339 261,757,369
Financial liabilities held at fair value through profit or lossInterest bearing securities held on short position:Level 1 - - - - - - - - Level 2 - - - - - - - - Level 3 - - - - - - - - Derivative liabilities:Level 1 - - - - - - - - Level 2 - - - - - - - - Level 3 - - - - - - - -
Total financial liabilities held at fair value through profit or loss 6.2 - - - - - - - -
83. OneAnswer - Schroder Australian Equity Trust
84. OneAnswer - Schroder Balanced Trust
81. OneAnswer - Platinum International Trust
82. OneAnswer - RARE Infastructure Value Trust

Financial Report Notes to the Financial Statements for the financial year ended 30 June 2020
334
9.5.1.1 Recurring fair value measurements
Note 30 June 2020 30 June 2019 30 June 2020 30 June 2019 30 June 2020 30 June 2019 30 June 2020 30 June 2019$ $ $ $ $ $ $ $
Financial assets held at fair value through profit or lossListed securities: Level 1 - - - - - - - - Level 2 - - - - - - - - Level 3 - - - - - - - - Interest bearing securities: Level 1 - - - - - - - - Level 2 - - - - - - - - Level 3 - - - - - - - - Unlisted unit trusts: Level 1 - - - - - - - - Level 2 201,020,890 223,172,735 373,011,366 432,190,442 13,847,256 23,631,275 6,491,211 4,773,386Level 3 - - - - - - - - Derivative assets: Level 1 - - - - - - - - Level 2 - - - - - - - - Level 3 - - - - - - - -
Total financial assets held at fair value through profit or loss 6.1 201,020,890 223,172,735 373,011,366 432,190,442 13,847,256 23,631,275 6,491,211 4,773,386
Financial liabilities held at fair value through profit or lossInterest bearing securities held on short position:Level 1 - - - - - - - - Level 2 - - - - - - - - Level 3 - - - - - - - - Derivative liabilities:Level 1 - - - - - - - - Level 2 - - - - - - - - Level 3 - - - - - - - -
Total financial liabilities held at fair value through profit or loss 6.2 - - - - - - - -
87. OneAnswer - SG Hiscock Property Trust
88. OneAnswer - Stewart Investors Worldwide
Sustainability Trust
85. OneAnswer - Schroder Fixed Income Trust
86. OneAnswer - Schroder Real Return Trust

Financial Report Notes to the Financial Statements for the financial year ended 30 June 2020
335
9.5.1.1 Recurring fair value measurements
Note 30 June 2020 30 June 2019 30 June 2020 30 June 2019 30 June 2020 30 June 2019 30 June 2020 30 June 2019$ $ $ $ $ $ $ $
Financial assets held at fair value through profit or lossListed securities: Level 1 - - - - - - - - Level 2 - - - - - - - - Level 3 - - - - - - - - Interest bearing securities: Level 1 - - - - - - - - Level 2 - - - - - - - - Level 3 - - - - - - - - Unlisted unit trusts: Level 1 - - - - - - - - Level 2 43,262,484 34,909,218 65,147,937 47,250,428 57,130,856 72,683,109 21,671,027 24,300,838Level 3 - - - - - - - - Derivative assets: Level 1 - - - - - - - - Level 2 - - - - - - - - Level 3 - - - - - - - -
Total financial assets held at fair value through profit or loss 6.1 43,262,484 34,909,218 65,147,937 47,250,428 57,130,856 72,683,109 21,671,027 24,300,838
Financial liabilities held at fair value through profit or lossInterest bearing securities held on short position:Level 1 - - - - - - - - Level 2 - - - - - - - - Level 3 - - - - - - - - Derivative liabilities:Level 1 - - - - - - - - Level 2 - - - - - - - - Level 3 - - - - - - - -
Total financial liabilities held at fair value through profit or loss 6.2 - - - - - - - -
91. OneAnswer - UBS Balanced Trust
92. OneAnswer - UBS Defensive Trust
89. OneAnswer - T. Rowe Price Global Equity Trust
90. OneAnswer - T.Rowe Price Dynamic Global Bond
Trust

Financial Report Notes to the Financial Statements for the financial year ended 30 June 2020
336
9.5.1.1 Recurring fair value measurements
Note 30 June 2020 30 June 2019 30 June 2020 30 June 2019 30 June 2020 30 June 2019 30 June 2020 30 June 2019$ $ $ $ $ $ $ $
Financial assets held at fair value through profit or lossListed securities: Level 1 - - - - - - - - Level 2 - - - - - - - - Level 3 - - - - - - - - Interest bearing securities: Level 1 - - - - - - - - Level 2 - - - - - - - - Level 3 - - - - - - - - Unlisted unit trusts: Level 1 - - - - - - - - Level 2 108,159,690 101,917,334 914,062,176 1,124,538,876 2,010,517,895 2,288,834,458 777,447,403 813,750,674Level 3 - - - - - - - - Derivative assets: Level 1 - - - - - - - - Level 2 - - - - - - - - Level 3 - - - - - - - -
Total financial assets held at fair value through profit or loss 6.1 108,159,690 101,917,334 914,062,176 1,124,538,876 2,010,517,895 2,288,834,458 777,447,403 813,750,674
Financial liabilities held at fair value through profit or lossInterest bearing securities held on short position:Level 1 - - - - - - - - Level 2 - - - - - - - - Level 3 - - - - - - - - Derivative liabilities:Level 1 - - - - - - - - Level 2 - - - - - - - - Level 3 - - - - - - - -
Total financial liabilities held at fair value through profit or loss 6.2 - - - - - - - -
95. OneAnswer - Vanguard Balanced Index Trust
96. OneAnswer - Vanguard Conservative Index Trust
93. OneAnswer - UBS Diversified Fixed Income
Trust
94. OneAnswer - Vanguard Australian Shares Index
Trust
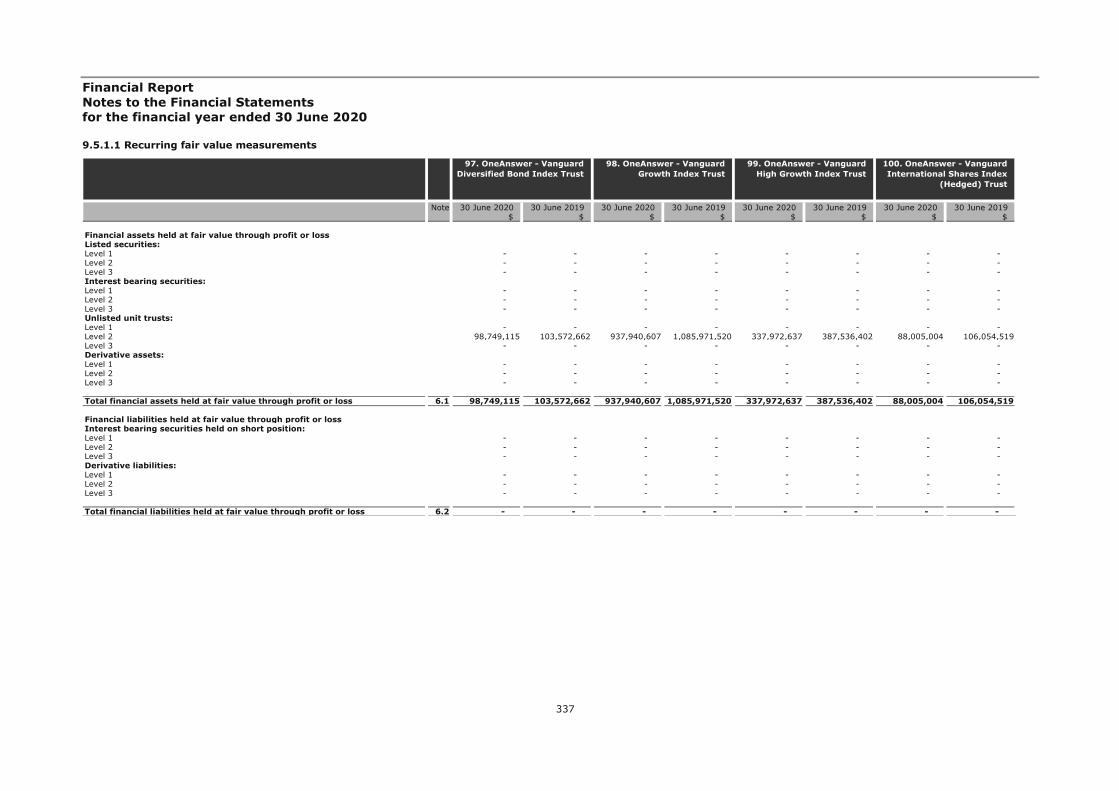
Financial Report Notes to the Financial Statements for the financial year ended 30 June 2020
337
9.5.1.1 Recurring fair value measurements
Note 30 June 2020 30 June 2019 30 June 2020 30 June 2019 30 June 2020 30 June 2019 30 June 2020 30 June 2019$ $ $ $ $ $ $ $
Financial assets held at fair value through profit or lossListed securities: Level 1 - - - - - - - - Level 2 - - - - - - - - Level 3 - - - - - - - - Interest bearing securities: Level 1 - - - - - - - - Level 2 - - - - - - - - Level 3 - - - - - - - - Unlisted unit trusts: Level 1 - - - - - - - - Level 2 98,749,115 103,572,662 937,940,607 1,085,971,520 337,972,637 387,536,402 88,005,004 106,054,519Level 3 - - - - - - - - Derivative assets: Level 1 - - - - - - - - Level 2 - - - - - - - - Level 3 - - - - - - - -
Total financial assets held at fair value through profit or loss 6.1 98,749,115 103,572,662 937,940,607 1,085,971,520 337,972,637 387,536,402 88,005,004 106,054,519
Financial liabilities held at fair value through profit or lossInterest bearing securities held on short position:Level 1 - - - - - - - - Level 2 - - - - - - - - Level 3 - - - - - - - - Derivative liabilities:Level 1 - - - - - - - - Level 2 - - - - - - - - Level 3 - - - - - - - -
Total financial liabilities held at fair value through profit or loss 6.2 - - - - - - - -
99. OneAnswer - Vanguard High Growth Index Trust
100. OneAnswer - Vanguard International Shares Index
(Hedged) Trust
97. OneAnswer - Vanguard Diversified Bond Index Trust
98. OneAnswer - Vanguard Growth Index Trust

Financial Report Notes to the Financial Statements for the financial year ended 30 June 2020
338
9.5.1.1 Recurring fair value measurements
Note 30 June 2020 30 June 2019 30 June 2020 30 June 2019 30 June 2020 30 June 2019 30 June 2020 30 June 2019$ $ $ $ $ $ $ $
Financial assets held at fair value through profit or lossListed securities: Level 1 - - - - - - - - Level 2 - - - - - - - - Level 3 - - - - - - - - Interest bearing securities: Level 1 - - - - - - - - Level 2 - - - - - - - - Level 3 - - - - - - - - Unlisted unit trusts: Level 1 - - - - - - - - Level 2 708,453,166 812,165,658 116,231,519 174,940,766 33,756,490 39,683,468 178,485,608 201,011,122Level 3 - - - - - - - - Derivative assets: Level 1 - - - - - - - - Level 2 - - - - - - - - Level 3 - - - - - - - -
Total financial assets held at fair value through profit or loss 6.1 708,453,166 812,165,658 116,231,519 174,940,766 33,756,490 39,683,468 178,485,608 201,011,122
Financial liabilities held at fair value through profit or lossInterest bearing securities held on short position:Level 1 - - - - - - - - Level 2 - - - - - - - - Level 3 - - - - - - - - Derivative liabilities:Level 1 - - - - - - - - Level 2 - - - - - - - - Level 3 - - - - - - - -
Total financial liabilities held at fair value through profit or loss 6.2 - - - - - - - -
103. OneAnswer - Walter Scott Global Equity (Hedged)
Trust
104. OnePath Alternatives Growth Fund
101. OneAnswer - Vanguard International Shares Index
Trust
102. OneAnswer - Vanguard Property Securities Index
Trust

Financial Report Notes to the Financial Statements for the financial year ended 30 June 2020
339
9.5.1.1 Recurring fair value measurements
Note 30 June 2020 30 June 2019 30 June 2020 30 June 2019 30 June 2020 30 June 2019 30 June 2020 30 June 2019$ $ $ $ $ $ $ $
Financial assets held at fair value through profit or lossListed securities: Level 1 - - - - - - - - Level 2 - - - - - - - - Level 3 - - - - - - - - Interest bearing securities: Level 1 - - - - - - - - Level 2 - - - - - - - - Level 3 - - - - - - - - Unlisted unit trusts: Level 1 - - - - - - - - Level 2 612,630,198 746,184,527 4,482,782 5,399,186 811,181 941,238 12,770,904 15,304,713Level 3 - - - - - - - - Derivative assets: Level 1 640 - - - - - - - Level 2 - - - - - - - - Level 3 - - - - - - - -
Total financial assets held at fair value through profit or loss 6.1 612,630,838 746,184,527 4,482,782 5,399,186 811,181 941,238 12,770,904 15,304,713
Financial liabilities held at fair value through profit or lossInterest bearing securities held on short position:Level 1 - - - - - - - - Level 2 - - - - - - - - Level 3 - - - - - - - - Derivative liabilities:Level 1 6,617 87,888 - - - - - - Level 2 - - - - - - - - Level 3 - - - - - - - -
Total financial liabilities held at fair value through profit or loss 6.2 6,617 87,888 - - - - - -
107. OnePath Diversified Credit Trust
108. OnePath Diversified Fixed Interest Trust
105. OnePath Capital Guaranteed Trust
106. OnePath Capital Stable Trust

Financial Report Notes to the Financial Statements for the financial year ended 30 June 2020
340
9.5.1.1 Recurring fair value measurements
Note 30 June 2020 30 June 2019 30 June 2020 30 June 2019 30 June 2020 30 June 2019 30 June 2020 30 June 2019$ $ $ $ $ $ $ $
Financial assets held at fair value through profit or lossListed securities: Level 1 - - - - - - - - Level 2 - - - - - - - - Level 3 - - - - - - - - Interest bearing securities: Level 1 - - - - - - - - Level 2 - - - - - - - - Level 3 - - - - - - - - Unlisted unit trusts: Level 1 - - - - - - - - Level 2 4,314,319 5,649,466 32,795,327 35,114,150 695,877 1,071,041 2,694,026 3,766,029Level 3 - - - - - - - - Derivative assets: Level 1 - - - - - - - - Level 2 - - - - - - - - Level 3 - - - - - - - -
Total financial assets held at fair value through profit or loss 6.1 4,314,319 5,649,466 32,795,327 35,114,150 695,877 1,071,041 2,694,026 3,766,029
Financial liabilities held at fair value through profit or lossInterest bearing securities held on short position:Level 1 - - - - - - - - Level 2 - - - - - - - - Level 3 - - - - - - - - Derivative liabilities:Level 1 - - - - - - - - Level 2 - - - - - - - - Level 3 - - - - - - - -
Total financial liabilities held at fair value through profit or loss 6.2 - - - - - - - -
111. OnePath Managed Growth Trust
112. OnePath Select Leaders Trust
109. OnePath Geared Australian Shares Index
Trust
110. OnePath Global Emerging Markets Share
Trust

Financial Report Notes to the Financial Statements for the financial year ended 30 June 2020
341
9.5.1.1 Recurring fair value measurements
Note 30 June 2020 30 June 2019 30 June 2020 30 June 2019 30 June 2020 30 June 2019 30 June 2020 30 June 2019$ $ $ $ $ $ $ $
Financial assets held at fair value through profit or lossListed securities: Level 1 - - - - - - - - Level 2 - - - - - - - - Level 3 - - - - - - - - Interest bearing securities: Level 1 - - - - - - - - Level 2 - - - - - - - - Level 3 - - - - - - - - Unlisted unit trusts: Level 1 - - - - - - - - Level 2 1,758,791 1,789,003 173,759,499 236,050,603 391,515,129 488,531,334 6,580,866 16,197,980Level 3 - - - - - - - - Derivative assets: Level 1 - - - - - 11,327 - - Level 2 - - - - - 6,891 - - Level 3 - - - - - - - -
Total financial assets held at fair value through profit or loss 6.1 1,758,791 1,789,003 173,759,499 236,050,603 391,515,129 488,549,552 6,580,866 16,197,980
Financial liabilities held at fair value through profit or lossInterest bearing securities held on short position:Level 1 - - - - - - - - Level 2 - - - - - - - - Level 3 - - - - - - - - Derivative liabilities:Level 1 - - - - 86,392 183,819 - - Level 2 - - - - 14,180 24,657 - - Level 3 - - - - - - - -
Total financial liabilities held at fair value through profit or loss 6.2 - - - - 100,572 208,476 - -
115. OnePath Wholesale Balanced Trust
116. OnePath Wholesale Blue Chip Imputation Trust
113. OnePath Sustainable Investments - Australian
Share Trust
114. OnePath Wholesale Australian Share Trust

Financial Report Notes to the Financial Statements for the financial year ended 30 June 2020
342
9.5.1.1 Recurring fair value measurements
Note 30 June 2020 30 June 2019 30 June 2020 30 June 2019 30 June 2020 30 June 2019 30 June 2020 30 June 2019$ $ $ $ $ $ $ $
Financial assets held at fair value through profit or lossListed securities: Level 1 - - - - - - - - Level 2 - - - - - - - - Level 3 - - - - - - - - Interest bearing securities: Level 1 - - - - - - - - Level 2 - - - - - - - - Level 3 - - - - - - - - Unlisted unit trusts: Level 1 - - - - - - - - Level 2 350,458,187 424,158,029 529,109,297 616,407,564 49,804,966 63,069,273 90,527,600 110,752,684Level 3 - - - - - - - - Derivative assets: Level 1 279 - - - - - 15,575 - Level 2 - - - - - - - - Level 3 - - - - - - - -
Total financial assets held at fair value through profit or loss 6.1 350,458,466 424,158,029 529,109,297 616,407,564 49,804,966 63,069,273 90,543,175 110,752,684
Financial liabilities held at fair value through profit or lossInterest bearing securities held on short position:Level 1 - - - - - - - - Level 2 - - - - - - - - Level 3 - - - - - - - - Derivative liabilities:Level 1 3,308 13,303 - - - - - - Level 2 - - - - - - - - Level 3 - - - - - - - -
Total financial liabilities held at fair value through profit or loss 6.2 3,308 13,303 - - - - - -
119. OnePath Wholesale Emerging Companies Trust
120. OnePath Wholesale Geared Australian Shares
Index Trust
117. OnePath Wholesale Capital Stable Trust
118. OnePath Wholesale Diversified Fixed Interest
Trust

Financial Report Notes to the Financial Statements for the financial year ended 30 June 2020
343
9.5.1.1 Recurring fair value measurements
Note 30 June 2020 30 June 2019 30 June 2020 30 June 2019 30 June 2020 30 June 2019 30 June 2020 30 June 2019$ $ $ $ $ $ $ $
Financial assets held at fair value through profit or lossListed securities: Level 1 - - - - - - - - Level 2 - - - - - - - - Level 3 - - - - - - - - Interest bearing securities: Level 1 - - - - - - - - Level 2 - - - - - - - - Level 3 - - - - - - - - Unlisted unit trusts: Level 1 - - - - - - - - Level 2 11,260,272 13,126,514 35,292,323 44,205,682 21,364,406 24,953,562 7,101,151 8,523,080Level 3 - - - - - - - - Derivative assets: Level 1 - - - - - - - - Level 2 - - - 1,664 - - - - Level 3 - - - - - - - -
Total financial assets held at fair value through profit or loss 6.1 11,260,272 13,126,514 35,292,323 44,207,346 21,364,406 24,953,562 7,101,151 8,523,080
Financial liabilities held at fair value through profit or lossInterest bearing securities held on short position:Level 1 - - - - - - - - Level 2 - - - - - - - - Level 3 - - - - - - - - Derivative liabilities:Level 1 - - 5,315 - - - - - Level 2 - - 1,350 14,365 - - - - Level 3 - - - - - - - -
Total financial liabilities held at fair value through profit or loss 6.2 - - 6,665 14,365 - - - -
123. OnePath Wholesale Index Balanced Trust
124. OnePath Wholesale Index Conservative Trust
121. OnePath Wholesale Global Emerging Markets
Share Trust
122. OnePath Wholesale High Growth Trust

Financial Report Notes to the Financial Statements for the financial year ended 30 June 2020
344
9.5.1.1 Recurring fair value measurements
† Level 3 Unlisted unit trusts include private equity holdings.
Note 30 June 2020 30 June 2019 30 June 2020 30 June 2019 30 June 2020 30 June 2019 30 June 2020 30 June 2019$ $ $ $ $ $ $ $
Financial assets held at fair value through profit or lossListed securities: Level 1 - - - - - - - - Level 2 - - - - - - - - Level 3 - - - - - - - - Interest bearing securities: Level 1 - - - - - - - - Level 2 - - - - - - - - Level 3 - - - - - - - - Unlisted unit trusts: Level 1 - - - - - - - - Level 2 4,405,698 5,589,484 843,547,935 1,039,230,692 1,616,825 2,438,026 75,923,872 99,981,237Level 3 - - 926,331 625,705 - - - - Derivative assets: Level 1 - - - 62,933 - - - - Level 2 - - - 27,873 - - - - Level 3 - - - - - - - -
Total financial assets held at fair value through profit or loss 6.1 4,405,698 5,589,484 844,474,266 1,039,947,203 1,616,825 2,438,026 75,923,872 99,981,237
Financial liabilities held at fair value through profit or lossInterest bearing securities held on short position:Level 1 - - - - - - - - Level 2 - - - - - - - - Level 3 - - - - - - - - Derivative liabilities:Level 1 - - 307,494 296,364 - - - - Level 2 - - 50,636 159,563 - - - - Level 3 - - - - - - - -
Total financial liabilities held at fair value through profit or loss 6.2 - - 358,130 455,927 - - - -
127. OnePath Wholesale Property Securities Trust
128. OnePath Wholesale Select Leaders Trust
125. OnePath Wholesale Index Moderate Trust
126. OnePath Wholesale Managed Growth Trust†

Financial Report Notes to the Financial Statements for the financial year ended 30 June 2020
345
9.5.1.1 Recurring fair value measurements
Note 30 June 2020 30 June 2019 30 June 2020 30 June 2019 30 June 2020 30 June 2019 30 June 2020 30 June 2019$ $ $ $ $ $ $ $
Financial assets held at fair value through profit or lossListed securities: Level 1 - - - - - - - - Level 2 - - - - - - - - Level 3 - - - - - - - - Interest bearing securities: Level 1 - - - - - - - - Level 2 - - - - - - - - Level 3 - - - - - - - - Unlisted unit trusts: Level 1 - - - - - - - - Level 2 3,394,919 3,621,203 9,637,438 12,974,442 31,984,483 39,630,718 9,178,950 11,682,999Level 3 - - - - - - - - Derivative assets: Level 1 - - - - - - - - Level 2 - - - - - - - - Level 3 - - - - - - - -
Total financial assets held at fair value through profit or loss 6.1 3,394,919 3,621,203 9,637,438 12,974,442 31,984,483 39,630,718 9,178,950 11,682,999
Financial liabilities held at fair value through profit or lossInterest bearing securities held on short position:Level 1 - - - - - - - - Level 2 - - - - - - - - Level 3 - - - - - - - - Derivative liabilities:Level 1 - - - - - - - - Level 2 - - - - - - - - Level 3 - - - - - - - -
Total financial liabilities held at fair value through profit or loss 6.2 - - - - - - - -
131. OptiMix Balanced Trust 132. OptiMix Conservative Trust
129. OptiMix Australian Fixed Interest Trust
130. OptiMix Australian Share Trust

Financial Report Notes to the Financial Statements for the financial year ended 30 June 2020
346
9.5.1.1 Recurring fair value measurements
Note 30 June 2020 30 June 2019 30 June 2020 30 June 2019 30 June 2020 30 June 2019 30 June 2020 30 June 2019$ $ $ $ $ $ $ $
Financial assets held at fair value through profit or lossListed securities: Level 1 - - - - - - - - Level 2 - - - - - - - - Level 3 - - - - - - - - Interest bearing securities: Level 1 - - - - - - - - Level 2 - - - - - - - - Level 3 - - - - - - - - Unlisted unit trusts: Level 1 - - - - - - - - Level 2 3,029,913 3,210,108 4,442,200 5,991,994 2,657,558 2,899,477 10,210,530 13,459,587Level 3 - - - - - - - - Derivative assets: Level 1 - - - - - - - - Level 2 - - - - - - - - Level 3 - - - - - - - -
Total financial assets held at fair value through profit or loss 6.1 3,029,913 3,210,108 4,442,200 5,991,994 2,657,558 2,899,477 10,210,530 13,459,587
Financial liabilities held at fair value through profit or lossInterest bearing securities held on short position:Level 1 - - - - - - - - Level 2 - - - - - - - - Level 3 - - - - - - - - Derivative liabilities:Level 1 - - - - - - - - Level 2 - - - - - - - - Level 3 - - - - - - - -
Total financial liabilities held at fair value through profit or loss 6.2 - - - - - - - -
135. OptiMix Global Smaller Companies Share Trust
136. OptiMix Growth Trust 133. OptiMix Global Emerging Markets Share
Trust
134. OptiMix Global Share Trust
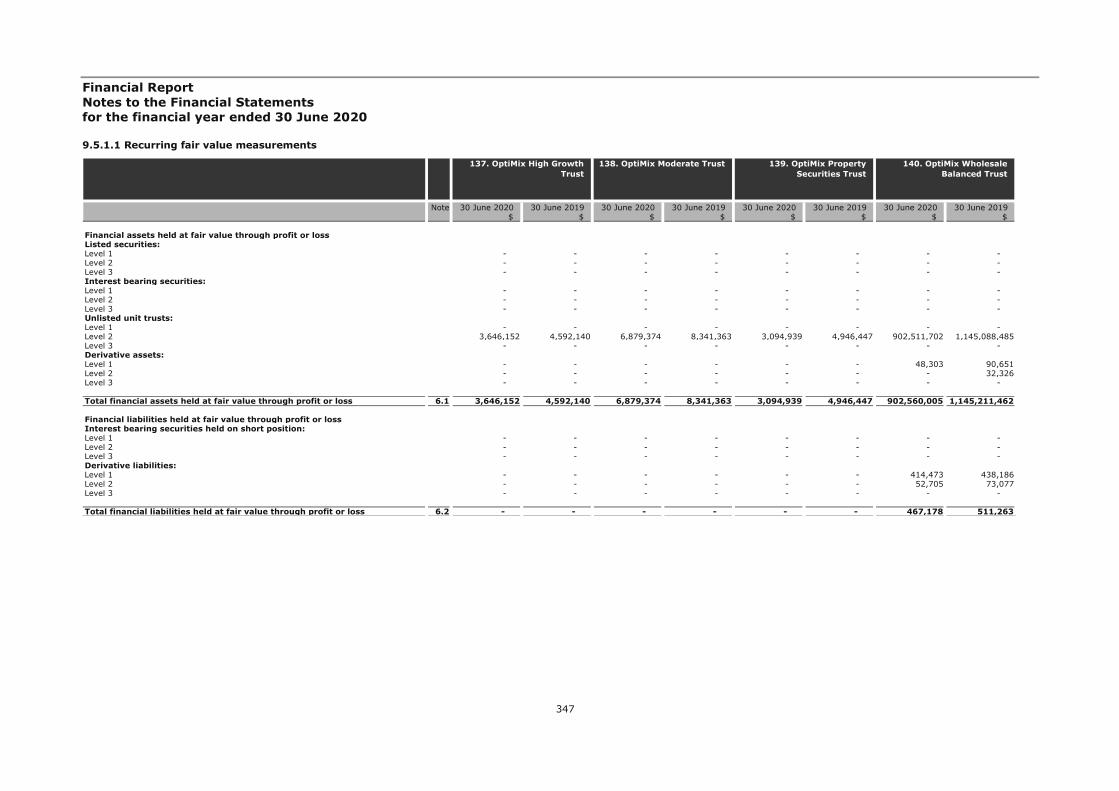
Financial Report Notes to the Financial Statements for the financial year ended 30 June 2020
347
9.5.1.1 Recurring fair value measurements
Note 30 June 2020 30 June 2019 30 June 2020 30 June 2019 30 June 2020 30 June 2019 30 June 2020 30 June 2019$ $ $ $ $ $ $ $
Financial assets held at fair value through profit or lossListed securities: Level 1 - - - - - - - - Level 2 - - - - - - - - Level 3 - - - - - - - - Interest bearing securities: Level 1 - - - - - - - - Level 2 - - - - - - - - Level 3 - - - - - - - - Unlisted unit trusts: Level 1 - - - - - - - - Level 2 3,646,152 4,592,140 6,879,374 8,341,363 3,094,939 4,946,447 902,511,702 1,145,088,485Level 3 - - - - - - - - Derivative assets: Level 1 - - - - - - 48,303 90,651Level 2 - - - - - - - 32,326Level 3 - - - - - - - -
Total financial assets held at fair value through profit or loss 6.1 3,646,152 4,592,140 6,879,374 8,341,363 3,094,939 4,946,447 902,560,005 1,145,211,462
Financial liabilities held at fair value through profit or lossInterest bearing securities held on short position:Level 1 - - - - - - - - Level 2 - - - - - - - - Level 3 - - - - - - - - Derivative liabilities:Level 1 - - - - - - 414,473 438,186Level 2 - - - - - - 52,705 73,077Level 3 - - - - - - - -
Total financial liabilities held at fair value through profit or loss 6.2 - - - - - - 467,178 511,263
139. OptiMix Property Securities Trust
140. OptiMix Wholesale Balanced Trust
137. OptiMix High Growth Trust
138. OptiMix Moderate Trust

Financial Report Notes to the Financial Statements for the financial year ended 30 June 2020
348
9.5.1.1 Recurring fair value measurements
Note 30 June 2020 30 June 2019 30 June 2020 30 June 2019 30 June 2020 30 June 2019 30 June 2020 30 June 2019$ $ $ $ $ $ $ $
Financial assets held at fair value through profit or lossListed securities: Level 1 - - - - - - - - Level 2 - - - - - - - - Level 3 - - - - - - - - Interest bearing securities: Level 1 - - - - - - - - Level 2 - - - - - - - - Level 3 - - - - - - - - Unlisted unit trusts: Level 1 - - - - - - - - Level 2 228,148,766 265,780,188 193,828,201 325,748,095 507,575,471 651,667,822 207,424,307 263,393,648Level 3 - - - - - - - - Derivative assets: Level 1 - - - - 38,927 45,421 - - Level 2 - - 8,278,887 3,121,879 - 18,715 - 6,550Level 3 - - - - - - - -
Total financial assets held at fair value through profit or loss 6.1 228,148,766 265,780,188 202,107,088 328,869,974 507,614,398 651,731,958 207,424,307 263,400,198
Financial liabilities held at fair value through profit or lossInterest bearing securities held on short position:Level 1 - - - - - - - - Level 2 - - - - - - - - Level 3 - - - - - - - - Derivative liabilities:Level 1 19,465 4,544 - - 157,171 163,911 65,848 18,454Level 2 - 15,774 52,340 926,216 8,779 79,216 9,452 47,401Level 3 - - - - - - - -
Total financial liabilities held at fair value through profit or loss 6.2 19,465 20,318 52,340 926,216 165,950 243,127 75,300 65,855
143. OptiMix Wholesale Growth Trust
144. OptiMix Wholesale High Growth Trust
141. OptiMix Wholesale Conservative Trust
142. OptiMix Wholesale Global (Hedged) Share Trust

Financial Report Notes to the Financial Statements for the financial year ended 30 June 2020
349
9.5.1.1 Recurring fair value measurements
9.5.1.2 Non - recurring fair value measurements
The Schemes have no assets or liabilities measured at fair value on a non - recurring basis in the current reporting period.
Note 30 June 2020 30 June 2019 30 June 2020 30 June 2019 30 June 2020 30 June 2019$ $ $ $ $ $
Financial assets held at fair value through profit or lossListed securities: Level 1 - - - - - - Level 2 - - - - - - Level 3 - - - - - - Interest bearing securities: Level 1 - - - - - - Level 2 - - - - - - Level 3 - - - - - - Unlisted unit trusts: Level 1 - - - - - - Level 2 348,542,571 440,564,326 183,060,592 221,254,823 4,203,709 6,659,202Level 3 - - - - - - Derivative assets: Level 1 31,016 8,883 - - - - Level 2 - 11,580 - - - - Level 3 - - - - - -
Total financial assets held at fair value through profit or loss 6.1 348,573,587 440,584,789 183,060,592 221,254,823 4,203,709 6,659,202
Financial liabilities held at fair value through profit or lossInterest bearing securities held on short position:Level 1 - - - - - - Level 2 - - - - - - Level 3 - - - - - - Derivative liabilities:Level 1 132,318 159,973 - - - - Level 2 15,527 - - - - - Level 3 - - - - - -
Total financial liabilities held at fair value through profit or loss 6.2 147,845 159,973 - - - -
147. Property Securities Trust
145. OptiMix Wholesale Moderate Trust
146. Pooled Australian Share Fund

Financial Report Notes to the Financial Statements for the financial year ended 30 June 2020
350
9.5.2 Movements of Level 3 securities
Level 3 securities held are securities valued by using inputs not derived from observable market data. Inputs are prices derived from external sources which use various valuation techniques that include unobservable inputs. Transfers are considered when the underlying conditions of the financial instruments change.
There were no transfers between Level 1, Level 2 and Level 3 of the fair value hierarchy during the financial year ended 30 June 2020.
The following tables detail a reconciliation of opening balances to the closing balances for fair value measurements in Level 3 of the fair value hierarchy:
† The Scheme holds unlisted unit trusts which include private equity.
Note$ $ $ $ $ $ $ $ $ $
Financial assets and liabilities at fair value through profit or lossOpening balance - - - - - - - - - - Total gains or losses in profit or loss* - - - - - - - (19,346) - (19,346)Sales - - - - - - - 19,346 - 19,346Settlements - - - - - - - - - - Transfers in/out of Level 3 - - - - - - - - - - Closing balance 9.5.1.1 - - - - - - - - - -
Total unrealised gains or losses for the period included in profit or loss for assets held at the end of the reporting period* - - - - - - - - - - * These amounts are included in 'Net change in fair value of investments' within the Statements of Comprehensive Income.
Trading derivatives Total
Financial assets & liabilities at fair value through profit or loss 30 June 2020 Financial assets & liabilities at fair value through profit or loss 30 June 2019Listed
equitiesInterest bearing
securitiesUnlisted unit
trustsTrading
derivatives TotalListed
equitiesInterest bearing
securitiesUnlisted unit
trusts
18. ANZ OA OnePath Income Trust
Note$ $ $ $ $ $ $ $ $ $
Financial assets and liabilities at fair value through profit or lossOpening balance - - 625,705 - 625,705 - - 997,582 - 997,582Total gains or losses in profit or loss* - - 300,626 - 300,626 - - (134,490) - (134,490)Sales - - - - - - - - - - Settlements - - - - - - - (237,387) - (237,387)Transfers in/out of Level 3 - - - - - - - - - - Closing balance 9.5.1.1 - - 926,331 - 926,331 - - 625,705 - 625,705
Total unrealised gains or losses for the period included in profit or loss for assets held at the end of the reporting period* - - 300,626 - 300,626 - - (13,692) - (13,692)* These amounts are included in 'Net change in fair value of investments' within the Statements of Comprehensive Income.
Trading derivatives Total
Financial assets & liabilities at fair value through profit or loss 30 June 2020 Financial assets & liabilities at fair value through profit or loss 30 June 2019Listed
equitiesInterest bearing
securitiesUnlisted unit
trustsTrading
derivatives TotalListed
equitiesInterest bearing
securitiesUnlisted unit
trusts
126. OnePath Wholesale Managed Growth Trust†
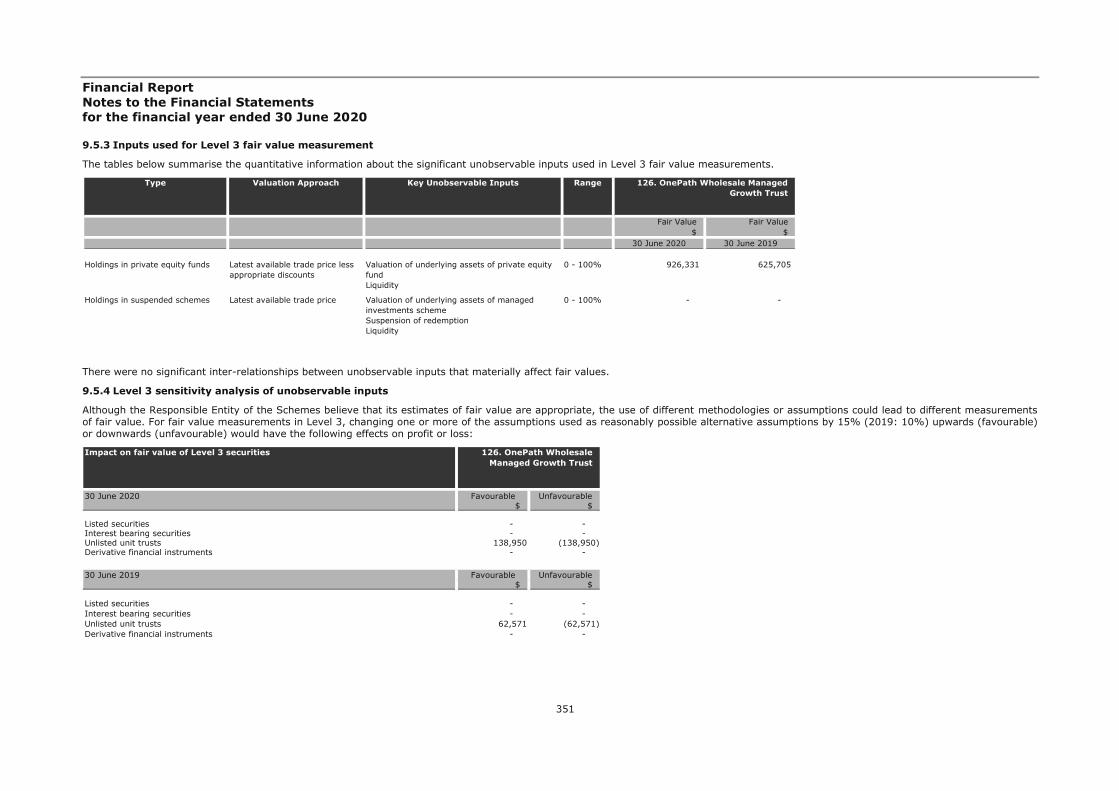
Financial Report Notes to the Financial Statements for the financial year ended 30 June 2020
351
9.5.3 Inputs used for Level 3 fair value measurement
The tables below summarise the quantitative information about the significant unobservable inputs used in Level 3 fair value measurements.
There were no significant inter-relationships between unobservable inputs that materially affect fair values.
9.5.4 Level 3 sensitivity analysis of unobservable inputs
Although the Responsible Entity of the Schemes believe that its estimates of fair value are appropriate, the use of different methodologies or assumptions could lead to different measurements of fair value. For fair value measurements in Level 3, changing one or more of the assumptions used as reasonably possible alternative assumptions by 15% (2019: 10%) upwards (favourable) or downwards (unfavourable) would have the following effects on profit or loss:
30 June 2020 30 June 2019
Holdings in private equity funds Latest available trade price less appropriate discounts
Valuation of underlying assets of private equity fundLiquidity
0 - 100% 926,331 625,705
Holdings in suspended schemes Latest available trade price Valuation of underlying assets of managed investments schemeSuspension of redemptionLiquidity
0 - 100% - -
Type
Fair Value$
Fair Value$
Valuation Approach Key Unobservable Inputs Range 126. OnePath Wholesale Managed Growth Trust
Impact on fair value of Level 3 securities
30 June 2020 Favourable Unfavourable$ $
Listed securities - - Interest bearing securities - - Unlisted unit trusts 138,950 (138,950)Derivative financial instruments - -
30 June 2019 Favourable Unfavourable$ $
Listed securities - - Interest bearing securities - - Unlisted unit trusts 62,571 (62,571)Derivative financial instruments - -
126. OnePath Wholesale Managed Growth Trust

Financial Report Notes to the Financial Statements for the financial year ended 30 June 2020
352
9.5.5 Valuation processes
The Responsible Entity's Investment Management Committee (IMC) reviews valuations of the financial instruments.
On a monthly basis the Responsible Entity’s Investment Valuation Forum provides valuation exceptions and reports to IMC.
10. Auditor's remuneration
During the year the following fees were paid or payable for services provided by the auditor of the Schemes:
30 June 2020 30 June 2019 30 June 2020 30 June 2019 30 June 2020 30 June 2019 30 June 2020 30 June 2019$ $ $ $ $ $ $ $
KPMG – Financial statement auditPaid by Responsible Entity 4,767 4,887 4,767 4,887 4,767 4,887 4,767 4,887– Compliance and regulatoryPaid by Responsible Entity 850 765 850 765 850 765 850 765Total audit fees paid 5,617 5,652 5,617 5,652 5,617 5,652 5,617 5,652
3. ANZ Equity Trust No 1 4. ANZ Fixed Interest Trust 1. Active Growth Trust 2. ANZ Equity Imputation Trust
30 June 2020 30 June 2019 30 June 2020 30 June 2019 30 June 2020 30 June 2019 30 June 2020 30 June 2019$ $ $ $ $ $ $ $
KPMG – Financial statement auditPaid by Responsible Entity 3,851 3,995 4,767 4,887 4,767 4,887 3,851 3,995– Compliance and regulatoryPaid by Responsible Entity 850 765 850 765 850 765 850 765Total audit fees paid 4,701 4,760 5,617 5,652 5,617 5,652 4,701 4,760
7. ANZ OA Colonial First State Imputation Trust
8. ANZ OA Investors Mutual Australian Share Trust
5. ANZ OA - Pendal Core Hedged Global Shares Trust
6. ANZ OA Arrowstreet Global Equity (Hedged) Trust
30 June 2020 30 June 2019 30 June 2020 30 June 2019 30 June 2020 30 June 2019 30 June 2020 30 June 2019$ $ $ $ $ $ $ $
KPMG – Financial statement auditPaid by Responsible Entity 3,851 3,995 4,767 4,887 4,767 4,887 4,767 4,887– Compliance and regulatoryPaid by Responsible Entity 850 765 850 765 850 765 850 765Total audit fees paid 4,701 4,760 5,617 5,652 5,617 5,652 5,617 5,652
11. ANZ OA OnePath Australian Share Trust
12. ANZ OA OnePath Balanced Trust
9. ANZ OA Magellan Global Trust
10. ANZ OA OnePath Active Growth Trust

Financial Report Notes to the Financial Statements for the financial year ended 30 June 2020
353
10. Auditor's remuneration
30 June 2020 30 June 2019 30 June 2020 30 June 2019 30 June 2020 30 June 2019 30 June 2020 30 June 2019$ $ $ $ $ $ $ $
KPMG – Financial statement auditPaid by Responsible Entity 4,767 4,887 4,767 4,887 4,767 4,887 4,767 4,887– Compliance and regulatoryPaid by Responsible Entity 850 765 850 765 850 765 850 765Total audit fees paid 5,617 5,652 5,617 5,652 5,617 5,652 5,617 5,652
15. ANZ OA OnePath Diversified Fixed Interest
Trust
16. ANZ OA OnePath Global Emerging Markets Share
Trust
13. ANZ OA OnePath Blue Chip Imputation Trust
14. ANZ OA OnePath Conservative Trust
30 June 2020 30 June 2019 30 June 2020 30 June 2019 30 June 2020 30 June 2019 30 June 2020 30 June 2019$ $ $ $ $ $ $ $
KPMG – Financial statement auditPaid by Responsible Entity 3,851 3,995 4,767 4,887 4,767 4,887 4,767 4,887– Compliance and regulatoryPaid by Responsible Entity 850 765 850 765 850 765 850 765Total audit fees paid 4,701 4,760 5,617 5,652 5,617 5,652 5,617 5,652
19. ANZ OA OnePath Managed Growth Trust
20. ANZ OA OnePath Property Securities Trust
17. ANZ OA OnePath High Growth Trust
18. ANZ OA OnePath Income Trust
30 June 2020 30 June 2019 30 June 2020 30 June 2019 30 June 2020 30 June 2019 30 June 2020 30 June 2019$ $ $ $ $ $ $ $
KPMG – Financial statement auditPaid by Responsible Entity 4,767 4,887 3,851 3,995 4,767 4,887 3,851 3,995– Compliance and regulatoryPaid by Responsible Entity 850 765 850 765 850 765 850 765Total audit fees paid 5,617 5,652 4,701 4,760 5,617 5,652 4,701 4,760
23. ANZ OA OnePath Tax Effective Income Trust
24. ANZ OA OptiMix Australian Fixed Interest
Trust
21. ANZ OA OnePath Select Leaders Trust
22. ANZ OA OnePath Sustainable Investments -
Australian Share Trust
30 June 2020 30 June 2019 30 June 2020 30 June 2019 30 June 2020 30 June 2019 30 June 2020 30 June 2019$ $ $ $ $ $ $ $
KPMG – Financial statement auditPaid by Responsible Entity 4,767 4,887 4,767 4,887 4,767 4,887 3,851 3,995– Compliance and regulatoryPaid by Responsible Entity 850 765 850 765 850 765 850 765Total audit fees paid 5,617 5,652 5,617 5,652 5,617 5,652 4,701 4,760
27. ANZ OA OptiMix Global Share Trust
28. ANZ OA OptiMix Global Smaller Companies Share
Trust
25. ANZ OA OptiMix Australian Share Trust
26. ANZ OA OptiMix Conservative Trust

Financial Report Notes to the Financial Statements for the financial year ended 30 June 2020
354
10. Auditor's remuneration
30 June 2020 30 June 2019 30 June 2020 30 June 2019 30 June 2020 30 June 2019 30 June 2020 30 June 2019$ $ $ $ $ $ $ $
KPMG – Financial statement auditPaid by Responsible Entity 4,767 4,887 4,767 4,887 4,767 4,887 4,767 4,887– Compliance and regulatoryPaid by Responsible Entity 850 765 850 765 850 765 850 765Total audit fees paid 5,617 5,652 5,617 5,652 5,617 5,652 5,617 5,652
31. ANZ OA OptiMix Moderate Trust
32. ANZ OA OptiMix Property Securities Trust
29. ANZ OA OptiMix Growth Trust
30. ANZ OA OptiMix High Growth Trust
30 June 2020 30 June 2019 30 June 2020 30 June 2019 30 June 2020 30 June 2019 30 June 2020 30 June 2019$ $ $ $ $ $ $ $
KPMG – Financial statement auditPaid by Responsible Entity 4,767 4,887 4,767 4,887 4,767 4,887 3,851 3,995– Compliance and regulatoryPaid by Responsible Entity 850 765 850 765 850 765 850 765Total audit fees paid 5,617 5,652 5,617 5,652 5,617 5,652 4,701 4,760
35. ANZ OA SG Hiscock Property Trust
36. ANZ OA UBS Diversified Fixed Income Trust
33. ANZ OA Perpetual Australian Share Trust
34. ANZ OA Schroder Australian Equity Trust
30 June 2020 30 June 2019 30 June 2020 30 June 2019 30 June 2020 30 June 2019 30 June 2020 30 June 2019$ $ $ $ $ $ $ $
KPMG – Financial statement auditPaid by Responsible Entity 3,851 3,995 3,851 3,995 3,851 3,995 4,767 4,887– Compliance and regulatoryPaid by Responsible Entity 850 765 850 765 850 765 850 765Total audit fees paid 4,701 4,760 4,701 4,760 4,701 4,760 5,617 5,652
39. ANZ Private International Fixed Interest Fund
40. ANZ Property Securities Trust
37. ANZ OneAnswer - BR Scientific Australian Equity
Trust
38. ANZ OneAnswer - BR Scientific International
Equity Trust
30 June 2020 30 June 2019 30 June 2020 30 June 2019 30 June 2020 30 June 2019 30 June 2020 30 June 2019$ $ $ $ $ $ $ $
KPMG – Financial statement auditPaid by Responsible Entity 4,767 4,887 4,767 4,887 4,767 4,887 4,767 4,887– Compliance and regulatoryPaid by Responsible Entity 850 765 850 765 850 765 850 765Total audit fees paid 5,617 5,652 5,617 5,652 5,617 5,652 5,617 5,652
43. Blue Chip Imputation Trust
44. Emerging Companies Trust
41. Australian Share Trust 42. Balanced Trust
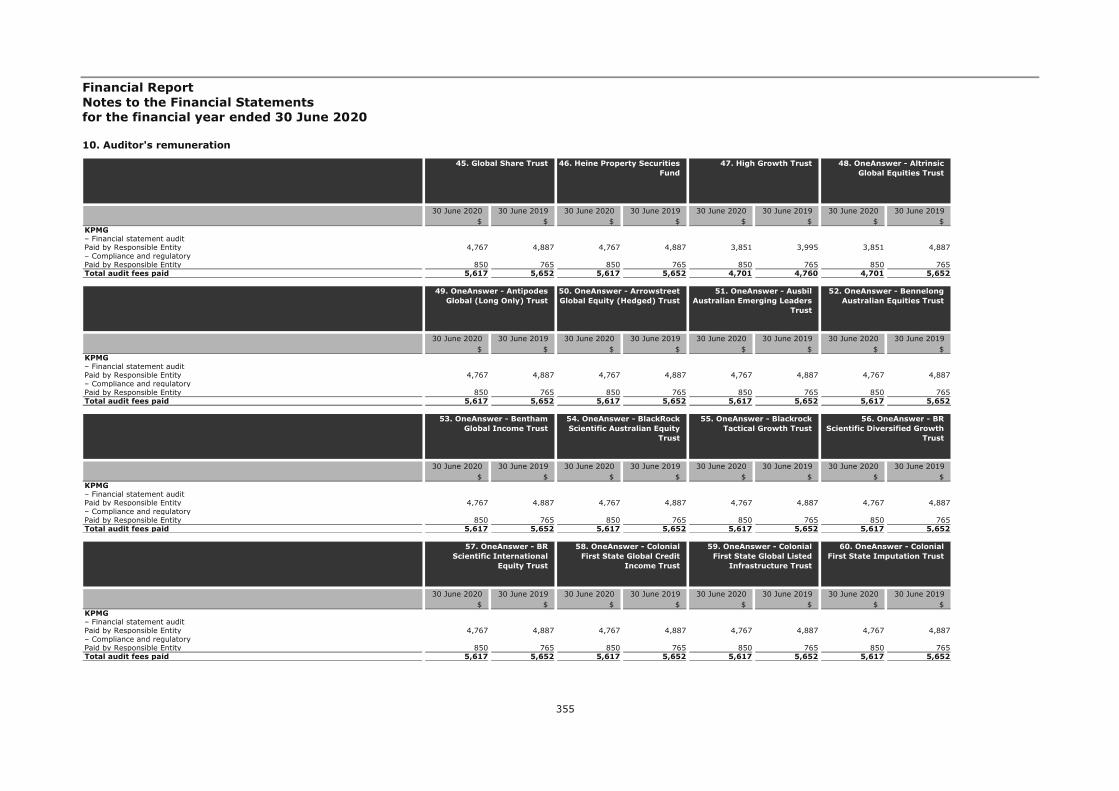
Financial Report Notes to the Financial Statements for the financial year ended 30 June 2020
355
10. Auditor's remuneration
30 June 2020 30 June 2019 30 June 2020 30 June 2019 30 June 2020 30 June 2019 30 June 2020 30 June 2019$ $ $ $ $ $ $ $
KPMG – Financial statement auditPaid by Responsible Entity 4,767 4,887 4,767 4,887 3,851 3,995 3,851 4,887– Compliance and regulatoryPaid by Responsible Entity 850 765 850 765 850 765 850 765Total audit fees paid 5,617 5,652 5,617 5,652 4,701 4,760 4,701 5,652
47. High Growth Trust 48. OneAnswer - Altrinsic Global Equities Trust
45. Global Share Trust 46. Heine Property Securities Fund
30 June 2020 30 June 2019 30 June 2020 30 June 2019 30 June 2020 30 June 2019 30 June 2020 30 June 2019$ $ $ $ $ $ $ $
KPMG – Financial statement auditPaid by Responsible Entity 4,767 4,887 4,767 4,887 4,767 4,887 4,767 4,887– Compliance and regulatoryPaid by Responsible Entity 850 765 850 765 850 765 850 765Total audit fees paid 5,617 5,652 5,617 5,652 5,617 5,652 5,617 5,652
51. OneAnswer - Ausbil Australian Emerging Leaders
Trust
52. OneAnswer - Bennelong Australian Equities Trust
49. OneAnswer - Antipodes Global (Long Only) Trust
50. OneAnswer - Arrowstreet Global Equity (Hedged) Trust
30 June 2020 30 June 2019 30 June 2020 30 June 2019 30 June 2020 30 June 2019 30 June 2020 30 June 2019$ $ $ $ $ $ $ $
KPMG – Financial statement auditPaid by Responsible Entity 4,767 4,887 4,767 4,887 4,767 4,887 4,767 4,887– Compliance and regulatoryPaid by Responsible Entity 850 765 850 765 850 765 850 765Total audit fees paid 5,617 5,652 5,617 5,652 5,617 5,652 5,617 5,652
55. OneAnswer - Blackrock Tactical Growth Trust
56. OneAnswer - BR Scientific Diversified Growth
Trust
53. OneAnswer - Bentham Global Income Trust
54. OneAnswer - BlackRock Scientific Australian Equity
Trust
30 June 2020 30 June 2019 30 June 2020 30 June 2019 30 June 2020 30 June 2019 30 June 2020 30 June 2019$ $ $ $ $ $ $ $
KPMG – Financial statement auditPaid by Responsible Entity 4,767 4,887 4,767 4,887 4,767 4,887 4,767 4,887– Compliance and regulatoryPaid by Responsible Entity 850 765 850 765 850 765 850 765Total audit fees paid 5,617 5,652 5,617 5,652 5,617 5,652 5,617 5,652
59. OneAnswer - Colonial First State Global Listed
Infrastructure Trust
60. OneAnswer - Colonial First State Imputation Trust
57. OneAnswer - BR Scientific International
Equity Trust
58. OneAnswer - Colonial First State Global Credit
Income Trust

Financial Report Notes to the Financial Statements for the financial year ended 30 June 2020
356
10. Auditor's remuneration
30 June 2020 30 June 2019 30 June 2020 30 June 2019 30 June 2020 30 June 2019 30 June 2020 30 June 2019$ $ $ $ $ $ $ $
KPMG – Financial statement auditPaid by Responsible Entity 4,767 4,887 4,767 4,887 4,767 4,887 3,851 3,995– Compliance and regulatoryPaid by Responsible Entity 850 765 850 765 850 765 850 765Total audit fees paid 5,617 5,652 5,617 5,652 5,617 5,652 4,701 4,760
63. OneAnswer - Investors Mutual Australian Share
Trust
64. OneAnswer - Janus Henderson Global Fixed
Interest Total Return Trust
61. OneAnswer - Fidelity Australian Equities Trust
62. OneAnswer - Greencape Broadcap Trust
30 June 2020 30 June 2019 30 June 2020 30 June 2019 30 June 2020 30 June 2019 30 June 2020 30 June 2019$ $ $ $ $ $ $ $
KPMG – Financial statement auditPaid by Responsible Entity 4,767 4,887 4,767 4,887 4,767 4,887 4,767 4,887– Compliance and regulatoryPaid by Responsible Entity 850 765 850 765 850 765 850 765Total audit fees paid 5,617 5,652 5,617 5,652 5,617 5,652 5,617 5,652
67. OneAnswer - Merlon Australian Share Income
Trust
68. OneAnswer - MFS Global Equity Trust
65. OneAnswer - Kapstream Absolute Return Income
Trust
66. OneAnswer - Magellan Global Trust
30 June 2020 30 June 2019 30 June 2020 30 June 2019 30 June 2020 30 June 2019 30 June 2020 30 June 2019$ $ $ $ $ $ $ $
KPMG – Financial statement auditPaid by Responsible Entity 4,767 4,887 4,767 4,887 4,767 4,887 4,767 4,887– Compliance and regulatoryPaid by Responsible Entity 850 765 850 765 850 765 850 765Total audit fees paid 5,617 5,652 5,617 5,652 5,617 5,652 5,617 5,652
71. OneAnswer - Pendal Australian Share Trust
72. OneAnswer - Pendal Core Hedged Global Shares Trust
69. OneAnswer - Nikko AM Australian Shares Trust
70. OneAnswer - OnePath Global Property Securities
Index Trust
30 June 2020 30 June 2019 30 June 2020 30 June 2019 30 June 2020 30 June 2019 30 June 2020 30 June 2019$ $ $ $ $ $ $ $
KPMG – Financial statement auditPaid by Responsible Entity 3,851 3,995 4,767 4,887 4,767 4,887 4,767 4,887– Compliance and regulatoryPaid by Responsible Entity 850 765 850 765 850 765 850 765Total audit fees paid 4,701 4,760 5,617 5,652 5,617 5,652 5,617 5,652
75. OneAnswer - Perennial Value Shares Trust
76. OneAnswer - Perpetual Australian Share Trust
73. OneAnswer - Pendal Monthly Income Plus Trust
74. OneAnswer - Pendal Smaller Companies Trust
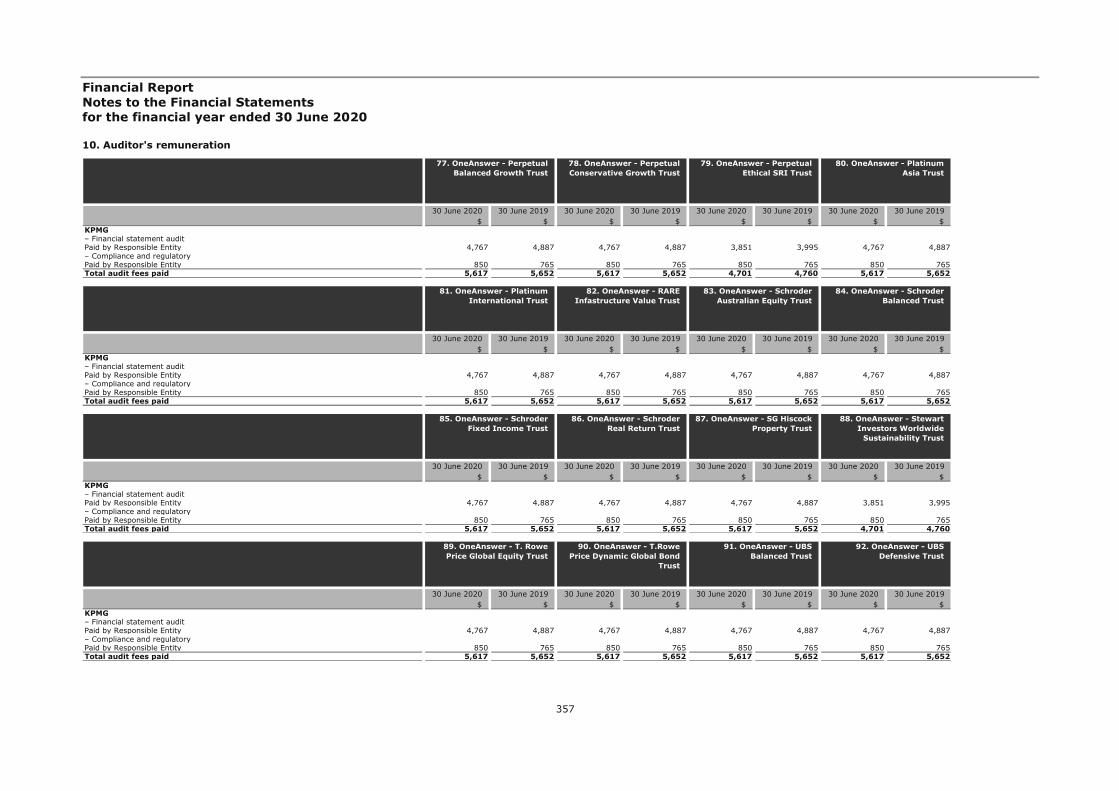
Financial Report Notes to the Financial Statements for the financial year ended 30 June 2020
357
10. Auditor's remuneration
30 June 2020 30 June 2019 30 June 2020 30 June 2019 30 June 2020 30 June 2019 30 June 2020 30 June 2019$ $ $ $ $ $ $ $
KPMG – Financial statement auditPaid by Responsible Entity 4,767 4,887 4,767 4,887 3,851 3,995 4,767 4,887– Compliance and regulatoryPaid by Responsible Entity 850 765 850 765 850 765 850 765Total audit fees paid 5,617 5,652 5,617 5,652 4,701 4,760 5,617 5,652
79. OneAnswer - Perpetual Ethical SRI Trust
80. OneAnswer - Platinum Asia Trust
77. OneAnswer - Perpetual Balanced Growth Trust
78. OneAnswer - Perpetual Conservative Growth Trust
30 June 2020 30 June 2019 30 June 2020 30 June 2019 30 June 2020 30 June 2019 30 June 2020 30 June 2019$ $ $ $ $ $ $ $
KPMG – Financial statement auditPaid by Responsible Entity 4,767 4,887 4,767 4,887 4,767 4,887 4,767 4,887– Compliance and regulatoryPaid by Responsible Entity 850 765 850 765 850 765 850 765Total audit fees paid 5,617 5,652 5,617 5,652 5,617 5,652 5,617 5,652
83. OneAnswer - Schroder Australian Equity Trust
84. OneAnswer - Schroder Balanced Trust
81. OneAnswer - Platinum International Trust
82. OneAnswer - RARE Infastructure Value Trust
30 June 2020 30 June 2019 30 June 2020 30 June 2019 30 June 2020 30 June 2019 30 June 2020 30 June 2019$ $ $ $ $ $ $ $
KPMG – Financial statement auditPaid by Responsible Entity 4,767 4,887 4,767 4,887 4,767 4,887 3,851 3,995– Compliance and regulatoryPaid by Responsible Entity 850 765 850 765 850 765 850 765Total audit fees paid 5,617 5,652 5,617 5,652 5,617 5,652 4,701 4,760
87. OneAnswer - SG Hiscock Property Trust
88. OneAnswer - Stewart Investors Worldwide
Sustainability Trust
85. OneAnswer - Schroder Fixed Income Trust
86. OneAnswer - Schroder Real Return Trust
30 June 2020 30 June 2019 30 June 2020 30 June 2019 30 June 2020 30 June 2019 30 June 2020 30 June 2019$ $ $ $ $ $ $ $
KPMG – Financial statement auditPaid by Responsible Entity 4,767 4,887 4,767 4,887 4,767 4,887 4,767 4,887– Compliance and regulatoryPaid by Responsible Entity 850 765 850 765 850 765 850 765Total audit fees paid 5,617 5,652 5,617 5,652 5,617 5,652 5,617 5,652
91. OneAnswer - UBS Balanced Trust
92. OneAnswer - UBS Defensive Trust
89. OneAnswer - T. Rowe Price Global Equity Trust
90. OneAnswer - T.Rowe Price Dynamic Global Bond
Trust
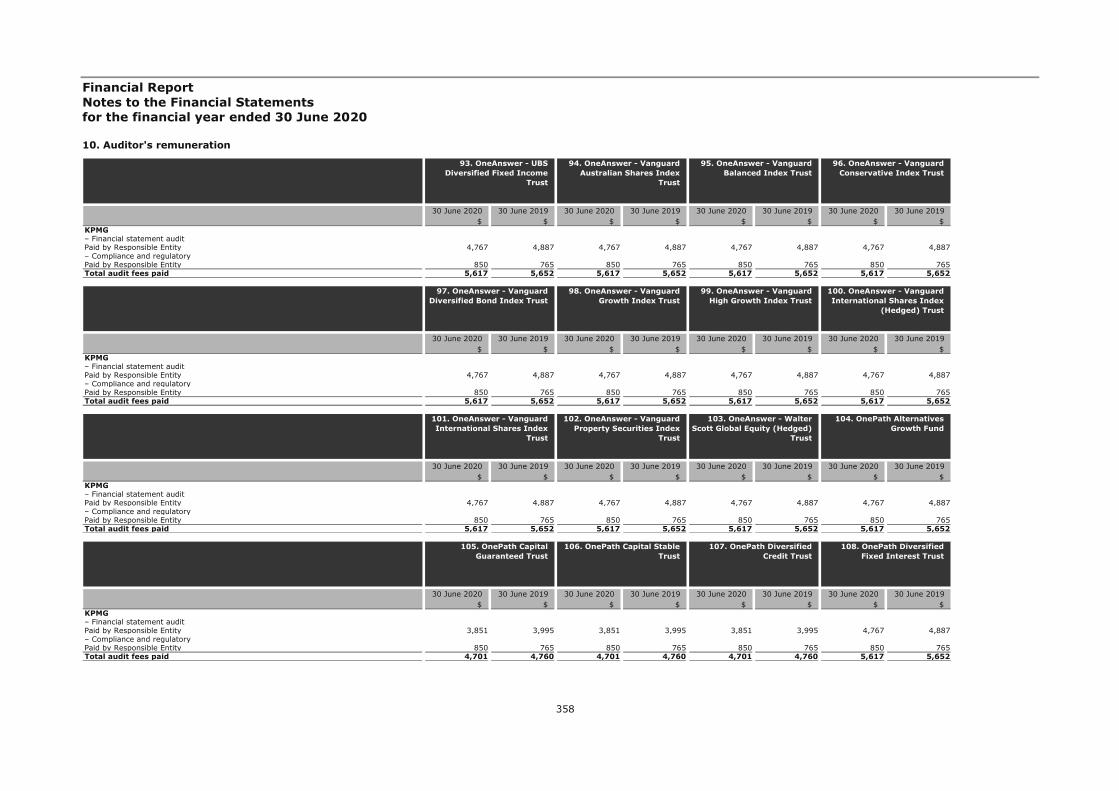
Financial Report Notes to the Financial Statements for the financial year ended 30 June 2020
358
10. Auditor's remuneration
30 June 2020 30 June 2019 30 June 2020 30 June 2019 30 June 2020 30 June 2019 30 June 2020 30 June 2019$ $ $ $ $ $ $ $
KPMG – Financial statement auditPaid by Responsible Entity 4,767 4,887 4,767 4,887 4,767 4,887 4,767 4,887– Compliance and regulatoryPaid by Responsible Entity 850 765 850 765 850 765 850 765Total audit fees paid 5,617 5,652 5,617 5,652 5,617 5,652 5,617 5,652
95. OneAnswer - Vanguard Balanced Index Trust
96. OneAnswer - Vanguard Conservative Index Trust
93. OneAnswer - UBS Diversified Fixed Income
Trust
94. OneAnswer - Vanguard Australian Shares Index
Trust
30 June 2020 30 June 2019 30 June 2020 30 June 2019 30 June 2020 30 June 2019 30 June 2020 30 June 2019$ $ $ $ $ $ $ $
KPMG – Financial statement auditPaid by Responsible Entity 4,767 4,887 4,767 4,887 4,767 4,887 4,767 4,887– Compliance and regulatoryPaid by Responsible Entity 850 765 850 765 850 765 850 765Total audit fees paid 5,617 5,652 5,617 5,652 5,617 5,652 5,617 5,652
99. OneAnswer - Vanguard High Growth Index Trust
100. OneAnswer - Vanguard International Shares Index
(Hedged) Trust
97. OneAnswer - Vanguard Diversified Bond Index Trust
98. OneAnswer - Vanguard Growth Index Trust
30 June 2020 30 June 2019 30 June 2020 30 June 2019 30 June 2020 30 June 2019 30 June 2020 30 June 2019$ $ $ $ $ $ $ $
KPMG – Financial statement auditPaid by Responsible Entity 4,767 4,887 4,767 4,887 4,767 4,887 4,767 4,887– Compliance and regulatoryPaid by Responsible Entity 850 765 850 765 850 765 850 765Total audit fees paid 5,617 5,652 5,617 5,652 5,617 5,652 5,617 5,652
103. OneAnswer - Walter Scott Global Equity (Hedged)
Trust
104. OnePath Alternatives Growth Fund
101. OneAnswer - Vanguard International Shares Index
Trust
102. OneAnswer - Vanguard Property Securities Index
Trust
30 June 2020 30 June 2019 30 June 2020 30 June 2019 30 June 2020 30 June 2019 30 June 2020 30 June 2019$ $ $ $ $ $ $ $
KPMG – Financial statement auditPaid by Responsible Entity 3,851 3,995 3,851 3,995 3,851 3,995 4,767 4,887– Compliance and regulatoryPaid by Responsible Entity 850 765 850 765 850 765 850 765Total audit fees paid 4,701 4,760 4,701 4,760 4,701 4,760 5,617 5,652
107. OnePath Diversified Credit Trust
108. OnePath Diversified Fixed Interest Trust
105. OnePath Capital Guaranteed Trust
106. OnePath Capital Stable Trust

Financial Report Notes to the Financial Statements for the financial year ended 30 June 2020
359
10. Auditor's remuneration
30 June 2020 30 June 2019 30 June 2020 30 June 2019 30 June 2020 30 June 2019 30 June 2020 30 June 2019$ $ $ $ $ $ $ $
KPMG – Financial statement auditPaid by Responsible Entity 4,767 4,887 4,767 4,887 3,851 3,995 4,767 4,887– Compliance and regulatoryPaid by Responsible Entity 850 765 850 765 850 765 850 765Total audit fees paid 5,617 5,652 5,617 5,652 4,701 4,760 5,617 5,652
111. OnePath Managed Growth Trust
112. OnePath Select Leaders Trust
109. OnePath Geared Australian Shares Index
Trust
110. OnePath Global Emerging Markets Share
Trust
30 June 2020 30 June 2019 30 June 2020 30 June 2019 30 June 2020 30 June 2019 30 June 2020 30 June 2019$ $ $ $ $ $ $ $
KPMG – Financial statement auditPaid by Responsible Entity 3,851 3,995 3,851 3,995 3,851 3,995 3,851 3,995– Compliance and regulatoryPaid by Responsible Entity 850 765 850 765 850 765 850 765Total audit fees paid 4,701 4,760 4,701 4,760 4,701 4,760 4,701 4,760
115. OnePath Wholesale Balanced Trust
116. OnePath Wholesale Blue Chip Imputation Trust
113. OnePath Sustainable Investments - Australian
Share Trust
114. OnePath Wholesale Australian Share Trust
30 June 2020 30 June 2019 30 June 2020 30 June 2019 30 June 2020 30 June 2019 30 June 2020 30 June 2019$ $ $ $ $ $ $ $
KPMG – Financial statement auditPaid by Responsible Entity 3,851 3,995 4,767 4,887 3,851 3,995 3,851 3,995– Compliance and regulatoryPaid by Responsible Entity 850 765 850 765 850 765 850 765Total audit fees paid 4,701 4,760 5,617 5,652 4,701 4,760 4,701 4,760
119. OnePath Wholesale Emerging Companies Trust
120. OnePath Wholesale Geared Australian Shares
Index Trust
117. OnePath Wholesale Capital Stable Trust
118. OnePath Wholesale Diversified Fixed Interest
Trust
30 June 2020 30 June 2019 30 June 2020 30 June 2019 30 June 2020 30 June 2019 30 June 2020 30 June 2019$ $ $ $ $ $ $ $
KPMG – Financial statement auditPaid by Responsible Entity 3,851 3,995 3,851 3,995 3,851 3,995 3,851 3,995– Compliance and regulatoryPaid by Responsible Entity 850 765 850 765 850 765 850 765Total audit fees paid 4,701 4,760 4,701 4,760 4,701 4,760 4,701 4,760
123. OnePath Wholesale Index Balanced Trust
124. OnePath Wholesale Index Conservative Trust
121. OnePath Wholesale Global Emerging Markets
Share Trust
122. OnePath Wholesale High Growth Trust
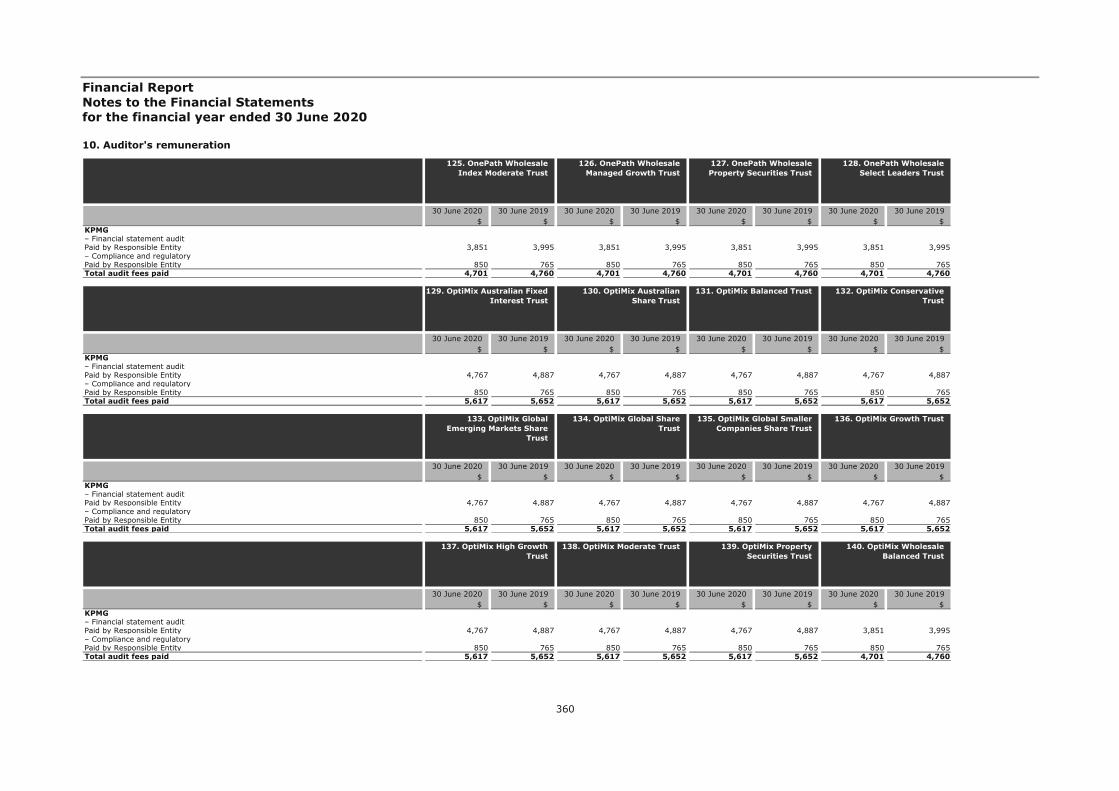
Financial Report Notes to the Financial Statements for the financial year ended 30 June 2020
360
10. Auditor's remuneration
30 June 2020 30 June 2019 30 June 2020 30 June 2019 30 June 2020 30 June 2019 30 June 2020 30 June 2019$ $ $ $ $ $ $ $
KPMG – Financial statement auditPaid by Responsible Entity 3,851 3,995 3,851 3,995 3,851 3,995 3,851 3,995– Compliance and regulatoryPaid by Responsible Entity 850 765 850 765 850 765 850 765Total audit fees paid 4,701 4,760 4,701 4,760 4,701 4,760 4,701 4,760
127. OnePath Wholesale Property Securities Trust
128. OnePath Wholesale Select Leaders Trust
125. OnePath Wholesale Index Moderate Trust
126. OnePath Wholesale Managed Growth Trust
30 June 2020 30 June 2019 30 June 2020 30 June 2019 30 June 2020 30 June 2019 30 June 2020 30 June 2019$ $ $ $ $ $ $ $
KPMG – Financial statement auditPaid by Responsible Entity 4,767 4,887 4,767 4,887 4,767 4,887 4,767 4,887– Compliance and regulatoryPaid by Responsible Entity 850 765 850 765 850 765 850 765Total audit fees paid 5,617 5,652 5,617 5,652 5,617 5,652 5,617 5,652
131. OptiMix Balanced Trust 132. OptiMix Conservative Trust
129. OptiMix Australian Fixed Interest Trust
130. OptiMix Australian Share Trust
30 June 2020 30 June 2019 30 June 2020 30 June 2019 30 June 2020 30 June 2019 30 June 2020 30 June 2019$ $ $ $ $ $ $ $
KPMG – Financial statement auditPaid by Responsible Entity 4,767 4,887 4,767 4,887 4,767 4,887 4,767 4,887– Compliance and regulatoryPaid by Responsible Entity 850 765 850 765 850 765 850 765Total audit fees paid 5,617 5,652 5,617 5,652 5,617 5,652 5,617 5,652
135. OptiMix Global Smaller Companies Share Trust
136. OptiMix Growth Trust 133. OptiMix Global Emerging Markets Share
Trust
134. OptiMix Global Share Trust
30 June 2020 30 June 2019 30 June 2020 30 June 2019 30 June 2020 30 June 2019 30 June 2020 30 June 2019$ $ $ $ $ $ $ $
KPMG – Financial statement auditPaid by Responsible Entity 4,767 4,887 4,767 4,887 4,767 4,887 3,851 3,995– Compliance and regulatoryPaid by Responsible Entity 850 765 850 765 850 765 850 765Total audit fees paid 5,617 5,652 5,617 5,652 5,617 5,652 4,701 4,760
139. OptiMix Property Securities Trust
140. OptiMix Wholesale Balanced Trust
137. OptiMix High Growth Trust
138. OptiMix Moderate Trust
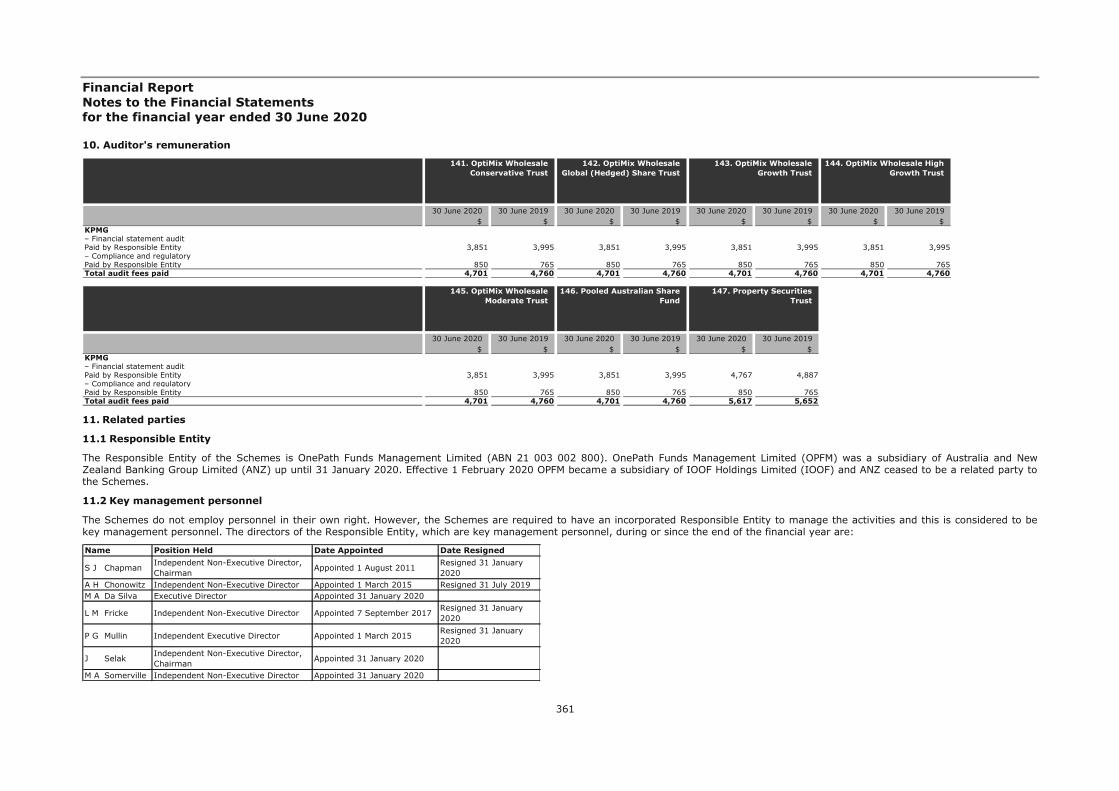
Financial Report Notes to the Financial Statements for the financial year ended 30 June 2020
361
10. Auditor's remuneration
11. Related parties
11.1 Responsible Entity
The Responsible Entity of the Schemes is OnePath Funds Management Limited (ABN 21 003 002 800). OnePath Funds Management Limited (OPFM) was a subsidiary of Australia and New Zealand Banking Group Limited (ANZ) up until 31 January 2020. Effective 1 February 2020 OPFM became a subsidiary of IOOF Holdings Limited (IOOF) and ANZ ceased to be a related party to the Schemes.
11.2 Key management personnel
The Schemes do not employ personnel in their own right. However, the Schemes are required to have an incorporated Responsible Entity to manage the activities and this is considered to be key management personnel. The directors of the Responsible Entity, which are key management personnel, during or since the end of the financial year are:
30 June 2020 30 June 2019 30 June 2020 30 June 2019 30 June 2020 30 June 2019 30 June 2020 30 June 2019$ $ $ $ $ $ $ $
KPMG – Financial statement auditPaid by Responsible Entity 3,851 3,995 3,851 3,995 3,851 3,995 3,851 3,995– Compliance and regulatoryPaid by Responsible Entity 850 765 850 765 850 765 850 765Total audit fees paid 4,701 4,760 4,701 4,760 4,701 4,760 4,701 4,760
143. OptiMix Wholesale Growth Trust
144. OptiMix Wholesale High Growth Trust
141. OptiMix Wholesale Conservative Trust
142. OptiMix Wholesale Global (Hedged) Share Trust
30 June 2020 30 June 2019 30 June 2020 30 June 2019 30 June 2020 30 June 2019$ $ $ $ $ $
KPMG – Financial statement auditPaid by Responsible Entity 3,851 3,995 3,851 3,995 4,767 4,887– Compliance and regulatoryPaid by Responsible Entity 850 765 850 765 850 765Total audit fees paid 4,701 4,760 4,701 4,760 5,617 5,652
147. Property Securities Trust
145. OptiMix Wholesale Moderate Trust
146. Pooled Australian Share Fund
Position Held Date Appointed Date Resigned
S J Chapman Independent Non-Executive Director, Chairman Appointed 1 August 2011 Resigned 31 January
2020A H Chonowitz Independent Non-Executive Director Appointed 1 March 2015 Resigned 31 July 2019M A Da Silva Executive Director Appointed 31 January 2020
L M Fricke Independent Non-Executive Director Appointed 7 September 2017 Resigned 31 January 2020
P G Mullin Independent Executive Director Appointed 1 March 2015 Resigned 31 January 2020
J Selak Independent Non-Executive Director, Chairman Appointed 31 January 2020
M A Somerville Independent Non-Executive Director Appointed 31 January 2020
Name
Financial Report Notes to the Financial Statements for the financial year ended 30 June 2020
362
The Schemes have not made, guaranteed or secured, directly or indirectly, any loans to the key management personnel at any time during the reporting period.
No director has entered into a material contract with the Schemes since the end of the previous financial year and there were no material contracts involving directors' interests existing at financial year end.
11.3 Related party transactions
All related party transactions are conducted on commercial terms and conditions.
The Directors of the Responsible Entity may also be employees and/or directors of other companies owned by IOOF. The Responsible Entity may also be involved in activities other than the business of managed investment schemes.
The Schemes have not made, guaranteed or secured, directly or indirectly, any loans to the Responsible Entity at any time during the reporting period.
During the year there was no compensation paid directly by the Schemes to the Directors of the Responsible Entity. From 1 July 2019 to 31 January 2020, Directors compensation was paid by a subsidiary of Australia and New Zealand Banking Group Limited. Effective from 1 February 2020, Directors compensation was paid by IOOF Service Co Pty Ltd (a wholly owned subsidiary of IOOF Holdings Ltd, the ultimate parent company of OPFM).
From time to time the Directors of OnePath Funds Management Limited may invest or withdraw from the Schemes. These investments or withdrawals are on the same terms and conditions as those entered into by other unitholders in the Schemes.
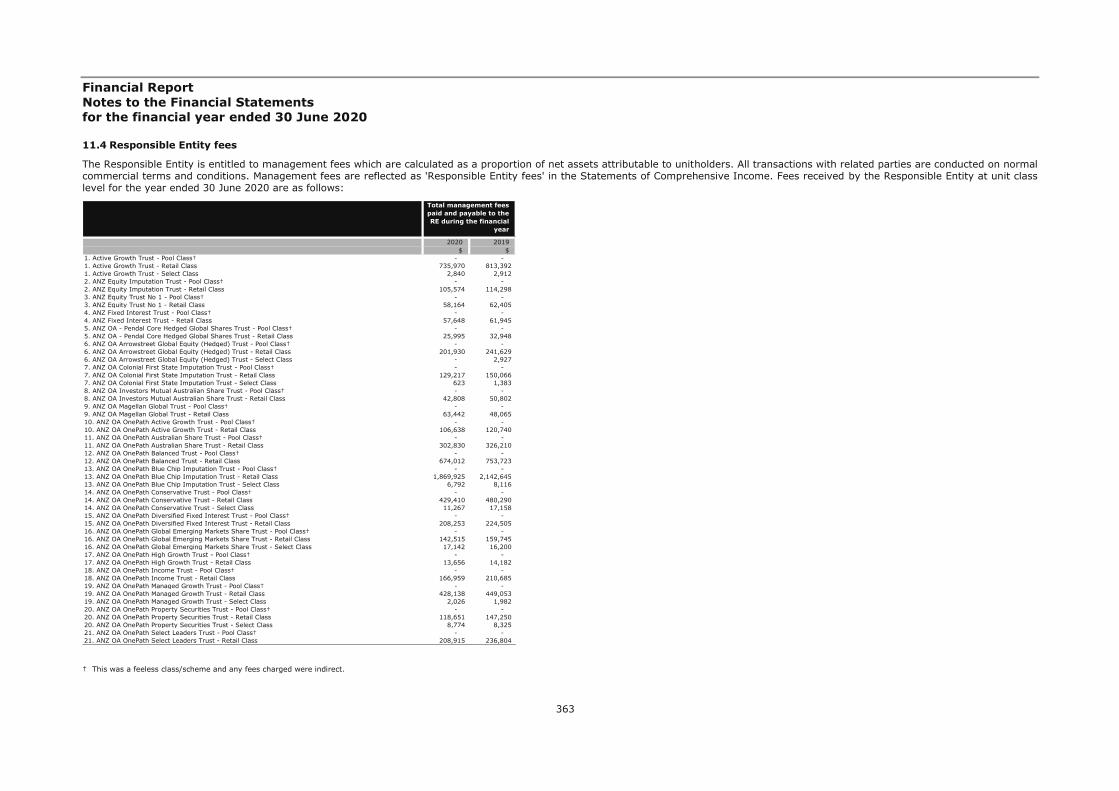
Financial Report Notes to the Financial Statements for the financial year ended 30 June 2020
363
11.4 Responsible Entity fees
The Responsible Entity is entitled to management fees which are calculated as a proportion of net assets attributable to unitholders. All transactions with related parties are conducted on normal commercial terms and conditions. Management fees are reflected as 'Responsible Entity fees' in the Statements of Comprehensive Income. Fees received by the Responsible Entity at unit class level for the year ended 30 June 2020 are as follows:
† This was a feeless class/scheme and any fees charged were indirect.
2020 2019$ $
1. Active Growth Trust - Pool Class† - - 1. Active Growth Trust - Retail Class 735,970 813,392 1. Active Growth Trust - Select Class 2,840 2,912 2. ANZ Equity Imputation Trust - Pool Class† - - 2. ANZ Equity Imputation Trust - Retail Class 105,574 114,298 3. ANZ Equity Trust No 1 - Pool Class† - - 3. ANZ Equity Trust No 1 - Retail Class 58,164 62,405 4. ANZ Fixed Interest Trust - Pool Class† - - 4. ANZ Fixed Interest Trust - Retail Class 57,648 61,945 5. ANZ OA - Pendal Core Hedged Global Shares Trust - Pool Class† - - 5. ANZ OA - Pendal Core Hedged Global Shares Trust - Retail Class 25,995 32,948 6. ANZ OA Arrowstreet Global Equity (Hedged) Trust - Pool Class† - - 6. ANZ OA Arrowstreet Global Equity (Hedged) Trust - Retail Class 201,930 241,629 6. ANZ OA Arrowstreet Global Equity (Hedged) Trust - Select Class - 2,927 7. ANZ OA Colonial First State Imputation Trust - Pool Class† - - 7. ANZ OA Colonial First State Imputation Trust - Retail Class 129,217 150,066 7. ANZ OA Colonial First State Imputation Trust - Select Class 623 1,383 8. ANZ OA Investors Mutual Australian Share Trust - Pool Class† - - 8. ANZ OA Investors Mutual Australian Share Trust - Retail Class 42,808 50,802 9. ANZ OA Magellan Global Trust - Pool Class† - - 9. ANZ OA Magellan Global Trust - Retail Class 63,442 48,065 10. ANZ OA OnePath Active Growth Trust - Pool Class† - - 10. ANZ OA OnePath Active Growth Trust - Retail Class 106,638 120,740 11. ANZ OA OnePath Australian Share Trust - Pool Class† - - 11. ANZ OA OnePath Australian Share Trust - Retail Class 302,830 326,210 12. ANZ OA OnePath Balanced Trust - Pool Class† - - 12. ANZ OA OnePath Balanced Trust - Retail Class 674,012 753,723 13. ANZ OA OnePath Blue Chip Imputation Trust - Pool Class† - - 13. ANZ OA OnePath Blue Chip Imputation Trust - Retail Class 1,869,925 2,142,645 13. ANZ OA OnePath Blue Chip Imputation Trust - Select Class 6,792 8,116 14. ANZ OA OnePath Conservative Trust - Pool Class† - - 14. ANZ OA OnePath Conservative Trust - Retail Class 429,410 480,290 14. ANZ OA OnePath Conservative Trust - Select Class 11,267 17,158 15. ANZ OA OnePath Diversified Fixed Interest Trust - Pool Class† - - 15. ANZ OA OnePath Diversified Fixed Interest Trust - Retail Class 208,253 224,505 16. ANZ OA OnePath Global Emerging Markets Share Trust - Pool Class† - - 16. ANZ OA OnePath Global Emerging Markets Share Trust - Retail Class 142,515 159,745 16. ANZ OA OnePath Global Emerging Markets Share Trust - Select Class 17,142 16,200 17. ANZ OA OnePath High Growth Trust - Pool Class† - - 17. ANZ OA OnePath High Growth Trust - Retail Class 13,656 14,182 18. ANZ OA OnePath Income Trust - Pool Class† - - 18. ANZ OA OnePath Income Trust - Retail Class 166,959 210,685 19. ANZ OA OnePath Managed Growth Trust - Pool Class† - - 19. ANZ OA OnePath Managed Growth Trust - Retail Class 428,138 449,053 19. ANZ OA OnePath Managed Growth Trust - Select Class 2,026 1,982 20. ANZ OA OnePath Property Securities Trust - Pool Class† - - 20. ANZ OA OnePath Property Securities Trust - Retail Class 118,651 147,250 20. ANZ OA OnePath Property Securities Trust - Select Class 8,774 8,325 21. ANZ OA OnePath Select Leaders Trust - Pool Class† - - 21. ANZ OA OnePath Select Leaders Trust - Retail Class 208,915 236,804
Total management fees paid and payable to the RE during the financial
year
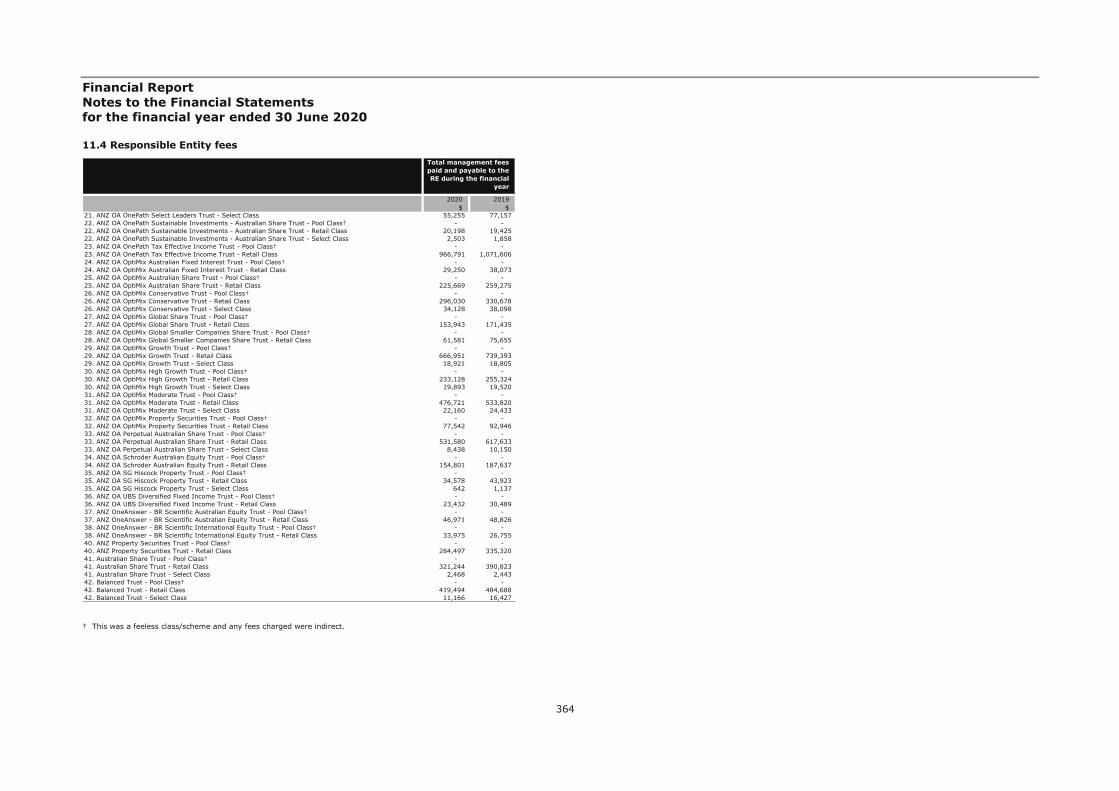
Financial Report Notes to the Financial Statements for the financial year ended 30 June 2020
364
11.4 Responsible Entity fees
† This was a feeless class/scheme and any fees charged were indirect.
2020 2019$ $
21. ANZ OA OnePath Select Leaders Trust - Select Class 55,255 77,157 22. ANZ OA OnePath Sustainable Investments - Australian Share Trust - Pool Class† - - 22. ANZ OA OnePath Sustainable Investments - Australian Share Trust - Retail Class 20,198 19,425 22. ANZ OA OnePath Sustainable Investments - Australian Share Trust - Select Class 2,503 1,858 23. ANZ OA OnePath Tax Effective Income Trust - Pool Class† - - 23. ANZ OA OnePath Tax Effective Income Trust - Retail Class 966,791 1,071,606 24. ANZ OA OptiMix Australian Fixed Interest Trust - Pool Class† - - 24. ANZ OA OptiMix Australian Fixed Interest Trust - Retail Class 29,250 38,073 25. ANZ OA OptiMix Australian Share Trust - Pool Class† - - 25. ANZ OA OptiMix Australian Share Trust - Retail Class 225,669 259,275 26. ANZ OA OptiMix Conservative Trust - Pool Class† - - 26. ANZ OA OptiMix Conservative Trust - Retail Class 296,030 330,678 26. ANZ OA OptiMix Conservative Trust - Select Class 34,128 38,098 27. ANZ OA OptiMix Global Share Trust - Pool Class† - - 27. ANZ OA OptiMix Global Share Trust - Retail Class 153,943 171,435 28. ANZ OA OptiMix Global Smaller Companies Share Trust - Pool Class† - - 28. ANZ OA OptiMix Global Smaller Companies Share Trust - Retail Class 61,581 75,655 29. ANZ OA OptiMix Growth Trust - Pool Class† - - 29. ANZ OA OptiMix Growth Trust - Retail Class 666,951 739,393 29. ANZ OA OptiMix Growth Trust - Select Class 18,921 18,805 30. ANZ OA OptiMix High Growth Trust - Pool Class† - - 30. ANZ OA OptiMix High Growth Trust - Retail Class 233,128 255,324 30. ANZ OA OptiMix High Growth Trust - Select Class 19,893 19,520 31. ANZ OA OptiMix Moderate Trust - Pool Class† - - 31. ANZ OA OptiMix Moderate Trust - Retail Class 476,721 533,820 31. ANZ OA OptiMix Moderate Trust - Select Class 22,160 24,433 32. ANZ OA OptiMix Property Securities Trust - Pool Class† - - 32. ANZ OA OptiMix Property Securities Trust - Retail Class 77,542 92,946 33. ANZ OA Perpetual Australian Share Trust - Pool Class† - - 33. ANZ OA Perpetual Australian Share Trust - Retail Class 531,580 617,633 33. ANZ OA Perpetual Australian Share Trust - Select Class 8,438 10,150 34. ANZ OA Schroder Australian Equity Trust - Pool Class† - - 34. ANZ OA Schroder Australian Equity Trust - Retail Class 154,801 187,637 35. ANZ OA SG Hiscock Property Trust - Pool Class† - - 35. ANZ OA SG Hiscock Property Trust - Retail Class 34,578 43,923 35. ANZ OA SG Hiscock Property Trust - Select Class 642 1,137 36. ANZ OA UBS Diversified Fixed Income Trust - Pool Class† - - 36. ANZ OA UBS Diversified Fixed Income Trust - Retail Class 23,432 30,489 37. ANZ OneAnswer - BR Scientific Australian Equity Trust - Pool Class† - - 37. ANZ OneAnswer - BR Scientific Australian Equity Trust - Retail Class 46,971 48,826 38. ANZ OneAnswer - BR Scientific International Equity Trust - Pool Class† - - 38. ANZ OneAnswer - BR Scientific International Equity Trust - Retail Class 33,975 26,755 40. ANZ Property Securities Trust - Pool Class† - - 40. ANZ Property Securities Trust - Retail Class 284,497 335,320 41. Australian Share Trust - Pool Class† - - 41. Australian Share Trust - Retail Class 321,244 390,823 41. Australian Share Trust - Select Class 2,468 2,443 42. Balanced Trust - Pool Class† - - 42. Balanced Trust - Retail Class 419,494 484,688 42. Balanced Trust - Select Class 11,166 16,427
Total management fees paid and payable to the RE during the financial
year
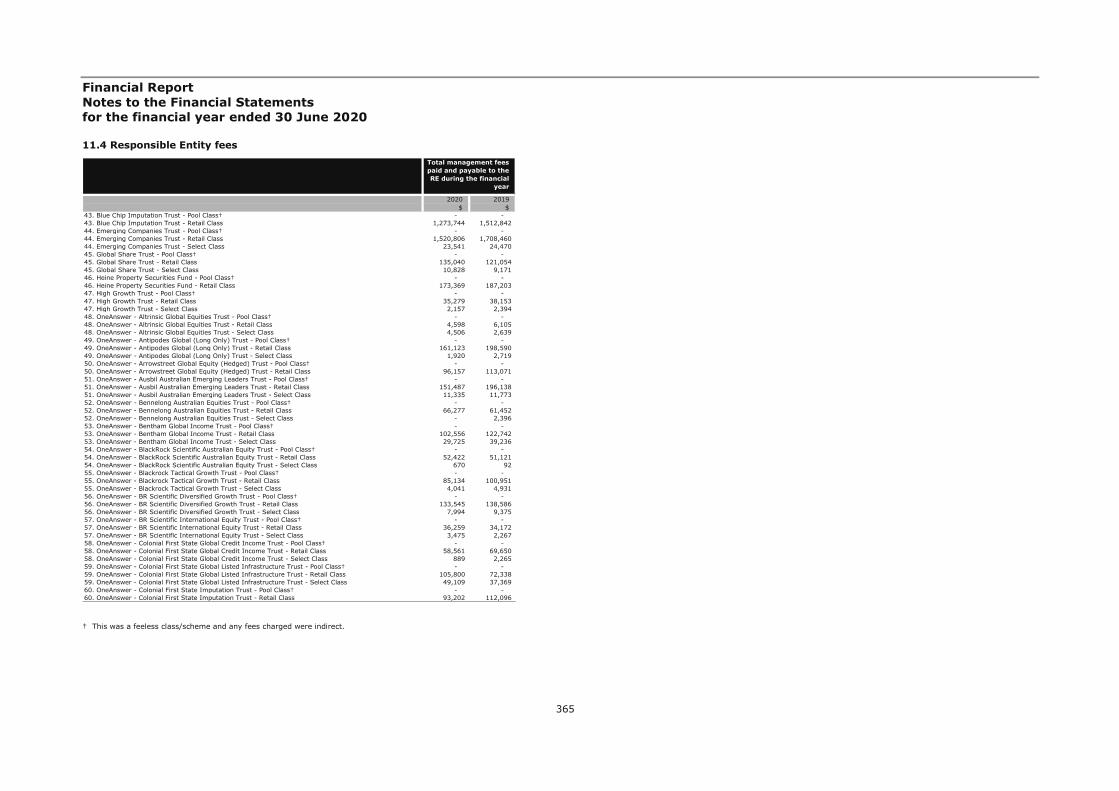
Financial Report Notes to the Financial Statements for the financial year ended 30 June 2020
365
11.4 Responsible Entity fees
† This was a feeless class/scheme and any fees charged were indirect.
2020 2019$ $
43. Blue Chip Imputation Trust - Pool Class† - - 43. Blue Chip Imputation Trust - Retail Class 1,273,744 1,512,842 44. Emerging Companies Trust - Pool Class† - - 44. Emerging Companies Trust - Retail Class 1,520,806 1,708,460 44. Emerging Companies Trust - Select Class 23,541 24,470 45. Global Share Trust - Pool Class† - - 45. Global Share Trust - Retail Class 135,040 121,054 45. Global Share Trust - Select Class 10,828 9,171 46. Heine Property Securities Fund - Pool Class† - - 46. Heine Property Securities Fund - Retail Class 173,369 187,203 47. High Growth Trust - Pool Class† - - 47. High Growth Trust - Retail Class 35,279 38,153 47. High Growth Trust - Select Class 2,157 2,394 48. OneAnswer - Altrinsic Global Equities Trust - Pool Class† - - 48. OneAnswer - Altrinsic Global Equities Trust - Retail Class 4,598 6,105 48. OneAnswer - Altrinsic Global Equities Trust - Select Class 4,506 2,639 49. OneAnswer - Antipodes Global (Long Only) Trust - Pool Class† - - 49. OneAnswer - Antipodes Global (Long Only) Trust - Retail Class 161,123 198,590 49. OneAnswer - Antipodes Global (Long Only) Trust - Select Class 1,920 2,719 50. OneAnswer - Arrowstreet Global Equity (Hedged) Trust - Pool Class† - - 50. OneAnswer - Arrowstreet Global Equity (Hedged) Trust - Retail Class 96,157 113,071 51. OneAnswer - Ausbil Australian Emerging Leaders Trust - Pool Class† - - 51. OneAnswer - Ausbil Australian Emerging Leaders Trust - Retail Class 151,487 196,138 51. OneAnswer - Ausbil Australian Emerging Leaders Trust - Select Class 11,335 11,773 52. OneAnswer - Bennelong Australian Equities Trust - Pool Class† - - 52. OneAnswer - Bennelong Australian Equities Trust - Retail Class 66,277 61,452 52. OneAnswer - Bennelong Australian Equities Trust - Select Class - 2,396 53. OneAnswer - Bentham Global Income Trust - Pool Class† - - 53. OneAnswer - Bentham Global Income Trust - Retail Class 102,556 122,742 53. OneAnswer - Bentham Global Income Trust - Select Class 29,725 39,236 54. OneAnswer - BlackRock Scientific Australian Equity Trust - Pool Class† - - 54. OneAnswer - BlackRock Scientific Australian Equity Trust - Retail Class 52,422 51,121 54. OneAnswer - BlackRock Scientific Australian Equity Trust - Select Class 670 92 55. OneAnswer - Blackrock Tactical Growth Trust - Pool Class† - - 55. OneAnswer - Blackrock Tactical Growth Trust - Retail Class 85,134 100,951 55. OneAnswer - Blackrock Tactical Growth Trust - Select Class 4,041 4,931 56. OneAnswer - BR Scientific Diversified Growth Trust - Pool Class† - - 56. OneAnswer - BR Scientific Diversified Growth Trust - Retail Class 133,545 138,586 56. OneAnswer - BR Scientific Diversified Growth Trust - Select Class 7,994 9,375 57. OneAnswer - BR Scientific International Equity Trust - Pool Class† - - 57. OneAnswer - BR Scientific International Equity Trust - Retail Class 36,259 34,172 57. OneAnswer - BR Scientific International Equity Trust - Select Class 3,475 2,267 58. OneAnswer - Colonial First State Global Credit Income Trust - Pool Class† - - 58. OneAnswer - Colonial First State Global Credit Income Trust - Retail Class 58,561 69,650 58. OneAnswer - Colonial First State Global Credit Income Trust - Select Class 889 2,265 59. OneAnswer - Colonial First State Global Listed Infrastructure Trust - Pool Class† - - 59. OneAnswer - Colonial First State Global Listed Infrastructure Trust - Retail Class 105,800 72,338 59. OneAnswer - Colonial First State Global Listed Infrastructure Trust - Select Class 49,109 37,369 60. OneAnswer - Colonial First State Imputation Trust - Pool Class† - - 60. OneAnswer - Colonial First State Imputation Trust - Retail Class 93,202 112,096
Total management fees paid and payable to the RE during the financial
year
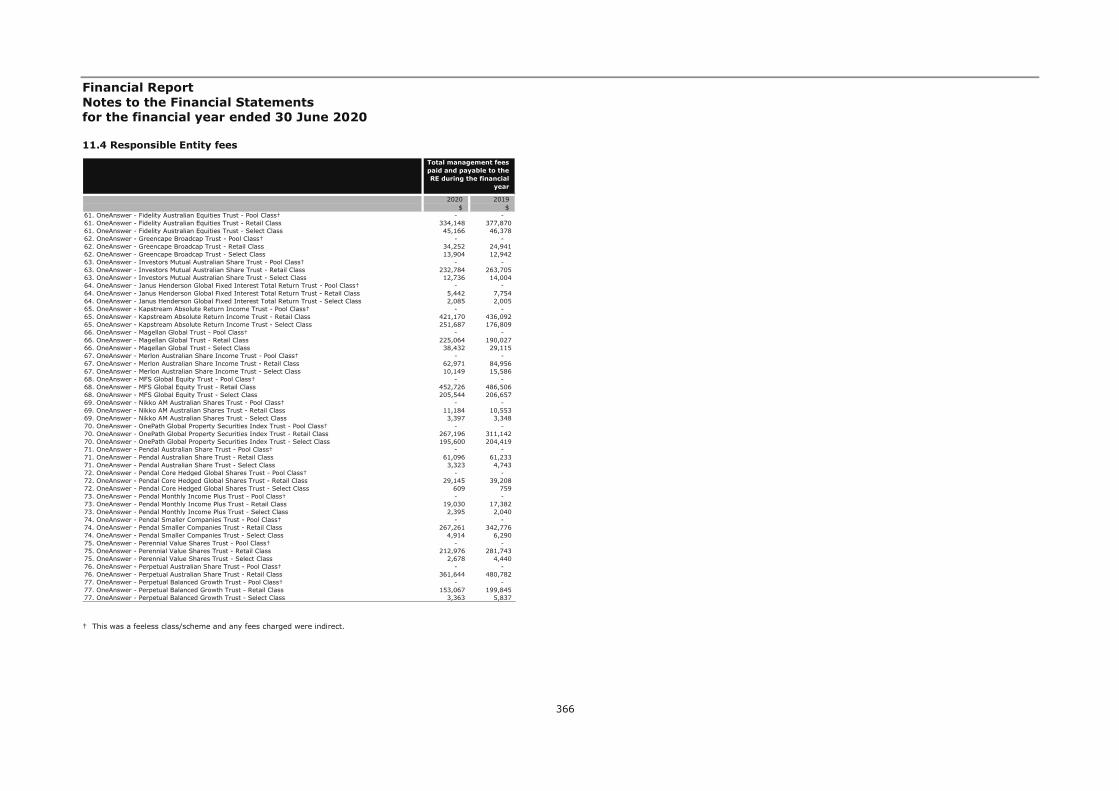
Financial Report Notes to the Financial Statements for the financial year ended 30 June 2020
366
11.4 Responsible Entity fees
† This was a feeless class/scheme and any fees charged were indirect.
2020 2019$ $
61. OneAnswer - Fidelity Australian Equities Trust - Pool Class† - - 61. OneAnswer - Fidelity Australian Equities Trust - Retail Class 334,148 377,870 61. OneAnswer - Fidelity Australian Equities Trust - Select Class 45,166 46,378 62. OneAnswer - Greencape Broadcap Trust - Pool Class† - - 62. OneAnswer - Greencape Broadcap Trust - Retail Class 34,252 24,941 62. OneAnswer - Greencape Broadcap Trust - Select Class 13,904 12,942 63. OneAnswer - Investors Mutual Australian Share Trust - Pool Class† - - 63. OneAnswer - Investors Mutual Australian Share Trust - Retail Class 232,784 263,705 63. OneAnswer - Investors Mutual Australian Share Trust - Select Class 12,736 14,004 64. OneAnswer - Janus Henderson Global Fixed Interest Total Return Trust - Pool Class† - - 64. OneAnswer - Janus Henderson Global Fixed Interest Total Return Trust - Retail Class 5,442 7,754 64. OneAnswer - Janus Henderson Global Fixed Interest Total Return Trust - Select Class 2,085 2,005 65. OneAnswer - Kapstream Absolute Return Income Trust - Pool Class† - - 65. OneAnswer - Kapstream Absolute Return Income Trust - Retail Class 421,170 436,092 65. OneAnswer - Kapstream Absolute Return Income Trust - Select Class 251,687 176,809 66. OneAnswer - Magellan Global Trust - Pool Class† - - 66. OneAnswer - Magellan Global Trust - Retail Class 225,064 190,027 66. OneAnswer - Magellan Global Trust - Select Class 38,432 29,115 67. OneAnswer - Merlon Australian Share Income Trust - Pool Class† - - 67. OneAnswer - Merlon Australian Share Income Trust - Retail Class 62,971 84,956 67. OneAnswer - Merlon Australian Share Income Trust - Select Class 10,149 15,586 68. OneAnswer - MFS Global Equity Trust - Pool Class† - - 68. OneAnswer - MFS Global Equity Trust - Retail Class 452,726 486,506 68. OneAnswer - MFS Global Equity Trust - Select Class 205,544 206,657 69. OneAnswer - Nikko AM Australian Shares Trust - Pool Class† - - 69. OneAnswer - Nikko AM Australian Shares Trust - Retail Class 11,184 10,553 69. OneAnswer - Nikko AM Australian Shares Trust - Select Class 3,397 3,348 70. OneAnswer - OnePath Global Property Securities Index Trust - Pool Class† - - 70. OneAnswer - OnePath Global Property Securities Index Trust - Retail Class 267,196 311,142 70. OneAnswer - OnePath Global Property Securities Index Trust - Select Class 195,600 204,419 71. OneAnswer - Pendal Australian Share Trust - Pool Class† - - 71. OneAnswer - Pendal Australian Share Trust - Retail Class 61,096 61,233 71. OneAnswer - Pendal Australian Share Trust - Select Class 3,323 4,743 72. OneAnswer - Pendal Core Hedged Global Shares Trust - Pool Class† - - 72. OneAnswer - Pendal Core Hedged Global Shares Trust - Retail Class 29,145 39,208 72. OneAnswer - Pendal Core Hedged Global Shares Trust - Select Class 609 759 73. OneAnswer - Pendal Monthly Income Plus Trust - Pool Class† - - 73. OneAnswer - Pendal Monthly Income Plus Trust - Retail Class 19,030 17,382 73. OneAnswer - Pendal Monthly Income Plus Trust - Select Class 2,395 2,040 74. OneAnswer - Pendal Smaller Companies Trust - Pool Class† - - 74. OneAnswer - Pendal Smaller Companies Trust - Retail Class 267,261 342,776 74. OneAnswer - Pendal Smaller Companies Trust - Select Class 4,914 6,290 75. OneAnswer - Perennial Value Shares Trust - Pool Class† - - 75. OneAnswer - Perennial Value Shares Trust - Retail Class 212,976 281,743 75. OneAnswer - Perennial Value Shares Trust - Select Class 2,678 4,440 76. OneAnswer - Perpetual Australian Share Trust - Pool Class† - - 76. OneAnswer - Perpetual Australian Share Trust - Retail Class 361,644 480,782 77. OneAnswer - Perpetual Balanced Growth Trust - Pool Class† - - 77. OneAnswer - Perpetual Balanced Growth Trust - Retail Class 153,067 199,845 77. OneAnswer - Perpetual Balanced Growth Trust - Select Class 3,363 5,837
Total management fees paid and payable to the RE during the financial
year

Financial Report Notes to the Financial Statements for the financial year ended 30 June 2020
367
11.4 Responsible Entity fees
† This was a feeless class/scheme and any fees charged were indirect.
2020 2019$ $
78. OneAnswer - Perpetual Conservative Growth Trust - Pool Class† - - 78. OneAnswer - Perpetual Conservative Growth Trust - Retail Class 450,258 417,440 78. OneAnswer - Perpetual Conservative Growth Trust - Select Class 26,664 24,433 79. OneAnswer - Perpetual Ethical SRI Trust - Pool Class† - - 79. OneAnswer - Perpetual Ethical SRI Trust - Retail Class 12,339 13,404 79. OneAnswer - Perpetual Ethical SRI Trust - Select Class 1,953 2,203 80. OneAnswer - Platinum Asia Trust - Pool Class† - - 80. OneAnswer - Platinum Asia Trust - Retail Class 27,702 33,074 80. OneAnswer - Platinum Asia Trust - Select Class 6,958 7,791 81. OneAnswer - Platinum International Trust - Pool Class† - - 81. OneAnswer - Platinum International Trust - Retail Class 502,354 637,597 81. OneAnswer - Platinum International Trust - Select Class 66,944 79,710 82. OneAnswer - RARE Infastructure Value Trust - Pool Class† - - 82. OneAnswer - RARE Infastructure Value Trust - Retail Class 124,666 150,963 82. OneAnswer - RARE Infastructure Value Trust - Select Class 31,592 40,535 83. OneAnswer - Schroder Australian Equity Trust - Pool Class† - - 83. OneAnswer - Schroder Australian Equity Trust - Retail Class 241,002 294,243 83. OneAnswer - Schroder Australian Equity Trust - Select Class 12,017 15,189 84. OneAnswer - Schroder Balanced Trust - Pool Class† - - 84. OneAnswer - Schroder Balanced Trust - Retail Class 228,071 252,952 84. OneAnswer - Schroder Balanced Trust - Select Class 23,288 33,176 85. OneAnswer - Schroder Fixed Income Trust - Pool Class† - - 85. OneAnswer - Schroder Fixed Income Trust - Retail Class 182,509 206,019 85. OneAnswer - Schroder Fixed Income Trust - Select Class 71,754 85,592 86. OneAnswer - Schroder Real Return Trust - Pool Class† - - 86. OneAnswer - Schroder Real Return Trust - Retail Class 332,484 363,643 86. OneAnswer - Schroder Real Return Trust - Select Class 48,880 55,220 87. OneAnswer - SG Hiscock Property Trust - Pool Class† - - 87. OneAnswer - SG Hiscock Property Trust - Retail Class 19,906 29,881 88. OneAnswer - Stewart Investors Worldwide Sustainability Trust - Pool Class† - - 88. OneAnswer - Stewart Investors Worldwide Sustainability Trust - Retail Class 9,297 9,163 88. OneAnswer - Stewart Investors Worldwide Sustainability Trust - Select Class 3,980 3,406 89. OneAnswer - T. Rowe Price Global Equity Trust - Pool Class† - - 89. OneAnswer - T. Rowe Price Global Equity Trust - Retail Class 46,867 36,196 89. OneAnswer - T. Rowe Price Global Equity Trust - Select Class 8,181 6,865 90. OneAnswer - T.Rowe Price Dynamic Global Bond Trust - Pool Class† - - 90. OneAnswer - T.Rowe Price Dynamic Global Bond Trust - Retail Class 23,478 17,718 90. OneAnswer - T.Rowe Price Dynamic Global Bond Trust - Select Class 24,310 15,342 91. OneAnswer - UBS Balanced Trust - Pool Class† - - 91. OneAnswer - UBS Balanced Trust - Retail Class 84,960 98,761 91. OneAnswer - UBS Balanced Trust - Select Class 1,943 2,821 92. OneAnswer - UBS Defensive Trust - Pool Class† - - 92. OneAnswer - UBS Defensive Trust - Retail Class 50,012 55,607 92. OneAnswer - UBS Defensive Trust - Select Class 3,799 4,366 93. OneAnswer - UBS Diversified Fixed Income Trust - Pool Class† - - 93. OneAnswer - UBS Diversified Fixed Income Trust - Retail Class 119,318 144,920 93. OneAnswer - UBS Diversified Fixed Income Trust - Select Class 18,131 17,036 94. OneAnswer - Vanguard Australian Shares Index Trust - Pool Class† - - 94. OneAnswer - Vanguard Australian Shares Index Trust - Retail Class 1,112,027 1,235,815 94. OneAnswer - Vanguard Australian Shares Index Trust - Select Class 797,171 791,312
Total management fees paid and payable to the RE during the financial
year

Financial Report Notes to the Financial Statements for the financial year ended 30 June 2020
368
11.4 Responsible Entity fees
† This was a feeless class/scheme and any fees charged were indirect.
2020 2019$ $
95. OneAnswer - Vanguard Balanced Index Trust - Pool Class† - - 95. OneAnswer - Vanguard Balanced Index Trust - Retail Class 1,337,936 1,395,909 95. OneAnswer - Vanguard Balanced Index Trust - Select Class 1,899,351 1,863,424 96. OneAnswer - Vanguard Conservative Index Trust - Pool Class† - - 96. OneAnswer - Vanguard Conservative Index Trust - Retail Class 642,270 615,101 96. OneAnswer - Vanguard Conservative Index Trust - Select Class 918,604 873,757 97. OneAnswer - Vanguard Diversified Bond Index Trust - Pool Class† - - 97. OneAnswer - Vanguard Diversified Bond Index Trust - Retail Class 143,490 154,787 97. OneAnswer - Vanguard Diversified Bond Index Trust - Select Class 70,925 77,715 98. OneAnswer - Vanguard Growth Index Trust - Pool Class† - - 98. OneAnswer - Vanguard Growth Index Trust - Retail Class 664,286 704,120 98. OneAnswer - Vanguard Growth Index Trust - Select Class 618,171 604,980 99. OneAnswer - Vanguard High Growth Index Trust - Pool Class† - - 99. OneAnswer - Vanguard High Growth Index Trust - Retail Class 432,321 456,195 99. OneAnswer - Vanguard High Growth Index Trust - Select Class 218,418 222,674 100. OneAnswer - Vanguard International Shares Index (Hedged) Trust - Pool Class† - - 100. OneAnswer - Vanguard International Shares Index (Hedged) Trust - Retail Class 246,256 287,753 100. OneAnswer - Vanguard International Shares Index (Hedged) Trust - Select Class 24,013 23,281 101. OneAnswer - Vanguard International Shares Index Trust - Pool Class† - - 101. OneAnswer - Vanguard International Shares Index Trust - Retail Class 748,022 846,545 101. OneAnswer - Vanguard International Shares Index Trust - Select Class 674,160 640,419 102. OneAnswer - Vanguard Property Securities Index Trust - Pool Class† - - 102. OneAnswer - Vanguard Property Securities Index Trust - Retail Class 242,019 281,640 102. OneAnswer - Vanguard Property Securities Index Trust - Select Class 74,328 77,639 103. OneAnswer - Walter Scott Global Equity (Hedged) Trust - Pool Class† - - 103. OneAnswer - Walter Scott Global Equity (Hedged) Trust - Retail Class 30,415 38,978 103. OneAnswer - Walter Scott Global Equity (Hedged) Trust - Select Class 2,989 4,051 104. OnePath Alternatives Growth Fund - Pool Class† - - 104. OnePath Alternatives Growth Fund - Retail Class 119,343 144,628 104. OnePath Alternatives Growth Fund - Select Class 144,239 147,708 106. OnePath Capital Stable Trust - Pool Class† - - 106. OnePath Capital Stable Trust - Retail Class 68,203 85,857 107. OnePath Diversified Credit Trust - Pool Class† - - 107. OnePath Diversified Credit Trust - Retail Class 18,219 21,917 107. OnePath Diversified Credit Trust - Select Class 1,251 1,994 108. OnePath Diversified Fixed Interest Trust - Pool Class† - - 108. OnePath Diversified Fixed Interest Trust - Retail Class 137,242 161,180 109. OnePath Geared Australian Shares Index Trust - Pool Class† - - 109. OnePath Geared Australian Shares Index Trust - Retail Class 141,252 158,101 109. OnePath Geared Australian Shares Index Trust - Select Class 16,021 14,242 110. OnePath Global Emerging Markets Share Trust - Pool Class† - - 110. OnePath Global Emerging Markets Share Trust - Retail Class 77,375 95,064 111. OnePath Managed Growth Trust - Pool Class† - - 111. OnePath Managed Growth Trust - Retail Class 24,759 33,872 112. OnePath Select Leaders Trust - Pool Class† - - 112. OnePath Select Leaders Trust - Retail Class 83,236 105,662 113. OnePath Sustainable Investments - Australian Share Trust - Pool Class† - - 113. OnePath Sustainable Investments - Australian Share Trust - Retail Class 17,139 17,841 114. OnePath Wholesale Australian Share Trust - Pool Class† - - 114. OnePath Wholesale Australian Share Trust - Wholesale Class 160,555 201,135
Total management fees paid and payable to the RE during the financial
year

Financial Report Notes to the Financial Statements for the financial year ended 30 June 2020
369
11.4 Responsible Entity fees
† This was a feeless class/scheme and any fees charged were indirect.
2020 2019$ $
115. OnePath Wholesale Balanced Trust - Pool Class† - - 115. OnePath Wholesale Balanced Trust - Wholesale Class 275,442 342,084 116. OnePath Wholesale Blue Chip Imputation Trust - Pool Class† - - 116. OnePath Wholesale Blue Chip Imputation Trust - Wholesale Class 115,113 166,625 117. OnePath Wholesale Capital Stable Trust - Pool Class† - - 117. OnePath Wholesale Capital Stable Trust - Wholesale Class 68,473 103,447 118. OnePath Wholesale Diversified Fixed Interest Trust - Pool Class† - - 118. OnePath Wholesale Diversified Fixed Interest Trust - Select Class 334,444 346,747 118. OnePath Wholesale Diversified Fixed Interest Trust - Wholesale Class 804,187 819,376 119. OnePath Wholesale Emerging Companies Trust - Pool Class† - - 119. OnePath Wholesale Emerging Companies Trust - Wholesale Class 305,330 327,497 120. OnePath Wholesale Geared Australian Shares Index Trust - Class B 2,744 3,034 120. OnePath Wholesale Geared Australian Shares Index Trust - Class C† - - 121. OnePath Wholesale Global Emerging Markets Share Trust - Pool Class† - - 121. OnePath Wholesale Global Emerging Markets Share Trust - Wholesale Class 94,068 92,639 122. OnePath Wholesale High Growth Trust - Pool Class† - - 122. OnePath Wholesale High Growth Trust - Wholesale Class 8,066 9,098 126. OnePath Wholesale Managed Growth Trust - Pool Class† - - 126. OnePath Wholesale Managed Growth Trust - Wholesale Class 1 206,480 245,553 127. OnePath Wholesale Property Securities Trust - Pool Class† - - 127. OnePath Wholesale Property Securities Trust - Wholesale Class 21,254 26,305 128. OnePath Wholesale Select Leaders Trust - Pool Class† - - 128. OnePath Wholesale Select Leaders Trust - Wholesale Class 65,254 83,513 129. OptiMix Australian Fixed Interest Trust - Pool Class† - - 129. OptiMix Australian Fixed Interest Trust - Retail Class 44,968 55,781 129. OptiMix Australian Fixed Interest Trust - Select Class 14,847 14,866 130. OptiMix Australian Share Trust - Pool Class† - - 130. OptiMix Australian Share Trust - Retail Class 328,858 393,450 130. OptiMix Australian Share Trust - Select Class 3,081 2,998 131. OptiMix Balanced Trust - Pool Class† - - 131. OptiMix Balanced Trust - Retail Class 976,049 1,093,642 131. OptiMix Balanced Trust - Select Class 34,646 34,580 132. OptiMix Conservative Trust - Pool Class† - - 132. OptiMix Conservative Trust - Retail Class 294,022 347,238 133. OptiMix Global Emerging Markets Share Trust - Pool Class† - - 133. OptiMix Global Emerging Markets Share Trust - Retail Class 52,879 66,985 133. OptiMix Global Emerging Markets Share Trust - Select Class 24,846 21,884 134. OptiMix Global Share Trust - Pool Class† - - 134. OptiMix Global Share Trust - Retail Class 165,076 188,454 134. OptiMix Global Share Trust - Select Class 7,953 8,619 135. OptiMix Global Smaller Companies Share Trust - Pool Class† - - 135. OptiMix Global Smaller Companies Share Trust - Retail Class 58,537 79,361 135. OptiMix Global Smaller Companies Share Trust - Select Class 15,244 15,165 136. OptiMix Growth Trust - Pool Class† - - 136. OptiMix Growth Trust - Retail Class 350,733 390,574 137. OptiMix High Growth Trust - Pool Class† - - 137. OptiMix High Growth Trust - Retail Class 126,119 175,557 138. OptiMix Moderate Trust - Pool Class† - - 138. OptiMix Moderate Trust - Retail Class 216,265 256,361 139. OptiMix Property Securities Trust - Pool Class† - -
Total management fees paid and payable to the RE during the financial
year
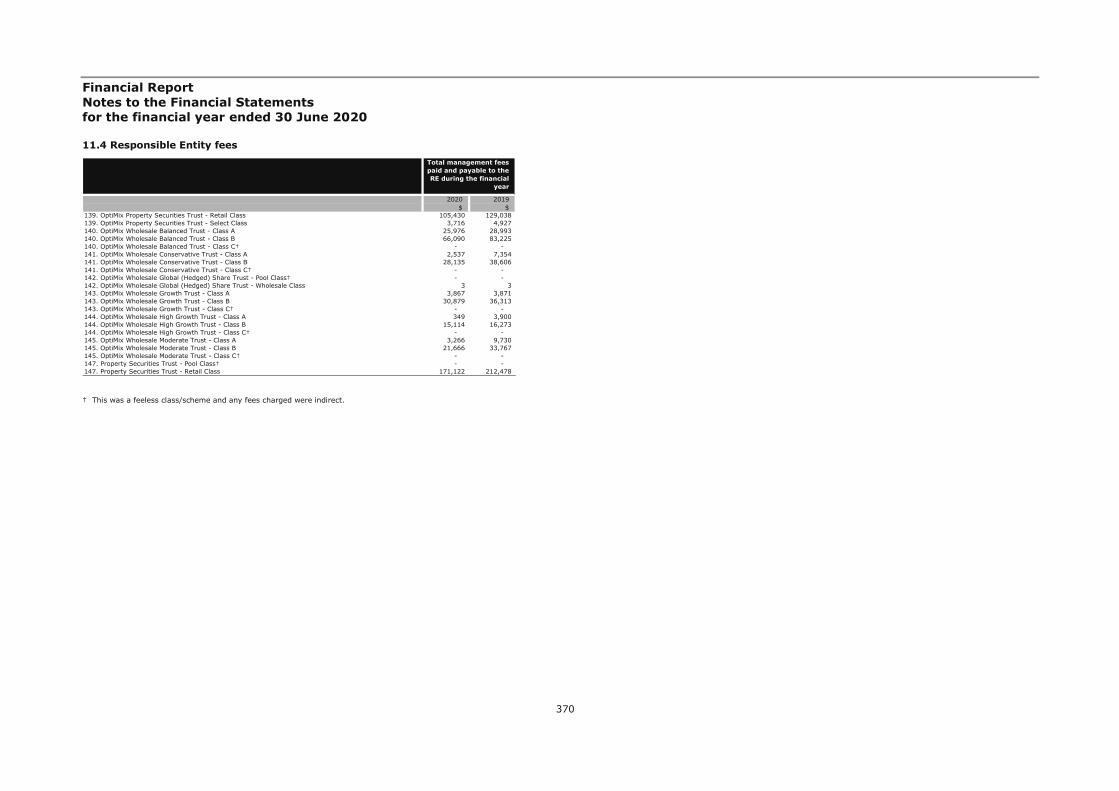
Financial Report Notes to the Financial Statements for the financial year ended 30 June 2020
370
11.4 Responsible Entity fees
† This was a feeless class/scheme and any fees charged were indirect.
2020 2019$ $
139. OptiMix Property Securities Trust - Retail Class 105,430 129,038 139. OptiMix Property Securities Trust - Select Class 3,716 4,927 140. OptiMix Wholesale Balanced Trust - Class A 25,976 28,993 140. OptiMix Wholesale Balanced Trust - Class B 66,090 83,225 140. OptiMix Wholesale Balanced Trust - Class C† - - 141. OptiMix Wholesale Conservative Trust - Class A 2,537 7,354 141. OptiMix Wholesale Conservative Trust - Class B 28,135 38,606 141. OptiMix Wholesale Conservative Trust - Class C† - - 142. OptiMix Wholesale Global (Hedged) Share Trust - Pool Class† - - 142. OptiMix Wholesale Global (Hedged) Share Trust - Wholesale Class 3 3 143. OptiMix Wholesale Growth Trust - Class A 3,867 3,871 143. OptiMix Wholesale Growth Trust - Class B 30,879 36,313 143. OptiMix Wholesale Growth Trust - Class C† - - 144. OptiMix Wholesale High Growth Trust - Class A 349 3,900 144. OptiMix Wholesale High Growth Trust - Class B 15,114 16,273 144. OptiMix Wholesale High Growth Trust - Class C† - - 145. OptiMix Wholesale Moderate Trust - Class A 3,266 9,730 145. OptiMix Wholesale Moderate Trust - Class B 21,666 33,767 145. OptiMix Wholesale Moderate Trust - Class C† - - 147. Property Securities Trust - Pool Class† - - 147. Property Securities Trust - Retail Class 171,122 212,478
Total management fees paid and payable to the RE during the financial
year

Financial Report Notes to the Financial Statements for the financial year ended 30 June 2020
371
11.5 Related party investments held by the Schemes
The Schemes may purchase and sell units in other schemes managed by OnePath Funds Management Limited in the ordinary course of business at application and redemption prices calculated in accordance with the Constitutions of the Schemes.
Details of the Schemes' investments in other Schemes operated by OnePath Funds Management Limited are set out in the table below:
Name of entity 2020 2019 2020 2019 2020 2019 2020 2019 2020 2019 2020 2019 Name of related entity $ $ % % $ $ $ $ $ $
1. Active Growth Trust ANZ OA OnePath Active Growth Trust 42,623,323 52,726,106 88.23 87.74 3,199,150 4,002,958 8,061,901 9,038,925 4,151,807 3,272,295 40,091,360 43,992,877 2. ANZ Equity Imputation Trust ANZ OA OnePath Blue Chip Imputation Trust 7,843,436 9,742,797 3.75 3.36 514,526 579,773 703,721 1,390,605 502,810 553,673 8,995,405 9,214,084 3. ANZ Equity Trust No 1 ANZ Australian Industrial Equities Fund 35,246,760 37,747,196 8.78 7.69 1,866,851 3,128,144 450,762 582,362 1,485,880 1,795,794 28,222,675 27,170,374 4. ANZ Fixed Interest Trust ANZ Australian Fixed Interest Fund 5,608,219 5,951,206 1.36 1.28 581,295 349,422 855,789 1,245,270 272,458 271,653 5,559,952 5,823,698 5. ANZ OA - Pendal Core Hedged Global Shares Trust OneAnswer - Pendal Core Hedged Global Shares Trust 11,852,875 18,000,933 34.35 35.48 249 3,933,912 3,514,160 4,257,639 1,219,266 249 14,584,560 18,190,362 8. ANZ OA Investors Mutual Australian Share Trust OneAnswer - Investors Mutual Australian Share Trust 46,884,639 55,288,387 33.67 33.94 11,166,726 6,426,666 6,829,470 13,480,072 5,859,657 9,557,707 44,576,467 41,288,424 9. ANZ OA Magellan Global Trust OneAnswer - Magellan Global Trust 102,098,184 84,365,759 47.21 46.31 25,815,127 9,962,823 1,031,600 1,297,412 14,950,641 4,372,117 77,137,752 60,584,335 10. ANZ OA OnePath Active Growth Trust ANZ Australian Cash Fund 250,831 149,043 0.02 0.01 552,176 805,740 450,000 680,000 2,038 5,967 248,946 147,942 OnePath Australian Bonds Index Pool 1,880,240 2,008,614 0.09 0.10 71,608 75,069 200,000 242,000 84,421 71,608 1,680,634 1,787,593 OnePath Australian Shares Index Pool 5,539,560 6,449,207 0.09 0.09 819,551 425,406 1,171,436 1,434,244 296,304 450,510 4,478,961 4,585,456 OnePath Global Bonds (Hedged) Index Pool 1,681,213 2,219,513 0.07 0.08 - 585,907 560,000 360,000 83,461 - 1,303,208 1,721,754 OnePath Global Emerging Markets Shares (Unhedged) Index Pool 789,386 881,787 0.08 0.08 91,786 77,395 144,000 300,000 27,068 31,786 553,378 588,794 OnePath Global Listed Property (Hedged) Index Pool 1,360,517 1,789,610 0.13 0.15 13,696 251,360 162,000 626,480 27,503 13,696 1,228,119 1,328,305 OnePath Global Shares – Large Cap (Hedged) Index Pool 1,578,317 2,206,618 0.08 0.08 138,770 515,247 621,646 289,926 192,693 92,770 1,307,887 1,652,571 OnePath Global Shares – Large Cap (Unhedged) Index Pool 2,496,070 2,810,398 0.06 0.05 540,220 132,834 821,000 790,451 248,446 257,557 1,373,357 1,485,764 OnePath Global Shares – Small Cap (Unhedged) Index Pool 525,474 581,764 0.08 0.11 43,889 37,970 60,000 - 28,671 43,889 364,761 371,131 OptiMix Global Listed Infrastructure Securities Trust 1,658,348 1,962,824 1.30 1.27 6,844 115,524 184,000 55,000 2,287 21,281 3,019,885 3,317,056 OptiMix Wholesale Australian Fixed Interest Trust 2,461,819 3,387,593 0.70 0.77 364,024 158,366 1,232,596 1,023,924 191,660 182,450 2,455,230 3,285,920 OptiMix Wholesale Global (Hedged) Share Trust 2,034,608 3,198,276 0.92 0.91 427,550 792,611 1,192,169 844,208 233,882 147,441 2,564,135 3,475,708 OptiMix Wholesale Global Emerging Markets Share Trust 1,842,338 2,093,997 1.08 1.02 330,049 353,538 321,672 160,000 133,659 110,049 2,174,293 2,176,621 OptiMix Wholesale Global Share Trust 3,047,658 3,896,094 0.53 0.47 1,002,418 446,068 1,160,000 2,063,677 740,944 527,614 3,801,669 3,933,799 OptiMix Wholesale Global Smaller Companies Share Trust 1,061,782 998,989 0.99 0.93 165,263 488,008 49,000 745,000 38,552 119,524 1,495,250 1,347,439 OptiMix Wholesale International Fixed Interest Trust 2,204,238 2,704,181 0.88 0.89 572,604 487,294 963,218 576,000 183,593 72,604 2,421,981 2,848,569 Pooled Australian Share Fund 8,131,322 9,972,809 4.24 4.31 1,274,115 595,555 1,981,338 2,316,509 320,556 576,371 3,879,744 4,178,636 Wholesale Alternatives Defensive Trust 3,954,678 4,289,306 1.27 1.25 422,697 58,668 672,000 810,000 127,547 122,697 3,732,150 3,955,535 Wholesale Alternatives Growth Trust 5,677,288 8,133,302 1.34 1.36 388,641 844,986 2,053,610 1,051,000 600,783 49,293 5,648,707 7,201,630 11. ANZ OA OnePath Australian Share Trust ANZ Australian Industrial Equities Fund 70,765,319 83,550,961 17.63 17.01 3,966,073 7,495,918 8,757,887 9,614,394 3,088,104 4,102,343 56,662,985 60,139,853 12. ANZ OA OnePath Balanced Trust OnePath Wholesale Balanced Trust 22,072,240 26,208,621 5.65 5.36 1,173,859 1,393,537 3,213,197 13,280,570 1,876,562 1,269,797 22,183,062 24,080,509 13. ANZ OA OnePath Blue Chip Imputation Trust Blue Chip Pool 224,802,781 310,767,172 62.13 63.24 15,703,985 20,809,193 52,665,990 62,417,490 14,929,893 18,439,116 254,960,402 290,624,687
Number of units held Fair value of unit holdings % Interest held
Units purchased/reinvested during the period
Units redeemed during the period
Distributions received/receivable(including Return of
Capital)
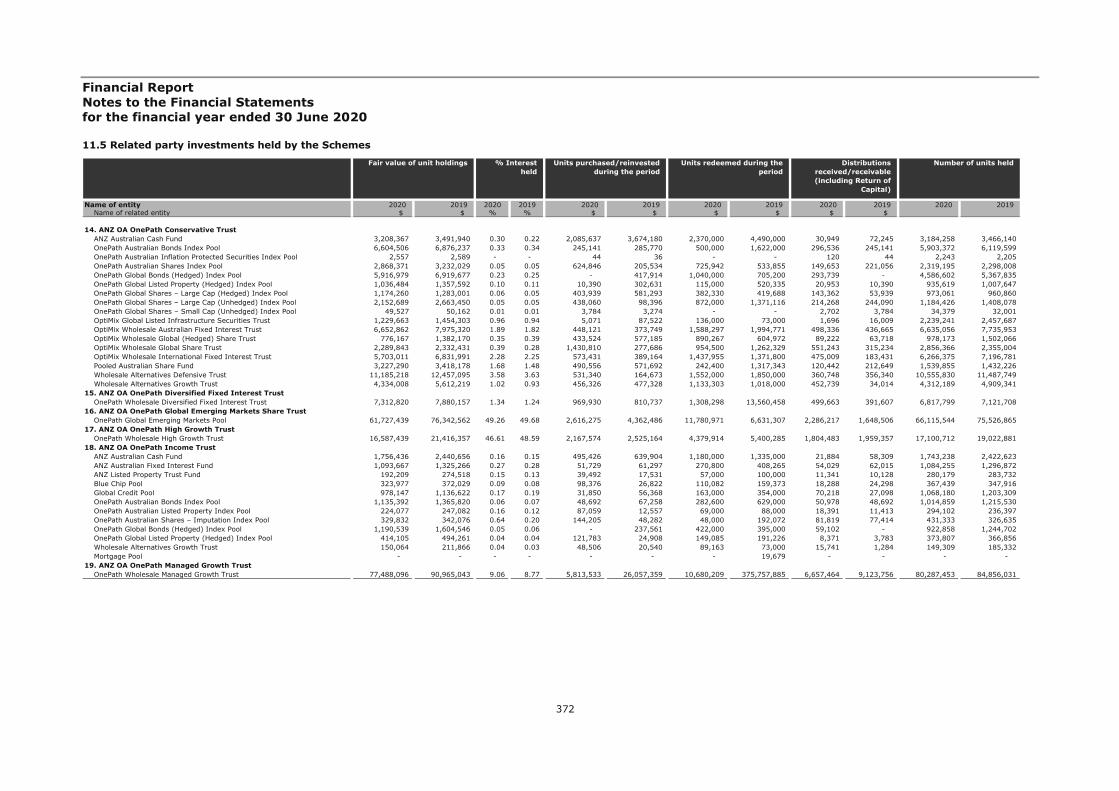
Financial Report Notes to the Financial Statements for the financial year ended 30 June 2020
372
11.5 Related party investments held by the Schemes
Name of entity 2020 2019 2020 2019 2020 2019 2020 2019 2020 2019 2020 2019 Name of related entity $ $ % % $ $ $ $ $ $
14. ANZ OA OnePath Conservative Trust ANZ Australian Cash Fund 3,208,367 3,491,940 0.30 0.22 2,085,637 3,674,180 2,370,000 4,490,000 30,949 72,245 3,184,258 3,466,140 OnePath Australian Bonds Index Pool 6,604,506 6,876,237 0.33 0.34 245,141 285,770 500,000 1,622,000 296,536 245,141 5,903,372 6,119,599 OnePath Australian Inflation Protected Securities Index Pool 2,557 2,589 - - 44 36 - - 120 44 2,243 2,205 OnePath Australian Shares Index Pool 2,868,371 3,232,029 0.05 0.05 624,846 205,534 725,942 533,855 149,653 221,056 2,319,195 2,298,008 OnePath Global Bonds (Hedged) Index Pool 5,916,979 6,919,677 0.23 0.25 - 417,914 1,040,000 705,200 293,739 - 4,586,602 5,367,835 OnePath Global Listed Property (Hedged) Index Pool 1,036,484 1,357,592 0.10 0.11 10,390 302,631 115,000 520,335 20,953 10,390 935,619 1,007,647 OnePath Global Shares – Large Cap (Hedged) Index Pool 1,174,260 1,283,001 0.06 0.05 403,939 581,293 382,330 419,688 143,362 53,939 973,061 960,860 OnePath Global Shares – Large Cap (Unhedged) Index Pool 2,152,689 2,663,450 0.05 0.05 438,060 98,396 872,000 1,371,116 214,268 244,090 1,184,426 1,408,078 OnePath Global Shares – Small Cap (Unhedged) Index Pool 49,527 50,162 0.01 0.01 3,784 3,274 - - 2,702 3,784 34,379 32,001 OptiMix Global Listed Infrastructure Securities Trust 1,229,663 1,454,303 0.96 0.94 5,071 87,522 136,000 73,000 1,696 16,009 2,239,241 2,457,687 OptiMix Wholesale Australian Fixed Interest Trust 6,652,862 7,975,320 1.89 1.82 448,121 373,749 1,588,297 1,994,771 498,336 436,665 6,635,056 7,735,953 OptiMix Wholesale Global (Hedged) Share Trust 776,167 1,382,170 0.35 0.39 433,524 577,185 890,267 604,972 89,222 63,718 978,173 1,502,066 OptiMix Wholesale Global Share Trust 2,289,843 2,332,431 0.39 0.28 1,430,810 277,686 954,500 1,262,329 551,243 315,234 2,856,366 2,355,004 OptiMix Wholesale International Fixed Interest Trust 5,703,011 6,831,991 2.28 2.25 573,431 389,164 1,437,955 1,371,800 475,009 183,431 6,266,375 7,196,781 Pooled Australian Share Fund 3,227,290 3,418,178 1.68 1.48 490,556 571,692 242,400 1,317,343 120,442 212,649 1,539,855 1,432,226 Wholesale Alternatives Defensive Trust 11,185,218 12,457,095 3.58 3.63 531,340 164,673 1,552,000 1,850,000 360,748 356,340 10,555,830 11,487,749 Wholesale Alternatives Growth Trust 4,334,008 5,612,219 1.02 0.93 456,326 477,328 1,133,303 1,018,000 452,739 34,014 4,312,189 4,909,341 15. ANZ OA OnePath Diversified Fixed Interest Trust OnePath Wholesale Diversified Fixed Interest Trust 7,312,820 7,880,157 1.34 1.24 969,930 810,737 1,308,298 13,560,458 499,663 391,607 6,817,799 7,121,708 16. ANZ OA OnePath Global Emerging Markets Share Trust OnePath Global Emerging Markets Pool 61,727,439 76,342,562 49.26 49.68 2,616,275 4,362,486 11,780,971 6,631,307 2,286,217 1,648,506 66,115,544 75,526,865 17. ANZ OA OnePath High Growth Trust OnePath Wholesale High Growth Trust 16,587,439 21,416,357 46.61 48.59 2,167,574 2,525,164 4,379,914 5,400,285 1,804,483 1,959,357 17,100,712 19,022,881 18. ANZ OA OnePath Income Trust ANZ Australian Cash Fund 1,756,436 2,440,656 0.16 0.15 495,426 639,904 1,180,000 1,335,000 21,884 58,309 1,743,238 2,422,623 ANZ Australian Fixed Interest Fund 1,093,667 1,325,266 0.27 0.28 51,729 61,297 270,800 408,265 54,029 62,015 1,084,255 1,296,872 ANZ Listed Property Trust Fund 192,209 274,518 0.15 0.13 39,492 17,531 57,000 100,000 11,341 10,128 280,179 283,732 Blue Chip Pool 323,977 372,029 0.09 0.08 98,376 26,822 110,082 159,373 18,288 24,298 367,439 347,916 Global Credit Pool 978,147 1,136,622 0.17 0.19 31,850 56,368 163,000 354,000 70,218 27,098 1,068,180 1,203,309 OnePath Australian Bonds Index Pool 1,135,392 1,365,820 0.06 0.07 48,692 67,258 282,600 629,000 50,978 48,692 1,014,859 1,215,530 OnePath Australian Listed Property Index Pool 224,077 247,082 0.16 0.12 87,059 12,557 69,000 88,000 18,391 11,413 294,102 236,397 OnePath Australian Shares – Imputation Index Pool 329,832 342,076 0.64 0.20 144,205 48,282 48,000 192,072 81,819 77,414 431,333 326,635 OnePath Global Bonds (Hedged) Index Pool 1,190,539 1,604,546 0.05 0.06 - 237,561 422,000 395,000 59,102 - 922,858 1,244,702 OnePath Global Listed Property (Hedged) Index Pool 414,105 494,261 0.04 0.04 121,783 24,908 149,085 191,226 8,371 3,783 373,807 366,856 Wholesale Alternatives Growth Trust 150,064 211,866 0.04 0.03 48,506 20,540 89,163 73,000 15,741 1,284 149,309 185,332 Mortgage Pool - - - - - - - 19,679 - - - - 19. ANZ OA OnePath Managed Growth Trust OnePath Wholesale Managed Growth Trust 77,488,096 90,965,043 9.06 8.77 5,813,533 26,057,359 10,680,209 375,757,885 6,657,464 9,123,756 80,287,453 84,856,031
Number of units held Fair value of unit holdings % Interest held
Units purchased/reinvested during the period
Units redeemed during the period
Distributions received/receivable(including Return of
Capital)
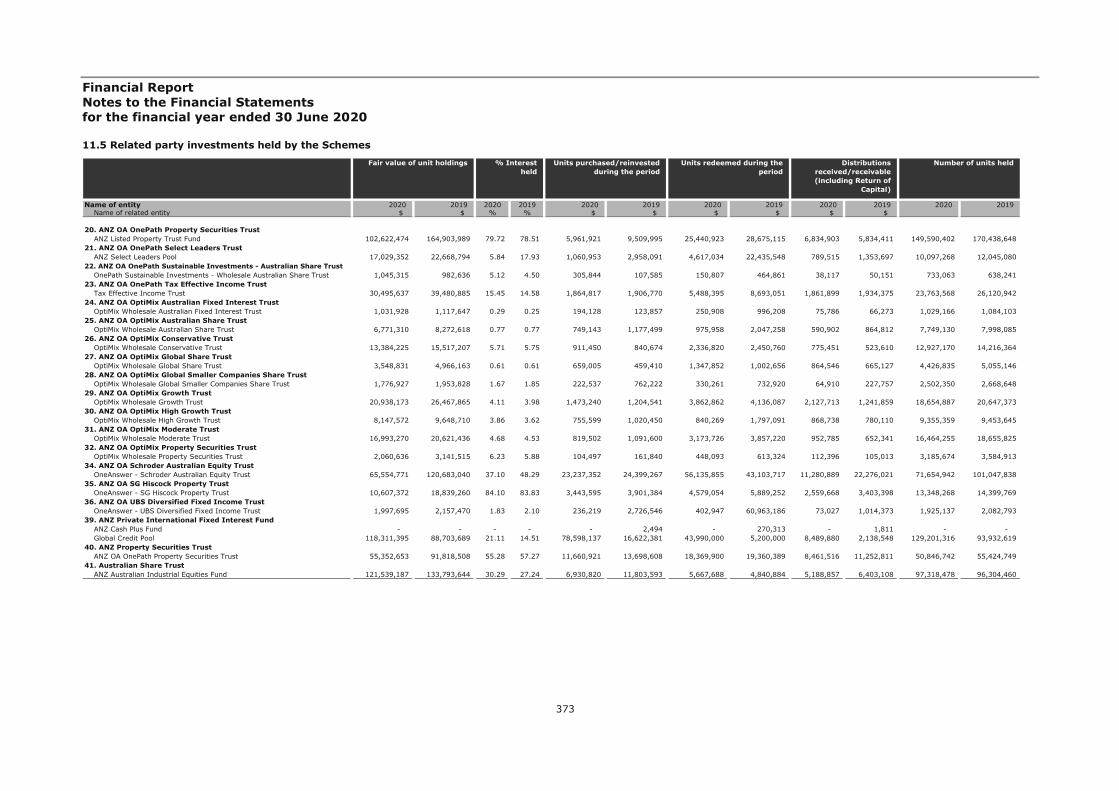
Financial Report Notes to the Financial Statements for the financial year ended 30 June 2020
373
11.5 Related party investments held by the Schemes
Name of entity 2020 2019 2020 2019 2020 2019 2020 2019 2020 2019 2020 2019 Name of related entity $ $ % % $ $ $ $ $ $
20. ANZ OA OnePath Property Securities Trust ANZ Listed Property Trust Fund 102,622,474 164,903,989 79.72 78.51 5,961,921 9,509,995 25,440,923 28,675,115 6,834,903 5,834,411 149,590,402 170,438,648 21. ANZ OA OnePath Select Leaders Trust ANZ Select Leaders Pool 17,029,352 22,668,794 5.84 17.93 1,060,953 2,958,091 4,617,034 22,435,548 789,515 1,353,697 10,097,268 12,045,080 22. ANZ OA OnePath Sustainable Investments - Australian Share Trust OnePath Sustainable Investments - Wholesale Australian Share Trust 1,045,315 982,636 5.12 4.50 305,844 107,585 150,807 464,861 38,117 50,151 733,063 638,241 23. ANZ OA OnePath Tax Effective Income Trust Tax Effective Income Trust 30,495,637 39,480,885 15.45 14.58 1,864,817 1,906,770 5,488,395 8,693,051 1,861,899 1,934,375 23,763,568 26,120,942 24. ANZ OA OptiMix Australian Fixed Interest Trust OptiMix Wholesale Australian Fixed Interest Trust 1,031,928 1,117,647 0.29 0.25 194,128 123,857 250,908 996,208 75,786 66,273 1,029,166 1,084,103 25. ANZ OA OptiMix Australian Share Trust OptiMix Wholesale Australian Share Trust 6,771,310 8,272,618 0.77 0.77 749,143 1,177,499 975,958 2,047,258 590,902 864,812 7,749,130 7,998,085 26. ANZ OA OptiMix Conservative Trust OptiMix Wholesale Conservative Trust 13,384,225 15,517,207 5.71 5.75 911,450 840,674 2,336,820 2,450,760 775,451 523,610 12,927,170 14,216,364 27. ANZ OA OptiMix Global Share Trust OptiMix Wholesale Global Share Trust 3,548,831 4,966,163 0.61 0.61 659,005 459,410 1,347,852 1,002,656 864,546 665,127 4,426,835 5,055,146 28. ANZ OA OptiMix Global Smaller Companies Share Trust OptiMix Wholesale Global Smaller Companies Share Trust 1,776,927 1,953,828 1.67 1.85 222,537 762,222 330,261 732,920 64,910 227,757 2,502,350 2,668,648 29. ANZ OA OptiMix Growth Trust OptiMix Wholesale Growth Trust 20,938,173 26,467,865 4.11 3.98 1,473,240 1,204,541 3,862,862 4,136,087 2,127,713 1,241,859 18,654,887 20,647,373 30. ANZ OA OptiMix High Growth Trust OptiMix Wholesale High Growth Trust 8,147,572 9,648,710 3.86 3.62 755,599 1,020,450 840,269 1,797,091 868,738 780,110 9,355,359 9,453,645 31. ANZ OA OptiMix Moderate Trust OptiMix Wholesale Moderate Trust 16,993,270 20,621,436 4.68 4.53 819,502 1,091,600 3,173,726 3,857,220 952,785 652,341 16,464,255 18,655,825 32. ANZ OA OptiMix Property Securities Trust OptiMix Wholesale Property Securities Trust 2,060,636 3,141,515 6.23 5.88 104,497 161,840 448,093 613,324 112,396 105,013 3,185,674 3,584,913 34. ANZ OA Schroder Australian Equity Trust OneAnswer - Schroder Australian Equity Trust 65,554,771 120,683,040 37.10 48.29 23,237,352 24,399,267 56,135,855 43,103,717 11,280,889 22,276,021 71,654,942 101,047,838 35. ANZ OA SG Hiscock Property Trust OneAnswer - SG Hiscock Property Trust 10,607,372 18,839,260 84.10 83.83 3,443,595 3,901,384 4,579,054 5,889,252 2,559,668 3,403,398 13,348,268 14,399,769 36. ANZ OA UBS Diversified Fixed Income Trust OneAnswer - UBS Diversified Fixed Income Trust 1,997,695 2,157,470 1.83 2.10 236,219 2,726,546 402,947 60,963,186 73,027 1,014,373 1,925,137 2,082,793 39. ANZ Private International Fixed Interest Fund ANZ Cash Plus Fund - - - - - 2,494 - 270,313 - 1,811 - - Global Credit Pool 118,311,395 88,703,689 21.11 14.51 78,598,137 16,622,381 43,990,000 5,200,000 8,489,880 2,138,548 129,201,316 93,932,619 40. ANZ Property Securities Trust ANZ OA OnePath Property Securities Trust 55,352,653 91,818,508 55.28 57.27 11,660,921 13,698,608 18,369,900 19,360,389 8,461,516 11,252,811 50,846,742 55,424,749 41. Australian Share Trust ANZ Australian Industrial Equities Fund 121,539,187 133,793,644 30.29 27.24 6,930,820 11,803,593 5,667,688 4,840,884 5,188,857 6,403,108 97,318,478 96,304,460
Number of units held Fair value of unit holdings % Interest held
Units purchased/reinvested during the period
Units redeemed during the period
Distributions received/receivable(including Return of
Capital)

Financial Report Notes to the Financial Statements for the financial year ended 30 June 2020
374
11.5 Related party investments held by the Schemes
Name of entity 2020 2019 2020 2019 2020 2019 2020 2019 2020 2019 2020 2019 Name of related entity $ $ % % $ $ $ $ $ $
42. Balanced Trust OnePath Wholesale Balanced Trust 66,780,685 78,867,189 17.10 16.17 3,553,523 5,975,051 9,297,720 63,135,095 5,692,896 3,913,877 67,115,981 72,685,225 43. Blue Chip Imputation Trust ANZ OA OnePath Blue Chip Imputation Trust 73,765,226 98,888,834 35.23 34.12 5,001,633 7,238,928 14,171,885 36,205,998 4,793,876 6,274,987 84,599,160 93,522,425 44. Emerging Companies Trust Small Companies Pool 190,383,807 256,294,820 100.00 100.00 35,987,035 25,352,814 57,450,875 33,915,623 39,726,251 37,011,200 332,298,675 364,631,312 45. Global Share Trust International Share Pool 182,252,782 180,658,575 49.67 44.64 5,352,216 4,107,417 19,194,093 17,659,777 1,973,492 2,375,693 84,322,550 90,950,877 46. Heine Property Securities Fund ANZ OA OnePath Property Securities Trust 6,219,043 8,751,466 6.21 5.46 1,104,155 1,268,093 406,933 1,443,633 930,312 1,072,815 5,712,790 5,282,680 47. High Growth Trust OnePath Wholesale High Growth Trust 1,298,367 1,471,943 3.65 3.34 234,250 350,541 199,719 2,310,746 140,432 159,179 1,338,543 1,307,440 50. OneAnswer - Arrowstreet Global Equity (Hedged) Trust ANZ OA Arrowstreet Global Equity (Hedged) Trust 9,302,599 11,801,221 3.49 3.29 485,842 2,377,941 2,468,809 5,991,620 228,233 87,242 5,860,485 7,144,122 60. OneAnswer - Colonial First State Imputation Trust ANZ OA Colonial First State Imputation Trust 3,946,885 5,312,950 3.00 3.36 462,858 6,219,433 1,399,804 71,416,773 357,468 2,448,063 4,140,720 4,981,880 70. OneAnswer - OnePath Global Property Securities Index Trust OnePath Global Listed Property (Hedged) Index Pool 189,086,348 257,339,825 17.92 20.96 3,302,708 11,353,550 31,811,759 25,129,715 3,822,418 1,969,481 170,685,513 191,005,676 Residual Asset Pool - CLO's 4,957 4,920 100.00 100.00 7 - - - 7 - 800 799 76. OneAnswer - Perpetual Australian Share Trust ANZ OA Perpetual Australian Share Trust 14,874,555 22,316,964 6.01 6.83 1,605,887 3,494,538 6,638,473 69,671,195 592,217 2,336,481 20,270,706 26,382,770 94. OneAnswer - Vanguard Australian Shares Index Trust OnePath Australian Shares Index Pool 914,062,176 1,124,538,876 14.52 15.88 60,640,419 80,749,627 144,664,401 101,213,790 50,517,052 73,170,204 739,056,633 799,559,296 95. OneAnswer - Vanguard Balanced Index Trust OnePath Australian Bonds Index Pool 303,844,060 342,082,533 15.32 16.93 51,051,672 29,485,017 89,370,557 40,240,000 13,642,316 12,195,393 271,588,004 304,440,943 OnePath Australian Shares Index Pool 412,103,227 460,845,359 6.55 6.51 148,697,822 62,050,977 144,234,880 86,220,000 22,232,237 30,826,156 333,202,305 327,666,031 OnePath Global Bonds (Hedged) Index Pool 706,153,196 827,284,458 27.82 30.40 84,685,558 62,436,403 211,034,409 81,760,000 35,055,878 - 547,381,341 641,753,516 OnePath Global Emerging Markets Shares (Unhedged) Index Pool 61,827,104 66,363,047 5.93 6.37 3,392,169 9,376,663 5,157,000 9,300,000 2,120,066 2,392,169 43,342,260 44,312,462 OnePath Global Shares – Large Cap (Hedged) Index Pool 172,674,626 204,639,711 8.44 7.77 60,310,972 27,003,414 74,958,500 29,634,186 21,081,417 8,603,387 143,088,430 153,257,941 OnePath Global Shares – Large Cap (Unhedged) Index Pool 282,397,412 309,742,398 6.26 5.81 80,255,579 30,982,175 98,728,787 63,659,000 28,108,426 28,386,108 155,377,221 163,750,548 OnePath Global Shares – Small Cap (Unhedged) Index Pool 71,518,269 77,876,952 11.10 14.57 10,564,665 9,910,020 11,562,000 8,637,597 3,902,224 5,875,065 49,644,874 49,680,874 96. OneAnswer - Vanguard Conservative Index Trust ANZ Australian Cash Fund 79,783,033 80,452,660 7.36 5.01 20,384,699 15,555,348 21,065,000 19,350,000 839,879 1,739,881 79,183,512 79,858,247 OnePath Australian Bonds Index Pool 140,245,848 144,741,421 7.09 7.16 19,931,721 7,932,716 24,126,471 19,680,000 6,296,908 5,160,095 125,613,992 128,814,571 OnePath Australian Shares Index Pool 95,487,142 97,991,720 1.52 1.38 42,733,674 18,021,834 33,084,046 25,708,179 5,044,883 6,563,963 77,205,257 69,673,172 OnePath Global Bonds (Hedged) Index Pool 326,315,855 349,947,707 12.86 12.86 26,135,726 16,063,147 51,146,689 40,940,000 16,199,443 - 252,946,827 271,466,688 OnePath Global Emerging Markets Shares (Unhedged) Index Pool 15,761,729 15,964,268 1.51 1.53 1,925,459 2,415,851 1,428,000 2,200,850 540,473 575,459 11,049,344 10,659,788 OnePath Global Shares – Large Cap (Hedged) Index Pool 40,311,206 44,552,481 1.97 1.69 20,523,018 7,662,255 20,737,000 9,918,004 4,921,495 1,873,059 33,404,255 33,366,063 OnePath Global Shares – Large Cap (Unhedged) Index Pool 63,892,534 64,148,802 1.42 1.20 25,412,738 8,857,221 23,283,828 18,690,000 6,359,543 5,878,869 35,154,162 33,913,347 OnePath Global Shares – Small Cap (Unhedged) Index Pool 15,650,056 15,951,616 2.43 2.98 3,257,796 2,460,040 2,375,000 3,328,300 853,908 1,203,396 10,863,589 10,176,184
Number of units held Fair value of unit holdings % Interest held
Units purchased/reinvested during the period
Units redeemed during the period
Distributions received/receivable(including Return of
Capital)
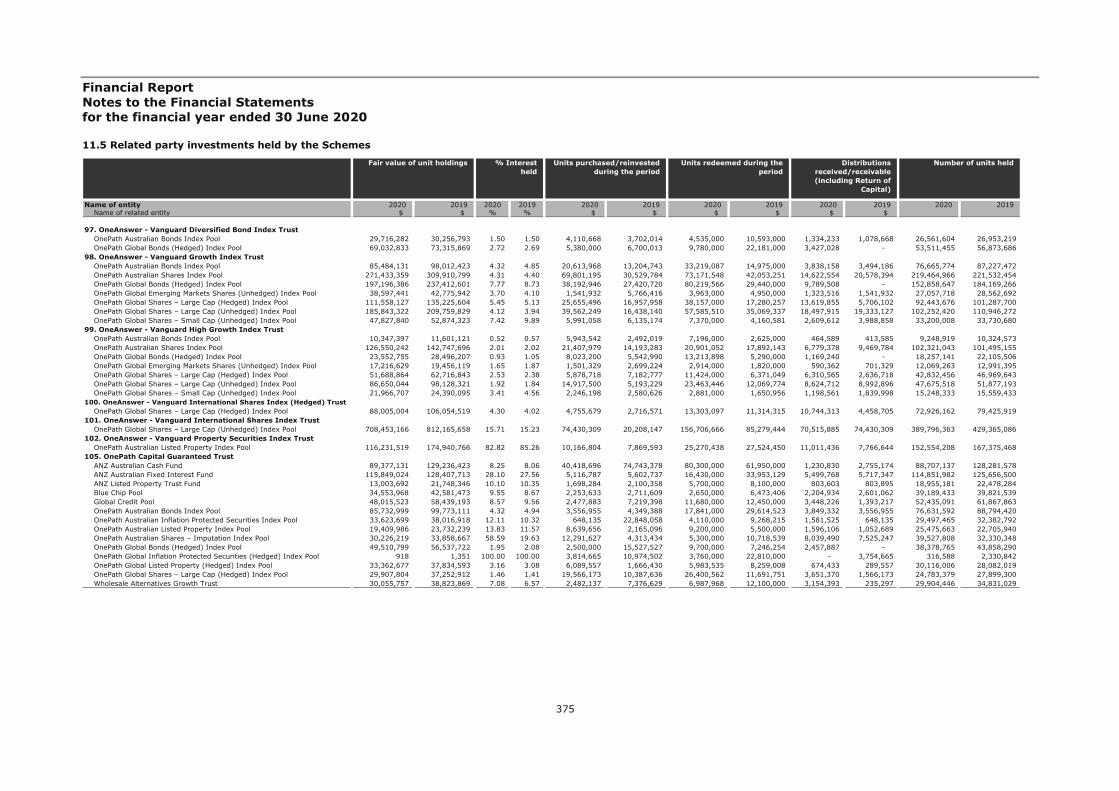
Financial Report Notes to the Financial Statements for the financial year ended 30 June 2020
375
11.5 Related party investments held by the Schemes
Name of entity 2020 2019 2020 2019 2020 2019 2020 2019 2020 2019 2020 2019 Name of related entity $ $ % % $ $ $ $ $ $
97. OneAnswer - Vanguard Diversified Bond Index Trust OnePath Australian Bonds Index Pool 29,716,282 30,256,793 1.50 1.50 4,110,668 3,702,014 4,535,000 10,593,000 1,334,233 1,078,668 26,561,604 26,953,219 OnePath Global Bonds (Hedged) Index Pool 69,032,833 73,315,869 2.72 2.69 5,380,000 6,700,013 9,780,000 22,181,000 3,427,028 - 53,511,455 56,873,686 98. OneAnswer - Vanguard Growth Index Trust OnePath Australian Bonds Index Pool 85,484,131 98,012,423 4.32 4.85 20,613,968 13,204,743 33,219,087 14,975,000 3,838,158 3,494,186 76,665,774 87,227,472 OnePath Australian Shares Index Pool 271,433,359 309,910,799 4.31 4.40 69,801,195 30,529,784 73,171,548 42,053,251 14,622,554 20,578,394 219,464,966 221,532,454 OnePath Global Bonds (Hedged) Index Pool 197,196,386 237,412,601 7.77 8.73 38,192,946 27,420,720 80,219,566 29,440,000 9,789,508 - 152,858,647 184,169,266 OnePath Global Emerging Markets Shares (Unhedged) Index Pool 38,597,441 42,775,942 3.70 4.10 1,541,932 5,766,416 3,963,000 4,950,000 1,323,516 1,541,932 27,057,718 28,562,692 OnePath Global Shares – Large Cap (Hedged) Index Pool 111,558,127 135,225,604 5.45 5.13 25,655,496 16,957,958 38,157,000 17,280,257 13,619,855 5,706,102 92,443,676 101,287,700 OnePath Global Shares – Large Cap (Unhedged) Index Pool 185,843,322 209,759,829 4.12 3.94 39,562,249 16,438,140 57,585,510 35,069,337 18,497,915 19,333,127 102,252,420 110,946,272 OnePath Global Shares – Small Cap (Unhedged) Index Pool 47,827,840 52,874,323 7.42 9.89 5,991,058 6,135,174 7,370,000 4,160,581 2,609,612 3,988,858 33,200,008 33,730,680 99. OneAnswer - Vanguard High Growth Index Trust OnePath Australian Bonds Index Pool 10,347,397 11,601,121 0.52 0.57 5,943,542 2,492,019 7,196,000 2,625,000 464,589 413,585 9,248,919 10,324,573 OnePath Australian Shares Index Pool 126,550,242 142,747,696 2.01 2.02 21,407,979 14,193,283 20,901,052 17,892,143 6,779,378 9,469,784 102,321,043 101,495,155 OnePath Global Bonds (Hedged) Index Pool 23,552,755 28,496,207 0.93 1.05 8,023,200 5,542,990 13,213,898 5,290,000 1,169,240 - 18,257,141 22,105,506 OnePath Global Emerging Markets Shares (Unhedged) Index Pool 17,216,629 19,456,119 1.65 1.87 1,501,329 2,699,224 2,914,000 1,820,000 590,362 701,329 12,069,263 12,991,395 OnePath Global Shares – Large Cap (Hedged) Index Pool 51,688,864 62,716,843 2.53 2.38 5,878,718 7,182,777 11,424,000 6,371,049 6,310,565 2,636,718 42,832,456 46,969,643 OnePath Global Shares – Large Cap (Unhedged) Index Pool 86,650,044 98,128,321 1.92 1.84 14,917,500 5,193,229 23,463,446 12,069,774 8,624,712 8,992,896 47,675,518 51,877,193 OnePath Global Shares – Small Cap (Unhedged) Index Pool 21,966,707 24,390,095 3.41 4.56 2,246,198 2,580,626 2,881,000 1,650,956 1,198,561 1,839,998 15,248,333 15,559,433 100. OneAnswer - Vanguard International Shares Index (Hedged) Trust OnePath Global Shares – Large Cap (Hedged) Index Pool 88,005,004 106,054,519 4.30 4.02 4,755,679 2,716,571 13,303,097 11,314,315 10,744,313 4,458,705 72,926,162 79,425,919 101. OneAnswer - Vanguard International Shares Index Trust OnePath Global Shares – Large Cap (Unhedged) Index Pool 708,453,166 812,165,658 15.71 15.23 74,430,309 20,208,147 156,706,666 85,279,444 70,515,885 74,430,309 389,796,363 429,365,086 102. OneAnswer - Vanguard Property Securities Index Trust OnePath Australian Listed Property Index Pool 116,231,519 174,940,766 82.82 85.26 10,166,804 7,869,593 25,270,438 27,524,450 11,011,436 7,766,644 152,554,208 167,375,468 105. OnePath Capital Guaranteed Trust ANZ Australian Cash Fund 89,377,131 129,236,423 8.25 8.06 40,418,696 74,743,378 80,300,000 61,950,000 1,230,830 2,755,174 88,707,137 128,281,578 ANZ Australian Fixed Interest Fund 115,849,024 128,407,713 28.10 27.56 5,116,787 5,602,737 16,430,000 33,953,129 5,499,768 5,717,347 114,851,982 125,656,500 ANZ Listed Property Trust Fund 13,003,692 21,748,346 10.10 10.35 1,698,284 2,100,358 5,700,000 8,100,000 803,603 803,895 18,955,181 22,478,284 Blue Chip Pool 34,553,968 42,581,473 9.55 8.67 2,253,633 2,711,609 2,650,000 6,473,406 2,204,934 2,601,062 39,189,433 39,821,539 Global Credit Pool 48,015,523 58,439,193 8.57 9.56 2,477,883 7,219,398 11,680,000 12,450,000 3,448,226 1,393,217 52,435,091 61,867,863 OnePath Australian Bonds Index Pool 85,732,999 99,773,111 4.32 4.94 3,556,955 4,349,388 17,841,000 29,614,523 3,849,332 3,556,955 76,631,592 88,794,420 OnePath Australian Inflation Protected Securities Index Pool 33,623,699 38,016,918 12.11 10.32 648,135 22,848,058 4,110,000 9,268,215 1,581,525 648,135 29,497,465 32,382,792 OnePath Australian Listed Property Index Pool 19,409,986 23,732,239 13.83 11.57 8,639,656 2,165,096 9,200,000 5,500,000 1,596,106 1,052,689 25,475,663 22,705,940 OnePath Australian Shares – Imputation Index Pool 30,226,219 33,858,667 58.59 19.63 12,291,627 4,313,434 5,300,000 10,718,539 8,039,490 7,525,247 39,527,808 32,330,348 OnePath Global Bonds (Hedged) Index Pool 49,510,799 56,537,722 1.95 2.08 2,500,000 15,527,527 9,700,000 7,246,254 2,457,887 - 38,378,765 43,858,290 OnePath Global Inflation Protected Securities (Hedged) Index Pool 918 1,351 100.00 100.00 3,814,665 10,974,502 3,760,000 22,810,000 - 3,754,665 316,588 2,330,842 OnePath Global Listed Property (Hedged) Index Pool 33,362,677 37,834,593 3.16 3.08 6,089,557 1,666,430 5,983,535 8,259,008 674,433 289,557 30,116,006 28,082,019 OnePath Global Shares – Large Cap (Hedged) Index Pool 29,907,804 37,252,912 1.46 1.41 19,566,173 10,387,636 26,400,562 11,691,751 3,651,370 1,566,173 24,783,379 27,899,300 Wholesale Alternatives Growth Trust 30,055,757 38,823,869 7.08 6.57 2,482,137 7,376,629 6,987,968 12,100,000 3,154,393 235,297 29,904,446 34,831,029
Number of units held Fair value of unit holdings % Interest held
Units purchased/reinvested during the period
Units redeemed during the period
Distributions received/receivable(including Return of
Capital)
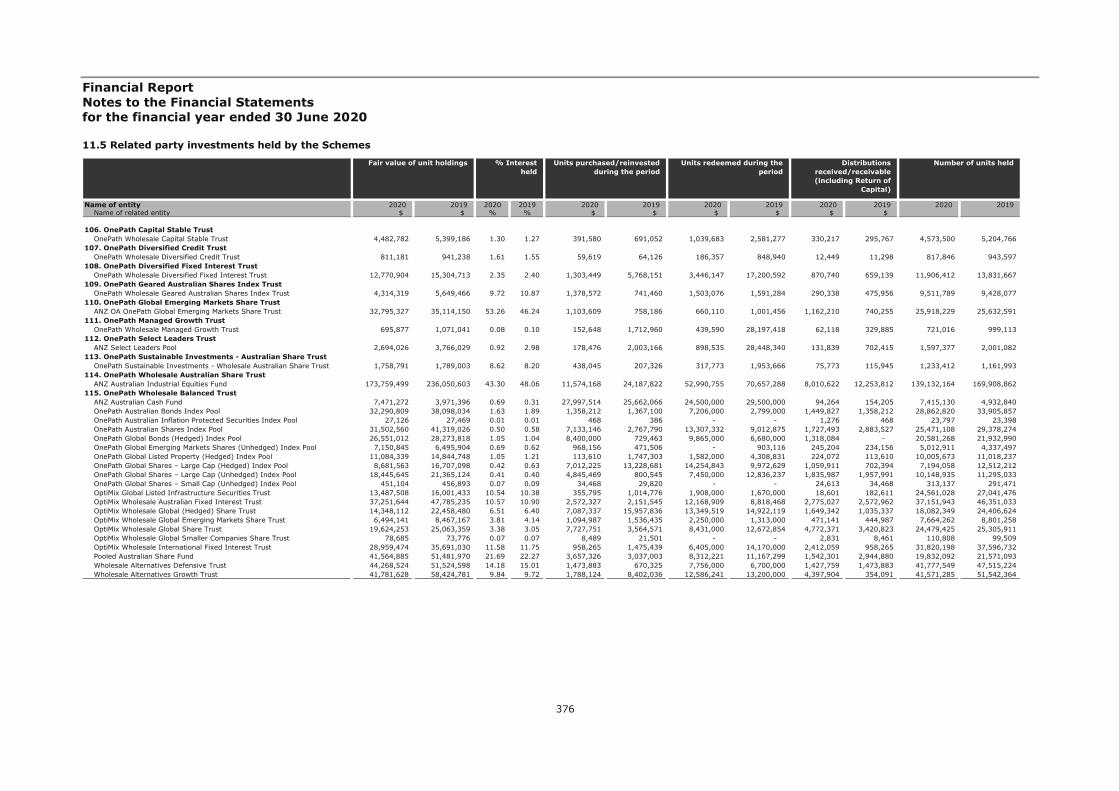
Financial Report Notes to the Financial Statements for the financial year ended 30 June 2020
376
11.5 Related party investments held by the Schemes
Name of entity 2020 2019 2020 2019 2020 2019 2020 2019 2020 2019 2020 2019 Name of related entity $ $ % % $ $ $ $ $ $
106. OnePath Capital Stable Trust OnePath Wholesale Capital Stable Trust 4,482,782 5,399,186 1.30 1.27 391,580 691,052 1,039,683 2,581,277 330,217 295,767 4,573,500 5,204,766 107. OnePath Diversified Credit Trust OnePath Wholesale Diversified Credit Trust 811,181 941,238 1.61 1.55 59,619 64,126 186,357 848,940 12,449 11,298 817,846 943,597 108. OnePath Diversified Fixed Interest Trust OnePath Wholesale Diversified Fixed Interest Trust 12,770,904 15,304,713 2.35 2.40 1,303,449 5,768,151 3,446,147 17,200,592 870,740 659,139 11,906,412 13,831,667 109. OnePath Geared Australian Shares Index Trust OnePath Wholesale Geared Australian Shares Index Trust 4,314,319 5,649,466 9.72 10.87 1,378,572 741,460 1,503,076 1,591,284 290,338 475,956 9,511,789 9,428,077 110. OnePath Global Emerging Markets Share Trust ANZ OA OnePath Global Emerging Markets Share Trust 32,795,327 35,114,150 53.26 46.24 1,103,609 758,186 660,110 1,001,456 1,162,210 740,255 25,918,229 25,632,591 111. OnePath Managed Growth Trust OnePath Wholesale Managed Growth Trust 695,877 1,071,041 0.08 0.10 152,648 1,712,960 439,590 28,197,418 62,118 329,885 721,016 999,113 112. OnePath Select Leaders Trust ANZ Select Leaders Pool 2,694,026 3,766,029 0.92 2.98 178,476 2,003,166 898,535 28,448,340 131,839 702,415 1,597,377 2,001,082 113. OnePath Sustainable Investments - Australian Share Trust OnePath Sustainable Investments - Wholesale Australian Share Trust 1,758,791 1,789,003 8.62 8.20 438,045 207,326 317,773 1,953,666 75,773 115,945 1,233,412 1,161,993 114. OnePath Wholesale Australian Share Trust ANZ Australian Industrial Equities Fund 173,759,499 236,050,603 43.30 48.06 11,574,168 24,187,822 52,990,755 70,657,288 8,010,622 12,253,812 139,132,164 169,908,862 115. OnePath Wholesale Balanced Trust ANZ Australian Cash Fund 7,471,272 3,971,396 0.69 0.31 27,997,514 25,662,066 24,500,000 29,500,000 94,264 154,205 7,415,130 4,932,840 OnePath Australian Bonds Index Pool 32,290,809 38,098,034 1.63 1.89 1,358,212 1,367,100 7,206,000 2,799,000 1,449,827 1,358,212 28,862,820 33,905,857 OnePath Australian Inflation Protected Securities Index Pool 27,126 27,469 0.01 0.01 468 386 - - 1,276 468 23,797 23,398 OnePath Australian Shares Index Pool 31,502,560 41,319,026 0.50 0.58 7,133,146 2,767,790 13,307,332 9,012,875 1,727,493 2,883,527 25,471,108 29,378,274 OnePath Global Bonds (Hedged) Index Pool 26,551,012 28,273,818 1.05 1.04 8,400,000 729,463 9,865,000 6,680,000 1,318,084 - 20,581,268 21,932,990 OnePath Global Emerging Markets Shares (Unhedged) Index Pool 7,150,845 6,495,904 0.69 0.62 968,156 471,506 - 903,116 245,204 234,156 5,012,911 4,337,497 OnePath Global Listed Property (Hedged) Index Pool 11,084,339 14,844,748 1.05 1.21 113,610 1,747,303 1,582,000 4,308,831 224,072 113,610 10,005,673 11,018,237 OnePath Global Shares – Large Cap (Hedged) Index Pool 8,681,563 16,707,098 0.42 0.63 7,012,225 13,228,681 14,254,843 9,972,629 1,059,911 702,394 7,194,058 12,512,212 OnePath Global Shares – Large Cap (Unhedged) Index Pool 18,445,645 21,365,124 0.41 0.40 4,845,469 800,545 7,450,000 12,836,237 1,835,987 1,957,991 10,148,935 11,295,033 OnePath Global Shares – Small Cap (Unhedged) Index Pool 451,104 456,893 0.07 0.09 34,468 29,820 - - 24,613 34,468 313,137 291,471 OptiMix Global Listed Infrastructure Securities Trust 13,487,508 16,001,433 10.54 10.38 355,795 1,014,776 1,908,000 1,670,000 18,601 182,611 24,561,028 27,041,476 OptiMix Wholesale Australian Fixed Interest Trust 37,251,644 47,785,235 10.57 10.90 2,572,327 2,151,545 12,168,909 8,818,468 2,775,027 2,572,962 37,151,943 46,351,033 OptiMix Wholesale Global (Hedged) Share Trust 14,348,112 22,458,480 6.51 6.40 7,087,337 15,957,836 13,349,519 14,922,119 1,649,342 1,035,337 18,082,349 24,406,624 OptiMix Wholesale Global Emerging Markets Share Trust 6,494,141 8,467,167 3.81 4.14 1,094,987 1,536,435 2,250,000 1,313,000 471,141 444,987 7,664,262 8,801,258 OptiMix Wholesale Global Share Trust 19,624,253 25,063,359 3.38 3.05 7,727,751 3,564,571 8,431,000 12,672,854 4,772,371 3,420,823 24,479,425 25,305,911 OptiMix Wholesale Global Smaller Companies Share Trust 78,685 73,776 0.07 0.07 8,489 21,501 - - 2,831 8,461 110,808 99,509 OptiMix Wholesale International Fixed Interest Trust 28,959,474 35,691,030 11.58 11.75 958,265 1,475,439 6,405,000 14,170,000 2,412,059 958,265 31,820,198 37,596,732 Pooled Australian Share Fund 41,564,885 51,481,970 21.69 22.27 3,657,326 3,037,003 8,312,221 11,167,299 1,542,301 2,944,880 19,832,092 21,571,093 Wholesale Alternatives Defensive Trust 44,268,524 51,524,598 14.18 15.01 1,473,883 670,325 7,756,000 6,700,000 1,427,759 1,473,883 41,777,549 47,515,224 Wholesale Alternatives Growth Trust 41,781,628 58,424,781 9.84 9.72 1,788,124 8,402,036 12,586,241 13,200,000 4,397,904 354,091 41,571,285 51,542,364
Number of units held Fair value of unit holdings % Interest held
Units purchased/reinvested during the period
Units redeemed during the period
Distributions received/receivable(including Return of
Capital)
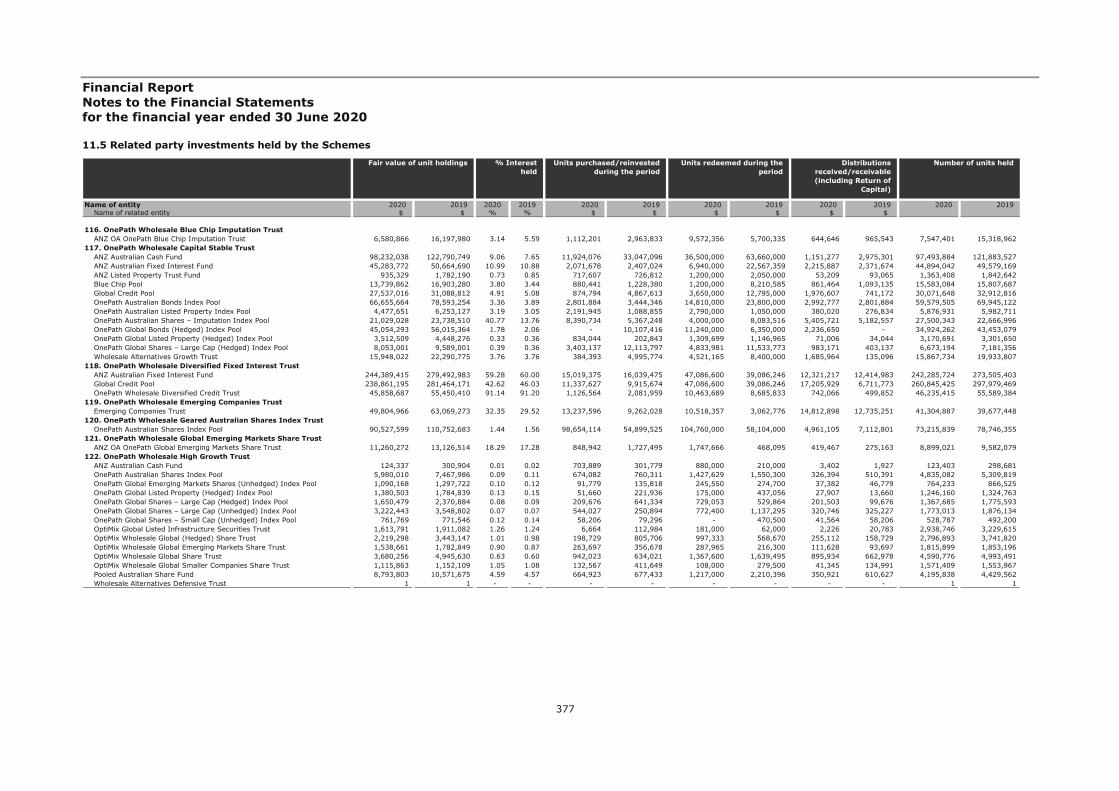
Financial Report Notes to the Financial Statements for the financial year ended 30 June 2020
377
11.5 Related party investments held by the Schemes
Name of entity 2020 2019 2020 2019 2020 2019 2020 2019 2020 2019 2020 2019 Name of related entity $ $ % % $ $ $ $ $ $
116. OnePath Wholesale Blue Chip Imputation Trust ANZ OA OnePath Blue Chip Imputation Trust 6,580,866 16,197,980 3.14 5.59 1,112,201 2,963,833 9,572,356 5,700,335 644,646 965,543 7,547,401 15,318,962 117. OnePath Wholesale Capital Stable Trust ANZ Australian Cash Fund 98,232,038 122,790,749 9.06 7.65 11,924,076 33,047,096 36,500,000 63,660,000 1,151,277 2,975,301 97,493,884 121,883,527 ANZ Australian Fixed Interest Fund 45,283,772 50,664,690 10.99 10.88 2,071,678 2,407,024 6,940,000 22,567,359 2,215,887 2,371,674 44,894,042 49,579,169 ANZ Listed Property Trust Fund 935,329 1,782,190 0.73 0.85 717,607 726,812 1,200,000 2,050,000 53,209 93,065 1,363,408 1,842,642 Blue Chip Pool 13,739,862 16,903,280 3.80 3.44 880,441 1,228,380 1,200,000 8,210,585 861,464 1,093,135 15,583,084 15,807,687 Global Credit Pool 27,537,016 31,088,812 4.91 5.08 874,794 4,867,613 3,650,000 12,795,000 1,976,607 741,172 30,071,648 32,912,816 OnePath Australian Bonds Index Pool 66,655,664 78,593,254 3.36 3.89 2,801,884 3,444,346 14,810,000 23,800,000 2,992,777 2,801,884 59,579,505 69,945,122 OnePath Australian Listed Property Index Pool 4,477,651 6,253,127 3.19 3.05 2,191,945 1,088,855 2,790,000 1,050,000 380,020 276,834 5,876,931 5,982,711 OnePath Australian Shares – Imputation Index Pool 21,029,028 23,738,510 40.77 13.76 8,390,734 5,367,248 4,000,000 8,083,516 5,405,721 5,182,557 27,500,343 22,666,996 OnePath Global Bonds (Hedged) Index Pool 45,054,293 56,015,364 1.78 2.06 - 10,107,416 11,240,000 6,350,000 2,236,650 - 34,924,262 43,453,079 OnePath Global Listed Property (Hedged) Index Pool 3,512,509 4,448,276 0.33 0.36 834,044 202,843 1,309,699 1,146,965 71,006 34,044 3,170,691 3,301,650 OnePath Global Shares – Large Cap (Hedged) Index Pool 8,053,001 9,589,001 0.39 0.36 3,403,137 12,113,797 4,833,981 11,533,773 983,171 403,137 6,673,194 7,181,356 Wholesale Alternatives Growth Trust 15,948,022 22,290,775 3.76 3.76 384,393 4,995,774 4,521,165 8,400,000 1,685,964 135,096 15,867,734 19,933,807 118. OnePath Wholesale Diversified Fixed Interest Trust ANZ Australian Fixed Interest Fund 244,389,415 279,492,983 59.28 60.00 15,019,375 16,039,475 47,086,600 39,086,246 12,321,217 12,414,983 242,285,724 273,505,403 Global Credit Pool 238,861,195 281,464,171 42.62 46.03 11,337,627 9,915,674 47,086,600 39,086,246 17,205,929 6,711,773 260,845,425 297,979,469 OnePath Wholesale Diversified Credit Trust 45,858,687 55,450,410 91.14 91.20 1,126,564 2,081,959 10,463,689 8,685,833 742,066 499,852 46,235,415 55,589,384 119. OnePath Wholesale Emerging Companies Trust Emerging Companies Trust 49,804,966 63,069,273 32.35 29.52 13,237,596 9,262,028 10,518,357 3,062,776 14,812,898 12,735,251 41,304,887 39,677,448 120. OnePath Wholesale Geared Australian Shares Index Trust OnePath Australian Shares Index Pool 90,527,599 110,752,683 1.44 1.56 98,654,114 54,899,525 104,760,000 58,104,000 4,961,105 7,112,801 73,215,839 78,746,355 121. OnePath Wholesale Global Emerging Markets Share Trust ANZ OA OnePath Global Emerging Markets Share Trust 11,260,272 13,126,514 18.29 17.28 848,942 1,727,495 1,747,666 468,095 419,467 275,163 8,899,021 9,582,079 122. OnePath Wholesale High Growth Trust ANZ Australian Cash Fund 124,337 300,904 0.01 0.02 703,889 301,779 880,000 210,000 3,402 1,927 123,403 298,681 OnePath Australian Shares Index Pool 5,980,010 7,467,986 0.09 0.11 674,082 760,311 1,427,629 1,550,300 326,394 510,391 4,835,082 5,309,819 OnePath Global Emerging Markets Shares (Unhedged) Index Pool 1,090,168 1,297,722 0.10 0.12 91,779 135,818 245,550 274,700 37,382 46,779 764,233 866,525 OnePath Global Listed Property (Hedged) Index Pool 1,380,503 1,784,839 0.13 0.15 51,660 221,936 175,000 437,056 27,907 13,660 1,246,160 1,324,763 OnePath Global Shares – Large Cap (Hedged) Index Pool 1,650,479 2,370,884 0.08 0.09 209,676 641,334 729,053 529,864 201,503 99,676 1,367,685 1,775,593 OnePath Global Shares – Large Cap (Unhedged) Index Pool 3,222,443 3,548,802 0.07 0.07 544,027 250,894 772,400 1,137,295 320,746 325,227 1,773,013 1,876,134 OnePath Global Shares – Small Cap (Unhedged) Index Pool 761,769 771,546 0.12 0.14 58,206 79,296 - 470,500 41,564 58,206 528,787 492,200 OptiMix Global Listed Infrastructure Securities Trust 1,613,791 1,911,082 1.26 1.24 6,664 112,984 181,000 62,000 2,226 20,783 2,938,746 3,229,615 OptiMix Wholesale Global (Hedged) Share Trust 2,219,298 3,443,147 1.01 0.98 198,729 805,706 997,333 568,670 255,112 158,729 2,796,893 3,741,820 OptiMix Wholesale Global Emerging Markets Share Trust 1,538,661 1,782,849 0.90 0.87 263,697 356,678 287,965 216,300 111,628 93,697 1,815,899 1,853,196 OptiMix Wholesale Global Share Trust 3,680,256 4,945,630 0.63 0.60 942,023 634,021 1,367,600 1,639,495 895,934 662,978 4,590,776 4,993,491 OptiMix Wholesale Global Smaller Companies Share Trust 1,115,863 1,152,109 1.05 1.08 132,567 411,649 108,000 279,500 41,345 134,991 1,571,409 1,553,967 Pooled Australian Share Fund 8,793,803 10,571,675 4.59 4.57 664,923 677,433 1,217,000 2,210,396 350,921 610,627 4,195,838 4,429,562 Wholesale Alternatives Defensive Trust 1 1 - - - - - - - - 1 1
Number of units held Fair value of unit holdings % Interest held
Units purchased/reinvested during the period
Units redeemed during the period
Distributions received/receivable(including Return of
Capital)
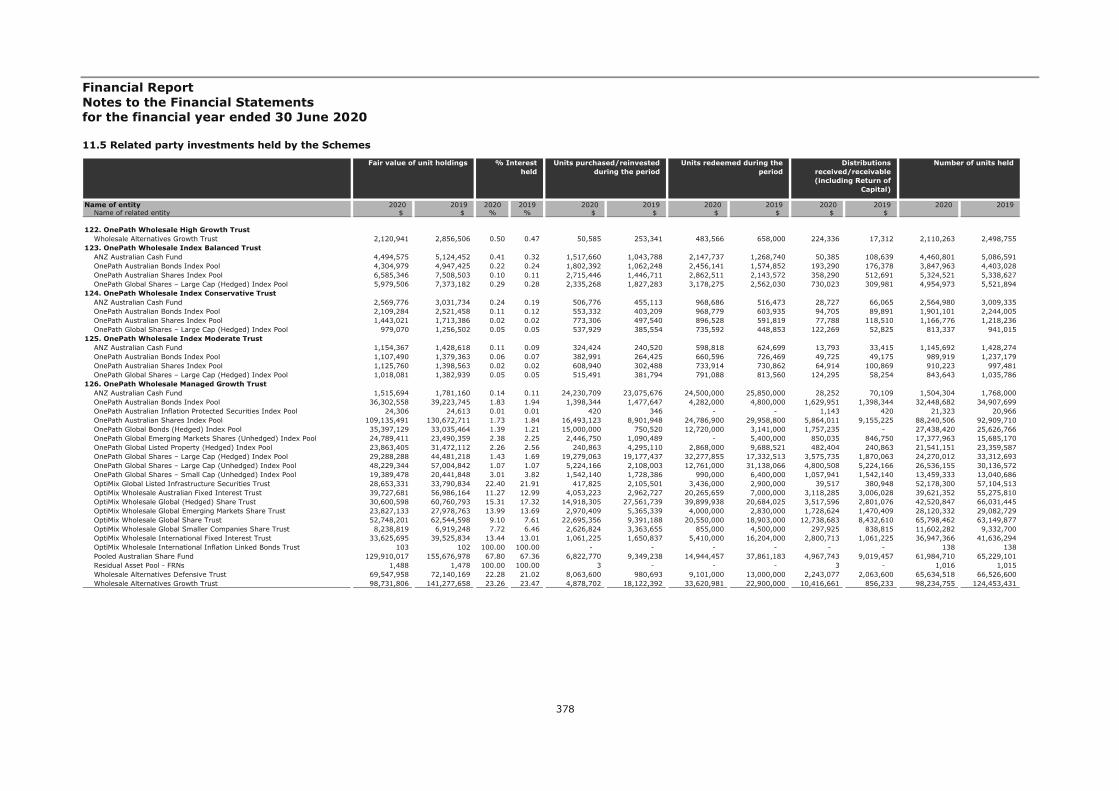
Financial Report Notes to the Financial Statements for the financial year ended 30 June 2020
378
11.5 Related party investments held by the Schemes
Name of entity 2020 2019 2020 2019 2020 2019 2020 2019 2020 2019 2020 2019 Name of related entity $ $ % % $ $ $ $ $ $
122. OnePath Wholesale High Growth Trust Wholesale Alternatives Growth Trust 2,120,941 2,856,506 0.50 0.47 50,585 253,341 483,566 658,000 224,336 17,312 2,110,263 2,498,755 123. OnePath Wholesale Index Balanced Trust ANZ Australian Cash Fund 4,494,575 5,124,452 0.41 0.32 1,517,660 1,043,788 2,147,737 1,268,740 50,385 108,639 4,460,801 5,086,591 OnePath Australian Bonds Index Pool 4,304,979 4,947,425 0.22 0.24 1,802,392 1,062,248 2,456,141 1,574,852 193,290 176,378 3,847,963 4,403,028 OnePath Australian Shares Index Pool 6,585,346 7,508,503 0.10 0.11 2,715,446 1,446,711 2,862,511 2,143,572 358,290 512,691 5,324,521 5,338,627 OnePath Global Shares – Large Cap (Hedged) Index Pool 5,979,506 7,373,182 0.29 0.28 2,335,268 1,827,283 3,178,275 2,562,030 730,023 309,981 4,954,973 5,521,894 124. OnePath Wholesale Index Conservative Trust ANZ Australian Cash Fund 2,569,776 3,031,734 0.24 0.19 506,776 455,113 968,686 516,473 28,727 66,065 2,564,980 3,009,335 OnePath Australian Bonds Index Pool 2,109,284 2,521,458 0.11 0.12 553,332 403,209 968,779 603,935 94,705 89,891 1,901,101 2,244,005 OnePath Australian Shares Index Pool 1,443,021 1,713,386 0.02 0.02 773,306 497,540 896,528 591,819 77,788 118,510 1,166,776 1,218,236 OnePath Global Shares – Large Cap (Hedged) Index Pool 979,070 1,256,502 0.05 0.05 537,929 385,554 735,592 448,853 122,269 52,825 813,337 941,015 125. OnePath Wholesale Index Moderate Trust ANZ Australian Cash Fund 1,154,367 1,428,618 0.11 0.09 324,424 240,520 598,818 624,699 13,793 33,415 1,145,692 1,428,274 OnePath Australian Bonds Index Pool 1,107,490 1,379,363 0.06 0.07 382,991 264,425 660,596 726,469 49,725 49,175 989,919 1,237,179 OnePath Australian Shares Index Pool 1,125,760 1,398,563 0.02 0.02 608,940 302,488 733,914 730,862 64,914 100,869 910,223 997,481 OnePath Global Shares – Large Cap (Hedged) Index Pool 1,018,081 1,382,939 0.05 0.05 515,491 381,794 791,088 813,560 124,295 58,254 843,643 1,035,786 126. OnePath Wholesale Managed Growth Trust ANZ Australian Cash Fund 1,515,694 1,781,160 0.14 0.11 24,230,709 23,075,676 24,500,000 25,850,000 28,252 70,109 1,504,304 1,768,000 OnePath Australian Bonds Index Pool 36,302,558 39,223,745 1.83 1.94 1,398,344 1,477,647 4,282,000 4,800,000 1,629,951 1,398,344 32,448,682 34,907,699 OnePath Australian Inflation Protected Securities Index Pool 24,306 24,613 0.01 0.01 420 346 - - 1,143 420 21,323 20,966 OnePath Australian Shares Index Pool 109,135,491 130,672,711 1.73 1.84 16,493,123 8,901,948 24,786,900 29,958,800 5,864,011 9,155,225 88,240,506 92,909,710 OnePath Global Bonds (Hedged) Index Pool 35,397,129 33,035,464 1.39 1.21 15,000,000 750,520 12,720,000 3,141,000 1,757,235 - 27,438,420 25,626,766 OnePath Global Emerging Markets Shares (Unhedged) Index Pool 24,789,411 23,490,359 2.38 2.25 2,446,750 1,090,489 - 5,400,000 850,035 846,750 17,377,963 15,685,170 OnePath Global Listed Property (Hedged) Index Pool 23,863,405 31,472,112 2.26 2.56 240,863 4,295,110 2,868,000 9,688,521 482,404 240,863 21,541,151 23,359,587 OnePath Global Shares – Large Cap (Hedged) Index Pool 29,288,288 44,481,218 1.43 1.69 19,279,063 19,177,437 32,277,855 17,332,513 3,575,735 1,870,063 24,270,012 33,312,693 OnePath Global Shares – Large Cap (Unhedged) Index Pool 48,229,344 57,004,842 1.07 1.07 5,224,166 2,108,003 12,761,000 31,138,066 4,800,508 5,224,166 26,536,155 30,136,572 OnePath Global Shares – Small Cap (Unhedged) Index Pool 19,389,478 20,441,848 3.01 3.82 1,542,140 1,728,386 990,000 6,400,000 1,057,941 1,542,140 13,459,333 13,040,686 OptiMix Global Listed Infrastructure Securities Trust 28,653,331 33,790,834 22.40 21.91 417,825 2,105,501 3,436,000 2,900,000 39,517 380,948 52,178,300 57,104,513 OptiMix Wholesale Australian Fixed Interest Trust 39,727,681 56,986,164 11.27 12.99 4,053,223 2,962,727 20,265,659 7,000,000 3,118,285 3,006,028 39,621,352 55,275,810 OptiMix Wholesale Global (Hedged) Share Trust 30,600,598 60,760,793 15.31 17.32 14,918,305 27,561,739 39,899,938 20,684,025 3,517,596 2,801,076 42,520,847 66,031,445 OptiMix Wholesale Global Emerging Markets Share Trust 23,827,133 27,978,763 13.99 13.69 2,970,409 5,365,339 4,000,000 2,830,000 1,728,624 1,470,409 28,120,332 29,082,729 OptiMix Wholesale Global Share Trust 52,748,201 62,544,598 9.10 7.61 22,695,356 9,391,188 20,550,000 18,903,000 12,738,683 8,432,610 65,798,462 63,149,877 OptiMix Wholesale Global Smaller Companies Share Trust 8,238,819 6,919,248 7.72 6.46 2,626,824 3,363,655 855,000 4,500,000 297,925 838,815 11,602,282 9,332,700 OptiMix Wholesale International Fixed Interest Trust 33,625,695 39,525,834 13.44 13.01 1,061,225 1,650,837 5,410,000 16,204,000 2,800,713 1,061,225 36,947,366 41,636,294 OptiMix Wholesale International Inflation Linked Bonds Trust 103 102 100.00 100.00 - - - - - - 138 138 Pooled Australian Share Fund 129,910,017 155,676,978 67.80 67.36 6,822,770 9,349,238 14,944,457 37,861,183 4,967,743 9,019,457 61,984,710 65,229,101 Residual Asset Pool - FRNs 1,488 1,478 100.00 100.00 3 - - - 3 - 1,016 1,015 Wholesale Alternatives Defensive Trust 69,547,958 72,140,169 22.28 21.02 8,063,600 980,693 9,101,000 13,000,000 2,243,077 2,063,600 65,634,518 66,526,600 Wholesale Alternatives Growth Trust 98,731,806 141,277,658 23.26 23.47 4,878,702 18,122,392 33,620,981 22,900,000 10,416,661 856,233 98,234,755 124,453,431
Number of units held Fair value of unit holdings % Interest held
Units purchased/reinvested during the period
Units redeemed during the period
Distributions received/receivable(including Return of
Capital)

Financial Report Notes to the Financial Statements for the financial year ended 30 June 2020
379
11.5 Related party investments held by the Schemes
Name of entity 2020 2019 2020 2019 2020 2019 2020 2019 2020 2019 2020 2019 Name of related entity $ $ % % $ $ $ $ $ $
127. OnePath Wholesale Property Securities Trust ANZ OA OnePath Property Securities Trust 1,616,765 2,437,937 1.61 1.52 303,485 427,201 286,262 541,215 243,471 300,995 1,485,154 1,471,621 ANZ Property Securities Trust 61 89 - - 16 100 - - 19 13 63 53 128. OnePath Wholesale Select Leaders Trust ANZ Select Leaders Pool 75,923,872 99,981,236 26.05 79.09 4,271,348 34,472,246 19,164,997 13,584,378 3,496,765 4,206,206 45,017,784 53,125,102 129. OptiMix Australian Fixed Interest Trust OptiMix Wholesale Australian Fixed Interest Trust 3,394,919 3,621,203 0.96 0.83 561,496 285,111 690,919 1,504,670 247,757 197,542 3,385,832 3,532,007 130. OptiMix Australian Share Trust OptiMix Wholesale Australian Share Trust 9,637,438 12,974,442 1.10 1.20 1,248,230 1,709,174 2,711,062 2,453,216 856,678 1,359,189 11,056,040 12,467,632 131. OptiMix Balanced Trust OptiMix Wholesale Balanced Trust 31,984,482 39,630,718 3.55 3.42 2,609,950 3,703,998 5,952,669 6,557,881 3,200,931 2,524,054 35,314,578 38,377,934 132. OptiMix Conservative Trust OptiMix Wholesale Conservative Trust 9,178,949 11,682,999 3.94 4.36 382,587 833,362 2,386,959 2,582,865 541,278 400,772 8,917,014 10,786,399 133. OptiMix Global Emerging Markets Share Trust OptiMix Wholesale Global Emerging Markets Share Trust 3,029,913 3,210,108 1.80 1.57 848,731 985,931 640,426 1,029,874 219,816 168,706 3,611,983 3,336,770 134. OptiMix Global Share Trust OptiMix Wholesale Global Share Trust 4,442,200 5,991,994 0.77 0.73 794,174 680,185 1,331,440 1,671,355 1,078,293 804,716 5,567,673 6,049,981 135. OptiMix Global Smaller Companies Share Trust OptiMix Wholesale Global Smaller Companies Share Trust 2,657,558 2,899,477 2.49 2.71 626,749 1,222,639 756,382 723,900 95,848 337,492 3,742,495 3,910,822 136. OptiMix Growth Trust OptiMix Wholesale Growth Trust 10,210,529 13,459,587 2.01 2.01 631,444 581,877 2,371,583 1,319,959 1,037,858 621,748 9,097,081 10,423,669 137. OptiMix High Growth Trust OptiMix Wholesale High Growth Trust 3,646,151 4,592,139 1.73 1.72 353,295 682,556 680,242 2,265,407 387,519 396,797 4,186,653 4,499,301 138. OptiMix Moderate Trust OptiMix Wholesale Moderate Trust 6,879,374 8,341,363 1.89 1.83 450,162 439,257 1,400,682 2,377,354 383,732 268,973 6,665,213 7,546,274 139. OptiMix Property Securities Trust OptiMix Wholesale Property Securities Trust 3,094,939 4,946,447 9.43 9.22 239,652 252,437 962,114 933,979 170,422 163,823 4,823,927 5,620,951 140. OptiMix Wholesale Balanced Trust ANZ Australian Cash Fund 6,126,973 936,045 0.57 0.06 16,026,218 14,579,994 10,830,000 14,750,000 27,830 79,579 6,080,932 929,129 OnePath Global Listed Property (Hedged) Index Pool 26,360,875 35,294,810 2.50 2.87 270,119 4,145,627 3,733,000 10,828,666 532,890 270,119 23,795,580 26,196,913 OptiMix Global Listed Infrastructure Securities Trust 30,607,813 38,067,643 23.93 24.69 132,738 2,281,344 5,142,000 1,750,000 42,212 417,836 55,737,452 64,332,068 OptiMix Wholesale Australian Fixed Interest Trust 82,782,695 102,007,161 23.49 23.26 8,744,082 4,410,512 25,685,000 12,150,000 6,299,472 5,406,536 82,561,132 98,945,569 OptiMix Wholesale Australian Share Trust 254,165,456 310,092,972 29.02 28.77 36,396,040 42,189,942 46,071,302 77,596,925 21,780,939 32,597,909 290,868,577 297,980,061 OptiMix Wholesale Enhanced Cash Trust 2,617,532 2,382,474 11.74 10.46 236,317 143,196 - 3,000,000 28,284 105,975 2,643,055 2,404,571 OptiMix Wholesale Global (Hedged) Share Trust 65,800,146 109,654,349 31.27 31.26 23,871,889 38,382,457 56,166,914 35,834,880 7,563,849 5,055,071 86,881,424 119,166,237 OptiMix Wholesale Global Emerging Markets Share Trust 51,117,726 62,118,389 30.01 30.39 5,914,599 10,913,183 10,500,000 6,070,000 3,708,517 3,264,599 60,328,172 64,569,414 OptiMix Wholesale Global Share Trust 102,514,240 133,764,371 17.68 16.28 32,621,492 16,075,159 41,226,845 56,405,947 24,818,358 18,052,691 127,876,953 135,058,883 OptiMix Wholesale Global Smaller Companies Share Trust 31,138,913 30,290,181 29.18 28.28 3,888,043 14,689,925 1,537,000 13,800,000 1,135,361 3,548,453 43,851,239 40,855,477 OptiMix Wholesale International Fixed Interest Trust 66,306,608 79,978,773 26.50 26.33 3,647,343 3,964,244 14,360,000 37,290,000 5,522,734 2,147,343 72,856,620 84,249,195 Wholesale Alternatives Defensive Trust 75,231,692 80,850,847 24.10 23.56 9,812,773 1,123,743 13,781,000 16,700,000 2,426,390 2,312,773 70,998,429 74,559,458
Number of units held Fair value of unit holdings % Interest held
Units purchased/reinvested during the period
Units redeemed during the period
Distributions received/receivable(including Return of
Capital)
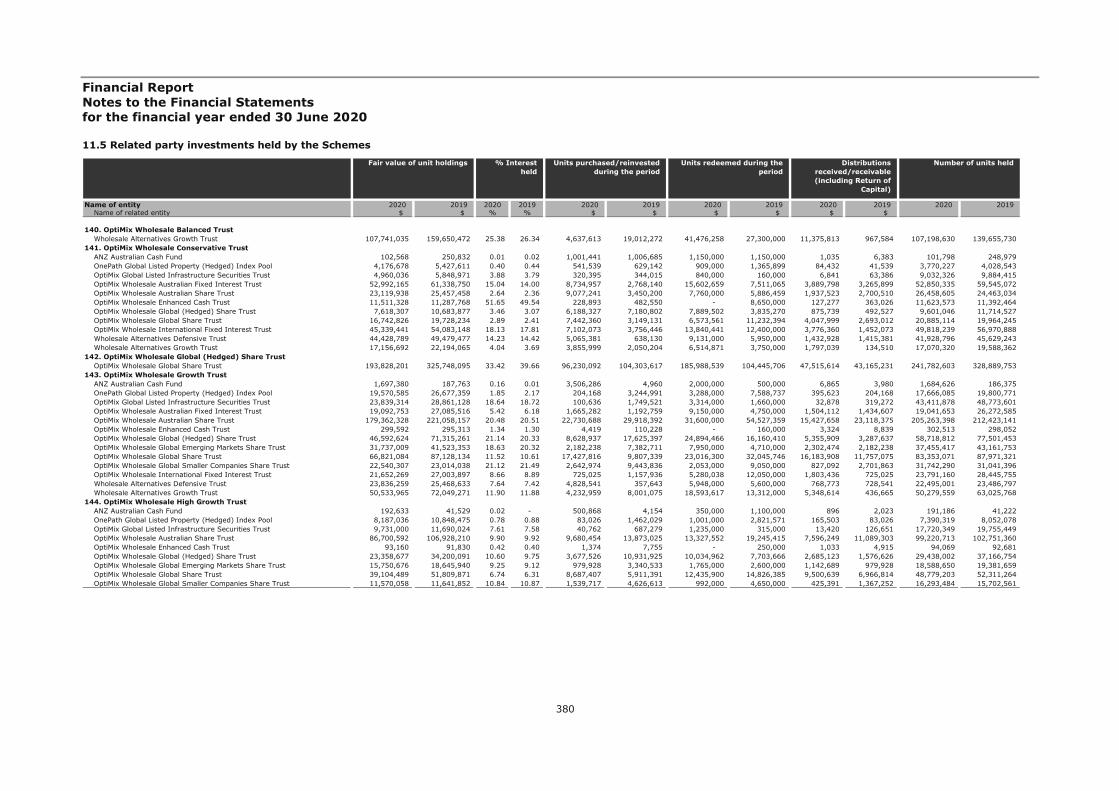
Financial Report Notes to the Financial Statements for the financial year ended 30 June 2020
380
11.5 Related party investments held by the Schemes
Name of entity 2020 2019 2020 2019 2020 2019 2020 2019 2020 2019 2020 2019 Name of related entity $ $ % % $ $ $ $ $ $
140. OptiMix Wholesale Balanced Trust Wholesale Alternatives Growth Trust 107,741,035 159,650,472 25.38 26.34 4,637,613 19,012,272 41,476,258 27,300,000 11,375,813 967,584 107,198,630 139,655,730 141. OptiMix Wholesale Conservative Trust ANZ Australian Cash Fund 102,568 250,832 0.01 0.02 1,001,441 1,006,685 1,150,000 1,150,000 1,035 6,383 101,798 248,979 OnePath Global Listed Property (Hedged) Index Pool 4,176,678 5,427,611 0.40 0.44 541,539 629,142 909,000 1,365,899 84,432 41,539 3,770,227 4,028,543 OptiMix Global Listed Infrastructure Securities Trust 4,960,036 5,848,971 3.88 3.79 320,395 344,015 840,000 160,000 6,841 63,386 9,032,326 9,884,415 OptiMix Wholesale Australian Fixed Interest Trust 52,992,165 61,338,750 15.04 14.00 8,734,957 2,768,140 15,602,659 7,511,065 3,889,798 3,265,899 52,850,335 59,545,072 OptiMix Wholesale Australian Share Trust 23,119,938 25,457,458 2.64 2.36 9,077,241 3,450,200 7,760,000 5,886,459 1,937,523 2,700,510 26,458,605 24,463,034 OptiMix Wholesale Enhanced Cash Trust 11,511,328 11,287,768 51.65 49.54 228,893 482,550 - 8,650,000 127,277 363,026 11,623,573 11,392,464 OptiMix Wholesale Global (Hedged) Share Trust 7,618,307 10,683,877 3.46 3.07 6,188,327 7,180,802 7,889,502 3,835,270 875,739 492,527 9,601,046 11,714,527 OptiMix Wholesale Global Share Trust 16,742,826 19,728,234 2.89 2.41 7,442,360 3,149,131 6,573,561 11,232,394 4,047,999 2,693,012 20,885,114 19,964,245 OptiMix Wholesale International Fixed Interest Trust 45,339,441 54,083,148 18.13 17.81 7,102,073 3,756,446 13,840,441 12,400,000 3,776,360 1,452,073 49,818,239 56,970,888 Wholesale Alternatives Defensive Trust 44,428,789 49,479,477 14.23 14.42 5,065,381 638,130 9,131,000 5,950,000 1,432,928 1,415,381 41,928,796 45,629,243 Wholesale Alternatives Growth Trust 17,156,692 22,194,065 4.04 3.69 3,855,999 2,050,204 6,514,871 3,750,000 1,797,039 134,510 17,070,320 19,588,362 142. OptiMix Wholesale Global (Hedged) Share Trust OptiMix Wholesale Global Share Trust 193,828,201 325,748,095 33.42 39.66 96,230,092 104,303,617 185,988,539 104,445,706 47,515,614 43,165,231 241,782,603 328,889,753 143. OptiMix Wholesale Growth Trust ANZ Australian Cash Fund 1,697,380 187,763 0.16 0.01 3,506,286 4,960 2,000,000 500,000 6,865 3,980 1,684,626 186,375 OnePath Global Listed Property (Hedged) Index Pool 19,570,585 26,677,359 1.85 2.17 204,168 3,244,991 3,288,000 7,588,737 395,623 204,168 17,666,085 19,800,771 OptiMix Global Listed Infrastructure Securities Trust 23,839,314 28,861,128 18.64 18.72 100,636 1,749,521 3,314,000 1,660,000 32,878 319,272 43,411,878 48,773,601 OptiMix Wholesale Australian Fixed Interest Trust 19,092,753 27,085,516 5.42 6.18 1,665,282 1,192,759 9,150,000 4,750,000 1,504,112 1,434,607 19,041,653 26,272,585 OptiMix Wholesale Australian Share Trust 179,362,328 221,058,157 20.48 20.51 22,730,688 29,918,392 31,600,000 54,527,359 15,427,658 23,118,375 205,263,398 212,423,141 OptiMix Wholesale Enhanced Cash Trust 299,592 295,313 1.34 1.30 4,419 110,228 - 160,000 3,324 8,839 302,513 298,052 OptiMix Wholesale Global (Hedged) Share Trust 46,592,624 71,315,261 21.14 20.33 8,628,937 17,625,397 24,894,466 16,160,410 5,355,909 3,287,637 58,718,812 77,501,453 OptiMix Wholesale Global Emerging Markets Share Trust 31,737,009 41,523,353 18.63 20.32 2,182,238 7,382,711 7,950,000 4,710,000 2,302,474 2,182,238 37,455,417 43,161,753 OptiMix Wholesale Global Share Trust 66,821,084 87,128,134 11.52 10.61 17,427,816 9,807,339 23,016,300 32,045,746 16,183,908 11,757,075 83,353,071 87,971,321 OptiMix Wholesale Global Smaller Companies Share Trust 22,540,307 23,014,038 21.12 21.49 2,642,974 9,443,836 2,053,000 9,050,000 827,092 2,701,863 31,742,290 31,041,396 OptiMix Wholesale International Fixed Interest Trust 21,652,269 27,003,897 8.66 8.89 725,025 1,157,936 5,280,038 12,050,000 1,803,436 725,025 23,791,160 28,445,755 Wholesale Alternatives Defensive Trust 23,836,259 25,468,633 7.64 7.42 4,828,541 357,643 5,948,000 5,600,000 768,773 728,541 22,495,001 23,486,797 Wholesale Alternatives Growth Trust 50,533,965 72,049,271 11.90 11.88 4,232,959 8,001,075 18,593,617 13,312,000 5,348,614 436,665 50,279,559 63,025,768 144. OptiMix Wholesale High Growth Trust ANZ Australian Cash Fund 192,633 41,529 0.02 - 500,868 4,154 350,000 1,100,000 896 2,023 191,186 41,222 OnePath Global Listed Property (Hedged) Index Pool 8,187,036 10,848,475 0.78 0.88 83,026 1,462,029 1,001,000 2,821,571 165,503 83,026 7,390,319 8,052,078 OptiMix Global Listed Infrastructure Securities Trust 9,731,000 11,690,024 7.61 7.58 40,762 687,279 1,235,000 315,000 13,420 126,651 17,720,349 19,755,449 OptiMix Wholesale Australian Share Trust 86,700,592 106,928,210 9.90 9.92 9,680,454 13,873,025 13,327,552 19,245,415 7,596,249 11,089,303 99,220,713 102,751,360 OptiMix Wholesale Enhanced Cash Trust 93,160 91,830 0.42 0.40 1,374 7,755 - 250,000 1,033 4,915 94,069 92,681 OptiMix Wholesale Global (Hedged) Share Trust 23,358,677 34,200,091 10.60 9.75 3,677,526 10,931,925 10,034,962 7,703,666 2,685,123 1,576,626 29,438,002 37,166,754 OptiMix Wholesale Global Emerging Markets Share Trust 15,750,676 18,645,940 9.25 9.12 979,928 3,340,533 1,765,000 2,600,000 1,142,689 979,928 18,588,650 19,381,659 OptiMix Wholesale Global Share Trust 39,104,489 51,809,871 6.74 6.31 8,687,407 5,911,391 12,435,900 14,826,385 9,500,639 6,966,814 48,779,203 52,311,264 OptiMix Wholesale Global Smaller Companies Share Trust 11,570,058 11,641,852 10.84 10.87 1,539,717 4,626,613 992,000 4,650,000 425,391 1,367,252 16,293,484 15,702,561
Number of units held Fair value of unit holdings % Interest held
Units purchased/reinvested during the period
Units redeemed during the period
Distributions received/receivable(including Return of
Capital)
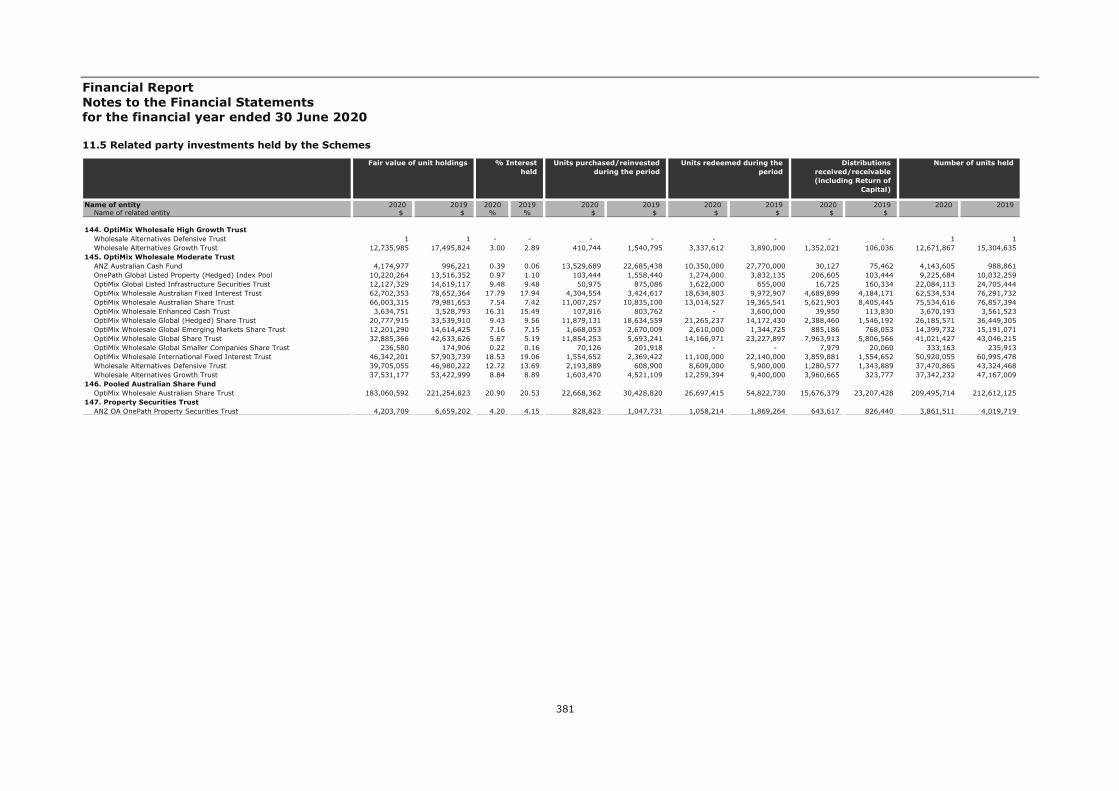
Financial Report Notes to the Financial Statements for the financial year ended 30 June 2020
381
11.5 Related party investments held by the Schemes
Name of entity 2020 2019 2020 2019 2020 2019 2020 2019 2020 2019 2020 2019 Name of related entity $ $ % % $ $ $ $ $ $
144. OptiMix Wholesale High Growth Trust Wholesale Alternatives Defensive Trust 1 1 - - - - - - - - 1 1 Wholesale Alternatives Growth Trust 12,735,985 17,495,824 3.00 2.89 410,744 1,540,795 3,337,612 3,890,000 1,352,021 106,036 12,671,867 15,304,635 145. OptiMix Wholesale Moderate Trust ANZ Australian Cash Fund 4,174,977 996,221 0.39 0.06 13,529,689 22,685,438 10,350,000 27,770,000 30,127 75,462 4,143,605 988,861 OnePath Global Listed Property (Hedged) Index Pool 10,220,264 13,516,352 0.97 1.10 103,444 1,558,440 1,274,000 3,832,135 206,605 103,444 9,225,684 10,032,259 OptiMix Global Listed Infrastructure Securities Trust 12,127,329 14,619,117 9.48 9.48 50,975 875,086 1,622,000 655,000 16,725 160,334 22,084,113 24,705,444 OptiMix Wholesale Australian Fixed Interest Trust 62,702,353 78,652,364 17.79 17.94 4,304,554 3,424,617 18,634,803 9,972,907 4,689,899 4,184,171 62,534,534 76,291,732 OptiMix Wholesale Australian Share Trust 66,003,315 79,981,653 7.54 7.42 11,007,257 10,835,100 13,014,527 19,365,541 5,621,903 8,405,445 75,534,616 76,857,394 OptiMix Wholesale Enhanced Cash Trust 3,634,751 3,528,793 16.31 15.49 107,816 803,762 - 3,600,000 39,950 113,830 3,670,193 3,561,523 OptiMix Wholesale Global (Hedged) Share Trust 20,777,915 33,539,910 9.43 9.56 11,879,131 18,634,559 21,265,237 14,172,430 2,388,460 1,546,192 26,185,571 36,449,305 OptiMix Wholesale Global Emerging Markets Share Trust 12,201,290 14,614,425 7.16 7.15 1,668,053 2,670,009 2,610,000 1,344,725 885,186 768,053 14,399,732 15,191,071 OptiMix Wholesale Global Share Trust 32,885,366 42,633,626 5.67 5.19 11,854,253 5,693,241 14,166,971 23,227,897 7,963,913 5,806,566 41,021,427 43,046,215 OptiMix Wholesale Global Smaller Companies Share Trust 236,580 174,906 0.22 0.16 70,126 201,918 - - 7,979 20,060 333,163 235,913 OptiMix Wholesale International Fixed Interest Trust 46,342,201 57,903,739 18.53 19.06 1,554,652 2,369,422 11,100,000 22,140,000 3,859,881 1,554,652 50,920,055 60,995,478 Wholesale Alternatives Defensive Trust 39,705,055 46,980,222 12.72 13.69 2,193,889 608,900 8,609,000 5,900,000 1,280,577 1,343,889 37,470,865 43,324,468 Wholesale Alternatives Growth Trust 37,531,177 53,422,999 8.84 8.89 1,603,470 4,521,109 12,259,394 9,400,000 3,960,665 323,777 37,342,232 47,167,009 146. Pooled Australian Share Fund OptiMix Wholesale Australian Share Trust 183,060,592 221,254,823 20.90 20.53 22,668,362 30,428,820 26,697,415 54,822,730 15,676,379 23,207,428 209,495,714 212,612,125 147. Property Securities Trust ANZ OA OnePath Property Securities Trust 4,203,709 6,659,202 4.20 4.15 828,823 1,047,731 1,058,214 1,869,264 643,617 826,440 3,861,511 4,019,719
Number of units held Fair value of unit holdings % Interest held
Units purchased/reinvested during the period
Units redeemed during the period
Distributions received/receivable(including Return of
Capital)
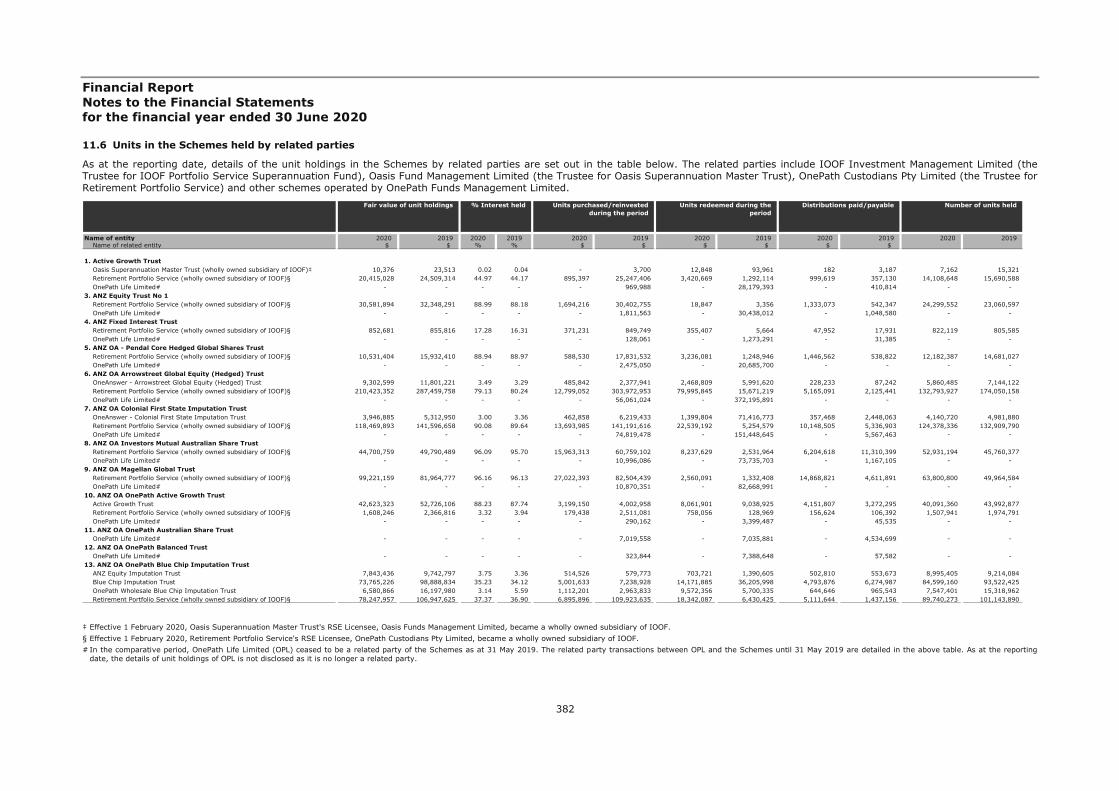
Financial Report Notes to the Financial Statements for the financial year ended 30 June 2020
382
11.6 Units in the Schemes held by related parties
As at the reporting date, details of the unit holdings in the Schemes by related parties are set out in the table below. The related parties include IOOF Investment Management Limited (the Trustee for IOOF Portfolio Service Superannuation Fund), Oasis Fund Management Limited (the Trustee for Oasis Superannuation Master Trust), OnePath Custodians Pty Limited (the Trustee for Retirement Portfolio Service) and other schemes operated by OnePath Funds Management Limited.
‡ Effective 1 February 2020, Oasis Superannuation Master Trust's RSE Licensee, Oasis Funds Management Limited, became a wholly owned subsidiary of IOOF. § Effective 1 February 2020, Retirement Portfolio Service's RSE Licensee, OnePath Custodians Pty Limited, became a wholly owned subsidiary of IOOF. # In the comparative period, OnePath Life Limited (OPL) ceased to be a related party of the Schemes as at 31 May 2019. The related party transactions between OPL and the Schemes until 31 May 2019 are detailed in the above table. As at the reporting
date, the details of unit holdings of OPL is not disclosed as it is no longer a related party.
Name of entity 2020 2019 2020 2019 2020 2019 2020 2019 2020 2019 2020 2019 Name of related entity $ $ % % $ $ $ $ $ $
1. Active Growth Trust Oasis Superannuation Master Trust (wholly owned subsidiary of IOOF)‡ 10,376 23,513 0.02 0.04 - 3,700 12,848 93,961 182 3,187 7,162 15,321 Retirement Portfolio Service (wholly owned subsidiary of IOOF)§ 20,415,028 24,509,314 44.97 44.17 895,397 25,247,406 3,420,669 1,292,114 999,619 357,130 14,108,648 15,690,588 OnePath Life Limited# - - - - - 969,988 - 28,179,393 - 410,814 - - 3. ANZ Equity Trust No 1 Retirement Portfolio Service (wholly owned subsidiary of IOOF)§ 30,581,894 32,348,291 88.99 88.18 1,694,216 30,402,755 18,847 3,356 1,333,073 542,347 24,299,552 23,060,597 OnePath Life Limited# - - - - - 1,811,563 - 30,438,012 - 1,048,580 - - 4. ANZ Fixed Interest Trust Retirement Portfolio Service (wholly owned subsidiary of IOOF)§ 852,681 855,816 17.28 16.31 371,231 849,749 355,407 5,664 47,952 17,931 822,119 805,585 OnePath Life Limited# - - - - - 128,061 - 1,273,291 - 31,385 - - 5. ANZ OA - Pendal Core Hedged Global Shares Trust Retirement Portfolio Service (wholly owned subsidiary of IOOF)§ 10,531,404 15,932,410 88.94 88.97 588,530 17,831,532 3,236,081 1,248,946 1,446,562 538,822 12,182,387 14,681,027 OnePath Life Limited# - - - - - 2,475,050 - 20,685,700 - - - - 6. ANZ OA Arrowstreet Global Equity (Hedged) Trust OneAnswer - Arrowstreet Global Equity (Hedged) Trust 9,302,599 11,801,221 3.49 3.29 485,842 2,377,941 2,468,809 5,991,620 228,233 87,242 5,860,485 7,144,122 Retirement Portfolio Service (wholly owned subsidiary of IOOF)§ 210,423,352 287,459,758 79.13 80.24 12,799,052 303,972,953 79,995,845 15,671,219 5,165,091 2,125,441 132,793,927 174,050,158 OnePath Life Limited# - - - - - 56,061,024 - 372,195,891 - - - - 7. ANZ OA Colonial First State Imputation Trust OneAnswer - Colonial First State Imputation Trust 3,946,885 5,312,950 3.00 3.36 462,858 6,219,433 1,399,804 71,416,773 357,468 2,448,063 4,140,720 4,981,880 Retirement Portfolio Service (wholly owned subsidiary of IOOF)§ 118,469,893 141,596,658 90.08 89.64 13,693,985 141,191,616 22,539,192 5,254,579 10,148,505 5,336,903 124,378,336 132,909,790 OnePath Life Limited# - - - - - 74,819,478 - 151,448,645 - 5,567,463 - - 8. ANZ OA Investors Mutual Australian Share Trust Retirement Portfolio Service (wholly owned subsidiary of IOOF)§ 44,700,759 49,790,489 96.09 95.70 15,963,313 60,759,102 8,237,629 2,531,964 6,204,618 11,310,399 52,931,194 45,760,377 OnePath Life Limited# - - - - - 10,996,086 - 73,735,703 - 1,167,105 - - 9. ANZ OA Magellan Global Trust Retirement Portfolio Service (wholly owned subsidiary of IOOF)§ 99,221,159 81,964,777 96.16 96.13 27,022,393 82,504,439 2,560,091 1,332,408 14,868,821 4,611,891 63,800,800 49,964,584 OnePath Life Limited# - - - - - 10,870,351 - 82,668,991 - - - - 10. ANZ OA OnePath Active Growth Trust Active Growth Trust 42,623,323 52,726,106 88.23 87.74 3,199,150 4,002,958 8,061,901 9,038,925 4,151,807 3,272,295 40,091,360 43,992,877 Retirement Portfolio Service (wholly owned subsidiary of IOOF)§ 1,608,246 2,366,816 3.32 3.94 179,438 2,511,081 758,056 128,969 156,624 106,392 1,507,941 1,974,791 OnePath Life Limited# - - - - - 290,162 - 3,399,487 - 45,535 - - 11. ANZ OA OnePath Australian Share Trust OnePath Life Limited# - - - - - 7,019,558 - 7,035,881 - 4,534,699 - - 12. ANZ OA OnePath Balanced Trust OnePath Life Limited# - - - - - 323,844 - 7,388,648 - 57,582 - - 13. ANZ OA OnePath Blue Chip Imputation Trust ANZ Equity Imputation Trust 7,843,436 9,742,797 3.75 3.36 514,526 579,773 703,721 1,390,605 502,810 553,673 8,995,405 9,214,084 Blue Chip Imputation Trust 73,765,226 98,888,834 35.23 34.12 5,001,633 7,238,928 14,171,885 36,205,998 4,793,876 6,274,987 84,599,160 93,522,425 OnePath Wholesale Blue Chip Imputation Trust 6,580,866 16,197,980 3.14 5.59 1,112,201 2,963,833 9,572,356 5,700,335 644,646 965,543 7,547,401 15,318,962 Retirement Portfolio Service (wholly owned subsidiary of IOOF)§ 78,247,957 106,947,625 37.37 36.90 6,895,896 109,923,635 18,342,087 6,430,425 5,111,644 1,437,156 89,740,273 101,143,890
Number of units held Fair value of unit holdings % Interest held Units purchased/reinvested during the period
Units redeemed during the period
Distributions paid/payable
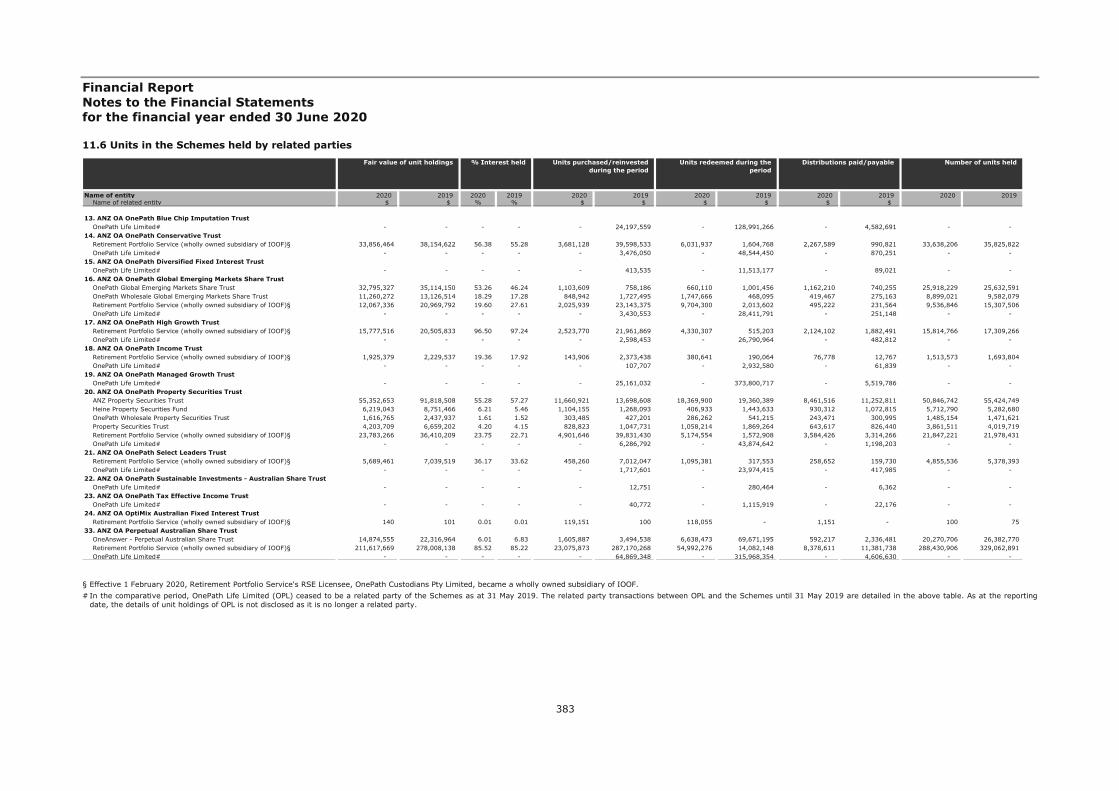
Financial Report Notes to the Financial Statements for the financial year ended 30 June 2020
383
11.6 Units in the Schemes held by related parties
§ Effective 1 February 2020, Retirement Portfolio Service's RSE Licensee, OnePath Custodians Pty Limited, became a wholly owned subsidiary of IOOF. # In the comparative period, OnePath Life Limited (OPL) ceased to be a related party of the Schemes as at 31 May 2019. The related party transactions between OPL and the Schemes until 31 May 2019 are detailed in the above table. As at the reporting
date, the details of unit holdings of OPL is not disclosed as it is no longer a related party.
Name of entity 2020 2019 2020 2019 2020 2019 2020 2019 2020 2019 2020 2019 Name of related entity $ $ % % $ $ $ $ $ $
13. ANZ OA OnePath Blue Chip Imputation Trust OnePath Life Limited# - - - - - 24,197,559 - 128,991,266 - 4,582,691 - - 14. ANZ OA OnePath Conservative Trust Retirement Portfolio Service (wholly owned subsidiary of IOOF)§ 33,856,464 38,154,622 56.38 55.28 3,681,128 39,598,533 6,031,937 1,604,768 2,267,589 990,821 33,638,206 35,825,822 OnePath Life Limited# - - - - - 3,476,050 - 48,544,450 - 870,251 - - 15. ANZ OA OnePath Diversified Fixed Interest Trust OnePath Life Limited# - - - - - 413,535 - 11,513,177 - 89,021 - - 16. ANZ OA OnePath Global Emerging Markets Share Trust OnePath Global Emerging Markets Share Trust 32,795,327 35,114,150 53.26 46.24 1,103,609 758,186 660,110 1,001,456 1,162,210 740,255 25,918,229 25,632,591 OnePath Wholesale Global Emerging Markets Share Trust 11,260,272 13,126,514 18.29 17.28 848,942 1,727,495 1,747,666 468,095 419,467 275,163 8,899,021 9,582,079 Retirement Portfolio Service (wholly owned subsidiary of IOOF)§ 12,067,336 20,969,792 19.60 27.61 2,025,939 23,143,375 9,704,300 2,013,602 495,222 231,564 9,536,846 15,307,506 OnePath Life Limited# - - - - - 3,430,553 - 28,411,791 - 251,148 - - 17. ANZ OA OnePath High Growth Trust Retirement Portfolio Service (wholly owned subsidiary of IOOF)§ 15,777,516 20,505,833 96.50 97.24 2,523,770 21,961,869 4,330,307 515,203 2,124,102 1,882,491 15,814,766 17,309,266 OnePath Life Limited# - - - - - 2,598,453 - 26,790,964 - 482,812 - - 18. ANZ OA OnePath Income Trust Retirement Portfolio Service (wholly owned subsidiary of IOOF)§ 1,925,379 2,229,537 19.36 17.92 143,906 2,373,438 380,641 190,064 76,778 12,767 1,513,573 1,693,804 OnePath Life Limited# - - - - - 107,707 - 2,932,580 - 61,839 - - 19. ANZ OA OnePath Managed Growth Trust OnePath Life Limited# - - - - - 25,161,032 - 373,800,717 - 5,519,786 - - 20. ANZ OA OnePath Property Securities Trust ANZ Property Securities Trust 55,352,653 91,818,508 55.28 57.27 11,660,921 13,698,608 18,369,900 19,360,389 8,461,516 11,252,811 50,846,742 55,424,749 Heine Property Securities Fund 6,219,043 8,751,466 6.21 5.46 1,104,155 1,268,093 406,933 1,443,633 930,312 1,072,815 5,712,790 5,282,680 OnePath Wholesale Property Securities Trust 1,616,765 2,437,937 1.61 1.52 303,485 427,201 286,262 541,215 243,471 300,995 1,485,154 1,471,621 Property Securities Trust 4,203,709 6,659,202 4.20 4.15 828,823 1,047,731 1,058,214 1,869,264 643,617 826,440 3,861,511 4,019,719 Retirement Portfolio Service (wholly owned subsidiary of IOOF)§ 23,783,266 36,410,209 23.75 22.71 4,901,646 39,831,430 5,174,554 1,572,908 3,584,426 3,314,266 21,847,221 21,978,431 OnePath Life Limited# - - - - - 6,286,792 - 43,874,642 - 1,198,203 - - 21. ANZ OA OnePath Select Leaders Trust Retirement Portfolio Service (wholly owned subsidiary of IOOF)§ 5,689,461 7,039,519 36.17 33.62 458,260 7,012,047 1,095,381 317,553 258,652 159,730 4,855,536 5,378,393 OnePath Life Limited# - - - - - 1,717,601 - 23,974,415 - 417,985 - - 22. ANZ OA OnePath Sustainable Investments - Australian Share Trust OnePath Life Limited# - - - - - 12,751 - 280,464 - 6,362 - - 23. ANZ OA OnePath Tax Effective Income Trust OnePath Life Limited# - - - - - 40,772 - 1,115,919 - 22,176 - - 24. ANZ OA OptiMix Australian Fixed Interest Trust Retirement Portfolio Service (wholly owned subsidiary of IOOF)§ 140 101 0.01 0.01 119,151 100 118,055 - 1,151 - 100 75 33. ANZ OA Perpetual Australian Share Trust OneAnswer - Perpetual Australian Share Trust 14,874,555 22,316,964 6.01 6.83 1,605,887 3,494,538 6,638,473 69,671,195 592,217 2,336,481 20,270,706 26,382,770 Retirement Portfolio Service (wholly owned subsidiary of IOOF)§ 211,617,669 278,008,138 85.52 85.22 23,075,873 287,170,268 54,992,276 14,082,148 8,378,611 11,381,738 288,430,906 329,062,891 OnePath Life Limited# - - - - - 64,869,348 - 315,968,354 - 4,606,630 - -
Number of units held Fair value of unit holdings % Interest held Units purchased/reinvested during the period
Units redeemed during the period
Distributions paid/payable
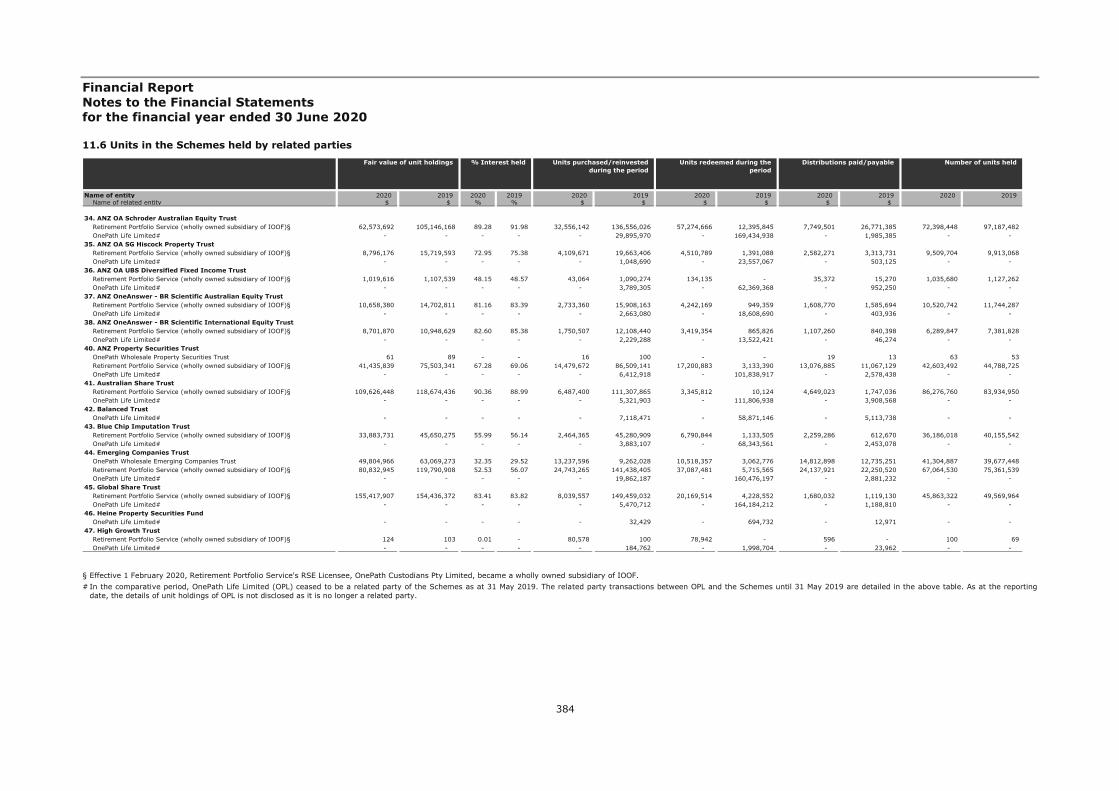
Financial Report Notes to the Financial Statements for the financial year ended 30 June 2020
384
11.6 Units in the Schemes held by related parties
§ Effective 1 February 2020, Retirement Portfolio Service's RSE Licensee, OnePath Custodians Pty Limited, became a wholly owned subsidiary of IOOF. # In the comparative period, OnePath Life Limited (OPL) ceased to be a related party of the Schemes as at 31 May 2019. The related party transactions between OPL and the Schemes until 31 May 2019 are detailed in the above table. As at the reporting
date, the details of unit holdings of OPL is not disclosed as it is no longer a related party.
Name of entity 2020 2019 2020 2019 2020 2019 2020 2019 2020 2019 2020 2019 Name of related entity $ $ % % $ $ $ $ $ $
34. ANZ OA Schroder Australian Equity Trust Retirement Portfolio Service (wholly owned subsidiary of IOOF)§ 62,573,692 105,146,168 89.28 91.98 32,556,142 136,556,026 57,274,666 12,395,845 7,749,501 26,771,385 72,398,448 97,187,482 OnePath Life Limited# - - - - - 29,895,970 - 169,434,938 - 1,985,385 - - 35. ANZ OA SG Hiscock Property Trust Retirement Portfolio Service (wholly owned subsidiary of IOOF)§ 8,796,176 15,719,593 72.95 75.38 4,109,671 19,663,406 4,510,789 1,391,088 2,582,271 3,313,731 9,509,704 9,913,068 OnePath Life Limited# - - - - - 1,048,690 - 23,557,067 - 503,125 - - 36. ANZ OA UBS Diversified Fixed Income Trust Retirement Portfolio Service (wholly owned subsidiary of IOOF)§ 1,019,616 1,107,539 48.15 48.57 43,064 1,090,274 134,135 - 35,372 15,270 1,035,680 1,127,262 OnePath Life Limited# - - - - - 3,789,305 - 62,369,368 - 952,250 - - 37. ANZ OneAnswer - BR Scientific Australian Equity Trust Retirement Portfolio Service (wholly owned subsidiary of IOOF)§ 10,658,380 14,702,811 81.16 83.39 2,733,360 15,908,163 4,242,169 949,359 1,608,770 1,585,694 10,520,742 11,744,287 OnePath Life Limited# - - - - - 2,663,080 - 18,608,690 - 403,936 - - 38. ANZ OneAnswer - BR Scientific International Equity Trust Retirement Portfolio Service (wholly owned subsidiary of IOOF)§ 8,701,870 10,948,629 82.60 85.38 1,750,507 12,108,440 3,419,354 865,826 1,107,260 840,398 6,289,847 7,381,828 OnePath Life Limited# - - - - - 2,229,288 - 13,522,421 - 46,274 - - 40. ANZ Property Securities Trust OnePath Wholesale Property Securities Trust 61 89 - - 16 100 - - 19 13 63 53 Retirement Portfolio Service (wholly owned subsidiary of IOOF)§ 41,435,839 75,503,341 67.28 69.06 14,479,672 86,509,141 17,200,883 3,133,390 13,076,885 11,067,129 42,603,492 44,788,725 OnePath Life Limited# - - - - - 6,412,918 - 101,838,917 - 2,578,438 - - 41. Australian Share Trust Retirement Portfolio Service (wholly owned subsidiary of IOOF)§ 109,626,448 118,674,436 90.36 88.99 6,487,400 111,307,865 3,345,812 10,124 4,649,023 1,747,036 86,276,760 83,934,950 OnePath Life Limited# - - - - - 5,321,903 - 111,806,938 - 3,908,568 - - 42. Balanced Trust OnePath Life Limited# - - - - - 7,118,471 - 58,871,146 - 5,113,738 - - 43. Blue Chip Imputation Trust Retirement Portfolio Service (wholly owned subsidiary of IOOF)§ 33,883,731 45,650,275 55.99 56.14 2,464,365 45,280,909 6,790,844 1,133,505 2,259,286 612,670 36,186,018 40,155,542 OnePath Life Limited# - - - - - 3,883,107 - 68,343,561 - 2,453,078 - - 44. Emerging Companies Trust OnePath Wholesale Emerging Companies Trust 49,804,966 63,069,273 32.35 29.52 13,237,596 9,262,028 10,518,357 3,062,776 14,812,898 12,735,251 41,304,887 39,677,448 Retirement Portfolio Service (wholly owned subsidiary of IOOF)§ 80,832,945 119,790,908 52.53 56.07 24,743,265 141,438,405 37,087,481 5,715,565 24,137,921 22,250,520 67,064,530 75,361,539 OnePath Life Limited# - - - - - 19,862,187 - 160,476,197 - 2,881,232 - - 45. Global Share Trust Retirement Portfolio Service (wholly owned subsidiary of IOOF)§ 155,417,907 154,436,372 83.41 83.82 8,039,557 149,459,032 20,169,514 4,228,552 1,680,032 1,119,130 45,863,322 49,569,964 OnePath Life Limited# - - - - - 5,470,712 - 164,184,212 - 1,188,810 - - 46. Heine Property Securities Fund OnePath Life Limited# - - - - - 32,429 - 694,732 - 12,971 - - 47. High Growth Trust Retirement Portfolio Service (wholly owned subsidiary of IOOF)§ 124 103 0.01 - 80,578 100 78,942 - 596 - 100 69 OnePath Life Limited# - - - - - 184,762 - 1,998,704 - 23,962 - -
Number of units held Fair value of unit holdings % Interest held Units purchased/reinvested during the period
Units redeemed during the period
Distributions paid/payable

Financial Report Notes to the Financial Statements for the financial year ended 30 June 2020
385
11.6 Units in the Schemes held by related parties
§ Effective 1 February 2020, Retirement Portfolio Service's RSE Licensee, OnePath Custodians Pty Limited, became a wholly owned subsidiary of IOOF. # In the comparative period, OnePath Life Limited (OPL) ceased to be a related party of the Schemes as at 31 May 2019. The related party transactions between OPL and the Schemes until 31 May 2019 are detailed in the above table. As at the reporting
date, the details of unit holdings of OPL is not disclosed as it is no longer a related party.
Name of entity 2020 2019 2020 2019 2020 2019 2020 2019 2020 2019 2020 2019 Name of related entity $ $ % % $ $ $ $ $ $
48. OneAnswer - Altrinsic Global Equities Trust Retirement Portfolio Service (wholly owned subsidiary of IOOF)§ 6,779,222 14,114,970 87.62 89.79 2,622,207 16,507,788 9,134,352 1,117,270 1,047,346 1,640,118 8,613,352 15,088,189 OnePath Life Limited# - - - - - 2,800,415 - 18,867,495 - 51 - - 49. OneAnswer - Antipodes Global (Long Only) Trust Retirement Portfolio Service (wholly owned subsidiary of IOOF)§ 59,522,172 75,936,970 73.79 75.34 1,814,999 78,171,951 16,613,487 3,569,640 425 757,772 114,262,501 141,558,062 OnePath Life Limited# - - - - - 4,140,762 - 90,378,385 - 343 - - 50. OneAnswer - Arrowstreet Global Equity (Hedged) Trust Retirement Portfolio Service (wholly owned subsidiary of IOOF)§ 4,651,332 5,303,605 36.73 32.33 400,299 5,437,807 775,677 120,861 112,121 39,325 2,256,153 2,468,550 OnePath Life Limited# - - - - - 497,517 - 10,836,182 - - - - 51. OneAnswer - Ausbil Australian Emerging Leaders Trust Retirement Portfolio Service (wholly owned subsidiary of IOOF)§ 50,995,753 69,008,752 86.00 86.11 5,029,744 74,386,620 14,960,803 3,707,023 4,090,063 2,981,070 54,686,176 64,112,910 OnePath Life Limited# - - - - - 17,247,647 - 79,532,546 - 790,022 - - 52. OneAnswer - Bennelong Australian Equities Trust Retirement Portfolio Service (wholly owned subsidiary of IOOF)§ 81,678,352 89,200,500 90.87 90.36 12,234,545 91,286,449 15,481,120 2,645,153 10,006,480 3,381,602 68,361,636 70,562,399 OnePath Life Limited# - - - - - 17,858,428 - 102,624,479 - 919,366 - - 53. OneAnswer - Bentham Global Income Trust Retirement Portfolio Service (wholly owned subsidiary of IOOF)§ 49,151,804 61,883,712 83.71 83.39 5,282,687 65,604,970 15,116,713 2,813,799 2,376,125 920,329 46,969,828 56,289,390 OnePath Life Limited# - - - - - 8,739,055 - 73,424,102 - 1,911,569 - - 54. OneAnswer - BlackRock Scientific Australian Equity Trust Retirement Portfolio Service (wholly owned subsidiary of IOOF)§ 511,787 543,394 12.11 12.59 29,557 512,664 10,987 4,825 13,046 8,744 371,096 358,950 OnePath Life Limited# - - - - - 19,900 - 509,275 - 12,796 - - 55. OneAnswer - Blackrock Tactical Growth Trust Retirement Portfolio Service (wholly owned subsidiary of IOOF)§ 35,372,588 43,518,010 89.11 89.22 6,114,514 49,703,618 11,605,727 3,461,851 2,879,052 4,786,213 41,807,634 47,835,248 OnePath Life Limited# - - - - - 9,002,924 - 60,049,675 - 426,606 - - 56. OneAnswer - BR Scientific Diversified Growth Trust Retirement Portfolio Service (wholly owned subsidiary of IOOF)§ 23,061,571 30,789,699 69.30 74.75 5,145,665 34,267,332 9,533,430 2,724,344 3,167,980 2,326,922 18,905,395 22,227,933 OnePath Life Limited# - - - - - 4,246,048 - 37,846,745 - 75,370 - - 57. OneAnswer - BR Scientific International Equity Trust Retirement Portfolio Service (wholly owned subsidiary of IOOF)§ 287,394 274,967 10.04 9.27 7,478 266,574 2,727 1,436 4,720 2,939 106,034 104,300 OnePath Life Limited# - - - - - 10,905 - 272,710 - 991 - - 58. OneAnswer - Colonial First State Global Credit Income Trust Retirement Portfolio Service (wholly owned subsidiary of IOOF)§ 29,374,728 37,175,234 82.85 84.75 2,604,080 39,079,960 9,690,035 1,961,078 336,567 158,991 31,602,257 39,485,994 OnePath Life Limited# - - - - - 2,667,927 - 43,509,791 - 383,572 - - 59. OneAnswer - Colonial First State Global Listed Infrastructure Trust Retirement Portfolio Service (wholly owned subsidiary of IOOF)§ 122,409,016 131,367,449 83.39 84.29 18,554,104 129,195,556 8,226,095 1,391,230 10,050,384 1,632,250 137,388,803 127,192,823 OnePath Life Limited# - - - - - 73,321,053 - 124,588,332 - 1,066,324 - - 60. OneAnswer - Colonial First State Imputation Trust OnePath Life Limited# - - - - - 6,145,483 - 70,348,343 - 1,951,143 - - 61. OneAnswer - Fidelity Australian Equities Trust Retirement Portfolio Service (wholly owned subsidiary of IOOF)§ 197,138,846 279,157,402 87.82 88.34 23,062,458 277,349,166 55,327,301 9,851,880 34,695,327 8,551,940 158,059,510 179,062,916
Number of units held Fair value of unit holdings % Interest held Units purchased/reinvested during the period
Units redeemed during the period
Distributions paid/payable

Financial Report Notes to the Financial Statements for the financial year ended 30 June 2020
386
11.6 Units in the Schemes held by related parties
§ Effective 1 February 2020, Retirement Portfolio Service's RSE Licensee, OnePath Custodians Pty Limited, became a wholly owned subsidiary of IOOF. # In the comparative period, OnePath Life Limited (OPL) ceased to be a related party of the Schemes as at 31 May 2019. The related party transactions between OPL and the Schemes until 31 May 2019 are detailed in the above table. As at the reporting
date, the details of unit holdings of OPL is not disclosed as it is no longer a related party.
Name of entity 2020 2019 2020 2019 2020 2019 2020 2019 2020 2019 2020 2019 Name of related entity $ $ % % $ $ $ $ $ $
61. OneAnswer - Fidelity Australian Equities Trust OnePath Life Limited# - - - - - 24,610,820 - 285,196,046 - 5,964,871 - - 62. OneAnswer - Greencape Broadcap Trust Retirement Portfolio Service (wholly owned subsidiary of IOOF)§ 65,334,402 67,110,415 88.67 88.97 10,468,351 66,589,413 13,146,562 1,325,836 1,038,100 2,122,920 60,442,514 62,771,055 OnePath Life Limited# - - - - - 34,101,640 - 63,153,388 - 938,700 - - 63. OneAnswer - Investors Mutual Australian Share Trust ANZ OA Investors Mutual Australian Share Trust 46,884,639 55,288,387 33.67 33.94 11,166,726 6,426,666 6,829,470 13,480,072 5,859,657 9,557,707 44,576,467 41,288,424 Retirement Portfolio Service (wholly owned subsidiary of IOOF)§ 76,304,282 89,019,284 54.80 54.83 22,830,738 103,661,335 15,273,519 6,111,407 9,478,895 13,432,422 72,547,754 66,710,390 OnePath Life Limited# - - - - - 14,078,296 - 127,015,567 - 2,003,704 - - 64. OneAnswer - Janus Henderson Global Fixed Interest Total Return Trust Retirement Portfolio Service (wholly owned subsidiary of IOOF)§ 3,277,118 3,226,684 85.87 85.73 737,884 3,381,186 628,256 244,118 236,417 - 3,419,520 3,297,818 OnePath Life Limited# - - - - - 340,494 - 4,980,470 - 27,393 - - 65. OneAnswer - Kapstream Absolute Return Income Trust Retirement Portfolio Service (wholly owned subsidiary of IOOF)§ 462,183,555 540,750,755 79.60 80.59 28,882,680 559,011,577 98,858,823 20,881,193 11,173,532 2,879,787 400,273,814 459,776,503 OnePath Life Limited# - - - - - 35,300,707 - 614,662,533 - 12,362,351 - - 66. OneAnswer - Magellan Global Trust ANZ OA Magellan Global Trust 102,098,184 84,365,759 47.21 46.31 25,815,127 9,962,823 1,031,600 1,297,412 14,950,641 4,372,117 77,137,752 60,584,335 Retirement Portfolio Service (wholly owned subsidiary of IOOF)§ 84,935,786 70,650,326 39.30 38.82 25,373,202 70,719,110 5,211,988 1,010,530 12,444,864 3,664,751 64,209,211 50,782,373 OnePath Life Limited# - - - - - 12,202,786 - 73,809,746 - 14 - - 67. OneAnswer - Merlon Australian Share Income Trust Retirement Portfolio Service (wholly owned subsidiary of IOOF)§ 47,010,278 64,687,437 85.87 85.60 5,626,575 68,397,099 16,351,553 4,858,343 3,065,954 879,020 59,066,885 71,058,967 OnePath Life Limited# - - - - - 6,390,081 - 78,130,000 - 2,938,682 - - 68. OneAnswer - MFS Global Equity Trust Retirement Portfolio Service (wholly owned subsidiary of IOOF)§ 279,933,004 391,740,791 82.75 83.24 79,079,540 455,735,905 107,176,443 22,928,344 88,169,411 66,370,895 203,905,293 218,089,247 OnePath Life Limited# - - - - - 54,138,632 - 493,785,848 - - - - 69. OneAnswer - Nikko AM Australian Shares Trust Retirement Portfolio Service (wholly owned subsidiary of IOOF)§ 8,805,855 17,799,423 85.56 87.98 3,422,826 19,098,451 9,710,500 584,882 501,521 1,433,481 12,461,682 20,394,578 OnePath Life Limited# - - - - - 11,078,965 - 18,510,588 - 270,202 - - 70. OneAnswer - OnePath Global Property Securities Index Trust Retirement Portfolio Service (wholly owned subsidiary of IOOF)§ 160,091,480 219,879,227 77.48 78.52 9,246,678 231,430,016 35,629,860 9,579,421 3,235,176 2,010,373 134,941,022 152,366,355 OnePath Life Limited# - - - - - 25,442,449 - 250,556,090 - - - - 71. OneAnswer - Pendal Australian Share Trust Retirement Portfolio Service (wholly owned subsidiary of IOOF)§ 28,486,510 34,413,135 90.49 89.41 5,591,628 35,057,705 7,272,935 1,598,521 2,167,201 1,115,047 35,943,655 37,800,361 OnePath Life Limited# - - - - - 8,577,617 - 39,072,330 - 969,254 - - 72. OneAnswer - Pendal Core Hedged Global Shares Trust ANZ OA - Pendal Core Hedged Global Shares Trust 11,852,875 18,000,933 34.35 35.48 249 3,933,912 3,514,160 4,257,639 1,219,266 249 14,584,560 18,190,362 Retirement Portfolio Service (wholly owned subsidiary of IOOF)§ 20,820,908 30,166,273 60.34 59.46 50,418 31,459,511 4,683,833 1,090,757 2,141,778 418 25,619,421 30,483,721 OnePath Life Limited# - - - - - 6,080,844 - 35,303,710 - - - - 73. OneAnswer - Pendal Monthly Income Plus Trust Retirement Portfolio Service (wholly owned subsidiary of IOOF)§ 16,635,774 12,492,812 88.74 86.30 7,149,459 13,268,283 2,436,201 935,138 573,923 186,985 16,463,156 11,956,793
Number of units held Fair value of unit holdings % Interest held Units purchased/reinvested during the period
Units redeemed during the period
Distributions paid/payable
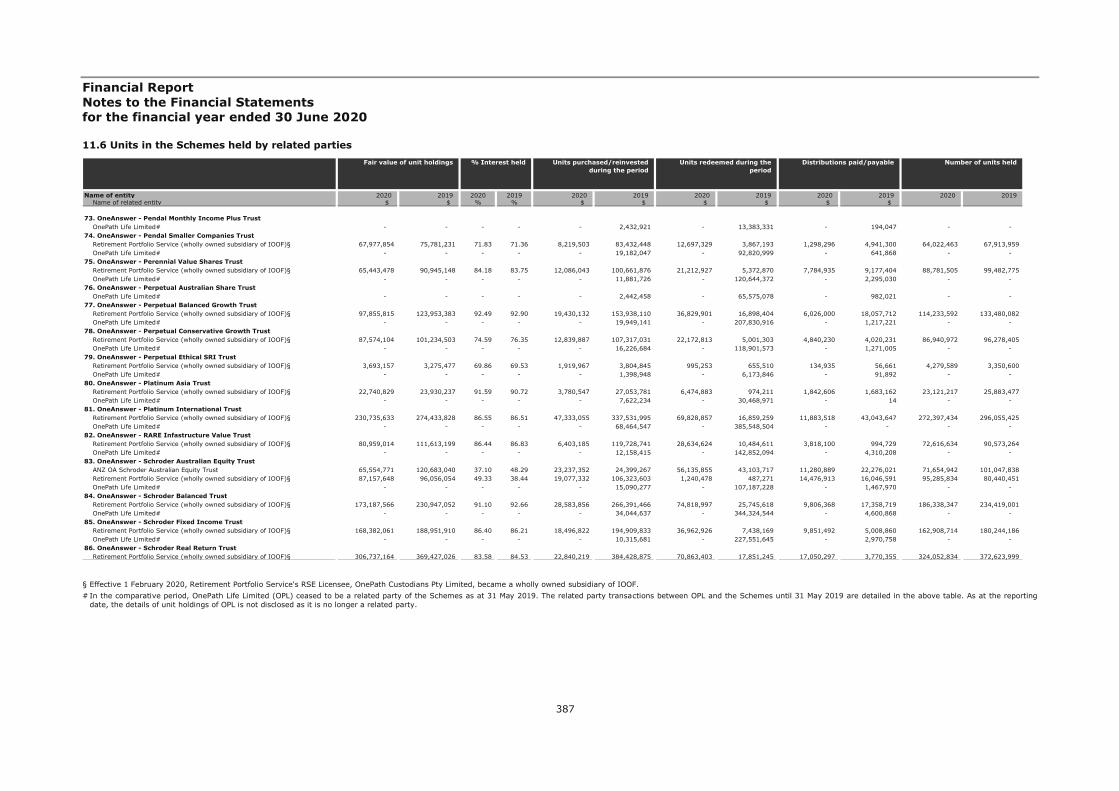
Financial Report Notes to the Financial Statements for the financial year ended 30 June 2020
387
11.6 Units in the Schemes held by related parties
§ Effective 1 February 2020, Retirement Portfolio Service's RSE Licensee, OnePath Custodians Pty Limited, became a wholly owned subsidiary of IOOF. # In the comparative period, OnePath Life Limited (OPL) ceased to be a related party of the Schemes as at 31 May 2019. The related party transactions between OPL and the Schemes until 31 May 2019 are detailed in the above table. As at the reporting
date, the details of unit holdings of OPL is not disclosed as it is no longer a related party.
Name of entity 2020 2019 2020 2019 2020 2019 2020 2019 2020 2019 2020 2019 Name of related entity $ $ % % $ $ $ $ $ $
73. OneAnswer - Pendal Monthly Income Plus Trust OnePath Life Limited# - - - - - 2,432,921 - 13,383,331 - 194,047 - - 74. OneAnswer - Pendal Smaller Companies Trust Retirement Portfolio Service (wholly owned subsidiary of IOOF)§ 67,977,854 75,781,231 71.83 71.36 8,219,503 83,432,448 12,697,329 3,867,193 1,298,296 4,941,300 64,022,463 67,913,959 OnePath Life Limited# - - - - - 19,182,047 - 92,820,999 - 641,868 - - 75. OneAnswer - Perennial Value Shares Trust Retirement Portfolio Service (wholly owned subsidiary of IOOF)§ 65,443,478 90,945,148 84.18 83.75 12,086,043 100,661,876 21,212,927 5,372,870 7,784,935 9,177,404 88,781,505 99,482,775 OnePath Life Limited# - - - - - 11,881,726 - 120,644,372 - 2,295,030 - - 76. OneAnswer - Perpetual Australian Share Trust OnePath Life Limited# - - - - - 2,442,458 - 65,575,078 - 982,021 - - 77. OneAnswer - Perpetual Balanced Growth Trust Retirement Portfolio Service (wholly owned subsidiary of IOOF)§ 97,855,815 123,953,383 92.49 92.90 19,430,132 153,938,110 36,829,901 16,898,404 6,026,000 18,057,712 114,233,592 133,480,082 OnePath Life Limited# - - - - - 19,949,141 - 207,830,916 - 1,217,221 - - 78. OneAnswer - Perpetual Conservative Growth Trust Retirement Portfolio Service (wholly owned subsidiary of IOOF)§ 87,574,104 101,234,503 74.59 76.35 12,839,887 107,317,031 22,172,813 5,001,303 4,840,230 4,020,231 86,940,972 96,278,405 OnePath Life Limited# - - - - - 16,226,684 - 118,901,573 - 1,271,005 - - 79. OneAnswer - Perpetual Ethical SRI Trust Retirement Portfolio Service (wholly owned subsidiary of IOOF)§ 3,693,157 3,275,477 69.86 69.53 1,919,967 3,804,845 995,253 655,510 134,935 56,661 4,279,589 3,350,600 OnePath Life Limited# - - - - - 1,398,948 - 6,173,846 - 91,892 - - 80. OneAnswer - Platinum Asia Trust Retirement Portfolio Service (wholly owned subsidiary of IOOF)§ 22,740,829 23,930,237 91.59 90.72 3,780,547 27,053,781 6,474,883 974,211 1,842,606 1,683,162 23,121,217 25,883,477 OnePath Life Limited# - - - - - 7,622,234 - 30,468,971 - 14 - - 81. OneAnswer - Platinum International Trust Retirement Portfolio Service (wholly owned subsidiary of IOOF)§ 230,735,633 274,433,828 86.55 86.51 47,333,055 337,531,995 69,828,857 16,859,259 11,883,518 43,043,647 272,397,434 296,055,425 OnePath Life Limited# - - - - - 68,464,547 - 385,548,504 - - - - 82. OneAnswer - RARE Infastructure Value Trust Retirement Portfolio Service (wholly owned subsidiary of IOOF)§ 80,959,014 111,613,199 86.44 86.83 6,403,185 119,728,741 28,634,624 10,484,611 3,818,100 994,729 72,616,634 90,573,264 OnePath Life Limited# - - - - - 12,158,415 - 142,852,094 - 4,310,208 - - 83. OneAnswer - Schroder Australian Equity Trust ANZ OA Schroder Australian Equity Trust 65,554,771 120,683,040 37.10 48.29 23,237,352 24,399,267 56,135,855 43,103,717 11,280,889 22,276,021 71,654,942 101,047,838 Retirement Portfolio Service (wholly owned subsidiary of IOOF)§ 87,157,648 96,056,054 49.33 38.44 19,077,332 106,323,603 1,240,478 487,271 14,476,913 16,046,591 95,285,834 80,440,451 OnePath Life Limited# - - - - - 15,090,277 - 107,187,228 - 1,467,970 - - 84. OneAnswer - Schroder Balanced Trust Retirement Portfolio Service (wholly owned subsidiary of IOOF)§ 173,187,566 230,947,052 91.10 92.66 28,583,856 266,391,466 74,818,997 25,745,618 9,806,368 17,358,719 186,338,347 234,419,001 OnePath Life Limited# - - - - - 34,044,637 - 344,324,544 - 4,600,868 - - 85. OneAnswer - Schroder Fixed Income Trust Retirement Portfolio Service (wholly owned subsidiary of IOOF)§ 168,382,061 188,951,910 86.40 86.21 18,496,822 194,909,833 36,962,926 7,438,169 9,851,492 5,008,860 162,908,714 180,244,186 OnePath Life Limited# - - - - - 10,315,681 - 227,551,645 - 2,970,758 - - 86. OneAnswer - Schroder Real Return Trust Retirement Portfolio Service (wholly owned subsidiary of IOOF)§ 306,737,164 369,427,026 83.58 84.53 22,840,219 384,428,875 70,863,403 17,851,245 17,050,297 3,770,355 324,052,834 372,623,999
Number of units held Fair value of unit holdings % Interest held Units purchased/reinvested during the period
Units redeemed during the period
Distributions paid/payable

Financial Report Notes to the Financial Statements for the financial year ended 30 June 2020
388
11.6 Units in the Schemes held by related parties
§ Effective 1 February 2020, Retirement Portfolio Service's RSE Licensee, OnePath Custodians Pty Limited, became a wholly owned subsidiary of IOOF. # In the comparative period, OnePath Life Limited (OPL) ceased to be a related party of the Schemes as at 31 May 2019. The related party transactions between OPL and the Schemes until 31 May 2019 are detailed in the above table. As at the reporting
date, the details of unit holdings of OPL is not disclosed as it is no longer a related party.
Name of entity 2020 2019 2020 2019 2020 2019 2020 2019 2020 2019 2020 2019 Name of related entity $ $ % % $ $ $ $ $ $
86. OneAnswer - Schroder Real Return Trust OnePath Life Limited# - - - - - 29,359,692 - 455,951,932 - 6,483,151 - - 87. OneAnswer - SG Hiscock Property Trust ANZ OA SG Hiscock Property Trust 10,607,372 18,839,260 84.10 83.83 3,443,595 3,901,384 4,579,054 5,889,252 2,559,668 3,403,398 13,348,268 14,399,769 Retirement Portfolio Service (wholly owned subsidiary of IOOF)§ 508,996 705,422 4.04 3.14 146,360 780,150 16,009 - 119,992 105,949 640,518 539,188 OnePath Life Limited# - - - - - 124,194 - 788,631 - 18,712 - - 88. OneAnswer - Stewart Investors Worldwide Sustainability Trust Retirement Portfolio Service (wholly owned subsidiary of IOOF)§ 4,752,186 3,758,497 74.97 77.70 2,271,778 4,295,764 1,110,036 359,375 477,679 339,288 4,047,893 3,112,352 OnePath Life Limited# - - - - - 634,236 - 5,270,797 - 25,186 - - 89. OneAnswer - T. Rowe Price Global Equity Trust Retirement Portfolio Service (wholly owned subsidiary of IOOF)§ 36,308,819 29,322,345 86.35 85.79 11,866,108 33,533,390 5,546,062 1,220,539 6,169,142 3,835,136 25,140,441 20,761,445 OnePath Life Limited# - - - - - 14,014,885 - 31,652,788 - 76 - - 90. OneAnswer - T.Rowe Price Dynamic Global Bond Trust Retirement Portfolio Service (wholly owned subsidiary of IOOF)§ 57,228,027 41,964,602 87.08 88.34 16,110,762 42,325,023 2,933,096 822,607 416,003 143,398 55,758,785 42,386,052 OnePath Life Limited# - - - - - 22,361,788 - 38,641,498 - 291,134 - - 91. OneAnswer - UBS Balanced Trust Retirement Portfolio Service (wholly owned subsidiary of IOOF)§ 51,380,018 65,751,110 90.83 91.07 4,759,145 69,881,639 12,575,255 2,770,847 4,902,818 3,585,343 44,184,522 50,257,920 OnePath Life Limited# - - - - - 4,678,017 - 81,450,718 - 245,593 - - 92. OneAnswer - UBS Defensive Trust Retirement Portfolio Service (wholly owned subsidiary of IOOF)§ 17,936,077 19,794,241 85.77 84.66 6,464,493 23,195,597 6,660,241 2,662,697 1,540,839 1,418,412 18,260,467 18,527,317 OnePath Life Limited# - - - - - 2,330,794 - 28,516,812 - 229,994 - - 93. OneAnswer - UBS Diversified Fixed Income Trust ANZ OA UBS Diversified Fixed Income Trust 1,997,695 2,157,470 1.83 2.10 236,219 2,726,546 402,947 60,963,186 73,027 1,014,373 1,925,137 2,082,793 Retirement Portfolio Service (wholly owned subsidiary of IOOF)§ 95,360,942 90,288,884 87.49 87.78 15,380,222 92,265,532 10,381,755 3,428,127 3,283,331 1,250,414 91,945,624 87,163,681 OnePath Life Limited# - - - - - 56,046,910 - 95,060,885 - 1,193,331 - - 94. OneAnswer - Vanguard Australian Shares Index Trust Retirement Portfolio Service (wholly owned subsidiary of IOOF)§ 748,857,717 943,442,196 85.00 85.66 98,217,436 939,335,737 162,832,968 30,294,595 66,302,315 36,133,035 670,383,437 720,095,882 OnePath Life Limited# - - - - - 105,235,728 - 1,022,441,167 - 40,700,942 - - 95. OneAnswer - Vanguard Balanced Index Trust Retirement Portfolio Service (wholly owned subsidiary of IOOF)§ 1,678,849,653 1,976,511,343 86.67 87.26 211,323,310 2,049,210,265 364,764,300 70,104,389 182,707,886 78,264,053 1,545,025,102 1,673,269,866 OnePath Life Limited# - - - - - 131,381,773 - 2,202,575,910 - 30,561,217 - - 96. OneAnswer - Vanguard Conservative Index Trust Retirement Portfolio Service (wholly owned subsidiary of IOOF)§ 614,706,547 661,922,558 80.68 82.17 73,051,874 686,565,538 89,198,521 26,979,451 49,005,782 19,407,452 570,690,857 585,335,059 OnePath Life Limited# - - - - - 49,059,514 - 760,082,593 - 8,580,715 - - 97. OneAnswer - Vanguard Diversified Bond Index Trust Retirement Portfolio Service (wholly owned subsidiary of IOOF)§ 83,247,961 88,747,509 83.97 84.83 11,615,661 93,394,861 16,542,842 7,052,346 4,597,431 292,998 80,080,292 84,742,373 OnePath Life Limited# - - - - - 10,461,138 - 116,020,139 - 624,834 - - 98. OneAnswer - Vanguard Growth Index Trust Retirement Portfolio Service (wholly owned subsidiary of IOOF)§ 809,290,595 973,174,394 89.99 90.59 95,460,414 1,005,575,483 170,420,870 24,625,182 97,094,770 48,011,905 758,764,339 820,955,300 OnePath Life Limited# - - - - - 72,870,377 - 1,082,560,671 - 18,375,198 - -
Number of units held Fair value of unit holdings % Interest held Units purchased/reinvested during the period
Units redeemed during the period
Distributions paid/payable
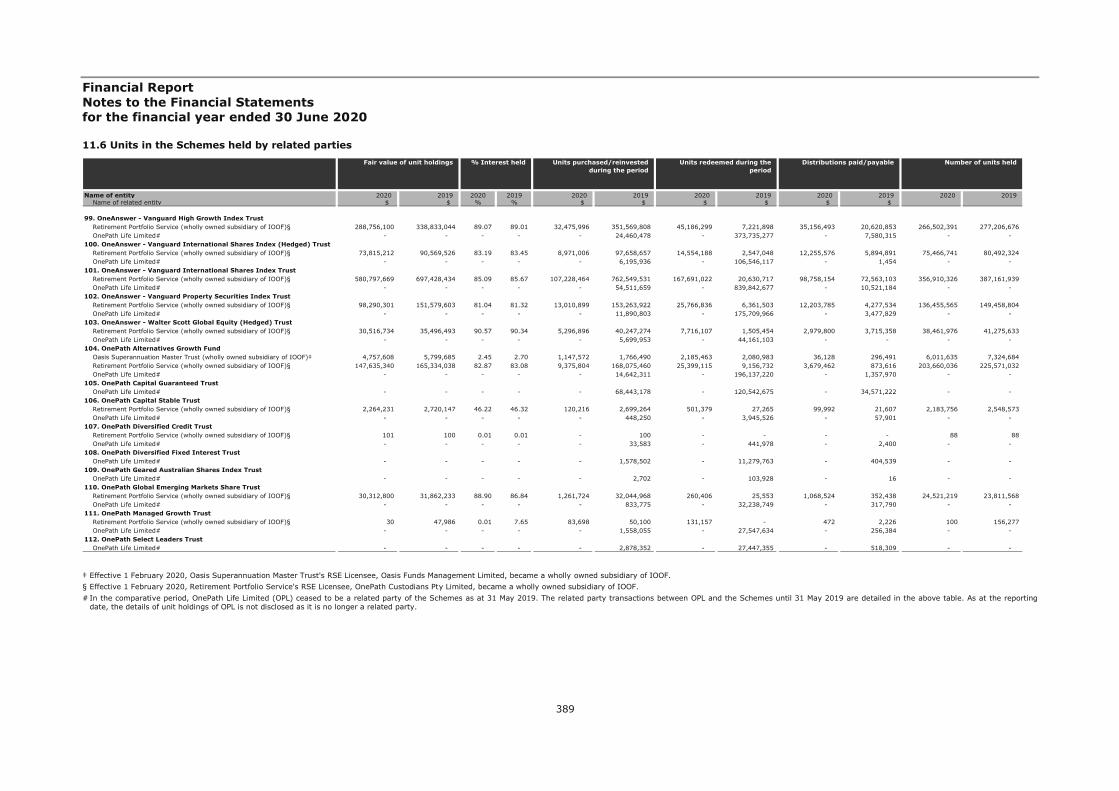
Financial Report Notes to the Financial Statements for the financial year ended 30 June 2020
389
11.6 Units in the Schemes held by related parties
‡ Effective 1 February 2020, Oasis Superannuation Master Trust's RSE Licensee, Oasis Funds Management Limited, became a wholly owned subsidiary of IOOF. § Effective 1 February 2020, Retirement Portfolio Service's RSE Licensee, OnePath Custodians Pty Limited, became a wholly owned subsidiary of IOOF. # In the comparative period, OnePath Life Limited (OPL) ceased to be a related party of the Schemes as at 31 May 2019. The related party transactions between OPL and the Schemes until 31 May 2019 are detailed in the above table. As at the reporting
date, the details of unit holdings of OPL is not disclosed as it is no longer a related party.
Name of entity 2020 2019 2020 2019 2020 2019 2020 2019 2020 2019 2020 2019 Name of related entity $ $ % % $ $ $ $ $ $
99. OneAnswer - Vanguard High Growth Index Trust Retirement Portfolio Service (wholly owned subsidiary of IOOF)§ 288,756,100 338,833,044 89.07 89.01 32,475,996 351,569,808 45,186,299 7,221,898 35,156,493 20,620,853 266,502,391 277,206,676 OnePath Life Limited# - - - - - 24,460,478 - 373,735,277 - 7,580,315 - - 100. OneAnswer - Vanguard International Shares Index (Hedged) Trust Retirement Portfolio Service (wholly owned subsidiary of IOOF)§ 73,815,212 90,569,526 83.19 83.45 8,971,006 97,658,657 14,554,188 2,547,048 12,255,576 5,894,891 75,466,741 80,492,324 OnePath Life Limited# - - - - - 6,195,936 - 106,546,117 - 1,454 - - 101. OneAnswer - Vanguard International Shares Index Trust Retirement Portfolio Service (wholly owned subsidiary of IOOF)§ 580,797,669 697,428,434 85.09 85.67 107,228,464 762,549,531 167,691,022 20,630,717 98,758,154 72,563,103 356,910,326 387,161,939 OnePath Life Limited# - - - - - 54,511,659 - 839,842,677 - 10,521,184 - - 102. OneAnswer - Vanguard Property Securities Index Trust Retirement Portfolio Service (wholly owned subsidiary of IOOF)§ 98,290,301 151,579,603 81.04 81.32 13,010,899 153,263,922 25,766,836 6,361,503 12,203,785 4,277,534 136,455,565 149,458,804 OnePath Life Limited# - - - - - 11,890,803 - 175,709,966 - 3,477,829 - - 103. OneAnswer - Walter Scott Global Equity (Hedged) Trust Retirement Portfolio Service (wholly owned subsidiary of IOOF)§ 30,516,734 35,496,493 90.57 90.34 5,296,896 40,247,274 7,716,107 1,505,454 2,979,800 3,715,358 38,461,976 41,275,633 OnePath Life Limited# - - - - - 5,699,953 - 44,161,103 - - - - 104. OnePath Alternatives Growth Fund Oasis Superannuation Master Trust (wholly owned subsidiary of IOOF)‡ 4,757,608 5,799,685 2.45 2.70 1,147,572 1,766,490 2,185,463 2,080,983 36,128 296,491 6,011,635 7,324,684 Retirement Portfolio Service (wholly owned subsidiary of IOOF)§ 147,635,340 165,334,038 82.87 83.08 9,375,804 168,075,460 25,399,115 9,156,732 3,679,462 873,616 203,660,036 225,571,032 OnePath Life Limited# - - - - - 14,642,311 - 196,137,220 - 1,357,970 - - 105. OnePath Capital Guaranteed Trust OnePath Life Limited# - - - - - 68,443,178 - 120,542,675 - 34,571,222 - - 106. OnePath Capital Stable Trust Retirement Portfolio Service (wholly owned subsidiary of IOOF)§ 2,264,231 2,720,147 46.22 46.32 120,216 2,699,264 501,379 27,265 99,992 21,607 2,183,756 2,548,573 OnePath Life Limited# - - - - - 448,250 - 3,945,526 - 57,901 - - 107. OnePath Diversified Credit Trust Retirement Portfolio Service (wholly owned subsidiary of IOOF)§ 101 100 0.01 0.01 - 100 - - - - 88 88 OnePath Life Limited# - - - - - 33,583 - 441,978 - 2,400 - - 108. OnePath Diversified Fixed Interest Trust OnePath Life Limited# - - - - - 1,578,502 - 11,279,763 - 404,539 - - 109. OnePath Geared Australian Shares Index Trust OnePath Life Limited# - - - - - 2,702 - 103,928 - 16 - - 110. OnePath Global Emerging Markets Share Trust Retirement Portfolio Service (wholly owned subsidiary of IOOF)§ 30,312,800 31,862,233 88.90 86.84 1,261,724 32,044,968 260,406 25,553 1,068,524 352,438 24,521,219 23,811,568 OnePath Life Limited# - - - - - 833,775 - 32,238,749 - 317,790 - - 111. OnePath Managed Growth Trust Retirement Portfolio Service (wholly owned subsidiary of IOOF)§ 30 47,986 0.01 7.65 83,698 50,100 131,157 - 472 2,226 100 156,277 OnePath Life Limited# - - - - - 1,558,055 - 27,547,634 - 256,384 - - 112. OnePath Select Leaders Trust OnePath Life Limited# - - - - - 2,878,352 - 27,447,355 - 518,309 - -
Number of units held Fair value of unit holdings % Interest held Units purchased/reinvested during the period
Units redeemed during the period
Distributions paid/payable

Financial Report Notes to the Financial Statements for the financial year ended 30 June 2020
390
11.6 Units in the Schemes held by related parties
† Effective 1 February 2020, IOOF Portfolio Service Superannuation Fund and RSE Licensee, IOOF Investment Management Limited became a related party of the Scheme due to sale of OnePath P&I business. The period to date is from 1 February 2020 to 30
June 2020. Refer to Note 15 Significant events during the financial period. ‡ Effective 1 February 2020, Oasis Superannuation Master Trust's RSE Licensee, Oasis Funds Management Limited, became a wholly owned subsidiary of IOOF. § Effective 1 February 2020, Retirement Portfolio Service's RSE Licensee, OnePath Custodians Pty Limited, became a wholly owned subsidiary of IOOF. # In the comparative period, OnePath Life Limited (OPL) ceased to be a related party of the Schemes as at 31 May 2019. The related party transactions between OPL and the Schemes until 31 May 2019 are detailed in the above table. As at the reporting
date, the details of unit holdings of OPL is not disclosed as it is no longer a related party.
Name of entity 2020 2019 2020 2019 2020 2019 2020 2019 2020 2019 2020 2019 Name of related entity $ $ % % $ $ $ $ $ $
113. OnePath Sustainable Investments - Australian Share Trust OnePath Life Limited# - - - - - 468,773 - 1,686,547 - 86,126 - - 114. OnePath Wholesale Australian Share Trust IOOF Portfolio Service Superannuation Fund (wholly owned subsidiary of IOOF)† 3,699,603 - 1.57 - 51,183 - 276,095 - 212,914 - 2,173,903 - Oasis Superannuation Master Trust (wholly owned subsidiary of IOOF)‡ 1,046,148 1,549,173 0.43 0.46 118,329 192,955 433,426 756,194 92,205 131,313 591,144 744,151 Retirement Portfolio Service (wholly owned subsidiary of IOOF)§ 140,923,352 193,893,105 86.44 87.55 18,101,020 199,646,800 47,777,714 11,344,713 12,348,972 10,882,939 119,846,834 142,649,545 OnePath Life Limited# - - - - - 12,149,710 - 254,151,041 - 8,863,313 - - 115. OnePath Wholesale Balanced Trust ANZ OA OnePath Balanced Trust 22,072,240 26,208,621 5.65 5.36 1,173,859 1,393,537 3,213,197 13,280,570 1,876,562 1,269,797 22,183,062 24,080,509 Balanced Trust 66,780,685 78,867,189 17.10 16.17 3,553,523 5,975,051 9,297,720 63,135,095 5,692,896 3,913,877 67,115,981 72,685,225 IOOF Portfolio Service Superannuation Fund (wholly owned subsidiary of IOOF)† 8,929,297 - 2.15 - 104,405 - 909,525 - 642,299 - 8,423,805 - Oasis Superannuation Master Trust (wholly owned subsidiary of IOOF)‡ 1,291,366 1,759,899 0.29 0.33 68,487 81,035 463,724 576,141 95,291 62,028 1,142,195 1,475,930 Retirement Portfolio Service (wholly owned subsidiary of IOOF)§ 264,090,894 333,802,584 67.55 68.32 16,327,914 345,750,055 61,494,693 15,672,224 22,592,006 10,384,204 265,187,927 307,049,597 OnePath Life Limited# - - - - - 53,536,053 - 386,698,507 - 5,581,081 - - 116. OnePath Wholesale Blue Chip Imputation Trust Oasis Superannuation Master Trust (wholly owned subsidiary of IOOF)‡ 372,867 501,036 5.57 3.02 26,398 35,740 79,781 118,773 23,557 25,886 476,508 525,526 Retirement Portfolio Service (wholly owned subsidiary of IOOF)§ 112,088 141,456 1.67 0.85 - 1,182 6,098 56,636 9,185 7,509 143,244 148,370 117. OnePath Wholesale Capital Stable Trust OnePath Capital Stable Trust 4,482,782 5,399,186 1.30 1.27 391,580 691,052 1,039,683 2,581,277 330,217 295,767 4,573,500 5,204,766 IOOF Portfolio Service Superannuation Fund (wholly owned subsidiary of IOOF)† 1,087,968 - 0.36 - 22,487 - 206,105 - 68,450 - 1,270,287 - Oasis Superannuation Master Trust (wholly owned subsidiary of IOOF)‡ 1,933,535 2,605,774 0.61 0.68 238,773 120,792 827,046 1,755,155 148,446 127,056 2,139,339 2,782,757 Retirement Portfolio Service (wholly owned subsidiary of IOOF)§ 261,921,521 322,252,779 75.77 75.81 14,958,238 49,511,412 60,169,281 68,169,757 19,191,585 16,567,347 267,330,356 310,756,964 OnePath Life Limited# - - - - - 6,698,900 - 62,523,840 - 5,316,574 - - 118. OnePath Wholesale Diversified Fixed Interest Trust ANZ OA OnePath Diversified Fixed Interest Trust 7,312,820 7,880,157 1.34 1.24 969,930 810,737 1,308,298 13,560,458 499,663 391,607 6,817,799 7,121,708 OnePath Diversified Fixed Interest Trust 12,770,904 15,304,713 2.35 2.40 1,303,449 5,768,151 3,446,147 17,200,592 870,740 659,139 11,906,412 13,831,667 IOOF Portfolio Service Superannuation Fund (wholly owned subsidiary of IOOF)† 2,678,437 - 0.56 - 10,799 - 254,550 - 163,348 - 2,838,351 - Oasis Superannuation Master Trust (wholly owned subsidiary of IOOF)‡ 11,741,427 15,895,642 2.34 2.78 1,612,320 1,626,922 5,697,817 4,824,076 941,662 512,422 11,857,632 16,033,530 Retirement Portfolio Service (wholly owned subsidiary of IOOF)§ 332,173,091 398,587,947 61.29 62.82 32,318,612 396,540,598 89,243,890 13,489,863 23,043,820 8,707,857 310,853,590 361,880,109 OnePath Life Limited# - - - - - 47,934,208 - 443,609,916 - 5,943,048 - - 119. OnePath Wholesale Emerging Companies Trust IOOF Portfolio Service Superannuation Fund (wholly owned subsidiary of IOOF)† 1,905,291 - 1.93 - 4,726 - 260,617 - 649,093 - 463,355 - Oasis Superannuation Master Trust (wholly owned subsidiary of IOOF)‡ 5,942,611 7,733,907 4.53 5.13 684,294 838,239 1,597,714 1,110,311 1,946,048 723,627 1,086,162 1,247,264 Retirement Portfolio Service (wholly owned subsidiary of IOOF)§ 25,604,414 30,445,830 55.70 50.07 4,562,821 23,743,377 2,059,643 869,018 8,667,640 2,916,983 13,362,442 12,165,297 OnePath Life Limited# - - - - - 1,015,671 - 22,517,196 - 2,002,626 - - 120. OnePath Wholesale Geared Australian Shares Index Trust OnePath Geared Australian Shares Index Trust 4,314,319 5,649,466 9.72 10.87 1,378,572 741,460 1,503,076 1,591,284 290,338 475,956 9,511,789 9,428,077 Oasis Superannuation Master Trust (wholly owned subsidiary of IOOF)‡ 47,251 63,206 0.11 0.12 - 190 897 - 1,379 2,883 105,519 105,519 Retirement Portfolio Service (wholly owned subsidiary of IOOF)§ 38,209,822 44,114,393 86.00 84.88 21,193,361 45,628,304 15,994,433 4,281,305 2,543,431 3,711,356 84,196,048 73,620,126 OnePath Life Limited# - - - - - 9,145,206 - 55,730,753 - 178,706 - -
Number of units held Fair value of unit holdings % Interest held Units purchased/reinvested during the period
Units redeemed during the period
Distributions paid/payable

Financial Report Notes to the Financial Statements for the financial year ended 30 June 2020
391
11.6 Units in the Schemes held by related parties
† Effective 1 February 2020, IOOF Portfolio Service Superannuation Fund and RSE Licensee, IOOF Investment Management Limited became a related party of the Scheme due to sale of OnePath P&I business. The period to date is from 1 February 2020 to 30
June 2020. Refer to Note 15 Significant events during the financial period. ‡ Effective 1 February 2020, Oasis Superannuation Master Trust's RSE Licensee, Oasis Funds Management Limited, became a wholly owned subsidiary of IOOF. § Effective 1 February 2020, Retirement Portfolio Service's RSE Licensee, OnePath Custodians Pty Limited, became a wholly owned subsidiary of IOOF. # In the comparative period, OnePath Life Limited (OPL) ceased to be a related party of the Schemes as at 31 May 2019. The related party transactions between OPL and the Schemes until 31 May 2019 are detailed in the above table. As at the reporting
date, the details of unit holdings of OPL is not disclosed as it is no longer a related party.
Name of entity 2020 2019 2020 2019 2020 2019 2020 2019 2020 2019 2020 2019 Name of related entity $ $ % % $ $ $ $ $ $
121. OnePath Wholesale Global Emerging Markets Share Trust Oasis Superannuation Master Trust (wholly owned subsidiary of IOOF)‡ 1,480,037 2,115,568 13.67 16.71 166,481 457,705 667,139 272,358 74,979 24,430 1,434,284 1,894,821 Retirement Portfolio Service (wholly owned subsidiary of IOOF)§ 5,312,411 5,820,077 43.72 41.14 777,680 4,377,556 827,210 206,405 187,867 64,440 4,587,179 4,665,415 OnePath Life Limited# - - - - - 84,086 - 3,408,769 - 33,324 - - 122. OnePath Wholesale High Growth Trust ANZ OA OnePath High Growth Trust 16,587,439 21,416,357 46.61 48.59 2,167,574 2,525,164 4,379,914 5,400,285 1,804,483 1,959,357 17,100,712 19,022,881 High Growth Trust 1,298,367 1,471,943 3.65 3.34 234,250 350,541 199,719 2,310,746 140,432 159,179 1,338,543 1,307,440 Oasis Superannuation Master Trust (wholly owned subsidiary of IOOF)‡ 16,688 17,048 0.07 0.06 1,833 2,472 - - 1,473 1,254 24,904 22,293 Retirement Portfolio Service (wholly owned subsidiary of IOOF)§ 16,470,267 19,623,371 46.28 44.52 2,343,535 20,522,533 2,844,818 439,239 1,774,643 1,343,511 16,979,914 17,430,278 OnePath Life Limited# - - - - - 3,914,457 - 22,118,038 - 425,628 - - 123. OnePath Wholesale Index Balanced Trust Retirement Portfolio Service (wholly owned subsidiary of IOOF)§ 20,096,950 24,256,206 100.00 100.00 2,816,714 25,488,249 4,300,365 742,313 2,692,189 1,359,623 20,911,944 22,280,447 OnePath Life Limited# - - - - - 2,539,500 - 28,978,102 - 540,432 - - 124. OnePath Wholesale Index Conservative Trust Retirement Portfolio Service (wholly owned subsidiary of IOOF)§ 6,857,017 8,342,175 100.00 100.00 535,425 8,908,928 1,482,250 451,304 638,113 367,282 7,072,626 7,955,294 OnePath Life Limited# - - - - - 949,951 - 9,722,747 - 190,454 - - 125. OnePath Wholesale Index Moderate Trust Retirement Portfolio Service (wholly owned subsidiary of IOOF)§ 4,173,580 5,375,531 100.00 100.00 443,535 6,003,008 1,156,162 454,116 510,970 357,516 4,457,238 5,180,698 OnePath Life Limited# - - - - - 640,911 - 7,785,053 - 128,959 - - 126. OnePath Wholesale Managed Growth Trust ANZ OA OnePath Managed Growth Trust 77,488,096 90,965,043 9.06 8.77 5,813,533 26,057,359 10,680,209 375,757,885 6,657,464 9,123,756 80,287,453 84,856,031 OnePath Managed Growth Trust 695,877 1,071,041 0.08 0.10 152,648 1,712,960 439,590 28,197,418 62,118 329,885 721,016 999,113 IOOF Portfolio Service Superannuation Fund (wholly owned subsidiary of IOOF)† 3,743,235 - 0.56 - 142,599 - 157,904 - 264,268 - 5,005,367 - Oasis Superannuation Master Trust (wholly owned subsidiary of IOOF)‡ 3,340,309 4,069,211 0.47 0.48 435,400 367,758 840,689 1,094,265 242,175 223,983 4,194,260 4,683,176 Retirement Portfolio Service (wholly owned subsidiary of IOOF)§ 635,715,547 775,391,022 74.37 74.81 50,999,541 815,190,600 120,277,186 33,507,321 54,758,691 37,481,398 658,898,408 723,587,248 OnePath Life Limited# - - - - - 386,454,027 - 906,065,813 - 19,967,340 - - 127. OnePath Wholesale Property Securities Trust Oasis Superannuation Master Trust (wholly owned subsidiary of IOOF)‡ 75,817 129,828 4.25 4.83 1,019 5,947 27,034 - 4,044 3,048 160,459 194,791 Retirement Portfolio Service (wholly owned subsidiary of IOOF)§ 72,270 112,571 4.05 4.18 - 23,371 7,008 - 5,711 2,257 152,854 168,809 128. OnePath Wholesale Select Leaders Trust Oasis Superannuation Master Trust (wholly owned subsidiary of IOOF)‡ 2,733,944 4,069,278 3.17 3.49 105,224 238,883 957,906 1,455,853 243,633 225,718 2,005,093 2,563,163 Retirement Portfolio Service (wholly owned subsidiary of IOOF)§ 69,676,510 93,221,640 95.27 94.99 6,718,616 93,102,714 19,245,343 7,380,448 5,650,185 2,716,029 60,253,574 69,844,725 OnePath Life Limited# - - - - - 32,877,743 - 97,116,577 - 2,657,283 - - 130. OptiMix Australian Share Trust OnePath Life Limited# - - - - - 1,810 - - - 1,401 - - 132. OptiMix Conservative Trust Retirement Portfolio Service (wholly owned subsidiary of IOOF)§ 302 295 - - 6 300 - - - 6 241 236 133. OptiMix Global Emerging Markets Share Trust OnePath Life Limited# - - - - - 3 - - - 49 - -
Number of units held Fair value of unit holdings % Interest held Units purchased/reinvested during the period
Units redeemed during the period
Distributions paid/payable
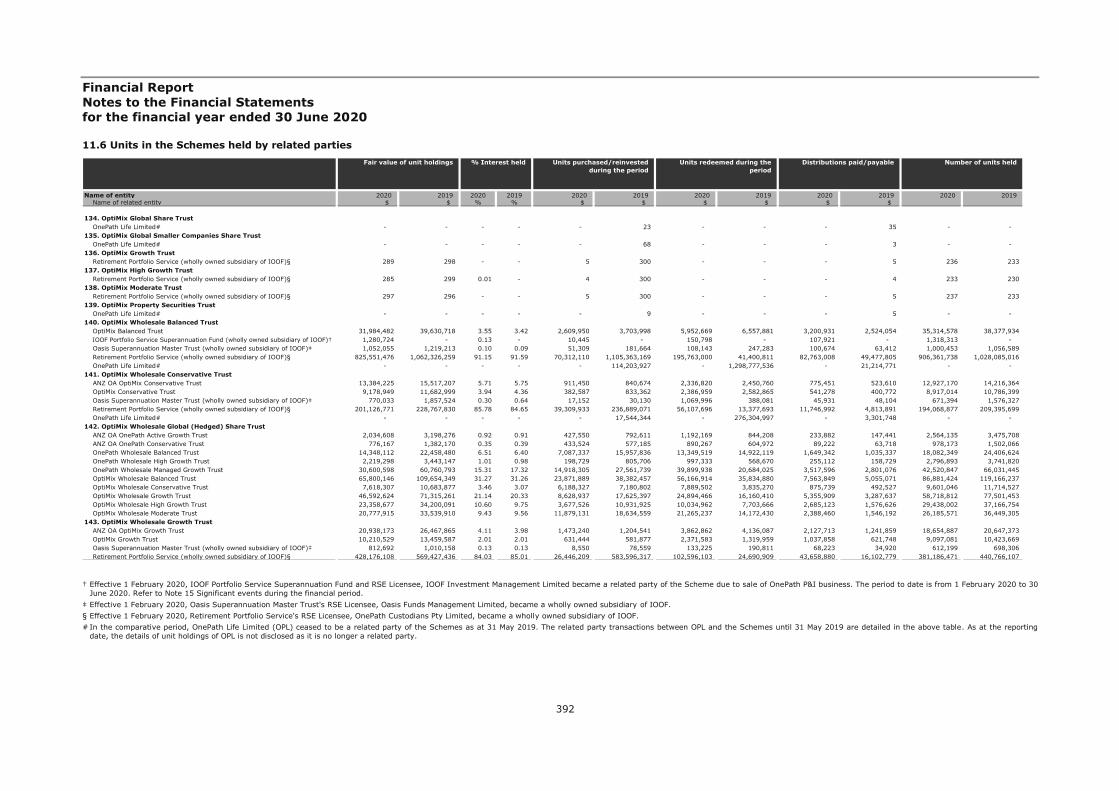
Financial Report Notes to the Financial Statements for the financial year ended 30 June 2020
392
11.6 Units in the Schemes held by related parties
† Effective 1 February 2020, IOOF Portfolio Service Superannuation Fund and RSE Licensee, IOOF Investment Management Limited became a related party of the Scheme due to sale of OnePath P&I business. The period to date is from 1 February 2020 to 30
June 2020. Refer to Note 15 Significant events during the financial period. ‡ Effective 1 February 2020, Oasis Superannuation Master Trust's RSE Licensee, Oasis Funds Management Limited, became a wholly owned subsidiary of IOOF. § Effective 1 February 2020, Retirement Portfolio Service's RSE Licensee, OnePath Custodians Pty Limited, became a wholly owned subsidiary of IOOF. # In the comparative period, OnePath Life Limited (OPL) ceased to be a related party of the Schemes as at 31 May 2019. The related party transactions between OPL and the Schemes until 31 May 2019 are detailed in the above table. As at the reporting
date, the details of unit holdings of OPL is not disclosed as it is no longer a related party.
Name of entity 2020 2019 2020 2019 2020 2019 2020 2019 2020 2019 2020 2019 Name of related entity $ $ % % $ $ $ $ $ $
134. OptiMix Global Share Trust OnePath Life Limited# - - - - - 23 - - - 35 - - 135. OptiMix Global Smaller Companies Share Trust OnePath Life Limited# - - - - - 68 - - - 3 - - 136. OptiMix Growth Trust Retirement Portfolio Service (wholly owned subsidiary of IOOF)§ 289 298 - - 5 300 - - - 5 236 233 137. OptiMix High Growth Trust Retirement Portfolio Service (wholly owned subsidiary of IOOF)§ 285 299 0.01 - 4 300 - - - 4 233 230 138. OptiMix Moderate Trust Retirement Portfolio Service (wholly owned subsidiary of IOOF)§ 297 296 - - 5 300 - - - 5 237 233 139. OptiMix Property Securities Trust OnePath Life Limited# - - - - - 9 - - - 5 - - 140. OptiMix Wholesale Balanced Trust OptiMix Balanced Trust 31,984,482 39,630,718 3.55 3.42 2,609,950 3,703,998 5,952,669 6,557,881 3,200,931 2,524,054 35,314,578 38,377,934 IOOF Portfolio Service Superannuation Fund (wholly owned subsidiary of IOOF)† 1,280,724 - 0.13 - 10,445 - 150,798 - 107,921 - 1,318,313 - Oasis Superannuation Master Trust (wholly owned subsidiary of IOOF)‡ 1,052,055 1,219,213 0.10 0.09 51,309 181,664 108,143 247,283 100,674 63,412 1,000,453 1,056,589 Retirement Portfolio Service (wholly owned subsidiary of IOOF)§ 825,551,476 1,062,326,259 91.15 91.59 70,312,110 1,105,363,169 195,763,000 41,400,811 82,763,008 49,477,805 906,361,738 1,028,085,016 OnePath Life Limited# - - - - - 114,203,927 - 1,298,777,536 - 21,214,771 - - 141. OptiMix Wholesale Conservative Trust ANZ OA OptiMix Conservative Trust 13,384,225 15,517,207 5.71 5.75 911,450 840,674 2,336,820 2,450,760 775,451 523,610 12,927,170 14,216,364 OptiMix Conservative Trust 9,178,949 11,682,999 3.94 4.36 382,587 833,362 2,386,959 2,582,865 541,278 400,772 8,917,014 10,786,399 Oasis Superannuation Master Trust (wholly owned subsidiary of IOOF)‡ 770,033 1,857,524 0.30 0.64 17,152 30,130 1,069,996 388,081 45,931 48,104 671,394 1,576,327 Retirement Portfolio Service (wholly owned subsidiary of IOOF)§ 201,126,771 228,767,830 85.78 84.65 39,309,933 236,889,071 56,107,696 13,377,693 11,746,992 4,813,891 194,068,877 209,395,699 OnePath Life Limited# - - - - - 17,544,344 - 276,304,997 - 3,301,748 - - 142. OptiMix Wholesale Global (Hedged) Share Trust ANZ OA OnePath Active Growth Trust 2,034,608 3,198,276 0.92 0.91 427,550 792,611 1,192,169 844,208 233,882 147,441 2,564,135 3,475,708 ANZ OA OnePath Conservative Trust 776,167 1,382,170 0.35 0.39 433,524 577,185 890,267 604,972 89,222 63,718 978,173 1,502,066 OnePath Wholesale Balanced Trust 14,348,112 22,458,480 6.51 6.40 7,087,337 15,957,836 13,349,519 14,922,119 1,649,342 1,035,337 18,082,349 24,406,624 OnePath Wholesale High Growth Trust 2,219,298 3,443,147 1.01 0.98 198,729 805,706 997,333 568,670 255,112 158,729 2,796,893 3,741,820 OnePath Wholesale Managed Growth Trust 30,600,598 60,760,793 15.31 17.32 14,918,305 27,561,739 39,899,938 20,684,025 3,517,596 2,801,076 42,520,847 66,031,445 OptiMix Wholesale Balanced Trust 65,800,146 109,654,349 31.27 31.26 23,871,889 38,382,457 56,166,914 35,834,880 7,563,849 5,055,071 86,881,424 119,166,237 OptiMix Wholesale Conservative Trust 7,618,307 10,683,877 3.46 3.07 6,188,327 7,180,802 7,889,502 3,835,270 875,739 492,527 9,601,046 11,714,527 OptiMix Wholesale Growth Trust 46,592,624 71,315,261 21.14 20.33 8,628,937 17,625,397 24,894,466 16,160,410 5,355,909 3,287,637 58,718,812 77,501,453 OptiMix Wholesale High Growth Trust 23,358,677 34,200,091 10.60 9.75 3,677,526 10,931,925 10,034,962 7,703,666 2,685,123 1,576,626 29,438,002 37,166,754 OptiMix Wholesale Moderate Trust 20,777,915 33,539,910 9.43 9.56 11,879,131 18,634,559 21,265,237 14,172,430 2,388,460 1,546,192 26,185,571 36,449,305 143. OptiMix Wholesale Growth Trust ANZ OA OptiMix Growth Trust 20,938,173 26,467,865 4.11 3.98 1,473,240 1,204,541 3,862,862 4,136,087 2,127,713 1,241,859 18,654,887 20,647,373 OptiMix Growth Trust 10,210,529 13,459,587 2.01 2.01 631,444 581,877 2,371,583 1,319,959 1,037,858 621,748 9,097,081 10,423,669 Oasis Superannuation Master Trust (wholly owned subsidiary of IOOF)‡ 812,692 1,010,158 0.13 0.13 8,550 78,559 133,225 190,811 68,223 34,920 612,199 698,306 Retirement Portfolio Service (wholly owned subsidiary of IOOF)§ 428,176,108 569,427,436 84.03 85.01 26,446,209 583,596,317 102,596,103 24,690,909 43,658,880 16,102,779 381,186,471 440,766,107
Number of units held Fair value of unit holdings % Interest held Units purchased/reinvested during the period
Units redeemed during the period
Distributions paid/payable
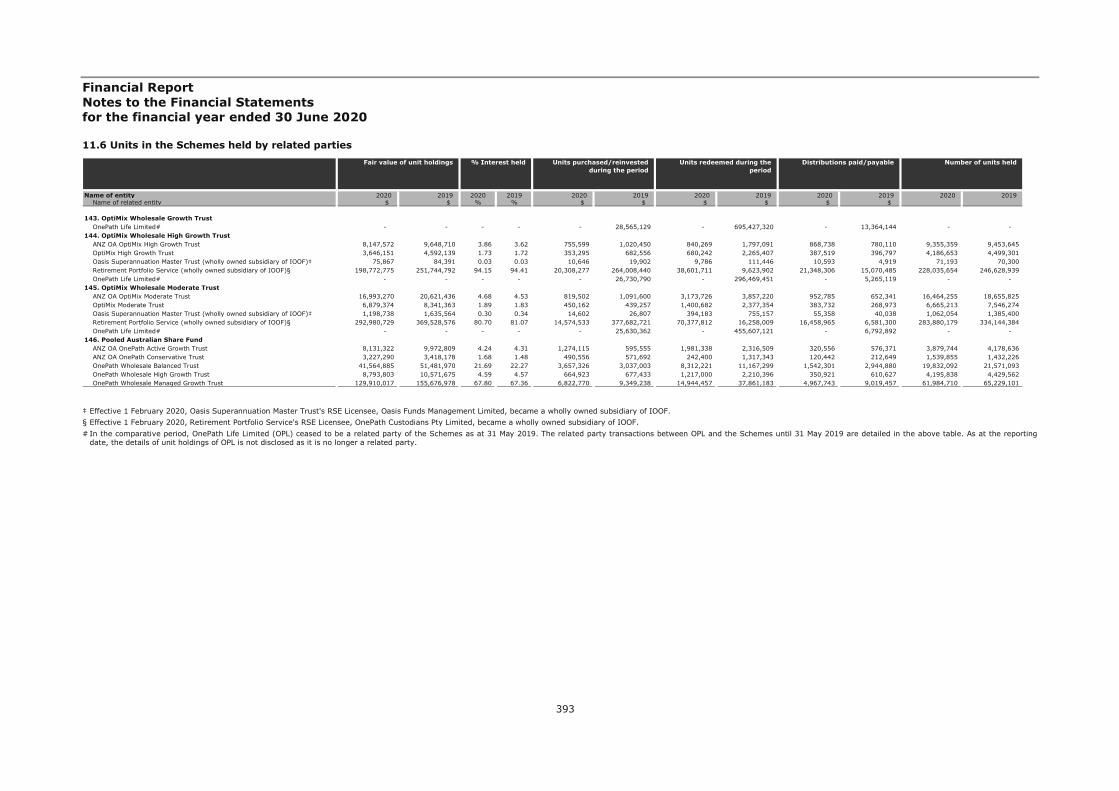
Financial Report Notes to the Financial Statements for the financial year ended 30 June 2020
393
11.6 Units in the Schemes held by related parties
‡ Effective 1 February 2020, Oasis Superannuation Master Trust's RSE Licensee, Oasis Funds Management Limited, became a wholly owned subsidiary of IOOF. § Effective 1 February 2020, Retirement Portfolio Service's RSE Licensee, OnePath Custodians Pty Limited, became a wholly owned subsidiary of IOOF. # In the comparative period, OnePath Life Limited (OPL) ceased to be a related party of the Schemes as at 31 May 2019. The related party transactions between OPL and the Schemes until 31 May 2019 are detailed in the above table. As at the reporting
date, the details of unit holdings of OPL is not disclosed as it is no longer a related party.
Name of entity 2020 2019 2020 2019 2020 2019 2020 2019 2020 2019 2020 2019 Name of related entity $ $ % % $ $ $ $ $ $
143. OptiMix Wholesale Growth Trust OnePath Life Limited# - - - - - 28,565,129 - 695,427,320 - 13,364,144 - - 144. OptiMix Wholesale High Growth Trust ANZ OA OptiMix High Growth Trust 8,147,572 9,648,710 3.86 3.62 755,599 1,020,450 840,269 1,797,091 868,738 780,110 9,355,359 9,453,645 OptiMix High Growth Trust 3,646,151 4,592,139 1.73 1.72 353,295 682,556 680,242 2,265,407 387,519 396,797 4,186,653 4,499,301 Oasis Superannuation Master Trust (wholly owned subsidiary of IOOF)‡ 75,867 84,391 0.03 0.03 10,646 19,902 9,786 111,446 10,593 4,919 71,193 70,300 Retirement Portfolio Service (wholly owned subsidiary of IOOF)§ 198,772,775 251,744,792 94.15 94.41 20,308,277 264,008,440 38,601,711 9,623,902 21,348,306 15,070,485 228,035,654 246,628,939 OnePath Life Limited# - - - - - 26,730,790 - 296,469,451 - 5,265,119 - - 145. OptiMix Wholesale Moderate Trust ANZ OA OptiMix Moderate Trust 16,993,270 20,621,436 4.68 4.53 819,502 1,091,600 3,173,726 3,857,220 952,785 652,341 16,464,255 18,655,825 OptiMix Moderate Trust 6,879,374 8,341,363 1.89 1.83 450,162 439,257 1,400,682 2,377,354 383,732 268,973 6,665,213 7,546,274 Oasis Superannuation Master Trust (wholly owned subsidiary of IOOF)‡ 1,198,738 1,635,564 0.30 0.34 14,602 26,807 394,183 755,157 55,358 40,038 1,062,054 1,385,400 Retirement Portfolio Service (wholly owned subsidiary of IOOF)§ 292,980,729 369,528,576 80.70 81.07 14,574,533 377,682,721 70,377,812 16,258,009 16,458,965 6,581,300 283,880,179 334,144,384 OnePath Life Limited# - - - - - 25,630,362 - 455,607,121 - 6,792,892 - - 146. Pooled Australian Share Fund ANZ OA OnePath Active Growth Trust 8,131,322 9,972,809 4.24 4.31 1,274,115 595,555 1,981,338 2,316,509 320,556 576,371 3,879,744 4,178,636 ANZ OA OnePath Conservative Trust 3,227,290 3,418,178 1.68 1.48 490,556 571,692 242,400 1,317,343 120,442 212,649 1,539,855 1,432,226 OnePath Wholesale Balanced Trust 41,564,885 51,481,970 21.69 22.27 3,657,326 3,037,003 8,312,221 11,167,299 1,542,301 2,944,880 19,832,092 21,571,093 OnePath Wholesale High Growth Trust 8,793,803 10,571,675 4.59 4.57 664,923 677,433 1,217,000 2,210,396 350,921 610,627 4,195,838 4,429,562 OnePath Wholesale Managed Growth Trust 129,910,017 155,676,978 67.80 67.36 6,822,770 9,349,238 14,944,457 37,861,183 4,967,743 9,019,457 61,984,710 65,229,101
Number of units held Fair value of unit holdings % Interest held Units purchased/reinvested during the period
Units redeemed during the period
Distributions paid/payable
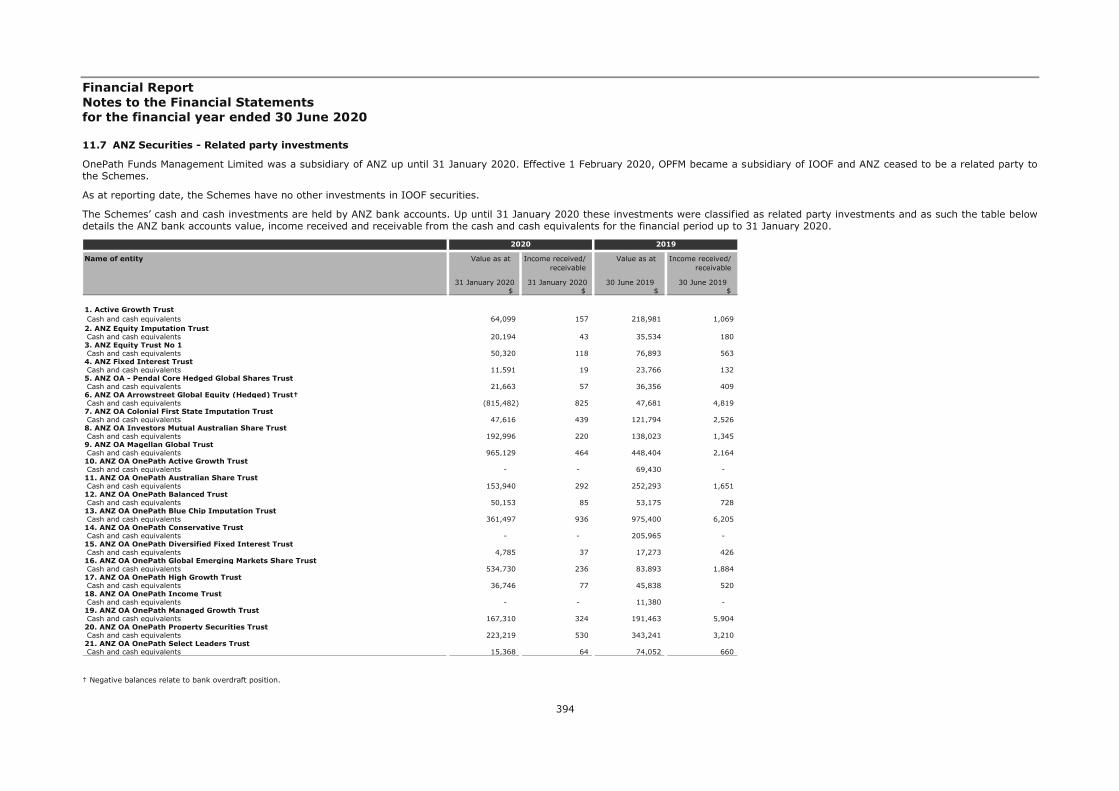
Financial Report Notes to the Financial Statements for the financial year ended 30 June 2020
394
11.7 ANZ Securities - Related party investments
OnePath Funds Management Limited was a subsidiary of ANZ up until 31 January 2020. Effective 1 February 2020, OPFM became a subsidiary of IOOF and ANZ ceased to be a related party to the Schemes.
As at reporting date, the Schemes have no other investments in IOOF securities.
The Schemes’ cash and cash investments are held by ANZ bank accounts. Up until 31 January 2020 these investments were classified as related party investments and as such the table below details the ANZ bank accounts value, income received and receivable from the cash and cash equivalents for the financial period up to 31 January 2020.
† Negative balances relate to bank overdraft position.
Name of entity Value as at Income received/ Value as at Income received/receivable receivable
31 January 2020 31 January 2020 30 June 2019 30 June 2019$ $ $ $
1. Active Growth Trust Cash and cash equivalents 64,099 157 218,981 1,069 2. ANZ Equity Imputation Trust Cash and cash equivalents 20,194 43 35,534 180 3. ANZ Equity Trust No 1 Cash and cash equivalents 50,320 118 76,893 563 4. ANZ Fixed Interest Trust Cash and cash equivalents 11,591 19 23,766 132 5. ANZ OA - Pendal Core Hedged Global Shares Trust Cash and cash equivalents 21,663 57 36,356 409 6. ANZ OA Arrowstreet Global Equity (Hedged) Trust† Cash and cash equivalents (815,482) 825 47,681 4,819 7. ANZ OA Colonial First State Imputation Trust Cash and cash equivalents 47,616 439 121,794 2,526 8. ANZ OA Investors Mutual Australian Share Trust Cash and cash equivalents 192,996 220 138,023 1,345 9. ANZ OA Magellan Global Trust Cash and cash equivalents 965,129 464 448,404 2,164 10. ANZ OA OnePath Active Growth Trust Cash and cash equivalents - - 69,430 - 11. ANZ OA OnePath Australian Share Trust Cash and cash equivalents 153,940 292 252,293 1,651 12. ANZ OA OnePath Balanced Trust Cash and cash equivalents 50,153 85 53,175 728 13. ANZ OA OnePath Blue Chip Imputation Trust Cash and cash equivalents 361,497 936 975,400 6,205 14. ANZ OA OnePath Conservative Trust Cash and cash equivalents - - 205,965 - 15. ANZ OA OnePath Diversified Fixed Interest Trust Cash and cash equivalents 4,785 37 17,273 426 16. ANZ OA OnePath Global Emerging Markets Share Trust Cash and cash equivalents 534,730 236 83,893 1,884 17. ANZ OA OnePath High Growth Trust Cash and cash equivalents 36,746 77 45,838 520 18. ANZ OA OnePath Income Trust Cash and cash equivalents - - 11,380 - 19. ANZ OA OnePath Managed Growth Trust Cash and cash equivalents 167,310 324 191,463 5,904 20. ANZ OA OnePath Property Securities Trust Cash and cash equivalents 223,219 530 343,241 3,210 21. ANZ OA OnePath Select Leaders Trust Cash and cash equivalents 15,368 64 74,052 660
2020 2019

Financial Report Notes to the Financial Statements for the financial year ended 30 June 2020
395
11.7 ANZ Securities - Related party investments
† Negative balances relate to bank overdraft position.
Name of entity Value as at Income received/ Value as at Income received/receivable receivable
31 January 2020 31 January 2020 30 June 2019 30 June 2019$ $ $ $
22. ANZ OA OnePath Sustainable Investments - Australian Share Trust Cash and cash equivalents 2,481 4 2,243 23 23. ANZ OA OnePath Tax Effective Income Trust Cash and cash equivalents 77,401 121 2,593 770 24. ANZ OA OptiMix Australian Fixed Interest Trust Cash and cash equivalents 1,223 4 2,299 34 25. ANZ OA OptiMix Australian Share Trust Cash and cash equivalents 6,814 30 35,155 185 26. ANZ OA OptiMix Conservative Trust Cash and cash equivalents 9,856 57 48,981 371 27. ANZ OA OptiMix Global Share Trust Cash and cash equivalents 3,877 19 22,188 125 28. ANZ OA OptiMix Global Smaller Companies Share Trust Cash and cash equivalents 2,705 8 7,479 57 29. ANZ OA OptiMix Growth Trust Cash and cash equivalents 54,565 87 81,630 685 30. ANZ OA OptiMix High Growth Trust Cash and cash equivalents 19,189 42 38,179 240 31. ANZ OA OptiMix Moderate Trust Cash and cash equivalents 16,190 75 55,282 441 32. ANZ OA OptiMix Property Securities Trust Cash and cash equivalents 6,030 11 9,700 65 33. ANZ OA Perpetual Australian Share Trust Cash and cash equivalents 203,823 939 858,396 4,198 34. ANZ OA Schroder Australian Equity Trust Cash and cash equivalents 224,436 446 269,459 3,036 35. ANZ OA SG Hiscock Property Trust Cash and cash equivalents 48,558 70 26,206 467 36. ANZ OA UBS Diversified Fixed Income Trust Cash and cash equivalents 4,623 9 8,790 810 37. ANZ OneAnswer - BR Scientific Australian Equity Trust Cash and cash equivalents 17,608 49 7,168 270 38. ANZ OneAnswer - BR Scientific International Equity Trust† Cash and cash equivalents (187,129) 31 (24,109) 241 39. ANZ Private International Fixed Interest Fund Cash and cash equivalents - - 1,000,000 - 40. ANZ Property Securities Trust Cash and cash equivalents 144,099 319 225,148 2,076 41. Australian Share Trust Cash and cash equivalents 287,367 385 208,342 2,012 42. Balanced Trust Cash and cash equivalents 162,508 245 244,295 2,249
2020 2019
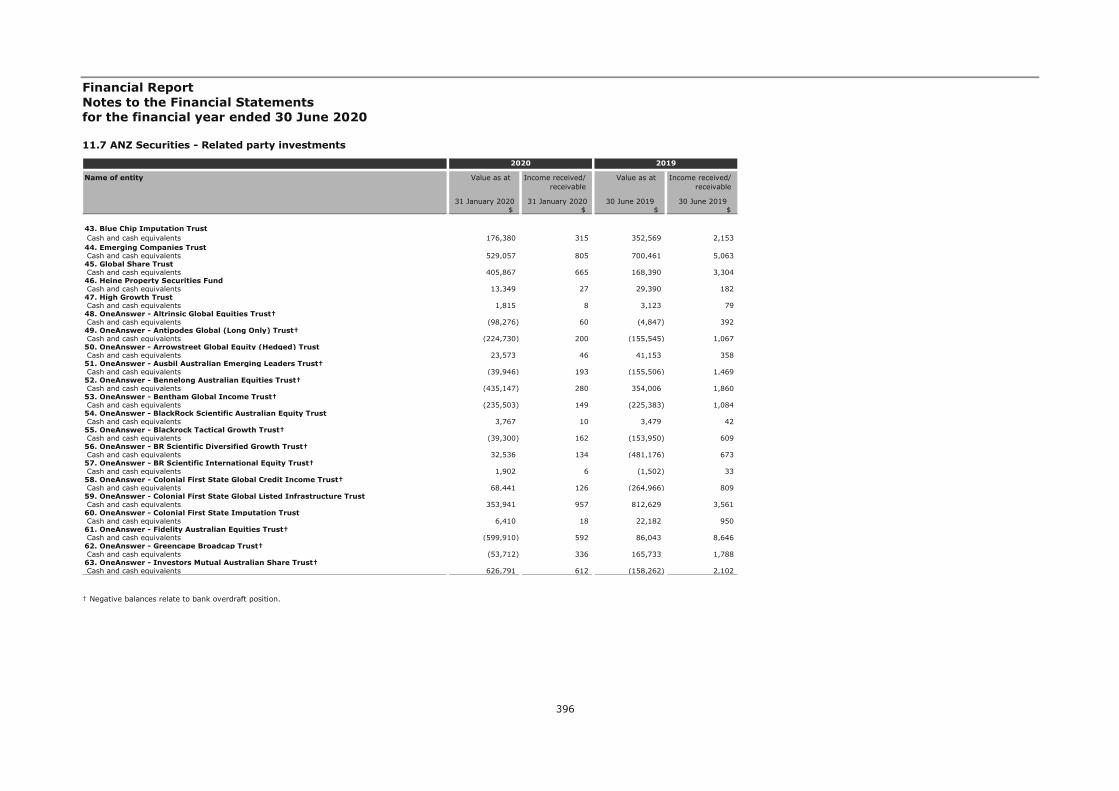
Financial Report Notes to the Financial Statements for the financial year ended 30 June 2020
396
11.7 ANZ Securities - Related party investments
† Negative balances relate to bank overdraft position.
Name of entity Value as at Income received/ Value as at Income received/receivable receivable
31 January 2020 31 January 2020 30 June 2019 30 June 2019$ $ $ $
43. Blue Chip Imputation Trust Cash and cash equivalents 176,380 315 352,569 2,153 44. Emerging Companies Trust Cash and cash equivalents 529,057 805 700,461 5,063 45. Global Share Trust Cash and cash equivalents 405,867 665 168,390 3,304 46. Heine Property Securities Fund Cash and cash equivalents 13,349 27 29,390 182 47. High Growth Trust Cash and cash equivalents 1,815 8 3,123 79 48. OneAnswer - Altrinsic Global Equities Trust† Cash and cash equivalents (98,276) 60 (4,847) 392 49. OneAnswer - Antipodes Global (Long Only) Trust† Cash and cash equivalents (224,730) 200 (155,545) 1,067 50. OneAnswer - Arrowstreet Global Equity (Hedged) Trust Cash and cash equivalents 23,573 46 41,153 358 51. OneAnswer - Ausbil Australian Emerging Leaders Trust† Cash and cash equivalents (39,946) 193 (155,506) 1,469 52. OneAnswer - Bennelong Australian Equities Trust† Cash and cash equivalents (435,147) 280 354,006 1,860 53. OneAnswer - Bentham Global Income Trust† Cash and cash equivalents (235,503) 149 (225,383) 1,084 54. OneAnswer - BlackRock Scientific Australian Equity Trust Cash and cash equivalents 3,767 10 3,479 42 55. OneAnswer - Blackrock Tactical Growth Trust† Cash and cash equivalents (39,300) 162 (153,950) 609 56. OneAnswer - BR Scientific Diversified Growth Trust† Cash and cash equivalents 32,536 134 (481,176) 673 57. OneAnswer - BR Scientific International Equity Trust† Cash and cash equivalents 1,902 6 (1,502) 33 58. OneAnswer - Colonial First State Global Credit Income Trust† Cash and cash equivalents 68,441 126 (264,966) 809 59. OneAnswer - Colonial First State Global Listed Infrastructure Trust Cash and cash equivalents 353,941 957 812,629 3,561 60. OneAnswer - Colonial First State Imputation Trust Cash and cash equivalents 6,410 18 22,182 950 61. OneAnswer - Fidelity Australian Equities Trust† Cash and cash equivalents (599,910) 592 86,043 8,646 62. OneAnswer - Greencape Broadcap Trust† Cash and cash equivalents (53,712) 336 165,733 1,788 63. OneAnswer - Investors Mutual Australian Share Trust† Cash and cash equivalents 626,791 612 (158,262) 2,102
2020 2019
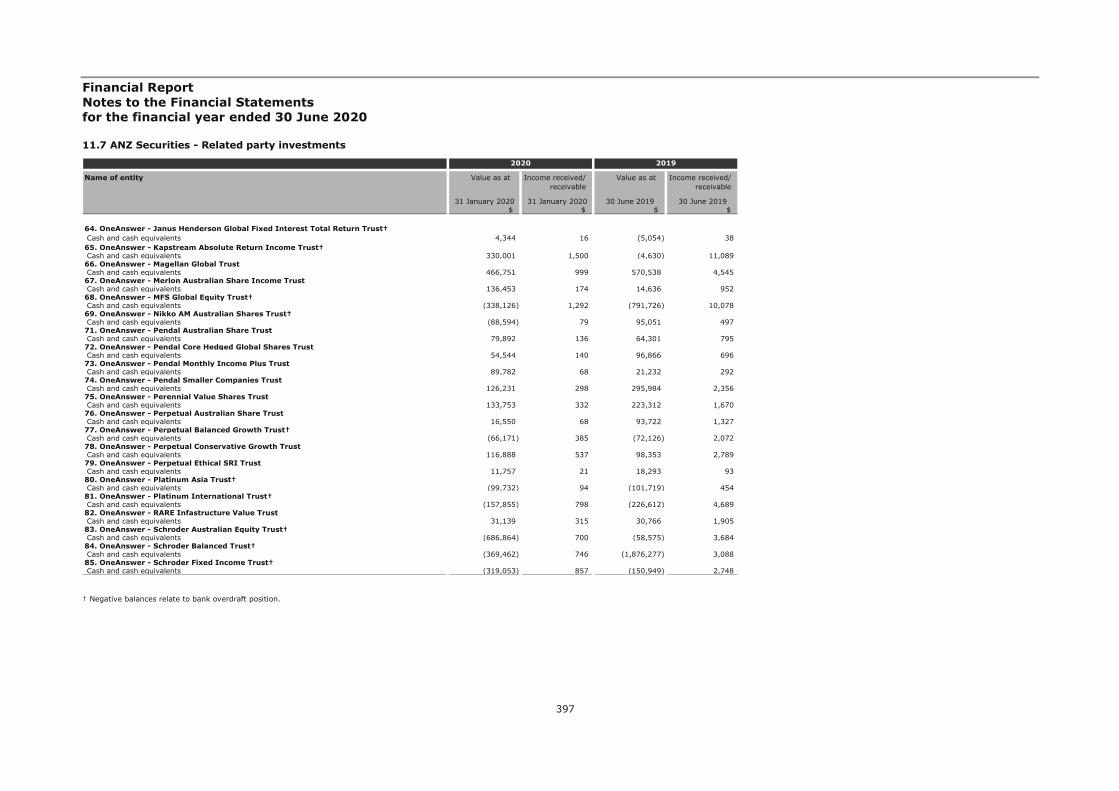
Financial Report Notes to the Financial Statements for the financial year ended 30 June 2020
397
11.7 ANZ Securities - Related party investments
† Negative balances relate to bank overdraft position.
Name of entity Value as at Income received/ Value as at Income received/receivable receivable
31 January 2020 31 January 2020 30 June 2019 30 June 2019$ $ $ $
64. OneAnswer - Janus Henderson Global Fixed Interest Total Return Trust† Cash and cash equivalents 4,344 16 (5,054) 38 65. OneAnswer - Kapstream Absolute Return Income Trust† Cash and cash equivalents 330,001 1,500 (4,630) 11,089 66. OneAnswer - Magellan Global Trust Cash and cash equivalents 466,751 999 570,538 4,545 67. OneAnswer - Merlon Australian Share Income Trust Cash and cash equivalents 136,453 174 14,636 952 68. OneAnswer - MFS Global Equity Trust† Cash and cash equivalents (338,126) 1,292 (791,726) 10,078 69. OneAnswer - Nikko AM Australian Shares Trust† Cash and cash equivalents (88,594) 79 95,051 497 71. OneAnswer - Pendal Australian Share Trust Cash and cash equivalents 79,892 136 64,301 795 72. OneAnswer - Pendal Core Hedged Global Shares Trust Cash and cash equivalents 54,544 140 96,866 696 73. OneAnswer - Pendal Monthly Income Plus Trust Cash and cash equivalents 89,782 68 21,232 292 74. OneAnswer - Pendal Smaller Companies Trust Cash and cash equivalents 126,231 298 295,984 2,356 75. OneAnswer - Perennial Value Shares Trust Cash and cash equivalents 133,753 332 223,312 1,670 76. OneAnswer - Perpetual Australian Share Trust Cash and cash equivalents 16,550 68 93,722 1,327 77. OneAnswer - Perpetual Balanced Growth Trust† Cash and cash equivalents (66,171) 385 (72,126) 2,072 78. OneAnswer - Perpetual Conservative Growth Trust Cash and cash equivalents 116,888 537 98,353 2,789 79. OneAnswer - Perpetual Ethical SRI Trust Cash and cash equivalents 11,757 21 18,293 93 80. OneAnswer - Platinum Asia Trust† Cash and cash equivalents (99,732) 94 (101,719) 454 81. OneAnswer - Platinum International Trust† Cash and cash equivalents (157,855) 798 (226,612) 4,689 82. OneAnswer - RARE Infastructure Value Trust Cash and cash equivalents 31,139 315 30,766 1,905 83. OneAnswer - Schroder Australian Equity Trust† Cash and cash equivalents (686,864) 700 (58,575) 3,684 84. OneAnswer - Schroder Balanced Trust† Cash and cash equivalents (369,462) 746 (1,876,277) 3,088 85. OneAnswer - Schroder Fixed Income Trust† Cash and cash equivalents (319,053) 857 (150,949) 2,748
2020 2019

Financial Report Notes to the Financial Statements for the financial year ended 30 June 2020
398
11.7 ANZ Securities - Related party investments
† Negative balances relate to bank overdraft position.
Name of entity Value as at Income received/ Value as at Income received/receivable receivable
31 January 2020 31 January 2020 30 June 2019 30 June 2019$ $ $ $
86. OneAnswer - Schroder Real Return Trust† Cash and cash equivalents (602,475) 1,265 (206,323) 5,364 87. OneAnswer - SG Hiscock Property Trust† Cash and cash equivalents (27,020) 61 30,038 383 88. OneAnswer - Stewart Investors Worldwide Sustainability Trust Cash and cash equivalents 11,745 26 12,552 126 89. OneAnswer - T. Rowe Price Global Equity Trust Cash and cash equivalents 155,921 209 71,424 754 90. OneAnswer - T.Rowe Price Dynamic Global Bond Trust Cash and cash equivalents 175,071 275 212,225 1,062 91. OneAnswer - UBS Balanced Trust† Cash and cash equivalents (103,189) 197 (151,197) 986 92. OneAnswer - UBS Defensive Trust† Cash and cash equivalents 119,025 81 (36,566) 249 93. OneAnswer - UBS Diversified Fixed Income Trust† Cash and cash equivalents 208,668 344 (169,056) 1,250 94. OneAnswer - Vanguard Australian Shares Index Trust Cash and cash equivalents 1,084,390 3,309 3,897,995 17,678 96. OneAnswer - Vanguard Conservative Index Trust Cash and cash equivalents 100,000 - - - 98. OneAnswer - Vanguard Growth Index Trust Cash and cash equivalents - - 1,700,000 - 100. OneAnswer - Vanguard International Shares Index (Hedged) Trust Cash and cash equivalents 297,170 338 409,092 2,309 101. OneAnswer - Vanguard International Shares Index Trust Cash and cash equivalents 1,740,109 456 3,087,074 9,308 102. OneAnswer - Vanguard Property Securities Index Trust Cash and cash equivalents 345,454 293 155,623 1,594 103. OneAnswer - Walter Scott Global Equity (Hedged) Trust† Cash and cash equivalents (169,998) 106 7,079 816 104. OnePath Alternatives Growth Fund Cash and cash equivalents 2,451,273 6,564 1,489,681 60,075 105. OnePath Capital Guaranteed Trust Cash and cash equivalents - - 5,668,132 - 106. OnePath Capital Stable Trust Cash and cash equivalents 7,021 20 22,393 122 107. OnePath Diversified Credit Trust Cash and cash equivalents 772 3 1,884 27 108. OnePath Diversified Fixed Interest Trust Cash and cash equivalents 18,234 57 47,064 464 109. OnePath Geared Australian Shares Index Trust Cash and cash equivalents 12,112 31 55,607 185
2020 2019
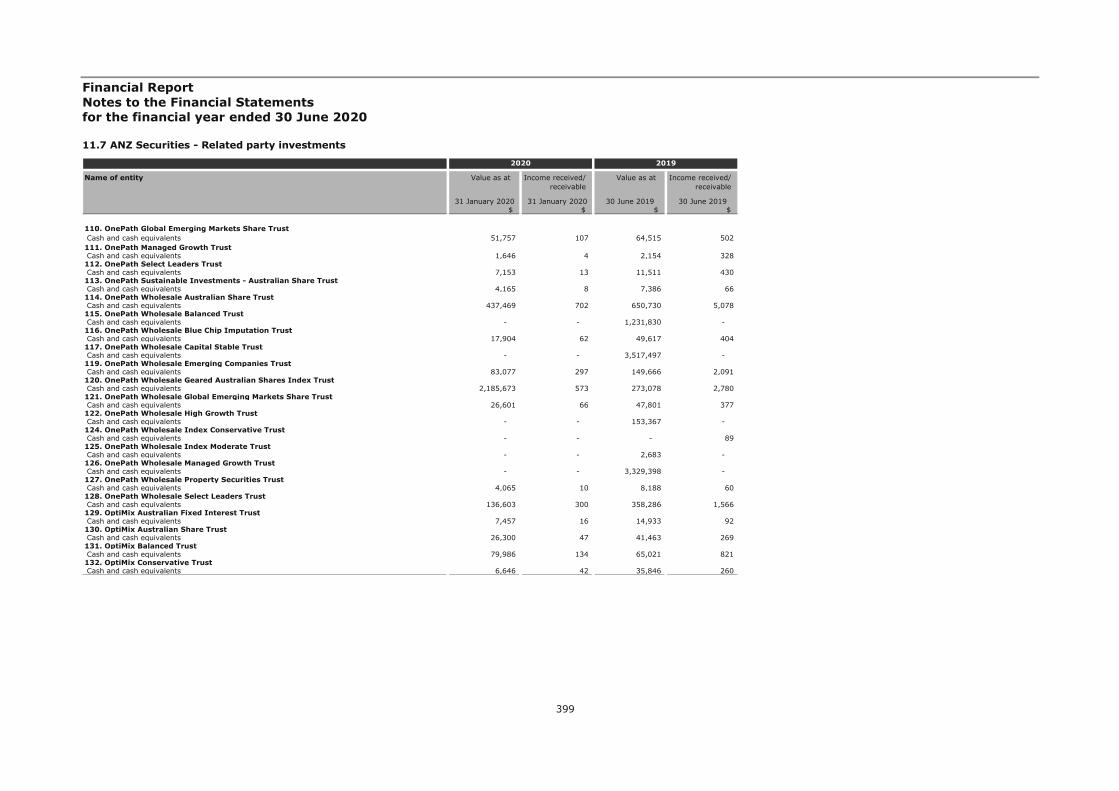
Financial Report Notes to the Financial Statements for the financial year ended 30 June 2020
399
11.7 ANZ Securities - Related party investments
Name of entity Value as at Income received/ Value as at Income received/receivable receivable
31 January 2020 31 January 2020 30 June 2019 30 June 2019$ $ $ $
110. OnePath Global Emerging Markets Share Trust Cash and cash equivalents 51,757 107 64,515 502 111. OnePath Managed Growth Trust Cash and cash equivalents 1,646 4 2,154 328 112. OnePath Select Leaders Trust Cash and cash equivalents 7,153 13 11,511 430 113. OnePath Sustainable Investments - Australian Share Trust Cash and cash equivalents 4,165 8 7,386 66 114. OnePath Wholesale Australian Share Trust Cash and cash equivalents 437,469 702 650,730 5,078 115. OnePath Wholesale Balanced Trust Cash and cash equivalents - - 1,231,830 - 116. OnePath Wholesale Blue Chip Imputation Trust Cash and cash equivalents 17,904 62 49,617 404 117. OnePath Wholesale Capital Stable Trust Cash and cash equivalents - - 3,517,497 - 119. OnePath Wholesale Emerging Companies Trust Cash and cash equivalents 83,077 297 149,666 2,091 120. OnePath Wholesale Geared Australian Shares Index Trust Cash and cash equivalents 2,185,673 573 273,078 2,780 121. OnePath Wholesale Global Emerging Markets Share Trust Cash and cash equivalents 26,601 66 47,801 377 122. OnePath Wholesale High Growth Trust Cash and cash equivalents - - 153,367 - 124. OnePath Wholesale Index Conservative Trust Cash and cash equivalents - - - 89 125. OnePath Wholesale Index Moderate Trust Cash and cash equivalents - - 2,683 - 126. OnePath Wholesale Managed Growth Trust Cash and cash equivalents - - 3,329,398 - 127. OnePath Wholesale Property Securities Trust Cash and cash equivalents 4,065 10 8,188 60 128. OnePath Wholesale Select Leaders Trust Cash and cash equivalents 136,603 300 358,286 1,566 129. OptiMix Australian Fixed Interest Trust Cash and cash equivalents 7,457 16 14,933 92 130. OptiMix Australian Share Trust Cash and cash equivalents 26,300 47 41,463 269 131. OptiMix Balanced Trust Cash and cash equivalents 79,986 134 65,021 821 132. OptiMix Conservative Trust Cash and cash equivalents 6,646 42 35,846 260
2020 2019
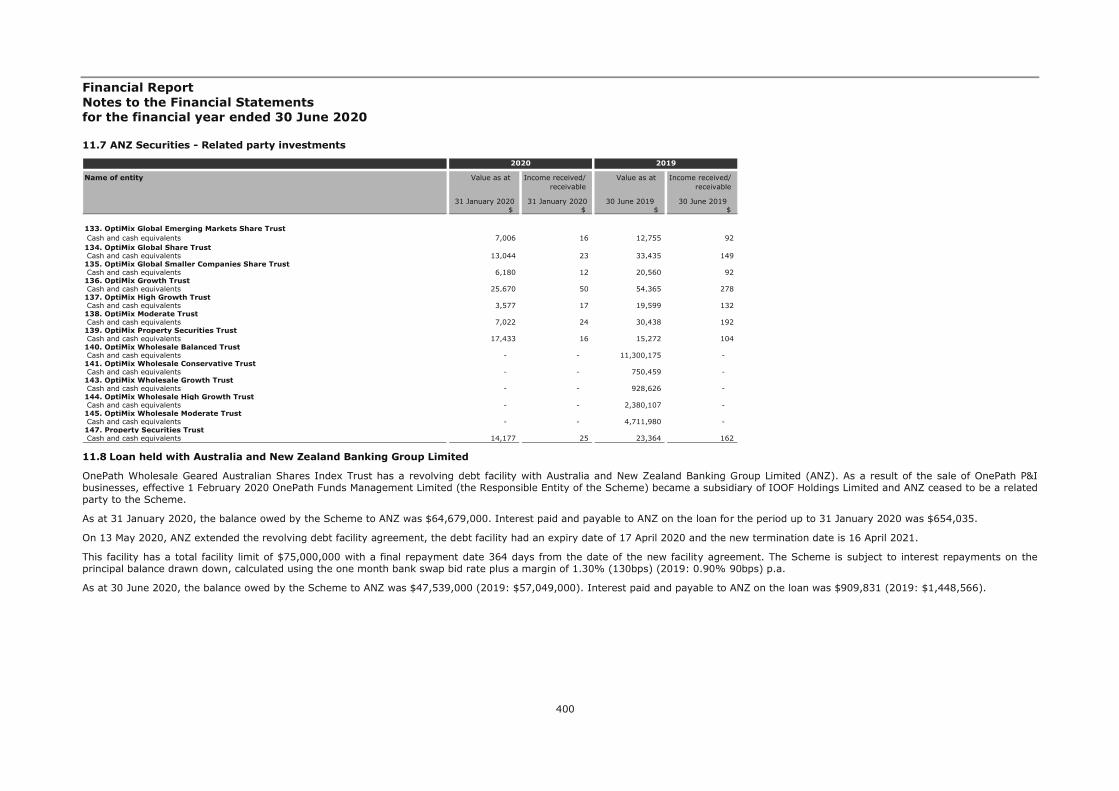
Financial Report Notes to the Financial Statements for the financial year ended 30 June 2020
400
11.7 ANZ Securities - Related party investments
11.8 Loan held with Australia and New Zealand Banking Group Limited
OnePath Wholesale Geared Australian Shares Index Trust has a revolving debt facility with Australia and New Zealand Banking Group Limited (ANZ). As a result of the sale of OnePath P&I businesses, effective 1 February 2020 OnePath Funds Management Limited (the Responsible Entity of the Scheme) became a subsidiary of IOOF Holdings Limited and ANZ ceased to be a related party to the Scheme.
As at 31 January 2020, the balance owed by the Scheme to ANZ was $64,679,000. Interest paid and payable to ANZ on the loan for the period up to 31 January 2020 was $654,035.
On 13 May 2020, ANZ extended the revolving debt facility agreement, the debt facility had an expiry date of 17 April 2020 and the new termination date is 16 April 2021.
This facility has a total facility limit of $75,000,000 with a final repayment date 364 days from the date of the new facility agreement. The Scheme is subject to interest repayments on the principal balance drawn down, calculated using the one month bank swap bid rate plus a margin of 1.30% (130bps) (2019: 0.90% 90bps) p.a.
As at 30 June 2020, the balance owed by the Scheme to ANZ was $47,539,000 (2019: $57,049,000). Interest paid and payable to ANZ on the loan was $909,831 (2019: $1,448,566).
Name of entity Value as at Income received/ Value as at Income received/receivable receivable
31 January 2020 31 January 2020 30 June 2019 30 June 2019$ $ $ $
133. OptiMix Global Emerging Markets Share Trust Cash and cash equivalents 7,006 16 12,755 92 134. OptiMix Global Share Trust Cash and cash equivalents 13,044 23 33,435 149 135. OptiMix Global Smaller Companies Share Trust Cash and cash equivalents 6,180 12 20,560 92 136. OptiMix Growth Trust Cash and cash equivalents 25,670 50 54,365 278 137. OptiMix High Growth Trust Cash and cash equivalents 3,577 17 19,599 132 138. OptiMix Moderate Trust Cash and cash equivalents 7,022 24 30,438 192 139. OptiMix Property Securities Trust Cash and cash equivalents 17,433 16 15,272 104 140. OptiMix Wholesale Balanced Trust Cash and cash equivalents - - 11,300,175 - 141. OptiMix Wholesale Conservative Trust Cash and cash equivalents - - 750,459 - 143. OptiMix Wholesale Growth Trust Cash and cash equivalents - - 928,626 - 144. OptiMix Wholesale High Growth Trust Cash and cash equivalents - - 2,380,107 - 145. OptiMix Wholesale Moderate Trust Cash and cash equivalents - - 4,711,980 - 147. Property Securities Trust Cash and cash equivalents 14,177 25 23,364 162
2020 2019
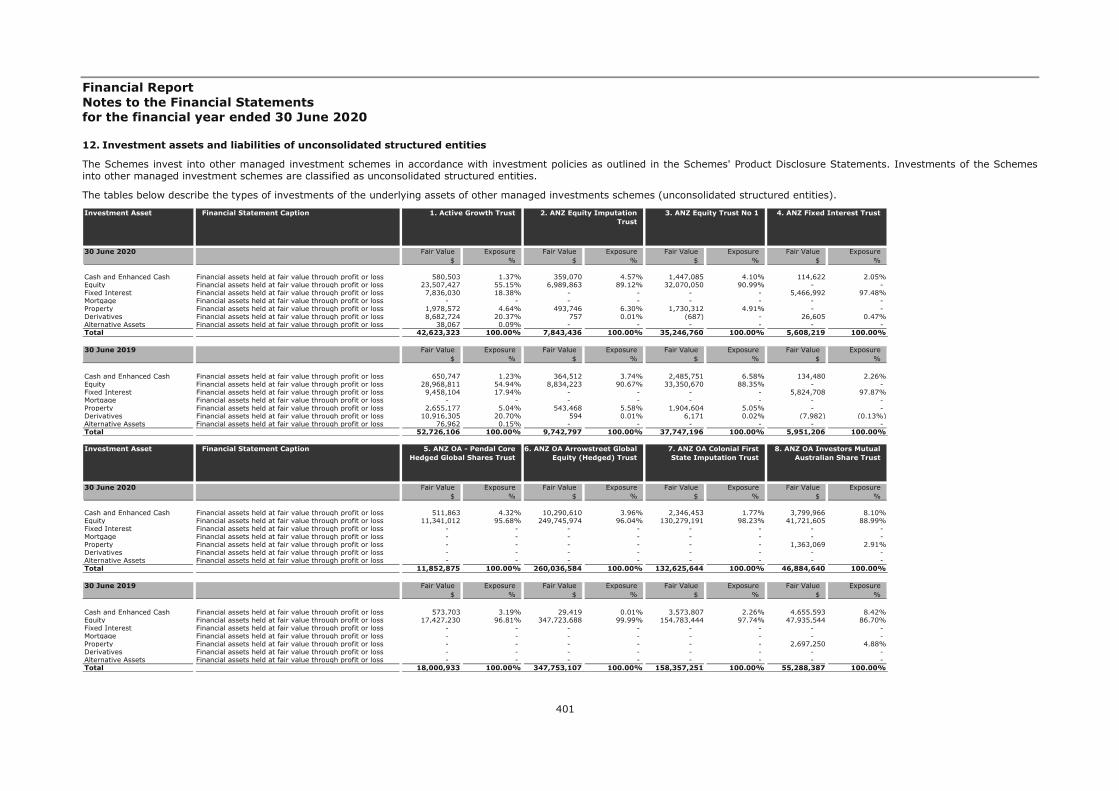
Financial Report Notes to the Financial Statements for the financial year ended 30 June 2020
401
12. Investment assets and liabilities of unconsolidated structured entities
The Schemes invest into other managed investment schemes in accordance with investment policies as outlined in the Schemes' Product Disclosure Statements. Investments of the Schemes into other managed investment schemes are classified as unconsolidated structured entities.
The tables below describe the types of investments of the underlying assets of other managed investments schemes (unconsolidated structured entities).
Cash and Enhanced Cash Financial assets held at fair value through profit or loss 580,503 1.37% 359,070 4.57% 1,447,085 4.10% 114,622 2.05%Equity Financial assets held at fair value through profit or loss 23,507,427 55.15% 6,989,863 89.12% 32,070,050 90.99% - - Fixed Interest Financial assets held at fair value through profit or loss 7,836,030 18.38% - - - - 5,466,992 97.48%Mortgage Financial assets held at fair value through profit or loss - - - - - - - - Property Financial assets held at fair value through profit or loss 1,978,572 4.64% 493,746 6.30% 1,730,312 4.91% - - Derivatives Financial assets held at fair value through profit or loss 8,682,724 20.37% 757 0.01% (687) - 26,605 0.47%Alternative Assets Financial assets held at fair value through profit or loss 38,067 0.09% - - - - - - Total 42,623,323 100.00% 7,843,436 100.00% 35,246,760 100.00% 5,608,219 100.00%
Cash and Enhanced Cash Financial assets held at fair value through profit or loss 650,747 1.23% 364,512 3.74% 2,485,751 6.58% 134,480 2.26%Equity Financial assets held at fair value through profit or loss 28,968,811 54.94% 8,834,223 90.67% 33,350,670 88.35% - - Fixed Interest Financial assets held at fair value through profit or loss 9,458,104 17.94% - - - - 5,824,708 97.87%Mortgage Financial assets held at fair value through profit or loss - - - - - - - - Property Financial assets held at fair value through profit or loss 2,655,177 5.04% 543,468 5.58% 1,904,604 5.05% - - Derivatives Financial assets held at fair value through profit or loss 10,916,305 20.70% 594 0.01% 6,171 0.02% (7,982) (0.13%)Alternative Assets Financial assets held at fair value through profit or loss 76,962 0.15% - - - - - - Total 52,726,106 100.00% 9,742,797 100.00% 37,747,196 100.00% 5,951,206 100.00%
Exposure%
Fair Value$
Exposure%
Fair Value$
Exposure%
30 June 2019 Fair Value$
Exposure%
Fair Value$
Exposure%
1. Active Growth Trust 2. ANZ Equity Imputation Trust
Investment Asset Financial Statement Caption
30 June 2020 Fair Value$
Exposure%
Fair Value$
Fair Value$
Exposure%
Fair Value$
Exposure%
3. ANZ Equity Trust No 1 4. ANZ Fixed Interest Trust
Cash and Enhanced Cash Financial assets held at fair value through profit or loss 511,863 4.32% 10,290,610 3.96% 2,346,453 1.77% 3,799,966 8.10%Equity Financial assets held at fair value through profit or loss 11,341,012 95.68% 249,745,974 96.04% 130,279,191 98.23% 41,721,605 88.99%Fixed Interest Financial assets held at fair value through profit or loss - - - - - - - - Mortgage Financial assets held at fair value through profit or loss - - - - - - - - Property Financial assets held at fair value through profit or loss - - - - - - 1,363,069 2.91%Derivatives Financial assets held at fair value through profit or loss - - - - - - - - Alternative Assets Financial assets held at fair value through profit or loss - - - - - - - - Total 11,852,875 100.00% 260,036,584 100.00% 132,625,644 100.00% 46,884,640 100.00%
Cash and Enhanced Cash Financial assets held at fair value through profit or loss 573,703 3.19% 29,419 0.01% 3,573,807 2.26% 4,655,593 8.42%Equity Financial assets held at fair value through profit or loss 17,427,230 96.81% 347,723,688 99.99% 154,783,444 97.74% 47,935,544 86.70%Fixed Interest Financial assets held at fair value through profit or loss - - - - - - - - Mortgage Financial assets held at fair value through profit or loss - - - - - - - - Property Financial assets held at fair value through profit or loss - - - - - - 2,697,250 4.88%Derivatives Financial assets held at fair value through profit or loss - - - - - - - - Alternative Assets Financial assets held at fair value through profit or loss - - - - - - - - Total 18,000,933 100.00% 347,753,107 100.00% 158,357,251 100.00% 55,288,387 100.00%
Exposure%
Fair Value$
Exposure%
Fair Value$
Exposure%
30 June 2019 Fair Value$
Exposure%
Fair Value$
Exposure%
5. ANZ OA - Pendal Core Hedged Global Shares Trust
6. ANZ OA Arrowstreet Global Equity (Hedged) Trust
Investment Asset Financial Statement Caption
30 June 2020 Fair Value$
Exposure%
Fair Value$
Fair Value$
Exposure%
Fair Value$
Exposure%
7. ANZ OA Colonial First State Imputation Trust
8. ANZ OA Investors Mutual Australian Share Trust
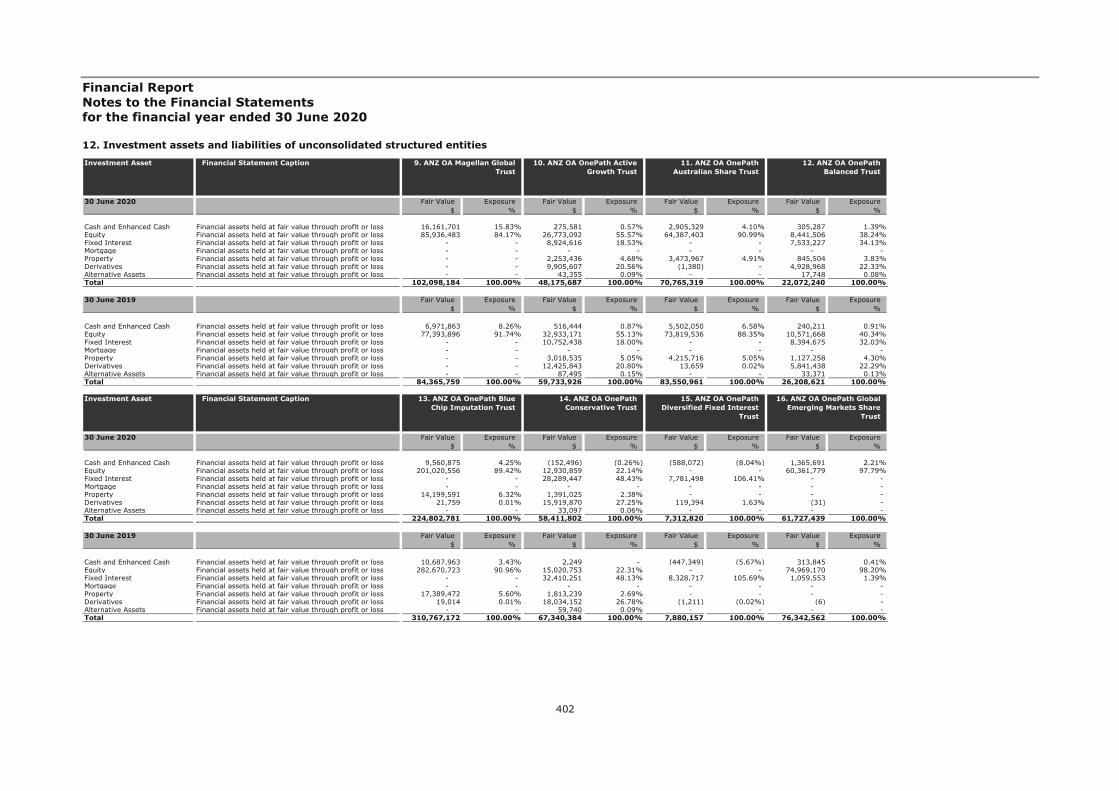
Financial Report Notes to the Financial Statements for the financial year ended 30 June 2020
402
12. Investment assets and liabilities of unconsolidated structured entities
Cash and Enhanced Cash Financial assets held at fair value through profit or loss 16,161,701 15.83% 275,581 0.57% 2,905,329 4.10% 305,287 1.39%Equity Financial assets held at fair value through profit or loss 85,936,483 84.17% 26,773,092 55.57% 64,387,403 90.99% 8,441,506 38.24%Fixed Interest Financial assets held at fair value through profit or loss - - 8,924,616 18.53% - - 7,533,227 34.13%Mortgage Financial assets held at fair value through profit or loss - - - - - - - - Property Financial assets held at fair value through profit or loss - - 2,253,436 4.68% 3,473,967 4.91% 845,504 3.83%Derivatives Financial assets held at fair value through profit or loss - - 9,905,607 20.56% (1,380) - 4,928,968 22.33%Alternative Assets Financial assets held at fair value through profit or loss - - 43,355 0.09% - - 17,748 0.08%Total 102,098,184 100.00% 48,175,687 100.00% 70,765,319 100.00% 22,072,240 100.00%
Cash and Enhanced Cash Financial assets held at fair value through profit or loss 6,971,863 8.26% 516,444 0.87% 5,502,050 6.58% 240,211 0.91%Equity Financial assets held at fair value through profit or loss 77,393,896 91.74% 32,933,171 55.13% 73,819,536 88.35% 10,571,668 40.34%Fixed Interest Financial assets held at fair value through profit or loss - - 10,752,438 18.00% - - 8,394,675 32.03%Mortgage Financial assets held at fair value through profit or loss - - - - - - - - Property Financial assets held at fair value through profit or loss - - 3,018,535 5.05% 4,215,716 5.05% 1,127,258 4.30%Derivatives Financial assets held at fair value through profit or loss - - 12,425,843 20.80% 13,659 0.02% 5,841,438 22.29%Alternative Assets Financial assets held at fair value through profit or loss - - 87,495 0.15% - - 33,371 0.13%Total 84,365,759 100.00% 59,733,926 100.00% 83,550,961 100.00% 26,208,621 100.00%
Exposure%
Fair Value$
Exposure%
Fair Value$
Exposure%
30 June 2019 Fair Value$
Exposure%
Fair Value$
Exposure%
9. ANZ OA Magellan Global Trust
10. ANZ OA OnePath Active Growth Trust
Investment Asset Financial Statement Caption
30 June 2020 Fair Value$
Exposure%
Fair Value$
Fair Value$
Exposure%
Fair Value$
Exposure%
11. ANZ OA OnePath Australian Share Trust
12. ANZ OA OnePath Balanced Trust
Cash and Enhanced Cash Financial assets held at fair value through profit or loss 9,560,875 4.25% (152,496) (0.26%) (588,072) (8.04%) 1,365,691 2.21%Equity Financial assets held at fair value through profit or loss 201,020,556 89.42% 12,930,859 22.14% - - 60,361,779 97.79%Fixed Interest Financial assets held at fair value through profit or loss - - 28,289,447 48.43% 7,781,498 106.41% - - Mortgage Financial assets held at fair value through profit or loss - - - - - - - - Property Financial assets held at fair value through profit or loss 14,199,591 6.32% 1,391,025 2.38% - - - - Derivatives Financial assets held at fair value through profit or loss 21,759 0.01% 15,919,870 27.25% 119,394 1.63% (31) - Alternative Assets Financial assets held at fair value through profit or loss - - 33,097 0.06% - - - - Total 224,802,781 100.00% 58,411,802 100.00% 7,312,820 100.00% 61,727,439 100.00%
Cash and Enhanced Cash Financial assets held at fair value through profit or loss 10,687,963 3.43% 2,249 - (447,349) (5.67%) 313,845 0.41%Equity Financial assets held at fair value through profit or loss 282,670,723 90.96% 15,020,753 22.31% - - 74,969,170 98.20%Fixed Interest Financial assets held at fair value through profit or loss - - 32,410,251 48.13% 8,328,717 105.69% 1,059,553 1.39%Mortgage Financial assets held at fair value through profit or loss - - - - - - - - Property Financial assets held at fair value through profit or loss 17,389,472 5.60% 1,813,239 2.69% - - - - Derivatives Financial assets held at fair value through profit or loss 19,014 0.01% 18,034,152 26.78% (1,211) (0.02%) (6) - Alternative Assets Financial assets held at fair value through profit or loss - - 59,740 0.09% - - - - Total 310,767,172 100.00% 67,340,384 100.00% 7,880,157 100.00% 76,342,562 100.00%
Exposure%
Fair Value$
Exposure%
Fair Value$
Exposure%
30 June 2019 Fair Value$
Exposure%
Fair Value$
Exposure%
13. ANZ OA OnePath Blue Chip Imputation Trust
14. ANZ OA OnePath Conservative Trust
Investment Asset Financial Statement Caption
30 June 2020 Fair Value$
Exposure%
Fair Value$
Fair Value$
Exposure%
Fair Value$
Exposure%
15. ANZ OA OnePath Diversified Fixed Interest
Trust
16. ANZ OA OnePath Global Emerging Markets Share
Trust
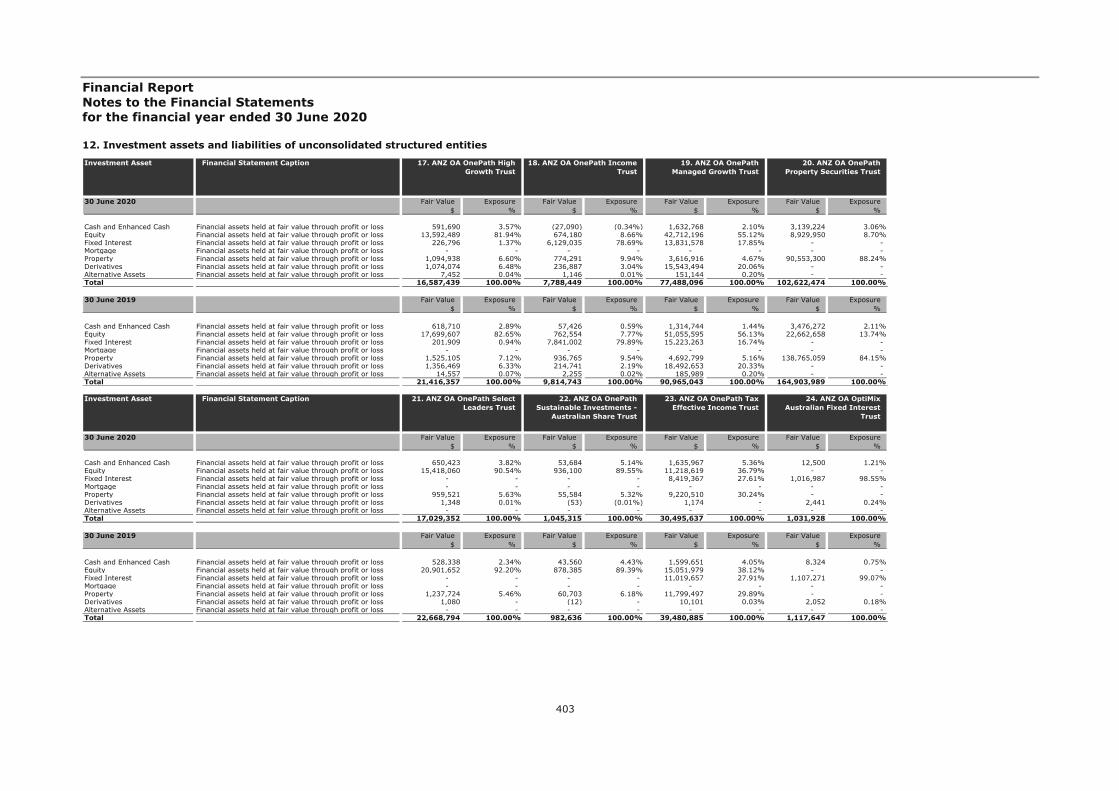
Financial Report Notes to the Financial Statements for the financial year ended 30 June 2020
403
12. Investment assets and liabilities of unconsolidated structured entities
Cash and Enhanced Cash Financial assets held at fair value through profit or loss 591,690 3.57% (27,090) (0.34%) 1,632,768 2.10% 3,139,224 3.06%Equity Financial assets held at fair value through profit or loss 13,592,489 81.94% 674,180 8.66% 42,712,196 55.12% 8,929,950 8.70%Fixed Interest Financial assets held at fair value through profit or loss 226,796 1.37% 6,129,035 78.69% 13,831,578 17.85% - - Mortgage Financial assets held at fair value through profit or loss - - - - - - - - Property Financial assets held at fair value through profit or loss 1,094,938 6.60% 774,291 9.94% 3,616,916 4.67% 90,553,300 88.24%Derivatives Financial assets held at fair value through profit or loss 1,074,074 6.48% 236,887 3.04% 15,543,494 20.06% - - Alternative Assets Financial assets held at fair value through profit or loss 7,452 0.04% 1,146 0.01% 151,144 0.20% - - Total 16,587,439 100.00% 7,788,449 100.00% 77,488,096 100.00% 102,622,474 100.00%
Cash and Enhanced Cash Financial assets held at fair value through profit or loss 618,710 2.89% 57,426 0.59% 1,314,744 1.44% 3,476,272 2.11%Equity Financial assets held at fair value through profit or loss 17,699,607 82.65% 762,554 7.77% 51,055,595 56.13% 22,662,658 13.74%Fixed Interest Financial assets held at fair value through profit or loss 201,909 0.94% 7,841,002 79.89% 15,223,263 16.74% - - Mortgage Financial assets held at fair value through profit or loss - - - - - - - - Property Financial assets held at fair value through profit or loss 1,525,105 7.12% 936,765 9.54% 4,692,799 5.16% 138,765,059 84.15%Derivatives Financial assets held at fair value through profit or loss 1,356,469 6.33% 214,741 2.19% 18,492,653 20.33% - - Alternative Assets Financial assets held at fair value through profit or loss 14,557 0.07% 2,255 0.02% 185,989 0.20% - - Total 21,416,357 100.00% 9,814,743 100.00% 90,965,043 100.00% 164,903,989 100.00%
Exposure%
Fair Value$
Exposure%
Fair Value$
Exposure%
30 June 2019 Fair Value$
Exposure%
Fair Value$
Exposure%
17. ANZ OA OnePath High Growth Trust
18. ANZ OA OnePath Income Trust
Investment Asset Financial Statement Caption
30 June 2020 Fair Value$
Exposure%
Fair Value$
Fair Value$
Exposure%
Fair Value$
Exposure%
19. ANZ OA OnePath Managed Growth Trust
20. ANZ OA OnePath Property Securities Trust
Cash and Enhanced Cash Financial assets held at fair value through profit or loss 650,423 3.82% 53,684 5.14% 1,635,967 5.36% 12,500 1.21%Equity Financial assets held at fair value through profit or loss 15,418,060 90.54% 936,100 89.55% 11,218,619 36.79% - - Fixed Interest Financial assets held at fair value through profit or loss - - - - 8,419,367 27.61% 1,016,987 98.55%Mortgage Financial assets held at fair value through profit or loss - - - - - - - - Property Financial assets held at fair value through profit or loss 959,521 5.63% 55,584 5.32% 9,220,510 30.24% - - Derivatives Financial assets held at fair value through profit or loss 1,348 0.01% (53) (0.01%) 1,174 - 2,441 0.24%Alternative Assets Financial assets held at fair value through profit or loss - - - - - - - - Total 17,029,352 100.00% 1,045,315 100.00% 30,495,637 100.00% 1,031,928 100.00%
Cash and Enhanced Cash Financial assets held at fair value through profit or loss 528,338 2.34% 43,560 4.43% 1,599,651 4.05% 8,324 0.75%Equity Financial assets held at fair value through profit or loss 20,901,652 92.20% 878,385 89.39% 15,051,979 38.12% - - Fixed Interest Financial assets held at fair value through profit or loss - - - - 11,019,657 27.91% 1,107,271 99.07%Mortgage Financial assets held at fair value through profit or loss - - - - - - - - Property Financial assets held at fair value through profit or loss 1,237,724 5.46% 60,703 6.18% 11,799,497 29.89% - - Derivatives Financial assets held at fair value through profit or loss 1,080 - (12) - 10,101 0.03% 2,052 0.18%Alternative Assets Financial assets held at fair value through profit or loss - - - - - - - - Total 22,668,794 100.00% 982,636 100.00% 39,480,885 100.00% 1,117,647 100.00%
Exposure%
Fair Value$
Exposure%
Fair Value$
Exposure%
30 June 2019 Fair Value$
Exposure%
Fair Value$
Exposure%
21. ANZ OA OnePath Select Leaders Trust
22. ANZ OA OnePath Sustainable Investments -
Australian Share Trust
Investment Asset Financial Statement Caption
30 June 2020 Fair Value$
Exposure%
Fair Value$
Fair Value$
Exposure%
Fair Value$
Exposure%
23. ANZ OA OnePath Tax Effective Income Trust
24. ANZ OA OptiMix Australian Fixed Interest
Trust

Financial Report Notes to the Financial Statements for the financial year ended 30 June 2020
404
12. Investment assets and liabilities of unconsolidated structured entities
Cash and Enhanced Cash Financial assets held at fair value through profit or loss 230,500 3.40% (9,868) (0.08%) 108,057 3.05% 16,530 0.92%Equity Financial assets held at fair value through profit or loss 5,943,325 87.77% 2,811,817 21.01% 3,335,780 94.00% 1,712,729 96.39%Fixed Interest Financial assets held at fair value through profit or loss 165,078 2.44% 6,614,514 49.42% 99,106 2.79% - - Mortgage Financial assets held at fair value through profit or loss - - - - - - - - Property Financial assets held at fair value through profit or loss 429,329 6.34% 300,622 2.25% 2,220 0.06% 47,712 2.69%Derivatives Financial assets held at fair value through profit or loss 3,078 0.05% 3,659,518 27.34% 3,668 0.10% (44) - Alternative Assets Financial assets held at fair value through profit or loss - - 7,623 0.06% - - - - Total 6,771,310 100.00% 13,384,226 100.00% 3,548,831 100.00% 1,776,927 100.00%
Cash and Enhanced Cash Financial assets held at fair value through profit or loss 257,673 3.11% (53,753) (0.34%) 59,881 1.21% 41,883 2.15%Equity Financial assets held at fair value through profit or loss 7,454,434 90.11% 3,398,445 21.90% 4,803,729 96.73% 1,846,650 94.51%Fixed Interest Financial assets held at fair value through profit or loss 5,421 0.07% 7,599,495 48.97% 72,645 1.46% - - Mortgage Financial assets held at fair value through profit or loss - - - - - - - - Property Financial assets held at fair value through profit or loss 555,174 6.71% 393,672 2.54% 30,365 0.61% 65,291 3.34%Derivatives Financial assets held at fair value through profit or loss (84) - 4,165,510 26.84% (457) (0.01%) 4 - Alternative Assets Financial assets held at fair value through profit or loss - - 13,838 0.09% - - - - Total 8,272,618 100.00% 15,517,207 100.00% 4,966,163 100.00% 1,953,828 100.00%
Exposure%
Fair Value$
Exposure%
Fair Value$
Exposure%
30 June 2019 Fair Value$
Exposure%
Fair Value$
Exposure%
25. ANZ OA OptiMix Australian Share Trust
26. ANZ OA OptiMix Conservative Trust
Investment Asset Financial Statement Caption
30 June 2020 Fair Value$
Exposure%
Fair Value$
Fair Value$
Exposure%
Fair Value$
Exposure%
27. ANZ OA OptiMix Global Share Trust
28. ANZ OA OptiMix Global Smaller Companies Share
Trust
Cash and Enhanced Cash Financial assets held at fair value through profit or loss 455,101 2.17% 315,503 3.86% 208,756 1.23% 82,642 4.01%Equity Financial assets held at fair value through profit or loss 13,968,286 66.71% 6,618,372 81.23% 6,403,846 37.68% 123,481 5.99%Fixed Interest Financial assets held at fair value through profit or loss 2,120,977 10.13% 159,327 1.96% 5,907,738 34.77% - - Mortgage Financial assets held at fair value through profit or loss - - - - - - - - Property Financial assets held at fair value through profit or loss 1,202,902 5.75% 505,706 6.21% 638,438 3.76% 1,854,514 90.00%Derivatives Financial assets held at fair value through profit or loss 3,175,088 15.16% 544,902 6.69% 3,820,676 22.48% - - Alternative Assets Financial assets held at fair value through profit or loss 15,820 0.08% 3,762 0.05% 13,816 0.08% - - Total 20,938,174 100.00% 8,147,572 100.00% 16,993,270 100.00% 2,060,637 100.00%
Cash and Enhanced Cash Financial assets held at fair value through profit or loss 531,628 2.01% 320,524 3.32% 284,948 1.38% 85,805 2.73%Equity Financial assets held at fair value through profit or loss 17,934,989 67.76% 7,986,111 82.77% 8,071,345 39.14% 269,805 8.59%Fixed Interest Financial assets held at fair value through profit or loss 2,408,726 9.10% 55,797 0.58% 6,772,649 32.84% - - Mortgage Financial assets held at fair value through profit or loss - - - - - - - - Property Financial assets held at fair value through profit or loss 1,649,333 6.23% 650,352 6.74% 834,154 4.05% 2,785,905 88.68%Derivatives Financial assets held at fair value through profit or loss 3,912,174 14.78% 629,177 6.52% 4,631,853 22.46% - - Alternative Assets Financial assets held at fair value through profit or loss 31,015 0.12% 6,750 0.07% 26,487 0.13% - - Total 26,467,865 100.00% 9,648,711 100.00% 20,621,436 100.00% 3,141,515 100.00%
Exposure%
Fair Value$
Exposure%
Fair Value$
Exposure%
30 June 2019 Fair Value$
Exposure%
Fair Value$
Exposure%
29. ANZ OA OptiMix Growth Trust
30. ANZ OA OptiMix High Growth Trust
Investment Asset Financial Statement Caption
30 June 2020 Fair Value$
Exposure%
Fair Value$
Fair Value$
Exposure%
Fair Value$
Exposure%
31. ANZ OA OptiMix Moderate Trust
32. ANZ OA OptiMix Property Securities Trust

Financial Report Notes to the Financial Statements for the financial year ended 30 June 2020
405
12. Investment assets and liabilities of unconsolidated structured entities
Cash and Enhanced Cash Financial assets held at fair value through profit or loss 15,334,502 6.10% 1,931,088 2.95% 231,901 2.19% 591,546 29.62%Equity Financial assets held at fair value through profit or loss 227,429,988 90.41% 63,623,683 97.05% - - 671 0.03%Fixed Interest Financial assets held at fair value through profit or loss - - - - - - 1,394,879 69.82%Mortgage Financial assets held at fair value through profit or loss - - - - - - - - Property Financial assets held at fair value through profit or loss 8,788,194 3.49% - - 10,375,470 97.81% - - Derivatives Financial assets held at fair value through profit or loss - - - - - - 10,599 0.53%Alternative Assets Financial assets held at fair value through profit or loss - - - - - - - - Total 251,552,684 100.00% 65,554,771 100.00% 10,607,371 100.00% 1,997,695 100.00%
Cash and Enhanced Cash Financial assets held at fair value through profit or loss 28,978,882 8.74% 3,285,497 2.72% 144,847 0.77% 1,441,929 66.84%Equity Financial assets held at fair value through profit or loss 297,168,620 89.65% 117,397,543 97.28% - - 1,096 0.05%Fixed Interest Financial assets held at fair value through profit or loss - - - - - - 726,211 33.66%Mortgage Financial assets held at fair value through profit or loss - - - - - - - - Property Financial assets held at fair value through profit or loss 5,324,973 1.61% - - 18,694,412 99.23% - - Derivatives Financial assets held at fair value through profit or loss - - - - - - (11,766) (0.55%)Alternative Assets Financial assets held at fair value through profit or loss - - - - - - - - Total 331,472,475 100.00% 120,683,040 100.00% 18,839,259 100.00% 2,157,470 100.00%
Exposure%
Fair Value$
Exposure%
Fair Value$
Exposure%
30 June 2019 Fair Value$
Exposure%
Fair Value$
Exposure%
33. ANZ OA Perpetual Australian Share Trust
34. ANZ OA Schroder Australian Equity Trust
Investment Asset Financial Statement Caption
30 June 2020 Fair Value$
Exposure%
Fair Value$
Fair Value$
Exposure%
Fair Value$
Exposure%
35. ANZ OA SG Hiscock Property Trust
36. ANZ OA UBS Diversified Fixed Income Trust
Cash and Enhanced Cash Financial assets held at fair value through profit or loss 83,159 0.60% 13,064 0.12% (23,585,971) (9.74%) 1,837,241 3.32%Equity Financial assets held at fair value through profit or loss 13,670,754 99.40% 11,006,449 99.88% - - 4,803,723 8.68%Fixed Interest Financial assets held at fair value through profit or loss - - - - 262,198,054 108.30% - - Mortgage Financial assets held at fair value through profit or loss - - - - - - - - Property Financial assets held at fair value through profit or loss - - - - - - 48,711,689 88.00%Derivatives Financial assets held at fair value through profit or loss - - - - 3,480,370 1.44% - - Alternative Assets Financial assets held at fair value through profit or loss - - - - - - - - Total 13,753,913 100.00% 11,019,513 100.00% 242,092,453 100.00% 55,352,653 100.00%
Cash and Enhanced Cash Financial assets held at fair value through profit or loss 408,187 2.24% 140,186 1.08% (13,123,200) (7.32%) 2,122,286 2.32%Equity Financial assets held at fair value through profit or loss 16,095,166 88.50% 12,389,580 94.93% - - 12,592,353 13.71%Fixed Interest Financial assets held at fair value through profit or loss - - - - 192,178,475 107.28% - - Mortgage Financial assets held at fair value through profit or loss - - - - - - - - Property Financial assets held at fair value through profit or loss 1,345,766 7.40% 500,910 3.84% - - 77,103,869 83.97%Derivatives Financial assets held at fair value through profit or loss - - 19,950 0.15% 74,917 0.04% - - Alternative Assets Financial assets held at fair value through profit or loss 337,548 1.86% - - - - - - Total 18,186,667 100.00% 13,050,626 100.00% 179,130,192 100.00% 91,818,508 100.00%
Exposure%
Fair Value$
Exposure%
Fair Value$
Exposure%
30 June 2019 Fair Value$
Exposure%
Fair Value$
Exposure%
37. ANZ OneAnswer - BR Scientific Australian Equity
Trust
38. ANZ OneAnswer - BR Scientific International
Equity Trust
Investment Asset Financial Statement Caption
30 June 2020 Fair Value$
Exposure%
Fair Value$
Fair Value$
Exposure%
Fair Value$
Exposure%
39. ANZ Private International Fixed Interest Fund
40. ANZ Property Securities Trust

Financial Report Notes to the Financial Statements for the financial year ended 30 June 2020
406
12. Investment assets and liabilities of unconsolidated structured entities
Cash and Enhanced Cash Financial assets held at fair value through profit or loss 4,989,891 4.10% 923,661 1.39% 3,376,951 4.57% 8,911,022 4.68%Equity Financial assets held at fair value through profit or loss 110,585,139 90.99% 25,540,206 38.24% 65,737,618 89.12% 181,472,785 95.32%Fixed Interest Financial assets held at fair value through profit or loss - - 22,792,161 34.13% - - - - Mortgage Financial assets held at fair value through profit or loss - - - - - - - - Property Financial assets held at fair value through profit or loss 5,966,527 4.91% 2,558,116 3.83% 4,643,541 6.30% - - Derivatives Financial assets held at fair value through profit or loss (2,370) - 14,912,844 22.33% 7,116 0.01% - - Alternative Assets Financial assets held at fair value through profit or loss - - 53,697 0.08% - - - - Total 121,539,187 100.00% 66,780,685 100.00% 73,765,226 100.00% 190,383,807 100.00%
Cash and Enhanced Cash Financial assets held at fair value through profit or loss 8,810,663 6.58% 722,841 0.91% 3,699,771 3.74% 3,886,072 1.51%Equity Financial assets held at fair value through profit or loss 118,210,306 88.35% 31,812,348 40.34% 89,666,862 90.67% 248,905,666 97.12%Fixed Interest Financial assets held at fair value through profit or loss - - 25,261,323 32.03% - - - - Mortgage Financial assets held at fair value through profit or loss - - - - - - - - Property Financial assets held at fair value through profit or loss 6,750,802 5.05% 3,392,154 4.30% 5,516,169 5.58% 3,503,082 1.37%Derivatives Financial assets held at fair value through profit or loss 21,873 0.02% 17,578,102 22.29% 6,032 0.01% - - Alternative Assets Financial assets held at fair value through profit or loss - - 100,421 0.13% - - - - Total 133,793,644 100.00% 78,867,189 100.00% 98,888,834 100.00% 256,294,820 100.00%
Exposure%
Fair Value$
Exposure%
Fair Value$
Exposure%
30 June 2019 Fair Value$
Exposure%
Fair Value$
Exposure%
41. Australian Share Trust 42. Balanced Trust Investment Asset Financial Statement Caption
30 June 2020 Fair Value$
Exposure%
Fair Value$
Fair Value$
Exposure%
Fair Value$
Exposure%
43. Blue Chip Imputation Trust
44. Emerging Companies Trust
Cash and Enhanced Cash Financial assets held at fair value through profit or loss 7,523,730 4.13% 206,420 3.32% 46,315 3.57% 158,791 1.90%Equity Financial assets held at fair value through profit or loss 174,729,737 95.87% 539,713 8.68% 1,063,940 81.94% 8,212,406 98.10%Fixed Interest Financial assets held at fair value through profit or loss - - - - 17,752 1.37% - - Mortgage Financial assets held at fair value through profit or loss - - - - - - - - Property Financial assets held at fair value through profit or loss - - 5,472,910 88.00% 85,705 6.60% - - Derivatives Financial assets held at fair value through profit or loss (685) - - - 84,072 6.48% - - Alternative Assets Financial assets held at fair value through profit or loss - - - - 583 0.04% - - Total 182,252,782 100.00% 6,219,043 100.00% 1,298,367 100.00% 8,371,197 100.00%
Cash and Enhanced Cash Financial assets held at fair value through profit or loss 2,817,697 1.56% 202,281 2.32% 42,524 2.89% 369,449 2.28%Equity Financial assets held at fair value through profit or loss 175,453,241 97.12% 1,200,211 13.71% 1,216,491 82.65% 15,809,566 97.69%Fixed Interest Financial assets held at fair value through profit or loss - - - - 13,877 0.94% - - Mortgage Financial assets held at fair value through profit or loss - - - - - - - - Property Financial assets held at fair value through profit or loss 2,388,303 1.32% 7,348,974 83.97% 104,820 7.12% - - Derivatives Financial assets held at fair value through profit or loss (666) - - - 93,230 6.33% 5,001 0.03%Alternative Assets Financial assets held at fair value through profit or loss - - - - 1,001 0.07% - - Total 180,658,575 100.00% 8,751,466 100.00% 1,471,943 100.00% 16,184,016 100.00%
Exposure%
Fair Value$
Exposure%
Fair Value$
Exposure%
30 June 2019 Fair Value$
Exposure%
Fair Value$
Exposure%
45. Global Share Trust 46. Heine Property Securities Fund
Investment Asset Financial Statement Caption
30 June 2020 Fair Value$
Exposure%
Fair Value$
Fair Value$
Exposure%
Fair Value$
Exposure%
47. High Growth Trust 48. OneAnswer - Altrinsic Global Equities Trust
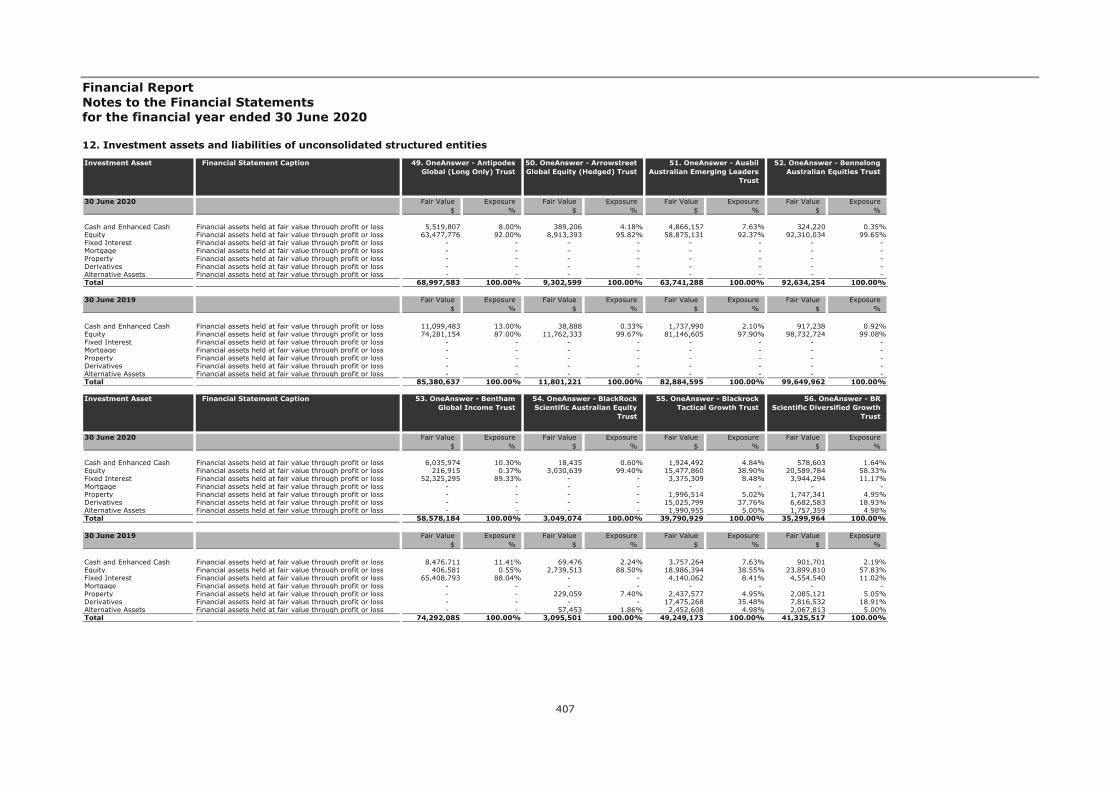
Financial Report Notes to the Financial Statements for the financial year ended 30 June 2020
407
12. Investment assets and liabilities of unconsolidated structured entities
Cash and Enhanced Cash Financial assets held at fair value through profit or loss 5,519,807 8.00% 389,206 4.18% 4,866,157 7.63% 324,220 0.35%Equity Financial assets held at fair value through profit or loss 63,477,776 92.00% 8,913,393 95.82% 58,875,131 92.37% 92,310,034 99.65%Fixed Interest Financial assets held at fair value through profit or loss - - - - - - - - Mortgage Financial assets held at fair value through profit or loss - - - - - - - - Property Financial assets held at fair value through profit or loss - - - - - - - - Derivatives Financial assets held at fair value through profit or loss - - - - - - - - Alternative Assets Financial assets held at fair value through profit or loss - - - - - - - - Total 68,997,583 100.00% 9,302,599 100.00% 63,741,288 100.00% 92,634,254 100.00%
Cash and Enhanced Cash Financial assets held at fair value through profit or loss 11,099,483 13.00% 38,888 0.33% 1,737,990 2.10% 917,238 0.92%Equity Financial assets held at fair value through profit or loss 74,281,154 87.00% 11,762,333 99.67% 81,146,605 97.90% 98,732,724 99.08%Fixed Interest Financial assets held at fair value through profit or loss - - - - - - - - Mortgage Financial assets held at fair value through profit or loss - - - - - - - - Property Financial assets held at fair value through profit or loss - - - - - - - - Derivatives Financial assets held at fair value through profit or loss - - - - - - - - Alternative Assets Financial assets held at fair value through profit or loss - - - - - - - - Total 85,380,637 100.00% 11,801,221 100.00% 82,884,595 100.00% 99,649,962 100.00%
Exposure%
Fair Value$
Exposure%
Fair Value$
Exposure%
30 June 2019 Fair Value$
Exposure%
Fair Value$
Exposure%
49. OneAnswer - Antipodes Global (Long Only) Trust
50. OneAnswer - Arrowstreet Global Equity (Hedged) Trust
Investment Asset Financial Statement Caption
30 June 2020 Fair Value$
Exposure%
Fair Value$
Fair Value$
Exposure%
Fair Value$
Exposure%
51. OneAnswer - Ausbil Australian Emerging Leaders
Trust
52. OneAnswer - Bennelong Australian Equities Trust
Cash and Enhanced Cash Financial assets held at fair value through profit or loss 6,035,974 10.30% 18,435 0.60% 1,924,492 4.84% 578,603 1.64%Equity Financial assets held at fair value through profit or loss 216,915 0.37% 3,030,639 99.40% 15,477,860 38.90% 20,589,784 58.33%Fixed Interest Financial assets held at fair value through profit or loss 52,325,295 89.33% - - 3,375,309 8.48% 3,944,294 11.17%Mortgage Financial assets held at fair value through profit or loss - - - - - - - - Property Financial assets held at fair value through profit or loss - - - - 1,996,514 5.02% 1,747,341 4.95%Derivatives Financial assets held at fair value through profit or loss - - - - 15,025,799 37.76% 6,682,583 18.93%Alternative Assets Financial assets held at fair value through profit or loss - - - - 1,990,955 5.00% 1,757,359 4.98%Total 58,578,184 100.00% 3,049,074 100.00% 39,790,929 100.00% 35,299,964 100.00%
Cash and Enhanced Cash Financial assets held at fair value through profit or loss 8,476,711 11.41% 69,476 2.24% 3,757,264 7.63% 901,701 2.19%Equity Financial assets held at fair value through profit or loss 406,581 0.55% 2,739,513 88.50% 18,986,394 38.55% 23,899,810 57.83%Fixed Interest Financial assets held at fair value through profit or loss 65,408,793 88.04% - - 4,140,062 8.41% 4,554,540 11.02%Mortgage Financial assets held at fair value through profit or loss - - - - - - - - Property Financial assets held at fair value through profit or loss - - 229,059 7.40% 2,437,577 4.95% 2,085,121 5.05%Derivatives Financial assets held at fair value through profit or loss - - - - 17,475,268 35.48% 7,816,532 18.91%Alternative Assets Financial assets held at fair value through profit or loss - - 57,453 1.86% 2,452,608 4.98% 2,067,813 5.00%Total 74,292,085 100.00% 3,095,501 100.00% 49,249,173 100.00% 41,325,517 100.00%
Exposure%
Fair Value$
Exposure%
Fair Value$
Exposure%
30 June 2019 Fair Value$
Exposure%
Fair Value$
Exposure%
53. OneAnswer - Bentham Global Income Trust
54. OneAnswer - BlackRock Scientific Australian Equity
Trust
Investment Asset Financial Statement Caption
30 June 2020 Fair Value$
Exposure%
Fair Value$
Fair Value$
Exposure%
Fair Value$
Exposure%
55. OneAnswer - Blackrock Tactical Growth Trust
56. OneAnswer - BR Scientific Diversified Growth
Trust

Financial Report Notes to the Financial Statements for the financial year ended 30 June 2020
408
12. Investment assets and liabilities of unconsolidated structured entities
Cash and Enhanced Cash Financial assets held at fair value through profit or loss 2,592 0.12% 3,683,442 10.55% 4,382,559 3.00% 83,809 2.12%Equity Financial assets held at fair value through profit or loss 2,183,879 99.88% - - 141,702,745 97.00% 3,863,076 97.88%Fixed Interest Financial assets held at fair value through profit or loss - - 31,219,585 89.45% - - - - Mortgage Financial assets held at fair value through profit or loss - - - - - - - - Property Financial assets held at fair value through profit or loss - - - - - - - - Derivatives Financial assets held at fair value through profit or loss - - - - - - - - Alternative Assets Financial assets held at fair value through profit or loss - - - - - - - - Total 2,186,471 100.00% 34,903,027 100.00% 146,085,304 100.00% 3,946,885 100.00%
Cash and Enhanced Cash Financial assets held at fair value through profit or loss 24,456 1.08% 6,392,020 14.73% 3,099,861 2.00% 123,894 2.33%Equity Financial assets held at fair value through profit or loss 2,161,430 94.93% - - 151,893,216 98.00% 5,189,056 97.67%Fixed Interest Financial assets held at fair value through profit or loss - - 36,988,093 85.27% - - - - Mortgage Financial assets held at fair value through profit or loss - - - - - - - - Property Financial assets held at fair value through profit or loss 87,387 3.84% - - - - - - Derivatives Financial assets held at fair value through profit or loss 3,480 0.15% - - - - - - Alternative Assets Financial assets held at fair value through profit or loss - - - - - - - - Total 2,276,753 100.00% 43,380,113 100.00% 154,993,077 100.00% 5,312,950 100.00%
Exposure%
Fair Value$
Exposure%
Fair Value$
Exposure%
30 June 2019 Fair Value$
Exposure%
Fair Value$
Exposure%
57. OneAnswer - BR Scientific International
Equity Trust
58. OneAnswer - Colonial First State Global Credit
Income Trust
Investment Asset Financial Statement Caption
30 June 2020 Fair Value$
Exposure%
Fair Value$
Fair Value$
Exposure%
Fair Value$
Exposure%
59. OneAnswer - Colonial First State Global Listed
Infrastructure Trust
60. OneAnswer - Colonial First State Imputation Trust
Cash and Enhanced Cash Financial assets held at fair value through profit or loss 4,760,878 1.92% 4,406,725 6.00% 11,199,443 7.73% 562,473 14.48%Equity Financial assets held at fair value through profit or loss 243,791,810 98.08% 69,038,680 94.00% 129,405,615 89.35% - - Fixed Interest Financial assets held at fair value through profit or loss - - - - - - 3,322,635 85.52%Mortgage Financial assets held at fair value through profit or loss - - - - - - - - Property Financial assets held at fair value through profit or loss - - - - 4,227,757 2.92% - - Derivatives Financial assets held at fair value through profit or loss - - - - - - - - Alternative Assets Financial assets held at fair value through profit or loss - - - - - - - - Total 248,552,688 100.00% 73,445,405 100.00% 144,832,815 100.00% 3,885,108 100.00%
Cash and Enhanced Cash Financial assets held at fair value through profit or loss 5,281,196 1.62% 5,270,676 7.00% 14,436,854 8.22% 674,390 17.52%Equity Financial assets held at fair value through profit or loss 320,563,689 98.38% 70,024,683 93.00% 152,487,571 86.89% - - Fixed Interest Financial assets held at fair value through profit or loss - - - - - - 3,175,094 82.48%Mortgage Financial assets held at fair value through profit or loss - - - - - - - - Property Financial assets held at fair value through profit or loss - - - - 8,580,211 4.89% - - Derivatives Financial assets held at fair value through profit or loss - - - - - - - - Alternative Assets Financial assets held at fair value through profit or loss - - - - - - - - Total 325,844,885 100.00% 75,295,359 100.00% 175,504,636 100.00% 3,849,484 100.00%
Exposure%
Fair Value$
Exposure%
Fair Value$
Exposure%
30 June 2019 Fair Value$
Exposure%
Fair Value$
Exposure%
61. OneAnswer - Fidelity Australian Equities Trust
62. OneAnswer - Greencape Broadcap Trust
Investment Asset Financial Statement Caption
30 June 2020 Fair Value$
Exposure%
Fair Value$
Fair Value$
Exposure%
Fair Value$
Exposure%
63. OneAnswer - Investors Mutual Australian Share
Trust
64. OneAnswer - Janus Henderson Global Fixed
Interest Total Return Trust

Financial Report Notes to the Financial Statements for the financial year ended 30 June 2020
409
12. Investment assets and liabilities of unconsolidated structured entities
Cash and Enhanced Cash Financial assets held at fair value through profit or loss 7,801,440 1.40% 35,282,636 15.39% 1,801,537 3.35% 4,631,166 1.21%Equity Financial assets held at fair value through profit or loss - - 193,901,053 84.61% 51,913,980 96.65% 377,503,407 98.79%Fixed Interest Financial assets held at fair value through profit or loss 549,444,270 98.60% - - - - - - Mortgage Financial assets held at fair value through profit or loss - - - - - - - - Property Financial assets held at fair value through profit or loss - - - - - - - - Derivatives Financial assets held at fair value through profit or loss - - - - - - - - Alternative Assets Financial assets held at fair value through profit or loss - - - - - - - - Total 557,245,710 100.00% 229,183,689 100.00% 53,715,517 100.00% 382,134,573 100.00%
Cash and Enhanced Cash Financial assets held at fair value through profit or loss 8,183,295 1.27% 13,951,370 7.97% 4,339,148 5.85% 3,751,892 0.78%Equity Financial assets held at fair value through profit or loss - - 161,206,115 92.03% 69,831,278 94.15% 474,196,143 99.22%Fixed Interest Financial assets held at fair value through profit or loss 636,170,618 98.73% - - - - - - Mortgage Financial assets held at fair value through profit or loss - - - - - - - - Property Financial assets held at fair value through profit or loss - - - - - - - - Derivatives Financial assets held at fair value through profit or loss - - - - - - - - Alternative Assets Financial assets held at fair value through profit or loss - - - - - - - - Total 644,353,913 100.00% 175,157,485 100.00% 74,170,426 100.00% 477,948,035 100.00%
Exposure%
Fair Value$
Exposure%
Fair Value$
Exposure%
30 June 2019 Fair Value$
Exposure%
Fair Value$
Exposure%
65. OneAnswer - Kapstream Absolute Return Income
Trust
66. OneAnswer - Magellan Global Trust
Investment Asset Financial Statement Caption
30 June 2020 Fair Value$
Exposure%
Fair Value$
Fair Value$
Exposure%
Fair Value$
Exposure%
67. OneAnswer - Merlon Australian Share Income
Trust
68. OneAnswer - MFS Global Equity Trust
Cash and Enhanced Cash Financial assets held at fair value through profit or loss - - (2,302,172) (1.22%) 1,015,385 3.10% 1,337,285 4.00%Equity Financial assets held at fair value through profit or loss 9,441,744 94.00% 26,619,314 14.08% 31,693,585 96.90% 32,094,807 96.00%Fixed Interest Financial assets held at fair value through profit or loss - - - - - - - - Mortgage Financial assets held at fair value through profit or loss - - - - - - - - Property Financial assets held at fair value through profit or loss 602,664 6.00% 158,262,838 83.70% - - - - Derivatives Financial assets held at fair value through profit or loss - - 6,511,325 3.44% - - - - Alternative Assets Financial assets held at fair value through profit or loss - - - - - - - - Total 10,044,408 100.00% 189,091,305 100.00% 32,708,970 100.00% 33,432,092 100.00%
Cash and Enhanced Cash Financial assets held at fair value through profit or loss 200,947 1.00% 851,341 0.34% 1,120,251 2.79% 1,503,873 3.00%Equity Financial assets held at fair value through profit or loss 18,487,119 92.00% 33,307,996 12.94% 39,053,276 97.21% 48,625,196 97.00%Fixed Interest Financial assets held at fair value through profit or loss - - - - - - - - Mortgage Financial assets held at fair value through profit or loss - - - - - - - - Property Financial assets held at fair value through profit or loss 1,406,629 7.00% 221,611,737 86.11% - - - - Derivatives Financial assets held at fair value through profit or loss - - 1,573,671 0.61% - - - - Alternative Assets Financial assets held at fair value through profit or loss - - - - - - - - Total 20,094,695 100.00% 257,344,745 100.00% 40,173,527 100.00% 50,129,069 100.00%
Exposure%
Fair Value$
Exposure%
Fair Value$
Exposure%
30 June 2019 Fair Value$
Exposure%
Fair Value$
Exposure%
69. OneAnswer - Nikko AM Australian Shares Trust
70. OneAnswer - OnePath Global Property Securities
Index Trust
Investment Asset Financial Statement Caption
30 June 2020 Fair Value$
Exposure%
Fair Value$
Fair Value$
Exposure%
Fair Value$
Exposure%
71. OneAnswer - Pendal Australian Share Trust
72. OneAnswer - Pendal Core Hedged Global Shares Trust

Financial Report Notes to the Financial Statements for the financial year ended 30 June 2020
410
12. Investment assets and liabilities of unconsolidated structured entities
Cash and Enhanced Cash Financial assets held at fair value through profit or loss 3,391,941 18.00% 4,077,829 4.62% 3,567,438 4.31% 951,296 6.40%Equity Financial assets held at fair value through profit or loss 1,507,530 8.00% 84,103,639 95.38% 79,262,352 95.69% 13,405,263 90.12%Fixed Interest Financial assets held at fair value through profit or loss 13,944,648 74.00% - - - - - - Mortgage Financial assets held at fair value through profit or loss - - - - - - - - Property Financial assets held at fair value through profit or loss - - - - - - 517,997 3.48%Derivatives Financial assets held at fair value through profit or loss - - - - - - - - Alternative Assets Financial assets held at fair value through profit or loss - - - - - - - - Total 18,844,119 100.00% 88,181,468 100.00% 82,829,790 100.00% 14,874,556 100.00%
Cash and Enhanced Cash Financial assets held at fair value through profit or loss 2,034,006 14.00% 6,534,057 6.63% 6,552,372 5.70% 2,003,659 8.98%Equity Financial assets held at fair value through profit or loss 2,905,723 20.00% 91,991,486 93.37% 108,486,292 94.30% 19,955,718 89.42%Fixed Interest Financial assets held at fair value through profit or loss 9,588,885 66.00% - - - - - - Mortgage Financial assets held at fair value through profit or loss - - - - - - - - Property Financial assets held at fair value through profit or loss - - - - - - 357,587 1.60%Derivatives Financial assets held at fair value through profit or loss - - - - - - - - Alternative Assets Financial assets held at fair value through profit or loss - - - - - - - - Total 14,528,614 100.00% 98,525,543 100.00% 115,038,664 100.00% 22,316,964 100.00%
Exposure%
Fair Value$
Exposure%
Fair Value$
Exposure%
30 June 2019 Fair Value$
Exposure%
Fair Value$
Exposure%
73. OneAnswer - Pendal Monthly Income Plus Trust
74. OneAnswer - Pendal Smaller Companies Trust
Investment Asset Financial Statement Caption
30 June 2020 Fair Value$
Exposure%
Fair Value$
Fair Value$
Exposure%
Fair Value$
Exposure%
75. OneAnswer - Perennial Value Shares Trust
76. OneAnswer - Perpetual Australian Share Trust
Cash and Enhanced Cash Financial assets held at fair value through profit or loss 16,483,166 15.70% 26,059,768 21.89% 403,859 8.00% 1,285,349 5.27%Equity Financial assets held at fair value through profit or loss 56,829,925 54.11% 24,210,297 20.34% 4,543,408 90.00% 23,105,944 94.73%Fixed Interest Financial assets held at fair value through profit or loss 19,495,982 18.56% 58,458,852 49.12% - - - - Mortgage Financial assets held at fair value through profit or loss - - - - - - - - Property Financial assets held at fair value through profit or loss 11,459,829 10.91% 9,397,037 7.90% 100,965 2.00% - - Derivatives Financial assets held at fair value through profit or loss - - - - - - - - Alternative Assets Financial assets held at fair value through profit or loss 754,107 0.72% 887,567 0.75% - - - - Total 105,023,009 100.00% 119,013,521 100.00% 5,048,232 100.00% 24,391,293 100.00%
Cash and Enhanced Cash Financial assets held at fair value through profit or loss 22,864,389 16.19% 28,317,276 21.10% 450,636 10.00% 8,802,164 32.98%Equity Financial assets held at fair value through profit or loss 80,119,922 56.76% 29,812,091 22.22% 3,920,531 87.00% 17,885,957 67.02%Fixed Interest Financial assets held at fair value through profit or loss 24,605,533 17.43% 65,289,805 48.67% - - - - Mortgage Financial assets held at fair value through profit or loss - - - - - - - - Property Financial assets held at fair value through profit or loss 10,537,067 7.46% 7,955,498 5.93% 135,191 3.00% - - Derivatives Financial assets held at fair value through profit or loss 2,664,130 1.89% 2,426,112 1.81% - - - - Alternative Assets Financial assets held at fair value through profit or loss 375,121 0.27% 357,142 0.27% - - - - Total 141,166,162 100.00% 134,157,924 100.00% 4,506,358 100.00% 26,688,121 100.00%
Exposure%
Fair Value$
Exposure%
Fair Value$
Exposure%
30 June 2019 Fair Value$
Exposure%
Fair Value$
Exposure%
77. OneAnswer - Perpetual Balanced Growth Trust
78. OneAnswer - Perpetual Conservative Growth Trust
Investment Asset Financial Statement Caption
30 June 2020 Fair Value$
Exposure%
Fair Value$
Fair Value$
Exposure%
Fair Value$
Exposure%
79. OneAnswer - Perpetual Ethical SRI Trust
80. OneAnswer - Platinum Asia Trust

Financial Report Notes to the Financial Statements for the financial year ended 30 June 2020
411
12. Investment assets and liabilities of unconsolidated structured entities
Cash and Enhanced Cash Financial assets held at fair value through profit or loss 32,973,110 12.59% 2,644,643 2.83% 4,928,270 2.54% 19,371,139 10.09%Equity Financial assets held at fair value through profit or loss 228,981,833 87.41% - - 188,774,741 97.46% 118,044,485 61.50%Fixed Interest Financial assets held at fair value through profit or loss - - - - - - 54,532,715 28.41%Mortgage Financial assets held at fair value through profit or loss - - - - - - - - Property Financial assets held at fair value through profit or loss - - - - - - - - Derivatives Financial assets held at fair value through profit or loss - - - - - - - - Alternative Assets Financial assets held at fair value through profit or loss - - 90,805,655 97.17% - - - - Total 261,954,943 100.00% 93,450,298 100.00% 193,703,011 100.00% 191,948,339 100.00%
Cash and Enhanced Cash Financial assets held at fair value through profit or loss 52,729,562 15.87% 5,333,927 4.15% 7,066,190 2.53% 47,850,289 18.29%Equity Financial assets held at fair value through profit or loss 279,463,242 84.13% - - 272,731,932 97.47% 141,963,493 54.23%Fixed Interest Financial assets held at fair value through profit or loss - - - - - - 71,943,587 27.48%Mortgage Financial assets held at fair value through profit or loss - - - - - - - - Property Financial assets held at fair value through profit or loss - - - - - - - - Derivatives Financial assets held at fair value through profit or loss - - - - - - - - Alternative Assets Financial assets held at fair value through profit or loss - - 123,194,437 95.85% - - - - Total 332,192,804 100.00% 128,528,364 100.00% 279,798,122 100.00% 261,757,369 100.00%
Exposure%
Fair Value$
Exposure%
Fair Value$
Exposure%
30 June 2019 Fair Value$
Exposure%
Fair Value$
Exposure%
81. OneAnswer - Platinum International Trust
82. OneAnswer - RARE Infastructure Value Trust
Investment Asset Financial Statement Caption
30 June 2020 Fair Value$
Exposure%
Fair Value$
Fair Value$
Exposure%
Fair Value$
Exposure%
83. OneAnswer - Schroder Australian Equity Trust
84. OneAnswer - Schroder Balanced Trust
Cash and Enhanced Cash Financial assets held at fair value through profit or loss 16,399,587 8.16% 93,755,895 25.13% 248,014 1.79% 584,209 9.00%Equity Financial assets held at fair value through profit or loss - - 105,370,648 28.25% - - 5,907,002 91.00%Fixed Interest Financial assets held at fair value through profit or loss 184,621,303 91.84% 173,884,823 46.62% - - - - Mortgage Financial assets held at fair value through profit or loss - - - - - - - - Property Financial assets held at fair value through profit or loss - - - - 13,599,242 98.21% - - Derivatives Financial assets held at fair value through profit or loss - - - - - - - - Alternative Assets Financial assets held at fair value through profit or loss - - - - - - - - Total 201,020,890 100.00% 373,011,366 100.00% 13,847,256 100.00% 6,491,211 100.00%
Cash and Enhanced Cash Financial assets held at fair value through profit or loss 22,329,927 10.01% 99,457,912 23.01% 151,885 0.64% 668,274 14.00%Equity Financial assets held at fair value through profit or loss - - 96,685,929 22.37% - - 4,105,112 86.00%Fixed Interest Financial assets held at fair value through profit or loss 200,842,808 89.99% 236,046,601 54.62% - - - - Mortgage Financial assets held at fair value through profit or loss - - - - - - - - Property Financial assets held at fair value through profit or loss - - - - 23,479,390 99.36% - - Derivatives Financial assets held at fair value through profit or loss - - - - - - - - Alternative Assets Financial assets held at fair value through profit or loss - - - - - - - - Total 223,172,735 100.00% 432,190,442 100.00% 23,631,275 100.00% 4,773,386 100.00%
Exposure%
Fair Value$
Exposure%
Fair Value$
Exposure%
30 June 2019 Fair Value$
Exposure%
Fair Value$
Exposure%
85. OneAnswer - Schroder Fixed Income Trust
86. OneAnswer - Schroder Real Return Trust
Investment Asset Financial Statement Caption
30 June 2020 Fair Value$
Exposure%
Fair Value$
Fair Value$
Exposure%
Fair Value$
Exposure%
87. OneAnswer - SG Hiscock Property Trust
88. OneAnswer - Stewart Investors Worldwide
Sustainability Trust

Financial Report Notes to the Financial Statements for the financial year ended 30 June 2020
412
12. Investment assets and liabilities of unconsolidated structured entities
Cash and Enhanced Cash Financial assets held at fair value through profit or loss 237,943 0.55% 6,514,794 10.00% 4,473,665 7.83% 3,474,078 16.03%Equity Financial assets held at fair value through profit or loss 43,024,541 99.45% - - 36,787,843 64.39% 6,609,675 30.50%Fixed Interest Financial assets held at fair value through profit or loss - - 58,633,143 90.00% 11,539,542 20.20% 10,099,247 46.60%Mortgage Financial assets held at fair value through profit or loss - - - - - - - - Property Financial assets held at fair value through profit or loss - - - - 2,876,787 5.04% 1,190,569 5.49%Derivatives Financial assets held at fair value through profit or loss - - - - 252,863 0.44% 105,278 0.49%Alternative Assets Financial assets held at fair value through profit or loss - - - - 1,200,156 2.10% 192,180 0.89%Total 43,262,484 100.00% 65,147,937 100.00% 57,130,856 100.00% 21,671,027 100.00%
Cash and Enhanced Cash Financial assets held at fair value through profit or loss 965,432 2.77% 4,725,042 10.00% 18,009,257 24.79% 11,304,586 46.51%Equity Financial assets held at fair value through profit or loss 33,943,786 97.23% - - 46,346,272 63.76% 7,229,793 29.75%Fixed Interest Financial assets held at fair value through profit or loss - - 42,525,386 90.00% 3,412,205 4.69% 4,190,903 17.25%Mortgage Financial assets held at fair value through profit or loss - - - - - - - - Property Financial assets held at fair value through profit or loss - - - - 3,272,216 4.50% 1,464,573 6.03%Derivatives Financial assets held at fair value through profit or loss - - - - (40,121) (0.06%) (97,933) (0.40%)Alternative Assets Financial assets held at fair value through profit or loss - - - - 1,683,280 2.32% 208,916 0.86%Total 34,909,218 100.00% 47,250,428 100.00% 72,683,109 100.00% 24,300,838 100.00%
Exposure%
Fair Value$
Exposure%
Fair Value$
Exposure%
30 June 2019 Fair Value$
Exposure%
Fair Value$
Exposure%
89. OneAnswer - T. Rowe Price Global Equity Trust
90. OneAnswer - T.Rowe Price Dynamic Global Bond
Trust
Investment Asset Financial Statement Caption
30 June 2020 Fair Value$
Exposure%
Fair Value$
Fair Value$
Exposure%
Fair Value$
Exposure%
91. OneAnswer - UBS Balanced Trust
92. OneAnswer - UBS Defensive Trust
Cash and Enhanced Cash Financial assets held at fair value through profit or loss 31,819,659 29.42% 3,908,428 0.44% (8,979,228) (0.45%) 2,239,850 0.29%Equity Financial assets held at fair value through profit or loss 36,450 0.03% 849,560,406 92.94% 950,502,414 47.28% 219,537,491 28.24%Fixed Interest Financial assets held at fair value through profit or loss 75,728,169 70.02% - - 995,381,007 49.51% 533,258,676 68.59%Mortgage Financial assets held at fair value through profit or loss - - - - - - - - Property Financial assets held at fair value through profit or loss - - 60,555,531 6.62% 43,673,275 2.17% 10,011,739 1.29%Derivatives Financial assets held at fair value through profit or loss 575,412 0.53% 37,811 - 29,940,427 1.49% 12,399,647 1.59%Alternative Assets Financial assets held at fair value through profit or loss - - - - - - - - Total 108,159,690 100.00% 914,062,176 100.00% 2,010,517,895 100.00% 777,447,403 100.00%
Cash and Enhanced Cash Financial assets held at fair value through profit or loss 68,045,686 66.77% 8,483,260 0.76% 19,477,415 0.85% 11,405,373 1.41%Equity Financial assets held at fair value through profit or loss 51,876 0.05% 1,032,790,346 91.84% 1,056,923,346 46.18% 225,363,162 27.69%Fixed Interest Financial assets held at fair value through profit or loss 34,376,752 33.73% - - 1,155,142,984 50.47% 564,468,839 69.37%Mortgage Financial assets held at fair value through profit or loss - - - - - - - - Property Financial assets held at fair value through profit or loss - - 83,223,928 7.40% 54,060,368 2.36% 11,425,919 1.40%Derivatives Financial assets held at fair value through profit or loss (556,980) (0.55%) 41,342 - 3,230,345 0.14% 1,087,381 0.13%Alternative Assets Financial assets held at fair value through profit or loss - - - - - - - - Total 101,917,334 100.00% 1,124,538,876 100.00% 2,288,834,458 100.00% 813,750,674 100.00%
Exposure%
Fair Value$
Exposure%
Fair Value$
Exposure%
30 June 2019 Fair Value$
Exposure%
Fair Value$
Exposure%
93. OneAnswer - UBS Diversified Fixed Income
Trust
94. OneAnswer - Vanguard Australian Shares Index
Trust
Investment Asset Financial Statement Caption
30 June 2020 Fair Value$
Exposure%
Fair Value$
Fair Value$
Exposure%
Fair Value$
Exposure%
95. OneAnswer - Vanguard Balanced Index Trust
96. OneAnswer - Vanguard Conservative Index Trust
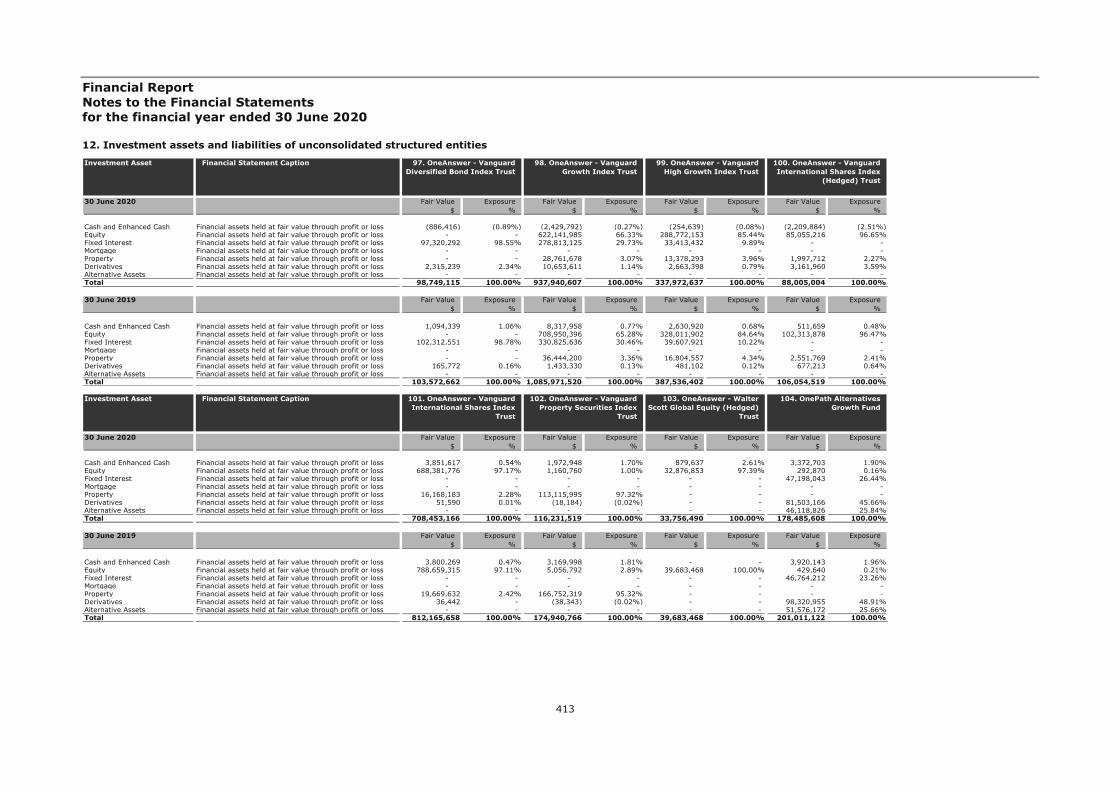
Financial Report Notes to the Financial Statements for the financial year ended 30 June 2020
413
12. Investment assets and liabilities of unconsolidated structured entities
Cash and Enhanced Cash Financial assets held at fair value through profit or loss (886,416) (0.89%) (2,429,792) (0.27%) (254,639) (0.08%) (2,209,884) (2.51%)Equity Financial assets held at fair value through profit or loss - - 622,141,985 66.33% 288,772,153 85.44% 85,055,216 96.65%Fixed Interest Financial assets held at fair value through profit or loss 97,320,292 98.55% 278,813,125 29.73% 33,413,432 9.89% - - Mortgage Financial assets held at fair value through profit or loss - - - - - - - - Property Financial assets held at fair value through profit or loss - - 28,761,678 3.07% 13,378,293 3.96% 1,997,712 2.27%Derivatives Financial assets held at fair value through profit or loss 2,315,239 2.34% 10,653,611 1.14% 2,663,398 0.79% 3,161,960 3.59%Alternative Assets Financial assets held at fair value through profit or loss - - - - - - - - Total 98,749,115 100.00% 937,940,607 100.00% 337,972,637 100.00% 88,005,004 100.00%
Cash and Enhanced Cash Financial assets held at fair value through profit or loss 1,094,339 1.06% 8,317,958 0.77% 2,630,920 0.68% 511,659 0.48%Equity Financial assets held at fair value through profit or loss - - 708,950,396 65.28% 328,011,902 84.64% 102,313,878 96.47%Fixed Interest Financial assets held at fair value through profit or loss 102,312,551 98.78% 330,825,636 30.46% 39,607,921 10.22% - - Mortgage Financial assets held at fair value through profit or loss - - - - - - - - Property Financial assets held at fair value through profit or loss - - 36,444,200 3.36% 16,804,557 4.34% 2,551,769 2.41%Derivatives Financial assets held at fair value through profit or loss 165,772 0.16% 1,433,330 0.13% 481,102 0.12% 677,213 0.64%Alternative Assets Financial assets held at fair value through profit or loss - - - - - - - - Total 103,572,662 100.00% 1,085,971,520 100.00% 387,536,402 100.00% 106,054,519 100.00%
Exposure%
Fair Value$
Exposure%
Fair Value$
Exposure%
30 June 2019 Fair Value$
Exposure%
Fair Value$
Exposure%
97. OneAnswer - Vanguard Diversified Bond Index Trust
98. OneAnswer - Vanguard Growth Index Trust
Investment Asset Financial Statement Caption
30 June 2020 Fair Value$
Exposure%
Fair Value$
Fair Value$
Exposure%
Fair Value$
Exposure%
99. OneAnswer - Vanguard High Growth Index Trust
100. OneAnswer - Vanguard International Shares Index
(Hedged) Trust
Cash and Enhanced Cash Financial assets held at fair value through profit or loss 3,851,617 0.54% 1,972,948 1.70% 879,637 2.61% 3,372,703 1.90%Equity Financial assets held at fair value through profit or loss 688,381,776 97.17% 1,160,760 1.00% 32,876,853 97.39% 292,870 0.16%Fixed Interest Financial assets held at fair value through profit or loss - - - - - - 47,198,043 26.44%Mortgage Financial assets held at fair value through profit or loss - - - - - - - - Property Financial assets held at fair value through profit or loss 16,168,183 2.28% 113,115,995 97.32% - - - - Derivatives Financial assets held at fair value through profit or loss 51,590 0.01% (18,184) (0.02%) - - 81,503,166 45.66%Alternative Assets Financial assets held at fair value through profit or loss - - - - - - 46,118,826 25.84%Total 708,453,166 100.00% 116,231,519 100.00% 33,756,490 100.00% 178,485,608 100.00%
Cash and Enhanced Cash Financial assets held at fair value through profit or loss 3,800,269 0.47% 3,169,998 1.81% - - 3,920,143 1.96%Equity Financial assets held at fair value through profit or loss 788,659,315 97.11% 5,056,792 2.89% 39,683,468 100.00% 429,640 0.21%Fixed Interest Financial assets held at fair value through profit or loss - - - - - - 46,764,212 23.26%Mortgage Financial assets held at fair value through profit or loss - - - - - - - - Property Financial assets held at fair value through profit or loss 19,669,632 2.42% 166,752,319 95.32% - - - - Derivatives Financial assets held at fair value through profit or loss 36,442 - (38,343) (0.02%) - - 98,320,955 48.91%Alternative Assets Financial assets held at fair value through profit or loss - - - - - - 51,576,172 25.66%Total 812,165,658 100.00% 174,940,766 100.00% 39,683,468 100.00% 201,011,122 100.00%
Exposure%
Fair Value$
Exposure%
Fair Value$
Exposure%
30 June 2019 Fair Value$
Exposure%
Fair Value$
Exposure%
101. OneAnswer - Vanguard International Shares Index
Trust
102. OneAnswer - Vanguard Property Securities Index
Trust
Investment Asset Financial Statement Caption
30 June 2020 Fair Value$
Exposure%
Fair Value$
Fair Value$
Exposure%
Fair Value$
Exposure%
103. OneAnswer - Walter Scott Global Equity (Hedged)
Trust
104. OnePath Alternatives Growth Fund
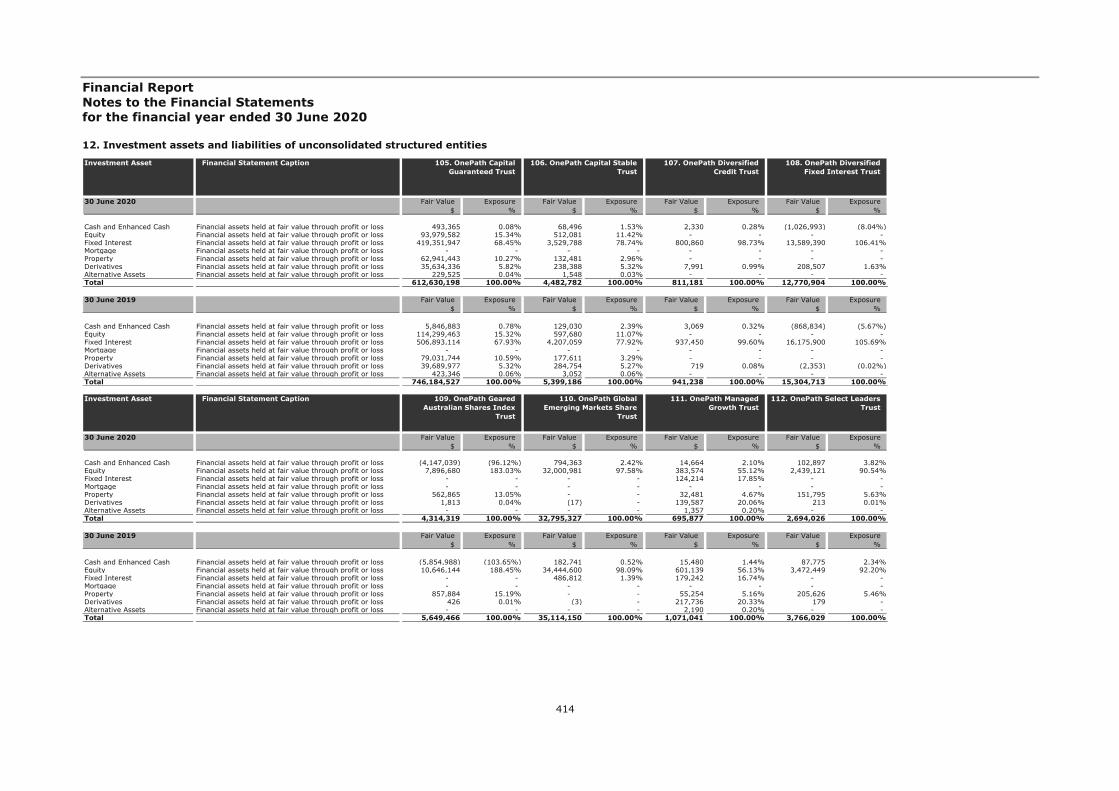
Financial Report Notes to the Financial Statements for the financial year ended 30 June 2020
414
12. Investment assets and liabilities of unconsolidated structured entities
Cash and Enhanced Cash Financial assets held at fair value through profit or loss 493,365 0.08% 68,496 1.53% 2,330 0.28% (1,026,993) (8.04%)Equity Financial assets held at fair value through profit or loss 93,979,582 15.34% 512,081 11.42% - - - - Fixed Interest Financial assets held at fair value through profit or loss 419,351,947 68.45% 3,529,788 78.74% 800,860 98.73% 13,589,390 106.41%Mortgage Financial assets held at fair value through profit or loss - - - - - - - - Property Financial assets held at fair value through profit or loss 62,941,443 10.27% 132,481 2.96% - - - - Derivatives Financial assets held at fair value through profit or loss 35,634,336 5.82% 238,388 5.32% 7,991 0.99% 208,507 1.63%Alternative Assets Financial assets held at fair value through profit or loss 229,525 0.04% 1,548 0.03% - - - - Total 612,630,198 100.00% 4,482,782 100.00% 811,181 100.00% 12,770,904 100.00%
Cash and Enhanced Cash Financial assets held at fair value through profit or loss 5,846,883 0.78% 129,030 2.39% 3,069 0.32% (868,834) (5.67%)Equity Financial assets held at fair value through profit or loss 114,299,463 15.32% 597,680 11.07% - - - - Fixed Interest Financial assets held at fair value through profit or loss 506,893,114 67.93% 4,207,059 77.92% 937,450 99.60% 16,175,900 105.69%Mortgage Financial assets held at fair value through profit or loss - - - - - - - - Property Financial assets held at fair value through profit or loss 79,031,744 10.59% 177,611 3.29% - - - - Derivatives Financial assets held at fair value through profit or loss 39,689,977 5.32% 284,754 5.27% 719 0.08% (2,353) (0.02%)Alternative Assets Financial assets held at fair value through profit or loss 423,346 0.06% 3,052 0.06% - - - - Total 746,184,527 100.00% 5,399,186 100.00% 941,238 100.00% 15,304,713 100.00%
Exposure%
Fair Value$
Exposure%
Fair Value$
Exposure%
30 June 2019 Fair Value$
Exposure%
Fair Value$
Exposure%
105. OnePath Capital Guaranteed Trust
106. OnePath Capital Stable Trust
Investment Asset Financial Statement Caption
30 June 2020 Fair Value$
Exposure%
Fair Value$
Fair Value$
Exposure%
Fair Value$
Exposure%
107. OnePath Diversified Credit Trust
108. OnePath Diversified Fixed Interest Trust
Cash and Enhanced Cash Financial assets held at fair value through profit or loss (4,147,039) (96.12%) 794,363 2.42% 14,664 2.10% 102,897 3.82%Equity Financial assets held at fair value through profit or loss 7,896,680 183.03% 32,000,981 97.58% 383,574 55.12% 2,439,121 90.54%Fixed Interest Financial assets held at fair value through profit or loss - - - - 124,214 17.85% - - Mortgage Financial assets held at fair value through profit or loss - - - - - - - - Property Financial assets held at fair value through profit or loss 562,865 13.05% - - 32,481 4.67% 151,795 5.63%Derivatives Financial assets held at fair value through profit or loss 1,813 0.04% (17) - 139,587 20.06% 213 0.01%Alternative Assets Financial assets held at fair value through profit or loss - - - - 1,357 0.20% - - Total 4,314,319 100.00% 32,795,327 100.00% 695,877 100.00% 2,694,026 100.00%
Cash and Enhanced Cash Financial assets held at fair value through profit or loss (5,854,988) (103.65%) 182,741 0.52% 15,480 1.44% 87,775 2.34%Equity Financial assets held at fair value through profit or loss 10,646,144 188.45% 34,444,600 98.09% 601,139 56.13% 3,472,449 92.20%Fixed Interest Financial assets held at fair value through profit or loss - - 486,812 1.39% 179,242 16.74% - - Mortgage Financial assets held at fair value through profit or loss - - - - - - - - Property Financial assets held at fair value through profit or loss 857,884 15.19% - - 55,254 5.16% 205,626 5.46%Derivatives Financial assets held at fair value through profit or loss 426 0.01% (3) - 217,736 20.33% 179 - Alternative Assets Financial assets held at fair value through profit or loss - - - - 2,190 0.20% - - Total 5,649,466 100.00% 35,114,150 100.00% 1,071,041 100.00% 3,766,029 100.00%
Exposure%
Fair Value$
Exposure%
Fair Value$
Exposure%
30 June 2019 Fair Value$
Exposure%
Fair Value$
Exposure%
109. OnePath Geared Australian Shares Index
Trust
110. OnePath Global Emerging Markets Share
Trust
Investment Asset Financial Statement Caption
30 June 2020 Fair Value$
Exposure%
Fair Value$
Fair Value$
Exposure%
Fair Value$
Exposure%
111. OnePath Managed Growth Trust
112. OnePath Select Leaders Trust
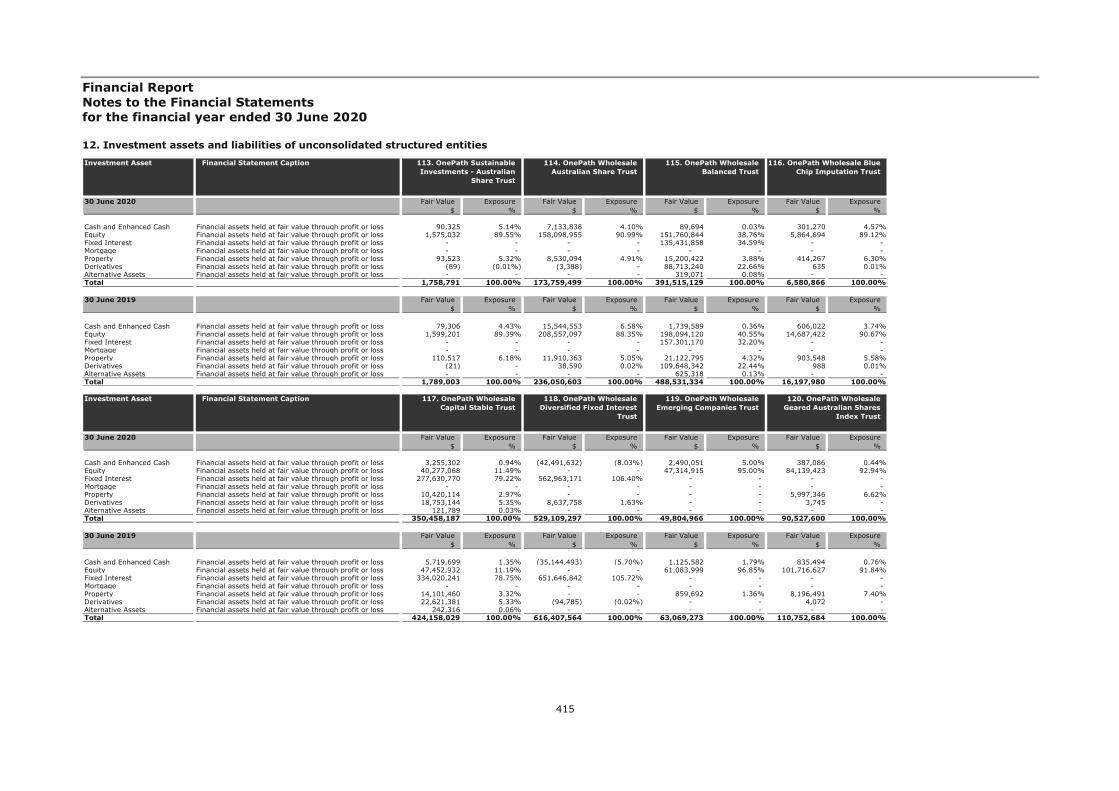
Financial Report Notes to the Financial Statements for the financial year ended 30 June 2020
415
12. Investment assets and liabilities of unconsolidated structured entities
Cash and Enhanced Cash Financial assets held at fair value through profit or loss 90,325 5.14% 7,133,838 4.10% 89,694 0.03% 301,270 4.57%Equity Financial assets held at fair value through profit or loss 1,575,032 89.55% 158,098,955 90.99% 151,760,844 38.76% 5,864,694 89.12%Fixed Interest Financial assets held at fair value through profit or loss - - - - 135,431,858 34.59% - - Mortgage Financial assets held at fair value through profit or loss - - - - - - - - Property Financial assets held at fair value through profit or loss 93,523 5.32% 8,530,094 4.91% 15,200,422 3.88% 414,267 6.30%Derivatives Financial assets held at fair value through profit or loss (89) (0.01%) (3,388) - 88,713,240 22.66% 635 0.01%Alternative Assets Financial assets held at fair value through profit or loss - - - - 319,071 0.08% - - Total 1,758,791 100.00% 173,759,499 100.00% 391,515,129 100.00% 6,580,866 100.00%
Cash and Enhanced Cash Financial assets held at fair value through profit or loss 79,306 4.43% 15,544,553 6.58% 1,739,589 0.36% 606,022 3.74%Equity Financial assets held at fair value through profit or loss 1,599,201 89.39% 208,557,097 88.35% 198,094,120 40.55% 14,687,422 90.67%Fixed Interest Financial assets held at fair value through profit or loss - - - - 157,301,170 32.20% - - Mortgage Financial assets held at fair value through profit or loss - - - - - - - - Property Financial assets held at fair value through profit or loss 110,517 6.18% 11,910,363 5.05% 21,122,795 4.32% 903,548 5.58%Derivatives Financial assets held at fair value through profit or loss (21) - 38,590 0.02% 109,648,342 22.44% 988 0.01%Alternative Assets Financial assets held at fair value through profit or loss - - - - 625,318 0.13% - - Total 1,789,003 100.00% 236,050,603 100.00% 488,531,334 100.00% 16,197,980 100.00%
Exposure%
Fair Value$
Exposure%
Fair Value$
Exposure%
30 June 2019 Fair Value$
Exposure%
Fair Value$
Exposure%
113. OnePath Sustainable Investments - Australian
Share Trust
114. OnePath Wholesale Australian Share Trust
Investment Asset Financial Statement Caption
30 June 2020 Fair Value$
Exposure%
Fair Value$
Fair Value$
Exposure%
Fair Value$
Exposure%
115. OnePath Wholesale Balanced Trust
116. OnePath Wholesale Blue Chip Imputation Trust
Cash and Enhanced Cash Financial assets held at fair value through profit or loss 3,255,302 0.94% (42,491,632) (8.03%) 2,490,051 5.00% 387,086 0.44%Equity Financial assets held at fair value through profit or loss 40,277,068 11.49% - - 47,314,915 95.00% 84,139,423 92.94%Fixed Interest Financial assets held at fair value through profit or loss 277,630,770 79.22% 562,963,171 106.40% - - - - Mortgage Financial assets held at fair value through profit or loss - - - - - - - - Property Financial assets held at fair value through profit or loss 10,420,114 2.97% - - - - 5,997,346 6.62%Derivatives Financial assets held at fair value through profit or loss 18,753,144 5.35% 8,637,758 1.63% - - 3,745 - Alternative Assets Financial assets held at fair value through profit or loss 121,789 0.03% - - - - - - Total 350,458,187 100.00% 529,109,297 100.00% 49,804,966 100.00% 90,527,600 100.00%
Cash and Enhanced Cash Financial assets held at fair value through profit or loss 5,719,699 1.35% (35,144,493) (5.70%) 1,125,582 1.79% 835,494 0.76%Equity Financial assets held at fair value through profit or loss 47,452,932 11.19% - - 61,083,999 96.85% 101,716,627 91.84%Fixed Interest Financial assets held at fair value through profit or loss 334,020,241 78.75% 651,646,842 105.72% - - - - Mortgage Financial assets held at fair value through profit or loss - - - - - - - - Property Financial assets held at fair value through profit or loss 14,101,460 3.32% - - 859,692 1.36% 8,196,491 7.40%Derivatives Financial assets held at fair value through profit or loss 22,621,381 5.33% (94,785) (0.02%) - - 4,072 - Alternative Assets Financial assets held at fair value through profit or loss 242,316 0.06% - - - - - - Total 424,158,029 100.00% 616,407,564 100.00% 63,069,273 100.00% 110,752,684 100.00%
Exposure%
Fair Value$
Exposure%
Fair Value$
Exposure%
30 June 2019 Fair Value$
Exposure%
Fair Value$
Exposure%
117. OnePath Wholesale Capital Stable Trust
118. OnePath Wholesale Diversified Fixed Interest
Trust
Investment Asset Financial Statement Caption
30 June 2020 Fair Value$
Exposure%
Fair Value$
Fair Value$
Exposure%
Fair Value$
Exposure%
119. OnePath Wholesale Emerging Companies Trust
120. OnePath Wholesale Geared Australian Shares
Index Trust

Financial Report Notes to the Financial Statements for the financial year ended 30 June 2020
416
12. Investment assets and liabilities of unconsolidated structured entities
Cash and Enhanced Cash Financial assets held at fair value through profit or loss 272,745 2.42% 520,824 1.47% 224,206 1.04% 181,088 2.56%Equity Financial assets held at fair value through profit or loss 10,987,533 97.58% 29,541,636 83.71% 11,899,727 55.70% 2,276,856 32.06%Fixed Interest Financial assets held at fair value through profit or loss - - 492,914 1.40% 8,453,355 39.57% 4,490,855 63.24%Mortgage Financial assets held at fair value through profit or loss - - - - - - - - Property Financial assets held at fair value through profit or loss - - 2,379,716 6.74% 572,006 2.68% 117,278 1.65%Derivatives Financial assets held at fair value through profit or loss (6) - 2,341,036 6.63% 215,112 1.01% 35,074 0.49%Alternative Assets Financial assets held at fair value through profit or loss - - 16,197 0.05% - - - - Total 11,260,272 100.00% 35,292,323 100.00% 21,364,406 100.00% 7,101,151 100.00%
Cash and Enhanced Cash Financial assets held at fair value through profit or loss 68,313 0.52% 751,560 1.70% 403,572 1.62% 201,981 2.37%Equity Financial assets held at fair value through profit or loss 12,876,220 98.09% 36,970,339 83.63% 14,009,025 56.14% 2,785,779 32.69%Fixed Interest Financial assets held at fair value through profit or loss 181,982 1.39% 421,741 0.95% 9,760,512 39.11% 5,370,195 63.01%Mortgage Financial assets held at fair value through profit or loss - - - - - - - - Property Financial assets held at fair value through profit or loss - - 3,185,588 7.21% 733,088 2.94% 157,035 1.84%Derivatives Financial assets held at fair value through profit or loss (1) - 2,846,047 6.44% 47,365 0.19% 8,090 0.09%Alternative Assets Financial assets held at fair value through profit or loss - - 30,407 0.07% - - - - Total 13,126,514 100.00% 44,205,682 100.00% 24,953,562 100.00% 8,523,080 100.00%
Exposure%
Fair Value$
Exposure%
Fair Value$
Exposure%
30 June 2019 Fair Value$
Exposure%
Fair Value$
Exposure%
121. OnePath Wholesale Global Emerging Markets
Share Trust
122. OnePath Wholesale High Growth Trust
Investment Asset Financial Statement Caption
30 June 2020 Fair Value$
Exposure%
Fair Value$
Fair Value$
Exposure%
Fair Value$
Exposure%
123. OnePath Wholesale Index Balanced Trust
124. OnePath Wholesale Index Conservative Trust
Cash and Enhanced Cash Financial assets held at fair value through profit or loss 68,158 1.55% 4,294,339 0.51% 53,664 3.32% 2,899,852 3.82%Equity Financial assets held at fair value through profit or loss 2,030,276 46.08% 472,882,184 56.00% 140,315 8.68% 68,740,069 90.54%Fixed Interest Financial assets held at fair value through profit or loss 2,172,947 49.32% 153,134,403 18.13% - - - - Mortgage Financial assets held at fair value through profit or loss - - - - - - - - Property Financial assets held at fair value through profit or loss 97,691 2.22% 40,044,185 4.74% 1,422,846 88.00% 4,277,939 5.63%Derivatives Financial assets held at fair value through profit or loss 36,626 0.83% 172,445,780 20.42% - - 6,012 0.01%Alternative Assets Financial assets held at fair value through profit or loss - - 1,673,375 0.20% - - - - Total 4,405,698 100.00% 844,474,266 100.00% 1,616,825 100.00% 75,923,872 100.00%
Cash and Enhanced Cash Financial assets held at fair value through profit or loss 104,205 1.86% 8,857,616 0.85% 56,353 2.32% 2,330,249 2.34%Equity Financial assets held at fair value through profit or loss 2,610,594 46.71% 586,942,998 56.44% 334,360 13.71% 92,187,217 92.20%Fixed Interest Financial assets held at fair value through profit or loss 2,729,368 48.83% 175,008,977 16.83% - - - - Mortgage Financial assets held at fair value through profit or loss - - - - - - - - Property Financial assets held at fair value through profit or loss 136,474 2.44% 53,949,138 5.19% 2,047,313 83.97% 5,459,009 5.46%Derivatives Financial assets held at fair value through profit or loss 8,843 0.16% 212,959,514 20.48% - - 4,762 - Alternative Assets Financial assets held at fair value through profit or loss - - 2,138,154 0.21% - - - - Total 5,589,484 100.00% 1,039,856,397 100.00% 2,438,026 100.00% 99,981,237 100.00%
Exposure%
Fair Value$
Exposure%
Fair Value$
Exposure%
30 June 2019 Fair Value$
Exposure%
Fair Value$
Exposure%
125. OnePath Wholesale Index Moderate Trust
126. OnePath Wholesale Managed Growth Trust
Investment Asset Financial Statement Caption
30 June 2020 Fair Value$
Exposure%
Fair Value$
Fair Value$
Exposure%
Fair Value$
Exposure%
127. OnePath Wholesale Property Securities Trust
128. OnePath Wholesale Select Leaders Trust

Financial Report Notes to the Financial Statements for the financial year ended 30 June 2020
417
12. Investment assets and liabilities of unconsolidated structured entities
Cash and Enhanced Cash Financial assets held at fair value through profit or loss 41,124 1.21% 328,066 3.40% 593,985 1.86% (6,766) (0.08%)Equity Financial assets held at fair value through profit or loss - - 8,458,987 87.77% 17,336,955 54.20% 1,928,354 21.01%Fixed Interest Financial assets held at fair value through profit or loss 3,345,764 98.55% 234,951 2.44% 6,048,309 18.91% 4,536,257 49.42%Mortgage Financial assets held at fair value through profit or loss - - - - - - - - Property Financial assets held at fair value through profit or loss - - 611,053 6.34% 1,410,667 4.41% 206,167 2.25%Derivatives Financial assets held at fair value through profit or loss 8,031 0.24% 4,381 0.05% 6,565,764 20.53% 2,509,710 27.34%Alternative Assets Financial assets held at fair value through profit or loss - - - - 28,803 0.09% 5,228 0.06%Total 3,394,919 100.00% 9,637,438 100.00% 31,984,483 100.00% 9,178,950 100.00%
Cash and Enhanced Cash Financial assets held at fair value through profit or loss 26,971 0.75% 404,123 3.11% 907,750 2.29% (40,471) (0.34%)Equity Financial assets held at fair value through profit or loss - - 11,691,235 90.11% 21,927,122 55.33% 2,558,710 21.90%Fixed Interest Financial assets held at fair value through profit or loss 3,587,583 99.07% 8,503 0.07% 6,691,642 16.88% 5,721,706 48.97%Mortgage Financial assets held at fair value through profit or loss - - - - - - - - Property Financial assets held at fair value through profit or loss - - 870,713 6.71% 1,891,699 4.77% 296,398 2.54%Derivatives Financial assets held at fair value through profit or loss 6,649 0.18% (132) - 8,154,447 20.58% 3,136,237 26.84%Alternative Assets Financial assets held at fair value through profit or loss - - - - 58,058 0.15% 10,419 0.09%Total 3,621,203 100.00% 12,974,442 100.00% 39,630,718 100.00% 11,682,999 100.00%
Exposure%
Fair Value$
Exposure%
Fair Value$
Exposure%
30 June 2019 Fair Value$
Exposure%
Fair Value$
Exposure%
129. OptiMix Australian Fixed Interest Trust
130. OptiMix Australian Share Trust
Investment Asset Financial Statement Caption
30 June 2020 Fair Value$
Exposure%
Fair Value$
Fair Value$
Exposure%
Fair Value$
Exposure%
131. OptiMix Balanced Trust 132. OptiMix Conservative Trust
Cash and Enhanced Cash Financial assets held at fair value through profit or loss 127,049 4.19% 135,258 3.05% 24,722 0.92% 221,931 2.17%Equity Financial assets held at fair value through profit or loss 2,902,837 95.81% 4,175,517 94.00% 2,561,544 96.39% 6,811,654 66.71%Fixed Interest Financial assets held at fair value through profit or loss - - 124,054 2.79% - - 1,034,297 10.13%Mortgage Financial assets held at fair value through profit or loss - - - - - - - - Property Financial assets held at fair value through profit or loss - - 2,779 0.06% 71,358 2.69% 586,597 5.75%Derivatives Financial assets held at fair value through profit or loss 27 - 4,592 0.10% (66) - 1,548,336 15.16%Alternative Assets Financial assets held at fair value through profit or loss - - - - - - 7,715 0.08%Total 3,029,913 100.00% 4,442,200 100.00% 2,657,558 100.00% 10,210,530 100.00%
Cash and Enhanced Cash Financial assets held at fair value through profit or loss 116,548 3.64% 72,251 1.21% 62,157 2.15% 270,346 2.01%Equity Financial assets held at fair value through profit or loss 3,062,569 95.40% 5,796,007 96.73% 2,740,424 94.51% 9,120,401 67.76%Fixed Interest Financial assets held at fair value through profit or loss 16,089 0.50% 87,651 1.46% - - 1,224,899 9.10%Mortgage Financial assets held at fair value through profit or loss - - - - - - - - Property Financial assets held at fair value through profit or loss 14,903 0.46% 36,637 0.61% 96,891 3.34% 838,728 6.23%Derivatives Financial assets held at fair value through profit or loss (1) - (552) (0.01%) 5 - 1,989,441 14.78%Alternative Assets Financial assets held at fair value through profit or loss - - - - - - 15,772 0.12%Total 3,210,108 100.00% 5,991,994 100.00% 2,899,477 100.00% 13,459,587 100.00%
Exposure%
Fair Value$
Exposure%
Fair Value$
Exposure%
30 June 2019 Fair Value$
Exposure%
Fair Value$
Exposure%
133. OptiMix Global Emerging Markets Share
Trust
134. OptiMix Global Share Trust
Investment Asset Financial Statement Caption
30 June 2020 Fair Value$
Exposure%
Fair Value$
Fair Value$
Exposure%
Fair Value$
Exposure%
135. OptiMix Global Smaller Companies Share Trust
136. OptiMix Growth Trust
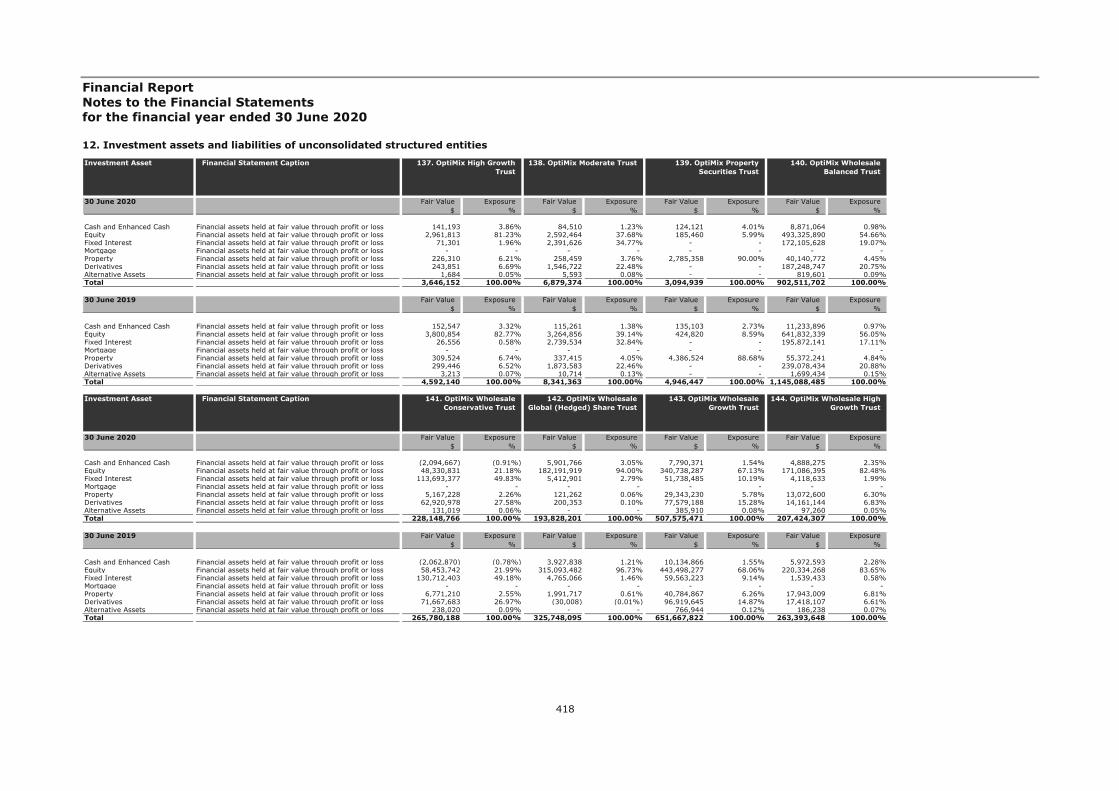
Financial Report Notes to the Financial Statements for the financial year ended 30 June 2020
418
12. Investment assets and liabilities of unconsolidated structured entities
Cash and Enhanced Cash Financial assets held at fair value through profit or loss 141,193 3.86% 84,510 1.23% 124,121 4.01% 8,871,064 0.98%Equity Financial assets held at fair value through profit or loss 2,961,813 81.23% 2,592,464 37.68% 185,460 5.99% 493,325,890 54.66%Fixed Interest Financial assets held at fair value through profit or loss 71,301 1.96% 2,391,626 34.77% - - 172,105,628 19.07%Mortgage Financial assets held at fair value through profit or loss - - - - - - - - Property Financial assets held at fair value through profit or loss 226,310 6.21% 258,459 3.76% 2,785,358 90.00% 40,140,772 4.45%Derivatives Financial assets held at fair value through profit or loss 243,851 6.69% 1,546,722 22.48% - - 187,248,747 20.75%Alternative Assets Financial assets held at fair value through profit or loss 1,684 0.05% 5,593 0.08% - - 819,601 0.09%Total 3,646,152 100.00% 6,879,374 100.00% 3,094,939 100.00% 902,511,702 100.00%
Cash and Enhanced Cash Financial assets held at fair value through profit or loss 152,547 3.32% 115,261 1.38% 135,103 2.73% 11,233,896 0.97%Equity Financial assets held at fair value through profit or loss 3,800,854 82.77% 3,264,856 39.14% 424,820 8.59% 641,832,339 56.05%Fixed Interest Financial assets held at fair value through profit or loss 26,556 0.58% 2,739,534 32.84% - - 195,872,141 17.11%Mortgage Financial assets held at fair value through profit or loss - - - - - - - - Property Financial assets held at fair value through profit or loss 309,524 6.74% 337,415 4.05% 4,386,524 88.68% 55,372,241 4.84%Derivatives Financial assets held at fair value through profit or loss 299,446 6.52% 1,873,583 22.46% - - 239,078,434 20.88%Alternative Assets Financial assets held at fair value through profit or loss 3,213 0.07% 10,714 0.13% - - 1,699,434 0.15%Total 4,592,140 100.00% 8,341,363 100.00% 4,946,447 100.00% 1,145,088,485 100.00%
Exposure%
Fair Value$
Exposure%
Fair Value$
Exposure%
30 June 2019 Fair Value$
Exposure%
Fair Value$
Exposure%
137. OptiMix High Growth Trust
138. OptiMix Moderate Trust Investment Asset Financial Statement Caption
30 June 2020 Fair Value$
Exposure%
Fair Value$
Fair Value$
Exposure%
Fair Value$
Exposure%
139. OptiMix Property Securities Trust
140. OptiMix Wholesale Balanced Trust
Cash and Enhanced Cash Financial assets held at fair value through profit or loss (2,094,667) (0.91%) 5,901,766 3.05% 7,790,371 1.54% 4,888,275 2.35%Equity Financial assets held at fair value through profit or loss 48,330,831 21.18% 182,191,919 94.00% 340,738,287 67.13% 171,086,395 82.48%Fixed Interest Financial assets held at fair value through profit or loss 113,693,377 49.83% 5,412,901 2.79% 51,738,485 10.19% 4,118,633 1.99%Mortgage Financial assets held at fair value through profit or loss - - - - - - - - Property Financial assets held at fair value through profit or loss 5,167,228 2.26% 121,262 0.06% 29,343,230 5.78% 13,072,600 6.30%Derivatives Financial assets held at fair value through profit or loss 62,920,978 27.58% 200,353 0.10% 77,579,188 15.28% 14,161,144 6.83%Alternative Assets Financial assets held at fair value through profit or loss 131,019 0.06% - - 385,910 0.08% 97,260 0.05%Total 228,148,766 100.00% 193,828,201 100.00% 507,575,471 100.00% 207,424,307 100.00%
Cash and Enhanced Cash Financial assets held at fair value through profit or loss (2,062,870) (0.78%) 3,927,838 1.21% 10,134,866 1.55% 5,972,593 2.28%Equity Financial assets held at fair value through profit or loss 58,453,742 21.99% 315,093,482 96.73% 443,498,277 68.06% 220,334,268 83.65%Fixed Interest Financial assets held at fair value through profit or loss 130,712,403 49.18% 4,765,066 1.46% 59,563,223 9.14% 1,539,433 0.58%Mortgage Financial assets held at fair value through profit or loss - - - - - - - - Property Financial assets held at fair value through profit or loss 6,771,210 2.55% 1,991,717 0.61% 40,784,867 6.26% 17,943,009 6.81%Derivatives Financial assets held at fair value through profit or loss 71,667,683 26.97% (30,008) (0.01%) 96,919,645 14.87% 17,418,107 6.61%Alternative Assets Financial assets held at fair value through profit or loss 238,020 0.09% - - 766,944 0.12% 186,238 0.07%Total 265,780,188 100.00% 325,748,095 100.00% 651,667,822 100.00% 263,393,648 100.00%
Exposure%
Fair Value$
Exposure%
Fair Value$
Exposure%
30 June 2019 Fair Value$
Exposure%
Fair Value$
Exposure%
141. OptiMix Wholesale Conservative Trust
142. OptiMix Wholesale Global (Hedged) Share Trust
Investment Asset Financial Statement Caption
30 June 2020 Fair Value$
Exposure%
Fair Value$
Fair Value$
Exposure%
Fair Value$
Exposure%
143. OptiMix Wholesale Growth Trust
144. OptiMix Wholesale High Growth Trust
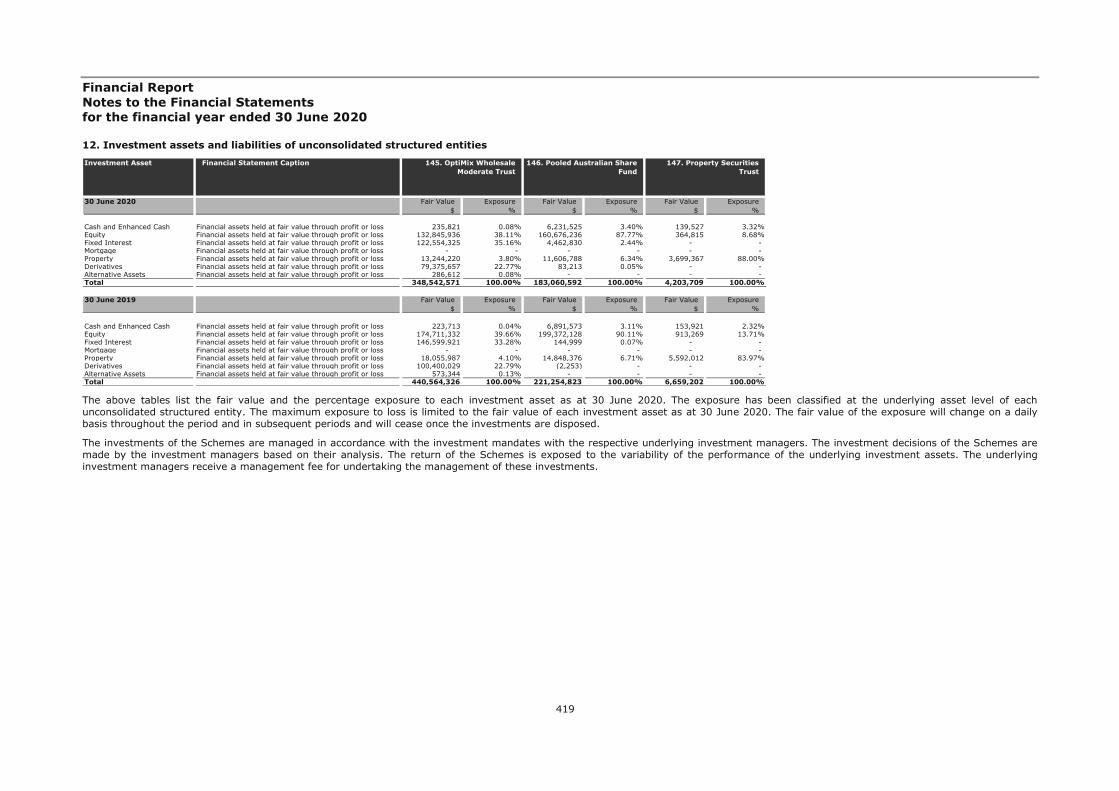
Financial Report Notes to the Financial Statements for the financial year ended 30 June 2020
419
12. Investment assets and liabilities of unconsolidated structured entities
The above tables list the fair value and the percentage exposure to each investment asset as at 30 June 2020. The exposure has been classified at the underlying asset level of each unconsolidated structured entity. The maximum exposure to loss is limited to the fair value of each investment asset as at 30 June 2020. The fair value of the exposure will change on a daily basis throughout the period and in subsequent periods and will cease once the investments are disposed.
The investments of the Schemes are managed in accordance with the investment mandates with the respective underlying investment managers. The investment decisions of the Schemes are made by the investment managers based on their analysis. The return of the Schemes is exposed to the variability of the performance of the underlying investment assets. The underlying investment managers receive a management fee for undertaking the management of these investments.
Cash and Enhanced Cash Financial assets held at fair value through profit or loss 235,821 0.08% 6,231,525 3.40% 139,527 3.32%Equity Financial assets held at fair value through profit or loss 132,845,936 38.11% 160,676,236 87.77% 364,815 8.68%Fixed Interest Financial assets held at fair value through profit or loss 122,554,325 35.16% 4,462,830 2.44% - - Mortgage Financial assets held at fair value through profit or loss - - - - - - Property Financial assets held at fair value through profit or loss 13,244,220 3.80% 11,606,788 6.34% 3,699,367 88.00%Derivatives Financial assets held at fair value through profit or loss 79,375,657 22.77% 83,213 0.05% - - Alternative Assets Financial assets held at fair value through profit or loss 286,612 0.08% - - - - Total 348,542,571 100.00% 183,060,592 100.00% 4,203,709 100.00%
Cash and Enhanced Cash Financial assets held at fair value through profit or loss 223,713 0.04% 6,891,573 3.11% 153,921 2.32%Equity Financial assets held at fair value through profit or loss 174,711,332 39.66% 199,372,128 90.11% 913,269 13.71%Fixed Interest Financial assets held at fair value through profit or loss 146,599,921 33.28% 144,999 0.07% - - Mortgage Financial assets held at fair value through profit or loss - - - - - - Property Financial assets held at fair value through profit or loss 18,055,987 4.10% 14,848,376 6.71% 5,592,012 83.97%Derivatives Financial assets held at fair value through profit or loss 100,400,029 22.79% (2,253) - - - Alternative Assets Financial assets held at fair value through profit or loss 573,344 0.13% - - - - Total 440,564,326 100.00% 221,254,823 100.00% 6,659,202 100.00%
Exposure%
Fair Value$
Exposure%
30 June 2019 Fair Value$
Exposure%
Fair Value$
Exposure%
145. OptiMix Wholesale Moderate Trust
146. Pooled Australian Share Fund
Investment Asset Financial Statement Caption
30 June 2020 Fair Value$
Exposure%
Fair Value$
Fair Value$
Exposure%
147. Property Securities Trust
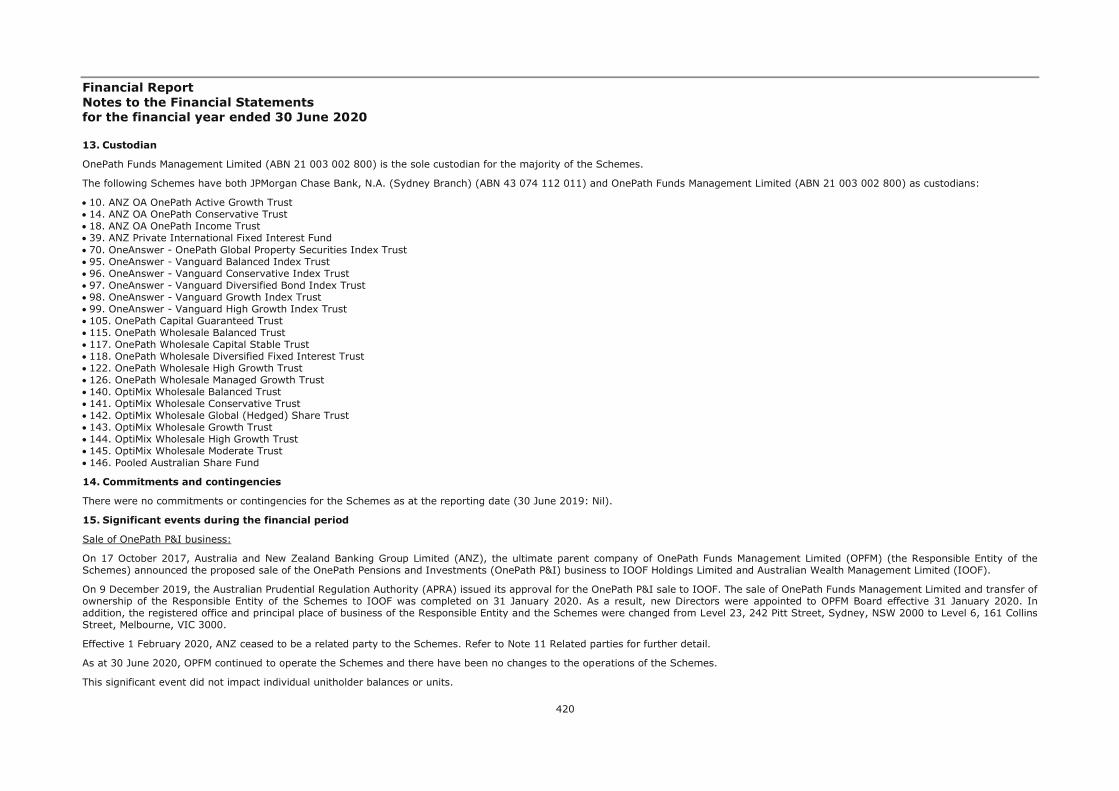
Financial Report Notes to the Financial Statements for the financial year ended 30 June 2020
420
13. Custodian
OnePath Funds Management Limited (ABN 21 003 002 800) is the sole custodian for the majority of the Schemes.
The following Schemes have both JPMorgan Chase Bank, N.A. (Sydney Branch) (ABN 43 074 112 011) and OnePath Funds Management Limited (ABN 21 003 002 800) as custodians:
10. ANZ OA OnePath Active Growth Trust 14. ANZ OA OnePath Conservative Trust 18. ANZ OA OnePath Income Trust 39. ANZ Private International Fixed Interest Fund 70. OneAnswer - OnePath Global Property Securities Index Trust 95. OneAnswer - Vanguard Balanced Index Trust 96. OneAnswer - Vanguard Conservative Index Trust 97. OneAnswer - Vanguard Diversified Bond Index Trust 98. OneAnswer - Vanguard Growth Index Trust 99. OneAnswer - Vanguard High Growth Index Trust 105. OnePath Capital Guaranteed Trust 115. OnePath Wholesale Balanced Trust 117. OnePath Wholesale Capital Stable Trust 118. OnePath Wholesale Diversified Fixed Interest Trust 122. OnePath Wholesale High Growth Trust 126. OnePath Wholesale Managed Growth Trust 140. OptiMix Wholesale Balanced Trust 141. OptiMix Wholesale Conservative Trust 142. OptiMix Wholesale Global (Hedged) Share Trust 143. OptiMix Wholesale Growth Trust 144. OptiMix Wholesale High Growth Trust 145. OptiMix Wholesale Moderate Trust 146. Pooled Australian Share Fund
14. Commitments and contingencies
There were no commitments or contingencies for the Schemes as at the reporting date (30 June 2019: Nil).
15. Significant events during the financial period
Sale of OnePath P&I business:
On 17 October 2017, Australia and New Zealand Banking Group Limited (ANZ), the ultimate parent company of OnePath Funds Management Limited (OPFM) (the Responsible Entity of the Schemes) announced the proposed sale of the OnePath Pensions and Investments (OnePath P&I) business to IOOF Holdings Limited and Australian Wealth Management Limited (IOOF).
On 9 December 2019, the Australian Prudential Regulation Authority (APRA) issued its approval for the OnePath P&I sale to IOOF. The sale of OnePath Funds Management Limited and transfer of ownership of the Responsible Entity of the Schemes to IOOF was completed on 31 January 2020. As a result, new Directors were appointed to OPFM Board effective 31 January 2020. In addition, the registered office and principal place of business of the Responsible Entity and the Schemes were changed from Level 23, 242 Pitt Street, Sydney, NSW 2000 to Level 6, 161 Collins Street, Melbourne, VIC 3000.
Effective 1 February 2020, ANZ ceased to be a related party to the Schemes. Refer to Note 11 Related parties for further detail.
As at 30 June 2020, OPFM continued to operate the Schemes and there have been no changes to the operations of the Schemes.
This significant event did not impact individual unitholder balances or units.
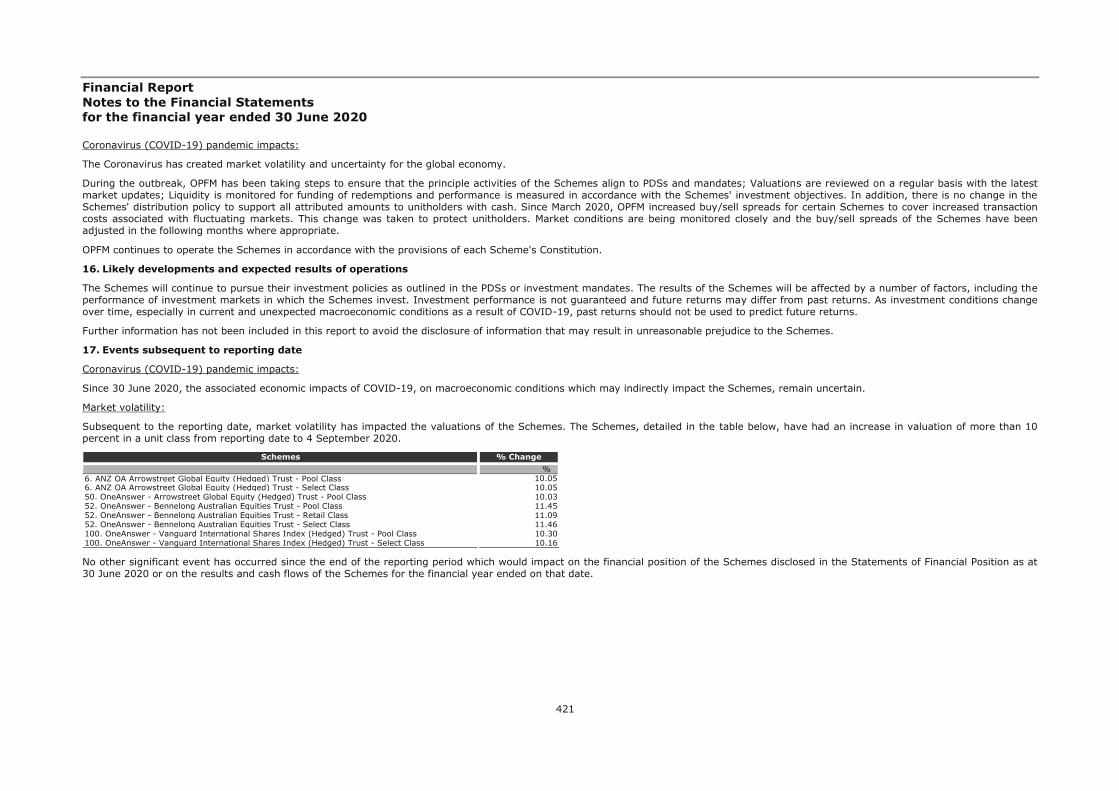
Financial Report Notes to the Financial Statements for the financial year ended 30 June 2020
421
Coronavirus (COVID-19) pandemic impacts:
The Coronavirus has created market volatility and uncertainty for the global economy.
During the outbreak, OPFM has been taking steps to ensure that the principle activities of the Schemes align to PDSs and mandates; Valuations are reviewed on a regular basis with the latest market updates; Liquidity is monitored for funding of redemptions and performance is measured in accordance with the Schemes' investment objectives. In addition, there is no change in the Schemes' distribution policy to support all attributed amounts to unitholders with cash. Since March 2020, OPFM increased buy/sell spreads for certain Schemes to cover increased transaction costs associated with fluctuating markets. This change was taken to protect unitholders. Market conditions are being monitored closely and the buy/sell spreads of the Schemes have been adjusted in the following months where appropriate.
OPFM continues to operate the Schemes in accordance with the provisions of each Scheme's Constitution.
16. Likely developments and expected results of operations
The Schemes will continue to pursue their investment policies as outlined in the PDSs or investment mandates. The results of the Schemes will be affected by a number of factors, including the performance of investment markets in which the Schemes invest. Investment performance is not guaranteed and future returns may differ from past returns. As investment conditions change over time, especially in current and unexpected macroeconomic conditions as a result of COVID-19, past returns should not be used to predict future returns.
Further information has not been included in this report to avoid the disclosure of information that may result in unreasonable prejudice to the Schemes.
17. Events subsequent to reporting date
Coronavirus (COVID-19) pandemic impacts:
Since 30 June 2020, the associated economic impacts of COVID-19, on macroeconomic conditions which may indirectly impact the Schemes, remain uncertain.
Market volatility:
Subsequent to the reporting date, market volatility has impacted the valuations of the Schemes. The Schemes, detailed in the table below, have had an increase in valuation of more than 10 percent in a unit class from reporting date to 4 September 2020.
No other significant event has occurred since the end of the reporting period which would impact on the financial position of the Schemes disclosed in the Statements of Financial Position as at 30 June 2020 or on the results and cash flows of the Schemes for the financial year ended on that date.
Schemes % Change%
6. ANZ OA Arrowstreet Global Equity (Hedged) Trust - Pool Class 10.056. ANZ OA Arrowstreet Global Equity (Hedged) Trust - Select Class 10.0550. OneAnswer - Arrowstreet Global Equity (Hedged) Trust - Pool Class 10.0352. OneAnswer - Bennelong Australian Equities Trust - Pool Class 11.4552. OneAnswer - Bennelong Australian Equities Trust - Retail Class 11.0952. OneAnswer - Bennelong Australian Equities Trust - Select Class 11.46100. OneAnswer - Vanguard International Shares Index (Hedged) Trust - Pool Class 10.30100. OneAnswer - Vanguard International Shares Index (Hedged) Trust - Select Class 10.16
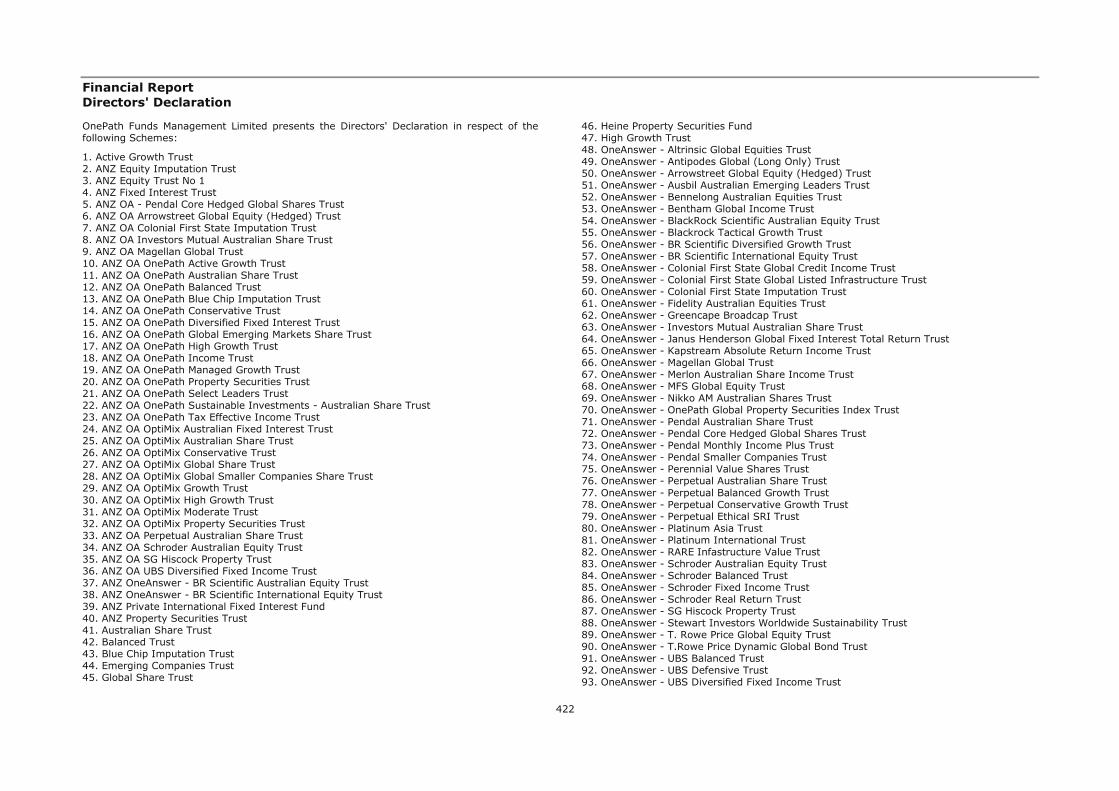
Financial Report Directors' Declaration
422
OnePath Funds Management Limited presents the Directors' Declaration in respect of the following Schemes:
1. Active Growth Trust 2. ANZ Equity Imputation Trust 3. ANZ Equity Trust No 1 4. ANZ Fixed Interest Trust 5. ANZ OA - Pendal Core Hedged Global Shares Trust 6. ANZ OA Arrowstreet Global Equity (Hedged) Trust 7. ANZ OA Colonial First State Imputation Trust 8. ANZ OA Investors Mutual Australian Share Trust 9. ANZ OA Magellan Global Trust 10. ANZ OA OnePath Active Growth Trust 11. ANZ OA OnePath Australian Share Trust 12. ANZ OA OnePath Balanced Trust 13. ANZ OA OnePath Blue Chip Imputation Trust 14. ANZ OA OnePath Conservative Trust 15. ANZ OA OnePath Diversified Fixed Interest Trust 16. ANZ OA OnePath Global Emerging Markets Share Trust 17. ANZ OA OnePath High Growth Trust 18. ANZ OA OnePath Income Trust 19. ANZ OA OnePath Managed Growth Trust 20. ANZ OA OnePath Property Securities Trust 21. ANZ OA OnePath Select Leaders Trust 22. ANZ OA OnePath Sustainable Investments - Australian Share Trust 23. ANZ OA OnePath Tax Effective Income Trust 24. ANZ OA OptiMix Australian Fixed Interest Trust 25. ANZ OA OptiMix Australian Share Trust 26. ANZ OA OptiMix Conservative Trust 27. ANZ OA OptiMix Global Share Trust 28. ANZ OA OptiMix Global Smaller Companies Share Trust 29. ANZ OA OptiMix Growth Trust 30. ANZ OA OptiMix High Growth Trust 31. ANZ OA OptiMix Moderate Trust 32. ANZ OA OptiMix Property Securities Trust 33. ANZ OA Perpetual Australian Share Trust 34. ANZ OA Schroder Australian Equity Trust 35. ANZ OA SG Hiscock Property Trust 36. ANZ OA UBS Diversified Fixed Income Trust 37. ANZ OneAnswer - BR Scientific Australian Equity Trust 38. ANZ OneAnswer - BR Scientific International Equity Trust 39. ANZ Private International Fixed Interest Fund 40. ANZ Property Securities Trust 41. Australian Share Trust 42. Balanced Trust 43. Blue Chip Imputation Trust 44. Emerging Companies Trust 45. Global Share Trust
46. Heine Property Securities Fund 47. High Growth Trust 48. OneAnswer - Altrinsic Global Equities Trust 49. OneAnswer - Antipodes Global (Long Only) Trust 50. OneAnswer - Arrowstreet Global Equity (Hedged) Trust 51. OneAnswer - Ausbil Australian Emerging Leaders Trust 52. OneAnswer - Bennelong Australian Equities Trust 53. OneAnswer - Bentham Global Income Trust 54. OneAnswer - BlackRock Scientific Australian Equity Trust 55. OneAnswer - Blackrock Tactical Growth Trust 56. OneAnswer - BR Scientific Diversified Growth Trust 57. OneAnswer - BR Scientific International Equity Trust 58. OneAnswer - Colonial First State Global Credit Income Trust 59. OneAnswer - Colonial First State Global Listed Infrastructure Trust 60. OneAnswer - Colonial First State Imputation Trust 61. OneAnswer - Fidelity Australian Equities Trust 62. OneAnswer - Greencape Broadcap Trust 63. OneAnswer - Investors Mutual Australian Share Trust 64. OneAnswer - Janus Henderson Global Fixed Interest Total Return Trust 65. OneAnswer - Kapstream Absolute Return Income Trust 66. OneAnswer - Magellan Global Trust 67. OneAnswer - Merlon Australian Share Income Trust 68. OneAnswer - MFS Global Equity Trust 69. OneAnswer - Nikko AM Australian Shares Trust 70. OneAnswer - OnePath Global Property Securities Index Trust 71. OneAnswer - Pendal Australian Share Trust 72. OneAnswer - Pendal Core Hedged Global Shares Trust 73. OneAnswer - Pendal Monthly Income Plus Trust 74. OneAnswer - Pendal Smaller Companies Trust 75. OneAnswer - Perennial Value Shares Trust 76. OneAnswer - Perpetual Australian Share Trust 77. OneAnswer - Perpetual Balanced Growth Trust 78. OneAnswer - Perpetual Conservative Growth Trust 79. OneAnswer - Perpetual Ethical SRI Trust 80. OneAnswer - Platinum Asia Trust 81. OneAnswer - Platinum International Trust 82. OneAnswer - RARE Infastructure Value Trust 83. OneAnswer - Schroder Australian Equity Trust 84. OneAnswer - Schroder Balanced Trust 85. OneAnswer - Schroder Fixed Income Trust 86. OneAnswer - Schroder Real Return Trust 87. OneAnswer - SG Hiscock Property Trust 88. OneAnswer - Stewart Investors Worldwide Sustainability Trust 89. OneAnswer - T. Rowe Price Global Equity Trust 90. OneAnswer - T.Rowe Price Dynamic Global Bond Trust 91. OneAnswer - UBS Balanced Trust 92. OneAnswer - UBS Defensive Trust 93. OneAnswer - UBS Diversified Fixed Income Trust
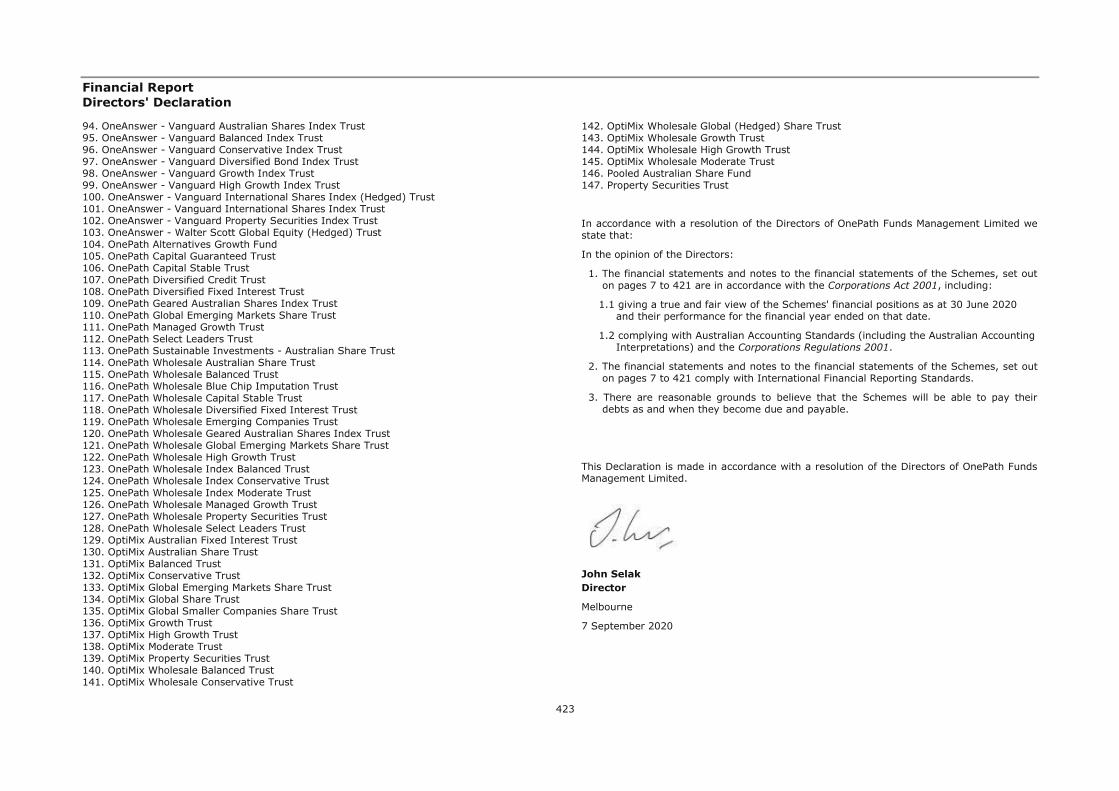
Financial Report Directors' Declaration
423
94. OneAnswer - Vanguard Australian Shares Index Trust 95. OneAnswer - Vanguard Balanced Index Trust 96. OneAnswer - Vanguard Conservative Index Trust 97. OneAnswer - Vanguard Diversified Bond Index Trust 98. OneAnswer - Vanguard Growth Index Trust 99. OneAnswer - Vanguard High Growth Index Trust 100. OneAnswer - Vanguard International Shares Index (Hedged) Trust 101. OneAnswer - Vanguard International Shares Index Trust 102. OneAnswer - Vanguard Property Securities Index Trust 103. OneAnswer - Walter Scott Global Equity (Hedged) Trust 104. OnePath Alternatives Growth Fund 105. OnePath Capital Guaranteed Trust 106. OnePath Capital Stable Trust 107. OnePath Diversified Credit Trust 108. OnePath Diversified Fixed Interest Trust 109. OnePath Geared Australian Shares Index Trust 110. OnePath Global Emerging Markets Share Trust 111. OnePath Managed Growth Trust 112. OnePath Select Leaders Trust 113. OnePath Sustainable Investments - Australian Share Trust 114. OnePath Wholesale Australian Share Trust 115. OnePath Wholesale Balanced Trust 116. OnePath Wholesale Blue Chip Imputation Trust 117. OnePath Wholesale Capital Stable Trust 118. OnePath Wholesale Diversified Fixed Interest Trust 119. OnePath Wholesale Emerging Companies Trust 120. OnePath Wholesale Geared Australian Shares Index Trust 121. OnePath Wholesale Global Emerging Markets Share Trust 122. OnePath Wholesale High Growth Trust 123. OnePath Wholesale Index Balanced Trust 124. OnePath Wholesale Index Conservative Trust 125. OnePath Wholesale Index Moderate Trust 126. OnePath Wholesale Managed Growth Trust 127. OnePath Wholesale Property Securities Trust 128. OnePath Wholesale Select Leaders Trust 129. OptiMix Australian Fixed Interest Trust 130. OptiMix Australian Share Trust 131. OptiMix Balanced Trust 132. OptiMix Conservative Trust 133. OptiMix Global Emerging Markets Share Trust 134. OptiMix Global Share Trust 135. OptiMix Global Smaller Companies Share Trust 136. OptiMix Growth Trust 137. OptiMix High Growth Trust 138. OptiMix Moderate Trust 139. OptiMix Property Securities Trust 140. OptiMix Wholesale Balanced Trust 141. OptiMix Wholesale Conservative Trust
142. OptiMix Wholesale Global (Hedged) Share Trust 143. OptiMix Wholesale Growth Trust 144. OptiMix Wholesale High Growth Trust 145. OptiMix Wholesale Moderate Trust 146. Pooled Australian Share Fund 147. Property Securities Trust
In accordance with a resolution of the Directors of OnePath Funds Management Limited we state that:
In the opinion of the Directors:
1. The financial statements and notes to the financial statements of the Schemes, set out on pages 7 to 421 are in accordance with the Corporations Act 2001, including:
1.1 giving a true and fair view of the Schemes' financial positions as at 30 June 2020 and their performance for the financial year ended on that date.
1.2 complying with Australian Accounting Standards (including the Australian Accounting Interpretations) and the Corporations Regulations 2001.
2. The financial statements and notes to the financial statements of the Schemes, set out on pages 7 to 421 comply with International Financial Reporting Standards.
3. There are reasonable grounds to believe that the Schemes will be able to pay their debts as and when they become due and payable.
This Declaration is made in accordance with a resolution of the Directors of OnePath Funds Management Limited.
John SelakDirector
Melbourne
7 September 2020
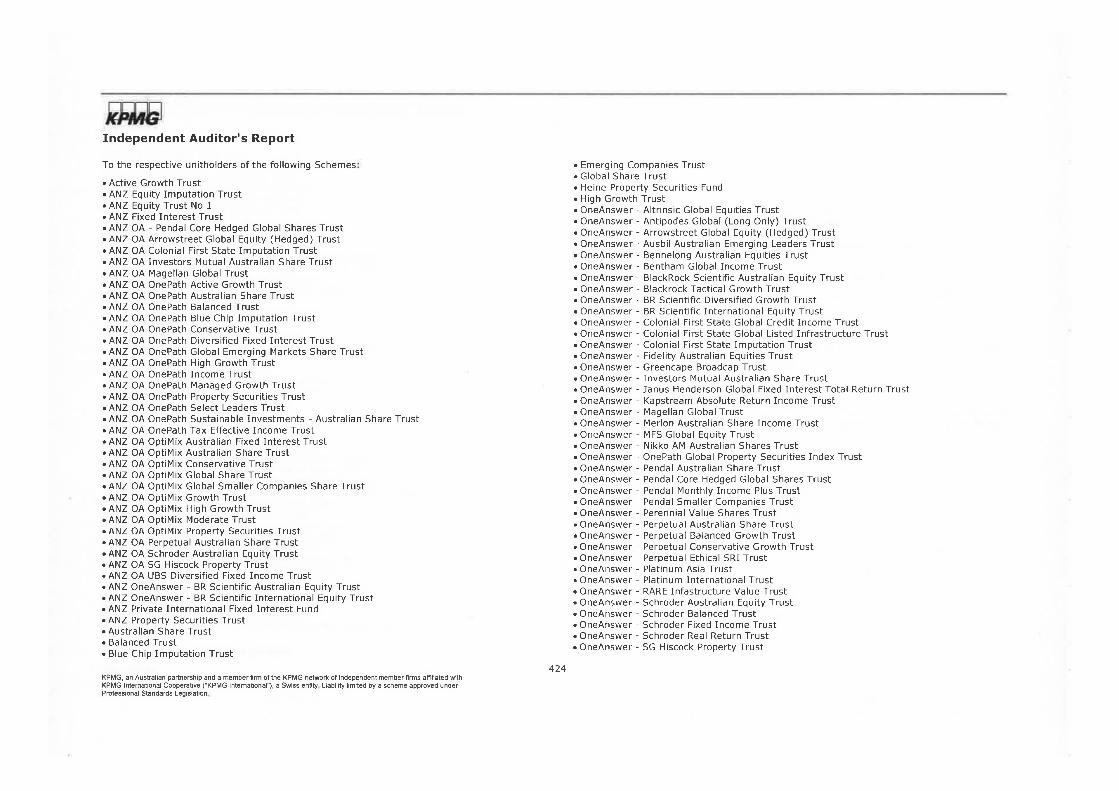


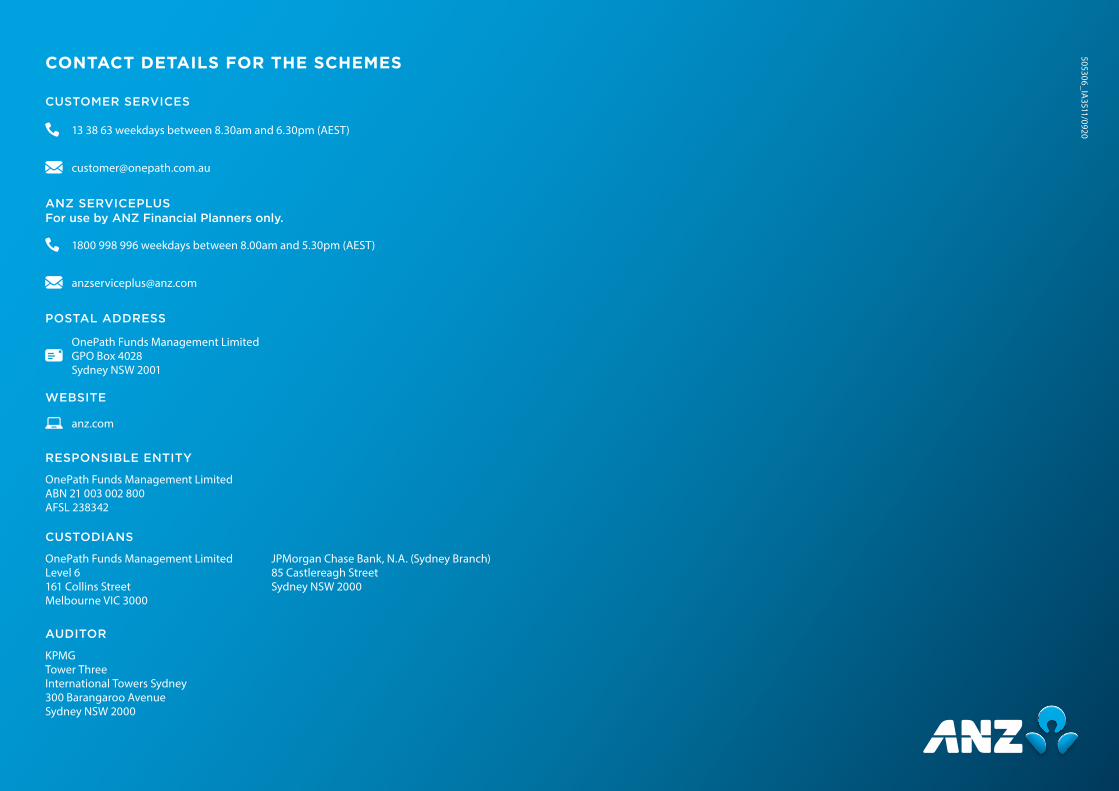
505306_IA3511/0920
CONTACT DETAILS FOR THE SCHEMES
CUSTOMER SERVICES
13 38 63 weekdays between 8.30am and 6.30pm (AEST)
ANZ SERVICEPLUS For use by ANZ Financial Planners only.
1800 998 996 weekdays between 8.00am and 5.30pm (AEST)
POSTAL ADDRESS
OnePath Funds Management Limited GPO Box 4028 Sydney NSW 2001
WEBSITE
anz.com
RESPONSIBLE ENTITY
OnePath Funds Management Limited ABN 21 003 002 800 AFSL 238342
CUSTODIANS
OnePath Funds Management Limited JPMorgan Chase Bank, N.A. (Sydney Branch) Level 6 85 Castlereagh Street 161 Collins Street Sydney NSW 2000 Melbourne VIC 3000
AUDITOR
KPMG Tower Three International Towers Sydney 300 Barangaroo Avenue Sydney NSW 2000
Related Documents


