…ONE CALL …ONE SOLUTION …ONE SOURCE ANNUAL REPORT 2001 CLARCOR TOTAL FILTRATION

Welcome message from author
This document is posted to help you gain knowledge. Please leave a comment to let me know what you think about it! Share it to your friends and learn new things together.
Transcript

…ONE CALL
…ONE SOLUTION
…ONE SOURCE
ANNUAL REPORT 2001
CLARCORTOTAL FILTRATION

Worldwide Market Size–$4 billion CLARCOR 2001 Revenues–$251 million
Customers: Aftermarket distributors and dealers, OEM truck and engine manufacturers,major fleets, private label accounts, parts wholesalers and jobbers, railroads,national accounts, truck quick lube and service centers
Product Brands: Baldwin Filters, Hastings Filters, Clark Filter
Major Product Lines: Heavy-duty and light-duty oil, air, hydraulic, coolant, transmission,fuel and desiccant filters, fuel/water separators
Applications: Trucks, buses, automobiles, construction equipment, locomotives, marine equipment, mining equipment, agricultural equipment, industrial equipment
CLARCOR is a global provider of filtration products and services. We have a worldwide customer base, superb product quality, well-known brands, an extensive distribution network, theindustry’s broadest product line and its largest sales force. Our focus on a consumable, disposableproduct that is continually purchased, used and then repurchased provides CLARCOR with a stablesource of recurring business. Our goal is to record compound annual growth rates in earnings pershare of 10% to 15% driven by internal growth programs, cost reduction efforts and acquisitions.
Worldwide Market Size–$25 billion CLARCOR 2001 Revenues–$346 million
Customers: Commercial and industrial distributors, OEM and dealer networks,private label accounts, retailers, national accounts
Environmental Product Brands: Purolator, Airguard, Facet, UAS (United Air Specialists), ATI (Air Technologies, Inc.)Worldwide Market Size–$7 billion
Major Product Lines: Air filters, antimicrobial filters, dust collection systems and filters, electrostatic air filtration, carbon filters, paint overspray filters, HEPA filters,air pollution control systems
Applications: Residences, commercial and industrial buildings, factories and plants,clean rooms, hospitals and medical facilities, industrial machinery,power generation
Process Product Brands: Purolator Facet, Facet, Purolator, FPI (Filter Products, Inc.)Worldwide Market Size–$18 billion
Major Product Lines: Hydraulic filters, sand control filters, aviation fuel filters, waste water filters, fuel/water separators, oil/water separators and coalescers,blood filtration, depth filters, microfiltration and ultrafiltration products
Applications: Airports and aircraft, oil drilling and refining, chemical, paper,pharmaceutical, food and beverage processing, general manufacturing, medical,utilities, office equipment, shipyards, military, power generation, water treatment
INDUSTRIAL/ENVIRONMENTAL FILTRATION
Agricultural and construction vehiclesRailroad locomotives
ENGINE/MOBILE FILTRATION
Heavy-duty and light-duty trucks
CLARCOR 1
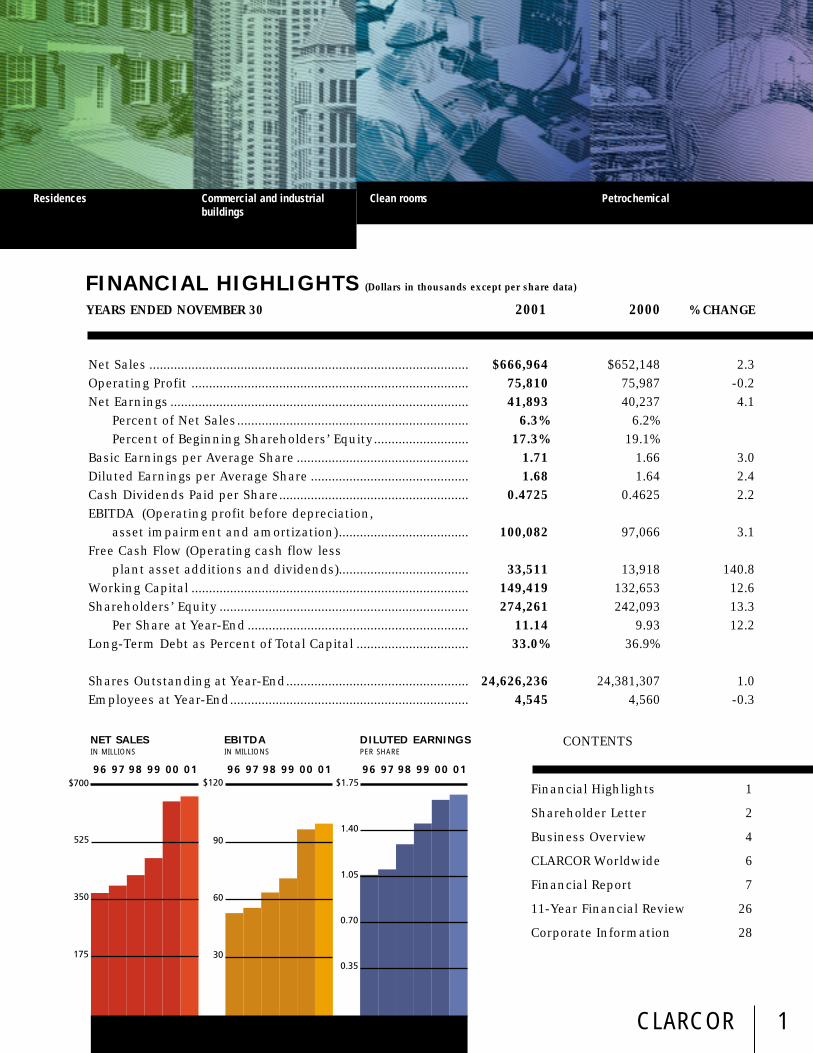
YEARS ENDED NOVEMBER 30 2001 2000 % CHANGE
Net Sales ........................................................................................... $666,964 $652,148 2.3Operating Profit ............................................................................... 75,810 75,987 -0.2Net Earnings ..................................................................................... 41,893 40,237 4.1
Percent of Net Sales.................................................................. 6.3% 6.2%Percent of Beginning Shareholders’ Equity........................... 17.3% 19.1%
Basic Earnings per Average Share ................................................. 1.71 1.66 3.0Diluted Earnings per Average Share ............................................. 1.68 1.64 2.4Cash Dividends Paid per Share...................................................... 0.4725 0.4625 2.2EBITDA (Operating profit before depreciation,
asset impairment and amortization)..................................... 100,082 97,066 3.1Free Cash Flow (Operating cash flow less
plant asset additions and dividends)..................................... 33,511 13,918 140.8Working Capital ............................................................................... 149,419 132,653 12.6Shareholders’ Equity ....................................................................... 274,261 242,093 13.3
Per Share at Year-End ............................................................... 11.14 9.93 12.2Long-Term Debt as Percent of Total Capital ................................ 33.0% 36.9%
Shares Outstanding at Year-End.................................................... 24,626,236 24,381,307 1.0 Employees at Year-End.................................................................... 4,545 4,560 -0.3
FINANCIAL HIGHLIGHTS (Dollars in thousands except per share data)
CONTENTS
Financial Highlights 1
Shareholder Letter 2
Business Overview 4
CLARCOR Worldwide 6
Financial Report 7
11-Year Financial Review 26
Corporate Information 28
Residences Commercial and industrialbuildings
Clean rooms Petrochemical
NET SALESIN MILLIONS
EBITDAIN MILLIONS
DILUTED EARNINGSPER SHARE

CLARCOR2
n my letter to you last year I wrote,“We approach 2001 optimistically, butwe are conscious of a slowing world
economy.” In addition to a recession in2001, none of us could have imagined theevents of September 11th and its impacton our country and our economy. Still,CLARCOR had a solid fiscal 2001. Sales,earnings and cash flow all ended higherin 2001 than in fiscal 2000 and we madesubstantial progress in building our TotalFiltration Program. Moreover, even after asignificant acquisition, we strengthenedour balance sheet with increasedshareholders’ equity and lower borrowings.
Overall filter markets continue to growabout 2-3% faster than the economy. There is anincreasing demand for a cleaner environment andworkplace, and filter maintenance requirements fortransportation and manufacturing equipment alsocontinue to expand. The majority of the products we sellare consumable and disposable, and are sold mostly tothe aftermarket. Since our customers will always need tomaintain their facilities and equipment, this provides uswith a stable base of business when the economy isslow. Equally important, we have a strong platform togrow our business when the economy recovers.
THE CLARCOR TOTAL FILTRATION PROGRAM
I wrote last year about the CLARCOR Total FiltrationProgram and our initial efforts to become the total filtersupplier to companies throughout North America. TheTotal Filtration Program is one of our principal growthstrategies: to provide a company’s entire filterrequirements, not just certain filters for specificapplications. The worldwide filtration market is verylarge with sales approaching $30 billion annually. TheCLARCOR Total Filtration Program now gives us theopportunity to sell to nearly all of this market.
Let me tell you some of the things we accomplished in 2001:
• CLARCOR became the exclusive filter supplier to a $13billion manufacturing company for its 40 plants in NorthAmerica. After each plant is converted to the CLARCORprogram, we expect customer purchases to exceed $4 millionannually. Before this year, CLARCOR had not sold filters tothis company.
• CLARCOR became the exclusivefilter supplier to a $20 billiondiversified manufacturing companywith over 150 facilities in NorthAmerica. We will supply thefiltration needs for itsmanufacturing plants, warehousesand offices. We expect that totalcustomer purchases will exceed $5million annually.
• We developed Total FiltrationPrograms for specific industries andapplications, including power plants,petrochemical companies andintegrated suppliers. By the end of2001, we had signed several total
filter contracts in these areas and were negotiating filtercontracts with additional companies. These contracts arewith companies which previously had little or no businesswith CLARCOR.
• In June 2001, we strengthened our Total FiltrationProgram with the acquisition of Total Filtration Services(TFS). The leading total filter supplier to the North Americanautomotive industry, TFS serves over 90 manufacturing andassembly plants. TFS has developed the logistics andtechnical support systems critical to providing acomprehensive total filter management program tocustomers with multiple locations and sophisticatedfiltration requirements.
We are currently presenting the CLARCOR Total FiltrationProgram to many potential customers. Some are currentcustomers who already buy part of their filtration needsfrom CLARCOR. Some are companies who have neverpreviously purchased our filters, and some are ourcurrent distributors who previously purchased only oneof our filter brands. What they find attractive about ourprogram is the ease and convenience of ordering, theexpertise we have to provide the right filter solutionwherever they operate, the breadth and quality of ourfilters, and our ability to offer the level of service andresponsiveness they require. The appeal of the TotalFiltration Program is obvious to every company anddistributor we speak to. It makes their life simpler and,in most cases, will save them money.
OUR FISCAL 2001 OPERATING RESULTS
Overall, we were pleased with this year’s results.However, growth was less than in prior years, and theincreases in sales and earnings were less than weexpected when the year began. Despite the slowingeconomy which affected most industrial companies in2001 and the aftermath of the terrible events of
Norman E. Johnson,Chairman, President and Chief Executive Officer
I
TO OUR SHAREHOLDERS...

CLARCOR 3
September 11th, sales grew by 2.3% and net earnings by4.1%. After capital expenditures for new facilities andequipment, investment in working capital and paymentof dividends, free cash flow more than doubled to $34million, a new record.
We paid particular attention to discretionary spendingas the economy slowed during the year. As a result, wereduced selling and administrative costs in 2001 as apercentage of sales below 2000 levels. We believe thiswill benefit us when the economy recovers.
In addition to our focus on developing the TotalFiltration Program, we also accomplished a lot in otherareas in 2001. Several filter manufacturing plants thatopened during 2000 in our Industrial/Environmentalsegment became progressively more efficient andproductive throughout the year. By year-end, each ofthese plants was profitable, and we expect they willbecome more so in 2002. We developed more new filterproducts than we had in any other year in our history.When it became apparent that 2001 was going to be adifficult year, our operating companies initiated newcost reduction programs. We successfully beganmanufacturing our electrostatic air pollution controlsystems in our Weifang, China plant for sale in Chinaand throughout Southeast Asia. With increased oildrilling in 2001, sales of our sand control filters grew,and we introduced a less costly version for certainenvironments, which should increase sales further.Overall, 2001 was a solid year for CLARCOR and providesa base for greater growth as we move into 2002.
OUR PEOPLE
We were fortunate to have Keith Wandell join our Boardof Directors in March 2001. Keith is the President of theAutomotive Systems Group, Battery at Johnson Controls,Inc. in Milwaukee, Wisconsin. His experience inoperations and marketing is an asset to CLARCOR.
At our Annual Meeting in March 2002, Milt Brown willretire from our Board of Directors. Milt joined our Boardin 1990 and we deeply appreciate the counsel andguidance he has given us over the years.
I am very pleased that we were able to hire Sam Ferriseas the new President for our Baldwin Filters operationand Rich Larson as the new President for United AirSpecialists. Both Sam and Rich bring great experience,enthusiasm and drive to these companies. We arefortunate to have both working with us.
I also want to recognize all the employees at CLARCOR.Through their perseverance, imagination anddedication to delivering continuing value to our
customers, they have made CLARCOR, over a period ofnearly 100 years, into what I firmly believe is the bestcompany in our industry.
OUR FUTURE
As the economy recovers, we expect 2002 will be a betteryear than 2001 and that both sales and net earnings willgrow at a faster rate than in 2001. We also expectCLARCOR to grow faster than the filtration industry. Theinvestments we have made in people, systems andmarketing programs for our Total Filtration Program willprovide an increasing return over the next several years.
The result is that internal growth will come from two areas:
• First, it will come from the individual efforts of eachcompany developing and selling its own products to its owncustomers with new product development and aggressivemarketing programs.
• Second, each company will work, through the TotalFiltration Program, to reach those customers seekingcomplete filter solutions that require the combined effortsand product offerings of all of our operating companies.
Over the years, one of CLARCOR’s hallmarks has beenour consistent growth and profitability. Sales haveincreased for 15 consecutive years and profits for nineconsecutive years. We have a strong foundation: aworldwide customer base, superb product quality, anextensive distribution network, the industry’s broadestproduct line and its largest sales force. Our filters areused everywhere you look. Our focus on a consumable,disposable product that is continually purchased, usedand then repurchased provides CLARCOR with a strongsource of recurring business. When combined with ourTotal Filtration Program, I am tremendously excitedabout our future prospects and the ability of ourcompany to bring value to our shareholders, ourcustomers and our employees.
Norman E. Johnson,Chairman, President and Chief Executive Officer
February 1, 2002

CLARCOR4
he CLARCOR Total Filtration Program enablesour customers to purchase 100% of their filterrequirements from one company. Whether the
filters are used to clean fluids used in manufacturingequipment; to purify the air in offices, factories,hospitals and homes; to protect trucks, construction and farm equipment, automobiles and locomotives; or to provide the specialized filtration needs for oil drilling,power plants, pharmaceutical production, aviation refueling, or biohazard air contamination, CLARCOR provides the filters to meet these and many other filtration needs.
We believe CLARCOR has the largest number of filters for more filter applications than any other company in the world. For our customers, this meansthat rather than purchasing filters from a variety of different suppliers, they can purchase their entire filterneeds from one company. With more than 20 filter manufacturing plants, dozens of warehouses, over 25company-owned filter outlets, thousands of distributorsthroughout North America and the largest filter salesforce in the industry, CLARCOR provides customers withthe right filter at the right location at the right time.
OUR ACCOMPLISHMENTS IN 2001
• Expanded the CLARCOR Total Filtration Program with new customers, including several Fortune 500 companies. Equally important, we began discussionswith a number of the largest corporations in the UnitedStates about the Program’s benefits and expect to signadditional agreements in 2002.
• Acquired Total Filtration Services (TFS) in June. TFS provides filtration management services to all of themajor automotive companies and has developed theproduct procurement and delivery systems critical tomaking the Total Filtration Program successful.
• Through continual efforts during the year to reduce costs, our selling and administrative expenseswere a lower percentage of sales in 2001 than they were in 2000. Maintaining appropriate cost disciplinesregardless of the state of the economy is an importantobjective for CLARCOR.
• Significantly increased productivity in our newer manufacturing and distribution facilities and we expectfurther productivity gains in 2002.
• Other accomplishments:
• Developed a new, less costly version of our successful sand control filter which is used extensivelyin the oil drilling industry.
• Secured the largest number of FAA approvals everreceived by CLARCOR for aerospace filter applications.
• Began manufacturing our electrostatic air pollution control systems in our Weifang, China plantfor sale throughout China and Southeast Asia. Demand for these systems in this region has greatly exceededour expectations.
• Set a new record in 2001 by generating free cash flow of $34 million, after investments in new plant andequipment and working capital and payment of divi-dends. This enabled us to increase the dividend to ourshareholders for the 18th consecutive year, reduce ourbank borrowings and pay for a significant acquisition.
• We compare the filters youcurrently use to the filters manufactured in ourplants and available through our distribution net-work which is the largest in the industry.
• A team of experienced filtration experts will visit yourfacilities to make a record of your filter applications andassess your filtration needs. We will recommend alterna-tives to improve filter efficiency and longevity and will pro-vide a copy of our report for your review.
One Call …
ProductList …
CrossReference …
T
…more filter products
for more filter applications
in more filter markets
than anyone else
anywhere!
• A single call to CLARCOR Total Filtration puts theresources and expertise of our filtration manufacturing,distribution and service companies at your disposal.
TOTAL FILTRATION:WHAT IT IS AND HOW IT WORKS…
CLARCOR 5
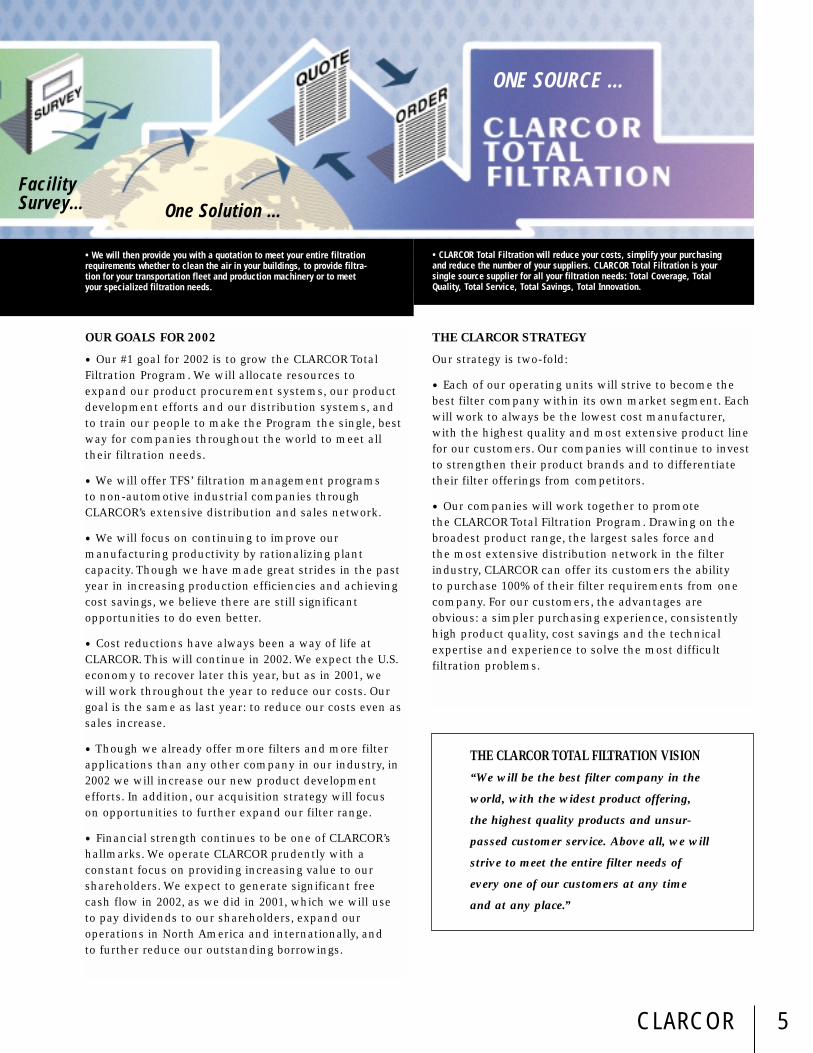
OUR GOALS FOR 2002
• Our #1 goal for 2002 is to grow the CLARCOR TotalFiltration Program. We will allocate resources to expand our product procurement systems, our product development efforts and our distribution systems, andto train our people to make the Program the single, bestway for companies throughout the world to meet alltheir filtration needs.
• We will offer TFS’ filtration management programs to non-automotive industrial companies throughCLARCOR’s extensive distribution and sales network.
• We will focus on continuing to improve our manufacturing productivity by rationalizing plant capacity. Though we have made great strides in the pastyear in increasing production efficiencies and achievingcost savings, we believe there are still significant opportunities to do even better.
• Cost reductions have always been a way of life atCLARCOR. This will continue in 2002. We expect the U.S.economy to recover later this year, but as in 2001, wewill work throughout the year to reduce our costs. Ourgoal is the same as last year: to reduce our costs even assales increase.
• Though we already offer more filters and more filterapplications than any other company in our industry, in2002 we will increase our new product developmentefforts. In addition, our acquisition strategy will focus on opportunities to further expand our filter range.
• Financial strength continues to be one of CLARCOR’shallmarks. We operate CLARCOR prudently with a constant focus on providing increasing value to ourshareholders. We expect to generate significant free cash flow in 2002, as we did in 2001, which we will useto pay dividends to our shareholders, expand our operations in North America and internationally, and to further reduce our outstanding borrowings.
THE CLARCOR STRATEGY
Our strategy is two-fold:
• Each of our operating units will strive to become thebest filter company within its own market segment. Eachwill work to always be the lowest cost manufacturer,with the highest quality and most extensive product linefor our customers. Our companies will continue to investto strengthen their product brands and to differentiatetheir filter offerings from competitors.
• Our companies will work together to promotethe CLARCOR Total Filtration Program. Drawing on the broadest product range, the largest sales force and the most extensive distribution network in the filter industry, CLARCOR can offer its customers the ability to purchase 100% of their filter requirements from onecompany. For our customers, the advantages are obvious: a simpler purchasing experience, consistentlyhigh product quality, cost savings and the technicalexpertise and experience to solve the most difficult filtration problems.
• We will then provide you with a quotation to meet your entire filtrationrequirements whether to clean the air in your buildings, to provide filtra-tion for your transportation fleet and production machinery or to meetyour specialized filtration needs.
• CLARCOR Total Filtration will reduce your costs, simplify your purchasingand reduce the number of your suppliers. CLARCOR Total Filtration is yoursingle source supplier for all your filtration needs: Total Coverage, TotalQuality, Total Service, Total Savings, Total Innovation.
ONE SOURCE …
FacilitySurvey… One Solution …
THE CLARCOR TOTAL FILTRATION VISION“We will be the best filter company in the
world, with the widest product offering,
the highest quality products and unsur-
passed customer service. Above all, we will
strive to meet the entire filter needs of
every one of our customers at any time
and at any place.”

CLARCOR6
CLARCOR WORLDWIDE
CLARCOR CORPORATE OFFICESRockford, Illinois
ENGINE/MOBILE FILTRATION
BALDWIN FILTERSHeadquarters:
Kearney, NebraskaOther U.S. Locations:
Gothenburg, NebraskaYankton, South Dakota
International Locations:AustraliaBelgiumChinaMexicoSouth AfricaUnited Kingdom
CLARK FILTERHeadquarters:
Lancaster, Pennsylvania
PACKAGING
J.L. CLARKHeadquarters:
Rockford, IllinoisOther U.S. Locations:
Lathrop, CaliforniaLancaster, Pennsylvania
AIRGUARDHeadquarters:
Louisville, Kentucky Other U.S. Locations:
Birmingham, AlabamaCorona, CaliforniaCommerce City,ColoradoAtlanta, GeorgiaRockford, Illinois New Albany, IndianaOttawa, KansasCampbellsville & Jeffersontown, KentuckyKansas City, MissouriGastonia, North CarolinaCincinnati, Columbus & Toledo, OhioPortland, OregonNashville, TennesseeDallas, Texas
International Locations:MalaysiaSingapore
FACET INTERNATIONALU.S. Locations:
Stillwell & Tulsa,Oklahoma
International Locations:AustraliaFranceGermanyItalyNetherlandsSpainUnited Kingdom
FILTER PRODUCTS, INC.Headquarters:
Sacramento, California
PUROLATOR AIR FILTRATIONHeadquarters:
Henderson, North CarolinaOther U.S. Locations:
Fresno, Hayward & Sacramento, CaliforniaDavenport, IowaWichita, KansasSparks, NevadaMetuchen, New JerseyKenly, North CarolinaFairfax, VirginiaAuburn, Washington
INDUSTRIAL/ENVIRONMENTAL FILTRATION
PUROLATOR FACET, INC.Headquarters:
Greensboro, North Carolina
TOTAL FILTRATION SERVICESHeadquarters:
Rochester Hills, MichiganOther U.S. Locations:
Cincinnati, OhioGoodlettsville, Tennessee
International Locations:Mexico
UNITED AIR SPECIALISTSHeadquarters:
Cincinnati, OhioOther U.S. Locations:
Phoenix, ArizonaAnaheim & Hayward,CaliforniaLouisville, KentuckyTroy, MichiganJackson, MississippiHouston, Texas
International Locations:GermanyUnited Kingdom

CLARCOR’s operating results for fiscal 2001 reached recordlevels for sales, cash flow and earnings. Fiscal 2001 includedsix-month results from Total Filtration Services, Inc. (TFS)which was acquired at the beginning of the third quarter offiscal 2001. This acquisition increased CLARCOR’s sales andoperating profit, and after related interest and amortizationexpenses, also increased net earnings and diluted earningsper share in fiscal 2001. Purchase accounting adjustments forthe acquisition will be completed in fiscal 2002 as describedin Note C to the Consolidated Financial Statements. TheCompany also made several smaller acquisitions in fiscal 2000that were not material to the Company’s operating results.Fiscal 2000 included the full-year results from three industrialfiltration companies (hereafter, the Industrial FiltrationAcquisitions) that were acquired at the beginning of thefourth quarter 1999. TFS, the Industrial Filtration Acquisitionsand the smaller fiscal 2000 acquisitions are included in theIndustrial/Environmental Filtration segment.
The information presented in this financial review should be read in conjunction with other financial information pro-vided throughout this 2001 Annual Report. The following dis-cussion of operating results focuses on the Company’s threereportable business segments: Engine/Mobile Filtration,Industrial/Environmental Filtration and Packaging. Fiscal2001 was a fifty-two week year for the Company and fiscalyears 2000 and 1999 were fifty-three and fifty-two weekyears, respectively.
OPERATING RESULTS SalesNet sales in fiscal 2001 were $667.0 million, a 2.3% increasefrom $652.1 million in fiscal 2000. The 2001 net sales includedapproximately $28 million for TFS which was acquired at thebeginning of the third quarter. Fiscal 2000 included approxi-mately $12-$13 million in additional sales compared to fiscal2001 as fiscal year 2000 was a fifty-three week year for theCompany. The 2001 sales increase was the 15th consecutiveyear of sales growth for the Company. Net sales grew 36.5% in2000 over the 1999 level of $477.9 million primarily due to afull year of sales from the Industrial Filtration Acquisitionscompared to 1999 which included only the fourth quarteractivity. Excluding the additional sales from the IndustrialFiltration Acquisitions, sales increased approximately 11% in2000 from 1999.
Comparative net sales information related to CLARCOR’soperating segments is shown in the following tables.
2001 vs. 2000Change
NET SALES 2001 % Total $ %Engine/Mobile Filtration .................... $ 251.0 37.6% $ (8.8) -3.4%Industrial/Environmental Filtration .... 346.4 52.0% 26.7) 8.3%Packaging ............................................ 69.6 10.4% (3.0) -4.1%
Total ................................................ $ 667.0 100.0% $14.9 2.3%
2000 vs. 1999
Change
NET SALES 2000 % Total $ %
Engine/Mobile Filtration........................ $259.8 39.9% $ 21.1 8.8%
Industrial/Environmental Filtration .... 319.7 49.0% 144.8 82.8%
Packaging ................................................ 72.6 11.1% 8.3 12.9%
Total .................................................. $652.1 100.0% $174.2 36.5%
The Engine/Mobile Filtration segment’s sales decreased 3.4% in 2001 from 2000, or approximately 1.5%, excluding theadditional week in fiscal 2000. The segment’s sales werelower than expected for fiscal 2001 due to the slowdown inthe U.S. economy that led to competitive pricing pressuresand a reduction in inventory levels and product demand byour customers. Fiscal 2000 sales included increases for heavy-duty, light-duty and railroad filter products from bothdomestic and international markets compared to fiscal 1999.The segment’s sales were favorably impacted in 2000 by newproduct introductions, additional OEM sales, and penetrationinto new domestic and international distribution channels,primarily through sales to quick lube and truck service cen-ters, fleets and automotive parts buying groups.
The Company’s Industrial/Environmental Filtration segmentrecorded an 8.3% increase in sales in 2001 over 2000. Includedin 2001 were sales of approximately $28 million for sixmonths of activity from TFS. Excluding sales from TFS andthe additional week in fiscal 2000, sales for the segmentincreased approximately 1.5% compared to fiscal 2000. Fiscal2001 also included additional sales from new products intro-duced late in fiscal 2000 and greater distribution coverage forenvironmental filters. This increase was partially offset bylower sales due to the U.S. economic recession which primari-ly affected sales of filtration equipment and systems. Thesegment’s sales increased 82.8% in 2000, or excluding acquisi-tions, approximately 11% over fiscal 1999. The 11% salesincrease resulted primarily from higher sales of environmen-tal air filtration and electrostatic air quality products.
The Packaging segment’s sales of $69.6 million decreased 4.1% in fiscal 2001 from 2000. Included in 2001 was a non-recurring $7.0 million payment arising from the early termi-nation of a supply and license agreement by a customer.Sales to this customer of plastic closures decreased substan-tially beginning in the first quarter 2001. The segment wasunable to completely replace this business during the yearalthough sales increased for non-promotional metal packag-ing products and flat sheet decorating. The segment focuseson sales of non-promotional packaging products such asmetal closures for food and beverage containers, wire spools,and film and battery cartridges. This focus resulted in a 12.9% increase in sales in 2000 from 1999.
Operating ProfitOperating profit of $75.8 million in 2001 was slightly lowerthan $76.0 million in 2000. Operating profit in 2001 includedapproximately $1.2 million from the TFS acquisition and oper-ating profit in 2000 included approximately $1.5 million ofadditional profit due to the fifty-three week fiscal year in2000. Operating profit increased 35.5% in fiscal 2000 from1999. Excluding the Industrial Filtration Acquisitions, fiscal
CLARCOR 7
(Dollars in millions except per share data)
FINANCIAL REVIEW

2000 operating profit rose approximately 19% over fiscal 1999.Operating margin was 11.4% of sales in 2001 and 11.7% ofsales in both fiscal 2000 and 1999.
In both fiscal 2001 and 2000, continued cost reductions,improved manufacturing productivity and the integration ofacquired businesses positively impacted operating margin.These profit improvements offset, in part, competitive pricingpressures and cost increases the Company experienced forenergy, employee insurance and pensions. Selling and admin-istrative expenses were reduced to $119.7 million in 2001 from$122.3 million in 2000 primarily due to discretionary costreductions and reduced incentive compensation expenses.Selling and administrative expenses increased to $122.3 mil-lion in 2000 from $92.5 million in 1999 primarily due to theIndustrial Filtration Acquisitions that were included for anadditional nine months in 2000 and related amortizationcharges, and also due to new product development and salesand marketing programs. Although foreign currency fluctua-tions reduced sales and operating profit in fiscal 2001 and2000, currency adjustments did not have a material impact onconsolidated operating profit in 2001, 2000 or 1999.
Comparative operating profit information related to theCompany’s business segments is as follows.
2001 vs. 2000Change
OPERATING PROFIT 2001 % Total $ %Engine/Mobile Filtration .................... $ 51.8 68.3% $ 2.6 5.3%Industrial/Environmental Filtration .... 16.8 22.1% (1.6) -9.1%Packaging ............................................ 7.2 9.6% (1.2) -13.4%
Total ................................................ $ 75.8 100.0% $ (0.2) -0.2%
2000 vs. 1999
Change
OPERATING PROFIT 2000 % Total $ %
Engine/Mobile Filtration........................ $ 49.2 64.7% $ 5.6 12.8%
Industrial/Environmental Filtration .... 18.4 24.3% 13.3 260.0%
Packaging ................................................ 8.4 11.0% 1.0 13.9%
Total .................................................. $ 76.0 100.0% $19.9 35.5%
OPERATING MARGIN AS A PERCENT OF NET SALES 2001 2000 1999
Engine/Mobile Filtration........................ 20.6% 18.9% 18.3%
Industrial/Environmental Filtration .... 4.8% 5.8% 2.9%
Packaging ................................................ 10.4% 11.6% 11.5%
Total .................................................. 11.4% 11.7% 11.7%
Operating profit for the Engine/Mobile Filtration segmentincreased to $51.8 million in 2001 from $49.2 million in 2000,an increase of 5.3%. Operating margin as a percent of sales infiscal 2001 improved to a record 20.6% from 18.9% in 2000 and18.3% in 1999. In fiscal 2001, the segment’s operating marginimproved as a result of material and labor cost reductions andimproved productivity in its main distribution and light-dutyfilter manufacturing facilities. These improvements morethan offset increased energy and employee insurance costsand competitive pricing pressures. In fiscal 2000, the seg-ment’s operating profit was favorably impacted compared to
1999 by higher sales volumes, productivity improvements andreduced legal costs, which more than offset the negativeimpacts of increased energy, labor and raw material costs.
The Industrial/Environmental Filtration segment’s operatingprofit in 2001 was $16.8 million, a decrease from $18.4 millionin 2000 primarily as a result of start-up costs early in fiscal2001 related to two new production facilities and reducedsales of filtration equipment and systems. The start-up costsassociated with the new facilities and new product introduc-tions decreased during the third quarter of 2001 as productionefficiencies and capacity utilization improved. Fiscal 2001also included approximately $1.2 million of operating profitfrom TFS for the six-month period since the acquisition. Thesegment’s operating profit of $18.4 million in 2000 increasedsignificantly from $5.1 million in 1999. Approximately $9 mil-lion of the increase was due to the Industrial FiltrationAcquisitions. The remaining increase of $4.3 million, or anincrease of approximately 90%, was due to improvements inpreviously existing businesses. The increased profit in thesebusinesses reflected a significantly higher sales volume ofindustrial and environmental air filtration products, improvedmanufacturing operations and significant reductions in over-head and administrative costs, many of which were imple-mented beginning in fiscal 1999.
The Packaging segment’s operating profit in fiscal 2001decreased to $7.2 million from $8.4 million in fiscal 2000.Fiscal 2001 results included approximately $7.0 million relatedto a non-recurring termination payment from a customer thatwas reduced by $2.4 million for related asset impairmentcharges. Excluding this item, operating profit was lower than2000 due to the lower sales of plastic closures to this cus-tomer, reduced capacity utilization, higher energy and pen-sion costs, and increased costs related to the installation ofnew lithography equipment in early 2001. Due to difficultieswith the start-up of this new equipment, plant utilization wasreduced throughout 2001 from expected levels and costs wereincurred for product scrap and rework. In fiscal 2000, the seg-ment’s operating profit increased to $8.4 million from $7.4million in 1999, or 13.9%. This increase resulted from bettercapacity utilization, a significant increase in sales volume andreduced discretionary spending.
Other Income & ExpenseNet other expense totaled $10.1 million in 2001, $12.5 millionin 2000 and $0.5 million in 1999. Interest expense of $10.3million was lower in 2001 compared with $11.5 million in2000, due to declining interest rates and reduced overall bor-rowings during the year. Interest expense increased in 2000from $3.7 million in 1999 due to additional borrowings in thefourth quarter of 1999 for the Industrial FiltrationAcquisitions. Interest income was $0.7 million for both 2001and 2000, which was reduced from $1.5 million in 1999 as aresult of lower interest rates and lower average cash andshort-term cash investment balances primarily due to the useof cash for acquisitions in 1999. Currency gains of $0.2 mil-lion in 2001 and losses of $1.2 million in 2000 resulted prima-rily from fluctuations in European currency exchange ratesagainst the U.S. dollar. There were no significant gains orlosses on the disposition of plant assets in fiscal 2001 or 2000;however, a gain of $1.7 million recorded in 1999 was primarilyfrom the sale of a building.
CLARCOR8
(Dollars in millions except per share data)
FINANCIAL REVIEW
Provision for Income TaxesThe provision for income taxes in 2001 was $23.8 millionand resulted in an effective tax rate of 36.2%, which wasslightly lower than the effective tax rate of 36.5% in 2000.The effective tax rate was 36.2% in 1999. The effective taxrate in 2002 is expected to be approximately the same rateas recorded in 2001.
Net Earnings and Earnings Per ShareNet earnings were a record $41.9 million in 2001, or dilutedearnings per share of $1.68, compared to $40.2 million, or $1.64per diluted share in 2000. Net earnings in 1999 were $35.4 mil-lion, or $1.46 per diluted share. Diluted average shares out-standing for fiscal 2001 were 24,892,062 compared to 24,506,171for 2000, an increase of 1.6%. Diluted average shares outstand-ing for fiscal 1999 were 24,313,607. The increase in outstandingshares was primarily due to stock options.
FINANCIAL CONDITIONCorporate LiquidityThe Consolidated Statements of Cash Flows are shown on page15, and this discussion of corporate liquidity should be read inconjunction with information presented in those statements.
Cash and short-term cash investments decreased to $7.4 mil-lion at year-end 2001 from $10.9 million at year-end 2000.Cash provided by operating activities totaled $63.3 million in2001 compared to $54.1 million in 2000 and $38.6 million in1999. As a result of an increased emphasis on working capitalmanagement during fiscal 2001, accounts receivable andinventories decreased excluding the TFS assets acquired inthe third quarter 2001. Accounts receivable and inventoriesincreased during 2000 due to the higher level of businessactivity throughout the Company. Other current assets andpension liabilities were reduced in 2000 as restricted trustassets were used for the payment of nonqualified pension lia-bilities. Depreciation and amortization increased in fiscal2000 from 1999 primarily due to the fourth quarter 1999Industrial Filtration Acquisitions.
The Company used cash of $51.4 million for investing activi-ties in 2001, $42.1 million in 2000 and $160.7 million in 1999.Cash used for acquisitions in 2001, primarily for TFS, totaled$33.4 million, while cash used for the acquisition of severalsmall filtration businesses in 2000 totaled $12.7 million. Infiscal 1999, $142.7 million, net of cash acquired, was used foracquisitions, primarily the Industrial Filtration Acquisitions.Additions to plant assets totaled $18.2 million in 2001 andincluded residual payments on several projects begun in fis-cal 2000. Additions to plant assets in 2000 totaled $29.0 mil-lion and included payments on new state-of-the-art lithog-raphy equipment, the purchase and refurbishment of a man-ufacturing building in Campbellsville, Kentucky, and addi-tional manufacturing capacity throughout the Company.Additions to plant assets in 1999 of $21.8 million includedadding plant capacity and the completion of an expansion toa manufacturing and distribution facility in Kearney,Nebraska. Cash of $3.9 million was received in 1999 primari-ly from the sale of a building.
Net cash used in financing activities totaled $15.3 million and$15.9 million in 2001 and 2000, respectively. The Companyreceived $8.0 million in 2001 from the issuance of industrialrevenue bonds related to the manufacturing facility inCampbellsville, Kentucky. During 2001 the Company also bor-rowed an additional $27.5 million against a revolving creditagreement, primarily for the TFS acquisition; however, pay-ments of $36.5 million were made during the year whichreduced the total borrowed from the agreement at year-end2001 to $107.0 million. The Company borrowed a net addi-tional $1.0 million against the revolving credit agreement dur-ing 2000. Net cash provided by financing activities in fiscal1999 totaled $103.5 million and included $115.0 million in bor-rowings used for the Industrial Filtration Acquisitions. TheCompany did not repurchase any shares in 2001 or 2000 underthe remaining authorization of approximately 920,000 sharesfrom the December 1997 Board of Directors’ approved stockrepurchase plan. The Company purchased 50,000 shares ofCLARCOR common stock for $0.9 million in 1999. Dividendpayments totaled $11.6 million, $11.2 million and $10.8 mil-lion in 2001, 2000 and 1999, respectively. Payments on long-term debt were $5.3 million in 2001, $7.0 million in 2000 and$0.5 million in 1999.
CLARCOR’s current operations continue to generate cash andsufficient lines of credit remain available to fund currentoperating needs, pay dividends, provide for additions and thereplacement of necessary plant facilities, and to service andrepay long-term debt. Capital expenditures for normal facilitymaintenance, productivity improvements and new productsare expected to be approximately $21-$23 million in fiscal2002. Due to the September 1999 Industrial FiltrationAcquisitions, a $185.0 million multicurrency revolving creditfacility was established with several financial institutions. Ofthe $185.0 million, a total of $107.0 million of the credit facili-ty was outstanding as of year-end 2001 and $11.2 million wasoutstanding for letters of credit. Principal payments on long-term debt will be approximately $5.6 million in 2002 based onscheduled payments in current debt agreements. No pay-ments are required in fiscal 2002 on the multicurrency revolv-ing credit facility and the Company is in compliance with allcovenants related to the credit facility, as described in Note Hto the Consolidated Financial Statements. Other than operat-ing leases, as described in Note I to the Consolidated FinancialStatements, the Company has no material off-balance sheetarrangements. Commitments for noncancellable leases in2002 total approximately $7.3 million.
While customer demand for our products will affect operatingcash flow, the Company is not aware of any known trends,demands or reasonably likely events that would materiallyaffect cash flow from operations in the future. It is possiblethat business acquisitions or dispositions could be made inthe future that may require changes in the Company’s debtand capitalization.
Capital ResourcesThe Company’s financial position at November 30, 2001 con-tinued to be sufficiently liquid to support current operations.Total assets increased to $530.6 million at the end of fiscal2001, an increase of 5.7% from the year-end 2000 level of$501.9 million. Total current assets increased to $244.4 mil-
CLARCOR 9

lion from $230.5 million at year-end 2000 and total current lia-bilities decreased to $94.9 million from $97.8 million at year-end 2000. The current ratio was 2.6 at year-end 2001 com-pared to 2.4 at year-end 2000. Excluding the TFS assetsacquired at the beginning of the third quarter 2001, accountsreceivable and inventories decreased during fiscal 2001 par-tially due to increased emphasis on working capital manage-ment. Current liabilities at year-end 2001 were lower primari-ly due to reduced accruals for incentive plans and incometaxes. Plant assets decreased to $137.3 million as a result ofincreased depreciation and the write-off of certain Packagingmanufacturing equipment, which offset the plant asset addi-tions made during the year. Acquired intangibles increased to$116.7 million primarily due to the acquisition of TFS duringfiscal 2001. Current liabilities include accruals for costs relat-ed to litigation matters arising in the normal course of busi-ness. See Note L in the Notes to Consolidated FinancialStatements for further information on these matters.
Long-term debt of $135.2 million at year-end 2001 includedthe borrowing against the revolving credit facility.Shareholders’ equity increased to $274.3 million from $242.1million at year-end 2000. The increase in shareholders’ equityresulted primarily from net earnings of $41.9 million offset bydividend payments of $11.6 million, or $0.4725 per share.Long-term debt decreased to 33.0% of total capitalization atyear-end 2001, compared to 36.9% at year-end 2000.
At November 30, 2001, CLARCOR had 24,626,236 shares ofcommon stock outstanding at $1.00 par value, compared to24,381,307 shares outstanding at the end of 2000.
OTHER MATTERSMarket RiskThe Company’s market risk is primarily the potential lossarising from adverse changes in interest rates. TheCompany’s long-term debt obligations are primarily at vari-able LIBOR-associated rates and fixed interest rates and aredenominated in U.S. dollars. In order to minimize the long-term costs of borrowing, the Company manages its interestrate risk by monitoring trends in rates as a basis for deter-mining whether to enter into fixed rate or variable rateagreements. In addition, during fiscal 2000 the Companyentered into several interest rate agreements related to therevolving credit agreement as described in Note H to theConsolidated Financial Statements. Market risk is estimatedas the potential change in fair value of the Company’s long-term debt obligations resulting from a hypothetical 1%increase in interest rates. A hypothetical 1% increase ininterest rates on the Company’s variable rate agreementswould adversely affect fiscal 2002 net earnings and cashflows by approximately $0.4 million and reduce the fair valueof fixed rate long-term debt, as measured at November 30,2001, by approximately $0.3 million. Last year, a hypothetical1% increase in interest rates would have adversely affectedfiscal 2001’s net earnings and cash flows by approximately$0.3 million and reduced the fair value of fixed rate long-term debt by approximately $0.9 million.
Although the Company continues to evaluate derivativefinancial instruments, including forwards, swaps and pur-chased options, to manage foreign currency exchange rate
changes, the Company did not hold derivatives for tradingpurposes during 2001, 2000 or 1999. The Company uses for-ward exchange contracts on a limited basis to manage foreigncurrency exchange risk related to certain transactions, prima-rily equipment purchases denominated in currencies otherthan U.S. dollars. As a result of increased foreign sales andbusiness activities, the Company will continue to evaluate theuse of derivative financial instruments to manage foreign cur-rency exchange rate changes in the future.
Critical Accounting PoliciesThe Company’s critical accounting policies, including theassumptions and judgments underlying them, are disclosed inthe Notes to the Consolidated Financial Statements. Thesepolicies have been consistently applied in all material respectsand address such matters as revenue recognition, depreciationmethods, inventory valuation, asset impairment recognition,business combination accounting and pension and postretire-ment benefits. While the estimates and judgments associatedwith the application of these policies may be affected by dif-ferent assumptions or conditions, the Company believes theestimates and judgments associated with the reportedamounts are appropriate in the circumstances.
Recent Accounting PronouncementsIn June 2001, the Financial Accounting Standards Board issuedStatement of Financial Accounting Standards (SFAS) No. 141,“Business Combinations” and SFAS No. 142, “Goodwill andOther Intangible Assets.” SFAS 141 requires that the purchasemethod of accounting be used for business combinations ini-tiated after June 30, 2001. Under SFAS 142, amortization ofgoodwill, including goodwill recorded in past business combi-nations, will discontinue upon adoption of this standard. Inaddition, goodwill and intangible assets with indefinite liveswill be tested for impairment in accordance with the provi-sions of SFAS 142. Although not required to adopt the provi-sions of SFAS 142 until fiscal 2003, the Company expects toadopt SFAS 142 in the first quarter of fiscal 2002. TheCompany has not completed an assessment of the impact ofthese statements including the impairment test of goodwilland other intangible assets; however, at this time, it is expect-ed that amortization expense will be reduced by approximate-ly $2.5 million in fiscal 2002 as a result of adopting SFAS 142.
Two other recently issued pronouncements, SFAS No. 143,“Accounting for Asset Retirement Obligations” and SFAS No. 144, “Accounting for the Impairment or Disposal ofLong-Lived Assets” will be effective for the Company begin-ning in fiscal 2003. The Company has not yet evaluated theimpact of these standards on its financial statements.
OutlookThe Company’s long-term objective to record compoundannual growth rates in diluted earnings per share of 10% to15% will require both sales growth and improved profitabilityin the Company’s existing operations and additional acquisi-tions. Due in part to the recession in the U.S. economy during2001, growth in diluted earnings per share was less in fiscal2001 than in 2000 and in 1999. During fiscal 2001 theCompany incurred significant start-up costs related to newproduction facilities and equipment, and incurred higher
CLARCOR10
(Dollars in millions except per share data)
FINANCIAL REVIEW
energy, employee insurance and pension costs than in prioryears. If the U.S. economy improves during 2002 as expected,the Company anticipates that improved economic conditionswill positively impact sales and earnings, and that 2002 will be the tenth consecutive year of earnings per share growth for the Company.
The Company’s Total Filtration Program that was started infiscal 2000 is expected to continually add to sales levels in theCompany’s two filtration segments over the next severalyears. The acquisition of TFS in June 2001 increased theCompany’s ability to provide filtration management servicesto industrial companies throughout North America. Since theTFS acquisition, the Company’s various other total filtrationactivities have been combined with TFS to provide a singlefocus throughout the Company. Several total filtration man-agement contracts were completed late in 2001 and negotia-tions continue on others. The impact of these contracts willgrow over the next several years as customers’ facilities areconverted to CLARCOR’s Total Filtration Program. The TotalFiltration Program is expected to serve as an added distribu-tion channel for all of the Company’s filtration products. TheCompany expects to make investments at TFS in 2002 that areplanned to significantly accelerate its sales growth, but willslow the improvement in its operating margin in 2002. It isanticipated that TFS’ margins will improve beginning in 2003.
The Engine/Mobile Filtration segment is expected to increaseits sales and profit by providing outstanding customer service,introducing new products and expanding marketing pro-grams. These sales initiatives are expected to offset any con-tinued reduction in sales due to reduced customer demand asa result of the economic recession, especially due to reducedfreight mileage. The Industrial/Environmental Filtration seg-ment is expected to grow sales and profits as a result of con-tinued expansion of sales programs throughout various distri-bution channels, including the Total Filtration Program, and bycontinuing to achieve synergies and cost savings from inte-grating production facilities and processes. This segment con-tinues to have the most potential for improved operating mar-gins over the next few years, although this continues to be ahighly competitive industry. The Packaging segment’s focuson non-promotional metal decorating sales is expected toincrease utilization of both the new lithography equipmentand other production capacity. Due to decreased customerorders for plastic closures and the non-recurring terminationpayment received in 2001, overall sales and operating profitfor the segment are expected to be lower in fiscal 2002 than in2001. Excluding the $7.0 million non-recurring terminationpayment in 2001, Packaging sales are expected to increase toapproximately $67-$69 million in fiscal 2002 compared toapproximately $63 million in fiscal 2001.
The Company will continue to implement cost reductions andproductivity improvements, although competitive pricingpressures, increases in labor, healthcare, insurance and ener-gy costs, and worldwide business conditions may reduce theoverall profit improvement. Due to significantly reduced pen-sion asset valuations and lower discount rates, pensionexpense will increase by approximately $3.0 million in fiscal2002 from 2001. Capital investments will continue to be madein each segment’s facilities during 2002 to improve productivi-
ty and support new products. It is expected that the invest-ments made in fiscal 2001 and 2000 for new manufacturingfacilities and production lines will continue to improve pro-ductivity and profitability. While the Company fully antici-pates that sales and profits will improve as a result of theseefforts, the Company has developed contingency plans toreduce discretionary spending if recessionary economic con-ditions persist.
The Company continues to look at acquisition opportunities,primarily in related filtration businesses. It is expected thatthese acquisitions would expand the Company’s market base,distribution coverage and product offerings. The Companyhas established financial standards that will continue to bevigorously applied in the review of all acquisition opportuni-ties. Additionally, even though debt increased significantly in1999 due to the Industrial Filtration Acquisitions, theCompany believes that it has sufficient additional borrowingcapacity to continue this acquisition program.
FORWARD-LOOKING STATEMENTSCertain statements quoted in this Annual Report are forward-looking. These statements involve risk and uncertainty.Actual future results and trends may differ materiallydepending on a variety of factors including: the volume andtiming of orders received during the year; the mix of changesin distribution channels through which the Company’s prod-ucts are sold; the success of the Company’s Total FiltrationProgram; the timing and acceptance of new products andproduct enhancements by the Company or its competitors;changes in pricing, labor availability and related costs, prod-uct life cycles, raw material costs, insurance, pension andenergy costs and purchasing patterns of distributors and cus-tomers; competitive conditions in the industry; businesscycles affecting the markets in which the Company’s productsare sold; the effectiveness of plant conversions, plant expan-sions and productivity improvement programs; the manage-ment of both growth and acquisitions; the fluctuation in for-eign and U.S. currency exchange rates; the fluctuation ininterest rates, primarily LIBOR, which affect the cost of bor-rowing under the revolving credit facility; extraordinaryevents such as litigation, acquisitions or divestitures includingrelated charges; and economic conditions generally or in vari-ous geographic areas. All of the foregoing matters are difficultto forecast. The future results of the Company may fluctuateas a result of these and the other risk factors detailed fromtime to time in the Company’s filings with the Securities andExchange Commission.
Due to the foregoing items, it is possible that, in the future,the Company’s operating results will be below the expecta-tions of stock market analysts and investors. In such event,the price of CLARCOR common stock could be materiallyadversely affected.
CLARCOR 11

CLARCOR12
CONSOLIDATED BALANCE SHEETS
The accompanying notes are an integral part of the consolidated financial statements.
NOVEMBER 30, 2001 AND 2000(Dollars in thousands except per share data)
ASSETS 2001) 2000)
Current assets:Cash and short-term cash investments .............................................................. $ 7,418) $ 10,864)
Accounts receivable, less allowance for losses of $7,920for 2001 and $5,027 for 2000............................................................................ 115,003) 110,083)
Inventories ............................................................................................................... 104,291) 100,561)
Prepaid expenses and other current assets ........................................................ 4,120) 3,640)
Deferred income taxes ........................................................................................... 13,518) 5,331)
Total current assets.................................................................................... 244,350) 230,479)
Plant assets, at cost less accumulated depreciation ............................................. 137,316) 140,121)
Acquired intangibles, less accumulated amortization ......................................... 116,746) 101,877)
Pension assets............................................................................................................. 18,939) 19,519)
Other noncurrent assets............................................................................................ 13,266) 9,934)
Total assets.................................................................................................. $530,617) )$501,930)
LIABILITIES
Current liabilities:Current portion of long-term debt ....................................................................... $ 5,579) $ 5,482)
Accounts payable and accrued liabilities ............................................................ 84,826) 84,187)
Income taxes ........................................................................................................... 4,526) 8,157)
Total current liabilities .............................................................................. 94,931) 97,826)
Long-term debt, less current portion....................................................................... 135,203) 141,486)
Postretirement health care benefits ........................................................................ 3,851) 3,574)
Long-term pension liabilities.................................................................................... 4,955) 4,374)
Deferred income taxes............................................................................................... 15,114) 10,663)
Other long-term liabilities......................................................................................... 1,868) 1,519)
Minority interests ....................................................................................................... 434) 395)
Contingencies
SHAREHOLDERS’ EQUITY
Capital stock:Preferred, par value $1, authorized 5,000,000 shares,
none issued ....................................................................................................... –) –)
Common, par value $1, authorized 60,000,000 shares,issued 24,626,236 in 2001 and 24,381,307 in 2000 ........................................ 24,626) 24,381)
Capital in excess of par value ............................................................................... 9,565) 5,700)
Accumulated other comprehensive earnings .................................................... (9,179) (6,919)Retained earnings................................................................................................... 249,249) 218,931)
Total shareholders’ equity ........................................................................ 274,261) 242,093)
Total liabilities and shareholders’ equity ............................................... $530,617) $501,930)

CLARCOR 13
CONSOLIDATED STATEMENTS OF EARNINGS
The accompanying notes are an integral part of the consolidated financial statements.
FOR THE YEARS ENDED NOVEMBER 30, 2001, 2000 AND 1999(Dollars in thousands except per share data)
2001) 2000) 1999)
Net sales ........................................................................................................ $666,964) $652,148) $477,869)
Cost of sales .................................................................................................. 471,477) 453,803) 329,282)
Gross profit.......................................................................................... 195,487) 198,345) 148,587)
Selling and administrative expenses ........................................................ 119,677) 122,358) 92,510)
Operating profit .................................................................................. 75,810) 75,987) 56,077)
Other income (expense):Interest expense ....................................................................................... (10,270) (11,534) (3,733)Interest income......................................................................................... 654) 698) 1,451)
Other, net ................................................................................................... (460) (1,664) 1,820)
(10,076) (12,500) (462)
Earnings before income taxes and minority interests ................. 65,734) 63,487) 55,615)
Provision for income taxes ......................................................................... 23,804) 23,201) 20,137)
Earnings before minority interests.................................................. 41,930) 40,286) 35,478)
Minority interests in earnings of subsidiaries ......................................... (37) (49) (66)
Net earnings ................................................................................................. $ 41,893) $ 40,237) $ 35,412)
Net earnings per common share:Basic ........................................................................................................... $ 1.71) $ 1.66) $ 1.48)
Diluted ....................................................................................................... $ 1.68) $ 1.64) $ 1.46)
Average number of common shares outstanding:Basic ........................................................................................................... 24,535,199) 24,269,675) 23,970,011)
Diluted ....................................................................................................... 24,892,062) 24,506,171) 24,313,607)
CLARCOR14
FOR THE YEARS ENDED NOVEMBER 30, 2001, 2000 AND 1999(Dollars in thousands except per share data)
The accompanying notes are an integral part of the consolidated financial statements.
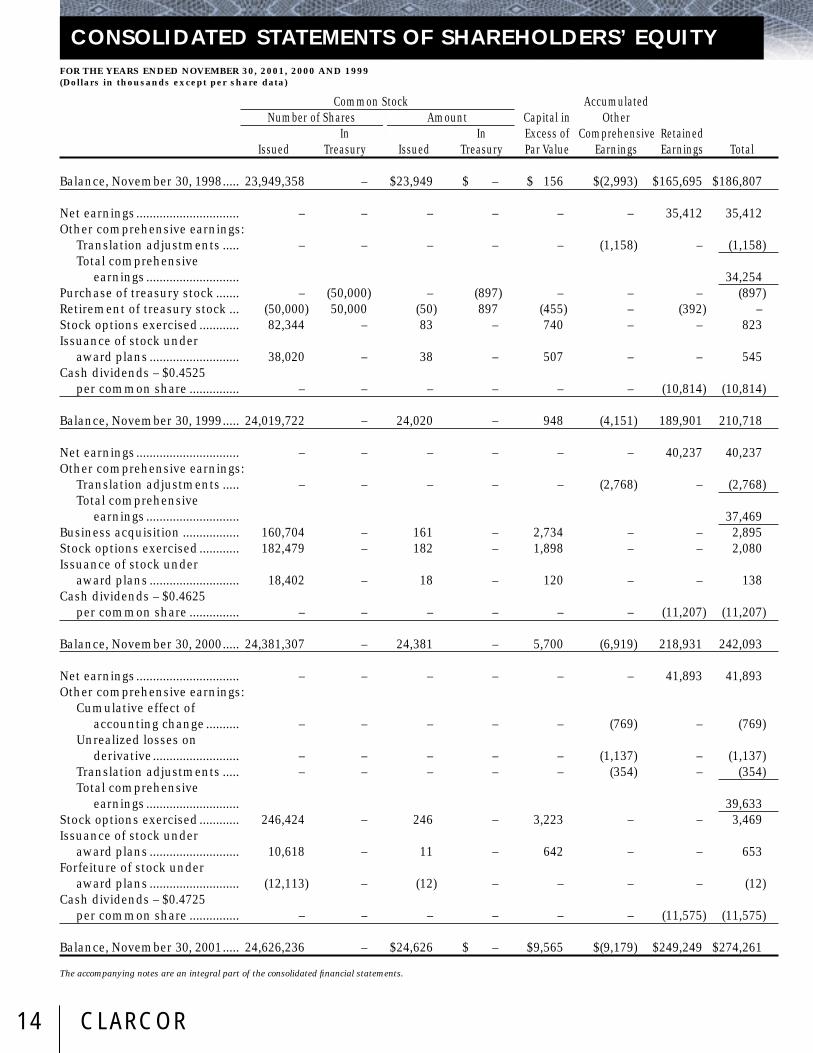
CONSOLIDATED STATEMENTS OF SHAREHOLDERS’ EQUITY
Common Stock AccumulatedNumber of Shares Amount Capital in Other
In In Excess of Comprehensive RetainedIssued Treasury Issued Treasury Par Value Earnings Earnings Total
Balance, November 30, 1998..... 23,949,358) –) $23,949) $ –) $ 156) $(2,993) $165,695) $186,807)
Net earnings............................... –) –) –) –) –) –) 35,412) 35,412)Other comprehensive earnings:
Translation adjustments ..... –) –) –) –) –) (1,158) –) (1,158)Total comprehensive
earnings ............................ 34,254)Purchase of treasury stock ....... –) (50,000) –) (897) –) –) –) (897)Retirement of treasury stock ... (50,000) 50,000) (50) 897) (455) –) (392) –)Stock options exercised ............ 82,344) –) 83) –) 740) –) –) 823)Issuance of stock under
award plans ........................... 38,020) –) 38) –) 507) –) –) 545)Cash dividends – $0.4525
per common share ............... –) –) –) –) –) –) (10,814) (10,814)
Balance, November 30, 1999..... 24,019,722) –) 24,020) –) 948) (4,151) 189,901) 210,718)
Net earnings............................... –) –) –) –) –) –) 40,237) 40,237)Other comprehensive earnings:
Translation adjustments ..... –) –) –) –) –) (2,768) –) (2,768)Total comprehensive
earnings ............................ 37,469)Business acquisition ................. 160,704) –) 161) –) 2,734) –) –) 2,895)Stock options exercised ............ 182,479) –) 182) –) 1,898) –) –) 2,080)Issuance of stock under
award plans ........................... 18,402) –) 18) –) 120) –) –) 138)Cash dividends – $0.4625
per common share ............... –) –) –) –) –) –) (11,207) (11,207)
Balance, November 30, 2000..... 24,381,307) –) 24,381) –) 5,700) (6,919) 218,931) 242,093)
Net earnings............................... –) –) –) –) –) –) 41,893) 41,893)Other comprehensive earnings:
Cumulative effect of accounting change .......... –) –) –) –) –) (769) –) (769)
Unrealized losses on derivative.......................... –) –) –) –) –) (1,137) –) (1,137)
Translation adjustments ..... –) –) –) –) –) (354) –) (354)Total comprehensive
earnings ............................ 39,633)Stock options exercised ............ 246,424) –) 246) –) 3,223) –) –) 3,469)Issuance of stock under
award plans ........................... 10,618) –) 11) –) 642) –) –) 653)Forfeiture of stock under
award plans ........................... (12,113) –) (12) –) –) –) –) (12)Cash dividends – $0.4725
per common share ............... –) –) –) –) –) –) (11,575) (11,575)
Balance, November 30, 2001..... 24,626,236) –) $24,626) $ –) $9,565) $(9,179) $249,249) $274,261)

CLARCOR 15
FOR THE YEARS ENDED NOVEMBER 30, 2001, 2000 AND 1999(Dollars in thousands)
The accompanying notes are an integral part of the consolidated financial statements.
2001) 2000) 1999)
Cash flows from operating activities:Net earnings.............................................................................................. $ 41,893) $ 40,237) $ 35,412)
Adjustments to reconcile net earnings to net cash provided by operations:
Depreciation ....................................................................................... 18,187) 17,537) 13,729)
Amortization....................................................................................... 3,663) 3,542) 1,643)
Minority interests in earnings of subsidiaries ............................... 37) 49) 66)
Net (gain) loss on dispositions of plant assets............................... 338) 109) (1,660)Impairment of plant assets .............................................................. 2,422) –) –)
Changes in assets and liabilities, net of business acquisitions:Accounts receivable..................................................................... 5,116) (3,448) (6,062)Inventories .................................................................................... 5,190) (9,636) (4,585)Prepaid expenses and other current assets ............................. (374) 8,040) (1,369)Other noncurrent assets ............................................................. (2,523) (554) (18)Accounts payable and accrued liabilities ................................. (8,693) (1,170) 4,790)
Pension assets and liabilities, net.............................................. 1,163) (7,430) (583)Income taxes ................................................................................ (2,683) 4,663) (2,366)Deferred income taxes ................................................................ (446) 2,191) (355)
Net cash provided by operating activities........................... 63,290) 54,130) 38,642)
Cash flows from investing activities:Additions to plant assets......................................................................... (18,204) (29,005) (21,822)Business acquisitions, net of cash acquired......................................... (33,388) (12,735) (142,709)Dispositions of plant assets .................................................................... 539) 55) 3,873)
Other, net .................................................................................................. (300) (440) –)
Net cash used in investing activities ................................... (51,353) (42,125) (160,658)
Cash flows from financing activities:Proceeds from multicurrency revolving credit agreement................. 27,500) 43,200) 115,000)
Payments on multicurrency revolving credit agreement ................... (36,500) (42,200) –)
Proceeds from borrowings under long-term debt ............................... 8,000) –) –)
Reduction of long-term debt................................................................... (5,349) (7,034) (468)Sales of capital stock under stock option plan..................................... 2,598) 1,379) 680)
Purchases of treasury stock .................................................................... –) –) (897)Cash dividends paid................................................................................. (11,575) (11,207) (10,814)
Net cash provided by (used in) financing activities........... (15,326) (15,862) 103,501)
Net effect of exchange rate changes on cash .......................................... (57) (24) (61)
Net change in cash and short-term cash investments .......................... (3,446) (3,881) (18,576)Cash and short-term cash investments, beginning of year................... 10,864) 14,745) 33,321)
Cash and short-term cash investments, end of year.............................. $ 7,418) $ 10,864) $ 14,745)
CONSOLIDATED STATEMENTS OF CASH FLOWS
A. ACCOUNTING POLICIESPrinciples of ConsolidationThe consolidated financial statements include all domesticand foreign subsidiaries that are more than 50% owned andcontrolled. CLARCOR Inc. and its subsidiaries are hereinaftercollectively referred to as the “Company” or CLARCOR.
Minority interests represent an outside shareholder’s 10%ownership of the common stock of Filtros Baldwin de Mexico(FIBAMEX) and outside shareholders’ 20% ownership ofBaldwin-Unifil S.A.
Foreign Currency TranslationFinancial statements of foreign subsidiaries are translatedinto U.S. dollars at current rates, except that revenues, costsand expenses are translated at average current rates duringeach reporting period. Net exchange gains or losses resultingfrom the translation of foreign financial statements and theeffect of exchange rate changes on intercompany transactionsof a long-term investment nature are accumulated with othercomprehensive earnings as a separate component of share-holders’ equity and are presented, net of tax, in theConsolidated Statements of Shareholders’ Equity.
Plant AssetsDepreciation is provided by the straight-line and acceleratedmethods for financial statement purposes and by the acceler-ated method for tax purposes. The provision for depreciationis based on the estimated useful lives of the assets (15 to 40years for buildings and improvements and 3 to 15 years formachinery and equipment). It is the policy of the Company tocapitalize renewals and betterments and to charge to expensethe cost of current maintenance and repairs. When propertyor equipment is retired or otherwise disposed of, the net bookvalue of the asset is removed from the Company’s books andthe resulting gain or loss is reflected in earnings.
Excess of Cost Over Fair Value of Assets Acquired andOther Intangible AssetsThe excess of cost over fair value of assets acquired is beingamortized over a forty-year period using the straight-linemethod. Other acquired intangible assets are being amortizedover the estimated periods to be benefited using the straight-line method. These intangibles include trademarks (40 yearlife), patents (average 14 year life), and other identifiableintangible assets with lives ranging from one to thirty years.
In June 2001, the Financial Accounting Standards Board issued Statement of Financial Accounting Standards No. 142(SFAS 142), “Goodwill and Other Intangible Assets,” which dis-continues amortization of the excess of cost over fair value ofassets acquired and of intangible assets with indefinite lives. Italso requires goodwill and intangible assets with indefinitelives to be tested for impairment annually or whenever there isan impairment indicator. Although not required to adopt theprovisions of SFAS 142 until fiscal 2003, the Company expectsto adopt SFAS 142 in the first quarter of fiscal 2002. TheCompany has not completed an assessment of the impact ofthis statement, including the impairment tests. However, as aresult of adopting SFAS 142, the Company expects amortizationexpense will be reduced by approximately $2,500 in fiscal 2002.
In accordance with Statement of Financial AccountingStandards No. 121 (SFAS 121), “Accounting for the Impairmentof Long-Lived Assets and Long-Lived Assets to Be DisposedOf,” the Company determines any impairment losses based onunderlying cash flows related to specific groups of acquiredplant assets and identifiable intangibles and excess of costover fair value of assets acquired, and would first apply anysuch impairment losses to related goodwill.
Statements of Cash FlowsAll highly liquid investments with a maturity of three monthsor less when purchased or that are readily saleable are con-sidered to be short-term cash equivalents. The carryingamount of the investments approximates fair value.
Income TaxesThe Company provides for income taxes in accordance with Statement of Financial Accounting Standards No. 109(SFAS 109), “Accounting for Income Taxes.” SFAS 109 requiresthe recognition of deferred tax liabilities and assets for theexpected future tax consequences of temporary differencesbetween the financial statement carrying amounts and thetax basis of assets and liabilities.
Revenue RecognitionRevenue is recognized when product ownership and risk ofloss has transferred to the customer or performance of servic-es is complete and the Company has no remaining obliga-tions regarding the transaction. In December 1999, theSecurities and Exchange Commission issued Staff AccountingBulletin No. 101 (SAB 101), “Revenue Recognition in FinancialStatements,” relating to revenue recognition under generallyaccepted accounting principles in financial statements. Nosignificant changes to the Company’s revenue recognitionpolicies were necessary to comply with SAB 101.
Product WarrantiesThe Company provides for estimated warranty costs whenthe related products are recorded as sales or for specific itemsat the time their existence is known and the amounts are rea-sonably determinable.
Comprehensive EarningsForeign currency translation adjustments and unrealized loss-es on derivative instruments are included in other compre-hensive earnings, net of tax, in accordance with Statement ofFinancial Accounting Standards No. 130 (SFAS 130), “ReportingComprehensive Income.”
Use of Management’s EstimatesThe preparation of the financial statements in conformitywith accounting principles generally accepted in the UnitedStates of America requires management to make estimatesand assumptions that affect the reported amounts of assetsand liabilities and disclosure of contingent liabilities at thedate of the financial statements and the reported amounts ofrevenues and expenses during the reporting period. Actualresults could differ from those estimates.
(Dollars in thousands except per share data)
NOTES TO CONSOLIDATED FINANCIAL STATEMENTS
CLARCOR16
Accounting PeriodThe Company’s fiscal year ends on the Saturday closest toNovember 30. The fiscal year ended December 1, 2001 includ-ed fifty-two weeks. The fiscal years ended December 2, 2000and November 27, 1999 were comprised of fifty-three andfifty-two weeks, respectively. In the consolidated financialstatements, all fiscal years are shown to begin as of December1 and end as of November 30 for clarity of presentation.
ReclassificationsCertain reclassifications have been made to conform prioryears’ data to the current presentation. These reclassifica-tions had no effect on reported earnings.
B. ACCOUNTING CHANGE AND DERIVATIVE INSTRUMENTS
The Company makes limited use of derivative financialinstruments to manage certain interest rate and foreign cur-rency risks. Interest rate swap agreements are utilized to con-vert certain floating rate debt into fixed rate debt. Cash flowsrelated to interest rate swap agreements are included in inter-est expense over the terms of the agreements.
Effective December 1, 2000, the Company adopted Statementof Financial Accounting Standards No. 133 (SFAS 133),“Accounting for Derivative Instruments and HedgingActivities.” SFAS 133 requires the recognition of all derivativesin the balance sheet as either an asset or a liability measuredat fair value and requires a company to recognize changes inthe derivative’s fair value currently in earnings unless itmeets specific hedge accounting criteria. If the derivative isdesignated as a cash flow hedge, the effective portions ofchanges in the fair value of the derivative are recorded inother comprehensive earnings and are recognized in theincome statement when the hedged item affects earnings.
The Company documents all relationships between hedginginstruments and hedged items, as well as its risk-manage-ment objective and strategy for undertaking various hedgetransactions. In addition, the Company assesses (both at thehedge’s inception and on an ongoing basis) the effectivenessof the derivatives that are used in hedging transactions. If itis determined that a derivative is not (or has ceased to be)effective as a hedge, the Company would discontinueaccounting for it as a hedge prospectively. Ineffective por-tions of changes in the fair value of cash flow hedges are rec-ognized in earnings.
During 2000, the Company entered into interest rate agree-ments to manage its interest exposure related to the multicur-rency credit revolver. The agreement in place at November 30,2001 provides for the Company to pay a 7.34% fixed interestrate on a notional amount of $60,000. The agreement expiresSeptember 11, 2002. Under the agreement the Company willreceive interest at floating rates based on LIBOR.
The adoption of SFAS 133 resulted in a cumulative effect of anaccounting change to accumulated other comprehensiveearnings of a negative $769 ($1,183 pretax) and the recogni-tion of a liability. The Company’s derivative instrument isdesignated as a cashflow hedge and determined to be effec-tive. Therefore, there was no adjustment to net earnings. At
November 30, 2001, the fair value of the agreement was a neg-ative $2,932 and is included in other current liabilities. Thenet loss included in other comprehensive earnings for the fis-cal year ended November 30, 2001 was $1,137 ($1,750 pretax).Derivative gains and losses will be reclassified into earningsas payments are made on its variable rate interest debt.Approximately $711 ($1,094 pretax) was reclassified into earn-ings during the fiscal year ended November 30, 2001. Theamount of net derivative losses included in other comprehen-sive income at November 30, 2001 will be reclassified intoearnings in fiscal year 2002.
C. BUSINESS COMBINATIONS AND INVESTMENTS IN AFFILIATES
On June 4, 2001, the Company acquired the stock of several fil-tration management companies for approximately $33,258,net of cash received, including acquisition expenses. The pur-chase price was paid in cash with available funds and pro-ceeds from long-term borrowings from a revolving credit facil-ity. As a result of the acquisition, the companies were com-bined into one company, Total Filtration Services, Inc. (TFS),and became a subsidiary of the Company. TFS is included inthe Industrial/Environmental Filtration segment. The transac-tion was accounted for under the purchase method ofaccounting with the excess of the initial purchase price overthe estimated fair value of the net tangible and identifiableintangible assets acquired recorded as goodwill and amortizedover 40 years by the straight-line method. The initial pur-chase price was based on the net assets of the businessesacquired as shown on a June 4, 2001 balance sheet and is sub-ject to a final adjustment. A preliminary allocation of the ini-tial purchase price has been made to major categories ofassets and liabilities. The allocation will be completed whenthe Company finalizes a closing balance sheet in accordancewith the purchase agreement with the seller. The results areincluded in the Company’s consolidated results of operationsfrom the date of acquisition.
The following unaudited pro forma information summarizesthe results of operations for the periods indicated as if theacquisition had been completed as of the beginning of theperiods presented. The pro forma information gives effect tothe actual operating results prior to the acquisition, adjustedto include the pro forma effect of interest expense, deprecia-tion, amortization of intangibles and income taxes. These proforma amounts do not purport to be indicative of the resultsthat would have actually been obtained if the acquisition hadoccurred as of the beginning of the periods presented or thatmay be obtained in the future. Unaudited pro forma net salesfor the Company would have been $695,729 and $707,460 forthe years ended November 30, 2001 and 2000. Net earningsand earnings per share for each of these periods would nothave been significantly affected.
During 2000, the Company purchased Filter Products, Inc., aSacramento, California liquid process filtration manufactur-er, and two air filtration distributors. All three of theseacquisitions were accounted for under the purchase methodof accounting and are included in the Industrial/Environmental Filtration segment. Two of the acquisitionswere paid for in cash. The purchase price of the other waspaid in cash and stock. For these acquisitions, the Company
CLARCOR 17
paid $12,730 in cash, net of cash received, and issued 160,704shares of its common stock (valued at $2,895). The final allo-cation of the purchase price to the assets and liabilitiesacquired with the purchase of Filter Products, Inc. resulted inan increase to goodwill of $615 in the second quarter of2001. These acquisitions did not have a significant impacton the results of the Company.
On September 10, 1999, the Company completed its acquisi-tions of Purolator Air Filtration (Purolator), Facet International(Facet), and Purolator Facet, Inc. (PFI), manufacturers of airand liquid filtration products, for approximately $140,985, netof cash received, including acquisition expenses. The pur-chase price was paid in cash with available funds and pro-ceeds from long-term borrowings of approximately $115,000from a revolving credit facility. (See Note H.) As a result ofthe acquisitions, Purolator, Facet, and PFI became subsidiariesof the Company and are included in the Company’sIndustrial/Environmental Filtration segment. The Company’snon-cash investing and financing activities related to thisacquisition included assumed liabilities of $25,910. The trans-action was accounted for under the purchase method ofaccounting with the excess of the purchase price over theestimated fair value of the net tangible and identifiable intan-gible assets acquired recorded as goodwill and amortized over40 years by the straight-line method. Other acquired intangi-ble assets are being amortized as discussed in Note A. Duringfiscal year 2000, the Company finalized the purchase priceaccording to the terms of the purchase agreement and com-pleted the estimates of assets acquired and liabilitiesassumed, including those associated with exit and other costsof the acquisition. The finalized allocation to major cate-gories of assets and liabilities resulted in a reduction to good-will of $34. As part of the final allocation of purchase price,the Company had accrued and paid $1,012 for severance andexit costs as of November 30, 2001. The operating results areincluded in the Company’s consolidated results of operationsfrom September 1, 1999, the effective date of the acquisitions.
D. INVENTORIESInventories are stated at the lower of cost or market. Cost is determined by the last-in, first-out (LIFO) method forapproximately 40% and 43% of the Company’s inventories atNovember 30, 2001 and 2000, respectively, and by the first-in,first-out (FIFO) method for all other inventories. The FIFOmethod approximates current cost. Inventories are summa-rized as follows:
2001 2000Raw materials ...................................................... $ 37,455 $ 38,444Work-in-process .................................................. 12,120 14,253Finished products ................................................ 55,078 48,316Total at FIFO .......................................................... 104,653 101,013Less excess of FIFO over LIFO ............................ 362 452
$104,291 $100,561
During 2001 and 2000, certain LIFO inventory quantities werereduced resulting in a partial liquidation of the LIFO bases.The effect on net earnings was not material.
E. PLANT ASSETS AND IMPAIRMENT LOSSPlant assets at November 30, 2001 and 2000 were as follows:
2001 2000Land........................................................................ $ 4,736 $ 3,911Buildings and building fixtures.......................... 73,497 67,986Machinery and equipment ................................ 191,984 182,689Construction-in-process...................................... 7,092 17,666
277,309 272,252Less accumulated depreciation.......................... 139,993 132,131
$137,316 $140,121
During the first quarter of 2001, the Company recognized an impairment loss in its Packaging segment of $2,422 relat-ed to certain plant assets used exclusively in the manufac-ture of plastic closures for a customer who terminated amanufacturing contract. The loss is included in the cost ofsales and was calculated under the guidelines of Statementof Financial Accounting Standards No. 121, “Accounting forthe Impairment of Long-Lived Assets and for Long-LivedAssets to be Disposed of.”
F. ACQUIRED INTANGIBLESAcquired intangibles, net of accumulated amortization, atNovember 30, 2001 and 2000 consisted of the following:
2001 2000Excess of cost over fair value
of assets acquired........................................ $ 78,620 $ 62,333Trademarks .......................................................... 28,358 29,090Other acquired intangibles ................................ 9,768 10,454
$116,746 $101,877
Accumulated amortization was $17,392 and $13,812 atNovember 30, 2001 and 2000, respectively.
G. ACCOUNTS PAYABLE AND ACCRUED LIABILITIES
Accounts payable and accrued liabilities at November 30, 2001and 2000 were as follows:
2001 2000Accounts payable ................................................ $ 42,657 $ 40,826Accrued salaries, wages and commissions ...... 8,733 12,678Compensated absences ...................................... 6,366 6,192Accrued pension liabilities ................................ 263 262Other accrued liabilities ...................................... 26,807 24,229
$ 84,826 $ 84,187
(Dollars in thousands except per share data)
NOTES TO CONSOLIDATED FINANCIAL STATEMENTS
CLARCOR18

H. LONG-TERM DEBTLong-term debt at November 30, 2001 and 2000 consisted ofthe following:
2001 2000Multicurrency revolving credit agreement,
interest payable at the end of each funding period at an adjusted LIBOR ...... $107,000 $116,000
Promissory note, interest payable semi-annually at 6.69% .............................. 15,000 20,000
Industrial Revenue Bonds, at 1.6% to 5.85% interest rates ................................ 17,815 10,063
Other ...................................................................... 967 905140,782 146,968
Less current portion ............................................ 5,579 5,482$135,203 $141,486
A fair value estimate of $140,023 and $145,990 for long-termdebt in 2001 and 2000, respectively, is based on the currentinterest rates available to the Company for debt with similarremaining maturities.
On May 1, 2001, the Company, in cooperation with theCampbellsville-Taylor County Industrial DevelopmentAuthority (Kentucky), issued $8,000 of Industrial RevenueBonds. The bonds are due May 1, 2031, with a variable rate of interest that is reset weekly. In conjunction with theissuance of the Industrial Revenue Bonds, the Companyholds in trust certain restricted investments committed forthe acquisition of plant equipment. At November 30, 2001,the restricted asset balance was $2,343 and is included inother noncurrent assets. The Company has other industrialrevenue bonds, including $8,410 issued in cooperation withthe South Dakota Economic Development Finance Authoritydue February 1, 2016 with a variable rate of interest that isreset weekly and additional bonds of $1,405 and $1,653 out-standing as of November 30, 2001 and 2000, respectively,which mature in 2005.
In September 1999, the Company entered into a three-year,multicurrency revolving credit agreement with a group of par-ticipating financial institutions under which it may borrow upto $185,000. The agreement, which was extended for oneadditional year in 2000, provides that loans may be madeunder a selection of currencies and rate formulas. The inter-est rate is based upon either a defined Base Rate or theLondon Interbank Offered Rate (LIBOR) plus a variable spreadof .55% to 1.25%. The variable spread is based on the ratio ofthe Company’s outstanding borrowings compared with itsshareholders’ equity. The spread was .65% and .80% atNovember 30, 2001 and 2000, respectively. Facility fees andother fees on the entire loan commitment are payable for theduration of this facility. At November 30, 2001 and 2000,$107,000 and $116,000 were outstanding under this agreementand the related LIBOR, including the spread, was 4.17% and7.46%, respectively.
Borrowings under the credit facility are unsecured but areguaranteed by certain of the Company’s subsidiaries. Theagreement related to this borrowing includes certain restric-tive covenants that include maintaining minimum consolidat-
ed net worth, limiting new borrowings, maintaining a mini-mum interest coverage, and restricting certain changes inownership as stipulated in the agreement. The Company wasin compliance with these covenants as of November 30, 2001and 2000. This agreement also includes a letter of credit facil-ity, against which $11,182 and $10,841 in letters of credit hadbeen issued as of November 30, 2001 and 2000, respectively.
The 6.69% promissory note matures July 25, 2004, but theCompany is required to prepay, without premium, certainprincipal amounts as stated in the agreement. Under thenote agreement, the Company must meet certain restrictivecovenants. The covenants were amended during 1999 to besimilar to those contained in the multicurrency revolvingcredit facility.
Exclusive of the multicurrency revolving credit facility, princi-pal maturities of long-term debt for the next five fiscal yearsending November 30 approximates: $5,579 in 2002, $5,624 in2003, $5,629 in 2004, $381 in 2005, $166 in 2006 and $16,403thereafter. The borrowings under the revolving credit facilitythat matures in 2003 have been classified as long-term as theCompany has both the intent and ability to refinance thisamount on a long-term basis.
Interest paid totaled $10,666, $10,714 and $2,228 during 2001,2000 and 1999, respectively.
I. LEASESThe Company has various lease agreements for offices, ware-houses, manufacturing plants, and equipment that expire onvarious dates through June 2007 and contain renewal options.Some of these leases provide for payment of property taxes,utilities and certain other expenses. Commitments for mini-mum rentals under noncancellable leases at November 30,2001 for the next five years are: $7,278 in 2002, $4,881 in 2003,$3,641 in 2004, $1,997 in 2005, and $936 in 2006. Rent expensetotaled $8,869, $8,367 and $6,063 for the years endedNovember 30, 2001, 2000 and 1999, respectively.
J. PENSION AND OTHER POSTRETIREMENT PLANS
The Company has defined benefit pension plans and postre-tirement health care plans covering certain employees andretired employees. In addition to the plan assets related toqualified plans, the Company has funded approximately$2,281 and $2,580 at November 30, 2001 and 2000, respectively,in restricted trusts for its nonqualified plans. These trusts areincluded in other noncurrent assets in the Company’sConsolidated Balance Sheets.
During 2001, the Company received approval from theInternal Revenue Service to terminate one of its plans relatedto a business that was previously sold and distribute all theplan’s assets. The Company terminated the plan and settledall of its obligations by making lump-sum distributions orpurchasing annuity contracts for its participants.
The following table shows reconciliations of the pensionplans and other postretirement plan benefits as of November30, 2001 and 2000. The accrued pension benefit liabilityincludes an unfunded benefit obligation of $6,974 and $5,231
CLARCOR 19

as of November 30, 2001 and 2000, respectively. The obliga-tions have been determined with a weighted average discountrate of 7.25% and 7.75% in 2001 and 2000, respectively, and arate of increase in future compensation of primarily 5.0% inboth years. The expected weighted average long-term rate ofreturn was 9.0% in both 2001 and 2000.
Pension PostretirementBenefits Benefits
2001 2000 2001 2000Change in benefit obligation:Benefit obligation at beginning
of year ....................................... $68,980) $73,356) $ 4,082) $ 3,866)Service cost ..................................... 3,142) 3,122) 107) 92)Interest cost .................................... 5,114) 5,021) 305) 280)Amendments.................................. 1,154) –) –) –)Actuarial losses / (gains)............... 3,750) (2,038) (808) (6)Benefits paid................................... (5,717) (10,481) (151) (150)Benefit obligation at end of year..... 76,423) 68,980) 3,535) 4,082)Change in plan assets:Fair value of plan assets at
beginning of year..................... 86,686) 87,214) –) –)Actual return on plan assets........ (10,726) 3,012) –) –)Benefits paid................................... (5,455) (3,540) –) –)Fair value of plan assets at end
of year ....................................... 70,505) 86,686) –) –)
Funded status................................. (5,918) 17,706) (3,535) (4,082)Unrecognized prior
service cost............................... 1,320) 188) –) –)Unrecognized net actuarial
loss / (gain) ............................... 18,319) (3,011) (570) 238)Net amount recognized ................ $13,721) $14,883) $(4,105) $(3,844)Amounts recognized in the
Consolidated Balance Sheets include:
Prepaid benefit cost.......... $18,939) $19,519) $ –) $ –)Accrued benefit liability... (5,218) (4,636) (4,105) (3,844)
Net amount recognized ................ $13,721) $14,883) $(4,105) $(3,844)
The components of net periodic benefit cost for pensions areshown below.
Pension Benefits2001) 2000) 1999)
Components of net periodic benefit cost:Service cost ...................................... $3,142) $3,122) $2,364)Interest cost ..................................... 5,114) 5,021) 5,251)Expected return on plan assets .... (7,527) (7,695) (7,041)Additional recognition amount..... –) –) 196)Amortization of unrecognized:
Net transition asset................... –) (1,056) (1,056)Prior service cost........................ 22) 21) 62)Net actuarial loss....................... 5) 7) 54)Settlement cost for a
terminated plan ................... 669) –) –)Net periodic benefit
cost / (income)............................ $1,425) $ (580) $ (170)
The postretirement obligations represent a fixed dollaramount per retiree. The Company has the right to modify orterminate these benefits. The participants will assume
substantially all future health care benefit cost increases, andtherefore, future increases in health care costs will notincrease the postretirement benefit obligation or cost to theCompany. Therefore, the Company has not assumed anyannual rate of increase in the per capita cost of coveredhealth care benefits for future years. The components of netperiodic benefit cost for postretirement health care benefitsare shown below.
Postretirement Benefits2001 2000 1999
Components of net periodic benefit cost:Service cost ...................................... $ 107 $ 92 $ 13Interest cost ..................................... 305 280 149Net periodic benefit cost................ $ 412 $ 372 $ 162
The Company also sponsors various defined contributionplans that provide employees with an opportunity to accumu-late funds for their retirement. The Company matches thecontributions of participating employees based on the per-centages specified in the respective plans. The Company rec-ognized expense related to these plans of $1,395, $1,408 and$1,211 in 2001, 2000 and 1999, respectively.
K. INCOME TAXESThe provision for income taxes consisted of:
2001 2000 1999)Current:
Federal .............................................. $21,644) $17,693) $18,398)State .................................................. 2,751) 2,574) 2,177)Foreign .............................................. 1,460) 1,063) 547)
Deferred ................................................. (2,051) 1,871) (985)$23,804) $23,201) $20,137)
Income taxes paid, net of refunds, totaled $26,858, $16,458 and$22,234 during 2001, 2000 and 1999, respectively.
Earnings before income taxes and minority interests includedthe following components:
2001 2000 1999)Domestic income.................................. $62,664) $60,471) $53,467)Foreign income ..................................... 3,070) 3,016) 2,148)
$65,734) $63,487) $55,615)
The provision for income taxes resulted in effective tax ratesthat differ from the statutory United States federal incometax rate. The reasons for these differences are as follows:
Percent of Pretax Earnings2001 2000 1999
Statutory U.S. tax rate .......................... 35.0% 35.0% 35.0%State income taxes, net of
federal benefit ................................. 2.6 2.6 2.6Foreign sales.......................................... (1.1) (0.8) (0.8)Other, net ............................................... (0.3) (0.3) (0.6)Consolidated effective
income tax rate ............................... 36.2% 36.5% 36.2%
The components of the net deferred tax liability as ofNovember 30, 2001 and 2000 were as follows:
(Dollars in thousands except per share data)
NOTES TO CONSOLIDATED FINANCIAL STATEMENTS
CLARCOR20
2001) 2000)Deferred tax assets:
Deferred compensation.............................. $ 4,304) $ 3,930)Other postretirement benefits .................. 931) 783)Foreign net operating loss carryforwards 406) 377)Accounts receivable .................................... 3,385) 2,177)Inventories.................................................... 3,113) 1,774)Other comprehensive income items........ 1,026) -)Accrued liabilities and other .................... 2,915) 2,071)
Total gross deferred tax assets .......................... 16,080) 11,112)Deferred tax liabilities:
Pensions........................................................ (5,069) (5,209)Plant assets .................................................. (12,081) (11,189)Intangibles.................................................... (526) 36)Other ............................................................ -) (82)
Total gross deferred tax liabilities .................... (17,676) (16,444)Net deferred tax liability .................................... $ (1,596) $ (5,332)
The Company expects to realize the deferred tax assets,including foreign net operating loss carryforwards, through thereversal of taxable temporary differences and future earnings.
As of November 30, 2001, the Company has not provided taxeson accumulated unremitted foreign earnings of approximate-ly $6,000 that are intended to be indefinitely reinvested tofinance operations and expansion outside the United States.If such earnings were distributed beyond the amount forwhich taxes have been provided, foreign tax credits wouldsubstantially offset any incremental U.S. tax liability.
L. CONTINGENCIESThe Company is involved in legal actions arising in the nor-mal course of business. Additionally, the Company is party tovarious proceedings relating to environmental issues. TheU.S. Environmental Protection Agency (EPA) and/or otherresponsible state agencies have designated the Company as apotentially responsible party (PRP), along with other compa-nies, in remedial activities for the cleanup of waste sitesunder the federal Superfund statute.
Environmental and related remediation costs are difficult toquantify for a number of reasons, including the number ofparties involved, the difficulty in determining the extent ofthe contamination, the length of time remediation mayrequire, the complexity of the environmental regulation andthe continuing advancement of remediation technology.Applicable federal law may impose joint and several liabilityon each PRP for the cleanup.
It is the opinion of management that additional liabilities, ifany, resulting from these legal or environmental issues, are notexpected to have a material adverse effect on the Company’sfinancial condition or consolidated results of operations.
M. PREFERRED STOCK PURCHASE RIGHTSIn March 1996, the Board of Directors of CLARCOR adopted a Shareholder Rights Plan to replace an existing plan thatexpired on April 25, 1996. Under the terms of the Plan, eachshareholder received rights to purchase shares of CLARCORSeries B Junior Participating Preferred Stock. The rightsbecome exercisable only after the earlier to occur of (i) 10business days after the first public announcement that a
person or group (other than a CLARCOR-related entity) hasbecome the beneficial owner of 15% or more of the outstand-ing shares of CLARCOR Common Stock; or (ii) 10 businessdays (unless extended by the CLARCOR Board in accordancewith the Rights Agreement) after the commencement of, orthe intention to make, a tender or exchange offer, the con-summation of which would result in any person or group(other than a CLARCOR related entity) becoming such a 15%beneficial owner. Each right entitles the holder to buy one-hundredth of a share of such preferred stock at an exerciseprice of $80 subject to certain adjustments.
Once the rights become exercisable, each right will entitle the holder, other than the acquiring person or group, to pur-chase a number of CLARCOR common shares at a 50% dis-count to the then-market price of CLARCOR Common Stock.In addition, under certain circumstances, if the rights becomeexercisable, the holder will be entitled to purchase the stockof the acquiring individual or group at a 50% discount. TheBoard may also elect to redeem the rights at $.01 per right.The rights expire on April 25, 2006.
The authorized preferred stock includes 300,000 shares desig-nated as Series B Junior Participating Preferred Stock.
N. INCENTIVE PLANIn 1994, the shareholders of CLARCOR adopted the 1994Incentive Plan, which allows the Company to grant stockoptions, restricted stock and performance awards to officers,directors and key employees. The 1994 Incentive Plan incor-porates the various incentive plans in existence prior toMarch 1994. In addition, the Company has, in connectionwith the 1997 acquisition of United Air Specialists, Inc. (UAS),assumed the stock option plans of UAS and has reserved6,949 shares of the Company’s common stock for issuanceunder the assumed UAS stock option plans.
The amended 1994 Incentive Plan allows grants and awards ofup to 1.5% of the outstanding common stock as of January 1of each calendar year. In addition, the Compensation andStock Option Committee of the Company’s Board of Directorsmay approve an additional 1% of outstanding common stockto be awarded during any calendar year. Any portion that isnot granted in a given year is available for future grants. Afterthe close of fiscal year 2001, 314,761 shares were granted,including the restricted stock units discussed hereafter.
The following is a description and a summary of key provi-sions related to this Plan.
Stock OptionsIn accordance with Statement of Financial AccountingStandards No. 123 (SFAS 123), “Accounting for Stock-BasedCompensation,” the Company accounts for stock-based com-pensation using the intrinsic value method as prescribedunder Accounting Principles Board Opinion No. 25,“Accounting for Stock Issued to Employees,” and relatedInterpretations and provides the disclosure-only provisions of SFAS 123.
CLARCOR 21
Nonqualified stock options may, at the discretion of the Boardof Directors, be granted at the fair market value at the date ofgrant or at an exercise price less than the fair market value atthe date of grant. All options granted in 2001, 2000, and 1999were at the fair market value at the dates of the grants.Options granted to key employees prior to the end of fiscalyear 2000 vest 25% per year beginning at the end of the thirdyear; therefore, they become fully exercisable at the end of sixyears. Options granted to key employees after the close of fis-cal year 2000 vest 25% per year beginning at the end of thefirst year; therefore, they become fully exercisable at the endof four years. Options granted to non-employee directors vestimmediately. All options expire ten years from the date ofgrant unless otherwise terminated.
The following table summarizes the activity under the non-qualified stock option plans.
2001 2000 1999Weighted Weighted WeightedAverage Average AverageExercise Exercise Exercise
Shares Price Shares Price Shares PriceOutstanding at
beginning of year..... 2,286,026) $14.53 2,239,162) $14.83 2,116,182) $14.18
Granted.......................... 449,366) 19.93 412,404) 17.80 287,982) 18.00
Exercised/surrendered .............. (411,262) 14.15 (365,540) 12.75 (165,002) 12.93
Outstanding at end of year................ 2,324,130) $16.83 2,286,026) $14.53 2,239,162) $14.83
Options exercisable at end of year ........... 1,531,152) $16.06 1,508,859) $14.68 1,159,462) $12.62
The following table summarizes information about theoptions at November 30, 2001.
Options Outstanding Options ExercisableWeighted Weighted Weighted
Range of Average Average AverageExercise Exercise Remaining Exercise
Prices Number Price Life in Years Number Price$12.17 - $17.94 1,247,757 $14.49 4.57 935,988 $13.49$18.38 - $26.00 1,076,373 $19.55 7.49 595,164 $20.10
In addition, stock options outstanding and exercisable atNovember 30, 2001 and 2000 assumed as part of the UASacquisition were 6,949 and 20,669, respectively. These substi-tute options have an exercisable price range per share of$2.40 to $5.94 at November 30, 2001 and expire between 2002and 2005.
Long Range Performance and Restricted Stock AwardsOfficers and key employees may be granted target awards ofCompany shares of common stock and performance units,which represent the right to a cash payment. The awards areearned and shares are issued only to the extent that theCompany achieves performance goals determined by theBoard of Directors during a three-year performance period.The Company granted 28,383 performance shares onDecember 1, 1999. The shares vest at the end of three years.As of November 30, 2001, the Company has cancelled 14,609and 4,860 shares of the 2000 and 1999 grants, respectively.
Subsequent to the end of the fiscal year, the Company can-celled an additional 4,475 shares of the 1999 grant.
During the performance period, officers and key employeesare permitted to vote the performance shares and receivecompensation equal to dividends declared on commonshares. The Company accrues compensation expense assum-ing attainment of the performance goals ratably during theperformance cycle. Distributions of Company common stockand cash for the performance periods ended November 30,2001, 2000 and 1999 were $437, $488 and $485, respectively.
During 2001, the Company granted 35,222 restricted units ofCompany common stock with a fair value of $18.50 per share,the market price of the stock at the date granted. In connec-tion therewith, the Company cancelled 12,113 performanceshares and 8,074 performance units from the December 1,1999 grant and replaced them with 9,182 units of restrictedstock and with additional stock option awards. The restrictedshare units require no payment from the employee and com-pensation cost is recorded based on the market price on thegrant date and is recorded over the vesting period of fouryears. During the vesting period, officers and key employeesreceive compensation equal to dividends declared on com-mon shares. Upon vesting, the employee may elect to deferreceipt of their shares. Subsequent to the end of fiscal year2001, 2,464 shares (net of 1,157 shares withheld for taxes) ofthe December 2000 restricted unit grant were issued and 6,855units were deferred. In addition, the Company granted 25,436restricted stock units in December 2001 at the market priceon the date granted of $27.50.
Compensation expense related to long range performanceand restricted stock awards totaled $618, $901 and $534 in2001, 2000 and 1999, respectively. No future awards of longrange performance shares or units are expected to be granted.
Directors’ Restricted Stock CompensationThe 1994 Incentive Plan, as amended on March 25, 2000, pro-vides for grants of shares of common stock to all non-employ-ee directors equal to a one-year annual retainer in lieu ofcash. The directors’ rights to the shares vest immediately onthe date of grant. In 2001 and 2000, respectively, 10,618 and7,076 shares of Company common stock were issued underthe amended plan. During 1999, 16,002 shares of Companycommon stock were issued under the plan of which 15,488were cancelled in 2000 due to the plan amendment. During1999, 1,321 shares from a prior year grant were forfeited.Compensation expense for the plan totaled $252, $184 and$191 in 2001, 2000 and 1999, respectively.
Fair Value Accounting (SFAS 123)Had compensation expense for the Company’s stock-basedcompensation plans been determined based on the fair valueat the grant dates consistent with the method of SFAS 123,the Company’s pro forma net earnings and diluted earningsper share would have been $40,760, $39,520 and $34,848 and$1.64, $1.61 and $1.43 for 2001, 2000 and 1999, respectively.
The fair value of each option grant is estimated on the date ofgrant using the Black-Scholes option pricing model with thefollowing weighted average assumptions for 2001, 2000, and1999. Adjustments for forfeitures are made as they occur.
(Dollars in thousands except per share data)
NOTES TO CONSOLIDATED FINANCIAL STATEMENTS
CLARCOR22

2001 2000 1999Risk-free interest rate .......................... 5.53% 6.34% 4.87%Expected dividend yield ...................... 2.50% 2.47% 2.35%Expected volatility factor..................... 25.50% 25.00% 24.50%Expected option term (in years) ......... 7.0 7.0 7.0
The weighted average fair value per option at the date ofgrant for options granted in 2001, 2000 and 1999 was $5.12,$5.28 and $4.88, respectively.
The above pro forma disclosures may not be representativeof the effects on reported net income and earnings pershare for future years because compensation cost underSFAS 123 is amortized over the options’ vesting period andcompensation cost for options granted prior to fiscal year1996 is not considered.
O. TREASURY STOCK TRANSACTIONS ANDEARNINGS PER SHARE
During 1999, the Company purchased and retired 50,000shares of common stock. The number of issued shares wasreduced as a result of the retirement of these shares.
The Company calculates and presents basic and dilutedearnings per share in accordance with Statement of FinancialAccounting Standards No. 128 (SFAS 128), “Earnings perShare.” Diluted earnings per share reflects the impact ofoutstanding stock options if exercised during the periods pre-sented using the treasury stock method. The following tableprovides a reconciliation of the numerators and denomina-tors utilized in the calculation of basic and diluted earningsper share:
2001 2000 1999Net Earnings (numerator) ................. $41,893 $40,237 $35,412Basic EPS:
Weighted average number of common shares outstanding (denominator) .......................... 24,535,199 24,269,675 23,970,011Basic per share amount ......... $1.71 $1.66 $1.48
Diluted EPS:Weighted average number
of common shares outstanding.............................. 24,535,199 24,269,675 23,970,011
Dilutive effect of stock options... 356,863 236,496 343,596Diluted weighted average
number of common shares outstanding (denominator) .................... 24,892,062 24,506,171 24,313,607
Diluted per share amount ..... $1.68 $1.64 $1.46
For fiscal years ended November 30, 2001, 2000 and 1999,respectively, 28,491, 682,866 and 525,156 stock options with aweighted average exercise price of $25.97, $19.34 and $19.81were not included in the computation of diluted earnings pershare as the exercise prices of the options were greater thanthe average market price of the common shares during therespective periods.
P. UNAUDITED QUARTERLY FINANCIAL DATAThe unaudited quarterly data for 2001 and 2000 were as fol-lows:
First Second Third FourthQuarter Quarter Quarter Quarter Total
2001:Net sales ............$156,197 $159,505 $175,645 $175,617 $666,964Gross profit........ 46,286 45,344 50,306 53,551 195,487Net earnings...... 9,804 8,936 10,257 12,896 41,893Net earnings per
common share:Basic ............. $0.40 $0.36 $0.42 $0.52 $1.71Diluted.......... $0.40 $0.36 $0.41 $0.51 $1.68
2000:Net sales.............. $150,697 $ 162,205 $ 160,830 $ 178,416 $ 652,148Gross profit ......... 44,283 49,985 47,778 56,299 198,345Net earnings ....... 7,063 10,090 10,078 13,006 40,237Net earnings per
common share:Basic ............... $0.29 $0.42 $0.41 $0.53 $1.66Diluted ........... $0.29 $0.41 $0.41 $0.53 $1.64
Fiscal year 2001 was a fifty-two week year, whereas fiscal year2000 was a fifty-three week year. Likewise, fourth quarter2001 was a thirteen week quarter while fourth quarter 2000was a fourteen week quarter. During the first quarter of 2001,the Company received a settlement payment of $7,000 for theearly termination of a supply and license agreement and inconnection therewith recognized an impairment loss in itsPackaging segment of $2,422 related to certain plant assets asdiscussed in Note E.
Q. SEGMENT INFORMATIONThe Company adopted Statement of Financial AccountingStandards No. 131 (SFAS 131), “Disclosures About Segments ofan Enterprise and Related Information” effective with year-end 1999. This standard requires that companies discloseselected information by operating segment. SFAS 131 definesan operating segment as a component of a company whichengages in business activities from which it may earn rev-enues and incur expenses; has its operating results regularlyreviewed by the entity’s chief operating decision makers tomake decisions about the allocation of resources and theassessment of performance; and has discrete financial infor-mation available. Based on the economic characteristics ofthe Company’s business activities, the nature of products,customers and markets served, and the performance evalua-tion by management and the Company’s Board of Directors,the Company has identified three reportable segments:Engine/Mobile Filtration, Industrial/Environmental Filtrationand Packaging.
The Engine/Mobile Filtration segment manufactures and mar-kets a complete line of filters used in the filtration of oils, air,fuel, coolant, hydraulic and transmission fluids in bothdomestic and international markets. The Engine/MobileFiltration segment provides filters for certain types of trans-portation equipment including automobiles, heavy-duty andlight trucks, buses and locomotives, marine and miningequipment, industrial equipment and heavy-duty construc-
CLARCOR 23

tion and agricultural equipment. The products are sold toaftermarket distributors, original equipment manufacturersand dealer networks, private label accounts and directly totruck service centers and large national accounts.
The Industrial/Environmental Filtration segment manufac-tures and markets a complete line of filters, cartridges, dustcollectors and filtration systems used in the filtration of airand industrial fluid processes in both domestic and interna-tional markets. The filters and filter systems are used incommercial and industrial buildings, hospitals, manufactur-ing processes, pharmaceutical processes, clean rooms, air-ports, shipyards, refineries, power generation plants and resi-dences. The products are sold to commercial and industrialdistributors, original equipment manufacturers and dealernetworks, private label accounts, retailers and directly tolarge national accounts.
The Packaging segment manufactures and markets consumerand industrial packaging products including custom-designedplastic and metal containers and closures and lithographedmetal sheets in both domestic and international markets.The products are sold directly to consumer and industrialpackaging customers. As discussed in Note P, the Companyreceived a settlement payment of $7,000 for the early termi-nation of a supply and license agreement and in connectiontherewith recognized an impairment loss in its Packaging seg-ment of $2,422 related to certain plant assets as discussed inNote E. The segment’s sales of plastic closures were reducedin 2001 as a result of the termination of the agreement.
Net sales represent sales to unaffiliated customers. No singlecustomer or class of product accounted for 10% or more of theCompany’s consolidated 2001 sales. Intersegment sales arenot material. Assets are those assets used in each businesssegment. Corporate assets consist of cash and short-termcash investments, deferred income taxes, headquarters facili-ty and equipment, pension assets and various other assetsthat are not specific to an operating segment. Unallocatedamounts include interest income and expense and other non-operating income and expense items.
The segment data for the years ended November 30, 2001,2000 and 1999 were as follows:
2001) 2000) 1999)Net sales:Engine/Mobile Filtration ..................... $250,960) $259,791) $238,680)Industrial/Environmental Filtration ..... 346,394) 319,746) 174,889)Packaging .............................................. 69,610) 72,611) 64,300)
$666,964) $652,148) $477,869)Operating profit:Engine/Mobile Filtration ..................... $ 51,785) $ 49,162) $ 43,591)Industrial/Environmental Filtration ..... 16,761) 18,433) 5,120)Packaging .............................................. 7,264) 8,392) 7,366)
75,810) 75,987) 56,077)Other income (expense)...................... (10,076) (12,500) (462)Earnings before income taxes and
minority interests........................... $ 65,734) $ 63,487) $ 55,615)
Identifiable assets:Engine/Mobile Filtration ..................... $135,265) $144,563) $137,351)Industrial/Environmental Filtration ..... 303,901) 271,669) 241,471)Packaging .............................................. 41,652) 41,891) 36,173)Corporate............................................... 49,799) 43,807) 57,996)
$530,617) $501,930) $472,991)Additions to plant assets:Engine/Mobile Filtration ..................... $ 3,852) $ 7,588) $ 13,115)Industrial/Environmental Filtration ..... 8,746) 10,842) 4,824)Packaging .............................................. 5,404) 8,045) 3,217)Corporate............................................... 202) 2,530) 666)
$ 18,204) $ 29,005) $ 21,822)Depreciation and amortization:Engine/Mobile Filtration ..................... $ 7,725) $ 7,475) $ 6,944)Industrial/Environmental Filtration ..... 10,711) 10,145) 5,132)Packaging .............................................. 2,725) 2,832) 2,742)Corporate............................................... 689) 627) 554)
$ 21,850) $ 21,079) $ 15,372)
Financial data relating to the geographic areas in which theCompany operates are shown for the years ended November30, 2001, 2000 and 1999. Net sales by geographic area arebased on sales to final customers within that region.
2001) 2000) 1999)Net sales:United States ........................................ $549,210) $532,210) $399,717)Europe.................................................... 58,490) 60,250) 35,984)Other international.............................. 59,264) 59,688) 42,168)
$666,964) $652,148) $477,869)Plant assets, at cost less
accumulated depreciation:United States ........................................ $131,171) $133,323) $119,196)Europe.................................................... 5,144) 5,695) 5,650)Other international.............................. 1,001) 1,103) 1,180)
$137,316) $140,121) $126,026)
(Dollars in thousands except per share data)
NOTES TO CONSOLIDATED FINANCIAL STATEMENTS
CLARCOR24

CLARCOR 25
The management of CLARCOR is responsible for the prepara-tion, integrity and objectivity of the Company’s financialstatements and the other financial information in this report.The financial statements were prepared in conformity withgenerally accepted accounting principles and reflect, in allmaterial respects, the results of operations and theCompany’s financial position for the periods shown. Thefinancial statements are presented on the accrual basis ofaccounting and, where appropriate, reflect estimates basedupon judgments of management.
In addition, management maintains a system of internal con-trols designed to assure that Company assets are safeguardedfrom loss or unauthorized use or disposition. Also, the con-trols system provides assurance that transactions are author-ized according to the intent of management and are accurate-ly recorded to permit the preparation of financial statementsin accordance with generally accepted accounting principles.For the periods covered by the financial statements in thisreport, management believes this system of internal controls
was effective concerning all material matters. The effective-ness of the controls system is supported by the selection andtraining of qualified personnel, an organizational structurethat provides an appropriate division of responsibility, astrong budgetary system of control and a comprehensiveinternal audit program.
The Audit Committee of the Board of Directors, which iscomposed of three outside directors, serves in an oversightrole to assure the integrity and objectivity of the Company’sfinancial reporting process. The Committee meets periodi-cally with representatives of management and the indepen-dent and internal auditors to review matters of a materialnature related to financial reporting and the planning, resultsand recommendations of audits. The independent and inter-nal auditors have free access to the Audit Committee. TheCommittee is also responsible for making recommendationsto the Board of Directors concerning the selection of theindependent auditors.
The Board of Directors and ShareholdersCLARCOR Inc.Rockford, Illinois
In our opinion, the accompanying consolidated balancesheets and the related consolidated statements of earnings,shareholders’ equity and cash flows present fairly, in allmaterial respects, the consolidated financial position of CLARCOR Inc. and its subsidiaries at November 30, 2001 andNovember 30, 2000 and the consolidated results of their oper-ations and their cash flows for each of the three years in theperiod ended November 30, 2001, in conformity with account-ing principles generally accepted in the United States ofAmerica. These financial statements are the responsibility ofthe Company’s management; our responsibility is to expressan opinion on these financial statements based on our audits.We conducted our audits of these statements in accordancewith auditing standards generally accepted in the United
States of America, which require that we plan and performthe audit to obtain reasonable assurance about whether thefinancial statements are free of material misstatement. Anaudit includes examining, on a test basis, evidence supportingthe amounts and disclosures in the financial statements,assessing the accounting principles used and significant esti-mates made by management, and evaluating the overallfinancial statement presentation. We believe that our auditsprovide a reasonable basis for our opinion.
Chicago, IllinoisJanuary 8, 2002
REPORT OF INDEPENDENT ACCOUNTANTS
MANAGEMENT’S REPORT ON RESPONSIBILITY FOR FINANCIAL REPORTING
Norman E. Johnson Bruce A. Klein Marcia S. BlaylockChairman, President and Vice President-Finance and Vice President, Controller Chief Executive Officer Chief Financial Officer
January 8, 2002

CLARCOR26
11–YEAR FINANCIAL REVIEW
2001) 2000) 1999) 1998)
PER SHAREEquity . . . . . . . . . . . . . . . . . . . . . . . . . . . . . . . . . . . . . . . . . . . . . . . . . . . $ 11.14) $ 9.93) $ 8.77) $ 7.80)Diluted Earnings from Continuing Operations . . . . . . . . . . . . . . . . . 1.68) 1.64) 1.46) 1.30)Diluted Net Earnings. . . . . . . . . . . . . . . . . . . . . . . . . . . . . . . . . . . . . . . 1.68) 1.64) 1.46) 1.30)Dividends . . . . . . . . . . . . . . . . . . . . . . . . . . . . . . . . . . . . . . . . . . . . . . . . 0.4725) 0.4625) 0.4525) 0.4425)Price: High . . . . . . . . . . . . . . . . . . . . . . . . . . . . . . . . . . . . . . . . . . . . . . . 27.59) 21.44) 21.38) 24.63)
Low . . . . . . . . . . . . . . . . . . . . . . . . . . . . . . . . . . . . . . . . . . . . . . . . 16.88) 16.06) 14.25) 14.25)
EARNINGS DATA ($000)Net Sales. . . . . . . . . . . . . . . . . . . . . . . . . . . . . . . . . . . . . . . . . . . . . . . . . $666,964) $652,148) $477,869) $426,773)Operating Profit . . . . . . . . . . . . . . . . . . . . . . . . . . . . . . . . . . . . . . . . . . . 75,810) 75,987) 56,077) 51,663)Interest Expense . . . . . . . . . . . . . . . . . . . . . . . . . . . . . . . . . . . . . . . . . . 10,270) 11,534) 3,733) 2,336)Pretax Income . . . . . . . . . . . . . . . . . . . . . . . . . . . . . . . . . . . . . . . . . . . . 65,734) 63,487) 55,615) 51,347)Income Taxes . . . . . . . . . . . . . . . . . . . . . . . . . . . . . . . . . . . . . . . . . . . . . 23,804) 23,201) 20,137) 19,262)Income from Continuing Operations . . . . . . . . . . . . . . . . . . . . . . . . . 41,893) 40,237) 35,412) 32,079)Income from Discontinued Operations . . . . . . . . . . . . . . . . . . . . . . . –) –) –) –)Cumulative Effect of Accounting Changes . . . . . . . . . . . . . . . . . . . . –) –) –) –)Net Earnings. . . . . . . . . . . . . . . . . . . . . . . . . . . . . . . . . . . . . . . . . . . . . . 41,893) 40,237) 35,412) 32,079)Basic Average Shares Outstanding . . . . . . . . . . . . . . . . . . . . . . . . . . . 24,535) 24,270) 23,970) 24,268)Diluted Average Shares Outstanding . . . . . . . . . . . . . . . . . . . . . . . . . 24,892) 24,506) 24,314) 24,649)
EARNINGS ANALYSISOperating Margin . . . . . . . . . . . . . . . . . . . . . . . . . . . . . . . . . . . . . . . . . 11.4%) 11.7%) 11.7%) 12.1%)Pretax Margin. . . . . . . . . . . . . . . . . . . . . . . . . . . . . . . . . . . . . . . . . . . . . 9.9%) 9.7%) 11.6%) 12.0%)Effective Tax Rate . . . . . . . . . . . . . . . . . . . . . . . . . . . . . . . . . . . . . . . . . 36.2%) 36.5%) 36.2%) 37.5%)Net Margin-Continuing Operations . . . . . . . . . . . . . . . . . . . . . . . . . . 6.3%) 6.2%) 7.4%) 7.5%)Net Margin . . . . . . . . . . . . . . . . . . . . . . . . . . . . . . . . . . . . . . . . . . . . . . . 6.3%) 6.2%) 7.4%) 7.5%)Return on Beginning Assets. . . . . . . . . . . . . . . . . . . . . . . . . . . . . . . . . 8.3%) 8.5%) 11.6%) 11.4%)Return on Beginning Shareholders’ Equity . . . . . . . . . . . . . . . . . . . 17.3%) 19.1%) 19.0%) 18.7%)Dividend Payout to Net Earnings . . . . . . . . . . . . . . . . . . . . . . . . . . . . 27.6%) 27.9%) 30.5%) 33.4%)
BALANCE SHEET DATA ($000)Current Assets . . . . . . . . . . . . . . . . . . . . . . . . . . . . . . . . . . . . . . . . . . . . $244,350) $230,479) $227,670) $168,173)Plant Assets, Net . . . . . . . . . . . . . . . . . . . . . . . . . . . . . . . . . . . . . . . . . . 137,316) 140,121) 126,026) 86,389)Total Assets . . . . . . . . . . . . . . . . . . . . . . . . . . . . . . . . . . . . . . . . . . . . . . 530,617) 501,930) 472,991) 305,766)Current Liabilities . . . . . . . . . . . . . . . . . . . . . . . . . . . . . . . . . . . . . . . . . 94,931) 97,826) 97,475) 61,183)Long-Term Debt. . . . . . . . . . . . . . . . . . . . . . . . . . . . . . . . . . . . . . . . . . . 135,203) 141,486) 145,981) 36,419)Shareholders’ Equity. . . . . . . . . . . . . . . . . . . . . . . . . . . . . . . . . . . . . . . 274,261) 242,093) 210,718) 186,807)
BALANCE SHEET ANALYSIS ($000)Debt to Capitalization. . . . . . . . . . . . . . . . . . . . . . . . . . . . . . . . . . . . . . 33.0%) 36.9%) 40.9%) 16.3%)Working Capital. . . . . . . . . . . . . . . . . . . . . . . . . . . . . . . . . . . . . . . . . . . $149,419) $132,653) $130,195) $106,990)Current Ratio . . . . . . . . . . . . . . . . . . . . . . . . . . . . . . . . . . . . . . . . . . . . . 2.6) 2.4) 2.3) 2.7)
CASH FLOW DATA ($000)From Operations . . . . . . . . . . . . . . . . . . . . . . . . . . . . . . . . . . . . . . . . . . $ 63,290) $ 54,130) $ 38,642) $ 42,267)For Investment. . . . . . . . . . . . . . . . . . . . . . . . . . . . . . . . . . . . . . . . . . . . (51,353) (42,125) (160,658) (19,290)From/(For) Financing. . . . . . . . . . . . . . . . . . . . . . . . . . . . . . . . . . . . . . . (15,326) (15,862) 103,501) (19,943)Change in Cash & Equivalents . . . . . . . . . . . . . . . . . . . . . . . . . . . . . . (3,446) (3,881) (18,576) 2,997)Capital Expenditures . . . . . . . . . . . . . . . . . . . . . . . . . . . . . . . . . . . . . . 18,204) 29,005) 21,822) 15,825)Depreciation & Amortization . . . . . . . . . . . . . . . . . . . . . . . . . . . . . . . 21,850) 21,079) 15,372) 12,380)Dividends Paid . . . . . . . . . . . . . . . . . . . . . . . . . . . . . . . . . . . . . . . . . . . . 11,575) 11,207) 10,814) 10,717)Net Interest Expense. . . . . . . . . . . . . . . . . . . . . . . . . . . . . . . . . . . . . . . 9,616) 10,836) 2,282) 1,053)Income Taxes Paid. . . . . . . . . . . . . . . . . . . . . . . . . . . . . . . . . . . . . . . . . 26,858) 16,458) 22,234) 16,199)EBITDA (A) . . . . . . . . . . . . . . . . . . . . . . . . . . . . . . . . . . . . . . . . . . . . . . . 100,082) 97,066) 71,449) 64,043)Free Cash Flow (B) . . . . . . . . . . . . . . . . . . . . . . . . . . . . . . . . . . . . . . . . . 33,511) 13,918) 6,006) 15,725)
(A) Operating profit before depreciation, asset impairment and amortization.(B) Cash flow from operations less capital expenditures and dividends paid.
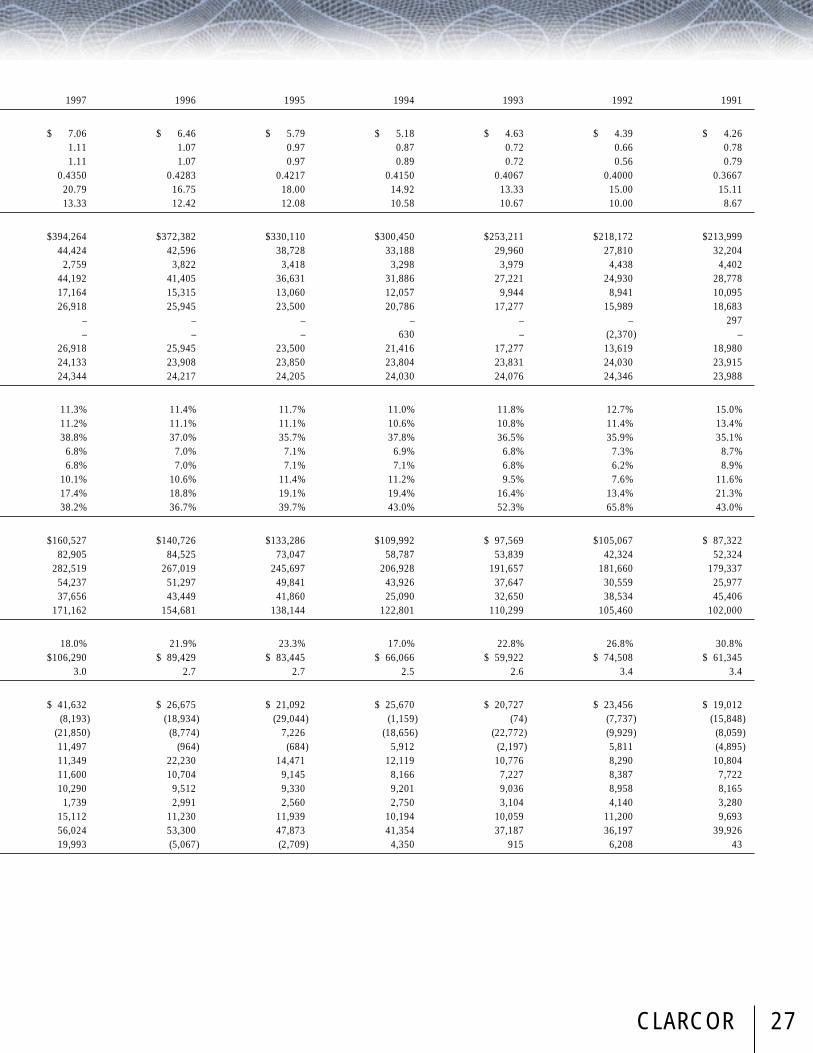
CLARCOR 27
1997) 1996) 1995) 1994) 1993) 1992) 1991)
$ 7.06) $ 6.46) $ 5.79) $ 5.18) $ 4.63) $ 4.39) $ 4.26)1.11) 1.07) 0.97) 0.87) 0.72) 0.66) 0.78)1.11) 1.07) 0.97) 0.89) 0.72) 0.56) 0.79)
0.4350) 0.4283) 0.4217) 0.4150) 0.4067) 0.4000) 0.3667)20.79) 16.75) 18.00) 14.92) 13.33) 15.00) 15.11)13.33) 12.42) 12.08) 10.58) 10.67) 10.00) 8.67)
$394,264) $372,382) $330,110) $300,450) $253,211) $218,172) $213,999)44,424) 42,596) 38,728) 33,188) 29,960) 27,810) 32,204)2,759) 3,822) 3,418) 3,298) 3,979) 4,438) 4,402)
44,192) 41,405) 36,631) 31,886) 27,221) 24,930) 28,778)17,164) 15,315) 13,060) 12,057) 9,944) 8,941) 10,095)26,918) 25,945) 23,500) 20,786) 17,277) 15,989) 18,683)
–) –) –) –) –) –) 297)–) –) –) 630) –) (2,370) –)
26,918) 25,945) 23,500) 21,416) 17,277) 13,619) 18,980)24,133) 23,908) 23,850) 23,804) 23,831) 24,030) 23,915)24,344) 24,217) 24,205) 24,030) 24,076) 24,346) 23,988)
11.3%) 11.4%) 11.7%) 11.0%) 11.8%) 12.7%) 15.0%)11.2%) 11.1%) 11.1%) 10.6%) 10.8%) 11.4%) 13.4%)38.8%) 37.0%) 35.7%) 37.8%) 36.5%) 35.9%) 35.1%)6.8%) 7.0%) 7.1%) 6.9%) 6.8%) 7.3%) 8.7%)6.8%) 7.0%) 7.1%) 7.1%) 6.8%) 6.2%) 8.9%)
10.1%) 10.6%) 11.4%) 11.2%) 9.5%) 7.6%) 11.6%)17.4%) 18.8%) 19.1%) 19.4%) 16.4%) 13.4%) 21.3%)38.2%) 36.7%) 39.7%) 43.0%) 52.3%) 65.8%) 43.0%)
$160,527) $140,726) $133,286) $109,992) $ 97,569) $105,067) $ 87,322)82,905) 84,525) 73,047) 58,787) 53,839) 42,324) 52,324)
282,519) 267,019) 245,697) 206,928) 191,657) 181,660) 179,337)54,237) 51,297) 49,841) 43,926) 37,647) 30,559) 25,977)37,656) 43,449) 41,860) 25,090) 32,650) 38,534) 45,406)
171,162) 154,681) 138,144) 122,801) 110,299) 105,460) 102,000)
18.0%) 21.9%) 23.3%) 17.0%) 22.8%) 26.8%) 30.8%)$106,290) $ 89,429) $ 83,445) $ 66,066) $ 59,922) $ 74,508) $ 61,345)
3.0) 2.7) 2.7) 2.5) 2.6) 3.4) 3.4)
$ 41,632) $ 26,675) $ 21,092) $ 25,670) $ 20,727) $ 23,456) $ 19,012)(8,193) (18,934) (29,044) (1,159) (74) (7,737) (15,848)
(21,850) (8,774) 7,226) (18,656) (22,772) (9,929) (8,059)11,497) (964) (684) 5,912) (2,197) 5,811) (4,895)11,349) 22,230) 14,471) 12,119) 10,776) 8,290) 10,804)11,600) 10,704) 9,145) 8,166) 7,227) 8,387) 7,722)10,290) 9,512) 9,330) 9,201) 9,036) 8,958) 8,165)
1,739) 2,991) 2,560) 2,750) 3,104) 4,140) 3,280)15,112) 11,230) 11,939) 10,194) 10,059) 11,200) 9,693)56,024) 53,300) 47,873) 41,354) 37,187) 36,197) 39,926)19,993) (5,067) (2,709) 4,350) 915) 6,208) 43)
CLARCOR28
BOARD OF DIRECTORS
J. Marc AdamRetired Vice President, Marketing3M (A diversified manufacturer)St. Paul, MinnesotaAge: 63Director Since: 1991
Milton R. BrownRetired Chairman &Chief Executive OfficerSuntec Industries Incorporated(A diversified manufacturer)Rockford, IllinoisAge: 70Director Since: 1990
Robert J. BurgstahlerSenior Vice President,Business Development &Corporate Services 3M (A diversified manufacturer)St. Paul, MinnesotaAge: 57Director Since: 2000
Lawrence E. GloydChairman Emeritus,Retired Chairman & Chief Executive OfficerCLARCOR Inc.Rockford, IllinoisAge: 69Director Since: 1984
Robert H. JenkinsRetired ChairmanHamilton Sundstrand Corporation(A diversified manufacturer)Rockford, IllinoisAge: 58Director Since: 1999
Norman E. JohnsonChairman, President &Chief Executive OfficerCLARCOR Inc.Rockford, IllinoisAge: 53Director Since: 1996
Philip R. Lochner, Jr.Retired Senior Vice President -Chief Administrative OfficerTime Warner, Inc.(A diversified media company)New York, New YorkAge: 58Director Since: 1999
James L. PackardChairman, President &Chief Executive OfficerRegal-Beloit Corporation(A diversified manufacturer)Beloit, WisconsinAge: 59Director Since: 1998
Keith E. WandellPresident - Automotive Systems Group, BatteryJohnson Controls, Inc.Milwaukee, WIAge: 51Director Since: 2001
CORPORATE INFORMATION

2323 Sixth StreetP.O. Box 7007Rockford, Illinois 61125815/962-8867FAX: 815/962-0417www.clarcor.com
TRANSFER AGENT & REGISTRARDIVIDEND REINVESTMENT PLANEquiServe Trust Company N.A.P.O. Box 2506Jersey City, New Jersey 07303-2506800/446-2617www.equiserve.com
AUDITORSPricewaterhouseCoopers LLPCertified Public AccountantsOne North WackerChicago, Illinois 60606
STOCK PRICE & DIVIDEND INFORMATION
CLARCOR common stock is traded on the New York StockExchange under the symbol CLC. The tables set forth thehigh and low market prices as quoted by the New York StockExchange and dividends paid for each quarter of the lasttwo fiscal years.
Market PriceQuarter Ended High Low DividendMarch 3, 2001 ................ $25.375 $16.875 $.1175June 2, 2001 ................... 26.844 22.500 .1175September 1, 2001 ........ 27.547 24.656 .1175December 1, 2001 ......... 27.594 21.906 .1200Total Dividends ................................................. $.4725
Market PriceQuarter Ended High Low DividendFebruary 26, 2000.......... $19.500 $16.063 $.1150May 27, 2000.................. 19.750 17.000 .1150August 26, 2000............. 21.375 17.375 .1150December 2, 2000 ......... 21.438 16.938 .1175Total Dividends ................................................. $.4625
EXECUTIVE OFFICERS
Norman E. JohnsonChairman, President &Chief Executive OfficerAge: 5311 Years of Service
David J. AndersonVice President -Corporate DevelopmentAge: 6311 Years of Service
Marcia S.BlaylockVice President, Controller Age: 4527 Years of Service
David J. BoydVice President,General Counsel & Corporate SecretaryAge 622 Years of Service
Bruce A. KleinVice President - Finance & Chief Financial OfficerAge: 547 Years of Service
David J. LindsayVice President -Administration & ChiefAdministrative OfficerAge: 4614 Years of Service
Peter F. NangleVice President -Information Services & Chief Information OfficerAge: 408 Years of Service
William B. WalkerPresident -Environmental FiltrationAge: 6135 Years of Service
ANNUAL MEETINGThe University of IllinoisCollege of Medicine at Rockford1601 Parkview AvenueRockford, Illinois 61107Tuesday, March 19, 20026:00 p.m. C.S.T.
SEC FORM 10-KA copy of the 2001 Form 10-Kmay be obtained from:Corporate SecretaryCLARCOR2323 Sixth StreetP.O. Box 7007Rockford, Illinois 61125

2323 Sixth StreetP.O. Box 7007Rockford, Illinois 61125TEL: 815/962-8867FAX: 815/962-0417www.clarcor.com
Related Documents