HC 40 London: The Stationery Office Price:£29.25 Department for Environment, Food and Rural Affairs Annual Report and Accounts 2012–13

Welcome message from author
This document is posted to help you gain knowledge. Please leave a comment to let me know what you think about it! Share it to your friends and learn new things together.
Transcript
HC 40 London: The Stationery Office Price:£29.25
Department for Environment, Food and
Rural Affairs
Annual Report and Accounts
2012–13

HC 40 London: The Stationery Office Price:£29.25
Department for Environment, Food and
Rural Affairs
Annual Report and Accounts
2012–13
(For the year ended 31 March 2013)
Accounts presented to the House of Commons pursuant to Section 6(4) of the Government Resources and Accounts Act 2000
Annual Report presented to the House of Commons by Command of Her Majesty
Ordered by the House of Commons to be printed 10 July 2013
This is part of a series of departmental publications which, along with the Main Estimates 2013–14 and the document Public Expenditure: Statistical Analyses 2013, present the Government‟s Outturn for 2012–13 and planned expenditure for 2013–14.
© Crown copyright 2013 You may re-use this information (excluding logos) free of charge in any format or medium, under the terms of the Open Government Licence. To view this licence, visit http://www.nationalarchives.gov.uk/doc/open-government-licence/ or e-mail: [email protected]. Where we have identified any third party copyright information you will need to obtain permission from the copyright holders concerned. Any enquiries regarding this publication should be sent to us at [email protected] You can download this publication from www.gov.uk
ISBN: 9780102985672 Printed in the UK for The Stationery Office Limited on behalf of the Controller of Her Majesty‟s Stationery Office ID 2570423 07/13 Printed on paper containing 75% recycled fibre content minimum.
Department for Environment, Food and Rural Affairs Annual Report and Accounts 2012–13
Foreword by the Permanent Secretary
i
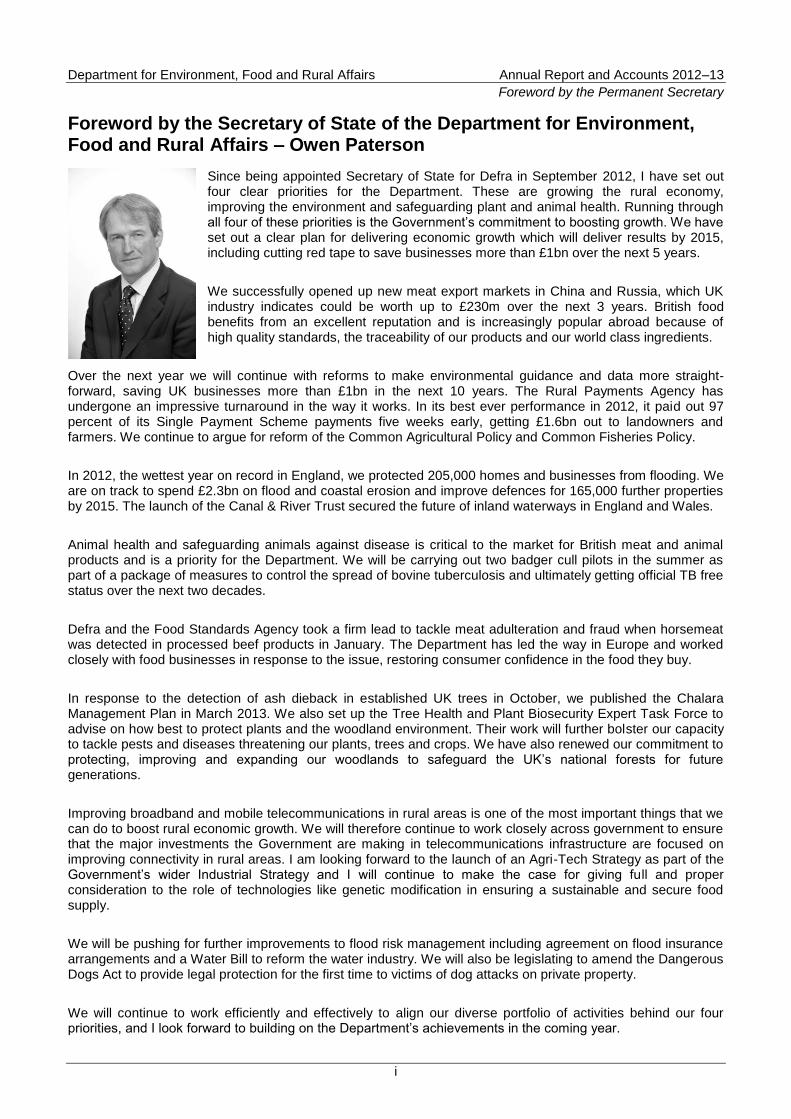
Foreword by the Secretary of State of the Department for Environment, Food and Rural Affairs – Owen Paterson
Since being appointed Secretary of State for Defra in September 2012, I have set out four clear priorities for the Department. These are growing the rural economy, improving the environment and safeguarding plant and animal health. Running through all four of these priorities is the Government‟s commitment to boosting growth. We have set out a clear plan for delivering economic growth which will deliver results by 2015, including cutting red tape to save businesses more than £1bn over the next 5 years.
We successfully opened up new meat export markets in China and Russia, which UK industry indicates could be worth up to £230m over the next 3 years. British food benefits from an excellent reputation and is increasingly popular abroad because of high quality standards, the traceability of our products and our world class ingredients.
Over the next year we will continue with reforms to make environmental guidance and data more straight-forward, saving UK businesses more than £1bn in the next 10 years. The Rural Payments Agency has undergone an impressive turnaround in the way it works. In its best ever performance in 2012, it paid out 97 percent of its Single Payment Scheme payments five weeks early, getting £1.6bn out to landowners and farmers. We continue to argue for reform of the Common Agricultural Policy and Common Fisheries Policy.
In 2012, the wettest year on record in England, we protected 205,000 homes and businesses from flooding. We are on track to spend £2.3bn on flood and coastal erosion and improve defences for 165,000 further properties by 2015. The launch of the Canal & River Trust secured the future of inland waterways in England and Wales.
Animal health and safeguarding animals against disease is critical to the market for British meat and animal products and is a priority for the Department. We will be carrying out two badger cull pilots in the summer as part of a package of measures to control the spread of bovine tuberculosis and ultimately getting official TB free status over the next two decades.
Defra and the Food Standards Agency took a firm lead to tackle meat adulteration and fraud when horsemeat was detected in processed beef products in January. The Department has led the way in Europe and worked closely with food businesses in response to the issue, restoring consumer confidence in the food they buy.
In response to the detection of ash dieback in established UK trees in October, we published the Chalara Management Plan in March 2013. We also set up the Tree Health and Plant Biosecurity Expert Task Force to advise on how best to protect plants and the woodland environment. Their work will further bolster our capacity to tackle pests and diseases threatening our plants, trees and crops. We have also renewed our commitment to protecting, improving and expanding our woodlands to safeguard the UK‟s national forests for future generations.
Improving broadband and mobile telecommunications in rural areas is one of the most important things that we can do to boost rural economic growth. We will therefore continue to work closely across government to ensure that the major investments the Government are making in telecommunications infrastructure are focused on improving connectivity in rural areas. I am looking forward to the launch of an Agri-Tech Strategy as part of the Government‟s wider Industrial Strategy and I will continue to make the case for giving full and proper consideration to the role of technologies like genetic modification in ensuring a sustainable and secure food supply.
We will be pushing for further improvements to flood risk management including agreement on flood insurance arrangements and a Water Bill to reform the water industry. We will also be legislating to amend the Dangerous Dogs Act to provide legal protection for the first time to victims of dog attacks on private property.
We will continue to work efficiently and effectively to align our diverse portfolio of activities behind our four priorities, and I look forward to building on the Department‟s achievements in the coming year.
Department for Environment, Food and Rural Affairs Annual Report and Accounts 2012–13
Foreword by the Permanent Secretary
ii
Foreword by the Permanent Secretary of the Department for Environment, Food and Rural Affairs – Bronwyn Hill
The Secretary of State has highlighted his four priorities for Defra and the considerable achievements of the Defra network over the past year. Like him, I am immensely proud of what we have achieved.
The past year has seen us respond quickly and effectively to a series of natural events: widespread drought in spring, the emergence of ash dieback in the autumn and record levels of flooding across many parts of the country.
Over the summer, we were actively involved in ensuring that the UK could be proud of the 2012 Olympics. We helped to create the greenest games ever and a legacy for the future at many sites up and down the country.
In September, we saw significant changes in our Ministerial Team, developed the Secretary of State‟s four priorities and a new Defra Growth Plan to highlight work across the Department which will contribute to promoting economic growth. In January, we worked closely with the Food Standards Agency to respond to the discovery of contamination of beef products with horsemeat.
Defra and its network continued to restructure and change to deliver savings and improve the way we work. Our emphasis on One Team working, has enabled us to respond quickly and effectively to events, to improve services to customers and implement the Government‟s strategic priorities. I am particularly pleased with the significant improvements in performance on Common Agricultural Policy (CAP) payments at the Rural Payments Agency, delivered as part of their Strategic Improvement Plan.
The launch in July 2012 of the Canal & River Trust was another landmark for Defra. This was a great example of our ability to be innovative and to implement successfully a major change in the way that public services are delivered. It represented the largest single transfer of a public body into the charitable sector and is something we can be proud of.
It is clear that we will continue to operate in a climate of tough economic conditions and lower public spending for longer. We will need to continue to be rigorous in assessing where our interventions can make the biggest difference and how we can deliver outcomes innovatively and at lower cost.
We have made good progress in implementing the Civil Service Reform Plan, and will be looking next year to engage staff more actively in continuous improvement and to ensure everyone benefits from the new learning and development on offer.
I have valued the continuing contribution made throughout the year by our four Non–Executive Director members on the Board. Their experience and constructive challenge has again been of great value.
Finally, I would like to pay tribute to the huge contribution made by staff and colleagues across the Defra group without whom none of our achievements would be possible. I remain continually grateful for the commitment, professionalism and passion they demonstrate in their vitally important work.
Department for Environment, Food and Rural Affairs Annual Report and Accounts 2012–13
Contents
1
Contents Foreword by the Secretary of State of the Department for Environment, Food and Rural Affairs –
Owen Paterson i
Foreword by the Permanent Secretary of the Department for Environment, Food and Rural Affairs –
Bronwyn Hill ii
Chapter 1: Who We Are 3
Our Priorities 3
Our Ministers, Senior Staff and Non-Executives 4
How We Operate 5
Chapter 2: How We Deliver 8
Our Delivery Partners 8
Public Appointments for Network Bodies 11
Civil Service Reform 11
Better Regulation and Simplification 13
Decentralisation 15
Chapter 3: Performance 16
Highlights from 2012–13 16
Structural Reform Plan Summary 18
Input and Impact Indicators 22
Quarterly Data Summary 29
Chapter 4: Other Key Information 30
People and Culture 30
Performance on Sustainability 32
Rural Proofing 34
Adapting to Climate Change 36
Other Public Interest Information 36
Remuneration Report 39
Chapter 5: Finance Overview 45
Introduction 45
Financial Summary 45
Other Information 48
Core Tables 2012–13 52
Chapter 6: The Accounts 68
Statement of Accounting Officer's Responsibilities 68
Governance Statement 69
Non–Executive Directors‟ Report 79
The Certificate of the Comptroller and Auditor General to the House of Commons 82
The Report of the Comptroller and Auditor General to the House of Commons 85
Statement of Parliamentary Supply 88
Consolidated Statement of Comprehensive Net Expenditure 90
Department for Environment, Food and Rural Affairs Annual Report and Accounts 2012–13
Contents
2
Consolidated Statement of Financial Position 91
Consolidated Statement of Cash Flows 92
Consolidated Statement of Changes in Taxpayers‟ Equity 93
Notes to the Departmental Accounts 99
1 Statement of Accounting Policies 99
2 Net Outturn 110
3 Reconciliation of Outturn to Net Operating Cost and against Administration Budget 112
4 Reconciliation of Net Resource Outturn to Net Cash Requirement 114
5 Statement of Operating Costs by Operating Segment 115
6 Staff Numbers and Related Costs 116
7 Other Administration Costs 120
8 Programme Costs 121
9 Income 122
10 Property, Plant and Equipment 124
11 Intangible Assets 133
12 Financial Instruments 136
13 Financial Assets 140
14 Impairments 141
15 Inventories 141
16 Trade Receivables, Financial and Other Assets 142
17 Cash and Cash Equivalents 143
18 Trade Payables and Other Current Liabilities 144
19 Provisions 146
20 Pension Liabilities 149
21 Capital Commitments 164
22 Commitments under Leases 165
23 Commitments under PFI Contracts 167
24 Other Financial Commitments 168
25 Contingent Liabilities Disclosed under IAS 37 and Contingent Assets 169
26 Contingent Liabilities not Required to be Disclosed Under IAS 37 but Included for
Parliamentary Reporting and Accountability Purposes 170
27 Losses and Special Payments 171
28 Related Party Transactions 172
29 Events After the Reporting Period 173
30 Prior Year Adjustments 174
31 Third Party Assets 178
32 Entities within the Departmental Boundary 179
33 Entities outside the Departmental Boundary 180
Annex 1: Commentary on Sustainable Performance 182
Department for Environment, Food and Rural Affairs Annual Report and Accounts 2012–13
Chapter 1: Who We Are
3
Chapter 1: Who We Are
Our Priorities This Annual Report and Accounts reports performance against Defra‟s 2012–2015 Business Plan
1, refreshed in
May 2012, which sets out three coalition priorities.
Support and develop British farming and encourage sustainable food production Enhance the competitiveness and resilience of the whole food chain, including farms and the fishing industry, to ensure a secure, environmentally sustainable and healthy supply of food with improved standards of animal welfare.
Enhance the environment and biodiversity to improve quality of life Enhance and protect the natural environment, including biodiversity and the marine environment, by reducing pollution and greenhouse gas emissions and preventing habitat loss and degradation.
Support a strong and sustainable green economy, including thriving rural communities, resilient to climate change Create the conditions in which businesses can innovate, invest and grow; promote rural communities; encourage businesses, people and communities to use natural resources sustainably and reduce waste; and ensure that the UK economy is resilient to climate change.
In addition, Defra has two other major responsibilities.
Prepare for and manage risk from animal and plant disease Protect the environment, society and the economy from the risks of animal and plant disease through a range of controls, surveillance and horizon-scanning activities that help us understand the risks and maintain proportionate management responses.
Prepare for and manage risk from flood and other environmental emergencies Maintain an effective, resilient and robust capacity to respond to the full range of environmental emergencies, including reducing the threat of flooding and coastal erosion by understanding and managing the risks.
Detailed commentary on Defra‟s performance against these responsibilities follows in Chapter 3. During this year our priorities were reviewed. Our new priorities are to:
grow the rural economy;
improve the environment;
safeguard animal health; and
safeguard plant health. Defra‟s 2013–2014 Business Plan
2 reflects the four new priorities. Performance from 2013–14 onwards will be
measured against these new priorities.
1 http://webarchive.nationalarchives.gov.uk/20130109092234/
2 http://transparency.number10.gov.uk/business-plan/10
Department for Environment, Food and Rural Affairs Annual Report and Accounts 2012–13
Chapter 1: Who We Are
4
Our Ministers, Senior Staff and Non-Executives
The Secretary of State has overall statutory and political accountability to Parliament for all matters associated with the Department.
The Ministerial Team
From September 2012 Until September 2012
Rt Hon Owen Paterson MP Secretary of State
Rt Hon Caroline Spelman MP Secretary of State
David Heath MP Minister of State for Agriculture and Food
James Paice MP Minister of State for Agriculture and Food
Richard Benyon MP Parliamentary Under-Secretary for Natural Environment, Water and Rural Affairs
Richard Benyon MP Parliamentary Under-Secretary for Natural Environment and Fisheries
Lord de Mauley Parliamentary Under-Secretary for Resource Management, the Local Environment and Environmental Science
Lord Taylor of Holbeach Parliamentary Under-Secretary
The Senior Team
The Permanent Secretary, Bronwyn Hill, has responsibility for the overall organisation, management and staffing of the Department. She is responsible for the effectiveness and efficiency of all aspects of the Department‟s work, including management of Defra‟s operations, staff and financial resources. As Accounting Officer, she also has responsibility for the propriety and regularity of the Department‟s finances, for ensuring that Defra operates effectively and to a high standard of probity and is personally accountable to Parliament
3.
Defra has four Directors General (DGs).
DG Strategy, Evidence and Customers, Katrina Williams, leads new and innovative ways of working, brings a stronger strategic focus on EU and international work; and develops a stronger focus on customers and on how we communicate our strategic purpose more clearly both within the Department and outside it.
DG Policy Delivery, Peter Unwin, brings together farming and environment with a strong focus on working more closely in partnership with our Executive Agencies on delivery, leading relationships with our main NDPBs and many of our external stakeholders.
DG Chief Operating Officer, Ian Trenholm from 6 June 2012, Graham Ledward until 30 April 2012, is responsible for leading corporate services reform across the Network, key business transformation projects (e.g. Shared Services), major projects with the Network Bodies and for strengthening our commercial capability. They are responsible for Spending Review delivery, finance and performance across Defra and its Executive Agencies.
A Chief Scientific Adviser, Professor Ian Boyd from 30 August 2012, Professor Sir Robert Watson until 16 September 2012, at DG level reflects the importance of evidence to our work. Reflecting this emphasis on evidence-based policy, the Chief Scientific Adviser is a member of the Defra Board and reports on the progress of the Department‟s evidence work.
3 HM Treasury, Managing Public Money, 2 June 2011, chapter 3 “Accounting Officers”, p. 2, box 3.1.
Department for Environment, Food and Rural Affairs Annual Report and Accounts 2012–13
Chapter 1: Who We Are
5
The Non–Executive Directors
There are four Board Non–Executive Directors (NEDs) who bring external experience and expertise to the Department‟s decisions and processes, serve on sub-committees, ensure all appropriate information is considered and take an interest in Defra‟s relationship with the Network Bodies
4.
Iain Ferguson Lead Non–Executive Director Chair of the Nominations Committee
Paul Rew Non–Executive Director Chair of the Audit and Risk Committee
Catherine Doran Non–Executive Director
Sir Tony Hawkhead Non–Executive Director
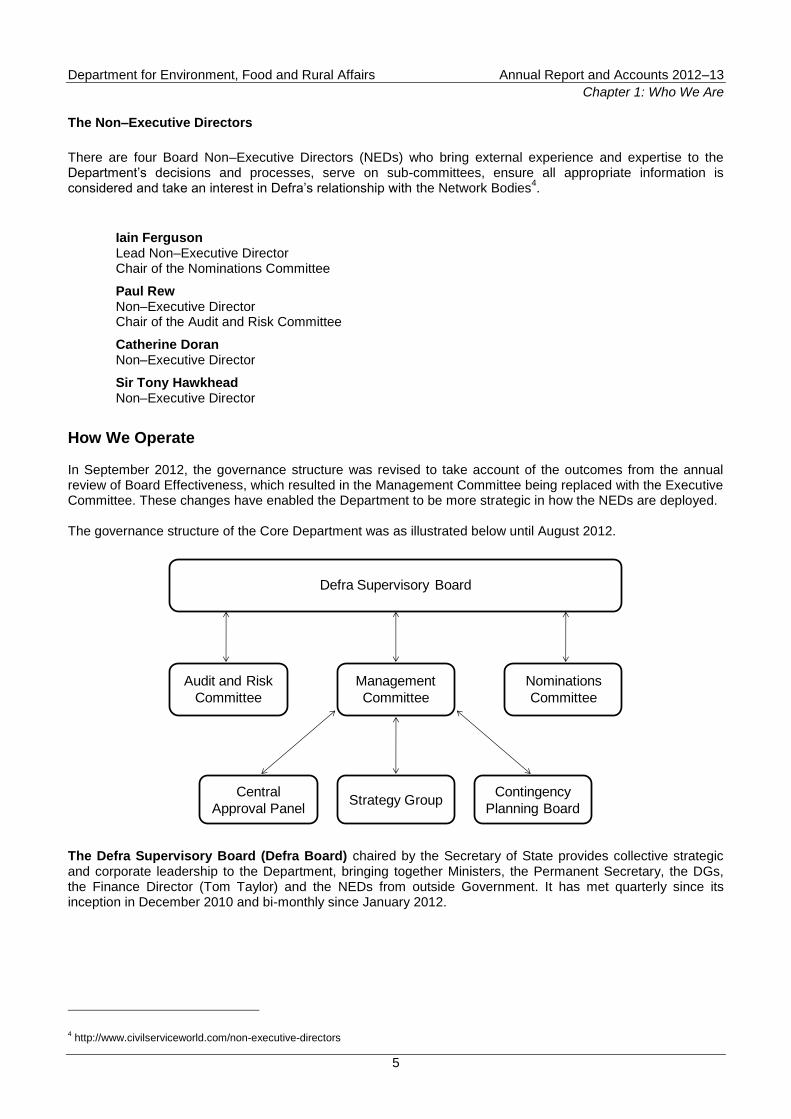
How We Operate In September 2012, the governance structure was revised to take account of the outcomes from the annual review of Board Effectiveness, which resulted in the Management Committee being replaced with the Executive Committee. These changes have enabled the Department to be more strategic in how the NEDs are deployed. The governance structure of the Core Department was as illustrated below until August 2012.
Defra Supervisory Board
Audit and Risk
Committee
Management
Committee
Nominations
Committee
Central
Approval PanelStrategy Group
Contingency
Planning Board
The Defra Supervisory Board (Defra Board) chaired by the Secretary of State provides collective strategic and corporate leadership to the Department, bringing together Ministers, the Permanent Secretary, the DGs, the Finance Director (Tom Taylor) and the NEDs from outside Government. It has met quarterly since its inception in December 2010 and bi-monthly since January 2012.
4 http://www.civilserviceworld.com/non-executive-directors
Department for Environment, Food and Rural Affairs Annual Report and Accounts 2012–13
Chapter 1: Who We Are
6
Until August 2012, the Defra Board had three sub-committees.
The Management Committee focusing on operations, performance and risk. It comprised all the members of the Defra Board, except Ministers. It met every other month, alternating with the Defra Board.
The Audit and Risk Committee is a non-executive sub-committee. It supports and advises the Defra Board and the Accounting Officer on issues of risk, control, governance and other related matters. It is chaired by one of the NEDs and comprises independent members. Officials, including the Finance Director and the Head of Internal Audit, attend routinely as observers and contributors, as does a National Audit Office representative. It meets approximately five times each year.
The Nominations Committee scrutinises incentives and rewards for the executive board members and senior civil service, advises on the extent to which these are effective at improving performance, and considers succession planning for NEDs and other Defra Board members. It is chaired by the Lead NED, and comprises the Permanent Secretary, the Director of Strategic Human Resources and the Head of Talent. It meets approximately quarterly.
There were also three sub-groups of the Management Committee.
The Central Approval Panel, responsible for resource allocation.
The Strategy Group advising on Defra‟s strategy.
The Contingency Planning Board advising and offering assurance on Defra‟s overall state of preparedness to address emergencies, and its ability to continue with its essential business in the face of any serious disruption to its staff or infrastructure.
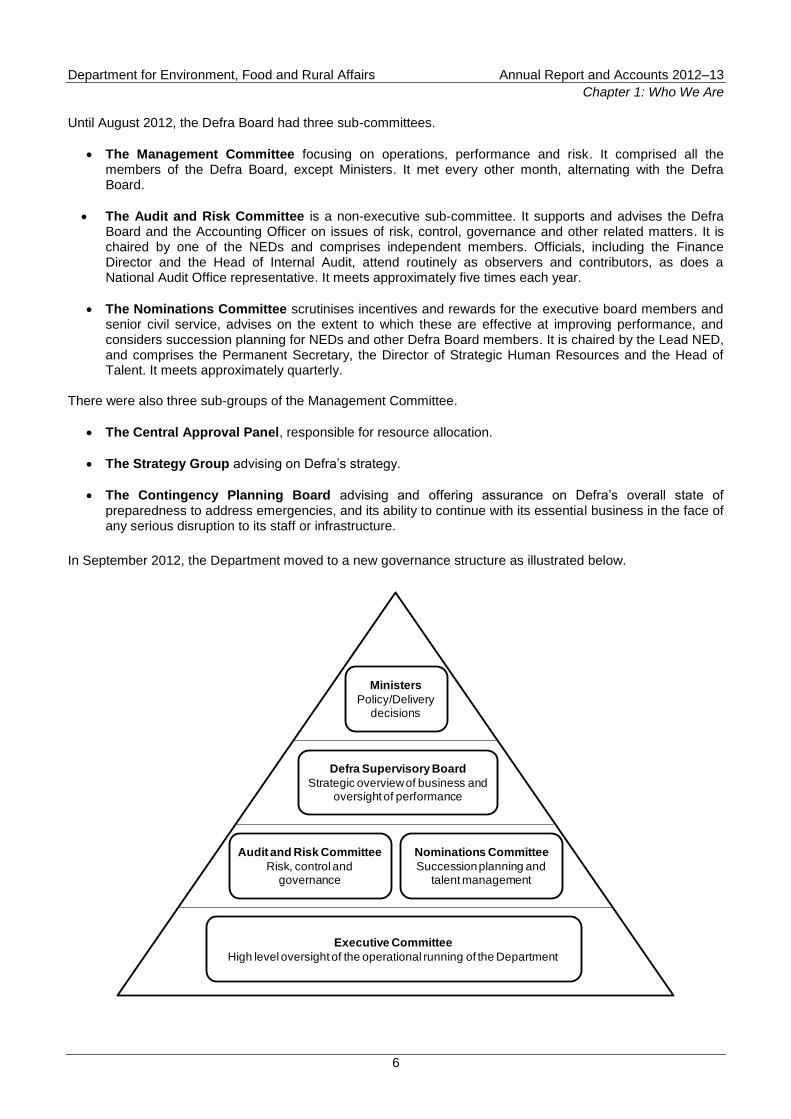
In September 2012, the Department moved to a new governance structure as illustrated below.
Ministers
Policy/Delivery decisions
Defra Supervisory Board
Strategic overview of business and oversight of performance
Audit and Risk Committee
Risk, control and governance
Nominations Committee
Succession planning and talent management
Executive Committee
High level oversight of the operational running of the Department
Department for Environment, Food and Rural Affairs Annual Report and Accounts 2012–13
Chapter 1: Who We Are
7
In the new structure the Defra Board delegates aspects of its work to two sub-committees, the Audit and Risk Committee and Nominations Committee, whose remits are unchanged.
The Executive Committee, which started in September 2012, brings together the Permanent Secretary and four DGs to take key decisions on the management of the Department, to review plans and progress on improving Defra‟s capacity and capability for the future, and to oversee cross departmental initiatives to inform strategic decisions by Ministers on their priorities and spending plans.
To support the Executive Committee‟s work in 2013–14 and beyond, the Executive Committee has established four Panels, focusing on Risks, Operations, People and Finance.
Department for Environment, Food and Rural Affairs Annual Report and Accounts 2012–13
Chapter 2: How We Deliver
8
Chapter 2: How We Deliver
Our Delivery Partners
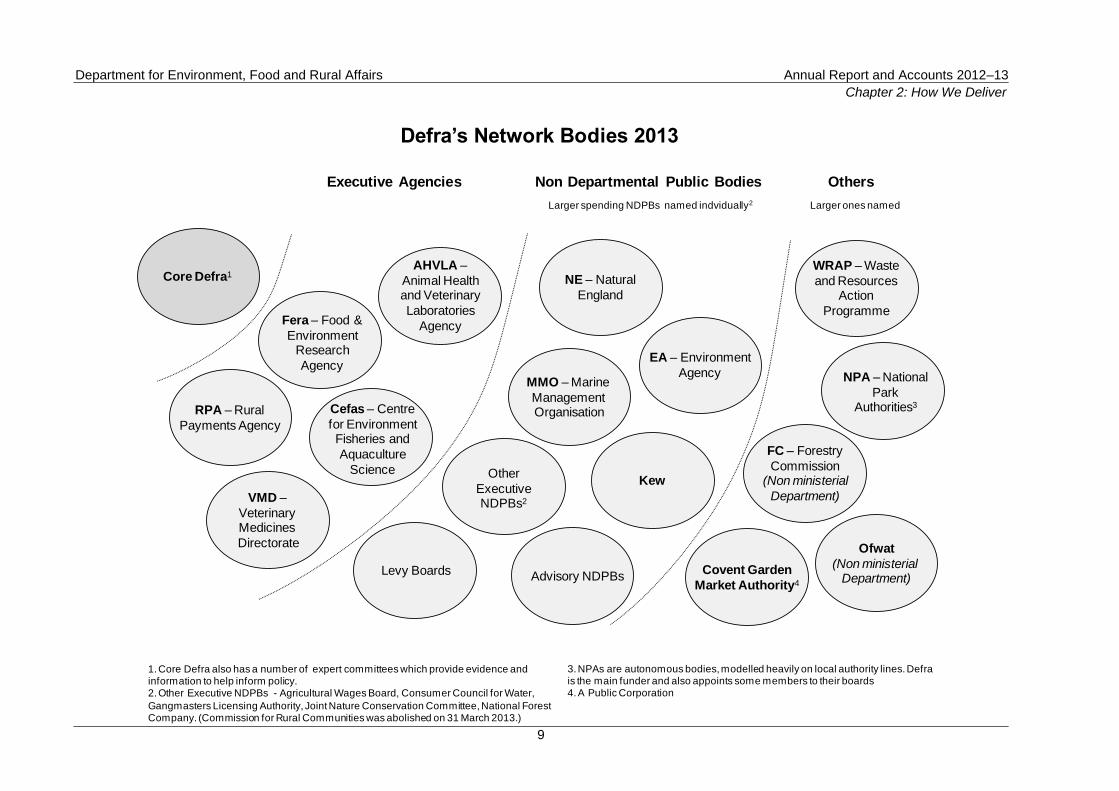
The Core Department focuses on supporting Ministers to achieve the outcomes they seek by developing and implementing policy, including legislation. The Department is committed to evidence-based policy making, prioritising rigorous and relevant evidence in all its policy formulation and implementation decisions. Defra‟s stakeholders are regularly involved and consulted, and delivery bodies in particular are fully involved so that any issues which may arise during implementation are identified and addressed as early as possible. Risk assessment and mitigation is built in at every stage of the process. The delivery of Defra‟s policies is largely delegated to our Network Bodies, including our Executive Agencies, Non–Departmental Public Bodies (NDPBs) and other public bodies. Defra‟s Executive Agencies operate with a degree of autonomy within a framework of direct accountability to the Department and to Ministers who remain directly accountable for their overall performance. They are part of the Department and do not have a separate legal identity; the Chief Executive Officer (CEO) is appointed as the Accounting Officer for the Agency. All Executive Agencies have a business plan measurable against key performance indicators and framework agreements. During 2012–13, Defra introduced more effective and efficient arrangements for the governance of Defra Executive Agencies. The DG Chief Operating Officer now acts as the Corporate Owner in relation to all of the Executive Agencies, providing line management for the Chief Executives, holding them to account for performance measured against targets and Agency internal processes, and taking a longer term strategic view of the Agencies‟ interaction with Defra. The governance and performance management of the Agencies is supported by a quarterly review of the Agencies‟ performance which is assessed and then reported to the Defra Board. A Defra Director with a policy interest in a particular Agency‟s business takes on the role of Corporate Customer, ensuring that all policy customer interests are represented effectively, including working closely with the Devolved Administrations. Each Agency has a Management Board, which is chaired by a Non–Executive Director (NED) and on which other NEDs and the Agency senior team sit. The effectiveness of these arrangements is considered in more detail in the Governance Statement on page 69 of these Annual Report and Accounts. Defra‟s executive NDPBs have been established through legislation, which specifies each NDPB‟s purpose and functions, what powers are invested in it, and how it should be financed. Each has its own independent Board, Chairman and Executive Management Team, with the CEO designated as the Accounting Officer for that organisation. In practice, NDPBs operate with some independence and are not under day-to-day ministerial control, but Ministers agree funding and key objectives for each NDPB and, together with Defra‟s Board, hold them to account. The NDPBs provide quarterly performance reports to the Defra board. The delivery network map on the following page shows Defra‟s Network Bodies, and gives an indication of the distance from Core Defra at which they operate.
Department for Environment, Food and Rural Affairs Annual Report and Accounts 2012–13
Chapter 2: How We Deliver
9
Core Defra1AHVLA –
Animal Healthand Veterinary
Laboratories
Agency
Cefas – Centre
for Environment Fisheries and
Aquaculture
Science Other
Executive NDPBs2
Levy Boards
Executive Agencies Non Departmental Public Bodies
RPA – Rural
Payments Agency
VMD –
Veterinary Medicines
Directorate
Fera – Food &
Environment Research
Agency
Advisory NDPBs
EA – Environment
Agency
NE – Natural
England
Kew
Covent Garden
Market Authority4
NPA – National
Park Authorities3
FC – Forestry
Commission(Non ministerial
Department)
WRAP – Waste
and Resources Action
Programme
MMO – Marine
Management Organisation
Larger spending NDPBs named indvidually2
Ofwat
(Non ministerial Department)
Others
Defra’s Network Bodies 2013
3. NPAs are autonomous bodies, modelled heavily on local authority lines. Defra is the main funder and also appoints some members to their boards4. A Public Corporation
1. Core Defra also has a number of expert committees which provide evidence and information to help inform policy.2. Other Executive NDPBs - Agricultural Wages Board, Consumer Council for Water,
Gangmasters Licensing Authority, Joint Nature Conservation Committee, National Forest Company. (Commission for Rural Communities was abolished on 31 March 2013.)
Larger ones named
Department for Environment, Food and Rural Affairs Annual Report and Accounts 2012–13
Chapter 2: How We Deliver
10
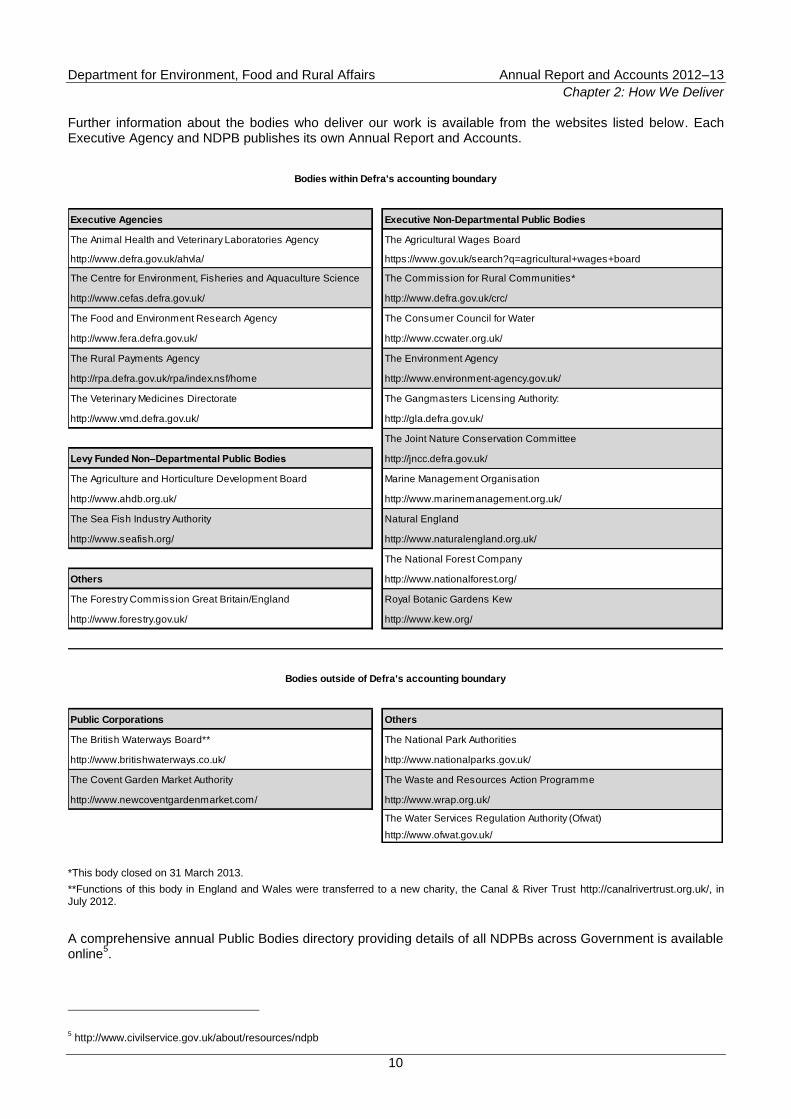
Further information about the bodies who deliver our work is available from the websites listed below. Each Executive Agency and NDPB publishes its own Annual Report and Accounts.
Executive Agencies Executive Non-Departmental Public Bodies
The Animal Health and Veterinary Laboratories Agency The Agricultural Wages Board
http://www.defra.gov.uk/ahvla/ https://www.gov.uk/search?q=agricultural+wages+board
The Centre for Environment, Fisheries and Aquaculture Science The Commission for Rural Communities*
http://www.cefas.defra.gov.uk/ http://www.defra.gov.uk/crc/
The Food and Environment Research Agency The Consumer Council for Water
http://www.fera.defra.gov.uk/ http://www.ccwater.org.uk/
The Rural Payments Agency The Environment Agency
http://rpa.defra.gov.uk/rpa/index.nsf/home http://www.environment-agency.gov.uk/
The Veterinary Medicines Directorate The Gangmasters Licensing Authority:
http://www.vmd.defra.gov.uk/ http://gla.defra.gov.uk/
The Joint Nature Conservation Committee
Levy Funded Non–Departmental Public Bodies http://jncc.defra.gov.uk/
The Agriculture and Horticulture Development Board Marine Management Organisation
http://www.ahdb.org.uk/ http://www.marinemanagement.org.uk/
The Sea Fish Industry Authority Natural England
http://www.seafish.org/ http://www.naturalengland.org.uk/
The National Forest Company
Others http://www.nationalforest.org/
The Forestry Commission Great Britain/England Royal Botanic Gardens Kew
http://www.forestry.gov.uk/ http://www.kew.org/
Public Corporations Others
The British Waterways Board** The National Park Authorities
http://www.britishwaterways.co.uk/ http://www.nationalparks.gov.uk/
The Covent Garden Market Authority The Waste and Resources Action Programme
http://www.newcoventgardenmarket.com/ http://www.wrap.org.uk/
The Water Services Regulation Authority (Ofwat)
http://www.ofwat.gov.uk/
Bodies within Defra's accounting boundary
Bodies outside of Defra's accounting boundary
*This body closed on 31 March 2013.
**Functions of this body in England and Wales were transferred to a new charity, the Canal & River Trust http://canalrivertrust.org.uk/, in July 2012.
A comprehensive annual Public Bodies directory providing details of all NDPBs across Government is available online
5.
5 http://www.civilservice.gov.uk/about/resources/ndpb
Department for Environment, Food and Rural Affairs Annual Report and Accounts 2012–13
Chapter 2: How We Deliver
11
Changes to Our Delivery Network
A key reform in 2012–13 has been the transfer of functions of British Waterways in England and Wales to a new charity, the Canal & River Trust.
The Commission for Rural Communities was abolished on 31 March 2013. Rural policy functions are now being undertaken by the Rural Communities Policy Unit in Defra.
A joint Triennial Review of EA and NE commenced in December 2012 and reported in June 2013, concluding that the EA and NE should be retained as two separate NDPBs but with further reform of their functions and ways of working. The Review makes thirteen conclusions about the bodies‟ functions, organisation and customer focus. These conclusions will act as the foundation for ongoing reform, to provide improved and more efficient environmental services to customers. Defra will set a clear commission for the Chairmen and Chief Executives of both bodies to produce and deliver a joint plan to address these conclusions.
A Triennial Review of the Joint Nature Conservation Committee (JNCC) was launched in March 2013 and reported in June 2013, concluding that JNCC should be retained as an NDPB with some reforms. A Triennial Review of the Veterinary Products Committee was launched in March 2013, and is expected to report in autumn 2013.
The Agricultural Wages Board was abolished on 25 June 2013 under provisions in the Enterprise and Regulatory Reform Act 2013.
Public Appointments for Network Bodies
Between April 2012 and March 2013, the Department has advertised for approximately 44 public appointments regulated by the Office of the Commissioner for Public Appointments across 24 public bodies. The total cost of the 39 adverts covering these posts was approximately £70,000.
Defra has five Chair roles which are subject to pre-appointment scrutiny by the Environment Food and Rural Affairs (EFRA) Select Committee. These are: the Chair of Natural England; the Chair of the Environment Agency; the Chair of the Gangmasters Licensing Authority; the Chair of the Water Services Regulation Authority (Ofwat); and the Chair of the Agricultural Wages Board.
Civil Service Reform
Defra is committed to delivering the Civil Service Reform (CSR) Agenda. Many of the themes it covers tie in closely with Defra‟s work now in progress, in the Department and Network Bodies, and the improvements which are being made. A summary of the work across the range of reform proposals is provided below.
Clarifying Future Shape and Size
Core Defra concluded its Change Programme to reshape the Department in September 2012. On 1 April 2012 Defra moved to a new structure for Senior Civil Service (SCS) posts, and for all posts below SCS from 1 September 2012.
Delivery models In February 2013 the Permanent Secretary initiated a new piece of strategic work – Defra Network Strategic Alignment – to look at the future Business Model and ways of working for Defra and its Network. This is looking at how the Defra Network can work better together, for example, to be more efficient over the medium term and to provide a better service to customers.
Digital by default Defra is working closely with the Government Digital Service (GDS) and published the Departmental Digital Strategy in December 2012. Defra is currently working on a roadmap of developments.
Department for Environment, Food and Rural Affairs Annual Report and Accounts 2012–13
Chapter 2: How We Deliver
12
Shared services Defra is an active founder member of Independent Shared Services Centre Two (ISSC2) contributing directly to shape the commercial delivery model and technology strategy, in order to migrate transactional services.
Improving Policy Making Capability
Open policy making Defra and its delivery network have many examples of innovative approaches to policy development and delivery. The most radical involves external experts in creating policy through the Animal Health and Welfare Board for England. This brings together farming experts with the Chief Veterinary Officer and officials to make policy recommendations to Ministers on the health and welfare of farm animals and pets.
Defra has a Civil Society Advisory Board (CSAB) appointed by Ministers to develop capacity and expertise to apply the principles of open policy-making to our engagement with civil society. The CSAB will continue until March 2014, when it will be formally wound up in line with the Cabinet Office requirement for ad hoc advisory bodies to be limited to a two year lifespan.
Online delivery through user-friendly consultation and openly engaging digitally with online communities, the intelligence gathered in this way is used to inform policy-making and shape formal consultation. The Department has proactively engaged with stakeholders as part of the Triennial Review of NE and EA by holding several stakeholder workshops, consulting extensively and conducting meetings with key stakeholders.
Implementing Policy and Sharpening Accountability
Matching resources to policy priorities Defra has introduced a business planning process which sets out for each business area a clear, consistent picture of what will be done over a given period (activities) with their available resources (inputs) and how these are expected to deliver the Department‟s strategic priorities (outputs and outcomes). This was developed in 2012–13 for full implementation in 2013–14. The Civil Service Reform Plan
6 highlighted Defra‟s work reviewing new and existing initiatives through an
approvals process based on delivering outcomes aligned with Business Plan priorities, operating in accordance with best practice and value for money.
Building Capability and Improving Performance
Competency framework Defra successfully launched refreshed competencies in April 2012 which were embedded in all relevant Human Resources (HR) processes. Defra (Core and Agencies) adopted the new Civil Service-wide competency framework (which draws heavily on the Defra model) from April 2013.
Talent management Defra participated in all Civil Service talent schemes both in providing participants and helping shape them. Staff talent reviews are ongoing. A talent toolkit is being phased in with a nine box grid, succession plan, and vacancy map already in place. Talent management and succession planning are assured by the Nominations Committee.
Departmental capability The Defra Learning and Development Strategy and Plan identified the key capability gaps for the Department, alongside its plan for developing staff in those areas. This has been launched and implementation started. Defra will consider any amendments that may be needed following the publication of the Civil Service Capabilities Plan in April 2013.
6 http://www.civilservice.gov.uk/wp-content/uploads/2012/06/Civil-Service-Reform-Plan-acc-final.pdf
Department for Environment, Food and Rural Affairs Annual Report and Accounts 2012–13
Chapter 2: How We Deliver
13
Creating a Modern Employment Offer
Terms and conditions review Defra has reviewed terms and conditions with the active engagement of CEOs and HR leads across Core Defra and its five Executive Agencies. The new terms and conditions will apply to new joiners from March and April 2013, with the date for introducing changes to occupational sick pay still to be decided due to the complexity of the system changes needed.
Creating a decent working environment for staff In parallel with the terms and conditions review, Defra is reviewing the wider offer to its staff; covering physical workspace, provision of IT, ways of working and learning and development.
Defra‟s DG Chief Operating Officer is an active member of the Cross Government Digital Leaders Network and is keen to promote common platform strategy with common easy to use IT systems. Defra is currently scoping options for moving to a „consolidated approach‟ of ICT services across the Defra Network. Defra is looking at sharing IT infrastructure at sites where different Defra organisations are located, supporting flexible shared use of Defra estates.
Better Regulation and Simplification
Defra‟s vision is to create the environment in which its policies contribute to sustainable economic growth in ways that are least burdensome on those affected, intervening only when necessary and preferably through non–regulatory approaches. Defra has developed a new internal system of policy appraisal (Policy Implementation Management Made Simpler) that challenges policy teams on whether regulation is the only way of achieving desired outcomes alongside the scope for applying non–regulatory approaches.
One-In, One-Out (OIOO) and One-In, Two-Out (OITO) Statement of New Regulation (SNR5)
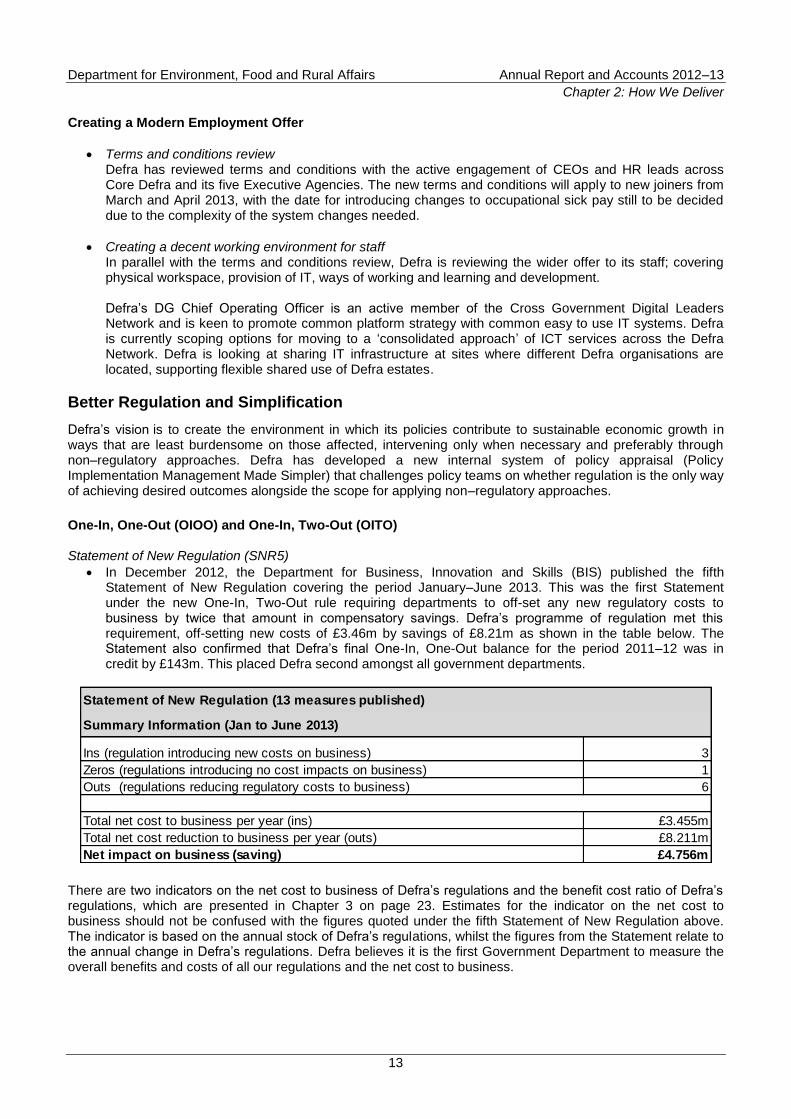
In December 2012, the Department for Business, Innovation and Skills (BIS) published the fifth Statement of New Regulation covering the period January–June 2013. This was the first Statement under the new One-In, Two-Out rule requiring departments to off-set any new regulatory costs to business by twice that amount in compensatory savings. Defra‟s programme of regulation met this requirement, off-setting new costs of £3.46m by savings of £8.21m as shown in the table below. The Statement also confirmed that Defra‟s final One-In, One-Out balance for the period 2011–12 was in credit by £143m. This placed Defra second amongst all government departments.
Statement of New Regulation (13 measures published)
Ins (regulation introducing new costs on business) 3
Zeros (regulations introducing no cost impacts on business) 1
Outs (regulations reducing regulatory costs to business) 6
Total net cost to business per year (ins) £3.455m
Total net cost reduction to business per year (outs) £8.211m
Net impact on business (saving) £4.756m
Summary Information (Jan to June 2013)
There are two indicators on the net cost to business of Defra‟s regulations and the benefit cost ratio of Defra‟s regulations, which are presented in Chapter 3 on page 23. Estimates for the indicator on the net cost to business should not be confused with the figures quoted under the fifth Statement of New Regulation above. The indicator is based on the annual stock of Defra‟s regulations, whilst the figures from the Statement relate to the annual change in Defra‟s regulations. Defra believes it is the first Government Department to measure the overall benefits and costs of all our regulations and the net cost to business.
Department for Environment, Food and Rural Affairs Annual Report and Accounts 2012–13
Chapter 2: How We Deliver
14
Regulatory Policy Committee
The number of Defra Impact Assessments assessed as „fit for purpose‟ by the Committee has improved to 83 percent in 2012 from 70 percent in 2011.
Micro-Business Moratorium and Alternative Approaches to Regulation
The Department continues to challenge both domestic and European policies which impact on micro-businesses. For example, Defra is seeking an exemption for micro-businesses from the European Union (EU) waste carriers, brokers and dealers registration requirements for businesses transporting their own waste.
Defra has developed an online training module to help policy makers apply the range of regulatory and other interventions to achieve policy goals. Defra has contributed three exercises out of six on alternatives to regulation being piloted across Government, covering appliances and fuels subject to the Clean Air Act, pollution control inspection by local authorities and climate change reporting.
Red Tape Challenge
Defra published its Red Tape Challenge Environment Theme Implementation Plan in September 2012. Over 10 percent of this package, which save business more than £1bn over five years, has been implemented. In December 2012, Defra committed to scrap or improve 63 percent of the 168 water regulations under the Water and Marine theme. Proposals on marine regulations will be published in a combined water and marine implementation plan in summer 2013.
Implementation and Guidance
Defra has reviewed the scope for significant rationalisation of environmental guidance, data reporting and legislation, through its Smarter Environmental Regulation Review. The ambition by March 2014 is to:
revise and publish environmental guidance so it is simple, clear and easy to find;
conduct a root and branch review of the environmental information required from businesses and publish plans for making changes to reduce the burden; and
pilot a simplified way to report environmental information from business and establish whether, how and when it can be extended.
Following the Farming Regulation Task Force Report, Defra has incorporated an earned recognition approach for farm animal welfare inspections. As a result, producers who are members of accredited welfare assurance schemes were not selected in 2012 for a risk-based animal welfare inspection under Common Agricultural Policy cross-compliance requirements. Defra has applied an earned recognition approach to the Nitrate Regulations Inspection Regime, resulting in reduced inspections for those with a Nutrient Management Plan and some exemptions from record-keeping for low intensity farms.
Focus on Enforcement
Defra and its delivery network have participated constructively in the majority of regulatory reviews carried out to date in the Government‟s Focus on Enforcement Programme. For example, in response to the Chemicals Review, the Control of Major Accident Hazards (COMAH) Competent Authority (Health and Safety Executive and EA) has developed an ambitious programme to make further significant improvement to arrangements for regulating onshore major hazards. The Programme aims to reduce unnecessary burdens on business whilst securing the protection of people and the environment from major accidents. In response to the Coastal Projects and Investments Review an action plan is being developed to consider how marine licensing processes can be further improved.
EU Regulations
Defra is seeking to minimise the potential regulatory burdens of EU dossiers under negotiation or emerging as proposals. For example, Defra has lobbied other Member States effectively to maintain a
Department for Environment, Food and Rural Affairs Annual Report and Accounts 2012–13
Chapter 2: How We Deliver
15
blocking minority on the proposed Soils Framework Directive, including evidence that, at a cost of up to £3bn, this Directive would be disproportionately costly, and would impose unnecessary burdens.
In negotiations on Directive 2012/12 relating to fruit juices, the UK achieved proportionate provisions that avoided or reduced burdens on industry where there were no corresponding benefits to consumers. Domestic rules on fruit juices have been reviewed and some „gold-plating‟ identified. These will be rectified in a consolidated single set of new implementing regulations.
Decentralisation
Defra was given a three star rating in the Decentralisation: An Assessment of Progress7 report, published in
December 2012. The assessment looked at whether or not government departments were decentralising power. A three star rating reflects „significant progress on individual reforms – full programme of reform still in development‟.
The report recognises that the Department is constrained because its largest programmes are determined at a European level. However, it welcomes a number of decentralisation measures, such as Local Nature Partnerships, the transfer of British Waterways in England and Wales to a charity, and the Big Tree Plant. It also highlights Defra‟s work to reform the funding of flood and coastal erosion risk management, to review National Parks‟ governance, to increase local accountability and to provide new accountability through Commons Councils.
7https://www.gov.uk/government/uploads/system/uploads/attachment_data/file/16593/Decentralisation_an_assessment_of_progress.pdf
Department for Environment, Food and Rural Affairs Annual Report and Accounts 2012–13
Chapter 3: Performance
16
Chapter 3: Performance
Defra‟s Business Plan for 2012–15 sets out the Department‟s priorities and objectives in meeting the Coalition Government‟s Programme for Government commitments. Progress against the Structural Reform Plan (SRP) actions and indicators in the Business Plan is reported in this chapter, along with details of how we manage performance internally.
Highlights from 2012–13
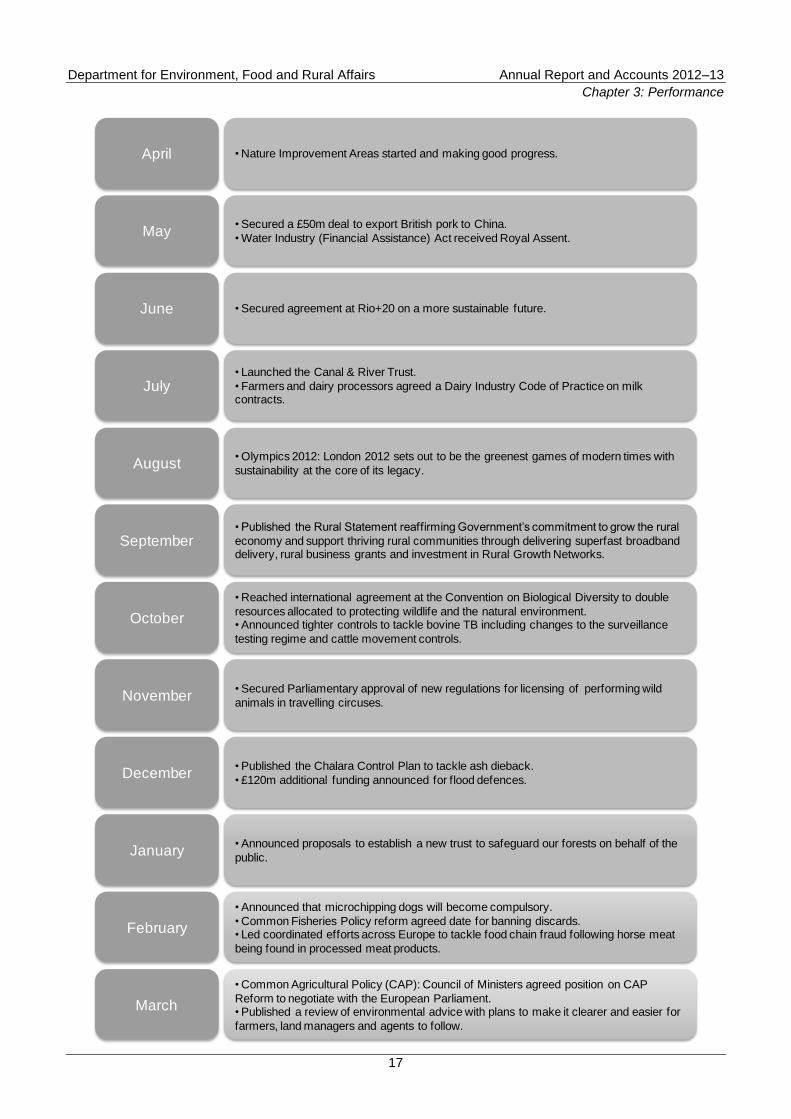
The diagram on the following page highlights some of Defra‟s achievements from across 2012–13. It includes a mix of SRP achievements and other activities in order to reflect the breadth of Defra‟s responsibilities. All the SRP actions completed in 2012–13 are described in more detail in the following section. More information can be found on all our work areas online
8.
8 www.gov.uk/defra
Department for Environment, Food and Rural Affairs Annual Report and Accounts 2012–13
Chapter 3: Performance
17
April • Nature Improvement Areas started and making good progress.
May• Secured a £50m deal to export British pork to China.
• Water Industry (Financial Assistance) Act received Royal Assent.
June • Secured agreement at Rio+20 on a more sustainable future.
July• Launched the Canal & River Trust.
• Farmers and dairy processors agreed a Dairy Industry Code of Practice on milk contracts.
August• Olympics 2012: London 2012 sets out to be the greenest games of modern times with
sustainability at the core of its legacy.
September• Published the Rural Statement reaffirming Government‟s commitment to grow the rural
economy and support thriving rural communities through delivering superfast broadband delivery, rural business grants and investment in Rural Growth Networks.
October
• Reached international agreement at the Convention on Biological Diversity to double
resources allocated to protecting wildlife and the natural environment.• Announced tighter controls to tackle bovine TB including changes to the surveillance
testing regime and cattle movement controls.
November• Secured Parliamentary approval of new regulations for licensing of performing wild
animals in travelling circuses.
December• Published the Chalara Control Plan to tackle ash dieback.
• £120m additional funding announced for flood defences.
January• Announced proposals to establish a new trust to safeguard our forests on behalf of the
public.
February
• Announced that microchipping dogs will become compulsory.
• Common Fisheries Policy reform agreed date for banning discards.• Led coordinated efforts across Europe to tackle food chain fraud following horse meat
being found in processed meat products.
March
• Common Agricultural Policy (CAP): Council of Ministers agreed position on CAP
Reform to negotiate with the European Parliament.• Published a review of environmental advice with plans to make it clearer and easier for
farmers, land managers and agents to follow.
Department for Environment, Food and Rural Affairs Annual Report and Accounts 2012–13
Chapter 3: Performance
18
Structural Reform Plan Summary
The 2012 SRP specifies 63 actions derived from the Coalition priorities which Defra will implement during the current Spending Review (SR) period (2011–15). In 2012–13, Defra completed 34 of our 63 SRP actions due for completion over the SR period. This leaves 29 further actions to be completed by 2014–15 (although new actions will be added in the 2013 Business Plan refresh). A comprehensive list of actions is available on the Number 10 Transparency website
9.
May
Food and Farming Minister Jim Paice secured a deal worth up to £50m, to export British pork to China during a visit to develop trade relationships and promote British food and drink.
June
The Government announced its intention to make it compulsory for companies to include greenhouse gas emissions data for their entire organisation in their annual reports. Reporting is the first vital step for companies to make reductions in emissions, it is estimated this will save four million tonnes of CO2 emissions by 2021. These reductions will contribute towards the commitment to reduce UK emissions to 50 percent of 1990 levels by 2025.
Environment Secretary Caroline Spelman led talks at the Rio+20 summit to reach international agreement on a more sustainable future and on how to take forward work on Sustainable Development Goals, and the themes that they should cover – including food, water and energy.
July
Defra published a report on the Green Food Project, a joint initiative between government, industry and environmental partners to reconcile how to improve the environment and increase food production. The report laid the foundation for further discussion which will shape future policy and decision making.
Farmers and dairy processors agreed a Dairy Industry Code of Practice on milk contracts. In December 2012, Defra launched a consultation on plans to allow dairy farmers to form producer organisations, which would give farmers greater negotiation power. A £5m dairy fund was set up to provide grants to help farmers set up producer organisations and co-operatives.
Defra handed over ownership of waterways comprising 2,000 miles of historic canals and rivers across England and Wales to the newly formed Canal & River Trust as part of the Public Bodies Reform Programme. This has and will enable even more community involvement in conserving, restoring, and enhancing the waterways.
The Independent Panel on Forestry published its report and in January 2013 Defra published the Government‟s response.
Defra received advice on Marine Conservation Zones from the statutory nature conservation bodies and on the basis of this formulated a set of proposals. These proposals aim to enhance the protection of vulnerable marine areas through establishing a network of conservation sites covering the representative habitats and species in our seas, large enough and close enough together to support functioning communities of wildlife. The public consultation on the proposals ended on 31 March and the results will be published later in 2013.
9 http://transparency.number10.gov.uk/business-plan/10
“This Government is determined to deliver public services in different, better ways and that’s just what this new charity will do. The Canal & River Trust will empower the very people who know British canals and waterways the best to get involved in how they are run. This is the Big Society in action - and because it’s also the largest single transfer of a public body into the charitable sector, it’s also a major milestone in our programme to reform quangos.”
Francis Maude Minister for the Cabinet Office
Department for Environment, Food and Rural Affairs Annual Report and Accounts 2012–13
Chapter 3: Performance
19
The first Local Nature Partnerships (LNPs) were announced. They were set up to drive positive change in the natural environment by taking a strategic view and embedding its value into local decision-making for the benefit of the environment, people and the economy. Each LNP is developing its own strategic priorities and ways of working to reflect local situations. However, key activities include working with local authorities on the development of local plans, with Local Enterprise Partnerships to inform local growth programme investment strategies and contributing to health and wellbeing strategies. A further 7 LNPs were announced in October 2012, bringing the total to 48.
Defra published the draft Water Bill based on the Water White Paper 2012. The draft Bill sets out an ambitious reform of the water industry in an effort to reduce red tape, drive innovation and open the market to new companies. Evidence suggests that opening up the water market and allowing businesses to switch supplier could deliver benefits to the economy of £2bn over 30 years.
September
Defra unveiled the Rural Statement, giving rural communities the power to hold government to account on its promise to grow the rural economy and support thriving rural communities. Superfast broadband delivery, rural business grants and Rural Growth Networks were among initiatives designed to create rural jobs, new business opportunities and rural economic growth.
October
International agreement was reached at the Convention on Biological Diversity in Hyderabad to double the resources allocated to protecting wildlife and the natural environment by 2020. This will help ensure that the agreement, made at Nagoya in 2010, to halt the loss of wildlife across the world can be achieved.
Plans were published in the Growth and Infrastructure Bill to improve balance between protecting high quality green space valued by local communities and enabling the right development to occur in the right place at the right time. The bill received Royal Assent on 25 April 2013.
January
Defra published its response to the Independent Panel on Forestry report, setting out the Government‟s vision for the future of our forests and priorities for future government policy-making. The statement confirmed that the Public Forest Estate will remain in public ownership, in a new body set up to hold the Estate in trust for the nation and manage it for the long-term benefit of people, the economy and the environment. This will require primary legislation.
“We welcome this focus on rural economic growth. Long-term sustainability and the competitiveness of rural businesses are crucial in the present economic climate. It is vital Defra understands the needs and interests of rural businesses as well as those who live and work in rural areas.” Harry Cotterell President of the Country Land & Business Association (CLA)
“Battersea warmly welcomes today’s Government announcement on microchipping in England. It’s so worrying for owners when a dog strays from home, yet a tiny microchip the size of a grain of rice means charities like Battersea can often reunite pets with their owners within hours. Having no chip in a dog can mean any reunion can take days to happen, if it happens at all. So our three centres around London will help by offering dog owners free microchipping for their dog.”
Claire Horton Chief Executive of Battersea Dogs & Cats Home
Department for Environment, Food and Rural Affairs Annual Report and Accounts 2012–13
Chapter 3: Performance
20
March
Defra published a review of environmental advice, incentives and partnership approaches for the farming sector in England. The report sets out how we intend to deliver a more integrated, streamlined and efficient approach to providing advice on the environment in England for farmers, land managers and agents. The benefits of this new approach include greater focus on competitiveness and growth potential, increased likelihood of achieving environmental outcomes and greater value to the taxpayer. This approach should deliver savings of up to 25 percent from the £20m a year government currently spends in this area.
Defra published the final report from the Ecosystem Markets Task Force. The report states the business case for why nature matters. It makes practical recommendations for both government and business where interventions would assist in the creation and development of new markets, enhancing opportunities for growth that also benefit the environment. Defra will publish the Government‟s response to the report later this year.
Outstanding Structural Reform Plan Actions
There are five outstanding actions.
Publish a cross-Government progress report on mainstreaming sustainable development with the Minister for Government Policy. The publication of this report was delayed to allow the incorporation of interim results from impact assessments as well as new research on sustainable development. The report was published on 17 May 2013.
Secure, with industry, new arrangements for flood insurance beyond 2013. The Government announced on 27 June its proposed way forward on flood insurance. A public consultation will run over the summer, with the final proposals included in the Water Bill in the autumn.
Implement a carefully managed and science-led policy of badger control in two pilot areas of high and persistent levels of bovine TB (bTB). See below.
Announce whether further licences for badger control should be granted following a review of the pilots and the report of an independent panel. In October 2012, the National Farmers Union requested that the pilot badger cull be postponed until 2013 following a new survey of badger numbers. Final authorisation of the badger control licences for West Gloucestershire and West Somerset was granted in February 2013 and Dorset has been named as a reserve pilot area. The badger cull pilots will go ahead in 2013 and a decision on whether further licences should be granted is planned for early 2014.
Negotiate and agree with Thames Water the delivery route for the Thames Tunnel, including the financing structure and procurement strategy. Defra is working with Infrastructure UK, HM Treasury, Ofwat and Thames Water Utilities Limited (TWUL) on a preferred delivery model for the Thames Tideway Tunnel. In February 2013, TWUL submitted a Development Consent Order application to the Planning Inspectorate. However, some challenges remain in implementing this preferred model, reflecting the size and complexity of the project and the lack of any precedent in the sector. All parties are working hard to ensure that the delivery model is finalised. Final agreement is expected to allow initial procurement activities to begin by early 2014.
Other Major Responsibilities
Plant Health
In March 2013, Defra published the Government‟s Management Plan in response to Chalara Fraxinea (ash dieback). This built on the Government‟s initial response and was informed by the interim report of the Tree Health and Plant Biosecurity Task Force both of which were published in December 2012. This followed the discovery of diseased ash trees at sites in Buckinghamshire. The Management Plan acknowledges that even though the disease cannot realistically be eradicated, action can be taken to improve our economic and environmental resilience to it. The Plan sets out work that will be undertaken to understand the genetic variability of ash and identify resistant trees, the best hope of securing the future of the ash tree in Britain.
Department for Environment, Food and Rural Affairs Annual Report and Accounts 2012–13
Chapter 3: Performance
21
Flood Risk Management
2012 was the wettest year on record for England and the second wettest for the UK as a whole. England received 1,126mm of rain which is 32 percent above average. One in every five days saw flooding in 2012, with over 6,000 flood warnings and alerts issued. 7,950 properties were flooded, but 205,000 homes and businesses were protected by flood defences. The number of properties protected is estimated from the Environment Agency‟s (EA) analysis of properties which would have been in a flood zone had a flood defence not been in place. This analysis is one of the factors which informs the EA‟s decisions on flood defence investment.
In December 2012, the Government allocated a further £120m for flood risk over the next two years. This extra funding will unlock economic growth, help create and protect jobs and speed up the construction of around 50 schemes in 2013–14 and 2014–15, delivering up to £1bn in economic benefits.
In February 2013, Defra announced that 93 new flood defence schemes would begin construction in 2013–14, a number of which will benefit from a share of the £120m. On completion, these schemes will provide better protection to 64,000 households.
Defra is now on course to spend £2.3bn on reducing the risk from flooding and coastal erosion over the 4 years to 2015, providing protection for 165,000 households, exceeding the previous goal by 20,000. Reforms to Defra‟s funding approach have so far identified £148m of potential contributions over the 4 years to 2015, enabling more schemes to go ahead and giving local people greater choice about local flood protection.
Meat Adulteration
In January 2013, following advice from the Food Safety Agency in Ireland, the Food Standards Agency (FSA) announced their plan to investigate meat adulteration in the UK market. The testing of products by the Irish Food Safety Agency had led to the discovery of products available in the UK contaminated with horse meat and pig meat.
Defra, having responsibility for food labelling, worked together with the FSA, the Devolved Administrations and local authorities to undertake a UK-wide study of food authenticity in processed beef products. In support of the FSA, Defra co-ordinated meetings with producers and retailers in early February, securing an unprecedented level of testing and reporting by industry, and took the lead on discussions with the European Commission once it was clear that the problem was Europe-wide. Since then Defra and the FSA have published regular updates on the progress of the investigation.
Defra and the FSA are committed to working with food businesses to learn any lessons and to identify any changes that are needed to reinforce the integrity of the food chain. This will include taking forward the findings of the FSA review of its response to the incident and the joint Defra/Department of Health (DH) strategic review of the incident. Defra and the FSA will continue to take a proactive role in the EU to ensure that any follow-up action is proportionate, evidence based and compatible with broader trade agreements.
Poor Weather Affecting the Farming Sector
Drought conditions at the beginning of the year, followed by wet weather in the summer and exceptional late snowfall this spring, have significantly affected arable and livestock farming. Defra has made available up to £250,000 to reimburse sheep farmers, who suffered devastating losses, for the cost of removing animals that died on their farms as a result of the March snowfall.
The impact of this bad weather may be felt for some time, and on 8 May, the Secretary of State hosted a summit of representatives of banks, farmers and insurance companies to see what more can be done to support farmers who are struggling financially. The summit was very constructive and representatives will meet again in July. In the meantime, a working group will look at identifying risks and improving resilience of the farming industry.
Department for Environment, Food and Rural Affairs Annual Report and Accounts 2012–13
Chapter 3: Performance
22
Input and Impact Indicators
The Business Plan sets out how Defra will measure progress towards achieving the Department‟s priorities and objectives. A set of indicators has been developed to monitor progress in key areas. These constitute inputs (use of resources) and impacts. Defra‟s input and impact indicators are based on data which is collected and compared across time periods of varying frequency – monthly, quarterly, annually, and over five year intervals (the Farmland Birds Index). This variation is determined by a number of factors, including the cost of collecting the data, the process by which the data is collected, and the usefulness of more frequent surveys.
For example, a five year interval is used to assess statistically the farmland bird index as bird populations fluctuate from year to year owing to weather conditions and sampling changes. A yearly assessment is unlikely to be a true indication of changes. Farmland bird numbers are also calculated using statistical techniques that allow the smoothing of data. This means that the most recent year of data, i.e. 2011 in this update, is likely to change following the inclusion of 2012 data in next year‟s update. Therefore, it is not appropriate to make assessments based on this figure and a statistical comparison is drawn between 2005 and 2010 in this document.
Household Recycling Rates are surveyed on a quarterly basis. However the annual data used here overcomes the problem of seasonal variation.
By their nature, impact indicators can be affected by many factors, including those outside of Defra‟s control, and it can take some time to see Defra‟s actions reflected as changes in indicator performance. The set of indicators were not designed to cover the entirety of Defra‟s work and so should be considered alongside progress on the SRP actions to provide a fuller picture of Defra‟s performance. Defra recognises the importance of performance management and a management information pack is discussed at each meeting of the Defra Board. This pack is described in more detail later in this chapter.
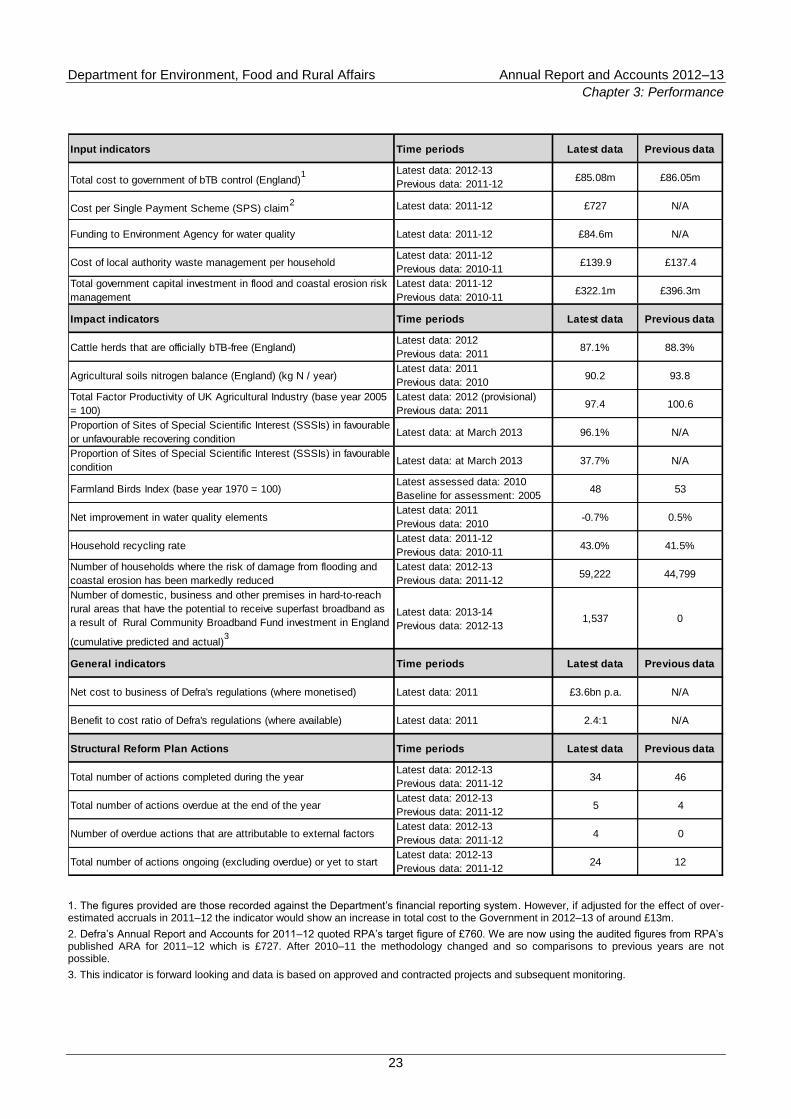
The table on the following page sets out all input and impact indicators, comparing latest performance with the previous dataset. It also compares this year‟s performance against the SRP actions with performance in the last financial year. Further information about the nature of the indicators and the measurement detail is available in the Measurement Annex to Defra‟s Quarterly Data Summary (QDS)
10. Defra produce a wide range
of statistical datasets, all of which are available online11
.
10
http://data.gov.uk/dataset/defra-business-plan-quarterly-data-summary 11
https://www.gov.uk/government/organisations/department-for-environment-food-rural-affairs/about/statistics
Department for Environment, Food and Rural Affairs Annual Report and Accounts 2012–13
Chapter 3: Performance
23
Input indicators Time periods Latest data Previous data
Total cost to government of bTB control (England)1 Latest data: 2012-13
Previous data: 2011-12£85.08m £86.05m
Cost per Single Payment Scheme (SPS) claim2 Latest data: 2011-12 £727 N/A
Funding to Environment Agency for water quality Latest data: 2011-12 £84.6m N/A
Cost of local authority waste management per householdLatest data: 2011-12
Previous data: 2010-11£139.9 £137.4
Total government capital investment in flood and coastal erosion risk
management
Latest data: 2011-12
Previous data: 2010-11£322.1m £396.3m
Impact indicators Time periods Latest data Previous data
Cattle herds that are officially bTB-free (England)Latest data: 2012
Previous data: 201187.1% 88.3%
Agricultural soils nitrogen balance (England) (kg N / year)Latest data: 2011
Previous data: 201090.2 93.8
Total Factor Productivity of UK Agricultural Industry (base year 2005
= 100)
Latest data: 2012 (provisional)
Previous data: 201197.4 100.6
Proportion of Sites of Special Scientific Interest (SSSIs) in favourable
or unfavourable recovering conditionLatest data: at March 2013 96.1% N/A
Proportion of Sites of Special Scientific Interest (SSSIs) in favourable
conditionLatest data: at March 2013 37.7% N/A
Farmland Birds Index (base year 1970 = 100)Latest assessed data: 2010
Baseline for assessment: 200548 53
Net improvement in water quality elementsLatest data: 2011
Previous data: 2010-0.7% 0.5%
Household recycling rateLatest data: 2011-12
Previous data: 2010-1143.0% 41.5%
Number of households where the risk of damage from flooding and
coastal erosion has been markedly reduced
Latest data: 2012-13
Previous data: 2011-1259,222 44,799
Number of domestic, business and other premises in hard-to-reach
rural areas that have the potential to receive superfast broadband as
a result of Rural Community Broadband Fund investment in England
(cumulative predicted and actual)3
Latest data: 2013-14
Previous data: 2012-131,537 0
General indicators Time periods Latest data Previous data
Net cost to business of Defra's regulations (where monetised) Latest data: 2011 £3.6bn p.a. N/A
Benefit to cost ratio of Defra's regulations (where available) Latest data: 2011 2.4:1 N/A
Structural Reform Plan Actions Time periods Latest data Previous data
Total number of actions completed during the yearLatest data: 2012-13
Previous data: 2011-1234 46
Total number of actions overdue at the end of the yearLatest data: 2012-13
Previous data: 2011-125 4
Number of overdue actions that are attributable to external factorsLatest data: 2012-13
Previous data: 2011-124 0
Total number of actions ongoing (excluding overdue) or yet to startLatest data: 2012-13
Previous data: 2011-1224 12
1. The figures provided are those recorded against the Department‟s financial reporting system. However, if adjusted for the effect of over-estimated accruals in 2011–12 the indicator would show an increase in total cost to the Government in 2012–13 of around £13m.
2. Defra‟s Annual Report and Accounts for 2011–12 quoted RPA‟s target figure of £760. We are now using the audited figures from RPA‟s published ARA for 2011–12 which is £727. After 2010–11 the methodology changed and so comparisons to previous years are not possible.
3. This indicator is forward looking and data is based on approved and contracted projects and subsequent monitoring.
Department for Environment, Food and Rural Affairs Annual Report and Accounts 2012–13
Chapter 3: Performance
24
Support and Develop British Farming and Encourage Sustainable Food Production
In this section, five indicators show how we are performing in supporting and developing British farming and encouraging sustainable food production.
The total cost to government of bovine TB (bTB) controls in England was first calculated for 2011–12, and so it is not yet possible to identify any trend. Government interventions to tackle the disease increased during 2012–13, so our current expectation is that the corresponding figure for 2013–14 is likely to be higher.
The percentage of cattle herds that are officially bTB-free in England continues to show a gradual decrease over time. This is due to both a decreasing number of cattle herds in the country, and an increasing number of cattle herds that are not officially bTB-free each year (i.e. a still worsening disease situation). The number of herds tested each year increased on 1 January 2012 and again on 1 January 2013. As a result, more disease is expected to be found in the short term and it is likely that the indicator will continue to show a downward trend. Earlier detection of disease should, all other things being equal, eventually feed through into improvements in this indicator over the longer term.
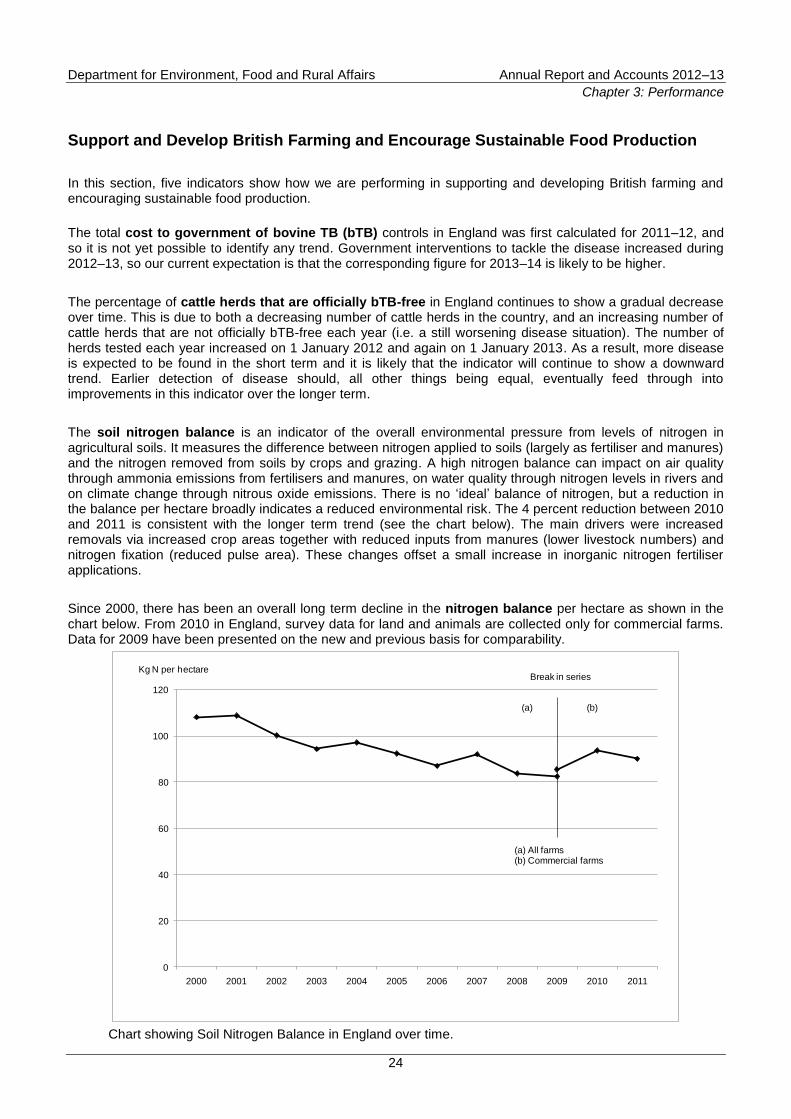
The soil nitrogen balance is an indicator of the overall environmental pressure from levels of nitrogen in agricultural soils. It measures the difference between nitrogen applied to soils (largely as fertiliser and manures) and the nitrogen removed from soils by crops and grazing. A high nitrogen balance can impact on air quality through ammonia emissions from fertilisers and manures, on water quality through nitrogen levels in rivers and on climate change through nitrous oxide emissions. There is no „ideal‟ balance of nitrogen, but a reduction in the balance per hectare broadly indicates a reduced environmental risk. The 4 percent reduction between 2010 and 2011 is consistent with the longer term trend (see the chart below). The main drivers were increased removals via increased crop areas together with reduced inputs from manures (lower livestock numbers) and nitrogen fixation (reduced pulse area). These changes offset a small increase in inorganic nitrogen fertiliser applications.
Since 2000, there has been an overall long term decline in the nitrogen balance per hectare as shown in the chart below. From 2010 in England, survey data for land and animals are collected only for commercial farms. Data for 2009 have been presented on the new and previous basis for comparability.
0
20
40
60
80
100
120
2000 2001 2002 2003 2004 2005 2006 2007 2008 2009 2010 2011
Kg N per hectareBreak in series
(a) (b)
(a) All farms(b) Commercial farms
Chart showing Soil Nitrogen Balance in England over time.
Department for Environment, Food and Rural Affairs Annual Report and Accounts 2012–13
Chapter 3: Performance
25
The cost per Single Payment Scheme (SPS) claim figure for 2011–12 was £727 against a challenge to reduce the cost to less than £760. In 2012–13, the challenge was to reduce the cost further and the Rural Payments Agency (RPA) expects to be on target to achieve this, and audited figures for 2012–13 will be published by RPA in summer 2013.
Total factor productivity is an indicator for how well inputs are converted into outputs. Over the longer term, total factor productivity for the agricultural industry in the UK has increased by 20 percent between 1986 and 2012. In that time, the volume of final output has remained largely unchanged while the volume of all inputs fell by 19 percent. However, total factor productivity has remained relatively unchanged since 2005. Total factor productivity is at its lowest since 2004 due to a 3.2 percent fall in 2012. This is the largest single year fall in productivity since 1985. The fall in productivity in 2012 was due to the poor weather conditions which resulted in lower volumes of outputs. The 2012 figure is provisional and based on the first estimate released in May 2013
12. A second estimate, incorporating data that becomes available later, will be released towards the end of
2013.
Help to Enhance the Environment and Biodiversity to Improve Quality of Life
In this section, five indicators show how we are performing in helping to enhance the environment and biodiversity to improve quality of life.
In 2011–12, funding to EA for water quality was £84.6m. The water quality index is a lagging indicator being reported in the year after the last samples are taken. The first two years 2008 and 2009 showed a positive change of 1.8 percent and 0.5 percent respectively. Between 2010 and 2011 the index has shown a decrease of 0.7 percent. This may be due to the effects of the 2011 drought leading to low flows causing a large number of dissolved oxygen downgrades in the South East.
In 2011, the breeding farmland birds index in England was less than half (a decline of 52 percent) of its value in 1970. Most of the declines in farmland birds occurred between the late seventies and the early nineties. The smoothed index shows a statistically significant rate of decline of 9 percent between 2005 and 2010.
Many of the declines in farmland bird populations have been caused by land management changes and intensification of farming that took place over a long period, such as the loss of mixed farming, a move from spring to autumn sowing of arable crops, change in grassland management (e.g. a switch from hay to silage production), increased pesticide and fertiliser use, and the removal of non–cropped features, such as hedgerows.
The rate of these changes, which resulted in the loss of both suitable nesting and feeding habitats and a reduction in available food, was greatest during the late 1970s and early 1980s and hence many farmland bird populations declined most rapidly during that period. This is shown in the chart below. Some species of birds are restricted to, or highly dependent on, particular habitats and these are known as „specialists‟. Species which are associated with a wider range of habitats are referred to as „generalists‟. Farmland specialists include corn bunting, goldfinch and grey partridge. Farmland generalists include greenfinch, jackdaw and kestrel.
12
https://www.gov.uk/government/uploads/system/uploads/attachment_data/file/198979/agriproductivity-statsnotice-15may13.pdf
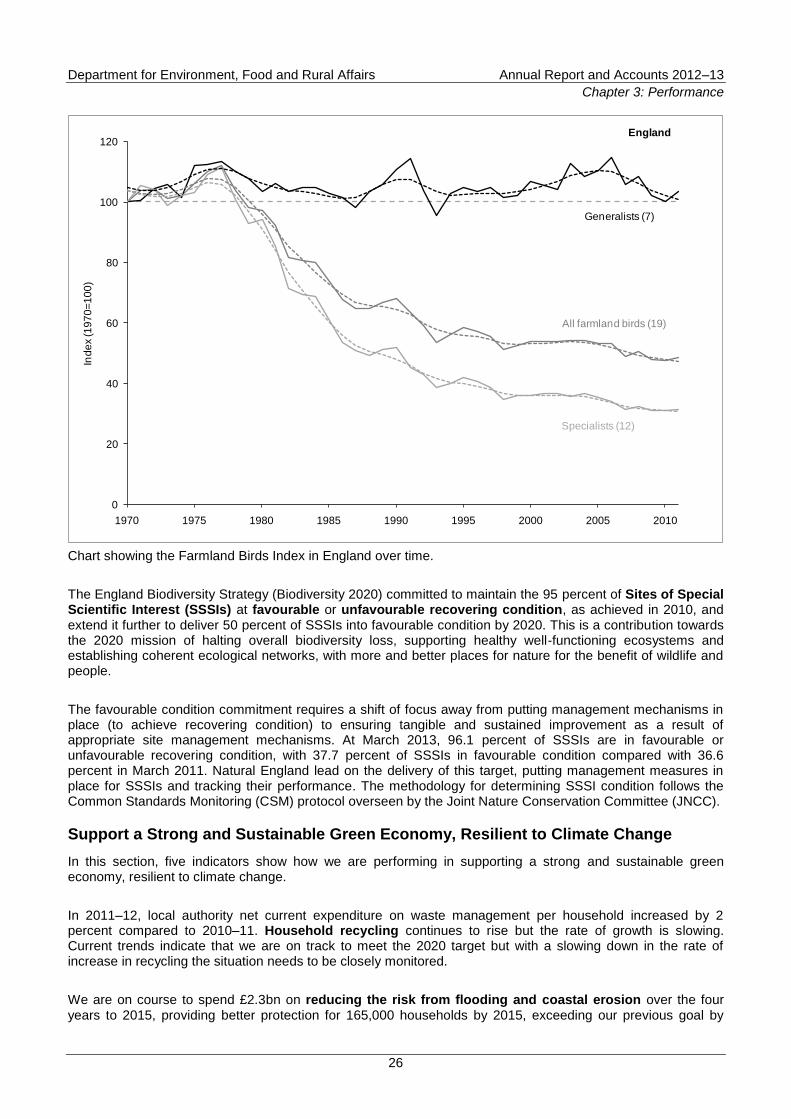
Department for Environment, Food and Rural Affairs Annual Report and Accounts 2012–13
Chapter 3: Performance
26
0
20
40
60
80
100
120
1970 1975 1980 1985 1990 1995 2000 2005 2010
Ind
ex (1
97
0=
10
0)
All farmland birds (19)
Generalists (7)
Specialists (12)
England
Chart showing the Farmland Birds Index in England over time.
The England Biodiversity Strategy (Biodiversity 2020) committed to maintain the 95 percent of Sites of Special Scientific Interest (SSSIs) at favourable or unfavourable recovering condition, as achieved in 2010, and extend it further to deliver 50 percent of SSSIs into favourable condition by 2020. This is a contribution towards the 2020 mission of halting overall biodiversity loss, supporting healthy well-functioning ecosystems and establishing coherent ecological networks, with more and better places for nature for the benefit of wildlife and people.
The favourable condition commitment requires a shift of focus away from putting management mechanisms in place (to achieve recovering condition) to ensuring tangible and sustained improvement as a result of appropriate site management mechanisms. At March 2013, 96.1 percent of SSSIs are in favourable or unfavourable recovering condition, with 37.7 percent of SSSIs in favourable condition compared with 36.6 percent in March 2011. Natural England lead on the delivery of this target, putting management measures in place for SSSIs and tracking their performance. The methodology for determining SSSI condition follows the Common Standards Monitoring (CSM) protocol overseen by the Joint Nature Conservation Committee (JNCC).
Support a Strong and Sustainable Green Economy, Resilient to Climate Change
In this section, five indicators show how we are performing in supporting a strong and sustainable green economy, resilient to climate change.
In 2011–12, local authority net current expenditure on waste management per household increased by 2 percent compared to 2010–11. Household recycling continues to rise but the rate of growth is slowing. Current trends indicate that we are on track to meet the 2020 target but with a slowing down in the rate of increase in recycling the situation needs to be closely monitored.
We are on course to spend £2.3bn on reducing the risk from flooding and coastal erosion over the four years to 2015, providing better protection for 165,000 households by 2015, exceeding our previous goal by
Department for Environment, Food and Rural Affairs Annual Report and Accounts 2012–13
Chapter 3: Performance
27
20,000. In 2011–12, £322m was invested in capital schemes to manage flood and erosion risk. 59,222 households were better protected from flooding as a result of schemes completed in 2012–13.
The joint Defra/Broadband Delivery UK (BDUK)13
£20m Rural Community Broadband Fund (RCBF) allows communities in hard to reach areas to secure funding for projects that will give them the potential to receive superfast broadband. Such communities would otherwise only have the potential to receive standard broadband through the Government‟s £530m investment to support the roll-out of broadband in rural areas and may be disadvantaged.
Based on contracted projects, in 2013–14 a total of 1,537 premises in hard-to-reach areas are expected to have the potential to receive superfast broadband. These predicted premises are within one community project which was approved for funding from the RCBF and contracted in 2012–13. The RCBF has a target of up to 70,000 premises to have the potential to receive superfast broadband by mid 2015. More explanation on this indicator is available in the latest statistical release.
14
Major Projects
Defra is involved in several large commercial projects amounting to over £1bn in net present value. The „Top 10‟ projects with an important commercial element are wide ranging and in some cases novel and ambitious. These include a project to repair the Temperate House at Royal Botanic Gardens, Kew and projects to pursue alternative business models, including for Defra‟s shared services. A management information pack, with an assessment of commercial risk and progress for each project, is provided to the Defra Board and further ways to strengthen project assurance and risk management across Defra‟s project portfolio are being explored.
At the beginning of the financial year, the Major Projects Authority (MPA) included four of Defra‟s major projects in the Government‟s Major Project Portfolio (GMPP). Since then, the New Waterways Charity project has successfully completed with the vesting of the Canal & River Trust and the Thames Tideway Tunnel project has joined the MPA portfolio. The Covent Garden Market Authority (CGMA) redevelopment project („Project Chrysalis‟) will no longer be overseen by the MPA from the beginning of 2013–14, and Defra‟s three remaining major projects are listed below. Project summaries will be published online
15 and detailed information on each
project is available via the footnoted websites:
Thames Estuary 2100, Phase 1 (led by EA)16
;
Thames Tideway Tunnel (led by Thames Water plc)17
; and
CAP Delivery Programme (led by Defra)18
.
13
www.gov.uk/broadband-delivery-uk 14
https://www.gov.uk/government/publications/rural-community-broadband-fund-rcbf-output-indicator 15
http://data.gov.uk/dataset/government-major-projects-portfolio-data-for-defra 16
http://www.environment-agency.gov.uk/homeandleisure/floods/125045.aspx 17
http://www.thameswater.co.uk/about-us/10115.htm 18
http://rpa.defra.gov.uk/rpa/index.nsf/home

Department for Environment, Food and Rural Affairs Annual Report and Accounts 2012–13
Chapter 3: Performance
28
Performance Management
Each Defra Board meeting reviews the operational performance of the Department and its network, using a management information report which includes the following:
a summary and detailed look at the current and projected finance position for the Department;
an overview of any key emerging or changing strategic risks and a summary of the main 20–25 risks facing the Department, together with mitigating actions; and
a wide ranging picture of performance across the Department.
- Quarterly Data Summaries.
- Progress of key SRP actions, particularly those which are due for completion, or at risk of missing their deadlines.
- Update reports from Core Department Directors showing progress against the measures set out in their portfolios and spend against budgets, including issues or emerging risks.
- Quarterly reports from the ten main Network Bodies. These reports present a strategic review of performance against key indicators and budgetary position, risks and exceptions, with a short statement by the Chief Executive Officer (CEO) and the Defra corporate owner.
- A report on progress of Defra‟s ten most significant commercial projects. This includes those which are overseen by the Major Projects Authority, managed by Executive Agencies or the wider Network that are above delegated limits, and other high risk / high impact projects.
- An update from Human Resources on key staffing issues.
- On rotation, a series of performance reports on operational data. These include reports on performance against central government targets on prompt payments, recruitment freeze, reducing regulation, communications, complaints and briefing on parliamentary scrutiny of EU business.
Each year, business areas within the Core Department and Network Bodies prepare business plans setting out their performance expectations for the year ahead. Plans identify the key activities and outputs to be delivered with the resources allocated and how these support delivery of the Department‟s strategic priorities (outcomes). Plans identify relevant performance measures, including key milestones and indicators, that managers will review during the year and report regularly to the Defra Board through the MI report.
Transparency Framework
Defra is implementing an open data strategy which includes publishing more open data, improving the quality of data published and encouraging the private sector to develop new web and mobile service devices. Updates on Defra‟s performance, efficiency and effectiveness of its operations and implementation of its policy objectives are on the gov.uk website. This includes Defra‟s Business Plan, performance indicators and the QDS.
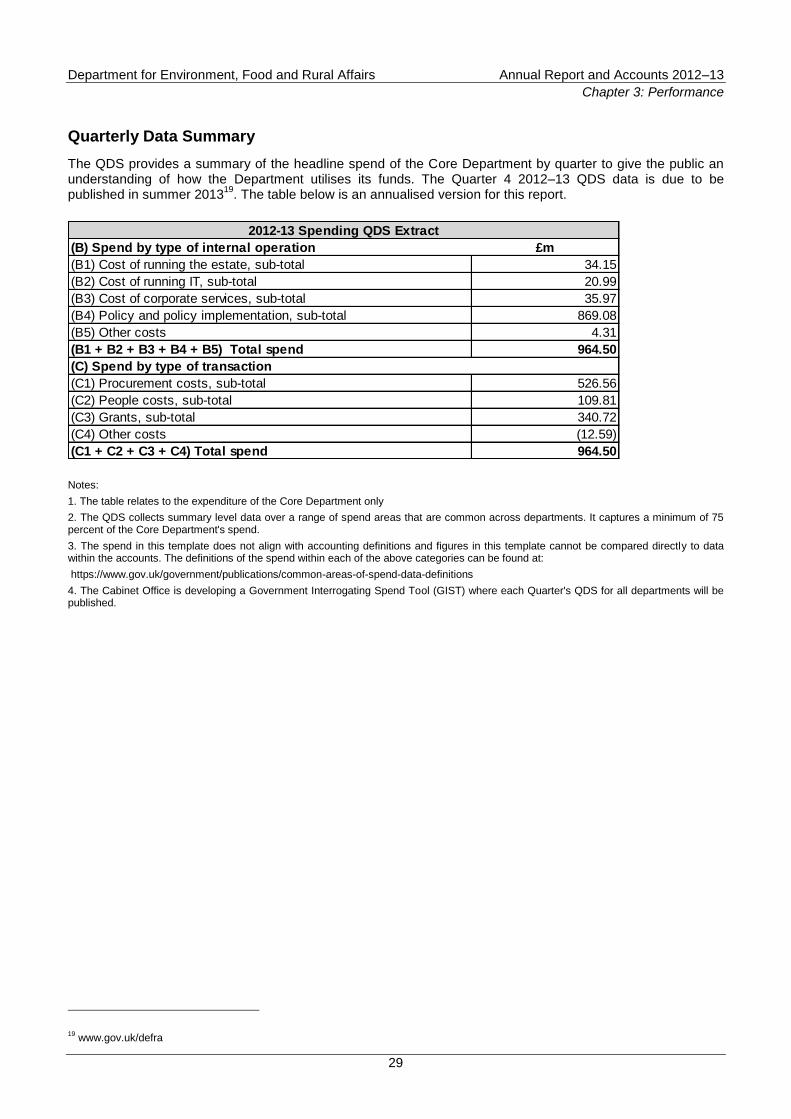
Department for Environment, Food and Rural Affairs Annual Report and Accounts 2012–13
Chapter 3: Performance
29
Quarterly Data Summary
The QDS provides a summary of the headline spend of the Core Department by quarter to give the public an understanding of how the Department utilises its funds. The Quarter 4 2012–13 QDS data is due to be published in summer 2013
19. The table below is an annualised version for this report.
(B) Spend by type of internal operation £m
(B1) Cost of running the estate, sub-total 34.15
(B2) Cost of running IT, sub-total 20.99
(B3) Cost of corporate services, sub-total 35.97
(B4) Policy and policy implementation, sub-total 869.08
(B5) Other costs 4.31
(B1 + B2 + B3 + B4 + B5) Total spend 964.50
(C) Spend by type of transaction
(C1) Procurement costs, sub-total 526.56
(C2) People costs, sub-total 109.81
(C3) Grants, sub-total 340.72
(C4) Other costs (12.59)
(C1 + C2 + C3 + C4) Total spend 964.50
2012-13 Spending QDS Extract
Notes:
1. The table relates to the expenditure of the Core Department only
2. The QDS collects summary level data over a range of spend areas that are common across departments. It captures a minimum of 75 percent of the Core Department's spend.
3. The spend in this template does not align with accounting definitions and figures in this template cannot be compared directly to data within the accounts. The definitions of the spend within each of the above categories can be found at:
https://www.gov.uk/government/publications/common-areas-of-spend-data-definitions
4. The Cabinet Office is developing a Government Interrogating Spend Tool (GIST) where each Quarter's QDS for all departments will be published.
19
www.gov.uk/defra
Department for Environment, Food and Rural Affairs Annual Report and Accounts 2012–13
Chapter 4: Other Key Information
30
Chapter 4: Other Key Information
People and Culture
Recruitment Practice
The Civil Service Order in Council 1995 sets out the legal basis for Defra‟s recruitment policies and practice. The Civil Service Commissioners‟ Principles for Recruitment and the Recruitment Code are mandatory and must be followed when any post is opened to competition from outside the Civil Service.
During the reporting period the freeze on recruitment into the Civil Service resulted in Defra continuing with an approval process requiring Director General approval to recruit externally into business critical and/or frontline posts.
Diversity and Employment of Disabled Persons
Defra continues to strengthen relationships with its Trade Unions and all its diversity staff networks. These include: the Lesbian, Gay and Bisexual people, Transgender people and Asexual people network; the Ethnic Minority network; and Disnet (Disability network). In 2013, the Environment Agency (EA) was recognised as one of 65 Star Performers and rated number 5 in the top 10 public sector employers‟ category of Stonewall‟s benchmarking index for LGBT equality. Defra recognises that more work needs to be done to promote opportunities for some employees with protected characteristics and to increase our diversity declaration rates. A refreshed Departmental Diversity Strategy and prioritised action plan to address key equality and diversity issues have been drafted for stakeholder consultation. We plan to publish in summer 2013.
Defra published an update of its Public Sector Equality Duty (PSED) Report in June 2013 which includes customer objectives and supporting action plans.
The Department operates the „Two Ticks‟ disability symbol in recruitment and employment. Reasonable adjustments for disabled employees are funded from a central budget in the Core Department and the Executive Agencies use the Access to Work Scheme. Disability leave enables disabled employees to take paid time off work for assessment, treatment and rehabilitation. Alternatively, special leave is allowed in appropriate circumstances.
Wellbeing and Managing Attendance
A Corporate Strategy for Managing Attendance is in place in Core Defra to support employee recruitment and retention. The Department closely monitors sickness absence, including benchmarking sickness absence rates. Actions include workplace events, return–to–work interviews, occupational health professionals advice, provision of counselling, information, training and advisory services through a contracted Employee Assistance Programme, or through internal staff welfare services. For Defra and its Executive Agencies, an average 6.5 days per employee were lost to sickness absence during 2012–13, compared with 6.4 days in 2011–12. Although the absence rate has increased slightly since last year, there has been a general downward trend since September 2008, when it was 8.6 days. In Defra‟s Non–Departmental Public Bodies (NDPBs), the average number of sickness absence days per employee in 2012–13 was 5.9, whilst the equivalent figure in 2011–12 was 6.3 days.
Defra demonstrated its commitment to the Corporate Social Responsibility agenda by providing information on an intranet webpage on opportunities to take up volunteering. Defra employees are offered one day special leave with pay each year to use their skills to help others by volunteering individually, or as part of a team, for a non-profit making organisation which serves the public. Reservists are allowed ten days paid special leave a year to participate in training.
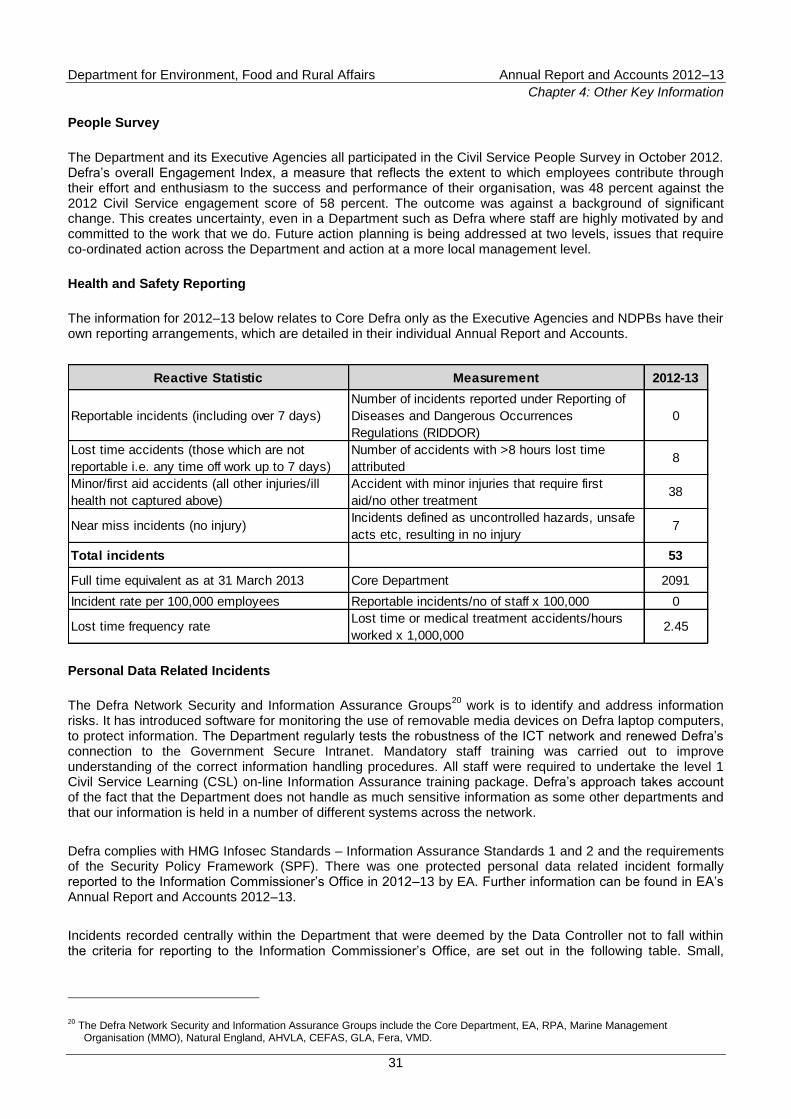
Department for Environment, Food and Rural Affairs Annual Report and Accounts 2012–13
Chapter 4: Other Key Information
31
People Survey
The Department and its Executive Agencies all participated in the Civil Service People Survey in October 2012. Defra‟s overall Engagement Index, a measure that reflects the extent to which employees contribute through their effort and enthusiasm to the success and performance of their organisation, was 48 percent against the 2012 Civil Service engagement score of 58 percent. The outcome was against a background of significant change. This creates uncertainty, even in a Department such as Defra where staff are highly motivated by and committed to the work that we do. Future action planning is being addressed at two levels, issues that require co-ordinated action across the Department and action at a more local management level.
Health and Safety Reporting
The information for 2012–13 below relates to Core Defra only as the Executive Agencies and NDPBs have their own reporting arrangements, which are detailed in their individual Annual Report and Accounts.
Reactive Statistic Measurement 2012-13
Reportable incidents (including over 7 days)
Number of incidents reported under Reporting of
Diseases and Dangerous Occurrences
Regulations (RIDDOR)
0
Lost time accidents (those which are not
reportable i.e. any time off work up to 7 days)
Number of accidents with >8 hours lost time
attributed8
Minor/first aid accidents (all other injuries/ill
health not captured above)
Accident with minor injuries that require first
aid/no other treatment38
Near miss incidents (no injury)Incidents defined as uncontrolled hazards, unsafe
acts etc, resulting in no injury7
Total incidents 53
Full time equivalent as at 31 March 2013 Core Department 2091
Incident rate per 100,000 employees Reportable incidents/no of staff x 100,000 0
Lost time frequency rateLost time or medical treatment accidents/hours
worked x 1,000,0002.45
Personal Data Related Incidents
The Defra Network Security and Information Assurance Groups20
work is to identify and address information risks. It has introduced software for monitoring the use of removable media devices on Defra laptop computers, to protect information. The Department regularly tests the robustness of the ICT network and renewed Defra‟s connection to the Government Secure Intranet. Mandatory staff training was carried out to improve understanding of the correct information handling procedures. All staff were required to undertake the level 1 Civil Service Learning (CSL) on-line Information Assurance training package. Defra‟s approach takes account of the fact that the Department does not handle as much sensitive information as some other departments and that our information is held in a number of different systems across the network.
Defra complies with HMG Infosec Standards – Information Assurance Standards 1 and 2 and the requirements of the Security Policy Framework (SPF). There was one protected personal data related incident formally reported to the Information Commissioner‟s Office in 2012–13 by EA. Further information can be found in EA‟s Annual Report and Accounts 2012–13.
Incidents recorded centrally within the Department that were deemed by the Data Controller not to fall within the criteria for reporting to the Information Commissioner‟s Office, are set out in the following table. Small,
20
The Defra Network Security and Information Assurance Groups include the Core Department, EA, RPA, Marine Management Organisation (MMO), Natural England, AHVLA, CEFAS, GLA, Fera, VMD.
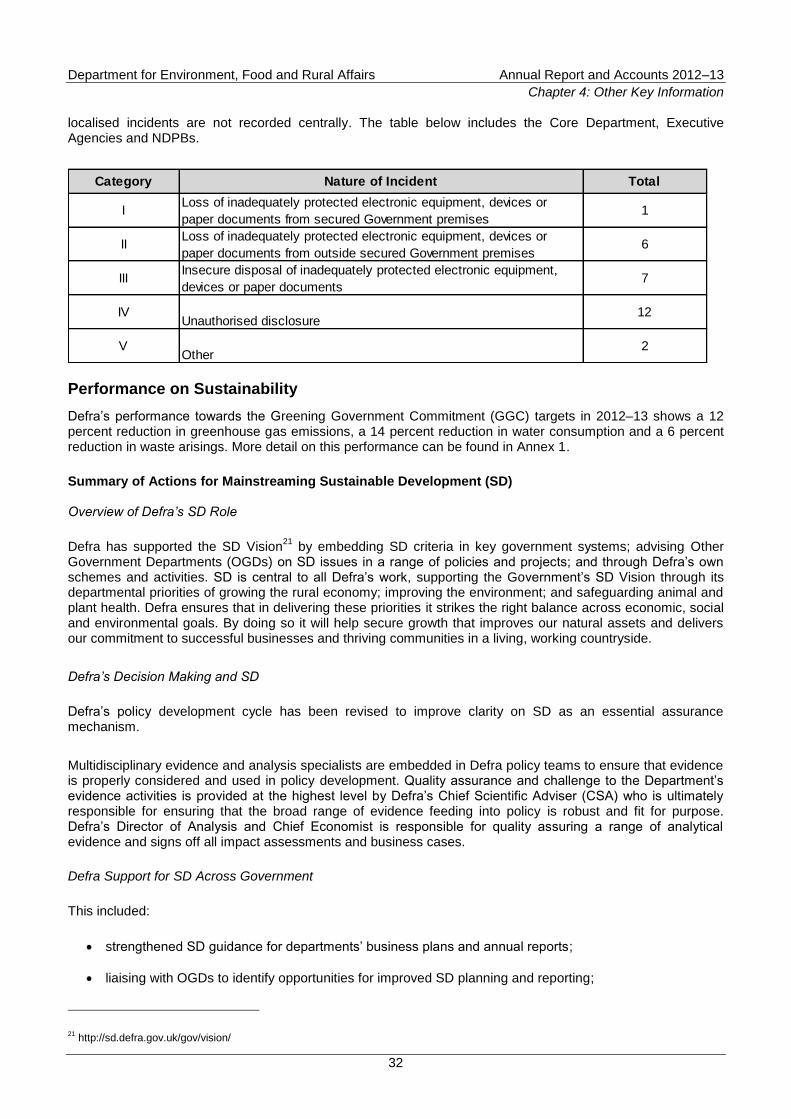
Department for Environment, Food and Rural Affairs Annual Report and Accounts 2012–13
Chapter 4: Other Key Information
32
localised incidents are not recorded centrally. The table below includes the Core Department, Executive Agencies and NDPBs.
Category Nature of Incident Total
ILoss of inadequately protected electronic equipment, devices or
paper documents from secured Government premises1
IILoss of inadequately protected electronic equipment, devices or
paper documents from outside secured Government premises6
IIIInsecure disposal of inadequately protected electronic equipment,
devices or paper documents7
IVUnauthorised disclosure
12
VOther
2
Performance on Sustainability
Defra‟s performance towards the Greening Government Commitment (GGC) targets in 2012–13 shows a 12 percent reduction in greenhouse gas emissions, a 14 percent reduction in water consumption and a 6 percent reduction in waste arisings. More detail on this performance can be found in Annex 1.
Summary of Actions for Mainstreaming Sustainable Development (SD) Overview of Defra’s SD Role
Defra has supported the SD Vision21
by embedding SD criteria in key government systems; advising Other Government Departments (OGDs) on SD issues in a range of policies and projects; and through Defra‟s own schemes and activities. SD is central to all Defra‟s work, supporting the Government‟s SD Vision through its departmental priorities of growing the rural economy; improving the environment; and safeguarding animal and plant health. Defra ensures that in delivering these priorities it strikes the right balance across economic, social and environmental goals. By doing so it will help secure growth that improves our natural assets and delivers our commitment to successful businesses and thriving communities in a living, working countryside.
Defra’s Decision Making and SD
Defra‟s policy development cycle has been revised to improve clarity on SD as an essential assurance mechanism.
Multidisciplinary evidence and analysis specialists are embedded in Defra policy teams to ensure that evidence is properly considered and used in policy development. Quality assurance and challenge to the Department‟s evidence activities is provided at the highest level by Defra‟s Chief Scientific Adviser (CSA) who is ultimately responsible for ensuring that the broad range of evidence feeding into policy is robust and fit for purpose. Defra‟s Director of Analysis and Chief Economist is responsible for quality assuring a range of analytical evidence and signs off all impact assessments and business cases.
Defra Support for SD Across Government
This included:
strengthened SD guidance for departments‟ business plans and annual reports;
liaising with OGDs to identify opportunities for improved SD planning and reporting;
21
http://sd.defra.gov.uk/gov/vision/
Department for Environment, Food and Rural Affairs Annual Report and Accounts 2012–13
Chapter 4: Other Key Information
33
commissioning research on how well SD and environmental guidance is incorporated in impact assessments across departments, to highlight good practice and areas for improvement. The first stage, a desk study, was completed in February 2013. These initial results indicated that while many assessments are proportionate and reflect SD impacts well, there are still some that miss important impacts or have not applied sufficient rigour in their analysis. The second stage will include in-depth research leading to a fuller report with recommendations in summer 2013;
leading the cross-Whitehall SD Group, sharing SD knowledge and resources;
analysing cross-government performance against the GGCs and advised the Home Affairs (GGC) Cabinet sub-committee to drive delivery of these targets; and
continued funding (£0.5m from August 2011 to July 2014) to the Sustainable Development Research Network (SDRN) which builds links between government policy-makers and academic researchers to enable access to social and natural science evidence. In June 2012, SDRN launched its case-study database of examples of SD in practice from business, communities and research
22.
Cross Government SD Report
As part of its 2012–13 business plan commitment, Defra published a cross-government report on progress in mainstreaming SD in May 2013
23. This concluded that there has been good progress in mainstreaming SD
since the launch of the Government‟s Vision for Mainstreaming SD in 2011. However, it also reflected that it would take time to embed SD fully across Government, highlighting, for example, continued efforts required by departments in relation to sustainability reporting, meeting GGCs and following up on the results of the Impact Assessment Review.
Example of SD in Practice – London 2012 Olympic and Paralympic Games
London 2012 was regarded as the greenest Games ever. Defra co-chaired the London 2012 Sustainability Group which advised the London Organising Committee of the Olympic and Paralympic Games (LOCOG) on sustainability issues.
During the Games, Defra set up a team to ensure that its network would be ready to respond if anything happened in its areas of responsibility (e.g. animal welfare). Defra was also successful in meeting the Government target of 50 percent travel reduction in London during the Games.
Defra part funded a number of sustainability case studies from the Games that are on the London 2012 learning legacy website. In March 2013, the Waste and Resources Action Programme (WRAP) launched its Zero Waste Roadmap for the Events Sector which is based in part on the learning from London 2012. They also produced a number of waste case studies and micro reports for the legacy website, with an online resource management planning tool.
Defra’s GGCs and Small and Medium Enterprise (SME) Contracts
Full details of Defra‟s action plan on the GGCs24
can be found in Annex 1 of the Annual Report and Accounts with an overview of the Sustainable Operations and Procurement Strategy.
Government departments have a commitment to increase procurement from small businesses with the aspiration that 25 percent of contracts should be awarded to SMEs. Full information for 2012–13 is not available at the time of publication and will be made available later in 2013. Actions to achieve the target include three supplier-event days in London, Bristol and Leeds with a large number of SME (and non SME) suppliers attending.
22
http://sdrncs.wordpress.com/ 23
https://www.gov.uk/government/publications/mainstreaming-sustainable-development-government-progress-2013 24
http://sd.defra.gov.uk/gov/green-government/commitments/
Department for Environment, Food and Rural Affairs Annual Report and Accounts 2012–13
Chapter 4: Other Key Information
34
SD Stakeholder Engagement
Defra ensures that its policy development is informed through consultation and work with stakeholders. For example, in July 2012, the Government proposed new SD Indicators (SDIs) and held an informal public consultation. SDIs will provide high level transparency on whether the UK is developing on a sustainable path. The Government received over 300 responses to the consultation, and additionally over 2,500 responses via a campaign response regarding protection of the Green Belt. The SDI set will be revised in light of the consultation responses and recommendations made by the Environmental Audit Committee, and will be published in summer 2013.
Defra’s SD People Initiatives
Defra supports departments‟ performance on SD through its leadership on cross-government SD groups which test ideas, explain new initiatives and share learning and resources. Defra also liaises with individual departments, providing advice on demand.
Other initiatives include:
working with Civil Service Learning to incorporate SD into its learning programme and Civil Service Competences;
bringing in guest speakers, including the Chair of Divine Chocolate Ltd, a social enterprise company operating on a fair trade basis, and the Chief Executive of DESSO, a large global company with corporate responsibility at the centre of its business model;
lunchtime seminars on specific SD topics; and
updating Defra‟s policy-cycle guidance to improve clarity on SD as an essential assurance mechanism.
Rural Proofing
Defra works closely with other departments to help them to understand the rural impacts of their policies and to ensure that they work effectively for rural businesses and communities. Defra has published refreshed advice for policy makers to assist them in rural proofing their policies and programmes and intends to update the Rural Proofing Toolkit in summer 2013. This will assist policy officials, in Defra, as well as other departments, to examine the rural context in which their policies will apply and the likely impacts that they will have in different types of rural area.
Examples of Defra policies and initiatives that have been rural proofed over the past year include:
Promoting Growth in the Rural Economy
The Government is investing in a £530m Rural Broadband Programme to support the rollout of broadband across the country. The aim is to enable at least 90 percent of households and businesses in every county to have access to a superfast broadband service by 2015, with the remainder having access to a minimum of at least two megabits per second by this date. Local Authority Local Broadband Plans set out how this target is to be achieved in individual areas. Ensuring SMEs have the awareness, confidence and skills to take advantage of a faster and more reliable broadband network is also a top priority for Government.
To complement the Government‟s mainstream Rural Broadband Programme, Defra has established the £20m Rural Community Broadband Fund, jointly financed by Broadband Delivery UK (BDUK) and Defra and operated through the Rural Development Programme for England (RDPE). The Fund is specifically designed to extend superfast broadband into the final 10 percent hard to reach rural communities that will otherwise only receive standard broadband under the BDUK Rural Broadband Programme (to ensure that they are not disadvantaged).
Department for Environment, Food and Rural Affairs Annual Report and Accounts 2012–13
Chapter 4: Other Key Information
35
The Government is also investing £150m to improve mobile coverage for consumers and businesses in areas where coverage is poor or non-existent. The Mobile Infrastructure Project (MIP) aims to address voice „not spots‟ and support mobile broadband roll-out across the UK. It will improve voice and data coverage, and will yield important benefits in rural areas across the UK where commercial providers are reluctant to invest. The MIP is being delivered by BDUK, and it is expected that it will:
- provide coverage for up to 60,000 premises across the UK in complete not-spots; and
- address total not-spots along an initial 10 key road routes which suffer coverage problems.
Defra has created five Rural Growth Networks25
in Swindon and Wiltshire, Durham and Northumberland, Devon and Somerset, Cumbria, and Coventry and Warwickshire to help businesses in rural areas to reach their potential by breaking down barriers to economic growth such as a shortage of work premises, slow internet connection and fragmented business networks. An estimated 3,000 jobs and 700 businesses are expected to be created.
The £20m Farm and Forestry Improvement Scheme26
was launched, this uses RDPE funding to provide small grants of between £2,500 up to £25,000 to farm, forestry and horticulture businesses.
The £60m RDPE funded Rural Economy Grant Scheme27
was launched, which is providing larger grants of between £25,000 and around £1m (no set upper cap) with a maximum intervention rate of 40 percent to enable a „game changing‟ transformation of farm, agri-food, tourism and forestry businesses and micro-enterprises in other high growth sectors located in the Rural Growth Networks. For the tourism specific theme of the fund, the Programme is about investing in a variety of rural tourism projects, which contribute to 5 percent year on year growth in the value of tourism.
The Rural Tourism Package was launched. This is a £10m fund, delivered through the RDPE Rural Economy Grant Scheme (designed to complement the Visit England campaign) for the development and improvement of tourism destinations, facilities and products. Defra received approximately £60m of outline tourism grant applications, against an available £10m budget. There was a high level of demand for the £10m fund, with 120 projects shortlisted to develop full business plans. In addition, the RDPE supported the „Paths for Communities‟ Fund. This fund provided up to £2m, delivered through Natural England, to enable rural communities to enhance their local tourism offer by improving their public rights of way networks.
The £20m Skills and Knowledge Transfer Programme,28
a flexible and locally targetable skills training programme to enable rural business growth, was launched in autumn 2012. Up to £12m of this will be available under the framework with the remaining £8m being already assigned to contracts that are continuing in the south west and north west. All contracts have been awarded and delivery is now underway.
Taking forward the actions set out in a food and drink export action plan29
, published in January 2012 to raise awareness of the potential for growth in this key rural sector.
Strengthening Engagement With Key Local Rural Networks:
The Rural and Farming Network (RFN) is a network of 17 local groups in England set up in January 2012 to identify local issues and concerns for discussion with Defra‟s Ministers. Each group brings together people from rural communities and rural businesses (including the food and farming industries). The Networks have scope to evolve and introduce new members around local priorities and national interests. Defra‟s Ministers have held a further 28 meetings with RFN Chairs in their localities since April 2012.
25
https://www.gov.uk/government/news/new-rural-growth-drive-to-create-3-000-new-jobs-and-700-businesses 26
https://www.gov.uk/government/news/20-million-for-farming-and-forestry-businesses 27
https://www.gov.uk/government/news/60-million-grants-to-boost-rural-businesses 28
https://www.gov.uk/government/news/20-million-to-provide-rural-businesses-with-work-based-training 29
http://www.defra.gov.uk/publications/files/pb13702-food-export-actionplan.pdf
Department for Environment, Food and Rural Affairs Annual Report and Accounts 2012–13
Chapter 4: Other Key Information
36
Adapting to Climate Change
After the publication of the Climate Change Risk Assessment in January 2012, work started to develop the National Adaptation Programme (NAP). The NAP is based on shared ownership and responsibility and timely decision making. Our approach has been to engage a wide range of stakeholders in open policy making. As part of this process, Defra Ministers have convened three high level round tables and an event with stakeholders from all economic sectors in November 2012. Defra aims to publish a report on the NAP by November 2013. This will fulfil a legal obligation under the Climate Change Act 2008.
Other Public Interest Information
Charging and Cost Allocation Policies
As a public sector information holder, Defra has complied with the cost allocation and charging requirements set out in HM Treasury and the Office of Public Sector Information guidance.
Responding to Public Correspondence
The Department has a centralised Customer Contact Unit (CCU) to handle ministerial and public correspondence. Between 1 April 2012 and 31 March 2013, the CCU handled 17,846 letters and emails from the public, answering 94 percent within the target of 15 working days. CCU also handled 11,380 letters from MPs and/or major stakeholders, answering 72 percent within the target of 15 working days. The Defra telephone helplines (Defra Helpline, Pet Travel Scheme Helpline and Poultry Register Helpline) handled 105,012 calls, answering 93 percent within the target of 20 seconds.
Defra‟s Executive Agencies and NDPBs have enquiry centres that deal with public correspondence relating to their areas of work and expertise. Further information and statistics can be found within their individual Annual Report and Accounts.
Publicity and Advertising
The Cabinet Office advertising marketing and communications freeze (from June 2010) is now a permanent feature, known as the Spending Controls. These measures have helped reduce the dependence on paid communications and advertising. This has helped Defra focus on low or no cost channels using press and partnership routes. However, this does not necessarily mean overall communication spend across the Departmental Group will decrease year on year, as it depends on a number of factors such as major project timings and increased network body activity.
Complaints to the Parliamentary and Health Service Ombudsman (PHSO)
Complaints
accepted for
investigation
Complaints
reported on
Complaints fully
upheld
Complaints
partly upheld
Complaints not
upheld
Total Defra 4 2 2
Decision
Pending
Decision
Pending
In the 2012 calendar year, 128 complaints were made to the PHSO relating to the Defra Network, 4 of which were accepted for investigation.
The Ombudsman has upheld two complaints both against the Rural Payments Agency (RPA) for failures in the implementation of the Single Payment Scheme. The RPA has worked hard to improve its complaints and appeals process, working with the PHSO to address the issues identified.
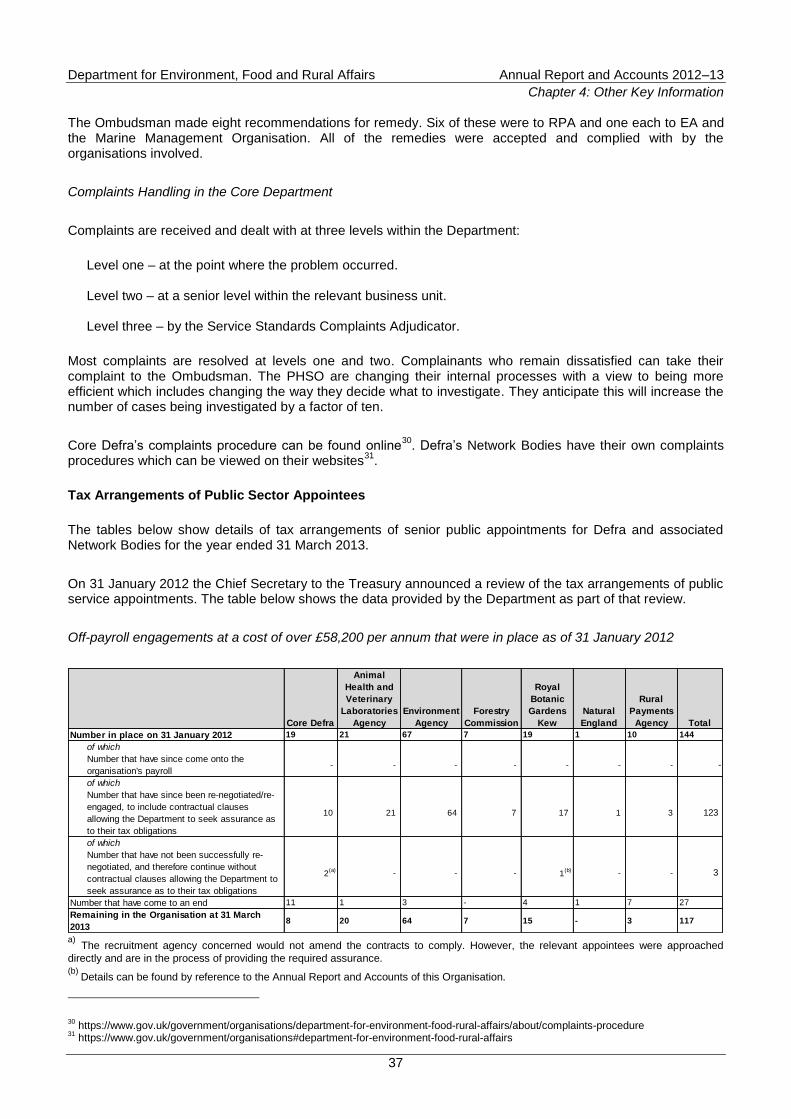
Department for Environment, Food and Rural Affairs Annual Report and Accounts 2012–13
Chapter 4: Other Key Information
37
The Ombudsman made eight recommendations for remedy. Six of these were to RPA and one each to EA and the Marine Management Organisation. All of the remedies were accepted and complied with by the organisations involved.
Complaints Handling in the Core Department
Complaints are received and dealt with at three levels within the Department:
Level one – at the point where the problem occurred.
Level two – at a senior level within the relevant business unit.
Level three – by the Service Standards Complaints Adjudicator.
Most complaints are resolved at levels one and two. Complainants who remain dissatisfied can take their complaint to the Ombudsman. The PHSO are changing their internal processes with a view to being more efficient which includes changing the way they decide what to investigate. They anticipate this will increase the number of cases being investigated by a factor of ten.
Core Defra‟s complaints procedure can be found online30
. Defra‟s Network Bodies have their own complaints procedures which can be viewed on their websites
31.
Tax Arrangements of Public Sector Appointees
The tables below show details of tax arrangements of senior public appointments for Defra and associated Network Bodies for the year ended 31 March 2013.
On 31 January 2012 the Chief Secretary to the Treasury announced a review of the tax arrangements of public service appointments. The table below shows the data provided by the Department as part of that review.
Off-payroll engagements at a cost of over £58,200 per annum that were in place as of 31 January 2012
Core Defra
Animal
Health and
Veterinary
Laboratories
Agency
Environment
Agency
Forestry
Commission
Royal
Botanic
Gardens
Kew
Natural
England
Rural
Payments
Agency Total
Number in place on 31 January 2012 19 21 67 7 19 1 10 144
of which
Number that have since come onto the
organisation's payroll- - - - - - - -
of which
Number that have since been re-negotiated/re-
engaged, to include contractual clauses
allowing the Department to seek assurance as
to their tax obligations
10 21 64 7 17 1 3 123
of which
Number that have not been successfully re-
negotiated, and therefore continue without
contractual clauses allowing the Department to
seek assurance as to their tax obligations
2(a) - - - 1
(b) - - 3
Number that have come to an end 11 1 3 - 4 1 7 27
Remaining in the Organisation at 31 March
20138 20 64 7 15 - 3 117
a)
The recruitment agency concerned would not amend the contracts to comply. However, the relevant appointees were approached
directly and are in the process of providing the required assurance. (b)
Details can be found by reference to the Annual Report and Accounts of this Organisation.
30
https://www.gov.uk/government/organisations/department-for-environment-food-rural-affairs/about/complaints-procedure 31
https://www.gov.uk/government/organisations#department-for-environment-food-rural-affairs
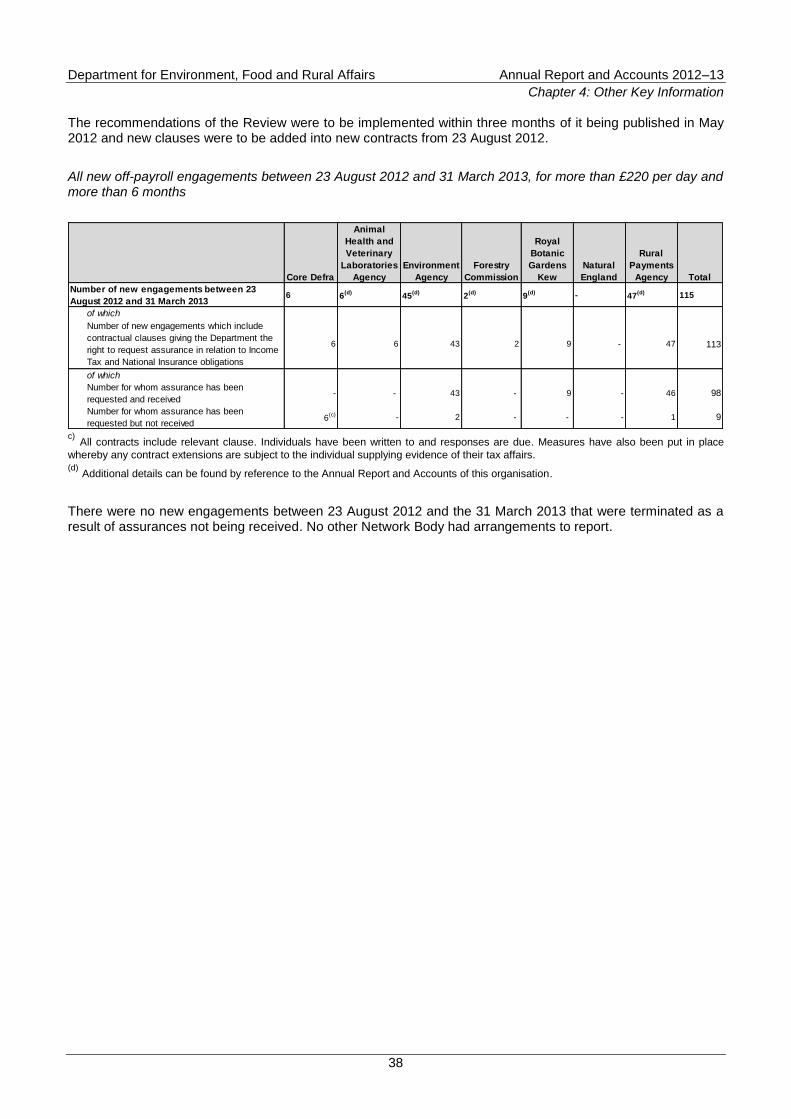
Department for Environment, Food and Rural Affairs Annual Report and Accounts 2012–13
Chapter 4: Other Key Information
38
The recommendations of the Review were to be implemented within three months of it being published in May 2012 and new clauses were to be added into new contracts from 23 August 2012.
All new off-payroll engagements between 23 August 2012 and 31 March 2013, for more than £220 per day and more than 6 months
Core Defra
Animal
Health and
Veterinary
Laboratories
Agency
Environment
Agency
Forestry
Commission
Royal
Botanic
Gardens
Kew
Natural
England
Rural
Payments
Agency Total
Number of new engagements between 23
August 2012 and 31 March 20136 6
(d)45
(d)2
(d)9
(d) - 47(d) 115
of which
Number of new engagements which include
contractual clauses giving the Department the
right to request assurance in relation to Income
Tax and National Insurance obligations
6 6 43 2 9 - 47 113
of which
Number for whom assurance has been
requested and received- - 43 - 9 - 46 98
Number for whom assurance has been
requested but not received 6
(c) - 2 - - - 1 9
c) All contracts include relevant clause. Individuals have been written to and responses are due. Measures have also been put in place
whereby any contract extensions are subject to the individual supplying evidence of their tax affairs. (d)
Additional details can be found by reference to the Annual Report and Accounts of this organisation.
There were no new engagements between 23 August 2012 and the 31 March 2013 that were terminated as a result of assurances not being received. No other Network Body had arrangements to report.
Department for Environment, Food and Rural Affairs Annual Report and Accounts 2012–13
Chapter 4: Other Key Information
39
Remuneration Report
Remuneration Policy
The remuneration of the Senior Civil Service (SCS) is set by the Prime Minister following independent advice from the Review Body on senior salaries. The Cabinet Office advises the Department in March or April each year of the Government‟s response to the Senior Salaries Review Body‟s (SSRB) recommendations and produces guidance for departments to follow.
Defra develops its SCS Reward Strategy within the Cabinet Office framework, ensuring that the overall pay awards for the SCS are within the cost ceiling allowed.
Members of the SCS, excluding the Permanent Secretary, are eligible to be considered for individual levels of bonus as non–pensionable non–consolidated variable pay (NCVP), based on their performance. NCVP is paid in the financial year after that in which it was earned. During 2012–13, NCVP for 2011–12 performance was paid to approximately 25 percent of the SCS and was capped at between £8,000 and £15,000 per individual. NCVP values, informed by each individual‟s appraisal grade, were paid within Cabinet Office guidelines.
The Permanent Secretary is eligible to be considered for a non–pensionable NCVP bonus award measured against achievement of objectives, which for performance in 2011–12 was subject to a maximum of 15 percent of salary. Such awards are made by the Permanent Secretaries‟ Remuneration Committee which comprises the Chairman of the SSRB (who acts as Chair), two other members of the SSRB, the Cabinet Secretary and the Permanent Secretary of HM Treasury.
Ministerial salaries are determined by the Cabinet Office, under the Ministerial and Other Salaries Act 1997.
Service Contracts
The Constitutional Reform and Governance Act 2010 requires Civil Service appointments to be made on merit, on the basis of fair and open competition. The Recruitment Principles published by the Civil Service Commission specify the circumstances when appointments may be made otherwise.
Unless otherwise stated below, the officials covered by this report hold appointments which are open ended. Early termination, other than for misconduct, would result in the individual receiving compensation as set out in the Civil Service Compensation Scheme.
Further information about the work of the Civil Service Commissioners can be found on the Civil Service Commission website
32. All Defra Executive Committee members are on permanent Civil Service contracts, with
the exception of Professor Sir Robert Watson who was on a fixed term contract which ended on 16 September 2012, Graham Ledward who was on secondment to Defra from EA until 30 April 2012, Ian Trenholm who is on a fixed term contract until 5 June 2015 and Professor Ian Boyd who is on a fixed term contract until 29 August 2015.
Remuneration (Including Salary) and Pension Entitlements (Audited)
The following sections provide details of the remuneration and pension interests of the Ministers and Defra Board members who were employees of the Department, during 2012–13. The following tables in the Remuneration Report have been subject to audit.
32
http://www.civilservicecommission.org.uk
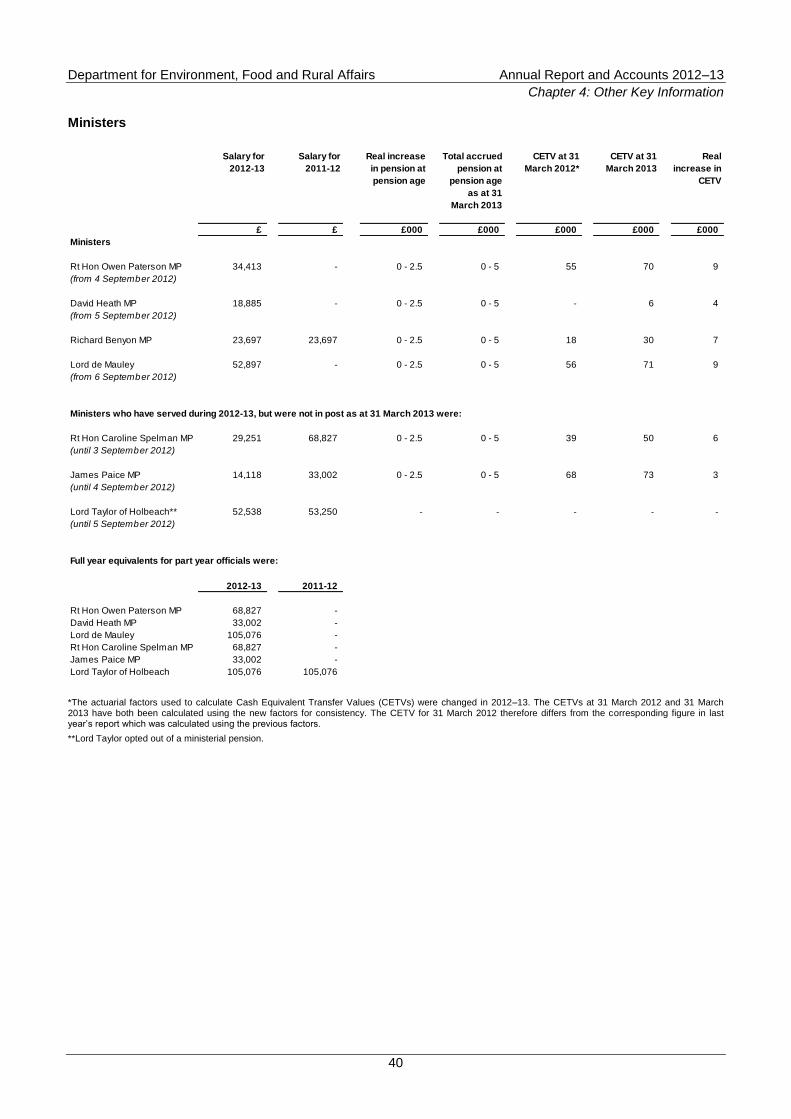
Department for Environment, Food and Rural Affairs Annual Report and Accounts 2012–13
Chapter 4: Other Key Information
40
Ministers
Salary for
2012-13
Salary for
2011-12
Real increase
in pension at
pension age
Total accrued
pension at
pension age
as at 31
March 2013
CETV at 31
March 2012*
CETV at 31
March 2013
Real
increase in
CETV
£ £ £000 £000 £000 £000 £000
Ministers
Rt Hon Owen Paterson MP 34,413 - 0 - 2.5 0 - 5 55 70 9
(from 4 September 2012)
David Heath MP 18,885 - 0 - 2.5 0 - 5 - 6 4
(from 5 September 2012)
Richard Benyon MP 23,697 23,697 0 - 2.5 0 - 5 18 30 7
Lord de Mauley 52,897 - 0 - 2.5 0 - 5 56 71 9
(from 6 September 2012)
Ministers who have served during 2012-13, but were not in post as at 31 March 2013 were:
Rt Hon Caroline Spelman MP 29,251 68,827 0 - 2.5 0 - 5 39 50 6
(until 3 September 2012)
James Paice MP 14,118 33,002 0 - 2.5 0 - 5 68 73 3
(until 4 September 2012)
Lord Taylor of Holbeach** 52,538 53,250 - - - - -
(until 5 September 2012)
Full year equivalents for part year officials were:
2012-13 2011-12
Rt Hon Owen Paterson MP 68,827 -
David Heath MP 33,002 -
Lord de Mauley 105,076 -
Rt Hon Caroline Spelman MP 68,827 -
James Paice MP 33,002 -
Lord Taylor of Holbeach 105,076 105,076
*The actuarial factors used to calculate Cash Equivalent Transfer Values (CETVs) were changed in 2012–13. The CETVs at 31 March 2012 and 31 March 2013 have both been calculated using the new factors for consistency. The CETV for 31 March 2012 therefore differs from the corresponding figure in last year‟s report which was calculated using the previous factors.
**Lord Taylor opted out of a ministerial pension.
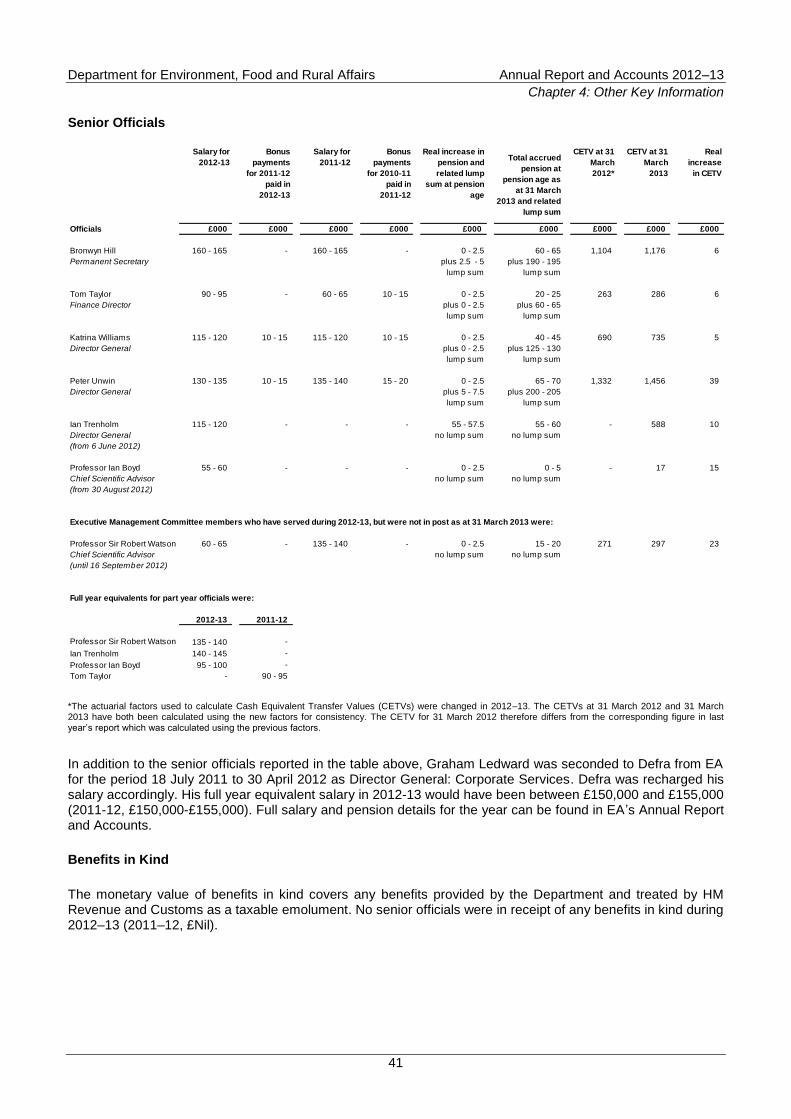
Department for Environment, Food and Rural Affairs Annual Report and Accounts 2012–13
Chapter 4: Other Key Information
41
Senior Officials
Salary for
2012-13
Bonus
payments
for 2011-12
paid in
2012-13
Salary for
2011-12
Bonus
payments
for 2010-11
paid in
2011-12
Real increase in
pension and
related lump
sum at pension
age
Total accrued
pension at
pension age as
at 31 March
2013 and related
lump sum
CETV at 31
March
2012*
CETV at 31
March
2013
Real
increase
in CETV
Officials £000 £000 £000 £000 £000 £000 £000 £000 £000
Bronwyn Hill 160 - 165 - 160 - 165 - 0 - 2.5 60 - 65 1,104 1,176 6
Permanent Secretary plus 2.5 - 5 plus 190 - 195
lump sum lump sum
Tom Taylor 90 - 95 - 60 - 65 10 - 15 0 - 2.5 20 - 25 263 286 6
Finance Director plus 0 - 2.5 plus 60 - 65
lump sum lump sum
Katrina Williams 115 - 120 10 - 15 115 - 120 10 - 15 0 - 2.5 40 - 45 690 735 5
Director General plus 0 - 2.5 plus 125 - 130
lump sum lump sum
Peter Unwin 130 - 135 10 - 15 135 - 140 15 - 20 0 - 2.5 65 - 70 1,332 1,456 39
Director General plus 5 - 7.5 plus 200 - 205
lump sum lump sum
Ian Trenholm 115 - 120 - - - 55 - 57.5 55 - 60 - 588 10
Director General no lump sum no lump sum
(from 6 June 2012)
Professor Ian Boyd 55 - 60 - - - 0 - 2.5 0 - 5 - 17 15
Chief Scientific Advisor no lump sum no lump sum
(from 30 August 2012)
Executive Management Committee members who have served during 2012-13, but were not in post as at 31 March 2013 were:
Professor Sir Robert Watson 60 - 65 - 135 - 140 - 0 - 2.5 15 - 20 271 297 23
Chief Scientific Advisor no lump sum no lump sum
(until 16 September 2012)
Full year equivalents for part year officials were:
2012-13 2011-12
Professor Sir Robert Watson 135 - 140 -
Ian Trenholm 140 - 145 -
Professor Ian Boyd 95 - 100 -
Tom Taylor - 90 - 95
*The actuarial factors used to calculate Cash Equivalent Transfer Values (CETVs) were changed in 2012–13. The CETVs at 31 March 2012 and 31 March 2013 have both been calculated using the new factors for consistency. The CETV for 31 March 2012 therefore differs from the corresponding figure in last year‟s report which was calculated using the previous factors.
In addition to the senior officials reported in the table above, Graham Ledward was seconded to Defra from EA for the period 18 July 2011 to 30 April 2012 as Director General: Corporate Services. Defra was recharged his salary accordingly. His full year equivalent salary in 2012-13 would have been between £150,000 and £155,000 (2011-12, £150,000-£155,000). Full salary and pension details for the year can be found in EA‟s Annual Report and Accounts.
Benefits in Kind
The monetary value of benefits in kind covers any benefits provided by the Department and treated by HM Revenue and Customs as a taxable emolument. No senior officials were in receipt of any benefits in kind during 2012–13 (2011–12, £Nil).
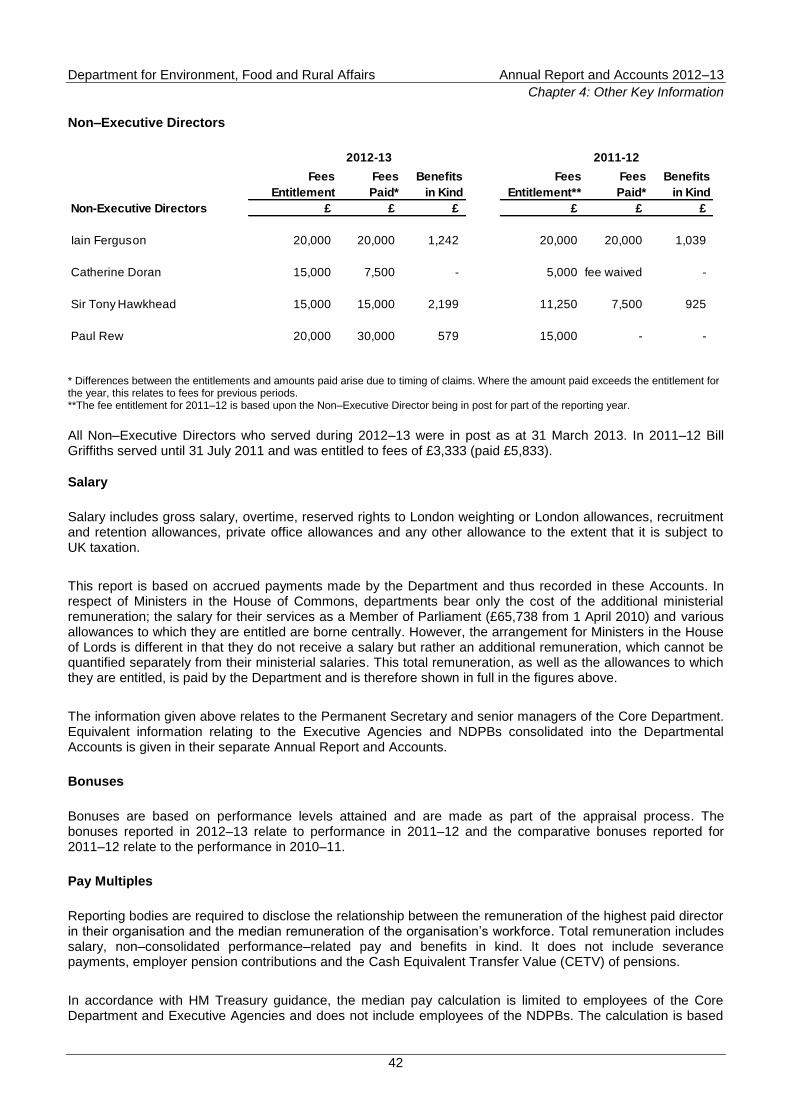
Department for Environment, Food and Rural Affairs Annual Report and Accounts 2012–13
Chapter 4: Other Key Information
42
Non–Executive Directors
2012-13 2011-12
Fees
Entitlement
Fees
Paid*
Benefits
in Kind
Fees
Entitlement**
Fees
Paid*
Benefits
in Kind
Non-Executive Directors £ £ £ £ £ £
Iain Ferguson 20,000 20,000 1,242 20,000 20,000 1,039
Catherine Doran 15,000 7,500 - 5,000 fee waived -
Sir Tony Hawkhead 15,000 15,000 2,199 11,250 7,500 925
Paul Rew 20,000 30,000 579 15,000 - - * Differences between the entitlements and amounts paid arise due to timing of claims. Where the amount paid exceeds the entitlement for the year, this relates to fees for previous periods. **The fee entitlement for 2011–12 is based upon the Non–Executive Director being in post for part of the reporting year.
All Non–Executive Directors who served during 2012–13 were in post as at 31 March 2013. In 2011–12 Bill Griffiths served until 31 July 2011 and was entitled to fees of £3,333 (paid £5,833).
Salary
Salary includes gross salary, overtime, reserved rights to London weighting or London allowances, recruitment and retention allowances, private office allowances and any other allowance to the extent that it is subject to UK taxation.
This report is based on accrued payments made by the Department and thus recorded in these Accounts. In respect of Ministers in the House of Commons, departments bear only the cost of the additional ministerial remuneration; the salary for their services as a Member of Parliament (£65,738 from 1 April 2010) and various allowances to which they are entitled are borne centrally. However, the arrangement for Ministers in the House of Lords is different in that they do not receive a salary but rather an additional remuneration, which cannot be quantified separately from their ministerial salaries. This total remuneration, as well as the allowances to which they are entitled, is paid by the Department and is therefore shown in full in the figures above.
The information given above relates to the Permanent Secretary and senior managers of the Core Department. Equivalent information relating to the Executive Agencies and NDPBs consolidated into the Departmental Accounts is given in their separate Annual Report and Accounts.
Bonuses
Bonuses are based on performance levels attained and are made as part of the appraisal process. The bonuses reported in 2012–13 relate to performance in 2011–12 and the comparative bonuses reported for 2011–12 relate to the performance in 2010–11.
Pay Multiples
Reporting bodies are required to disclose the relationship between the remuneration of the highest paid director in their organisation and the median remuneration of the organisation‟s workforce. Total remuneration includes salary, non–consolidated performance–related pay and benefits in kind. It does not include severance payments, employer pension contributions and the Cash Equivalent Transfer Value (CETV) of pensions.
In accordance with HM Treasury guidance, the median pay calculation is limited to employees of the Core Department and Executive Agencies and does not include employees of the NDPBs. The calculation is based
Department for Environment, Food and Rural Affairs Annual Report and Accounts 2012–13
Chapter 4: Other Key Information
43
on the annualised, full–time equivalent of staff in post as at the reporting date. Similarly, following HM Treasury guidance, the scope of the highest paid director is limited to the Core Department.
The banded remuneration of the highest paid director in Core Defra in the financial year 2012–13 was £160,000–£165,000 (2011–12, £170,000–175,000). This was 6.0 times (2011–12, 6.6 times) the median remuneration of the workforce, which was £27,013 (2011–12, £25,903). The change in the median salary can mainly be attributed to a change in staff profile within the Department, with fewer staff at the lowest tier grades and proportionately more staff in the middle tier grades.
The highest paid director in 2012–13 was the Accounting Officer, although this was not the case in the previous reporting year.
Remuneration for staff in Core Defra and Executive Agencies ranged from £9,750 to £204,278 (2011–12, £9,500 to £249,600). The employees receiving the lowest pay in the pay range are employed as apprentices by one of Defra‟s Executive Agencies. In 2012–13, 20 employees (2011–12, 19) received remuneration in excess of the highest paid director. These were temporary employees in post at 31 March and their earnings were estimated as a percentage of their full-time equivalent cost. The Department did not necessarily incur the full cost of these employees for the entire year.
Pension Benefits Ministerial Pensions
Pension benefits for ministers are provided by the Parliamentary Contributory Pension Fund (PCPF). The scheme is established under statute (the regulations are set out in Statutory Instrument SI 1993 No 3253, as amended).
Those ministers who are Members of Parliament (MP) may accrue an MP's pension under the PCPF (details of which are not included in this report). The accrual rate has been 1/40th since 15 July 2002 (or 5 July 2001 for those that chose to backdate the change) but ministers, in common with all other members of the PCPF, can opt for a 1/50th accrual rate for a lower rate of employee contribution. An additional 1/60th accrual rate option (backdated to 1 April 2008) was introduced from 1 January 2010.
Benefits for ministers are payable at the same time as MP‟s benefits become payable under the PCPF or, for those who are not MPs, on retirement from ministerial office from age 65. Pensions are revalued annually in line with Pensions Increase Legislation. From 1 April 2013 members pay contributions between 7.9 percent and 16.7 percent depending on their level of seniority and chosen accrual rate. The contribution rates are planned to increase in April 2014, subject to consultation.
The accrued pension quoted is the pension the minister is entitled to receive when they reach 65, or immediately on ceasing to be an active member of the scheme if they are already 65.
In line with reforms to other public service pension schemes, it is intended to reform the Ministerial Pension Scheme in 2015.
Civil Service Pensions
Pension benefits are provided through the Civil Service pension arrangements. From 30 July 2007, civil servants may be in one of four defined benefit schemes; either a final salary scheme (classic, premium or classic plus); or a whole career scheme (nuvos). These statutory arrangements are unfunded with the cost of benefits met by monies voted by Parliament each year. Pensions payable under classic, premium, classic plus and nuvos are increased annually in line with Pensions Increase Legislation. Members joining from October 2002 may opt for either the appropriate defined benefit arrangement or a „money purchase‟ stakeholder pension with an employer contribution (partnership pension account).
Department for Environment, Food and Rural Affairs Annual Report and Accounts 2012–13
Chapter 4: Other Key Information
44
Employee contributions are salary-related and range between 1.5 percent and 3.9 percent of pensionable earnings for classic and 3.5 percent and 5.9 percent for premium, classic plus and nuvos. Increases to employee contributions have applied from 1 April 2013. Benefits in classic accrue at the rate of 1/80th of final pensionable earnings for each year of service. In addition, a lump sum equivalent to three years‟ initial pension is payable on retirement. For premium, benefits accrue at the rate of 1/60th of final pensionable earnings for each year of service. Unlike classic, there is no automatic lump sum. Classic plus is essentially a hybrid with benefits for service before 1 October 2002 calculated broadly as per classic and benefits for service from October 2002 worked out as in premium. In nuvos, a member builds up a pension based on pensionable earnings during their period of scheme membership. At the end of the scheme year (31 March), the member‟s earned pension account is credited with 2.3 percent of their pensionable earnings in that scheme year and the accrued pension is uprated in line with Pensions Increase Legislation. In all cases members may opt to give up (commute) pension for a lump sum up to the limits set by the Finance Act 2004.
The partnership pension account is a stakeholder pension arrangement. The employer makes a basic contribution of between 3 percent and 12.5 percent (depending on the age of the member) into a stakeholder pension product chosen by the employee from a panel of three providers. The employee does not have to contribute, but where they do make contributions, the employer will match these up to a limit of 3 percent of pensionable salary (in addition to the employer‟s basic contribution). Employers also contribute a further 0.8 percent of pensionable salary to cover the cost of centrally–provided risk benefit cover (death in service and ill health retirement).
The accrued pension quoted is the pension the member is entitled to receive when they reach pension age, or immediately on ceasing to be an active member of the scheme if they are already at or over pension age. Pension age is 60 for members of classic, premium and classic plus and 65 for members of nuvos. Further details about the Civil Service pension arrangements can be found on the Civil Service website
33.
Cash Equivalent Transfer Values (CETV)
A CETV is the actuarially–assessed capitalised value of the pension scheme benefits accrued by a member at a particular point in time. The benefits valued are the member‟s accrued benefits and any contingent spouse‟s pension payable from the scheme. A CETV is a payment made by a pension scheme or arrangement to secure pension benefits in another pension scheme or arrangement when the member leaves a scheme and chooses to transfer the pension benefits they have accrued in their former scheme. The pension figures shown relate to the benefits that the individual has accrued as a consequence of their total membership of the pension scheme, not just their service in a senior capacity to which disclosure applies. CETVs are calculated in accordance with The Occupational Pension Schemes (Transfer Values) (Amendment) Regulations 2008 and do not take account of any actual or potential reduction to benefits resulting from Lifetime Allowance Tax which may be due when pension benefits are taken.
Regarding the Executive Committee, the CETV figures include the value of any pension benefit in another scheme or arrangement which the individual has transferred to the Civil Service pension arrangements. They also include any additional pension benefit accrued to the member as a result of their buying additional pension benefits at their own cost.
Real Increase in CETV
For the Executive Committee, this reflects the increase in CETV that is funded by the employer. It does not include the increase in accrued pension due to inflation, contributions paid by the employee (including the value of any benefits transferred from another pension scheme or arrangement) and uses common market valuation factors for the start and end of the period.
For ministers, this is the element of the increase in accrued pension funded by the Exchequer. It excludes increases due to inflation and contributions paid by the Minister. It is worked out using common market valuation factors for the start and end of the period.
33
http://www.civilservice.gov.uk/pensions
Department for Environment, Food and Rural Affairs Annual Report and Accounts 2012–13
Chapter 5: Finance Overview
45
Chapter 5: Finance Overview
Introduction
The Department has continued to make good progress with delivering the savings and reforms set out in the 2010 Spending Review (SR10). Compared to the SR10 baseline (2010–11) set by HM Treasury DEL expenditure in 2012–13 was £621m lower, which is a reduction of 20 percent in nominal terms. Within this Administration expenditure was £214m lower, which is a reduction of 28 percent in equivalent terms. The Department has once again in 2012–13 exceeded its target for savings in administration costs, particularly through efficiencies within corporate services, in order to focus more of its available funds on higher priority activities.
Defra‟s gross spending in the economy is twice the size that its DEL budget would suggest because of the value of schemes administered on behalf of the EU, which are also exposed to foreign currency fluctuations. Nonetheless, continuous improvements in financial management resulted in an outturn within 1 percent of the DEL budget.
Included in Defra‟s Resource DEL Budget are payments made in respect of Common Agricultural Policy (CAP) and rural development schemes, net of income received from the EU. For 2012–13, Defra supported the rural economy with £1,722m in CAP scheme expenditure for schemes in England plus £554m for rural development schemes. An additional £1,173m was also distributed to the Devolved Administrations for equivalent schemes in the rest of the UK. Despite the considerable challenges of administering this complex scheme of payments:
an above-target 99.5 percent of the 2012 SPS scheme payments were made by 31 March 2013;
disallowance penalties finalised in 2012–13 amounted to less than 1 percent of scheme value; and
the Department again successfully mitigated the foreign exchange risks associated with the operation of the EU schemes.
Financial Summary
The Statement of Parliamentary Supply on page 88 shows that Defra‟s total Voted funding for the 2012–13 financial year was £2,647m. This consisted of £2,510m in Departmental Expenditure Limits (DEL), £115m in Annually Managed Expenditure (AME), and £22m outside of the Department‟s budgetary boundary. The latter category is primarily for expenditure incurred and income received on behalf of the Devolved Administrations in Scotland, Wales and Northern Ireland – referred to as „Non–Budget‟.
The Department‟s final Outturn against the budgets within its control was £2,492m in DEL and (£30m) in AME. This amounts to an underspend against budgets of £19m in DEL and £145m in AME. The Outturn on expenditure outside of the Department‟s budgetary boundary (Non–Budget) resulted in an underspend of £20m. Therefore in total this amounts to an Outturn on Voted expenditure of £2,464m; £184m under combined Voted limits. Explanation of these variances is provided below.
Departmental Expenditure Limits
DEL is the budget total, issued by HM Treasury on behalf of Parliament, that Defra uses to fund its strategic objectives. Including an allowance for the consumption of assets over time (depreciation), these are the totals that are issued to business units across the Defra network as budgets to fund ministerial outcomes.
Set against the context of the Government‟s priorities to simultaneously boost growth and reduce the fiscal deficit, Defra‟s financial performance over 2012–13 continued to contribute to both. As Chapter 3 demonstrates, over 2012–13 the Department has delivered against an ambitious set of Structural Reform Plan actions while at the same time reducing DEL spending and living within all Voted limits set down for it by Parliament.
Department for Environment, Food and Rural Affairs Annual Report and Accounts 2012–13
Chapter 5: Finance Overview
46
To help boost growth, the Department spent 99 percent of its Capital DEL budget. This was achieved by rigorous prioritisation of investment, largely in vital infrastructure projects to protect communities against the risks of flood and coastal erosion.
To help reduce the fiscal deficit, the Department economised in back–office Administration spending within Resource DEL to protect front–line Programme spending. By reducing staff costs, estates and other overheads Defra was able to forecast early in the year a saving against the Administration budget in 2012–13 of £71m.
Through in year reprioritisation, the Department recycled around 79 percent of this Administration saving into front line areas, exceeding its plans for Resource Programme spending (which is not a control total) by £56m and enabling delivery of ministerial priorities.
The end year position was an underspend against DEL budgets of £19m (£4m on Capital DEL and £15m on Resource DEL). Of this, £7m was in ring–fenced budgets (Disallowance of £1m, Depreciation of £3m and £3m for Sustainable Urban Drainage Systems). Under HM Treasury rules, underspends in ring–fenced budgets cannot be used for other purposes. Excluding these ring–fenced items, underspend against DEL budgets in 2012–13 was £12m, which is less than 1 percent of the DEL budget.
Other Budgets
AME is used largely for technical accounting treatments only. Therefore, Defra‟s AME budget does not directly fund the achievement of ministerial priorities but is used largely for accounting treatment associated with the movement into and out of liabilities on the Consolidated Statement of Financial Position. This explains the unusual pattern of movements in Resource AME reported in Core Table 1.
The following provides important context for understanding Defra‟s underspend on AME of £145m in 2012–13.
£53m of this relates to a contingency for potential Disallowance provision on the 2012 Single Payment Scheme (SPS), where the actual provision depends on timing of European Union (EU) audits. As no EU audit has been carried out on this scheme year, the provision was not required.
The remaining £92m of underspend on the AME budget was mainly due to the following items.
£34m underspend in the Rural Payments Agency (RPA). £5m of which reflects gains on foreign currency balances and £19m relates to a potential provision relating to a British Sugar compensation claim. This claim has now been settled, so the provision is no longer required. The balance consists of movements in provisions, the largest movement being a reduction of £5m for the Bad Debt Provision.
£22m primarily relating to the utilisation of an existing provision for Disallowance for the Fruit and Vegetable Trader scheme, which was expected to happen in the next financial year but has crystallised earlier than expected, creating a credit in AME in 2012–13.
£12m in the Environment Agency (EA) Closed Pension Fund, where the future liabilities have reduced due to revised actuarial assumptions of life expectancy.
A further £24m underspend primarily relating to potential provisions created across the Defra Group which were not required.
There is one other area of Defra funding, called Non–Budget, which is used primarily to account for expenditure and income relating to Common Agricultural Programme (CAP) payments on behalf of the Devolved Administrations. The Department‟s Outturn against Non–Budget in 2012–13 was an underspend of £20m, reflecting foreign exchange movements, and an underspend against the expected movement for prior period adjustments.
Department for Environment, Food and Rural Affairs Annual Report and Accounts 2012–13
Chapter 5: Finance Overview
47
Net Cash Requirement
There will invariably be a difference between Defra‟s budgets (as described above) and the Net Cash Requirement (NCR) Voted from the Consolidated Fund to pay for that resource and capital consumption when falling due. This is because, in line with standard accounting practice, spending is recorded in the Accounts on an accruals basis and as such reflects the consumption of resource and not necessarily the payment of cash.
As detailed in the Statement of Parliamentary Supply, Defra‟s Outturn against its Estimate in the 2012–13 NCR is an underspend of £163m. This variance is primarily due to the following.
£102m underspend relating to a decrease in the amount owed by the EU as at 31 March 2013. A cautious view was taken when setting the NCR in the Supplementary Estimate as reimbursement from the EU, particularly for payments made under the European Agricultural Fund for Rural Development (EAFRD), is not guaranteed to occur before the end of the financial year. A partial reimbursement was eventually received during the last week of March 2013.
£30m underspend on Grant-in-Aid payments to NDPBs, due to their cash requirements being less than expected. This was partially expected following the measures taken to mitigate against the risk of a delay, beyond 31 March 2013, in the reimbursement of EC monies as described above.
£31m various other smaller under and overspends.
Consolidated Statement of Financial Position
Over the 2012–13 financial year, Defra‟s total assets less liabilities decreased by £197m. Non–current assets reduced by £26m over the year, reflecting a number of net additions and revaluations across the Network (including flood defences and IT assets). This was offset by total depreciation, amortisation and impairment charged in year on non–current assets of £215m. Current assets have reduced by £274m, mainly due to a reduction in cash balances of £165m and a reduction in receivables of £102m, where accrued EU income is £80m lower. Current liabilities have decreased by £180m, where trade payables have reduced, mainly due to a £127m reduction in the Consolidated Fund creditor. Non–current liabilities have increased by £77m, with the main movement being due to an increase in the net pension liability.
Financial Position Risks The main financial risks relate to the administration of RPA‟s scheme payments.
Foreign Currency Risk
Excluding RPA, there is no significant foreign currency risk. RPA enters into forward foreign exchange contracts to manage its risk relating to the euro denominated receipts from the EU. Full details of the financial derivatives relating to RPA are given in Note 12 to the Accounts.
After mitigating these risks, in order to minimise any gains or losses, RPA achieved an overall realised foreign exchange gain of only £10m, on over £3bn worth of scheme payments.
Liquidity Risk
Excluding RPA, there is no significant exposure to liquidity risk as the Department‟s net resource requirement is financed through resources voted annually by Parliament.
RPA has maintained liquidity by timely submission of funding claims to the EU. Where necessary, Defra draws down from HM Treasury‟s Contingency Fund, on behalf of RPA, on a short term basis and borrowings are repayable within the financial year.
Department for Environment, Food and Rural Affairs Annual Report and Accounts 2012–13
Chapter 5: Finance Overview
48
Remote Contingent Liabilities
An analysis of contingent liabilities disclosed under International Accounting Standard (IAS) 37 and contingent assets is given in Note 25.
Defra has entered into a number of agreements resulting in remote contingent liabilities that are disclosed in Note 26 under parliamentary reporting requirements. These are outside the meaning of IAS 37 since the possibility of a transfer of economic benefit in settlement is too remote.
Other Information
This section covers other key financial information which may be of interest to readers of the Accounts.
Disallowance
„Disallowance‟ arises as a result of financial corrections applied by the EU where they take the view that EU regulations for payments funded through European Schemes, including the Common Agricultural Policy, have not been applied correctly. The financial correction typically materialises as a deduction by the EU from a UK claim for reimbursement under European Schemes – in essence, a penalty.
Disallowance is accounted for in Defra‟s Accounts in three stages.
Stage 1: Money is initially set aside for Disallowance (via a provision) when there is sufficient evidence that a penalty is likely, but not certain, to be incurred in a future accounting period. These amounts are held on the Statement of Financial Position (SoFP), often referred to as the balance sheet, as non–current liabilities (provisions).
Stage 2: Disallowance penalties are confirmed in the Accounts (via an 'accrual') when the Disallowance has been decided by the EU and will not be contested by the Department. These amounts, typically unwinding a previous provision, are held on the SoFP as current liabilities (accruals). Both Stage 1 and Stage 2 transactions result in charges to Resource (either AME or DEL), and are therefore charged to the Statement of Comprehensive Net Expenditure (SoCNE), as shown in the Charges to the SoCNE for EU Disallowance table below. Depending on when notification is received from the EU, Stage 1 may be skipped, and occasionally transactions can move from Stage 1 to Stage 3 within the same financial year.
Stage 3: Disallowance penalties are finally transacted when the EU decides to deduct the owed amount from a claim for reimbursement under European Schemes made by the UK, typically some time after the penalty has been confirmed (and therefore accrued). Stage 3 payments are accounted for purely through the SoFP, exchanging a current liability (accrual) for a current asset (cash) and so are not shown on the SoCNE. The Balances from the SoFP for EU Disallowance table shows the accumulation over time of Stage 1, 2 and 3 transactions in Defra‟s Accounts.
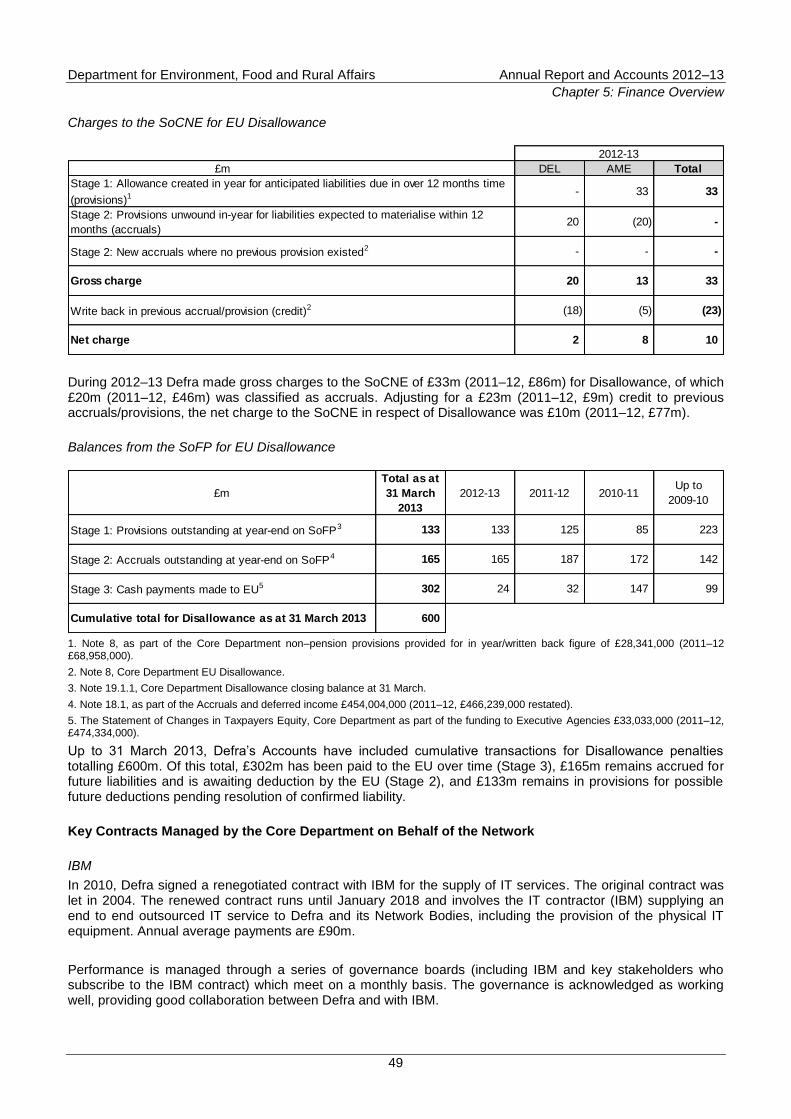
Department for Environment, Food and Rural Affairs Annual Report and Accounts 2012–13
Chapter 5: Finance Overview
49
Charges to the SoCNE for EU Disallowance
£m DEL AME Total
- 33 33
20 (20) -
- - -
20 13 33
(18) (5) (23)
2 8 10 Net charge
2012-13
Stage 1: Allowance created in year for anticipated liabilities due in over 12 months time
(provisions)1
Stage 2: Provisions unwound in-year for liabilities expected to materialise within 12
months (accruals)
Stage 2: New accruals where no previous provision existed2
Gross charge
Write back in previous accrual/provision (credit)2
During 2012–13 Defra made gross charges to the SoCNE of £33m (2011–12, £86m) for Disallowance, of which £20m (2011–12, £46m) was classified as accruals. Adjusting for a £23m (2011–12, £9m) credit to previous accruals/provisions, the net charge to the SoCNE in respect of Disallowance was £10m (2011–12, £77m).
Balances from the SoFP for EU Disallowance
£m
Total as at
31 March
2013
2012-13 2011-12 2010-11Up to
2009-10
Stage 1: Provisions outstanding at year-end on SoFP3 133 133 125 85 223
Stage 2: Accruals outstanding at year-end on SoFP4 165 165 187 172 142
Stage 3: Cash payments made to EU5 302 24 32 147 99
Cumulative total for Disallowance as at 31 March 2013 600
1. Note 8, as part of the Core Department non–pension provisions provided for in year/written back figure of £28,341,000 (2011–12 £68,958,000).
2. Note 8, Core Department EU Disallowance.
3. Note 19.1.1, Core Department Disallowance closing balance at 31 March.
4. Note 18.1, as part of the Accruals and deferred income £454,004,000 (2011–12, £466,239,000 restated).
5. The Statement of Changes in Taxpayers Equity, Core Department as part of the funding to Executive Agencies £33,033,000 (2011–12, £474,334,000).
Up to 31 March 2013, Defra‟s Accounts have included cumulative transactions for Disallowance penalties totalling £600m. Of this total, £302m has been paid to the EU over time (Stage 3), £165m remains accrued for future liabilities and is awaiting deduction by the EU (Stage 2), and £133m remains in provisions for possible future deductions pending resolution of confirmed liability.
Key Contracts Managed by the Core Department on Behalf of the Network
IBM
In 2010, Defra signed a renegotiated contract with IBM for the supply of IT services. The original contract was let in 2004. The renewed contract runs until January 2018 and involves the IT contractor (IBM) supplying an end to end outsourced IT service to Defra and its Network Bodies, including the provision of the physical IT equipment. Annual average payments are £90m.
Performance is managed through a series of governance boards (including IBM and key stakeholders who subscribe to the IBM contract) which meet on a monthly basis. The governance is acknowledged as working well, providing good collaboration between Defra and with IBM.
Department for Environment, Food and Rural Affairs Annual Report and Accounts 2012–13
Chapter 5: Finance Overview
50
Details of how the contract is accounted for can be found in the accounting policy Note 1.5.2 in the Accounts. Disclosures relating to the value of the right to use assets can be found in Note 10.2, and the amount of the contract relating to the maintenance element of the contract is included in Note 24 of the Accounts.
Interserve
Defra signed a 15 year contract with Interserve Plc in 2009 for facilities management for its estate. This involves delivery of support services, maintenance of the estate and utilities management. The value of the contract for the network is £349m for the remainder of the contract (11 years) which is an average of £32m per year. This is included in Note 24 of the Accounts.
Performance is managed through a series of internal governance boards within Defra, and the operational output is monitored by the Performance and Contract Management Board via performance indicators. In 2012–13, the main focus was on embedding the new arrangements, which the Strategic Review (finalised in March 2012) recommended. Operational and financial performance has been monitored and risks and issues identified on a continual basis. Mitigating action has been taken as required.
Details of key contracts managed directly by Network Bodies can be found in their individual Annual Report and Accounts where appropriate.
Pension Liabilities Details of pension liabilities can be found in Note 20 to the Accounts. Supplier Payment Policies
The standard terms of payment for all supplier contracts is 30 days from receipt and agreement of a valid invoice. This is embedded in all contracts with suppliers, with any exceptions agreed as part of contractual negotiations. Payment terms for most other types of valid payments for grants, funding and to other bodies are immediate.
In 2012–13 the Core Department paid 95 percent of suppliers‟ invoices within 5 days (97 percent in 2011–12). This exceeds the Government target of 80 percent paid within 5 days. Details relating to Executive Agencies and Non–Departmental Public Bodies (NDPBs) can be found in their individual Annual Report and Accounts.
Events after the Reporting Period
Details of the events after the reporting period are included within Note 29.
Going Concern
The Statement of Financial Position at 31 March 2013 shows Taxpayers Equity and other reserves of £1,932,811,000 (2011–12 restated, £2,129,425,000). This reflects the inclusion of liabilities falling due in future years. Under the Government Resources and Accounts Act 2000, no money may be drawn from the Consolidated Fund other than that required for the service of the specified year or retained in excess of that need. All unspent monies, including those derived from the Department's income, must be surrendered to the Consolidated Fund.
In common with other government departments, the future financing of Defra's liabilities is to be met by future grants of Supply and the application of future income approved annually by Parliament. Approval for amounts required for 2013–14 is due to be given before the Parliamentary Recess and there is no reason to believe that future approvals will not be made. It has accordingly been considered appropriate to adopt a going concern basis for the preparation of these financial statements.
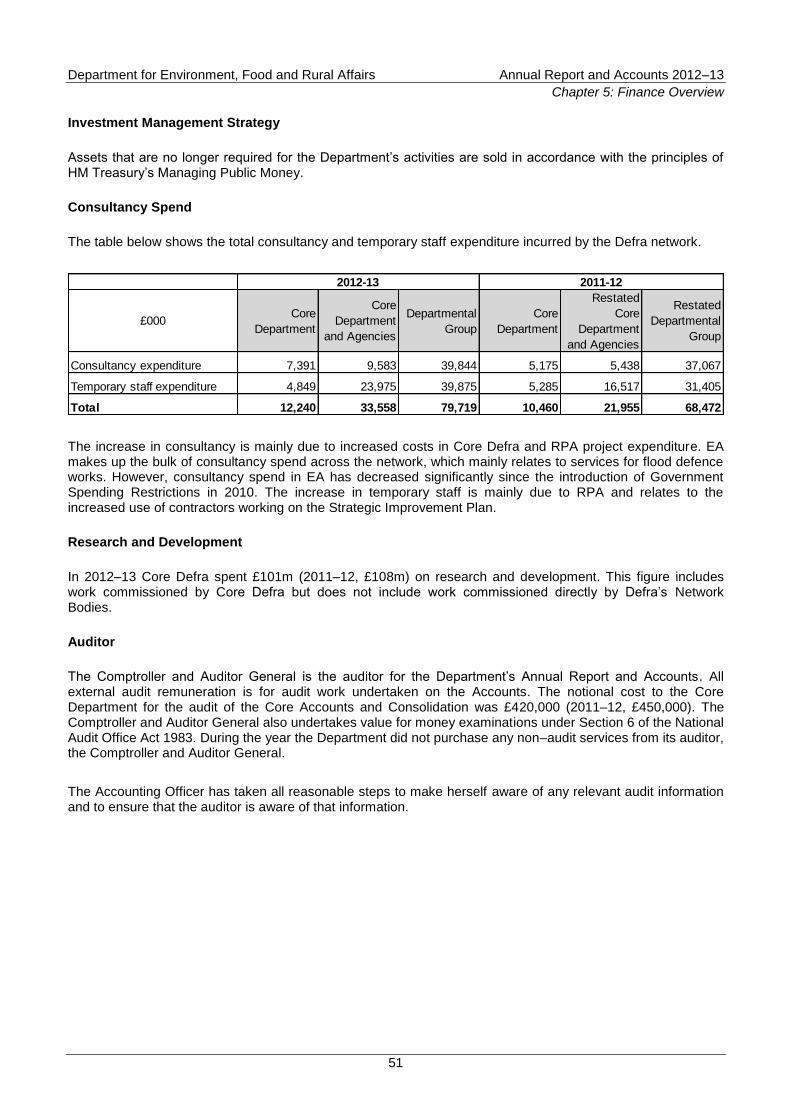
Department for Environment, Food and Rural Affairs Annual Report and Accounts 2012–13
Chapter 5: Finance Overview
51
Investment Management Strategy
Assets that are no longer required for the Department‟s activities are sold in accordance with the principles of HM Treasury‟s Managing Public Money.
Consultancy Spend
The table below shows the total consultancy and temporary staff expenditure incurred by the Defra network.
£000Core
Department
Core
Department
and Agencies
Departmental
Group
Core
Department
Restated
Core
Department
and Agencies
Restated
Departmental
Group
Consultancy expenditure 7,391 9,583 39,844 5,175 5,438 37,067
Temporary staff expenditure 4,849 23,975 39,875 5,285 16,517 31,405
Total 12,240 33,558 79,719 10,460 21,955 68,472
2012-13 2011-12
The increase in consultancy is mainly due to increased costs in Core Defra and RPA project expenditure. EA makes up the bulk of consultancy spend across the network, which mainly relates to services for flood defence works. However, consultancy spend in EA has decreased significantly since the introduction of Government Spending Restrictions in 2010. The increase in temporary staff is mainly due to RPA and relates to the increased use of contractors working on the Strategic Improvement Plan.
Research and Development
In 2012–13 Core Defra spent £101m (2011–12, £108m) on research and development. This figure includes work commissioned by Core Defra but does not include work commissioned directly by Defra‟s Network Bodies.
Auditor
The Comptroller and Auditor General is the auditor for the Department‟s Annual Report and Accounts. All external audit remuneration is for audit work undertaken on the Accounts. The notional cost to the Core Department for the audit of the Core Accounts and Consolidation was £420,000 (2011–12, £450,000). The Comptroller and Auditor General also undertakes value for money examinations under Section 6 of the National Audit Office Act 1983. During the year the Department did not purchase any non–audit services from its auditor, the Comptroller and Auditor General.
The Accounting Officer has taken all reasonable steps to make herself aware of any relevant audit information and to ensure that the auditor is aware of that information.
Department for Environment, Food and Rural Affairs Annual Report and Accounts 2012–13
Chapter 5: Finance Overview
52
Core Tables 2012–13
The aim of the published tables is to provide an explanation of what Defra spends money on. The analysis shows departmental expenditure split between resource consumption and capital investment. The tables also show how Defra spends its money by country and region, staff numbers employed by body and capital employed. The format of the tables is dictated by HM Treasury.
HM Treasury publishes a glossary in the Public Expenditure Statistical Analyses report (CM 8376)34
that explains the majority of the terms used in the core tables and in the commentary below so these are not all repeated here.
Details of the Parliamentary Main Estimate and Parliamentary Supplementary Estimate are published separately
35.
Table 1 – Defra’s Resource and Capital Budget
This table sets out a summary of the Resource and Capital Budget expenditure for the Department, covering the period from 2008–09 to 2014–15. It shows DEL and AME elements separately for control purposes. Future years‟ figures reflect the budgeted figures agreed with HM Treasury for the Department.
DEL budgets cover spending that is within a department‟s control and are negotiated with HM Treasury via Spending Reviews. The Spending Review in 2010 (SR10) covers the years 2011–12 to 2014–15.
The Resource DEL Budget includes the administrative costs of running Core Defra and its Network Bodies (referred to as „Administration‟) and the programme spend on areas including waste, animal disease, health and welfare, natural environment, and floods (referred to as „Programme‟). CAP scheme payments are included within Programme DEL, net of income received from the EU.
AME budgets are usually demand-led and not easily controllable by departments, so are set at the beginning of each year via the Parliamentary Main Estimate. They can be updated during the year via the Supplementary Estimate, subject to approval by HM Treasury and Parliament.
Defra‟s AME Budget is all classified as Programme, as there is no split between Administration and Programme within Resource AME. It includes movements on provisions, including CAP Disallowance and the Environment Agency (EA) Pension Funds, as well as the resource costs of the Levy Funded Bodies, net of levy and other income.
The Capital Budget covers Defra and its Network Bodies and includes expenditure on fixed assets, net of sales, and the payment of capital grants.
Table 2 – Defra’s Administration Budget
This table shows the administration costs of running the Department in more detail. The Administration Budget includes staff costs, resource expenditure on accommodation, utilities and services etc, where they are not directly associated with front-line service delivery. The commentary on administration costs is included in the detailed analysis below, but in general terms, the Administration Budget reflects the savings required by SR10.
34
https://www.gov.uk/government/publications/public-expenditure-statistical-analyses-2012 35
https://www.gov.uk/government/publications/supply-estimates-guidance-manual
Department for Environment, Food and Rural Affairs Annual Report and Accounts 2012–13
Chapter 5: Finance Overview
53
Detailed Analysis on Tables 1 and 2
These tables have both been produced from HM Treasury‟s OSCAR database and, as required by HM Treasury, follow the 2012–13 HM Treasury rules. These tables are therefore produced on the same basis as the Statement of Parliamentary Supply.
As part of the 2013–14 Main Estimate two Machinery of Government changes took place which affected the years 2011–12 to 2014–15. The first related to the transfer to the Department of Communities and Local Government (DCLG) of responsibility for Lead Local Flood Authorities. The second related to the transfer of EA Wales to Natural Resources Wales. The Core Tables do not reflect these Machinery of Government changes, to ensure consistency with rest of the Annual Report and Accounts.
These tables follow the layout of the Part II Table of the Estimate, as decided by HM Treasury.
Resource Budget (Programme and Administration) DEL
Support and develop British farming
The decrease in Outturn in 2011–12 and 2012–13 is primarily due to a decrease in the CAP Disallowance payments. This reflects a change in the profile of the CAP Disallowance provision. Disallowance penalties for a number of years became due in 2010–11 when EU Disallowance judgements covering SPS 2007, 2008 and 2009 were finalised. Defra transferred £46m of the provision from 2011–12 to 2010–11 in the 2010–11 Spring Supplementary Estimate to fund these penalties. A similar transfer took place in the 2012–13 Supplementary Estimate which transferred £87m from 2012–13 to 2013–14. This transfer was required because an EU decision in relation to SPS 2009 and 2010 and the 2009 Fruit and Vegetable schemes was not received until after the 2012–13 year end. These adjustments are in line with the SR10 settlement to allow flexibility in Disallowance funding between years to handle the timing of Disallowance costs which are outside the Department‟s control. The overall Disallowance costs during the SR10 period, however, are still expected to be within the funding available.
Help to enhance the environment and biodiversity
The increase in Outturn in 2009–10 relates to expenditure on the Rural Development Programme for England (RDPE). The Exchequer element of this spend has gradually increased from 2007–08 through to 2010–11, but reduces towards the end of the SR10 period as more payments are expected to be funded by the EU. The RDPE scheme provides a degree of flexibility over the percentage split between Exchequer and EU funded payments across years as long as the overall total is in line with the scheme rules. There is also a planned decrease in RDPE spend through SR10 as several RDPE schemes come to an end and fewer new agreements are signed.
From 2011–12 onwards, in accordance with HM Treasury guidance, this section includes income from the Welsh Assembly Government to fund the EA‟s work in Wales.
The 2011–12 Outturn includes a one off payment of £25m to the British Waterways Board Pension Fund to enable the transfer of its historic public sector pension liabilities to the new Canal & River Trust.
The decrease in 2013–14 is primarily due to a reduction in the UK Exchequer funding for RDPE and efficiencies within the Forestry Commission.
Support a strong and sustainable green economy
The 2011–12 Outturn included one off funding for the International Climate Fund, which is included within the Support and develop British farming Capital DEL for the years 2012–13 onwards. The Regional Development
Department for Environment, Food and Rural Affairs Annual Report and Accounts 2012–13
Chapter 5: Finance Overview
54
Agency funding transferred to the Department for Business, Innovation and Skills in 2012–13 contributing towards the reduction from 2011–12; this transfer covered the years 2012–13 to 2014–15.
Increased spending through the SR10 period is primarily due to Waste Private Finance Initiative (PFI) credits in support of the Waste Infrastructure Development Programme. The PFI policy and budget was transferred from the Department for Communities and Local Government to Defra, to pay Local Authorities.
Prepare for and manage risk from animal and plant diseases
Spending decreased in 2011–12 as a result of Animal Health merging with the Veterinary Laboratories Agency to form the Animal Health and Veterinary Laboratories Agency (AHVLA). The decrease in 2014–15 is primarily due to the sponsorship of the AHVLA being further spread over a number of lines rather than being recorded centrally on this line. This budget position will be reviewed during the 2014–15 business planning exercise.
Prepare for and manage risk from environmental emergencies
The increase in Outturn for 2009–10 is due to spend on Floods and Coastal Erosion Risk Management, which increased in 2010–11 before decreasing in 2011–12 as part of the overall decrease in public spending. The increase from 2012–13 to the end of SR10 is due to the Department standing by its commitment to fund new burdens under the Flood and Water Management Act and the EU Floods Directive, with grants being provided directly to Lead Local Flood Authorities (LLFAs).
Departmental operating costs
There has been a decrease in Outturn through to 2011–12, with several different items contributing to this decrease in expenditure. There have been significant savings made due to rationalising the estate, including the disposal of the Page Street property in central London.
The further reduction in 2012–13 and the increase in 2013–14 is a result of Defra using the Budget Exchange mechanism to transfer £20m Administration budget from 2012–13 to 2013–14. The downward trend resumes in 2014–15 as efficiencies and the restructuring of the Department takes full effect.
Support and develop British farming (NDPB)(Net)
The decrease in Outturn from 2009–10 is a result of the closure of Food From Britain (FFB) on 31 March 2009. The remaining budget relates to the Gangmasters Licensing Authority.
Help to enhance the environment and biodiversity (NDPB)(Net)
The increase in Outturn for 2011–12 is due to an increase in allocations to EA as part of the Water Framework Directive together with the EA Wales expenditure which was not included in previous years.
Support a strong and sustainable green economy (NDPB)(Net)
The decrease in Outturn for 2011–12 is due to the closure of the Sustainable Development Commission (SDC) and the Commission for Rural Communities (CRC). The SDC was closed as part of the Government‟s reform of public bodies. The CRC operated at a reduced capacity during its final year of operations in 2012–13 before final closure in March 2013.
Department for Environment, Food and Rural Affairs Annual Report and Accounts 2012–13
Chapter 5: Finance Overview
55
Prepare for and manage risk from environmental emergencies (NDPB)(Net)
EA Flood Outturn shows an increase to 2011–12 in relation to the funding for EA Wales and then decreases towards the end of SR10 as part of the overall reduction in public spending.
Resource Budget AME
Resource AME balances vary greatly over the years due to the volatility of provisions recorded as AME. A debit (a positive) is recorded as provisions are created, and a credit (a negative) recorded when a provision is utilised.
Support and develop British farming
The negative values in Outturn reflect the utilisation of the CAP Disallowance provision, which peaked in 2010–11 as described in the DEL section above. A positive figure appears in 2011–12 as the utilisation in this year was lower, due to the budget transfer of £46m from 2011–12 to 2010–11, so it does not fully offset the annual increase to the provision. In 2012–13 a credit of £87m was transferred to 2013–14 as part of the Supplementary Estimate, as described in the DEL section above. The credit in 2014–15 relates to the current CAP scheme which will be reformed in 2013. Any new provisions for 2014–15 will be considered once we know more about the new CAP schemes.
Help to enhance the environment and biodiversity
The large credit figure that occurs in the 2010–11 Outturn is due to the Government‟s decision to index public service benefits using the Consumer Prices Index (CPI) rather that the Retail Prices Index (RPI). This had a significant impact on the EA Closed Pension scheme provision.
Prepare for and manage risk from animal and plant diseases
The increase in Outturn for 2009–10 relates to a property write-down at the Veterinary Laboratories Agency (VLA). The increase in Outturn for 2012–13 relates to dilapidation provisions at AHVLA for the Weybridge site.
Departmental operating costs
The negative Outturn for 2009–10 is caused by the early release of a provision for an onerous lease held for the Page Street office. The balances for future years‟ budgets were agreed with HM Treasury as part of the SR10 settlement and reflect budget cover held centrally which may be utilised in the respective years.
Support and develop British farming (NDPB)(Net)
The credit figure that occurs in 2010–11 relates to the Government‟s decision to index public service benefits using the CPI rather than the RPI and reflects the impact this had on the Agriculture and Horticulture Development Board‟s Pension scheme.
Help to enhance the environment and biodiversity (NDPB)(Net)
The large credit figure that occurs in 2010–11 relates to the Government‟s decision to index public service benefits using the CPI rather than the RPI and reflects the impact this had on the EA Pension Fund. The 2011–12 Outturn reflects the utilisation of some provisions and an increase in fees, levies and charges income at the Sea Fish Industry Authority (SFIA) due to the outcome of a legal case, which allowed SFIA to reclaim the levies from those companies that import fish via air-freight rather than sea.
Department for Environment, Food and Rural Affairs Annual Report and Accounts 2012–13
Chapter 5: Finance Overview
56
Prepare for and manage risk from environmental emergencies (NDPB)(Net)
The large credit figure that occurs in 2010–11 relates to the Government‟s decision to index public service benefits using the CPI rather than the RPI and reflects the impact this had on the EA Pension Fund.
Capital Budget DEL
The largest element of the Capital DEL Budget relates to flood management. Also included within the Capital DEL Budget for future years is a ring-fenced budget for the International Climate Fund. The remainder of the Capital DEL Budget for the latter half of the SR10 period is largely held centrally and will be allocated in accordance with the Department‟s prioritisation of capital projects each year.
Support and develop British farming
2008–09 and 2009–10 Outturn included specific increased investment within the RPA for their recovery plan. The increase from 2012–13 relates to the ring-fenced budget for the International Climate Fund.
Help to enhance the environment and biodiversity
The 2008–09 Outturn included a one off extra funding to the British Waterways Board to carry out essential works. For 2009–10 the 2008 Pre-Budget Report Fiscal Stimulus Package brought forward some capital spend from 2010–11 for the British Waterways Board. This contributes towards the reduction in 2010–11 together with the transfer of the Contaminated Land Capital Grant Scheme to the EA, who from July 2010 were responsible for all technical and financial aspects of that programme. The decrease in 2012–13 primarily relates to a reduction in the level of capital grants provided to the Canal & River Trust when compared to the British Waterways Board in previous years. Some budgets for 2013–14 and 2014–15 are centrally held and awaiting allocation in accordance with the Department‟s prioritisation of capital projects.
Support a strong and sustainable green economy
The increase in Outturn for 2009–10 is due to added investment in the London Waste and Recycling Board. Throughout the period of CSR07, the Waste programme made Waste Infrastructure Capital Grants to Local Authorities. This scheme finished at the end of CSR07, hence the decrease in the 2011–12 Outturn.
Prepare for and manage risk from animal and plant diseases
The decrease in Outturn from 2008–09 to 2011–12 relates to a reduced level of long term investment in laboratory facilities at the Veterinary Laboratories Agency and the Animal Health Agency.
Prepare for and manage risk from environmental emergencies
The negative Outturn for 2011–12 onwards is due to the income received from the Welsh Assembly Government to fund the capital costs of EA in Wales.
Departmental operating costs
The negative Outturn for 2008–09 relates to Capital receipts from the sale of the Guildford site. As this was a one off receipt, the Outturn increases again for 2009–10. The negative Outturn for 2011–12 relates to Capital receipts from the sale of buildings. These were one off receipts. The increased Capital budget for the remaining SR10 years is due to some Capital budgets currently being held centrally, prior to being allocated in accordance with the Department‟s prioritisation of capital projects.
Department for Environment, Food and Rural Affairs Annual Report and Accounts 2012–13
Chapter 5: Finance Overview
57
Help to enhance the environment and biodiversity (NDPB)(Net)
The reduction for the remaining years of SR10 relates to a reduction in the funding for non flood work within EA. Further capital allocations will be reviewed as part of the business planning process.
Prepare for and manage risk from environmental emergencies (NDPB)(Net)
There was an increase in EA‟s flood capital allocation for 2009–10, including the impact of the 2008 Pre–Budget Report Fiscal Stimulus Package which brought forward capital spend from 2010–11 into 2009–10. The increase in 2014–15 relates to the additional budget for floods announced by HM Treasury in the 2012 Autumn Budget Statement.
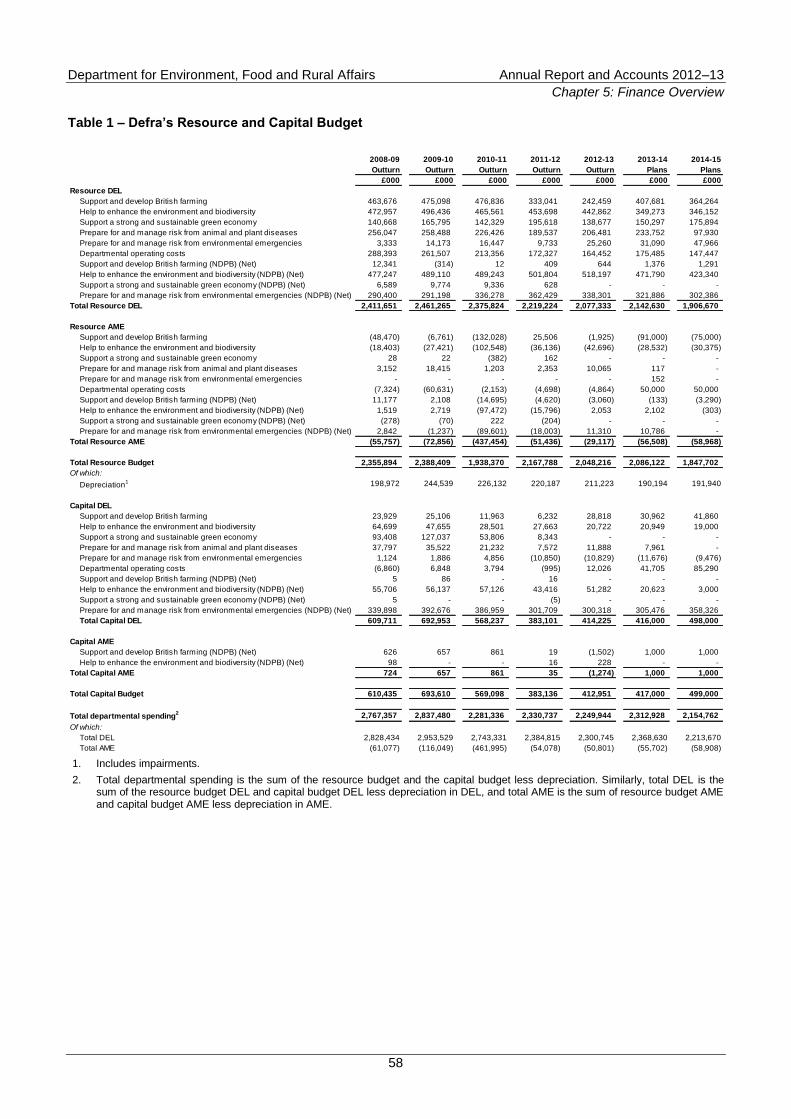
Department for Environment, Food and Rural Affairs Annual Report and Accounts 2012–13
Chapter 5: Finance Overview
58
Table 1 – Defra’s Resource and Capital Budget
2008-09 2009-10 2010-11 2011-12 2012-13 2013-14 2014-15
Outturn Outturn Outturn Outturn Outturn Plans Plans
£000 £000 £000 £000 £000 £000 £000
Support and develop British farming 463,676 475,098 476,836 333,041 242,459 407,681 364,264
Help to enhance the environment and biodiversity 472,957 496,436 465,561 453,698 442,862 349,273 346,152
Support a strong and sustainable green economy 140,668 165,795 142,329 195,618 138,677 150,297 175,894
Prepare for and manage risk from animal and plant diseases 256,047 258,488 226,426 189,537 206,481 233,752 97,930
Prepare for and manage risk from environmental emergencies 3,333 14,173 16,447 9,733 25,260 31,090 47,966
Departmental operating costs 288,393 261,507 213,356 172,327 164,452 175,485 147,447
Support and develop British farming (NDPB) (Net) 12,341 (314) 12 409 644 1,376 1,291
Help to enhance the environment and biodiversity (NDPB) (Net) 477,247 489,110 489,243 501,804 518,197 471,790 423,340
Support a strong and sustainable green economy (NDPB) (Net) 6,589 9,774 9,336 628 - - -
Prepare for and manage risk from environmental emergencies (NDPB) (Net) 290,400 291,198 336,278 362,429 338,301 321,886 302,386
Total Resource DEL 2,411,651 2,461,265 2,375,824 2,219,224 2,077,333 2,142,630 1,906,670
Support and develop British farming (48,470) (6,761) (132,028) 25,506 (1,925) (91,000) (75,000)
Help to enhance the environment and biodiversity (18,403) (27,421) (102,548) (36,136) (42,696) (28,532) (30,375)
Support a strong and sustainable green economy 28 22 (382) 162 - - -
Prepare for and manage risk from animal and plant diseases 3,152 18,415 1,203 2,353 10,065 117 -
Prepare for and manage risk from environmental emergencies - - - - - 152 -
Departmental operating costs (7,324) (60,631) (2,153) (4,698) (4,864) 50,000 50,000
Support and develop British farming (NDPB) (Net) 11,177 2,108 (14,695) (4,620) (3,060) (133) (3,290)
Help to enhance the environment and biodiversity (NDPB) (Net) 1,519 2,719 (97,472) (15,796) 2,053 2,102 (303)
Support a strong and sustainable green economy (NDPB) (Net) (278) (70) 222 (204) - - -
Prepare for and manage risk from environmental emergencies (NDPB) (Net) 2,842 (1,237) (89,601) (18,003) 11,310 10,786 -
Total Resource AME (55,757) (72,856) (437,454) (51,436) (29,117) (56,508) (58,968)
Total Resource Budget 2,355,894 2,388,409 1,938,370 2,167,788 2,048,216 2,086,122 1,847,702
Depreciation1 198,972 244,539 226,132 220,187 211,223 190,194 191,940
Support and develop British farming 23,929 25,106 11,963 6,232 28,818 30,962 41,860
Help to enhance the environment and biodiversity 64,699 47,655 28,501 27,663 20,722 20,949 19,000
Support a strong and sustainable green economy 93,408 127,037 53,806 8,343 - - -
Prepare for and manage risk from animal and plant diseases 37,797 35,522 21,232 7,572 11,888 7,961 -
Prepare for and manage risk from environmental emergencies 1,124 1,886 4,856 (10,850) (10,829) (11,676) (9,476)
Departmental operating costs (6,860) 6,848 3,794 (995) 12,026 41,705 85,290
Support and develop British farming (NDPB) (Net) 5 86 - 16 - - -
Help to enhance the environment and biodiversity (NDPB) (Net) 55,706 56,137 57,126 43,416 51,282 20,623 3,000
Support a strong and sustainable green economy (NDPB) (Net) 5 - - (5) - - -
Prepare for and manage risk from environmental emergencies (NDPB) (Net) 339,898 392,676 386,959 301,709 300,318 305,476 358,326
Total Capital DEL 609,711 692,953 568,237 383,101 414,225 416,000 498,000
Support and develop British farming (NDPB) (Net) 626 657 861 19 (1,502) 1,000 1,000
Help to enhance the environment and biodiversity (NDPB) (Net) 98 - - 16 228 - -
Total Capital AME 724 657 861 35 (1,274) 1,000 1,000
Total Capital Budget 610,435 693,610 569,098 383,136 412,951 417,000 499,000
Total departmental spending2 2,767,357 2,837,480 2,281,336 2,330,737 2,249,944 2,312,928 2,154,762
Total DEL 2,828,434 2,953,529 2,743,331 2,384,815 2,300,745 2,368,630 2,213,670
Total AME (61,077) (116,049) (461,995) (54,078) (50,801) (55,702) (58,908)
Resource DEL
Resource AME
Of which:
Capital DEL
Capital AME
Of which:
1. Includes impairments.
2. Total departmental spending is the sum of the resource budget and the capital budget less depreciation. Similarly, total DEL is the sum of the resource budget DEL and capital budget DEL less depreciation in DEL, and total AME is the sum of resource budget AME and capital budget AME less depreciation in AME.
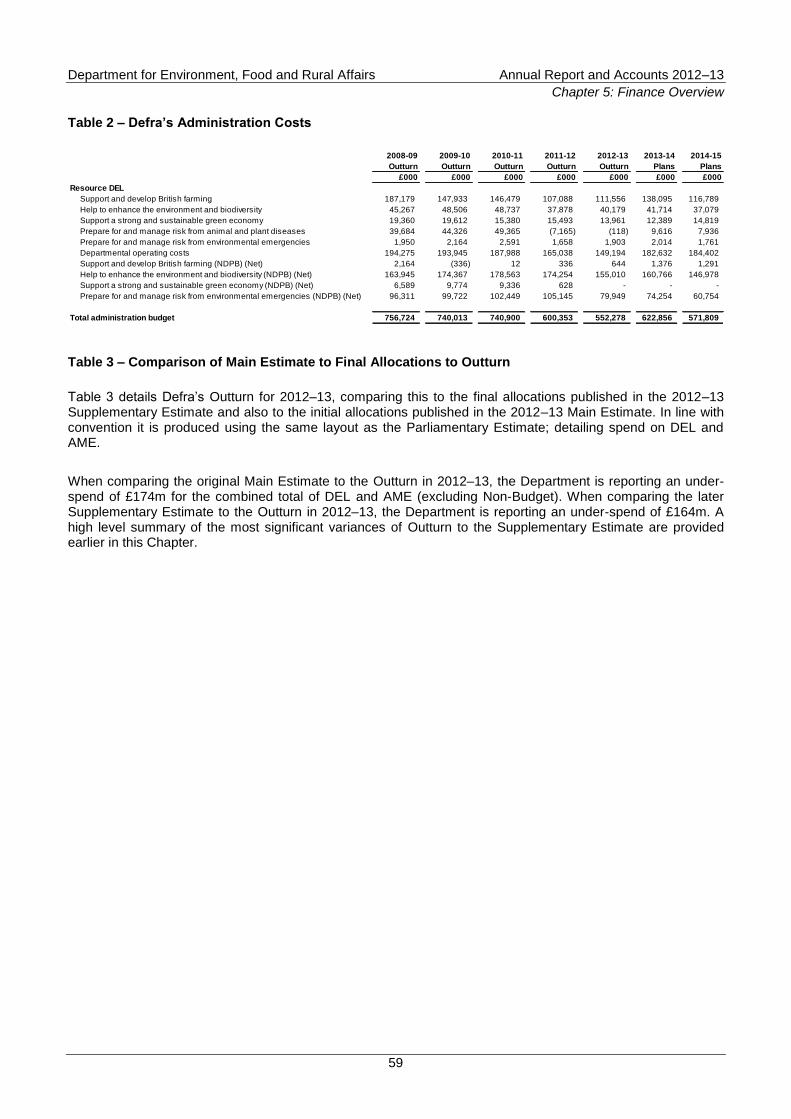
Department for Environment, Food and Rural Affairs Annual Report and Accounts 2012–13
Chapter 5: Finance Overview
59
Table 2 – Defra’s Administration Costs
2008-09 2009-10 2010-11 2011-12 2012-13 2013-14 2014-15
Outturn Outturn Outturn Outturn Outturn Plans Plans
£000 £000 £000 £000 £000 £000 £000
Support and develop British farming 187,179 147,933 146,479 107,088 111,556 138,095 116,789
Help to enhance the environment and biodiversity 45,267 48,506 48,737 37,878 40,179 41,714 37,079
Support a strong and sustainable green economy 19,360 19,612 15,380 15,493 13,961 12,389 14,819
Prepare for and manage risk from animal and plant diseases 39,684 44,326 49,365 (7,165) (118) 9,616 7,936
Prepare for and manage risk from environmental emergencies 1,950 2,164 2,591 1,658 1,903 2,014 1,761
Departmental operating costs 194,275 193,945 187,988 165,038 149,194 182,632 184,402
Support and develop British farming (NDPB) (Net) 2,164 (336) 12 336 644 1,376 1,291
Help to enhance the environment and biodiversity (NDPB) (Net) 163,945 174,367 178,563 174,254 155,010 160,766 146,978
Support a strong and sustainable green economy (NDPB) (Net) 6,589 9,774 9,336 628 - - -
Prepare for and manage risk from environmental emergencies (NDPB) (Net) 96,311 99,722 102,449 105,145 79,949 74,254 60,754
756,724 740,013 740,900 600,353 552,278 622,856 571,809
Total administration budget
Resource DEL
Table 3 – Comparison of Main Estimate to Final Allocations to Outturn
Table 3 details Defra‟s Outturn for 2012–13, comparing this to the final allocations published in the 2012–13 Supplementary Estimate and also to the initial allocations published in the 2012–13 Main Estimate. In line with convention it is produced using the same layout as the Parliamentary Estimate; detailing spend on DEL and AME.
When comparing the original Main Estimate to the Outturn in 2012–13, the Department is reporting an under-spend of £174m for the combined total of DEL and AME (excluding Non-Budget). When comparing the later Supplementary Estimate to the Outturn in 2012–13, the Department is reporting an under-spend of £164m. A high level summary of the most significant variances of Outturn to the Supplementary Estimate are provided earlier in this Chapter.
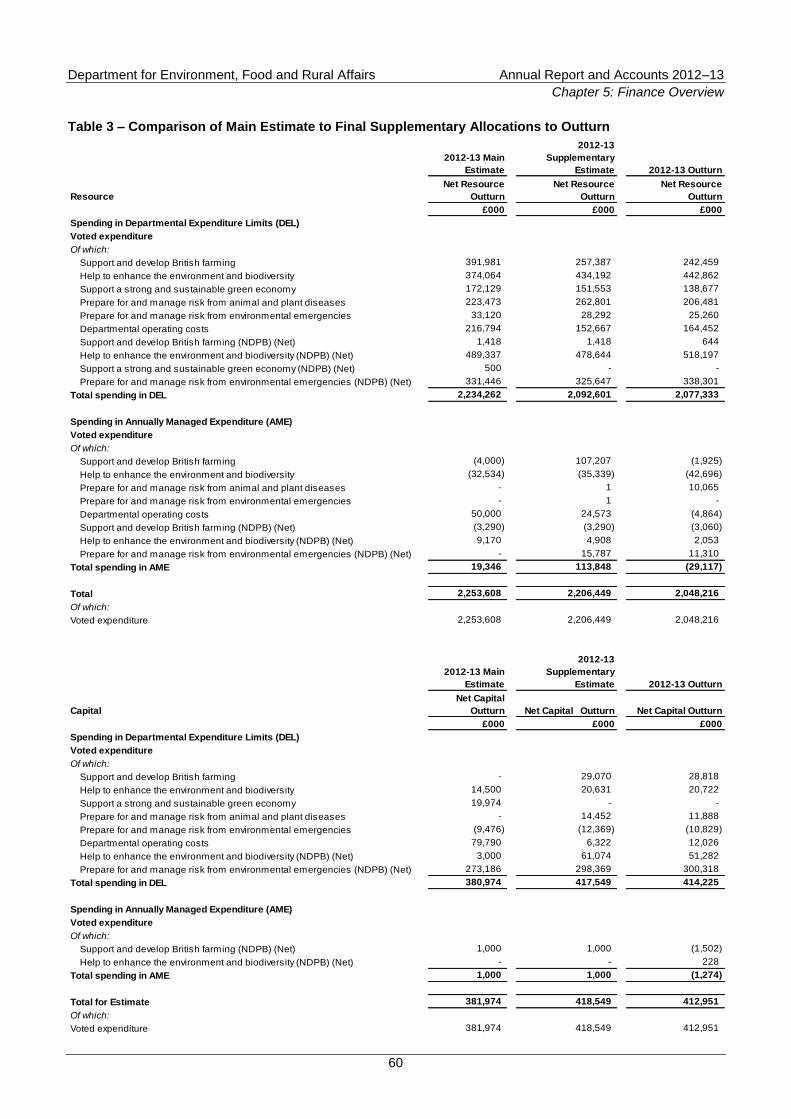
Department for Environment, Food and Rural Affairs Annual Report and Accounts 2012–13
Chapter 5: Finance Overview
60
Table 3 – Comparison of Main Estimate to Final Supplementary Allocations to Outturn
2012-13 Main
Estimate
2012-13
Supplementary
Estimate 2012-13 Outturn
Resource
Net Resource
Outturn
Net Resource
Outturn
Net Resource
Outturn
£000 £000 £000
Spending in Departmental Expenditure Limits (DEL)
Voted expenditure
Of which:
Support and develop British farming 391,981 257,387 242,459
Help to enhance the environment and biodiversity 374,064 434,192 442,862
Support a strong and sustainable green economy 172,129 151,553 138,677
Prepare for and manage risk from animal and plant diseases 223,473 262,801 206,481
Prepare for and manage risk from environmental emergencies 33,120 28,292 25,260
Departmental operating costs 216,794 152,667 164,452
Support and develop British farming (NDPB) (Net) 1,418 1,418 644
Help to enhance the environment and biodiversity (NDPB) (Net) 489,337 478,644 518,197
Support a strong and sustainable green economy (NDPB) (Net) 500 - -
Prepare for and manage risk from environmental emergencies (NDPB) (Net) 331,446 325,647 338,301
Total spending in DEL 2,234,262 2,092,601 2,077,333
Spending in Annually Managed Expenditure (AME)
Voted expenditure
Of which:
Support and develop British farming (4,000) 107,207 (1,925)
Help to enhance the environment and biodiversity (32,534) (35,339) (42,696)
Prepare for and manage risk from animal and plant diseases - 1 10,065
Prepare for and manage risk from environmental emergencies - 1 -
Departmental operating costs 50,000 24,573 (4,864)
Support and develop British farming (NDPB) (Net) (3,290) (3,290) (3,060)
Help to enhance the environment and biodiversity (NDPB) (Net) 9,170 4,908 2,053
Prepare for and manage risk from environmental emergencies (NDPB) (Net) - 15,787 11,310
Total spending in AME 19,346 113,848 (29,117)
Total 2,253,608 2,206,449 2,048,216
Of which:
Voted expenditure 2,253,608 2,206,449 2,048,216
2012-13 Main
Estimate
2012-13
Supplementary
Estimate 2012-13 Outturn
Capital
Net Capital
Outturn Net Capital Outturn Net Capital Outturn
£000 £000 £000
Spending in Departmental Expenditure Limits (DEL)
Voted expenditure
Of which:
Support and develop British farming - 29,070 28,818
Help to enhance the environment and biodiversity 14,500 20,631 20,722
Support a strong and sustainable green economy 19,974 - -
Prepare for and manage risk from animal and plant diseases - 14,452 11,888
Prepare for and manage risk from environmental emergencies (9,476) (12,369) (10,829)
Departmental operating costs 79,790 6,322 12,026
Help to enhance the environment and biodiversity (NDPB) (Net) 3,000 61,074 51,282
Prepare for and manage risk from environmental emergencies (NDPB) (Net) 273,186 298,369 300,318
Total spending in DEL 380,974 417,549 414,225
Spending in Annually Managed Expenditure (AME)
Voted expenditure
Of which:
Support and develop British farming (NDPB) (Net) 1,000 1,000 (1,502)
Help to enhance the environment and biodiversity (NDPB) (Net) - - 228
Total spending in AME 1,000 1,000 (1,274)
Total for Estimate 381,974 418,549 412,951
Of which:
Voted expenditure 381,974 418,549 412,951
Department for Environment, Food and Rural Affairs Annual Report and Accounts 2012–13
Chapter 5: Finance Overview
61
Table 4 – Capital Employed
The figures for the years 2012–13 and earlier are extracted from the audited Annual Report and Accounts for those years, including those of the Non–Departmental Public Bodies (NDPB‟s).
In 2009–10 a reclassification occurred between tangible equipment and IT and intangible assets as a result of implementing International Financial Reporting Standards (IFRS).
2010–11 reductions in intangible and property plant and equipment reflect the Spending Controls introduced by the Coalition Government ahead of the Spending Review 2010 (SR10) settlement.
During the SR10 period (2011–12 to 2014–15) plans incorporate a reduction in land and buildings, through a disposal programme, with proceeds reinvested in upgrading IT capability to underpin efficiency improvements.
Current assets reduced by £1.2bn in 2009–10, mainly because of a reduction in the bank account balance due to repayment of the Consolidated Fund (CF) for Supply and payment of Consolidated Funds Extra Receipt (CFER) balances.
Additionally, a change in accounting policy for the recognition of income and expenditure for SPS England resulted in a decrease in trade receivables and other current assets.
Bank account balances reduced again in 2012–13, reflecting an initiative by HM Treasury and Government Banking Service to hold smaller balances.
In 2009–10 the above reductions in current assets were mirrored by reductions in payables (<1 year), with reductions in CF and CFER as noted above, and the change in SPS accounting policy also leading to a decrease in trade payables and other current liabilities. CFER balances were eliminated altogether in 2011–12 due to a change in HM Treasury guidance.
Provisions reduced in 2010–11 mainly due to the utilisation of the CAP Disallowance provision as amounts for SPS Scheme years 2007, 2008 and 2009 crystallised.
In 2012–13 Defra‟s provision for the EA closed pension scheme liability reduced, mainly due to ongoing contributions into the scheme for pensions in payment.
Network Bodies‟ net assets decreased in 2009–10 because of a devaluation of EA‟s tangible assets as a result of the economic downturn, and a substantial increase in their active pension scheme liability.
Network body net assets increased in 2010–11 as the EA pension liability reduced, future pension increases being linked to the CPI and not the RPI, a change introduced in the 2010 Budget Statement. This increase was partially offset by the recognition of a long term liability in respect of the EA Reservoir Agreement.
In 2012–13 the EA pension liability increased. This increase, partially offset by an increase in EA‟s infrastructure assets, was the main reason for the decrease in Network Bodies‟ net assets.
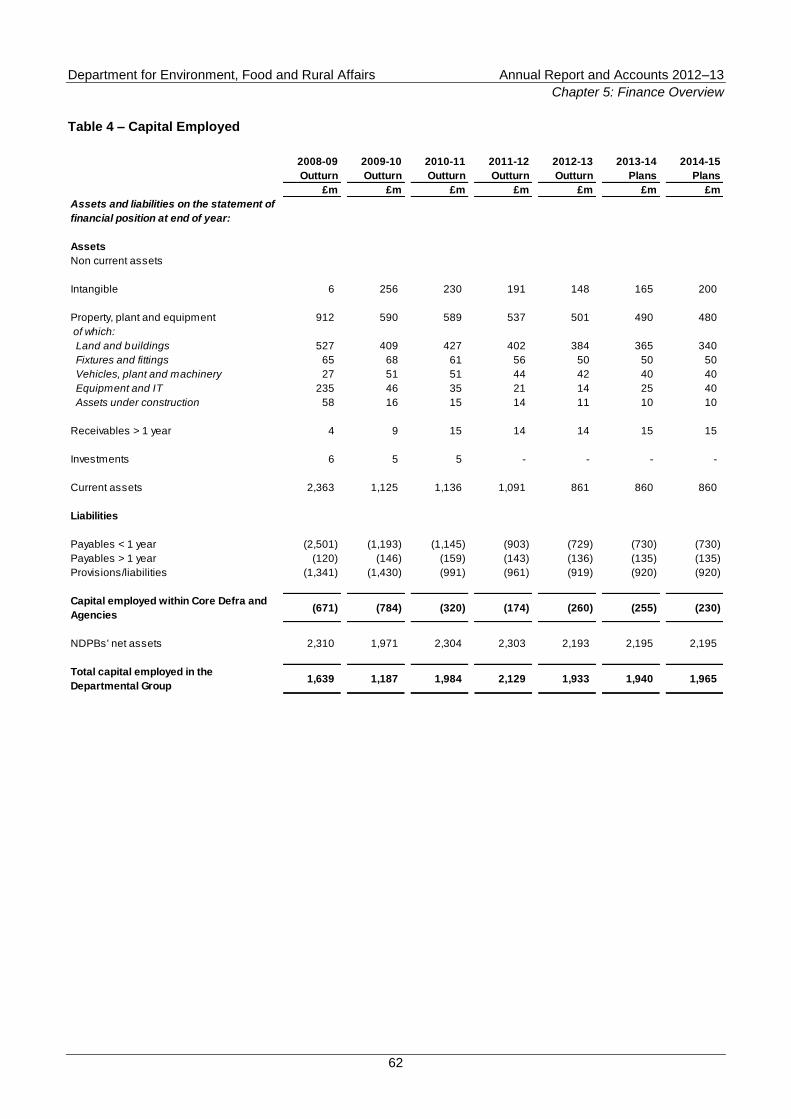
Department for Environment, Food and Rural Affairs Annual Report and Accounts 2012–13
Chapter 5: Finance Overview
62
Table 4 – Capital Employed
2008-09
Outturn
2009-10
Outturn
2010-11
Outturn
2011-12
Outturn
2012-13
Outturn
2013-14
Plans
2014-15
Plans
£m £m £m £m £m £m £m
Assets and liabilities on the statement of
financial position at end of year:
Assets
Non current assets
Intangible 6 256 230 191 148 165 200
Property, plant and equipment 912 590 589 537 501 490 480
of which:
Land and buildings 527 409 427 402 384 365 340
Fixtures and fittings 65 68 61 56 50 50 50
Vehicles, plant and machinery 27 51 51 44 42 40 40
Equipment and IT 235 46 35 21 14 25 40
Assets under construction 58 16 15 14 11 10 10
Receivables > 1 year 4 9 15 14 14 15 15
Investments 6 5 5 - - - -
Current assets 2,363 1,125 1,136 1,091 861 860 860
Liabilities
Payables < 1 year (2,501) (1,193) (1,145) (903) (729) (730) (730)
Payables > 1 year (120) (146) (159) (143) (136) (135) (135)
Provisions/liabilities (1,341) (1,430) (991) (961) (919) (920) (920)
Capital employed within Core Defra and
Agencies(671) (784) (320) (174) (260) (255) (230)
NDPBs' net assets 2,310 1,971 2,304 2,303 2,193 2,195 2,195
Total capital employed in the
Departmental Group1,639 1,187 1,984 2,129 1,933 1,940 1,965
Department for Environment, Food and Rural Affairs Annual Report and Accounts 2012–13
Chapter 5: Finance Overview
63
Table 5 – Staff in Post
Table 5 shows the number of payroll and non-payroll staff in Defra, its Executive Agencies and NDPBs as at 31 March 2010, 2011, 2012 and 2013. The data in this table is taken from the Monthly Workforce returns sent to the Cabinet Office, apart from the 31 March 2010 data where the information was collected for a separate exercise commissioned by the Cabinet Office. In order to ensure consistency with other Cabinet Office returns, the Forestry Commission is excluded.
The total number of payroll staff at 31 March 2013 was just over 23,700, a reduction of approximately 2,900 (11 percent) against the 26,600 staff at 31 March 2010 (the reduction in Core Defra was 17 percent). Non–payroll staff have reduced by almost 700 (34 percent) over the same period.
Staff reductions have been achieved through a combination of recruitment freezes, voluntary exit schemes, compulsory redundancies and significant restructuring programmes across Core Defra and its Network Bodies. During 2012–13, 479 staff left under an exit scheme, mostly from AHVLA and RPA, whose staff numbers reduced by over 400 during the financial year.
Overall payroll staff numbers increased by just over 530 during 2012–13, mainly due to an increase of over 780 staff in EA. EA remains on course to meet its SR10 financial targets and has seen a reduction in staffing levels since 2010. During 2012–13 there was a temporary increase in staff levels in line with additional ring fenced funding provided from Defra. This enabled EA to focus on planned frontline priorities in environment protection and flood defence, as well as provide emergency response to the major flood events in 2012.
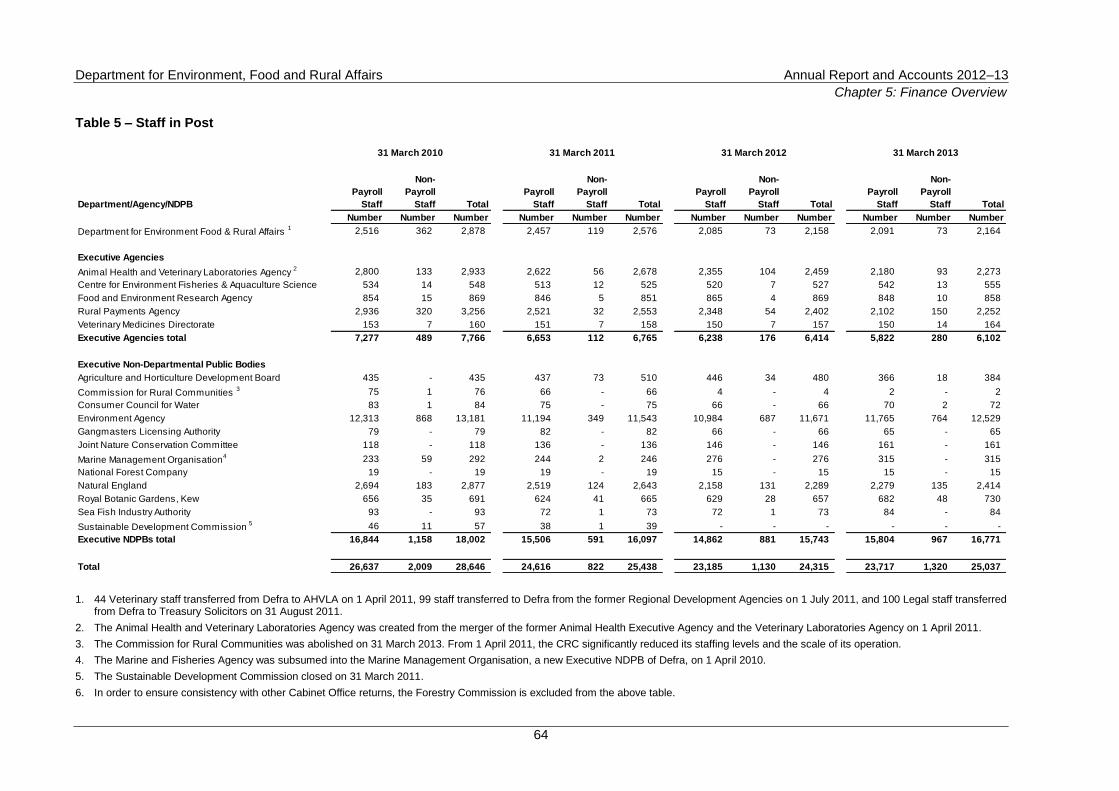
Department for Environment, Food and Rural Affairs Annual Report and Accounts 2012–13
Chapter 5: Finance Overview
64
Table 5 – Staff in Post
Department/Agency/NDPB
Payroll
Staff
Non-
Payroll
Staff Total
Payroll
Staff
Non-
Payroll
Staff Total
Payroll
Staff
Non-
Payroll
Staff Total
Payroll
Staff
Non-
Payroll
Staff Total
Number Number Number Number Number Number Number Number Number Number Number Number
Department for Environment Food & Rural Affairs 1 2,516 362 2,878 2,457 119 2,576 2,085 73 2,158 2,091 73 2,164
Executive Agencies
Animal Health and Veterinary Laboratories Agency 2 2,800 133 2,933 2,622 56 2,678 2,355 104 2,459 2,180 93 2,273
Centre for Environment Fisheries & Aquaculture Science 534 14 548 513 12 525 520 7 527 542 13 555
Food and Environment Research Agency 854 15 869 846 5 851 865 4 869 848 10 858
Rural Payments Agency 2,936 320 3,256 2,521 32 2,553 2,348 54 2,402 2,102 150 2,252
Veterinary Medicines Directorate 153 7 160 151 7 158 150 7 157 150 14 164
Executive Agencies total 7,277 489 7,766 6,653 112 6,765 6,238 176 6,414 5,822 280 6,102
Executive Non-Departmental Public Bodies
Agriculture and Horticulture Development Board 435 - 435 437 73 510 446 34 480 366 18 384
Commission for Rural Communities 3 75 1 76 66 - 66 4 - 4 2 - 2
Consumer Council for Water 83 1 84 75 - 75 66 - 66 70 2 72
Environment Agency 12,313 868 13,181 11,194 349 11,543 10,984 687 11,671 11,765 764 12,529
Gangmasters Licensing Authority 79 - 79 82 - 82 66 - 66 65 - 65
Joint Nature Conservation Committee 118 - 118 136 - 136 146 - 146 161 - 161
Marine Management Organisation4 233 59 292 244 2 246 276 - 276 315 - 315
National Forest Company 19 - 19 19 - 19 15 - 15 15 - 15
Natural England 2,694 183 2,877 2,519 124 2,643 2,158 131 2,289 2,279 135 2,414
Royal Botanic Gardens, Kew 656 35 691 624 41 665 629 28 657 682 48 730
Sea Fish Industry Authority 93 - 93 72 1 73 72 1 73 84 - 84
Sustainable Development Commission 5 46 11 57 38 1 39 - - - - - -
Executive NDPBs total 16,844 1,158 18,002 15,506 591 16,097 14,862 881 15,743 15,804 967 16,771
Total 26,637 2,009 28,646 24,616 822 25,438 23,185 1,130 24,315 23,717 1,320 25,037
31 March 2010 31 March 2011 31 March 2012 31 March 2013
1. 44 Veterinary staff transferred from Defra to AHVLA on 1 April 2011, 99 staff transferred to Defra from the former Regional Development Agencies on 1 July 2011, and 100 Legal staff transferred from Defra to Treasury Solicitors on 31 August 2011.
2. The Animal Health and Veterinary Laboratories Agency was created from the merger of the former Animal Health Executive Agency and the Veterinary Laboratories Agency on 1 April 2011.
3. The Commission for Rural Communities was abolished on 31 March 2013. From 1 April 2011, the CRC significantly reduced its staffing levels and the scale of its operation.
4. The Marine and Fisheries Agency was subsumed into the Marine Management Organisation, a new Executive NDPB of Defra, on 1 April 2010.
5. The Sustainable Development Commission closed on 31 March 2011.
6. In order to ensure consistency with other Cabinet Office returns, the Forestry Commission is excluded from the above table.
Department for Environment, Food and Rural Affairs Annual Report and Accounts 2012–13
Chapter 5: Finance Overview
65
Tables 6, 7 and 8 – Regional Tables
Tables 6, 7 and 8 show analyses of the Department‟s spending by country and region, and by function. The data presented in these tables are consistent with the Country and Regional Analyses (CRA) published by HM Treasury in October 2012 as part of its National Statistics release. The figures were taken from the HM Treasury public spending database in summer 2012 and the regional distributions were completed by autumn 2012. Therefore, the tables may not show the latest position and are not consistent with other tables. The analyses are set within the overall framework of Total Expenditure on Services (TES). TES broadly represents the current and capital expenditure of the public sector, with some differences from the national accounts measure Total Managed Expenditure. The tables show the central Government and public corporation elements of TES. They include current and capital spending by the Department and its NDPBs, and public corporations‟ capital expenditure, but do not include capital finance to public corporations. They do not include payments to local authorities or local authorities‟ own expenditure.
TES is a cash equivalent measure of public spending. The tables do not include depreciation, cost of capital charges, or movements in provisions that are in departmental budgets. They do include pay, procurement, capital expenditure, and grants and subsidies to individuals and private sector enterprises. Further information on TES can be found in Appendix E of PESA 2012.
The data are based on a subset of spending – identifiable expenditure on services – which is capable of being analysed as being for the benefit of individual countries and regions. Expenditure that is incurred for the benefit of the UK as a whole is excluded.
Across government, most expenditure is not planned or allocated on a regional basis. So the analyses show the regional outcome of spending decisions that on the whole have not been made primarily on a regional basis.
The functional analyses of spending in Table 8 are based on the United Nations Classification of the Functions of Government (COFOG), the international standard. The presentations of spending by function are consistent with those used in Chapter A of the CRA October 2012 release. These are not the same as the strategic priorities shown elsewhere in the report.
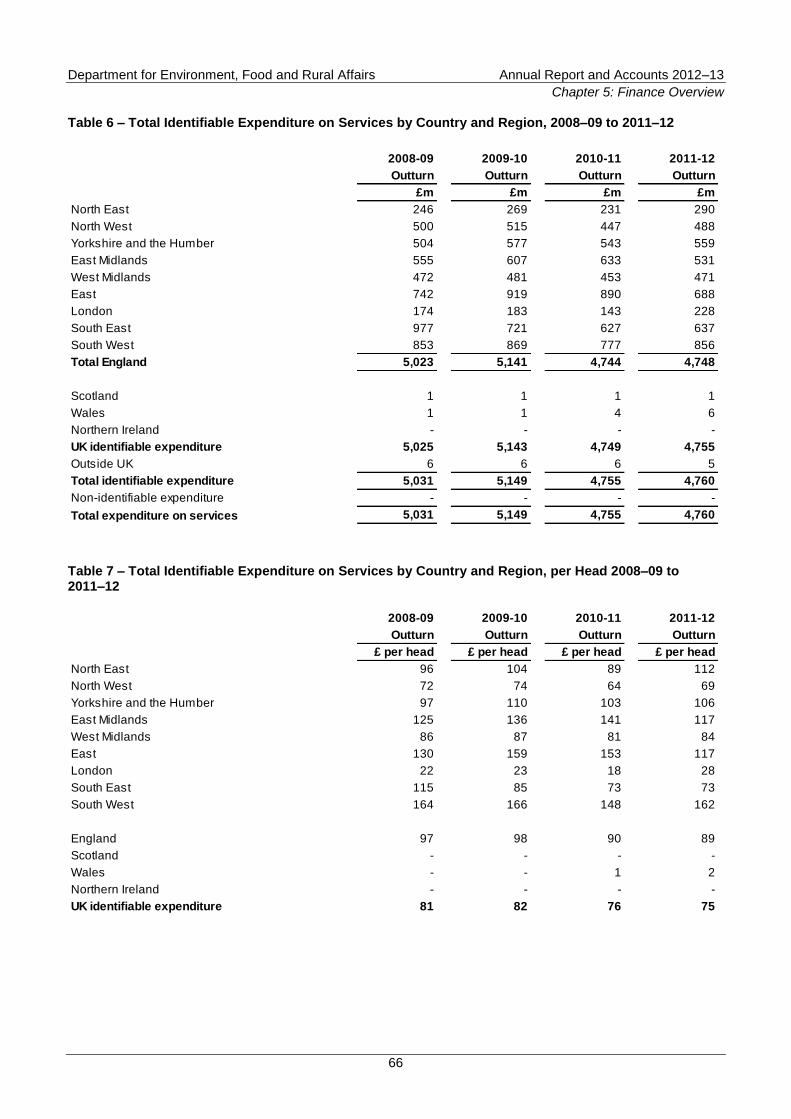
Department for Environment, Food and Rural Affairs Annual Report and Accounts 2012–13
Chapter 5: Finance Overview
66
Table 6 – Total Identifiable Expenditure on Services by Country and Region, 2008–09 to 2011–12
2008-09 2009-10 2010-11 2011-12
Outturn Outturn Outturn Outturn
£m £m £m £m
North East 246 269 231 290
North West 500 515 447 488
Yorkshire and the Humber 504 577 543 559
East Midlands 555 607 633 531
West Midlands 472 481 453 471
East 742 919 890 688
London 174 183 143 228
South East 977 721 627 637
South West 853 869 777 856
Total England 5,023 5,141 4,744 4,748
Scotland 1 1 1 1
Wales 1 1 4 6
Northern Ireland - - - -
UK identifiable expenditure 5,025 5,143 4,749 4,755
Outside UK 6 6 6 5
Total identifiable expenditure 5,031 5,149 4,755 4,760
Non-identifiable expenditure - - - -
Total expenditure on services 5,031 5,149 4,755 4,760
Table 7 – Total Identifiable Expenditure on Services by Country and Region, per Head 2008–09 to 2011–12
2008-09 2009-10 2010-11 2011-12
Outturn Outturn Outturn Outturn
£ per head £ per head £ per head £ per head
North East 96 104 89 112
North West 72 74 64 69
Yorkshire and the Humber 97 110 103 106
East Midlands 125 136 141 117
West Midlands 86 87 81 84
East 130 159 153 117
London 22 23 18 28
South East 115 85 73 73
South West 164 166 148 162
England 97 98 90 89
Scotland - - - -
Wales - - 1 2
Northern Ireland - - - -
UK identifiable expenditure 81 82 76 75
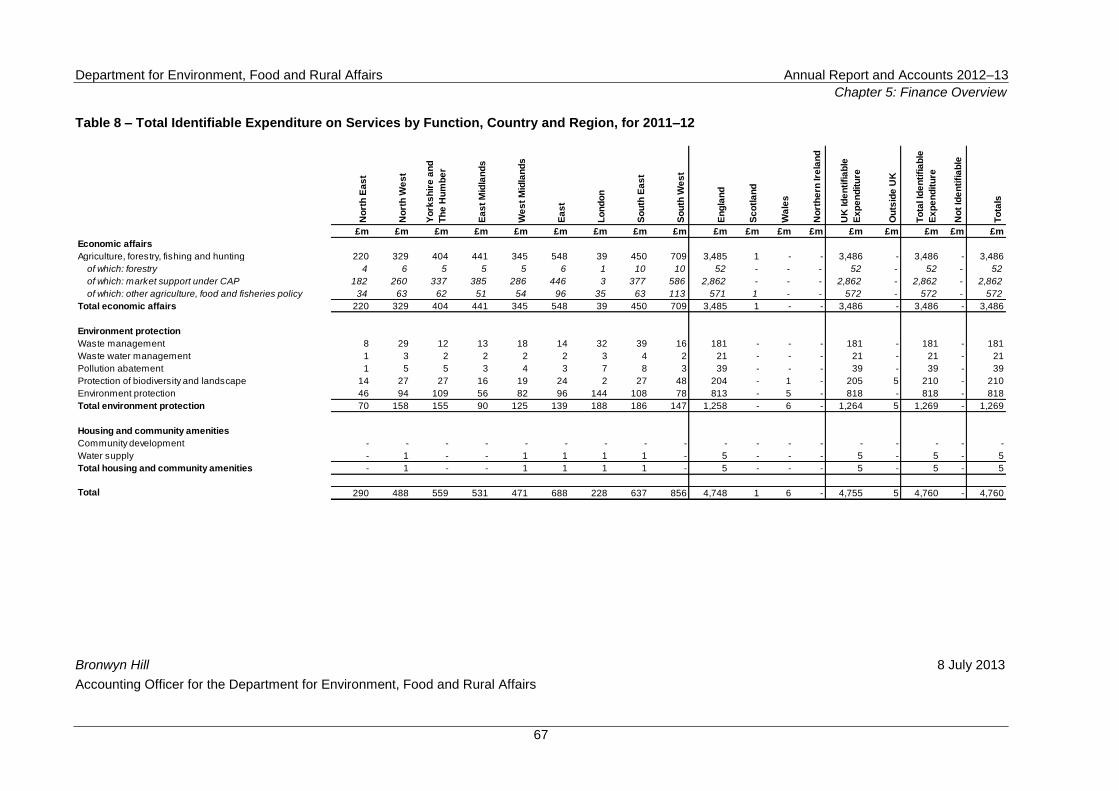
Department for Environment, Food and Rural Affairs Annual Report and Accounts 2012–13
Chapter 5: Finance Overview
67
Table 8 – Total Identifiable Expenditure on Services by Function, Country and Region, for 2011–12
No
rth
Ea
st
No
rth
We
st
Yo
rks
hir
e a
nd
Th
e H
um
be
r
Ea
st
Mid
lan
ds
We
st
Mid
lan
ds
Ea
st
Lo
nd
on
So
uth
Ea
st
So
uth
We
st
En
gla
nd
Sc
otl
an
d
Wa
les
No
rth
ern
Ire
lan
d
UK
Id
en
tifi
ab
le
Ex
pe
nd
itu
re
Ou
tsid
e U
K
To
tal Id
en
tifi
ab
le
Ex
pe
nd
itu
re
No
t Id
en
tifi
ab
le
To
tals
£m £m £m £m £m £m £m £m £m £m £m £m £m £m £m £m £m £m
Economic affairs
Agriculture, forestry, fishing and hunting 220 329 404 441 345 548 39 450 709 3,485 1 - - 3,486 - 3,486 - 3,486
of which: forestry 4 6 5 5 5 6 1 10 10 52 - - - 52 - 52 - 52
of which: market support under CAP 182 260 337 385 286 446 3 377 586 2,862 - - - 2,862 - 2,862 - 2,862
of which: other agriculture, food and fisheries policy 34 63 62 51 54 96 35 63 113 571 1 - - 572 - 572 - 572
Total economic affairs 220 329 404 441 345 548 39 450 709 3,485 1 - - 3,486 - 3,486 - 3,486
Environment protection
Waste management 8 29 12 13 18 14 32 39 16 181 - - - 181 - 181 - 181
Waste water management 1 3 2 2 2 2 3 4 2 21 - - - 21 - 21 - 21
Pollution abatement 1 5 5 3 4 3 7 8 3 39 - - - 39 - 39 - 39
Protection of biodiversity and landscape 14 27 27 16 19 24 2 27 48 204 - 1 - 205 5 210 - 210
Environment protection 46 94 109 56 82 96 144 108 78 813 - 5 - 818 - 818 - 818
Total environment protection 70 158 155 90 125 139 188 186 147 1,258 - 6 - 1,264 5 1,269 - 1,269
Housing and community amenities
Community development - - - - - - - - - - - - - - - - - -
Water supply - 1 - - 1 1 1 1 - 5 - - - 5 - 5 - 5
Total housing and community amenities - 1 - - 1 1 1 1 - 5 - - - 5 - 5 - 5
Total 290 488 559 531 471 688 228 637 856 4,748 1 6 - 4,755 5 4,760 - 4,760
Bronwyn Hill 8 July 2013
Accounting Officer for the Department for Environment, Food and Rural Affairs
Department for Environment, Food and Rural Affairs Annual Report and Accounts 2012–13
Statement of Accounting Officer’s Responsibilities
68
Chapter 6: The Accounts
Statement of Accounting Officer's Responsibilities
Under the Government Resources and Accounts Act 2000 (the GRAA), HM Treasury has directed the Department for Environment, Food and Rural Affairs to prepare, for each financial year, consolidated accounts detailing the resources acquired, held or disposed of, and the use of resources, during the year by the Department (inclusive of its Executive Agencies) and its sponsored Non–Departmental Public Bodies (NDPBs) designated by order made under the GRAA by Statutory Instrument 2012 no. 717 (together known as the „Departmental Group‟, consisting of the Department and sponsored bodies listed at Note 32 to the Accounts). The Accounts are prepared on an accruals basis and must give a true and fair view of the state of affairs of the Department and the Departmental Group and of the net resource Outturn, application of resources, changes in taxpayers‟ equity and cash flows of the Departmental Group for the financial year.
In preparing the Accounts, the Accounting Officer of the Department is required to comply with the requirements of the Government Financial Reporting Manual and in particular to:
observe the Accounts Direction issued by HM Treasury, including the relevant accounting and disclosure requirements, and apply suitable accounting policies on a consistent basis;
ensure that the Department has in place appropriate and reliable systems and procedures to carry out the consolidation process;
make judgements and estimates on a reasonable basis, including those judgements involved in consolidating the accounting information provided by NDPBs;
state whether applicable accounting standards as set out in the Government Financial Reporting Manual have been followed, and disclose and explain any material departures in the Accounts; and
prepare the Accounts on a going concern basis.
HM Treasury has appointed the Permanent Head of the Department as Accounting Officer of the Department for Environment, Food and Rural Affairs. In addition, HM Treasury has appointed an additional Accounting Officer (Ian Gambles) to be accountable for those parts of the Department‟s Accounts relating to the Forestry Commission. This appointment does not detract from the Head of Department‟s overall responsibility as Accounting Officer for the Department‟s Accounts.
The Accounting Officer of the Department has appointed the Chief Executives of its Executive Agencies and sponsored NDPBs as accounting officers of those bodies. The Accounting Officer of the Department is responsible for ensuring that appropriate systems and controls are in place to ensure that any grants that the Department makes to its sponsored bodies are applied for the purposes intended and that such expenditure and the other income and expenditure of the sponsored bodies are properly accounted for, for the purposes of consolidation within the resource accounts. Under their terms of appointment, the accounting officers of the sponsored bodies are accountable for the use, including the regularity and propriety, of the grants received and the other income and expenditure of the sponsored bodies.
The responsibilities of an accounting officer, including responsibility for the propriety and regularity of the public finances for which the Accounting Officer is answerable, for keeping proper records and for safeguarding the assets of the Department or NDPB for which the Accounting Officer is responsible, are set out in Managing Public Money published by HM Treasury.
Department for Environment, Food and Rural Affairs Annual Report and Accounts 2012–13
Governance Statement
69
Governance Statement
This statement explains the Department‟s governance arrangements, describes how risk is managed, and outlines our system of internal control and the stewardship of resources. It evaluates the effectiveness of these arrangements, and how they support the Accounting Officer‟s responsibilities for the use of resources by the Department. The statement also reflects the governance arrangements of our Network Bodies
36 who deliver
many of our policies and services, and spend approximately 80 percent of our budget. Each of these bodies produces its own governance statement in their Annual Report and Accounts. The conclusions of these statements are reflected in the content of this departmental statement.
The last twelve months have been challenging for the Department, given continuing spending restraints and a series of significant external events we have had to respond to. The Department has continued to deliver on the Coalition Priorities set out in its Business Plan, whilst reducing costs, restructuring and improving corporate support functions. During this time, the governance structures and processes, risk management and internal controls within the Core Department were effective, and were strengthened by improvements during the year.
The ministerial team changed in September, with three new Ministers out of four, including the Secretary of State. This, together with two new Directors General level appointments during the year (the Chief Scientific Adviser and a new Chief Operating Officer), meant a big change in the membership of the Department‟s Board. However, the recent Board Effectiveness Review demonstrated that the working of the Board has continued to develop during 2012–13.
The Department moved to its new structure during the first half of the year, reflecting the outcome of the Change Programme initiated during 2011–12. We have also undertaken a range of actions to implement our Capability Action Plan published in April 2012
37; to improve leadership and capability (for example on
commercial and digital) and to implement the wider Civil Service Reform plan, published in June 2012. These include a new commercial Strategy, a new performance management framework, and moving to the new Civil Service competency framework from 1 April 2013. The senior leadership team have initiated work with CEOs from its Executive Agencies and the larger NDPBs to identify further improvements in the operating model of the Department and the network with a view to identifying additional opportunities to improve value and reduce cost during the current Spending Review period and in the medium term.
The Department has introduced changes to strengthen the governance arrangements of the Executive Agencies (see Chapter 2 on page 8). The governance arrangements of our Network Bodies still materially comply with the relevant code of good practice
38.
The Department‟s resilience and its ability to respond quickly was tested through a series of external events, in particular handling the very extensive flooding which occurred in England and Wales over the summer and autumn/winter, the widespread outbreak of ash dieback in September and the discovery of adulteration of meat products with horsemeat in February. The Department delivered a number of major projects, including the successful transfer of British Waterways to the Canal & River Trust and the procurement by the New Covent Garden Market Authority of a development partner for the redevelopment of their site at Nine Elms. We also made significant progress on preparations for the implementation of the Common Agricultural Policy (CAP) reforms, on the first phase of the Thames Estuary 2100 programme, and on the Thames Tideway Tunnel project. The Department has developed a „Growth Plan‟ to reflect new ministerial priorities which focuses on growing the rural economy, investing in infrastructure and removing regulatory and other barriers to growth.
The Department responded on 31 January 2013 to the Independent Panel on Forestry‟s review39
confirming that England‟s Public Forest Estate will remain in public ownership, and set out plans to protect and improve our woodlands; and to invigorate the woodland economy and bring neglected woodlands back into
36
References to Network Bodies refers collectively to Defra‟s Executive Agencies, Non-Departmental Public Bodies (NDPBs), Public Corporations and non-Ministerial Department.
37 The Capablity Action Plan is available at https://www.gov.uk/government/publications/capability-review-2012
38 The „Corporate Governance Code‟ is available from HM Treasury at https://www.gov.uk/government/publications/corporate-governance-
code-for-central-government-departments 39
The Independent Panel‟s report and the Department‟s response are available on the Department‟s website at http://www.defra.gov.uk/forestrypanel/
Department for Environment, Food and Rural Affairs Annual Report and Accounts 2012–13
Governance Statement
70
management. It carried out a joint Triennial Review of its two largest NDPBs (the Environment Agency and Natural England) which concluded, following extensive stakeholder engagement, that both organisations should be retained as two separate NDPBs but with further ongoing reform of their functions and ways of working. The Department also conducted a Triennial Review of the Joint Nature Conservation Committee (JNCC), which concluded that JNCC should be retained as a NDPB with some reforms.
Governance Arrangements
Governance Structures
The Department‟s governance structures and processes are described in detail in Chapter 1 of this Annual Report and Accounts. The review that follows focuses in particular on activities and changes made during 2012–13, and on an assessment of effectiveness.
Defra‟s Supervisory Board (the Board) established in December 2010, provides collective strategic, corporate leadership to the Department and has particular responsibility for monitoring performance and delivery, including oversight of Defra‟s Network Bodies. The Board brings together the Ministerial Team, the Permanent Secretary, four Directors General, the Finance Director, and four Non–Executive Directors (NEDs) and meets every other month. All members have attended all meetings with the following exceptions:
Owen Paterson, Secretary of State, December 2012;
David Heath, Minister of State, February 2013;
Richard Benyon, Parliamentary Under Secretary Commons, May 2012, and December 2012;
Sir Tony Hawkhead, NED, December 2012;
Catherine Doran, NED, December 2012; and
Katrina Williams, Director General, September 2012.
The Board has two sub-committees. The Audit and Risk Committee (ARC) advises the Accounting Officer and the Board on issues of risk, control and governance. During 2012–13 its work included scrutiny of risk, governance, financial control, business continuity and emergency preparedness; scrutiny of internal and external audit arrangements and results; delivery of the Department‟s Annual Report and Accounts and specific strategic risks. The Nominations Committee ensures that there are satisfactory systems for identifying and developing leadership, and scrutinises incentives and succession planning for the Board and the senior leadership of the Department. In 2012–13 the Committee‟s work included, senior appointments, Defra Senior Civil Service pay award, review of talent management and NEDs‟ succession planning.
Until August 2012, the Management Committee also operated as a sub-committee of the Board. The Committee focused on operations, performance and risk, and comprised all the members of the Board except Ministers and met every other month, alternating with the Board. It had three sub–groups: the Central Approvals Panel, responsible for resource allocation; the Strategy Group advising on Defra‟s strategy; and the Contingency Planning Board offering assurance on Defra‟s overall state of preparedness to respond to emergencies and disruptions to business.
In September 2012 the governance structure was revised to take account of the outcome of the annual review of Board Effectiveness. This resulted in the Management Committee being replaced with the Executive Committee to allow the Department‟s senior executive team to focus better on operational and performance issues before bringing them to the Board where necessary. These changes have also enabled the Department to be more selective in how the NEDs are deployed, for example by enabling them to participate on Programme Boards for major projects. The Executive Committee brings together the Permanent Secretary and four Directors General to take decisions on the management of the Department, to review plans and progress on improving Defra‟s capacity and capability for the future and to oversee cross departmental initiatives, and together with the Finance Director to inform strategic decisions by Ministers on their priorities and spending plans.
Department for Environment, Food and Rural Affairs Annual Report and Accounts 2012–13
Governance Statement
71
To support its work in 2013–14 and beyond, the Executive Committee has established four Panels, focusing on Risk, Operations, People and Finance.
Internal Audit (IA) reviewed these changes in the final quarter of the year and confirmed that they represent improvements in the governance arrangements. However, as the new structures and processes put in place have not yet had time to mature, IA recommend that work needs to be done to define more clearly the respective roles, responsibilities and accountabilities of the different groups within the governance structure, to clarify the interrelationships between them and to confirm the routes for taking and delegating decision-making.
The Performance of the Board
The Board regularly reviews performance management information on finance, strategic risk, Structural Reform Plan priorities, commercial projects including major projects, Defra Network Bodies, human resources and other key indicators of departmental performance. More in-depth reviews were carried out during the year on the Thames Tideway Tunnel, Common Agricultural Policy Delivery, Thames Estuary 2100, future of the Food and Environment Research Agency, Olympic risks, Animal Health Risks, Civil Service Reform, Evidence Investment Strategy, and Animal Health and Veterinary Laboratories Agency risks.
On Board Effectiveness, the actions from the 2012 review have been implemented, including the changes in governance structures described above. The 2013 Board Effectiveness review was completed in March under the leadership of the Lead NED. The review recognised that the introduction of new members had some temporary impact on the Board‟s momentum, but relationships and dynamics have been re-established quickly and the Board believes it is functioning effectively.
The Board identified some areas to progress which can be summarised as: improving further the collaborative working of the Board by achieving the right balance of formal and informal time together; defining the Board‟s shared appetite for risk; and understanding better the Board‟s role in strategy formulation.
Performance assessment of individual Board members is in place, including the assessment of the NEDs against their agreed objectives, and the Executives on the Board through the annual Senior Civil Service performance cycle.
Quality of Information used by the Board
The Non–Executive Directors‟ report on page 79 confirms the continued improvement in the quality of Management Information to support the Board, including better visibility of programmes, major projects and Network Bodies reporting. Further work on Management Information is planned to improve understanding of the link between resources and outcomes, and the newly established Risk Panel will consider how risk reporting may be refined.
Compliance with ‘Corporate Governance Code’
Defra is in full compliance with the good practice requirements of the „Corporate Governance Code‟ for central government departments, except for one area. The Code stipulates that the Nominations Committee should advise on and scrutinise the Department‟s implementation of corporate governance policy. However, Defra‟s Board have asked the ARC to take on oversight of governance as they feel the ARC is better resourced and qualified to take on this responsibility. The ARC now has a second Board NED as a member which brings it into full compliance with the Code.
Conflicts of Interest
Defra has put in place procedures that follow the requirements of the „Corporate Governance Code‟ to handle conflicts of interest for all Board members. Board members are required on appointment to complete a form listing interests which could emerge as a conflict of interest. There is a standing agenda item at the start of every Board meeting on declarations of interest. Board papers are not circulated to Board members who are known to have a specific conflict of interest. Board members with a specific conflict of interest are requested to
Department for Environment, Food and Rural Affairs Annual Report and Accounts 2012–13
Governance Statement
72
leave the room during discussion of that item. A conflict of interest register is maintained for Board members and during 2012–13 seven conflicts of interest were identified and managed in line with these procedures. They arose in the context of discussions on the procurement of future IT delivery systems for the Common Agricultural Policy, on the Thames Tideway Tunnel project, and the Thames Estuary project.
Governance of Network Bodies
The major organisations that make up the Defra Network and which deliver many of our policies and services are shown in the diagram on page 9. There are different types of bodies within the Network including Executive Agencies, NDPBs, Public Corporations and two Non-Ministerial Departments which have different governance arrangements, in some cases based on statute. The internal governance structures of each of these bodies are described in their own Governance Statements.
Each Executive Agency has an Agency Management Board (AMB) which is chaired by a Non-Executive Director (NED) and on which other NEDs and the Agency senior team sit. A Defra Director with no direct policy interest serves as a NED on each AMB. In June 2012, to help improve strategic alignment, the newly appointed Director General Chief Operating Officer (DG COO) became the single Corporate Owner for the Department‟s five Executive Agencies. During the year, the governance arrangements for Executive Agencies were further changed. The former „Strategic Advisory Boards‟ or „Corporate Owner Boards‟ were replaced with formal Quarterly Performance Reviews between the DG COO and the Agency CEO. In addition, Agency CEOs are now members of the Department‟s Operations Group which meets every fortnight to discuss key operational delivery issues. This enables CEOs to keep the Department sighted on potential cross-cutting issues and creates opportunities for them to seek advice or solutions from across the Department. These new arrangements have improved effectiveness in several ways: they are more streamlined; more clearly focussed on strategy, performance and risk; more efficient to run; more clearly support the Defra Board reporting process; and have a more focused membership. Internal Audit have again, however, identified that the new arrangements need time to mature, and that further work may be required for example to test and clarify the roles and accountabilities of the different groups within the governance structure, and the interrelationships between them.
In order to simplify governance for the Rural Payments Agency (RPA), reflecting its improving performance and a strengthened Agency Board, the Minister of State and DG COO meet quarterly with the CEO in place of the Ministerial Oversight Board. There is also a quarterly meeting between the Minister of State and the RPA‟s Non–Executive Directors.
The Department is undertaking a Science Agency Review which is assessing options to ensure it has secure access to the capabilities that Defra‟s science agencies provide. This is linked to a wider review of Defra‟s future science needs. There is a particular focus at present on the Food and Environment Research Agency (Fera). As part of the review the Department is also assessing the future options for the configuration of its science estate.
The number of Defra NDPBs has continued to reduce as the Department implements its public bodies reform programme. The main reform during 2012–13 was the transfer of British Waterways functions in England and Wales to the Canal & River Trust, a new charity. Governance and the relationships between Defra and its NDPBs are appropriate and effective, although the situation is not static, and arrangements will continue to evolve to ensure they are fit for purpose and to ensure best use of our available resources.
The effectiveness of governance relating to NDPBs is being considered through a programme of Triennial Reviews to meet the Government‟s commitment to ensure accountability, value for money and transparency for public bodies. The first three year cycle of this programme of Reviews will conclude in March 2014. In addition to considering alternative delivery arrangements, each Triennial Review examines the effectiveness of governance arrangements in place and whether improvements can be made in line with the „Principles of Good Corporate Governance‟. Defra‟s Triennial Review of the Independent Agricultural Appeals Panel was published in May 2012 and included recommendations to improve the visibility and quality of governance arrangements. Triennial Reviews of EA and NE (joint Review), the JNCC and the Veterinary Products Council were launched in 2012–13. The conclusions of these reviews are covered earlier in this Report.
Department for Environment, Food and Rural Affairs Annual Report and Accounts 2012–13
Governance Statement
73
During 2012–13, the National Audit Office (NAO) published two value for money reports which looked at the work of our Network Bodies
40. Their report on „Improving the delivery of animal health and welfare services
through the Business Reform Programme‟ published in July 2012 concluded that this major change programme at AHVLA had been strongly managed in the last few years and that the potential to deliver value for money was realistic if the funding continued to allow its completion. Further funding for the programme has been confirmed for 2013–14. In their report on „Streamlining farm oversight‟ in December 2012, NAO recommended that Network Bodies including RPA, AHVLA and the Environment Agency should do more to coordinate their farm inspection activities and better share intelligence. They also highlighted a need for better information on risk, compliance and the cost of activity to help identify opportunities for the streamlining and better targeting of inspections. We are considering how best to respond to the recommendations in this report.
Local Government
The Department provides a number of grants to local authorities, for example for waste recycling work. In accordance with the Coalition Government‟s policy, these grants are not ring-fenced. However, there is a robust audit process in place for such funds through the accountability requirements placed on local authorities.
For local authority services in which Defra has a policy interest, central government funding is provided mainly through the general Revenue Support Grant and through some specific Defra revenue grants from the Department‟s own budgets. Defra and the Environment Agency also provide some minor capital grants to local authorities. The Department of Communities and Local Government‟s Accounting Officer, as lead Accounting Officer across central government with respect to local government, provides the assurance that a core framework is in place that requires local authorities to act with regularity, propriety and value for money in the use of these resources.
Within this core framework, local authorities are responsible and accountable for the legal use of funds, and every local authority has a responsibility to make arrangements for the proper administration of their financial affairs and to ensure that one of their officers has responsibility for the administration of those affairs. A system of legal duties requires councillors to spend money with regularity and propriety. Local authorities are required to have an annual external audit, and the certification of authorities‟ annual accounts by the auditor provides general assurance that the totality of their expenditure is within their legal powers. Local authority auditors also assess whether authorities have used their resources effectively as part of their annual audit of accounts.
As well as the accountability provided through this core framework, specific Defra grants, for example for flood prevention or waste recycling are often provided in recognition of a statutory obligation on local authorities to perform a function or provide a service. Other Defra grants may be made to address a specific need, for example for a time-limited programme or project and can be demand-led, reimbursing expenditure in areas where it is difficult to forecast, or „pump priming‟, or piloting new approaches or policies. In such cases, value for money is scrutinised in the relevant approvals process and outcomes are specified explicitly in the agreement and claim processes. These arrangements are established in a way that allows local authorities the flexibility to respond to local priorities, pursue balanced outcomes and choose their own methods of achieving desired outcomes, whilst taking into account the policy intentions of Defra.
These accountability arrangements are explained in more detail in the Defra‟s „Accountability System Statement‟
41.
Internal Audit have provided limited assurance about the oversight of EU Official Feed and Food Controls particularly because of non-compliance with audit requirements at local authority level. A limited assurance opinion was also given last year. Three key issues prompted this opinion in 2011–12, two of which have been resolved. However, only limited progress has been made during 2012–13 to resolve the remaining issue. During the year an audit was completed by the European Commission‟s Food and Veterinary Office (FVO). As a result of this audit Defra has submitted an action plan to the FVO detailing the action it will take to gain the required assurance from local authorities.
40
These are available from NAO at http://www.nao.org.uk/ 41
Available at https://www.gov.uk/government/organisations/department-for-environment-food-rural-affairs
Department for Environment, Food and Rural Affairs Annual Report and Accounts 2012–13
Governance Statement
74
Risk Management
Defra’s Risk Profile
Defra is responsible for two broad categories of risk: risks to the public and the wider national interest, and risks to delivering its own business objectives. The former requires Defra to assess the risks within complex environmental systems (e.g. air, waste, soil, water, marine). Some of these risks have a strong emergency response component, where Defra has a lead-department role (e.g. flooding and animal or plant disease outbreaks). Many have important elements that are outside the Department‟s direct control, and therefore rely on Defra‟s ability to influence decision makers, stakeholders and partners or to handle scientific uncertainty or gaps in evidence. Throughout 2012–13, Defra‟s risk environment has remained challenging, as the Department has had to manage its risks with fewer resources, as have many of Defra‟s partners and delivery bodies, and deal with a number of new or worsening environmental risks and events including drought, extensive flooding and ash dieback.
Risk Strategy
Defra‟s approach to risk relies on three lines of defence. First, skilled front-line teams mitigating and managing residual risk, reporting progress and escalating concerns. Second, central co-ordinators who act as gate-keepers and custodians of good practice, challenging business areas and helping them to improve performance and capability. This includes: heads of profession, non-executives on programme boards and a departmental risk co-ordinator. Third, internal and external assurance reviews. These include: Defra‟s Audit and Risk Committee, Internal Audit, the NAO and Gateway Review. Defra aims to implement the recommendations from such reviews to secure improvements in the way it manages risk and delivers ministerial priorities.
Defra‟s Board is responsible for the Department‟s approach to risk and for the overall level of risk borne by Defra. The Board leads on strategic risk, and reviews the status of the top risks to the Department‟s objectives at each meeting. Updates are compiled as part of performance management information. Given the diverse nature and range of Defra‟s risks, the Board has not developed a departmental statement of risk appetite, but has revealed its risk priorities throughout the year: in defining ministerial priorities; in making decisions on how to live within its Spending Review allocation and subsequent adjustments; in specific investment decisions; in its regular review of the Department‟s strategic risk register; and in reviewing the performance of its Network Bodies. The main strategic risks that the Board has reviewed during 2012–13 include:
controlling Bovine TB;
reform of the Common Agricultural Policy;
designating Marine Conservation Zones;
managing health and safety risks across the laboratory estate;
responding to growing antimicrobial resistance in humans and animals;
assessing threats to bees and pollinators;
preparing to respond effectively to emergencies (particularly flooding and animal disease); and
preparing for increased tree disease risks.
The Department is also involved in a number of major high risk commercial projects, in particular Thames Estuary 2100, Phase 1 (led by the Environment Agency), Thames Tideway Tunnel (led by Thames Water plc), and the CAP Delivery Programme (led by Defra). More information about these projects including links to relevant websites can be found on page 27.
The need to prepare for increased plant and tree disease risks was highlighted by the outbreak of ash dieback last year. Following confirmation of ash dieback caused by Chalara Fraxinea in March 2012, a pest risk analysis was conducted by Forest Research. The disease was confirmed in mature trees in the wider
Department for Environment, Food and Rural Affairs Annual Report and Accounts 2012–13
Governance Statement
75
environment in October 2012 and is most likely to have been caused by windborne fungal spores from the continent, where the disease has been established for a number of years. A rapid GB-wide survey was carried out to establish a picture of the distribution of the disease. The findings confirmed that the disease was well-established in the south-eastern corner of England and eradication would not be possible. A Chalara interim control plan was published in December 2012, and an updated version was launched in March 2013. In parallel, an independent taskforce on tree health and plant biosecurity was established to draw lessons for the future, in recognition of the wider threat to plants. One outcome of this will be the development of a prioritised UK risk register for tree health and plant biosecurity and a review of the governance arrangements. A more general outcome of the growing threat of plant pests and diseases has been the designation of a new ministerial priority around safeguarding plant health.
The Audit and Risk Committee has taken an active role in reviewing a range of strategic risks and risk management processes. This included a session with the Chief Scientific Adviser on the lessons to be learned from the outbreak of ash dieback, and specific discussions about: Spending Review risks, disallowance risks, business continuity, and risk management in major commercial contracts and projects.
To encourage further improvements in Defra‟s handling of risk, a Risk Panel was established in April 2013. This supports the Executive Committee‟s oversight of the operational running of the Department, and has a remit to review Defra‟s strategic risks and risk management processes, and to improve the use of intelligence from customers, stakeholders and the public in Defra‟s identification, assessment and management of risk.
Day-to-day management of many of Defra‟s risks is delegated to the Executive Agencies and NDPBs in the Defra Network, where much of Defra‟s operational, financial and reputational risks lie. Chief Executives of Network Bodies are responsible for ensuring that effective approaches to risk management are in place locally, and provide quarterly performance reports to the Defra Board. In the case of executive NDPBs and the Forestry Commission (a Non–Ministerial Department), independent boards hold the executive to account for their performance, including their management of risk.
Stewardship of Resources
The system of internal control has been in place in Defra for the year ended 31 March 2013 and up to the date of approval of the Annual Report and Accounts, and accords with HM Treasury guidance
42. This conclusion is
informed by the work of internal and external auditors, and by executive managers within the Department who have responsibility for the development and maintenance of the internal control framework and who provide a formal annual assurance statement on the system of internal control and report areas of weakness.
Our Head of Internal Audit has confirmed in her Assurance Opinion for 2012–13, that the Department has systems of internal control including finance which are adequate and effective. She also confirms that the structures and arrangements in place to identify and manage risk are appropriate, and that our governance arrangements are satisfactory in most respects.
Financial Management
The NAO concluded in its report on „Financial Management in Defra‟ published on 25 November 201143
that overall the Department had improved its financial management and reporting processes since 2008. The NAO also made a number of recommendations to which the Department is responding. The Department is continuing work to improve its financial monitoring and forecasting through stronger analysis of the causes of under spends and looking at trend analysis to target improvement action. In 2012–13, underspend against budget for the whole of Defra and the Network was approximately 1 percent, and because of improved forecasting, we were better able to identify underspends at an early stage which allowed this money to be reallocated or returned to HM Treasury.
The Department has sustained its financial capacity and capability by maintaining the number of permanent, qualified finance staff. We have also moved during 2012–13 to a new finance operating model with finance
42
HM Treasury‟s „Managing Public Money‟ available online at https://www.gov.uk/government/publications/managing-public-money 43
Available at: http://www.nao.org.uk/publications/1012/defra_financial_management.aspx
Department for Environment, Food and Rural Affairs Annual Report and Accounts 2012–13
Governance Statement
76
business partners supporting and challenging operational managers to manage their budgets more effectively. The model also incorporates centres of excellence, for example a Transactions and Technical Services Team. We have revised and updated our anti-fraud and bribery policy and procedures, and close to 100 percent of staff in the Core Department and Executive Agencies have completed on-line anti-fraud training.
In recent years, the Department has managed the risk of significant foreign exchange volatility by adopting a proactive currency hedging strategy with a hedge provider. Internal Audit have provided substantial assurance on the adequacy and effectiveness of the strategy, and we will continue with it in 2014–15.
Efforts have continued to improve collective capability within the Department and its Network Bodies in business planning and performance management so that resources are allocated optimally to deliver the outcomes we are seeking, and to ensure value for money. During the early part of the year, Defra Directors prepared short Delivery Agreements for 2012–13, setting out what they expected to achieve with their resources and how they would do it. This process established the firm link between setting performance expectations through business planning and reviewing delivery progress through in-year performance reporting. A more comprehensive approach to planning was established for 2013–14, in particular adding greater clarity on how resources are allocated across the network to deliver particular policy outcomes and priorities. There remains scope to improve the design of these management tools to simplify planning and reporting processes; improve consistency in quality and coverage of plans; support increasing alignment in approaches across the Department and the Network; and make greater use of the information generated to embed effective planning and performance management disciplines within regular management processes.
AHVLA‟s accounts were qualified by the Comptroller and Auditor General (C&AG) in 2011–12 because records in place at the point of income generation could not support income in the Accounts. Improvements mean that this qualification will not be applied to their 2012–13 Accounts. During 2012–13, the Agency has been working to ensure that adequate systems and processes are in place to provide the full audit trail for all figures in the financial statements. The NAO also highlighted in 2011–12 the need to continue to build financial management capability in the Agency‟s finance team and more widely. Action taken in 2012–13 to address the issues identified included recruiting permanent staff to fill a number of vacant posts in the central finance team; restructuring the team to build greater resilience; and taking action to address poor performance. Work to strengthen the Agency in this area will need to continue, and the Department is working closely with AHVLA under its new CEO and the DG COO to tackle the financial and other challenges it faces.
Information Management
Defra and its Network Bodies handle a comparatively low level of sensitive and personal information. Defra consequently takes a proportionate approach to the management of security risks. For 2012–13 there has been an overall progression in security standards across the Defra Network as reflected in improved Information Assurance Maturity Model (IAMM) compliance scores. There have been no reported significant data losses during this year. Despite this improved overall picture, however, there are some Network Bodies which have not achieved some of the level 1 IAMM scores. Action and further improvement will be taken forward on these areas during 2013–14.
Action is underway to put in place improved technical controls for monitoring inappropriate email and internet traffic by shared IT service users across the Defra Network. This work is expected to be in place by summer 2013. In the meantime the risk has been mitigated by a range of actions including the following:
The annual „Protecting Information Level 1‟ staff training was conducted during 2012 (September–December).
An update of the Personal Commitment Statement (November–December 2012) which required all staff to read and sign-up to good information assurance practice.
The issue of a revised Acceptable Use policy on-line which provides all staff with information about email/information handling and good practices (January 2013).
Department for Environment, Food and Rural Affairs Annual Report and Accounts 2012–13
Governance Statement
77
Roll-out of device control software (Lumension) was completed in January 2013 which will improve our capability to monitor and control unauthorised devices on the Defra IT Network.
A range of communications (Office Notices, Security Bulletins, leaflets) have been issued throughout 2012 providing guidance on IT Security and promoting good practice.
The recruitment of a member of staff to the Defra Security team who will be responsible for raising information assurance awareness across the Information Asset Owner community (April 2013).
Business Critical models
The Department and its Network Bodies fully participated in the Macpherson review of quality assurance of government models. We are in the final stages of a review of our list of business critical models to ensure that it is up to date. We have made considerable progress in assessing and improving the quality assurance of these models, and in developing an appropriate Quality Assurance framework. In addition, we have allocated resources to strengthen modelling capability in the Department.
Major Contracts
A strategic review of our major Facilities Management contract has been completed and new arrangements are in place, including strengthening the Department‟s capacity to manage the supplier‟s performance. Whilst performance has improved, a number of Network Bodies have raised concerns about key elements of the supplier‟s operational performance and project delivery including the robustness of the management information used by the supplier to determine costs. The Department is investigating and we expect the problems to be resolved.
Other Business Issues
Business Continuity Plans (BCP) and IT systems recovery plans are either in place or being finalised. Internal Audit have, however, identified a lack of testing of local BCPs and recommended that further work be done to develop a fully co-ordinated approach across the Network. We will be acting on these recommendations.
During 2012–13 a number of health and safety incidents were reported at AHVLA, and the Health and Safety Executive were notified. This resulted in a crown censure being placed on the Agency. In response, AHVLA have strengthened the Health and Safety Team, improved training for senior management to ensure they understand their responsibilities and targeted training for key groups of staff. The Chief Executive has introduced a new governance structure and improved Board reporting.
Significant Issues
Rural Payments Agency
RPA has continued to make good progress in improving its performance. Defra approved the RPA‟s Strategic Improvement Plan (SIP) published in February 2012. This plan sets out a series of projects to stabilise the agency and deliver improvements in data quality addressing the issues leading to accounts qualification, improved processes and controls to help mitigate disallowance, and deliver a better service to customers. During 2012–13, the Agency delivered 40 of the 43 public commitments in the SIP. These included the implementation of a Quality Assurance Team; completion of an end-to-end review of the land eligibility, cross compliance and remote sensing inspection processes; and development of a Debt and Credit Strategy. Although positive progress is being made, RPA Internal Audit have identified that further improvements are required to underlying processes, and that those improvements already made as part of the SIP need time to fully mature.
CAP Reform
The SIP also covers the RPA‟s preparations for CAP Reform. The programme to take this work forward, formerly known as the „Future Options Programme‟ was re-scoped, restructured and renamed during 2012–13.
Department for Environment, Food and Rural Affairs Annual Report and Accounts 2012–13
Governance Statement
78
The „CAP Delivery Programme‟, as it is now known, extends beyond the RPA to Core Defra‟s regional delivery teams and to the other two Network Bodies involved in CAP delivery: Natural England and the Forestry Commission. The Chief Executives of all these Network Bodies are members of the Programme Board, and the governance brings together the SRO, Programme team, CAP negotiation and policy teams and Network Bodies. The Defra DG COO is now SRO for the programme. Whilst these changes have been made to strengthen governance of the programme and support the delivery of its objectives, the structures and processes need further time to mature and continuing work is required. Successfully delivering the CAP reforms is a significant challenge. Significant risks include the nature and timing of EU negotiations on the reforms, developing and consulting on implementation in England, a complex set of related procurements, use of „agile‟ methods for some elements, maintaining legacy systems, and data cleansing and transition. All delivered while maintaining business as usual. An effective CAP Delivery Programme will be critical to the successful delivery of CAP Reform in order to apply Scheme regulations correctly, to pay claimants accurately and to minimise penalties.
Accounts Qualifications
Despite the progress made the C&AG has applied a qualification (a Limitation of Scope) to RPA‟s 2012–13 Financial Statements, which because of materiality has also been applied to Defra‟s Annual Report and Accounts, because of insufficient audit evidence to support the completeness in their accounts of receivables and payables (over and under payments) arising from the SPS. During 2012–13, RPA have made significant progress in reducing balances outstanding at the year-end for the valuation and existence elements of the SPS receivables and payables which has allowed the C&AG to lift qualifications applied in previous years because of these issues. However, further work is still required to prove completeness, and this will continue in 2013–14.
EU Disallowance Penalties
Disallowance penalties are imposed by the European Commission as a result of problems with the administration of EU schemes including those under the Common Agricultural Policy (CAP). More detailed background on these penalties is set out on page 49 of these Accounts. The £20m disallowance penalties crystallising in 2012–13 were largely in respect of the Fruit and Vegetable Scheme and resulted from an EC decision that Producer Organisations receiving support were not constituted and operating in line with scheme requirements. The amounts disallowed depend in each case on the assessed severity of the breach of regulations and on subsequent clarification negotiations with the EC. In the case of the Fruit and Vegetable Scheme the disallowance penalties were equivalent to 75 percent of the funding provided. In previous years the C&AG has applied a Qualified Opinion on Regularity to Defra‟s Annual Report and Accounts because of the recognition of disallowance penalties. A qualification has not, however, been applied to the Department‟s 2012–13 accounts because the C&AG considers the level of disallowance this year to be not material to these accounts. He has also stressed, however, that the reduction in penalties finalised during 2012-13 was largely due to delays within the EC, and that it is likely therefore that the level of penalties will increase again in future years which in turn may impact on his opinion on future Financial Statements.
Defra‟s Annual Report and Accounts have previously had disallowance penalties applied by the EU in respect of the Single Payment Scheme (SPS), and other schemes: we have made provision for future disallowance penalties, full details of which are provided in Chapter 5 of these Accounts. We are working hard to mitigate and contain SPS and other disallowance risks. We are using the opportunity of the introduction of new schemes as part of CAP reform, to apply the lessons of the last reform and to build in effective controls from the start in the new business processes and IT system which are needed.
Bronwyn Hill 8 July 2013
Accounting Officer for the Department for Environment, Food and Rural Affairs
Department for Environment, Food and Rural Affairs Annual Report and Accounts 2012–13
Non-Executive Directors’ Report
79
Non–Executive Directors’ Report
Context
The year has seen considerable change in structures and leadership within Defra, overlaid with a number of major challenges from both environmental and policy factors. While there are two new Directors General in the small top team, and three new ministers in the team of four, the NED team has remained the same throughout the year. The Department‟s change programme culminated in a reorganisation of the programme team structures designed to remove silos and to cope with the reduced number of staff. An Executive Committee was put in place of the previous Management Committee to allow the top team of civil servants to focus better on operational and performance issues before bringing them to the Board. Most of these changes happened in the first third of the year, followed by a natural period of bedding down and, in the New Year, the Department has been operating as normal and is better placed to meet the considerable challenges ahead. We are grateful for the support we have received within the Department from the Executive team at Board level and beyond enabling us to make useful contributions to the work of the Board and the Department.
Strategic Clarity of the Department
The Ministerial Team have taken the lead in articulating a sharper focus on the purpose of the Defra Network as a whole and particularly its role in growth in the rural economy. Business plans and responsibilities are being aligned and progress will need to be measured. The Department recognises the need to plan for a future of reduced resources and that may need to reflect new methods of delivery and working generally. While efficiencies have been achieved and more can probably be identified, the Defra Network will need to severely reduce or cease doing some of its current activities to be able to live within its expected funding. Management will need to make sure that appropriately focused financial and other information is reliably produced to enable Ministers to make those choices. The recent prioritisation by Ministers together with the revised business planning process is helpful in this regard.
Linkages between the Department and its Network Bodies have been improved with new governance arrangements for Executive Agencies within the Network which should simplify and improve accountability. The report of the Triennial Review of the Environment Agency and Natural England was published in June 2013, setting out a number of conclusions for the bodies to implement to provide better, more integrated and more efficient environmental services to customers. There is still some variability around relationships and dependencies of individual bodies within the Network and how strategies and key areas of operational focus for them converge with those of the Network as a whole.
Commercial Acumen and the role of the Commercial and Finance Directors in the Department
While there is still more to be done, there has been continued improvement in the finance function which has been recognised by the National Audit Office and Board, with more reliable forecasting and challenge in making funding decisions. Improvements have also been made in the commercial management of the Department with the new role of Director General Chief Operating Officer, some limited recruitment into the commercial function and clearer management information around the portfolio of commercial projects. The Non–Executive Directors question whether, as may be the case in other departments, there is an adequate level of commercial expertise in Defra to handle a portfolio of this magnitude, ranging from major infrastructure projects (for example Thames Tunnel, Covent Garden Market, Thames Tideway defences, Flood defences and new Rural Payments Agency systems for the new Common Agriculture Policy schemes for farmers) through to organisational challenges such as new shared services organisations with other government bodies and the future strategy for laboratory services. Input from Non–Executive Directors has been keenly sought, and given, to many of these projects.
Management of Talented People
The Executive are very much aware of the 2 percent reduction in Engagement Index scores for the Department in the October People Survey and the overall poor results with low scores on key areas around leadership and change. The survey took place in a difficult context, but the Board agreed that it was important to prioritise action on leadership and managing change, employee engagement and learning and development. More widely, public sector pay restraint is putting strains on the retention and attraction of talented people, particularly for specialist skills.
Department for Environment, Food and Rural Affairs Annual Report and Accounts 2012–13
Non-Executive Directors’ Report
80
The reorganisation of programmes in the Department as part of the Change Programme has afforded the opportunity to refresh the management team responsibilities at Director and Deputy Director level and re-energise teams around the objectives of the Department.
Focus on Results and Implementation
The Department continues to focus persistently on completing Business Plan activities on time with much success, except where extraneous barriers are extra difficult. The better defined growth plan should be helpful in focusing priorities.
To achieve many of the desired outcomes, the Department depends upon influencing many third parties including other government departments, local authorities and civil society organisations. Strengthening this influencing ability remains an important area for the Department.
Common Agricultural Policy reform has been a continuing major challenge throughout the year. The Department has decided to lead implementation of the new processes and systems, working closely with the Executive Agencies and NDPBs involved.
Generally, there is more acknowledgement of the need for Defra to work better across its Network and to make internal boundaries between Network Bodies less of a barrier to cohesion and the elevation of risk to the right level.
Quality of Management Information
Last year we noted that the regular management information had improved and provided a solid source of information to support the Board. The improvement has continued with better visibility of programmes, major projects and Network Bodies. Efforts are under way to achieve more granular transparency of resource usage and the trade-offs between individual projects and programmes. A better and fuller set of outcome/output based key performance measures would be helpful in measuring how well the Department is achieving its objectives, but is proving hard to develop given the wide and specialised nature of the Department‟s activities. The recent prioritisation by Ministers will be helpful in achieving greater transparency across the network. Management information on risk management can be refined to give greater insight on what risks are and progress on their management, particularly in the Network Bodies and progress is expected on this in the next year, through the establishment of the recently formed executive risk panel.
Impact of the Enhanced Board in 2012–13 and Board Effectiveness Reviews
We noted last year that in the first full year of the enhanced Board, momentum grew in the Board dynamics and this was continued into the early part of the 2012–13 financial year. All of the actions from last year‟s Board review have been implemented, and it was agreed that the Management Committee be replaced by an Executive Committee from September 2012, enabling Defra to be more selective in deploying Non–Executive Directors time.
With the big changes in the Director General and Ministerial Teams and in department organisation in the early autumn, some of the momentum in the Board naturally and temporarily slowed in the latter part of 2012, but relationships and dynamics have been re-established and the Board believes it is functioning effectively. The Non–Executive Directors have been particularly encouraged by the strong and effective team work that has developed between ministers and senior executives.
Non–Executive Directors contribution at the six Supervisory Board meetings and annual awayday have now been supplemented by a wide range of other inputs: through regular meetings on major projects (eg new Common Agricultural Policy delivery systems, Thames Tunnel); departmental organisational change (eg Change Programme and the Triennial Review of Environment Agency and Natural England); regular meetings with individual senior executives to review progress on issues in their areas of responsibility; individual engagement with Network Bodies; and leadership in committees (Nominations and Audit and Risk Committee).
Department for Environment, Food and Rural Affairs Annual Report and Accounts 2012–13
Non-Executive Directors’ Report
81
The second year Board Effectiveness Review, completed in March under the leadership of the Lead Non–Executive Director, reflected the positive views on progress noted above. The Board agreed to hold a further awayday, to provide informal time ahead of some Board meetings starting from May and to develop an action plan with recommendations to address other issues around risk appetite and the role of the Board in setting strategic direction. Actions are in hand to address each of these areas. In overall terms, Defra remains on-line or ahead of the Cabinet Office guidelines for Enhanced Boards.
Iain Ferguson
Catherine Doran
Tony Hawkhead
Paul Rew
Department for Environment, Food and Rural Affairs Annual Report and Accounts 2012–13
Certificate of the Comptroller and Auditor General
82
The Certificate of the Comptroller and Auditor General to the House of Commons
I certify that I have audited the financial statements of the Department for Environment, Food and Rural Affairs and of its Departmental Group for the year ended 31 March 2013 under the Government Resources and Accounts Act 2000. The Department consists of the core Department and its agencies. The Departmental Group consists of the Department and the bodies designated for inclusion under the Government Resources and Accounts Act 2000 (Estimates and Accounts) Order 2012. The financial statements comprise: the Department‟s and Departmental Group‟s Statements of Comprehensive Net Expenditure, Financial Position, Cash Flows, Changes in Taxpayers‟ Equity; and the related notes. I have also audited the Statement of Parliamentary Supply and the related notes. These financial statements have been prepared under the accounting policies set out within them. I have also audited the information in the Remuneration Report that is described in that report as having been audited.
Respective responsibilities of the Accounting Officer and auditor
As explained more fully in the Statement of Accounting Officer‟s Responsibilities, the Accounting Officer is responsible for the preparation of the financial statements and for being satisfied that they give a true and fair view. My responsibility is to audit, certify and report on the financial statements in accordance with the Government Resources and Accounts Act 2000. I conducted my audit in accordance with International Standards on Auditing (UK and Ireland). Those standards require me and my staff to comply with the Auditing Practices Board‟s Ethical Standards for Auditors.
Scope of the audit of the financial statements
An audit involves obtaining evidence about the amounts and disclosures in the financial statements sufficient to give reasonable assurance that the financial statements are free from material misstatement, whether caused by fraud or error. This includes an assessment of: whether the accounting policies are appropriate to the Department‟s and the Departmental Group‟s circumstances and have been consistently applied and adequately disclosed; the reasonableness of significant accounting estimates made by the Accounting Officer; and the overall presentation of the financial statements. In addition I read all the financial and non-financial information in the Annual Report to identify material inconsistencies with the audited financial statements. If I become aware of any apparent material misstatements or inconsistencies I consider the implications for my certificate.
I am required to obtain evidence sufficient to give reasonable assurance that the Statement of Parliamentary Supply properly presents the outturn against voted Parliamentary control totals and that those totals have not been exceeded. The voted Parliamentary control totals are Departmental Expenditure Limits (Resource and Capital), Annually Managed Expenditure (Resource and Capital), Non-Budget (Resource) and Net Cash Requirement. I am also required to obtain evidence sufficient to give reasonable assurance that the expenditure and income recorded in the financial statements have been applied to the purposes intended by Parliament and the financial transactions recorded in the financial statements conform to the authorities which govern them.
Opinion on regularity
In my opinion, in all material respects:
the Statement of Parliamentary Supply properly presents the outturn against voted Parliamentary control totals for the year ended 31 March 2013 and shows that those totals have not been exceeded; and
the expenditure and income recorded in the financial statements have been applied to the purposes intended by Parliament and the financial transactions recorded in the financial statements conform to the authorities which govern them.
Department for Environment, Food and Rural Affairs Annual Report and Accounts 2012–13
Certificate of the Comptroller and Auditor General
83
Basis for qualified opinion on financial statements
The audit evidence available to me was limited, as there was insufficient evidence to support the completeness of the Single Payment Scheme trade receivables balance of £6.7 million and the completeness of the Single Payment Scheme trade payables balance of £16.0 million recorded in the financial statements.
Qualified opinion on financial statements
In my opinion, except for the possible effects of the matters described in the „Basis for qualified opinion on financial statements‟ paragraph:
the financial statements give a true and fair view of the state of the Department‟s and the Departmental Group‟s affairs as at 31 March 2013 and of the Department‟s net operating cost and the Departmental Group‟s net operating cost for the year then ended; and
the financial statements have been properly prepared in accordance with the Government Resources and Accounts Act 2000 and HM Treasury directions issued thereunder.
My report on pages 85 to 87 provides further details of my qualified opinion on the financial statements.
Opinion on other matters
In my opinion:
the part of the Remuneration Report to be audited has been properly prepared in accordance with HM Treasury directions made under the Government Resources and Accounts Act 2000; and
the information given in the “Our Ministers, Senior Staff and Non-Executives” section of chapter 1, the Management Commentary which comprises chapter 5 “Finance Overview”, the progress against agreed performance indicators as shown in chapter 3 “Performance”, and the “Commentary on Sustainable Performance” in the Annex of the Annual Report for the financial year for which the financial statements are prepared is consistent with the financial statements.
Matters on which I report by exception
In respect solely of the limitation on our work relating to the Single Payment Scheme trade receivables and Single Payment Scheme trade payables balances:
I have not obtained all the information and explanations that I considered necessary for the purpose of my audit; and
I was unable to determine whether proper accounting records had been maintained.
I have nothing further to report in respect of the following matters which I report to you if, in my opinion:
adequate accounting records have not been kept or returns adequate for my audit have not been received from branches not visited by my staff; or
the financial statements and the part of the Remuneration Report to be audited are not in agreement with the accounting records and returns; or
I have not received all of the information and explanations I require for my audit; or
the Governance Statement does not reflect compliance with HM Treasury‟s guidance.
Department for Environment, Food and Rural Affairs Annual Report and Accounts 2012–13
Certificate of the Comptroller and Auditor General
84
Amyas C E Morse 9 July 2013
Comptroller and Auditor General
National Audit Office
157–197 Buckingham Palace Road
Victoria, London SW1W 9SP
Department for Environment, Food and Rural Affairs Annual Report and Accounts 2012–13
Report of the Comptroller and Auditor General
85
The Report of the Comptroller and Auditor General to the House of Commons
Introduction
The Department for Environment, Food and Rural Affairs (the Department) develops and implements policy relating to the environment, food and rural issues. It is also responsible for negotiating European agricultural and rural funding on behalf of the UK. The Department receives funding from the European Commission (the Commission) to deliver the Common Agricultural Policy (CAP) and other initiatives, some £3.3 billion in 2012-13 (2011-12 £3.7 billion).
I have reported previously on the problems experienced by the Rural Payments Agency (the Agency), an executive agency of the Department, in implementing the Single Payment Scheme (the Scheme). The Scheme was introduced by the European Union as part of the 2003 Common Agricultural Policy reforms which replaced 11 separate crop and livestock based production subsidies with a single payment based on land area.
Purpose of this report
The financial statements on the following pages represent the results of the Department for the period from 1 April 2012 to 31 March 2013. This report explains the nature of Scheme related qualifications in 2012-13 and progress made by the Department and Agency in correcting the problems experienced in the past.
I have limited the scope of my audit opinion as I was unable to obtain sufficient audit assurance to support the completeness of balances relating to Scheme trade receivables (amounts due from claimants) of £6.7 million and Scheme trade payables (amounts due to claimants) of £16.0 million which are recorded in the Department‟s financial statements. These amounts are administered and accounted for by the Agency, but consolidated into the Department‟s financial statements.
In 2011-12, I qualified my opinion on the financial statements on the grounds of regularity. The requirement to pay material financial penalties (“disallowance”) where Scheme regulations are not correctly applied results in a loss to the UK Exchequer which is outside Parliament‟s intentions in relation to the proper administration of European funding. Due to delays by the Commission in assessing the level of financial penalties, and a subsequent significant reduction in penalties finalised in 2012-13, I have not qualified my regularity opinion on the 2012-13 financial statements in this respect.
Limitation of scope in respect of the completeness of Scheme trade receivables and Scheme trade payables
The 2012-13 financial statements reports Scheme trade receivables of £6.7 million (2011-12: £14.9 million) and Scheme trade payables of £16.0 million (2011-12: £56.8 million). During 2012-13, the Agency has prioritised validation of the balances reported in the financial statements (valuation and existence), but has not yet undertaken the more extensive work necessary to address whether these balances reflect all amounts due to, and payable by the Department (completeness).
I have obtained sufficient evidence to support the existence and valuation of Scheme trade receivables and Scheme trade payables as reported in the 2012-13 financial statements. I am therefore able to provide a clear opinion on these aspects of the Scheme trade receivables and Scheme payables balances.
I have been unable to obtain assurance that these balances in the financial statements reflect all amounts due to, and payable by, the Agency. I have therefore limited the scope of my audit opinion in respect of the completeness of Scheme trade receivables and Scheme trade payables balances. I qualified my opinion in this respect in 2011-12.
Department for Environment, Food and Rural Affairs Annual Report and Accounts 2012–13
Report of the Comptroller and Auditor General
86
Progress on Scheme trade receivables and Scheme trade payables since my report on the 2011–12 financial statements
In April 2012, the Department implemented a 3 year Strategic Improvement Plan with the aim of stabilising itself in preparation for CAP reform, which includes the validation of Scheme trade receivables and Scheme trade payables balances. Validation involves the identification and correction of corrupt data, recalculation of claim values and checking of data held in operational, accounting and payments systems. By 31 March 2013 this work was partially complete with 39% of the balances reported at 31 March 2012 validated.
The Department has also taken further action to write off balances where they represent irrecoverable overpayments to claimants or where it is not value for money to pursue recovery. In addition to the data cleanse under the Strategic Improvement Plan and write offs, there have been further movements on Scheme trade receivables and Scheme trade payables, including payments, provision for doubtful debts, corrections and new balances.
Scheme trade payables have fallen to £16.0 million (2011-12 £56.8 million), of which £11.3m relates to the 2012 scheme year and is either awaiting payment or related to a historic unvalidated balance. The balance relating to the current year represents 0.9 per cent (2011-12 2.7 per cent) of current year Scheme expenditure, which is an appropriate level for the nature of the Agency‟s operations and the reduction since 2011-12 further demonstrates improved processing by the Agency.
As a result of the improvements in data quality, and a reduction in the value of unvalidated debts, I was able to obtain evidence over the existence and valuation of Scheme trade receivables and Scheme trade payables. There remains a risk of further movements in the value of reported balances as the Agency completes its validation processes; however my testing has provided sufficient evidence that Scheme trade receivables and Scheme trade payables balances as reported in the financial statements for 2012-13 exist and are accurately valued.
Planned action to address the completeness of Scheme trade receivables and Scheme trade payables
The Agency aims to address completeness, and conclude its validation of known Scheme trade receivables and Scheme trade payables balances, through the financial statements Payable/Accounts Receivable (AP/AR) Cleanse project. The final project scope was approved in March 2013.
The Agency recognises the importance of continuing its work to improve data quality and to cleanse important data sets for land, customer and financial information. The AP/AR Cleanse project is scheduled to conclude the validation of Scheme trade receivables and Scheme trade payables and address completeness of these balances by the end of March 2014. Further work will be required to confirm that current plans, including the AP/AR Cleanse project, will fully address my remaining qualification on the completeness of these balances.
Financial Penalties arising from European Union Schemes
Where the Commission takes the view that the detailed European Regulations have not been applied correctly in processing European Union (EU) Scheme transactions there is a risk of financial penalties or disallowance under the Scheme. These penalties are payable by the Department as a deduction from future Commission funding. In anticipation of these financial penalties the Department makes a provision in its financial statements for disallowance penalties arising in respect of the Single Payment Scheme, for a number of smaller on-going schemes and for Single Payment Scheme predecessor schemes.
The Department finalises penalties when either the Commission confirms a penalty or the Department will not contest it. At this point the value of disallowance becomes certain and I consider it to be irregular as it represents a shortfall in EU funding, which will be met by the UK taxpayer and which has arisen through ineffective controls operated by the UK managing body (maladministration). This has resulted in the Defra financial statements having been qualified since 2008-09, on the basis of material irregular expenditure in relation to the finalised disallowance penalties in year.
Department for Environment, Food and Rural Affairs Annual Report and Accounts 2012–13
Report of the Comptroller and Auditor General
87
As a result of administrative delays within the Commission, during 2012-13, the Department finalised disallowance penalties of £20.2 million (2011-12 £46.3 million), which are reflected in the Statement of Comprehensive Net Expenditure. Whilst I still consider this level of cost to the taxpayer significant, I do not consider this to be material in the context of the £3.3 billion of Commission funded expenditure managed by the Department. I have therefore not qualified my audit opinion on the Department‟s 2012-13 financial statements on the grounds of regularity.
The Department‟s 2012-13 financial statements also include a provision for £133.0 million in respect of estimated disallowance penalties (2011-12 £125.4 million), which are subject to challenge and so are not yet finalised. The total value of disallowance penalties finalised or provided for since the introduction of the CAP 2005 in 2008-09 is currently £600.1 million. As the main cause of the reduction in penalties provided and finalised during 2012-13 was due to delays within the Commission rather than underlying improvements in compliance with EU scheme rules, it is likely that the level of penalties finalised will increase again in future years. I will continue to assess the materiality of the value of penalties finalised in year to determine the impact on my opinion on subsequent financial statements.
Common Agricultural Policy reforms
As I have reported previously, the problems experienced by the Department in implementing the 2003 CAP reforms have undoubtedly contributed to the disallowance penalties since the Scheme‟s introduction in 2005. However, the Commission are planning major changes to the way CAP works to create a more effective policy for a more competitive and sustainable agriculture and vibrant rural areas. The Department is actively involved in the current negotiations on the reform, with one of their aims being to improve the effectiveness of the CAP for farmers and authorities.
To do this, the CAP Delivery Programme (the Programme) was established. The programme is owned by the Chief Operating Officer for Defra, supported by a Programme Board led by Defra‟s Accounting Officer, and includes representatives from all bodies responsible for delivering CAP. The Programme incorporates the procurement, development and implementation of new systems during 2013-14. Development and implementation of these will present a number of challenges, including the requirement that data cleansing is completed on time, in order to ensure that accurate and complete data is transferred to the new systems.
Delivery of the CAP Delivery Programme is critical to the successful provision of CAP reform; to correctly apply Scheme regulations to pay claimants accurately; and to minimise penalties. Successful implementation of the reform will involve development and delivery of new Schemes which will present a number of significant challenges. Defra will need to work with its agencies and other delivery bodies to ensure successful delivery of the new Schemes which are expected to be more complex, based on unconfirmed regulations and subject to an uncertain implementation date. In addition, the IT element of the programme will be delivered through an agile approach which involves outsourcing to multiple IT providers. The Department has recognised a number of significant risks relating to the Programme. It will need a strong relationship between the Programme team and other important stakeholders, and appropriate governance arrangements, to ensure that these risks are adequately managed and that the Department learns the lessons from the implementation of CAP 2005.
Amyas C E Morse 9 July 2013
Comptroller and Auditor General
National Audit Office
157–197 Buckingham Palace Road
Victoria, London SW1W 9SP
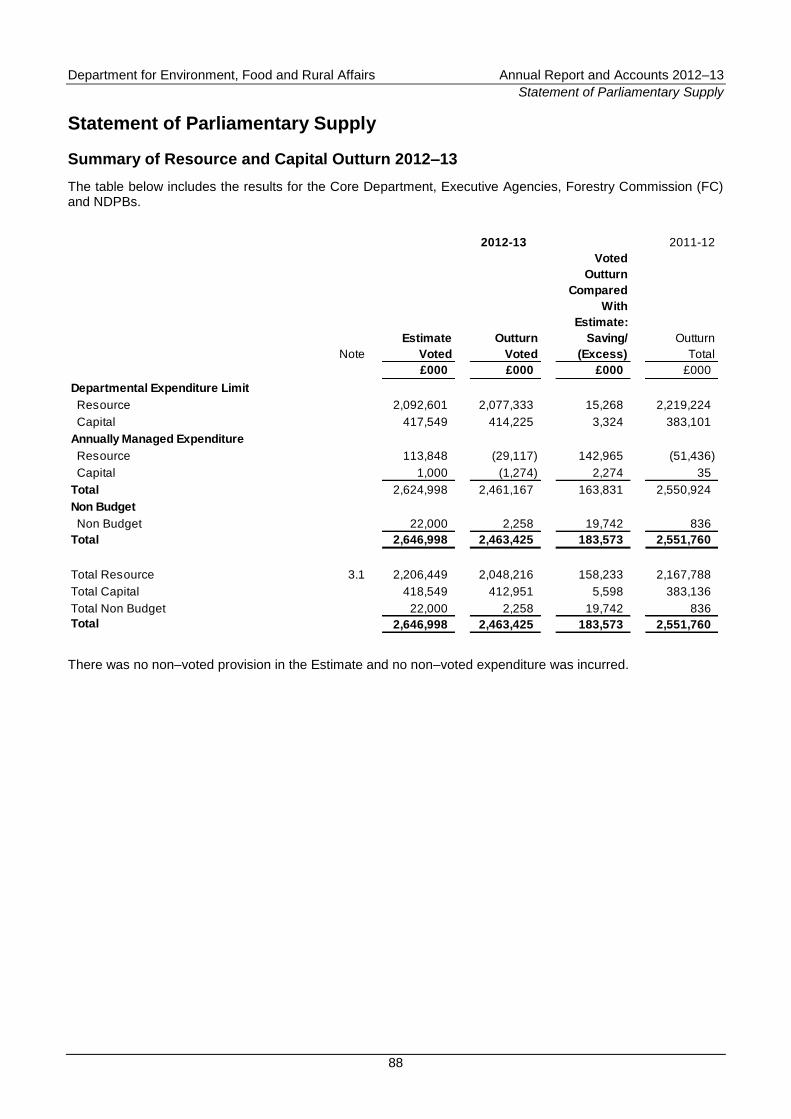
Department for Environment, Food and Rural Affairs Annual Report and Accounts 2012–13
Statement of Parliamentary Supply
88
Statement of Parliamentary Supply
Summary of Resource and Capital Outturn 2012–13
The table below includes the results for the Core Department, Executive Agencies, Forestry Commission (FC) and NDPBs.
2012-13 2011-12
Note
Estimate
Voted
Outturn
Voted
Voted
Outturn
Compared
With
Estimate:
Saving/
(Excess)
Outturn
Total
£000 £000 £000 £000
Departmental Expenditure Limit
Resource 2,092,601 2,077,333 15,268 2,219,224
Capital 417,549 414,225 3,324 383,101
Annually Managed Expenditure
Resource 113,848 (29,117) 142,965 (51,436)
Capital 1,000 (1,274) 2,274 35
Total 2,624,998 2,461,167 163,831 2,550,924
Non Budget
Non Budget 22,000 2,258 19,742 836
Total 2,646,998 2,463,425 183,573 2,551,760
Total Resource 3.1 2,206,449 2,048,216 158,233 2,167,788
Total Capital 418,549 412,951 5,598 383,136
Total Non Budget 22,000 2,258 19,742 836
Total 2,646,998 2,463,425 183,573 2,551,760
There was no non–voted provision in the Estimate and no non–voted expenditure was incurred.
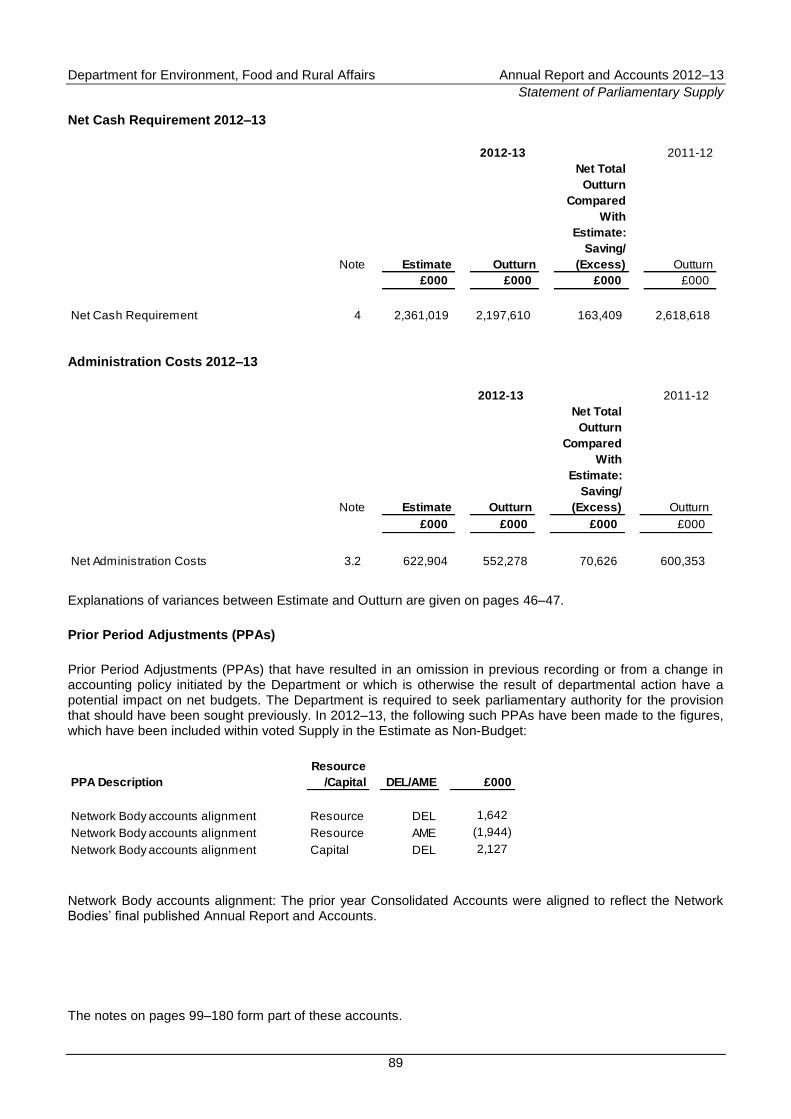
Department for Environment, Food and Rural Affairs Annual Report and Accounts 2012–13
Statement of Parliamentary Supply
89
Net Cash Requirement 2012–13
2012-13 2011-12
Note Estimate Outturn
Net Total
Outturn
Compared
With
Estimate:
Saving/
(Excess) Outturn
£000 £000 £000 £000
Net Cash Requirement 4 2,361,019 2,197,610 163,409 2,618,618 Administration Costs 2012–13
2012-13 2011-12
Note Estimate Outturn
Net Total
Outturn
Compared
With
Estimate:
Saving/
(Excess) Outturn
£000 £000 £000 £000
Net Administration Costs 3.2 622,904 552,278 70,626 600,353
Explanations of variances between Estimate and Outturn are given on pages 46–47.
Prior Period Adjustments (PPAs)
Prior Period Adjustments (PPAs) that have resulted in an omission in previous recording or from a change in accounting policy initiated by the Department or which is otherwise the result of departmental action have a potential impact on net budgets. The Department is required to seek parliamentary authority for the provision that should have been sought previously. In 2012–13, the following such PPAs have been made to the figures, which have been included within voted Supply in the Estimate as Non-Budget:
PPA Description
Resource
/Capital
DEL/AME £000
Network Body accounts alignment Resource DEL 1,642
Network Body accounts alignment Resource AME (1,944)
Network Body accounts alignment Capital DEL 2,127
Network Body accounts alignment: The prior year Consolidated Accounts were aligned to reflect the Network Bodies‟ final published Annual Report and Accounts.
The notes on pages 99–180 form part of these accounts.
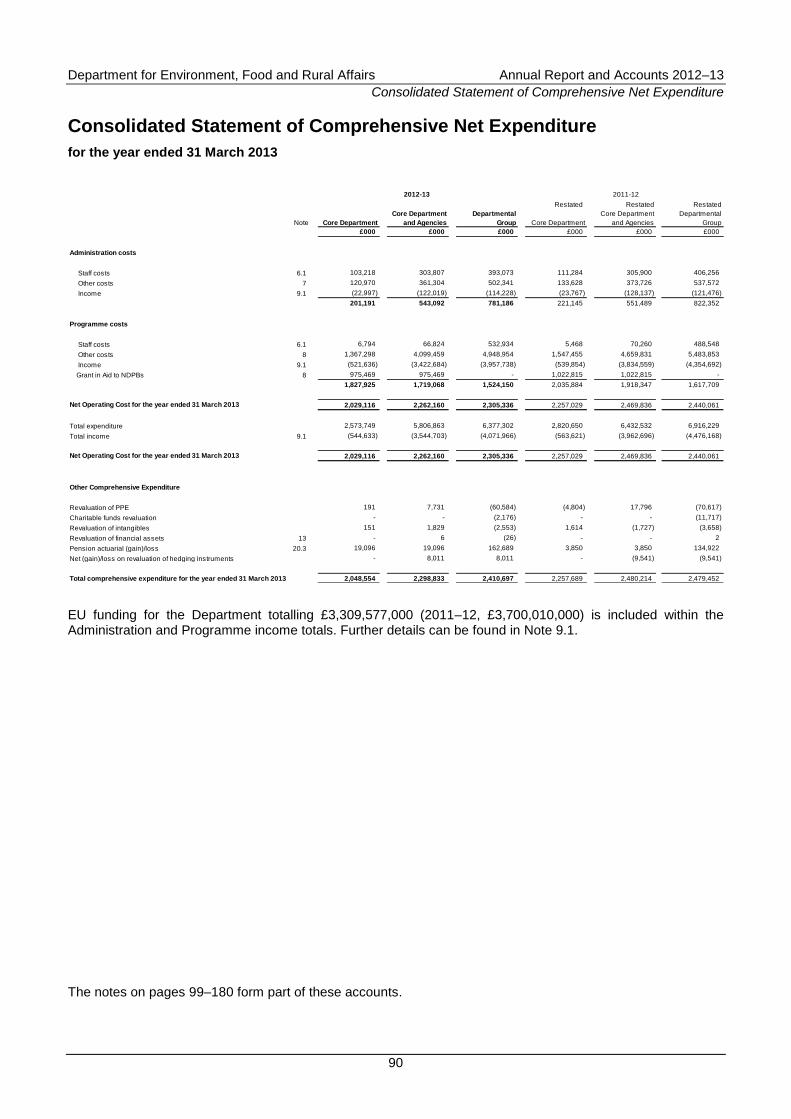
Department for Environment, Food and Rural Affairs Annual Report and Accounts 2012–13
Consolidated Statement of Comprehensive Net Expenditure
90
Consolidated Statement of Comprehensive Net Expenditure
for the year ended 31 March 2013
2012-13 2011-12
Restated Restated Restated
Note Core Department
Core Department
and Agencies
Departmental
Group Core Department
Core Department
and Agencies
Departmental
Group
£000 £000 £000 £000 £000 £000
Administration costs
Staff costs 6.1 103,218 303,807 393,073 111,284 305,900 406,256
Other costs 7 120,970 361,304 502,341 133,628 373,726 537,572
Income 9.1 (22,997) (122,019) (114,228) (23,767) (128,137) (121,476)
201,191 543,092 781,186 221,145 551,489 822,352
Programme costs
Staff costs 6.1 6,794 66,824 532,934 5,468 70,260 488,548
Other costs 8 1,367,298 4,099,459 4,948,954 1,547,455 4,659,831 5,483,853
Income 9.1 (521,636) (3,422,684) (3,957,738) (539,854) (3,834,559) (4,354,692)
Grant in Aid to NDPBs 8 975,469 975,469 - 1,022,815 1,022,815 -
1,827,925 1,719,068 1,524,150 2,035,884 1,918,347 1,617,709
Net Operating Cost for the year ended 31 March 2013 2,029,116 2,262,160 2,305,336 2,257,029 2,469,836 2,440,061
Total expenditure 2,573,749 5,806,863 6,377,302 2,820,650 6,432,532 6,916,229
Total income 9.1 (544,633) (3,544,703) (4,071,966) (563,621) (3,962,696) (4,476,168)
Net Operating Cost for the year ended 31 March 2013 2,029,116 2,262,160 2,305,336 2,257,029 2,469,836 2,440,061
Other Comprehensive Expenditure
Revaluation of PPE 191 7,731 (60,584) (4,804) 17,796 (70,617)
Charitable funds revaluation - - (2,176) - - (11,717)
Revaluation of intangibles 151 1,829 (2,553) 1,614 (1,727) (3,658)
Revaluation of financial assets 13 - 6 (26) - - 2
Pension actuarial (gain)/loss 20.3 19,096 19,096 162,689 3,850 3,850 134,922
Net (gain)/loss on revaluation of hedging instruments - 8,011 8,011 - (9,541) (9,541)
2,048,554 2,298,833 2,410,697 2,257,689 2,480,214 2,479,452 Total comprehensive expenditure for the year ended 31 March 2013
EU funding for the Department totalling £3,309,577,000 (2011–12, £3,700,010,000) is included within the Administration and Programme income totals. Further details can be found in Note 9.1.
The notes on pages 99–180 form part of these accounts.
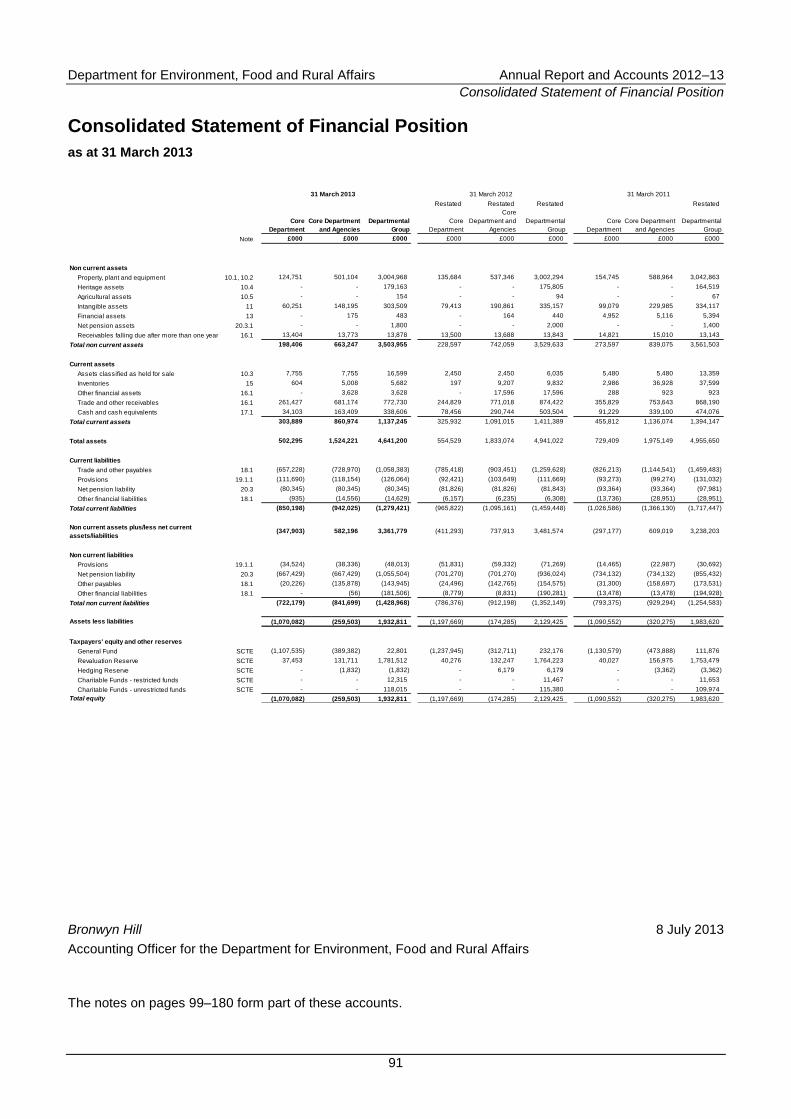
Department for Environment, Food and Rural Affairs Annual Report and Accounts 2012–13
Consolidated Statement of Financial Position
91
Consolidated Statement of Financial Position
as at 31 March 2013
31 March 2013 31 March 2012 31 March 2011
Restated Restated Restated Restated
Core
Department
Core Department
and Agencies
Departmental
Group
Core
Department
Core
Department and
Agencies
Departmental
Group
Core
Department
Core Department
and Agencies
Departmental
Group
Note £000 £000 £000 £000 £000 £000 £000 £000 £000
Non current assets
Property, plant and equipment 10.1, 10.2 124,751 501,104 3,004,968 135,684 537,346 3,002,294 154,745 588,964 3,042,863
Heritage assets 10.4 - - 179,163 - - 175,805 - - 164,519
Agricultural assets 10.5 - - 154 - - 94 - - 67
Intangible assets 11 60,251 148,195 303,509 79,413 190,861 335,157 99,079 229,985 334,117
Financial assets 13 - 175 483 - 164 440 4,952 5,116 5,394
Net pension assets 20.3.1 - - 1,800 - - 2,000 - - 1,400
Receivables falling due after more than one year 16.1 13,404 13,773 13,878 13,500 13,688 13,843 14,821 15,010 13,143
Total non current assets 198,406 663,247 3,503,955 228,597 742,059 3,529,633 273,597 839,075 3,561,503
Current assets
Assets classified as held for sale 10.3 7,755 7,755 16,599 2,450 2,450 6,035 5,480 5,480 13,359
Inventories 15 604 5,008 5,682 197 9,207 9,832 2,986 36,928 37,599
Other financial assets 16.1 - 3,628 3,628 - 17,596 17,596 288 923 923
Trade and other receivables 16.1 261,427 681,174 772,730 244,829 771,018 874,422 355,829 753,643 868,190
Cash and cash equivalents 17.1 34,103 163,409 338,606 78,456 290,744 503,504 91,229 339,100 474,076
Total current assets 303,889 860,974 1,137,245 325,932 1,091,015 1,411,389 455,812 1,136,074 1,394,147
Total assets 502,295 1,524,221 4,641,200 554,529 1,833,074 4,941,022 729,409 1,975,149 4,955,650
Current liabilities
Trade and other payables 18.1 (657,228) (728,970) (1,058,383) (785,418) (903,451) (1,259,628) (826,213) (1,144,541) (1,459,483)
Provisions 19.1.1 (111,690) (118,154) (126,064) (92,421) (103,649) (111,669) (93,273) (99,274) (131,032)
Net pension liability 20.3 (80,345) (80,345) (80,345) (81,826) (81,826) (81,843) (93,364) (93,364) (97,981)
Other financial liabilities 18.1 (935) (14,556) (14,629) (6,157) (6,235) (6,308) (13,736) (28,951) (28,951)
Total current liabilities (850,198) (942,025) (1,279,421) (965,822) (1,095,161) (1,459,448) (1,026,586) (1,366,130) (1,717,447)
Non current assets plus/less net current
assets/liabilities (347,903) 582,196 3,361,779 (411,293) 737,913 3,481,574 (297,177) 609,019 3,238,203
Non current liabilities
Provisions 19.1.1 (34,524) (38,336) (48,013) (51,831) (59,332) (71,269) (14,465) (22,987) (30,692)
Net pension liability 20.3 (667,429) (667,429) (1,055,504) (701,270) (701,270) (936,024) (734,132) (734,132) (855,432)
Other payables 18.1 (20,226) (135,878) (143,945) (24,496) (142,765) (154,575) (31,300) (158,697) (173,531)
Other financial liabilities 18.1 - (56) (181,506) (8,779) (8,831) (190,281) (13,478) (13,478) (194,928)
Total non current liabilities (722,179) (841,699) (1,428,968) (786,376) (912,198) (1,352,149) (793,375) (929,294) (1,254,583)
Assets less liabilities (1,070,082) (259,503) 1,932,811 (1,197,669) (174,285) 2,129,425 (1,090,552) (320,275) 1,983,620
Taxpayers' equity and other reserves
General Fund SCTE (1,107,535) (389,382) 22,801 (1,237,945) (312,711) 232,176 (1,130,579) (473,888) 111,876
Revaluation Reserve SCTE 37,453 131,711 1,781,512 40,276 132,247 1,764,223 40,027 156,975 1,753,479
Hedging Reserve SCTE - (1,832) (1,832) - 6,179 6,179 - (3,362) (3,362)
Charitable Funds - restricted funds SCTE - - 12,315 - - 11,467 - - 11,653
Charitable Funds - unrestricted funds SCTE - - 118,015 - - 115,380 - - 109,974
Total equity (1,070,082) (259,503) 1,932,811 (1,197,669) (174,285) 2,129,425 (1,090,552) (320,275) 1,983,620
Bronwyn Hill 8 July 2013
Accounting Officer for the Department for Environment, Food and Rural Affairs
The notes on pages 99–180 form part of these accounts.
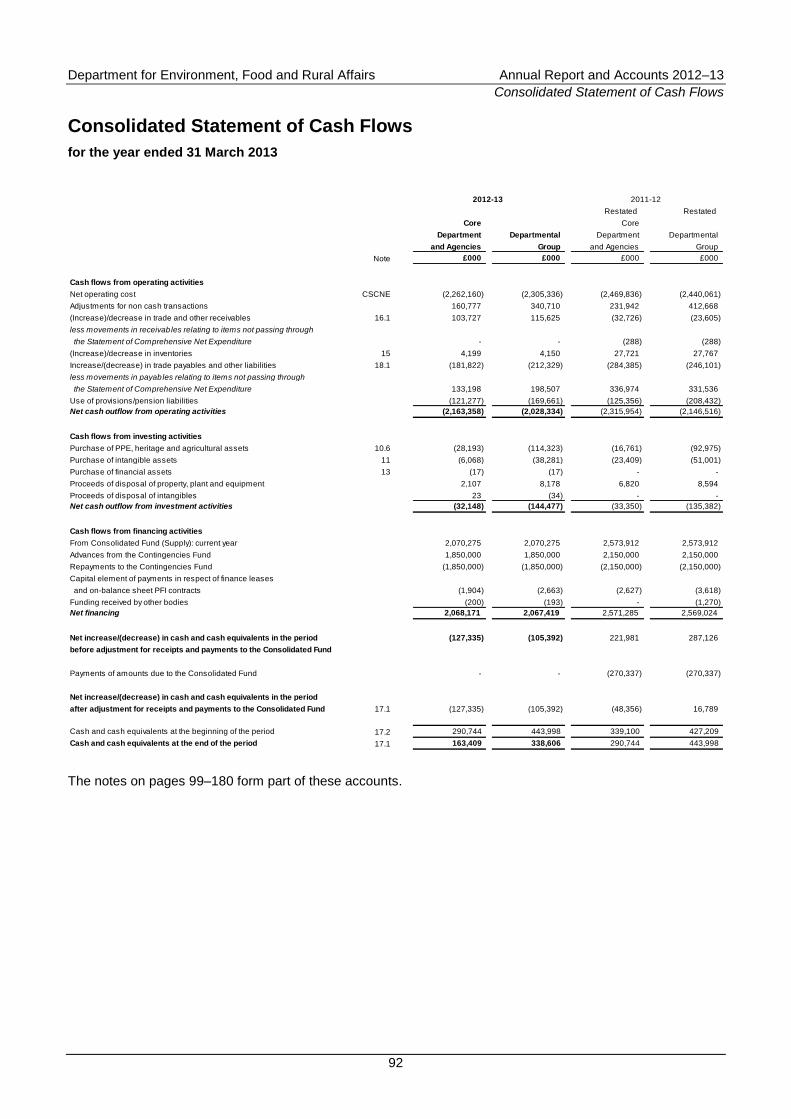
Department for Environment, Food and Rural Affairs Annual Report and Accounts 2012–13
Consolidated Statement of Cash Flows
92
Consolidated Statement of Cash Flows
for the year ended 31 March 2013
2012-13 2011-12
Restated Restated
Core Core
Department Departmental Department Departmental
and Agencies Group and Agencies Group
Note £000 £000 £000 £000
Cash flows from operating activities
Net operating cost CSCNE (2,262,160) (2,305,336) (2,469,836) (2,440,061)
Adjustments for non cash transactions 160,777 340,710 231,942 412,668
(Increase)/decrease in trade and other receivables 16.1 103,727 115,625 (32,726) (23,605)
less movements in receivables relating to items not passing through
the Statement of Comprehensive Net Expenditure - - (288) (288)
(Increase)/decrease in inventories 15 4,199 4,150 27,721 27,767
Increase/(decrease) in trade payables and other liabilities 18.1 (181,822) (212,329) (284,385) (246,101)
less movements in payables relating to items not passing through
the Statement of Comprehensive Net Expenditure 133,198 198,507 336,974 331,536
Use of provisions/pension liabilities (121,277) (169,661) (125,356) (208,432)
Net cash outflow from operating activities (2,163,358) (2,028,334) (2,315,954) (2,146,516)
Cash flows from investing activities
Purchase of PPE, heritage and agricultural assets 10.6 (28,193) (114,323) (16,761) (92,975)
Purchase of intangible assets 11 (6,068) (38,281) (23,409) (51,001)
Purchase of financial assets 13 (17) (17) - -
Proceeds of disposal of property, plant and equipment 2,107 8,178 6,820 8,594
Proceeds of disposal of intangibles 23 (34) - -
Net cash outflow from investment activities (32,148) (144,477) (33,350) (135,382)
Cash flows from financing activities
From Consolidated Fund (Supply): current year 2,070,275 2,070,275 2,573,912 2,573,912
Advances from the Contingencies Fund 1,850,000 1,850,000 2,150,000 2,150,000
Repayments to the Contingencies Fund (1,850,000) (1,850,000) (2,150,000) (2,150,000)
Capital element of payments in respect of finance leases
and on-balance sheet PFI contracts (1,904) (2,663) (2,627) (3,618)
Funding received by other bodies (200) (193) - (1,270)
Net financing 2,068,171 2,067,419 2,571,285 2,569,024
Net increase/(decrease) in cash and cash equivalents in the period (127,335) (105,392) 221,981 287,126
before adjustment for receipts and payments to the Consolidated Fund
Payments of amounts due to the Consolidated Fund - - (270,337) (270,337)
Net increase/(decrease) in cash and cash equivalents in the period
after adjustment for receipts and payments to the Consolidated Fund 17.1 (127,335) (105,392) (48,356) 16,789
Cash and cash equivalents at the beginning of the period 17.2 290,744 443,998 339,100 427,209
Cash and cash equivalents at the end of the period 17.1 163,409 338,606 290,744 443,998
The notes on pages 99–180 form part of these accounts.
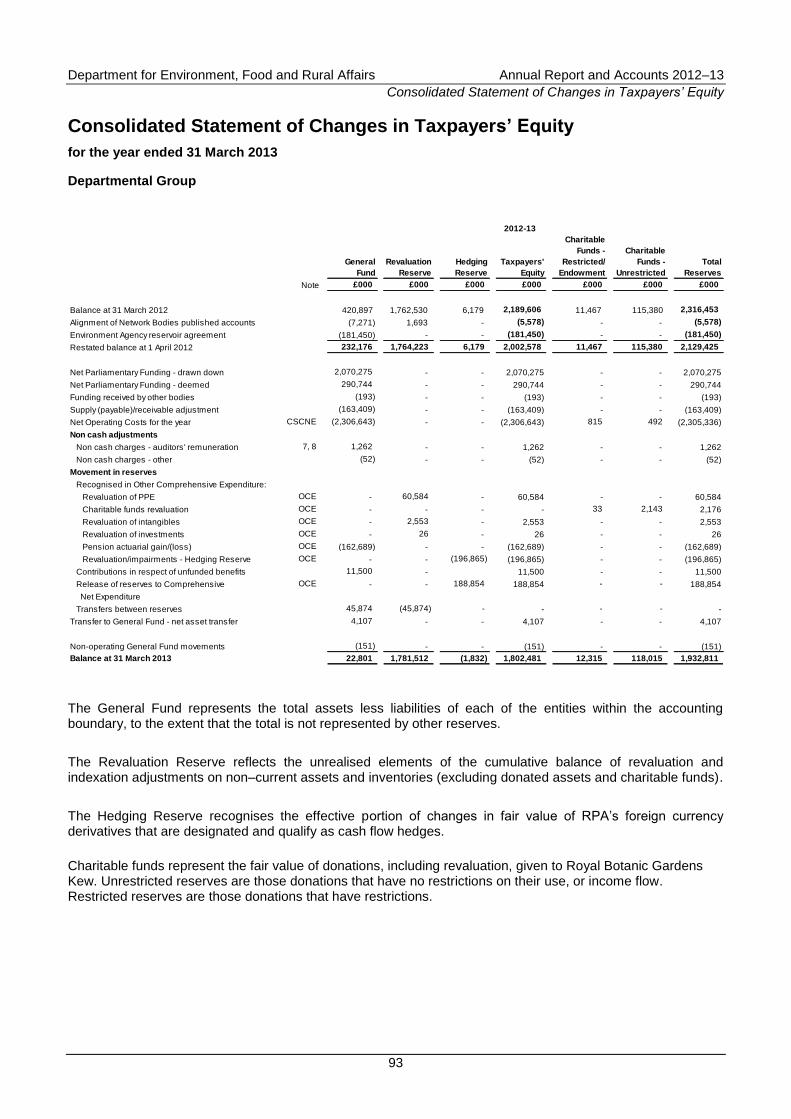
Department for Environment, Food and Rural Affairs Annual Report and Accounts 2012–13
Consolidated Statement of Changes in Taxpayers’ Equity
93
Consolidated Statement of Changes in Taxpayers’ Equity
for the year ended 31 March 2013
Departmental Group
2012-13
General
Fund
Revaluation
Reserve
Hedging
Reserve
Taxpayers'
Equity
Charitable
Funds -
Restricted/
Endowment
Charitable
Funds -
Unrestricted
Total
Reserves
Note £000 £000 £000 £000 £000 £000 £000
Balance at 31 March 2012 420,897 1,762,530 6,179 2,189,606 11,467 115,380 2,316,453
Alignment of Network Bodies published accounts (7,271) 1,693 - (5,578) - - (5,578)
Environment Agency reservoir agreement (181,450) - - (181,450) - - (181,450)
Restated balance at 1 April 2012 232,176 1,764,223 6,179 2,002,578 11,467 115,380 2,129,425
Net Parliamentary Funding - drawn down 2,070,275 - - 2,070,275 - - 2,070,275
Net Parliamentary Funding - deemed 290,744 - - 290,744 - - 290,744
Funding received by other bodies (193) - - (193) - - (193)
Supply (payable)/receivable adjustment (163,409) - - (163,409) - - (163,409)
Net Operating Costs for the year CSCNE (2,306,643) - - (2,306,643) 815 492 (2,305,336)
Non cash adjustments
Non cash charges - auditors' remuneration 7, 8 1,262 - - 1,262 - - 1,262
Non cash charges - other (52) - - (52) - - (52)
Movement in reserves
Recognised in Other Comprehensive Expenditure:
Revaluation of PPE OCE - 60,584 - 60,584 - - 60,584
Charitable funds revaluation OCE - - - - 33 2,143 2,176
Revaluation of intangibles OCE - 2,553 - 2,553 - - 2,553
Revaluation of investments OCE - 26 - 26 - - 26
Pension actuarial gain/(loss) OCE (162,689) - - (162,689) - - (162,689)
Revaluation/impairments - Hedging Reserve OCE - - (196,865) (196,865) - - (196,865)
Contributions in respect of unfunded benefits 11,500 - 11,500 - - 11,500
Release of reserves to Comprehensive OCE - - 188,854 188,854 - - 188,854
Net Expenditure
Transfers between reserves 45,874 (45,874) - - - - -
Transfer to General Fund - net asset transfer 4,107 - - 4,107 - - 4,107
Non-operating General Fund movements (151) - - (151) - - (151)
Balance at 31 March 2013 22,801 1,781,512 (1,832) 1,802,481 12,315 118,015 1,932,811
The General Fund represents the total assets less liabilities of each of the entities within the accounting boundary, to the extent that the total is not represented by other reserves.
The Revaluation Reserve reflects the unrealised elements of the cumulative balance of revaluation and indexation adjustments on non–current assets and inventories (excluding donated assets and charitable funds).
The Hedging Reserve recognises the effective portion of changes in fair value of RPA‟s foreign currency derivatives that are designated and qualify as cash flow hedges.
Charitable funds represent the fair value of donations, including revaluation, given to Royal Botanic Gardens Kew. Unrestricted reserves are those donations that have no restrictions on their use, or income flow. Restricted reserves are those donations that have restrictions.
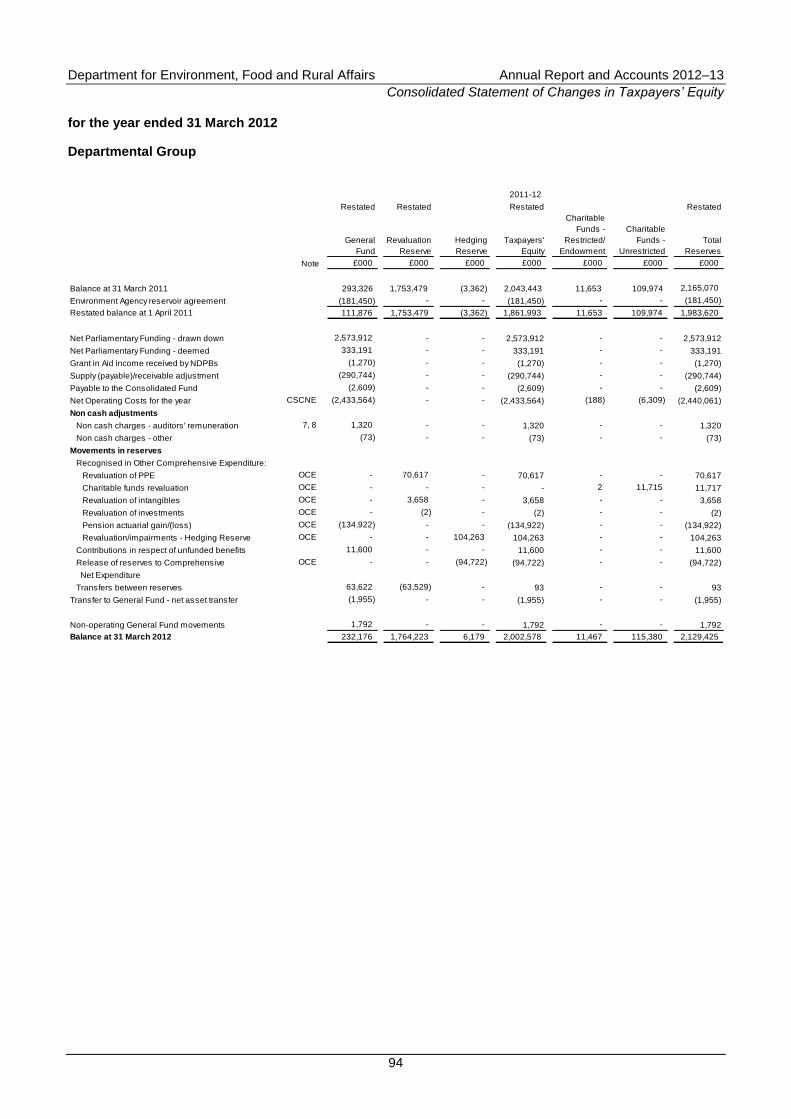
Department for Environment, Food and Rural Affairs Annual Report and Accounts 2012–13
Consolidated Statement of Changes in Taxpayers’ Equity
94
for the year ended 31 March 2012
Departmental Group
2011-12
Restated Restated Restated Restated
General
Fund
Revaluation
Reserve
Hedging
Reserve
Taxpayers'
Equity
Charitable
Funds -
Restricted/
Endowment
Charitable
Funds -
Unrestricted
Total
Reserves
Note £000 £000 £000 £000 £000 £000 £000
Balance at 31 March 2011 293,326 1,753,479 (3,362) 2,043,443 11,653 109,974 2,165,070
Environment Agency reservoir agreement (181,450) - - (181,450) - - (181,450)
Restated balance at 1 April 2011 111,876 1,753,479 (3,362) 1,861,993 11,653 109,974 1,983,620
Net Parliamentary Funding - drawn down 2,573,912 - - 2,573,912 - - 2,573,912
Net Parliamentary Funding - deemed 333,191 - - 333,191 - - 333,191
Grant in Aid income received by NDPBs (1,270) - - (1,270) - - (1,270)
Supply (payable)/receivable adjustment (290,744) - - (290,744) - - (290,744)
Payable to the Consolidated Fund (2,609) - - (2,609) - - (2,609)
Net Operating Costs for the year CSCNE (2,433,564) - - (2,433,564) (188) (6,309) (2,440,061)
Non cash adjustments
Non cash charges - auditors' remuneration 7, 8 1,320 - - 1,320 - - 1,320
Non cash charges - other (73) - - (73) - - (73)
Movements in reserves
Recognised in Other Comprehensive Expenditure:
Revaluation of PPE OCE - 70,617 - 70,617 - - 70,617
Charitable funds revaluation OCE - - - - 2 11,715 11,717
Revaluation of intangibles OCE - 3,658 - 3,658 - - 3,658
Revaluation of investments OCE - (2) - (2) - - (2)
Pension actuarial gain/(loss) OCE (134,922) - - (134,922) - - (134,922)
Revaluation/impairments - Hedging Reserve OCE - - 104,263 104,263 - - 104,263
Contributions in respect of unfunded benefits 11,600 - - 11,600 - - 11,600
Release of reserves to Comprehensive OCE - - (94,722) (94,722) - - (94,722)
Net Expenditure
Transfers between reserves 63,622 (63,529) - 93 - - 93
Transfer to General Fund - net asset transfer (1,955) - - (1,955) - - (1,955)
Non-operating General Fund movements 1,792 - - 1,792 - - 1,792
Balance at 31 March 2012 232,176 1,764,223 6,179 2,002,578 11,467 115,380 2,129,425
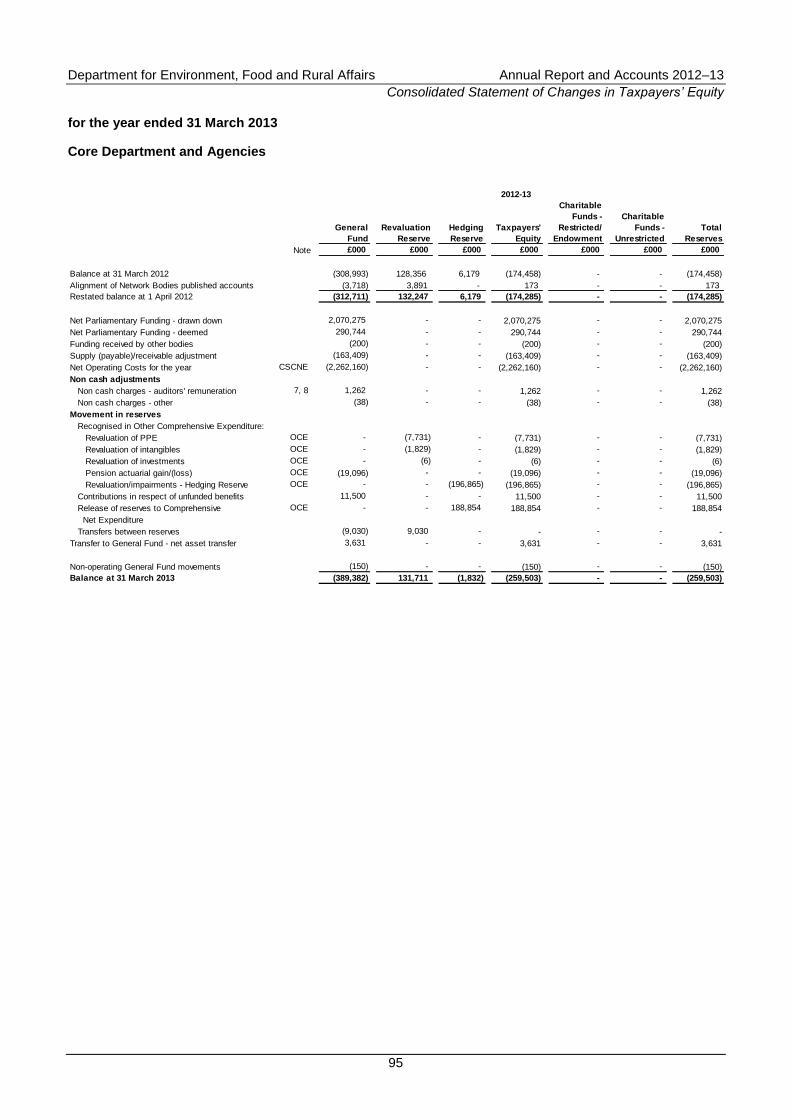
Department for Environment, Food and Rural Affairs Annual Report and Accounts 2012–13
Consolidated Statement of Changes in Taxpayers’ Equity
95
for the year ended 31 March 2013
Core Department and Agencies
2012-13
General
Fund
Revaluation
Reserve
Hedging
Reserve
Taxpayers'
Equity
Charitable
Funds -
Restricted/
Endowment
Charitable
Funds -
Unrestricted
Total
Reserves
Note £000 £000 £000 £000 £000 £000 £000
Balance at 31 March 2012 (308,993) 128,356 6,179 (174,458) - - (174,458)
Alignment of Network Bodies published accounts (3,718) 3,891 - 173 - - 173
Restated balance at 1 April 2012 (312,711) 132,247 6,179 (174,285) - - (174,285)
Net Parliamentary Funding - drawn down 2,070,275 - - 2,070,275 - - 2,070,275
Net Parliamentary Funding - deemed 290,744 - - 290,744 - - 290,744
Funding received by other bodies (200) - - (200) - - (200)
Supply (payable)/receivable adjustment (163,409) - - (163,409) - - (163,409)
Net Operating Costs for the year CSCNE (2,262,160) - - (2,262,160) - - (2,262,160)
Non cash adjustments
Non cash charges - auditors' remuneration 7, 8 1,262 - - 1,262 - - 1,262
Non cash charges - other (38) - - (38) - - (38)
Movement in reserves
Recognised in Other Comprehensive Expenditure:
Revaluation of PPE OCE - (7,731) - (7,731) - - (7,731)
Revaluation of intangibles OCE - (1,829) - (1,829) - - (1,829)
Revaluation of investments OCE - (6) - (6) - - (6)
Pension actuarial gain/(loss) OCE (19,096) - - (19,096) - - (19,096)
Revaluation/impairments - Hedging Reserve OCE - - (196,865) (196,865) - - (196,865)
Contributions in respect of unfunded benefits 11,500 - - 11,500 - - 11,500
Release of reserves to Comprehensive OCE - - 188,854 188,854 - - 188,854
Net Expenditure
Transfers between reserves (9,030) 9,030 - - - - -
Transfer to General Fund - net asset transfer 3,631 - - 3,631 - - 3,631
Non-operating General Fund movements (150) - - (150) - - (150)
Balance at 31 March 2013 (389,382) 131,711 (1,832) (259,503) - - (259,503)
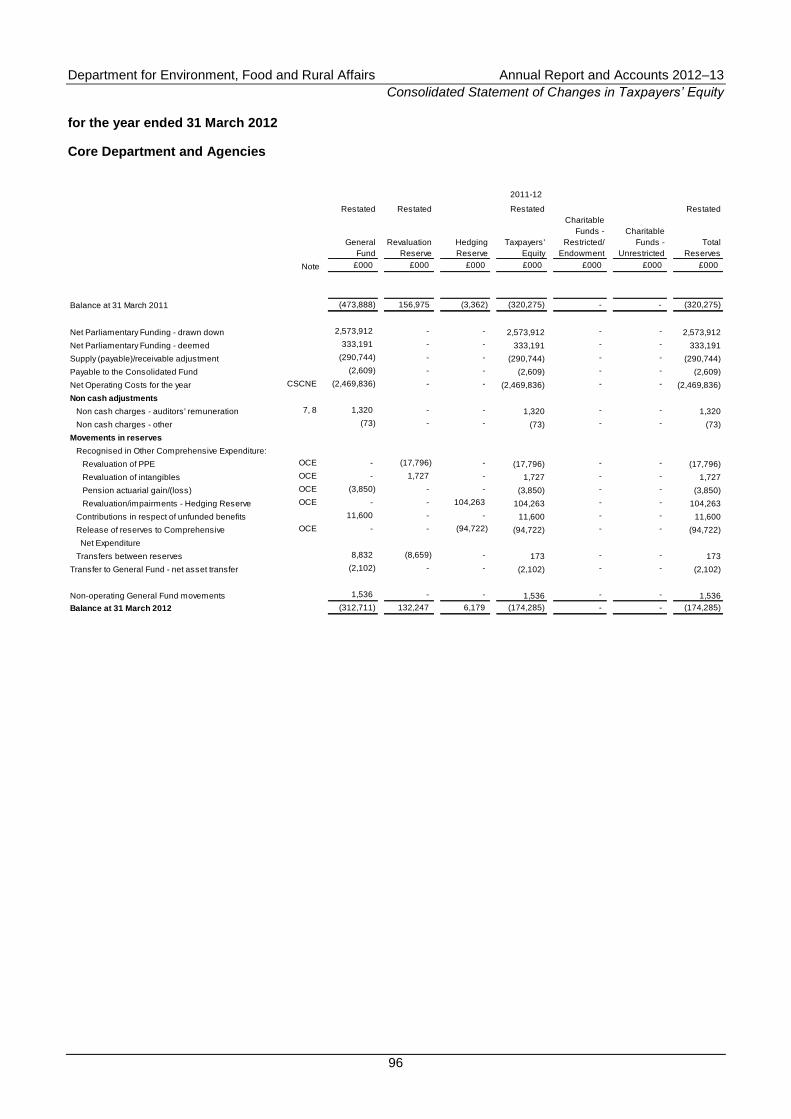
Department for Environment, Food and Rural Affairs Annual Report and Accounts 2012–13
Consolidated Statement of Changes in Taxpayers’ Equity
96
for the year ended 31 March 2012
Core Department and Agencies
2011-12
Restated Restated Restated Restated
General
Fund
Revaluation
Reserve
Hedging
Reserve
Taxpayers'
Equity
Charitable
Funds -
Restricted/
Endowment
Charitable
Funds -
Unrestricted
Total
Reserves
Note £000 £000 £000 £000 £000 £000 £000
Balance at 31 March 2011 (473,888) 156,975 (3,362) (320,275) - - (320,275)
Net Parliamentary Funding - drawn down 2,573,912 - - 2,573,912 - - 2,573,912
Net Parliamentary Funding - deemed 333,191 - - 333,191 - - 333,191
Supply (payable)/receivable adjustment (290,744) - - (290,744) - - (290,744)
Payable to the Consolidated Fund (2,609) - - (2,609) - - (2,609)
Net Operating Costs for the year CSCNE (2,469,836) - - (2,469,836) - - (2,469,836)
Non cash adjustments
Non cash charges - auditors' remuneration 7, 8 1,320 - - 1,320 - - 1,320
Non cash charges - other (73) - - (73) - - (73)
Movements in reserves
Recognised in Other Comprehensive Expenditure:
Revaluation of PPE OCE - (17,796) - (17,796) - - (17,796)
Revaluation of intangibles OCE - 1,727 - 1,727 - - 1,727
Pension actuarial gain/(loss) OCE (3,850) - - (3,850) - - (3,850)
Revaluation/impairments - Hedging Reserve OCE - - 104,263 104,263 - - 104,263
Contributions in respect of unfunded benefits 11,600 - - 11,600 - - 11,600
Release of reserves to Comprehensive OCE - - (94,722) (94,722) - - (94,722)
Net Expenditure
Transfers between reserves 8,832 (8,659) - 173 - - 173
Transfer to General Fund - net asset transfer (2,102) - - (2,102) - - (2,102)
Non-operating General Fund movements 1,536 - - 1,536 - - 1,536
Balance at 31 March 2012 (312,711) 132,247 6,179 (174,285) - - (174,285)
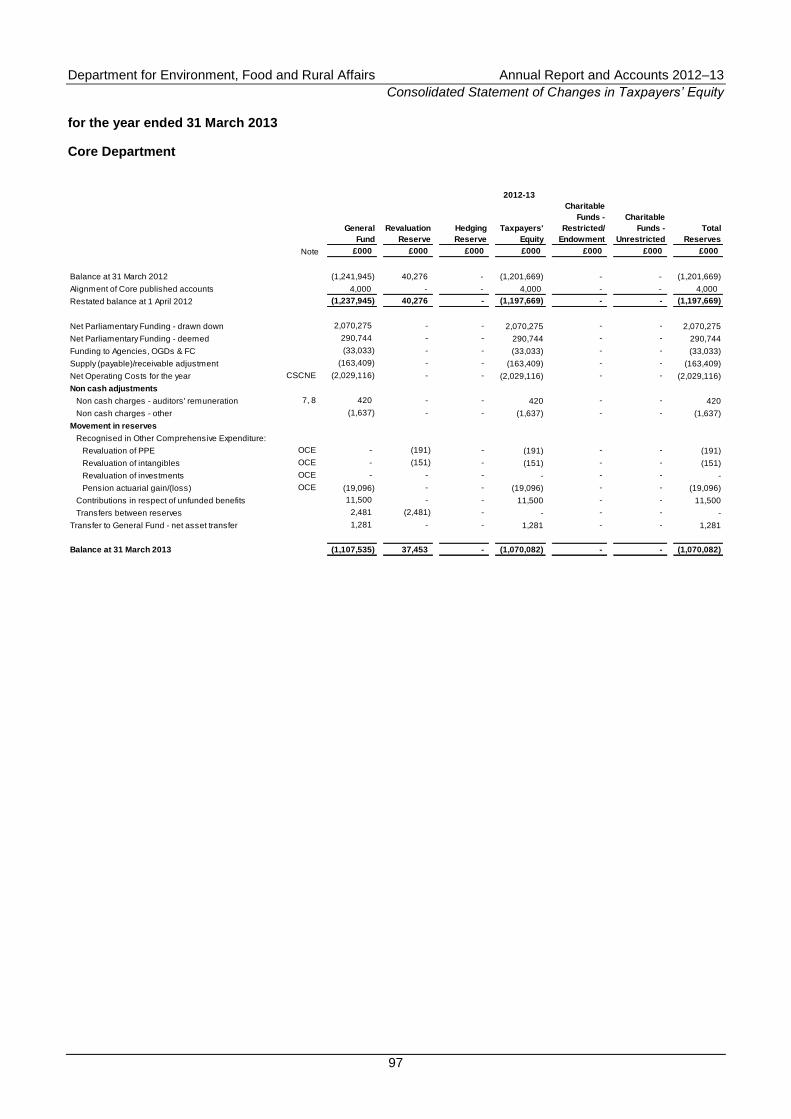
Department for Environment, Food and Rural Affairs Annual Report and Accounts 2012–13
Consolidated Statement of Changes in Taxpayers’ Equity
97
for the year ended 31 March 2013
Core Department
2012-13
General
Fund
Revaluation
Reserve
Hedging
Reserve
Taxpayers'
Equity
Charitable
Funds -
Restricted/
Endowment
Charitable
Funds -
Unrestricted
Total
Reserves
Note £000 £000 £000 £000 £000 £000 £000
Balance at 31 March 2012 (1,241,945) 40,276 - (1,201,669) - - (1,201,669)
Alignment of Core published accounts 4,000 - - 4,000 - - 4,000
Restated balance at 1 April 2012 (1,237,945) 40,276 - (1,197,669) - - (1,197,669)
Net Parliamentary Funding - drawn down 2,070,275 - - 2,070,275 - - 2,070,275
Net Parliamentary Funding - deemed 290,744 - - 290,744 - - 290,744
Funding to Agencies, OGDs & FC (33,033) - - (33,033) - - (33,033)
Supply (payable)/receivable adjustment (163,409) - - (163,409) - - (163,409)
Net Operating Costs for the year CSCNE (2,029,116) - - (2,029,116) - - (2,029,116)
Non cash adjustments
Non cash charges - auditors' remuneration 7, 8 420 - - 420 - - 420
Non cash charges - other (1,637) - - (1,637) - - (1,637)
Movement in reserves
Recognised in Other Comprehensive Expenditure:
Revaluation of PPE OCE - (191) - (191) - - (191)
Revaluation of intangibles OCE - (151) - (151) - - (151)
Revaluation of investments OCE - - - - - - -
Pension actuarial gain/(loss) OCE (19,096) - - (19,096) - - (19,096)
Contributions in respect of unfunded benefits 11,500 - - 11,500 - - 11,500
Transfers between reserves 2,481 (2,481) - - - - -
Transfer to General Fund - net asset transfer 1,281 - - 1,281 - - 1,281
Balance at 31 March 2013 (1,107,535) 37,453 - (1,070,082) - - (1,070,082)
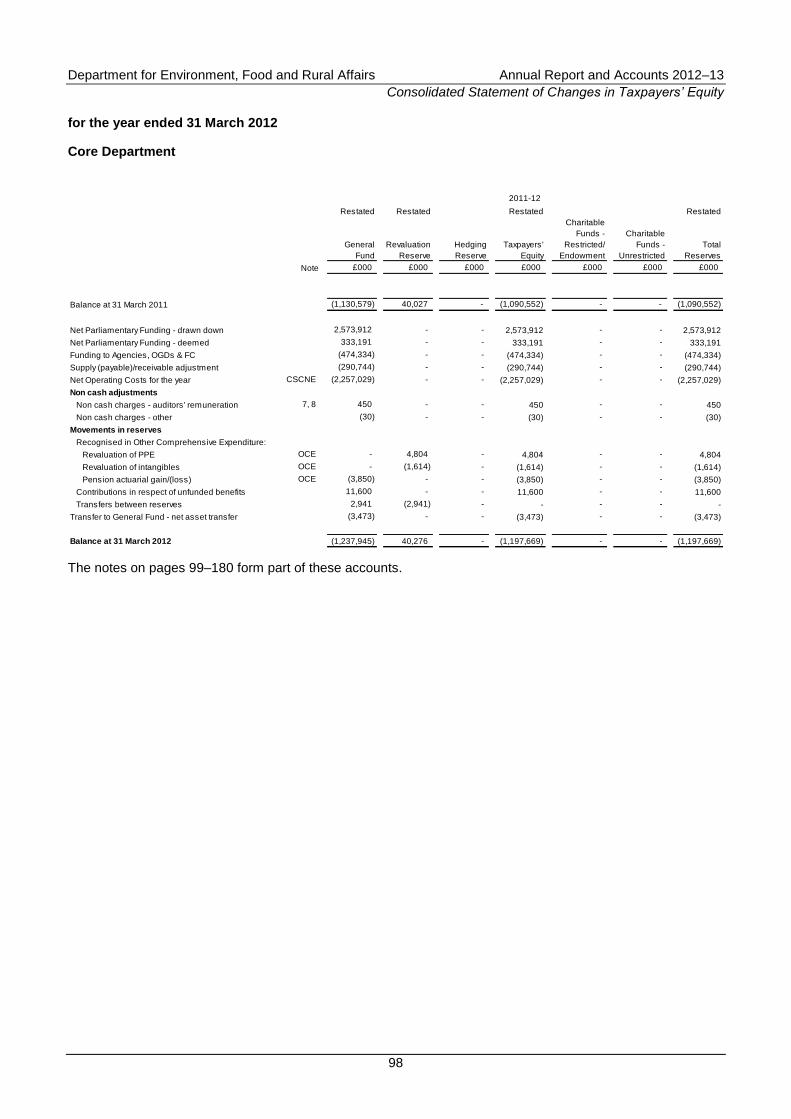
Department for Environment, Food and Rural Affairs Annual Report and Accounts 2012–13
Consolidated Statement of Changes in Taxpayers’ Equity
98
for the year ended 31 March 2012
Core Department
2011-12
Restated Restated Restated Restated
General
Fund
Revaluation
Reserve
Hedging
Reserve
Taxpayers'
Equity
Charitable
Funds -
Restricted/
Endowment
Charitable
Funds -
Unrestricted
Total
Reserves
Note £000 £000 £000 £000 £000 £000 £000
Balance at 31 March 2011 (1,130,579) 40,027 - (1,090,552) - - (1,090,552)
Net Parliamentary Funding - drawn down 2,573,912 - - 2,573,912 - - 2,573,912
Net Parliamentary Funding - deemed 333,191 - - 333,191 - - 333,191
Funding to Agencies, OGDs & FC (474,334) - - (474,334) - - (474,334)
Supply (payable)/receivable adjustment (290,744) - - (290,744) - - (290,744)
Net Operating Costs for the year CSCNE (2,257,029) - - (2,257,029) - - (2,257,029)
Non cash adjustments
Non cash charges - auditors' remuneration 7, 8 450 - - 450 - - 450
Non cash charges - other (30) - - (30) - - (30)
Movements in reserves
Recognised in Other Comprehensive Expenditure:
Revaluation of PPE OCE - 4,804 - 4,804 - - 4,804
Revaluation of intangibles OCE - (1,614) - (1,614) - - (1,614)
Pension actuarial gain/(loss) OCE (3,850) - - (3,850) - - (3,850)
Contributions in respect of unfunded benefits 11,600 - - 11,600 - - 11,600
Transfers between reserves 2,941 (2,941) - - - - -
Transfer to General Fund - net asset transfer (3,473) - - (3,473) - - (3,473)
Balance at 31 March 2012 (1,237,945) 40,276 - (1,197,669) - - (1,197,669)
The notes on pages 99–180 form part of these accounts.
Department for Environment, Food and Rural Affairs Annual Report and Accounts 2012–13
Notes to the Departmental Accounts
99
Notes to the Departmental Accounts
1 Statement of Accounting Policies
The financial statements have been prepared in accordance with the 2012–13 Government Financial Reporting Manual (FReM) issued by HM Treasury and are in accordance with directions issued by the Secretary of State for the Environment, Food and Rural Affairs.
The accounting policies contained in the FReM apply International Financial Reporting Standards (IFRS), as adapted or interpreted for the public sector context, and comply with the guidelines issued by the International Financial Reporting Interpretations Committee (IFRIC).
In addition to the primary statements prepared under IFRS, the FReM also requires the Department to prepare an additional primary statement. The Statement of Parliamentary Supply and supporting notes show Voted Outturn against Estimate, Administration Costs and the Net Cash Requirement.
Where the FReM permits a choice of accounting policy, a judgment has been made to select the most appropriate policy to suit the particular circumstances of the Department, for the purpose of giving a true and fair view. The Department‟s accounting policies have been applied consistently in dealing with items which are considered material in relation to the Accounts.
1.1 Significant Judgments and Estimation Uncertainty
The preparation of financial statements requires management to make judgments, estimates and assumptions that affect the reported amounts of assets and liabilities, disclosures of contingent assets and liabilities and the reported amount of income and expenditure. All estimates are based on knowledge of current facts and circumstances, assumptions concerning past events, and forecasts of future events and actions. For example, estimates for provisions are informed by the outcome of previous and relevant legal cases and the extrapolation of average costs required to settle the resulting liabilities. Pension liabilities are assessed by actuaries, and are based on factors such as life expectancy, age of scheme members, prevailing interest and inflation rates and projected returns on invested funds. Actual results may differ from these estimates. Where appropriate, the relevant notes to the Accounts provide further detail on estimation techniques.
Details of significant judgments, apart from those involving estimation, that management have made in the process of applying the Department‟s accounting policies are as follows:
revenue recognition – Single Payment Scheme (SPS) (see Note 1.4.1) and Rural Development Programme Expenditure (RDPE) (see Note 1.4.2);
service concession arrangements (see Note 1.5.2);
lease breaks (see Note 1.5.3);
foreign exchange (see Note 1.18);
disallowance provisions (see Note 19);
Environment Agency (EA) pension liabilities (see Note 20.1.1 and 20.1.6);
useful economic lives of Property, Plant and Equipment (see Note 1.8);
impairment of assets (see Note 1.9);
EA capital works expensed (see Note 1.16); and
EA accrued and deferred income (see Note 1.12).
Department for Environment, Food and Rural Affairs Annual Report and Accounts 2012–13
Notes to the Departmental Accounts
100
1.2 Accounting Convention
These accounts have been prepared on an accruals basis under the historical cost convention, modified to account for the revaluation of property, plant and equipment, intangible assets, inventories and certain financial assets and liabilities, where material.
1.3 Basis of Consolidation
These accounts comprise a consolidation of the Core Department, Executive Agencies and those other Network Bodies which fall within the departmental boundary as defined in the FReM and make up the „Departmental Group‟. A list of those entities within the departmental boundary is given in Note 32. This includes the Forestry Commission (FC), which is included within the results of the Core Department and Executive Agencies. Transactions between entities included in the consolidation have been eliminated.
1.4 Scheme Costs and Grants
1.4.1 RPA Reported Income and Expenditure
SPS expenditure for England is recognised by the Rural Payments Agency (RPA) when it has a present obligation to make payments to the claimants as a result of the completion of all substantive processes to validate each claim, and the amount payable to each claimant is considered reliably measured and probable.
SPS income for England is recognised by RPA when it is probable that it will receive a reimbursement from the European Commission (EC) for scheme expenditure incurred and the amount to be received from the EC is considered reliably measurable. These conditions are deemed to be met at the point that the related scheme expenditure is recognised, that is, upon the completion of all substantive processes to validate and reliably measure each claim.
For all other European Agricultural Guarantee Fund (EAGF) schemes administered by RPA an accrual point has been established according to the applicable scheme rules and regulations. Where a present obligation for payment is identified to fall on or before the Statement of Financial Position date, it is shown as a payable in the current year‟s financial statements with a corresponding EC receivable. Similarly, any element paid in advance of these accrual points is treated as a prepayment.
In accordance with EC regulations, RPA collects and surrenders both sugar and isoglucose production charges and other charges to fund the restructuring of the sugar regime. These receipts are remitted directly to the EC and are not reported in these accounts.
Other UK Paying Agencies make payments to claimants under both the EAGF and the European Agricultural Fund for Rural Development. The payments made by the other UK Paying Agencies are funded by RPA and subsequently recovered by the Agency from the EC.
Scheme expenditure in relation to funding provided by RPA is recognised when RPA has a present obligation to make payment to the other UK Paying Agencies and the amount payable is considered reliably measurable and probable. These conditions are deemed to be met upon the receipt of a funding request from the other UK Paying Agencies, adjusted for amounts unspent by the paying agencies at period end.
Scheme income in relation to funding provided to the other UK Paying Agencies is recognised by RPA when it is probable that it will receive reimbursement from the EC for scheme expenditure incurred and the amount to be received from the EC is considered reliably measurable. These conditions are deemed to be met at the point that the related scheme expenditure is recognised. However, the impacts of any foreign exchange movements between the claim date and the date of actual reimbursement by the EC are borne by RPA and accordingly recognised within the Statement of Comprehensive Net Expenditure. With effect from the year ended 30 September 2012, certain foreign exchange gains and losses are shared with the other UK Paying Agencies. RPA‟s foreign exchange figures are presented net of these recharges.
Department for Environment, Food and Rural Affairs Annual Report and Accounts 2012–13
Notes to the Departmental Accounts
101
1.4.2 Other Reported Scheme Income and Expenditure
Rural Development expenditure under the RDPE is managed by RPA and the Forestry Commission (FC) on behalf of Defra. Defra delegates authority to RPA to make payments on eligible claims as authorised by Natural England (NE) and the RDPE Delivery Team (RDT). FC has delegated authority from RPA to authorise and make its own payments. Generally the expenditure is recognised as each claim is validated and the amount payable to the claimant is reliably measurable, with the following exceptions:
NE agri–environment schemes recognition points are the anniversaries of the agreement start dates, when it is deemed that contractual obligations have been met. Other schemes recognition points are at the date the claim is paid.
RDT‟s recognition point is when claims have been received.
EU income is recognised at the same time as the EU element of the expenditure is recognised.
This income and expenditure is reported in Defra‟s Accounts. Expenditure is reported as a movement through the General Fund. The impacts of any foreign exchange movements between the claim date and the date of actual reimbursement by the EU are borne by RPA and recognised within the Statement of Comprehensive Net Expenditure.
1.4.3 Modulation
Modulation is a vehicle for redirecting into Rural Development a proportion of support payments to farmers and other claimants. This process is supported by EC and national legislation. Under these arrangements, there are two types of Modulation – National (or Voluntary) Modulation and EC (or Compulsory) Modulation.
From SPS 2007 onwards, scheme payments are reclaimed by RPA from the EC net of all modulation. National Modulation funds for the UK are reclaimed when the Rural Development expenditure is incurred.
European Commission Modulation reduces the net amounts paid to traders and farmers, with the funds retained in the first instance by the EC. However, the EC has committed at least 80 percent of these funds to be available to cover Rural Development expenditure in the UK. European Commission Modulation is reclaimed from the EC when the Rural Development expenditure is incurred.
Within these accounts SPS expenditure is reported net of National Modulation and EC Modulation for SPS 2007 and subsequent years.
1.5 Property, Plant and Equipment
1.5.1 Recognition and Valuation
With the exception of the EA‟s Infrastructure Assets (see below), Freehold land and buildings and, where appropriate, Construction in Progress (CIP), are subject to professional valuation at five yearly intervals with some entities within the accounting boundary also conducting an interim valuation. These are carried out by professionally qualified independent valuers, who adhere to the principles outlined in the Rural Institute of Chartered Surveyors (RICS) Red Book. The most recent valuation at the Core Department was conducted in March 2010 by DTZ Ltd under the guidance of a qualified director in their valuation department, whilst NE and EA commissioned a full quinquennial valuation exercise in March 2011 performed by the Valuation Office Agency and Chartered Surveyors King Sturge respectively. Land and Buildings are stated at fair value, which in practice is either depreciated replacement cost, open market value, existing use value or based on discounted cash flow. In use non specialised properties are stated at open market for existing use, in line with stated requirements in the FReM. Between professional valuations, annual desk top revaluations are conducted, which have regard for prevailing local and national conditions.
EA‟s Infrastructure Asset category represent those assets used in their service delivery and are specific in either nature, location or function. It is not possible to effectively revalue these assets using market
Department for Environment, Food and Rural Affairs Annual Report and Accounts 2012–13
Notes to the Departmental Accounts
102
comparatives or professional valuations. These assets are held in the Statement of Financial Position at depreciated replacement cost and are indexed biannually using an appropriate index. Typically, these assets include flood defence works, such as barriers and flood meadows, and water resource assets such as telemetry stations and boreholes.
Non property tangible assets have been stated at fair value using appropriate indices.
Minimum levels of capitalisation within the departmental boundary are usually in the ranges of £1,000–£10,000 although, for certain elements of land at the EA and buildings at FC, no de minimis threshold is in force. Subsequent expenditure is capitalised if the criteria for initial capitalisation are met, i.e. if it is probable that economic benefits will flow to the Department, and that the cost of the expenditure can be reliably measured.
Further details are provided in Note 10.
1.5.2 Service Concession Arrangements (IFRIC 12)
Defra has entered into a contract with IBM for the supply of IT services. The contract is for a term of eight years from February 2010. The contract falls within the scope of IFRIC 12 and is disclosed within the Accounts as a service concession arrangement. A lease liability has been included to reflect the capital value of payments to IBM to lease IT infrastructure assets throughout the duration of the eight year contract. A matching asset has been raised to reflect the benefit that the Department will derive from having access to IBM‟s IT infrastructure assets. Depreciation has been applied on a straight line basis consistent with the Department‟s depreciation policy. These IT infrastructure assets, which consist of laptops, servers and hardware, are classed as one tangible service concession asset under property, plant and equipment.
1.5.3 Lease Breaks
The Estates Strategy states that the default position is that lease breaks are exercised. Defra undertakes a detailed annual review on the material lease exits to confirm this judgment holds true. This has the implication of recognising the lease commitment (and any depreciation) to the lease break date. If however, the evidence suggests that it is unlikely individual lease breaks will be exercised, the commitment is until the end of the lease.
1.5.4 Assets Classified as Held for Sale
This classification is appropriate if an asset‟s carrying amount is to be recovered principally through a sale transaction rather than through continuing use. Assets classified as held for sale are being actively marketed for sale at a sales price reasonable in relation to its fair value and sale is expected to be completed within one year of classification. Depreciation ceases immediately on the classification of the assets as being held for sale. They are stated at the lower of their carrying amount and fair value less costs to sell. They are recorded in the current assets section of the Department's Statement of Financial Position.
Further details are provided in Note 10.3.
1.6 Heritage Assets
NE fulfils a stewardship role in respect of National Nature Reserves (NNRs). NNRs are land that is held in support of NE‟s strategic outcome to support a healthy natural environment and continue to ensure that our rich biodiversity thrives across the landscape, with ecosystems and habitats resilient to climate change. Although open to the public for quiet recreation, NNRs are held principally for their contribution to knowledge and culture. NNR land is classified as non operational heritage assets, and is treated in line with the requirements of Financial Reporting Standard (FRS) 30. The NNR land is stated at market value, and is subject to professional internal valuation at five yearly intervals. In between valuations, values are updated using indices from the Rural Market Survey indices produced by RICS. Any surplus or deficit of the NNRs compared to their historic cost is recognised in the Revaluation Reserve, and is reported in the Statement of Comprehensive Net Expenditure and Statement of Changes in Taxpayers‟ Equity.
Department for Environment, Food and Rural Affairs Annual Report and Accounts 2012–13
Notes to the Departmental Accounts
103
NE also holds operational heritage assets, which comprise buildings attached to the NNR land. These include visitor and information centres, and offices for NNR staff. These operational support buildings are not classified as heritage assets, and are therefore treated in line with International Accounting Standard (IAS) 16. The NNR buildings are stated at market value, and subject to professional external valuation at five yearly intervals. In between valuations, values are updated using indices from the Construction Tender Price Indices produced by the Department for Business, Innovation and Skills (BIS).
Royal Botanic Gardens Kew (RBG Kew) also holds heritage assets. These are generally represented by collections and buildings. Only new acquisitions are capitalised, as the cost of obtaining valuations for older collections and buildings is onerous compared to the benefit to the readers of the Accounts.
Further details are provided in Note 10.4.
1.7 Intangible Non–Current Assets
These comprise software licences and internally developed IT software, including CIP.
The Department holds various software licences, which were capitalised at purchase cost where this exceeds capitalisation thresholds. Such assets are revalued only where it is possible to obtain a reliable estimate of their market value. They are reviewed annually for any impairment, to ensure they are not carried in the Statement of Financial Position above their recoverable amounts.
The Department's expenditure on research activities is written off to the Statement of Comprehensive Net Expenditure as incurred, due to the inherent uncertainty surrounding the economic benefit resulting from it. Capitalisation of development costs is contingent on fulfilment of the criteria noted in IAS 38 (Intangible Assets). Internally generated assets recognised as CIP are not amortised until the completed asset is brought into service.
Internally developed computer software includes capitalisation of internal IT staff costs on projects costing in excess of £100,000 for RPA, £50,000 for the Core Department and the Animal Health and Veterinary Laboratories Agency (AHVLA) and £20,000 for the Food and Environment Research Agency (Fera). Other entities within the Departmental boundary have capitalisation levels between £2,000 and £10,000. The Department does not hold any intangible assets with an indefinite useful life.
When fully operational in the business, internally generated software is stated at fair value, which generally, if it is not income generating, is depreciated replacement cost. Values are updated annually using appropriate indices.
Further details are provided in Note 11.
1.8 Depreciation and Amortisation
Depreciation and amortisation are provided at rates estimated to write off the valuation of freehold buildings, other items of property, plant and equipment, software licences and fully operational internally developed software by the straight line method over the estimated useful life of the asset.
Componentisation has been adopted by certain entities within the consolidation boundary, where this is deemed to be appropriate. In these instances, each component of an asset with a value deemed material to the total fair value of the asset is capitalised and depreciated separately. Components no longer to be used are derecognised. Where componentisation is not yet fully in place, proxy values have been estimated using the weighted average useful life method. Estimated useful lives, component values and residual values are revised annually.
Department for Environment, Food and Rural Affairs Annual Report and Accounts 2012–13
Notes to the Departmental Accounts
104
Depreciation and amortisation are not charged on assets held for sale, freehold land and CIP. Estimated useful lives at initial recognition are normally in the following ranges:
Infrastructure assets (EA) 15 to 100 years
Freehold buildings Up to 80 years
Property on lease Remaining life of lease
Buildings on leased land Average component life and length of lease
Scientific equipment 5 to 20 years
IT hardware 2 to 20 years
IT software 2 to 20 years
Software licences Up to 25 years
Furniture and fittings Up to 30 years
Vehicles, plant and machinery 3 to 25 years
Office equipment Up to 20 years
Vessels 15 to 30 years
Further details are provided in Notes 10 and 11.
1.9 Impairment
Impairments are recognised when the recoverable amount of non–current assets falls below their carrying amount.
In line with an adaptation in the FReM, any permanent diminution in the value of an asset due to clear consumption of economic benefit or service potential should be recognised in full as an impairment loss in the Statement of Comprehensive Net Expenditure. However, in order to align the balance in the Revaluation Reserve with that which would have resulted through strict application of IAS 36, an amount up to the value of the impairment is transferred to the General Fund for the individual asset concerned.
Downward revaluations, resulting from changes in market value, only result in an impairment where the asset is revalued below its historical cost carrying amount. In these cases the accounting treatment is as for any other impairment, with amounts being firstly set against any accumulated balance in the Revaluation Reserve, and any amount in addition to this being recognised as an impairment and recorded in the Statement of Comprehensive Net Expenditure.
1.10 Inventories and Work in Progress
1.10.1 Inventories
Any inventories are brought into the Accounts at the lower of cost (or at current replacement cost where materially different) or net realisable value.
1.10.2 Work in Progress
Work in progress is valued at the lower of cost (including appropriate overheads) or net realisable value.
1.10.3 Intervention Inventories
These comprise agricultural commodities purchased into intervention under terms specified by EAGF and valued in accordance with its direction. The effect of these directions is to secure inventories at the stated value, as any shortfall in sales revenues is made good by the EC. Further details of inventories are provided in Note 15.
1.11 Cash and Cash Equivalents
Cash and cash equivalents comprise cash in hand and current balances with banks and other financial institutions, which are readily convertible to known amounts of cash and which are subject to insignificant risk of
Department for Environment, Food and Rural Affairs Annual Report and Accounts 2012–13
Notes to the Departmental Accounts
105
changes in value and have an original maturity of three months or less. The carrying amount of these assets approximates their fair value. Bank overdraft amounts are included within trade and other payables in the Statement of Financial Position where applicable.
1.12 Income
1.12.1 Operating Income
Operating income relates directly to the operating activities of the Department, including income from the EU.
Accrued and deferred income have been included for EA‟s fees and charges balances where there is a surplus or deficit. These have been included due to the fact that charging schemes are required to break even over a reasonable period of time. The balances are considered when setting future years‟ fees and charges, to enable a break even position to be achieved over a reasonable time period, which is currently considered to be three years.
Two Levy Funded Bodies are included in the accounting boundary. The Agriculture and Horticulture Development Board (AHDB) raises a statutory levy from the meat and livestock (cattle, sheep and pigs) sector in England; commercial horticulture, milk and potato sectors in Great Britain; and cereals and oilseeds sector in the UK. The Sea Fish Industry Authority (SFIA) is funded primarily by a levy on the first hand sale of fish, shellfish and seafood products landed, imported or cultivated in the UK.
1.13 Other Income
The Department‟s Public Corporations are required to pay a dividend to the Core Department. This is effectively an internal rate of return and is calculated on an external finance basis, based upon the weighted average cost of financing, charges and assets for each significant programme of work.
The Department has no Consolidated Fund Extra Receipts.
1.14 Grant–in–Aid funding
Grant–in–Aid from the Core Department, both in respect of capital and revenue expenditure, is treated as funding.
1.15 Administration and Programme Expenditure and Income
The Statement of Comprehensive Net Expenditure is analysed between administration and programme income and expenditure. The classification of expenditure and income as administration or programme follows the definition set by HM Treasury. Administration costs reflect the costs of running the Department, as defined under the administration cost control regime, together with associated operating income. Income is analysed in the notes between that which is allowed to be offset against gross administrative costs and that operating income which is not. Programme costs reflect administration costs of frontline services and all other non–administration costs, including payments of grants, subsidies and other disbursements by the Department, as well as certain staff costs where they relate directly to service delivery.
1.16 Capital Works Expensed
Capital work expensed in year is expenditure which is capital in nature, but for which EA does not retain the risks and rewards in the future, or cannot reliably estimate the useful life of the assets. This includes items such as flood assets built on land which is not owned by EA, where it has permissive powers and assets where it is not possible to check for impairment so it is more prudent to write the asset off in year, including beach replenishment.
1.17 Foreign Exchange
The functional and presentational currency of the Department is sterling. Transactions in foreign currencies are translated into sterling using the rate at the date of the transactions. Exchange differences are recognised in the Statement of Comprehensive Net Expenditure in the period in which they arise, except for exchange differences on transactions entered in to hedge certain foreign currency risks (RPA only).
Department for Environment, Food and Rural Affairs Annual Report and Accounts 2012–13
Notes to the Departmental Accounts
106
Balances held in foreign currencies are translated at the rate of exchange ruling at the date of the Statement of Financial Position. Any gains or losses on translation are recorded against expenditure in the year they are incurred.
RPA receives reimbursements from the EC in euros for funds administered by the Agency and other UK Paying Agencies in relation to the SPS, the Rural Development Programme and Trader Schemes in accordance with the respective scheme rules and regulations. Furthermore, the Agency makes a portion of payments under the SPS in euros to farmers, and funds other UK Paying Agencies in sterling and euros. These foreign currency transactions are recognised as scheme income and scheme expenditure at the rates of exchange prevailing on the dates of recognition of those transactions. At each Statement of Financial Position date, monetary assets and liabilities that are denominated in foreign currencies are retranslated at the rates prevailing at that date, see Note 12.2.2.
In agreement with HM Treasury, RPA hedges against currency movements associated with the EU reimbursement process. Reporting and disclosure is in line with IAS 39 and is discussed in Note 1.18.3: Derivative Financial Instruments.
1.18 Financial Instruments
1.18.1 Financial Assets
The Department holds receivables and financial assets in this category. Receivables are non derivative financial assets with fixed or determinable payments that are not quoted in an active market.
Financial assets are non derivative financial assets that are classed as available for sale on initial recognition, or are not categorised in line with any other financial asset classification. Financial assets are measured at fair value, with all unrealised gains or losses set against equity reserves and with gains or losses on disposal recognised in the Statement of Comprehensive Net Expenditure.
1.18.2 Financial Liabilities
These comprise trade and other payables and other financial liabilities. They are initially recognised at fair value and are subsequently measured at amortised cost.
EA holds certain financial instrument liabilities as a result of operating agreements with a number of water companies entered into at their privatisation. These liabilities are treated as perpetuities and recorded in the balance sheet at amortised cost. The annual payments arising from these liabilities increase annually in line with RPI. Further details can be found in Note 12.2.3.
1.18.3 Derivative Financial Instruments
Derivative financial instruments are initially recognised at fair value at the date a derivative contract is entered into and are subsequently re–measured to their fair value at each Statement of Financial Position date. The resulting gain or loss is recognised in the Statement of Comprehensive Net Expenditure immediately, unless the derivative is designated and effective as a hedging instrument, in which event the timing of the recognition in the Statement of Comprehensive Net Expenditure depends on the nature of the hedge relationship. RPA designates certain derivatives as hedges of highly probable forecast transactions (cash flow hedges).
A derivative with a positive fair value is recognised as a financial asset, whereas a derivative with a negative fair value is recognised as a financial liability. A derivative is presented as a current asset or current liability if the remaining maturity of the instrument is less than 12 months or is greater than 12 months but is expected to be realised or settled within 12 months.
In accordance with IAS 39, RPA elected to designate certain foreign currency derivatives as cash flow hedges of the euro denominated receipts from the EC in relation to SPS and RDPE. At the inception of the hedge relationship, RPA documents the relationship between the hedging instrument and the hedged item, along with its risk management objectives and its strategy for undertaking various hedge transactions. Furthermore, at the
Department for Environment, Food and Rural Affairs Annual Report and Accounts 2012–13
Notes to the Departmental Accounts
107
inception of the hedge and on an ongoing basis, RPA documents whether the hedging instrument is highly effective in offsetting changes in cash flows of the hedged items, as required by the standard.
The effective portion of changes in the fair value of derivatives that are designated and qualify as cash flow hedges is recognised in the cash flow hedge reserve within Taxpayers‟ Equity. The gain or loss relating to the ineffective portion is recognised immediately in income or cost, and is included in the Statement of Comprehensive Net Expenditure.
Amounts previously recognised in the cash flow hedge reserve and accumulated in Taxpayers‟ Equity are reclassified to expenditure or income in the periods when the hedged item is recognised in the Statement of Comprehensive Net Expenditure, in the same line as the recognised hedged item.
Hedge accounting is discontinued when RPA revokes the hedging relationship, the hedging instrument expires or is sold, terminated or exercised, or no longer qualifies for hedge accounting. Any gain or loss recognised in the cash flow hedge reserve at that time is accumulated in Taxpayers‟ Equity and is recognised when the forecast transaction is ultimately recognised in the Statement of Comprehensive Net Expenditure. When a forecast transaction is no longer expected to occur, the gain or loss accumulated in Taxpayers‟ Equity is recognised immediately in the Statement of Comprehensive Net Expenditure.
In September 2012 RPA entered into forward exchange contracts to hedge the monthly euro denominated receipts in relation to SPS. It is anticipated that the funds will be received during 2013–14 at which time the amount deferred in equity will be reclassified to the Statement of Comprehensive Net Expenditure.
RPA also entered into forward exchange contracts to hedge the quarterly euro denominated receipts in relation to the Rural Development Programmes.
In December 2011 RPA entered into forward exchange contracts to hedge the exposure on the repayment of the European Fisheries Fund advance held by Defra. As the underlying liability is with Defra an internal hedge has been established to transfer the risk exposure on the contracts. There is no deferral of gains or losses under these contracts to the cash flow hedge reserve.
1.19 Employee Benefits
1.19.1 Pensions
Generally pension benefits are provided through the civil service pension arrangements, full details of which can be found in the Remuneration Report and in Note 6.
Although the Principal Civil Service Pension Scheme (PCSPS) is an unfunded defined benefit scheme, in accordance with explicit requirements in the FReM, departments, agencies and other bodies account for the scheme as if it were a defined contribution plan. Costs of the elements are recognised on a systematic and rational basis over the period during which it benefits from employees‟ services by payment to the PCSPS of amounts calculated on an accruing basis. Liability for payment of future benefits is a charge on PCSPS. The PCSPS pension scheme undergoes a reassessment of the contribution rates by the Government Actuary at four–yearly intervals. In respect of defined contribution schemes, the Department recognises the contributions payable for the year.
Where the Department is responsible for pension schemes from delivery bodies, it has fully adopted IAS 19 Employee Benefits. The Department recognises a liability in respect of any deficit, being the excess of the present value of the scheme‟s liabilities over the value of the assets in the scheme, to the extent that the Department has a legal or constructive obligation to make good the deficit in the scheme.
Within the Departmental accounting boundary are a number of funded schemes. These are a mixture of defined benefit and defined contribution schemes. The EA Pension Fund (known as the ‟Active Fund‟) is the largest of these. Being funded schemes, the liabilities are not subject to HM Treasury discount rate, but are instead determined by an appropriate authority and comply fully with the requirements of IAS 19. Some of
Department for Environment, Food and Rural Affairs Annual Report and Accounts 2012–13
Notes to the Departmental Accounts
108
these schemes are vested and administered independently of the Department. Full details of contribution rates, along with further details on pensions, are disclosed in Note 20.
1.19.2 Other Employee Benefits
The Department recognises a liability and expense for all other employee benefits, including unused annual leave, accrued at the Statement of Financial Position date, provided these amounts are material in the context of the overall staff costs.
Termination benefits are recognised as a liability when the Department has a binding commitment to terminate the employment of an employee or group of employees before the normal retirement date, or as a result of an offer to encourage voluntary redundancy.
1.20 Early Departure Costs
The Department is required to meet the additional costs of benefits beyond the normal PCSPS benefits in respect of employees who retire early. The Department provides in full for this cost when the early retirement programme has been announced and is binding on the Department. The Department may, in certain circumstances, settle some or all of its liability in advance by making a payment through the Government Banking Service for the credit of the Civil Superannuation Vote. The amount provided is shown net of any such payments. Further information is provided in Note 6.3.
1.21 Provisions
The Department provides for obligations arising from past events where the Department has a present obligation at the Statement of Financial Position date, and where it is probable that it will be required to settle the obligation and a reliable estimate can be made. Where material, the future costs have been discounted using the rates as directed by HM Treasury.
The Department considers that an obligation arises in relation to payments made on schemes regulated by the EU when a breach in the EU‟s regulations has been identified, and moreover that it is probable this breach will lead to financial corrections, known as disallowances, and a reliable estimate can be made. Further information is provided in Note 19. The Department does not make provision relating to the risk of disallowance in respect of the UK Devolved Administrations. Disallowance provisions are not discounted due to the uncertainty around timing, estimates and foreign exchange fluctuations.
1.22 Leases
A finance lease is one which transfers substantially all the risks and rewards of ownership to the lessee. An operating lease is a lease other than a finance lease.
The determination of whether an arrangement is, or contains, a lease, is based on the substance of that arrangement. This assessment is based on whether the arrangement is dependent on the use of a specific asset and conveys the right to use the asset. The Department‟s contractual arrangements, including those classed within Public–Private Partnerships (PPP), are evaluated in this way.
Both the asset value and liability to pay future rentals under a finance lease are discounted at the interest rate implicit in the lease to derive the present value. Assets obtained under a finance lease are revalued and depreciated.
Where the total of future minimum lease payments are known, the expense is recognised in the Statement of Comprehensive Net Expenditure on a straight line basis over the length of the lease. Otherwise, payments are charged to the Statement of Comprehensive Net Expenditure as they are incurred.
1.23 Machinery of Government Changes
Machinery of Government (MOG) changes which involve the transfer of functions or responsibilities between two or more government departments are accounted for in accordance with the FReM.
Department for Environment, Food and Rural Affairs Annual Report and Accounts 2012–13
Notes to the Departmental Accounts
109
1.24 Value Added Tax (VAT)
Core Defra and its Executive Agencies share a single VAT registration and for the most part, input tax cannot be recovered. However, under a HM Treasury concession applying to government departments, limited input VAT recovery may be possible on certain specified contracted out services attributable to those activities. For those limited activities where output VAT is charged, directly attributable input VAT can be recovered under the normal rules.
Other bodies within the Defra Network are separately registered for VAT, where applicable.
In all instances, where output tax is charged, and input tax is recoverable, amounts are stated net of VAT. Where input tax cannot be recovered, amounts are stated inclusive of VAT.
1.25 Corporation Tax
Corporation tax is levied at a small number of the Department‟s NDPBs, and is restricted to trading income and returns on investments.
1.26 Contingent Liabilities
In addition to contingent liabilities disclosed in accordance with IAS 37 (Provisions, Contingent Liabilities and Contingent Assets), the Department discloses, for Parliamentary reporting and accountability purposes, certain statutory and non–statutory contingent liabilities where the likelihood of a transfer of economic benefit is remote.
Where the time value of money is material, contingent liabilities are stated at discounted amounts and the amount reported to Parliament separately noted. Contingent liabilities that are not required to be disclosed by IAS 37 are stated at the amounts reported to Parliament. Further information is provided in Notes 25 and 26.
1.27 Carbon Reduction Commitment (CRC)
Defra is required to participate in the CRC Energy Efficiency Scheme. This scheme is currently in its introductory phase, which will last until April 2014. Defra is required to purchase and surrender allowances on the basis of Carbon Dioxide emissions. As Carbon Dioxide is emitted, a liability and an expense are recognised. The liability will be discharged by surrendering allowances. The liability is measured at the best estimate of the expenditure required to meet the obligation, normally at the current market price of the number of allowances required to meet the liability at the reporting date.
1.28 Impending Application of Newly Issued Accounting Standards Not Yet Effective
At the date of authorisation of these financial statements, the following standards relevant to the Department were issued but not yet effective:
IAS 1 Presentation of Financial Statements (Other Comprehensive Income);
IAS 19 Post–Employment Benefits (Pensions);
IAS 27 Separate Financial Statements;
IFRS 9 Financial Instruments, Classification and Measurement;
IFRS 10 Consolidated Financial Statements;
IFRS 11 Joint Arrangements;
IFRS 12 Disclosure of Interests in Other Entities; and
IFRS 13 Fair Value Measurement.
These standards have not been adopted by the Department ahead of their implementation date. The future impact of IAS 1 and 19 is not considered to be significant. IFRS 9, 10, 11, 12, 13 and IAS 27 are still subject to consultation by HM Treasury. The Department will review and assess the impact following the outcome of these consultations.
Defra has also reviewed the changes in the FReM and determined that there will be no significant impact on the accounts from 2012–13.
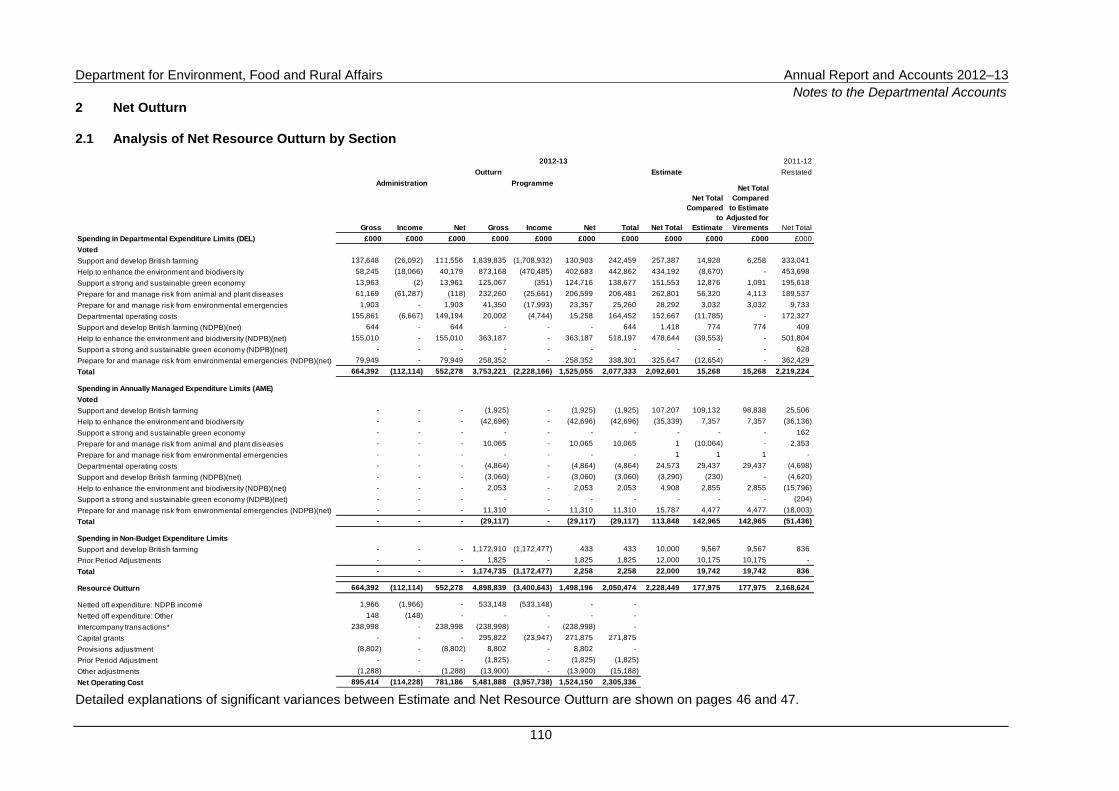
Department for Environment, Food and Rural Affairs Annual Report and Accounts 2012–13
Notes to the Departmental Accounts
110
2 Net Outturn
2.1 Analysis of Net Resource Outturn by Section
2011-12
Estimate Restated
Spending in Departmental Expenditure Limits (DEL) £000 £000 £000 £000 £000 £000 £000 £000 £000 £000 £000
Voted
Support and develop British farming 137,648 (26,092) 111,556 1,839,835 (1,708,932) 130,903 242,459 257,387 14,928 6,258 333,041
Help to enhance the environment and biodiversity 58,245 (18,066) 40,179 873,168 (470,485) 402,683 442,862 434,192 (8,670) - 453,698
Support a strong and sustainable green economy 13,963 (2) 13,961 125,067 (351) 124,716 138,677 151,553 12,876 1,091 195,618
Prepare for and manage risk from animal and plant diseases 61,169 (61,287) (118) 232,260 (25,661) 206,599 206,481 262,801 56,320 4,113 189,537
Prepare for and manage risk from environmental emergencies 1,903 - 1,903 41,350 (17,993) 23,357 25,260 28,292 3,032 3,032 9,733
Departmental operating costs 155,861 (6,667) 149,194 20,002 (4,744) 15,258 164,452 152,667 (11,785) - 172,327
Support and develop British farming (NDPB)(net) 644 - 644 - - - 644 1,418 774 774 409
Help to enhance the environment and biodiversity (NDPB)(net) 155,010 - 155,010 363,187 - 363,187 518,197 478,644 (39,553) - 501,804
Support a strong and sustainable green economy (NDPB)(net) - - - - - - - - - - 628
Prepare for and manage risk from environmental emergencies (NDPB)(net) 79,949 - 79,949 258,352 - 258,352 338,301 325,647 (12,654) - 362,429
Total 664,392 (112,114) 552,278 3,753,221 (2,228,166) 1,525,055 2,077,333 2,092,601 15,268 15,268 2,219,224
Spending in Annually Managed Expenditure Limits (AME)
Voted
Support and develop British farming - - - (1,925) - (1,925) (1,925) 107,207 109,132 98,838 25,506
Help to enhance the environment and biodiversity - - - (42,696) - (42,696) (42,696) (35,339) 7,357 7,357 (36,136)
Support a strong and sustainable green economy - - - - - - - - - - 162
Prepare for and manage risk from animal and plant diseases - - - 10,065 - 10,065 10,065 1 (10,064) - 2,353
Prepare for and manage risk from environmental emergencies - - - - - - - 1 1 1 -
Departmental operating costs - - - (4,864) - (4,864) (4,864) 24,573 29,437 29,437 (4,698)
Support and develop British farming (NDPB)(net) - - - (3,060) - (3,060) (3,060) (3,290) (230) - (4,620)
Help to enhance the environment and biodiversity (NDPB)(net) - - - 2,053 - 2,053 2,053 4,908 2,855 2,855 (15,796)
Support a strong and sustainable green economy (NDPB)(net) - - - - - - - - - - (204)
Prepare for and manage risk from environmental emergencies (NDPB)(net) - - - 11,310 - 11,310 11,310 15,787 4,477 4,477 (18,003)
Total - - - (29,117) - (29,117) (29,117) 113,848 142,965 142,965 (51,436)
Spending in Non-Budget Expenditure Limits
Support and develop British farming - - - 1,172,910 (1,172,477) 433 433 10,000 9,567 9,567 836
Prior Period Adjustments - - - 1,825 - 1,825 1,825 12,000 10,175 10,175 -
Total - - - 1,174,735 (1,172,477) 2,258 2,258 22,000 19,742 19,742 836
Resource Outturn 664,392 (112,114) 552,278 4,898,839 (3,400,643) 1,498,196 2,050,474 2,228,449 177,975 177,975 2,168,624
Netted off expenditure: NDPB income 1,966 (1,966) - 533,148 (533,148) - -
Netted off expenditure: Other 148 (148) - - - - -
Intercompany transactions* 238,998 - 238,998 (238,998) - (238,998) -
Capital grants - - - 295,822 (23,947) 271,875 271,875
Provisions adjustment (8,802) - (8,802) 8,802 - 8,802 -
Prior Period Adjustment - - - (1,825) - (1,825) (1,825)
Other adjustments (1,288) - (1,288) (13,900) - (13,900) (15,188)
Net Operating Cost 895,414 (114,228) 781,186 5,481,888 (3,957,738) 1,524,150 2,305,336
Outturn
Administration Programme
2012-13
Total Net Total
Net Total
Compared
to
Estimate
Net Total
Compared
to Estimate
Adjusted for
Virements Net TotalGross Income Net Gross Income Net
Detailed explanations of significant variances between Estimate and Net Resource Outturn are shown on pages 46 and 47.
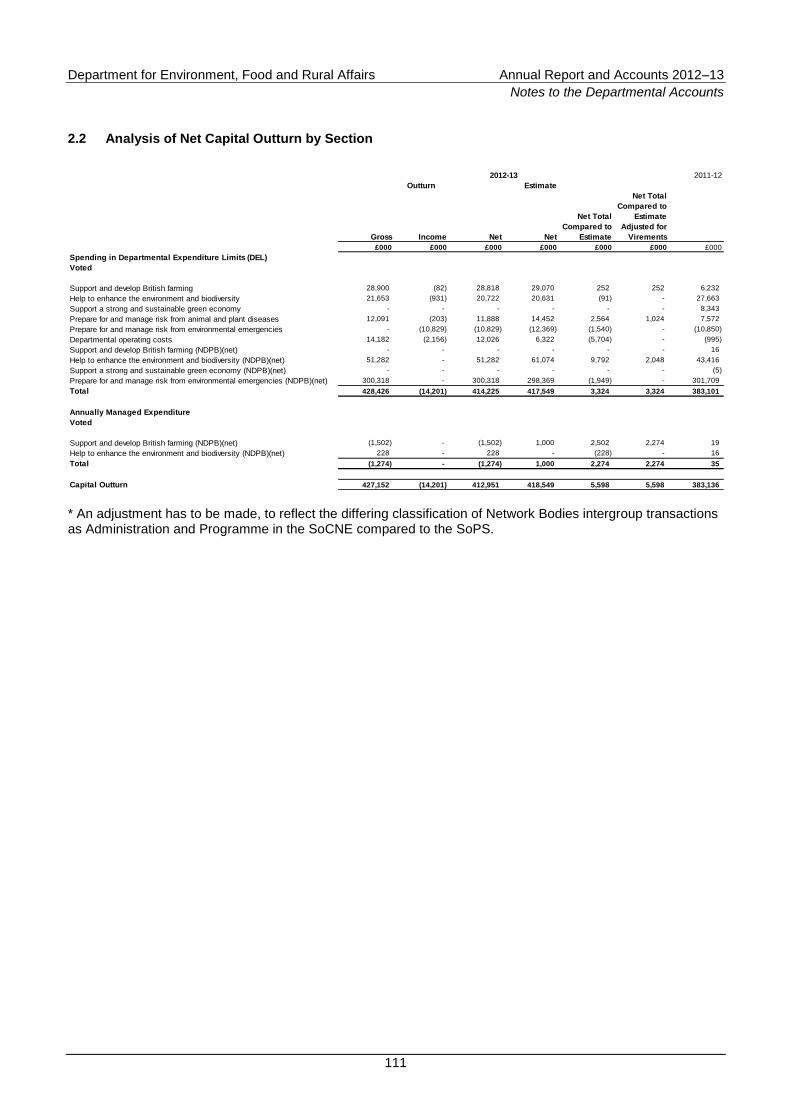
Department for Environment, Food and Rural Affairs Annual Report and Accounts 2012–13
Notes to the Departmental Accounts
111
2.2 Analysis of Net Capital Outturn by Section
2011-12
Estimate
Gross Income Net Net
Net Total
Compared to
Estimate
Net Total
Compared to
Estimate
Adjusted for
Virements
£000 £000 £000 £000 £000 £000 £000
Spending in Departmental Expenditure Limits (DEL)
Voted
Support and develop British farming 28,900 (82) 28,818 29,070 252 252 6,232
Help to enhance the environment and biodiversity 21,653 (931) 20,722 20,631 (91) - 27,663
Support a strong and sustainable green economy - - - - - - 8,343
Prepare for and manage risk from animal and plant diseases 12,091 (203) 11,888 14,452 2,564 1,024 7,572
Prepare for and manage risk from environmental emergencies - (10,829) (10,829) (12,369) (1,540) - (10,850)
Departmental operating costs 14,182 (2,156) 12,026 6,322 (5,704) - (995)
Support and develop British farming (NDPB)(net) - - - - - - 16
Help to enhance the environment and biodiversity (NDPB)(net) 51,282 - 51,282 61,074 9,792 2,048 43,416
Support a strong and sustainable green economy (NDPB)(net) - - - - - - (5)
Prepare for and manage risk from environmental emergencies (NDPB)(net) 300,318 - 300,318 298,369 (1,949) - 301,709
Total 428,426 (14,201) 414,225 417,549 3,324 3,324 383,101
Annually Managed Expenditure
Voted
Support and develop British farming (NDPB)(net) (1,502) - (1,502) 1,000 2,502 2,274 19
Help to enhance the environment and biodiversity (NDPB)(net) 228 - 228 - (228) - 16
Total (1,274) - (1,274) 1,000 2,274 2,274 35
Capital Outturn 427,152 (14,201) 412,951 418,549 5,598 5,598 383,136
2012-13
Outturn
* An adjustment has to be made, to reflect the differing classification of Network Bodies intergroup transactions as Administration and Programme in the SoCNE compared to the SoPS.
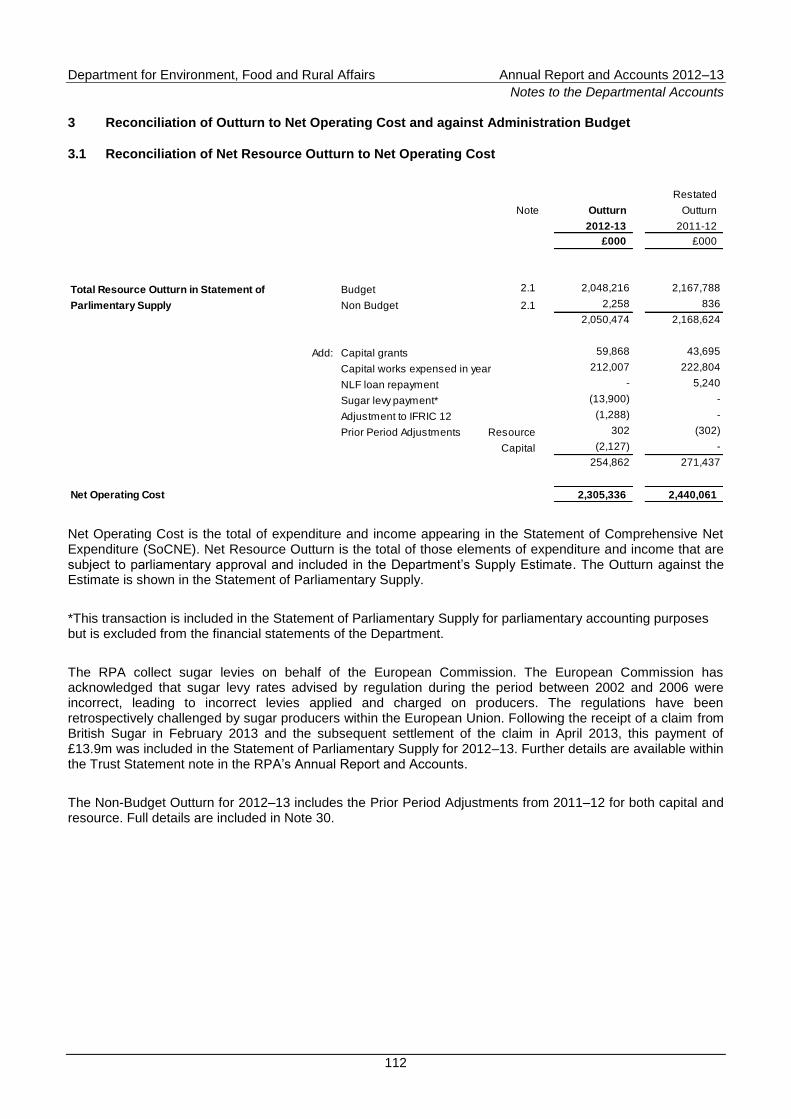
Department for Environment, Food and Rural Affairs Annual Report and Accounts 2012–13
Notes to the Departmental Accounts
112
3 Reconciliation of Outturn to Net Operating Cost and against Administration Budget
3.1 Reconciliation of Net Resource Outturn to Net Operating Cost
Restated
Note Outturn Outturn
2012-13 2011-12
£000 £000
Total Resource Outturn in Statement of Budget 2.1 2,048,216 2,167,788
Parlimentary Supply Non Budget 2.1 2,258 836
2,050,474 2,168,624
Add: Capital grants 59,868 43,695
Capital works expensed in year 212,007 222,804
NLF loan repayment - 5,240
Sugar levy payment* (13,900) -
Adjustment to IFRIC 12 (1,288) -
Prior Period Adjustments Resource 302 (302)
Capital (2,127) -
254,862 271,437
Net Operating Cost 2,305,336 2,440,061
Net Operating Cost is the total of expenditure and income appearing in the Statement of Comprehensive Net Expenditure (SoCNE). Net Resource Outturn is the total of those elements of expenditure and income that are subject to parliamentary approval and included in the Department‟s Supply Estimate. The Outturn against the Estimate is shown in the Statement of Parliamentary Supply.
*This transaction is included in the Statement of Parliamentary Supply for parliamentary accounting purposes but is excluded from the financial statements of the Department.
The RPA collect sugar levies on behalf of the European Commission. The European Commission has acknowledged that sugar levy rates advised by regulation during the period between 2002 and 2006 were incorrect, leading to incorrect levies applied and charged on producers. The regulations have been retrospectively challenged by sugar producers within the European Union. Following the receipt of a claim from British Sugar in February 2013 and the subsequent settlement of the claim in April 2013, this payment of £13.9m was included in the Statement of Parliamentary Supply for 2012–13. Further details are available within the Trust Statement note in the RPA‟s Annual Report and Accounts.
The Non-Budget Outturn for 2012–13 includes the Prior Period Adjustments from 2011–12 for both capital and resource. Full details are included in Note 30.
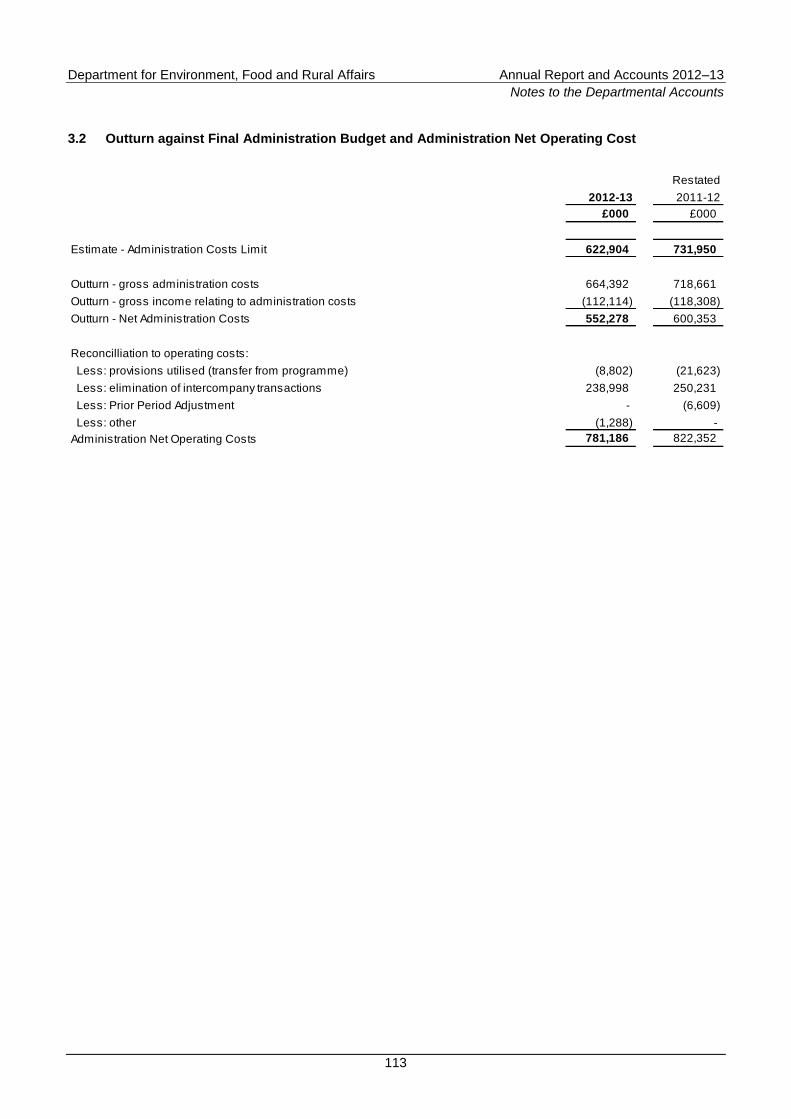
Department for Environment, Food and Rural Affairs Annual Report and Accounts 2012–13
Notes to the Departmental Accounts
113
3.2 Outturn against Final Administration Budget and Administration Net Operating Cost
Restated
2012-13 2011-12
£000 £000
Estimate - Administration Costs Limit 622,904 731,950
Outturn - gross administration costs 664,392 718,661
Outturn - gross income relating to administration costs (112,114) (118,308)
Outturn - Net Administration Costs 552,278 600,353
Reconcilliation to operating costs:
Less: provisions utilised (transfer from programme) (8,802) (21,623)
Less: elimination of intercompany transactions 238,998 250,231
Less: Prior Period Adjustment - (6,609)
Less: other (1,288) -
Administration Net Operating Costs 781,186 822,352
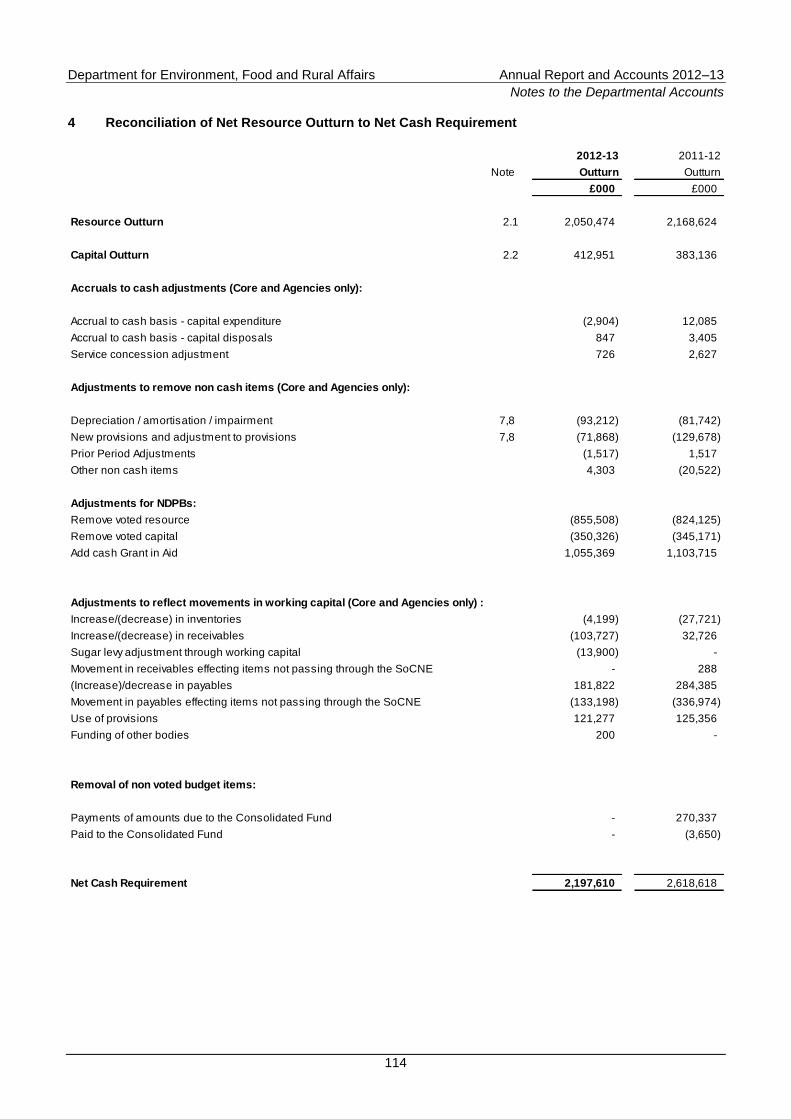
Department for Environment, Food and Rural Affairs Annual Report and Accounts 2012–13
Notes to the Departmental Accounts
114
4 Reconciliation of Net Resource Outturn to Net Cash Requirement
2012-13 2011-12
Note Outturn Outturn
£000 £000
Resource Outturn 2.1 2,050,474 2,168,624
Capital Outturn 2.2 412,951 383,136
Accruals to cash adjustments (Core and Agencies only):
Accrual to cash basis - capital expenditure (2,904) 12,085
Accrual to cash basis - capital disposals 847 3,405
Service concession adjustment 726 2,627
Adjustments to remove non cash items (Core and Agencies only):
Depreciation / amortisation / impairment 7,8 (93,212) (81,742)
New provisions and adjustment to provisions 7,8 (71,868) (129,678)
Prior Period Adjustments (1,517) 1,517
Other non cash items 4,303 (20,522)
Adjustments for NDPBs:
Remove voted resource (855,508) (824,125)
Remove voted capital (350,326) (345,171)
Add cash Grant in Aid 1,055,369 1,103,715
Adjustments to reflect movements in working capital (Core and Agencies only) :
Increase/(decrease) in inventories (4,199) (27,721)
Increase/(decrease) in receivables (103,727) 32,726
Sugar levy adjustment through working capital (13,900) -
Movement in receivables effecting items not passing through the SoCNE - 288
(Increase)/decrease in payables 181,822 284,385
Movement in payables effecting items not passing through the SoCNE (133,198) (336,974)
Use of provisions 121,277 125,356
Funding of other bodies 200 -
Removal of non voted budget items:
Payments of amounts due to the Consolidated Fund - 270,337
Paid to the Consolidated Fund - (3,650)
Net Cash Requirement 2,197,610 2,618,618
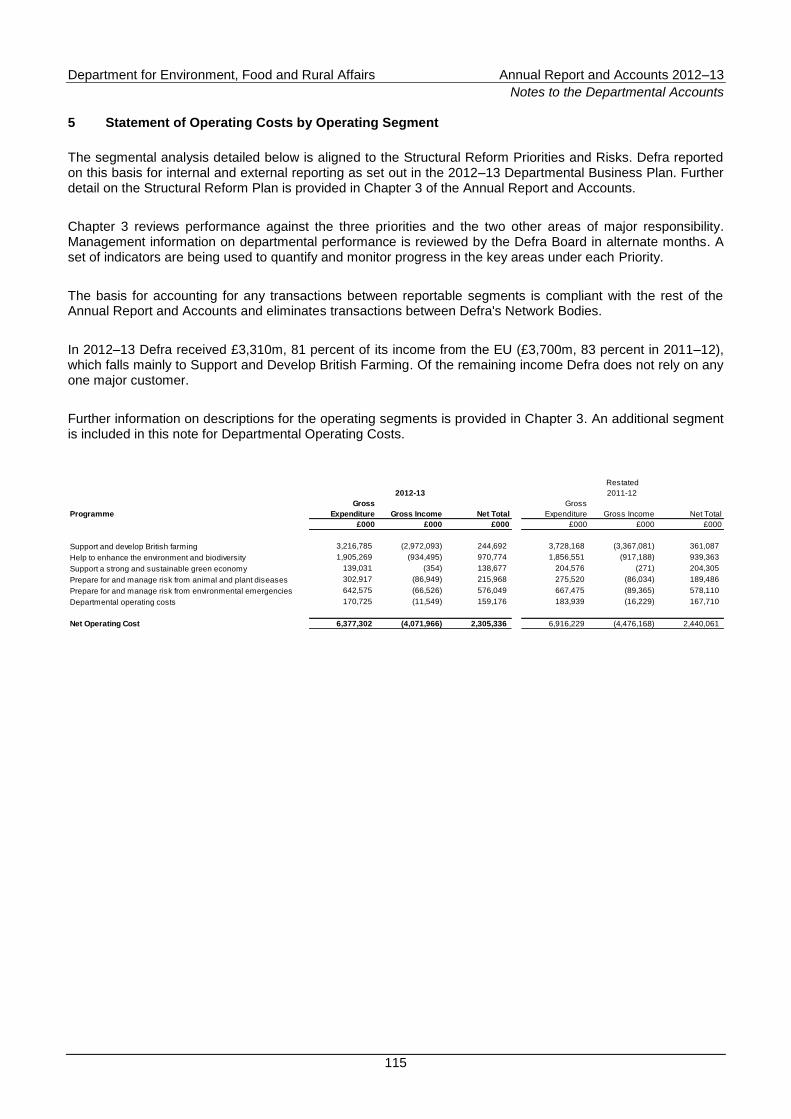
Department for Environment, Food and Rural Affairs Annual Report and Accounts 2012–13
Notes to the Departmental Accounts
115
5 Statement of Operating Costs by Operating Segment
The segmental analysis detailed below is aligned to the Structural Reform Priorities and Risks. Defra reported on this basis for internal and external reporting as set out in the 2012–13 Departmental Business Plan. Further detail on the Structural Reform Plan is provided in Chapter 3 of the Annual Report and Accounts.
Chapter 3 reviews performance against the three priorities and the two other areas of major responsibility. Management information on departmental performance is reviewed by the Defra Board in alternate months. A set of indicators are being used to quantify and monitor progress in the key areas under each Priority.
The basis for accounting for any transactions between reportable segments is compliant with the rest of the Annual Report and Accounts and eliminates transactions between Defra's Network Bodies.
In 2012–13 Defra received £3,310m, 81 percent of its income from the EU (£3,700m, 83 percent in 2011–12), which falls mainly to Support and Develop British Farming. Of the remaining income Defra does not rely on any one major customer.
Further information on descriptions for the operating segments is provided in Chapter 3. An additional segment is included in this note for Departmental Operating Costs.
Restated
Programme
Gross
Expenditure Gross Income Net Total
Gross
Expenditure Gross Income Net Total
£000 £000 £000 £000 £000 £000
Support and develop British farming 3,216,785 (2,972,093) 244,692 3,728,168 (3,367,081) 361,087
Help to enhance the environment and biodiversity 1,905,269 (934,495) 970,774 1,856,551 (917,188) 939,363
Support a strong and sustainable green economy 139,031 (354) 138,677 204,576 (271) 204,305
Prepare for and manage risk from animal and plant diseases 302,917 (86,949) 215,968 275,520 (86,034) 189,486
Prepare for and manage risk from environmental emergencies 642,575 (66,526) 576,049 667,475 (89,365) 578,110
Departmental operating costs 170,725 (11,549) 159,176 183,939 (16,229) 167,710
Net Operating Cost 6,377,302 (4,071,966) 2,305,336 6,916,229 (4,476,168) 2,440,061
2012-13 2011-12
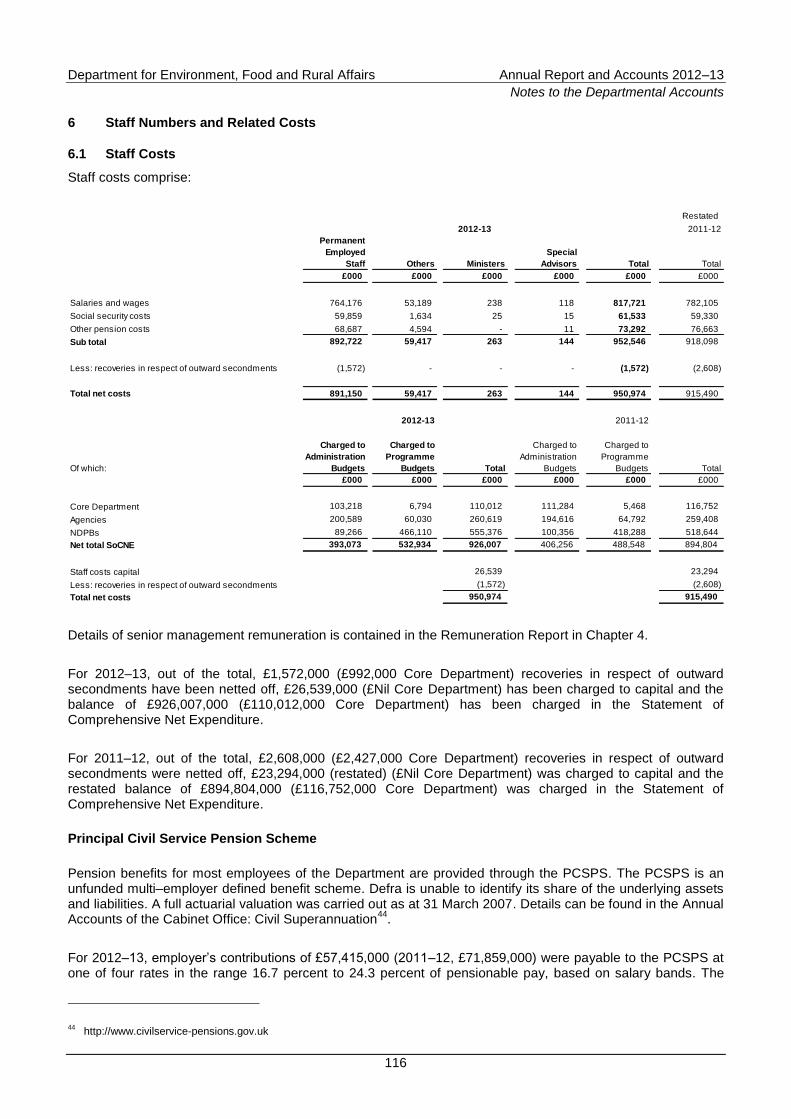
Department for Environment, Food and Rural Affairs Annual Report and Accounts 2012–13
Notes to the Departmental Accounts
116
6 Staff Numbers and Related Costs
6.1 Staff Costs
Staff costs comprise:
Restated
2012-13 2011-12
Permanent
Employed
Staff Others Ministers
Special
Advisors Total Total
£000 £000 £000 £000 £000 £000
Salaries and wages 764,176 53,189 238 118 817,721 782,105
Social security costs 59,859 1,634 25 15 61,533 59,330
Other pension costs 68,687 4,594 - 11 73,292 76,663
Sub total 892,722 59,417 263 144 952,546 918,098
Less: recoveries in respect of outward secondments (1,572) - - - (1,572) (2,608)
Total net costs 891,150 59,417 263 144 950,974 915,490
2012-13 2011-12
Of which:
Charged to
Administration
Budgets
Charged to
Programme
Budgets Total
Charged to
Administration
Budgets
Charged to
Programme
Budgets Total
£000 £000 £000 £000 £000 £000
Core Department 103,218 6,794 110,012 111,284 5,468 116,752
Agencies 200,589 60,030 260,619 194,616 64,792 259,408
NDPBs 89,266 466,110 555,376 100,356 418,288 518,644
Net total SoCNE 393,073 532,934 926,007 406,256 488,548 894,804
Staff costs capital 26,539 23,294
Less: recoveries in respect of outward secondments (1,572) (2,608)
Total net costs 950,974 915,490
Details of senior management remuneration is contained in the Remuneration Report in Chapter 4.
For 2012–13, out of the total, £1,572,000 (£992,000 Core Department) recoveries in respect of outward secondments have been netted off, £26,539,000 (£Nil Core Department) has been charged to capital and the balance of £926,007,000 (£110,012,000 Core Department) has been charged in the Statement of Comprehensive Net Expenditure.
For 2011–12, out of the total, £2,608,000 (£2,427,000 Core Department) recoveries in respect of outward secondments were netted off, £23,294,000 (restated) (£Nil Core Department) was charged to capital and the restated balance of £894,804,000 (£116,752,000 Core Department) was charged in the Statement of Comprehensive Net Expenditure.
Principal Civil Service Pension Scheme
Pension benefits for most employees of the Department are provided through the PCSPS. The PCSPS is an unfunded multi–employer defined benefit scheme. Defra is unable to identify its share of the underlying assets and liabilities. A full actuarial valuation was carried out as at 31 March 2007. Details can be found in the Annual Accounts of the Cabinet Office: Civil Superannuation
44.
For 2012–13, employer‟s contributions of £57,415,000 (2011–12, £71,859,000) were payable to the PCSPS at one of four rates in the range 16.7 percent to 24.3 percent of pensionable pay, based on salary bands. The
44
http://www.civilservice-pensions.gov.uk
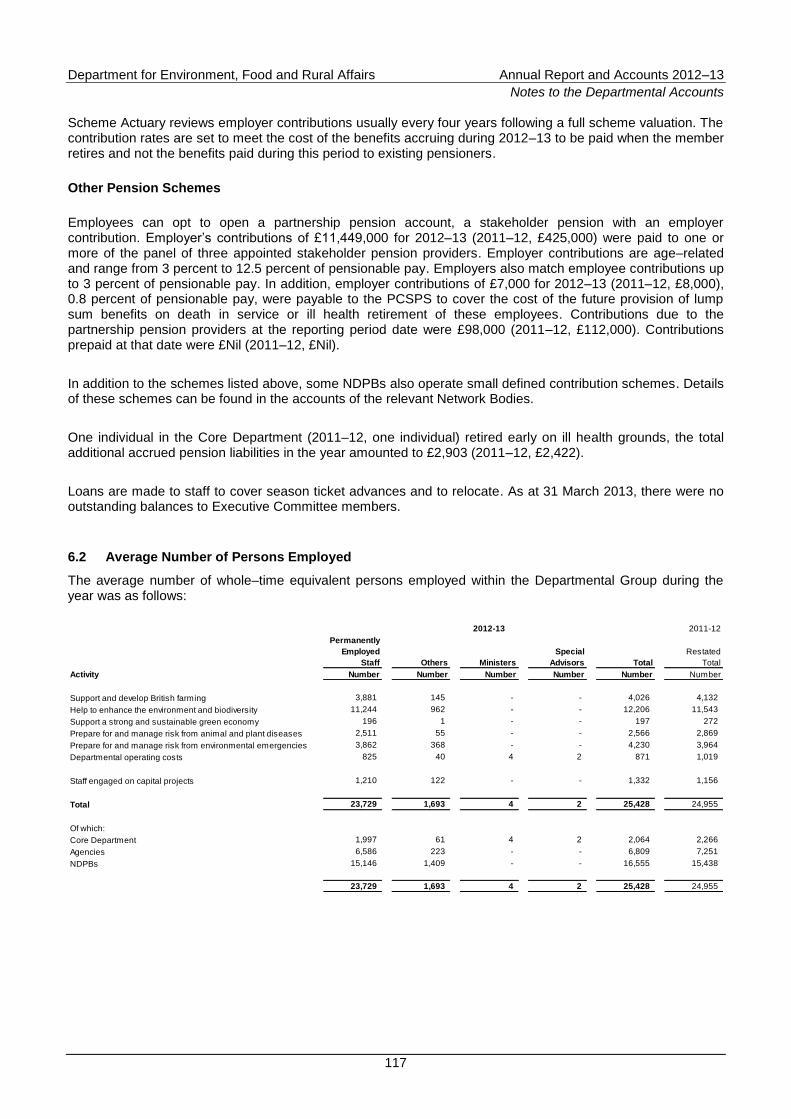
Department for Environment, Food and Rural Affairs Annual Report and Accounts 2012–13
Notes to the Departmental Accounts
117
Scheme Actuary reviews employer contributions usually every four years following a full scheme valuation. The contribution rates are set to meet the cost of the benefits accruing during 2012–13 to be paid when the member retires and not the benefits paid during this period to existing pensioners.
Other Pension Schemes
Employees can opt to open a partnership pension account, a stakeholder pension with an employer contribution. Employer‟s contributions of £11,449,000 for 2012–13 (2011–12, £425,000) were paid to one or more of the panel of three appointed stakeholder pension providers. Employer contributions are age–related and range from 3 percent to 12.5 percent of pensionable pay. Employers also match employee contributions up to 3 percent of pensionable pay. In addition, employer contributions of £7,000 for 2012–13 (2011–12, £8,000), 0.8 percent of pensionable pay, were payable to the PCSPS to cover the cost of the future provision of lump sum benefits on death in service or ill health retirement of these employees. Contributions due to the partnership pension providers at the reporting period date were £98,000 (2011–12, £112,000). Contributions prepaid at that date were £Nil (2011–12, £Nil).
In addition to the schemes listed above, some NDPBs also operate small defined contribution schemes. Details of these schemes can be found in the accounts of the relevant Network Bodies.
One individual in the Core Department (2011–12, one individual) retired early on ill health grounds, the total additional accrued pension liabilities in the year amounted to £2,903 (2011–12, £2,422).
Loans are made to staff to cover season ticket advances and to relocate. As at 31 March 2013, there were no outstanding balances to Executive Committee members.
6.2 Average Number of Persons Employed
The average number of whole–time equivalent persons employed within the Departmental Group during the year was as follows:
2012-13 2011-12
Permanently
Employed
Staff Others Ministers
Special
Advisors Total
Restated
Total
Activity Number Number Number Number Number Number
Support and develop British farming 3,881 145 - - 4,026 4,132
Help to enhance the environment and biodiversity 11,244 962 - - 12,206 11,543
Support a strong and sustainable green economy 196 1 - - 197 272
Prepare for and manage risk from animal and plant diseases 2,511 55 - - 2,566 2,869
Prepare for and manage risk from environmental emergencies 3,862 368 - - 4,230 3,964
Departmental operating costs 825 40 4 2 871 1,019
Staff engaged on capital projects 1,210 122 - - 1,332 1,156
Total 23,729 1,693 4 2 25,428 24,955
Of which:
Core Department 1,997 61 4 2 2,064 2,266
Agencies 6,586 223 - - 6,809 7,251
NDPBs 15,146 1,409 - - 16,555 15,438
23,729 1,693 4 2 25,428 24,955
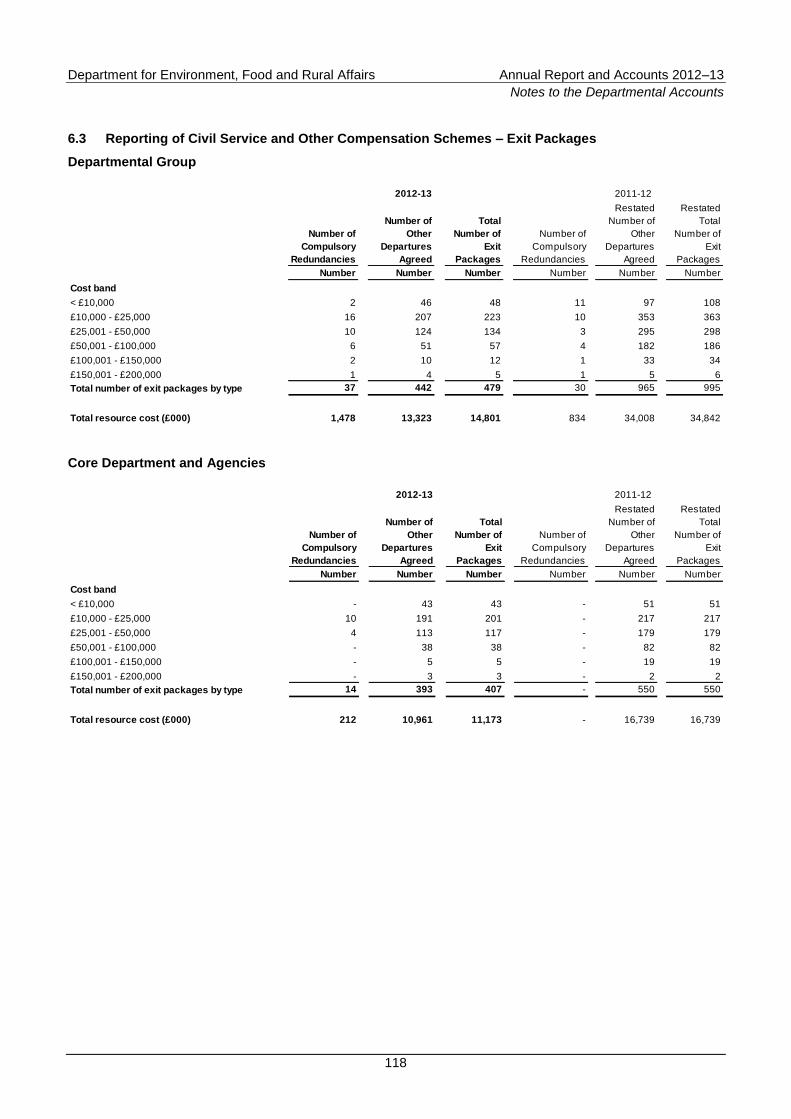
Department for Environment, Food and Rural Affairs Annual Report and Accounts 2012–13
Notes to the Departmental Accounts
118
6.3 Reporting of Civil Service and Other Compensation Schemes – Exit Packages
Departmental Group
2012-13 2011-12
Restated Restated
Number of
Compulsory
Redundancies
Number of
Other
Departures
Agreed
Total
Number of
Exit
Packages
Number of
Compulsory
Redundancies
Number of
Other
Departures
Agreed
Total
Number of
Exit
Packages
Number Number Number Number Number Number
Cost band
< £10,000 2 46 48 11 97 108
£10,000 - £25,000 16 207 223 10 353 363
£25,001 - £50,000 10 124 134 3 295 298
£50,001 - £100,000 6 51 57 4 182 186
£100,001 - £150,000 2 10 12 1 33 34
£150,001 - £200,000 1 4 5 1 5 6
Total number of exit packages by type 37 442 479 30 965 995
Total resource cost (£000) 1,478 13,323 14,801 834 34,008 34,842 Core Department and Agencies
2012-13 2011-12
Restated Restated
Number of
Compulsory
Redundancies
Number of
Other
Departures
Agreed
Total
Number of
Exit
Packages
Number of
Compulsory
Redundancies
Number of
Other
Departures
Agreed
Total
Number of
Exit
Packages
Number Number Number Number Number Number
Cost band
< £10,000 - 43 43 - 51 51
£10,000 - £25,000 10 191 201 - 217 217
£25,001 - £50,000 4 113 117 - 179 179
£50,001 - £100,000 - 38 38 - 82 82
£100,001 - £150,000 - 5 5 - 19 19
£150,001 - £200,000 - 3 3 - 2 2
Total number of exit packages by type 14 393 407 - 550 550
Total resource cost (£000) 212 10,961 11,173 - 16,739 16,739
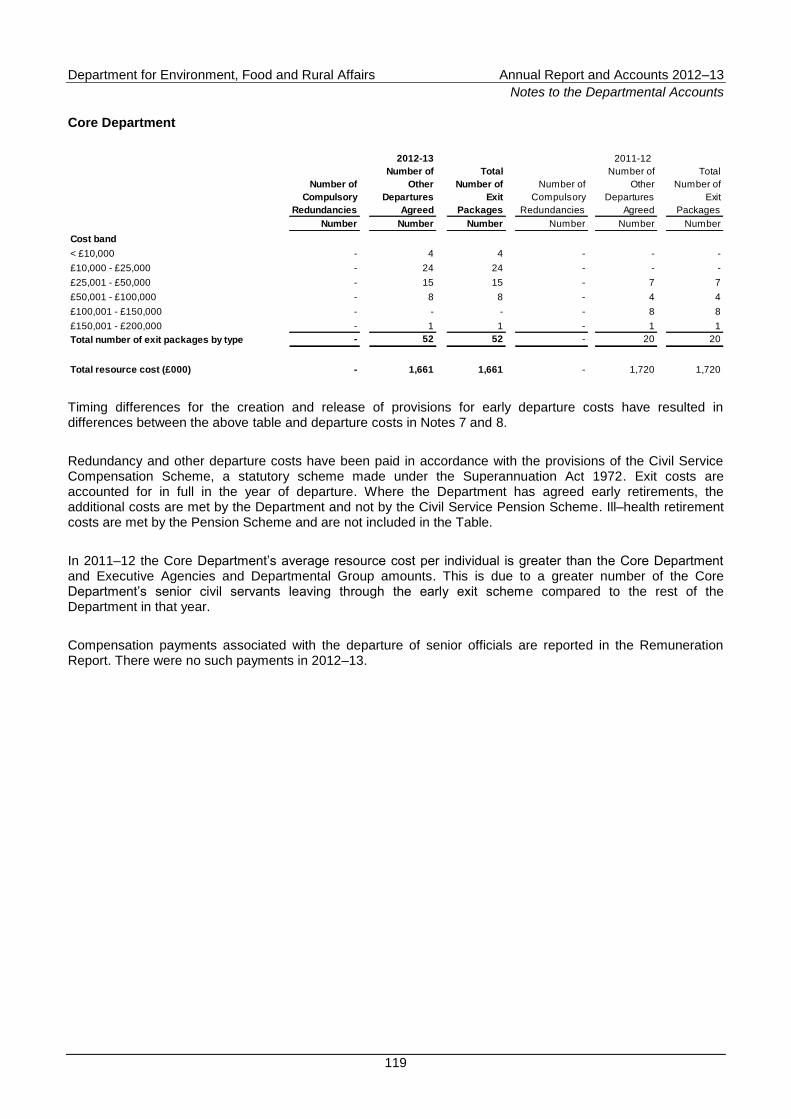
Department for Environment, Food and Rural Affairs Annual Report and Accounts 2012–13
Notes to the Departmental Accounts
119
Core Department
2012-13 2011-12
Number of
Compulsory
Redundancies
Number of
Other
Departures
Agreed
Total
Number of
Exit
Packages
Number of
Compulsory
Redundancies
Number of
Other
Departures
Agreed
Total
Number of
Exit
Packages
Number Number Number Number Number Number
Cost band
< £10,000 - 4 4 - - -
£10,000 - £25,000 - 24 24 - - -
£25,001 - £50,000 - 15 15 - 7 7
£50,001 - £100,000 - 8 8 - 4 4
£100,001 - £150,000 - - - - 8 8
£150,001 - £200,000 - 1 1 - 1 1
Total number of exit packages by type - 52 52 - 20 20
Total resource cost (£000) - 1,661 1,661 - 1,720 1,720
Timing differences for the creation and release of provisions for early departure costs have resulted in differences between the above table and departure costs in Notes 7 and 8.
Redundancy and other departure costs have been paid in accordance with the provisions of the Civil Service Compensation Scheme, a statutory scheme made under the Superannuation Act 1972. Exit costs are accounted for in full in the year of departure. Where the Department has agreed early retirements, the additional costs are met by the Department and not by the Civil Service Pension Scheme. Ill–health retirement costs are met by the Pension Scheme and are not included in the Table.
In 2011–12 the Core Department‟s average resource cost per individual is greater than the Core Department and Executive Agencies and Departmental Group amounts. This is due to a greater number of the Core Department‟s senior civil servants leaving through the early exit scheme compared to the rest of the Department in that year.
Compensation payments associated with the departure of senior officials are reported in the Remuneration Report. There were no such payments in 2012–13.
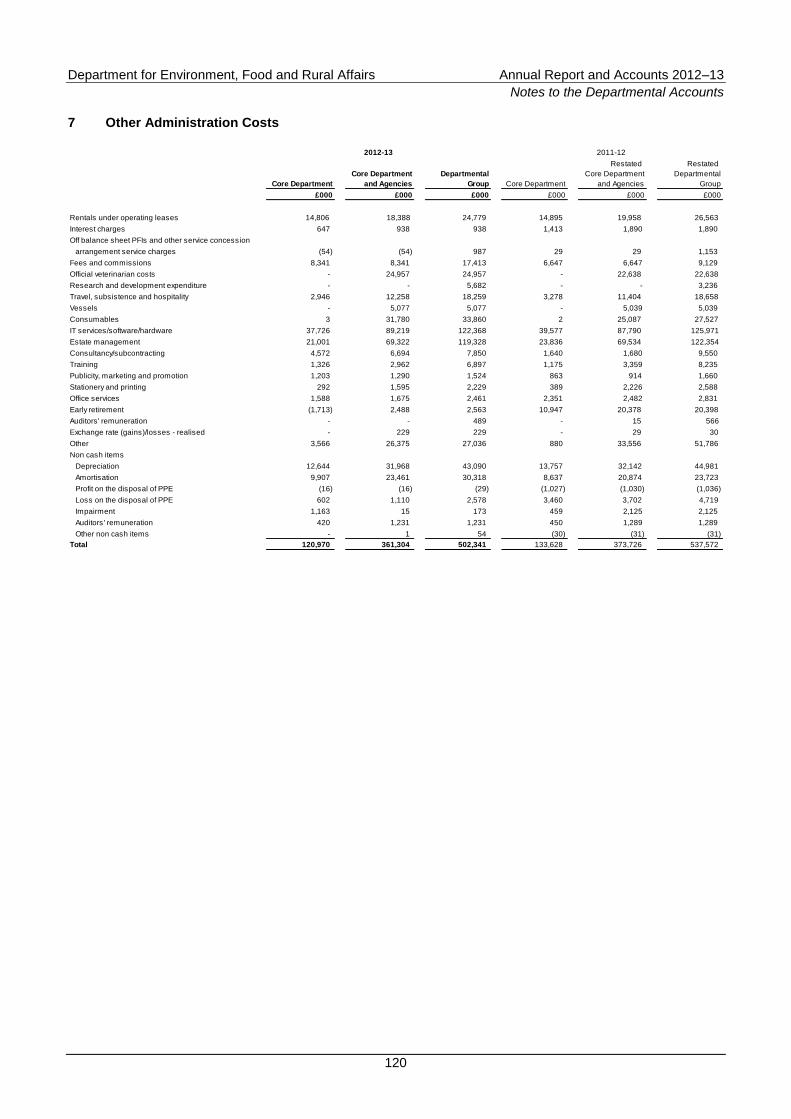
Department for Environment, Food and Rural Affairs Annual Report and Accounts 2012–13
Notes to the Departmental Accounts
120
7 Other Administration Costs
2012-13 2011-12
Restated Restated
Core Department
Core Department
and Agencies
Departmental
Group Core Department
Core Department
and Agencies
Departmental
Group
£000 £000 £000 £000 £000 £000
Rentals under operating leases 14,806 18,388 24,779 14,895 19,958 26,563
Interest charges 647 938 938 1,413 1,890 1,890
Off balance sheet PFIs and other service concession
arrangement service charges (54) (54) 987 29 29 1,153
Fees and commissions 8,341 8,341 17,413 6,647 6,647 9,129
Official veterinarian costs - 24,957 24,957 - 22,638 22,638
Research and development expenditure - - 5,682 - - 3,236
Travel, subsistence and hospitality 2,946 12,258 18,259 3,278 11,404 18,658
Vessels - 5,077 5,077 - 5,039 5,039
Consumables 3 31,780 33,860 2 25,087 27,527
IT services/software/hardware 37,726 89,219 122,368 39,577 87,790 125,971
Estate management 21,001 69,322 119,328 23,836 69,534 122,354
Consultancy/subcontracting 4,572 6,694 7,850 1,640 1,680 9,550
Training 1,326 2,962 6,897 1,175 3,359 8,235
Publicity, marketing and promotion 1,203 1,290 1,524 863 914 1,660
Stationery and printing 292 1,595 2,229 389 2,226 2,588
Office services 1,588 1,675 2,461 2,351 2,482 2,831
Early retirement (1,713) 2,488 2,563 10,947 20,378 20,398
Auditors' remuneration - - 489 - 15 566
Exchange rate (gains)/losses - realised - 229 229 - 29 30
Other 3,566 26,375 27,036 880 33,556 51,786
Non cash items
Depreciation 12,644 31,968 43,090 13,757 32,142 44,981
Amortisation 9,907 23,461 30,318 8,637 20,874 23,723
Profit on the disposal of PPE (16) (16) (29) (1,027) (1,030) (1,036)
Loss on the disposal of PPE 602 1,110 2,578 3,460 3,702 4,719
Impairment 1,163 15 173 459 2,125 2,125
Auditors' remuneration 420 1,231 1,231 450 1,289 1,289
Other non cash items - 1 54 (30) (31) (31)
Total 120,970 361,304 502,341 133,628 373,726 537,572
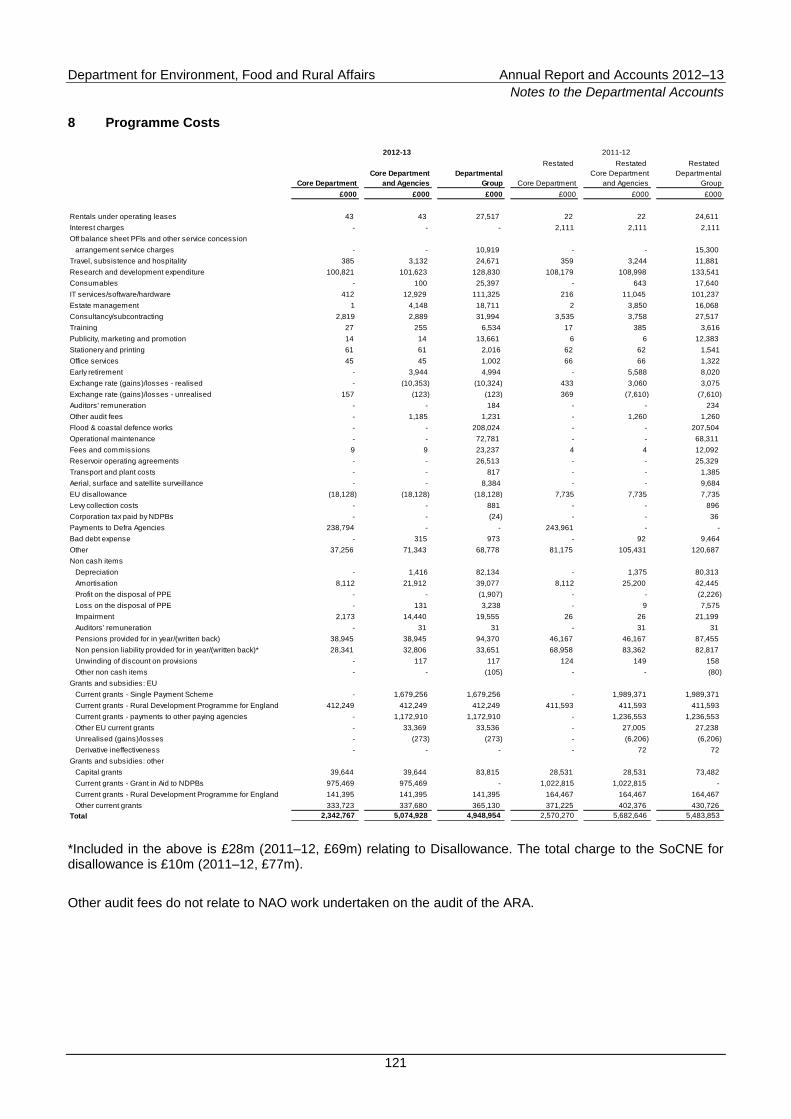
Department for Environment, Food and Rural Affairs Annual Report and Accounts 2012–13
Notes to the Departmental Accounts
121
8 Programme Costs
2012-13 2011-12
Restated Restated Restated
Core Department
Core Department
and Agencies
Departmental
Group Core Department
Core Department
and Agencies
Departmental
Group
£000 £000 £000 £000 £000 £000
Rentals under operating leases 43 43 27,517 22 22 24,611
Interest charges - - - 2,111 2,111 2,111
Off balance sheet PFIs and other service concession
arrangement service charges - - 10,919 - - 15,300
Travel, subsistence and hospitality 385 3,132 24,671 359 3,244 11,881
Research and development expenditure 100,821 101,623 128,830 108,179 108,998 133,541
Consumables - 100 25,397 - 643 17,640
IT services/software/hardware 412 12,929 111,325 216 11,045 101,237
Estate management 1 4,148 18,711 2 3,850 16,068
Consultancy/subcontracting 2,819 2,889 31,994 3,535 3,758 27,517
Training 27 255 6,534 17 385 3,616
Publicity, marketing and promotion 14 14 13,661 6 6 12,383
Stationery and printing 61 61 2,016 62 62 1,541
Office services 45 45 1,002 66 66 1,322
Early retirement - 3,944 4,994 - 5,588 8,020
Exchange rate (gains)/losses - realised - (10,353) (10,324) 433 3,060 3,075
Exchange rate (gains)/losses - unrealised 157 (123) (123) 369 (7,610) (7,610)
Auditors' remuneration - - 184 - - 234
Other audit fees - 1,185 1,231 - 1,260 1,260
Flood & coastal defence works - - 208,024 - - 207,504
Operational maintenance - - 72,781 - - 68,311
Fees and commissions 9 9 23,237 4 4 12,092
Reservoir operating agreements - - 26,513 - - 25,329
Transport and plant costs - - 817 - - 1,385
Aerial, surface and satellite surveillance - - 8,384 - - 9,684
EU disallowance (18,128) (18,128) (18,128) 7,735 7,735 7,735
Levy collection costs - - 881 - - 896
Corporation tax paid by NDPBs - - (24) - - 36
Payments to Defra Agencies 238,794 - - 243,961 - -
Bad debt expense - 315 973 - 92 9,464
Other 37,256 71,343 68,778 81,175 105,431 120,687
Non cash items
Depreciation - 1,416 82,134 - 1,375 80,313
Amortisation 8,112 21,912 39,077 8,112 25,200 42,445
Profit on the disposal of PPE - - (1,907) - - (2,226)
Loss on the disposal of PPE - 131 3,238 - 9 7,575
Impairment 2,173 14,440 19,555 26 26 21,199
Auditors' remuneration - 31 31 - 31 31
Pensions provided for in year/(written back) 38,945 38,945 94,370 46,167 46,167 87,455
Non pension liability provided for in year/(written back)* 28,341 32,806 33,651 68,958 83,362 82,817
Unwinding of discount on provisions - 117 117 124 149 158
Other non cash items - - (105) - - (80)
Grants and subsidies: EU
Current grants - Single Payment Scheme - 1,679,256 1,679,256 - 1,989,371 1,989,371
Current grants - Rural Development Programme for England 412,249 412,249 412,249 411,593 411,593 411,593
Current grants - payments to other paying agencies - 1,172,910 1,172,910 - 1,236,553 1,236,553
Other EU current grants - 33,369 33,536 - 27,005 27,238
Unrealised (gains)/losses - (273) (273) - (6,206) (6,206)
Derivative ineffectiveness - - - - 72 72
Grants and subsidies: other
Capital grants 39,644 39,644 83,815 28,531 28,531 73,482
Current grants - Grant in Aid to NDPBs 975,469 975,469 - 1,022,815 1,022,815 -
Current grants - Rural Development Programme for England 141,395 141,395 141,395 164,467 164,467 164,467
Other current grants 333,723 337,680 365,130 371,225 402,376 430,726
Total 2,342,767 5,074,928 4,948,954 2,570,270 5,682,646 5,483,853
*Included in the above is £28m (2011–12, £69m) relating to Disallowance. The total charge to the SoCNE for disallowance is £10m (2011–12, £77m).
Other audit fees do not relate to NAO work undertaken on the audit of the ARA.
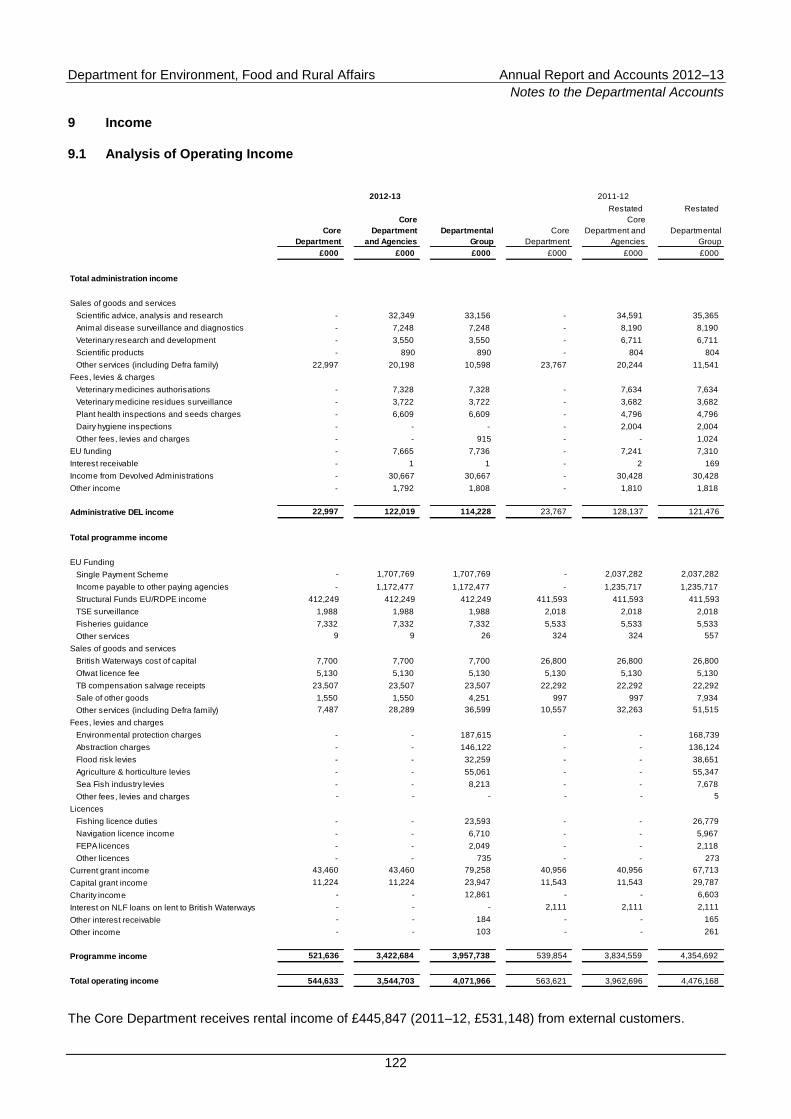
Department for Environment, Food and Rural Affairs Annual Report and Accounts 2012–13
Notes to the Departmental Accounts
122
9 Income
9.1 Analysis of Operating Income
2012-13 2011-12
Restated Restated
Core
Department
Core
Department
and Agencies
Departmental
Group
Core
Department
Core
Department and
Agencies
Departmental
Group
£000 £000 £000 £000 £000 £000
Total administration income
Sales of goods and services
Scientific advice, analysis and research - 32,349 33,156 - 34,591 35,365
Animal disease surveillance and diagnostics - 7,248 7,248 - 8,190 8,190
Veterinary research and development - 3,550 3,550 - 6,711 6,711
Scientific products - 890 890 - 804 804
Other services (including Defra family) 22,997 20,198 10,598 23,767 20,244 11,541
Fees, levies & charges
Veterinary medicines authorisations - 7,328 7,328 - 7,634 7,634
Veterinary medicine residues surveillance - 3,722 3,722 - 3,682 3,682
Plant health inspections and seeds charges - 6,609 6,609 - 4,796 4,796
Dairy hygiene inspections - - - - 2,004 2,004
Other fees, levies and charges - - 915 - - 1,024
EU funding - 7,665 7,736 - 7,241 7,310
Interest receivable - 1 1 - 2 169
Income from Devolved Administrations - 30,667 30,667 - 30,428 30,428
Other income - 1,792 1,808 - 1,810 1,818
Administrative DEL income 22,997 122,019 114,228 23,767 128,137 121,476
Total programme income
EU Funding
Single Payment Scheme - 1,707,769 1,707,769 - 2,037,282 2,037,282
Income payable to other paying agencies - 1,172,477 1,172,477 - 1,235,717 1,235,717
Structural Funds EU/RDPE income 412,249 412,249 412,249 411,593 411,593 411,593
TSE surveillance 1,988 1,988 1,988 2,018 2,018 2,018
Fisheries guidance 7,332 7,332 7,332 5,533 5,533 5,533
Other services 9 9 26 324 324 557
Sales of goods and services
British Waterways cost of capital 7,700 7,700 7,700 26,800 26,800 26,800
Ofwat licence fee 5,130 5,130 5,130 5,130 5,130 5,130
TB compensation salvage receipts 23,507 23,507 23,507 22,292 22,292 22,292
Sale of other goods 1,550 1,550 4,251 997 997 7,934
Other services (including Defra family) 7,487 28,289 36,599 10,557 32,263 51,515
Fees, levies and charges
Environmental protection charges - - 187,615 - - 168,739
Abstraction charges - - 146,122 - - 136,124
Flood risk levies - - 32,259 - - 38,651
Agriculture & horticulture levies - - 55,061 - - 55,347
Sea Fish industry levies - - 8,213 - - 7,678
Other fees, levies and charges - - - - - 5
Licences
Fishing licence duties - - 23,593 - - 26,779
Navigation licence income - - 6,710 - - 5,967
FEPA licences - - 2,049 - - 2,118
Other licences - - 735 - - 273
Current grant income 43,460 43,460 79,258 40,956 40,956 67,713
Capital grant income 11,224 11,224 23,947 11,543 11,543 29,787
Charity income - - 12,861 - - 6,603
Interest on NLF loans on lent to British Waterways - - - 2,111 2,111 2,111
Other interest receivable - - 184 - - 165
Other income - - 103 - - 261
Programme income 521,636 3,422,684 3,957,738 539,854 3,834,559 4,354,692
Total operating income 544,633 3,544,703 4,071,966 563,621 3,962,696 4,476,168
The Core Department receives rental income of £445,847 (2011–12, £531,148) from external customers.
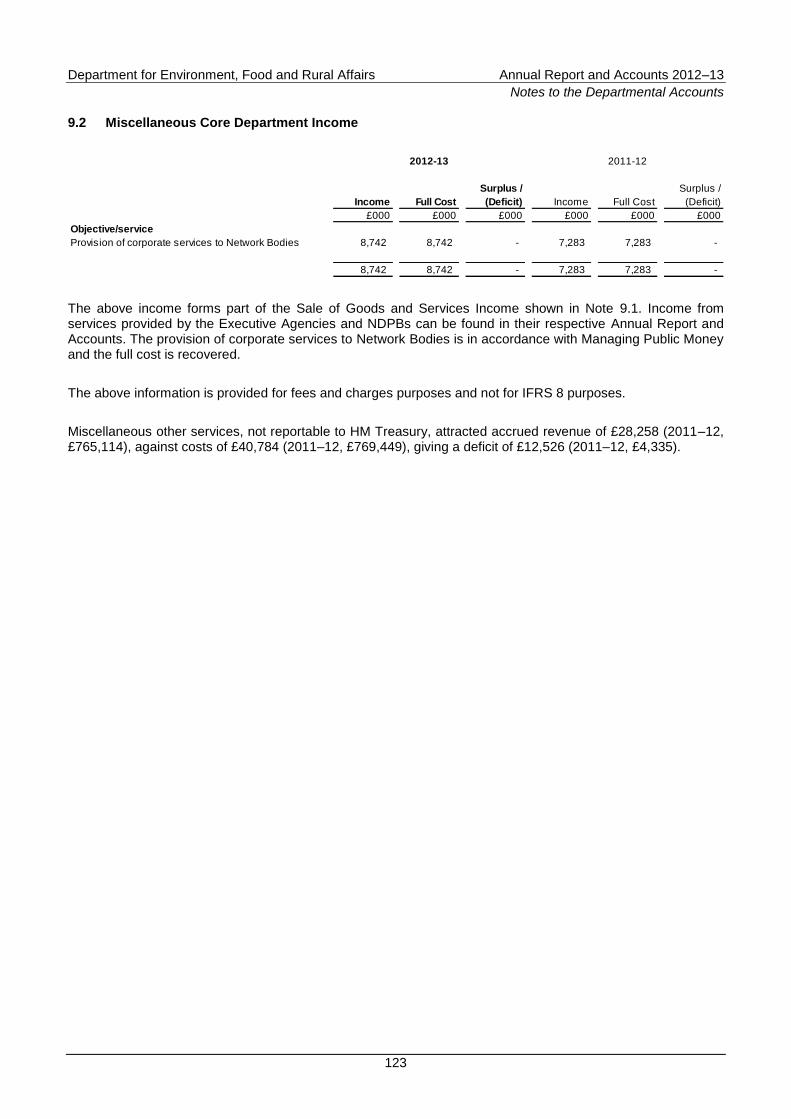
Department for Environment, Food and Rural Affairs Annual Report and Accounts 2012–13
Notes to the Departmental Accounts
123
9.2 Miscellaneous Core Department Income
Income Full Cost
Surplus /
(Deficit) Income Full Cost
Surplus /
(Deficit)
£000 £000 £000 £000 £000 £000
Objective/service
Provision of corporate services to Network Bodies 8,742 8,742 - 7,283 7,283 -
8,742 8,742 - 7,283 7,283 -
2012-13 2011-12
The above income forms part of the Sale of Goods and Services Income shown in Note 9.1. Income from services provided by the Executive Agencies and NDPBs can be found in their respective Annual Report and Accounts. The provision of corporate services to Network Bodies is in accordance with Managing Public Money and the full cost is recovered.
The above information is provided for fees and charges purposes and not for IFRS 8 purposes.
Miscellaneous other services, not reportable to HM Treasury, attracted accrued revenue of £28,258 (2011–12, £765,114), against costs of £40,784 (2011–12, £769,449), giving a deficit of £12,526 (2011–12, £4,335).
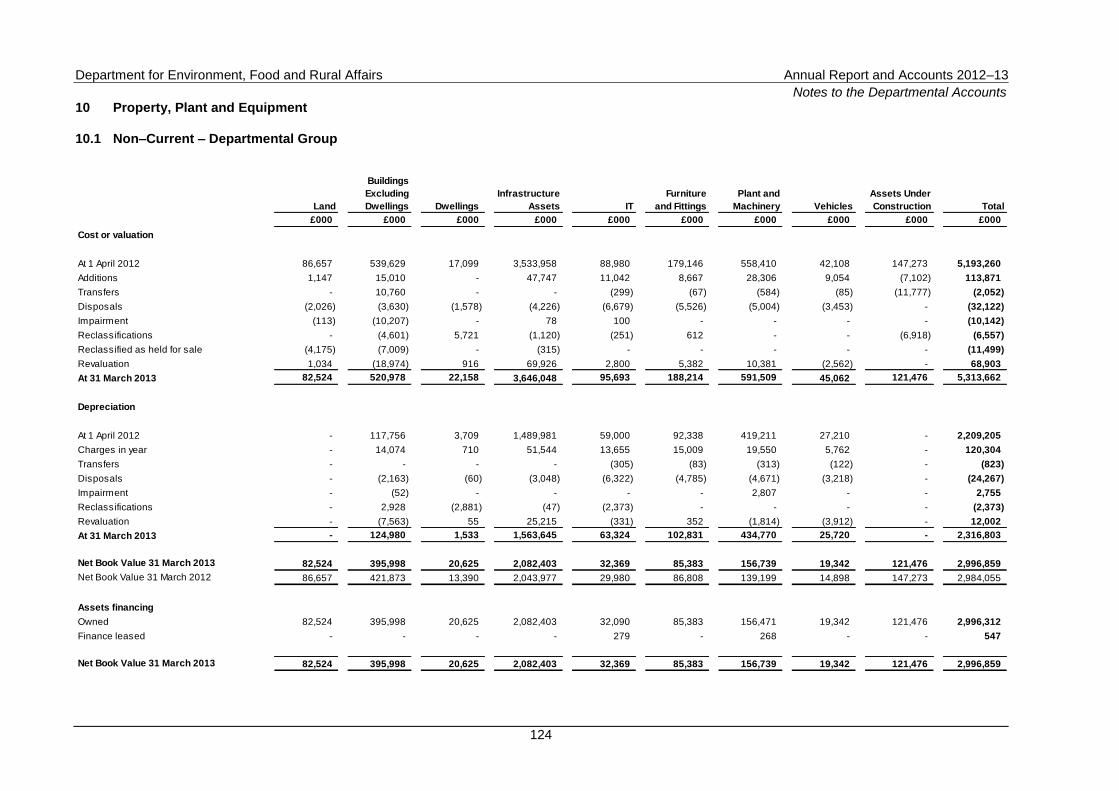
Department for Environment, Food and Rural Affairs Annual Report and Accounts 2012–13
Notes to the Departmental Accounts
124
10 Property, Plant and Equipment
10.1 Non–Current – Departmental Group
Land
Buildings
Excluding
Dwellings Dwellings
Infrastructure
Assets IT
Furniture
and Fittings
Plant and
Machinery Vehicles
Assets Under
Construction Total
£000 £000 £000 £000 £000 £000 £000 £000 £000 £000
Cost or valuation
At 1 April 2012 86,657 539,629 17,099 3,533,958 88,980 179,146 558,410 42,108 147,273 5,193,260
Additions 1,147 15,010 - 47,747 11,042 8,667 28,306 9,054 (7,102) 113,871
Transfers - 10,760 - - (299) (67) (584) (85) (11,777) (2,052)
Disposals (2,026) (3,630) (1,578) (4,226) (6,679) (5,526) (5,004) (3,453) - (32,122)
Impairment (113) (10,207) - 78 100 - - - - (10,142)
Reclassifications - (4,601) 5,721 (1,120) (251) 612 - - (6,918) (6,557)
Reclassified as held for sale (4,175) (7,009) - (315) - - - - - (11,499)
Revaluation 1,034 (18,974) 916 69,926 2,800 5,382 10,381 (2,562) - 68,903
At 31 March 2013 82,524 520,978 22,158 3,646,048 95,693 188,214 591,509 45,062 121,476 5,313,662
Depreciation
At 1 April 2012 - 117,756 3,709 1,489,981 59,000 92,338 419,211 27,210 - 2,209,205
Charges in year - 14,074 710 51,544 13,655 15,009 19,550 5,762 - 120,304
Transfers - - - - (305) (83) (313) (122) - (823)
Disposals - (2,163) (60) (3,048) (6,322) (4,785) (4,671) (3,218) - (24,267)
Impairment - (52) - - - - 2,807 - - 2,755
Reclassifications - 2,928 (2,881) (47) (2,373) - - - - (2,373)
Revaluation - (7,563) 55 25,215 (331) 352 (1,814) (3,912) - 12,002
At 31 March 2013 - 124,980 1,533 1,563,645 63,324 102,831 434,770 25,720 - 2,316,803
Net Book Value 31 March 2013 82,524 395,998 20,625 2,082,403 32,369 85,383 156,739 19,342 121,476 2,996,859
Net Book Value 31 March 2012 86,657 421,873 13,390 2,043,977 29,980 86,808 139,199 14,898 147,273 2,984,055
Assets financing
Owned 82,524 395,998 20,625 2,082,403 32,090 85,383 156,471 19,342 121,476 2,996,312
Finance leased - - - - 279 - 268 - - 547
Net Book Value 31 March 2013 82,524 395,998 20,625 2,082,403 32,369 85,383 156,739 19,342 121,476 2,996,859
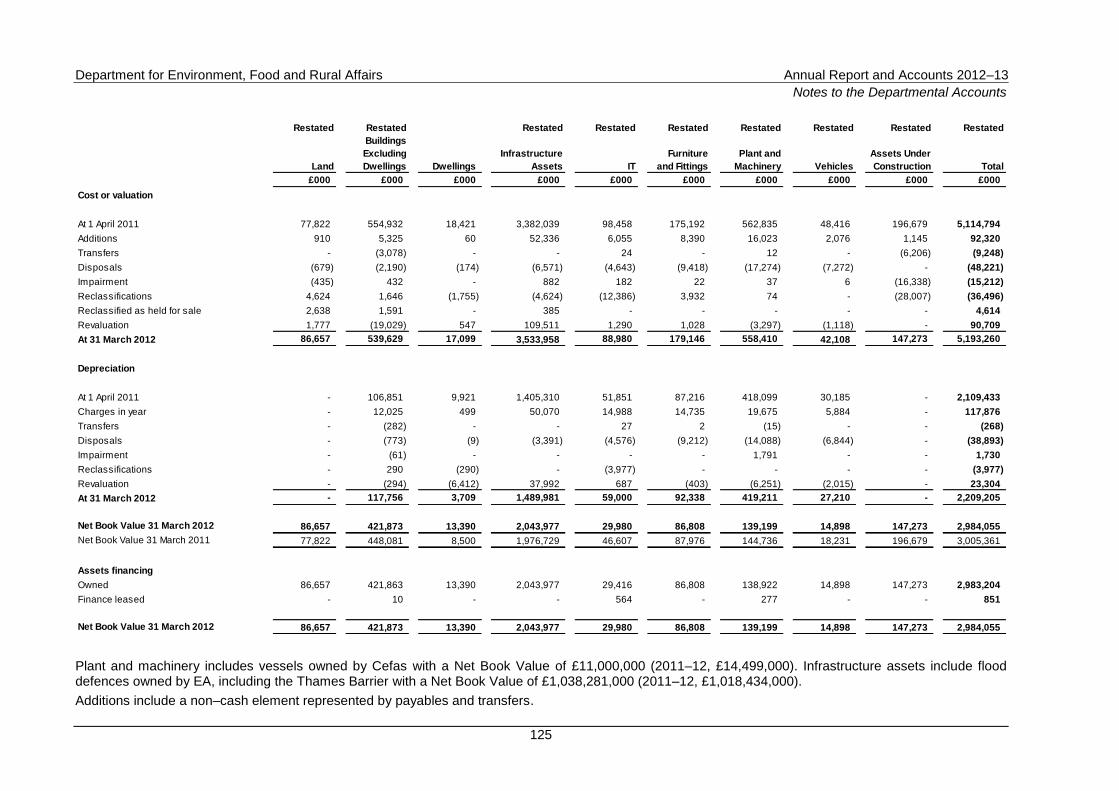
Department for Environment, Food and Rural Affairs Annual Report and Accounts 2012–13
Notes to the Departmental Accounts
125
Restated Restated Restated Restated Restated Restated Restated Restated Restated
Land
Buildings
Excluding
Dwellings Dwellings
Infrastructure
Assets IT
Furniture
and Fittings
Plant and
Machinery Vehicles
Assets Under
Construction Total
£000 £000 £000 £000 £000 £000 £000 £000 £000 £000
Cost or valuation
At 1 April 2011 77,822 554,932 18,421 3,382,039 98,458 175,192 562,835 48,416 196,679 5,114,794
Additions 910 5,325 60 52,336 6,055 8,390 16,023 2,076 1,145 92,320
Transfers - (3,078) - - 24 - 12 - (6,206) (9,248)
Disposals (679) (2,190) (174) (6,571) (4,643) (9,418) (17,274) (7,272) - (48,221)
Impairment (435) 432 - 882 182 22 37 6 (16,338) (15,212)
Reclassifications 4,624 1,646 (1,755) (4,624) (12,386) 3,932 74 - (28,007) (36,496)
Reclassified as held for sale 2,638 1,591 - 385 - - - - - 4,614
Revaluation 1,777 (19,029) 547 109,511 1,290 1,028 (3,297) (1,118) - 90,709
At 31 March 2012 86,657 539,629 17,099 3,533,958 88,980 179,146 558,410 42,108 147,273 5,193,260
Depreciation
At 1 April 2011 - 106,851 9,921 1,405,310 51,851 87,216 418,099 30,185 - 2,109,433
Charges in year - 12,025 499 50,070 14,988 14,735 19,675 5,884 - 117,876
Transfers - (282) - - 27 2 (15) - - (268)
Disposals - (773) (9) (3,391) (4,576) (9,212) (14,088) (6,844) - (38,893)
Impairment - (61) - - - - 1,791 - - 1,730
Reclassifications - 290 (290) - (3,977) - - - - (3,977)
Revaluation - (294) (6,412) 37,992 687 (403) (6,251) (2,015) - 23,304
At 31 March 2012 - 117,756 3,709 1,489,981 59,000 92,338 419,211 27,210 - 2,209,205
Net Book Value 31 March 2012 86,657 421,873 13,390 2,043,977 29,980 86,808 139,199 14,898 147,273 2,984,055
Net Book Value 31 March 2011 77,822 448,081 8,500 1,976,729 46,607 87,976 144,736 18,231 196,679 3,005,361
Assets financing
Owned 86,657 421,863 13,390 2,043,977 29,416 86,808 138,922 14,898 147,273 2,983,204
Finance leased - 10 - - 564 - 277 - - 851
Net Book Value 31 March 2012 86,657 421,873 13,390 2,043,977 29,980 86,808 139,199 14,898 147,273 2,984,055
Plant and machinery includes vessels owned by Cefas with a Net Book Value of £11,000,000 (2011–12, £14,499,000). Infrastructure assets include flood defences owned by EA, including the Thames Barrier with a Net Book Value of £1,038,281,000 (2011–12, £1,018,434,000).
Additions include a non–cash element represented by payables and transfers.
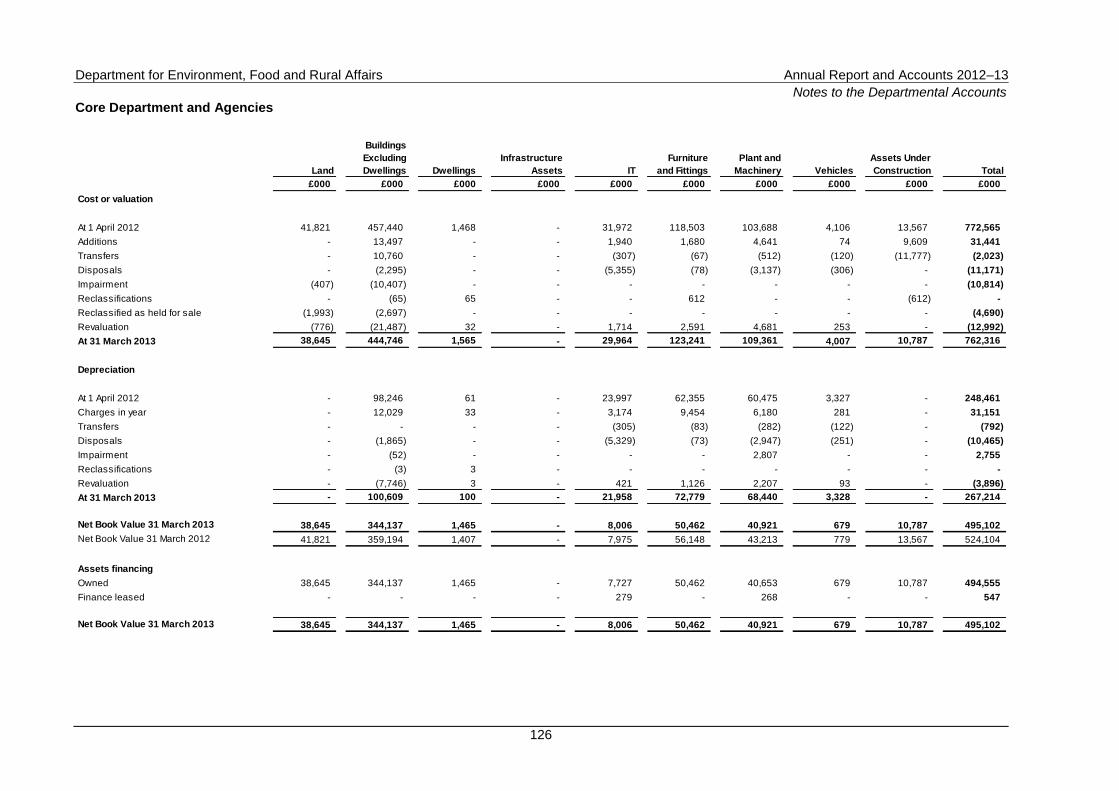
Department for Environment, Food and Rural Affairs Annual Report and Accounts 2012–13
Notes to the Departmental Accounts
126
Core Department and Agencies
Land
Buildings
Excluding
Dwellings Dwellings
Infrastructure
Assets IT
Furniture
and Fittings
Plant and
Machinery Vehicles
Assets Under
Construction Total
£000 £000 £000 £000 £000 £000 £000 £000 £000 £000
Cost or valuation
At 1 April 2012 41,821 457,440 1,468 - 31,972 118,503 103,688 4,106 13,567 772,565
Additions - 13,497 - - 1,940 1,680 4,641 74 9,609 31,441
Transfers - 10,760 - - (307) (67) (512) (120) (11,777) (2,023)
Disposals - (2,295) - - (5,355) (78) (3,137) (306) - (11,171)
Impairment (407) (10,407) - - - - - - - (10,814)
Reclassifications - (65) 65 - - 612 - - (612) -
Reclassified as held for sale (1,993) (2,697) - - - - - - - (4,690)
Revaluation (776) (21,487) 32 - 1,714 2,591 4,681 253 - (12,992)
At 31 March 2013 38,645 444,746 1,565 - 29,964 123,241 109,361 4,007 10,787 762,316
Depreciation
At 1 April 2012 - 98,246 61 - 23,997 62,355 60,475 3,327 - 248,461
Charges in year - 12,029 33 - 3,174 9,454 6,180 281 - 31,151
Transfers - - - - (305) (83) (282) (122) - (792)
Disposals - (1,865) - - (5,329) (73) (2,947) (251) - (10,465)
Impairment - (52) - - - - 2,807 - - 2,755
Reclassifications - (3) 3 - - - - - - -
Revaluation - (7,746) 3 - 421 1,126 2,207 93 - (3,896)
At 31 March 2013 - 100,609 100 - 21,958 72,779 68,440 3,328 - 267,214
Net Book Value 31 March 2013 38,645 344,137 1,465 - 8,006 50,462 40,921 679 10,787 495,102
Net Book Value 31 March 2012 41,821 359,194 1,407 - 7,975 56,148 43,213 779 13,567 524,104
Assets financing
Owned 38,645 344,137 1,465 - 7,727 50,462 40,653 679 10,787 494,555
Finance leased - - - - 279 - 268 - - 547
Net Book Value 31 March 2013 38,645 344,137 1,465 - 8,006 50,462 40,921 679 10,787 495,102
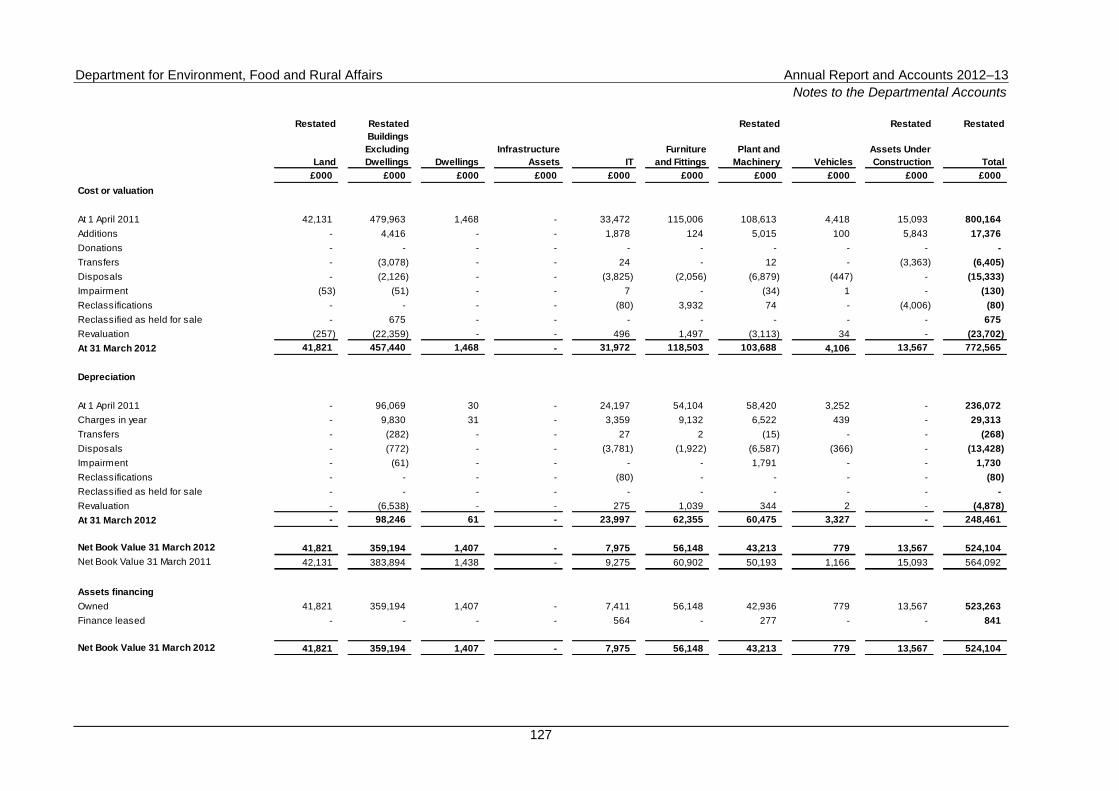
Department for Environment, Food and Rural Affairs Annual Report and Accounts 2012–13
Notes to the Departmental Accounts
127
Restated Restated Restated Restated Restated
Land
Buildings
Excluding
Dwellings Dwellings
Infrastructure
Assets IT
Furniture
and Fittings
Plant and
Machinery Vehicles
Assets Under
Construction Total
£000 £000 £000 £000 £000 £000 £000 £000 £000 £000
Cost or valuation
At 1 April 2011 42,131 479,963 1,468 - 33,472 115,006 108,613 4,418 15,093 800,164
Additions - 4,416 - - 1,878 124 5,015 100 5,843 17,376
Donations - - - - - - - - - -
Transfers - (3,078) - - 24 - 12 - (3,363) (6,405)
Disposals - (2,126) - - (3,825) (2,056) (6,879) (447) - (15,333)
Impairment (53) (51) - - 7 - (34) 1 - (130)
Reclassifications - - - - (80) 3,932 74 - (4,006) (80)
Reclassified as held for sale - 675 - - - - - - - 675
Revaluation (257) (22,359) - - 496 1,497 (3,113) 34 - (23,702)
At 31 March 2012 41,821 457,440 1,468 - 31,972 118,503 103,688 4,106 13,567 772,565
Depreciation
At 1 April 2011 - 96,069 30 - 24,197 54,104 58,420 3,252 - 236,072
Charges in year - 9,830 31 - 3,359 9,132 6,522 439 - 29,313
Transfers - (282) - - 27 2 (15) - - (268)
Disposals - (772) - - (3,781) (1,922) (6,587) (366) - (13,428)
Impairment - (61) - - - - 1,791 - - 1,730
Reclassifications - - - - (80) - - - - (80)
Reclassified as held for sale - - - - - - - - - -
Revaluation - (6,538) - - 275 1,039 344 2 - (4,878)
At 31 March 2012 - 98,246 61 - 23,997 62,355 60,475 3,327 - 248,461
Net Book Value 31 March 2012 41,821 359,194 1,407 - 7,975 56,148 43,213 779 13,567 524,104
Net Book Value 31 March 2011 42,131 383,894 1,438 - 9,275 60,902 50,193 1,166 15,093 564,092
Assets financing
Owned 41,821 359,194 1,407 - 7,411 56,148 42,936 779 13,567 523,263
Finance leased - - - - 564 - 277 - - 841
Net Book Value 31 March 2012 41,821 359,194 1,407 - 7,975 56,148 43,213 779 13,567 524,104
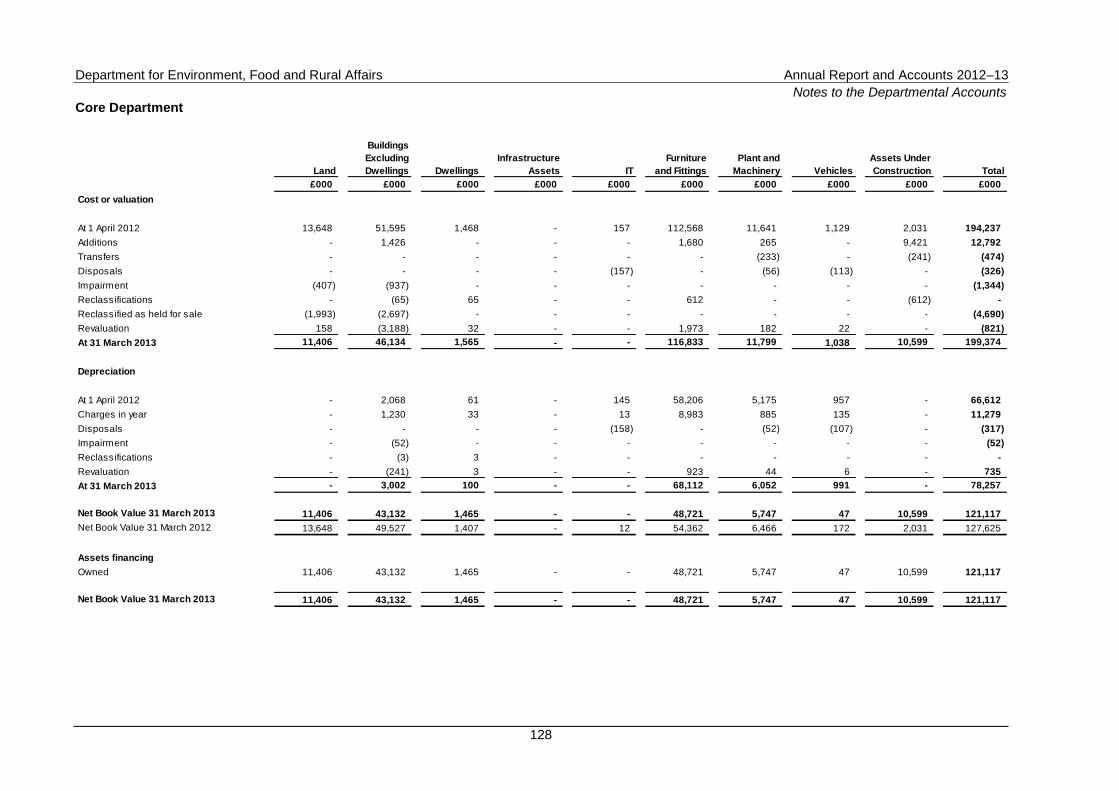
Department for Environment, Food and Rural Affairs Annual Report and Accounts 2012–13
Notes to the Departmental Accounts
128
Core Department
Land
Buildings
Excluding
Dwellings Dwellings
Infrastructure
Assets IT
Furniture
and Fittings
Plant and
Machinery Vehicles
Assets Under
Construction Total
£000 £000 £000 £000 £000 £000 £000 £000 £000 £000
Cost or valuation
At 1 April 2012 13,648 51,595 1,468 - 157 112,568 11,641 1,129 2,031 194,237
Additions - 1,426 - - - 1,680 265 - 9,421 12,792
Transfers - - - - - - (233) - (241) (474)
Disposals - - - - (157) - (56) (113) - (326)
Impairment (407) (937) - - - - - - - (1,344)
Reclassifications - (65) 65 - - 612 - - (612) -
Reclassified as held for sale (1,993) (2,697) - - - - - - - (4,690)
Revaluation 158 (3,188) 32 - - 1,973 182 22 - (821)
At 31 March 2013 11,406 46,134 1,565 - - 116,833 11,799 1,038 10,599 199,374
Depreciation
At 1 April 2012 - 2,068 61 - 145 58,206 5,175 957 - 66,612
Charges in year - 1,230 33 - 13 8,983 885 135 - 11,279
Disposals - - - - (158) - (52) (107) - (317)
Impairment - (52) - - - - - - - (52)
Reclassifications - (3) 3 - - - - - - -
Revaluation - (241) 3 - - 923 44 6 - 735
At 31 March 2013 - 3,002 100 - - 68,112 6,052 991 - 78,257
Net Book Value 31 March 2013 11,406 43,132 1,465 - - 48,721 5,747 47 10,599 121,117
Net Book Value 31 March 2012 13,648 49,527 1,407 - 12 54,362 6,466 172 2,031 127,625
Assets financing
Owned 11,406 43,132 1,465 - - 48,721 5,747 47 10,599 121,117
Net Book Value 31 March 2013 11,406 43,132 1,465 - - 48,721 5,747 47 10,599 121,117
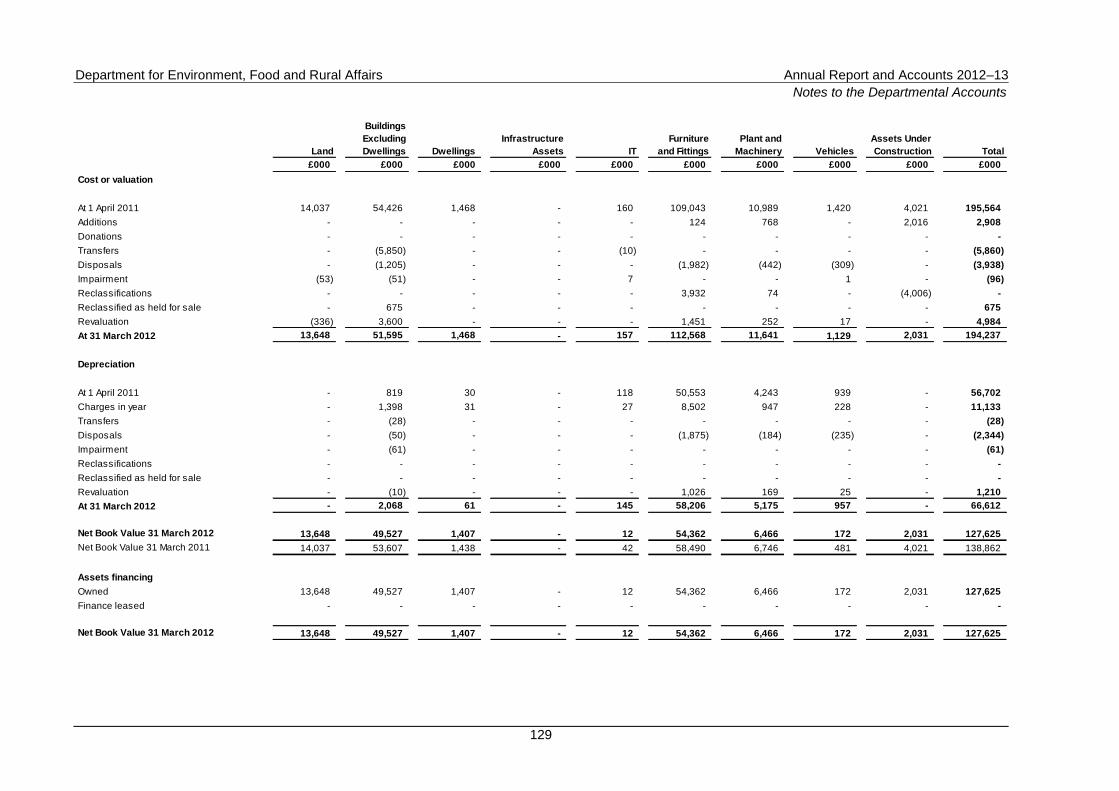
Department for Environment, Food and Rural Affairs Annual Report and Accounts 2012–13
Notes to the Departmental Accounts
129
Land
Buildings
Excluding
Dwellings Dwellings
Infrastructure
Assets IT
Furniture
and Fittings
Plant and
Machinery Vehicles
Assets Under
Construction Total
£000 £000 £000 £000 £000 £000 £000 £000 £000 £000
Cost or valuation
At 1 April 2011 14,037 54,426 1,468 - 160 109,043 10,989 1,420 4,021 195,564
Additions - - - - - 124 768 - 2,016 2,908
Donations - - - - - - - - - -
Transfers - (5,850) - - (10) - - - - (5,860)
Disposals - (1,205) - - - (1,982) (442) (309) - (3,938)
Impairment (53) (51) - - 7 - - 1 - (96)
Reclassifications - - - - - 3,932 74 - (4,006) -
Reclassified as held for sale - 675 - - - - - - - 675
Revaluation (336) 3,600 - - - 1,451 252 17 - 4,984
At 31 March 2012 13,648 51,595 1,468 - 157 112,568 11,641 1,129 2,031 194,237
Depreciation
At 1 April 2011 - 819 30 - 118 50,553 4,243 939 - 56,702
Charges in year - 1,398 31 - 27 8,502 947 228 - 11,133
Transfers - (28) - - - - - - - (28)
Disposals - (50) - - - (1,875) (184) (235) - (2,344)
Impairment - (61) - - - - - - - (61)
Reclassifications - - - - - - - - - -
Reclassified as held for sale - - - - - - - - - -
Revaluation - (10) - - - 1,026 169 25 - 1,210
At 31 March 2012 - 2,068 61 - 145 58,206 5,175 957 - 66,612
Net Book Value 31 March 2012 13,648 49,527 1,407 - 12 54,362 6,466 172 2,031 127,625
Net Book Value 31 March 2011 14,037 53,607 1,438 - 42 58,490 6,746 481 4,021 138,862
Assets financing
Owned 13,648 49,527 1,407 - 12 54,362 6,466 172 2,031 127,625
Finance leased - - - - - - - - - -
Net Book Value 31 March 2012 13,648 49,527 1,407 - 12 54,362 6,466 172 2,031 127,625
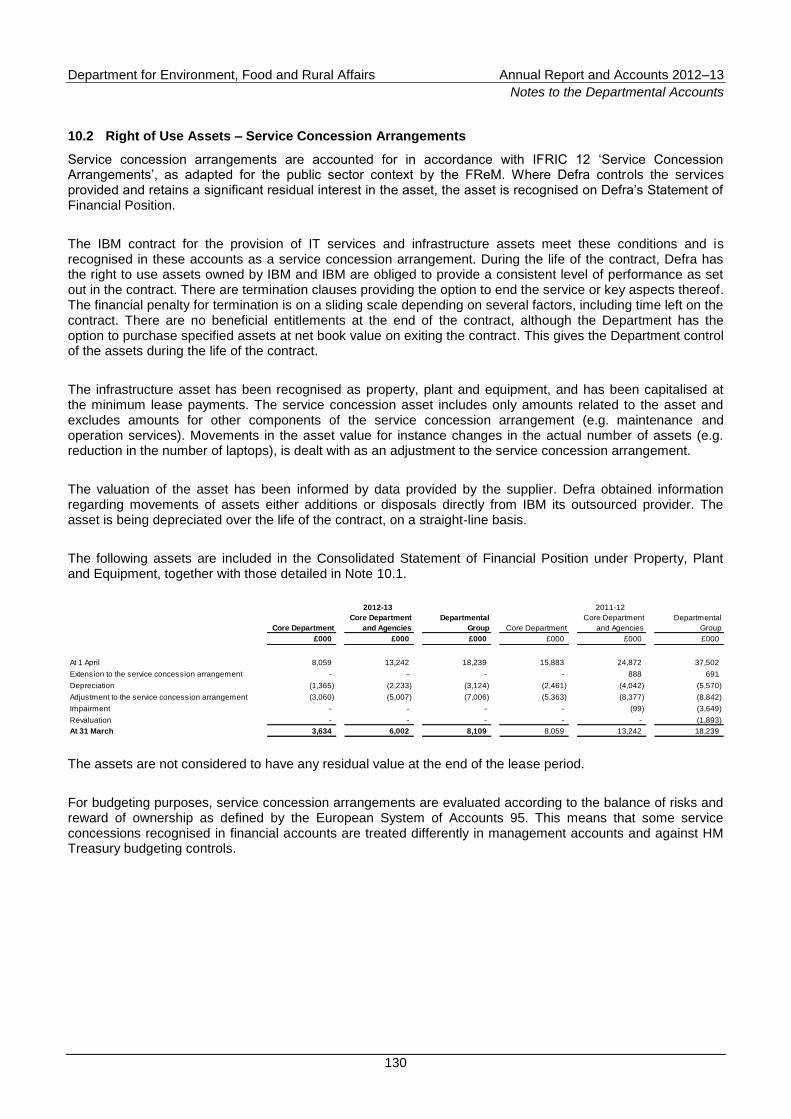
Department for Environment, Food and Rural Affairs Annual Report and Accounts 2012–13
Notes to the Departmental Accounts
130
10.2 Right of Use Assets – Service Concession Arrangements
Service concession arrangements are accounted for in accordance with IFRIC 12 „Service Concession Arrangements‟, as adapted for the public sector context by the FReM. Where Defra controls the services provided and retains a significant residual interest in the asset, the asset is recognised on Defra‟s Statement of Financial Position.
The IBM contract for the provision of IT services and infrastructure assets meet these conditions and is recognised in these accounts as a service concession arrangement. During the life of the contract, Defra has the right to use assets owned by IBM and IBM are obliged to provide a consistent level of performance as set out in the contract. There are termination clauses providing the option to end the service or key aspects thereof. The financial penalty for termination is on a sliding scale depending on several factors, including time left on the contract. There are no beneficial entitlements at the end of the contract, although the Department has the option to purchase specified assets at net book value on exiting the contract. This gives the Department control of the assets during the life of the contract.
The infrastructure asset has been recognised as property, plant and equipment, and has been capitalised at the minimum lease payments. The service concession asset includes only amounts related to the asset and excludes amounts for other components of the service concession arrangement (e.g. maintenance and operation services). Movements in the asset value for instance changes in the actual number of assets (e.g. reduction in the number of laptops), is dealt with as an adjustment to the service concession arrangement.
The valuation of the asset has been informed by data provided by the supplier. Defra obtained information regarding movements of assets either additions or disposals directly from IBM its outsourced provider. The asset is being depreciated over the life of the contract, on a straight-line basis.
The following assets are included in the Consolidated Statement of Financial Position under Property, Plant and Equipment, together with those detailed in Note 10.1.
2012-13 2011-12
Core Department
Core Department
and Agencies
Departmental
Group Core Department
Core Department
and Agencies
Departmental
Group
£000 £000 £000 £000 £000 £000
At 1 April 8,059 13,242 18,239 15,883 24,872 37,502
Extension to the service concession arrangement - - - - 888 691
Depreciation (1,365) (2,233) (3,124) (2,461) (4,042) (5,570)
Adjustment to the service concession arrangement (3,060) (5,007) (7,006) (5,363) (8,377) (8,842)
Impairment - - - - (99) (3,649)
Revaluation - - - - - (1,893)
At 31 March 3,634 6,002 8,109 8,059 13,242 18,239
The assets are not considered to have any residual value at the end of the lease period.
For budgeting purposes, service concession arrangements are evaluated according to the balance of risks and reward of ownership as defined by the European System of Accounts 95. This means that some service concessions recognised in financial accounts are treated differently in management accounts and against HM Treasury budgeting controls.
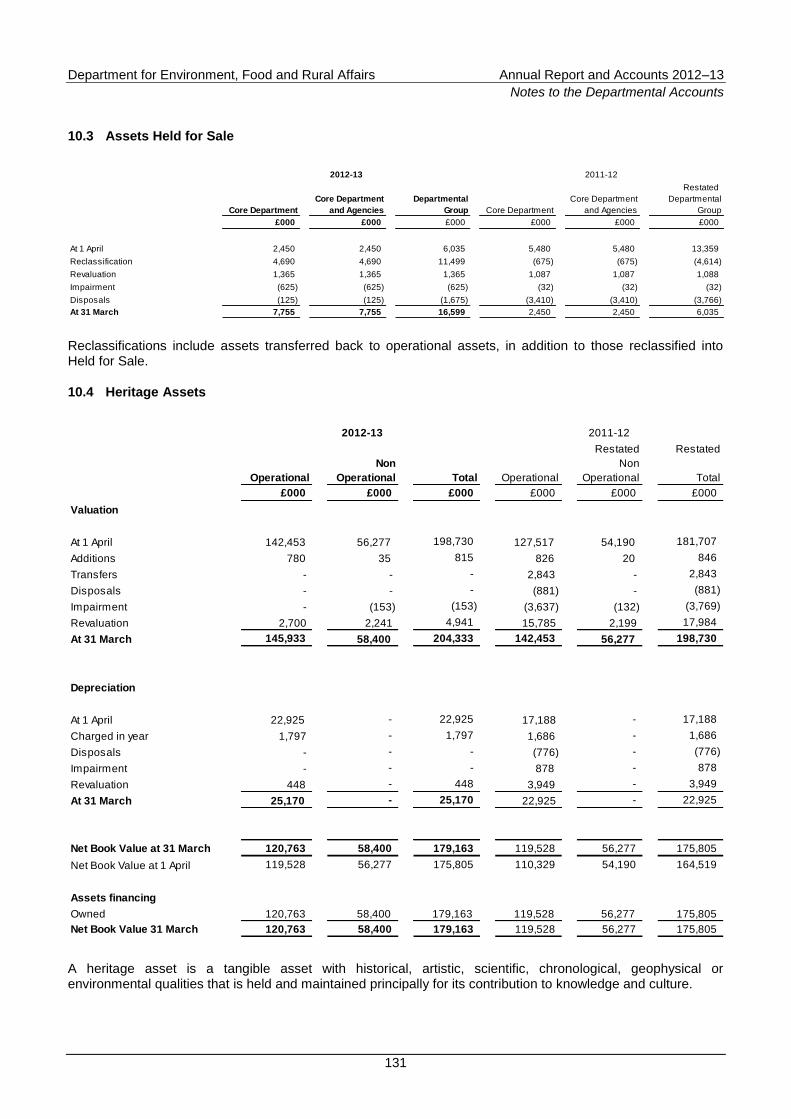
Department for Environment, Food and Rural Affairs Annual Report and Accounts 2012–13
Notes to the Departmental Accounts
131
10.3 Assets Held for Sale
2012-13 2011-12
Restated
Core Department
Core Department
and Agencies
Departmental
Group Core Department
Core Department
and Agencies
Departmental
Group
£000 £000 £000 £000 £000 £000
At 1 April 2,450 2,450 6,035 5,480 5,480 13,359
Reclassification 4,690 4,690 11,499 (675) (675) (4,614)
Revaluation 1,365 1,365 1,365 1,087 1,087 1,088
Impairment (625) (625) (625) (32) (32) (32)
Disposals (125) (125) (1,675) (3,410) (3,410) (3,766)
At 31 March 7,755 7,755 16,599 2,450 2,450 6,035
Reclassifications include assets transferred back to operational assets, in addition to those reclassified into Held for Sale.
10.4 Heritage Assets
2012-13 2011-12
Restated Restated
Operational
Non
Operational Total Operational
Non
Operational Total
£000 £000 £000 £000 £000 £000
Valuation
At 1 April 142,453 56,277 198,730 127,517 54,190 181,707
Additions 780 35 815 826 20 846
Transfers - - - 2,843 - 2,843
Disposals - - - (881) - (881)
Impairment - (153) (153) (3,637) (132) (3,769)
Revaluation 2,700 2,241 4,941 15,785 2,199 17,984
At 31 March 145,933 58,400 204,333 142,453 56,277 198,730
Depreciation
At 1 April 22,925 - 22,925 17,188 - 17,188
Charged in year 1,797 - 1,797 1,686 - 1,686
Disposals - - - (776) - (776)
Impairment - - - 878 - 878
Revaluation 448 - 448 3,949 - 3,949
At 31 March 25,170 - 25,170 22,925 - 22,925
Net Book Value at 31 March 120,763 58,400 179,163 119,528 56,277 175,805
Net Book Value at 1 April 119,528 56,277 175,805 110,329 54,190 164,519
Assets financing
Owned 120,763 58,400 179,163 119,528 56,277 175,805
Net Book Value 31 March 120,763 58,400 179,163 119,528 56,277 175,805
A heritage asset is a tangible asset with historical, artistic, scientific, chronological, geophysical or environmental qualities that is held and maintained principally for its contribution to knowledge and culture.
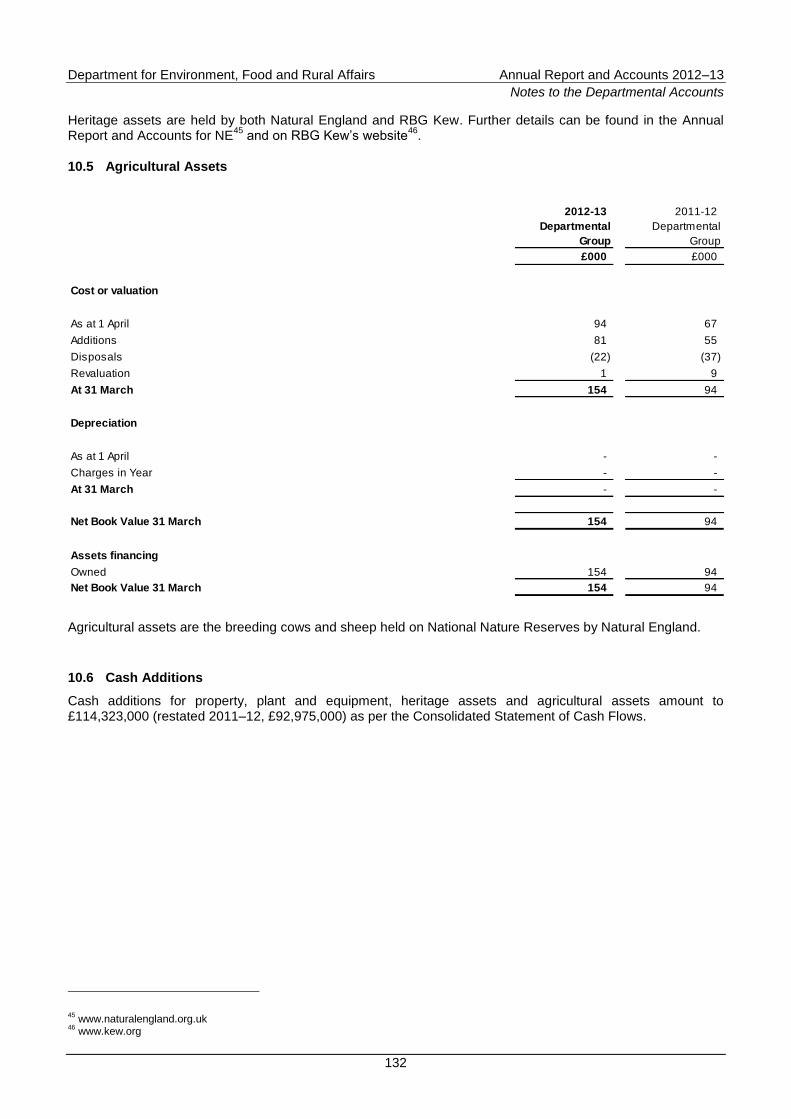
Department for Environment, Food and Rural Affairs Annual Report and Accounts 2012–13
Notes to the Departmental Accounts
132
Heritage assets are held by both Natural England and RBG Kew. Further details can be found in the Annual Report and Accounts for NE
45 and on RBG Kew‟s website
46.
10.5 Agricultural Assets
2012-13 2011-12
Departmental
Group
Departmental
Group
£000 £000
Cost or valuation
As at 1 April 94 67
Additions 81 55
Disposals (22) (37)
Revaluation 1 9
At 31 March 154 94
Depreciation
As at 1 April - -
Charges in Year - -
At 31 March - -
Net Book Value 31 March 154 94
Assets financing
Owned 154 94
Net Book Value 31 March 154 94
Agricultural assets are the breeding cows and sheep held on National Nature Reserves by Natural England.
10.6 Cash Additions
Cash additions for property, plant and equipment, heritage assets and agricultural assets amount to £114,323,000 (restated 2011–12, £92,975,000) as per the Consolidated Statement of Cash Flows.
45
www.naturalengland.org.uk 46
www.kew.org
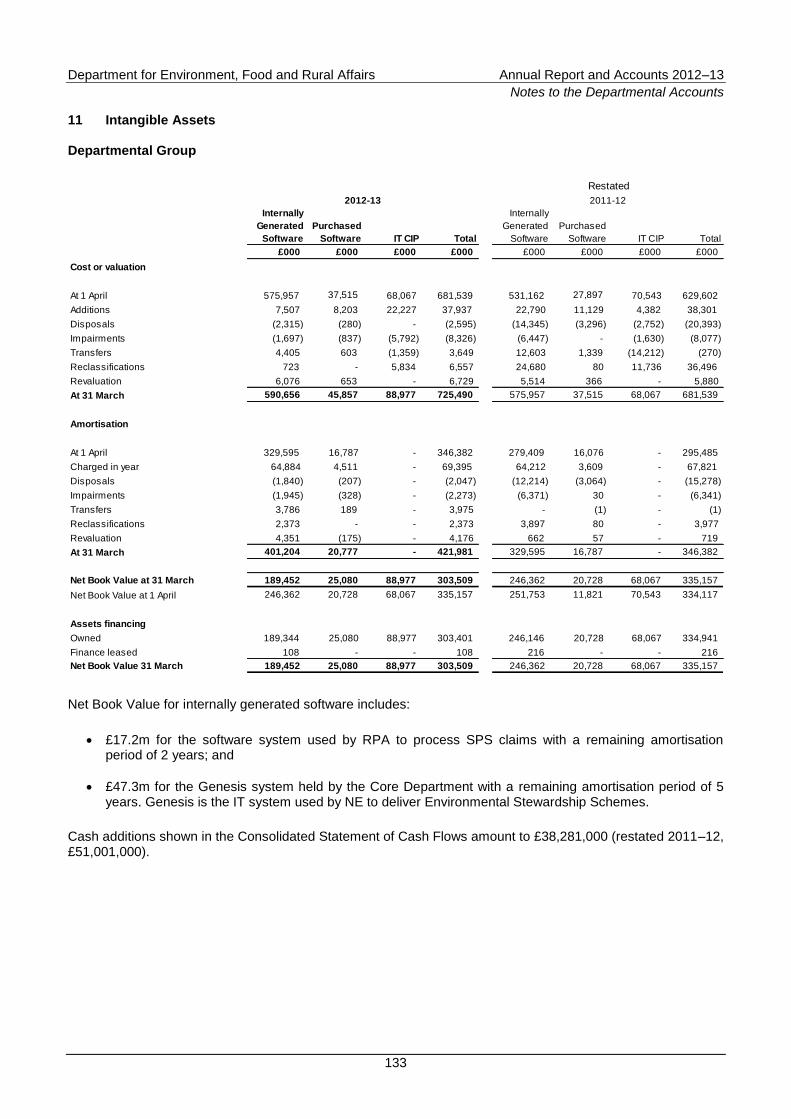
Department for Environment, Food and Rural Affairs Annual Report and Accounts 2012–13
Notes to the Departmental Accounts
133
11 Intangible Assets Departmental Group
Internally
Generated
Software
Purchased
Software IT CIP Total
Internally
Generated
Software
Purchased
Software IT CIP Total
£000 £000 £000 £000 £000 £000 £000 £000
Cost or valuation
At 1 April 575,957 37,515 68,067 681,539 531,162 27,897 70,543 629,602
Additions 7,507 8,203 22,227 37,937 22,790 11,129 4,382 38,301
Disposals (2,315) (280) - (2,595) (14,345) (3,296) (2,752) (20,393)
Impairments (1,697) (837) (5,792) (8,326) (6,447) - (1,630) (8,077)
Transfers 4,405 603 (1,359) 3,649 12,603 1,339 (14,212) (270)
Reclassifications 723 - 5,834 6,557 24,680 80 11,736 36,496
Revaluation 6,076 653 - 6,729 5,514 366 - 5,880
At 31 March 590,656 45,857 88,977 725,490 575,957 37,515 68,067 681,539
Amortisation
At 1 April 329,595 16,787 - 346,382 279,409 16,076 - 295,485
Charged in year 64,884 4,511 - 69,395 64,212 3,609 - 67,821
Disposals (1,840) (207) - (2,047) (12,214) (3,064) - (15,278)
Impairments (1,945) (328) - (2,273) (6,371) 30 - (6,341)
Transfers 3,786 189 - 3,975 - (1) - (1)
Reclassifications 2,373 - - 2,373 3,897 80 - 3,977
Revaluation 4,351 (175) - 4,176 662 57 - 719
At 31 March 401,204 20,777 - 421,981 329,595 16,787 - 346,382
Net Book Value at 31 March 189,452 25,080 88,977 303,509 246,362 20,728 68,067 335,157
Net Book Value at 1 April 246,362 20,728 68,067 335,157 251,753 11,821 70,543 334,117
Assets financing
Owned 189,344 25,080 88,977 303,401 246,146 20,728 68,067 334,941
Finance leased 108 - - 108 216 - - 216
Net Book Value 31 March 189,452 25,080 88,977 303,509 246,362 20,728 68,067 335,157
2012-13 2011-12
Restated
Net Book Value for internally generated software includes:
£17.2m for the software system used by RPA to process SPS claims with a remaining amortisation period of 2 years; and
£47.3m for the Genesis system held by the Core Department with a remaining amortisation period of 5 years. Genesis is the IT system used by NE to deliver Environmental Stewardship Schemes.
Cash additions shown in the Consolidated Statement of Cash Flows amount to £38,281,000 (restated 2011–12, £51,001,000).
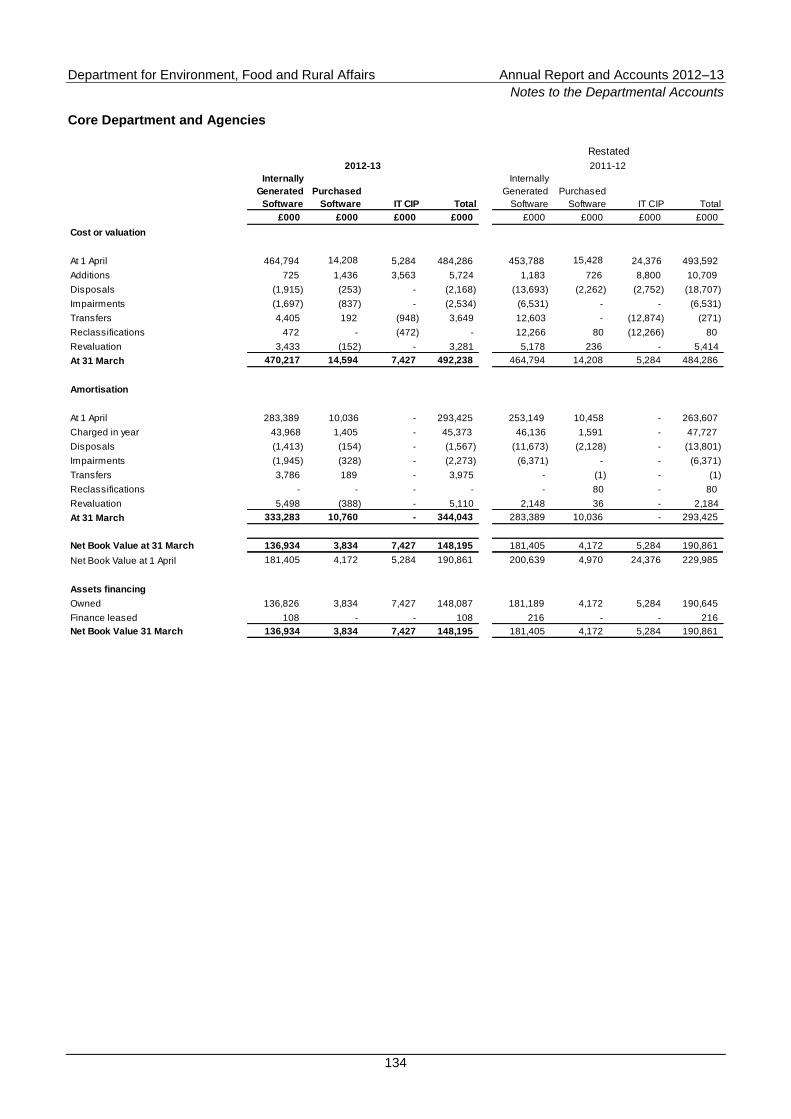
Department for Environment, Food and Rural Affairs Annual Report and Accounts 2012–13
Notes to the Departmental Accounts
134
Core Department and Agencies
Internally
Generated
Software
Purchased
Software IT CIP Total
Internally
Generated
Software
Purchased
Software IT CIP Total
£000 £000 £000 £000 £000 £000 £000 £000
Cost or valuation
At 1 April 464,794 14,208 5,284 484,286 453,788 15,428 24,376 493,592
Additions 725 1,436 3,563 5,724 1,183 726 8,800 10,709
Disposals (1,915) (253) - (2,168) (13,693) (2,262) (2,752) (18,707)
Impairments (1,697) (837) - (2,534) (6,531) - - (6,531)
Transfers 4,405 192 (948) 3,649 12,603 - (12,874) (271)
Reclassifications 472 - (472) - 12,266 80 (12,266) 80
Revaluation 3,433 (152) - 3,281 5,178 236 - 5,414
At 31 March 470,217 14,594 7,427 492,238 464,794 14,208 5,284 484,286
Amortisation
At 1 April 283,389 10,036 - 293,425 253,149 10,458 - 263,607
Charged in year 43,968 1,405 - 45,373 46,136 1,591 - 47,727
Disposals (1,413) (154) - (1,567) (11,673) (2,128) - (13,801)
Impairments (1,945) (328) - (2,273) (6,371) - - (6,371)
Transfers 3,786 189 - 3,975 - (1) - (1)
Reclassifications - - - - - 80 - 80
Revaluation 5,498 (388) - 5,110 2,148 36 - 2,184
At 31 March 333,283 10,760 - 344,043 283,389 10,036 - 293,425
Net Book Value at 31 March 136,934 3,834 7,427 148,195 181,405 4,172 5,284 190,861
Net Book Value at 1 April 181,405 4,172 5,284 190,861 200,639 4,970 24,376 229,985
Assets financing
Owned 136,826 3,834 7,427 148,087 181,189 4,172 5,284 190,645
Finance leased 108 - - 108 216 - - 216
Net Book Value 31 March 136,934 3,834 7,427 148,195 181,405 4,172 5,284 190,861
2012-13 2011-12
Restated
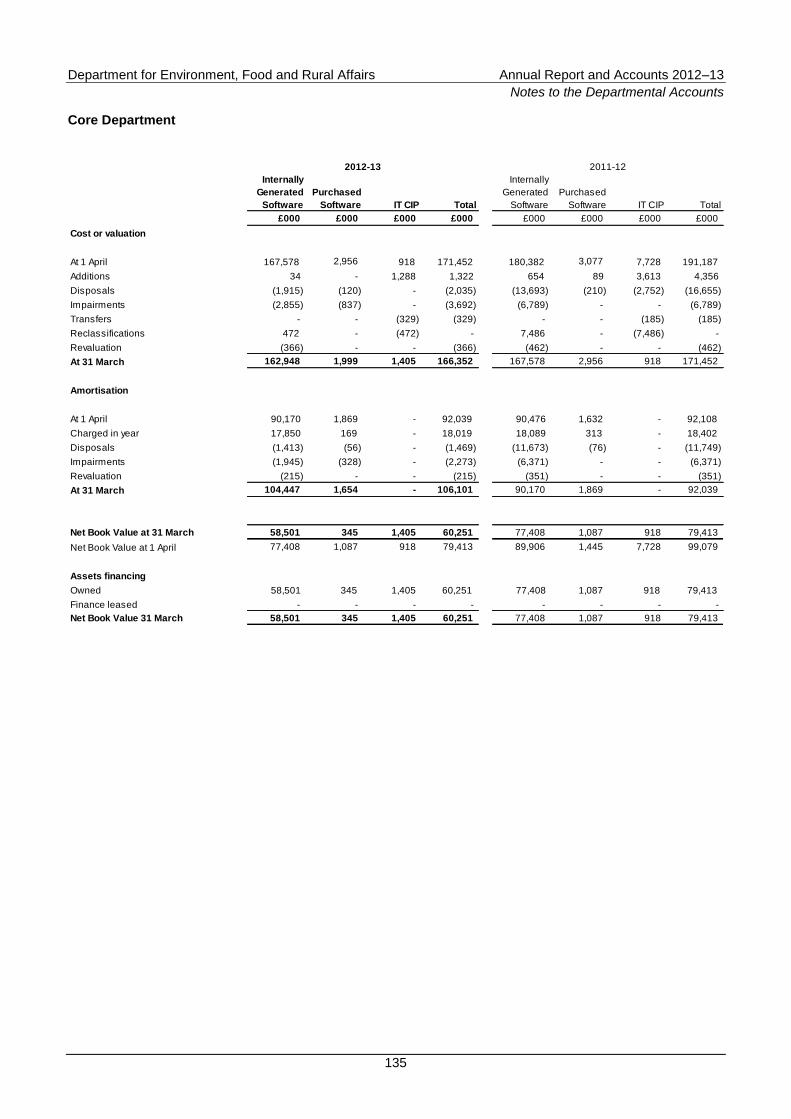
Department for Environment, Food and Rural Affairs Annual Report and Accounts 2012–13
Notes to the Departmental Accounts
135
Core Department
Internally
Generated
Software
Purchased
Software IT CIP Total
Internally
Generated
Software
Purchased
Software IT CIP Total
£000 £000 £000 £000 £000 £000 £000 £000
Cost or valuation
At 1 April 167,578 2,956 918 171,452 180,382 3,077 7,728 191,187
Additions 34 - 1,288 1,322 654 89 3,613 4,356
Disposals (1,915) (120) - (2,035) (13,693) (210) (2,752) (16,655)
Impairments (2,855) (837) - (3,692) (6,789) - - (6,789)
Transfers - - (329) (329) - - (185) (185)
Reclassifications 472 - (472) - 7,486 - (7,486) -
Revaluation (366) - - (366) (462) - - (462)
At 31 March 162,948 1,999 1,405 166,352 167,578 2,956 918 171,452
Amortisation
At 1 April 90,170 1,869 - 92,039 90,476 1,632 - 92,108
Charged in year 17,850 169 - 18,019 18,089 313 - 18,402
Disposals (1,413) (56) - (1,469) (11,673) (76) - (11,749)
Impairments (1,945) (328) - (2,273) (6,371) - - (6,371)
Revaluation (215) - - (215) (351) - - (351)
At 31 March 104,447 1,654 - 106,101 90,170 1,869 - 92,039
Net Book Value at 31 March 58,501 345 1,405 60,251 77,408 1,087 918 79,413
Net Book Value at 1 April 77,408 1,087 918 79,413 89,906 1,445 7,728 99,079
Assets financing
Owned 58,501 345 1,405 60,251 77,408 1,087 918 79,413
Finance leased - - - - - - - -
Net Book Value 31 March 58,501 345 1,405 60,251 77,408 1,087 918 79,413
2012-13 2011-12
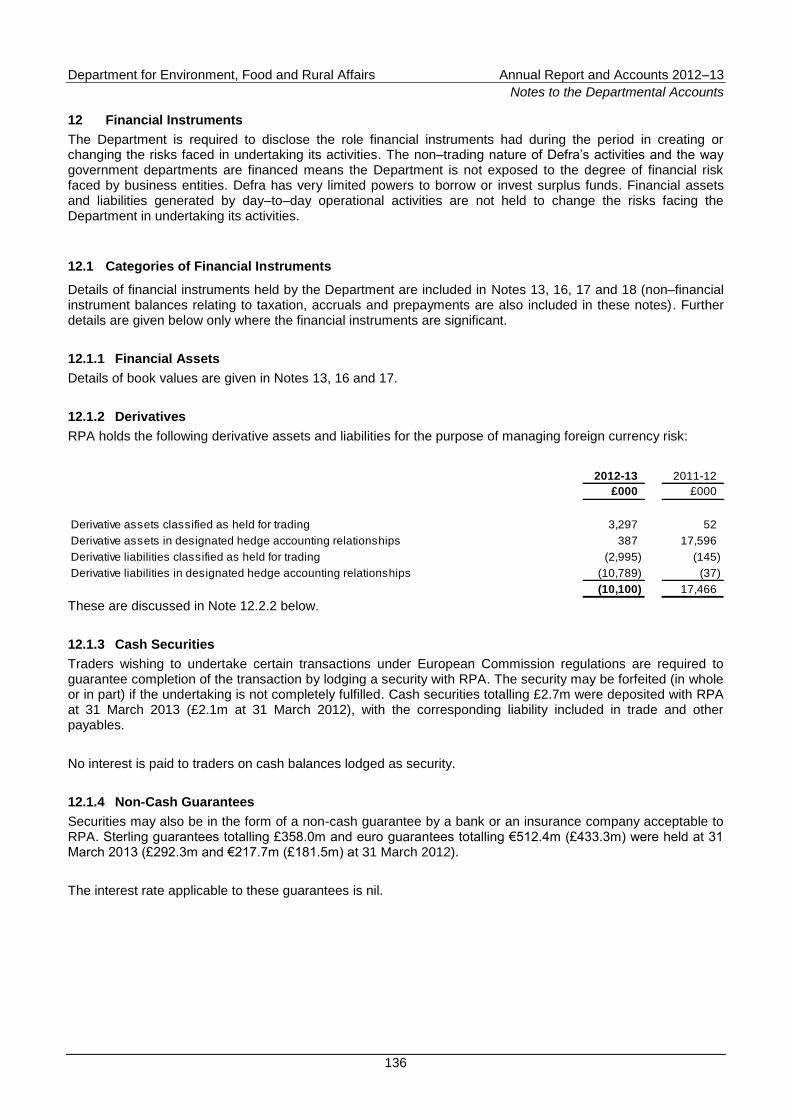
Department for Environment, Food and Rural Affairs Annual Report and Accounts 2012–13
Notes to the Departmental Accounts
136
12 Financial Instruments
The Department is required to disclose the role financial instruments had during the period in creating or changing the risks faced in undertaking its activities. The non–trading nature of Defra‟s activities and the way government departments are financed means the Department is not exposed to the degree of financial risk faced by business entities. Defra has very limited powers to borrow or invest surplus funds. Financial assets and liabilities generated by day–to–day operational activities are not held to change the risks facing the Department in undertaking its activities.
12.1 Categories of Financial Instruments
Details of financial instruments held by the Department are included in Notes 13, 16, 17 and 18 (non–financial instrument balances relating to taxation, accruals and prepayments are also included in these notes). Further details are given below only where the financial instruments are significant.
12.1.1 Financial Assets
Details of book values are given in Notes 13, 16 and 17.
12.1.2 Derivatives
RPA holds the following derivative assets and liabilities for the purpose of managing foreign currency risk:
2012-13 2011-12
£000 £000
Derivative assets classified as held for trading 3,297 52
Derivative assets in designated hedge accounting relationships 387 17,596
Derivative liabilities classified as held for trading (2,995) (145)
Derivative liabilities in designated hedge accounting relationships (10,789) (37)
(10,100) 17,466
These are discussed in Note 12.2.2 below.
12.1.3 Cash Securities
Traders wishing to undertake certain transactions under European Commission regulations are required to guarantee completion of the transaction by lodging a security with RPA. The security may be forfeited (in whole or in part) if the undertaking is not completely fulfilled. Cash securities totalling £2.7m were deposited with RPA at 31 March 2013 (£2.1m at 31 March 2012), with the corresponding liability included in trade and other payables.
No interest is paid to traders on cash balances lodged as security.
12.1.4 Non-Cash Guarantees
Securities may also be in the form of a non-cash guarantee by a bank or an insurance company acceptable to RPA. Sterling guarantees totalling £358.0m and euro guarantees totalling €512.4m (£433.3m) were held at 31 March 2013 (£292.3m and €217.7m (£181.5m) at 31 March 2012).
The interest rate applicable to these guarantees is nil.
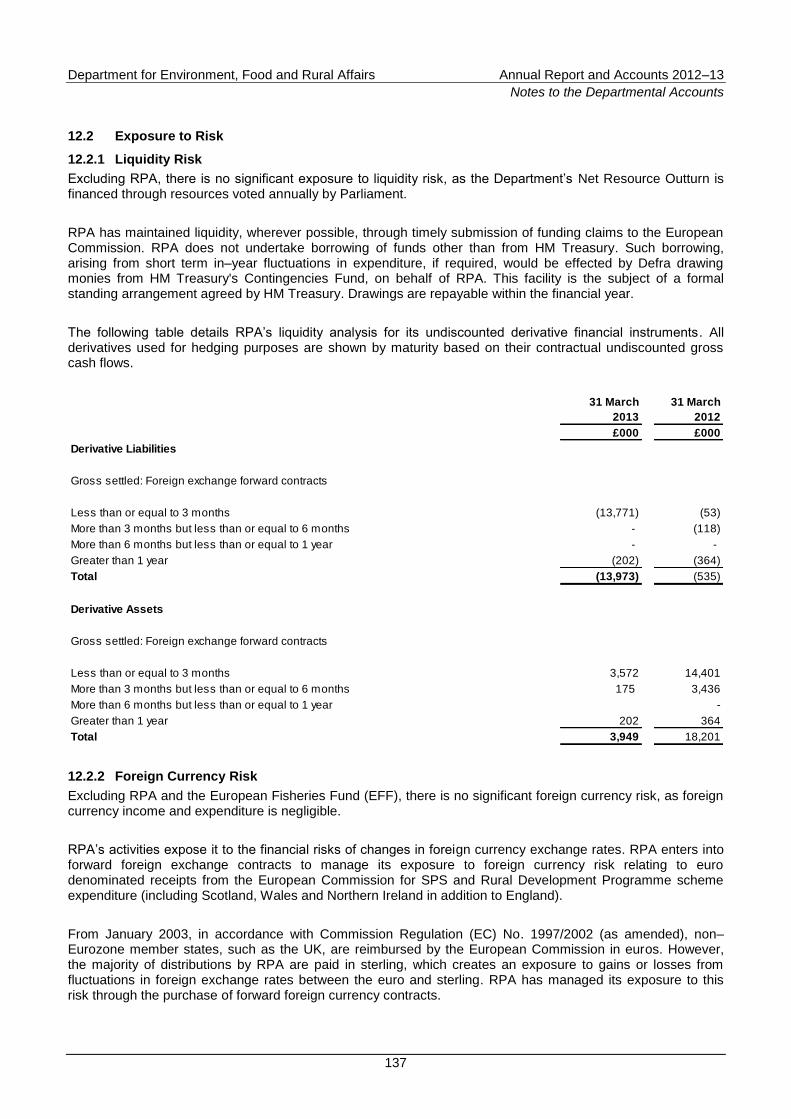
Department for Environment, Food and Rural Affairs Annual Report and Accounts 2012–13
Notes to the Departmental Accounts
137
12.2 Exposure to Risk
12.2.1 Liquidity Risk
Excluding RPA, there is no significant exposure to liquidity risk, as the Department‟s Net Resource Outturn is financed through resources voted annually by Parliament.
RPA has maintained liquidity, wherever possible, through timely submission of funding claims to the European Commission. RPA does not undertake borrowing of funds other than from HM Treasury. Such borrowing, arising from short term in–year fluctuations in expenditure, if required, would be effected by Defra drawing monies from HM Treasury's Contingencies Fund, on behalf of RPA. This facility is the subject of a formal standing arrangement agreed by HM Treasury. Drawings are repayable within the financial year.
The following table details RPA‟s liquidity analysis for its undiscounted derivative financial instruments. All derivatives used for hedging purposes are shown by maturity based on their contractual undiscounted gross cash flows.
31 March
2013
31 March
2012
£000 £000
Derivative Liabilities
Gross settled: Foreign exchange forward contracts
Less than or equal to 3 months (13,771) (53)
More than 3 months but less than or equal to 6 months - (118)
More than 6 months but less than or equal to 1 year - -
Greater than 1 year (202) (364)
Total (13,973) (535)
Derivative Assets
Gross settled: Foreign exchange forward contracts
Less than or equal to 3 months 3,572 14,401
More than 3 months but less than or equal to 6 months 175 3,436
More than 6 months but less than or equal to 1 year -
Greater than 1 year 202 364
Total 3,949 18,201
12.2.2 Foreign Currency Risk
Excluding RPA and the European Fisheries Fund (EFF), there is no significant foreign currency risk, as foreign currency income and expenditure is negligible.
RPA‟s activities expose it to the financial risks of changes in foreign currency exchange rates. RPA enters into forward foreign exchange contracts to manage its exposure to foreign currency risk relating to euro denominated receipts from the European Commission for SPS and Rural Development Programme scheme expenditure (including Scotland, Wales and Northern Ireland in addition to England).
From January 2003, in accordance with Commission Regulation (EC) No. 1997/2002 (as amended), non–Eurozone member states, such as the UK, are reimbursed by the European Commission in euros. However, the majority of distributions by RPA are paid in sterling, which creates an exposure to gains or losses from fluctuations in foreign exchange rates between the euro and sterling. RPA has managed its exposure to this risk through the purchase of forward foreign currency contracts.
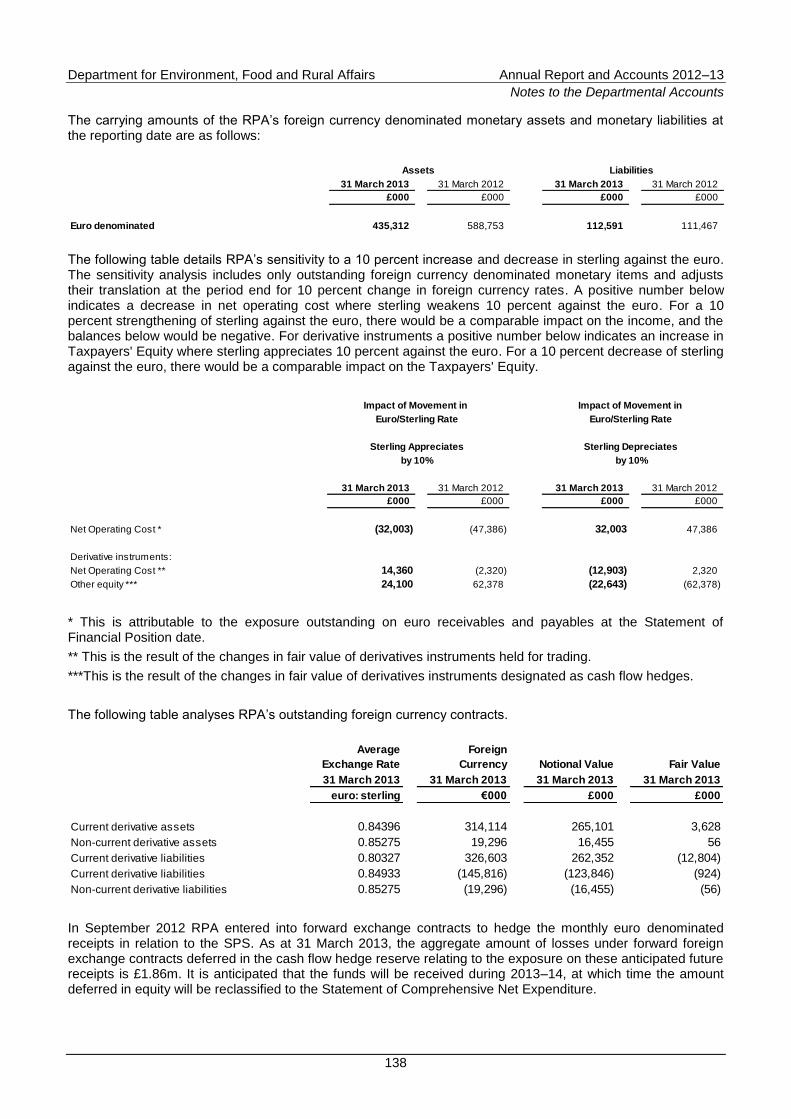
Department for Environment, Food and Rural Affairs Annual Report and Accounts 2012–13
Notes to the Departmental Accounts
138
The carrying amounts of the RPA‟s foreign currency denominated monetary assets and monetary liabilities at the reporting date are as follows:
31 March 2013 31 March 2012 31 March 2013 31 March 2012
£000 £000 £000 £000
Euro denominated 435,312 588,753 112,591 111,467
Assets Liabilities
The following table details RPA‟s sensitivity to a 10 percent increase and decrease in sterling against the euro. The sensitivity analysis includes only outstanding foreign currency denominated monetary items and adjusts their translation at the period end for 10 percent change in foreign currency rates. A positive number below indicates a decrease in net operating cost where sterling weakens 10 percent against the euro. For a 10 percent strengthening of sterling against the euro, there would be a comparable impact on the income, and the balances below would be negative. For derivative instruments a positive number below indicates an increase in Taxpayers' Equity where sterling appreciates 10 percent against the euro. For a 10 percent decrease of sterling against the euro, there would be a comparable impact on the Taxpayers' Equity.
31 March 2013 31 March 2012 31 March 2013 31 March 2012
£000 £000 £000 £000
Net Operating Cost * (32,003) (47,386) 32,003 47,386
Derivative instruments:
Net Operating Cost ** 14,360 (2,320) (12,903) 2,320
Other equity *** 24,100 62,378 (22,643) (62,378)
by 10% by 10%
Impact of Movement in Impact of Movement in
Euro/Sterling Rate Euro/Sterling Rate
Sterling Appreciates Sterling Depreciates
* This is attributable to the exposure outstanding on euro receivables and payables at the Statement of Financial Position date.
** This is the result of the changes in fair value of derivatives instruments held for trading.
***This is the result of the changes in fair value of derivatives instruments designated as cash flow hedges.
The following table analyses RPA‟s outstanding foreign currency contracts.
Average
Exchange Rate
Foreign
Currency Notional Value Fair Value
31 March 2013 31 March 2013 31 March 2013 31 March 2013
euro: sterling €000 £000 £000
Current derivative assets 0.84396 314,114 265,101 3,628
Non-current derivative assets 0.85275 19,296 16,455 56
Current derivative liabilities 0.80327 326,603 262,352 (12,804)
Current derivative liabilities 0.84933 (145,816) (123,846) (924)
Non-current derivative liabilities 0.85275 (19,296) (16,455) (56)
In September 2012 RPA entered into forward exchange contracts to hedge the monthly euro denominated receipts in relation to the SPS. As at 31 March 2013, the aggregate amount of losses under forward foreign exchange contracts deferred in the cash flow hedge reserve relating to the exposure on these anticipated future receipts is £1.86m. It is anticipated that the funds will be received during 2013–14, at which time the amount deferred in equity will be reclassified to the Statement of Comprehensive Net Expenditure.
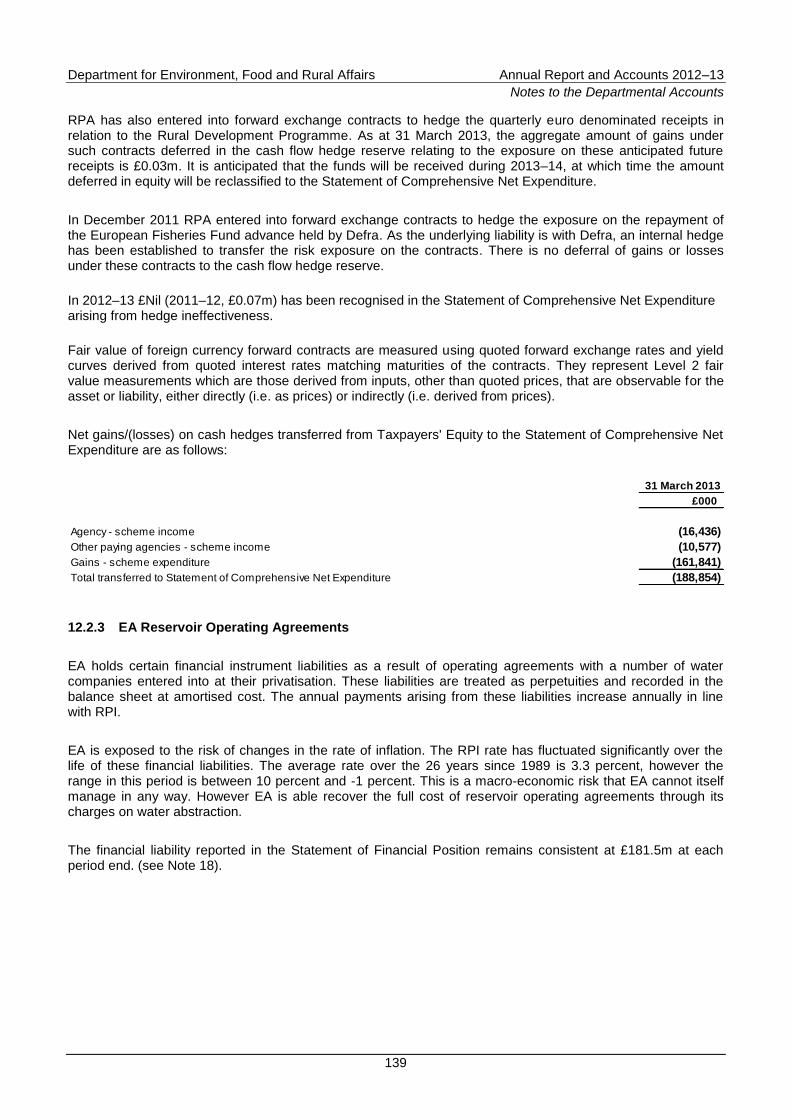
Department for Environment, Food and Rural Affairs Annual Report and Accounts 2012–13
Notes to the Departmental Accounts
139
RPA has also entered into forward exchange contracts to hedge the quarterly euro denominated receipts in relation to the Rural Development Programme. As at 31 March 2013, the aggregate amount of gains under such contracts deferred in the cash flow hedge reserve relating to the exposure on these anticipated future receipts is £0.03m. It is anticipated that the funds will be received during 2013–14, at which time the amount deferred in equity will be reclassified to the Statement of Comprehensive Net Expenditure.
In December 2011 RPA entered into forward exchange contracts to hedge the exposure on the repayment of the European Fisheries Fund advance held by Defra. As the underlying liability is with Defra, an internal hedge has been established to transfer the risk exposure on the contracts. There is no deferral of gains or losses under these contracts to the cash flow hedge reserve.
In 2012–13 £Nil (2011–12, £0.07m) has been recognised in the Statement of Comprehensive Net Expenditure arising from hedge ineffectiveness.
Fair value of foreign currency forward contracts are measured using quoted forward exchange rates and yield curves derived from quoted interest rates matching maturities of the contracts. They represent Level 2 fair value measurements which are those derived from inputs, other than quoted prices, that are observable for the asset or liability, either directly (i.e. as prices) or indirectly (i.e. derived from prices).
Net gains/(losses) on cash hedges transferred from Taxpayers' Equity to the Statement of Comprehensive Net Expenditure are as follows:
31 March 2013
£000
Agency - scheme income (16,436)
Other paying agencies - scheme income (10,577)
Gains - scheme expenditure (161,841)
Total transferred to Statement of Comprehensive Net Expenditure (188,854)
12.2.3 EA Reservoir Operating Agreements
EA holds certain financial instrument liabilities as a result of operating agreements with a number of water companies entered into at their privatisation. These liabilities are treated as perpetuities and recorded in the balance sheet at amortised cost. The annual payments arising from these liabilities increase annually in line with RPI.
EA is exposed to the risk of changes in the rate of inflation. The RPI rate has fluctuated significantly over the life of these financial liabilities. The average rate over the 26 years since 1989 is 3.3 percent, however the range in this period is between 10 percent and -1 percent. This is a macro-economic risk that EA cannot itself manage in any way. However EA is able recover the full cost of reservoir operating agreements through its charges on water abstraction.
The financial liability reported in the Statement of Financial Position remains consistent at £181.5m at each period end. (see Note 18).
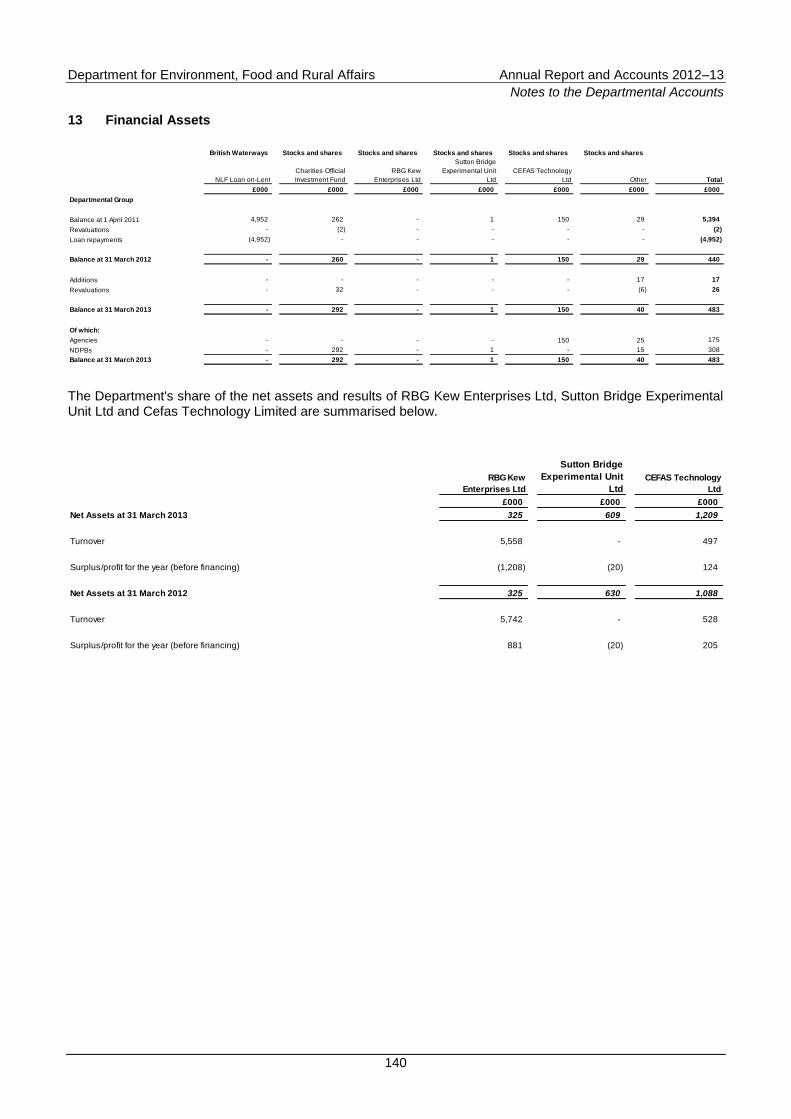
Department for Environment, Food and Rural Affairs Annual Report and Accounts 2012–13
Notes to the Departmental Accounts
140
13 Financial Assets
British Waterways Stocks and shares Stocks and shares Stocks and shares Stocks and shares Stocks and shares
NLF Loan on-Lent
Charities Official
Investment Fund
RBG Kew
Enterprises Ltd
Sutton Bridge
Experimental Unit
Ltd
CEFAS Technology
Ltd Other Total
£000 £000 £000 £000 £000 £000 £000
Departmental Group
Balance at 1 April 2011 4,952 262 - 1 150 29 5,394
Revaluations - (2) - - - - (2)
Loan repayments (4,952) - - - - - (4,952)
Balance at 31 March 2012 - 260 - 1 150 29 440
Additions - - - - - 17 17
Revaluations - 32 - - - (6) 26
Balance at 31 March 2013 - 292 - 1 150 40 483
Of which:
Agencies - - - - 150 25 175
NDPBs - 292 - 1 - 15 308
Balance at 31 March 2013 - 292 - 1 150 40 483
The Department's share of the net assets and results of RBG Kew Enterprises Ltd, Sutton Bridge Experimental Unit Ltd and Cefas Technology Limited are summarised below.
RBG Kew
Enterprises Ltd
Sutton Bridge
Experimental Unit
Ltd
CEFAS Technology
Ltd
£000 £000 £000
Net Assets at 31 March 2013 325 609 1,209
Turnover 5,558 - 497
Surplus/profit for the year (before financing) (1,208) (20) 124
Net Assets at 31 March 2012 325 630 1,088
Turnover 5,742 - 528
Surplus/profit for the year (before financing) 881 (20) 205
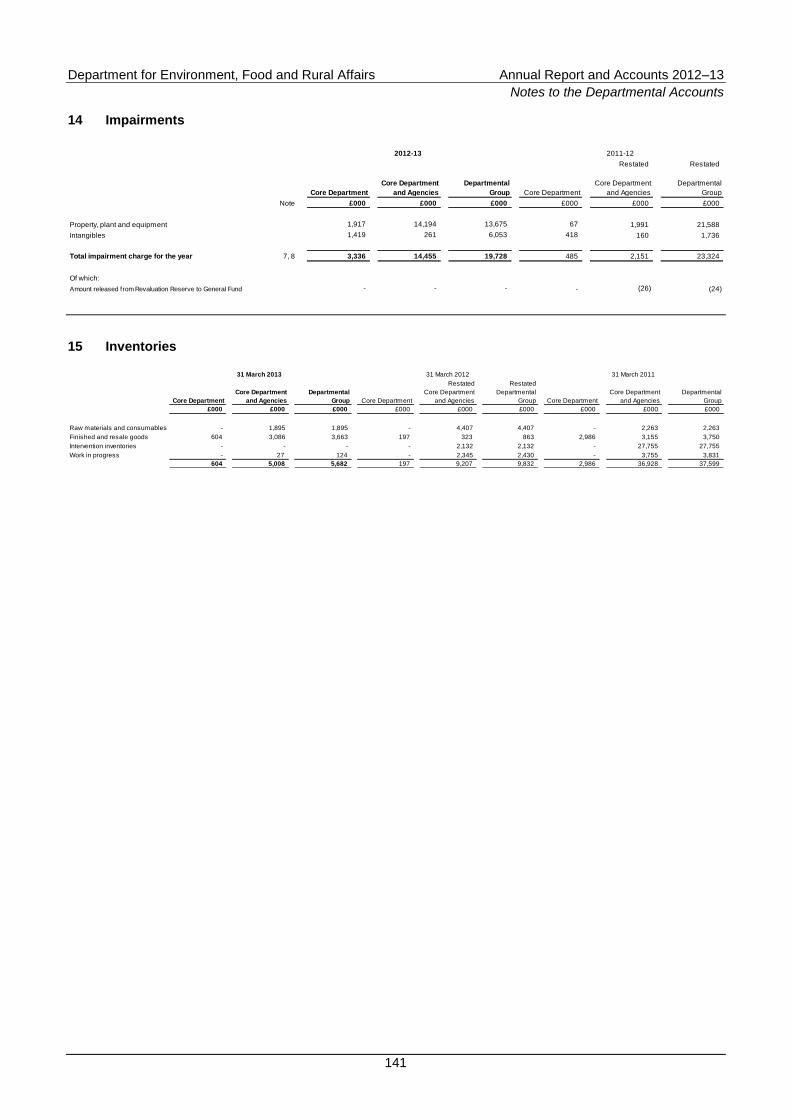
Department for Environment, Food and Rural Affairs Annual Report and Accounts 2012–13
Notes to the Departmental Accounts
141
14 Impairments
2012-13 2011-12
Restated Restated
Core Department
Core Department
and Agencies
Departmental
Group Core Department
Core Department
and Agencies
Departmental
Group
Note £000 £000 £000 £000 £000 £000
Property, plant and equipment 1,917 14,194 13,675 67 1,991 21,588
Intangibles 1,419 261 6,053 418 160 1,736
Total impairment charge for the year 7, 8 3,336 14,455 19,728 485 2,151 23,324
Of which:
Amount released from Revaluation Reserve to General Fund - - - - (26) (24)
15 Inventories
31 March 2013 31 March 2012 31 March 2011
Restated Restated
Core Department
Core Department
and Agencies
Departmental
Group Core Department
Core Department
and Agencies
Departmental
Group Core Department
Core Department
and Agencies
Departmental
Group
£000 £000 £000 £000 £000 £000 £000 £000 £000
Raw materials and consumables - 1,895 1,895 - 4,407 4,407 - 2,263 2,263
Finished and resale goods 604 3,086 3,663 197 323 863 2,986 3,155 3,750
Intervention inventories - - - - 2,132 2,132 - 27,755 27,755
Work in progress - 27 124 - 2,345 2,430 - 3,755 3,831
604 5,008 5,682 197 9,207 9,832 2,986 36,928 37,599
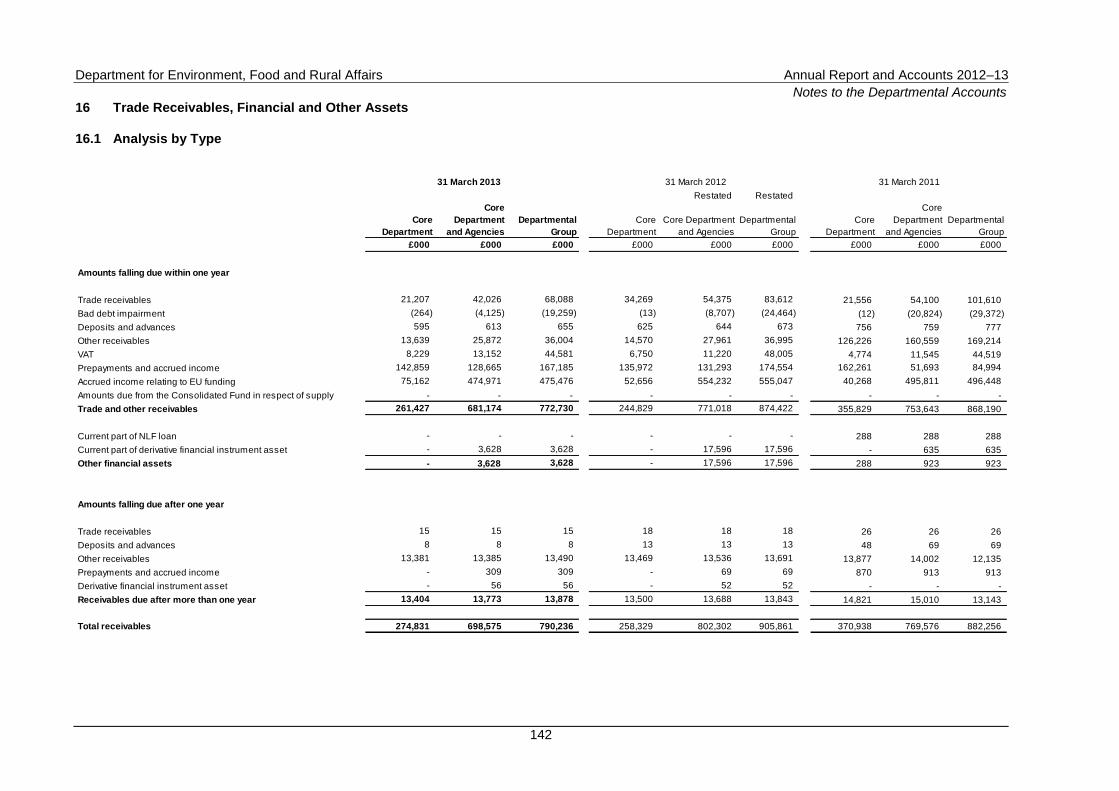
Department for Environment, Food and Rural Affairs Annual Report and Accounts 2012–13
Notes to the Departmental Accounts
142
16 Trade Receivables, Financial and Other Assets
16.1 Analysis by Type
31 March 2013 31 March 2012 31 March 2011
Restated Restated
Core
Department
Core
Department
and Agencies
Departmental
Group
Core
Department
Core Department
and Agencies
Departmental
Group
Core
Department
Core
Department
and Agencies
Departmental
Group
£000 £000 £000 £000 £000 £000 £000 £000 £000
Amounts falling due within one year
Trade receivables 21,207 42,026 68,088 34,269 54,375 83,612 21,556 54,100 101,610
Bad debt impairment (264) (4,125) (19,259) (13) (8,707) (24,464) (12) (20,824) (29,372)
Deposits and advances 595 613 655 625 644 673 756 759 777
Other receivables 13,639 25,872 36,004 14,570 27,961 36,995 126,226 160,559 169,214
VAT 8,229 13,152 44,581 6,750 11,220 48,005 4,774 11,545 44,519
Prepayments and accrued income 142,859 128,665 167,185 135,972 131,293 174,554 162,261 51,693 84,994
Accrued income relating to EU funding 75,162 474,971 475,476 52,656 554,232 555,047 40,268 495,811 496,448
Amounts due from the Consolidated Fund in respect of supply - - - - - - - - -
Trade and other receivables 261,427 681,174 772,730 244,829 771,018 874,422 355,829 753,643 868,190
Current part of NLF loan - - - - - - 288 288 288
Current part of derivative financial instrument asset - 3,628 3,628 - 17,596 17,596 - 635 635
Other financial assets - 3,628 3,628 - 17,596 17,596 288 923 923
Amounts falling due after one year
Trade receivables 15 15 15 18 18 18 26 26 26
Deposits and advances 8 8 8 13 13 13 48 69 69
Other receivables 13,381 13,385 13,490 13,469 13,536 13,691 13,877 14,002 12,135
Prepayments and accrued income - 309 309 - 69 69 870 913 913
Derivative financial instrument asset - 56 56 - 52 52 - - -
Receivables due after more than one year 13,404 13,773 13,878 13,500 13,688 13,843 14,821 15,010 13,143
Total receivables 274,831 698,575 790,236 258,329 802,302 905,861 370,938 769,576 882,256
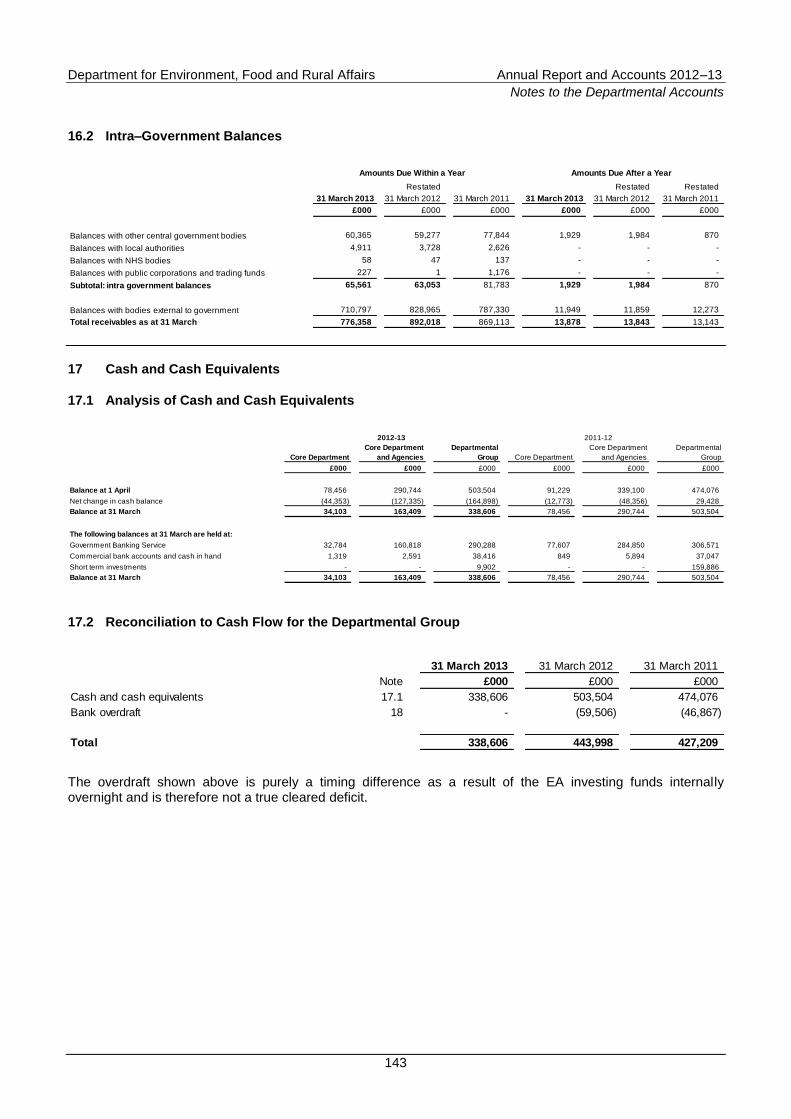
Department for Environment, Food and Rural Affairs Annual Report and Accounts 2012–13
Notes to the Departmental Accounts
143
16.2 Intra–Government Balances
Restated Restated Restated
31 March 2013 31 March 2012 31 March 2011 31 March 2013 31 March 2012 31 March 2011
£000 £000 £000 £000 £000 £000
Balances with other central government bodies 60,365 59,277 77,844 1,929 1,984 870
Balances with local authorities 4,911 3,728 2,626 - - -
Balances with NHS bodies 58 47 137 - - -
Balances with public corporations and trading funds 227 1 1,176 - - -
Subtotal: intra government balances 65,561 63,053 81,783 1,929 1,984 870
Balances with bodies external to government 710,797 828,965 787,330 11,949 11,859 12,273
Total receivables as at 31 March 776,358 892,018 869,113 13,878 13,843 13,143
Amounts Due Within a Year Amounts Due After a Year
17 Cash and Cash Equivalents
17.1 Analysis of Cash and Cash Equivalents
2012-13 2011-12
Core Department
Core Department
and Agencies
Departmental
Group Core Department
Core Department
and Agencies
Departmental
Group
£000 £000 £000 £000 £000 £000
Balance at 1 April 78,456 290,744 503,504 91,229 339,100 474,076
Net change in cash balance (44,353) (127,335) (164,898) (12,773) (48,356) 29,428
Balance at 31 March 34,103 163,409 338,606 78,456 290,744 503,504
The following balances at 31 March are held at:
Government Banking Service 32,784 160,818 290,288 77,607 284,850 306,571
Commercial bank accounts and cash in hand 1,319 2,591 38,416 849 5,894 37,047
Short term investments - - 9,902 - - 159,886
Balance at 31 March 34,103 163,409 338,606 78,456 290,744 503,504
17.2 Reconciliation to Cash Flow for the Departmental Group
31 March 2013 31 March 2012 31 March 2011
Note £000 £000 £000
Cash and cash equivalents 17.1 338,606 503,504 474,076
Bank overdraft 18 - (59,506) (46,867)
Total 338,606 443,998 427,209
The overdraft shown above is purely a timing difference as a result of the EA investing funds internally overnight and is therefore not a true cleared deficit.
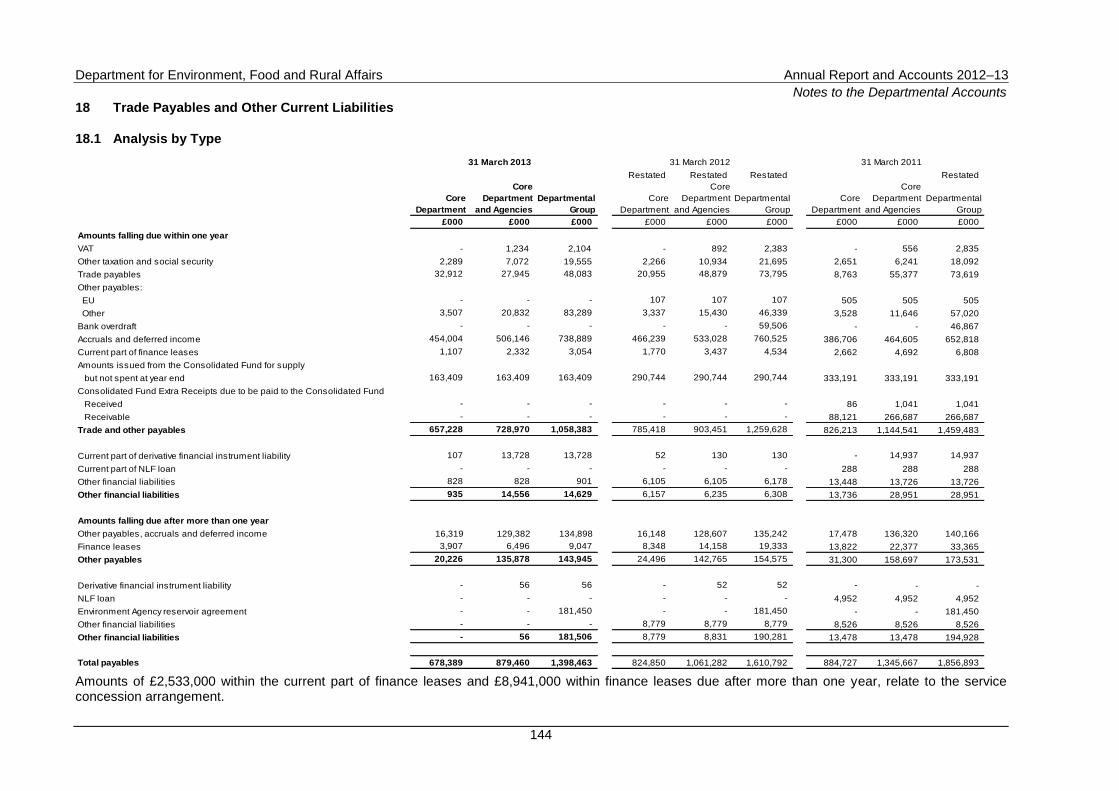
Department for Environment, Food and Rural Affairs Annual Report and Accounts 2012–13
Notes to the Departmental Accounts
144
18 Trade Payables and Other Current Liabilities
18.1 Analysis by Type
31 March 2013 31 March 2012 31 March 2011
Restated Restated Restated Restated
Core
Department
Core
Department
and Agencies
Departmental
Group
Core
Department
Core
Department
and Agencies
Departmental
Group
Core
Department
Core
Department
and Agencies
Departmental
Group
£000 £000 £000 £000 £000 £000 £000 £000 £000
Amounts falling due within one year
VAT - 1,234 2,104 - 892 2,383 - 556 2,835
Other taxation and social security 2,289 7,072 19,555 2,266 10,934 21,695 2,651 6,241 18,092
Trade payables 32,912 27,945 48,083 20,955 48,879 73,795 8,763 55,377 73,619
Other payables:
EU - - - 107 107 107 505 505 505
Other 3,507 20,832 83,289 3,337 15,430 46,339 3,528 11,646 57,020
Bank overdraft - - - - - 59,506 - - 46,867
Accruals and deferred income 454,004 506,146 738,889 466,239 533,028 760,525 386,706 464,605 652,818
Current part of finance leases 1,107 2,332 3,054 1,770 3,437 4,534 2,662 4,692 6,808
Amounts issued from the Consolidated Fund for supply
but not spent at year end 163,409 163,409 163,409 290,744 290,744 290,744 333,191 333,191 333,191
Consolidated Fund Extra Receipts due to be paid to the Consolidated Fund
Received - - - - - - 86 1,041 1,041
Receivable - - - - - - 88,121 266,687 266,687
Trade and other payables 657,228 728,970 1,058,383 785,418 903,451 1,259,628 826,213 1,144,541 1,459,483
Current part of derivative financial instrument liability 107 13,728 13,728 52 130 130 - 14,937 14,937
Current part of NLF loan - - - - - - 288 288 288
Other financial liabilities 828 828 901 6,105 6,105 6,178 13,448 13,726 13,726
Other financial liabilities 935 14,556 14,629 6,157 6,235 6,308 13,736 28,951 28,951
Amounts falling due after more than one year
Other payables, accruals and deferred income 16,319 129,382 134,898 16,148 128,607 135,242 17,478 136,320 140,166
Finance leases 3,907 6,496 9,047 8,348 14,158 19,333 13,822 22,377 33,365
Other payables 20,226 135,878 143,945 24,496 142,765 154,575 31,300 158,697 173,531
Derivative financial instrument liability - 56 56 - 52 52 - - -
NLF loan - - - - - - 4,952 4,952 4,952
Environment Agency reservoir agreement - - 181,450 - - 181,450 - - 181,450
Other financial liabilities - - - 8,779 8,779 8,779 8,526 8,526 8,526
Other financial liabilities - 56 181,506 8,779 8,831 190,281 13,478 13,478 194,928
Total payables 678,389 879,460 1,398,463 824,850 1,061,282 1,610,792 884,727 1,345,667 1,856,893
Amounts of £2,533,000 within the current part of finance leases and £8,941,000 within finance leases due after more than one year, relate to the service concession arrangement.
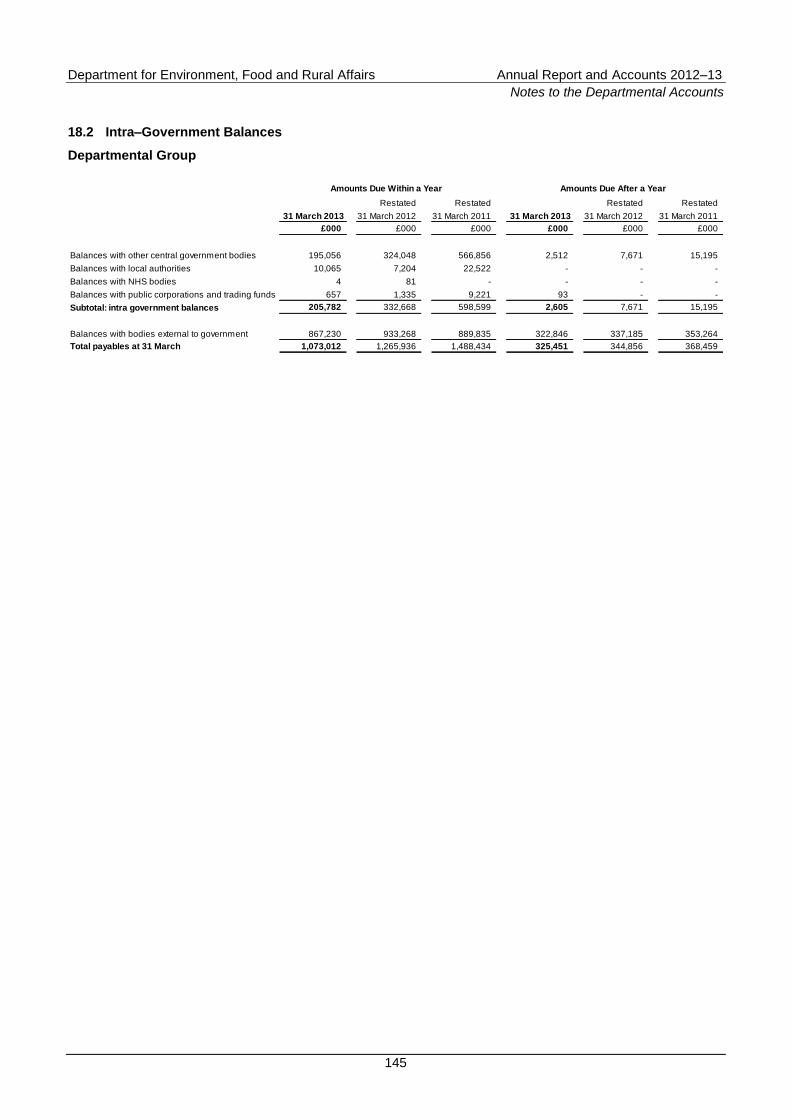
Department for Environment, Food and Rural Affairs Annual Report and Accounts 2012–13
Notes to the Departmental Accounts
145
18.2 Intra–Government Balances
Departmental Group
Restated Restated Restated Restated
31 March 2013 31 March 2012 31 March 2011 31 March 2013 31 March 2012 31 March 2011
£000 £000 £000 £000 £000 £000
Balances with other central government bodies 195,056 324,048 566,856 2,512 7,671 15,195
Balances with local authorities 10,065 7,204 22,522 - - -
Balances with NHS bodies 4 81 - - - -
Balances with public corporations and trading funds 657 1,335 9,221 93 - -
Subtotal: intra government balances 205,782 332,668 598,599 2,605 7,671 15,195
Balances with bodies external to government 867,230 933,268 889,835 322,846 337,185 353,264
Total payables at 31 March 1,073,012 1,265,936 1,488,434 325,451 344,856 368,459
Amounts Due Within a Year Amounts Due After a Year
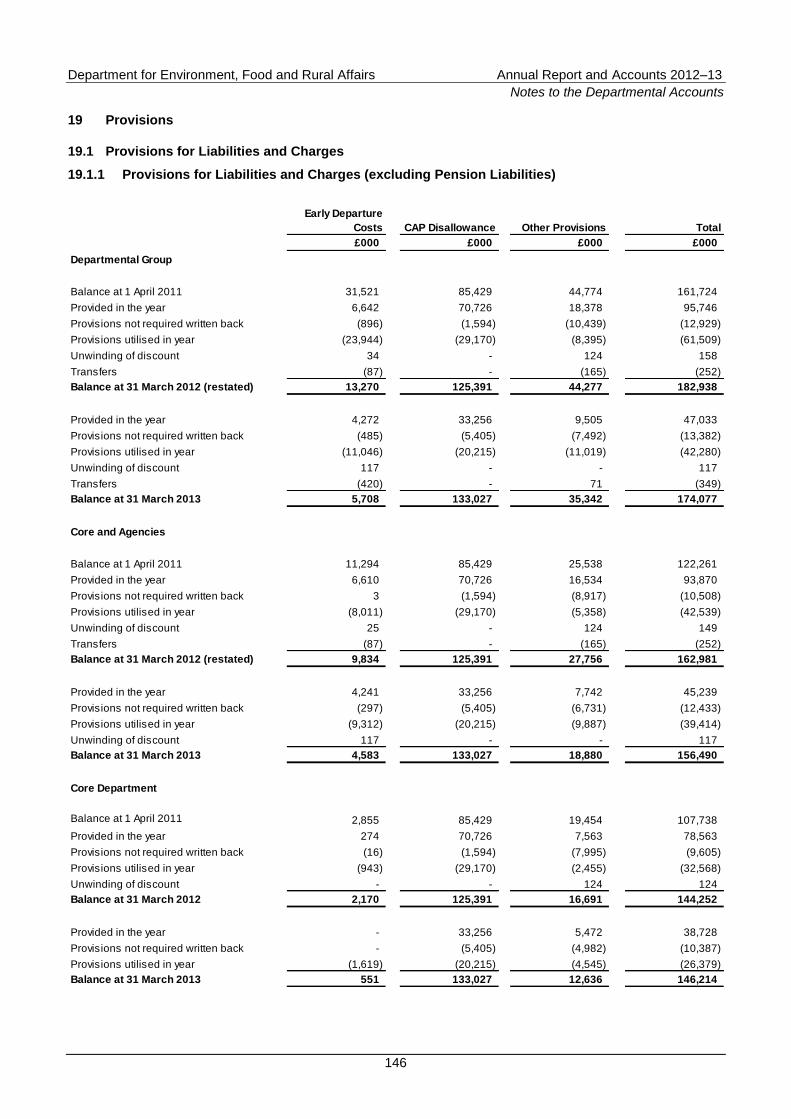
Department for Environment, Food and Rural Affairs Annual Report and Accounts 2012–13
Notes to the Departmental Accounts
146
19 Provisions
19.1 Provisions for Liabilities and Charges
19.1.1 Provisions for Liabilities and Charges (excluding Pension Liabilities)
Early Departure
Costs CAP Disallowance Other Provisions Total
£000 £000 £000 £000
Departmental Group
Balance at 1 April 2011 31,521 85,429 44,774 161,724
Provided in the year 6,642 70,726 18,378 95,746
Provisions not required written back (896) (1,594) (10,439) (12,929)
Provisions utilised in year (23,944) (29,170) (8,395) (61,509)
Unwinding of discount 34 - 124 158
Transfers (87) - (165) (252)
Balance at 31 March 2012 (restated) 13,270 125,391 44,277 182,938
Provided in the year 4,272 33,256 9,505 47,033
Provisions not required written back (485) (5,405) (7,492) (13,382)
Provisions utilised in year (11,046) (20,215) (11,019) (42,280)
Unwinding of discount 117 - - 117
Transfers (420) - 71 (349)
Balance at 31 March 2013 5,708 133,027 35,342 174,077
Core and Agencies
Balance at 1 April 2011 11,294 85,429 25,538 122,261
Provided in the year 6,610 70,726 16,534 93,870
Provisions not required written back 3 (1,594) (8,917) (10,508)
Provisions utilised in year (8,011) (29,170) (5,358) (42,539)
Unwinding of discount 25 - 124 149
Transfers (87) - (165) (252)
Balance at 31 March 2012 (restated) 9,834 125,391 27,756 162,981
Provided in the year 4,241 33,256 7,742 45,239
Provisions not required written back (297) (5,405) (6,731) (12,433)
Provisions utilised in year (9,312) (20,215) (9,887) (39,414)
Unwinding of discount 117 - - 117
Balance at 31 March 2013 4,583 133,027 18,880 156,490
Core Department
Balance at 1 April 2011 2,855 85,429 19,454 107,738
Provided in the year 274 70,726 7,563 78,563
Provisions not required written back (16) (1,594) (7,995) (9,605)
Provisions utilised in year (943) (29,170) (2,455) (32,568)
Unwinding of discount - - 124 124
Balance at 31 March 2012 2,170 125,391 16,691 144,252
Provided in the year - 33,256 5,472 38,728
Provisions not required written back - (5,405) (4,982) (10,387)
Provisions utilised in year (1,619) (20,215) (4,545) (26,379)
Balance at 31 March 2013 551 133,027 12,636 146,214
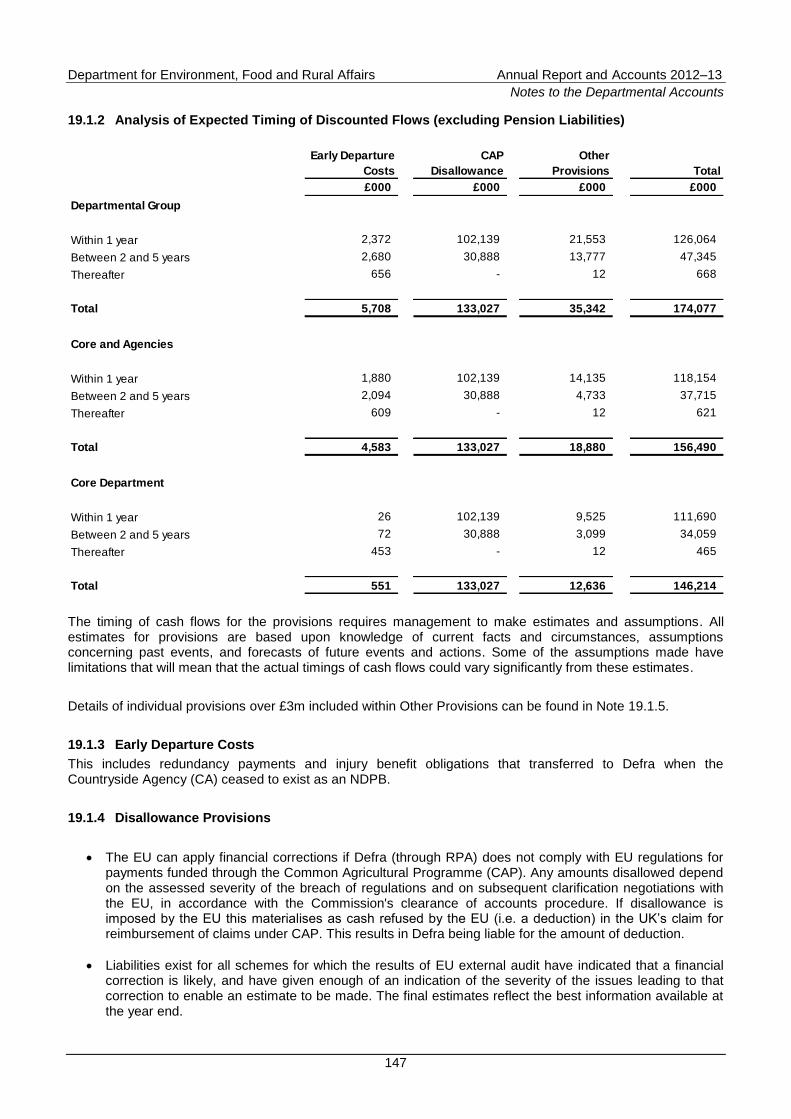
Department for Environment, Food and Rural Affairs Annual Report and Accounts 2012–13
Notes to the Departmental Accounts
147
19.1.2 Analysis of Expected Timing of Discounted Flows (excluding Pension Liabilities)
Early Departure
Costs
CAP
Disallowance
Other
Provisions Total
£000 £000 £000 £000
Departmental Group
Within 1 year 2,372 102,139 21,553 126,064
Between 2 and 5 years 2,680 30,888 13,777 47,345
Thereafter 656 - 12 668
Total 5,708 133,027 35,342 174,077
Core and Agencies
Within 1 year 1,880 102,139 14,135 118,154
Between 2 and 5 years 2,094 30,888 4,733 37,715
Thereafter 609 - 12 621
Total 4,583 133,027 18,880 156,490
Core Department
Within 1 year 26 102,139 9,525 111,690
Between 2 and 5 years 72 30,888 3,099 34,059
Thereafter 453 - 12 465
Total 551 133,027 12,636 146,214
The timing of cash flows for the provisions requires management to make estimates and assumptions. All estimates for provisions are based upon knowledge of current facts and circumstances, assumptions concerning past events, and forecasts of future events and actions. Some of the assumptions made have limitations that will mean that the actual timings of cash flows could vary significantly from these estimates.
Details of individual provisions over £3m included within Other Provisions can be found in Note 19.1.5.
19.1.3 Early Departure Costs
This includes redundancy payments and injury benefit obligations that transferred to Defra when the Countryside Agency (CA) ceased to exist as an NDPB.
19.1.4 Disallowance Provisions
The EU can apply financial corrections if Defra (through RPA) does not comply with EU regulations for payments funded through the Common Agricultural Programme (CAP). Any amounts disallowed depend on the assessed severity of the breach of regulations and on subsequent clarification negotiations with the EU, in accordance with the Commission's clearance of accounts procedure. If disallowance is imposed by the EU this materialises as cash refused by the EU (i.e. a deduction) in the UK‟s claim for reimbursement of claims under CAP. This results in Defra being liable for the amount of deduction.
Liabilities exist for all schemes for which the results of EU external audit have indicated that a financial correction is likely, and have given enough of an indication of the severity of the issues leading to that correction to enable an estimate to be made. The final estimates reflect the best information available at the year end.

Department for Environment, Food and Rural Affairs Annual Report and Accounts 2012–13
Notes to the Departmental Accounts
148
Liabilities which are expected to impact in future accounting periods are disclosed as provisions, covering all relevant schemes. Where a cash refusal is expected within the next 12 months, the liability is disclosed as an accrual in resource terms. Finally, the point at which the „cash refused‟ is physically transacted may come sometime after the accrual point and typically in a later accounting period. Therefore it is important to recognise that liabilities for disallowance can cover a number of scheme years and do not just reflect any disallowance imposed in the financial year covered by any single year's accounts.
For the 2012–13 Accounts, the closing provision balance for disallowance is £133m. This consists of £93m for the SPS 2010 and 2011, and £40m for non–SPS schemes. The non–SPS element includes the Cross Compliance of £33m, and RDPE 2010–11 of £7m. The audits for these scheme years have taken place and Defra is currently awaiting final confirmation of the amount to be disallowed.
For those schemes where Defra has received formal notification of the final amount of disallowance and where this cash refusal is expected within the next 12 months, the 2012–13 Accounts show accruals totalling £165m. This relates to SPS 2007–9 of £110m and non–SPS of £55m.
The non–SPS element includes the Fruit and Vegetable Trader Scheme 2009–11 of £50m, and other smaller schemes amounting to £5m. In terms of cash refusals actually deducted in 2012–13 (i.e. physically transacted out of Defra‟s bank account), £23m was deducted relating to Cross Compliance in 2008.
There is an assumption that a baseline 2 percent flat rate disallowance for SPS will continue, but if this was to increase to 5 percent (the next flat rate level) the provision position would increase by £65m. Uncertainty in these assumptions will be resolved upon receipt of an Article 11 letter of notification from the EU, which will detail the level of disallowance. There is an ongoing potential liability in respect of financial corrections which is uncertain and unquantifiable at present.
19.1.5 Other Provisions
The Habitats Directive (92/43/EEC) obliges the UK to select and submit sites to the European Commission for adoption as Sites of Community Importance and subsequent designation as Special Areas of Conservation. The designation of Bolton Fell Moss is part of the UK Government‟s response to Commission infraction proceedings with regard to sufficiency of designated sites. The provision currently stands at £6.5m in pursuance of this. The estimated clearance date is 2014–15.
The Environment Agency has provisions for £13.5m to cover dilapidations, insurance claims and operational risks.
The Core Department, Executive Agencies and NDPBs have a total of £15.3m relating to smaller provisions with an individual value of less than £3m.
Department for Environment, Food and Rural Affairs Annual Report and Accounts 2012–13
Notes to the Departmental Accounts
149
20 Pension Liabilities
The Department has a number of pension schemes which it manages. The details for the schemes are noted below. The Department also contributes to the PCSPS which is noted in the Remuneration Report.
Net liabilities represents the gap between the money held by the scheme and the total present value of the funded and unfunded obligations. The assumptions underlying the calculation of the net liability are only used for accounting purposes as prescribed under IAS 19. In particular, IAS 19 has no impact on the level of cash contributions paid by the Department and there is no requirement for the net liability to be met as a lump sum or otherwise. Cash contributions will continue to be set by reference to assumptions agreed at each actuarial valuation of the scheme.
The liabilities for Core Department and Executive Agencies solely relate to the Core Department.
20.1.1 Environment Agency (EA) Pension Liability (Closed Scheme)
The EA Closed Fund (the Fund) is vested in EA by Regulation 2(1) of the Local Government Pension Scheme Regulations 1996 and Environment Act 1996 and is maintained for the purposes of Section 7 of the Superannuation Act 1972. The Secretary of State has the function conferred by Section 173 of the Water Act 1989 (the Act) to make such payments into the Fund as may be considered appropriate in respect of the actual and contingent liabilities falling from time to time. This was reaffirmed through the Memorandum of Understanding between the Accounting Officers of Defra and EA, 17 May 2005. These are met out of the Fund to persons who were ex–employees of regional water authorities and other water industry bodies at the time of water privatisation in 1989 (the Closed Fund members).
EA is responsible for providing the Actuary with the relevant information to carry out the triennial valuations of the Closed Fund. This information includes, but is not limited to, details of:
scheme membership, including age and gender profile, active membership, deferred pensioners and pensioners;
statutory benefit structure, including details of any discretionary benefits and any proposals to amend these; and
following consultation with the Actuary, the key assumptions that should be used to value the scheme liabilities, ensuring that the assumptions are mutually compatible and reflect a best estimate of future experience.
The value of the liability included on the Statement of Financial Position may be significantly affected by even small changes in assumptions. For example, if at a subsequent valuation it is considered appropriate to reduce the assumed rate of inflation then the value of the pension scheme liability will decrease (other things being equal). Conversely, if the assumed rates are increased, the value of the liability will increase. The managers of the scheme accept that, as a consequence, the valuation provided by the Actuary is inherently uncertain. The note also discloses „experience‟ gains or losses for the year, showing the amount charged or credited for the year because events have not coincided with assumptions made for the last valuation.
The last formal valuation of the Fund was carried out as at 31 March 2010. The results of this valuation have been projected forward using approximate methods.
20.1.2 Nature Conservancy Council (NCC) Pension
The NCC pensions liability provides for former NCC staff (and their surviving dependents) who decided not to transfer to an alternative scheme when the NCC was disbanded.
Department for Environment, Food and Rural Affairs Annual Report and Accounts 2012–13
Notes to the Departmental Accounts
150
An actuarial valuation was carried out on this scheme as at 31 March 2013 by the Government Actuary‟s Department.
20.1.3 Former Countryside Agency (CA) Pension Schemes (RCC and Ex–Chairmen Schemes)
The former CA Rural Community Councils (RCC) and Ex–Chairmen pension liabilities were transferred to the Core Department on 30 September 2006. The RCC fund is managed by the Xafinity Paymaster, and any pensions are administered by them in accordance with standard rules (by–analogy with the PCSPS).
An actuarial valuation was carried out on these schemes as at 31 March 2013 by the Government Actuary‟s Department.
20.1.4 Horticultural Research International (HRI) Pension Scheme
The HRI pension scheme is now closed following the restructuring of HRI in 2004. There are no active members in the scheme, only pensioners (deferred and current). The HRI pension scheme is PCSPS by-analogy and is a final salary scheme providing a combination of pension and lump sum benefits on a range of contingencies: retirement, death and resignation.
An actuarial valuation was carried out on this scheme as at 31 March 2013 by the Government Actuary‟s Department.
20.1.5 Home Grown Cereals Authority (HGCA) Pension Scheme
The HGCA Pension scheme is closed to new entrants and any new employees to Agriculture and Horticulture Development Board (AHDB) join the new AHDB Pension Scheme. Actuarial valuations are prepared on a triennial basis. The latest valuation was completed on 1 April 2010. AHDB pay funds into this scheme as part of the recovery plan agreed under the previous actuarial valuation at 1 April 2007.
20.1.6 Environment Agency Active Pension Scheme
The EA operates a defined benefit pension scheme for employees and transferees from the former Defra, National Rivers Authority (NRA), Her Majesty‟s Inspectorate of Pollution (HMIP), London Waste Regulation Authority (LWRA) and other local waste regulation authorities. It is a statutory scheme, administered in accordance with the Local Government Pension Scheme (Benefits, Membership and Contributions) Regulations 2007, the Local Government Pension Scheme (Administration) Regulations 2008 and the Local Government Pension Scheme (Transitional Provisions) Regulations 2008. It is contracted out of the State Second Pension.
The pension charge relating to the scheme was assessed in accordance with the advice of an independent qualified actuary using the projected unit method of valuation to calculate the service costs.
All calculations have been made by a qualified independent actuary and were based on the most recent full actuarial valuation of the fund at 31 March 2010 updated to 31 March 2011, 31 March 2012 and 31 March 2013, respectively.
20.1.7 Natural England (NE) Pension Scheme
The Former and Current chairs of NE were prohibited from joining the PCSPS pension scheme, and are included in a separate pension scheme set up by Defra which is described as „by-analogy to the main scheme‟. This is an unfunded scheme, with benefits being paid as they fall due to the employer. There is no fund, and therefore no surplus or deficit.
Department for Environment, Food and Rural Affairs Annual Report and Accounts 2012–13
Notes to the Departmental Accounts
151
An actuarial valuation was carried out on this scheme as at 31 March 2013 by the Government Actuary‟s Department.
20.1.8 Sea Fish Industry Authority (SFIA)
SFIA contributes to the West Yorkshire Pension Fund in respect of the pension obligations to employees employed before 1 April 2006 when it was closed to new members.
In addition to the West Yorkshire Pension Fund, SFIA provisionally operated a scheme on behalf of former Herring Industry Board employees, which was also independently invested and administered. The Sea Fish Industry Pension and Life Assurance Fund (Ex–Herring Industry Board Scheme) was closed to new members and was a fully paid up scheme; however, the Scheme was formerly wound up on 31 May 1999. The annuities which had been established to cover basic pension rights of the existing pensionable members will be met by the Norwich Union. SFIA will continue to meet the indexation costs associated with basic pension rights.
For new employees, SFIA makes contributions to the scheme administered by Legal and General Group.
20.1.9 Meat and Livestock Commission (MLC) Pension Scheme
The MLC pension scheme is now closed to new entrants following the creation of AHDB. This scheme is a contributory pension scheme. Contributions to the scheme are charged to AHDB‟s Statement of Comprehensive Net Expenditure and are determined by a qualified actuary on the basis of annual valuations using the projected unit method.
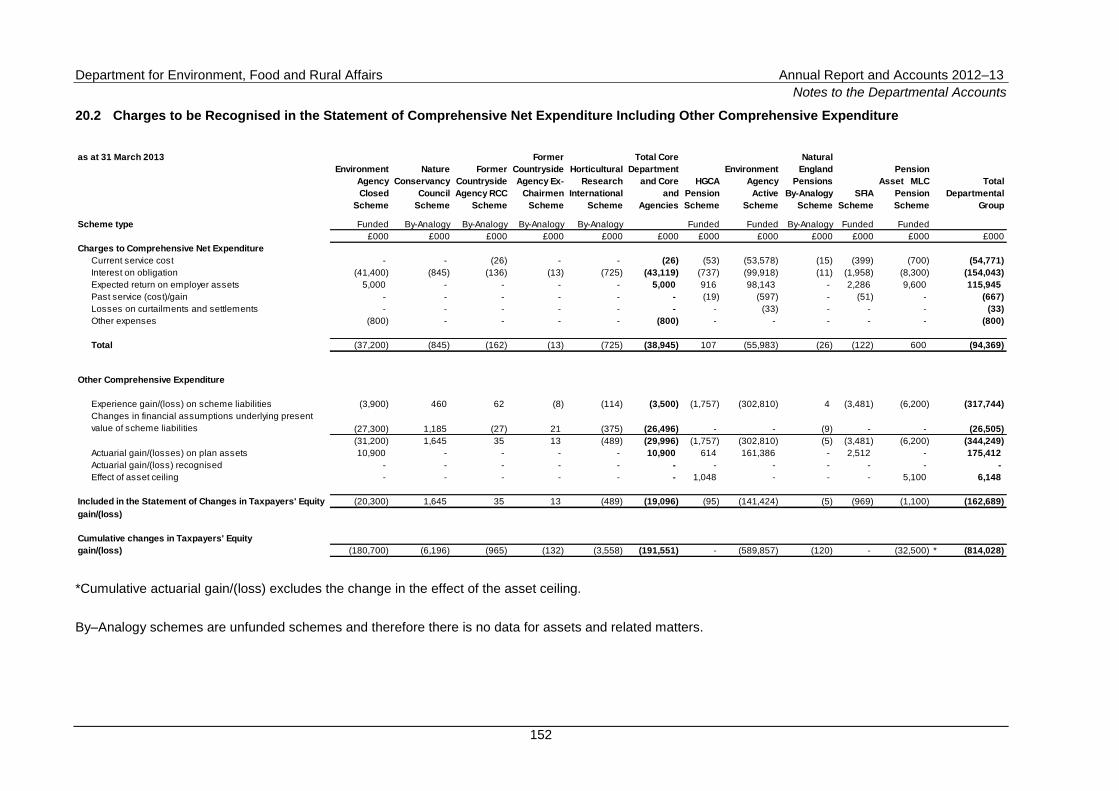
Department for Environment, Food and Rural Affairs Annual Report and Accounts 2012–13
Notes to the Departmental Accounts
152
20.2 Charges to be Recognised in the Statement of Comprehensive Net Expenditure Including Other Comprehensive Expenditure
as at 31 March 2013
Environment
Agency
Closed
Scheme
Nature
Conservancy
Council
Scheme
Former
Countryside
Agency RCC
Scheme
Former
Countryside
Agency Ex-
Chairmen
Scheme
Horticultural
Research
International
Scheme
Total Core
Department
and Core
and
Agencies
HGCA
Pension
Scheme
Environment
Agency
Active
Scheme
Natural
England
Pensions
By-Analogy
Scheme
SFIA
Scheme
Pension
Asset MLC
Pension
Scheme
Total
Departmental
Group
Scheme type Funded By-Analogy By-Analogy By-Analogy By-Analogy Funded Funded By-Analogy Funded Funded
£000 £000 £000 £000 £000 £000 £000 £000 £000 £000 £000 £000
Charges to Comprehensive Net Expenditure
Current service cost - - (26) - - (26) (53) (53,578) (15) (399) (700) (54,771)
Interest on obligation (41,400) (845) (136) (13) (725) (43,119) (737) (99,918) (11) (1,958) (8,300) (154,043)
Expected return on employer assets 5,000 - - - - 5,000 916 98,143 - 2,286 9,600 115,945
Past service (cost)/gain - - - - - - (19) (597) - (51) - (667)
Losses on curtailments and settlements - - - - - - - (33) - - - (33)
Other expenses (800) - - - - (800) - - - - - (800)
Total (37,200) (845) (162) (13) (725) (38,945) 107 (55,983) (26) (122) 600 (94,369)
Other Comprehensive Expenditure
Experience gain/(loss) on scheme liabilities (3,900) 460 62 (8) (114) (3,500) (1,757) (302,810) 4 (3,481) (6,200) (317,744)
(27,300) 1,185 (27) 21 (375) (26,496) - - (9) - - (26,505)
(31,200) 1,645 35 13 (489) (29,996) (1,757) (302,810) (5) (3,481) (6,200) (344,249)
Actuarial gain/(losses) on plan assets 10,900 - - - - 10,900 614 161,386 - 2,512 - 175,412
Actuarial gain/(loss) recognised - - - - - - - - - - - -
Effect of asset ceiling - - - - - - 1,048 - - - 5,100 6,148
Included in the Statement of Changes in Taxpayers' Equity (20,300) 1,645 35 13 (489) (19,096) (95) (141,424) (5) (969) (1,100) (162,689)
Cumulative changes in Taxpayers' Equity
(180,700) (6,196) (965) (132) (3,558) (191,551) - (589,857) (120) - (32,500) * (814,028)
Changes in financial assumptions underlying present
value of scheme liabilities
gain/(loss)
gain/(loss)
*Cumulative actuarial gain/(loss) excludes the change in the effect of the asset ceiling.
By–Analogy schemes are unfunded schemes and therefore there is no data for assets and related matters.
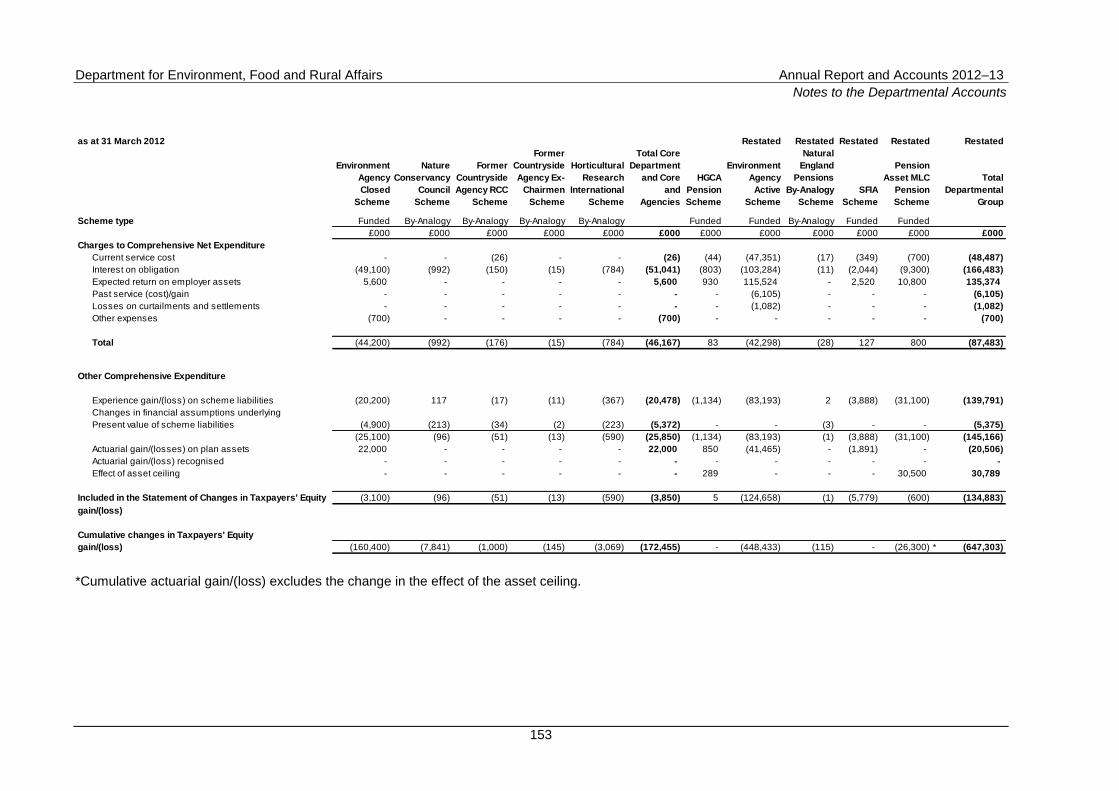
Department for Environment, Food and Rural Affairs Annual Report and Accounts 2012–13
Notes to the Departmental Accounts
153
as at 31 March 2012 Restated Restated Restated Restated Restated
Environment
Agency
Closed
Scheme
Nature
Conservancy
Council
Scheme
Former
Countryside
Agency RCC
Scheme
Former
Countryside
Agency Ex-
Chairmen
Scheme
Horticultural
Research
International
Scheme
Total Core
Department
and Core
and
Agencies
HGCA
Pension
Scheme
Environment
Agency
Active
Scheme
Natural
England
Pensions
By-Analogy
Scheme
SFIA
Scheme
Pension
Asset MLC
Pension
Scheme
Total
Departmental
Group
Scheme type Funded By-Analogy By-Analogy By-Analogy By-Analogy Funded Funded By-Analogy Funded Funded
£000 £000 £000 £000 £000 £000 £000 £000 £000 £000 £000 £000
Charges to Comprehensive Net Expenditure
Current service cost - - (26) - - (26) (44) (47,351) (17) (349) (700) (48,487)
Interest on obligation (49,100) (992) (150) (15) (784) (51,041) (803) (103,284) (11) (2,044) (9,300) (166,483)
Expected return on employer assets 5,600 - - - - 5,600 930 115,524 - 2,520 10,800 135,374
Past service (cost)/gain - - - - - - - (6,105) - - - (6,105)
Losses on curtailments and settlements - - - - - - - (1,082) - - - (1,082)
Other expenses (700) - - - - (700) - - - - - (700)
Total (44,200) (992) (176) (15) (784) (46,167) 83 (42,298) (28) 127 800 (87,483)
Other Comprehensive Expenditure
Experience gain/(loss) on scheme liabilities (20,200) 117 (17) (11) (367) (20,478) (1,134) (83,193) 2 (3,888) (31,100) (139,791)
Changes in financial assumptions underlying
Present value of scheme liabilities (4,900) (213) (34) (2) (223) (5,372) - - (3) - - (5,375)
(25,100) (96) (51) (13) (590) (25,850) (1,134) (83,193) (1) (3,888) (31,100) (145,166)
Actuarial gain/(losses) on plan assets 22,000 - - - - 22,000 850 (41,465) - (1,891) - (20,506)
Actuarial gain/(loss) recognised - - - - - - - - - - - -
Effect of asset ceiling - - - - - - 289 - - - 30,500 30,789
(3,100) (96) (51) (13) (590) (3,850) 5 (124,658) (1) (5,779) (600) (134,883)
gain/(loss) (160,400) (7,841) (1,000) (145) (3,069) (172,455) - (448,433) (115) - (26,300) * (647,303)
Included in the Statement of Changes in Taxpayers' Equity
Cumulative changes in Taxpayers' Equity
gain/(loss)
*Cumulative actuarial gain/(loss) excludes the change in the effect of the asset ceiling.
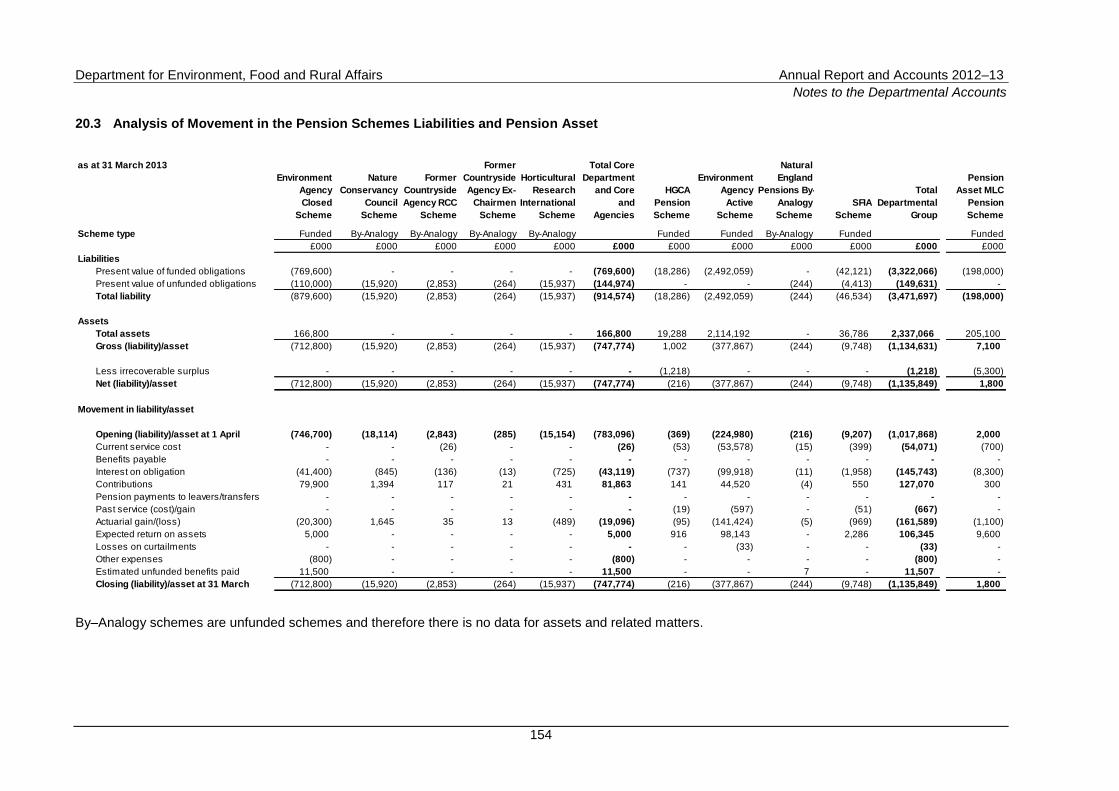
Department for Environment, Food and Rural Affairs Annual Report and Accounts 2012–13
Notes to the Departmental Accounts
154
20.3 Analysis of Movement in the Pension Schemes Liabilities and Pension Asset
as at 31 March 2013
Environment
Agency
Closed
Scheme
Nature
Conservancy
Council
Scheme
Former
Countryside
Agency RCC
Scheme
Former
Countryside
Agency Ex-
Chairmen
Scheme
Horticultural
Research
International
Scheme
Total Core
Department
and Core
and
Agencies
HGCA
Pension
Scheme
Environment
Agency
Active
Scheme
Natural
England
Pensions By-
Analogy
Scheme
SFIA
Scheme
Total
Departmental
Group
Pension
Asset MLC
Pension
Scheme
Scheme type Funded By-Analogy By-Analogy By-Analogy By-Analogy Funded Funded By-Analogy Funded Funded
£000 £000 £000 £000 £000 £000 £000 £000 £000 £000 £000 £000
Liabilities
Present value of funded obligations (769,600) - - - - (769,600) (18,286) (2,492,059) - (42,121) (3,322,066) (198,000)
Present value of unfunded obligations (110,000) (15,920) (2,853) (264) (15,937) (144,974) - - (244) (4,413) (149,631) -
Total liability (879,600) (15,920) (2,853) (264) (15,937) (914,574) (18,286) (2,492,059) (244) (46,534) (3,471,697) (198,000)
Assets
Total assets 166,800 - - - - 166,800 19,288 2,114,192 - 36,786 2,337,066 205,100
Gross (liability)/asset (712,800) (15,920) (2,853) (264) (15,937) (747,774) 1,002 (377,867) (244) (9,748) (1,134,631) 7,100
Less irrecoverable surplus - - - - - - (1,218) - - - (1,218) (5,300)
Net (liability)/asset (712,800) (15,920) (2,853) (264) (15,937) (747,774) (216) (377,867) (244) (9,748) (1,135,849) 1,800
Movement in liability/asset
Opening (liability)/asset at 1 April (746,700) (18,114) (2,843) (285) (15,154) (783,096) (369) (224,980) (216) (9,207) (1,017,868) 2,000
Current service cost - - (26) - - (26) (53) (53,578) (15) (399) (54,071) (700)
Benefits payable - - - - - - - - - - - -
Interest on obligation (41,400) (845) (136) (13) (725) (43,119) (737) (99,918) (11) (1,958) (145,743) (8,300)
Contributions 79,900 1,394 117 21 431 81,863 141 44,520 (4) 550 127,070 300
Pension payments to leavers/transfers - - - - - - - - - - - -
Past service (cost)/gain - - - - - - (19) (597) - (51) (667) -
Actuarial gain/(loss) (20,300) 1,645 35 13 (489) (19,096) (95) (141,424) (5) (969) (161,589) (1,100)
Expected return on assets 5,000 - - - - 5,000 916 98,143 - 2,286 106,345 9,600
Losses on curtailments - - - - - - - (33) - - (33) -
Other expenses (800) - - - - (800) - - - - (800) -
Estimated unfunded benefits paid 11,500 - - - - 11,500 - - 7 - 11,507 -
Closing (liability)/asset at 31 March (712,800) (15,920) (2,853) (264) (15,937) (747,774) (216) (377,867) (244) (9,748) (1,135,849) 1,800
By–Analogy schemes are unfunded schemes and therefore there is no data for assets and related matters.
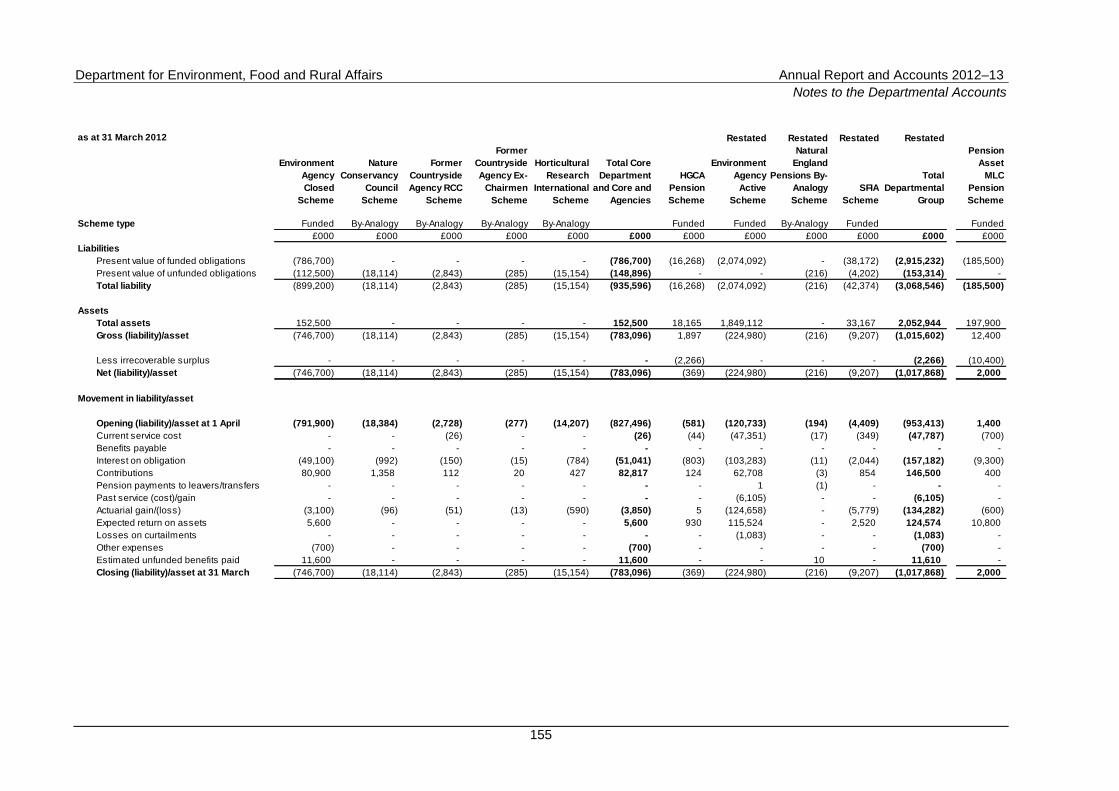
Department for Environment, Food and Rural Affairs Annual Report and Accounts 2012–13
Notes to the Departmental Accounts
155
as at 31 March 2012 Restated Restated Restated Restated
Environment
Agency
Closed
Scheme
Nature
Conservancy
Council
Scheme
Former
Countryside
Agency RCC
Scheme
Former
Countryside
Agency Ex-
Chairmen
Scheme
Horticultural
Research
International
Scheme
Total Core
Department
and Core and
Agencies
HGCA
Pension
Scheme
Environment
Agency
Active
Scheme
Natural
England
Pensions By-
Analogy
Scheme
SFIA
Scheme
Total
Departmental
Group
Pension
Asset
MLC
Pension
Scheme
Scheme type Funded By-Analogy By-Analogy By-Analogy By-Analogy Funded Funded By-Analogy Funded Funded
£000 £000 £000 £000 £000 £000 £000 £000 £000 £000 £000 £000
Liabilities
Present value of funded obligations (786,700) - - - - (786,700) (16,268) (2,074,092) - (38,172) (2,915,232) (185,500)
Present value of unfunded obligations (112,500) (18,114) (2,843) (285) (15,154) (148,896) - - (216) (4,202) (153,314) -
Total liability (899,200) (18,114) (2,843) (285) (15,154) (935,596) (16,268) (2,074,092) (216) (42,374) (3,068,546) (185,500)
Assets
Total assets 152,500 - - - - 152,500 18,165 1,849,112 - 33,167 2,052,944 197,900
Gross (liability)/asset (746,700) (18,114) (2,843) (285) (15,154) (783,096) 1,897 (224,980) (216) (9,207) (1,015,602) 12,400
Less irrecoverable surplus - - - - - - (2,266) - - - (2,266) (10,400)
Net (liability)/asset (746,700) (18,114) (2,843) (285) (15,154) (783,096) (369) (224,980) (216) (9,207) (1,017,868) 2,000
Movement in liability/asset
Opening (liability)/asset at 1 April (791,900) (18,384) (2,728) (277) (14,207) (827,496) (581) (120,733) (194) (4,409) (953,413) 1,400
Current service cost - - (26) - - (26) (44) (47,351) (17) (349) (47,787) (700)
Benefits payable - - - - - - - - - - - -
Interest on obligation (49,100) (992) (150) (15) (784) (51,041) (803) (103,283) (11) (2,044) (157,182) (9,300)
Contributions 80,900 1,358 112 20 427 82,817 124 62,708 (3) 854 146,500 400
Pension payments to leavers/transfers - - - - - - - 1 (1) - - -
Past service (cost)/gain - - - - - - - (6,105) - - (6,105) -
Actuarial gain/(loss) (3,100) (96) (51) (13) (590) (3,850) 5 (124,658) - (5,779) (134,282) (600)
Expected return on assets 5,600 - - - - 5,600 930 115,524 - 2,520 124,574 10,800
Losses on curtailments - - - - - - - (1,083) - - (1,083) -
Other expenses (700) - - - - (700) - - - - (700) -
Estimated unfunded benefits paid 11,600 - - - - 11,600 - - 10 - 11,610 -
Closing (liability)/asset at 31 March (746,700) (18,114) (2,843) (285) (15,154) (783,096) (369) (224,980) (216) (9,207) (1,017,868) 2,000
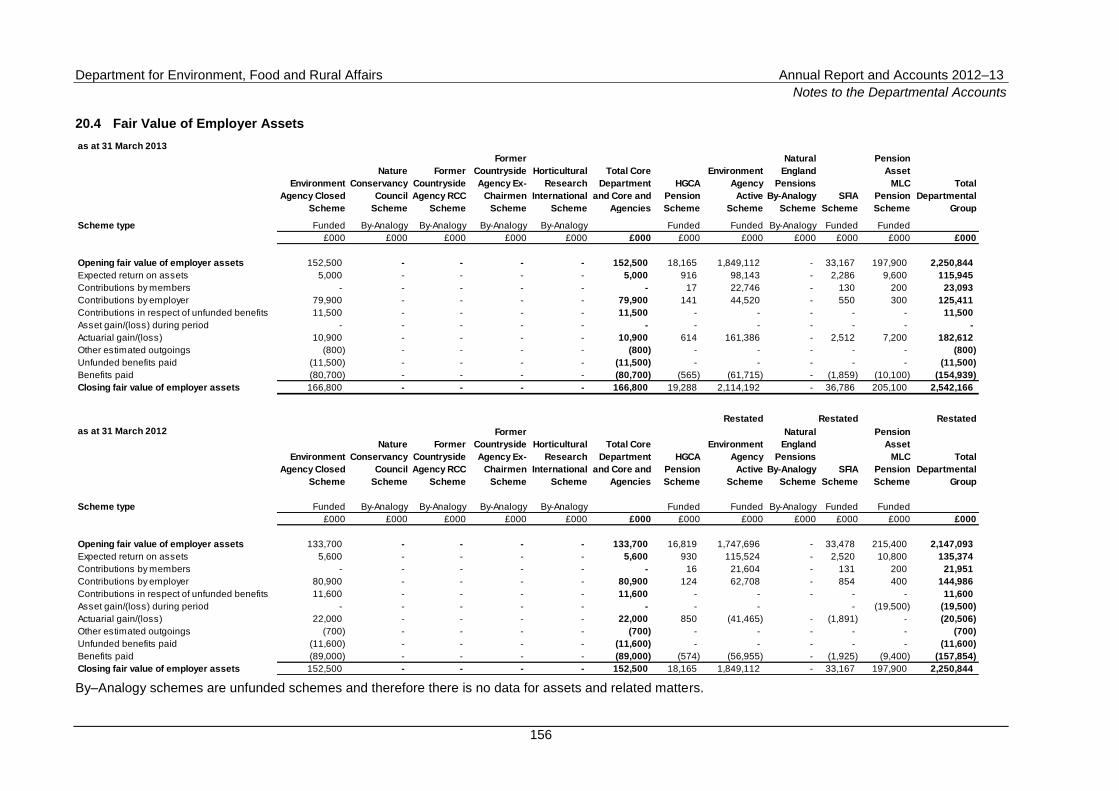
Department for Environment, Food and Rural Affairs Annual Report and Accounts 2012–13
Notes to the Departmental Accounts
156
20.4 Fair Value of Employer Assets
as at 31 March 2013
Environment
Agency Closed
Scheme
Nature
Conservancy
Council
Scheme
Former
Countryside
Agency RCC
Scheme
Former
Countryside
Agency Ex-
Chairmen
Scheme
Horticultural
Research
International
Scheme
Total Core
Department
and Core and
Agencies
HGCA
Pension
Scheme
Environment
Agency
Active
Scheme
Natural
England
Pensions
By-Analogy
Scheme
SFIA
Scheme
Pension
Asset
MLC
Pension
Scheme
Total
Departmental
Group
Scheme type Funded By-Analogy By-Analogy By-Analogy By-Analogy Funded Funded By-Analogy Funded Funded
£000 £000 £000 £000 £000 £000 £000 £000 £000 £000 £000 £000
Opening fair value of employer assets 152,500 - - - - 152,500 18,165 1,849,112 - 33,167 197,900 2,250,844
Expected return on assets 5,000 - - - - 5,000 916 98,143 - 2,286 9,600 115,945
Contributions by members - - - - - - 17 22,746 - 130 200 23,093
Contributions by employer 79,900 - - - - 79,900 141 44,520 - 550 300 125,411
Contributions in respect of unfunded benefits 11,500 - - - - 11,500 - - - - - 11,500
Asset gain/(loss) during period - - - - - - - - - - - -
Actuarial gain/(loss) 10,900 - - - - 10,900 614 161,386 - 2,512 7,200 182,612
Other estimated outgoings (800) - - - - (800) - - - - - (800)
Unfunded benefits paid (11,500) - - - - (11,500) - - - - - (11,500)
Benefits paid (80,700) - - - - (80,700) (565) (61,715) - (1,859) (10,100) (154,939)
Closing fair value of employer assets 166,800 - - - - 166,800 19,288 2,114,192 - 36,786 205,100 2,542,166
Restated Restated Restated
as at 31 March 2012
Environment
Agency Closed
Scheme
Nature
Conservancy
Council
Scheme
Former
Countryside
Agency RCC
Scheme
Former
Countryside
Agency Ex-
Chairmen
Scheme
Horticultural
Research
International
Scheme
Total Core
Department
and Core and
Agencies
HGCA
Pension
Scheme
Environment
Agency
Active
Scheme
Natural
England
Pensions
By-Analogy
Scheme
SFIA
Scheme
Pension
Asset
MLC
Pension
Scheme
Total
Departmental
Group
Scheme type Funded By-Analogy By-Analogy By-Analogy By-Analogy Funded Funded By-Analogy Funded Funded
£000 £000 £000 £000 £000 £000 £000 £000 £000 £000 £000 £000
Opening fair value of employer assets 133,700 - - - - 133,700 16,819 1,747,696 - 33,478 215,400 2,147,093
Expected return on assets 5,600 - - - - 5,600 930 115,524 - 2,520 10,800 135,374
Contributions by members - - - - - - 16 21,604 - 131 200 21,951
Contributions by employer 80,900 - - - - 80,900 124 62,708 - 854 400 144,986
Contributions in respect of unfunded benefits 11,600 - - - - 11,600 - - - - - 11,600
Asset gain/(loss) during period - - - - - - - - - (19,500) (19,500)
Actuarial gain/(loss) 22,000 - - - - 22,000 850 (41,465) - (1,891) - (20,506)
Other estimated outgoings (700) - - - - (700) - - - - - (700)
Unfunded benefits paid (11,600) - - - - (11,600) - - - - - (11,600)
Benefits paid (89,000) - - - - (89,000) (574) (56,955) - (1,925) (9,400) (157,854)
Closing fair value of employer assets 152,500 - - - - 152,500 18,165 1,849,112 - 33,167 197,900 2,250,844
By–Analogy schemes are unfunded schemes and therefore there is no data for assets and related matters.
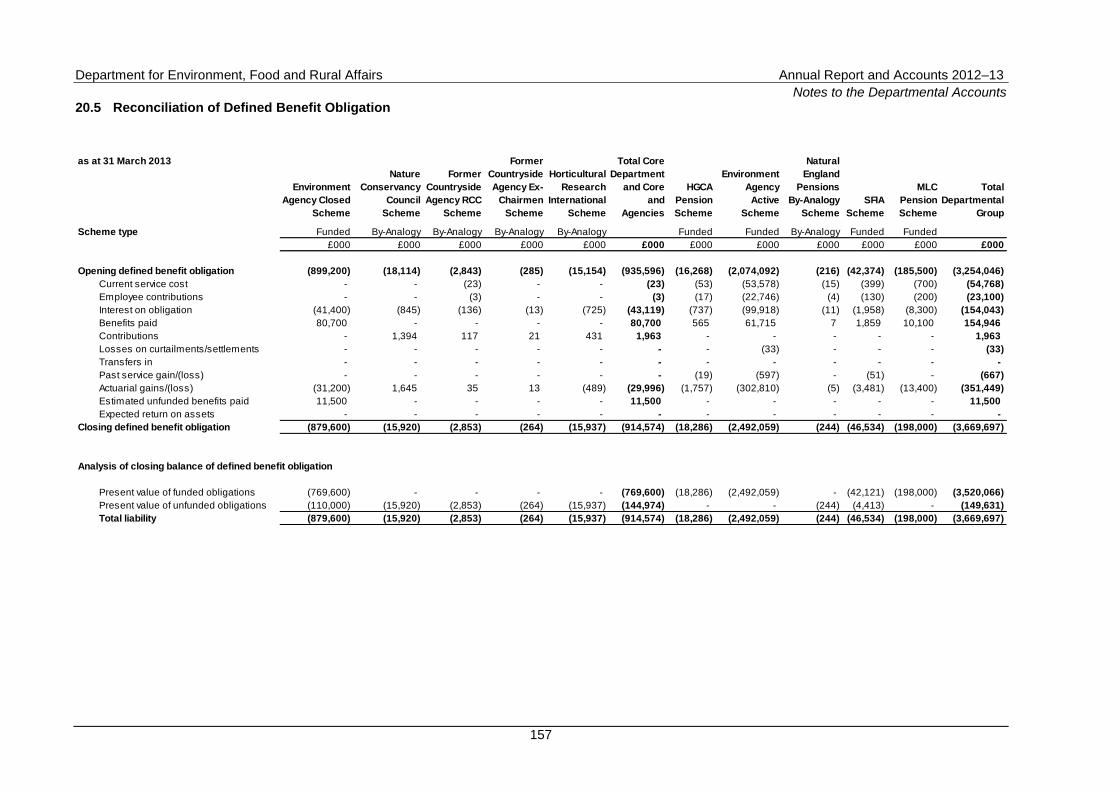
Department for Environment, Food and Rural Affairs Annual Report and Accounts 2012–13
Notes to the Departmental Accounts
157
20.5 Reconciliation of Defined Benefit Obligation
as at 31 March 2013
Environment
Agency Closed
Scheme
Nature
Conservancy
Council
Scheme
Former
Countryside
Agency RCC
Scheme
Former
Countryside
Agency Ex-
Chairmen
Scheme
Horticultural
Research
International
Scheme
Total Core
Department
and Core
and
Agencies
HGCA
Pension
Scheme
Environment
Agency
Active
Scheme
Natural
England
Pensions
By-Analogy
Scheme
SFIA
Scheme
MLC
Pension
Scheme
Total
Departmental
Group
Scheme type Funded By-Analogy By-Analogy By-Analogy By-Analogy Funded Funded By-Analogy Funded Funded
£000 £000 £000 £000 £000 £000 £000 £000 £000 £000 £000 £000
Opening defined benefit obligation (899,200) (18,114) (2,843) (285) (15,154) (935,596) (16,268) (2,074,092) (216) (42,374) (185,500) (3,254,046)
Current service cost - - (23) - - (23) (53) (53,578) (15) (399) (700) (54,768)
Employee contributions - - (3) - - (3) (17) (22,746) (4) (130) (200) (23,100)
Interest on obligation (41,400) (845) (136) (13) (725) (43,119) (737) (99,918) (11) (1,958) (8,300) (154,043)
Benefits paid 80,700 - - - - 80,700 565 61,715 7 1,859 10,100 154,946
Contributions - 1,394 117 21 431 1,963 - - - - - 1,963
Losses on curtailments/settlements - - - - - - - (33) - - - (33)
Transfers in - - - - - - - - - - - -
Past service gain/(loss) - - - - - - (19) (597) - (51) - (667)
Actuarial gains/(loss) (31,200) 1,645 35 13 (489) (29,996) (1,757) (302,810) (5) (3,481) (13,400) (351,449)
Estimated unfunded benefits paid 11,500 - - - - 11,500 - - - - - 11,500
Expected return on assets - - - - - - - - - - - -
Closing defined benefit obligation (879,600) (15,920) (2,853) (264) (15,937) (914,574) (18,286) (2,492,059) (244) (46,534) (198,000) (3,669,697)
Analysis of closing balance of defined benefit obligation
Present value of funded obligations (769,600) - - - - (769,600) (18,286) (2,492,059) - (42,121) (198,000) (3,520,066)
Present value of unfunded obligations (110,000) (15,920) (2,853) (264) (15,937) (144,974) - - (244) (4,413) - (149,631)
Total liability (879,600) (15,920) (2,853) (264) (15,937) (914,574) (18,286) (2,492,059) (244) (46,534) (198,000) (3,669,697)
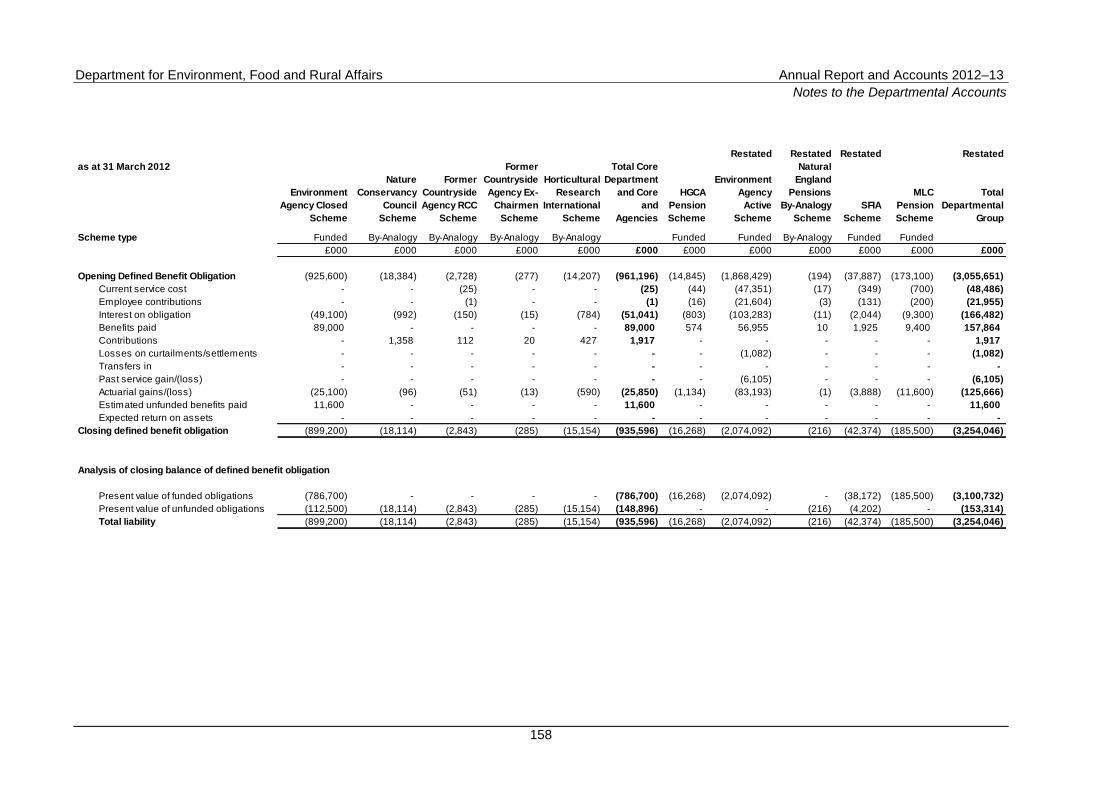
Department for Environment, Food and Rural Affairs Annual Report and Accounts 2012–13
Notes to the Departmental Accounts
158
Restated Restated Restated Restated
as at 31 March 2012
Environment
Agency Closed
Scheme
Nature
Conservancy
Council
Scheme
Former
Countryside
Agency RCC
Scheme
Former
Countryside
Agency Ex-
Chairmen
Scheme
Horticultural
Research
International
Scheme
Total Core
Department
and Core
and
Agencies
HGCA
Pension
Scheme
Environment
Agency
Active
Scheme
Natural
England
Pensions
By-Analogy
Scheme
SFIA
Scheme
MLC
Pension
Scheme
Total
Departmental
Group
Scheme type Funded By-Analogy By-Analogy By-Analogy By-Analogy Funded Funded By-Analogy Funded Funded
£000 £000 £000 £000 £000 £000 £000 £000 £000 £000 £000 £000
Opening Defined Benefit Obligation (925,600) (18,384) (2,728) (277) (14,207) (961,196) (14,845) (1,868,429) (194) (37,887) (173,100) (3,055,651)
Current service cost - - (25) - - (25) (44) (47,351) (17) (349) (700) (48,486)
Employee contributions - - (1) - - (1) (16) (21,604) (3) (131) (200) (21,955)
Interest on obligation (49,100) (992) (150) (15) (784) (51,041) (803) (103,283) (11) (2,044) (9,300) (166,482)
Benefits paid 89,000 - - - - 89,000 574 56,955 10 1,925 9,400 157,864
Contributions - 1,358 112 20 427 1,917 - - - - - 1,917
Losses on curtailments/settlements - - - - - - - (1,082) - - - (1,082)
Transfers in - - - - - - - - - - - -
Past service gain/(loss) - - - - - - - (6,105) - - - (6,105)
Actuarial gains/(loss) (25,100) (96) (51) (13) (590) (25,850) (1,134) (83,193) (1) (3,888) (11,600) (125,666)
Estimated unfunded benefits paid 11,600 - - - - 11,600 - - - - - 11,600
Expected return on assets - - - - - - - - - - - -
Closing defined benefit obligation (899,200) (18,114) (2,843) (285) (15,154) (935,596) (16,268) (2,074,092) (216) (42,374) (185,500) (3,254,046)
Analysis of closing balance of defined benefit obligation
Present value of funded obligations (786,700) - - - - (786,700) (16,268) (2,074,092) - (38,172) (185,500) (3,100,732)
Present value of unfunded obligations (112,500) (18,114) (2,843) (285) (15,154) (148,896) - - (216) (4,202) - (153,314)
Total liability (899,200) (18,114) (2,843) (285) (15,154) (935,596) (16,268) (2,074,092) (216) (42,374) (185,500) (3,254,046)
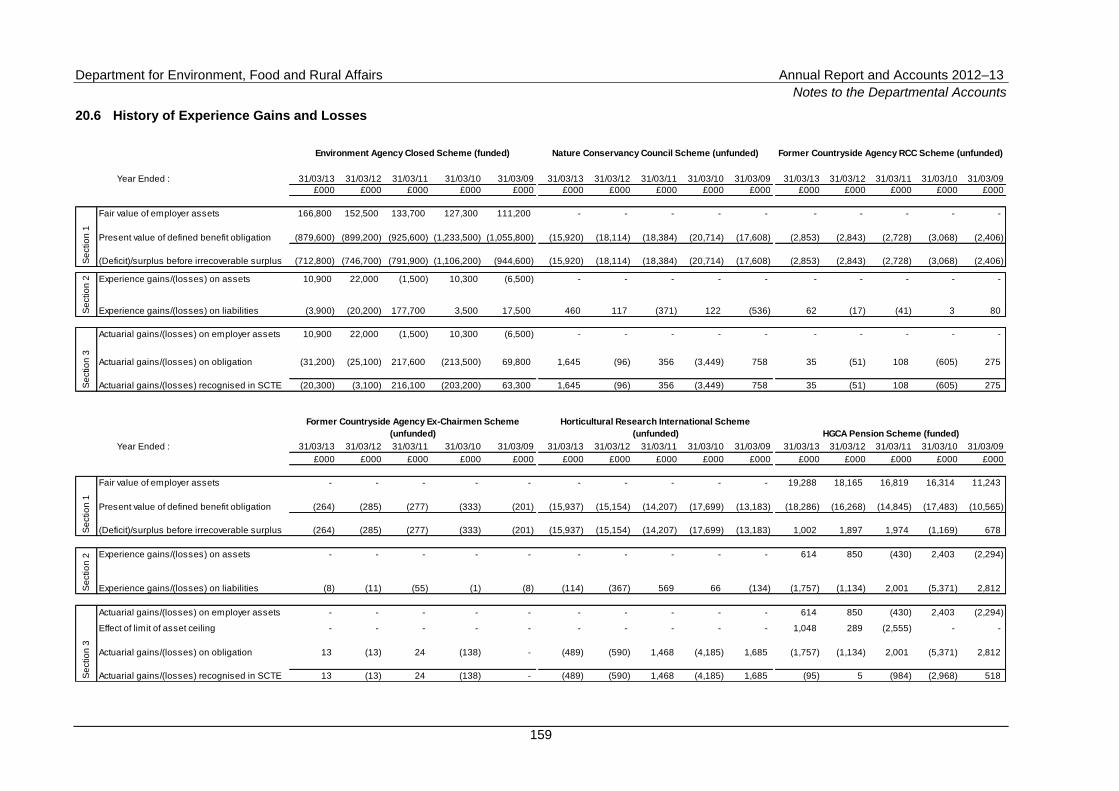
Department for Environment, Food and Rural Affairs Annual Report and Accounts 2012–13
Notes to the Departmental Accounts
159
20.6 History of Experience Gains and Losses
Year Ended : 31/03/13 31/03/12 31/03/11 31/03/10 31/03/09 31/03/13 31/03/12 31/03/11 31/03/10 31/03/09 31/03/13 31/03/12 31/03/11 31/03/10 31/03/09
£000 £000 £000 £000 £000 £000 £000 £000 £000 £000 £000 £000 £000 £000 £000
Fair value of employer assets 166,800 152,500 133,700 127,300 111,200 - - - - - - - - - -
Present value of defined benefit obligation (879,600) (899,200) (925,600) (1,233,500) (1,055,800) (15,920) (18,114) (18,384) (20,714) (17,608) (2,853) (2,843) (2,728) (3,068) (2,406)
(Deficit)/surplus before irrecoverable surplus (712,800) (746,700) (791,900) (1,106,200) (944,600) (15,920) (18,114) (18,384) (20,714) (17,608) (2,853) (2,843) (2,728) (3,068) (2,406)
Experience gains/(losses) on assets 10,900 22,000 (1,500) 10,300 (6,500) - - - - - - - - - -
Experience gains/(losses) on liabilities (3,900) (20,200) 177,700 3,500 17,500 460 117 (371) 122 (536) 62 (17) (41) 3 80
Actuarial gains/(losses) on employer assets 10,900 22,000 (1,500) 10,300 (6,500) - - - - - - - - - -
Actuarial gains/(losses) on obligation (31,200) (25,100) 217,600 (213,500) 69,800 1,645 (96) 356 (3,449) 758 35 (51) 108 (605) 275
Actuarial gains/(losses) recognised in SCTE (20,300) (3,100) 216,100 (203,200) 63,300 1,645 (96) 356 (3,449) 758 35 (51) 108 (605) 275
Year Ended : 31/03/13 31/03/12 31/03/11 31/03/10 31/03/09 31/03/13 31/03/12 31/03/11 31/03/10 31/03/09 31/03/13 31/03/12 31/03/11 31/03/10 31/03/09
£000 £000 £000 £000 £000 £000 £000 £000 £000 £000 £000 £000 £000 £000 £000
Fair value of employer assets - - - - - - - - - - 19,288 18,165 16,819 16,314 11,243
Present value of defined benefit obligation (264) (285) (277) (333) (201) (15,937) (15,154) (14,207) (17,699) (13,183) (18,286) (16,268) (14,845) (17,483) (10,565)
(Deficit)/surplus before irrecoverable surplus (264) (285) (277) (333) (201) (15,937) (15,154) (14,207) (17,699) (13,183) 1,002 1,897 1,974 (1,169) 678
Experience gains/(losses) on assets - - - - - - - - - - 614 850 (430) 2,403 (2,294)
Experience gains/(losses) on liabilities (8) (11) (55) (1) (8) (114) (367) 569 66 (134) (1,757) (1,134) 2,001 (5,371) 2,812
Actuarial gains/(losses) on employer assets - - - - - - - - - - 614 850 (430) 2,403 (2,294)
Effect of limit of asset ceiling - - - - - - - - - - 1,048 289 (2,555) - -
Actuarial gains/(losses) on obligation 13 (13) 24 (138) - (489) (590) 1,468 (4,185) 1,685 (1,757) (1,134) 2,001 (5,371) 2,812
Actuarial gains/(losses) recognised in SCTE 13 (13) 24 (138) - (489) (590) 1,468 (4,185) 1,685 (95) 5 (984) (2,968) 518
Environment Agency Closed Scheme (funded) Nature Conservancy Council Scheme (unfunded) Former Countryside Agency RCC Scheme (unfunded)
Se
ctio
n 1
Se
ctio
n 2
Se
ctio
n 3
Former Countryside Agency Ex-Chairmen Scheme
(unfunded)
Horticultural Research International Scheme
(unfunded) HGCA Pension Scheme (funded)
Se
ctio
n 1
Se
ctio
n 3
Se
ctio
n 2
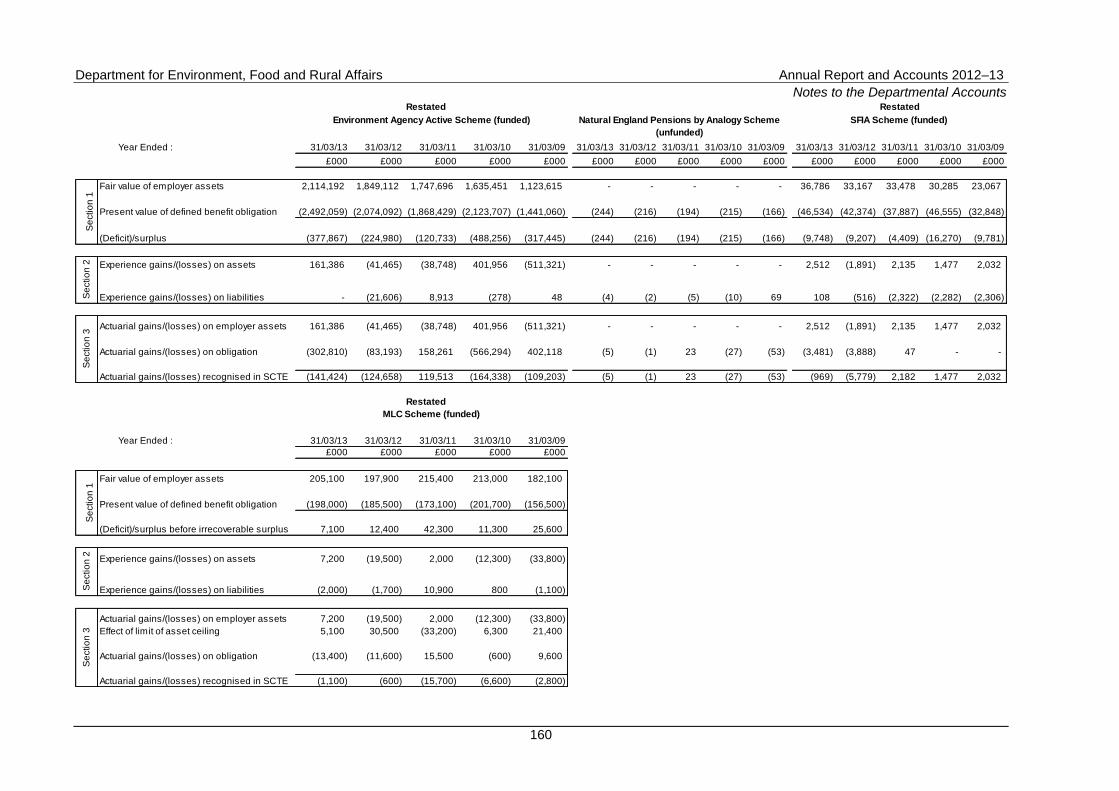
Department for Environment, Food and Rural Affairs Annual Report and Accounts 2012–13
Notes to the Departmental Accounts
160
Restated Restated
Year Ended : 31/03/13 31/03/12 31/03/11 31/03/10 31/03/09 31/03/13 31/03/12 31/03/11 31/03/10 31/03/09 31/03/13 31/03/12 31/03/11 31/03/10 31/03/09
£000 £000 £000 £000 £000 £000 £000 £000 £000 £000 £000 £000 £000 £000 £000
Fair value of employer assets 2,114,192 1,849,112 1,747,696 1,635,451 1,123,615 - - - - - 36,786 33,167 33,478 30,285 23,067
Present value of defined benefit obligation (2,492,059) (2,074,092) (1,868,429) (2,123,707) (1,441,060) (244) (216) (194) (215) (166) (46,534) (42,374) (37,887) (46,555) (32,848)
(Deficit)/surplus (377,867) (224,980) (120,733) (488,256) (317,445) (244) (216) (194) (215) (166) (9,748) (9,207) (4,409) (16,270) (9,781)
Experience gains/(losses) on assets 161,386 (41,465) (38,748) 401,956 (511,321) - - - - - 2,512 (1,891) 2,135 1,477 2,032
Experience gains/(losses) on liabilities - (21,606) 8,913 (278) 48 (4) (2) (5) (10) 69 108 (516) (2,322) (2,282) (2,306)
Actuarial gains/(losses) on employer assets 161,386 (41,465) (38,748) 401,956 (511,321) - - - - - 2,512 (1,891) 2,135 1,477 2,032
Actuarial gains/(losses) on obligation (302,810) (83,193) 158,261 (566,294) 402,118 (5) (1) 23 (27) (53) (3,481) (3,888) 47 - -
Actuarial gains/(losses) recognised in SCTE (141,424) (124,658) 119,513 (164,338) (109,203) (5) (1) 23 (27) (53) (969) (5,779) 2,182 1,477 2,032
Restated
Year Ended : 31/03/13 31/03/12 31/03/11 31/03/10 31/03/09
£000 £000 £000 £000 £000
Fair value of employer assets 205,100 197,900 215,400 213,000 182,100
Present value of defined benefit obligation (198,000) (185,500) (173,100) (201,700) (156,500)
(Deficit)/surplus before irrecoverable surplus 7,100 12,400 42,300 11,300 25,600
Experience gains/(losses) on assets 7,200 (19,500) 2,000 (12,300) (33,800)
Experience gains/(losses) on liabilities (2,000) (1,700) 10,900 800 (1,100)
Actuarial gains/(losses) on employer assets 7,200 (19,500) 2,000 (12,300) (33,800)
Effect of limit of asset ceiling 5,100 30,500 (33,200) 6,300 21,400
Actuarial gains/(losses) on obligation (13,400) (11,600) 15,500 (600) 9,600
Actuarial gains/(losses) recognised in SCTE (1,100) (600) (15,700) (6,600) (2,800)
MLC Scheme (funded)
Se
ctio
n 1
Se
ctio
n 2
Se
ctio
n 3
Se
ctio
n 3
Environment Agency Active Scheme (funded) Natural England Pensions by Analogy Scheme
(unfunded)
SFIA Scheme (funded)
Se
ctio
n 1
Se
ctio
n 2
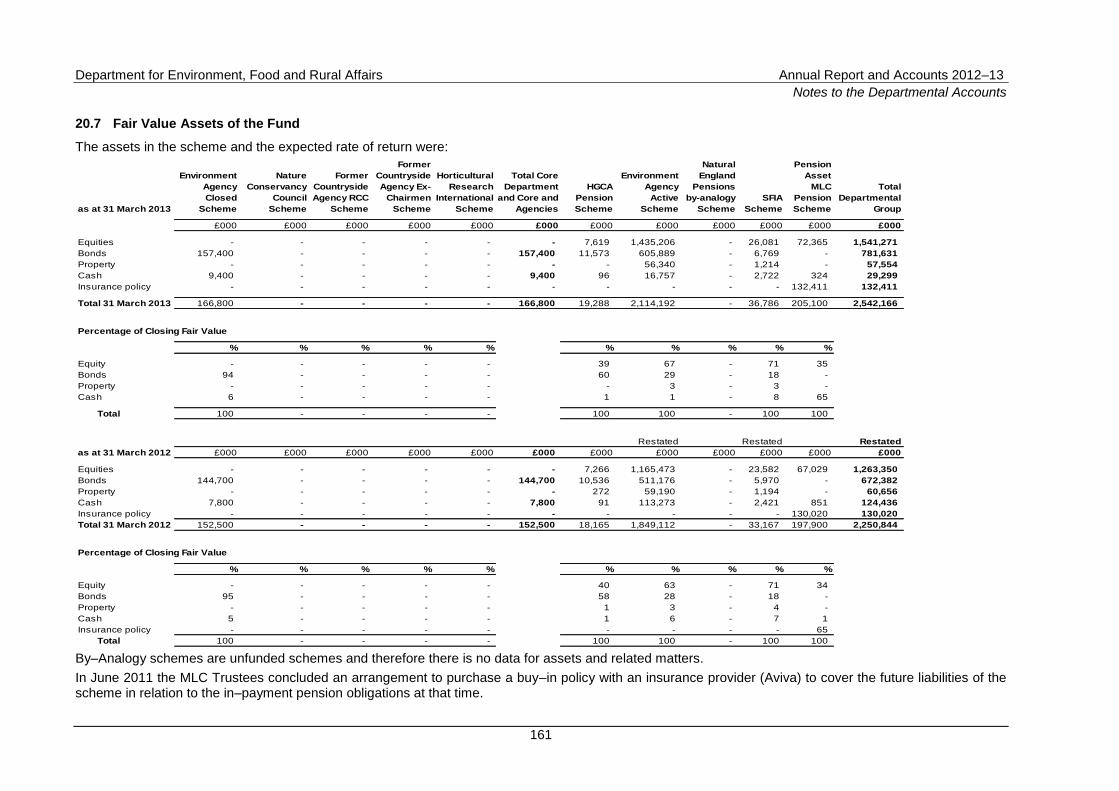
Department for Environment, Food and Rural Affairs Annual Report and Accounts 2012–13
Notes to the Departmental Accounts
161
20.7 Fair Value Assets of the Fund
The assets in the scheme and the expected rate of return were:
as at 31 March 2013
Environment
Agency
Closed
Scheme
Nature
Conservancy
Council
Scheme
Former
Countryside
Agency RCC
Scheme
Former
Countryside
Agency Ex-
Chairmen
Scheme
Horticultural
Research
International
Scheme
Total Core
Department
and Core and
Agencies
HGCA
Pension
Scheme
Environment
Agency
Active
Scheme
Natural
England
Pensions
by-analogy
Scheme
SFIA
Scheme
Pension
Asset
MLC
Pension
Scheme
Total
Departmental
Group
£000 £000 £000 £000 £000 £000 £000 £000 £000 £000 £000 £000
Equities - - - - - - 7,619 1,435,206 - 26,081 72,365 1,541,271
Bonds 157,400 - - - - 157,400 11,573 605,889 - 6,769 - 781,631
Property - - - - - - - 56,340 - 1,214 - 57,554
Cash 9,400 - - - - 9,400 96 16,757 - 2,722 324 29,299
Insurance policy - - - - - - - - - - 132,411 132,411
Total 31 March 2013 166,800 - - - - 166,800 19,288 2,114,192 - 36,786 205,100 2,542,166
Percentage of Closing Fair Value
% % % % % % % % % %
Equity - - - - - 39 67 - 71 35
Bonds 94 - - - - 60 29 - 18 -
Property - - - - - - 3 - 3 -
Cash 6 - - - - 1 1 - 8 65
Total 100 - - - - 100 100 - 100 100
Restated Restated Restated
as at 31 March 2012 £000 £000 £000 £000 £000 £000 £000 £000 £000 £000 £000 £000
Equities - - - - - - 7,266 1,165,473 - 23,582 67,029 1,263,350
Bonds 144,700 - - - - 144,700 10,536 511,176 - 5,970 - 672,382
Property - - - - - - 272 59,190 - 1,194 - 60,656
Cash 7,800 - - - - 7,800 91 113,273 - 2,421 851 124,436
Insurance policy - - - - - - - - - - 130,020 130,020
Total 31 March 2012 152,500 - - - - 152,500 18,165 1,849,112 - 33,167 197,900 2,250,844
Percentage of Closing Fair Value
% % % % % % % % % %
Equity - - - - - 40 63 - 71 34
Bonds 95 - - - - 58 28 - 18 -
Property - - - - - 1 3 - 4 -
Cash 5 - - - - 1 6 - 7 1
Insurance policy - - - - - - - - - 65
Total 100 - - - - 100 100 - 100 100
By–Analogy schemes are unfunded schemes and therefore there is no data for assets and related matters.
In June 2011 the MLC Trustees concluded an arrangement to purchase a buy–in policy with an insurance provider (Aviva) to cover the future liabilities of the scheme in relation to the in–payment pension obligations at that time.
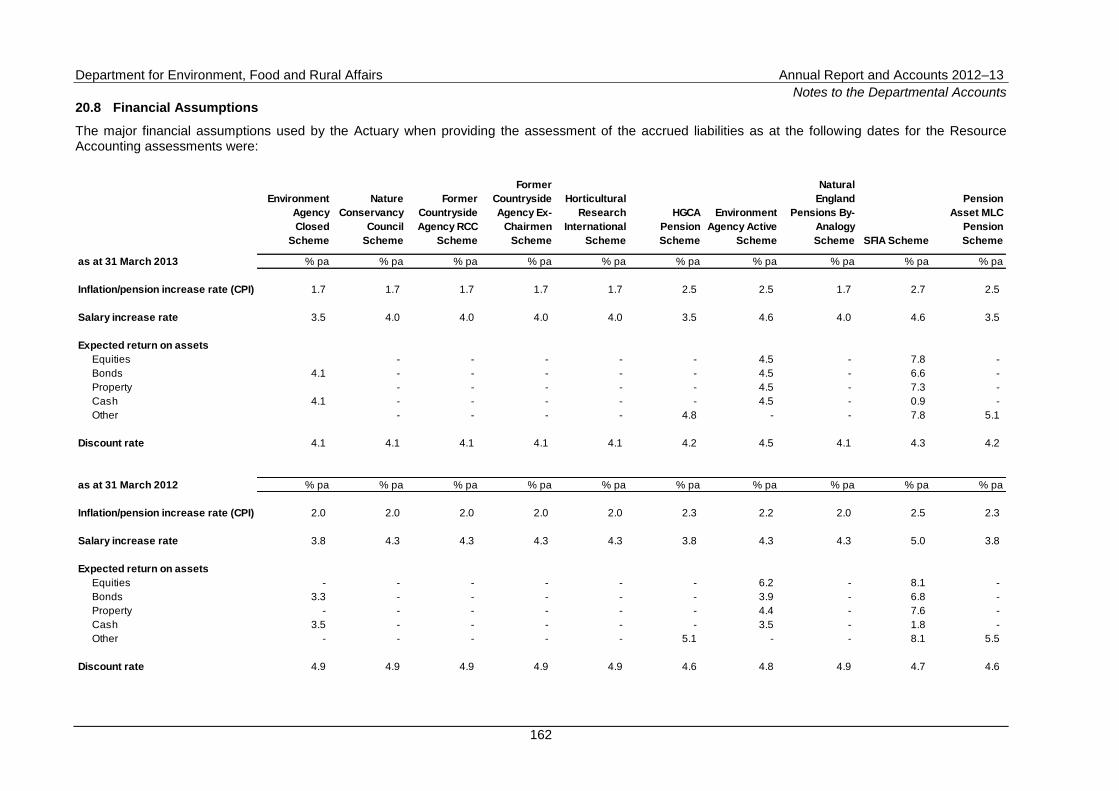
Department for Environment, Food and Rural Affairs Annual Report and Accounts 2012–13
Notes to the Departmental Accounts
162
20.8 Financial Assumptions
The major financial assumptions used by the Actuary when providing the assessment of the accrued liabilities as at the following dates for the Resource Accounting assessments were:
Environment
Agency
Closed
Scheme
Nature
Conservancy
Council
Scheme
Former
Countryside
Agency RCC
Scheme
Former
Countryside
Agency Ex-
Chairmen
Scheme
Horticultural
Research
International
Scheme
HGCA
Pension
Scheme
Environment
Agency Active
Scheme
Natural
England
Pensions By-
Analogy
Scheme SFIA Scheme
Pension
Asset MLC
Pension
Scheme
as at 31 March 2013 % pa % pa % pa % pa % pa % pa % pa % pa % pa % pa
Inflation/pension increase rate (CPI) 1.7 1.7 1.7 1.7 1.7 2.5 2.5 1.7 2.7 2.5
Salary increase rate 3.5 4.0 4.0 4.0 4.0 3.5 4.6 4.0 4.6 3.5
Expected return on assets
Equities - - - - - 4.5 - 7.8 -
Bonds 4.1 - - - - - 4.5 - 6.6 -
Property - - - - - 4.5 - 7.3 -
Cash 4.1 - - - - - 4.5 - 0.9 -
Other - - - - 4.8 - - 7.8 5.1
Discount rate 4.1 4.1 4.1 4.1 4.1 4.2 4.5 4.1 4.3 4.2
as at 31 March 2012 % pa % pa % pa % pa % pa % pa % pa % pa % pa % pa
Inflation/pension increase rate (CPI) 2.0 2.0 2.0 2.0 2.0 2.3 2.2 2.0 2.5 2.3
Salary increase rate 3.8 4.3 4.3 4.3 4.3 3.8 4.3 4.3 5.0 3.8
Expected return on assets
Equities - - - - - - 6.2 - 8.1 -
Bonds 3.3 - - - - - 3.9 - 6.8 -
Property - - - - - - 4.4 - 7.6 -
Cash 3.5 - - - - - 3.5 - 1.8 -
Other - - - - - 5.1 - - 8.1 5.5
Discount rate 4.9 4.9 4.9 4.9 4.9 4.6 4.8 4.9 4.7 4.6
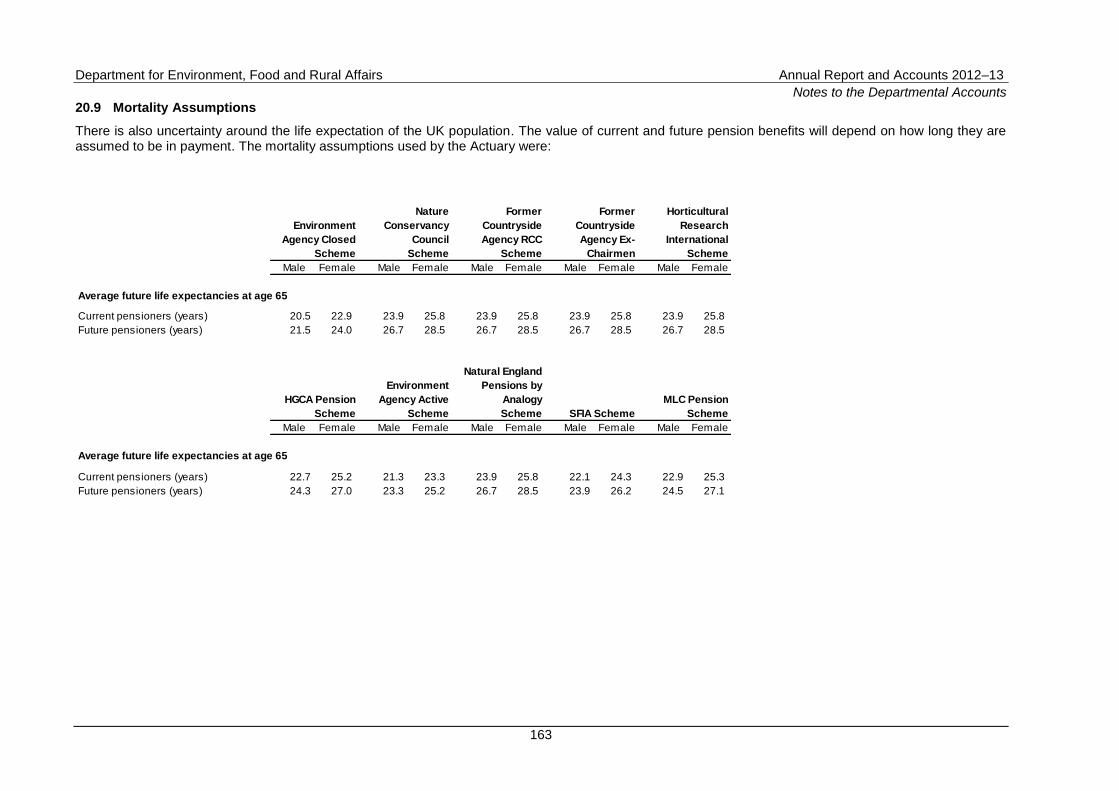
Department for Environment, Food and Rural Affairs Annual Report and Accounts 2012–13
Notes to the Departmental Accounts
163
20.9 Mortality Assumptions
There is also uncertainty around the life expectation of the UK population. The value of current and future pension benefits will depend on how long they are assumed to be in payment. The mortality assumptions used by the Actuary were:
Male Female Male Female Male Female Male Female Male Female
Average future life expectancies at age 65
Current pensioners (years) 20.5 22.9 23.9 25.8 23.9 25.8 23.9 25.8 23.9 25.8
Future pensioners (years) 21.5 24.0 26.7 28.5 26.7 28.5 26.7 28.5 26.7 28.5
Male Female Male Female Male Female Male Female Male Female
Average future life expectancies at age 65
Current pensioners (years) 22.7 25.2 21.3 23.3 23.9 25.8 22.1 24.3 22.9 25.3
Future pensioners (years) 24.3 27.0 23.3 25.2 26.7 28.5 23.9 26.2 24.5 27.1
HGCA Pension
Scheme
Environment
Agency Active
Scheme
Natural England
Pensions by
Analogy
Scheme SFIA Scheme
MLC Pension
Scheme
Environment
Agency Closed
Scheme
Nature
Conservancy
Council
Scheme
Former
Countryside
Agency RCC
Scheme
Former
Countryside
Agency Ex-
Chairmen
Horticultural
Research
International
Scheme
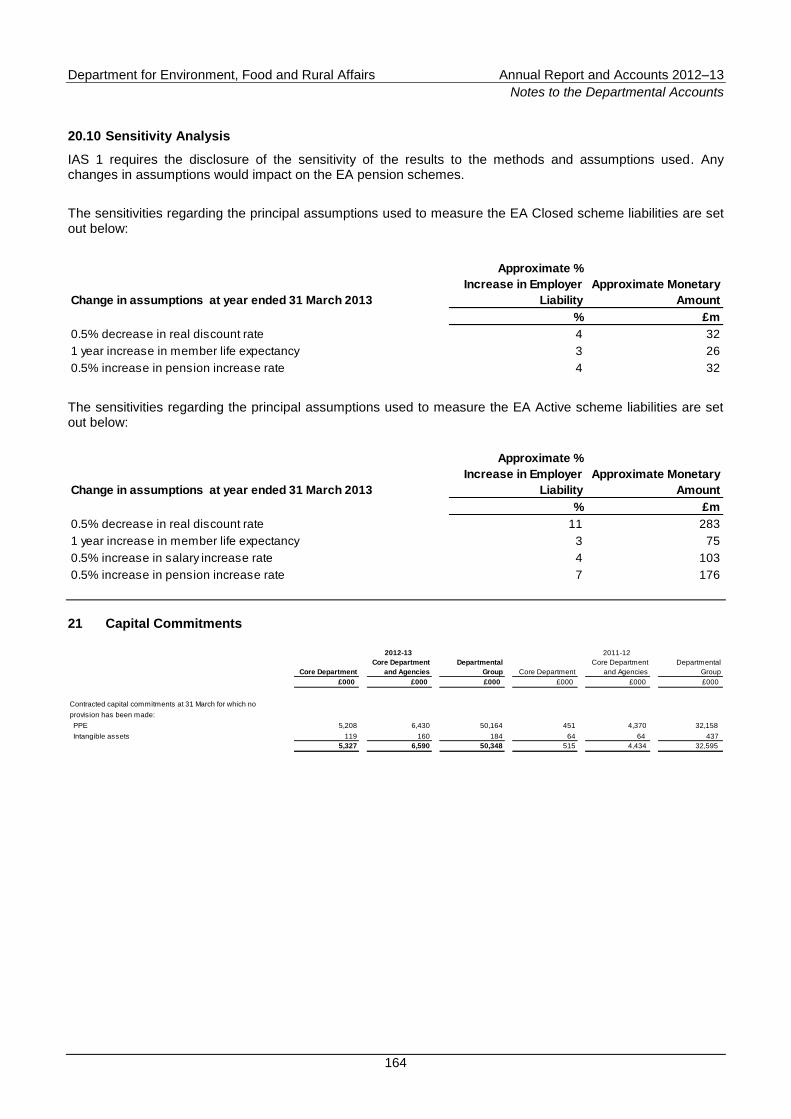
Department for Environment, Food and Rural Affairs Annual Report and Accounts 2012–13
Notes to the Departmental Accounts
164
20.10 Sensitivity Analysis
IAS 1 requires the disclosure of the sensitivity of the results to the methods and assumptions used. Any changes in assumptions would impact on the EA pension schemes.
The sensitivities regarding the principal assumptions used to measure the EA Closed scheme liabilities are set out below:
Change in assumptions at year ended 31 March 2013
Approximate %
Increase in Employer
Liability
Approximate Monetary
Amount
% £m
0.5% decrease in real discount rate 4 32
1 year increase in member life expectancy 3 26
0.5% increase in pension increase rate 4 32
The sensitivities regarding the principal assumptions used to measure the EA Active scheme liabilities are set out below:
Change in assumptions at year ended 31 March 2013
Approximate %
Increase in Employer
Liability
Approximate Monetary
Amount
% £m
0.5% decrease in real discount rate 11 283
1 year increase in member life expectancy 3 75
0.5% increase in salary increase rate 4 103
0.5% increase in pension increase rate 7 176
21 Capital Commitments 2012-13 2011-12
Core Department
Core Department
and Agencies
Departmental
Group Core Department
Core Department
and Agencies
Departmental
Group
£000 £000 £000 £000 £000 £000
Contracted capital commitments at 31 March for which no
provision has been made:
PPE 5,208 6,430 50,164 451 4,370 32,158
Intangible assets 119 160 184 64 64 437
5,327 6,590 50,348 515 4,434 32,595
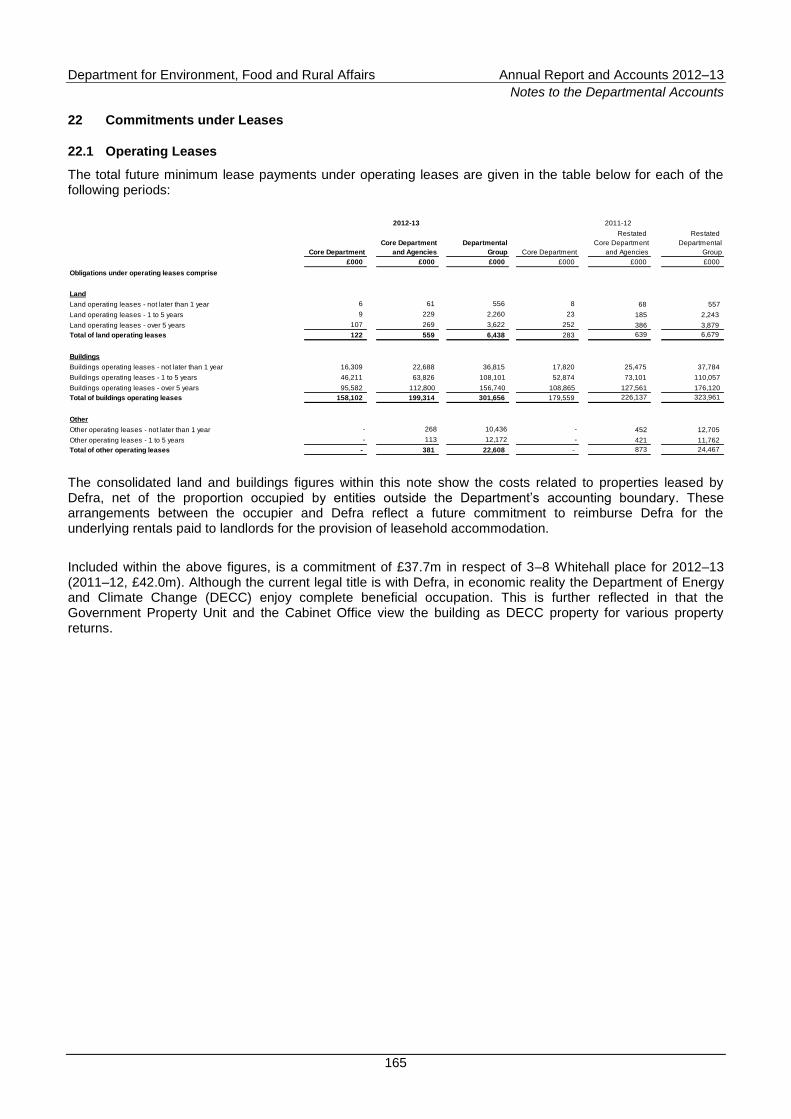
Department for Environment, Food and Rural Affairs Annual Report and Accounts 2012–13
Notes to the Departmental Accounts
165
22 Commitments under Leases
22.1 Operating Leases
The total future minimum lease payments under operating leases are given in the table below for each of the following periods:
2012-13 2011-12
Restated Restated
Core Department
Core Department
and Agencies
Departmental
Group Core Department
Core Department
and Agencies
Departmental
Group
£000 £000 £000 £000 £000 £000
Obligations under operating leases comprise
Land
Land operating leases - not later than 1 year 6 61 556 8 68 557
Land operating leases - 1 to 5 years 9 229 2,260 23 185 2,243
Land operating leases - over 5 years 107 269 3,622 252 386 3,879
Total of land operating leases 122 559 6,438 283 639 6,679
Buildings
Buildings operating leases - not later than 1 year 16,309 22,688 36,815 17,820 25,475 37,784
Buildings operating leases - 1 to 5 years 46,211 63,826 108,101 52,874 73,101 110,057
Buildings operating leases - over 5 years 95,582 112,800 156,740 108,865 127,561 176,120
Total of buildings operating leases 158,102 199,314 301,656 179,559 226,137 323,961
Other
Other operating leases - not later than 1 year - 268 10,436 - 452 12,705
Other operating leases - 1 to 5 years - 113 12,172 - 421 11,762
Total of other operating leases - 381 22,608 - 873 24,467
The consolidated land and buildings figures within this note show the costs related to properties leased by Defra, net of the proportion occupied by entities outside the Department‟s accounting boundary. These arrangements between the occupier and Defra reflect a future commitment to reimburse Defra for the underlying rentals paid to landlords for the provision of leasehold accommodation.
Included within the above figures, is a commitment of £37.7m in respect of 3–8 Whitehall place for 2012–13 (2011–12, £42.0m). Although the current legal title is with Defra, in economic reality the Department of Energy and Climate Change (DECC) enjoy complete beneficial occupation. This is further reflected in that the Government Property Unit and the Cabinet Office view the building as DECC property for various property returns.
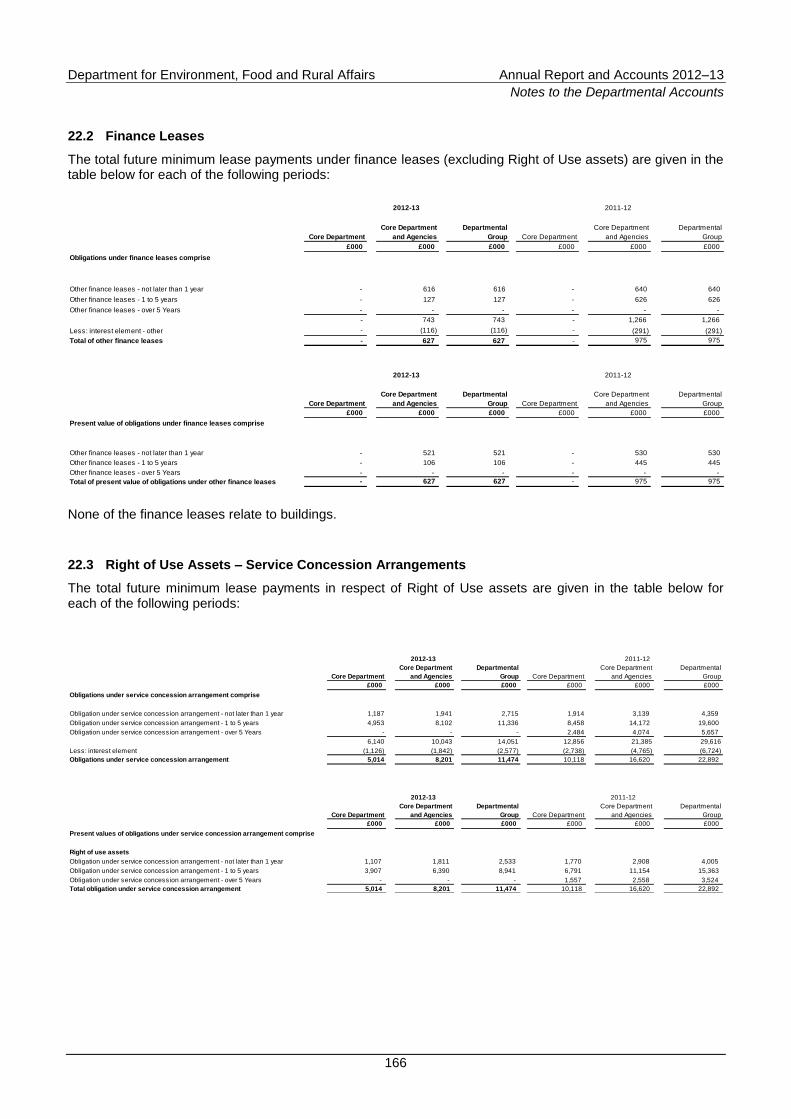
Department for Environment, Food and Rural Affairs Annual Report and Accounts 2012–13
Notes to the Departmental Accounts
166
22.2 Finance Leases
The total future minimum lease payments under finance leases (excluding Right of Use assets) are given in the table below for each of the following periods:
2012-13 2011-12
Core Department
Core Department
and Agencies
Departmental
Group Core Department
Core Department
and Agencies
Departmental
Group
£000 £000 £000 £000 £000 £000
Obligations under finance leases comprise
Other finance leases - not later than 1 year - 616 616 - 640 640
Other finance leases - 1 to 5 years - 127 127 - 626 626
Other finance leases - over 5 Years - - - - - -
- 743 743 - 1,266 1,266
Less: interest element - other - (116) (116) - (291) (291)
Total of other finance leases - 627 627 - 975 975
2012-13 2011-12
Core Department
Core Department
and Agencies
Departmental
Group Core Department
Core Department
and Agencies
Departmental
Group
£000 £000 £000 £000 £000 £000
Present value of obligations under finance leases comprise
Other finance leases - not later than 1 year - 521 521 - 530 530
Other finance leases - 1 to 5 years - 106 106 - 445 445
Other finance leases - over 5 Years - - - - - -
Total of present value of obligations under other finance leases - 627 627 - 975 975
None of the finance leases relate to buildings.
22.3 Right of Use Assets – Service Concession Arrangements
The total future minimum lease payments in respect of Right of Use assets are given in the table below for each of the following periods:
2012-13 2011-12
Core Department
Core Department
and Agencies
Departmental
Group Core Department
Core Department
and Agencies
Departmental
Group
£000 £000 £000 £000 £000 £000
Obligations under service concession arrangement comprise
Obligation under service concession arrangement - not later than 1 year 1,187 1,941 2,715 1,914 3,139 4,359
Obligation under service concession arrangement - 1 to 5 years 4,953 8,102 11,336 8,458 14,172 19,600
Obligation under service concession arrangement - over 5 Years - - - 2,484 4,074 5,657
6,140 10,043 14,051 12,856 21,385 29,616
Less: interest element (1,126) (1,842) (2,577) (2,738) (4,765) (6,724)
Obligations under service concession arrangement 5,014 8,201 11,474 10,118 16,620 22,892
2012-13 2011-12
Core Department
Core Department
and Agencies
Departmental
Group Core Department
Core Department
and Agencies
Departmental
Group
£000 £000 £000 £000 £000 £000
Present values of obligations under service concession arrangement comprise
Right of use assets
Obligation under service concession arrangement - not later than 1 year 1,107 1,811 2,533 1,770 2,908 4,005
Obligation under service concession arrangement - 1 to 5 years 3,907 6,390 8,941 6,791 11,154 15,363
Obligation under service concession arrangement - over 5 Years - - - 1,557 2,558 3,524
Total obligation under service concession arrangement 5,014 8,201 11,474 10,118 16,620 22,892
Department for Environment, Food and Rural Affairs Annual Report and Accounts 2012–13
Notes to the Departmental Accounts
167
23 Commitments under PFI Contracts
23.1 Off–balance Sheet
The majority of Private Finance Initiative (PFI) contracts associated with Defra are funded by NDPBs and Public Corporations.
An off–balance sheet contract was signed by the Department in February 2001. The scheme involved the grant of a 129 year ground lease to a PFI partner who constructed an office building for Defra, occupied in 2003, subject to a 30 year lease to 31 March 2033. The building is not an asset of the Department and will not revert to Defra at the end of the lease term. The freehold land subject to the ground lease is a Defra asset. Defra occupies 0.39 percent (2011–12, 0.39 percent) of the building and recharges other occupiers for their share of the costs, with Natural England occupying 19.7 percent (2011–12, 24.7 percent) of the site.
In addition, EA has entered into two Public-Private Partnership (PPP) Contracts.
Broadland Flood Alleviation Project
This contract commenced in February 2001. It is a contract costing in excess of £120m over a 20 year period, to restore flood defences to at least the levels measured in a 1995 topographical survey of the area. The improvement works are to be completed by 2015 with a 7 year remaining life on the works before they erode below the 1995 condition.
Expenditure incurred during the period is charged to the Statement of Comprehensive Net Expenditure. For maintenance work, emergency response and strategy development, costs are accrued based on the agreed annual charge for these services. For planning approvals and improvement works, costs are recognised when the work is completed in accordance with the „Framework for the Preparation and Presentation of Financial Statements‟. For planning approvals, costs are recognised when formal notification of the granting of planning permission has been received. For improvement works, the flood defence work is recognised when the Environment Agency accepts the work through the issuing of an Improved Service Level Certificate. The contract end date is May 2021.
Pevensey Bay Sea Defences
In May 2000, EA and Pevensey Coastal Defence Ltd (PCDL) signed a £27.4m PPP contract for the Pevensey Bay Sea Defences. The contract is for 25 years, and in May 2003 the contract was varied to include the Sovereign Harbour frontage. The current contract value with a January 2013 price base is £39m. Under the contract PCDL have carried out improvement works, and now continue to maintain the improved sea defences in return for a monthly fee, detailed in an annual payments schedule. The contract is based on the provision of a service rather than the creation of a physical asset. The principal service provided under the contract is protection against the breaching and erosion of the sea defences up to specified service levels.
Full details of the PPP contracts can be found in EA‟s Annual Report and Accounts47
.
47
www.environment-agency.gov.uk
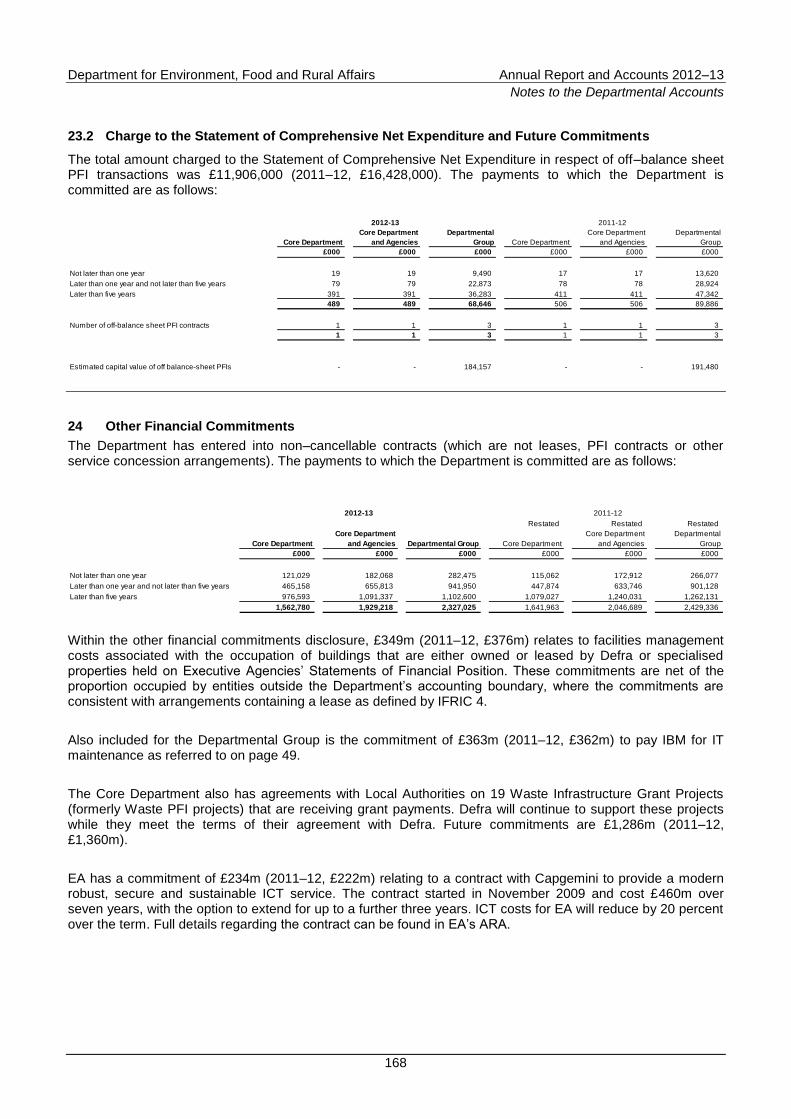
Department for Environment, Food and Rural Affairs Annual Report and Accounts 2012–13
Notes to the Departmental Accounts
168
23.2 Charge to the Statement of Comprehensive Net Expenditure and Future Commitments
The total amount charged to the Statement of Comprehensive Net Expenditure in respect of off–balance sheet PFI transactions was £11,906,000 (2011–12, £16,428,000). The payments to which the Department is committed are as follows:
2012-13 2011-12
Core Department
Core Department
and Agencies
Departmental
Group Core Department
Core Department
and Agencies
Departmental
Group
£000 £000 £000 £000 £000 £000
Not later than one year 19 19 9,490 17 17 13,620
Later than one year and not later than five years 79 79 22,873 78 78 28,924
Later than five years 391 391 36,283 411 411 47,342
489 489 68,646 506 506 89,886
Number of off-balance sheet PFI contracts 1 1 3 1 1 3
1 1 3 1 1 3
Estimated capital value of off balance-sheet PFIs - - 184,157 - - 191,480
24 Other Financial Commitments
The Department has entered into non–cancellable contracts (which are not leases, PFI contracts or other service concession arrangements). The payments to which the Department is committed are as follows:
2012-13 2011-12
Restated Restated Restated
Core Department
Core Department
and Agencies Departmental Group Core Department
Core Department
and Agencies
Departmental
Group
£000 £000 £000 £000 £000 £000
Not later than one year 121,029 182,068 282,475 115,062 172,912 266,077
Later than one year and not later than five years 465,158 655,813 941,950 447,874 633,746 901,128
Later than five years 976,593 1,091,337 1,102,600 1,079,027 1,240,031 1,262,131
1,562,780 1,929,218 2,327,025 1,641,963 2,046,689 2,429,336
Within the other financial commitments disclosure, £349m (2011–12, £376m) relates to facilities management costs associated with the occupation of buildings that are either owned or leased by Defra or specialised properties held on Executive Agencies‟ Statements of Financial Position. These commitments are net of the proportion occupied by entities outside the Department‟s accounting boundary, where the commitments are consistent with arrangements containing a lease as defined by IFRIC 4.
Also included for the Departmental Group is the commitment of £363m (2011–12, £362m) to pay IBM for IT maintenance as referred to on page 49.
The Core Department also has agreements with Local Authorities on 19 Waste Infrastructure Grant Projects (formerly Waste PFI projects) that are receiving grant payments. Defra will continue to support these projects while they meet the terms of their agreement with Defra. Future commitments are £1,286m (2011–12, £1,360m).
EA has a commitment of £234m (2011–12, £222m) relating to a contract with Capgemini to provide a modern robust, secure and sustainable ICT service. The contract started in November 2009 and cost £460m over seven years, with the option to extend for up to a further three years. ICT costs for EA will reduce by 20 percent over the term. Full details regarding the contract can be found in EA‟s ARA.
Department for Environment, Food and Rural Affairs Annual Report and Accounts 2012–13
Notes to the Departmental Accounts
169
25 Contingent Liabilities Disclosed under IAS 37 and Contingent Assets
25.1 Contingent Liabilities
There are a number of events, with uncertain outcomes, that could potentially lead to liabilities for the Department. Given such uncertainties, these items have not been accrued for in the Accounts, but are instead listed separately as contingent liabilities. Due to their variable nature some of these liabilities are unquantifiable. At 31 March 2013, the main items under this heading were as follows.
Liability for landfill sites that do not reach the standards required by the Environmental Permitting regulations if the permit holder becomes insolvent. Potential liability to the Core Department is estimated at £15–30m.
Infringements of the Urban Waste Water Treatment Directive could lead to substantial fines for the Core Department from the EU (unquantifiable).
Potential future claims (both civil and criminal) against the Core Department for pollution that may arise from FMD farm burial grounds (unquantifiable).
A contractual liability for dilapidations arises to the extent that the tenant fails to repair, maintain or decorate in accordance with the terms of the lease. A liability for reinstatement arises where a leased building is altered by the tenant at the request of the tenant. These obligations cannot be reliably estimated at inception. Provision is made where the landlord has notified an intention to enforce a claim and the amount of such a claim can be assessed. A contingent liability therefore exists for potential claims against the Core Department over and above the existing provision. The potential liability is £15.5m (2011–12, £21.2m).
As part of the revised contract with our Facilities Management providers it has been agreed that under certain conditions arising from the rationalisation of the Estate and subsequent reduction in demand, any restructuring costs such as redundancies or early retirement will be recharged to the Core Department (unquantifiable).
A potential liability arising from the Government‟s Outline Position 1998, in which the Government set out circumstances in which it would meet compensation payable by local planning authorities in meeting its responsibilities under regulation 63 of the Conservation of Habitats and Species Regulations 2010. The potential liability to the Core Department is £3.2m.
The Core Department has a potential liability for restitution of property enquiry searches (unquantifiable).
There is a potential liability in respect of the Common Agricultural Programme (CAP) where the European Commission have questioned the debt management procedures. This liability to the Core Department is uncertain and unquantifiable at present.
RPA is currently in receipt of appeals from scheme claimants against the non payment of claims covering the Single Payment Scheme (SPS) and trader related schemes. If the appeals are successful they could either result in a liability for EU or Exchequer funded payments (unquantifiable).
Potential liabilities arising from small claims, individually less than £3m, against Defra, its Executive Agencies and NDPBs. The potential liability is estimated at no more than £13.8m (2011–12, £9.6m).
25.2 Contingent Assets
At 31 March 2013, the main items under this heading were as follows.
The Core Department is entitled to a future share of enhancement in value on a number of properties and land previously sold. These enhancements generally arise from the planning and development process and are based on a number of trigger points, planning thresholds and increased values (unquantifiable).
Department for Environment, Food and Rural Affairs Annual Report and Accounts 2012–13
Notes to the Departmental Accounts
170
Natural England has entered into a management and purchase agreement with a private company relating to land at Bolton Fell Moss, Cumbria. Under the agreement signed in March 2010 the company has agreed to phase out peat extraction from the site by November 2013. Once peat extraction is complete the ownership will transfer to Natural England and the land will be included in the Statement of Financial Position (unquantifiable).
The Department has other potential small assets, individually valued at less than £3m, with an estimated value of £4.7m (2011–12, £3m).
26 Contingent Liabilities not Required to be Disclosed Under IAS 37 but Included for Parliamentary
Reporting and Accountability Purposes
26.1 Quantifiable
Defra has entered into the following quantifiable contingent liabilities by offering guarantees, indemnities or by giving letters of comfort. None of these are contingent liabilities within the meaning of IAS 37 since the likelihood of a transfer of economic benefits in settlement is too remote.
A transfer of economic benefits is considered to be remote on the following.
Defra provided a letter of comfort to close a funding gap that would otherwise prevent the completion of the redevelopment of the New Covent Garden Market site at Nine Elms. The Department has agreed to underwrite the redevelopment of the Covent Garden Market Authority (CGMA) in the event that costs exceed the budget allowed to them by HM Treasury, up to a maximum of £10m (2011–12, £10m). Funding would not be available to CGMA until after 1 April 2015. To reduce the risk of the liability crystallising Defra maintains a senior level oversight of the Project through senior representation at CGMA Board meetings where the development is discussed.
Indemnity signed by the Defra, Canal & River Trust and British Waterways pension trustees in relation to the historic public sector pension liability. The potential liability is estimated at £125m (2011–12, £125m).
Possible European Court of Justice fines for the Core Department relating to alleged failure to transpose the Wild Birds Directive. Legal advice is that the minimum fine in this case is estimated to be £7.5m.
Potential liabilities arising from small claims are estimated at no more than £1.5m (2011–12 £1m).
26.2 Unquantifiable
Defra has entered into the following contingent liabilities by offering guarantees, indemnities or by giving letters of comfort. Due to the variable nature of these contingent liabilities they are classified as unquantifiable. None of these are contingent liabilities within the meaning of IAS 37 since the possibility of a transfer of economic benefits in settlement is too remote.
Indemnities:
Indemnity to maintain an offshore works, built in the 1970s, to ensure that no danger or nuisance is caused.
A transfer of economic benefits is also considered to be remote on the following:
Where Defra has assigned a previously held lease to a third party, Defra remains potentially liable to compensate the landlord where the subsequent lessee defaults and the landlord fails to achieve redress elsewhere.
Environmental contamination arising from the use, and former use of sites which Defra controls, or formerly controlled, may give rise to a future remediation liability.
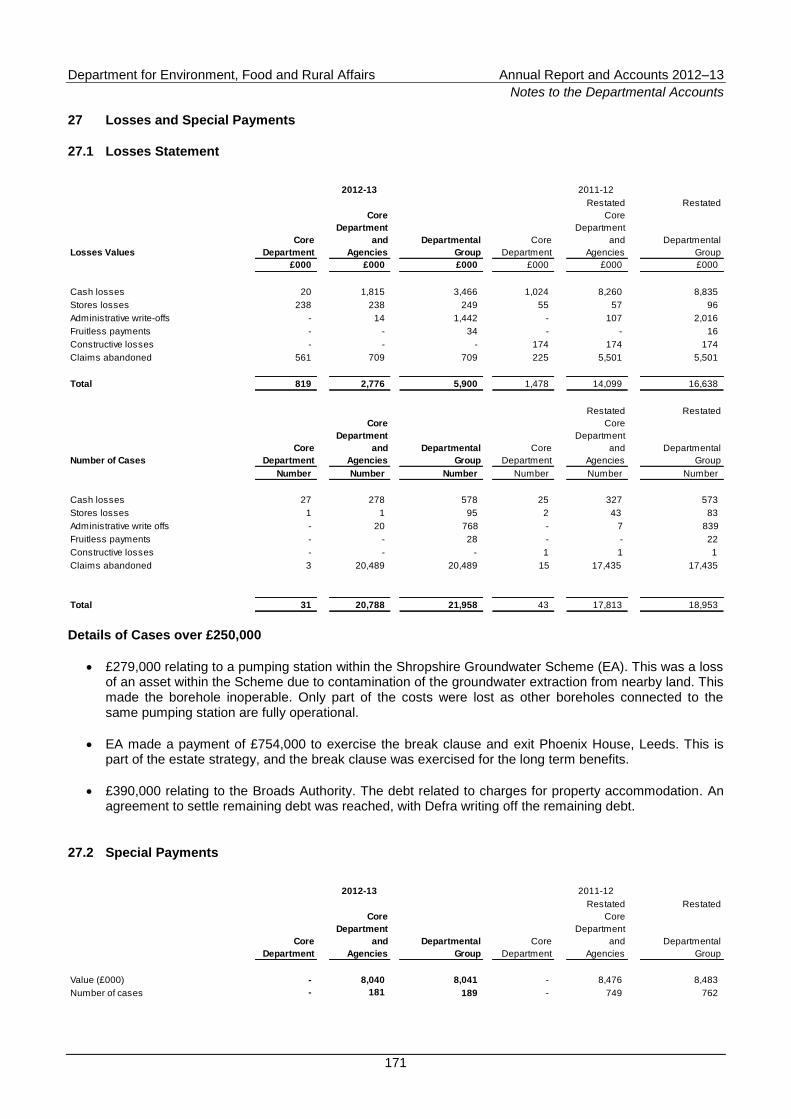
Department for Environment, Food and Rural Affairs Annual Report and Accounts 2012–13
Notes to the Departmental Accounts
171
27 Losses and Special Payments
27.1 Losses Statement
2012-13 2011-12
Restated Restated
Losses Values
Core
Department
Core
Department
and
Agencies
Departmental
Group
Core
Department
Core
Department
and
Agencies
Departmental
Group
£000 £000 £000 £000 £000 £000
Cash losses 20 1,815 3,466 1,024 8,260 8,835
Stores losses 238 238 249 55 57 96
Administrative write-offs - 14 1,442 - 107 2,016
Fruitless payments - - 34 - - 16
Constructive losses - - - 174 174 174
Claims abandoned 561 709 709 225 5,501 5,501
Total 819 2,776 5,900 1,478 14,099 16,638
Restated Restated
Number of Cases
Core
Department
Core
Department
and
Agencies
Departmental
Group
Core
Department
Core
Department
and
Agencies
Departmental
Group
Number Number Number Number Number Number
Cash losses 27 278 578 25 327 573
Stores losses 1 1 95 2 43 83
Administrative write offs - 20 768 - 7 839
Fruitless payments - - 28 - - 22
Constructive losses - - - 1 1 1
Claims abandoned 3 20,489 20,489 15 17,435 17,435
Total 31 20,788 21,958 43 17,813 18,953 Details of Cases over £250,000
£279,000 relating to a pumping station within the Shropshire Groundwater Scheme (EA). This was a loss of an asset within the Scheme due to contamination of the groundwater extraction from nearby land. This made the borehole inoperable. Only part of the costs were lost as other boreholes connected to the same pumping station are fully operational.
EA made a payment of £754,000 to exercise the break clause and exit Phoenix House, Leeds. This is part of the estate strategy, and the break clause was exercised for the long term benefits.
£390,000 relating to the Broads Authority. The debt related to charges for property accommodation. An agreement to settle remaining debt was reached, with Defra writing off the remaining debt.
27.2 Special Payments
2012-13 2011-12
Restated Restated
Core
Department
Core
Department
and
Agencies
Departmental
Group
Core
Department
Core
Department
and
Agencies
Departmental
Group
Value (£000) - 8,040 8,041 - 8,476 8,483
Number of cases - 181 189 - 749 762
Department for Environment, Food and Rural Affairs Annual Report and Accounts 2012–13
Notes to the Departmental Accounts
172
Details of Cases over £250,000
RPA made a payment of £3,537,000 to Angus Growers, and a payment of £3,698,000 was made to Speciality Produce Ltd. There payments arose as a result of a Producer Organisation review of the Fruit and Vegetable Trader Scheme, where all payments for aid accrued during the 2010 scheme year were held pending the outcome. Based on legal advice Ministers took a decision to make payments to all Producer Organisations involved, including those interpreted as non-compliant by the Commission. HM Treasury granted approval that these payments could be made ex-gratia as they are the subject of disallowance if paid from the EU fund.
Nu-Star received a payment of £413,000 this year from RPA in relation to a claim for damage to rented premises during the BSE crisis.
27.3 Sugar Levies
The RPA collect sugar levies on behalf of the European Commission. The European Commission has acknowledged that sugar levy rates advised by regulation during the period between 2002 and 2006 were incorrect, leading to incorrect levies applied and charged on producers. The regulations have been retrospectively challenged by sugar producers within the European Union. Following the receipt of a claim from British Sugar in February 2013 and the subsequent settlement of the claim in April 2013, this payment of £13.9m was included in the Statement of Parliamentary Supply for 2012–13. Further details are available within the Trust Statement note in the RPA‟s Annual Report and Accounts.
28 Related Party Transactions
The Department is the sponsor of the Executive Agencies, NDPBs and Levy Funded Bodies (LFBs), all of which are within the Departmental accounting boundary, shown in Note 32. Public Corporations are outside the accounting boundary, and are shown in Note 33. All the bodies above are regarded as related parties with which the Department has had various material transactions during the year. These bodies also trade with each other and have had material transactions during the year.
In addition, the Department has had a number of transactions with other government departments and the Devolved Administrations.
A number of Defra Board members or other related parties claim CAP scheme payments as detailed below. Where this is the case, the standard EU terms and conditions for these schemes apply.
Katrina Williams‟ (Director General) husband is employed by Defra as a permanent, full time member of staff. He does not receive any preferential treatment.
Richard Benyon (Parliamentary Under-Secretary) is entitled to income from a family trust Englefield Estate Trust Corporation Limited and Sir William Benyon (as trustees). During the year the Trust received grants for Single Farm Payment, English Woodland Grant Scheme and Other Forestry Schemes, totalling £156,429. Richard Benyon‟s children are entitled to a benefit from Englefield Estate Trust Corporation Limited (as trustees). During the year, the Trust received grant payments relating to Single Farm Payment, Countryside Stewardship Scheme and Environmental Stewardship Scheme totalling £255,096.
Lord de Mauley (Parliamentary Under-Secretary since 6 September 2012) received grant payments totalling £16,689 in respect of Entry Level Stewardship, Single Payment Scheme, Woodland Grant Scheme and Farm Woodland Premium Scheme.
Department for Environment, Food and Rural Affairs Annual Report and Accounts 2012–13
Notes to the Departmental Accounts
173
In January 2003 RPA signed a contract with Accenture to provide IT services. Caroline Spelman‟s husband has worked for Accenture since 1989. He was Global Head of Strategy during the reporting year until December 2012. Mr Spelman does not take part in any work involving Defra or the RPA. The value of payments made to Accenture by RPA during the reporting year, up to Mrs Spelman‟s departure as Secretary of State on 3 September 2012 was £3,790,339 including VAT.
Details for related party transactions for Executive Agencies, NDPBs and Levy Funded Bodies can be found in the notes to their Annual Report and Accounts.
Other than those disclosed above, none of the Defra Board members or other related parties have undertaken any material transactions with the Department during the year.
29 Events After the Reporting Period
Defra‟s Financial Statements are laid before the House of Commons by HM Treasury. International Accounting Standard 10: Events after the reporting period requires Defra to disclose the date on which the accounts are authorised for issue.
The Accounting Officer authorised these financial statements for issue on 9 July 2013.
Natural Resources Body for Wales
On the 1 April 2013, the activities of the Environment Agency in Wales (Environment Agency Wales (EAW)) were transferred to a new single body for the environment in Wales, called Natural Resources Wales (NRW), pursuant to the Natural Resources Body for Wales Transfer Scheme 2013 under the Public Bodies Act 2011. The Welsh activities of the Forestry Commission and the Countryside Council for Wales have also been transferred to NRW on that date.
All remaining rights and obligations of EAW transferred to NRW on 1 April 2013 by virtue of a transfer scheme under the authority of the Public Bodies Act 2011. All assets, liabilities and reserves relating to EAW have been transferred to NRW on 1 April 2013 and have been accounted for under the appropriate accounting treatment outlined in the FReM.
As the rights and obligations of EAW were transferred to NRW by virtue of a transfer scheme under Parliamentary legislation, with no compensation arising, the assets and liabilities are not deemed as being held for resale. They have therefore been included in non-current assets, current assets and current and long term liabilities as in prior years. Similarly they have not been included as discontinued operations in the Statement of Consolidated Net Expenditure. The employees of NRW that were employees of EA remain members of the EA Pension Fund.
A number of the reservoir operating agreements that EA has been a party to relate to reservoirs in Wales. These agreements have been novated to NRW at 1 April 2013. As a result, the obligations arising under these agreements to pay annual amounts that are increased in line with inflation have also been transferred on 1 April 2013. Liabilities of £39.8m are included as non-current liabilities in the Statement of Financial Position.
Department for Environment, Food and Rural Affairs Annual Report and Accounts 2012–13
Notes to the Departmental Accounts
174
30 Prior Year Adjustments
30.1 Effect on Major Statements
Prior year adjustments have been made to reflect the following:
30.1.1 Network Bodies’ Consolidation Exercise
The prior year Consolidated Accounts were aligned to reflect the Network Bodies‟ final published Annual Report and Accounts. The effect of this exercise on the published 2011–12 Annual Report and Accounts is shown below.
30.1.2 EA Reservoir Operating Agreements
A prior year adjustment has been made to reflect a change in the required treatment of a number of reservoir operating agreements that EA is a party to. EA is bound by agreements entered into by its predecessor bodies regarding return on investment payments, which were agreed at the time of water company privatisation. Upon review of these agreements in 2012–13 against the current accounting standards, it was identified that financial liabilities exist under IAS 39 Financial Instruments: Recognition and Measurement.
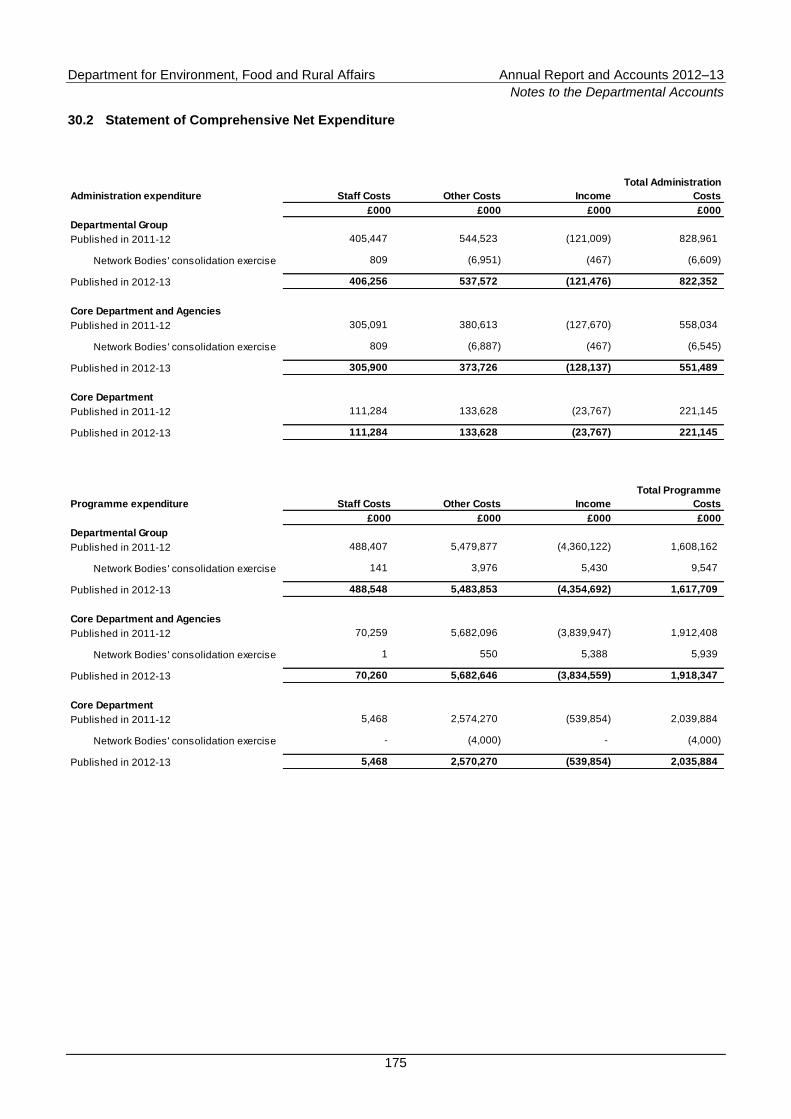
Department for Environment, Food and Rural Affairs Annual Report and Accounts 2012–13
Notes to the Departmental Accounts
175
30.2 Statement of Comprehensive Net Expenditure
Administration expenditure Staff Costs Other Costs Income
Total Administration
Costs
£000 £000 £000 £000
Departmental Group
Published in 2011-12 405,447 544,523 (121,009) 828,961
Network Bodies' consolidation exercise 809 (6,951) (467) (6,609)
Published in 2012-13 406,256 537,572 (121,476) 822,352
Core Department and Agencies
Published in 2011-12 305,091 380,613 (127,670) 558,034
Network Bodies' consolidation exercise 809 (6,887) (467) (6,545)
Published in 2012-13 305,900 373,726 (128,137) 551,489
Core Department
Published in 2011-12 111,284 133,628 (23,767) 221,145
Published in 2012-13 111,284 133,628 (23,767) 221,145
Programme expenditure Staff Costs Other Costs Income
Total Programme
Costs
£000 £000 £000 £000
Departmental Group
Published in 2011-12 488,407 5,479,877 (4,360,122) 1,608,162
Network Bodies' consolidation exercise 141 3,976 5,430 9,547
Published in 2012-13 488,548 5,483,853 (4,354,692) 1,617,709
Core Department and Agencies
Published in 2011-12 70,259 5,682,096 (3,839,947) 1,912,408
Network Bodies' consolidation exercise 1 550 5,388 5,939
Published in 2012-13 70,260 5,682,646 (3,834,559) 1,918,347
Core Department
Published in 2011-12 5,468 2,574,270 (539,854) 2,039,884
Network Bodies' consolidation exercise - (4,000) - (4,000)
Published in 2012-13 5,468 2,570,270 (539,854) 2,035,884
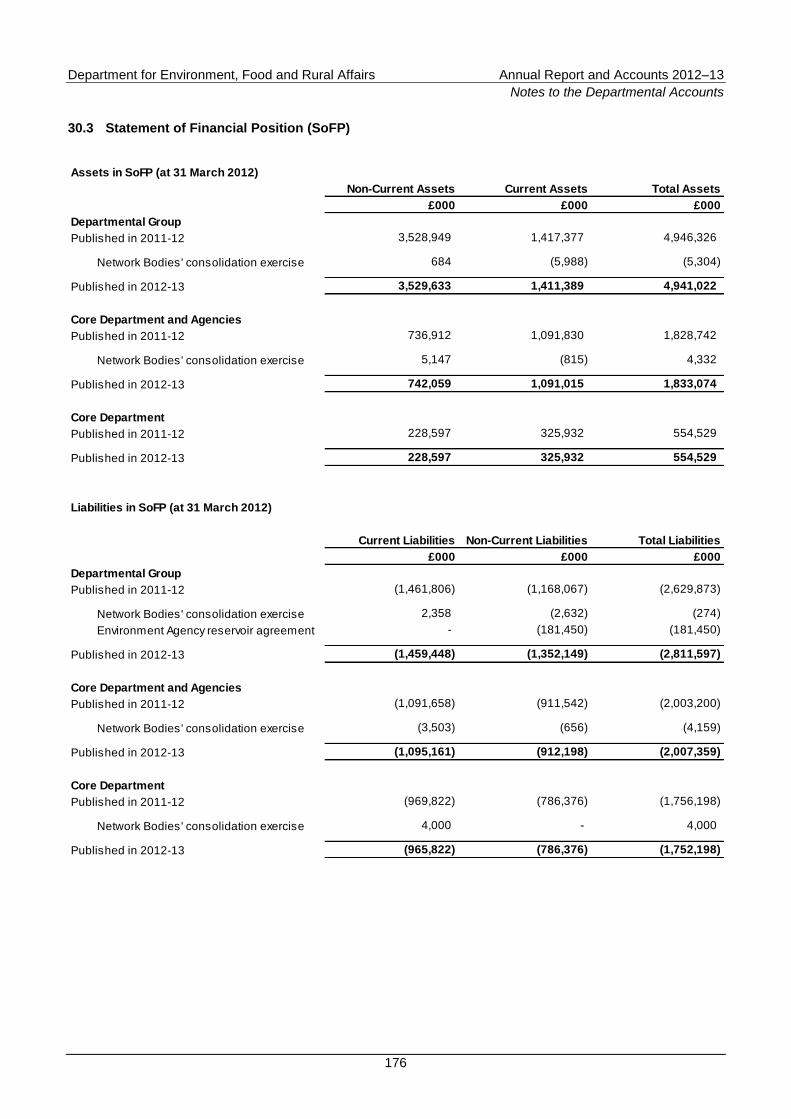
Department for Environment, Food and Rural Affairs Annual Report and Accounts 2012–13
Notes to the Departmental Accounts
176
30.3 Statement of Financial Position (SoFP)
Assets in SoFP (at 31 March 2012)
Non-Current Assets Current Assets Total Assets
£000 £000 £000
Departmental Group
Published in 2011-12 3,528,949 1,417,377 4,946,326
Network Bodies' consolidation exercise 684 (5,988) (5,304)
Published in 2012-13 3,529,633 1,411,389 4,941,022
Core Department and Agencies
Published in 2011-12 736,912 1,091,830 1,828,742
Network Bodies' consolidation exercise 5,147 (815) 4,332
Published in 2012-13 742,059 1,091,015 1,833,074
Core Department
Published in 2011-12 228,597 325,932 554,529
Published in 2012-13 228,597 325,932 554,529
Liabilities in SoFP (at 31 March 2012)
Current Liabilities Non-Current Liabilities Total Liabilities
£000 £000 £000
Departmental Group
Published in 2011-12 (1,461,806) (1,168,067) (2,629,873)
Network Bodies' consolidation exercise 2,358 (2,632) (274)
Environment Agency reservoir agreement - (181,450) (181,450)
Published in 2012-13 (1,459,448) (1,352,149) (2,811,597)
Core Department and Agencies
Published in 2011-12 (1,091,658) (911,542) (2,003,200)
Network Bodies' consolidation exercise (3,503) (656) (4,159)
Published in 2012-13 (1,095,161) (912,198) (2,007,359)
Core Department
Published in 2011-12 (969,822) (786,376) (1,756,198)
Network Bodies' consolidation exercise 4,000 - 4,000
Published in 2012-13 (965,822) (786,376) (1,752,198)
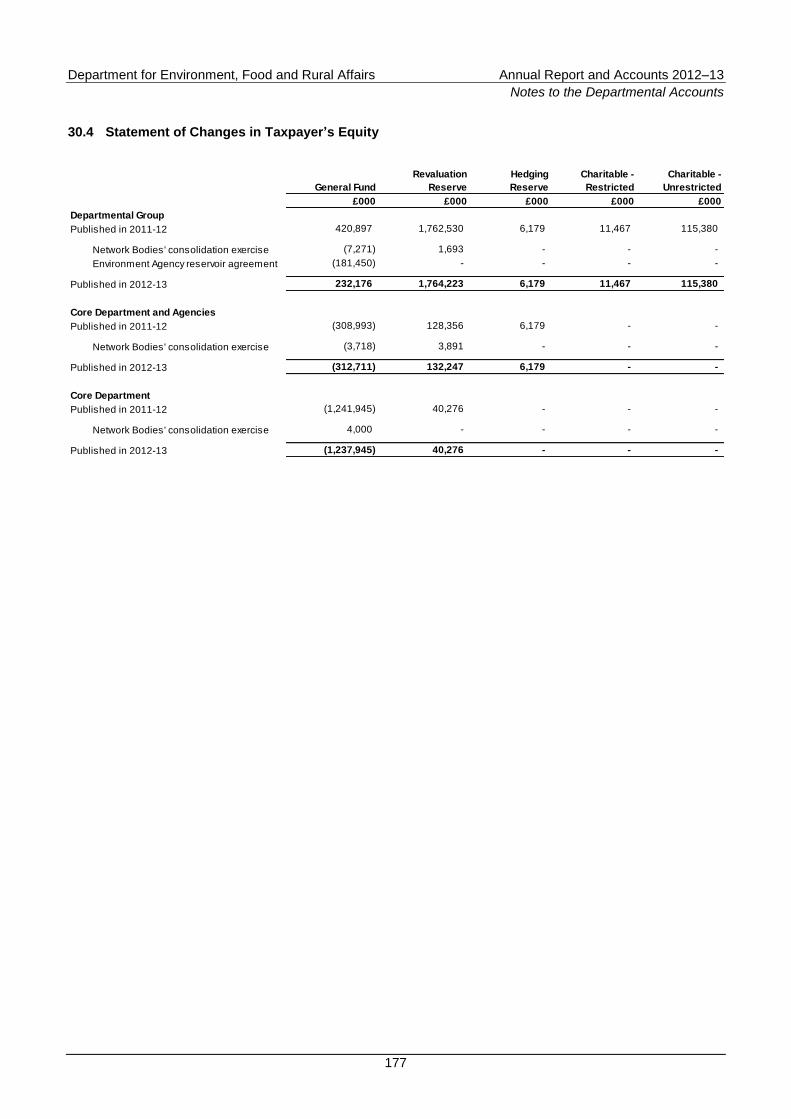
Department for Environment, Food and Rural Affairs Annual Report and Accounts 2012–13
Notes to the Departmental Accounts
177
30.4 Statement of Changes in Taxpayer’s Equity
General Fund
Revaluation
Reserve
Hedging
Reserve
Charitable -
Restricted
Charitable -
Unrestricted
£000 £000 £000 £000 £000
Departmental Group
Published in 2011-12 420,897 1,762,530 6,179 11,467 115,380
Network Bodies' consolidation exercise (7,271) 1,693 - - -
Environment Agency reservoir agreement (181,450) - - - -
Published in 2012-13 232,176 1,764,223 6,179 11,467 115,380
Core Department and Agencies
Published in 2011-12 (308,993) 128,356 6,179 - -
Network Bodies' consolidation exercise (3,718) 3,891 - - -
Published in 2012-13 (312,711) 132,247 6,179 - -
Core Department
Published in 2011-12 (1,241,945) 40,276 - - -
Network Bodies' consolidation exercise 4,000 - - - -
Published in 2012-13 (1,237,945) 40,276 - - -
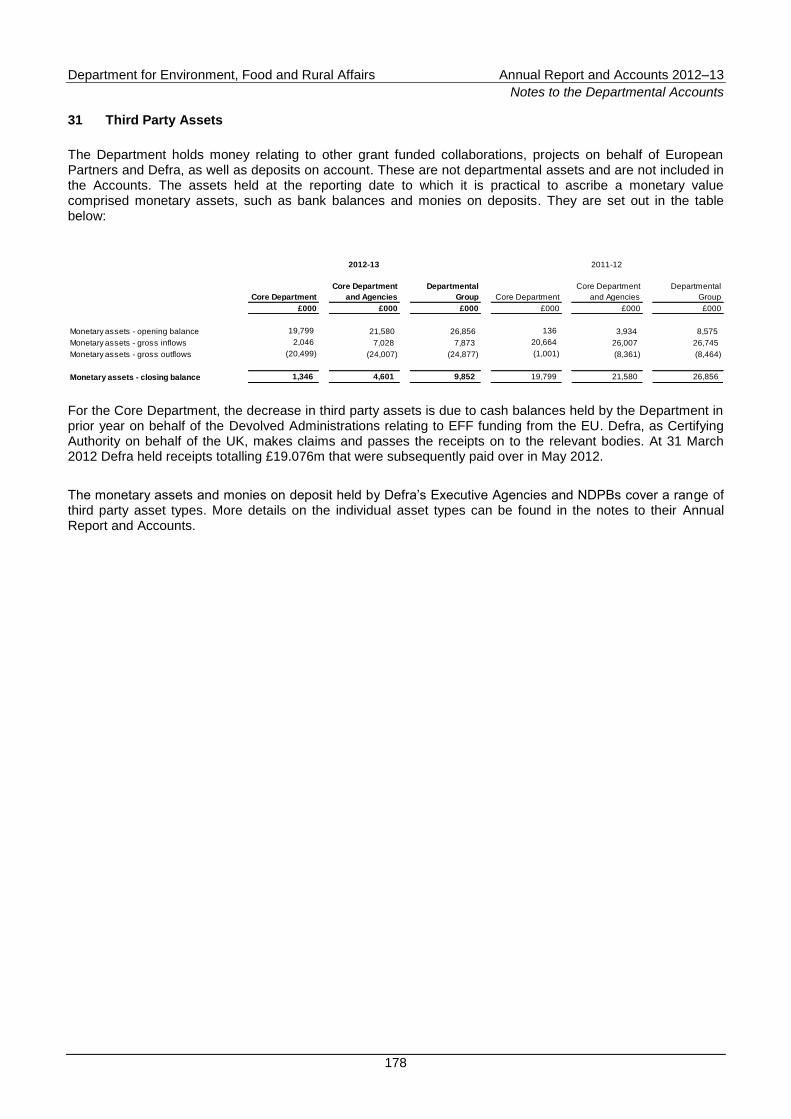
Department for Environment, Food and Rural Affairs Annual Report and Accounts 2012–13
Notes to the Departmental Accounts
178
31 Third Party Assets
The Department holds money relating to other grant funded collaborations, projects on behalf of European Partners and Defra, as well as deposits on account. These are not departmental assets and are not included in the Accounts. The assets held at the reporting date to which it is practical to ascribe a monetary value comprised monetary assets, such as bank balances and monies on deposits. They are set out in the table below:
2012-13 2011-12
Core Department
Core Department
and Agencies
Departmental
Group Core Department
Core Department
and Agencies
Departmental
Group
£000 £000 £000 £000 £000 £000
Monetary assets - opening balance 19,799 21,580 26,856 136 3,934 8,575
Monetary assets - gross inflows 2,046 7,028 7,873 20,664 26,007 26,745
Monetary assets - gross outflows (20,499) (24,007) (24,877) (1,001) (8,361) (8,464)
Monetary assets - closing balance 1,346 4,601 9,852 19,799 21,580 26,856
For the Core Department, the decrease in third party assets is due to cash balances held by the Department in prior year on behalf of the Devolved Administrations relating to EFF funding from the EU. Defra, as Certifying Authority on behalf of the UK, makes claims and passes the receipts on to the relevant bodies. At 31 March 2012 Defra held receipts totalling £19.076m that were subsequently paid over in May 2012.
The monetary assets and monies on deposit held by Defra‟s Executive Agencies and NDPBs cover a range of third party asset types. More details on the individual asset types can be found in the notes to their Annual Report and Accounts.
Department for Environment, Food and Rural Affairs Annual Report and Accounts 2012–13
Notes to the Departmental Accounts
179
32 Entities within the Departmental Boundary
The entities within the departmental boundary during 2012–13 comprise the Core Department, its Executive Agencies and NDPBs and the Forestry Commission as follows:
Executive Agencies
Animal Health and Veterinary Laboratories Agency (AHVLA)
Centre for Environment, Fisheries and Aquaculture Science (Cefas)
Food and Environment Research Agency (Fera)
Rural Payments Agency (RPA)
Veterinary Medicines Directorate (VMD)
The Executive Agencies‟ Annual Report and Accounts have been prepared under the direction of HM Treasury in accordance with Section 7(2) of the Government Resources and Accounts Act 2000 and are published separately.
Forestry Commission (FC) has been included in Defra‟s Estimate. Therefore FC has been fully consolidated and is included within the results for the Core Department and Executive Agencies.
Executive NDPBs
Commission for Rural Communities (abolished on 31 March 2013)
Consumer Council for Water
Environment Agency
Food from Britain (dormant)
Gangmasters Licensing Authority
Joint Nature Conservation Committee
Marine Management Organisation
National Forest Company
Natural England
Royal Botanic Gardens, Kew
Sustainable Development Commission (dormant)
Executive NDPBs (Defra Funded)
Agricultural Wages Board for England and Wales
Agricultural Wages Committee for England (x 13)
Advisory NDPBs (Defra Funded)
Advisory Committee on Hazardous Substances (ACHS) (abolished on 22 July 2012)
Advisory Committee on Pesticides (ACP)
Advisory Committee on Releases to the Environment (ACRE)
Agricultural Dwelling House Advisory Committees (ADHAC) (x 16)
Committee on Agricultural Valuation (dormant)
Independent Agricultural Appeals Panel
Inland Waterways Advisory Council (abolished on 2 July 2012)
Science Advisory Council
Veterinary Products Committee
Department for Environment, Food and Rural Affairs Annual Report and Accounts 2012–13
Notes to the Departmental Accounts
180
Levy Bodies
Agriculture and Horticulture Development Board
Sea Fish Industry Authority
Tribunal NDPBs (Defra Funded)
Agricultural Land Tribunal (England)
Plant Varieties and Seeds Tribunal (dormant)
33 Entities outside the Departmental Boundary
The public sector bodies which have not been consolidated in these Accounts, but for which Defra‟s Ministers had lead policy responsibility during the year, are as follows:
Public Corporations
Covent Garden Market Authority
Other Bodies
National Parks Authorities (x9)
Water Services Regulation Authority (Ofwat)
Waste and Resources Action Programme (WRAP)
British Wool Marketing Board
Broads Authority
Department for Environment, Food and Rural Affairs Annual Report and Accounts 2012–13
Annex
181
Annex
This Annex does not form part of the financial statements and has not been subject to audit.
Department for Environment, Food and Rural Affairs Annual Report and Accounts 2012–13
Commentary on Sustainable Performance
182
Annex 1: Commentary on Sustainable Performance
Background
As part of its Sustainable Development Strategy, the Government encourages both companies and public bodies to disclose their sustainability and environmental performance via their Annual Reports and Accounts. The environmental data and associated financial costs presented in the following pages are consistent with the requirements of HM Treasury‟s Public Sector Annual Reports: Sustainability Reporting Guidance for 2012–13 Reporting.
The information contained within this Annex has not been subject to audit and does not form part of the auditors‟ opinion on the Accounts.
Introduction
This Annex is divided into two sections. Section A outlines the performance of the Defra Network and Section B covers the Core Department only.
The main driver for improving sustainability within Defra‟s operations are the Greening Government Commitments (GGCs) and it is against this set of targets that sustainability performance is measured (Section A). As most of the GGCs‟ targets do not complete until April 2015, a series of milestones has been calculated in order to assess performance in year. This method places performance in one of the following categories for each of the target areas:
exceeding target – this means the target for 2015 has been exceeded;
on target – this means performance is ahead of the milestone and is expected to reach the target by 2015;
behind milestone – this means performance has not reached the level required of the milestone and therefore needs to improve in order to meet the 2015 target;
increase from baseline – this indicates that a reduction has not been made and performance in this area has worsened since the baseline year; and
continue to exceed target – where a target was completed before 2012 and yet performance is still being measured and is exceeding the original target requirement.
About the Data
The data in Table 1 and the charts that accompany it, present the energy consumption, water use and waste arisings figures as reported as part of the GGCs and report performance for the year ending 31 March 2013.
Cost data is not reported as part of the GGCs, so all financial data presented in this report is sourced from accounting records for this period.
Energy and water data is primarily taken from supplier invoices. In most cases, the data in these invoices is informed by manual meter readings or automatic half hourly meter readings. This gives assurance that the data is, as far as possible, accurate and robust.
Waste data is derived from figures provided by contractors. Wherever possible actual weights are used but where this is not possible, waste data is calculated using a metric based on the number of bins emptied. In order to improve the accuracy of this data, audits have been undertaken on common waste streams from a number of key sites to establish the average weights and waste ratios. This estimation methodology will result
Department for Environment, Food and Rural Affairs Annual Report and Accounts 2012–13
Commentary on Sustainable Performance
183
in a small margin of error. It is not currently cost effective to weigh all waste streams removed from the Defra Estate.
Section A
Departmental Performance
Section A of this report provides an overview of the sustainability strategy and performance of the Department, using the GGCs‟ targets to assess progress. For the purposes of GGCs reporting the Department comprises the following Network Bodies:
Core Defra
Forestry Commission (FC)
Executive Agencies
Animal Health and Veterinary Laboratories Agency (AHVLA)
Centre for Environment, Fisheries and Aquaculture Science (Cefas)
Food and Environment Research Agency (Fera)
Rural Payments Agency (RPA)
Veterinary Medicines Directorate (VMD)
Non–Departmental Public Bodies
Environment Agency (EA)
Marine Management Organisation (MMO)
Natural England (NE)
Royal Botanic Gardens Kew (RBG Kew)
Other Defra Network Bodies and Other Government Departments
Under the „major occupier‟ rule, Defra reports some floor space occupied by other Government Departments and its own Network Bodies which do not meet the threshold for GGCs reporting.
The GGCs are a set of targets to reduce greenhouse gas emissions, reduce waste, reduce water use and make the procurement of goods and services more sustainable.
Defra is committed to achieving the following GGCs‟ targets by 2015 (measured against a 2009–10 baseline):
reduce greenhouse gas emissions from the whole estate and business related transport by 25 percent;
reduce the number of domestic flights by 20 percent;
reduce the amount of waste generated by 25 percent;
Department for Environment, Food and Rural Affairs Annual Report and Accounts 2012–13
Commentary on Sustainable Performance
184
reduce water consumption and report on office water use against best practice benchmarks;
ensure that more sustainable and efficient products are bought and undertake engagement with suppliers to understand and reduce the impacts of the supply chain; and
cut paper use by 10 percent (2012 „in year‟ target). Governance
Defra‟s Sustainable Operations and Procurement Strategy is developed and delivered through a Sustainability Governance Board, which for the forthcoming year will report progress to Defra‟s Executive Committee on a quarterly basis through the Defra Operations Panel. During 2012–13 the Sustainability Governance Board reported directly to the Executive Committee through monthly reports. The Sustainability Governance Board is currently under review to ensure it remains fit for purpose, has the right membership and has the necessary key objectives to deliver the Department‟s sustainability targets.
GGC Performance and Future Strategy
Defra‟s aspiration is to continue to put sustainability at the heart of its business delivery and operations. This ensures that the Department operates in the most sustainable and environmentally responsible manner: improving the way building space is used, reducing the amount of energy and water that is used, reducing the amount of waste generated, reviewing the way IT is used and assessing the products and services that are bought to support all operational activities. Defra‟s performance in delivering improvements is measured through progress towards the GGCs.
Historically the Department has performed well against pan-government sustainability targets, for example delivering a 36 percent reduction in carbon emissions against a 12.5 percent Sustainable Operations on the Government Estate (SOGE) 2010 target. Whilst this does make it more difficult to identify further savings, Defra is committed to identifying more innovative ways of improving performance and contributing to the delivery of efficiency savings through internal programmes, such as Strategic Alignment and Collective Procurement to deliver its GGCs targets.
Estates
Business delivery activities undertaken in Defra‟s buildings are the most significant contributors to overall operational environmental impact. The Defra portfolio comprises properties, ranging from office buildings and storage facilities to experimental farms and laboratory campus facilities.
The diverse activities Defra undertakes presents a considerable challenge in delivering savings in energy and water used and waste generated. Consequently performance against some of the targets is disappointing particularly in light of the Department‟s focus on sustainability. The following section details performance and also outlines future plans for meeting all of the GGCs‟ targets.
Procurement
Defra will continue to foster the sustainable procurement agenda across government to influence procurement practice. We will endeavour to meet the commitments on Green Operations and Procurement within the Defra Business Plan. We will continue to ensure that Defra‟s contracts and procurements meet the Government Buying Standards (GBS) and reflect wider sustainability policy. We will also continue efforts to meet the Government‟s aspiration that 25 percent of procurement spend goes to Small and Medium Sized Enterprises (SMEs).
Department for Environment, Food and Rural Affairs Annual Report and Accounts 2012–13
Commentary on Sustainable Performance
185
GGC Greenhouse Gas (GHG) Emissions target
Carbon Reduction
2012-13 vs. Baseline
Current in Year
Milestone Target 2015
Current
Performance
12% 15% 25% Behind milestone
More detail on the carbon figures can be found in Table 1. The definition of the Current Performance columns can be found on the first page of the Annex.
The slip in performance against the GGCs‟ GHG target has highlighted the need for more innovative measures to put Defra on track to achieve the 2015 target. The challenge was evidenced by outputs from energy and water use surveys carried out across the Defra Estate in January 2013 which confirmed that most of the opportunities for low cost, quick win initiatives have already been implemented. There are also a number of material factors which limit the Department‟s ability to reduce its energy use.
EA‟s requirement to run flood pumps for extended periods throughout the year.
The Laboratory Estate‟s requirement to undertake research into, and respond to, animal and plant disease outbreaks which often require intensive energy use.
Unseasonable cold weather requiring more energy to heat buildings and protect plant species.
Initiatives planned for the 2013–14 year and beyond.
Improvements to the Department‟s energy monitoring. This will provide smarter targeting of consumption at a building level, enabling quicker response times to rectify spurious or excessive consumption.
Increased scrutiny of building controls, such as timers and temperature set-points to ensure buildings are heated or cooled within specific parameters and checking that equipment such as boilers and lighting are not running unnecessarily outside of standard office operating hours.
Recent changes made to the Department‟s Facilities Management Contract will make facilities managers more accountable for energy use in the buildings they manage, for example, through the implementation of regular building level performance reporting.
An increased emphasis on staff culture change through awareness campaigns using internal communication channels and engagement exercises.
Continued estate rationalisation will deliver additional energy savings, although this is expected to be limited to smaller properties and will therefore only make a minor contribution.
Travel data in 2011–12 was not separated into Scope 1, 2 and 3. All grey fleet transport for this period is therefore included in the Scope 1 total. This has the effect of showing a slight increase in Scope 1 emissions and a significant decrease in Scope 3 emissions compared to the baseline.
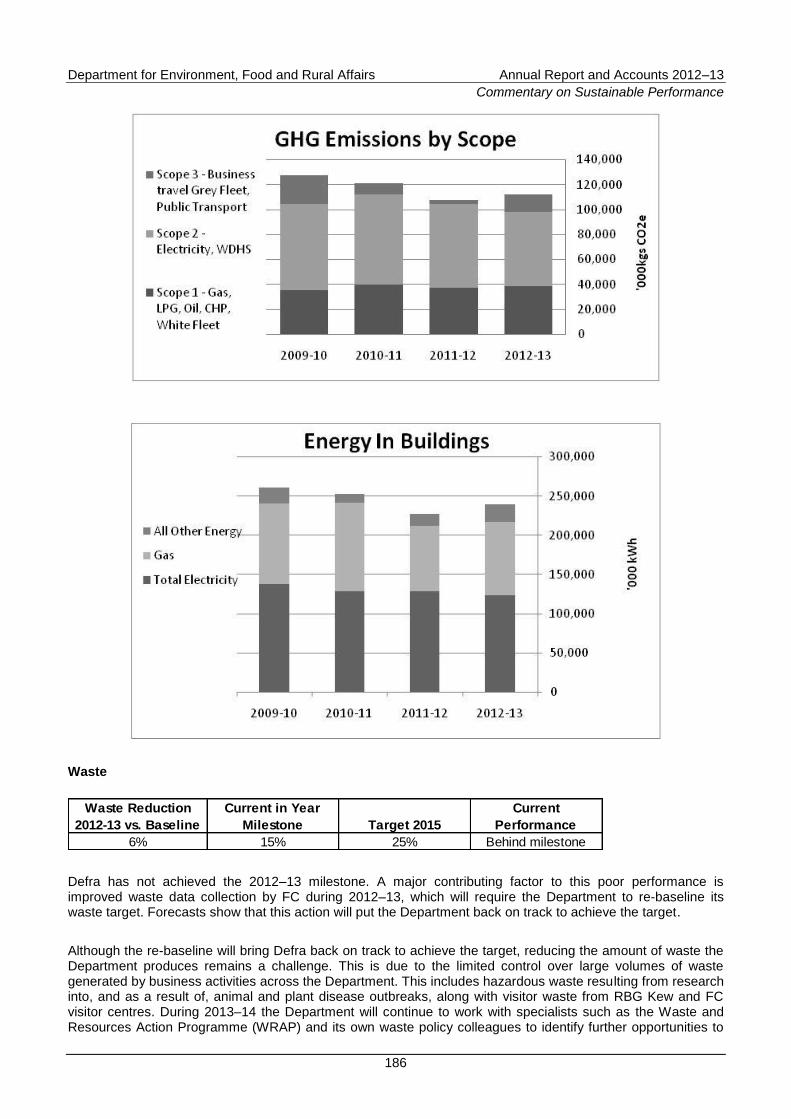
Department for Environment, Food and Rural Affairs Annual Report and Accounts 2012–13
Commentary on Sustainable Performance
186
Waste
Waste Reduction
2012-13 vs. Baseline
Current in Year
Milestone Target 2015
Current
Performance
6% 15% 25% Behind milestone
Defra has not achieved the 2012–13 milestone. A major contributing factor to this poor performance is improved waste data collection by FC during 2012–13, which will require the Department to re-baseline its waste target. Forecasts show that this action will put the Department back on track to achieve the target.
Although the re-baseline will bring Defra back on track to achieve the target, reducing the amount of waste the Department produces remains a challenge. This is due to the limited control over large volumes of waste generated by business activities across the Department. This includes hazardous waste resulting from research into, and as a result of, animal and plant disease outbreaks, along with visitor waste from RBG Kew and FC visitor centres. During 2013–14 the Department will continue to work with specialists such as the Waste and Resources Action Programme (WRAP) and its own waste policy colleagues to identify further opportunities to
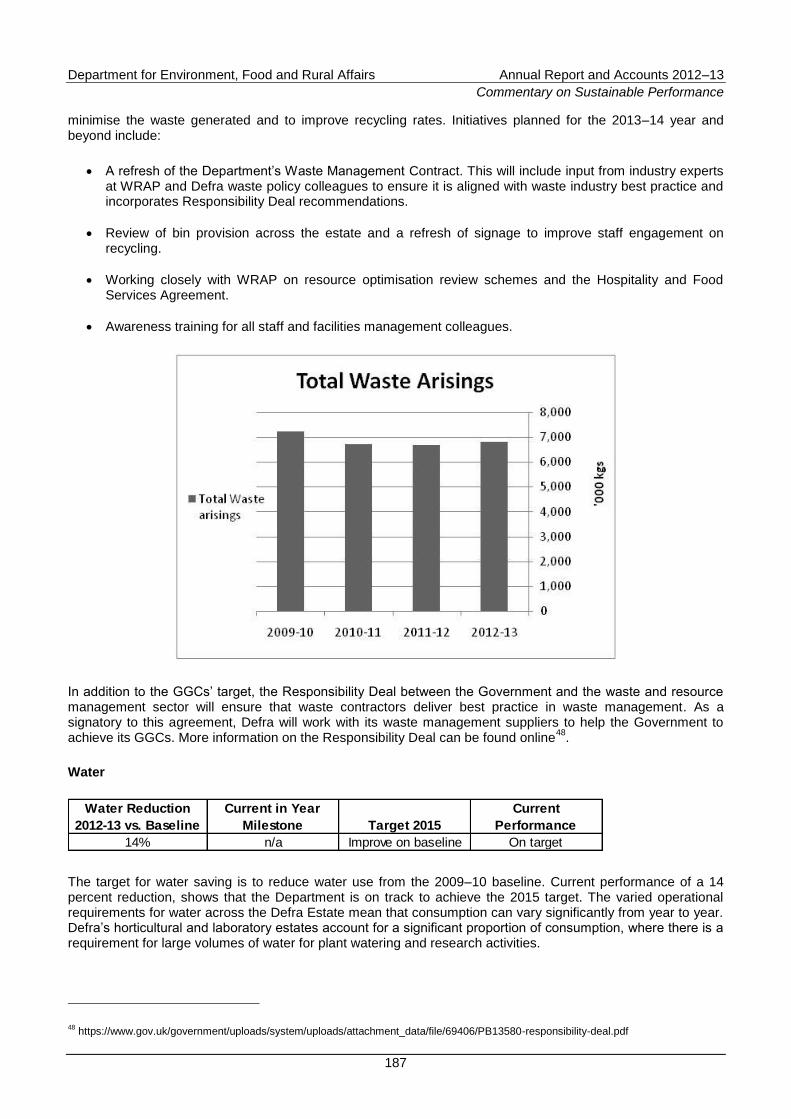
Department for Environment, Food and Rural Affairs Annual Report and Accounts 2012–13
Commentary on Sustainable Performance
187
minimise the waste generated and to improve recycling rates. Initiatives planned for the 2013–14 year and beyond include:
A refresh of the Department‟s Waste Management Contract. This will include input from industry experts at WRAP and Defra waste policy colleagues to ensure it is aligned with waste industry best practice and incorporates Responsibility Deal recommendations.
Review of bin provision across the estate and a refresh of signage to improve staff engagement on recycling.
Working closely with WRAP on resource optimisation review schemes and the Hospitality and Food Services Agreement.
Awareness training for all staff and facilities management colleagues.
In addition to the GGCs‟ target, the Responsibility Deal between the Government and the waste and resource management sector will ensure that waste contractors deliver best practice in waste management. As a signatory to this agreement, Defra will work with its waste management suppliers to help the Government to achieve its GGCs. More information on the Responsibility Deal can be found online
48.
Water
Water Reduction
2012-13 vs. Baseline
Current in Year
Milestone Target 2015
Current
Performance
14% n/a Improve on baseline On target
The target for water saving is to reduce water use from the 2009–10 baseline. Current performance of a 14 percent reduction, shows that the Department is on track to achieve the 2015 target. The varied operational requirements for water across the Defra Estate mean that consumption can vary significantly from year to year. Defra‟s horticultural and laboratory estates account for a significant proportion of consumption, where there is a requirement for large volumes of water for plant watering and research activities.
48
https://www.gov.uk/government/uploads/system/uploads/attachment_data/file/69406/PB13580-responsibility-deal.pdf
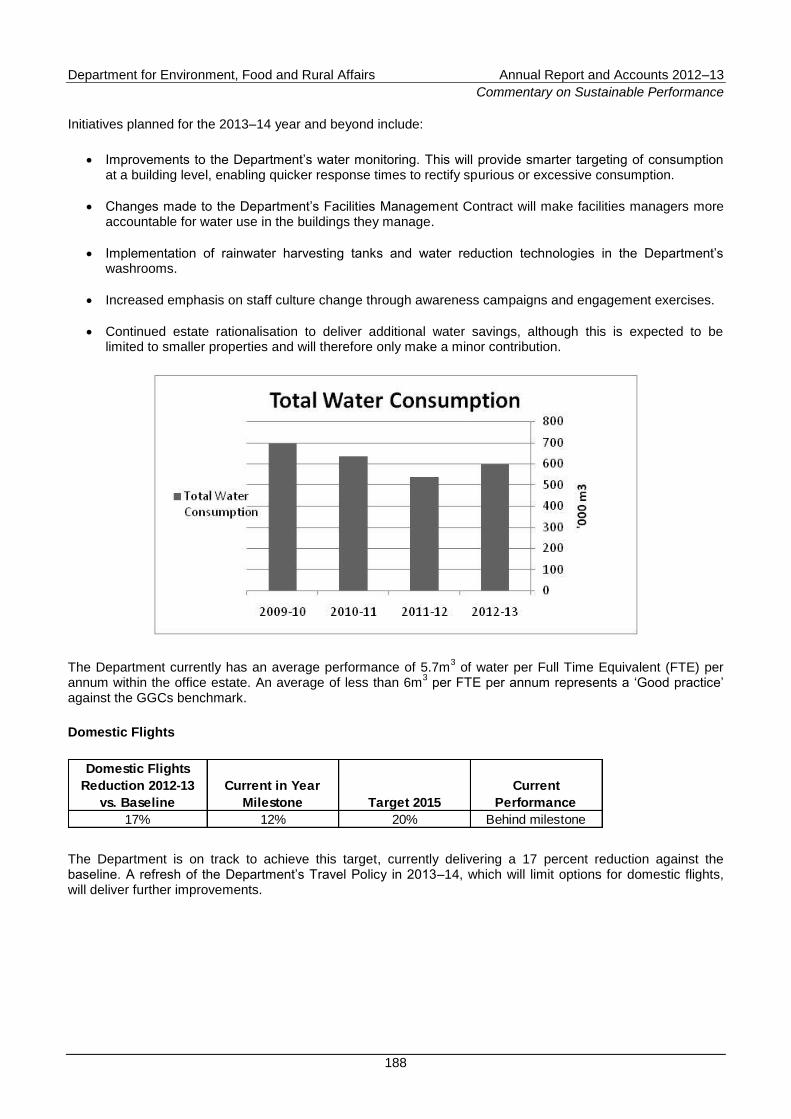
Department for Environment, Food and Rural Affairs Annual Report and Accounts 2012–13
Commentary on Sustainable Performance
188
Initiatives planned for the 2013–14 year and beyond include:
Improvements to the Department‟s water monitoring. This will provide smarter targeting of consumption at a building level, enabling quicker response times to rectify spurious or excessive consumption.
Changes made to the Department‟s Facilities Management Contract will make facilities managers more accountable for water use in the buildings they manage.
Implementation of rainwater harvesting tanks and water reduction technologies in the Department‟s washrooms.
Increased emphasis on staff culture change through awareness campaigns and engagement exercises.
Continued estate rationalisation to deliver additional water savings, although this is expected to be limited to smaller properties and will therefore only make a minor contribution.
The Department currently has an average performance of 5.7m3 of water per Full Time Equivalent (FTE) per
annum within the office estate. An average of less than 6m3 per FTE per annum represents a „Good practice‟
against the GGCs benchmark.
Domestic Flights
Domestic Flights
Reduction 2012-13
vs. Baseline
Current in Year
Milestone Target 2015
Current
Performance
17% 12% 20% Behind milestone
The Department is on track to achieve this target, currently delivering a 17 percent reduction against the baseline. A refresh of the Department‟s Travel Policy in 2013–14, which will limit options for domestic flights, will deliver further improvements.
Department for Environment, Food and Rural Affairs Annual Report and Accounts 2012–13
Commentary on Sustainable Performance
189
Paper Use Reduction
Paper Use
Reduction 2012-13
vs. Baseline
Current in Year
Milestone Target 2012
Current
Performance
20% n/a 10%
Continue to exceed
target
Current data confirms the Department is currently achieving a 20 percent reduction in the amount of paper purchased, exceeding the 10 percent target. This target expired in April 2012 and Defra were successful in meeting it, but monitoring continues in order to maintain this level of achievement until 2015.
Sustainable Procurement
Many of Defra‟s contracts are awarded through pan-Government frameworks operated by the Government Procurement Service (GPS). Defra works to ensure that the Government Buying Standards (GBS) are applied through these frameworks and that, where applicable, goods and services available on the frameworks meet the standards and are clearly highlighted as doing so.
Where Defra leads on a procurement, for contracts over £25,000 a sustainability appraisal is carried out and GBS applied, where possible. For contracts where there are no applicable GBS in existence alternative sustainability clauses are incorporated (in the specification and terms and conditions).
Defra is also working towards the achievement of the Government‟s target that 25 percent of expenditure goes to SMEs by 2014–15. In 2011–12 17 percent of Defra‟s spend went to SME prime contractors.
Green ICT
Defra plays a key role in taking forward the Greening Government Information and Communications Technology (ICT) Strategy. A first annual assessment report was produced and published in June 2012, showing the progress made in raising the level of Green ICT maturity across Government, and to what extent Green ICT best practices are being adopted.
A regular monthly footprint report is provided by Defra‟s major ICT supplier, IBM, to track the level of carbon emissions generated by ICT kit deployed on its behalf either on site or in IBM locations.
Defra is registered as an endorser of the EU code of conduct for energy efficient data centres and IBM has gained participant status for all its European Data Centres, including the centre used to support Defra Network ICT services.
Initiatives taken in the last two years with significant green impacts include:
Provision of web conference services to enable staff to share documents and desktops online in time to enable staff to use these services over the Olympic period (July–August 2012) and assist the Department in reducing its business travel in London to meet the Government‟s 50 percent reduction target.
Completion of a print rationalisation programme saving an estimated 90 tonnes of CO2(tCO2) per annum.
New workstation provisions being implemented in Nobel House to provide energy efficient screens, keyboard and mouse at each desk to facilitate flexible work spaces and a significant reduction in London‟s office space.
Department for Environment, Food and Rural Affairs Annual Report and Accounts 2012–13
Commentary on Sustainable Performance
190
Defra continues to drive down its residue from the recycling and disposal of its ICT assets. When IT hardware is no longer required for its current application, IBM pool such hardware and seek to re-use elsewhere within Defra. If no home is found it is then collected for external re-use, recycling and eventual disposal. Defra receives monthly statistics from IBM‟s recycling service provider on their handling of unwanted kit. This includes a list of all items processed and summary statistics. 98 percent of materials are reused or recycled.
Transparency Reporting
In addition to the targets on improving sustainability performance, Defra also reports a transparency statement as part of the GGCs
49. This covers Climate Change Adaptation, Biodiversity and Natural Environment,
Procurement of Food and Catering Services, Sustainable Construction and People.
Further Information
In order to monitor progress against the GGCs, Defra has developed and implemented a series of milestones to measure current performance and give an indication of expected future performance. Quarterly updates on Defra‟s performance on these targets can be found online
50.
For a complete picture of current and future sustainability activities being undertaken across the Defra Network, this report should be read in conjunction with the Annual Report and Account Sustainability Reports produced by each of Defra‟s Network Bodies.
The GGCs reporting procedure utilises the Defra reporting standards and therefore all energy and carbon reporting in this document uses the conversion factors required by Defra‟s standards.
The data contained in this Annex is reported as absolute values and has not been normalised against metrics such as FTE staff, financial turnover or metre squared (m
2) of floor space. The diverse nature of the operations
undertaken across the Defra Estate, which are influenced by numerous factors such as weather, scientific undertakings and tourism numbers, makes it difficult to report trends in this way. It also makes it difficult to make comparisons to other organisations. For example, due to the operational activities undertaken across Defra, water consumption does not correlate to the Department‟s floor space foot print, turnover, expenditure or FTE.
49
https://whitehall-admin.production.alphagov.co.uk/government/uploads/system/uploads/attachment_data/file/139525/defra-ggc-performance.pdf
50 https://www.gov.uk/government/organisations/Department-for-environment-food-rural-affairs/about/our-energy-use
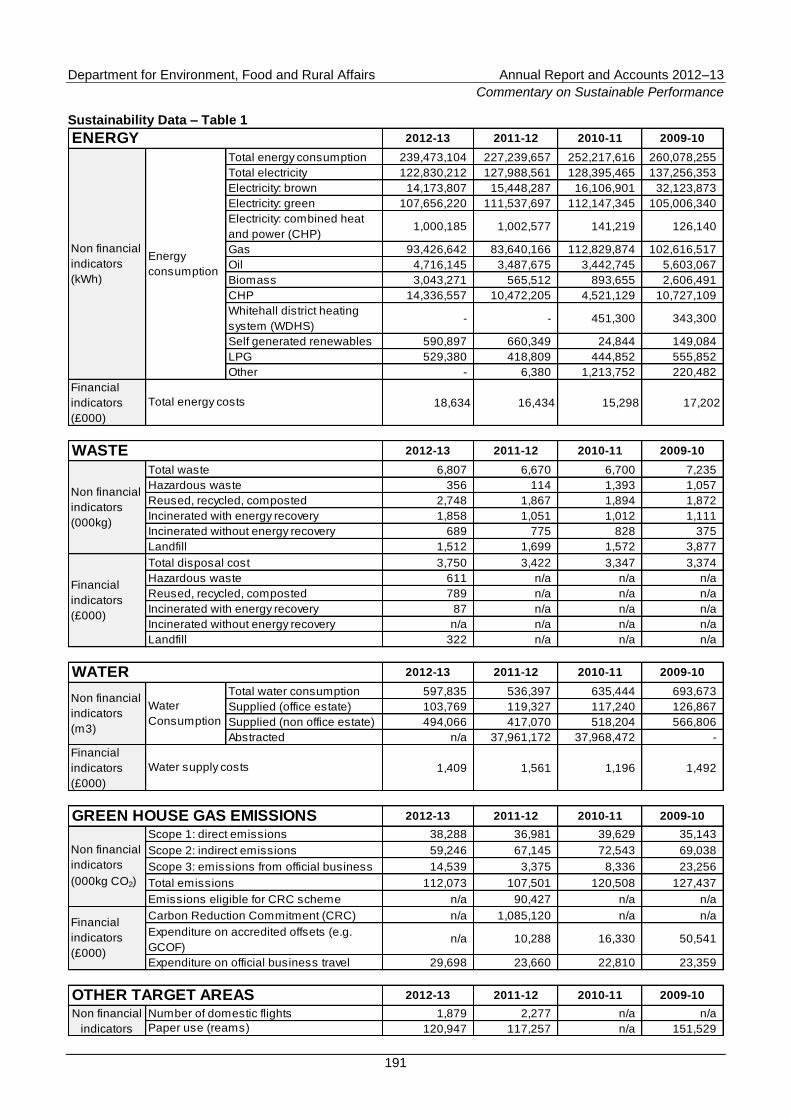
Department for Environment, Food and Rural Affairs Annual Report and Accounts 2012–13
Commentary on Sustainable Performance
191
Sustainability Data – Table 1
2012-13 2011-12 2010-11 2009-10
Total energy consumption 239,473,104 227,239,657 252,217,616 260,078,255
Total electricity 122,830,212 127,988,561 128,395,465 137,256,353
Electricity: brown 14,173,807 15,448,287 16,106,901 32,123,873
Electricity: green 107,656,220 111,537,697 112,147,345 105,006,340
Electricity: combined heat
and power (CHP)1,000,185 1,002,577 141,219 126,140
Gas 93,426,642 83,640,166 112,829,874 102,616,517
Oil 4,716,145 3,487,675 3,442,745 5,603,067
Biomass 3,043,271 565,512 893,655 2,606,491
CHP 14,336,557 10,472,205 4,521,129 10,727,109
Whitehall district heating
system (WDHS)- - 451,300 343,300
Self generated renewables 590,897 660,349 24,844 149,084
LPG 529,380 418,809 444,852 555,852
Other - 6,380 1,213,752 220,482
Financial
indicators
(£000)
18,634 16,434 15,298 17,202
2012-13 2011-12 2010-11 2009-10
6,807 6,670 6,700 7,235
356 114 1,393 1,057
2,748 1,867 1,894 1,872
1,858 1,051 1,012 1,111
689 775 828 375
1,512 1,699 1,572 3,877
3,750 3,422 3,347 3,374
611 n/a n/a n/a
789 n/a n/a n/a
87 n/a n/a n/a
n/a n/a n/a n/a
322 n/a n/a n/a
2012-13 2011-12 2010-11 2009-10
Total water consumption 597,835 536,397 635,444 693,673
Supplied (office estate) 103,769 119,327 117,240 126,867
Supplied (non office estate) 494,066 417,070 518,204 566,806
Abstracted n/a 37,961,172 37,968,472 -
Financial
indicators
(£000)
1,409 1,561 1,196 1,492
2012-13 2011-12 2010-11 2009-10
38,288 36,981 39,629 35,143
59,246 67,145 72,543 69,038
14,539 3,375 8,336 23,256
112,073 107,501 120,508 127,437
n/a 90,427 n/a n/a
n/a 1,085,120 n/a n/a
n/a 10,288 16,330 50,541
29,698 23,660 22,810 23,359
2012-13 2011-12 2010-11 2009-10
1,879 2,277 n/a n/a
120,947 117,257 n/a 151,529
ENERGY
Non financial
indicators
(kWh)
Energy
consumption
Total energy costs
WASTE
Non financial
indicators
(000kg)
Total waste
Hazardous waste
Reused, recycled, composted
Incinerated with energy recovery
Incinerated without energy recovery
Landfill
Financial
indicators
(£000)
Total disposal cost
Hazardous waste
Reused, recycled, composted
Incinerated with energy recovery
Incinerated without energy recovery
Landfill
Carbon Reduction Commitment (CRC)
Expenditure on accredited offsets (e.g.
GCOF)
WATER
Non financial
indicators
(m3)
Water
Consumption
Water supply costs
Scope 1: direct emissions
Scope 2: indirect emissions
Scope 3: emissions from official business
Number of domestic flights
GREEN HOUSE GAS EMISSIONS
Non financial
indicators
(000kg CO2)
Financial
indicators
(£000)Expenditure on official business travel
OTHER TARGET AREASNon financial
indicators Paper use (reams)
Total emissions
Emissions eligible for CRC scheme
Department for Environment, Food and Rural Affairs Annual Report and Accounts 2012–13
Commentary on Sustainable Performance
192
Notes
(i) Under GGCs‟ reporting, areas of a building occupied by non government occupants are not included. Where this is the case buildings have been apportioned according to floor space occupancies.
(ii) „Scope 3: Emissions from Official Business Travel‟ data does not include international travel in accordance with the GGCs‟ reporting requirements.
(iii) The abstracted water figure for 2012–13 is not available at the time of publication.
(iv) Gas used in Combined Heat and Power (CHP) units is not included in the „gas‟ figure as GGCs‟ reporting guidance states that this energy is reported as CHP output.
(v) The first Carbon Reduction Commitment (CRC) payment was made for 2011–12. Payment for 2012–13 is not due to be made until August 2013.
(vi) All consumption data presented in this report reflects reported GGCs figures. Cost figures reflect the accounting records for the respective year.
(vii) Data for waste component categories do not always equal the total waste figure. This is due to additional waste streams that are not required to be reported. As part of GGCs reporting, hazardous waste is included in the landfill figure and is not double counted in the total waste figure.
(viii) Historically a breakdown of waste costs was not available due to the contractual agreement in place at this time.
(ix) Travel data in 2011–12 was not separated into Scope 1, 2 and 3. All grey fleet transport for this period is therefore included in the Scope 1 total. This has the effect of showing a slight increase in Scope 1 emissions and a significant decrease in Scope 3 emissions compared to the baseline.
(x) A proportion of the apparent increase in CO2 emissions is due to an invoicing error in 2011–12 that is now impacting on performance in 2012–13. Furthermore, the spring season was slightly colder in 2012–13 which resulted in an increase in gas for heating. Nationwide droughts and floods in 2012–13 caused the EA to activate water pumping stations that cause an increase in their electricity consumption.
(xi) A Government Carbon Offsetting Fund (GCOF) payment for 2012–13 has not yet been made as this is done annually.
(xii) All 2011–12 data has been revised from last year‟s publication to include actual data from Quarter 4 that was not available at time of publication. For this reason charts and performance may appear differently to previous years‟ reports.
(xiii) All 2009–10 data has been revised from previous publications to reflect the data reported for the purposes of GGCs. This includes some estimates in the form of substituted data from subsequent years where data from 2009–10 was not available. In such instances data from subsequent years was substituted as per the GGCs‟ guidance. For this reason charts and performance may appear differently to previous years‟ reports.
(xiv) RBG Kew do not have a provision for capturing travel data, however the emissions are understood to be not material.
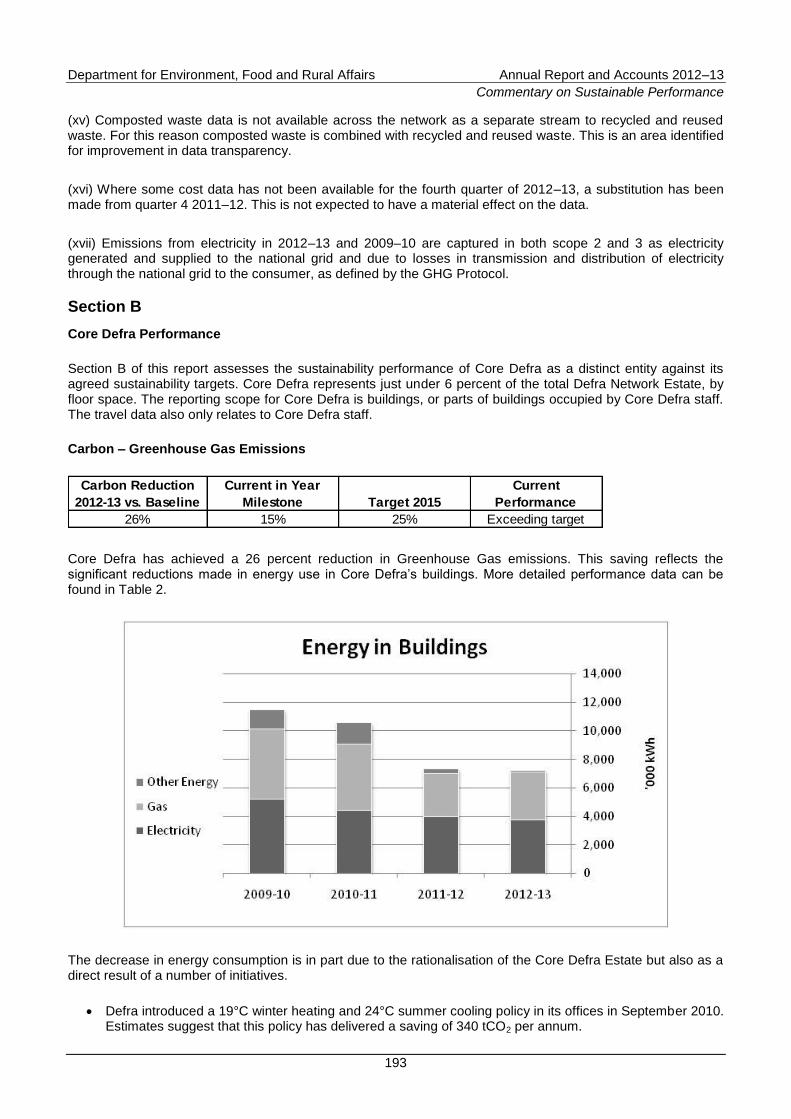
Department for Environment, Food and Rural Affairs Annual Report and Accounts 2012–13
Commentary on Sustainable Performance
193
(xv) Composted waste data is not available across the network as a separate stream to recycled and reused waste. For this reason composted waste is combined with recycled and reused waste. This is an area identified for improvement in data transparency.
(xvi) Where some cost data has not been available for the fourth quarter of 2012–13, a substitution has been made from quarter 4 2011–12. This is not expected to have a material effect on the data.
(xvii) Emissions from electricity in 2012–13 and 2009–10 are captured in both scope 2 and 3 as electricity generated and supplied to the national grid and due to losses in transmission and distribution of electricity through the national grid to the consumer, as defined by the GHG Protocol.
Section B
Core Defra Performance
Section B of this report assesses the sustainability performance of Core Defra as a distinct entity against its agreed sustainability targets. Core Defra represents just under 6 percent of the total Defra Network Estate, by floor space. The reporting scope for Core Defra is buildings, or parts of buildings occupied by Core Defra staff. The travel data also only relates to Core Defra staff.
Carbon – Greenhouse Gas Emissions
Carbon Reduction
2012-13 vs. Baseline
Current in Year
Milestone Target 2015
Current
Performance
26% 15% 25% Exceeding target
Core Defra has achieved a 26 percent reduction in Greenhouse Gas emissions. This saving reflects the significant reductions made in energy use in Core Defra‟s buildings. More detailed performance data can be found in Table 2.
The decrease in energy consumption is in part due to the rationalisation of the Core Defra Estate but also as a direct result of a number of initiatives.
Defra introduced a 19°C winter heating and 24°C summer cooling policy in its offices in September 2010. Estimates suggest that this policy has delivered a saving of 340 tCO2 per annum.
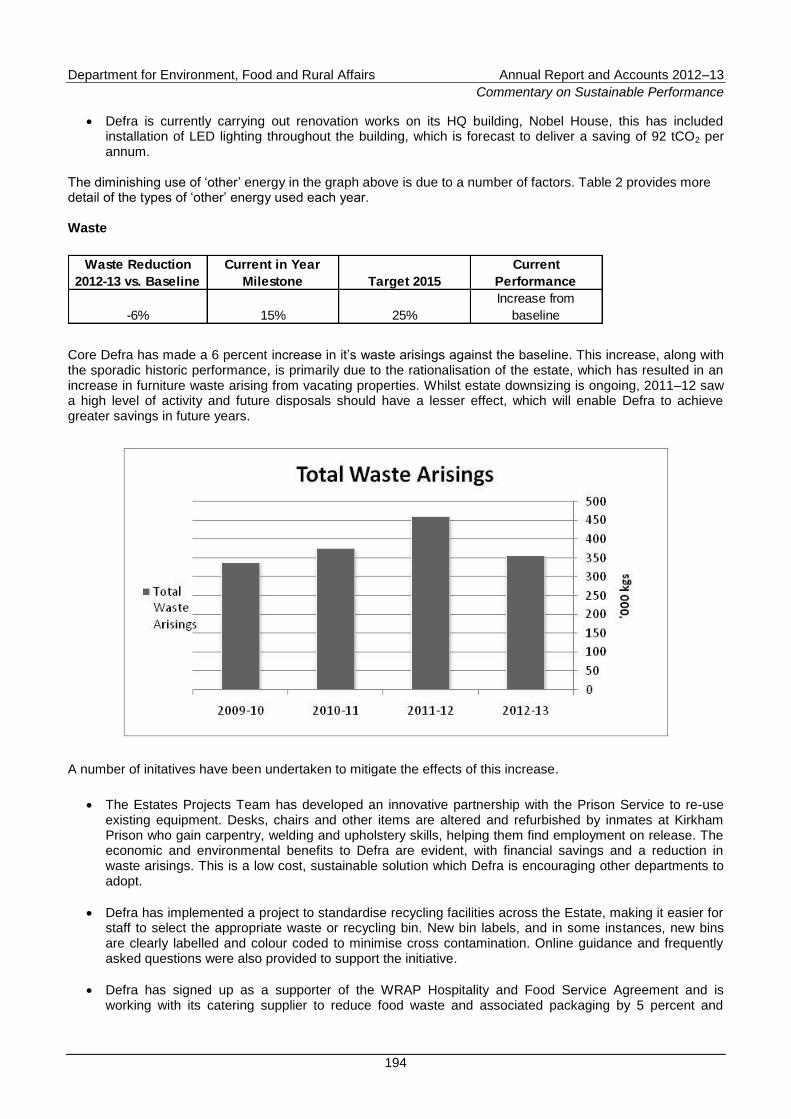
Department for Environment, Food and Rural Affairs Annual Report and Accounts 2012–13
Commentary on Sustainable Performance
194
Defra is currently carrying out renovation works on its HQ building, Nobel House, this has included installation of LED lighting throughout the building, which is forecast to deliver a saving of 92 tCO2 per annum.
The diminishing use of „other‟ energy in the graph above is due to a number of factors. Table 2 provides more detail of the types of „other‟ energy used each year. Waste
Waste Reduction
2012-13 vs. Baseline
Current in Year
Milestone Target 2015
Current
Performance
-6% 15% 25%
Increase from
baseline
Core Defra has made a 6 percent increase in it‟s waste arisings against the baseline. This increase, along with the sporadic historic performance, is primarily due to the rationalisation of the estate, which has resulted in an increase in furniture waste arising from vacating properties. Whilst estate downsizing is ongoing, 2011–12 saw a high level of activity and future disposals should have a lesser effect, which will enable Defra to achieve greater savings in future years.
A number of initatives have been undertaken to mitigate the effects of this increase.
The Estates Projects Team has developed an innovative partnership with the Prison Service to re-use existing equipment. Desks, chairs and other items are altered and refurbished by inmates at Kirkham Prison who gain carpentry, welding and upholstery skills, helping them find employment on release. The economic and environmental benefits to Defra are evident, with financial savings and a reduction in waste arisings. This is a low cost, sustainable solution which Defra is encouraging other departments to adopt.
Defra has implemented a project to standardise recycling facilities across the Estate, making it easier for staff to select the appropriate waste or recycling bin. New bin labels, and in some instances, new bins are clearly labelled and colour coded to minimise cross contamination. Online guidance and frequently asked questions were also provided to support the initiative.
Defra has signed up as a supporter of the WRAP Hospitality and Food Service Agreement and is working with its catering supplier to reduce food waste and associated packaging by 5 percent and
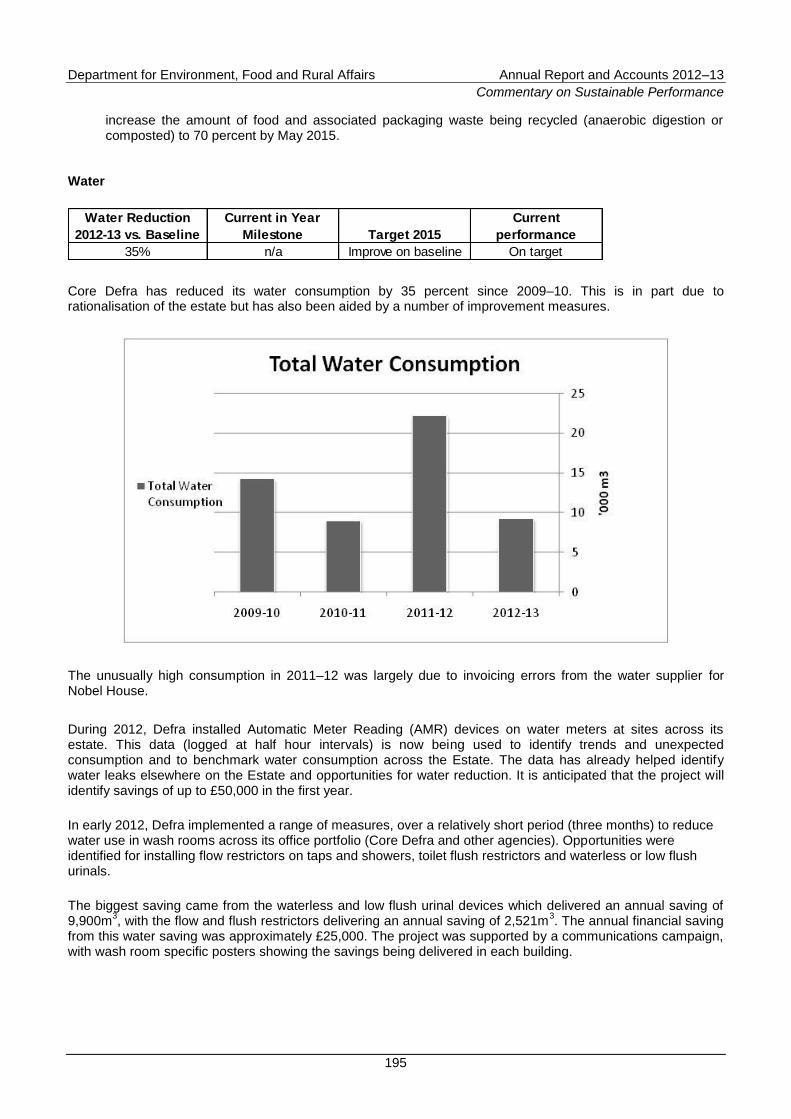
Department for Environment, Food and Rural Affairs Annual Report and Accounts 2012–13
Commentary on Sustainable Performance
195
increase the amount of food and associated packaging waste being recycled (anaerobic digestion or composted) to 70 percent by May 2015.
Water
Water Reduction
2012-13 vs. Baseline
Current in Year
Milestone Target 2015
Current
performance
35% n/a Improve on baseline On target
Core Defra has reduced its water consumption by 35 percent since 2009–10. This is in part due to rationalisation of the estate but has also been aided by a number of improvement measures.
The unusually high consumption in 2011–12 was largely due to invoicing errors from the water supplier for Nobel House.
During 2012, Defra installed Automatic Meter Reading (AMR) devices on water meters at sites across its estate. This data (logged at half hour intervals) is now being used to identify trends and unexpected consumption and to benchmark water consumption across the Estate. The data has already helped identify water leaks elsewhere on the Estate and opportunities for water reduction. It is anticipated that the project will identify savings of up to £50,000 in the first year.
In early 2012, Defra implemented a range of measures, over a relatively short period (three months) to reduce water use in wash rooms across its office portfolio (Core Defra and other agencies). Opportunities were identified for installing flow restrictors on taps and showers, toilet flush restrictors and waterless or low flush urinals.
The biggest saving came from the waterless and low flush urinal devices which delivered an annual saving of 9,900m
3, with the flow and flush restrictors delivering an annual saving of 2,521m
3. The annual financial saving
from this water saving was approximately £25,000. The project was supported by a communications campaign, with wash room specific posters showing the savings being delivered in each building.
Department for Environment, Food and Rural Affairs Annual Report and Accounts 2012–13
Commentary on Sustainable Performance
196
Domestic Flights
Domestic Flights
Reduction 2012-13
vs. Baseline
Current in Year
Milestone Target 2015
Current
Performance
26% 12% 20% Behind milestone
Core Defra is on track to exceed this target and is currently delivering a 26 percent reduction against the baseline. A refresh of the Department‟s Travel Policy in 2013–14, which will limit options for domestic flights, will deliver further improvements.
Paper Use
Paper Use Reduction
2012-13 vs. Baseline
Current in Year
Milestone Target 2012
Current
Performance
26% n/a 20% Exceeding target
This reduction of 26 percent against the baseline is a significant achievement and has been achieved through the rollout of multi-function devices. This gives staff a means to reduce the amount of paper they use, through double-sided printing and also the option to scan documents for distribution without printing. Introduction of more effective controls through procurement have also brought reductions. The Department is also participating in the Government Closed Loop Paper Contract whereby the office paper sent for recycling is returned as recycled printer paper.
Biodiversity
Defra sites at Rhydymwyn, North Wales; Watchtree, Cumbria and Tow Law, County Durham are managed as nature reserves by Wildlife Trusts. These sites provide an array of habitats and the enhancement of biodiversity forms a key part of their management.
When building and refurbishment work is carried out at Defra sites, biodiversity is considered (in accordance with current building regulations and where applicable Building Research Establishment Environmental Assessment Method (BREEAM) requirements) to ensure habitats are preserved and enhanced wherever appropriate. Features, such as bird and bat boxes, are added, where appropriate, to encourage biodiversity.
Environmental Management System
Defra operates an Environmental Management System (EMS) which is externally certified to the internationally recognised standard ISO14001:2004. This incorporates an environmental policy with objectives and targets aimed at continual improvement of environmental performance on the Department‟s Estate. This certification also demonstrates Defra‟s compliance to all relevant environmental legislation.
The EMS is in place at 36 sites covering 80 percent of Defra and Agency staff. In 2013–14 the EMS will be extended to additional properties across the Estate.
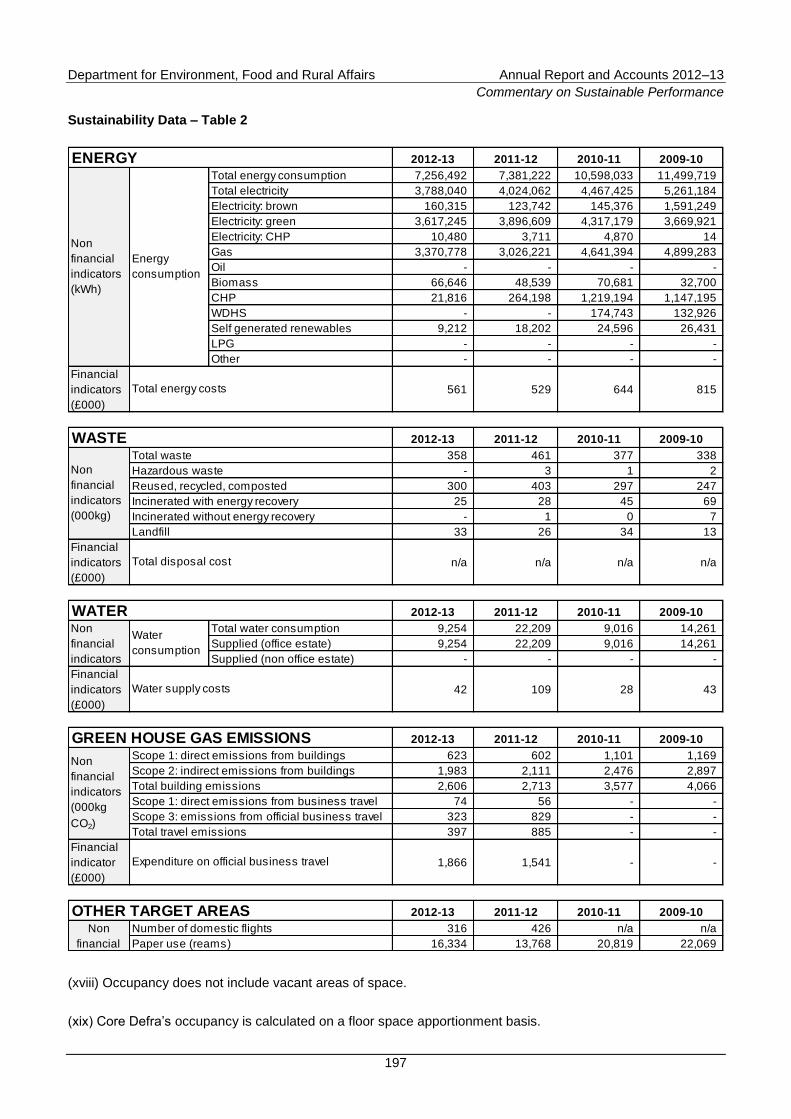
Department for Environment, Food and Rural Affairs Annual Report and Accounts 2012–13
Commentary on Sustainable Performance
197
Sustainability Data – Table 2
2012-13 2011-12 2010-11 2009-10
Total energy consumption 7,256,492 7,381,222 10,598,033 11,499,719
Total electricity 3,788,040 4,024,062 4,467,425 5,261,184
Electricity: brown 160,315 123,742 145,376 1,591,249
Electricity: green 3,617,245 3,896,609 4,317,179 3,669,921
Electricity: CHP 10,480 3,711 4,870 14
Gas 3,370,778 3,026,221 4,641,394 4,899,283
Oil - - - -
Biomass 66,646 48,539 70,681 32,700
CHP 21,816 264,198 1,219,194 1,147,195
WDHS - - 174,743 132,926
Self generated renewables 9,212 18,202 24,596 26,431
LPG - - - -
Other - - - -
Financial
indicators
(£000)
561 529 644 815
2012-13 2011-12 2010-11 2009-10
358 461 377 338
- 3 1 2
300 403 297 247
25 28 45 69
- 1 0 7
33 26 34 13
Financial
indicators
(£000)
n/a n/a n/a n/a
2012-13 2011-12 2010-11 2009-10
Total water consumption 9,254 22,209 9,016 14,261
Supplied (office estate) 9,254 22,209 9,016 14,261
Supplied (non office estate) - - - -
Financial
indicators
(£000)
42 109 28 43
2012-13 2011-12 2010-11 2009-10
623 602 1,101 1,169
1,983 2,111 2,476 2,897
2,606 2,713 3,577 4,066
74 56 - -
323 829 - -
397 885 - -
Financial
indicator
(£000)
1,866 1,541 - -
2012-13 2011-12 2010-11 2009-10
316 426 n/a n/a
16,334 13,768 20,819 22,069
Non
financial
Number of domestic flights
Paper use (reams)
Total energy costs
GREEN HOUSE GAS EMISSIONS
Non
financial
indicators
(000kg
CO2)
Scope 1: direct emissions from buildings
Scope 2: indirect emissions from buildings
Total travel emissions
Non
financial
indicators
Water
consumption
Water supply costs
Expenditure on official business travel
OTHER TARGET AREAS
Reused, recycled, composted
Incinerated with energy recovery
Incinerated without energy recovery
Total building emissions
Scope 1: direct emissions from business travel
Scope 3: emissions from official business travel
Landfill
Total disposal cost
WATER
ENERGY
WASTE
Non
financial
indicators
(000kg)
Total waste
Hazardous waste
Non
financial
indicators
(kWh)
Energy
consumption
(xviii) Occupancy does not include vacant areas of space.
(xix) Core Defra‟s occupancy is calculated on a floor space apportionment basis.
Department for Environment, Food and Rural Affairs Annual Report and Accounts 2012–13
Commentary on Sustainable Performance
198
(xx) Water consumption at Nobel House has been incorrectly billed in 2009–10 and 2010–11. It was subsequently reconciled in 2011–12. This is responsible for most of the increase seen in the 2011–12 figures.
(xxi) Travel emissions data for Core Defra is not available prior to 2011–12. Travel data does not include international travel in accordance with GGCs‟ guidance.
(xxii) Breakdown of waste costs for Core Defra cannot be extrapolated from the figure for the whole Department.
(xxiii) Paper data for quarter 4 2011–12 was not available and so an estimate has been made using the average Quarters 1, 2 and 3 of 2012–13.
(xxiv) Core Defra vacated property which used the WDHS in March 2011.
(xxv) The wind turbines and the CHP unit within the Core Defra estate were offline for the majority of 2012–13 due to technical faults. The wind turbines were repaired in February 2013.

Published by TSO (The Stationery Office) and available from:
Online www.tsoshop.co.uk Mail, telephone, fax and email
TSO
PO Box 29, Norwich NR3 1GN
Telephone orders/general enquiries: 0870 600 5522
Order through the Parliamentary Hotline Lo-Call 0845 7 023474
Fax orders: 0870 600 5533
Email: [email protected]
Textphone: 0870 240 3701
The Houses of Parliament Shop 12 Bridge Street, Parliament Square, London SW1A 2JX Telephone orders/general enquiries: 020 7219 3890
Fax orders: 020 7219 3866
Email: [email protected]
Internet: http://www.shop.parliament.uk
TSO@Blackwell and other accredited agents
Related Documents


