Notes to the Annual Report and Accounts This PDF version of the Unilever Annual Report and Accounts 2009 is an exact copy of the document provided to Unilever’s shareholders. Certain sections of the Unilever Annual Report and Accounts 2009 have been audited. These are on pages 79 to 128, 131 to 132 and those parts noted as audited within the Directors’ Remuneration Report on pages 71 to 73. The maintenance and integrity of the Unilever website is the responsibility of the Directors; the work carried out by the auditors does not involve consideration of these matters. Accordingly, the auditors accept no responsibility for any changes that may have occurred to the financial statements since they were initially placed on the website. Legislation in the United Kingdom and the Netherlands governing the preparation and dissemination of financial statements may differ from legislation in other jurisdictions. Disclaimer Except where you are a shareholder, this material is provided for information purposes only and is not, in particular, intended to confer any legal rights on you. This Annual Report and Accounts does not constitute an invitation to invest in Unilever shares. Any decisions you make in reliance on this information are solely your responsibility. The information is given as of the dates specified, is not updated, and any forward-looking statements are made subject to the reservations specified on the final page of the Report. Unilever accepts no responsibility for any information on other websites that may be accessed from this site by hyperlinks. Disclaimer

Welcome message from author
This document is posted to help you gain knowledge. Please leave a comment to let me know what you think about it! Share it to your friends and learn new things together.
Transcript
Notes to the Annual Report and Accounts This PDF version of the Unilever Annual Report and Accounts 2009 is an exact copy of the document provided to Unilever’s shareholders.
Certain sections of the Unilever Annual Report and Accounts 2009 have been audited. These are on pages 79 to 128, 131 to 132 and those parts noted as audited within the Directors’ Remuneration Report on pages 71 to 73.
The maintenance and integrity of the Unilever website is the responsibility of the Directors; the work carried out by the auditors does not involve consideration of these matters. Accordingly, the auditors accept no responsibility for any changes that may have occurred to the financial statements since they were initially placed on the website.
Legislation in the United Kingdom and the Netherlands governing the preparation and dissemination of financial statements may differ from legislation in other jurisdictions.
Disclaimer Except where you are a shareholder, this material is provided for information purposes only and is not, in particular, intended to confer any legal rights on you.
This Annual Report and Accounts does not constitute an invitation to invest in Unilever shares. Any decisions you make in reliance on this information are solely your responsibility.
The information is given as of the dates specified, is not updated, and any forward-looking statements are made subject to the reservations specified on the final page of the Report.
Unilever accepts no responsibility for any information on other websites that may be accessed from this site by hyperlinks.
Disclaimer

Creating a better future every day
Annual Report and Accounts 2009
Contents
Report of the Directors
Overview1 Our vision2 Operational highlights4 Chairman’s statement5 Chief Executive Officer’s review7 Strategy
Our strategy8 Winning with brands
and innovation10 Winning in the market place12 Winning through
continuous improvement14 Winning with people
Performance 200916 Financial overview18 Making a difference in society20 Growing sustainably
Board and Executive22 Board of Directors24 Unilever Executive
About Unilever25 Our business30 Outlook and risks37 Financial Review 200947 Financial Review 2008
Governance50 Corporate governance63 Report of the Audit Committee64 Report of the Corporate
Responsibility and Reputation Committee
66 Report of the Nomination Committee
67 Directors’ Remuneration Report
Financial statements
76 Statement of Directors’ responsibilities
77 Auditors’ reports79 Consolidated income statement80 Consolidated statement
of comprehensive income80 Consolidated statement of changes
in equity81 Consolidated balance sheet82 Consolidated cash flow statement83 Notes to the consolidated
financial statements129 Financial record131 Principal group companies and
non-current investments133 Company accounts
Shareholder information
144 Analysis of shareholding146 Financial calendar146 Contact details147 Website147 Share registration147 Publications148 Index
Basis of reportingOur accounting policies are based on International Financial Reporting Standards (IFRS) as adopted by the European Union (EU), and on United Kingdom and Dutch law. They are also in accordance with IFRS as issued by the International Accounting Standards Board (IASB). Certain measures used in our reporting are not defined under IFRS or other generally accepted accounting principles. For further information about these measures, and the reasons why we believe they are important for an understanding of the performance of the business, please refer to our commentary on non-GAAP measures on pages 44 to 46 and the Financial Review on page 37.
Other informationThe brand names shown in this report are trademarks owned by or licensed to companies within the Unilever Group.
This document contains certain statements that are neither reported financial results nor other historical information. These statements are forward-looking statements, including within the meaning of the United States Private Securities Litigation Reform Act of 1995. Actual results may differ from those disclosed in our forward-looking statements. For a description of factors that could affect future results, reference should be made to the full ‘Cautionary statement’ on the inside back cover and to the section entitled ‘Outlook and risks’ on pages 30 to 36.
In our report we make reference to Unilever’s website. Information on our website does not form part of this document.
This Annual Report comprises regulated information within the meaning of sections 1:1 and 5:25c of the Dutch Financial Markets Supervision Act.
• Axe/Lynx• Blue Band• Dove• Flora/Becel• Heartbrand
ice creams• Hellmann’s• Knorr• Lipton• Lux• Omo• Rexona• Sunsilk• Surf
Our strong portfolio of foods, home and personal care brands is trusted by consumers the world over. Our top 13 brands account for total sales of over €23 billion and our top 25 brands represent nearly 75% of our sales.
Our top 13 brands*
* Some of our brands may be marketed under alternative names in certain countries.
Our brands

We work to create a better future every day.
We help people feel good, look good and get more out of life with brands and services that are good for them and good for others.
We will inspire people to take small, everyday actions that can add up to a big difference for the world.
We will develop new ways of doing business with the aim of doubling the size of our company while reducing our environmental impact.
Our vision
Financial
3.5%underlying sales growth
• Underlying volume growth of 2.3% accelerating through the year
• Turnover of €39.8 billion
• Underlying operating margin† up from 14.6% to 14.8%
• Cash flow from operating activities up by €1.4 billion
• Total shareholder return ranking up from 9th to 5th
• Earnings per share of €1.21
• First quarterly dividend of €0.195 payable March 2010
• Selective acquisitions including TIGI and Baltimor
Report of the Directors Overview
p16
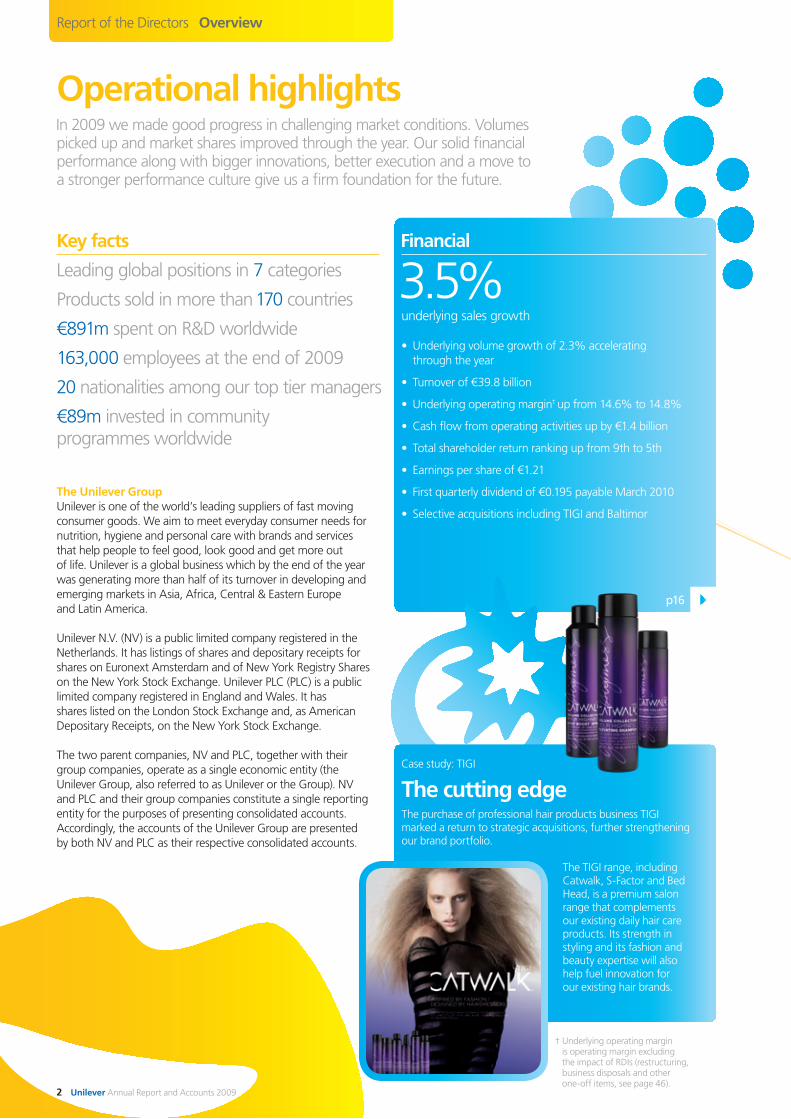
In 2009 we made good progress in challenging market conditions. Volumes picked up and market shares improved through the year. Our solid financial performance along with bigger innovations, better execution and a move to a stronger performance culture give us a firm foundation for the future.
Operational highlights
Key facts
Leading global positions in 7 categories
Products sold in more than 170 countries
€891m spent on R&D worldwide
163,000 employees at the end of 2009
20 nationalities among our top tier managers
€89m invested in community programmes worldwide
Case study: TIGI
The cutting edgeThe purchase of professional hair products business TIGI marked a return to strategic acquisitions, further strengthening our brand portfolio.
The TIGI range, including Catwalk, S-Factor and Bed Head, is a premium salon range that complements our existing daily hair care products. Its strength in styling and its fashion and beauty expertise will also help fuel innovation for our existing hair brands.
The Unilever GroupUnilever is one of the world’s leading suppliers of fast movingconsumer goods. We aim to meet everyday consumer needs for nutrition, hygiene and personal care with brands and services that help people to feel good, look good and get more out of life. Unilever is a global business which by the end of the year was generating more than half of its turnover in developing and emerging markets in Asia, Africa, Central & Eastern Europe and Latin America.
Unilever N.V. (NV) is a public limited company registered in the Netherlands. It has listings of shares and depositary receipts for shares on Euronext Amsterdam and of New York Registry Shares on the New York Stock Exchange. Unilever PLC (PLC) is a public limited company registered in England and Wales. It has shares listed on the London Stock Exchange and, as American Depositary Receipts, on the New York Stock Exchange.
The two parent companies, NV and PLC, together with their group companies, operate as a single economic entity (the Unilever Group, also referred to as Unilever or the Group). NV and PLC and their group companies constitute a single reporting entity for the purposes of presenting consolidated accounts. Accordingly, the accounts of the Unilever Group are presented by both NV and PLC as their respective consolidated accounts.
† Underlying operating margin is operating margin excluding the impact of RDIs (restructuring, business disposals and other one-off items, see page 46).
2 Unilever Annual Report and Accounts 2009

Social
2 billionconsumers worldwide use a Unilever product on any day
• 133 million people reached by Lifebuoy handwashing programmes since 2002
• 15 million people in 3 million households in India provided with safe drinking water through Pureit
• 44% of our products in line with internationally accepted guidelines for saturated and trans fat, sugar and salt
• Nearly 17 million school meals delivered to 80,000 children in 2009 through our partnership with the World Food Programme
• 45,000 women entrepreneurs reach 3 million consumers in 100,000 Indian villages with Unilever products
• 9%* reduction in total recordable accident frequency rate in 2009
Environmental
185,000tonnes of palm oil sourced sustainably via GreenPalm certificates
• Around 15% of our tea sourced from Rainforest Alliance Certified™ farms globally
• Around 430,000 climate-friendly (HFC-free) ice cream freezer cabinets purchased since 2004
• 41%* reduction in CO2 from energy per tonne of production over the period 1995-2009
• 65%* reduction in water per tonne of production over the period 1995-2009
• 73%* reduction in total waste per tonne of production over the period 1995-2009
• 11 years as sector leader of the Dow Jones Sustainability Indexes
p18 p20
Case study: Foodsolutions
Salt reductionsUnilever in the UK is supporting government efforts to reduce levels of salt in food consumed both in and out of the home.
Our brand reformulation programme means that within retail and the catering sector through Unilever’s Foodsolutions business, approximately 80% of our products meet the Food Standards Agency 2010 salt reduction targets. For example, in Unilever Foodsolutions UK we have reduced salt levels in Knorr soups by 25% and in sauces by 27%.
Case study: Comfort
Water waysIt is a challenge to develop ways to maintain business growth in the laundry category while reducing the impact of water use.
More water is used in the rinsing than in the cleaning process. To tackle this, our Comfort One Rinse fabric conditioner has been formulated so that much less water is required per wash to rinse the detergent from clothes. It has been launched in Vietnam, Indonesia and Brazil, and is expected to be rolled out to more countries during 2010.
* 2009 data is preliminary. It will be independently assured and reported in our online Sustainable Development Report 2009 at www.unilever.com/sustainability
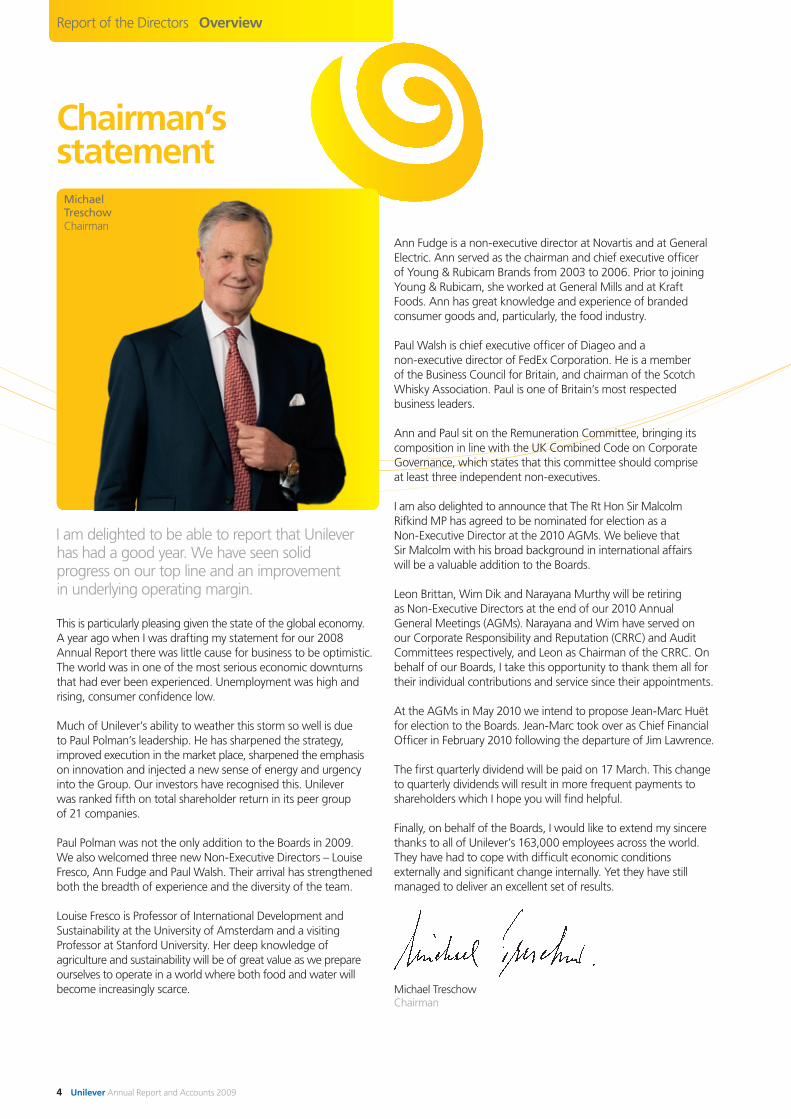
This is particularly pleasing given the state of the global economy. A year ago when I was drafting my statement for our 2008 Annual Report there was little cause for business to be optimistic. The world was in one of the most serious economic downturns that had ever been experienced. Unemployment was high and rising, consumer confidence low.
Much of Unilever’s ability to weather this storm so well is due to Paul Polman’s leadership. He has sharpened the strategy, improved execution in the market place, sharpened the emphasis on innovation and injected a new sense of energy and urgency into the Group. Our investors have recognised this. Unilever was ranked fifth on total shareholder return in its peer group of 21 companies.
Paul Polman was not the only addition to the Boards in 2009. We also welcomed three new Non-Executive Directors – Louise Fresco, Ann Fudge and Paul Walsh. Their arrival has strengthened both the breadth of experience and the diversity of the team.
Louise Fresco is Professor of International Development and Sustainability at the University of Amsterdam and a visiting Professor at Stanford University. Her deep knowledge of agriculture and sustainability will be of great value as we prepare ourselves to operate in a world where both food and water will become increasingly scarce.
Ann Fudge is a non-executive director at Novartis and at General Electric. Ann served as the chairman and chief executive officer of Young & Rubicam Brands from 2003 to 2006. Prior to joining Young & Rubicam, she worked at General Mills and at Kraft Foods. Ann has great knowledge and experience of branded consumer goods and, particularly, the food industry.
Paul Walsh is chief executive officer of Diageo and a non-executive director of FedEx Corporation. He is a member of the Business Council for Britain, and chairman of the Scotch Whisky Association. Paul is one of Britain’s most respected business leaders.
Ann and Paul sit on the Remuneration Committee, bringing its composition in line with the UK Combined Code on Corporate Governance, which states that this committee should comprise at least three independent non-executives.
I am also delighted to announce that The Rt Hon Sir Malcolm Rifkind MP has agreed to be nominated for election as a Non-Executive Director at the 2010 AGMs. We believe that Sir Malcolm with his broad background in international affairs will be a valuable addition to the Boards.
Leon Brittan, Wim Dik and Narayana Murthy will be retiring as Non-Executive Directors at the end of our 2010 Annual General Meetings (AGMs). Narayana and Wim have served on our Corporate Responsibility and Reputation (CRRC) and Audit Committees respectively, and Leon as Chairman of the CRRC. On behalf of our Boards, I take this opportunity to thank them all for their individual contributions and service since their appointments.
At the AGMs in May 2010 we intend to propose Jean-Marc Huët for election to the Boards. Jean-Marc took over as Chief Financial Officer in February 2010 following the departure of Jim Lawrence.
The first quarterly dividend will be paid on 17 March. This change to quarterly dividends will result in more frequent payments to shareholders which I hope you will find helpful.
Finally, on behalf of the Boards, I would like to extend my sincere thanks to all of Unilever’s 163,000 employees across the world. They have had to cope with difficult economic conditions externally and significant change internally. Yet they have still managed to deliver an excellent set of results.
Michael TreschowChairman
Chairman’s statement
Michael TreschowChairman
I am delighted to be able to report that Unilever has had a good year. We have seen solid progress on our top line and an improvement in underlying operating margin.
Report of the Directors Overview
4 Unilever Annual Report and Accounts 2009
Delivering growth in a tough yearAt the beginning of 2009 we took a long-term view, dropping guidance and setting the objective of restoring volume growth while protecting cash flow and underlying operating margin. As well as managing the short-term challenges, we increased support behind our brands and invested in R&D and people – the surest route to long-term shareholder value creation.
Volume growth was 2.3%, with acceleration throughout the year. This was driven by sharper execution and strong innovations, supported by incremental investment behind our brands in advertising and, to a lesser extent, promotions. Underlying sales growth was 3.5%.
Growth was broad based across markets and categories. By the end of the year we were growing volume share in two thirds of our business, compared with only one third a year earlier. Our competitive position strengthened during the year. Our biggest brands are getting stronger – ten of the top 13 brands are gaining volume share.
Good cost discipline meant that underlying operating margin was up 0.2% to 14.8% and tight working capital control meant cash flow from operating activities increased by €1.4 billion.
How we deliveredRecognising the severity of the economic crisis early and responding quickly was key to our strong performance, even if it meant some tough choices. The focus on volume growth, combined with protecting margins and cash flow, proved to be the right drivers in the current environment.
We targeted four key areas of activity:
Bigger and better innovations, rolled out faster and to more marketsOur innovations are getting bigger and better. The One Unilever structure allows for faster roll-out across multiple geographies. Dove Minimising Deodorant, for example, was rolled out across 37 markets; Signal White Now to 21 markets and Knorr Stockpots to 12 markets; Clear shampoo is now in 35 markets; and following its launch at the end of 2009, Dove for Men will be rolled out across 50 markets. Our innovation pipeline is equally getting stronger. The number of innovations in the pipeline with an expected incremental turnover in excess of €50 million has doubled. The opening of a new research centre in Shanghai, our second in the emerging markets, reflects a long-term commitment to R&D. Innovation will continue to be the key growth driver for your company. The business publication Fast Company recently recognised us as the fourth most innovative company in advertising and marketing.
More discipline throughout the organisationServing the consumer and customer with increasing passion every day is critical to our success. To help develop categories and accelerate our growth with our customers we have created a new global customer supply structure and are rolling out state of the art customer innovation centres to all regions. Our progress was recognised: we gained supplier of the year awards from a number of top customers. In a performance culture, we are increasingly focused on disciplined execution.
A more competitive cost structureOur emphasis on protecting short-term business fundamentals meant driving out costs that do not add value for consumers and customers. This included accelerating much needed restructuring projects, leveraging scale by moving to global procurement, establishing regional sourcing organisations across each of our geographies and simplifying and further streamlining our organisational structure. In total we achieved savings of over €1.4 billion, well ahead of target and which helped fuel investment behind our brands. By adopting best practices we also made significant improvements in working capital (€1.9 billion).
Driving a performance cultureWe start from a strong base of values and principles, which have served us well over the years: integrity, trust, investing in people, doing the right thing for the long term. In very competitive markets, we need to further increase consumer and customer focus, speed of action, and responsibility and accountability. To achieve this we have made the organisation flatter, simplified target setting and sharpened individual performance management.
The organisation rose to the challenge, showing its competitive strength in managing change. I am proud to work with a strong leadership team and a dedicated group of colleagues throughout the world. The results in 2009 are a testament to their passion, commitment, skill and hard work.
Chief Executive Officer’s review
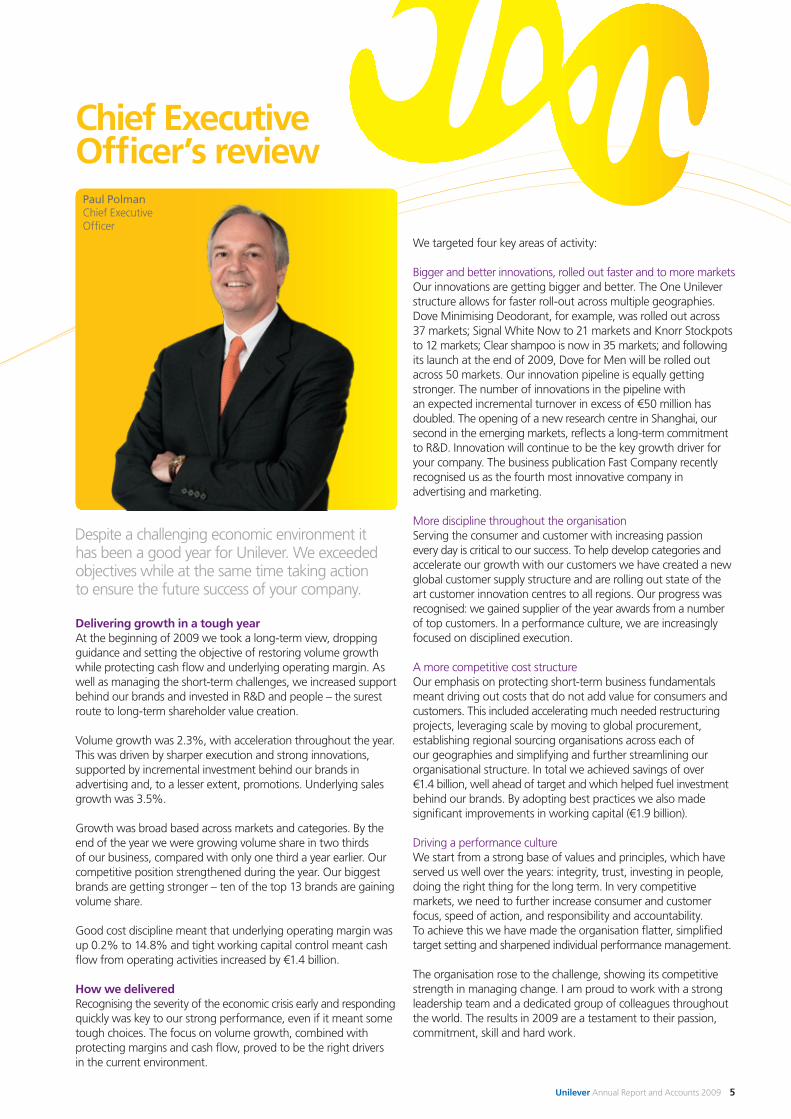
Despite a challenging economic environment it has been a good year for Unilever. We exceeded objectives while at the same time taking action to ensure the future success of your company.
Paul PolmanChief Executive Officer
Unilever Annual Report and Accounts 2009 5
Chief Executive Officer’s review (continued)
We equally made good progress in other areas to position us for future growth:
We sharpened the portfolioThe announced acquisition of Sara Lee’s personal care brands, including Sanex, Radox and Duschdas, will significantly strengthen our European business. We made smaller, bolt-on acquisitions, such as the TIGI professional hair care brands, mainly in the US and the Baltimor ketchup business in Russia. We assumed total control of our business in Vietnam and continued to divest non-strategic assets, such as our remaining equity stake in JohnsonDiversey and plantations in Congo.
We strengthened our supply chain capabilityThe appointment from outside of our first Chief Global Supply Chain Officer reflects the importance we attach to strengthening our operations and to leveraging our scale right across the supply chain.
We began the move to global business servicesWe created Unilever Enterprise Services (UES) to bring together HR and Finance transactions, as well as IT and Information Management services. UES will enable us to leverage scale in order to deliver improved services at better value. At the same time it will free up capacity for our businesses to concentrate on supporting our brands in the market place.
During the year we also found solutions to concerns raised by stakeholders, including the settlement of long running labour disputes in Pakistan and India. We continued to take the lead in driving sustainability, especially in moving to sustainable palm oil, converting to environmentally-friendly (HC) refrigerants in our ice cream freezers and in supporting smallholder farming.
Where we could do betterDespite significant progress, we did not fully achieve all our goals.
In two key markets, India and Spain, we took longer to respond to changing market dynamics and to the intense level of competition, especially from low-cost local competitors. And in two of our biggest categories – hair and spreads – we still need to build share consistently everywhere.
Our brands have plenty of room for improvement. Product quality is getting better, but we need more of our products to show superiority, and there is ample scope to sharpen our communications and to set the innovation bar even higher.
We are getting better at serving our customers but again we still fall short of best in class, for example in customer service levels and the on-shelf availability of our products.
Faced with growing competitive pressures, especially from lower-cost producers, we must continue to drive out all non value-added costs, building on the progress we have made in the last year.
The organisation is working hard in all these areas and I am confident that we will see continuous improvements. This is important because 2010 promises to be every bit as challenging. We expect two of the major drivers of our business – consumer spending and consumer confidence – to remain low. We also expect competitors to accelerate their plans to regain lost ground. This requires the best of us and we are ready for it.
A new business modelWith confidence in our ability to grow we launched a renewed, bold vision for the company – to double our size while improving our environmental footprint. With our portfolio of brands, presence in emerging markets and long-standing commitment to shared value creation – in which the long-term interests of the company, its communities and stakeholders are all directly linked – we believe your company is well placed to deliver on this ambition.
When it comes to environmental impact, for example, we lead the industry in the move to sustainable sourcing of commodities such as palm oil and tea. In fact we have given a firm commitment that by 2015 all of our supplies of palm oil and tea will come from certified sustainable sources.
Consumers will also have to change their habits. Through the Cleaner Planet Plan our laundry brands are helping to educate people about the benefits of washing at lower temperatures and using shorter cycles. With our products used in 125 billion washes a year, small actions like this can make a big difference. Likewise, poor sanitation and lack of hygiene standards are still the root causes of millions of preventable deaths, especially amongst children. With our health and handwashing campaigns we have reached millions of people over the years. The Lifebuoy brand’s ambitious new target is to change the hygiene behaviour of 1 billion people by 2015.
Leadership like this explains why, for the 11th year running, Unilever was sector leader in the Dow Jones Sustainability Indexes – a feat unmatched by any other company.
Looking ahead2009 was a good year for Unilever despite the tough conditions. 2010 won’t be any easier, but by embedding the changes we are already making and by fostering a sharper performance culture, there is no reason why we can’t go on growing in line with our ambitions. And we will do it in a way that continues to make our consumers, customers, partners and employees proud to be associated with Unilever.
Thank you for your support over 2009.
Paul PolmanChief Executive Officer
Report of the Directors Overview
6 Unilever Annual Report and Accounts 2009

Where we will win
Brands and innovation are at the heart of our business model. We aim to offer a broad portfolio that appeals to consumers with different needs and budgets. Unilever brands must also offer product quality that is recognised as superior by our consumers and supported by excellent marketing. Meanwhile, our innovation programme is focused on being ‘bigger, better, faster’. This means leveraging technology to create bigger, better innovation platforms that are then rolled out faster to multiple markets.
Our ambition is to win share and grow volume profitably across our categories and countries – and we believe we have the tools in place to do so. We have a portfolio fit for growth, with strong brands and many leading category positions. Geographically, our outstanding presence in the emerging markets leaves us well positioned to win where much of the future growth will be. Yet, we are also determined to grow in the developed world, which represents around half of our business and where the bulk of the world’s wealth will remain for many years to come.
The biggest opportunity for Unilever and our customers lies in growing the size of our categories, which we will strive to achieve through innovation and market development. We will further enhance and broaden our relationship with customers – working together on areas of mutual benefit such as consumer research, shopper behaviour and merchandising. To sustain winning customer relationships and to enable growth, we will also need to be consistently brilliant at customer service and in-store execution.
We will aim to reinforce our continuous improvement philosophy by further developing a customer and consumer-led, agile value chain. Our focus will be in three areas. We will prioritise speed and flexibility in the supply chain to deliver growth. Secondly we will leverage our global network capabilities and scale more aggressively. Finally we will work to get a better return on our advertising and promotional expenditure – one of our most significant areas of cost.
It is vital that we have the talent and organisation in place to match our growth ambition. Across the business, we are therefore looking ahead at what we need to achieve, and aim to equip ourselves with the necessary people, skills and capabilities to get there. We also know that engagement and a culture based on living our values are essential for keeping the best people. We believe our operating framework allows us to balance scale and global expertise to develop successful products with the local consumer intimacy needed to market and sell them.
Strategy “ With confidence in our ability to grow we launched a renewed, bold vision for the company – to double our size while improving our environmental footprint. With our portfolio of brands, presence in emerging markets and long-standing commitment to shared value creation, we believe your company is well placed to deliver on this ambition.”
Winning with brands and innovation
Growth priorities
Winning through continuous improvement
Winning in the market place
Winning with people
How we will win
More on p8
More on p10
More on p12
More on p14
Unilever Annual Report and Accounts 2009 7
Report of the Directors Our strategy
Winning with brands and innovation
How we will win
Superior productsOur aim is to give people a great experience when they use our brands – better than the competition. We are investing in improving product quality and making stronger functional claims. We are also focusing on design, packaging, marketing and advertising, in order to get our brand benefits across more persuasively.
Take Knorr Stockpot bouillon. Using a unique jelly technology that delivers homemade taste and quality, this product is helping people create a special meal at home instead of eating out. A major success in the UK where it enabled Knorr to become market leader in stocks, Stockpot (marketed under different names in different countries) is also performing well in Belgium, Greece, Ireland and Poland. It helped create the bouillon category in China and we are now rolling it out to other markets.
Widespread appealProduct superiority is essential, but we also need to offer a broad range of choice which meets differing consumer needs and price points wherever we operate.
Brands and innovation are at the heart of everything we do. We develop our products to keep pace with changes in consumer lifestyles and to appeal to people at all income levels. Success means getting bigger and better innovations into the market faster, supported by the very best marketing.
In the UK, understanding that consumers are looking for value without compromising on quality, and recognising the importance of fragrance in communicating a product’s benefits, we developed a range of liquid concentrates for Surf detergent with added essential oils, resulting in 29% growth.
In Russia, despite a severe economic recession, we achieved growth of more than 20% in our tea sales by offering choice across multiple price points with three distinctive brands – Lipton, Brooke Bond and Beseda.
And in India, where water quality remains a major concern, the breakthrough technology of Pureit, our in-home purification system, is providing safe and affordable drinking water with complete protection from the water-borne germs that cause diseases. In 2009, Pureit provided safe drinking water for more than 15 million people in 3 million households in India.
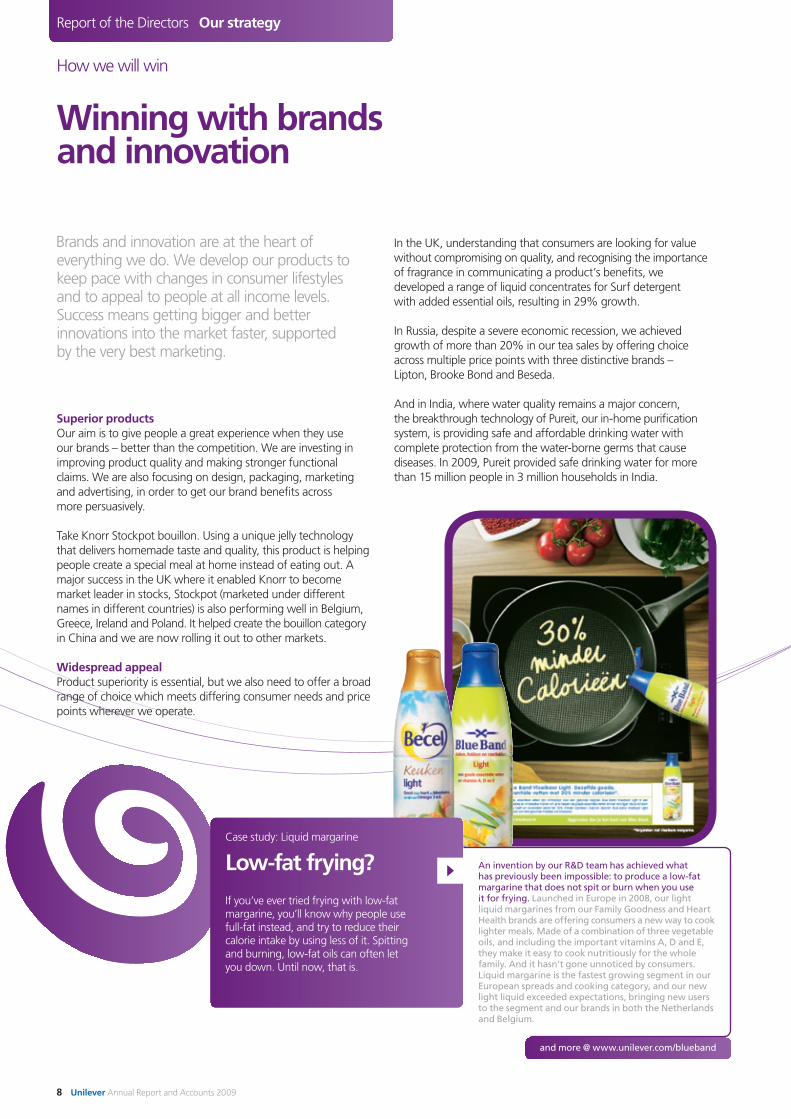
An invention by our R&D team has achieved what has previously been impossible: to produce a low-fat margarine that does not spit or burn when you use it for frying. Launched in Europe in 2008, our light liquid margarines from our Family Goodness and Heart Health brands are offering consumers a new way to cook lighter meals. Made of a combination of three vegetable oils, and including the important vitamins A, D and E, they make it easy to cook nutritiously for the whole family. And it hasn’t gone unnoticed by consumers. Liquid margarine is the fastest growing segment in our European spreads and cooking category, and our new light liquid exceeded expectations, bringing new users to the segment and our brands in both the Netherlands and Belgium.
Case study: Liquid margarine
Low-fat frying?
If you’ve ever tried frying with low-fat margarine, you’ll know why people use full-fat instead, and try to reduce their calorie intake by using less of it. Spitting and burning, low-fat oils can often let you down. Until now, that is.
and more @ www.unilever.com/blueband
8 Unilever Annual Report and Accounts 2009
Bigger, better, faster innovationsSuccessful innovation is based on deep consumer insight. The balance we seek to achieve is to marry global strength in R&D with local knowledge of people’s habits, tastes and behaviours.
To grow at the rate we want to, we focus investment on products that can work globally rather than on launches in just a few countries. We have also doubled the number of big projects we are working on. We are already seeing results. We have rolled out Axe Dark Temptation deodorant to 56 markets, Lipton Pyramid fruit tea bags to 38 markets and Clear shampoo to 35 markets.
For a product to work at a global level, it needs to address unmet needs with superior technology and a clear consumer concept. R&D must deliver breakthrough science in areas that really matter to consumers, with products that do what they claim. Success on this scale requires strict priorities and big ideas.
Within R&D, part of prioritising is getting the balance right between the short and the long term. With an eye to our future growth plans, during 2009 we developed a more robust process for fuelling our longer-term innovation pipeline. Called the Genesis Programme, it spans our foods and home and personal care categories and focuses on the breakthrough ideas that we expect will deliver the biggest wins. From 2011 we should begin to see some of these innovations in our products.
We continued to invest substantially in R&D, despite the economic environment. In 2009, we opened a new R&D centre in Shanghai. Located in a country which is increasingly recognised as a world leader in developing high-end innovations, the new centre further underscores our commitment to driving growth through R&D. We also started to leverage the power of our global network of R&D labs by getting them working interdependently on key projects. We put in place more rigorous planning processes to make sure that the right level and quality of resource is put behind the activities to ensure the projects succeed. And we have stepped up our focus on a number of areas identified as critical to success such as open innovation, clinicals and patents.
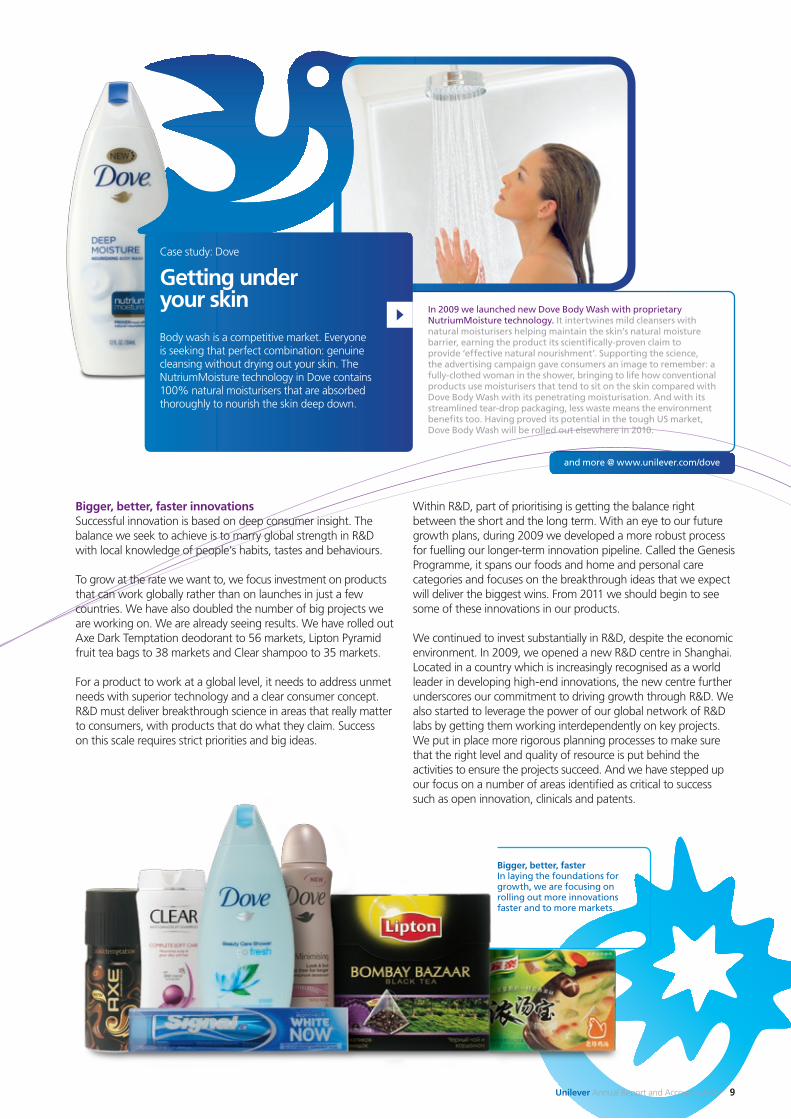
In 2009 we launched new Dove Body Wash with proprietary NutriumMoisture technology. It intertwines mild cleansers with natural moisturisers helping maintain the skin’s natural moisture barrier, earning the product its scientifically-proven claim to provide ‘effective natural nourishment’. Supporting the science, the advertising campaign gave consumers an image to remember: a fully-clothed woman in the shower, bringing to life how conventional products use moisturisers that tend to sit on the skin compared with Dove Body Wash with its penetrating moisturisation. And with its streamlined tear-drop packaging, less waste means the environment benefits too. Having proved its potential in the tough US market, Dove Body Wash will be rolled out elsewhere in 2010.
Case study: Dove
Getting under your skin
Body wash is a competitive market. Everyone is seeking that perfect combination: genuine cleansing without drying out your skin. The NutriumMoisture technology in Dove contains 100% natural moisturisers that are absorbed thoroughly to nourish the skin deep down.
Bigger, better, fasterIn laying the foundations for growth, we are focusing on rolling out more innovations faster and to more markets.
and more @ www.unilever.com/dove
Unilever Annual Report and Accounts 2009 9

Lead market developmentThe world’s population, currently 6.8 billion, is set to grow to 7.7 billion by 2020. Today, 5.9 billion live in developing and emerging markets – countries such as Brazil, India and Indonesia where Unilever has deep roots and a wide presence. We already reach many more consumers than our competitors in these markets.
Market development is about developing and growing categories. There are three ways of doing this:• more users (increasing market penetration);• more usage (increasing consumption);• more benefits (getting consumers to buy higher value products).
Take Axe. In recognising that fragrance is a major reason why people choose one brand over another, new fragrance launches are helping to increase market penetration, introduce new users to the brand and ensure our product mix remains up to date. This, in turn, has helped Axe become the world’s leading male deodorant and shower gel.
Putting market development into practice requires a rigorous, consistent approach across all our categories. During 2009 our global category development teams produced market development models for every category. These models are now with our country teams who are using them as the basis of plans for their local markets. This approach has already shown excellent results in many of the markets in which we operate.
Winning in the market place
Report of the Directors Our strategy
Our biggest growth opportunity lies in expanding the markets in which we compete. In developing and emerging countries there is huge potential for future growth as more and more people start consuming personal and household products for the first time. To realise this potential, we will need to partner with our customers in both the developed and developing markets.
How we will win
Unilever was the exclusive partner of Walmart Soundcheck. The campaign featured music talent such as Jennifer Hudson and Martina McBride. Our brands, including Dove and Suave, were able to reach their target consumers in a new, innovative way. A video of a latest hit, along with exclusive interviews with the artist, was shown in-store in the electronics department, and was available as a download from the Walmart website. In-store merchandising and additional online programming further amplified the campaign. Not only did the programme result in a big increase in sales for our products, but Walmart saw a rise in music sales of the featured artists. Soundcheck is a multi-year exclusive partnership, so we’re looking for another good year in 2010.
Case study: Walmart USA
Winning in Walmart
Using hit album releases to sell our personal care products? The Soundcheck campaign with Walmart engaged top artists whose images reinforce our brands. With continuous exposure in almost every Walmart store, the campaign reached around 130 million target consumers per week, making a huge contribution to our 6.8% uplift in sales in Walmart in 2009.
and more @ www.unileverusa.com/suave
10 Unilever Annual Report and Accounts 2009
Win with winning customersThere is a growing trend in the retail industry towards consolidation, with fewer but larger retailers. Thanks to our global scale and local knowledge, Unilever is ideally placed to help those customers achieve their own growth ambitions.
In 2008 we opened in New Jersey the first of a network of customer insight and innovation centres to work directly with retailers. The centre covers everything from merchandising and store layout, to displays and packaging. Through the centre, we work with customers to design and test concepts without going to the expense of real in-store pilots. Since opening, the centre has generated significant growth opportunities. Our London centre has since opened and we plan to open three more in 2010 in Paris, Shanghai and São Paulo.
Be an execution powerhouseMarket development and great relationships with customers will only be points of advantage if we execute with excellence. This is not a complicated concept. It is about the everyday disciplines of ensuring that we are delivering to our customers the products they want, in the quantities they ordered at the time they are needed. This involves having a customer-focused approach across our brand building, customer development and supply chain teams.
During 2009 we focused much more closely on ‘sales fundamentals’, a set of company-wide measures covering every aspect of our in-store presence. We have performed well against these measures, which have been one of the many drivers in improving customer service in most of our key countries.
The detail of what works in one type of store won’t work for all, however. A superstore in the US is very different from a local retailer in a small town in China, both in terms of the products it carries and the way those products are sold. But for each type of store, by channel and geography, there is a perfect concept – namely, what the shop would look like if it were the perfect sales vehicle for our categories and brands.
We developed the perfect store concept in the AAC region (Asia, Africa and Central & Eastern Europe) in early 2009. We began implementing it in modern trade outlets across the region, focusing on the region’s largest four categories – skin cleansing, hair, fabric cleaning and tea. In some smaller outlets, we even succeeded in executing the transformation overnight, taking the competition by surprise and maximising the impact of the change.
Over the next few years our aim is to continue implementing the perfect store concept across the AAC region, while in the coming year, the concept is being rolled out around the business.
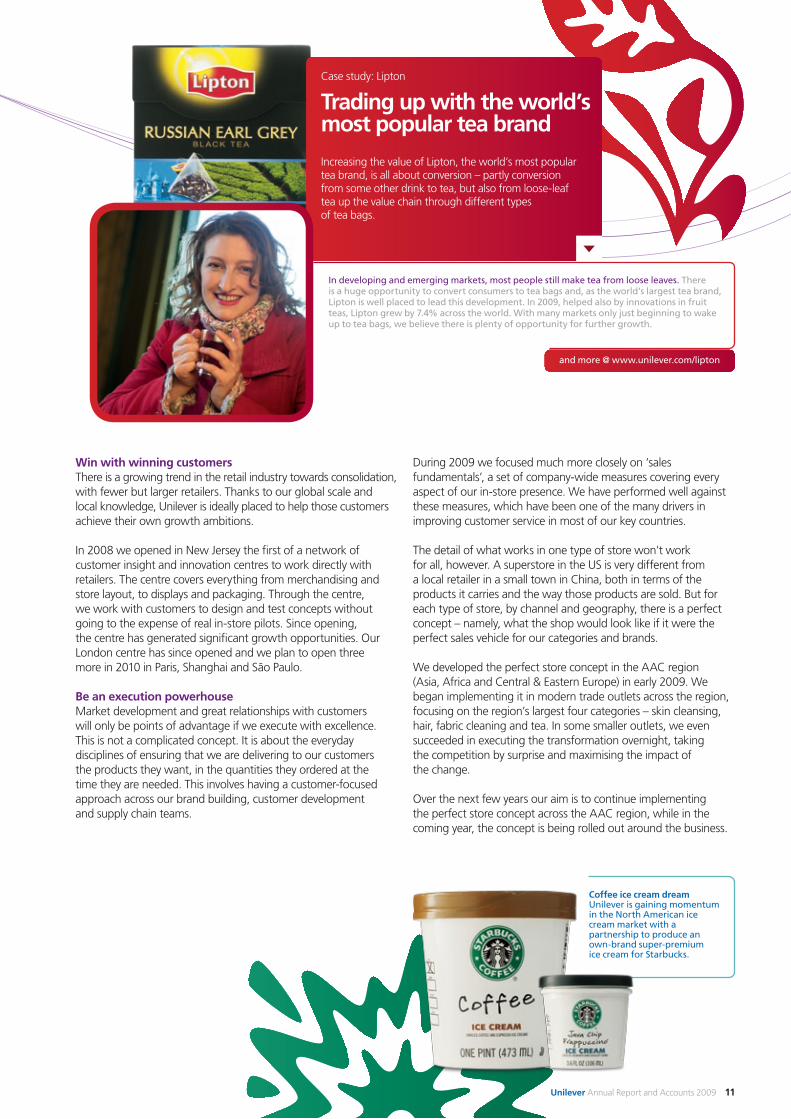
In developing and emerging markets, most people still make tea from loose leaves. There is a huge opportunity to convert consumers to tea bags and, as the world’s largest tea brand, Lipton is well placed to lead this development. In 2009, helped also by innovations in fruit teas, Lipton grew by 7.4% across the world. With many markets only just beginning to wake up to tea bags, we believe there is plenty of opportunity for further growth.
and more @ www.unilever.com/lipton
Case study: Lipton
Trading up with the world’s most popular tea brand
Increasing the value of Lipton, the world’s most popular tea brand, is all about conversion – partly conversion from some other drink to tea, but also from loose-leaf tea up the value chain through different types of tea bags.
Coffee ice cream dreamUnilever is gaining momentum in the North American ice cream market with a partnership to produce an own-brand super-premium ice cream for Starbucks.
Unilever Annual Report and Accounts 2009 11
Fast and flexible – and increasingly competitiveWinning in the market is about being fast and agile to meet the changing needs of today’s customers and consumers. Of course, being competitive on cost is vital, but rather than having a purely cost-based agenda for our supply chain, we have widened our focus to ensure that we are more responsive to the constantly changing needs of our customers.
Delivering significant valueDuring 2009 we launched a single strategy for the supply chain – One Unilever Supply Chain – putting customers and consumers at the heart of everything we do. The principal objectives for our supply chain are to deliver top-quality products with world-class service at a competitive cost. It’s a big ambition that:• supports top-line growth through speeding up the roll-out
of global launches;• ensures our products are constantly on the shelf;• increases profits by simplifying our structure and
reducing waste;• improves cash flow by reducing stock and providing
better payment terms.
The rewards are significant. In 2009, as part of this, our One Unilever Supply Chain team contributed significantly to delivering €1.4 billion in savings.
The advantages of global scaleUnilever has a global reach wider than many of its competitors. This gives us a tremendous opportunity for improving efficiencies by leveraging our scale. We are doing this in three critical areas:• procurement;• manufacturing;• back office services.
Single procurement strategyHaving a single, global procurement strategy means that where bigger is better, we are getting the benefits. For many items, buying globally gives us economies of scale. For example, significantly reducing the number of tomato ingredients that are used in our products from 300 to just 39 enhanced the consistency of product quality and, at the same time, substantially reduced costs.
Winning through continuous improvement
Report of the Directors Our strategy
Delivering sustained, profitable growth requires a philosophy of continuous improvement. This means being fast and flexible in the supply chain while keeping costs competitive. It will also require us to make the most of our scale and aim for the best return on every euro we spend on advertising and promotion.
How we will win
and more @ www.unilever.com/axe
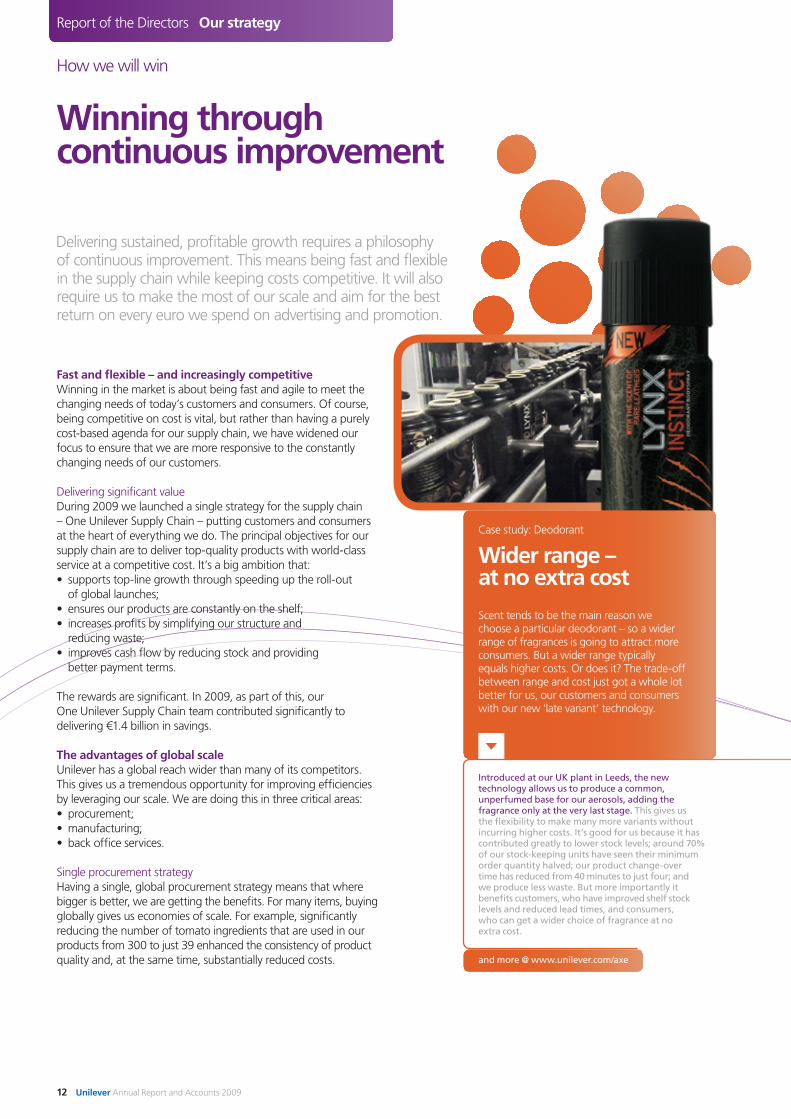
Introduced at our UK plant in Leeds, the new technology allows us to produce a common, unperfumed base for our aerosols, adding the fragrance only at the very last stage. This gives us the flexibility to make many more variants without incurring higher costs. It’s good for us because it has contributed greatly to lower stock levels; around 70% of our stock-keeping units have seen their minimum order quantity halved; our product change-over time has reduced from 40 minutes to just four; and we produce less waste. But more importantly it benefits customers, who have improved shelf stock levels and reduced lead times, and consumers, who can get a wider choice of fragrance at no extra cost.
Case study: Deodorant
Wider range – at no extra cost
Scent tends to be the main reason we choose a particular deodorant – so a wider range of fragrances is going to attract more consumers. But a wider range typically equals higher costs. Or does it? The trade-off between range and cost just got a whole lot better for us, our customers and consumers with our new ‘late variant’ technology.
12 Unilever Annual Report and Accounts 2009
Regional sourcing operationsIn manufacturing, we believe that most of the economies of scale are to be found at the regional level. To capture these, we are creating three regional sourcing companies. These are located in Singapore and Switzerland, where the Americas sourcing company will co-locate with the European company.
Internal services under one roofEven with activities such as IT, travel, office services, accounts payable and accounts receivable, there are big opportunities to leverage global scale. So in 2009 we set up a new business unit, Unilever Enterprise Support (UES). It will be operational in April 2010 and will bring together many of these activities as a key part of our initiatives to drive down costs.
The best return on brand and customer investmentUnilever is the second biggest advertiser in the world. Improving the return on our brand and customer support is one of the biggest things we can do to achieve growth.
There is a tendency to think that analysing this kind of return on investment is some form of mystery. We believe it is simply about being rigorous in applying our best evaluation and development techniques.
Everyday disciplines done brilliantlyFirst, we decide on the best ways of investing our spend. We do this on three levels:• allocating investment across geographies, categories
and brands;• allocating investment across particular projects and
product launches;• allocating spend locally across marketing channels
and promotions.
Before we invest, we use a number of tools to answer the questions: how much should we be investing; and how can we maximise its effectiveness? During and after the investment, we use other tools to look at whether it is working, how it could work better and what to do next. This is not about replacing creativity with analytics and measurement; it is about doing both brilliantly.
Through focusing on these basics, we are already seeing great improvements in return on investment in a number of areas. For example, our US foods business has increased returns by over 45% in six years, helped by its use of econometric modelling.
Future trendsLooking ahead, there are two big themes that will dominate our media planning: how we make best use of digital media and, given the rise in prominence of global retailers, how we can make the most of in-store investments.
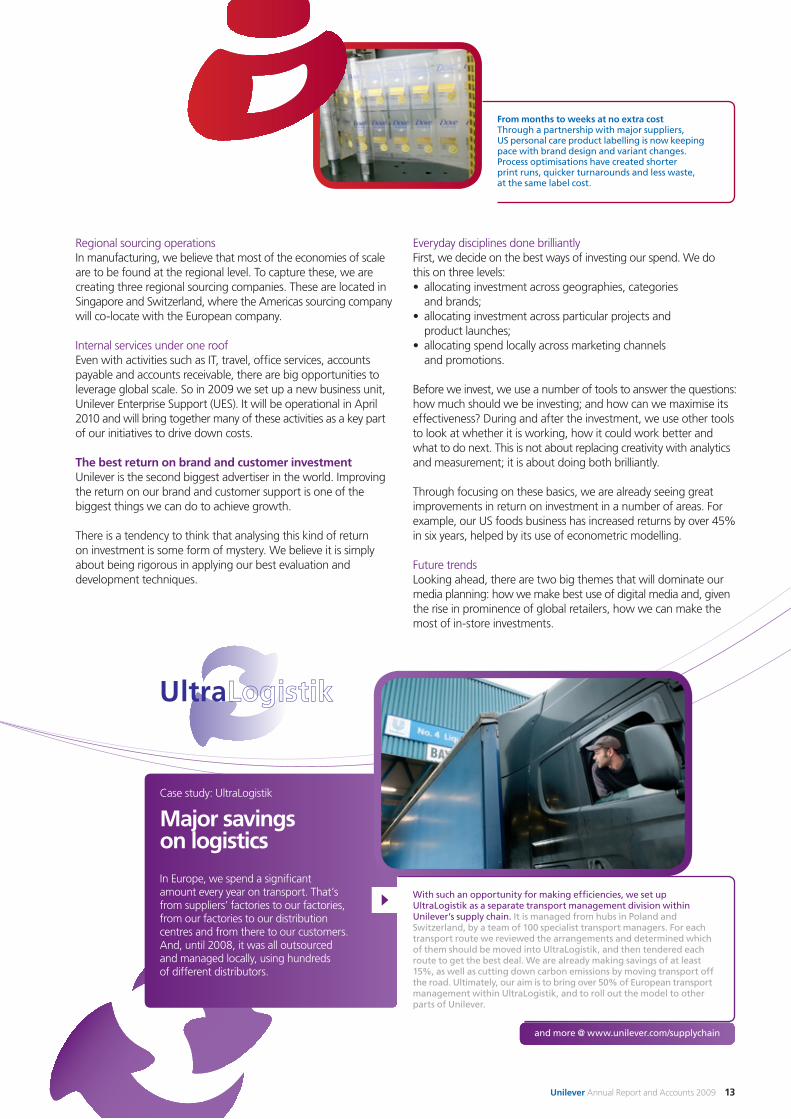
From months to weeks at no extra costThrough a partnership with major suppliers, US personal care product labelling is now keeping pace with brand design and variant changes. Process optimisations have created shorter print runs, quicker turnarounds and less waste, at the same label cost.
and more @ www.unilever.com/supplychain
With such an opportunity for making efficiencies, we set up UltraLogistik as a separate transport management division within Unilever’s supply chain. It is managed from hubs in Poland and Switzerland, by a team of 100 specialist transport managers. For each transport route we reviewed the arrangements and determined which of them should be moved into UltraLogistik, and then tendered each route to get the best deal. We are already making savings of at least 15%, as well as cutting down carbon emissions by moving transport off the road. Ultimately, our aim is to bring over 50% of European transport management within UltraLogistik, and to roll out the model to other parts of Unilever.
Case study: UltraLogistik
Major savings on logistics
In Europe, we spend a significant amount every year on transport. That’s from suppliers’ factories to our factories, from our factories to our distribution centres and from there to our customers. And, until 2008, it was all outsourced and managed locally, using hundreds of different distributors.
Unilever Annual Report and Accounts 2009 13
Our operating framework seeks to combine global scale, power and strength with local consumer intimacy. Taking advantage of this in all our chosen markets and categories – as we are already doing in many areas – will be critical in ensuring our success.
To do this we need to have a team capable of delivering, and to offer the career potential and working environment that make Unilever the best place to be.
Developing a team fit for growthSome of our major markets are doubling in size every five to six years, while our own growth ambitions mean that having enough people with the right skills is a challenge in itself. Getting the right number and quality of people in the pipeline for the future does not happen by accident. It requires an understanding of what is already in the business that can be built upon, and what will be needed in the future as markets develop.
In 2009 we launched our ‘talent and organisation readiness programme’, which will do just what it says: make sure our organisation and our talent are ready for growth. We are assessing those areas of the business most crucial to our strategy to define their specific goals, and whether we have the structure and the talent to deliver them. Where we identify gaps, we focus on developing targeted solutions. This may involve one or more of the following:• changing organisational structures;• revising our recruitment strategy and approach;• reviewing our retention schemes;• improving core processes such as decision making;• focusing on culture and employee engagement;• using development and training programmes to build
capability levels.
So far we have carried out four pilot programmes in China, Indonesia and Germany, and in our skin category. These have given us important new insights.
Winning with people
Report of the Directors Our strategy
Doubling in size is a challenging prospect. From a talent and organisational perspective, it cannot be business as usual. We will have to have in place the people and structures necessary to manage on a larger scale.
How we will win
and more on people development @ www.unilever.com/careers
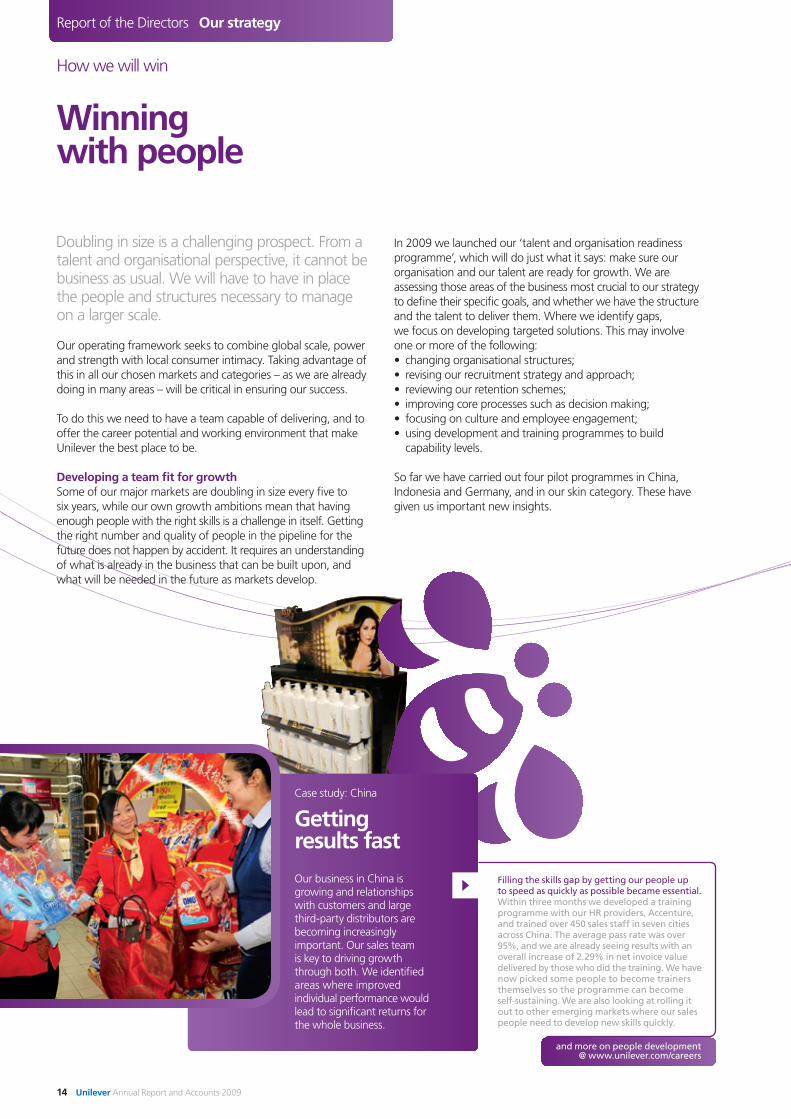
Filling the skills gap by getting our people up to speed as quickly as possible became essential. Within three months we developed a training programme with our HR providers, Accenture, and trained over 450 sales staff in seven cities across China. The average pass rate was over 95%, and we are already seeing results with an overall increase of 2.29% in net invoice value delivered by those who did the training. We have now picked some people to become trainers themselves so the programme can become self-sustaining. We are also looking at rolling it out to other emerging markets where our sales people need to develop new skills quickly.
Case study: China
Getting results fast
Our business in China is growing and relationships with customers and large third-party distributors are becoming increasingly important. Our sales team is key to driving growth through both. We identified areas where improved individual performance would lead to significant returns for the whole business.
14 Unilever Annual Report and Accounts 2009
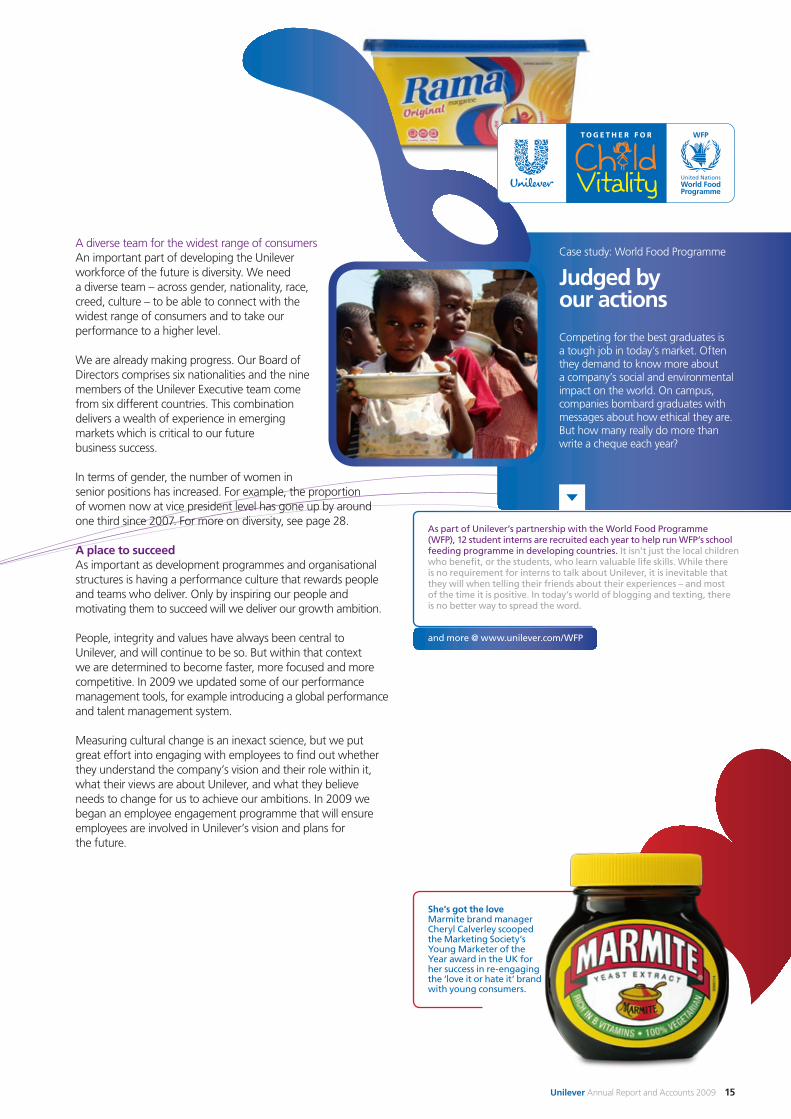
A diverse team for the widest range of consumersAn important part of developing the Unilever workforce of the future is diversity. We need a diverse team – across gender, nationality, race, creed, culture – to be able to connect with the widest range of consumers and to take our performance to a higher level.
We are already making progress. Our Board of Directors comprises six nationalities and the nine members of the Unilever Executive team come from six different countries. This combination delivers a wealth of experience in emerging markets which is critical to our future business success.
In terms of gender, the number of women in senior positions has increased. For example, the proportion of women now at vice president level has gone up by around one third since 2007. For more on diversity, see page 28.
A place to succeedAs important as development programmes and organisational structures is having a performance culture that rewards people and teams who deliver. Only by inspiring our people and motivating them to succeed will we deliver our growth ambition.
People, integrity and values have always been central to Unilever, and will continue to be so. But within that context we are determined to become faster, more focused and more competitive. In 2009 we updated some of our performance management tools, for example introducing a global performance and talent management system.
Measuring cultural change is an inexact science, but we put great effort into engaging with employees to find out whether they understand the company’s vision and their role within it, what their views are about Unilever, and what they believe needs to change for us to achieve our ambitions. In 2009 we began an employee engagement programme that will ensure employees are involved in Unilever’s vision and plans for the future.
and more @ www.unilever.com/WFP
As part of Unilever’s partnership with the World Food Programme (WFP), 12 student interns are recruited each year to help run WFP’s school feeding programme in developing countries. It isn’t just the local children who benefit, or the students, who learn valuable life skills. While there is no requirement for interns to talk about Unilever, it is inevitable that they will when telling their friends about their experiences – and most of the time it is positive. In today’s world of blogging and texting, there is no better way to spread the word.
Case study: World Food Programme
Judged by our actions
Competing for the best graduates is a tough job in today’s market. Often they demand to know more about a company’s social and environmental impact on the world. On campus, companies bombard graduates with messages about how ethical they are. But how many really do more than write a cheque each year?
She’s got the loveMarmite brand manager Cheryl Calverley scooped the Marketing Society’s Young Marketer of the Year award in the UK for her success in re-engaging the ‘love it or hate it’ brand with young consumers.
Unilever Annual Report and Accounts 2009 15
Financial overview
Report of the Directors Performance 2009
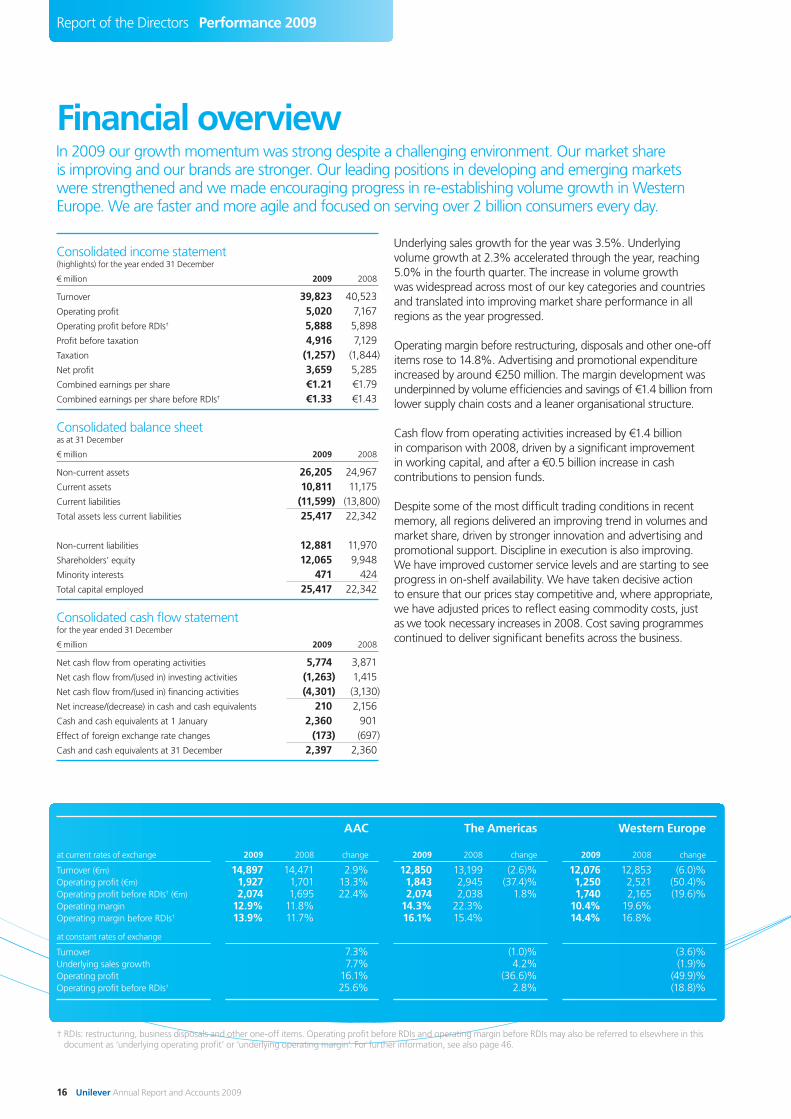
Consolidated income statement(highlights) for the year ended 31 December
€ million 2009 2008
Turnover 39,823 40,523Operating profit 5,020 7,167Operating profit before RDIs† 5,888 5,898Profit before taxation 4,916 7,129Taxation (1,257) (1,844)Net profit 3,659 5,285Combined earnings per share €1.21 €1.79Combined earnings per share before RDIs† €1.33 €1.43
Consolidated balance sheetas at 31 December
€ million 2009 2008
Non-current assets 26,205 24,967Current assets 10,811 11,175Current liabilities (11,599) (13,800)Total assets less current liabilities 25,417 22,342
Non-current liabilities 12,881 11,970Shareholders’ equity 12,065 9,948Minority interests 471 424Total capital employed 25,417 22,342
Consolidated cash flow statementfor the year ended 31 December
€ million 2009 2008
Net cash flow from operating activities 5,774 3,871Net cash flow from/(used in) investing activities (1,263) 1,415Net cash flow from/(used in) financing activities (4,301) (3,130)Net increase/(decrease) in cash and cash equivalents 210 2,156Cash and cash equivalents at 1 January 2,360 901Effect of foreign exchange rate changes (173) (697)Cash and cash equivalents at 31 December 2,397 2,360
In 2009 our growth momentum was strong despite a challenging environment. Our market share is improving and our brands are stronger. Our leading positions in developing and emerging markets were strengthened and we made encouraging progress in re-establishing volume growth in Western Europe. We are faster and more agile and focused on serving over 2 billion consumers every day.
Underlying sales growth for the year was 3.5%. Underlying volume growth at 2.3% accelerated through the year, reaching 5.0% in the fourth quarter. The increase in volume growth was widespread across most of our key categories and countries and translated into improving market share performance in all regions as the year progressed.
Operating margin before restructuring, disposals and other one-off items rose to 14.8%. Advertising and promotional expenditure increased by around €250 million. The margin development was underpinned by volume efficiencies and savings of €1.4 billion from lower supply chain costs and a leaner organisational structure.
Cash flow from operating activities increased by €1.4 billion in comparison with 2008, driven by a significant improvement in working capital, and after a €0.5 billion increase in cash contributions to pension funds.
Despite some of the most difficult trading conditions in recent memory, all regions delivered an improving trend in volumes and market share, driven by stronger innovation and advertising and promotional support. Discipline in execution is also improving. We have improved customer service levels and are starting to see progress in on-shelf availability. We have taken decisive action to ensure that our prices stay competitive and, where appropriate, we have adjusted prices to reflect easing commodity costs, just as we took necessary increases in 2008. Cost saving programmes continued to deliver significant benefits across the business.
at current rates of exchange
Turnover (€m)Operating profit (€m)Operating profit before RDIs† (€m)Operating marginOperating margin before RDIs†
at constant rates of exchange
TurnoverUnderlying sales growthOperating profitOperating profit before RDIs†
Western Europe
2009 2008 change
12,076 12,853 (6.0)% 1,250 2,521 (50.4)% 1,740 2,165 (19.6)% 10.4% 19.6% 14.4% 16.8%
(3.6)% (1.9)% (49.9)% (18.8)%
The Americas
2009 2008 change
12,850 13,199 (2.6)% 1,843 2,945 (37.4)% 2,074 2,038 1.8% 14.3% 22.3% 16.1% 15.4%
(1.0)% 4.2% (36.6)% 2.8%
AAC
2009 2008 change
14,897 14,471 2.9% 1,927 1,701 13.3% 2,074 1,695 22.4% 12.9% 11.8% 13.9% 11.7%
7.3% 7.7% 16.1% 25.6%
† RDIs: restructuring, business disposals and other one-off items. Operating profit before RDIs and operating margin before RDIs may also be referred to elsewhere in this document as ‘underlying operating profit’ or ‘underlying operating margin’. For further information, see also page 46.
16 Unilever Annual Report and Accounts 2009
before RDIs was down from 16.8% to 14.4% in the year, largely due to a substantial increase in marketing investment and the negative impact of a weaker sterling on our UK business.
We continued to support the growth of global brands through the rapid roll-out of bigger and better innovations to an increasing number of countries. In addition we substantially increased brand support levels at the same time as media rates were lower. We continue to see the impact of the tough economic conditions on consumers in many key markets as we are focused on providing products which meet their needs, increasingly at value prices.
In a very challenging and volatile environment the Asia, Africa and Central & Eastern Europe (AAC) region posted strong growth and margin improvement. We continue to invest aggressively behind the fast-growing emerging markets including China and Russia. The operating margin before RDIs was up from 11.7% to 13.9% in the year as a result of lower commodity costs and operational leverage.
The Americas region recorded a competitive performance with continuing momentum across the business. Volume growth continued to accelerate with all major units contributing. The operating margin before RDIs was up from 15.4% to 16.1% in the year despite the impact of dilution from business disposals.
In the Western Europe region there were encouraging performances in the year in a number of major markets, with an improving trend in quarterly volume growth. The challenging conditions in southern Europe continue. The operating margin
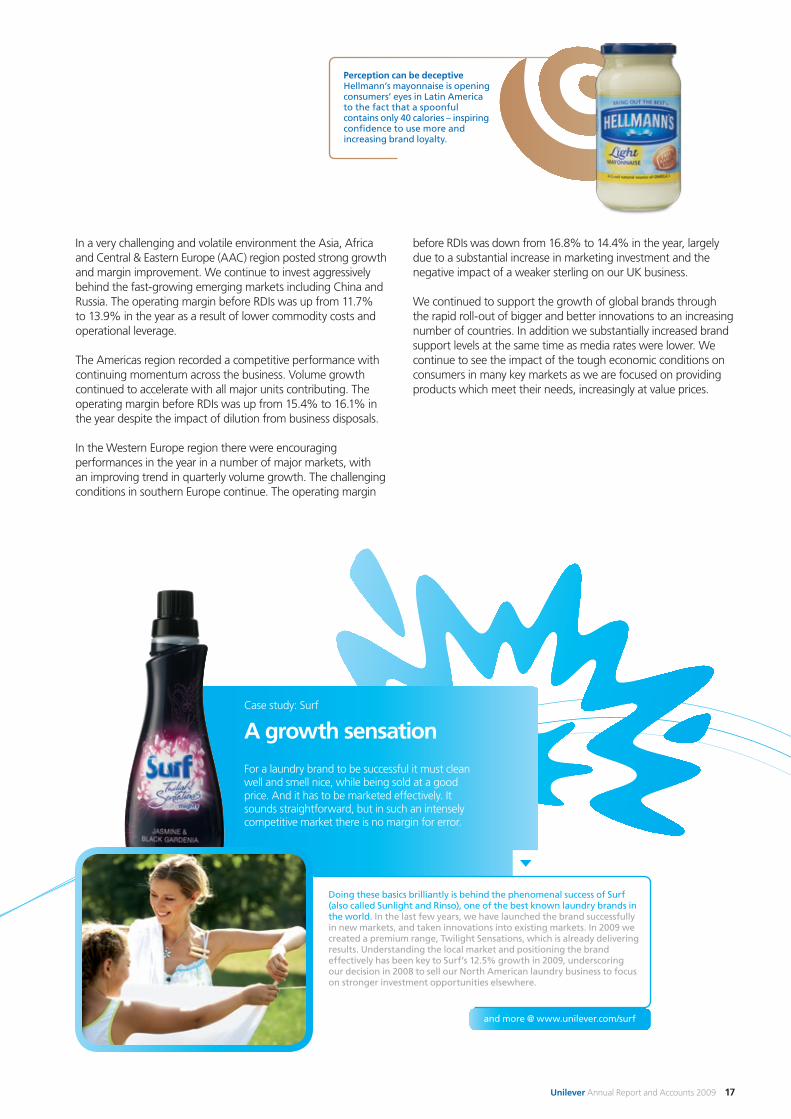
Perception can be deceptiveHellmann’s mayonnaise is opening consumers’ eyes in Latin America to the fact that a spoonful contains only 40 calories – inspiring confidence to use more and increasing brand loyalty.
and more @ www.unilever.com/surf
Doing these basics brilliantly is behind the phenomenal success of Surf (also called Sunlight and Rinso), one of the best known laundry brands in the world. In the last few years, we have launched the brand successfully in new markets, and taken innovations into existing markets. In 2009 we created a premium range, Twilight Sensations, which is already delivering results. Understanding the local market and positioning the brand effectively has been key to Surf’s 12.5% growth in 2009, underscoring our decision in 2008 to sell our North American laundry business to focus on stronger investment opportunities elsewhere.
Case study: Surf
A growth sensation
For a laundry brand to be successful it must clean well and smell nice, while being sold at a good price. And it has to be marketed effectively. It sounds straightforward, but in such an intensely competitive market there is no margin for error.
Unilever Annual Report and Accounts 2009 17
Making a difference in society
Report of the Directors Performance 2009
Our brands touch the lives of many millions every day. Through our products and the power of our marketing, we can help make a difference to health and well-being around the world.
To increase consumer choice, we provide variants of many brands, with full and low fat, sweetened and unsweetened options, and different portion sizes.
Nutritional labelling provides consumers with essential information such as levels of key nutrients.
The health claims we make are based on rigorous scientific evidence and are externally checked. During 2009 the European Union formally approved Unilever’s claim that the active ingredient in our Flora/Becel pro.activ products is proven to lower cholesterol. Lowering blood cholesterol may reduce the risk of coronary heart disease.
Extending our impactThe Food and Agriculture Organization estimates that more than 1 billion people are undernourished worldwide. Some of our brands can play a role in tackling under-nutrition, particularly micronutrient deficiencies, through food fortification. For example, our Rama/Blue Band spreads contain vitamins A and D. Annapurna iodised salt helps to prevent diseases related to iodine deficiency.
We play an active role in public debate and work in partnership with international organisations to extend the impact of our initiatives. One example is the World Food Programme (WFP), where we support efforts to improve the health and nutrition of school children in developing countries. In 2009, nearly 17 million meals for 80,000 children were provided by WFP, thanks to Unilever employee and brand initiatives. In addition, 50,000 school children in Indonesia, Kenya and Colombia were enrolled in nutrition and hygiene behavioural change campaigns, jointly developed and implemented by WFP and Unilever.
Nutrition – helping make the healthy choiceIncreasingly it is recognised that healthy diets along with regular physical activity play a major role in maintaining good health.
More and more, consumers are concerned about what they eat and how it affects their health and well-being. By developing brands that help them to enjoy a healthy diet, we can meet their expectations and grow our business.
Our approach is based around four elements:• improving the nutritional quality of all our products;• focusing research and development on healthy offerings;• expanding consumer choice;• providing clear information for consumers.
Making progressThe starting point is to improve the nutritional quality of our existing brand portfolio without compromising on taste. Since 2005 our Nutrition Enhancement Programme has reviewed our entire portfolio of products. By the end of 2009, this showed that 44% are in line with internationally accepted guidelines for saturated and trans fat, sugar and salt.
It is estimated that reducing salt by as little 1 g per day can reduce strokes by 5% and heart attacks by 3%. The World Health Organization recommends a daily intake of 5 g. In 2009 we set product benchmarks to achieve a dietary intake of 6 g of salt per day by the end of 2010, with the ambition to reduce further to 5 g per day by the end of 2015.
Innovation is bringing products that offer specific health and nutritional benefits. For example, our Hellmann’s Light and Extra Light mayonnaise use patented citrus fibre technology to give a smooth and creamy taste, but with 60-90% less oil than the full fat variant.
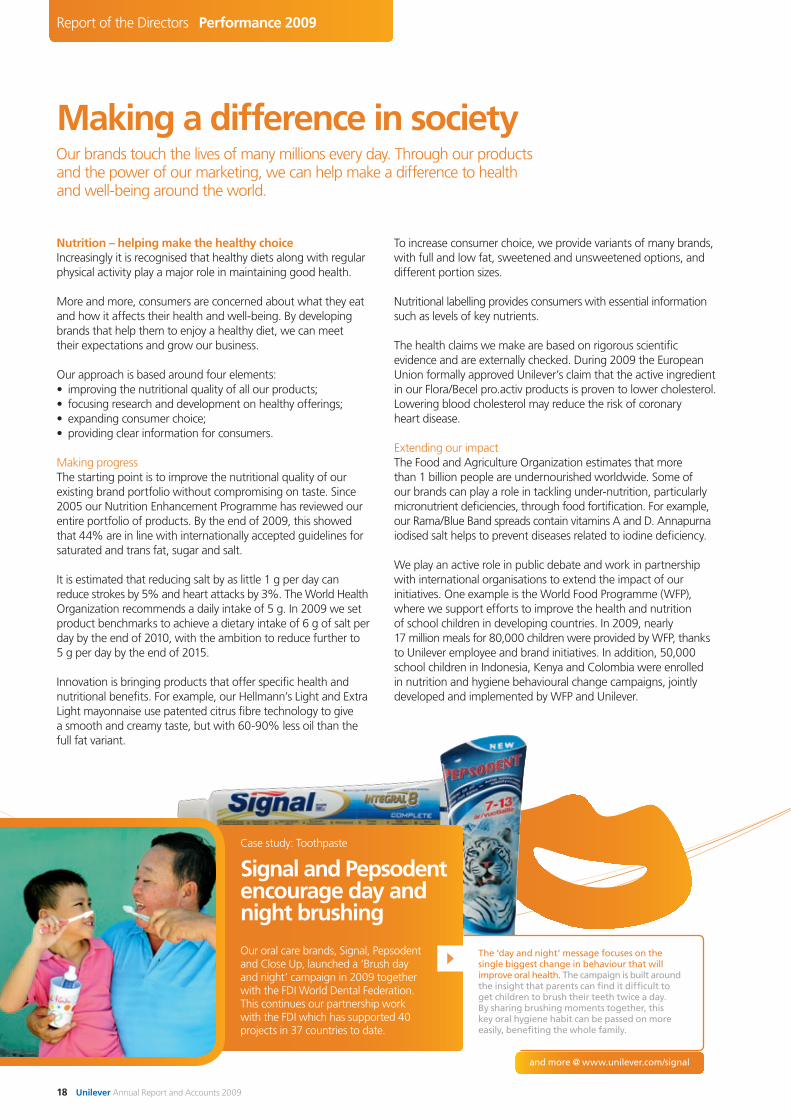
The ‘day and night’ message focuses on the single biggest change in behaviour that will improve oral health. The campaign is built around the insight that parents can find it difficult to get children to brush their teeth twice a day. By sharing brushing moments together, this key oral hygiene habit can be passed on more easily, benefiting the whole family.
Case study: Toothpaste
Signal and Pepsodent encourage day and night brushing
Our oral care brands, Signal, Pepsodent and Close Up, launched a ‘Brush day and night’ campaign in 2009 together with the FDI World Dental Federation. This continues our partnership work with the FDI which has supported 40 projects in 37 countries to date.
and more @ www.unilever.com/signal
18 Unilever Annual Report and Accounts 2009
and more @ www.lifebuoy.com
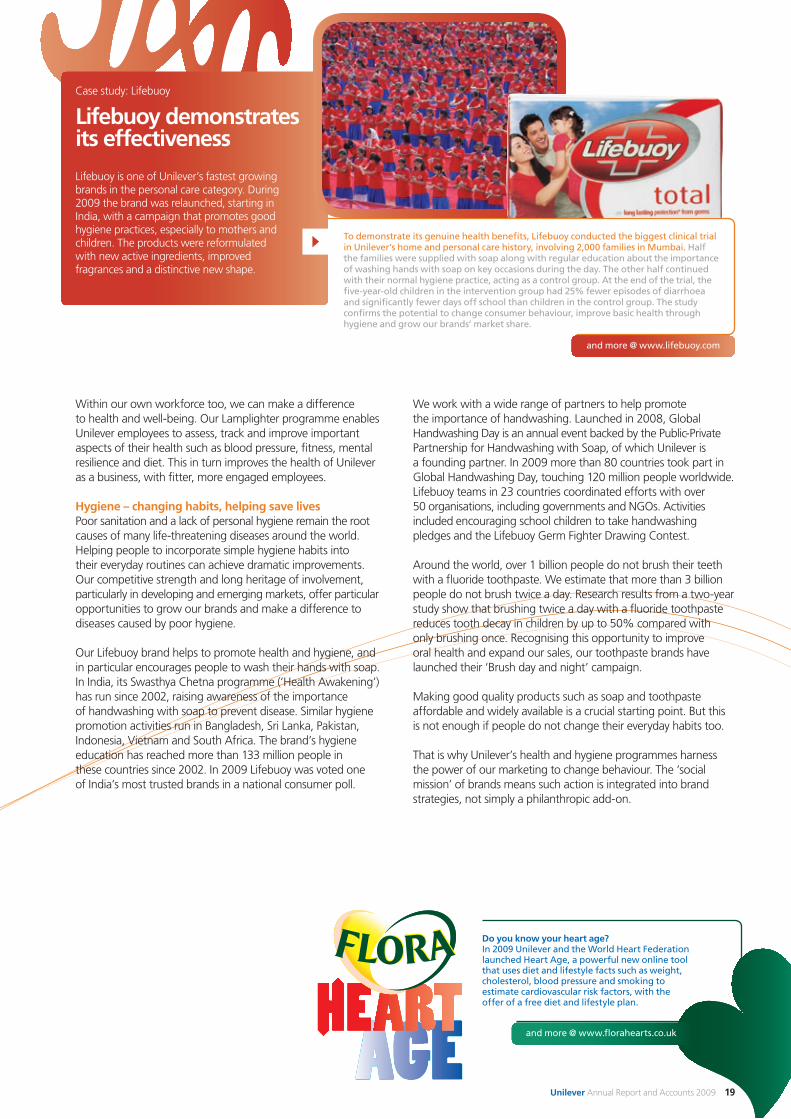
To demonstrate its genuine health benefits, Lifebuoy conducted the biggest clinical trial in Unilever’s home and personal care history, involving 2,000 families in Mumbai. Half the families were supplied with soap along with regular education about the importance of washing hands with soap on key occasions during the day. The other half continued with their normal hygiene practice, acting as a control group. At the end of the trial, the five-year-old children in the intervention group had 25% fewer episodes of diarrhoea and significantly fewer days off school than children in the control group. The study confirms the potential to change consumer behaviour, improve basic health through hygiene and grow our brands’ market share.
Case study: Lifebuoy
Lifebuoy demonstrates its effectiveness
Lifebuoy is one of Unilever’s fastest growing brands in the personal care category. During 2009 the brand was relaunched, starting in India, with a campaign that promotes good hygiene practices, especially to mothers and children. The products were reformulated with new active ingredients, improved fragrances and a distinctive new shape.
We work with a wide range of partners to help promote the importance of handwashing. Launched in 2008, Global Handwashing Day is an annual event backed by the Public-Private Partnership for Handwashing with Soap, of which Unilever is a founding partner. In 2009 more than 80 countries took part in Global Handwashing Day, touching 120 million people worldwide. Lifebuoy teams in 23 countries coordinated efforts with over 50 organisations, including governments and NGOs. Activities included encouraging school children to take handwashing pledges and the Lifebuoy Germ Fighter Drawing Contest.
Around the world, over 1 billion people do not brush their teeth with a fluoride toothpaste. We estimate that more than 3 billion people do not brush twice a day. Research results from a two-year study show that brushing twice a day with a fluoride toothpaste reduces tooth decay in children by up to 50% compared with only brushing once. Recognising this opportunity to improve oral health and expand our sales, our toothpaste brands have launched their ‘Brush day and night’ campaign.
Making good quality products such as soap and toothpaste affordable and widely available is a crucial starting point. But this is not enough if people do not change their everyday habits too.
That is why Unilever’s health and hygiene programmes harness the power of our marketing to change behaviour. The ‘social mission’ of brands means such action is integrated into brand strategies, not simply a philanthropic add-on.
Within our own workforce too, we can make a difference to health and well-being. Our Lamplighter programme enables Unilever employees to assess, track and improve important aspects of their health such as blood pressure, fitness, mental resilience and diet. This in turn improves the health of Unilever as a business, with fitter, more engaged employees.
Hygiene – changing habits, helping save livesPoor sanitation and a lack of personal hygiene remain the root causes of many life-threatening diseases around the world. Helping people to incorporate simple hygiene habits into their everyday routines can achieve dramatic improvements. Our competitive strength and long heritage of involvement, particularly in developing and emerging markets, offer particular opportunities to grow our brands and make a difference to diseases caused by poor hygiene.
Our Lifebuoy brand helps to promote health and hygiene, and in particular encourages people to wash their hands with soap. In India, its Swasthya Chetna programme (‘Health Awakening’) has run since 2002, raising awareness of the importance of handwashing with soap to prevent disease. Similar hygiene promotion activities run in Bangladesh, Sri Lanka, Pakistan, Indonesia, Vietnam and South Africa. The brand’s hygiene education has reached more than 133 million people in these countries since 2002. In 2009 Lifebuoy was voted one of India’s most trusted brands in a national consumer poll.
and more @ www.florahearts.co.uk
Do you know your heart age?In 2009 Unilever and the World Heart Federation launched Heart Age, a powerful new online tool that uses diet and lifestyle facts such as weight, cholesterol, blood pressure and smoking to estimate cardiovascular risk factors, with the offer of a free diet and lifestyle plan.
Unilever Annual Report and Accounts 2009 19
Total waste sent from our factories for disposal has been cut by 73%* per tonne of production since 1995.
One example of action is our detergent factory in Hefei, China. Straw waste previously burned by local farmers is now collected and used to generate power. This improves air quality, reduces CO2 emissions and provides farmers with extra income.
At our Gloucester factory in the UK, where we make Wall’s and Magnum ice cream, we will reduce CO2 from energy by more than 3,000 tonnes a year through the installation of a combined heat and power (CHP) plant. The 2.4 megawatt plant is primarily fuelled by natural gas, with heat in the form of hot water and steam produced as a by-product. This heat is re-used in the manufacturing process.
Sourcing sustainablyAround 50% of the raw materials that we use for our products come from agriculture and forestry. We buy approximately 12% of the world’s black tea, 6% of its tomatoes and 3% of its palm oil.
Our goal is to source all our key agricultural raw materials sustainably. Through our Sustainable Agriculture Programme, we have developed detailed guidelines on what sustainable agriculture means for our key crops. Our guidelines cover criteria such as reducing fertiliser and pesticide use, conserving water, promoting biodiversity and using less energy.
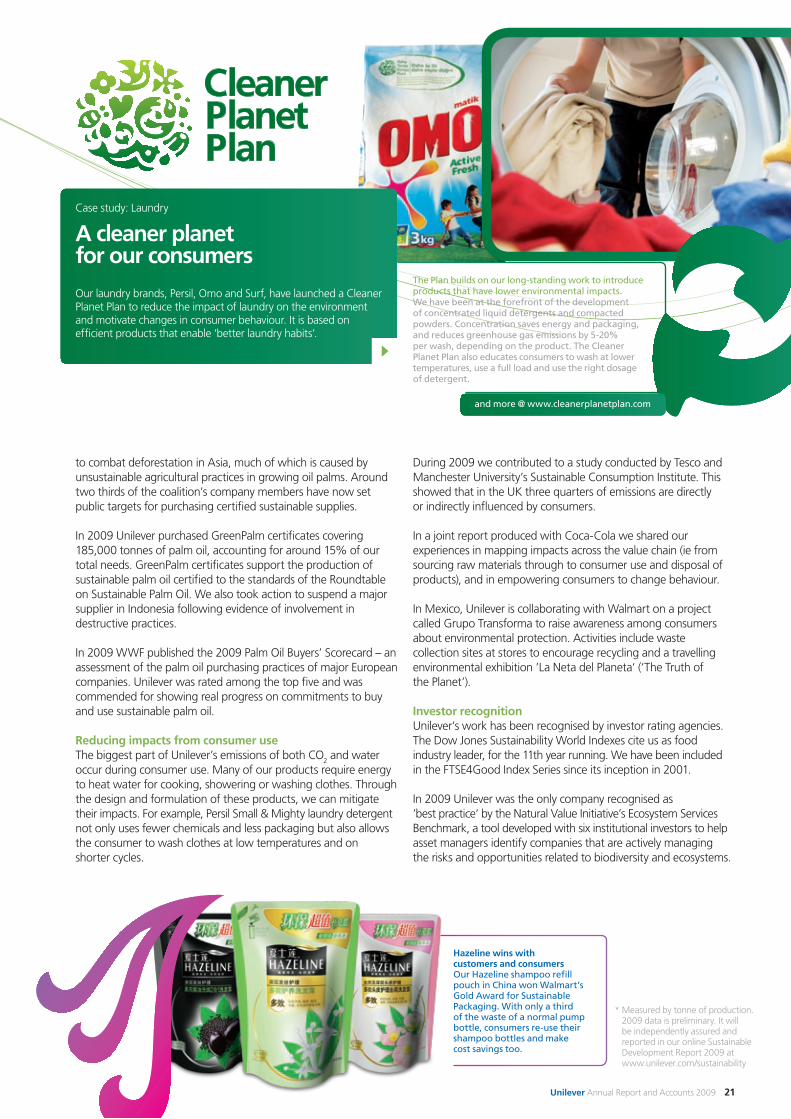
Palm oil is used in both food and home and personal care products. We have committed to have all our palm oil purchases externally certified as sustainable by 2015. Working with Greenpeace, we have built a global coalition of some 40 companies and NGOs
This is a challenging objective, but we start from a strong base. For more than a decade we have been reducing the environmental impact of our own factories and supporting our agricultural suppliers to improve their sustainability practices.
During 2009 we also carried out a major piece of work to measure more accurately Unilever’s impacts on the world around us. A new set of metrics was piloted to assess our global brands against four indicators – greenhouse gas emissions, water, waste and agricultural sourcing.
The analysis highlighted again that our direct impact from factories, offices, lorries, business travel and so forth was small in comparison with other parts of our value chain. How people use our washing powders, for example, has a much bigger impact than where or how we make them.
Our own operationsAlthough emissions and waste from factories represent only a small part of our footprint, we are committed to reducing them.
Since 1995 we have achieved a 41%* reduction in CO2 from
energy per tonne of production. In 2009 we achieved a reduction of 3%* compared to 2008.
Since 1995 we have reduced by 65%* the amount of water we use to make a tonne of product. During 2009 we achieved a 5.6%* reduction in water use compared to 2008.
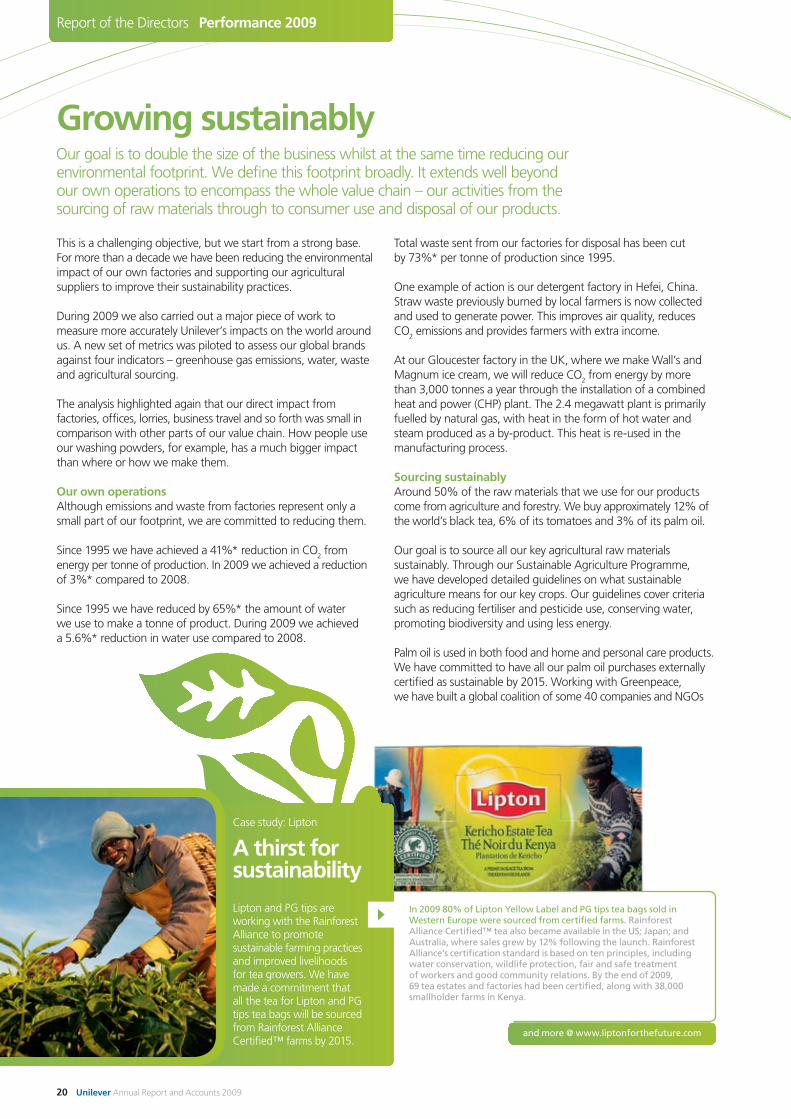
Growing sustainably
Report of the Directors Performance 2009
Our goal is to double the size of the business whilst at the same time reducing our environmental footprint. We define this footprint broadly. It extends well beyond our own operations to encompass the whole value chain – our activities from the sourcing of raw materials through to consumer use and disposal of our products.
and more @ www.liptonforthefuture.com
Case study: Lipton
A thirst for sustainability
Lipton and PG tips are working with the Rainforest Alliance to promote sustainable farming practices and improved livelihoods for tea growers. We have made a commitment that all the tea for Lipton and PG tips tea bags will be sourced from Rainforest Alliance Certified™ farms by 2015.
In 2009 80% of Lipton Yellow Label and PG tips tea bags sold in Western Europe were sourced from certified farms. Rainforest Alliance Certified™ tea also became available in the US; Japan; and Australia, where sales grew by 12% following the launch. Rainforest Alliance’s certification standard is based on ten principles, including water conservation, wildlife protection, fair and safe treatment of workers and good community relations. By the end of 2009, 69 tea estates and factories had been certified, along with 38,000 smallholder farms in Kenya.
20 Unilever Annual Report and Accounts 2009
During 2009 we contributed to a study conducted by Tesco and Manchester University’s Sustainable Consumption Institute. This showed that in the UK three quarters of emissions are directly or indirectly influenced by consumers.
In a joint report produced with Coca-Cola we shared our experiences in mapping impacts across the value chain (ie from sourcing raw materials through to consumer use and disposal of products), and in empowering consumers to change behaviour.
In Mexico, Unilever is collaborating with Walmart on a project called Grupo Transforma to raise awareness among consumers about environmental protection. Activities include waste collection sites at stores to encourage recycling and a travelling environmental exhibition ’La Neta del Planeta‘ (‘The Truth of the Planet’).
Investor recognitionUnilever’s work has been recognised by investor rating agencies. The Dow Jones Sustainability World Indexes cite us as food industry leader, for the 11th year running. We have been included in the FTSE4Good Index Series since its inception in 2001.
In 2009 Unilever was the only company recognised as ’best practice‘ by the Natural Value Initiative’s Ecosystem Services Benchmark, a tool developed with six institutional investors to help asset managers identify companies that are actively managing the risks and opportunities related to biodiversity and ecosystems.
to combat deforestation in Asia, much of which is caused by unsustainable agricultural practices in growing oil palms. Around two thirds of the coalition’s company members have now set public targets for purchasing certified sustainable supplies.
In 2009 Unilever purchased GreenPalm certificates covering 185,000 tonnes of palm oil, accounting for around 15% of our total needs. GreenPalm certificates support the production of sustainable palm oil certified to the standards of the Roundtable on Sustainable Palm Oil. We also took action to suspend a major supplier in Indonesia following evidence of involvement in destructive practices.
In 2009 WWF published the 2009 Palm Oil Buyers’ Scorecard – an assessment of the palm oil purchasing practices of major European companies. Unilever was rated among the top five and was commended for showing real progress on commitments to buy and use sustainable palm oil.
Reducing impacts from consumer useThe biggest part of Unilever’s emissions of both CO2 and water occur during consumer use. Many of our products require energy to heat water for cooking, showering or washing clothes. Through the design and formulation of these products, we can mitigate their impacts. For example, Persil Small & Mighty laundry detergent not only uses fewer chemicals and less packaging but also allows the consumer to wash clothes at low temperatures and on shorter cycles.
and more @ www.cleanerplanetplan.com
Case study: Laundry
A cleaner planet for our consumers
Our laundry brands, Persil, Omo and Surf, have launched a Cleaner Planet Plan to reduce the impact of laundry on the environment and motivate changes in consumer behaviour. It is based on efficient products that enable ‘better laundry habits’.
The Plan builds on our long-standing work to introduce products that have lower environmental impacts. We have been at the forefront of the development of concentrated liquid detergents and compacted powders. Concentration saves energy and packaging, and reduces greenhouse gas emissions by 5-20% per wash, depending on the product. The Cleaner Planet Plan also educates consumers to wash at lower temperatures, use a full load and use the right dosage of detergent.
Hazeline wins with customers and consumersOur Hazeline shampoo refill pouch in China won Walmart’s Gold Award for Sustainable Packaging. With only a third of the waste of a normal pump bottle, consumers re-use their shampoo bottles and make cost savings too.
* Measured by tonne of production. 2009 data is preliminary. It will be independently assured and reported in our online Sustainable Development Report 2009 at www.unilever.com/sustainability
Unilever Annual Report and Accounts 2009 21
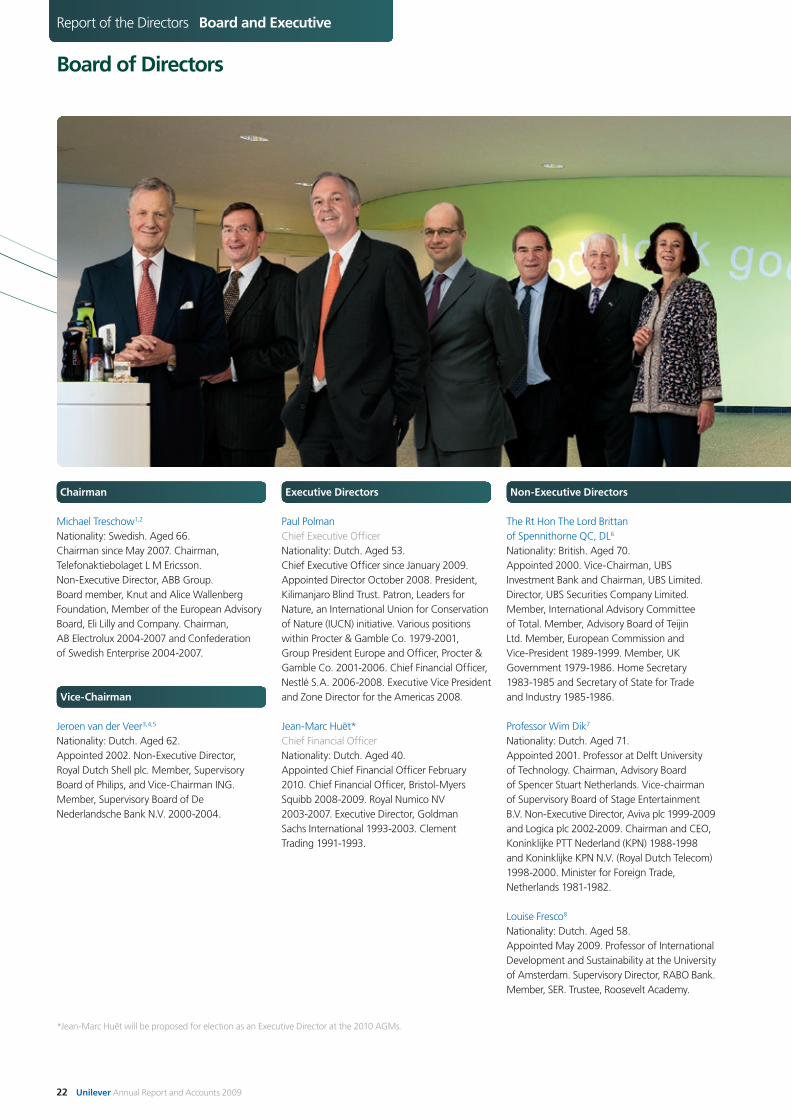
Report of the Directors Board and Executive
Chairman
Michael Treschow1,2
Nationality: Swedish. Aged 66. Chairman since May 2007. Chairman, Telefonaktiebolaget L M Ericsson. Non-Executive Director, ABB Group. Board member, Knut and Alice Wallenberg Foundation, Member of the European Advisory Board, Eli Lilly and Company. Chairman, AB Electrolux 2004-2007 and Confederation of Swedish Enterprise 2004-2007.
Vice-Chairman
Jeroen van der Veer3,4,5
Nationality: Dutch. Aged 62. Appointed 2002. Non-Executive Director, Royal Dutch Shell plc. Member, Supervisory Board of Philips, and Vice-Chairman ING. Member, Supervisory Board of De Nederlandsche Bank N.V. 2000-2004.
Non-Executive Directors
The Rt Hon The Lord Brittan of Spennithorne QC, DL6
Nationality: British. Aged 70. Appointed 2000. Vice-Chairman, UBS Investment Bank and Chairman, UBS Limited. Director, UBS Securities Company Limited. Member, International Advisory Committee of Total. Member, Advisory Board of Teijin Ltd. Member, European Commission and Vice-President 1989-1999. Member, UK Government 1979-1986. Home Secretary 1983-1985 and Secretary of State for Trade and Industry 1985-1986.
Professor Wim Dik7
Nationality: Dutch. Aged 71. Appointed 2001. Professor at Delft University of Technology. Chairman, Advisory Board of Spencer Stuart Netherlands. Vice-chairman of Supervisory Board of Stage Entertainment B.V. Non-Executive Director, Aviva plc 1999-2009 and Logica plc 2002-2009. Chairman and CEO, Koninklijke PTT Nederland (KPN) 1988-1998 and Koninklijke KPN N.V. (Royal Dutch Telecom) 1998-2000. Minister for Foreign Trade, Netherlands 1981-1982.
Louise Fresco8
Nationality: Dutch. Aged 58. Appointed May 2009. Professor of International Development and Sustainability at the University of Amsterdam. Supervisory Director, RABO Bank. Member, SER. Trustee, Roosevelt Academy.
Board of Directors
Executive Directors
Paul PolmanChief Executive OfficerNationality: Dutch. Aged 53. Chief Executive Officer since January 2009. Appointed Director October 2008. President, Kilimanjaro Blind Trust. Patron, Leaders for Nature, an International Union for Conservation of Nature (IUCN) initiative. Various positions within Procter & Gamble Co. 1979-2001, Group President Europe and Officer, Procter & Gamble Co. 2001-2006. Chief Financial Officer, Nestlé S.A. 2006-2008. Executive Vice President and Zone Director for the Americas 2008.
Jean-Marc Huët*Chief Financial OfficerNationality: Dutch. Aged 40.Appointed Chief Financial Officer February 2010. Chief Financial Officer, Bristol-Myers Squibb 2008-2009. Royal Numico NV 2003-2007. Executive Director, Goldman Sachs International 1993-2003. Clement Trading 1991-1993.
*Jean-Marc Huët will be proposed for election as an Executive Director at the 2010 AGMs.
22 Unilever Annual Report and Accounts 2009

Member Nomination CommitteeMember Remuneration CommitteeChairman Nomination CommitteeChairman Remuneration CommitteeSenior Independent DirectorChairman Corporate Responsibility and Reputation CommitteeMember Audit CommitteeMember Corporate Responsibility and Reputation CommitteeChairman Audit Committee
123456
78
9
Left to right:
Michael TreschowJeroen van der VeerPaul PolmanJean-Marc HuëtThe Rt Hon The Lord Brittan of Spennithorne Professor Wim DikLouise FrescoAnn FudgeCharles GoldenByron GroteNarayana MurthyHixonia NyasuluKees StormPaul Walsh
Hixonia Nyasulu8
Nationality: South African. Aged 55. Appointed 2007. Chairman, Sasol Ltd. Non-Executive Director, Barloworld Ltd and Tongaat-Hulett Group Ltd. Member, Advisory Board of JP Morgan SA. Director, Paton Tupper Associates (Pty) Ltd.
Kees Storm9
Nationality: Dutch. Aged 67. Appointed 2006. Chairman, Supervisory Board and Member of the Audit Committee, KLM Royal Dutch Airlines N.V. Member, Supervisory Board, AEGON N.V. Board member and Chairman of Audit Committee, Anheuser-Busch InBev S.A. Board member and member of the Audit Committee, Baxter International, Inc. Vice-Chairman, Supervisory Board, Pon Holdings B.V. Chairman, Executive Board, AEGON N.V. 1993-2002.
Paul Walsh1,2
Nationality: British. Aged 54. Appointed May 2009. Chief Executive Officer of Diageo. Non-Executive Director, FedEx Corporation Inc. Chairman, The Scotch Whisky Association. Member of the Council of the University of Reading, The Business Council for Britain, The Prince of Wales International Business Leaders Forum.
Ann Fudge2
Nationality: American. Aged 58. Appointed May 2009. Non-Executive Director, Novartis AG, General Electric Co., and Buzzient Inc. Chairman, US Programs Advisory Panel of Gates Foundation. Honorary director of Catalyst, Trustee of The Rockefeller Foundation and vice-chairman of the board of overseers of Harvard University.
Charles Golden7
Nationality: American. Aged 63. Appointed 2006. Non-Executive Director, Clarian Health Partners, Hill-Rom Holdings, Eaton Corporation and the Lilly Endowment. Member of Finance Committee, Indianapolis Museum of Art. Executive Vice-President, Chief Financial Officer and Director, Eli Lilly and Company 1996-2006.
Byron Grote7
Nationality: American/British. Aged 61. Appointed 2006. Chief Financial Officer, BP p.l.c. Member, UK Business – Government Forum on Tax and Globalisation. Vice-chairman, UK Government’s Public Services Productivity Panel.
Narayana Murthy8
Nationality: Indian. Aged 63. Appointed 2007. Chairman, Asia Business Council, International Institute of Information Technology and Infosys Technologies Limited. Director, Infosys Consulting, Inc., Infosys Technologies (China) Company Limited, New Delhi Television Ltd. Non-Executive Director, HSBC Holdings plc.
Unilever Annual Report and Accounts 2009 23
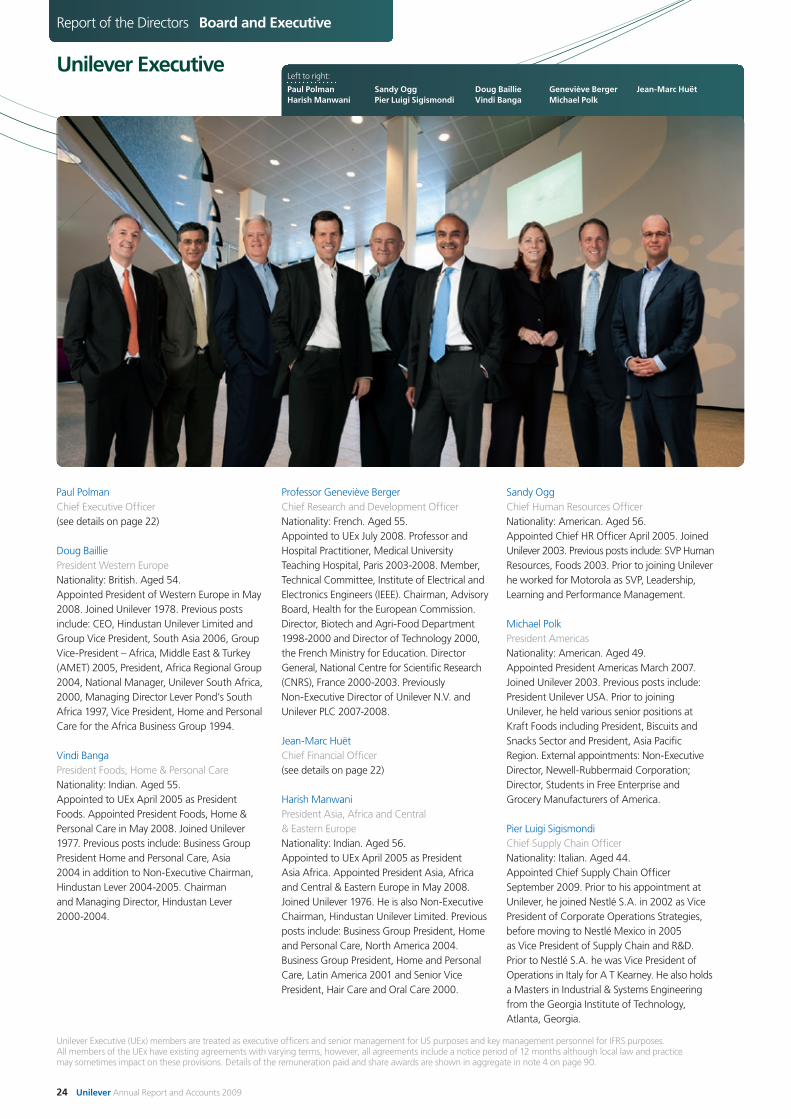
Paul PolmanChief Executive Officer(see details on page 22)
Doug BailliePresident Western EuropeNationality: British. Aged 54. Appointed President of Western Europe in May 2008. Joined Unilever 1978. Previous posts include: CEO, Hindustan Unilever Limited and Group Vice President, South Asia 2006, Group Vice-President – Africa, Middle East & Turkey (AMET) 2005, President, Africa Regional Group 2004, National Manager, Unilever South Africa, 2000, Managing Director Lever Pond’s South Africa 1997, Vice President, Home and Personal Care for the Africa Business Group 1994.
Vindi BangaPresident Foods, Home & Personal CareNationality: Indian. Aged 55. Appointed to UEx April 2005 as President Foods. Appointed President Foods, Home & Personal Care in May 2008. Joined Unilever 1977. Previous posts include: Business Group President Home and Personal Care, Asia 2004 in addition to Non-Executive Chairman, Hindustan Lever 2004-2005. Chairman and Managing Director, Hindustan Lever 2000-2004.
Sandy OggChief Human Resources OfficerNationality: American. Aged 56. Appointed Chief HR Officer April 2005. Joined Unilever 2003. Previous posts include: SVP Human Resources, Foods 2003. Prior to joining Unilever he worked for Motorola as SVP, Leadership, Learning and Performance Management.
Michael PolkPresident AmericasNationality: American. Aged 49. Appointed President Americas March 2007. Joined Unilever 2003. Previous posts include: President Unilever USA. Prior to joining Unilever, he held various senior positions at Kraft Foods including President, Biscuits and Snacks Sector and President, Asia Pacific Region. External appointments: Non-Executive Director, Newell-Rubbermaid Corporation; Director, Students in Free Enterprise and Grocery Manufacturers of America.
Pier Luigi SigismondiChief Supply Chain OfficerNationality: Italian. Aged 44. Appointed Chief Supply Chain Officer September 2009. Prior to his appointment at Unilever, he joined Nestlé S.A. in 2002 as Vice President of Corporate Operations Strategies, before moving to Nestlé Mexico in 2005 as Vice President of Supply Chain and R&D. Prior to Nestlé S.A. he was Vice President of Operations in Italy for A T Kearney. He also holds a Masters in Industrial & Systems Engineering from the Georgia Institute of Technology, Atlanta, Georgia.
Professor Geneviève BergerChief Research and Development OfficerNationality: French. Aged 55. Appointed to UEx July 2008. Professor and Hospital Practitioner, Medical University Teaching Hospital, Paris 2003-2008. Member, Technical Committee, Institute of Electrical and Electronics Engineers (IEEE). Chairman, Advisory Board, Health for the European Commission. Director, Biotech and Agri-Food Department 1998-2000 and Director of Technology 2000, the French Ministry for Education. Director General, National Centre for Scientific Research (CNRS), France 2000-2003. Previously Non-Executive Director of Unilever N.V. and Unilever PLC 2007-2008.
Jean-Marc HuëtChief Financial Officer(see details on page 22)
Harish ManwaniPresident Asia, Africa and Central & Eastern EuropeNationality: Indian. Aged 56. Appointed to UEx April 2005 as President Asia Africa. Appointed President Asia, Africa and Central & Eastern Europe in May 2008. Joined Unilever 1976. He is also Non-Executive Chairman, Hindustan Unilever Limited. Previous posts include: Business Group President, Home and Personal Care, North America 2004. Business Group President, Home and Personal Care, Latin America 2001 and Senior Vice President, Hair Care and Oral Care 2000.
Unilever Executive (UEx) members are treated as executive officers and senior management for US purposes and key management personnel for IFRS purposes. All members of the UEx have existing agreements with varying terms, however, all agreements include a notice period of 12 months although local law and practice may sometimes impact on these provisions. Details of the remuneration paid and share awards are shown in aggregate in note 4 on page 90.
Report of the Directors Board and Executive
Unilever ExecutiveLeft to right:
Paul Polman Harish Manwani
Sandy Ogg Pier Luigi Sigismondi
Doug Baillie Vindi Banga
Geneviève Berger Michael Polk
Jean-Marc Huët
24 Unilever Annual Report and Accounts 2009
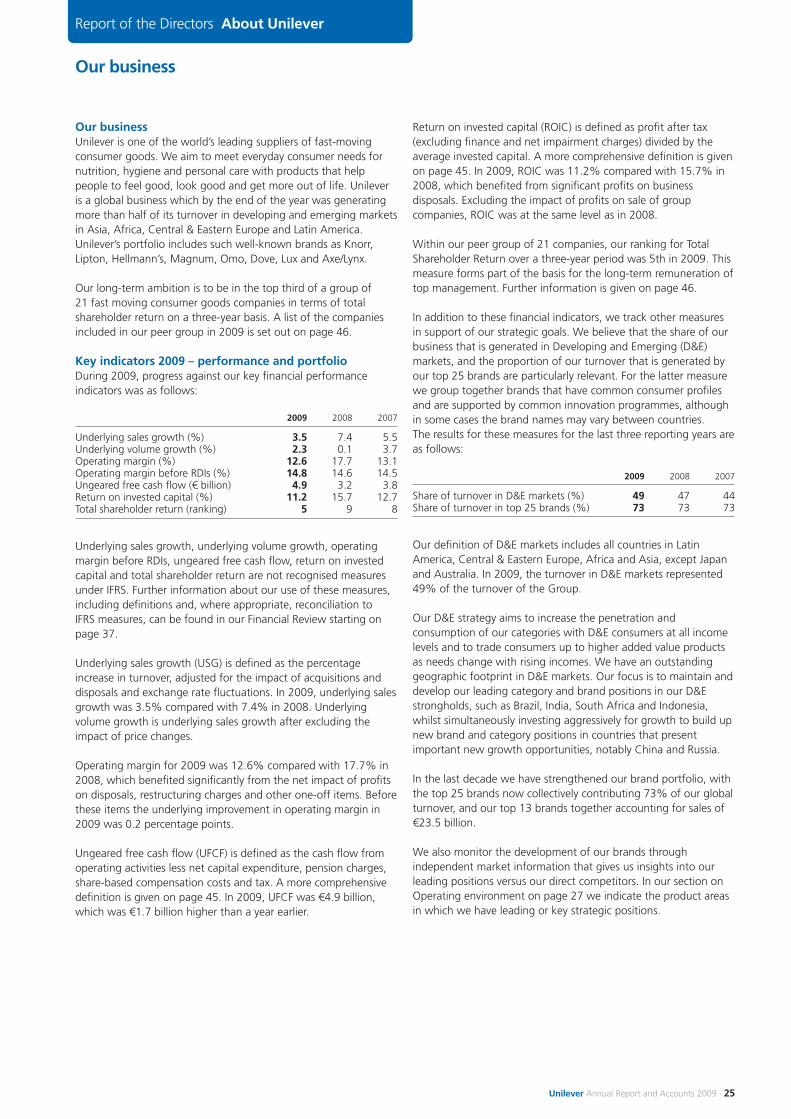
Our business
Unilever Annual Report and Accounts 2009 25
Our businessUnilever is one of the world’s leading suppliers of fast-movingconsumer goods. We aim to meet everyday consumer needs fornutrition, hygiene and personal care with products that helppeople to feel good, look good and get more out of life. Unileveris a global business which by the end of the year was generatingmore than half of its turnover in developing and emerging marketsin Asia, Africa, Central & Eastern Europe and Latin America.Unilever’s portfolio includes such well-known brands as Knorr,Lipton, Hellmann’s, Magnum, Omo, Dove, Lux and Axe/Lynx.
Our long-term ambition is to be in the top third of a group of 21 fast moving consumer goods companies in terms of totalshareholder return on a three-year basis. A list of the companiesincluded in our peer group in 2009 is set out on page 46.
Key indicators 2009 – performance and portfolioDuring 2009, progress against our key financial performanceindicators was as follows:
2009 2008 2007
Underlying sales growth (%) 3.5 7.4 5.5Underlying volume growth (%) 2.3 0.1 3.7Operating margin (%) 12.6 17.7 13.1Operating margin before RDIs (%) 14.8 14.6 14.5Ungeared free cash flow (€ billion) 4.9 3.2 3.8Return on invested capital (%) 11.2 15.7 12.7Total shareholder return (ranking) 5 9 8
Underlying sales growth, underlying volume growth, operatingmargin before RDIs, ungeared free cash flow, return on investedcapital and total shareholder return are not recognised measuresunder IFRS. Further information about our use of these measures,including definitions and, where appropriate, reconciliation to IFRS measures, can be found in our Financial Review starting onpage 37.
Underlying sales growth (USG) is defined as the percentageincrease in turnover, adjusted for the impact of acquisitions anddisposals and exchange rate fluctuations. In 2009, underlying salesgrowth was 3.5% compared with 7.4% in 2008. Underlyingvolume growth is underlying sales growth after excluding theimpact of price changes.
Operating margin for 2009 was 12.6% compared with 17.7% in2008, which benefited significantly from the net impact of profitson disposals, restructuring charges and other one-off items. Beforethese items the underlying improvement in operating margin in2009 was 0.2 percentage points.
Ungeared free cash flow (UFCF) is defined as the cash flow fromoperating activities less net capital expenditure, pension charges,share-based compensation costs and tax. A more comprehensivedefinition is given on page 45. In 2009, UFCF was €4.9 billion,which was €1.7 billion higher than a year earlier.
Return on invested capital (ROIC) is defined as profit after tax(excluding finance and net impairment charges) divided by theaverage invested capital. A more comprehensive definition is givenon page 45. In 2009, ROIC was 11.2% compared with 15.7% in2008, which benefited from significant profits on businessdisposals. Excluding the impact of profits on sale of groupcompanies, ROIC was at the same level as in 2008.
Within our peer group of 21 companies, our ranking for TotalShareholder Return over a three-year period was 5th in 2009. Thismeasure forms part of the basis for the long-term remuneration oftop management. Further information is given on page 46.
In addition to these financial indicators, we track other measuresin support of our strategic goals. We believe that the share of ourbusiness that is generated in Developing and Emerging (D&E)markets, and the proportion of our turnover that is generated byour top 25 brands are particularly relevant. For the latter measurewe group together brands that have common consumer profilesand are supported by common innovation programmes, althoughin some cases the brand names may vary between countries. The results for these measures for the last three reporting years areas follows:
2009 2008 2007
Share of turnover in D&E markets (%) 49 47 44Share of turnover in top 25 brands (%) 73 73 73
Our definition of D&E markets includes all countries in LatinAmerica, Central & Eastern Europe, Africa and Asia, except Japanand Australia. In 2009, the turnover in D&E markets represented49% of the turnover of the Group.
Our D&E strategy aims to increase the penetration andconsumption of our categories with D&E consumers at all incomelevels and to trade consumers up to higher added value productsas needs change with rising incomes. We have an outstandinggeographic footprint in D&E markets. Our focus is to maintain anddevelop our leading category and brand positions in our D&Estrongholds, such as Brazil, India, South Africa and Indonesia,whilst simultaneously investing aggressively for growth to build upnew brand and category positions in countries that presentimportant new growth opportunities, notably China and Russia.
In the last decade we have strengthened our brand portfolio, withthe top 25 brands now collectively contributing 73% of our globalturnover, and our top 13 brands together accounting for sales of€23.5 billion.
We also monitor the development of our brands throughindependent market information that gives us insights into ourleading positions versus our direct competitors. In our section onOperating environment on page 27 we indicate the product areasin which we have leading or key strategic positions.
Report of the Directors About Unilever
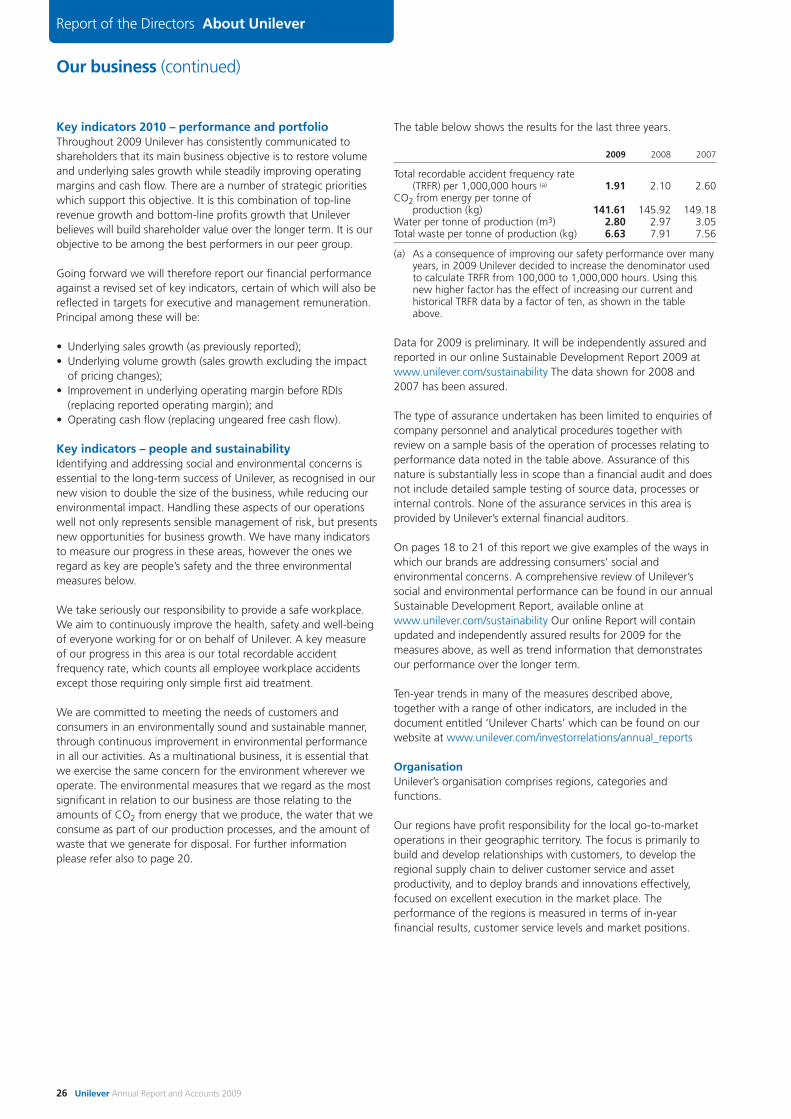
Our business (continued)
26 Unilever Annual Report and Accounts 2009
Report of the Directors About Unilever
Key indicators 2010 – performance and portfolioThroughout 2009 Unilever has consistently communicated toshareholders that its main business objective is to restore volumeand underlying sales growth while steadily improving operatingmargins and cash flow. There are a number of strategic prioritieswhich support this objective. It is this combination of top-linerevenue growth and bottom-line profits growth that Unileverbelieves will build shareholder value over the longer term. It is ourobjective to be among the best performers in our peer group.
Going forward we will therefore report our financial performanceagainst a revised set of key indicators, certain of which will also bereflected in targets for executive and management remuneration.Principal among these will be:
• Underlying sales growth (as previously reported);• Underlying volume growth (sales growth excluding the impact
of pricing changes);• Improvement in underlying operating margin before RDIs
(replacing reported operating margin); and• Operating cash flow (replacing ungeared free cash flow).
Key indicators – people and sustainabilityIdentifying and addressing social and environmental concerns isessential to the long-term success of Unilever, as recognised in ournew vision to double the size of the business, while reducing ourenvironmental impact. Handling these aspects of our operationswell not only represents sensible management of risk, but presentsnew opportunities for business growth. We have many indicatorsto measure our progress in these areas, however the ones weregard as key are people’s safety and the three environmentalmeasures below.
We take seriously our responsibility to provide a safe workplace.We aim to continuously improve the health, safety and well-beingof everyone working for or on behalf of Unilever. A key measureof our progress in this area is our total recordable accidentfrequency rate, which counts all employee workplace accidentsexcept those requiring only simple first aid treatment.
We are committed to meeting the needs of customers andconsumers in an environmentally sound and sustainable manner,through continuous improvement in environmental performancein all our activities. As a multinational business, it is essential thatwe exercise the same concern for the environment wherever weoperate. The environmental measures that we regard as the mostsignificant in relation to our business are those relating to theamounts of CO2 from energy that we produce, the water that weconsume as part of our production processes, and the amount ofwaste that we generate for disposal. For further informationplease refer also to page 20.
The table below shows the results for the last three years.
2009 2008 2007
Total recordable accident frequency rate(TRFR) per 1,000,000 hours (a) 1.91 2.10 2.60
CO2 from energy per tonne of production (kg) 141.61 145.92 149.18
Water per tonne of production (m3) 2.80 2.97 3.05Total waste per tonne of production (kg) 6.63 7.91 7.56
(a) As a consequence of improving our safety performance over manyyears, in 2009 Unilever decided to increase the denominator usedto calculate TRFR from 100,000 to 1,000,000 hours. Using thisnew higher factor has the effect of increasing our current andhistorical TRFR data by a factor of ten, as shown in the tableabove.
Data for 2009 is preliminary. It will be independently assured andreported in our online Sustainable Development Report 2009 atwww.unilever.com/sustainability The data shown for 2008 and2007 has been assured.
The type of assurance undertaken has been limited to enquiries ofcompany personnel and analytical procedures together withreview on a sample basis of the operation of processes relating toperformance data noted in the table above. Assurance of thisnature is substantially less in scope than a financial audit and doesnot include detailed sample testing of source data, processes orinternal controls. None of the assurance services in this area isprovided by Unilever’s external financial auditors.
On pages 18 to 21 of this report we give examples of the ways inwhich our brands are addressing consumers’ social andenvironmental concerns. A comprehensive review of Unilever’ssocial and environmental performance can be found in our annualSustainable Development Report, available online atwww.unilever.com/sustainability Our online Report will containupdated and independently assured results for 2009 for themeasures above, as well as trend information that demonstratesour performance over the longer term.
Ten-year trends in many of the measures described above,together with a range of other indicators, are included in thedocument entitled ‘Unilever Charts’ which can be found on ourwebsite at www.unilever.com/investorrelations/annual_reports
OrganisationUnilever’s organisation comprises regions, categories andfunctions.
Our regions have profit responsibility for the local go-to-marketoperations in their geographic territory. The focus is primarily tobuild and develop relationships with customers, to develop theregional supply chain to deliver customer service and assetproductivity, and to deploy brands and innovations effectively,focused on excellent execution in the market place. Theperformance of the regions is measured in terms of in-yearfinancial results, customer service levels and market positions.
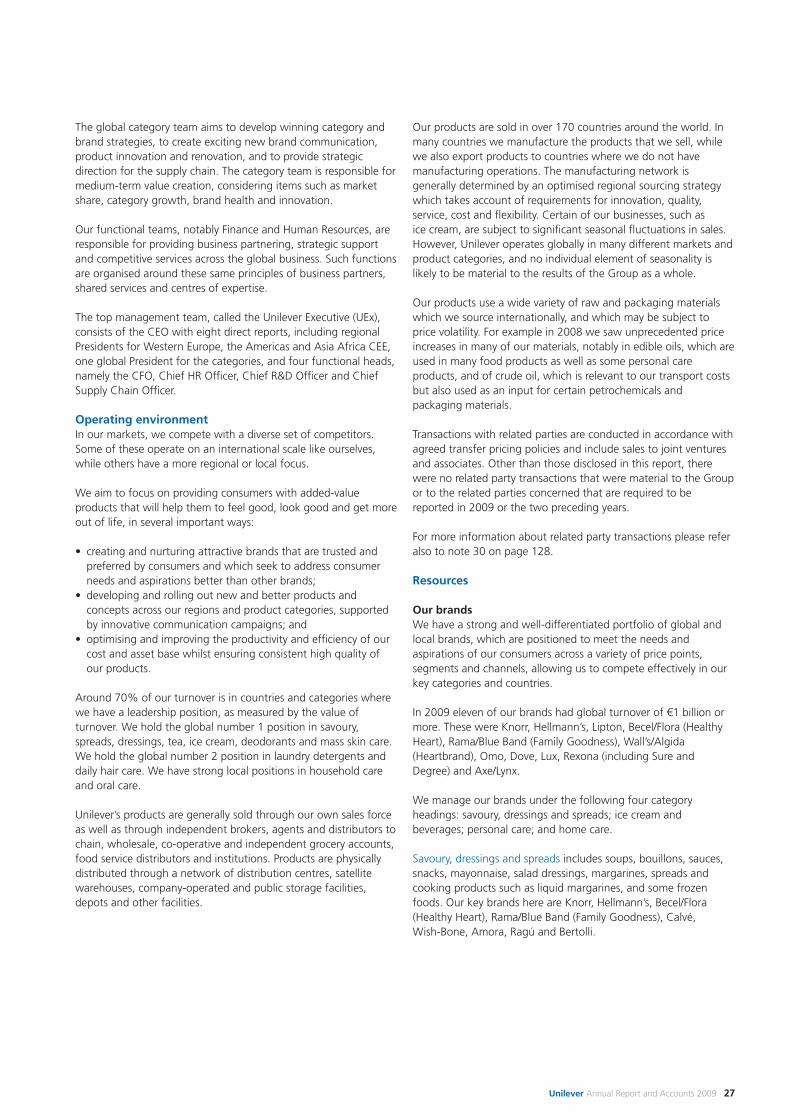
Unilever Annual Report and Accounts 2009 27
The global category team aims to develop winning category andbrand strategies, to create exciting new brand communication,product innovation and renovation, and to provide strategicdirection for the supply chain. The category team is responsible formedium-term value creation, considering items such as marketshare, category growth, brand health and innovation.
Our functional teams, notably Finance and Human Resources, areresponsible for providing business partnering, strategic supportand competitive services across the global business. Such functionsare organised around these same principles of business partners,shared services and centres of expertise.
The top management team, called the Unilever Executive (UEx),consists of the CEO with eight direct reports, including regionalPresidents for Western Europe, the Americas and Asia Africa CEE,one global President for the categories, and four functional heads,namely the CFO, Chief HR Officer, Chief R&D Officer and ChiefSupply Chain Officer.
Operating environmentIn our markets, we compete with a diverse set of competitors.Some of these operate on an international scale like ourselves,while others have a more regional or local focus.
We aim to focus on providing consumers with added-valueproducts that will help them to feel good, look good and get moreout of life, in several important ways:
• creating and nurturing attractive brands that are trusted andpreferred by consumers and which seek to address consumerneeds and aspirations better than other brands;
• developing and rolling out new and better products andconcepts across our regions and product categories, supportedby innovative communication campaigns; and
• optimising and improving the productivity and efficiency of ourcost and asset base whilst ensuring consistent high quality ofour products.
Around 70% of our turnover is in countries and categories wherewe have a leadership position, as measured by the value ofturnover. We hold the global number 1 position in savoury,spreads, dressings, tea, ice cream, deodorants and mass skin care.We hold the global number 2 position in laundry detergents anddaily hair care. We have strong local positions in household careand oral care.
Unilever’s products are generally sold through our own sales forceas well as through independent brokers, agents and distributors tochain, wholesale, co-operative and independent grocery accounts,food service distributors and institutions. Products are physicallydistributed through a network of distribution centres, satellitewarehouses, company-operated and public storage facilities,depots and other facilities.
Our products are sold in over 170 countries around the world. Inmany countries we manufacture the products that we sell, whilewe also export products to countries where we do not havemanufacturing operations. The manufacturing network isgenerally determined by an optimised regional sourcing strategywhich takes account of requirements for innovation, quality,service, cost and flexibility. Certain of our businesses, such as ice cream, are subject to significant seasonal fluctuations in sales.However, Unilever operates globally in many different markets andproduct categories, and no individual element of seasonality islikely to be material to the results of the Group as a whole.
Our products use a wide variety of raw and packaging materialswhich we source internationally, and which may be subject toprice volatility. For example in 2008 we saw unprecedented priceincreases in many of our materials, notably in edible oils, which areused in many food products as well as some personal careproducts, and of crude oil, which is relevant to our transport costsbut also used as an input for certain petrochemicals andpackaging materials.
Transactions with related parties are conducted in accordance withagreed transfer pricing policies and include sales to joint venturesand associates. Other than those disclosed in this report, therewere no related party transactions that were material to the Groupor to the related parties concerned that are required to bereported in 2009 or the two preceding years.
For more information about related party transactions please referalso to note 30 on page 128.
Resources
Our brandsWe have a strong and well-differentiated portfolio of global andlocal brands, which are positioned to meet the needs andaspirations of our consumers across a variety of price points,segments and channels, allowing us to compete effectively in ourkey categories and countries.
In 2009 eleven of our brands had global turnover of €1 billion ormore. These were Knorr, Hellmann’s, Lipton, Becel/Flora (HealthyHeart), Rama/Blue Band (Family Goodness), Wall’s/Algida(Heartbrand), Omo, Dove, Lux, Rexona (including Sure andDegree) and Axe/Lynx.
We manage our brands under the following four categoryheadings: savoury, dressings and spreads; ice cream andbeverages; personal care; and home care.
Savoury, dressings and spreads includes soups, bouillons, sauces,snacks, mayonnaise, salad dressings, margarines, spreads andcooking products such as liquid margarines, and some frozenfoods. Our key brands here are Knorr, Hellmann’s, Becel/Flora(Healthy Heart), Rama/Blue Band (Family Goodness), Calvé, Wish-Bone, Amora, Ragú and Bertolli.
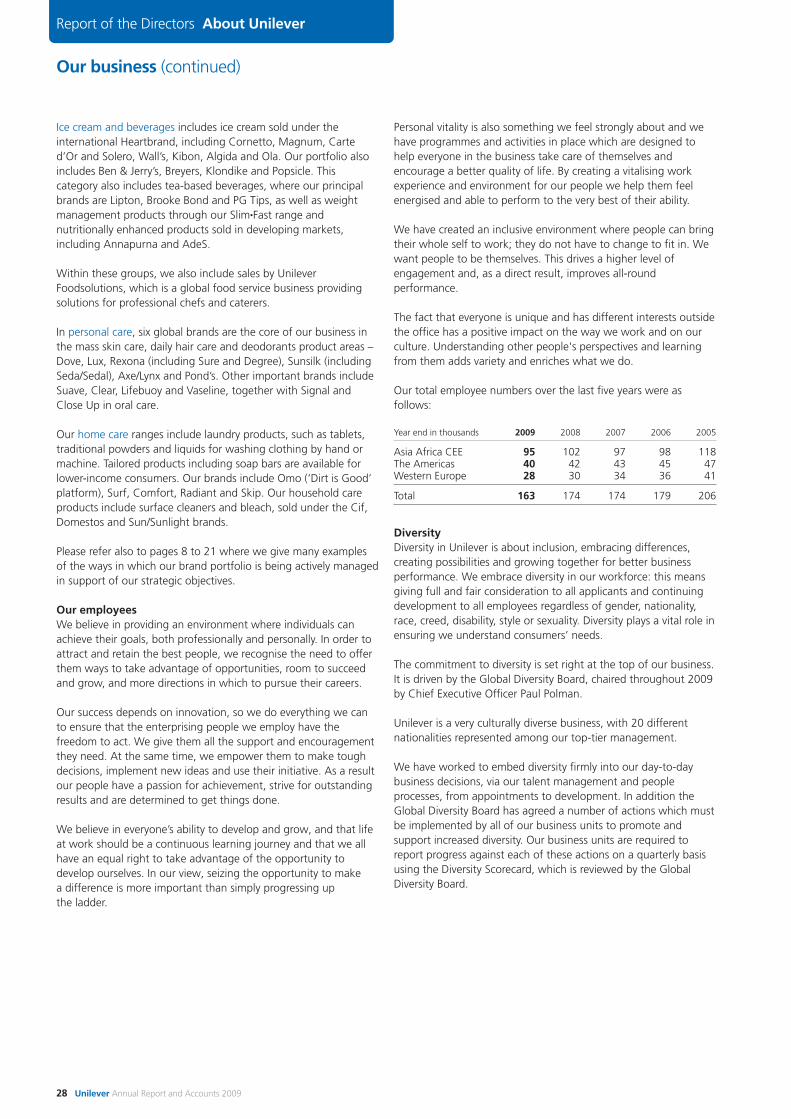
Our business (continued)
28 Unilever Annual Report and Accounts 2009
Report of the Directors About Unilever
Ice cream and beverages includes ice cream sold under theinternational Heartbrand, including Cornetto, Magnum, Carted’Or and Solero, Wall’s, Kibon, Algida and Ola. Our portfolio alsoincludes Ben & Jerry’s, Breyers, Klondike and Popsicle. Thiscategory also includes tea-based beverages, where our principalbrands are Lipton, Brooke Bond and PG Tips, as well as weightmanagement products through our Slim•Fast range andnutritionally enhanced products sold in developing markets,including Annapurna and AdeS.
Within these groups, we also include sales by UnileverFoodsolutions, which is a global food service business providingsolutions for professional chefs and caterers.
In personal care, six global brands are the core of our business inthe mass skin care, daily hair care and deodorants product areas –Dove, Lux, Rexona (including Sure and Degree), Sunsilk (includingSeda/Sedal), Axe/Lynx and Pond’s. Other important brands includeSuave, Clear, Lifebuoy and Vaseline, together with Signal andClose Up in oral care.
Our home care ranges include laundry products, such as tablets,traditional powders and liquids for washing clothing by hand ormachine. Tailored products including soap bars are available forlower-income consumers. Our brands include Omo (‘Dirt is Good’platform), Surf, Comfort, Radiant and Skip. Our household careproducts include surface cleaners and bleach, sold under the Cif,Domestos and Sun/Sunlight brands.
Please refer also to pages 8 to 21 where we give many examplesof the ways in which our brand portfolio is being actively managedin support of our strategic objectives.
Our employeesWe believe in providing an environment where individuals canachieve their goals, both professionally and personally. In order toattract and retain the best people, we recognise the need to offerthem ways to take advantage of opportunities, room to succeedand grow, and more directions in which to pursue their careers.
Our success depends on innovation, so we do everything we canto ensure that the enterprising people we employ have thefreedom to act. We give them all the support and encouragementthey need. At the same time, we empower them to make toughdecisions, implement new ideas and use their initiative. As a resultour people have a passion for achievement, strive for outstandingresults and are determined to get things done.
We believe in everyone’s ability to develop and grow, and that lifeat work should be a continuous learning journey and that we allhave an equal right to take advantage of the opportunity todevelop ourselves. In our view, seizing the opportunity to make a difference is more important than simply progressing up the ladder.
Personal vitality is also something we feel strongly about and wehave programmes and activities in place which are designed tohelp everyone in the business take care of themselves andencourage a better quality of life. By creating a vitalising workexperience and environment for our people we help them feelenergised and able to perform to the very best of their ability.
We have created an inclusive environment where people can bringtheir whole self to work; they do not have to change to fit in. Wewant people to be themselves. This drives a higher level ofengagement and, as a direct result, improves all-roundperformance.
The fact that everyone is unique and has different interests outsidethe office has a positive impact on the way we work and on ourculture. Understanding other people's perspectives and learningfrom them adds variety and enriches what we do.
Our total employee numbers over the last five years were asfollows:
Year end in thousands 2009 2008 2007 2006 2005
Asia Africa CEE 95 102 97 98 118The Americas 40 42 43 45 47Western Europe 28 30 34 36 41
Total 163 174 174 179 206
DiversityDiversity in Unilever is about inclusion, embracing differences,creating possibilities and growing together for better businessperformance. We embrace diversity in our workforce: this meansgiving full and fair consideration to all applicants and continuingdevelopment to all employees regardless of gender, nationality,race, creed, disability, style or sexuality. Diversity plays a vital role inensuring we understand consumers’ needs.
The commitment to diversity is set right at the top of our business.It is driven by the Global Diversity Board, chaired throughout 2009by Chief Executive Officer Paul Polman.
Unilever is a very culturally diverse business, with 20 differentnationalities represented among our top-tier management.
We have worked to embed diversity firmly into our day-to-daybusiness decisions, via our talent management and peopleprocesses, from appointments to development. In addition theGlobal Diversity Board has agreed a number of actions which mustbe implemented by all of our business units to promote andsupport increased diversity. Our business units are required toreport progress against each of these actions on a quarterly basisusing the Diversity Scorecard, which is reviewed by the GlobalDiversity Board.
Unilever Annual Report and Accounts 2009 29
Information TechnologyUnilever IT is a global function headed by a Chief InformationOfficer, reporting to the Chief Financial Officer, with a strategy to deliver simple and competitive IT solutions in a cost-effectiveway to support the business agenda.
A common technology framework and common standards forarchitecture, key technologies, process, information and serviceallow Unilever to simplify its IT operations to better exploit global scale in IT. For example, this common approach facilitatesthe move towards regional supply chain organisations and the development of regional shared service centres, notably in Finance and Human Resources, which in some cases are outsourced.
The IT function is a key enabler for the transformation towards aglobally aligned business through:
• strategic alliances and partnerships with global suppliers;• improving IT infrastructure and service levels, whilst
reducing costs;• building consistent IT capabilities, processes and databases; and• strategic outsourcing in selected key areas.
Unilever partners with a selected group of leading suppliers todevelop and maintain a limited number of complementary ITsystems that collectively cover our business needs. This promotesradical simplification, increased flexibility and agility, fasterimplementation and reduced costs.
Intellectual propertyWe have a large portfolio of patents and trademarks, and weconduct some of our operations under licences that are based onpatents or trademarks owned or controlled by others. We are notdependent on any one patent or group of patents. We use allappropriate efforts to protect our brands and technology.
Laws and regulationUnilever businesses are governed by laws and regulations designedto ensure that products may be safely used for their intendedpurpose and that labelling and advertising are truthful and notmisleading. Unilever businesses are further regulated by dataprotection and anti-trust legislation. Important regulatory bodies inrespect of our businesses include the European Commission andthe US Food and Drug Administration.
We have processes in place to ensure that products, ingredients,manufacturing processes, marketing materials and activitiescomply in all material respects with the above-mentioned laws andregulations.
Legal proceedingsWe are involved from time to time in legal and arbitrationproceedings arising in the ordinary course of business. Forinformation on current outstanding legal proceedings andongoing regulatory investigations please refer to ‘Legalproceedings’ within note 25 on page 122.
Outlook and risks
The following discussion about outlook and risk managementactivities includes ‘forward-looking’ statements that involve riskand uncertainties. The actual results could differ materially from those projected. See the ‘Cautionary statement’ on the inside back cover.
OutlookMarket conditions for our business were particularly challenging in2009 and we do not expect this to change significantly in 2010.Economic pressures are likely to weigh heavily on consumerspending. This is especially the case in some of our developedmarkets where we expect unemployment to remain relatively highand disposable incomes to be adversely impacted by thecombination of higher taxes and rising interest rates as fiscalstimulus packages start to be unwound. Under these conditionsconsumer confidence is not expected to rise significantly in theyear ahead and the search for value in the shopping basket willcontinue.
Against this background we expect continued deflationarypressure, exacerbated in the early part of the year by thecontinuing impact of lower commodity costs. However weanticipate commodity cost inflation to return around the middle ofthe year, albeit at more modest levels than in recent years, andthat this will put limited upward pressure on prices in the secondhalf of 2010.
The competitive environment for our business is likely to intensifyfurther in 2010. Our key competitors, both global and local, will
be aiming to regain market share in many of our key markets andcategories and will enhance their activity plans accordingly. Weexpect heightened levels of competitive challenge to our manyleadership positions based on innovation and wide-ranging brandsupport. We are well prepared for such challenges.
Faced with these challenges we will continue to focus on our keystrategic priorities for 2010 of driving volume growth whilstproviding a steady improvement in operating margin before RDIsand strong cash flow. We believe that our outstanding and long-established presence in D&E markets is a key competitive strengththat offers us opportunities for future growth. In these markets,per capita levels of consumption are much lower than indeveloped markets, and demographic trends suggest that over thenext ten years many millions of consumers may be able to affordour products. At the same time we are determined to grow also inthe developed world, which still represents around half of ourbusiness.
Principal risk factorsRisks and uncertainties could cause actual results to vary fromthose described in forward-looking statements made within thisdocument, or could impact on our ability to meet our targets or bedetrimental to our profitability or reputation. The risks that weregard as the most relevant to our business are identified below.We have also commented on certain mitigating actions that webelieve help us manage such risks; however, we may not besuccessful in deploying some or all of these mitigating actions.
30 Unilever Annual Report and Accounts 2009
Report of the Directors About Unilever
Description of risk What we are doing to manage the risk
Economic• Decline in business during an economic downturn• Avoiding customer and supplier default
Unilever’s business is dependent on continuing consumer demandfor our brands. Reduced consumer wealth driven by adverseeconomic conditions may result in our consumers becomingunwilling or unable to purchase our products, which couldadversely affect our cash flow, turnover, profits and profit margins.For example, in 2008 the economic downturn adversely impactedour business by reducing the demand for some of our products. Inaddition we have a large number of global brands, some of whichhave a significant carrying value as intangible assets: adverseeconomic conditions may reduce the value of those brands whichcould require us to impair their balance sheet value.
During economic downturns access to credit could be constrained:this happened in 2008 and 2009. This could impact the viability ofour suppliers and customers and could temporarily inhibit the flowof day-to-day cash transactions with suppliers and customers viathe banks.
Adverse economic conditions may affect one or more countrieswithin a region, or may extend globally. The impact on our overallportfolio will depend on the severity of the economic slowdown,the mix of countries affected and any government response toreduce the impact such as fiscal stimulus, changes to taxation andmeasures to minimise unemployment.
The breadth of Unilever’s portfolio and our geographic reach helpto mitigate local economic risks. We carefully monitor economicindicators and regularly model the impact of different economicscenarios. We monitor consumer behaviour through regular marketresearch and adopt a flexible business model which allows us toadapt our portfolio and respond quickly to develop new offeringsthat suit consumers’ and customers’ changing needs duringeconomic downturns. We regularly update our forecast of businessresults and cash flows and, where necessary, rebalance investmentpriorities. We undertake impairment testing reviews in accordancewith the relevant accounting standards.
We regularly monitor and review the health of our customers andsuppliers and implement credit limits and supply substitutionarrangements. These reviews are undertaken more frequentlyduring economic downturns.
Unilever Annual Report and Accounts 2009 31
Description of risk What we are doing to manage the risk
Markets• Managing the business across globally competitive markets• Volatility of emerging markets• Building strategic alliances and partnerships
Unilever operates globally in competitive markets where theactivities of other multinational companies, local and regionalcompanies and customers which have a significant private labelbusiness may adversely affect our market shares, cash flow,turnover, profits and/or profit margins.
49% of Unilever’s turnover in 2009 came from D&E marketsincluding Brazil, India, Indonesia, Turkey, South Africa, China,Mexico and Russia. These markets are typically more volatile thandeveloped markets, so we are continually exposed to changingeconomic, political and social developments outside our control,any of which could adversely affect our business. Failure tounderstand and respond effectively to local market developmentscould put at risk our cash flow, turnover, profit and/or profit margins.
Our strategy focuses on investing in markets and segments whichwe identify as attractive, i.e. where we have or can buildcompetitive advantage and where we can consistently grow salesand margins. Many years of exposure to D&E markets has given usthe ability to be able to operate and develop our businesssuccessfully during periods of economic, political or social change.
We seek in-fill acquisitions to support our category and geographicambitions and, through Unilever Corporate Ventures, invest inpotential future businesses, new technologies and differentbusiness models.
We identify strategic partnerships with specialists that enable us toleverage external expertise to more efficiently and cost-effectivelydevelop and manage our business.
Brand• Design, development and roll-out of consumer/customer
relevant products and services
Unilever’s vision is to help people feel good, look good and getmore out of life with brands and services that are good for themand good for others. This is achieved by designing and deliveringsuperior branded products/services at relevant price points toconsumers across the globe. Failure to provide sufficient funding todevelop new products, lack of technical capability in the R&Dfunction, lack of prioritisation of projects and/or failure by operatingmanagement to successfully and quickly roll out the products mayadversely impact our cash flow, turnover, profit and/or profitmargins and may impact our reputation.
We have processes to monitor external market trends and collateconsumer, customer and shopper insight in order to develop long-term category and brand strategies. Our established innovationmanagement process uses comprehensive marketing tools andtechniques to convert category strategies into a series of projects,building on internally developed know-how and expertise. It furtheridentifies, prioritises and allocates resources and develops relevantbrand communications. We have well-established procedures toplan and execute roll-out of products to our customers.
Customer• Building long-term, mutually beneficial relationships
with customers• Customer consolidation and growth of discount sector
Maintaining successful relationships with our customers is key toensuring our brands are successfully presented to our consumersand are available for purchase at all times. Any breakdown in therelationships with customers could reduce the availability to ourconsumers of existing products and new product launches andtherefore impact our cashflow, turnover, profits and/or profitmargins.
The retail industry continues to consolidate in many of our markets.Further consolidation and the continuing growth of discounterscould increase the competitive retail environment by increasingcustomers’ purchasing power, increasing the demand forcompetitive promotions and price discounts, increase cross-bordersourcing to take advantage of pricing arbitrage and thus adverselyimpact our cash flow, turnover, profits and/or profit margins.Increased competition between retailers could place pressure onretailer margins and increase the counterparty risk to Unilever.
We build and maintain trading relationships across a broadspectrum of channels ranging from centrally managed,multinational customers, to ‘discount’ chains and to the ‘traditional’trade via distributors in many developing countries. We developjoint business plans with all our key customers, including detailedinvestment plans and customer service objectives, and regularlymonitor progress.
Outlook and risks (continued)
32 Unilever Annual Report and Accounts 2009
Report of the Directors About Unilever
Description of risk What we are doing to manage the risk
Financial/Treasury• Funding the ongoing operation of the business• Counterparty default in a financial institution• Managing currency and interest rate differences and
movements• Efficiently meeting our pension fund and tax obligations
As a global organisation Unilever’s asset values, earnings and cashflows are influenced by a wide variety of currencies, interest rates,tax jurisdictions and differing taxes. If we are unable to manage ourexposures to any one, or a combination, of these factors, this couldadversely impact our cash flow, profits and/or profit margins. Amaterial and significant shortfall in net cash flow could undermineUnilever’s credit rating, impair investor confidence and hinder ourability to raise funds, whether through access to credit markets,commercial paper programmes, long-term bond issuances orotherwise. In times of financial market volatility, we are alsopotentially exposed to counterparty risks with banks.
We are exposed to market interest rate fluctuations on our floatingrate debt. Increases in benchmark interest rates could increase theinterest cost of our floating rate debt and increase the cost offuture borrowings. Our inability to manage the interest costeffectively could have an adverse impact on our cash flow, profitsand/or profit margins.
Because of the breadth of our international operations we aresubject to risks from changes to the relative value of currencieswhich can fluctuate widely and could have a significant impact onour assets, cash flow, turnover, profits and/or profit margins.Further, because Unilever consolidates its financial statements ineuros it is subject to exchange risks associated with the translationof the underlying net assets of its foreign subsidiaries. We are alsosubject to the imposition of exchange controls by individualcountries which could limit our ability to import materials paid byforeign currency or to remit dividends to the parent company.
Certain businesses have defined benefit pension plans, most nowclosed to new employees, which are exposed to movements ininterest rates, fluctuating values of underlying investments andincreased life expectancy. Changes in any or all of these inputscould potentially increase the cost to Unilever of funding theschemes and therefore have an adverse impact on profitability andcash flow.
In view of the current economic climate and deterioratinggovernment deficit positions, tax legislation in the countries inwhich we operate may be subject to change, which may have anadverse impact on our profits.
A key target for the Group is to manage our financial affairs so asto maintain our A1/A+ credit rating, which gives us continuedaccess to the global debt markets, even when the overall financialmarkets are under stress. We seek to manage our liquidityrequirements by maintaining access to global debt markets throughshort-term and long-term debt programmes. In addition, we havecommitted credit facilities to underpin our commercial paperprogramme and for general corporate purposes. We regularlyupdate our cashflow forecasts and assess the range of volatility dueto pension asset values, interest rates and currencies. Weconcentrate cash in parent and finance companies to ensuremaximum flexibility for meeting changing business needs. Wefinance our operating subsidiaries through a mixture of retainedearnings, third-party borrowings and loans from parent and groupcompanies. Group Treasury regularly monitors exposure to our third-party banks, tightening counterparty limits where appropriate.The Group actively manages its banking exposures on a daily basis.
In order to minimise interest costs and reduce volatility, our interestrate management policy aims to achieve an appropriate balancebetween fixed and floating rate interest exposures on forecast netdebt levels for the next five years. We achieve this through acombination of issuing fixed rate long-term debt and by modifyingthe interest rate exposure of debt and cash positions through theuse of interest rate swaps.
In order to manage currency exposures we maintain a policywhereby operating companies manage trading and financial foreignexchange exposures within prescribed limits and by the use offorward foreign exchange contracts. Regional groups monitorcompliance with this policy. Further, operating companies borrow inlocal currency except where inhibited by local regulations, lack oflocal liquidity or local market conditions. For those countries that, inthe view of management, have a substantial retranslation risk wemay decide to hedge such net investment through the use offoreign currency borrowing or forward exchange contracts.
Our pension investment policies require us to invest across a rangeof equities, bonds, property, hedge funds and cash such that thefailure of any single investment will not have a material impact onthe overall value of assets. The majority of assets, including thoseheld in our ‘pooled’ investment vehicle, ‘Univest’, are managed byexternal fund managers and are regularly monitored by pensiontrustees and central pensions department.
On tax, we maintain high quality tax compliance procedures anddocumentation, execute prudent tax planning strategies and makeproper provision for current and deferred taxation. Deferred taxassets are reviewed regularly for recoverability.
Unilever Annual Report and Accounts 2009 33
Description of risk What we are doing to manage the risk
Consumer safety and environmental sustainability• Maintaining high social and environmental standards• Designing and producing products that are safe for
consumers • Building an environmentally sustainable business
Unilever has developed a strong corporate reputation over manyyears for its focus on social and environmental issues, includingpromoting sustainable development and utilisation of renewableresources. The Unilever brand logo, now displayed on all ourproducts and advertising, increases our external exposure. Shouldwe fail to meet high product safety, social, environmental andethical standards across all our products and in all our operationsand activities it could impact our reputation, leading to the rejectionof products by consumers, damage to our brands including growthand profitability, and diversion of management time into rebuildingour reputation.
We aim to grow our business while reducing our environmentalimpact. The environmental measures that we regard as mostsignificant are those relating to the amounts of CO2 from energythat we use, the water we consume as part of our productionprocesses and the amount of waste that we generate for disposal.Failure to design products with a lower environmental footprintcould damage our reputation and hence long-term cash flow,turnover, profits and/or profit margins.
Our Code of Business Principles and other operational and businesspolicies are designed to ensure that we consistently maintain highsocial and environmental standards, and we have establishedprocesses to track performance in these areas. Our strategy benefitsfrom the insights of the Unilever Sustainable Development Group,comprising five external specialists in corporate responsibility andsustainability, that guide and critique the development of ourstrategy.
Detailed operational policies and procedures ensure that quality andsafety are built in to the design, manufacture and distribution of allof our products. Procedures are also in place to respond quickly toconsumer safety and quality incidents including provision to initiateproduct recalls where necessary.
Our ‘Brand Imprint’ process ensures that the direct and indirectenvironmental impacts of our products and brands are assessed in aconsistent way across the value chain. Specific targets have beenset against our environmental impact ambitions, and progress ismonitored and published in the annual Sustainable DevelopmentReport.
Operations• Securing raw materials and key third-party services• Maintaining safe, secure and operational production and
distribution capability• Maintaining a competitive cost structure• Handling major incidents and crises
Our ability to make products is dependent on securing timely andcost-effective supplies of production materials, some of which areglobally traded commodities. The price of commodities and otherkey materials, labour, warehousing and distribution fluctuatesaccording to global economic conditions, which can have asignificant impact on our product costs. For example, in 2008 wesaw unprecedented increases in many of our commodity costs,including edible oils and crude oil. If we are unable to increaseprices to compensate for higher input costs, this could reduce ourcash flow, profits and/or profit margins. If we increase prices morethan our competitors, this could undermine our competitivenessand hence market shares.
Further, two-thirds of the raw materials that we buy come fromagriculture. Changing weather patterns, water scarcity andunsustainable farming practices threaten the long-term viability ofagricultural production. A reduction in agricultural production maylimit our ability to manufacture products in the long term.
We are dependent on regional and global supply chains for thesupply of raw materials and services and for the manufacture,distribution and delivery of our products. We may be unable torespond to adverse events occurring in any part of this supply chainsuch as changes in local legal and regulatory schemes, labourshortages and disruptions, environmental and industrial accidents,bankruptcy of a key supplier or failure to deliver supplies on timeand in full, which could impact our ability to deliver orders to ourcustomers. Any of the foregoing could adversely impact our cashflow, turnover, profits and/or profit margins and harm ourreputation and our brands.
We have strategies and policies in place to monitor short- and long-term raw material demand forecasts. These are used todetermine future production requirements and facilitate theforward-buying of traded commodities to reduce future volatility ofcommodity costs. We have contingency plans to enable us to securealternative key material supplies at short notice, to transfer/shareproduction between manufacturing sites and to use substitutematerials in our product formulations and recipes.
We have programmes of regular preventative maintenance for key lines and production sites. We have in place mandatoryoccupational health and safety policies to ensure the well-being and safety of our employees, including procedures for regular self-certification.
We regularly undertake value improvement programmes to identifycost/value opportunities in direct and indirect costs. We benchmarkinternal product and service costs against external providers and weregularly model our production, distribution and warehousingcapability to optimise capacity utilisation and cost.
We routinely assess potential threats to our operations that could, ifthey materialise, give rise to a major incident or crisis. We reviewthe appropriateness of our incident response, business continuityand disaster recovery plans taking into account externaldevelopments.
Outlook and risks (continued)
34 Unilever Annual Report and Accounts 2009
Report of the Directors About Unilever
Description of risk What we are doing to manage the risk
People and talent• Attracting, developing and retaining a skilled workforce to
build and maintain a fit-for-purpose organisation
Attracting, developing and retaining talented employees is essentialto the delivery of our strategy. If we fail to determine theappropriate mix of skills required to implement our strategy andsubsequently fail to recruit or develop the right number ofappropriately qualified people, or if there are high levels of staffturnover, this could adversely affect our ability to operatesuccessfully, and hence grow our business and effectively competein the marketplace.
Resource Committees have been established and implementedthroughout our business. These committees have responsibility foridentifying future skills and capability needs, defining career pathsand professional training programmes, benchmarking the elementsof reward structures, both short- and long-term, and identifying thekey talent and leaders of the future. Regular internal surveys areconducted to gauge employee views and obtain feedback.
We have an integrated management development process whichincludes regular performance review, underpinned by a common setof ‘Standards of Leadership’ behaviours, skills and competencyprofiling, mentoring, coaching and training.
Legal and regulatory• Complying with and anticipating new legal and regulatory
requirements
Unilever is subject to local, regional and global rules, laws andregulations, covering such diverse areas as product safety, productclaims, trademarks, copyright, patents, employee health and safety,the environment, corporate governance, listing and disclosure,employment and taxes. Important regulatory bodies in respect ofour business include the European Commission and the US Foodand Drug Administration. Failure to comply with laws andregulations could leave Unilever open to civil and/or criminal legalchallenge and, if upheld, fines or imprisonment imposed on us orour employees. Further, our reputation could be significantlydamaged by adverse publicity relating to such a breach of laws orregulations and such damage could extend beyond a singlegeography.
Specialists or specialist teams at global, regional and local level areresponsible for setting policies and ensuring that all employees areaware and comply with regulations and laws specific and relevantto their roles. Internal competition law compliance procedures andtraining are reinforced and enhanced on an ongoing basis. There isa Legal Policy which sets out the specific activities and processes forwhich employees must seek the agreement of internal legal counselin advance of making a commitment.
Restructuring and change management• Delivering major restructuring projects effectively
In recent years Unilever has launched global and regionalrestructuring programmes to help simplify our organisationalstructure, leverage common platforms, realise benefits from ourregional and global scale and outsource business processes.Implementation of such programmes requires significant effort andattention from management and employees to complete to theagreed timescale and realise the anticipated benefits. In the eventthat we are unable to successfully implement these changes in atimely manner or at all, or effectively manage third-partyrelationships and/or outsourced processes, we may not be able torealise some or all of the anticipated expense reductions. Inaddition, because some of the restructuring changes involveimportant functions, any disruption could harm the operations ofour business, our reputation and/or relationship with ouremployees.
All significant global and regional restructuring projects areapproved by the Unilever Executive and sponsored by a UnileverExecutive member. Regular updates are provided to the UnileverExecutive.
Sound project disciplines are used in executing restructuringprojects including: clearly articulated project objectives, scope anddeliverables; an approved and properly authorised business caseupdated over time as necessary; detailed and up-to-date projectplanning; resourcing by appropriately qualified personnel; aneffective communication and change management plan; andproper closure, where learnings are captured and disseminated.
Other risks
Unilever is exposed to varying degrees of risk and uncertaintyrelated to other factors including physical risks, legislative,environmental, fiscal, tax and regulatory developments, legalmatters, insurance and resolution of such pending matters withincurrent estimates, our ability to integrate acquisitions and completeplanned divestitures, terrorism and economic, political and socialconditions in the environments where we operate and new orchanged priorities of the Boards. All these risks could materiallyaffect the Group’s business, our turnover, operating profits, netprofits, net assets and liquidity. There may be risks which areunknown to Unilever or which are currently believed to beimmaterial.
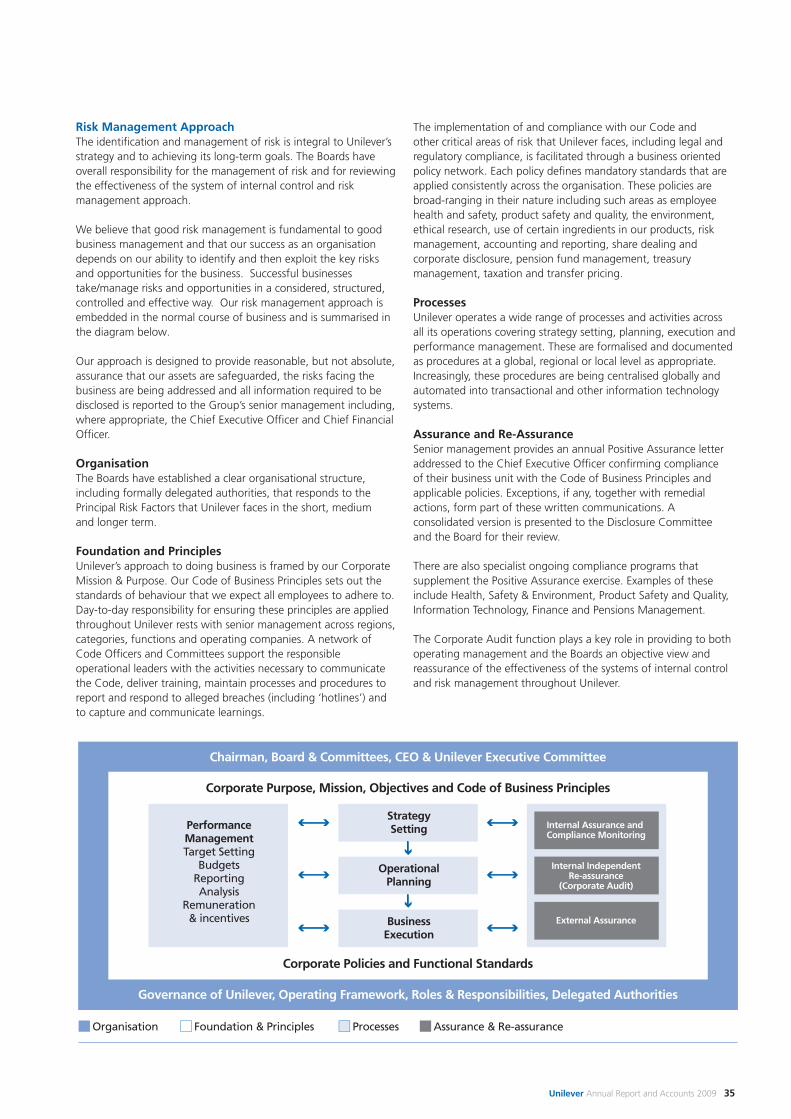
Unilever Annual Report and Accounts 2009 35
Risk Management ApproachThe identification and management of risk is integral to Unilever’sstrategy and to achieving its long-term goals. The Boards haveoverall responsibility for the management of risk and for reviewingthe effectiveness of the system of internal control and riskmanagement approach.
We believe that good risk management is fundamental to goodbusiness management and that our success as an organisationdepends on our ability to identify and then exploit the key risksand opportunities for the business. Successful businessestake/manage risks and opportunities in a considered, structured,controlled and effective way. Our risk management approach isembedded in the normal course of business and is summarised inthe diagram below.
Our approach is designed to provide reasonable, but not absolute,assurance that our assets are safeguarded, the risks facing thebusiness are being addressed and all information required to bedisclosed is reported to the Group’s senior management including,where appropriate, the Chief Executive Officer and Chief FinancialOfficer.
OrganisationThe Boards have established a clear organisational structure,including formally delegated authorities, that responds to thePrincipal Risk Factors that Unilever faces in the short, mediumand longer term.
Foundation and PrinciplesUnilever’s approach to doing business is framed by our CorporateMission & Purpose. Our Code of Business Principles sets out thestandards of behaviour that we expect all employees to adhere to.Day-to-day responsibility for ensuring these principles are appliedthroughout Unilever rests with senior management across regions,categories, functions and operating companies. A network ofCode Officers and Committees support the responsibleoperational leaders with the activities necessary to communicatethe Code, deliver training, maintain processes and procedures toreport and respond to alleged breaches (including ‘hotlines’) andto capture and communicate learnings.
The implementation of and compliance with our Code andother critical areas of risk that Unilever faces, including legal andregulatory compliance, is facilitated through a business orientedpolicy network. Each policy defines mandatory standards that areapplied consistently across the organisation. These policies arebroad-ranging in their nature including such areas as employeehealth and safety, product safety and quality, the environment,ethical research, use of certain ingredients in our products, riskmanagement, accounting and reporting, share dealing andcorporate disclosure, pension fund management, treasurymanagement, taxation and transfer pricing.
Processes Unilever operates a wide range of processes and activities acrossall its operations covering strategy setting, planning, execution andperformance management. These are formalised and documentedas procedures at a global, regional or local level as appropriate.Increasingly, these procedures are being centralised globally andautomated into transactional and other information technologysystems.
Assurance and Re-AssuranceSenior management provides an annual Positive Assurance letteraddressed to the Chief Executive Officer confirming complianceof their business unit with the Code of Business Principles andapplicable policies. Exceptions, if any, together with remedialactions, form part of these written communications. Aconsolidated version is presented to the Disclosure Committeeand the Board for their review.
There are also specialist ongoing compliance programs thatsupplement the Positive Assurance exercise. Examples of theseinclude Health, Safety & Environment, Product Safety and Quality,Information Technology, Finance and Pensions Management.
The Corporate Audit function plays a key role in providing to bothoperating management and the Boards an objective view andreassurance of the effectiveness of the systems of internal controland risk management throughout Unilever.
Chairman, Board & Committees, CEO & Unilever Executive Committee
Corporate Purpose, Mission, Objectives and Code of Business Principles
Corporate Policies and Functional Standards
Governance of Unilever, Operating Framework, Roles & Responsibilities, Delegated Authorities
PerformanceManagementTarget Setting
BudgetsReportingAnalysis
Remuneration& incentives
StrategySetting
OperationalPlanning
BusinessExecution
Internal Assurance and Compliance Monitoring
Internal IndependentRe-assurance
(Corporate Audit)
External Assurance
Organisation Foundation & Principles Processes Assurance & Re-assurance
Outlook and risks (continued)
36 Unilever Annual Report and Accounts 2009
Report of the Directors About Unilever
Boards’ assessment of compliance with theRisk Management frameworksThe Boards, through Committees where appropriate, regularlyreview significant risk areas and decisions that could have amaterial impact on Unilever. These reviews consider the risks thatUnilever is prepared to accept or tolerate, and how to manage andcontrol those risks.
The Boards, through the Audit Committee, have reviewed theassessment of risks, internal controls and disclosure controls andprocedures that operate in the Group and have considered theeffectiveness and remedial actions where applicable for the yearcovered by this report and up to the date of its approval by theBoards of Directors. Details of the activities of the AuditCommittee in relation to this can be found in the Report of theAudit Committee on page 63.
Further statements on compliance with the specific riskmanagement and control requirements in the Dutch CorporateGovernance Code, the UK Combined Code and the US SecuritiesExchange (1934) & Sarbanes-Oxley (2002) Acts can be found onpages 60, 61 and 62 respectively.
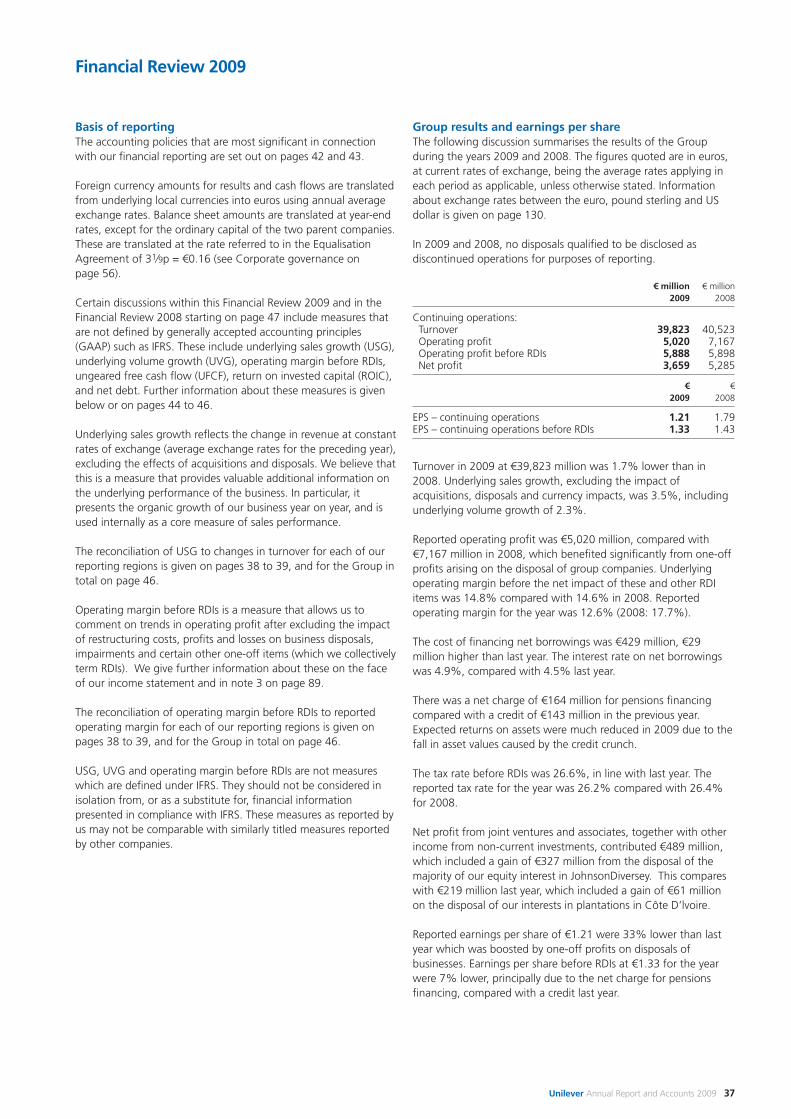
Unilever Annual Report and Accounts 2009 37
Basis of reportingThe accounting policies that are most significant in connectionwith our financial reporting are set out on pages 42 and 43.
Foreign currency amounts for results and cash flows are translatedfrom underlying local currencies into euros using annual averageexchange rates. Balance sheet amounts are translated at year-endrates, except for the ordinary capital of the two parent companies.These are translated at the rate referred to in the EqualisationAgreement of 31⁄9p = €0.16 (see Corporate governance onpage 56).
Certain discussions within this Financial Review 2009 and in theFinancial Review 2008 starting on page 47 include measures thatare not defined by generally accepted accounting principles(GAAP) such as IFRS. These include underlying sales growth (USG),underlying volume growth (UVG), operating margin before RDIs,ungeared free cash flow (UFCF), return on invested capital (ROIC),and net debt. Further information about these measures is givenbelow or on pages 44 to 46.
Underlying sales growth reflects the change in revenue at constantrates of exchange (average exchange rates for the preceding year),excluding the effects of acquisitions and disposals. We believe thatthis is a measure that provides valuable additional information onthe underlying performance of the business. In particular, itpresents the organic growth of our business year on year, and isused internally as a core measure of sales performance.
The reconciliation of USG to changes in turnover for each of ourreporting regions is given on pages 38 to 39, and for the Group intotal on page 46.
Operating margin before RDIs is a measure that allows us tocomment on trends in operating profit after excluding the impactof restructuring costs, profits and losses on business disposals,impairments and certain other one-off items (which we collectivelyterm RDIs). We give further information about these on the faceof our income statement and in note 3 on page 89.
The reconciliation of operating margin before RDIs to reportedoperating margin for each of our reporting regions is given onpages 38 to 39, and for the Group in total on page 46.
USG, UVG and operating margin before RDIs are not measureswhich are defined under IFRS. They should not be considered inisolation from, or as a substitute for, financial informationpresented in compliance with IFRS. These measures as reported byus may not be comparable with similarly titled measures reportedby other companies.
Group results and earnings per shareThe following discussion summarises the results of the Groupduring the years 2009 and 2008. The figures quoted are in euros,at current rates of exchange, being the average rates applying ineach period as applicable, unless otherwise stated. Informationabout exchange rates between the euro, pound sterling and USdollar is given on page 130.
In 2009 and 2008, no disposals qualified to be disclosed asdiscontinued operations for purposes of reporting.
€ million € million2009 2008
Continuing operations:Turnover 39,823 40,523Operating profit 5,020 7,167Operating profit before RDIs 5,888 5,898Net profit 3,659 5,285
€ €2009 2008
EPS – continuing operations 1.21 1.79EPS – continuing operations before RDIs 1.33 1.43
Turnover in 2009 at €39,823 million was 1.7% lower than in2008. Underlying sales growth, excluding the impact ofacquisitions, disposals and currency impacts, was 3.5%, includingunderlying volume growth of 2.3%.
Reported operating profit was €5,020 million, compared with€7,167 million in 2008, which benefited significantly from one-offprofits arising on the disposal of group companies. Underlyingoperating margin before the net impact of these and other RDIitems was 14.8% compared with 14.6% in 2008. Reportedoperating margin for the year was 12.6% (2008: 17.7%).
The cost of financing net borrowings was €429 million, €29million higher than last year. The interest rate on net borrowingswas 4.9%, compared with 4.5% last year.
There was a net charge of €164 million for pensions financingcompared with a credit of €143 million in the previous year.Expected returns on assets were much reduced in 2009 due to thefall in asset values caused by the credit crunch.
The tax rate before RDIs was 26.6%, in line with last year. Thereported tax rate for the year was 26.2% compared with 26.4%for 2008.
Net profit from joint ventures and associates, together with otherincome from non-current investments, contributed €489 million,which included a gain of €327 million from the disposal of themajority of our equity interest in JohnsonDiversey. This compareswith €219 million last year, which included a gain of €61 millionon the disposal of our interests in plantations in Côte D’lvoire.
Reported earnings per share of €1.21 were 33% lower than lastyear which was boosted by one-off profits on disposals ofbusinesses. Earnings per share before RDIs at €1.33 for the yearwere 7% lower, principally due to the net charge for pensionsfinancing, compared with a credit last year.
Financial Review 2009
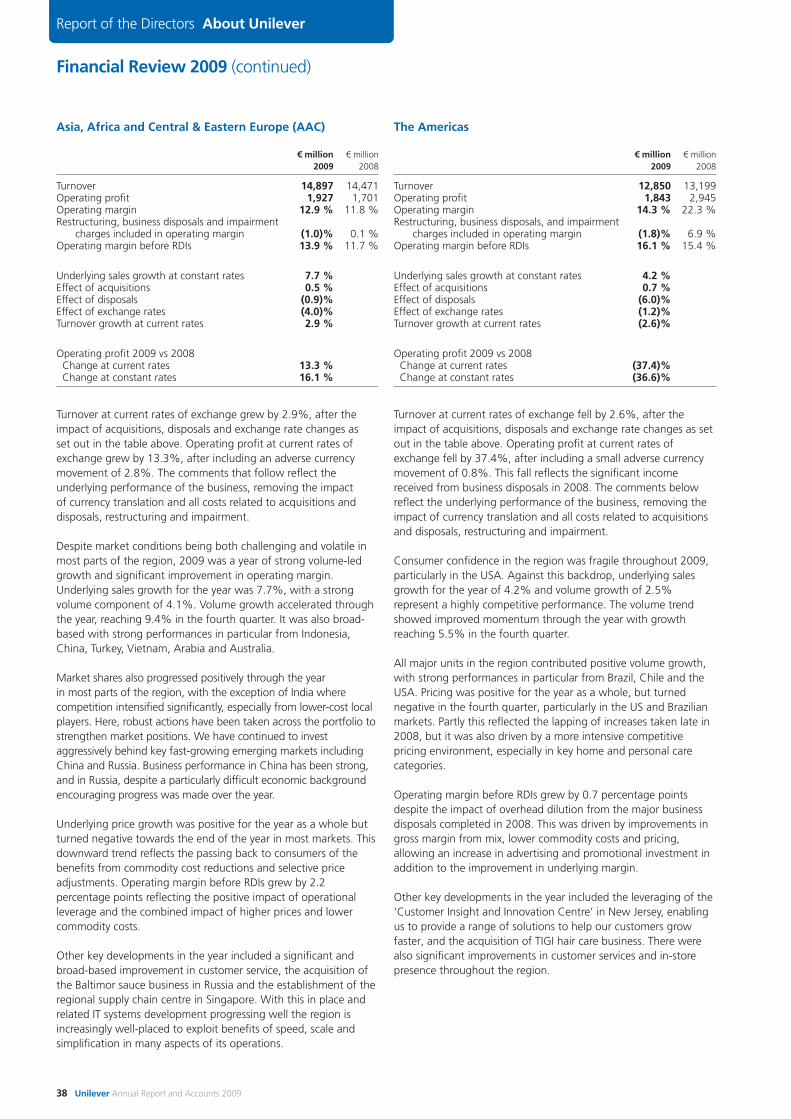
Financial Review 2009 (continued)
38 Unilever Annual Report and Accounts 2009
Report of the Directors About Unilever
Asia, Africa and Central & Eastern Europe (AAC)
€ million € million2009 2008
Turnover 14,897 14,471Operating profit 1,927 1,701Operating margin 12.9 % 11.8 %Restructuring, business disposals and impairment
charges included in operating margin (1.0)% 0.1 %Operating margin before RDIs 13.9 % 11.7 %
Underlying sales growth at constant rates 7.7 %Effect of acquisitions 0.5 %Effect of disposals (0.9)%Effect of exchange rates (4.0)%Turnover growth at current rates 2.9 %
Operating profit 2009 vs 2008Change at current rates 13.3 %Change at constant rates 16.1 %
Turnover at current rates of exchange grew by 2.9%, after theimpact of acquisitions, disposals and exchange rate changes as set out in the table above. Operating profit at current rates ofexchange grew by 13.3%, after including an adverse currencymovement of 2.8%. The comments that follow reflect theunderlying performance of the business, removing the impact of currency translation and all costs related to acquisitions anddisposals, restructuring and impairment.
Despite market conditions being both challenging and volatile inmost parts of the region, 2009 was a year of strong volume-ledgrowth and significant improvement in operating margin.Underlying sales growth for the year was 7.7%, with a strongvolume component of 4.1%. Volume growth accelerated throughthe year, reaching 9.4% in the fourth quarter. It was also broad-based with strong performances in particular from Indonesia,China, Turkey, Vietnam, Arabia and Australia.
Market shares also progressed positively through the year in most parts of the region, with the exception of India wherecompetition intensified significantly, especially from lower-cost localplayers. Here, robust actions have been taken across the portfolio tostrengthen market positions. We have continued to investaggressively behind key fast-growing emerging markets includingChina and Russia. Business performance in China has been strong,and in Russia, despite a particularly difficult economic backgroundencouraging progress was made over the year.
Underlying price growth was positive for the year as a whole butturned negative towards the end of the year in most markets. Thisdownward trend reflects the passing back to consumers of thebenefits from commodity cost reductions and selective priceadjustments. Operating margin before RDIs grew by 2.2percentage points reflecting the positive impact of operationalleverage and the combined impact of higher prices and lowercommodity costs.
Other key developments in the year included a significant andbroad-based improvement in customer service, the acquisition ofthe Baltimor sauce business in Russia and the establishment of theregional supply chain centre in Singapore. With this in place andrelated IT systems development progressing well the region isincreasingly well-placed to exploit benefits of speed, scale andsimplification in many aspects of its operations.
The Americas
€ million € million2009 2008
Turnover 12,850 13,199Operating profit 1,843 2,945Operating margin 14.3 % 22.3 %Restructuring, business disposals, and impairment
charges included in operating margin (1.8)% 6.9 %Operating margin before RDIs 16.1 % 15.4 %
Underlying sales growth at constant rates 4.2 %Effect of acquisitions 0.7 %Effect of disposals (6.0)%Effect of exchange rates (1.2)%Turnover growth at current rates (2.6)%
Operating profit 2009 vs 2008Change at current rates (37.4)%Change at constant rates (36.6)%
Turnover at current rates of exchange fell by 2.6%, after theimpact of acquisitions, disposals and exchange rate changes as setout in the table above. Operating profit at current rates ofexchange fell by 37.4%, after including a small adverse currencymovement of 0.8%. This fall reflects the significant incomereceived from business disposals in 2008. The comments belowreflect the underlying performance of the business, removing theimpact of currency translation and all costs related to acquisitionsand disposals, restructuring and impairment.
Consumer confidence in the region was fragile throughout 2009,particularly in the USA. Against this backdrop, underlying salesgrowth for the year of 4.2% and volume growth of 2.5%represent a highly competitive performance. The volume trendshowed improved momentum through the year with growthreaching 5.5% in the fourth quarter.
All major units in the region contributed positive volume growth,with strong performances in particular from Brazil, Chile and theUSA. Pricing was positive for the year as a whole, but turnednegative in the fourth quarter, particularly in the US and Brazilianmarkets. Partly this reflected the lapping of increases taken late in2008, but it was also driven by a more intensive competitivepricing environment, especially in key home and personal carecategories.
Operating margin before RDIs grew by 0.7 percentage pointsdespite the impact of overhead dilution from the major businessdisposals completed in 2008. This was driven by improvements ingross margin from mix, lower commodity costs and pricing,allowing an increase in advertising and promotional investment inaddition to the improvement in underlying margin.
Other key developments in the year included the leveraging of the‘Customer Insight and Innovation Centre’ in New Jersey, enablingus to provide a range of solutions to help our customers growfaster, and the acquisition of TIGI hair care business. There werealso significant improvements in customer services and in-storepresence throughout the region.
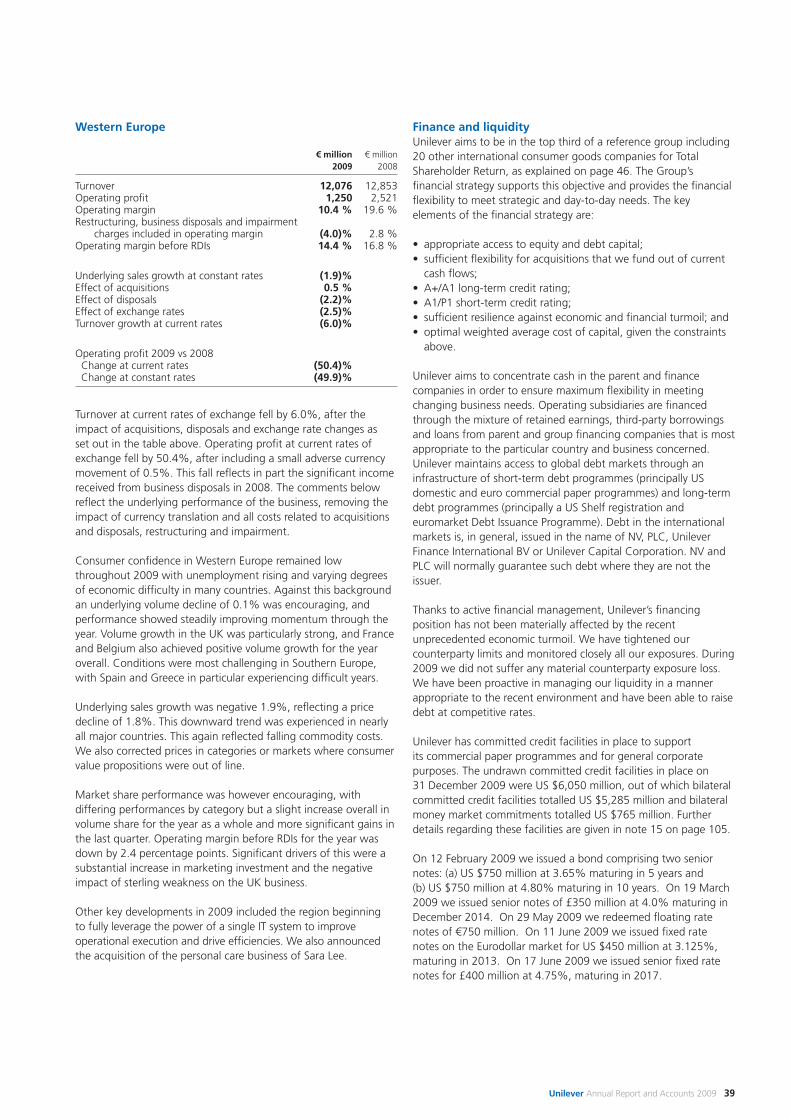
Unilever Annual Report and Accounts 2009 39
Western Europe
€ million € million2009 2008
Turnover 12,076 12,853Operating profit 1,250 2,521Operating margin 10.4 % 19.6 %Restructuring, business disposals and impairment
charges included in operating margin (4.0)% 2.8 %Operating margin before RDIs 14.4 % 16.8 %
Underlying sales growth at constant rates (1.9)%Effect of acquisitions 0.5 %Effect of disposals (2.2)%Effect of exchange rates (2.5)%Turnover growth at current rates (6.0)%
Operating profit 2009 vs 2008Change at current rates (50.4)%Change at constant rates (49.9)%
Turnover at current rates of exchange fell by 6.0%, after theimpact of acquisitions, disposals and exchange rate changes as set out in the table above. Operating profit at current rates ofexchange fell by 50.4%, after including a small adverse currencymovement of 0.5%. This fall reflects in part the significant incomereceived from business disposals in 2008. The comments belowreflect the underlying performance of the business, removing theimpact of currency translation and all costs related to acquisitionsand disposals, restructuring and impairment.
Consumer confidence in Western Europe remained lowthroughout 2009 with unemployment rising and varying degreesof economic difficulty in many countries. Against this backgroundan underlying volume decline of 0.1% was encouraging, andperformance showed steadily improving momentum through theyear. Volume growth in the UK was particularly strong, and Franceand Belgium also achieved positive volume growth for the yearoverall. Conditions were most challenging in Southern Europe,with Spain and Greece in particular experiencing difficult years.
Underlying sales growth was negative 1.9%, reflecting a pricedecline of 1.8%. This downward trend was experienced in nearlyall major countries. This again reflected falling commodity costs.We also corrected prices in categories or markets where consumervalue propositions were out of line.
Market share performance was however encouraging, withdiffering performances by category but a slight increase overall involume share for the year as a whole and more significant gains inthe last quarter. Operating margin before RDIs for the year wasdown by 2.4 percentage points. Significant drivers of this were asubstantial increase in marketing investment and the negativeimpact of sterling weakness on the UK business.
Other key developments in 2009 included the region beginning to fully leverage the power of a single IT system to improveoperational execution and drive efficiencies. We also announcedthe acquisition of the personal care business of Sara Lee.
Finance and liquidityUnilever aims to be in the top third of a reference group including20 other international consumer goods companies for TotalShareholder Return, as explained on page 46. The Group’sfinancial strategy supports this objective and provides the financialflexibility to meet strategic and day-to-day needs. The keyelements of the financial strategy are:
• appropriate access to equity and debt capital;• sufficient flexibility for acquisitions that we fund out of current
cash flows;• A+/A1 long-term credit rating;• A1/P1 short-term credit rating;• sufficient resilience against economic and financial turmoil; and• optimal weighted average cost of capital, given the constraints
above.
Unilever aims to concentrate cash in the parent and financecompanies in order to ensure maximum flexibility in meetingchanging business needs. Operating subsidiaries are financedthrough the mixture of retained earnings, third-party borrowingsand loans from parent and group financing companies that is mostappropriate to the particular country and business concerned.Unilever maintains access to global debt markets through aninfrastructure of short-term debt programmes (principally USdomestic and euro commercial paper programmes) and long-termdebt programmes (principally a US Shelf registration andeuromarket Debt Issuance Programme). Debt in the internationalmarkets is, in general, issued in the name of NV, PLC, UnileverFinance International BV or Unilever Capital Corporation. NV andPLC will normally guarantee such debt where they are not theissuer.
Thanks to active financial management, Unilever’s financingposition has not been materially affected by the recentunprecedented economic turmoil. We have tightened ourcounterparty limits and monitored closely all our exposures. During2009 we did not suffer any material counterparty exposure loss.We have been proactive in managing our liquidity in a mannerappropriate to the recent environment and have been able to raisedebt at competitive rates.
Unilever has committed credit facilities in place to support its commercial paper programmes and for general corporatepurposes. The undrawn committed credit facilities in place on31 December 2009 were US $6,050 million, out of which bilateralcommitted credit facilities totalled US $5,285 million and bilateralmoney market commitments totalled US $765 million. Furtherdetails regarding these facilities are given in note 15 on page 105.
On 12 February 2009 we issued a bond comprising two seniornotes: (a) US $750 million at 3.65% maturing in 5 years and (b) US $750 million at 4.80% maturing in 10 years. On 19 March2009 we issued senior notes of £350 million at 4.0% maturing inDecember 2014. On 29 May 2009 we redeemed floating ratenotes of €750 million. On 11 June 2009 we issued fixed ratenotes on the Eurodollar market for US $450 million at 3.125%,maturing in 2013. On 17 June 2009 we issued senior fixed ratenotes for £400 million at 4.75%, maturing in 2017.
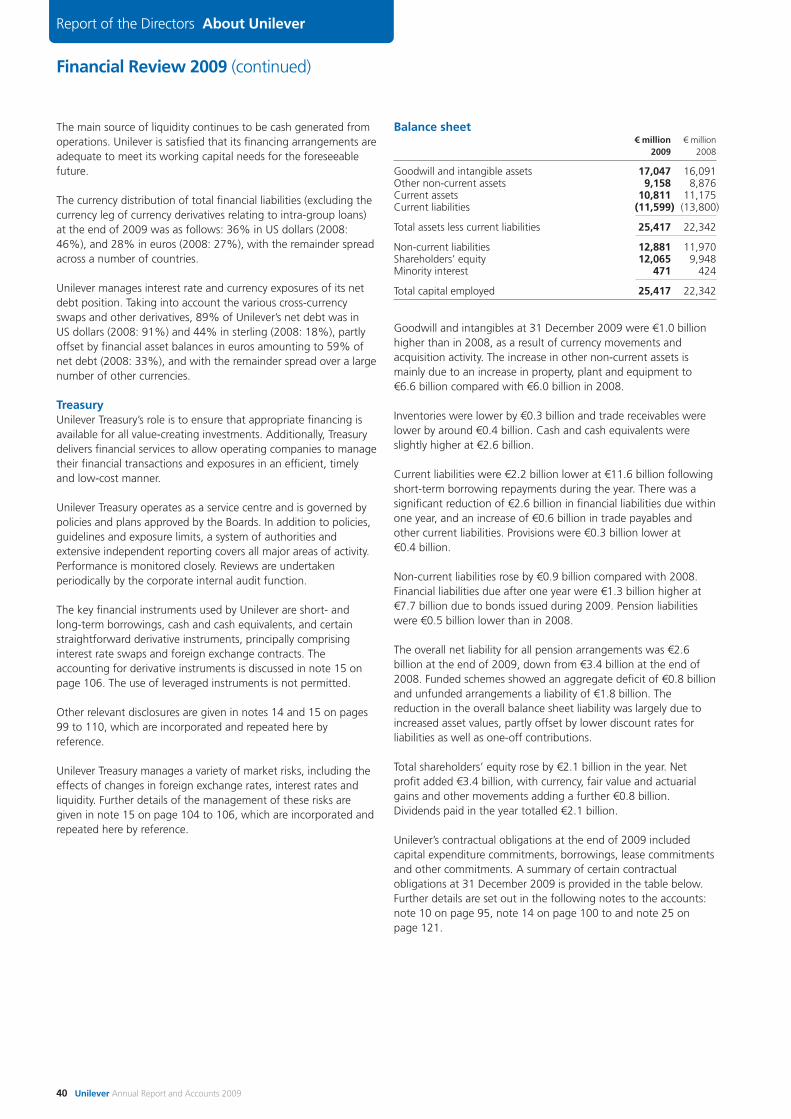
Financial Review 2009 (continued)
40 Unilever Annual Report and Accounts 2009
Report of the Directors About Unilever
The main source of liquidity continues to be cash generated fromoperations. Unilever is satisfied that its financing arrangements areadequate to meet its working capital needs for the foreseeablefuture.
The currency distribution of total financial liabilities (excluding thecurrency leg of currency derivatives relating to intra-group loans)at the end of 2009 was as follows: 36% in US dollars (2008:46%), and 28% in euros (2008: 27%), with the remainder spreadacross a number of countries.
Unilever manages interest rate and currency exposures of its netdebt position. Taking into account the various cross-currencyswaps and other derivatives, 89% of Unilever’s net debt was in US dollars (2008: 91%) and 44% in sterling (2008: 18%), partlyoffset by financial asset balances in euros amounting to 59% ofnet debt (2008: 33%), and with the remainder spread over a largenumber of other currencies.
TreasuryUnilever Treasury’s role is to ensure that appropriate financing isavailable for all value-creating investments. Additionally, Treasurydelivers financial services to allow operating companies to managetheir financial transactions and exposures in an efficient, timelyand low-cost manner.
Unilever Treasury operates as a service centre and is governed bypolicies and plans approved by the Boards. In addition to policies,guidelines and exposure limits, a system of authorities andextensive independent reporting covers all major areas of activity.Performance is monitored closely. Reviews are undertakenperiodically by the corporate internal audit function.
The key financial instruments used by Unilever are short- and long-term borrowings, cash and cash equivalents, and certainstraightforward derivative instruments, principally comprisinginterest rate swaps and foreign exchange contracts. Theaccounting for derivative instruments is discussed in note 15 onpage 106. The use of leveraged instruments is not permitted.
Other relevant disclosures are given in notes 14 and 15 on pages99 to 110, which are incorporated and repeated here byreference.
Unilever Treasury manages a variety of market risks, including theeffects of changes in foreign exchange rates, interest rates andliquidity. Further details of the management of these risks aregiven in note 15 on page 104 to 106, which are incorporated andrepeated here by reference.
Balance sheet€ million € million
2009 2008
Goodwill and intangible assets 17,047 16,091Other non-current assets 9,158 8,876Current assets 10,811 11,175Current liabilities (11,599) (13,800)
Total assets less current liabilities 25,417 22,342
Non-current liabilities 12,881 11,970Shareholders’ equity 12,065 9,948Minority interest 471 424
Total capital employed 25,417 22,342
Goodwill and intangibles at 31 December 2009 were €1.0 billionhigher than in 2008, as a result of currency movements andacquisition activity. The increase in other non-current assets ismainly due to an increase in property, plant and equipment to€6.6 billion compared with €6.0 billion in 2008.
Inventories were lower by €0.3 billion and trade receivables werelower by around €0.4 billion. Cash and cash equivalents wereslightly higher at €2.6 billion.
Current liabilities were €2.2 billion lower at €11.6 billion followingshort-term borrowing repayments during the year. There was asignificant reduction of €2.6 billion in financial liabilities due withinone year, and an increase of €0.6 billion in trade payables andother current liabilities. Provisions were €0.3 billion lower at €0.4 billion.
Non-current liabilities rose by €0.9 billion compared with 2008.Financial liabilities due after one year were €1.3 billion higher at€7.7 billion due to bonds issued during 2009. Pension liabilitieswere €0.5 billion lower than in 2008.
The overall net liability for all pension arrangements was €2.6billion at the end of 2009, down from €3.4 billion at the end of2008. Funded schemes showed an aggregate deficit of €0.8 billionand unfunded arrangements a liability of €1.8 billion. Thereduction in the overall balance sheet liability was largely due toincreased asset values, partly offset by lower discount rates forliabilities as well as one-off contributions.
Total shareholders’ equity rose by €2.1 billion in the year. Net profit added €3.4 billion, with currency, fair value and actuarialgains and other movements adding a further €0.8 billion.Dividends paid in the year totalled €2.1 billion.
Unilever’s contractual obligations at the end of 2009 includedcapital expenditure commitments, borrowings, lease commitmentsand other commitments. A summary of certain contractualobligations at 31 December 2009 is provided in the table below.Further details are set out in the following notes to the accounts:note 10 on page 95, note 14 on page 100 to and note 25 onpage 121.
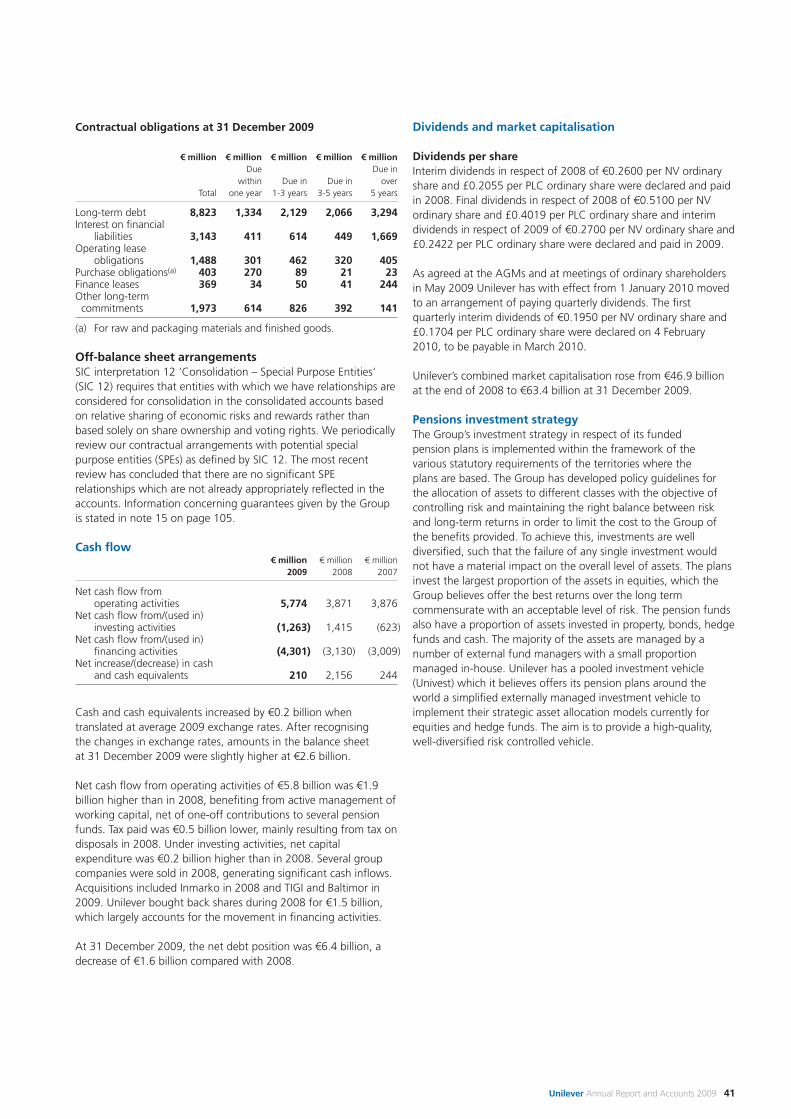
Unilever Annual Report and Accounts 2009 41
Contractual obligations at 31 December 2009
€ million € million € million € million € millionDue Due in
within Due in Due in overTotal one year 1-3 years 3-5 years 5 years
Long-term debt 8,823 1,334 2,129 2,066 3,294Interest on financial
liabilities 3,143 411 614 449 1,669Operating lease
obligations 1,488 301 462 320 405Purchase obligations(a) 403 270 89 21 23Finance leases 369 34 50 41 244Other long-termcommitments 1,973 614 826 392 141
(a) For raw and packaging materials and finished goods.
Off-balance sheet arrangementsSIC interpretation 12 ‘Consolidation – Special Purpose Entities’ (SIC 12) requires that entities with which we have relationships areconsidered for consolidation in the consolidated accounts basedon relative sharing of economic risks and rewards rather thanbased solely on share ownership and voting rights. We periodicallyreview our contractual arrangements with potential specialpurpose entities (SPEs) as defined by SIC 12. The most recentreview has concluded that there are no significant SPErelationships which are not already appropriately reflected in theaccounts. Information concerning guarantees given by the Groupis stated in note 15 on page 105.
Cash flow€ million € million € million
2009 2008 2007
Net cash flow from operating activities 5,774 3,871 3,876
Net cash flow from/(used in) investing activities (1,263) 1,415 (623)
Net cash flow from/(used in) financing activities (4,301) (3,130) (3,009)
Net increase/(decrease) in cashand cash equivalents 210 2,156 244
Cash and cash equivalents increased by €0.2 billion whentranslated at average 2009 exchange rates. After recognising the changes in exchange rates, amounts in the balance sheet at 31 December 2009 were slightly higher at €2.6 billion.
Net cash flow from operating activities of €5.8 billion was €1.9billion higher than in 2008, benefiting from active management ofworking capital, net of one-off contributions to several pensionfunds. Tax paid was €0.5 billion lower, mainly resulting from tax ondisposals in 2008. Under investing activities, net capitalexpenditure was €0.2 billion higher than in 2008. Several groupcompanies were sold in 2008, generating significant cash inflows.Acquisitions included Inmarko in 2008 and TIGI and Baltimor in2009. Unilever bought back shares during 2008 for €1.5 billion,which largely accounts for the movement in financing activities.
At 31 December 2009, the net debt position was €6.4 billion, adecrease of €1.6 billion compared with 2008.
Dividends and market capitalisation
Dividends per shareInterim dividends in respect of 2008 of €0.2600 per NV ordinaryshare and £0.2055 per PLC ordinary share were declared and paidin 2008. Final dividends in respect of 2008 of €0.5100 per NVordinary share and £0.4019 per PLC ordinary share and interimdividends in respect of 2009 of €0.2700 per NV ordinary share and£0.2422 per PLC ordinary share were declared and paid in 2009.
As agreed at the AGMs and at meetings of ordinary shareholdersin May 2009 Unilever has with effect from 1 January 2010 movedto an arrangement of paying quarterly dividends. The firstquarterly interim dividends of €0.1950 per NV ordinary share and£0.1704 per PLC ordinary share were declared on 4 February2010, to be payable in March 2010.
Unilever’s combined market capitalisation rose from €46.9 billionat the end of 2008 to €63.4 billion at 31 December 2009.
Pensions investment strategyThe Group’s investment strategy in respect of its funded pension plans is implemented within the framework of the various statutory requirements of the territories where the plans are based. The Group has developed policy guidelines forthe allocation of assets to different classes with the objective ofcontrolling risk and maintaining the right balance between riskand long-term returns in order to limit the cost to the Group ofthe benefits provided. To achieve this, investments are welldiversified, such that the failure of any single investment wouldnot have a material impact on the overall level of assets. The plansinvest the largest proportion of the assets in equities, which theGroup believes offer the best returns over the long termcommensurate with an acceptable level of risk. The pension fundsalso have a proportion of assets invested in property, bonds, hedgefunds and cash. The majority of the assets are managed by anumber of external fund managers with a small proportionmanaged in-house. Unilever has a pooled investment vehicle(Univest) which it believes offers its pension plans around theworld a simplified externally managed investment vehicle toimplement their strategic asset allocation models currently forequities and hedge funds. The aim is to provide a high-quality, well-diversified risk controlled vehicle.
Financial Review 2009 (continued)
42 Unilever Annual Report and Accounts 2009
Report of the Directors About Unilever
Acquisitions and disposals
2009On 2 April 2009 we announced the completion of our purchase of the global TIGI professional hair product business and itssupporting advanced education academies. TIGI’s major brandsinclude Bed Head, Catwalk and S-Factor. Turnover of the businessworldwide in 2008 was around US $250 million. The cashconsideration of US $411.5 million was made on a cash and debt-free basis. In addition, further limited payments related to futuregrowth may be made contingent upon meeting certain thresholds.
On 23 June 2009 we announced that we had increased ourholding in our business in Vietnam to 100%, following anagreement with Vinachem who previously owned 33.3% of the business.
On 3 July 2009 we completed the acquisition of Baltimor HoldingZAO’s sauces business in Russia. The acquisition includes ketchup,mayonnaise and tomato paste business under the Baltimor, Pomod’Oro and Vostochniy Gourmand brands – accounting for turnoverof around €70 million in 2008 – and a production facility atKolpino, near St Petersburg.
On 3 September 2009 we announced the sale of our oil palmplantation business in the Democratic Republic of Congo toFeronia Inc, for an undisclosed sum.
On 25 September 2009 we announced a binding offer to acquirethe personal care business of the Sara Lee Corporation for €1.275billion in cash. The Sara Lee brands involved, including Sanex,Radox and Duschdas, generated annual sales in excess of €750million in the year ending June 2009. The transaction is subject toregulatory approval and consultation with European WorksCouncils, and is expected to be completed by the third quarter of 2010.
On 24 November 2009 we completed the sale of our interest in JohnsonDiversey. The cash consideration received was US $390 million, which included both the originally announcedcash consideration of US $158 million plus the proceeds of thesale of the 10.5% senior notes in JohnsonDiversey Holdings, Inc.We retain a 4% interest in JohnsonDiversey in the form ofwarrants. See also note 11 on page 97.
2008With effect from 1 January 2008, we entered into an expandedinternational partnership with PepsiCo for the marketing anddistribution of ready-to-drink tea products under the Lipton brand.
On 3 January 2008 we completed the sale of the Boursin brand toLe Groupe Bel for €400 million. The turnover of this brand in 2007was approximately €100 million.
On 2 April 2008 we completed the acquisition of Inmarko, the leading Russian ice cream company. The company had aturnover in 2007 of approximately €115 million.
On 31 July 2008 we completed the sale of our Lawry’s andAdolph’s branded seasoning blends and marinades business in the US and Canada to McCormick & Company, Incorporated for€410 million. The combined annual turnover of the business in2007 was approximately €100 million.
On 9 September 2008 we completed the sale of our NorthAmerican laundry business in the US, Canada and Puerto Rico to Vestar Capital Partners, a leading global private equity firm, forconsideration of approximately US $1.45 billion, consisting mainlyof cash along with preferred shares and warrants. Thesebusinesses had a combined turnover in 2007 of approximately US $1.0 billion.
On 5 November 2008 we completed the sale of Komili, our oliveoil brand in Turkey, to Ana Gida, part of the Anadolu Group.
On 4 December 2008 we completed the sale of our edible oilbusiness in Côte d’Ivoire, together with interests in local oil palmplantations Palmci and PHCI, to SIFCA, the parent company of anIvorian agro-industry group, and to a 50:50 joint venture betweentwo Singapore-based companies, Wilmar International Limited andOlam International Limited. At the same time we acquired thesoap business of Cosmivoire, a subsidiary of SIFCA.
On 23 December 2008 we completed the disposal of our Bertolliolive oil and vinegar business to Grupo SOS for a consideration of€630 million. The transaction was structured as a worldwideperpetual licence by Unilever of the Bertolli brand in respect ofolive oil and premium vinegar. The transaction included the sale ofthe Italian Maya, Dante and San Giorgio olive oil and seed oilbusinesses, as well as the factory at Inveruno, Italy.
Significant events after the balance sheet dateAs agreed at the AGMs and at meetings of ordinary shareholdersin May 2009 Unilever has with effect from 1 January 2010 movedto an arrangement of paying quarterly dividends. The firstquarterly interim dividends of €0.1950 per NV ordinary share and£0.1704 per PLC ordinary share were declared on 4 February2010.
Critical accounting policiesThe accounts presented comply in all material respects with IFRS asadopted by the EU and with UK and Dutch law. They are also inaccordance with IFRS as issued by the International AccountingStandards Board. To prepare these accounts, we are required tomake estimates and assumptions, using judgement based onavailable information, including historical experience. We believethese estimates and assumptions are reasonable and we re-evaluate them on an ongoing basis. However, actual amountsand results could differ. Critical accounting policies are thosewhich are most important to the portrayal of Unilever’s financialposition and results of operations. Some of these policies requiredifficult, subjective or complex judgements from management.The most important are set out below.
Unilever Annual Report and Accounts 2009 43
Goodwill and intangible assets Impairment reviews in respect of goodwill and indefinite-livedintangible assets are performed at least annually. More regularreviews, and impairment reviews in respect of other assets, areperformed if events indicate that this is necessary. Impairmentreviews are performed by comparing the carrying value of theasset concerned to that asset’s recoverable amount (being thehigher of value in use and fair value less costs to sell). Value in use is a valuation derived from discounted future cash flows. Themost important assumptions when preparing these forecast cashflows are long-term growth rates and discount rates. These arechallenged at least annually and, although these are believed to beappropriate, changes in these assumptions could change theoutcomes of the impairment reviews.
The most significant balances of goodwill and intangible assetsrelate to the regional savoury and dressings sub-product groups. We have reviewed the carrying value of these cash generatingunits by considering expected future cash flows based on historicalexperience and planned growth rates and margins for the productgroups.
Please refer also to note 9 on page 93.
Financial instrumentsFinancial instruments are classified according to the purpose forwhich the instruments were acquired. This gives rise to thefollowing classes: held-to-maturity investments, loans andreceivables, financial assets at fair value through profit or loss, and available-for-sale financial assets. Please refer to note 1 onpage 84 for a description of each of these categories.
Derivative financial instruments are reported at fair value, withchanges in fair values booked through profit or loss unless thederivatives are designated and effective as hedges of future cashflows, in which case the changes are recognised directly in equity.At the time the hedged cash flow results in the recognition of anasset or a liability, the associated gains or losses on the derivativethat had previously been recognised in equity are included in theinitial measurement of the asset or liability. For hedged items thatdo not result in the recognition of an asset or liability, amountsdeferred in equity are recognised in the income statement in thesame period in which the hedged item affects net profit or loss.
Changes in fair value of net investment hedges in relation toforeign subsidiaries are recognised directly in equity.
Pensions and similar obligationsThe defined benefit plan surplus or deficit in the balance sheetcomprises the total for each plan of the fair value of plan assetsless the present value of the defined benefit obligation (using adiscount rate based on high-quality corporate bonds).
Pension accounting requires certain assumptions to be made inorder to value our obligations and to determine the charges to be made to the income statement. These figures are particularlysensitive to assumptions for discount rates, inflation rates,mortality rates and expected long-term rates of return on assets.Information about sensitivity to certain of these assumptions isgiven in note 19 on page 113 and 114.
The following table sets out these assumptions (except formortality rates), as at 31 December 2009, in respect of the fourlargest Unilever pension plans. Further details of assumptions(including mortality rates) made are given in note 19 on pages 114 and 115.
% % % %Nether- United
UK lands States Germany
Discount rate 5.7 5.1 5.6 5.1Inflation 3.1 1.9 2.4 1.9Expected long-term rate of return:Equities 8.0 7.7 7.8 7.7Bonds 4.9 4.6 5.0 4.6Property 6.5 6.2 6.3 6.2Others 6.7 5.3 2.0 5.5
These assumptions are set by reference to market conditions at thevaluation date. Actual experience may differ from the assumptionsmade. The effects of such differences are recognised through thestatement of comprehensive income.
Demographic assumptions, such as mortality rates, are set havingregard to the latest trends in life expectancy, plan experience andother relevant data. The assumptions are reviewed and updated asnecessary as part of the periodic actuarial valuation of the pensionplans. Mortality assumptions for the four largest plans are given inmore detail in note 19 on page 115.
ProvisionsProvision is made, amongst other reasons, for legal matters,disputed indirect taxes, employee termination costs andrestructuring where a legal or constructive obligation exists at thebalance sheet date and a reliable estimate can be made of thelikely outcome. See also note 18 on page 112.
TaxationFull provision is made for deferred and current taxation at the ratesof tax prevailing at the year end unless future rates have beensubstantively enacted, as detailed in note 17 on page 111.Deferred tax assets are regularly reviewed for recoverability, and avaluation allowance is established to the extent that recoverabilityis not considered likely.
Financial Review 2009 (continued)
44 Unilever Annual Report and Accounts 2009
Report of the Directors About Unilever
Non-GAAP measuresCertain discussions and analyses set out in this Annual Report and Accounts include measures which are not defined by generallyaccepted accounting principles (GAAP) such as IFRS. We believethis information, along with comparable GAAP measurements, isuseful to investors because it provides a basis for measuring ouroperating performance, ability to retire debt and invest in newbusiness opportunities. Our management uses these financialmeasures, along with the most directly comparable GAAP financialmeasures, in evaluating our operating performance and valuecreation. Non-GAAP financial measures should not be consideredin isolation from, or as a substitute for, financial informationpresented in compliance with GAAP. Non-GAAP financialmeasures as reported by us may not be comparable with similarlytitled amounts reported by other companies.
In the following sections we set out our definitions of thefollowing non-GAAP measures and provide reconciliations torelevant GAAP measures:
• Ungeared free cash flow;• Return on invested capital;• Underlying sales growth;• Underlying volume growth;• Operating margin before RDIs; and• Net debt.
At the end of this section we summarise the impact on TotalShareholder Return (TSR) which is a further key metric.
Measures of long-term value creationUnilever’s ambition for the creation of value for shareholders ismeasured by Total Shareholder Return over a rolling three-yearperiod compared with a peer group of 20 other internationalconsumer goods companies.
We communicate the contribution of the business to this objectivethrough the following measures:
• The delivery, over time, of Ungeared Free Cash Flow (UFCF),which expresses the translation of profit into cash, and thuslonger-term economic value; and
• The development, over time, of Return on Invested Capital(ROIC), which expresses the returns generated on capitalinvested in the Group.
We communicate progress against these measures annually, andmanagement remuneration is aligned with these objectives. TheUFCF over a three-year period is incorporated as a performanceelement of Unilever’s management incentive scheme.
UFCF and ROIC are non-GAAP measures. We comment on thesein detail here since they are the way in which we communicateour ambition and monitor progress towards our longer-term valuecreation goals and in order to:
• improve transparency for investors;• assist investors in their assessment of the long-term value
of Unilever;• ensure that the measures are fully understood in the light of
how Unilever reviews long-term value creation for shareholders;• properly define the metrics used and confirm their calculation;• share the metrics with all investors at the same time; and• disclose UFCF as it is one of the drivers of management
remuneration and therefore management behaviour.
As investor measures, we believe that there are no GAAPmeasures directly comparable with UFCF and ROIC. However, in the tables on page 45 we reconcile each as follows: UFCF tocash flow from operating activities and also to net profit; ROIC tonet profit.
CautionUnilever cautions that, while UFCF and ROIC are widely used astools for investment analysis, they are not defined terms underIFRS or other GAAP and therefore their definitions should becarefully reviewed and understood by investors. Investors shouldbe aware that their application may vary in practice and thereforethese measures may not be fully comparable between companies.In particular:
• We recognise that the usefulness of UFCF and ROIC asindicators of investment value is limited, as such measures are based on historical information;
• UFCF and ROIC measures are not intended to be a substitutefor, or superior to, GAAP measures in the financial statements;
• The fact that ROIC is a ratio inherently limits its use, andmanagement uses ROIC only for the purposes discussed above.The relevance and use of net profit for the year (being the most relevant comparable GAAP measure) is clearly morepervasive; and
• UFCF is not the residual cash available to pay dividends butrepresents cash generated by the business and broadly availableto the providers of finance, both debt and equity.
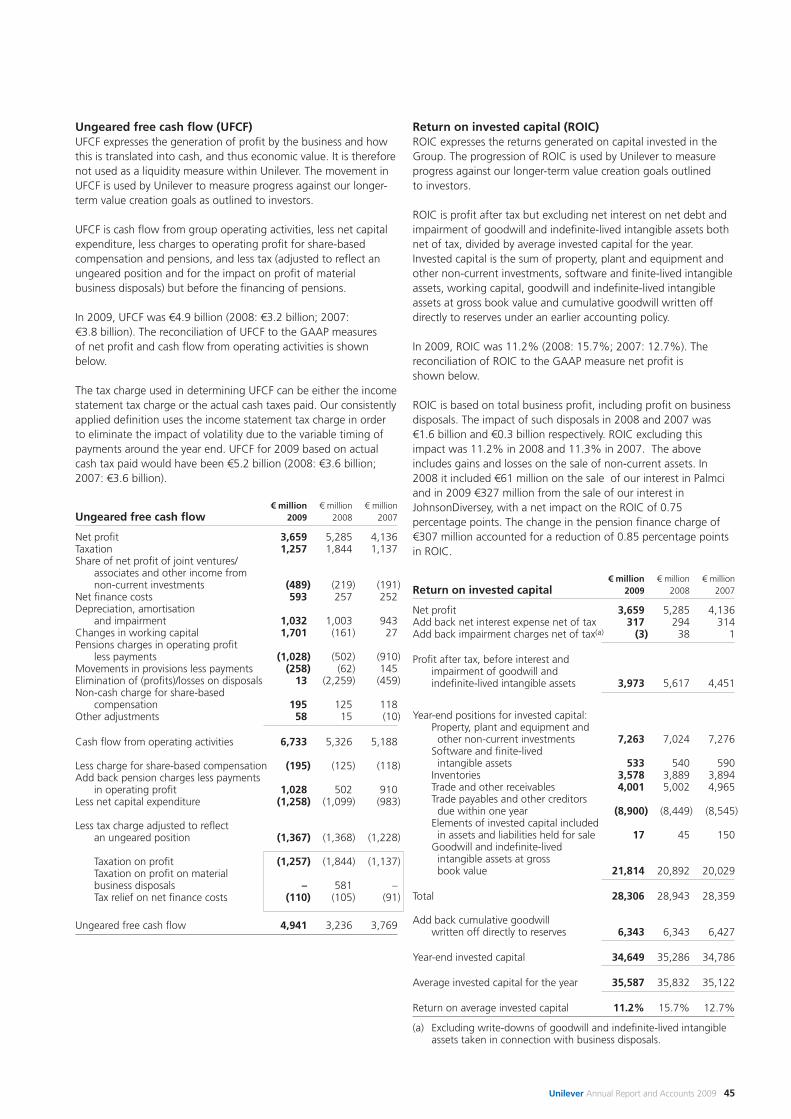
Return on invested capital (ROIC)ROIC expresses the returns generated on capital invested in theGroup. The progression of ROIC is used by Unilever to measureprogress against our longer-term value creation goals outlined to investors.
ROIC is profit after tax but excluding net interest on net debt andimpairment of goodwill and indefinite-lived intangible assets bothnet of tax, divided by average invested capital for the year.Invested capital is the sum of property, plant and equipment andother non-current investments, software and finite-lived intangibleassets, working capital, goodwill and indefinite-lived intangibleassets at gross book value and cumulative goodwill written offdirectly to reserves under an earlier accounting policy.
In 2009, ROIC was 11.2% (2008: 15.7%; 2007: 12.7%). Thereconciliation of ROIC to the GAAP measure net profit is shown below.
ROIC is based on total business profit, including profit on businessdisposals. The impact of such disposals in 2008 and 2007 was€1.6 billion and €0.3 billion respectively. ROIC excluding thisimpact was 11.2% in 2008 and 11.3% in 2007. The aboveincludes gains and losses on the sale of non-current assets. In2008 it included €61 million on the sale of our interest in Palmciand in 2009 €327 million from the sale of our interest inJohnsonDiversey, with a net impact on the ROIC of 0.75percentage points. The change in the pension finance charge of€307 million accounted for a reduction of 0.85 percentage pointsin ROIC.
€ million € million € millionReturn on invested capital 2009 2008 2007
Net profit 3,659 5,285 4,136Add back net interest expense net of tax 317 294 314Add back impairment charges net of tax(a) (3) 38 1
Profit after tax, before interest and impairment of goodwill and indefinite-lived intangible assets 3,973 5,617 4,451
Year-end positions for invested capital:Property, plant and equipment and other non-current investments 7,263 7,024 7,276
Software and finite-lived intangible assets 533 540 590
Inventories 3,578 3,889 3,894Trade and other receivables 4,001 5,002 4,965Trade payables and other creditors due within one year (8,900) (8,449) (8,545)
Elements of invested capital included in assets and liabilities held for sale 17 45 150
Goodwill and indefinite-lived intangible assets at gross book value 21,814 20,892 20,029
Total 28,306 28,943 28,359
Add back cumulative goodwill written off directly to reserves 6,343 6,343 6,427
Year-end invested capital 34,649 35,286 34,786
Average invested capital for the year 35,587 35,832 35,122
Return on average invested capital 11.2% 15.7% 12.7%
(a) Excluding write-downs of goodwill and indefinite-lived intangibleassets taken in connection with business disposals.
Unilever Annual Report and Accounts 2009 45
Ungeared free cash flow (UFCF)UFCF expresses the generation of profit by the business and howthis is translated into cash, and thus economic value. It is thereforenot used as a liquidity measure within Unilever. The movement inUFCF is used by Unilever to measure progress against our longer-term value creation goals as outlined to investors.
UFCF is cash flow from group operating activities, less net capitalexpenditure, less charges to operating profit for share-basedcompensation and pensions, and less tax (adjusted to reflect anungeared position and for the impact on profit of materialbusiness disposals) but before the financing of pensions.
In 2009, UFCF was €4.9 billion (2008: €3.2 billion; 2007: €3.8 billion). The reconciliation of UFCF to the GAAP measures of net profit and cash flow from operating activities is shownbelow.
The tax charge used in determining UFCF can be either the incomestatement tax charge or the actual cash taxes paid. Our consistentlyapplied definition uses the income statement tax charge in orderto eliminate the impact of volatility due to the variable timing ofpayments around the year end. UFCF for 2009 based on actualcash tax paid would have been €5.2 billion (2008: €3.6 billion;2007: €3.6 billion).
€ million € million € millionUngeared free cash flow 2009 2008 2007
Net profit 3,659 5,285 4,136Taxation 1,257 1,844 1,137Share of net profit of joint ventures/
associates and other income from non-current investments (489) (219) (191)
Net finance costs 593 257 252Depreciation, amortisation
and impairment 1,032 1,003 943Changes in working capital 1,701 (161) 27Pensions charges in operating profit
less payments (1,028) (502) (910)Movements in provisions less payments (258) (62) 145Elimination of (profits)/losses on disposals 13 (2,259) (459)Non-cash charge for share-based
compensation 195 125 118Other adjustments 58 15 (10)
Cash flow from operating activities 6,733 5,326 5,188
Less charge for share-based compensation (195) (125) (118)Add back pension charges less payments
in operating profit 1,028 502 910Less net capital expenditure (1,258) (1,099) (983)
Less tax charge adjusted to reflect an ungeared position (1,367) (1,368) (1,228)
Taxation on profit (1,257) (1,844) (1,137)Taxation on profit on material business disposals – 581 –Tax relief on net finance costs (110) (105) (91)
Ungeared free cash flow 4,941 3,236 3,769
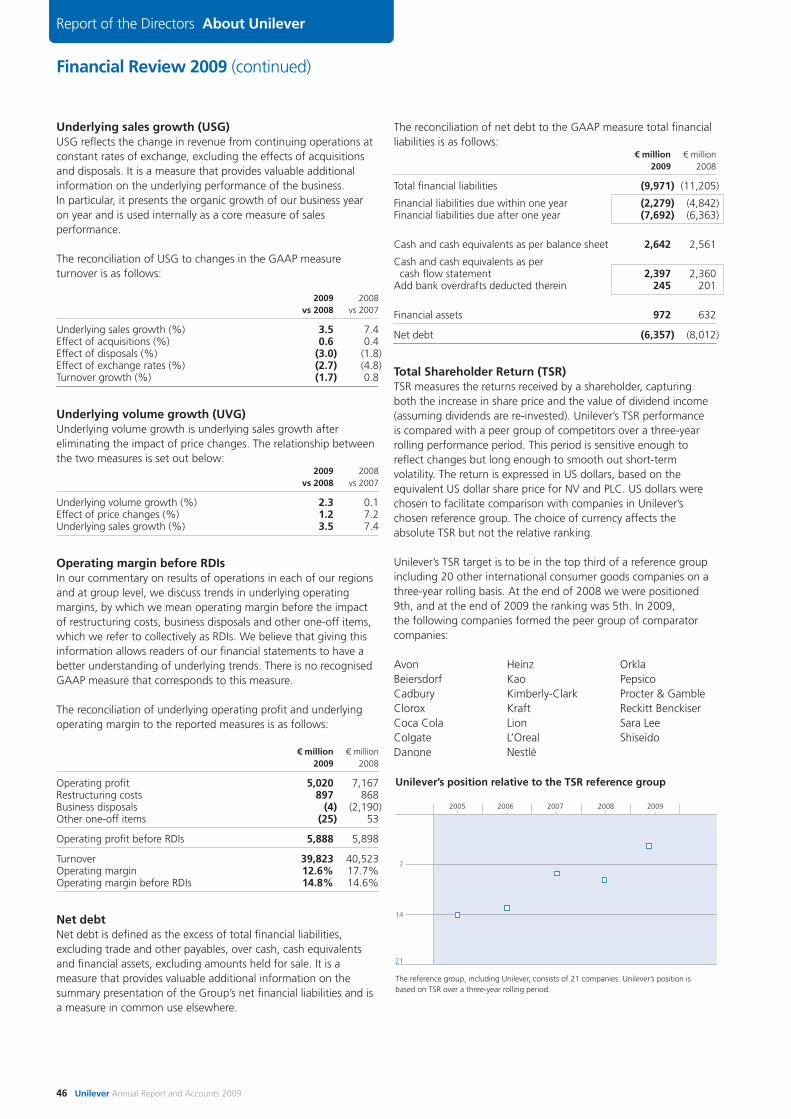
Financial Review 2009 (continued)
46 Unilever Annual Report and Accounts 2009
Report of the Directors About Unilever
Underlying sales growth (USG)USG reflects the change in revenue from continuing operations atconstant rates of exchange, excluding the effects of acquisitionsand disposals. It is a measure that provides valuable additionalinformation on the underlying performance of the business. In particular, it presents the organic growth of our business yearon year and is used internally as a core measure of salesperformance.
The reconciliation of USG to changes in the GAAP measureturnover is as follows:
2009 2008vs 2008 vs 2007
Underlying sales growth (%) 3.5 7.4Effect of acquisitions (%) 0.6 0.4Effect of disposals (%) (3.0) (1.8)Effect of exchange rates (%) (2.7) (4.8)Turnover growth (%) (1.7) 0.8
Underlying volume growth (UVG)Underlying volume growth is underlying sales growth aftereliminating the impact of price changes. The relationship betweenthe two measures is set out below:
2009 2008vs 2008 vs 2007
Underlying volume growth (%) 2.3 0.1Effect of price changes (%) 1.2 7.2Underlying sales growth (%) 3.5 7.4
Operating margin before RDIs In our commentary on results of operations in each of our regionsand at group level, we discuss trends in underlying operatingmargins, by which we mean operating margin before the impactof restructuring costs, business disposals and other one-off items,which we refer to collectively as RDIs. We believe that giving thisinformation allows readers of our financial statements to have abetter understanding of underlying trends. There is no recognisedGAAP measure that corresponds to this measure.
The reconciliation of underlying operating profit and underlyingoperating margin to the reported measures is as follows:
€ million € million2009 2008
Operating profit 5,020 7,167Restructuring costs 897 868Business disposals (4) (2,190)Other one-off items (25) 53
Operating profit before RDIs 5,888 5,898
Turnover 39,823 40,523Operating margin 12.6% 17.7%Operating margin before RDIs 14.8% 14.6%
Net debtNet debt is defined as the excess of total financial liabilities,excluding trade and other payables, over cash, cash equivalentsand financial assets, excluding amounts held for sale. It is ameasure that provides valuable additional information on thesummary presentation of the Group’s net financial liabilities and isa measure in common use elsewhere.
The reconciliation of net debt to the GAAP measure total financialliabilities is as follows:
€ million € million2009 2008
Total financial liabilities (9,971) (11,205)
Financial liabilities due within one year (2,279) (4,842)Financial liabilities due after one year (7,692) (6,363)
Cash and cash equivalents as per balance sheet 2,642 2,561
Cash and cash equivalents as per cash flow statement 2,397 2,360
Add bank overdrafts deducted therein 245 201
Financial assets 972 632
Net debt (6,357) (8,012)
Total Shareholder Return (TSR)TSR measures the returns received by a shareholder, capturingboth the increase in share price and the value of dividend income(assuming dividends are re-invested). Unilever’s TSR performance is compared with a peer group of competitors over a three-yearrolling performance period. This period is sensitive enough toreflect changes but long enough to smooth out short-termvolatility. The return is expressed in US dollars, based on theequivalent US dollar share price for NV and PLC. US dollars werechosen to facilitate comparison with companies in Unilever’schosen reference group. The choice of currency affects theabsolute TSR but not the relative ranking.
Unilever’s TSR target is to be in the top third of a reference groupincluding 20 other international consumer goods companies on athree-year rolling basis. At the end of 2008 we were positioned9th, and at the end of 2009 the ranking was 5th. In 2009, the following companies formed the peer group of comparatorcompanies:
Avon Heinz OrklaBeiersdorf Kao PepsicoCadbury Kimberly-Clark Procter & GambleClorox Kraft Reckitt BenckiserCoca Cola Lion Sara LeeColgate L’Oreal ShiseidoDanone Nestlé
200920082005 2006 2007
7
14
21
Unilever’s position relative to the TSR reference group
The reference group, including Unilever, consists of 21 companies. Unilever’s position isbased on TSR over a three-year rolling period.
Group results and earnings per shareThe following discussion summarises the results of the Groupduring the years 2008 and 2007. The figures quoted are in euros,at current rates of exchange, being the average or year-end ratesof each period as applicable, unless otherwise stated. Informationabout exchange rates between the euro, pound sterling andUS dollar is given on page 130.
In 2008 and 2007, no disposals qualified to be disclosed asdiscontinued operations for purposes of reporting. During 2006,we successfully completed the sale of the majority of ourEuropean frozen foods businesses. There was some impact on2007 as a result of the outcome of agreements made inconnection with the sale.
€ million € million2008 2007
Continuing operations:Turnover 40,523 40,187Operating profit 7,167 5,245Operating profit before RDIs 5,898 5,814Net profit 5,285 4,056
Net profit from discontinued operations – 80Net profit – total 5,285 4,136
€ €2008 2007
EPS – continuing operations 1.79 1.32EPS – total operations 1.79 1.35EPS – total operations before RDIs 1.43 1.42
Underlying sales growth of 7.4% was broad-based acrosscategories and in line with our markets overall. Growth wasprimarily driven by increased prices, with volumes essentially flat.Underlying sales growth was offset by movements of (4.8)% inexchange rates and a net impact of (1.4)% from disposals andacquisitions. Including these effects, turnover was €40,523 millionfor the full year, increasing by 0.8%.
During the year we continued to progress our One Unilevertransformation agenda, contributing to an underlyingimprovement in operating margin. We integrated multiplecountries into single multi-country operations in many of our keymarkets. We further shaped our portfolio through a number ofdisposals, including our North American laundry business, Boursin,Lawry’s and the Bertolli olive oil business, as well as through theacquisition of Inmarko, the market leader in ice cream in Russia.We also made further progress in the simplification of our supplychain network in Europe with the establishment of a regionalEuropean supply chain company in Switzerland, and we initiated a move to a similar regional structure for Asia based in Singapore.
Operating profit increased by €1,922 million to €7,167 million,including a higher level of profits on business disposals. Thesegenerated a pre-tax profit of €2,190 million in 2008, comparedwith €297 million in 2007. Before the impact of RDIs(restructuring, disposals, impairments and other one-off items),operating profit grew by 1% at current exchange rates, or 6% atconstant exchange rates, and there was an underlyingimprovement in operating margin of 0.1 percentage points.
Financial Review 2008
Unilever Annual Report and Accounts 2009 47
Costs of financing net borrowings were 1% lower than in theprevious year. The average interest rate was lower at 4.5%,offsetting the impact of a higher average level of net debt.
Share of net profit from joint ventures and associates and otherincome from non-current investments contributed €219 million.This included a gain of €61 million in non-current investmentsresulting from the disposal of our interests in plantations inCôte d’Ivoire.
The effective tax rate was 26.4% and the underlying tax ratebefore RDIs was 26.6% for the full year. This compared with anunderlying rate of 24.5% in 2007, which included substantialbenefits from the favourable settlement of prior year tax audits.
Net profit was 28% higher than in 2007, boosted by the profitson disposals. Earnings per share were €1.79, including a net gainof €0.36 from RDIs. This compared with €1.35 in the prior year,which included a net loss of €0.07 from RDIs.
Return on invested capital was 15.7%, boosted by profits onbusiness disposals. Excluding profits on disposals, ROIC was11.2%, broadly in line with 2007 on a comparable basis.
Asia, Africa and Central & Eastern Europe (AAC)
€ million € million2008 2007
Turnover 14,471 13,418Operating profit 1,701 1,711Operating margin 11.8 % 12.8 %Restructuring, business disposals and impairment
charges included in operating margin 0.1 % 0.9 %Operating margin before RDIs 11.7 % 11.9 %
Underlying sales growth at constant rates 14.2 %Effect of acquisitions 1.1 %Effect of disposals (0.4)%Effect of exchange rates (6.2)%Turnover growth at current rates 7.8 %
Operating profit 2008 vs 2007Change at current rates (0.6)%Change at constant rates 8.3 %
Turnover at current rates of exchange rose by 7.8%, after theimpact of acquisitions, disposals and exchange rate changes asset out in the table above. Operating profit at current rates ofexchange fell by 0.6%, after including an adverse currencymovement of 8.9%. The underlying performance of the businessafter eliminating these exchange translation effects and the impactof acquisitions and disposals is discussed below at constantexchange rates.
Underlying sales growth of 14.2% in 2008 was broad-basedacross countries and categories. Our top five Developing andEmerging market countries in the region grew by around 20%,from a combination of increased prices and higher volumes.Towards the end of the year underlying sales growth remainedstrong but volumes were flat with some countries seeing signs of a slow-down in consumption and a reduction in inventories byretailers.
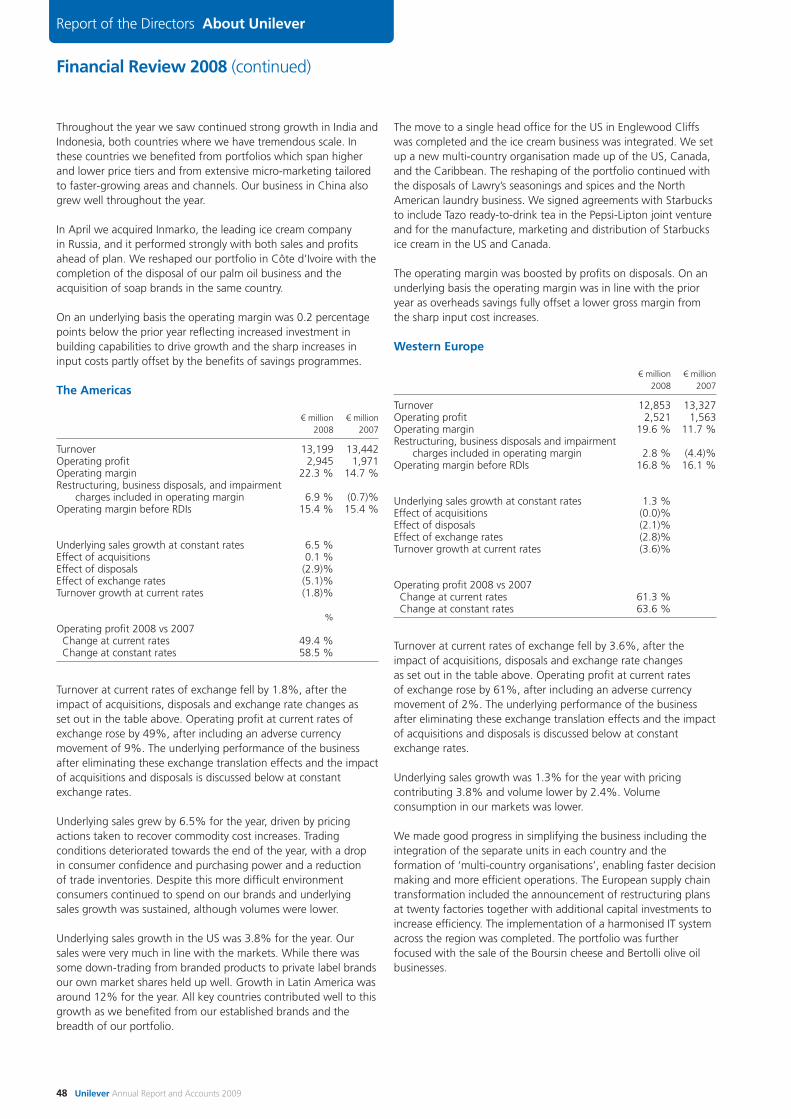
Financial Review 2008 (continued)
48 Unilever Annual Report and Accounts 2009
Report of the Directors About Unilever
Throughout the year we saw continued strong growth in India andIndonesia, both countries where we have tremendous scale. Inthese countries we benefited from portfolios which span higherand lower price tiers and from extensive micro-marketing tailoredto faster-growing areas and channels. Our business in China alsogrew well throughout the year.
In April we acquired Inmarko, the leading ice cream company in Russia, and it performed strongly with both sales and profitsahead of plan. We reshaped our portfolio in Côte d’Ivoire with thecompletion of the disposal of our palm oil business and theacquisition of soap brands in the same country.
On an underlying basis the operating margin was 0.2 percentagepoints below the prior year reflecting increased investment inbuilding capabilities to drive growth and the sharp increases ininput costs partly offset by the benefits of savings programmes.
The Americas
€ million € million2008 2007
Turnover 13,199 13,442Operating profit 2,945 1,971Operating margin 22.3 % 14.7 %Restructuring, business disposals, and impairment
charges included in operating margin 6.9 % (0.7)%Operating margin before RDIs 15.4 % 15.4 %
Underlying sales growth at constant rates 6.5 %Effect of acquisitions 0.1 %Effect of disposals (2.9)%Effect of exchange rates (5.1)%Turnover growth at current rates (1.8)%
%Operating profit 2008 vs 2007
Change at current rates 49.4 %Change at constant rates 58.5 %
Turnover at current rates of exchange fell by 1.8%, after theimpact of acquisitions, disposals and exchange rate changes as set out in the table above. Operating profit at current rates ofexchange rose by 49%, after including an adverse currencymovement of 9%. The underlying performance of the businessafter eliminating these exchange translation effects and the impactof acquisitions and disposals is discussed below at constantexchange rates.
Underlying sales grew by 6.5% for the year, driven by pricingactions taken to recover commodity cost increases. Tradingconditions deteriorated towards the end of the year, with a drop in consumer confidence and purchasing power and a reductionof trade inventories. Despite this more difficult environmentconsumers continued to spend on our brands and underlying sales growth was sustained, although volumes were lower.
Underlying sales growth in the US was 3.8% for the year. Oursales were very much in line with the markets. While there wassome down-trading from branded products to private label brandsour own market shares held up well. Growth in Latin America wasaround 12% for the year. All key countries contributed well to thisgrowth as we benefited from our established brands and thebreadth of our portfolio.
The move to a single head office for the US in Englewood Cliffswas completed and the ice cream business was integrated. We setup a new multi-country organisation made up of the US, Canada,and the Caribbean. The reshaping of the portfolio continued withthe disposals of Lawry’s seasonings and spices and the NorthAmerican laundry business. We signed agreements with Starbucksto include Tazo ready-to-drink tea in the Pepsi-Lipton joint ventureand for the manufacture, marketing and distribution of Starbucksice cream in the US and Canada.
The operating margin was boosted by profits on disposals. On anunderlying basis the operating margin was in line with the prioryear as overheads savings fully offset a lower gross margin fromthe sharp input cost increases.
Western Europe
€ million € million2008 2007
Turnover 12,853 13,327Operating profit 2,521 1,563Operating margin 19.6 % 11.7 %Restructuring, business disposals and impairment
charges included in operating margin 2.8 % (4.4)%Operating margin before RDIs 16.8 % 16.1 %
Underlying sales growth at constant rates 1.3 %Effect of acquisitions (0.0)%Effect of disposals (2.1)%Effect of exchange rates (2.8)%Turnover growth at current rates (3.6)%
Operating profit 2008 vs 2007Change at current rates 61.3 %Change at constant rates 63.6 %
Turnover at current rates of exchange fell by 3.6%, after theimpact of acquisitions, disposals and exchange rate changes as set out in the table above. Operating profit at current rates of exchange rose by 61%, after including an adverse currencymovement of 2%. The underlying performance of the businessafter eliminating these exchange translation effects and the impactof acquisitions and disposals is discussed below at constantexchange rates.
Underlying sales growth was 1.3% for the year with pricingcontributing 3.8% and volume lower by 2.4%. Volumeconsumption in our markets was lower.
We made good progress in simplifying the business including theintegration of the separate units in each country and theformation of ‘multi-country organisations’, enabling faster decisionmaking and more efficient operations. The European supply chaintransformation included the announcement of restructuring plansat twenty factories together with additional capital investments toincrease efficiency. The implementation of a harmonised IT systemacross the region was completed. The portfolio was furtherfocused with the sale of the Boursin cheese and Bertolli olive oilbusinesses.
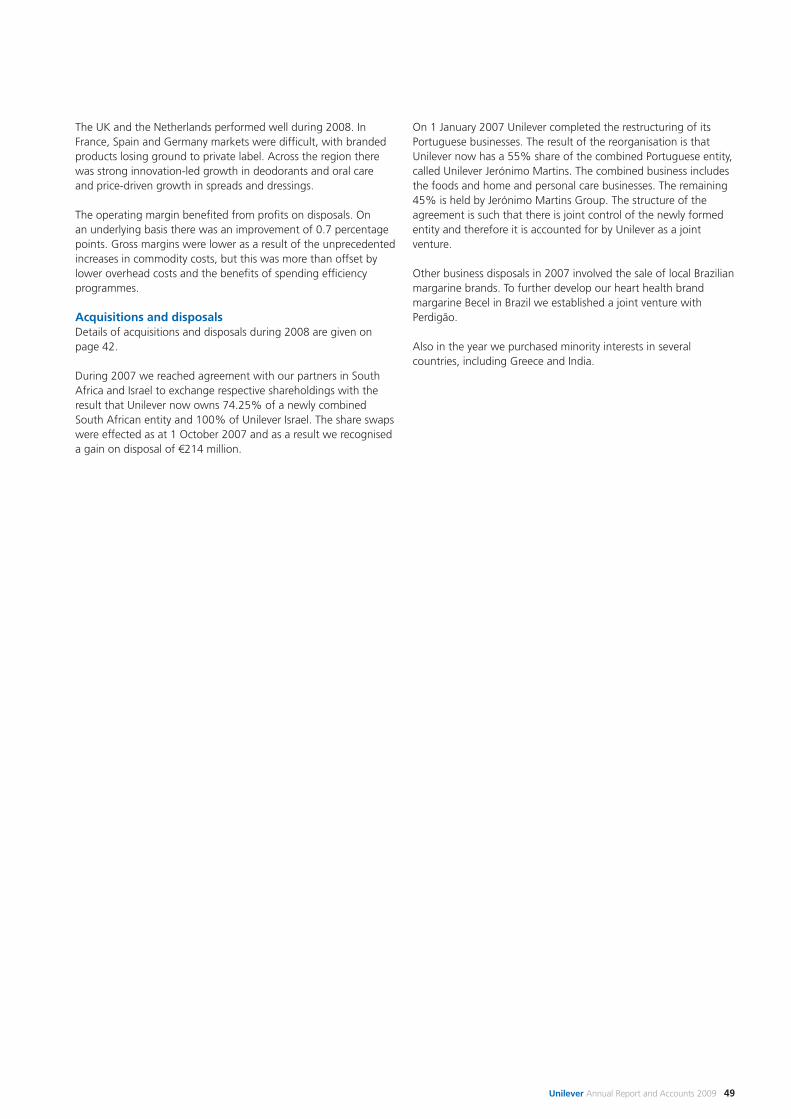
Unilever Annual Report and Accounts 2009 49
The UK and the Netherlands performed well during 2008. InFrance, Spain and Germany markets were difficult, with brandedproducts losing ground to private label. Across the region therewas strong innovation-led growth in deodorants and oral careand price-driven growth in spreads and dressings.
The operating margin benefited from profits on disposals. On an underlying basis there was an improvement of 0.7 percentagepoints. Gross margins were lower as a result of the unprecedentedincreases in commodity costs, but this was more than offset bylower overhead costs and the benefits of spending efficiencyprogrammes.
Acquisitions and disposalsDetails of acquisitions and disposals during 2008 are given onpage 42.
During 2007 we reached agreement with our partners in SouthAfrica and Israel to exchange respective shareholdings with theresult that Unilever now owns 74.25% of a newly combinedSouth African entity and 100% of Unilever Israel. The share swapswere effected as at 1 October 2007 and as a result we recogniseda gain on disposal of €214 million.
On 1 January 2007 Unilever completed the restructuring of itsPortuguese businesses. The result of the reorganisation is thatUnilever now has a 55% share of the combined Portuguese entity,called Unilever Jerónimo Martins. The combined business includesthe foods and home and personal care businesses. The remaining45% is held by Jerónimo Martins Group. The structure of theagreement is such that there is joint control of the newly formedentity and therefore it is accounted for by Unilever as a jointventure.
Other business disposals in 2007 involved the sale of local Brazilianmargarine brands. To further develop our heart health brandmargarine Becel in Brazil we established a joint venture withPerdigão.
Also in the year we purchased minority interests in severalcountries, including Greece and India.
Corporate governance
50 Unilever Annual Report and Accounts 2009
Report of the Directors Governance
Introduction
Unilever is subject to various corporate governance requirementsand best practice codes, the most relevant being those in theNetherlands, the United Kingdom and the United States. It isUnilever’s practice to comply, where practicable, with the highestlevel of these codes and respond to developments appropriately.The text that follows describes the corporate governancearrangements operating within Unilever.
The Unilever GroupUnilever N.V. and Unilever PLC are the two parent companies ofthe Unilever Group, and together with their respective groupcompanies, NV and PLC operate effectively as a single economicentity. This is achieved by a series of agreements between NV andPLC (the Foundation Agreements, see page 56), together withspecial provisions in the Articles of Association of NV and PLC.NV and PLC have the same Directors, adopt the same accountingprinciples, and pay dividends to their respective shareholders on anequalised basis. NV and PLC and their group companies constitutea single reporting entity for the purposes of presentingconsolidated accounts. Accordingly, the accounts of the UnileverGroup are presented by both NV and PLC as their respectiveconsolidated accounts.
NV and PLC have agreed to co-operate in all areas and to ensurethat all group companies act accordingly. NV and PLC are holdingand service companies, and the business activity of Unilever iscarried out by their subsidiaries around the world. Shares in groupcompanies may ultimately be held wholly by either NV or PLC orby the two companies in varying proportions.
NV was incorporated under the name Naamlooze VennootschapMargarine Unie in the Netherlands in 1927, and PLC wasincorporated under the name Lever Brothers Limited in Englandand Wales in 1894. The two companies have different shareholderconstituencies and shareholders can hold shares in either or bothcompanies but cannot convert or exchange the shares of onecompany for shares of the other. NV is listed in Amsterdam andNew York, and PLC is listed in London and New York.
Unilever PLC’s and Unilever N.V.’s respective Articles of Associationcontain, among other things, the objects clause, which sets outthe scope of activities that PLC and NV are authorised toundertake. PLC’s and NV’s Articles of Association are drafted togive a wide scope and provide that the primary objectives are: tocarry on business as a holding company, to manage anycompanies in which it has an interest and to operate and carryinto effect the Equalisation Agreement. It is proposed that at the2010 AGM the objects clause be removed from PLC’s Articles ofAssociation so that there are no restrictions on its objects.
Our risk management approach and associated systems of internalcontrol are described on page 35.
The Boards The Boards of NV and PLC comprise the same Directors and havethe same Chairman. This guarantees unity of governance andmanagement by ensuring that all matters are considered by theBoards as a single intellect, reaching the same conclusions on thesame set of facts, save where specific local factors apply.
The Boards are one-tier boards, comprising Executive Directors and,in a majority, Non-Executive Directors. The Boards have ultimateresponsibility for the management, general affairs, direction andperformance of our business as a whole. The responsibility of theDirectors is collective, taking into account their respective roles asExecutive Directors and Non-Executive Directors, with the ExecutiveDirectors having additional responsibilities for the operation of thebusiness as determined by the Boards and the Chief ExecutiveOfficer.
Our Directors have set out a number of areas of responsibility whichare reserved to the Boards and other areas for which matters aredelegated to the Chief Executive Officer. The Boards have alsoestablished committees whose actions are regularly reported to andmonitored by the Boards, and these are described on pages 53 and54. Further details of how our Boards effectively operate as oneboard, govern themselves and delegate their authorities, are set outin the document entitled ‘The Governance of Unilever’, which can befound at www.unilever.com/investorrelations/corp_governance
Appointment of Directors Directors are normally appointed by shareholders at the AGMs. All existing Directors, unless they are retiring, submit themselves for re-election every year, and shareholders can remove any of themby a simple majority vote. A list of our current Directors and theperiods during which they have served as such is set out on pages22 and 23.
In order to seek to ensure that NV and PLC have the same Directors,the Articles of Association of NV and PLC contain provisions whichare designed to ensure that both NV and PLC shareholders arepresented with the same candidates for election as Directors. This isachieved through a nomination procedure operated by the Boards ofNV and PLC through Unilever’s Nomination Committee.
Based on the evaluation of the Boards, its Committees and itsindividual members, the Nomination Committee recommends to theBoards a list of candidates for nomination at the AGMs of both NVand PLC. In addition, shareholders are able to nominate Directors,and to do so they must put a resolution to both meetings in linewith local requirements. However, in order to ensure that the Boardsremain identical, anyone being elected as a Director of NV must alsobe elected as a Director of PLC and vice versa. Therefore, if anindividual fails to be elected to both companies then he or she willbe unable to take their place on the Boards.
The provisions in the Articles of Association for appointing Directorscannot be changed without the permission, in the case of NV, of theholders of the special ordinary shares numbered 1-2,400 inclusiveand, in the case of PLC, of the holders of PLC's deferred stock. TheNV special ordinary shares may only be transferred to one or moreother holders of such shares. The joint holders of both the NV specialordinary shares and the PLC deferred stock are N.V. Elma and UnitedHoldings Limited, which are joint subsidiaries of NV and PLC. TheBoards of N.V. Elma and United Holdings Limited comprise themembers of the Nomination Committee, which comprisesNon-Executive Directors of Unilever only.
Board meetings Our Boards meet at least seven times a year to consider importantcorporate events and actions, such as:
Unilever Annual Report and Accounts 2009 51
• approval of corporate strategy;• approval of the corporate Annual Plan;• oversight of the performance of the business;• review of risks and controls;• authorisation of major transactions;• preparation of the Annual Report and Accounts;• declaration of dividends;• agreement of quarterly results announcements;• convening of shareholders’ meetings;• nominations for Board appointments;• approval of Board remuneration policy; and• review of the functioning of the Boards and their Committees.
The following table shows the attendance of Directors at Boardmeetings for the year ended 31 December 2009. If Directors areunable to attend a meeting, they have the opportunity before themeeting to discuss with the Chairman any agenda items or Boardpapers:
Name Attendance
Michael Treschow 8 of 8Paul Polman* 8 of 8James Lawrence* 8 of 8Leon Brittan 7 of 8Wim Dik 8 of 8Louise Fresco (from 14 May 2009) 5 of 5Ann Fudge (from 14 May 2009) 5 of 5Charles Golden 7 of 8Byron Grote 7 of 8Narayana Murthy 8 of 8Hixonia Nyasulu 7 of 8David Simon (to 14 May 2009) 3 of 3Kees Storm 8 of 8Jeroen van der Veer 7 of 8Paul Walsh (from 14 May 2009) 5 of 5
Attendance is expressed as number of meetings attended out ofnumber eligible to attend.*Executive Director
Board meetings are normally held either in London or Rotterdam,with one or two off-site Board meetings a year. The Chairman isassisted by the Group Secretary, who ensures that the Boards aresupplied with all the information necessary for their deliberations.The Chairman and the Group Secretary involve the SeniorIndependent Director (see page 52) in the arrangements for Board meetings.
Board induction and training Upon election, Directors receive a comprehensive Directors’Information Pack and are briefed thoroughly on theirresponsibilities and the business. Ongoing training is provided forDirectors by way of site visits, presentations, circulated updates,teach-ins at Board or Board committee meetings on, among otherthings, Unilever’s business, environmental, social and corporategovernance, regulatory developments and investor relationsmatters. In 2009, a Board meeting was held at the offices ofUnilever in China which included customer visits to local retailoutlets.
Board evaluation The evaluation process of our Boards consists of an internalexercise performed annually with an independent third-partyevaluation carried out when the Boards consider appropriate. Thelast time an independent third-party evaluation was carried outwas in 2006. Since 2007 the Chairman, in conjunction with theSenior Independent Director, has conducted the internal
evaluation process which includes an extensive questionnaire forall Board members to complete. In addition, each year theChairman conducts a process of evaluating the performance ofeach individual Board member, including an interview with each.The evaluation of the performance of the Chairman was led by theSenior Independent Director. Committees of the Boards evaluatethemselves under supervision of their respective chairmen takinginto account the views of respective committee members and theBoards. The results of the various evaluations were discussed bythe Boards and changes were made in respect of Board practicesand processes where considered necessary. The Boards agreed toan enhanced Board training programme in 2010 that wouldconcentrate on further instruction and familiarisation with Unileverand its businesses. In addition, formal training for Non-ExecutiveDirectors will also be enhanced in 2010, and all Directors will beencouraged to attend events of importance in Unilever’s calendarsuch as Investor Relations seminars.
Board support The Group Secretary is available to advise all Directors and ensurethat Board procedures are complied with. The Boards have thepower to appoint and remove the Group Secretary.
The Group Secretary is Steve Williams, who replaced SvenDumoulin in that role in October 2009.
A procedure is in place to enable Directors, if they so wish, to seekindependent professional advice at Unilever’s expense.
Board changes The current Directors, with their biographies, are shown on pages22 and 23.
Following his appointment as a Director in October 2008, PaulPolman succeeded Patrick Cescau as Chief Executive Officer inJanuary 2009.
Leon Brittan, Wim Dik, Charles Golden, Byron Grote, NarayanaMurthy, Hixonia Nyasulu, Kees Storm, Michael Treschow andJeroen van der Veer were re-elected as Non-Executive Directors ofNV and PLC at the 2009 AGMs. In addition, Louise Fresco, AnnFudge and Paul Walsh were appointed as Non-Executive Directors.
At the 2009 AGMs, David Simon retired as a Non-ExecutiveDirector. At the conclusion of the 2009 AGMs, Jeroen van der Veer was appointed to the roles of Senior IndependentDirector, Vice-Chairman of NV and PLC, and Chairman of ourRemuneration and Nomination Committees that David Simon held up to the date of his retirement.
Jim Lawrence resigned as an Executive Director on 31 December2009, and following a smooth transition Jean-Marc Huët wasappointed Chief Financial Officer in February 2010 and will beproposed for election as an Executive Director at the 2010 AGMs.
At the 2010 AGMs all current Executive and Non-ExecutiveDirectors will be nominated for re-election, with the exception ofLeon Brittan, Wim Dik and Narayana Murthy who will be retiringas Non-Executive Directors at the end of our 2010 AGMs. LeonBrittan will also step down as Chairman of the CorporateResponsibility and Reputation Committee.
Corporate governance (continued)
52 Unilever Annual Report and Accounts 2009
Report of the Directors Governance
Chairman and Chief Executive OfficerUnilever has a separate independent Non-Executive Chairman andChief Executive Officer. There is a clear division of responsibilitiesbetween their roles. The Chairman is primarily responsible forleadership of the Boards, ensuring their effectiveness and settingtheir agendas.
The Chief Executive Officer has been entrusted, within theparameters set out in the Articles of Association of NV and PLCand in the document entitled ‘The Governance of Unilever’, withall the Boards’ powers, authorities and discretions in relation to theoperational management of Unilever. The Chief Executive Officerhas the authority to determine which duties regarding theoperational management of the companies and their businessenterprises will be carried out under his responsibility by one ormore Executive Directors or by one or more other persons. Thisprovides a basis for the Unilever Executive team (UEx) that ischaired by and reports to the Chief Executive Officer. For UExmembers’ biographies see page 24. For our business structure,please refer to ‘Our business’ on pages 26 and 27.
Executive Directors During 2009, Unilever had two Executive Directors, the ChiefExecutive Officer and Chief Financial Officer, who were alsomembers of the UEx, and are full-time employees of Unilever.
Jim Lawrence resigned as an Executive Director on 31 December2009, and following a smooth transition Jean-Marc Huët wasappointed Chief Financial Officer in February 2010 and will beproposed for election as an Executive Director at the 2010 AGMs.
The Executive Directors submit themselves for re-election at theAGMs each year, and the Nomination Committee carefullyconsiders each nomination for reappointment. Executive Directorsstop holding executive office on ceasing to be Directors. TheRemuneration Committee takes the view that the entitlement ofthe Executive Directors to the security of twelve months’ notice oftermination of employment is in line with both the practice ofmany comparable companies and the entitlement of other seniorexecutives within Unilever. It is our policy to set the level ofseverance payments for Executive Directors at no more than one year’s salary, unless the Boards, at the proposal of theRemuneration Committee, find this manifestly unreasonable given the circumstances or unless dictated by applicable law.
We do not grant our Executive Directors any personal loans orguarantees.
There are no family relationships between any of our ExecutiveDirectors, other key management personnel or Non-ExecutiveDirectors, and none of our Executive Directors or other keymanagement personnel are elected or appointed under anyarrangement or understanding, either with any major shareholder,customer, supplier or otherwise.
Outside appointmentsUnilever recognises the benefit to the individual and to the Groupof involvement by Unilever executives acting as directors of othercompanies outside the Unilever Group, broadening theirexperience and knowledge. The number of outside directorshipsof listed companies is generally limited to one per individual, andin the case of publicly listed companies approval is required fromthe Chairman. Outside directorships must not involve an excessive
commitment or conflict of interest, and Unilever Executives mustat all times ensure that their time commitment to Unilever takesprecedence over any outside directorship. Fees paid in connectionwith an outside directorship may be retained by the individual,reflecting that any outside directorship is for the responsibility ofthe individual and that Unilever takes no responsibility in thisregard.
Non-Executive Directors The Non-Executive Directors share responsibility for the executionof the Boards’ duties, taking into account their specificresponsibilities, which are essentially supervisory. In particular, theycomprise the principal external presence in the governance ofUnilever, and provide a strong independent element. See pages 22and 23 for their biographies.
Role and Responsibility The key elements of the role and responsibilities of our Non-Executive Directors are:
• supervision of and advice to the Chief Executive Officer; • developing strategy with the Chief Executive Officer; • scrutiny of performance of the business and Chief Executive
Officer; • oversight of risks and controls; • reporting of performance; • remuneration of and succession planning for Executive
Directors; and • governance and compliance.
Our Non-Executive Directors are chosen for their broad andrelevant experience and international outlook, as well as for theirindependence. They form the Audit Committee, the NominationCommittee, the Remuneration Committee and the CorporateResponsibility and Reputation Committee, and the roles andmembership of these Board committees are described on pages 53and 54. The profile set by the Boards for the Non-ExecutiveDirectors and the schedule used for orderly succession planningcan be found on our website atwww.unilever.com/investorrelations/corp_governance
Meetings The Non-Executive Directors meet as a group, without theExecutive Directors present, under the leadership of the Chairmanto consider specific agenda items and wide-ranging businessmatters of relevance to the Group. In 2009 they met six times. Inaddition, the Non-Executive Directors (including the Chairman)usually meet before each Board meeting with the Chief ExecutiveOfficer, the Chief Financial Officer, other senior executives and theGroup Secretary.
Senior Independent Director Our Non-Executive Directors have appointed Jeroen van der Veeras Senior Independent Director following David Simon’s retirementat the 2009 AGMs. He acts as their spokesman, and is consultedby the Chairman on the agenda and arrangements for Boardmeetings. He is also, in appropriate cases, a point of contact forshareholders and other stakeholders.
Tenure Our Non-Executive Directors submit themselves for re-electioneach year at the AGMs. Although the Dutch CorporateGovernance Code sets the suggested length of tenure at a
Unilever Annual Report and Accounts 2009 53
maximum of twelve years for Non-Executive Directors, theynormally serve for a maximum of nine years in accordance withthe UK Combined Code on Corporate Governance. Theirnomination for re-election is subject to continued goodperformance which is evaluated by the Boards, based on the recommendations of the Nomination Committee. TheNomination Committee carefully considers each nomination for reappointment.
Remuneration The remuneration of the Non-Executive Directors is determined by the Boards, within the overall limit set by the shareholders atthe AGMs in 2007, and it is reported on page 73. We do notgrant our Non-Executive Directors any personal loans orguarantees nor are they entitled to any severance payments.Details of the engagement of our Non-Executive Directors can be seen on the Unilever website atwww.unilever.com/investorrelations/corp_governance
Other appointmentsNon-Executive Directors may serve on boards of other companies,provided such service does not involve a conflict of interest orrestrict their ability to discharge their duties to Unilever.
Independence Taking into account the role of Non-Executive Directors, which isessentially supervisory, and the fact that they make up the keyCommittees of the Boards, it is important that our Non-ExecutiveDirectors can be considered to be independent.
Our definition of independence for Directors is set out in thedocument entitled ‘The Governance of Unilever’, and is derivedfrom the applicable definitions in use in the Netherlands, the UKand the US. Our Boards consider all of our Non-Executive Directorsto be independent of Unilever following the conclusion of athorough review of all relevant relationships of the Non-ExecutiveDirectors, and their related or connected persons.
The UK Combined Code on Corporate Governance suggests thatlength of tenure is a factor to consider when determiningindependence of a non-executive director. The UK CombinedCode also provides that a non-executive director who serves morethan six years should be subject to particularly rigorous review, and if more than nine years should be subject to annual re-election. It is our standard practice for all Directors to seek re-election annually. Leon Brittan has served on the Boards since2000. He continues to demonstrate the essential characteristics of independence expected by the Boards as was confirmedthrough our annual performance review. His length of service, and his resulting experience and knowledge of Unilever, areviewed by the Boards as being especially valuable, particularly inthe light of recent changes to the Boards. Leon Brittan will retire as a Non-Executive Director at the conclusion of the 2010 AGMs.
A number of relationships, such as non-executive directorships,exist between various of our Non-Executive Directors andcompanies that provide banking, insurance or financial advisoryservices to Unilever. Our Boards considered in each case thenumber of other companies that also provide or could readilyprovide such services to Unilever, the significance to thosecompanies of the services they provide to Unilever, the roles of the Non-Executive Directors within those companies and thesignificance of those roles to our Non-Executive Directors.
The Boards concluded that none of these relationships impact theindependence of the Non-Executive Directors concerned, and havesatisfied themselves that the services provided by Paton TupperAssociates (Pty) Limited and Barloworld Limited, of which HixoniaNyasulu is a director and shareholder and director respectively, toUnilever South Africa is not material. The Boards further concludedthat Narayana Murthy’s directorship of HSBC Holdings plc, one ofUnilever’s preferred banks, is not impacted by the bankingrelationship and therefore that he should be consideredindependent. The Boards have also satisfied themselves that Leon Brittan’s position at UBS Investment Bank and UBS SecuritiesCompany Limited does not involve him in any way in its brokingrelationship with Unilever.
None of our Non-Executive Directors are elected or appointedunder any arrangement or understanding, either with any majorshareholder, customer, supplier or otherwise.
Committees
Board Committees The Boards have established the committees described below, allformally set up by Board resolutions with carefully defined remits.They are made up solely of Non-Executive Directors and reportregularly to the Boards. For all committees, if Directors are unableto attend a meeting, they are given the opportunity before themeeting to discuss with the Chairman of the committee anyagenda items or committee papers. All committees are providedwith sufficient resources to undertake their duties, and the termsof reference for each committee can be found on our website atwww.unilever.com/investorrelations/corp_governance
Audit Committee The Audit Committee is comprised only of independent Non-Executive Directors with a minimum requirement of three suchmembers. It is chaired by Kees Storm, and its other members areWim Dik, Charles Golden and Byron Grote. Wim Dik will stepdown as a member of the Committee following his retirement as aDirector at the 2010 AGMs in May. The Boards have satisfiedthemselves that all the current members of the Audit Committeeare competent in financial matters and have recent and relevantexperience and that, for the purposes of the US Sarbanes-OxleyAct of 2002, Kees Storm is the Audit Committee’s financial expert.The Audit Committee’s meetings are attended, by invitation, bythe Chief Financial Officer, the Chief Legal Officer, the GroupController, the Chief Auditor and our external auditors.
The Audit Committee assists the Boards in fulfilling their oversightresponsibilities in respect of: the integrity of Unilever’s financialstatements; risk management and internal control arrangements;compliance with legal and regulatory requirements; theperformance, qualifications and independence of the externalauditors; and the performance of the internal audit function. TheAudit Committee is supplied with all information necessary for theperformance of its duties by the Chief Auditor, Chief FinancialOfficer and Group Controller, and both the Chief Auditor and theexternal auditors have direct access to the Audit Committeeseparately from management. The Audit Committee is directlyresponsible, subject to local laws regarding shareholder approval,for the nomination, compensation and oversight of the externalauditors. The Audit Committee is compliant with the rulesregarding audit committees applicable in the Netherlands, the UKand the US.
Corporate governance (continued)
54 Unilever Annual Report and Accounts 2009
Report of the Directors Governance
The following table shows the attendance of Directors at AuditCommittee meetings for the year ended 31 December 2009:
Name Attendance
Kees Storm (Chairman) 5 of 5Wim Dik 5 of 5Charles Golden 5 of 5Byron Grote 5 of 5
Attendance is expressed as number of meetings attended out ofnumber eligible to attend.
See page 63 for the Report of the Audit Committee to theshareholders.
Nomination Committee The Nomination Committee recommends to the Boards candidatesfor the positions of Director. It also has responsibilities forsuccession planning and oversight of corporate governancematters. It is supplied with information by the Group Secretary.
The Nomination Committee comprises two independent Non-Executive Directors and the Chairman. The Nomination Committeeis chaired by Jeroen van der Veer, following the retirement ofDavid Simon as Chairman of the Committee at the 2009 AGMs.Its other members are Michael Treschow and Paul Walsh, whojoined the Committee following the 2009 AGMs.
The following table shows the attendance of Directors atNomination Committee meetings for the year ended31 December 2009:
Name Attendance
Jeroen van der Veer (Chairman from 14 May 2009) 6 of 6David Simon (Chairman to 14 May 2009) 3 of 3Michael Treschow 6 of 6Paul Walsh (from 14 May 2009) 2 of 3
Attendance is expressed as number of meetings attended out ofnumber eligible to attend.
See page 66 for the Report of the Nomination Committee to the shareholders.
Remuneration Committee The Remuneration Committee reviews Directors’ remunerationand is responsible for the executive share-based incentive plans. Itdetermines, within the parameters set by our shareholders, specificremuneration arrangements for each of the Executive Directors,the remuneration scales and arrangements for Non-ExecutiveDirectors and the policy for the remuneration of the tier ofmanagement directly below the Boards. The Committee is advisedby the Group Secretary on matters of corporate governance.
The Remuneration Committee comprises a minimum of threeindependent Non-Executive Directors. The RemunerationCommittee is chaired by Jeroen van der Veer, following theretirement of David Simon as Chairman of the Committee at the2009 AGMs. Its other members are Ann Fudge, Michael Treschowand Paul Walsh. Ann Fudge and Paul Walsh joined the Committeefollowing the 2009 AGMs.
The following table shows the attendance of Directors atRemuneration Committee meetings for the year ended 31 December 2009:
Name Attendance
Jeroen van der Veer (Chairman from 14 May 2009) 7 of 7David Simon (Chairman to 14 May 2009) 3 of 3Ann Fudge (from 14 May 2009) 4 of 4Michael Treschow 7 of 7Paul Walsh (from 14 May 2009) 2 of 4
Attendance is expressed as number of meetings attended out ofnumber eligible to attend.
The Directors’ Remuneration Report is on pages 67 to 73.
Corporate Responsibility and Reputation Committee The Corporate Responsibility and Reputation Committee hasresponsibility for the oversight of Unilever’s conduct with regard toits corporate and societal obligations and its reputation as aresponsible corporate citizen. It comprises a minimum of threeNon-Executive Directors. It is chaired by Leon Brittan and its othermembers are Louise Fresco, who joined the Committee followingthe 2009 AGMs, Narayana Murthy and Hixonia Nyasulu. BothLeon Brittan and Narayana Murthy will step down as members ofthe Committee following their retirement as Directors at the 2010AGMs in May.
The following table shows the attendance of Directors atCorporate Responsibility and Reputation Committee meetings forthe year ended 31 December 2009:
Name Attendance
Leon Brittan (Chairman) 4 of 4Louise Fresco (from 14 May 2009) 2 of 2Narayana Murthy 3 of 4Hixonia Nyasulu 4 of 4
Attendance is expressed as number of meetings attended out ofnumber eligible to attend.
See pages 64 and 65 for the Report of the CorporateResponsibility and Reputation Committee to shareholders.
Routine business committees Committees are also set up to conduct routine business as andwhen they are necessary. They comprise any two of the Directorsand certain senior executives and officers, and they administer orimplement certain matters previously agreed by our Boards or theChief Executive Officer. The Group Secretary is responsible for theoperation of these committees.
Disclosure Committee The Boards have set up a Disclosure Committee which isresponsible for helping the Boards ensure that financial and otherinformation required to be disclosed publicly is disclosed in atimely manner and that the information that is disclosed iscomplete and accurate in all material aspects. The Committeecomprises the Group Controller (Chairman), the Group Secretaryand Chief Legal Officer, the Group Treasurer and the NV CorporateLegal Counsel.
Unilever Annual Report and Accounts 2009 55
Director matters
Conflicts of interest We attach special importance to avoiding conflicts of interestbetween NV and PLC and their Directors. The Boards areresponsible for ensuring that there are rules in place to avoidconflicts of interest by Board members. Conflicts of interest areunderstood not to include transactions and other activitiesbetween companies in the Unilever Group.
Authorisation of situational conflicts are given by the Boards to therelevant Director in accordance with the Articles of Association ofPLC. The authorisation includes conditions relating to keepingUnilever information confidential and to the exclusion fromreceiving and discussing relevant information at Board meetings.Situational conflicts are reviewed annually by the Boards as part ofthe determination of Director independence, and in betweenthose reviews Directors have a duty to inform the Boards of anyrelevant changes to the situation. A Director may not vote on, orbe counted in a quorum in relation to, any resolution of theBoards in respect of any contract in which he or she has a materialinterest. The procedures that Unilever have put in place to dealwith conflicts of interest have operated effectively.
Various formal matters The borrowing powers of NV Directors on behalf of NV are notlimited by the Articles of Association of NV. PLC Directors have the power to borrow on behalf of PLC up to three times theadjusted capital and reserves of PLC, as defined in its Articles ofAssociation, without the approval of shareholders (any exceptionsrequiring an ordinary resolution).
The Articles of Association of NV and PLC do not require Directorsof NV or Directors of PLC to hold shares in NV or PLC. However,the remuneration arrangements applicable to our ExecutiveDirectors require them to build and retain a personal shareholdingin Unilever.
Indemnification Directors’ indemnification, including the terms thereof, is providedfor in Article 19 of NV’s Articles of Association. The power toindemnify Directors is provided for in PLC’s Articles of Associationand deeds of indemnity have been issued to all PLC Directors.Appropriate qualifying third-party Directors’ and Officers’ liabilityinsurance was in place for all Unilever Directors throughout thefinancial year and is currently in force.
In addition, PLC provides indemnities (including, where applicable,a qualifying pension scheme indemnity provision) to the Directorsfrom time to time of two subsidiaries that act as trusteerespectively of two of Unilever's UK pension schemes. Appropriatetrustee liability insurance is also in place.
Shareholder matters
Relations with shareholders and other investors We believe it is important both to explain our businessdevelopments and financial results to investors and to understand their objectives.
The Chief Financial Officer has lead responsibility for investorrelations, with the active involvement of the Chief ExecutiveOfficer. They are supported by our Investor Relations department
which organises presentations for analysts and investors, and suchpresentations are generally made available on our website.Briefings on quarterly results are given via teleconference and areaccessible by telephone or via our website. For further informationvisit our website at www.unilever.com/investorrelations
The Boards are briefed on reactions to quarterly resultsannouncements. They, or the relevant Board Committee, arebriefed on any issues raised by shareholders that are relevant totheir responsibilities. Our shareholders can, and do, raise issuesdirectly with the Chairman and, if appropriate, the SeniorIndependent Director.
Both NV and PLC communicate with their respective shareholdersat the AGMs as well as responding to their questions and enquiriesduring the course of the year. We take the views of ourshareholders into account and, in accordance with all applicablelegislation and regulations, may consult them in an appropriateway before putting proposals to our AGMs.
General Meetings of shareholders The business to be conducted at the AGMs of NV and PLC is setout in the separate Notices of AGM for NV and PLC. It typicallyincludes approval/consideration of the Annual Report and Accountsand remuneration framework, appointment of Directors,appointment of external auditors, and authorisation for the Boardsto allot and repurchase shares, and to restrict pre-emptive rights ofshareholders.
At the AGMs, a review is given of the progress of the business over the last year and there is a discussion of current issues.Shareholders are encouraged to attend the meetings and askquestions, and the question-and-answer sessions form animportant part of the meetings.
General Meetings of shareholders of NV and PLC are held at timesand places decided by our Boards. NV meetings are normally heldin Rotterdam and PLC meetings are normally held in London, onconsecutive days. The notices calling the meetings normally go outmore than 30 days prior to the meetings.
We welcome our external auditors to the AGMs and they areentitled to address the meetings.
Electronic communicationWe are committed to efforts to continue more effective ways ofcommunication with our shareholders around the AGMs. Electroniccommunication is already an important and established mediumfor shareholders, providing ready access to shareholder informationand reports, and for voting purposes.
Shareholders of PLC can choose to receive electronic notificationthat the Annual Report and Accounts and Notice of AGMs havebeen published on our website, instead of receiving printed copies,and can also electronically appoint a proxy to vote on their behalfat the AGM.
Registration for electronic communication by shareholders of PLCcan be made at www.unilever.com/shareholderservices The UKCompanies Act 2006 contains provisions facilitatingcommunications between companies and their shareholders
Corporate governance (continued)
56 Unilever Annual Report and Accounts 2009
Report of the Directors Governance
electronically and PLC has established such a facility afterconsulting with its shareholders to offer them the opportunity toreview their method of receiving shareholder communications inthe future.
Voting rightsShareholders that hold NV shares on the record date are entitledto attend and vote at NV General Meetings. The record date is setby the Board at a date not more than 30 days before the meeting,and shares are not blocked between the record date and the dateof the meeting. NV shareholders can cast one vote for each €0.16nominal capital that they hold. This means that they can cast onevote for each NV ordinary share, or NV New York Registry Share.Shareholders can vote in person or by proxy. Similar arrangementsapply to holders of depositary receipts issued for NV shares andthe holders of NV preference shares (see page 59).
PLC shareholders can cast one vote for each 31⁄ 9p nominal capitalthat they hold. This means shareholders can cast one vote for eachPLC ordinary share, or PLC American Depositary Receipt of shares.Proxy appointments need to be with our Registrars 48 hoursbefore the meeting, and the shareholding at this time willdetermine both the right to vote and the ability to attend themeeting.
More information on the exercise of voting rights can be found inNV’s and PLC’s Articles of Association and in the respective Noticesof Meetings which can be found on our website atwww.unilever.com/investorrelations/corp_governance
Holders of NV New York Registry Shares or PLC AmericanDepositary Receipts of shares will receive a proxy form enablingthem to authorise and instruct a notary public or Citibank, N.A.respectively to vote on their behalf at the General Meeting of NVor PLC.
N.V. Elma and United Holdings Limited (the holders of NV’s specialshares), other group companies of NV which hold ordinary orpreference shares, and United Holdings Limited, which owns halfof PLC’s deferred stock, are not permitted to vote at GeneralMeetings.
Voting on each of the resolutions contained in the Notice of AGMsis conducted by poll. The final vote is published at the meetingsand the outcome of the votes, including the proxy votes, is put onUnilever’s website.
Shareholder proposed resolutions Shareholders of NV may propose resolutions if they individually ortogether hold 1% of NV’s issued capital in the form of shares ordepositary receipts for shares, or if they individually or togetherhold shares or depositary receipts worth or representing themarket value in shares as set in respect thereto by or pursuant tothe law (currently €50 million). They must submit these requests atleast 60 days before the date of the General Meeting, and therequest will be honoured unless, in the opinion of the Boards, it isagainst a substantive interest of the Company. Shareholders whotogether represent at least 10% of the issued capital of NV canalso requisition Extraordinary General Meetings to deal withspecific resolutions.
Shareholders who together hold shares representing at least 5% of the total voting rights of PLC, or 100 shareholders whohold on average £100 each in nominal value of PLC capital, canrequire PLC to propose a resolution at a general meeting. PLCshareholders holding in aggregate 5% of the issued PLC ordinaryshares are able to convene a general meeting of PLC.
Required majorities Resolutions are usually adopted at NV and PLC shareholdermeetings by an absolute majority of votes cast, unless there areother requirements under the applicable laws or NV’s or PLC’sArticles of Association. For example, there are special requirementsfor resolutions relating to the alteration of the Articles ofAssociation, the liquidation of NV or PLC and the alteration of theEqualisation Agreement (see below).
A proposal to alter the Articles of Association of NV can only bemade by the Board of NV. A proposal to alter the Articles ofAssociation of PLC can be made either by the Board of PLC or byshareholders in the manner permitted under the UK CompaniesAct 2006. Unless expressly specified to the contrary in the Articlesof Association of PLC, PLC’s Articles of Association may beamended by a special resolution. Proposals to alter the provisionsin the Articles of Association of NV and PLC respectively relating tothe unity of management require the prior approval of meetings ofthe holders of the NV special shares and the PLC deferred stock.The Articles of Association of both NV and PLC can be found onour website atwww.unilever.com/investorrelations/corp_governance
Right to hold shares Unilever’s constitutional documents place no limitations on theright to hold NV and PLC shares. There are no limitations on theright to hold or exercise voting rights on the ordinary shares of NV and PLC imposed by foreign law.
Foundation Agreements
Equalisation Agreement The Equalisation Agreement makes the economic position of theshareholders of NV and PLC, as far as possible, the same as if theyheld shares in a single company. The Equalisation Agreementregulates the mutual rights of the shareholders of NV and PLC.Under the Equalisation Agreement, NV and PLC must adopt thesame financial periods and accounting policies.
Each NV ordinary share represents the same underlying economicinterest in the Unilever Group as each PLC ordinary share.
We pay ordinary dividends for NV and PLC on the same day. NV and PLC allocate funds for the dividend from their parts of the current profits and free reserves. We pay the same amount on each NV share as on one PLC share calculated at the relevantexchange rate. As agreed at the 2009 AGMs and separatemeetings of ordinary shareholders, the Equalisation Agreementwas in part amended to allow Unilever to move to quarterlydividend payments with effect from 1 January 2010. Interimdividends are determined in euros and converted into equivalent
Unilever Annual Report and Accounts 2009 57
Under Article 2 and 3 of the NV and PLC Articles of Associationrespectively, each company is required to carry out the EqualisationAgreement with the other. Both documents state that theAgreement cannot be changed or terminated without theapproval of shareholders. For NV, the General Meeting can decideto alter or terminate the Equalisation Agreement at the proposalof the Board. The necessary approval of the General Meeting isthen that at least one half of the total issued ordinary capital mustbe represented at an ordinary shareholders’ meeting, where themajority must vote in favour; and (if they would be disadvantagedor the agreement is to be terminated) at least two-thirds of thetotal issued preference share capital must be represented at apreference shareholders’ meeting, where at least three-quarters ofthem must vote in favour. For PLC, the necessary approval must begiven by the holders of a majority of all issued shares voting at aGeneral Meeting and the holders of the ordinary shares, by asimple majority voting at a General Meeting where the majority ofthe ordinary shares in issue are represented.
The Equalisation Agreement can be found on our website atwww.unilever.com/investorrelations/corp_governance
The Deed of Mutual Covenants The Deed of Mutual Covenants provides that NV and PLC andtheir respective subsidiary companies shall co-operate in every wayfor the purpose of maintaining a common operating policy. Theyshall exchange all relevant information about their respectivebusinesses – the intention being to create and maintain a commonoperating platform for the Unilever Group throughout the world.The Deed illustrates some of the information which makes up thiscommon platform, such as the mutual exchange and free use ofknow-how, patents, trade marks and all other commerciallyvaluable information.
The Deed contains provisions which allow the Directors of NV andPLC to take any actions to ensure that the dividend-generatingcapacity of each of NV and PLC is aligned with the economicinterests of their respective shareholders. These provisions alsoallow assets to be transferred between NV and PLC and theirassociated companies (as defined in the Deed) to ensure thatassets are allocated in the most efficient manner. Thesearrangements are designed to create a balance between the two parent companies and the funds generated by them, for the benefit of their respective sets of shareholders.
The Agreement for Mutual Guarantees of BorrowingUnder the Agreement for Mutual Guarantees of Borrowingbetween NV and PLC, each company will, if asked by the other,guarantee the borrowings of the other. The two companies alsojointly guarantee the borrowings of their subsidiaries. Thesearrangements are used, as a matter of financial policy, for certainsignificant public borrowings. They enable lenders to rely on ourcombined financial strength.
sterling and US dollar amounts using exchange rates issued by theEuropean Central Bank two days before the announcement of thedividend. The new method for determining dividend paymentswas used for the 2009 interim dividends of NV and PLC. Thisamendment has enabled us to change to a simpler and moretransparent dividend practice for the Unilever Group, resulting inmore frequent payments to shareholders, and better alignmentwith the cash flow generation of the business.
The Equalisation Agreement provides that if one company hadlosses, or was unable to pay its preference dividends, the loss orshortfall would be made up out of:
• the current profits of the other company (after it has paid itsown preference shareholders);
• then its own free reserves; and • then the free reserves of the other company.
If either company could not pay its ordinary dividends, we wouldfollow the same procedure, except that the current profits of theother company would only be used after it had paid its ownordinary shareholders and if the Directors thought this moreappropriate than, for example, using its own free reserves.
So far, NV and PLC have always been able to pay their owndividends, so we have never had to follow this procedure. If we did, the payment from one company to the other would be subject to any United Kingdom and Dutch tax and exchangecontrol laws applicable at that time.
Under the Equalisation Agreement, the two companies arepermitted to pay different dividends in the event of anunreasonable increase or decrease in dividend pay-out of one of the companies due to currency fluctuations and in the eventthat either the UK or Dutch government imposes restrictions ondividend pay-outs. In either of these rare cases, NV and PLC couldpay different amounts of dividend if the Boards thought itappropriate.
If both companies were to go into liquidation, NV and PLC wouldeach use any funds legally available to pay the prior claims of theirown preference shareholders. Then they would use any surplus topay each other’s preference shareholders, if necessary. After theseclaims had been met, they would pay out any equalisation ordividend reserve to their own shareholders before pooling theremaining surplus. This would be distributed to the ordinaryshareholders of both companies on an equal basis. If one companywere to go into liquidation, we would apply the same principles asif both had gone into liquidation simultaneously.
In principle, issues of bonus shares and rights offerings can only be made in ordinary shares. Again, we would ensure thatshareholders of NV and PLC received shares in equal proportions.The subscription price for one new NV share would have to be thesame, at the prevailing exchange rate, as the price for one newPLC share. Neither company can issue or reduce capital withoutthe consent of the other.
The Articles of Association of NV establish that any payment underthe Equalisation Agreement will be credited or debited to theincome statement for the financial year in question.
Corporate governance (continued)
58 Unilever Annual Report and Accounts 2009
Report of the Directors Governance
Share capital matters
Share capital NV’s issued share capital on 31 December 2009 was made up of:
• €274,356,432 split into 1,714,727,700 ordinary shares of €0.16 each;
• €1,028,568 split into 2,400 ordinary shares numbered 1 to 2,400, known as special shares; and
• €113,599,014 split into several classes (4%, 6% and 7%) ofcumulative preference shares (‘financing preference shares’).
The voting rights attached to NV's outstanding shares are split asfollows:
Total number of votes % of issued capital
1,714,727,700 ordinary shares 1,714,727,700(a) 70.532,400 special shares 6,428,550 0.26750,000 4% cumulative
preference shares 200,906,250 8.26161,060 6% cumulative
preference shares 431,409,276 17.7529,000 7% cumulative
preference shares 77,678,312 3.20
(a) Of which 141,560,629 shares were held in treasury and28,618,015 shares were held in connection with share-basedpayments as at 31 December 2009. These shares are not voted on.
NV may issue shares not yet issued and grant rights to subscribefor shares only pursuant to a resolution of the General Meeting ofShareholders or of another corporate body designated for suchpurpose by a resolution of the General Meeting. At the AGM heldon 14 May 2009 the Board was designated, in accordance withArticles 96 and 96a of Book 2 of the Netherlands Civil Code, asthe corporate body authorised until 14 November 2010 to resolveon the issue of – or on the granting of rights to subscribe for –shares not yet issued and to restrict or exclude the statutory pre-emption rights that accrue to shareholders upon issue of shares,on the understanding that this authority is limited to 10% of theissued share capital of the Company, plus an additional 10% ofthe issued share capital of the Company in connection with or onthe occasion of mergers and acquisitions.
At the 2009 AGM the Board of NV was authorised, in accordancewith Article 98 of Book 2 of the Netherlands Civil Code, until 14 November 2010 to cause the Company to buy back its ownshares and depositary receipts thereof, with a maximum of 10%of issued share capital, either through purchase on a stockexchange or otherwise, at a price, excluding expenses, not lowerthan the nominal value of the shares and not higher than 10%above the average of the closing price of the shares on Eurolist byEuronext Amsterdam for the five business days before the day onwhich the purchase is made.
The above mentioned authorities are renewed annually.
PLC’s issued share capital on 31 December 2009 was made up of:
• £40,760,420 split into 1,310,156,361 ordinary shares of31⁄ 9p each; and
• £100,000 of deferred stock.
The total number of voting rights attached to PLC’s outstandingshares are shown hereunder:
Total number of votes % of issued capital
1,310,156,361 ordinary shares 1,310,156,361(a) 99.76£100,000 deferred stock 3,214,285 0.24
(a) Of which 26,696,994 shares were held by PLC in treasury and23,850,000 shares were held by NV group companies or by sharetrusts as at 31 December 2009. These shares are not voted on.
The Board of PLC may, under sections 551 and 561 of the UKCompanies Act 2006 and subject to the passing of the appropriateresolutions at a meeting of shareholders, issue shares within thelimits prescribed within the resolutions. At the 2009 AGM theDirectors were authorised to issue new shares pursuant to section80 of the UK Companies Act 1985, limited to a maximum of£13,290,000 nominal value, which at the time representedapproximately 33% of the Company’s issued Ordinary sharecapital and pursuant to section 89 of that Act, to disapply pre-emption rights up to approximately 5% of PLC’s issued ordinaryshare capital. These authorities are renewed annually and from2010 will be sought under the applicable sections of the UKCompanies Act 2006.
At the 2009 AGM the Board of PLC was authorised in accordancewith its Articles of Association to make market purchases of itsordinary shares representing just under 10% of the Company’sissued capital and within the limits prescribed within the resolutionuntil the earlier of the 6-month anniversary after the 2009 yearend or the conclusion of the 2010 AGM. A similar authority will besought at the 2010 AGM of PLC pursuant to the UK CompaniesAct 2006.
Margarine Union (1930) Limited: Conversion RightsThe first Viscount Leverhulme was the founder of the companywhich became PLC. When he died in 1925, he left in his will alarge number of PLC shares in various trusts.
When the will trusts were varied in 1983, the interests of thebeneficiaries of his will were also preserved. Four classes of specialshares were created in Margarine Union (1930) Limited, asubsidiary of PLC. One of these classes can be converted at theend of the year 2038 into 70,875,000 PLC ordinary shares of 31⁄9p each. This currently represents 5.4% of PLC’s issued ordinarycapital. These convertible shares replicate the rights which thedescendants of the first Viscount would have had under his will.This class of the special shares only has a right to dividends inspecified circumstances, and no dividends have yet been paid. PLC guarantees the dividend and conversion rights of the specialshares.
Foundation Unilever NV Trust OfficeAs at 1 March 2010, around 76% of NV’s ordinary shares andaround 34% of NV’s 7% cumulative preference shares were heldby the Foundation Unilever NV Trust Office (StichtingAdministratiekantoor Unilever N.V.), a trust office with a boardindependent of Unilever. As part of its corporate objects, theFoundation issues depositary receipts in exchange for these shares.
Unilever Annual Report and Accounts 2009 59
These depositary receipts are listed on Euronext Amsterdam, as are the NV ordinary and 7% preference shares themselves.
Holders of depositary receipts can under all circumstancesexchange their depositary receipts for the underlying shares (and vice versa).
Holders of depositary receipts are entitled to dividends and alleconomic benefits on the underlying shares held by theFoundation.
The members of the board at the foundation are Mr J H Schraven(chairman), Mr P P de Koning, Prof Emeritus Dr L Koopmans andMr A A Olijslager.
The Foundation reports periodically on its activities.
Voting by holders of depositary receipts Although the depositary receipts themselves do not formally havevoting rights, holders of depositary receipts are in practice equatedwith shareholders. They can attend all General Meetings of NV,either personally or by proxy, and also have the right to speak. Theholders of the depositary receipts will then automatically, withoutlimitation and under all circumstances, receive a voting proxy onbehalf of the Foundation to vote on the underlying shares.
The Foundation is obliged to follow the voting instructions ofholders of depositary receipts. The same applies to the votinginstructions of holders of depositary receipts not attending ashareholders’ meeting and who issue voting instructions to theFoundation via the Dutch Shareholders’ Communication Channel.
Voting by the Foundation Unilever NV Trust Office Shares for which the Foundation has not granted voting proxies or for which it has not received voting instructions are voted on bythe Foundation in such a way as it deems to be in the interests ofthe holders of the depositary receipts. This voting policy is laiddown in the Conditions of Administration that apply to thedepositary receipts.
Specific provisions apply in the event that a meeting of the holdersof NV 7% cumulative preference shares is convened.
If a change to shareholders’ rights is proposed, the Foundation willlet shareholders know if it intends to vote, at least 14 days inadvance of the meeting if possible.
Hitherto the majority of votes cast by ordinary shareholders at NVmeetings have been cast by the Foundation. Unilever and theFoundation have a policy of actively encouraging holders ofdepositary receipts to exercise their voting rights in NV meetings.
Unilever considers the arrangements of the Foundationappropriate and in the interest of NV and its shareholders giventhe size of the voting rights attached to the financing preferenceshares and the relatively low attendance of holders of ordinaryshares at the General Meetings of NV.
Foundation Unilever NV Trust Office’s shareholding Foundation NV Trust Office’s shareholding fluctuates daily – itsholdings on 1 March 2010 were:
• NV ordinary shares of €0.16: 1,295,616,498 (75.56%); and• NV 7% cumulative preference shares of €428.57: 9,776 (33.71%).
Further information on the Foundation, including its Articles ofAssociation and Conditions of Administration, can be found on itswebsite at www.administratiekantoor-unilever.nl
Requirements and compliance – general Unilever is subject to corporate governance requirements in theNetherlands, the UK and as a foreign private issuer in the US. Inthis section we report on our compliance with the corporategovernance regulations and best practice codes applicable in theNetherlands and the UK and we also describe compliance withcorporate governance standards in the US.
Under the European Takeover Directive, the UK Companies Act2006 and rules of the US Securities and Exchange Commission, weare required to provide information on contracts and otherarrangements essential or material to the business of the Group.We believe we do not have any such contracts or arrangements.
Our governance arrangements are designed and structured topromote and further the interests of our companies and theirshareholders. The Boards however reserve the right, in caseswhere they decide such to be in the interests of the companiesor our shareholders, to depart from that which is set out in thepresent and previous sections in relation to our corporategovernance. Any such changes will be reported in future AnnualReports and Accounts and, when necessary, through changes tothe relevant documents published on our website. As appropriate,proposals for change will be put to our shareholders for approval.
Further information can be found on our website and in thedocument entitled ‘The Governance of Unilever’. This describesthe terms of reference of our Board Committees, including theirfull responsibilities. It will be kept up to date with changes in ourinternal constitutional arrangements that our Boards may makefrom time to time and it is available on our website at www.unilever.com/Investorrelations/corp_governance
Requirements – European UnionFollowing implementation of the European Takeover Directive,certain information is required to be disclosed in relation to controland share structures and interests of NV and PLC. Such disclosures,which are not covered elsewhere in this Annual Report, includethe following:
• there are no requirements to obtain the approval of NV or PLC,or of other holders of securities in NV or PLC, for a transfer ofsuch securities;
• there are no arrangements by which, with NV or PLC'scooperation, financial rights carried by securities are held by aperson other than the holder of such securities;
Corporate governance (continued)
60 Unilever Annual Report and Accounts 2009
Report of the Directors Governance
• NV and PLC are not aware of any agreements between holdersof securities which may result in restrictions on the transfer ofsuch securities or on voting rights;
• neither NV nor PLC are parties to any significant agreementswhich include provisions that take effect, alter or terminate suchagreement upon a change of control following a takeover bid;
• NV and PLC do not have any agreements with any Director oremployee that would provide compensation for loss of office oremployment resulting from a takeover except that most ofUnilever's share schemes contain provisions which operate inthe event of a takeover of Unilever, which provisions may forinstance cause options or awards granted to employees undersuch schemes to vest after a takeover or be exchanged into newawards for shares in another entity; and
• the Trustees of the PLC employee share trusts may vote orabstain in any way they think fit and in doing so may take into account both financial and non-financial interests of thebeneficiaries of the employee share trusts or their dependants.Historically the Trustees tend not to exercise this right.
Requirements – the Netherlands NV is required to state in its Annual Report and Accounts whetherit complies or will comply with the Principles and best practiceprovisions (‘bpp’) of the Dutch Corporate Governance Code (theDutch Code) and, if it does not comply, to explain the reasons forthis. As will be clear from the description of our governancearrangements, NV complies with almost all of the principles andbest practice provisions of the Dutch Code, a copy of which isavailable at www.commissiecorporategovernance.nl The text thatfollows sets out certain statements that the Dutch Code invites us to make to our shareholders that are not included elsewhere in this Annual Report and Accounts as well as areas of non-compliance.
On 10 December 2008 the Dutch Corporate Governance CodeCompliance Committee published a revised version of the Code,which is applicable to our annual reporting over 2009 and wetherefore report compliance under the revised Code in our Annual Report and Accounts 2009.
Unilever places a great deal of importance on corporateresponsibility and sustainability as is evidenced by our visionto double the size of the company while reducing ourenvironmental impact. With respect to our performance measuresUnilever is keen to ensure focus on key financial performancemeasures which we believe to be the drivers of shareholder valuecreation and relative total shareholder return. Unilever thereforebelieves that the interests of the business and shareholders arebest served by linking the long-term share plans to the measuresas described in the Directors’ Remuneration Report on page 67and has not included a non-financial performance indicator(Principle II.2 and bpp II.2.3).
Board and Committee structures NV has a one-tier board, consisting of both Executive and, in amajority, Non-Executive Directors. We achieve compliance of ourboard arrangements with the Dutch Code, which is for the mostpart based on the customary two-tier structure in the Netherlands,by, as far as is possible and practicable, applying the provisions ofthe Dutch Code relating to members of a management board toour Executive Directors and by applying the provisions relating to
members of a supervisory board to our Non-Executive Directors.Management tasks not capable of delegation are performed bythe Board as a whole.
Risk management and control Our principal risks are described on pages 30 to 34. Our approachto risk management and systems of internal control are describedon page 35.
As a result of the review of the Audit Committee (as described in their report on page 63) the Board believes that as regardsfinancial reporting risks the risk management and control systemsprovide reasonable assurance that the financial statements do not contain any errors of material importance and the riskmanagement and control systems have worked properly in 2009 (bpp ll.1.5).
The aforesaid statements are not statements in accordance withthe requirements of Section 404 of the US Sarbanes-Oxley Act of 2002.
Retention period of shares The Dutch Code recommends that shares granted to ExecutiveDirectors must be retained for a period of at least five years (bpp II.2.5). Our shareholder-approved remuneration policyrequires Executive Directors to build and retain a personalshareholding in Unilever. The Board believes that this is in line withthe spirit of the Dutch Code.
Severance pay It is our policy to set the level of severance payments for Directorsat no more than one year’s salary, unless the Board, at theproposal of the Remuneration Committee, finds this manifestlyunreasonable given circumstances or unless otherwise dictated byapplicable law (bpp II.2.8).
Conflicts of interest In the event of a potential conflict of interest, the provisions of theDutch Code (Principles II.3 and III.6) are applied. Conflicts ofinterest are not understood to include transactions and otheractivities between companies in the Unilever Group.
Financing preference shares NV issued 4%, 6% and 7% cumulative preference shares between1927 and 1970. Their voting rights are based on their nominalvalue, as prescribed by Dutch law. The Dutch Code recommendsthat the voting rights on such shares should, in any event whenthey are newly issued, be based on their economic value ratherthan on their nominal value (bpp IV.1.2). NV agrees with thisprinciple but cannot unilaterally reduce voting rights of itsoutstanding preference shares.
Anti-takeover constructions and control over the company NV confirms that it has no anti-takeover constructions, in thesense of constructions that are intended solely, or primarily, toblock future hostile public offers for its shares (bpp IV.3.11). Nordoes NV have any constructions whose specific purpose is toprevent a bidder, after acquiring 75% of the capital, fromappointing or dismissing members of the Board and subsequentlyaltering the Articles of Association. The acquisition through apublic offer of a majority of the shares in a company does notunder Dutch law preclude in all circumstances the continued rightof the Board of the company to exercise its powers.
Unilever Annual Report and Accounts 2009 61
Provision of information We consider it important to comply with all applicable statutoryregulations on the equal treatment of shareholders and provisionof information and communication with shareholders and otherparties (Principles IV.2 and IV.3).
Meetings of analysts and presentations to investors We have extensive procedures for handling relations with andcommunicating with shareholders, investors, analysts and themedia (also see page 55). The important presentations andmeetings are conducted as far as practicable in accordance withthe Dutch Code (bpp IV.3.1). Due to their large number andoverlap in information, however, some of the less important onesare not announced in advance, made accessible to everyone or puton our website.
Corporate Governance StatementNV is required to make a statement concerning corporategovernance as referred to in article 2a of the decree on additionalrequirements for annual reports (Vaststellingsbesluit naderevoorschriften inhoud jaarverslag) with effect from 1 January 2010(the ‘Decree’). The information required to be included in thiscorporate governance statement as described in articles 3, 3a and3b of the Decree can be found in the following sections of thisdocument:
• the information concerning compliance with the DutchCorporate Governance Code, as required by article 3 of theDecree, can be found under ‘Corporate Governance’ within thesection ‘Requirements – the Netherlands’ in this document;
• the information concerning Unilever’s risk management andcontrol frameworks relating to the financial reporting process,as required by article 3a(a) of the Decree, can be found under‘Outlook and risks’ on pages 30 to 36 and within the relevantsections under ‘Corporate Governance’ in this document;
• the information regarding the functioning of Unilever’s GeneralMeeting of shareholders, and the authority and rights ofUnilever’s shareholders, as required by article 3a(b) of theDecree, can be found within the relevant sections under‘Corporate Governance’ in this document;
• the information regarding the composition and functioning ofUnilever’s Boards and its Committees, as required by article 3a(c)of the Decree, can be found within the relevant sections under‘Corporate Governance’ in this document; and
• the information concerning the inclusion of the informationrequired by the decree Article 10 European Takeover Directive,as required by article 3b of the Decree, can be found within therelevant sections under ‘Corporate Governance’ and within thesection ‘Shareholder information, Analysis of shareholding’ inthis document.
Requirements – the United Kingdom PLC is required, as a company that is incorporated in the UK andlisted on the London Stock Exchange, to state how it has appliedthe main principles and how far it has complied with theprovisions set out in Section 1 of the 2008 UK Combined Code onCorporate Governance (‘the Combined Code’), a copy of which isavailable at www.frc.org.uk
In the preceding pages we have described how we have appliedthe main principles and the provisions in the Combined Code. In2009, PLC complied with the Combined Code except in thefollowing areas:
• Between February 2008 and the 2009 AGMs in May theRemuneration Committee’s membership consisted of twoindependent Non-Executive Directors and the Chairman.Subsequent to the appointments of Ann Fudge and Paul Walshto that Committee, following their Board appointments at the2009 AGMs, the Committee has complied with the membershipprinciple of the Code applicable to a remuneration committee.
• Due to the requirement for Unilever to hold two AGMs for itsrespective companies on consecutive days, it may not always bepossible for all Directors, and possibly the Chairmen of theAudit, Remuneration and Nomination Committees, to bepresent at both meetings. The Chairman ensures that a majorityof Directors attend both meetings and that at least one memberof each Committee attends each AGM.
Risk management and control Our principal risks are described on pages 30 to 34. Our approachto risk management and systems of internal control are describedon page 35.
This approach to risk management and systems of internal controlis in line with the recommendations in the report on ‘InternalControl – Revised Guidance for Directors on the UK CombinedCode’ (’The Turnbull Guidance’).
The effectiveness of the system of internal control, includingprocesses in relation to financial reporting and preparation ofconsolidated accounts, has been reviewed by the AuditCommittee.
The Committee reviewed Unilever's overall approach to riskmanagement and control, and its processes, outcomes anddisclosure, including specifically:
• review of level of disclosure in quarterly financial resultsannouncements;
• review of accounting principles and judgements with respect tofinancial statements, including the annual impairment review ofgoodwill and intangibles;
• review of the analysis supporting the going concern judgementof the 2009 Annual Report and Accounts;
• review of Unilever’s Risk Management framework undertakenby management, agreeing to a streamlined process forassessment of corporate and operational risks;
• annual report on the Chief Executive Officer’s Top CorporateRisks and a quarterly review of business risks and safeguards;
• annual Positive Assurance report from the Chief ExecutiveOfficer on compliance with corporate policies and operatingcontrols;
• review the application of the requirements under Section 404 ofthe US Sarbanes-Oxley Act of 2002 with respect to internalcontrols over financial reporting; and
• annual review of anti-fraud arrangements.
It is Unilever’s practice to bring acquired companies within theGroup’s governance procedures as soon as is practicable and inany event by the end of the first full year of operation.
Corporate governance (continued)
62 Unilever Annual Report and Accounts 2009
Report of the Directors Governance
Requirements – the United States Both NV and PLC are listed on the New York Stock Exchange andmust therefore comply with such of the requirements of USlegislation, such as the Sarbanes-Oxley Act of 2002, regulationsenacted under US securities laws and the Listing Standards of theNew York Stock Exchange as are applicable to foreign privateissuers. In some cases the requirements are mandatory and inother cases the obligation is to ’comply or explain’.
We have complied in all material respects with the requirementsconcerning corporate governance that were in force during 2009.Attention is drawn in particular to the remit of the AuditCommittee on page 53 and the Report of the Audit Committee onpage 63.
Actions already taken to ensure compliance in all material respectsthat are not specifically disclosed elsewhere or otherwise clearfrom reading this document include:
• the issuance of a Code of Ethics for senior financial officers; • the issuance of instructions restricting the employment of
former employees of the audit firm; and • the establishment of a policy on reporting requirements under
SEC rules relating to standards of professional conduct for US attorneys.
In each of these cases, existing practices were revised and/ordocumented in such a way as to conform to the newrequirements.
The Code of Ethics applies to the senior executive, financial andaccounting officers and comprises the standards prescribed by theSEC, and a copy has been posted on our website atwww.unilever.com/investorrelations/corp_governance The Code ofEthics comprises an extract of the relevant provisions of Unilever’sCode of Business Principles and the more detailed rules of conductthat implement it. The only amendment to these pre-existingprovisions and rules that was made in preparing the Codeof Ethics was made at the request of the Audit Committee andconsisted of a strengthening of the explicit requirement to keepproper accounting records. No waiver from any provision of theCode of Ethics was granted to any of the persons falling withinthe scope of the SEC requirements in 2009.
We are required by US securities laws and the Listing Standards ofthe New York Stock Exchange to have an Audit Committee thatsatisfies Rule 10A-3 under the Exchange Act and the ListingStandards of the New York Stock Exchange (NYSE). We arecompliant with these requirements. We are also required todisclose any significant ways in which our corporate governancepractices differ from those typically followed by US companieslisted on the NYSE. In addition to the information we have givento you in this document about our corporate governancearrangements, further details are provided in the documententitled ‘The Governance of Unilever’, which is on our website atwww.unilever.com/investorrelations/corp_governance
We are compliant with the Listing Standards of the New YorkStock Exchange applicable to foreign private issuers. Our corporategovernance practices do not significantly differ from thoserequired of US companies listed on the New York Stock Exchange.
We also confirm that our shareholders have the opportunity tovote on certain equity compensation plans.
Risk management and control Our principal risks are described on pages 30 to 34. Our approachto risk management and systems of internal control are describedon page 35.
Based on an evaluation by the Boards, the Chief Executive Officerand the Chief Financial Officer concluded that the design andoperation of the Group’s disclosure controls and procedures,including those defined in United States Securities Exchange Act of1934 - Rule 13a – 15(e), as at 31 December 2009 were effective,and that subsequently until the date of the approval of the AnnualReport by the Board, there have been no significant changes in theGroup’s internal controls, or in other factors that couldsignificantly affect those controls.
Unilever is required by Section 404 of the US Sarbanes-Oxley Actof 2002 to report on the effectiveness of internal control overfinancial reporting. This requirement will be reported on separatelyand will form part of Unilever’s Annual Report on Form 20-F.
Unilever Annual Report and Accounts 2009 63
Report of the Audit Committee
The role and terms of reference of the Audit Committee is to assistthe Unilever Boards in fulfilling their oversight responsibilitiesregarding the integrity of Unilever’s financial statements, riskmanagement and internal control, compliance with legal andregulatory requirements, the external auditors’ performance,qualifications and independence, and the performance of theinternal audit function. During the year ended 31 December 2009,principal activities were as follows:
Financial statementsThe Committee considered reports from the Chief Financial Officeron the quarterly and annual financial statements, including otherfinancial statements and disclosures prior to their publication andissues reviewed by the Disclosure Committee. They also reviewedthe Annual Report and Accounts and Annual Report on Form 20-Fprior to publication.
Audit of the Annual AccountsPricewaterhouseCoopers, Unilever’s external auditors, reported indepth to the Committee on the scope and outcome of the annualaudit, including their audit of internal control over financialreporting as required by Section 404 of the US Sarbanes-Oxley Actof 2002. Their reports included accounting matters, governanceand control, and accounting developments.
The Committee held independent meetings with the externalauditors during the year.
Risk management and internal control arrangementsThe Committee reviewed Unilever's overall approach to riskmanagement and control, and its processes, outcomes anddisclosure, including specifically:
• review of level of disclosure in quarterly financial resultsannouncements;
• review of accounting principles and judgements with respect to financial statements, including the annual impairment reviewof goodwill and intangibles;
• review of regular updates on outstanding litigation andregulatory investigations from the Chief Legal Officer;
• review of the analysis supporting the going concern judgementof the 2009 Annual Report and Accounts;
• review of Unilever’s Risk Management framework undertaken bymanagement, agreeing to a streamlined process for assessmentof corporate and operational risks;
• annual report on the Chief Executive Officer’s Top CorporateRisks and a quarterly review of business risks and safeguards;
• annual Positive Assurance report from the Chief ExecutiveOfficer on compliance with corporate policies and operatingcontrols;
• Corporate Audit’s interim and year-end summary reports, andmanagement’s response;
• the interim and year-end reports from the Code of BusinessPrinciples Compliance Committee including the resolution ofcomplaints received through the global Ethics hotline includingprocedures for handling complaints and concerns relating toaccounting, internal control and auditing matters;
• review the application of the requirements under Section 404 ofthe US Sarbanes-Oxley Act of 2002 with respect to internalcontrols over financial reporting;
• review of the application of information and communicationtechnology;
• review of the annual pension report and the impact of financialvolatility on pensions;
• annual review of anti-fraud arrangements;• review of tax planning policy; • review of treasury policies, including debt issuance and hedging;• review of the annual financial plan; and• review of the revised dividend policy and dividend proposals.
External auditors The Audit Committee conducted a formal evaluation of theeffectiveness of the external audit process. The Committee hasconsidered the tenure, quality and fees of the auditors anddetermined that a tender for the audit work is not necessary.As a result, the Committee has approved the extension of thecurrent external audit contract by one year, and recommended to the Boards the reappointment of external auditors. On therecommendation of the Audit Committee, the Directors will beproposing the re-appointment of PricewaterhouseCoopers at theAGMs in May 2010 (see pages 137 and 143).
Both Unilever and the auditors have for many years had safeguardsin place to avoid the possibility that the auditors’ objectivity and independence could be compromised. The Committeereviewed the report from PricewaterhouseCoopers on the actionsthey take to comply with the professional and regulatoryrequirements and best practice designed to ensure theirindependence from Unilever.
The Committee also reviewed the statutory audit, other audit, tax and other services provided by PricewaterhouseCoopers,and compliance with Unilever’s documented approach, whichprescribes in detail the types of engagements for which theexternal auditors can and cannot be used:
• statutory audit services – including audit of subsidiaries;• other audit services – work which regulations or agreements
with third parties require the auditors to undertake;• other services – statutory auditors may carry out work that they
are best placed to undertake, including internal control reviews;• acquisition and disposal services – where the auditors are best
placed to do this work;• tax services – all significant tax consulting work is put to tender,
except where the auditors are best placed to do this; and• general consulting – external auditors may not tender for
general consulting work.
All engagements over €100,000 require specific advance approvalof the Audit Committee Chairman. The overall policy is regularlyreviewed and, where necessary, updated in the light of internaldevelopments, external developments and best practice.
Internal audit functionThe Committee reviewed the Corporate Audit department’s audit plan for the year, and agreed its budget and resourcerequirements. The Committee carried out a formal evaluation ofthe performance of the internal audit function and confirmed thatthey were satisfied with the effectiveness of the function. TheCommittee held independent meetings with the Chief Auditorduring the year.
Audit Committee terms of referenceThe Audit Committee’s terms of reference are reviewed annuallyby the Committee taking into account relevant legislation andrecommended good practice. The terms of reference can beviewed on Unilever’s website or supplied on request.
Board Assessment of the Audit CommitteeThe Board evaluated the performance of the Committee and theCommittee carried out a self-assessment of its performance.
Kees Storm Chairman of the Audit CommitteeWim DikCharles GoldenByron Grote
Report of the Corporate Responsibility and Reputation Committee
64 Unilever Annual Report and Accounts 2009
Report of the Directors Governance
Terms of referenceThe Corporate Responsibility and Reputation Committee overseesUnilever’s conduct as a responsible multinational business. It is alsocharged with ensuring that Unilever’s reputation is protected andenhanced. Inherent in this is the need to identify any externaldevelopments which are likely to have an influence upon Unilever’sstanding in society and to bring these to the attention of theBoards.
Pursuant to this remit the Boards have expressly delegated to theCommittee day-to-day oversight of the conduct of Unilever’sresponse to the ongoing investigations by the EuropeanCommission and other national authorities into allegedinfringements of competition law. The Chief Legal Officer andexternal counsel report to the Committee in this regard andmatters are then considered by the full Board. For furtherinformation please refer to ‘Legal proceedings’ on page 122.
The Committee comprises four independent Non-ExecutiveDirectors: Leon Brittan (Chairman), Hixonia Nyasulu, NarayanaMurthy and Louise Fresco.
To ensure that it is kept up to date with current and emergingsustainability issues, the Committee benefits from the insights oftwo groups. The first is the Unilever Sustainable DevelopmentGroup (USDG) – five experts from outside the Group who adviseon Unilever’s sustainability strategy. The second is CRISP, theCorporate Responsibility, Issues, Sustainability and Partnershipsgroup of senior executives from across the business. Both groupsare chaired by Vindi Banga, President Foods, Home and PersonalCare and member of the Unilever Executive.
The Committee’s terms of reference and details of the UnileverSustainable Development Group are available on our website at www.unilever.com
Meetings Meetings are held quarterly. The Committee Chairman reports theconclusions to the Board.
In 2009 the Committee continued to offer its advice on thedevelopment of Unilever’s sustainability strategy. Members wereupdated on the Group’s sustainability priorities (climate change,water, sustainable sourcing and waste) and commented onproposals for creating business-wide environmental targets.
Topics discussed in 2009 included: competition-related issues; food labelling and health claims; genetically modified organisms inthe food chain; packaging; palm oil, deforestation and climatechange. Particular attention was given to the topics set out below.
Code of Business Principles and Business Partner Code The Committee scrutinises two important codes of practice – theCode of Business Principles and the Business Partner Code – toensure that they remain fit for purpose and are appropriatelyapplied. It complements the role of the Audit Committee, whichconsiders the Codes as part of its remit to review riskmanagement.
The Committee is responsible for the oversight of both codes.Implementation rests with the Unilever Executive who aresupported by the Corporate Code Committee and the global codecompliance organisation. Implementation is further supported bythe legal function for the Code of Business Principles and thesupply management function for the Business Partner Code.Supply management is also responsible for gaining assurance fromsuppliers that they adhere to the Business Partner Code.
Code of Business PrinciplesThe Code of Business Principles sets out the standards of conductto which we expect our employees to adhere. It is complementedby a ‘Management Commentary’ which provides guidelines foremployees on practical implementation of the Code of BusinessPrinciples. In 2009 Unilever’s Global Code Officer conducted abenchmarking exercise on the Commentary, leading to clearer andmore detailed guidance on topics such as gifts and entertainment.
In 2009 existing training on the Code was strengthened by theroll-out of a new online training module and separate trainingsessions on compliance with competition policy.
The Committee endorsed these developments as they are essentialin ensuring that Unilever’s standards are well-understood andrespected by employees.
Alleged infringements of the Code of Business Principles aremonitored by the Committee. This responsibility includes allegedinfringements of competition law.
Business Partner CodeUnilever’s Business Partner Code sets the standards that we expectof suppliers in areas such as health and safety at work, businessintegrity, respect for labour standards, consumer safety andsafeguarding the environment.
The Committee has monitored the development andimplementation of the Code over recent years. The Code issupported by an Assurance Policy that sets out the operationalstandards needed from suppliers to deliver the Code’scommitments.
Labour standards Between 2006 and 2009, four complaints were brought toUnilever's attention by the International Union of Food,Agricultural, Hotel, Restaurant, Catering, Tobacco and AlliedWorkers' Associations (IUF) relating to our operations in India andPakistan. These complaints concerned site closure (Sewri factory,India), freedom of association and collective bargaining (DoomDooma factory, India) and the use of temporary and contractedlabour at our factories in Pakistan (Rahim Yar Khan andKhanewal). A further complaint regarding a supplier’s factory inTurkey was submitted by the Turkish transport union TUMTISin 2008.
Under the terms of the OECD Guidelines for MultinationalEnterprises, the unions referred their complaints to the OECD'sNational Contact Points in the UK and Turkey for investigation.
Four of the complaints have been resolved:
• The TUMTIS complaint in Turkey was settled locally in January2009;
• Unilever Pakistan reached agreement with the IUF to settle thedispute at Rahim Yar Khan in June 2009. In October UnileverPakistan reached an agreement relating to Khanewal; and
• at Sewri, a settlement payment was agreed by HindustanUnilever and local trade union representatives (HLEU) in October 2009.
Unilever Annual Report and Accounts 2009 65
The only case outstanding is at Doom Dooma, India where thecompany is seeking resolution of the issue.
Given the potential damage that these complaints pose toUnilever’s reputation as a responsible business, the Committeekept a close watch on progress during the year. Members urgedUnilever to address the matter in detail and welcomed the revisedapproach that the Group put in place to adjust its labour practices.
Leon BrittanChairman of the Corporate Responsibility andReputation CommitteeLouise FrescoNarayana MurthyHixonia Nyasulu
66 Unilever Annual Report and Accounts 2009
Report of the Directors Governance
Report of the Nomination Committee
Terms of ReferenceThe Nomination Committee comprises two Independent Non-Executive Directors and the Chairman. Following the retirement ofDavid Simon at the 2009 AGMs, it is chaired by Jeroen van derVeer. Its other members are Michael Treschow and, following hisappointment at the 2009 AGMs, Paul Walsh. The Group Secretaryacts as secretary to the Committee.
The Nomination Committee is responsible for drawing up selectioncriteria and appointment procedures for Directors. Under Unilever’scorporate governance arrangements Executive and Non-ExecutiveDirectors offer themselves for election each year at the AnnualGeneral Meetings. The Nomination Committee is responsible forrecommending candidates for nomination as Executive Directors,including the Chief Executive Officer, and Non-Executive Directorseach year based on the process of evaluations referred to below.After Directors have been appointed by shareholders theCommittee recommends to the Board candidates for election asChairman and Vice-Chairman. The Committee also hasresponsibility for supervising the policy of the Chief ExecutiveOfficer on the selection criteria and appointment procedures forsenior management and it keeps oversight of all matters relatingto corporate governance, bringing any issues to the attention ofthe Boards. The Committee’s Terms of Reference are available onour website www.unilever.com/investorrelations/corp_governance
Process for the appointment of DirectorsUnilever has formal procedures for evaluation of the Boards, theBoard Committees and the individual Directors. The Chairman, in conjunction with the Senior Independent Director, leads theprocess whereby the Board assesses its own performance and theresults of the evaluations are provided to the Committee when itdiscusses the nominations for re-election as Directors.
Where a vacancy arises on the Boards, the Committee seeks theservices of specialist recruitment firms and other external expertsto assist in finding individuals with the appropriate skills andexpertise.
In nominating Directors, the Committee follows the agreed BoardProfile of potential Non-Executive Directors, which takes intoaccount the roles of Non-Executive Directors set out in the DutchCorporate Governance Code and the UK Combined Code onCorporate Governance. Under the terms of The Governance ofUnilever the Boards should comprise a majority of Non-ExecutiveDirectors. To represent Unilever’s areas of interest, the profile alsoindicates there should be a strong representation from Developingand Emerging markets as well as from Europe and North America.Non-Executive Directors should be independent of Unilever andfree from any conflicts of interest. The profile looks at diversity in terms of nationality, race, gender and relevant expertise anddirects that, wherever possible, the Boards should reflect Unilever’sconsumer base.
Activities of the Committee during the yearThe Committee met six times in 2009. All meetings were attendedby Jeroen van der Veer and Michael Treschow. Paul Walshattended two meetings after joining the Committee in May 2009.The members also regularly met outside of formal Committeemeetings to discuss succession issues.
At the AGMs in May 2009, David Simon retired as a Non-ExecutiveDirector. Jeroen van der Veer succeeded David Simon as Vice-Chairman, Senior Independent Director and Chairman of theNomination Committee from the conclusion of the 2009 AGMs.
The Committee proposed the nomination of all Directors offeringthemselves for re-election at the 2009 AGMs. During 2009, theCommittee also proposed the nominations of Louise Fresco, AnnFudge and Paul Walsh as Non-Executive Directors at the AGMs inMay 2009. These nominees were chosen to further strengthen therange of expertise available on the Boards, as well as respondingto our diversity criteria. Ann Fudge and Paul Walsh weresubsequently appointed to the Remuneration Committee and PaulWalsh was also appointed to the Nomination Committee. Inmaking these appointments the Committee was supported by anindependent executive search firm chosen by the Committeewhich had been engaged to identify suitable candidates for theroles required.
In 2009 an independent executive search firm chosen by thecommittee was also engaged to identify candidates for the role of Chief Financial Officer, in the light of the resignation of JimLawrence as from the year end. The process resulted in theCommittee’s recommendation to the Boards to nominate Jean-Marc Huët as Jim Lawrence’s successor. The Committee ispleased to have identified a strong candidate whose backgroundand expertise in the corporate and financial world will beimportant in helping realise our growth ambitions. Following asmooth transition Jean-Marc Huët became Chief Financial Officerin February 2010, and he will be nominated for election as anExecutive Director at the 2010 AGMs.
The Committee received a full presentation of Unilever initiativesbeing implemented in 2009 in relation to Senior Leadershipchanges and endorsed management’s approach. A successfuldiversity programme was considered essential for Unilever and aspart of establishing an articulated performance culture.
The Committee reviewed and approved the externalbenchmarking of the capabilities, strengths and opportunities ofthe Senior Executives carried out by the Chief Executive Officerand Chief HR Officer. Periodically throughout the year theCommittee reviewed with the Chief Executive Officer proposedchanges to roles and responsibilities amongst senior executives.
During the year the Committee reviewed the Board profile andupdated the composition, desired expertise and experience andavailability elements of the profile, to reflect the currentrequirements of the Boards.
An internal evaluation was undertaken by the Chairman andSenior Independent Director with the assistance of the GroupSecretary during 2009 in relation to the performance of theBoards, of the Chairman, of the individual Directors and of theBoard Committees. This evaluation, as in the previous two years,was based on the completion of questionnaires and a series ofinterviews with individual Directors. The Committee has alsocarried out an assessment of its own performance, led by theCommittee Chairman.
Supported by an independent executive search firm, the Committeecarried out a search for a new Non-Executive Director and isdelighted that The Rt Hon Sir Malcolm Rifkind MP has agreed to joinour Boards. Sir Malcolm’s experience will further strengthen theexpertise of the Boards particularly in the areas of governance andreputation. Sir Malcolm will be nominated by the Committee forelection as Non-Executive Director at the 2010 AGMs.
Jeroen van der Veer Chairman of the Nomination CommitteeMichael TreschowPaul Walsh
Unilever Annual Report and Accounts 2009 67
Directors’ Remuneration Report
The Committee’s aim is to ensure that the remunerationarrangements for Unilever’s Executive Directors support Unilever’sdrive for profitable growth and a level of performance amongstthe best of our peers.
As a result the Committee has decided to make adjustments tothe remuneration structure for Executive Directors and otherUnilever senior managers. These are:
• a significant increase in the required shareholding levels forUnilever managers from January 2010;
• the introduction of a new operating margin measure and anamended cash flow measure for Global Share Incentive Planawards from 2010 onwards; and
• for Executive Directors, replacing underlying sales growthand trading contribution with underlying volume growth,underlying operating margin and trade working capitalimprovement as drivers for the business performance of theAnnual Bonus from 2010 onwards. This brings theirperformance measures in line with those for the other managersin Unilever.
I would emphasise that the Committee has made no changes tothe remuneration levels for Executive Directors. As in 2009, andgiven prevailing economic circumstances, the Committee hasdecided that it is not appropriate to increase base salaries in 2010for Executive Directors nor for most other senior business leaders.The Committee has also decided to exclude the Executive Directorsfrom participation in the Management Co-Investment Plan (whichshareholders will be asked to approve at the forthcoming AGMs)at least for the first year of its operation in 2011. Our managersbelow Board level will, however, be invited to participate in thenew plan in 2011. The Committee is of the view that wider shareownership will encourage greater commitment, engagement andalignment with our shareholders.
The rewards received by Executive Directors over 2009 reflectUnilever’s good underlying progress towards its longer-termobjectives especially in the current tough trading environment.
Jeroen van der Veer Chairman of the Remuneration Committee Ann FudgeMichael TreschowPaul Walsh
Remuneration CommitteeIt is the role and terms of reference of the RemunerationCommittee (the Committee) to make proposals to the Boards fordecisions on:
• the individual remuneration arrangements for ExecutiveDirectors;
• the remuneration policy for the Unilever Executive as a whole;and
• the design and terms of all share-based plans.
During 2009 the Committee comprised Jeroen van der Veer, whobecame Committee Chairman in May 2009 on the retirement ofDavid Simon, Michael Treschow and, from May 2009, Ann Fudgeand Paul Walsh.
While it is the Committee’s responsibility to exercise independentjudgement, the Committee does request advice frommanagement and professional advisers, as appropriate, to ensureits decisions are fully informed given the internal and externalenvironment.
During 2009, the Chief Executive Officer provided the Committeewith his views on business objectives and, together with the ChiefHuman Resources Officer, remuneration arrangements for seniorexecutives were framed so as to be aligned with these objectives.The Committee also received legal and compliance advice fromthe Chief Legal Officer supported by external counsel.
A copy of the Committee’s terms of reference is available onUnilever’s website. Details on meeting attendance are contained inthe section on ‘Corporate Governance’ on page 54.
Executive Directors
Our aims and guiding principlesThe overriding aim of the Committee is to ensure that theremuneration arrangements for Executive Directors support thelonger-term objectives of Unilever and, in turn, the longer-terminterests of shareholders.
This means that we must ensure that:
• the fixed elements of the remuneration package offered toExecutive Directors are sufficiently competitive to attract andretain highly experienced and talented individuals; and
• the performance-related elements are structured so that targetlevels are competitive but Executive Directors can only earnhigher rewards once they have delivered to the standards ofperformance that Unilever requires.
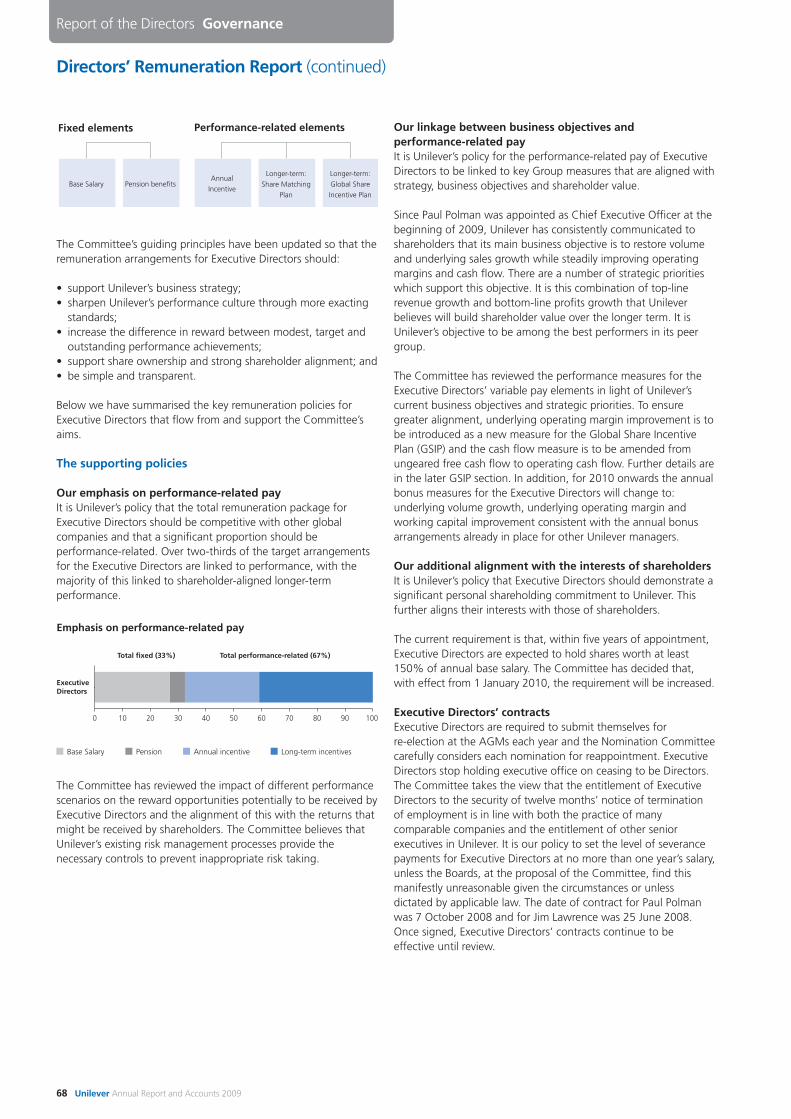
68 Unilever Annual Report and Accounts 2009
Report of the Directors Governance
Directors’ Remuneration Report (continued)
The Committee’s guiding principles have been updated so that theremuneration arrangements for Executive Directors should:
• support Unilever’s business strategy;• sharpen Unilever’s performance culture through more exacting
standards;• increase the difference in reward between modest, target and
outstanding performance achievements; • support share ownership and strong shareholder alignment; and• be simple and transparent.
Below we have summarised the key remuneration policies forExecutive Directors that flow from and support the Committee’saims.
The supporting policies
Our emphasis on performance-related payIt is Unilever’s policy that the total remuneration package forExecutive Directors should be competitive with other globalcompanies and that a significant proportion should beperformance-related. Over two-thirds of the target arrangementsfor the Executive Directors are linked to performance, with themajority of this linked to shareholder-aligned longer-termperformance.
The Committee has reviewed the impact of different performancescenarios on the reward opportunities potentially to be received byExecutive Directors and the alignment of this with the returns thatmight be received by shareholders. The Committee believes thatUnilever’s existing risk management processes provide thenecessary controls to prevent inappropriate risk taking.
0 10 20 30 40 50 60 70 80 90 100
Emphasis on performance-related pay
Base Salary Long-term incentivesAnnual incentivePension
Total fixed (33%)
ExecutiveDirectors
Total performance-related (67%)
Base Salary Pension benefitsAnnual
Incentive
Longer-term:
Share Matching
Plan
Longer-term:
Global Share
Incentive Plan
Fixed elements Performance-related elements Our linkage between business objectives and performance-related pay It is Unilever’s policy for the performance-related pay of ExecutiveDirectors to be linked to key Group measures that are aligned withstrategy, business objectives and shareholder value.
Since Paul Polman was appointed as Chief Executive Officer at thebeginning of 2009, Unilever has consistently communicated toshareholders that its main business objective is to restore volumeand underlying sales growth while steadily improving operatingmargins and cash flow. There are a number of strategic prioritieswhich support this objective. It is this combination of top-linerevenue growth and bottom-line profits growth that Unileverbelieves will build shareholder value over the longer term. It isUnilever’s objective to be among the best performers in its peergroup.
The Committee has reviewed the performance measures for theExecutive Directors’ variable pay elements in light of Unilever’scurrent business objectives and strategic priorities. To ensuregreater alignment, underlying operating margin improvement is tobe introduced as a new measure for the Global Share IncentivePlan (GSIP) and the cash flow measure is to be amended fromungeared free cash flow to operating cash flow. Further details arein the later GSIP section. In addition, for 2010 onwards the annualbonus measures for the Executive Directors will change to:underlying volume growth, underlying operating margin andworking capital improvement consistent with the annual bonusarrangements already in place for other Unilever managers.
Our additional alignment with the interests of shareholdersIt is Unilever’s policy that Executive Directors should demonstrate asignificant personal shareholding commitment to Unilever. Thisfurther aligns their interests with those of shareholders.
The current requirement is that, within five years of appointment,Executive Directors are expected to hold shares worth at least150% of annual base salary. The Committee has decided that,with effect from 1 January 2010, the requirement will be increased.
Executive Directors’ contracts Executive Directors are required to submit themselves for re-election at the AGMs each year and the Nomination Committeecarefully considers each nomination for reappointment. ExecutiveDirectors stop holding executive office on ceasing to be Directors.The Committee takes the view that the entitlement of ExecutiveDirectors to the security of twelve months’ notice of terminationof employment is in line with both the practice of manycomparable companies and the entitlement of other seniorexecutives in Unilever. It is our policy to set the level of severancepayments for Executive Directors at no more than one year’s salary,unless the Boards, at the proposal of the Committee, find thismanifestly unreasonable given the circumstances or unlessdictated by applicable law. The date of contract for Paul Polmanwas 7 October 2008 and for Jim Lawrence was 25 June 2008.Once signed, Executive Directors’ contracts continue to beeffective until review.
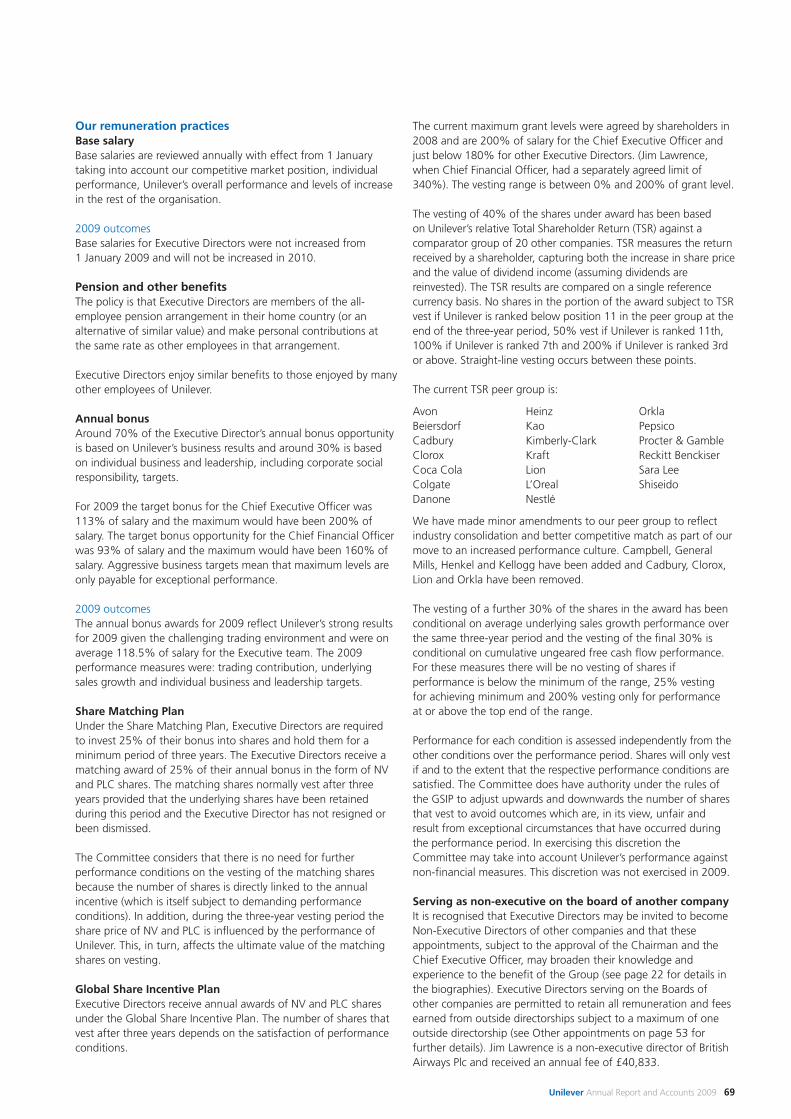
Unilever Annual Report and Accounts 2009 69
Our remuneration practicesBase salaryBase salaries are reviewed annually with effect from 1 Januarytaking into account our competitive market position, individualperformance, Unilever’s overall performance and levels of increasein the rest of the organisation.
2009 outcomesBase salaries for Executive Directors were not increased from 1 January 2009 and will not be increased in 2010.
Pension and other benefitsThe policy is that Executive Directors are members of the all-employee pension arrangement in their home country (or analternative of similar value) and make personal contributions at the same rate as other employees in that arrangement.
Executive Directors enjoy similar benefits to those enjoyed by manyother employees of Unilever.
Annual bonusAround 70% of the Executive Director’s annual bonus opportunityis based on Unilever’s business results and around 30% is basedon individual business and leadership, including corporate socialresponsibility, targets.
For 2009 the target bonus for the Chief Executive Officer was113% of salary and the maximum would have been 200% ofsalary. The target bonus opportunity for the Chief Financial Officerwas 93% of salary and the maximum would have been 160% ofsalary. Aggressive business targets mean that maximum levels areonly payable for exceptional performance.
2009 outcomesThe annual bonus awards for 2009 reflect Unilever’s strong resultsfor 2009 given the challenging trading environment and were onaverage 118.5% of salary for the Executive team. The 2009performance measures were: trading contribution, underlyingsales growth and individual business and leadership targets.
Share Matching PlanUnder the Share Matching Plan, Executive Directors are required to invest 25% of their bonus into shares and hold them for aminimum period of three years. The Executive Directors receive amatching award of 25% of their annual bonus in the form of NVand PLC shares. The matching shares normally vest after threeyears provided that the underlying shares have been retainedduring this period and the Executive Director has not resigned orbeen dismissed.
The Committee considers that there is no need for furtherperformance conditions on the vesting of the matching sharesbecause the number of shares is directly linked to the annualincentive (which is itself subject to demanding performanceconditions). In addition, during the three-year vesting period theshare price of NV and PLC is influenced by the performance ofUnilever. This, in turn, affects the ultimate value of the matchingshares on vesting.
Global Share Incentive PlanExecutive Directors receive annual awards of NV and PLC sharesunder the Global Share Incentive Plan. The number of shares thatvest after three years depends on the satisfaction of performanceconditions.
The current maximum grant levels were agreed by shareholders in2008 and are 200% of salary for the Chief Executive Officer andjust below 180% for other Executive Directors. (Jim Lawrence,when Chief Financial Officer, had a separately agreed limit of340%). The vesting range is between 0% and 200% of grant level.
The vesting of 40% of the shares under award has been basedon Unilever’s relative Total Shareholder Return (TSR) against acomparator group of 20 other companies. TSR measures the returnreceived by a shareholder, capturing both the increase in share priceand the value of dividend income (assuming dividends arereinvested). The TSR results are compared on a single referencecurrency basis. No shares in the portion of the award subject to TSRvest if Unilever is ranked below position 11 in the peer group at theend of the three-year period, 50% vest if Unilever is ranked 11th,100% if Unilever is ranked 7th and 200% if Unilever is ranked 3rdor above. Straight-line vesting occurs between these points.
The current TSR peer group is:
Avon Heinz OrklaBeiersdorf Kao PepsicoCadbury Kimberly-Clark Procter & GambleClorox Kraft Reckitt BenckiserCoca Cola Lion Sara LeeColgate L’Oreal ShiseidoDanone Nestlé
We have made minor amendments to our peer group to reflectindustry consolidation and better competitive match as part of ourmove to an increased performance culture. Campbell, GeneralMills, Henkel and Kellogg have been added and Cadbury, Clorox,Lion and Orkla have been removed.
The vesting of a further 30% of the shares in the award has beenconditional on average underlying sales growth performance overthe same three-year period and the vesting of the final 30% isconditional on cumulative ungeared free cash flow performance.For these measures there will be no vesting of shares ifperformance is below the minimum of the range, 25% vesting for achieving minimum and 200% vesting only for performance at or above the top end of the range.
Performance for each condition is assessed independently from theother conditions over the performance period. Shares will only vestif and to the extent that the respective performance conditions aresatisfied. The Committee does have authority under the rules ofthe GSIP to adjust upwards and downwards the number of sharesthat vest to avoid outcomes which are, in its view, unfair andresult from exceptional circumstances that have occurred duringthe performance period. In exercising this discretion theCommittee may take into account Unilever’s performance againstnon-financial measures. This discretion was not exercised in 2009.
Serving as non-executive on the board of another companyIt is recognised that Executive Directors may be invited to becomeNon-Executive Directors of other companies and that theseappointments, subject to the approval of the Chairman and theChief Executive Officer, may broaden their knowledge andexperience to the benefit of the Group (see page 22 for details inthe biographies). Executive Directors serving on the Boards ofother companies are permitted to retain all remuneration and feesearned from outside directorships subject to a maximum of oneoutside directorship (see Other appointments on page 53 forfurther details). Jim Lawrence is a non-executive director of BritishAirways Plc and received an annual fee of £40,833.
UNI04_01 AR_09 Pp063-074.qxd 3/3/10 23:12 Page 69
70 Unilever Annual Report and Accounts 2009
Report of the Directors Governance
Directors’ Remuneration Report (continued)
Proposed changes from 2010 onwards
Annual BonusFor Executive Directors, we are replacing underlying sales growthand trading contribution with underlying volume growth,underlying operating margin and trade working capitalimprovement as drivers for the business performance for theAnnual Bonus from 2010 onwards. This brings their performancemeasures in line with those for the other managers in Unilever.
Global Share Incentive PlanThe performance measures attached to GSIP awards will be:
• underlying sales growth (as now)• underlying operating margin improvement (a new measure); • operating cash flow (instead of ungeared free cash flow); and • relative total shareholder return (as now) but with a revised
reference group as set out earlier.
The structure of vesting will remain the same as for previousawards except that for Executive Directors and the UnileverExecutive the four measures will be equally weighted. In addition,the minimum of the performance range for both underlying salesgrowth and underlying operating margin must be reached beforeany shares subject to either metric can vest. At the end of thethree-year performance period the Committee will also assessUnilever’s performance against the internal measures relative tothe performance of peer group companies. Dividends will also bere-invested in respect of the shares under award but will only bepaid out to the extent that the underlying shares vest.
It is also proposed that, with respect to GSIP awards made in2008 and 2009, these performance measures will apply to thoseyears of the performance period that have yet to be completed.For example, for GSIP awards made in 2009, this means thatthe original performance conditions will apply for 2009 and the updated performance measures for 2010 and 2011. TheRemuneration Committee is satisfied that the new measuresare no easier to satisfy. This is confirmed by independent advice.
Shareholding commitmentThe Committee has decided that, with effect from 1 January2010, the shareholding commitment should be increased to 400% of base salary for the Chief Executive Officer and to 300% for other Executive Directors and the Unilever Executive.
New Management Co-Investment PlanAt the 2010 AGMs, shareholders will be asked to approve a newManagement Co-Investment Plan. The Plan is being introduced tosupport Unilever’s drive for profitable growth by encouragingUnilever’s managers to take a greater financial interest in theperformance of the Company and the value of Unilever sharesover the long term. Under the new plan, Unilever’s seniormanagers will have the opportunity to invest up to 60% of theirannual bonus in Unilever shares and to receive a corresponding
award of performance shares. The performance shares will vestafter three years, depending on Unilever’s performance, continuedemployment and maintenance of the underlying investment. Theperformance measures for the new Plan will be the same as weare proposing to introduce for the Global Share Incentive Plan (asset out earlier in this report) to ensure alignment with the drive forprofitable growth. As under the GSIP, the maximum vesting levelwill be 200% for outstanding performance. Although ExecutiveDirectors will be eligible, technically, to participate in the new Plan,the Remuneration Committee has determined that participation in the new Plan is unnecessary for the time being given theadditional alignment provided through the amended GSIPperformance measures and the increased share ownershiprequirements. Further details on the new Plan are available in the Notices of Meeting to the AGMs.
Arrangements for Jim LawrenceJim Lawrence left Unilever in December 2009. His salary has beenpaid until 31 December 2009 and his annual bonus for 2009 hasbeen paid in full. The matching shares of his 2007 Share Matchingaward have vested. The final tranche of the 2007 restricted shareaward will vest later in 2010 and the 2007 GSIP performanceaward will also vest later this year but will be time-proportioned.The shares awarded in 2008 and 2009 both under the ShareMatching Plan and the GSIP have lapsed in full.
Arrangements for Jean-Marc HuëtJean-Marc Huët joined Unilever in February 2010 as Chief FinancialOfficer. He will be proposed for election to the Boards of NV andPLC at the AGMs in May 2010. Given Unilever’s objective ofbalancing remuneration more clearly towards performance-linkedvariable pay, the agreed package follows this policy direction. Hissalary in 2010 has been set at £680,000 per annum; the maximumannual bonus opportunity for 2010 will be 150% of salary and thegrant value in 2010 under the GSIP will be 180% of salary. He willbe in a defined contribution plan with a similar value to that ofUnilever’s in the Netherlands, his home country.
To compensate for the forfeiture of incentives from his formeremployer he has received a cash bonus of £680,000 and arestricted share award with a value of £2.6 million. The shares willvest in instalments of one-third of the total number of restrictedshares on each anniversary of the grant date over the next threeyears, provided that he remains an employee of the companythrough each vesting date.
Jean-Marc Huët has purchased 23,000 NV ordinary shares and23,000 PLC ordinary shares.
UNI04_01 AR_09 Pp063-074.qxd 3/3/10 17:38 Page 70
Unilever Annual Report and Accounts 2009 71
Executive Directors’ remuneration in 2009Remuneration for individual Executive Directors (audited)
Annual Emoluments 2009
AllowancesBase and other Value of
salary payments(a) benefits(b) Bonus TotalName and Base Country € ‘000 € ‘000 € ‘000 € ‘000 € ‘000
Jim Lawrence (UK)(d) 816 17 4 918 1,755
Paul Polman (UK)(e) 1,033 402 2 1,687(c) 3,124
Total 2009 1,849 419 6 2,605 4,879
Total 2008 (including former Directors) 2,682 1,154 62 4,156 8,054
(a) Includes allowance in lieu of company car, entertaining allowance, a one-off housing allowance and payment for social security obligations incountry of residence in 2008 and 2009.
(b) Includes benefits for private use of chauffeur-driven cars and medical insurance. Included are benefits that are taxable in the country ofresidence. In addition, Unilever provides support to Executive Directors in relation to spouses’ travel expenses when travelling together oncompany business. This amount is capped at 5% of base salary and for 2009 totalled €130,506 (including related taxes payable).
(c) Bonus for the year 2009. Includes the value of both the cash element and the element paid in shares of NV and PLC. In addition to theelement of the bonus paid in shares, an equivalent number of matching shares is awarded on a conditional basis.
(d) Chief Financial Officer. Base salary set in US dollars was $1,133,000 per annum. (e) Chief Executive Officer. Base salary set in sterling was £920,000 per annum.
Amounts have been translated into euros using the average exchange rate over the year: €1 = £0.8905 (2008: €1 = £0.7880) and €1 = $1.388(2008: €1 = $1.468).
Both Jim Lawrence and Paul Polman are members of a defined contribution arrangement. The company contribution during the period was€73,000 for Jim Lawrence and €292,000 for Paul Polman. The contribution for Paul Polman includes €130,000 accrued to compensate for theforfeiture of pension from his previous employer, which will vest at age 60 or later at actual retirement date. In addition, Jim Lawrence made apersonal contribution of €41,000 and Paul Polman made a personal contribution of €16,000, both by individual salary sacrifice. The total pensioncontributions, including all the company contributions paid, the contributions by individual salary sacrifice and the cost of death in serviceprovision were €147,000 for Jim Lawrence and €330,000 for Paul Polman.
Share Matching Plan (audited)
Balance of Balance ofconditional conditional
shares shares atat 1 January Conditional shares 31 December
2009 awarded in 2009(a) 2009Share No. of No. of Price at No. oftype shares shares award shares
Jim Lawrence NV 1,830 9,069 €13.59 10,899PLC 1,830 9,069 £12.46 10,899
Paul Polman NV – 3,413 €13.59 3,413PLC – 3,413 £12.46 3,413
(a) Each award of matching shares is conditional and vests three years after the date of the award subject to certain conditions. The 2009 awardwas made at grant date 19 March 2009.
Global Share Incentive Plan (audited)The following conditional shares were granted during 2009 and outstanding at 31 December 2009 under the Global Share Incentive Plan:
Balance of Conditional grant 2009 Balance ofconditional shares at (Performance period conditional shares at
1 January 2009 1 January 2009 to 31 December 2011)(a) 31 December 2009
Share type No. of shares No. of shares(a) Price at award No. of shares
Jim Lawrence NV 106,947 103,811 €13.59 210,758PLC 106,947 103,811 £12.46 210,758
Paul Polman NV 58,752 69,210 €13.59 127,962PLC 58,752 69,210 £12.46 127,962
(a) Each award of conditional shares vests subject to certain conditions three years after the date of the award. The 2009 award was made atgrant date 19 March 2009.
UNI04_01 AR_09 Pp063-074.qxd 3/3/10 13:17 Page 71
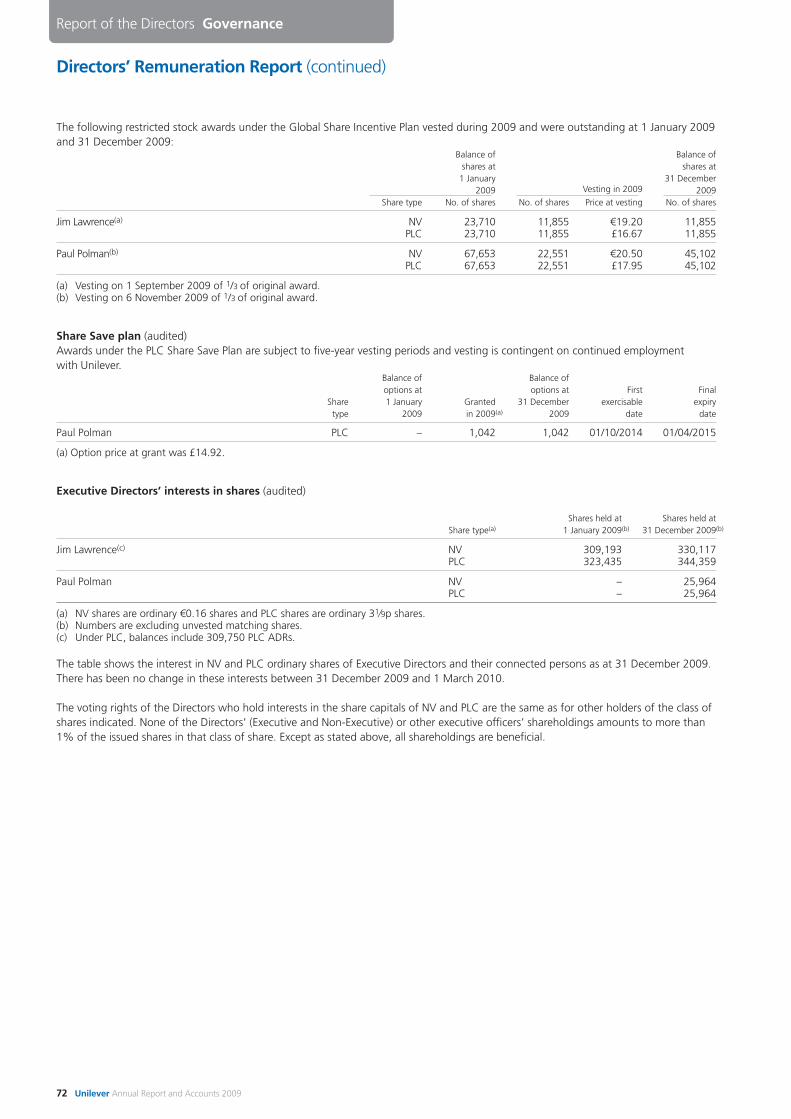
72 Unilever Annual Report and Accounts 2009
Report of the Directors Governance
Directors’ Remuneration Report (continued)
The following restricted stock awards under the Global Share Incentive Plan vested during 2009 and were outstanding at 1 January 2009and 31 December 2009:
Balance of Balance ofshares at shares at
1 January 31 December2009 Vesting in 2009 2009
Share type No. of shares No. of shares Price at vesting No. of shares
Jim Lawrence(a) NV 23,710 11,855 €19.20 11,855PLC 23,710 11,855 £16.67 11,855
Paul Polman(b) NV 67,653 22,551 €20.50 45,102PLC 67,653 22,551 £17.95 45,102
(a) Vesting on 1 September 2009 of 1/3 of original award.(b) Vesting on 6 November 2009 of 1/3 of original award.
Share Save plan (audited)Awards under the PLC Share Save Plan are subject to five-year vesting periods and vesting is contingent on continued employmentwith Unilever.
Balance of Balance ofoptions at options at First Final
Share 1 January Granted 31 December exercisable expirytype 2009 in 2009(a) 2009 date date
Paul Polman PLC – 1,042 1,042 01/10/2014 01/04/2015
(a) Option price at grant was £14.92.
Executive Directors’ interests in shares (audited)
Shares held at Shares held atShare type(a) 1 January 2009(b) 31 December 2009(b)
Jim Lawrence(c) NV 309,193 330,117PLC 323,435 344,359
Paul Polman NV – 25,964PLC – 25,964
(a) NV shares are ordinary €0.16 shares and PLC shares are ordinary 31⁄9p shares.(b) Numbers are excluding unvested matching shares.(c) Under PLC, balances include 309,750 PLC ADRs.
The table shows the interest in NV and PLC ordinary shares of Executive Directors and their connected persons as at 31 December 2009.There has been no change in these interests between 31 December 2009 and 1 March 2010.
The voting rights of the Directors who hold interests in the share capitals of NV and PLC are the same as for other holders of the class ofshares indicated. None of the Directors’ (Executive and Non-Executive) or other executive officers’ shareholdings amounts to more than1% of the issued shares in that class of share. Except as stated above, all shareholdings are beneficial.
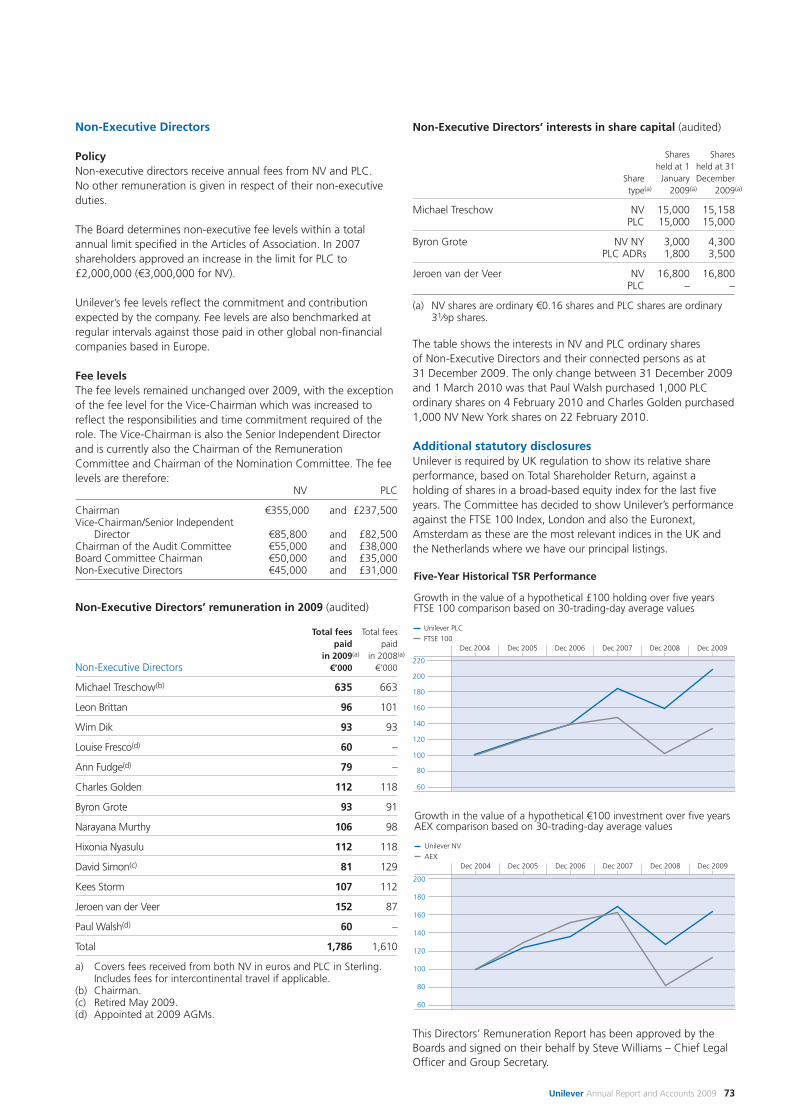
Unilever Annual Report and Accounts 2009 73
Non-Executive Directors
PolicyNon-executive directors receive annual fees from NV and PLC. No other remuneration is given in respect of their non-executiveduties.
The Board determines non-executive fee levels within a totalannual limit specified in the Articles of Association. In 2007shareholders approved an increase in the limit for PLC to£2,000,000 (€3,000,000 for NV).
Unilever’s fee levels reflect the commitment and contributionexpected by the company. Fee levels are also benchmarked atregular intervals against those paid in other global non-financialcompanies based in Europe.
Fee levelsThe fee levels remained unchanged over 2009, with the exceptionof the fee level for the Vice-Chairman which was increased toreflect the responsibilities and time commitment required of therole. The Vice-Chairman is also the Senior Independent Directorand is currently also the Chairman of the RemunerationCommittee and Chairman of the Nomination Committee. The feelevels are therefore:
NV PLC
Chairman €355,000 and £237,500Vice-Chairman/Senior Independent
Director €85,800 and £82,500Chairman of the Audit Committee €55,000 and £38,000Board Committee Chairman €50,000 and £35,000Non-Executive Directors €45,000 and £31,000
Non-Executive Directors’ remuneration in 2009 (audited)
Total fees Total feespaid paid
in 2009(a) in 2008(a)
Non-Executive Directors €’000 €’000
Michael Treschow(b) 635 663
Leon Brittan 96 101
Wim Dik 93 93
Louise Fresco(d) 60 –
Ann Fudge(d) 79 –
Charles Golden 112 118
Byron Grote 93 91
Narayana Murthy 106 98
Hixonia Nyasulu 112 118
David Simon(c) 81 129
Kees Storm 107 112
Jeroen van der Veer 152 87
Paul Walsh(d) 60 –
Total 1,786 1,610
a) Covers fees received from both NV in euros and PLC in Sterling.Includes fees for intercontinental travel if applicable.
(b) Chairman.(c) Retired May 2009.(d) Appointed at 2009 AGMs.
Non-Executive Directors’ interests in share capital (audited)
Shares Sharesheld at 1 held at 31
Share January Decembertype(a) 2009(a) 2009(a)
Michael Treschow NV 15,000 15,158PLC 15,000 15,000
Byron Grote NV NY 3,000 4,300PLC ADRs 1,800 3,500
Jeroen van der Veer NV 16,800 16,800PLC – –
(a) NV shares are ordinary €0.16 shares and PLC shares are ordinary31⁄9p shares.
The table shows the interests in NV and PLC ordinary shares of Non-Executive Directors and their connected persons as at 31 December 2009. The only change between 31 December 2009and 1 March 2010 was that Paul Walsh purchased 1,000 PLCordinary shares on 4 February 2010 and Charles Golden purchased1,000 NV New York shares on 22 February 2010.
Additional statutory disclosuresUnilever is required by UK regulation to show its relative shareperformance, based on Total Shareholder Return, against aholding of shares in a broad-based equity index for the last fiveyears. The Committee has decided to show Unilever’s performanceagainst the FTSE 100 Index, London and also the Euronext,Amsterdam as these are the most relevant indices in the UK andthe Netherlands where we have our principal listings.
This Directors’ Remuneration Report has been approved by theBoards and signed on their behalf by Steve Williams – Chief LegalOfficer and Group Secretary.
Unilever NV
AEXDec 2004 Dec 2005 Dec 2006 Dec 2007 Dec 2008 Dec 2009
200
160
180
120
140
100
80
60
Growth in the value of a hypothetical €100 investment over five yearsAEX comparison based on 30-trading-day average values
Unilever PLC
FTSE 100Dec 2004 Dec 2005 Dec 2006 Dec 2007 Dec 2008 Dec 2009
220
180
160
200
140
120
100
80
60
Five-Year Historical TSR Performance Growth in the value of a hypothetical £100 holding over five yearsFTSE 100 comparison based on 30-trading-day average values

74 Unilever Annual Report and Accounts 2009
This page is intentionally blank
Financial statements
Unilever Annual Report and Accounts 2009 75
Contents
Statement of Directors’ responsibilities 76
Auditors’ reports 77
Consolidated income statement 79
Consolidated statement of comprehensive income 80
Consolidated statement of changes in equity 80
Consolidated balance sheet 81
Consolidated cash flow statement 82
Notes to the consolidated financial statements 83
1 Accounting information and policies 83
2 Segment information 87
3 Gross profit and operating costs 89
4 Staff and management costs 90
5 Net ffinance costs 90
6 Taxation 91
7 Combined earnings per share 92
8 Dividends on ordinary capital 93
9 Goodwill and intangible assets 93
10 Property, plant and equipment 95
11 Other non-current assets 97
12 Inventories 98
13 Trade and other receivables 98
14 Financial assets and liabilities 99
15 Financial instruments and treasury risk management 104
16 Trade payables and other liabilities 110
17 Deferred taxation 111
18 Provisions 112
Notes to the consolidated financial statements (continued)
19 Pensions and similar obligations 113
20 Comprehensive income 117
21 Equity 118
22 Share capital 119
23 Other reserves 119
24 Retained profit 120
25 Commitments and contingent liabilities 121
26 Acquisitions and disposals 123
27 Assets held for sale and discontinued operations 125
28 Reconciliation of net profit to cash flow from
operating activities 126
29 Share-based compensation plans 126
30 Related party transactions 128
31 Remuneration of auditors 128
32 Events after the balance sheet date 128
Financial record 129
Principal group companies and non-current investments 131
Auditor’s report – Unilever N.V. 133
Company accounts – Unilever N.V. 134
Notes to the company accounts – Unilever N.V. 135
Further statutory and other information – Unilever N.V. 137
Auditor’s report – Unilever PLC 138
Company accounts – Unilever PLC 139
Notes to the company accounts – Unilever PLC 140
Further statutory and other information – Unilever PLC 142
Statement of Directors’ responsibilities
Annual accountsThe Directors are required by Part 9 of Book 2 of the Civil Code inthe Netherlands and the United Kingdom Companies Act 2006 to prepare accounts for each financial year which give a true andfair view of the state of affairs of the Unilever Group, and the NVand PLC entities as at the end of the financial year and of theprofit or loss and cash flows for that year.
The Directors consider that, in preparing the accounts, the Groupand the NV and PLC entities have used the most appropriateaccounting policies, consistently applied and supported byreasonable and prudent judgements and estimates, and that allInternational Financial Reporting Standards as adopted by the EUand as issued by the International Accounting Standards Board (in the case of the consolidated accounts) and United Kingdomaccounting standards (in the case of the parent company accounts)which they consider to be applicable have been followed.
The Directors have responsibility for ensuring that NV and PLCkeep accounting records which disclose with reasonable accuracytheir financial position and which enable the Directors to ensurethat the accounts comply with the relevant legislation. They alsohave a general responsibility for taking such steps as arereasonably open to them to safeguard the assets of the Group,and to prevent and detect fraud and other irregularities.
This statement, which should be read in conjunction with theAuditors’ report, is made with a view to distinguishing forshareholders the respective responsibilities of the Directors and of the auditors in relation to the accounts.
A copy of the financial statements of the Unilever Group isplaced on our website at www.unilever.com/investorrelations Themaintenance and integrity of the website are the responsibility ofthe Directors, and the work carried out by the auditors does notinvolve consideration of these matters. Accordingly, the auditorsaccept no responsibility for any changes that may have occurred to the financial statements since they were initially placed on thewebsite. Legislation in the United Kingdom and the Netherlandsgoverning the preparation and dissemination of financialstatements may differ from legislation in other jurisdictions.
UK law sets out additional responsibilities for the Directors of PLC regarding disclosure of information to auditors. Disclosure in respect of these responsibilities is made on page 143.
Directors’ responsibility statementEach of the Directors confirms that, to the best of his or herknowledge:
• the financial statements which have been prepared inaccordance with International Financial Reporting Standards asadopted by the EU and as issued by the InternationalAccounting Standards Board (in the case of the consolidatedaccounts) and United Kingdom accounting standards (in thecase of the PLC parent company accounts) and United Kingdomaccounting standards and Part 9 of Book 2 of the Dutch CivilCode (in the case of the NV parent company accounts), give atrue and fair view of the assets, liabilities, financial position andprofit or loss of the Group and the NV and PLC entities taken asa whole; and
• the Report of the Directors includes a fair review of thedevelopment and performance of the business and the positionof the Group and the NV and the PLC entities taken as a whole,together with a description of the principal risks anduncertainties they face.
The Directors and their functions are listed on pages 22 and 23.
Going concernThe activities of the Group, together with the factors likely toaffect its future development, performance and position are setout on pages 1 to 21 and 25 to 36. The financial position of theGroup, its cash flows, liquidity position and borrowing facilities aredescribed in the Financial Review 2009 on pages 37 to 46 and theFinancial Review 2008 on pages 47 to 49. In addition, we describein note 15 on pages 104 to 110: the Group’s objectives, policiesand processes for managing its capital; its financial riskmanagement objectives; details of its financial instruments andhedging activities; and its exposures to credit and liquidity risk.
The Group has considerable financial resources together withestablished business relationships with many customers andsuppliers in countries throughout the world. As a consequence,the Directors believe that the Group is well placed to manage itsbusiness risks successfully despite the current uncertain outlook.
After making enquiries, the Directors have a reasonableexpectation that the Group has adequate resources to continue inoperational existence for the foreseeable future. Accordingly, theycontinue to adopt the going concern basis in preparing the AnnualReport and Accounts.
Internal and disclosure controls and proceduresPlease refer to pages 30 to 34 for a discussion of Unilever’sprincipal risk factors and to page 35 for commentary on theGroup’s approach to risk management and control.
76 Unilever Annual Report and Accounts 2009
Financial statements
Auditor’s report Netherlands
Unilever Annual Report and Accounts 2009 77
Independent auditor’s report to the shareholders of Unilever N.V.
Report on the consolidated financial statementsWe have audited the consolidated financial statements which arepart of the Annual Report 2009 of the Unilever Group for the yearended 31 December 2009 which comprise the consolidatedincome statement, consolidated balance sheet, consolidated cashflow statement, consolidated statement of comprehensive income,consolidated statement of changes in equity and the related noteson pages 79 to 128 and 131 to 132.
We have reported separately on the company accounts of UnileverN.V. for the year ended 31 December 2009.
Directors’ responsibilityThe Directors are responsible for the preparation and fairpresentation of the consolidated financial statements inaccordance with International Financial Reporting Standards asadopted by the European Union and as issued by the InternationalAccounting Standards Board and with Part 9 of Book 2 of theNetherlands Civil Code, and for the preparation of the Report ofthe Directors in accordance with Part 9 of Book 2 of theNetherlands Civil Code. This responsibility includes: designing,implementing and maintaining internal control relevant to thepreparation and fair presentation of the consolidated financialstatements that are free from material misstatement, whether dueto fraud or error; selecting and applying appropriate accountingpolicies; and making accounting estimates that are reasonable inthe circumstances.
Auditor’s responsibilityOur responsibility is to express an opinion on the consolidatedfinancial statements based on our audit. We conducted our auditin accordance with Dutch law. This law requires that we comply with ethical requirements and plan and perform the audit toobtain reasonable assurance whether the consolidated financialstatements are free from material misstatement.
An audit involves performing procedures to obtain audit evidenceabout the amounts and disclosures in the consolidated financialstatements. The procedures selected depend on the auditor’sjudgement, including the assessment of the risks of materialmisstatement of the consolidated financial statements, whetherdue to fraud or error. In making those risk assessments, theauditor considers internal control relevant to the entity’spreparation and fair presentation of the consolidated financialstatements in order to design audit procedures that areappropriate in the circumstances, but not for the purpose ofexpressing an opinion on the effectiveness of the entity’s internalcontrol. An audit also includes evaluating the appropriateness ofaccounting policies used and the reasonableness of accountingestimates made by the Directors, as well as evaluating the overallpresentation of the consolidated financial statements.
We believe that the audit evidence we have obtained is sufficientand appropriate to provide a basis for our audit opinion.
OpinionIn our opinion, the consolidated financial statements give a trueand fair view of the financial position of the Unilever Group as at 31 December 2009, and of its result and its cash flows for the yearthen ended in accordance with International Financial ReportingStandards as adopted by the European Union and as issued by theInternational Accounting Standards Board and with Part 9 of Book 2 of the Netherlands Civil Code.
Report on other legal and regulatory requirementsPursuant to the legal requirement under 2:393 sub 5 part f of the Netherlands Civil Code, we report, to the extent of ourcompetence, that the Report of the Directors is consistent with theconsolidated financial statements as required by 2:391 sub 4 ofthe Netherlands Civil Code.
Rotterdam, The Netherlands, 2 March 2010PricewaterhouseCoopers Accountants N.V.
R A J Swaak RA
Auditor’s report United Kingdom
78 Unilever Annual Report and Accounts 2009
Financial statements
Independent auditors’ report to the members of UnileverPLC on the consolidated financial stetementsWe have audited the consolidated financial statements of theUnilever Group for the year ended 31 December 2009 whichcomprise the consolidated income statement, consolidatedbalance sheet, consolidated cash flow statement, consolidatedstatement of comprehensive income, consolidated statement ofchanges in equity, the related notes on pages 79 to 128, andprincipal group companies and non-current investments on pages131 and 132. These consolidated financial statements have beenprepared under the accounting policies set out in note 1 on pages83 to 86. The financial reporting framework that has been appliedin their preparation is applicable law and International FinancialReporting Standards (IFRSs) as adopted by the European Union.
Respective responsibilities of Directors and auditorsAs explained more fully in the Statement of Directors’responsibilities set out on page 76, the directors are responsible forthe preparation of the group financial statements and for beingsatisfied that they give a true and fair view. Our responsibility is toaudit the consolidated financial statements in accordance withapplicable law and International Standards on Auditing (UK andIreland). Those standards require us to comply with the AuditingPractices Board’s Ethical Standards for Auditors.
This report, including the opinions, has been prepared for and onlyfor the shareholders of Unilever PLC as a body in accordance withChapter 3 of Part 16 of the Companies Act 2006 and for no otherpurpose. We do not, in giving these opinions, accept or assumeresponsibility for any other purpose or to any other person towhom this report is shown or into whose hands it may come savewhere expressly agreed by our prior consent in writing.
Scope of the audit of financial statementsAn audit involves obtaining evidence about the amounts anddisclosures in the financial statements sufficient to give reasonableassurance that the financial statements are free from materialmisstatement, whether caused by fraud or error. This includes anassessment of: whether the accounting policies are appropriate tothe Group’s circumstances and have been consistently applied andadequately disclosed; the reasonableness of significant accountingestimates made by the directors; and the overall presentation ofthe financial statements.
Opinion on financial statementsIn our opinion the Group financial statements:
• give a true and fair view of the state of the Group’s affairs as at31 December 2009 and of its profit and cash flows for the yearthen ended;
• have been properly prepared in accordance with IFRSs asadopted by the European Union; and
• have been prepared in accordance with the requirements of theCompanies Act 2006 and Article 4 of the IAS Regulation.
Separate opinion in relation to IFRS as issued by the IASBAs explained in note 1 to the consolidated financial statements,the Group in addition to complying with its legal obligation toapply IFRSs as adopted by the European Union, has also appliedIFRSs as issued by the International Accounting Standards Board,(IASB).
In our opinion the Group financial statements comply with IFRSs asissued by the IASB.
Opinion on other matter prescribed by the Companies Act2006In our opinion the information given in the Report of the Directorsfor the financial year for which the Group financial statements areprepared is consistent with the Group financial statements.
Matters on which we are required to report by exceptionWe have nothing to report in respect of the following:
Under the Companies Act 2006 we are required to report to youif, in our opinion:
• certain disclosures of directors’ remuneration specified by laware not made; or
• we have not received all the information and explanations werequire for our audit.
Under the Listing Rules we are required to review:
• the Directors’ statement, set out on page 76, in relation togoing concern; and
• the part of the Corporate Governance statement relating to thecompany’s compliance with the nine provisions of the 2008Combined Code specified for our review.
Other matterWe have reported separately on the parent company accounts ofUnilever PLC for the year ended 31 December 2009 and on theinformation in the Directors’ Remuneration Report that isdescribed as having been audited.
Richard Sexton (Senior Statutory Auditor)For and on behalf of PricewaterhouseCoopers LLPChartered Accountants and Statutory AuditorsLondon, United Kingdom2 March 2010
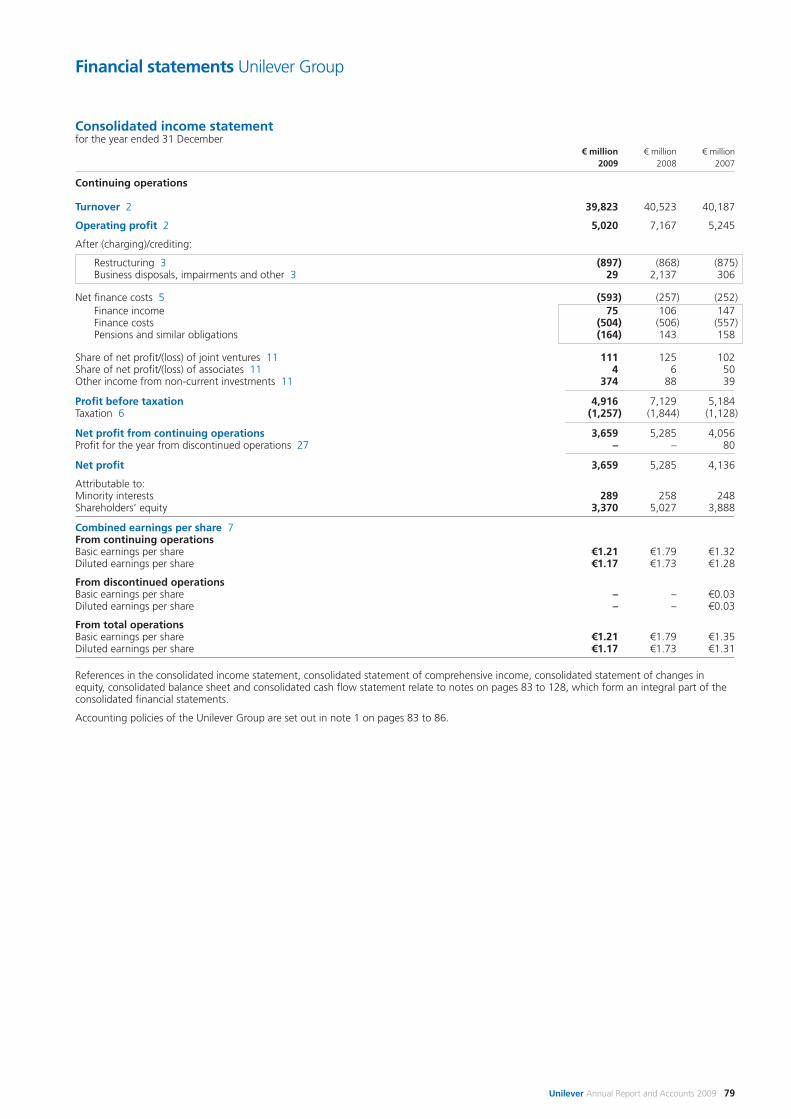
Financial statements Unilever Group
Consolidated income statementfor the year ended 31 December
€ million € million € million2009 2008 2007
Continuing operations
Turnover 2 39,823 40,523 40,187
Operating profit 2 5,020 7,167 5,245
After (charging)/crediting:
Restructuring 3 (897) (868) (875)Business disposals, impairments and other 3 29 2,137 306
Net finance costs 5 (593) (257) (252)Finance income 75 106 147Finance costs (504) (506) (557)Pensions and similar obligations (164) 143 158
Share of net profit/(loss) of joint ventures 11 111 125 102Share of net profit/(loss) of associates 11 4 6 50Other income from non-current investments 11 374 88 39
Profit before taxation 4,916 7,129 5,184Taxation 6 (1,257) (1,844) (1,128)
Net profit from continuing operations 3,659 5,285 4,056Profit for the year from discontinued operations 27 – – 80
Net profit 3,659 5,285 4,136
Attributable to:Minority interests 289 258 248Shareholders’ equity 3,370 5,027 3,888
Combined earnings per share 7From continuing operationsBasic earnings per share €1.21 €1.79 €1.32Diluted earnings per share €1.17 €1.73 €1.28
From discontinued operationsBasic earnings per share – – €0.03Diluted earnings per share – – €0.03
From total operationsBasic earnings per share €1.21 €1.79 €1.35Diluted earnings per share €1.17 €1.73 €1.31
References in the consolidated income statement, consolidated statement of comprehensive income, consolidated statement of changes inequity, consolidated balance sheet and consolidated cash flow statement relate to notes on pages 83 to 128, which form an integral part of theconsolidated financial statements.
Accounting policies of the Unilever Group are set out in note 1 on pages 83 to 86.
Unilever Annual Report and Accounts 2009 79
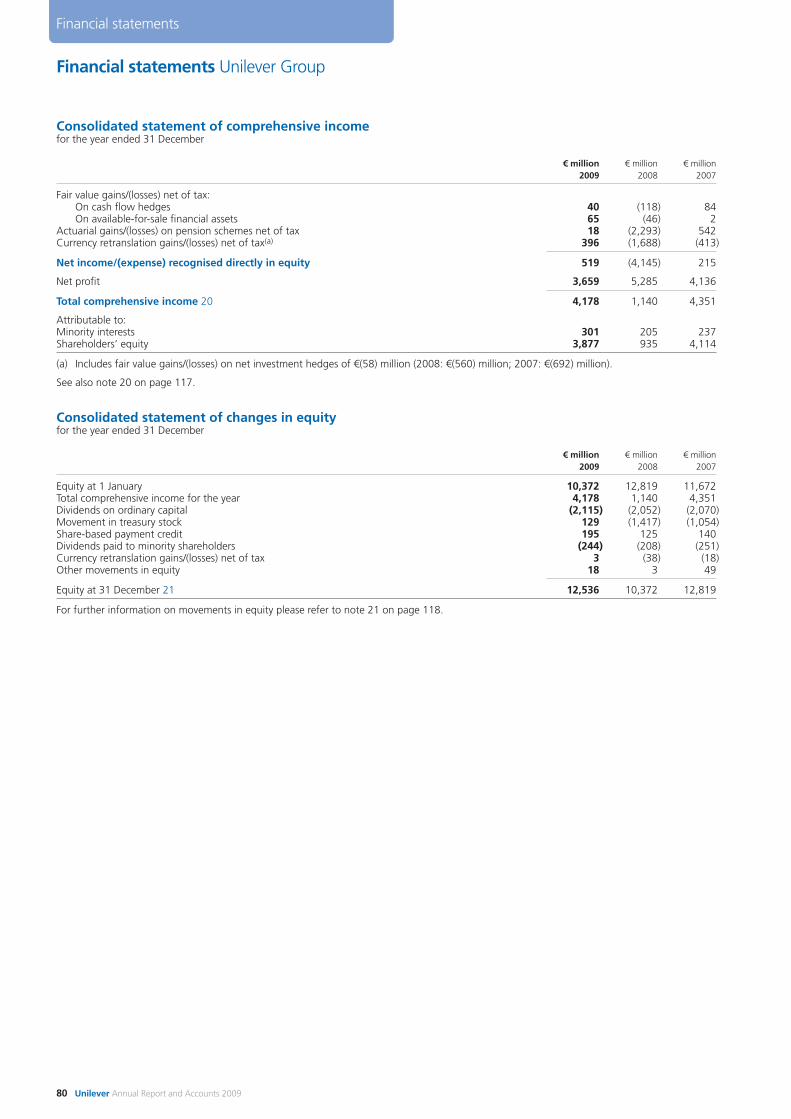
Financial statements Unilever Group
Consolidated statement of comprehensive incomefor the year ended 31 December
€ million € million € million2009 2008 2007
Fair value gains/(losses) net of tax:On cash flow hedges 40 (118) 84On available-for-sale financial assets 65 (46) 2
Actuarial gains/(losses) on pension schemes net of tax 18 (2,293) 542Currency retranslation gains/(losses) net of tax(a) 396 (1,688) (413)
Net income/(expense) recognised directly in equity 519 (4,145) 215
Net profit 3,659 5,285 4,136
Total comprehensive income 20 4,178 1,140 4,351
Attributable to:Minority interests 301 205 237Shareholders’ equity 3,877 935 4,114
(a) Includes fair value gains/(losses) on net investment hedges of €(58) million (2008: €(560) million; 2007: €(692) million).
See also note 20 on page 117.
Consolidated statement of changes in equityfor the year ended 31 December
€ million € million € million2009 2008 2007
Equity at 1 January 10,372 12,819 11,672Total comprehensive income for the year 4,178 1,140 4,351Dividends on ordinary capital (2,115) (2,052) (2,070)Movement in treasury stock 129 (1,417) (1,054)Share-based payment credit 195 125 140Dividends paid to minority shareholders (244) (208) (251)Currency retranslation gains/(losses) net of tax 3 (38) (18)Other movements in equity 18 3 49
Equity at 31 December 21 12,536 10,372 12,819
For further information on movements in equity please refer to note 21 on page 118.
80 Unilever Annual Report and Accounts 2009
Financial statements
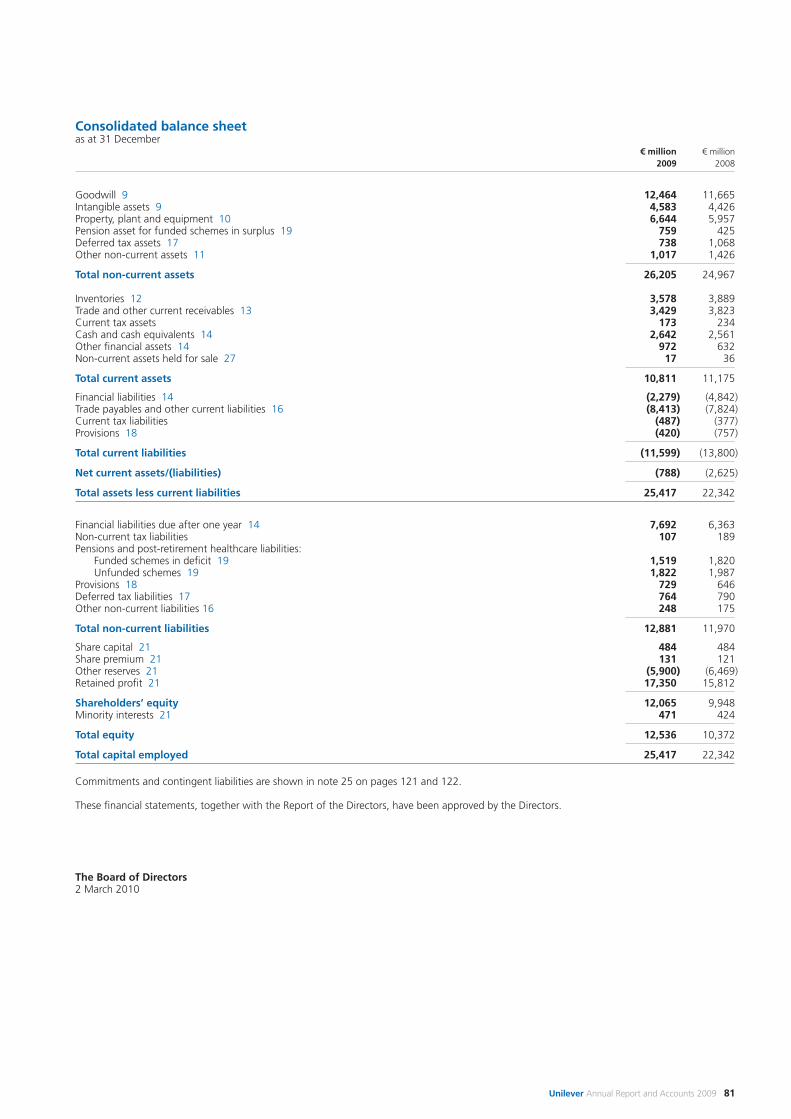
Consolidated balance sheetas at 31 December
€ million € million2009 2008
Goodwill 9 12,464 11,665Intangible assets 9 4,583 4,426Property, plant and equipment 10 6,644 5,957Pension asset for funded schemes in surplus 19 759 425Deferred tax assets 17 738 1,068Other non-current assets 11 1,017 1,426
Total non-current assets 26,205 24,967
Inventories 12 3,578 3,889Trade and other current receivables 13 3,429 3,823Current tax assets 173 234Cash and cash equivalents 14 2,642 2,561Other financial assets 14 972 632Non-current assets held for sale 27 17 36
Total current assets 10,811 11,175
Financial liabilities 14 (2,279) (4,842)Trade payables and other current liabilities 16 (8,413) (7,824)Current tax liabilities (487) (377)Provisions 18 (420) (757)
Total current liabilities (11,599) (13,800)
Net current assets/(liabilities) (788) (2,625)
Total assets less current liabilities 25,417 22,342
Financial liabilities due after one year 14 7,692 6,363Non-current tax liabilities 107 189Pensions and post-retirement healthcare liabilities:
Funded schemes in deficit 19 1,519 1,820Unfunded schemes 19 1,822 1,987
Provisions 18 729 646Deferred tax liabilities 17 764 790Other non-current liabilities 16 248 175
Total non-current liabilities 12,881 11,970
Share capital 21 484 484Share premium 21 131 121Other reserves 21 (5,900) (6,469)Retained profit 21 17,350 15,812
Shareholders’ equity 12,065 9,948Minority interests 21 471 424
Total equity 12,536 10,372
Total capital employed 25,417 22,342
Commitments and contingent liabilities are shown in note 25 on pages 121 and 122.
These financial statements, together with the Report of the Directors, have been approved by the Directors.
The Board of Directors2 March 2010
Unilever Annual Report and Accounts 2009 81
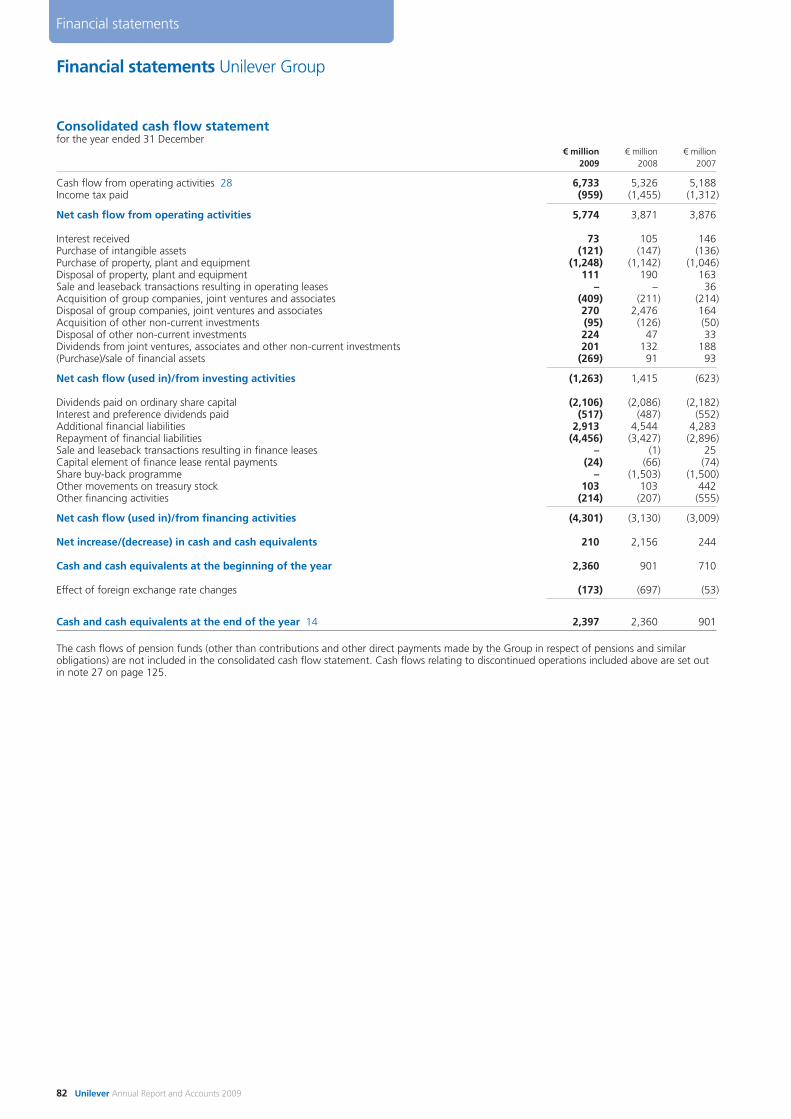
Financial statements Unilever Group
Consolidated cash flow statementfor the year ended 31 December
€ million € million € million2009 2008 2007
Cash flow from operating activities 28 6,733 5,326 5,188Income tax paid (959) (1,455) (1,312)
Net cash flow from operating activities 5,774 3,871 3,876
Interest received 73 105 146Purchase of intangible assets (121) (147) (136)Purchase of property, plant and equipment (1,248) (1,142) (1,046)Disposal of property, plant and equipment 111 190 163Sale and leaseback transactions resulting in operating leases – – 36Acquisition of group companies, joint ventures and associates (409) (211) (214)Disposal of group companies, joint ventures and associates 270 2,476 164Acquisition of other non-current investments (95) (126) (50)Disposal of other non-current investments 224 47 33Dividends from joint ventures, associates and other non-current investments 201 132 188(Purchase)/sale of financial assets (269) 91 93
Net cash flow (used in)/from investing activities (1,263) 1,415 (623)
Dividends paid on ordinary share capital (2,106) (2,086) (2,182)Interest and preference dividends paid (517) (487) (552)Additional financial liabilities 2,913 4,544 4,283Repayment of financial liabilities (4,456) (3,427) (2,896)Sale and leaseback transactions resulting in finance leases – (1) 25Capital element of finance lease rental payments (24) (66) (74)Share buy-back programme – (1,503) (1,500)Other movements on treasury stock 103 103 442Other financing activities (214) (207) (555)
Net cash flow (used in)/from financing activities (4,301) (3,130) (3,009)
Net increase/(decrease) in cash and cash equivalents 210 2,156 244
Cash and cash equivalents at the beginning of the year 2,360 901 710
Effect of foreign exchange rate changes (173) (697) (53)
Cash and cash equivalents at the end of the year 14 2,397 2,360 901
The cash flows of pension funds (other than contributions and other direct payments made by the Group in respect of pensions and similarobligations) are not included in the consolidated cash flow statement. Cash flows relating to discontinued operations included above are set outin note 27 on page 125.
82 Unilever Annual Report and Accounts 2009
Financial statements
Notes to the consolidated financial statements Unilever Group
Unilever Annual Report and Accounts 2009 83
1 Accounting information and policiesThe accounting policies adopted are the same as those which appliedfor the previous financial year, except as set out below under theheading of ‘Recent accounting developments’.
UnileverThe two parent companies, NV and PLC, together with their groupcompanies, operate as a single economic entity (the Unilever Group,also referred to as Unilever or the Group). NV and PLC have the sameDirectors and are linked by a series of agreements, including anEqualisation Agreement, which are designed so that the position ofthe shareholders of both companies is as nearly as possible the sameas if they held shares in a single company.
The Equalisation Agreement provides that both companies adopt the same accounting principles and requires as a general rule the dividends and other rights and benefits (including rights onliquidation) attaching to each €0.16 nominal of ordinary share capitalof NV to be equal in value at the relevant rate of exchange to thedividends and other rights and benefits attaching to each 31⁄9pnominal of ordinary share capital of PLC, as if each such unit of capitalformed part of the ordinary capital of one and the same company. For additional information please refer to ‘Corporate governance’on page 56.
Basis of consolidationDue to the operational and contractual arrangements referred toabove, NV and PLC form a single reporting entity for the purposes of presenting consolidated accounts. Accordingly, the accounts ofUnilever are presented by both NV and PLC as their respectiveconsolidated accounts. Group companies included in the consolidationare those companies controlled by NV or PLC. Control exists when theGroup has the power to govern the financial and operating policies ofan entity so as to obtain benefits from its activities.
The net assets and results of acquired businesses are included in theconsolidated accounts from their respective dates of acquisition, beingthe date on which the Group obtains control. The results of disposedbusinesses are included in the consolidated accounts up to their dateof disposal, being the date control ceases.
Inter-company transactions and balances are eliminated.
Companies legislation and accounting standardsThe consolidated accounts have been prepared in accordance withInternational Financial Reporting Standards (IFRS) as adopted by the European Union (EU), IFRIC Interpretations and in accordance withPart 9 of Book 2 of the Civil Code in the Netherlands and the UnitedKingdom Companies Act 2006. They are also in compliance with IFRSas issued by the International Accounting Standards Board.
The accounts are prepared under the historical cost convention unlessotherwise indicated.
The accounting policies adopted are consistent with those of theprevious financial year except as set out on page 86.
Foreign currenciesItems included in the financial statements of group companies aremeasured using the currency of the primary economic environment inwhich each entity operates (its functional currency). The consolidatedfinancial statements are presented in euros. The functional currenciesof NV and PLC are euros and sterling respectively.
Foreign currency transactions are translated into the functionalcurrency using the exchange rates prevailing at the dates of thetransactions. Foreign exchange gains and losses resulting from thesettlement of such transactions and from the translation at year-endexchange rates of monetary assets and liabilities denominated inforeign currencies are recognised in the income statement, exceptwhen deferred in equity as qualifying hedges. Those arising on tradingtransactions are taken to operating profit; those arising on cash,financial assets and financial liabilities are classified as finance incomeor cost.
In preparing the consolidated financial statements, the incomestatement, the cash flow statement and all other movements in assetsand liabilities are translated at average rates of exchange. The balancesheet, other than the ordinary share capital of NV and PLC, istranslated at year-end rates of exchange. In the case of hyper-inflationary economies the accounts are adjusted to reflect currentprice levels and remove the influences of inflation before beingtranslated.
The ordinary share capital of NV and PLC is translated in accordancewith the Equalisation Agreement. The difference between the resultingvalue for PLC and the value derived by applying the year-end rate ofexchange is taken to other reserves (see note 23 on page 119).
The effects of exchange rate changes during the year on net assets at the beginning of the year are recorded as a movement inshareholders’ equity, as is the difference between profit of the yearretained at average rates of exchange and at year-end rates ofexchange. For these purposes net assets include loans between groupcompanies and related foreign exchange contracts, if any, for whichsettlement is neither planned nor likely to occur in the foreseeablefuture. Exchange gains/losses on hedges of net assets are also recordedas a movement in equity.
Cumulative exchange differences arising since the date of transition toIFRS of 1 January 2004 are reported as a separate component of otherreserves (see note 23 on page 119). In the event of disposal or partdisposal of an interest in a group company either through sale or as aresult of a repayment of capital, the cumulative exchange difference isrecognised in the income statement as part of the profit or loss ondisposal of group companies.
Business combinationsBusiness combinations are accounted for using the acquisitionaccounting method. This involves recognising identifiable assets and liabilities of the acquired business at fair value as at the dateof acquisition.
Acquisitions of minority interests are accounted for using the parententity method, whereby the difference between the consideration and the book value of the share of the net assets acquired isrecognised as goodwill.
GoodwillGoodwill (being the difference between the fair value of considerationpaid for new interests in group companies and the fair value of theGroup’s share of their net identifiable assets and contingent liabilitiesat the date of acquisition) is capitalised. Goodwill is not amortised, butis subject to an annual review for impairment (or more frequently ifnecessary). Any impairment is charged to the income statement as itarises.
For the purpose of impairment testing, goodwill acquired in a businesscombination is, from the acquisition date, allocated to each of theGroup’s cash generating units, or groups of cash generating units, thatare expected to benefit from the synergies of the combination,irrespective of whether other assets or liabilities of the acquiredbusiness are assigned to those units or group of units. Each unit orgroup of units to which the goodwill is allocated represents the lowestlevel within the Group at which the goodwill is monitored for internalmanagement purposes, and is not larger than an operating segment.
Intangible assetsOn acquisition of group companies, Unilever recognises any specificallyidentifiable intangible assets separately from goodwill, initiallymeasuring the intangible assets at fair value as at the date ofacquisition. Separately purchased intangible assets are initiallymeasured at cost. Finite-lived intangible assets mainly comprisepatented and non-patented technology, know-how and software.These assets are capitalised and amortised on a straight-line basis inthe income statement over the period of their expected useful lives, orthe period of legal rights if shorter, none of which exceeds ten years.Periods in excess of five years are used only where the Directors aresatisfied that the life of these assets will clearly exceed that period.
Notes to the consolidated financial statements Unilever Group
84 Unilever Annual Report and Accounts 2009
Financial statements
1 Accounting information and policies (continued)Indefinite-lived intangibles are not amortised, but are subject to anannual review for impairment (or more frequently if necessary).Any impairment is charged to the income statement as it arises.
Unilever monitors the level of product development costs against all the criteria set out in IAS 38. These include the requirement toestablish that a flow of economic benefits is probable before costs arecapitalised. For Unilever this is evident only shortly before a product islaunched into the market. The level of costs incurred after thesecriteria have been met is currently insignificant.
Property, plant and equipmentProperty, plant and equipment is stated at cost less depreciation and impairment. Eligible borrowing costs are capitalised as part of thecost of an asset. Depreciation is provided on a straight-line basis atpercentages of cost based on the expected average useful lives of theassets and their residual values which are reviewed at least annually.Estimated useful lives by major class of assets are as follows:
Freehold buildings 40 years(no depreciation on freehold land)Leasehold buildings 40 years*Plant and equipment 2–20 years
*or life of lease if less than 40 years
Property, plant and equipment is subject to review for impairmentif triggering events or circumstances indicate that this is necessary. Any impairment is charged to the income statement as it arises.
Other non-current assetsJoint ventures are undertakings in which the Group has an interest andwhich are jointly controlled by the Group and one or more otherparties. Associates are undertakings in which the Group has aninvestment and can exercise significant influence.
Interests in joint ventures and associates are accounted for using theequity method and are stated in the consolidated balance sheet at cost, adjusted for the movement in the Group’s share of their netassets and liabilities. The Group’s share of the profit or loss after tax of joint ventures and associates is included in the Group’s consolidatedprofit before taxation.
Biological assets are stated at fair value less costs to sell.
Financial instruments
Financial assetsThe classification of financial assets is determined at initial recognitiondepending on the purpose for which they were acquired. Anyimpairment is recognised in the income statement as it arises.
Held-to-maturity investmentsHeld-to-maturity investments are assets with set cash flows and fixedmaturities which Unilever intends to hold to maturity. They are held atcost plus interest using the effective interest method, less anyimpairments.
Loans and receivablesLoans and receivables have set payments and are not quoted in anactive market. They arise when the Group provides money, goods orservices. Loans and receivables are included in the balance sheet atamortised cost.
Short-term loans and receivables are initially measured at originalinvoice amount less any impairments.
Financial assets at fair value through profit or lossA financial asset is in this category if it is intended to be sold in theshort term. They are current assets if they are expected to be realisedwithin 12 months. Transaction costs related to the purchase of theassets are expensed as incurred. Derivatives are classified here unlessthey are designated as hedges. Gains and losses arising from changesin value are included in the income statement.
Available-for-sale financial assetsAvailable-for-sale financial assets are assets that are designated in thiscategory or not classified in any of the other categories. They are non-current assets unless the Group intends to dispose of them within 12months. Changes in value are recognised in equity until the investmentis sold or impaired, when they are included in the income statement.
Interest on available-for-sale securities is calculated using the effectiveinterest rate method and recognised within other income. Dividendson equity investments are also recognised within other income.
Financial liabilitiesFinancial liabilities are recognised initially at fair value, net oftransaction costs. They are subsequently held at amortised cost unlessthey are part of a fair value hedge. Any difference between theamount on initial recognition and the redemption value is recognisedin the income statement using the effective interest method.
Short-term financial liabilities are measured at original invoice amount.
DerivativesDerivatives are measured on the balance sheet at fair value and areused primarily to manage the risks of changes in exchange and interestrates. The Group uses foreign exchange forward contracts, interestrate swap contracts and forward rate agreements to hedge theseexposures. The Group also uses commodity contracts to hedge someraw materials. Contracts that can be settled in cash are treated asfinancial instruments. The Group does not use derivative financialinstruments for speculative purposes.
Changes in the fair value of derivatives that do not qualify for hedgeaccounting are recognised in the income statement as they arise.
Cash flow hedgesChanges in the value of derivatives used as hedges of future cashflows are recognised in equity with any ineffective portion recognisedin the income statement. If the cash flow hedge results in therecognition of a non-financial asset or a liability the gain or loss on thederivative is included in the initial measurement of that asset orliability. For other cash flow hedges amounts deferred in equity aretaken to the income statement when the hedged item affects profit or loss.
When a hedging instrument no longer qualifies for hedge accounting,any cumulative gain or loss is retained in equity until the forecastedtransaction occurs. If a hedged transaction is no longer expected tooccur, the cumulative gain or loss is transferred to the incomestatement.
Fair value hedgesIn an effective fair value hedge, the hedged item is adjusted forchanges in fair value, with the corresponding entry in the incomestatement. Gains and losses on the hedging instrument are recognisedin the income statement. In a fully effective hedge the adjustments tothe income statement are of equal and opposite value. For non-derivatives only the foreign currency element can be a hedginginstrument.
Net investment hedgesNet investment hedges are hedges of exchange risks from investmentsin foreign subsidiaries. Gains and losses are recognised in equity. Theaccumulated gains and losses are taken to the income statement whenthe foreign operation is sold or partially disposed.
Valuation principlesThe fair values of quoted investments are based on current bid prices.For listed securities where the market is not liquid, and for unlistedsecurities, the Group uses valuation techniques. These include the useof recent arm’s length transactions, reference to other instruments thatare substantially the same and discounted cash flow calculations.
Unilever Annual Report and Accounts 2009 85
1 Accounting information and policies (continued)Impairment of financial instrumentsAt each balance sheet date the Group assesses whether there isevidence that financial assets are impaired. A significant or prolongedfall in value below cost is considered in determining whether an assetis impaired. For available-for-sale financial assets the cumulative loss isremoved from equity and recognised in the income statement. Anysubsequent reversals of impairment losses on available-for-sale equityinstruments are not recognised in the income statement.
InventoriesInventories are valued at the lower of weighted average cost and netrealisable value. Cost comprises direct costs and, where appropriate, a proportion of attributable production overheads.
Cash and cash equivalentsFor the purpose of preparation of the cash flow statement, cash andcash equivalents includes cash at bank and in hand, highly liquidinterest-bearing securities with original maturities of three months or less, investments in money market funds with insignificant risk ofchanges in value, and bank overdrafts.
Pensions and similar obligationsThe operating and financing costs of defined benefit plans arerecognised separately in the income statement. Service costs aresystematically allocated over the service lives of employees, andfinancing costs are recognised in the periods in which they arise. Thecosts of individual events such as past service benefit enhancements,settlements and curtailments are recognised immediately in the incomestatement. Variations from expected costs, arising from the experienceof the plans or changes in actuarial assumptions, are recognisedimmediately in the statement of comprehensive income. The definedbenefit plan surplus or deficit in the balance sheet comprises the totalfor each plan of the fair value of plan assets less the present value ofthe defined benefit obligation (using a discount rate based on highquality corporate bonds).
The charges to the income statement for defined contribution plansare the company contributions payable, and the assets and liabilitiesof such plans are not included in the balance sheet of the Group.
All defined benefit plans are subject to regular actuarial review usingthe projected unit method, either by external consultants or byactuaries employed by Unilever. Group policy is that the mostimportant plans, representing approximately 80% of the definedbenefit liabilities, are formally valued every year; other principal plans,accounting for approximately a further 15% of liabilities, have theirliabilities updated each year. Group policy for the remaining plansrequires a full actuarial valuation at least every three years. Asset valuesfor all plans are updated every year.
TaxationIncome tax on the profit or loss for the year comprises current anddeferred tax. Income tax is recognised in the income statement exceptto the extent that it relates to items recognised directly in equity.
Current tax is the expected tax payable on the taxable income for the year, using tax rates enacted or substantively enacted at the balance sheet date, and any adjustments to tax payable in respect of previous years.
Deferred taxation is recognised using the liability method on taxabletemporary differences between the tax base and the accounting base of items included in the balance sheet of the Group. The followingtemporary differences are not provided for: goodwill not deductible fortax purposes, the initial recognition of assets or liabilities that affectneither accounting nor taxable profit, and differences relating toinvestments in subsidiaries to the extent that they will probably notreverse in the forseeable future. The amount of deferred tax provided is based on the expected manner of realisation or settlement of thecarrying amount of assets and liabilities, using tax rates prevailing atthe year end unless future rates have been enacted or substantivelyenacted.
A deferred tax asset is recognised only to the extent that it is probablethat future taxable profits will be available against which the asset can
be utilised. Deferred tax assets are reduced to the extent that it is nolonger probable that the related tax benefit will be realised.
ProvisionsProvisions are recognised when either a legal or constructiveobligation, as a result of a past event, exists at the balance sheet dateand where the amount of the obligation can be reliably estimated.
Segment informationSegment information is provided based on the geographic segmentsof the management structure of the Group. Additional information isprovided by product area.
Revenue recognitionTurnover comprises sales of goods and services after deduction ofdiscounts and sales taxes. It does not include sales between groupcompanies. Discounts given by Unilever include rebates, pricereductions and incentives given to customers, promotional couponingand trade communication costs.
Turnover is recognised when the risks and rewards of the underlyingproducts and services have been substantially transferred to thecustomer. Revenue from services is recognised as the services are performed. Interest income is recognised as interest accrues using the effective interest method.
Research and market support costsExpenditure on research and market support, such as advertising, is charged to the income statement when incurred.
LeasesLeases are classified as finance leases whenever the terms of the leasetransfer substantially all the risks and rewards of ownership to thelessee. All other leases are classified as operating leases.
Assets held under finance leases are recognised as non-current assetsof the Group at their fair value at the date of commencement of the lease or, if lower, at the present value of the minimum leasepayments. These assets are depreciated on a straight-line basis overthe shorter of the useful life of the asset and the lease term. Thecorresponding liability to the lessor is included in the balance sheet asa finance lease obligation. Lease payments are apportioned betweenfinance charges and reduction of the lease obligation so as to achievea constant rate of interest on the remaining balance of the liability.Finance charges are charged directly against income.
Lease payments under operating leases are charged to the incomestatement on a straight-line basis over the term of the lease.
Share-based paymentsThe economic cost of awarding shares and share options to employeesis reflected by recording a charge in the income statement equivalentto the fair value of the benefit awarded over the vesting period. Thefair value is determined with reference to option pricing models,principally adjusted Black-Scholes models or a multinomial pricingmodel.
Shares held by employee share trustsThe assets and liabilities of certain PLC trusts, NV and groupcompanies which purchase and hold NV and PLC shares to satisfyoptions granted are included in the consolidated accounts. The bookvalue of shares held is deducted from other reserves, and trusts’borrowings are included in the Group’s liabilities. The costs of thetrusts are included in the results of the Group. These shares areexcluded from the calculation of earnings per share.
Assets held for saleAssets and groups of assets and liabilities which comprise disposalgroups are classified as ‘held for sale’ when all of the following criteriaare met: a decision has been made to sell, the assets are available forsale immediately, the assets are being actively marketed, and a sale hasbeen or is expected to be concluded within twelve months of the balance sheet date. Assets and disposal groups held for saleare valued at the lower of book value or fair value less disposal costs. Assets held for sale are not depreciated.
Notes to the consolidated financial statements Unilever Group
86 Unilever Annual Report and Accounts 2009
Financial statements
1 Accounting information and policies (continued)Critical accounting estimates and judgementsEstimates and judgements are continually evaluated and are based on historical experience and other factors, including expectations of future events that are believed to be reasonable under thecircumstances.
The preparation of financial statements requires management to makeestimates and assumptions concerning the future. The resultingaccounting estimates will, by definition, seldom equal the relatedactual results. The estimates and assumptions that have a significantrisk of causing a material adjustment to the carrying amounts of assetsand liabilities within the next financial year are discussed below.
Income statement presentationOn the face of the income statement, costs and revenues relating to restructuring, business disposals and impairments are disclosed. In addition, individual items judged to be significant are disclosedseparately. These are material in terms of nature and amount. Thesedisclosures are given in order to provide additional information to helpusers better understand financial performance.
Impairment of goodwill and indefinite-lived intangible assetsImpairment reviews in respect of goodwill and indefinite-livedintangible assets are performed at least annually. More regular reviewsare performed if events indicate that this is necessary. Examples ofsuch triggering events would include a significant plannedrestructuring, a major change in market conditions or technology,expectations of future operating losses, or negative cash flows.
The recoverable amounts of cash-generating units are determinedbased on the higher of fair value less costs to sell and value-in-usecalculations. These calculations require the use of estimates. Detailsof key assumptions made are set out in note 9 on page 94.
Retirement benefitsPension accounting requires certain assumptions to be made in orderto value our obligations and to determine the charges to be made to the income statement. These figures are particularly sensitive toassumptions for discount rates, mortality, inflation rates and expectedlong-term rates of return on assets. Details of assumptions made aregiven in note 19 on pages 113 to 115.
TaxationThe Group is subject to taxes in numerous jurisdictions. Significantjudgement is required in determining worldwide provision for taxes.There are many transactions and calculations during the ordinarycourse of business for which the ultimate tax determination isuncertain. The Group recognises liabilities for anticipated tax auditissues based on estimates of whether additional taxes will be due.Where the final tax outcome of these matters is different from theamounts that were initially recorded, such differences will impact theincome tax and deferred tax provisions in the period in which suchdetermination is made.
ProvisionsProvision is made, among other reasons, for legal matters, disputedindirect taxes, employee termination costs and restructuring where a legal or constructive obligation exists at the balance sheet date anda reliable estimate can be made of the likely outcome. The nature ofthese costs is such that judgement has to be applied to estimate thetiming and amount of cash outflows.
Recent accounting developments
Adopted by the GroupThe Group adopted IFRS 7 ‘Financial Instruments: Disclosures’amendments (effective for periods beginning on or after 1 January2009) which requires additional disclosures about fair valuemeasurement and liquidity risk.
IFRS 8 ‘Operating Segments’ (effective for periods beginning onor after 1 January 2009) has replaced IAS 14 Segment Reporting andintroduced a management approach to segment reporting.
We have implemented the Revised IAS 1 ‘Presentation of FinancialStatements’ relating to the presentation of the statement ofcomprehensive income.
The Group has also adopted the following new and amended IFRSsand IFRIC interpretations with no material impact:
• Amendment to IFRS 2 ‘Share-based Payment’ relating to vestingconditions and cancellations.
• Revised IAS 23 ‘Borrowing Costs’ relating to capitalisation ofborrowing costs.
• IFRIC 13 ‘Customer Loyalty Programmes’ requiring customer loyaltycredits to be accounted for as a separate component of the salestransaction in which they are granted.
• IFRIC 16 ‘Hedges of a Net Investment in a Foreign Operation’relating to guidance on the accounting for hedges of a netinvestment in foreign operations.
• IFRIC 18 ‘Transfers of Assets from Customers’ relating to treatmentof items of property plant and equipment or cash to acquire orconstruct such assets received from customers.
Not adopted by the GroupThe Group is currently assessing the impact of the following revisedstandards and interpretations or amendments that are not yeteffective. These changes will be adopted on the effective dates notedand are not expected to have a material impact on the Group’s resultsof operations, financial position or disclosures:
• IFRS 3 ‘Business Combinations (Revised)’ and IAS 27 ‘Consolidatedand Separate Financial Statements (Amended)’ (effective for periodsbeginning on or after 1 July 2009). The changes will affect futureacquisitions or loss of control of subsidiaries and transactions withnon-controlling interests.
• IFRS 2 (Amendments), ‘Group cash-settled and share-basedpayment transactions’ (effective 1 January 2010).
• Amendment to IAS 39 ‘Financial Instruments: Recognition andMeasurement – Eligible Hedged Items’ (effective for periodsbeginning or on 1 July 2009).
• IFRIC 17, ‘Distribution of non-cash assets to owners’ (effective forperiods beginning on or after 1 July 2009).
• Improvements to IFRSs (issued April 2009) (effective for periodsbeginning on or after 1 January 2010).
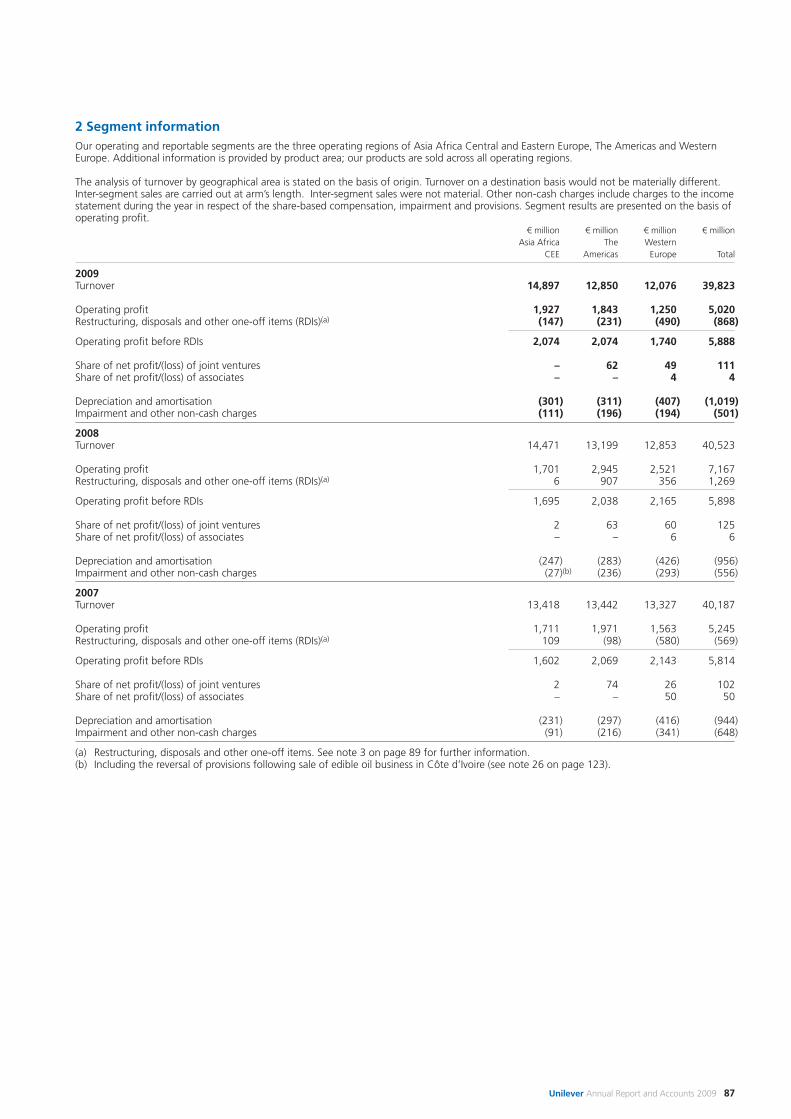
Unilever Annual Report and Accounts 2009 87
2 Segment informationOur operating and reportable segments are the three operating regions of Asia Africa Central and Eastern Europe, The Americas and WesternEurope. Additional information is provided by product area; our products are sold across all operating regions.
The analysis of turnover by geographical area is stated on the basis of origin. Turnover on a destination basis would not be materially different. Inter-segment sales are carried out at arm’s length. Inter-segment sales were not material. Other non-cash charges include charges to the incomestatement during the year in respect of the share-based compensation, impairment and provisions. Segment results are presented on the basis ofoperating profit.
€ million € million € million € millionAsia Africa The Western
CEE Americas Europe Total
2009Turnover 14,897 12,850 12,076 39,823
Operating profit 1,927 1,843 1,250 5,020Restructuring, disposals and other one-off items (RDIs)(a) (147) (231) (490) (868)
Operating profit before RDIs 2,074 2,074 1,740 5,888
Share of net profit/(loss) of joint ventures – 62 49 111Share of net profit/(loss) of associates – – 4 4
Depreciation and amortisation (301) (311) (407) (1,019)Impairment and other non-cash charges (111) (196) (194) (501)
2008Turnover 14,471 13,199 12,853 40,523
Operating profit 1,701 2,945 2,521 7,167Restructuring, disposals and other one-off items (RDIs)(a) 6 907 356 1,269
Operating profit before RDIs 1,695 2,038 2,165 5,898
Share of net profit/(loss) of joint ventures 2 63 60 125Share of net profit/(loss) of associates – – 6 6
Depreciation and amortisation (247) (283) (426) (956)Impairment and other non-cash charges (27)(b) (236) (293) (556)
2007Turnover 13,418 13,442 13,327 40,187
Operating profit 1,711 1,971 1,563 5,245Restructuring, disposals and other one-off items (RDIs)(a) 109 (98) (580) (569)
Operating profit before RDIs 1,602 2,069 2,143 5,814
Share of net profit/(loss) of joint ventures 2 74 26 102Share of net profit/(loss) of associates – – 50 50
Depreciation and amortisation (231) (297) (416) (944)Impairment and other non-cash charges (91) (216) (341) (648)
(a) Restructuring, disposals and other one-off items. See note 3 on page 89 for further information.(b) Including the reversal of provisions following sale of edible oil business in Côte d’Ivoire (see note 26 on page 123).
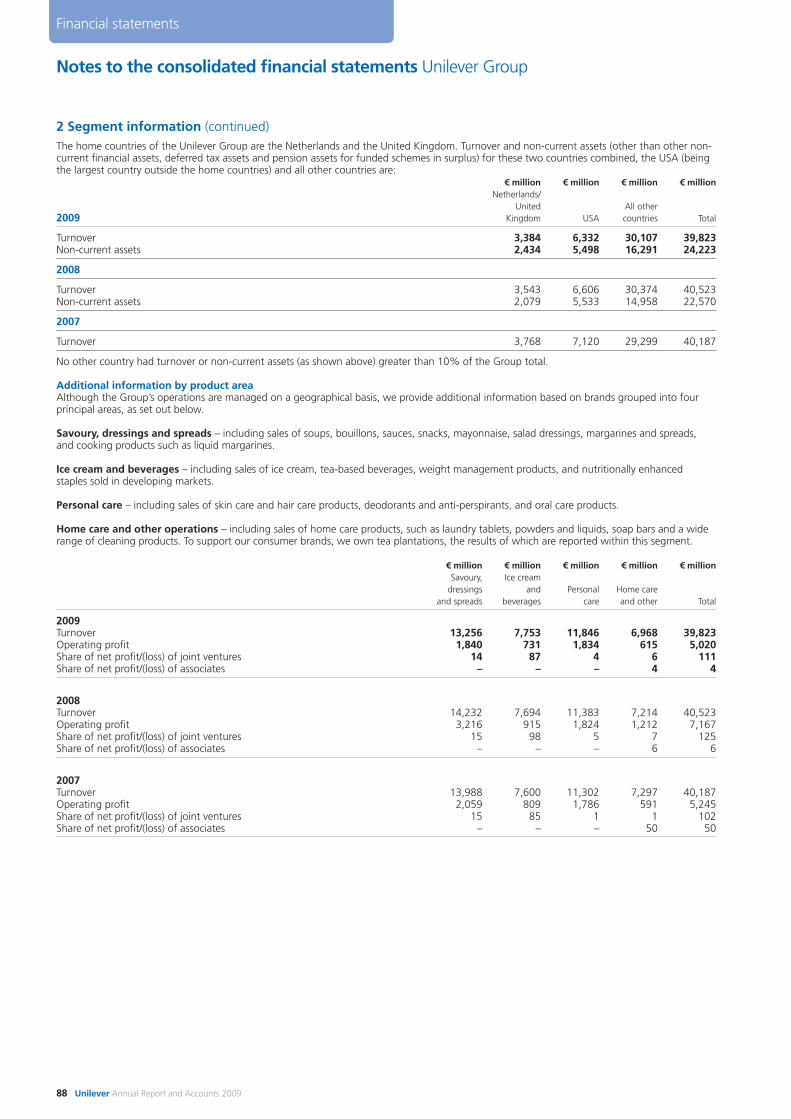
Notes to the consolidated financial statements Unilever Group
88 Unilever Annual Report and Accounts 2009
Financial statements
2 Segment information (continued)The home countries of the Unilever Group are the Netherlands and the United Kingdom. Turnover and non-current assets (other than other non-current financial assets, deferred tax assets and pension assets for funded schemes in surplus) for these two countries combined, the USA (beingthe largest country outside the home countries) and all other countries are:
€ million € million € million € millionNetherlands/
United All other 2009 Kingdom USA countries Total
Turnover 3,384 6,332 30,107 39,823Non-current assets 2,434 5,498 16,291 24,223
2008
Turnover 3,543 6,606 30,374 40,523Non-current assets 2,079 5,533 14,958 22,570
2007
Turnover 3,768 7,120 29,299 40,187
No other country had turnover or non-current assets (as shown above) greater than 10% of the Group total.
Additional information by product areaAlthough the Group’s operations are managed on a geographical basis, we provide additional information based on brands grouped into fourprincipal areas, as set out below.
Savoury, dressings and spreads – including sales of soups, bouillons, sauces, snacks, mayonnaise, salad dressings, margarines and spreads,and cooking products such as liquid margarines.
Ice cream and beverages – including sales of ice cream, tea-based beverages, weight management products, and nutritionally enhancedstaples sold in developing markets.
Personal care – including sales of skin care and hair care products, deodorants and anti-perspirants, and oral care products.
Home care and other operations – including sales of home care products, such as laundry tablets, powders and liquids, soap bars and a widerange of cleaning products. To support our consumer brands, we own tea plantations, the results of which are reported within this segment.
€ million € million € million € million € millionSavoury, Ice cream
dressings and Personal Home careand spreads beverages care and other Total
2009Turnover 13,256 7,753 11,846 6,968 39,823Operating profit 1,840 731 1,834 615 5,020Share of net profit/(loss) of joint ventures 14 87 4 6 111Share of net profit/(loss) of associates – – – 4 4
2008Turnover 14,232 7,694 11,383 7,214 40,523Operating profit 3,216 915 1,824 1,212 7,167Share of net profit/(loss) of joint ventures 15 98 5 7 125Share of net profit/(loss) of associates – – – 6 6
2007Turnover 13,988 7,600 11,302 7,297 40,187Operating profit 2,059 809 1,786 591 5,245Share of net profit/(loss) of joint ventures 15 85 1 1 102Share of net profit/(loss) of associates – – – 50 50
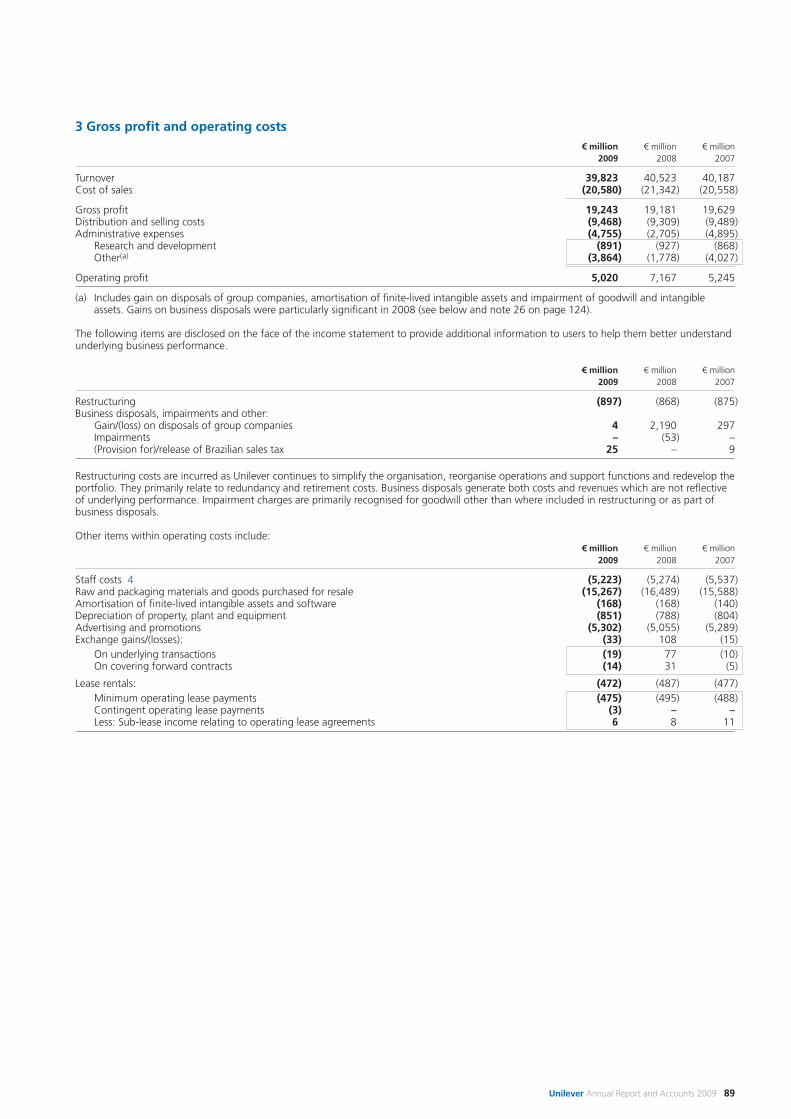
Unilever Annual Report and Accounts 2009 89
3 Gross profit and operating costs€ million € million € million
2009 2008 2007
Turnover 39,823 40,523 40,187Cost of sales (20,580) (21,342) (20,558)
Gross profit 19,243 19,181 19,629Distribution and selling costs (9,468) (9,309) (9,489)Administrative expenses (4,755) (2,705) (4,895)
Research and development (891) (927) (868)Other(a) (3,864) (1,778) (4,027)
Operating profit 5,020 7,167 5,245
(a) Includes gain on disposals of group companies, amortisation of finite-lived intangible assets and impairment of goodwill and intangibleassets. Gains on business disposals were particularly significant in 2008 (see below and note 26 on page 124).
The following items are disclosed on the face of the income statement to provide additional information to users to help them better understandunderlying business performance.
€ million € million € million2009 2008 2007
Restructuring (897) (868) (875)Business disposals, impairments and other:
Gain/(loss) on disposals of group companies 4 2,190 297Impairments – (53) –(Provision for)/release of Brazilian sales tax 25 – 9
Restructuring costs are incurred as Unilever continues to simplify the organisation, reorganise operations and support functions and redevelop theportfolio. They primarily relate to redundancy and retirement costs. Business disposals generate both costs and revenues which are not reflectiveof underlying performance. Impairment charges are primarily recognised for goodwill other than where included in restructuring or as part ofbusiness disposals.
Other items within operating costs include:€ million € million € million
2009 2008 2007
Staff costs 4 (5,223) (5,274) (5,537)Raw and packaging materials and goods purchased for resale (15,267) (16,489) (15,588)Amortisation of finite-lived intangible assets and software (168) (168) (140)Depreciation of property, plant and equipment (851) (788) (804)Advertising and promotions (5,302) (5,055) (5,289)Exchange gains/(losses): (33) 108 (15)
On underlying transactions (19) 77 (10)On covering forward contracts (14) 31 (5)
Lease rentals: (472) (487) (477)Minimum operating lease payments (475) (495) (488)Contingent operating lease payments (3) – –Less: Sub-lease income relating to operating lease agreements 6 8 11
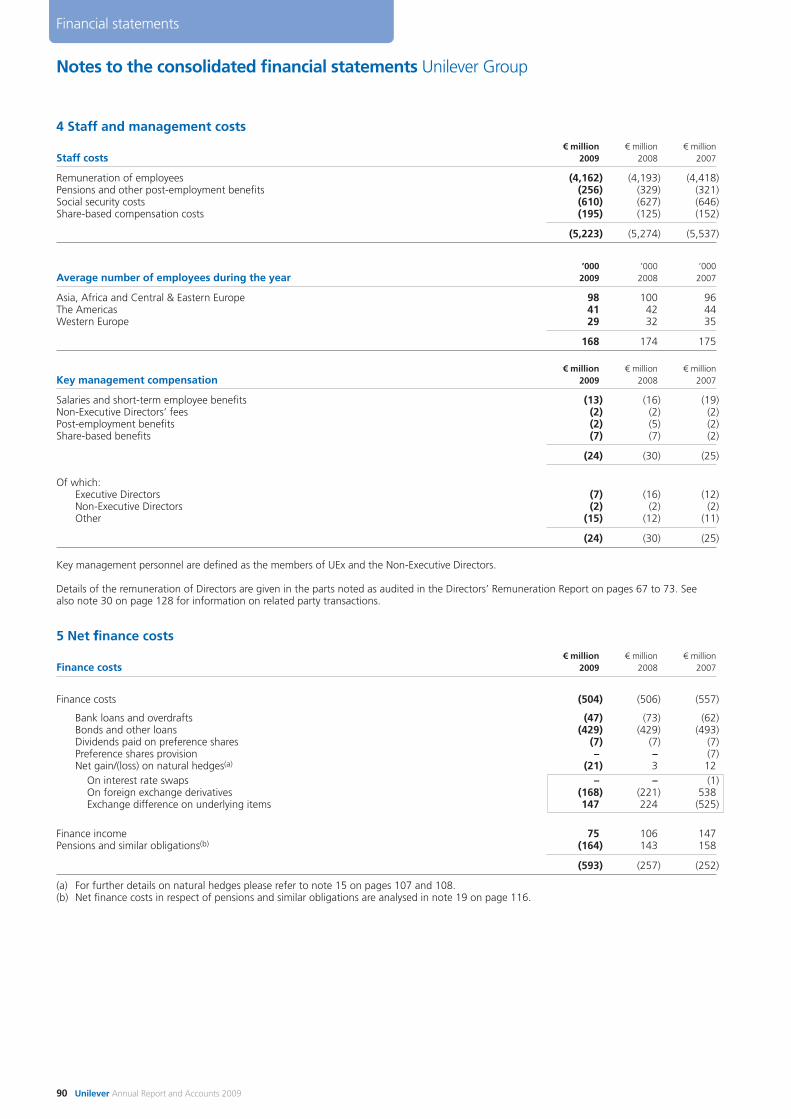
Notes to the consolidated financial statements Unilever Group
90 Unilever Annual Report and Accounts 2009
Financial statements
4 Staff and management costs€ million € million € million
Staff costs 2009 2008 2007
Remuneration of employees (4,162) (4,193) (4,418)Pensions and other post-employment benefits (256) (329) (321)Social security costs (610) (627) (646)Share-based compensation costs (195) (125) (152)
(5,223) (5,274) (5,537)
’000 ’000 ’000Average number of employees during the year 2009 2008 2007
Asia, Africa and Central & Eastern Europe 98 100 96The Americas 41 42 44Western Europe 29 32 35
168 174 175
€ million € million € millionKey management compensation 2009 2008 2007
Salaries and short-term employee benefits (13) (16) (19)Non-Executive Directors’ fees (2) (2) (2)Post-employment benefits (2) (5) (2)Share-based benefits (7) (7) (2)
(24) (30) (25)
Of which:Executive Directors (7) (16) (12)Non-Executive Directors (2) (2) (2)Other (15) (12) (11)
(24) (30) (25)
Key management personnel are defined as the members of UEx and the Non-Executive Directors.
Details of the remuneration of Directors are given in the parts noted as audited in the Directors’ Remuneration Report on pages 67 to 73. Seealso note 30 on page 128 for information on related party transactions.
5 Net ffinance costs€ million € million € million
Finance costs 2009 2008 2007
Finance costs (504) (506) (557)
Bank loans and overdrafts (47) (73) (62)Bonds and other loans (429) (429) (493)Dividends paid on preference shares (7) (7) (7)Preference shares provision – – (7)Net gain/(loss) on natural hedges(a) (21) 3 12
On interest rate swaps – – (1)On foreign exchange derivatives (168) (221) 538Exchange difference on underlying items 147 224 (525)
Finance income 75 106 147Pensions and similar obligations(b) (164) 143 158
(593) (257) (252)
(a) For further details on natural hedges please refer to note 15 on pages 107 and 108.(b) Net finance costs in respect of pensions and similar obligations are analysed in note 19 on page 116.
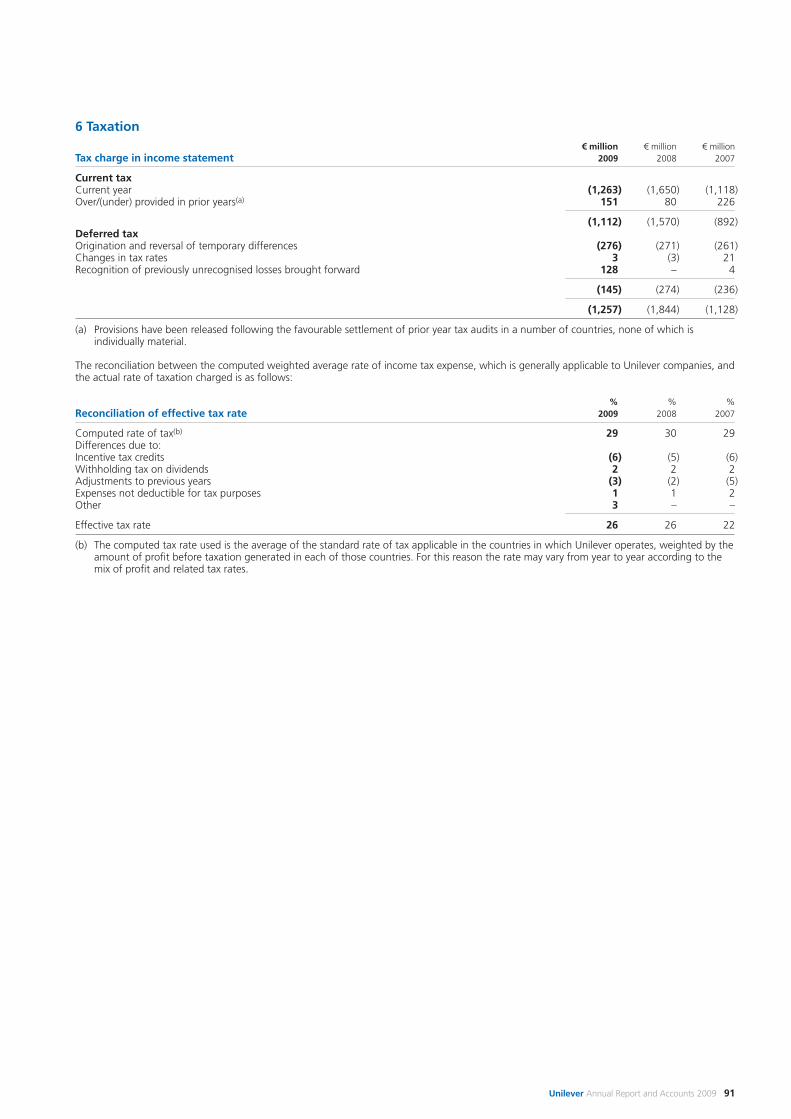
Unilever Annual Report and Accounts 2009 91
6 Taxation€ million € million € million
Tax charge in income statement 2009 2008 2007
Current taxCurrent year (1,263) (1,650) (1,118)Over/(under) provided in prior years(a) 151 80 226
(1,112) (1,570) (892)Deferred taxOrigination and reversal of temporary differences (276) (271) (261)Changes in tax rates 3 (3) 21Recognition of previously unrecognised losses brought forward 128 – 4
(145) (274) (236)
(1,257) (1,844) (1,128)
(a) Provisions have been released following the favourable settlement of prior year tax audits in a number of countries, none of which isindividually material.
The reconciliation between the computed weighted average rate of income tax expense, which is generally applicable to Unilever companies, andthe actual rate of taxation charged is as follows:
% % %Reconciliation of effective tax rate 2009 2008 2007
Computed rate of tax(b) 29 30 29Differences due to:Incentive tax credits (6) (5) (6)Withholding tax on dividends 2 2 2Adjustments to previous years (3) (2) (5)Expenses not deductible for tax purposes 1 1 2Other 3 – –
Effective tax rate 26 26 22
(b) The computed tax rate used is the average of the standard rate of tax applicable in the countries in which Unilever operates, weighted by theamount of profit before taxation generated in each of those countries. For this reason the rate may vary from year to year according to themix of profit and related tax rates.
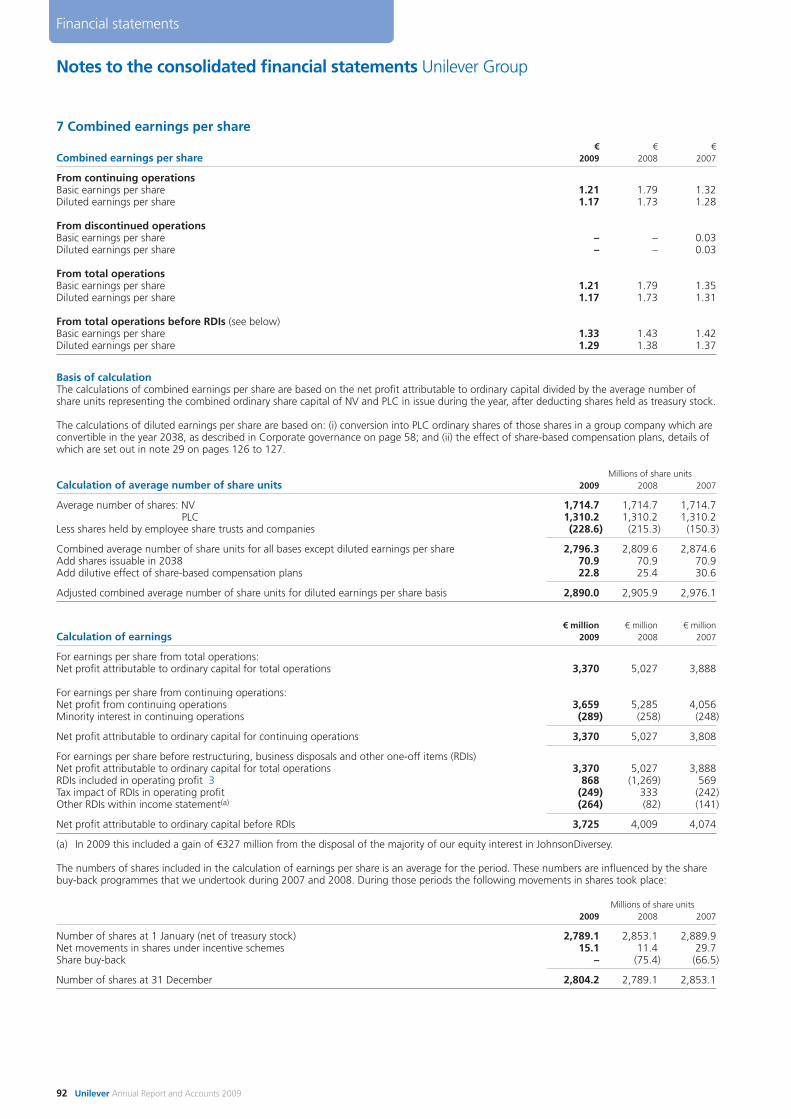
Notes to the consolidated financial statements Unilever Group
92 Unilever Annual Report and Accounts 2009
Financial statements
7 Combined earnings per share€ € €
Combined earnings per share 2009 2008 2007
From continuing operationsBasic earnings per share 1.21 1.79 1.32Diluted earnings per share 1.17 1.73 1.28
From discontinued operationsBasic earnings per share – – 0.03Diluted earnings per share – – 0.03
From total operationsBasic earnings per share 1.21 1.79 1.35Diluted earnings per share 1.17 1.73 1.31
From total operations before RDIs (see below)Basic earnings per share 1.33 1.43 1.42Diluted earnings per share 1.29 1.38 1.37
Basis of calculationThe calculations of combined earnings per share are based on the net profit attributable to ordinary capital divided by the average number ofshare units representing the combined ordinary share capital of NV and PLC in issue during the year, after deducting shares held as treasury stock.
The calculations of diluted earnings per share are based on: (i) conversion into PLC ordinary shares of those shares in a group company which areconvertible in the year 2038, as described in Corporate governance on page 58; and (ii) the effect of share-based compensation plans, details ofwhich are set out in note 29 on pages 126 to 127.
Millions of share unitsCalculation of average number of share units 2009 2008 2007
Average number of shares: NV 1,714.7 1,714.7 1,714.7PLC 1,310.2 1,310.2 1,310.2
Less shares held by employee share trusts and companies (228.6) (215.3) (150.3)
Combined average number of share units for all bases except diluted earnings per share 2,796.3 2,809.6 2,874.6Add shares issuable in 2038 70.9 70.9 70.9Add dilutive effect of share-based compensation plans 22.8 25.4 30.6
Adjusted combined average number of share units for diluted earnings per share basis 2,890.0 2,905.9 2,976.1
€ million € million € millionCalculation of earnings 2009 2008 2007
For earnings per share from total operations:Net profit attributable to ordinary capital for total operations 3,370 5,027 3,888
For earnings per share from continuing operations:Net profit from continuing operations 3,659 5,285 4,056Minority interest in continuing operations (289) (258) (248)
Net profit attributable to ordinary capital for continuing operations 3,370 5,027 3,808
For earnings per share before restructuring, business disposals and other one-off items (RDIs)Net profit attributable to ordinary capital for total operations 3,370 5,027 3,888RDIs included in operating profit 3 868 (1,269) 569Tax impact of RDIs in operating profit (249) 333 (242)Other RDIs within income statement(a) (264) (82) (141)
Net profit attributable to ordinary capital before RDIs 3,725 4,009 4,074
(a) In 2009 this included a gain of €327 million from the disposal of the majority of our equity interest in JohnsonDiversey.
The numbers of shares included in the calculation of earnings per share is an average for the period. These numbers are influenced by the sharebuy-back programmes that we undertook during 2007 and 2008. During those periods the following movements in shares took place:
Millions of share units2009 2008 2007
Number of shares at 1 January (net of treasury stock) 2,789.1 2,853.1 2,889.9Net movements in shares under incentive schemes 15.1 11.4 29.7Share buy-back – (75.4) (66.5)
Number of shares at 31 December 2,804.2 2,789.1 2,853.1
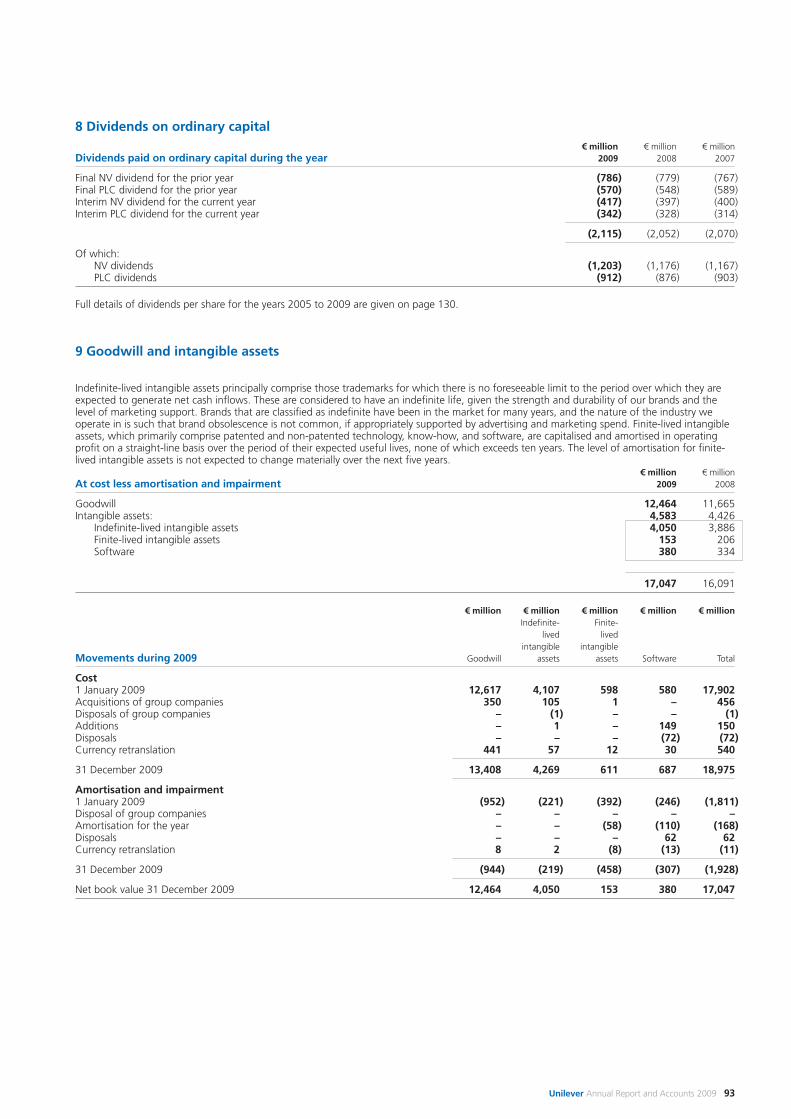
Unilever Annual Report and Accounts 2009 93
8 Dividends on ordinary capital€ million € million € million
Dividends paid on ordinary capital during the year 2009 2008 2007
Final NV dividend for the prior year (786) (779) (767)Final PLC dividend for the prior year (570) (548) (589)Interim NV dividend for the current year (417) (397) (400)Interim PLC dividend for the current year (342) (328) (314)
(2,115) (2,052) (2,070)
Of which:NV dividends (1,203) (1,176) (1,167)PLC dividends (912) (876) (903)
Full details of dividends per share for the years 2005 to 2009 are given on page 130.
9 Goodwill and intangible assets
Indefinite-lived intangible assets principally comprise those trademarks for which there is no foreseeable limit to the period over which they areexpected to generate net cash inflows. These are considered to have an indefinite life, given the strength and durability of our brands and the level of marketing support. Brands that are classified as indefinite have been in the market for many years, and the nature of the industry weoperate in is such that brand obsolescence is not common, if appropriately supported by advertising and marketing spend. Finite-lived intangibleassets, which primarily comprise patented and non-patented technology, know-how, and software, are capitalised and amortised in operatingprofit on a straight-line basis over the period of their expected useful lives, none of which exceeds ten years. The level of amortisation for finite-lived intangible assets is not expected to change materially over the next five years.
€ million € millionAt cost less amortisation and impairment 2009 2008
Goodwill 12,464 11,665Intangible assets: 4,583 4,426
Indefinite-lived intangible assets 4,050 3,886Finite-lived intangible assets 153 206Software 380 334
17,047 16,091
€ million € million € million € million € millionIndefinite- Finite-
lived livedintangible intangible
Movements during 2009 Goodwill assets assets Software Total
Cost1 January 2009 12,617 4,107 598 580 17,902Acquisitions of group companies 350 105 1 – 456Disposals of group companies – (1) – – (1)Additions – 1 – 149 150Disposals – – – (72) (72)Currency retranslation 441 57 12 30 540
31 December 2009 13,408 4,269 611 687 18,975
Amortisation and impairment1 January 2009 (952) (221) (392) (246) (1,811)Disposal of group companies – – – – –Amortisation for the year – – (58) (110) (168)Disposals – – – 62 62Currency retranslation 8 2 (8) (13) (11)
31 December 2009 (944) (219) (458) (307) (1,928)
Net book value 31 December 2009 12,464 4,050 153 380 17,047
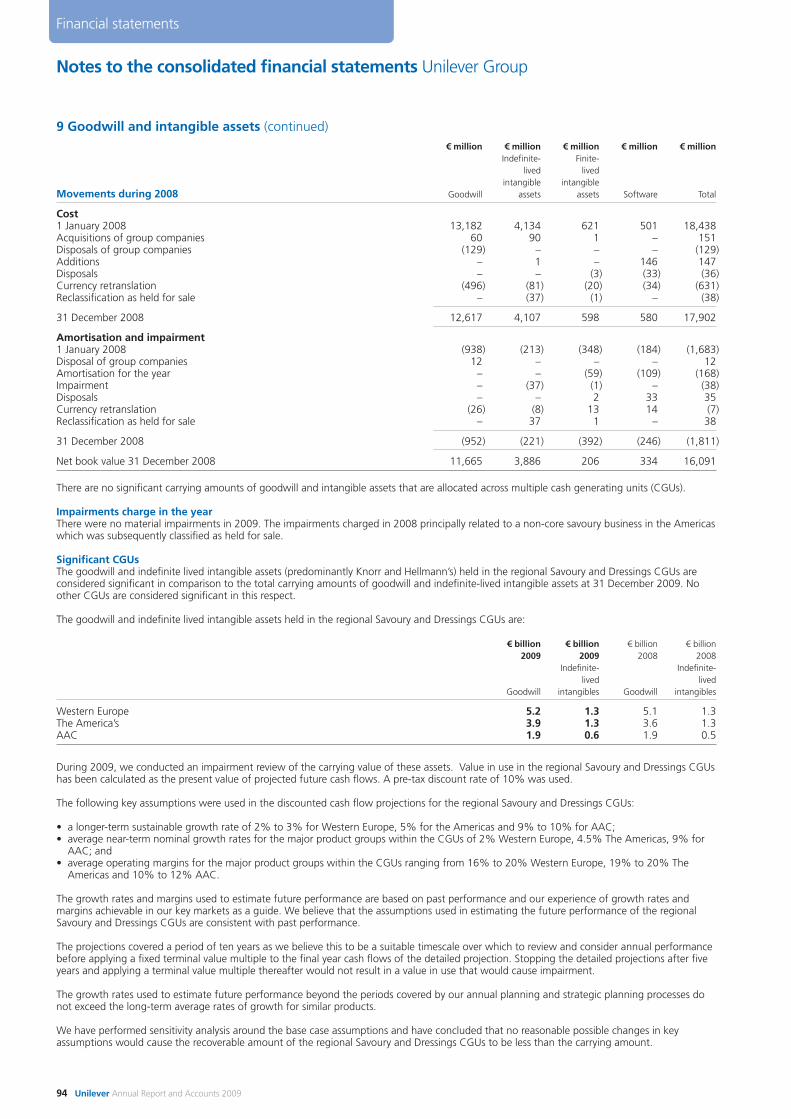
Notes to the consolidated financial statements Unilever Group
94 Unilever Annual Report and Accounts 2009
Financial statements
9 Goodwill and intangible assets (continued)€ million € million € million € million € million
Indefinite- Finite-lived lived
intangible intangibleMovements during 2008 Goodwill assets assets Software Total
Cost1 January 2008 13,182 4,134 621 501 18,438Acquisitions of group companies 60 90 1 – 151Disposals of group companies (129) – – – (129)Additions – 1 – 146 147Disposals – – (3) (33) (36)Currency retranslation (496) (81) (20) (34) (631)Reclassification as held for sale – (37) (1) – (38)
31 December 2008 12,617 4,107 598 580 17,902
Amortisation and impairment1 January 2008 (938) (213) (348) (184) (1,683)Disposal of group companies 12 – – – 12Amortisation for the year – – (59) (109) (168)Impairment – (37) (1) – (38)Disposals – – 2 33 35Currency retranslation (26) (8) 13 14 (7)Reclassification as held for sale – 37 1 – 38
31 December 2008 (952) (221) (392) (246) (1,811)
Net book value 31 December 2008 11,665 3,886 206 334 16,091
There are no significant carrying amounts of goodwill and intangible assets that are allocated across multiple cash generating units (CGUs).
Impairments charge in the yearThere were no material impairments in 2009. The impairments charged in 2008 principally related to a non-core savoury business in the Americaswhich was subsequently classified as held for sale.
Significant CGUsThe goodwill and indefinite lived intangible assets (predominantly Knorr and Hellmann’s) held in the regional Savoury and Dressings CGUs areconsidered significant in comparison to the total carrying amounts of goodwill and indefinite-lived intangible assets at 31 December 2009. Noother CGUs are considered significant in this respect.
The goodwill and indefinite lived intangible assets held in the regional Savoury and Dressings CGUs are:
€ billion € billion € billion € billion2009 2009 2008 2008
Indefinite- Indefinite-lived lived
Goodwill intangibles Goodwill intangibles
Western Europe 5.2 1.3 5.1 1.3The America’s 3.9 1.3 3.6 1.3AAC 1.9 0.6 1.9 0.5
During 2009, we conducted an impairment review of the carrying value of these assets. Value in use in the regional Savoury and Dressings CGUshas been calculated as the present value of projected future cash flows. A pre-tax discount rate of 10% was used.
The following key assumptions were used in the discounted cash flow projections for the regional Savoury and Dressings CGUs:
• a longer-term sustainable growth rate of 2% to 3% for Western Europe, 5% for the Americas and 9% to 10% for AAC;• average near-term nominal growth rates for the major product groups within the CGUs of 2% Western Europe, 4.5% The Americas, 9% for
AAC; and• average operating margins for the major product groups within the CGUs ranging from 16% to 20% Western Europe, 19% to 20% The
Americas and 10% to 12% AAC.
The growth rates and margins used to estimate future performance are based on past performance and our experience of growth rates andmargins achievable in our key markets as a guide. We believe that the assumptions used in estimating the future performance of the regionalSavoury and Dressings CGUs are consistent with past performance.
The projections covered a period of ten years as we believe this to be a suitable timescale over which to review and consider annual performancebefore applying a fixed terminal value multiple to the final year cash flows of the detailed projection. Stopping the detailed projections after fiveyears and applying a terminal value multiple thereafter would not result in a value in use that would cause impairment.
The growth rates used to estimate future performance beyond the periods covered by our annual planning and strategic planning processes donot exceed the long-term average rates of growth for similar products.
We have performed sensitivity analysis around the base case assumptions and have concluded that no reasonable possible changes in keyassumptions would cause the recoverable amount of the regional Savoury and Dressings CGUs to be less than the carrying amount.
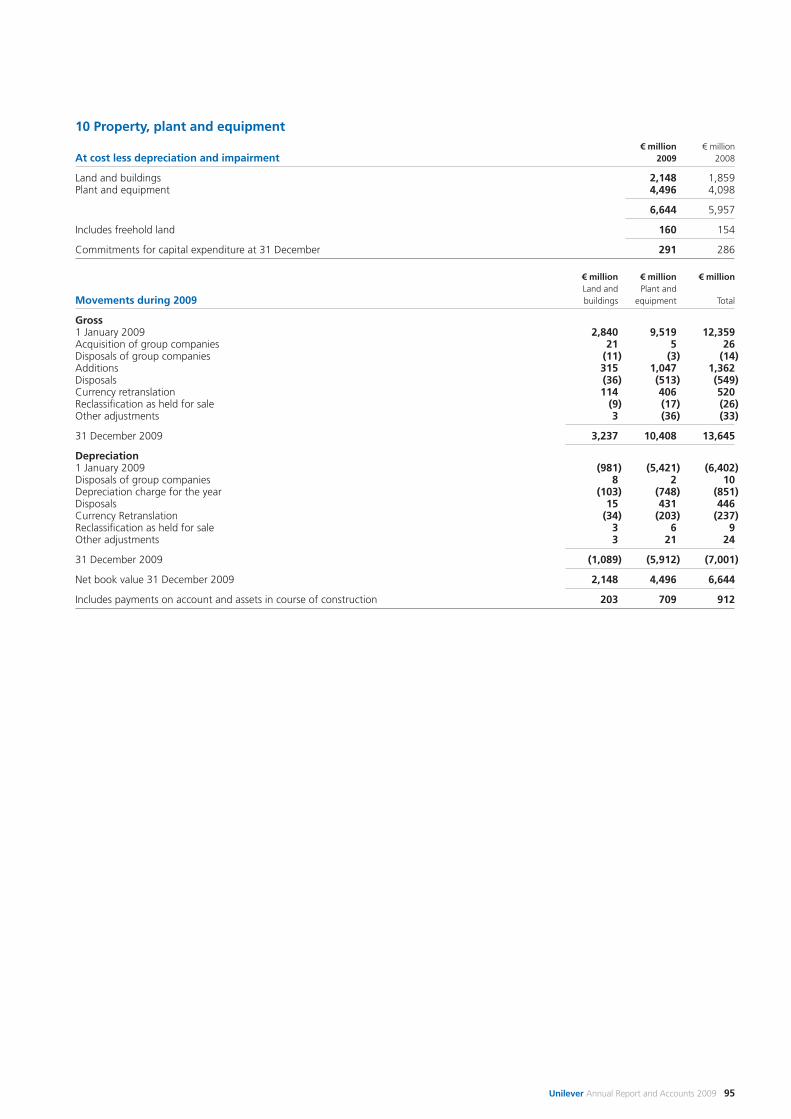
Unilever Annual Report and Accounts 2009 95
10 Property, plant and equipment€ million € million
At cost less depreciation and impairment 2009 2008
Land and buildings 2,148 1,859Plant and equipment 4,496 4,098
6,644 5,957
Includes freehold land 160 154
Commitments for capital expenditure at 31 December 291 286
€ million € million € millionLand and Plant and
Movements during 2009 buildings equipment Total
Gross1 January 2009 2,840 9,519 12,359Acquisition of group companies 21 5 26Disposals of group companies (11) (3) (14)Additions 315 1,047 1,362Disposals (36) (513) (549)Currency retranslation 114 406 520Reclassification as held for sale (9) (17) (26)Other adjustments 3 (36) (33)
31 December 2009 3,237 10,408 13,645
Depreciation1 January 2009 (981) (5,421) (6,402)Disposals of group companies 8 2 10Depreciation charge for the year (103) (748) (851)Disposals 15 431 446Currency Retranslation (34) (203) (237)Reclassification as held for sale 3 6 9Other adjustments 3 21 24
31 December 2009 (1,089) (5,912) (7,001)
Net book value 31 December 2009 2,148 4,496 6,644
Includes payments on account and assets in course of construction 203 709 912
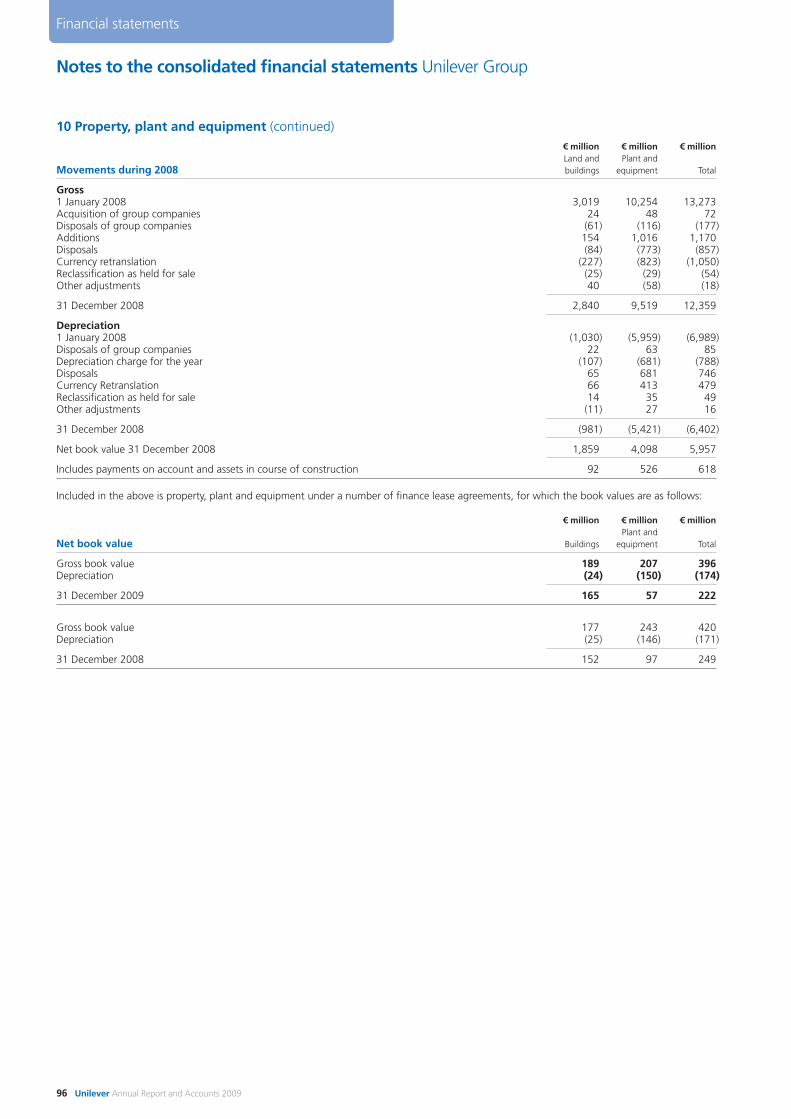
Notes to the consolidated financial statements Unilever Group
96 Unilever Annual Report and Accounts 2009
Financial statements
10 Property, plant and equipment (continued)€ million € million € millionLand and Plant and
Movements during 2008 buildings equipment Total
Gross1 January 2008 3,019 10,254 13,273Acquisition of group companies 24 48 72Disposals of group companies (61) (116) (177)Additions 154 1,016 1,170Disposals (84) (773) (857)Currency retranslation (227) (823) (1,050)Reclassification as held for sale (25) (29) (54)Other adjustments 40 (58) (18)
31 December 2008 2,840 9,519 12,359
Depreciation 1 January 2008 (1,030) (5,959) (6,989)Disposals of group companies 22 63 85Depreciation charge for the year (107) (681) (788)Disposals 65 681 746Currency Retranslation 66 413 479Reclassification as held for sale 14 35 49Other adjustments (11) 27 16
31 December 2008 (981) (5,421) (6,402)
Net book value 31 December 2008 1,859 4,098 5,957
Includes payments on account and assets in course of construction 92 526 618
Included in the above is property, plant and equipment under a number of finance lease agreements, for which the book values are as follows:
€ million € million € millionPlant and
Net book value Buildings equipment Total
Gross book value 189 207 396Depreciation (24) (150) (174)
31 December 2009 165 57 222
Gross book value 177 243 420Depreciation (25) (146) (171)
31 December 2008 152 97 249
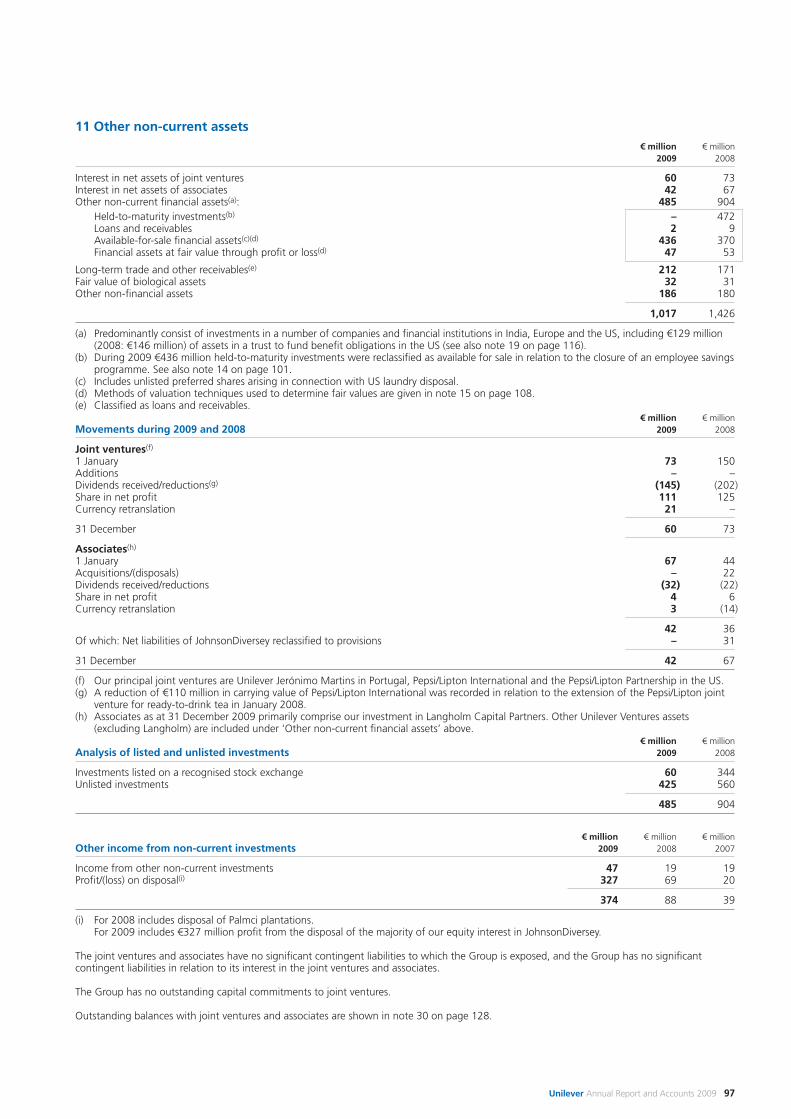
Unilever Annual Report and Accounts 2009 97
11 Other non-current assets€ million € million
2009 2008
Interest in net assets of joint ventures 60 73Interest in net assets of associates 42 67Other non-current financial assets(a): 485 904
Held-to-maturity investments(b) – 472Loans and receivables 2 9Available-for-sale financial assets(c)(d) 436 370Financial assets at fair value through profit or loss(d) 47 53
Long-term trade and other receivables(e) 212 171Fair value of biological assets 32 31Other non-financial assets 186 180
1,017 1,426
(a) Predominantly consist of investments in a number of companies and financial institutions in India, Europe and the US, including €129 million(2008: €146 million) of assets in a trust to fund benefit obligations in the US (see also note 19 on page 116).
(b) During 2009 €436 million held-to-maturity investments were reclassified as available for sale in relation to the closure of an employee savingsprogramme. See also note 14 on page 101.
(c) Includes unlisted preferred shares arising in connection with US laundry disposal.(d) Methods of valuation techniques used to determine fair values are given in note 15 on page 108.(e) Classified as loans and receivables.
€ million € millionMovements during 2009 and 2008 2009 2008
Joint ventures(f)
1 January 73 150Additions – –Dividends received/reductions(g) (145) (202)Share in net profit 111 125Currency retranslation 21 –
31 December 60 73
Associates(h)
1 January 67 44Acquisitions/(disposals) – 22Dividends received/reductions (32) (22)Share in net profit 4 6Currency retranslation 3 (14)
42 36Of which: Net liabilities of JohnsonDiversey reclassified to provisions – 31
31 December 42 67
(f) Our principal joint ventures are Unilever Jerónimo Martins in Portugal, Pepsi/Lipton International and the Pepsi/Lipton Partnership in the US.(g) A reduction of €110 million in carrying value of Pepsi/Lipton International was recorded in relation to the extension of the Pepsi/Lipton joint
venture for ready-to-drink tea in January 2008. (h) Associates as at 31 December 2009 primarily comprise our investment in Langholm Capital Partners. Other Unilever Ventures assets
(excluding Langholm) are included under ‘Other non-current financial assets’ above.€ million € million
Analysis of listed and unlisted investments 2009 2008
Investments listed on a recognised stock exchange 60 344Unlisted investments 425 560
485 904
€ million € million € millionOther income from non-current investments 2009 2008 2007
Income from other non-current investments 47 19 19Profit/(loss) on disposal(i) 327 69 20
374 88 39
(i) For 2008 includes disposal of Palmci plantations.For 2009 includes €327 million profit from the disposal of the majority of our equity interest in JohnsonDiversey.
The joint ventures and associates have no significant contingent liabilities to which the Group is exposed, and the Group has no significantcontingent liabilities in relation to its interest in the joint ventures and associates.
The Group has no outstanding capital commitments to joint ventures.
Outstanding balances with joint ventures and associates are shown in note 30 on page 128.
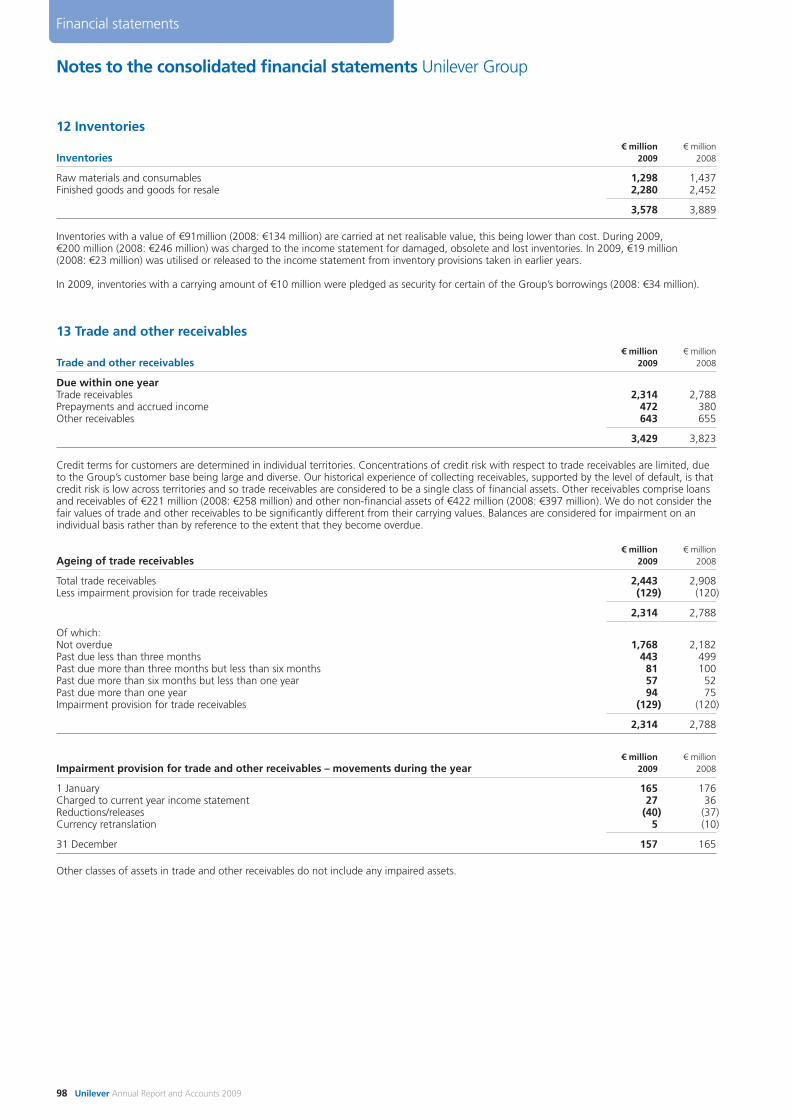
Notes to the consolidated financial statements Unilever Group
98 Unilever Annual Report and Accounts 2009
Financial statements
12 Inventories€ million € million
Inventories 2009 2008
Raw materials and consumables 1,298 1,437Finished goods and goods for resale 2,280 2,452
3,578 3,889
Inventories with a value of €91million (2008: €134 million) are carried at net realisable value, this being lower than cost. During 2009,€200 million (2008: €246 million) was charged to the income statement for damaged, obsolete and lost inventories. In 2009, €19 million (2008: €23 million) was utilised or released to the income statement from inventory provisions taken in earlier years.
In 2009, inventories with a carrying amount of €10 million were pledged as security for certain of the Group’s borrowings (2008: €34 million).
13 Trade and other receivables€ million € million
Trade and other receivables 2009 2008
Due within one yearTrade receivables 2,314 2,788Prepayments and accrued income 472 380Other receivables 643 655
3,429 3,823
Credit terms for customers are determined in individual territories. Concentrations of credit risk with respect to trade receivables are limited, dueto the Group’s customer base being large and diverse. Our historical experience of collecting receivables, supported by the level of default, is thatcredit risk is low across territories and so trade receivables are considered to be a single class of financial assets. Other receivables comprise loansand receivables of €221 million (2008: €258 million) and other non-financial assets of €422 million (2008: €397 million). We do not consider thefair values of trade and other receivables to be significantly different from their carrying values. Balances are considered for impairment on anindividual basis rather than by reference to the extent that they become overdue.
€ million € millionAgeing of trade receivables 2009 2008
Total trade receivables 2,443 2,908Less impairment provision for trade receivables (129) (120)
2,314 2,788
Of which:Not overdue 1,768 2,182Past due less than three months 443 499Past due more than three months but less than six months 81 100Past due more than six months but less than one year 57 52Past due more than one year 94 75Impairment provision for trade receivables (129) (120)
2,314 2,788
€ million € millionImpairment provision for trade and other receivables – movements during the year 2009 2008
1 January 165 176Charged to current year income statement 27 36Reductions/releases (40) (37)Currency retranslation 5 (10)
31 December 157 165
Other classes of assets in trade and other receivables do not include any impaired assets.
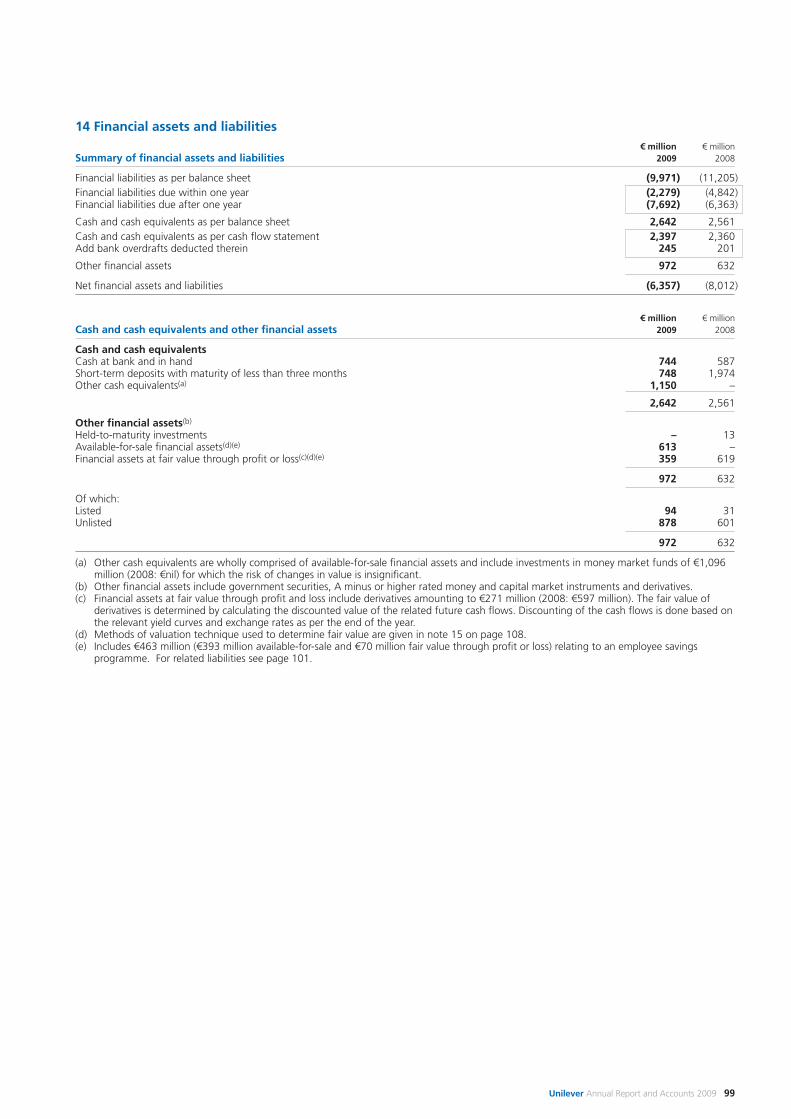
Unilever Annual Report and Accounts 2009 99
14 Financial assets and liabilities€ million € million
Summary of financial assets and liabilities 2009 2008
Financial liabilities as per balance sheet (9,971) (11,205)Financial liabilities due within one year (2,279) (4,842)Financial liabilities due after one year (7,692) (6,363)
Cash and cash equivalents as per balance sheet 2,642 2,561Cash and cash equivalents as per cash flow statement 2,397 2,360Add bank overdrafts deducted therein 245 201
Other financial assets 972 632
Net financial assets and liabilities (6,357) (8,012)
€ million € millionCash and cash equivalents and other financial assets 2009 2008
Cash and cash equivalentsCash at bank and in hand 744 587Short-term deposits with maturity of less than three months 748 1,974Other cash equivalents(a) 1,150 –
2,642 2,561
Other financial assets(b)
Held-to-maturity investments – 13Available-for-sale financial assets(d)(e) 613 –Financial assets at fair value through profit or loss(c)(d)(e) 359 619
972 632
Of which:Listed 94 31Unlisted 878 601
972 632
(a) Other cash equivalents are wholly comprised of available-for-sale financial assets and include investments in money market funds of €1,096million (2008: €nil) for which the risk of changes in value is insignificant.
(b) Other financial assets include government securities, A minus or higher rated money and capital market instruments and derivatives.(c) Financial assets at fair value through profit and loss include derivatives amounting to €271 million (2008: €597 million). The fair value of
derivatives is determined by calculating the discounted value of the related future cash flows. Discounting of the cash flows is done based onthe relevant yield curves and exchange rates as per the end of the year.
(d) Methods of valuation technique used to determine fair value are given in note 15 on page 108.(e) Includes €463 million (€393 million available-for-sale and €70 million fair value through profit or loss) relating to an employee savings
programme. For related liabilities see page 101.
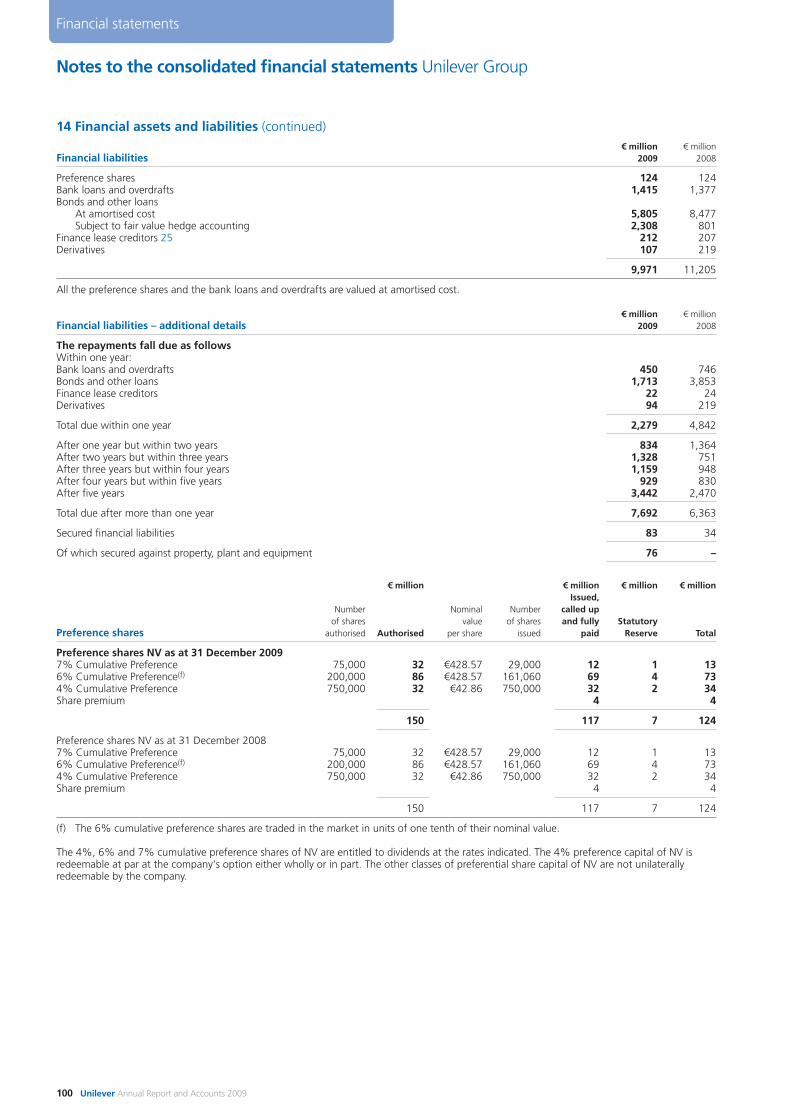
Notes to the consolidated financial statements Unilever Group
100 Unilever Annual Report and Accounts 2009
Financial statements
14 Financial assets and liabilities (continued)€ million € million
Financial liabilities 2009 2008
Preference shares 124 124Bank loans and overdrafts 1,415 1,377Bonds and other loans
At amortised cost 5,805 8,477Subject to fair value hedge accounting 2,308 801
Finance lease creditors 25 212 207Derivatives 107 219
9,971 11,205
All the preference shares and the bank loans and overdrafts are valued at amortised cost.
€ million € millionFinancial liabilities – additional details 2009 2008
The repayments fall due as followsWithin one year:Bank loans and overdrafts 450 746Bonds and other loans 1,713 3,853Finance lease creditors 22 24Derivatives 94 219
Total due within one year 2,279 4,842
After one year but within two years 834 1,364After two years but within three years 1,328 751After three years but within four years 1,159 948After four years but within five years 929 830After five years 3,442 2,470
Total due after more than one year 7,692 6,363
Secured financial liabilities 83 34
Of which secured against property, plant and equipment 76 –
€ million € million € million € millionIssued,
Number Nominal Number called upof shares value of shares and fully Statutory
Preference shares authorised Authorised per share issued paid Reserve Total
Preference shares NV as at 31 December 20097% Cumulative Preference 75,000 32 €428.57 29,000 12 1 136% Cumulative Preference(f) 200,000 86 €428.57 161,060 69 4 734% Cumulative Preference 750,000 32 €42.86 750,000 32 2 34Share premium 4 4
150 117 7 124
Preference shares NV as at 31 December 20087% Cumulative Preference 75,000 32 €428.57 29,000 12 1 136% Cumulative Preference(f) 200,000 86 €428.57 161,060 69 4 734% Cumulative Preference 750,000 32 €42.86 750,000 32 2 34Share premium 4 4
150 117 7 124
(f) The 6% cumulative preference shares are traded in the market in units of one tenth of their nominal value.
The 4%, 6% and 7% cumulative preference shares of NV are entitled to dividends at the rates indicated. The 4% preference capital of NV isredeemable at par at the company‘s option either wholly or in part. The other classes of preferential share capital of NV are not unilaterallyredeemable by the company.
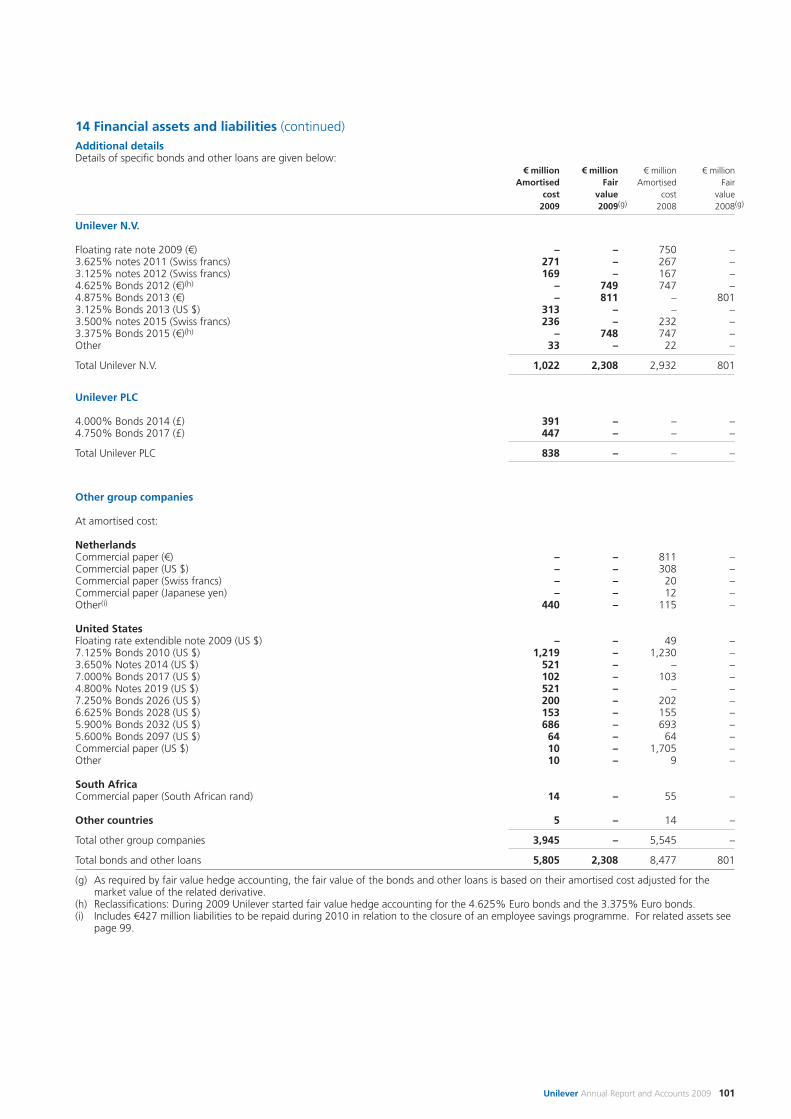
Unilever Annual Report and Accounts 2009 101
14 Financial assets and liabilities (continued)Additional detailsDetails of specific bonds and other loans are given below:
€ million € million € million € millionAmortised Fair Amortised Fair
cost value cost value2009 2009(g) 2008 2008(g)
Unilever N.V.
Floating rate note 2009 (€) – – 750 –3.625% notes 2011 (Swiss francs) 271 – 267 –3.125% notes 2012 (Swiss francs) 169 – 167 –4.625% Bonds 2012 (€)(h) – 749 747 –4.875% Bonds 2013 (€) – 811 – 8013.125% Bonds 2013 (US $) 313 – – –3.500% notes 2015 (Swiss francs) 236 – 232 –3.375% Bonds 2015 (€)(h) – 748 747 –Other 33 – 22 –
Total Unilever N.V. 1,022 2,308 2,932 801
Unilever PLC
4.000% Bonds 2014 (£) 391 – – –4.750% Bonds 2017 (£) 447 – – –
Total Unilever PLC 838 – – –
Other group companies
At amortised cost:
NetherlandsCommercial paper (€) – – 811 –Commercial paper (US $) – – 308 –Commercial paper (Swiss francs) – – 20 –Commercial paper (Japanese yen) – – 12 –Other(i) 440 – 115 –
United StatesFloating rate extendible note 2009 (US $) – – 49 –7.125% Bonds 2010 (US $) 1,219 – 1,230 –3.650% Notes 2014 (US $) 521 – – –7.000% Bonds 2017 (US $) 102 – 103 –4.800% Notes 2019 (US $) 521 – – –7.250% Bonds 2026 (US $) 200 – 202 –6.625% Bonds 2028 (US $) 153 – 155 –5.900% Bonds 2032 (US $) 686 – 693 –5.600% Bonds 2097 (US $) 64 – 64 –Commercial paper (US $) 10 – 1,705 –Other 10 – 9 –
South AfricaCommercial paper (South African rand) 14 – 55 –
Other countries 5 – 14 –
Total other group companies 3,945 – 5,545 –
Total bonds and other loans 5,805 2,308 8,477 801
(g) As required by fair value hedge accounting, the fair value of the bonds and other loans is based on their amortised cost adjusted for themarket value of the related derivative.
(h) Reclassifications: During 2009 Unilever started fair value hedge accounting for the 4.625% Euro bonds and the 3.375% Euro bonds.(i) Includes €427 million liabilities to be repaid during 2010 in relation to the closure of an employee savings programme. For related assets see
page 99.
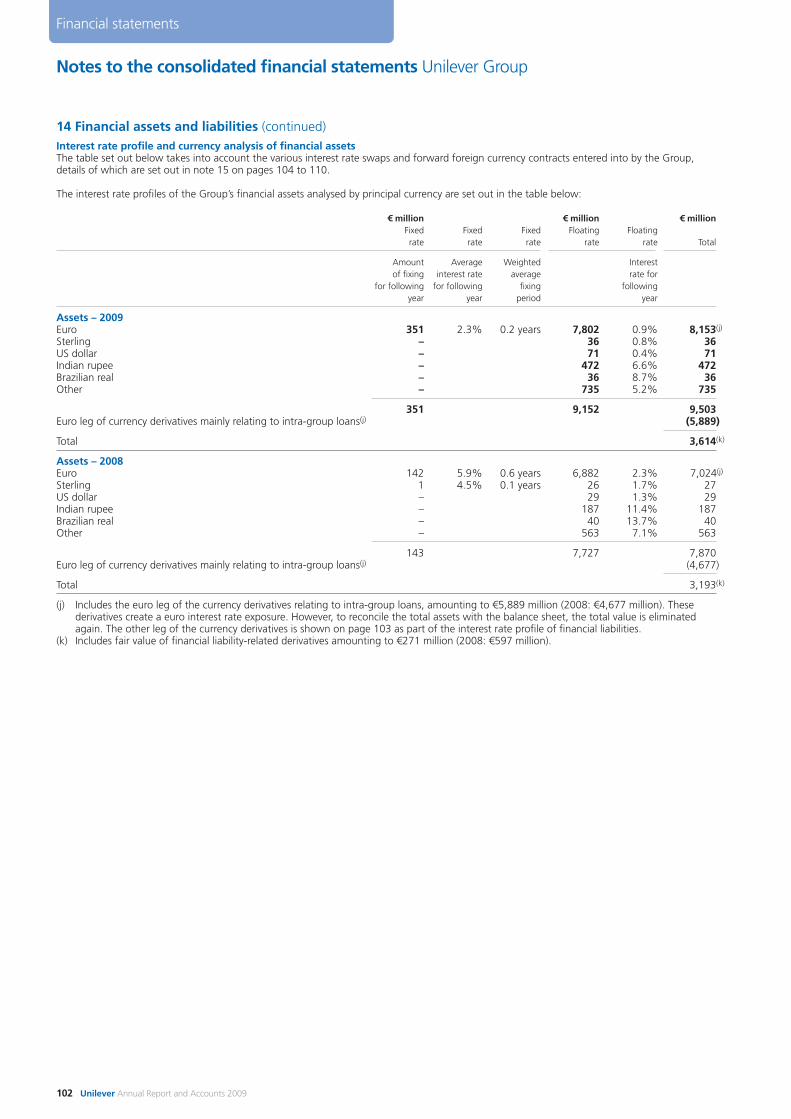
Notes to the consolidated financial statements Unilever Group
102 Unilever Annual Report and Accounts 2009
Financial statements
14 Financial assets and liabilities (continued)Interest rate profile and currency analysis of financial assetsThe table set out below takes into account the various interest rate swaps and forward foreign currency contracts entered into by the Group,details of which are set out in note 15 on pages 104 to 110.
The interest rate profiles of the Group’s financial assets analysed by principal currency are set out in the table below:
€ million € million € millionFixed Fixed Fixed Floating Floatingrate rate rate rate rate Total
Amount Average Weighted Interestof fixing interest rate average rate for
for following for following fixing followingyear year period year
Assets – 2009Euro 351 2.3% 0.2 years 7,802 0.9% 8,153(j)
Sterling – 36 0.8% 36US dollar – 71 0.4% 71Indian rupee – 472 6.6% 472Brazilian real – 36 8.7% 36Other – 735 5.2% 735
351 9,152 9,503Euro leg of currency derivatives mainly relating to intra-group loans(j) (5,889)
Total 3,614(k)
Assets – 2008Euro 142 5.9% 0.6 years 6,882 2.3% 7,024(j)
Sterling 1 4.5% 0.1 years 26 1.7% 27US dollar – 29 1.3% 29Indian rupee – 187 11.4% 187Brazilian real – 40 13.7% 40Other – 563 7.1% 563
143 7,727 7,870Euro leg of currency derivatives mainly relating to intra-group loans(j) (4,677)
Total 3,193(k)
(j) Includes the euro leg of the currency derivatives relating to intra-group loans, amounting to €5,889 million (2008: €4,677 million). Thesederivatives create a euro interest rate exposure. However, to reconcile the total assets with the balance sheet, the total value is eliminatedagain. The other leg of the currency derivatives is shown on page 103 as part of the interest rate profile of financial liabilities.
(k) Includes fair value of financial liability-related derivatives amounting to €271 million (2008: €597 million).
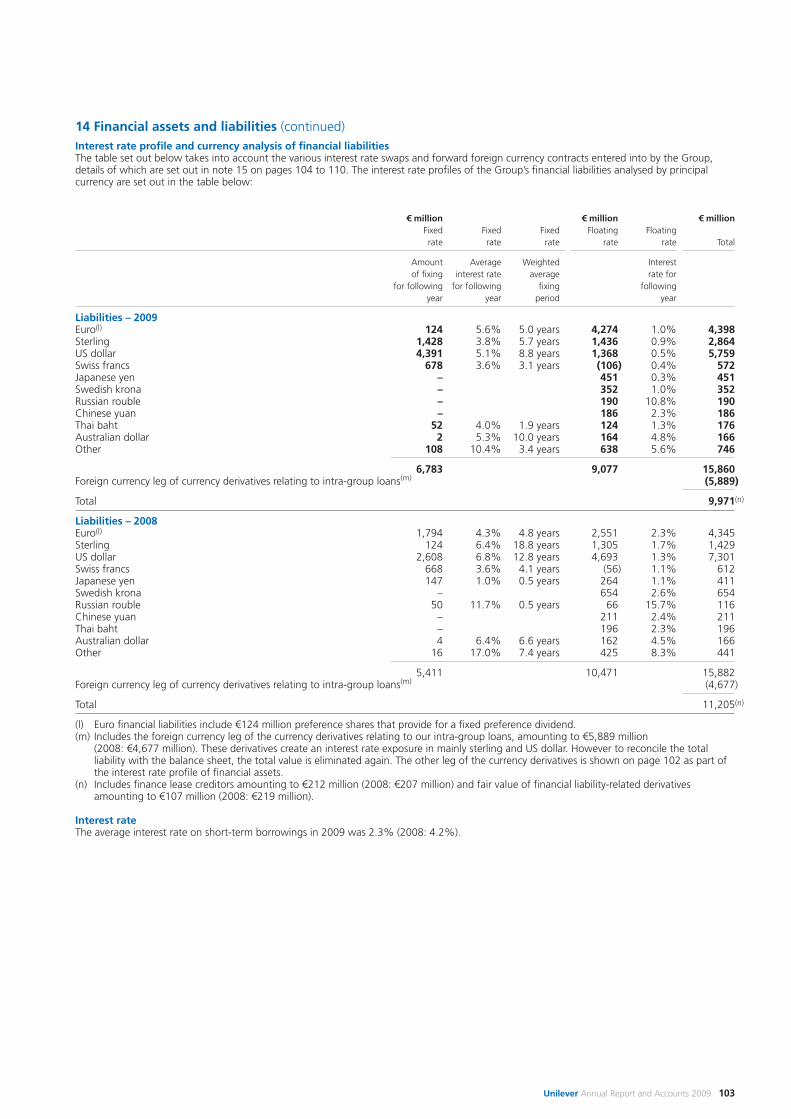
Unilever Annual Report and Accounts 2009 103
14 Financial assets and liabilities (continued)Interest rate profile and currency analysis of financial liabilitiesThe table set out below takes into account the various interest rate swaps and forward foreign currency contracts entered into by the Group,details of which are set out in note 15 on pages 104 to 110. The interest rate profiles of the Group’s financial liabilities analysed by principalcurrency are set out in the table below:
€ million € million € millionFixed Fixed Fixed Floating Floatingrate rate rate rate rate Total
Amount Average Weighted Interestof fixing interest rate average rate for
for following for following fixing followingyear year period year
Liabilities – 2009Euro(l) 124 5.6% 5.0 years 4,274 1.0% 4,398Sterling 1,428 3.8% 5.7 years 1,436 0.9% 2,864US dollar 4,391 5.1% 8.8 years 1,368 0.5% 5,759Swiss francs 678 3.6% 3.1 years (106) 0.4% 572Japanese yen – 451 0.3% 451Swedish krona – 352 1.0% 352Russian rouble – 190 10.8% 190Chinese yuan – 186 2.3% 186Thai baht 52 4.0% 1.9 years 124 1.3% 176Australian dollar 2 5.3% 10.0 years 164 4.8% 166Other 108 10.4% 3.4 years 638 5.6% 746
6,783 9,077 15,860Foreign currency leg of currency derivatives relating to intra-group loans(m) (5,889)
Total 9,971(n)
Liabilities – 2008Euro(l) 1,794 4.3% 4.8 years 2,551 2.3% 4,345Sterling 124 6.4% 18.8 years 1,305 1.7% 1,429US dollar 2,608 6.8% 12.8 years 4,693 1.3% 7,301Swiss francs 668 3.6% 4.1 years (56) 1.1% 612Japanese yen 147 1.0% 0.5 years 264 1.1% 411Swedish krona – 654 2.6% 654Russian rouble 50 11.7% 0.5 years 66 15.7% 116Chinese yuan – 211 2.4% 211Thai baht – 196 2.3% 196Australian dollar 4 6.4% 6.6 years 162 4.5% 166Other 16 17.0% 7.4 years 425 8.3% 441
5,411 10,471 15,882Foreign currency leg of currency derivatives relating to intra-group loans(m) (4,677)
Total 11,205(n)
(l) Euro financial liabilities include €124 million preference shares that provide for a fixed preference dividend.(m) Includes the foreign currency leg of the currency derivatives relating to our intra-group loans, amounting to €5,889 million
(2008: €4,677 million). These derivatives create an interest rate exposure in mainly sterling and US dollar. However to reconcile the totalliability with the balance sheet, the total value is eliminated again. The other leg of the currency derivatives is shown on page 102 as part ofthe interest rate profile of financial assets.
(n) Includes finance lease creditors amounting to €212 million (2008: €207 million) and fair value of financial liability-related derivativesamounting to €107 million (2008: €219 million).
Interest rateThe average interest rate on short-term borrowings in 2009 was 2.3% (2008: 4.2%).
Notes to the consolidated financial statements Unilever Group
104 Unilever Annual Report and Accounts 2009
Financial statements
15 Financial instruments and treasury risk managementUncertainty and volatility in the financial markets: impact on TreasuryWe believe our strong single-A rating and active financial management have served us well in the current financial uncertainty. Maintaining ourstrong single-A rating has been and will remain a key priority.
To cope with the volatility and uncertainty in the financial markets, we undertook, amongst others, the following actions:
Liquidity management: • During 2009 we issued four bonds at competitive rates for a total of €2.2 billion to take advantage of historically low long term interest rates;• As a result, we have been able to keep commercial paper at a low level, issuing at significant discounts to Libor, when needed; and• As the business successfully managed working capital positions throughout the year, Unilever closed the year with a cash and cash equivalents
balance of around €2.6 billion.
Counterparty exposures: We regularly reviewed and tightened counterparty limits. Banking exposures were actively monitored on a daily basis. During the year most ofour deposits remained on an overnight basis providing maximum flexibility. Unilever benefits from collateral agreements with our principal banks(see also page 106) based on which banks need to deposit securities and/or cash as collateral for their obligations in respect of derivative financialinstruments. Unilever did not encounter any material counterparty exposure loss from financial institutions during 2009.
Funding costs: Throughout the year, in general, credit spreads have decreased significantly but remain volatile. During 2009 we were able to issue commercialpaper and bonds at competitive rates, with a very good reception by the markets.
Bank facility renewal: Our bank facilities are renewed annually. On 31 December 2009 we had US $6,050 million of undrawn committed facilities. For further details,see ’Liquidity risk' section below.
Treasury risk managementUnilever manages a variety of market risks, including the effects of changes in foreign exchange rates, interest rates, liquidity and counterpartyrisks.
Currency risksBecause of Unilever’s broad operational reach, it is subject to risks from changes in foreign currency values that could affect earnings. As a practicalmatter, it is not feasible to fully hedge these fluctuations. Unilever does have a foreign exchange policy that requires operating companies to managetrading and financial foreign exchange exposures within prescribed limits. This is achieved primarily through the use of forward foreign exchangecontracts. On a case-by-case basis, depending on potential income statement volatility that can be caused by the fair value movement of thederivative, companies decide whether or not to apply cash flow hedge accounting. Regional groups monitor compliance with this foreignexchange policy. At the end of 2009, there was no material exposure from companies holding assets and liabilities other than in their functionalcurrency.
In addition, as Unilever conducts business in many foreign currencies but publishes its financial statements and measures its performance in euros,it is subject to exchange risk due to the effects that exchange rate movements have on the translation of the underlying net assets of its foreignsubsidiaries. Unilever aims to minimise its foreign exchange exposure in operating companies by borrowing in the local currency, except whereinhibited by local regulations, lack of local liquidity or local market conditions. For those countries that in the view of management have asubstantial retranslation risk, Unilever may decide on a case-by-case basis, taking into account amongst other factors the impact on the incomestatement, to hedge such net investments. This is achieved through the use of forward foreign exchange contracts on which hedge accounting isapplied. Nevertheless, from time to time, currency revaluations on unhedged investments will trigger exchange translation movements in thebalance sheet.
Interest rate risksUnilever has an interest rate management policy aimed at achieving an optimal balance between fixed and floating rate interest rate exposures onexpected net debt (gross borrowings minus cash and cash equivalents). The objective of the policy is to minimise annual interest costs and toreduce volatility. This is achieved by issuing fixed rate long-term debt and by modifying the interest rate exposure of debt and cash positionsthrough the use of interest rate swaps. The fixing levels for the next five years are managed within agreed fixing bands, with minimum andmaximum fixing level percentages, decreasing by 10 percentage points per calendar year. The minimum level is set to avoid unacceptable interestcost volatility and the maximum level is set to prevent over-fixing, recognising that future debt levels can be volatile.
At the end of 2009, interest rates were fixed on approximately 95% of the projected net of cash and financial liability positions for 2010, slightlyhigher than 90%, the upper limit of the band due to the good cash delivery from the business and 75% for 2011 (compared with 56% for 2009and 51% for 2010 at the end of 2008).
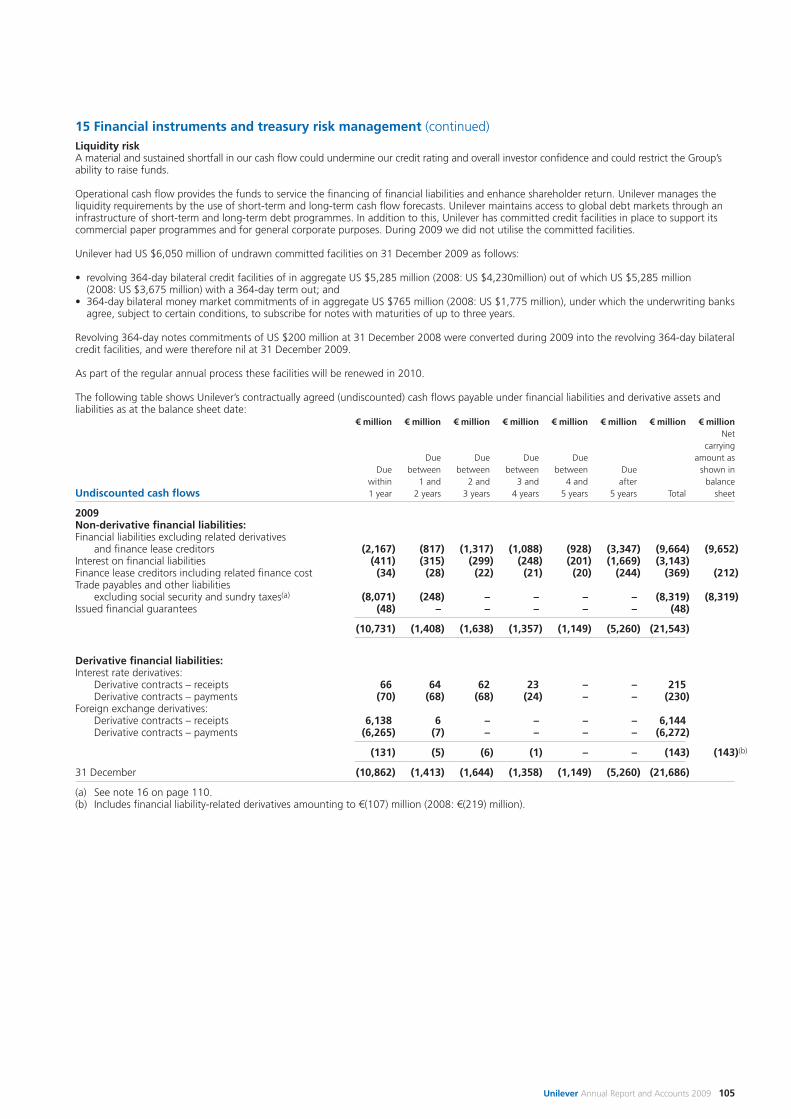
Unilever Annual Report and Accounts 2009 105
15 Financial instruments and treasury risk management (continued)Liquidity riskA material and sustained shortfall in our cash flow could undermine our credit rating and overall investor confidence and could restrict the Group’sability to raise funds.
Operational cash flow provides the funds to service the financing of financial liabilities and enhance shareholder return. Unilever manages theliquidity requirements by the use of short-term and long-term cash flow forecasts. Unilever maintains access to global debt markets through aninfrastructure of short-term and long-term debt programmes. In addition to this, Unilever has committed credit facilities in place to support itscommercial paper programmes and for general corporate purposes. During 2009 we did not utilise the committed facilities.
Unilever had US $6,050 million of undrawn committed facilities on 31 December 2009 as follows:
• revolving 364-day bilateral credit facilities of in aggregate US $5,285 million (2008: US $4,230million) out of which US $5,285 million(2008: US $3,675 million) with a 364-day term out; and
• 364-day bilateral money market commitments of in aggregate US $765 million (2008: US $1,775 million), under which the underwriting banksagree, subject to certain conditions, to subscribe for notes with maturities of up to three years.
Revolving 364-day notes commitments of US $200 million at 31 December 2008 were converted during 2009 into the revolving 364-day bilateralcredit facilities, and were therefore nil at 31 December 2009.
As part of the regular annual process these facilities will be renewed in 2010.
The following table shows Unilever’s contractually agreed (undiscounted) cash flows payable under financial liabilities and derivative assets andliabilities as at the balance sheet date:
€ million € million € million € million € million € million € million € millionNet
carryingDue Due Due Due amount as
Due between between between between Due shown inwithin 1 and 2 and 3 and 4 and after balance
Undiscounted cash flows 1 year 2 years 3 years 4 years 5 years 5 years Total sheet
2009Non-derivative financial liabilities:Financial liabilities excluding related derivatives
and finance lease creditors (2,167) (817) (1,317) (1,088) (928) (3,347) (9,664) (9,652)Interest on financial liabilities (411) (315) (299) (248) (201) (1,669) (3,143)Finance lease creditors including related finance cost (34) (28) (22) (21) (20) (244) (369) (212)Trade payables and other liabilities
excluding social security and sundry taxes(a) (8,071) (248) – – – – (8,319) (8,319)Issued financial guarantees (48) – – – – – (48)
(10,731) (1,408) (1,638) (1,357) (1,149) (5,260) (21,543)
Derivative financial liabilities:Interest rate derivatives:
Derivative contracts – receipts 66 64 62 23 – – 215Derivative contracts – payments (70) (68) (68) (24) – – (230)
Foreign exchange derivatives:Derivative contracts – receipts 6,138 6 – – – – 6,144Derivative contracts – payments (6,265) (7) – – – – (6,272)
(131) (5) (6) (1) – – (143) (143)(b)
31 December (10,862) (1,413) (1,644) (1,358) (1,149) (5,260) (21,686)
(a) See note 16 on page 110.(b) Includes financial liability-related derivatives amounting to €(107) million (2008: €(219) million).
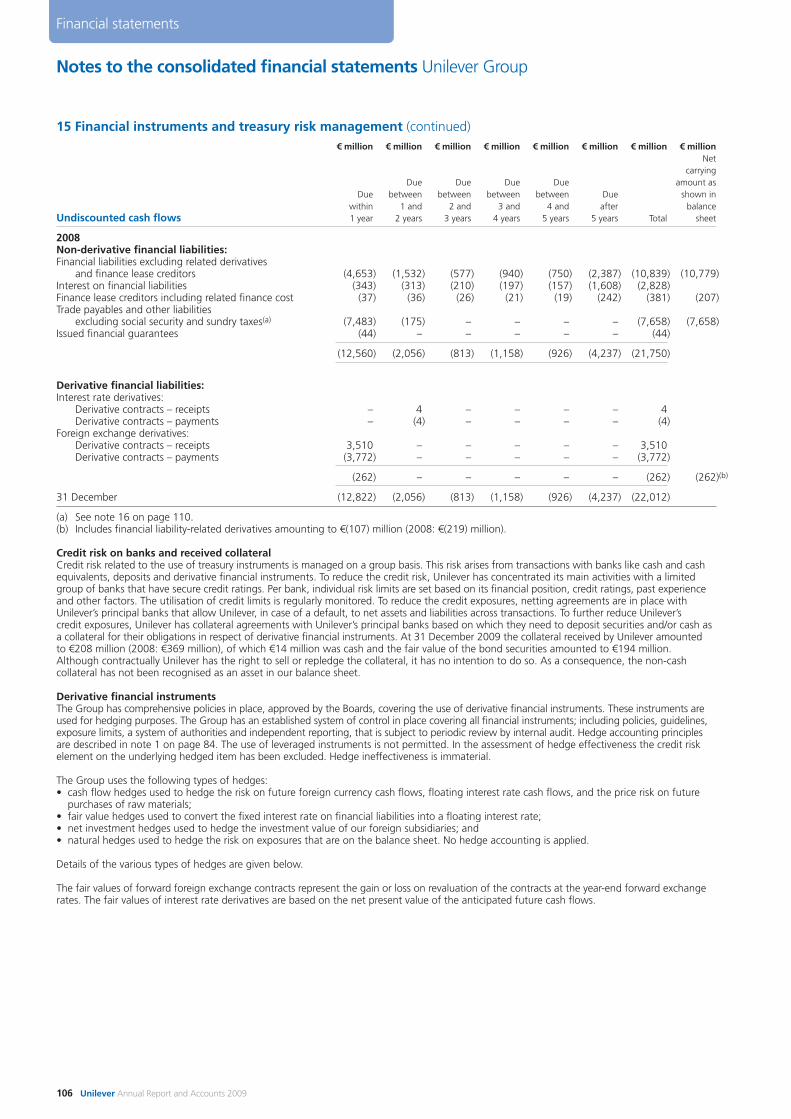
Notes to the consolidated financial statements Unilever Group
106 Unilever Annual Report and Accounts 2009
Financial statements
15 Financial instruments and treasury risk management (continued)€ million € million € million € million € million € million € million € million
Netcarrying
Due Due Due Due amount asDue between between between between Due shown in
within 1 and 2 and 3 and 4 and after balanceUndiscounted cash flows 1 year 2 years 3 years 4 years 5 years 5 years Total sheet
2008Non-derivative financial liabilities:Financial liabilities excluding related derivatives
and finance lease creditors (4,653) (1,532) (577) (940) (750) (2,387) (10,839) (10,779)Interest on financial liabilities (343) (313) (210) (197) (157) (1,608) (2,828)Finance lease creditors including related finance cost (37) (36) (26) (21) (19) (242) (381) (207)Trade payables and other liabilities
excluding social security and sundry taxes(a) (7,483) (175) – – – – (7,658) (7,658)Issued financial guarantees (44) – – – – – (44)
(12,560) (2,056) (813) (1,158) (926) (4,237) (21,750)
Derivative financial liabilities:Interest rate derivatives:
Derivative contracts – receipts – 4 – – – – 4Derivative contracts – payments – (4) – – – – (4)
Foreign exchange derivatives:Derivative contracts – receipts 3,510 – – – – – 3,510Derivative contracts – payments (3,772) – – – – – (3,772)
(262) – – – – – (262) (262)(b)
31 December (12,822) (2,056) (813) (1,158) (926) (4,237) (22,012)
(a) See note 16 on page 110.(b) Includes financial liability-related derivatives amounting to €(107) million (2008: €(219) million).
Credit risk on banks and received collateralCredit risk related to the use of treasury instruments is managed on a group basis. This risk arises from transactions with banks like cash and cashequivalents, deposits and derivative financial instruments. To reduce the credit risk, Unilever has concentrated its main activities with a limitedgroup of banks that have secure credit ratings. Per bank, individual risk limits are set based on its financial position, credit ratings, past experienceand other factors. The utilisation of credit limits is regularly monitored. To reduce the credit exposures, netting agreements are in place withUnilever’s principal banks that allow Unilever, in case of a default, to net assets and liabilities across transactions. To further reduce Unilever’scredit exposures, Unilever has collateral agreements with Unilever’s principal banks based on which they need to deposit securities and/or cash as a collateral for their obligations in respect of derivative financial instruments. At 31 December 2009 the collateral received by Unilever amountedto €208 million (2008: €369 million), of which €14 million was cash and the fair value of the bond securities amounted to €194 million.Although contractually Unilever has the right to sell or repledge the collateral, it has no intention to do so. As a consequence, the non-cashcollateral has not been recognised as an asset in our balance sheet.
Derivative financial instrumentsThe Group has comprehensive policies in place, approved by the Boards, covering the use of derivative financial instruments. These instruments areused for hedging purposes. The Group has an established system of control in place covering all financial instruments; including policies, guidelines,exposure limits, a system of authorities and independent reporting, that is subject to periodic review by internal audit. Hedge accounting principlesare described in note 1 on page 84. The use of leveraged instruments is not permitted. In the assessment of hedge effectiveness the credit riskelement on the underlying hedged item has been excluded. Hedge ineffectiveness is immaterial.
The Group uses the following types of hedges:• cash flow hedges used to hedge the risk on future foreign currency cash flows, floating interest rate cash flows, and the price risk on future
purchases of raw materials;• fair value hedges used to convert the fixed interest rate on financial liabilities into a floating interest rate; • net investment hedges used to hedge the investment value of our foreign subsidiaries; and • natural hedges used to hedge the risk on exposures that are on the balance sheet. No hedge accounting is applied.
Details of the various types of hedges are given below.
The fair values of forward foreign exchange contracts represent the gain or loss on revaluation of the contracts at the year-end forward exchangerates. The fair values of interest rate derivatives are based on the net present value of the anticipated future cash flows.
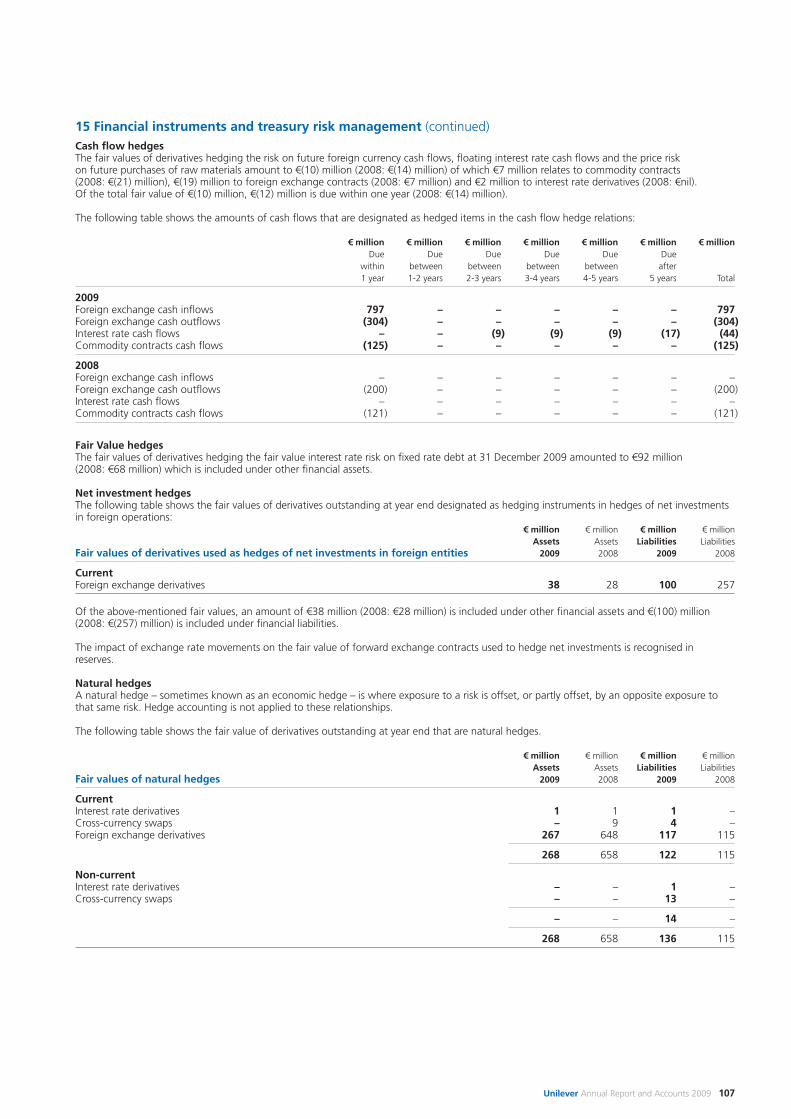
Unilever Annual Report and Accounts 2009 107
15 Financial instruments and treasury risk management (continued)Cash flow hedgesThe fair values of derivatives hedging the risk on future foreign currency cash flows, floating interest rate cash flows and the price riskon future purchases of raw materials amount to €(10) million (2008: €(14) million) of which €7 million relates to commodity contracts(2008: €(21) million), €(19) million to foreign exchange contracts (2008: €7 million) and €2 million to interest rate derivatives (2008: €nil).Of the total fair value of €(10) million, €(12) million is due within one year (2008: €(14) million).
The following table shows the amounts of cash flows that are designated as hedged items in the cash flow hedge relations:
€ million € million € million € million € million € million € millionDue Due Due Due Due Due
within between between between between after1 year 1-2 years 2-3 years 3-4 years 4-5 years 5 years Total
2009Foreign exchange cash inflows 797 – – – – – 797Foreign exchange cash outflows (304) – – – – – (304)Interest rate cash flows – – (9) (9) (9) (17) (44)Commodity contracts cash flows (125) – – – – – (125)
2008Foreign exchange cash inflows – – – – – – –Foreign exchange cash outflows (200) – – – – – (200)Interest rate cash flows – – – – – – –Commodity contracts cash flows (121) – – – – – (121)
Fair Value hedgesThe fair values of derivatives hedging the fair value interest rate risk on fixed rate debt at 31 December 2009 amounted to €92 million (2008: €68 million) which is included under other financial assets.
Net investment hedgesThe following table shows the fair values of derivatives outstanding at year end designated as hedging instruments in hedges of net investmentsin foreign operations:
€ million € million € million € millionAssets Assets Liabilities Liabilities
Fair values of derivatives used as hedges of net investments in foreign entities 2009 2008 2009 2008
CurrentForeign exchange derivatives 38 28 100 257
Of the above-mentioned fair values, an amount of €38 million (2008: €28 million) is included under other financial assets and €(100) million (2008: €(257) million) is included under financial liabilities.
The impact of exchange rate movements on the fair value of forward exchange contracts used to hedge net investments is recognised inreserves.
Natural hedgesA natural hedge – sometimes known as an economic hedge – is where exposure to a risk is offset, or partly offset, by an opposite exposure tothat same risk. Hedge accounting is not applied to these relationships.
The following table shows the fair value of derivatives outstanding at year end that are natural hedges.
€ million € million € million € millionAssets Assets Liabilities Liabilities
Fair values of natural hedges 2009 2008 2009 2008
CurrentInterest rate derivatives 1 1 1 –Cross-currency swaps – 9 4 –Foreign exchange derivatives 267 648 117 115
268 658 122 115
Non-currentInterest rate derivatives – – 1 –Cross-currency swaps – – 13 –
– – 14 –
268 658 136 115
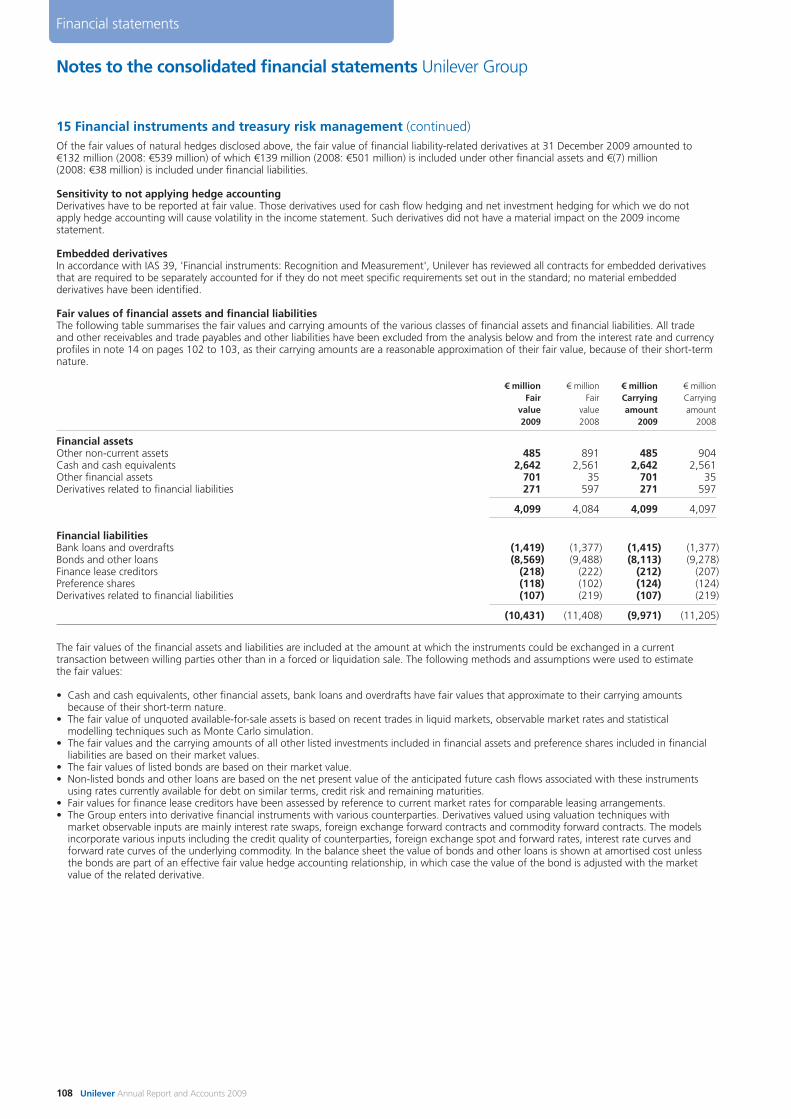
Notes to the consolidated financial statements Unilever Group
108 Unilever Annual Report and Accounts 2009
Financial statements
15 Financial instruments and treasury risk management (continued)Of the fair values of natural hedges disclosed above, the fair value of financial liability-related derivatives at 31 December 2009 amounted to€132 million (2008: €539 million) of which €139 million (2008: €501 million) is included under other financial assets and €(7) million (2008: €38 million) is included under financial liabilities.
Sensitivity to not applying hedge accountingDerivatives have to be reported at fair value. Those derivatives used for cash flow hedging and net investment hedging for which we do notapply hedge accounting will cause volatility in the income statement. Such derivatives did not have a material impact on the 2009 incomestatement.
Embedded derivativesIn accordance with IAS 39, 'Financial instruments: Recognition and Measurement', Unilever has reviewed all contracts for embedded derivativesthat are required to be separately accounted for if they do not meet specific requirements set out in the standard; no material embeddedderivatives have been identified.
Fair values of financial assets and financial liabilitiesThe following table summarises the fair values and carrying amounts of the various classes of financial assets and financial liabilities. All tradeand other receivables and trade payables and other liabilities have been excluded from the analysis below and from the interest rate and currencyprofiles in note 14 on pages 102 to 103, as their carrying amounts are a reasonable approximation of their fair value, because of their short-termnature.
€ million € million € million € millionFair Fair Carrying Carrying
value value amount amount2009 2008 2009 2008
Financial assetsOther non-current assets 485 891 485 904Cash and cash equivalents 2,642 2,561 2,642 2,561Other financial assets 701 35 701 35Derivatives related to financial liabilities 271 597 271 597
4,099 4,084 4,099 4,097
Financial liabilitiesBank loans and overdrafts (1,419) (1,377) (1,415) (1,377)Bonds and other loans (8,569) (9,488) (8,113) (9,278)Finance lease creditors (218) (222) (212) (207)Preference shares (118) (102) (124) (124)Derivatives related to financial liabilities (107) (219) (107) (219)
(10,431) (11,408) (9,971) (11,205)
The fair values of the financial assets and liabilities are included at the amount at which the instruments could be exchanged in a currenttransaction between willing parties other than in a forced or liquidation sale. The following methods and assumptions were used to estimatethe fair values:
• Cash and cash equivalents, other financial assets, bank loans and overdrafts have fair values that approximate to their carrying amountsbecause of their short-term nature.
• The fair value of unquoted available-for-sale assets is based on recent trades in liquid markets, observable market rates and statisticalmodelling techniques such as Monte Carlo simulation.
• The fair values and the carrying amounts of all other listed investments included in financial assets and preference shares included in financialliabilities are based on their market values.
• The fair values of listed bonds are based on their market value.• Non-listed bonds and other loans are based on the net present value of the anticipated future cash flows associated with these instruments
using rates currently available for debt on similar terms, credit risk and remaining maturities.• Fair values for finance lease creditors have been assessed by reference to current market rates for comparable leasing arrangements.• The Group enters into derivative financial instruments with various counterparties. Derivatives valued using valuation techniques with
market observable inputs are mainly interest rate swaps, foreign exchange forward contracts and commodity forward contracts. The modelsincorporate various inputs including the credit quality of counterparties, foreign exchange spot and forward rates, interest rate curves andforward rate curves of the underlying commodity. In the balance sheet the value of bonds and other loans is shown at amortised cost unlessthe bonds are part of an effective fair value hedge accounting relationship, in which case the value of the bond is adjusted with the marketvalue of the related derivative.
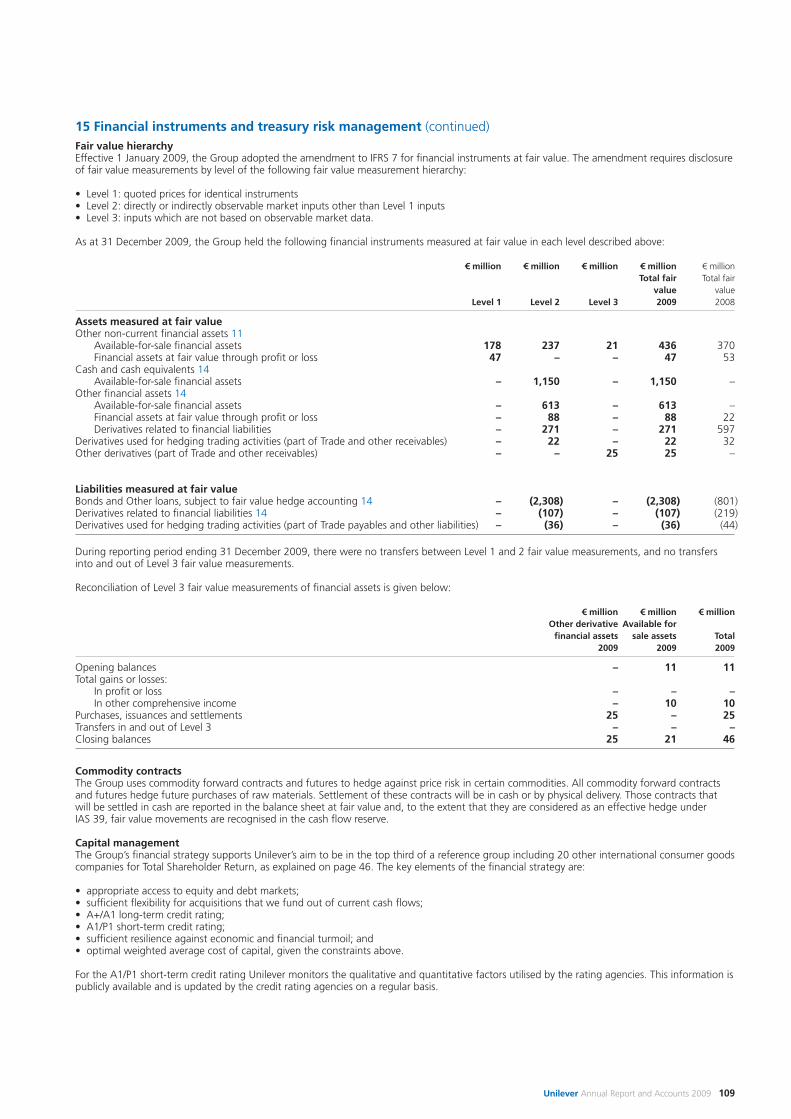
Unilever Annual Report and Accounts 2009 109
15 Financial instruments and treasury risk management (continued)Fair value hierarchy Effective 1 January 2009, the Group adopted the amendment to IFRS 7 for financial instruments at fair value. The amendment requires disclosureof fair value measurements by level of the following fair value measurement hierarchy:
• Level 1: quoted prices for identical instruments• Level 2: directly or indirectly observable market inputs other than Level 1 inputs• Level 3: inputs which are not based on observable market data.
As at 31 December 2009, the Group held the following financial instruments measured at fair value in each level described above:
€ million € million € million € million € millionTotal fair Total fair
value valueLevel 1 Level 2 Level 3 2009 2008
Assets measured at fair valueOther non-current financial assets 11
Available-for-sale financial assets 178 237 21 436 370Financial assets at fair value through profit or loss 47 – – 47 53
Cash and cash equivalents 14Available-for-sale financial assets – 1,150 – 1,150 –
Other financial assets 14Available-for-sale financial assets – 613 – 613 –Financial assets at fair value through profit or loss – 88 – 88 22Derivatives related to financial liabilities – 271 – 271 597
Derivatives used for hedging trading activities (part of Trade and other receivables) – 22 – 22 32Other derivatives (part of Trade and other receivables) – – 25 25 –
Liabilities measured at fair valueBonds and Other loans, subject to fair value hedge accounting 14 – (2,308) – (2,308) (801)Derivatives related to financial liabilities 14 – (107) – (107) (219)Derivatives used for hedging trading activities (part of Trade payables and other liabilities) – (36) – (36) (44)
During reporting period ending 31 December 2009, there were no transfers between Level 1 and 2 fair value measurements, and no transfersinto and out of Level 3 fair value measurements.
Reconciliation of Level 3 fair value measurements of financial assets is given below:
€ million € million € millionOther derivative Available for
financial assets sale assets Total2009 2009 2009
Opening balances – 11 11Total gains or losses:
In profit or loss – – –In other comprehensive income – 10 10
Purchases, issuances and settlements 25 – 25Transfers in and out of Level 3 – – –Closing balances 25 21 46
Commodity contractsThe Group uses commodity forward contracts and futures to hedge against price risk in certain commodities. All commodity forward contractsand futures hedge future purchases of raw materials. Settlement of these contracts will be in cash or by physical delivery. Those contracts thatwill be settled in cash are reported in the balance sheet at fair value and, to the extent that they are considered as an effective hedge under IAS 39, fair value movements are recognised in the cash flow reserve.
Capital managementThe Group’s financial strategy supports Unilever’s aim to be in the top third of a reference group including 20 other international consumer goodscompanies for Total Shareholder Return, as explained on page 46. The key elements of the financial strategy are:
• appropriate access to equity and debt markets;• sufficient flexibility for acquisitions that we fund out of current cash flows;• A+/A1 long-term credit rating;• A1/P1 short-term credit rating;• sufficient resilience against economic and financial turmoil; and• optimal weighted average cost of capital, given the constraints above.
For the A1/P1 short-term credit rating Unilever monitors the qualitative and quantitative factors utilised by the rating agencies. This information ispublicly available and is updated by the credit rating agencies on a regular basis.
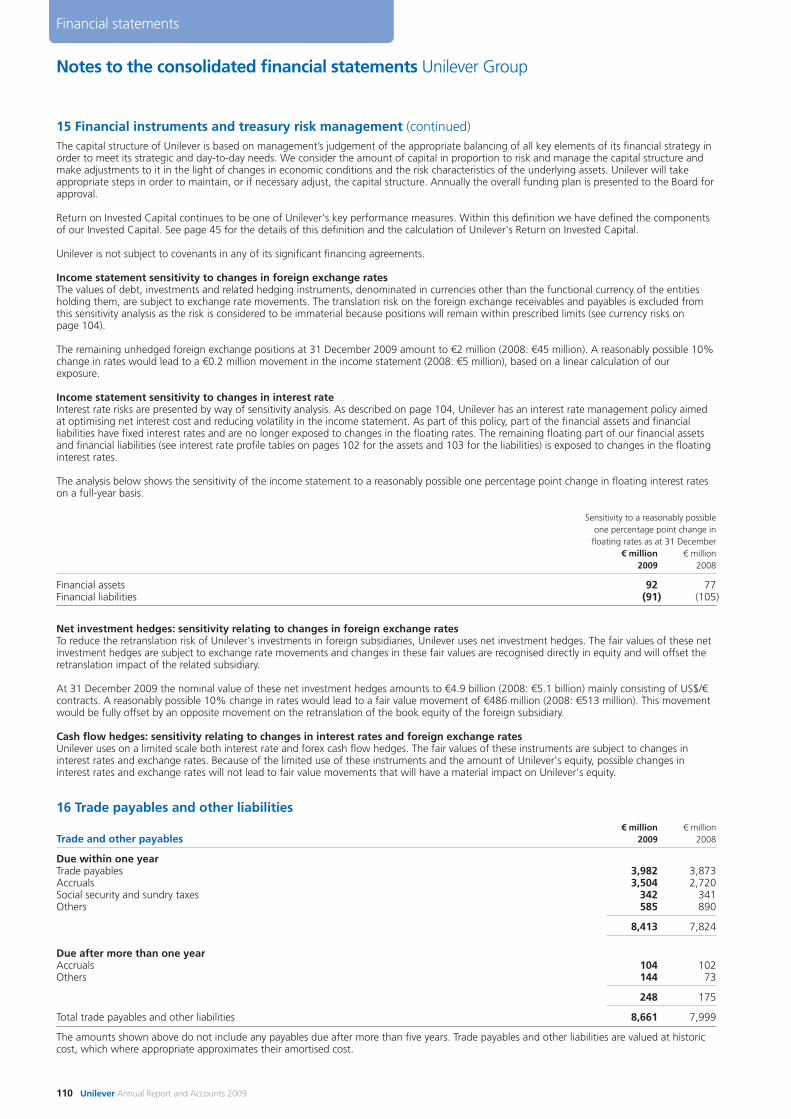
Notes to the consolidated financial statements Unilever Group
110 Unilever Annual Report and Accounts 2009
Financial statements
15 Financial instruments and treasury risk management (continued)The capital structure of Unilever is based on management’s judgement of the appropriate balancing of all key elements of its financial strategy inorder to meet its strategic and day-to-day needs. We consider the amount of capital in proportion to risk and manage the capital structure andmake adjustments to it in the light of changes in economic conditions and the risk characteristics of the underlying assets. Unilever will takeappropriate steps in order to maintain, or if necessary adjust, the capital structure. Annually the overall funding plan is presented to the Board forapproval.
Return on Invested Capital continues to be one of Unilever's key performance measures. Within this definition we have defined the componentsof our Invested Capital. See page 45 for the details of this definition and the calculation of Unilever's Return on Invested Capital.
Unilever is not subject to covenants in any of its significant financing agreements.
Income statement sensitivity to changes in foreign exchange ratesThe values of debt, investments and related hedging instruments, denominated in currencies other than the functional currency of the entitiesholding them, are subject to exchange rate movements. The translation risk on the foreign exchange receivables and payables is excluded fromthis sensitivity analysis as the risk is considered to be immaterial because positions will remain within prescribed limits (see currency risks on page 104).
The remaining unhedged foreign exchange positions at 31 December 2009 amount to €2 million (2008: €45 million). A reasonably possible 10%change in rates would lead to a €0.2 million movement in the income statement (2008: €5 million), based on a linear calculation of ourexposure.
Income statement sensitivity to changes in interest rate Interest rate risks are presented by way of sensitivity analysis. As described on page 104, Unilever has an interest rate management policy aimedat optimising net interest cost and reducing volatility in the income statement. As part of this policy, part of the financial assets and financialliabilities have fixed interest rates and are no longer exposed to changes in the floating rates. The remaining floating part of our financial assetsand financial liabilities (see interest rate profile tables on pages 102 for the assets and 103 for the liabilities) is exposed to changes in the floatinginterest rates.
The analysis below shows the sensitivity of the income statement to a reasonably possible one percentage point change in floating interest rateson a full-year basis.
Sensitivity to a reasonably possible one percentage point change in
floating rates as at 31 December€ million € million
2009 2008
Financial assets 92 77Financial liabilities (91) (105)
Net investment hedges: sensitivity relating to changes in foreign exchange ratesTo reduce the retranslation risk of Unilever's investments in foreign subsidiaries, Unilever uses net investment hedges. The fair values of these netinvestment hedges are subject to exchange rate movements and changes in these fair values are recognised directly in equity and will offset theretranslation impact of the related subsidiary.
At 31 December 2009 the nominal value of these net investment hedges amounts to €4.9 billion (2008: €5.1 billion) mainly consisting of US$/€contracts. A reasonably possible 10% change in rates would lead to a fair value movement of €486 million (2008: €513 million). This movementwould be fully offset by an opposite movement on the retranslation of the book equity of the foreign subsidiary.
Cash flow hedges: sensitivity relating to changes in interest rates and foreign exchange ratesUnilever uses on a limited scale both interest rate and forex cash flow hedges. The fair values of these instruments are subject to changes ininterest rates and exchange rates. Because of the limited use of these instruments and the amount of Unilever's equity, possible changes ininterest rates and exchange rates will not lead to fair value movements that will have a material impact on Unilever's equity.
16 Trade payables and other liabilities€ million € million
Trade and other payables 2009 2008
Due within one yearTrade payables 3,982 3,873Accruals 3,504 2,720Social security and sundry taxes 342 341Others 585 890
8,413 7,824
Due after more than one yearAccruals 104 102Others 144 73
248 175
Total trade payables and other liabilities 8,661 7,999
The amounts shown above do not include any payables due after more than five years. Trade payables and other liabilities are valued at historiccost, which where appropriate approximates their amortised cost.
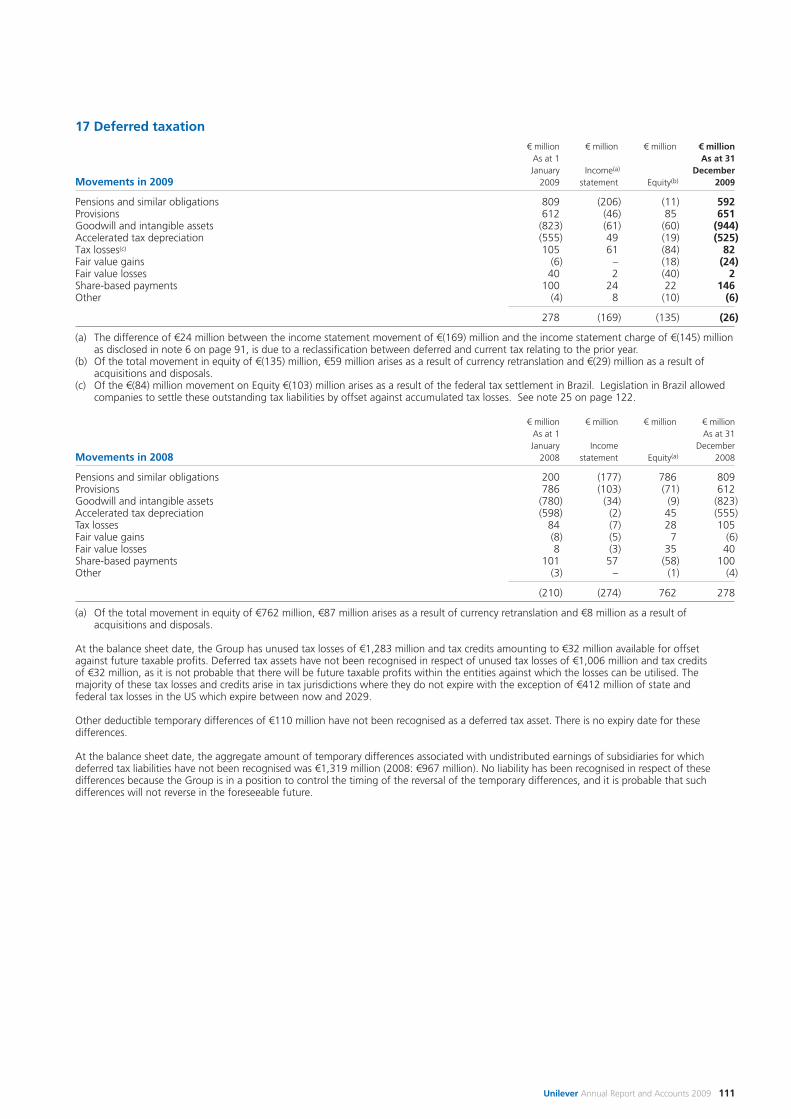
Unilever Annual Report and Accounts 2009 111
17 Deferred taxation€ million € million € million € million
As at 1 As at 31January Income(a) December
Movements in 2009 2009 statement Equity(b) 2009
Pensions and similar obligations 809 (206) (11) 592Provisions 612 (46) 85 651Goodwill and intangible assets (823) (61) (60) (944)Accelerated tax depreciation (555) 49 (19) (525)Tax losses(c) 105 61 (84) 82Fair value gains (6) – (18) (24)Fair value losses 40 2 (40) 2Share-based payments 100 24 22 146Other (4) 8 (10) (6)
278 (169) (135) (26)
(a) The difference of €24 million between the income statement movement of €(169) million and the income statement charge of €(145) millionas disclosed in note 6 on page 91, is due to a reclassification between deferred and current tax relating to the prior year.
(b) Of the total movement in equity of €(135) million, €59 million arises as a result of currency retranslation and €(29) million as a result ofacquisitions and disposals.
(c) Of the €(84) million movement on Equity €(103) million arises as a result of the federal tax settlement in Brazil. Legislation in Brazil allowedcompanies to settle these outstanding tax liabilities by offset against accumulated tax losses. See note 25 on page 122.
€ million € million € million € millionAs at 1 As at 31January Income December
Movements in 2008 2008 statement Equity(a) 2008
Pensions and similar obligations 200 (177) 786 809Provisions 786 (103) (71) 612Goodwill and intangible assets (780) (34) (9) (823)Accelerated tax depreciation (598) (2) 45 (555)Tax losses 84 (7) 28 105Fair value gains (8) (5) 7 (6)Fair value losses 8 (3) 35 40Share-based payments 101 57 (58) 100Other (3) – (1) (4)
(210) (274) 762 278
(a) Of the total movement in equity of €762 million, €87 million arises as a result of currency retranslation and €8 million as a result ofacquisitions and disposals.
At the balance sheet date, the Group has unused tax losses of €1,283 million and tax credits amounting to €32 million available for offset against future taxable profits. Deferred tax assets have not been recognised in respect of unused tax losses of €1,006 million and tax credits of €32 million, as it is not probable that there will be future taxable profits within the entities against which the losses can be utilised. Themajority of these tax losses and credits arise in tax jurisdictions where they do not expire with the exception of €412 million of state and federal tax losses in the US which expire between now and 2029.
Other deductible temporary differences of €110 million have not been recognised as a deferred tax asset. There is no expiry date for thesedifferences.
At the balance sheet date, the aggregate amount of temporary differences associated with undistributed earnings of subsidiaries for whichdeferred tax liabilities have not been recognised was €1,319 million (2008: €967 million). No liability has been recognised in respect of thesedifferences because the Group is in a position to control the timing of the reversal of the temporary differences, and it is probable that suchdifferences will not reverse in the foreseeable future.
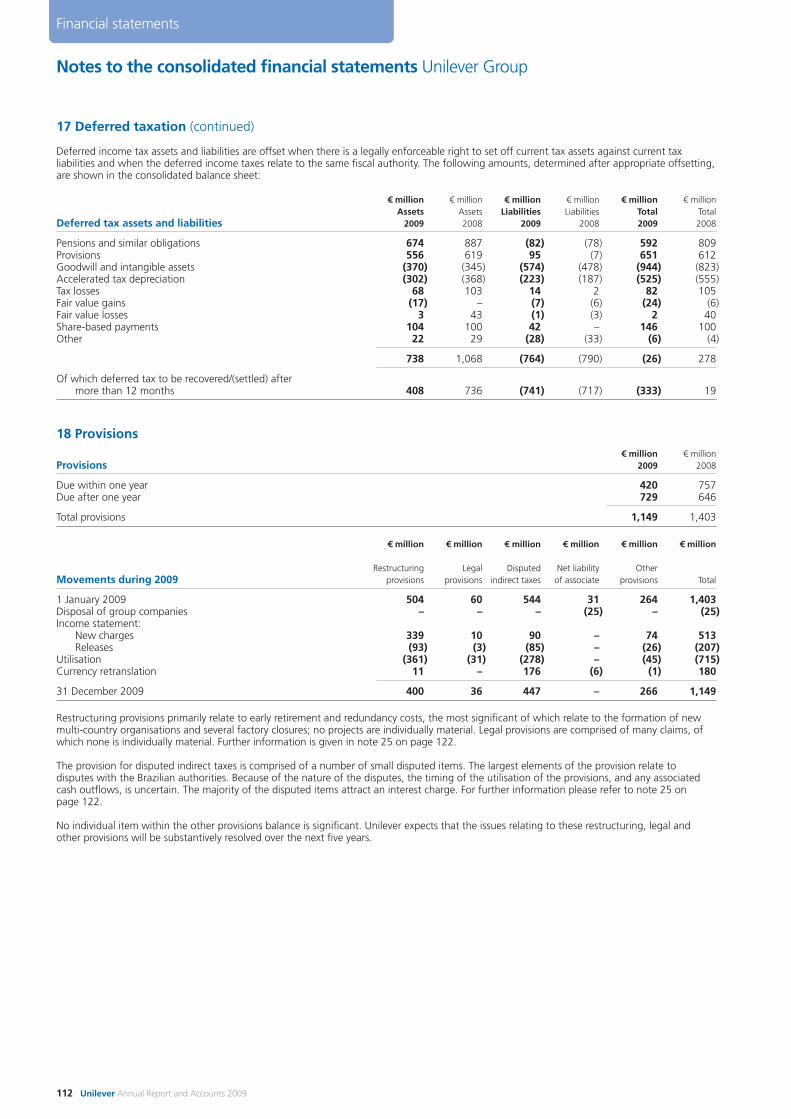
17 Deferred taxation (continued)
Deferred income tax assets and liabilities are offset when there is a legally enforceable right to set off current tax assets against current taxliabilities and when the deferred income taxes relate to the same fiscal authority. The following amounts, determined after appropriate offsetting,are shown in the consolidated balance sheet:
€ million € million € million € million € million € millionAssets Assets Liabilities Liabilities Total Total
Deferred tax assets and liabilities 2009 2008 2009 2008 2009 2008
Pensions and similar obligations 674 887 (82) (78) 592 809Provisions 556 619 95 (7) 651 612Goodwill and intangible assets (370) (345) (574) (478) (944) (823)Accelerated tax depreciation (302) (368) (223) (187) (525) (555)Tax losses 68 103 14 2 82 105Fair value gains (17) – (7) (6) (24) (6)Fair value losses 3 43 (1) (3) 2 40Share-based payments 104 100 42 – 146 100Other 22 29 (28) (33) (6) (4)
738 1,068 (764) (790) (26) 278
Of which deferred tax to be recovered/(settled) after more than 12 months 408 736 (741) (717) (333) 19
18 Provisions€ million € million
Provisions 2009 2008
Due within one year 420 757Due after one year 729 646
Total provisions 1,149 1,403
€ million € million € million € million € million € million
Restructuring Legal Disputed Net liability OtherMovements during 2009 provisions provisions indirect taxes of associate provisions Total
1 January 2009 504 60 544 31 264 1,403Disposal of group companies – – – (25) – (25)Income statement:
New charges 339 10 90 – 74 513Releases (93) (3) (85) – (26) (207)
Utilisation (361) (31) (278) – (45) (715)Currency retranslation 11 – 176 (6) (1) 180
31 December 2009 400 36 447 – 266 1,149
Restructuring provisions primarily relate to early retirement and redundancy costs, the most significant of which relate to the formation of newmulti-country organisations and several factory closures; no projects are individually material. Legal provisions are comprised of many claims, ofwhich none is individually material. Further information is given in note 25 on page 122.
The provision for disputed indirect taxes is comprised of a number of small disputed items. The largest elements of the provision relate todisputes with the Brazilian authorities. Because of the nature of the disputes, the timing of the utilisation of the provisions, and any associatedcash outflows, is uncertain. The majority of the disputed items attract an interest charge. For further information please refer to note 25 onpage 122.
No individual item within the other provisions balance is significant. Unilever expects that the issues relating to these restructuring, legal andother provisions will be substantively resolved over the next five years.
Notes to the consolidated financial statements Unilever Group
112 Unilever Annual Report and Accounts 2009
Financial statements
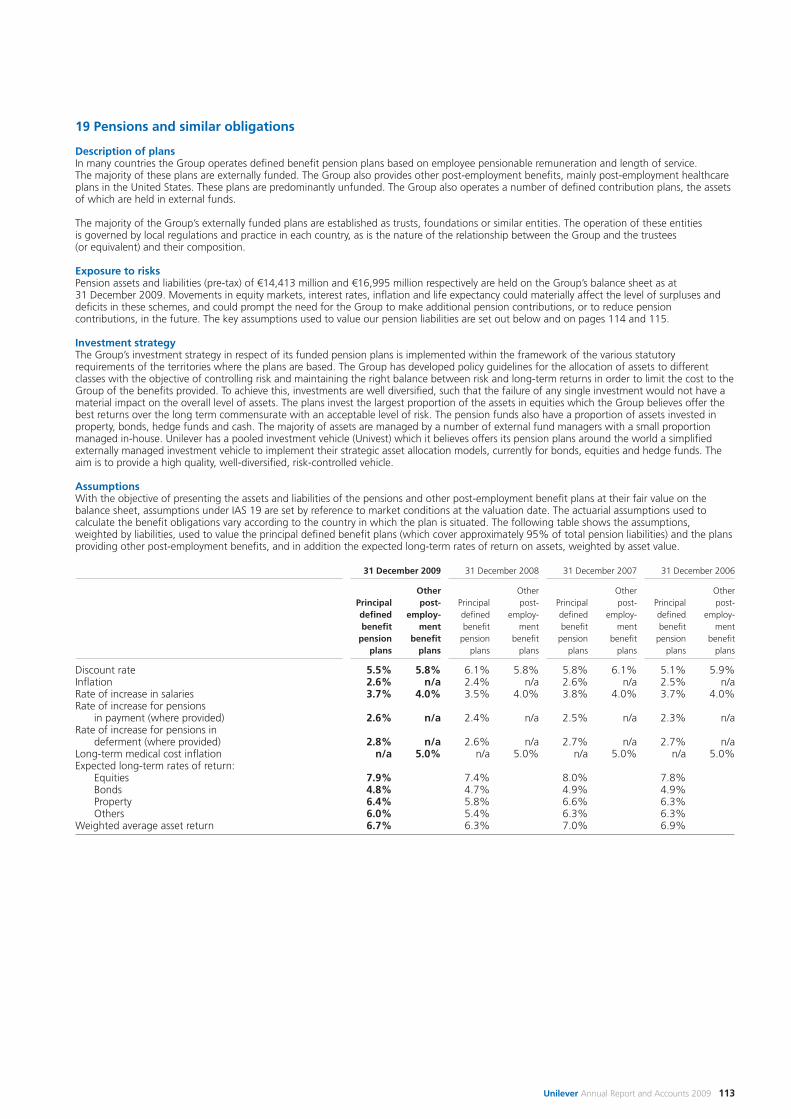
Unilever Annual Report and Accounts 2009 113
19 Pensions and similar obligations
Description of plansIn many countries the Group operates defined benefit pension plans based on employee pensionable remuneration and length of service. The majority of these plans are externally funded. The Group also provides other post-employment benefits, mainly post-employment healthcareplans in the United States. These plans are predominantly unfunded. The Group also operates a number of defined contribution plans, the assetsof which are held in external funds.
The majority of the Group’s externally funded plans are established as trusts, foundations or similar entities. The operation of these entities is governed by local regulations and practice in each country, as is the nature of the relationship between the Group and the trustees(or equivalent) and their composition.
Exposure to risksPension assets and liabilities (pre-tax) of €14,413 million and €16,995 million respectively are held on the Group’s balance sheet as at31 December 2009. Movements in equity markets, interest rates, inflation and life expectancy could materially affect the level of surpluses anddeficits in these schemes, and could prompt the need for the Group to make additional pension contributions, or to reduce pensioncontributions, in the future. The key assumptions used to value our pension liabilities are set out below and on pages 114 and 115.
Investment strategyThe Group’s investment strategy in respect of its funded pension plans is implemented within the framework of the various statutoryrequirements of the territories where the plans are based. The Group has developed policy guidelines for the allocation of assets to differentclasses with the objective of controlling risk and maintaining the right balance between risk and long-term returns in order to limit the cost to theGroup of the benefits provided. To achieve this, investments are well diversified, such that the failure of any single investment would not have amaterial impact on the overall level of assets. The plans invest the largest proportion of the assets in equities which the Group believes offer thebest returns over the long term commensurate with an acceptable level of risk. The pension funds also have a proportion of assets invested inproperty, bonds, hedge funds and cash. The majority of assets are managed by a number of external fund managers with a small proportionmanaged in-house. Unilever has a pooled investment vehicle (Univest) which it believes offers its pension plans around the world a simplifiedexternally managed investment vehicle to implement their strategic asset allocation models, currently for bonds, equities and hedge funds. Theaim is to provide a high quality, well-diversified, risk-controlled vehicle.
AssumptionsWith the objective of presenting the assets and liabilities of the pensions and other post-employment benefit plans at their fair value on thebalance sheet, assumptions under IAS 19 are set by reference to market conditions at the valuation date. The actuarial assumptions used tocalculate the benefit obligations vary according to the country in which the plan is situated. The following table shows the assumptions,weighted by liabilities, used to value the principal defined benefit plans (which cover approximately 95% of total pension liabilities) and the plansproviding other post-employment benefits, and in addition the expected long-term rates of return on assets, weighted by asset value.
31 December 2009 31 December 2008 31 December 2007 31 December 2006
Other Other Other OtherPrincipal post- Principal post- Principal post- Principal post-defined employ- defined employ- defined employ- defined employ-benefit ment benefit ment benefit ment benefit ment
pension benefit pension benefit pension benefit pension benefitplans plans plans plans plans plans plans plans
Discount rate 5.5% 5.8% 6.1% 5.8% 5.8% 6.1% 5.1% 5.9%Inflation 2.6% n/a 2.4% n/a 2.6% n/a 2.5% n/aRate of increase in salaries 3.7% 4.0% 3.5% 4.0% 3.8% 4.0% 3.7% 4.0%Rate of increase for pensions
in payment (where provided) 2.6% n/a 2.4% n/a 2.5% n/a 2.3% n/aRate of increase for pensions in
deferment (where provided) 2.8% n/a 2.6% n/a 2.7% n/a 2.7% n/aLong-term medical cost inflation n/a 5.0% n/a 5.0% n/a 5.0% n/a 5.0%Expected long-term rates of return:
Equities 7.9% 7.4% 8.0% 7.8%Bonds 4.8% 4.7% 4.9% 4.9%Property 6.4% 5.8% 6.6% 6.3%Others 6.0% 5.4% 6.3% 6.3%
Weighted average asset return 6.7% 6.3% 7.0% 6.9%
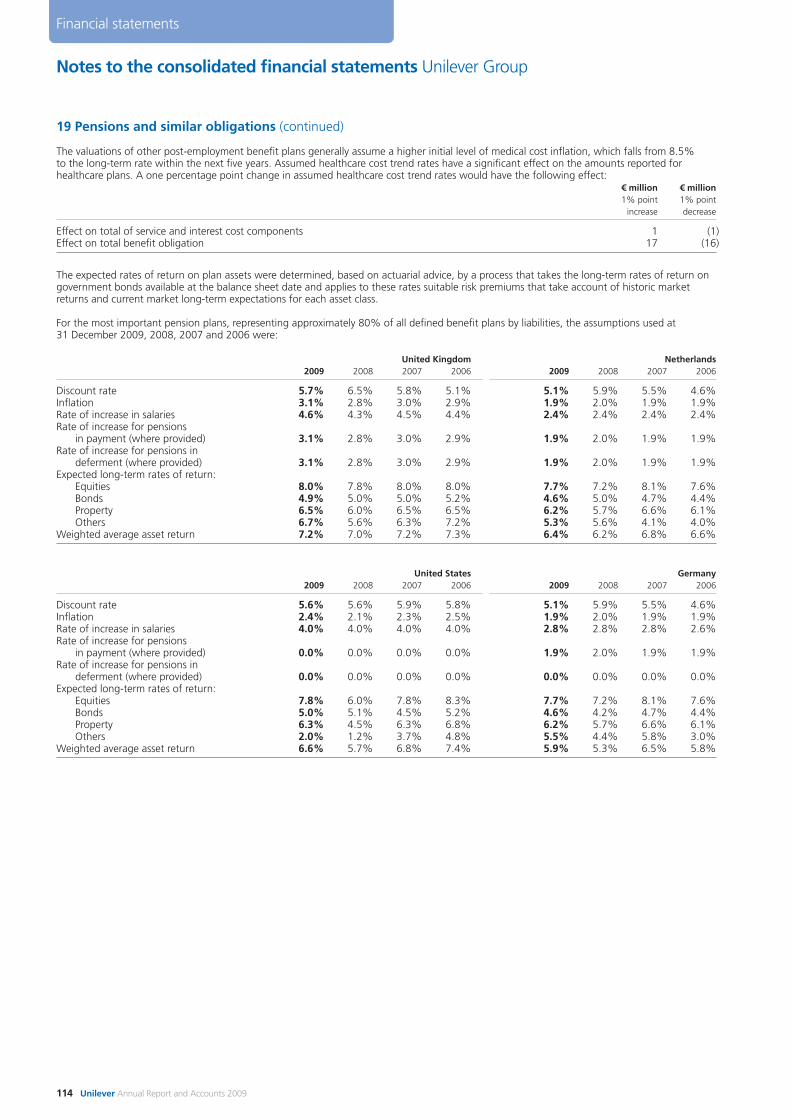
19 Pensions and similar obligations (continued)
The valuations of other post-employment benefit plans generally assume a higher initial level of medical cost inflation, which falls from 8.5% to the long-term rate within the next five years. Assumed healthcare cost trend rates have a significant effect on the amounts reported forhealthcare plans. A one percentage point change in assumed healthcare cost trend rates would have the following effect:
€ million € million1% point 1% point
increase decrease
Effect on total of service and interest cost components 1 (1)Effect on total benefit obligation 17 (16)
The expected rates of return on plan assets were determined, based on actuarial advice, by a process that takes the long-term rates of return ongovernment bonds available at the balance sheet date and applies to these rates suitable risk premiums that take account of historic marketreturns and current market long-term expectations for each asset class.
For the most important pension plans, representing approximately 80% of all defined benefit plans by liabilities, the assumptions used at 31 December 2009, 2008, 2007 and 2006 were:
United Kingdom Netherlands2009 2008 2007 2006 2009 2008 2007 2006
Discount rate 5.7% 6.5% 5.8% 5.1% 5.1% 5.9% 5.5% 4.6%Inflation 3.1% 2.8% 3.0% 2.9% 1.9% 2.0% 1.9% 1.9%Rate of increase in salaries 4.6% 4.3% 4.5% 4.4% 2.4% 2.4% 2.4% 2.4%Rate of increase for pensions
in payment (where provided) 3.1% 2.8% 3.0% 2.9% 1.9% 2.0% 1.9% 1.9%Rate of increase for pensions in
deferment (where provided) 3.1% 2.8% 3.0% 2.9% 1.9% 2.0% 1.9% 1.9%Expected long-term rates of return:
Equities 8.0% 7.8% 8.0% 8.0% 7.7% 7.2% 8.1% 7.6%Bonds 4.9% 5.0% 5.0% 5.2% 4.6% 5.0% 4.7% 4.4%Property 6.5% 6.0% 6.5% 6.5% 6.2% 5.7% 6.6% 6.1%Others 6.7% 5.6% 6.3% 7.2% 5.3% 5.6% 4.1% 4.0%
Weighted average asset return 7.2% 7.0% 7.2% 7.3% 6.4% 6.2% 6.8% 6.6%
United States Germany2009 2008 2007 2006 2009 2008 2007 2006
Discount rate 5.6% 5.6% 5.9% 5.8% 5.1% 5.9% 5.5% 4.6%Inflation 2.4% 2.1% 2.3% 2.5% 1.9% 2.0% 1.9% 1.9%Rate of increase in salaries 4.0% 4.0% 4.0% 4.0% 2.8% 2.8% 2.8% 2.6%Rate of increase for pensions
in payment (where provided) 0.0% 0.0% 0.0% 0.0% 1.9% 2.0% 1.9% 1.9%Rate of increase for pensions in
deferment (where provided) 0.0% 0.0% 0.0% 0.0% 0.0% 0.0% 0.0% 0.0%Expected long-term rates of return:
Equities 7.8% 6.0% 7.8% 8.3% 7.7% 7.2% 8.1% 7.6%Bonds 5.0% 5.1% 4.5% 5.2% 4.6% 4.2% 4.7% 4.4%Property 6.3% 4.5% 6.3% 6.8% 6.2% 5.7% 6.6% 6.1%Others 2.0% 1.2% 3.7% 4.8% 5.5% 4.4% 5.8% 3.0%
Weighted average asset return 6.6% 5.7% 6.8% 7.4% 5.9% 5.3% 6.5% 5.8%
Notes to the consolidated financial statements Unilever Group
114 Unilever Annual Report and Accounts 2009
Financial statements
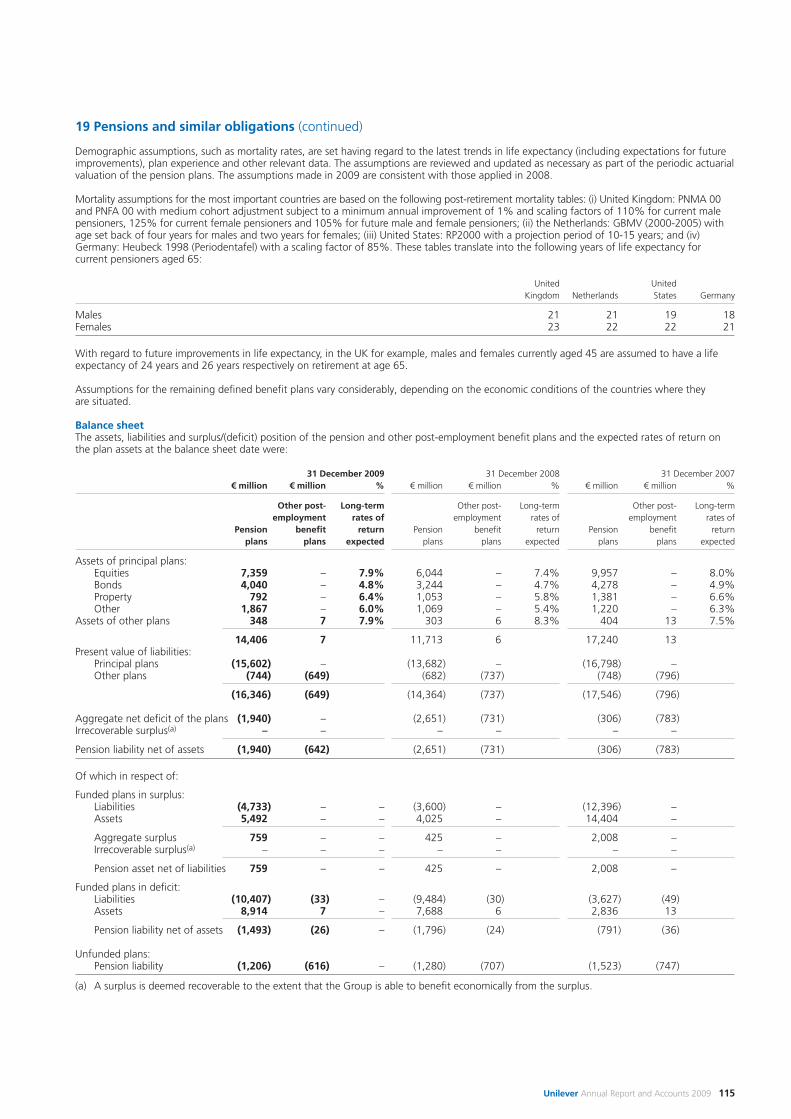
Unilever Annual Report and Accounts 2009 115
19 Pensions and similar obligations (continued)
Demographic assumptions, such as mortality rates, are set having regard to the latest trends in life expectancy (including expectations for futureimprovements), plan experience and other relevant data. The assumptions are reviewed and updated as necessary as part of the periodic actuarialvaluation of the pension plans. The assumptions made in 2009 are consistent with those applied in 2008.
Mortality assumptions for the most important countries are based on the following post-retirement mortality tables: (i) United Kingdom: PNMA 00and PNFA 00 with medium cohort adjustment subject to a minimum annual improvement of 1% and scaling factors of 110% for current malepensioners, 125% for current female pensioners and 105% for future male and female pensioners; (ii) the Netherlands: GBMV (2000-2005) withage set back of four years for males and two years for females; (iii) United States: RP2000 with a projection period of 10-15 years; and (iv)Germany: Heubeck 1998 (Periodentafel) with a scaling factor of 85%. These tables translate into the following years of life expectancy forcurrent pensioners aged 65:
United UnitedKingdom Netherlands States Germany
Males 21 21 19 18Females 23 22 22 21
With regard to future improvements in life expectancy, in the UK for example, males and females currently aged 45 are assumed to have a lifeexpectancy of 24 years and 26 years respectively on retirement at age 65.
Assumptions for the remaining defined benefit plans vary considerably, depending on the economic conditions of the countries where they are situated.
Balance sheetThe assets, liabilities and surplus/(deficit) position of the pension and other post-employment benefit plans and the expected rates of return onthe plan assets at the balance sheet date were:
31 December 2009 31 December 2008 31 December 2007€ million € million % € million € million % € million € million %
Other post- Long-term Other post- Long-term Other post- Long-termemployment rates of employment rates of employment rates of
Pension benefit return Pension benefit return Pension benefit returnplans plans expected plans plans expected plans plans expected
Assets of principal plans:Equities 7,359 – 7.9% 6,044 – 7.4% 9,957 – 8.0%Bonds 4,040 – 4.8% 3,244 – 4.7% 4,278 – 4.9%Property 792 – 6.4% 1,053 – 5.8% 1,381 – 6.6%Other 1,867 – 6.0% 1,069 – 5.4% 1,220 – 6.3%
Assets of other plans 348 7 7.9% 303 6 8.3% 404 13 7.5%
14,406 7 11,713 6 17,240 13Present value of liabilities:
Principal plans (15,602) – (13,682) – (16,798) –Other plans (744) (649) (682) (737) (748) (796)
(16,346) (649) (14,364) (737) (17,546) (796)
Aggregate net deficit of the plans (1,940) – (2,651) (731) (306) (783)Irrecoverable surplus(a) – – – – – –
Pension liability net of assets (1,940) (642) (2,651) (731) (306) (783)
Of which in respect of:
Funded plans in surplus:Liabilities (4,733) – – (3,600) – (12,396) –Assets 5,492 – – 4,025 – 14,404 –
Aggregate surplus 759 – – 425 – 2,008 –Irrecoverable surplus(a) – – – – – – –
Pension asset net of liabilities 759 – – 425 – 2,008 –
Funded plans in deficit:Liabilities (10,407) (33) – (9,484) (30) (3,627) (49)Assets 8,914 7 – 7,688 6 2,836 13
Pension liability net of assets (1,493) (26) – (1,796) (24) (791) (36)
Unfunded plans:Pension liability (1,206) (616) – (1,280) (707) (1,523) (747)
(a) A surplus is deemed recoverable to the extent that the Group is able to benefit economically from the surplus.
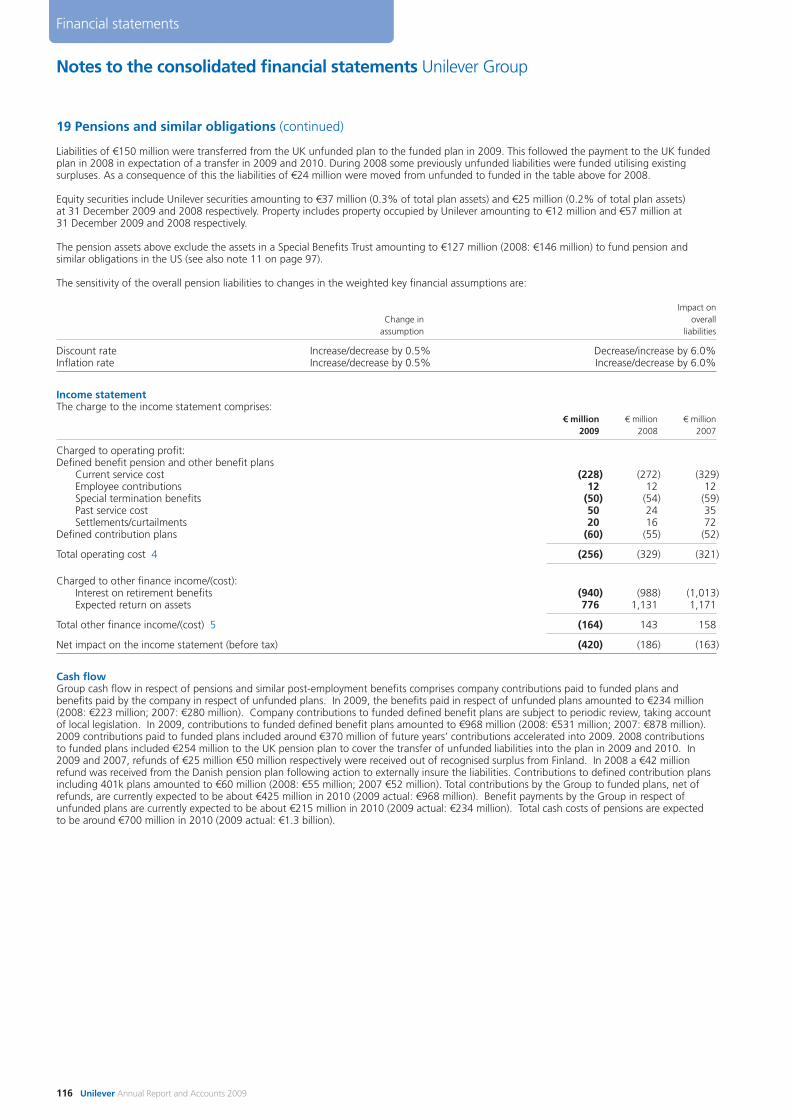
19 Pensions and similar obligations (continued)
Liabilities of €150 million were transferred from the UK unfunded plan to the funded plan in 2009. This followed the payment to the UK fundedplan in 2008 in expectation of a transfer in 2009 and 2010. During 2008 some previously unfunded liabilities were funded utilising existingsurpluses. As a consequence of this the liabilities of €24 million were moved from unfunded to funded in the table above for 2008.
Equity securities include Unilever securities amounting to €37 million (0.3% of total plan assets) and €25 million (0.2% of total plan assets) at 31 December 2009 and 2008 respectively. Property includes property occupied by Unilever amounting to €12 million and €57 million at 31 December 2009 and 2008 respectively.
The pension assets above exclude the assets in a Special Benefits Trust amounting to €127 million (2008: €146 million) to fund pension andsimilar obligations in the US (see also note 11 on page 97).
The sensitivity of the overall pension liabilities to changes in the weighted key financial assumptions are:
Impact onChange in overall
assumption liabilities
Discount rate Increase/decrease by 0.5% Decrease/increase by 6.0%Inflation rate Increase/decrease by 0.5% Increase/decrease by 6.0%
Income statementThe charge to the income statement comprises:
€ million € million € million2009 2008 2007
Charged to operating profit:Defined benefit pension and other benefit plans
Current service cost (228) (272) (329)Employee contributions 12 12 12Special termination benefits (50) (54) (59)Past service cost 50 24 35Settlements/curtailments 20 16 72
Defined contribution plans (60) (55) (52)
Total operating cost 4 (256) (329) (321)
Charged to other finance income/(cost):Interest on retirement benefits (940) (988) (1,013)Expected return on assets 776 1,131 1,171
Total other finance income/(cost) 5 (164) 143 158
Net impact on the income statement (before tax) (420) (186) (163)
Cash flowGroup cash flow in respect of pensions and similar post-employment benefits comprises company contributions paid to funded plans andbenefits paid by the company in respect of unfunded plans. In 2009, the benefits paid in respect of unfunded plans amounted to €234 million(2008: €223 million; 2007: €280 million). Company contributions to funded defined benefit plans are subject to periodic review, taking accountof local legislation. In 2009, contributions to funded defined benefit plans amounted to €968 million (2008: €531 million; 2007: €878 million).2009 contributions paid to funded plans included around €370 million of future years’ contributions accelerated into 2009. 2008 contributionsto funded plans included €254 million to the UK pension plan to cover the transfer of unfunded liabilities into the plan in 2009 and 2010. In2009 and 2007, refunds of €25 million €50 million respectively were received out of recognised surplus from Finland. In 2008 a €42 millionrefund was received from the Danish pension plan following action to externally insure the liabilities. Contributions to defined contribution plansincluding 401k plans amounted to €60 million (2008: €55 million; 2007 €52 million). Total contributions by the Group to funded plans, net ofrefunds, are currently expected to be about €425 million in 2010 (2009 actual: €968 million). Benefit payments by the Group in respect ofunfunded plans are currently expected to be about €215 million in 2010 (2009 actual: €234 million). Total cash costs of pensions are expected to be around €700 million in 2010 (2009 actual: €1.3 billion).
Notes to the consolidated financial statements Unilever Group
116 Unilever Annual Report and Accounts 2009
Financial statements
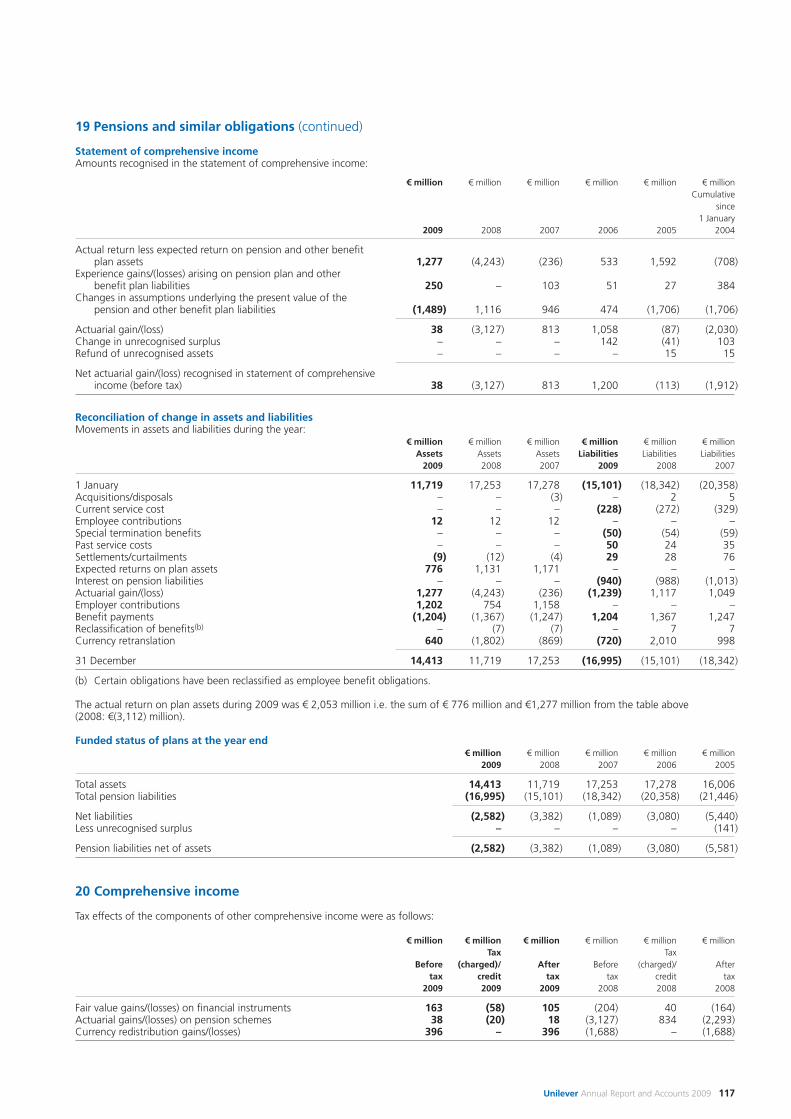
Unilever Annual Report and Accounts 2009 117
19 Pensions and similar obligations (continued)
Statement of comprehensive incomeAmounts recognised in the statement of comprehensive income:
€ million € million € million € million € million € millionCumulative
since1 January
2009 2008 2007 2006 2005 2004
Actual return less expected return on pension and other benefit plan assets 1,277 (4,243) (236) 533 1,592 (708)
Experience gains/(losses) arising on pension plan and other benefit plan liabilities 250 – 103 51 27 384
Changes in assumptions underlying the present value of the pension and other benefit plan liabilities (1,489) 1,116 946 474 (1,706) (1,706)
Actuarial gain/(loss) 38 (3,127) 813 1,058 (87) (2,030)Change in unrecognised surplus – – – 142 (41) 103Refund of unrecognised assets – – – – 15 15
Net actuarial gain/(loss) recognised in statement of comprehensiveincome (before tax) 38 (3,127) 813 1,200 (113) (1,912)
Reconciliation of change in assets and liabilitiesMovements in assets and liabilities during the year:
€ million € million € million € million € million € millionAssets Assets Assets Liabilities Liabilities Liabilities
2009 2008 2007 2009 2008 2007
1 January 11,719 17,253 17,278 (15,101) (18,342) (20,358)Acquisitions/disposals – – (3) – 2 5Current service cost – – – (228) (272) (329)Employee contributions 12 12 12 – – –Special termination benefits – – – (50) (54) (59)Past service costs – – – 50 24 35Settlements/curtailments (9) (12) (4) 29 28 76Expected returns on plan assets 776 1,131 1,171 – – –Interest on pension liabilities – – – (940) (988) (1,013)Actuarial gain/(loss) 1,277 (4,243) (236) (1,239) 1,117 1,049Employer contributions 1,202 754 1,158 – – –Benefit payments (1,204) (1,367) (1,247) 1,204 1,367 1,247Reclassification of benefits(b) – (7) (7) – 7 7Currency retranslation 640 (1,802) (869) (720) 2,010 998
31 December 14,413 11,719 17,253 (16,995) (15,101) (18,342)
(b) Certain obligations have been reclassified as employee benefit obligations.
The actual return on plan assets during 2009 was € 2,053 million i.e. the sum of € 776 million and €1,277 million from the table above (2008: €(3,112) million).
Funded status of plans at the year end€ million € million € million € million € million
2009 2008 2007 2006 2005
Total assets 14,413 11,719 17,253 17,278 16,006Total pension liabilities (16,995) (15,101) (18,342) (20,358) (21,446)
Net liabilities (2,582) (3,382) (1,089) (3,080) (5,440)Less unrecognised surplus – – – – (141)
Pension liabilities net of assets (2,582) (3,382) (1,089) (3,080) (5,581)
20 Comprehensive income
Tax effects of the components of other comprehensive income were as follows:
€ million € million € million € million € million € millionTax Tax
Before (charged)/ After Before (charged)/ Aftertax credit tax tax credit tax
2009 2009 2009 2008 2008 2008
Fair value gains/(losses) on financial instruments 163 (58) 105 (204) 40 (164)Actuarial gains/(losses) on pension schemes 38 (20) 18 (3,127) 834 (2,293)Currency redistribution gains/(losses) 396 – 396 (1,688) – (1,688)
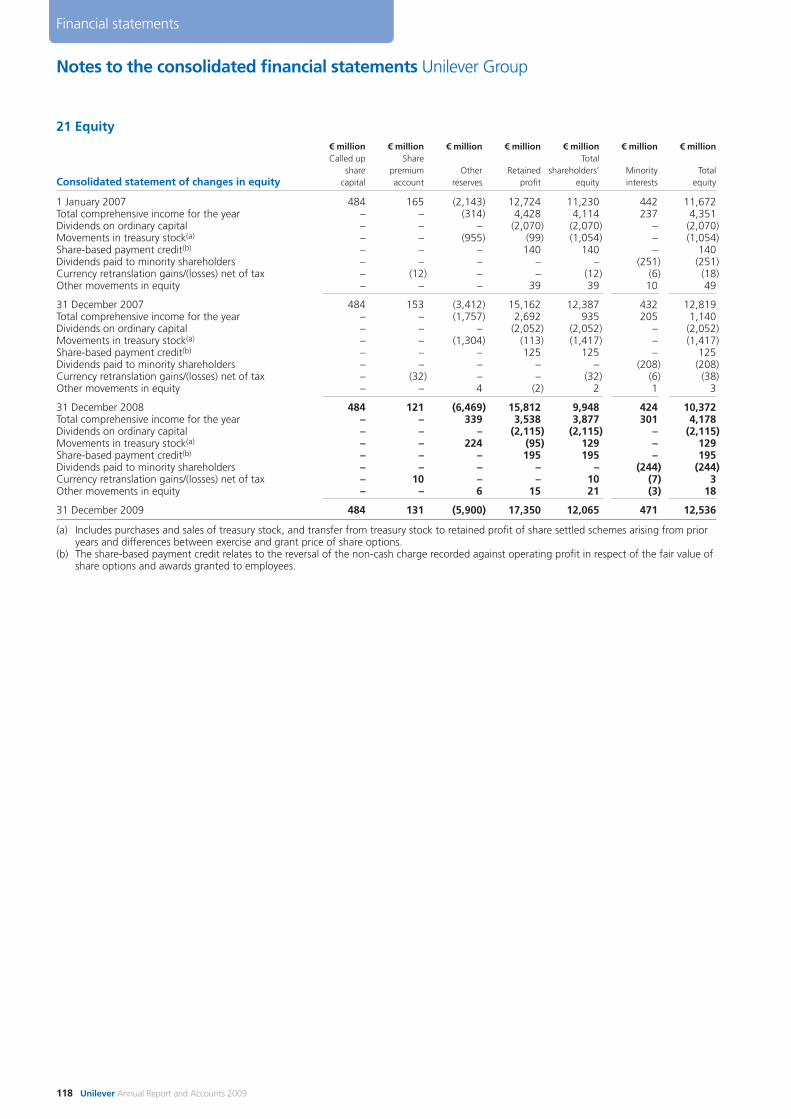
21 Equity€ million € million € million € million € million € million € millionCalled up Share Total
share premium Other Retained shareholders’ Minority TotalConsolidated statement of changes in equity capital account reserves profit equity interests equity
1 January 2007 484 165 (2,143) 12,724 11,230 442 11,672Total comprehensive income for the year – – (314) 4,428 4,114 237 4,351Dividends on ordinary capital – – – (2,070) (2,070) – (2,070)Movements in treasury stock(a) – – (955) (99) (1,054) – (1,054)Share-based payment credit(b) – – – 140 140 – 140Dividends paid to minority shareholders – – – – – (251) (251)Currency retranslation gains/(losses) net of tax – (12) – – (12) (6) (18)Other movements in equity – – – 39 39 10 49
31 December 2007 484 153 (3,412) 15,162 12,387 432 12,819Total comprehensive income for the year – – (1,757) 2,692 935 205 1,140Dividends on ordinary capital – – – (2,052) (2,052) – (2,052)Movements in treasury stock(a) – – (1,304) (113) (1,417) – (1,417)Share-based payment credit(b) – – – 125 125 – 125Dividends paid to minority shareholders – – – – – (208) (208)Currency retranslation gains/(losses) net of tax – (32) – – (32) (6) (38)Other movements in equity – – 4 (2) 2 1 3
31 December 2008 484 121 (6,469) 15,812 9,948 424 10,372Total comprehensive income for the year – – 339 3,538 3,877 301 4,178Dividends on ordinary capital – – – (2,115) (2,115) – (2,115)Movements in treasury stock(a) – – 224 (95) 129 – 129Share-based payment credit(b) – – – 195 195 – 195Dividends paid to minority shareholders – – – – – (244) (244)Currency retranslation gains/(losses) net of tax – 10 – – 10 (7) 3Other movements in equity – – 6 15 21 (3) 18
31 December 2009 484 131 (5,900) 17,350 12,065 471 12,536
(a) Includes purchases and sales of treasury stock, and transfer from treasury stock to retained profit of share settled schemes arising from prioryears and differences between exercise and grant price of share options.
(b) The share-based payment credit relates to the reversal of the non-cash charge recorded against operating profit in respect of the fair value ofshare options and awards granted to employees.
Notes to the consolidated financial statements Unilever Group
118 Unilever Annual Report and Accounts 2009
Financial statements
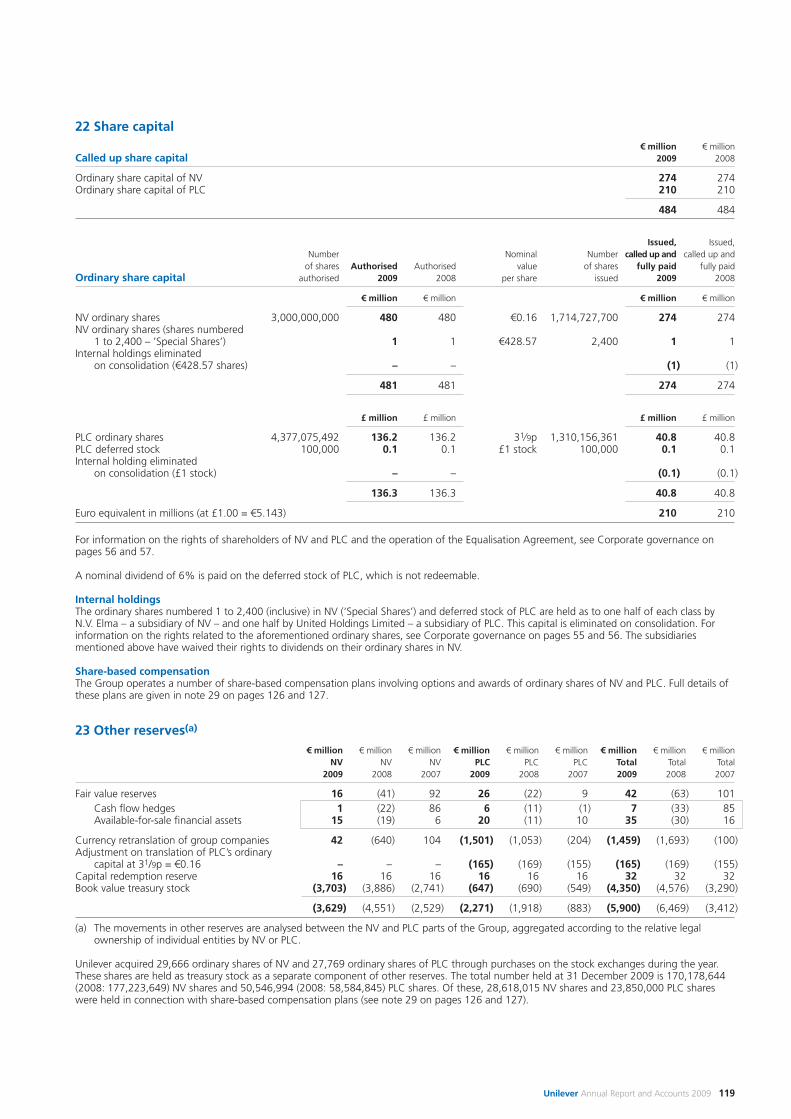
Unilever Annual Report and Accounts 2009 119
22 Share capital€ million € million
Called up share capital 2009 2008
Ordinary share capital of NV 274 274Ordinary share capital of PLC 210 210
484 484
Issued, Issued,Number Nominal Number called up and called up and
of shares Authorised Authorised value of shares fully paid fully paidOrdinary share capital authorised 2009 2008 per share issued 2009 2008
€ million € million € million € million
NV ordinary shares 3,000,000,000 480 480 €0.16 1,714,727,700 274 274NV ordinary shares (shares numbered
1 to 2,400 – ’Special Shares’) 1 1 €428.57 2,400 1 1Internal holdings eliminated
on consolidation (€428.57 shares) – – (1) (1)
481 481 274 274
£ million £ million £ million £ million
PLC ordinary shares 4,377,075,492 136.2 136.2 31⁄9p 1,310,156,361 40.8 40.8PLC deferred stock 100,000 0.1 0.1 £1 stock 100,000 0.1 0.1Internal holding eliminated
on consolidation (£1 stock) – – (0.1) (0.1)
136.3 136.3 40.8 40.8
Euro equivalent in millions (at £1.00 = €5.143) 210 210
For information on the rights of shareholders of NV and PLC and the operation of the Equalisation Agreement, see Corporate governance onpages 56 and 57.
A nominal dividend of 6% is paid on the deferred stock of PLC, which is not redeemable.
Internal holdingsThe ordinary shares numbered 1 to 2,400 (inclusive) in NV (‘Special Shares’) and deferred stock of PLC are held as to one half of each class byN.V. Elma – a subsidiary of NV – and one half by United Holdings Limited – a subsidiary of PLC. This capital is eliminated on consolidation. Forinformation on the rights related to the aforementioned ordinary shares, see Corporate governance on pages 55 and 56. The subsidiariesmentioned above have waived their rights to dividends on their ordinary shares in NV.
Share-based compensationThe Group operates a number of share-based compensation plans involving options and awards of ordinary shares of NV and PLC. Full details ofthese plans are given in note 29 on pages 126 and 127.
23 Other reserves(a)
€ million € million € million € million € million € million € million € million € millionNV NV NV PLC PLC PLC Total Total Total
2009 2008 2007 2009 2008 2007 2009 2008 2007
Fair value reserves 16 (41) 92 26 (22) 9 42 (63) 101Cash flow hedges 1 (22) 86 6 (11) (1) 7 (33) 85Available-for-sale financial assets 15 (19) 6 20 (11) 10 35 (30) 16
Currency retranslation of group companies 42 (640) 104 (1,501) (1,053) (204) (1,459) (1,693) (100)Adjustment on translation of PLC’s ordinary
capital at 31/9p = €0.16 – – – (165) (169) (155) (165) (169) (155)Capital redemption reserve 16 16 16 16 16 16 32 32 32Book value treasury stock (3,703) (3,886) (2,741) (647) (690) (549) (4,350) (4,576) (3,290)
(3,629) (4,551) (2,529) (2,271) (1,918) (883) (5,900) (6,469) (3,412)
(a) The movements in other reserves are analysed between the NV and PLC parts of the Group, aggregated according to the relative legalownership of individual entities by NV or PLC.
Unilever acquired 29,666 ordinary shares of NV and 27,769 ordinary shares of PLC through purchases on the stock exchanges during the year.These shares are held as treasury stock as a separate component of other reserves. The total number held at 31 December 2009 is 170,178,644(2008: 177,223,649) NV shares and 50,546,994 (2008: 58,584,845) PLC shares. Of these, 28,618,015 NV shares and 23,850,000 PLC shareswere held in connection with share-based compensation plans (see note 29 on pages 126 and 127).
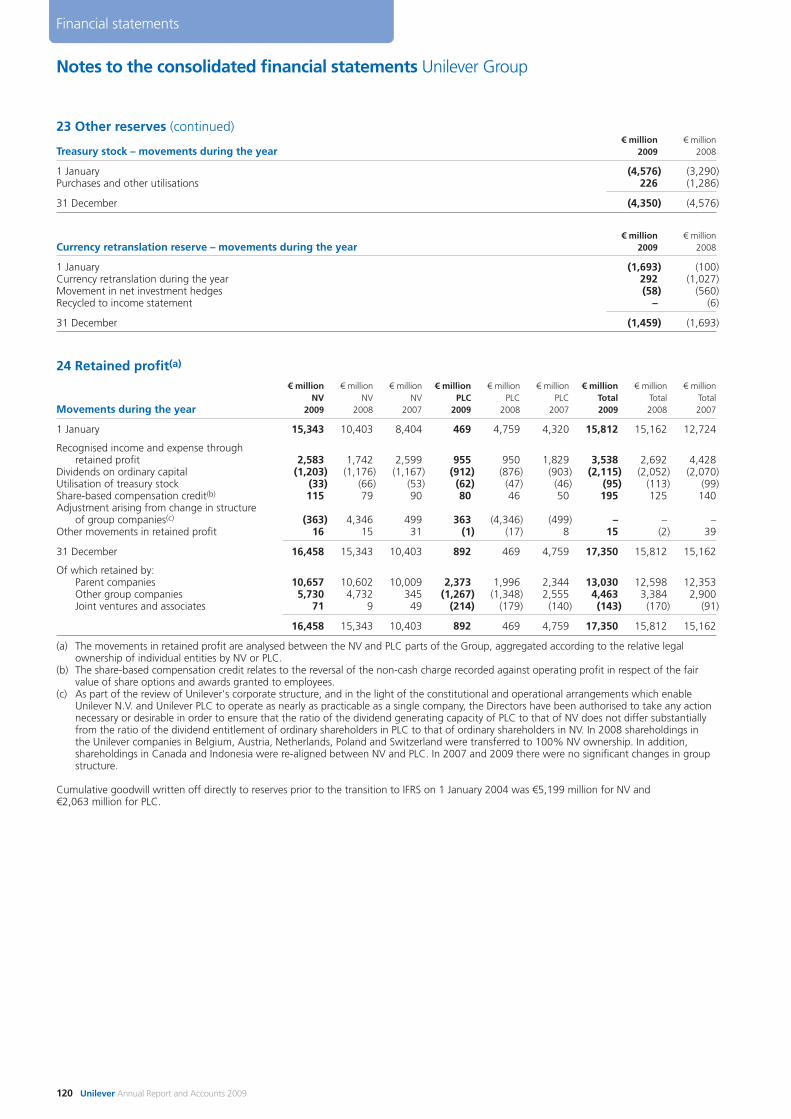
23 Other reserves (continued)€ million € million
Treasury stock – movements during the year 2009 2008
1 January (4,576) (3,290)Purchases and other utilisations 226 (1,286)
31 December (4,350) (4,576)
€ million € millionCurrency retranslation reserve – movements during the year 2009 2008
1 January (1,693) (100)Currency retranslation during the year 292 (1,027)Movement in net investment hedges (58) (560)Recycled to income statement – (6)
31 December (1,459) (1,693)
24 Retained profit(a)
€ million € million € million € million € million € million € million € million € millionNV NV NV PLC PLC PLC Total Total Total
Movements during the year 2009 2008 2007 2009 2008 2007 2009 2008 2007
1 January 15,343 10,403 8,404 469 4,759 4,320 15,812 15,162 12,724
Recognised income and expense throughretained profit 2,583 1,742 2,599 955 950 1,829 3,538 2,692 4,428
Dividends on ordinary capital (1,203) (1,176) (1,167) (912) (876) (903) (2,115) (2,052) (2,070)Utilisation of treasury stock (33) (66) (53) (62) (47) (46) (95) (113) (99)Share-based compensation credit(b) 115 79 90 80 46 50 195 125 140Adjustment arising from change in structure
of group companies(c) (363) 4,346 499 363 (4,346) (499) – – –Other movements in retained profit 16 15 31 (1) (17) 8 15 (2) 39
31 December 16,458 15,343 10,403 892 469 4,759 17,350 15,812 15,162
Of which retained by:Parent companies 10,657 10,602 10,009 2,373 1,996 2,344 13,030 12,598 12,353Other group companies 5,730 4,732 345 (1,267) (1,348) 2,555 4,463 3,384 2,900Joint ventures and associates 71 9 49 (214) (179) (140) (143) (170) (91)
16,458 15,343 10,403 892 469 4,759 17,350 15,812 15,162
(a) The movements in retained profit are analysed between the NV and PLC parts of the Group, aggregated according to the relative legalownership of individual entities by NV or PLC.
(b) The share-based compensation credit relates to the reversal of the non-cash charge recorded against operating profit in respect of the fairvalue of share options and awards granted to employees.
(c) As part of the review of Unilever's corporate structure, and in the light of the constitutional and operational arrangements which enableUnilever N.V. and Unilever PLC to operate as nearly as practicable as a single company, the Directors have been authorised to take any actionnecessary or desirable in order to ensure that the ratio of the dividend generating capacity of PLC to that of NV does not differ substantiallyfrom the ratio of the dividend entitlement of ordinary shareholders in PLC to that of ordinary shareholders in NV. In 2008 shareholdings inthe Unilever companies in Belgium, Austria, Netherlands, Poland and Switzerland were transferred to 100% NV ownership. In addition,shareholdings in Canada and Indonesia were re-aligned between NV and PLC. In 2007 and 2009 there were no significant changes in groupstructure.
Cumulative goodwill written off directly to reserves prior to the transition to IFRS on 1 January 2004 was €5,199 million for NV and €2,063 million for PLC.
Notes to the consolidated financial statements Unilever Group
120 Unilever Annual Report and Accounts 2009
Financial statements
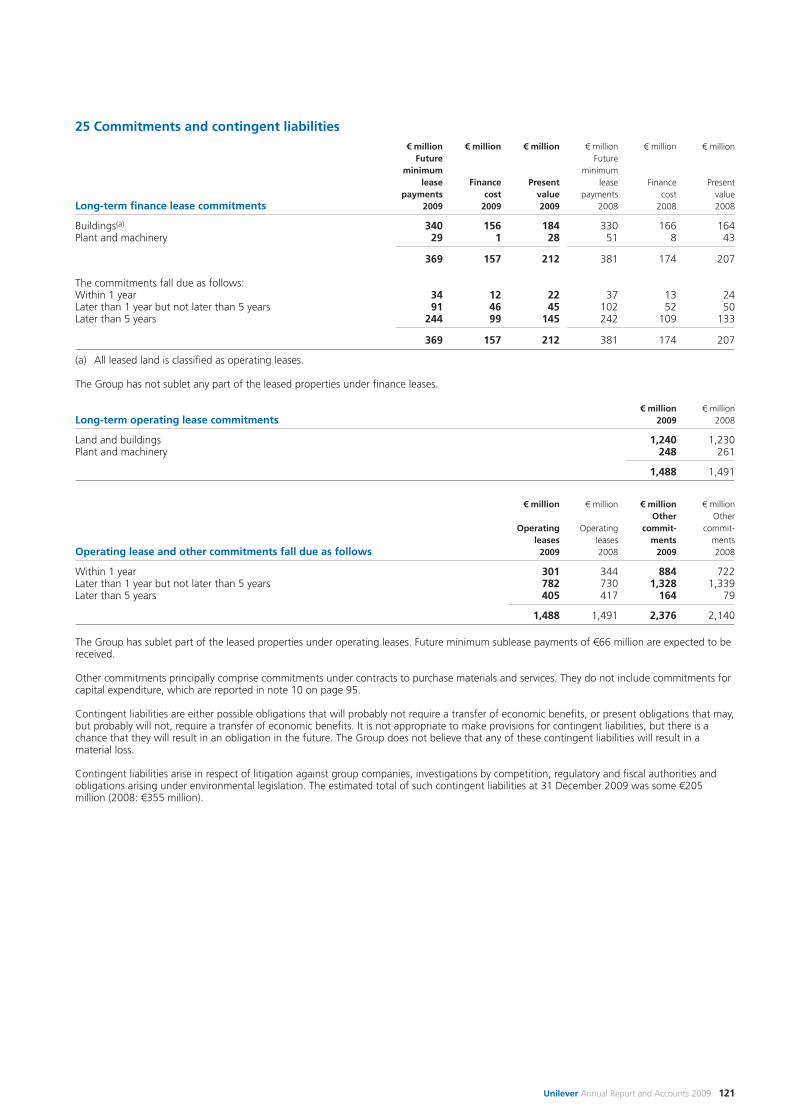
Unilever Annual Report and Accounts 2009 121
25 Commitments and contingent liabilities€ million € million € million € million € million € million
Future Futureminimum minimum
lease Finance Present lease Finance Presentpayments cost value payments cost value
Long-term finance lease commitments 2009 2009 2009 2008 2008 2008
Buildings(a) 340 156 184 330 166 164Plant and machinery 29 1 28 51 8 43
369 157 212 381 174 207
The commitments fall due as follows:Within 1 year 34 12 22 37 13 24Later than 1 year but not later than 5 years 91 46 45 102 52 50Later than 5 years 244 99 145 242 109 133
369 157 212 381 174 207
(a) All leased land is classified as operating leases.
The Group has not sublet any part of the leased properties under finance leases.
€ million € millionLong-term operating lease commitments 2009 2008
Land and buildings 1,240 1,230Plant and machinery 248 261
1,488 1,491
€ million € million € million € millionOther Other
Operating Operating commit- commit-leases leases ments ments
Operating lease and other commitments fall due as follows 2009 2008 2009 2008
Within 1 year 301 344 884 722Later than 1 year but not later than 5 years 782 730 1,328 1,339Later than 5 years 405 417 164 79
1,488 1,491 2,376 2,140
The Group has sublet part of the leased properties under operating leases. Future minimum sublease payments of €66 million are expected to bereceived.
Other commitments principally comprise commitments under contracts to purchase materials and services. They do not include commitments forcapital expenditure, which are reported in note 10 on page 95.
Contingent liabilities are either possible obligations that will probably not require a transfer of economic benefits, or present obligations that may,but probably will not, require a transfer of economic benefits. It is not appropriate to make provisions for contingent liabilities, but there is achance that they will result in an obligation in the future. The Group does not believe that any of these contingent liabilities will result in amaterial loss.
Contingent liabilities arise in respect of litigation against group companies, investigations by competition, regulatory and fiscal authorities andobligations arising under environmental legislation. The estimated total of such contingent liabilities at 31 December 2009 was some €205million (2008: €355 million).
25 Commitments and contingent liabilities (continued)
Legal proceedingsDetails of significant outstanding legal proceedings and ongoing regulatory investigations are as follows:
Competition investigationsAs previously reported, in June 2008 the European Commission initiated an investigation into potential competition law infringements in theEuropean Union in relation to consumer detergents. Unilever has received a number of requests for information from the European Commissionregarding the investigation and has been subject to unannounced investigations at some of its premises. The investigation is ongoing althoughno statement of objections against Unilever has been issued to date. It is too early to reliably assess the ultimate resolution or to estimate thefines which the Commission will seek to impose on Unilever as a result of this investigation. Therefore no provision has been made. However,substantial fines can be levied as a result of European Commission investigations. Fines imposed in other sectors for violations of competitionrules have amounted to hundreds of millions of euros.
In December 2009, Unilever received separate statements of objection from the French competition authority and from the Italian competitionauthority in connection with investigations into certain product markets in France and Italy respectively. An earlier decision by the Greek authorityfining Unilever in relation to alleged restrictions on parallel trade within certain of its contracts with retailers in Greece is under appeal.Appropriate provisions have been made in relation to these investigations and the fining decision.
In addition and as previously reported, Unilever is involved in a number of other ongoing investigations by national competition authorities.These include investigations in Belgium, France, Germany and The Netherlands. These investigations are at various stages and concern a varietyof product markets. In several cases it is not clear that the authorities will seek to impose a fine on Unilever, and in others it is too early to be ablereasonably to assess the level of fines which the authorities may seek to impose.
It is Unilever’s policy to co-operate fully with the competition authorities in the context of all ongoing investigations. In addition, Unileverreinforces and enhances its internal competition law compliance procedures on an ongoing basis.
Tax cases BrazilDuring 2004 the Federal Supreme Court in Brazil (local acronym STF) announced a review of certain cases that it had previously decided in favourof taxpayers. Because of this action, we established a provision in 2004 for the potential repayment of sales tax credits in the event that the casesestablishing precedents in our favour are reversed. Since that time we continue to monitor the situation and have made changes as appropriateto the amount provided.
In June 2007, the Supreme Court ruled against the taxpayers in one of these cases. Industry associations (of which Unilever is a member)attempted to negotiate a settlement with the Federal Revenue Service to reduce or avoid the payment of interest and/or penalties on suchamounts. On 3 December 2008 the negotiations resulted in the publication of a settlement by the Brazilian government, open to all taxpayersincluding Unilever. This settlement was ratified by the President of Brazil in 2009 and was subsequently supported by further legislation whichincreased the discount on the interest payable. Unilever made a payment on October 29th, 2009 to settle the claim and this matter is nowresolved.
Also during 2004 in Brazil, and in common with many other businesses operating in that country, one of our Brazilian subsidiaries received anotice of infringement from the Federal Revenue Service. The notice alleges that a 2001 reorganisation of our local corporate structure wasundertaken without valid business purpose. The dispute is in court and if upheld, will result in a tax payment relating to years from 2001 to thepresent day. The 2001 reorganisation was comparable with restructurings done by many companies in Brazil. We believe that the likelihood of asuccessful challenge by the tax authorities is remote. While this view is supported by the opinion of outside counsel there can be no guarantee ofsuccess in court.
Notes to the consolidated financial statements Unilever Group
122 Unilever Annual Report and Accounts 2009
Financial statements
Unilever Annual Report and Accounts 2009 123
26 Acquisitions and disposals
On 2 April 2009 we announced the completion of our purchase of the global TIGI professional hair product business and its supporting advancededucation academies. TIGI’s major brands include Bed Head, Catwalk and S-Factor. Turnover of the business worldwide in 2008 was around US $250 million. The cash consideration of $411.5 million was made on a cash and debt free basis. In addition, further limited payments relatedto future growth may be made contingent upon meeting certain thresholds.
On 23 June 2009 we announced that we had increased our holding in our business in Vietnam to 100%, following an agreement with Vinachemwho previously owned 33.3% of the business.
On 3 July 2009 we completed the acquisition of Baltimor Holding ZAO’s sauces business in Russia. The acquisition includes ketchup, mayonnaiseand tomato paste business under the Baltimor, Pomo d’Oro and Vostochniy Gourmand brands – accounting for turnover of around €70 million in2008 – and a production facility at Kolpino, near St Petersburg.
On 3 September 2009 we announced the sale of our oil palm plantation business in the Democratic Republic of Congo to Feronia Inc, for anundisclosed sum.
On 25 September 2009 we announced a binding offer to acquire the personal care business of the Sara Lee Corporation for €1.275 billion incash. The Sara Lee brands involved include Sanex, Radox and Duschdas, and generated annual sales in excess of €750 million in the year endingJune 2009. The transaction is subject to regulatory approval and consultation with European Works Councils, and is expected to be completed bythe third quarter of 2010.
On 24 November 2009 we completed the sale of our interest in JohnsonDiversey. The cash consideration received was US $390 million, whichincluded both the originally announced cash consideration of US $158 million plus the proceeds of the sale of the 10.5% senior notes inJohnsonDiversey Holdings, Inc. We retain a 4% interest in JohnsonDiversey in the form of warrants. See also note 11 on page 97.
2008With effect from 1 January 2008, we entered into an expanded international partnership with PepsiCo for the marketing and distribution ofready-to-drink tea products under the Lipton brand.
On 3 January 2008 we completed the sale of the Boursin brand to Le Groupe Bel for €400 million. The turnover of this brand in 2007 wasapproximately €100 million.
On 2 April 2008 we completed the acquisition of Inmarko, the leading Russian ice cream company. The company had a turnover in 2007 ofapproximately €115 million.
On 31 July 2008 we completed the sale of our Lawry’s and Adolph’s branded seasoning blends and marinades business in the US andCanada to McCormick & Company, Incorporated for €410 million. The combined annual turnover of the business in 2007 was approximately €100 million.
On 9 September 2008 we completed the sale of our North American laundry business in the US, Canada and Puerto Rico to Vestar CapitalPartners, a leading global private equity firm, for consideration of approximately US $1.45 billion, consisting mainly of cash, along with preferredshares and warrants. These businesses had a combined turnover in 2007 of approximately US $1.0 billion.
On 5 November 2008 we completed the sale of Komili, our olive oil brand in Turkey, to Ana Gida, part of the Anadolu Group.
On 4 December 2008 we completed the sale of our edible oil business in Côte d’Ivoire, together with interests in local oil palm plantations Palmciand PHCI, to SIFCA, the parent company of an Ivorian agro-industry group, and to a 50:50 joint venture between two Singapore-basedcompanies, Wilmar International Limited and Olam International Limited. At the same time we acquired the soap business of Cosmivoire, asubsidiary of SIFCA.
On 23 December 2008 we completed the disposal of our Bertolli olive oil and vinegar business to Grupo SOS for a consideration of €630 million.The transaction was structured as a worldwide perpetual licence by Unilever of the Bertolli brand in respect of olive oil and premium vinegar. Thetransaction included the sale of the Italian Maya, Dante and San Giorgio olive oil and seed oil businesses, as well as the factory at Inveruno, Italy.
2007During 2007 we purchased minority interests in subsidiary companies in Greece and India. We invested in a new venture fund, Physic Ventures,which is accounted for as an associate, and made additional investments in two other venture companies, Spa and Salon International Limitedand Langholm Capital, both of which are accounted for as associates.
With effect from 1 October 2007, Unilever and Remgro Ltd. reached agreement to reorganise their respective shareholdings in the Unileverbusinesses in South Africa and Israel. In the reorganised shareholding Unilever has a majority share in a single South African business and fullyowns the Unilever Israel foods and home and personal care business. As a result of this transaction, Unilever reported a profit on disposal of €214 million and goodwill of €168 million.
On 1 January 2007, Unilever completed the restructuring of its Portuguese businesses. The result of the reorganisation is that Unilever now has a 55% share of the combined Portuguese entity, called Unilever Jerónimo Martins. The combined business includes the foods and home andpersonal care businesses. The remaining 45% interest is held by Jerónimo Martins Group. The structure of the agreement is such that there isjoint control of the newly formed entity and so it is accounted for by Unilever as a joint venture.
Other disposals in 2007 included the sale of local Brazilian margarine brands. In addition, to further develop our healthy heart brand margarine,Becel, in Brazil we established a joint venture with Perdigão.
UNI04_01 AR_09 Pp111-128.qxd 4/3/10 11:51 Page 123
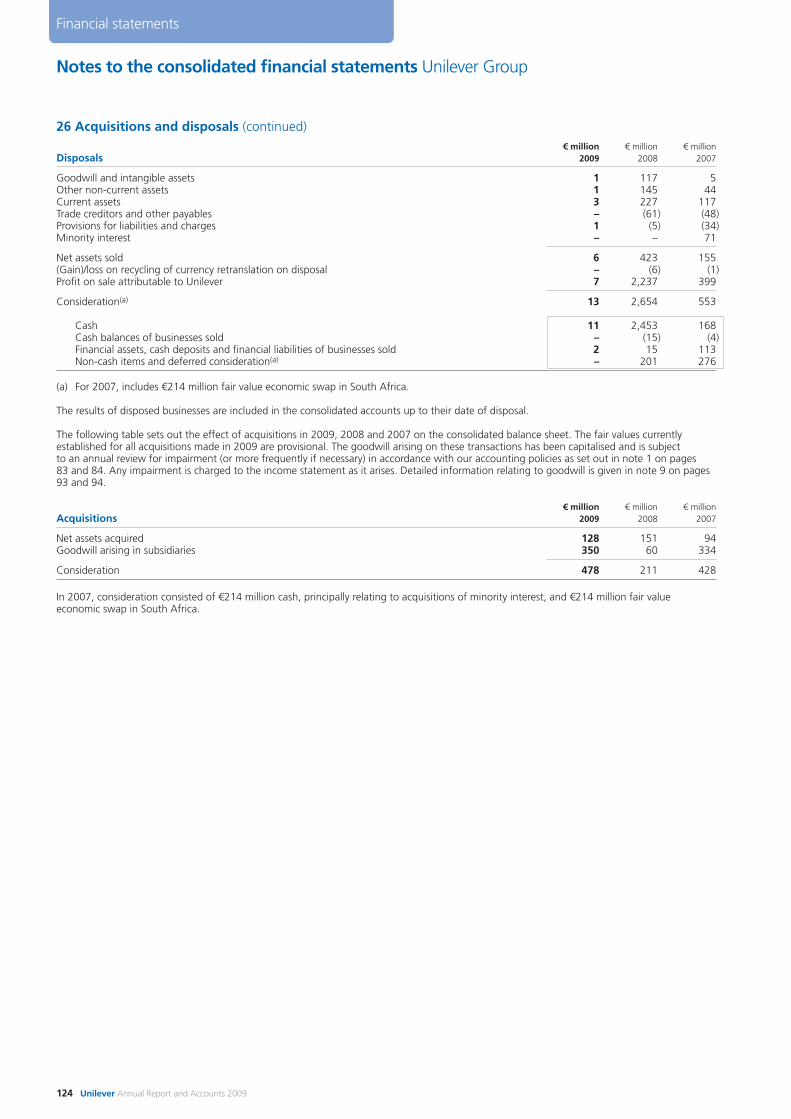
Notes to the consolidated financial statements Unilever Group
26 Acquisitions and disposals (continued)€ million € million € million
Disposals 2009 2008 2007
Goodwill and intangible assets 1 117 5Other non-current assets 1 145 44Current assets 3 227 117Trade creditors and other payables – (61) (48)Provisions for liabilities and charges 1 (5) (34)Minority interest – – 71
Net assets sold 6 423 155(Gain)/loss on recycling of currency retranslation on disposal – (6) (1)Profit on sale attributable to Unilever 7 2,237 399
Consideration(a) 13 2,654 553
Cash 11 2,453 168Cash balances of businesses sold – (15) (4)Financial assets, cash deposits and financial liabilities of businesses sold 2 15 113Non-cash items and deferred consideration(a) – 201 276
(a) For 2007, includes €214 million fair value economic swap in South Africa.
The results of disposed businesses are included in the consolidated accounts up to their date of disposal.
The following table sets out the effect of acquisitions in 2009, 2008 and 2007 on the consolidated balance sheet. The fair values currentlyestablished for all acquisitions made in 2009 are provisional. The goodwill arising on these transactions has been capitalised and is subject to an annual review for impairment (or more frequently if necessary) in accordance with our accounting policies as set out in note 1 on pages83 and 84. Any impairment is charged to the income statement as it arises. Detailed information relating to goodwill is given in note 9 on pages93 and 94.
€ million € million € millionAcquisitions 2009 2008 2007
Net assets acquired 128 151 94Goodwill arising in subsidiaries 350 60 334
Consideration 478 211 428
In 2007, consideration consisted of €214 million cash, principally relating to acquisitions of minority interest, and €214 million fair valueeconomic swap in South Africa.
124 Unilever Annual Report and Accounts 2009
Financial statements
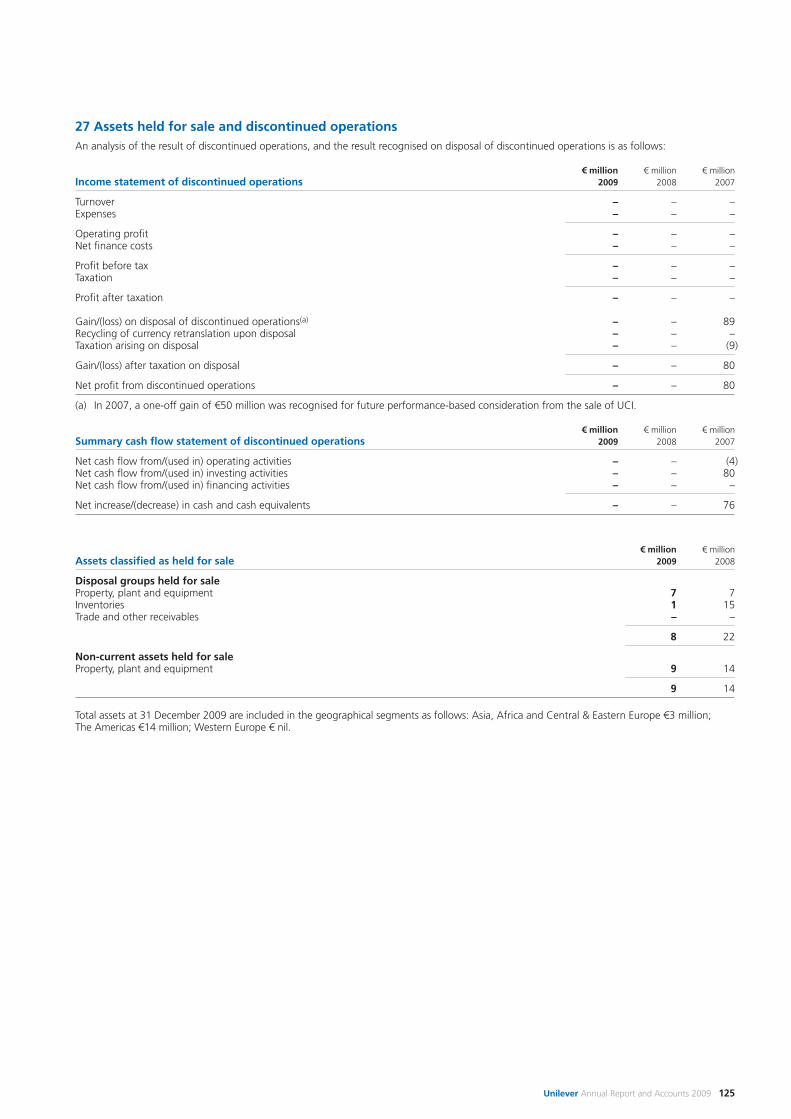
27 Assets held for sale and discontinued operationsAn analysis of the result of discontinued operations, and the result recognised on disposal of discontinued operations is as follows:
€ million € million € millionIncome statement of discontinued operations 2009 2008 2007
Turnover – – –Expenses – – –
Operating profit – – –Net finance costs – – –
Profit before tax – – –Taxation – – –
Profit after taxation – – –
Gain/(loss) on disposal of discontinued operations(a) – – 89Recycling of currency retranslation upon disposal – – –Taxation arising on disposal – – (9)
Gain/(loss) after taxation on disposal – – 80
Net profit from discontinued operations – – 80
(a) In 2007, a one-off gain of €50 million was recognised for future performance-based consideration from the sale of UCI.
€ million € million € millionSummary cash flow statement of discontinued operations 2009 2008 2007
Net cash flow from/(used in) operating activities – – (4)Net cash flow from/(used in) investing activities – – 80Net cash flow from/(used in) financing activities – – –
Net increase/(decrease) in cash and cash equivalents – – 76
€ million € millionAssets classified as held for sale 2009 2008
Disposal groups held for saleProperty, plant and equipment 7 7Inventories 1 15Trade and other receivables – –
8 22
Non-current assets held for saleProperty, plant and equipment 9 14
9 14
Total assets at 31 December 2009 are included in the geographical segments as follows: Asia, Africa and Central & Eastern Europe €3 million;The Americas €14 million; Western Europe € nil.
Unilever Annual Report and Accounts 2009 125
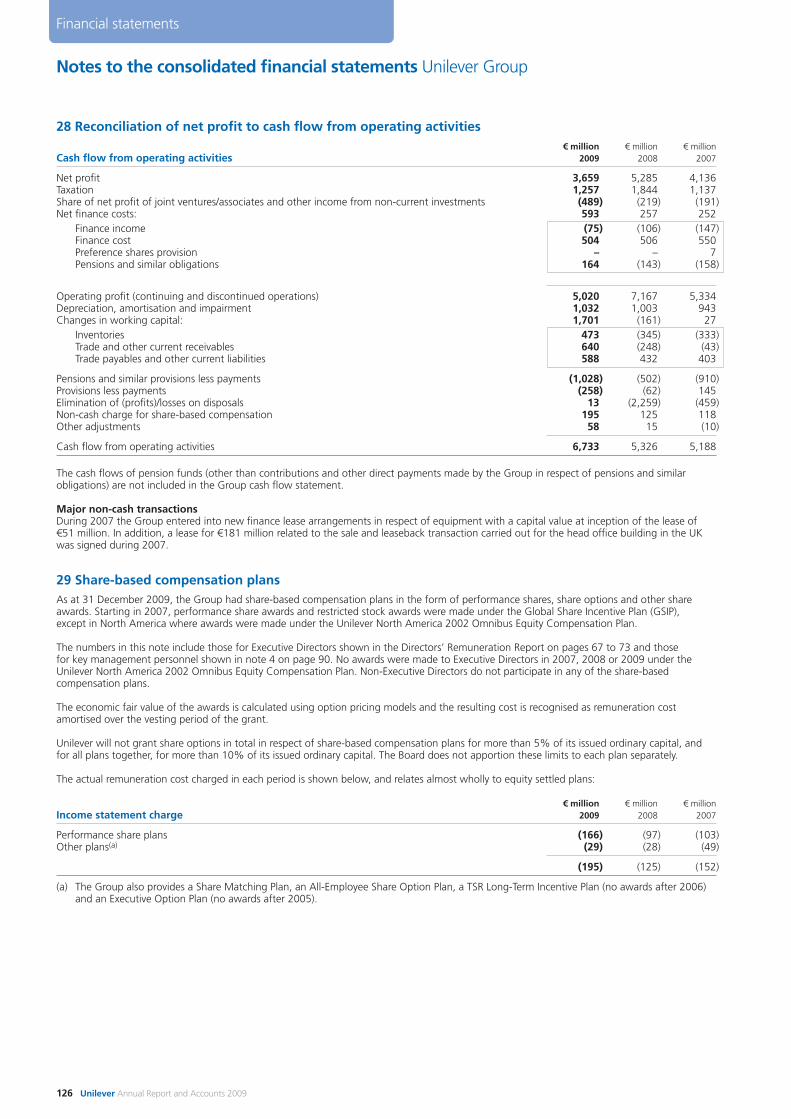
Notes to the consolidated financial statements Unilever Group
28 Reconciliation of net profit to cash flow from operating activities€ million € million € million
Cash flow from operating activities 2009 2008 2007
Net profit 3,659 5,285 4,136Taxation 1,257 1,844 1,137Share of net profit of joint ventures/associates and other income from non-current investments (489) (219) (191)Net finance costs: 593 257 252
Finance income (75) (106) (147)Finance cost 504 506 550Preference shares provision – – 7Pensions and similar obligations 164 (143) (158)
Operating profit (continuing and discontinued operations) 5,020 7,167 5,334Depreciation, amortisation and impairment 1,032 1,003 943Changes in working capital: 1,701 (161) 27
Inventories 473 (345) (333)Trade and other current receivables 640 (248) (43)Trade payables and other current liabilities 588 432 403
Pensions and similar provisions less payments (1,028) (502) (910)Provisions less payments (258) (62) 145Elimination of (profits)/losses on disposals 13 (2,259) (459)Non-cash charge for share-based compensation 195 125 118Other adjustments 58 15 (10)
Cash flow from operating activities 6,733 5,326 5,188
The cash flows of pension funds (other than contributions and other direct payments made by the Group in respect of pensions and similarobligations) are not included in the Group cash flow statement.
Major non-cash transactionsDuring 2007 the Group entered into new finance lease arrangements in respect of equipment with a capital value at inception of the lease of€51 million. In addition, a lease for €181 million related to the sale and leaseback transaction carried out for the head office building in the UKwas signed during 2007.
29 Share-based compensation plansAs at 31 December 2009, the Group had share-based compensation plans in the form of performance shares, share options and other shareawards. Starting in 2007, performance share awards and restricted stock awards were made under the Global Share Incentive Plan (GSIP),except in North America where awards were made under the Unilever North America 2002 Omnibus Equity Compensation Plan.
The numbers in this note include those for Executive Directors shown in the Directors’ Remuneration Report on pages 67 to 73 and those for key management personnel shown in note 4 on page 90. No awards were made to Executive Directors in 2007, 2008 or 2009 under theUnilever North America 2002 Omnibus Equity Compensation Plan. Non-Executive Directors do not participate in any of the share-basedcompensation plans.
The economic fair value of the awards is calculated using option pricing models and the resulting cost is recognised as remuneration costamortised over the vesting period of the grant.
Unilever will not grant share options in total in respect of share-based compensation plans for more than 5% of its issued ordinary capital, andfor all plans together, for more than 10% of its issued ordinary capital. The Board does not apportion these limits to each plan separately.
The actual remuneration cost charged in each period is shown below, and relates almost wholly to equity settled plans:
€ million € million € millionIncome statement charge 2009 2008 2007
Performance share plans (166) (97) (103)Other plans(a) (29) (28) (49)
(195) (125) (152)
(a) The Group also provides a Share Matching Plan, an All-Employee Share Option Plan, a TSR Long-Term Incentive Plan (no awards after 2006)and an Executive Option Plan (no awards after 2005).
126 Unilever Annual Report and Accounts 2009
Financial statements
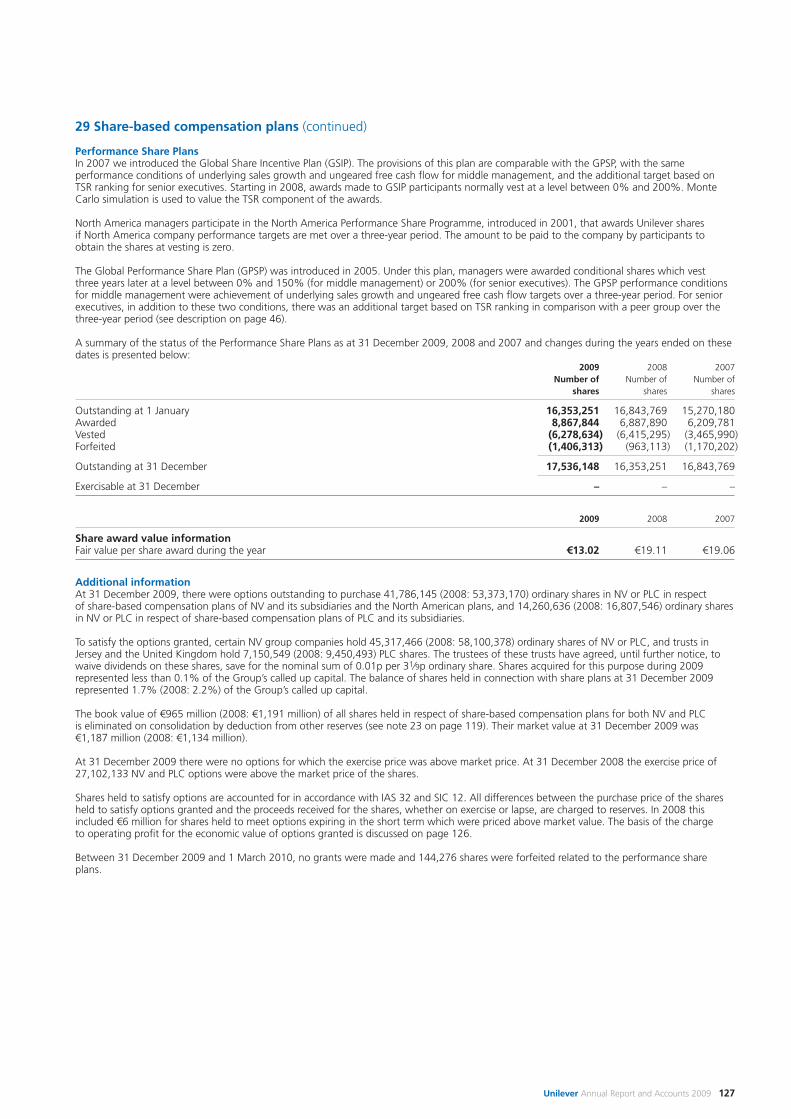
29 Share-based compensation plans (continued)
Performance Share PlansIn 2007 we introduced the Global Share Incentive Plan (GSIP). The provisions of this plan are comparable with the GPSP, with the sameperformance conditions of underlying sales growth and ungeared free cash flow for middle management, and the additional target based on TSR ranking for senior executives. Starting in 2008, awards made to GSIP participants normally vest at a level between 0% and 200%. MonteCarlo simulation is used to value the TSR component of the awards.
North America managers participate in the North America Performance Share Programme, introduced in 2001, that awards Unilever shares if North America company performance targets are met over a three-year period. The amount to be paid to the company by participants toobtain the shares at vesting is zero.
The Global Performance Share Plan (GPSP) was introduced in 2005. Under this plan, managers were awarded conditional shares which vest three years later at a level between 0% and 150% (for middle management) or 200% (for senior executives). The GPSP performance conditionsfor middle management were achievement of underlying sales growth and ungeared free cash flow targets over a three-year period. For seniorexecutives, in addition to these two conditions, there was an additional target based on TSR ranking in comparison with a peer group over thethree-year period (see description on page 46).
A summary of the status of the Performance Share Plans as at 31 December 2009, 2008 and 2007 and changes during the years ended on thesedates is presented below:
2009 2008 2007Number of Number of Number of
shares shares shares
Outstanding at 1 January 16,353,251 16,843,769 15,270,180Awarded 8,867,844 6,887,890 6,209,781Vested (6,278,634) (6,415,295) (3,465,990)Forfeited (1,406,313) (963,113) (1,170,202)
Outstanding at 31 December 17,536,148 16,353,251 16,843,769
Exercisable at 31 December – – –
2009 2008 2007
Share award value informationFair value per share award during the year €13.02 €19.11 €19.06
Additional informationAt 31 December 2009, there were options outstanding to purchase 41,786,145 (2008: 53,373,170) ordinary shares in NV or PLC in respect of share-based compensation plans of NV and its subsidiaries and the North American plans, and 14,260,636 (2008: 16,807,546) ordinary sharesin NV or PLC in respect of share-based compensation plans of PLC and its subsidiaries.
To satisfy the options granted, certain NV group companies hold 45,317,466 (2008: 58,100,378) ordinary shares of NV or PLC, and trusts inJersey and the United Kingdom hold 7,150,549 (2008: 9,450,493) PLC shares. The trustees of these trusts have agreed, until further notice, towaive dividends on these shares, save for the nominal sum of 0.01p per 31⁄9p ordinary share. Shares acquired for this purpose during 2009represented less than 0.1% of the Group’s called up capital. The balance of shares held in connection with share plans at 31 December 2009represented 1.7% (2008: 2.2%) of the Group’s called up capital.
The book value of €965 million (2008: €1,191 million) of all shares held in respect of share-based compensation plans for both NV and PLC is eliminated on consolidation by deduction from other reserves (see note 23 on page 119). Their market value at 31 December 2009 was €1,187 million (2008: €1,134 million).
At 31 December 2009 there were no options for which the exercise price was above market price. At 31 December 2008 the exercise price of27,102,133 NV and PLC options were above the market price of the shares.
Shares held to satisfy options are accounted for in accordance with IAS 32 and SIC 12. All differences between the purchase price of the sharesheld to satisfy options granted and the proceeds received for the shares, whether on exercise or lapse, are charged to reserves. In 2008 thisincluded €6 million for shares held to meet options expiring in the short term which were priced above market value. The basis of the charge to operating profit for the economic value of options granted is discussed on page 126.
Between 31 December 2009 and 1 March 2010, no grants were made and 144,276 shares were forfeited related to the performance shareplans.
Unilever Annual Report and Accounts 2009 127
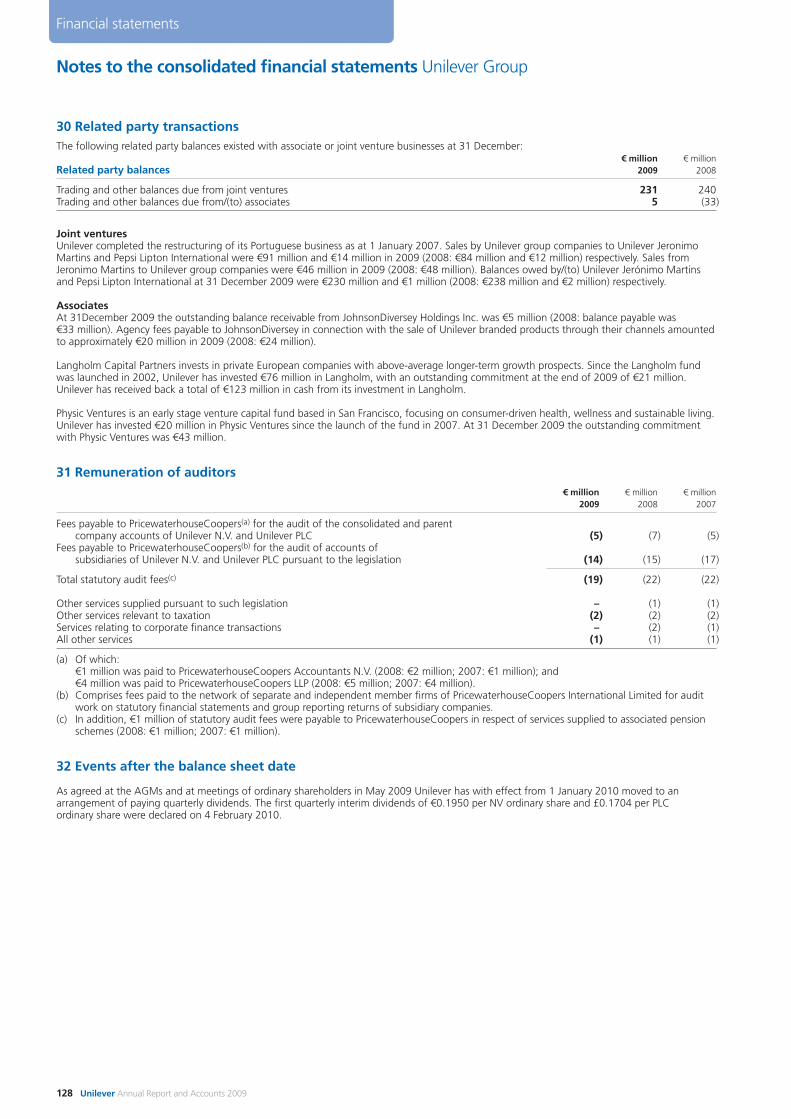
Notes to the consolidated financial statements Unilever Group
30 Related party transactionsThe following related party balances existed with associate or joint venture businesses at 31 December:
€ million € millionRelated party balances 2009 2008
Trading and other balances due from joint ventures 231 240Trading and other balances due from/(to) associates 5 (33)
Joint venturesUnilever completed the restructuring of its Portuguese business as at 1 January 2007. Sales by Unilever group companies to Unilever JeronimoMartins and Pepsi Lipton International were €91 million and €14 million in 2009 (2008: €84 million and €12 million) respectively. Sales fromJeronimo Martins to Unilever group companies were €46 million in 2009 (2008: €48 million). Balances owed by/(to) Unilever Jerónimo Martinsand Pepsi Lipton International at 31 December 2009 were €230 million and €1 million (2008: €238 million and €2 million) respectively.
AssociatesAt 31December 2009 the outstanding balance receivable from JohnsonDiversey Holdings Inc. was €5 million (2008: balance payable was €33 million). Agency fees payable to JohnsonDiversey in connection with the sale of Unilever branded products through their channels amounted to approximately €20 million in 2009 (2008: €24 million).
Langholm Capital Partners invests in private European companies with above-average longer-term growth prospects. Since the Langholm fundwas launched in 2002, Unilever has invested €76 million in Langholm, with an outstanding commitment at the end of 2009 of €21 million.Unilever has received back a total of €123 million in cash from its investment in Langholm.
Physic Ventures is an early stage venture capital fund based in San Francisco, focusing on consumer-driven health, wellness and sustainable living.Unilever has invested €20 million in Physic Ventures since the launch of the fund in 2007. At 31 December 2009 the outstanding commitmentwith Physic Ventures was €43 million.
31 Remuneration of auditors€ million € million € million
2009 2008 2007
Fees payable to PricewaterhouseCoopers(a) for the audit of the consolidated and parent company accounts of Unilever N.V. and Unilever PLC (5) (7) (5)
Fees payable to PricewaterhouseCoopers(b) for the audit of accounts of subsidiaries of Unilever N.V. and Unilever PLC pursuant to the legislation (14) (15) (17)
Total statutory audit fees(c) (19) (22) (22)
Other services supplied pursuant to such legislation – (1) (1)Other services relevant to taxation (2) (2) (2)Services relating to corporate finance transactions – (2) (1)All other services (1) (1) (1)
(a) Of which:€1 million was paid to PricewaterhouseCoopers Accountants N.V. (2008: €2 million; 2007: €1 million); and€4 million was paid to PricewaterhouseCoopers LLP (2008: €5 million; 2007: €4 million).
(b) Comprises fees paid to the network of separate and independent member firms of PricewaterhouseCoopers International Limited for auditwork on statutory financial statements and group reporting returns of subsidiary companies.
(c) In addition, €1 million of statutory audit fees were payable to PricewaterhouseCoopers in respect of services supplied to associated pensionschemes (2008: €1 million; 2007: €1 million).
32 Events after the balance sheet date
As agreed at the AGMs and at meetings of ordinary shareholders in May 2009 Unilever has with effect from 1 January 2010 moved to anarrangement of paying quarterly dividends. The first quarterly interim dividends of €0.1950 per NV ordinary share and £0.1704 per PLCordinary share were declared on 4 February 2010.
128 Unilever Annual Report and Accounts 2009
Financial statements
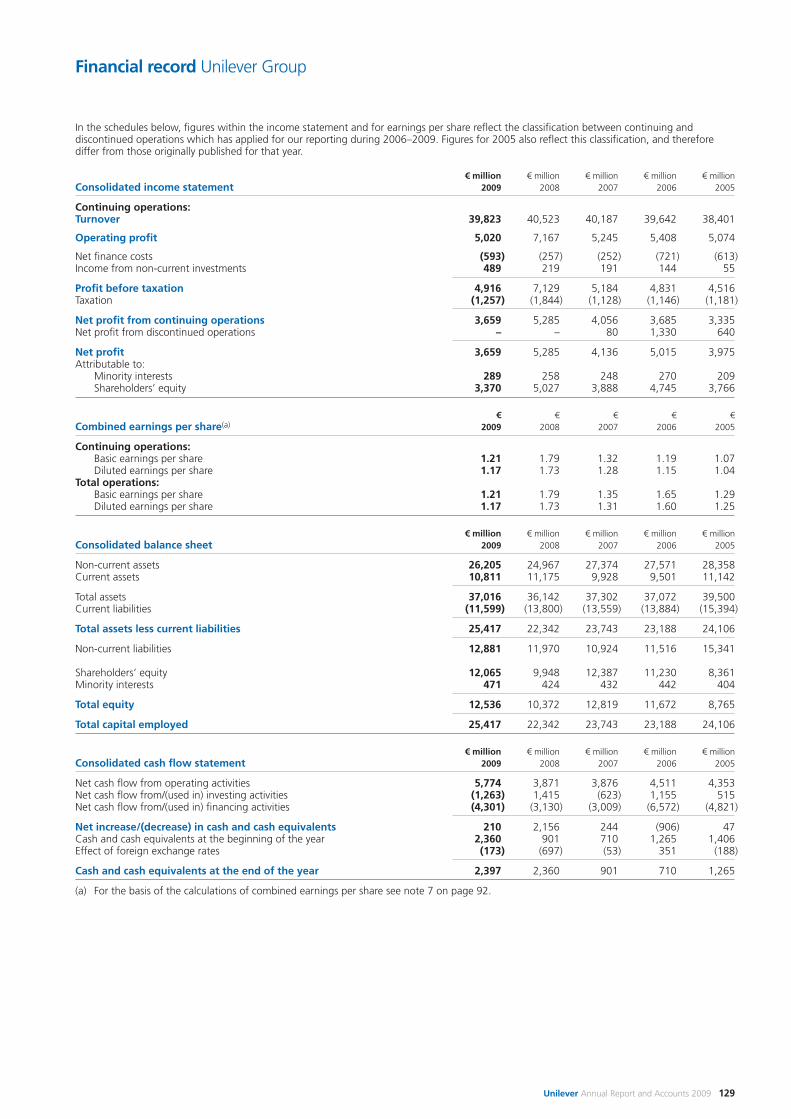
Unilever Annual Report and Accounts 2009 129
In the schedules below, figures within the income statement and for earnings per share reflect the classification between continuing anddiscontinued operations which has applied for our reporting during 2006–2009. Figures for 2005 also reflect this classification, and thereforediffer from those originally published for that year.
€ million € million € million € million € millionConsolidated income statement 2009 2008 2007 2006 2005
Continuing operations:Turnover 39,823 40,523 40,187 39,642 38,401
Operating profit 5,020 7,167 5,245 5,408 5,074
Net finance costs (593) (257) (252) (721) (613)Income from non-current investments 489 219 191 144 55
Profit before taxation 4,916 7,129 5,184 4,831 4,516 Taxation (1,257) (1,844) (1,128) (1,146) (1,181)
Net profit from continuing operations 3,659 5,285 4,056 3,685 3,335 Net profit from discontinued operations – – 80 1,330 640
Net profit 3,659 5,285 4,136 5,015 3,975 Attributable to:
Minority interests 289 258 248 270 209 Shareholders’ equity 3,370 5,027 3,888 4,745 3,766
€ € € € € Combined earnings per share(a) 2009 2008 2007 2006 2005
Continuing operations:Basic earnings per share 1.21 1.79 1.32 1.19 1.07Diluted earnings per share 1.17 1.73 1.28 1.15 1.04
Total operations:Basic earnings per share 1.21 1.79 1.35 1.65 1.29Diluted earnings per share 1.17 1.73 1.31 1.60 1.25
€ million € million € million € million € millionConsolidated balance sheet 2009 2008 2007 2006 2005
Non-current assets 26,205 24,967 27,374 27,571 28,358 Current assets 10,811 11,175 9,928 9,501 11,142
Total assets 37,016 36,142 37,302 37,072 39,500Current liabilities (11,599) (13,800) (13,559) (13,884) (15,394)
Total assets less current liabilities 25,417 22,342 23,743 23,188 24,106
Non-current liabilities 12,881 11,970 10,924 11,516 15,341
Shareholders’ equity 12,065 9,948 12,387 11,230 8,361 Minority interests 471 424 432 442 404
Total equity 12,536 10,372 12,819 11,672 8,765
Total capital employed 25,417 22,342 23,743 23,188 24,106
€ million € million € million € million € millionConsolidated cash flow statement 2009 2008 2007 2006 2005
Net cash flow from operating activities 5,774 3,871 3,876 4,511 4,353 Net cash flow from/(used in) investing activities (1,263) 1,415 (623) 1,155 515 Net cash flow from/(used in) financing activities (4,301) (3,130) (3,009) (6,572) (4,821)
Net increase/(decrease) in cash and cash equivalents 210 2,156 244 (906) 47 Cash and cash equivalents at the beginning of the year 2,360 901 710 1,265 1,406 Effect of foreign exchange rates (173) (697) (53) 351 (188)
Cash and cash equivalents at the end of the year 2,397 2,360 901 710 1,265
(a) For the basis of the calculations of combined earnings per share see note 7 on page 92.
Financial record Unilever Group
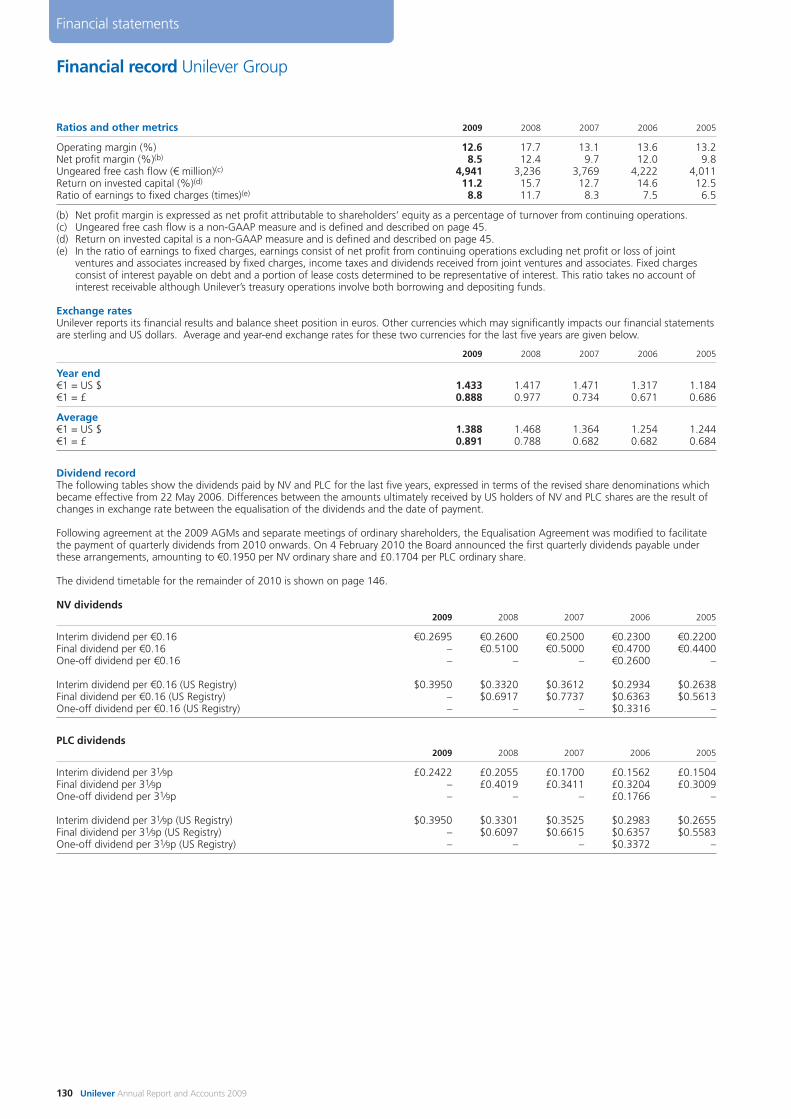
Financial record Unilever Group
130 Unilever Annual Report and Accounts 2009
Financial statements
Ratios and other metrics 2009 2008 2007 2006 2005
Operating margin (%) 12.6 17.7 13.1 13.6 13.2Net profit margin (%)(b) 8.5 12.4 9.7 12.0 9.8Ungeared free cash flow (€ million)(c) 4,941 3,236 3,769 4,222 4,011Return on invested capital (%)(d) 11.2 15.7 12.7 14.6 12.5Ratio of earnings to fixed charges (times)(e) 8.8 11.7 8.3 7.5 6.5
(b) Net profit margin is expressed as net profit attributable to shareholders’ equity as a percentage of turnover from continuing operations.(c) Ungeared free cash flow is a non-GAAP measure and is defined and described on page 45.(d) Return on invested capital is a non-GAAP measure and is defined and described on page 45.(e) In the ratio of earnings to fixed charges, earnings consist of net profit from continuing operations excluding net profit or loss of joint
ventures and associates increased by fixed charges, income taxes and dividends received from joint ventures and associates. Fixed chargesconsist of interest payable on debt and a portion of lease costs determined to be representative of interest. This ratio takes no account ofinterest receivable although Unilever’s treasury operations involve both borrowing and depositing funds.
Exchange rates Unilever reports its financial results and balance sheet position in euros. Other currencies which may significantly impacts our financial statementsare sterling and US dollars. Average and year-end exchange rates for these two currencies for the last five years are given below.
2009 2008 2007 2006 2005
Year end€1 = US $ 1.433 1.417 1.471 1.317 1.184€1 = £ 0.888 0.977 0.734 0.671 0.686
Average€1 = US $ 1.388 1.468 1.364 1.254 1.244€1 = £ 0.891 0.788 0.682 0.682 0.684
Dividend recordThe following tables show the dividends paid by NV and PLC for the last five years, expressed in terms of the revised share denominations whichbecame effective from 22 May 2006. Differences between the amounts ultimately received by US holders of NV and PLC shares are the result ofchanges in exchange rate between the equalisation of the dividends and the date of payment.
Following agreement at the 2009 AGMs and separate meetings of ordinary shareholders, the Equalisation Agreement was modified to facilitatethe payment of quarterly dividends from 2010 onwards. On 4 February 2010 the Board announced the first quarterly dividends payable underthese arrangements, amounting to €0.1950 per NV ordinary share and £0.1704 per PLC ordinary share.
The dividend timetable for the remainder of 2010 is shown on page 146.
NV dividends2009 2008 2007 2006 2005
Interim dividend per €0.16 €0.2695 €0.2600 €0.2500 €0.2300 €0.2200Final dividend per €0.16 – €0.5100 €0.5000 €0.4700 €0.4400One-off dividend per €0.16 – – – €0.2600 –
Interim dividend per €0.16 (US Registry) $0.3950 $0.3320 $0.3612 $0.2934 $0.2638Final dividend per €0.16 (US Registry) – $0.6917 $0.7737 $0.6363 $0.5613One-off dividend per €0.16 (US Registry) – – – $0.3316 –
PLC dividends2009 2008 2007 2006 2005
Interim dividend per 31⁄9p £0.2422 £0.2055 £0.1700 £0.1562 £0.1504Final dividend per 31⁄9p – £0.4019 £0.3411 £0.3204 £0.3009One-off dividend per 31⁄9p – – – £0.1766 –
Interim dividend per 31⁄9p (US Registry) $0.3950 $0.3301 $0.3525 $0.2983 $0.2655Final dividend per 31⁄9p (US Registry) – $0.6097 $0.6615 $0.6357 $0.5583One-off dividend per 31⁄9p (US Registry) – – – $0.3372 –
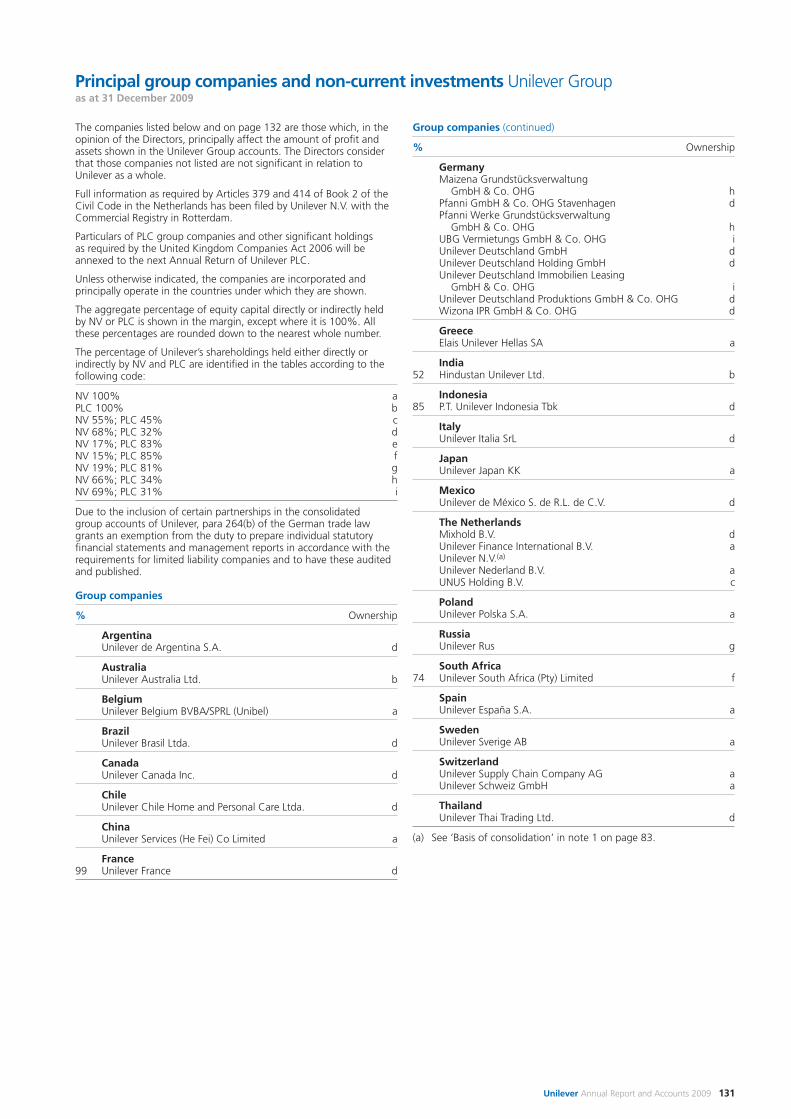
Unilever Annual Report and Accounts 2009 131
The companies listed below and on page 132 are those which, in theopinion of the Directors, principally affect the amount of profit andassets shown in the Unilever Group accounts. The Directors considerthat those companies not listed are not significant in relation toUnilever as a whole.
Full information as required by Articles 379 and 414 of Book 2 of theCivil Code in the Netherlands has been filed by Unilever N.V. with theCommercial Registry in Rotterdam.
Particulars of PLC group companies and other significant holdingsas required by the United Kingdom Companies Act 2006 will beannexed to the next Annual Return of Unilever PLC.
Unless otherwise indicated, the companies are incorporated andprincipally operate in the countries under which they are shown.
The aggregate percentage of equity capital directly or indirectly held by NV or PLC is shown in the margin, except where it is 100%. Allthese percentages are rounded down to the nearest whole number.
The percentage of Unilever’s shareholdings held either directly orindirectly by NV and PLC are identified in the tables according to thefollowing code:
NV 100% aPLC 100% bNV 55%; PLC 45% cNV 68%; PLC 32% dNV 17%; PLC 83% eNV 15%; PLC 85% fNV 19%; PLC 81% gNV 66%; PLC 34% hNV 69%; PLC 31% i
Due to the inclusion of certain partnerships in the consolidatedgroup accounts of Unilever, para 264(b) of the German trade lawgrants an exemption from the duty to prepare individual statutoryfinancial statements and management reports in accordance with therequirements for limited liability companies and to have these auditedand published.
Group companies
% Ownership
ArgentinaUnilever de Argentina S.A. d
AustraliaUnilever Australia Ltd. b
BelgiumUnilever Belgium BVBA/SPRL (Unibel) a
BrazilUnilever Brasil Ltda. d
CanadaUnilever Canada Inc. d
ChileUnilever Chile Home and Personal Care Ltda. d
ChinaUnilever Services (He Fei) Co Limited a
France 99 Unilever France d
Group companies (continued)
% Ownership
GermanyMaizena Grundstücksverwaltung
GmbH & Co. OHG hPfanni GmbH & Co. OHG Stavenhagen dPfanni Werke Grundstücksverwaltung
GmbH & Co. OHG hUBG Vermietungs GmbH & Co. OHG iUnilever Deutschland GmbH dUnilever Deutschland Holding GmbH dUnilever Deutschland Immobilien Leasing
GmbH & Co. OHG iUnilever Deutschland Produktions GmbH & Co. OHG dWizona IPR GmbH & Co. OHG d
GreeceElais Unilever Hellas SA a
India52 Hindustan Unilever Ltd. b
Indonesia85 P.T. Unilever Indonesia Tbk d
ItalyUnilever Italia SrL d
Japan Unilever Japan KK a
MexicoUnilever de México S. de R.L. de C.V. d
The NetherlandsMixhold B.V. dUnilever Finance International B.V. aUnilever N.V.(a)
Unilever Nederland B.V. aUNUS Holding B.V. c
PolandUnilever Polska S.A. a
RussiaUnilever Rus g
South Africa74 Unilever South Africa (Pty) Limited f
Spain Unilever España S.A. a
SwedenUnilever Sverige AB a
Switzerland Unilever Supply Chain Company AG aUnilever Schweiz GmbH a
ThailandUnilever Thai Trading Ltd. d
(a) See ‘Basis of consolidation’ in note 1 on page 83.
Principal group companies and non-current investments Unilever Groupas at 31 December 2009
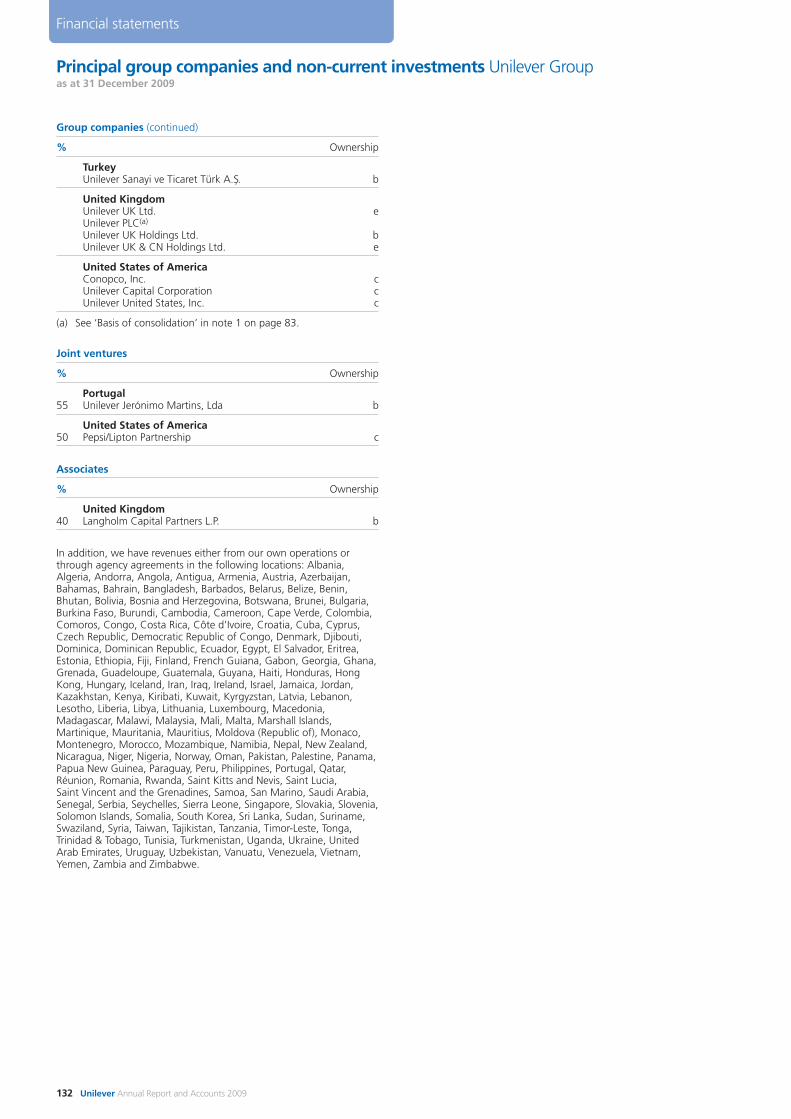
Group companies (continued)
% Ownership
TurkeyUnilever Sanayi ve Ticaret Türk A.S,. b
United Kingdom Unilever UK Ltd. eUnilever PLC(a)
Unilever UK Holdings Ltd. bUnilever UK & CN Holdings Ltd. e
United States of AmericaConopco, Inc. cUnilever Capital Corporation cUnilever United States, Inc. c
(a) See ‘Basis of consolidation’ in note 1 on page 83.
Joint ventures
% Ownership
Portugal55 Unilever Jerónimo Martins, Lda b
United States of America 50 Pepsi/Lipton Partnership c
Associates
% Ownership
United Kingdom40 Langholm Capital Partners L.P. b
In addition, we have revenues either from our own operations orthrough agency agreements in the following locations: Albania,Algeria, Andorra, Angola, Antigua, Armenia, Austria, Azerbaijan,Bahamas, Bahrain, Bangladesh, Barbados, Belarus, Belize, Benin,Bhutan, Bolivia, Bosnia and Herzegovina, Botswana, Brunei, Bulgaria,Burkina Faso, Burundi, Cambodia, Cameroon, Cape Verde, Colombia,Comoros, Congo, Costa Rica, Côte d’Ivoire, Croatia, Cuba, Cyprus,Czech Republic, Democratic Republic of Congo, Denmark, Djibouti,Dominica, Dominican Republic, Ecuador, Egypt, El Salvador, Eritrea,Estonia, Ethiopia, Fiji, Finland, French Guiana, Gabon, Georgia, Ghana,Grenada, Guadeloupe, Guatemala, Guyana, Haiti, Honduras, HongKong, Hungary, Iceland, Iran, Iraq, Ireland, Israel, Jamaica, Jordan,Kazakhstan, Kenya, Kiribati, Kuwait, Kyrgyzstan, Latvia, Lebanon,Lesotho, Liberia, Libya, Lithuania, Luxembourg, Macedonia,Madagascar, Malawi, Malaysia, Mali, Malta, Marshall Islands,Martinique, Mauritania, Mauritius, Moldova (Republic of), Monaco,Montenegro, Morocco, Mozambique, Namibia, Nepal, New Zealand,Nicaragua, Niger, Nigeria, Norway, Oman, Pakistan, Palestine, Panama, Papua New Guinea, Paraguay, Peru, Philippines, Portugal, Qatar,Réunion, Romania, Rwanda, Saint Kitts and Nevis, Saint Lucia, Saint Vincent and the Grenadines, Samoa, San Marino, Saudi Arabia,Senegal, Serbia, Seychelles, Sierra Leone, Singapore, Slovakia, Slovenia,Solomon Islands, Somalia, South Korea, Sri Lanka, Sudan, Suriname,Swaziland, Syria, Taiwan, Tajikistan, Tanzania, Timor-Leste, Tonga,Trinidad & Tobago, Tunisia, Turkmenistan, Uganda, Ukraine, UnitedArab Emirates, Uruguay, Uzbekistan, Vanuatu, Venezuela, Vietnam,Yemen, Zambia and Zimbabwe.
Principal group companies and non-current investments Unilever Groupas at 31 December 2009
132 Unilever Annual Report and Accounts 2009
Financial statements
Unilever Annual Report and Accounts 2009 133
Independent auditor’s report to the shareholders of UnileverN.V.
Report on the company accountsWe have audited the company accounts which are part of theAnnual Report 2009 of Unilever N.V., Rotterdam, for the yearended 31 December 2009 which comprise the balance sheet, profitand loss account and the related notes on pages 134 to 136.
We have reported separately on the consolidated accounts of theUnilever Group for the year ended 31 December 2009.
Directors’ responsibilityThe Directors are responsible for the preparation and fairpresentation of the company accounts in accordance with UnitedKingdom accounting standards and with Part 9 of Book 2 of theNetherlands Civil Code, and for the preparation of the Report of the Directors in accordance with Part 9 of Book 2 of theNetherlands Civil Code. This responsibility includes: designing,implementing and maintaining internal control relevant to thepreparation and fair presentation of the company accounts thatare free from material misstatement, whether due to fraud orerror; selecting and applying appropriate accounting policies; and making accounting estimates that are reasonable in the circumstances.
Auditor’s responsibilityOur responsibility is to express an opinion on the companyaccounts based on our audit. We conducted our audit inaccordance with Dutch law. This law requires that we comply with ethical requirements and plan and perform the audit toobtain reasonable assurance whether the company accounts are free from material misstatement.
An audit involves performing procedures to obtain audit evidenceabout the amounts and disclosures in the company accounts.
The procedures selected depend on the auditor’s judgement,including the assessment of the risks of material misstatement ofthe company accounts, whether due to fraud or error. In makingthose risk assessments, the auditor considers internal controlrelevant to the entity’s preparation and fair presentation of thecompany accounts in order to design audit procedures that areappropriate in the circumstances, but not for the purpose ofexpressing an opinion on the effectiveness of the entity’s internalcontrol. An audit also includes evaluating the appropriateness ofaccounting policies used and the reasonableness of accountingestimates made by the Directors, as well as evaluating the overallpresentation of the company accounts.
We believe that the audit evidence we have obtained is sufficientand appropriate to provide a basis for our audit opinion.
OpinionIn our opinion, the company accounts give a true and fair view of the financial position of Unilever N.V. as at 31 December 2009,and of its result for the year then ended in accordance with UnitedKingdom accounting standards and with Part 9 of Book 2 of theNetherlands Civil Code.
Report on other legal and regulatory requirements Pursuant to the legal requirement under 2:393 sub 5 part f of the Netherlands Civil Code, we report, to the extent of our competence, that the Report of the Directors is consistent withthe company accounts as required by 2:391 sub 4 of the Netherlands Civil Code.
Rotterdam, The Netherlands, 2 March 2010PricewaterhouseCoopers Accountants N.V.
R A J Swaak RA
Company accounts Auditor’s report – Unilever N.V.
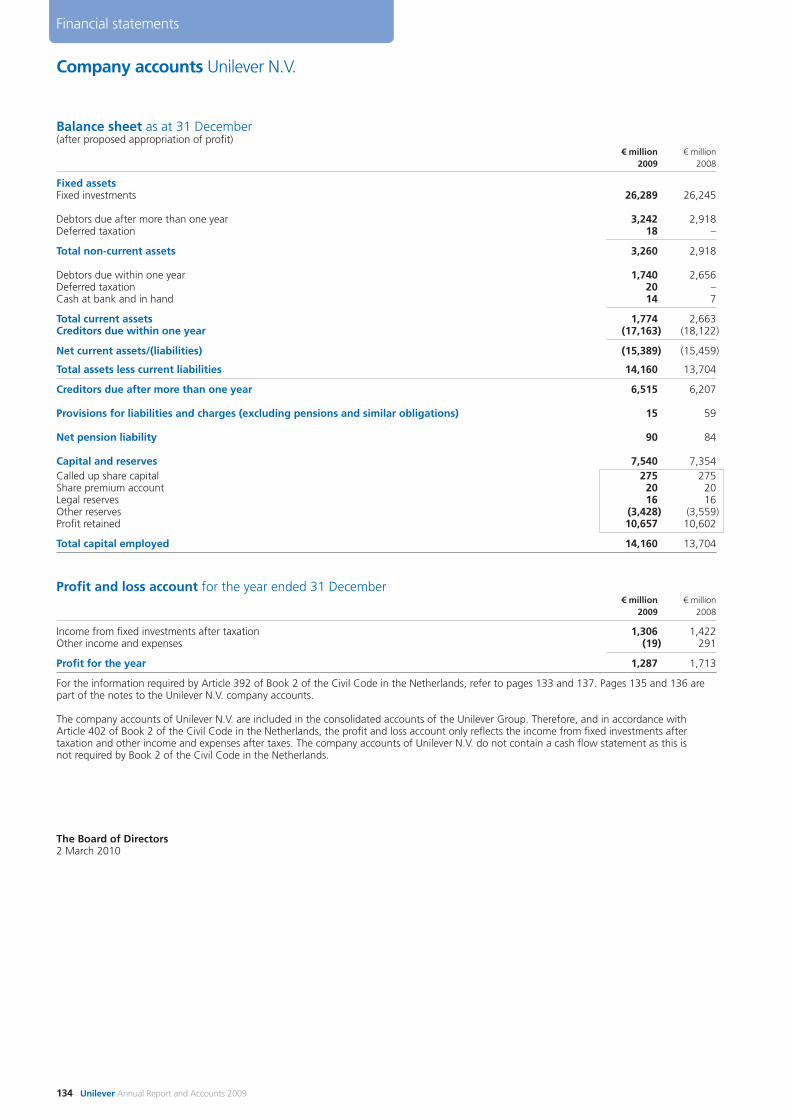
Company accounts Unilever N.V.
134 Unilever Annual Report and Accounts 2009
Financial statements
Balance sheet as at 31 December(after proposed appropriation of profit)
€ million € million2009 2008
Fixed assetsFixed investments 26,289 26,245
Debtors due after more than one year 3,242 2,918Deferred taxation 18 –
Total non-current assets 3,260 2,918
Debtors due within one year 1,740 2,656Deferred taxation 20 –Cash at bank and in hand 14 7
Total current assets 1,774 2,663Creditors due within one year (17,163) (18,122)
Net current assets/(liabilities) (15,389) (15,459)
Total assets less current liabilities 14,160 13,704
Creditors due after more than one year 6,515 6,207
Provisions for liabilities and charges (excluding pensions and similar obligations) 15 59
Net pension liability 90 84
Capital and reserves 7,540 7,354Called up share capital 275 275Share premium account 20 20Legal reserves 16 16Other reserves (3,428) (3,559)Profit retained 10,657 10,602
Total capital employed 14,160 13,704
Profit and loss account for the year ended 31 December€ million € million
2009 2008
Income from fixed investments after taxation 1,306 1,422Other income and expenses (19) 291
Profit for the year 1,287 1,713
For the information required by Article 392 of Book 2 of the Civil Code in the Netherlands, refer to pages 133 and 137. Pages 135 and 136 arepart of the notes to the Unilever N.V. company accounts.
The company accounts of Unilever N.V. are included in the consolidated accounts of the Unilever Group. Therefore, and in accordance withArticle 402 of Book 2 of the Civil Code in the Netherlands, the profit and loss account only reflects the income from fixed investments aftertaxation and other income and expenses after taxes. The company accounts of Unilever N.V. do not contain a cash flow statement as this isnot required by Book 2 of the Civil Code in the Netherlands.
The Board of Directors2 March 2010
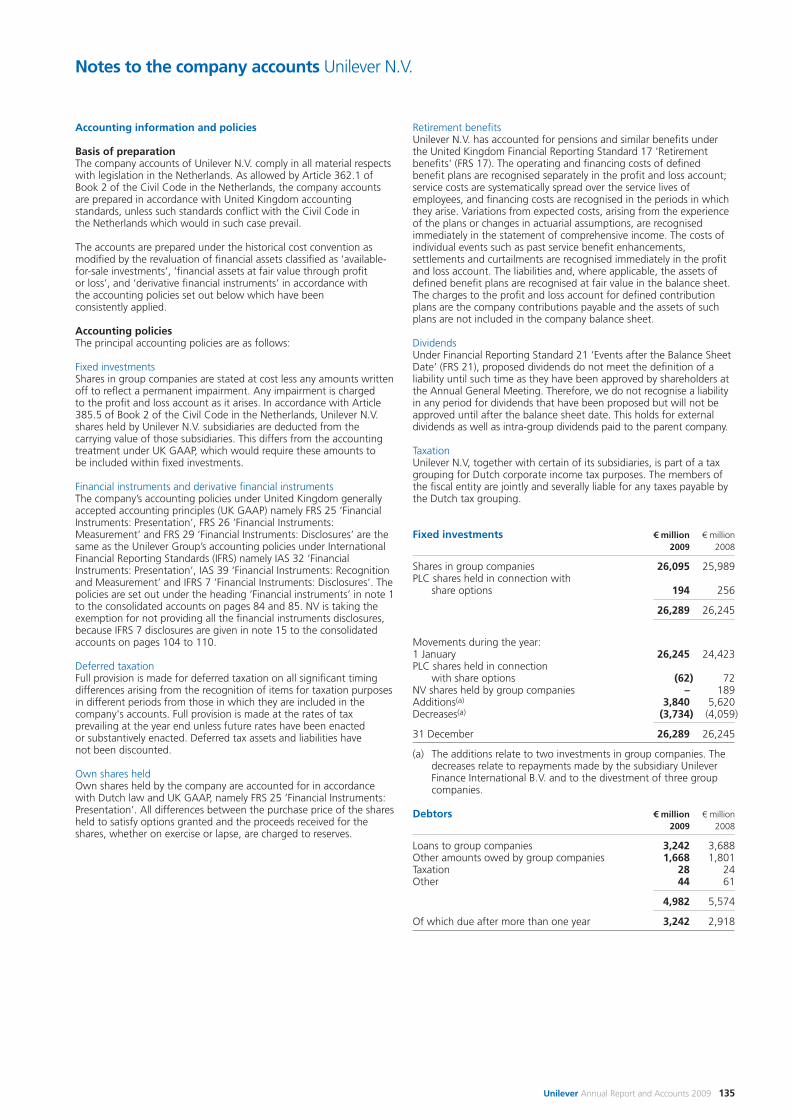
Unilever Annual Report and Accounts 2009 135
Notes to the company accounts Unilever N.V.
Accounting information and policies
Basis of preparationThe company accounts of Unilever N.V. comply in all material respectswith legislation in the Netherlands. As allowed by Article 362.1 ofBook 2 of the Civil Code in the Netherlands, the company accountsare prepared in accordance with United Kingdom accountingstandards, unless such standards conflict with the Civil Code in the Netherlands which would in such case prevail.
The accounts are prepared under the historical cost convention asmodified by the revaluation of financial assets classified as ‘available-for-sale investments’, ‘financial assets at fair value through profit or loss’, and ‘derivative financial instruments’ in accordance withthe accounting policies set out below which have been consistently applied.
Accounting policiesThe principal accounting policies are as follows:
Fixed investmentsShares in group companies are stated at cost less any amounts writtenoff to reflect a permanent impairment. Any impairment is charged to the profit and loss account as it arises. In accordance with Article385.5 of Book 2 of the Civil Code in the Netherlands, Unilever N.V.shares held by Unilever N.V. subsidiaries are deducted from thecarrying value of those subsidiaries. This differs from the accountingtreatment under UK GAAP, which would require these amounts tobe included within fixed investments.
Financial instruments and derivative financial instrumentsThe company’s accounting policies under United Kingdom generallyaccepted accounting principles (UK GAAP) namely FRS 25 ‘FinancialInstruments: Presentation’, FRS 26 ‘Financial Instruments:Measurement’ and FRS 29 ‘Financial Instruments: Disclosures’ are thesame as the Unilever Group’s accounting policies under InternationalFinancial Reporting Standards (IFRS) namely IAS 32 ‘FinancialInstruments: Presentation’, IAS 39 ‘Financial Instruments: Recognitionand Measurement’ and IFRS 7 ‘Financial Instruments: Disclosures’. Thepolicies are set out under the heading ‘Financial instruments’ in note 1to the consolidated accounts on pages 84 and 85. NV is taking theexemption for not providing all the financial instruments disclosures,because IFRS 7 disclosures are given in note 15 to the consolidatedaccounts on pages 104 to 110.
Deferred taxationFull provision is made for deferred taxation on all significant timingdifferences arising from the recognition of items for taxation purposesin different periods from those in which they are included in thecompany's accounts. Full provision is made at the rates of taxprevailing at the year end unless future rates have been enacted or substantively enacted. Deferred tax assets and liabilities have not been discounted.
Own shares held Own shares held by the company are accounted for in accordancewith Dutch law and UK GAAP, namely FRS 25 ‘Financial Instruments:Presentation’. All differences between the purchase price of the sharesheld to satisfy options granted and the proceeds received for theshares, whether on exercise or lapse, are charged to reserves.
Retirement benefitsUnilever N.V. has accounted for pensions and similar benefits underthe United Kingdom Financial Reporting Standard 17 'Retirementbenefits' (FRS 17). The operating and financing costs of definedbenefit plans are recognised separately in the profit and loss account;service costs are systematically spread over the service lives ofemployees, and financing costs are recognised in the periods in whichthey arise. Variations from expected costs, arising from the experienceof the plans or changes in actuarial assumptions, are recognisedimmediately in the statement of comprehensive income. The costs ofindividual events such as past service benefit enhancements,settlements and curtailments are recognised immediately in the profitand loss account. The liabilities and, where applicable, the assets ofdefined benefit plans are recognised at fair value in the balance sheet.The charges to the profit and loss account for defined contributionplans are the company contributions payable and the assets of suchplans are not included in the company balance sheet.
DividendsUnder Financial Reporting Standard 21 ‘Events after the Balance SheetDate’ (FRS 21), proposed dividends do not meet the definition of aliability until such time as they have been approved by shareholders atthe Annual General Meeting. Therefore, we do not recognise a liabilityin any period for dividends that have been proposed but will not beapproved until after the balance sheet date. This holds for externaldividends as well as intra-group dividends paid to the parent company.
TaxationUnilever N.V, together with certain of its subsidiaries, is part of a taxgrouping for Dutch corporate income tax purposes. The members ofthe fiscal entity are jointly and severally liable for any taxes payable bythe Dutch tax grouping.
Fixed investments € million € million2009 2008
Shares in group companies 26,095 25,989PLC shares held in connection with
share options 194 256
26,289 26,245
Movements during the year:1 January 26,245 24,423PLC shares held in connection
with share options (62) 72NV shares held by group companies – 189Additions(a) 3,840 5,620Decreases(a) (3,734) (4,059)
31 December 26,289 26,245
(a) The additions relate to two investments in group companies. Thedecreases relate to repayments made by the subsidiary UnileverFinance International B.V. and to the divestment of three groupcompanies.
Debtors € million € million2009 2008
Loans to group companies 3,242 3,688Other amounts owed by group companies 1,668 1,801Taxation 28 24Other 44 61
4,982 5,574
Of which due after more than one year 3,242 2,918
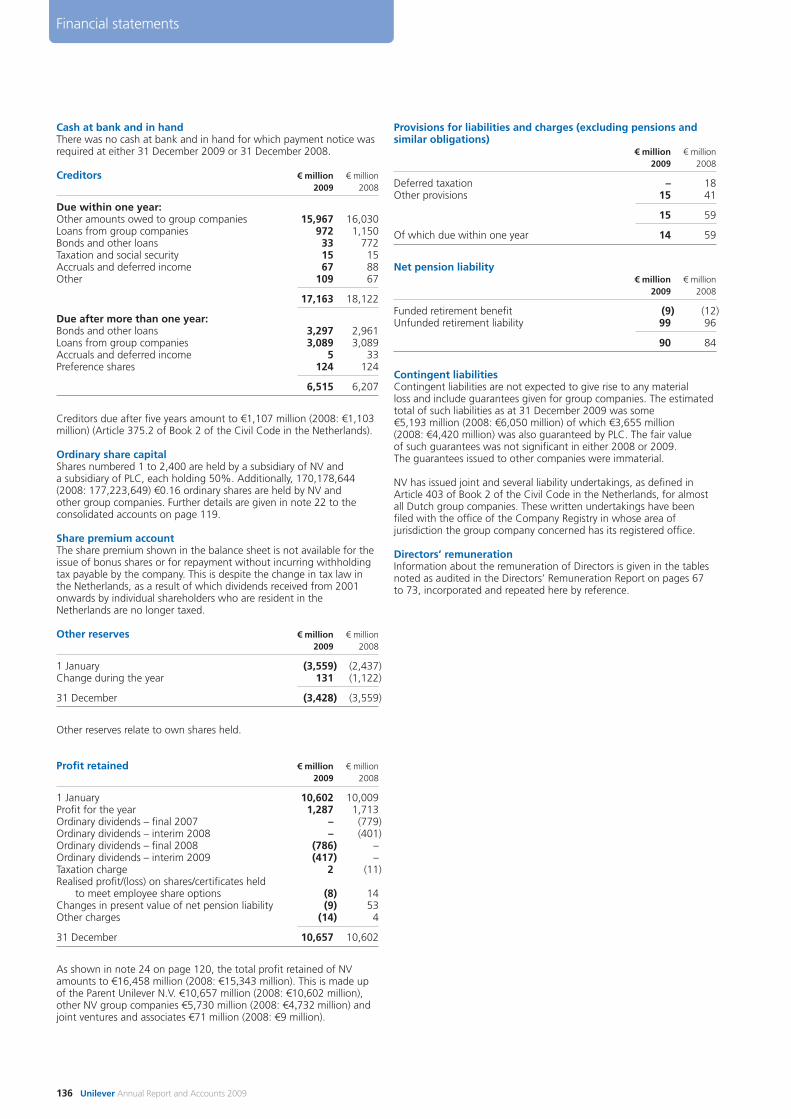
136 Unilever Annual Report and Accounts 2009
Financial statements
Cash at bank and in handThere was no cash at bank and in hand for which payment notice wasrequired at either 31 December 2009 or 31 December 2008.
Creditors € million € million2009 2008
Due within one year:Other amounts owed to group companies 15,967 16,030Loans from group companies 972 1,150Bonds and other loans 33 772Taxation and social security 15 15Accruals and deferred income 67 88Other 109 67
17,163 18,122
Due after more than one year:Bonds and other loans 3,297 2,961Loans from group companies 3,089 3,089Accruals and deferred income 5 33Preference shares 124 124
6,515 6,207
Creditors due after five years amount to €1,107 million (2008: €1,103million) (Article 375.2 of Book 2 of the Civil Code in the Netherlands).
Ordinary share capitalShares numbered 1 to 2,400 are held by a subsidiary of NV anda subsidiary of PLC, each holding 50%. Additionally, 170,178,644(2008: 177,223,649) €0.16 ordinary shares are held by NV andother group companies. Further details are given in note 22 to theconsolidated accounts on page 119.
Share premium accountThe share premium shown in the balance sheet is not available for theissue of bonus shares or for repayment without incurring withholdingtax payable by the company. This is despite the change in tax law inthe Netherlands, as a result of which dividends received from 2001onwards by individual shareholders who are resident in theNetherlands are no longer taxed.
Other reserves € million € million2009 2008
1 January (3,559) (2,437)Change during the year 131 (1,122)
31 December (3,428) (3,559)
Other reserves relate to own shares held.
Profit retained € million € million2009 2008
1 January 10,602 10,009Profit for the year 1,287 1,713Ordinary dividends – final 2007 – (779)Ordinary dividends – interim 2008 – (401)Ordinary dividends – final 2008 (786) –Ordinary dividends – interim 2009 (417) –Taxation charge 2 (11)Realised profit/(loss) on shares/certificates held
to meet employee share options (8) 14Changes in present value of net pension liability (9) 53Other charges (14) 4
31 December 10,657 10,602
As shown in note 24 on page 120, the total profit retained of NVamounts to €16,458 million (2008: €15,343 million). This is made upof the Parent Unilever N.V. €10,657 million (2008: €10,602 million),other NV group companies €5,730 million (2008: €4,732 million) andjoint ventures and associates €71 million (2008: €9 million).
Provisions for liabilities and charges (excluding pensions andsimilar obligations)
€ million € million2009 2008
Deferred taxation – 18Other provisions 15 41
15 59
Of which due within one year 14 59
Net pension liability € million € million
2009 2008
Funded retirement benefit (9) (12)Unfunded retirement liability 99 96
90 84
Contingent liabilitiesContingent liabilities are not expected to give rise to any material loss and include guarantees given for group companies. The estimatedtotal of such liabilities as at 31 December 2009 was some€5,193 million (2008: €6,050 million) of which €3,655 million(2008: €4,420 million) was also guaranteed by PLC. The fair value of such guarantees was not significant in either 2008 or 2009. The guarantees issued to other companies were immaterial.
NV has issued joint and several liability undertakings, as defined inArticle 403 of Book 2 of the Civil Code in the Netherlands, for almostall Dutch group companies. These written undertakings have beenfiled with the office of the Company Registry in whose area ofjurisdiction the group company concerned has its registered office.
Directors’ remunerationInformation about the remuneration of Directors is given in the tablesnoted as audited in the Directors’ Remuneration Report on pages 67to 73, incorporated and repeated here by reference.
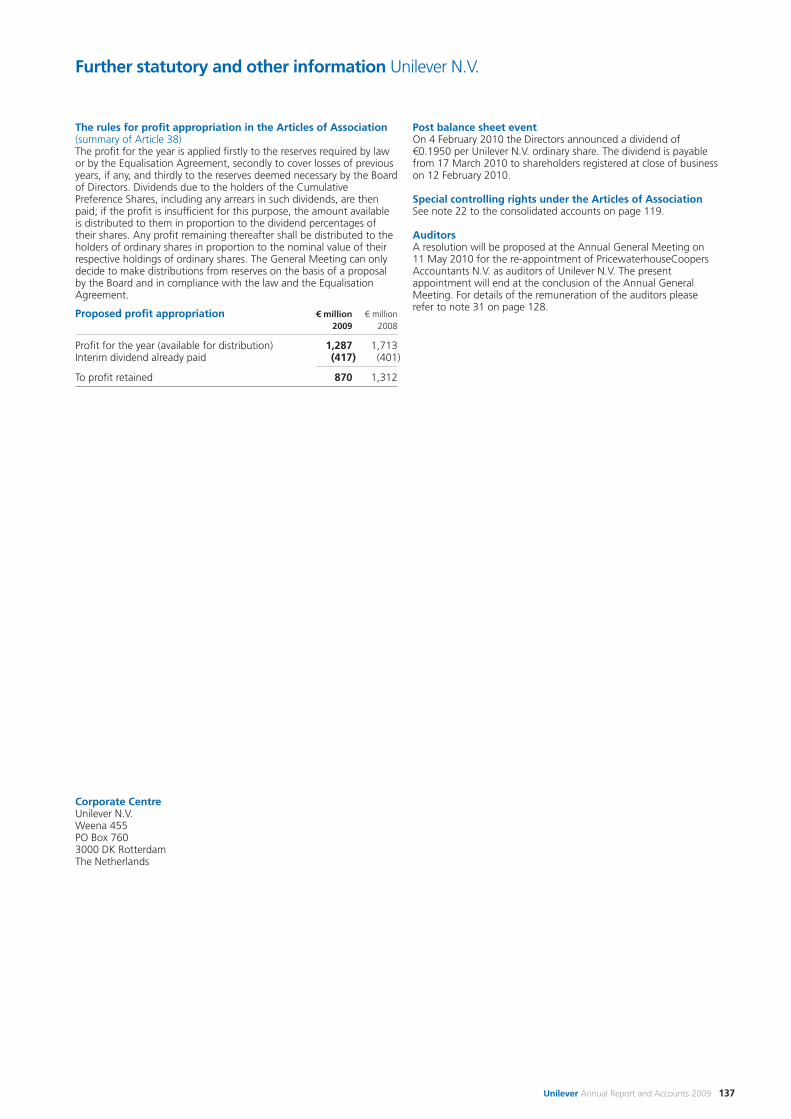
Unilever Annual Report and Accounts 2009 137
Further statutory and other information Unilever N.V.
The rules for profit appropriation in the Articles of Association(summary of Article 38)The profit for the year is applied firstly to the reserves required by lawor by the Equalisation Agreement, secondly to cover losses of previousyears, if any, and thirdly to the reserves deemed necessary by the Boardof Directors. Dividends due to the holders of the CumulativePreference Shares, including any arrears in such dividends, are thenpaid; if the profit is insufficient for this purpose, the amount availableis distributed to them in proportion to the dividend percentages oftheir shares. Any profit remaining thereafter shall be distributed to theholders of ordinary shares in proportion to the nominal value of theirrespective holdings of ordinary shares. The General Meeting can onlydecide to make distributions from reserves on the basis of a proposalby the Board and in compliance with the law and the EqualisationAgreement.
Proposed profit appropriation € million € million2009 2008
Profit for the year (available for distribution) 1,287 1,713Interim dividend already paid (417) (401)
To profit retained 870 1,312
Post balance sheet eventOn 4 February 2010 the Directors announced a dividend of€0.1950 per Unilever N.V. ordinary share. The dividend is payablefrom 17 March 2010 to shareholders registered at close of businesson 12 February 2010.
Special controlling rights under the Articles of AssociationSee note 22 to the consolidated accounts on page 119.
AuditorsA resolution will be proposed at the Annual General Meeting on11 May 2010 for the re-appointment of PricewaterhouseCoopersAccountants N.V. as auditors of Unilever N.V. The presentappointment will end at the conclusion of the Annual GeneralMeeting. For details of the remuneration of the auditors pleaserefer to note 31 on page 128.
Corporate CentreUnilever N.V.Weena 455PO Box 7603000 DK RotterdamThe Netherlands
138 Unilever Annual Report and Accounts 2009
Financial statements
Company accounts Auditors’ report – Unilever PLC
Independent auditors’ report to the members of UnileverPLC on the parent company accountsWe have audited the parent company accounts of Unilever PLC forthe year ended 31 December 2009 which comprise the balancesheet and the related notes. The financial reporting frameworkthat has been applied in their preparation is applicable law andUnited Kingdom Accounting Standards (United Kingdom GenerallyAccepted Accounting Practice).
Respective responsibilities of Directors and auditorsAs explained more fully in the Statement of Directors’Responsibilities on page 76, the Directors are responsible for thepreparation of the parent company accounts and for beingsatisfied that they give a true and fair view. Our responsibility is toaudit the parent company accounts in accordance with applicablelaw and International Standards on Auditing (UK and Ireland).Those standards require us to comply with the Auditing PracticesBoard’s Ethical Standards for Auditors.
This report, including the opinions, has been prepared for and onlyfor the shareholders of Unilever PLC as a body in accordance withChapter 3 of Part 16 of the Companies Act 2006 and for no otherpurpose. We do not, in giving these opinions, accept or assumeresponsibility for any other purpose or to any other person towhom this report is shown or into whose hands it may come savewhere expressly agreed by our prior consent in writing.
Scope of the audit of the accountsAn audit involves obtaining evidence about the amounts anddisclosures in the accounts sufficient to give reasonable assurancethat the accounts are free from material misstatement, whethercaused by fraud or error. This includes an assessment of: whetherthe accounting policies are appropriate to the parent company’scircumstances and have been consistently applied and adequatelydisclosed; the reasonableness of significant accounting estimatesmade by the directors; and the overall presentation of theaccounts.
Opinion on accountsIn our opinion the parent company accounts:
• give a true and fair view of the state of the company’s affairs asat 31 December 2009;
• have been properly prepared in accordance with UnitedKingdom Generally Accepted Accounting Practice; and
• have been prepared in accordance with the Companies Act2006.
Opinion on other matters prescribed by the Companies Act2006In our opinion:
• the part of the Directors’ Remuneration Report to be auditedhas been properly prepared in accordance with the CompaniesAct 2006; and
• the information given in the Report of the Directors for thefinancial year for which the parent company accounts areprepared is consistent with the parent company accounts.
Matters on which we are required to report by exceptionWe have nothing to report in respect of the following matterswhere the Companies Act 2006 requires us to report to you if, inour opinion:
• adequate accounting records have not been kept by the parentcompany, or returns adequate for our audit have not beenreceived from branches not visited by us; or
• the parent company accounts and the part of the Directors’Remuneration Report to be audited are not in agreement withthe accounting records and returns; or
• certain disclosures of directors’ remuneration specified by laware not made; or
• we have not received all the information and explanations werequire for our audit.
Other matterWe have reported separately on the consolidated financialstatements of Unilever Group for the year ended 31 December2009.
Richard Sexton (Senior Statutory Auditor)For and on behalf of PricewaterhouseCoopers LLPChartered Accountants and Statutory AuditorsLondon, United Kingdom2 March 2010
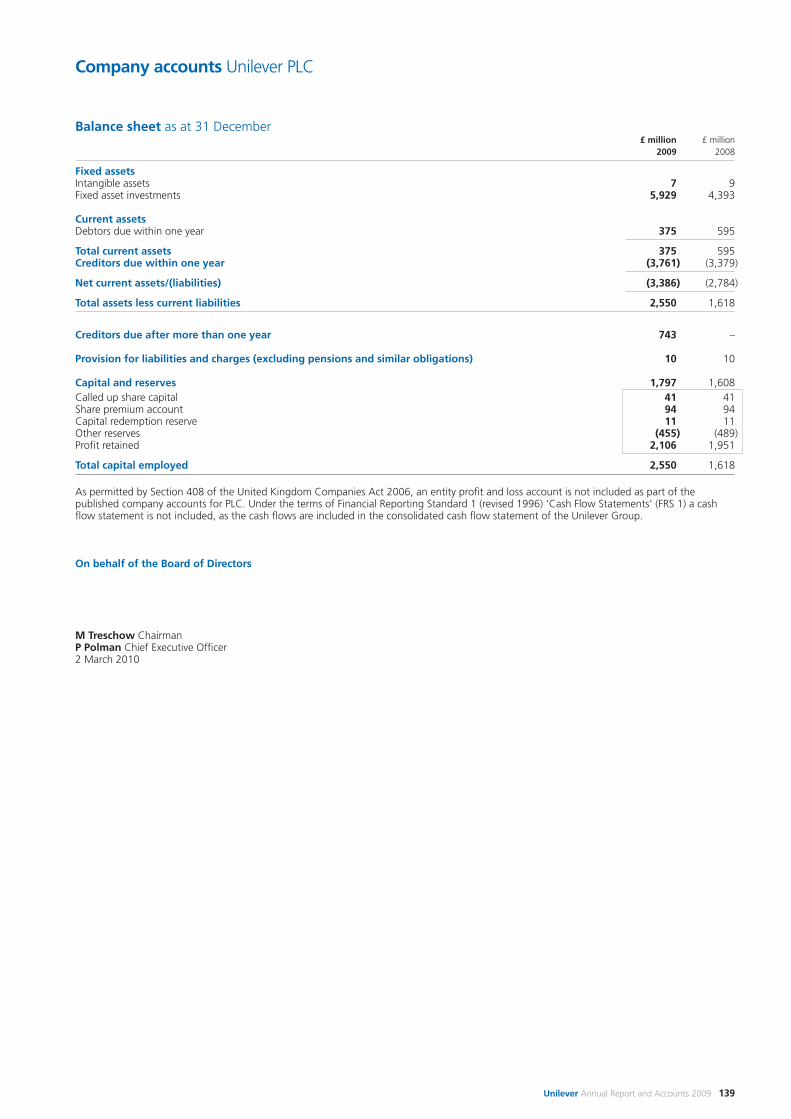
Unilever Annual Report and Accounts 2009 139
Company accounts Unilever PLC
Balance sheet as at 31 December£ million £ million
2009 2008
Fixed assetsIntangible assets 7 9Fixed asset investments 5,929 4,393
Current assetsDebtors due within one year 375 595
Total current assets 375 595Creditors due within one year (3,761) (3,379)
Net current assets/(liabilities) (3,386) (2,784)
Total assets less current liabilities 2,550 1,618
Creditors due after more than one year 743 –
Provision for liabilities and charges (excluding pensions and similar obligations) 10 10
Capital and reserves 1,797 1,608Called up share capital 41 41Share premium account 94 94Capital redemption reserve 11 11Other reserves (455) (489)Profit retained 2,106 1,951
Total capital employed 2,550 1,618
As permitted by Section 408 of the United Kingdom Companies Act 2006, an entity profit and loss account is not included as part of thepublished company accounts for PLC. Under the terms of Financial Reporting Standard 1 (revised 1996) ‘Cash Flow Statements’ (FRS 1) a cashflow statement is not included, as the cash flows are included in the consolidated cash flow statement of the Unilever Group.
On behalf of the Board of Directors
M Treschow ChairmanP Polman Chief Executive Officer2 March 2010
140 Unilever Annual Report and Accounts 2009
Financial statements
Notes to the company accounts Unilever PLC
Accounting information and policies
Basis of preparationThe accounts have been prepared in accordance with applicableUnited Kingdom accounting standards and the United KingdomCompanies Act 2006.
The accounts are prepared under the historical cost convention asmodified by the revaluation of financial assets classified as ‘available-for-sale investments’, ‘financial assets at fair value through profit or loss’,and ‘derivative financial instruments’ in accordance with the accountingpolicies set out below which have been consistently applied.
Accounting policiesThe principal accounting policies are as follows:
Intangible assetsIntangible assets comprise trademarks purchased after 1 January 1998and are amortised in the profit and loss account over their expecteduseful lives of up to a maximum of 20 years. They are subject to reviewfor impairment in accordance with United Kingdom FinancialReporting Standard 11 ‘Impairment of Fixed Assets and Goodwill’ (FRS 11). Any impairment is charged to the profit and loss account as it arises.
Fixed asset investmentsShares in group companies are stated at cost less any amounts writtenoff to reflect a permanent impairment. Any impairment is charged tothe profit and loss account as it arises.
Financial instruments The company’s accounting policies under United Kingdom generallyaccepted accounting principles (UK GAAP) namely FRS 25 ‘FinancialInstruments: Presentation’, FRS 26 ‘Financial Instruments:Measurement’ and FRS 29 ‘Financial Instruments: Disclosures’ are thesame as the Unilever Group’s accounting policies under InternationalFinancial Reporting Standards (IFRS) namely IAS 32 ‘FinancialInstruments: Presentation’, IAS 39 ‘Financial Instruments: Recognitionand Measurement’ and IFRS 7 ‘Financial Instruments: Disclosures’. Thepolicies are set out under the heading ‘Financial instruments’ in note 1to the consolidated accounts on pages 84 and 85. PLC is taking theexemption for not providing all the financial instruments disclosures,because IFRS 7 disclosures are given in note 15 to the consolidatedaccounts on pages 104 to 110.
Deferred taxationFull provision is made for deferred taxation on all significant timingdifferences arising from the recognition of items for taxation purposesin different periods from those in which they are included in thecompany’s accounts. Full provision is made at the rates of taxprevailing at the year end unless future rates have been enacted or substantively enacted. Deferred tax assets and liabilities have notbeen discounted.
Shares held by employee share trustsShares held to satisfy options are accounted for in accordance with UKGAAP, namely FRS 25 ‘Financial Instruments: Presentation’, FRS 20‘Share Based Payments’ and Urgent Issues Task Force abstract 38‘Accounting for ESOP Trusts’ (UITF 38). All differences between thepurchase price of the shares held to satisfy options granted and theproceeds received for the shares, whether on exercise or lapse, arecharged to other reserves.
DividendsUnder Financial Reporting Standard 21 ‘Events after the Balance SheetDate’ (FRS 21), proposed dividends do not meet the definition of aliability until such time as they have been approved by shareholders at the Annual General Meeting. Therefore, we do not recognise aliability in any period for dividends that have been proposed but willnot be approved until after the balance sheet date. This holds forexternal dividends as well as intra-group dividends paid to the parentcompany.
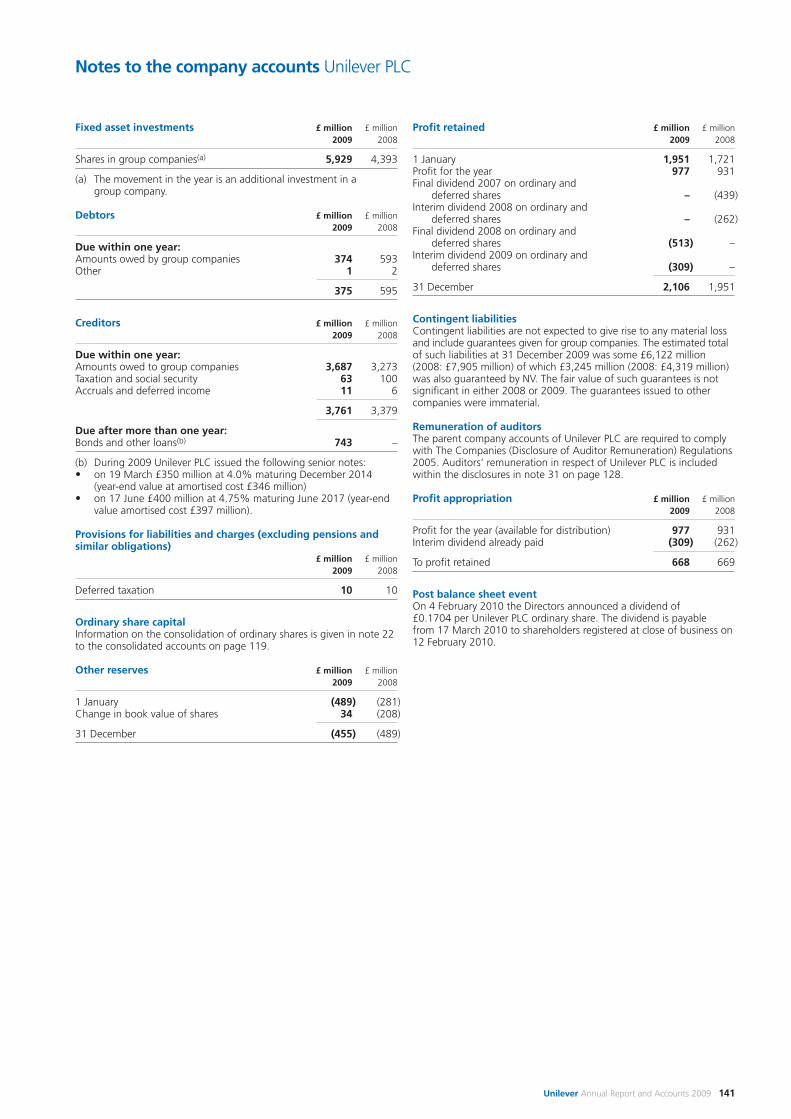
Unilever Annual Report and Accounts 2009 141
Notes to the company accounts Unilever PLC
Fixed asset investments £ million £ million2009 2008
Shares in group companies(a) 5,929 4,393
(a) The movement in the year is an additional investment in a group company.
Debtors £ million £ million2009 2008
Due within one year:Amounts owed by group companies 374 593Other 1 2
375 595
Creditors £ million £ million2009 2008
Due within one year:Amounts owed to group companies 3,687 3,273Taxation and social security 63 100Accruals and deferred income 11 6
3,761 3,379
Due after more than one year:Bonds and other loans(b) 743 –
(b) During 2009 Unilever PLC issued the following senior notes:• on 19 March £350 million at 4.0% maturing December 2014
(year-end value at amortised cost £346 million)• on 17 June £400 million at 4.75% maturing June 2017 (year-end
value amortised cost £397 million).
Provisions for liabilities and charges (excluding pensions andsimilar obligations)
£ million £ million2009 2008
Deferred taxation 10 10
Ordinary share capitalInformation on the consolidation of ordinary shares is given in note 22to the consolidated accounts on page 119.
Other reserves £ million £ million2009 2008
1 January (489) (281)Change in book value of shares 34 (208)
31 December (455) (489)
Profit retained £ million £ million2009 2008
1 January 1,951 1,721Profit for the year 977 931Final dividend 2007 on ordinary and
deferred shares – (439)Interim dividend 2008 on ordinary and
deferred shares – (262)Final dividend 2008 on ordinary and
deferred shares (513) –Interim dividend 2009 on ordinary and
deferred shares (309) –
31 December 2,106 1,951
Contingent liabilitiesContingent liabilities are not expected to give rise to any material lossand include guarantees given for group companies. The estimated totalof such liabilities at 31 December 2009 was some £6,122 million (2008: £7,905 million) of which £3,245 million (2008: £4,319 million) was also guaranteed by NV. The fair value of such guarantees is notsignificant in either 2008 or 2009. The guarantees issued to othercompanies were immaterial.
Remuneration of auditorsThe parent company accounts of Unilever PLC are required to complywith The Companies (Disclosure of Auditor Remuneration) Regulations2005. Auditors’ remuneration in respect of Unilever PLC is includedwithin the disclosures in note 31 on page 128.
Profit appropriation £ million £ million2009 2008
Profit for the year (available for distribution) 977 931Interim dividend already paid (309) (262)
To profit retained 668 669
Post balance sheet eventOn 4 February 2010 the Directors announced a dividend of £0.1704 per Unilever PLC ordinary share. The dividend is payable from 17 March 2010 to shareholders registered at close of business on12 February 2010.
142 Unilever Annual Report and Accounts 2009
Financial statements
Further statutory and other information Unilever PLC
Directors’ Report of PLC and limitations of liabilityFor the purposes of the Companies Act 2006, the Directors’Report of Unilever PLC for the year ended 31 December 2009comprises this and the following page and the informationcontained in the Report of the Directors on pages 2 to 62 whichincludes the Company’s position on environment and corporateresponsibility matters, the Directors’ Remuneration Report inrespect of Directors’ interests in shares or debentures of the Groupon pages 72 and 73, Dividends on page 93, Principal groupcompanies and non-current investments on pages 131 and 132,Significant shareholders of PLC as disclosed on page 144, andFinancial instruments and Treasury risk management on page 104.The information required to be given pursuant to Section 992 ofthe UK Companies Act 2006 is covered elsewhere in this AnnualReport.
The Directors’ Report has been drawn up and presented inaccordance with and in reliance upon English company law andliabilities of the Directors in connection with that report shall besubject to the limitations and restrictions provided by such law.
Under the Companies Act 2006, a safe harbour limits the liabilityof Directors in respect of statements in and omissions from theDirectors’ Report. Under English Law the Directors would be liableto Unilever (but not to any third party) if the Directors’ Reportcontains errors as a result of recklessness or knowing misstatementor dishonest concealment of a material fact, but would nototherwise be liable.
Business reviewThe UK Companies Act 2006 requires Unilever PLC to set out inthis report a fair review of the business of the Group during thefinancial year ended 31 December 2009 including a descriptionof the principal risks and uncertainties facing the Group and ananalysis of the position of the Group’s business at the end of thefinancial year, known as a ‘Business review’.
The information that fulfils the current Business reviewrequirements can be found on the following pages of this AnnualReport which are incorporated into this report by reference:
• a description of the principal risks and uncertainties facing theGroup see pages 30 to 34;
• the development and performance of the Group’s businessduring the year see pages 37 to 46;
• the position of the Group’s business at the end of the year seepages 40 and 81;
• key performance indicators see page 25 and 26;• other key indicators see pages 25 and 26;• main trends and factors likely to affect the future development,
performance and position of the Group see page 30;• environmental matters and policy, including the impact of the
Group’s business on the environment see pages 20 to 21;• employee matters and policy see pages 14 to 15, 28 and also
below; and• a statement that the Directors do not believe that there are any
contracts or other arrangements which are essential to thebusiness of the Group is given on page 59.
Employee involvement and communicationUnilever’s UK companies maintain formal processes to inform,consult and involve employees and their representatives. Werecognise collective bargaining on a number of sites and engagewith employees via the Sourcing Unit Forum including officer
representation from the three recognised trade unions. Our sitesuse tools such as Total Productive Maintenance which rely heavilyon employee involvement, contribution and commitment.
A National Consultative Council covering employees andmanagement representatives exists to provide a forum fordiscussing issues relating to the United Kingdom. A EuropeanWorks Council, embracing employee and managementrepresentatives from countries within Europe, has been inexistence for several years and provides a forum for discussingissues that extend across national boundaries.
The company carries out regular and wide-ranging monitoringsurveys providing valuable insight into employee views, attitudesand levels of engagement.
The Directors’ Reports of the United Kingdom group companiescontain more details about how they have communicated withtheir employees during 2009.
Equal opportunities and diversityUnder the umbrella of our Code of Business Principles, Unileveraims to ensure that people with disabilities, and other under-represented groups, are given the same training, development andprospects as other employees. Every effort is also made to retrainand support employees who become disabled while workingwithin the Group.
The company continues to review ways in which greater diversitycan be achieved in recruitment and selection. We have put inplace policies which promote the achievement of diversity in ourbusiness and we review these regularly. For example, Unilever UKprovides policies on home working, flexible working, maternityand paternity leave, child care provision and career breaks, whichhelp us to meet the objective of greater employee diversity.
Charitable and other contributionsUnilever collates the cost of its community involvement activitiesusing the London Benchmarking Group model. The modelrecommends the separation of charitable donations, communityinvestment, commercial initiatives in the community andmanagement costs relating to the programme of activity.
During 2009 UK group companies made a total contribution of£7.8 million, analysed as follows:
• Charitable donations: £0.4million• Community investment: £1.1 million• Commercial initiatives in the community: £6.1 million• Management costs: £0.2 million
No donation or contribution was made or expenditure incurred forpolitical purposes.
Supplier payment policiesIndividual operating companies are responsible for agreeing theterms and conditions under which business transactions with theirsuppliers are conducted. The Directors’ Reports of the UnitedKingdom operating companies give information about theirsupplier payment policies as required by the UK Companies Act2006. PLC, as a holding company, does not itself make anyrelevant payments in this respect.
Unilever Annual Report and Accounts 2009 143
Further statutory and other information Unilever PLC
Auditors and disclosure of information to auditorsA resolution will be proposed at the AGM on 12 May 2010 forthe re-appointment of PricewaterhouseCoopers LLP as auditorsof PLC. The present appointment will end at the conclusion ofthe AGM.
To the best of each of the Directors’ knowledge and belief, andhaving made appropriate enquiries of other officers of the UnileverGroup, all information relevant to enabling the auditors to providetheir opinions on PLC’s consolidated and parent company accountshas been provided. Each of the Directors has taken all reasonablesteps to ensure their awareness of any relevant audit informationand to establish that the company’s auditors are aware of any suchinformation.
Authority to purchase own sharesAt the AGM of PLC held on 13 May 2009, authority was givenpursuant to Article 64 of the PLC Articles of Association to makemarket purchases of PLC ordinary shares of 31⁄9p each, to amaximum of 290 million shares. This authority will expire at theAGM on 12 May 2010, and a resolution will be proposed to renewthe authority.
Details of shares purchased by an employee share trust andUnilever group companies to satisfy options granted under PLC’semployee share schemes are given in note 29 to the consolidatedaccounts on pages 126 to 127.
Corporate Centre Unilever PLC Registered OfficeUnilever PLC Port SunlightUnilever House Wirral100 Victoria Embankment Merseyside CH62 4ZDLondon EC4Y 0DY Registered number 41424
Unilever PLC RegistrarsComputershare Investor Services PLCThe PavilionsBridgwater RoadBristol BS99 6ZY
By Order of the Board
S G WilliamsSecretary of Unilever PLC2 March 2010
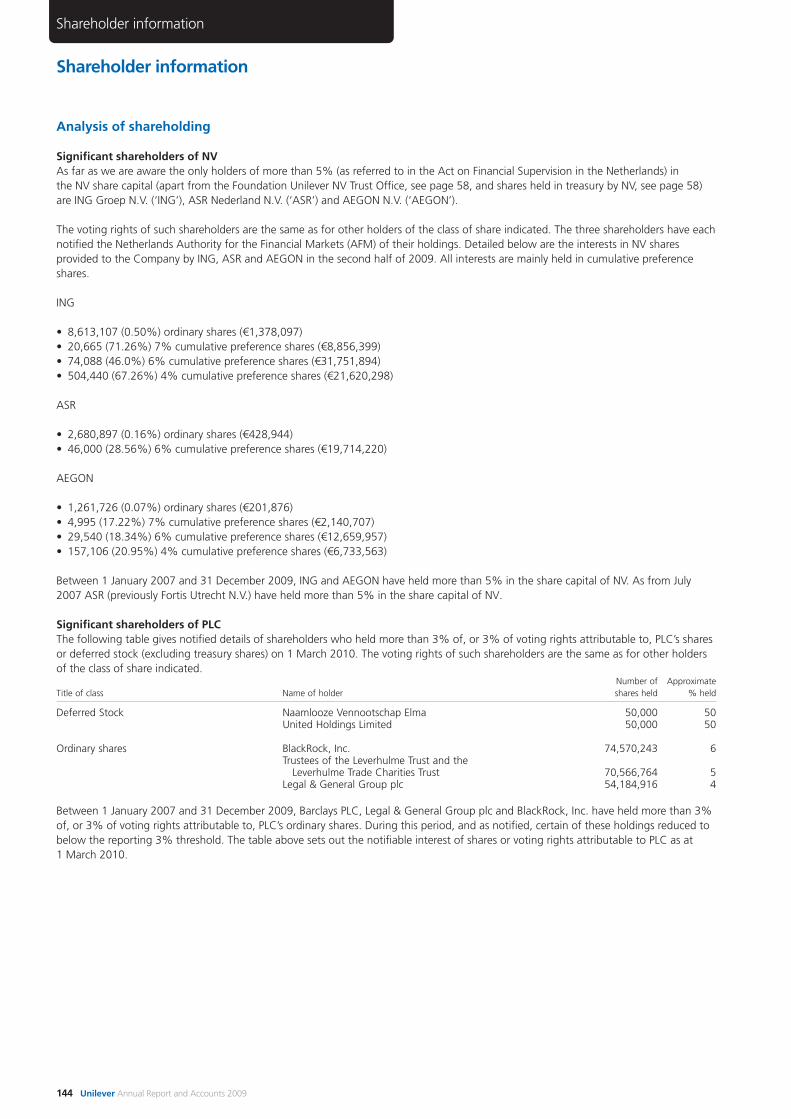
Shareholder information
144 Unilever Annual Report and Accounts 2009
Shareholder information
Analysis of shareholding
Significant shareholders of NVAs far as we are aware the only holders of more than 5% (as referred to in the Act on Financial Supervision in the Netherlands) in the NV share capital (apart from the Foundation Unilever NV Trust Office, see page 58, and shares held in treasury by NV, see page 58)are ING Groep N.V. (‘ING’), ASR Nederland N.V. (‘ASR’) and AEGON N.V. (‘AEGON’).
The voting rights of such shareholders are the same as for other holders of the class of share indicated. The three shareholders have eachnotified the Netherlands Authority for the Financial Markets (AFM) of their holdings. Detailed below are the interests in NV sharesprovided to the Company by ING, ASR and AEGON in the second half of 2009. All interests are mainly held in cumulative preferenceshares.
ING
• 8,613,107 (0.50%) ordinary shares (€1,378,097)• 20,665 (71.26%) 7% cumulative preference shares (€8,856,399)• 74,088 (46.0%) 6% cumulative preference shares (€31,751,894)• 504,440 (67.26%) 4% cumulative preference shares (€21,620,298)
ASR
• 2,680,897 (0.16%) ordinary shares (€428,944)• 46,000 (28.56%) 6% cumulative preference shares (€19,714,220)
AEGON
• 1,261,726 (0.07%) ordinary shares (€201,876)• 4,995 (17.22%) 7% cumulative preference shares (€2,140,707)• 29,540 (18.34%) 6% cumulative preference shares (€12,659,957)• 157,106 (20.95%) 4% cumulative preference shares (€6,733,563)
Between 1 January 2007 and 31 December 2009, ING and AEGON have held more than 5% in the share capital of NV. As from July2007 ASR (previously Fortis Utrecht N.V.) have held more than 5% in the share capital of NV.
Significant shareholders of PLCThe following table gives notified details of shareholders who held more than 3% of, or 3% of voting rights attributable to, PLC’s sharesor deferred stock (excluding treasury shares) on 1 March 2010. The voting rights of such shareholders are the same as for other holdersof the class of share indicated.
Number of ApproximateTitle of class Name of holder shares held % held
Deferred Stock Naamlooze Vennootschap Elma 50,000 50United Holdings Limited 50,000 50
Ordinary shares BlackRock, Inc. 74,570,243 6Trustees of the Leverhulme Trust and the
Leverhulme Trade Charities Trust 70,566,764 5Legal & General Group plc 54,184,916 4
Between 1 January 2007 and 31 December 2009, Barclays PLC, Legal & General Group plc and BlackRock, Inc. have held more than 3%of, or 3% of voting rights attributable to, PLC’s ordinary shares. During this period, and as notified, certain of these holdings reduced tobelow the reporting 3% threshold. The table above sets out the notifiable interest of shares or voting rights attributable to PLC as at1 March 2010.
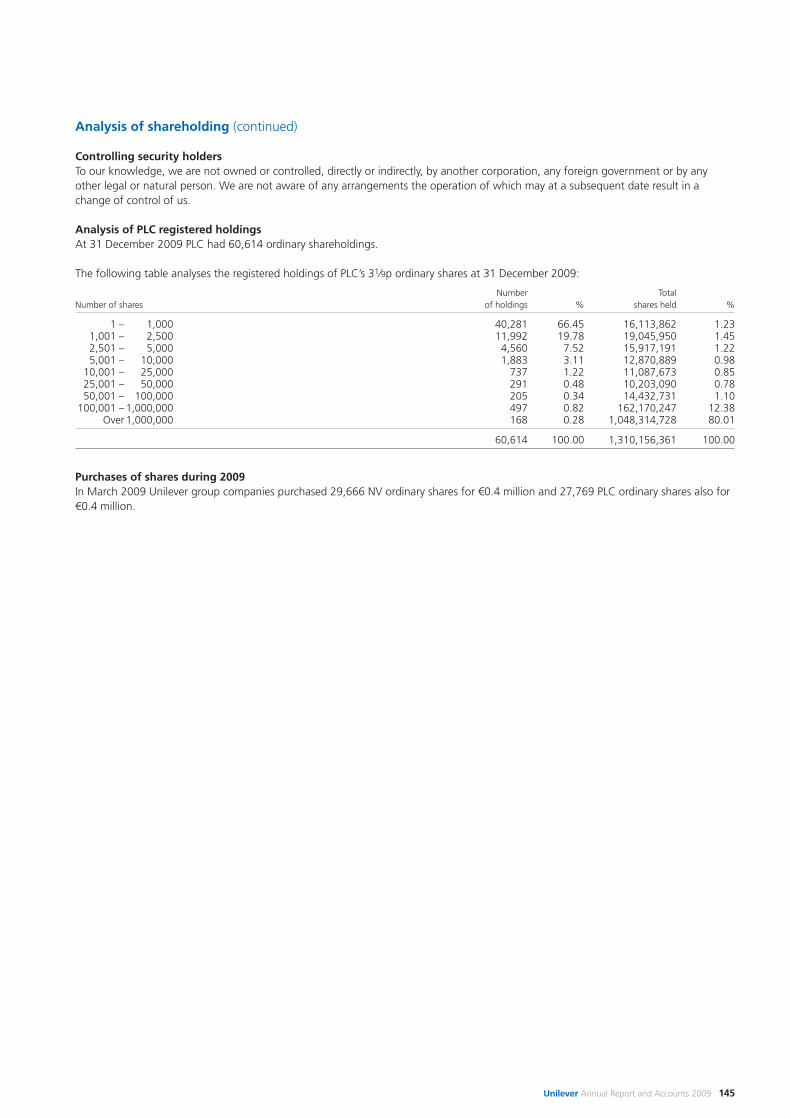
Unilever Annual Report and Accounts 2009 145
Analysis of shareholding (continued)
Controlling security holdersTo our knowledge, we are not owned or controlled, directly or indirectly, by another corporation, any foreign government or by anyother legal or natural person. We are not aware of any arrangements the operation of which may at a subsequent date result in achange of control of us.
Analysis of PLC registered holdingsAt 31 December 2009 PLC had 60,614 ordinary shareholdings.
The following table analyses the registered holdings of PLC’s 31⁄9p ordinary shares at 31 December 2009:
Number TotalNumber of shares of holdings % shares held %
1 – 1,000 40,281 66.45 16,113,862 1.231,001 – 2,500 11,992 19.78 19,045,950 1.452,501 – 5,000 4,560 7.52 15,917,191 1.225,001 – 10,000 1,883 3.11 12,870,889 0.98
10,001 – 25,000 737 1.22 11,087,673 0.8525,001 – 50,000 291 0.48 10,203,090 0.7850,001 – 100,000 205 0.34 14,432,731 1.10
100,001 – 1,000,000 497 0.82 162,170,247 12.38Over 1,000,000 168 0.28 1,048,314,728 80.01
60,614 100.00 1,310,156,361 100.00
Purchases of shares during 2009In March 2009 Unilever group companies purchased 29,666 NV ordinary shares for €0.4 million and 27,769 PLC ordinary shares also for€0.4 million.
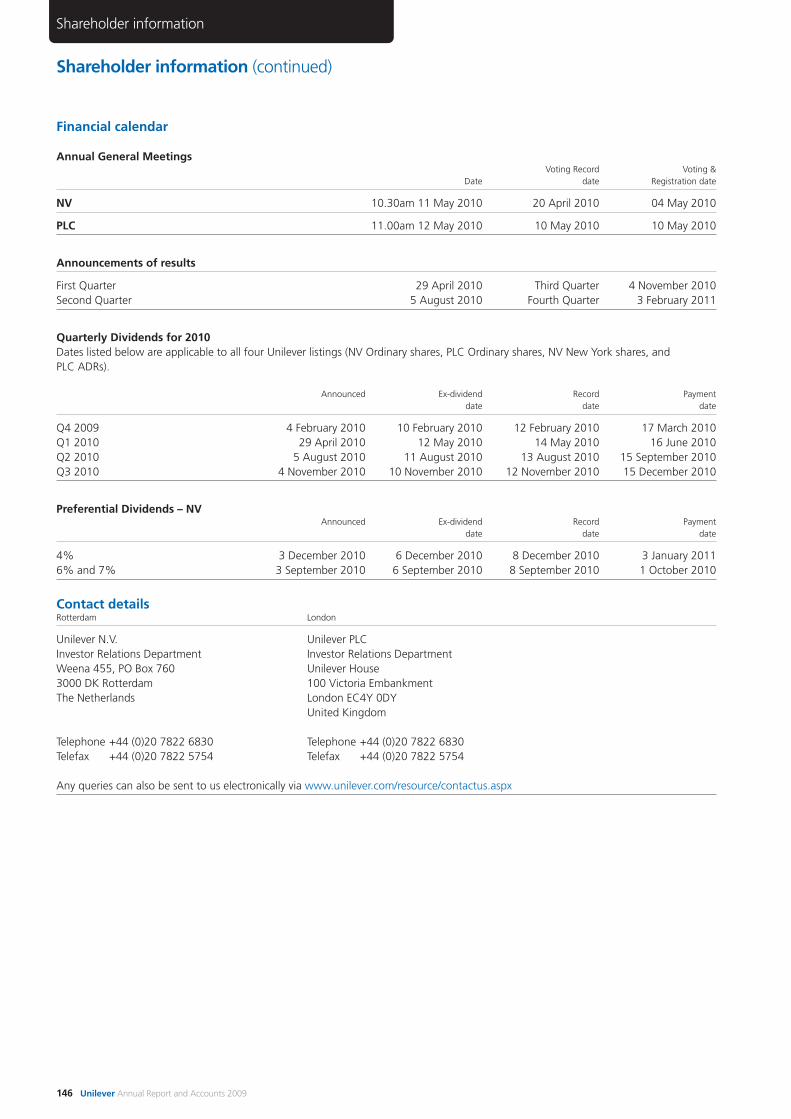
Shareholder information (continued)
146 Unilever Annual Report and Accounts 2009
Shareholder information
Financial calendar
Annual General MeetingsVoting Record Voting &
Date date Registration date
NV 10.30am 11 May 2010 20 April 2010 04 May 2010
PLC 11.00am 12 May 2010 10 May 2010 10 May 2010
Announcements of results
First Quarter 29 April 2010 Third Quarter 4 November 2010Second Quarter 5 August 2010 Fourth Quarter 3 February 2011
Quarterly Dividends for 2010Dates listed below are applicable to all four Unilever listings (NV Ordinary shares, PLC Ordinary shares, NV New York shares, and PLC ADRs).
Announced Ex-dividend Record Paymentdate date date
Q4 2009 4 February 2010 10 February 2010 12 February 2010 17 March 2010Q1 2010 29 April 2010 12 May 2010 14 May 2010 16 June 2010Q2 2010 5 August 2010 11 August 2010 13 August 2010 15 September 2010Q3 2010 4 November 2010 10 November 2010 12 November 2010 15 December 2010
Preferential Dividends – NVAnnounced Ex-dividend Record Payment
date date date
4% 3 December 2010 6 December 2010 8 December 2010 3 January 20116% and 7% 3 September 2010 6 September 2010 8 September 2010 1 October 2010
Contact detailsRotterdam London
Unilever N.V. Unilever PLCInvestor Relations Department Investor Relations DepartmentWeena 455, PO Box 760 Unilever House3000 DK Rotterdam 100 Victoria EmbankmentThe Netherlands London EC4Y 0DY
United Kingdom
Telephone +44 (0)20 7822 6830 Telephone +44 (0)20 7822 6830Telefax +44 (0)20 7822 5754 Telefax +44 (0)20 7822 5754
Any queries can also be sent to us electronically via www.unilever.com/resource/contactus.aspx
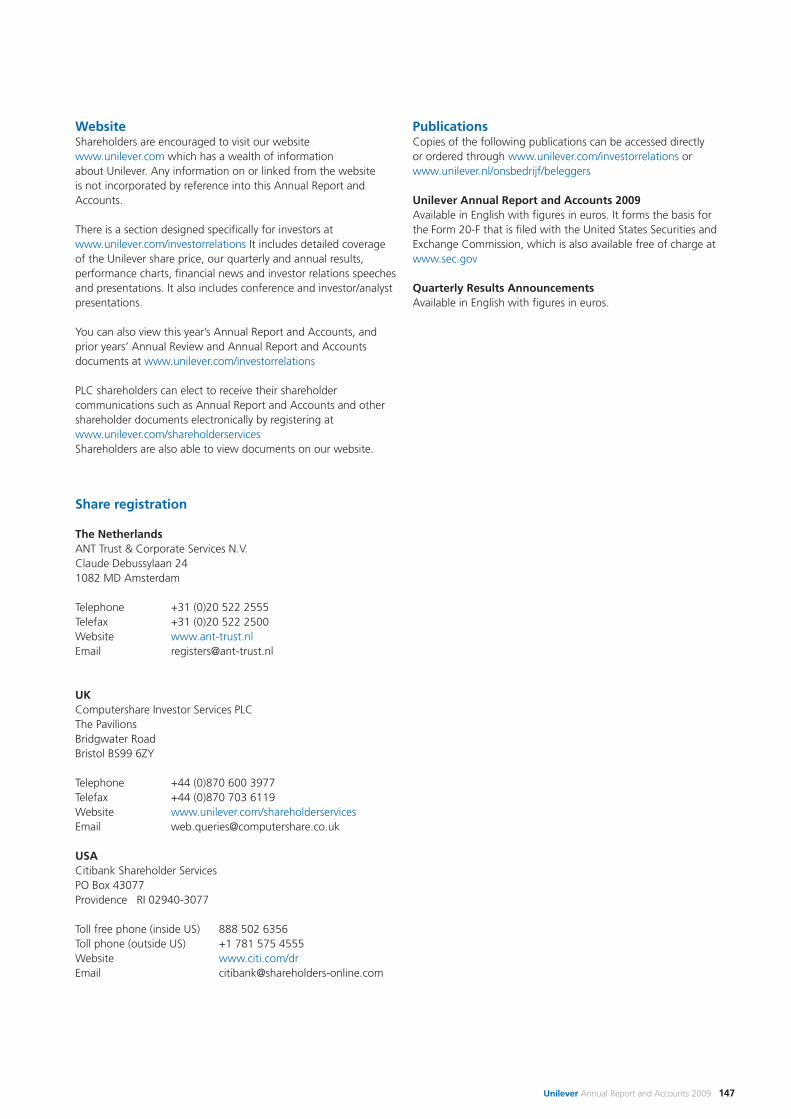
Unilever Annual Report and Accounts 2009 147
WebsiteShareholders are encouraged to visit our websitewww.unilever.com which has a wealth of informationabout Unilever. Any information on or linked from the website is not incorporated by reference into this Annual Report andAccounts.
There is a section designed specifically for investors atwww.unilever.com/investorrelations It includes detailed coverageof the Unilever share price, our quarterly and annual results,performance charts, financial news and investor relations speechesand presentations. It also includes conference and investor/analystpresentations.
You can also view this year’s Annual Report and Accounts, andprior years’ Annual Review and Annual Report and Accountsdocuments at www.unilever.com/investorrelations
PLC shareholders can elect to receive their shareholdercommunications such as Annual Report and Accounts and othershareholder documents electronically by registering atwww.unilever.com/shareholderservicesShareholders are also able to view documents on our website.
Share registration
The NetherlandsANT Trust & Corporate Services N.V.Claude Debussylaan 241082 MD Amsterdam
Telephone +31 (0)20 522 2555 Telefax +31 (0)20 522 2500Website www.ant-trust.nlEmail [email protected]
UKComputershare Investor Services PLCThe PavilionsBridgwater RoadBristol BS99 6ZY
Telephone +44 (0)870 600 3977Telefax +44 (0)870 703 6119Website www.unilever.com/shareholderservicesEmail [email protected]
USACitibank Shareholder ServicesPO Box 43077Providence RI 02940-3077
Toll free phone (inside US) 888 502 6356Toll phone (outside US) +1 781 575 4555Website www.citi.com/drEmail [email protected]
PublicationsCopies of the following publications can be accessed directlyor ordered through www.unilever.com/investorrelations orwww.unilever.nl/onsbedrijf/beleggers
Unilever Annual Report and Accounts 2009Available in English with figures in euros. It forms the basis forthe Form 20-F that is filed with the United States Securities andExchange Commission, which is also available free of charge atwww.sec.gov
Quarterly Results AnnouncementsAvailable in English with figures in euros.
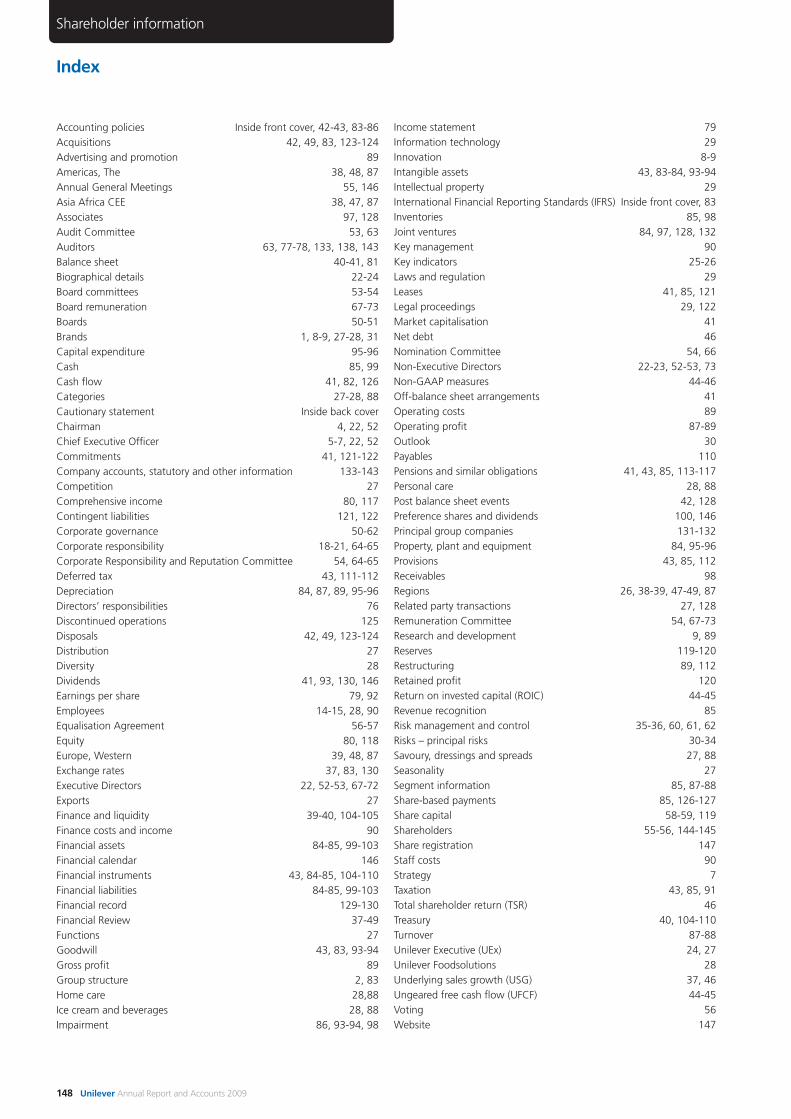
Index
148 Unilever Annual Report and Accounts 2009
Shareholder information
Accounting policies Inside front cover, 42-43, 83-86Acquisitions 42, 49, 83, 123-124Advertising and promotion 89Americas, The 38, 48, 87Annual General Meetings 55, 146Asia Africa CEE 38, 47, 87Associates 97, 128Audit Committee 53, 63Auditors 63, 77-78, 133, 138, 143Balance sheet 40-41, 81Biographical details 22-24Board committees 53-54Board remuneration 67-73Boards 50-51Brands 1, 8-9, 27-28, 31Capital expenditure 95-96Cash 85, 99Cash flow 41, 82, 126Categories 27-28, 88Cautionary statement Inside back coverChairman 4, 22, 52Chief Executive Officer 5-7, 22, 52Commitments 41, 121-122Company accounts, statutory and other information 133-143Competition 27Comprehensive income 80, 117Contingent liabilities 121, 122Corporate governance 50-62Corporate responsibility 18-21, 64-65Corporate Responsibility and Reputation Committee 54, 64-65Deferred tax 43, 111-112Depreciation 84, 87, 89, 95-96Directors’ responsibilities 76Discontinued operations 125Disposals 42, 49, 123-124Distribution 27Diversity 28Dividends 41, 93, 130, 146Earnings per share 79, 92Employees 14-15, 28, 90Equalisation Agreement 56-57Equity 80, 118Europe, Western 39, 48, 87Exchange rates 37, 83, 130Executive Directors 22, 52-53, 67-72Exports 27Finance and liquidity 39-40, 104-105Finance costs and income 90Financial assets 84-85, 99-103Financial calendar 146Financial instruments 43, 84-85, 104-110Financial liabilities 84-85, 99-103Financial record 129-130Financial Review 37-49Functions 27Goodwill 43, 83, 93-94Gross profit 89Group structure 2, 83Home care 28,88Ice cream and beverages 28, 88Impairment 86, 93-94, 98
Income statement 79Information technology 29Innovation 8-9Intangible assets 43, 83-84, 93-94Intellectual property 29International Financial Reporting Standards (IFRS) Inside front cover, 83Inventories 85, 98Joint ventures 84, 97, 128, 132Key management 90Key indicators 25-26Laws and regulation 29Leases 41, 85, 121Legal proceedings 29, 122Market capitalisation 41Net debt 46Nomination Committee 54, 66Non-Executive Directors 22-23, 52-53, 73Non-GAAP measures 44-46Off-balance sheet arrangements 41Operating costs 89Operating profit 87-89Outlook 30Payables 110Pensions and similar obligations 41, 43, 85, 113-117Personal care 28, 88Post balance sheet events 42, 128Preference shares and dividends 100, 146Principal group companies 131-132Property, plant and equipment 84, 95-96Provisions 43, 85, 112Receivables 98Regions 26, 38-39, 47-49, 87Related party transactions 27, 128Remuneration Committee 54, 67-73Research and development 9, 89Reserves 119-120Restructuring 89, 112Retained profit 120Return on invested capital (ROIC) 44-45Revenue recognition 85Risk management and control 35-36, 60, 61, 62Risks – principal risks 30-34Savoury, dressings and spreads 27, 88Seasonality 27Segment information 85, 87-88Share-based payments 85, 126-127Share capital 58-59, 119Shareholders 55-56, 144-145Share registration 147Staff costs 90Strategy 7Taxation 43, 85, 91Total shareholder return (TSR) 46Treasury 40, 104-110Turnover 87-88Unilever Executive (UEx) 24, 27Unilever Foodsolutions 28Underlying sales growth (USG) 37, 46Ungeared free cash flow (UFCF) 44-45Voting 56Website 147
Cautionary statementThis document may contain forward-looking statements, including ‘forward-looking statements’ within the meaning of the United States Private Securities Litigation Reform Act of 1995. Words such as ‘expects’, ‘anticipates’, ‘intends’, ‘believes’ or the negative of these terms and other similar expressions of future performance or results, and their negatives, are intended to identify such forward-looking statements. These forward-looking statements are based upon current expectations and assumptions regarding anticipated developments and other factors affecting the Group. They are not historical facts, nor are they guarantees of future performance.
Because these forward-looking statements involve risks and uncertainties, there are important factors that could cause actual results to differ materially from those expressed or implied by these forward-looking statements, including, among others, competitive pricing and activities, economic slowdown, industry consolidation, access to credit markets, recruitment levels, reputational risks, commodity prices, continued availability of raw materials, prioritisation of projects, consumption levels, costs, the ability to maintain and manage key customer relationships and supply chain sources, consumer demands, currency values, interest rates, the ability to integrate acquisitions and complete planned divestitures, the ability to complete planned restructuring activities, physical risks, environmental risks, the ability to manage regulatory, tax and legal matters and resolve pending matters within current estimates, legislative, fiscal and regulatory developments, political, economic and social conditions in the geographic markets where the Group operates and new or changed priorities of the Boards. Further details of potential risks and uncertainties affecting the Group are described in the Group’s filings with the London Stock Exchange, Euronext Amsterdam and the US Securities and Exchange Commission, including the 20-F Report and the Annual Report and Accounts 2009. These forward-looking statements speak only as of the date of this document. Except as required by any applicable law or regulation, the Group expressly disclaims any obligation or undertaking to release publicly any updates or revisions to any forward-looking statements contained herein to reflect any change in the Group’s expectations with regard thereto or any change in events, conditions or circumstances on which any such statement is based.
This document does not comply with US GAAP and should not therefore be relied upon by readers as such. The Group’s Annual Report on Form 20-F for 2009 is separately filed with the US Securities and Exchange Commission and is available on our corporate website www.unilever.com. Any information on or linked from the website is not incorporated by reference into the Annual Report on Form 20-F. In addition, a printed copy of the Annual Report on Form 20-F is available, free of charge, upon request to Unilever PLC, Investor Relations Department, Unilever House, 100 Victoria Embankment, London EC4Y 0DY, United Kingdom.
Designed and produced by Unilever Communications in conjunction with Addison at www.addison.co.uk.Board photography by Jaap van den Beukel and Igor Emmerich.Product photography by The Pack Shot Company.Feature photography by Chris Moyse, Philip Gatward (page 13), WFP/Anne-Mischa van Schouwenburg (page 15), Aaron Huey (page 20) and from the Unilever image library.Printed by St Ives Westerham Press Ltd. ISO 14001: 2004, FSC certified and CarbonNeutral.
This document is printed on Greencoat Plus Velvet which has been independently certified according to the rules of the Forest Stewardship Council (FSC). Greencoat Plus Velvet contains 80% recycled fibre. The manufacturing mill is accredited with the ISO 14001 Environmental Standard. In recognition of its recycled content Greencoat Plus Velvet has also been awarded the NAPM recycled mark. In addition, the carbon impact of this paper has been measured and balanced through the World Land Trust, an ecological charity.
This document is completely recyclable. If you have finished with it and no longer wish to retain it, please pass it on to other interested readers or dispose of it in your recycled paper waste. Thank you.
Unilever N.V.Weena 455, PO Box 7603000 DK RotterdamThe NetherlandsT +31 (0)10 217 4000F +31 (0)10 217 4798
Commercial Register RotterdamNumber: 24051830
Unilever PLCUnilever House100 Victoria EmbankmentLondon EC4Y 0DYUnited KingdomT +44 (0)20 7822 5252F +44 (0)20 7822 5951
Unilever PLC registered officeUnilever PLCPort SunlightWirralMerseyside CH62 4ZDUnited Kingdom
Registered in England and WalesCompany Number: 41424
www.unilever.com
Related Documents