ANNUAL REPORT 2021 $1.865 Dec 2021 $0.704 1 Jan 2017 ASX:BFG

Welcome message from author
This document is posted to help you gain knowledge. Please leave a comment to let me know what you think about it! Share it to your friends and learn new things together.
Transcript
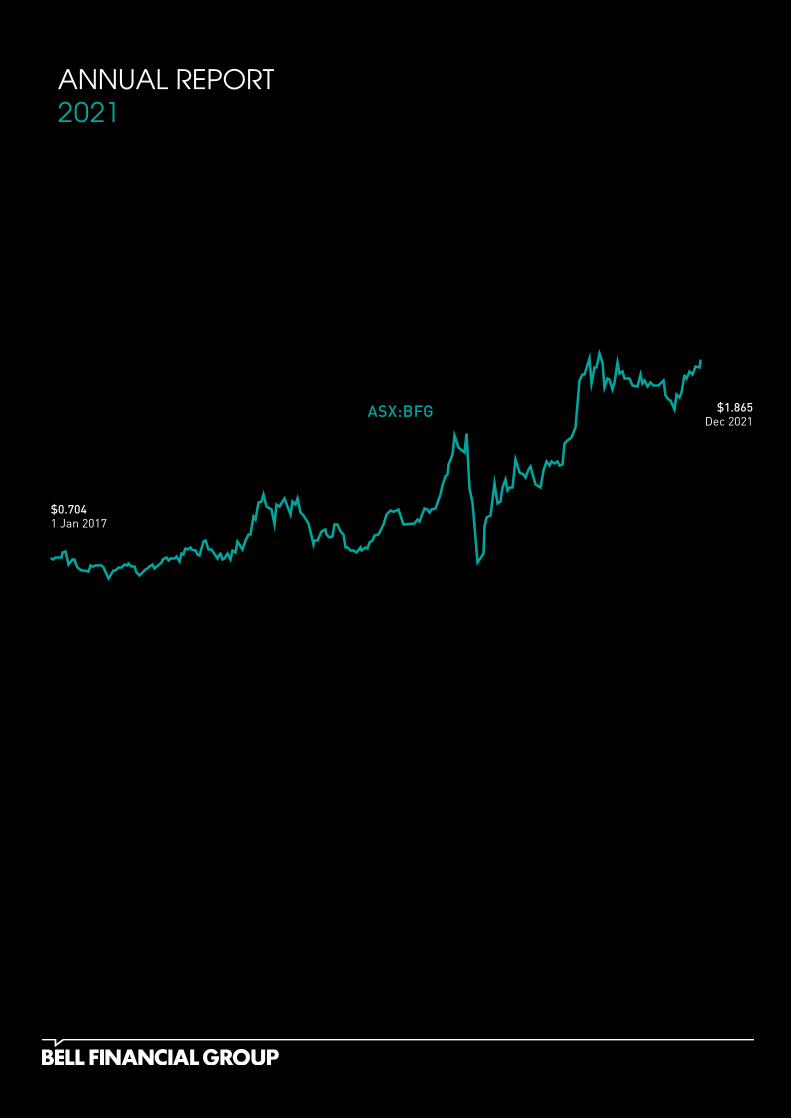
ANNUAL REPORT2021
$1.865Dec 2021
$0.7041 Jan 2017
ASX:BFG
Bell Financial G
roup Limited Annual R
eport 2021
Bell Financial Group Ltd ABN 59 083 194 763
Overview
01 Highlights
Performance
02 Operating and Financial Review
08 Directors’ Report (Including Remuneration Report)
17 Lead Auditor’s Independence Declaration
Financial Statements
18 Statement of Profit or Loss
19 Statement of Comprehensive Income
20 Statement of Financial Position
21 Statement of Changes in Equity
22 Statement of Cash Flows
23 Notes to the Financial Statements
61 Directors’ Declaration
62 Independent Auditor’s Report
Other Information
66 Shareholder Information
68 Directory
CONTENTS
Bell Financial Group Ltd is an Australian-based provider of full service and online broking, investment and financial advisory services to private, institutional and corporate clients. Bell Financial Group has over 760 employees, operates across 13 offices in Australia and has offices in New York, London, Hong Kong and Kuala Lumpur.
Australia
AdelaideBrisbaneCairnsCoolumGeelongHobartMackayMelbourneMorningtonOrangePerthSydneyToowoomba
International
LondonNew YorkHong KongKuala Lumpur
Bell Potter Securities Limited
Bell Potter Capital Limited
Third Party Platform Pty Ltd
BELL POTTER CAPITAL
POTTER ONLINE
COMMODITIES FX
Bell Financial GroupAnnual Report 2021
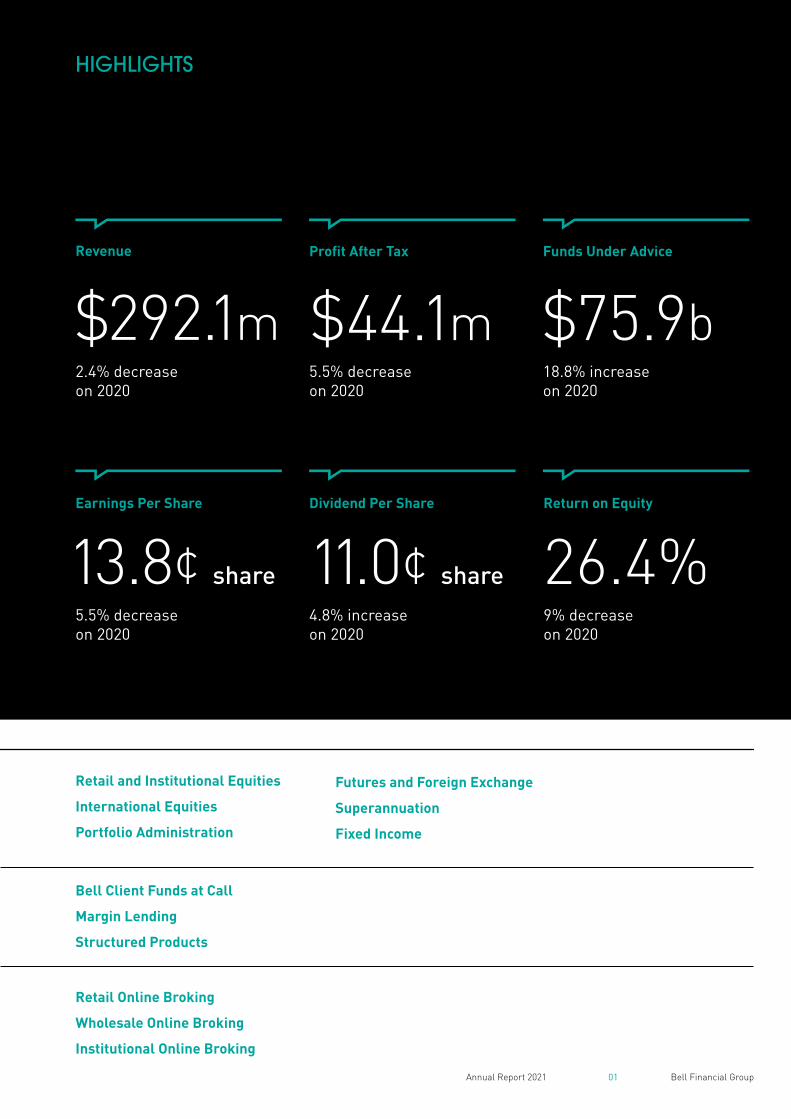
HIGHLIGHTS
Dividend Per Share Return on Equity
4.8% increase on 2020
9% decrease on 2020
11.0¢ share 26.4%
Funds Under Advice
18.8% increase on 2020
$75.9b
Profit After Tax
5.5% decrease on 2020
$44.1m
Earnings Per Share
5.5% decrease on 2020
13.8¢ share
Revenue
2.4% decrease on 2020
$292.1m
01
Retail and Institutional Equities
International Equities
Portfolio Administration
Bell Client Funds at Call
Margin Lending
Structured Products
Retail Online Broking
Wholesale Online Broking
Institutional Online Broking
Futures and Foreign Exchange
Superannuation
Fixed Income
02 Bell Financial GroupAnnual Report 2021
OPERATING AND FINANCIAL REVIEW
In many ways, 2021 was a repeat of 2020. Ongoing uncertainty with rolling lockdowns, border closures, working from home, restrictions on travel, record low interest rates and ongoing fiscal stimulus. Against that backdrop it’s pleasing to report the Group recorded another outstanding result with a $44 million profit (after tax), just shy of the record result achieved in 2020.
All our businesses performed well.
Retail and Institutional Broking revenue was consistent with 2020. The Equity Capital Markets (ECM) team had another excellent year notwithstanding revenue was down marginally due to a skew towards IPO transactions this year versus secondary market transactions last year which are less time consuming. Over 100 transactions were completed, raising more than $2.6 billion in new equity capital for ASX listed companies.
We continue executing on our strategy of investing in technology, platforms, products and services. While the investment is reflected in an increase in overheads, the benefits are real and measurable. Revenues and profit in these two divisions grew 10% and 12.5% in 2021 to $68 million and $15 million (after tax) respectively, and are becoming an increasingly material component of our earnings.
TPP currently clears one third of Bell Potter Securities trades, with the remainder to be cleared from mid-2022.
This will result in a meaningful release in cost synergies across the Group. Another significant milestone achieved in 2021 was the signing of our first external Third Party Clearing client, Macquarie Equities Limited. We ran a pilot program in the third quarter of 2021, and successfully migrated and commenced clearing for the first tranche of clients in late November. The balance of clients are expected to transfer in the first half of 2022. We expect the Third Party Clearing business will make a meaningful contribution to our numbers going forward.
During the year we were fortunate enough to be in a position to renew several of our long-term property leases, taking
advantage of a depressed commercial property market. We expect cash flow savings totalling $30 million over the next 10 years.
Funds under Advice, which underpin our long-term performance continue to grow. They have reached almost $76 billion at the end of December, having increased 19% on 2020, and have grown at a compound rate of over 12% across the last 5 years.
Importantly, the Group’s strong performance has enabled us to increase the fully franked dividend payout again this year to a record 11 cents per share.
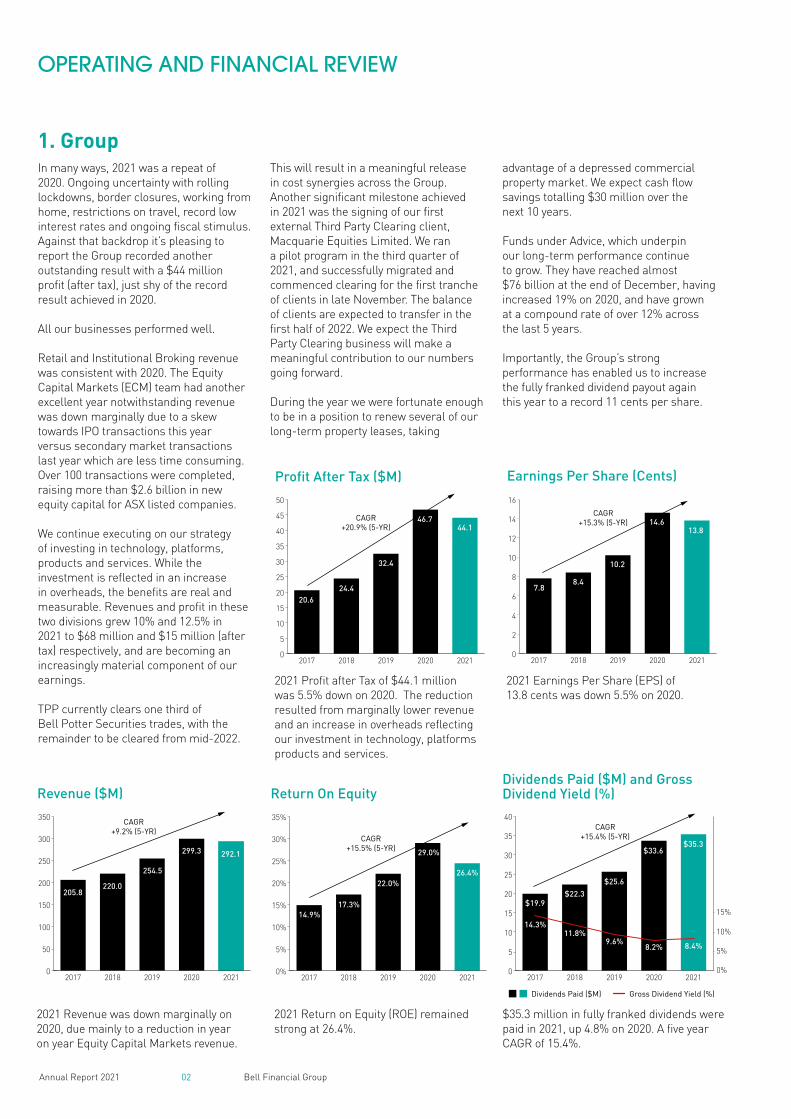
2021 Profit after Tax of $44.1 million was 5.5% down on 2020. The reduction resulted from marginally lower revenue and an increase in overheads reflecting our investment in technology, platforms products and services.
2021 Earnings Per Share (EPS) of 13.8 cents was down 5.5% on 2020.
$35.3 million in fully franked dividends were paid in 2021, up 4.8% on 2020. A five year CAGR of 15.4%.
2021 Return on Equity (ROE) remained strong at 26.4%.
2021 Revenue was down marginally on 2020, due mainly to a reduction in year on year Equity Capital Markets revenue.
1. Group
Revenue ($M)
0
50
100
150
200
250
300
350
20212020201920182017
CAGR+9.2% (5-YR)
205.8220.0
254.5
299.3 292.1
Return On Equity
0%
5%
10%
15%
20%
25%
30%
35%
20212020201920182017
CAGR+15.5% (5-YR)
14.9%17.3%
22.0%
29.0%
26.4%
Earnings Per Share (Cents)
0
2
4
6
8
10
12
14
16
20212020201920182017
CAGR+15.3% (5-YR)
7.88.4
10.2
14.613.8
Profit After Tax ($M)
0
5
10
15
20
25
30
35
40
45
50
20212020201920182017
CAGR+20.9% (5-YR)
20.624.4
32.4
46.744.1
Dividends Paid ($M) and Gross Dividend Yield (%)
0
5
10
15
20
25
30
35
40
20212020201920182017
$19.9
11.8%9.6%
8.2% 8.4%
Dividends Paid ($M) Gross Dividend Yield (%)
14.3%
CAGR+15.4% (5-YR)
$22.3
$25.6
$33.6$35.3
0%
5%
10%
15%
03 Bell Financial GroupAnnual Report 2021
2 Jan 17 2 Jan 18 2 Jan 19 2 Jan 20 2 Jan 21
200%
150%
100%
50%
0%
-50%
BFG Share Price Movement: January 2017 – December 2021
XJO (%)BFG Share Price ($A)
$2.00
$1.75
$1.50
$1.25
$1.00
$0.75
$0.50
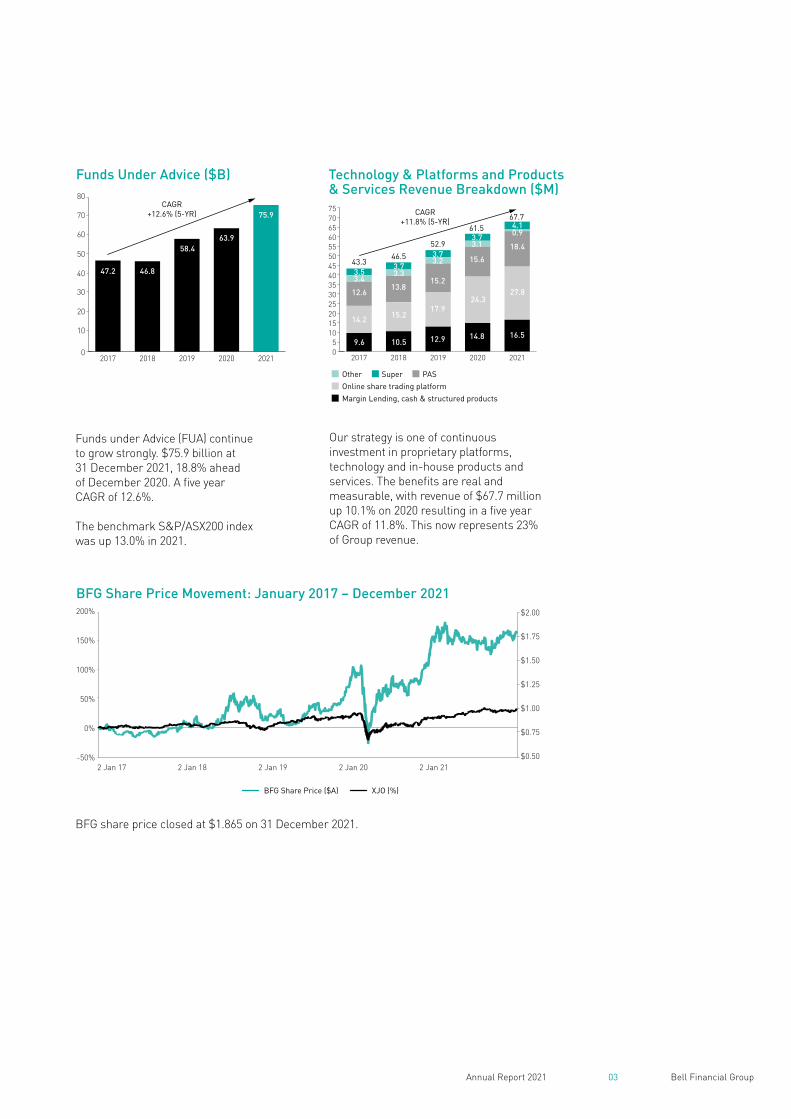
Funds under Advice (FUA) continue to grow strongly. $75.9 billion at 31 December 2021, 18.8% ahead of December 2020. A five year CAGR of 12.6%.
The benchmark S&P/ASX200 index was up 13.0% in 2021.
BFG share price closed at $1.865 on 31 December 2021.
Our strategy is one of continuous investment in proprietary platforms, technology and in-house products and services. The benefits are real and measurable, with revenue of $67.7 million up 10.1% on 2020 resulting in a five year CAGR of 11.8%. This now represents 23% of Group revenue.
Funds Under Advice ($B)
0
10
20
30
40
50
60
70
80
20212020201920182017
CAGR+12.6% (5-YR)
47.2 46.8
58.463.9
75.9
Technology & Platforms and Products & Services Revenue Breakdown ($M)
05
1015202530354045505560657075
20212020201920182017
CAGR+11.8% (5-YR)
16.5
27.8
18.4
4.1
3.7
3.7
3.73.53.4
12.6
14.2
9.6
3.3
13.8
15.2
10.5
3.2
15.2
17.9
12.9
3.1
15.6
24.3
14.8
0.9
67.761.5
52.9
46.543.3
PAS
Online share trading platform
Other Super
Margin Lending, cash & structured products
04 Bell Financial GroupAnnual Report 2021
OPERATING AND FINANCIAL REVIEW continued
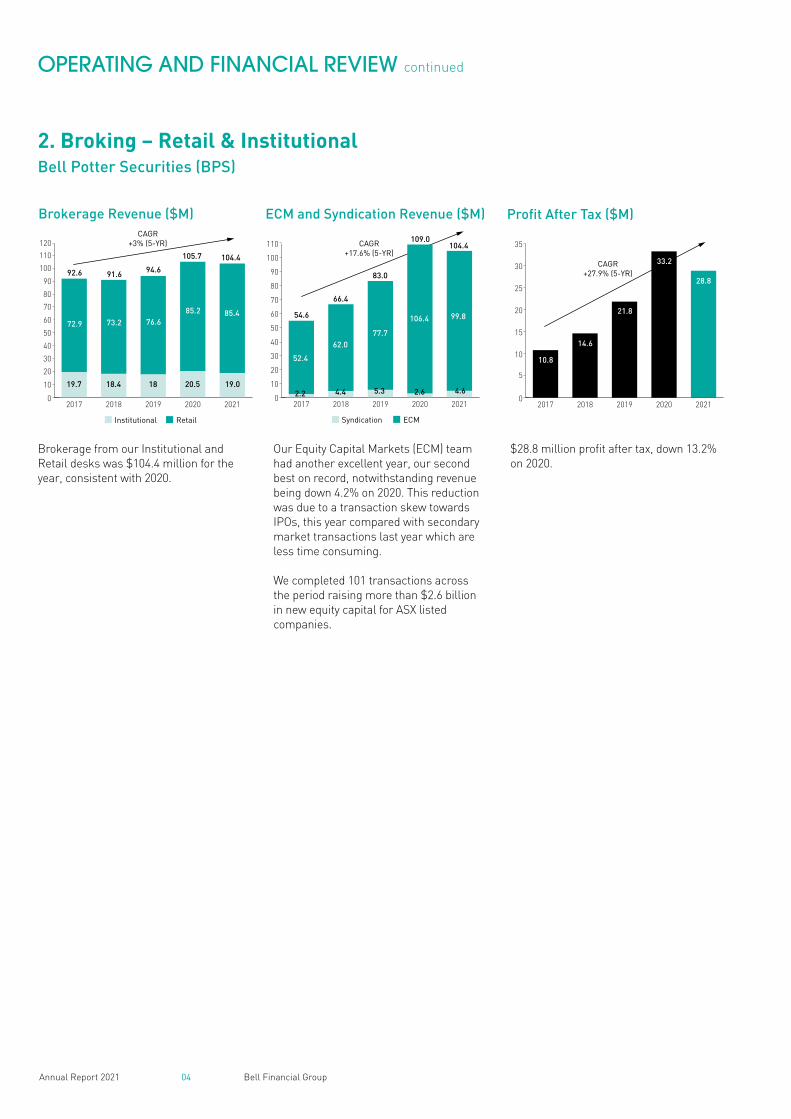
Brokerage from our Institutional and Retail desks was $104.4 million for the year, consistent with 2020.
Our Equity Capital Markets (ECM) team had another excellent year, our second best on record, notwithstanding revenue being down 4.2% on 2020. This reduction was due to a transaction skew towards IPOs, this year compared with secondary market transactions last year which are less time consuming.
We completed 101 transactions across the period raising more than $2.6 billion in new equity capital for ASX listed companies.
$28.8 million profit after tax, down 13.2% on 2020.
Brokerage Revenue ($M)
0
10
20
30
40
50
60
70
80
90
100
110
120
20212020201920182017
72.9 73.2 76.685.2 85.4
19.7 18.4 18 20.5 19.0
92.6 91.6 94.6
104.4105.7
RetailInstitutional
CAGR+3% (5-YR)
ECM and Syndication Revenue ($M)
0
10
20
30
40
50
60
70
80
90
100
110
20212020201920182017
52.4
62.077.7
106.4 99.8
2.2 4.4 5.3 2.6 4.6
54.6
66.4
83.0
109.0104.4
ECMSyndication
CAGR+17.6% (5-YR)
2. Broking – Retail & InstitutionalBell Potter Securities (BPS)
Profit After Tax ($M)
0
5
10
15
20
25
30
35
20212020201920182017
CAGR+27.9% (5-YR)
10.8
14.6
21.8
33.2
28.8
05 Bell Financial GroupAnnual Report 2021
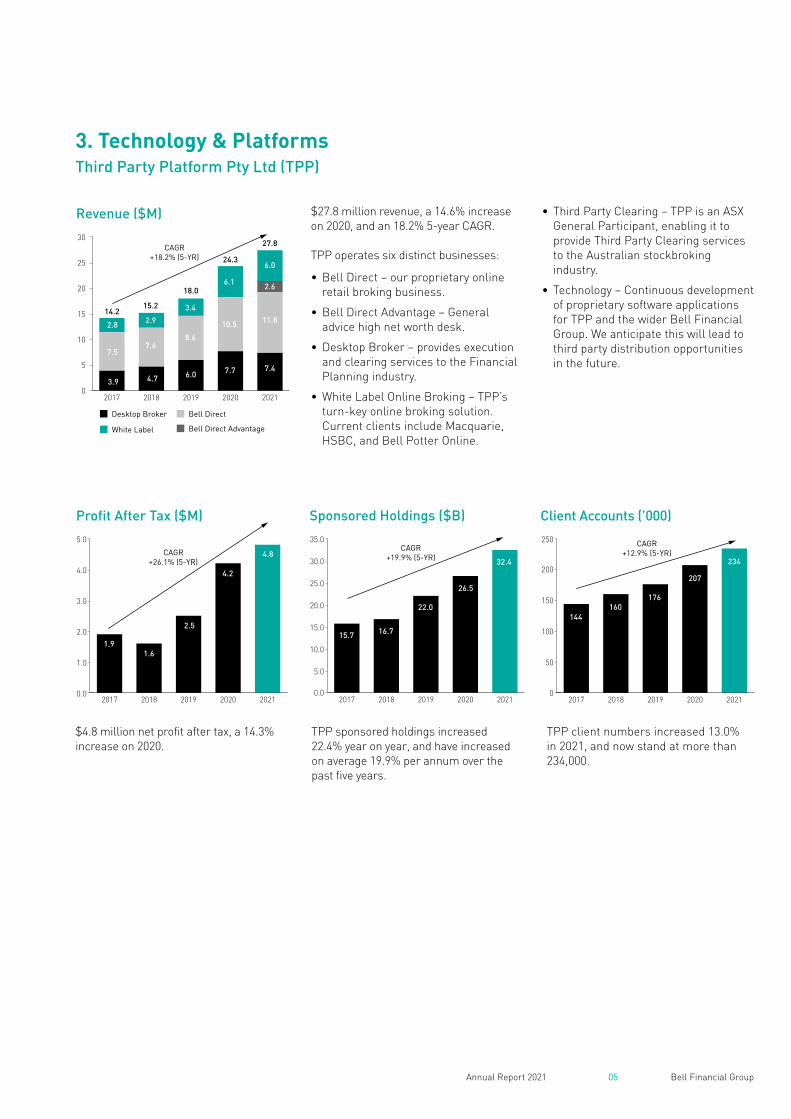
$27.8 million revenue, a 14.6% increase on 2020, and an 18.2% 5-year CAGR.
TPP operates six distinct businesses:
• Bell Direct – our proprietary online retail broking business.
• Bell Direct Advantage – General advice high net worth desk.
• Desktop Broker – provides execution and clearing services to the Financial Planning industry.
• White Label Online Broking – TPP’s turn-key online broking solution. Current clients include Macquarie, HSBC, and Bell Potter Online.
• Third Party Clearing – TPP is an ASX General Participant, enabling it to provide Third Party Clearing services to the Australian stockbroking industry.
• Technology – Continuous development of proprietary software applications for TPP and the wider Bell Financial Group. We anticipate this will lead to third party distribution opportunities in the future.
Sponsored Holdings ($B)
0.0
5.0
10.0
15.0
20.0
25.0
30.0
35.0
20212020201920182017
CAGR+19.9% (5-YR)
15.7 16.7
22.0
26.5
32.4
Profit After Tax ($M)
0.0
1.0
2.0
3.0
4.0
5.0
20212020201920182017
CAGR+26.1% (5-YR)
1.91.6
2.5
4.2
4.8
Client Accounts (’000)
0
50
100
150
200
250
20212020201920182017
CAGR+12.9% (5-YR)
144160
176
207
234
Revenue ($M)
30
25
20
15
10
5
020212020201920182017
7.5
2.8
7.6
2.9
8.6
3.4
10.5
6.1
2.82.9
3.4
6.1
6.1
6.0
11.8
2.6
7.4
3.9 4.7 6.0 7.7
14.215.2
18.0
24.3
27.8
Desktop Broker Bell Direct
Bell Direct AdvantageWhite Label
CAGR+18.2% (5-YR)
3. Technology & Platforms Third Party Platform Pty Ltd (TPP)
$4.8 million net profit after tax, a 14.3% increase on 2020.
TPP sponsored holdings increased 22.4% year on year, and have increased on average 19.9% per annum over the past five years.
TPP client numbers increased 13.0% in 2021, and now stand at more than 234,000.
06 Bell Financial GroupAnnual Report 2021
OPERATING AND FINANCIAL REVIEW continued
Loan Book ($M)
0
100
200
300
400
500
600
20212020201920182017
286 296
534
470
CAGR+16.9% (5-YR) 545
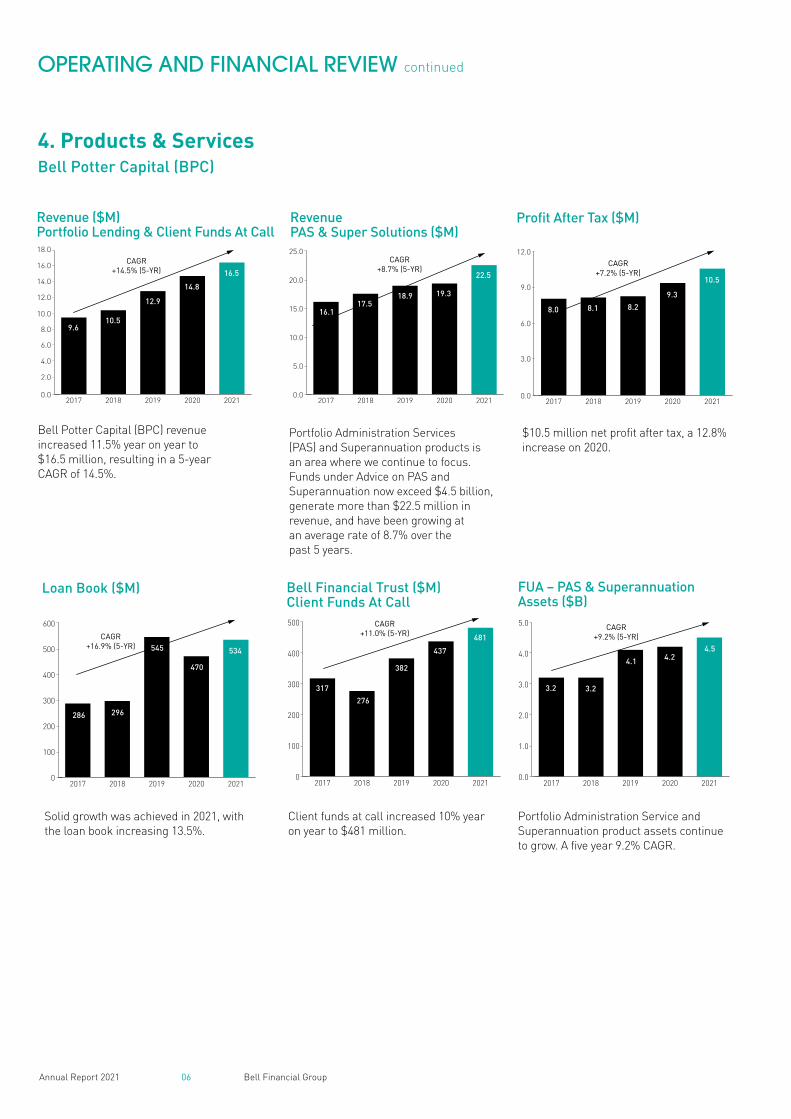
Bell Potter Capital (BPC) revenue increased 11.5% year on year to $16.5 million, resulting in a 5-year CAGR of 14.5%.
Solid growth was achieved in 2021, with the loan book increasing 13.5%.
Client funds at call increased 10% year on year to $481 million.
Portfolio Administration Service and Superannuation product assets continue to grow. A five year 9.2% CAGR.
Revenue ($M)Portfolio Lending & Client Funds At Call
0.0
4.0
2.0
6.0
8.0
12.0
10.0
16.0
14.0
18.0
20212020201920182017
CAGR+14.5% (5-YR)
9.610.5
12.9
14.8
16.5
Bell Financial Trust ($M) Client Funds At Call
0
100
200
300
400
500
20212020201920182017
317
276
382
437
481
CAGR+11.0% (5-YR)
FUA – PAS & Superannuation Assets ($B)
0.0
1.0
2.0
3.0
4.0
5.0
20212020201920182017
CAGR+9.2% (5-YR)
3.2 3.2
4.1 4.24.5
4. Products & ServicesBell Potter Capital (BPC)
Revenue PAS & Super Solutions ($M)
0.0
5.0
10.0
15.0
20.0
25.0
20212020201920182017
CAGR+8.7% (5-YR)
16.117.5
18.9 19.3
22.5
Profit After Tax ($M)
0.0
6.0
3.0
9.0
12.0
20212020201920182017
CAGR+7.2% (5-YR)
8.0 8.1 8.2
9.3
10.5
Portfolio Administration Services (PAS) and Superannuation products is an area where we continue to focus. Funds under Advice on PAS and Superannuation now exceed $4.5 billion, generate more than $22.5 million in revenue, and have been growing at an average rate of 8.7% over the past 5 years.
$10.5 million net profit after tax, a 12.8% increase on 2020.
07 Bell Financial GroupAnnual Report 2021
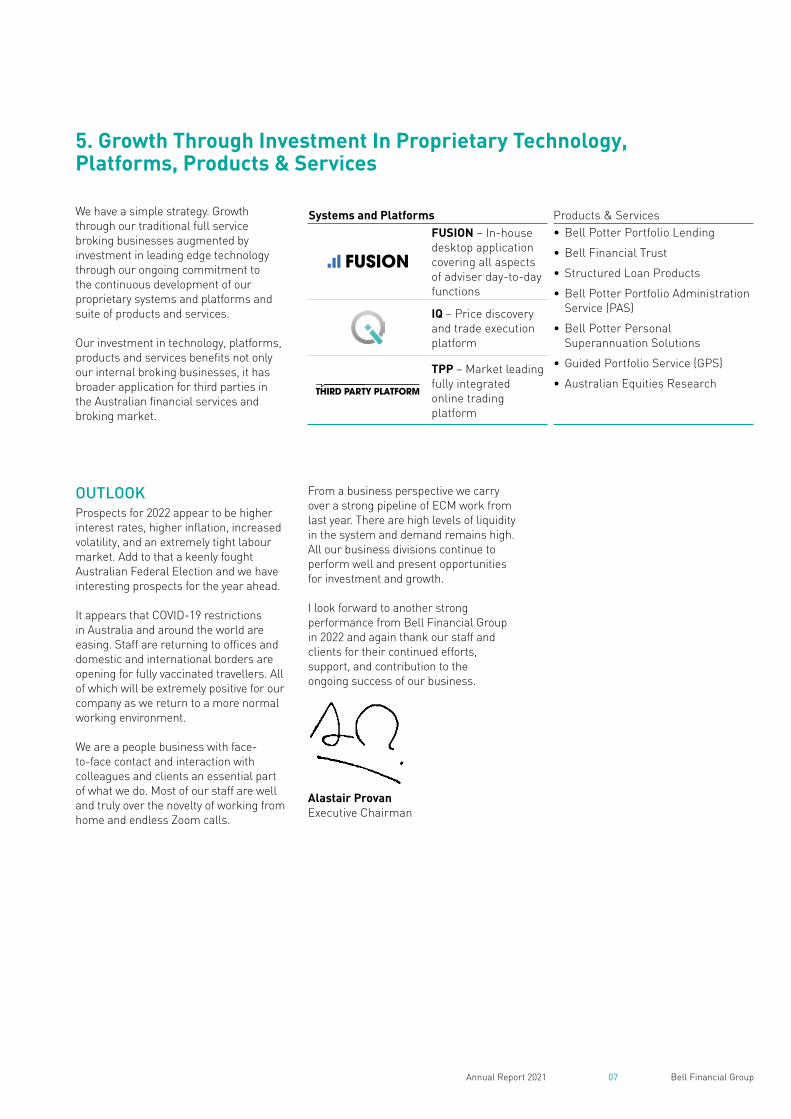
5. Growth Through Investment In Proprietary Technology, Platforms, Products & Services
OUTLOOKProspects for 2022 appear to be higher interest rates, higher inflation, increased volatility, and an extremely tight labour market. Add to that a keenly fought Australian Federal Election and we have interesting prospects for the year ahead.
It appears that COVID-19 restrictions in Australia and around the world are easing. Staff are returning to offices and domestic and international borders are opening for fully vaccinated travellers. All of which will be extremely positive for our company as we return to a more normal working environment.
We are a people business with face-to-face contact and interaction with colleagues and clients an essential part of what we do. Most of our staff are well and truly over the novelty of working from home and endless Zoom calls.
From a business perspective we carry over a strong pipeline of ECM work from last year. There are high levels of liquidity in the system and demand remains high. All our business divisions continue to perform well and present opportunities for investment and growth.
I look forward to another strong performance from Bell Financial Group in 2022 and again thank our staff and clients for their continued efforts, support, and contribution to the ongoing success of our business.
Alastair ProvanExecutive Chairman
We have a simple strategy. Growth through our traditional full service broking businesses augmented by investment in leading edge technology through our ongoing commitment to the continuous development of our proprietary systems and platforms and suite of products and services.
Our investment in technology, platforms, products and services benefits not only our internal broking businesses, it has broader application for third parties in the Australian financial services and broking market.
Systems and Platforms Products & ServicesFUSION – In-house desktop application covering all aspects of adviser day-to-day functions
• Bell Potter Portfolio Lending
• Bell Financial Trust
• Structured Loan Products
• Bell Potter Portfolio Administration Service (PAS)
• Bell Potter Personal Superannuation Solutions
• Guided Portfolio Service (GPS)
• Australian Equities Research
IQ – Price discovery and trade execution platform
THIRD PARTY PLATFORM
TPP – Market leading fully integrated online trading platform
08 Bell Financial GroupAnnual Report 2021
The Directors of Bell Financial Group Limited (Bell Financial or the Company) present their report, together with the financial report, on the consolidated entity (Group) consisting of Bell Financial and its controlled entities for the financial year ended 31 December 2021.
Board of DirectorsThe names and details of the Directors of the Company holding office during the financial year and as at the date of this report are listed below. Directors were in office for the entire period, unless otherwise stated.
DIRECTORS’ REPORTFor the year ended 31 December 2021
Alastair Provan
Mr Provan is the Executive Chairman of Bell Financial and he is responsible for the day-to-day management of all businesses within the Group. Mr Provan was appointed as Executive Chairman of Bell Financial in August 2019. Prior to that he was the Managing Director. Mr Provan joined Bell Commodities in 1983 and held a number of dealing and management roles prior to becoming Managing Director in 1989.
Graham CubbinBEcon (Hons), FAICD
Mr Cubbin is an Independent Director. He is also Chairman of the Group Risk and Audit Committee. Mr Cubbin was appointed to the Board in September 2007. Mr Cubbin was a senior executive with Consolidated Press Holdings Limited (CPH) from 1990 until September 2005, including Chief Financial Officer for 13 years. Prior to joining CPH, he held senior finance positions with a number of major companies including Capita Financial Group and Ford Motor Company. Mr Cubbin has over 20 years’ experience as a Director and Audit Committee member of public companies in Australia and the US. He is a Non-Executive Director of Teys Australia Pty Ltd.
Other listed companies – past three years
Non-Executive Director, McPherson’s Limited (September 2010-present)
Non-Executive Director, White Energy Company Limited (February 2010-present)
Non-Executive Director, WPP AUNZ Limited (May 2008-May 2021)
Brian Wilson AOMComm (Hons), Hon DUniv
Mr Wilson is an Independent Director. He is also a member of the Group Risk and Audit Committee. Mr Wilson was appointed to the Board in October 2009. He is a Senior Advisor to The Carlyle Group and Chairman of the UTS Foundation. Mr Wilson is the former Chairman of Australia’s Foreign Investment Review Board, a former Chancellor of University of Technology Sydney and a former member of the Payments System Board of the Reserve Bank of Australia. He was a member of the Commonwealth Government Review of Australia’s Superannuation System and a member of the ATO Superannuation Reform Steering Committee. Mr Wilson retired in 2009 as a Managing Director of the global investment bank Lazard, after co-founding the firm in Australia in 2004 and prior to that was a Vice-Chairman of Citigroup Australia and its predecessor companies.

09 Bell Financial GroupAnnual Report 2021
Christine FeldmanisBComm, MAppFin, SFFin, TFASFA, FAICD, CPA, CSA, AGIA, JP
Ms Feldmanis is a Non-Executive Director and was appointed to the Board in February 2020. She has more than 30 years of experience in the financial arena, with both government and private sectors. Ms Feldmanis has extensive experience in investment management, finance, accounting and risk management, legal and regulatory compliance, governance and business building in both the listed and unlisted financial products markets. She is currently a Non-Executive Director and Chair of the Audit and Risk Committees of Omni Bridgeway Ltd (formerly IMF Bentham Ltd), Rabobank Australia Ltd, Utilities of Australia Pty Ltd, Deputy Chair of Hunter Water Corporation, and is Chair of Bell Asset Management Ltd. Ms Feldmanis formerly held senior executive and C suite positions with firms including Deloitte, Elders Finance, Bankers Trust, NSW TCorp and Treasury Group Limited.
Other listed companies – past three years
Non-Executive Director, Omni Bridgeway Ltd (May 2008-present)
Non-Executive Director, Perpetual Equity Investment Company Ltd (September 2014-October 2020)
Craig ColemanBComm
Mr Coleman was appointed to the Board in July 2007 and retired on 17 February 2021. He was an Independent Director and a member of the Group Risk and Audit Committee. Mr Coleman is Executive Chairman of private and public equities fund manager, Viburnum Funds Pty Ltd. Previously, he was Managing Director and a Non-Executive Director of Home Building Society Limited. Prior to joining Home Building Society, Mr Coleman held a number of senior executive positions and directorships with ANZ, including Managing Director – Banking Products, Managing Director – Wealth Management and Non-Executive Director of Etrade Australia Limited.
Other listed companies – past three years
Chairman, Sports Entertainment Group Ltd (November 2017-present)
Chairman, Universal Biosensors Inc (June 2016-present)
10 Bell Financial GroupAnnual Report 2021
DIRECTORS’ REPORT continued
For the year ended 31 December 2021
Principal activitiesBell Financial is an Australian-based provider of full service and online broking, investment and financial advisory services to private, institutional and corporate clients. The Group is also a developer of proprietary technology, platforms, products and services for the Australian stockbroking market. With over 760 employees, Bell Financial operates across 13 offices in Australia and has offices in New York, London, Hong Kong and Kuala Lumpur.
Review and results of operationsInformation on the operations and financial position of the Group is set out in our Operating and Financial Review on pages 2 to 7.
At the date of issue of this financial report, the impact of COVID-19 on Bell Financial has not been material. The future impact on global and domestic economies and investment market indices is uncertain and Bell Financial continues to monitor.
DividendsOn 16 February 2022, the Directors resolved to pay a fully franked final dividend of 6.5 cents per share.
Dividends paid to shareholders during the year ended 31 December 2021 were as follows:
Dividend Per shareTotal
$’000Fully
FrankedDate of
paymentFinal 2020 ordinary 6.5 cents 20,848 Yes 17 March 2021Interim 2021 ordinary 4.5 cents 14,433 Yes 26 August 2021
Significant changes in the state of affairsThere were no significant changes in Bell Financial’s state of affairs or the nature of its principal activities during the financial year ended 31 December 2021.
Business strategies, prospects and likely developmentsThe Operating and Financial Review sets out key information on Bell Financial’s operations and financial position, and provides an overview of its business strategies and prospects for future financial years. Details likely to result in unreasonable prejudice to the Group (e.g. information that is commercially sensitive, confidential or which could give a third party a commercial advantage) have not been included.
Events after the end of the financial yearThere has not arisen in the interval between the end of the financial year and the date of this report, any matter or circumstance that has significantly affected, or may significantly affect, in the opinion of the Directors of Bell Financial:
(a) the Group’s operations in future financial years, or
(b) the results of those operations in future financial years, or
(c) the Group’s state of affairs in future financial years.
Directors’ meetingsThe number of Board and Committee meetings held during the year that each Director was eligible to attend, and the number of meetings attended by each Director were:
Board Group Risk and Audit CommitteeDirector Held Attended Held Attended ObservedAlastair Provan 4 4 5 - 5Graham Cubbin 4 4 5 5 -Brian Wilson AO 4 4 5 5 -Christine Feldmanis 4 4 5 4 1Craig Coleman1 1 1 1 1 -
1. Craig Coleman retired from the Board on 17 February 2021.
11 Bell Financial GroupAnnual Report 2021
Directors’ shareholdings in Bell Financial GroupAs at the date of this report, the relevant interests of each Director in BFG ordinary shares, as notified to the ASX in accordance with the Corporations Act 2001 (Corporations Act), are set out below. No Directors held options over BFG shares during the year ended 31 December 2021.
Director
Fully paid ordinary
shares
Deemed relevant interest Total
Alastair Provan1 4,999,070 146,230,350 151,229,420Graham Cubbin 216,000 - 216,000Brian Wilson AO 1,200,000 - 1,200,000Christine Feldmanis 50,000 - 50,000
1. Bell Group Holdings Pty Limited (BGH) holds 143,998,350 BFG ordinary shares. BGH’s wholly-owned subsidiary, Bell Securities Pty Limited (BSPL) holds 2,232,000 BFG ordinary shares. Alastair Provan holds more than 20% of BGH and therefore under the Corporations Act is deemed to have a relevant interest in the 146,230,350 BFG ordinary shares held by BGH and BSPL.
Company SecretaryCindy-Jane Lee, BEc, LLB, GAICD was appointed as Company Secretary on 10 January 2014 and is also the Group’s General Counsel. Before joining Bell Financial, Ms Lee held the position of Regional Legal Counsel, South Asia with Mercer. Ms Lee has over 20 years’ experience in corporate and financial services law working in law firms and multinational companies in Australia, London and Singapore. Ms Lee holds a Bachelor of Economics and a Bachelor of Laws from Monash University.
Corporate GovernanceBell Financial recognises the importance of good corporate governance. As required under the ASX listing rules, Bell Financial has a Corporate Governance Statement which has been lodged with the ASX, disclosing the extent to which we have followed the recommendations set by the ASX Corporate Governance Council during the reporting period. A copy of our Corporate Governance Statement is located at the Corporate Governance section of our website: www.bellfg.com.au/#corporate-governance. Copies of the Board Charter, Code of Conduct, Group Risk and Audit Committee Charter, Diversity Policy, Disclosure and Communication Policy and Guidelines, Description of Risk Management Policy and Framework, Trading Policy, Whistleblower Policy and Modern Slavery Statement are also located here.
Directors’ and officers’ indemnity and insuranceBell Financial has agreed to indemnify the Directors against all liabilities to another person (other than Bell Financial or a related entity) that may arise from their position as officers of Bell Financial or its controlled entities, except where the liability arises out of conduct including a lack of good faith. Except for the above, neither Bell Financial nor any of its controlled entities has indemnified any person who is or has been an officer or auditor of Bell Financial or its controlled entities. Since the end of the previous financial year Bell Financial has paid a premium for an insurance policy for the benefit of the Directors, officers, company secretaries and senior executives. The insurance policy prohibits disclosure of the premium payable under the policy and the nature of the liability covered.
Environmental regulationThe operations of the Group are not subject to any particular and significant environmental regulation under a law of the Commonwealth or of a State or Territory.
Non-audit servicesDuring the year, Bell Financial’s auditor, KPMG, performed certain other services in addition to its statutory auditor duties. Details of the amounts paid to KPMG for audit and non-audit services during the year are set out in Note 38 of the Financial Statements.
The Directors are satisfied, based on advice provided by the Group Risk and Audit Committee, that the provision of these non-audit services during the year by the auditor is compatible with, and does not compromise, the general standard of independence for auditors imposed by the Corporations Act, for the reasons that:
• services provided during the year are not considered to be materially in conflict with the role of the auditor; and
• the Directors are unaware of any matter relating to the provision of non-audit services which would impair the impartial and objective judgement of the auditor.
A copy of the Lead Auditor’s Independence Declaration is set out on page 17.
12 Bell Financial GroupAnnual Report 2021
DIRECTORS’ REPORT continued
For the year ended 31 December 2021
Remuneration Report (audited)This Remuneration Report describes Bell Financial’s ‘Key Management Personnel’ (KMP) remuneration arrangements as required by the Corporations Act.
1. KMPBell Financial’s KMP during the reporting period were:
DirectorsAlastair Provan Executive ChairmanGraham Cubbin Independent DirectorBrian Wilson AO Independent DirectorChristine Feldmanis Non-Executive DirectorCraig Coleman1 Independent Director
Senior ExecutivesLewis Bell Head of ComplianceAndrew Bell Executive Director – Bell Potter Securities LtdDean Davenport Chief Financial OfficerRowan Fell Chief Executive Officer – Bell Potter Capital Ltd
1. Craig Coleman retired from the Board on 17 February 2021.
In this report, ‘Executive KMP’ refers to the above persons excluding Independent Directors and Non-Executive Directors.
2. Overview of remuneration policy and frameworkBell Financial remunerates Executive KMP and other executives, management and advisers by one or more of fixed salary, commission entitlements and other short-term and long-term incentives. Independent Directors and Non-Executive Directors receive a fixed fee and the superannuation guarantee rate only for their role on the Board. Where remuneration is linked to performance, net profit/(loss) after tax and Earnings per Share are key performance measures, in addition to individual objectives. In considering the Group’s performance and benefits for shareholder wealth, the Board has regard to the following financial indicators in respect of the current financial year and previous financial years.
2017 2018 2019 2020 2021Net profit/(loss) after tax $’000 $21,443 $24,737 $32,443 $46,695 $44,118Share price at year end $ $0.75 $0.85 $1.19 $1.82 $1.865Earnings per Share (cents) 7.8 8.4 10.2 14.6 13.8Dividends paid $’000 $15,196 $23,312 $24,660 $27,263 $35,281
The Company has established two equity-based plans to assist in the attraction, retention and motivation of Executive KMP, management and employees of the Company, the Long-Term Incentive Plan (LTIP) and the Employee Share Acquisition (Tax Exempt) Plan. Each plan contains customary and standard terms for dealing with the administration of an employee share plan, and the termination and suspension of the plan. Participants in the plans must not enter into a transaction or arrangement or otherwise deal in financial products which operate to limit the economic risk of the unvested Bell Financial securities issued under the plans.
3. Fixed compensationFixed compensation consists of base compensation as well as employer contributions to superannuation funds. Compensation levels are reviewed annually through a process that considers individual performance and that of the overall Group.
4. CommissionCommission entitlements are determined by the Board from time to time and aim to align the remuneration of Executive KMP and advisers with the Company’s performance. Certain executives and advisers are paid a commission based on revenue generated by the individual during the year. This creates a strong incentive for key executives and advisers to maximise the Company’s revenue and performance.
13 Bell Financial GroupAnnual Report 2021
5. Performance linked compensationPerformance linked compensation includes both short-term and long-term incentives and is designed to reward Executive KMP for meeting or exceeding their financial and individual objectives. The short-term incentive is an ‘at risk’ bonus provided in the form of cash and/or shares, while the long-term incentive is provided as options or performance rights over ordinary shares of the Company.
6. Short-term incentive bonusThe Company may pay Executive KMP and other executives a short-term incentive (STI) annually. The Board is responsible for determining who is eligible to participate in STI arrangements, as well as the structure of those arrangements.
There are two types of STI arrangements, being:
• the STI payable to executives who are not remunerated by reference to commission, which is a discretionary annual cash bonus and/or shares determined based on the Company’s financial performance during the year, key performance indicators, industry competitive measures and individual performance over the period; and
• the STI payable to the Executive Chairman, which is a discretionary annual cash bonus, up to three times annual salary, determined based on the Company’s financial performance during the year, key performance indicators and individual performance over the period.
These STI arrangements aim to ensure that executive remuneration is aligned with the Company’s financial performance and growth.
7. Long-term incentive plan (LTIP)The LTIP is part of the Company’s remuneration strategy and is designed to align the interests of the Company’s Executive KMP, other executives and advisers with the interests of shareholders to assist the Company in the attraction, motivation and retention of Executive KMP, other executives and advisers. In particular, the LTIP is designed to provide relevant Executive KMP, other executives and advisers with an incentive for future performance, with conditions for the vesting and exercise of the options or performance rights under the LTIP, therefore encouraging them to remain with the Company and contribute to its future performance.
Eligible persons participating may be granted options or performance rights on the terms and conditions in the LTIP rules and as determined by the Board from time to time. An option or performance right is a right, subject to the satisfaction of the applicable vesting conditions and exercise conditions, to subscribe for a share in the Company.
If persons become entitled to participate in the LTIP and their participation requires approval under Chapter 10 of the ASX listing rules, they will not participate in the LTIP until that shareholder approval is received.
No options or performance rights were granted under the LTIP in 2021.
8. Service agreements
8.1 Executive ChairmanBell Financial entered into a service agreement with its Executive Chairman, Alastair Provan effective from listing in December 2007. This agreement sets out the terms of his appointment, including responsibilities, duties, rights and remuneration.
A summary of Mr Provan’s remuneration including benefits under the short-term and long-term incentive plans is set out in the KMP remuneration table in Section 8.4.
Bell Financial may terminate Mr Provan’s service agreement on 12 months’ notice, or immediately for cause. If his agreement is terminated on 12 months’ notice, Bell Financial has agreed to vest early any unvested options under the LTIP and to allow their early exercise. Mr Provan may terminate his service agreement on six months’ notice. He has entered into non-competition covenants with Bell Financial which operate for six months from termination of his service agreement.
8.2 Senior ExecutivesAll key executives are permanent employees of Bell Financial. Each executive has an employment contract with no fixed end date. Any executive may resign from their position by giving four weeks’ written notice. The Company may terminate an employment contract by providing written notice or making payment in lieu of notice in accordance with the Company’s termination policies. The Company may terminate an employment contract at any time for serious misconduct.
14 Bell Financial GroupAnnual Report 2021
DIRECTORS’ REPORT continued
For the year ended 31 December 2021
Remuneration Report (audited) continued
8. Service agreements continued
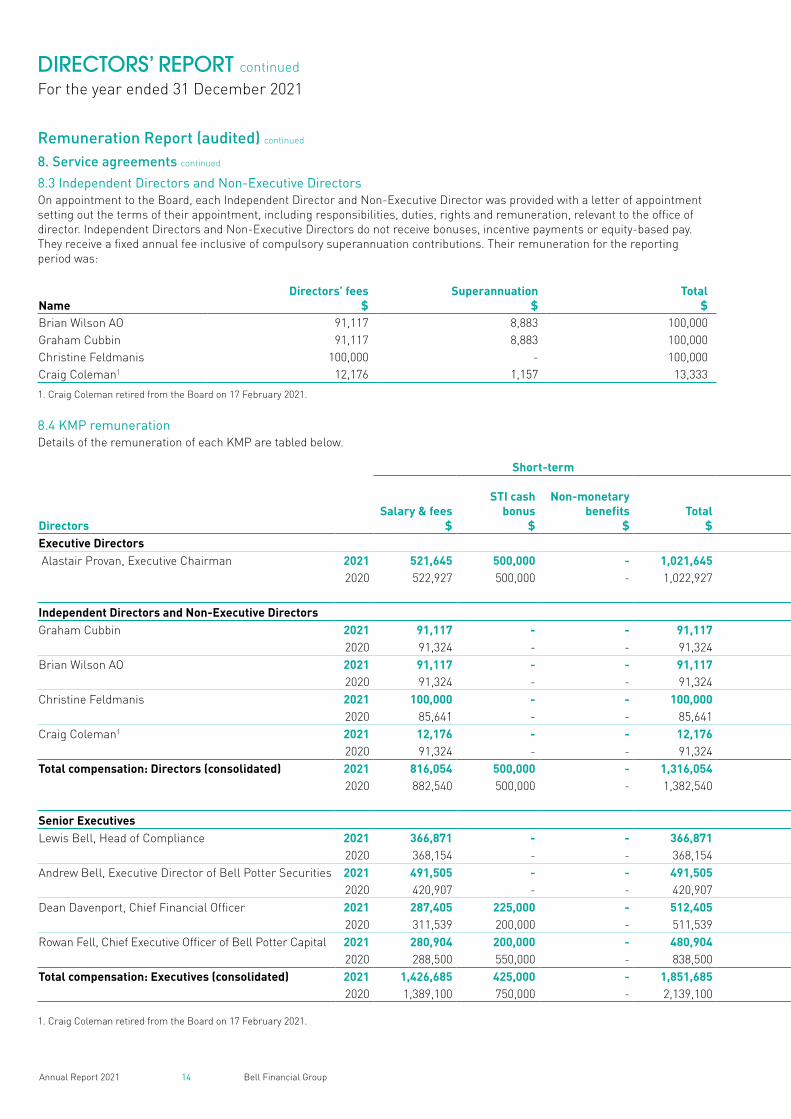
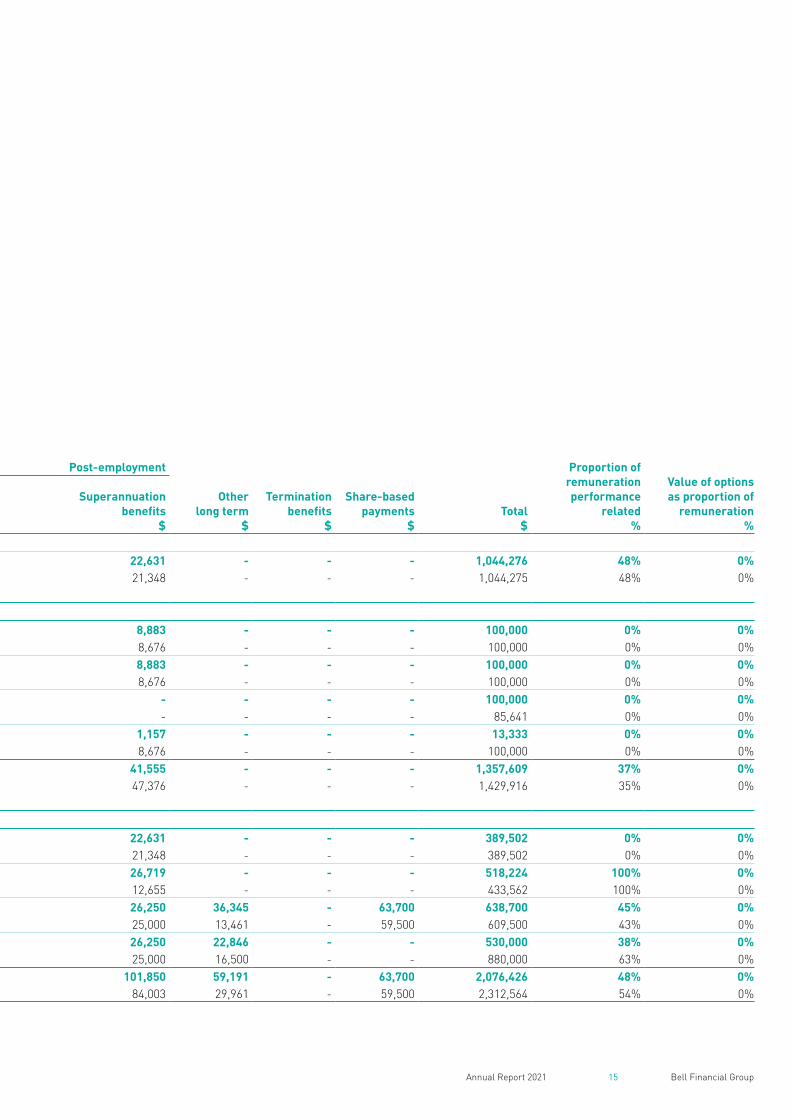
8.3 Independent Directors and Non-Executive DirectorsOn appointment to the Board, each Independent Director and Non-Executive Director was provided with a letter of appointment setting out the terms of their appointment, including responsibilities, duties, rights and remuneration, relevant to the office of director. Independent Directors and Non-Executive Directors do not receive bonuses, incentive payments or equity-based pay. They receive a fixed annual fee inclusive of compulsory superannuation contributions. Their remuneration for the reporting period was:
NameDirectors’ fees
$Superannuation
$Total
$Brian Wilson AO 91,117 8,883 100,000Graham Cubbin 91,117 8,883 100,000Christine Feldmanis 100,000 - 100,000Craig Coleman1 12,176 1,157 13,333
1. Craig Coleman retired from the Board on 17 February 2021.
8.4 KMP remunerationDetails of the remuneration of each KMP are tabled below.
Short-term Post-employment
Other long term
$
Termination benefits
$
Share-based payments
$Total
$
Proportion of remuneration performance
related%
Value of options as proportion of
remuneration %Directors
Salary & fees $
STI cash bonus
$
Non-monetary benefits
$Total
$
Superannuation benefits
$Executive Directors Alastair Provan, Executive Chairman 2021 521,645 500,000 - 1,021,645 22,631 - - - 1,044,276 48% 0%
2020 522,927 500,000 - 1,022,927 21,348 - - - 1,044,275 48% 0%
Independent Directors and Non-Executive DirectorsGraham Cubbin 2021 91,117 - - 91,117 8,883 - - - 100,000 0% 0%
2020 91,324 - - 91,324 8,676 - - - 100,000 0% 0%Brian Wilson AO 2021 91,117 - - 91,117 8,883 - - - 100,000 0% 0%
2020 91,324 - - 91,324 8,676 - - - 100,000 0% 0%Christine Feldmanis 2021 100,000 - - 100,000 - - - - 100,000 0% 0%
2020 85,641 - - 85,641 - - - - 85,641 0% 0%Craig Coleman1 2021 12,176 - - 12,176 1,157 - - - 13,333 0% 0%
2020 91,324 - - 91,324 8,676 - - - 100,000 0% 0%Total compensation: Directors (consolidated) 2021 816,054 500,000 - 1,316,054 41,555 - - - 1,357,609 37% 0%
2020 882,540 500,000 - 1,382,540 47,376 - - - 1,429,916 35% 0%
Senior ExecutivesLewis Bell, Head of Compliance 2021 366,871 - - 366,871 22,631 - - - 389,502 0% 0%
2020 368,154 - - 368,154 21,348 - - - 389,502 0% 0%Andrew Bell, Executive Director of Bell Potter Securities 2021 491,505 - - 491,505 26,719 - - - 518,224 100% 0%
2020 420,907 - - 420,907 12,655 - - - 433,562 100% 0%Dean Davenport, Chief Financial Officer 2021 287,405 225,000 - 512,405 26,250 36,345 - 63,700 638,700 45% 0%
2020 311,539 200,000 - 511,539 25,000 13,461 - 59,500 609,500 43% 0%Rowan Fell, Chief Executive Officer of Bell Potter Capital 2021 280,904 200,000 - 480,904 26,250 22,846 - - 530,000 38% 0%
2020 288,500 550,000 - 838,500 25,000 16,500 - - 880,000 63% 0%Total compensation: Executives (consolidated) 2021 1,426,685 425,000 - 1,851,685 101,850 59,191 - 63,700 2,076,426 48% 0%
2020 1,389,100 750,000 - 2,139,100 84,003 29,961 - 59,500 2,312,564 54% 0%
1. Craig Coleman retired from the Board on 17 February 2021.
15 Bell Financial GroupAnnual Report 2021
Remuneration Report (audited) continued
8. Service agreements continued
8.3 Independent Directors and Non-Executive DirectorsOn appointment to the Board, each Independent Director and Non-Executive Director was provided with a letter of appointment setting out the terms of their appointment, including responsibilities, duties, rights and remuneration, relevant to the office of director. Independent Directors and Non-Executive Directors do not receive bonuses, incentive payments or equity-based pay. They receive a fixed annual fee inclusive of compulsory superannuation contributions. Their remuneration for the reporting period was:
NameDirectors’ fees
$Superannuation
$Total
$Brian Wilson AO 91,117 8,883 100,000Graham Cubbin 91,117 8,883 100,000Christine Feldmanis 100,000 - 100,000Craig Coleman1 12,176 1,157 13,333
1. Craig Coleman retired from the Board on 17 February 2021.
8.4 KMP remunerationDetails of the remuneration of each KMP are tabled below.
Short-term Post-employment
Other long term
$
Termination benefits
$
Share-based payments
$Total
$
Proportion of remuneration performance
related%
Value of options as proportion of
remuneration %Directors
Salary & fees $
STI cash bonus
$
Non-monetary benefits
$Total
$
Superannuation benefits
$Executive Directors Alastair Provan, Executive Chairman 2021 521,645 500,000 - 1,021,645 22,631 - - - 1,044,276 48% 0%
2020 522,927 500,000 - 1,022,927 21,348 - - - 1,044,275 48% 0%
Independent Directors and Non-Executive DirectorsGraham Cubbin 2021 91,117 - - 91,117 8,883 - - - 100,000 0% 0%
2020 91,324 - - 91,324 8,676 - - - 100,000 0% 0%Brian Wilson AO 2021 91,117 - - 91,117 8,883 - - - 100,000 0% 0%
2020 91,324 - - 91,324 8,676 - - - 100,000 0% 0%Christine Feldmanis 2021 100,000 - - 100,000 - - - - 100,000 0% 0%
2020 85,641 - - 85,641 - - - - 85,641 0% 0%Craig Coleman1 2021 12,176 - - 12,176 1,157 - - - 13,333 0% 0%
2020 91,324 - - 91,324 8,676 - - - 100,000 0% 0%Total compensation: Directors (consolidated) 2021 816,054 500,000 - 1,316,054 41,555 - - - 1,357,609 37% 0%
2020 882,540 500,000 - 1,382,540 47,376 - - - 1,429,916 35% 0%
Senior ExecutivesLewis Bell, Head of Compliance 2021 366,871 - - 366,871 22,631 - - - 389,502 0% 0%
2020 368,154 - - 368,154 21,348 - - - 389,502 0% 0%Andrew Bell, Executive Director of Bell Potter Securities 2021 491,505 - - 491,505 26,719 - - - 518,224 100% 0%
2020 420,907 - - 420,907 12,655 - - - 433,562 100% 0%Dean Davenport, Chief Financial Officer 2021 287,405 225,000 - 512,405 26,250 36,345 - 63,700 638,700 45% 0%
2020 311,539 200,000 - 511,539 25,000 13,461 - 59,500 609,500 43% 0%Rowan Fell, Chief Executive Officer of Bell Potter Capital 2021 280,904 200,000 - 480,904 26,250 22,846 - - 530,000 38% 0%
2020 288,500 550,000 - 838,500 25,000 16,500 - - 880,000 63% 0%Total compensation: Executives (consolidated) 2021 1,426,685 425,000 - 1,851,685 101,850 59,191 - 63,700 2,076,426 48% 0%
2020 1,389,100 750,000 - 2,139,100 84,003 29,961 - 59,500 2,312,564 54% 0%
1. Craig Coleman retired from the Board on 17 February 2021.
16 Bell Financial GroupAnnual Report 2021
DIRECTORS’ REPORT continued
For the year ended 31 December 2021
Remuneration Report (audited) continued
8. Service agreements continued
8.5 Options and equity instrumentsNo options over the Company’s shares or other equity instruments are held by KMP.
9. Loans to KMP and their related parties
All loans to KMP and their related parties are margin loans provided in the ordinary course of business on standard terms and conditions that are no more favourable than those provided to other employees or clients, including the interest rate and security required. Details on the aggregate loans provided to KMP and their related parties are as follows.
31 Dec 2021$
Opening balance 1,896,810Closing balance1 2,020,423Interest charged 52,649
1. The aggregate loan amount at the end of the reporting period includes loans to 5 KMP.
Details of KMP (including their related parties) with an aggregate of loans above $100,000 during the reporting period are as follows:
Balance 1 Jan 21
$
Balance 31 Dec 21
$
Interest paid and payable
in period $
Highest balance in
period1
$Lewis Bell 100,965 298,908 3,248 298,908Andrew Bell 404,494 539,310 11,282 539,310Rowan Fell 861,383 971,756 29,404 1,190,222Dean Davenport 176,093 210,449 5,554 220,822Craig Coleman 353,875 - 3,161 476,527
1. Represents the highest loan balance during the reporting period for the individual KMP. All other items in the table relate to KMP and their related parties.
Lead auditor’s independence declarationThe lead auditor’s independence declaration is set out on page 17 and forms part of the Directors’ Report for the financial year ended 31 December 2021.
Rounding of amountsBell Financial is an entity to which ASIC Corporations (Rounding in Financial/Directors’ Reports) Instrument 2016/191 applies. Amounts in this report have been rounded off in accordance with that instrument to the nearest thousand dollars, or in certain cases, to the nearest dollar.
This report is made on 16 February 2022 in accordance with a resolution of the directors.
Alastair ProvanExecutive Chairman
16 February 2022
17 Bell Financial GroupAnnual Report 2021
LEAD AUDITOR’S INDEPENDENCE DECLARATIONFor the year ended 31 December 2021
KPMG, an Australian partnership and a member firm of the KPMG global organisation of independent member firms affiliated with KPMG International Limited, a private English company limited by guarantee. All rights reserved. The KPMG name and logo are trademarks used under license by the independent member firms of the KPMG global organisation. Liability limited by a scheme approved under Professional Standards Legislation.
Lead Auditor’s Independence Declaration under
Section 307C of the Corporations Act 2001
To the Directors of Bell Financial Group Ltd
I declare that, to the best of my knowledge and belief, in relation to the audit of Bell Financial Group Limited for the financial year ended 31 December 2021 there have been:
i. no contraventions of the auditor independence requirements as set out in theCorporations Act 2001 in relation to the audit; and
ii. no contraventions of any applicable code of professional conduct in relation to the audit.
KPMG Chris Wooden
Partner
Melbourne
16 February 2022
18 Bell Financial GroupAnnual Report 2021
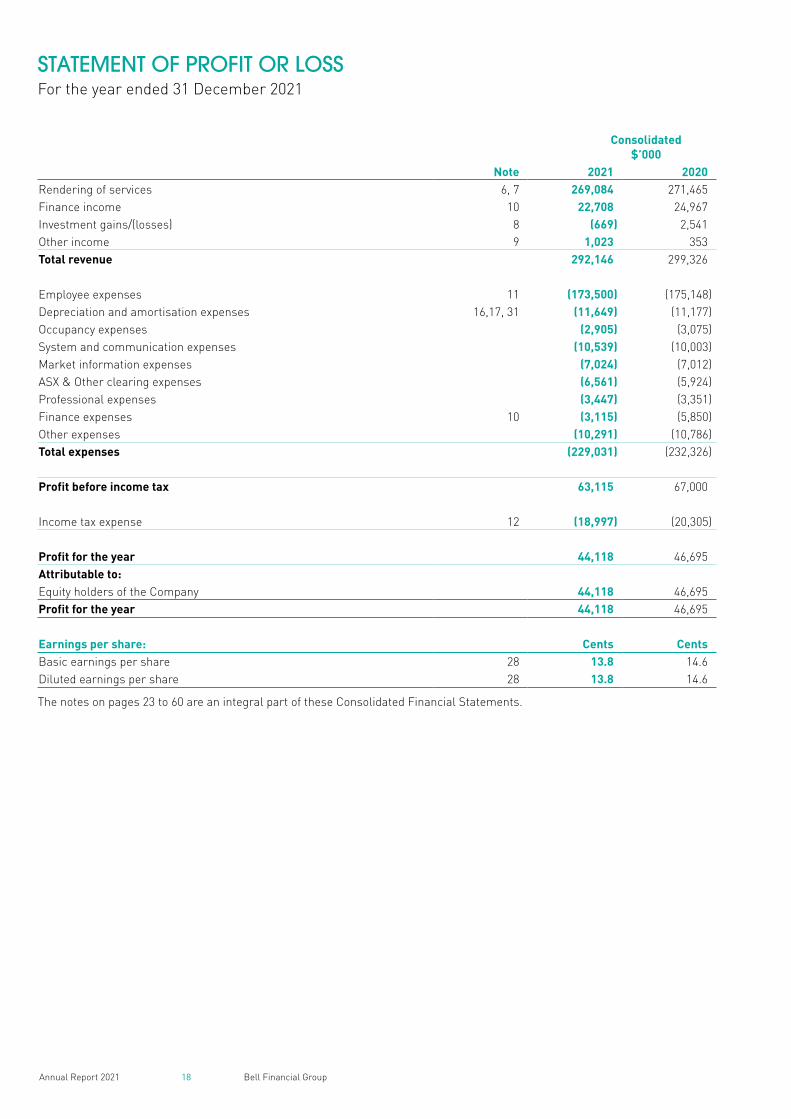
STATEMENT OF PROFIT OR LOSSFor the year ended 31 December 2021
Consolidated $’000
Note 2021 2020Rendering of services 6, 7 269,084 271,465Finance income 10 22,708 24,967Investment gains/(losses) 8 (669) 2,541Other income 9 1,023 353Total revenue 292,146 299,326
Employee expenses 11 (173,500) (175,148)Depreciation and amortisation expenses 16,17, 31 (11,649) (11,177)Occupancy expenses (2,905) (3,075)System and communication expenses (10,539) (10,003)Market information expenses (7,024) (7,012)ASX & Other clearing expenses (6,561) (5,924)Professional expenses (3,447) (3,351)Finance expenses 10 (3,115) (5,850)Other expenses (10,291) (10,786)Total expenses (229,031) (232,326)
Profit before income tax 63,115 67,000
Income tax expense 12 (18,997) (20,305)
Profit for the year 44,118 46,695Attributable to:Equity holders of the Company 44,118 46,695Profit for the year 44,118 46,695
Earnings per share: Cents CentsBasic earnings per share 28 13.8 14.6Diluted earnings per share 28 13.8 14.6
The notes on pages 23 to 60 are an integral part of these Consolidated Financial Statements.
19 Bell Financial GroupAnnual Report 2021
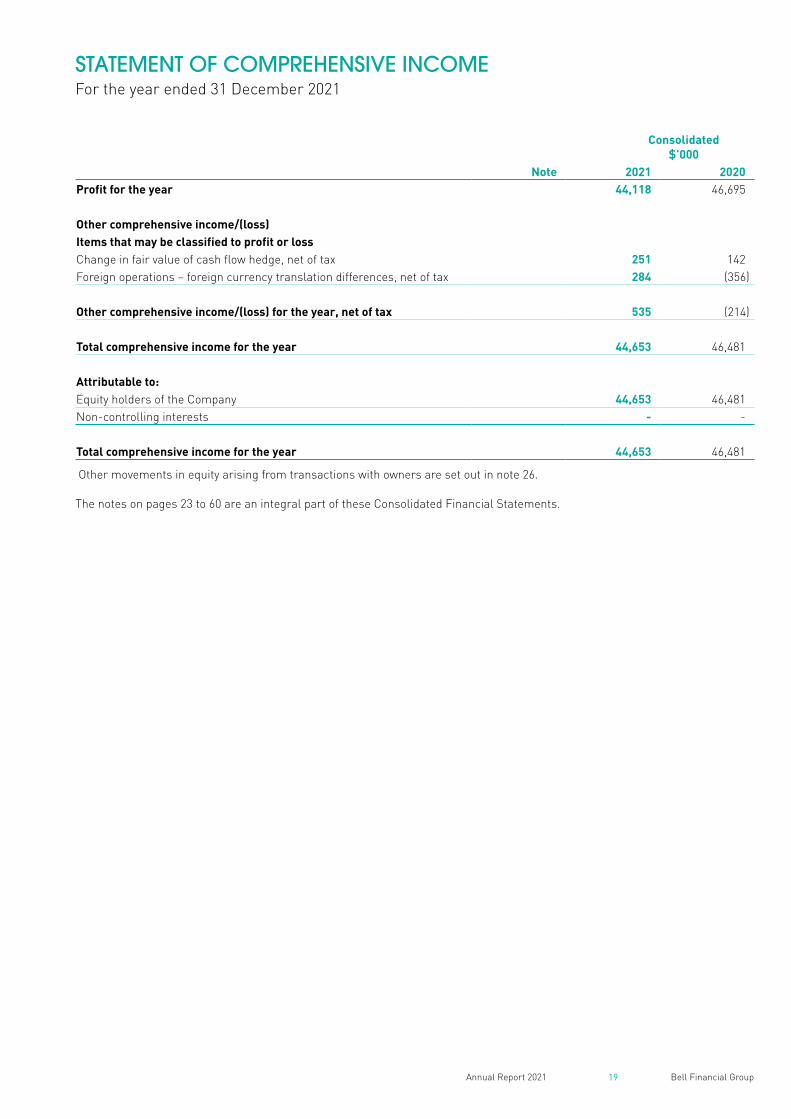
STATEMENT OF COMPREHENSIVE INCOMEFor the year ended 31 December 2021
Consolidated$’000
Note 2021 2020Profit for the year 44,118 46,695
Other comprehensive income/(loss)Items that may be classified to profit or lossChange in fair value of cash flow hedge, net of tax 251 142Foreign operations – foreign currency translation differences, net of tax 284 (356)
Other comprehensive income/(loss) for the year, net of tax 535 (214)
Total comprehensive income for the year 44,653 46,481
Attributable to:Equity holders of the Company 44,653 46,481Non-controlling interests - -
Total comprehensive income for the year 44,653 46,481
Other movements in equity arising from transactions with owners are set out in note 26.
The notes on pages 23 to 60 are an integral part of these Consolidated Financial Statements.
20 Bell Financial GroupAnnual Report 2021
Consolidated$’000
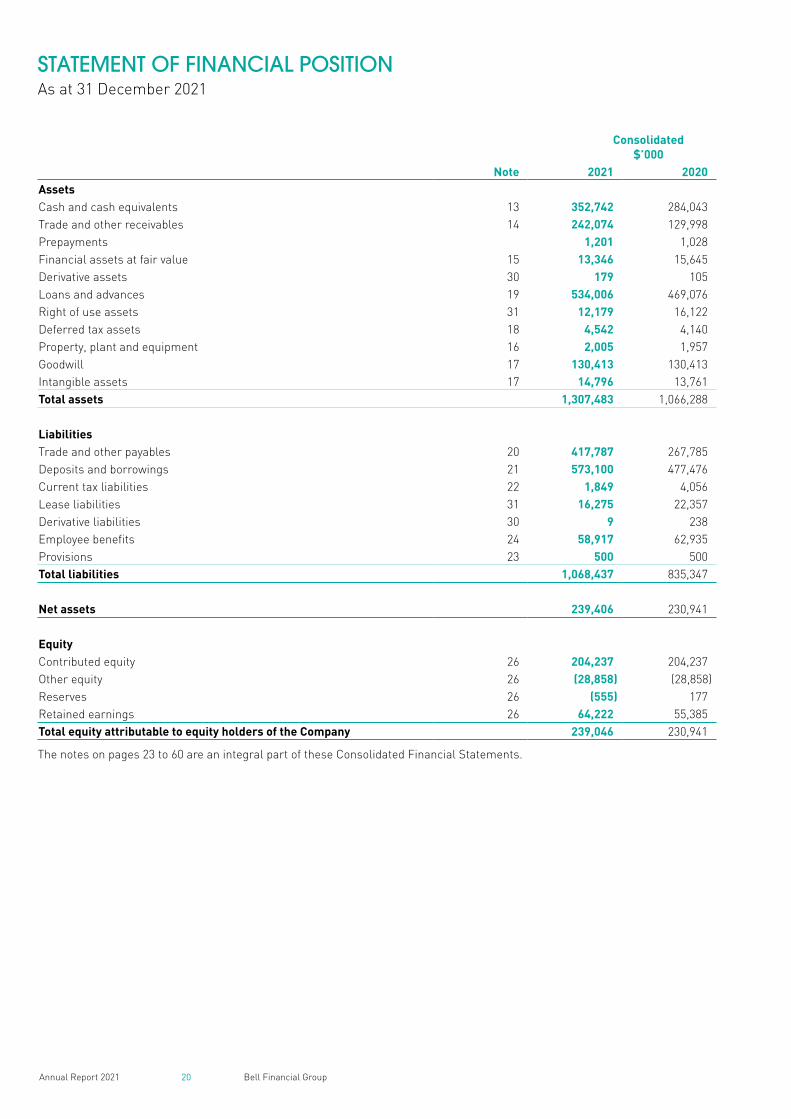
Note 2021 2020AssetsCash and cash equivalents 13 352,742 284,043Trade and other receivables 14 242,074 129,998Prepayments 1,201 1,028Financial assets at fair value 15 13,346 15,645Derivative assets 30 179 105Loans and advances 19 534,006 469,076Right of use assets 31 12,179 16,122Deferred tax assets 18 4,542 4,140Property, plant and equipment 16 2,005 1,957Goodwill 17 130,413 130,413Intangible assets 17 14,796 13,761Total assets 1,307,483 1,066,288
LiabilitiesTrade and other payables 20 417,787 267,785Deposits and borrowings 21 573,100 477,476Current tax liabilities 22 1,849 4,056Lease liabilities 31 16,275 22,357Derivative liabilities 30 9 238Employee benefits 24 58,917 62,935Provisions 23 500 500Total liabilities 1,068,437 835,347
Net assets 239,406 230,941
EquityContributed equity 26 204,237 204,237Other equity 26 (28,858) (28,858)Reserves 26 (555) 177Retained earnings 26 64,222 55,385Total equity attributable to equity holders of the Company 239,046 230,941
The notes on pages 23 to 60 are an integral part of these Consolidated Financial Statements.
STATEMENT OF FINANCIAL POSITIONAs at 31 December 2021
21 Bell Financial GroupAnnual Report 2021
STATEMENT OF CHANGES IN EQUITY
Share Capital
$‘000
OtherEquity$‘000
Treasury Shares
Reserve$‘000
Share Based
Payments Reserve
$‘000
Cash Flow
Hedge Reserve
$‘000
Foreign Currency Reserve
$‘000
Retained Earnings
$‘000
TotalEquity$‘000
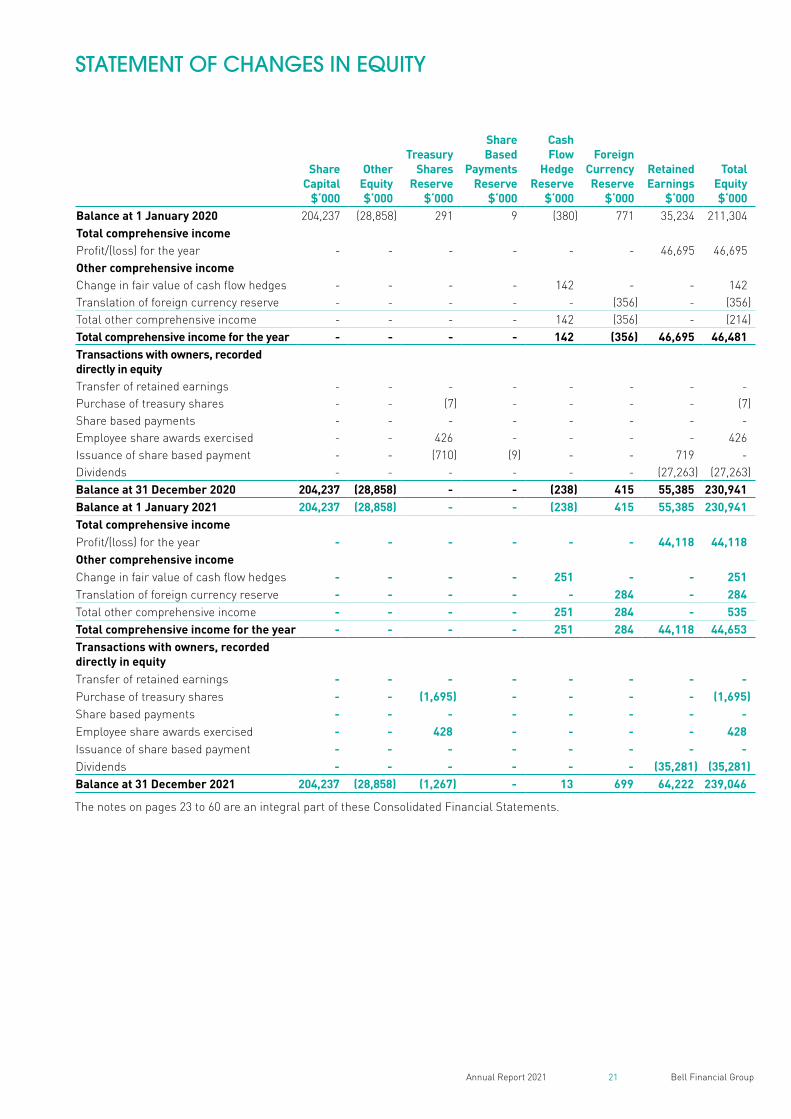
Balance at 1 January 2020 204,237 (28,858) 291 9 (380) 771 35,234 211,304Total comprehensive incomeProfit/(loss) for the year - - - - - - 46,695 46,695Other comprehensive incomeChange in fair value of cash flow hedges - - - - 142 - - 142Translation of foreign currency reserve - - - - - (356) - (356)Total other comprehensive income - - - - 142 (356) - (214)Total comprehensive income for the year - - - - 142 (356) 46,695 46,481Transactions with owners, recorded directly in equityTransfer of retained earnings - - - - - - - -Purchase of treasury shares - - (7) - - - - (7)Share based payments - - - - - - - -Employee share awards exercised - - 426 - - - - 426Issuance of share based payment - - (710) (9) - - 719 -Dividends - - - - - - (27,263) (27,263)Balance at 31 December 2020 204,237 (28,858) - - (238) 415 55,385 230,941Balance at 1 January 2021 204,237 (28,858) - - (238) 415 55,385 230,941Total comprehensive incomeProfit/(loss) for the year - - - - - - 44,118 44,118Other comprehensive incomeChange in fair value of cash flow hedges - - - - 251 - - 251Translation of foreign currency reserve - - - - - 284 - 284Total other comprehensive income - - - - 251 284 - 535Total comprehensive income for the year - - - - 251 284 44,118 44,653Transactions with owners, recorded directly in equityTransfer of retained earnings - - - - - - - -Purchase of treasury shares - - (1,695) - - - - (1,695)Share based payments - - - - - - - -Employee share awards exercised - - 428 - - - - 428Issuance of share based payment - - - - - - - -Dividends - - - - - - (35,281) (35,281)Balance at 31 December 2021 204,237 (28,858) (1,267) - 13 699 64,222 239,046
The notes on pages 23 to 60 are an integral part of these Consolidated Financial Statements.
22 Bell Financial GroupAnnual Report 2021
Consolidated$’000
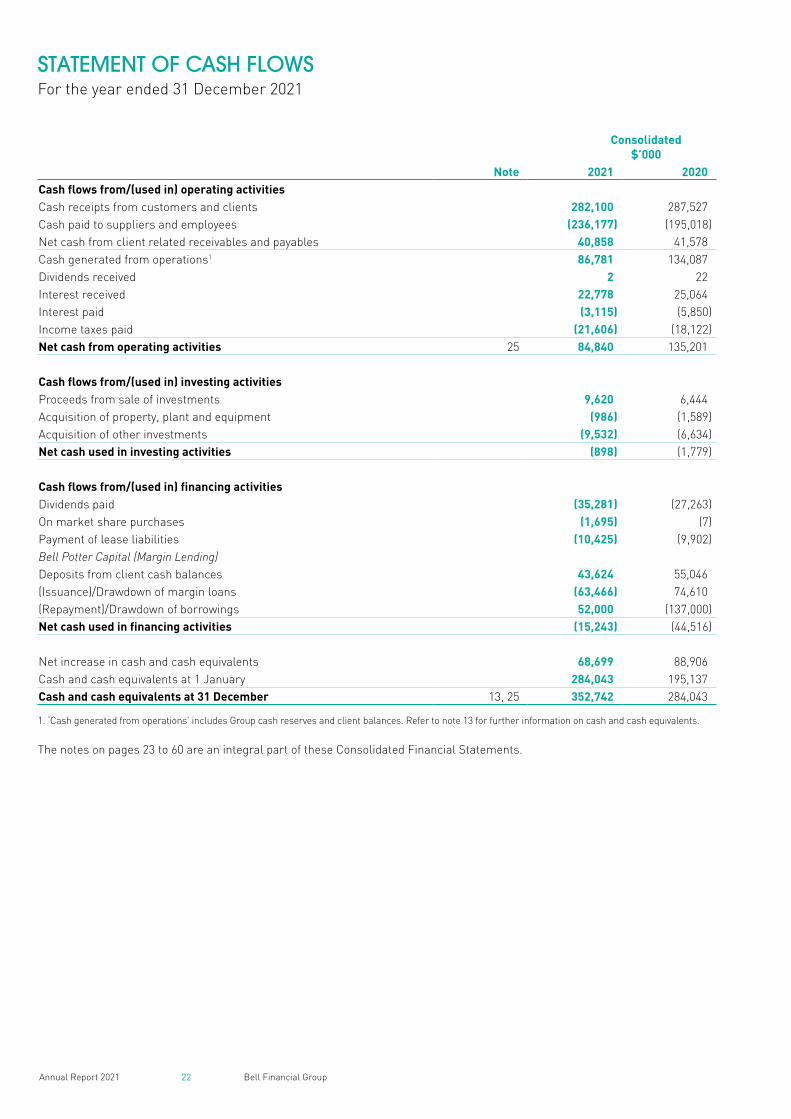
Note 2021 2020Cash flows from/(used in) operating activitiesCash receipts from customers and clients 282,100 287,527Cash paid to suppliers and employees (236,177) (195,018)Net cash from client related receivables and payables 40,858 41,578Cash generated from operations1 86,781 134,087Dividends received 2 22Interest received 22,778 25,064Interest paid (3,115) (5,850)Income taxes paid (21,606) (18,122)Net cash from operating activities 25 84,840 135,201
Cash flows from/(used in) investing activitiesProceeds from sale of investments 9,620 6,444Acquisition of property, plant and equipment (986) (1,589)Acquisition of other investments (9,532) (6,634)Net cash used in investing activities (898) (1,779)
Cash flows from/(used in) financing activitiesDividends paid (35,281) (27,263)On market share purchases (1,695) (7)Payment of lease liabilities (10,425) (9,902)Bell Potter Capital (Margin Lending)Deposits from client cash balances 43,624 55,046(Issuance)/Drawdown of margin loans (63,466) 74,610(Repayment)/Drawdown of borrowings 52,000 (137,000)Net cash used in financing activities (15,243) (44,516)
Net increase in cash and cash equivalents 68,699 88,906Cash and cash equivalents at 1 January 284,043 195,137Cash and cash equivalents at 31 December 13, 25 352,742 284,043
1. ‘Cash generated from operations’ includes Group cash reserves and client balances. Refer to note 13 for further information on cash and cash equivalents.
The notes on pages 23 to 60 are an integral part of these Consolidated Financial Statements.
STATEMENT OF CASH FLOWSFor the year ended 31 December 2021
23 Bell Financial GroupAnnual Report 2021
NOTES TO THE FINANCIAL STATEMENTSFor the year ended 31 December 2021
Bell Financial Group Ltd (“Bell Financial” or the “Company”) is domiciled in Australia. The address of the Company’s registered office is Level 29, 101 Collins Street, Melbourne, VIC. The Consolidated Financial Statements of the Company comprise the Company, and its controlled entities (the “Group” or “Consolidated Entity”). The Group is a for-profit entity. Bell Financial Group Ltd is an Australian-based provider of full service and online broking, investment and financial advisory services.
1. Significant accounting policiesSet out below is a summary of significant accounting policies adopted by the Company and its subsidiaries in the preparation of the Consolidated Financial Statements.
a) Basis of preparation
Statement of compliance The financial report is a general purpose financial report prepared in accordance with Australian Accounting Standards (AASBs)(including Australian Accounting Interpretations) adopted by the Australian Accounting Standards Board (AASB) and the Corporations Act 2001. The consolidated financial report of the Group and the financial report of the Company comply with International Financial Reporting Standards (IFRS) and interpretations adopted by the International Accounting Standards Board (IASB).
The Financial Statements were approved by the Board of Directors on 16 February 2022.
The accounting policies set out below, except as noted, have been applied consistently to all periods presented in these Consolidated Financial Statements, and have been consistently applied by all entities within the consolidated entity.
Basis of measurement These Consolidated Financial Statements have been prepared under the historical cost convention, except for financial assets and liabilities (including derivative instruments and loans) at fair value through the profit or loss.
Functional and presentation currencyThese Consolidated Financial Statements are presented in Australian dollars, which is the Company’s functional currency and the functional currency of the majority of the Group. The Company is of a kind referred to in ASIC Corporations (Rounding in Financial/Directors’ Reports) Instrument 2016/191 and in accordance with that Instrument, all financial information presented in Australian dollars has been rounded to the nearest thousand dollars unless otherwise stated.
Removal of parent entity financial statementsThe Group has applied amendments to Section 295(2)(b) of the Corporations Act 2001 that remove the requirement for the Group to lodge parent entity financial statements. Parent entity financial statements have been replaced by the specific parent entity disclosures in note 32.
b) Principles of consolidation
Business combinationsThe Group applies AASB 3 Business Combinations (2008) and amended AASB 127 Consolidated and Separate Financial Statements (2008) for business combinations.
SubsidiariesSubsidiaries are all entities controlled by the Group. The Group controls an entity when it is exposed to, or has rights to, variable returns from its involvement with the entity and has the ability to affect those returns through its power
over the entity. The financial statements of subsidiaries are included in the Consolidated Financial Statements from the date that control commenced until the date that control ceases. All controlled entities have a 31 December balance date.
Intra-group balances, and any unrealised income and expenses arising from intra-group transactions, are eliminated in preparing the Consolidated Financial Statements.
c) Revenue recognition
AASB 15 Revenue from Contracts with CustomersAASB 15 requires identification of discrete performance obligations within a transaction and an associated transaction price allocation to these obligations. Revenue is recognised upon satisfaction of these performance obligations, which occur when control of the goods or services are transferred to the customer.
Under AASB 15, revenue is recognised when a customer obtains control of the goods or services have been rendered. Determining the timing of the transfer of control – at a point in time or over time – requires judgement. AASB 15 specifically excludes financial instruments recognised under AASB 9 Financial Instruments. Revenue streams for Bell Financial are limited to fee-based revenue items such as brokerage, fee income, commissions and portfolio administration fees.
Revenue under AASB 15 is recognised when the Group satisfies the performance obligations relating to its service to a customer. The Group measures revenue based on the consideration specified in a contract with a customer. The following specific criteria must also be met before revenue can be recognised.
24 Bell Financial GroupAnnual Report 2021
NOTES TO THE FINANCIAL STATEMENTS continued
For the year ended 31 December 2021
1. Significant accounting policies continued
c) Revenue recognition continued
Rendering of servicesRevenue arising from brokerage, fee income and corporate finance transactions are recognised by the Group when performance obligations under the contract with a customer are satisfied.
Brokerage is recognised at a point in time when a trade is executed and payment is received upon settlement, which is normally 2 days after the trade.
Portfolio administration fees are recognised over time as the service is provided and are collected on a quarterly basis. Corporate fees are recognised at a point in time when the Group satisfies its performance obligation, which is usually upon the successful completion of the transaction. Payment is normally received within 7 days of the completion of the transaction.
Other revenue streamsOther revenue is recognised to the extent that it is probable that performance obligations are satisfied and the revenue can be reliably measured.
Interest incomeInterest income is recognised as it accrues using the effective interest rate method, in accordance with AASB 9.
Dividend incomeDividend income is recognised when the right to receive the payment is established, in accordance with AASB 9.
d) Leases
AASB 16 LeasesAt inception of a contract, the Group assesses whether a contract is, or contains, a lease. A contract is, or contains, a lease if the contract conveys the right to control the use of an identified asset for a period of time in exchange for consideration.
AASB 16 Leases applies a single, on-balance sheet accounting model for lessees. A lessee recognises a right of- use asset representing its right to use the underlying asset and a lease liability representing its obligation to make lease payments. There are optional exemptions for short-term leases and leases of low value items.
As a LesseeThe Group recognises a right-of-use asset and a lease liability at the lease commencement date. The right-of-use asset is initially measured at cost, and subsequently at cost less any accumulated depreciation and impairment losses.
The lease liability is initially measured at the present value of the lease payments that are not paid at initial application date, discounted using the incremental borrowing rate determined by the Group. The lease liability is subsequently increased by the interest cost on the lease liability and decreased by the lease payment made.
When measuring lease liabilities for leases that were classified as operating leases, the Group discounted lease payments using its incremental borrowing rate at inception of lease. The Group determines its incremental borrowing rate by obtaining interest rates from various external financing sources. The weighted average rate applied is 4.1%.
Short-term leases and leases of low-value assetsThe Group has elected not to recognise right-of-use assets and lease liabilities for leases of low-value assets and short-term leases. The Group recognises the lease payments associated with these leases as an expense on a straight-line basis over the lease term.
e) Statement of Cash FlowsThe Statement of Cash Flows is prepared on the basis of net cash flows in relation to settlement of trades. This is consistent with the Group’s revenue recognition policy whereby the entity acts as an agent and receives and pays funds on behalf of its clients,
however only recognises as revenue, the Group’s entitlement to brokerage commission. For the purpose of the Statement of Cash Flows, cash and cash equivalents comprise cash at bank and on hand, investments in money market instruments maturing within less than 14 days (net of bank overdrafts) and short-term deposits with an original maturity of 3 months or less. It is important to note that the Statement of Financial Position discloses trade debtors and payables that represent net client accounts being the accumulation of gross trading.
f) Income taxIncome tax expense or benefit for the period comprises current and deferred tax. Income tax is recognised in the Statement of Profit or Loss except to the extent that it relates to items recognised directly in equity, in which case it is recognised in equity.
Current tax is the expected tax payable on the taxable income for the year, using tax rates enacted or substantially enacted at the balance sheet date, and any adjustments to tax payable in respect of previous years.
Deferred tax is recognised using the balance sheet method, providing for temporary differences between the carrying amounts of assets and liabilities for financial reporting purposes and the amounts used for taxation purposes. Deferred tax is not recognised for the following temporary differences: the initial recognition of goodwill, the initial recognition of assets or liabilities in a transaction that is not a business combination and that affects neither accounting nor taxable profit, and differences relating to investments in subsidiaries to the extent that they probably will not reverse in the foreseeable future. Deferred tax is measured at the tax rates that are expected to be applied to the temporary differences when they reverse, based on the laws that have been enacted or substantively enacted by the reporting date.

25 Bell Financial GroupAnnual Report 2021
Deferred tax assets and liabilities are offset if there is a legally enforceable right to offset current tax liabilities and assets, and they relate to income taxes levied by the same tax authority on the same taxable entity, or on different tax entities, but they intend to settle current tax liabilities and assets on a net basis or their tax assets and liabilities will be realised simultaneously.
Deferred tax assets are recognised for unused tax losses, unused tax credits and deductible temporary differences to the extent that it is probable that future taxable profits will be available against which they can be used. Future taxable profits are based on the reversal of relevant taxable temporary differences. If the amount of taxable temporary differences is insufficient to recognise a deferred tax asset in full, then future taxable profits, adjusted for reversals of existing temporary differences, are considered, based on the business plans for individual subsidiaries in the Group. Deferred tax assets are reviewed at each reporting date and are reduced to the extent that it is no longer probable that the related tax benefit will be realised; such reductions are reversed when the probability of future taxable profits improves.
Tax consolidationEffective 1st January 2003, the Company elected to apply the tax consolidation legislation. All current tax amounts relating to the Group have been assumed by the head entity of the tax-consolidated group, Bell Financial Group.
Deferred tax amounts in relation to temporary differences are allocated as if each entity continued to be a taxable entity in its own right.
g) Goods and services taxRevenues, expenses and assets are recognised net of the amount of goods and services tax (GST), except where the amount of GST incurred is not recoverable from the Australian Tax Office (ATO). In these circumstances the GST is recognised as part of the cost of acquisition of the asset or as part of an item of the expense.
Receivables and payables are stated with the amount of GST excluded.
The net amount of GST recoverable from, or payable to, the ATO is included as a current asset or liability in the Statement of Financial Position.
Cash flows are included in the Statement of Cash Flows on a gross basis. The GST components of cash flows arising from investing and financing activities that are recoverable from, or payable to, the ATO are classified as operating cash flows.
h) Cash and cash equivalentsCash and cash equivalents comprise cash balances, investments in money market instruments maturing within less than 14 days and short-term deposits with original maturity of less than three months. Bank overdrafts that are repayable on demand are included as a component of cash and cash equivalents for the purpose of the Statement of Cash Flows. Cash held in trust for clients (refer to note 13) is included as cash and cash equivalents and is included within trade and other payables.
i) DerivativesDerivative financial instruments are contracts whose value is derived from one or more underlying price indices or other variables. They include swaps, forward rate agreements, options or a combination of all three.
Certain derivative instruments are held for trading for the purpose of making short-term gains such as FX swaps. These derivatives do not qualify for hedge accounting. The right to receive options arising from the provision of services to corporate fee clients are valued using the Black Scholes model. On disposal of options, any realised gains/losses are taken to the Statement of Profit or Loss. Derivatives are recognised at fair value and attributable transaction costs are recognised in profit or loss when incurred.
Derivative financial instruments are also used for hedging purposes to mitigate the Group’s exposure to interest rate risk. The Group applied the hedge accounting model in AASB 9 Financial Instruments. Refer to Note 1q(iii) for further information. Derivative financial instruments are recognised initially at fair value.
Where the derivative is designated effective as a hedging instrument, the timing of the recognition of any resultant gain or loss is dependent on the hedging designation. The Group designated interest rate swaps as cash flow hedges during the period. Details of the hedging instruments are outlined below:
Cash flow hedgesChanges in the fair value of cash flow hedges are recognised directly in equity to the extent that the hedges are effective. To the extent hedges are ineffective, changes in the fair value are recognised in the profit or loss. Hedge effectiveness is tested at each reporting date and is assessed against the hedge effectiveness criteria in AASB 9.
If the hedging instrument no longer meets the criteria for hedge accounting, expires or is sold, terminated or exercised, the hedge accounting is discontinued prospectively. The cumulative gain or loss previously recognised in equity remains there until the forecast transaction occurs.
j) Impairment of assetsAt each reporting date, the Group reviews the carrying values of its tangible and intangible assets to determine whether there is any indication that those assets have been impaired. If such an indication exists, the recoverable amount of the asset, being the higher of the asset’s fair value less costs to sell and value in use, is compared to the asset’s carrying value. Any excess of the asset’s carrying value over its recoverable amount is expensed to the Statement of Profit or Loss. Where it is not possible to estimate the recoverable amount of an individual asset, the Group estimates the recoverable amount of the cash-generating unit to which the asset belongs. An impairment loss, with the exception of goodwill, is reversed if the reversal can be related objectively to an event occurring after the impairment loss was recognised. For financial assets measured at amortised cost and available-for-sale financial assets that are debt securities the reversal is recognised in profit or loss.
26 Bell Financial GroupAnnual Report 2021
NOTES TO THE FINANCIAL STATEMENTS continued
For the year ended 31 December 2021
1. Significant accounting policies continued
k) Trade and other receivablesTrade receivables issued are initially recognised when they are originated. A trade receivable is initially measured at the transaction price. Trade debtors to be settled within 2 trading days are carried at amortised cost. Term debtors are also carried at amortised cost. Recoverability of Trade and other receivables is assessed using the lifetime expected credit loss approach.
l) Trade and other payablesLiabilities for trade creditors and other amounts are carried at cost, which is the fair value of the consideration to be paid in the future for goods and services received, whether or not billed to the parent entity or Group. Trade accounts payable are normally settled within 60 days.
m) Borrowing costsBorrowing costs are recognised using the effective interest method. The ‘effective interest rate’ is the rate that exactly discounts estimated future cash payments or receipts through the expected life of the financial instrument to: the gross carrying amount of the financial asset; or the amortised cost of the financial liability.
n) ProvisionsA provision is recognised if, as a result of a past event, the Group has a present legal or constructive obligation that can be estimated reliably, and it is probable that an outflow of economic benefits will be required to settle the obligation. Provisions are determined by discounting the expected future cash flows at a pre-tax rate that reflects current market assessments of the time value of money and the risks specific to the liability.
o) Deposits and borrowingsAll deposits and borrowings are recognised at the fair value net of issue costs associated with the borrowings at origination and subsequently measured using effective interest method.
p) Goodwill and intangible assets
GoodwillGoodwill on acquisition is initially measured at cost being the excess of the costs of the business combination over the acquirer’s interest in the net fair value of the identifiable assets, liabilities and contingent liabilities. Following initial recognition, goodwill is measured at cost less accumulated impairment losses. Goodwill is reviewed for impairment, annually or more frequently if events or changes in circumstances indicate that the carrying amount is impaired. An impairment loss in respect to goodwill is not reversed.
The CGUs currently in place consist of Retail, Institutional, Technology & Platforms and Product & Services.
The Group provides traditional stockbroking, investment and financial advisory services to private, institutional and corporate clients. It also develops proprietary technology, platforms, products and services for the Australian stockbroking market. Historically the business has been viewed and managed as two operating divisions, Wholesale and Retail. With the significant investment over a number of years in technology, platforms, products and services, revenues and profits emanating from these areas is now significant, and the subject of Management focus in terms of future business decisions.
Other intangible assetsSoftwareExpenditure on research activities is recognised in profit or loss as incurred. Development expenditure is capitalised only if the expenditure can be measured reliably, the product or process is technically and commercially feasible, the asset is controlled by the Group, future economic benefits are probable and the Group intends to and has sufficient resources to complete development and to use or sell the asset. Otherwise, it is recognised in profit or loss as incurred. Subsequent to initial recognition, development expenditure is measured at cost less accumulated amortisation and any accumulated impairment losses.
Customer listsCustomer lists that are acquired by the Group, which have finite lives, are measured at cost less accumulated amortisation and accumulated impairment losses.
Amortisation is recognised in the profit or loss on a straight-line basis over the estimated useful lives of intangible assets. The estimated useful lives are as follows:
2021 2020Software 10 years 10 yearsCustomer list 10 years 10 years
q) Financial instrumentsAll investments are initially recognised at fair value plus directly attributable transaction costs. Subsequent to initial recognition, investments, which are classified as financial assets and liabilities, are measured as described below.
Fair value measurementAASB 13 Fair Value Measurement establishes a single framework for measuring fair value and making disclosures about fair value measurements when such measurements are required or permitted by other AASBs. It unifies the definition of fair value as the price that would be received to sell an asset or paid to transfer a liability in an orderly transaction between market participants at the measurement date.
AASB 9 Financial InstrumentsAASB 9 sets out requirements for recognising and measuring financial assets and financial liabilities.
i. Classification and measurement of financial assets and financial liabilitiesOn initial recognition, a financial asset is classified as measured at: amortised cost; fair value through other comprehensive income (FVTOCI) – debt investment; FVTOCI – equity investment; or fair value through profit or loss (FVTPL). The classification of financial assets under AASB 9 is generally based on the business model in which a financial asset is managed and its contractual cash flow characteristics.
27 Bell Financial GroupAnnual Report 2021
A financial asset is measured at amortised cost if it meets both of the following conditions and is not designated as at FVTPL:
• It is held within a business model whose objective is to hold assets to collect contractual cash flows; and
• Its contractual terms give rise on specified dates to cash flows that are solely payments of principal and interest on the principal amount outstanding.
All financial assets not classified as measured at amortised cost or FVTOCI are measured at FVTPL. On initial recognition, the Group may irrevocably designate a financial asset that otherwise meets the requirements to be measured at amortised cost or at FVTOCI as at FVTPL if doing so eliminates or significantly reduces an accounting mismatch that would otherwise arise.
The following accounting policies apply to the subsequent measurement of financial assets held by the Group.
Financial assets at amortised costThese assets are subsequently measured at amortised cost using the effective interest method. The amortised cost is reduced by impairment losses (see (ii) below). Interest income, foreign exchange gains and losses and impairment are recognised in profit or loss. Any gain or loss on derecognition is recognised in profit or loss.
Financial assets at FVTPLThese assets are subsequently measured at fair value. Net gains and losses, including any interest or dividend income, are recognised in profit or loss.
Business model assessmentThe Group will determine the business model at the level that reflects how groups of financial assets are managed using all relevant evidence that is available at the date of the assessment, including:
• The stated policies and objectives for the portfolio and the operation of those policies in practice;
• How the performance of the portfolio is evaluated and reported to the Group’s management;
• The risks that affect the performance of the business model (and the financial assets held within that business model) and how those risks are managed; and
• How managers of the business are compensated.
Assessment whether contractual cash flows are solely payments of principal and interest (SPPI)For the purposes of this assessment, ‘principal’ is defined as the fair value of the financial asset on initial recognition. ‘Interest’ is defined as consideration for the time value of money and for the credit risk associated with the principal amount outstanding during a particular period of time and for other basic lending risks and costs (e.g. liquidity risk and administrative costs), as well as profit margin.
In assessing whether the contractual cash flows are SPPI, the Group considers the contractual terms of the instrument. This includes assessing whether the financial asset contains a contractual term that could change the timing or amount of contractual cash flows such that it would not meet this condition.
Measurement categories of financial assetsCash and cash equivalents, Trade and other receivables, and Loans and advances that meets SPPI are classified and measured at amortised cost. Certain Loans and advances and other financial assets that do not meet SPPI are classified and measured at FVTPL. There were no changes in classification and measurements of the Group’s financial assets for the years ended 31 December 2020 and 2021.
Modifications of financial assets and financial liabilitiesFinancial assetsIf the terms of a financial asset are modified, the Group evaluates whether the cash flows of the modified asset are substantially different. If the cash flows are substantially different, the contractual rights to cash flows from the original financial asset are deemed to have expired. The original financial asset is derecognised and a new financial
asset is recognised at fair value. The difference between the carrying amount of the financial asset derecognised and the fair value of the new financial asset is recognised in profit or loss.
If the cash flows of the modified asset are not substantially different, the Group recalculates the gross carrying amount of the financial asset and recognises the derecognition as a modification gain or loss in profit or loss. If such a modification is carried out because of financial difficulties of the borrower, the gain or loss is presented together with impairment losses.
Financial liabilitiesThe Group derecognises a financial liability when its terms are modified and the cash flows of the modified liability are substantially different. A new financial liability based on the modified terms is recognised at fair value. The difference between the carrying amount of the financial liability extinguished and the new financial liability with modified terms is recognised in profit or loss.
ii. Impairment of financial assetsUnder AASB 9, loss allowances are measured on either of the following bases:
• 12-month ECLs: these are ECLs that result from possible default events within the 12 months after the reporting date; and
• Lifetime ECLs: these are ECLs that result from all possible default events over the expected life of a financial instrument.
For all financial assets at amortised cost, the Group measures loss allowances at an amount equal to lifetime ECLs, except for loans and advances, which are measured at 12-month ECLs where credit risk has not increased significantly since initial recognition and lifetime ECLs where credit risk has increased significantly since initial recognition.
28 Bell Financial GroupAnnual Report 2021
NOTES TO THE FINANCIAL STATEMENTS continued
For the year ended 31 December 2021
1. Significant accounting policies continued
q) Financial instruments continued
ii. Impairment of financial assets continued
When determining whether credit risk of a financial asset has increased significantly since initial recognition and when estimating ECLs, the Group considers reasonable and supportable information that is relevant and available without undue cost or effort. This includes quantitative and qualitative information and analysis based on the Group’s historical experience and forward-looking information.
The Group assumes that the credit risk on a financial asset has increased significantly if it is more than 30 days past due or the expected probability of default has increased significantly.
The Group considers a financial asset to be in default when:
• The borrower is unlikely to pay its credit obligations to the Group in full, without recourse by the Group to actions such as realising security (if any is held); or
• The financial asset is more than 90 days past due.
The maximum period considered when estimating ECLs is the maximum contractual period over which the Group is exposed to credit risk.
Measurement of ECLsECLs are a probability-weighted estimate of credit losses. Credit losses are measured as the present value of all cash shortfalls (i.e. the difference between the cash flows due to the entity in accordance with the contract and the cash flows that the Group expects to receive). ECLs are discounted at the effective interest rate of the financial asset.
Credit-impaired financial assetsAt each reporting date, the Group assesses whether financial assets carried at amortised cost are credit-impaired. A financial asset is ‘credit-impaired’ when one or more events that have a detrimental impact on the estimated future cash flows of the financial asset have occurred.
Presentation of impairmentLoss allowances for financial assets measured at amortised cost are deducted from the gross carrying amount of the assets.
Impairment losses are presented separately in the Consolidated Statement of Profit or Loss and OCI. There were no impairment losses for the year ended 31 December 2021 (2020: Nil).
Trade and other receivablesECLs are calculated based on actual historical credit loss experience. Exposures are segmented based on past events, current conditions and reasonable and supportable information about future events and economic conditions. There were no significant changes during the period to the Group’s exposure to credit risk and there was no significant impact to credit provisioning over trade and other receivables as at 31 December 2021.
Loans and advancesECLs are calculated based on actual historical credit loss experience. Exposures are segmented based on past events, current conditions and reasonable and supportable information about future events and economic conditions. There were no significant changes during the period to the Group’s exposure to credit risk and there was no significant impact to credit provisioning over loans and advances as at 31 December 2021.
iii. Hedge accountingThe Group ensures that hedge accounting relationships are aligned with its risk management objectives and strategy and to apply a more qualitative and forward-looking approach to assessing hedge effectiveness, in accordance with the requirements of AASB 9.
The Group only uses interest rate swaps to hedge exposure to fluctuations in interest rates.
Share capitalOrdinary sharesOrdinary shares are classified as equity. Incremental costs directly attributable to issue of ordinary shares and share options are recognised as a deduction from equity, net of any tax effects.
DividendsDividends are recognised as a liability in the period in which they are declared, being appropriately authorised and no longer at the discretion of the Company.
Treasury sharesWhen share capital recognised as equity is repurchased, the amount of the consideration paid is recognised as a deduction from equity. Repurchased shares are classified as treasury shares and are presented in the reserve until sold or reissued.
r) Property, plant and equipmentProperty, plant and equipment is included at cost less accumulated depreciation and any impairment in value. All property, plant and equipment is depreciated over its estimated useful life, commencing from the time assets are held ready for use.
Items of property, plant and equipment are depreciated/amortised using the straight-line method over their estimated useful lives. The depreciation rates for each class of asset are as follows:
2021 2020Leasehold improvements 20–25% 20–25%Office equipment 20–50% 20–50%Furniture and fittings 20–50% 20–50%
s) Employee entitlements
Wages, salaries and annual leave The provisions for entitlements to wages, salaries and annual leave expected to be settled within 12 months of reporting date represent the amounts which the Group has a present obligation to pay resulting from employees’ services provided up to reporting date.

29 Bell Financial GroupAnnual Report 2021
Long-service leaveThe provision for salaried employee entitlements to long-service leave represents the present value of the estimated future cash outflows to be made resulting from employees’ service provided up to reporting date. Liabilities for employee entitlements, which are not expected to be settled within twelve months, are discounted using the rates attaching to national government securities at balance date, which most closely match the terms of maturity of the related liabilities.
In determining the liability for employee entitlements, consideration has been given to future increases in wage and salary rates, and experience with staff departures. Related on-costs have also been included in the liability.
BonusesThe Group recognises a liability and an expense for bonuses. The Group recognises a provision where contractually obliged or where there is a past performance that has created a constructive obligation.
Defined contribution plansA defined contribution plan is a post-employment benefit plan under which the Company pays fixed contributions into a separate entity and will have no legal or constructive obligation to pay further amounts. Obligations for contributions to defined contribution plans are recognised as an employee expense in profit or loss when they are due.
Share-based paymentsThe Company has adopted a number of share-based equity incentive plans in which employees and Directors participate. The grant date fair value of shares expected to be issued under the various equity incentive plans, including options, granted to employees and Directors is recognised as an employee expense, with a corresponding increase in equity over the period in which the employees become unconditionally entitled to the shares.
The fair value of options at grant date is independently determined using the Black Scholes option pricing model that takes into account the exercise price, the vesting period, the vesting and performance criteria, the impact of dilution, the share price at grant date and the expected price volatility of the underlying share and the risk free interest rate for the vesting period.
t) Earnings per shareThe Group presents basic and diluted Earnings Per Share (EPS) data for its ordinary shares.
Basic earnings per shareBasic EPS is calculated by dividing the profit or loss attributable to ordinary shareholders of the Company by the weighted average number of ordinary shares outstanding during the period.
Diluted earnings per shareDiluted EPS is determined by adjusting the profit or loss attributable to ordinary shareholders and the weighted average number of ordinary shares outstanding for the effects of all dilutive potential ordinary shares and share options granted to employees and Directors.
u) Foreign currency
Foreign currency transactionsTransactions in foreign currencies are translated to the functional currency of the Group at exchange rates at the date of the transaction. Monetary assets and liabilities denominated in foreign currencies at the reporting date are retranslated to the functional currency at the foreign exchange rate at that date. Non-monetary assets and liabilities denominated in foreign currencies that are measured at fair value are retranslated to the functional currency at the exchange rate at the date that the fair value was determined.
Foreign currency differences arising on retranslation are recognised in profit or loss, except for differences arising on FVOCI instruments that are recognised directly in OCI.
Foreign operationsThe assets and liabilities of foreign operations, including goodwill and fair value adjustments arising on acquisition, are translated into Australian dollars at the exchange rates at the reporting date. The income and expenses of foreign operations are translated into Australian dollars at the exchange rates at the dates of the transactions. Foreign currency differences are recognised in OCI and accumulated in the translation reserve, except to the extent that the translation difference is allocated to NCI.
v) Segment reportingThe Group determines and presents operating segments based on the information that is internally provided to the Chief Decision Makers in accordance with AASB 8 Operating Segments.
An operating segment is a component of the Group that engages in business activities from which it may earn revenues and incur expenses, including revenues and expenses that relate to transactions with any of the Group’s other components. An operating segment’s results are reviewed regularly by management to make decisions about resources to be allocated to the segment and assess its performance. Segment results that are reported to management include items directly attributable to a segment as well as to those that can be allocated on a reasonable basis.
w) New standards and interpretations not yet adoptedA number of new standards, amendments to standards and interpretations are effective for annual periods beginning after 1 January 2021, and have not been applied in preparing these Consolidated Financial Statements. Those which may be relevant to the Group are set out below. The Group does not plan to adopt these standards early.
30 Bell Financial GroupAnnual Report 2021
NOTES TO THE FINANCIAL STATEMENTS continued
For the year ended 31 December 2021
1. Significant accounting policies continued
w) New standards and interpretations not yet adopted continued
The following new and amended standards and interpretations are not expected to have a significant impact on the Group’s consolidated financial statements.
• COVID-19-Related Rent Concessions beyond 30 June 2021 (Amendment to IFRS 16).
• Annual Improvements to IFRS Standards 2018–2020.
• Property, Plant and Equipment: Proceeds before Intended Use (Amendments to IAS 16).
• Reference to Conceptual Framework (Amendments to IFRS 3).
• Classification of Liabilities as Current or Non-current (Amendments to IAS 1).
• IFRS 17 Insurance Contracts and amendments to IFRS 17 Insurance Contracts.
• Disclosure of Accounting Policies (Amendments to IAS 1 and IFRS Practice Statement 2).
• Definition of Accounting Estimates (Amendments to IAS 8).
Furthermore, during the year ended 31 December 2021, the International Financial Reporting Standards Interpretations Committee (IFRIC) issued a final agenda decision, Configuration or Customisation Costs in a Cloud Computing Arrangement. The decision discusses whether configuration or customisation expenditure relating to cloud computing arrangements is able to be recognised as an intangible asset and if not, over what time period the expenditure is expensed.
Software as a Service (“SaaS”) are service contracts providing an entity with the right to access the cloud provider’s application software over the contract period. Costs incurred to configure or customise, and the ongoing fees to obtain access to the cloud provider’s application software, are recognised as operating expenses when the services are received. The Group
reviewed the IFRIC decision and did not identify any costs incurred to configure and customise software under SaaS contracts in the current year or in prior years.
2. Significant accounting judgements, estimates and assumptionsIn applying the Group’s accounting policies management continually evaluates judgements, estimates and assumptions based on experience and other factors, including expectations of future events that may have an impact on the Group. All judgements, estimates and assumptions made are believed to be reasonable based on the most current set of circumstances available to management and are reviewed on an ongoing basis. Actual results may differ from the judgements, estimates and assumptions. Significant judgements, estimates and assumptions made by management in the preparation of these financial statements are outlined below:
Recovery of deferred tax assetsDeferred tax assets are recognised for deductible temporary differences as management considers that it is probable that future taxable profits will be available to utilise those temporary differences. (Refer to note 18).
Impairment of loans and advancesThe Company assesses impairment of all loans at each reporting date by evaluating the expected credit loss on those loans. In the Directors’ opinion, no such impairment exists beyond that provided at 31 December 2021 (2020: Nil). (Refer to note 19 and note 1q(ii)).
Long service leave provisionsThe liability for long service leave is recognised and measured as the present value of the estimated future cash flows to be made in respect of all employees at balance date. In determining the present value of a liability, attrition rates and pay increases through promotion and inflation have been taken into account. A discount rate equal to the government bond rate has been used in determining the present value of the obligation. (Refer to note 24).
Legal provisionFrom time to time claims are made against the Group. The recognition of any provision requires judgement to determine management’s best estimate of the provision. As at 31 December 2021, a $500,000 provision has been accrued to reflect potential claims. (Refer to note 23).
Financial assetsThe fair value of options is determined using the Black Scholes option-pricing model.
Determination of fair value for loans is based on the option value used to mitigate the risk on the limited recourse margin loans and the interest rate implicit in the loan.
Intangible assetsThe customer lists acquired have been valued using the net present value of the unlevered free cash flow from each business’ client list and software development costs incurred are initially measured at cost and are amortised over the useful life. These valuations are outlined below:
Bell Foreign Exchange and Futures businessThe amortisation period for the acquired intangible assets of the Foreign Exchange and Futures business is deemed to be 10 years. This was determined by analysing the average length of the relationship clients have with the business.
Development costsAmortisation period for the incurred intangible asset development costs is deemed to be 10 years. This was determined by assessing the average length of the useful life of the assets.
Impairment of goodwillGoodwill is tested for impairment annually or more frequently if events or changes in circumstances indicate that it might be impaired. For the purpose of impairment testing, goodwill is allocated to Retail, Institutional, Technology and Platforms, and Products and Services which represents the level at which it is monitored for internal management purposes.
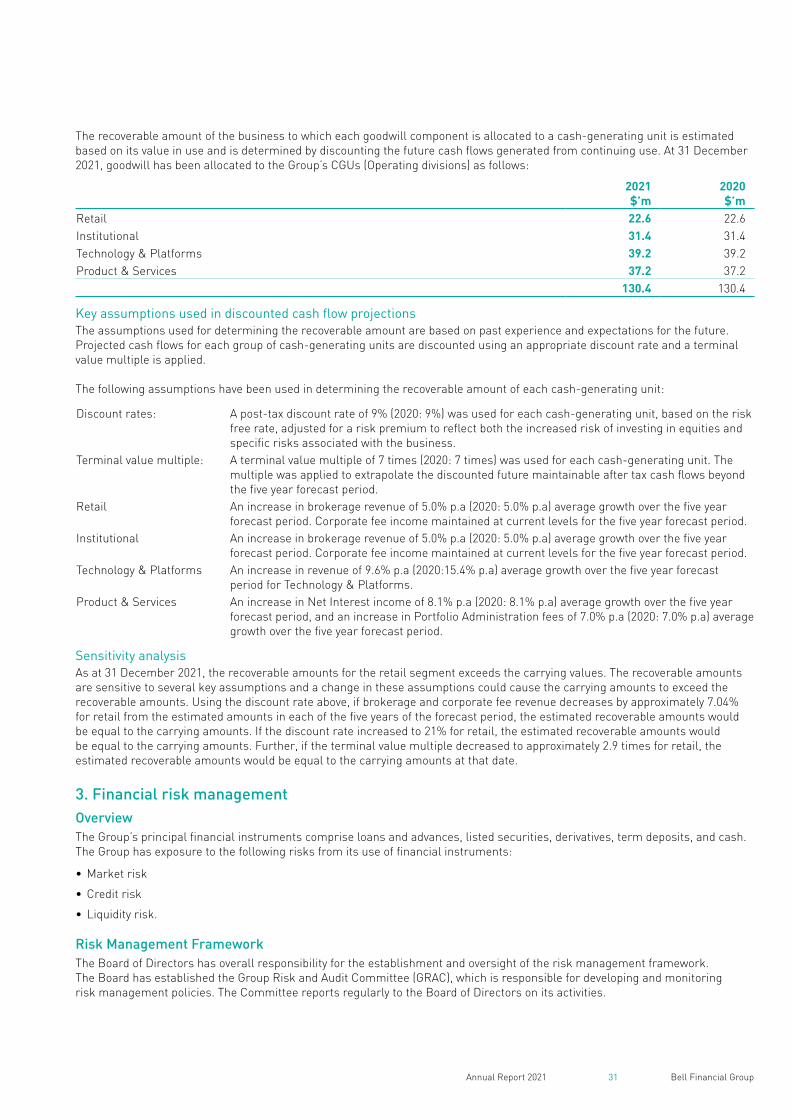
31 Bell Financial GroupAnnual Report 2021
The recoverable amount of the business to which each goodwill component is allocated to a cash-generating unit is estimated based on its value in use and is determined by discounting the future cash flows generated from continuing use. At 31 December 2021, goodwill has been allocated to the Group’s CGUs (Operating divisions) as follows:
2021$’m
2020$’m
Retail 22.6 22.6Institutional 31.4 31.4Technology & Platforms 39.2 39.2Product & Services 37.2 37.2
130.4 130.4
Key assumptions used in discounted cash flow projectionsThe assumptions used for determining the recoverable amount are based on past experience and expectations for the future. Projected cash flows for each group of cash-generating units are discounted using an appropriate discount rate and a terminal value multiple is applied.
The following assumptions have been used in determining the recoverable amount of each cash-generating unit:
Discount rates: A post-tax discount rate of 9% (2020: 9%) was used for each cash-generating unit, based on the risk free rate, adjusted for a risk premium to reflect both the increased risk of investing in equities and specific risks associated with the business.
Terminal value multiple: A terminal value multiple of 7 times (2020: 7 times) was used for each cash-generating unit. The multiple was applied to extrapolate the discounted future maintainable after tax cash flows beyond the five year forecast period.
Retail An increase in brokerage revenue of 5.0% p.a (2020: 5.0% p.a) average growth over the five year forecast period. Corporate fee income maintained at current levels for the five year forecast period.
Institutional An increase in brokerage revenue of 5.0% p.a (2020: 5.0% p.a) average growth over the five year forecast period. Corporate fee income maintained at current levels for the five year forecast period.
Technology & Platforms An increase in revenue of 9.6% p.a (2020:15.4% p.a) average growth over the five year forecast period for Technology & Platforms.
Product & Services An increase in Net Interest income of 8.1% p.a (2020: 8.1% p.a) average growth over the five year forecast period, and an increase in Portfolio Administration fees of 7.0% p.a (2020: 7.0% p.a) average growth over the five year forecast period.
Sensitivity analysisAs at 31 December 2021, the recoverable amounts for the retail segment exceeds the carrying values. The recoverable amounts are sensitive to several key assumptions and a change in these assumptions could cause the carrying amounts to exceed the recoverable amounts. Using the discount rate above, if brokerage and corporate fee revenue decreases by approximately 7.04% for retail from the estimated amounts in each of the five years of the forecast period, the estimated recoverable amounts would be equal to the carrying amounts. If the discount rate increased to 21% for retail, the estimated recoverable amounts would be equal to the carrying amounts. Further, if the terminal value multiple decreased to approximately 2.9 times for retail, the estimated recoverable amounts would be equal to the carrying amounts at that date.
3. Financial risk managementOverviewThe Group’s principal financial instruments comprise loans and advances, listed securities, derivatives, term deposits, and cash. The Group has exposure to the following risks from its use of financial instruments:
• Market risk
• Credit risk
• Liquidity risk.
Risk Management FrameworkThe Board of Directors has overall responsibility for the establishment and oversight of the risk management framework. The Board has established the Group Risk and Audit Committee (GRAC), which is responsible for developing and monitoring risk management policies. The Committee reports regularly to the Board of Directors on its activities.
32 Bell Financial GroupAnnual Report 2021
NOTES TO THE FINANCIAL STATEMENTS continued
For the year ended 31 December 2021
3. Financial risk management continued
Risk Management Framework continued
Risk management policies are established to identify and analyse the risks faced by the Group, to set appropriate risk limits and controls, and to monitor risks and adherence to limits. Risk management policies and systems are reviewed regularly to reflect changes in market conditions and the Group’s activities. The Group, through its training and management standards and procedures, aims to develop a disciplined and constructive control environment in which all employees understand their roles and obligations.
The Group Risk and Audit Committee oversees how management monitors compliance with the Group’s risk management policies and procedures and reviews the adequacy of the risk management framework in relation to the risks faced by the Group. Internal Audit assists the Group Risk and Audit Committee in its oversight role.
Internal Audit undertakes both regular and ad hoc reviews of risk management controls and procedures, the results of which are reported to the Group Risk and Audit Committee.
The risk management framework incorporates active management and monitoring of a range of risks. These include operational, information technology, cyber, market, credit, liquidity, legal, regulatory, reputation, fraud and systemic risks.
The Board of Directors recognises that cyber risk is an increasing area of concern across the financial services industry, and is committed to the ongoing development of cyber security measures through awareness training, implementation of network security measures, and preventive controls to protect our assets and networks. Cyber resilience is an integral component of effective risk management.
Market riskMarket risk is the risk that changes in market prices, such as interest rates, equity prices, and foreign exchange rates will affect the Group’s income or the value of its holdings of financial instruments. The objective of market risk management is to manage and control exposures within acceptable parameters, while optimising returns.
Equity price riskAll instruments are subject to the risk that future changes in market conditions may make an instrument less valuable. As trading instruments are valued with reference to the market or Black Scholes model, changes in equity prices directly affect reported income in each period. The Group continually monitors equity price movements to ensure the impact on the Group’s activities is managed.
Interest rate riskInterest rate risk arises from the potential for change in interest rates to have an adverse effect on the Group’s net earnings. The Group continually monitors movements in interest rates and manages exposure accordingly.
The Board has also approved the use of derivatives, in the form of interest rate swaps, to mitigate its exposure to interest rate risk. Changes in the fair value and effectiveness of interest rate swaps (which are designated cash flow hedging instruments) are monitored on a six-monthly basis.
Currency riskThe Group is exposed to currency risk on monetary assets and liabilities held in a currency other than the respective functional currency of the Group. The Group ensures the net exposure is kept to an acceptable level by buying or selling foreign currencies at spot rates where necessary to address short-term imbalances.
Liquidity riskLiquidity risk is the risk that the Group will not be able to meet its financial obligations as they fall due. The Group’s approach to managing this risk is to ensure that it will always have sufficient liquidity to meet its liabilities when due, under both normal and stressed conditions, without incurring unacceptable losses or risking damage to the Group’s reputation.
Ultimate responsibility for liquidity risk management rests with the Board of Directors, which has built an appropriate liquidity risk management framework for the management of the Group’s short, medium and long-term funding requirements. The Group manages liquidity by maintaining reserves, banking facilities and reserve borrowing facilities and by continuously monitoring forecast and actual cash flows and matching up maturity profiles of financial assets and liabilities.
With respect to the maturity of financial liabilities, the Group also:
• holds financial assets for which there is a liquid market and that they are readily saleable to meet liquidity needs; and
• has committed borrowing facilities or other lines of credit that it can access to meet liquidity needs.
Credit riskCredit risk is the financial loss to the Group if a debtor or counterparty to a financial instrument fails to meet its contractual obligations.
Trade and other receivablesThe credit risk for these accounts is that financial assets recognised on the balance sheet exceed their carrying amount, net of any provisions for doubtful debts. In relation to client debtors, the Group’s credit risk concentration is minimised as transactions are settled on a delivery versus payment basis with a settlement regime of trade day plus two days.
33 Bell Financial GroupAnnual Report 2021
Margin lendingManagement monitors exposure to credit risk on an ongoing basis. The Group requires collateral in respect of margin loans made in the course of business. This collateral is generally in the form of the underlying security the margin loan is used to invest in. Loan-to-value ratios (LVRs) are assigned to determine the amounts of lending allowed against each security. Loans balances are reviewed daily and are subject to margin calls once the geared value falls 10% lower than the loan balance. Warnings are sent between 5% and 10%. The lender can also require the borrower to repay on demand part or all of the amount owing at any time, whether or not the borrower or any guarantor is in default.
Capital managementThe Board’s policy is to maintain a strong capital base so as to maintain investor, creditor and market confidence and to sustain future development of the business. Capital consists of ordinary shares and retained earnings of the Group. The Group is required to comply with certain capital and liquidity requirements imposed by regulators as a licensed broking firm. All capital requirements are monitored by the Board and the Group was in compliance with all requirements throughout the year.
Security arrangementsThe ANZ Bank has a Registered Mortgage Debenture over the assets and undertakings of the Company.
4. Determination of fair valuesA number of the Group’s accounting policies and disclosures require the determination of fair value, for both financial and non-financial assets and liabilities. Fair values have been determined and disclosed based on the following methods. Where applicable, further information about the assumptions made in determining fair values is disclosed in the notes specific to that asset or liability.
Investments in equityThe fair values of financial assets at fair value through profit or loss are determined with reference to the quoted bid price, or if unquoted determined using a valuation model at reporting date.
DerivativesThe fair value of interest rate swaps is based on a mark-to-market model with reference to prevailing fixed and floating interest rates. These quotes are tested for reasonableness by discounting estimated future cash flows based on term to maturity of each contract and using market interest rates for a similar instrument at the measurement date.
The fair value of currency swaps is determined using quoted forward exchange rates at the reporting date and present value calculations based on high quality yield curves in the respective currencies.
Financial assets and loans at fair value through profit or lossThe fair value of options is determined using the Black Scholes option-pricing model.
Determination of fair value for loans is based on the option value used to mitigate the risk on the limited recourse margin loans and the interest rate implicit in the loan.
Share based paymentsThe fair value of employee stock options is determined using a Black Scholes model. Measurement inputs include share price, exercise price, volatility, weighted average expected life of the instrument, expected dividends and risk free interest rate. Service and non-market conditions are not taken into account in determining fair value.
5. Segment ReportingBusiness segmentsThe segments reported below are consistent with internal reporting provided to the chief decision makers:
• Technology & Platforms: Proprietary technology and platforms including online broking.
• Products & Services: Margin lending, Cash, Portfolio Administration and Superannuation Solutions products and services
• Retail: traditional retail client broking (Retail client focus),
• Institutional: traditional wholesale client broking (Institutional and Wholesale client focus).
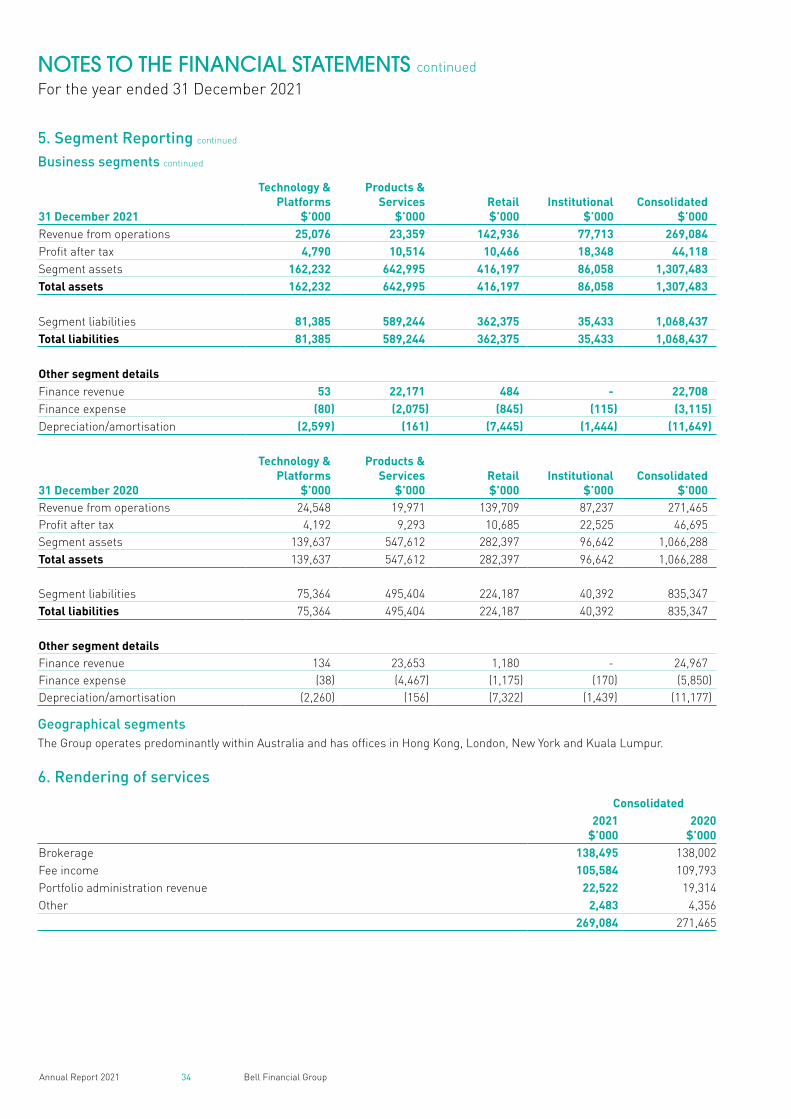
34 Bell Financial GroupAnnual Report 2021
NOTES TO THE FINANCIAL STATEMENTS continued
For the year ended 31 December 2021
5. Segment Reporting continued
Business segments continued
31 December 2021
Technology & Platforms
$’000
Products & Services
$’000Retail$’000
Institutional$’000
Consolidated$’000
Revenue from operations 25,076 23,359 142,936 77,713 269,084Profit after tax 4,790 10,514 10,466 18,348 44,118Segment assets 162,232 642,995 416,197 86,058 1,307,483Total assets 162,232 642,995 416,197 86,058 1,307,483
Segment liabilities 81,385 589,244 362,375 35,433 1,068,437Total liabilities 81,385 589,244 362,375 35,433 1,068,437
Other segment detailsFinance revenue 53 22,171 484 - 22,708Finance expense (80) (2,075) (845) (115) (3,115)Depreciation/amortisation (2,599) (161) (7,445) (1,444) (11,649)
31 December 2020
Technology & Platforms
$’000
Products & Services
$’000Retail$’000
Institutional$’000
Consolidated$’000
Revenue from operations 24,548 19,971 139,709 87,237 271,465Profit after tax 4,192 9,293 10,685 22,525 46,695Segment assets 139,637 547,612 282,397 96,642 1,066,288Total assets 139,637 547,612 282,397 96,642 1,066,288
Segment liabilities 75,364 495,404 224,187 40,392 835,347Total liabilities 75,364 495,404 224,187 40,392 835,347
Other segment detailsFinance revenue 134 23,653 1,180 - 24,967Finance expense (38) (4,467) (1,175) (170) (5,850)Depreciation/amortisation (2,260) (156) (7,322) (1,439) (11,177)
Geographical segmentsThe Group operates predominantly within Australia and has offices in Hong Kong, London, New York and Kuala Lumpur.
6. Rendering of services
Consolidated2021
$’0002020
$’000Brokerage 138,495 138,002Fee income 105,584 109,793Portfolio administration revenue 22,522 19,314Other 2,483 4,356
269,084 271,465
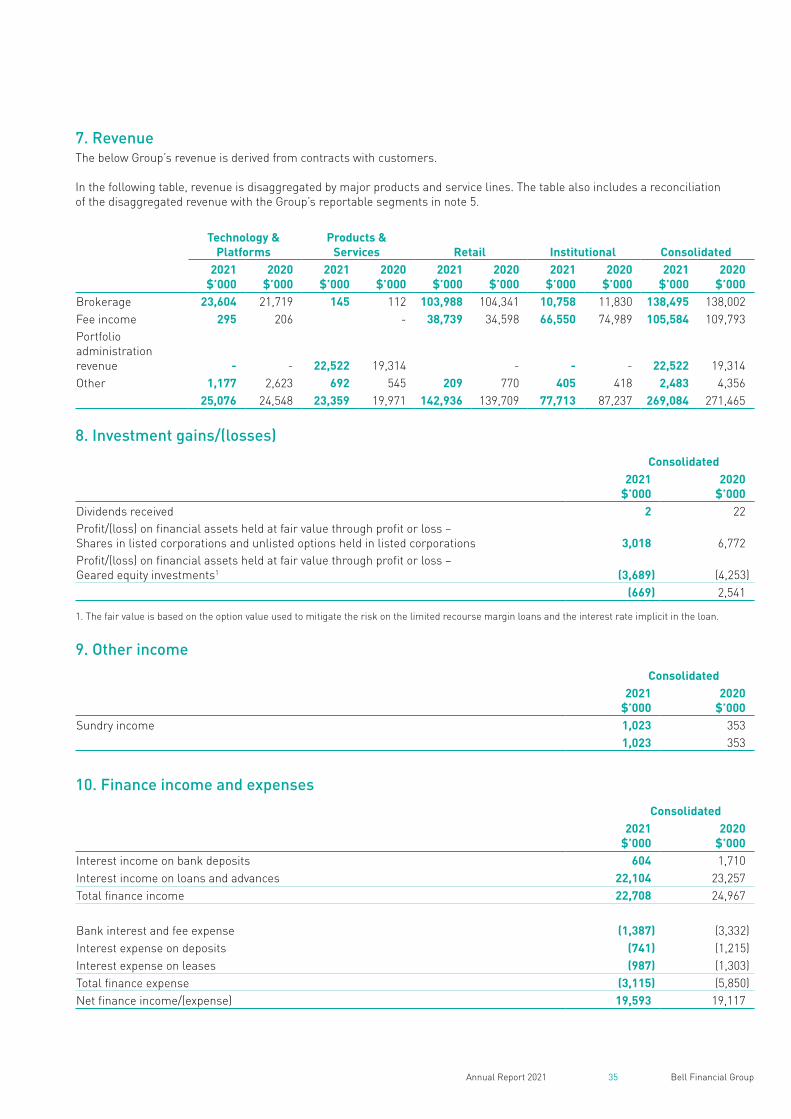
35 Bell Financial GroupAnnual Report 2021
7. RevenueThe below Group’s revenue is derived from contracts with customers.
In the following table, revenue is disaggregated by major products and service lines. The table also includes a reconciliation of the disaggregated revenue with the Group’s reportable segments in note 5.
Technology & Platforms
Products & Services Retail Institutional Consolidated
2021$’000
2020$’000
2021$’000
2020$’000
2021 $’000
2020$’000
2021$’000
2020$’000
2021$’000
2020$’000
Brokerage 23,604 21,719 145 112 103,988 104,341 10,758 11,830 138,495 138,002Fee income 295 206 - 38,739 34,598 66,550 74,989 105,584 109,793Portfolio administration revenue - - 22,522 19,314 - - - 22,522 19,314Other 1,177 2,623 692 545 209 770 405 418 2,483 4,356
25,076 24,548 23,359 19,971 142,936 139,709 77,713 87,237 269,084 271,465
8. Investment gains/(losses)
Consolidated2021
$’0002020
$’000Dividends received 2 22Profit/(loss) on financial assets held at fair value through profit or loss – Shares in listed corporations and unlisted options held in listed corporations 3,018 6,772Profit/(loss) on financial assets held at fair value through profit or loss – Geared equity investments1 (3,689) (4,253)
(669) 2,541
1. The fair value is based on the option value used to mitigate the risk on the limited recourse margin loans and the interest rate implicit in the loan.
9. Other income
Consolidated2021
$’0002020
$’000Sundry income 1,023 353
1,023 353
10. Finance income and expenses
Consolidated2021
$’0002020
$’000Interest income on bank deposits 604 1,710Interest income on loans and advances 22,104 23,257Total finance income 22,708 24,967
Bank interest and fee expense (1,387) (3,332)Interest expense on deposits (741) (1,215)Interest expense on leases (987) (1,303)Total finance expense (3,115) (5,850)Net finance income/(expense) 19,593 19,117
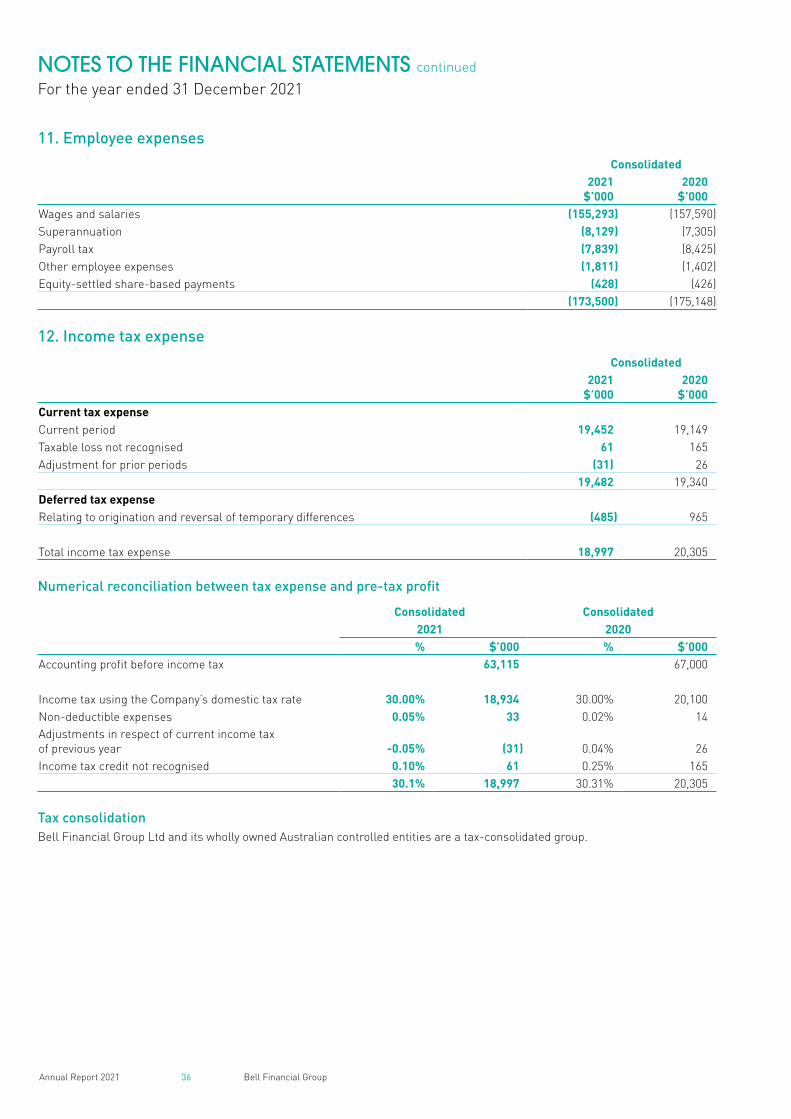
36 Bell Financial GroupAnnual Report 2021
NOTES TO THE FINANCIAL STATEMENTS continued
For the year ended 31 December 2021
11. Employee expenses
Consolidated2021
$’0002020
$’000Wages and salaries (155,293) (157,590)Superannuation (8,129) (7,305)Payroll tax (7,839) (8,425)Other employee expenses (1,811) (1,402)Equity-settled share-based payments (428) (426)
(173,500) (175,148)
12. Income tax expense
Consolidated2021
$’0002020
$’000Current tax expenseCurrent period 19,452 19,149Taxable loss not recognised 61 165Adjustment for prior periods (31) 26
19,482 19,340Deferred tax expenseRelating to origination and reversal of temporary differences (485) 965
Total income tax expense 18,997 20,305
Numerical reconciliation between tax expense and pre-tax profit
Consolidated Consolidated2021 2020% $’000 % $’000
Accounting profit before income tax 63,115 67,000
Income tax using the Company’s domestic tax rate 30.00% 18,934 30.00% 20,100Non-deductible expenses 0.05% 33 0.02% 14Adjustments in respect of current income tax of previous year -0.05% (31) 0.04% 26Income tax credit not recognised 0.10% 61 0.25% 165
30.1% 18,997 30.31% 20,305
Tax consolidationBell Financial Group Ltd and its wholly owned Australian controlled entities are a tax-consolidated group.
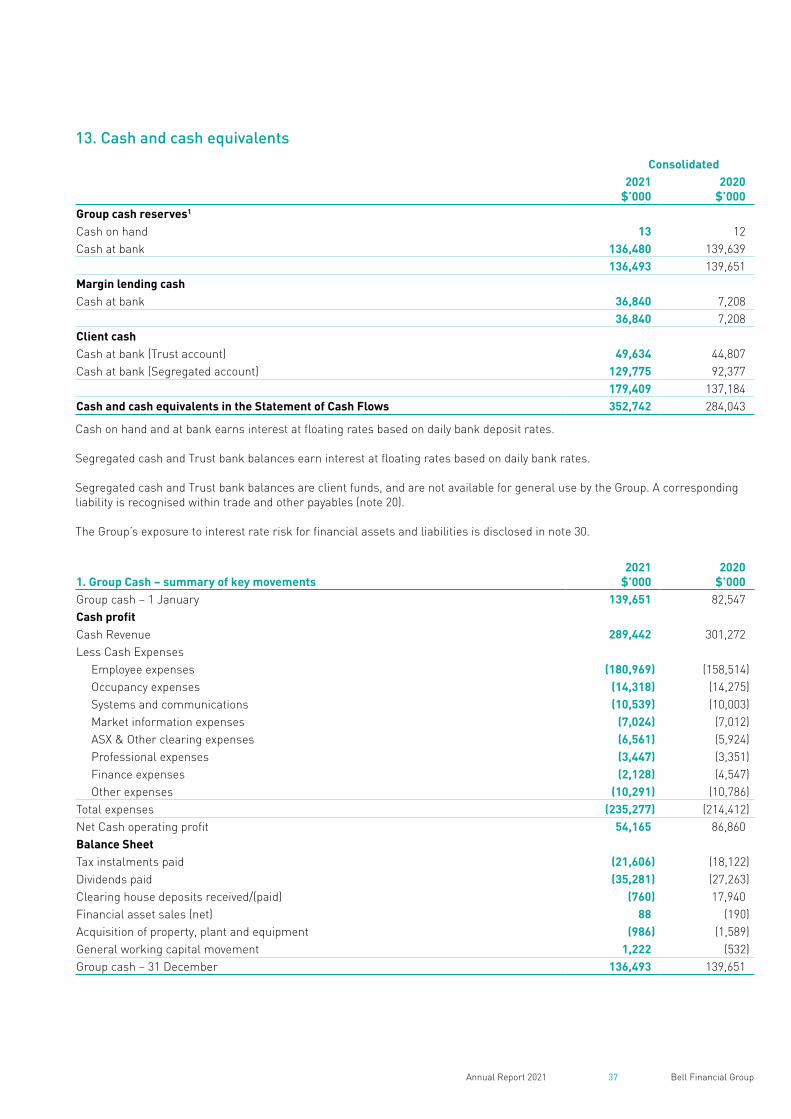
37 Bell Financial GroupAnnual Report 2021
13. Cash and cash equivalents
Consolidated2021
$’0002020
$’000Group cash reserves1
Cash on hand 13 12Cash at bank 136,480 139,639
136,493 139,651Margin lending cashCash at bank 36,840 7,208
36,840 7,208Client cashCash at bank (Trust account) 49,634 44,807Cash at bank (Segregated account) 129,775 92,377
179,409 137,184Cash and cash equivalents in the Statement of Cash Flows 352,742 284,043
Cash on hand and at bank earns interest at floating rates based on daily bank deposit rates.
Segregated cash and Trust bank balances earn interest at floating rates based on daily bank rates.
Segregated cash and Trust bank balances are client funds, and are not available for general use by the Group. A corresponding liability is recognised within trade and other payables (note 20).
The Group’s exposure to interest rate risk for financial assets and liabilities is disclosed in note 30.
1. Group Cash – summary of key movements2021
$’0002020
$’000Group cash – 1 January 139,651 82,547Cash profitCash Revenue 289,442 301,272Less Cash Expenses Employee expenses (180,969) (158,514) Occupancy expenses (14,318) (14,275) Systems and communications (10,539) (10,003) Market information expenses (7,024) (7,012) ASX & Other clearing expenses (6,561) (5,924) Professional expenses (3,447) (3,351) Finance expenses (2,128) (4,547) Other expenses (10,291) (10,786)Total expenses (235,277) (214,412)Net Cash operating profit 54,165 86,860Balance SheetTax instalments paid (21,606) (18,122)Dividends paid (35,281) (27,263)Clearing house deposits received/(paid) (760) 17,940Financial asset sales (net) 88 (190)Acquisition of property, plant and equipment (986) (1,589)General working capital movement 1,222 (532)Group cash – 31 December 136,493 139,651
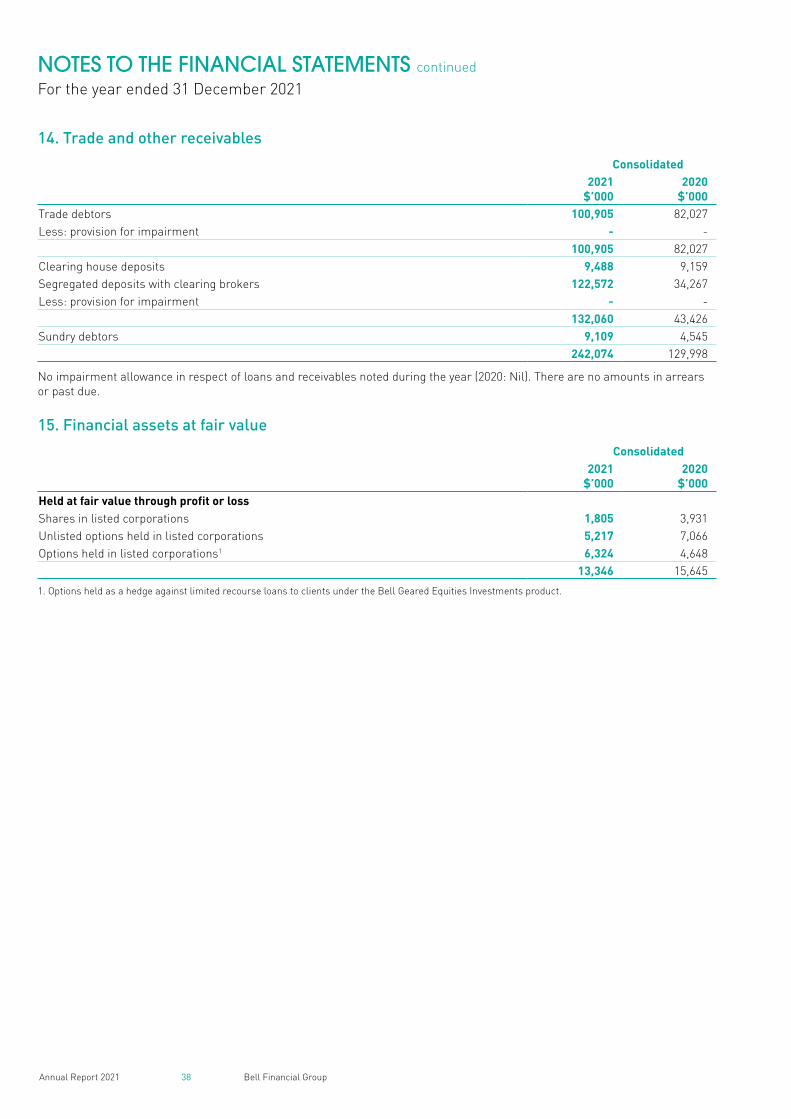
38 Bell Financial GroupAnnual Report 2021
NOTES TO THE FINANCIAL STATEMENTS continued
For the year ended 31 December 2021
14. Trade and other receivables
Consolidated2021
$’0002020
$’000Trade debtors 100,905 82,027Less: provision for impairment - -
100,905 82,027Clearing house deposits 9,488 9,159Segregated deposits with clearing brokers 122,572 34,267Less: provision for impairment - -
132,060 43,426Sundry debtors 9,109 4,545
242,074 129,998
No impairment allowance in respect of loans and receivables noted during the year (2020: Nil). There are no amounts in arrears or past due.
15. Financial assets at fair value
Consolidated2021
$’0002020
$’000Held at fair value through profit or lossShares in listed corporations 1,805 3,931Unlisted options held in listed corporations 5,217 7,066Options held in listed corporations1 6,324 4,648
13,346 15,645
1. Options held as a hedge against limited recourse loans to clients under the Bell Geared Equities Investments product.
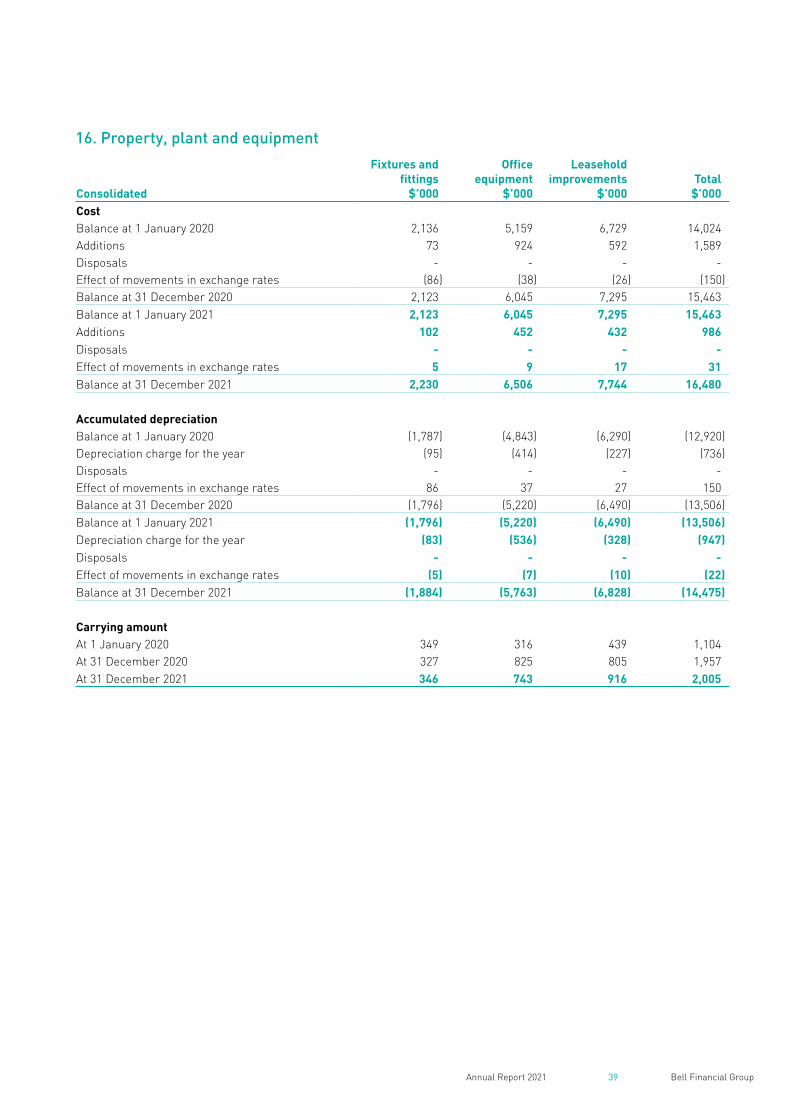
39 Bell Financial GroupAnnual Report 2021
16. Property, plant and equipment
Consolidated
Fixtures and fittings
$’000
Office equipment
$’000
Leasehold improvements
$’000Total
$’000CostBalance at 1 January 2020 2,136 5,159 6,729 14,024Additions 73 924 592 1,589Disposals - - - -Effect of movements in exchange rates (86) (38) (26) (150)Balance at 31 December 2020 2,123 6,045 7,295 15,463Balance at 1 January 2021 2,123 6,045 7,295 15,463Additions 102 452 432 986Disposals - - - -Effect of movements in exchange rates 5 9 17 31Balance at 31 December 2021 2,230 6,506 7,744 16,480
Accumulated depreciationBalance at 1 January 2020 (1,787) (4,843) (6,290) (12,920)Depreciation charge for the year (95) (414) (227) (736)Disposals - - - -Effect of movements in exchange rates 86 37 27 150Balance at 31 December 2020 (1,796) (5,220) (6,490) (13,506)Balance at 1 January 2021 (1,796) (5,220) (6,490) (13,506)Depreciation charge for the year (83) (536) (328) (947)Disposals - - - -Effect of movements in exchange rates (5) (7) (10) (22)Balance at 31 December 2021 (1,884) (5,763) (6,828) (14,475)
Carrying amountAt 1 January 2020 349 316 439 1,104At 31 December 2020 327 825 805 1,957At 31 December 2021 346 743 916 2,005
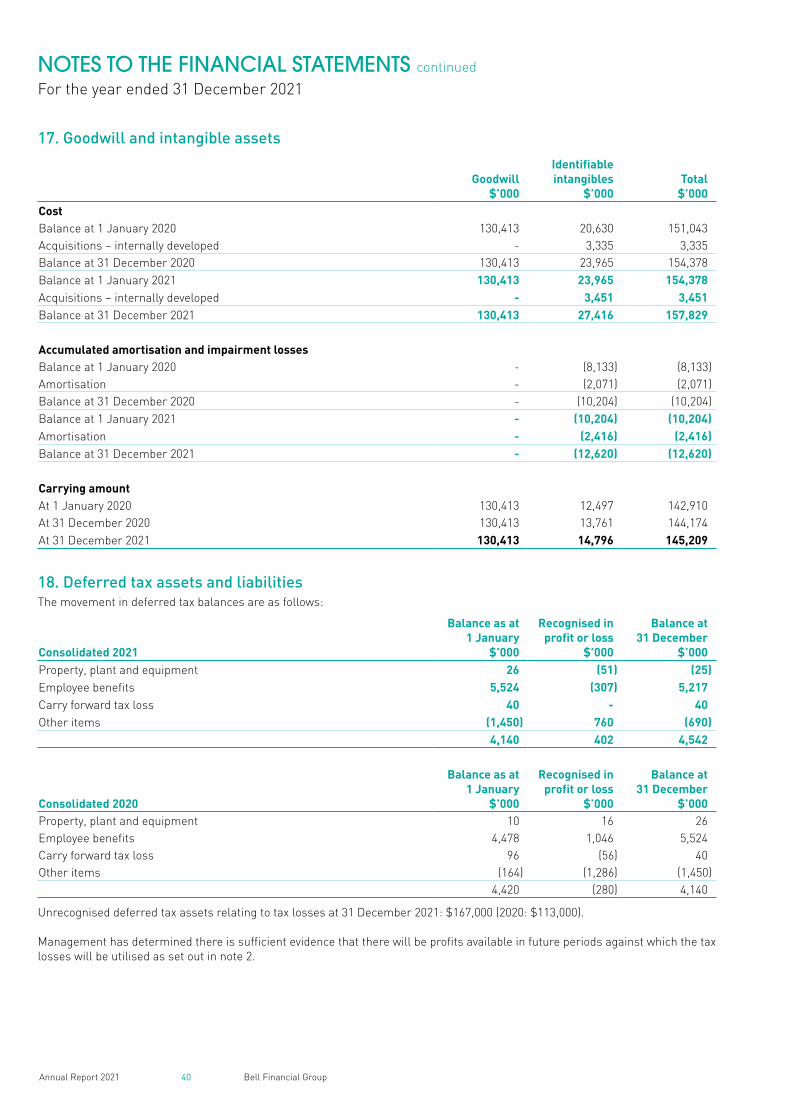
40 Bell Financial GroupAnnual Report 2021
NOTES TO THE FINANCIAL STATEMENTS continued
For the year ended 31 December 2021
17. Goodwill and intangible assets
Goodwill$’000
Identifiable intangibles
$’000Total
$’000CostBalance at 1 January 2020 130,413 20,630 151,043Acquisitions – internally developed - 3,335 3,335Balance at 31 December 2020 130,413 23,965 154,378Balance at 1 January 2021 130,413 23,965 154,378Acquisitions – internally developed - 3,451 3,451Balance at 31 December 2021 130,413 27,416 157,829
Accumulated amortisation and impairment lossesBalance at 1 January 2020 - (8,133) (8,133)Amortisation - (2,071) (2,071)Balance at 31 December 2020 - (10,204) (10,204)Balance at 1 January 2021 - (10,204) (10,204)Amortisation - (2,416) (2,416)Balance at 31 December 2021 - (12,620) (12,620)
Carrying amountAt 1 January 2020 130,413 12,497 142,910At 31 December 2020 130,413 13,761 144,174At 31 December 2021 130,413 14,796 145,209
18. Deferred tax assets and liabilitiesThe movement in deferred tax balances are as follows:
Consolidated 2021
Balance as at 1 January
$’000
Recognised in profit or loss
$’000
Balance at 31 December
$’000Property, plant and equipment 26 (51) (25)Employee benefits 5,524 (307) 5,217Carry forward tax loss 40 - 40Other items (1,450) 760 (690)
4,140 402 4,542
Consolidated 2020
Balance as at 1 January
$’000
Recognised in profit or loss
$’000
Balance at 31 December
$’000Property, plant and equipment 10 16 26Employee benefits 4,478 1,046 5,524Carry forward tax loss 96 (56) 40Other items (164) (1,286) (1,450)
4,420 (280) 4,140
Unrecognised deferred tax assets relating to tax losses at 31 December 2021: $167,000 (2020: $113,000).
Management has determined there is sufficient evidence that there will be profits available in future periods against which the tax losses will be utilised as set out in note 2.
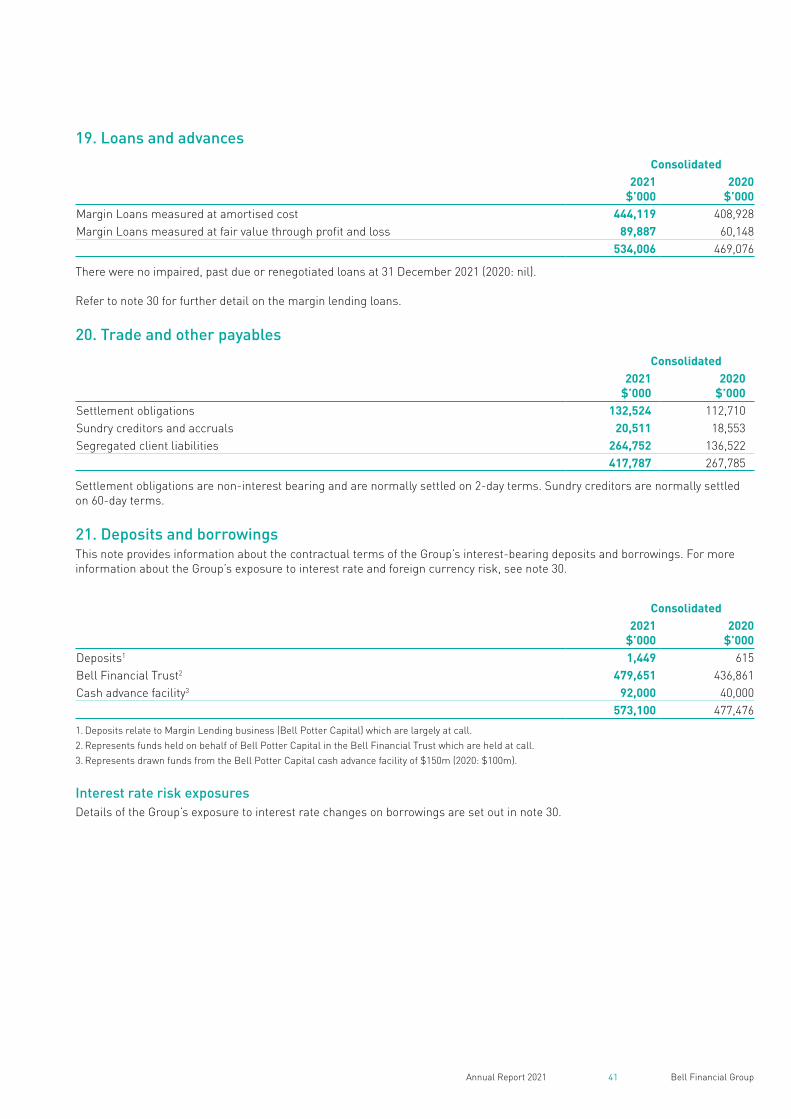
41 Bell Financial GroupAnnual Report 2021
19. Loans and advances
Consolidated2021
$’0002020
$’000Margin Loans measured at amortised cost 444,119 408,928Margin Loans measured at fair value through profit and loss 89,887 60,148
534,006 469,076
There were no impaired, past due or renegotiated loans at 31 December 2021 (2020: nil).
Refer to note 30 for further detail on the margin lending loans.
20. Trade and other payables
Consolidated2021
$’0002020
$’000Settlement obligations 132,524 112,710Sundry creditors and accruals 20,511 18,553Segregated client liabilities 264,752 136,522
417,787 267,785
Settlement obligations are non-interest bearing and are normally settled on 2-day terms. Sundry creditors are normally settled on 60-day terms.
21. Deposits and borrowingsThis note provides information about the contractual terms of the Group’s interest-bearing deposits and borrowings. For more information about the Group’s exposure to interest rate and foreign currency risk, see note 30.
Consolidated2021
$’0002020
$’000Deposits1 1,449 615Bell Financial Trust2 479,651 436,861Cash advance facility3 92,000 40,000
573,100 477,476
1. Deposits relate to Margin Lending business (Bell Potter Capital) which are largely at call.2. Represents funds held on behalf of Bell Potter Capital in the Bell Financial Trust which are held at call.3. Represents drawn funds from the Bell Potter Capital cash advance facility of $150m (2020: $100m).
Interest rate risk exposuresDetails of the Group’s exposure to interest rate changes on borrowings are set out in note 30.
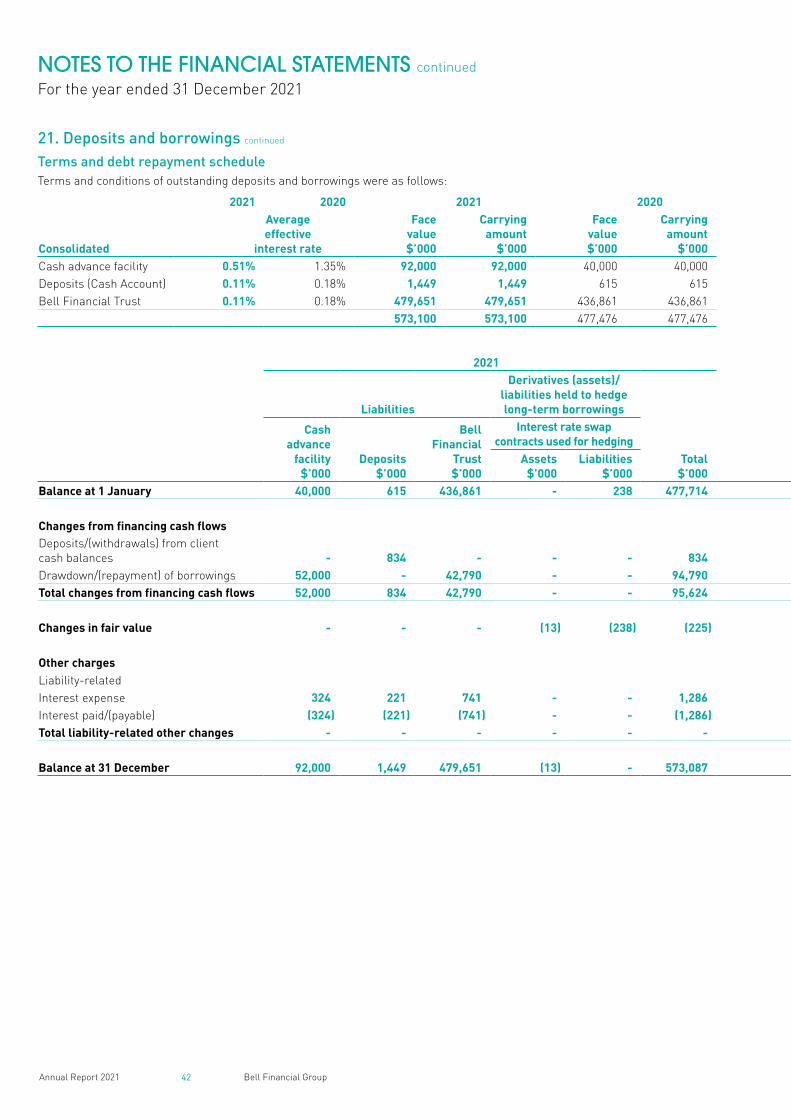
42 Bell Financial GroupAnnual Report 2021
NOTES TO THE FINANCIAL STATEMENTS continued
For the year ended 31 December 2021
21. Deposits and borrowings continued
Terms and debt repayment scheduleTerms and conditions of outstanding deposits and borrowings were as follows:
2021 2020 2021 2020
Consolidated
Average effective
interest rate
Face value $’000
Carrying amount
$’000
Facevalue $’000
Carrying amount
$’000Cash advance facility 0.51% 1.35% 92,000 92,000 40,000 40,000Deposits (Cash Account) 0.11% 0.18% 1,449 1,449 615 615Bell Financial Trust 0.11% 0.18% 479,651 479,651 436,861 436,861
573,100 573,100 477,476 477,476
2021 2020
Liabilities
Derivatives (assets)/liabilities held to hedgelong-term borrowings Liabilities
Derivatives (assets)/liabilities held to hedge long-term borrowings
Cash advance
facility$’000
Deposits $’000
Bell Financial
Trust$’000
Interest rate swap contracts used for hedging
Total$’000
Cash advance
facility $’000
Deposits $’000
Bell Financial
Trust $’000
Interest rate swap contracts used for Hedging
Assets$’000
Liabilities$’000
Assets$’000
Liabilities$’000
Total$’000
Balance at 1 January 40,000 615 436,861 - 238 477,714 177,000 635 381,795 - 380 559,810
Changes from financing cash flowsDeposits/(withdrawals) from client cash balances - 834 - - - 834 - (20) - - - (20)Drawdown/(repayment) of borrowings 52,000 - 42,790 - - 94,790 (137,000) - 55,066 - - (81,934)Total changes from financing cash flows 52,000 834 42,790 - - 95,624 (137,000) (20) 55,066 - - (81,954)
Changes in fair value - - - (13) (238) (225) - - - - (142) (142)
Other chargesLiability-relatedInterest expense 324 221 741 - - 1,286 612 1,249 1,215 - - 3,076Interest paid/(payable) (324) (221) (741) - - (1,286) (612) (1,249) (1,215) - - (3,076)Total liability-related other changes - - - - - - - - - - - -
Balance at 31 December 92,000 1,449 479,651 (13) - 573,087 40,000 615 436,861 - 238 477,714
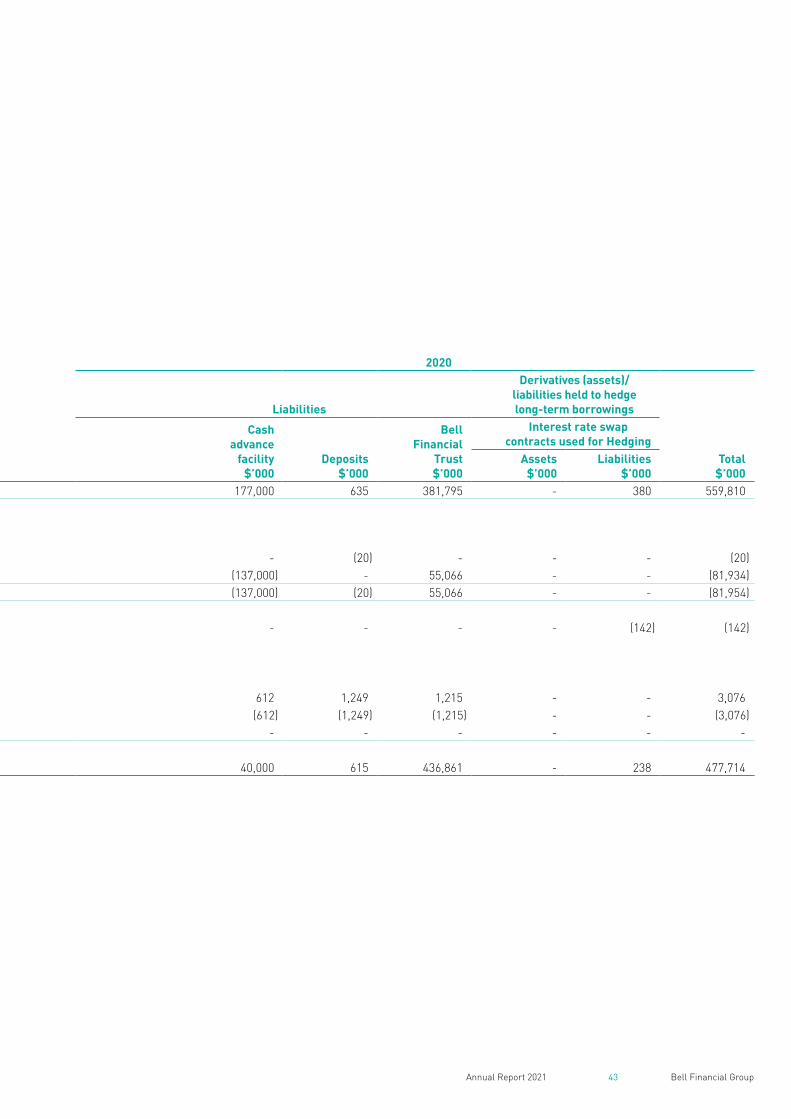
43 Bell Financial GroupAnnual Report 2021
21. Deposits and borrowings continued
Terms and debt repayment scheduleTerms and conditions of outstanding deposits and borrowings were as follows:
2021 2020 2021 2020
Consolidated
Average effective
interest rate
Face value $’000
Carrying amount
$’000
Facevalue $’000
Carrying amount
$’000Cash advance facility 0.51% 1.35% 92,000 92,000 40,000 40,000Deposits (Cash Account) 0.11% 0.18% 1,449 1,449 615 615Bell Financial Trust 0.11% 0.18% 479,651 479,651 436,861 436,861
573,100 573,100 477,476 477,476
2021 2020
Liabilities
Derivatives (assets)/liabilities held to hedgelong-term borrowings Liabilities
Derivatives (assets)/liabilities held to hedge long-term borrowings
Cash advance
facility$’000
Deposits $’000
Bell Financial
Trust$’000
Interest rate swap contracts used for hedging
Total$’000
Cash advance
facility $’000
Deposits $’000
Bell Financial
Trust $’000
Interest rate swap contracts used for Hedging
Assets$’000
Liabilities$’000
Assets$’000
Liabilities$’000
Total$’000
Balance at 1 January 40,000 615 436,861 - 238 477,714 177,000 635 381,795 - 380 559,810
Changes from financing cash flowsDeposits/(withdrawals) from client cash balances - 834 - - - 834 - (20) - - - (20)Drawdown/(repayment) of borrowings 52,000 - 42,790 - - 94,790 (137,000) - 55,066 - - (81,934)Total changes from financing cash flows 52,000 834 42,790 - - 95,624 (137,000) (20) 55,066 - - (81,954)
Changes in fair value - - - (13) (238) (225) - - - - (142) (142)
Other chargesLiability-relatedInterest expense 324 221 741 - - 1,286 612 1,249 1,215 - - 3,076Interest paid/(payable) (324) (221) (741) - - (1,286) (612) (1,249) (1,215) - - (3,076)Total liability-related other changes - - - - - - - - - - - -
Balance at 31 December 92,000 1,449 479,651 (13) - 573,087 40,000 615 436,861 - 238 477,714
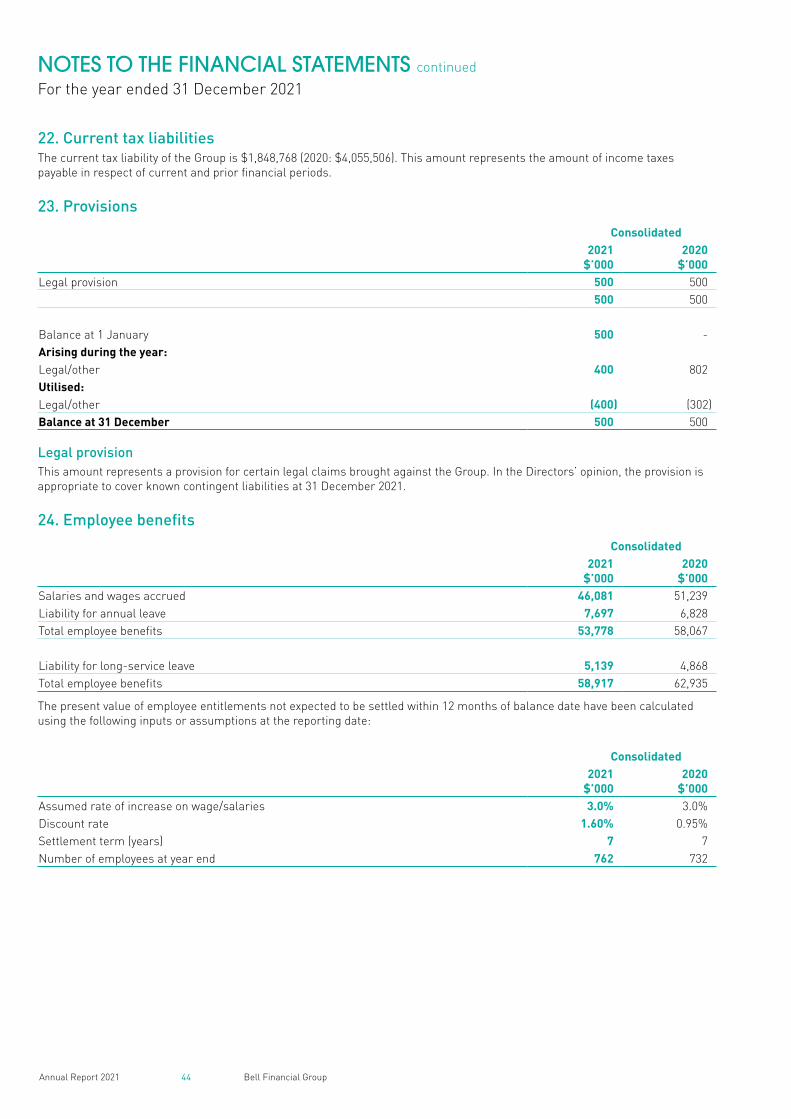
44 Bell Financial GroupAnnual Report 2021
NOTES TO THE FINANCIAL STATEMENTS continued
For the year ended 31 December 2021
22. Current tax liabilitiesThe current tax liability of the Group is $1,848,768 (2020: $4,055,506). This amount represents the amount of income taxes payable in respect of current and prior financial periods.
23. Provisions
Consolidated2021
$’0002020
$’000Legal provision 500 500
500 500
Balance at 1 January 500 -Arising during the year:Legal/other 400 802Utilised:Legal/other (400) (302)Balance at 31 December 500 500
Legal provisionThis amount represents a provision for certain legal claims brought against the Group. In the Directors’ opinion, the provision is appropriate to cover known contingent liabilities at 31 December 2021.
24. Employee benefits
Consolidated2021
$’0002020
$’000Salaries and wages accrued 46,081 51,239Liability for annual leave 7,697 6,828Total employee benefits 53,778 58,067
Liability for long-service leave 5,139 4,868Total employee benefits 58,917 62,935
The present value of employee entitlements not expected to be settled within 12 months of balance date have been calculated using the following inputs or assumptions at the reporting date:
Consolidated2021
$’0002020
$’000Assumed rate of increase on wage/salaries 3.0% 3.0%Discount rate 1.60% 0.95%Settlement term (years) 7 7Number of employees at year end 762 732
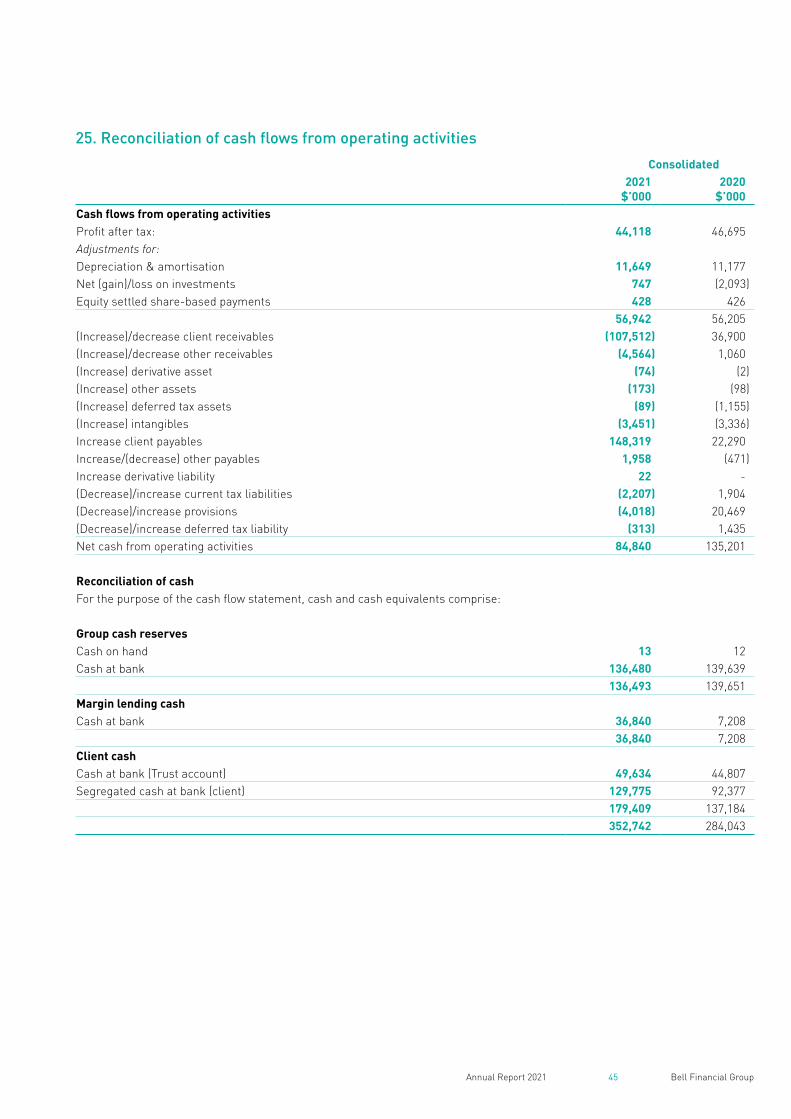
45 Bell Financial GroupAnnual Report 2021
25. Reconciliation of cash flows from operating activities
Consolidated2021
$’0002020
$’000Cash flows from operating activitiesProfit after tax: 44,118 46,695Adjustments for:Depreciation & amortisation 11,649 11,177Net (gain)/loss on investments 747 (2,093)Equity settled share-based payments 428 426
56,942 56,205(Increase)/decrease client receivables (107,512) 36,900(Increase)/decrease other receivables (4,564) 1,060(Increase) derivative asset (74) (2)(Increase) other assets (173) (98)(Increase) deferred tax assets (89) (1,155)(Increase) intangibles (3,451) (3,336)Increase client payables 148,319 22,290Increase/(decrease) other payables 1,958 (471)Increase derivative liability 22 -(Decrease)/increase current tax liabilities (2,207) 1,904(Decrease)/increase provisions (4,018) 20,469(Decrease)/increase deferred tax liability (313) 1,435Net cash from operating activities 84,840 135,201
Reconciliation of cashFor the purpose of the cash flow statement, cash and cash equivalents comprise:
Group cash reservesCash on hand 13 12Cash at bank 136,480 139,639
136,493 139,651Margin lending cashCash at bank 36,840 7,208
36,840 7,208Client cashCash at bank (Trust account) 49,634 44,807Segregated cash at bank (client) 129,775 92,377
179,409 137,184352,742 284,043
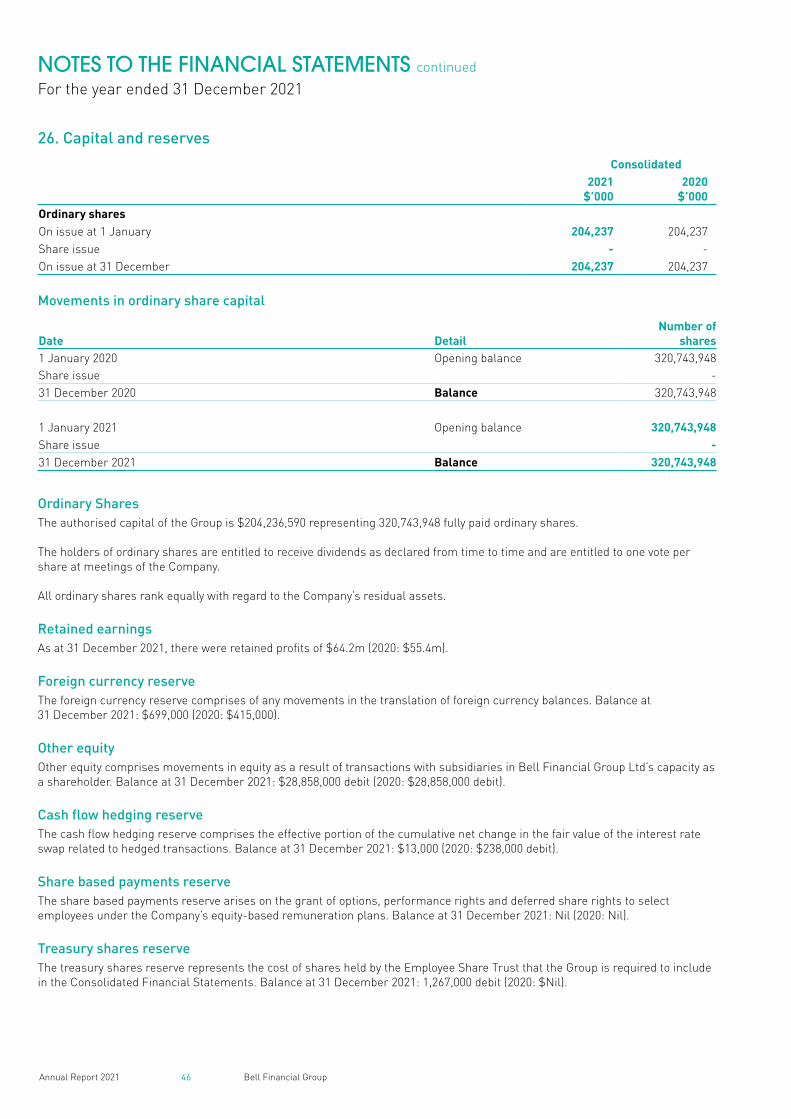
46 Bell Financial GroupAnnual Report 2021
NOTES TO THE FINANCIAL STATEMENTS continued
For the year ended 31 December 2021
26. Capital and reserves
Consolidated2021
$’0002020
$’000Ordinary sharesOn issue at 1 January 204,237 204,237Share issue - -On issue at 31 December 204,237 204,237
Movements in ordinary share capital
Date DetailNumber of
shares1 January 2020 Opening balance 320,743,948Share issue -31 December 2020 Balance 320,743,948
1 January 2021 Opening balance 320,743,948Share issue -31 December 2021 Balance 320,743,948
Ordinary SharesThe authorised capital of the Group is $204,236,590 representing 320,743,948 fully paid ordinary shares.
The holders of ordinary shares are entitled to receive dividends as declared from time to time and are entitled to one vote per share at meetings of the Company.
All ordinary shares rank equally with regard to the Company’s residual assets.
Retained earnings As at 31 December 2021, there were retained profits of $64.2m (2020: $55.4m).
Foreign currency reserve The foreign currency reserve comprises of any movements in the translation of foreign currency balances. Balance at 31 December 2021: $699,000 (2020: $415,000).
Other equityOther equity comprises movements in equity as a result of transactions with subsidiaries in Bell Financial Group Ltd’s capacity as a shareholder. Balance at 31 December 2021: $28,858,000 debit (2020: $28,858,000 debit).
Cash flow hedging reserve The cash flow hedging reserve comprises the effective portion of the cumulative net change in the fair value of the interest rate swap related to hedged transactions. Balance at 31 December 2021: $13,000 (2020: $238,000 debit).
Share based payments reserveThe share based payments reserve arises on the grant of options, performance rights and deferred share rights to select employees under the Company’s equity-based remuneration plans. Balance at 31 December 2021: Nil (2020: Nil).
Treasury shares reserveThe treasury shares reserve represents the cost of shares held by the Employee Share Trust that the Group is required to include in the Consolidated Financial Statements. Balance at 31 December 2021: 1,267,000 debit (2020: $Nil).
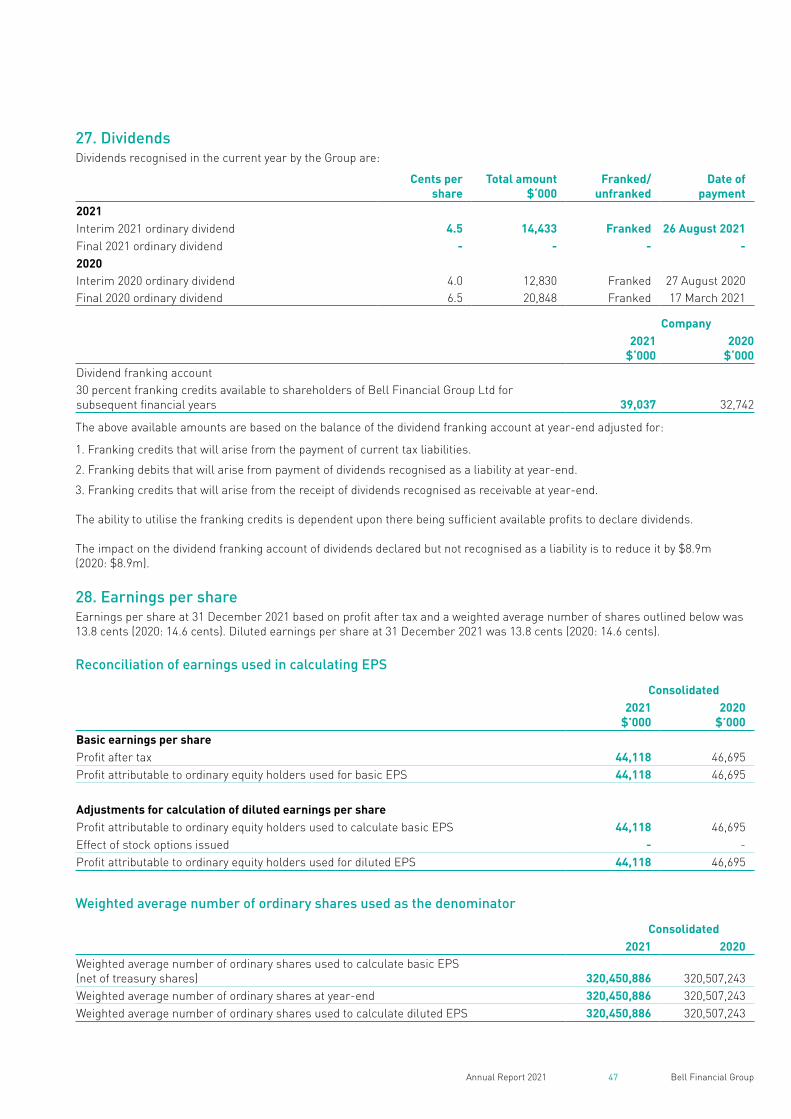
47 Bell Financial GroupAnnual Report 2021
27. DividendsDividends recognised in the current year by the Group are:
Cents pershare
Total amount $‘000
Franked/unfranked
Date ofpayment
2021Interim 2021 ordinary dividend 4.5 14,433 Franked 26 August 2021Final 2021 ordinary dividend - - - -2020Interim 2020 ordinary dividend 4.0 12,830 Franked 27 August 2020Final 2020 ordinary dividend 6.5 20,848 Franked 17 March 2021
Company2021
$‘0002020
$‘000Dividend franking account30 percent franking credits available to shareholders of Bell Financial Group Ltd for subsequent financial years 39,037 32,742
The above available amounts are based on the balance of the dividend franking account at year-end adjusted for:
1. Franking credits that will arise from the payment of current tax liabilities.
2. Franking debits that will arise from payment of dividends recognised as a liability at year-end.
3. Franking credits that will arise from the receipt of dividends recognised as receivable at year-end.
The ability to utilise the franking credits is dependent upon there being sufficient available profits to declare dividends.
The impact on the dividend franking account of dividends declared but not recognised as a liability is to reduce it by $8.9m (2020: $8.9m).
28. Earnings per shareEarnings per share at 31 December 2021 based on profit after tax and a weighted average number of shares outlined below was 13.8 cents (2020: 14.6 cents). Diluted earnings per share at 31 December 2021 was 13.8 cents (2020: 14.6 cents).
Reconciliation of earnings used in calculating EPS
Consolidated2021
$’0002020
$’000Basic earnings per shareProfit after tax 44,118 46,695Profit attributable to ordinary equity holders used for basic EPS 44,118 46,695
Adjustments for calculation of diluted earnings per shareProfit attributable to ordinary equity holders used to calculate basic EPS 44,118 46,695Effect of stock options issued - -Profit attributable to ordinary equity holders used for diluted EPS 44,118 46,695
Weighted average number of ordinary shares used as the denominator
Consolidated2021 2020
Weighted average number of ordinary shares used to calculate basic EPS (net of treasury shares) 320,450,886 320,507,243Weighted average number of ordinary shares at year-end 320,450,886 320,507,243Weighted average number of ordinary shares used to calculate diluted EPS 320,450,886 320,507,243
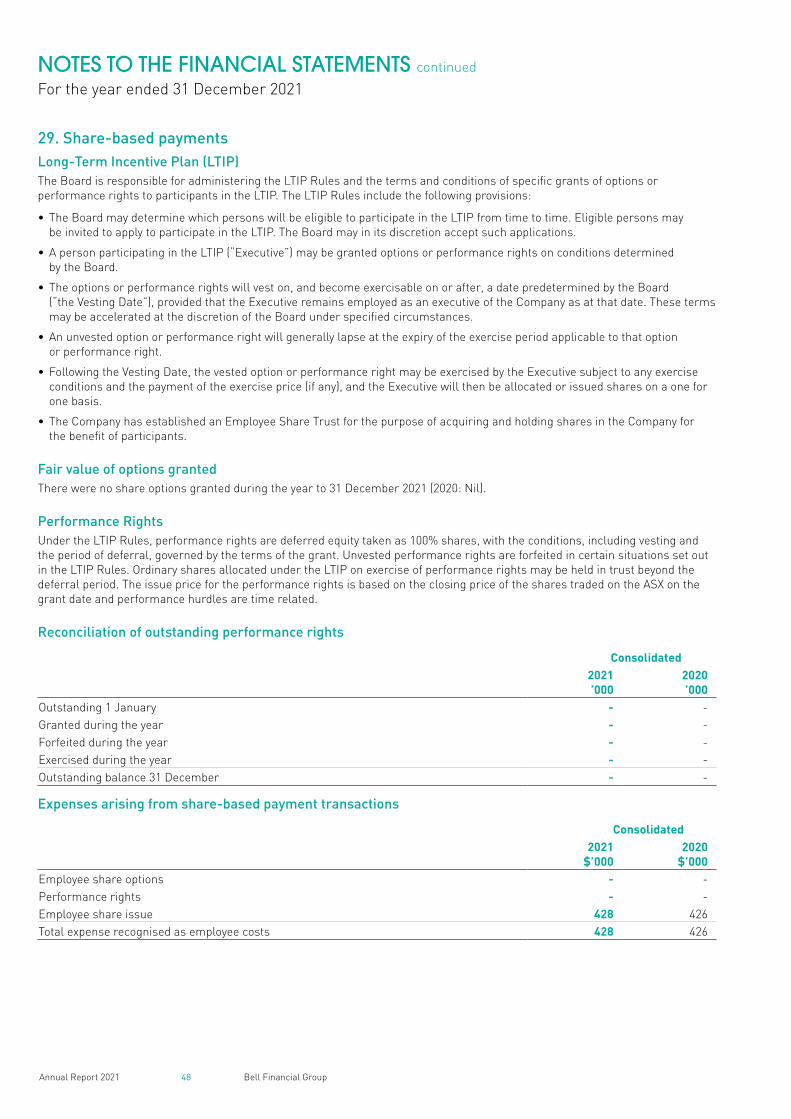
48 Bell Financial GroupAnnual Report 2021
NOTES TO THE FINANCIAL STATEMENTS continued
For the year ended 31 December 2021
29. Share-based paymentsLong-Term Incentive Plan (LTIP)The Board is responsible for administering the LTIP Rules and the terms and conditions of specific grants of options or performance rights to participants in the LTIP. The LTIP Rules include the following provisions:
• The Board may determine which persons will be eligible to participate in the LTIP from time to time. Eligible persons may be invited to apply to participate in the LTIP. The Board may in its discretion accept such applications.
• A person participating in the LTIP (“Executive”) may be granted options or performance rights on conditions determined by the Board.
• The options or performance rights will vest on, and become exercisable on or after, a date predetermined by the Board (“the Vesting Date”), provided that the Executive remains employed as an executive of the Company as at that date. These terms may be accelerated at the discretion of the Board under specified circumstances.
• An unvested option or performance right will generally lapse at the expiry of the exercise period applicable to that option or performance right.
• Following the Vesting Date, the vested option or performance right may be exercised by the Executive subject to any exercise conditions and the payment of the exercise price (if any), and the Executive will then be allocated or issued shares on a one for one basis.
• The Company has established an Employee Share Trust for the purpose of acquiring and holding shares in the Company for the benefit of participants.
Fair value of options grantedThere were no share options granted during the year to 31 December 2021 (2020: Nil).
Performance RightsUnder the LTIP Rules, performance rights are deferred equity taken as 100% shares, with the conditions, including vesting and the period of deferral, governed by the terms of the grant. Unvested performance rights are forfeited in certain situations set out in the LTIP Rules. Ordinary shares allocated under the LTIP on exercise of performance rights may be held in trust beyond the deferral period. The issue price for the performance rights is based on the closing price of the shares traded on the ASX on the grant date and performance hurdles are time related.
Reconciliation of outstanding performance rights
Consolidated2021’000
2020’000
Outstanding 1 January - -Granted during the year - -Forfeited during the year - -Exercised during the year - -Outstanding balance 31 December - -
Expenses arising from share-based payment transactions
Consolidated2021
$’0002020
$’000Employee share options - -Performance rights - -Employee share issue 428 426Total expense recognised as employee costs 428 426
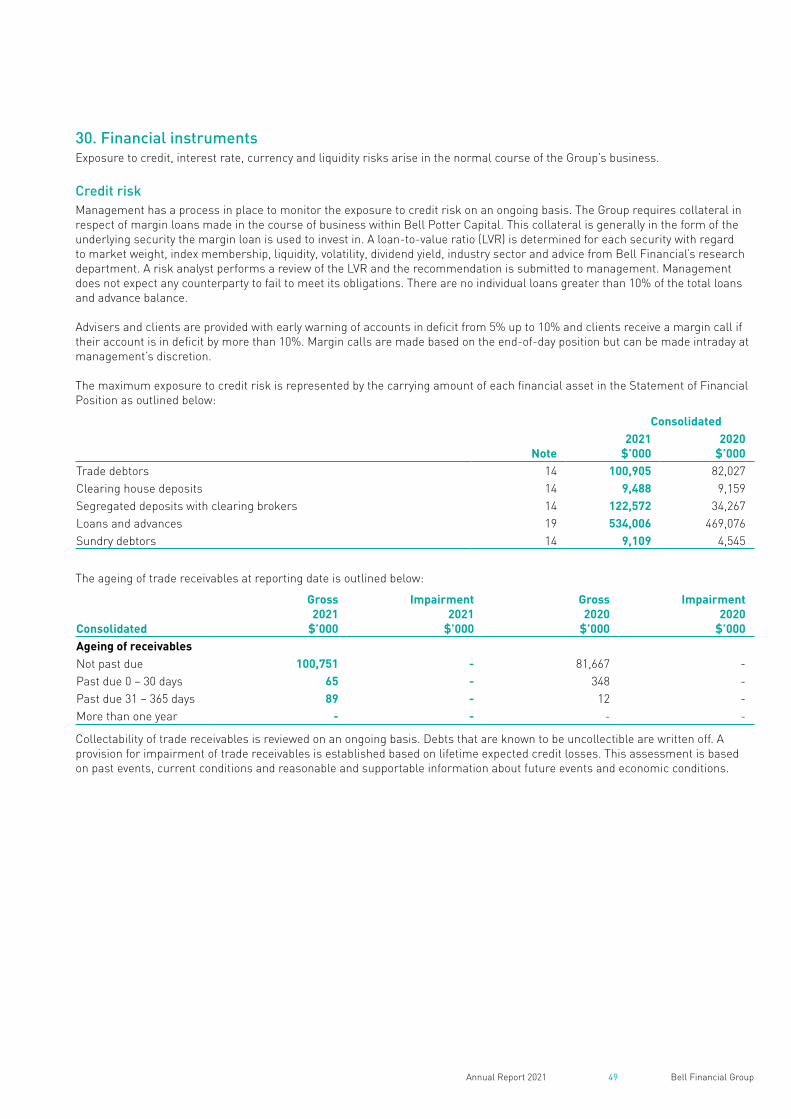
49 Bell Financial GroupAnnual Report 2021
30. Financial instrumentsExposure to credit, interest rate, currency and liquidity risks arise in the normal course of the Group’s business.
Credit risk Management has a process in place to monitor the exposure to credit risk on an ongoing basis. The Group requires collateral in respect of margin loans made in the course of business within Bell Potter Capital. This collateral is generally in the form of the underlying security the margin loan is used to invest in. A loan-to-value ratio (LVR) is determined for each security with regard to market weight, index membership, liquidity, volatility, dividend yield, industry sector and advice from Bell Financial’s research department. A risk analyst performs a review of the LVR and the recommendation is submitted to management. Management does not expect any counterparty to fail to meet its obligations. There are no individual loans greater than 10% of the total loans and advance balance.
Advisers and clients are provided with early warning of accounts in deficit from 5% up to 10% and clients receive a margin call if their account is in deficit by more than 10%. Margin calls are made based on the end-of-day position but can be made intraday at management’s discretion. The maximum exposure to credit risk is represented by the carrying amount of each financial asset in the Statement of Financial Position as outlined below:
Consolidated
Note2021
$’0002020
$’000Trade debtors 14 100,905 82,027Clearing house deposits 14 9,488 9,159Segregated deposits with clearing brokers 14 122,572 34,267Loans and advances 19 534,006 469,076Sundry debtors 14 9,109 4,545
The ageing of trade receivables at reporting date is outlined below:
Consolidated
Gross2021
$’000
Impairment2021
$’000
Gross2020
$’000
Impairment2020
$’000Ageing of receivablesNot past due 100,751 - 81,667 -Past due 0 – 30 days 65 - 348 -Past due 31 – 365 days 89 - 12 -More than one year - - - -
Collectability of trade receivables is reviewed on an ongoing basis. Debts that are known to be uncollectible are written off. A provision for impairment of trade receivables is established based on lifetime expected credit losses. This assessment is based on past events, current conditions and reasonable and supportable information about future events and economic conditions.
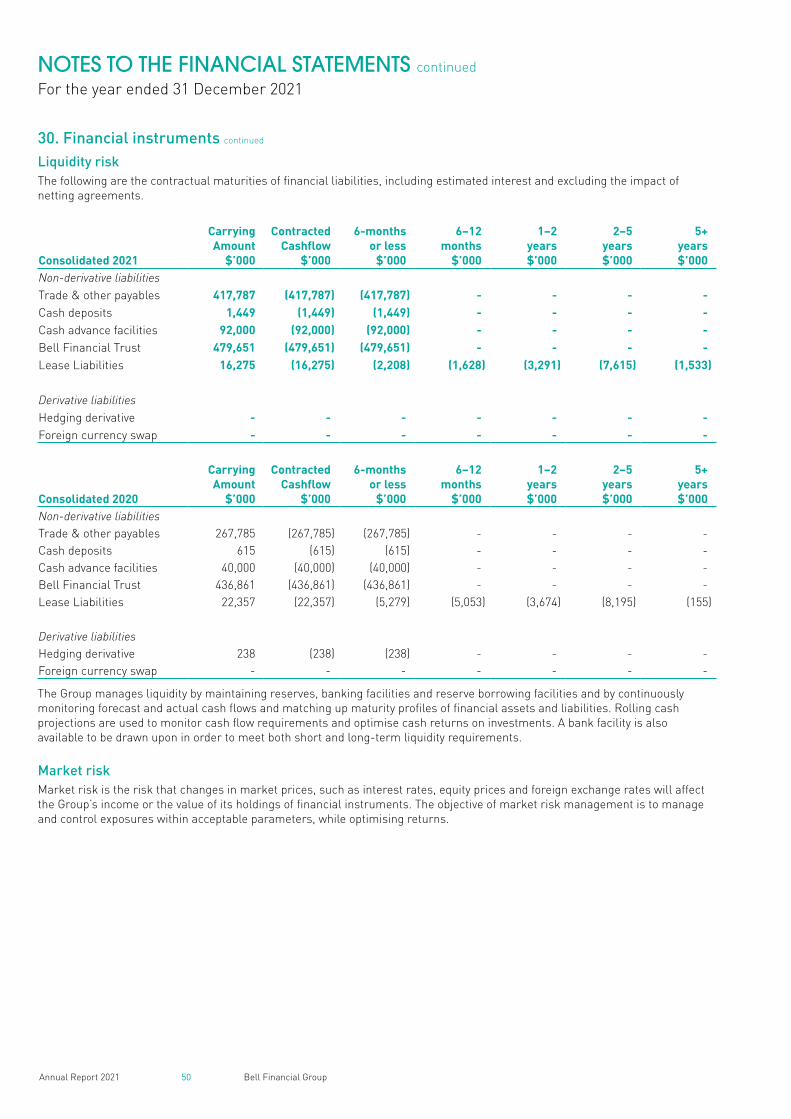
50 Bell Financial GroupAnnual Report 2021
NOTES TO THE FINANCIAL STATEMENTS continued
For the year ended 31 December 2021
30. Financial instruments continued
Liquidity riskThe following are the contractual maturities of financial liabilities, including estimated interest and excluding the impact of netting agreements.
Consolidated 2021
Carrying Amount
$’000
Contracted Cashflow
$’000
6-months or less
$’000
6–12 months
$’000
1–2 years$’000
2–5 years$’000
5+ years$’000
Non-derivative liabilitiesTrade & other payables 417,787 (417,787) (417,787) - - - -Cash deposits 1,449 (1,449) (1,449) - - - -Cash advance facilities 92,000 (92,000) (92,000) - - - -Bell Financial Trust 479,651 (479,651) (479,651) - - - -Lease Liabilities 16,275 (16,275) (2,208) (1,628) (3,291) (7,615) (1,533)
Derivative liabilitiesHedging derivative - - - - - - -Foreign currency swap - - - - - - -
Consolidated 2020
Carrying Amount
$’000
Contracted Cashflow
$’000
6-months or less
$’000
6–12 months
$’000
1–2 years$’000
2–5 years$’000
5+ years$’000
Non-derivative liabilitiesTrade & other payables 267,785 (267,785) (267,785) - - - -Cash deposits 615 (615) (615) - - - -Cash advance facilities 40,000 (40,000) (40,000) - - - -Bell Financial Trust 436,861 (436,861) (436,861) - - - -Lease Liabilities 22,357 (22,357) (5,279) (5,053) (3,674) (8,195) (155)
Derivative liabilitiesHedging derivative 238 (238) (238) - - - -Foreign currency swap - - - - - - -
The Group manages liquidity by maintaining reserves, banking facilities and reserve borrowing facilities and by continuously monitoring forecast and actual cash flows and matching up maturity profiles of financial assets and liabilities. Rolling cash projections are used to monitor cash flow requirements and optimise cash returns on investments. A bank facility is also available to be drawn upon in order to meet both short and long-term liquidity requirements.
Market riskMarket risk is the risk that changes in market prices, such as interest rates, equity prices and foreign exchange rates will affect the Group’s income or the value of its holdings of financial instruments. The objective of market risk management is to manage and control exposures within acceptable parameters, while optimising returns.

51 Bell Financial GroupAnnual Report 2021
Interest rate riskThe Group’s investments in fixed-rate debt securities and its fixed-rate borrowings are exposed to a risk of change in their fair value due to changes in interest rates. The Group’s investments in variable-rate debt securities and its variable-rate borrowings are exposed to a risk of change in cash flows due to changes in interest rates. Interest rate swaps are used to hedge exposure to fluctuations in interest rates. Changes in the fair value of these derivative hedging instruments are recognised directly in equity to the extent that the hedge is effective. To the extent the hedge is ineffective, changes in the fair value are recognised in profit or loss.
In managing interest rate risk the Group aims to reduce the impact of short-term fluctuations on the Group’s earnings. Over the longer-term, however, permanent changes in interest rates will have an impact on profit.
Investments in equity securities and short-term receivables and payables are not exposed to interest rate risk.
Equity price risk All instruments are subject to the risk that future changes in market conditions may make an instrument less valuable. As trading instruments are valued with reference to the market or Black Scholes model, changes in equity prices directly affect reported income each period. The Group monitors equity price movements to ensure there is no material impact on the Group’s activities.
The Group is exposed to equity price risks through its listed and unlisted investments. These investments are classified as financial assets or liabilities at fair value through the profit or loss.
Foreign currency riskThe Group is exposed to insignificant currency risk on monetary assets and liabilities held in a currency other than the respective functional currency of the Group. The Group ensures the net exposure is kept to an acceptable level by buying or selling foreign currencies at spot rates where necessary to address short-term imbalances.
Sensitivity analysis
Interest rate riskAt 31 December 2021, it is estimated that a general decrease of one-percentage point in interest rates would decrease the Group’s profit before income tax by approximately $3,159,000 (2020: $2,766,000 decrease to profit) and would decrease equity by approximately $2,211,000 (2020: $1,936,000 decrease to equity). Interest rate swaps have been included in this calculation. A general increase of one-percentage point in interest rates would have an equal but opposite effect.
Equity price riskAt 31 December 2021, it is estimated that a 10% decrease in equity prices would decrease the Group’s profit before income tax by approximately $1,335,000 (2020: $1,565,000 decrease to profit) and would decrease equity by approximately $935,000 (2020: $1,095,000 decrease to equity). A 10% increase in equity prices would have an equal but opposite effect. The impact of an equity price decrease excludes the impact on options that are used to mitigate the risk on limited recourse margin loans issued to clients.
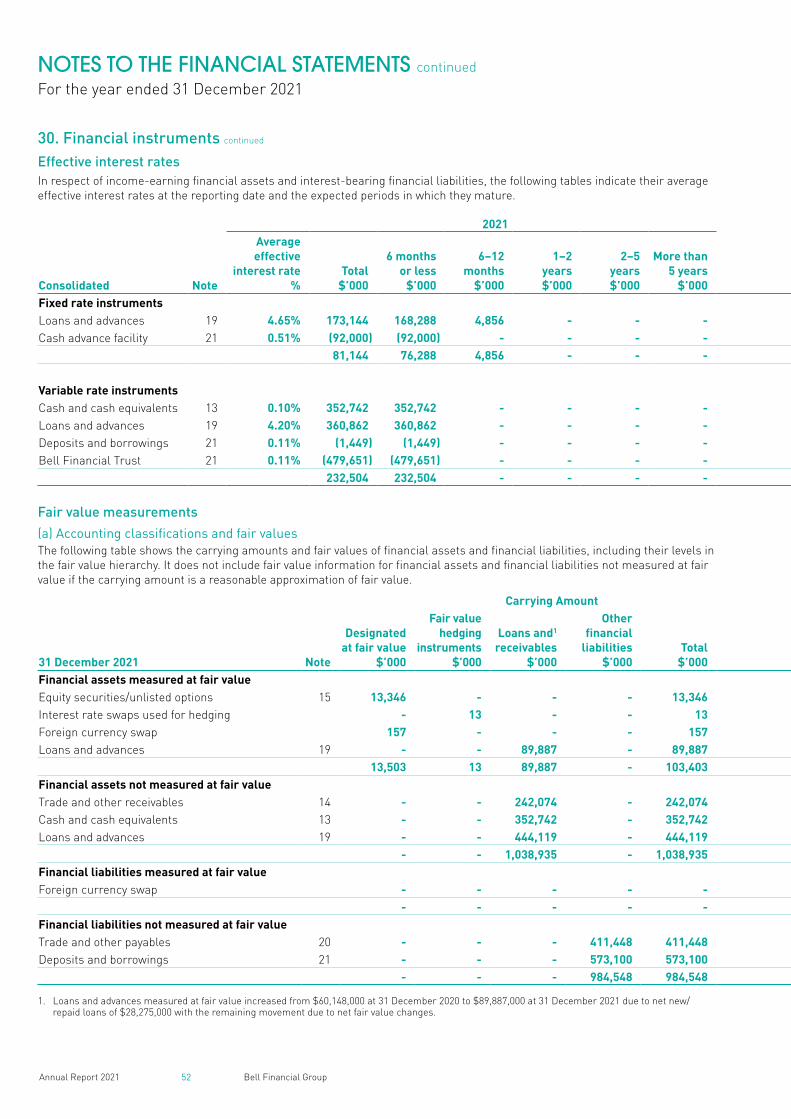
52 Bell Financial GroupAnnual Report 2021
NOTES TO THE FINANCIAL STATEMENTS continued
For the year ended 31 December 2021
30. Financial instruments continued
Effective interest rates In respect of income-earning financial assets and interest-bearing financial liabilities, the following tables indicate their average effective interest rates at the reporting date and the expected periods in which they mature.
2021 2020
Consolidated Note
Average effective
interest rate%
Total$’000
6 months or less
$’000
6–12 months
$’000
1–2years$’000
2–5 years$’000
More than 5 years
$’000
Average Effective
interest rate%
Total$’000
6 months or less
$’000
6–12 months
$’000
1–2years$’000
2–5years$’000
More than 5 years
$’000Fixed rate instrumentsLoans and advances 19 4.65% 173,144 168,288 4,856 - - - 5.30% 129,688 128,198 1,490 - - -Cash advance facility 21 0.51% (92,000) (92,000) - - - - 1.35% (40,000) (40,000) - - - -
81,144 76,288 4,856 - - - 89,688 88,198 1,490 - - -
Variable rate instrumentsCash and cash equivalents 13 0.10% 352,742 352,742 - - - - 0.31% 284,043 284,043 - - - -Loans and advances 19 4.20% 360,862 360,862 - - - - 4.36% 339,388 339,388 - - - -Deposits and borrowings 21 0.11% (1,449) (1,449) - - - - 0.18% (615) (615) - - - -Bell Financial Trust 21 0.11% (479,651) (479,651) - - - - 0.18% (436,861) (436,861) - - - -
232,504 232,504 - - - - 185,955 185,955 - - - -
Fair value measurements
(a) Accounting classifications and fair valuesThe following table shows the carrying amounts and fair values of financial assets and financial liabilities, including their levels in the fair value hierarchy. It does not include fair value information for financial assets and financial liabilities not measured at fair value if the carrying amount is a reasonable approximation of fair value.
Carrying Amount Fair Value
31 December 2021 Note
Designated at fair value
$’000
Fair value hedging
instruments$’000
Loans and1 receivables
$’000
Other financial
liabilities$’000
Total$’000
Level 1$’000
Level 2$’000
Level 3$’000
Total$’000
Financial assets measured at fair valueEquity securities/unlisted options 15 13,346 - - - 13,346 1,805 11,541 - 13,346Interest rate swaps used for hedging - 13 - - 13 - 13 - 13Foreign currency swap 157 - - - 157 - 157 - 157Loans and advances 19 - - 89,887 - 89,887 - - 89,887 89,887
13,503 13 89,887 - 103,403 1,805 11,711 89,887 103,403Financial assets not measured at fair valueTrade and other receivables 14 - - 242,074 - 242,074 - - - -Cash and cash equivalents 13 - - 352,742 - 352,742 - - - -Loans and advances 19 - - 444,119 - 444,119 - - - -
- - 1,038,935 - 1,038,935 - - - -Financial liabilities measured at fair valueForeign currency swap - - - - - - - - -
- - - - - - - - -Financial liabilities not measured at fair valueTrade and other payables 20 - - - 411,448 411,448 - - - -Deposits and borrowings 21 - - - 573,100 573,100 - - - -
- - - 984,548 984,548 - - - -
1. Loans and advances measured at fair value increased from $60,148,000 at 31 December 2020 to $89,887,000 at 31 December 2021 due to net new/repaid loans of $28,275,000 with the remaining movement due to net fair value changes.
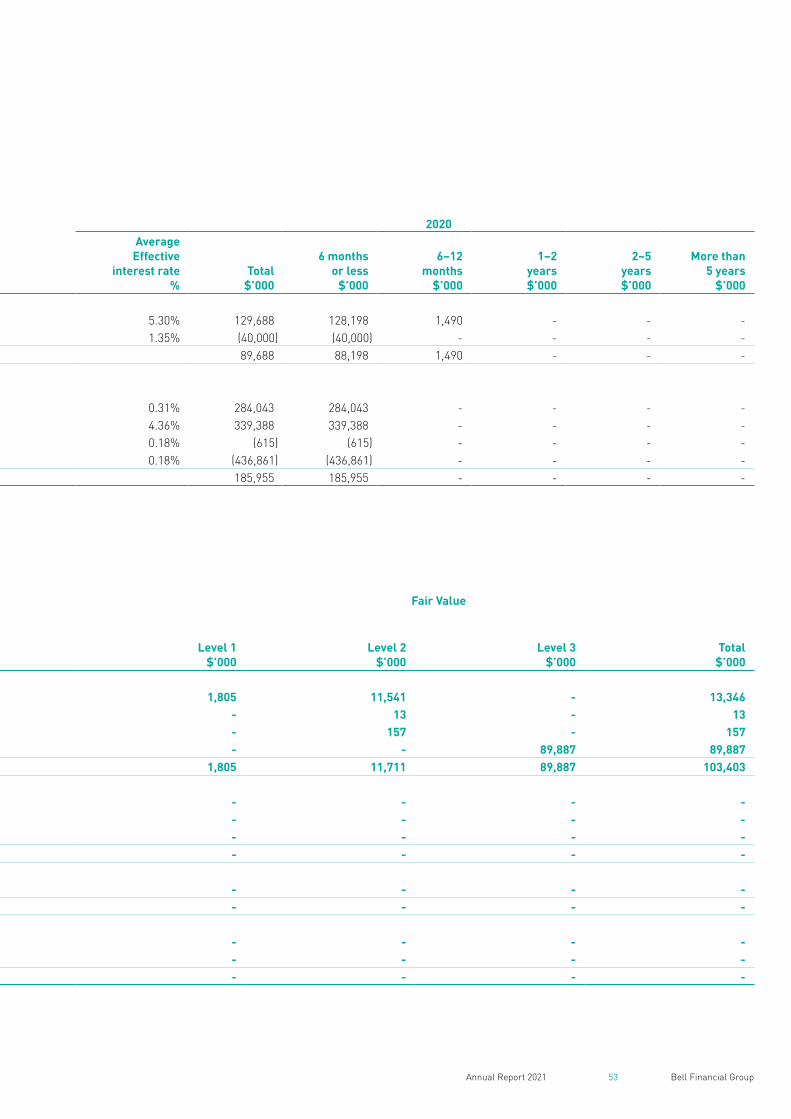
53 Bell Financial GroupAnnual Report 2021
30. Financial instruments continued
Effective interest rates In respect of income-earning financial assets and interest-bearing financial liabilities, the following tables indicate their average effective interest rates at the reporting date and the expected periods in which they mature.
2021 2020
Consolidated Note
Average effective
interest rate%
Total$’000
6 months or less
$’000
6–12 months
$’000
1–2years$’000
2–5 years$’000
More than 5 years
$’000
Average Effective
interest rate%
Total$’000
6 months or less
$’000
6–12 months
$’000
1–2years$’000
2–5years$’000
More than 5 years
$’000Fixed rate instrumentsLoans and advances 19 4.65% 173,144 168,288 4,856 - - - 5.30% 129,688 128,198 1,490 - - -Cash advance facility 21 0.51% (92,000) (92,000) - - - - 1.35% (40,000) (40,000) - - - -
81,144 76,288 4,856 - - - 89,688 88,198 1,490 - - -
Variable rate instrumentsCash and cash equivalents 13 0.10% 352,742 352,742 - - - - 0.31% 284,043 284,043 - - - -Loans and advances 19 4.20% 360,862 360,862 - - - - 4.36% 339,388 339,388 - - - -Deposits and borrowings 21 0.11% (1,449) (1,449) - - - - 0.18% (615) (615) - - - -Bell Financial Trust 21 0.11% (479,651) (479,651) - - - - 0.18% (436,861) (436,861) - - - -
232,504 232,504 - - - - 185,955 185,955 - - - -
Fair value measurements
(a) Accounting classifications and fair valuesThe following table shows the carrying amounts and fair values of financial assets and financial liabilities, including their levels in the fair value hierarchy. It does not include fair value information for financial assets and financial liabilities not measured at fair value if the carrying amount is a reasonable approximation of fair value.
Carrying Amount Fair Value
31 December 2021 Note
Designated at fair value
$’000
Fair value hedging
instruments$’000
Loans and1 receivables
$’000
Other financial
liabilities$’000
Total$’000
Level 1$’000
Level 2$’000
Level 3$’000
Total$’000
Financial assets measured at fair valueEquity securities/unlisted options 15 13,346 - - - 13,346 1,805 11,541 - 13,346Interest rate swaps used for hedging - 13 - - 13 - 13 - 13Foreign currency swap 157 - - - 157 - 157 - 157Loans and advances 19 - - 89,887 - 89,887 - - 89,887 89,887
13,503 13 89,887 - 103,403 1,805 11,711 89,887 103,403Financial assets not measured at fair valueTrade and other receivables 14 - - 242,074 - 242,074 - - - -Cash and cash equivalents 13 - - 352,742 - 352,742 - - - -Loans and advances 19 - - 444,119 - 444,119 - - - -
- - 1,038,935 - 1,038,935 - - - -Financial liabilities measured at fair valueForeign currency swap - - - - - - - - -
- - - - - - - - -Financial liabilities not measured at fair valueTrade and other payables 20 - - - 411,448 411,448 - - - -Deposits and borrowings 21 - - - 573,100 573,100 - - - -
- - - 984,548 984,548 - - - -
1. Loans and advances measured at fair value increased from $60,148,000 at 31 December 2020 to $89,887,000 at 31 December 2021 due to net new/repaid loans of $28,275,000 with the remaining movement due to net fair value changes.
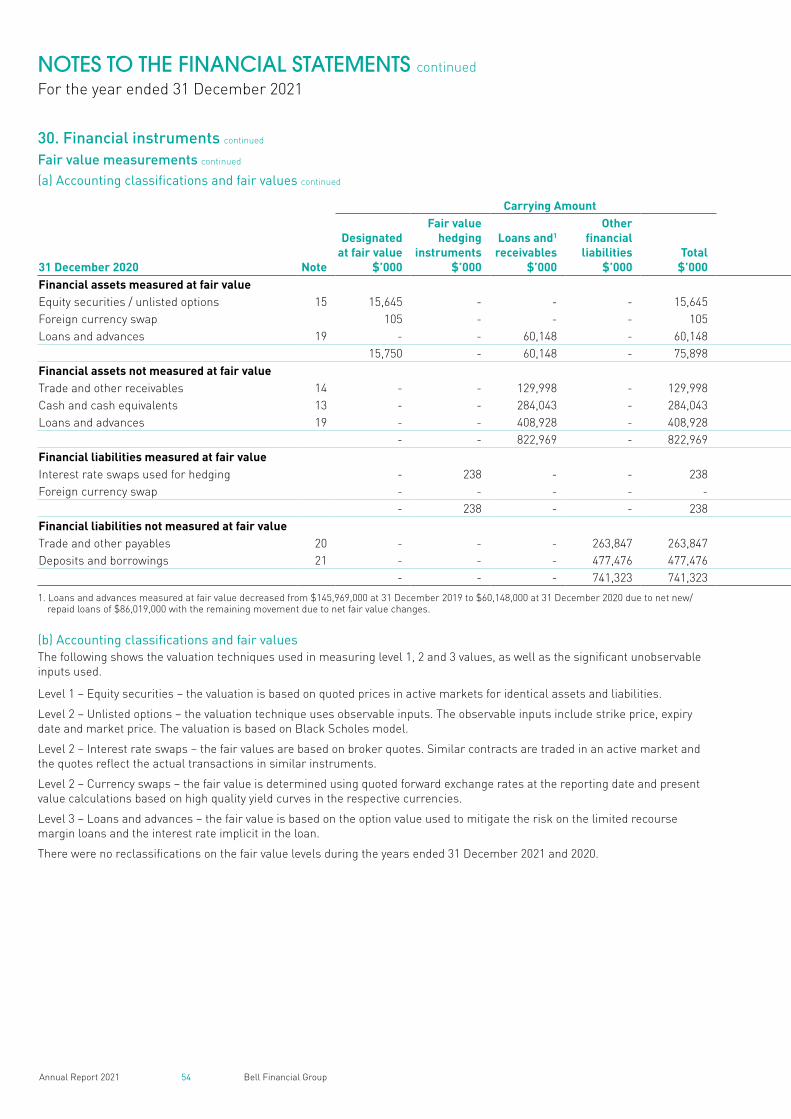
54 Bell Financial GroupAnnual Report 2021
NOTES TO THE FINANCIAL STATEMENTS continued
For the year ended 31 December 2021
30. Financial instruments continued
Fair value measurements continued
(a) Accounting classifications and fair values continued
Carrying Amount Fair Value
31 December 2020 Note
Designated at fair value
$’000
Fair value hedging
instruments$’000
Loans and1 receivables
$’000
Other financial
liabilities$’000
Total$’000
Level 1$’000
Level 2$’000
Level 31$’000
Total$’000
Financial assets measured at fair valueEquity securities / unlisted options 15 15,645 - - - 15,645 3,931 11,714 - 15,645Foreign currency swap 105 - - - 105 - 105 - 105Loans and advances 19 - - 60,148 - 60,148 - - 60,148 60,148
15,750 - 60,148 - 75,898 3,931 11,819 60,148 75,898Financial assets not measured at fair valueTrade and other receivables 14 - - 129,998 - 129,998 - - - -Cash and cash equivalents 13 - - 284,043 - 284,043 - - - -Loans and advances 19 - - 408,928 - 408,928 - - - -
- - 822,969 - 822,969 - - - -Financial liabilities measured at fair valueInterest rate swaps used for hedging - 238 - - 238 - 238 - 238Foreign currency swap - - - - - - - - -
- 238 - - 238 - 238 - 238Financial liabilities not measured at fair valueTrade and other payables 20 - - - 263,847 263,847 - - - -Deposits and borrowings 21 - - - 477,476 477,476 - - - -
- - - 741,323 741,323 - - - -
1. Loans and advances measured at fair value decreased from $145,969,000 at 31 December 2019 to $60,148,000 at 31 December 2020 due to net new/ repaid loans of $86,019,000 with the remaining movement due to net fair value changes.
(b) Accounting classifications and fair valuesThe following shows the valuation techniques used in measuring level 1, 2 and 3 values, as well as the significant unobservable inputs used.
Level 1 – Equity securities – the valuation is based on quoted prices in active markets for identical assets and liabilities.
Level 2 – Unlisted options – the valuation technique uses observable inputs. The observable inputs include strike price, expiry date and market price. The valuation is based on Black Scholes model.
Level 2 – Interest rate swaps – the fair values are based on broker quotes. Similar contracts are traded in an active market and the quotes reflect the actual transactions in similar instruments.
Level 2 – Currency swaps – the fair value is determined using quoted forward exchange rates at the reporting date and present value calculations based on high quality yield curves in the respective currencies.
Level 3 – Loans and advances – the fair value is based on the option value used to mitigate the risk on the limited recourse margin loans and the interest rate implicit in the loan.
There were no reclassifications on the fair value levels during the years ended 31 December 2021 and 2020.
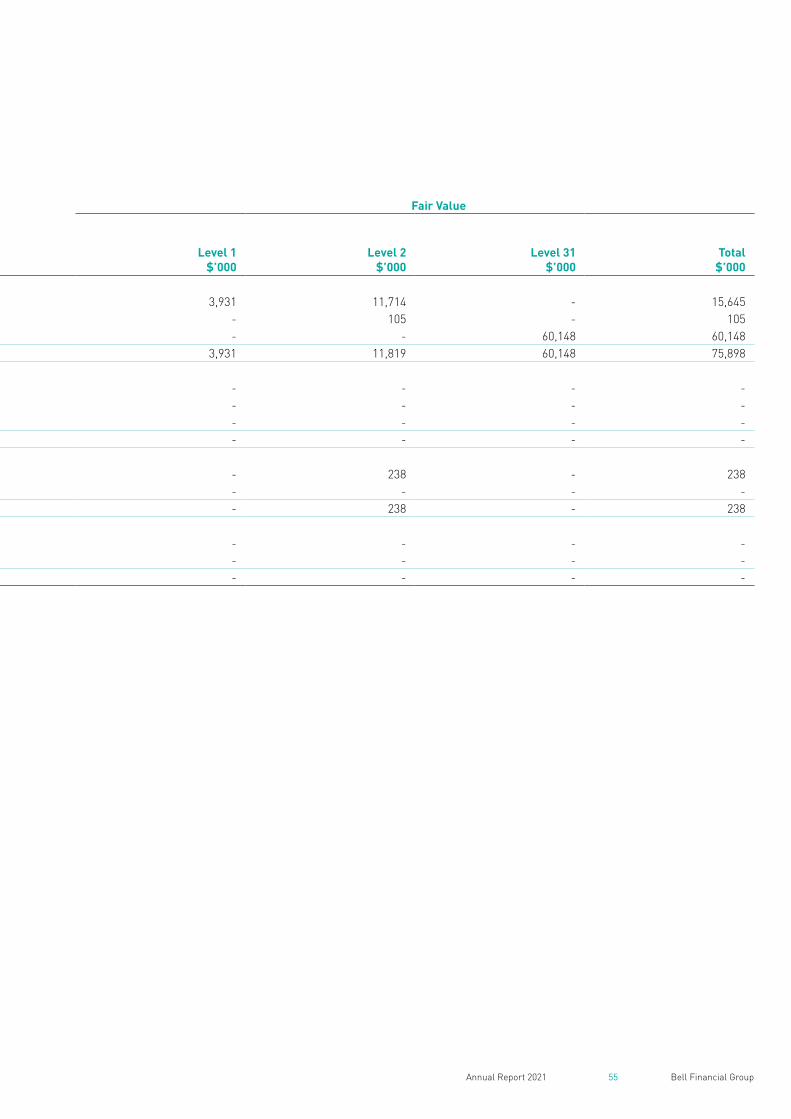
55 Bell Financial GroupAnnual Report 2021
30. Financial instruments continued
Fair value measurements continued
(a) Accounting classifications and fair values continued
Carrying Amount Fair Value
31 December 2020 Note
Designated at fair value
$’000
Fair value hedging
instruments$’000
Loans and1 receivables
$’000
Other financial
liabilities$’000
Total$’000
Level 1$’000
Level 2$’000
Level 31$’000
Total$’000
Financial assets measured at fair valueEquity securities / unlisted options 15 15,645 - - - 15,645 3,931 11,714 - 15,645Foreign currency swap 105 - - - 105 - 105 - 105Loans and advances 19 - - 60,148 - 60,148 - - 60,148 60,148
15,750 - 60,148 - 75,898 3,931 11,819 60,148 75,898Financial assets not measured at fair valueTrade and other receivables 14 - - 129,998 - 129,998 - - - -Cash and cash equivalents 13 - - 284,043 - 284,043 - - - -Loans and advances 19 - - 408,928 - 408,928 - - - -
- - 822,969 - 822,969 - - - -Financial liabilities measured at fair valueInterest rate swaps used for hedging - 238 - - 238 - 238 - 238Foreign currency swap - - - - - - - - -
- 238 - - 238 - 238 - 238Financial liabilities not measured at fair valueTrade and other payables 20 - - - 263,847 263,847 - - - -Deposits and borrowings 21 - - - 477,476 477,476 - - - -
- - - 741,323 741,323 - - - -
1. Loans and advances measured at fair value decreased from $145,969,000 at 31 December 2019 to $60,148,000 at 31 December 2020 due to net new/ repaid loans of $86,019,000 with the remaining movement due to net fair value changes.
(b) Accounting classifications and fair valuesThe following shows the valuation techniques used in measuring level 1, 2 and 3 values, as well as the significant unobservable inputs used.
Level 1 – Equity securities – the valuation is based on quoted prices in active markets for identical assets and liabilities.
Level 2 – Unlisted options – the valuation technique uses observable inputs. The observable inputs include strike price, expiry date and market price. The valuation is based on Black Scholes model.
Level 2 – Interest rate swaps – the fair values are based on broker quotes. Similar contracts are traded in an active market and the quotes reflect the actual transactions in similar instruments.
Level 2 – Currency swaps – the fair value is determined using quoted forward exchange rates at the reporting date and present value calculations based on high quality yield curves in the respective currencies.
Level 3 – Loans and advances – the fair value is based on the option value used to mitigate the risk on the limited recourse margin loans and the interest rate implicit in the loan.
There were no reclassifications on the fair value levels during the years ended 31 December 2021 and 2020.
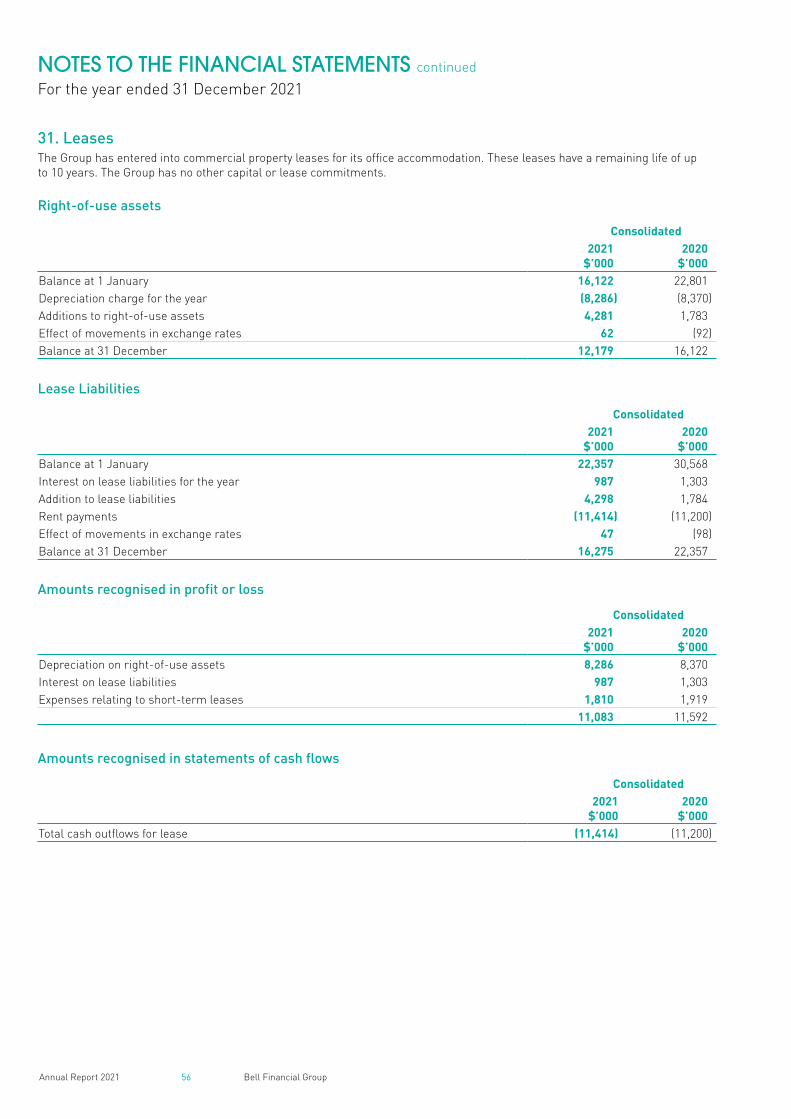
56 Bell Financial GroupAnnual Report 2021
NOTES TO THE FINANCIAL STATEMENTS continued
For the year ended 31 December 2021
31. LeasesThe Group has entered into commercial property leases for its office accommodation. These leases have a remaining life of up to 10 years. The Group has no other capital or lease commitments.
Right-of-use assets
Consolidated2021
$’0002020
$’000Balance at 1 January 16,122 22,801Depreciation charge for the year (8,286) (8,370)Additions to right-of-use assets 4,281 1,783Effect of movements in exchange rates 62 (92)Balance at 31 December 12,179 16,122
Lease Liabilities
Consolidated2021
$’0002020
$’000Balance at 1 January 22,357 30,568Interest on lease liabilities for the year 987 1,303Addition to lease liabilities 4,298 1,784Rent payments (11,414) (11,200)Effect of movements in exchange rates 47 (98)Balance at 31 December 16,275 22,357
Amounts recognised in profit or loss
Consolidated2021
$’0002020
$’000Depreciation on right-of-use assets 8,286 8,370Interest on lease liabilities 987 1,303Expenses relating to short-term leases 1,810 1,919
11,083 11,592
Amounts recognised in statements of cash flows
Consolidated2021
$’0002020
$’000Total cash outflows for lease (11,414) (11,200)
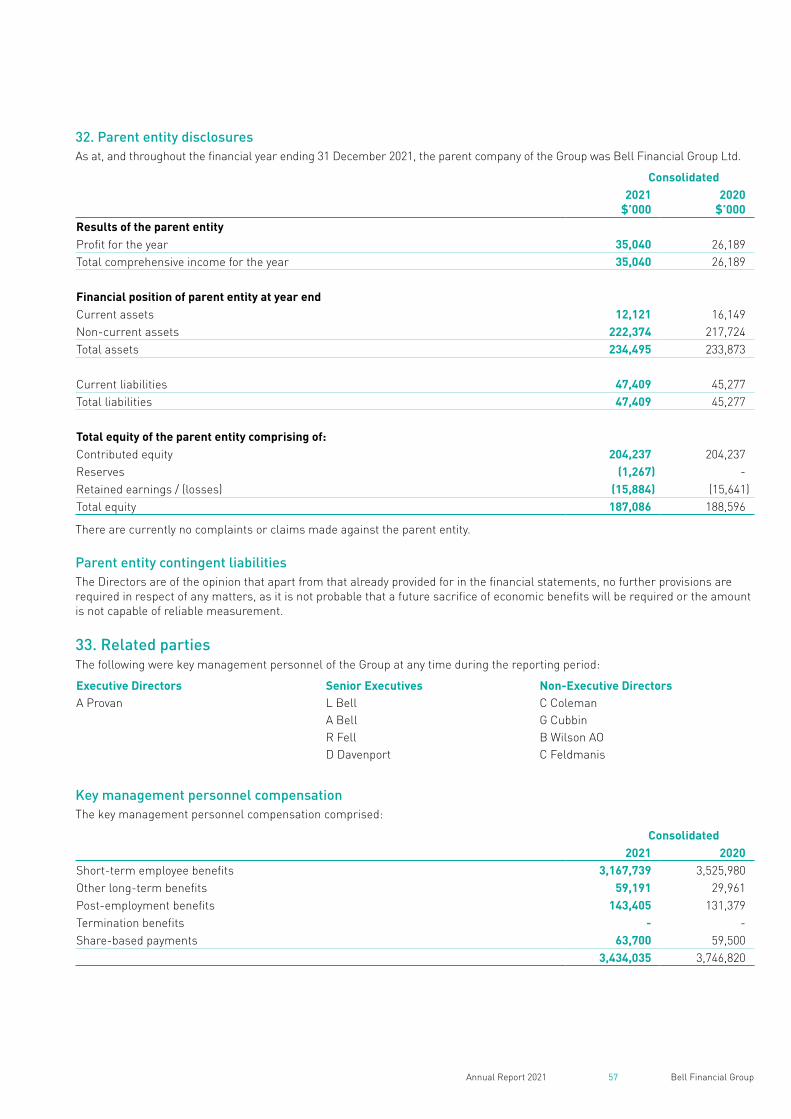
57 Bell Financial GroupAnnual Report 2021
32. Parent entity disclosuresAs at, and throughout the financial year ending 31 December 2021, the parent company of the Group was Bell Financial Group Ltd.
Consolidated2021
$’0002020
$’000Results of the parent entityProfit for the year 35,040 26,189Total comprehensive income for the year 35,040 26,189
Financial position of parent entity at year endCurrent assets 12,121 16,149Non-current assets 222,374 217,724Total assets 234,495 233,873
Current liabilities 47,409 45,277Total liabilities 47,409 45,277
Total equity of the parent entity comprising of:Contributed equity 204,237 204,237Reserves (1,267) -Retained earnings / (losses) (15,884) (15,641)Total equity 187,086 188,596
There are currently no complaints or claims made against the parent entity.
Parent entity contingent liabilitiesThe Directors are of the opinion that apart from that already provided for in the financial statements, no further provisions are required in respect of any matters, as it is not probable that a future sacrifice of economic benefits will be required or the amount is not capable of reliable measurement.
33. Related partiesThe following were key management personnel of the Group at any time during the reporting period:
Executive Directors Senior Executives Non-Executive Directors A Provan L Bell C Coleman
A Bell G CubbinR Fell B Wilson AOD Davenport C Feldmanis
Key management personnel compensationThe key management personnel compensation comprised:
Consolidated2021 2020
Short-term employee benefits 3,167,739 3,525,980Other long-term benefits 59,191 29,961Post-employment benefits 143,405 131,379Termination benefits - -Share-based payments 63,700 59,500
3,434,035 3,746,820
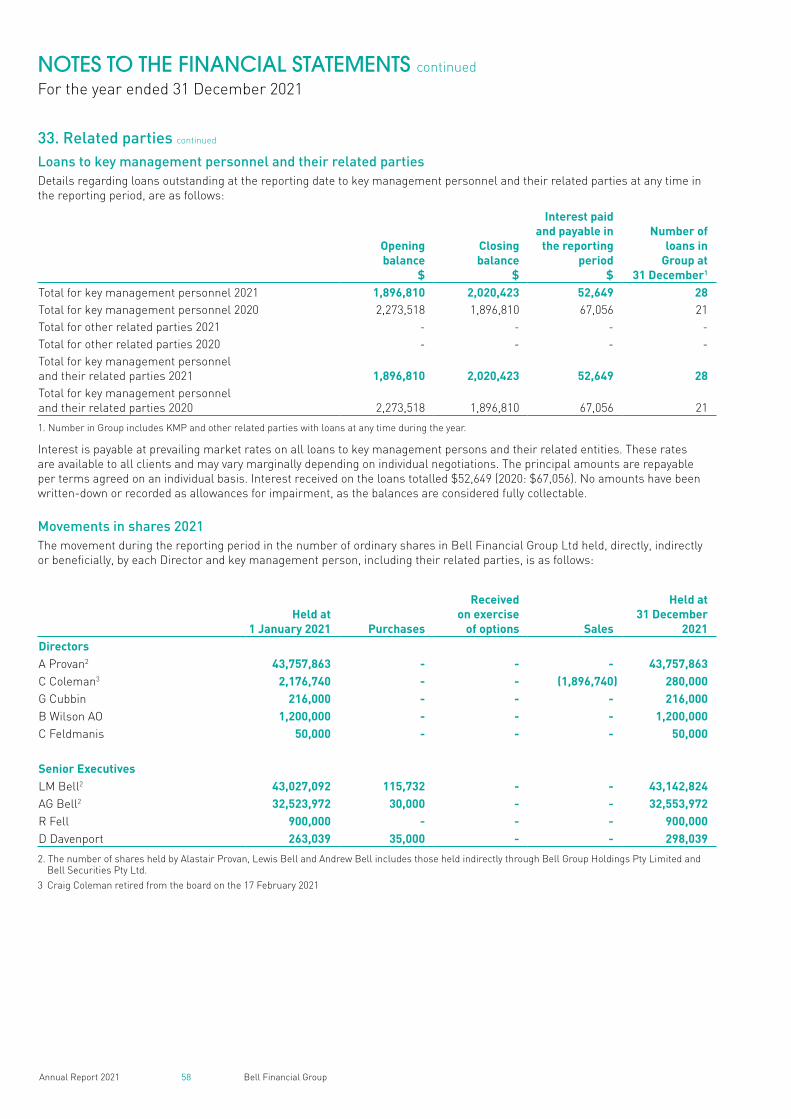
58 Bell Financial GroupAnnual Report 2021
NOTES TO THE FINANCIAL STATEMENTS continued
For the year ended 31 December 2021
33. Related parties continued
Loans to key management personnel and their related partiesDetails regarding loans outstanding at the reporting date to key management personnel and their related parties at any time in the reporting period, are as follows:
Opening balance
$
Closingbalance
$
Interest paid and payable in
the reporting period
$
Number of loans in
Group at 31 December1
Total for key management personnel 2021 1,896,810 2,020,423 52,649 28Total for key management personnel 2020 2,273,518 1,896,810 67,056 21Total for other related parties 2021 - - - -Total for other related parties 2020 - - - -Total for key management personnel and their related parties 2021 1,896,810 2,020,423 52,649 28Total for key management personnel and their related parties 2020 2,273,518 1,896,810 67,056 21
1. Number in Group includes KMP and other related parties with loans at any time during the year.
Interest is payable at prevailing market rates on all loans to key management persons and their related entities. These rates are available to all clients and may vary marginally depending on individual negotiations. The principal amounts are repayable per terms agreed on an individual basis. Interest received on the loans totalled $52,649 (2020: $67,056). No amounts have been written-down or recorded as allowances for impairment, as the balances are considered fully collectable.
Movements in shares 2021The movement during the reporting period in the number of ordinary shares in Bell Financial Group Ltd held, directly, indirectly or beneficially, by each Director and key management person, including their related parties, is as follows:
Held at 1 January 2021 Purchases
Received on exercise
of options Sales
Held at 31 December
2021DirectorsA Provan2 43,757,863 - - - 43,757,863C Coleman3 2,176,740 - - (1,896,740) 280,000G Cubbin 216,000 - - - 216,000B Wilson AO 1,200,000 - - - 1,200,000C Feldmanis 50,000 - - - 50,000
Senior ExecutivesLM Bell2 43,027,092 115,732 - - 43,142,824AG Bell2 32,523,972 30,000 - - 32,553,972R Fell 900,000 - - - 900,000D Davenport 263,039 35,000 - - 298,039
2. The number of shares held by Alastair Provan, Lewis Bell and Andrew Bell includes those held indirectly through Bell Group Holdings Pty Limited and Bell Securities Pty Ltd.3 Craig Coleman retired from the board on the 17 February 2021
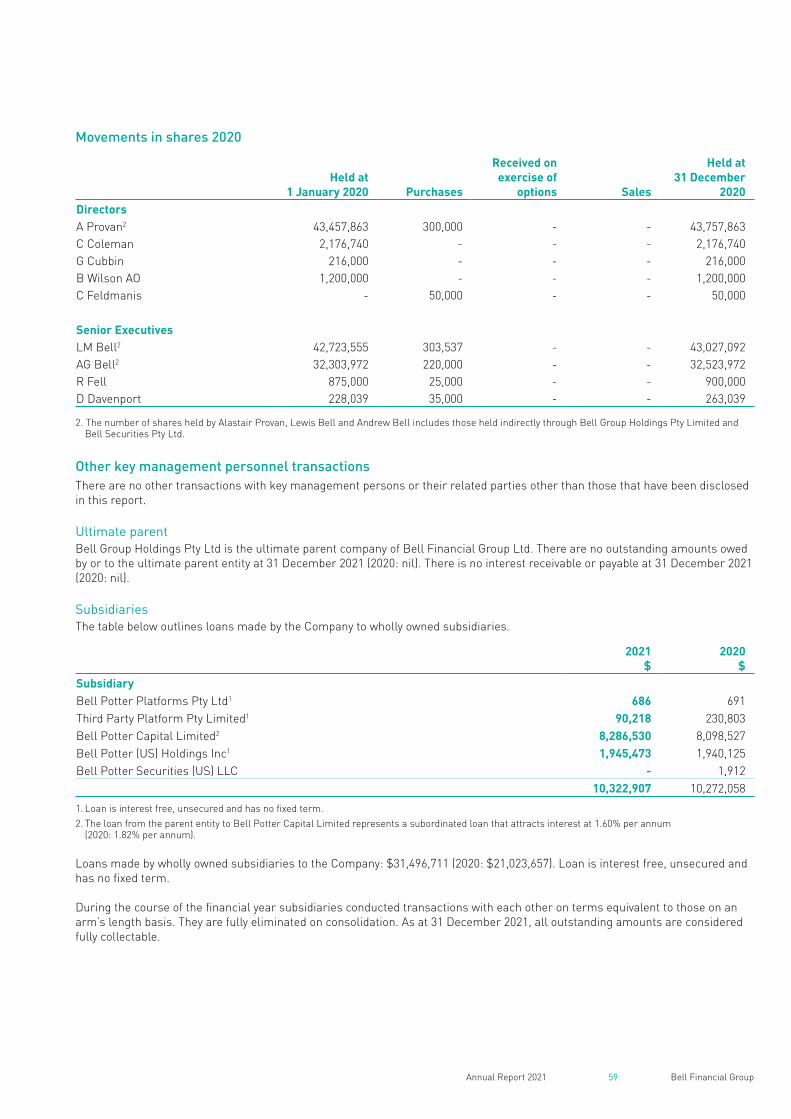
59 Bell Financial GroupAnnual Report 2021
Movements in shares 2020
Held at1 January 2020 Purchases
Received on exercise of
options Sales
Held at 31 December
2020DirectorsA Provan2 43,457,863 300,000 - - 43,757,863C Coleman 2,176,740 - - - 2,176,740G Cubbin 216,000 - - - 216,000B Wilson AO 1,200,000 - - - 1,200,000C Feldmanis - 50,000 - - 50,000
Senior ExecutivesLM Bell2 42,723,555 303,537 - - 43,027,092AG Bell2 32,303,972 220,000 - - 32,523,972R Fell 875,000 25,000 - - 900,000D Davenport 228,039 35,000 - - 263,039
2. The number of shares held by Alastair Provan, Lewis Bell and Andrew Bell includes those held indirectly through Bell Group Holdings Pty Limited and Bell Securities Pty Ltd.
Other key management personnel transactionsThere are no other transactions with key management persons or their related parties other than those that have been disclosed in this report.
Ultimate parentBell Group Holdings Pty Ltd is the ultimate parent company of Bell Financial Group Ltd. There are no outstanding amounts owed by or to the ultimate parent entity at 31 December 2021 (2020: nil). There is no interest receivable or payable at 31 December 2021 (2020: nil).
SubsidiariesThe table below outlines loans made by the Company to wholly owned subsidiaries.
2021$
2020$
SubsidiaryBell Potter Platforms Pty Ltd1 686 691Third Party Platform Pty Limited1 90,218 230,803Bell Potter Capital Limited2 8,286,530 8,098,527Bell Potter (US) Holdings Inc1 1,945,473 1,940,125Bell Potter Securities (US) LLC - 1,912
10,322,907 10,272,058
1. Loan is interest free, unsecured and has no fixed term.2. The loan from the parent entity to Bell Potter Capital Limited represents a subordinated loan that attracts interest at 1.60% per annum (2020: 1.82% per annum).
Loans made by wholly owned subsidiaries to the Company: $31,496,711 (2020: $21,023,657). Loan is interest free, unsecured and has no fixed term.
During the course of the financial year subsidiaries conducted transactions with each other on terms equivalent to those on an arm’s length basis. They are fully eliminated on consolidation. As at 31 December 2021, all outstanding amounts are considered fully collectable.
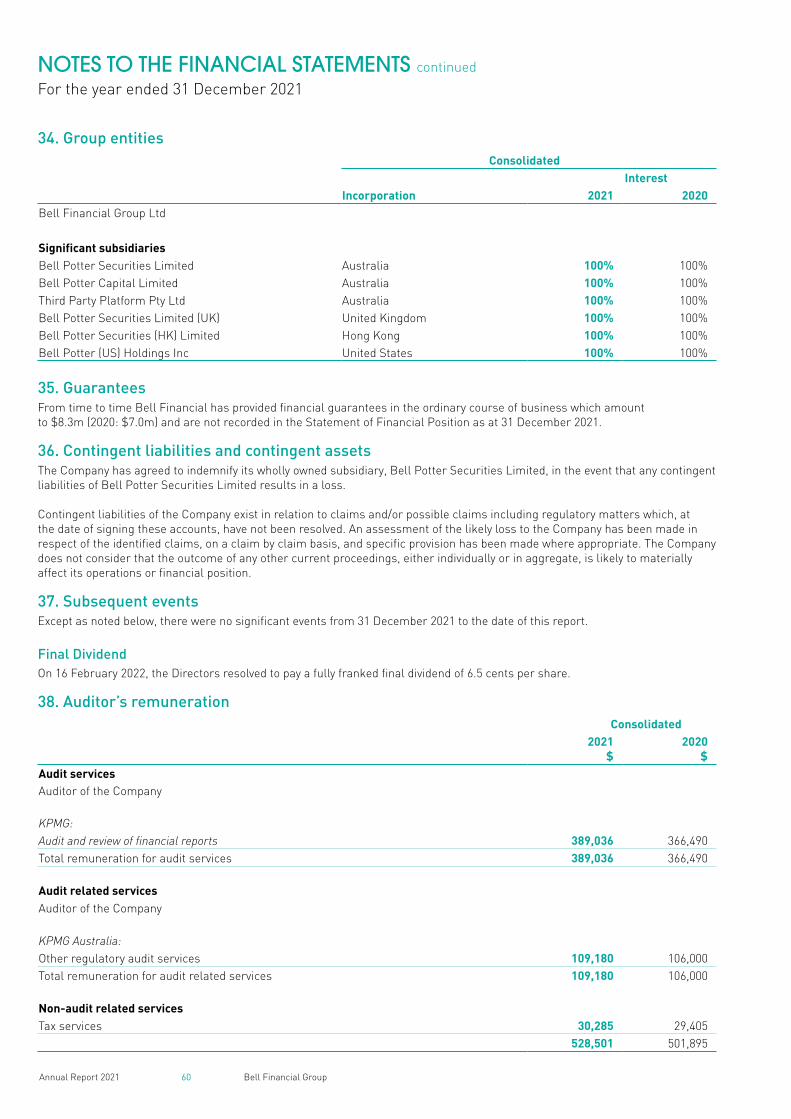
60 Bell Financial GroupAnnual Report 2021
NOTES TO THE FINANCIAL STATEMENTS continued
For the year ended 31 December 2021
34. Group entitiesConsolidated
InterestIncorporation 2021 2020
Bell Financial Group Ltd
Significant subsidiariesBell Potter Securities Limited Australia 100% 100%Bell Potter Capital Limited Australia 100% 100%Third Party Platform Pty Ltd Australia 100% 100%Bell Potter Securities Limited (UK) United Kingdom 100% 100%Bell Potter Securities (HK) Limited Hong Kong 100% 100%Bell Potter (US) Holdings Inc United States 100% 100%
35. GuaranteesFrom time to time Bell Financial has provided financial guarantees in the ordinary course of business which amount to $8.3m (2020: $7.0m) and are not recorded in the Statement of Financial Position as at 31 December 2021.
36. Contingent liabilities and contingent assetsThe Company has agreed to indemnify its wholly owned subsidiary, Bell Potter Securities Limited, in the event that any contingent liabilities of Bell Potter Securities Limited results in a loss.
Contingent liabilities of the Company exist in relation to claims and/or possible claims including regulatory matters which, at the date of signing these accounts, have not been resolved. An assessment of the likely loss to the Company has been made in respect of the identified claims, on a claim by claim basis, and specific provision has been made where appropriate. The Company does not consider that the outcome of any other current proceedings, either individually or in aggregate, is likely to materially affect its operations or financial position.
37. Subsequent eventsExcept as noted below, there were no significant events from 31 December 2021 to the date of this report.
Final DividendOn 16 February 2022, the Directors resolved to pay a fully franked final dividend of 6.5 cents per share.
38. Auditor’s remunerationConsolidated
2021$
2020$
Audit servicesAuditor of the Company
KPMG:Audit and review of financial reports 389,036 366,490Total remuneration for audit services 389,036 366,490
Audit related servicesAuditor of the Company
KPMG Australia:Other regulatory audit services 109,180 106,000Total remuneration for audit related services 109,180 106,000
Non-audit related servicesTax services 30,285 29,405
528,501 501,895
61 Bell Financial GroupAnnual Report 2021
1. In the opinion of the Directors of Bell Financial Group Limited (‘the Company’):
(a) the Consolidated Financial Statements and notes that are set out on pages 18 to 60 and the Remuneration Report on pages 12 to 16 in the Directors’ Report, are in accordance with the Corporations Act 2001, including:
(i) giving a true and fair view of the Group’s financial position as at 31 December 2021 and of its performance, for the financial year ended on that date; and
(ii) complying with Australian Accounting Standards and the Corporations Regulations 2001;
(b) there are reasonable grounds to believe that the Company will be able to pay its debts as and when they become due and payable.
2. The Directors have been given the declarations required by section 295A of the Corporations Act 2001 from the Chief Executive Officer (who is the Executive Chairman) and the Chief Financial Officer for the financial year ended 31 December 2021.
Note 1(a) of the Consolidated Financial Statements includes a statement of compliance with International Financial Reporting Standards.
This declaration is made on 16 February 2022 in accordance with a resolution of the Directors:
Alastair ProvanExecutive Chairman
16 February 2022
DIRECTORS’ DECLARATION
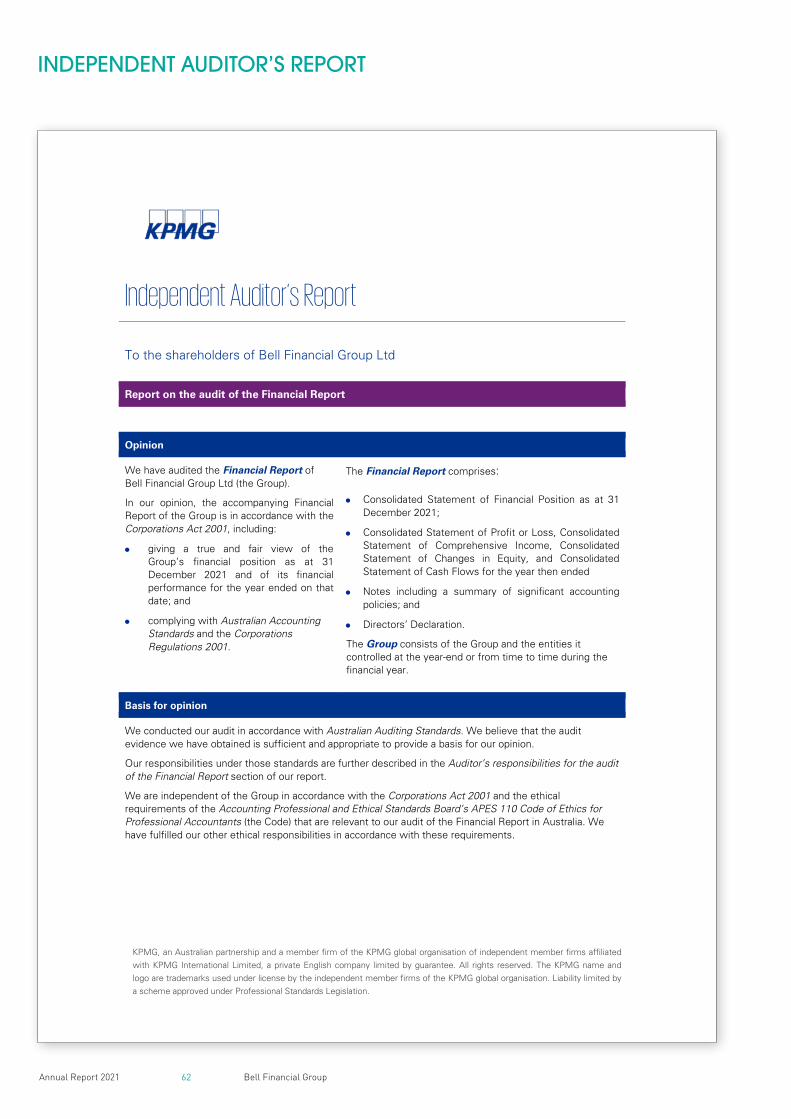
62 Bell Financial GroupAnnual Report 2021
INDEPENDENT AUDITOR’S REPORT
KPMG, an Australian partnership and a member firm of the KPMG global organisation of independent member firms affiliated with KPMG International Limited, a private English company limited by guarantee. All rights reserved. The KPMG name and logo are trademarks used under license by the independent member firms of the KPMG global organisation. Liability limited by a scheme approved under Professional Standards Legislation.
Independent Auditor’s Report
To the shareholders of Bell Financial Group Ltd
Report on the audit of the Financial Report
Opinion
We have audited the Financial Report of Bell Financial Group Ltd (the Group).
In our opinion, the accompanying Financial Report of the Group is in accordance with the Corporations Act 2001, including:
• giving a true and fair view of the Group’s financial position as at 31 December 2021 and of its financial performance for the year ended on that date; and
• complying with Australian Accounting Standards and the Corporations Regulations 2001.
The Financial Report comprises: • Consolidated Statement of Financial Position as at 31
December 2021;
• Consolidated Statement of Profit or Loss, Consolidated Statement of Comprehensive Income, Consolidated Statement of Changes in Equity, and Consolidated Statement of Cash Flows for the year then ended
• Notes including a summary of significant accounting policies; and
• Directors’ Declaration.
The Group consists of the Group and the entities it controlled at the year-end or from time to time during the financial year.
Basis for opinion
We conducted our audit in accordance with Australian Auditing Standards. We believe that the audit evidence we have obtained is sufficient and appropriate to provide a basis for our opinion.
Our responsibilities under those standards are further described in the Auditor’s responsibilities for the audit of the Financial Report section of our report.
We are independent of the Group in accordance with the Corporations Act 2001 and the ethical requirements of the Accounting Professional and Ethical Standards Board’s APES 110 Code of Ethics for Professional Accountants (the Code) that are relevant to our audit of the Financial Report in Australia. We have fulfilled our other ethical responsibilities in accordance with these requirements.
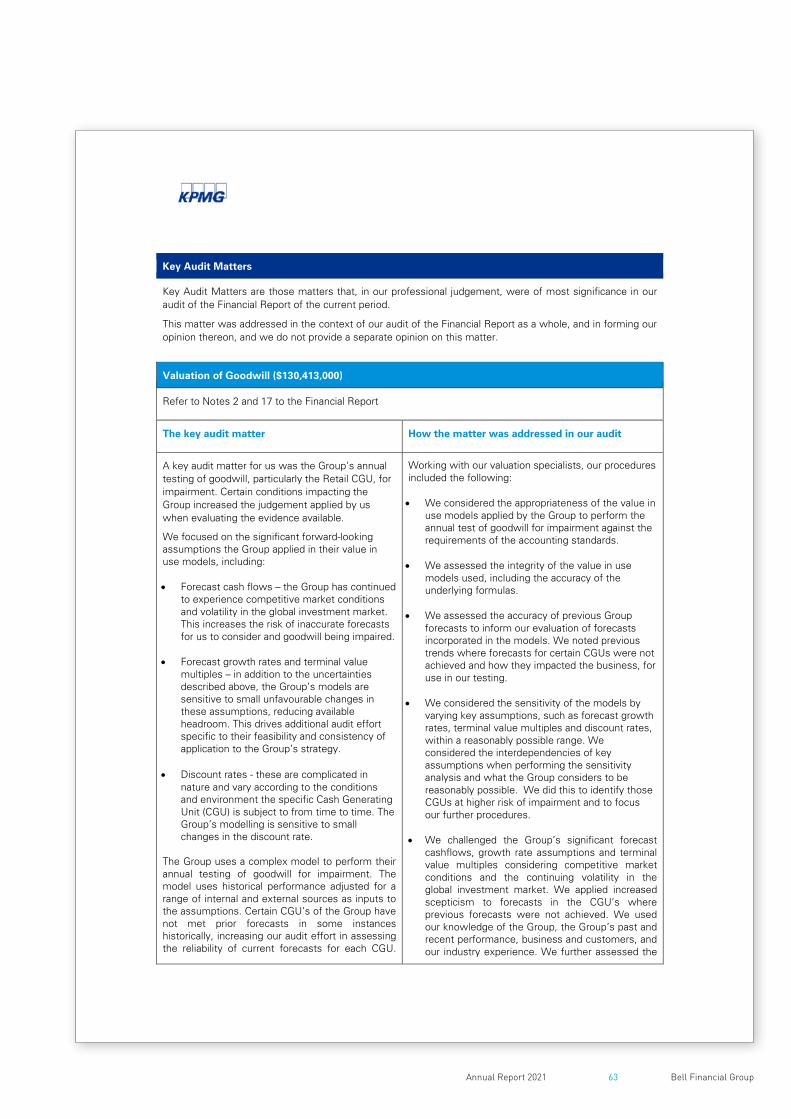
63 Bell Financial GroupAnnual Report 2021
Key Audit Matters
Key Audit Matters are those matters that, in our professional judgement, were of most significance in our audit of the Financial Report of the current period.
This matter was addressed in the context of our audit of the Financial Report as a whole, and in forming our opinion thereon, and we do not provide a separate opinion on this matter.
Valuation of Goodwill ($130,413,000)
Refer to Notes 2 and 17 to the Financial Report
The key audit matter How the matter was addressed in our audit
A key audit matter for us was the Group’s annual testing of goodwill, particularly the Retail CGU, for impairment. Certain conditions impacting the Group increased the judgement applied by us when evaluating the evidence available.
We focused on the significant forward-looking assumptions the Group applied in their value in use models, including: • Forecast cash flows – the Group has continued
to experience competitive market conditions and volatility in the global investment market. This increases the risk of inaccurate forecasts for us to consider and goodwill being impaired.
• Forecast growth rates and terminal value multiples – in addition to the uncertainties described above, the Group’s models are sensitive to small unfavourable changes in these assumptions, reducing available headroom. This drives additional audit effort specific to their feasibility and consistency of application to the Group’s strategy.
• Discount rates - these are complicated in
nature and vary according to the conditions and environment the specific Cash Generating Unit (CGU) is subject to from time to time. The Group’s modelling is sensitive to small changes in the discount rate.
The Group uses a complex model to perform their annual testing of goodwill for impairment. The model uses historical performance adjusted for a range of internal and external sources as inputs to the assumptions. Certain CGU’s of the Group have not met prior forecasts in some instances historically, increasing our audit effort in assessing the reliability of current forecasts for each CGU.
Working with our valuation specialists, our procedures included the following: • We considered the appropriateness of the value in
use models applied by the Group to perform the annual test of goodwill for impairment against the requirements of the accounting standards.
• We assessed the integrity of the value in use models used, including the accuracy of the underlying formulas.
• We assessed the accuracy of previous Group forecasts to inform our evaluation of forecasts incorporated in the models. We noted previous trends where forecasts for certain CGUs were not achieved and how they impacted the business, for use in our testing.
• We considered the sensitivity of the models by varying key assumptions, such as forecast growth rates, terminal value multiples and discount rates, within a reasonably possible range. We considered the interdependencies of key assumptions when performing the sensitivity analysis and what the Group considers to be reasonably possible. We did this to identify those CGUs at higher risk of impairment and to focus our further procedures.
• We challenged the Group’s significant forecast
cashflows, growth rate assumptions and terminal value multiples considering competitive market conditions and the continuing volatility in the global investment market. We applied increased scepticism to forecasts in the CGU’s where previous forecasts were not achieved. We used our knowledge of the Group, the Group’s past and recent performance, business and customers, and our industry experience. We further assessed the
64 Bell Financial GroupAnnual Report 2021
INDEPENDENT AUDITOR’S REPORT continued
Complex modelling, using forward-looking assumptions tends to be prone to greater risk for potential bias, error and inconsistent application. These conditions necessitate additional scrutiny by us, in particular to address the objectivity of sources used for assumptions, and their consistent application. We involved valuation specialists to supplement our senior audit team members in assessing this key audit matter.
Group’s forecast cashflows and terminal value multiples by comparing the Group’s current and forecast net profit after tax valuation multiple to publicly available data of comparable companies.
• We checked the consistency of the growth rate assumptions to the past performance of the Group, and our experience regarding the feasibility of these in the industry in which they operate and compared the forecast cash flows contained in the value in use model to those contained within the Board reviewed goodwill impairment assessment memorandum.
• We independently developed a discount rate
range considered comparable using publicly available market data for comparable entities to the Group and the industry it operates in.
• We assessed the disclosures in the Financial Report using our understanding obtained from our testing and against the requirements of the accounting standards.
Other Information
Other Information is financial and non-financial information in Bell Financial Group Ltd’s annual reporting which is provided in addition to the Financial Report and the Auditor’s Report. The Directors are responsible for the Other Information.
Our opinion on the Financial Report does not cover the Other Information and, accordingly, we do not express an audit opinion or any form of assurance conclusion thereon, with the exception of the Remuneration Report and our related assurance opinion.
In connection with our audit of the Financial Report, our responsibility is to read the Other Information. In doing so, we consider whether the Other Information is materially inconsistent with the Financial Report or our knowledge obtained in the audit, or otherwise appears to be materially misstated.
We are required to report if we conclude that there is a material misstatement of this Other Information, and based on the work we have performed on the Other Information that we obtained prior to the date of this Auditor’s Report we have nothing to report.
Responsibilities of the Directors for the Financial Report
The Directors are responsible for:
• preparing the Financial Report that gives a true and fair view in accordance with Australian Accounting Standards and the Corporations Act 2001;
• implementing necessary internal control to enable the preparation of a Financial Report that gives a true and fair view and is free from material misstatement, whether due to fraud or error; and
• assessing the Group and Company’s ability to continue as a going concern and whether the use of the going concern basis of accounting is appropriate. This includes disclosing, as applicable, matters related to going concern and using the going concern basis of accounting unless they either intend to
65 Bell Financial GroupAnnual Report 2021
liquidate the Group and Company or to cease operations, or have no realistic alternative but to do so.
Auditor’s responsibilities for the audit of the Financial Report
Our objective is:
• to obtain reasonable assurance about whether the Financial Report as a whole is free from materialmisstatement, whether due to fraud or error; and
• to issue an Auditor’s Report that includes our opinion.
Reasonable assurance is a high level of assurance, but is not a guarantee that an audit conducted in accordance with Australian Auditing Standards will always detect a material misstatement when it exists.
Misstatements can arise from fraud or error. They are considered material if, individually or in the aggregate, they could reasonably be expected to influence the economic decisions of users taken on the basis of the Financial Report.
A further description of our responsibilities for the audit of the Financial Report is located at the Auditing and Assurance Standards Board website at: https://www.auasb.gov.au/admin/file/content102/c3/ar1_2020.pdf. This description forms part of our Auditor’s Report.
Report on the Remuneration Report
Opinion
In our opinion, the Remuneration Report of Bell Financial Group Ltd for the year ended 31 December 2021, complies with Section 300A of the Corporations Act 2001.
Directors’ responsibilities
The Directors of the Company are responsible for the preparation and presentation of the Remuneration Report in accordance with Section 300A of the Corporations Act 2001.
Our responsibilities
We have audited the Remuneration Report included in pages 12 to 16 of the Directors’ report for the year ended 31 December 2021.
Our responsibility is to express an opinion on the Remuneration Report, based on our audit conducted in accordance with Australian Auditing Standards.
KPMG Chris Wooden
Partner
Melbourne
16 February 2022
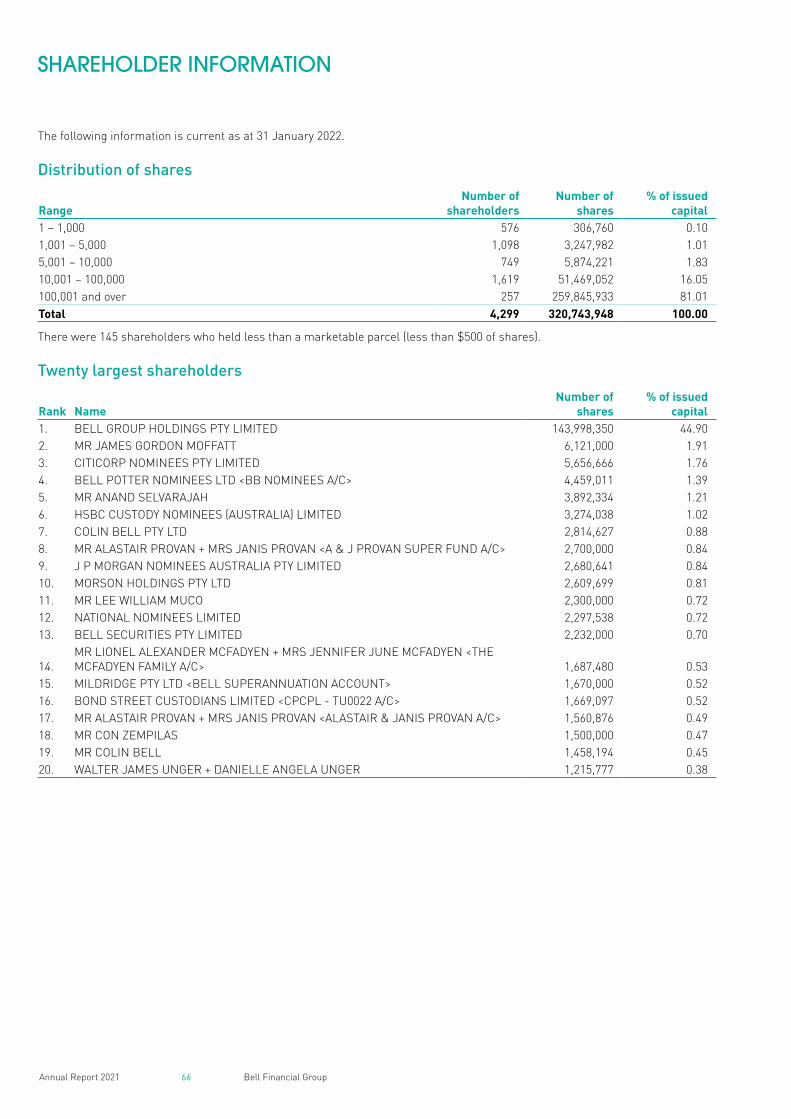
66 Bell Financial GroupAnnual Report 2021
SHAREHOLDER INFORMATION
The following information is current as at 31 January 2022.
Distribution of shares
RangeNumber of
shareholdersNumber of
shares% of issued
capital1 – 1,000 576 306,760 0.101,001 – 5,000 1,098 3,247,982 1.015,001 – 10,000 749 5,874,221 1.8310,001 – 100,000 1,619 51,469,052 16.05100,001 and over 257 259,845,933 81.01Total 4,299 320,743,948 100.00
There were 145 shareholders who held less than a marketable parcel (less than $500 of shares).
Twenty largest shareholders
Rank NameNumber of
shares% of issued
capital1. BELL GROUP HOLDINGS PTY LIMITED 143,998,350 44.902. MR JAMES GORDON MOFFATT 6,121,000 1.913. CITICORP NOMINEES PTY LIMITED 5,656,666 1.764. BELL POTTER NOMINEES LTD <BB NOMINEES A/C> 4,459,011 1.395. MR ANAND SELVARAJAH 3,892,334 1.216. HSBC CUSTODY NOMINEES (AUSTRALIA) LIMITED 3,274,038 1.027. COLIN BELL PTY LTD 2,814,627 0.888. MR ALASTAIR PROVAN + MRS JANIS PROVAN <A & J PROVAN SUPER FUND A/C> 2,700,000 0.849. J P MORGAN NOMINEES AUSTRALIA PTY LIMITED 2,680,641 0.8410. MORSON HOLDINGS PTY LTD 2,609,699 0.8111. MR LEE WILLIAM MUCO 2,300,000 0.7212. NATIONAL NOMINEES LIMITED 2,297,538 0.7213. BELL SECURITIES PTY LIMITED 2,232,000 0.70
14.MR LIONEL ALEXANDER MCFADYEN + MRS JENNIFER JUNE MCFADYEN <THE MCFADYEN FAMILY A/C> 1,687,480 0.53
15. MILDRIDGE PTY LTD <BELL SUPERANNUATION ACCOUNT> 1,670,000 0.5216. BOND STREET CUSTODIANS LIMITED <CPCPL - TU0022 A/C> 1,669,097 0.5217. MR ALASTAIR PROVAN + MRS JANIS PROVAN <ALASTAIR & JANIS PROVAN A/C> 1,560,876 0.4918. MR CON ZEMPILAS 1,500,000 0.4719. MR COLIN BELL 1,458,194 0.4520. WALTER JAMES UNGER + DANIELLE ANGELA UNGER 1,215,777 0.38

67 Bell Financial GroupAnnual Report 2021
Substantial shareholdingsThe following shareholders were registered by the Company as substantial shareholders, having declared a relevant interest in accordance with the Corporations Act:
Substantial shareholderNumber of
shares% of issued
capitalBELL GROUP HOLDINGS PTY LIMITED 146,230,350 45.591
ALASTAIR PROVAN 151,229,420 47.151, 2
COLIN BELL 150,554,711 46.941, 3
LEWIS BELL 150,114,381 46.801, 4
1. Bell Group Holdings Pty Limited (BGH) holds 143,998,350 BFG ordinary shares. BGH’s wholly-owned subsidiary, Bell Securities Pty Limited (BSPL) holds 2,232,000 BFG ordinary shares. Colin Bell, Alastair Provan and Lewis Bell each hold more than 20% of BGH and therefore under the Corporations Act they are each deemed to have a relevant interest in the 146,230,350 BFG ordinary shares held by BGH and BSPL.2. Alastair Provan has a relevant interest in 4,999,070 BFG ordinary shares.3. Colin Bell has a relevant interest in 4,324,361 BFG ordinary shares.4. Lewis Bell has a relevant interest in 3,884,031 BFG ordinary shares.
Voting rightsBell Financial has one class of fully paid ordinary shares. On a show of hands, every member present at the meeting in person or by proxy shall have one vote and upon a poll each share shall have one vote. There are no voting rights attached to the options or performance rights.
On-market buy-backThere is no current on-market buy-back.
68 Bell Financial GroupAnnual Report 2021
DIRECTORY
Bell Financial Group Ltd
ABN59 083 194 763
DirectorsAlastair Provan, Executive Chairman Graham Cubbin, Independent DirectorBrian Wilson AO, Independent DirectorChristine Feldmanis, Non-Executive Director
Company SecretaryCindy-Jane Lee
Registered OfficeLevel 29, 101 Collins StreetMelbourne VIC 3000Telephone 03 9256 8700
Share RegistryComputershare Investor Services Pty Limited452 Johnston StreetAbbotsford VIC 3067Telephone 03 9415 5000
ASX CodeBFGShares are listed on the Australian Securities Exchange
BankerAustralia and New Zealand Banking Group Limited
AuditorKPMG
Website Addresswww.bellfg.com.au

Bell Financial GroupAnnual Report 2021
Bell Financial G
roup Limited Annual R
eport 2021

Bell Financial Group LimitedLevel 29, 101 Collins StreetMelbourne VIC 3000Australia
GPO Box 4718Melbourne VIC 3001Australia
www.bellfg.com.au
Related Documents