We light up your world. Annual Report 2020

Welcome message from author
This document is posted to help you gain knowledge. Please leave a comment to let me know what you think about it! Share it to your friends and learn new things together.
Transcript

We light upyour world.Annual Report 2020
Business
This is Fagerhult Group 2Events of the year 4Key performance indicators 5Comments from the CEO 6Business environment and drivers 8Strategy 10Sustainability 12People 14Environment 15Business 16Whitecroft Vitality 17Value creation 18Business Areas 20
Financials
The Fagerhult share 30Five-year overview 32Administration report 34Corporate governance report 39Board of Directors 46Senior management 48The Group’s annual accounts 50The Parent company’s annual accounts 55Accounting policies 60Notes 67Signatures 89Audit report 90Shareholder information 126Financial definitions 127Industry glossary 128Addresses Inside cover
Sustainability Report
About our Sustainability Report 94Materiality analysis and stakeholder dialogue 96Impact across the value chain 98Focus area: People 99Focus area: Environment 106Focus area: Business 111Governance of sustainability efforts 114GRI-index 118Statutory sustainability report 124Limited assurance review 125
The official Annual Report which has been examined by the company’s auditors comprises pages 30–89.
Together, Fagerhult’s Annual Report and Sustainability Report should be viewed as the company’s summary for 2020. The Sustainability Report, pages 94–125, with the accompanying GRI appendix, has been prepared in accordance with the GRI Standards; Core option and has been externally reviewed.
Contents

2 FA G E R H U LT G R O U P A N N U A L R E P O R T 2 0 2 0
T H I S I S F A G E R H U L T G R O U P
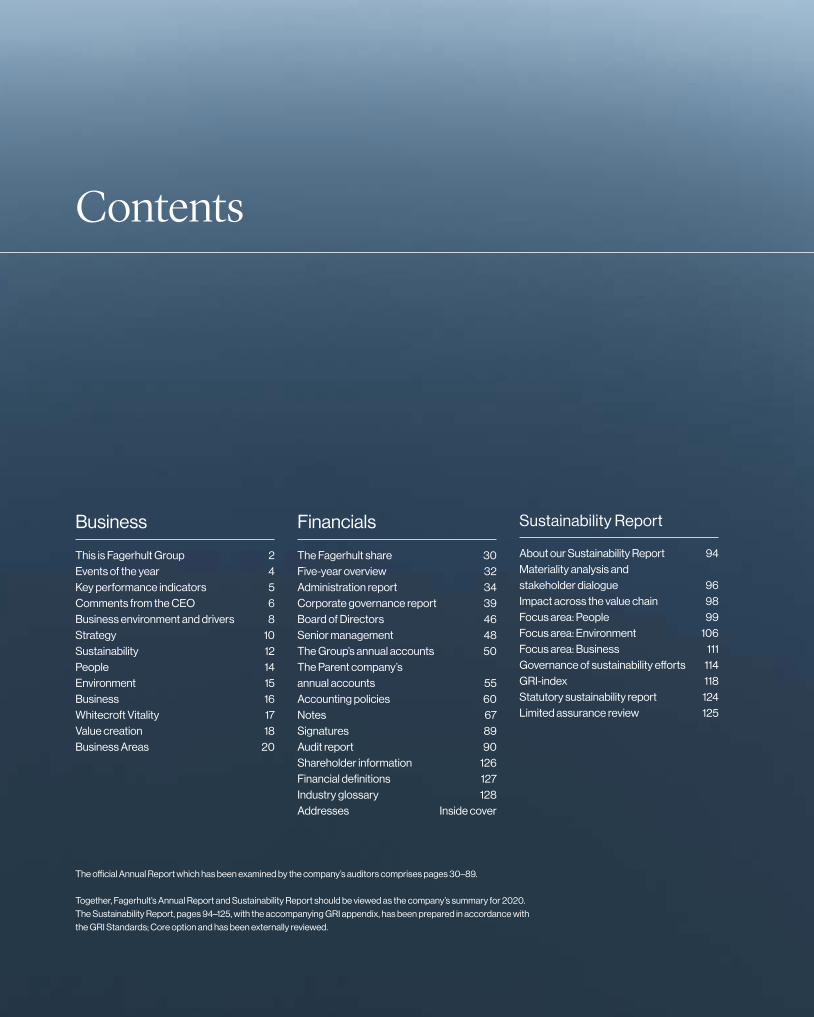
Collection
Global brands with focus on environments with high demands for archiectural design.
Premium
Customized lighting solutions for Euro-pean markets and customers.
Professional
Lighting solutions for indoor environ-ments with focus on local and nearby markets.
Infrastructure
Specialty lighting solu - tions for environments with special require-ments on installation and robustness.
Four business areas
The Fagerhult Group is one of Europe’s leading lighting
companies with a total of 4,400 employees in 28 countries.
The Group consists of 13 lighting brands organised into four
business areas; Collection, Premium, Professional and Infra-
structure. Each brand designs, develops, manufactures and
markets innovative and energy efficient lighting solutions for
professional applications. Together we offer a wide range of
products and solutions for different application areas. Since
the start in 1945, we have more than 75 years of experience
and knowledge about the positive impact of better lighting for
people. Fagerhult’s share is listed on Nasdaq Stockholm.
This is Fagerhult Group
A history rooted in Västergötland, SwedenFagerhult was founded in 1945 by Bertil Svensson and achieved sales of SEK 13,000 in its first year. A few years later, the first factory was built in Fagerhult, at that time with six employees and sales amounting to SEK 53,000. This factory, which has now been joined by the Group’s other manufacturing units, currently has around 600 employees.
Collection, 44%
Premium, 35%
Professional, 11%
Infrastructure, 10%
Sales per business area
FA G E R H U LT G R O U P A N N U A L R E P O R T 2 0 2 0 3
0,0
0,5
1,0
1,5
2,0
2,5
3,0
0
2000
4000
6000
8000
0
200
400
600
800
T H I S I S F A G E R H U L T G R O U P
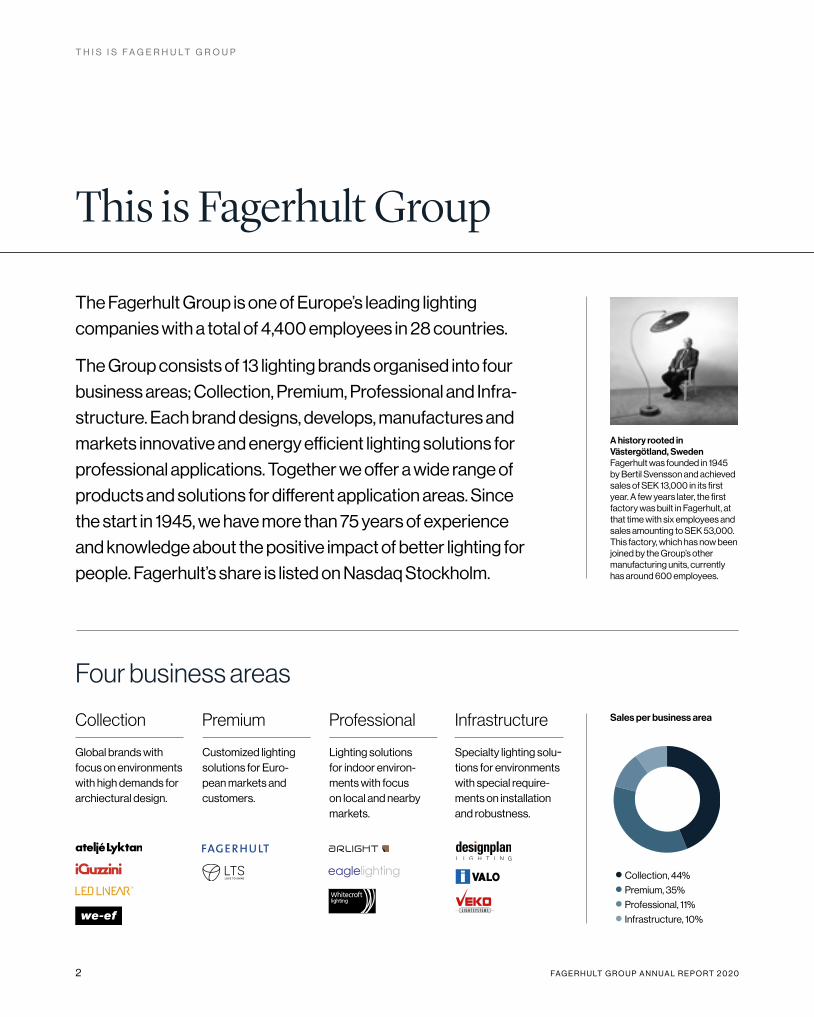
International group
Trends for sales and operating profit, MSEK Dividend yield, %
2011 2012 2013 2014 2015 2016 2017 2018 2019 2020
Sales 3,023 3,085 3,095 3,736 3,909 4,491 5,170 5,621 7,845 6,816
Operating profit 317 251 277 379 396 524 678 706 795 333
2016 2017 2018 2019 2020
1.9 2.0 2.6 – 1.1
Subsidiaries in 28 countries, the international business is divided into four business areas.
Marketing and sales activities are primarily performed locally through subsidiaries and also via agents and distributors, thus giving Fagerhult access to more than 40 markets.
R&D, design and production units: Sweden, Italy, Finland, the UK, Germany, Australia, Turkey, China, Thailand, the Netherlands and Canada.
4 FA G E R H U LT G R O U P A N N U A L R E P O R T 2 0 2 0
E V E N T S O F T H E Y E A R
Events of the year
New structure During the first quarter, the Group successfully launched the new business areas; Collection, Premium, Profes-sional and Infrastructure as an integral part of the strategic alignment process.
Fagerhult Group – branding To compliment and distinguish from the 13 brands the new Fagerhult Group branding was launched.
Organic growth The first quarter order intake delivered 7.1 per cent organic growth before the pandemic struck – a positive sign we are heading in the right direction.
Business as usual Early in the second quarter, following the impact of Covid-19, the Group quickly established a new way of working, protecting employees and all operations remained open for the rest of the year.
Emergency medicare delivery Many of the Group's brands helped support the medical crisis by delivering almost 20,000 luminaires to eme r-gency Covid-19 hospitals in various markets.
Strong operating margin The Group's operating margin recovered to 8.9 per cent, ahead of the 8.5 per cent in 2019.
Organic Response in Sweden The Group opened a new Organic Response compe-tence centre in Linköping, Sweden.
Whitecroft Vitality Whitecroft Lighting, launched the sustainability focussed cer-tified cradle to cradle product platform known as Vitality.
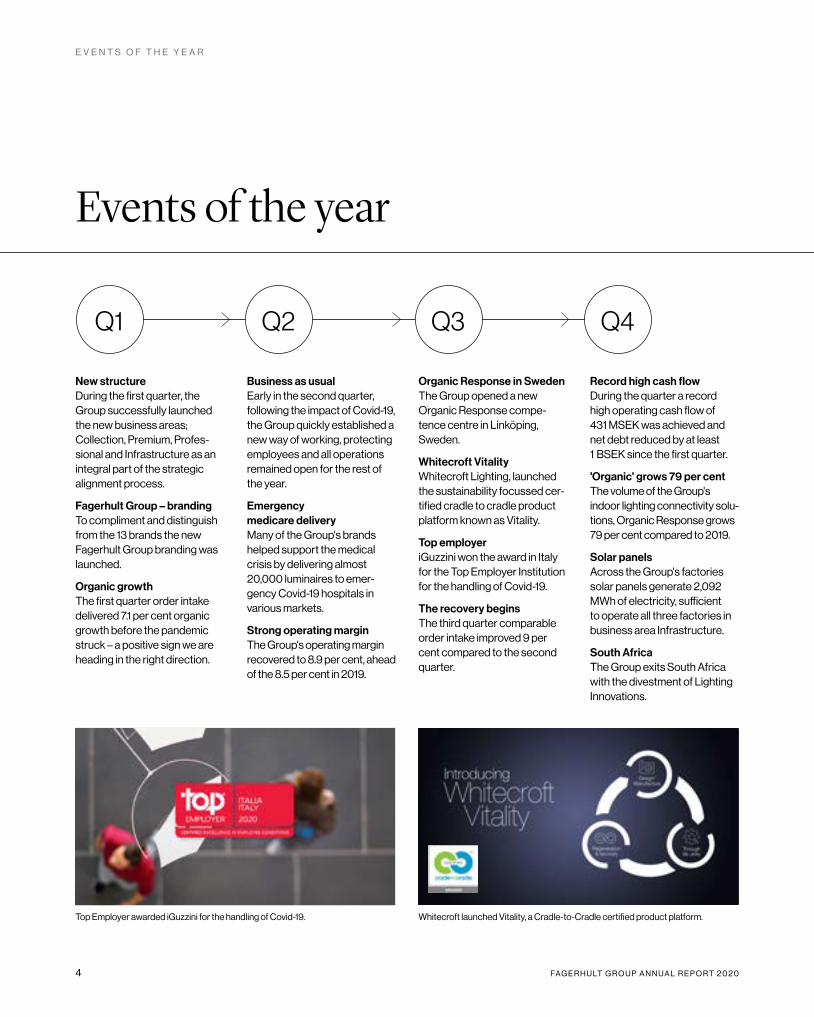
Top employer iGuzzini won the award in Italy for the Top Employer Institution for the handling of Covid-19.
The recovery begins The third quarter comparable order intake improved 9 per cent compared to the second quarter.
Record high cash flow During the quarter a record high operating cash flow of 431 MSEK was achieved and net debt reduced by at least 1 BSEK since the first quarter.
'Organic' grows 79 per cent The volume of the Group's indoor lighting connectivity solu-tions, Organic Response grows 79 per cent compared to 2019.
Solar panels Across the Group's factories solar panels generate 2,092 MWh of electricity, sufficient to operate all three factories in business area Infrastructure.
South Africa The Group exits South Africa with the divestment of Lighting Innovations.
Q1 Q2 Q3 Q4
Whitecroft launched Vitality, a Cradle-to-Cradle certified product platform.Top Employer awarded iGuzzini for the handling of Covid-19.
FA G E R H U LT G R O U P A N N U A L R E P O R T 2 0 2 0 5
K E Y P E R F O R M A N C E I N D I C A T O R S
Key performance indicators
2020 2019 2018 2017 2016
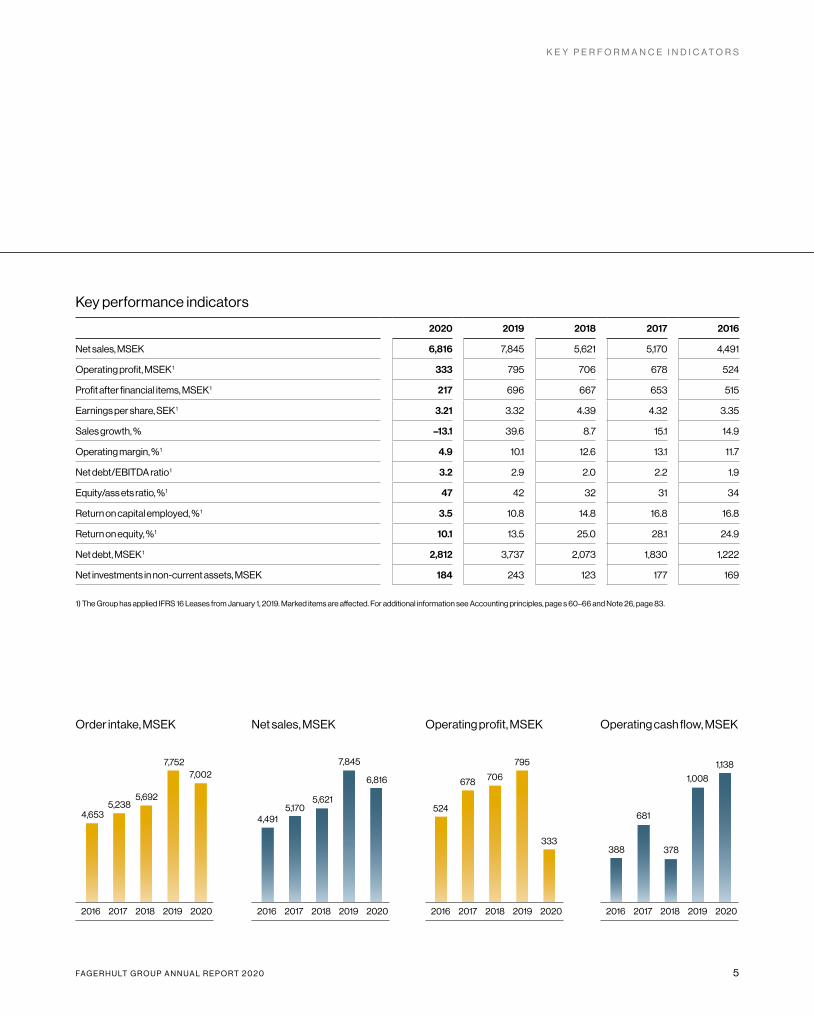
Net sales, MSEK 6,816 7,845 5,621 5,170 4,491
Operating profit, MSEK 1 333 795 706 678 524
Profit after financial items, MSEK 1 217 696 667 653 515
Earnings per share, SEK 1 3.21 3.32 4.39 4.32 3.35
Sales growth, % –13.1 39.6 8.7 15.1 14.9
Operating margin, % 1 4.9 10.1 12.6 13.1 11.7
Net debt/EBITDA ratio 1 3.2 2.9 2.0 2.2 1.9
Equity/ass ets ratio, % 1 47 42 32 31 34
Return on capital employed, % 1 3.5 10.8 14.8 16.8 16.8
Return on equity, % 1 10.1 13.5 25.0 28.1 24.9
Net debt, MSEK 1 2,812 3,737 2,073 1,830 1,222
Net investments in non-current assets, MSEK 184 243 123 177 169
1) The Group has applied IFRS 16 Leases from January 1, 2019. Marked items are affected. For additional information see Accounting principles, page s 60–66 and Note 26, page 83.
Order intake, MSEK Net sales, MSEK Operating profit, MSEK Operating cash flow, MSEK
4,6535,238
5,692
7,7527,002
4,4915,170
5,621
7,845
6,816
524
678 706
795
333388
681
378
1,008
1,138
2016 2017 2018 2019 2020 2016 2017 2018 2019 2020 2016 2017 2018 2019 2020 2016 2017 2018 2019 2020

6 FA G E R H U LT G R O U P A N N U A L R E P O R T 2 0 2 0
“We maintained our calm and continued as planned”2020 was a unique year, where the Covid-19 pandemic set the agenda for many companies. How would you summarise the year?It has been a year filled with both challenges and successes. The pandemic has impacted the entire globe as well as companies, primarily during the spring when major lockdowns were imple-mented in Europe. Nevertheless, we have made important gains with the implementation of our new strategy. When the extent of the pandemic became clear, we quickly decided to continue strategic efforts according to plan. The rapid transition to a digital norm developed smoothly and has led to even closer contact within the management team, which has been positive.
We made every effort to contain the impact of the pandemic during the year, all the while maintaining a fantastic team spirit and organisational vitality. Our goal has always been to do more than what is required locally in order to remain at the cutting edge. In Italy, iGuzzini was awarded a prize for its management of the Covid-19 situation from an HR perspective, an accolade we are proud of. Our role as a lighting company was also bestowed a new significance as we supplied lighting to several temporary hospi-tals that were erected in Sweden and the UK during the spring.
In March, the new structure entered force with the aim of increasing organisational growth and collaboration between companies. How has it progressed?Our new strategy and structure with the business areas has been well-received. During the year, the business areas have worked with the strategy, achieving various stages of implementation. Many activities have taken place during the year for which the focus has been on exploring shared business opportunities in various geographical markets. One example is Infrastructure, which includes offering lighting solutions for industrial environ-ments that have specific requirements. For Infrastructure, I-Valo sold products from Veko to joint projects in Finland, and now the companies are examining a more formal sales collaboration for the Nordic markets.
In 2020, we also defined our priorities at Group level with a new vision and mission statement and the consistent use of the Fagerhult Group as a brand. In conjunction with this, we also launched our new website www.fagerhultgroup.com.At Group level, we have focused on four different themes for
which we believe we can collaboratively add most value. These are: sustainability, connected solutions, digital transformation and our work with corporate culture.
What is your view on the year’s performance?The year began positively with a healthy order intake, which was unfortunately reversed when Europe closed down from the middle of March. The order intake then stabilised during the summer, and we have subsequently reduced the gap step by step. We enter 2021 with a somewhat improved order stock com-pared with last year. We also placed considerable focus on costs savings, leading to savings exceeding 16 per cent. A very strong cash flow has also been positive, resulting from such aspects as a focus on increased inventory turnover.
In terms of markets, there have been major differences in earn-ings depending on location and area of application. The pandemic has been more challenging for our global companies, and we have also noted improved results in Northern Europe. In terms of pro-fessional lighting, we are working on a broad front and have been successful in healthcare and logistics centres for e-commerce, while traditional clothing stores have experienced difficulties.
Sustainability has a central position in the new strategy. Where does the Fagerhult Group have the greatest opportunity to influence?It is very gratifying that we have set an ambitious mission state-ment with a considerable focus on sustainability. The idea is for sustainability to be a natural part of the entire company and that all functions are important for us in reaching our goals.
More tangibly, our greatest opportunity to influence is with connected lighting solutions combined with our sustainability know-how. There is still much to be done in the market for professional lighting. We have fully completed the technological shift to LED, but only a third of commercial buildings in Europe have changed to LED lighting. If the EU is to reach its climate goals, major renovation programmes are required such as the EU Renovation Program, which has now been launched.
Our business model provides us with leverage to influence, and as such we need to construct a sustainable value chain containing an ecosystem of suppliers and partners. It is equally important that we train our customers to correctly use our products and
C O M M E N T S F R O M T H E C E O
FA G E R H U LT G R O U P A N N U A L R E P O R T 2 0 2 0 7
connected lighting solutions. In this way, they can maximise the benefit from our products and we are able to reduce environ-mental and climate impact.
Our sustainability agenda is driven within the Group globally and locally. We have a central direction in place within which many local initiatives are run and divided within the Group. A very good example of such an initiative is Whitecroft Vitality, which is a concept with circular lighting solutions.
The demand for connected lighting solutions continues to rise. What does this business mean for the Fagerhult Group?This is an important area for us, and during the year, we have pulled together our expertise in a new function: Connectivity. This includes our Organic Response technology that supplies our companies with products and expertise for connected lighting solutions. Demand is partly driven based on new user areas, but also by demands for sustainable lighting solutions. Our product life cycle analyses in the Nordic market show that 75 per cent of energy consumption comes from the products in-use phase. Connected solutions enable optimised use based on requirements, and reduce energy consumption and climate impact as a result.
During the year, we opened a new competence centre for Organic Response in Sweden, where we are now developing operations. The investment in a new competence centre is a long-term initiative that will run for many years and link us more closely with our European companies and customers. In 2020, sales of Organic Response rose 79 per cent, demonstrating the market potential.
A new year is underway, and with it, new opportunities for Fagerhult Group. What will be the focus moving forward? Our new strategy has created stable ground from which to grow. Acquisitions have been and remain part of our long-term strategy, but our primary short-term focus is on finalising the business areas’ various strategies and commencing the implementation of said strategies. Opportunities persist for increased organic growth by focusing on mutual business opportunities, and on a Group level, work will continue with our focus areas.
An important aspect of this will be to continue to develop our shared values. This cultural effort is an important cornerstone of our new strategy and will facilitate internal collaboration.
This project began in 2020 and has been received with great enthusiasm by all participants, experiencing these efforts as enjoyable and energising.
2020 has been unlike any other year, and I want to extend my thanks to all of my colleagues for their fantastic work. Despite these sometimes-trying challenges that require quick decision- making, we have managed to maintain our composure and keep pace with operations. This provides us with considerable faith for 2021, a year in which I am also looking forward to being able to visit operations and meet with each other again, something that I think all of us have missed.
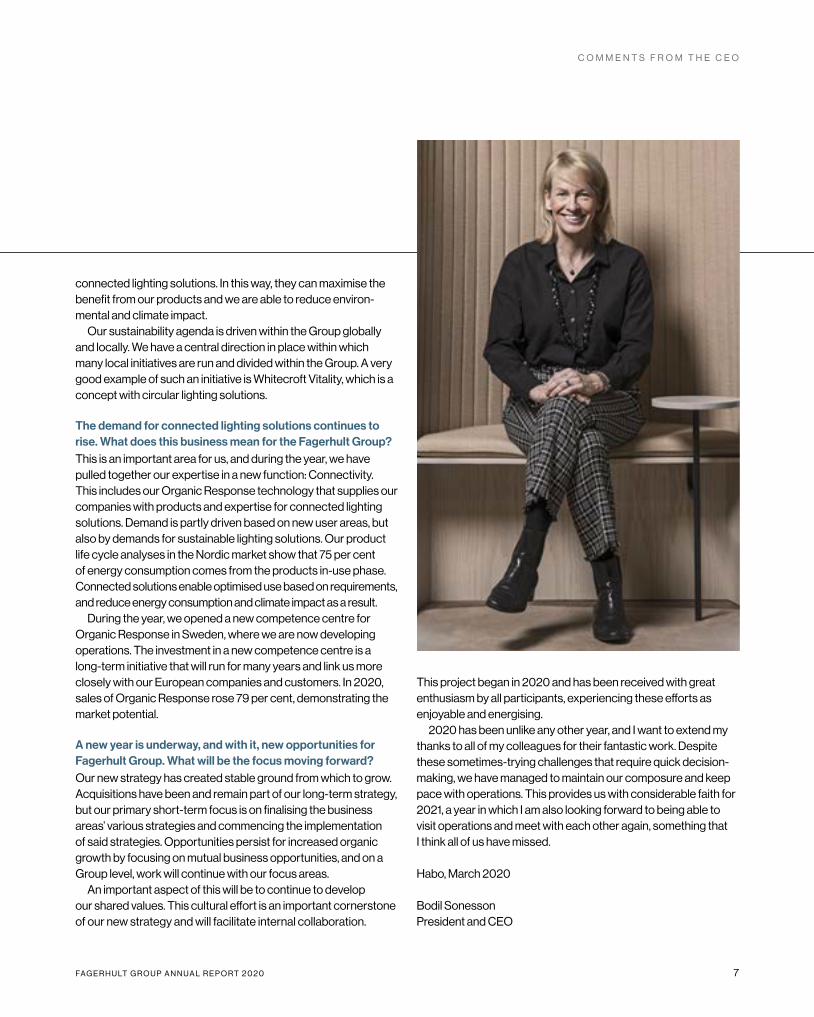
Habo, March 2020
Bodil SonessonPresident and CEO
C O M M E N T S F R O M T H E C E O
8 FA G E R H U LT G R O U P A N N U A L R E P O R T 2 0 2 0
B U S I N E S S E N V I R O N M E N T A N D D R I V E R S
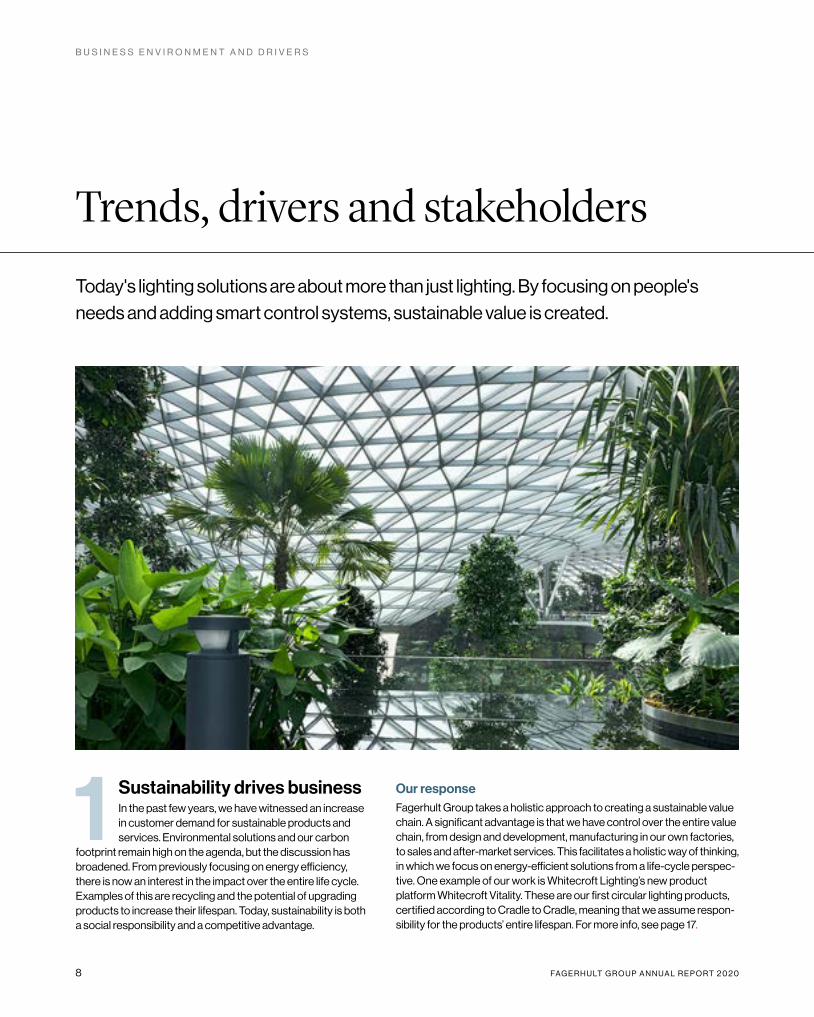
Trends, drivers and stakeholdersToday's lighting solutions are about more than just lighting. By focusing on people's needs and adding smart control systems, sustainable value is created.
1 Sustainability drives businessIn the past few years, we have witnessed an increase in customer demand for sustainable products and services. Environmental solutions and our carbon
footprint remain high on the agenda, but the discussion has broadened. From previously focusing on energy efficiency, there is now an interest in the impact over the entire life cycle. Examples of this are recycling and the potential of upgrading products to increase their lifespan. Today, sustainability is both a social responsibility and a competitive advantage.
Our responseFagerhult Group takes a holistic approach to creating a sustainable value chain. A significant advantage is that we have control over the entire value chain, from design and development, manufacturing in our own factories, to sales and after-market services. This facilitates a holistic way of thinking, in which we focus on energy-efficient solutions from a life-cycle perspec-tive. One example of our work is Whitecroft Lighting’s new product platform Whitecroft Vitality. These are our first circular lighting products, certified according to Cradle to Cradle, meaning that we assume respon-sibility for the products’ entire lifespan. For more info, see page 17.
FA G E R H U LT G R O U P A N N U A L R E P O R T 2 0 2 0 9
B U S I N E S S E N V I R O N M E N T A N D D R I V E R S
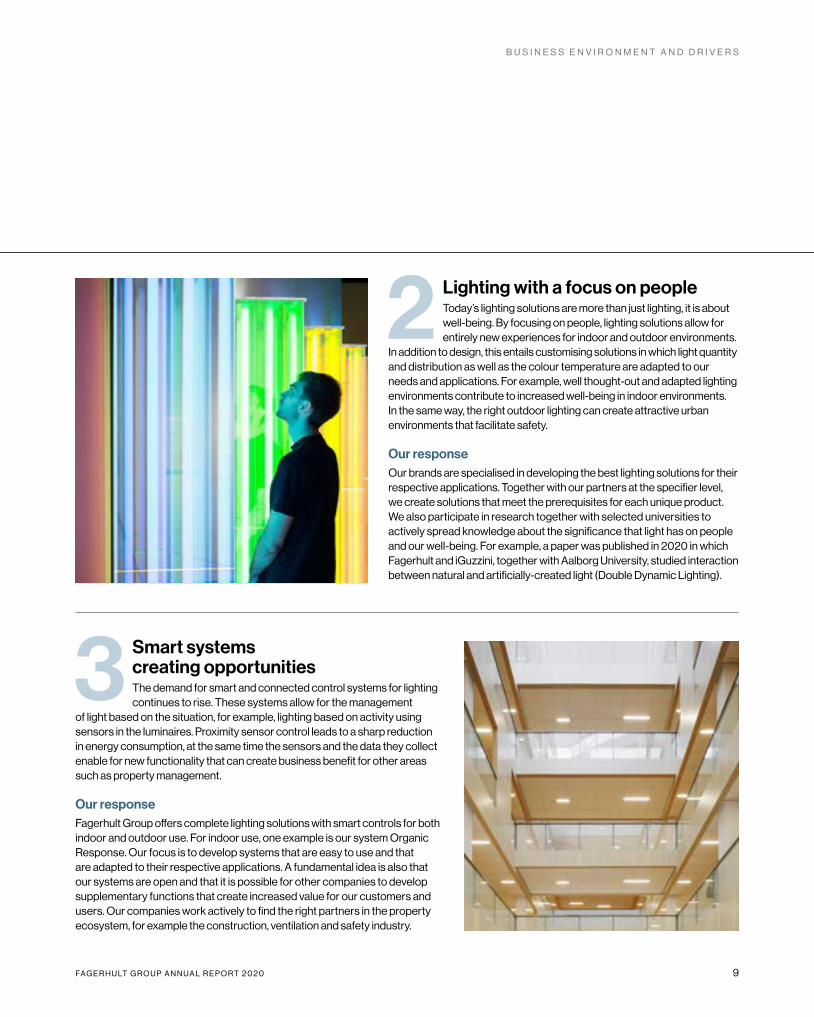
2 Lighting with a focus on people Today’s lighting solutions are more than just lighting, it is about well-being. By focusing on people, lighting solutions allow for entirely new experiences for indoor and outdoor environments.
In addition to design, this entails customising solutions in which light quantity and distribution as well as the colour temperature are adapted to our needs and applications. For example, well thought-out and adapted lighting environments contribute to increased well-being in indoor environments. In the same way, the right outdoor lighting can create attractive urban environments that facilitate safety.
Our responseOur brands are specialised in developing the best lighting solutions for their respective applications. Together with our partners at the specifier level, we create solutions that meet the prerequisites for each unique product. We also participate in research together with selected universities to actively spread knowledge about the significance that light has on people and our well-being. For example, a paper was published in 2020 in which Fagerhult and iGuzzini, together with Aalborg University, studied interaction between natural and artificially-created light (Double Dynamic Lighting).
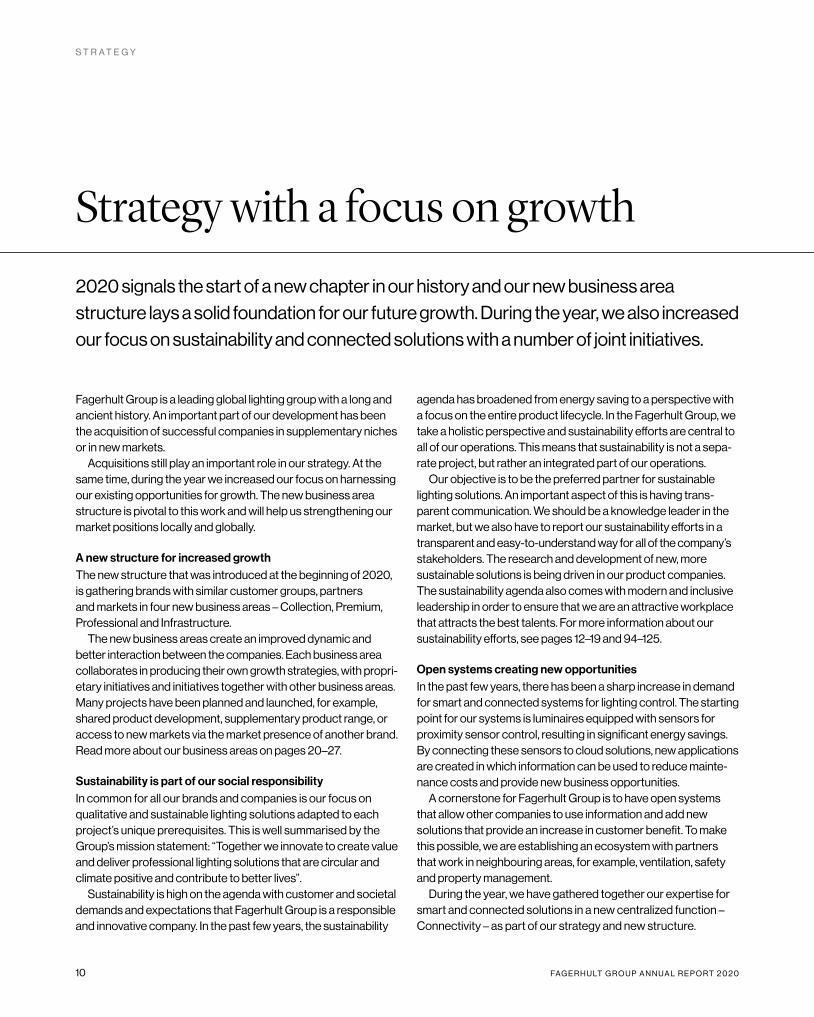
3 Smart systems creating opportunitiesThe demand for smart and connected control systems for lighting continues to rise. These systems allow for the management
of light based on the situation, for example, lighting based on activity using sensors in the luminaires. Proximity sensor control leads to a sharp reduction in energy consumption, at the same time the sensors and the data they collect enable for new functionality that can create business benefit for other areas such as property management.
Our responseFagerhult Group offers complete lighting solutions with smart controls for both indoor and outdoor use. For indoor use, one example is our system Organic Response. Our focus is to develop systems that are easy to use and that are adapted to their respective applications. A fundamental idea is also that our systems are open and that it is possible for other companies to develop supplementary functions that create increased value for our customers and users. Our companies work actively to find the right partners in the property ecosystem, for example the construction, ventilation and safety industry.
10 FA G E R H U LT G R O U P A N N U A L R E P O R T 2 0 2 0
S T R A T E G Y
Strategy with a focus on growth2020 signals the start of a new chapter in our history and our new business area structure lays a solid foundation for our future growth. During the year, we also increased our focus on sustainability and connected solutions with a number of joint initiatives.
Fagerhult Group is a leading global lighting group with a long and ancient history. An important part of our development has been the acquisition of successful companies in supplementary niches or in new markets.
Acquisitions still play an important role in our strategy. At the same time, during the year we increased our focus on harnessing our existing opportunities for growth. The new business area structure is pivotal to this work and will help us strengthening our market positions locally and globally.
A new structure for increased growthThe new structure that was introduced at the beginning of 2020, is gathering brands with similar customer groups, partners and markets in four new business areas – Collection, Premium, Professional and Infrastructure.
The new business areas create an improved dynamic and better interaction between the companies. Each business area collaborates in producing their own growth strategies, with propri-etary initiatives and initiatives together with other business areas. Many projects have been planned and launched, for example, shared product development, supplementary product range, or access to new markets via the market presence of another brand. Read more about our business areas on pages 20–27.
Sustainability is part of our social responsibilityIn common for all our brands and companies is our focus on qualitative and sustainable lighting solutions adapted to each project’s unique prerequisites. This is well summarised by the Group’s mission statement: “Together we innovate to create value and deliver professional lighting solutions that are circular and climate positive and contribute to better lives”.
Sustainability is high on the agenda with customer and societal demands and expectations that Fagerhult Group is a responsible and innovative company. In the past few years, the sustainability
agenda has broadened from energy saving to a perspective with a focus on the entire product lifecycle. In the Fagerhult Group, we take a holistic perspective and sustainability efforts are central to all of our operations. This means that sustainability is not a sepa-rate project, but rather an integrated part of our operations.
Our objective is to be the preferred partner for sustainable lighting solutions. An important aspect of this is having trans-parent communication. We should be a knowledge leader in the market, but we also have to report our sustainability efforts in a transparent and easy-to-understand way for all of the company’s stakeholders. The research and development of new, more sustainable solutions is being driven in our product companies. The sustainability agenda also comes with modern and inclusive leadership in order to ensure that we are an attractive workplace that attracts the best talents. For more information about our sustainability efforts, see pages 12–19 and 94–125.
Open systems creating new opportunitiesIn the past few years, there has been a sharp increase in demand for smart and connected systems for lighting control. The starting point for our systems is luminaires equipped with sensors for proximity sensor control, resulting in significant energy savings. By connecting these sensors to cloud solutions, new applications are created in which information can be used to reduce mainte-nance costs and provide new business opportunities.
A cornerstone for Fagerhult Group is to have open systems that allow other companies to use information and add new solutions that provide an increase in customer benefit. To make this possible, we are establishing an ecosystem with partners that work in neighbouring areas, for example, ventilation, safety and property management.
During the year, we have gathered together our expertise for smart and connected solutions in a new centralized function – Connectivity – as part of our strategy and new structure.
FA G E R H U LT G R O U P A N N U A L R E P O R T 2 0 2 0 11
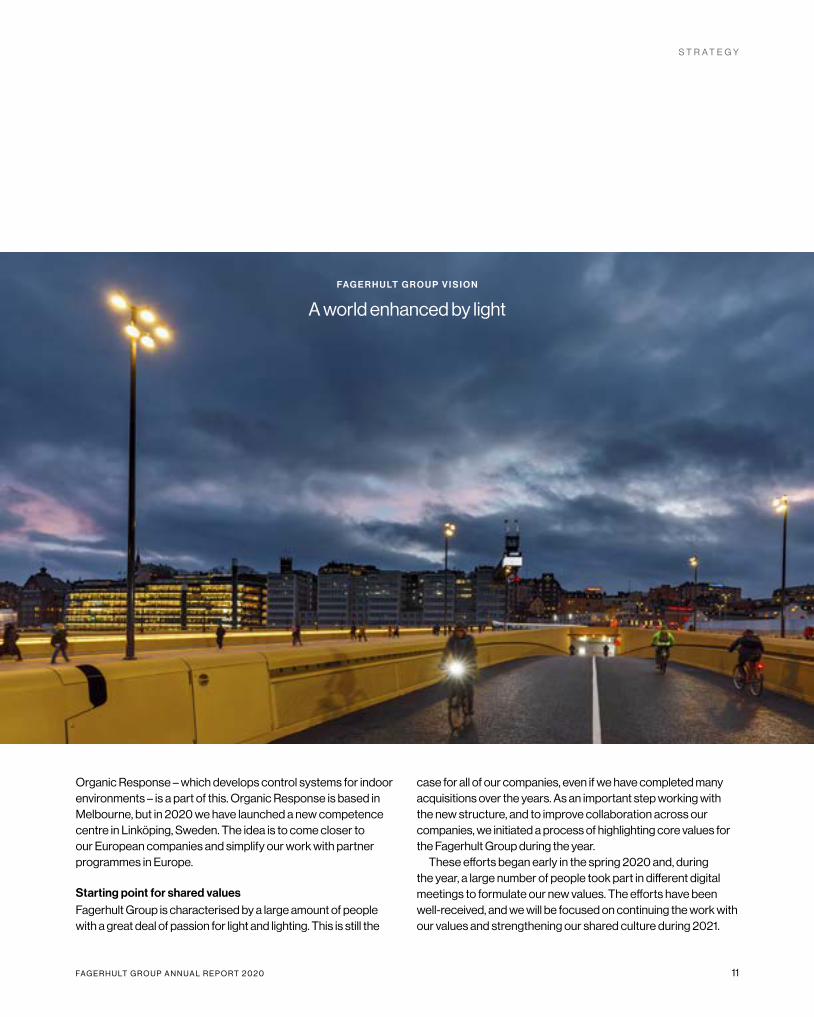
FA G E R H U LT G R O U P V I S I O N
A world enhanced by light
S T R A T E G Y
Organic Response – which develops control systems for indoor environments – is a part of this. Organic Response is based in Melbourne, but in 2020 we have launched a new competence centre in Linköping, Sweden. The idea is to come closer to our European companies and simplify our work with partner programmes in Europe.
Starting point for shared valuesFagerhult Group is characterised by a large amount of people with a great deal of passion for light and lighting. This is still the
case for all of our companies, even if we have completed many acquisitions over the years. As an important step working with the new structure, and to improve collaboration across our companies, we initiated a process of highlighting core values for the Fagerhult Group during the year.
These efforts began early in the spring 2020 and, during the year, a large number of people took part in different digital meetings to formulate our new values. The efforts have been well- received, and we will be focused on continuing the work with our values and strengthening our shared culture during 2021.
12 FA G E R H U LT G R O U P A N N U A L R E P O R T 2 0 2 0
S U S T A I N A B I L I T Y
Our ambition is to apply societal, business and environmental responsibility in developing and manufacturing energy- efficient professional lighting solutions that help create sustainable value for people, society and the environment. This shared road ahead for all companies within the Group can be summed up by our mission:
“Together we innovate to create value and deliver professional lighting solutions that are circular, climate positive and contribute to better lives”.
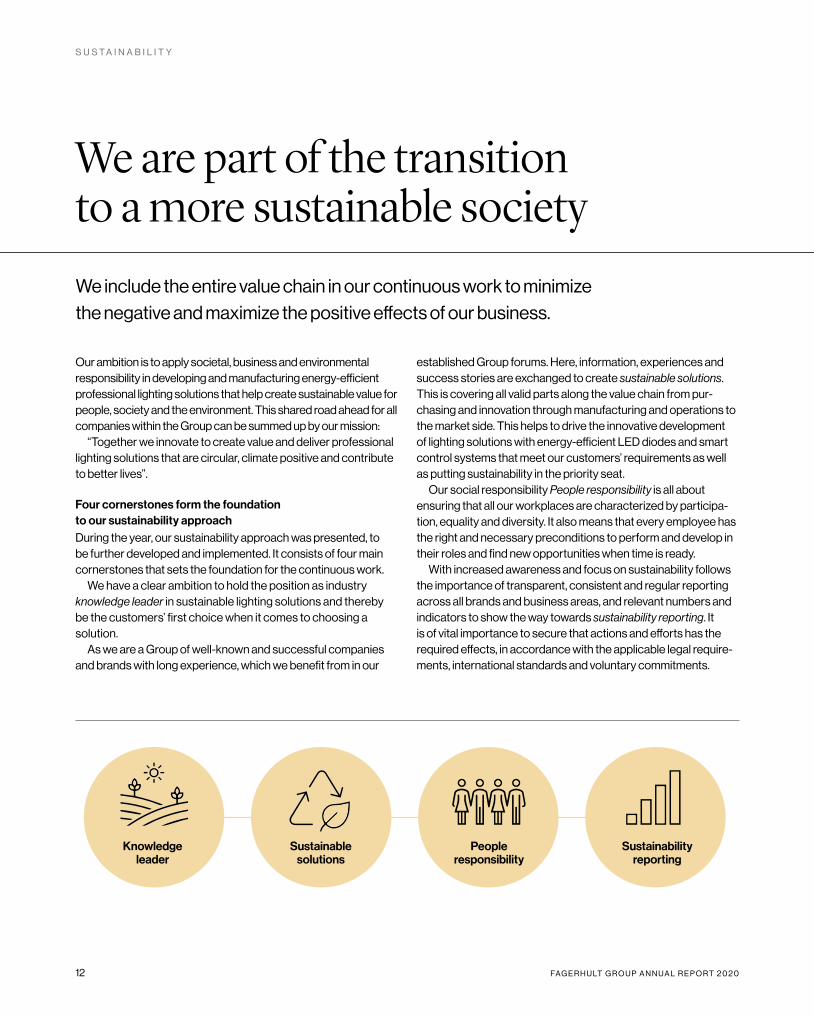
Four cornerstones form the foundation to our sustainability approachDuring the year, our sustainability approach was presented, to be further developed and implemented. It consists of four main cornerstones that sets the foundation for the continuous work.
We have a clear ambition to hold the position as industry knowledge leader in sustainable lighting solutions and thereby be the customers’ first choice when it comes to choosing a solution.
As we are a Group of well-known and successful companies and brands with long experience, which we benefit from in our
established Group forums. Here, information, experiences and success stories are exchanged to create sustainable solutions. This is covering all valid parts along the value chain from pur-chasing and innovation through manufacturing and operations to the market side. This helps to drive the innovative development of lighting solutions with energy-efficient LED diodes and smart control systems that meet our customers’ requirements as well as putting sustainability in the priority seat.
Our social responsibility People responsibility is all about ensuring that all our workplaces are characterized by participa-tion, equality and diversity. It also means that every employee has the right and necessary preconditions to perform and develop in their roles and find new opportunities when time is ready.
With increased awareness and focus on sustainability follows the importance of transparent, consistent and regular reporting across all brands and business areas, and relevant numbers and indicators to show the way towards sustainability reporting. It is of vital importance to secure that actions and efforts has the required effects, in accordance with the applicable legal require-ments, international standards and voluntary commitments.
We are part of the transition to a more sustainable societyWe include the entire value chain in our continuous work to minimize the negative and maximize the positive effects of our business.
Knowledge leader
Sustainable solutions
People responsibility
Sustainability reporting
FA G E R H U LT G R O U P A N N U A L R E P O R T 2 0 2 0 13
S U S T A I N A B I L I T Y
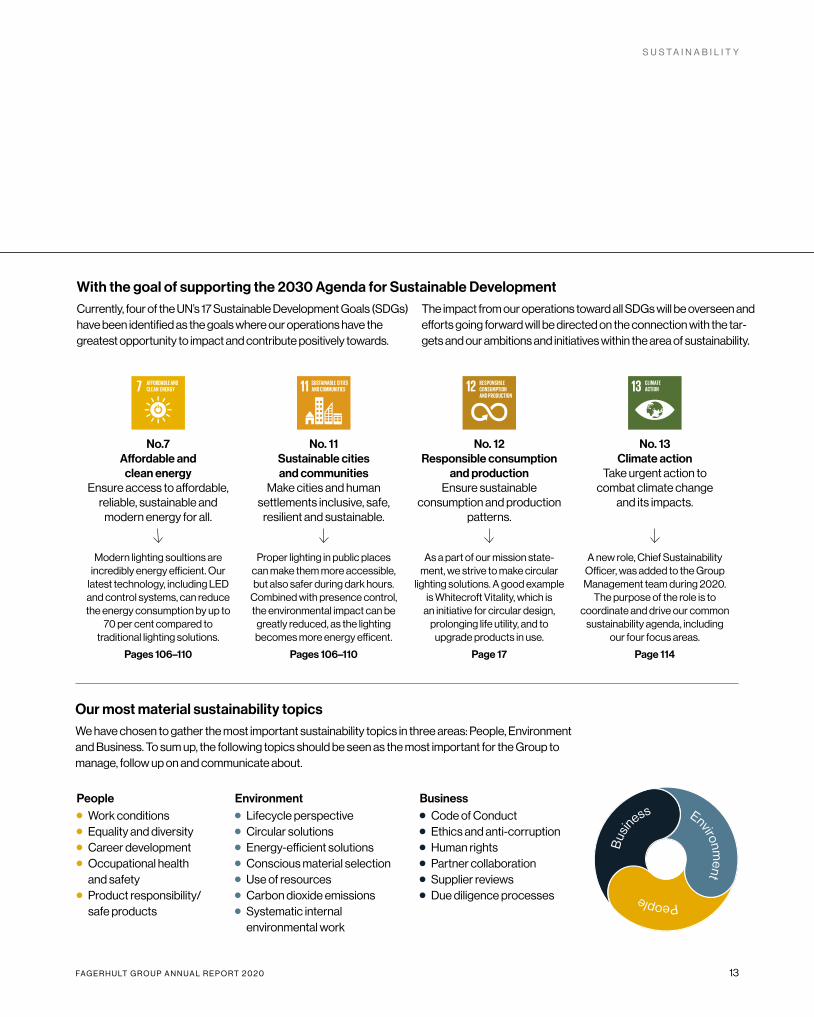
No.7 Affordable and
clean energyEnsure access to affordable,
reliable, sustainable and modern energy for all.
No. 11Sustainable cities and communities
Make cities and human settlements inclusive, safe,
resilient and sustainable.
No. 12Responsible consumption
and productionEnsure sustainable
consumption and production patterns.
No. 13 Climate action
Take urgent action to combat climate change
and its impacts.
Modern lighting soultions are incredibly energy efficient. Our
latest technology, including LED and control systems, can reduce the energy consumption by up to
70 per cent compared to traditional lighting solutions.
Pages 106–110
Proper lighting in public places can make them more accessible, but also safer during dark hours.
Combined with presence control, the environmental impact can be
greatly reduced, as the lighting becomes more energy efficent.
Pages 106–110
As a part of our mission state-ment, we strive to make circular
lighting solutions. A good example is Whitecroft Vitality, which is
an initiative for circular design, prolonging life utility, and to
upgrade products in use.
Page 17
A new role, Chief Sustainability Officer, was added to the Group Management team during 2020.
The purpose of the role is to coordinate and drive our common
sustainability agenda, including our four focus areas.
Page 114
Our most material sustainability topicsWe have chosen to gather the most important sustainability topics in three areas: People, Environment and Business. To sum up, the following topics should be seen as the most important for the Group to manage, follow up on and communicate about.
With the goal of supporting the 2030 Agenda for Sustainable DevelopmentCurrently, four of the UN’s 17 Sustainable Development Goals (SDGs) have been identified as the goals where our operations have the greatest opportunity to impact and contribute positively towards.
The impact from our operations toward all SDGs will be overseen and efforts going forward will be directed on the connection with the tar-gets and our ambitions and initiatives within the area of sustainability.
People Work conditions Equality and diversity Career development Occupational health
and safety Product responsibility/
safe products
Environment Lifecycle perspective Circular solutions Energy-efficient solutions Conscious material selection Use of resources Carbon dioxide emissions Systematic internal
environmental work
Business Code of Conduct Ethics and anti-corruption Human rights Partner collaboration Supplier reviews Due diligence processes
Bus
iness Environment People
14 FA G E R H U LT G R O U P A N N U A L R E P O R T 2 0 2 0
P E O P L E
In many ways, 2020 has been characterised by the global spread of the coronavirus pan-demic. Our responsibility as an employer was to, in any way possible, reduce the spread of infection and quickly adapt the company’s operations in line with the national rules and recommendations that were introduced to various degrees during the year. Keeping operations running safely was essential and comprehensive efforts therefore took place to make workplaces coronavirus-safe based on local requirements and adapting work procedures by, for example, increasing opportunities to work remotely.
Sustainable workplaces, leadership and employeesOur workplaces are characterised by partic-ipation, commitment and well-being that pro-vide every employee with good preconditions to develop. Group-wide core values unite and
guide all employees, and are an integral part of all our processes and in our daily work.
Each company has the goal of offering its employees an inclusive working environment characterised by good development oppor-tunities and attractive career paths, locally as well as globally. It is equally important to develop the kind of leadership in which those that lead feel comfortable in their roles and can apply a coaching style of leadership.
Appreciating people’s differences and various skills is an important way to increase diversity, something that in turn leads to better conditions for creating a more innovative company culture. There is also a clear overall intention to create a better balance between the genders.
For more information about the year’s developments, see pages 99–105.
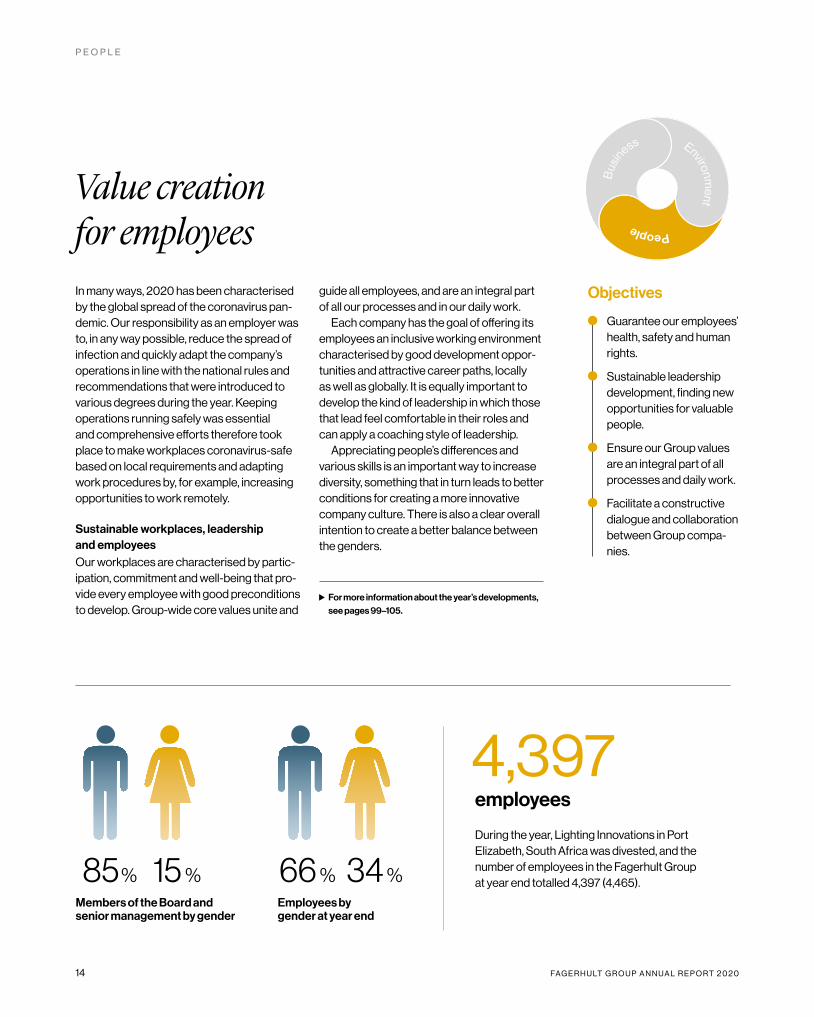
Value creation for employees
Members of the Board and senior management by gender
85 % 15 %Employees by gender at year end
66 % 34 %
4,397employees
During the year, Lighting Innovations in Port Eliza beth, South Africa was divested, and the number of employees in the Fagerhult Group at year end totalled 4,397 (4,465).
Bus
iness Environment People
Objectives
Guarantee our employees’ health, safety and human rights.
Sustainable leadership development, finding new opportunities for valuable people.
Ensure our Group values are an integral part of all processes and daily work.
Facilitate a constructive dialogue and collaboration between Group compa-nies.

FA G E R H U LT G R O U P A N N U A L R E P O R T 2 0 2 0 15
E N V I R O N M E N T
The combination of LED technology’s long life and low energy consumption with smart control systems has quickly become the major driving force in lighting professional indoor and outdoor environments. This is a development in technology that generates sustainable values and is applied for proximity sensor-controlled lighting that automatically regulates comfortable and energy-efficient lighting according to the time of day and pres-ence in a space or in an outdoor environment. The continual development of LED technol-ogy combined with connected lighting solu-tions can, depending on application, reduce energy consumption up to 70 per cent.
A circular business model is being cultivatedA shared goal for all companies is to limit the environmental impact of their luminaires throughout their life cycle, from the choice
of materials, product development and manufacturing to use and recyclability. For example, Whitecroft are already offering a circular product platform for lighting, Whitecroft Vitality, and they launched their first Cradle to Cradle certified product last autumn.
A summary of the Group’s direct and indirect emissions 2020
CO2e emissions (tonnes) 2020 2019
Total CO2e emissions Scope 1 9,888 7,468
Total CO2e emissions Scope 21 7,673 5,052
Total CO2e emissions Scope 32 345 1,200
1) Emissions from sales offices are not included 2019.
2) Information regarding total Scope 3 emissions is unavailable. It covers business trips by flights.
For more information about the year’s developments, see pages 106–110.
Sustainable values generated in the user phase
2,092 To continually reduce our indirect CO2 emissions, we have invested in solar panels at several of our production units. In 2020 we produced 2,092 MWh with solar panels installed across the Fagerhult Group which is more than the entire electricity consumed in the three factories in our Infrastructure business area during the year.
Business Environm
ent People
Objectives Maximize energy savings,
using the latest LED tech-nology and smart lighting control.
Ensure that all products and services fulfill appli-cable regulations and standards.
Lifecycle perspective on our solutions to minimize our environmental impact.
Environmental consider-ation throughout our full value chain, internally and externally.

16 FA G E R H U LT G R O U P A N N U A L R E P O R T 2 0 2 0
B U S I N E S S
Running a responsible enterprise is core for our success. The Code of Conduct – which includes guidelines for labour conditions, business ethics, anti- corruption, respect for human rights and environmental responsi-bility – is a guide for this work. Our common Code of Conduct is supplemented by the companies’ local versions alongside their policies and guidelines.
Fagerhult Group is a transparent, sound and open organisation and everyone who works within the Group, from the Board of Directors and management to individual companies’ management and employees, is covered by and must act in accordance with laws, regulations and our Code of Conduct. In the event that a serious irregularity is suspected that is in breach of the Code of Conduct, it is possible to anonymously report the incident using the whistle-blower func-tion, which is accessible via the intranet and on our public website.
A sustainable chain of suppliersThe general assessment is that the Group has a low risk exposure for purchases since a large portion of the procurement is conducted with well-established global companies or from suppliers within our companies’ near environments. In line with the decentralised business model, it is each company’s responsibility to integrate sustainability with its procurement process in order to ensure a sustainable and ethical supply chain. The companies’ procurement functions have the core responsibility for acquiring knowledge of and ensuring that the contracted suppliers adhere to the international guidelines for human rights, freedom of association, right to collective agreements, anti-corruption, and efforts to combat child and forced labour. Many companies also supplement their agreements with a supplier code of conduct and regularly carry out supplier reviews.
For more information about the year’s developments, see pages 111–113.
Responsible enterprise is our foundation
Bus
iness Environment People
Objectives
All companies and part-ners conduct business according to current laws and regulations.
Our shared Code of Conduct forms the basis for everything we do and how we act.
Ensure a sustainable supply chain, making sure all suppliers meet our requirements.
Thorough due diligence is conducted for every company acquisition.
FA G E R H U LT G R O U P A N N U A L R E P O R T 2 0 2 0 17
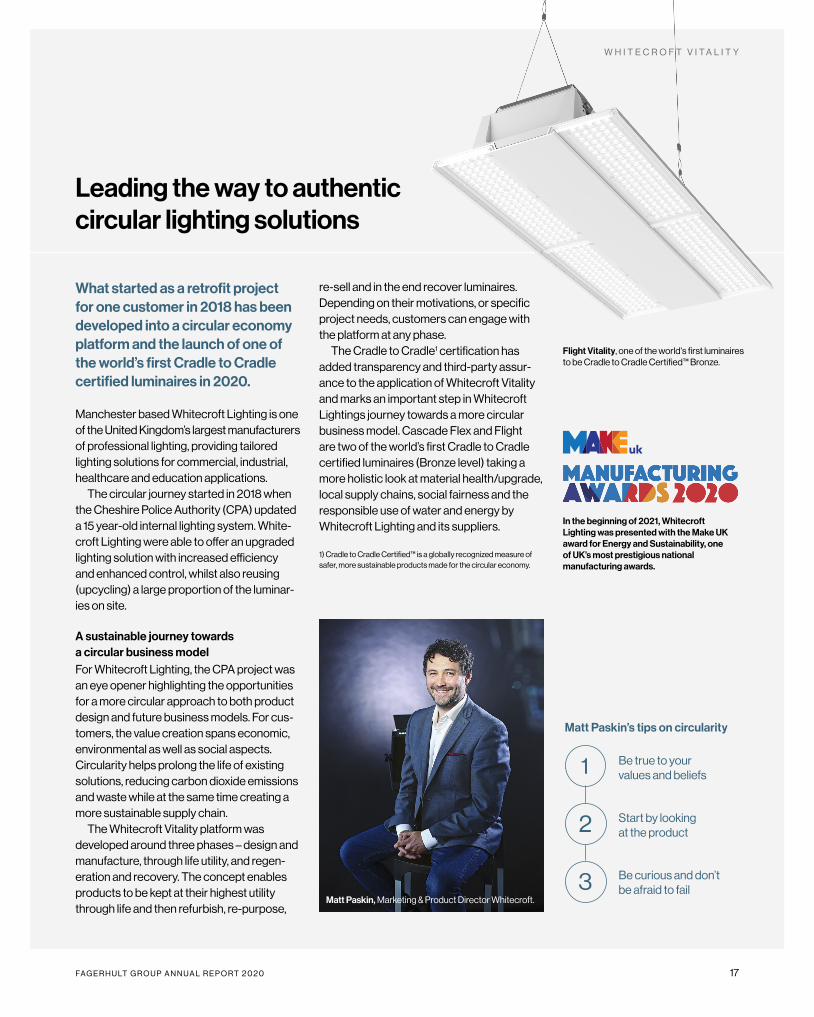
What started as a retrofit project for one customer in 2018 has been developed into a circular economy platform and the launch of one of the world’s first Cradle to Cradle certified luminaires in 2020.
Manchester based Whitecroft Lighting is one of the United Kingdom’s largest manufacturers of professional lighting, providing tailored lighting solutions for commercial, industrial, healthcare and education applications.
The circular journey started in 2018 when the Cheshire Police Authority (CPA) updated a 15 year-old internal lighting system. White-croft Lighting were able to offer an upgraded lighting solution with increased efficiency and enhanced control, whilst also reusing (upcycling) a large proportion of the luminar-ies on site.
A sustainable journey towards a circular business modelFor Whitecroft Lighting, the CPA project was an eye opener highlighting the opportunities for a more circular approach to both product design and future business models. For cus-tomers, the value creation spans economic, environmental as well as social aspects. Circularity helps prolong the life of existing solutions, reducing carbon dioxide emissions and waste while at the same time creating a more sustainable supply chain.
The Whitecroft Vitality platform was developed around three phases – design and manufacture, through life utility, and regen-eration and recovery. The concept enables products to be kept at their highest utility through life and then refurbish, re-purpose,
re-sell and in the end recover luminaires. Depending on their motivations, or specific project needs, customers can engage with the platform at any phase.
The Cradle to Cradle1 certification has added transparency and third-party assur-ance to the application of Whitecroft Vitality and marks an important step in Whitecroft Lightings journey towards a more circular business model. Cascade Flex and Flight are two of the world’s first Cradle to Cradle certified luminaires (Bronze level) taking a more holistic look at material health/upgrade, local supply chains, social fairness and the responsible use of water and energy by Whitecroft Lighting and its suppliers.
1) Cradle to Cradle Certified™ is a globally recognized measure of safer, more sustainable products made for the circular economy.
Flight Vitality, one of the world's first luminaires to be Cradle to Cradle Certified™ Bronze.
In the beginning of 2021, Whitecroft Lighting was presented with the Make UK award for Energy and Sustainability, one of UK’s most prestigious national manufacturing awards.
Leading the way to authentic circular lighting solutions
W H I T E C R O F T V I T A L I T Y
Matt Paskin’s tips on circularity
Be true to your values and beliefs
Start by looking at the product
Be curious and don’t be afraid to fail
Matt Paskin, Marketing & Product Director Whitecroft.
1
2
3
V A L U E C R E A T I O N
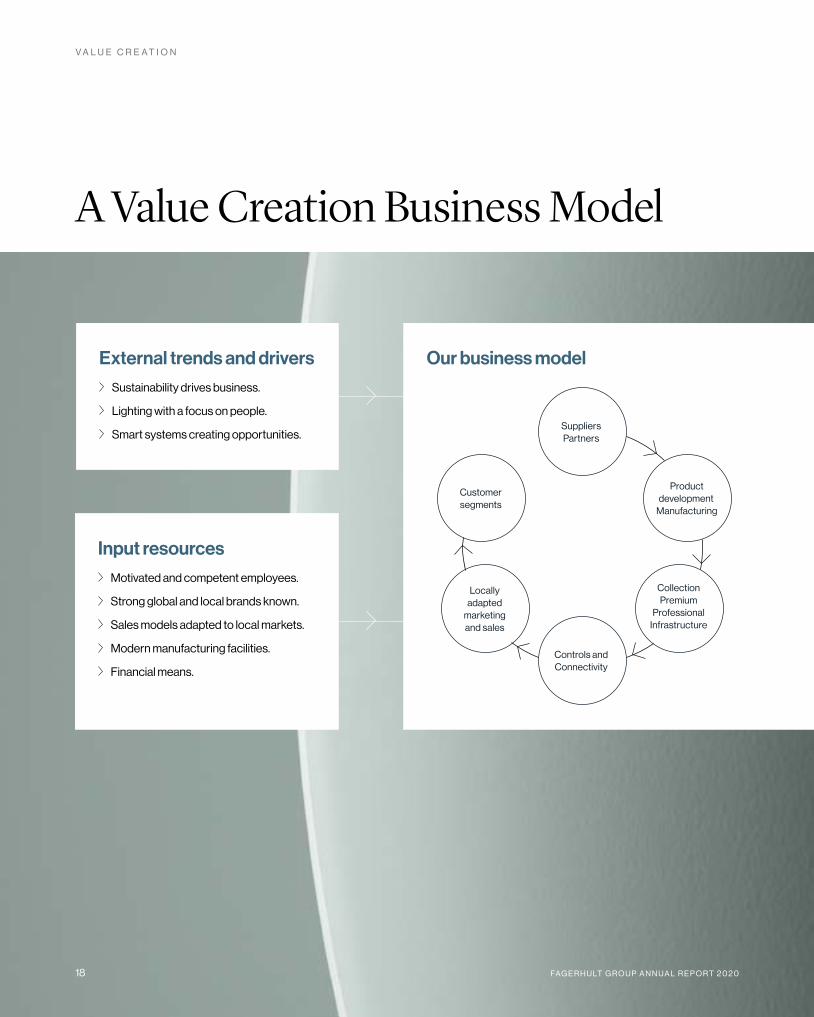
A Value Creation Business Model
Our business modelExternal trends and drivers Sustainability drives business.
Lighting with a focus on people.
Smart systems creating opportunities.
Input resources Motivated and competent employees.
Strong global and local brands known.
Sales models adapted to local markets.
Modern manufacturing facilities.
Financial means.
18 FA G E R H U LT G R O U P A N N U A L R E P O R T 2 0 2 0
Customer segments
Locally adapted
marketing and sales
Suppliers Partners
Controls and Connectivity
Product development
Manufacturing
Collection Premium
Professional Infrastructure
V A L U E C R E A T I O N
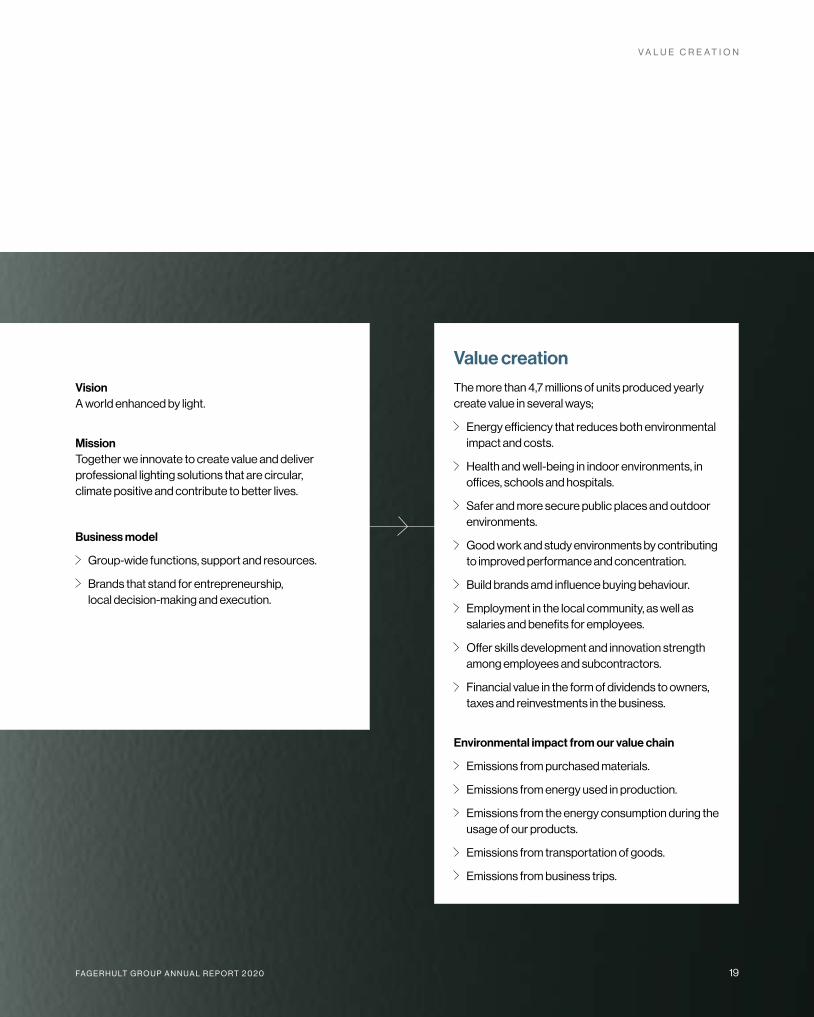
Our business model Value creation The more than 4,7 millions of units produced yearly create value in several ways;
Energy efficiency that reduces both environmental impact and costs.
Health and well-being in indoor environments, in offices, schools and hospitals.
Safer and more secure public places and outdoor environments.
Good work and study environments by contributing to improved performance and concentration.
Build brands amd influence buying behaviour.
Employment in the local community, as well as salaries and benefits for employees.
Offer skills development and innovation strength among employees and subcontractors.
Financial value in the form of dividends to owners, taxes and reinvestments in the business.
Environmental impact from our value chain
Emissions from purchased materials.
Emissions from energy used in production.
Emissions from the energy consumption during the usage of our products.
Emissions from transportation of goods.
Emissions from business trips.
Business model
Group-wide functions, support and resources.
Brands that stand for entrepreneurship, local decision-making and execution.
VisionA world enhanced by light.
MissionTogether we innovate to create value and deliver professional lighting solutions that are circular, climate positive and contribute to better lives.
FA G E R H U LT G R O U P A N N U A L R E P O R T 2 0 2 0 19
20 FA G E R H U LT G R O U P A N N U A L R E P O R T 2 0 2 0
B U S I N E S S A R E A S
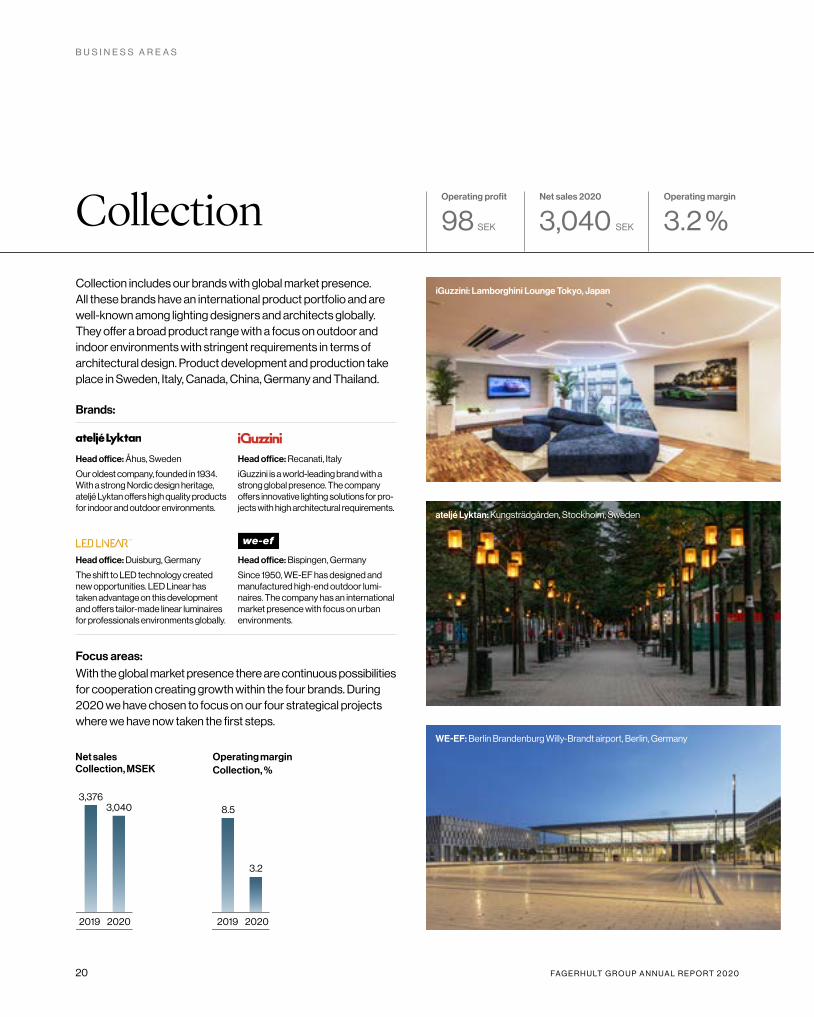
Collection includes our brands with global market presence. All these brands have an international product portfolio and are well-known among lighting designers and architects globally. They offer a broad product range with a focus on outdoor and indoor environments with stringent requirements in terms of architectural design. Product development and production take place in Sweden, Italy, Canada, China, Germany and Thailand.
Brands:
Head office: Åhus, Sweden
Our oldest company, founded in 1934. With a strong Nordic design heritage, ateljé Lyktan offers high quality products for indoor and outdoor environments.
Head office: Recanati, Italy
iGuzzini is a world-leading brand with a strong global presence. The company offers innovative lighting solutions for pro-jects with high architectural requirements.
Head office: Duisburg, Germany
The shift to LED technology created new opportunities. LED Linear has taken advantage on this development and offers tailor-made linear luminaires for professionals environments globally.
Head office: Bispingen, Germany
Since 1950, WE-EF has designed and manufactured high-end outdoor lumi-naires. The company has an international market presence with focus on urban environments.
Focus areas:With the global market presence there are continuous possibilities for cooperation creating growth within the four brands. During 2020 we have chosen to focus on our four strategical projects where we have now taken the first steps.
Collection Operating profit
98 SEK
Net sales 2020
3,040 SEK
Operating margin
3.2 %
ateljé Lyktan: Kungsträdgården, Stockholm, Sweden
Net sales Collection, MSEK
3,0403,376
2019 2020
iGuzzini: Lamborghini Lounge Tokyo, Japan
WE-EF: Berlin Brandenburg Willy-Brandt airport, Berlin, Germany
Operating margin Collection, %
3.2
8.5
2019 2020
FA G E R H U LT G R O U P A N N U A L R E P O R T 2 0 2 0 21
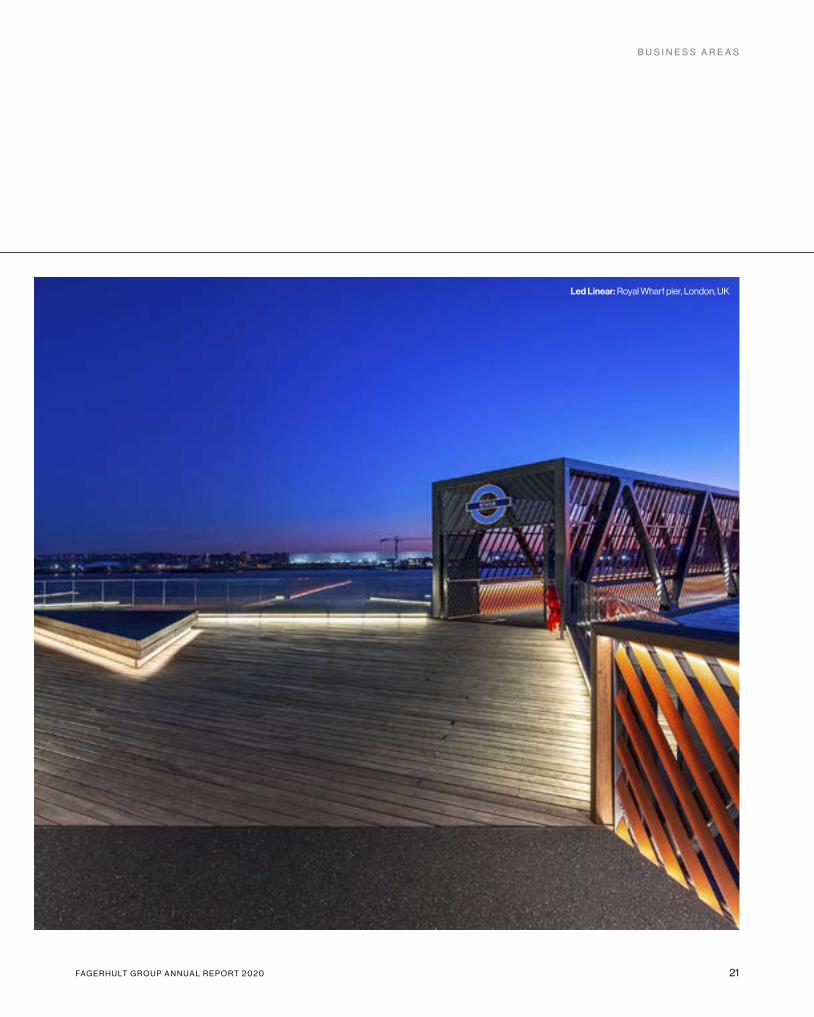
Led Linear: Royal Wharf pier, London, UK
B U S I N E S S A R E A S
22 FA G E R H U LT G R O U P A N N U A L R E P O R T 2 0 2 0
B U S I N E S S A R E A S
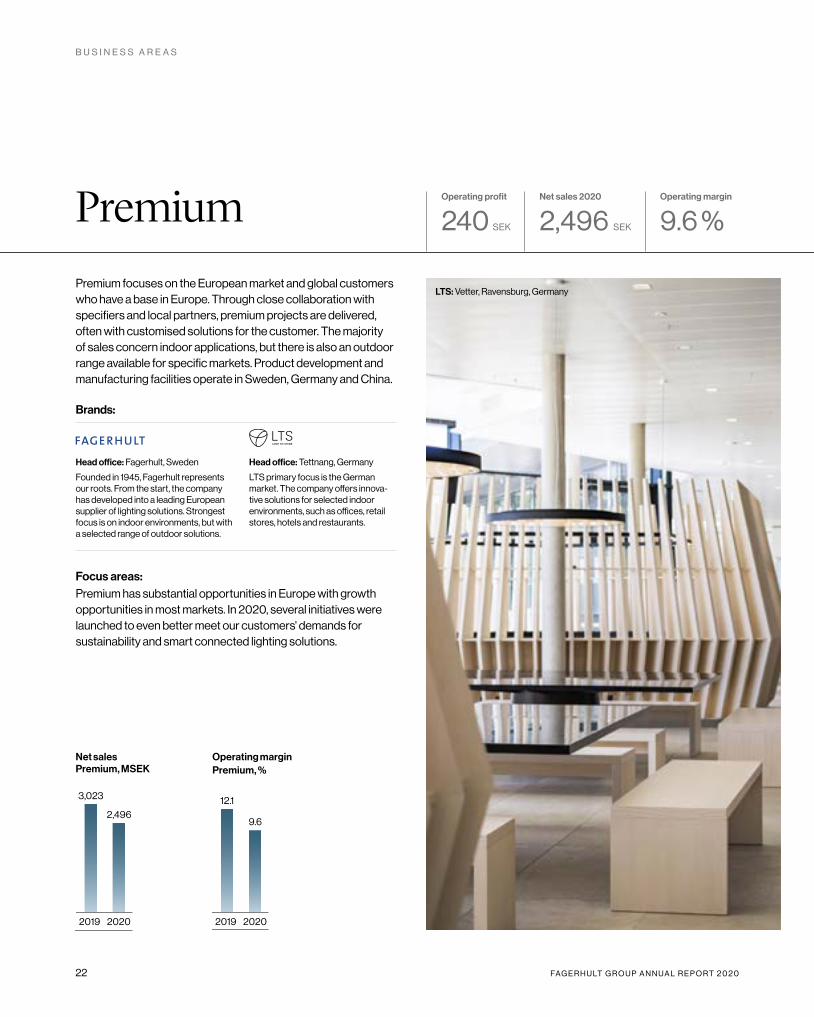
Premium focuses on the European market and global customers who have a base in Europe. Through close collaboration with specifiers and local partners, premium projects are delivered, often with customised solutions for the customer. The majority of sales concern indoor applications, but there is also an outdoor range available for specific markets. Product development and manufacturing facilities operate in Sweden, Germany and China.
Brands:
Head office: Fagerhult, Sweden
Founded in 1945, Fagerhult represents our roots. From the start, the company has developed into a leading European supplier of lighting solutions. Strongest focus is on indoor environments, but with a selected range of outdoor solutions.
Head office: Tettnang, Germany
LTS primary focus is the German market. The company offers innova-tive solutions for selected indoor environments, such as offices, retail stores, hotels and restaurants.
Focus areas:Premium has substantial opportunities in Europe with growth opportunities in most markets. In 2020, several initiatives werelaunched to even better meet our customers' demands for sustainability and smart connected lighting solutions.
Premium Operating profit
240 SEK
Net sales 2020
2,496 SEK
Operating margin
9.6 %
Net sales Premium, MSEK
2,496
3,023
2019 2020
LTS: Vetter, Ravensburg, Germany
Operating margin Premium, %
9.6
12.1
2019 2020
FA G E R H U LT G R O U P A N N U A L R E P O R T 2 0 2 0 23
B U S I N E S S A R E A S
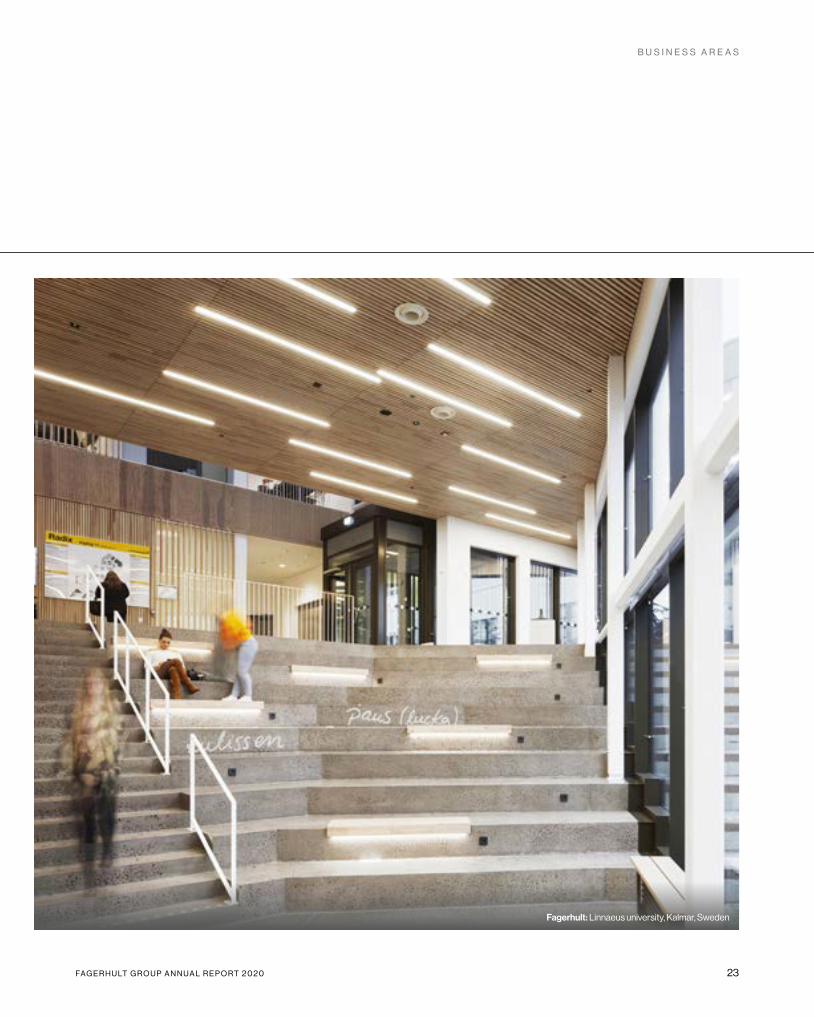
Fagerhult: Linnaeus university, Kalmar, Sweden
24 FA G E R H U LT G R O U P A N N U A L R E P O R T 2 0 2 0
Arlight: Hilmi Güner Architecture, Ankara, Turkey
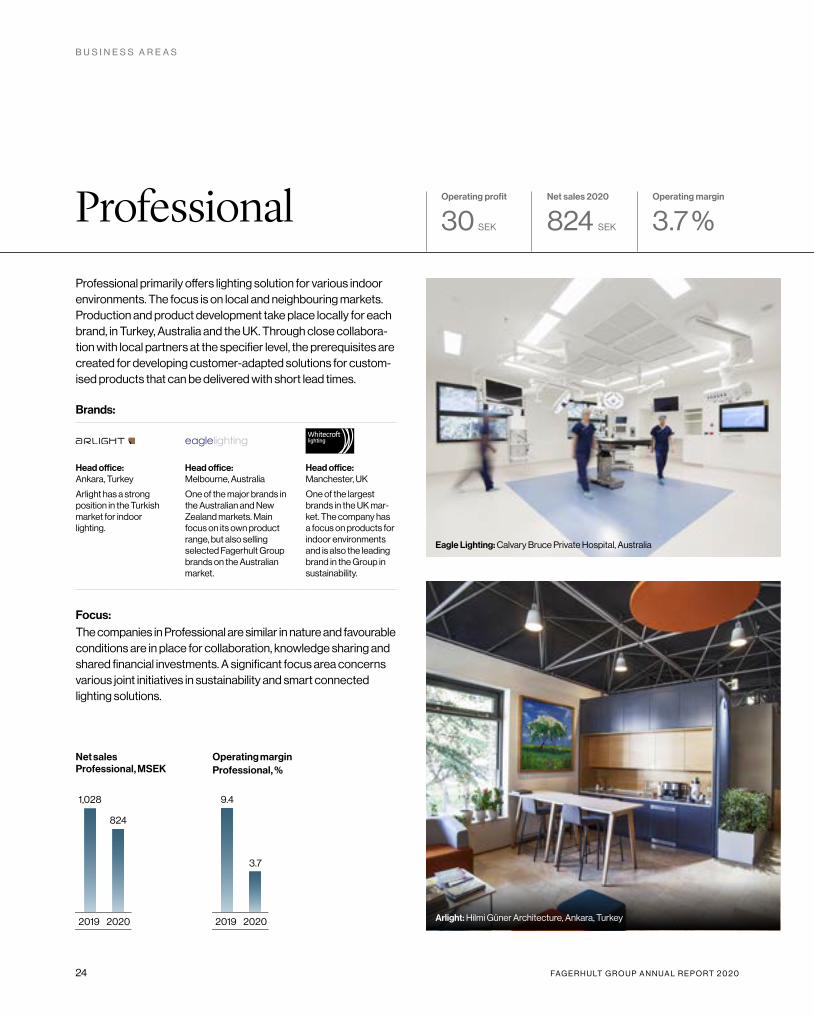
Eagle Lighting: Calvary Bruce Private Hospital, Australia
B U S I N E S S A R E A S
Professional primarily offers lighting solution for various indoor environments. The focus is on local and neighbouring markets. Production and product development take place locally for each brand, in Turkey, Australia and the UK. Through close collabora-tion with local partners at the specifier level, the prerequisites are created for developing customer-adapted solutions for custom-ised products that can be delivered with short lead times.
Brands:
Head office: Ankara, Turkey
Arlight has a strong position in the Turkish market for indoor lighting.
Head office: Melbourne, Australia
One of the major brands in the Australian and New Zealand markets. Main focus on its own product range, but also selling selected Fagerhult Group brands on the Australian market.
Head office: Manchester, UK
One of the largest brands in the UK mar-ket. The company has a focus on products for indoor environments and is also the leading brand in the Group in sustainability.
Focus:The companies in Professional are similar in nature and favourable conditions are in place for collaboration, knowledge sharing and shared financial investments. A significant focus area concerns various joint initiatives in sustainability and smart connected lighting solutions.
Professional Operating profit
30 SEK
Net sales 2020
824 SEK
Operating margin
3.7 %
Net sales Professional, MSEK
824
1,028
2019 2020
Operating margin Professional, %
3.7
9.4
2019 2020
FA G E R H U LT G R O U P A N N U A L R E P O R T 2 0 2 0 25
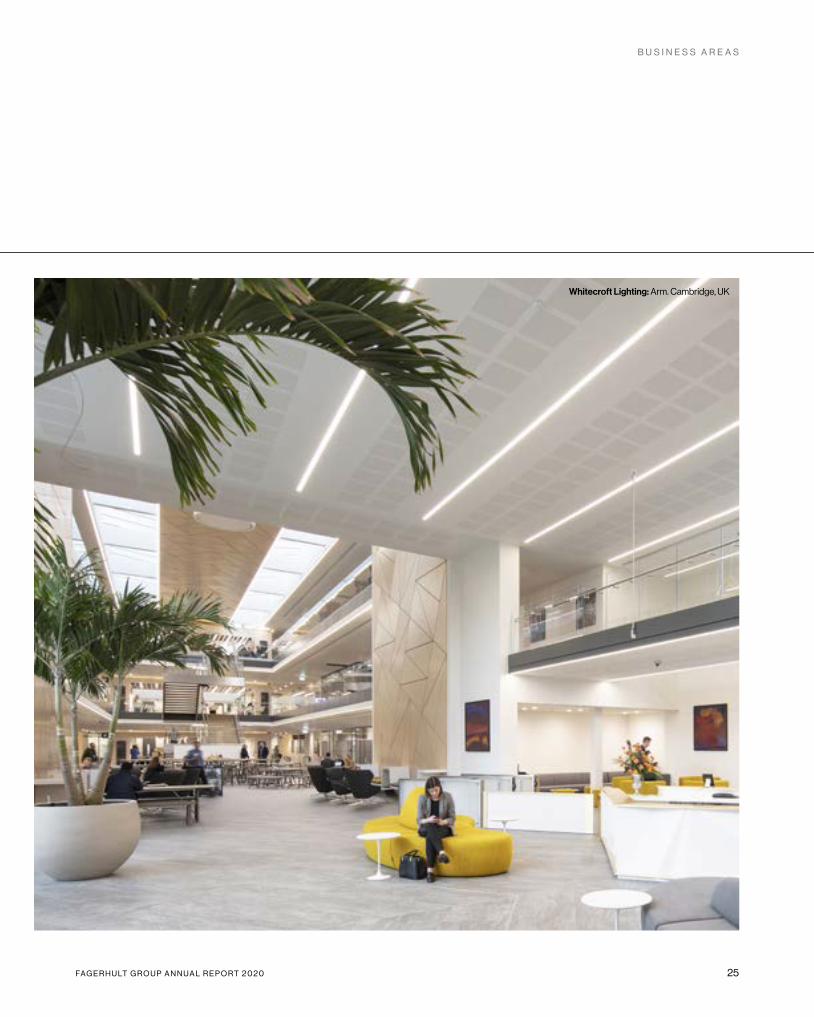
Whitecroft Lighting: Arm. Cambridge, UK
B U S I N E S S A R E A S
26 FA G E R H U LT G R O U P A N N U A L R E P O R T 2 0 2 0
B U S I N E S S A R E A S
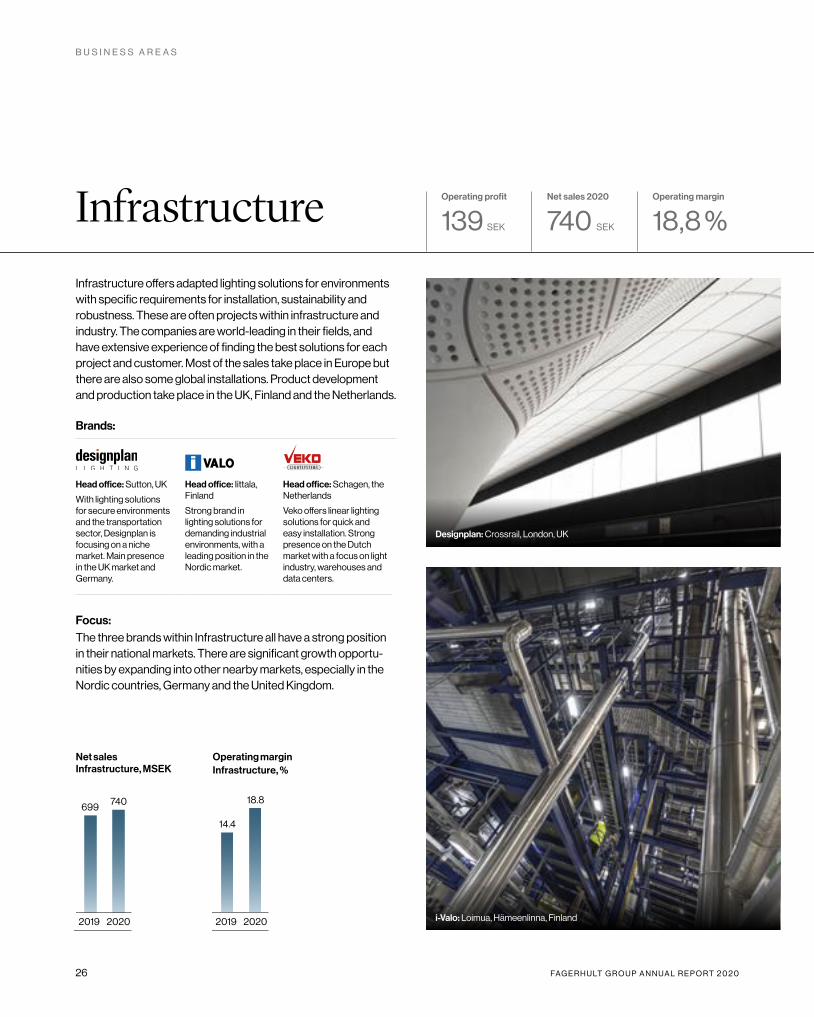
Infrastructure offers adapted lighting solutions for environments with specific requirements for installation, sustainability and robustness. These are often projects within infrastructure and industry. The companies are world-leading in their fields, and have extensive experience of finding the best solutions for each project and customer. Most of the sales take place in Europe but there are also some global installations. Product development and production take place in the UK, Finland and the Netherlands.
Brands:
Head office: Sutton, UK
With lighting solutions for secure environments and the transportation sector, Designplan is focusing on a niche market. Main presence in the UK market and Germany.
Head office: Iittala, Finland
Strong brand in lighting solutions for demanding industrial environments, with a leading position in the Nordic market.
Head office: Schagen, the Netherlands
Veko offers linear lighting solutions for quick and easy installation. Strong presence on the Dutch market with a focus on light industry, warehouses and data centers.
Focus:The three brands within Infrastructure all have a strong positionin their national markets. There are significant growth opportu-nities by expanding into other nearby markets, especially in the Nordic countries, Germany and the United Kingdom.
Infrastructure Operating profit
139 SEK
Net sales 2020
740 SEK
Operating margin
18,8 %
Net sales Infrastructure, MSEK
740699
2019 2020
Designplan: Crossrail, London, UK
i-Valo: Loimua, Hämeenlinna, Finland
Operating margin Infrastructure, %
18.8
14.4
2019 2020
FA G E R H U LT G R O U P A N N U A L R E P O R T 2 0 2 0 27
B U S I N E S S A R E A S
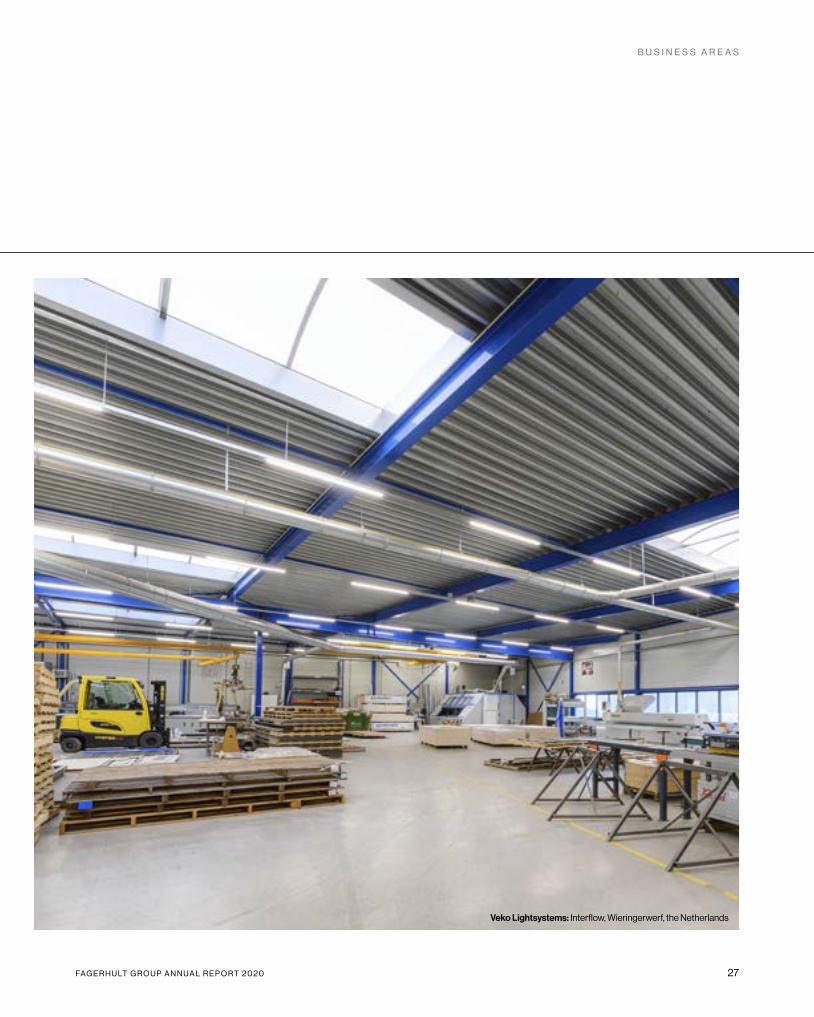
Veko Lightsystems: Interflow, Wieringerwerf, the Netherlands
Financial information
Contents
The Fagerhult share 30
Five-year overview 32
Administration Report 34
Corporate Governance 39
The Board of Directors 46
Group Management 48
The Group’s annual accounts 50
The Parent company’s annual accounts 55
Accounting policies 60
Notes 67
Signatures 89
Audit report 90
30 FA G E R H U LT G R O U P A N N U A L R E P O R T 2 0 2 0
F I N A N C I A L I N F O R M A T I O N | T H E S H A R E
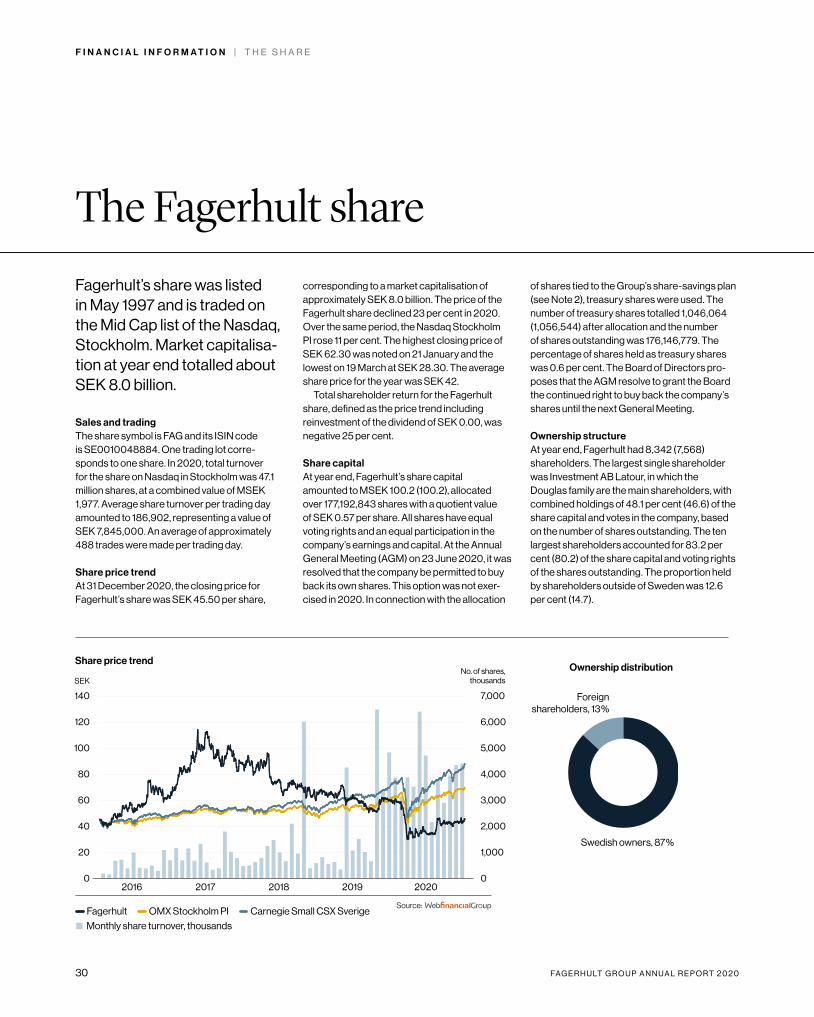
Fagerhult’s share was listed in May 1997 and is traded on the Mid Cap list of the Nasdaq, Stockholm. Market capitalisa-tion at year end totalled about SEK 8.0 billion.
Sales and tradingThe share symbol is FAG and its ISIN code is SE0010048884. One trading lot corre-sponds to one share. In 2020, total turnover for the share on Nasdaq in Stockholm was 47.1 million shares, at a combined value of MSEK 1,977. Average share turnover per trading day amounted to 186,902, representing a value of SEK 7,845,000. An average of approximately 488 trades were made per trading day.
Share price trendAt 31 December 2020, the closing price for Fagerhult’s share was SEK 45.50 per share,
corresponding to a market capitalisation of approximately SEK 8.0 billion. The price of the Fagerhult share declined 23 per cent in 2020. Over the same period, the Nasdaq Stockholm PI rose 11 per cent. The highest closing price of SEK 62.30 was noted on 21 January and the lowest on 19 March at SEK 28.30. The average share price for the year was SEK 42.
Total shareholder return for the Fagerhult share, defined as the price trend including reinvestment of the dividend of SEK 0.00, was negative 25 per cent.
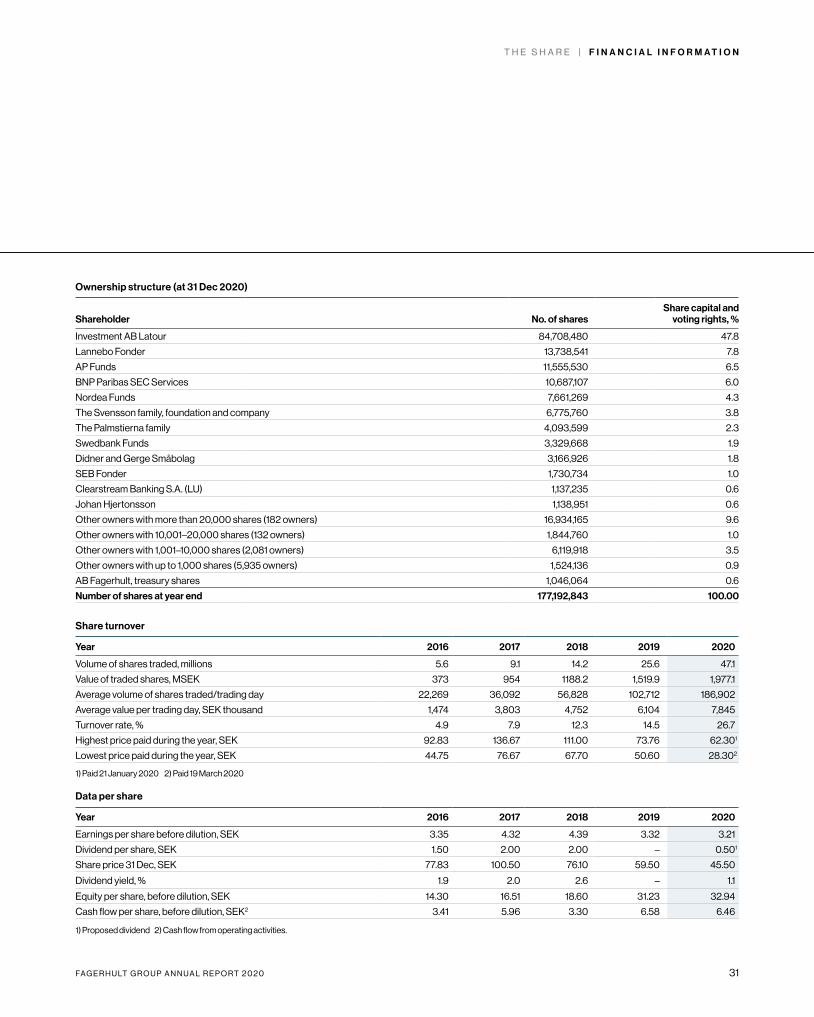
Share capitalAt year end, Fagerhult’s share capital amounted to MSEK 100.2 (100.2), allocated over 177,192,843 shares with a quotient value of SEK 0.57 per share. All shares have equal voting rights and an equal participation in the company’s earnings and capital. At the Annual General Meeting (AGM) on 23 June 2020, it was resolved that the company be permitted to buy back its own shares. This option was not exer-cised in 2020. In connection with the allocation
of shares tied to the Group’s share-savings plan (see Note 2), treasury shares were used. The number of treasury shares totalled 1,046,064 (1,056,544) after allocation and the number of shares outstanding was 176,146,779. The percentage of shares held as treasury shares was 0.6 per cent. The Board of Directors pro-poses that the AGM resolve to grant the Board the continued right to buy back the company’s shares until the next General Meeting.
Ownership structureAt year end, Fagerhult had 8,342 (7,568) shareholders. The largest single shareholder was Investment AB Latour, in which the Douglas family are the main shareholders, with combined holdings of 48.1 per cent (46.6) of the share capital and votes in the company, based on the number of shares outstanding. The ten largest shareholders accounted for 83.2 per cent (80.2) of the share capital and voting rights of the shares outstanding. The proportion held by shareholders outside of Sweden was 12.6 per cent (14.7).
The Fagerhult share
0
1 000
2 000
3 000
4 000
5 000
6 000
7 000
Omsatt antal aktier i 1000-tal per månad
20202019201820172016
0
20
40
60
80
100
120
140
Carnegie Small CSX SwedenOMX Stockholm_PIFagerhult
Källa:
Share price trend
2016 2017 2018 2019 2020
Fagerhult OMX Stockholm PI Carnegie Small CSX Sverige
Monthly share turnover, thousands
7,000
6,000
5,000
4,000
3,000
2,000
1,000
0
140
120
100
80
60
40
20
0
SEK
0
1 000
2 000
3 000
4 000
5 000
6 000
7 000
Omsatt antal aktier i 1000-tal per månad
20202019201820172016
0
20
40
60
80
100
120
140
Carnegie Small CSX SwedenOMX Stockholm_PIFagerhult
Source:
Swedish owners, 87 %
Foreign shareholders, 13 %
Ownership distribution No. of shares, thousands
FA G E R H U LT G R O U P A N N U A L R E P O R T 2 0 2 0 31
T H E S H A R E | F I N A N C I A L I N F O R M A T I O N
Ownership structure (at 31 Dec 2020)
Shareholder No. of sharesShare capital and
voting rights, %
Investment AB Latour 84,708,480 47.8
Lannebo Fonder 13,738,541 7.8
AP Funds 11,555,530 6.5
BNP Paribas SEC Services 10,687,107 6.0
Nordea Funds 7,661,269 4.3
The Svensson family, foundation and company 6,775,760 3.8
The Palmstierna family 4,093,599 2.3
Swedbank Funds 3,329,668 1.9
Didner and Gerge Småbolag 3,166,926 1.8
SEB Fonder 1,730,734 1.0
Clearstream Banking S.A. (LU) 1,137,235 0.6
Johan Hjertonsson 1,138,951 0.6
Other owners with more than 20,000 shares (182 owners) 16,934,165 9.6
Other owners with 10,001–20,000 shares (132 owners) 1,844,760 1.0
Other owners with 1,001–10,000 shares (2,081 owners) 6,119,918 3.5
Other owners with up to 1,000 shares (5,935 owners) 1,524,136 0.9
AB Fagerhult, treasury shares 1,046,064 0.6
Number of shares at year end 177,192,843 100.00
Share turnover
Year 2016 2017 2018 2019 2020
Volume of shares traded, millions 5.6 9.1 14.2 25.6 47.1
Value of traded shares, MSEK 373 954 1188.2 1,519.9 1,977.1
Average volume of shares traded/trading day 22,269 36,092 56,828 102,712 186,902
Average value per trading day, SEK thousand 1,474 3,803 4,752 6,104 7,845
Turnover rate, % 4.9 7.9 12.3 14.5 26.7
Highest price paid during the year, SEK 92.83 136.67 111.00 73.76 62.301
Lowest price paid during the year, SEK 44.75 76.67 67.70 50.60 28.302
1) Paid 21 January 2020 2) Paid 19 March 2020
Data per share
Year 2016 2017 2018 2019 2020
Earnings per share before dilution, SEK 3.35 4.32 4.39 3.32 3.21
Dividend per share, SEK 1.50 2.00 2.00 – 0.501
Share price 31 Dec, SEK 77.83 100.50 76.10 59.50 45.50
Dividend yield, % 1.9 2.0 2.6 – 1.1
Equity per share, before dilution, SEK 14.30 16.51 18.60 31.23 32.94
Cash flow per share, before dilution, SEK2 3.41 5.96 3.30 6.58 6.46
1) Proposed dividend 2) Cash flow from operating activities.
32 FA G E R H U LT G R O U P A N N U A L R E P O R T 2 0 2 0
F I N A N C I A L I N F O R M A T I O N | F I V E - Y E A R O V E R V I E W
Income items (MSEK)
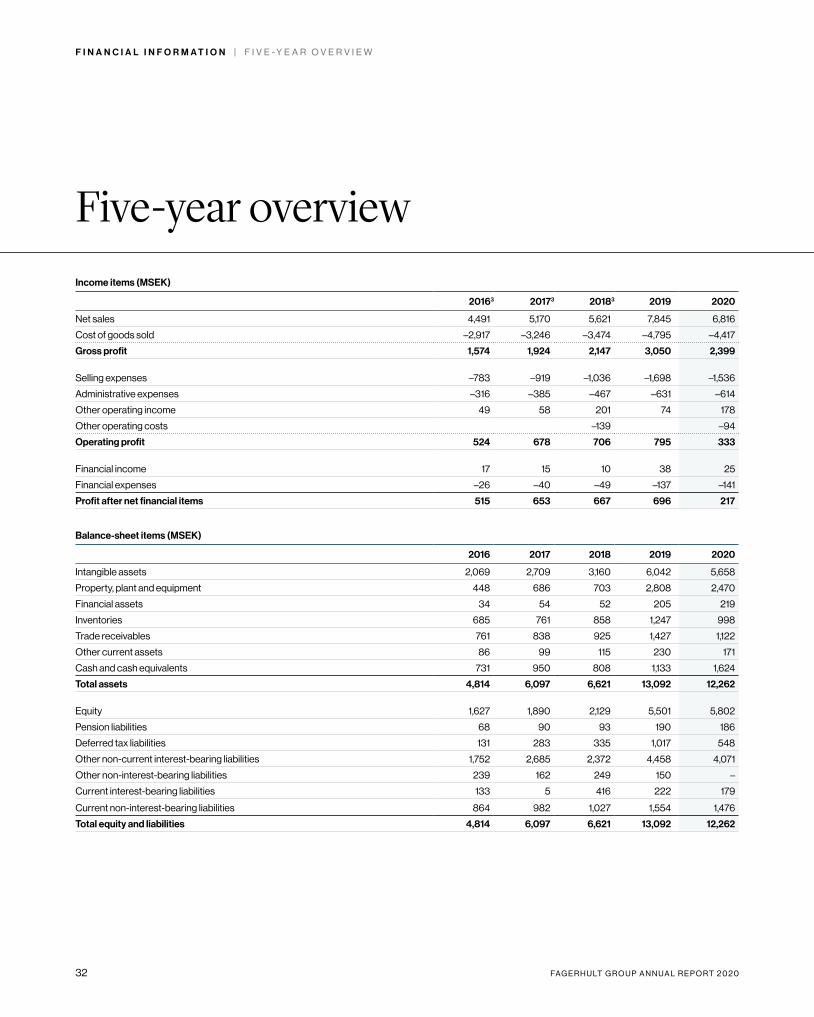
20163 20173 20183 2019 2020
Net sales 4,491 5,170 5,621 7,845 6,816
Cost of goods sold –2,917 –3,246 –3,474 –4,795 –4,417
Gross profit 1,574 1,924 2,147 3,050 2,399
Selling expenses –783 –919 –1,036 –1,698 –1,536
Administrative expenses –316 –385 –467 –631 –614
Other operating income 49 58 201 74 178
Other operating costs –139 –94
Operating profit 524 678 706 795 333
Financial income 17 15 10 38 25
Financial expenses –26 –40 –49 –137 –141
Profit after net financial items 515 653 667 696 217
Balance-sheet items (MSEK)
2016 2017 2018 2019 2020
Intangible assets 2,069 2,709 3,160 6,042 5,658
Property, plant and equipment 448 686 703 2,808 2,470
Financial assets 34 54 52 205 219
Inventories 685 761 858 1,247 998
Trade receivables 761 838 925 1,427 1,122
Other current assets 86 99 115 230 171
Cash and cash equivalents 731 950 808 1,133 1,624
Total assets 4,814 6,097 6,621 13,092 12,262
Equity 1,627 1,890 2,129 5,501 5,802
Pension liabilities 68 90 93 190 186
Deferred tax liabilities 131 283 335 1,017 548
Other non-current interest-bearing liabilities 1,752 2,685 2,372 4,458 4,071
Other non-interest- bearing liabilities 239 162 249 150 –
Current interest-bearing liabilities 133 5 416 222 179
Current non-interest- bearing liabilities 864 982 1,027 1,554 1,476
Total equity and liabilities 4,814 6,097 6,621 13,092 12,262
Five-year overview
FA G E R H U LT G R O U P A N N U A L R E P O R T 2 0 2 0 33
F I V E - Y E A R O V E R V I E W | F I N A N C I A L I N F O R M A T I O N
Key performance indicators and data per share
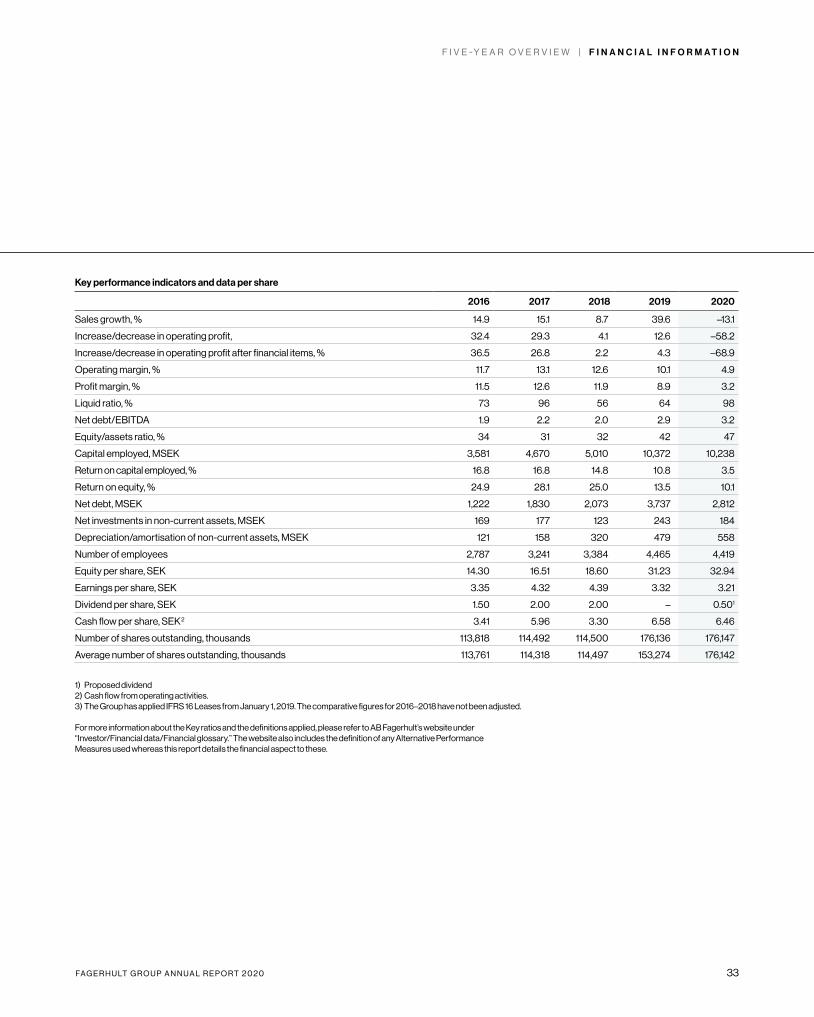
2016 2017 2018 2019 2020
Sales growth, % 14.9 15.1 8.7 39.6 –13.1
Increase/decrease in operating profit, 32.4 29.3 4.1 12.6 –58.2
Increase/decrease in operating profit after financial items, % 36.5 26.8 2.2 4.3 –68.9
Operating margin, % 11.7 13.1 12.6 10.1 4.9
Profit margin, % 11.5 12.6 11.9 8.9 3.2
Liquid ratio, % 73 96 56 64 98
Net debt/EBITDA 1.9 2.2 2.0 2.9 3.2
Equity/assets ratio, % 34 31 32 42 47
Capital employed, MSEK 3,581 4,670 5,010 10,372 10,238
Return on capital employed, % 16.8 16.8 14.8 10.8 3.5
Return on equity, % 24.9 28.1 25.0 13.5 10.1
Net debt, MSEK 1,222 1,830 2,073 3,737 2,812
Net investments in non-current assets, MSEK 169 177 123 243 184
Depreciation/amortisation of non-current assets, MSEK 121 158 320 479 558
Number of employees 2,787 3,241 3,384 4,465 4,419
Equity per share, SEK 14.30 16.51 18.60 31.23 32.94
Earnings per share, SEK 3.35 4.32 4.39 3.32 3.21
Dividend per share, SEK 1.50 2.00 2.00 – 0.501
Cash flow per share, SEK 2 3.41 5.96 3.30 6.58 6.46
Number of shares outstanding, thousands 113,818 114,492 114,500 176,136 176,147
Average number of shares outstanding, thousands 113,761 114,318 114,497 153,274 176,142
1) Proposed dividend 2) Cash flow from operating activities. 3) The Group has applied IFRS 16 Leases from January 1, 2019. The comparative figures for 2016–2018 have not been adjusted.
For more information about the Key ratios and the definitions applied, please refer to AB Fagerhult’s website under “Investor/Financial data/Financial glossary.” The website also includes the definition of any Alternative Performance Measures used whereas this report details the financial aspect to these.

34 FA G E R H U LT G R O U P A N N U A L R E P O R T 2 0 2 0
F I N A N C I A L I N F O R M A T I O N | A D M I N I S T R A T I O N R E P O R T
The Board of Directors and CEO of AB Fagerhult (publ.), Corporate Identity Number 556110-6203, hereby present the Annual Report for the Group and the Parent Company for the year 2020.
OperationsThe Fagerhult Group is one of Europe’s leading lighting groups. We design, develop, manufac-ture, and market professional lighting solutions for public environments with a focus on aesthetics, function, flexibility and energy-efficient solutions. The Group has 11 manufacturing facilities in Europe, factories also in China (two), Australia, Turkey, Thailand and Canada and sales compa-nies in more than 29 countries.
Fagerhult’s shares are listed on the Nasdaq, Nordic Exchange, Mid Cap list in Stockholm.
Changes in the GroupDuring 2019 the Fagerhult Group worked on a strategic alignment process. The ambition has been to find new opportunities for organic growth and to strengthen the individual brands and collaboration across the Group.
This work has resulted in a new structure and reporting basis for the Group effective from 1 January 2020.
The new structure for Fagerhult Group is based on four business areas; Collection, Premium, Professional and Infrastructure. Each of our 13 brands belongs to one of the business areas and the selection has been done based on product applications, geographic footprint and partner focus. For details on the different business areas see below. The new structure is also reflected in a new reporting basis. For 2020 we have reported financial results according to the four business areas. This replaced the former geographic and product area reporting structure. In the 2020 reporting, 2019 has been re-stated to reflect the new business areas and allow comparable numbers.
The strategic alignment process and the new
business area structure creates a new Fagerhult Group Management Team. The new management team consists of nine people; CEO, four Head of Business Areas, and four Group functions.
On the 30 October 2020 Fagerhult signed an agreement to divest Lighting Innovations Africa (Pty) Limited to Cape Mountain Concepts (Pty) Limited. The divestment took place on 2nd November 2020. The decision to exit its presence in South Africa was part of an ongoing strategic review. Since the acquisition in 2015, Lighting Innovations has managed the LED transition and maintained a position as a strong local brand for professional lighting solutions. However, the mar-ket continues not to develop as expected and the Fagerhult Group decides to focus its investments on more attractive growth opportunities.
The total losses for the year related to Lighting Innovations were 129.2 MSEK. Of this sum, 109.6 MSEK relates to one-off costs and write down of assets and 19.6 MSEK is the 2020 trading loss. The main elements of the 109.6 MSEK relate to the impairment of intangible assets (63,1 MSEK), the loss on disposal of the subsidiary (31.3 MSEK) and the balance 15.2 MSEK relates to local tangible asset write downs and redundancy costs.
As a consequence, Fagerhult made changes in the structure of its internal organisation and segment reporting. The reporting entity Lighting Innovations has been separated from the busi-ness area Professional and is reported as a sepa-rate segment Lighting Innovations. The segment reporting now follows the new structure of the Fagerhult Group which is based on four the busi-ness areas; Collection, Premium, Professional and Infrastructure plus Lighting Innovations.
The Group’s legal structure is regularly reviewed with the objective of reducing the num-ber of legal entities and reducing administration. Sometimes this is driven from a customer- market perspective like the 2020 combination of Fagerhult Lighting Limited and LED Linear UK Limited in the UK and sometimes from a simplification of the legal, administration and tax perspective similar to the holding company/sub-company mergers in Germany (WE-EF Trading) and USA/Canada (iGuzzini USA and Sistemalux Canada) in 2020. Finally for 2020,
the Group acquired the balance 10 per cent minority interest in iGuzzini Finland.
We also report a post balance sheet event. On the 28 January 2021 Fagerhult completed the transaction to sell 100 per cent of the shares in Commtech Commissioning Services SA to Aire Limpio S.L., a Spanish company based in Madrid. It had previously been decided that Commtech’s core business of site based commissioning ser-vices was strategically not core to the Fagerhult Group. In 2020 Commtech had net sales of 28 MSEK and employed 35 people. A minor capital gain was made from the disposal, refer to the fourth quarter report for further details.
Sales and earningsThe Covid-19 pandemic had a significant negative impact on revenues and earnings for 2020. For a full description of the impact of Covid-19 from a qualitative and quantitative aspects as well as the Fagerhult Group’s response see below.
During the first half of 2020 the Fagerhult Group faced several challenges, not only Covid-19 and as reported many of these challenges were one-off events which were promptly dealt with. During the second half of the year the Group continued to deal with the Covid-19 pandemic and also completed the exit from South Africa.
From a market perspective we experienced varied levels of activity depending upon geography or application area. Generally the pandemic had a negative impact in all geographical markets and in all application areas, but there were one or two exceptions. The impact of the pandemic was more significant the more global the business. From an application areas perspective, traditional retail was negatively affected whereas in e-retail, horticulture and healthcare (emergency hospitals and vaccination centres) experienced growth.
The Group’s businesses have taken the neces-sary actions to help offset the reduced profitability levels arising from a reduction in net sales, due to Covid-19. There have been significant cost savings in many areas, including for example discretionary expenses, customer events, travel, exhibitions and also employee levels. The many cost reduction programmes executed during 2020 have also been executed to prepare for the future.
For 2021 and beyond the shape and speed
Administration report
FA G E R H U LT G R O U P A N N U A L R E P O R T 2 0 2 0 35
A D M I N I S T R A T I O N R E P O R T | F I N A N C I A L I N F O R M A T I O N
of the recovery is uncertain and so our short term planning is on this basis. Short term growth aspirations are modest whilst the full annualised impact of the cost savings are expected. The strategic alignment process gathered momen-tum during the year and will ensure we address the market recovery from a stronger position with focussed opportunities for growth. The low level of the installed base of LED luminaires remains a significant opportunity, so too the opportunities presented from connected lighting solutions where sales of our Organic Response solution grew 79 per cent by number of units in the year. We report our growing focus on sus-tainability and development of our approach is making good progress, refer to the sustainability sections of this report.
The Fagerhult Group delivered acceptable overall results for the Covid-19 affected 2020 year. The first quarter was a disappointment but the net sales and operating profits for each of the second, third and fourth quarters were ahead of expectations as the Group responded quickly to the challenges presented from the pandemic.
The Group’s order intake of 7,002 (7,752) MSEK shows an overall –9.7 per cent decrease and on a comparable basis a decrease of –12.3 per cent when adjusting for acquisitions/dispos-als (439 (100) MSEK) and currency effects (–151 MSEK). During the year the comparable level of order intake was +7 per cent for Q1, –24 per cent for Q2 and –15 per cent for Q3 and Q4. It is clear to see the second quarter significant impact of Covid-19 from a strongly positive first quarter. The 9 per cent improvement for the third quarter repeated in the fourth despite the second wave of the pandemic.
The Group’s net sales of 6,816 (7,845) MSEK show a –13.1 per cent decline, increasing to –14.3 per cent when adjusting for acquisitions/dispos-als (318 (105) MSEK) and currency effects (–134 MSEK). The order backlog at the end of the year is 1,301 (1,218) MSEK.
The Group’s operating profit of 332.5 MSEK is adjusted to 442.1 (794.8) MSEK for 109.6 MSEK one-off costs and write downs in South Africa, refer to the above section for details. During the year there has been a 41.2 MSEK reversal of a provision for earn-out.
During Q2, Q3 & Q4 comparable cost savings of 300.8 MSEK were been delivered and the government subsidy income was 87.5 MSEK, gross and 67.5 MSEK net.
For the full year redundancy costs of 52.0 MSEK have been charged to operating profit. At the start of the year the FTE headcount was 4,608 and by the end of the year there was a reduction of 8,9 per cent, (FTE headcount 408) to 4,200. Of the 408, 144 relate to the exit from South Africa.
Operating cash flows improved to 1,137.9 (1,007.9) MSEK mainly as a result in a work-ing capital reduction of 490.9 (156.9) MSEK. Financial items of 115.8 (99.1) MSEK include 24.9 (22.0) MSEK for IFRS16, a 6.8 MSEK decrease in net interest costs and a 20.6 MSEK increase in FX losses etc.
As a result of new Italian tax legislation the tax charge in the year is a credit of 355.7 (expense 180.8) MSEK. The new legislation affects the accounting for intangible assets and the treat-ment of deferred tax. The 355.7 MSEK credit includes a credit of 436,3 MSEK. The underlying tax charge is 80.6 (180.9) MSEK.
Earnings per share, based on the earnings attributable to the shareholders of the parent company for 2020 was SEK 3.21 (3.32). The 2020 EPS of 3.21 is boosted by SEK 2.48 for the impact of the tax accounting regarding the new Italian tax legislation. For 2019 the average shares outstanding were 153.3m and for 2020 the average shares outstanding were 176.1m. The number of shares at the year-end were 176,1m.
Impact of Covid-19The Group’s ResponseDuring the year, the Group dealt with the Covid-19 pandemic in a good and professional way. Once the difficult initial impacts from the second quarter were overcome, a stable oper-ation returned and continued for the remainder of the year. The ongoing nature of the pandemic encourages the Group to remain diligent and resilient. Particular response actions were;• The Group followed the regulations of local
authorities and national governments.• The Group took measures for the protection of
employees and stakeholders.• The Group established Crisis Teams at Group
level and across subsidiary entities. • The Group where possible, moved to a
split-shift operation and home office set-up.• The Group established a regular Group wide
communication process.• The Group entered close dialogue with its
suppliers.• The Group was in regular and transparent
dialogue with its lenders.• The Group implemented new processes to
focus on short-medium-long term financial planning.
• The Group expanded the use of digitalisation to engage with employees, customers and suppliers.
Qualitative Impacts• From late March to early May there were up
to 4 factories closed at any one point.• During the third and fourth quarters, all
factories remained open.• All factories continue to function with 100 per
cent capability, but with reduced capacity.• The Group continues with many of its sales
offices closed with the employees working from home.
• In some markets we continue to see project volatility.
• In most regions we see a negative impact on the market activity, affecting the level of order intake.
• We see some disruption in the supply chain.• The uncertainties from the pandemic creates a
difficult position to forecast future performance.
Quantitative Financial Impacts• The decline in market activity resulted in
reduced order intake.• The Group continues to reduce its cost base. • Strategic cost reviews continue to take place.• Selling and administration expenses reduced
compared to 2019.• Capital investments reduced compared to 2019.• Government subsidy income helped support
the performance. • The liquidity position improved during the year. • Provisions for accounts receivable credit
losses and claims increased.• The original dividend proposal was not
proposed to the AGM during the year.• The new Italian tax legislation was acted upon.
36 FA G E R H U LT G R O U P A N N U A L R E P O R T 2 0 2 0
F I N A N C I A L I N F O R M A T I O N | A D M I N I S T R A T I O N R E P O R T
Business areasFagerhult has replaced the former geographical business area structure with the new structure for four business areas; Collection, Premium, Professional and Infrastructure. Each of the 13 brands (including ORT) belongs to one of the business areas and the selection was done based on product applications, geographic foot-print, partner focus and go-to-market approach.
Operations remain divided into the four business areas. In accordance with IFRS 8, the external reporting has been adapted so that segment reporting reflects the Group’s opera-tive leadership structure.
Collection – Exceptional lighting solutions for architectural applications worldwide. Collection is home to our brands with a global market footprint. All have an international product portfolio and are well-renowned in the lighting designer and architect communities globally. They offer a wide product range with a focus on indoor and outdoor architectural applications. Brands included are; ateljé Lyktan, iGuzzini, LED Linear and WE-EF with product development and manufacturing facilities in Sweden, Italy, Canada, China, Germany and Thailand. The business area also includes all sales companies for iGuzzini, LED Linear and WE-EF.
The business area is global and has been negatively affected to a higher degree than the other business areas. The strategic opportunity for growth is significant within the area. Net sales in 2020 were MSEK 3,040, a decline of –18.5 per cent after adjusting for currencies and acquisi-tions from MSEK 3,376 last year. The operating profit for the period was MSEK 98.2 (286.5) and the operating margin 3.2 (8.5) per cent.
Premium – Lighting solutions for all European markets and for global customers. Premium focuses on the European market and European-based global customers. Our Premium brands work closely with specifiers and partners to deliver premium projects, often with bespoke solutions for the customer. The majority of sales are related to indoor applica-tions, there is also an outdoor offering for specific markets. Brands included are; Fagerhult and LTS
with product development and manufacturing facilities in Sweden, Germany and China. The business area also includes all Fagerhult sales companies (except New Zealand) and the Organic Response Technologies business.
The business area improved profitability in the second half year from an operating margin of 7.6 per cent at the half year to 9.6 per cent for the full year, the average margin in the third and fourth quarters was 11.7 per cent. Net sales in 2020 were MSEK 2,497, an organic decline of –16.0 per cent from MSEK 3,023 last year. The operat-ing profit for the period was MSEK 240.1 (365.3) and the operating margin 9.6 (12.1) per cent.
Professional – Lighting solutions for selected applications, tailored to local market demands. Professional focuses mainly on indoor applica-tions for local and neighbouring markets. The brands work closely together with local partners on project specifications to deliver full and com-plete solutions. Local production and product development allows for tailored solutions with bespoke products delivered within short lead times. Brands included are; Arlight, Eagle Light-ing and Whitecroft, with product development and manufacturing facilities in Turkey, Australia and the UK. The sales company in New Zealand is consolidated in this business area.
The business area recorded a +1.8 per cent organic order intake growth during 2020 and early 2021 starts with a 20 per cent increased order backlog. Net sales in 2020 were MSEK 824, an organic decline of –15.9 per cent from MSEK 1,029 last year. The operating profit for the period was MSEK 30.1 (97.0) and the operat-ing margin 3.7 (9.4) per cent.
Infrastructure – Specialty lighting solutions for critical infrastructure and industry applications. Infrastructure provides lighting solutions for environments with specific requirements for installation, durability and robustness. The companies are world-leading in their areas and highly experienced in finding the best solutions for every project and customer. The majority of sales are within Europe with some global
installations. Brands included are; Designplan Lighting, i-Valo and Veko, with product develop-ment and manufacturing facilities in UK, Finland and the Netherlands.
The business area delivered 7.1 per cent organic growth during 2020 as increased activity was seen in e-retail and horticulture.
Net sales in 2020 were MSEK 740. The operating profit for the period was MSEK 139.4 (100.7) and the operating margin 18.8 (14.4) per cent. The MSEK 139.4 operating profit in the business area includes the MSEK 41.2 reversed earn-out provision as it relates to Veko in the Netherlands.
Financial positionThe Group’s equity/assets ratio at the end of the year was 47.3 (42.0) per cent. Cash and bank balances at year end amounted to MSEK 1,624 (1,134) and consolidated equity totalled MSEK 5,803 (5,501). Net debt amounted to MSEK 2,812 (3,737) where MSEK 785 (928) is due to the adoption of IFRS16 in 2019. Cash flow from operating activities for the year totalled MSEK 1,138 (1,008). The increase of MSEK 130 is due to MSEK 491 (157) working capital decrease, plus MSEK 489 (389) adjustments for non-cash items, plus the effect of reduced taxes and financial items paid of MSEK 159 (99). Pledged assets and contingent liabilities were MSEK 17.7 (18.3) and MSEK 6.5 (4.1), respectively.
EmployeesIn 2020, the average number of employees reduced by 46 to 4,419 (4,465). At the end of 2020 the number of employees was 4,200 (4,608), a reduction of 408, 8,9 per cent. The number of employees in the Group’s foreign companies amounted to 3,482 (3,856), which corresponded to 79 (88) per cent of the total number of employ-ees. The proportion of women during the year amounted to 31 (33) per cent of all employees. To further strengthen the Group’s knowledge capital, the established goals for individual and organisational development continue to increase, so too has the investment in developing talented individuals, both new and existing employees. The Bright Leaders programme and the Graduate Trainee programme are good examples of this.
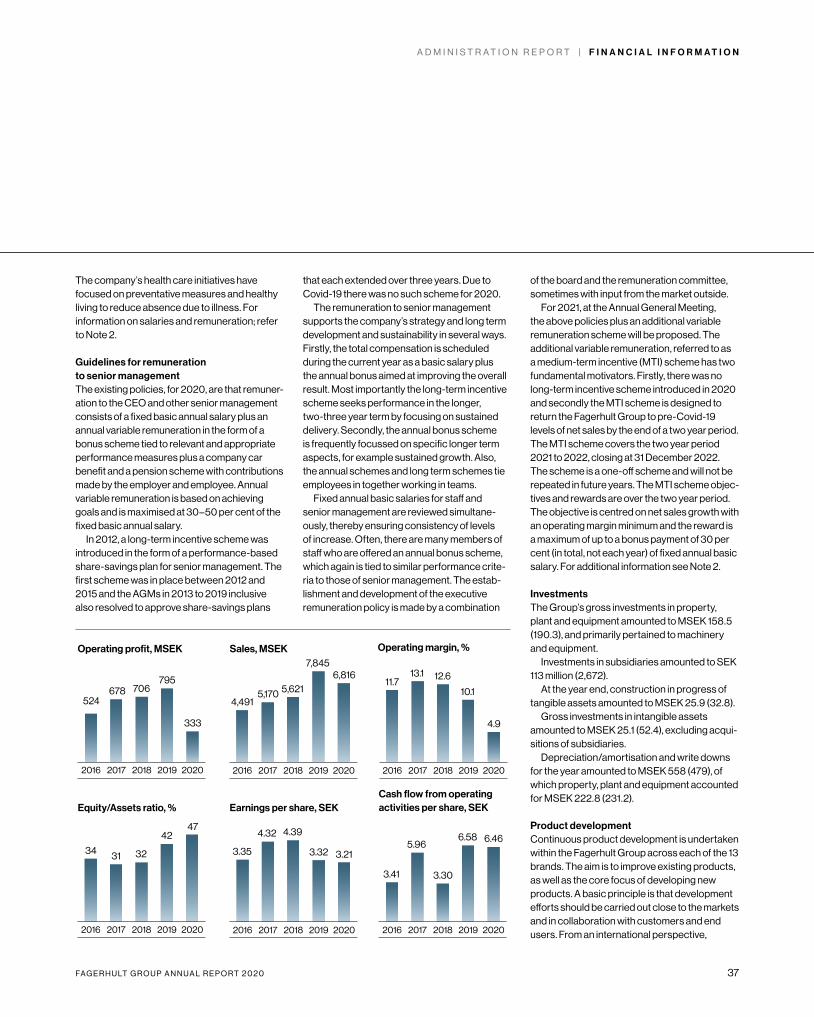
FA G E R H U LT G R O U P A N N U A L R E P O R T 2 0 2 0 37
A D M I N I S T R A T I O N R E P O R T | F I N A N C I A L I N F O R M A T I O N
The company’s health care initiatives have focused on preventative measures and healthy living to reduce absence due to illness. For information on salaries and remuneration; refer to Note 2.
Guidelines for remuneration to senior managementThe existing policies, for 2020, are that remuner-ation to the CEO and other senior management consists of a fixed basic annual salary plus an annual variable remuneration in the form of a bonus scheme tied to relevant and appropriate performance measures plus a company car benefit and a pension scheme with contributions made by the employer and employee. Annual variable remuneration is based on achieving goals and is maximised at 30–50 per cent of the fixed basic annual salary.
In 2012, a long-term incentive scheme was introduced in the form of a performance-based share-savings plan for senior management. The first scheme was in place between 2012 and 2015 and the AGMs in 2013 to 2019 inclusive also resolved to approve share-savings plans
that each extended over three years. Due to Covid-19 there was no such scheme for 2020.
The remuneration to senior management supports the company’s strategy and long term development and sustainability in several ways. Firstly, the total compensation is scheduled during the current year as a basic salary plus the annual bonus aimed at improving the overall result. Most importantly the long-term incentive scheme seeks performance in the longer, two-three year term by focusing on sustained delivery. Secondly, the annual bonus scheme is frequently focussed on specific longer term aspects, for example sustained growth. Also, the annual schemes and long term schemes tie employees in together working in teams.
Fixed annual basic salaries for staff and senior management are reviewed simultane-ously, thereby ensuring consistency of levels of increase. Often, there are many members of staff who are offered an annual bonus scheme, which again is tied to similar performance crite-ria to those of senior management. The estab-lishment and development of the executive remuneration policy is made by a combination
of the board and the remuneration committee, sometimes with input from the market outside.
For 2021, at the Annual General Meeting, the above policies plus an additional variable remuneration scheme will be proposed. The additional variable remuneration, referred to as a medium-term incentive (MTI) scheme has two fundamental motivators. Firstly, there was no long-term incentive scheme introduced in 2020 and secondly the MTI scheme is designed to return the Fagerhult Group to pre-Covid-19 levels of net sales by the end of a two year period. The MTI scheme covers the two year period 2021 to 2022, closing at 31 December 2022. The scheme is a one-off scheme and will not be repeated in future years. The MTI scheme objec-tives and rewards are over the two year period. The objective is centred on net sales growth with an operating margin minimum and the reward is a maximum of up to a bonus payment of 30 per cent (in total, not each year) of fixed annual basic salary. For additional information see Note 2.
InvestmentsThe Group’s gross investments in property, plant and equipment amounted to MSEK 158.5 (190.3), and primarily pertained to machinery and equipment.
Investments in subsidiaries amounted to SEK 113 million (2,672).
At the year end, construction in progress of tangible assets amounted to MSEK 25.9 (32.8).
Gross investments in intangible assets amounted to MSEK 25.1 (52.4), excluding acqui-sitions of subsidiaries.
Depreciation/amortisation and write downs for the year amounted to MSEK 558 (479), of which property, plant and equipment accounted for MSEK 222.8 (231.2).
Product developmentContinuous product development is undertaken within the Fagerhult Group across each of the 13 brands. The aim is to improve existing products, as well as the core focus of developing new products. A basic principle is that development efforts should be carried out close to the markets and in collaboration with customers and end users. From an international perspective,
Operating profit, MSEK Operating margin, %Sales, MSEK
Equity/Assets ratio, % Earnings per share, SEKCash flow from operating activities per share, SEK
20202019201820172016
20202019201820172016
20202019201820172016
20202019201820172016
20202019201820172016
20202019201820172016
4,491524
34
5,170678
31
5,621706
32
7,8456,816795
42
333
47
11.7
3.35
3.41
13.1
4.325.96
12.6
4.39
3.30
10.1
4.9
3.32 3.21
6.58 6.46
38 FA G E R H U LT G R O U P A N N U A L R E P O R T 2 0 2 0
F I N A N C I A L I N F O R M A T I O N | A D M I N I S T R A T I O N R E P O R T
Fagerhult holds a prominent position within the lighting design and technology field. Collabora-tion with the leading manufacturers of controls technologies, light sources and components is essential.
Fagerhult’s two main technical laboratories and engineering centres, TeknikCentrum in Sweden and the laboratory in Italy, are two of Europe’s best equipped facilities, where we can test the safety and performance of and approve our own products to international standards. Other developing technical facilities exist also in Sutton and Manchester in the UK.
A vitality index measures the share of net sales from products which are under 3 years old.
Development costs of MSEK 14.8 (19.4) were capitalised in the balance sheet for the year. Other costs are expensed as they arise.
For additional information; see Notes 11 and 29.
Sustainability report in accordance with the Swedish Annual Accounts ActIn accordance with Chapter 6, Section 11 of the Swedish Annual Accounts Act, AB Fagerhult has chosen to combine its sustainability report with its annual report. Refer to pages 94–125 of this document.
Share buybacks, new issues and treasury sharesThe AGM on 23 June 2020 authorised the Board to buy back the company’s own shares. No shares were bought back during the year. In connection with the allocation of shares tied to the expiring Group’s share savings plan, 10,480 treasury shares were used.
The number of treasury shares totalled 1,046,064 (1,056,544) after this allocation and the number of shares outstanding was 177,192,843 (177,192,843). The per centage of shares held as treasury shares was 0.6 (0.6) per cent.
The Board of Directors proposes that the AGM resolve to grant the Board continued authorisation, until the next AGM, to buy back the company’s own shares. As treasury shares are not entitled to dividends, they are excluded from the total number of shares in the proposed appropriation of profits stated below.
RisksA review of risks, including the manner in which these are managed, is found in Note 38.
The Fagerhult shareThere are no limitations on the transferability of shares (pre-emption clause). Nor are there any limitations as to the number of votes which each shareholder can exercise at general meetings. The company is not aware of any agreements between shareholders which could involve limitations on the right to transfer shares.
Appointment and removal of Board membersThere are no separate provisions in the Articles of Association regarding the appointment or removal of Board members.
Parent CompanyAB Fagerhult’s operations comprise Group Management, financing and the coordination of marketing, production, business and strategy development. The company’s net sales amounted to MSEK 11.7 (13.8) for the period. The profit after financial items was MSEK 80.9 (144.0). The number of employees during the period was eight (seven).
Outlook for 2021As the Group learns to work under the new conditions and with new tools, we continue to report a more stable operational situation. Of course there continues to be uncertainty in the market as the pandemic continues to present a medical crisis and a growing economic impact. Consequently, we maintain our view not to provide further forward looking guidance for 2021 and beyond.
We have commented regarding a lower market activity level. The comparable order intake in the third and fourth quarters was almost 9 per cent improved over the second quarter and we anticipate that order intake levels will be negatively affected for some time to come. Also, we comment regarding a reduced cost base which will provide a full years benefit in 2021. We base our forecasts and plan our business on a slow recovery.
The Group’s overall strategy and focus
remains intact, to deliver high-quality profes-sional lighting solutions to our customers within our 10 focus application areas. The new business area setup will strengthen collabora-tion and enable us to address focussed organic growth opportunities in the medium-to-longer term and bring benefits to our customers.
In addition, we continue to make good progress with connected solutions, and this remains a key part of the strategy. We experi-enced a 79 per cent increased demand for our Organic Response solutions in 2020 and see no reason why this does not continue to grow during 2021 and beyond.
Proposed appropriation of profitsThe following profits are at the disposal of the AGM:
Profit brought forward 3,565.6 MSEKNet profit for the year 88.5 MSEKProfit carried forward 3,654.1 MSEK
The total number of dividend-bearing shares on 17 March 2021 amounted to 176,146,779. The Board of Directors proposes that the profit be appropriated as follows:
To be distributed as dividends to shareholders:SEK 0.50 per share 88.1 MSEKTo be carried forward 3,566.0 MSEKTotal 3,654.1 MSEK
Board of Directors’ statement regarding the proposed dividendIt is the opinion of the Board of Directors that the proposed dividend will not prevent the company or the group from fulfilling its short or long-term obligations, nor will it prevent the company or the group from making the necessary invest-ments. Accordingly, the proposed dividend can be justified pursuant to the provisions of the Swedish Companies Act, Chapter 17, Section 3, paragraphs 2–3.
Considering that the operations of the com-pany and the group continue to be profitable, the equity/assets ratio is at a satisfactory level. It is the company’s and the Group’s assessment that liquidity can be maintained at a similarly satisfactory level.
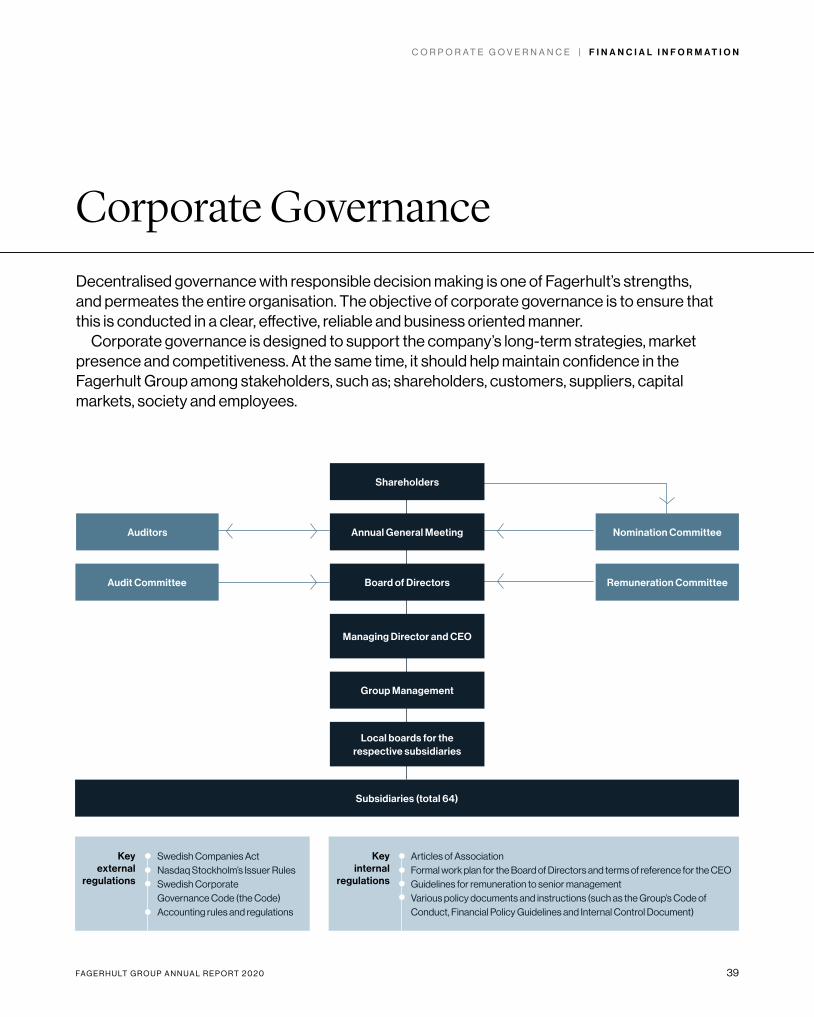
FA G E R H U LT G R O U P A N N U A L R E P O R T 2 0 2 0 39
C O R P O R A T E G O V E R N A N C E | F I N A N C I A L I N F O R M A T I O N
Decentralised governance with responsible decision making is one of Fagerhult’s strengths, and permeates the entire organisation. The objective of corporate governance is to ensure that this is conducted in a clear, effective, reliable and business oriented manner.
Corporate governance is designed to support the company’s long-term strategies, market presence and competitiveness. At the same time, it should help maintain confidence in the Fagerhult Group among stakeholders, such as; shareholders, customers, suppliers, capital markets, society and employees.
Group Management
Auditors
Audit Committee
Managing Director and CEO
Local boards for the respective subsidiaries
Subsidiaries (total 64)
Swedish Companies Act Nasdaq Stockholm’s Issuer Rules Swedish Corporate
Governance Code (the Code) Accounting rules and regulations
Articles of Association Formal work plan for the Board of Directors and terms of reference for the CEO Guidelines for remuneration to senior management Various policy documents and instructions (such as the Group’s Code of
Conduct, Financial Policy Guidelines and Internal Control Document)
Corporate Governance
Key external
regulations
Key internal
regulations
Board of Directors
Annual General Meeting
Shareholders
Nomination Committee
Remuneration Committee
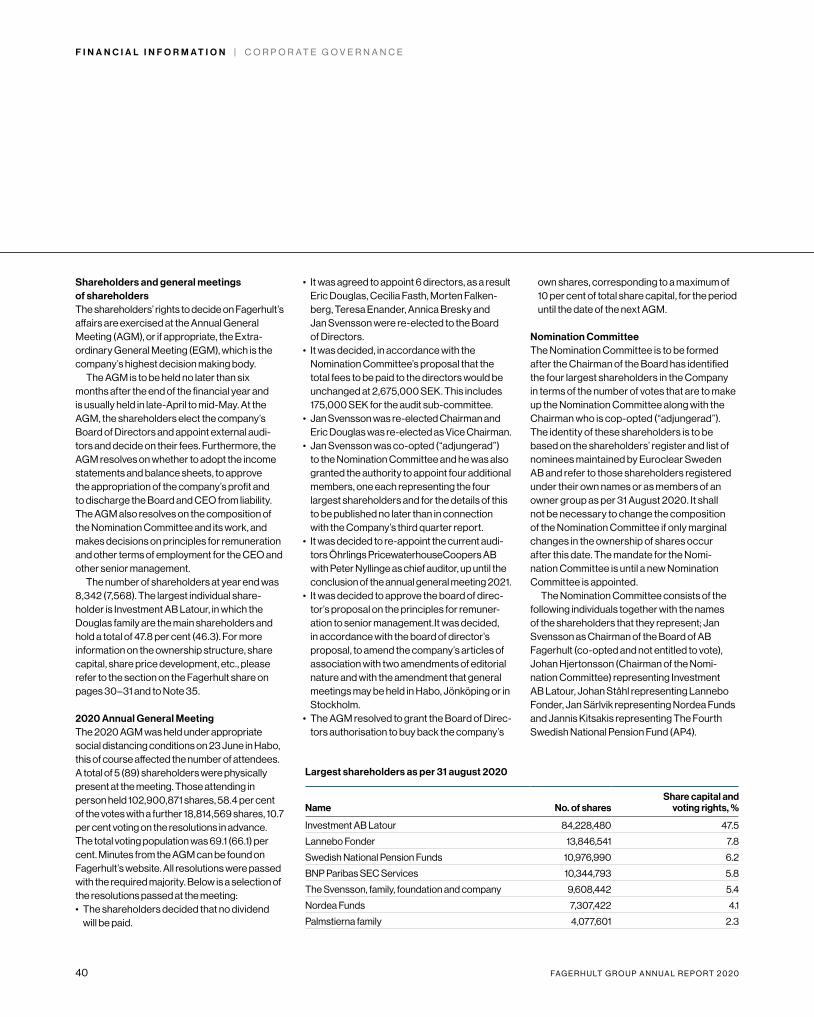
40 FA G E R H U LT G R O U P A N N U A L R E P O R T 2 0 2 0
F I N A N C I A L I N F O R M A T I O N | C O R P O R A T E G O V E R N A N C E
Shareholders and general meetings of shareholdersThe shareholders’ rights to decide on Fagerhult’s affairs are exercised at the Annual General Meeting (AGM), or if appropriate, the Extra-ordinary General Meeting (EGM), which is the company’s highest decision making body.
The AGM is to be held no later than six months after the end of the financial year and is usually held in late-April to mid-May. At the AGM, the shareholders elect the company’s Board of Directors and appoint external audi-tors and decide on their fees. Furthermore, the AGM resolves on whether to adopt the income statements and balance sheets, to approve the appropriation of the company’s profit and to discharge the Board and CEO from liability. The AGM also resolves on the composition of the Nomination Committee and its work, and makes decisions on principles for remuneration and other terms of employment for the CEO and other senior management.
The number of shareholders at year end was 8,342 (7,568). The largest individual share-holder is Investment AB Latour, in which the Douglas family are the main shareholders and hold a total of 47.8 per cent (46.3). For more information on the ownership structure, share capital, share price development, etc., please refer to the section on the Fagerhult share on pages 30–31 and to Note 35.
2020 Annual General MeetingThe 2020 AGM was held under appropriate social distancing conditions on 23 June in Habo, this of course affected the number of attendees. A total of 5 (89) shareholders were physically present at the meeting. Those attending in person held 102,900,871 shares, 58.4 per cent of the votes with a further 18,814,569 shares, 10.7 per cent voting on the resolutions in advance. The total voting population was 69.1 (66.1) per cent. Minutes from the AGM can be found on Fagerhult’s website. All resolutions were passed with the required majority. Below is a selection of the resolutions passed at the meeting:• The shareholders decided that no dividend
will be paid.
• It was agreed to appoint 6 directors, as a result Eric Douglas, Cecilia Fasth, Morten Falken-berg, Teresa Enander, Annica Bresky and Jan Svensson were re-elected to the Board of Directors.
• It was decided, in accordance with the Nomination Committee’s proposal that the total fees to be paid to the directors would be unchanged at 2,675,000 SEK. This includes 175,000 SEK for the audit sub-committee.
• Jan Svensson was re-elected Chairman and Eric Douglas was re-elected as Vice Chairman.
• Jan Svensson was co-opted (“adjungerad”) to the Nomination Committee and he was also granted the authority to appoint four additional members, one each representing the four largest shareholders and for the details of this to be published no later than in connection with the Company’s third quarter report.
• It was decided to re-appoint the current audi-tors Öhrlings PricewaterhouseCoopers AB with Peter Nyllinge as chief auditor, up until the conclusion of the annual general meeting 2021.
• It was decided to approve the board of direc-tor’s proposal on the principles for remuner-ation to senior management.It was decided, in accordance with the board of director’s proposal, to amend the company’s articles of association with two amendments of editorial nature and with the amendment that general meetings may be held in Habo, Jönköping or in Stockholm.
• The AGM resolved to grant the Board of Direc-tors authorisation to buy back the company’s
own shares, corresponding to a maximum of 10 per cent of total share capital, for the period until the date of the next AGM.
Nomination CommitteeThe Nomination Committee is to be formed after the Chairman of the Board has identified the four largest shareholders in the Company in terms of the number of votes that are to make up the Nomination Committee along with the Chairman who is cop-opted (“adjungerad”). The identity of these shareholders is to be based on the shareholders’ register and list of nominees maintained by Euroclear Sweden AB and refer to those shareholders registered under their own names or as members of an owner group as per 31 August 2020. It shall not be necessary to change the composition of the Nomination Committee if only marginal changes in the ownership of shares occur after this date. The mandate for the Nomi-nation Committee is until a new Nomination Committee is appointed.
The Nomination Committee consists of the following individuals together with the names of the shareholders that they represent; Jan Svensson as Chairman of the Board of AB Fagerhult (co-opted and not entitled to vote), Johan Hjertonsson (Chairman of the Nomi-nation Committee) representing Investment AB Latour, Johan Ståhl representing Lannebo Fonder, Jan Särlvik representing Nordea Funds and Jannis Kitsakis representing The Fourth Swedish National Pension Fund (AP4).
Largest shareholders as per 31 august 2020
Name No. of sharesShare capital and
voting rights, %
Investment AB Latour 84,228,480 47.5
Lannebo Fonder 13,846,541 7.8
Swedish National Pension Funds 10,976,990 6.2
BNP Paribas SEC Services 10,344,793 5.8
The Svensson, family, foundation and company 9,608,442 5.4
Nordea Funds 7,307,422 4.1
Palmstierna family 4,077,601 2.3
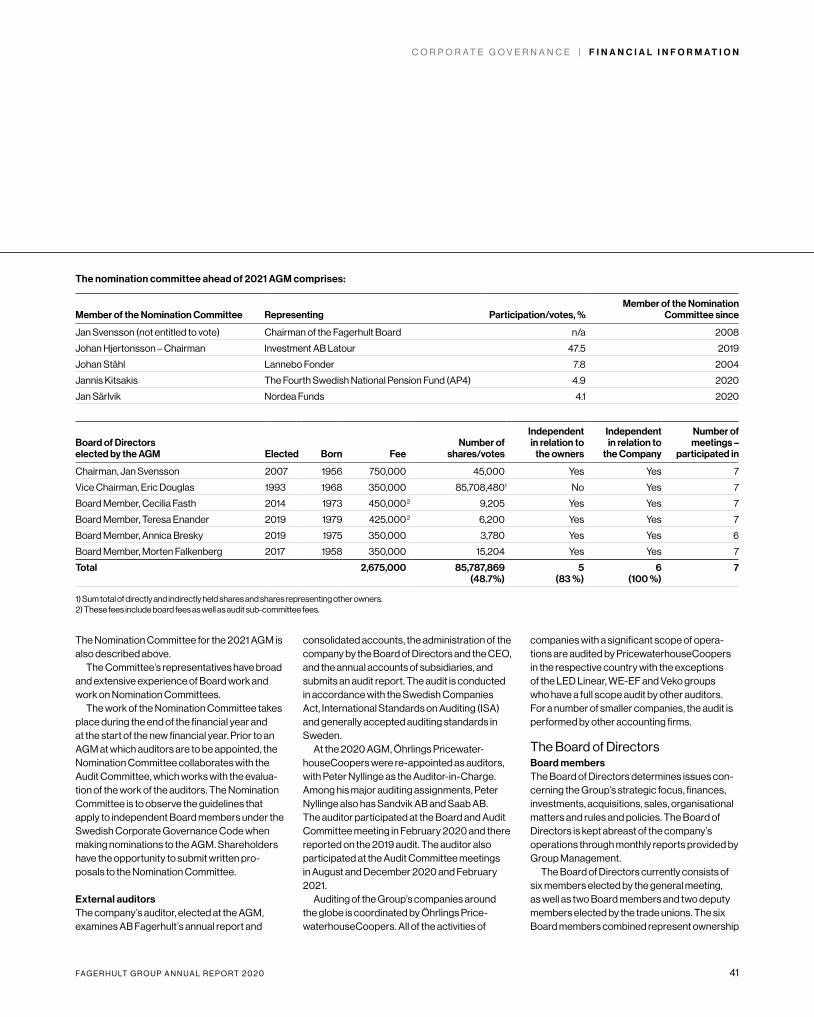
FA G E R H U LT G R O U P A N N U A L R E P O R T 2 0 2 0 41
C O R P O R A T E G O V E R N A N C E | F I N A N C I A L I N F O R M A T I O N
The nomination committee ahead of 2021 AGM comprises:
Member of the Nomination Committee Representing Participation/votes, %Member of the Nomination
Committee since
Jan Svensson (not entitled to vote) Chairman of the Fagerhult Board n/a 2008
Johan Hjertonsson – Chairman Investment AB Latour 47.5 2019
Johan Ståhl Lannebo Fonder 7.8 2004
Jannis Kitsakis The Fourth Swedish National Pension Fund (AP4) 4.9 2020
Jan Särlvik Nordea Funds 4.1 2020
Board of Directors elected by the AGM Elected Born Fee
Number of shares/votes
Independent in relation to
the owners
Independent in relation to
the Company
Number of meetings –
participated in
Chairman, Jan Svensson 2007 1956 750,000 45,000 Yes Yes 7
Vice Chairman, Eric Douglas 1993 1968 350,000 85,708,4801 No Yes 7
Board Member, Cecilia Fasth 2014 1973 450,000 2 9,205 Yes Yes 7
Board Member, Teresa Enander 2019 1979 425,000 2 6,200 Yes Yes 7
Board Member, Annica Bresky 2019 1975 350,000 3,780 Yes Yes 6
Board Member, Morten Falkenberg 2017 1958 350,000 15,204 Yes Yes 7
Total 2,675,000 85,787,869 (48.7%)
5 (83 %)
6 (100 %)
7
1) Sum total of directly and indirectly held shares and shares representing other owners. 2) These fees include board fees as well as audit sub-committee fees.
The Nomination Committee for the 2021 AGM is also described above.
The Committee’s representatives have broad and extensive experience of Board work and work on Nomination Committees.
The work of the Nomination Committee takes place during the end of the financial year and at the start of the new financial year. Prior to an AGM at which auditors are to be appointed, the Nomination Committee collaborates with the Audit Committee, which works with the evalua-tion of the work of the auditors. The Nomination Committee is to observe the guidelines that apply to independent Board members under the Swedish Corporate Governance Code when making nominations to the AGM. Shareholders have the opportunity to submit written pro-posals to the Nomination Committee.
External auditorsThe company’s auditor, elected at the AGM, examines AB Fagerhult’s annual report and
consolidated accounts, the administration of the company by the Board of Directors and the CEO, and the annual accounts of subsidiaries, and submits an audit report. The audit is conducted in accordance with the Swedish Companies Act, International Standards on Auditing (ISA) and generally accepted auditing standards in Sweden.
At the 2020 AGM, Öhrlings Pricewater-houseCoopers were re-appointed as auditors, with Peter Nyllinge as the Auditor-in-Charge. Among his major auditing assignments, Peter Nyllinge also has Sandvik AB and Saab AB. The auditor participated at the Board and Audit Committee meeting in February 2020 and there reported on the 2019 audit. The auditor also participated at the Audit Committee meetings in August and December 2020 and February 2021.
Auditing of the Group’s companies around the globe is coordinated by Öhrlings Price-waterhouseCoopers. All of the activities of
companies with a significant scope of opera-tions are audited by Price waterhouseCoopers in the respective country with the exceptions of the LED Linear, WE-EF and Veko groups who have a full scope audit by other auditors. For a number of smaller companies, the audit is performed by other accounting firms.
The Board of DirectorsBoard membersThe Board of Directors determines issues con-cerning the Group’s strategic focus, finances, investments, acquisitions, sales, organisational matters and rules and policies. The Board of Directors is kept abreast of the company’s operations through monthly reports provided by Group Management.
The Board of Directors currently consists of six members elected by the general meeting, as well as two Board members and two deputy members elected by the trade unions. The six Board members combined represent ownership
42 FA G E R H U LT G R O U P A N N U A L R E P O R T 2 0 2 0
F I N A N C I A L I N F O R M A T I O N | C O R P O R A T E G O V E R N A N C E
participations equivalent to 49 per cent (47) of the company’s share capital and votes. The trade union representatives are the only Board members employed by the Company. The CEO participates in all Board meetings and on occasion, other company employees participate in Board meetings in a reporting capacity. The company’s Chief Financial Officer serves as the Board’s secretary. For further information concerning the Board members elected at the company’s general meeting, refer to the section concerning the Board of Directors on pages 46–47 of this annual report.
The Board’s work is regulated by the Swedish Companies Act, the Articles of Association and the formal work plan adopted by the Board. Among other things, the Board’s work plan contains rules stipulating the number of Board meetings to be held each financial year, the issues to be addressed at the meetings, and the division of duties between the Board of Direc-tors and the CEO. The CEO’s terms of reference set out the CEO’s duties and obligation to report to the Board.
During 2020, seven, which is one more than usual, Board meetings took place. One of these was the statutory Board meeting and the extra Board meeting, during June, was as a result of the Covid-19 pandemic. Four of these meetings address the quarterly reports and the year-end report and one addresses the budget for the following year. At least one of the Board meetings takes place in conjunction with a visit to, and an in-depth review of, one of the Group’s companies, but due to Covid-19 this was not possible during 2020. One meeting per year is assigned additional time, and at this meeting a specific focus is placed on strategic issues.
During 2020 the Board held 6 normal Board meetings and 1 statutory Board meeting. The auditor of the company is present at Board meetings when needed, normally once a year. Notices and supporting documents are sent to the Board one week in advance of the Board meetings. When issues are to be decided upon, the Board usually receives supporting documents concerning these issues well in advance. The Board appoints two different
committees annually; the Audit Committee and the Remuneration Committee. The aim of these committees is to enhance and facilitate the Board’s work, and to address matters related to each area.
Board of Directors’ independenceFagerhult’s Board meets the stipulation in the Code that a majority of the elected members are independent of the company and its manage-ment, and that at least two of the members are independent in relation to major shareholders (that is, ownership exceeding 10 per cent). See the table on page 41. The Chairman of the Board, Jan Svensson became independent from 1 September 2019. Eric Douglas repre-sents Investment AB Latour and the Douglas family and is not considered to be independent. With the exception of the union representatives no members of the Board are employed by the Group. The Nomination Committee’s assess-ment regarding whether each proposed mem-ber meets the independence requirements is announced in connection with the Committee’s proposal.
The work of the Board in 2020The Board met seven times during the year, with one of these meetings being the statutory Board meeting. Five of the six meetings were fully attended by the Board. Only one meeting had one member absent. The company’s auditor was present at one of the Board meetings and three Audit Committee (AC) meetings. These were the Board and AC meetings in February that addressed the annual accounts for 2019 plus AC meetings in August and December.
Important matters dealt with during the year included, amongst other things:• Long-term operational goals• The strategic focus of the operations• Business plans, financial plans and forecasts• Major investments and divestments• Decisions on long-term financing• Policies and instructions• Review of the Group’s risk management• Interim reports and annual accounts• Reports by the Board’s committees
• Review of the Group’s CSR position and developments
• Follow-up of the external audit• The impact, effects and response to Covid-19
Evaluation of the work of the BoardThe Board will ensure that its work is continuously evaluated through a systematic and structured process. This evaluation is initiated by the Chairman of the Board. Among other things, the process includes an on-line questionnaire in which Board members have the opportunity to express their opinion of the Board’s work and to propose ways to improve it. The results of the evaluation are disclosed to the Board, followed by discussions and decisions regarding changes in working methods.
The Board continuously evaluates the work of the CEO and Group Management.
The Audit Committee The main duty of the Audit Committee (AC) is to audit the Group’s accounting and financial reporting, as well as to remain in continuous contact with the auditors and review their work plan and fees. Furthermore, the AC is to assist the Nomination Committee in its choice of audi-tors and their fees prior to those AGMs at which the appointment of auditors takes place.
In 2019, the AC was established as Cecilia Fasth as Chair and Teresa Enander as member. The CFO and auditor attended all three AC meetings during the year. All members of the AC attended the three meetings during 2020. The Chair of the AC gave a brief report to the Board at the February and December Board meetings.
The Remuneration Committee The work of the Remuneration Committee is, on behalf of the Board, to prepare and negotiate issues concerning the salary and other remu-neration to the CEO, and to approve the CEO’s proposals for salaries and remuneration for the other members of senior management.
Its duties also include examining the fees to Board members in the event that they are engaged as consultants by the company’s management. The Committee also addresses
FA G E R H U LT G R O U P A N N U A L R E P O R T 2 0 2 0 43
C O R P O R A T E G O V E R N A N C E | F I N A N C I A L I N F O R M A T I O N
any Group-wide bonus system and option pro-grammes. Decisions concerning remuneration for the CEO are determined by the Board.
The Remuneration Committee consists of Jan Svensson (Chairman of the Board) and Eric Douglas (Vice Chairman of the Board). The Committee has had two meetings during the year, at which both members were present.
CEO and Group ManagementFagerhult’s President and CEO is responsible for leading and developing operating activities pursuant to the guidelines and instructions issued by the Board. The framework is provided by the terms of reference issued to the CEO, which are determined annually by the Board.
The CEO is assisted by Group Management, consisting of the heads of business areas and staff units. In consultation with the Chairman, the CEO compiles the necessary information and documentation which provides the basis for the Board’s work and for the Board to make informed decisions. The CEO is responsible for bringing matters to the attention of the Board and for motivating proposed decisions. The CEO is responsible for and reports on an ongoing basis to the Board on the company’s development. In addition, the CEO leads the work of the Group Management and makes decisions in consul-tation with other members of management.
The CEO owns 12,106 shares in the company and this is stated in the presentation of the management on pages 48–49. The holding is not classified as significant and the CEO has no partnership in companies that have significant business relationships with companies in the Fagerhult Group.
During the year, the Group Management comprised the CEO, the CFO, the CPO, the head of Strategy & Communications plus three managers with responsibility for the business areas.
Group Management has had regular weekly and monthly meetings during the year where it followed up operations, discussed matters affecting the Group and drafted proposals for strategic alignment plans and budgets, which the CEO presented to the Board for decision. During
2020, a considerable number of meetings and time was devoted to the Covid-19 pandemic and its impact on the Group. Also during the first quarter the new strategic alignment, new business area set up and new Fagerhult Group branding were launched.
Management of subsidiariesFagerhult’s operations are organised into four business areas which include 64 subsidiaries. The operations of the respective subsidiaries are controlled by their Boards. The Boards of the subsidiaries consist of, among others, the managing director of the subsidiary, at least one business area manager and, in most cases, the Group’s CEO and Group’s CFO. A formal work plan is established annually for each subsidiary, in which responsibilities and authorities are clearly delegated and where the work of the subsidiary’s Board is governed.
Fagerhult has a decentralised structure, with a strong focus on responsibility and perfor-mance, which combines with clear, Group-wide processes to realise synergies. The Company’s senior managers and specialists meet continu-ously to reach a broad consensus on important issues.
Fagerhult’s Code of Conduct and Fagerhult’s global presence demand that our employees and business partners take responsibility for themselves and for each other. The Code clarifies Fagerhult’s position on issues related to human rights, labour conditions, the environ-ment, business ethics and communication. The Code applies to all Fagerhult employees regardless of their position. The Board and Group Management have a particular respon-sibility to promote the application of the Code of Conduct. The Code is also communicated to all of Fagerhult’s business partners with the expectation that it is complied with. Fagerhult acts as a reliable and honest Group that lives up to its commitments. Fagerhult believes in long-term business relationships in which we, together with our business partners, create a basis for strong financial results, concern for the environment and social commitment.
Remuneration to the Management and BoardGuidelines for remuneration to senior managementThe existing policies, for 2020, are that remu-neration to the CEO and other senior manage-ment consists of a fixed basic annual salary plus an annual variable remuneration in the form of a bonus scheme tied to relevant and appropriate performance measures plus a company car benefit and a pension scheme with contribu-tions made by the employer and employee. Annual variable remuneration is based on achieving goals and is maximised at 30–50 per cent of the fixed basic annual salary.
In 2012, a long-term incentive scheme was introduced in the form of a performance-based share-savings plan for senior management. The first scheme was in place between 2012 and 2015 and the AGMs in 2013 to 2019 inclu-sive also resolved to approve share-savings plans that each extended over three years. Due to Covid-19 there was no such scheme for 2020.
The remuneration to senior management supports the company’s strategy and long term development and sustainability in several ways. Firstly, the total compensation is sched-uled during the current year as a basic salary plus the annual bonus aimed at improving the overall result. Most importantly the long-term incentive scheme seeks performance in the longer, two-three year term by focusing on sustained delivery. Secondly, the annual bonus scheme is frequently focussed on specific longer term aspects, for example sustained growth. Also, the annual schemes and long term schemes tie employees in together working in teams.
Fixed annual basic salaries for staff and senior management are reviewed simultane-ously, thereby ensuring consistency of levels of increase. Often, there are many members of staff who are offered an annual bonus scheme, which again is tied to similar performance criteria to those of senior management. The establishment and development of the executive remuneration policy is made by a combination of the board and the remuneration
44 FA G E R H U LT G R O U P A N N U A L R E P O R T 2 0 2 0
F I N A N C I A L I N F O R M A T I O N | C O R P O R A T E G O V E R N A N C E
committee, sometimes with input from the market outside.
For 2021, at the Annual General Meeting, the above policies plus an additional variable remuneration scheme will be proposed. The additional variable remuneration, referred to as a medium-term incentive (MTI) scheme has two fundamental motivators. Firstly, there was no long-term incentive scheme introduced in 2020 and secondly the MTI scheme is designed to return the Fagerhult Group to pre-Covid-19 levels of net sales by the end of a two year period. The MTI scheme covers the two year period 2021 to 2022, closing at 31 December 2022. The scheme is a one-off scheme and will not be repeated in future years. The MTI scheme objectives and rewards are over the two year period. The objective is centred on net sales growth with an operating margin minimum and the reward is a maximum of up to a bonus payment of 30 per cent (in total, not each year) of fixed annual basic salary. For additional information see Note 2.
Long-term incentive schemeIn 2012, a long-term incentive scheme was introduced in the form of a performance-based share-savings plan for senior management. The first plan was approved by the 2012 AGM and runs from 2012 to 2015. The AGMs in 2013 to 2019 inclusive also resolved to approve addi-tional share-savings plans that each extended over three years. Due to Covid-19 there was no such plan introduced during 2020.
For further information on guidelines for remuneration, please refer to the material enclosed with the notice of the AGM. For additional information; see Note 2.
Remuneration to the BoardFees payable to Board members are deter-mined annually by the AGM. Board members who are also employees of the company receive no Board fees. From 2019 fees were also payable to members of the Audit Committees, separate to the standard Board fee. In 2020, remuneration was paid in accordance with the table on page 41.
Remuneration to the auditorsIn 2020, remuneration was paid in accordance with Note 27 on page 84.
Internal control of financial reportingInternal control aims to ensure accurate and reliable financial reporting and accounting in line with applicable laws and regulations, account-ing standards and other requirements for listed companies.
Control environmentThe control environment comprises the values and ethics which the Board of Directors, Audit Committee, the CEO and Group Management communicate and operate under.
The basis of internal control for financial reporting consists of the control environment together with the organisation, decision making paths, authorities and responsibilities which are documented and communicated in governing documents. One example is the division of responsibilities between the Board and the CEO and instructions regarding the delegation
of authority, as well as instructions applying to the accounting and reporting. Important internal control instruments include Fagerhult’s Code of Conduct and values. The Code includes principles governing how business is to be conducted and was reinforced during late 2019 as 1,694 managers across the group underwent an online training and testing process. This process will be repeated during 2021. These values represent a long-term commitment and a shared base connected to the business concept and strategies guiding employees in daily operations.
Fagerhult is characterised by a decentralised organisation based on goal-oriented manage-ment, where good performances are rewarded.
Financial reporting to the BoardThe CEO is responsible for ensuring that the Board receives the reports required for its ongoing assessment of the company’s and the Group’s financial positions. Fagerhult’s Board receives monthly financial reports and the Group’s financial situation is addressed at each Board meeting.
Risk assessmentRegarding financial risk assessment, the risks are assessed as mainly relating to the potential for material misstatement in the reporting of the company’s financial position and performance. To minimise these risks, governing documents have been established for accounting, for pro-cedures for annual reporting and for follow-up of reported annual accounts. Fagerhult’s Board regularly assesses reporting from a risk per-spective. As a support for these assessments, profit/loss items and balance-sheet items are compared with previous reports as well as budgets and forecasts. The risks identified in the financial reporting are managed through the Group’s control structure. In addition to assessing the risks in the financial reporting, the Board and management work continuously to identify and manage significant risks affecting Fagerhult’s business from an operational and financial perspective. Read more about risks on pages 85–88.
Code of Conduct
Our global presence demands that our employees and business partners take responsibility for themselves and for each other. Therefore, we have created a regula-tory framework, our Code of Conduct.
Our Code of Conduct should be followed by everyone included in our Group, employees as well as the Board and Management. We also communicate our Code of Conduct to our business partners, with the expecta- tion that it is complied with.
Our Code of Conduct states, amongst other things, that we will act as a reliable and honest Group that lives up to its commit-ments. We believe in long-term business relationships in which we, together with our business partners, create a basis for strong financial results, concern for the environ-ment and social commitment.
FA G E R H U LT G R O U P A N N U A L R E P O R T 2 0 2 0 45
C O R P O R A T E G O V E R N A N C E | F I N A N C I A L I N F O R M A T I O N
Control activities and follow-upControl activities involve all levels of the organ-isation and concern the measures selected to manage the Group’s risks.
To ensure completeness and accuracy in the financial reporting, instructions and guidelines are in place that have been communicated to the relevant personnel. The activities also limit risk from the identified risks. The Group’s central control function analyses and monitors budget deviations, prepares forecasts, monitors sig-nificant variations between periods, and reports these to others within the organisation, thereby minimising the risk of errors in the reporting. Control activities also include follow-up and comparisons of earnings trends or significant individual items, account reconciliations and balances, and the approval of all proxy and attestation instructions, as well as accounting and valuation principles.
Monitoring of the effectiveness and compli-ance with these control activities takes place through programmed controls and through indi-vidually established procedures. The Group has a shared reporting system in which all reporting is carried out. Financial follow-up is carried out by Group Management in conjunction with regular visits to the subsidiaries, in parallel with development of the control function.
Information and communicationFagerhult continuously provides information about the Group’s performance and financial position to the market. The quality of exter-nal financial reporting is ensured through various activities and procedures. The CEO is responsible for the accuracy and high quality of all information provided, for example, financial press releases and presentation materials for various meetings with the media, shareholders and investors
The policy is intended to ensure that Fagerhult’s information requirements are met in an accurate and complete manner. The most important governing documents, in the form of policies and instructions, are kept up-to-date and are communicated via the appropriate channels, mainly electronically.
Internal information and communication is about creating awareness among the Group’s employees about external and internal gov-erning instruments, including authorities and responsibilities. During 2019 the CFO re-issued to the relevant personnel an update of the Group’s Financial Internal Control Guidelines as well as the Group’s Financial Policy document. The significant update to the internal controls document was the addition of an IT internal controls section.
Fagerhult’s whistle-blower policy means that each employee has the right to report suspected breaches of laws or regulations without fear of reprisal.
Evaluation of the need for a separate audit functionThe Board and management have determined that a separate internal audit function will not be established in the Fagerhult Group. The Group’s Finance department continually monitors com-pliance with the company’s governance model, reporting principles and policies. In addition, the Finance department conducts ongoing analyses of the company’s reporting and financial results to gain assurance regarding the trend.
Together with the controls implemented by the Group’s management and the different business areas’ existing control functions, discussions with the company’s external auditors concerning the audit approach, as well as the auditing firm’s extensive organisation are assessed as providing a satisfactory level of assurance. This means that a separate internal audit function is not considered necessary.
Activities in 2020During the year there were two main focus areas. Firstly, to deal with the challenges arising as a result of the Covid-19 pandemic and secondly to launch the new strategic alignment process, new business areas and begin to develop the new 5 year strategy. The strategic alignment process was successfully launched during the first quarter, it has identified good opportunities for growth in each business area and the new strategy for business area Infrastructure and
Premium have both been communicated to the Board, approved and initiated. During the early part of 2021 the strategy for business areas Collection and Professional will also be communicated. Also during 2020 the Group has disposed of Lighting Innovations in South Africa as this was not considered a key strategic focus area for future investment.
From a technology perspective there has been significant progress. We continue the development of a connectivity strategy utilising the OR Technologies business in Australia as the foundation. This has been a key project during the year and the Group’s competences in ORT have been expanded in the northern hemisphere with the establishment of a new competence centre in Linköping, Sweden.
The Group continues to look at the declining retail segment and how to address this in the future where the operational set up will be critical in order to remain competitive. Within each new business area, focus and collaboration has been the message and this has determined significant growth opportunities in each business area.
Due to Covid-19, activities also increased in the area of financial management and managing the business during a reduced period of activity; reducing costs, generating cash, improving working capital and scaling the Group’s operat-ing businesses for 2021 and beyond where we see a gradual recovery. Focus and priority has also been given to many senior level recruit-ments, particularly within the local management functions as businesses transition from family owned to becoming members of a listed group.
Following the update of the Minimum Control Requirements in 2019 and the initial issue of the Financial Internal Guidelines, follow up work has been performed locally to improve the internal control in many businesses with the process and results being discussed by the auditor, the Audit Committee and the CFO. This work continues with further internal control improve-ments. The Minimum Control Requirement document and process is based on the COSO framework and the follow-up of internal control pursuant to these guidelines has become an integrated part of Group governance.
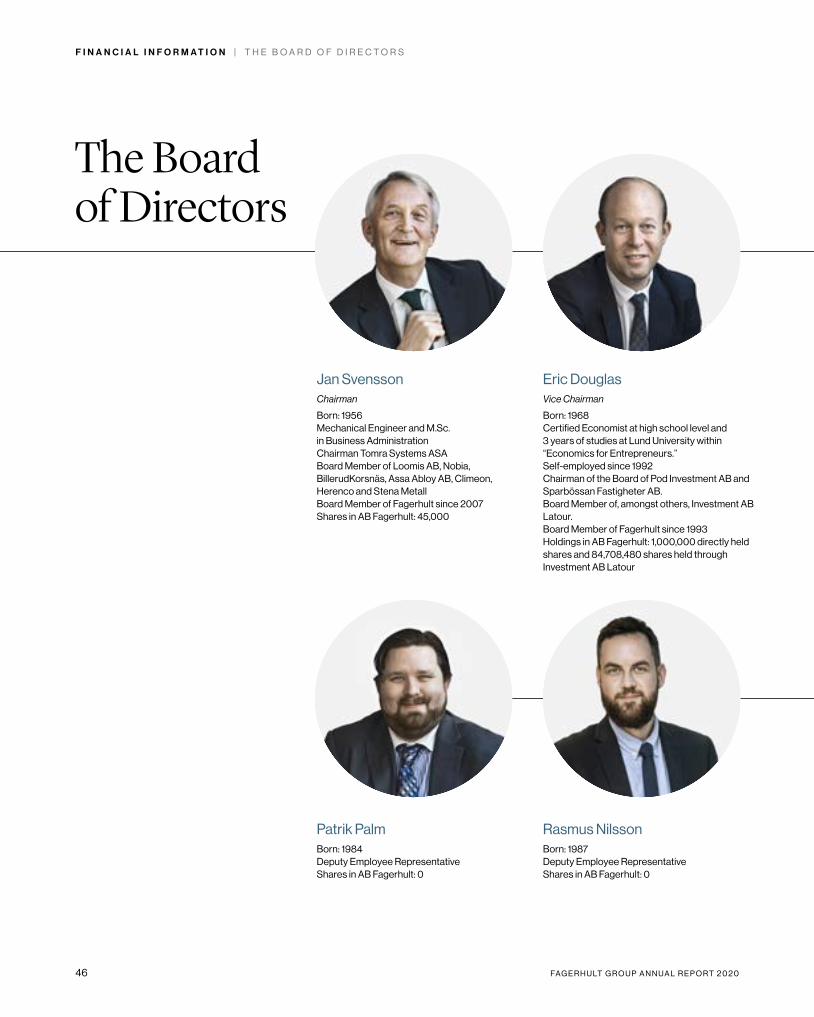
46 FA G E R H U LT G R O U P A N N U A L R E P O R T 2 0 2 0
F I N A N C I A L I N F O R M A T I O N | T H E B O A R D O F D I R E C T O R S
The Board of Directors
Jan SvenssonChairman
Born: 1956Mechanical Engineer and M.Sc. in Business AdministrationChairman Tomra Systems ASA Board Member of Loomis AB, Nobia, BillerudKorsnäs, Assa Abloy AB, Climeon, Herenco and Stena MetallBoard Member of Fagerhult since 2007Shares in AB Fagerhult: 45,000
Eric DouglasVice Chairman
Born: 1968Certified Economist at high school level and 3 years of studies at Lund University within “Economics for Entrepreneurs.” Self- employed since 1992Chairman of the Board of Pod Investment AB and Sparbössan Fastigheter AB. Board Member of, amongst others, Investment AB Latour. Board Member of Fagerhult since 1993 Holdings in AB Fagerhult: 1,000,000 directly held shares and 84,708,480 shares held through Investment AB Latour
Patrik PalmBorn: 1984Deputy Employee RepresentativeShares in AB Fagerhult: 0
Rasmus NilssonBorn: 1987Deputy Employee RepresentativeShares in AB Fagerhult: 0
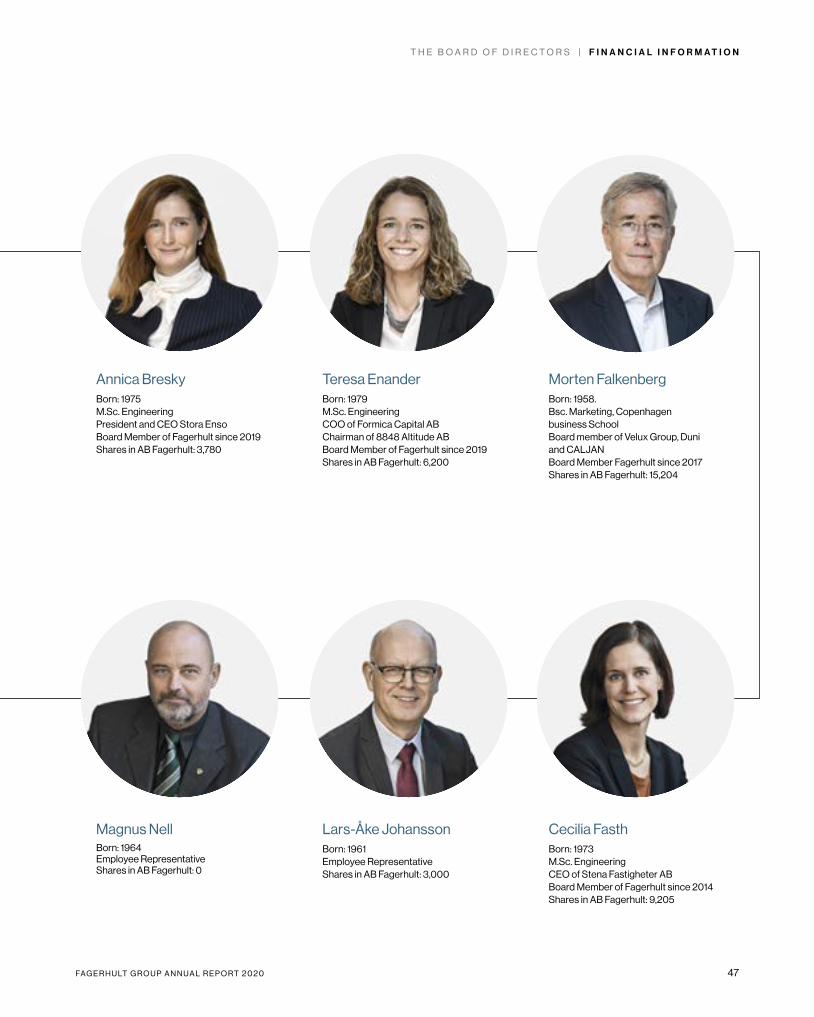
FA G E R H U LT G R O U P A N N U A L R E P O R T 2 0 2 0 47
T H E B O A R D O F D I R E C T O R S | F I N A N C I A L I N F O R M A T I O N
Annica BreskyBorn: 1975M.Sc. EngineeringPresident and CEO Stora EnsoBoard Member of Fagerhult since 2019Shares in AB Fagerhult: 3,780
Teresa EnanderBorn: 1979M.Sc. EngineeringCOO of Formica Capital ABChairman of 8848 Altitude ABBoard Member of Fagerhult since 2019Shares in AB Fagerhult: 6,200
Morten FalkenbergBorn: 1958.Bsc. Marketing, Copenhagen business School Board member of Velux Group, Duniand CALJANBoard Member Fagerhult since 2017Shares in AB Fagerhult: 15,204
Magnus NellBorn: 1964Employee RepresentativeShares in AB Fagerhult: 0
Lars-Åke JohanssonBorn: 1961Employee RepresentativeShares in AB Fagerhult: 3,000
Cecilia FasthBorn: 1973M.Sc. Engineering CEO of Stena Fastigheter ABBoard Member of Fagerhult since 2014Shares in AB Fagerhult: 9,205
48 FA G E R H U LT G R O U P A N N U A L R E P O R T 2 0 2 0
F I N A N C I A L I N F O R M A T I O N | G R O U P M A N A G E M E N T
Group Management
Bodil SonessonPresident and CEO
Born: 1968M.Sc. in Business Administration, MBAEmployed since: 2018Shares in Fagerhult: 12,106
FA G E R H U LT G R O U P A N N U A L R E P O R T 2 0 2 0 49
G R O U P M A N A G E M E N T | F I N A N C I A L I N F O R M A T I O N
Frank AugustssonHead of Business Area Premium
Born: 1965.Technical College GraduateEmployed since: 1986–2001, 2004Shares in Fagerhult: 31,372
Michael BrüerChief Strategy and Communication Officer
Born: 1983M.Sc. Engineering, M.Sc. Business AdministrationEmployed since: 2017Shares in Fagerhult: 4,375
Anders FranssonHead of Business Area Professional & Chief Sustainability Officer
Born: 1969M.Sc. EngineeringEmployed since: 2005Shares in Fagerhult: 25,602
Michael WoodChief Financial Officer
Born: 1964Chartered Accountant ACMAEmployed since: 2005Shares in Fagerhult: 19,522
Geert van der MeerHead of Business Area Infrastructure
Born: 1965PhD in PhysicsEmployed since: 2017Shares in Fagerhult: 1,187
Andrea GageikChief People Officer
Born: 1972Master of Arts M. A. Business Coaching and Change ManagementCertified in Systemic Organizational Development and Mediation,Employed since: 2021Shares in Fagerhult: 0
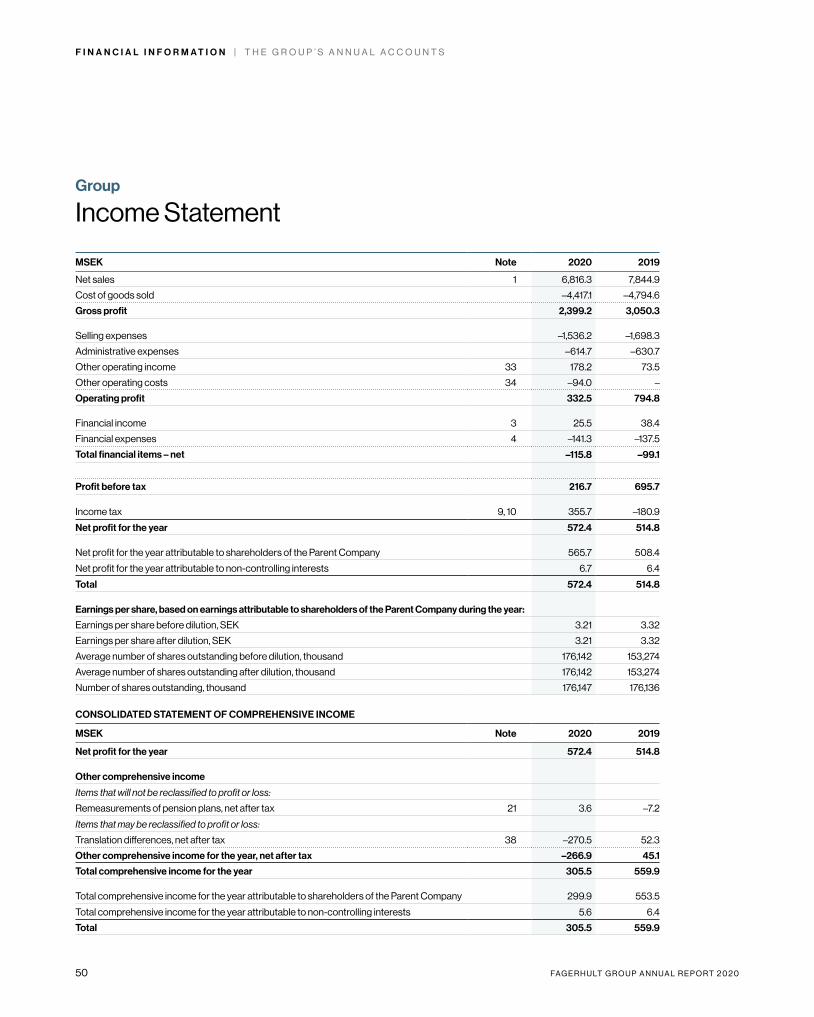
50 FA G E R H U LT G R O U P A N N U A L R E P O R T 2 0 2 0
F I N A N C I A L I N F O R M A T I O N | T H E G R O U P ’ S A N N U A L A C C O U N T S
MSEK Note 2020 2019
Net sales 1 6,816.3 7,844.9
Cost of goods sold –4,417.1 –4,794.6
Gross profit 2,399.2 3,050.3
Selling expenses –1,536.2 –1,698.3
Administrative expenses –614.7 –630.7
Other operating income 33 178.2 73.5
Other operating costs 34 –94.0 –
Operating profit 332.5 794.8
Financial income 3 25.5 38.4
Financial expenses 4 –141.3 –137.5
Total financial items – net –115.8 –99.1
Profit before tax 216.7 695.7
Income tax 9, 10 355.7 –180.9
Net profit for the year 572.4 514.8
Net profit for the year attributable to shareholders of the Parent Company 565.7 508.4
Net profit for the year attributable to non-controlling interests 6.7 6.4
Total 572.4 514.8
Earnings per share, based on earnings attributable to shareholders of the Parent Company during the year:
Earnings per share before dilution, SEK 3.21 3.32
Earnings per share after dilution, SEK 3.21 3.32
Average number of shares outstanding before dilution, thousand 176,142 153,274
Average number of shares outstanding after dilution, thousand 176,142 153,274
Number of shares outstanding, thousand 176,147 176,136
CONSOLIDATED STATEMENT OF COMPREHENSIVE INCOME
MSEK Note 2020 2019
Net profit for the year 572.4 514.8
Other comprehensive income
Items that will not be reclassified to profit or loss:
Remeasurements of pension plans, net after tax 21 3.6 –7.2
Items that may be reclassified to profit or loss:
Translation differences, net after tax 38 –270.5 52.3
Other comprehensive income for the year, net after tax –266.9 45.1
Total comprehensive income for the year 305.5 559.9
Total comprehensive income for the year attributable to shareholders of the Parent Company 299.9 553.5
Total comprehensive income for the year attributable to non-controlling interests 5.6 6.4
Total 305.5 559.9
Group
Income Statement
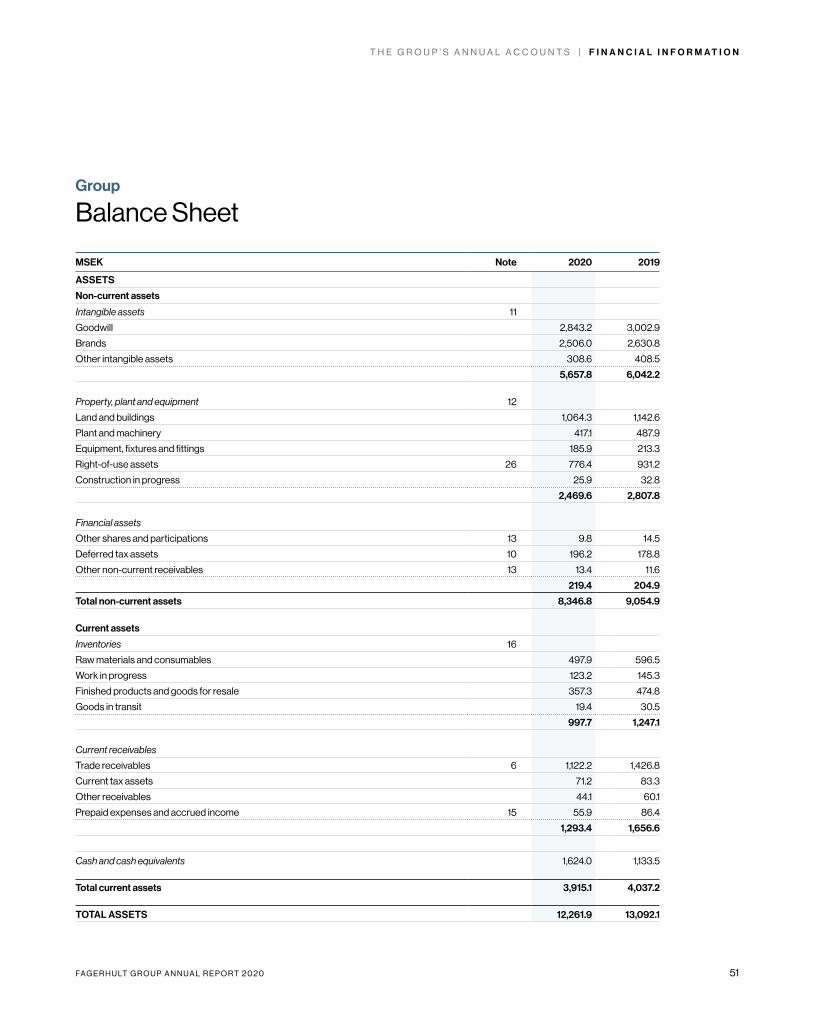
FA G E R H U LT G R O U P A N N U A L R E P O R T 2 0 2 0 51
T H E G R O U P ’ S A N N U A L A C C O U N T S | F I N A N C I A L I N F O R M A T I O N
MSEK Note 2020 2019
ASSETS
Non-current assets
Intangible assets 11
Goodwill 2,843.2 3,002.9
Brands 2,506.0 2,630.8
Other intangible assets 308.6 408.5
5,657.8 6,042.2
Property, plant and equipment 12
Land and buildings 1,064.3 1,142.6
Plant and machinery 417.1 487.9
Equipment, fixtures and fittings 185.9 213.3
Right-of-use assets 26 776.4 931.2
Construction in progress 25.9 32.8
2,469.6 2,807.8
Financial assets
Other shares and participations 13 9.8 14.5
Deferred tax assets 10 196.2 178.8
Other non-current receivables 13 13.4 11.6
219.4 204.9
Total non-current assets 8,346.8 9,054.9
Current assets
Inventories 16
Raw materials and consumables 497.9 596.5
Work in progress 123.2 145.3
Finished products and goods for resale 357.3 474.8
Goods in transit 19.4 30.5
997.7 1,247.1
Current receivables
Trade receivables 6 1,122.2 1,426.8
Current tax assets 71.2 83.3
Other receivables 44.1 60.1
Prepaid expenses and accrued income 15 55.9 86.4
1,293.4 1,656.6
Cash and cash equivalents 1,624.0 1,133.5
Total current assets 3,915.1 4,037.2
TOTAL ASSETS 12,261.9 13,092.1
Group
Balance Sheet
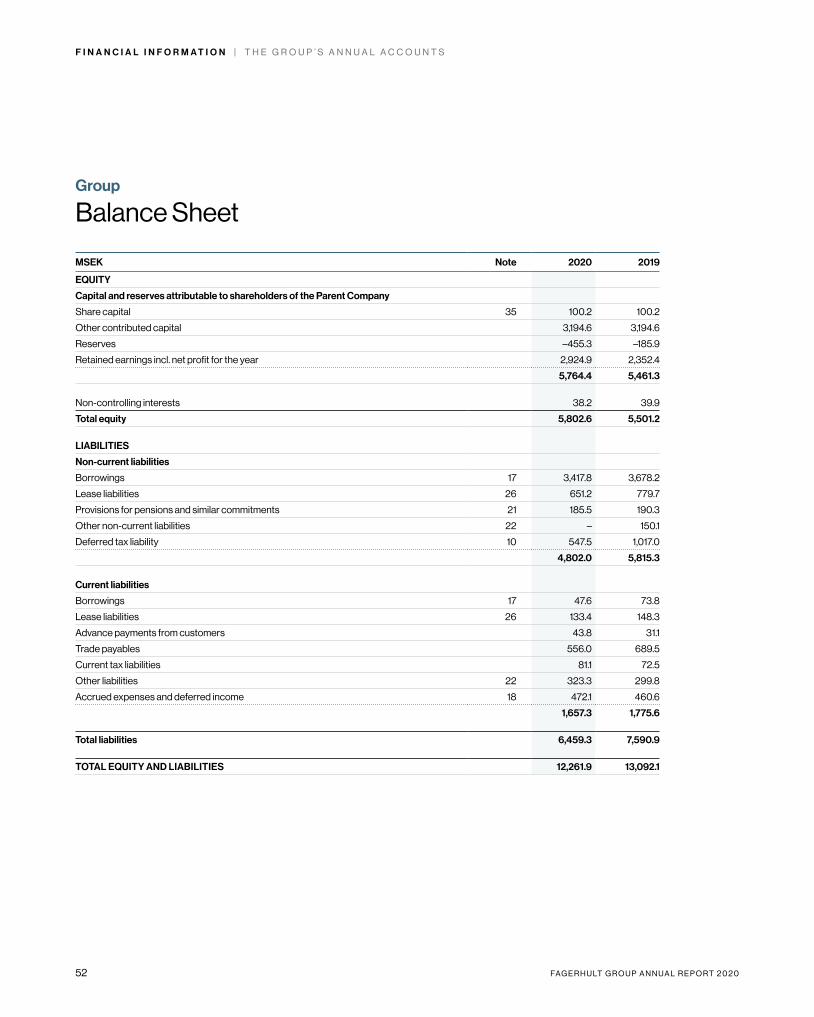
52 FA G E R H U LT G R O U P A N N U A L R E P O R T 2 0 2 0
F I N A N C I A L I N F O R M A T I O N | T H E G R O U P ’ S A N N U A L A C C O U N T S
MSEK Note 2020 2019
EQUITY
Capital and reserves attributable to shareholders of the Parent Company
Share capital 35 100.2 100.2
Other contributed capital 3,194.6 3,194.6
Reserves –455.3 –185.9
Retained earnings incl. net profit for the year 2,924.9 2,352.4
5,764.4 5,461.3
Non-controlling interests 38.2 39.9
Total equity 5,802.6 5,501.2
LIABILITIES
Non-current liabilities
Borrowings 17 3,417.8 3,678.2
Lease liabilities 26 651.2 779.7
Provisions for pensions and similar commitments 21 185.5 190.3
Other non-current liabilities 22 – 150.1
Deferred tax liability 10 547.5 1,017.0
4,802.0 5,815.3
Current liabilities
Borrowings 17 47.6 73.8
Lease liabilities 26 133.4 148.3
Advance payments from customers 43.8 31.1
Trade payables 556.0 689.5
Current tax liabilities 81.1 72.5
Other liabilities 22 323.3 299.8
Accrued expenses and deferred income 18 472.1 460.6
1,657.3 1,775.6
Total liabilities 6,459.3 7,590.9
TOTAL EQUITY AND LIABILITIES 12,261.9 13,092.1
Group
Balance Sheet
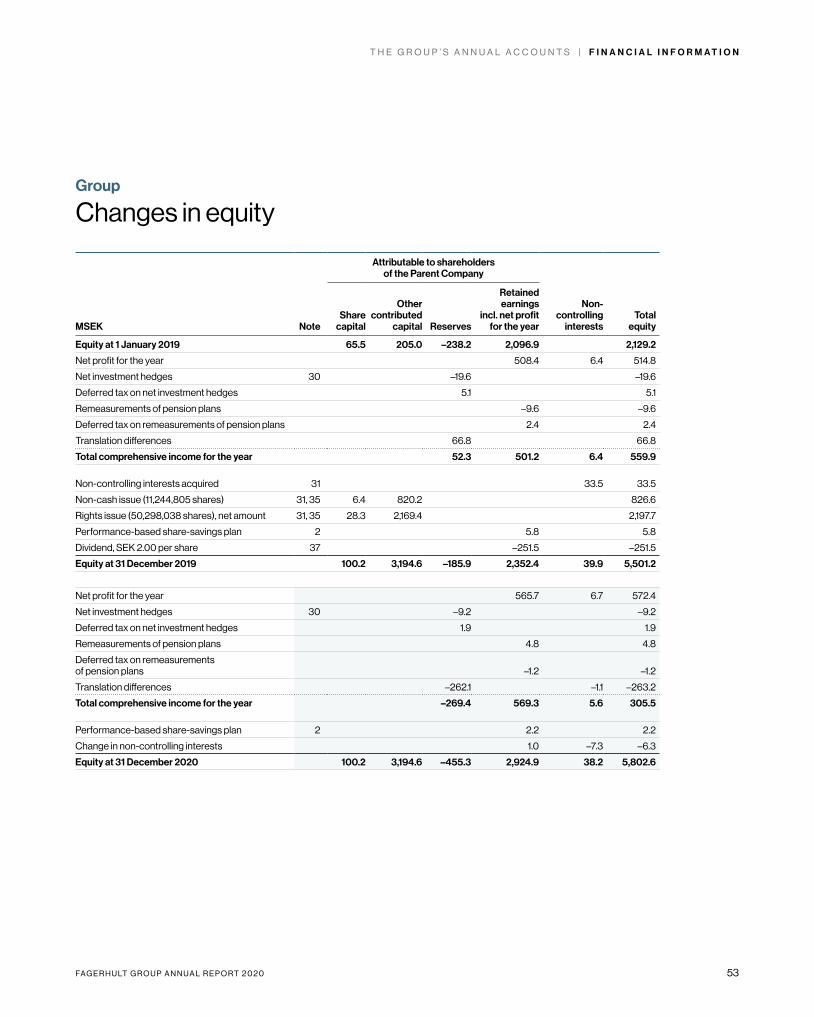
FA G E R H U LT G R O U P A N N U A L R E P O R T 2 0 2 0 53
T H E G R O U P ’ S A N N U A L A C C O U N T S | F I N A N C I A L I N F O R M A T I O N
Attributable to shareholders of the Parent Company
MSEK NoteShare
capital
Other contributed
capital Reserves
Retained earnings
incl. net profit for the year
Non- controlling
interestsTotal
equity
Equity at 1 January 2019 65.5 205.0 –238.2 2,096.9 2,129.2
Net profit for the year 508.4 6.4 514.8
Net investment hedges 30 –19.6 –19.6
Deferred tax on net investment hedges 5.1 5.1
Remeasurements of pension plans –9.6 –9.6
Deferred tax on remeasurements of pension plans 2.4 2.4
Translation differences 66.8 66.8
Total comprehensive income for the year 52.3 501.2 6.4 559.9
Non-controlling interests acquired 31 33.5 33.5
Non-cash issue (11,244,805 shares) 31, 35 6.4 820.2 826.6
Rights issue (50,298,038 shares), net amount 31, 35 28.3 2,169.4 2,197.7
Performance-based share-savings plan 2 5.8 5.8
Dividend, SEK 2.00 per share 37 –251.5 –251.5
Equity at 31 December 2019 100.2 3,194.6 –185.9 2,352.4 39.9 5,501.2
Net profit for the year 565.7 6.7 572.4
Net investment hedges 30 –9.2 –9.2
Deferred tax on net investment hedges 1.9 1.9
Remeasurements of pension plans 4.8 4.8
Deferred tax on remeasurements of pension plans –1.2 –1.2
Translation differences –262.1 –1.1 –263.2
Total comprehensive income for the year –269.4 569.3 5.6 305.5
Performance-based share-savings plan 2 2.2 2.2
Change in non-controlling interests 1.0 –7.3 –6.3
Equity at 31 December 2020 100.2 3,194.6 –455.3 2,924.9 38.2 5,802.6
Group
Changes in equity
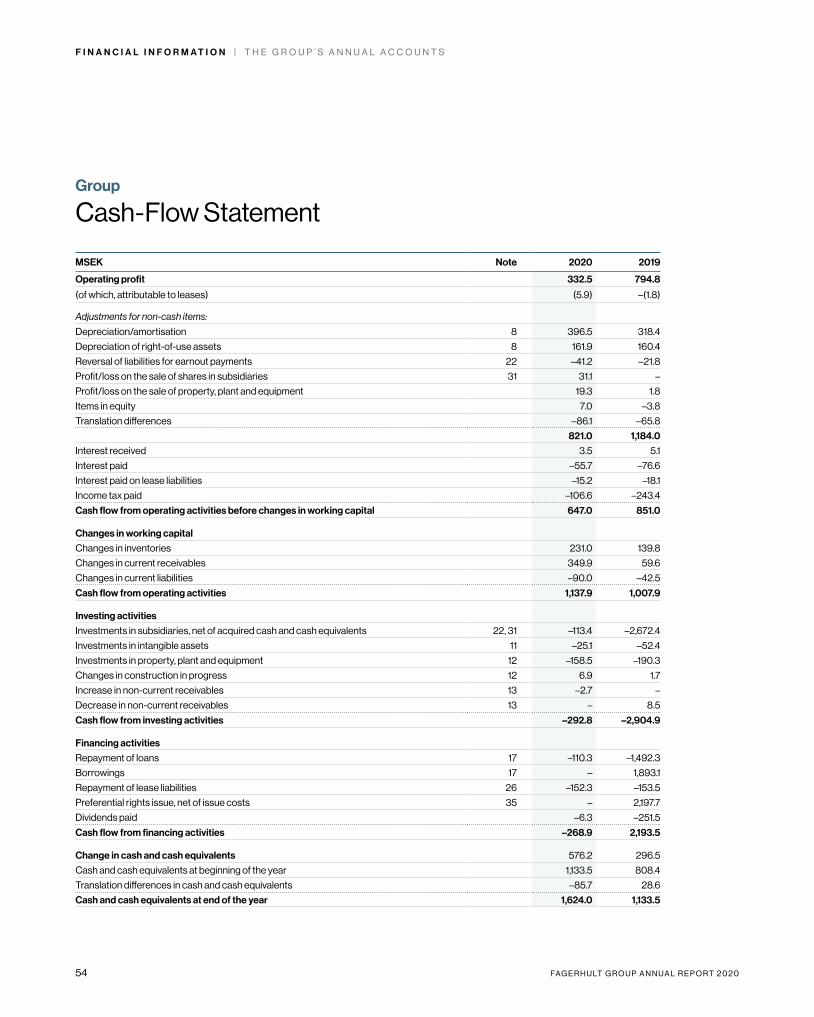
54 FA G E R H U LT G R O U P A N N U A L R E P O R T 2 0 2 0
F I N A N C I A L I N F O R M A T I O N | T H E G R O U P ’ S A N N U A L A C C O U N T S
MSEK Note 2020 2019
Operating profit 332.5 794.8
(of which, attributable to leases) (5.9) –(1.8)
Adjustments for non-cash items:
Depreciation/amortisation 8 396.5 318.4
Depreciation of right-of-use assets 8 161.9 160.4
Reversal of liabilities for earnout payments 22 –41.2 –21.8
Profit/loss on the sale of shares in subsidiaries 31 31.1 –
Profit/loss on the sale of property, plant and equipment 19.3 1.8
Items in equity 7.0 –3.8
Translation differences –86.1 –65.8
821.0 1,184.0
Interest received 3.5 5.1
Interest paid –55.7 –76.6
Interest paid on lease liabilities –15.2 –18.1
Income tax paid –106.6 –243.4
Cash flow from operating activities before changes in working capital 647.0 851.0
Changes in working capital
Changes in inventories 231.0 139.8
Changes in current receivables 349.9 59.6
Changes in current liabilities –90.0 –42.5
Cash flow from operating activities 1,137.9 1,007.9
Investing activities
Investments in subsidiaries, net of acquired cash and cash equivalents 22, 31 –113.4 –2,672.4
Investments in intangible assets 11 –25.1 –52.4
Investments in property, plant and equipment 12 –158.5 –190.3
Changes in construction in progress 12 6.9 1.7
Increase in non-current receivables 13 –2.7 –
Decrease in non-current receivables 13 – 8.5
Cash flow from investing activities –292.8 –2,904.9
Financing activities
Repayment of loans 17 –110.3 –1,492.3
Borrowings 17 – 1,893.1
Repayment of lease liabilities 26 –152.3 –153.5
Preferential rights issue, net of issue costs 35 – 2,197.7
Dividends paid –6.3 –251.5
Cash flow from financing activities –268.9 2,193.5
Change in cash and cash equivalents 576.2 296.5
Cash and cash equivalents at beginning of the year 1,133.5 808.4
Translation differences in cash and cash equivalents –85.7 28.6
Cash and cash equivalents at end of the year 1,624.0 1,133.5
Group
Cash-Flow Statement
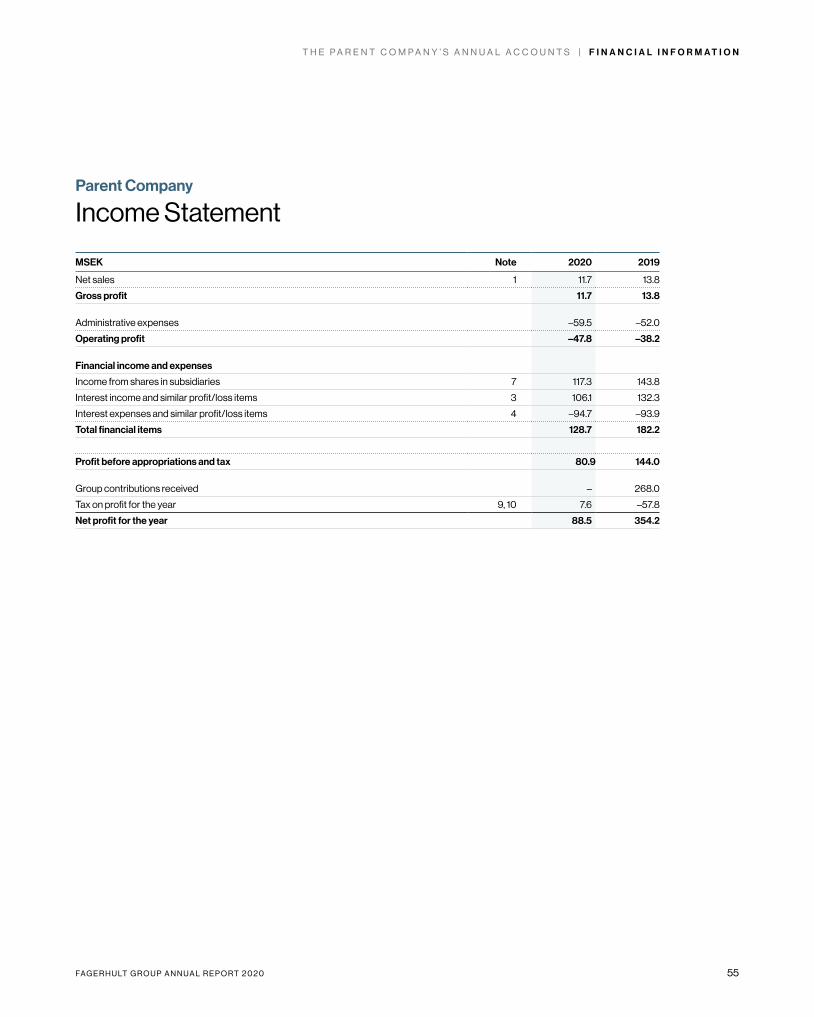
FA G E R H U LT G R O U P A N N U A L R E P O R T 2 0 2 0 55
T H E P A R E N T C O M P A N Y ’ S A N N U A L A C C O U N T S | F I N A N C I A L I N F O R M A T I O N
MSEK Note 2020 2019
Net sales 1 11.7 13.8
Gross profit 11.7 13.8
Administrative expenses –59.5 –52.0
Operating profit –47.8 –38.2
Financial income and expenses
Income from shares in subsidiaries 7 117.3 143.8
Interest income and similar profit/loss items 3 106.1 132.3
Interest expenses and similar profit/loss items 4 –94.7 –93.9
Total financial items 128.7 182.2
Profit before appropriations and tax 80.9 144.0
Group contributions received – 268.0
Tax on profit for the year 9, 10 7.6 –57.8
Net profit for the year 88.5 354.2
Parent Company
Income Statement
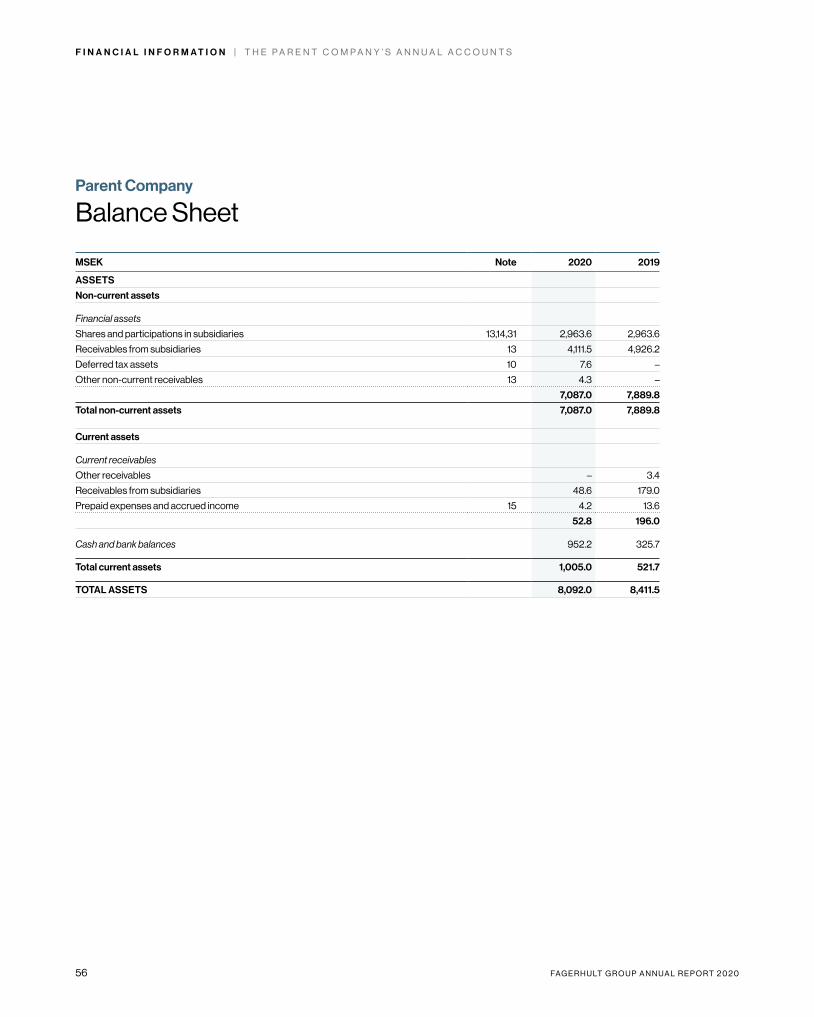
56 FA G E R H U LT G R O U P A N N U A L R E P O R T 2 0 2 0
F I N A N C I A L I N F O R M A T I O N | T H E P A R E N T C O M P A N Y ’ S A N N U A L A C C O U N T S
MSEK Note 2020 2019
ASSETS
Non-current assets
Financial assets
Shares and participations in subsidiaries 13,14,31 2,963.6 2,963.6
Receivables from subsidiaries 13 4,111.5 4,926.2
Deferred tax assets 10 7.6 –
Other non-current receivables 13 4.3 –
7,087.0 7,889.8
Total non-current assets 7,087.0 7,889.8
Current assets
Current receivables
Other receivables – 3.4
Receivables from subsidiaries 48.6 179.0
Prepaid expenses and accrued income 15 4.2 13.6
52.8 196.0
Cash and bank balances 952.2 325.7
Total current assets 1,005.0 521.7
TOTAL ASSETS 8,092.0 8,411.5
Parent Company
Balance Sheet
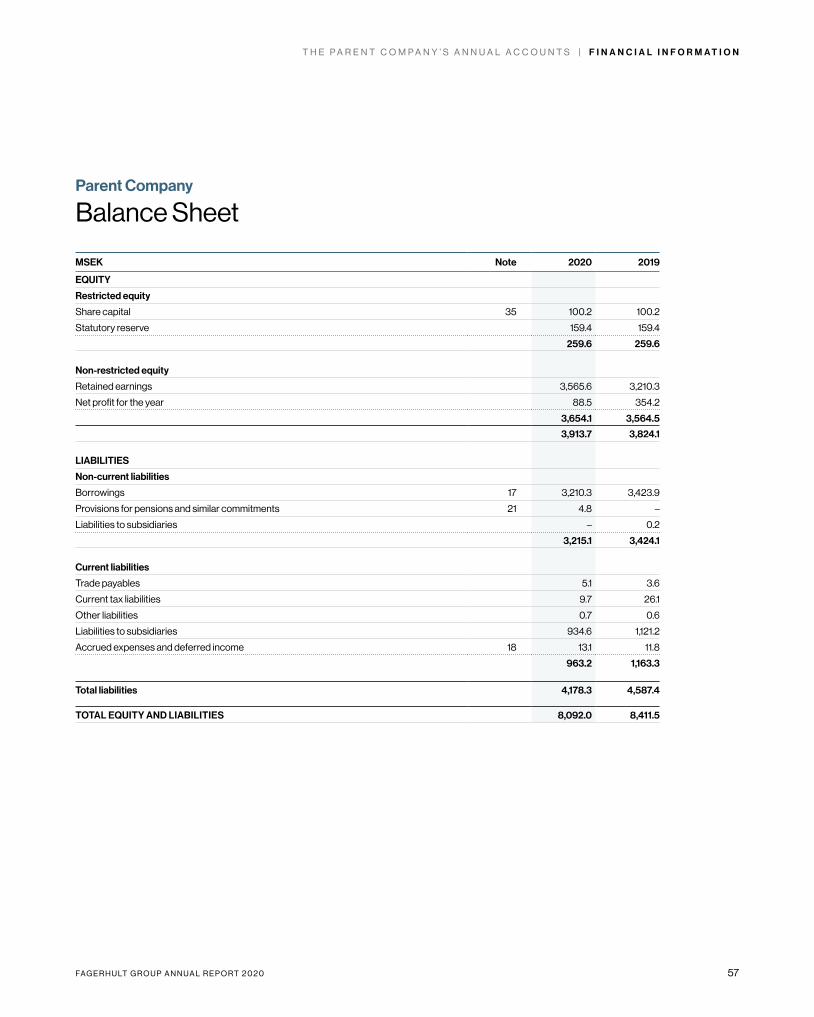
FA G E R H U LT G R O U P A N N U A L R E P O R T 2 0 2 0 57
T H E P A R E N T C O M P A N Y ’ S A N N U A L A C C O U N T S | F I N A N C I A L I N F O R M A T I O N
MSEK Note 2020 2019
EQUITY
Restricted equity
Share capital 35 100.2 100.2
Statutory reserve 159.4 159.4
259.6 259.6
Non-restricted equity
Retained earnings 3,565.6 3,210.3
Net profit for the year 88.5 354.2
3,654.1 3,564.5
3,913.7 3,824.1
LIABILITIES
Non-current liabilities
Borrowings 17 3,210.3 3,423.9
Provisions for pensions and similar commitments 21 4.8 –
Liabilities to subsidiaries – 0.2
3,215.1 3,424.1
Current liabilities
Trade payables 5.1 3.6
Current tax liabilities 9.7 26.1
Other liabilities 0.7 0.6
Liabilities to subsidiaries 934.6 1,121.2
Accrued expenses and deferred income 18 13.1 11.8
963.2 1,163.3
Total liabilities 4,178.3 4,587.4
TOTAL EQUITY AND LIABILITIES 8,092.0 8,411.5
Parent Company
Balance Sheet
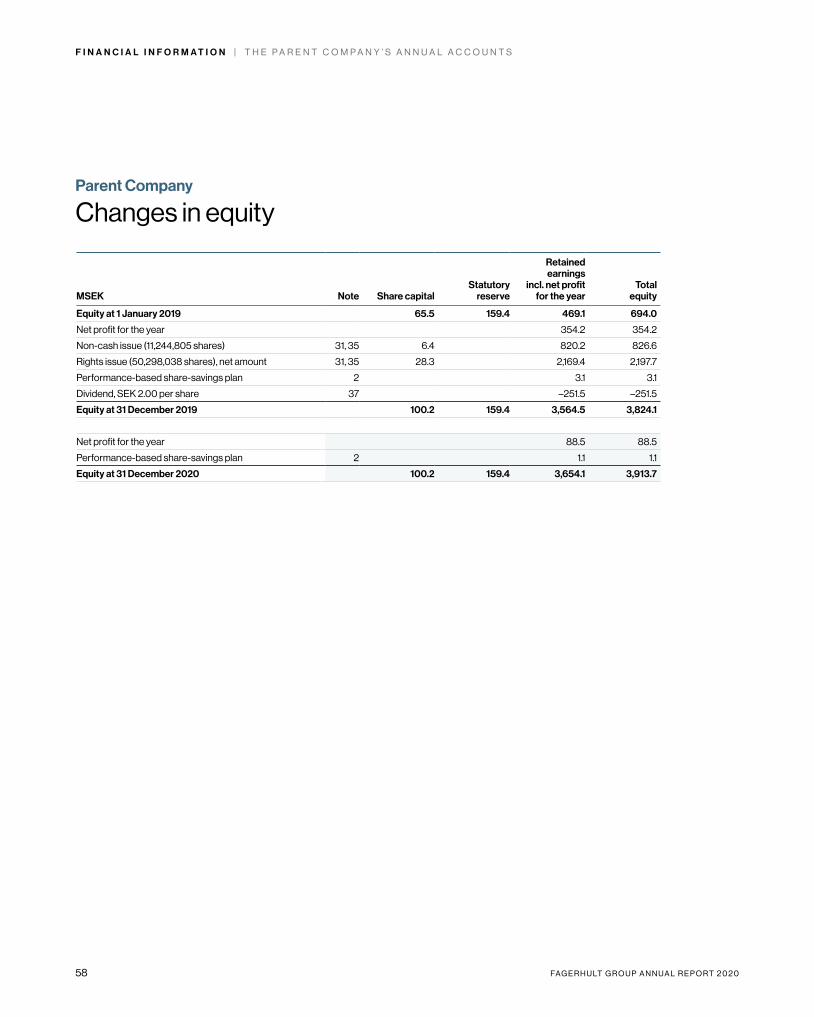
58 FA G E R H U LT G R O U P A N N U A L R E P O R T 2 0 2 0
F I N A N C I A L I N F O R M A T I O N | T H E P A R E N T C O M P A N Y ’ S A N N U A L A C C O U N T S
MSEK Note Share capitalStatutory
reserve
Retained earnings
incl. net profit for the year
Total equity
Equity at 1 January 2019 65.5 159.4 469.1 694.0
Net profit for the year 354.2 354.2
Non-cash issue (11,244,805 shares) 31, 35 6.4 820.2 826.6
Rights issue (50,298,038 shares), net amount 31, 35 28.3 2,169.4 2,197.7
Performance-based share-savings plan 2 3.1 3.1
Dividend, SEK 2.00 per share 37 –251.5 –251.5
Equity at 31 December 2019 100.2 159.4 3,564.5 3,824.1
Net profit for the year 88.5 88.5
Performance-based share-savings plan 2 1.1 1.1
Equity at 31 December 2020 100.2 159.4 3,654.1 3,913.7
Parent Company
Changes in equity

FA G E R H U LT G R O U P A N N U A L R E P O R T 2 0 2 0 59
T H E P A R E N T C O M P A N Y ’ S A N N U A L A C C O U N T S | F I N A N C I A L I N F O R M A T I O N
MSEK Note 2020 2019
Operating profit –47.8 –38.2
Adjustments for non-cash items:
Items in equity 1.1 3.1
Translation differences –165.8 3.5
–212.5 –31.6
Interest received 106.1 126.3
Interest paid –55.2 –62.8
Income tax paid –16.4 –47.4
Cash flow from operating activities before changes in working capital –178.0 –15.5
Changes in working capital
Changes in current receivables 134.7 –149.1
Changes in current liabilities –183.7 794.4
Cash flow from operating activities –227.0 629.8
Investing activities
Investments in subsidiaries 31 – –1,520.4
Increase in non-current receivables 13 703.1 –1,746.4
Group contributions and dividends received 224.6 411.8
Cash flow from investing activities 927.7 –2,855.0
Financing activities
Repayment of loans 17 –74.2 –1,104.8
Borrowings 17 – 1,380.8
Preferential rights issue, net of issue costs 35 – 2,197.7
Dividends paid – –251.5
Cash flow from financing activities –74.2 2,222.2
Change in cash and cash equivalents 626.5 –3.0
Cash and cash equivalents at beginning of the year 325.7 328.7
Cash and cash equivalents at end of the year 952.2 325.7
Parent Company
Cash-Flow Statement
60 FA G E R H U LT G R O U P A N N U A L R E P O R T 2 0 2 0
F I N A N C I A L I N F O R M A T I O N | A C C O U N T I N G P O L I C I E S
The consolidated accounts have been prepared in accordance with International Financial Reporting Standards (IFRS), as adopted by the EU, the Swedish Annual Accounts Act and the Swedish Financial Reporting Board’s recom-mendation RFR1.
The Parent Company applies the same accounting policies as the Group, except in the instances stated below in the section Parent Company’s Accounting Policies. The deviations arising between the Parent Company’s and the Group’s accounting policies result from limitations in the possibility of applying IFRS in the Parent Company primarily due to the stip-ulations of the Swedish Annual Accounts Act. The policies applied for the Parent Company are unchanged compared with the preceding year.
All amounts are reported in millions of Swedish kronor (MSEK), unless stated otherwise. Assets and liabilities are valued at historical cost with the exception of certain financial assets and liabilities (conditional earnout payments and derivatives) which are valued at fair value.
Consolidated accountsSubsidiariesThe consolidated accounts include subsidiaries over which the Group exercises control, that is when the Group is exposed to or has the right to variable returns from its holdings in the company and can affect returns through its control.
Companies acquired during the year are fully consolidated from the date on which control is transferred to the Group. Companies are de-consolidated from the date that control ceases.
The Group applies the acquisition method to recognise the Group’s business combinations. The acquisition price paid for a subsidiary is the fair values of the assets transferred, the liabilities incurred and the shares issued by the Group. The consideration transferred includes the fair value of any asset or liability resulting from an earnout arrangement. Acquisition-related costs are expensed as incurred and are included under the item Administrative expenses. Identi-fiable assets acquired and liabilities assumed in a business combination are measured initially at
their fair values at the acquisition date. For each acquisition, the Group determines whether all non-controlling interests in the acquired company are recognized at fair value or at the proportionate share of the acquired company’s net assets. The amount by which the consider-ation, any non-controlling interest and fair value at the acquisition dates of previous sharehold-ings exceeds the fair value of the Group’s share of identifiable net assets acquired is recorded as goodwill. If the consideration transferred is less than the fair value of the acquired subsidiary’s net assets, the difference is recognised directly in profit or loss.
Intra-Group transactions and balance-sheet items are eliminated in their entirety.
Translation of foreign currenciesFunctional currency and presentation currencyItems included in the financial statements of each of the Group’s entities are measured using the currency of the primary economic environ-ment in which the entity operates (the functional currency). The consolidated accounts are pre-sented in SEK, which is the Parent Company’s functional and presentation currency.
Transactions and balance-sheet itemsForeign currency transactions are translated into the functional currency using the exchange rates prevailing at the transaction dates or the date on which the items are remeasured. Foreign exchange-rate differences attributable to oper-ating activities are recognised in operating profit, while exchange-rate differences attributable to the Group’s financing are recognised under financial income and expenses. Exceptions to this include hedging transactions that meet the requirements for the hedge accounting of net investments, for which exchange-rate differ-ences are recognised in other comprehensive income.
SubsidiariesThe results and financial position of all subsidiaries (none of which has the currency of a hyper-inflationary economy) that have a
functional currency different from the presen-tation currency are translated into the Group’s presentation currency as follows:– assets and liabilities for each balance sheet
are translated at the closing rate of exchange;– income and expenses for each income state-
ment are translated at the respective average exchange rate (unless the average exchange rate is not a reasonable approximation of the cumulative effect of the rates prevailing on the transaction dates, in which case income and expenses are translated at the transaction- date rates); and
– all resulting exchange-rate differences are recognised as a separate component of other comprehensive income.
Goodwill and fair value adjustments arising on the acquisition of a foreign entity are treated as assets and liabilities of the foreign entity and are translated at the closing rate.
Income taxReported income tax includes tax which is to be paid or received for the current year and adjust-ments pertaining to previous years’ current taxes and changes in deferred tax.
The measurement of all income tax liabilities and assets is performed at nominal amounts, applying the tax rates and provisions that have been enacted, or substantially enacted, and which are expected to apply when the related deferred tax asset is realised or the deferred tax liability is settled.
In the case of items recognised in profit or loss, related tax effects are also recognised in profit or loss. The tax effects of items that are recognised in other comprehensive income or directly in equity are also recognised directly against the same.
Deferred tax is calculated using the balance- sheet method on all temporary differences arising between the tax bases of assets and liabilities and their carrying amounts. These tem-porary differences have primarily arisen through consolidation adjustments and transfers to tax allocation reserves.
Deferred tax assets pertaining to future tax
Accounting policies

FA G E R H U LT G R O U P A N N U A L R E P O R T 2 0 2 0 61
A C C O U N T I N G P O L I C I E S | F I N A N C I A L I N F O R M A T I O N
deductions are recognised to the extent that it is probable that such deductions can be netted against surpluses in future taxation. Deferred tax liabilities pertaining to temporary differ-ences attributable to investments in subsidiaries are not recognised in the consolidated accounts as the Parent Company can, in all cases, control the date for a reversal of the temporary differ-ences and it is not assessed as probable that a reversal will take place within the foreseeable future.
InventoriesInventories are reported using the first-in, first-out method at the lower of cost and net realisable value on the closing date.
The valuation of work in progress and finished products includes design costs, direct labour costs and other direct costs with a reasonable mark-up for indirect costs (based on normal production capacity). This item excludes borrowing costs.
Net realisable value is the estimated selling price in the on-going course of business, less applicable variable selling expenses.
Revenue recognitionGoodsThe Group manufactures and sells lighting solu-tions to the professional lighting market. Sales of goods are recognised when control of the goods is transferred – that is, upon delivery to the customer, when they have full right of deci-sions over the goods and there are no longer any unfulfilled obligations that might affect cus-tomers’ approval. Delivery is recognised when the goods have been delivered in accordance with the agreed-upon delivery terms and the risk for obsolete or missing goods has transferred to the customer and the customer has accepted the goods in accordance with the agreement, the timeframe for changes to the agreement has expired or the group has objective evidence that all the criteria for acceptance have been fulfilled.
Volume rebates are often applied to sold goods based on accumulated sales over a twelve-month period. Income from sales of goods is recognised based on the price in the
agreement, less calculated volume rebates. Historic data is used to estimate the rebate’s eventual value and income is recognised only to the extent that it is unlikely that a significant reversal will arise. A liability (which is included in accrued expenses) is recognised for estimated volume rebates applied to sales until the closing date. No financing component is assessed to be required at the time of sale with a credit period which is in alignment with market practice. The Group’s obligation to repair or replace defective products according to normal warranty rules is recognised in accrued costs.
A receivable is recognised when the goods have been delivered, as that is when payment becomes unconditional (that is, payment requires only the passage of time).
Other operating incomeIncome from activities outside the Group’s primary operations is recognised as Other operating income. Income in the form of state aid for Covid-19 is included in other operating income and is recognised when there is reasonable assurance that the grants will be received and the Group will meet the conditions associated with the aid.
Interest incomeInterest income is recognised on a time-propor-tion basis using the effective interest method.
Dividend incomeIncome from dividends is recognised when the right to receive payment has been determined.
Internal transfer pricingThe pricing of transactions such as intra-Group purchases and sales of goods and services, uses market terms.
LeasesThe Group’s leases pertain primarily to factories, offices and vehicles. The terms are negotiated on an individual basis and contain a wide range of different terms and conditions. Leases are recognised as a right-of-use asset and a corre-sponding liability, at the date at which the leased
asset is available for use by the Group. Each lease payment is allocated between repayment of the liability and the finance cost. The finance cost is charged to profit or loss over the lease term so as to produce a constant periodic rate of interest on the remaining balance of the liability for each period.
The right-of-use asset is depreciated on a straight-line basis over the shorter of the asset’s useful life and the lease term. Leases are typically made for fixed periods of three to ten years but may have extension or termination options as described below.
Assets and liabilities arising from a lease are initially measured on a present value basis.
Lease liabilities include the net present value of the following lease payments:• fixed fees; and• variable lease fees that are based on an index.
The lease payments are discounted using the incremental borrowing rate.
Right-of-use assets are measured at cost and comprise the following: • the initial valuation of the lease liability; and• payments made on or prior to the date the
leased asset was made available to the lessee.
Payments associated with short-term leases and leases of low-value assets are recognised on a straight-line basis as an expense in profit or loss. Short-term leases are leases with a lease term of 12 months or less. Low-value assets comprise IT equipment and small items of office furniture.
Lease extension and termination optionsExtension and termination options are included in most of the Group’s leases for factories/production plants and offices. These terms are used to maximise flexibility in terms of managing contracts. Options to extend or terminate leases are included in assets and liabilities, when it is reasonably certain that they will be exercised.
Borrowing costsThe Group capitalises borrowing costs which are directly attributable to the purchase, con-struction or production of an asset, and where
62 FA G E R H U LT G R O U P A N N U A L R E P O R T 2 0 2 0
F I N A N C I A L I N F O R M A T I O N | A C C O U N T I N G P O L I C I E S
a considerable amount of time is required to prepare the asset for use or sale, as a portion of the asset’s cost. Other borrowing costs are rec-ognised as expenses in the period in which they arise. No borrowing costs have been capitalised for the reporting periods presented.
Cash-flow statement and cash and cash equivalentsThe cash-flow statement has been prepared using the indirect method. The recognised cash flow includes only those transactions that have resulted in receipts or payments. Cash and cash equivalents include cash and bank balances as well as short-term financial investments with maturities of less than three months. In both 2020 and 2019, cash and cash equivalents were comprised solely of cash and bank balances.
Property, plant and equipmentLand and buildings comprise, primarily, factories and offices. All property, plant and equipment (PPEs) are measured at cost less depreciation and impairment.
Cost includes expenditure that is directly attributable to the acquisition of the items. Subsequent expenses are included in the asset’s carrying amount, or recognised as a separate asset, as appropriate, only when it is likely that future economic benefits associ-ated with the asset will accrue to the Group, and when the asset’s cost can be measured reliably. All other repairs and maintenance are recognised as expenses in profit or loss during the period in which they arise.
No depreciation is reported for land. Depre-ciation on other assets is calculated using the straight-line method to allocate their cost down to their residual values over their estimated useful lives, as follows:
Buildings 25–33 yearsPermanent equipment, service facilities, etc. in buildings 10–20 yearsLand improvements 20 yearsMachinery and equipment 5–10 yearsVehicles and IT systems 5 yearsComputers and tools 3 years
The assets’ residual values and useful lives are reviewed and adjusted, if appropriate, at each closing date. An asset’s carrying amount is immediately written down to its recoverable amount if the asset’s carrying amount exceeds its estimated recoverable amount.
Intangible assetsGoodwillGoodwill consists of the amount by which the consideration, any non-controlling interest and fair value at the acquisition dates of previous shareholdings exceeds the fair value of the Group’s share of identifiable net assets acquired. Goodwill on the acquisition of sub-sidiaries is recognised as an intangible asset. Goodwill is tested annually to identify any need for impairment and is recognised at cost less accumulated impairment. The gain or loss on the sale of an entity includes the remaining carrying amount for goodwill pertaining to the entity sold.
Goodwill is allocated to cash-generating units (CGUs), when testing for any impairment requirement. This allocation is made to the CGUs which are expected to benefit from the business combination which has given rise to the goodwill item. The Fagerhult Group allocates goodwill to all operating segments. In 2020, goodwill has been reallocated in conjunction with the changes in the internal organisation and external segment reporting. The reallocation has occurred based on the relative fair values.
BrandsThis item mainly includes assets in the form of brands, which have arisen in conjunction with the acquisition of subsidiaries and which are recognised at fair value on the acquisition date. Brands acquired as a part of a business combi-nation are assessed as having indefinite useful lives since the Group has made the judgement that these will drive sales for an indeterminate future and are annually tested for impairment as described above for goodwill. Brands that have been acquired separately have a finite useful life and are initially recognised at cost, less accumulated amortisation and impairment
in subsequent periods. Amortisation is applied on a straight-line basis over the estimated useful life of 20 years.
Other intangible assetsThe item Other intangible assets includes Capitalised expenditure for product develop-ment, which is internally generated, Technology identified in conjunction with a business combi-nation and IT systems.
Capitalised development expenditureThe Group incurs no expenses for research. Expenses arising from development projects (attributable to the development of new lumi-naires) are reported in the Group as intangible assets when it is likely that the project will be successful, in terms of its commercial and technical possibilities, and when the expenses can be reliably measured. Other develop-ment expenses are expensed as they arise. Development expenses previously recognised as an expense are not capitalised as assets in subsequent periods.
Capitalised development expenditure with a limited useful life is amortised on a straight-line basis from the point in time at which commercial production can be initiated. Amortisation is reported during the asset’s expected useful life, which is usually three to five years. Amortisation is included in profit or loss under the item Cost of goods sold.
Acquired technologyTechnology identified in conjunction with a business combination is recognised at fair value on the acquisition date. Technology has a finite useful life and is recognised at cost less accumu-lated amortisation and impairment. Amortisation is performed over the asset’s expected useful life, which is usually five to seven years.
IT systemsIT systems mainly pertain to acquired systems and external costs arising on the adaptation of systems in line with the Group’s operations and needs. All assets are measured at cost less amortisation and impairment.
FA G E R H U LT G R O U P A N N U A L R E P O R T 2 0 2 0 63
A C C O U N T I N G P O L I C I E S | F I N A N C I A L I N F O R M A T I O N
Cost includes expenditure that is directly attributable to the acquisition of the items. Subsequent expenses are included in the asset’s carrying amount, or recognised as a separate asset, as appropriate, only when it is likely that future economic benefits associated with the asset will accrue to the Group, and when the asset’s cost can be measured reliably. All other forms of maintenance are recognised as expenses in profit or loss during the period in which they arise.
Straight-line amortisation is applied over the estimated useful life of three to five years.
Impairment of non-financial assetsAssets which have an indefinite useful life (good-will and brand) or intangible assets that are not yet ready for use (capitalised development expenditure) are not subject to amortisation and, instead, are tested for annually or when necessary for any need for impairment. Assets that are subject to amortisation are reviewed for impairment whenever events or changes in circum stances indicate that the carrying amount may not be recoverable. In those cases, in which the carrying amount exceeds the esti-mated recoverable amount, the carrying amount is immediately impaired down to the recoverable amount. The recoverable amount is the greater of an asset’s fair value, less selling expenses and the asset’s value in use. For the purposes of assessing any need for impairment, assets are grouped at the lowest levels for which there are separate, identifiable cash flows (CGUs).
Financial InstrumentsFinancial instruments reported in the balance sheet include other shares and participations, other non-current receivables, operating receiv-ables, cash and cash equivalents, borrowings, other non-current liabilities (pertaining to condi-tional earnout payments) and operating liabilities. Derivative instruments included in the items operating receivables and operating liabilities.
Financial assets The Group classifies its financial assets in the following categories: Financial assets
recognised at FVTPL (encompasses the items other shares and participations, and derivative instruments with positive fair value recognised in the item other current receivables) and Financial assets recognised at amortised cost (encom-passes the items other non-current receivables, trade receivables, and parts of current receiv-ables and cash and cash equivalents).
The classification of investments in liability instruments is based on the Group’s business model for managing financial assets and the contractual conditions for the assets’ cash flows. All of the Group’s financial assets that comprise debt instruments are classified in the category Financial assets at amortised cost. These include assets held in order to collect contractual cash flows and where these cash flows consist solely of principal and interest which is recognised at amortised cost. Interest income from these financial assets is recognised as financial income on the basis of the effective interest method. Profits and losses that arise upon derecognition from the balance sheet are recognised directly in profit or loss.
Purchases and sales of financial assets are recognised on the trade date, the date on which the Group commits itself to purchase or sell the asset. Financial assets are derecognised from the balance sheet when the rights to receive cash flows from the instruments have expired or been transferred, and the Group has substan-tially transferred all of the risks and rewards associated with ownership.
Financial assets initially valued at fair value, plus transaction costs directly pertaining to the purchase when the asset is not recognised at fair value in profit or loss. Transaction costs pertaining to financial assets recognised at FVTPL are expensed directly in profit or loss. The Group measures all equity instruments at fair value in profit or loss. Changes in the fair value of financial assets recognised at FVTPL are recognised in profit or loss.
In accordance with IFRS 9, the Group applies a modified approach for impairment testing of trade receivables. The modification results in the loss allowance for ECLs being calculated based on the risk of loss for the entire term of
the receivable and is recognised when the receivable is first recognised. To measure the ECLs, trade receivables have been collectively based on past-due days. The Group uses prospective variables to calculate ECLs. ECLs are recognised in the Group’s income statement under the item selling expenses.
Financial liabilitiesThe Group classifies its financial liabilities in the categories Financial liabilities measured at fair value through profit or loss (consists of conditional earnout payments recognised under the items Non-current and Current liabilities and derivative instruments with negative fair values recognised under the item Other current liabilities) and Other financial liabilities (encompassing the items current and non-current borrowings, trade payables and parts of the item Other current liabilities).
Financial liabilities measured at FVTPL are initially measured at fair value, while applica-ble transaction costs are recognised in profit or loss. Other financial liabilities are initially measured at fair value, net after transaction costs, and thereafter, at amortised cost using the effective interest method. Derivative instru-ments are recognised on the trade date and are not used for hedge accounting. Changes in fair value are, therefore, recognised immediately in profit or loss under Operating profit. The change in fair value for conditional earnout payments are recognised under the item Other operating income in profit or loss.
Financial liabilities are removed from the balance sheet when obligations have been reg-ulated or annulled, or have otherwise expired. The difference between the carrying amount for a financial liability (or part of a financial liability) that has been extinguished or transferred to another party and the payment made, including transferred assets that are not cash or assumed liabilities, is recognised in profit or loss.
Net investment hedgesThe Group applies net investment hedges in foreign operations, which are recognised according to the following: Any gain or loss on
64 FA G E R H U LT G R O U P A N N U A L R E P O R T 2 0 2 0
F I N A N C I A L I N F O R M A T I O N | A C C O U N T I N G P O L I C I E S
the hedging instrument relating to the effective portion of the hedge is recognised in other comprehensive income and is accumulated in reserves in equity. The gain or loss relating to the ineffective portion is recognised directly in profit or loss. Gains and losses accumulated in the item reserves in equity are reclassified to the income statement when the foreign operation is partially disposed of or sold. As a hedging instrument for net investments, the Group designates borrowings in the same currency as the net investment.
EquityTransaction costs which are directly applicable to the issue of new shares or share options are reported, net after tax, in equity, with a deduction for the proceeds of the issue. In the case of a repurchase of shares, retained earnings are reduced by the amount paid for the shares. When treasury shares are sold, retained earn-ings increase by the amount received.
Borrowings Borrowings (encompassing the items non- current and current borrowings in the balance sheet) are initially recognised at fair value, net after transaction costs. Borrowings are recognised thereafter at amortised cost and any difference between the amount received (net after transaction costs) and the repayment amount is recognised in profit or loss over the duration of the term, using the effective interest method.
Borrowings are classified as current liabilities if the Group does not have an unconditional right to defer payment of the liability for at least twelve months after the end of the reporting period.
Employee benefitsPension commitments Within the Group, there are both defined- contribution plans and defined-benefit plans. A defined-benefit plan is a pension plan stipulating a determined amount of pension benefit which the employee receives after retirement, usually based on several factors, such as age, length of
service or salary. A defined-contribution plan is a pension plan according to which the Group pays a fixed amount to a separate legal entity and, therewith, has no obligation to pay addi-tional premiums. Costs for employees’ service during current or previous periods impact the Group’s earnings.
In defined-benefit plans, benefits to employ-ees and former employees are based on the employee’s salary at the retirement date and on the number of years of service. The Group is liable for payment of the benefits.
The liability recognised in the balance sheet pertaining to defined-benefit plans is the present value of the defined-benefit commit-ments at the closing date and is adjusted for unrecognised actuarial gains/losses for service during previous periods. The defined-benefit commitments are calculated yearly by an inde-pendent actuary, applying the projected unit credit method. This method allocates pension costs in pace with the employees’ execution of services for the company, which increases their right to future remuneration. The company’s commitments are valued at the present value of the expected future payments, utilising a discount rate corresponding to interest on first-class corporate bonds. The most important actuarial assumptions are stated in Note 21.
Actuarial gains and losses may arise in conjunction with determination of the present value of the commitments. These can arise from actual outcomes deviating from earlier assumptions or from changed assumptions. These items are then reported in Other compre-hensive income in the period in which they arise. Costs of employment for previous periods are recognised directly in profit or loss.
For defined-contribution plans, the Group pays premiums into a public or privately admin-istered pension insurance plan on an obligatory, contractual or voluntary basis. The Group has no additional payment obligations when these premiums are paid. The premiums are reported as pension costs when they fall due. Prepaid premiums are recognised as assets to the extent that cash repayment or a decrease in future payments may benefit the Group.
Share-based paymentsThe Group has a share-savings plan, which is recognised as a plan settled through equity. The cost of the plan is calculated on the basis of the allocated shares’ fair value at the time of alloca-tion and is allocated over the term of the plan. In those cases, in which the plan may lead to costs in the form of social security contributions, the Group reserves the social security contributions on an ongoing basis at fair value, allocated over the term of the plan.
Termination benefitsTermination benefits are payable when an employee’s employment is terminated prior to the normal pensionable age or when an employee voluntarily accepts termination of employment in exchange for such benefits. The Group reports severance pay when there is a demonstrable obligation to terminate the employment according to a detailed, formal plan with no the possibility of reinstatement, or when it is required to provide termination benefits as a result of an offer to encourage employees to leave service voluntarily. Benefits falling due more than 12 months after the closing date are discounted to present value.
ProvisionsProvisions for restructuring costs and statutory requirements are recognised when the Group has a legal or informal obligation to do so as a result of previous events, when it is more likely that an outflow of resources will be required to settle the obligation rather than not be required, and when the amount can be reliably calculated.
If there are a number of similar obligations, an assessment is made of the probability that an outflow of resources will be required to settle the entire Group’s obligations. A provision is recognised even if the probability of an outflow for a separate item in this group of obligations is minimal.
Earnings per shareEarnings per share are calculated as net profit for the year in accordance with the income statement attributable to shareholders of the
FA G E R H U LT G R O U P A N N U A L R E P O R T 2 0 2 0 65
A C C O U N T I N G P O L I C I E S | F I N A N C I A L I N F O R M A T I O N
Parent Company in relation to the average number of shares outstanding before and after dilution.
Segment reportingOperating segments are reported in a manner consistent with the internal reporting provided to the chief operating decision maker. The chief operating decision maker is responsible for allocating resources and assessing the performance of the operating segments. The Group has identified this function as the CEO who makes the strategic decisions.
Expenses attributable to a particular segment are comprised of both direct expenses and a portion of Group-wide expenses. Unspecified expenses represent Group-wide expenses. The operating segments’ assets consist mainly of intangible assets, property, plant and equipment, inventories and trade receivables. Segment liabilities consist mainly of trade pay-ables, and accrual and deferral items. Fagerhult only applies IFRS 16 at Group level, and not at operating segment level.
As previously communicated in 2020, the Group has been working with strategy since 2019. The ambition has been to identify new opportunities for growth and to strengthen the Group’s individual brands as well as intra-Group collaboration. These efforts resulted in a new structure for the operations and for segment reporting from 1 January 2020.
The Group’s new structure is based on four business areas: Collection, Premium, Profes-sional and Infrastructure. Each of the Group’s 13 brands belong to one of the business areas and has therefore not had to be reallocated. The allocation has been made based on the segment’s product range, geographical pres-ence and partner focus. This structure replaces the previous segment reporting, which was based on geographic areas and product areas. The comparative figures for 2019 have been restated and goodwill has been reallocated to the new business areas, refer to the section on goodwill above. As a further step in the strategic review, Fagerhult evaluated various options in 2020 for exiting its South African operations,
Lighting Innovations. As a result, Fagerhult has implemented further structural changes in its internal organisation and, consequentially, in the external segment reporting. Lighting Innovations has been removed from the business area Professional and is now reported as a separate business area and operating segment, Lighting Innovations.
Lighting Innovations does not meet the quantitative thresholds for being reported separately under IFRS 8 Segment reporting. However, it is Fagerhult’s considered opinion that the disclosures about Lighting Innovations comprise useful and relevant information. The comparative figures for 2020 and 2019 have been restated and goodwill has been reallocated to the new business area and operating segment, Lighting Innovations.
DividendDividends to AB Fagerhult’s shareholders are recognised as liabilities in the consolidated balance sheet in the period in which the divi-dends were adopted by the Parent Company’s shareholders.
Parent Company’s accounting policiesThe Parent Company’s annual accounts have been prepared in accordance with the Swedish Annual Accounts Act and the Swedish Finan-cial Reporting Board’s recommendation RFR 2 Accounting for Legal Entities. RFR 2 stipulates that, in its annual accounts, the Parent Company is to apply International Financial Reporting Standards (IFRS) as endorsed by the EU, where this is possible within the framework of the Swedish Annual Accounts Act, and with regard to the connection between accounting and taxation. RFR 2 specifies the exceptions and supplements to be applied in relation to IFRS. Identified differences between accounting policies of the Group and the Parent Company mainly pertain to IAS 12 Income taxes. The amounts transferred to untaxed reserves constitute taxable temporary differences. Due to the connection between accounting and taxation, deferred tax liabilities applicable to
untaxed reserves are not disclosed separately in the Parent Company. Accordingly, these are reported in their gross amounts in the balance sheet. Appropriations are recognised at gross value in profit or loss.
Group contributions are recognised as appropriations. Furthermore, the Parent Company does not measure in accordance with IFRS 9, and instead applies the points stated in RFR 2 (IFRS 9 Financial Instruments, pp. 3–10). Nor does the Parent Company apply IFRS 16 Leases and has, from 1 January 2019, instead chosen to apply points 2–12 pertaining to IFRS 16 contained in RFR 2.
Significant estimates and assumptionsThe preparation of the annual accounts requires that qualified estimates and assess-ments be made for accounting purposes. Furthermore, company management exercises its judgement in the application of the Group’s accounting policies. Estimates and assess-ments can affect the income statement and the balance sheet, as well as any additional infor-mation which has been reported in the annual accounts. Consequently, changes in valuations and assessments can lead to changes in the annual accounts.
Impairment testing of goodwill and brands with indefinite useful livesFor the Group, it has been determined that the estimates and assessments made in connec-tion with impairment testing of goodwill and brands are of significance for the consolidated accounts. Each year, the Group conducts tests to determine whether any impairment requirement exists for carrying amounts. The recoverable amounts of cash-generating units are determined based on value-in-use calcula-tions. These calculations are based on certain assumptions regarding the future which, for the Group, are associated with a risk of material adjustments of carrying amounts during the forthcoming financial year. Significant assump-tions and the effects of reasonable changes of such are stated in Note 11. Intangible assets

66 FA G E R H U LT G R O U P A N N U A L R E P O R T 2 0 2 0
F I N A N C I A L I N F O R M A T I O N | A C C O U N T I N G P O L I C I E S
Assessment of the length of the leasing agreements Extension and termination options are included in most of the Group’s leases for factories/ production plants and offices.
When the term of the lease was determined, the management considered all available information that provided a financial incentive to exercise an extension option, or to not utilise an option to terminate a contract. The possibility of extending a contract is only included in the term of the lease if it is reasonably certain that the contract will be extended (or not terminated). The following factors are normally most relevant for leases for factories/production facilities and offices:• Historic lease terms and the costs and dis-
ruptions to operations entailed by the need to replace an existing factory/production facility or office premises;
• If the lease contains any material fees for terminating the lease (or not extending it), the Group normally considers it reasonably certain that the lease will be extended (or not terminated).
• If the Group has any expenses for leasehold improvements and expects these to have a substantial residual value, it normally reason-ably certain that the lease will be extended (or not terminated).
The majority of the lease extension options for factories/production facilities have been included in the lease liability, since the Group cannot replace assets without material costs for disruption to operations. The majority of the office leases comprise shorter lease terms and notice periods of one to three years. The Group’s assessment is that these shorter lease terms do not reflect the actual terms, and therefore a minimum term of three years has been applied.
An individual assessment is conducted in conjunction with the lease expiring or as soon as a decision to change the operations is known and where the change would affect the term of the lease.
Measurement of trade receivablesTrade receivables are recognised net of any provisions for expected credit losses. The loss allowance for trade receivables is based on the assumptions for risk of default and expected loss levels. The Group makes its own assump-tions and choices of input data for calculating impairment. These are based on historic data, known market conditions and forward-looking calculations at the end of each reporting period. Refer also to Note 6 Trade receivables and the section on Credit risk in Note 38 Risks.
Measurement of inventoriesInventories are reported using the first-in, first-out method at the lower of cost and net realisable value on the closing date. Estimates are required of projected sales volumes, which are primarily based on historic data and projec-tions. Refer also to Note 16 Inventories
Application of new or amended standardsNew and amended standards applied by the Group.None of the amendments of standards that apply from 1 January 2020 have had any material impact on the consolidated financial statements.
New standards and interpretations that have not yet been adopted by the Group.A number of new standards and interpretations come into effect for financial years starting after 1 January 2021, and have not been applied in the preparation of these financial statements. None of these standards or interpretations are expected to have any material impact on the consolidated financial statements.
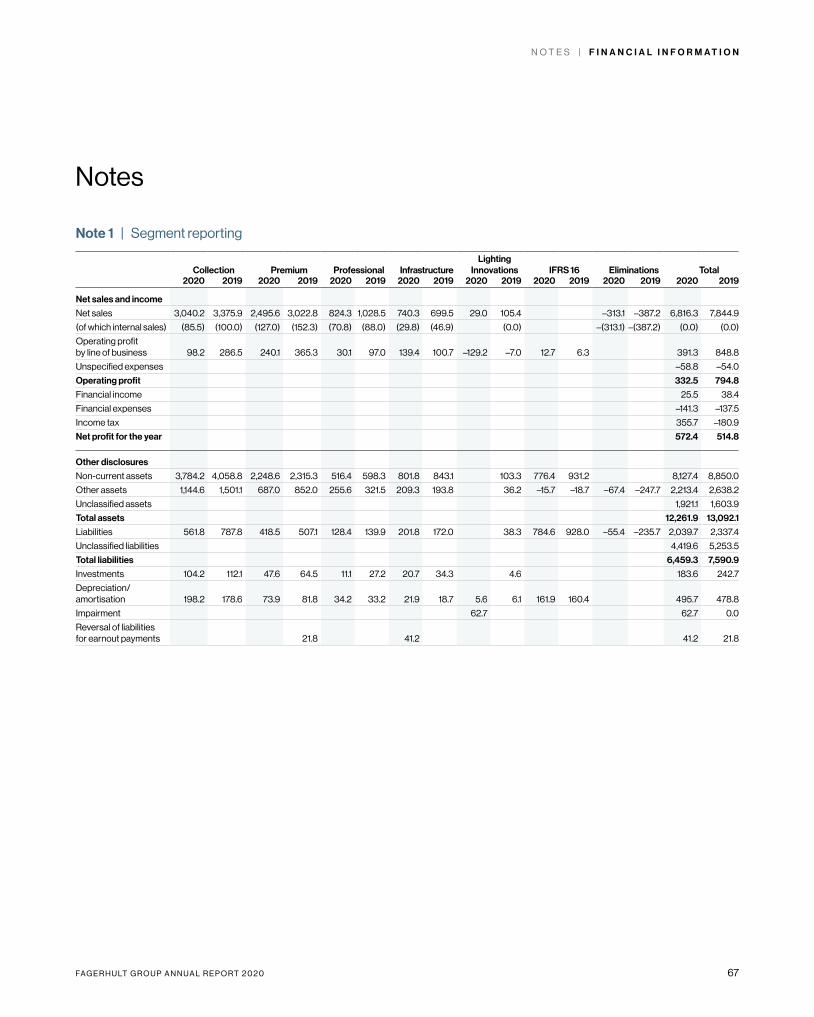
FA G E R H U LT G R O U P A N N U A L R E P O R T 2 0 2 0 67
N O T E S | F I N A N C I A L I N F O R M A T I O N
Note 1 | Segment reporting
Collection Premium Professional InfrastructureLighting
Innovations IFRS 16 Eliminations Total2020 2019 2020 2019 2020 2019 2020 2019 2020 2019 2020 2019 2020 2019 2020 2019
Net sales and income
Net sales 3,040.2 3,375.9 2,495.6 3,022.8 824.3 1,028.5 740.3 699.5 29.0 105.4 –313.1 –387.2 6,816.3 7,844.9
(of which internal sales) (85.5) (100.0) (127.0) (152.3) (70.8) (88.0) (29.8) (46.9) (0.0) –(313.1) –(387.2) (0.0) (0.0)
Operating profit by line of business 98.2 286.5 240.1 365.3 30.1 97.0 139.4 100.7 –129.2 –7.0 12.7 6.3 391.3 848.8
Unspecified expenses –58.8 –54.0
Operating profit 332.5 794.8
Financial income 25.5 38.4
Financial expenses –141.3 –137.5
Income tax 355.7 –180.9
Net profit for the year 572.4 514.8
Other disclosures
Non-current assets 3,784.2 4,058.8 2,248.6 2,315.3 516.4 598.3 801.8 843.1 103.3 776.4 931.2 8,127.4 8,850.0
Other assets 1,144.6 1,501.1 687.0 852.0 255.6 321.5 209.3 193.8 36.2 –15.7 –18.7 –67.4 –247.7 2,213.4 2,638.2
Unclassified assets 1,921.1 1,603.9
Total assets 12,261.9 13,092.1
Liabilities 561.8 787.8 418.5 507.1 128.4 139.9 201.8 172.0 38.3 784.6 928.0 –55.4 –235.7 2,039.7 2,337.4
Unclassified liabilities 4,419.6 5,253.5
Total liabilities 6,459.3 7,590.9
Investments 104.2 112.1 47.6 64.5 11.1 27.2 20.7 34.3 4.6 183.6 242.7
Depreciation/amortisation 198.2 178.6 73.9 81.8 34.2 33.2 21.9 18.7 5.6 6.1 161.9 160.4 495.7 478.8
Impairment 62.7 62.7 0.0
Reversal of liabilities for earnout payments 21.8 41.2 41.2 21.8
Notes
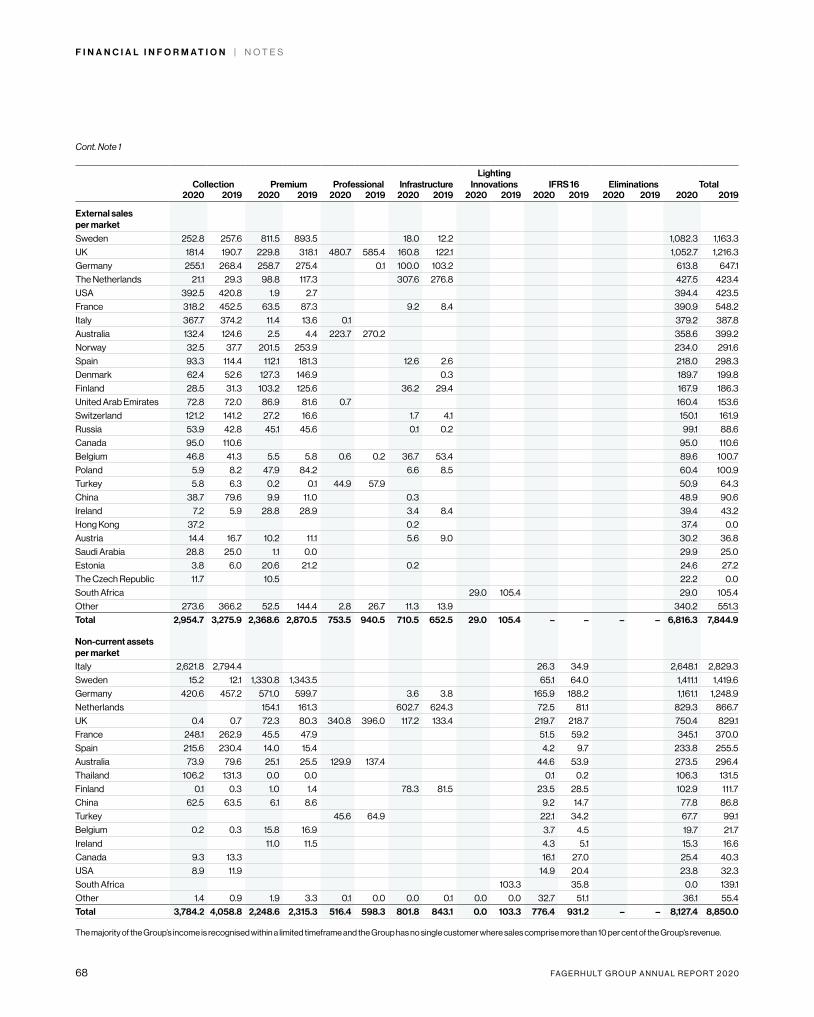
68 FA G E R H U LT G R O U P A N N U A L R E P O R T 2 0 2 0
F I N A N C I A L I N F O R M A T I O N | N O T E S
Collection Premium Professional InfrastructureLighting
Innovations IFRS 16 Eliminations Total2020 2019 2020 2019 2020 2019 2020 2019 2020 2019 2020 2019 2020 2019 2020 2019
External sales per market Sweden 252.8 257.6 811.5 893.5 18.0 12.2 1,082.3 1,163.3
UK 181.4 190.7 229.8 318.1 480.7 585.4 160.8 122.1 1,052.7 1,216.3
Germany 255.1 268.4 258.7 275.4 0.1 100.0 103.2 613.8 647.1
The Netherlands 21.1 29.3 98.8 117.3 307.6 276.8 427.5 423.4
USA 392.5 420.8 1.9 2.7 394.4 423.5
France 318.2 452.5 63.5 87.3 9.2 8.4 390.9 548.2
Italy 367.7 374.2 11.4 13.6 0.1 379.2 387.8
Australia 132.4 124.6 2.5 4.4 223.7 270.2 358.6 399.2
Norway 32.5 37.7 201.5 253.9 234.0 291.6
Spain 93.3 114.4 112.1 181.3 12.6 2.6 218.0 298.3
Denmark 62.4 52.6 127.3 146.9 0.3 189.7 199.8
Finland 28.5 31.3 103.2 125.6 36.2 29.4 167.9 186.3
United Arab Emirates 72.8 72.0 86.9 81.6 0.7 160.4 153.6
Switzerland 121.2 141.2 27.2 16.6 1.7 4.1 150.1 161.9
Russia 53.9 42.8 45.1 45.6 0.1 0.2 99.1 88.6
Canada 95.0 110.6 95.0 110.6
Belgium 46.8 41.3 5.5 5.8 0.6 0.2 36.7 53.4 89.6 100.7
Poland 5.9 8.2 47.9 84.2 6.6 8.5 60.4 100.9
Turkey 5.8 6.3 0.2 0.1 44.9 57.9 50.9 64.3
China 38.7 79.6 9.9 11.0 0.3 48.9 90.6
Ireland 7.2 5.9 28.8 28.9 3.4 8.4 39.4 43.2
Hong Kong 37.2 0.2 37.4 0.0
Austria 14.4 16.7 10.2 11.1 5.6 9.0 30.2 36.8
Saudi Arabia 28.8 25.0 1.1 0.0 29.9 25.0
Estonia 3.8 6.0 20.6 21.2 0.2 24.6 27.2
The Czech Republic 11.7 10.5 22.2 0.0
South Africa 29.0 105.4 29.0 105.4
Other 273.6 366.2 52.5 144.4 2.8 26.7 11.3 13.9 340.2 551.3
Total 2,954.7 3,275.9 2,368.6 2,870.5 753.5 940.5 710.5 652.5 29.0 105.4 – – – – 6,816.3 7,844.9
Non-current assets per market Italy 2,621.8 2,794.4 26.3 34.9 2,648.1 2,829.3
Sweden 15.2 12.1 1,330.8 1,343.5 65.1 64.0 1,411.1 1,419.6
Germany 420.6 457.2 571.0 599.7 3.6 3.8 165.9 188.2 1,161.1 1,248.9
Netherlands 154.1 161.3 602.7 624.3 72.5 81.1 829.3 866.7
UK 0.4 0.7 72.3 80.3 340.8 396.0 117.2 133.4 219.7 218.7 750.4 829.1
France 248.1 262.9 45.5 47.9 51.5 59.2 345.1 370.0
Spain 215.6 230.4 14.0 15.4 4.2 9.7 233.8 255.5
Australia 73.9 79.6 25.1 25.5 129.9 137.4 44.6 53.9 273.5 296.4
Thailand 106.2 131.3 0.0 0.0 0.1 0.2 106.3 131.5
Finland 0.1 0.3 1.0 1.4 78.3 81.5 23.5 28.5 102.9 111.7
China 62.5 63.5 6.1 8.6 9.2 14.7 77.8 86.8
Turkey 45.6 64.9 22.1 34.2 67.7 99.1
Belgium 0.2 0.3 15.8 16.9 3.7 4.5 19.7 21.7
Ireland 11.0 11.5 4.3 5.1 15.3 16.6
Canada 9.3 13.3 16.1 27.0 25.4 40.3
USA 8.9 11.9 14.9 20.4 23.8 32.3
South Africa 103.3 35.8 0.0 139.1
Other 1.4 0.9 1.9 3.3 0.1 0.0 0.0 0.1 0.0 0.0 32.7 51.1 36.1 55.4
Total 3,784.2 4,058.8 2,248.6 2,315.3 516.4 598.3 801.8 843.1 0.0 103.3 776.4 931.2 – – 8,127.4 8,850.0
The majority of the Group’s income is recognised within a limited timeframe and the Group has no single customer where sales comprise more than 10 per cent of the Group’s revenue.
Cont. Note 1
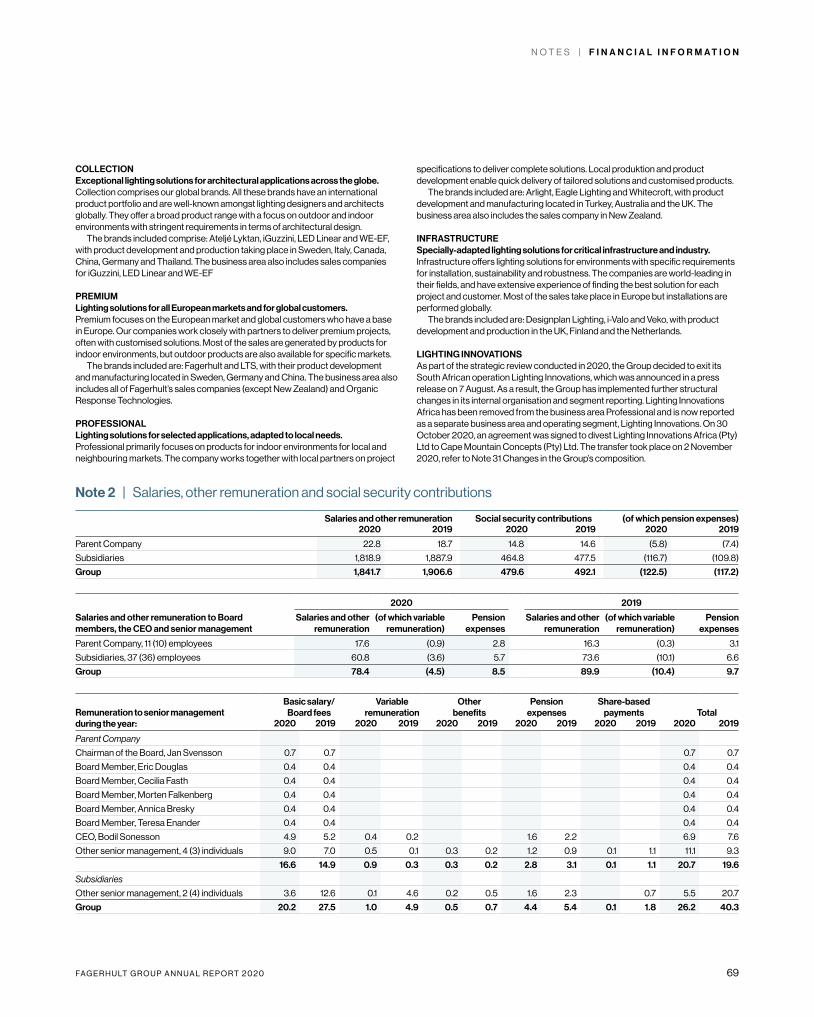
FA G E R H U LT G R O U P A N N U A L R E P O R T 2 0 2 0 69
N O T E S | F I N A N C I A L I N F O R M A T I O N
COLLECTIONExceptional lighting solutions for architectural applications across the globe.Collection comprises our global brands. All these brands have an international product portfolio and are well-known amongst lighting designers and architects globally. They offer a broad product range with a focus on outdoor and indoor environments with stringent requirements in terms of architectural design.
The brands included comprise: Ateljé Lyktan, iGuzzini, LED Linear and WE-EF, with product development and production taking place in Sweden, Italy, Canada, China, Germany and Thailand. The business area also includes sales companies for iGuzzini, LED Linear and WE-EF
PREMIUM Lighting solutions for all European markets and for global customers. Premium focuses on the European market and global customers who have a base in Europe. Our companies work closely with partners to deliver premium projects, often with customised solutions. Most of the sales are generated by products for indoor environments, but outdoor products are also available for specific markets.
The brands included are: Fagerhult and LTS, with their product development and manufacturing located in Sweden, Germany and China. The business area also includes all of Fagerhult’s sales companies (except New Zealand) and Organic Response Technologies.
PROFESSIONALLighting solutions for selected applications, adapted to local needs. Professional primarily focuses on products for indoor environments for local and neighbouring markets. The company works together with local partners on project
specifications to deliver complete solutions. Local produktion and product development enable quick delivery of tailored solutions and customised products.
The brands included are: Arlight, Eagle Lighting and Whitecroft, with product development and manufacturing located in Turkey, Australia and the UK. The business area also includes the sales company in New Zealand.
INFRASTRUCTURE Specially-adapted lighting solutions for critical infrastructure and industry. Infrastructure offers lighting solutions for environments with specific requirements for installation, sustainability and robustness. The companies are world-leading in their fields, and have extensive experience of finding the best solution for each project and customer. Most of the sales take place in Europe but installations are performed globally.
The brands included are: Designplan Lighting, i-Valo and Veko, with product development and production in the UK, Finland and the Netherlands.
LIGHTING INNOVATIONSAs part of the strategic review conducted in 2020, the Group decided to exit its South African operation Lighting Innovations, which was announced in a press release on 7 August. As a result, the Group has implemented further structural changes in its internal organisation and segment reporting. Lighting Innovations Africa has been removed from the business area Professional and is now reported as a separate business area and operating segment, Lighting Innovations. On 30 October 2020, an agreement was signed to divest Lighting Innovations Africa (Pty) Ltd to Cape Mountain Concepts (Pty) Ltd. The transfer took place on 2 November 2020, refer to Note 31 Changes in the Group’s composition.
Note 2 | Salaries, other remuneration and social security contributions
Salaries and other remuneration Social security contributions (of which pension expenses)2020 2019 2020 2019 2020 2019
Parent Company 22.8 18.7 14.8 14.6 (5.8) (7.4)
Subsidiaries 1,818.9 1,887.9 464.8 477.5 (116.7) (109.8)
Group 1,841.7 1,906.6 479.6 492.1 (122.5) (117.2)
2020 2019
Salaries and other remuneration to Board members, the CEO and senior management
Salaries and other remuneration
(of which variable remuneration)
Pension expenses
Salaries and other remuneration
(of which variable remuneration)
Pension expenses
Parent Company, 11 (10) employees 17.6 (0.9) 2.8 16.3 (0.3) 3.1
Subsidiaries, 37 (36) employees 60.8 (3.6) 5.7 73.6 (10.1) 6.6
Group 78.4 (4.5) 8.5 89.9 (10.4) 9.7
Remuneration to senior management during the year:
Basic salary/ Board fees
Variable remuneration
Other benefits
Pension expenses
Share-based payments Total
2020 2019 2020 2019 2020 2019 2020 2019 2020 2019 2020 2019
Parent Company
Chairman of the Board, Jan Svensson 0.7 0.7 0.7 0.7
Board Member, Eric Douglas 0.4 0.4 0.4 0.4
Board Member, Cecilia Fasth 0.4 0.4 0.4 0.4
Board Member, Morten Falkenberg 0.4 0.4 0.4 0.4
Board Member, Annica Bresky 0.4 0.4 0.4 0.4
Board Member, Teresa Enander 0.4 0.4 0.4 0.4
CEO, Bodil Sonesson 4.9 5.2 0.4 0.2 1.6 2.2 6.9 7.6
Other senior management, 4 (3) individuals 9.0 7.0 0.5 0.1 0.3 0.2 1.2 0.9 0.1 1.1 11.1 9.3
16.6 14.9 0.9 0.3 0.3 0.2 2.8 3.1 0.1 1.1 20.7 19.6
Subsidiaries
Other senior management, 2 (4) individuals 3.6 12.6 0.1 4.6 0.2 0.5 1.6 2.3 0.7 5.5 20.7
Group 20.2 27.5 1.0 4.9 0.5 0.7 4.4 5.4 0.1 1.8 26.2 40.3
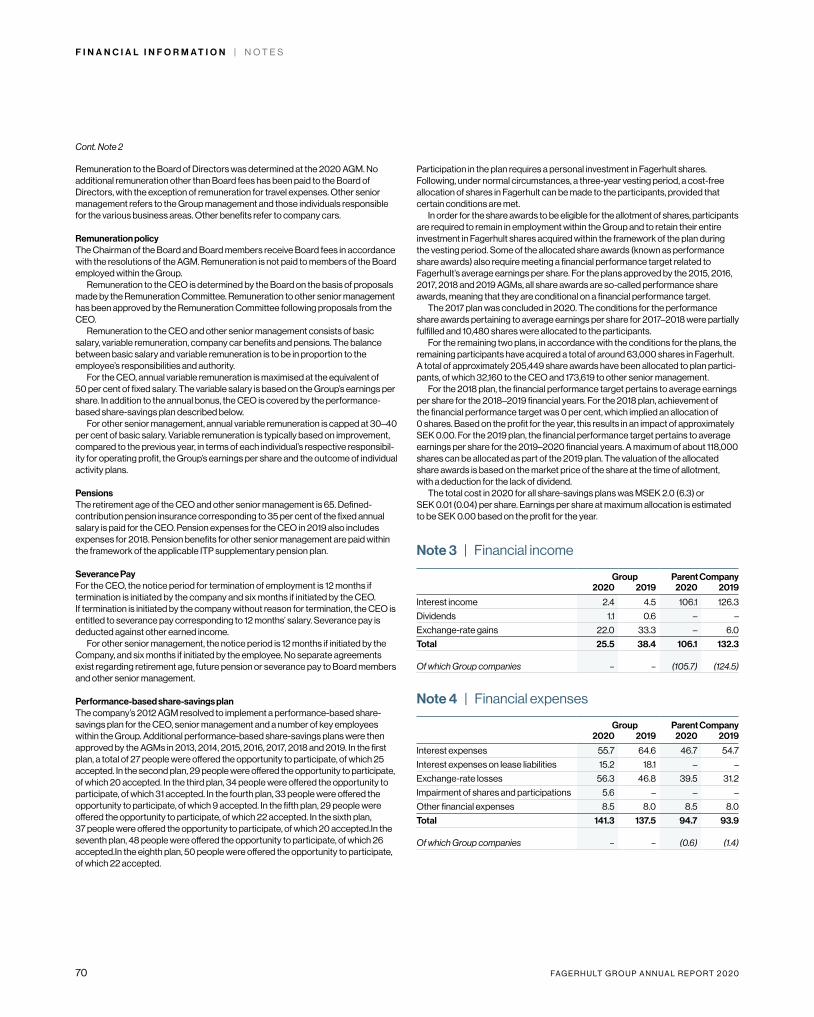
70 FA G E R H U LT G R O U P A N N U A L R E P O R T 2 0 2 0
F I N A N C I A L I N F O R M A T I O N | N O T E S
Remuneration to the Board of Directors was determined at the 2020 AGM. No additional remuneration other than Board fees has been paid to the Board of Directors, with the exception of remuneration for travel expenses. Other senior management refers to the Group management and those individuals responsible for the various business areas. Other benefits refer to company cars.
Remuneration policyThe Chairman of the Board and Board members receive Board fees in accordance with the resolutions of the AGM. Remuneration is not paid to members of the Board employed within the Group.
Remuneration to the CEO is determined by the Board on the basis of proposals made by the Remuneration Committee. Remuneration to other senior management has been approved by the Remuneration Committee following proposals from the CEO.
Remuneration to the CEO and other senior management consists of basic salary, variable remuneration, company car benefits and pensions. The balance between basic salary and variable remuneration is to be in proportion to the employee’s responsibilities and authority.
For the CEO, annual variable remuneration is maximised at the equivalent of 50 per cent of fixed salary. The variable salary is based on the Group’s earnings per share. In addition to the annual bonus, the CEO is covered by the performance- based share-savings plan described below.
For other senior management, annual variable remuneration is capped at 30–40 per cent of basic salary. Variable remuneration is typically based on improvement, compared to the previous year, in terms of each individual’s respective responsibil-ity for operating profit, the Group’s earnings per share and the outcome of individual activity plans.
PensionsThe retirement age of the CEO and other senior management is 65. Defined- contribution pension insurance corresponding to 35 per cent of the fixed annual salary is paid for the CEO. Pension expenses for the CEO in 2019 also includes expenses for 2018. Pension benefits for other senior management are paid within the framework of the applicable ITP supplementary pension plan.
Severance PayFor the CEO, the notice period for termination of employment is 12 months if termination is initiated by the company and six months if initiated by the CEO. If termination is initiated by the company without reason for termination, the CEO is entitled to severance pay corresponding to 12 months’ salary. Severance pay is deducted against other earned income.
For other senior management, the notice period is 12 months if initiated by the Company, and six months if initiated by the employee. No separate agreements exist regarding retirement age, future pension or severance pay to Board members and other senior management.
Performance-based share-savings planThe company’s 2012 AGM resolved to implement a performance-based share- savings plan for the CEO, senior management and a number of key employees within the Group. Additional performance-based share-savings plans were then approved by the AGMs in 2013, 2014, 2015, 2016, 2017, 2018 and 2019. In the first plan, a total of 27 people were offered the opportunity to participate, of which 25 accepted. In the second plan, 29 people were offered the opportunity to participate, of which 20 accepted. In the third plan, 34 people were offered the opportunity to participate, of which 31 accepted. In the fourth plan, 33 people were offered the opportunity to participate, of which 9 accepted. In the fifth plan, 29 people were offered the opportunity to participate, of which 22 accepted. In the sixth plan, 37 people were offered the opportunity to participate, of which 20 accepted.In the seventh plan, 48 people were offered the opportunity to participate, of which 26 accepted.In the eighth plan, 50 people were offered the opportunity to participate, of which 22 accepted.
Participation in the plan requires a personal investment in Fagerhult shares. Following, under normal circumstances, a three-year vesting period, a cost-free allocation of shares in Fagerhult can be made to the participants, provided that certain conditions are met.
In order for the share awards to be eligible for the allotment of shares, participants are required to remain in employment within the Group and to retain their entire investment in Fagerhult shares acquired within the framework of the plan during the vesting period. Some of the allocated share awards (known as performance share awards) also require meeting a financial performance target related to Fagerhult’s average earnings per share. For the plans approved by the 2015, 2016, 2017, 2018 and 2019 AGMs, all share awards are so-called performance share awards, meaning that they are conditional on a financial performance target.
The 2017 plan was concluded in 2020. The conditions for the performance share awards pertaining to average earnings per share for 2017–2018 were partially fulfilled and 10,480 shares were allocated to the participants.
For the remaining two plans, in accordance with the conditions for the plans, the remaining participants have acquired a total of around 63,000 shares in Fagerhult. A total of approximately 205,449 share awards have been allocated to plan partici-pants, of which 32,160 to the CEO and 173,619 to other senior management.
For the 2018 plan, the financial performance target pertains to average earnings per share for the 2018–2019 financial years. For the 2018 plan, achievement of the financial performance target was 0 per cent, which implied an allocation of 0 shares. Based on the profit for the year, this results in an impact of approximately SEK 0.00. For the 2019 plan, the financial performance target pertains to average earnings per share for the 2019–2020 financial years. A maximum of about 118,000 shares can be allocated as part of the 2019 plan. The valuation of the allocated share awards is based on the market price of the share at the time of allotment, with a deduction for the lack of dividend.
The total cost in 2020 for all share-savings plans was MSEK 2.0 (6.3) or SEK 0.01 (0.04) per share. Earnings per share at maximum allocation is estimated to be SEK 0.00 based on the profit for the year.
Note 3 | Financial income
Group Parent Company2020 2019 2020 2019
Interest income 2.4 4.5 106.1 126.3
Dividends 1.1 0.6 – –
Exchange-rate gains 22.0 33.3 – 6.0
Total 25.5 38.4 106.1 132.3
Of which Group companies – – (105.7) (124.5)
Note 4 | Financial expenses
Group Parent Company2020 2019 2020 2019
Interest expenses 55.7 64.6 46.7 54.7
Interest expenses on lease liabilities 15.2 18.1 – –
Exchange-rate losses 56.3 46.8 39.5 31.2
Impairment of shares and participations 5.6 – – –
Other financial expenses 8.5 8.0 8.5 8.0
Total 141.3 137.5 94.7 93.9
Of which Group companies – – (0.6) (1.4)
Cont. Note 2
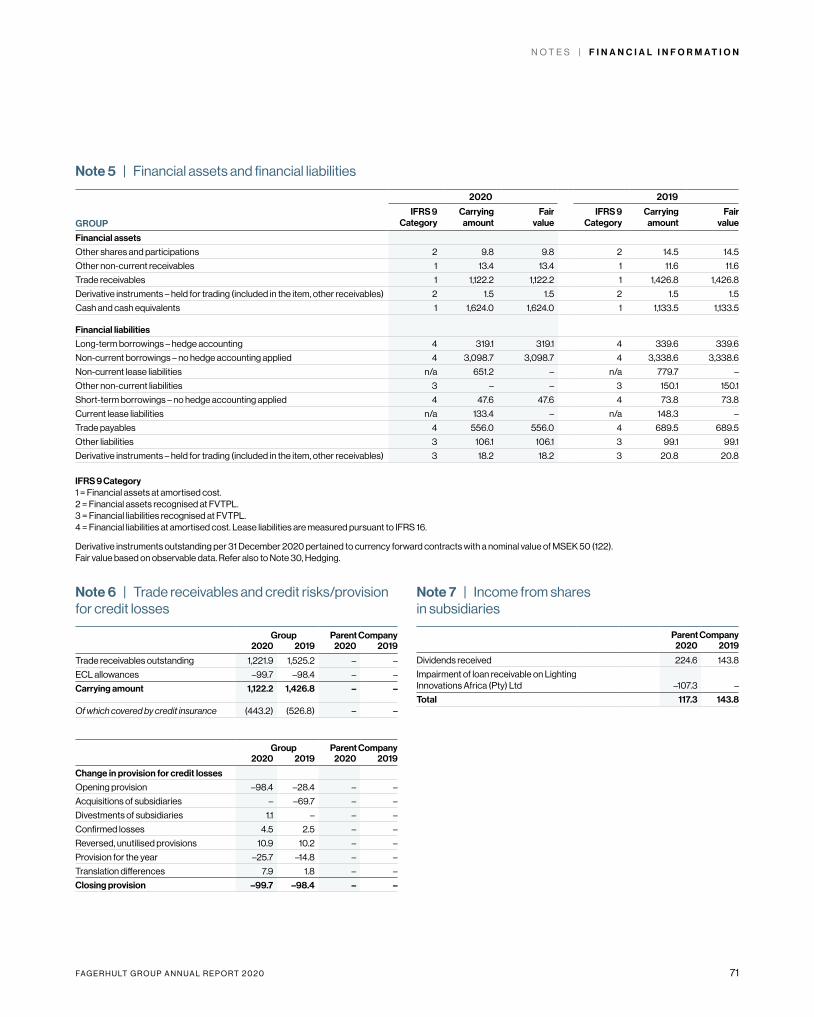
FA G E R H U LT G R O U P A N N U A L R E P O R T 2 0 2 0 71
N O T E S | F I N A N C I A L I N F O R M A T I O N
Note 5 | Financial assets and financial liabilities
GROUP
2020 2019
IFRS 9 Category
Carrying amount
Fair value
IFRS 9 Category
Carrying amount
Fair value
Financial assets
Other shares and participations 2 9.8 9.8 2 14.5 14.5
Other non-current receivables 1 13.4 13.4 1 11.6 11.6
Trade receivables 1 1,122.2 1,122.2 1 1,426.8 1,426.8
Derivative instruments – held for trading (included in the item, other receivables) 2 1.5 1.5 2 1.5 1.5
Cash and cash equivalents 1 1,624.0 1,624.0 1 1,133.5 1,133.5
Financial liabilities
Long-term borrowings – hedge accounting 4 319.1 319.1 4 339.6 339.6
Non-current borrowings – no hedge accounting applied 4 3,098.7 3,098.7 4 3,338.6 3,338.6
Non-current lease liabilities n/a 651.2 – n/a 779.7 –
Other non-current liabilities 3 – – 3 150.1 150.1
Short-term borrowings – no hedge accounting applied 4 47.6 47.6 4 73.8 73.8
Current lease liabilities n/a 133.4 – n/a 148.3 –
Trade payables 4 556.0 556.0 4 689.5 689.5
Other liabilities 3 106.1 106.1 3 99.1 99.1
Derivative instruments – held for trading (included in the item, other receivables) 3 18.2 18.2 3 20.8 20.8
IFRS 9 Category1 = Financial assets at amortised cost. 2 = Financial assets recognised at FVTPL. 3 = Financial liabilities recognised at FVTPL. 4 = Financial liabilities at amortised cost. Lease liabilities are measured pursuant to IFRS 16.
Derivative instruments outstanding per 31 December 2020 pertained to currency forward contracts with a nominal value of MSEK 50 (122). Fair value based on observable data. Refer also to Note 30, Hedging.
Note 6 | Trade receivables and credit risks/provision for credit losses
Group Parent Company2020 2019 2020 2019
Trade receivables outstanding 1,221.9 1,525.2 – –
ECL allowances –99.7 –98.4 – –
Carrying amount 1,122.2 1,426.8 – –
Of which covered by credit insurance (443.2) (526.8) – –
Group Parent Company2020 2019 2020 2019
Change in provision for credit losses
Opening provision –98.4 –28.4 – –
Acquisitions of subsidiaries – –69.7 – –
Divestments of subsidiaries 1.1 – – –
Confirmed losses 4.5 2.5 – –
Reversed, unutilised provisions 10.9 10.2 – –
Provision for the year –25.7 –14.8 – –
Translation differences 7.9 1.8 – –
Closing provision –99.7 –98.4 – –
Note 7 | Income from shares in subsidiaries
Parent Company2020 2019
Dividends received 224.6 143.8
Impairment of loan receivable on Lighting Innovations Africa (Pty) Ltd –107.3 –
Total 117.3 143.8
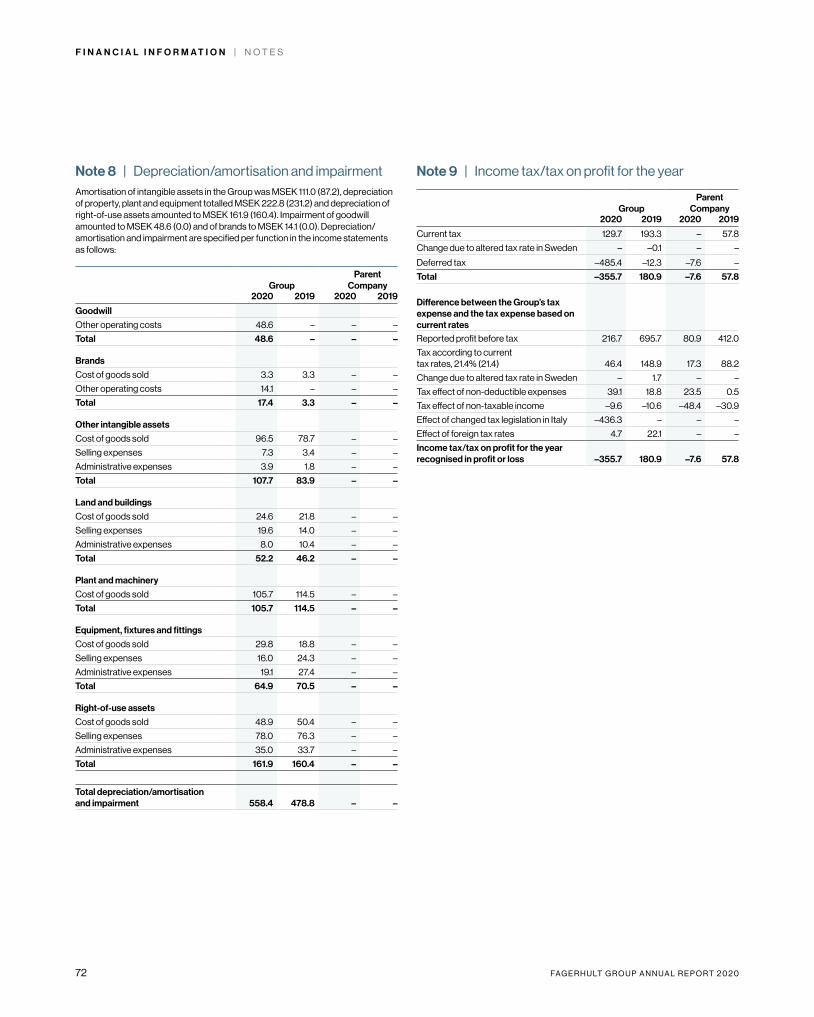
72 FA G E R H U LT G R O U P A N N U A L R E P O R T 2 0 2 0
F I N A N C I A L I N F O R M A T I O N | N O T E S
Note 8 | Depreciation/amortisation and impairmentAmortisation of intangible assets in the Group was MSEK 111.0 (87.2), depreciation of property, plant and equipment totalled MSEK 222.8 (231.2) and depreciation of right-of-use assets amounted to MSEK 161.9 (160.4). Impairment of goodwill amounted to MSEK 48.6 (0.0) and of brands to MSEK 14.1 (0.0). Depreciation/amortisation and impairment are specified per function in the income statements as follows:
GroupParent
Company2020 2019 2020 2019
Goodwill
Other operating costs 48.6 – – –
Total 48.6 – – –
Brands
Cost of goods sold 3.3 3.3 – –
Other operating costs 14.1 – – –
Total 17.4 3.3 – –
Other intangible assets
Cost of goods sold 96.5 78.7 – –
Selling expenses 7.3 3.4 – –
Administrative expenses 3.9 1.8 – –
Total 107.7 83.9 – –
Land and buildings
Cost of goods sold 24.6 21.8 – –
Selling expenses 19.6 14.0 – –
Administrative expenses 8.0 10.4 – –
Total 52.2 46.2 – –
Plant and machinery
Cost of goods sold 105.7 114.5 – –
Total 105.7 114.5 – –
Equipment, fixtures and fittings
Cost of goods sold 29.8 18.8 – –
Selling expenses 16.0 24.3 – –
Administrative expenses 19.1 27.4 – –
Total 64.9 70.5 – –
Right-of-use assets
Cost of goods sold 48.9 50.4 – –
Selling expenses 78.0 76.3 – –
Administrative expenses 35.0 33.7 – –
Total 161.9 160.4 – –
Total depreciation/amortisation and impairment 558.4 478.8 – –
Note 9 | Income tax/tax on profit for the year
GroupParent
Company2020 2019 2020 2019
Current tax 129.7 193.3 – 57.8
Change due to altered tax rate in Sweden – –0.1 – –
Deferred tax –485.4 –12.3 –7.6 –
Total –355.7 180.9 –7.6 57.8
Difference between the Group’s tax expense and the tax expense based on current rates Reported profit before tax 216.7 695.7 80.9 412.0
Tax according to current tax rates, 21.4% (21.4) 46.4 148.9 17.3 88.2
Change due to altered tax rate in Sweden – 1.7 – –
Tax effect of non-deductible expenses 39.1 18.8 23.5 0.5
Tax effect of non-taxable income –9.6 –10.6 –48.4 –30.9
Effect of changed tax legislation in Italy –436.3 – – –
Effect of foreign tax rates 4.7 22.1 – –
Income tax/tax on profit for the year recognised in profit or loss –355.7 180.9 –7.6 57.8
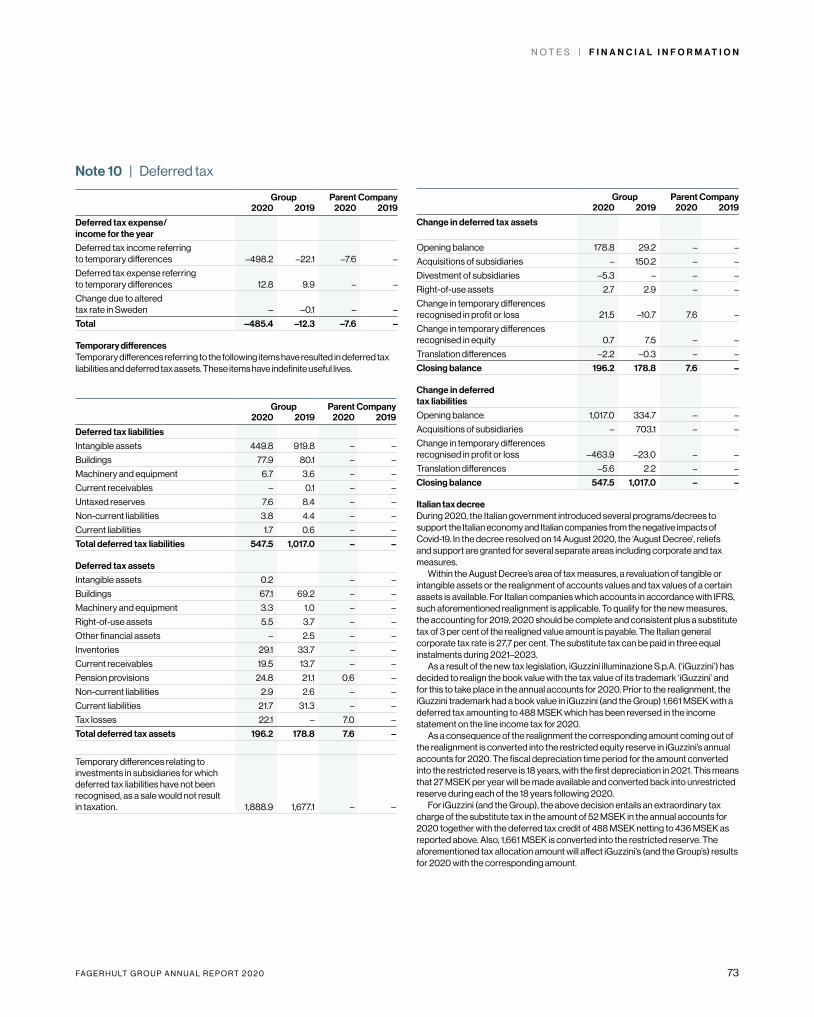
FA G E R H U LT G R O U P A N N U A L R E P O R T 2 0 2 0 73
N O T E S | F I N A N C I A L I N F O R M A T I O N
Note 10 | Deferred tax
Group Parent Company2020 2019 2020 2019
Deferred tax expense/ income for the year
Deferred tax income referring to temporary differences –498.2 –22.1 –7.6 –
Deferred tax expense referring to temporary differences 12.8 9.9 – –
Change due to altered tax rate in Sweden – –0.1 – –
Total –485.4 –12.3 –7.6 –
Temporary differences Temporary differences referring to the following items have resulted in deferred tax liabilities and deferred tax assets. These items have indefinite useful lives.
Group Parent Company2020 2019 2020 2019
Deferred tax liabilities
Intangible assets 449.8 919.8 – –
Buildings 77.9 80.1 – –
Machinery and equipment 6.7 3.6 – –
Current receivables – 0.1 – –
Untaxed reserves 7.6 8.4 – –
Non-current liabilities 3.8 4.4 – –
Current liabilities 1.7 0.6 – –
Total deferred tax liabilities 547.5 1,017.0 – –
Deferred tax assets
Intangible assets 0.2 – –
Buildings 67.1 69.2 – –
Machinery and equipment 3.3 1.0 – –
Right-of-use assets 5.5 3.7 – –
Other financial assets – 2.5 – –
Inventories 29.1 33.7 – –
Current receivables 19.5 13.7 – –
Pension provisions 24.8 21.1 0.6 –
Non-current liabilities 2.9 2.6 – –
Current liabilities 21.7 31.3 – –
Tax losses 22.1 – 7.0 –
Total deferred tax assets 196.2 178.8 7.6 –
Temporary differences relating to investments in subsidiaries for which deferred tax liabilities have not been recognised, as a sale would not result in taxation. 1,888.9 1,677.1 – –
Group Parent Company2020 2019 2020 2019
Change in deferred tax assets
Opening balance 178.8 29.2 – –
Acquisitions of subsidiaries – 150.2 – –
Divestment of subsidiaries –5.3 – – –
Right-of-use assets 2.7 2.9 – –
Change in temporary differences recognised in profit or loss 21.5 –10.7 7.6 –
Change in temporary differences recognised in equity 0.7 7.5 – –
Translation differences –2.2 –0.3 – –
Closing balance 196.2 178.8 7.6 –
Change in deferred tax liabilities
Opening balance 1,017.0 334.7 – –
Acquisitions of subsidiaries – 703.1 – –
Change in temporary differences recognised in profit or loss –463.9 –23.0 – –
Translation differences –5.6 2.2 – –
Closing balance 547.5 1,017.0 – –
Italian tax decreeDuring 2020, the Italian government introduced several programs/decrees to support the Italian economy and Italian companies from the negative impacts of Covid-19. In the decree resolved on 14 August 2020, the ‘August Decree’, reliefs and support are granted for several separate areas including corporate and tax measures.
Within the August Decree’s area of tax measures, a revaluation of tangible or intangible assets or the realignment of accounts values and tax values of a certain assets is available. For Italian companies which accounts in accordance with IFRS, such aforementioned realignment is applicable. To qualify for the new measures, the accounting for 2019, 2020 should be complete and consistent plus a substitute tax of 3 per cent of the realigned value amount is payable. The Italian general corporate tax rate is 27,7 per cent. The substitute tax can be paid in three equal instalments during 2021–2023.
As a result of the new tax legislation, iGuzzini illuminazione S.p.A. (‘iGuzzini’) has decided to realign the book value with the tax value of its trademark ‘iGuzzini’ and for this to take place in the annual accounts for 2020. Prior to the realignment, the iGuzzini trademark had a book value in iGuzzini (and the Group) 1,661 MSEK with a deferred tax amounting to 488 MSEK which has been reversed in the income statement on the line income tax for 2020.
As a consequence of the realignment the corresponding amount coming out of the realignment is converted into the restricted equity reserve in iGuzzini’s annual accounts for 2020. The fiscal depreciation time period for the amount converted into the restricted reserve is 18 years, with the first depreciation in 2021. This means that 27 MSEK per year will be made available and converted back into unrestricted reserve during each of the 18 years following 2020.
For iGuzzini (and the Group), the above decision entails an extraordinary tax charge of the substitute tax in the amount of 52 MSEK in the annual accounts for 2020 together with the deferred tax credit of 488 MSEK netting to 436 MSEK as reported above. Also, 1,661 MSEK is converted into the restricted reserve. The aforementioned tax allocation amount will affect iGuzzini’s (and the Group’s) results for 2020 with the corresponding amount.
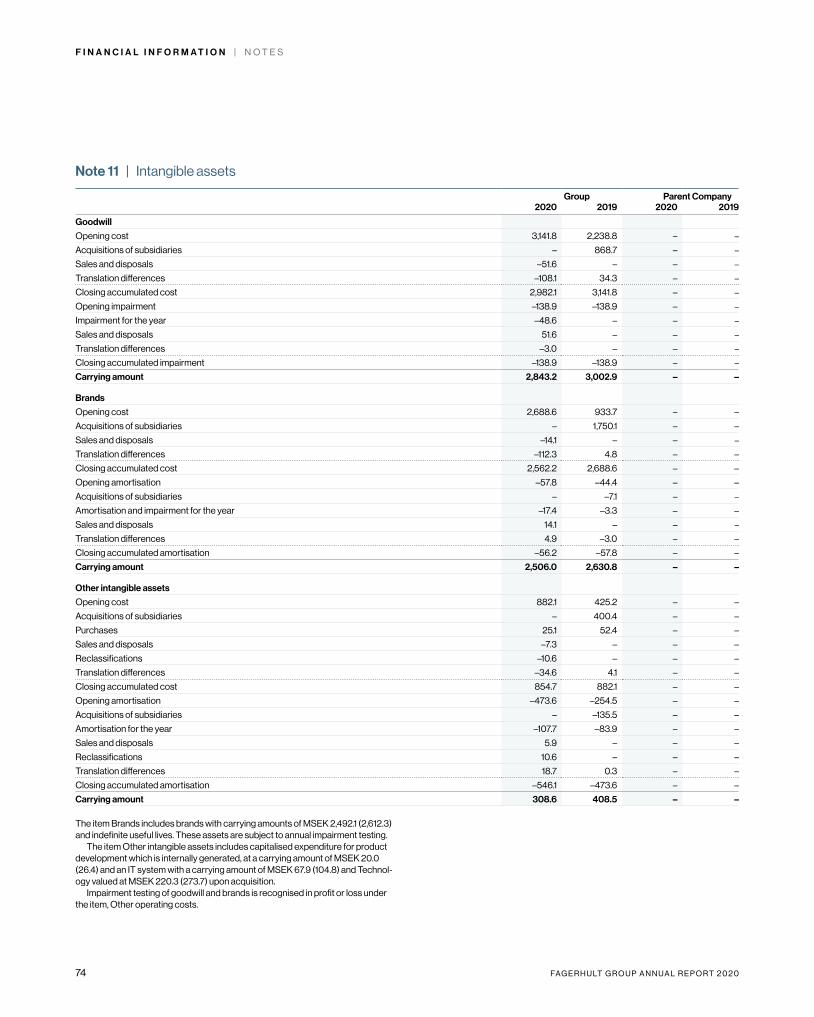
74 FA G E R H U LT G R O U P A N N U A L R E P O R T 2 0 2 0
F I N A N C I A L I N F O R M A T I O N | N O T E S
Note 11 | Intangible assets
Group Parent Company2020 2019 2020 2019
Goodwill
Opening cost 3,141.8 2,238.8 – –
Acquisitions of subsidiaries – 868.7 – –
Sales and disposals –51.6 – – –
Translation differences –108.1 34.3 – –
Closing accumulated cost 2,982.1 3,141.8 – –
Opening impairment –138.9 –138.9 – –
Impairment for the year –48.6 – – –
Sales and disposals 51.6 – – –
Translation differences –3.0 – – –
Closing accumulated impairment –138.9 –138.9 – –
Carrying amount 2,843.2 3,002.9 – –
Brands
Opening cost 2,688.6 933.7 – –
Acquisitions of subsidiaries – 1,750.1 – –
Sales and disposals –14.1 – – –
Translation differences –112.3 4.8 – –
Closing accumulated cost 2,562.2 2,688.6 – –
Opening amortisation –57.8 –44.4 – –
Acquisitions of subsidiaries – –7.1 – –
Amortisation and impairment for the year –17.4 –3.3 – –
Sales and disposals 14.1 – – –
Translation differences 4.9 –3.0 – –
Closing accumulated amortisation –56.2 –57.8 – –
Carrying amount 2,506.0 2,630.8 – –
Other intangible assets
Opening cost 882.1 425.2 – –
Acquisitions of subsidiaries – 400.4 – –
Purchases 25.1 52.4 – –
Sales and disposals –7.3 – – –
Reclassifications –10.6 – – –
Translation differences –34.6 4.1 – –
Closing accumulated cost 854.7 882.1 – –
Opening amortisation –473.6 –254.5 – –
Acquisitions of subsidiaries – –135.5 – –
Amortisation for the year –107.7 –83.9 – –
Sales and disposals 5.9 – – –
Reclassifications 10.6 – – –
Translation differences 18.7 0.3 – –
Closing accumulated amortisation –546.1 –473.6 – –
Carrying amount 308.6 408.5 – –
The item Brands includes brands with carrying amounts of MSEK 2,492.1 (2,612.3) and indefinite useful lives. These assets are subject to annual impairment testing.
The item Other intangible assets includes capitalised expenditure for product development which is internally generated, at a carrying amount of MSEK 20.0 (26.4) and an IT system with a carrying amount of MSEK 67.9 (104.8) and Technol-ogy valued at MSEK 220.3 (273.7) upon acquisition.
Impairment testing of goodwill and brands is recognised in profit or loss under the item, Other operating costs.
FA G E R H U LT G R O U P A N N U A L R E P O R T 2 0 2 0 75
N O T E S | F I N A N C I A L I N F O R M A T I O N
Impairment testing of Goodwill and Brands with indefinite useful livesOn 1 January 2020, the carrying amount for goodwill was reallocated based on relative fair values in conjunction with the changes in the internal organisation and external segment reporting. Each of the Group’s 13 brands belong to one of the business areas and therefore did not require reallocation. As of this date, the carry-ing amounts for goodwill of MSEK 48.6 and brands of MSEK 14.1 were allocated to the new segment Lighting Innovations. Both of these items were fully written down in 2020, refer also to Note 31 Changes in the Group’s composition and Note 34 Other operating costs.
As of 31 December 2019, goodwill and brands for the Group’s cash-generating units (CGUs), as identified according to the previous segment reporting, were distributed as follows; Northern Europe (goodwill MSEK 131.1 and brands MSEK 10.4), the UK and Ireland (goodwill MSEK 262.0 and brands MSEK 19.8), Western and Southern Europe (goodwill MSEK 2,341.5 and brands MSEK 2,543.4) and Africa, Asia and the Pacific (goodwill MSEK 267.3 and brands MSEK 38.7).
As of 31 December 2020, Goodwill and brands are distributed among the Group’s cash-generating units (CGUs) and identified per segment as follows.
Brands Goodwill2020 2019 2020 2019
Collection 2,220.6 – – –
Premium 61.1 – 1,945.9 –
Professional 10.8 – 389.6 –
Infrastructure 199.6 – 507.7 –
Total 2,492.1 – 2,843.2 –
Each year, the Group performs a test for each CGU to assess whether any need for impairment exists for goodwill and brands in line with the applied accounting policies. The recoverable amount for each CGU is determined by value-in-use calculations, which comprise the present value of estimated future payments expected to arise from an asset during its useful life, including the calculated residual value at the end of the asset’s useful life. These calculations assume estimated future cash flows based on financial forecasts for the coming eight-year period (five-year period), as approved by management. The projection period has been changed as part of adapting the strategic plan to the effects of Covid-19. To extrapolate cash flows beyond this period, a growth rate of 2.5 per cent (0.75–3.0) has been applied. The cash-flow method has been applied.
Management has designated a budgeted operating margin based on the pre vious results and on expectations of future market development. The discount rate before tax which has been applied is 10 per cent for all CGUs (10 per cent for all CGUs except Africa, Asia and the Pacific where a rate of 12 per cent is applied). At present, the risk-free interest rate is historically low. After taking into account the risk-free interest rate and stock market risk premiums, the discount rate has been lowered compared with the year earlier.
SIGNIFICANT ASSUMPTIONSMarket share and growthThe current market share has been applied to future periods. Forecasts are based on previous experience and on external sources of information. The estimated growth rate used to extrapolate cash flows beyond the budget period was as follows (Northern Europe 0.75 per cent, UK and Ireland 1 per cent, Western and Southern Europe 3 per cent and Africa, Asia and the Pacific 2.5 per cent):
Collection 2.5%Premium 2.5%Professional 2.5%Infrastructure 2.5%
ExpensesThe forecast of personnel costs is based on the expected inflation rate, increases in real salary (historical average) and the planned streamlining of the company’s production. The forecast is in line with previous experience and external sources of information.
Exchange ratesExchange-rate forecasts are based on the current listed exchange rates and on listed forward rates. The forecast is in accordance with external sources of information.
Variables appliedThe discount rate before tax which has been applied is 10 per cent for all CGUs (10 per cent for all CGUs except Africa, Asia and the Pacific where a rate of 12 per cent is applied).
Exchange rates: EUR 10.54 (10.59)GBP 11.90 (12.01)
Sensitivity analysis as per 31 December 2020– the discount rate before taxes was 1 per cent higher.– the estimated growth rate used to extrapolate cash flows for the entire projection
period was 1 per cent lower.
If the discount rate before tax used to calculate value in use for the CGU had been 1 per cent higher than the management’s assessment (11 per cent instead of 10 per cent), this would not have indicated any impairment in any CGU. If the projected growth rate were to decrease by a full 1 per cent for the entire projection period, no impairment would be required in any of the CGUs.
Sensitivity analysis as per 31 December 2019 If the discount rate before tax used to calculate value in use for the CGU Western and Southern Europe had been 1 per cent higher than the management’s assess-ment (11 per cent instead of 10 per cent), the Group would have reported an impair-ment of the carrying amount of MSEK 385. If the estimated growth rate used to extrapolate cash flows beyond the budget period was 2 per cent instead of the management’s assessment of 3 per cent, the Group would have recognised an impairment of the carrying amount of MSEK 93. The recoverable amount for other CGUs exceeds the carrying amounts for goodwill and brands with indefinite useful lives by a significant margin.
Cont. Note 11
76 FA G E R H U LT G R O U P A N N U A L R E P O R T 2 0 2 0
F I N A N C I A L I N F O R M A T I O N | N O T E S
Note 12 | Property, plant and equipment
Group Parent Company2020 2019 2020 2019
Land and buildings
Opening cost 1,803.3 491.1 – –
Acquisitions of subsidiaries – 1,283.1 – –
Purchases 23.4 24.4 – –
Sales and disposals –0.3 –4.3 – –
Translation differences –78.6 9.0 – –
Closing accumulated cost 1,747.8 1,803.3 – –
Opening depreciation –660.7 –225.9 – –
Acquisitions of subsidiaries – –390.9 – –
Depreciation for the year –52.2 –46.2 – –
Sales and disposals 0.1 4.2 – –
Translation differences 29.3 –1.9 – –
Closing accumulated depreciation –683.5 –660.7 – –
Carrying amount 1,064.3 1,142.6 – –
Plant and machinery
Opening cost 2,521.2 1,170.3 – –
Acquisitions of subsidiaries – 1,240.9 – –
Purchases 86.4 97.5 – –
Sales and disposals –55.9 –40.5 – –
Translation differences –110.6 53.0 – –
Closing accumulated cost 2,441.1 2,521.2 – –
Opening depreciation –2,033.3 –912.0 – –
Acquisitions of subsidiaries – –1,034.7 – –
Depreciation for the year –105.7 –114.5 – –
Sales and disposals 26.5 41.1 – –
Translation differences 88.5 –13.2 – –
Closing accumulated depreciation –2,024.0 –2,033.3 – –
Carrying amount 417.1 487.9 – –
Equipment, fixtures and fittings
Opening cost 949.1 582.1 – –
Acquisitions of subsidiaries – 312.1 – –
Purchases 48.7 68.4 – –
Sales and disposals –21.1 –25.2 – –
Translation differences –44.7 11.7 – –
Closing accumulated cost 932.0 949.1 – –
Opening depreciation –735.8 –437.0 – –
Acquisitions of subsidiaries – –245.9 – –
Depreciation for the year –64.9 –70.5 – –
Sales and disposals 19.9 23.1 – –
Translation differences 34.7 –5.5 – –
Closing accumulated depreciation –746.1 –735.8 – –
Carrying amount 185.9 213.3 – –
Construction in progress
Opening cost 32.8 34.5 – –
Acquisitions of subsidiaries – 14.2 – –
Land improvements during the year 22.8 21.8 – –
Reclassifications –29.3 –37.9 – –
Translation differences –0.4 0.2 – –
Carrying amount 25.9 32.8 – –
FA G E R H U LT G R O U P A N N U A L R E P O R T 2 0 2 0 77
N O T E S | F I N A N C I A L I N F O R M A T I O N
Note 13 | Financial assets
Parent Company2020 2019
Shares and participations in subsidiaries
Opening cost 2,963.6 616.6
Acquisitions during the year, see Note 31 – 2,347.0
Carrying amount 2,963.6 2,963.6
Parent Company2020 2019
Receivables from subsidiaries
Opening receivables 4,926.2 3,179.8
New receivables – 1,797.2
Amortised receivables –814.7 –50.8
Closing receivables 4,111.5 4,926.2
Group Parent Company2020 2019 2020 2019
Other shares and participations
Opening cost 14.5 18.7 – –
Acquisitions of subsidiaries – 4.7 – –
Divestments during the year – –8.9 – –
Acquisitions during the year 0.9 – – –
Impairment during the year –5.6 – – –
Closing receivables 9.8 14.5 – –
Group Parent Company2020 2019 2020 2019
Other non-current receivables
Opening receivables 11.6 4.2 – –
Acquisitions of subsidiaries – 7.2 – –
New receivables 1.8 0.2 – –
Closing receivables 13.4 11.6 – –
The fair values of the Group’s financial assets correspond with their carrying amounts.
Note 14 | Shares and participations in subsidiariesDetails of wholly owned subsidiaries, their corporate identity numbers and registered offices:
Carrying amount
Subsidiaries: Corporate Identity Number Registered offices No. of shares 2020 2019
Fagerhults Belysning AB 556321-8659 Habo 2,500 337.2 337.2
Fagerhult Retail AB 556337-4924 Bollebygd 5,000 0.6 0.6
Whitecroft Lighting Holdings Ltd, UK 03848868 Ashton-under-Lyne 11,915 275.6 275.6
Elenco Lighting AB 556035-5090 Borås 1,800 2.9 2.9
WE-EF Leuchten GmbH, Germany HRB 208064 Bispingen 1 0.2 0.2
iGuzzini illuminazione S.p.A, Italy IT 00082630435 Macerata 21,050,000 2,347.1 2,347.1
Carrying amount 2,963.6 2,963.6
Share of equity, %
Sub-subsidiaries: Corporate Identity Number Registered offices No. of shares 2020 2019
Fagerhults Belysning Sverige AB 556122-2000 Habo 1,000 100 100
Ateljé Lyktan AB 556063-9634 Åhus 2,000 100 100
Fagerhult Belysning AS, Norway 937418906 Oslo 100 100 100
Fagerhult AS, Denmark 63.128 Ishöj 65 100 100
Fagerhult OY, Finland 0980280-0 Helsinki 6,000 100 100
I-Valo OY, Finland 1571418-8 Iittala 2,020 100 100
Fagerhult Oü, Estonia 10703636 Tallinn 5,400 100 100
Fagerhult BV, Netherlands 96121 IJsselstein 2,250 100 100
Fagerhult NV, Belgium BE 0492.822.044 Baaigem 9,400 100 100
Fagerhult GmbH, Germany 13135 B Hamburg 1 100 100
LTS Licht & Leuchten GmbH, Germany HRB 630906 Tettnang 1 100 100
LED Linear GmbH, Germany HRB8188 Neukirchen-Vluyn 1 100 100
LED Linear USA Inc, USA SRV 131038296 Niagara Falls 3,000 100 100
LED Linear UK Ltd, UK 8280741 London 150 100 100
Arlight Aydinlatma A.S., Turkey 790,361,767 Kazan/Ankara 50,000 100 100
Lighting Innovations Africa (pty) Ltd, South Africa 2015/099974/07 Port Elizabeth 1 – 100
Whitecroft Lighting Ltd, UK 03848973 Ashton-under-Lyne 2 100 100
78 FA G E R H U LT G R O U P A N N U A L R E P O R T 2 0 2 0
F I N A N C I A L I N F O R M A T I O N | N O T E S
Share of equity, %
Sub-subsidiaries: Corporate Identity Number Registered offices No. of shares 2020 2019
Designplan Lighting Ltd, UK 00784246 Sutton 360,300 100 100
Fagerhult Lighting Ltd, UK 3488638 London 40,000 100 100
Fagerhult Lighting Ltd, Ireland 98.834 Dublin 100 100 100
Fagerhult Sp.z.o.o, Poland 260213 Warsaw 1000 100 100
Fagerhult France, France 391138385 Lyon 4,200 100 100
Fagerhult S.L., Spain B84215722 Madrid 3,010 100 100
Commtech Commissioning Services S.A., Spain A83770263 Madrid 60,120 100 100
Fagerhult Lighting System (Suzhou) Co. Ltd, China 3200044439 Suzhou 1 100 100
Fagerhult Trading (Hongkong) Co., Ltd 39362546-000-05-08-5 Hong Kong 1 100 100
Eagle Lighting (Australia) Pty Ltd, Australia 124400933 Melbourne 500,001 100 100
Organic Response Pty Ltd, Australia ACN 618 122 277 Melbourne 100 100 100
Fagerhult (NZ) Ltd, New Zealand 3233074 Christchurch 1 100 100
Fagerhult SPb, Russia 1097847074544 Saint Petersburg 1 100 100
WE-EF Trading & Design GmbH, Germany HRB 101286 Bispingen 1 – 100
WE-EF Lighting Co. Ltd, Thailand 105524015230 Bangplee 16,800 100 100
WE-EF Helvetica SA, Switzerland CHE-115970534/CH-6 Geneva 1,000 100 100
WE-EF Lighting Ltd, UK 5925012148 Nottingham 30,000 100 100
WE-EF Lighting Pty. Ltd, Australia 64570065 Braeside 50,000 100 100
WE-EF Lighting USA LLC, USA 2922528 Warrendale 1 100 100
WE-EF Lumiere S.A.S., France 398371088 Satolas-et-Bonce 5,000 100 100
Flux Eclairage S.A.S, France 504356346 Satolas-et-Bonce 4,000 100 100
Veko Lightsystems International B.V.Netherlands 37041869 Shagen 40,000 100 100
Veko Lightsystems GmbH, Germany HRB 25170 Duisburg 1 100 100
Orlandi S.R.L., Italy IT 08091600158 Macerata 1 100 100
iGuzzini illuminazione France SA, France FR 61300816287 Paris 31,000 100 100
iGuzzini illuminazione Iberica SA, Spain A58675208 Barcelona 100,000 100 100
iGuzzini illuminazione Deutschland GmbH, Germany DE 129381264 Munich 1 100 100
iGuzzini Illuminazione Österreich GmbH, Austria ATU72916623 Vienna 1 100 100
iGuzzini illuminazione UK Ltd, UK 2391370 London 121,578 100 100
iGuzzini illuminazione Norge AS, Norway NO 979 575 785 Oslo 500 100 100
iGuzzini illuminazione Schweiz AG, Switzerland 105493484 Zürich 3,000 100 100
iGuzzini illuminazione Ooo, Russia 7719275374 Moscow 1 99 99
iGuzzini Finland & Baltic Ltd., Finland FI06691842 Helsinki 105 100 89
iGuzzini Lighting (China) Co., Ltd., China 310000400453617 Shanghai 1 100 100
Shanghai iGuzzini Trading Co., Ltd., China 9131010669878976XQ Shanghai 1 100 100
iGuzzini Hong Kong Ltd, Hong Kong 788598 Hong Kong 2,000,000 100 100
iGuzzini S.E.A. Pte LTD, Singapore 200604874N Singapore 400,000 100 100
iGuzzini Middle East FZE, United Arab Emirates 1034 Dubai 1 100 100
iGuzzini Lighting WLL, Qatar 64564 Doha 200 95 95
iGuzzini Lighting North America Inc., Canada 1214227611 IC0001 Québec 2,000,100 – 70
iGuzzini Lighting USA, Ltd, USA 27-1923628 Delaware 100 70 70
iGuzzini Canada (9372-1801 Quèbec Inc), Canada 1173367138 Québec 32,001,000 100 100
9850-333 Canada Inc., Canada 1224250025 IC0001 Québec 10,516,742 70 70
Sistemalux Inc., Canada 1012637761 IC0001 Québec 12,248,100 70 70
Cont. Note 14
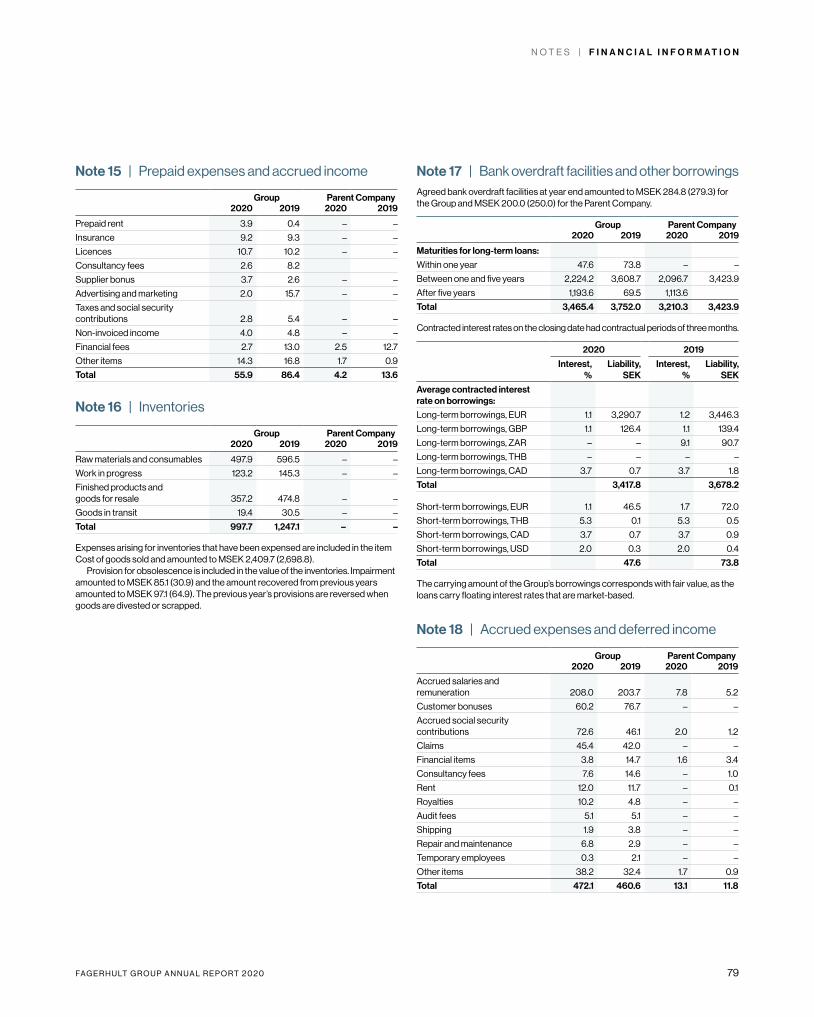
FA G E R H U LT G R O U P A N N U A L R E P O R T 2 0 2 0 79
N O T E S | F I N A N C I A L I N F O R M A T I O N
Note 15 | Prepaid expenses and accrued income
Group Parent Company2020 2019 2020 2019
Prepaid rent 3.9 0.4 – –
Insurance 9.2 9.3 – –
Licences 10.7 10.2 – –
Consultancy fees 2.6 8.2
Supplier bonus 3.7 2.6 – –
Advertising and marketing 2.0 15.7 – –
Taxes and social security contributions 2.8 5.4 – –
Non-invoiced income 4.0 4.8 – –
Financial fees 2.7 13.0 2.5 12.7
Other items 14.3 16.8 1.7 0.9
Total 55.9 86.4 4.2 13.6
Note 16 | Inventories
Group Parent Company2020 2019 2020 2019
Raw materials and consumables 497.9 596.5 – –
Work in progress 123.2 145.3 – –
Finished products and goods for resale 357.2 474.8 – –
Goods in transit 19.4 30.5 – –
Total 997.7 1,247.1 – –
Expenses arising for inventories that have been expensed are included in the item Cost of goods sold and amounted to MSEK 2,409.7 (2,698.8).
Provision for obsolescence is included in the value of the inventories. Impairment amounted to MSEK 85.1 (30.9) and the amount recovered from previous years amounted to MSEK 97.1 (64.9). The previous year’s provisions are reversed when goods are divested or scrapped.
Note 17 | Bank overdraft facilities and other borrowingsAgreed bank overdraft facilities at year end amounted to MSEK 284.8 (279.3) for the Group and MSEK 200.0 (250.0) for the Parent Company.
Group Parent Company2020 2019 2020 2019
Maturities for long-term loans:
Within one year 47.6 73.8 – –
Between one and five years 2,224.2 3,608.7 2,096.7 3,423.9
After five years 1,193.6 69.5 1,113.6
Total 3,465.4 3,752.0 3,210.3 3,423.9 Contracted interest rates on the closing date had contractual periods of three months.
2020 2019
Interest, %
Liability, SEK
Interest, %
Liability, SEK
Average contracted interest rate on borrowings:
Long-term borrowings, EUR 1.1 3,290.7 1.2 3,446.3
Long-term borrowings, GBP 1.1 126.4 1.1 139.4
Long-term borrowings, ZAR – – 9.1 90.7
Long-term borrowings, THB – – – –
Long-term borrowings, CAD 3.7 0.7 3.7 1.8
Total 3,417.8 3,678.2
Short-term borrowings, EUR 1.1 46.5 1.7 72.0
Short-term borrowings, THB 5.3 0.1 5.3 0.5
Short-term borrowings, CAD 3.7 0.7 3.7 0.9
Short-term borrowings, USD 2.0 0.3 2.0 0.4
Total 47.6 73.8 The carrying amount of the Group’s borrowings corresponds with fair value, as the loans carry floating interest rates that are market-based.
Note 18 | Accrued expenses and deferred income
Group Parent Company2020 2019 2020 2019
Accrued salaries and remuneration 208.0 203.7 7.8 5.2
Customer bonuses 60.2 76.7 – –
Accrued social security contributions 72.6 46.1 2.0 1.2
Claims 45.4 42.0 – –
Financial items 3.8 14.7 1.6 3.4
Consultancy fees 7.6 14.6 – 1.0
Rent 12.0 11.7 – 0.1
Royalties 10.2 4.8 – –
Audit fees 5.1 5.1 – –
Shipping 1.9 3.8 – –
Repair and maintenance 6.8 2.9 – –
Temporary employees 0.3 2.1 – –
Other items 38.2 32.4 1.7 0.9
Total 472.1 460.6 13.1 11.8

80 FA G E R H U LT G R O U P A N N U A L R E P O R T 2 0 2 0
F I N A N C I A L I N F O R M A T I O N | N O T E S
Note 19 | Pledged assets
Group Parent Company2020 2019 2020 2019
For own liabilities
Real estate mortgages 17.7 18.3 – –
Total pledged assets 17.7 18.3 – –
Note 20 | Contingent liabilities
Group Parent Company2020 2019 2020 2019
Guarantee FPG 1.2 0.9 – –
Guarantees, customs authorities 1.0 1.0 – –
Guarantee, direct pensions 4.3 2.2 4.3 2.2
Guarantees for subsidiaries – – 44.3 45.1
Total contingent liabilities 6.5 4.1 48.6 47.3
Note 21 | Provisions for pensions and similar commitments
Group Parent Company2020 2019 2020 2019
Provisions for pensions PRI (interest-bearing) 68.9 71.2 – –
Provisions for other pensions 116.6 119.1 4.8 –
Total 185.5 190.3 4.8 –
Defined-benefit plans Within the Group there are defined-benefit plans in Sweden, Turkey, Germany, France, Italy and Switzerland, in which employees retain the right to remuneration, after termination of employment, based on the final salary and length of service. The Group does not have any plan assets.
Pension insurance with AlectaITP2 Plan commitments for retirement pensions and family pensions for salaried employees in Sweden are guaranteed through insurance with Alecta. According to a statement from the Swedish Financial Reporting Board, UFR 10, Classification of ITP plans financed by insurance in Alecta, this is a defined-benefit multi-employer plan. For the 2020 financial year, the company did not have access to information that would enable it to report its proportional share of the plan’s obligations, plan assets and costs, which means the plan could not be reported as a defined-benefit plan. The ITP 2 pension plan which is secured through insurance with Alecta is, therefore, reported as a defined-contribution plan. Premiums for defined-benefit retirement and family pensions are calculated individually and depend, inter alia, on the insured party’s salary, previously earned pension rights and remaining length of service. Expected fees for the next reporting period for ITP 2 insurance with Alecta amount to MSEK 38.0 (2019: MSEK 34.3). The Group’s share of the total contribu-tions to the plan is negligible. The collective funding ratio is the market value of Alecta’s assets as a percentage of insurance commitments calculated according to Alecta’s actuarial methods and assumptions, which do not comply with IAS 19. The collective consolidation level is normally allowed to vary between 125 and 155 per cent. If Alecta’s collective consolidation level falls below 125 per cent or exceeds 155 per cent, actions must be taken to create the conditions enabling the consoli-dation level to revert to the normal interval. For low consolidation levels, one measure could be raising the contractual premiums for taking up new insurance and expanding existing benefits. With a high level consolidation, one measure could be to implement premium reductions. At the end of 2020, Alecta’s surplus in the form of the collective consolidation level was 148 per cent (2019: 144 per cent).
Group2020 2019
Defined-benefit plans
The amounts recognised in the consolidated income statement are:
Current service cost 18.4 21.1
Interest expenses 1.9 1.5
Total 20.3 22.6
Specification of changes in net debt recognised in the consolidated balance sheet:
Net debt at beginning of year recognised in the approved balance sheet 190.3 93.5
Acquisitions of subsidiaries – 86.5
Net cost recognised in profit or loss 20.3 22.6
Benefit payments –5.9 –9.2
Settlement of pension plan –15.9 –9.0
Actuarial gains (–)/losses (+) 1.9 7.4
Translation differences –5.2 –1.5
Net debt at year end 185.5 190.3
The amounts recognised in the balance sheet are determined as follows:
Present value of commitments 185.5 190.3
Net debt at year end 185.5 190.3
Total pension costs
Total pension costs recognised in the consolidated income statement:
Total costs for defined-benefit plans 20.3 22.6
Total costs for defined-contribution plans 102.2 94.6
Total pension costs 122.5 117.2
Pension costs are allocated in the consolidated income statement among the following items:
Cost of goods sold 48.5 43.5
Selling expenses 45.7 44.0
Administrative expenses 26.4 28.2
Financial expenses 1.9 1.5
Total 122.5 117.2
Actuarial assumptions
Significant actuarial assumptions as of the closing date pertaining to pension liabilities in Sweden (expressed as weighted averages)
Net liability in Sweden 68.8 71.2
Discount rate, % 0.80 1.05
Future annual pension growth rate, % 1.50 1.70
Assumptions regarding future life expectancy are based on the insurance study DUS14.
Sensitivity analysisIf the discount rate decreases 0.5 per cent, the present value of obligations will rise 6.7 per cent (6.9). If the interest rate increases 0.5 per cent, the present value of obligations will decline 6.0 per cent (6.2). If inflation decreases 0.5 per cent, the present value of obligations will decline 6.3 per cent (6.1). If inflation increases 0.5 per cent, the present value of obligations will rise 6.9 per cent (6.7). A change of one year in useful life affects the present value of obligations by 4.5 per cent (4.6).
Cont. Note 21
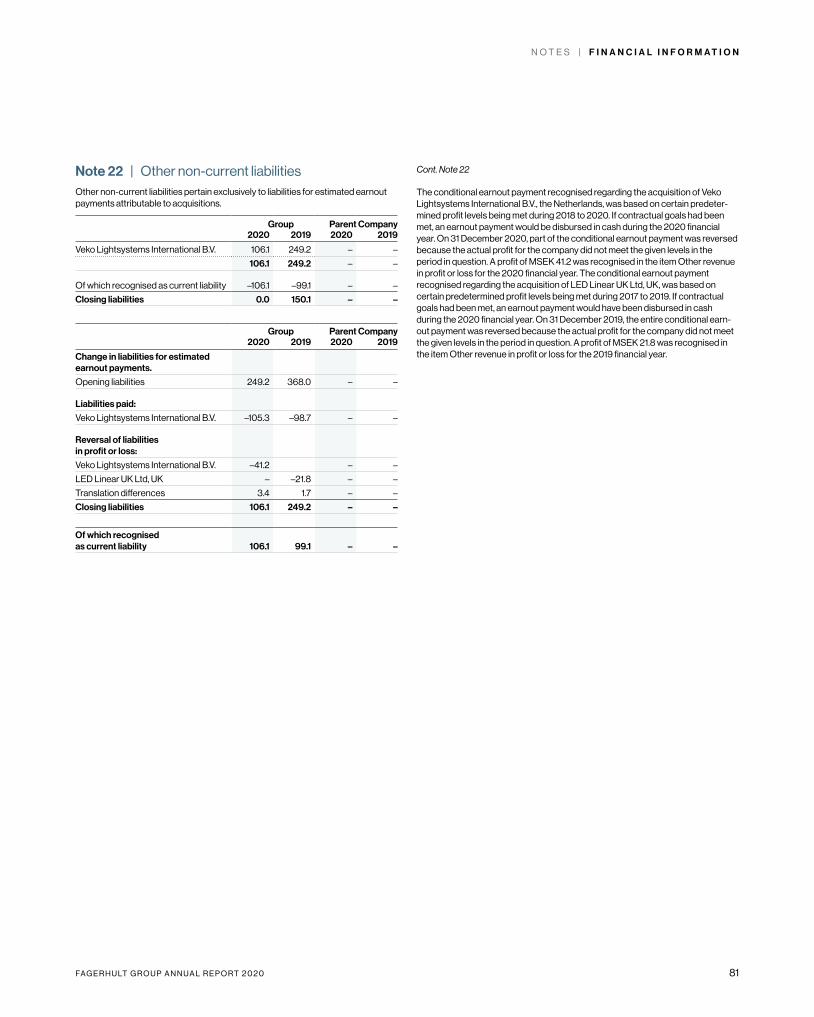
FA G E R H U LT G R O U P A N N U A L R E P O R T 2 0 2 0 81
N O T E S | F I N A N C I A L I N F O R M A T I O N
Note 22 | Other non-current liabilitiesOther non-current liabilities pertain exclusively to liabilities for estimated earnout payments attributable to acquisitions.
Group Parent Company2020 2019 2020 2019
Veko Lightsystems International B.V. 106.1 249.2 – –
106.1 249.2 – –
Of which recognised as current liability –106.1 –99.1 – –
Closing liabilities 0.0 150.1 – –
Group Parent Company2020 2019 2020 2019
Change in liabilities for estimated earnout payments.
Opening liabilities 249.2 368.0 – –
Liabilities paid:
Veko Lightsystems International B.V. –105.3 –98.7 – –
Reversal of liabilities in profit or loss:
Veko Lightsystems International B.V. –41.2 – –
LED Linear UK Ltd, UK – –21.8 – –
Translation differences 3.4 1.7 – –
Closing liabilities 106.1 249.2 – –
Of which recognised as current liability 106.1 99.1 – –
The conditional earnout payment recognised regarding the acquisition of Veko Lightsystems International B.V., the Netherlands, was based on certain predeter-mined profit levels being met during 2018 to 2020. If contractual goals had been met, an earnout payment would be disbursed in cash during the 2020 financial year. On 31 December 2020, part of the conditional earnout payment was reversed because the actual profit for the company did not meet the given levels in the period in question. A profit of MSEK 41.2 was recognised in the item Other revenue in profit or loss for the 2020 financial year. The conditional earnout payment recognised regarding the acquisition of LED Linear UK Ltd, UK, was based on certain predetermined profit levels being met during 2017 to 2019. If contractual goals had been met, an earnout payment would have been disbursed in cash during the 2020 financial year. On 31 December 2019, the entire conditional earn-out payment was reversed because the actual profit for the company did not meet the given levels in the period in question. A profit of MSEK 21.8 was recognised in the item Other revenue in profit or loss for the 2019 financial year.
Cont. Note 22
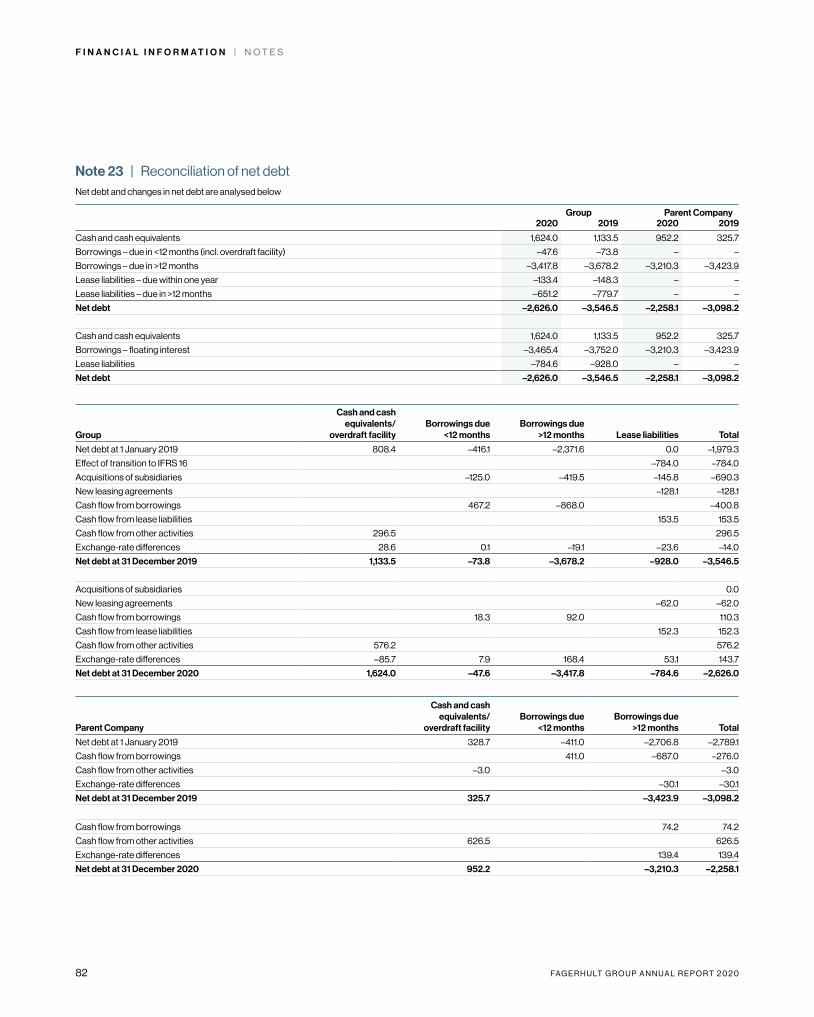
82 FA G E R H U LT G R O U P A N N U A L R E P O R T 2 0 2 0
F I N A N C I A L I N F O R M A T I O N | N O T E S
Note 23 | Reconciliation of net debtNet debt and changes in net debt are analysed below
Group Parent Company2020 2019 2020 2019
Cash and cash equivalents 1,624.0 1,133.5 952.2 325.7
Borrowings – due in <12 months (incl. overdraft facility) –47.6 –73.8 – –
Borrowings – due in >12 months –3,417.8 –3,678.2 –3,210.3 –3,423.9
Lease liabilities – due within one year –133.4 –148.3 – –
Lease liabilities – due in >12 months –651.2 –779.7 – –
Net debt –2,626.0 –3,546.5 –2,258.1 –3,098.2
Cash and cash equivalents 1,624.0 1,133.5 952.2 325.7
Borrowings – floating interest –3,465.4 –3,752.0 –3,210.3 –3,423.9
Lease liabilities –784.6 –928.0 – –
Net debt –2,626.0 –3,546.5 –2,258.1 –3,098.2
Group
Cash and cash equivalents/
overdraft facilityBorrowings due
<12 monthsBorrowings due
>12 months Lease liabilities Total
Net debt at 1 January 2019 808.4 –416.1 –2,371.6 0.0 –1,979.3
Effect of transition to IFRS 16 –784.0 –784.0
Acquisitions of subsidiaries –125.0 –419.5 –145.8 –690.3
New leasing agreements –128.1 –128.1
Cash flow from borrowings 467.2 –868.0 –400.8
Cash flow from lease liabilities 153.5 153.5
Cash flow from other activities 296.5 296.5
Exchange-rate differences 28.6 0.1 –19.1 –23.6 –14.0
Net debt at 31 December 2019 1,133.5 –73.8 –3,678.2 –928.0 –3,546.5
Acquisitions of subsidiaries 0.0
New leasing agreements –62.0 –62.0
Cash flow from borrowings 18.3 92.0 110.3
Cash flow from lease liabilities 152.3 152.3
Cash flow from other activities 576.2 576.2
Exchange-rate differences –85.7 7.9 168.4 53.1 143.7
Net debt at 31 December 2020 1,624.0 –47.6 –3,417.8 –784.6 –2,626.0
Parent Company
Cash and cash equivalents/
overdraft facilityBorrowings due
<12 monthsBorrowings due
>12 months Total
Net debt at 1 January 2019 328.7 –411.0 –2,706.8 –2,789.1
Cash flow from borrowings 411.0 –687.0 –276.0
Cash flow from other activities –3.0 –3.0
Exchange-rate differences –30.1 –30.1
Net debt at 31 December 2019 325.7 –3,423.9 –3,098.2
Cash flow from borrowings 74.2 74.2
Cash flow from other activities 626.5 626.5
Exchange-rate differences 139.4 139.4
Net debt at 31 December 2020 952.2 –3,210.3 –2,258.1
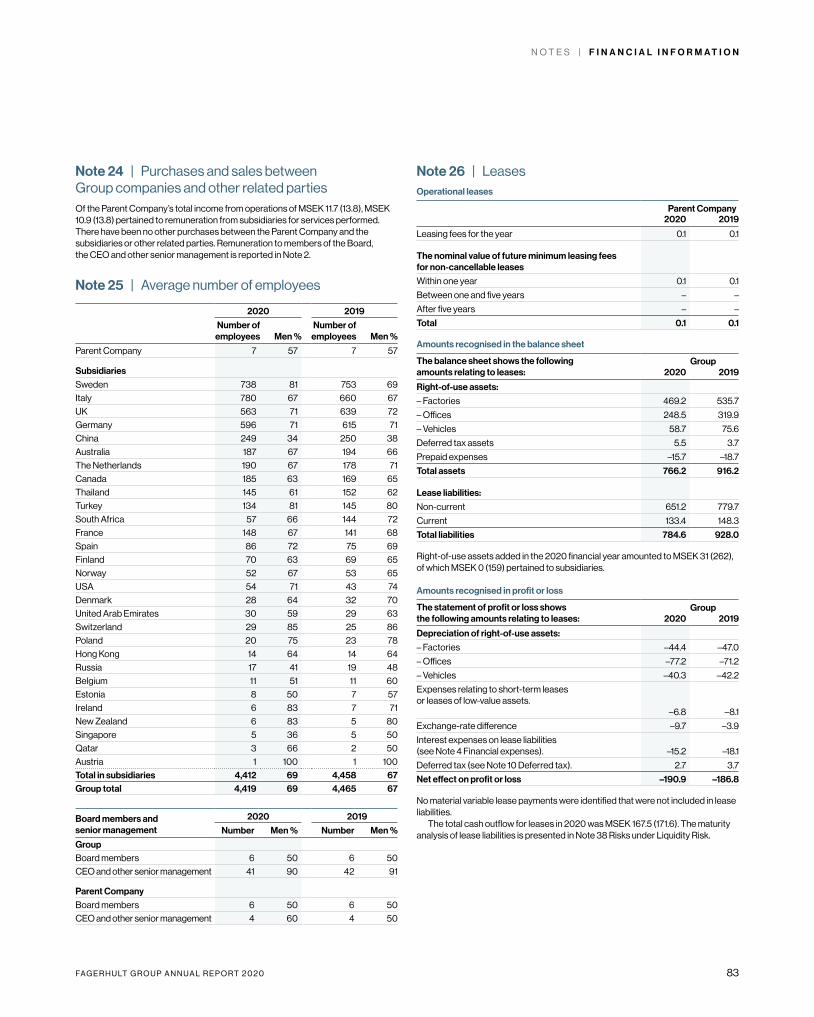
FA G E R H U LT G R O U P A N N U A L R E P O R T 2 0 2 0 83
N O T E S | F I N A N C I A L I N F O R M A T I O N
Note 24 | Purchases and sales between Group companies and other related partiesOf the Parent Company’s total income from operations of MSEK 11.7 (13.8), MSEK 10.9 (13.8) pertained to remuneration from subsidiaries for services performed. There have been no other purchases between the Parent Company and the subsidiaries or other related parties. Remuneration to members of the Board, the CEO and other senior management is reported in Note 2.
Note 25 | Average number of employees
2020 2019
Number of employees Men %
Number of employees Men %
Parent Company 7 57 7 57
SubsidiariesSweden 738 81 753 69
Italy 780 67 660 67
UK 563 71 639 72
Germany 596 71 615 71
China 249 34 250 38
Australia 187 67 194 66
The Netherlands 190 67 178 71
Canada 185 63 169 65
Thailand 145 61 152 62
Turkey 134 81 145 80
South Africa 57 66 144 72
France 148 67 141 68
Spain 86 72 75 69
Finland 70 63 69 65
Norway 52 67 53 65
USA 54 71 43 74
Denmark 28 64 32 70
United Arab Emirates 30 59 29 63
Switzerland 29 85 25 86
Poland 20 75 23 78
Hong Kong 14 64 14 64
Russia 17 41 19 48
Belgium 11 51 11 60
Estonia 8 50 7 57
Ireland 6 83 7 71
New Zealand 6 83 5 80
Singapore 5 36 5 50
Qatar 3 66 2 50
Austria 1 100 1 100
Total in subsidiaries 4,412 69 4,458 67Group total 4,419 69 4,465 67
Board members and senior management
2020 2019
Number Men % Number Men %
GroupBoard members 6 50 6 50
CEO and other senior management 41 90 42 91
Parent CompanyBoard members 6 50 6 50
CEO and other senior management 4 60 4 50
Note 26 | LeasesOperational leases
Parent Company2020 2019
Leasing fees for the year 0.1 0.1
The nominal value of future minimum leasing fees for non-cancellable leases
Within one year 0.1 0.1
Between one and five years – –
After five years – –
Total 0.1 0.1
Amounts recognised in the balance sheet
The balance sheet shows the following amounts relating to leases:
Group2020 2019
Right-of-use assets:
– Factories 469.2 535.7
– Offices 248.5 319.9
– Vehicles 58.7 75.6
Deferred tax assets 5.5 3.7
Prepaid expenses –15.7 –18.7
Total assets 766.2 916.2
Lease liabilities:
Non-current 651.2 779.7
Current 133.4 148.3
Total liabilities 784.6 928.0
Right-of-use assets added in the 2020 financial year amounted to MSEK 31 (262), of which MSEK 0 (159) pertained to subsidiaries.
Amounts recognised in profit or loss
The statement of profit or loss shows the following amounts relating to leases:
Group2020 2019
Depreciation of right-of-use assets:
– Factories –44.4 –47.0
– Offices –77.2 –71.2
– Vehicles –40.3 –42.2
Expenses relating to short-term leases or leases of low-value assets.
–6.8 –8.1
Exchange-rate difference –9.7 –3.9
Interest expenses on lease liabilities (see Note 4 Financial expenses). –15.2 –18.1
Deferred tax (see Note 10 Deferred tax). 2.7 3.7
Net effect on profit or loss –190.9 –186.8
No material variable lease payments were identified that were not included in lease liabilities.
The total cash outflow for leases in 2020 was MSEK 167.5 (171.6). The maturity analysis of lease liabilities is presented in Note 38 Risks under Liquidity Risk.
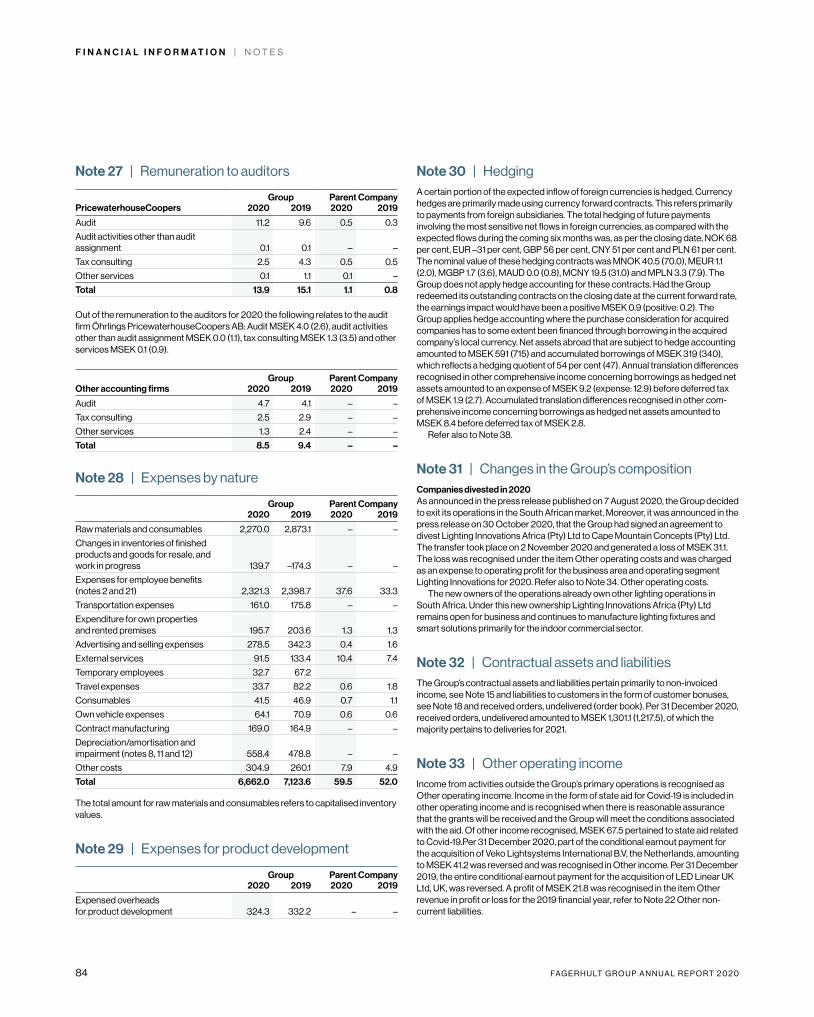
84 FA G E R H U LT G R O U P A N N U A L R E P O R T 2 0 2 0
F I N A N C I A L I N F O R M A T I O N | N O T E S
Note 27 | Remuneration to auditors
Group Parent CompanyPricewaterhouseCoopers 2020 2019 2020 2019
Audit 11.2 9.6 0.5 0.3
Audit activities other than audit assignment 0.1 0.1 – –
Tax consulting 2.5 4.3 0.5 0.5
Other services 0.1 1.1 0.1 –
Total 13.9 15.1 1.1 0.8
Out of the remuneration to the auditors for 2020 the following relates to the audit firm Öhrlings PricewaterhouseCoopers AB: Audit MSEK 4.0 (2.6), audit activities other than audit assignment MSEK 0.0 (1.1), tax consulting MSEK 1.3 (3.5) and other services MSEK 0.1 (0.9).
Group Parent CompanyOther accounting firms 2020 2019 2020 2019
Audit 4.7 4.1 – –
Tax consulting 2.5 2.9 – –
Other services 1.3 2.4 – –
Total 8.5 9.4 – –
Note 28 | Expenses by nature
Group Parent Company2020 2019 2020 2019
Raw materials and consumables 2,270.0 2,873.1 – –
Changes in inventories of finished products and goods for resale, and work in progress 139.7 –174.3 – –
Expenses for employee benefits (notes 2 and 21) 2,321.3 2,398.7 37.6 33.3
Transportation expenses 161.0 175.8 – –
Expenditure for own properties and rented premises 195.7 203.6 1.3 1.3
Advertising and selling expenses 278.5 342.3 0.4 1.6
External services 91.5 133.4 10.4 7.4
Temporary employees 32.7 67.2
Travel expenses 33.7 82.2 0.6 1.8
Consumables 41.5 46.9 0.7 1.1
Own vehicle expenses 64.1 70.9 0.6 0.6
Contract manufacturing 169.0 164.9 – –
Depreciation/amortisation and impairment (notes 8, 11 and 12) 558.4 478.8 – –
Other costs 304.9 260.1 7.9 4.9
Total 6,662.0 7,123.6 59.5 52.0 The total amount for raw materials and consumables refers to capitalised inventory values.
Note 29 | Expenses for product development
Group Parent Company2020 2019 2020 2019
Expensed overheads for product development 324.3 332.2 – –
Note 30 | HedgingA certain portion of the expected inflow of foreign currencies is hedged. Currency hedges are primarily made using currency forward contracts. This refers primarily to payments from foreign subsidiaries. The total hedging of future payments involving the most sensitive net flows in foreign currencies, as compared with the expected flows during the coming six months was, as per the closing date, NOK 68 per cent, EUR –31 per cent, GBP 56 per cent, CNY 51 per cent and PLN 61 per cent. The nominal value of these hedging contracts was MNOK 40.5 (70.0), MEUR 1.1 (2.0), MGBP 1.7 (3.6), MAUD 0.0 (0.8), MCNY 19.5 (31.0) and MPLN 3.3 (7.9). The Group does not apply hedge accounting for these contracts. Had the Group redeemed its outstanding contracts on the closing date at the current forward rate, the earnings impact would have been a positive MSEK 0.9 (positive: 0.2). The Group applies hedge accounting where the purchase consideration for acquired companies has to some extent been financed through borrowing in the acquired company’s local currency. Net assets abroad that are subject to hedge accounting amounted to MSEK 591 (715) and accumulated borrowings of MSEK 319 (340), which reflects a hedging quotient of 54 per cent (47). Annual translation differences recognised in other comprehensive income concerning borrowings as hedged net assets amounted to an expense of MSEK 9.2 (expense: 12.9) before deferred tax of MSEK 1.9 (2.7). Accumulated translation differences recognised in other com-prehensive income concerning borrowings as hedged net assets amounted to MSEK 8.4 before deferred tax of MSEK 2.8.
Refer also to Note 38.
Note 31 | Changes in the Group’s compositionCompanies divested in 2020As announced in the press release published on 7 August 2020, the Group decided to exit its operations in the South African market. Moreover, it was announced in the press release on 30 October 2020, that the Group had signed an agreement to divest Lighting Innovations Africa (Pty) Ltd to Cape Mountain Concepts (Pty) Ltd. The transfer took place on 2 November 2020 and generated a loss of MSEK 31.1. The loss was recognised under the item Other operating costs and was charged as an expense to operating profit for the business area and operating segment Lighting Innovations for 2020. Refer also to Note 34. Other operating costs.
The new owners of the operations already own other lighting operations in South Africa. Under this new ownership Lighting Innovations Africa (Pty) Ltd remains open for business and continues to manufacture lighting fixtures and smart solutions primarily for the indoor commercial sector.
Note 32 | Contractual assets and liabilitiesThe Group’s contractual assets and liabilities pertain primarily to non-invoiced income, see Note 15 and liabilities to customers in the form of customer bonuses, see Note 18 and received orders, undelivered (order book). Per 31 December 2020, received orders, undelivered amounted to MSEK 1,301.1 (1,217.5), of which the majority pertains to deliveries for 2021.
Note 33 | Other operating incomeIncome from activities outside the Group’s primary operations is recognised as Other operating income. Income in the form of state aid for Covid-19 is included in other operating income and is recognised when there is reasonable assurance that the grants will be received and the Group will meet the conditions associated with the aid. Of other income recognised, MSEK 67.5 pertained to state aid related to Covid-19.Per 31 December 2020, part of the conditional earnout payment for the acquisition of Veko Lightsystems International B.V, the Netherlands, amounting to MSEK 41.2 was reversed and was recognised in Other income. Per 31 December 2019, the entire conditional earnout payment for the acquisition of LED Linear UK Ltd, UK, was reversed. A profit of MSEK 21.8 was recognised in the item Other revenue in profit or loss for the 2019 financial year, refer to Note 22 Other non- current liabilities.
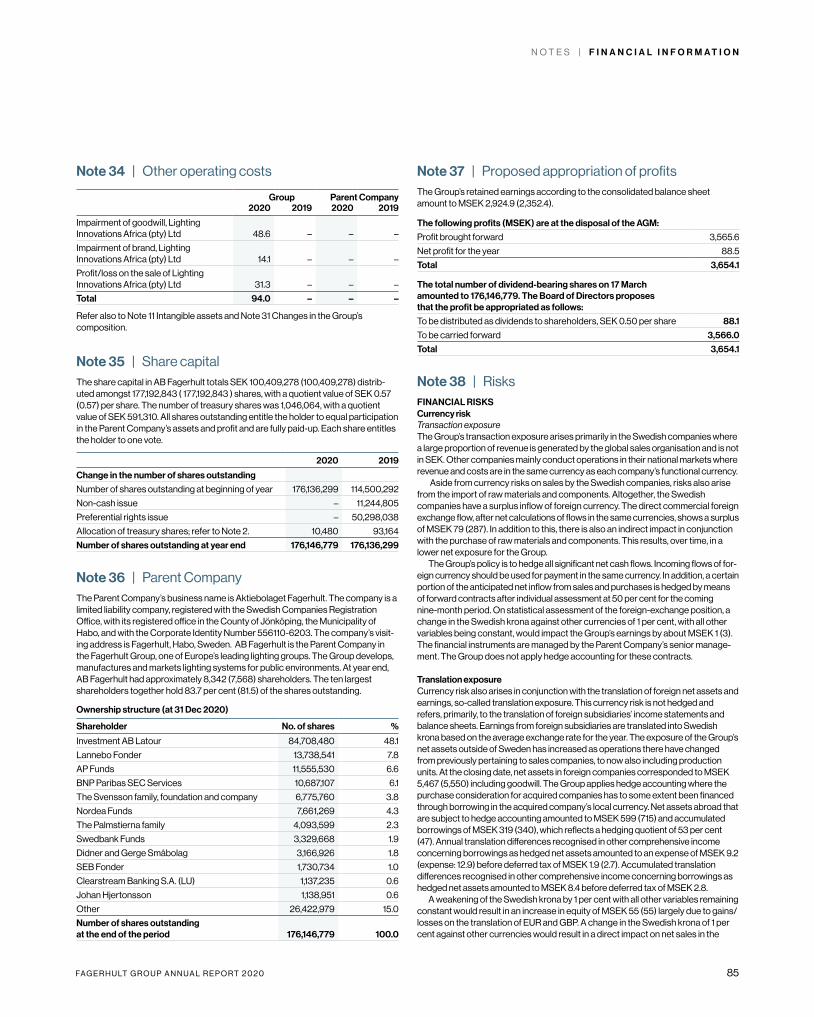
FA G E R H U LT G R O U P A N N U A L R E P O R T 2 0 2 0 85
N O T E S | F I N A N C I A L I N F O R M A T I O N
Note 34 | Other operating costs
Group Parent Company2020 2019 2020 2019
Impairment of goodwill, Lighting Innovations Africa (pty) Ltd 48.6 – – –
Impairment of brand, Lighting Innovations Africa (pty) Ltd 14.1 – – –
Profit/loss on the sale of Lighting Innovations Africa (pty) Ltd 31.3 – – –
Total 94.0 – – –
Refer also to Note 11 Intangible assets and Note 31 Changes in the Group’s composition.
Note 35 | Share capitalThe share capital in AB Fagerhult totals SEK 100,409,278 (100,409,278) distrib-uted amongst 177,192,843 ( 177,192,843 ) shares, with a quotient value of SEK 0.57 (0.57) per share. The number of treasury shares was 1,046,064, with a quotient value of SEK 591,310. All shares outstanding entitle the holder to equal participation in the Parent Company’s assets and profit and are fully paid-up. Each share entitles the holder to one vote.
2020 2019
Change in the number of shares outstanding
Number of shares outstanding at beginning of year 176,136,299 114,500,292
Non-cash issue – 11,244,805
Preferential rights issue – 50,298,038
Allocation of treasury shares; refer to Note 2. 10,480 93,164
Number of shares outstanding at year end 176,146,779 176,136,299
Note 36 | Parent CompanyThe Parent Company’s business name is Aktiebolaget Fagerhult. The company is a limited liability company, registered with the Swedish Companies Registration Office, with its registered office in the County of Jönköping, the Municipality of Habo, and with the Corporate Identity Number 556110-6203. The company’s visit-ing address is Fagerhult, Habo, Sweden. AB Fagerhult is the Parent Company in the Fagerhult Group, one of Europe’s leading lighting groups. The Group develops, manufactures and markets lighting systems for public environments. At year end, AB Fagerhult had approximately 8,342 (7,568) shareholders. The ten largest shareholders together hold 83.7 per cent (81.5) of the shares outstanding.
Ownership structure (at 31 Dec 2020)
Shareholder No. of shares %
Investment AB Latour 84,708,480 48.1
Lannebo Fonder 13,738,541 7.8
AP Funds 11,555,530 6.6
BNP Paribas SEC Services 10,687,107 6.1
The Svensson family, foundation and company 6,775,760 3.8
Nordea Funds 7,661,269 4.3
The Palmstierna family 4,093,599 2.3
Swedbank Funds 3,329,668 1.9
Didner and Gerge Småbolag 3,166,926 1.8
SEB Fonder 1,730,734 1.0
Clearstream Banking S.A. (LU) 1,137,235 0.6
Johan Hjertonsson 1,138,951 0.6
Other 26,422,979 15.0
Number of shares outstanding at the end of the period 176,146,779 100.0
Note 37 | Proposed appropriation of profitsThe Group’s retained earnings according to the consolidated balance sheet amount to MSEK 2,924.9 (2,352.4).
The following profits (MSEK) are at the disposal of the AGM:
Profit brought forward 3,565.6
Net profit for the year 88.5
Total 3,654.1
The total number of dividend-bearing shares on 17 March amounted to 176,146,779. The Board of Directors proposes that the profit be appropriated as follows:
To be distributed as dividends to shareholders, SEK 0.50 per share 88.1
To be carried forward 3,566.0
Total 3,654.1
Note 38 | RisksFINANCIAL RISKS Currency riskTransaction exposureThe Group’s transaction exposure arises primarily in the Swedish companies where a large proportion of revenue is generated by the global sales organisation and is not in SEK. Other companies mainly conduct operations in their national markets where revenue and costs are in the same currency as each company’s functional currency.
Aside from currency risks on sales by the Swedish companies, risks also arise from the import of raw materials and components. Altogether, the Swedish companies have a surplus inflow of foreign currency. The direct commercial foreign exchange flow, after net calculations of flows in the same currencies, shows a surplus of MSEK 79 (287). In addition to this, there is also an indirect impact in conjunction with the purchase of raw materials and components. This results, over time, in a lower net exposure for the Group.
The Group’s policy is to hedge all significant net cash flows. Incoming flows of for-eign currency should be used for payment in the same currency. In addition, a certain portion of the anticipated net inflow from sales and purchases is hedged by means of forward contracts after individual assessment at 50 per cent for the coming nine-month period. On statistical assessment of the foreign-exchange position, a change in the Swedish krona against other currencies of 1 per cent, with all other variables being constant, would impact the Group’s earnings by about MSEK 1 (3). The financial instruments are managed by the Parent Company’s senior manage-ment. The Group does not apply hedge accounting for these contracts.
Translation exposureCurrency risk also arises in conjunction with the translation of foreign net assets and earnings, so-called translation exposure. This currency risk is not hedged and refers, primarily, to the translation of foreign subsidiaries’ income statements and balance sheets. Earnings from foreign subsidiaries are translated into Swedish krona based on the average exchange rate for the year. The exposure of the Group’s net assets outside of Sweden has increased as operations there have changed from previously pertaining to sales companies, to now also including production units. At the closing date, net assets in foreign companies corresponded to MSEK 5,467 (5,550) including goodwill. The Group applies hedge accounting where the purchase consideration for acquired companies has to some extent been financed through borrowing in the acquired company’s local currency. Net assets abroad that are subject to hedge accounting amounted to MSEK 599 (715) and accumulated borrowings of MSEK 319 (340), which reflects a hedging quotient of 53 per cent (47). Annual translation differences recognised in other comprehensive income concerning borrowings as hedged net assets amounted to an expense of MSEK 9.2 (expense: 12.9) before deferred tax of MSEK 1.9 (2.7). Accumulated translation differences recognised in other comprehensive income concerning borrowings as hedged net assets amounted to MSEK 8.4 before deferred tax of MSEK 2.8.
A weakening of the Swedish krona by 1 per cent with all other variables remaining constant would result in an increase in equity of MSEK 55 (55) largely due to gains/losses on the translation of EUR and GBP. A change in the Swedish krona of 1 per cent against other currencies would result in a direct impact on net sales in the
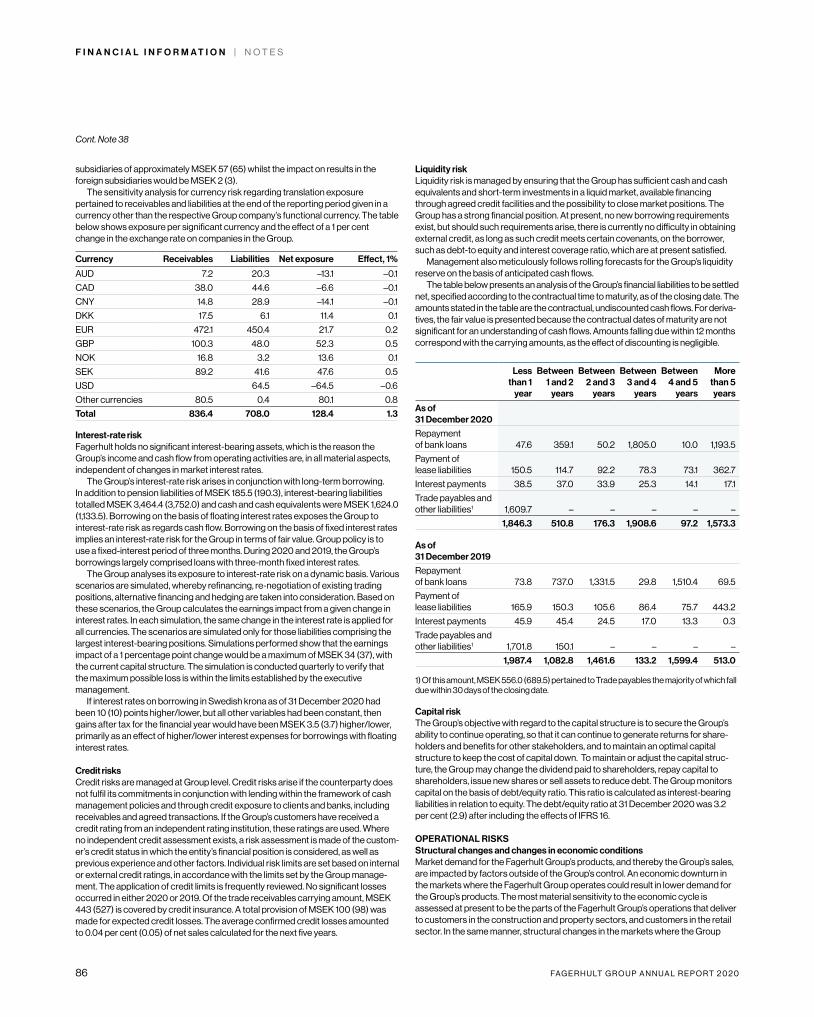
86 FA G E R H U LT G R O U P A N N U A L R E P O R T 2 0 2 0
F I N A N C I A L I N F O R M A T I O N | N O T E S
subsidiaries of approximately MSEK 57 (65) whilst the impact on results in the foreign subsidiaries would be MSEK 2 (3).
The sensitivity analysis for currency risk regarding translation exposure pertained to receivables and liabilities at the end of the reporting period given in a currency other than the respective Group company’s functional currency. The table below shows exposure per significant currency and the effect of a 1 per cent change in the exchange rate on companies in the Group.
Currency Receivables Liabilities Net exposure Effect, 1%
AUD 7.2 20.3 –13.1 –0.1
CAD 38.0 44.6 –6.6 –0.1
CNY 14.8 28.9 –14.1 –0.1
DKK 17.5 6.1 11.4 0.1
EUR 472.1 450.4 21.7 0.2
GBP 100.3 48.0 52.3 0.5
NOK 16.8 3.2 13.6 0.1
SEK 89.2 41.6 47.6 0.5
USD 64.5 –64.5 –0.6
Other currencies 80.5 0.4 80.1 0.8
Total 836.4 708.0 128.4 1.3
Interest-rate riskFagerhult holds no significant interest-bearing assets, which is the reason the Group’s income and cash flow from operating activities are, in all material aspects, independent of changes in market interest rates.
The Group’s interest-rate risk arises in conjunction with long-term borrowing. In addition to pension liabilities of MSEK 185.5 (190.3), interest-bearing liabilities totalled MSEK 3,464.4 (3,752.0) and cash and cash equivalents were MSEK 1,624.0 (1,133.5). Borrowing on the basis of floating interest rates exposes the Group to interest-rate risk as regards cash flow. Borrowing on the basis of fixed interest rates implies an interest-rate risk for the Group in terms of fair value. Group policy is to use a fixed-interest period of three months. During 2020 and 2019, the Group’s borrowings largely comprised loans with three-month fixed interest rates.
The Group analyses its exposure to interest-rate risk on a dynamic basis. Various scenarios are simulated, whereby refinancing, re-negotiation of existing trading positions, alternative financing and hedging are taken into consideration. Based on these scenarios, the Group calculates the earnings impact from a given change in interest rates. In each simulation, the same change in the interest rate is applied for all currencies. The scenarios are simulated only for those liabilities comprising the largest interest-bearing positions. Simulations performed show that the earnings impact of a 1 percentage point change would be a maximum of MSEK 34 (37), with the current capital structure. The simulation is conducted quarterly to verify that the maximum possible loss is within the limits established by the executive management.
If interest rates on borrowing in Swedish krona as of 31 December 2020 had been 10 (10) points higher/lower, but all other variables had been constant, then gains after tax for the financial year would have been MSEK 3.5 (3.7) higher/lower, primarily as an effect of higher/lower interest expenses for borrowings with floating interest rates.
Credit risksCredit risks are managed at Group level. Credit risks arise if the counterparty does not fulfil its commitments in conjunction with lending within the framework of cash management policies and through credit exposure to clients and banks, including receivables and agreed transactions. If the Group’s customers have received a credit rating from an independent rating institution, these ratings are used. Where no independent credit assessment exists, a risk assessment is made of the custom-er’s credit status in which the entity’s financial position is considered, as well as previous experience and other factors. Individual risk limits are set based on internal or external credit ratings, in accordance with the limits set by the Group manage-ment. The application of credit limits is frequently reviewed. No significant losses occurred in either 2020 or 2019. Of the trade receivables carrying amount, MSEK 443 (527) is covered by credit insurance. A total provision of MSEK 100 (98) was made for expected credit losses. The average confirmed credit losses amounted to 0.04 per cent (0.05) of net sales calculated for the next five years.
Liquidity riskLiquidity risk is managed by ensuring that the Group has sufficient cash and cash equivalents and short-term investments in a liquid market, available financing through agreed credit facilities and the possibility to close market positions. The Group has a strong financial position. At present, no new borrowing requirements exist, but should such requirements arise, there is currently no difficulty in obtaining external credit, as long as such credit meets certain covenants, on the borrower, such as debt-to equity and interest coverage ratio, which are at present satisfied.
Management also meticulously follows rolling forecasts for the Group’s liquidity reserve on the basis of anticipated cash flows.
The table below presents an analysis of the Group’s financial liabilities to be settled net, specified according to the contractual time to maturity, as of the closing date. The amounts stated in the table are the contractual, undiscounted cash flows. For deriva-tives, the fair value is presented because the contractual dates of maturity are not significant for an understanding of cash flows. Amounts falling due within 12 months correspond with the carrying amounts, as the effect of discounting is negligible.
Less than 1
year
Between 1 and 2
years
Between 2 and 3
years
Between 3 and 4
years
Between 4 and 5
years
More than 5 years
As of 31 December 2020
Repayment of bank loans 47.6 359.1 50.2 1,805.0 10.0 1,193.5
Payment of lease liabilities 150.5 114.7 92.2 78.3 73.1 362.7
Interest payments 38.5 37.0 33.9 25.3 14.1 17.1
Trade payables and other liabilities1 1,609.7 – – – – –
1,846.3 510.8 176.3 1,908.6 97.2 1,573.3
As of 31 December 2019
Repayment of bank loans 73.8 737.0 1,331.5 29.8 1,510.4 69.5
Payment of lease liabilities 165.9 150.3 105.6 86.4 75.7 443.2
Interest payments 45.9 45.4 24.5 17.0 13.3 0.3
Trade payables and other liabilities1 1,701.8 150.1 – – – –
1,987.4 1,082.8 1,461.6 133.2 1,599.4 513.0 1) Of this amount, MSEK 556.0 (689.5) pertained to Trade payables the majority of which fall due within 30 days of the closing date.
Capital riskThe Group’s objective with regard to the capital structure is to secure the Group’s ability to continue operating, so that it can continue to generate returns for share-holders and benefits for other stakeholders, and to maintain an optimal capital structure to keep the cost of capital down. To maintain or adjust the capital struc-ture, the Group may change the dividend paid to shareholders, repay capital to shareholders, issue new shares or sell assets to reduce debt. The Group monitors capital on the basis of debt/equity ratio. This ratio is calculated as interest-bearing liabilities in relation to equity. The debt/equity ratio at 31 December 2020 was 3.2 per cent (2.9) after including the effects of IFRS 16.
OPERATIONAL RISKSStructural changes and changes in economic conditionsMarket demand for the Fagerhult Group’s products, and thereby the Group’s sales, are impacted by factors outside of the Group’s control. An economic downturn in the markets where the Fagerhult Group operates could result in lower demand for the Group’s products. The most material sensitivity to the economic cycle is assessed at present to be the parts of the Fagerhult Group’s operations that deliver to customers in the construction and property sectors, and customers in the retail sector. In the same manner, structural changes in the markets where the Group
Cont. Note 38
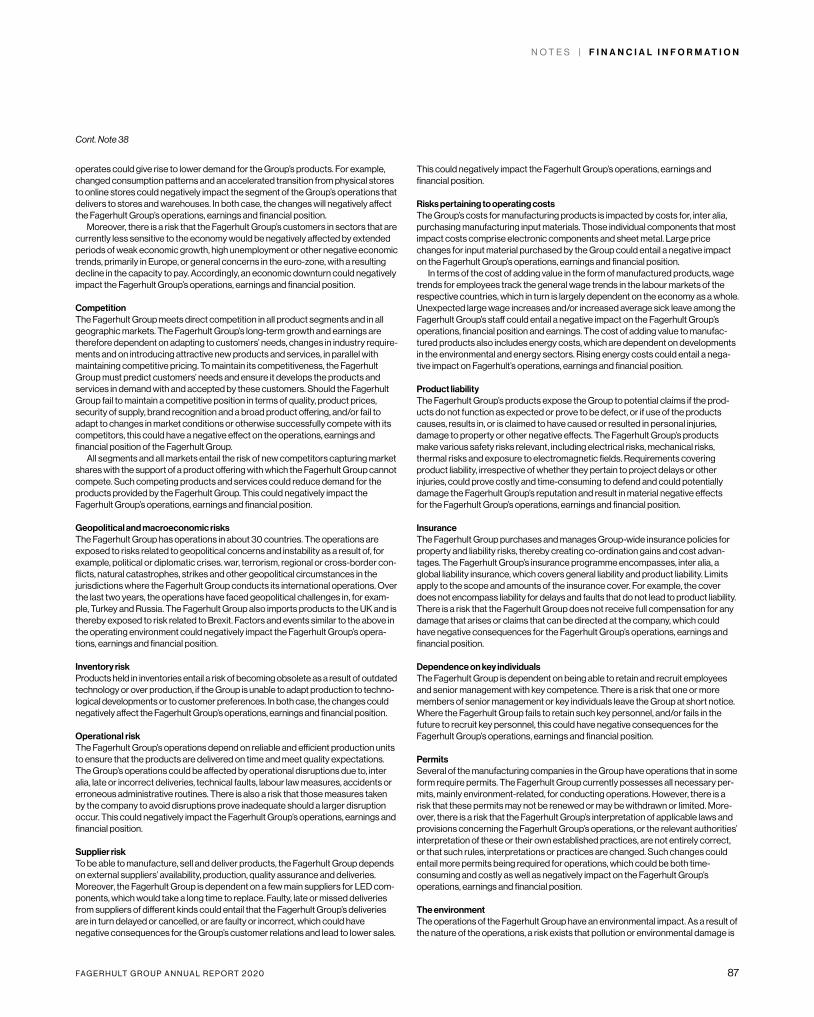
FA G E R H U LT G R O U P A N N U A L R E P O R T 2 0 2 0 87
N O T E S | F I N A N C I A L I N F O R M A T I O N
operates could give rise to lower demand for the Group’s products. For example, changed consumption patterns and an accelerated transition from physical stores to online stores could negatively impact the segment of the Group’s operations that delivers to stores and warehouses. In both case, the changes will negatively affect the Fagerhult Group’s operations, earnings and financial position.
Moreover, there is a risk that the Fagerhult Group’s customers in sectors that are currently less sensitive to the economy would be negatively affected by extended periods of weak economic growth, high unemployment or other negative economic trends, primarily in Europe, or general concerns in the euro-zone, with a resulting decline in the capacity to pay. Accordingly, an economic downturn could negatively impact the Fagerhult Group’s operations, earnings and financial position.
CompetitionThe Fagerhult Group meets direct competition in all product segments and in all geographic markets. The Fagerhult Group’s long-term growth and earnings are therefore dependent on adapting to customers’ needs, changes in industry require-ments and on introducing attractive new products and services, in parallel with maintaining competitive pricing. To maintain its competitiveness, the Fagerhult Group must predict customers’ needs and ensure it develops the products and services in demand with and accepted by these customers. Should the Fagerhult Group fail to maintain a competitive position in terms of quality, product prices, security of supply, brand recognition and a broad product offering, and/or fail to adapt to changes in market conditions or otherwise successfully compete with its competitors, this could have a negative effect on the operations, earnings and financial position of the Fagerhult Group.
All segments and all markets entail the risk of new competitors capturing market shares with the support of a product offering with which the Fagerhult Group cannot compete. Such competing products and services could reduce demand for the products provided by the Fagerhult Group. This could negatively impact the Fagerhult Group’s operations, earnings and financial position.
Geopolitical and macroeconomic risksThe Fagerhult Group has operations in about 30 countries. The operations are exposed to risks related to geopolitical concerns and instability as a result of, for example, political or diplomatic crises. war, terrorism, regional or cross-border con-flicts, natural catastrophes, strikes and other geopolitical circumstances in the jurisdictions where the Fagerhult Group conducts its international operations. Over the last two years, the operations have faced geopolitical challenges in, for exam-ple, Turkey and Russia. The Fagerhult Group also imports products to the UK and is thereby exposed to risk related to Brexit. Factors and events similar to the above in the operating environment could negatively impact the Fagerhult Group’s opera-tions, earnings and financial position.
Inventory riskProducts held in inventories entail a risk of becoming obsolete as a result of outdated technology or over production, if the Group is unable to adapt production to techno-logical developments or to customer preferences. In both case, the changes could negatively affect the Fagerhult Group’s operations, earnings and financial position.
Operational riskThe Fagerhult Group’s operations depend on reliable and efficient production units to ensure that the products are delivered on time and meet quality expectations. The Group’s operations could be affected by operational disruptions due to, inter alia, late or incorrect deliveries, technical faults, labour law measures, accidents or erroneous administrative routines. There is also a risk that those measures taken by the company to avoid disruptions prove inadequate should a larger disruption occur. This could negatively impact the Fagerhult Group’s operations, earnings and financial position.
Supplier riskTo be able to manufacture, sell and deliver products, the Fagerhult Group depends on external suppliers’ availability, production, quality assurance and deliveries. Moreover, the Fagerhult Group is dependent on a few main suppliers for LED com-ponents, which would take a long time to replace. Faulty, late or missed deliveries from suppliers of different kinds could entail that the Fagerhult Group’s deliveries are in turn delayed or cancelled, or are faulty or incorrect, which could have negative consequences for the Group’s customer relations and lead to lower sales.
This could negatively impact the Fagerhult Group’s operations, earnings and financial position.
Risks pertaining to operating costsThe Group’s costs for manufacturing products is impacted by costs for, inter alia, purchasing manufacturing input materials. Those individual components that most impact costs comprise electronic components and sheet metal. Large price changes for input material purchased by the Group could entail a negative impact on the Fagerhult Group’s operations, earnings and financial position.
In terms of the cost of adding value in the form of manufactured products, wage trends for employees track the general wage trends in the labour markets of the respective countries, which in turn is largely dependent on the economy as a whole. Unexpected large wage increases and/or increased average sick leave among the Fagerhult Group’s staff could entail a negative impact on the Fagerhult Group’s operations, financial position and earnings. The cost of adding value to manufac-tured products also includes energy costs, which are dependent on developments in the environmental and energy sectors. Rising energy costs could entail a nega-tive impact on Fagerhult’s operations, earnings and financial position.
Product liabilityThe Fagerhult Group’s products expose the Group to potential claims if the prod-ucts do not function as expected or prove to be defect, or if use of the products causes, results in, or is claimed to have caused or resulted in personal injuries, damage to property or other negative effects. The Fagerhult Group’s products make various safety risks relevant, including electrical risks, mechanical risks, thermal risks and exposure to electromagnetic fields. Requirements covering product liability, irrespective of whether they pertain to project delays or other injuries, could prove costly and time-consuming to defend and could potentially damage the Fagerhult Group’s reputation and result in material negative effects for the Fagerhult Group’s operations, earnings and financial position.
InsuranceThe Fagerhult Group purchases and manages Group-wide insurance policies for property and liability risks, thereby creating co-ordination gains and cost advan-tages. The Fagerhult Group’s insurance programme encompasses, inter alia, a global liability insurance, which covers general liability and product liability. Limits apply to the scope and amounts of the insurance cover. For example, the cover does not encompass liability for delays and faults that do not lead to product liability. There is a risk that the Fagerhult Group does not receive full compensation for any damage that arises or claims that can be directed at the company, which could have negative consequences for the Fagerhult Group’s operations, earnings and financial position.
Dependence on key individualsThe Fagerhult Group is dependent on being able to retain and recruit employees and senior management with key competence. There is a risk that one or more members of senior management or key individuals leave the Group at short notice. Where the Fagerhult Group fails to retain such key personnel, and/or fails in the future to recruit key personnel, this could have negative consequences for the Fagerhult Group’s operations, earnings and financial position.
PermitsSeveral of the manufacturing companies in the Group have operations that in some form require permits. The Fagerhult Group currently possesses all necessary per-mits, mainly environment-related, for conducting operations. However, there is a risk that these permits may not be renewed or may be withdrawn or limited. More-over, there is a risk that the Fagerhult Group’s interpretation of applicable laws and provisions concerning the Fagerhult Group’s operations, or the relevant authorities’ interpretation of these or their own established practices, are not entirely correct, or that such rules, interpretations or practices are changed. Such changes could entail more permits being required for operations, which could be both time- consuming and costly as well as negatively impact on the Fagerhult Group’s operations, earnings and financial position.
The environmentThe operations of the Fagerhult Group have an environmental impact. As a result of the nature of the operations, a risk exists that pollution or environmental damage is
Cont. Note 38
88 FA G E R H U LT G R O U P A N N U A L R E P O R T 2 0 2 0
F I N A N C I A L I N F O R M A T I O N | N O T E S
caused or has been caused in the operations run by the Group. There is also a risk that the operations previously conducted by other businesses at a plant or prop-erty, and which are now owned by the Group, may have given rise to pollution or environmental damage. Under current Swedish environmental legislation, the entity conducting operations that have contributed to environmental damage bears responsibility for rectifying the damage. If the business is unable to or lacks suffi-cient funds to rectify the damage, the acquirer of the property, who at the time of the acquisition was aware of or should have discovered the pollution, is responsi-ble. This means that, under certain conditions, claims could be directed at the Fagerhult Group for investigation, treatment or other remedial measures in the event of the presence or suspicion of pollution contaminating soil, bodies of water or groundwater. Such claims could negatively impact on the Fagerhult Group’s operations, earnings and financial position.
A risk exists that future changes in environmental regulations could entail increased expenses and costs to enable continued production. Developments in Sweden and internationally are heading towards stricter environmental rules, whereby new permits are normally subject to lower limits for maximum environmental impact. Regulatory changes could require significant new investments to enable continued production. If the Fagerhult Group is unable to meet these changes in a cost-efficient manner or to successfully maintain the necessary permits, this could negatively impact on the Fagerhult Group’s operations, earnings and financial position.
CorruptionFollowing the acquisition of iGuzzini, Fagerhult has operations in some 30 countries on four continents. The Group has a decentralised business model that, inter alia, entails that each subsidiary is responsible for compliance with the Group’s Code of Conduct. The large geographic spread and decentralised control leaves the Group exposed to the risk of corruption. If any member of management at any subsidiary should set aside the Code of Conduct’s rules concerning zero tolerance for corrup-tion, this could damage the Fagerhult Group’s reputation, lead to lost business and leave the company liable to pay fines. This could result in significant negative impacts on the Fagerhult Group’s operations, earnings and financial position.
IT riskThe Fagerhult Group needs to use IT systems to manage, inter alia, deliveries of products and input materials as well as to receive and manage customer orders. A major part of the Fagerhult Group’s operations are aimed at customers who set stringent requirements for reliable and exact deliveries, which in turn sets high requirements for functioning and secure IT systems that are well-integrated with the company’s various business segments. Maintaining, developing and investing in such systems requires significant capital investment and other resources. There is a risk that future investments required in IT systems will be greater than the com-pany’s expectations. Moreover, there is a risk that the company’s IT systems are disrupted by software and hardware issues, computer viruses, hacker attacks and physical damage. Such problems and disruptions could, depending on the extent, negatively impact on the Fagerhult Group’s operations, earnings and financial posi-tion.As computer-aided technology has assumed an increasingly greater scope within the companies, security requirements have also increased. The functional security of the databases and e-mail servers is checked via daily backups. Battery backup and diesel generators provide protection against operational disruption in the main manufacturing facility in Habo, from where the majority of the Group’s computer operations are controlled. To date, no costs have arisen as a result of damage. The internet connection is fixed and completely isolated from other networks via hardware firewalls. User access to the system is regulated via Group authorisations and entitlements based on actual assignments and roles within the company.
SUSTAINABILITY RISKSIn various ways, Fagerhult’s operations are associated with sustainability risks. In conjunction with the preparation of the Sustainability Report, the most significant sustainability risks in our own operations and in our value chain have been identi-fied. We have focused on the specific areas stated in the Swedish Annual Accounts Act where we are of the opinion that operations significantly impact people and the environment: the environment; personnel; societal conditions; respect for human rights; and anti-corruption.
Activity Risk Description/management
Product development Product quality • Quality defects in the product can result in injuries to customers or impact the company’s reputation. Fagerhult has a quality policy and guidelines in place for product development and training, which aim to maintain high quality and to reduce risks of the above.
The environment Energy efficiency and emissions
• Increased cost of energy due to legislation can lead to increased production costs. Fagerhult works continuously in all areas of operations to review energy needs and to work as efficiently as possible.
Personnel and societal conditions
Workplace accidents • Fagerhult has noted a risk that a workplace accident could occur that could lead to injury or loss of personnel. Fagerhult works daily with work environment issues and routines, and works proactively in activities that are assessed as having significant risk for injury.
Human rights • The risk of Fagerhult not respecting human rights is managed by ensuring that the all of the Group’s employees are familiar with the company’s Code of Conduct, which is always signed upon employment, and through continuous training in the code.
Anti-corruption Anti-corruption • Corruption, or any employees breaking the law, can lead to fines and lost business as well as affect Fagerhult’s reputation. Fagerhult works continuously with the issue and has a Code of Conduct that forms the basis for everything we do and how we act. We conduct company inspections upon acquisition, and all of the Group’s companies are to comply with the applicable laws and regulations.
Sustainable supply chain Ethics and human rights
• Fagerhult requires suppliers to fulfil the ethical standards we set for suppliers and sub-suppliers and demands human rights be respected. During the year, a supplier code of conduct has been implemented at Fagerhults Belysning, and Fagerhult applies the prudence concept for all relationships.
Note 39 | Events after the closing dateOn the 28 January 2021 Fagerhult completed the transaction to sell 100 per cent of the shares in Commtech to Aire Limpio S.L., a Spanish company based in Madrid. It had previously been decided that Commtech’s core business of site based commissioning services was strategically not core to the Fagerhult Group. In 2020 Commtech had net sales of 28 MSEK and employed 35 people.
The sales price was 12,0 MSEK and a profit on disposal of 1.2 MSEK was generated. The transaction had an 8,3 MSEK positive effect on cash balances.
In addition to the purchased price it has been agreed that the 2021 operating profits will be shared equally between Commtech and Fagerhult.
Between the closing date and the date on which this annual report was signed, no significant events or information has arisen concerning the circumstances per the closing date or thereafter, which may have a positive or negative effect on the Group, or any of the companies contained therein, and which require any further disclosures, other than those provided above.
Cont. Note 38
FA G E R H U LT G R O U P A N N U A L R E P O R T 2 0 2 0 89
S I G N A T U R E S | F I N A N C I A L I N F O R M A T I O N
Habo, 17 March 2021
Jan Svensson
Chairman
Eric Douglas
Vice Chairman
Cecilia Fasth
Board member
Morten Falkenberg
Board member
Annica Bresky
Board member
Teresa Enander
Board member
Bodil Sonesson
President and CEO
Magnus Nell
Employee Representative
Lars-Åke Johansson
Employee Representative
The Board of Directors and the CEO certify that the consolidated accounts have been prepared in accordance with international financial reporting standards, IFRS, as adopted by the EU, and that they provide a true and fair view of the Group’s financial position and the results of its operations. The annual report has been prepared in accordance with generally accepted accounting principles in Sweden and provides a true and fair view of the Parent Company’s financial position and results.
The administration report for the Group and Parent Company provides a true and fair overview of the development of the Group's and the Parent Company's operations, financial position and results, and describes significant risks and uncertainty factors facing the Parent Company and other companies within the Group.
The income statements and balance sheets will be submitted for adoption at the AGM on 29 April 2021.
Our audit report was submitted on 18 March 2021
Öhrlings PricewaterhouseCoopers AB
Signatures
Peter NyllingeAuthorised Public Accountant
Auditor-in-Charge
Martin Odqvist Authorised Public Accountant
90 FA G E R H U LT G R O U P A N N U A L R E P O R T 2 0 2 0
F I N A N C I A L I N F O R M A T I O N | A U D I T R E P O R T
Audit Report Unofficial translation
To the general meeting of the shareholders of AB Fagerhult, corporate identity number 556110-6203
Report on the annual accounts and consolidated accountsOpinionsWe have audited the annual accounts and con-solidated accounts of AB Fagerhult for the year 2020. The annual accounts and consolidated accounts of the company are included on pages 30–89 in this document.
In our opinion, the annual accounts have been prepared in accordance with the Annual Accounts Act and present fairly, in all mate-rial respects, the financial position of parent company and the group as of 31 December 2020 and its financial performance and cash flow for the year then ended in accordance with the Annual Accounts Act. The consolidated accounts have been prepared in accordance with the Annual Accounts Act and present fairly, in all material respects, the financial position of the group as of 31 December 2020 and their financial performance and cash flow for the year then ended in accordance with Inter-national Financial Reporting Standards (IFRS), as adopted by the EU, and the Annual Accounts Act.
A Corporate Governance Report has been prepared. The information provided in this Corporate Governance Report and in the statutory administration report is consistent with the other parts of the annual accounts and consolidated accounts, the information in the Corporate Governance Report is in accordance with the stipulations of the Annual Accounts Act.
We therefore recommend that the general meeting of shareholders adopts the income statement and balance sheet for the parent company and the group.
Our opinions in this report on the annual accounts and consolidated accounts are consistent with the content of the additional
report that has been submitted to the parent company’s audit committee in accordance with the Audit Regulation (537/2014) Article 11.
Basis for OpinionsWe conducted our audit in accordance with International Standards on Auditing (ISA) and generally accepted auditing standards in Sweden. Our responsibilities under those standards are further described in the Auditor’s Responsibilities section. We are independent of the parent company and the group in accor-dance with professional ethics for accountants in Sweden and have otherwise fulfilled our ethical responsibilities in accordance with these requirements. This includes that, based on the best of our knowledge and belief, no prohibited services referred to in the Audit Regulation (537/2014) Article 5.1 have been provided to the audited company or, where applicable, its parent company or its controlled companies within the EU.
We believe that the audit evidence we have obtained is sufficient and appropriate to provide a basis for our opinions.
Our audit approachThe focus and scope of the auditWe designed our audit by determining materiality and assessing the risks of material misstatement in the consolidated financial statements. In par-ticular, we considered where management made subjective judgements; for example, in respect of significant accounting estimates that involved making assumptions and considering future events that are inherently uncertain. As in all of our audits, we also addressed the risk of man-agement override of internal controls, including among other matters consideration of whether there was evidence of bias that represented a risk of material misstatement due to fraud.
We tailored the scope of our audit in order to perform sufficient work to enable us to provide an opinion on the consolidated financial statements as a whole, taking into account the structure of the Group, the accounting pro-cesses and controls, and the industry in which the group operates.
Fagerhult’s operations are undertaken in some 30 countries around the world. Each of the local operations has their own finance function reporting to the head office in Sweden.
Even if the operations are quite distributed, the four entities, Fagerhults Belysning AB, Fager-hults Belysning Sverige AB, Whitecroft Lighting Ltd. in the UK and iGuzzini in Italy, together, com-prise a decisive portion of the entire group. It was both natural and necessary to execute a full audit on these four entities. In Sweden, the audit was executed by the group team, while in the UK and Italy the local PwC teams executed the audits. The group team has studied the work under-taken by these local unit auditors to ensure that sufficient audit work has been performed, but has also communicated on an ongoing basis with the local teams to maintain a clear understand-ing of the manner in which the audits have been executed. In addition to these four units, after consultation with Fagerhult’s Board of Directors and group management, it was determined that the group audit was to include a further 39 units where full audits have been executed. A total of 24 of these units in the various countries have been audited by the PwC network.
As regards just a few companies, whose combined operations represent only a limited portion of the total operations of the group, the group audit team has undertaken analytical procedures. Local statutory audits have been executed on all of the entities in the group with such requirements even if the entity in question has not been included in the reporting on the audit of the consolidated accounts, or has not been included in the audit time schedule.
In addition, the group team has audited the group consolidation, the group’s annual financial statements and a number of complex transactions and issues. These have included the reallocation of goodwill and impairment testing of intangible assets with indefinite useful lifetimes, brands and goodwill.
Our overall conclusion is that we have evi-denced that sufficient audit activities have been executed, and that such activities have taken place primarily through the utilisation of PwC’s own network.
FA G E R H U LT G R O U P A N N U A L R E P O R T 2 0 2 0 91
A U D I T R E P O R T | F I N A N C I A L I N F O R M A T I O N
Materiality
The scope of our audit was influenced by our application of materiality. An audit is designed to obtain reasonable assurance whether the finan-cial statements are free from material misstate-ment. Misstatements may arise due to fraud or error. They are considered material if individually or in aggregate, they could reasonably be expected to influence the economic decisions of users taken on the basis of the consolidated financial statements.
Based on our professional judgement, we determined certain quantitative thresholds for materiality, including the overall group materi-ality for the consolidated financial statements as a whole. These, together with qualitative considerations, helped us to determine the scope of our audit and the nature, timing and extent of our audit procedures and to evaluate the effect of misstatements, both individually and in aggregate on the financial statements as a whole.
Key audit mattersKey audit matters of the audit are those matters that, in our professional judgment, were of most significance in our audit of the annual accounts and consolidated accounts of the current period. These matters were addressed in the context of our audit of, and in forming our opinion thereon, the annual accounts and consolidated accounts as a whole, but we do not provide a separate opinion on these matters.
Key audit matter How our audit addressed the Key audit matter
Valuation of intangible assets with indefinite useful lifetimes, brands and goodwillOn page 65 in the section, Significant Estimates and Assump-tions, amongst the Accounting Principles and in Note 11, Fagerhult describes its valuation of intangible assets with indefinite useful lifetimes which are comprised of brands and goodwill.
Of the group’s balance sheet total, MSEK 5,335 or 44 per cent is comprised of intangible assets with indefinite useful lifetimes. As these assets are not amortised on an ongoing basis, an impairment test is to be executed at least once a year. Fagerhult undertook such a test during the fourth quarter 2020.
Such a test includes the assumptions undertaken regarding, amongst other things, future growth, profitability and the discount factor. In other words, the assessments and estimations which are required to be made by the management and Board of Directors are complex.
As these tangible assets comprise a significant amount and the required assumptions include assessments and estimations which, taken individually, can have a decisive influence on the valuation, this is a particularly significant area for the audit.
During the year a new segment reporting was implemented which required the goodwill to be reallocated between the cash generated units Fagerhult have identified when performing the impairment test relating to intangible assets with indefinite useful lifetimes. Fagerhult describes the process in Note 11. The reallocation requires that a relevant distribution key is applied to achieve a true and fair view.
We started with ensuring our understanding of the structure of the new segments. We audited the reallocation of the goodwill between the cash-generated units Fagerhult presented and found it to be according to a true and fair view.
We determined, together with PwC’s valuation specialists, that the applied impairment tests, one per segment, were implemented according to established principles and methods.
The assumptions of greatest importance to the impairment tests which were made by the management and Board of Directors, referred to growth, profitability and the discount rates. We have assessed these assumptions by comparing these factors against Fagerhult’s budget and strategic plan, and also against historical outcome. We have also undertaken an independent assessment with the starting point on the premises of the markets in which the cash generating units operate. We have checked the discount rates against observable market data.
We have also examined significant assumptions to determine if they are consistent with previous years.
With the starting point being the impairment tests, we implemented simulations and undertook sensitivity analyses in order to understand the manner in which a given change could impact the values and which could indicate a possible impairment requirement. These tests have also provided the basis of our control of the information provided in Note 11 of the annual report.
As a final, overall control, we have compared the company’s stock market value in relation to its calculated net realisable value.
In conclusion, in our audit of the valuation of intangible assets with indefinite useful lifetimes, that is, the brands and goodwill, we have made no observations which are significant to the audit as a whole.

92 FA G E R H U LT G R O U P A N N U A L R E P O R T 2 0 2 0
F I N A N C I A L I N F O R M A T I O N | A U D I T R E P O R T
Other Information than the annual accounts and consolidated accountsThis document also contains other information than the annual accounts and consolidated accounts and is found on pages 1–29 and 94–130. The other information also consists of the remuneration report, which we have had access to prior to the date of this audit report. The Board of Directors and the Managing Direc-tor are responsible for this other information.
Our opinion on the annual accounts and consolidated accounts does not cover this other information and we do not express any form of assurance conclusion regarding this other information.
In connection with our audit of the annual accounts and consolidated accounts, our responsibility is to read the information identified above and consider whether the information is materially inconsistent with the annual accounts and consolidated accounts. In this procedure we also take into account our knowledge otherwise obtained in the audit and assess
whether the information otherwise appears to be materially misstated.
If we, based on the work performed concern-ing this information, conclude that there is a material misstatement of this other information, we are required to report that fact. We have nothing to report in this regard.
Responsibilities of the Board of Director’s and the Managing DirectorThe Board of Directors and the Managing Director are responsible for the preparation of the annual accounts and consolidated accounts and that they give a fair presentation in accordance with the Annual Accounts Act and, concerning the consolidated accounts, in accordance with IFRS as adopted by the EU. The Board of Directors and the Managing Direc-tor are also responsible for such internal control as they determine is necessary to enable the preparation of annual accounts and consol-idated accounts that are free from material misstatement, whether due to fraud or error.
In preparing the annual accounts and consol-idated accounts, The Board of Directors and the Managing Director are responsible for the assessment of the company’s and the group’s ability to continue as a going concern. They disclose, as applicable, matters related to going concern and using the going concern basis of accounting. The going concern basis of accounting is however not applied if the Board of Directors and the Managing Director intend to liquidate the company, to cease operations, or has no realistic alternative but to do so.
The Audit Committee shall, without prejudice to the Board of Director’s responsibilities and tasks in general, among other things oversee the company’s financial reporting process.
Auditor’s responsibilityOur objectives are to obtain reasonable assur-ance about whether the annual accounts and consolidated accounts as a whole are free from material misstatement, whether due to fraud or error, and to issue an auditor’s report that
Key audit matter How our audit addressed the Key audit matter
Changes in market demand and impact on revenue recognitionFagerhult describes how it recognises revenue on page 61 and under the heading “Revenue recognition.”
The internet of things (IoT) and sustainability are two areas that impact demand from Fagerhult’s end customers and thereby create new revenue opportunities for the Group. Offering connected products enables end customers to lower energy consumption, implement new lighting solutions and increase security among other improvements. It also makes it possible for other interested parties to integrate their products and services into Fagerhult’s products, which may be of great interest to end customers.
As a natural result of these opportunities, Fagerhult can, over time, be influenced by what these parties wish to and can offer end cus-tomers. While currently, the Group’s main revenue stream is through the sale of products, the future could also see systems, connectivity, maintenance, etc. being offered. Marketing could be conducted on a stand-alone or integrated basis.
Such a development could affect both when and how revenue is recognised.
We instructed each of the local audit teams to be alert to changes in customers’ demand and whether these changes affected Fagerhults’ customer offering.
The review included obtaining insight into how new products and services have developed in recent years. We instructed the auditors to discuss with the local sales departments to gain an understanding of market trends. The auditor should also make inquiries to the R&D departments, since they create the new products.
As part of our standard audit procedures regarding revenue, such as the review of customer agreements, invoices and payments, we have also tried to identify changes that indicate an impact on the revenue streams.
The Group audit team conducted discussions with Fagerhult’s company management to gain an understanding of how the market is changing and whether these changes affect revenue recognition.
Based on our audit, we have no observations that were material for the audit as a whole
FA G E R H U LT G R O U P A N N U A L R E P O R T 2 0 2 0 93
A U D I T R E P O R T | F I N A N C I A L I N F O R M A T I O N
includes our opinions. Reasonable assurance is a high level of assurance, but is not a guarantee that an audit conducted in accordance with ISAs and generally accepted auditing standards in Sweden will always detect a material misstate-ment when it exists. Misstatements can arise from fraud or error and are considered material if, individually or in the aggregate, they could rea-sonably be expected to influence the economic decisions of users taken on the basis of these annual accounts and consolidated accounts.
A further description of our responsibility for the audit of the annual accounts and consoli-dated accounts is available on Revisorsinspek-tionen’s website: www.revisorsinspektionen.se/revisornsansvar. This description is part of the auditor s report.
Report on other legal and regulatory requirementsOpinionsIn addition to our audit of the annual accounts and consolidated accounts, we have also audited the administration of the Board of Direc-tor’s and the Managing Director of AB Fagerhult for the year 2020 and the proposed appropria-tions of the company’s profit or loss.
We recommend to the general meeting of shareholders that the profit be appropriated in accordance with the proposal in the statutory administration report and that the members of the Board of Director’s and the Managing Director be discharged from liability for the financial year.
Basis for OpinionsWe conducted the audit in accordance with generally accepted auditing standards in Sweden. Our responsibilities under those
standards are further described in the Auditor’s Responsibilities section. We are independent of the parent company and the group in accor-dance with professional ethics for accountants in Sweden and have otherwise fulfilled our ethical responsibilities in accordance with these requirements.
We believe that the audit evidence we have obtained is sufficient and appropriate to provide a basis for our opinions.
Responsibilities of the Board of Director’s and the Managing DirectorThe Board of Directors is responsible for the proposal for appropriations of the company’s profit or loss. At the proposal of a dividend, this includes an assessment of whether the dividend is justifiable considering the requirements which the company’s and the group’s type of operations, size and risks place on the size of the parent company’s and the group’ equity, con-solidation requirements, liquidity and position in general.
The Board of Directors is responsible for the company’s organization and the administration of the company’s affairs. This includes among other things continuous assessment of the company’s and the group’s financial situation and ensuring that the company s organization is designed so that the accounting, management of assets and the company’s financial affairs otherwise are controlled in a reassuring manner. The Managing Director shall manage the ongoing administration according to the Board of Directors’ guidelines and instructions and among other matters take measures that are necessary to fulfill the company’s accounting in accordance with law and handle the manage-ment of assets in a reassuring manner.
Auditor’s responsibilityOur objective concerning the audit of the administration, and thereby our opinion about discharge from liability, is to obtain audit evidence to assess with a reasonable degree of assurance whether any member of the Board of Directors or the Managing Director in any material respect:• has undertaken any action or been guilty of
any omission which can give rise to liability to the company, or
• in any other way has acted in contravention of the Companies Act, the Annual Accounts Act or the Articles of Association.
Our objective concerning the audit of the pro-posed appropriations of the company’s profit or loss, and thereby our opinion about this, is to assess with reasonable degree of assurance whether the proposal is in accordance with the Companies Act.
Reasonable assurance is a high level of assur-ance, but is not a guarantee that an audit con-ducted in accordance with generally accepted auditing standards in Sweden will always detect actions or omissions that can give rise to liability to the company, or that the proposed appropri-ations of the company’s profit or loss are not in accordance with the Companies Act.
A further description of our responsibility for the audit of the administration is available on Revisorsinspektionen’s website: www.revisorsinspektionen.se/revisornsansvar. This description is part of the auditor’s report.
Öhrlings PricewaterhouseCoopers AB, Torsgatan 21, 113 97 Stockholm, was appointed AB Fagerhult’s auditors by the general meeting of shareholders held on 23 June 2020. We have served as auditors in the company for more than 20 years.
Jönköping 18 March 2021
Öhrlings PricewaterhouseCoopers AB
Peter NyllingeAuthorized Public Accountant
Auditor in Charge
Martin OdqvistAuthorized Public Accountant
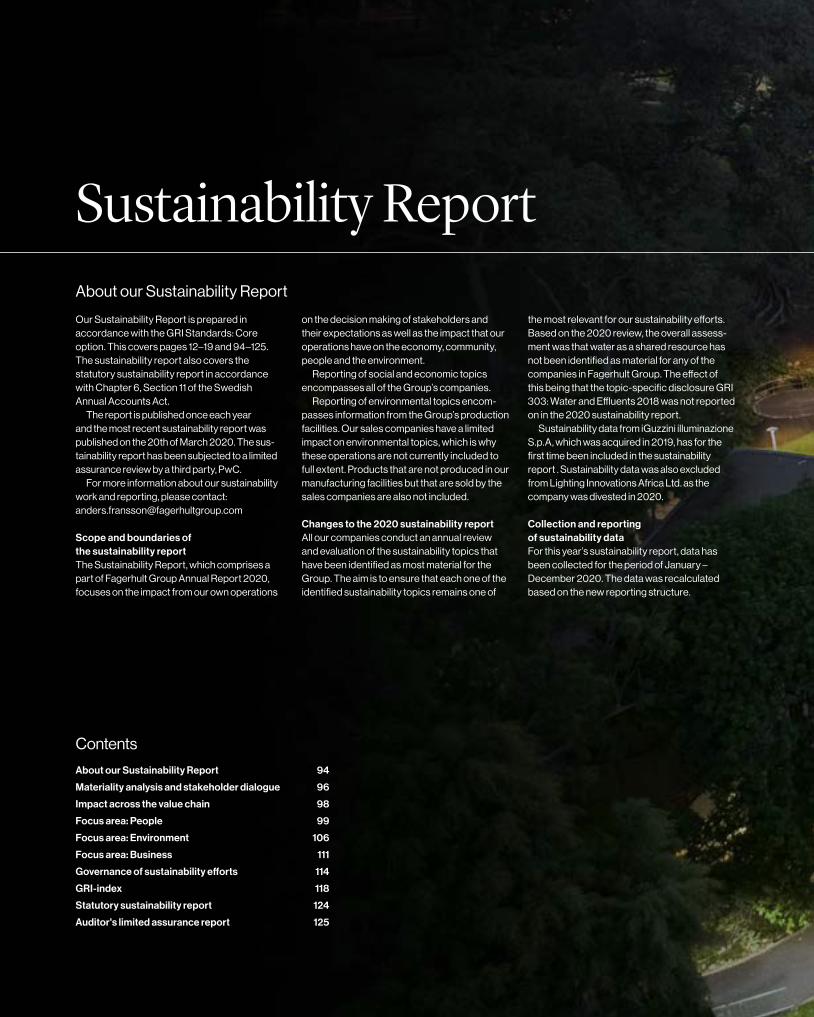
About our Sustainability Report
Our Sustainability Report is prepared in accordance with the GRI Standards: Core option. This covers pages 12–19 and 94–125. The sustainability report also covers the statutory sustainability report in accordance with Chapter 6, Section 11 of the Swedish Annual Accounts Act.
The report is published once each year and the most recent sustainability report was published on the 20th of March 2020. The sus-tainability report has been subjected to a limited assurance review by a third party, PwC.
For more information about our sustainability work and reporting, please contact: [email protected]
Scope and boundaries of the sustainability reportThe Sustainability Report, which comprises a part of Fagerhult Group Annual Report 2020, focuses on the impact from our own operations
on the decision making of stakeholders and their expectations as well as the impact that our operations have on the economy, community, people and the environment.
Reporting of social and economic topics encompasses all of the Group’s companies.
Reporting of environmental topics encom-passes information from the Group’s production facilities. Our sales companies have a limited impact on environmental topics, which is why these operations are not currently included to full extent. Products that are not produced in our manufacturing facilities but that are sold by the sales companies are also not included.
Changes to the 2020 sustainability reportAll our companies conduct an annual review and evaluation of the sustainability topics that have been identified as most material for the Group. The aim is to ensure that each one of the identified sustainability topics remains one of
the most relevant for our sustainability efforts.Based on the 2020 review, the overall assess-ment was that water as a shared resource has not been identified as material for any of the companies in Fagerhult Group. The effect of this being that the topic-specific disclosure GRI 303: Water and Effluents 2018 was not reported on in the 2020 sustainability report.
Sustainability data from iGuzzini illuminazione S.p.A, which was acquired in 2019, has for the first time been included in the sustainability report . Sustainability data was also excluded from Lighting Innovations Africa Ltd. as the company was divested in 2020.
Collection and reporting of sustainability dataFor this year’s sustainability report, data has been collected for the period of January – December 2020. The data was recalculated based on the new reporting structure.
Sustainability Report
Contents
About our Sustainability Report 94
Materiality analysis and stakeholder dialogue 96
Impact across the value chain 98
Focus area: People 99
Focus area: Environment 106
Focus area: Business 111
Governance of sustainability efforts 114
GRI-index 118
Statutory sustainability report 124
Auditor's limited assurance report 125

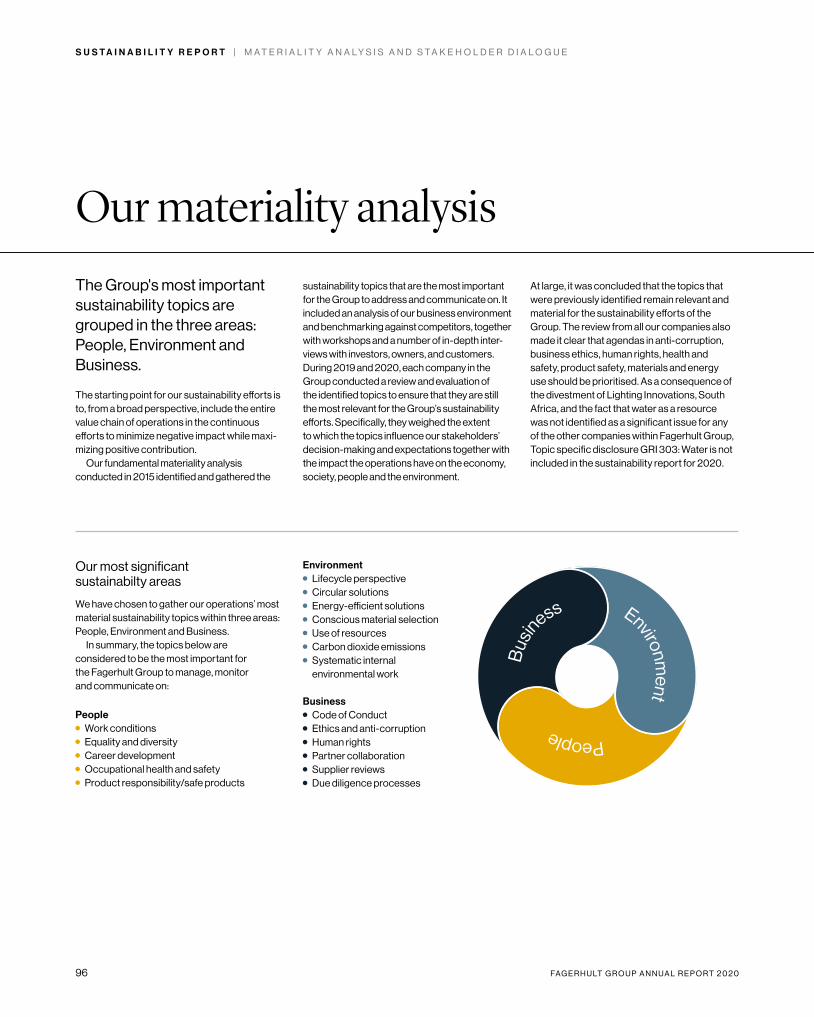
96 FA G E R H U LT G R O U P A N N U A L R E P O R T 2 0 2 0
S U S T A I N A B I L I T Y R E P O R T | M A T E R I A L I T Y A N A L Y S I S A N D S T A K E H O L D E R D I A L O G U E
The Group's most important sustainability topics are grouped in the three areas: People, Environment and Business.
The starting point for our sustainability efforts is to, from a broad perspective, include the entire value chain of operations in the continuous efforts to minimize negative impact while maxi-mizing positive contribution.
Our fundamental materiality analysis conducted in 2015 identified and gathered the
sustainability topics that are the most important for the Group to address and communicate on. It included an analysis of our business environment and benchmarking against competitors, together with workshops and a number of in-depth inter-views with investors, owners, and customers. During 2019 and 2020, each company in the Group conducted a review and evaluation of the identified topics to ensure that they are still the most relevant for the Group’s sustainability efforts. Specifically, they weighed the extent to which the topics influence our stakeholders’ decision-making and expectations together with the impact the operations have on the economy, society, people and the environment.
At large, it was concluded that the topics that were previously identified remain relevant and material for the sustainability efforts of the Group. The review from all our companies also made it clear that agendas in anti-corruption, business ethics, human rights, health and safety, product safety, materials and energy use should be prioritised. As a consequence of the divestment of Lighting Innovations, South Africa, and the fact that water as a resource was not identified as a significant issue for any of the other companies within Fagerhult Group, Topic specific disclosure GRI 303: Water is not included in the sustainability report for 2020.
Our materiality analysis
Our most significant sustainabilty areas
We have chosen to gather our operations’ most material sustainability topics within three areas: People, Environment and Business.
In summary, the topics below are considered to be the most important for the Fagerhult Group to manage, monitor and communicate on:
People Work conditions Equality and diversity Career development Occupational health and safety Product responsibility/safe products
Bus
iness Environment People
Environment Lifecycle perspective Circular solutions Energy-efficient solutions Conscious material selection Use of resources Carbon dioxide emissions Systematic internal
environmental work
Business Code of Conduct Ethics and anti-corruption Human rights Partner collaboration Supplier reviews Due diligence processes
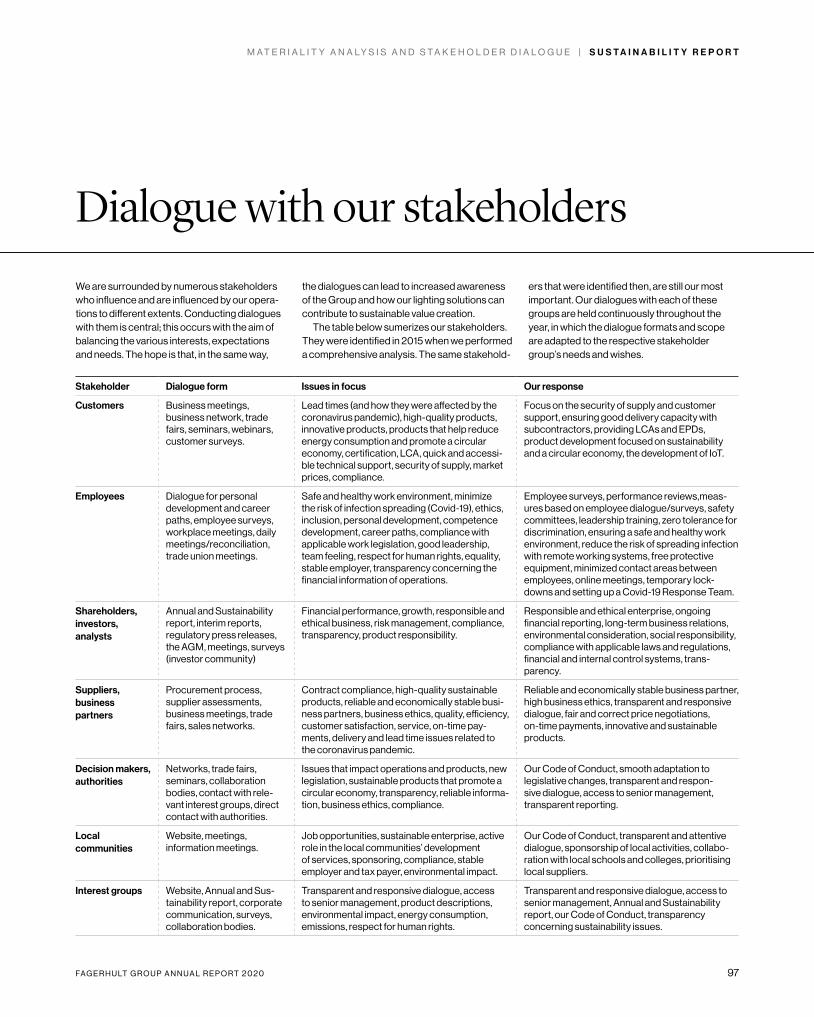
FA G E R H U LT G R O U P A N N U A L R E P O R T 2 0 2 0 97
M A T E R I A L I T Y A N A L Y S I S A N D S T A K E H O L D E R D I A L O G U E | S U S T A I N A B I L I T Y R E P O R T
Dialogue with our stakeholders
Stakeholder Dialogue form Issues in focus Our response
Customers Business meetings, business network, trade fairs, seminars, webinars, customer surveys.
Lead times (and how they were affected by the coronavirus pandemic), high-quality products, innovative products, products that help reduce energy consumption and promote a circular economy, certification, LCA, quick and accessi-ble technical support, security of supply, market prices, compliance.
Focus on the security of supply and customer support, ensuring good delivery capacity with subcontractors, providing LCAs and EPDs, product development focused on sustainability and a circular economy, the development of IoT.
Employees Dialogue for personal development and career paths, employee surveys, workplace meetings, daily meetings/reconciliation, trade union meetings.
Safe and healthy work environment, minimize the risk of infection spreading (Covid-19), ethics, inclusion, personal development, competence development, career paths, compliance with applicable work legislation, good leadership, team feeling, respect for human rights, equality, stable employer, transparency concerning the financial information of operations.
Employee surveys, performance reviews,meas-ures based on employee dialogue/surveys, safety committees, leadership training, zero tolerance for discrimination, ensuring a safe and healthy work environment, reduce the risk of spreading infection with remote working systems, free protective equipment, minimized contact areas between employees, online meetings, temporary lock-downs and setting up a Covid-19 Response Team.
Shareholders, investors, analysts
Annual and Sustainability report, interim reports, regulatory press releases, the AGM, meetings, surveys (investor community)
Financial performance, growth, responsible and ethical business, risk management, compliance, transparency, product responsibility.
Responsible and ethical enterprise, ongoing financial reporting, long-term business relations, environmental consideration, social responsi bility, compliance with applicable laws and regulations, financial and internal control systems, trans-parency.
Suppliers, business partners
Procurement process, supplier assessments, business meetings, trade fairs, sales networks.
Contract compliance, high-quality sustainable products, reliable and economically stable busi-ness partners, business ethics, quality, efficiency, customer satisfaction, service, on-time pay-ments, delivery and lead time issues related to the coronavirus pandemic.
Reliable and economically stable business partner, high business ethics, transparent and responsive dialogue, fair and correct price negotiations, on-time payments, innovative and sustainable products.
Decision makers, authorities
Networks, trade fairs, seminars, collaboration bodies, contact with rele-vant interest groups, direct contact with authorities.
Issues that impact operations and products, new legislation, sustainable products that promote a circular economy, transparency, reliable informa-tion, business ethics, compliance.
Our Code of Conduct, smooth adaptation to legislative changes, transparent and respon-sive dialogue, access to senior management, transparent reporting.
Local communities
Website, meetings, information meetings.
Job opportunities, sustainable enterprise, active role in the local communities’ development of services, sponsoring, compliance, stable employer and tax payer, environmental impact.
Our Code of Conduct, transparent and attentive dialogue, sponsorship of local activities, collabo-ration with local schools and colleges, prioritising local suppliers.
Interest groups Website, Annual and Sus-tainability report, corporate communication, surveys, collaboration bodies.
Transparent and responsive dialogue, access to senior management, product descriptions, environmental impact, energy consumption, emissions, respect for human rights.
Transparent and responsive dialogue, access to senior management, Annual and Sustainability report, our Code of Conduct, transparency concerning sustainability issues.
We are surrounded by numerous stakeholders who influence and are influenced by our opera-tions to different extents. Conducting dialogues with them is central; this occurs with the aim of balancing the various interests, expectations and needs. The hope is that, in the same way,
the dialogues can lead to increased awareness of the Group and how our lighting solutions can contribute to sustainable value creation.
The table below sumerizes our stakeholders. They were identified in 2015 when we performed a comprehensive analysis. The same stakehold-
ers that were identified then, are still our most important. Our dialogues with each of these groups are held continuously throughout the year, in which the dialogue formats and scope are adapted to the respective stakeholder group’s needs and wishes.
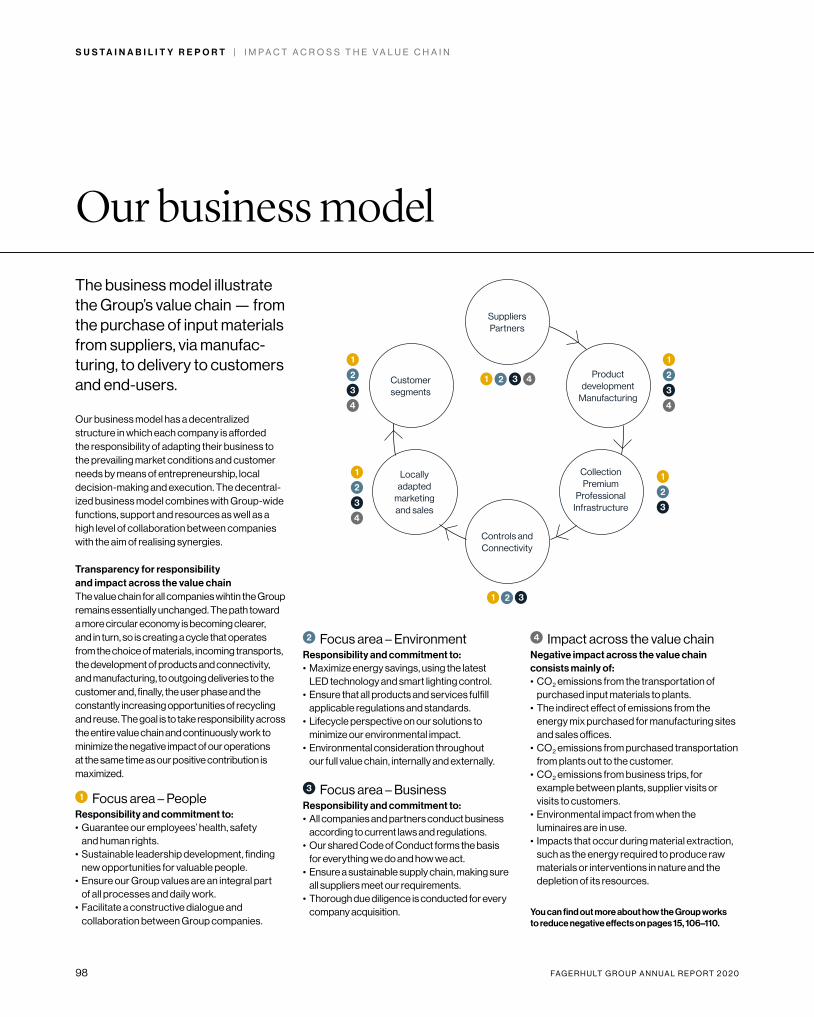
98 FA G E R H U LT G R O U P A N N U A L R E P O R T 2 0 2 0
S U S T A I N A B I L I T Y R E P O R T | I M P A C T A C R O S S T H E V A L U E C H A I N
The business model illustrate the Group’s value chain — from the purchase of input materials from suppliers, via manufac-turing, to delivery to customers and end-users.
Our business model has a decentralized structure in which each company is afforded the responsibility of adapting their business to the prevailing market conditions and customer needs by means of entrepreneurship, local decision-making and execution. The decentral-ized business model combines with Group-wide functions, support and resources as well as a high level of collaboration between companies with the aim of realising synergies.
Transparency for responsibility and impact across the value chain The value chain for all companies wihtin the Group remains essentially unchanged. The path toward a more circular economy is becoming clearer, and in turn, so is creating a cycle that operates from the choice of materials, incoming transports, the development of products and connectivity, and manufacturing, to outgoing deliveries to the customer and, finally, the user phase and the constantly increasing opportunities of recycling and reuse. The goal is to take responsibility across the entire value chain and continuously work to minimize the negative impact of our operations at the same time as our positive contribution is maximized.
1 Focus area – PeopleResponsibility and commitment to: • Guarantee our employees’ health, safety
and human rights.• Sustainable leadership development, finding
new opportunities for valuable people.• Ensure our Group values are an integral part
of all processes and daily work.• Facilitate a constructive dialogue and
collaboration between Group companies.
Our business model
You can find out more about how the Group works to reduce negative effects on pages 15, 106–110.
1
2
3
4
1
2
3
4
1
2
3
4
1
2
3
Customer segments
Locally adapted
marketing and sales
Suppliers Partners
Controls and Connectivity
Product development
Manufacturing
Collection Premium
Professional Infrastructure
1 2 3
1 2 3 4
2 Focus area – EnvironmentResponsibility and commitment to: • Maximize energy savings, using the latest
LED technology and smart lighting control.• Ensure that all products and services fulfill
applicable regulations and standards.• Lifecycle perspective on our solutions to
minimize our environmental impact.• Environmental consideration throughout
our full value chain, internally and externally.
3 Focus area – Business Responsibility and commitment to: • All companies and partners conduct business
according to current laws and regulations.• Our shared Code of Conduct forms the basis
for everything we do and how we act.• Ensure a sustainable supply chain, making sure
all suppliers meet our requirements.• Thorough due diligence is conducted for every
company acquisition.
4 Impact across the value chainNegative impact across the value chain consists mainly of: • CO2 emissions from the transportation of
purchased input materials to plants.• The indirect effect of emissions from the
energy mix purchased for manufacturing sites and sales offices.
• CO2 emissions from purchased transportation from plants out to the customer.
• CO2 emissions from business trips, for example between plants, supplier visits or visits to customers.
• Environmental impact from when the luminaires are in use.
• Impacts that occur during material extraction, such as the energy required to produce raw materials or interventions in nature and the depletion of its resources.

FA G E R H U LT G R O U P A N N U A L R E P O R T 2 0 2 0 99
F O C U S A R E A : P E O P L E | S U S T A I N A B I L I T Y R E P O R T
FO C U S A R E A :
People
At 31 December 2020, a total of 4,397 people (4,465) worked at Fagerhult Group.
4,397Number of employees per business area:
Objectives
Guarantee our employees’ health, safety and human rights.
Sustainable leadership development, finding new opportunities for valuable people.
Ensure our Group values are an integral part of all processes and daily work.
Facilitate a constructive dialogue and collaboration between Group companies.
In light of the coronavirus pandemic, most of the companies’ personnel management during the year was focused on ensuring the health and safety of employees. Keeping operations run-ning safely was fundamental and comprehen-sive efforts took place across the companies to establish coronavirus-safe workplaces based
on local requirements and to introduce newly adapted work procedures. Manufacturing com-panies took such measures as to implement non-overlapping shift work, and increased use of digital channels enabled extensive remote working.
Sustainable leadershipOur overall ambition is to develop sustainable managers who feel comfortable in their roles and with a coaching style of leadership. Manag-ers who have the ability to, in dialogue with their employees, meet requirements for change and cultivate a healthy and safe work environment. Sustainable leadership is also about the ability to engage employees and capitalise on the advantages of their differences and skills.
The leadership model within Fagerhult Group shall provide guidance and governance for all managers. At Group level, the international
leadership program, Bright Leaders, has been running for several years. It is focused on devel-oping leadership and collaboration between companies to strengthen the decentralized business model. So far, 73 of the Group’s managers have completed the programme.
Diversity and equalityOur Code of Conduct states that all employees, irrespective of gender, age, religion, sexual orientation, or ethnic background, should be given the same opportunities for development and advancement as well as equal pay for equal work.
We aspire for each company to actively work to create a better balance between the genders. In general, recruitment is seen as a good opportunity to strengthen diversity and gender balance.
The goal is to have at least one candidate of
Collection, 47%
Premium, 31%
Professional, 14%
Infrastructure, 8%
100 FA G E R H U LT G R O U P A N N U A L R E P O R T 2 0 2 0
S U S T A I N A B I L I T Y R E P O R T | F O C U S A R E A : P E O P L E
the under-represented gender on the “short list” during recruitments, which is also a requirement from the Group when a company purchases external recruitment services.
At year end, the composition of the Fagerhult Group’s Board of Directors and senior manage-ment was 85 per cent (85) men and 15 per cent (15) women.
For the Group as a whole, the gender balance among employees was 66 per cent (67) men and 34 per cent (33) women.
Career and competence developmentEmployees’ continuous competence devel-opment is primarily conducted within the framework of each company and with directed training activities that are adapted to local needs. Each company has the goal of being able to offer its employees an inclusive environment characterised by good development oppor-tunities and attractive career paths, locally as well as globally. There are also efforts in place to attract more young talents to the lighting indus-try in the long term. This requires a presence at labour markets and job fairs, and conducting regular dialogues with students from several universities.
The Group-wide Bright Prospects trainee program is an essential part of the Fagerhult Group’s long-term skills supply and an attrac-tive way into the Group. The 18-month program is designed for university graduates, and includes three project periods of six months at one of the Group’s companies. The third round, with two women and two men representing three different nationalities concluded in the spring of 2020. The plans for the fourth round had to be postponed as a result of changed priorities due to the effects of the pandemic.
Employees in focusThe recommendation from the Group manage-ment is that all employees should have at least one development dialogue with their immediate manager every year. The goal is also to establish greater consensus regarding the benefits of development dialogues and what they should include. Variation between companies remains
comparatively large, however 65 per cent (54) of all Fagerhult Group’s employees engaged in some kind of development dialogue during 2020. Various forms of employee surveys are conducted at different times around the com-panies. Due to the corona virus pandemic, two companies introduced pulse measurements to make it possible for employees to report their experiences of the work situation, stress, doubt and commitment in real time. Highlighting situations that give rise to ill-health became an important leadership tool which simplified implementing proactive efforts.
Examples from operations
During 2020, all of the Group's companies were impacted by the effects of the pandemic. This made it necessary to focus a substantial amount of resources on making workplaces corona-virus-safe and adapting work procedures to provide the opportunity for employees to work remotely. Many of the planned initiatives and projects in the employee area were postponed as a consequence.
Another effect was that staffing was lower than normal, with fewer hours worked. This is the main reason why the number of occupational accidents decreased in 2020 compared with the year before. At the same time, absenteeism from work-related accidents and illnesses increased. This is because individual cases have taken longer time to rehabilitate compared to previous years, but also because iGuzzini was added to this year's report.
Fagerhults Belysning/China: With a focus on a safe workplace, the plant was able to celebrate four years without any work- related accident. A cornerstone for the above is the implement- ed standard for a safe work environment. The safety standard, which adheres to national legal requirements, includes measures such as annual health check-ups, the identification of hazardous working conditions, first-aid training and regular fire drills.
Fagerhults Belysning/Sweden: As an activity to improve the handling of the situa-tion, pulse measurements were introduced early in the Covid-19 pandemic to obtain employees’ information and views. At the first survey in April 2020, 329 employees answered the survey. When asked how the management communicated about guide-lines for reducing the spread of Covid-19, the average result was above four on a five-point scale, where five was considered the best alternative.
Ateljé Lyktan/Sweden: The leadership program Chefsettan continued together with Lyktan Academy which offers various training from internal and external educators.
Designplan/UK: Regular training activities, development dialogues and employee surveys (pulse measurements) were conducted on a number of occasions throughout the year.
iGuzzini/Italy: Various training activities were regularly conducted throughout the year focusing on leadership, individual training and the ability to develop as a team.
Societal commitment is managed through external projects that provide young people coming from troubled backgrounds with the opportunity for a more structured life, and that lead to various training paths in the future for these individuals.
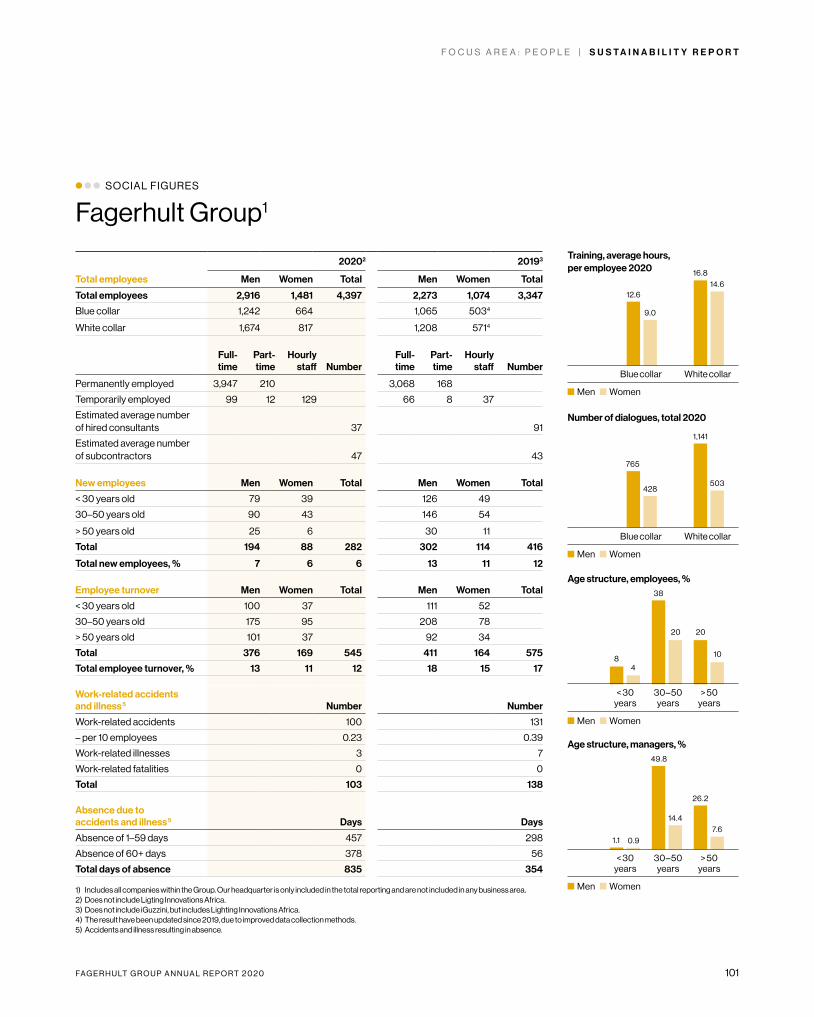
FA G E R H U LT G R O U P A N N U A L R E P O R T 2 0 2 0 101
F O C U S A R E A : P E O P L E | S U S T A I N A B I L I T Y R E P O R T
20202 20193
Total employees Men Women Total Men Women Total
Total employees 2,916 1,481 4,397 2,273 1,074 3,347
Blue collar 1,242 664 1,065 5034
White collar 1,674 817 1,208 5714
Full- time
Part- time
Hourly staff Number
Full- time
Part- time
Hourly staff Number
Permanently employed 3,947 210 3,068 168
Temporarily employed 99 12 129 66 8 37
Estimated average number of hired consultants 37 91
Estimated average number of subcontractors 47 43
New employees Men Women Total Men Women Total
< 30 years old 79 39 126 49
30–50 years old 90 43 146 54
> 50 years old 25 6 30 11
Total 194 88 282 302 114 416
Total new employees, % 7 6 6 13 11 12
Employee turnover Men Women Total Men Women Total
< 30 years old 100 37 111 52
30–50 years old 175 95 208 78
> 50 years old 101 37 92 34
Total 376 169 545 411 164 575
Total employee turnover, % 13 11 12 18 15 17
Work-related accidents and illness 5 Number Number
Work-related accidents 100 131
– per 10 employees 0.23 0.39
Work-related illnesses 3 7
Work-related fatalities 0 0
Total 103 138
Absence due to accidents and illness 5 Days Days
Absence of 1–59 days 457 298
Absence of 60+ days 378 56
Total days of absence 835 354
1) Includes all companies within the Group. Our headquarter is only included in the total reporting and are not included in any business area.2) Does not include Ligting Innovations Africa. 3) Does not include iGuzzini, but includes Lighting Innovations Africa. 4) The result have been updated since 2019, due to improved data collection methods. 5) Accidents and illness resulting in absence.
SOCIAL FIGURES
Fagerhult Group1
0
6
12
18Woman
Men
Training, average hours, per employee 2020
Blue collar White collar
Men Women
12.6
9.0
16.814.6
05
1015
2025303540
Woman
Men
Age structure, employees, %
< 30 years
30–50 years
> 50 years
Men Women
8
38
20
4
20
10
0
300
600
900
1200Woman
Men
Number of dialogues, total 2020
Blue collar White collar
Men Women
1,141
503428
765
0
10
20
30
40
50Woman
Men
Age structure, managers, %
< 30 years
30–50 years
> 50 years
Men Women
1.1
49.8
26.2
14.47.6
0.9
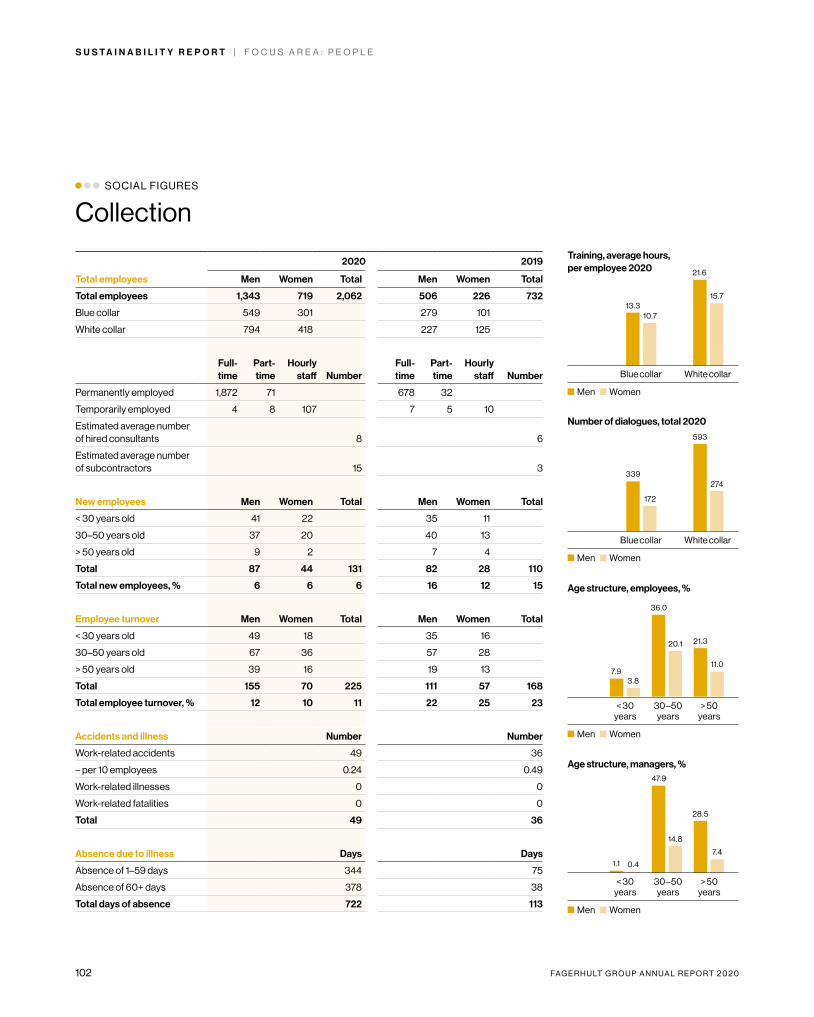
102 FA G E R H U LT G R O U P A N N U A L R E P O R T 2 0 2 0
0
120
240
360
480
600Woman
Men
0,000000
7,666667
15,333333
23,000000Woman
Men
S U S T A I N A B I L I T Y R E P O R T | F O C U S A R E A : P E O P L E
SOCIAL FIGURES
Collection
2020 2019
Total employees Men Women Total Men Women Total
Total employees 1,343 719 2,062 506 226 732
Blue collar 549 301 279 101
White collar 794 418 227 125
Full- time
Part- time
Hourly staff Number
Full- time
Part- time
Hourly staff Number
Permanently employed 1,872 71 678 32
Temporarily employed 4 8 107 7 5 10
Estimated average number of hired consultants 8 6
Estimated average number of subcontractors 15 3
New employees Men Women Total Men Women Total
< 30 years old 41 22 35 11
30–50 years old 37 20 40 13
> 50 years old 9 2 7 4
Total 87 44 131 82 28 110
Total new employees, % 6 6 6 16 12 15
Employee turnover Men Women Total Men Women Total
< 30 years old 49 18 35 16
30–50 years old 67 36 57 28
> 50 years old 39 16 19 13
Total 155 70 225 111 57 168
Total employee turnover, % 12 10 11 22 25 23
Accidents and illness Number Number
Work-related accidents 49 36
– per 10 employees 0.24 0.49
Work-related illnesses 0 0
Work-related fatalities 0 0
Total 49 36
Absence due to illness Days Days
Absence of 1–59 days 344 75
Absence of 60+ days 378 38
Total days of absence 722 113
Number of dialogues, total 2020
Blue collar White collar
Men Women
339
172
593
274
05
1015
2025303540
Woman
Men
Age structure, employees, %
< 30 years
30–50 years
> 50 years
Men Women
7.9
36.0
21.3
3.8
20.1
11.0
0
10
20
30
40
50Woman
Men
Age structure, managers, %
< 30 years
30–50 years
> 50 years
Men Women
1.1
47.9
28.5
0.4
14.8
7.4
Training, average hours, per employee 2020
Blue collar White collar
Men Women
10.7
21.6
15.713.3
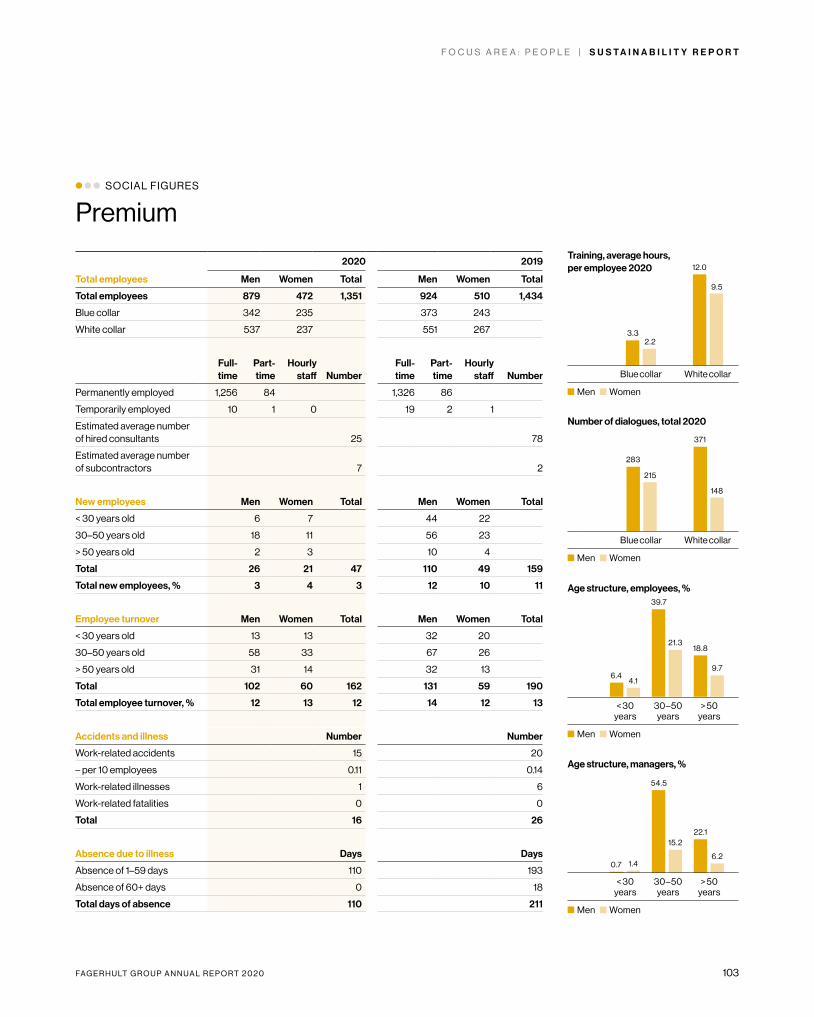
FA G E R H U LT G R O U P A N N U A L R E P O R T 2 0 2 0 103
0,0
2,4
4,8
7,2
9,6
12,0Woman
Men
0,000000
66,666667
133,333333
200,000000
266,666667
333,333333
400,000000Woman
Men
F O C U S A R E A : P E O P L E | S U S T A I N A B I L I T Y R E P O R T
SOCIAL FIGURES
Premium
2020 2019
Total employees Men Women Total Men Women Total
Total employees 879 472 1,351 924 510 1,434
Blue collar 342 235 373 243
White collar 537 237 551 267
Full- time
Part- time
Hourly staff Number
Full- time
Part- time
Hourly staff Number
Permanently employed 1,256 84 1,326 86
Temporarily employed 10 1 0 19 2 1
Estimated average number of hired consultants 25 78
Estimated average number of subcontractors 7 2
New employees Men Women Total Men Women Total
< 30 years old 6 7 44 22
30–50 years old 18 11 56 23
> 50 years old 2 3 10 4
Total 26 21 47 110 49 159
Total new employees, % 3 4 3 12 10 11
Employee turnover Men Women Total Men Women Total
< 30 years old 13 13 32 20
30–50 years old 58 33 67 26
> 50 years old 31 14 32 13
Total 102 60 162 131 59 190
Total employee turnover, % 12 13 12 14 12 13
Accidents and illness Number Number
Work-related accidents 15 20
– per 10 employees 0.11 0.14
Work-related illnesses 1 6
Work-related fatalities 0 0
Total 16 26
Absence due to illness Days Days
Absence of 1–59 days 110 193
Absence of 60+ days 0 18
Total days of absence 110 211
Number of dialogues, total 2020
Blue collar White collar
Men Women
283
215
371
148
05
1015
2025303540
Woman
Men
Age structure, employees, %
< 30 years
30–50 years
> 50 years
Men Women
6.4
39.7
18.8
4.1
21.3
9.7
0
10
20
30
40
50
60Woman
Men
Age structure, managers, %
< 30 years
30–50 years
> 50 years
Men Women
0.7
54.5
22.1
1.4
15.2
6.2
Training, average hours, per employee 2020
Blue collar White collar
Men Women
2.2
12.0
9.5
3.3
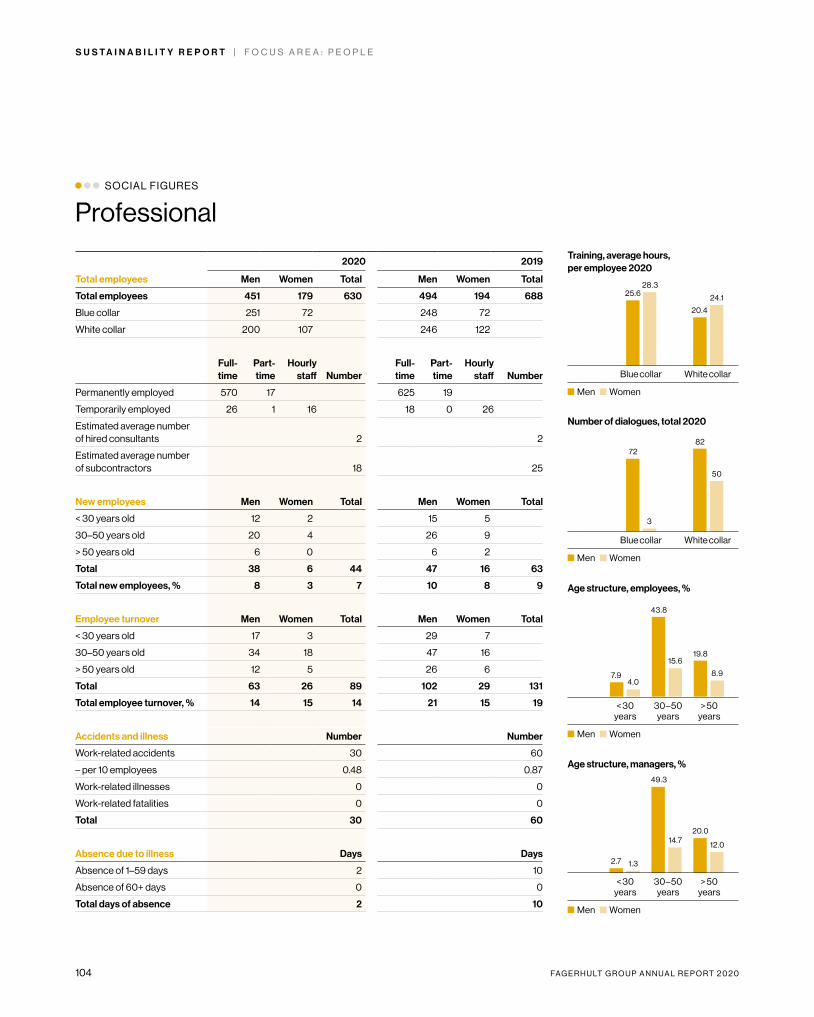
104 FA G E R H U LT G R O U P A N N U A L R E P O R T 2 0 2 0
0
14
28Woman
Men
010
2030405060708090
Woman
Men
0
10
20
30
40
50Woman
Men
0
10
20
30
40
50Woman
Men
Training, average hours, per employee 2020
Blue collar White collar
Men Women
S U S T A I N A B I L I T Y R E P O R T | F O C U S A R E A : P E O P L E
SOCIAL FIGURES
Professional
2020 2019
Total employees Men Women Total Men Women Total
Total employees 451 179 630 494 194 688
Blue collar 251 72 248 72
White collar 200 107 246 122
Full- time
Part- time
Hourly staff Number
Full- time
Part- time
Hourly staff Number
Permanently employed 570 17 625 19
Temporarily employed 26 1 16 18 0 26
Estimated average number of hired consultants 2 2
Estimated average number of subcontractors 18 25
New employees Men Women Total Men Women Total
< 30 years old 12 2 15 5
30–50 years old 20 4 26 9
> 50 years old 6 0 6 2
Total 38 6 44 47 16 63
Total new employees, % 8 3 7 10 8 9
Employee turnover Men Women Total Men Women Total
< 30 years old 17 3 29 7
30–50 years old 34 18 47 16
> 50 years old 12 5 26 6
Total 63 26 89 102 29 131
Total employee turnover, % 14 15 14 21 15 19
Accidents and illness Number Number
Work-related accidents 30 60
– per 10 employees 0.48 0.87
Work-related illnesses 0 0
Work-related fatalities 0 0
Total 30 60
Absence due to illness Days Days
Absence of 1–59 days 2 10
Absence of 60+ days 0 0
Total days of absence 2 10
Number of dialogues, total 2020
Blue collar White collar
Men Women
72
3
82
50
Age structure, employees, %
< 30 years
30–50 years
> 50 years
Men Women
7.9
43.8
19.8
4.0
15.6
8.9
Age structure, managers, %
< 30 years
30–50 years
> 50 years
Men Women
2.7
49.3
20.0
1.3
14.712.0
28.3
24.125.6
20.4
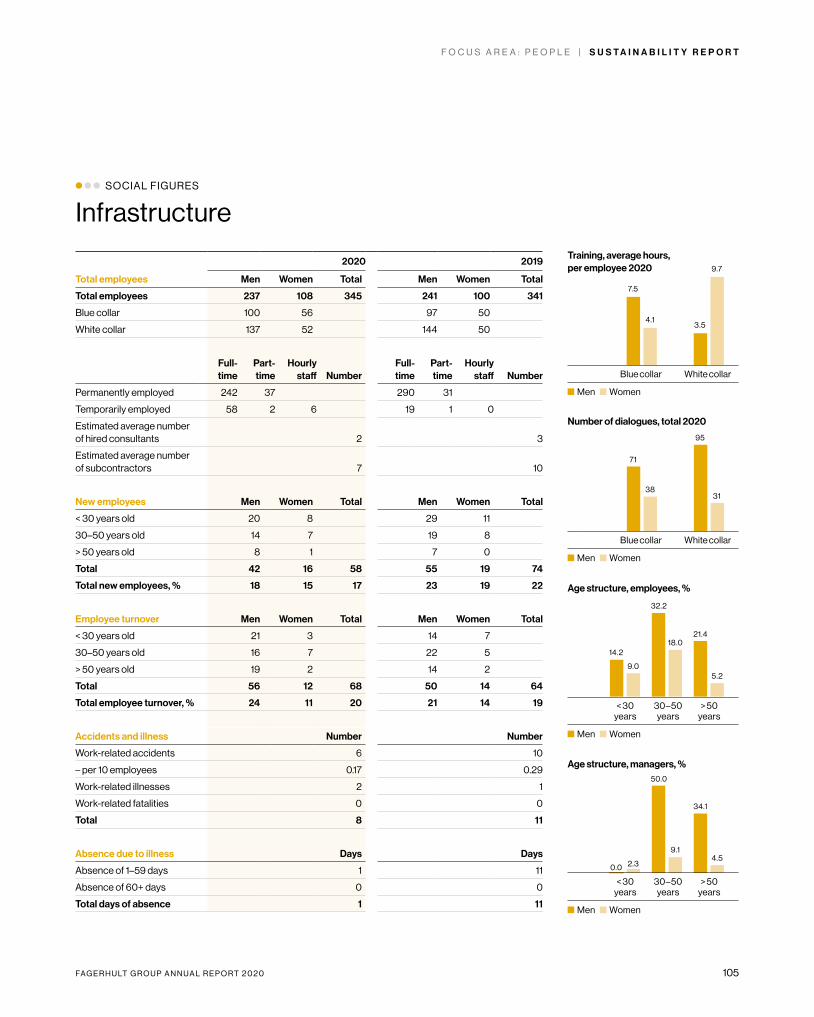
FA G E R H U LT G R O U P A N N U A L R E P O R T 2 0 2 0 105
0
10
20
30
40
50Woman
Men
0
5
10
15
20
25
30
35Woman
Men
Age structure, employees, %
< 30 years
30–50 years
> 50 years
Men Women
14.2
32.2
21.4
9.0
18.0
5.2
0
25
50
75
100Woman
Men
0
2
4
6
8
10Woman
Men
F O C U S A R E A : P E O P L E | S U S T A I N A B I L I T Y R E P O R T
SOCIAL FIGURES
Infrastructure
2020 2019
Total employees Men Women Total Men Women Total
Total employees 237 108 345 241 100 341
Blue collar 100 56 97 50
White collar 137 52 144 50
Full- time
Part- time
Hourly staff Number
Full- time
Part- time
Hourly staff Number
Permanently employed 242 37 290 31
Temporarily employed 58 2 6 19 1 0
Estimated average number of hired consultants 2 3
Estimated average number of subcontractors 7 10
New employees Men Women Total Men Women Total
< 30 years old 20 8 29 11
30–50 years old 14 7 19 8
> 50 years old 8 1 7 0
Total 42 16 58 55 19 74
Total new employees, % 18 15 17 23 19 22
Employee turnover Men Women Total Men Women Total
< 30 years old 21 3 14 7
30–50 years old 16 7 22 5
> 50 years old 19 2 14 2
Total 56 12 68 50 14 64
Total employee turnover, % 24 11 20 21 14 19
Accidents and illness Number Number
Work-related accidents 6 10
– per 10 employees 0.17 0.29
Work-related illnesses 2 1
Work-related fatalities 0 0
Total 8 11
Absence due to illness Days Days
Absence of 1–59 days 1 11
Absence of 60+ days 0 0
Total days of absence 1 11
Age structure, managers, %
< 30 years
30–50 years
> 50 years
Men Women
0.0
50.0
34.1
2.3
9.14.5
Number of dialogues, total 2020
Blue collar White collar
Men Women
71
38
95
31
Training, average hours, per employee 2020
Blue collar White collar
Men Women
4.13.5
9.7
7.5
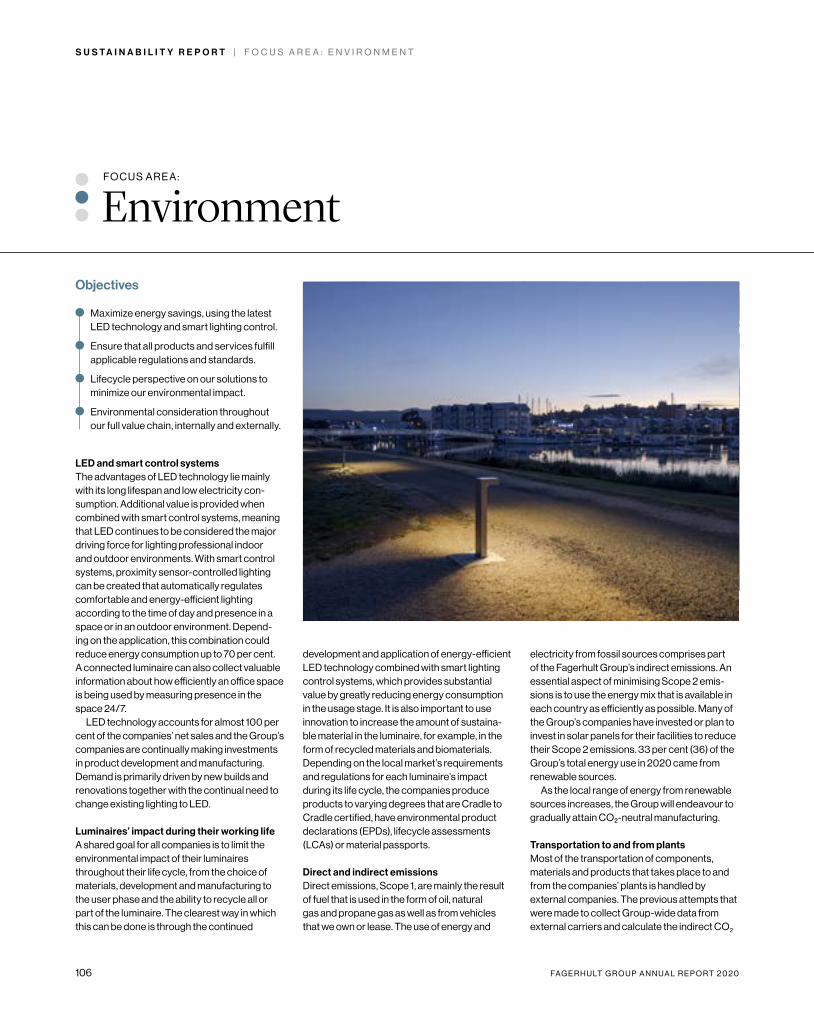
106 FA G E R H U LT G R O U P A N N U A L R E P O R T 2 0 2 0
S U S T A I N A B I L I T Y R E P O R T | F O C U S A R E A : E N V I R O N M E N T
FO C U S A R E A :
EnvironmentObjectives
Maximize energy savings, using the latest LED technology and smart lighting control.
Ensure that all products and services fulfill applicable regulations and standards.
Lifecycle perspective on our solutions to minimize our environmental impact.
Environmental consideration throughout our full value chain, internally and externally.
LED and smart control systemsThe advantages of LED technology lie mainly with its long lifespan and low electricity con-sumption. Additional value is provided when combined with smart control systems, meaning that LED continues to be considered the major driving force for lighting professional indoor and outdoor environments. With smart control systems, proximity sensor-controlled lighting can be created that automatically regulates comfortable and energy-efficient lighting according to the time of day and presence in a space or in an outdoor environment. Depend-ing on the application, this combination could reduce energy consumption up to 70 per cent. A connected luminaire can also collect valuable information about how efficiently an office space is being used by measuring presence in the space 24/7.
LED technology accounts for almost 100 per cent of the companies’ net sales and the Group’s companies are continually making investments in product development and manufacturing. Demand is primarily driven by new builds and renovations together with the continual need to change existing lighting to LED.
Luminaires’ impact during their working lifeA shared goal for all companies is to limit the environmental impact of their luminaires throughout their life cycle, from the choice of materials, development and manufacturing to the user phase and the ability to recycle all or part of the luminaire. The clearest way in which this can be done is through the continued
development and application of energy-efficient LED technology combined with smart lighting control systems, which provides substantial value by greatly reducing energy consumption in the usage stage. It is also important to use innovation to increase the amount of sustaina-ble material in the luminaire, for example, in the form of recycled materials and biomaterials. Depending on the local market’s requirements and regulations for each luminaire’s impact during its life cycle, the companies produce products to varying degrees that are Cradle to Cradle certified, have environmental product declarations (EPDs), lifecycle assessments (LCAs) or material passports.
Direct and indirect emissions Direct emissions, Scope 1, are mainly the result of fuel that is used in the form of oil, natural gas and propane gas as well as from vehicles that we own or lease. The use of energy and
electricity from fossil sources comprises part of the Fagerhult Group’s indirect emissions. An essential aspect of minimising Scope 2 emis-sions is to use the energy mix that is available in each country as efficiently as possible. Many of the Group’s companies have invested or plan to invest in solar panels for their facilities to reduce their Scope 2 emissions. 33 per cent (36) of the Group’s total energy use in 2020 came from renewable sources.
As the local range of energy from renewable sources increases, the Group will endeavour to gradually attain CO₂-neutral manufacturing.
Transportation to and from plantsMost of the transportation of components, materials and products that takes place to and from the companies’ plants is handled by external companies. The previous attempts that were made to collect Group-wide data from external carriers and calculate the indirect CO2
FA G E R H U LT G R O U P A N N U A L R E P O R T 2 0 2 0 107
F O C U S A R E A : E N V I R O N M E N T | S U S T A I N A B I L I T Y R E P O R T
emissions from transportation are still assessed to be of insufficient quality and incomplete. There are currently no Group- wide initiatives for the procurement of freight forwarders.
Product safetyEach company in the Group is responsible for testing and assessing the safety of all of their luminaires (100 per cent) according to current industry requirements and other regulations.
Fagerhult Group has several certified laboratories, for example at iGuzzini, Fager-hult and Arlight, where safety inspections and product approval are conducted. Since the regulations around safety testing in many areas are standardized, the same requirements apply regardless of company or country, in general.
Luminaire safety testing takes into account a number of risks such as electrical, mechanical and thermal risks. Photobiological safety and the risk of exposure to electromagnetic fields are also tested, which means that the different wavelengths and energy of the light are safe-guarded so as not to injure human eyes.
A finished luminaire undergoes final testing according to set rules and procedures and is also certified in line with the LVD, EMC, ErP and RoHS directives. Safety testing documentation conforms to the EU directives required for CE marking of luminaries.
Our assessment is that further requirements and standards will be added as luminaires continue to be connected to smart control sys-tems. Why this development is being carefully monitored by us.
Examples from operations
Fagerhults Belysning/Sweden: Upgrad-ing of the product families in indoor and outdoor continued during the year with even more energy-efficient LED diodes with flip-chip-technology. The flip chip LED is a relatively new technology for indoor lighting and involves mounting the chip upside down in the LED housing. This design improves heat dissipation providing a greater flow,
which helps to reduce energy consumption up to 20 per cent. Flip-chips, combined with a Constant Light Output operation in the driver, provides a lighting solution with a lifespan up to 100,000 hours without any decrease in light.
Whitecroft/UK: During the year, the first Cradle to Cradle certified products, Cascade Flex Vitality and Flight Sport Vitality, were launched. A new strategy for increasing product circularity, Whitecroft Vitality, was also introduced. It aims to enable future upgrades and to exchange lighting solutions without the need of replacing entire lumi-naires. As a result, parts of used products are able to live on in the next life cycle, contrib-uting to reduce our carbon footprint and to enable further energy savings.
Veko/ Netherlands: To reduce its environ-mental footprint, Veko is certified with the CO2-Performance Ladder, a carbon dioxide management system that is very well used in the Netherlands. The main goal is to reduce CO
2-emissions within scope 1 and 2 on a yearly basis. Solar cell investments resulted in an emission saving of 84.2 tonnes of carbon dioxide during the first two quarters of 2020. In the same period, emissions from business travel were also significantly reduced, due to the Covid-19 pandemic. Emissions from air travel alone decreased by 86 per cent, compared with the same period the year before.
Fagerhults Belysning/Sweden: An impor-tant focus in the work of reducing the impact throughout the products lifecycle is to make sustainable material choices that promote efficient resource management. During the year, a long term goal was adopted to con-struct all products with at least 80 per cent recycled or renewable content, by 2030.
iGuzzini/Italy: Several projects are ongoing to increase the share of recycled industrial waste in the form of iron and other metals for
alloys in new products. In a similar way the waste from casting of plastics is recycled to new plastic.
Fagerhults Belysning, Ateljé Lyktan/ Sweden: Alongside other companies in the Latour Group, our Swedish companies have conducted a joint procurement of freight forwarders for transportation. The procurement included a survey in which the freight forwarders responded to a number of questions related to their sustainability engagement. These included, for example, questions regarding environmental policies, targets, the type of vehicle fleet and the proportion of renewable fuel.
Based on the follow-up in 2020, the average amount of transportation using vehicles with an environmental class of at least Euro 5 amounted to 94 per cent (92), and at least Euro 6 to 65 per cent (51), for freight forwarders used.
The movement of certain shipments between Fagerhult Lighting Systems in Suzhou, China, and Fagerhults Belysning in Habo, Sweden from air to rail has contributed positively by reducing both transport costs and CO2 emissions.
In 2020, 2,694 m3 (8,108) of goods was shipped between the two destinations, a stretch covering over 8000 km. The volume was significantly reduced due to effects from the Covid-19 pandemic.
LTS/Germany: An initiative to minimize the use of plastic packaging for products led to a reduction in the plastic used of more than five tonnes in 2020.
iGuzzini/Italy: 41 per cent of the electricity consumption was from renewable sources, of which 27 per cent was produced by solar panels from iGuzzini's own installation on the roof of their factory.
Whitecroft/UK and Veko/ Netherlands: In 2020, the share of electricity from renewable sources was 100 per cent.
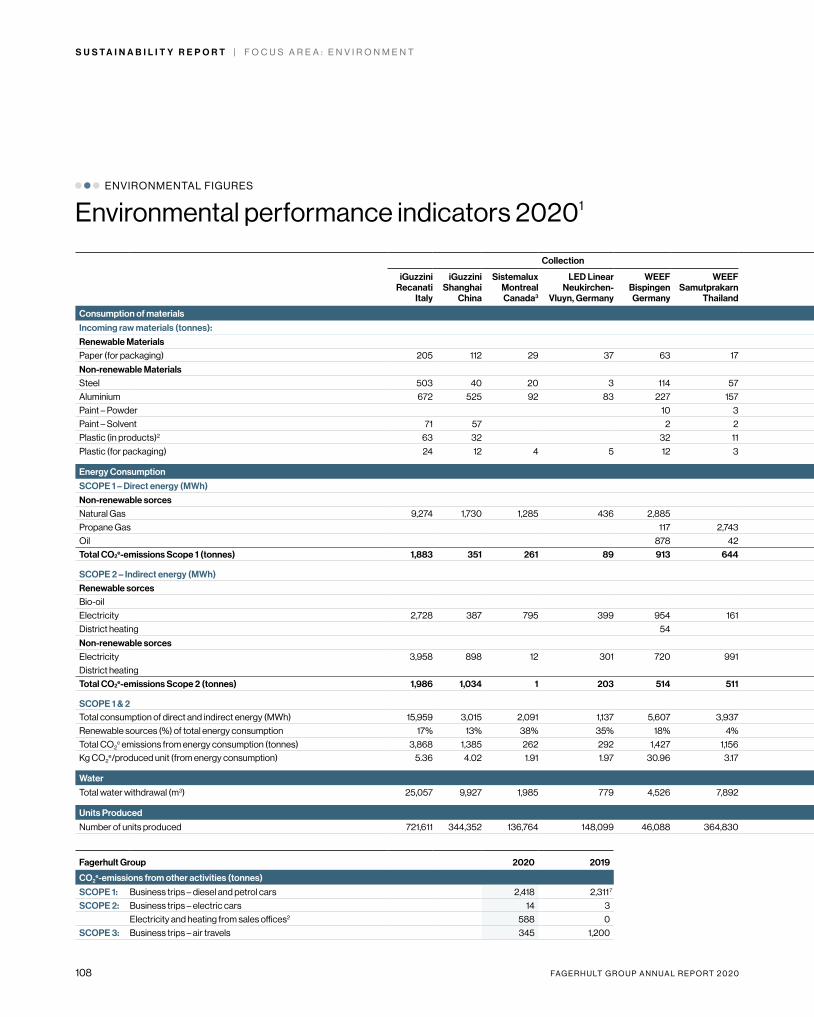
108 FA G E R H U LT G R O U P A N N U A L R E P O R T 2 0 2 0
S U S T A I N A B I L I T Y R E P O R T | F O C U S A R E A : E N V I R O N M E N T
ENVIRONMENTAL FIGURES
Environmental performance indicators 20201
Collection Premium Professional Infrastructure
iGuzziniRecanati
Italy
iGuzziniShanghai
China
SistemaluxMontreal Canada3
LED LinearNeukirchen-
Vluyn, Germany
WEEFBispingen
Germany
WEEFSamutprakarn
Thailand
Fagerhult Habo
Sweden
FagerhultÅhus
Sweden4
FagerhultSuzhou
China
LTSTettnang Germany
ArlightAnkara Turkey
Eagle LightingMelbourne
Australia
WhitecroftManchester
UK
DesignplanSutton
UK
I-ValoIttala
Finland
VEKOSchagen
NetherlandsTotal
2020 5Total 2019 6,7
Consumption of materials
Incoming raw materials (tonnes):
Renewable Materials Paper (for packaging) 205 112 29 37 63 17 129 57 42 173 187 6 132 68 26 36 1,318 1,264
Non-renewable Materials Steel 503 40 20 3 114 57 1,026 51 69 146 313 709 1,186 287 6 4,530 5,471
Aluminium 672 525 92 83 227 157 470 264 113 311 342 21 150 32 72 1,113 4,643 3,672
Paint – Powder 10 3 49 11 11 12 13 23 49 14 5 201 252
Paint – Solvent 71 57 2 2 2 1 136 11
Plastic (in products)2 63 32 32 11 32 24 139 331 0
Plastic (for packaging) 24 12 4 5 12 3 90 4 4 12 4 7 9 2 1 6 200 168
Energy Consumption
SCOPE 1 – Direct energy (MWh)
Non-renewable sorces Natural Gas 9,274 1,730 1,285 436 2,885 387 4,388 1,221 1,133 5,330 782 751 169 29,771 18,823
Propane Gas 117 2,743 557 30 3,447 3,464
Oil 878 42 75 9 51 951 5 2,012 1,499
Total CO2e-emissions Scope 1 (tonnes) 1,883 351 261 89 913 644 22 131 79 891 263 237 1,361 160 152 34 7,471 5,157
SCOPE 2 – Indirect energy (MWh)Renewable sorces Bio-oil 598 598 305
Electricity 2,728 387 795 399 954 161 7,296 795 104 713 729 1,996 530 87 360 18,033 13,466
District heating 54 2,870 505 3,429 2,972
Non-renewable sorces Electricity 3,958 898 12 301 720 991 311 633 631 50 261 8,765 6,477
District heating 1 1 0
Total CO2e-emissions Scope 2 (tonnes) 1,986 1,034 1 203 514 511 1,152 0 373 301 223 707 0 16 49 0 7,070 5,049
SCOPE 1 & 2 Total consumption of direct and indirect energy (MWh) 15,959 3,015 2,091 1,137 5,607 3,937 10,839 1,866 802 5,734 2,001 1,794 8,278 1,367 1,099 529 66,055 47,005
Renewable sources (%) of total energy consumption 17% 13% 38% 35% 18% 4% 99% 70% 13% 12% 36% 0% 24% 39% 8% 68% 33% 36%
Total CO2e emissions from energy consumption (tonnes) 3,868 1,385 262 292 1,427 1,156 1,174 131 452 1,192 486 944 1,361 176 202 34 14,541 10,206
Kg CO2e/produced unit (from energy consumption) 5.36 4.02 1.91 1.97 30.96 3.17 1.96 1.71 1.77 1.34 2.11 8.04 3.65 3.31 4.99 0.11 3.08 2.70
Water
Total water withdrawal (m3) 25,057 9,927 1,985 779 4,526 7,892 2,029 1,051 2,143 4,100 5,600 2,244 5,923 2,406 449 645 76,756 51,764
Units Produced
Number of units produced 721,611 344,352 136,764 148,099 46,088 364,830 600,128 76,368 254,869 891,496 230,322 117,430 373,000 53,061 40,407 315,000 4,713,825 3,786,968
Fagerhult Group 2020 2019
CO2e-emissions from other activities (tonnes)
SCOPE 1: Business trips – diesel and petrol cars 2,418 2,311 7
SCOPE 2: Business trips – electric cars 14 3
Electricity and heating from sales offices2 588 0
SCOPE 3: Business trips – air travels 345 1,200
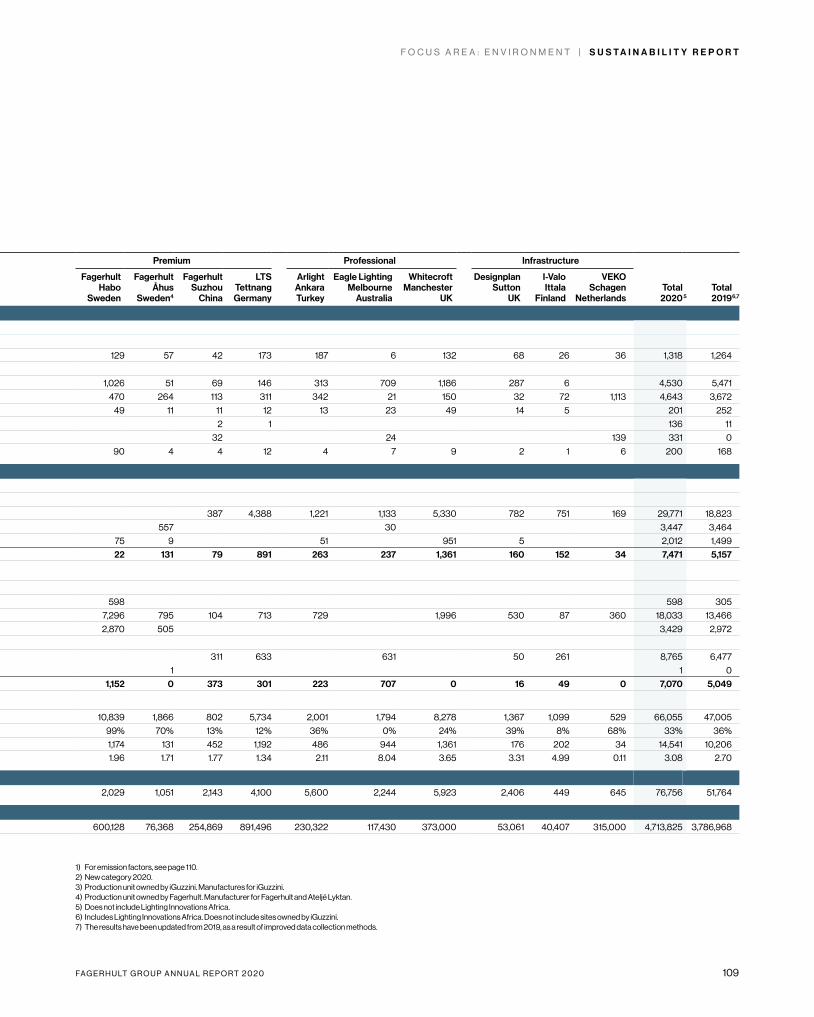
FA G E R H U LT G R O U P A N N U A L R E P O R T 2 0 2 0 109
F O C U S A R E A : E N V I R O N M E N T | S U S T A I N A B I L I T Y R E P O R T
Collection Premium Professional Infrastructure
iGuzziniRecanati
Italy
iGuzziniShanghai
China
SistemaluxMontreal Canada3
LED LinearNeukirchen-
Vluyn, Germany
WEEFBispingen
Germany
WEEFSamutprakarn
Thailand
Fagerhult Habo
Sweden
FagerhultÅhus
Sweden4
FagerhultSuzhou
China
LTSTettnang Germany
ArlightAnkara Turkey
Eagle LightingMelbourne
Australia
WhitecroftManchester
UK
DesignplanSutton
UK
I-ValoIttala
Finland
VEKOSchagen
NetherlandsTotal
2020 5Total 2019 6,7
Consumption of materials
Incoming raw materials (tonnes):
Renewable Materials Paper (for packaging) 205 112 29 37 63 17 129 57 42 173 187 6 132 68 26 36 1,318 1,264
Non-renewable Materials Steel 503 40 20 3 114 57 1,026 51 69 146 313 709 1,186 287 6 4,530 5,471
Aluminium 672 525 92 83 227 157 470 264 113 311 342 21 150 32 72 1,113 4,643 3,672
Paint – Powder 10 3 49 11 11 12 13 23 49 14 5 201 252
Paint – Solvent 71 57 2 2 2 1 136 11
Plastic (in products)2 63 32 32 11 32 24 139 331 0
Plastic (for packaging) 24 12 4 5 12 3 90 4 4 12 4 7 9 2 1 6 200 168
Energy Consumption
SCOPE 1 – Direct energy (MWh)
Non-renewable sorces Natural Gas 9,274 1,730 1,285 436 2,885 387 4,388 1,221 1,133 5,330 782 751 169 29,771 18,823
Propane Gas 117 2,743 557 30 3,447 3,464
Oil 878 42 75 9 51 951 5 2,012 1,499
Total CO2e-emissions Scope 1 (tonnes) 1,883 351 261 89 913 644 22 131 79 891 263 237 1,361 160 152 34 7,471 5,157
SCOPE 2 – Indirect energy (MWh)Renewable sorces Bio-oil 598 598 305
Electricity 2,728 387 795 399 954 161 7,296 795 104 713 729 1,996 530 87 360 18,033 13,466
District heating 54 2,870 505 3,429 2,972
Non-renewable sorces Electricity 3,958 898 12 301 720 991 311 633 631 50 261 8,765 6,477
District heating 1 1 0
Total CO2e-emissions Scope 2 (tonnes) 1,986 1,034 1 203 514 511 1,152 0 373 301 223 707 0 16 49 0 7,070 5,049
SCOPE 1 & 2 Total consumption of direct and indirect energy (MWh) 15,959 3,015 2,091 1,137 5,607 3,937 10,839 1,866 802 5,734 2,001 1,794 8,278 1,367 1,099 529 66,055 47,005
Renewable sources (%) of total energy consumption 17% 13% 38% 35% 18% 4% 99% 70% 13% 12% 36% 0% 24% 39% 8% 68% 33% 36%
Total CO2e emissions from energy consumption (tonnes) 3,868 1,385 262 292 1,427 1,156 1,174 131 452 1,192 486 944 1,361 176 202 34 14,541 10,206
Kg CO2e/produced unit (from energy consumption) 5.36 4.02 1.91 1.97 30.96 3.17 1.96 1.71 1.77 1.34 2.11 8.04 3.65 3.31 4.99 0.11 3.08 2.70
Water
Total water withdrawal (m3) 25,057 9,927 1,985 779 4,526 7,892 2,029 1,051 2,143 4,100 5,600 2,244 5,923 2,406 449 645 76,756 51,764
Units Produced
Number of units produced 721,611 344,352 136,764 148,099 46,088 364,830 600,128 76,368 254,869 891,496 230,322 117,430 373,000 53,061 40,407 315,000 4,713,825 3,786,968
Fagerhult Group 2020 2019
CO2e-emissions from other activities (tonnes)
SCOPE 1: Business trips – diesel and petrol cars 2,418 2,311 7
SCOPE 2: Business trips – electric cars 14 3
Electricity and heating from sales offices2 588 0
SCOPE 3: Business trips – air travels 345 1,200
1) For emission factors, see page 110. 2) New category 2020. 3) Production unit owned by iGuzzini. Manufactures for iGuzzini.4) Production unit owned by Fagerhult. Manufacturer for Fagerhult and Ateljé Lyktan.5) Does not include Lighting Innovations Africa. 6) Includes Lighting Innovations Africa. Does not include sites owned by iGuzzini.7) The results have been updated from 2019, as a result of improved data collection methods.
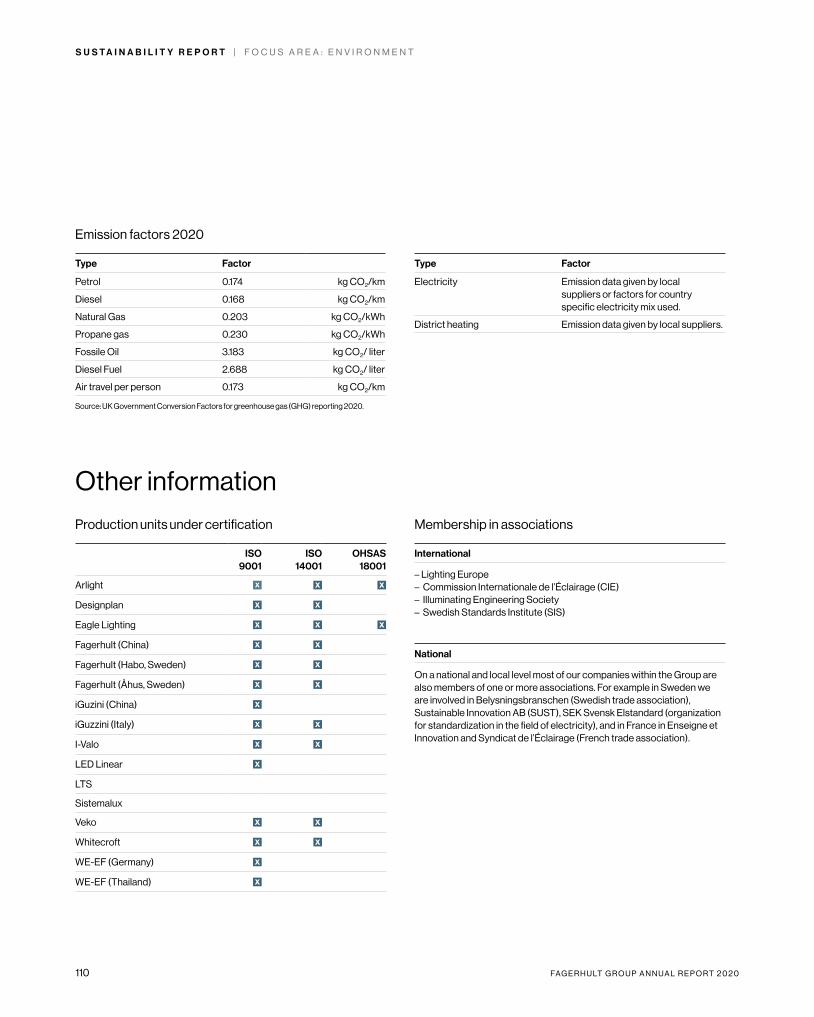
110 FA G E R H U LT G R O U P A N N U A L R E P O R T 2 0 2 0
S U S T A I N A B I L I T Y R E P O R T | F O C U S A R E A : E N V I R O N M E N T
Emission factors 2020
Type Factor
Petrol 0.174 kg CO2/km
Diesel 0.168 kg CO2/km
Natural Gas 0.203 kg CO2/kWh
Propane gas 0.230 kg CO2/kWh
Fossile Oil 3.183 kg CO2/ liter
Diesel Fuel 2.688 kg CO2/ liter
Air travel per person 0.173 kg CO2/km
Source: UK Government Conversion Factors for greenhouse gas (GHG) reporting 2020.
Type Factor
Electricity Emission data given by local suppliers or factors for country specific electricity mix used.
District heating Emission data given by local suppliers.
Other information
Production units under certification
ISO 9001
ISO 14001
OHSAS 18001
Arlight x x x
Designplan x x
Eagle Lighting x x x
Fagerhult (China) x x
Fagerhult (Habo, Sweden) x x
Fagerhult (Åhus, Sweden) x x
iGuzini (China) x
iGuzzini (Italy) x x
I-Valo x x
LED Linear x
LTS
Sistemalux
Veko x x
Whitecroft x x
WE-EF (Germany) x
WE-EF (Thailand) x
Membership in associations
International
– Lighting Europe – Commission Internationale de l’Éclairage (CIE)– Illuminating Engineering Society– Swedish Standards Institute (SIS)
National
On a national and local level most of our companies within the Group are also members of one or more associations. For example in Sweden we are involved in Belysningsbranschen (Swedish trade association), Sustainable Innovation AB (SUST), SEK Svensk Elstandard (organization for standardization in the field of electricity), and in France in Enseigne et Innovation and Syndicat de l’Éclairage (French trade association).
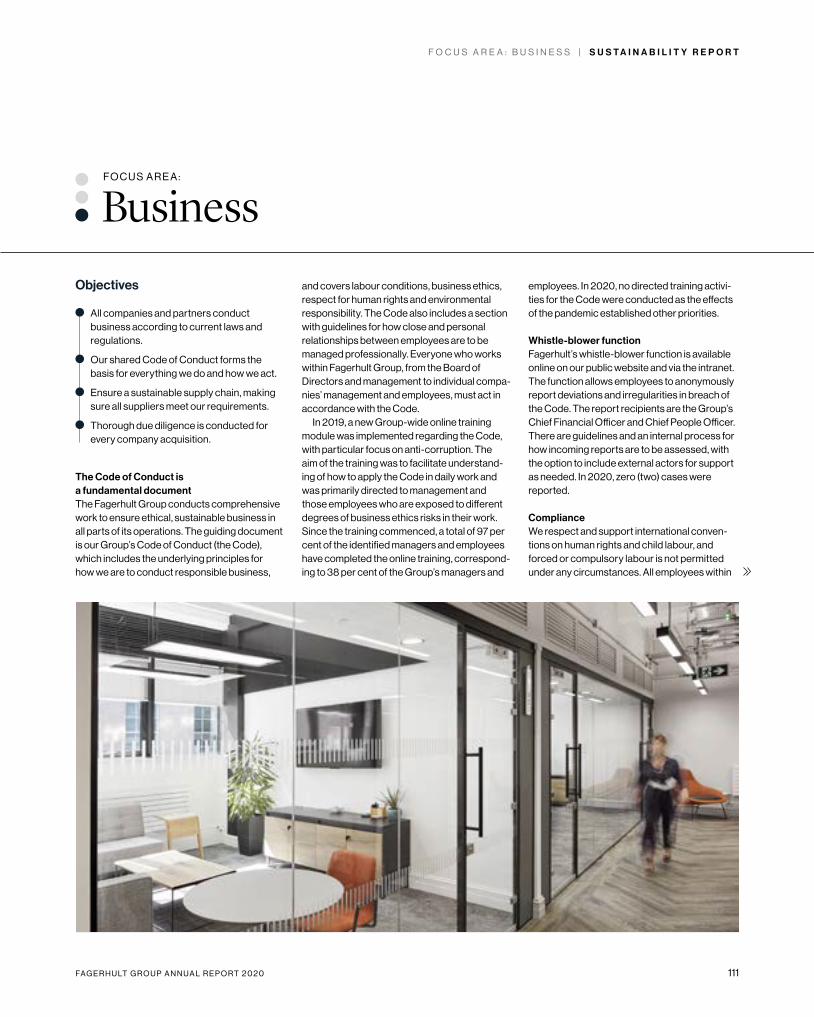
FA G E R H U LT G R O U P A N N U A L R E P O R T 2 0 2 0 111
F O C U S A R E A : B U S I N E S S | S U S T A I N A B I L I T Y R E P O R T
Objectives
All companies and partners conduct business according to current laws and regulations.
Our shared Code of Conduct forms the basis for everything we do and how we act.
Ensure a sustainable supply chain, making sure all suppliers meet our requirements.
Thorough due diligence is conducted for every company acquisition.
The Code of Conduct is a fundamental documentThe Fagerhult Group conducts comprehensive work to ensure ethical, sustainable business in all parts of its operations. The guiding document is our Group’s Code of Conduct (the Code), which includes the underlying principles for how we are to conduct responsible business,
and covers labour conditions, business ethics, respect for human rights and environmental responsibility. The Code also includes a section with guidelines for how close and personal relationships between employees are to be managed professionally. Everyone who works within Fagerhult Group, from the Board of Directors and management to individual compa-nies’ management and employees, must act in accordance with the Code.
In 2019, a new Group-wide online training module was implemented regarding the Code, with particular focus on anti-corruption. The aim of the training was to facilitate understand-ing of how to apply the Code in daily work and was primarily directed to management and those employees who are exposed to different degrees of business ethics risks in their work. Since the training commenced, a total of 97 per cent of the identified managers and employees have completed the online training, correspond-ing to 38 per cent of the Group’s managers and
employees. In 2020, no directed training activi-ties for the Code were conducted as the effects of the pandemic established other priorities.
Whistle-blower functionFagerhult’s whistle-blower function is available online on our public website and via the intranet. The function allows employees to anonymously report deviations and irregularities in breach of the Code. The report recipients are the Group’s Chief Financial Officer and Chief People Officer. There are guidelines and an internal process for how incoming reports are to be assessed, with the option to include external actors for support as needed. In 2020, zero (two) cases were reported.
ComplianceWe respect and support international conven-tions on human rights and child labour, and forced or compulsory labour is not permitted under any circumstances. All employees within
FO C U S A R E A :
Business
112 FA G E R H U LT G R O U P A N N U A L R E P O R T 2 0 2 0
S U S T A I N A B I L I T Y R E P O R T | F O C U S A R E A : B U S I N E S S
the Group enjoy freedom of association and the right to collective agreements. Corruption is never permitted and in cases where the risk of corruption exists, no business transactions will be entered into and no agreements signed. This is the basis for all operations conducted by every company in Fagerhult Group. Countries where operations are conducted and that are assessed as having the largest risk exposure in these issues are China, the United Arab Emirates, Russia and Turkey.
Due Diligence processUpon acquisition of companies, a due diligence process (DD) is always initiated, that is partly adapted based on current acquisition candi-dates. A thorough risk analysis is made in all cases together with detailed questions on the nature of the operations and the countries in which operations take place or in which the companies maintain a presence. For example,
there is a clear analysis structure that, from a strictly financial and ethical perspective, is to assess the senior management’s compe-tence, experience and core values together with an analysis of the risks associated with succession management. This takes place in the form of, for example, in-depth interviews with all members of senior management, in part to ensure that they have the correct image of Fagerhult Group and in part to provide these individuals with the opportunity to present any questions they may have.
You can learn about our DD process in Fagerhult Group's Annual Report 2018, page 38.
SuppliersIn line with our Group's decentralized business model, it is each company’s responsibility to manage its supply chain sustainably and ethically. Regardless of number, which can vary significantly among the companies, the
procurement function must acquire knowledge of and ensure that the contracted supplier lives up to the international guidelines for human rights, freedom of association, right to collective agreements, anti-corruption and efforts to combat child and forced labour.
Together all companies in Fagerhult Group have a large number of suppliers, the majority of which deliver input materials. These input materials consist mainly of electronic compo-nents, metal and plastic for the manufacturing of luminaires. Efforts to identify and monitor input materials must therefore be ongoing, not least in light of shifting legal requirements and any new substances and components brought on by a shift in technology.
During 2020, we added a total of 134 (180) new suppliers, of which 75 (57), were evaluated with the help of environmental criteria. 26 ot the total new suppliers were evaluated in a social perspective.
Country Presence Control and monitoring
China Fagerhults Belysning operates manufacturing in the Suzhou Industrial Park.
iGuzzini has operations located in Fengxian, Shanghai.
A Swedish site manager is responsible for monitoring and ensuring that the working conditions comply with international conventions and that the Code and other policies are followed.
Operations must comply with the local government authorities’ requirements to comply with local laws and regulations governing forced labour and human rights. Working hours and other conditions follow the directives of the industrial park.
As a way of reducing exposure to corruption, there is continual job rotation among vulnerable positions.
The acquisition of iGuzzini included a plant in Fengxian, Shanghai where an Italian manager is similarly responsible for ensuring compliance with international conventions and local legislation.
United Arab Emirates
Operations comprise a small sales company and business representatives for iGuzzini, LED Linear and Fagerhults Belysning in Dubai.
The Head of Business Area, who is also part of Fagerhult Group management, is responsible in consultation with the Regional Director and Country Manager for monitoring and ensuring compliance with international conventions, the Code and other policies.
Russia Sales companies in St Petersburg and Moscow, from our brands Fagerhult and iGuzzini.
The Head of Business Area, who is also part of Fagerhult Group management, is responsible in consultation with the Regional Director and Country Manager for monitoring and ensuring compliance with international conventions, the Code and other policies.
Turkey Arlight’s operations in Ankara The political risk and critical security situation continues in Turkey and neighbouring countries. The country’s legislation guarantees citizens human rights, but there are several gaps in compliance. Close contact and continuous visits to the company’s management on the topic of development is of the greatest importance for the Fagerhult Group Board and management.
FA G E R H U LT G R O U P A N N U A L R E P O R T 2 0 2 0 113
F O C U S A R E A : B U S I N E S S | S U S T A I N A B I L I T Y R E P O R T
Group-wide forum for procurementThe general assessment is that risk exposure for the Group’s purchases is low since a large por-tion of the procurement is with well-established global companies. This is particularly true of the Group-wide purchases that are made by the Group Purchase Forum (GPF). The aim of the forum is to collectively purchase large volumes of electrical components that all of the compa-nies are able to use. The forum is comprised of five purchasers who are each responsible for a number of companies. In 2020, global suppliers of diodes and LED drivers were procured. Since these suppliers are all global and well-known brands, GPF’s assessment is that the supplier codes of conduct of the procured suppliers are more extensive than our Code, and have a clearer focus on the environment, societal conditions and business ethics. This is also true for the purchases of assembled electronics components containing earth metals, albeit in small quantities, that are also purchased from well-established global companies. We have very limited insight into their extraction, but the assessment is nevertheless that the extraction is conducted sustainably and is in accordance with the codes of conduct for suppliers set by these global companies.
The Group’s companies also make a great number of own purchases, often in the near environment. In general, the opportunities for the companies to evaluate suppliers on site was limited in 2020 due to the effects of Covid-19.
Examples from operations
Fagerhults Belysning, Ateljé Lyktan/ Sweden: Since 2018, a supplier code of conduct has been a stipulation of agree-ments with Swedish companies. Each new supplier must confirm in writing that they have read the contents and that they commit to adhering to the Code. Alternatively, the supplier can present their own code of con-duct provided that it is equivalent in nature or more comprehensive. By the end of 2020, the number of suppliers that have signed the
Code will represent a purchase value of 93 per cent (93) of total purchases.
Since a couple of years a Supplier Quality Assurance (SQA) function has been in place with the main task of developing our suppliers' performancies, using supplier assessments and audits with focus on quality, security of supply and lead times. In 2020, a supplier classification scorecard was implemented, which is the main tool to evaluate our suppliers. They are assessed within different topics, including environmental impact as one focus area. Before starting a collabora-tion with a supplier, they shoud be approved by reaching a certain score in the scorecard assessment. In 2020, 14 existing suppliers were evaluated with the new tool.
Designplan/UK: Carry out ongoing supplier evaluations in which new and existing suppliers respond to a survey, which then acts as decision data for evaluation and to ensure that the supplier in question meets the requirements/standards that have been placed upon them.
Arlight/Turkey: Local suppliers must comply with Fagerhult Group's Code of Conduct, and supplier evaluations are carried out on location to ensure appropriate labour condi-tions. These visits were, however, limited in 2020 due to Covid-19.
LED Linear/Germany: A procurement function has been in place since 2019 tasked with evaluating suppliers in terms of having a safe work environment, protective equipment, access to company healthcare and in terms of emissions and environmental impact. These efforts were, however, limited in 2020 due to Covid-19.
Eagle Lighting/Australia: A supplier code of conduct is being developed and will be included as part of the supplier management programme. In 2020, four new suppliers were evaluated in parallel with regular follow-up assessments of 35 suppliers taking place
on a monthly and quarterly basis. The evaluations focused on issues concerning quality, delivery precision, risks and social and environmental responsibility.
One of the four new suppliers that were evaluated did not live up to the requirements and was rejected as a supplier, and is currently not up for collaboration. All 35 existing suppliers were deemed to comply with the requirements in place.
Fagerhults Belysning/China: It is mandatory for new suppliers to sign Fagerhult Group's Code of Conduct, which is also included in the quarterly meetings with the major existing suppliers. In 2020, eleven suppliers, of which two were new suppliers, performed a self-assessment on issues concerning quality, environment, health and safety and RoHS and REACH compliance. In order to pass, the supplier must score higher than 70 per cent. In 2020, the self-assessments resulted in an average score of 94 per cent, and all eleven suppliers passed the assess-ment.
iGuzzini/Italy: Fagerhult Group's Code of Conduct is provided to all suppliers. Suppliers who provide input materials with potential environmental impact and have a purchase value of over SEK 100,000 and/or have operations in risk countries, must perform a self-assessment.
WE-EF/Germany: In 2020, 58 suppliers performed a self-assessment, of which around 16 were new suppliers. It is standard to have an environmental policy or an ISO 14001 certification. Additionally, questions are presented concerning social criteria and compliance with RoHS.
114 FA G E R H U LT G R O U P A N N U A L R E P O R T 2 0 2 0
S U S T A I N A B I L I T Y R E P O R T | G O V E R N A N C E O F S U S T A I N A B I L I T Y E F F O R T S
Governance of our sustainability effortsFagerhult Group’s global presence and decentralized organisation require all companies and employees to take responsibility for their local environmental and societal impact.
A fundamental aspect of our decentralized business model is the absolute requirement for each company to maintain a responsible enterprise and a decision-making process that permeates the governance of all operations and activities. The governance of financial and sustainability topics must adopt a long-term approach and take place transparently, efficiently, reliably and be business oriented. In the same way, governance should help maintain confidence in Fagerhult Group among stakeholders, customers, employees, suppliers, capital markets and society.
Governance is based on all parts of the Group following the respective country’s laws and regulations, such as competition rules, environmental legislation, labour laws and collective union agreements that impact opera-tions. The UN’s Universal Declaration of Human Rights acts as a guide for all operations. Child labour, or labour performed through coercion or threat of violence, will not be tolerated under any circumstances. In all contexts, zero tolerance applies to all cases of bribery and corruption.
Development of Group-wide values and strategyNaturally, our global presence and decentral-ized organisation sets stringent requirements for good control and management of the social and environmental impact that the activities of our operations have. A core component of this strategy is therefore that each company is given substantial autonomy to address their impact and their own strong power to make decisions.
During the year, extensive work began to further develop our Group-wide values. New values are expected to be finalized in 2021.
Important steps were also taken in 2020 with efforts to clarify Fagerhult’s sustainability strategy and set sustainability goals at Group level. For example, the Group’s sustainability efforts were made clearer by separating the structure into four sections: Knowledge leader, Sustainable solutions, People responsibility and Sustainability reporting, which together make up the Group’s sustainability approach. The four sections will act as an important foundation for taking the next step to formulate tangible, measurable and visionary goals for the upcoming five-year period.
The Code of Conduct is a fundamental governance instrumentFagerhult’s Code of Conduct is the Group’s governance document concerning responsible enterprise. The Code of Conduct applies to all companies and all employees. The Code of Conduct states the Group’s views on human rights, business ethics, labour conditions, diversity and equal opportunities as well as environmental responsibility. Many of the companies supplement the Group-wide Code of Conduct with their own codes of conduct and policies. In addition, several companies conduct regular supplier reviews.
The companies’ MDs and other managers are responsible for communicating the content and importance of the Code of Conduct to their own parts of the organisation, and for ensuring that business partners/suppliers are also aware of it.
Our general approach in terms of the pre-cautionary approach is described in the Code of Conduct and the anti- corruption policy; see www.fagerhultgroup.com.
Sustainability governance and responsibility — The Group The sustainability area is highly prioritized by the Board of Directors and Group management is given the responsibility to determine the strategic direction of sustainability efforts as
well as the governance and monitoring of our sustainable working methods.
The Group CEO has the ultimate respon-sibility for sustainability issues, but the entire Group management has overall responsibility. In particular, the Chief Sustainability Officer (CSO), a new role from late 2020, and the Chief People Officer (CPO) has clear responsibilities to coordinate and drive our Group’s sustaina-bility agenda. This takes place in dialogue with our companies and within our various group forums. The purpose in our forums is to collab-orate, exchange knowledge and experiences between the companies and thereby spread best practice to find sustainable solutions. In our decentralized organization model each brand and company is outmost responsible for their own sustainability efforts and that they are har-monized with the Group agenda and strategy.
Sustainability governance and responsibility — the companiesOur MDs at respective companies have the ultimate responsibility for implementing and adhering to the Group's Code of Conduct and other regulations and guidelines at the local level, together with the relevant national laws and regu-lations as well as competition rules, environmen-tal legislation, labour laws and collective union agreements. The function of the companies that takes responsibility for operative sustainability efforts is usually the HR, Financial Director, Oper-ations Director, or EHS Director. Each company owns and is responsible for ensuring a sustaina-ble supply chain. The respective companies are also responsible for providing a safe and healthy workplace and work environment, along with a proactive effort to ensure an acceptable level of employee turnover and work-related illnesses. They are also responsible for ensuring ongoing competence development, primarily in the form of training activities that are based on local and individual needs.
The Group's Human Resource function has the task of supporting the companies’ personnel management and developing efficient processes to capitalise on and share the companies’ collective skills. Senior HR managers meet in the
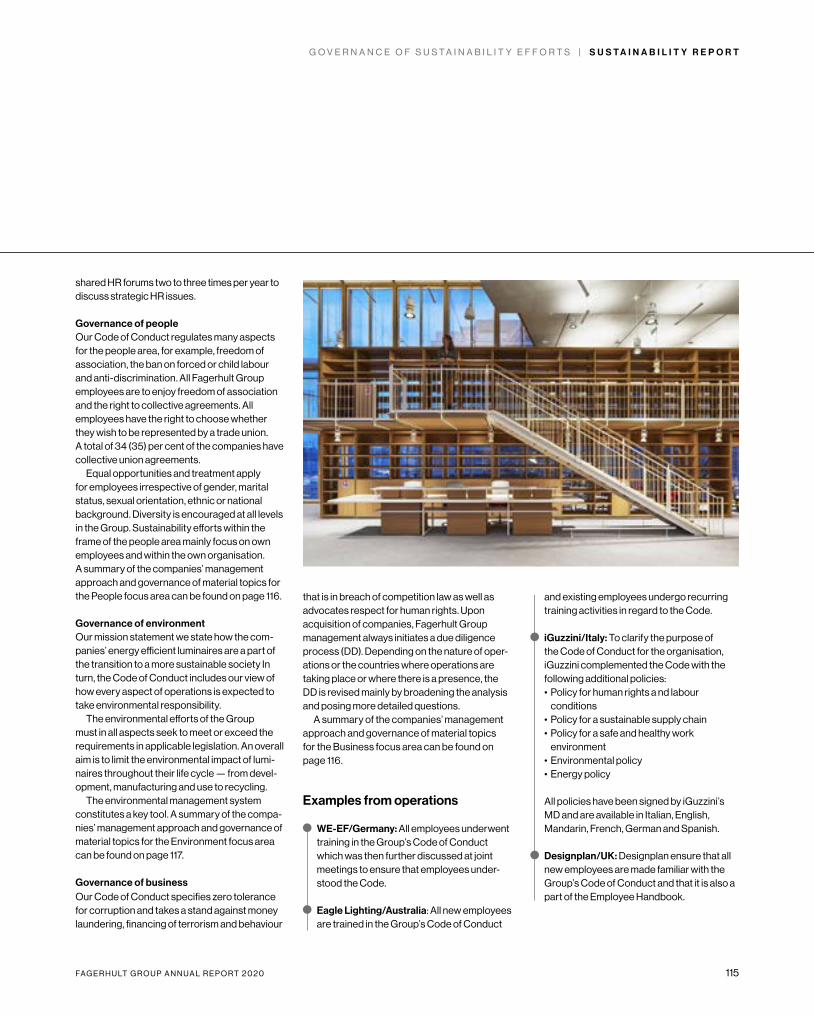
FA G E R H U LT G R O U P A N N U A L R E P O R T 2 0 2 0 115
G O V E R N A N C E O F S U S T A I N A B I L I T Y E F F O R T S | S U S T A I N A B I L I T Y R E P O R T
shared HR forums two to three times per year to discuss strategic HR issues.
Governance of people Our Code of Conduct regulates many aspects for the people area, for example, freedom of association, the ban on forced or child labour and anti-discrimination. All Fagerhult Group employees are to enjoy freedom of association and the right to collective agreements. All employees have the right to choose whether they wish to be represented by a trade union. A total of 34 (35) per cent of the companies have collective union agreements.
Equal opportunities and treatment apply for employees irrespective of gender, marital status, sexual orientation, ethnic or national background. Diversity is encouraged at all levels in the Group. Sustainability efforts within the frame of the people area mainly focus on own employees and within the own organisation. A summary of the companies’ management approach and governance of material topics for the People focus area can be found on page 116.
Governance of environmentOur mission statement we state how the com-panies’ energy efficient luminaires are a part of the transition to a more sustainable society In turn, the Code of Conduct includes our view of how every aspect of operations is expected to take environmental responsibility.
The environmental efforts of the Group must in all aspects seek to meet or exceed the requirements in applicable legislation. An overall aim is to limit the environmental impact of lumi-naires throughout their life cycle — from devel-opment, manufacturing and use to recycling.
The environmental management system constitutes a key tool. A summary of the compa-nies’ management approach and governance of material topics for the Environment focus area can be found on page 117.
Governance of businessOur Code of Conduct specifies zero tolerance for corruption and takes a stand against money laundering, financing of terrorism and behaviour
that is in breach of competition law as well as advocates respect for human rights. Upon acquisition of companies, Fagerhult Group management always initiates a due diligence process (DD). Depending on the nature of oper-ations or the countries where operations are taking place or where there is a presence, the DD is revised mainly by broadening the analysis and posing more detailed questions.
A summary of the companies’ management approach and governance of material topics for the Business focus area can be found on page 116.
Examples from operations
WE-EF/Germany: All employees underwent training in the Group’s Code of Conduct which was then further discussed at joint meetings to ensure that employees under-stood the Code.
Eagle Lighting/Australia: All new employees are trained in the Group’s Code of Conduct
and existing employees undergo recurring training activities in regard to the Code.
iGuzzini/Italy: To clarify the purpose of the Code of Conduct for the organisation, iGuzzini complemented the Code with the following additional policies:
• Policy for human rights a nd labour conditions
• Policy for a sustainable supply chain • Policy for a safe and healthy work
environment • Environmental policy • Energy policy
All policies have been signed by iGuzzini’s MD and are available in Italian, English, Mandarin, French, German and Spanish.
Designplan/UK: Designplan ensure that all new employees are made familiar with the Group’s Code of Conduct and that it is also a part of the Employee Handbook.
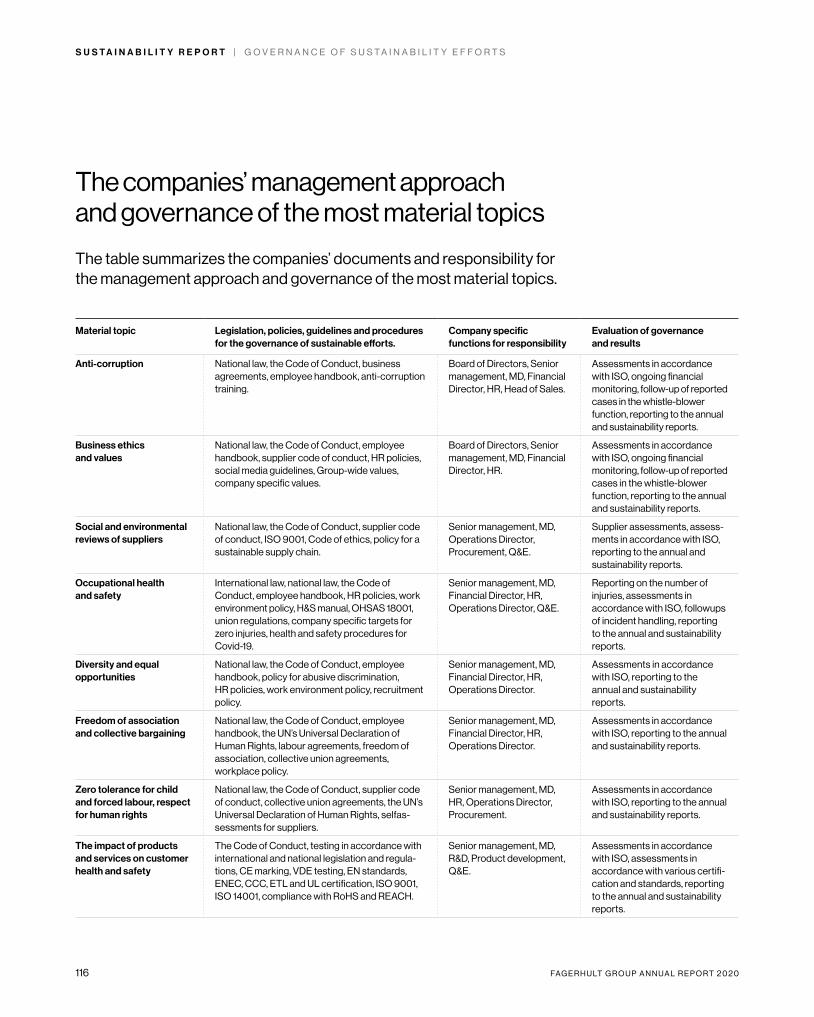
116 FA G E R H U LT G R O U P A N N U A L R E P O R T 2 0 2 0
S U S T A I N A B I L I T Y R E P O R T | G O V E R N A N C E O F S U S T A I N A B I L I T Y E F F O R T S
The companies’ management approach and governance of the most material topics
Material topic Legislation, policies, guidelines and procedures for the governance of sustainable efforts.
Company specific functions for responsibility
Evaluation of governance and results
Anti-corruption National law, the Code of Conduct, business agreements, employee handbook, anti-corruption training.
Board of Directors, Senior management, MD, Financial Director, HR, Head of Sales.
Assessments in accordance with ISO, ongoing financial monitoring, follow-up of reported cases in the whistle-blower function, reporting to the annual and sustainability reports.
Business ethics and values
National law, the Code of Conduct, employee handbook, supplier code of conduct, HR policies, social media guidelines, Group-wide values, company specific values.
Board of Directors, Senior management, MD, Financial Director, HR.
Assessments in accordance with ISO, ongoing financial monitoring, follow-up of reported cases in the whistle-blower function, reporting to the annual and sustainability reports.
Social and environmental reviews of suppliers
National law, the Code of Conduct, supplier code of conduct, ISO 9001, Code of ethics, policy for a sustainable supply chain.
Senior management, MD, Operations Director, Procurement, Q&E.
Supplier assessments, assess-ments in accordance with ISO, reporting to the annual and sustainability reports.
Occupational health and safety
International law, national law, the Code of Conduct, employee handbook, HR policies, work environment policy, H&S manual, OHSAS 18001, union regulations, company specific targets for zero injuries, health and safety procedures for Covid-19.
Senior management, MD, Financial Director, HR, Operations Director, Q&E.
Reporting on the number of injuries, assessments in accordance with ISO, followups of incident handling, reporting to the annual and sustainability reports.
Diversity and equal opportunities
National law, the Code of Conduct, employee handbook, policy for abusive discrimination, HR policies, work environment policy, recruitment policy.
Senior management, MD, Financial Director, HR, Operations Director.
Assessments in accordance with ISO, reporting to the annual and sustainability reports.
Freedom of association and collective bargaining
National law, the Code of Conduct, employee handbook, the UN’s Universal Declaration of Human Rights, labour agreements, freedom of association, collective union agreements, workplace policy.
Senior management, MD, Financial Director, HR, Operations Director.
Assessments in accordance with ISO, reporting to the annual and sustainability reports.
Zero tolerance for child and forced labour, respect for human rights
National law, the Code of Conduct, supplier code of conduct, collective union agreements, the UN’s Universal Declaration of Human Rights, selfas-sessments for suppliers.
Senior management, MD, HR, Operations Director, Procurement.
Assessments in accordance with ISO, reporting to the annual and sustainability reports.
The impact of products and services on customer health and safety
The Code of Conduct, testing in accordance with international and national legislation and regula-tions, CE marking, VDE testing, EN standards, ENEC, CCC, ETL and UL certification, ISO 9001, ISO 14001, compliance with RoHS and REACH.
Senior management, MD, R&D, Product development, Q&E.
Assessments in accordance with ISO, assessments in accordance with various certifi-cation and standards, reporting to the annual and sustainability reports.
The table summarizes the companies’ documents and responsibility for the management approach and governance of the most material topics.
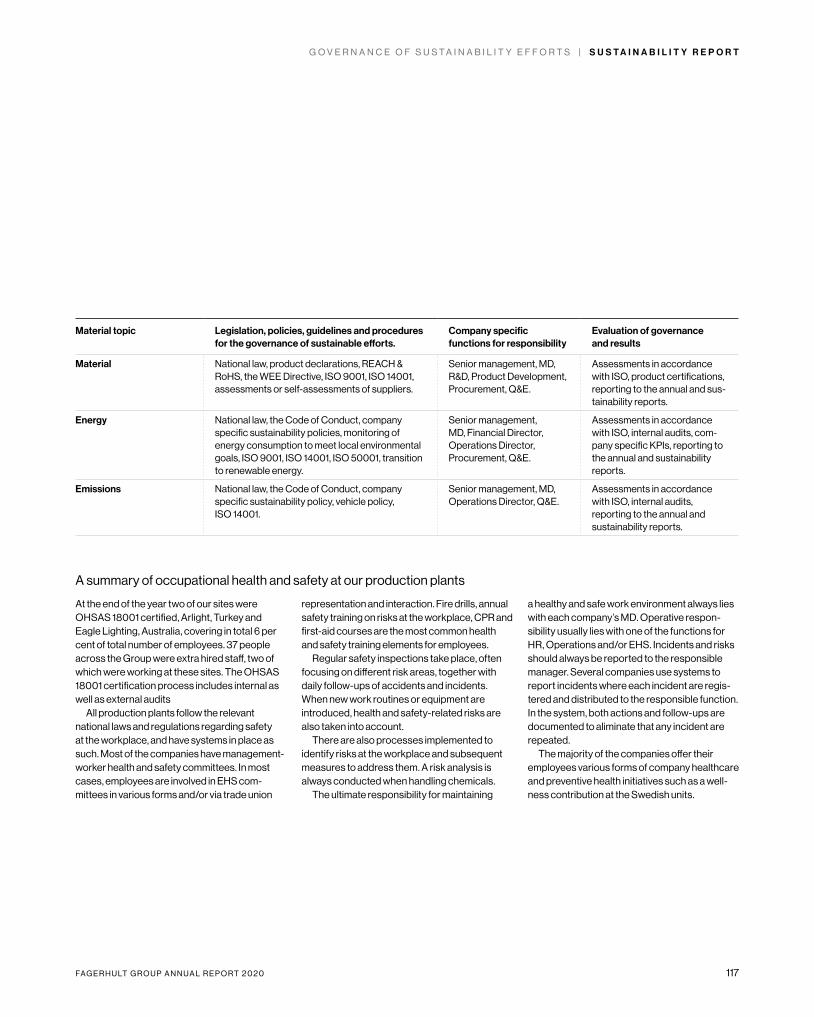
FA G E R H U LT G R O U P A N N U A L R E P O R T 2 0 2 0 117
G O V E R N A N C E O F S U S T A I N A B I L I T Y E F F O R T S | S U S T A I N A B I L I T Y R E P O R T
Material topic Legislation, policies, guidelines and procedures for the governance of sustainable efforts.
Company specific functions for responsibility
Evaluation of governance and results
Material National law, product declarations, REACH & RoHS, the WEE Directive, ISO 9001, ISO 14001, assessments or self-assessments of suppliers.
Senior management, MD, R&D, Product Development, Procurement, Q&E.
Assessments in accordance with ISO, product certifications, reporting to the annual and sus-tainability reports.
Energy National law, the Code of Conduct, company specific sustainability policies, monitoring of energy consumption to meet local environmental goals, ISO 9001, ISO 14001, ISO 50001, transition to renewable energy.
Senior management, MD, Financial Director, Operations Director, Procurement, Q&E.
Assessments in accordance with ISO, internal audits, com-pany specific KPIs, reporting to the annual and sustainability reports.
Emissions National law, the Code of Conduct, company specific sustainability policy, vehicle policy, ISO 14001.
Senior management, MD, Operations Director, Q&E.
Assessments in accordance with ISO, internal audits, reporting to the annual and sustainability reports.
A summary of occupational health and safety at our production plants
At the end of the year two of our sites were OHSAS 18001 certified, Arlight, Turkey and Eagle Lighting, Australia, covering in total 6 per cent of total number of employees. 37 people across the Group were extra hired staff, two of which were working at these sites. The OHSAS 18001 certification process includes internal as well as external audits
All production plants follow the relevant national laws and regulations regarding safety at the workplace, and have systems in place as such. Most of the companies have management- worker health and safety committees. In most cases, employees are involved in EHS com-mittees in various forms and/or via trade union
representation and interaction. Fire drills, annual safety training on risks at the workplace, CPR and first-aid courses are the most common health and safety training elements for employees.
Regular safety inspections take place, often focusing on different risk areas, together with daily follow-ups of accidents and incidents. When new work routines or equipment are introduced, health and safety-related risks are also taken into account.
There are also processes implemented to identify risks at the workplace and subsequent measures to address them. A risk analysis is always conducted when handling chemicals.
The ultimate responsibility for maintaining
a healthy and safe work environment always lies with each company’s MD. Operative respon-sibility usually lies with one of the functions for HR, Operations and/or EHS. Incidents and risks should always be reported to the responsible manager. Several companies use systems to report incidents where each incident are regis-tered and distributed to the responsible function. In the system, both actions and follow-ups are documented to aliminate that any incident are repeated.
The majority of the companies offer their employees various forms of company healthcare and preventive health initiatives such as a well-ness contribution at the Swedish units.
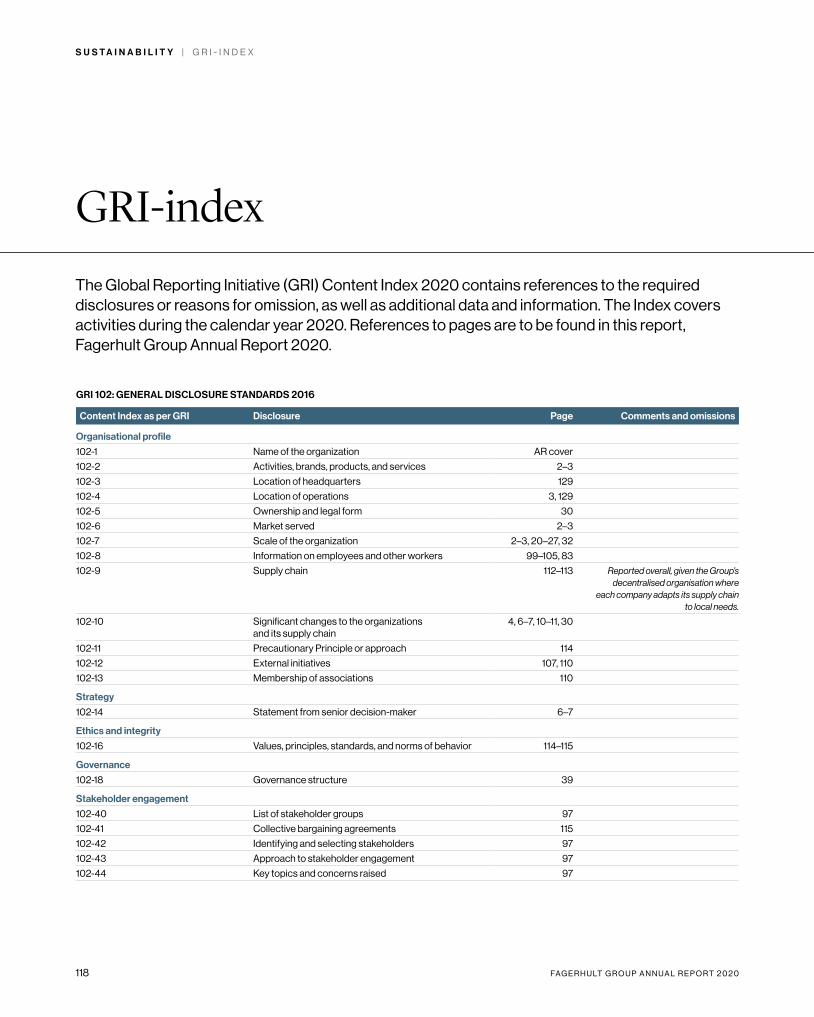
118 FA G E R H U LT G R O U P A N N U A L R E P O R T 2 0 2 0
S U S T A I N A B I L I T Y | G R I - I N D E X
The Global Reporting Initiative (GRI) Content Index 2020 contains references to the required disclosures or reasons for omission, as well as additional data and information. The Index covers activities during the calendar year 2020. References to pages are to be found in this report, Fagerhult Group Annual Report 2020.
GRI-index
GRI 102: GENERAL DISCLOSURE STANDARDS 2016
Content Index as per GRI Disclosure Page Comments and omissions
Organisational profile
102-1 Name of the organization AR cover
102-2 Activities, brands, products, and services 2–3
102-3 Location of headquarters 129
102-4 Location of operations 3, 129
102-5 Ownership and legal form 30
102-6 Market served 2–3
102-7 Scale of the organization 2–3, 20–27, 32
102-8 Information on employees and other workers 99–105, 83
102-9 Supply chain 112–113 Reported overall, given the Group’s decentralised organisation where
each company adapts its supply chain to local needs.
102-10 Significant changes to the organizations and its supply chain
4, 6–7, 10–11, 30
102-11 Precautionary Principle or approach 114
102-12 External initiatives 107, 110
102-13 Membership of associations 110
Strategy
102-14 Statement from senior decision-maker 6–7
Ethics and integrity
102-16 Values, principles, standards, and norms of behavior 114–115
Governance
102-18 Governance structure 39
Stakeholder engagement
102-40 List of stakeholder groups 97
102-41 Collective bargaining agreements 115
102-42 Identifying and selecting stakeholders 97
102-43 Approach to stakeholder engagement 97
102-44 Key topics and concerns raised 97
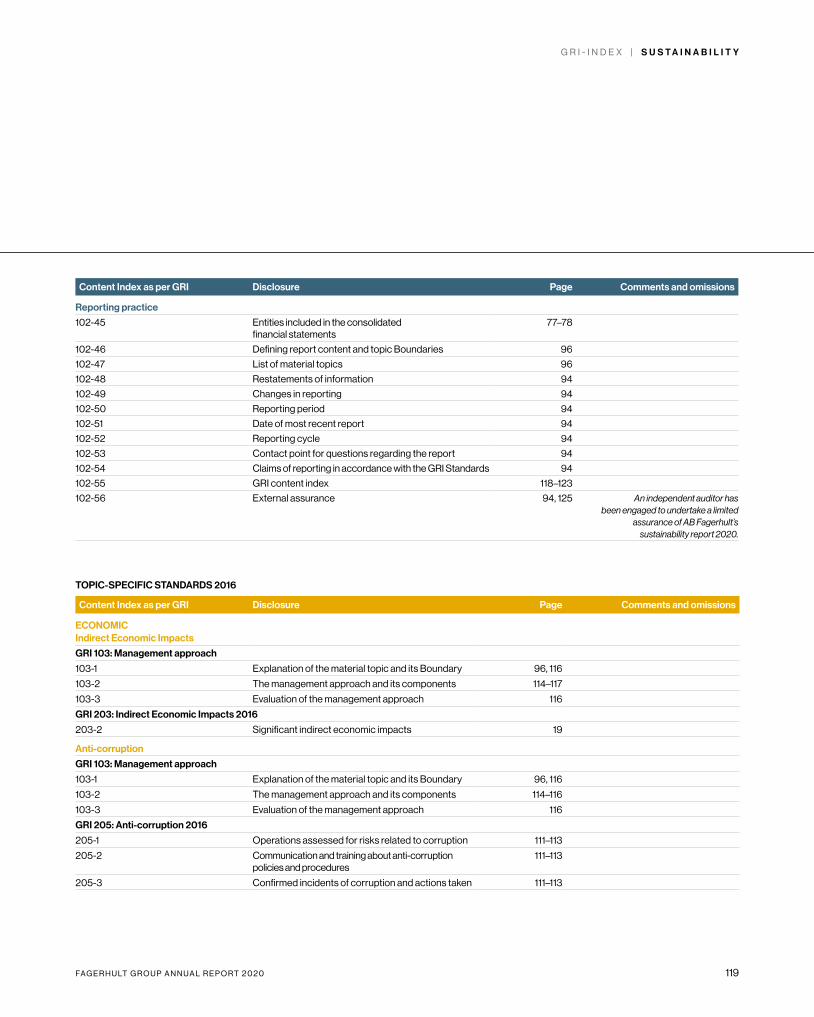
FA G E R H U LT G R O U P A N N U A L R E P O R T 2 0 2 0 119
G R I - I N D E X | S U S T A I N A B I L I T Y
Content Index as per GRI Disclosure Page Comments and omissions
Reporting practice
102-45 Entities included in the consolidated financial statements
77–78
102-46 Defining report content and topic Boundaries 96
102-47 List of material topics 96
102-48 Restatements of information 94
102-49 Changes in reporting 94
102-50 Reporting period 94
102-51 Date of most recent report 94
102-52 Reporting cycle 94
102-53 Contact point for questions regarding the report 94
102-54 Claims of reporting in accordance with the GRI Standards 94
102-55 GRI content index 118–123
102-56 External assurance 94, 125 An independent auditor has been engaged to undertake a limited
assurance of AB Fagerhult’s sustainability report 2020.
TOPIC-SPECIFIC STANDARDS 2016
Content Index as per GRI Disclosure Page Comments and omissions
ECONOMICIndirect Economic Impacts
GRI 103: Management approach
103-1 Explanation of the material topic and its Boundary 96, 116
103-2 The management approach and its components 114–117
103-3 Evaluation of the management approach 116
GRI 203: Indirect Economic Impacts 2016
203-2 Significant indirect economic impacts 19
Anti-corruption
GRI 103: Management approach
103-1 Explanation of the material topic and its Boundary 96, 116
103-2 The management approach and its components 114–116
103-3 Evaluation of the management approach 116
GRI 205: Anti-corruption 2016
205-1 Operations assessed for risks related to corruption 111–113
205-2 Communication and training about anti-corruption policies and procedures
111–113
205-3 Confirmed incidents of corruption and actions taken 111–113
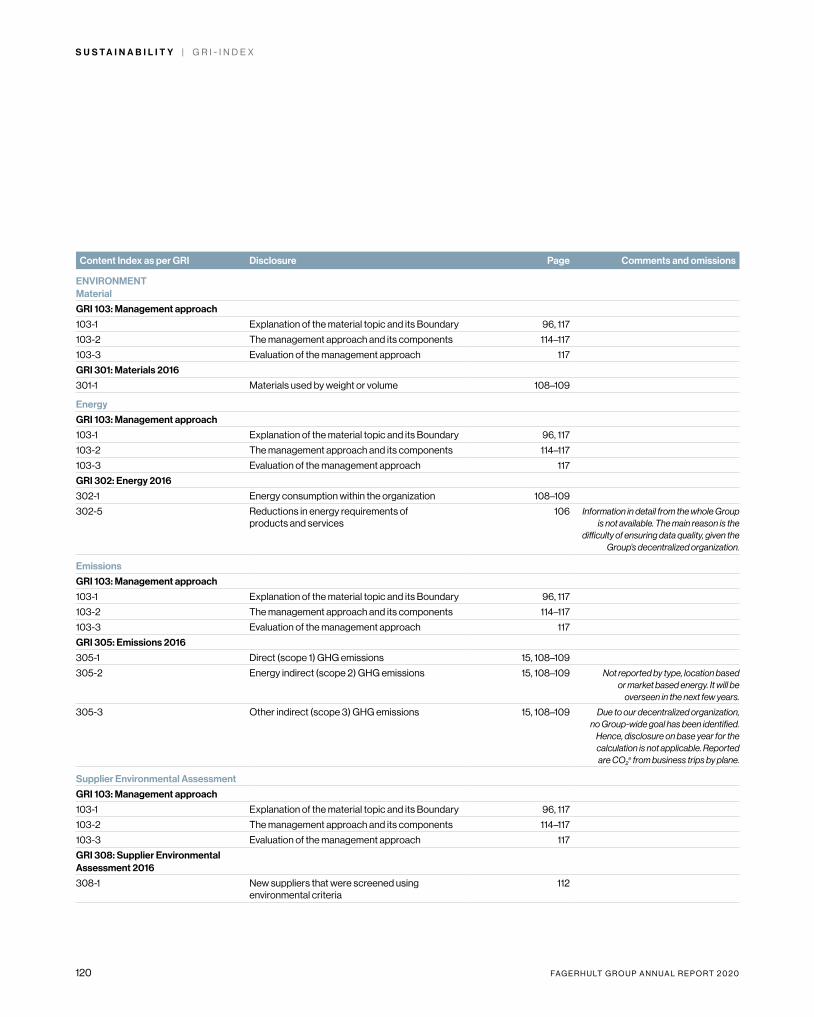
120 FA G E R H U LT G R O U P A N N U A L R E P O R T 2 0 2 0
S U S T A I N A B I L I T Y | G R I - I N D E X
Content Index as per GRI Disclosure Page Comments and omissions
ENVIRONMENTMaterial
GRI 103: Management approach
103-1 Explanation of the material topic and its Boundary 96, 117
103-2 The management approach and its components 114–117
103-3 Evaluation of the management approach 117
GRI 301: Materials 2016
301-1 Materials used by weight or volume 108–109
Energy
GRI 103: Management approach
103-1 Explanation of the material topic and its Boundary 96, 117
103-2 The management approach and its components 114–117
103-3 Evaluation of the management approach 117
GRI 302: Energy 2016
302-1 Energy consumption within the organization 108–109
302-5 Reductions in energy requirements of products and services
106 Information in detail from the whole Group is not available. The main reason is the
difficulty of ensuring data quality, given the Group’s decentralized organization.
Emissions
GRI 103: Management approach
103-1 Explanation of the material topic and its Boundary 96, 117
103-2 The management approach and its components 114–117
103-3 Evaluation of the management approach 117
GRI 305: Emissions 2016
305-1 Direct (scope 1) GHG emissions 15, 108–109
305-2 Energy indirect (scope 2) GHG emissions 15, 108–109 Not reported by type, location based or market based energy. It will be
overseen in the next few years.
305-3 Other indirect (scope 3) GHG emissions 15, 108–109 Due to our decentralized organization, no Group-wide goal has been identified.
Hence, disclosure on base year for the calculation is not applicable. Reported are CO2
e from business trips by plane.
Supplier Environmental Assessment
GRI 103: Management approach
103-1 Explanation of the material topic and its Boundary 96, 117
103-2 The management approach and its components 114–117
103-3 Evaluation of the management approach 117
GRI 308: Supplier Environmental Assessment 2016
308-1 New suppliers that were screened using environmental criteria
112
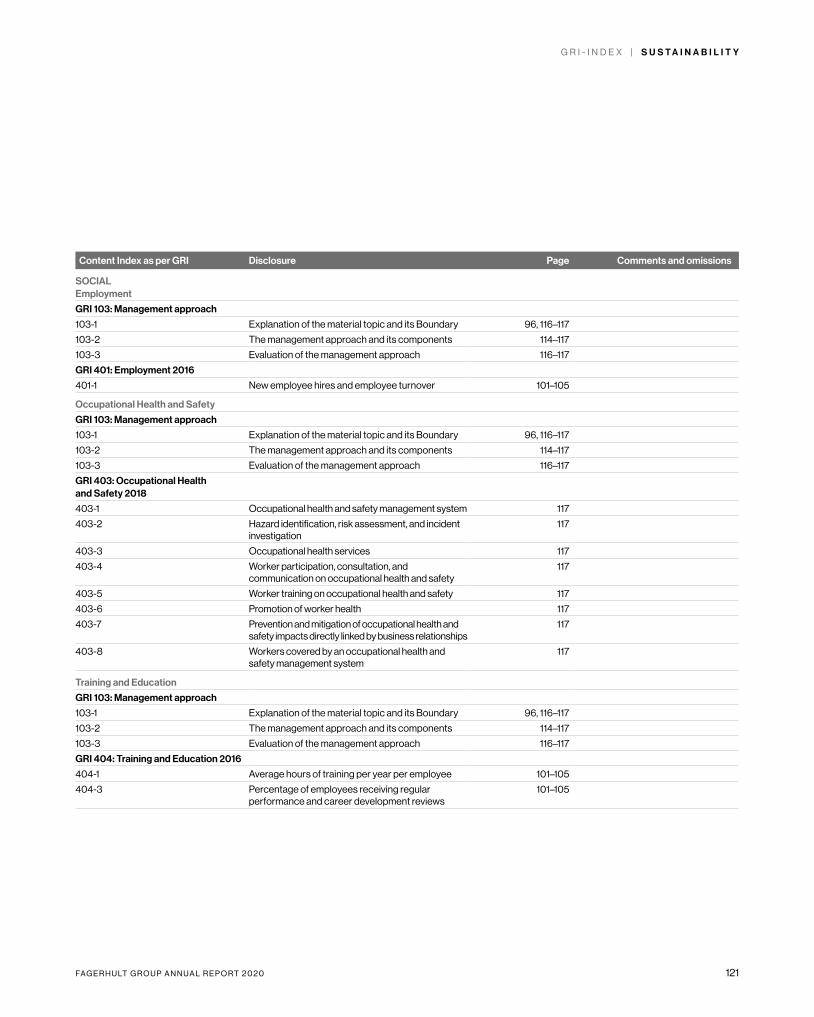
FA G E R H U LT G R O U P A N N U A L R E P O R T 2 0 2 0 121
G R I - I N D E X | S U S T A I N A B I L I T Y
Content Index as per GRI Disclosure Page Comments and omissions
SOCIALEmployment
GRI 103: Management approach
103-1 Explanation of the material topic and its Boundary 96, 116–117
103-2 The management approach and its components 114–117
103-3 Evaluation of the management approach 116–117
GRI 401: Employment 2016
401-1 New employee hires and employee turnover 101–105
Occupational Health and Safety
GRI 103: Management approach
103-1 Explanation of the material topic and its Boundary 96, 116–117
103-2 The management approach and its components 114–117
103-3 Evaluation of the management approach 116–117
GRI 403: Occupational Health and Safety 2018
403-1 Occupational health and safety management system 117
403-2 Hazard identification, risk assessment, and incident investigation
117
403-3 Occupational health services 117
403-4 Worker participation, consultation, and communication on occupational health and safety
117
403-5 Worker training on occupational health and safety 117
403-6 Promotion of worker health 117
403-7 Prevention and mitigation of occupational health and safety impacts directly linked by business relationships
117
403-8 Workers covered by an occupational health and safety management system
117
Training and Education
GRI 103: Management approach
103-1 Explanation of the material topic and its Boundary 96, 116–117
103-2 The management approach and its components 114–117
103-3 Evaluation of the management approach 116–117
GRI 404: Training and Education 2016
404-1 Average hours of training per year per employee 101–105
404-3 Percentage of employees receiving regular performance and career development reviews
101–105
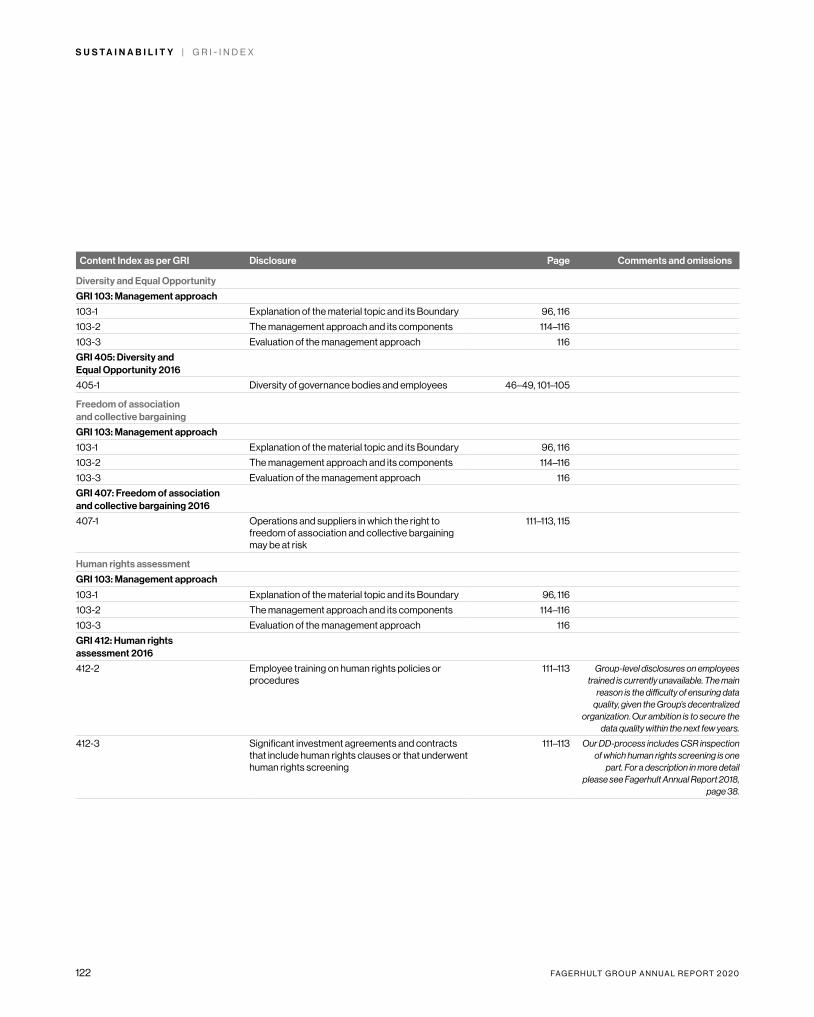
122 FA G E R H U LT G R O U P A N N U A L R E P O R T 2 0 2 0
S U S T A I N A B I L I T Y | G R I - I N D E X
Content Index as per GRI Disclosure Page Comments and omissions
Diversity and Equal Opportunity
GRI 103: Management approach
103-1 Explanation of the material topic and its Boundary 96, 116
103-2 The management approach and its components 114–116
103-3 Evaluation of the management approach 116
GRI 405: Diversity and Equal Opportunity 2016
405-1 Diversity of governance bodies and employees 46–49, 101–105
Freedom of association and collective bargaining
GRI 103: Management approach
103-1 Explanation of the material topic and its Boundary 96, 116
103-2 The management approach and its components 114–116
103-3 Evaluation of the management approach 116
GRI 407: Freedom of association and collective bargaining 2016
407-1 Operations and suppliers in which the right to freedom of association and collective bargaining may be at risk
111–113, 115
Human rights assessment
GRI 103: Management approach
103-1 Explanation of the material topic and its Boundary 96, 116
103-2 The management approach and its components 114–116
103-3 Evaluation of the management approach 116
GRI 412: Human rights assessment 2016
412-2 Employee training on human rights policies or procedures
111–113 Group-level disclosures on employees trained is currently unavailable. The main
reason is the difficulty of ensuring data quality, given the Group’s decentralized
organization. Our ambition is to secure the data quality within the next few years.
412-3 Significant investment agreements and contracts that include human rights clauses or that underwent human rights screening
111–113 Our DD-process includes CSR inspection of which human rights screening is one
part. For a description in more detail please see Fagerhult Annual Report 2018,
page 38.
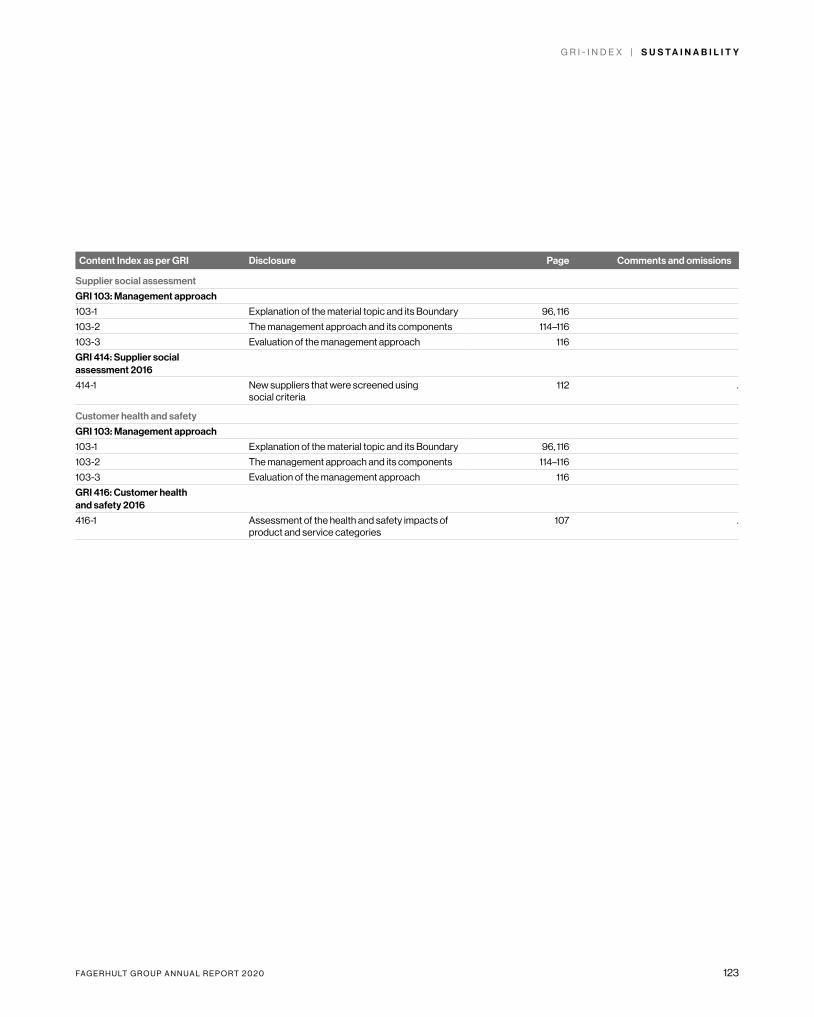
FA G E R H U LT G R O U P A N N U A L R E P O R T 2 0 2 0 123
G R I - I N D E X | S U S T A I N A B I L I T Y
Content Index as per GRI Disclosure Page Comments and omissions
Supplier social assessment
GRI 103: Management approach
103-1 Explanation of the material topic and its Boundary 96, 116
103-2 The management approach and its components 114–116
103-3 Evaluation of the management approach 116
GRI 414: Supplier social assessment 2016
414-1 New suppliers that were screened using social criteria
112 .
Customer health and safety
GRI 103: Management approach
103-1 Explanation of the material topic and its Boundary 96, 116
103-2 The management approach and its components 114–116
103-3 Evaluation of the management approach 116
GRI 416: Customer health and safety 2016
416-1 Assessment of the health and safety impacts of product and service categories
107 .
124 FA G E R H U LT G R O U P A N N U A L R E P O R T 2 0 2 0
S U S T A I N A B I L I T Y R E P O R T | S T A T U T O R Y S U S T A I N A B I L I T Y R E P O R T
AB Fagerhult’s Sustainability Report in accordancewith the Swedish Annual Accounts ActAB Fagerhult’s statutory sustainability report in accordance with the Swedish Annual Accounts Act is submitted in the form of a Sustainability Report prepared pursuant to the GRI Stand-ards. Reports regarding the Fagerhult Group’s most important areas of sustainability, business model, policies and performance indicators can be found on pages 94–117 and in Note 38 /risk/on pages 85–88. The GRI Index is available on pages 118–123.
The Board of Directors estimates that the
sustainability information is sufficient to obtain an understanding of the Group’s development, position, and earnings, as well as the conse-quences of its operations. The Sustainability Report indicates that stakeholder engagement is a central part of the work on defining materiality from a sustainability perspective.
A materiality analysis weighs the topics relevant to the Group, given the companies’ operations: the impact the operations have as regards the economy, society, people and the
environment; and the topics that influence the stakeholders’ decision-making and their expec-tations. This includes the environment, societal conditions, personnel, respect for human rights and counteracting corruption as well as the Group’s business model, the risks that can be linked to the areas, the allocation of responsi-bilities. Also policies/guidelines for governing important areas of sustainability as well as central performance indicators of relevance to the operations.
FA G E R H U LT G R O U P A N N U A L R E P O R T 2 0 2 0 125
L I M I T E D A S S U R A N C E R E P O R T | S U S T A I N A B I L I T Y R E P O R T
Auditor’s Limited Assurance Report on AB Fagerhult’s Sustainability Report and Statement on the Statutory Sustainability ReportThis is a translation of the original report in Swedish
To the Annual General Meeting of AB Fagerhult, org.nr 556110-6203
IntroductionWe have been engaged by the Group Manage-ment of AB Fagerhult to undertake a limited assurance of Fagerhult Group's Sustainability Report for the year 2020. The company has defined the scope of the sustainability report on page 94 in Fagerhult Group's Annual Report 2020. The statutory sustainability report is defined on page 124.
Responsibilities of the Board and Group Management for the Sustainability ReportThe Board of Directors and Group Management are responsible for preparing the Sustainability Report, including the Statutory Sustainability Report, in accordance with applicable criteria and the Annual Accounts Act. The criteria are described on page 94 of the Sustainability Report and consist of the parts of the standard for sustainability reports published by GRI (Global Reporting Initiative) that are applica-ble to the sustainability report, as well as the accounting and calculation principles that Fagerhult Group has developed. This responsi-bility also includes the internal control which is deemed necessary to establish a sustainability report that does not contain material misstate-ment, whether due to fraud or error.
Responsibilities of the auditor Our responsibility is to express a conclusion on the sustainability report based on o the limited assurance procedures we have performed and to provide an opinion on the statutory sustain-ability report. Our assignment is limited to the historical information that is presented and thus does not include future oriented information.
We conducted our limited assurance engage-ment in accordance with ISAE 3000 Assurance Engagements Other than Audits or Reviews of Historical Financial Information. A limited assurance engagement consists of making inquiries, primarily of persons responsible for the preparation of the Sustainability Report, and applying analytical and other limited assurance procedures. We have conducted our review regarding the statutory sustainability report in accordance with FAR’s recommendation RevR 12, the Auditor’s Opinion on the Statutory Sustainability Report. A limited assurance engagement and a statement according to RevR 12 have a different focus and a consider-ably smaller scope compared to the focus and scope of an audit in accordance with Interna-tional Standards on Auditing and generally accepted auditing standards in Sweden.
The audit firm applies ISQC 1 (International Standard on Quality Control) and accordingly maintains a comprehensive system of quality control including documented policies and procedures regarding compliance with ethical requirements, professional standards and
applicable legal and regulatory requirements. We are independent in relation to AB Fagerhult according to generally accepted auditing standards in Sweden and have fulfilled our professional ethics responsibility according to these requirements.
The procedures performed in a limited assurance engagement and review according to RevR 12 do not allow us to obtain such assurance that we become aware of all significant matters that could have been identified if an audit was performed. The stated conclusion based on a limited assurance and review in accordance with RevR 12, therefore, does not have the security that a stated conclusion based on an audit has.
Our procedures are based on the criteria defined by the Board of Directors and the Group Management as described above. We consider these criteria as suitable for the preparation of the Sustainability Report.
We believe that the evidence we have obtained is sufficient and appropriate to provide a basis for our conclusion below.
ConclusionBased on the limited assurance procedures we have performed, nothing has come to our atten-tion that causes us to believe that the Sustainabil-ity Report is not, in all material respects, prepared in accordance with the criteria defined by the Board of Directors and Group Management.
A statutory sustainability report has been prepared.
Jönköping, 18th of March 2021
Öhrlings PricewaterhouseCoopers AB
Peter NyllingeAuthorised Public Accountant
Isabelle HammarströmExpert Member of FAR
126 FA G E R H U LT G R O U P A N N U A L R E P O R T 2 0 2 0
S H A R E H O L D E R I N F O R M A T I O N
Shareholder information2021 Annual General MeetingThe Annual General Meeting of shareholders will be held on Thursday, 29 April 2021 in Fagerhult. In light of the Covid-19 pandemic, the Board of Directors has decided that the AGM will be conducted without the physical attendance of shareholders, proxies and members of the public, and that voting can only take place through postal voting prior to the AGM.
RegistrationShareholders who wish to attend the Annual General Meeting by postal voting must be registered as shareholders in the Company’s share register kept by Euroclear Sweden AB by 21 April, 2021 and must also announce their intention to attend the Annual General Meeting no later than 28 April, 2021 by having submitted the postal voting form in accordance with the instructions in the notice to the AGM, so that the postal vote is received by Euroclear Sweden AB no later than that day. Please note that notifica-tion to the Annual General Meeting can only be made by postal voting.
Holders of nominee-registered shares must, to be entitled to attend the AGM through postal voting, temporarily have their shares registered in their own name through their nominee to ensure that they are registered in the shareholders’ register before 21 April 2021. Such registration may be temporary (so-called voting rights registration) and is requested from the nominee in accordance with the nominee’s routines at such time in advance as the nominee decides. Voting rights registrations made no later than the second banking day after 21 April
2021 are taken into account in the production of the share register. If attendance by postal voting is made through a proxy, then the power of attorney granting the proxy such rights shall be submitted together with the postal vote.
DividendThe Board of Directors proposes to the AGM a dividend of SEK 0.50 per share. The proposed record day is 3 May 2021. In the event that AGM adopts this proposal, the dividend will be distributed through the offices of Euroclear Sweden AB starting on 6 May 2021. Nomination CommitteeThe Nomination Committee for the 2021 AGM comprises the following members:• Jan Svensson, Chairman of AB Fagerhult
(co-opted and ineligible to vote)• Johan Hjertonsson representing Investment
AB Latour• Johan Ståhl representing Lannebo Fonder• Jan Särlvik representing Nordea Funds• Jannis Kitsakis representing the Fourth
Swedish National Pension Fund
In order for the Nomination Committee to consider a proposal, it must be submitted well in advance of the AGM. Proposals may be submit-ted to the Nomination Committee by post to:
AB FagerhultAttn: Michael WoodTegelviksgatan 32SE-116 41 Stockholm, Sweden
Financial information 2021• 29 April – 2021 AGM• 29 April – Interim report for Q1, 2021• 23 August – Interim report for Q2, 2021• 29 October – Interim report for Q3, 2021
Distribution policyA printed copy of the Annual Report is available upon request and can be ordered by sending an e-mail to [email protected] or by calling +46 36 10 85 00. All of Fagerhult’s annual reports from previous years are available at www.fagerhultgroup.com. IR contactMichael Wood,Chief Financial Officer+46 73 087 46 [email protected] News, reports and share price performanceFollow us by subscribing to our press releases and financial reports by e-mail and text message. You are also able to obtain information on the share’s price performance. Register at www.fagerhultgroup.com
FA G E R H U LT G R O U P A N N U A L R E P O R T 2 0 2 0 127
D E F I N I T I O N S
Definitions A to ZNumber of employees Average number of full-time equivalents.
Return on equity Profit or loss according to the income statement as a percentage of the average (reported) equity.
Return on capital employed Profit/loss after financial items plus financial expenses in relation to the average capital employed.
Equity per share Equity divided by the number of shares outstanding.
Cash flow per share Cash flow from operating activities for the year divided by the average number of shares outstanding.
Liquid ratio Cash and cash equivalents in relation to current liabilities.
Cash and cash equivalents Cash and bank balances and short-term investments.
Net investments Investments for the year in property, plant and equipment, less income from the sale of non-current assets.
Net debt Interest-bearing liabilities less cash and cash equivalents.
Earnings per share Earnings according to the income statement in relation to the average number of shares outstanding.
Operating margin Operating profit in relation to net sales.
Net debt/equity ratio Net debt in relation to equity.
Equity/assets ratio Equity in relation to total assets.
Capital employed Total assets less non-interest-bearing liabilities.
Profit margin Profit after financial items in relation to net sales.
Other current assets The item refers to interim receivables, advance payments to suppliers, other receivables and Group receivables
For more information about the Key ratios and the definitions applied, please refer to AB Fagerhult’s website under “Investor/Financial data/Financial glossary.” The website also includes the definition of any Alternative Performance Measures used whereas this report details the financial aspect to these.
128 FA G E R H U LT G R O U P A N N U A L R E P O R T 2 0 2 0
I N D U S T R Y G L O S S A R Y
Industry glossaryLuminaire power: Stated in watts (W) and is the total system power for a luminaire.
Luminaire Luminous Flux: The total light output in lumens (lm) that a luminaire emits.
Luminaire Luminous Efficacy: Defined as the ratio between luminaire luminous flux and lumi-naire power of a LED luminaire and stated in lumens per watt (lm/W).
Lighting Europe: The European trade association for luminaire and light source manufacturers.
DALI: (Digital Addressable Lighting Interface) A standardised protocol for digital control.
Failure fraction – Fy: The failure of fraction at nominal lifetime and is given in per cent. For example, at 15 per cent failures, a factor of F15 is stated.
Color Rendering Index: (Color Rendering Index) Indicated as CRI on a scale from 0 to 100 and is a measure of a light source’s ability to reproduce colours.
IP class: Specifies the degree of protection against access to live electrical parts and how waterproof and dustproof the luminaires are. Stated as IP followed by two digits, e.g. IP23.
LEED: (Leadership in Energy and Environ-mental Design) is an international system for environmental certification for buildings. The certification focuses on reducing the use of resources such as land, water, energy and building materials.
LED: (Light-Emitting Diode) is a semiconductor light source. LED lights have long lifespans and high energy efficiency. The light is formed by electrolumi nescence.
Luminous Flux: The amount of visible light emitted from a light source. Measured in lumens (lm).
Luminous Intensity: Specifies the amount of light that radiates in a certain direction. Measured in candela (cd).
Luminous Intensity Distribution: The light distribution of a luminaire which is measured according to the CIE standard and stated in cd/1,000 lm. Reported in the table or with polar plot.
Luminous efficiency: Measurement of a light source’s efficiency and is calculated as the lumi-nous flux divided by the power the light source consumes (wattage). Measured in lumens per watt (lm/W).
LLMF: (Lamp Lumen Maintenance Factor). The light source’s maintained luminous flux at any given time.
LMF: (Luminaire Maintenance Factor) Specifies the luminaire’s pollution degree for a number of burning hours.
LSF: (Lamp Survival Factor) Specifies the number of light sources that still shine in a facility at any given time. (Expected shortfall of high quality LEDs can be assumed negligible and this factor then becomes 1.0.)
Luminance: Indicates how bright a surface is dependent on the light reflected from an object in a specific direction. Measured as candela per m2 (cd/m2).
MF: (Maintenance factor) The ratio between maintained illuminance and initial illuminance.
Rated Life: (Rated life) Defined as the number of burning hours after which a given part of the initial light output remains. Today, life expectancy is given as the number of hours when 70 per cent of the initial luminous flux remains and is designated as L70.
OLED: Abbreviation of organic light emitting diode.
PWM: (Pulse Width Modulation) A technique for light control with pulse width modulation recommended for LED.
Ra: An index that indicates light sources’ ability to render colours. Given on a scale from 0 to 100 where 100 indicates perfect colour reproduction.
RGB technique: A technique whereby mixing red, green and blue light can create white light or coloured light of a user’s choice.
UGR: (Unified Glare Rating) An inter national method developed by CIE to calculate an index of discomfort glare.
ZHAGA: An open consortium with the purpose of developing industry standards for LED components.
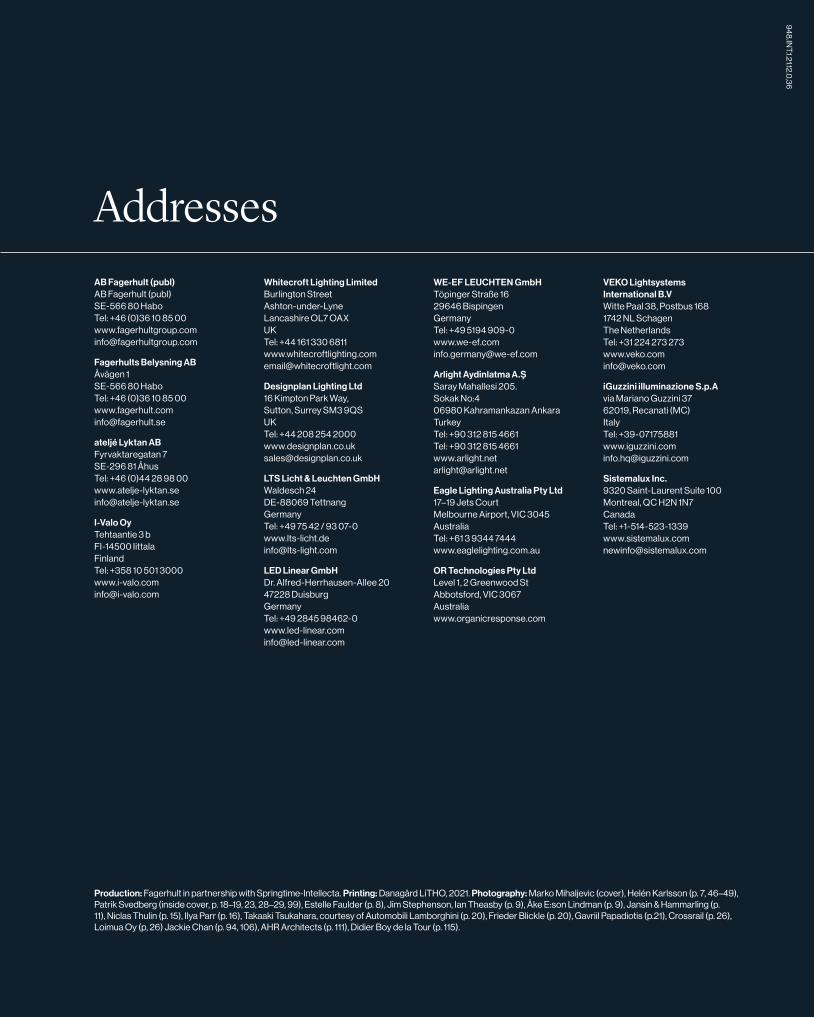
AddressesAB Fagerhult (publ) AB Fagerhult (publ) SE-566 80 Habo Tel: +46 (0)36 10 85 00 www.fagerhultgroup.com [email protected]
Fagerhults Belysning AB Åvägen 1 SE-566 80 Habo Tel: +46 (0)36 10 85 00 www.fagerhult.com [email protected]
ateljé Lyktan AB Fyrvaktaregatan 7 SE-296 81 Åhus Tel: +46 (0)44 28 98 00 www.atelje-lyktan.se [email protected]
I-Valo Oy Tehtaantie 3 b FI-14500 Iittala Finland Tel: +358 10 501 3000 www.i-valo.com [email protected]
Whitecroft Lighting Limited Burlington Street Ashton-under-Lyne Lancashire OL7 OAX UK Tel: +44 161 330 6811 www.whitecroftlighting.com [email protected]
Designplan Lighting Ltd 16 Kimpton Park Way, Sutton, Surrey SM3 9QS UK Tel: +44 208 254 2000 www.designplan.co.uk [email protected]
LTS Licht & Leuchten GmbH Waldesch 24 DE-88069 Tettnang Germany Tel: +49 75 42 / 93 07-0 www.lts-licht.de [email protected]
LED Linear GmbH Dr. Alfred-Herrhausen-Allee 20 47228 Duisburg Germany Tel: +49 2845 98462-0 www.led-linear.com [email protected]
WE-EF LEUCHTEN GmbH Töpinger Straße 16 29646 Bispingen Germany Tel: +49 5194 909-0 www.we-ef.com [email protected]
Arlight Aydinlatma A.Ş Saray Mahallesi 205. Sokak No:4 06980 Kahramankazan Ankara Turkey Tel: +90 312 815 4661 Tel: +90 312 815 4661 www.arlight.net [email protected]
Eagle Lighting Australia Pty Ltd 17–19 Jets Court Melbourne Airport, VIC 3045 Australia Tel: +61 3 9344 7444 www.eaglelighting.com.au
OR Technologies Pty Ltd Level 1, 2 Greenwood St Abbotsford, VIC 3067 Australia www.organicresponse.com
VEKO Lightsystems International B.V Witte Paal 38, Postbus 168 1742 NL Schagen The Netherlands Tel: +31 224 273 273 www.veko.com [email protected]
iGuzzini illuminazione S.p.A via Mariano Guzzini 37 62019, Recanati (MC) Italy Tel: +39-07175881 www.iguzzini.com [email protected]
Sistemalux Inc. 9320 Saint-Laurent Suite 100 Montreal, QC H2N 1N7 Canada Tel: +1-514-523-1339 www.sistemalux.com [email protected]
948
.INT.1.21.12.0
,36
Production: Fagerhult in partnership with Springtime-Intellecta. Printing: Danagård LiTHO, 2021. Photography: Marko Mihaljevic (cover), Helén Karlsson (p. 7, 46–49), Patrik Svedberg (inside cover, p. 18–19, 23, 28–29, 99), Estelle Faulder (p. 8), Jim Stephenson, Ian Theasby (p. 9), Åke E:son Lindman (p. 9), Jansin & Hammarling (p. 11), Niclas Thulin (p. 15), Ilya Parr (p. 16), Takaaki Tsukahara, courtesy of Automobili Lamborghini (p. 20), Frieder Blickle (p. 20), Gavriil Papadiotis (p.21), Crossrail (p. 26), Loimua Oy (p, 26) Jackie Chan (p. 94, 106), AHR Architects (p. 111), Didier Boy de la Tour (p. 115).

Related Documents