ANNUAL REPORT 2019

Welcome message from author
This document is posted to help you gain knowledge. Please leave a comment to let me know what you think about it! Share it to your friends and learn new things together.
Transcript
ANNUAL REPORT 2019
| 2
NOTHING TOO HEAVY, NOTHING TOO HIGH.
5 || 4
FINANCIAL INFORMATION
GENERAL INFORMATION10
KEY FIGURES
64CONSOLIDATEDBALANCE SHEET
16SGC-250 THE WORLD’S LARGEST CRANE
69NOTES
33LEADING INNOVATION CARL SARENS, DIRECTOR OF TECHNICAL SOLUTIONS, PROJECTS & ENGINEERING
43TELLING POWERFUL STORIES KLEOPATRA KYRIMI, GROUP MARKETING & COMMUNICATIONS MANAGER
45ICT STEVE VOSSEN
GROUP ICT MANAGER
52BOARD OF DIRECTORS
12KEY FACTS
65CONSOLIDATED STATEMENT OF PROFIT AND LOSS
19MAINTAINING A TOP FLEETGUY FREDERICKX, GROUP FLEET DIRECTOR
90AUDITOR’S REPORT
27ACHIEVING ZERO HARMJORIS MAREELS, GROUP SHEQ DIRECTOR
39BUILDING A GLOBAL SALES FORCE
GERT HENDRICKX, SALES DIRECTOR PROJECT
47EMPOWERING PEOPLE MARC DE BOOM, GROUP BUSINESS SUPPORT DIRECTOR
54REGIONAL DIRECTORS
07MESSAGE FROM THE CEOWIM SARENS
60MESSAGE FROM THE CFOLUDO VERRIJKEN
15PROJECT MANAGEMENT FIVE MILESTONES TO SUCCESS
68CONSOLIDATED CASH FLOW STATEMENT
22OUR
MARKETS
91GLOSSARY
30OUR BUSINESS LINES
41CREATING STRATEGIC SOLUTIONS ASTRID DE WITTE, GROUP ISABELLE DEMEESTER GROUP LEGAL DIRECTOR
56CORPORATE MANAGEMENT
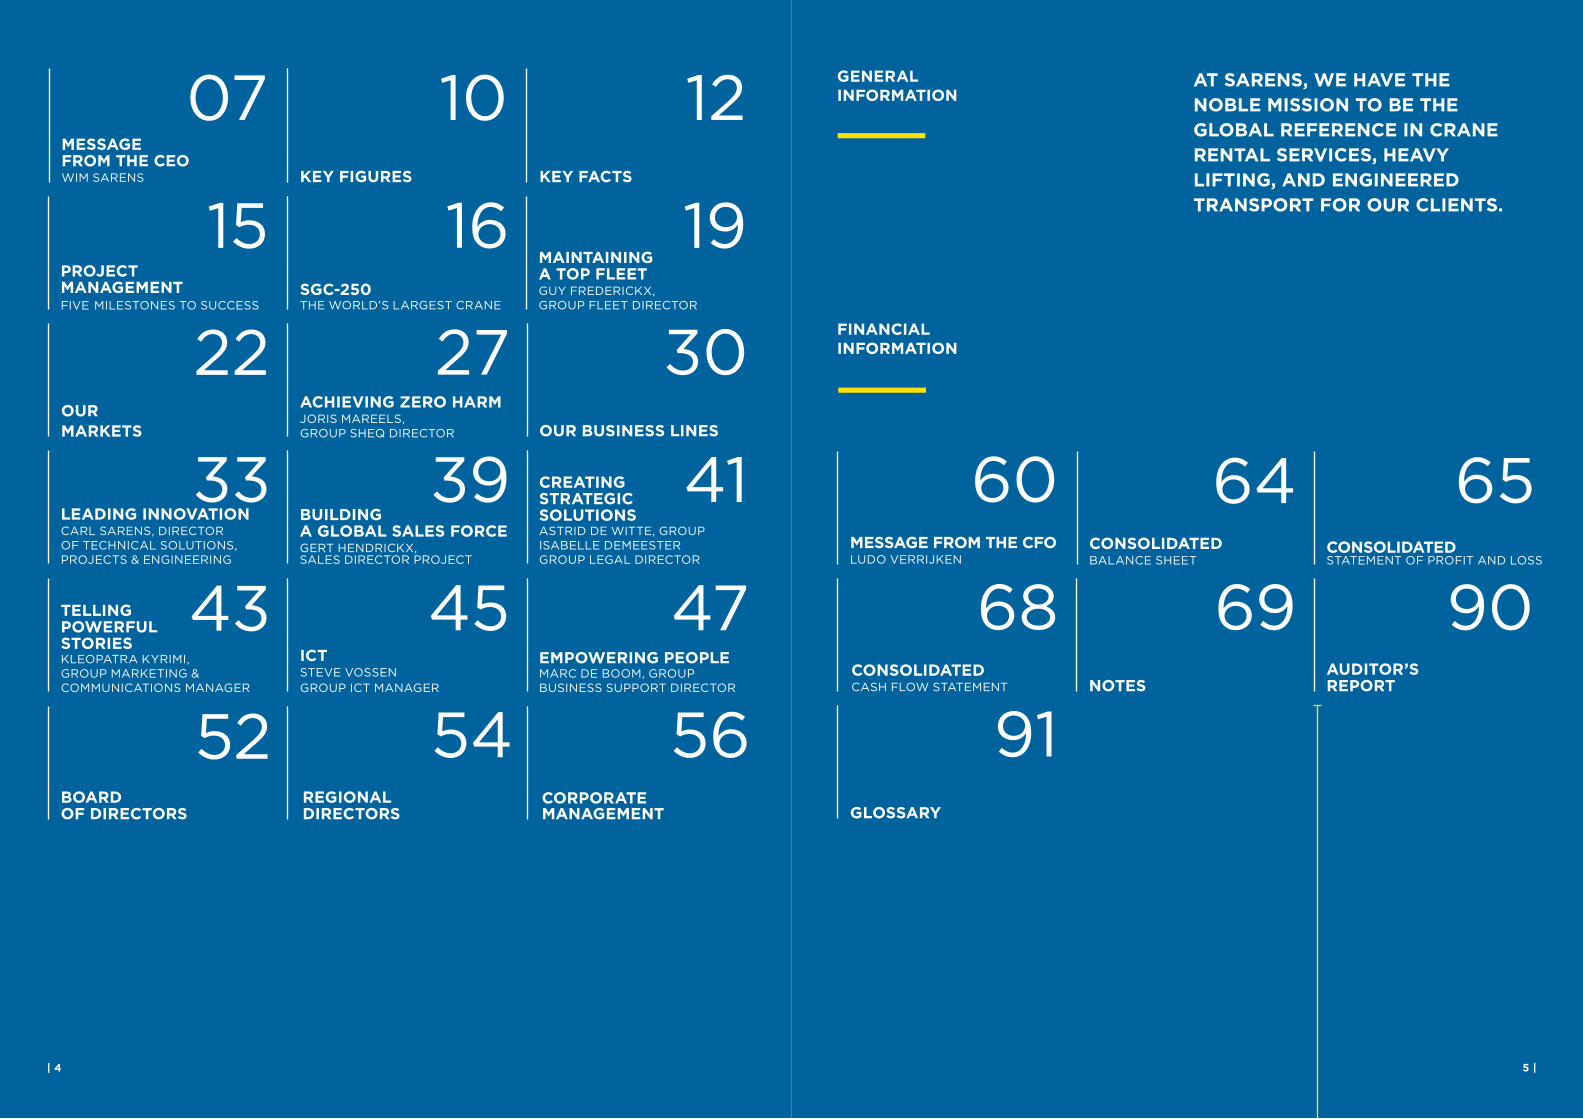
AT SARENS, WE HAVE THE
NOBLE MISSION TO BE THE
GLOBAL REFERENCE IN CRANE
RENTAL SERVICES, HEAVY
LIFTING, AND ENGINEERED
TRANSPORT FOR OUR CLIENTS.
7 |
GO TO THE INDEX
up our depots in Ontario, Vancouver, and Fort McMurray as well as across Europe, including Lithuania, Belarus, Tyumin, Paris and Europort in the Netherlands. We have also established a depot in Dubai and entered prospective markets in Bangladesh and Sri Lanka. Additionally, as part of our Capex program, we began renewing and replacing over 30 telescopic cranes in Europe, most of them in the 55T-160T capacity range. We will continue this renewal over the coming years to maintain a state-of-the-art rental leet.
PROJECTS
In 2019, we celebrated the launch of the world’s largest crane, the SGC-250, and collaborated with clients on high-impact projects across the globe. From a major project with Tengizchevroil (TCO) to our multi-phase involvement replacing a railway bridge in Stockholm, we have much to be proud of:• he TCO project, the largest in our
history, was fully operational with the SGC-140 and a large arsenal of cranes and equipment at our client’s service.
• We shipped the largest crane in the world, the SGC-250, to Hinkley Point C, where it completed its irst move. You can watch it here. he crane has spectacular upcoming lifts in 2020, and the adventures of “Big Carl” will be posted on our website and social media channels.
• As part of a multi-phase operation, we replaced a railway bridge in the Stockholm city centre-a fascinating project that had the entire Swedish capital in awe of what engineering can ofer. Watch the operation here.
For a full list of our projects, I invite you to visit the news section of our website, as well as our YouTube channel , where we ofer an anthology of all our large and small projects and rentals.
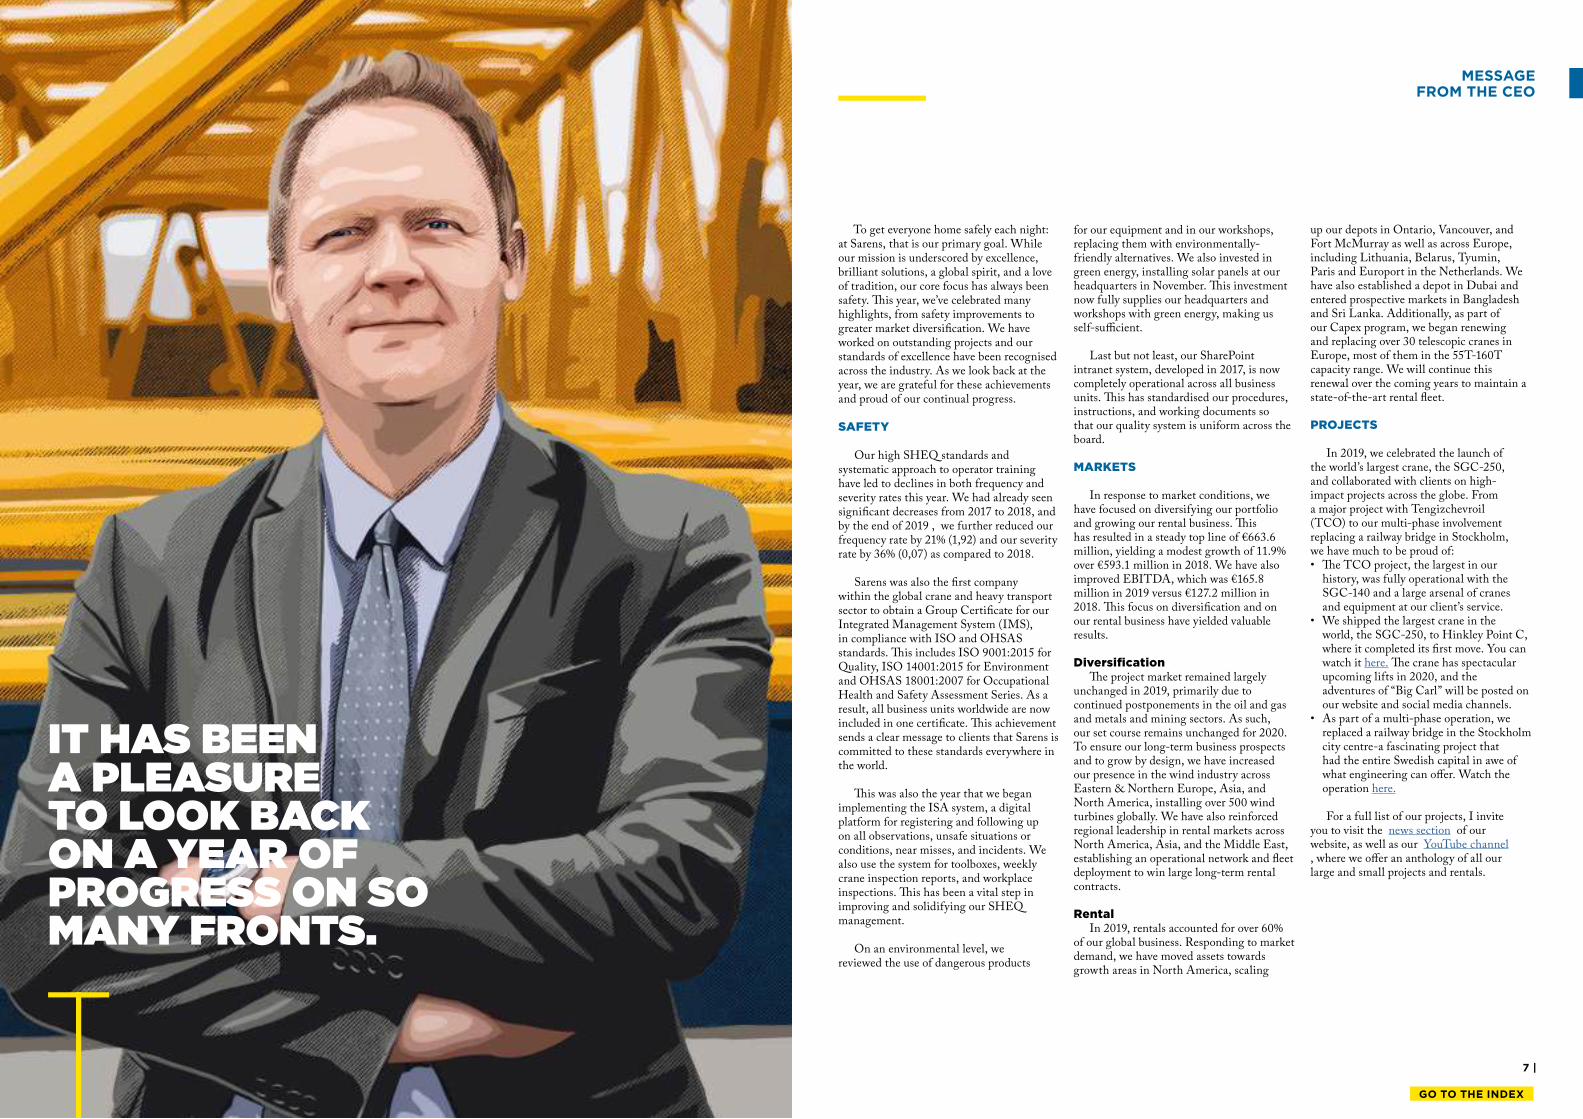
MESSAGE FROM THE CEO
To get everyone home safely each night: at Sarens, that is our primary goal. While our mission is underscored by excellence, brilliant solutions, a global spirit, and a love of tradition, our core focus has always been safety. his year, we’ve celebrated many highlights, from safety improvements to greater market diversiication. We have worked on outstanding projects and our standards of excellence have been recognised across the industry. As we look back at the year, we are grateful for these achievements and proud of our continual progress. SAFETY
Our high SHEQ standards and systematic approach to operator training have led to declines in both frequency and severity rates this year. We had already seen signiicant decreases from 2017 to 2018, and by the end of 2019 , we further reduced our frequency rate by 21% (1,92) and our severity rate by 36% (0,07) as compared to 2018.
Sarens was also the irst company within the global crane and heavy transport sector to obtain a Group Certiicate for our Integrated Management System (IMS), in compliance with ISO and OHSAS standards. his includes ISO 9001:2015 for Quality, ISO 14001:2015 for Environment and OHSAS 18001:2007 for Occupational Health and Safety Assessment Series. As a result, all business units worldwide are now included in one certiicate. his achievement sends a clear message to clients that Sarens is committed to these standards everywhere in the world.
his was also the year that we began implementing the ISA system, a digital platform for registering and following up on all observations, unsafe situations or conditions, near misses, and incidents. We also use the system for toolboxes, weekly crane inspection reports, and workplace inspections. his has been a vital step in improving and solidifying our SHEQ management.
On an environmental level, we reviewed the use of dangerous products
for our equipment and in our workshops, replacing them with environmentally-friendly alternatives. We also invested in green energy, installing solar panels at our headquarters in November. his investment now fully supplies our headquarters and workshops with green energy, making us self-suicient.
Last but not least, our SharePoint intranet system, developed in 2017, is now completely operational across all business units. his has standardised our procedures, instructions, and working documents so that our quality system is uniform across the board.
MARKETS
In response to market conditions, we have focused on diversifying our portfolio and growing our rental business. his has resulted in a steady top line of €663.6 million, yielding a modest growth of 11.9% over €593.1 million in 2018. We have also improved EBITDA, which was €165.8 million in 2019 versus €127.2 million in 2018. his focus on diversiication and on our rental business have yielded valuable results.
Diversificationhe project market remained largely
unchanged in 2019, primarily due to continued postponements in the oil and gas and metals and mining sectors. As such, our set course remains unchanged for 2020. To ensure our long-term business prospects and to grow by design, we have increased our presence in the wind industry across Eastern & Northern Europe, Asia, and North America, installing over 500 wind turbines globally. We have also reinforced regional leadership in rental markets across North America, Asia, and the Middle East, establishing an operational network and leet deployment to win large long-term rental contracts.
RentalIn 2019, rentals accounted for over 60%
of our global business. Responding to market demand, we have moved assets towards growth areas in North America, scaling
IT HAS BEEN A PLEASURE TO LOOK BACK ON A YEAR OF PROGRESS ON SO MANY FRONTS.
9 |
GO TO THE INDEX
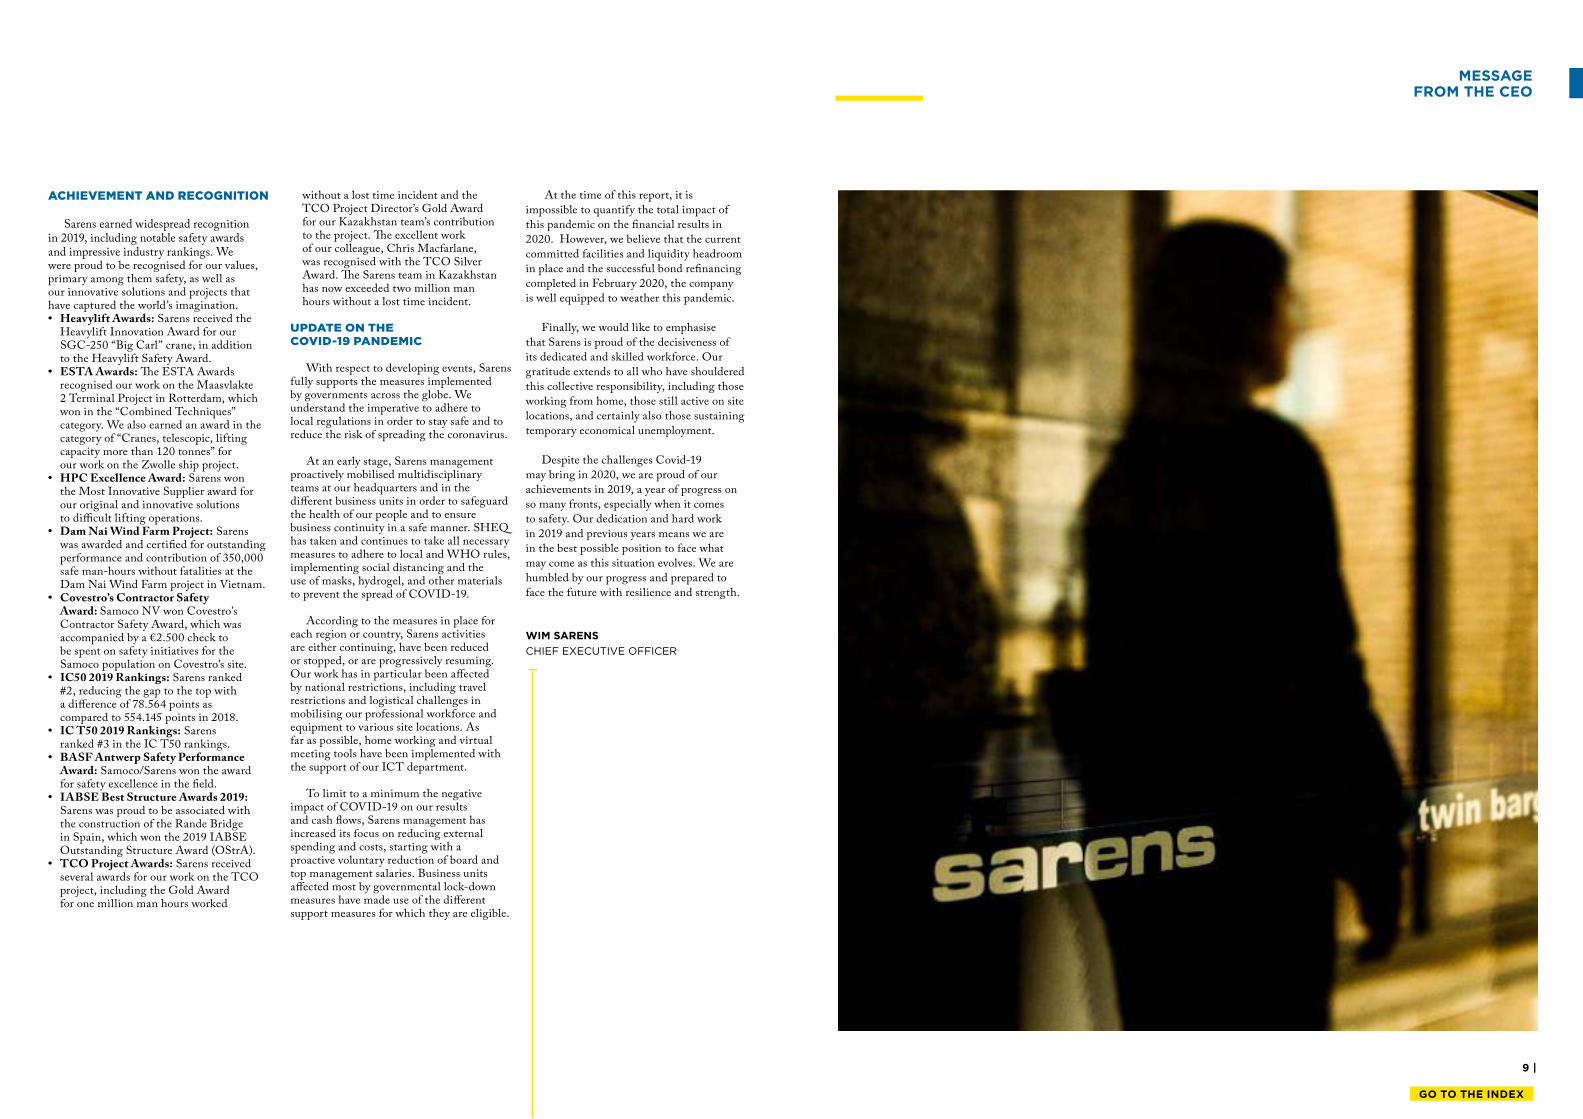
MESSAGE FROM THE CEO
WIM SARENS
CHIEF EXECUTIVE OFFICER
ACHIEVEMENT AND RECOGNITION
Sarens earned widespread recognition in 2019, including notable safety awards and impressive industry rankings. We were proud to be recognised for our values, primary among them safety, as well as our innovative solutions and projects that have captured the world’s imagination.• Heavylift Awards: Sarens received the
Heavylift Innovation Award for our SGC-250 “Big Carl” crane, in addition to the Heavylift Safety Award.
• ESTA Awards: he ESTA Awards recognised our work on the Maasvlakte 2 Terminal Project in Rotterdam, which won in the “Combined Techniques” category. We also earned an award in the category of “Cranes, telescopic, lifting capacity more than 120 tonnes” for our work on the Zwolle ship project.
• HPC Excellence Award: Sarens won the Most Innovative Supplier award for our original and innovative solutions to diicult lifting operations.
• Dam Nai Wind Farm Project: Sarens was awarded and certiied for outstanding performance and contribution of 350,000 safe man-hours without fatalities at the Dam Nai Wind Farm project in Vietnam.
• Covestro’s Contractor Safety Award: Samoco NV won Covestro’s Contractor Safety Award, which was accompanied by a €2.500 check to be spent on safety initiatives for the Samoco population on Covestro’s site.
• IC50 2019 Rankings: Sarens ranked #2, reducing the gap to the top with a diference of 78.564 points as compared to 554.145 points in 2018.
• IC T50 2019 Rankings: Sarens ranked #3 in the IC T50 rankings.
• BASF Antwerp Safety Performance Award: Samoco/Sarens won the award for safety excellence in the ield.
• IABSE Best Structure Awards 2019: Sarens was proud to be associated with the construction of the Rande Bridge in Spain, which won the 2019 IABSE Outstanding Structure Award (OStrA).
• TCO Project Awards: Sarens received several awards for our work on the TCO project, including the Gold Award for one million man hours worked
without a lost time incident and the TCO Project Director’s Gold Award for our Kazakhstan team’s contribution to the project. he excellent work of our colleague, Chris Macfarlane, was recognised with the TCO Silver Award. he Sarens team in Kazakhstan has now exceeded two million man hours without a lost time incident.
UPDATE ON THE COVID-19 PANDEMIC
With respect to developing events, Sarens fully supports the measures implemented by governments across the globe. We understand the imperative to adhere to local regulations in order to stay safe and to reduce the risk of spreading the coronavirus.
At an early stage, Sarens management
proactively mobilised multidisciplinary teams at our headquarters and in the diferent business units in order to safeguard the health of our people and to ensure business continuity in a safe manner. SHEQ has taken and continues to take all necessary measures to adhere to local and WHO rules, implementing social distancing and the use of masks, hydrogel, and other materials to prevent the spread of COVID-19.
According to the measures in place for
each region or country, Sarens activities are either continuing, have been reduced or stopped, or are progressively resuming. Our work has in particular been afected by national restrictions, including travel restrictions and logistical challenges in mobilising our professional workforce and equipment to various site locations. As far as possible, home working and virtual meeting tools have been implemented with the support of our ICT department.
To limit to a minimum the negative
impact of COVID-19 on our results and cash lows, Sarens management has increased its focus on reducing external spending and costs, starting with a proactive voluntary reduction of board and top management salaries. Business units afected most by governmental lock-down measures have made use of the diferent support measures for which they are eligible.
At the time of this report, it is
impossible to quantify the total impact of
this pandemic on the inancial results in
2020. However, we believe that the current
committed facilities and liquidity headroom
in place and the successful bond reinancing
completed in February 2020, the company
is well equipped to weather this pandemic.
Finally, we would like to emphasise
that Sarens is proud of the decisiveness of
its dedicated and skilled workforce. Our
gratitude extends to all who have shouldered
this collective responsibility, including those
working from home, those still active on site
locations, and certainly also those sustaining
temporary economical unemployment.
Despite the challenges Covid-19
may bring in 2020, we are proud of our
achievements in 2019, a year of progress on
so many fronts, especially when it comes
to safety. Our dedication and hard work
in 2019 and previous years means we are
in the best possible position to face what
may come as this situation evolves. We are
humbled by our progress and prepared to
face the future with resilience and strength.
11 |
GO TO THE INDEX
| 10
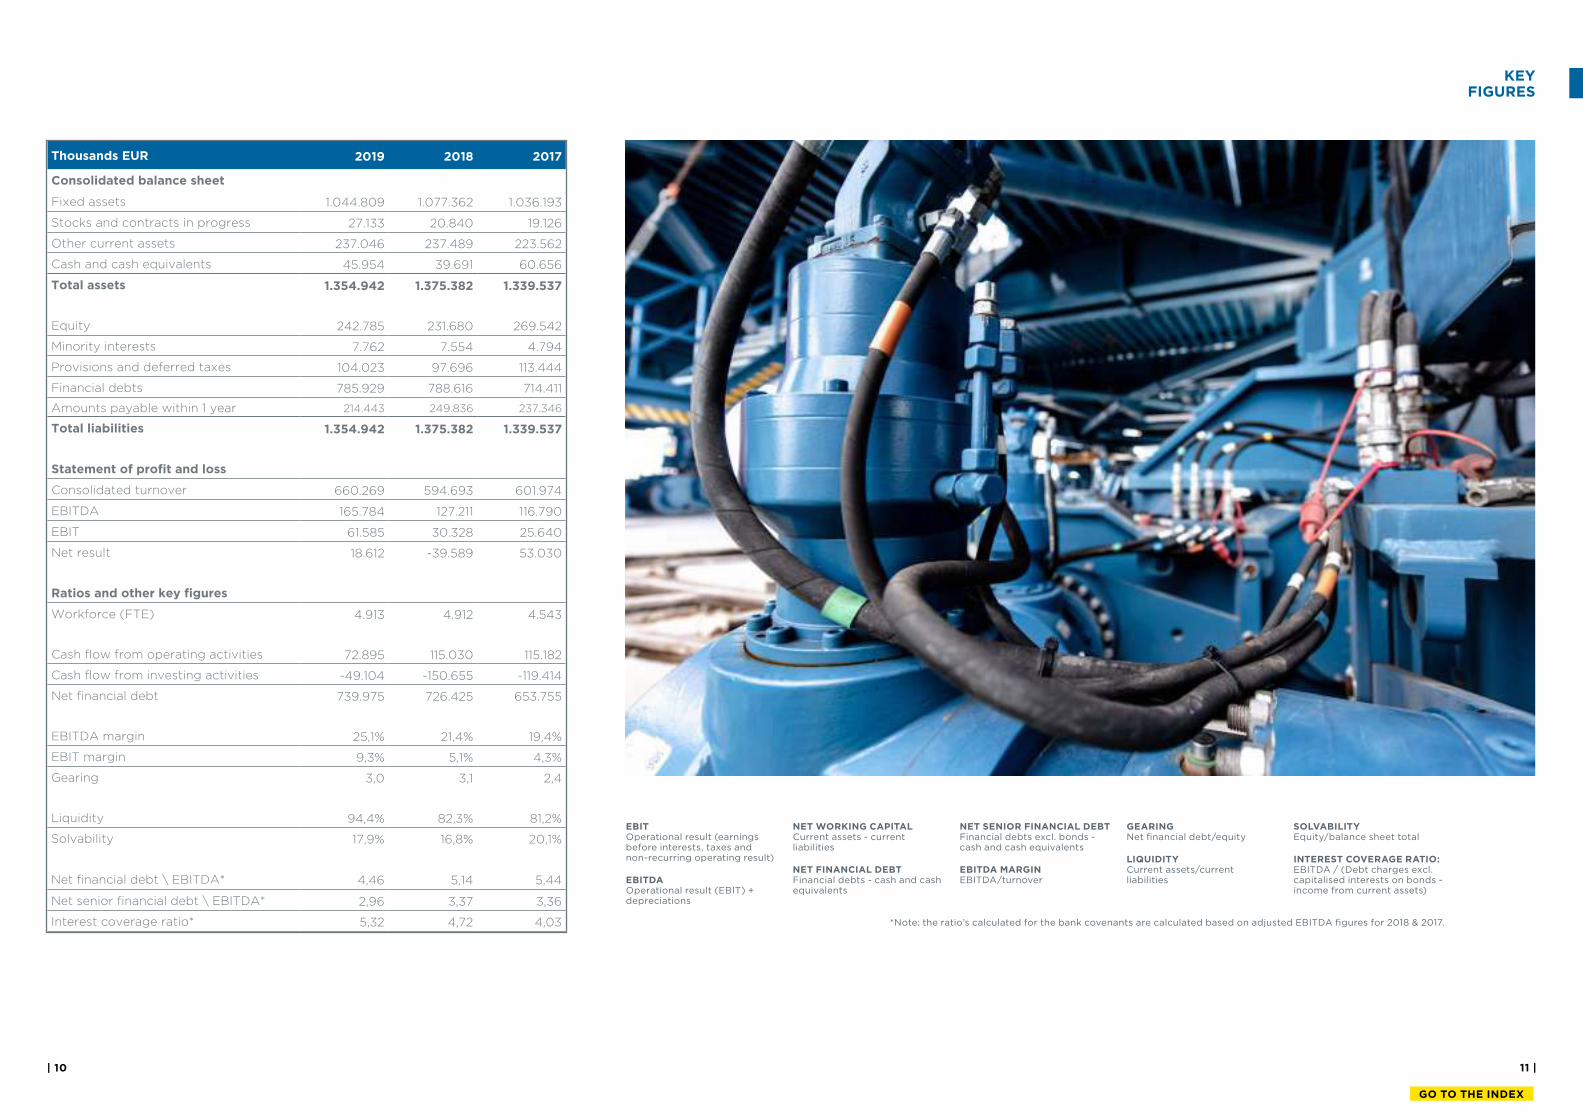
Thousands EUR 2019 2018 2017
Consolidated balance sheet
Fixed assets 1.044.809 1.077.362 1.036.193
Stocks and contracts in progress 27.133 20.840 19.126
Other current assets 237.046 237.489 223.562
Cash and cash equivalents 45.954 39.691 60.656
Total assets 1.354.942 1.375.382 1.339.537
Equity 242.785 231.680 269.542
Minority interests 7.762 7.554 4.794
Provisions and deferred taxes 104.023 97.696 113.444
Financial debts 785.929 788.616 714.411
Amounts payable within 1 year 214.443 249.836 237.346
Total liabilities 1.354.942 1.375.382 1.339.537
Statement of proit and loss
Consolidated turnover 660.269 594.693 601.974
EBITDA 165.784 127.211 116.790
EBIT 61.585 30.328 25.640
Net result 18.612 -39.589 53.030
Ratios and other key igures
Workforce (FTE) 4.913 4.912 4.543
Cash low from operating activities 72.895 115.030 115.182
Cash low from investing activities -49.104 -150.655 -119.414
Net inancial debt 739.975 726.425 653.755
EBITDA margin 25,1% 21,4% 19,4%
EBIT margin 9,3% 5,1% 4,3%
Gearing 3,0 3,1 2,4
Liquidity 94,4% 82,3% 81,2%
Solvability 17,9% 16,8% 20,1%
Net inancial debt \ EBITDA* 4,46 5,14 5,44
Net senior inancial debt \ EBITDA* 2,96 3,37 3,36
Interest coverage ratio* 5,32 4,72 4,03
KEY FIGURES
EBIT Operational result (earnings before interests, taxes and non-recurring operating result)
EBITDA Operational result (EBIT) + depreciations
NET WORKING CAPITAL Current assets - current liabilities
NET FINANCIAL DEBT Financial debts - cash and cash equivalents
NET SENIOR FINANCIAL DEBT Financial debts excl. bonds - cash and cash equivalents
EBITDA MARGIN EBITDA/turnover
GEARING Net financial debt/equity
LIQUIDITY Current assets/current liabilities
SOLVABILITY Equity/balance sheet total
INTEREST COVERAGE RATIO: EBITDA / (Debt charges excl. capitalised interests on bonds - income from current assets)
*Note: the ratio’s calculated for the bank covenants are calculated based on adjusted EBITDA figures for 2018 & 2017.
13 |
GO TO THE INDEX
| 12
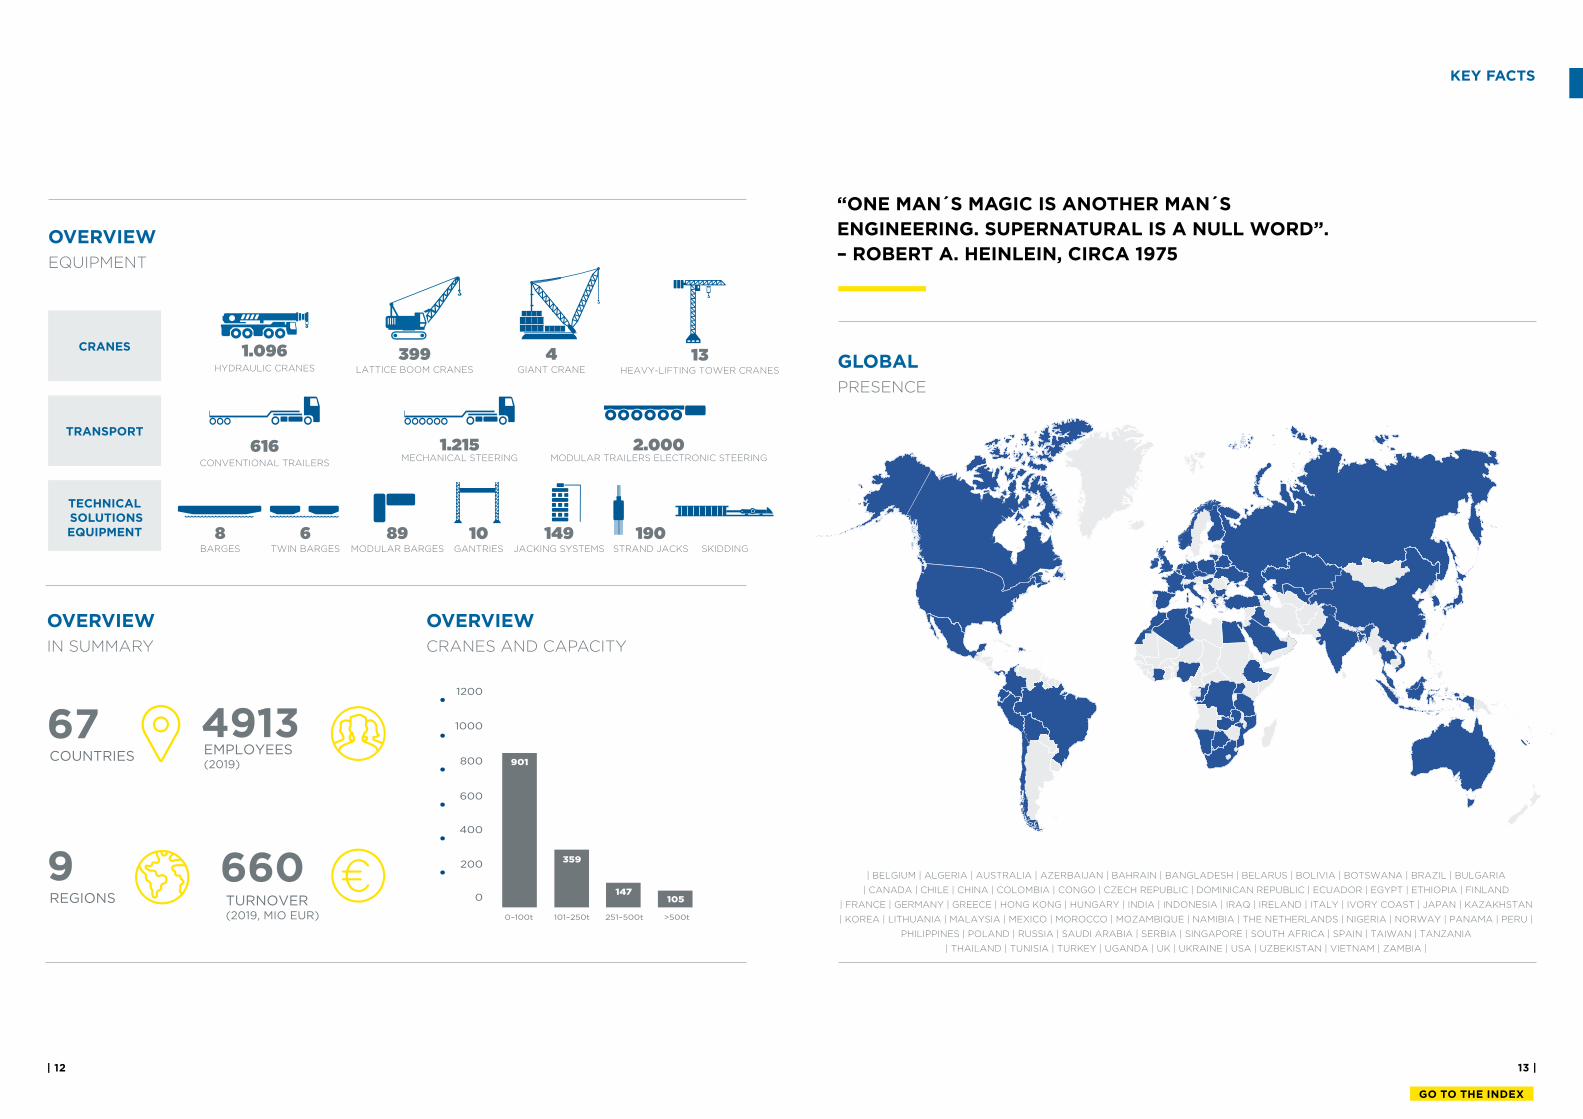
EMPLOYEES(2019)
491367COUNTRIES
9REGIONS
660TURNOVER(2019, MIO EUR)
1200
1000
800
600
400
200
0
0–100t 101–250t 251–500t >500t
901
359
147105
616CONVENTIONAL TRAILERS
8BARGES
6TWIN BARGES
89MODULAR BARGES SKIDDING
399LATTICE BOOM CRANES
4GIANT CRANE
1.215 MECHANICAL STEERING
13HEAVY-LIFTING TOWER CRANES
2.000 MODULAR TRAILERS ELECTRONIC STEERING
EQUIPMENT
CRANES
TRANSPORT
TECHNICAL SOLUTIONS EQUIPMENT
1.096HYDRAULIC CRANES
OVERVIEW
OVERVIEWOVERVIEW
EQUIPMENT
CRANES AND CAPACITYIN SUMMARY
10GANTRIES
149JACKING SYSTEMS
190STRAND JACKS
KEY FACTS
“ONE MAN´S MAGIC IS ANOTHER MAN´S
ENGINEERING. SUPERNATURAL IS A NULL WORD”.
– ROBERT A. HEINLEIN, CIRCA 1975
GLOBAL
PRESENCE
| BELGIUM | ALGERIA | AUSTRALIA | AZERBAIJAN | BAHRAIN | BANGLADESH | BELARUS | BOLIVIA | BOTSWANA | BRAZIL | BULGARIA
| CANADA | CHILE | CHINA | COLOMBIA | CONGO | CZECH REPUBLIC | DOMINICAN REPUBLIC | ECUADOR | EGYPT | ETHIOPIA | FINLAND
| FRANCE | GERMANY | GREECE | HONG KONG | HUNGARY | INDIA | INDONESIA | IRAQ | IRELAND | ITALY | IVORY COAST | JAPAN | KAZAKHSTAN
| KOREA | LITHUANIA | MALAYSIA | MEXICO | MOROCCO | MOZAMBIQUE | NAMIBIA | THE NETHERLANDS | NIGERIA | NORWAY | PANAMA | PERU |
PHILIPPINES | POLAND | RUSSIA | SAUDI ARABIA | SERBIA | SINGAPORE | SOUTH AFRICA | SPAIN | TAIWAN | TANZANIA
| THAILAND | TUNISIA | TURKEY | UGANDA | UK | UKRAINE | USA | UZBEKISTAN | VIETNAM | ZAMBIA |
15 |
GO TO THE INDEX
| 14
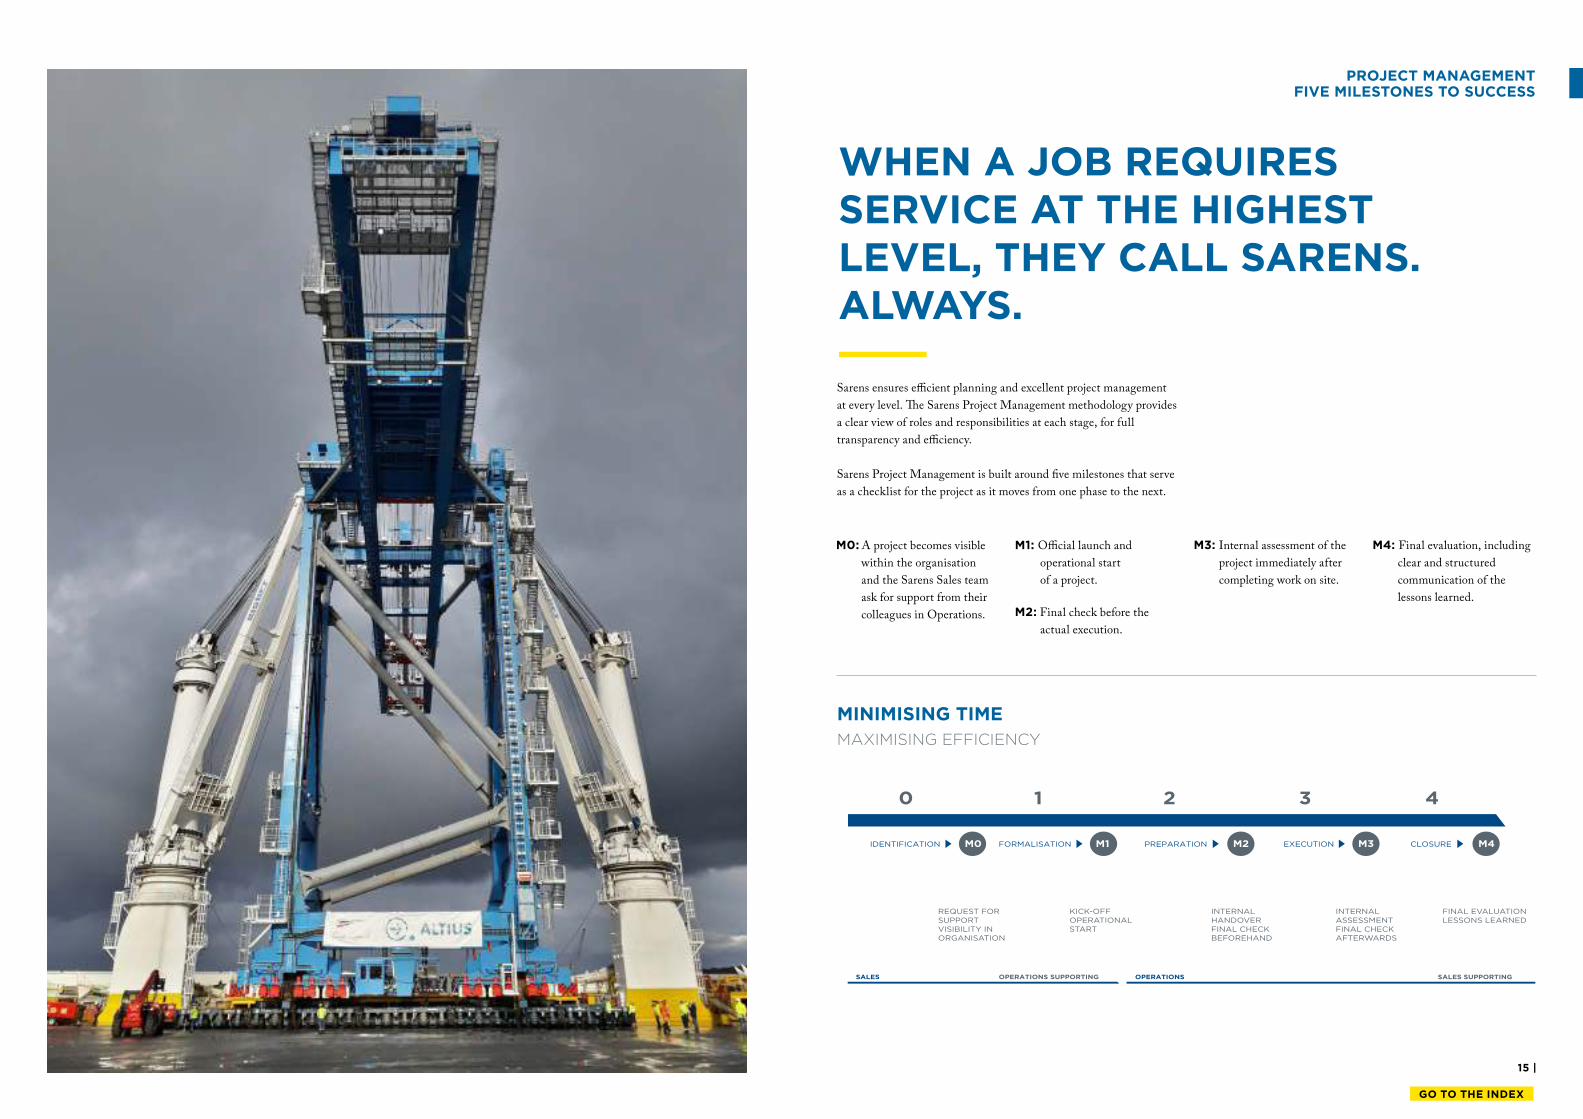
PROJECT MANAGEMENT FIVE MILESTONES TO SUCCESS
Sarens ensures eicient planning and excellent project management
at every level. he Sarens Project Management methodology provides
a clear view of roles and responsibilities at each stage, for full
transparency and eiciency.
Sarens Project Management is built around ive milestones that serve
as a checklist for the project as it moves from one phase to the next.
WHEN A JOB REQUIRES SERVICE AT THE HIGHEST LEVEL, THEY CALL SARENS. ALWAYS.
CLOSUREEXECUTIONPREPARATIONFORMALISATION
SALES OPERATIONS SUPPORTING OPERATIONS SALES SUPPORTING
M0 M1 M2 M3 M4IDENTIFICATION
0 1 2 3 4
INTERNAL HANDOVERFINAL CHECK BEFOREHAND
FINAL EVALUATIONLESSONS LEARNED
INTERNAL ASSESSMENTFINAL CHECK AFTERWARDS
KICK-OFFOPERATIONAL START
REQUEST FOR SUPPORTVISIBILITY IN ORGANISATION
MINIMISING TIME
MAXIMISING EFFICIENCY
M0: A project becomes visible
within the organisation
and the Sarens Sales team
ask for support from their
colleagues in Operations.
M1: Oicial launch and
operational start
of a project.
M2: Final check before the
actual execution.
M3: Internal assessment of the
project immediately after
completing work on site.
M4: Final evaluation, including
clear and structured
communication of the
lessons learned.
17 |
GO TO THE INDEX
| 16
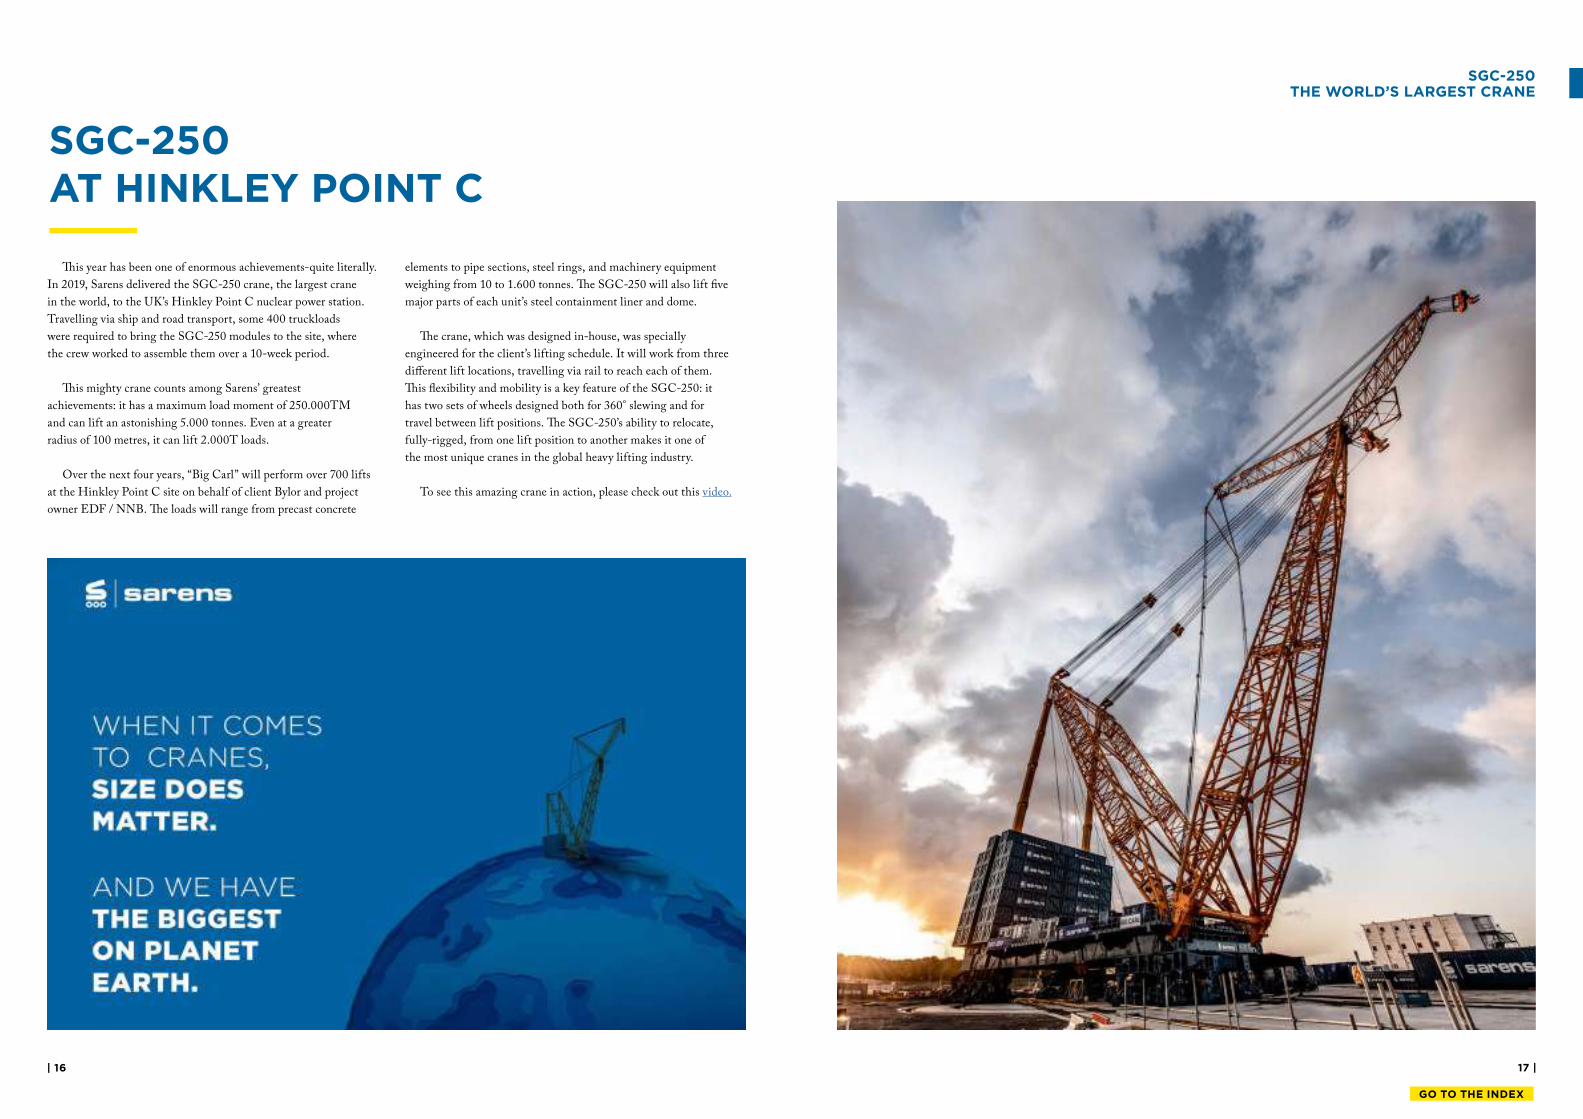
SGC-250 AT HINKLEY POINT C
SGC-250THE WORLD’S LARGEST CRANE
his year has been one of enormous achievements-quite literally.
In 2019, Sarens delivered the SGC-250 crane, the largest crane
in the world, to the UK’s Hinkley Point C nuclear power station.
Travelling via ship and road transport, some 400 truckloads
were required to bring the SGC-250 modules to the site, where
the crew worked to assemble them over a 10-week period.
his mighty crane counts among Sarens’ greatest
achievements: it has a maximum load moment of 250.000TM
and can lift an astonishing 5.000 tonnes. Even at a greater
radius of 100 metres, it can lift 2.000T loads.
Over the next four years, “Big Carl” will perform over 700 lifts
at the Hinkley Point C site on behalf of client Bylor and project
owner EDF / NNB. he loads will range from precast concrete
elements to pipe sections, steel rings, and machinery equipment
weighing from 10 to 1.600 tonnes. he SGC-250 will also lift ive
major parts of each unit’s steel containment liner and dome.
he crane, which was designed in-house, was specially
engineered for the client’s lifting schedule. It will work from three
diferent lift locations, travelling via rail to reach each of them.
his lexibility and mobility is a key feature of the SGC-250: it
has two sets of wheels designed both for 360° slewing and for
travel between lift positions. he SGC-250’s ability to relocate,
fully-rigged, from one lift position to another makes it one of
the most unique cranes in the global heavy lifting industry.
To see this amazing crane in action, please check out this video.
19 |
GO TO THE INDEX
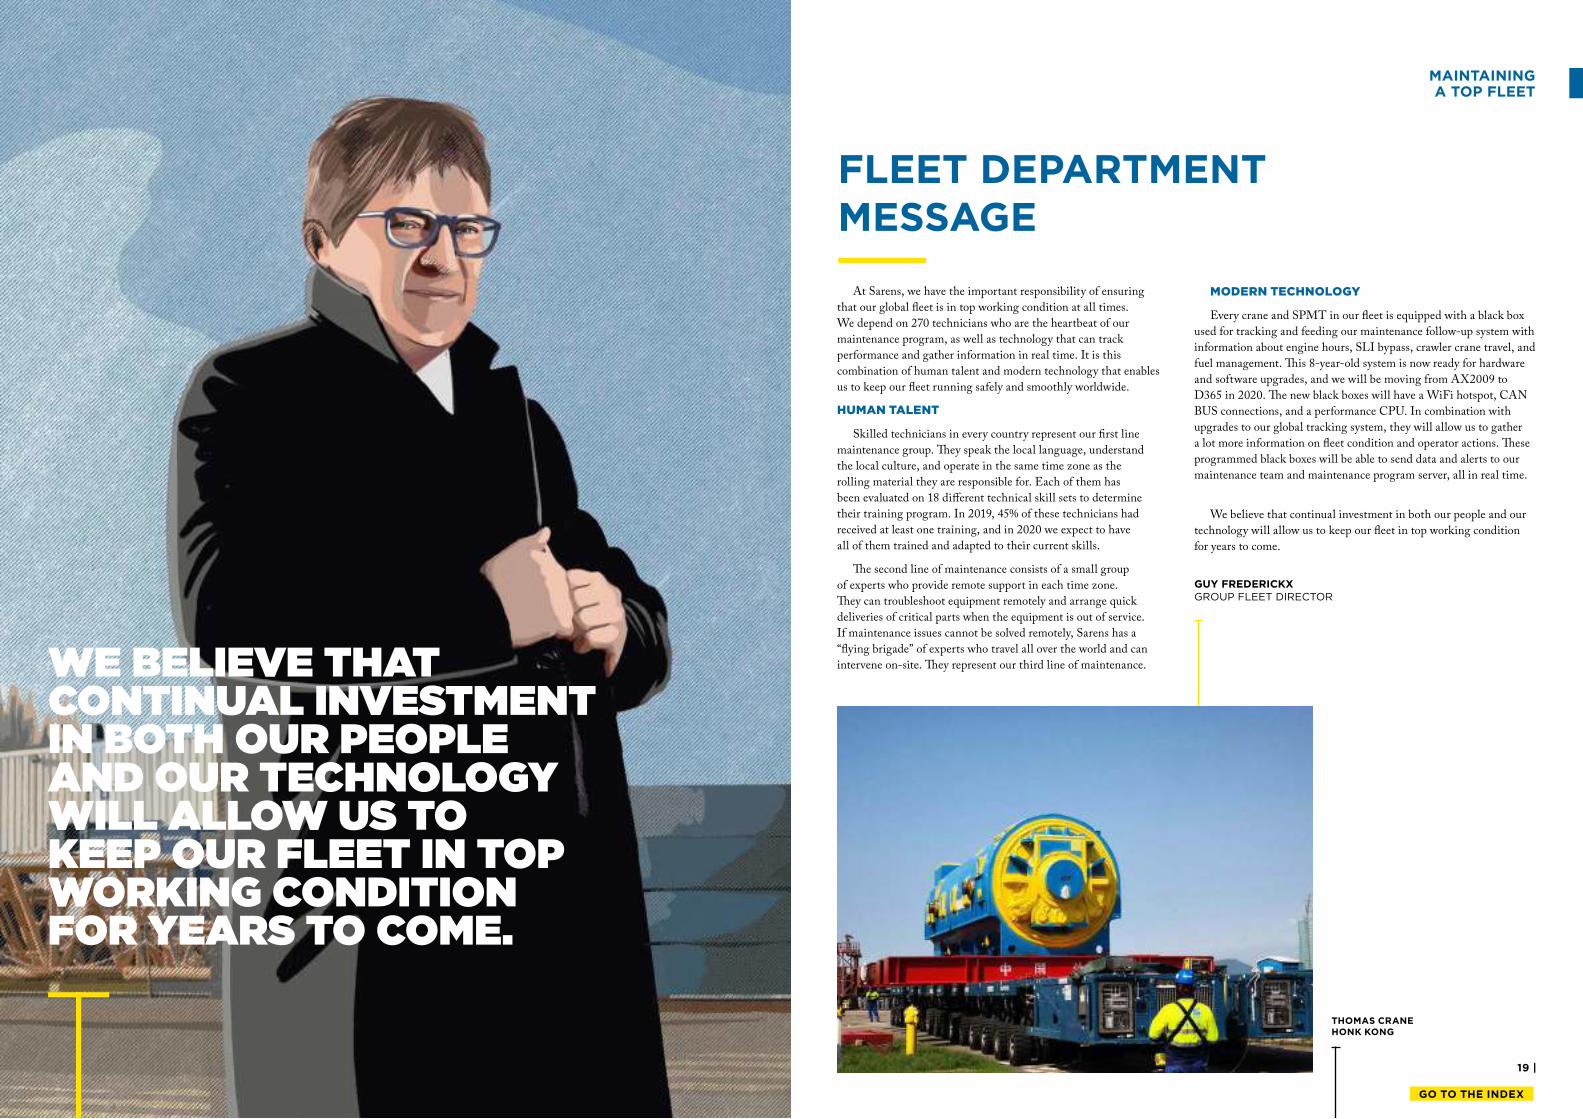
WE BELIEVE THAT CONTINUAL INVESTMENT IN BOTH OUR PEOPLE AND OUR TECHNOLOGY WILL ALLOW US TO KEEP OUR FLEET IN TOP WORKING CONDITION FOR YEARS TO COME.
MAINTAINING A TOP FLEET
At Sarens, we have the important responsibility of ensuring
that our global leet is in top working condition at all times.
We depend on 270 technicians who are the heartbeat of our
maintenance program, as well as technology that can track
performance and gather information in real time. It is this
combination of human talent and modern technology that enables
us to keep our leet running safely and smoothly worldwide.
HUMAN TALENT
Skilled technicians in every country represent our irst line
maintenance group. hey speak the local language, understand
the local culture, and operate in the same time zone as the
rolling material they are responsible for. Each of them has
been evaluated on 18 diferent technical skill sets to determine
their training program. In 2019, 45% of these technicians had
received at least one training, and in 2020 we expect to have
all of them trained and adapted to their current skills.
he second line of maintenance consists of a small group
of experts who provide remote support in each time zone.
hey can troubleshoot equipment remotely and arrange quick
deliveries of critical parts when the equipment is out of service.
If maintenance issues cannot be solved remotely, Sarens has a
“lying brigade” of experts who travel all over the world and can
intervene on-site. hey represent our third line of maintenance.
MODERN TECHNOLOGY
Every crane and SPMT in our leet is equipped with a black box
used for tracking and feeding our maintenance follow-up system with
information about engine hours, SLI bypass, crawler crane travel, and
fuel management. his 8-year-old system is now ready for hardware
and software upgrades, and we will be moving from AX2009 to
D365 in 2020. he new black boxes will have a WiFi hotspot, CAN
BUS connections, and a performance CPU. In combination with
upgrades to our global tracking system, they will allow us to gather
a lot more information on leet condition and operator actions. hese
programmed black boxes will be able to send data and alerts to our
maintenance team and maintenance program server, all in real time.
We believe that continual investment in both our people and our
technology will allow us to keep our leet in top working condition
for years to come.
GUY FREDERICKXGROUP FLEET DIRECTOR
THOMAS CRANE HONK KONG
FLEET DEPARTMENT MESSAGE
21 |
GO TO THE INDEX
| 20
OUR MARKETS
23 |
GO TO THE INDEX
| 22
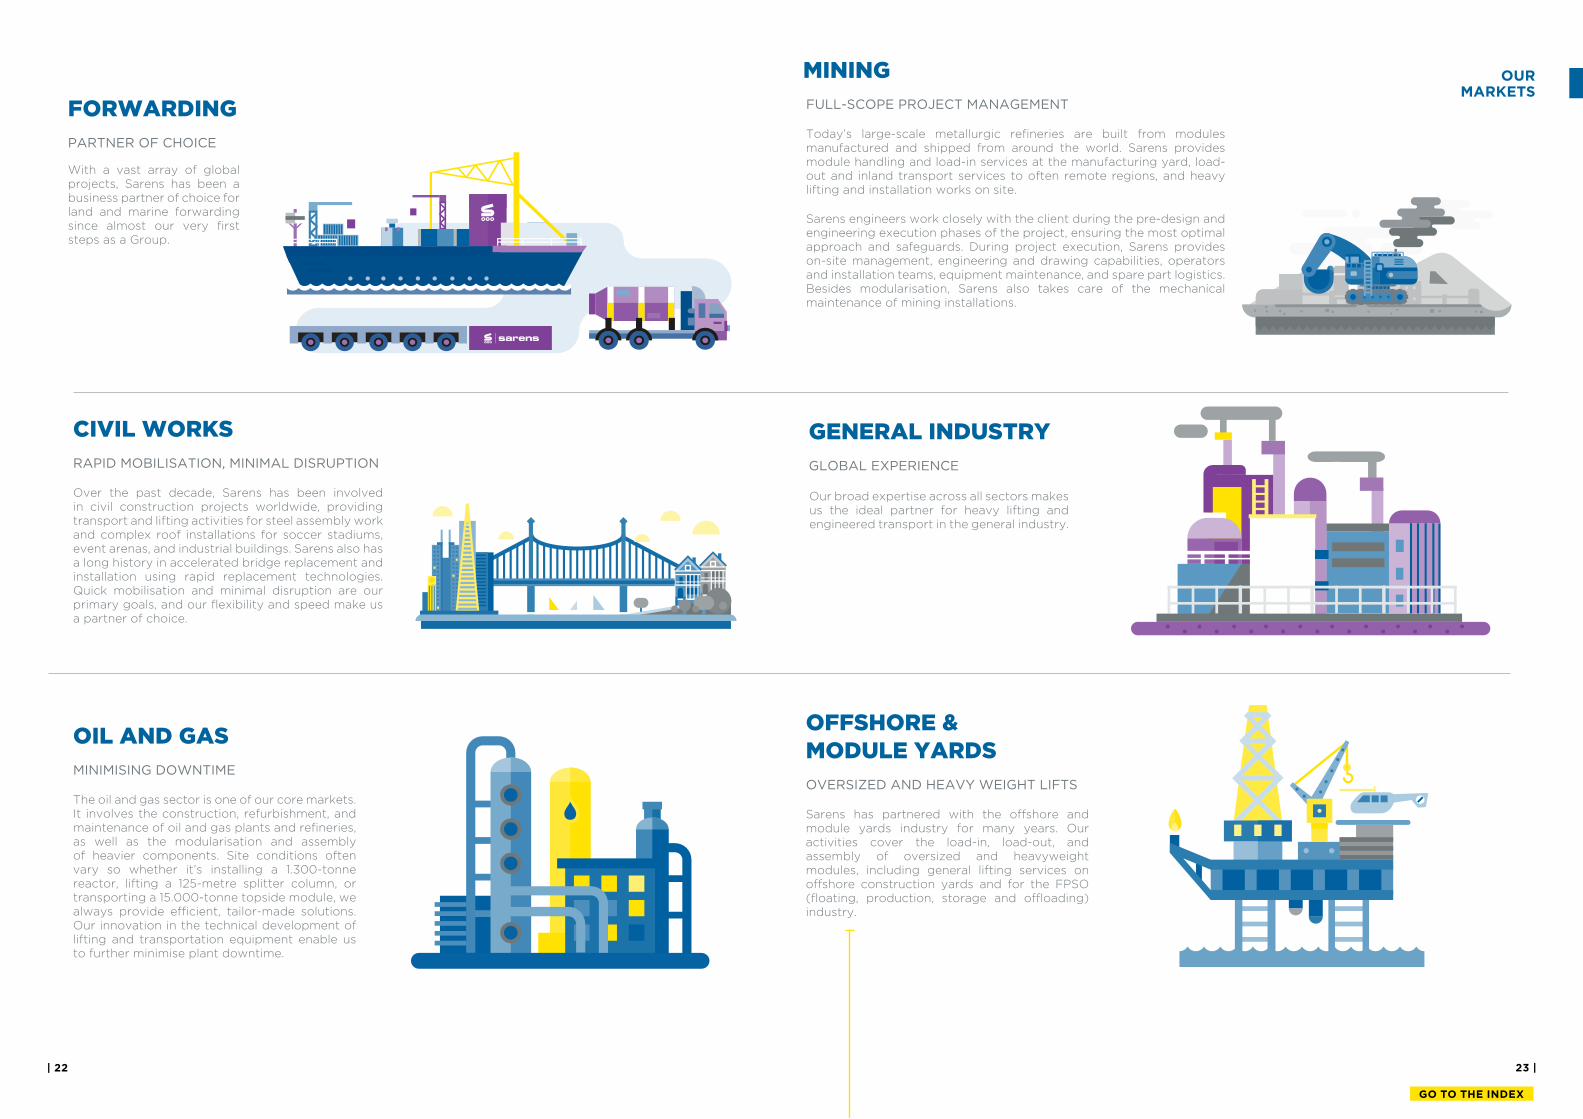
OIL AND GAS
MINIMISING DOWNTIME
The oil and gas sector is one of our core markets. It involves the construction, refurbishment, and maintenance of oil and gas plants and reineries, as well as the modularisation and assembly of heavier components. Site conditions often vary so whether it’s installing a 1.300-tonne reactor, lifting a 125-metre splitter column, or transporting a 15.000-tonne topside module, we always provide eicient, tailor-made solutions. Our innovation in the technical development of lifting and transportation equipment enable us to further minimise plant downtime.
CIVIL WORKS
RAPID MOBILISATION, MINIMAL DISRUPTION
Over the past decade, Sarens has been involved in civil construction projects worldwide, providing transport and lifting activities for steel assembly work and complex roof installations for soccer stadiums, event arenas, and industrial buildings. Sarens also has a long history in accelerated bridge replacement and installation using rapid replacement technologies. Quick mobilisation and minimal disruption are our primary goals, and our lexibility and speed make us a partner of choice.
With a vast array of global projects, Sarens has been a business partner of choice for land and marine forwarding since almost our very irst steps as a Group.
FORWARDING
PARTNER OF CHOICE
OFFSHORE & MODULE YARDS
OVERSIZED AND HEAVY WEIGHT LIFTS
Sarens has partnered with the ofshore and module yards industry for many years. Our activities cover the load-in, load-out, and assembly of oversized and heavyweight modules, including general lifting services on ofshore construction yards and for the FPSO (loating, production, storage and oloading) industry.
FULL-SCOPE PROJECT MANAGEMENT
Today’s large-scale metallurgic reineries are built from modules manufactured and shipped from around the world. Sarens provides module handling and load-in services at the manufacturing yard, load-out and inland transport services to often remote regions, and heavy lifting and installation works on site.
Sarens engineers work closely with the client during the pre-design and engineering execution phases of the project, ensuring the most optimal approach and safeguards. During project execution, Sarens provides on-site management, engineering and drawing capabilities, operators and installation teams, equipment maintenance, and spare part logistics. Besides modularisation, Sarens also takes care of the mechanical maintenance of mining installations.
Our broad expertise across all sectors makes us the ideal partner for heavy lifting and engineered transport in the general industry.
MINING OURMARKETS
GENERAL INDUSTRY
GLOBAL EXPERIENCE
25 |
GO TO THE INDEX
| 24
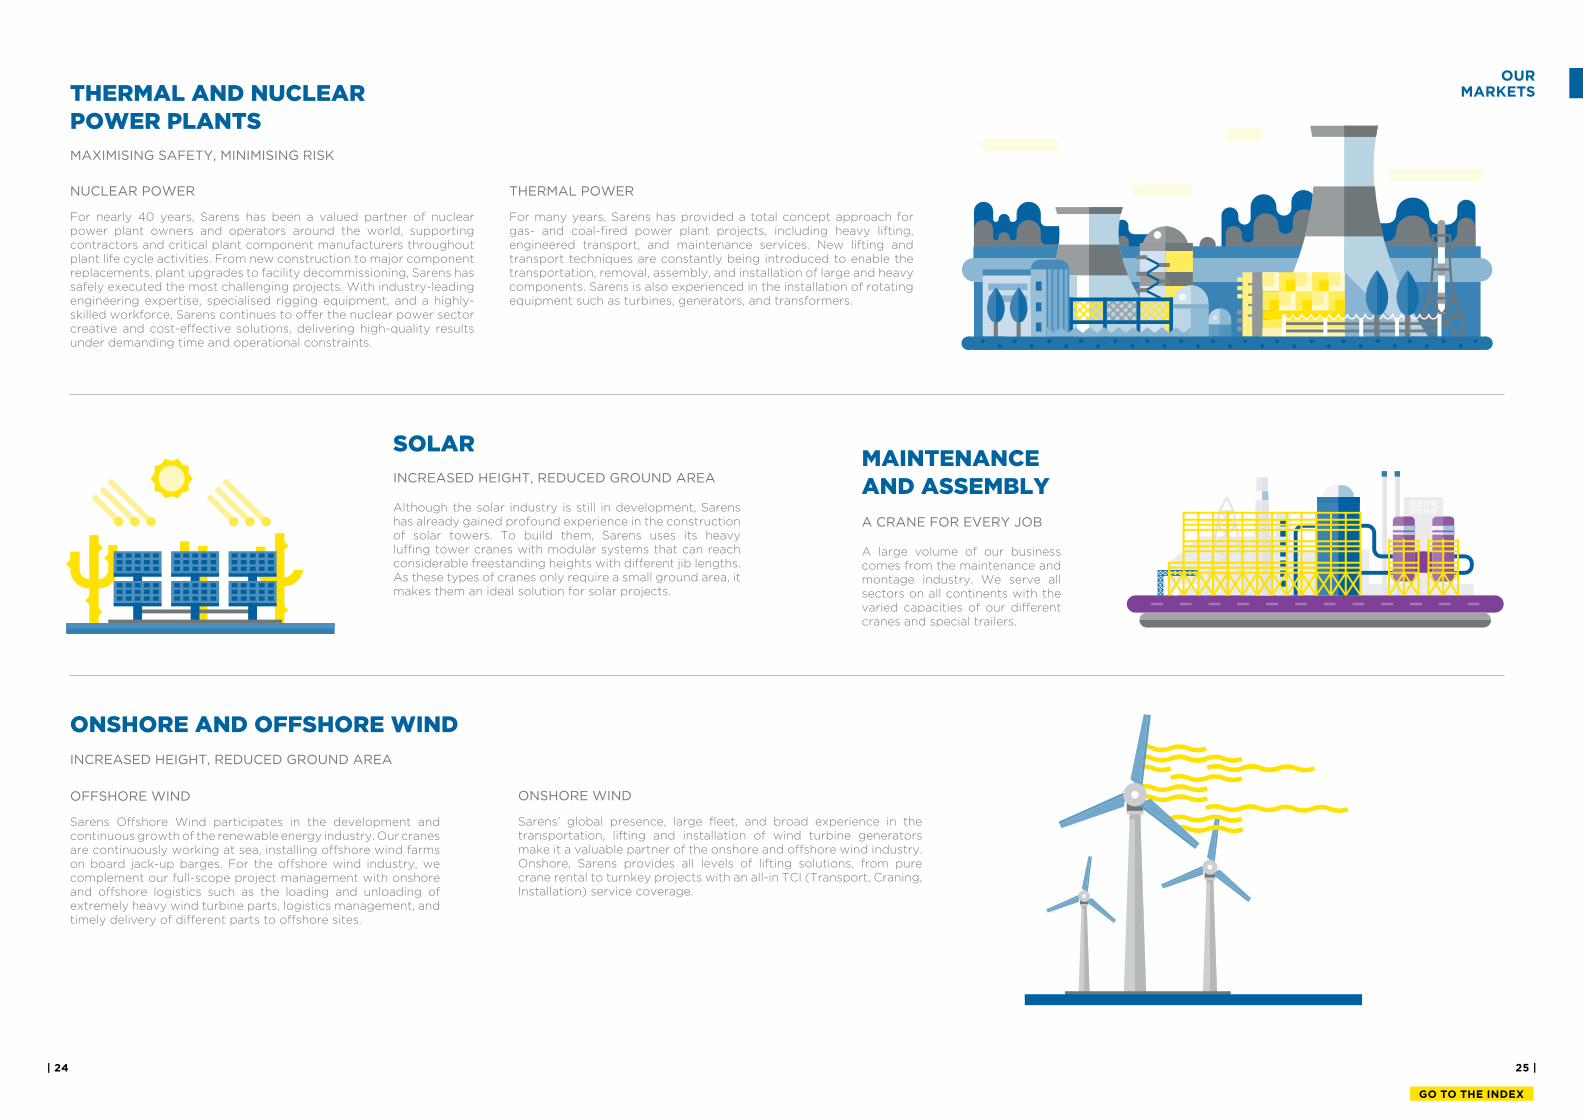
NUCLEAR POWER
For nearly 40 years, Sarens has been a valued partner of nuclear power plant owners and operators around the world, supporting contractors and critical plant component manufacturers throughout plant life cycle activities. From new construction to major component replacements, plant upgrades to facility decommissioning, Sarens has safely executed the most challenging projects. With industry-leading engineering expertise, specialised rigging equipment, and a highly-skilled workforce, Sarens continues to ofer the nuclear power sector creative and cost-efective solutions, delivering high-quality results under demanding time and operational constraints.
ONSHORE WIND
Sarens’ global presence, large leet, and broad experience in the transportation, lifting and installation of wind turbine generators make it a valuable partner of the onshore and ofshore wind industry. Onshore, Sarens provides all levels of lifting solutions, from pure crane rental to turnkey projects with an all-in TCI (Transport, Craning, Installation) service coverage.
THERMAL POWER
For many years, Sarens has provided a total concept approach for gas- and coal-ired power plant projects, including heavy lifting, engineered transport, and maintenance services. New lifting and transport techniques are constantly being introduced to enable the transportation, removal, assembly, and installation of large and heavy components. Sarens is also experienced in the installation of rotating equipment such as turbines, generators, and transformers.
OFFSHORE WIND
Sarens Ofshore Wind participates in the development and continuous growth of the renewable energy industry. Our cranes are continuously working at sea, installing ofshore wind farms on board jack-up barges. For the ofshore wind industry, we complement our full-scope project management with onshore and ofshore logistics such as the loading and unloading of extremely heavy wind turbine parts, logistics management, and timely delivery of diferent parts to ofshore sites.
SOLAR
INCREASED HEIGHT, REDUCED GROUND AREA
Although the solar industry is still in development, Sarens has already gained profound experience in the construction of solar towers. To build them, Sarens uses its heavy luing tower cranes with modular systems that can reach considerable freestanding heights with diferent jib lengths. As these types of cranes only require a small ground area, it makes them an ideal solution for solar projects.
THERMAL AND NUCLEAR POWER PLANTS
MAXIMISING SAFETY, MINIMISING RISK
ONSHORE AND OFFSHORE WIND
INCREASED HEIGHT, REDUCED GROUND AREA
OURMARKETS
MAINTENANCE AND ASSEMBLY
A CRANE FOR EVERY JOB
A large volume of our business comes from the maintenance and montage industry. We serve all sectors on all continents with the varied capacities of our diferent cranes and special trailers.
27 |
GO TO THE INDEX
| 26
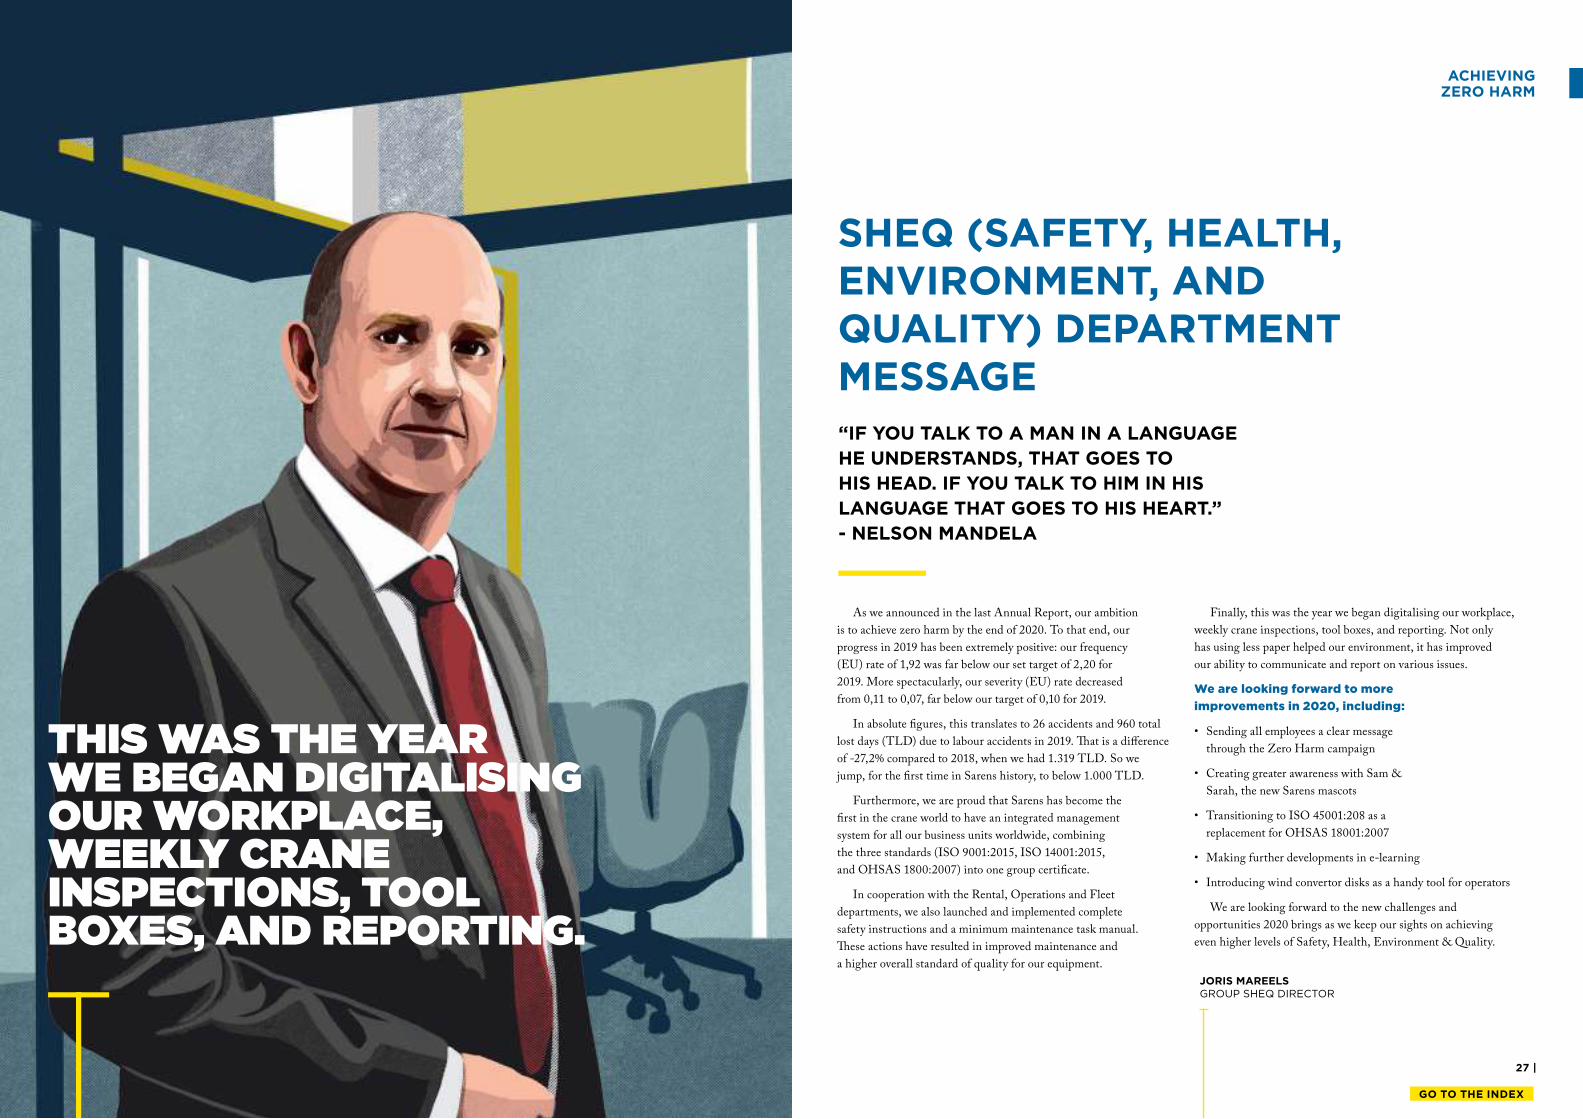
THIS WAS THE YEAR WE BEGAN DIGITALISING OUR WORKPLACE, WEEKLY CRANE INSPECTIONS, TOOL BOXES, AND REPORTING.
ACHIEVING ZERO HARM
As we announced in the last Annual Report, our ambition
is to achieve zero harm by the end of 2020. To that end, our
progress in 2019 has been extremely positive: our frequency
(EU) rate of 1,92 was far below our set target of 2,20 for
2019. More spectacularly, our severity (EU) rate decreased
from 0,11 to 0,07, far below our target of 0,10 for 2019.
In absolute igures, this translates to 26 accidents and 960 total
lost days (TLD) due to labour accidents in 2019. hat is a diference
of -27,2% compared to 2018, when we had 1.319 TLD. So we
jump, for the irst time in Sarens history, to below 1.000 TLD.
Furthermore, we are proud that Sarens has become the
irst in the crane world to have an integrated management
system for all our business units worldwide, combining
the three standards (ISO 9001:2015, ISO 14001:2015,
and OHSAS 1800:2007) into one group certiicate.
In cooperation with the Rental, Operations and Fleet
departments, we also launched and implemented complete
safety instructions and a minimum maintenance task manual.
hese actions have resulted in improved maintenance and
a higher overall standard of quality for our equipment.
Finally, this was the year we began digitalising our workplace,
weekly crane inspections, tool boxes, and reporting. Not only
has using less paper helped our environment, it has improved
our ability to communicate and report on various issues.
We are looking forward to more
improvements in 2020, including:
• Sending all employees a clear message
through the Zero Harm campaign
• Creating greater awareness with Sam &
Sarah, the new Sarens mascots
• Transitioning to ISO 45001:208 as a
replacement for OHSAS 18001:2007
• Making further developments in e-learning
• Introducing wind convertor disks as a handy tool for operators
We are looking forward to the new challenges and
opportunities 2020 brings as we keep our sights on achieving
even higher levels of Safety, Health, Environment & Quality.
“IF YOU TALK TO A MAN IN A LANGUAGE
HE UNDERSTANDS, THAT GOES TO
HIS HEAD. IF YOU TALK TO HIM IN HIS
LANGUAGE THAT GOES TO HIS HEART.”
- NELSON MANDELA
JORIS MAREELSGROUP SHEQ DIRECTOR
SHEQ (SAFETY, HEALTH, ENVIRONMENT, AND QUALITY) DEPARTMENT MESSAGE
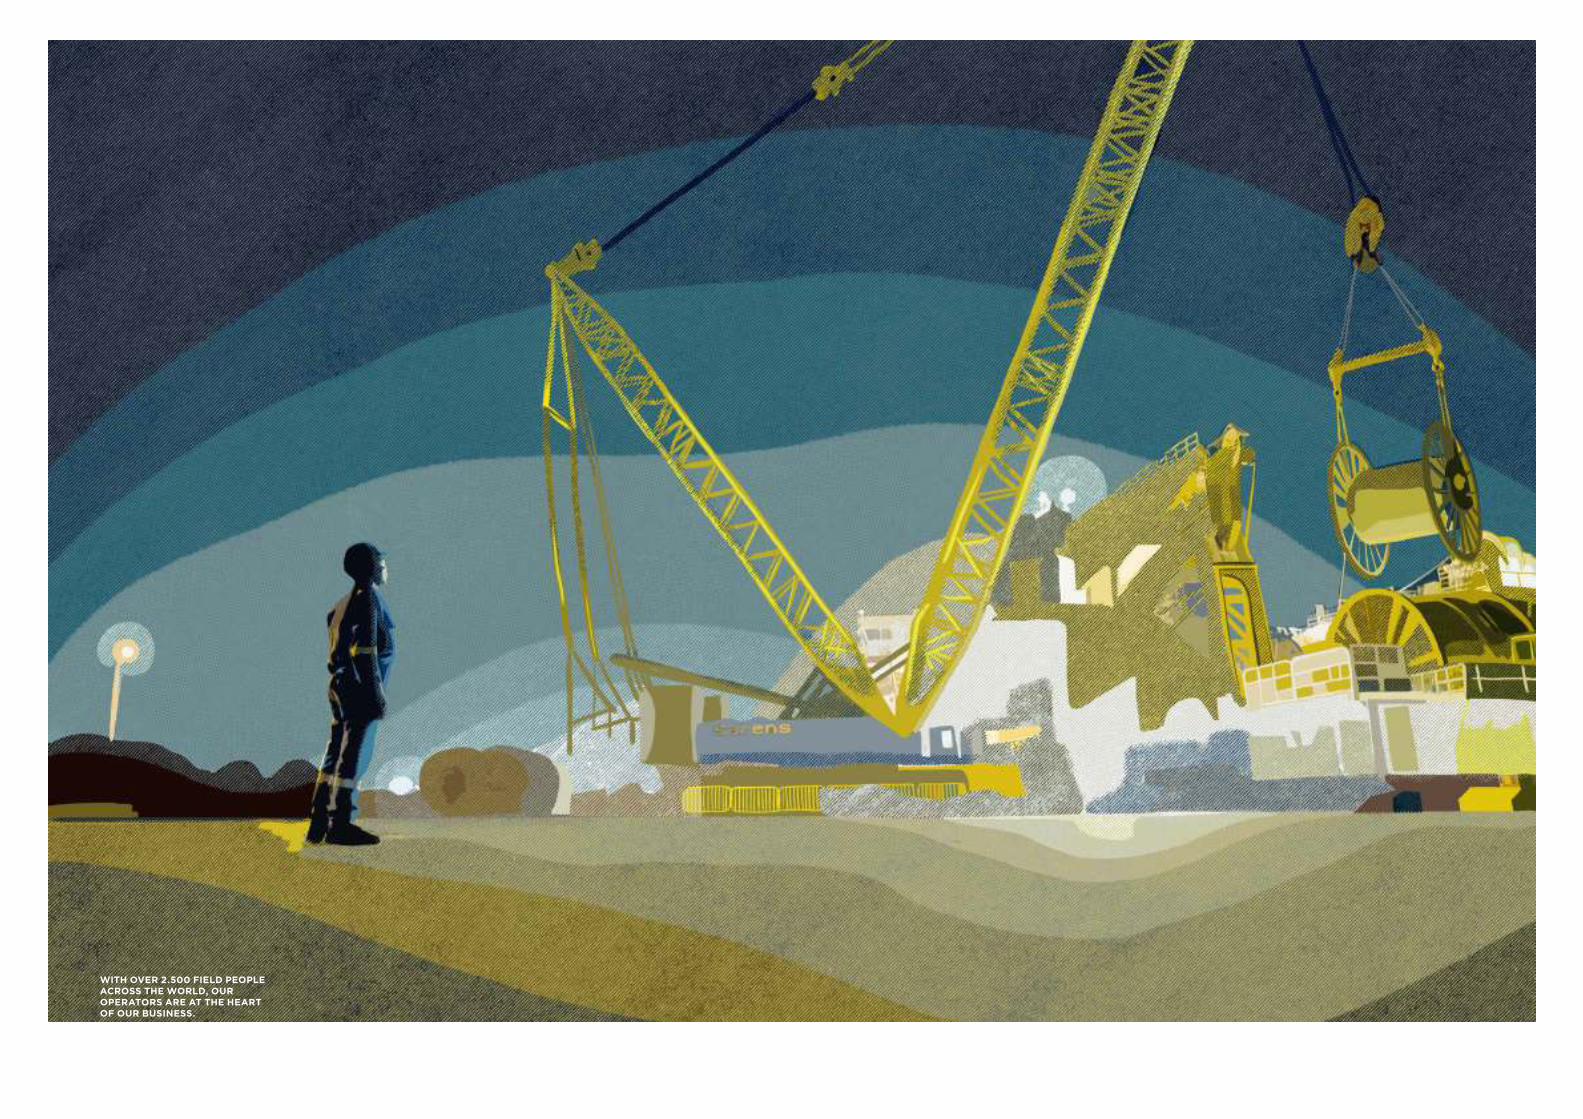
WITH OVER 2.500 FIELD PEOPLE ACROSS THE WORLD, OUR OPERATORS ARE AT THE HEART OF OUR BUSINESS.
31 |
GO TO THE INDEX
| 30
OUR BUSINESSLINES
33 |
GO TO THE INDEX
TE
CH
NIC
AL
SO
LU
TIO
NS
, P
RO
JE
CT
S &
EN
GIN
EE
RIN
G
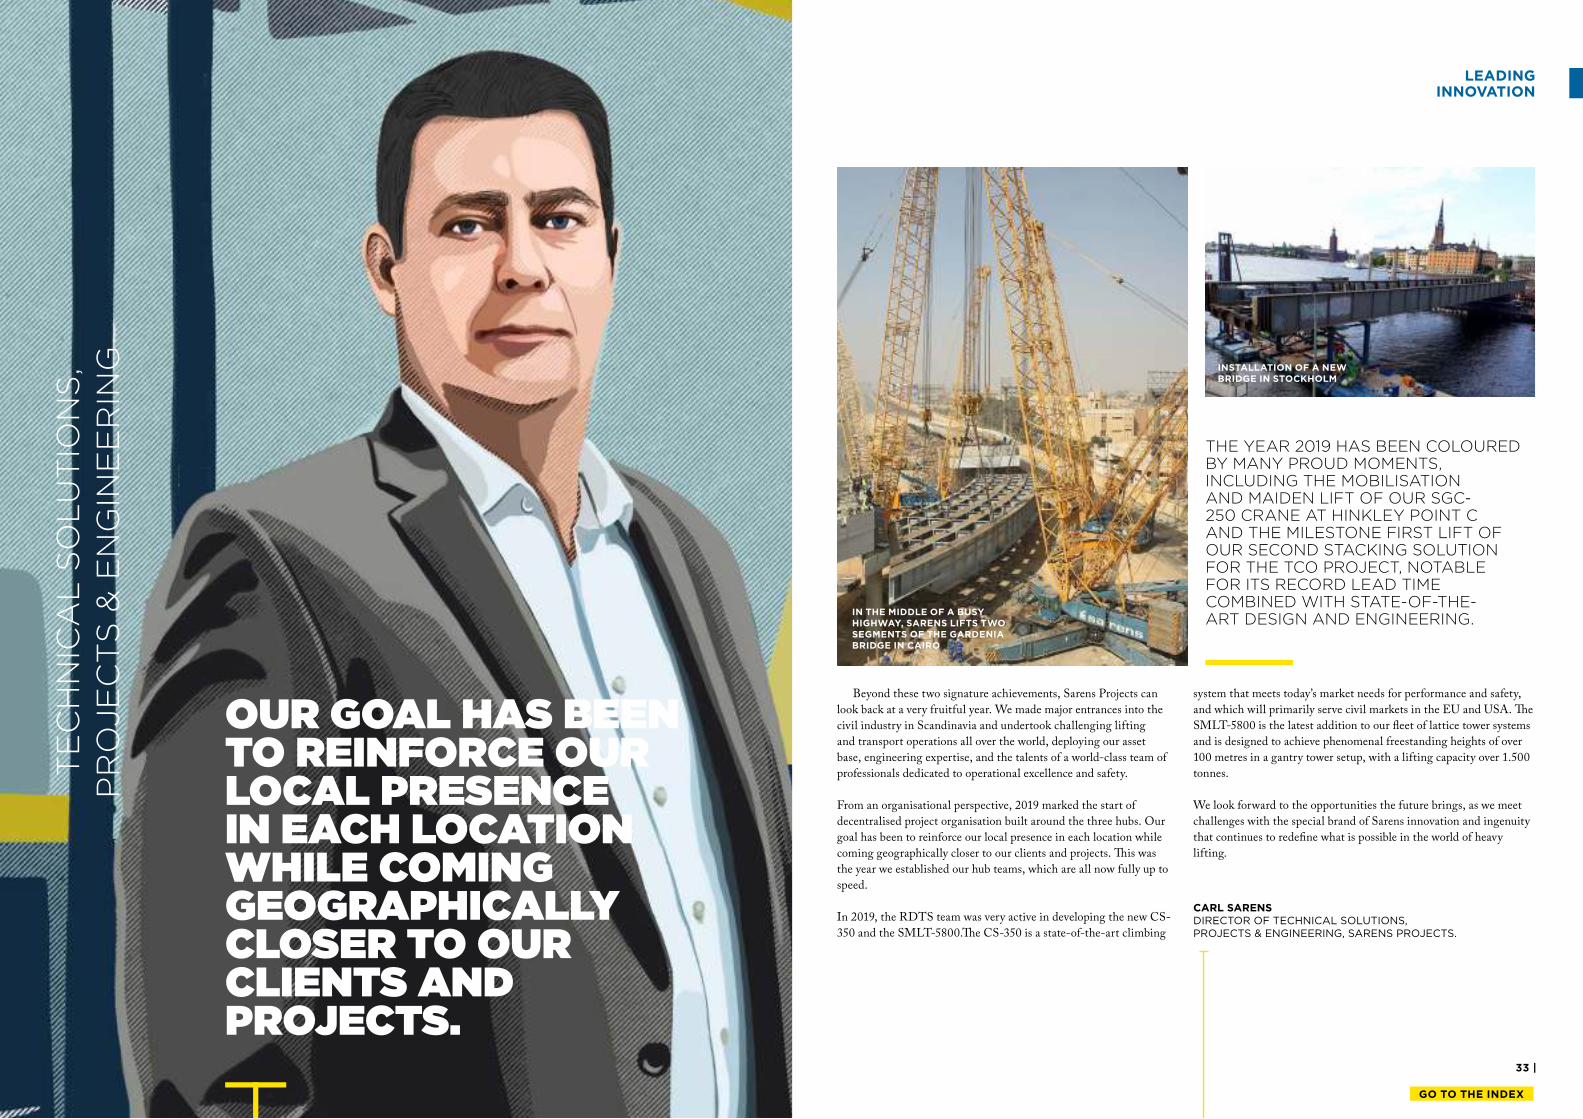
OUR GOAL HAS BEEN TO REINFORCE OUR LOCAL PRESENCE IN EACH LOCATION WHILE COMING GEOGRAPHICALLY CLOSER TO OUR CLIENTS AND PROJECTS.
Beyond these two signature achievements, Sarens Projects can
look back at a very fruitful year. We made major entrances into the
civil industry in Scandinavia and undertook challenging lifting
and transport operations all over the world, deploying our asset
base, engineering expertise, and the talents of a world-class team of
professionals dedicated to operational excellence and safety.
From an organisational perspective, 2019 marked the start of
decentralised project organisation built around the three hubs. Our
goal has been to reinforce our local presence in each location while
coming geographically closer to our clients and projects. his was
the year we established our hub teams, which are all now fully up to
speed.
In 2019, the RDTS team was very active in developing the new CS-
350 and the SMLT-5800.he CS-350 is a state-of-the-art climbing
system that meets today’s market needs for performance and safety,
and which will primarily serve civil markets in the EU and USA. he
SMLT-5800 is the latest addition to our leet of lattice tower systems
and is designed to achieve phenomenal freestanding heights of over
100 metres in a gantry tower setup, with a lifting capacity over 1.500
tonnes.
We look forward to the opportunities the future brings, as we meet
challenges with the special brand of Sarens innovation and ingenuity
that continues to redeine what is possible in the world of heavy
lifting.
LEADING INNOVATION
CARL SARENSDIRECTOR OF TECHNICAL SOLUTIONS, PROJECTS & ENGINEERING, SARENS PROJECTS.
IN THE MIDDLE OF A BUSY HIGHWAY, SARENS LIFTS TWO SEGMENTS OF THE GARDENIA BRIDGE IN CAIRO
INSTALLATION OF A NEW BRIDGE IN STOCKHOLM
THE YEAR 2019 HAS BEEN COLOURED BY MANY PROUD MOMENTS, INCLUDING THE MOBILISATION AND MAIDEN LIFT OF OUR SGC-250 CRANE AT HINKLEY POINT C AND THE MILESTONE FIRST LIFT OF OUR SECOND STACKING SOLUTION FOR THE TCO PROJECT, NOTABLE FOR ITS RECORD LEAD TIME COMBINED WITH STATE-OF-THE-ART DESIGN AND ENGINEERING.
35 |
GO TO THE INDEX
TR
AD
E
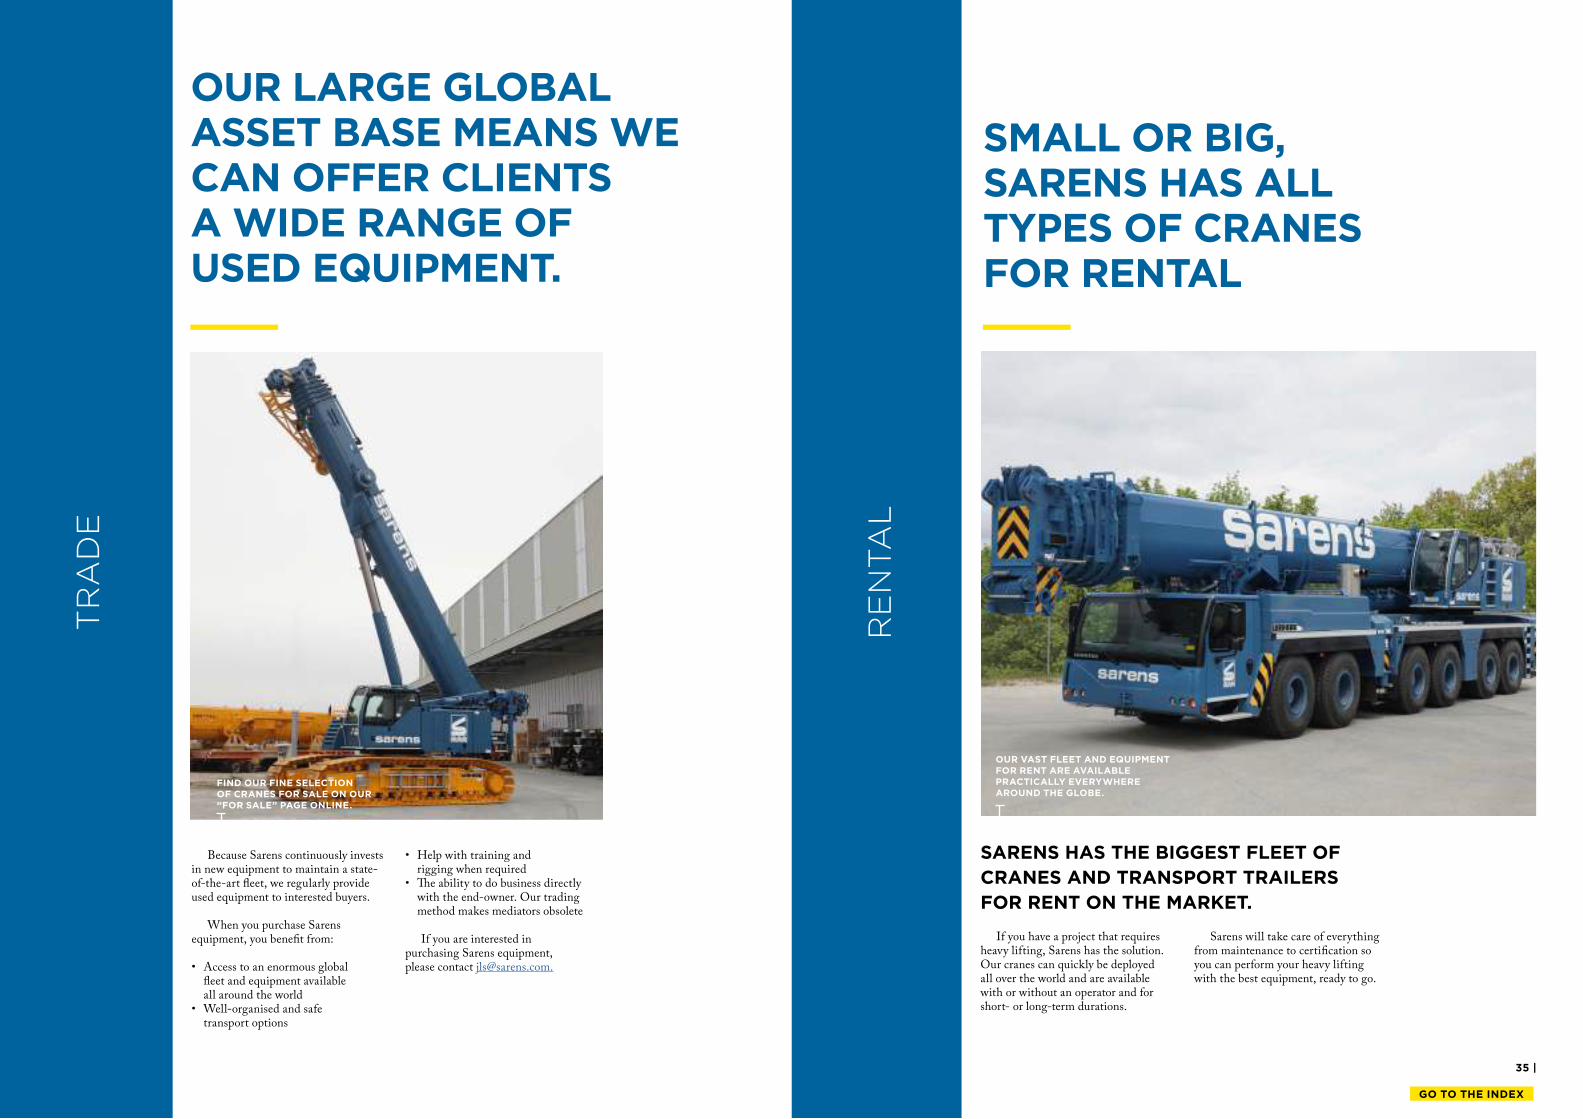
Because Sarens continuously invests in new equipment to maintain a state-of-the-art leet, we regularly provide used equipment to interested buyers.
When you purchase Sarens equipment, you beneit from:
• Access to an enormous global leet and equipment available all around the world
• Well-organised and safe transport options
• Help with training and rigging when required
• he ability to do business directly with the end-owner. Our trading method makes mediators obsolete
If you are interested in purchasing Sarens equipment, please contact [email protected].
FIND OUR FINE SELECTION OF CRANES FOR SALE ON OUR “FOR SALE” PAGE ONLINE.
RE
NTA
L
If you have a project that requires heavy lifting, Sarens has the solution. Our cranes can quickly be deployed all over the world and are available with or without an operator and for short- or long-term durations.
Sarens will take care of everything from maintenance to certiication so you can perform your heavy lifting with the best equipment, ready to go.
SARENS HAS THE BIGGEST FLEET OF
CRANES AND TRANSPORT TRAILERS
FOR RENT ON THE MARKET.
SMALL OR BIG, SARENS HAS ALL TYPES OF CRANES FOR RENTAL
OUR LARGE GLOBAL ASSET BASE MEANS WE CAN OFFER CLIENTS A WIDE RANGE OF USED EQUIPMENT.
OUR VAST FLEET AND EQUIPMENT FOR RENT ARE AVAILABLE PRACTICALLY EVERYWHERE AROUND THE GLOBE.
37 |
GO TO THE INDEX
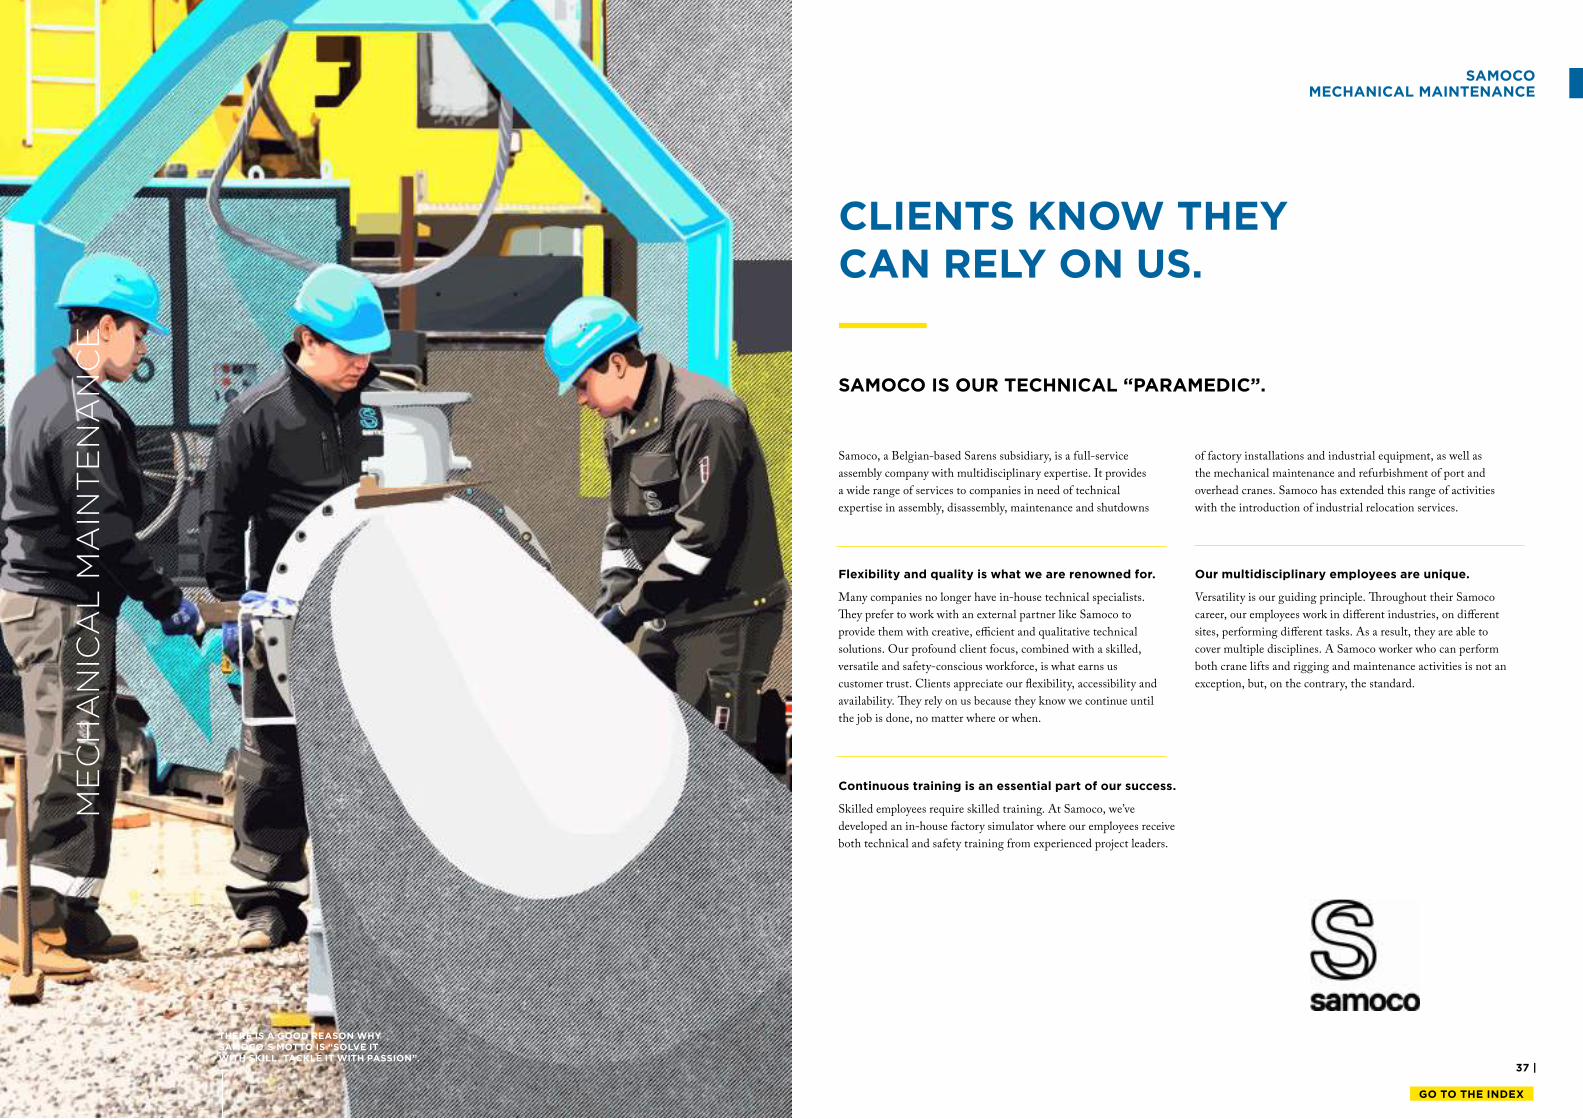
THERE IS A GOOD REASON WHY SAMOCO´S MOTTO IS “SOLVE IT WITH SKILL. TACKLE IT WITH PASSION”.
ME
CH
AN
ICA
L M
AIN
TE
NA
NC
ESAMOCO
MECHANICAL MAINTENANCE
Samoco, a Belgian-based Sarens subsidiary, is a full-service
assembly company with multidisciplinary expertise. It provides
a wide range of services to companies in need of technical
expertise in assembly, disassembly, maintenance and shutdowns
of factory installations and industrial equipment, as well as
the mechanical maintenance and refurbishment of port and
overhead cranes. Samoco has extended this range of activities
with the introduction of industrial relocation services.
Flexibility and quality is what we are renowned for.
Many companies no longer have in-house technical specialists.
hey prefer to work with an external partner like Samoco to
provide them with creative, eicient and qualitative technical
solutions. Our profound client focus, combined with a skilled,
versatile and safety-conscious workforce, is what earns us
customer trust. Clients appreciate our lexibility, accessibility and
availability. hey rely on us because they know we continue until
the job is done, no matter where or when.
Continuous training is an essential part of our success.
Skilled employees require skilled training. At Samoco, we’ve
developed an in-house factory simulator where our employees receive
both technical and safety training from experienced project leaders.
Our multidisciplinary employees are unique.
Versatility is our guiding principle. hroughout their Samoco
career, our employees work in diferent industries, on diferent
sites, performing diferent tasks. As a result, they are able to
cover multiple disciplines. A Samoco worker who can perform
both crane lifts and rigging and maintenance activities is not an
exception, but, on the contrary, the standard.
SAMOCO IS OUR TECHNICAL “PARAMEDIC”.
CLIENTS KNOW THEY CAN RELY ON US.
39 |
GO TO THE INDEX
| 38
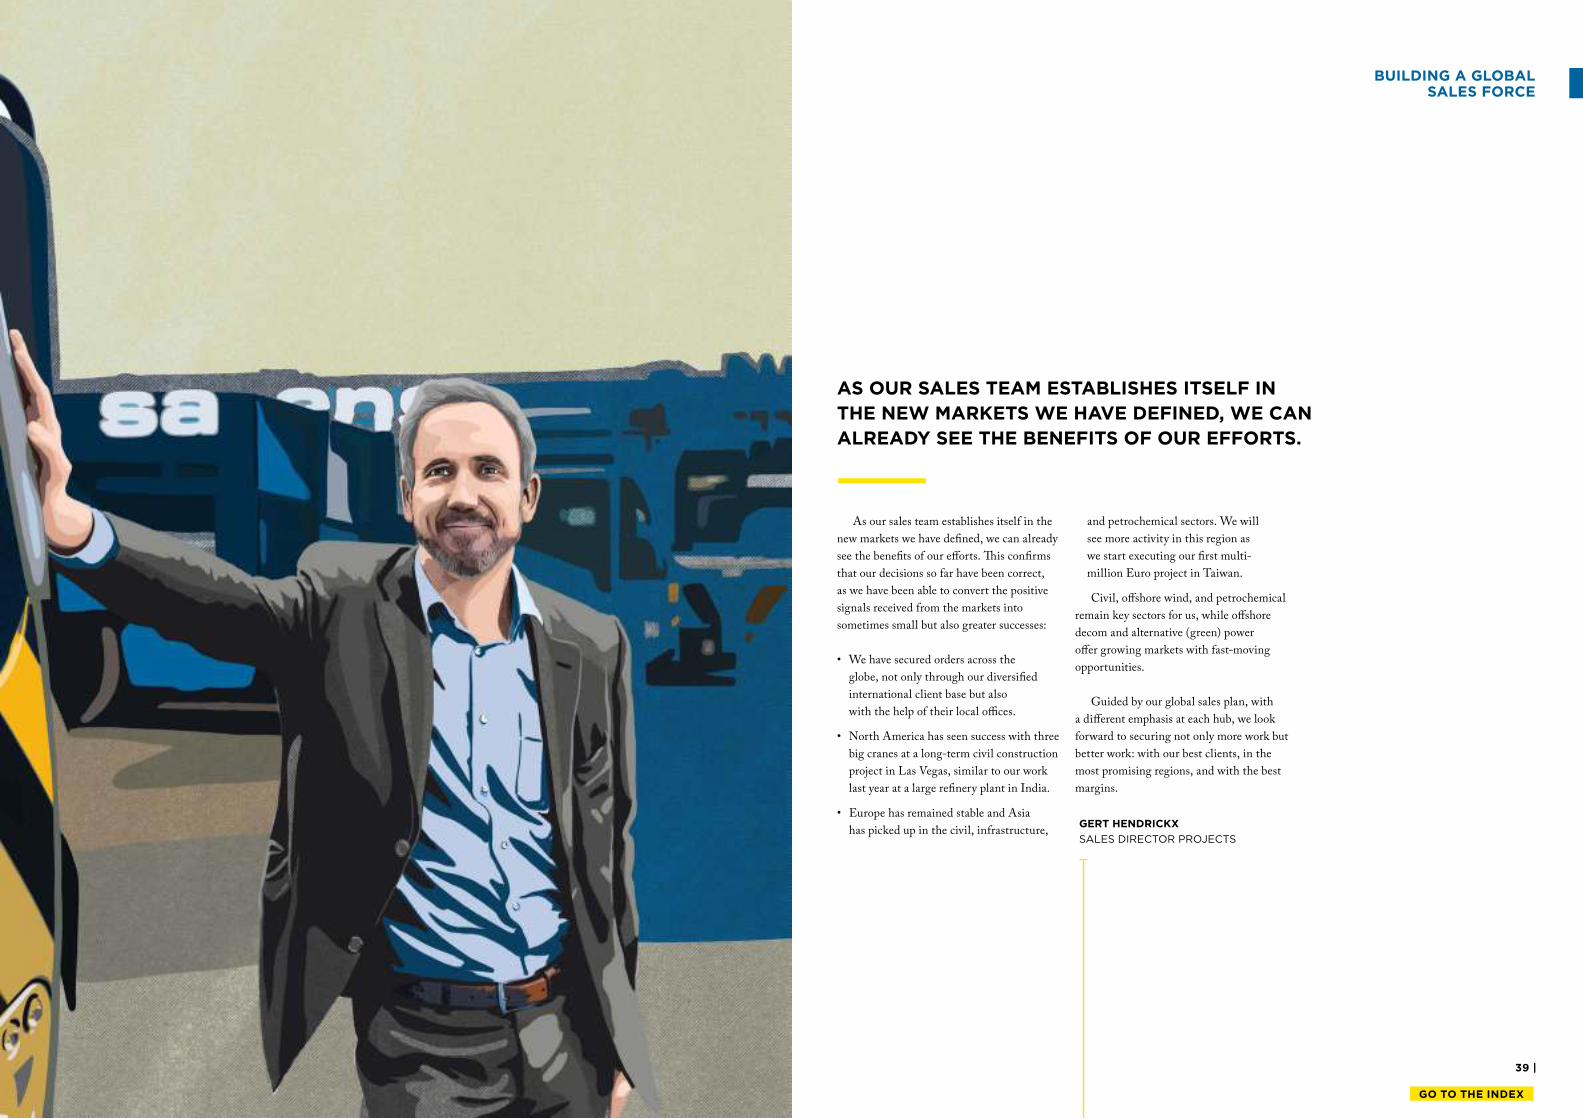
As our sales team establishes itself in the
new markets we have deined, we can already
see the beneits of our eforts. his conirms
that our decisions so far have been correct,
as we have been able to convert the positive
signals received from the markets into
sometimes small but also greater successes:
• We have secured orders across the
globe, not only through our diversiied
international client base but also
with the help of their local oices.
• North America has seen success with three
big cranes at a long-term civil construction
project in Las Vegas, similar to our work
last year at a large reinery plant in India.
• Europe has remained stable and Asia
has picked up in the civil, infrastructure,
and petrochemical sectors. We will
see more activity in this region as
we start executing our irst multi-
million Euro project in Taiwan.
Civil, ofshore wind, and petrochemical
remain key sectors for us, while ofshore
decom and alternative (green) power
ofer growing markets with fast-moving
opportunities.
Guided by our global sales plan, with
a diferent emphasis at each hub, we look
forward to securing not only more work but
better work: with our best clients, in the
most promising regions, and with the best
margins.
AS OUR SALES TEAM ESTABLISHES ITSELF IN
THE NEW MARKETS WE HAVE DEFINED, WE CAN
ALREADY SEE THE BENEFITS OF OUR EFFORTS.
GERT HENDRICKX
SALES DIRECTOR PROJECTS
BUILDING A GLOBAL SALES FORCE
41 |
GO TO THE INDEX
| 40
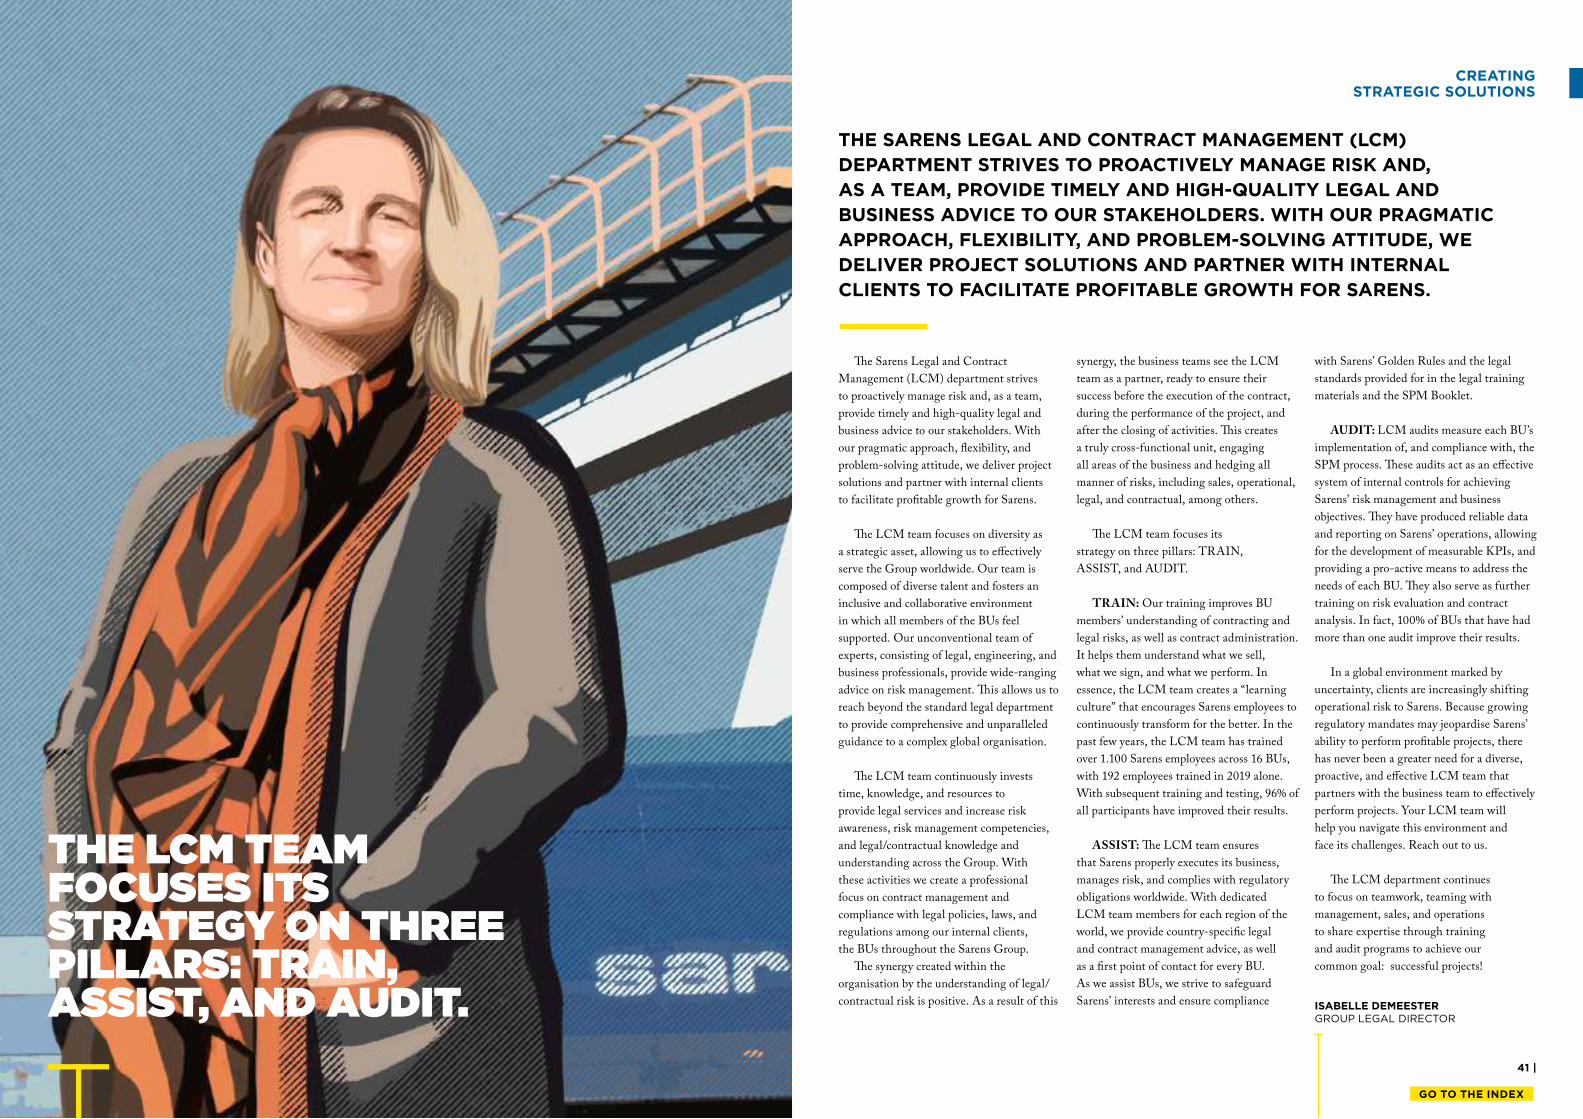
THE LCM TEAM FOCUSES ITS STRATEGY ON THREE PILLARS: TRAIN, ASSIST, AND AUDIT.
CREATING STRATEGIC SOLUTIONS
he Sarens Legal and Contract
Management (LCM) department strives
to proactively manage risk and, as a team,
provide timely and high-quality legal and
business advice to our stakeholders. With
our pragmatic approach, lexibility, and
problem-solving attitude, we deliver project
solutions and partner with internal clients
to facilitate proitable growth for Sarens.
he LCM team focuses on diversity as
a strategic asset, allowing us to efectively
serve the Group worldwide. Our team is
composed of diverse talent and fosters an
inclusive and collaborative environment
in which all members of the BUs feel
supported. Our unconventional team of
experts, consisting of legal, engineering, and
business professionals, provide wide-ranging
advice on risk management. his allows us to
reach beyond the standard legal department
to provide comprehensive and unparalleled
guidance to a complex global organisation.
he LCM team continuously invests
time, knowledge, and resources to
provide legal services and increase risk
awareness, risk management competencies,
and legal/contractual knowledge and
understanding across the Group. With
these activities we create a professional
focus on contract management and
compliance with legal policies, laws, and
regulations among our internal clients,
the BUs throughout the Sarens Group.
he synergy created within the
organisation by the understanding of legal/
contractual risk is positive. As a result of this
synergy, the business teams see the LCM
team as a partner, ready to ensure their
success before the execution of the contract,
during the performance of the project, and
after the closing of activities. his creates
a truly cross-functional unit, engaging
all areas of the business and hedging all
manner of risks, including sales, operational,
legal, and contractual, among others.
he LCM team focuses its
strategy on three pillars: TRAIN,
ASSIST, and AUDIT.
TRAIN: Our training improves BU
members’ understanding of contracting and
legal risks, as well as contract administration.
It helps them understand what we sell,
what we sign, and what we perform. In
essence, the LCM team creates a “learning
culture” that encourages Sarens employees to
continuously transform for the better. In the
past few years, the LCM team has trained
over 1.100 Sarens employees across 16 BUs,
with 192 employees trained in 2019 alone.
With subsequent training and testing, 96% of
all participants have improved their results.
ASSIST: he LCM team ensures
that Sarens properly executes its business,
manages risk, and complies with regulatory
obligations worldwide. With dedicated
LCM team members for each region of the
world, we provide country-speciic legal
and contract management advice, as well
as a irst point of contact for every BU.
As we assist BUs, we strive to safeguard
Sarens’ interests and ensure compliance
with Sarens’ Golden Rules and the legal
standards provided for in the legal training
materials and the SPM Booklet.
AUDIT: LCM audits measure each BU’s
implementation of, and compliance with, the
SPM process. hese audits act as an efective
system of internal controls for achieving
Sarens’ risk management and business
objectives. hey have produced reliable data
and reporting on Sarens’ operations, allowing
for the development of measurable KPIs, and
providing a pro-active means to address the
needs of each BU. hey also serve as further
training on risk evaluation and contract
analysis. In fact, 100% of BUs that have had
more than one audit improve their results.
In a global environment marked by
uncertainty, clients are increasingly shifting
operational risk to Sarens. Because growing
regulatory mandates may jeopardise Sarens’
ability to perform proitable projects, there
has never been a greater need for a diverse,
proactive, and efective LCM team that
partners with the business team to efectively
perform projects. Your LCM team will
help you navigate this environment and
face its challenges. Reach out to us.
he LCM department continues
to focus on teamwork, teaming with
management, sales, and operations
to share expertise through training
and audit programs to achieve our
common goal: successful projects!
THE SARENS LEGAL AND CONTRACT MANAGEMENT (LCM)
DEPARTMENT STRIVES TO PROACTIVELY MANAGE RISK AND,
AS A TEAM, PROVIDE TIMELY AND HIGH-QUALITY LEGAL AND
BUSINESS ADVICE TO OUR STAKEHOLDERS. WITH OUR PRAGMATIC
APPROACH, FLEXIBILITY, AND PROBLEM-SOLVING ATTITUDE, WE
DELIVER PROJECT SOLUTIONS AND PARTNER WITH INTERNAL
CLIENTS TO FACILITATE PROFITABLE GROWTH FOR SARENS.
ISABELLE DEMEESTERGROUP LEGAL DIRECTOR
43 |
GO TO THE INDEX
| 42
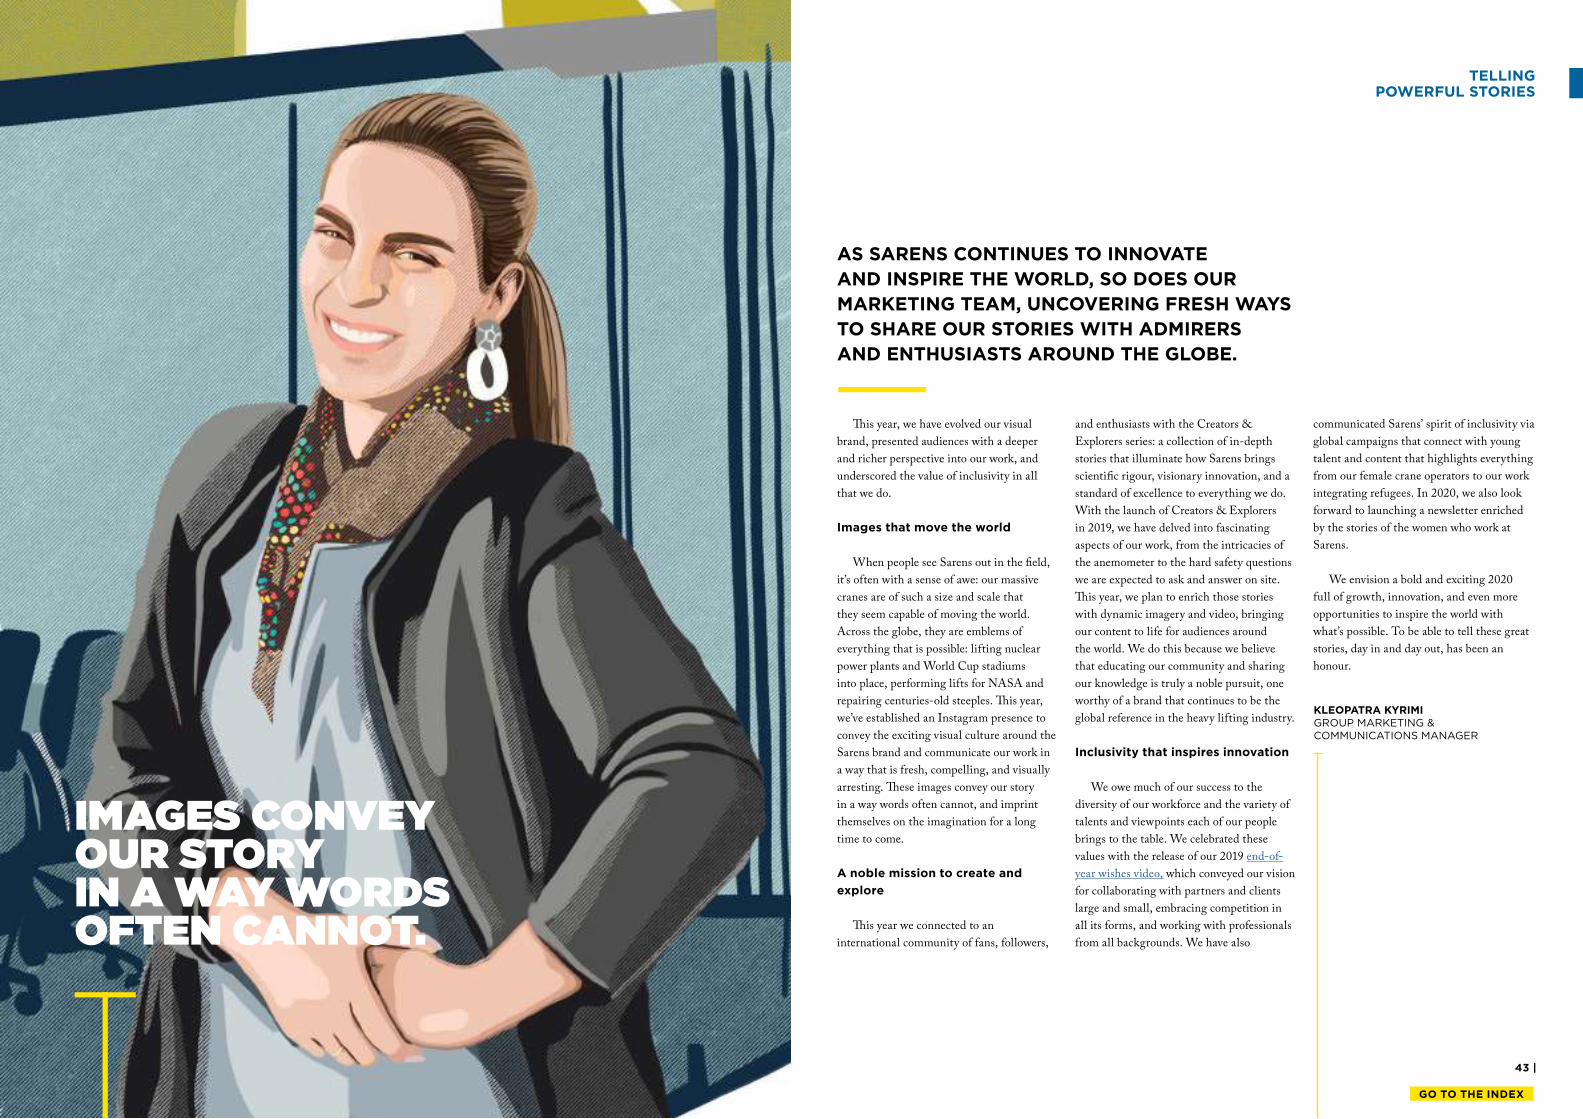
IMAGES CONVEY OUR STORYIN A WAY WORDS OFTEN CANNOT.
his year, we have evolved our visual
brand, presented audiences with a deeper
and richer perspective into our work, and
underscored the value of inclusivity in all
that we do.
Images that move the world
When people see Sarens out in the ield,
it’s often with a sense of awe: our massive
cranes are of such a size and scale that
they seem capable of moving the world.
Across the globe, they are emblems of
everything that is possible: lifting nuclear
power plants and World Cup stadiums
into place, performing lifts for NASA and
repairing centuries-old steeples. his year,
we’ve established an Instagram presence to
convey the exciting visual culture around the
Sarens brand and communicate our work in
a way that is fresh, compelling, and visually
arresting. hese images convey our story
in a way words often cannot, and imprint
themselves on the imagination for a long
time to come.
A noble mission to create and
explore
his year we connected to an
international community of fans, followers,
and enthusiasts with the Creators &
Explorers series: a collection of in-depth
stories that illuminate how Sarens brings
scientiic rigour, visionary innovation, and a
standard of excellence to everything we do.
With the launch of Creators & Explorers
in 2019, we have delved into fascinating
aspects of our work, from the intricacies of
the anemometer to the hard safety questions
we are expected to ask and answer on site.
his year, we plan to enrich those stories
with dynamic imagery and video, bringing
our content to life for audiences around
the world. We do this because we believe
that educating our community and sharing
our knowledge is truly a noble pursuit, one
worthy of a brand that continues to be the
global reference in the heavy lifting industry.
Inclusivity that inspires innovation
We owe much of our success to the
diversity of our workforce and the variety of
talents and viewpoints each of our people
brings to the table. We celebrated these
values with the release of our 2019 end-of-
year wishes video, which conveyed our vision
for collaborating with partners and clients
large and small, embracing competition in
all its forms, and working with professionals
from all backgrounds. We have also
communicated Sarens’ spirit of inclusivity via
global campaigns that connect with young
talent and content that highlights everything
from our female crane operators to our work
integrating refugees. In 2020, we also look
forward to launching a newsletter enriched
by the stories of the women who work at
Sarens.
We envision a bold and exciting 2020
full of growth, innovation, and even more
opportunities to inspire the world with
what’s possible. To be able to tell these great
stories, day in and day out, has been an
honour.
AS SARENS CONTINUES TO INNOVATE
AND INSPIRE THE WORLD, SO DOES OUR
MARKETING TEAM, UNCOVERING FRESH WAYS
TO SHARE OUR STORIES WITH ADMIRERS
AND ENTHUSIASTS AROUND THE GLOBE.
KLEOPATRA KYRIMIGROUP MARKETING & COMMUNICATIONS MANAGER
TELLING POWERFUL STORIES
45 |
GO TO THE INDEX
| 44
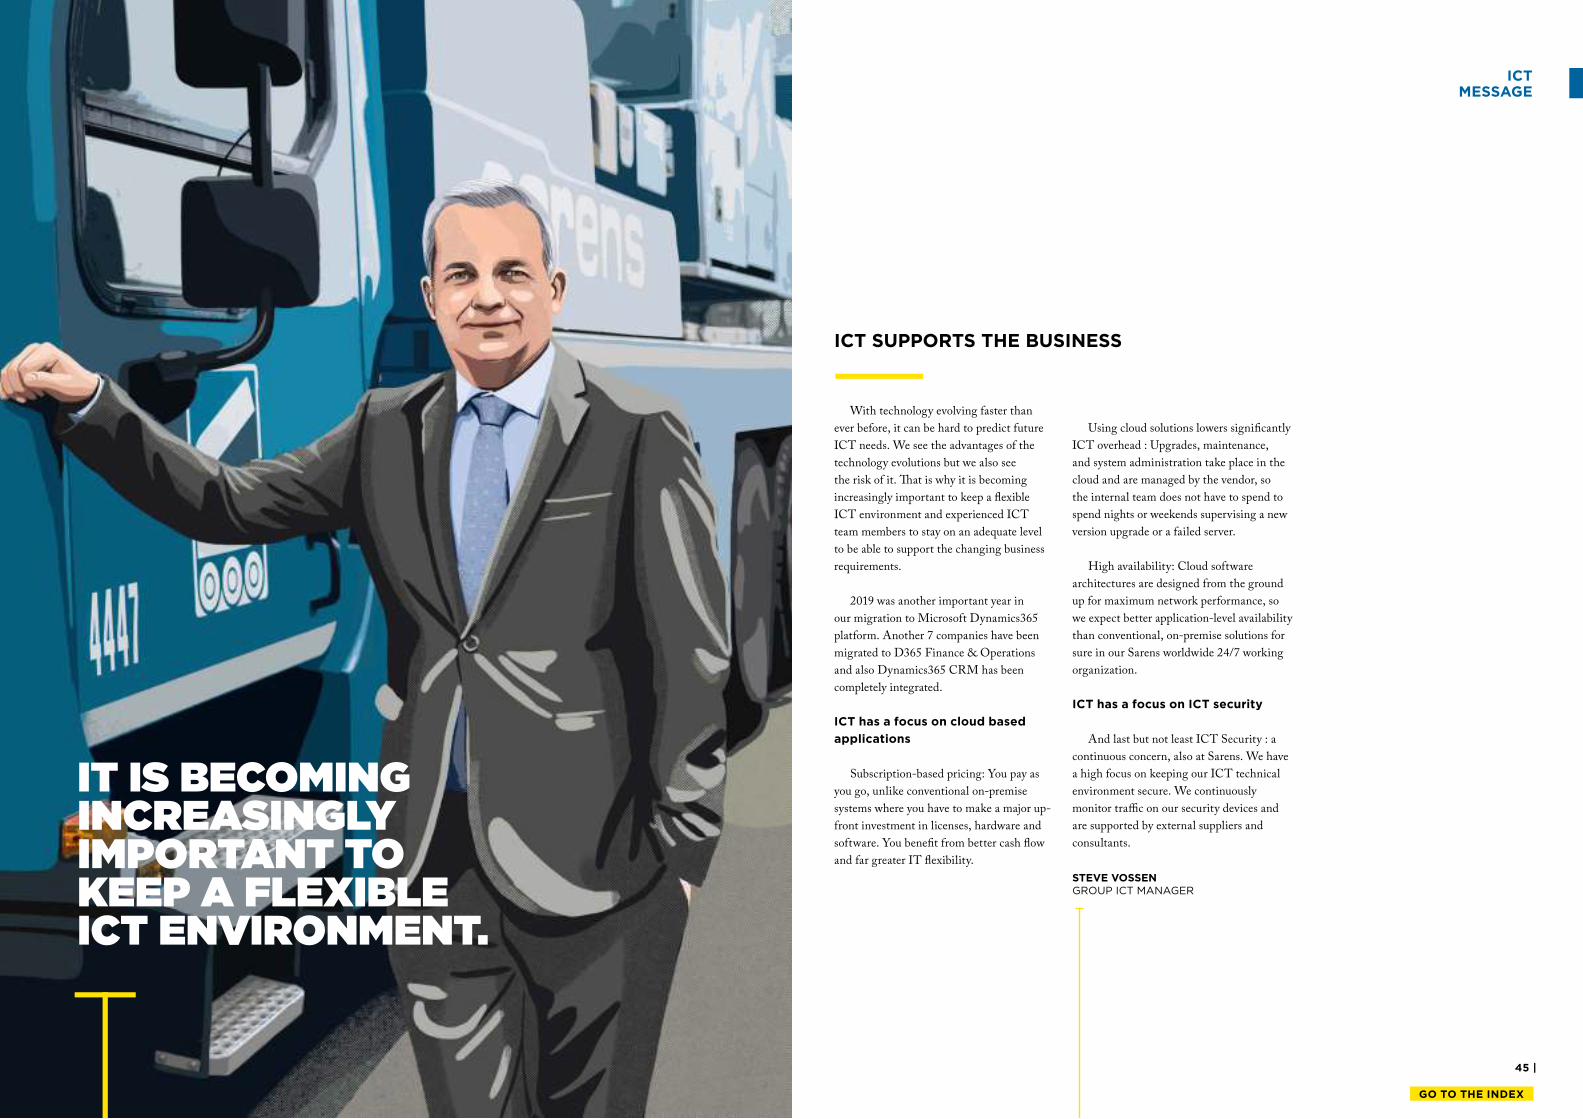
IT IS BECOMINGINCREASINGLY IMPORTANT TO KEEP A FLEXIBLEICT ENVIRONMENT.
With technology evolving faster than
ever before, it can be hard to predict future
ICT needs. We see the advantages of the
technology evolutions but we also see
the risk of it. hat is why it is becoming
increasingly important to keep a lexible
ICT environment and experienced ICT
team members to stay on an adequate level
to be able to support the changing business
requirements.
2019 was another important year in
our migration to Microsoft Dynamics365
platform. Another 7 companies have been
migrated to D365 Finance & Operations
and also Dynamics365 CRM has been
completely integrated.
ICT has a focus on cloud based
applications
Subscription-based pricing: You pay as
you go, unlike conventional on-premise
systems where you have to make a major up-
front investment in licenses, hardware and
software. You beneit from better cash low
and far greater IT lexibility.
Using cloud solutions lowers signiicantly
ICT overhead : Upgrades, maintenance,
and system administration take place in the
cloud and are managed by the vendor, so
the internal team does not have to spend to
spend nights or weekends supervising a new
version upgrade or a failed server.
High availability: Cloud software
architectures are designed from the ground
up for maximum network performance, so
we expect better application-level availability
than conventional, on-premise solutions for
sure in our Sarens worldwide 24/7 working
organization.
ICT has a focus on ICT security
And last but not least ICT Security : a
continuous concern, also at Sarens. We have
a high focus on keeping our ICT technical
environment secure. We continuously
monitor traic on our security devices and
are supported by external suppliers and
consultants.
ICT SUPPORTS THE BUSINESS
STEVE VOSSENGROUP ICT MANAGER
ICT MESSAGE
47 |
GO TO THE INDEX
| 46
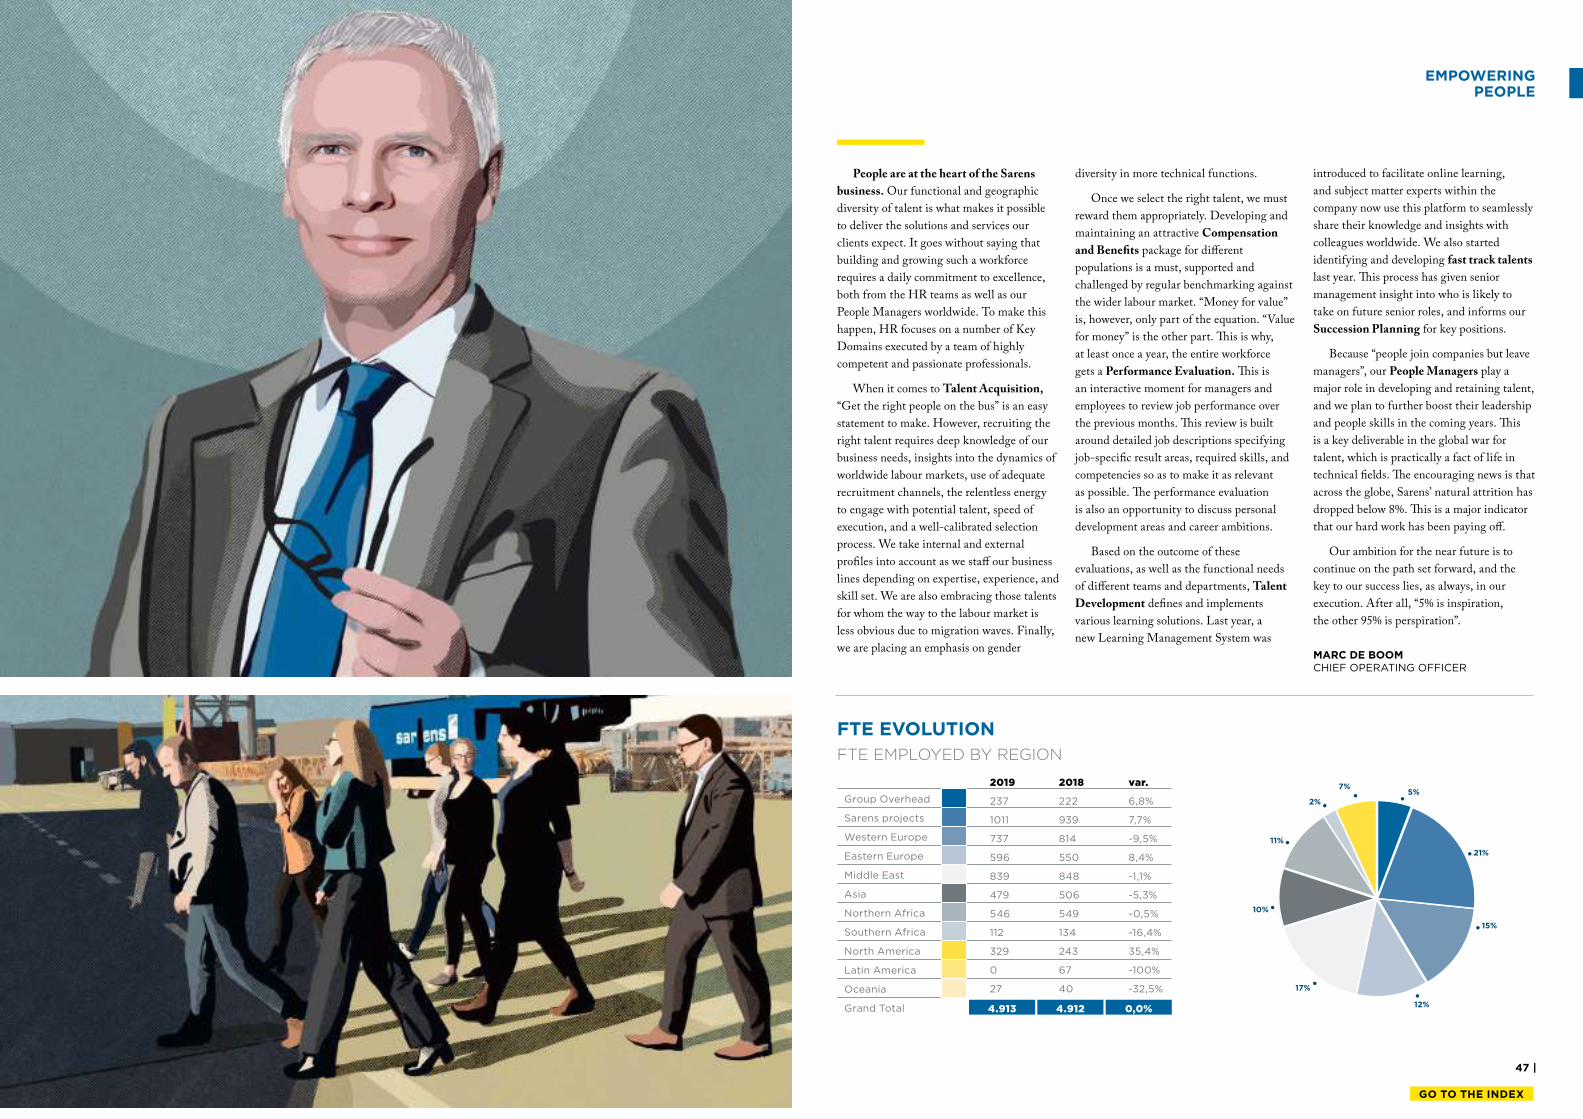
EMPOWERING PEOPLE
FTE EVOLUTION
FTE EMPLOYED BY REGION
Group Overhead
Sarens projects
Western Europe
Eastern Europe
Middle East
Asia
Northern Africa
Southern Africa
North America
Latin America
Oceania
Grand Total
2018
222
939
814
550
848
506
549
134
243
67
40
var.
6,8%
7,7%
-9,5%
8,4%
-1,1%
-5,3%
-0,5%
-16,4%
35,4%
-100%
-32,5%
2019
237
1011
737
596
839
479
546
112
329
0
27
4.913 4.912 0,0%
People are at the heart of the Sarens
business. Our functional and geographic
diversity of talent is what makes it possible
to deliver the solutions and services our
clients expect. It goes without saying that
building and growing such a workforce
requires a daily commitment to excellence,
both from the HR teams as well as our
People Managers worldwide. To make this
happen, HR focuses on a number of Key
Domains executed by a team of highly
competent and passionate professionals.
When it comes to Talent Acquisition,
“Get the right people on the bus” is an easy
statement to make. However, recruiting the
right talent requires deep knowledge of our
business needs, insights into the dynamics of
worldwide labour markets, use of adequate
recruitment channels, the relentless energy
to engage with potential talent, speed of
execution, and a well-calibrated selection
process. We take internal and external
proiles into account as we staf our business
lines depending on expertise, experience, and
skill set. We are also embracing those talents
for whom the way to the labour market is
less obvious due to migration waves. Finally,
we are placing an emphasis on gender
diversity in more technical functions.
Once we select the right talent, we must
reward them appropriately. Developing and
maintaining an attractive Compensation
and Beneits package for diferent
populations is a must, supported and
challenged by regular benchmarking against
the wider labour market. “Money for value”
is, however, only part of the equation. “Value
for money” is the other part. his is why,
at least once a year, the entire workforce
gets a Performance Evaluation. his is
an interactive moment for managers and
employees to review job performance over
the previous months. his review is built
around detailed job descriptions specifying
job-speciic result areas, required skills, and
competencies so as to make it as relevant
as possible. he performance evaluation
is also an opportunity to discuss personal
development areas and career ambitions.
Based on the outcome of these
evaluations, as well as the functional needs
of diferent teams and departments, Talent
Development deines and implements
various learning solutions. Last year, a
new Learning Management System was
introduced to facilitate online learning,
and subject matter experts within the
company now use this platform to seamlessly
share their knowledge and insights with
colleagues worldwide. We also started
identifying and developing fast track talents
last year. his process has given senior
management insight into who is likely to
take on future senior roles, and informs our
Succession Planning for key positions.
Because “people join companies but leave
managers”, our People Managers play a
major role in developing and retaining talent,
and we plan to further boost their leadership
and people skills in the coming years. his
is a key deliverable in the global war for
talent, which is practically a fact of life in
technical ields. he encouraging news is that
across the globe, Sarens’ natural attrition has
dropped below 8%. his is a major indicator
that our hard work has been paying of.
Our ambition for the near future is to
continue on the path set forward, and the
key to our success lies, as always, in our
execution. After all, “5% is inspiration,
the other 95% is perspiration”.
21%
5%
15%
12%
17%
7%
2%
MARC DE BOOMCHIEF OPERATING OFFICER
10%
11%
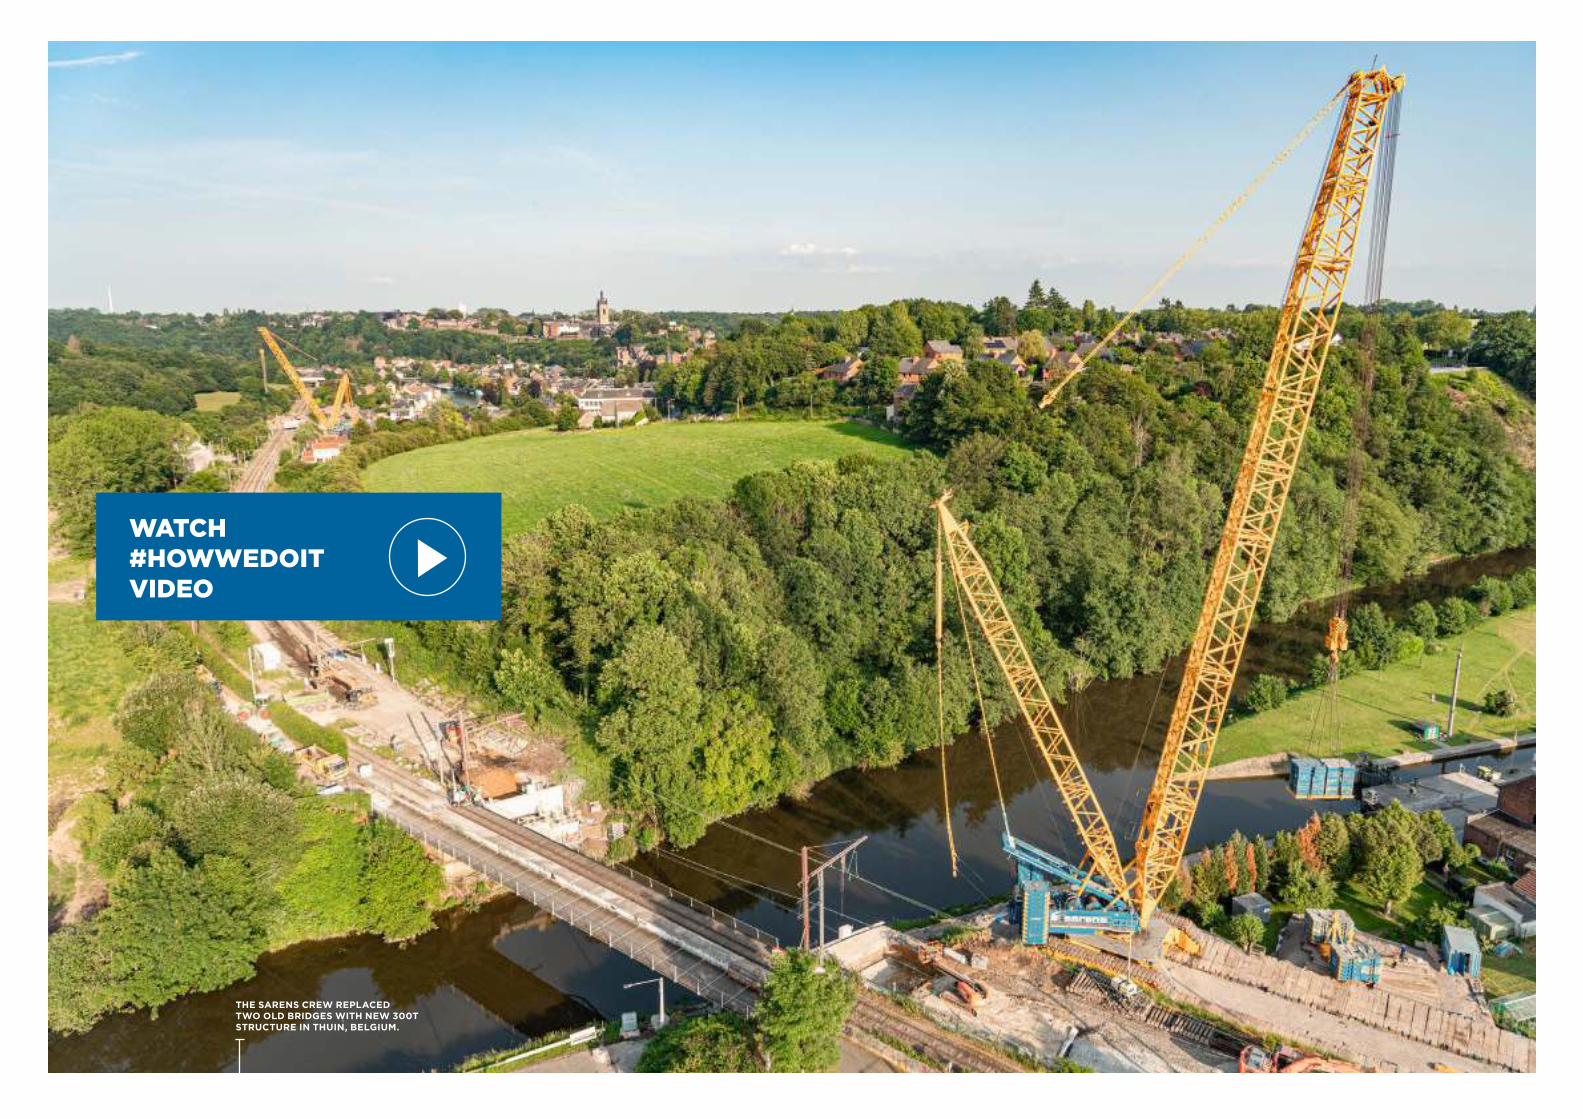
WATCH #HOWWEDOIT VIDEO
THE SARENS CREW REPLACED TWO OLD BRIDGES WITH NEW 300T STRUCTURE IN THUIN, BELGIUM.
51 |
GO TO THE INDEX
| 50
“STRIVE NOT BE A SUCCESS BUT RATHER TO BE OF VALUE”. – ALBERT EINSTEIN
53 |
GO TO THE INDEX
| 52
he Board of Directors is composed of nine members of the
Group. Supported by various advisory committees, the Board
meets on a quarterly basis — in practice, it meets monthly
— to discuss the operational and inancial situation of the
Group and to monitor the execution of the Strategic Business Plan.
EXECUTIVE BOARD MEMBERS
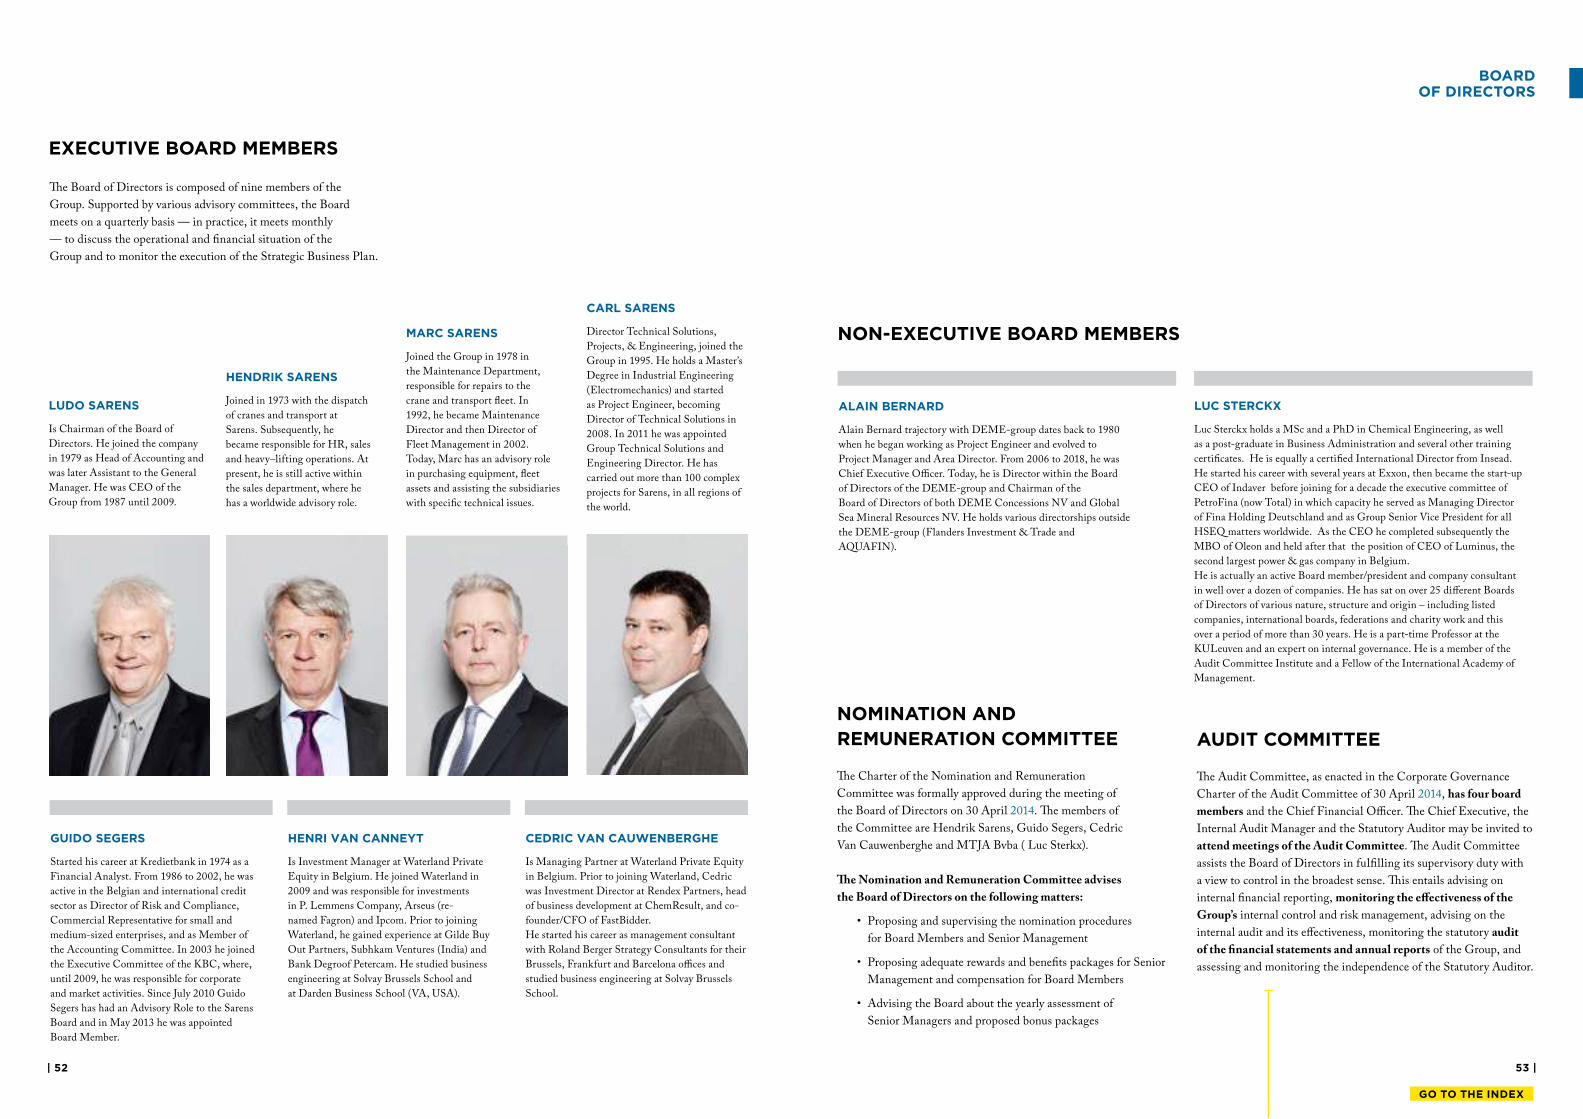
LUDO SARENS
Is Chairman of the Board of
Directors. He joined the company
in 1979 as Head of Accounting and
was later Assistant to the General
Manager. He was CEO of the
Group from 1987 until 2009.
HENDRIK SARENS
Joined in 1973 with the dispatch
of cranes and transport at
Sarens. Subsequently, he
became responsible for HR, sales
and heavy–lifting operations. At
present, he is still active within
the sales department, where he
has a worldwide advisory role.
MARC SARENS
Joined the Group in 1978 in
the Maintenance Department,
responsible for repairs to the
crane and transport leet. In
1992, he became Maintenance
Director and then Director of
Fleet Management in 2002.
Today, Marc has an advisory role
in purchasing equipment, leet
assets and assisting the subsidiaries
with speciic technical issues.
GUIDO SEGERS
Started his career at Kredietbank in 1974 as a
Financial Analyst. From 1986 to 2002, he was
active in the Belgian and international credit
sector as Director of Risk and Compliance,
Commercial Representative for small and
medium-sized enterprises, and as Member of
the Accounting Committee. In 2003 he joined
the Executive Committee of the KBC, where,
until 2009, he was responsible for corporate
and market activities. Since July 2010 Guido
Segers has had an Advisory Role to the Sarens
Board and in May 2013 he was appointed
Board Member.
HENRI VAN CANNEYT
Is Investment Manager at Waterland Private
Equity in Belgium. He joined Waterland in
2009 and was responsible for investments
in P. Lemmens Company, Arseus (re-
named Fagron) and Ipcom. Prior to joining
Waterland, he gained experience at Gilde Buy
Out Partners, Subhkam Ventures (India) and
Bank Degroof Petercam. He studied business
engineering at Solvay Brussels School and
at Darden Business School (VA, USA).
CEDRIC VAN CAUWENBERGHE
Is Managing Partner at Waterland Private Equity
in Belgium. Prior to joining Waterland, Cedric
was Investment Director at Rendex Partners, head
of business development at ChemResult, and co-
founder/CFO of FastBidder.
He started his career as management consultant
with Roland Berger Strategy Consultants for their
Brussels, Frankfurt and Barcelona oices and
studied business engineering at Solvay Brussels
School.
CARL SARENS
Director Technical Solutions,
Projects, & Engineering, joined the
Group in 1995. He holds a Master’s
Degree in Industrial Engineering
(Electromechanics) and started
as Project Engineer, becoming
Director of Technical Solutions in
2008. In 2011 he was appointed
Group Technical Solutions and
Engineering Director. He has
carried out more than 100 complex
projects for Sarens, in all regions of
the world.
BOARD OF DIRECTORS
NON-EXECUTIVE BOARD MEMBERS
ALAIN BERNARD
Alain Bernard trajectory with DEME‐group dates back to 1980
when he began working as Project Engineer and evolved to
Project Manager and Area Director. From 2006 to 2018, he was
Chief Executive Oicer. Today, he is Director within the Board
of Directors of the DEME‐group and Chairman of the
Board of Directors of both DEME Concessions NV and Global
Sea Mineral Resources NV. He holds various directorships outside
the DEME‐group (Flanders Investment & Trade and
AQUAFIN).
LUC STERCKX
Luc Sterckx holds a MSc and a PhD in Chemical Engineering, as well
as a post-graduate in Business Administration and several other training
certiicates. He is equally a certiied International Director from Insead.
He started his career with several years at Exxon, then became the start-up
CEO of Indaver before joining for a decade the executive committee of
PetroFina (now Total) in which capacity he served as Managing Director
of Fina Holding Deutschland and as Group Senior Vice President for all
HSEQ matters worldwide. As the CEO he completed subsequently the
MBO of Oleon and held after that the position of CEO of Luminus, the
second largest power & gas company in Belgium.
He is actually an active Board member/president and company consultant
in well over a dozen of companies. He has sat on over 25 diferent Boards
of Directors of various nature, structure and origin – including listed
companies, international boards, federations and charity work and this
over a period of more than 30 years. He is a part-time Professor at the
KULeuven and an expert on internal governance. He is a member of the
Audit Committee Institute and a Fellow of the International Academy of
Management.
NOMINATION AND
REMUNERATION COMMITTEE
he Charter of the Nomination and Remuneration
Committee was formally approved during the meeting of
the Board of Directors on 30 April 2014. he members of
the Committee are Hendrik Sarens, Guido Segers, Cedric
Van Cauwenberghe and MTJA Bvba ( Luc Sterkx).
he Nomination and Remuneration Committee advises
the Board of Directors on the following matters:
• Proposing and supervising the nomination procedures
for Board Members and Senior Management
• Proposing adequate rewards and beneits packages for Senior
Management and compensation for Board Members
• Advising the Board about the yearly assessment of
Senior Managers and proposed bonus packages
AUDIT COMMITTEE
he Audit Committee, as enacted in the Corporate Governance
Charter of the Audit Committee of 30 April 2014, has four board
members and the Chief Financial Oicer. he Chief Executive, the
Internal Audit Manager and the Statutory Auditor may be invited to
attend meetings of the Audit Committee. he Audit Committee
assists the Board of Directors in fulilling its supervisory duty with
a view to control in the broadest sense. his entails advising on
internal inancial reporting, monitoring the efectiveness of the
Group’s internal control and risk management, advising on the
internal audit and its efectiveness, monitoring the statutory audit
of the inancial statements and annual reports of the Group, and
assessing and monitoring the independence of the Statutory Auditor.
55 |
GO TO THE INDEX
| 54
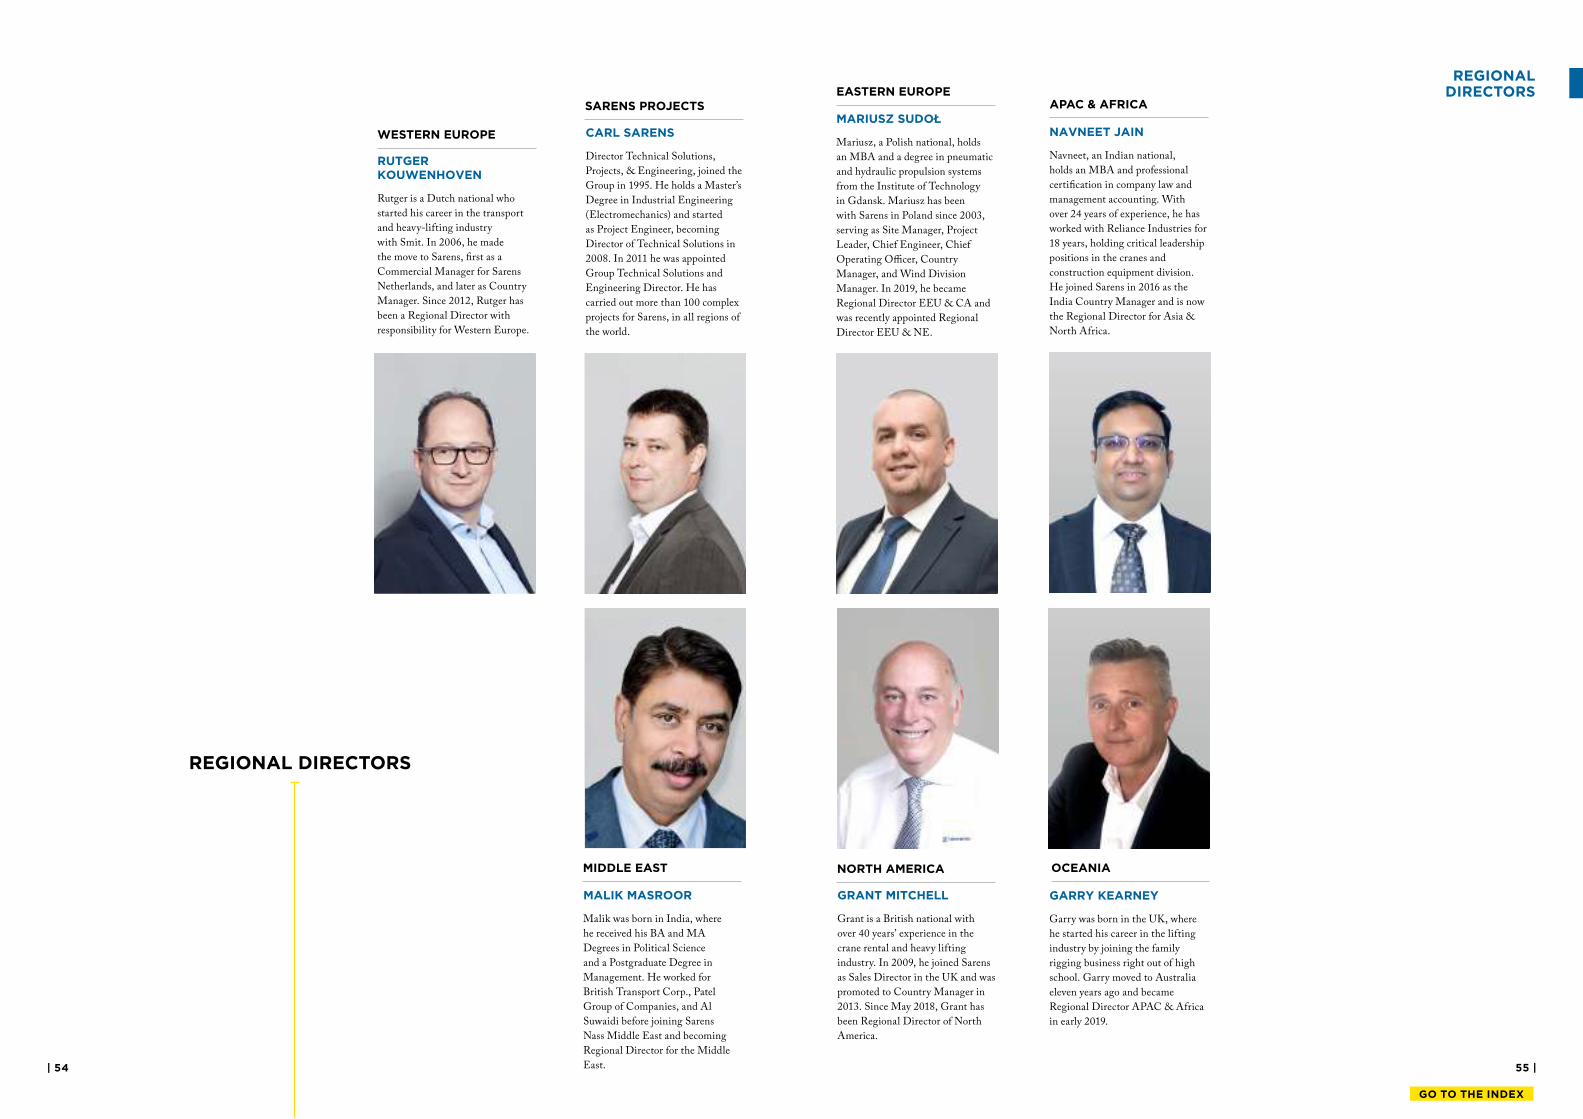
MALIK MASROOR
Malik was born in India, where
he received his BA and MA
Degrees in Political Science
and a Postgraduate Degree in
Management. He worked for
British Transport Corp., Patel
Group of Companies, and Al
Suwaidi before joining Sarens
Nass Middle East and becoming
Regional Director for the Middle
East.
GRANT MITCHELL
Grant is a British national with
over 40 years’ experience in the
crane rental and heavy lifting
industry. In 2009, he joined Sarens
as Sales Director in the UK and was
promoted to Country Manager in
2013. Since May 2018, Grant has
been Regional Director of North
America.
REGIONAL DIRECTORS
RUTGER KOUWENHOVEN
Rutger is a Dutch national who
started his career in the transport
and heavy-lifting industry
with Smit. In 2006, he made
the move to Sarens, irst as a
Commercial Manager for Sarens
Netherlands, and later as Country
Manager. Since 2012, Rutger has
been a Regional Director with
responsibility for Western Europe.
MARIUSZ SUDOL
Mariusz, a Polish national, holds
an MBA and a degree in pneumatic
and hydraulic propulsion systems
from the Institute of Technology
in Gdansk. Mariusz has been
with Sarens in Poland since 2003,
serving as Site Manager, Project
Leader, Chief Engineer, Chief
Operating Oicer, Country
Manager, and Wind Division
Manager. In 2019, he became
Regional Director EEU & CA and
was recently appointed Regional
Director EEU & NE.
CARL SARENS
Director Technical Solutions,
Projects, & Engineering, joined the
Group in 1995. He holds a Master’s
Degree in Industrial Engineering
(Electromechanics) and started
as Project Engineer, becoming
Director of Technical Solutions in
2008. In 2011 he was appointed
Group Technical Solutions and
Engineering Director. He has
carried out more than 100 complex
projects for Sarens, in all regions of
the world.
GARRY KEARNEY
Garry was born in the UK, where
he started his career in the lifting
industry by joining the family
rigging business right out of high
school. Garry moved to Australia
eleven years ago and became
Regional Director APAC & Africa
in early 2019.
NAVNEET JAIN
Navneet, an Indian national,
holds an MBA and professional
certiication in company law and
management accounting. With
over 24 years of experience, he has
worked with Reliance Industries for
18 years, holding critical leadership
positions in the cranes and
construction equipment division.
He joined Sarens in 2016 as the
India Country Manager and is now
the Regional Director for Asia &
North Africa.
WESTERN EUROPE
REGIONAL DIRECTORS
SARENS PROJECTSEASTERN EUROPE
NORTH AMERICAMIDDLE EAST
APAC & AFRICA
OCEANIA
57 |
GO TO THE INDEX
| 56
CORPORATE
MANAGEMENT
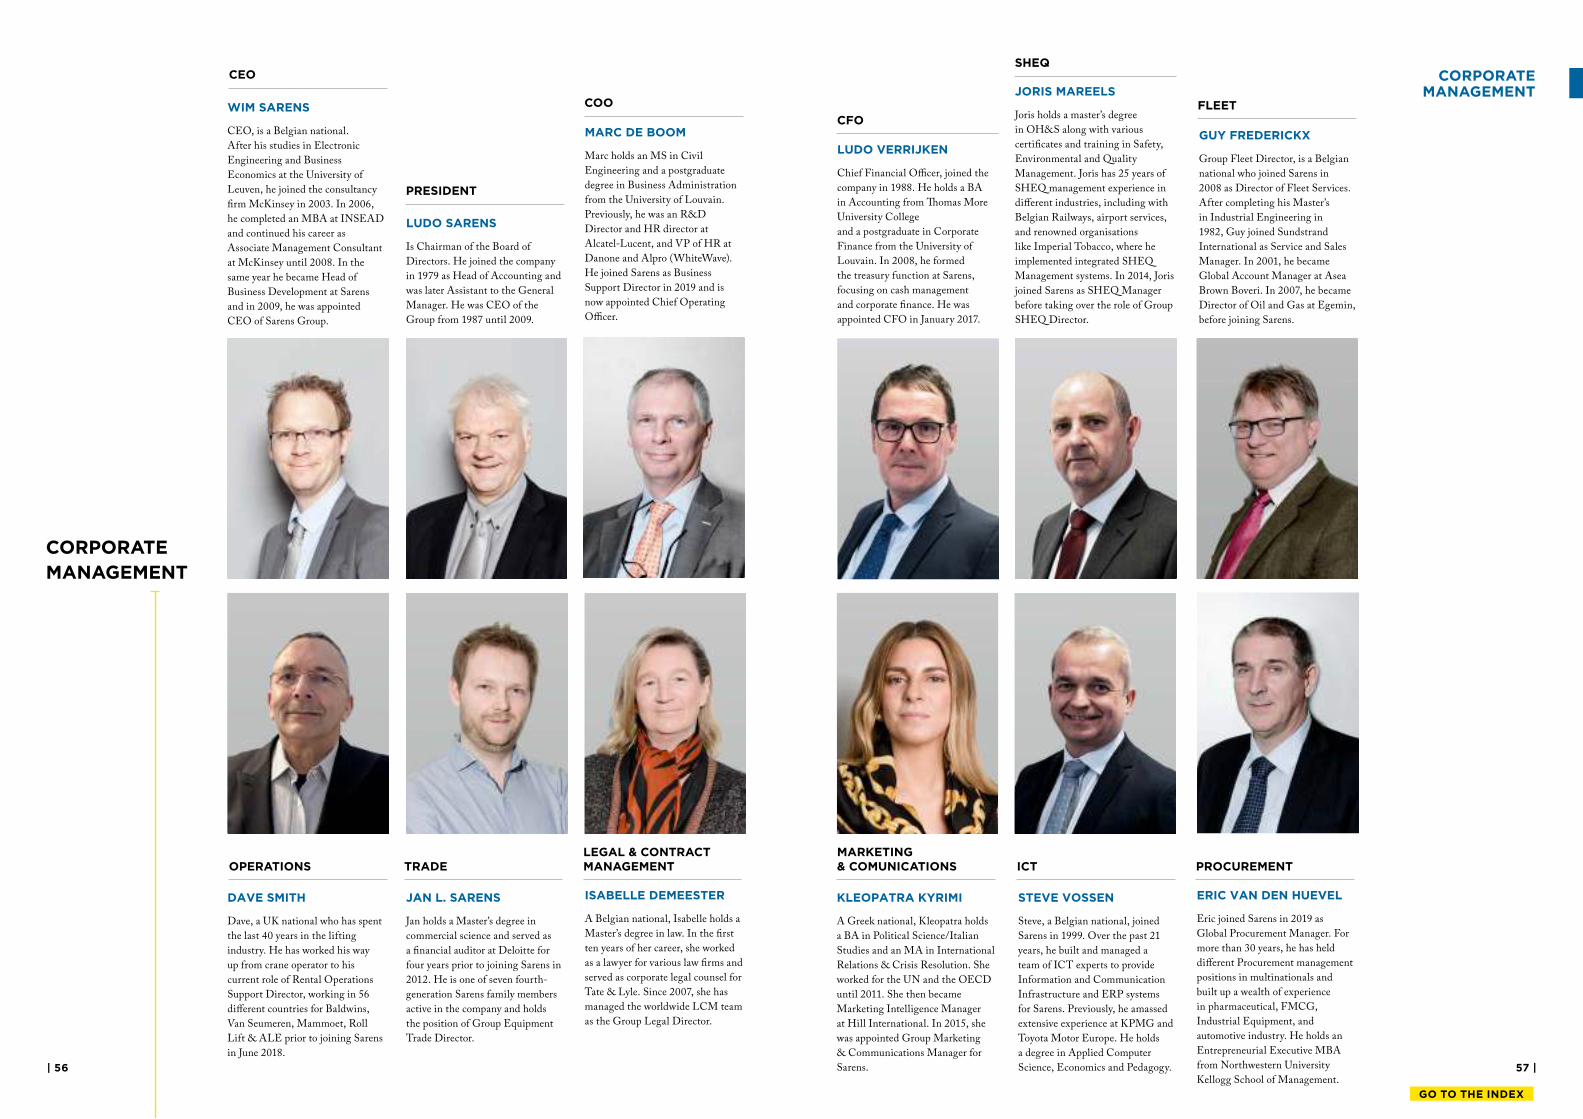
WIM SARENS
CEO, is a Belgian national.
After his studies in Electronic
Engineering and Business
Economics at the University of
Leuven, he joined the consultancy
irm McKinsey in 2003. In 2006,
he completed an MBA at INSEAD
and continued his career as
Associate Management Consultant
at McKinsey until 2008. In the
same year he became Head of
Business Development at Sarens
and in 2009, he was appointed
CEO of Sarens Group.
DAVE SMITH
Dave, a UK national who has spent
the last 40 years in the lifting
industry. He has worked his way
up from crane operator to his
current role of Rental Operations
Support Director, working in 56
diferent countries for Baldwins,
Van Seumeren, Mammoet, Roll
Lift & ALE prior to joining Sarens
in June 2018.
JORIS MAREELS
Joris holds a master’s degree
in OH&S along with various
certiicates and training in Safety,
Environmental and Quality
Management. Joris has 25 years of
SHEQ management experience in
diferent industries, including with
Belgian Railways, airport services,
and renowned organisations
like Imperial Tobacco, where he
implemented integrated SHEQ
Management systems. In 2014, Joris
joined Sarens as SHEQ Manager
before taking over the role of Group
SHEQ Director.
LUDO VERRIJKEN
Chief Financial Oicer, joined the
company in 1988. He holds a BA
in Accounting from homas More
University College
and a postgraduate in Corporate
Finance from the University of
Louvain. In 2008, he formed
the treasury function at Sarens,
focusing on cash management
and corporate inance. He was
appointed CFO in January 2017.
KLEOPATRA KYRIMI
A Greek national, Kleopatra holds
a BA in Political Science/Italian
Studies and an MA in International
Relations & Crisis Resolution. She
worked for the UN and the OECD
until 2011. She then became
Marketing Intelligence Manager
at Hill International. In 2015, she
was appointed Group Marketing
& Communications Manager for
Sarens.
MARC DE BOOM
Marc holds an MS in Civil
Engineering and a postgraduate
degree in Business Administration
from the University of Louvain.
Previously, he was an R&D
Director and HR director at
Alcatel-Lucent, and VP of HR at
Danone and Alpro (WhiteWave).
He joined Sarens as Business
Support Director in 2019 and is
now appointed Chief Operating
Oicer.
ISABELLE DEMEESTER
A Belgian national, Isabelle holds a
Master’s degree in law. In the irst
ten years of her career, she worked
as a lawyer for various law irms and
served as corporate legal counsel for
Tate & Lyle. Since 2007, she has
managed the worldwide LCM team
as the Group Legal Director.
ERIC VAN DEN HUEVEL
Eric joined Sarens in 2019 as
Global Procurement Manager. For
more than 30 years, he has held
diferent Procurement management
positions in multinationals and
built up a wealth of experience
in pharmaceutical, FMCG,
Industrial Equipment, and
automotive industry. He holds an
Entrepreneurial Executive MBA
from Northwestern University
Kellogg School of Management.
LUDO SARENS
Is Chairman of the Board of
Directors. He joined the company
in 1979 as Head of Accounting and
was later Assistant to the General
Manager. He was CEO of the
Group from 1987 until 2009.
JAN L. SARENS
Jan holds a Master’s degree in
commercial science and served as
a inancial auditor at Deloitte for
four years prior to joining Sarens in
2012. He is one of seven fourth-
generation Sarens family members
active in the company and holds
the position of Group Equipment
Trade Director.
GUY FREDERICKX
Group Fleet Director, is a Belgian
national who joined Sarens in
2008 as Director of Fleet Services.
After completing his Master’s
in Industrial Engineering in
1982, Guy joined Sundstrand
International as Service and Sales
Manager. In 2001, he became
Global Account Manager at Asea
Brown Boveri. In 2007, he became
Director of Oil and Gas at Egemin,
before joining Sarens.
STEVE VOSSEN
Steve, a Belgian national, joined
Sarens in 1999. Over the past 21
years, he built and managed a
team of ICT experts to provide
Information and Communication
Infrastructure and ERP systems
for Sarens. Previously, he amassed
extensive experience at KPMG and
Toyota Motor Europe. He holds
a degree in Applied Computer
Science, Economics and Pedagogy.
CORPORATE MANAGEMENT
CEO
PRESIDENT
COO
SHEQ
CFOFLEET
OPERATIONS TRADELEGAL & CONTRACT MANAGEMENT
MARKETING & COMUNICATIONS ICT PROCUREMENT
59 |
FINANCIAL REPORT 2019
61 || 60
GO TO THE INDEX
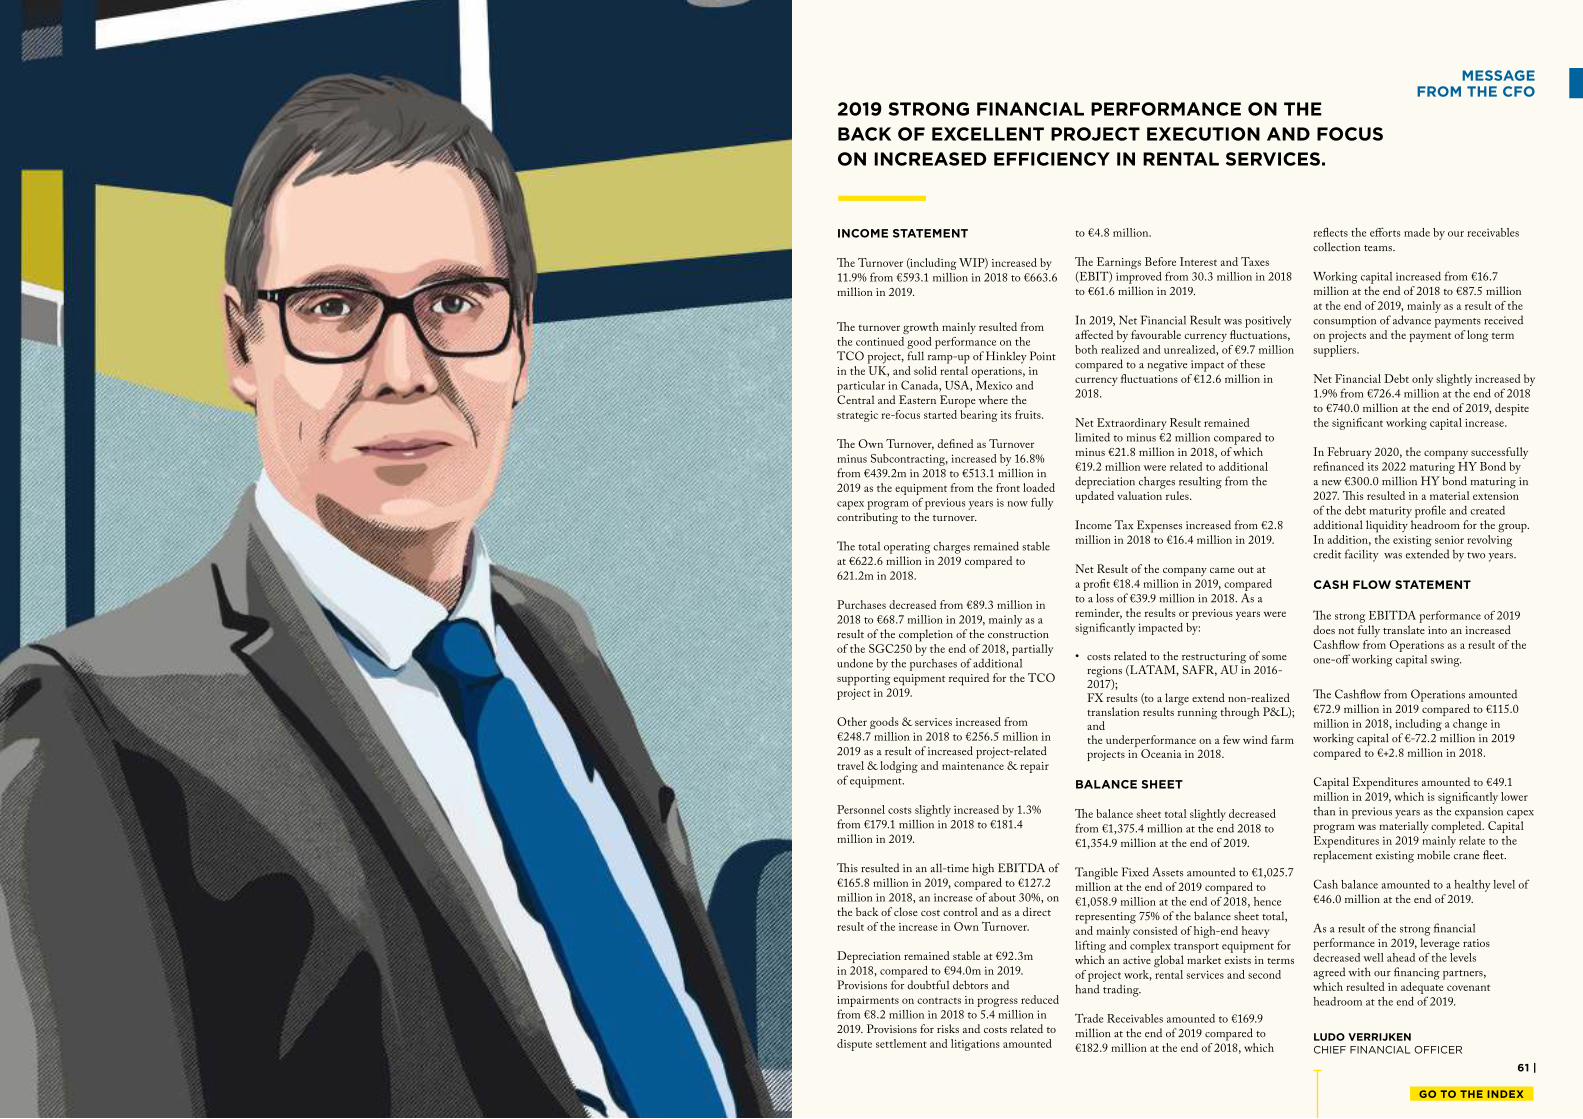
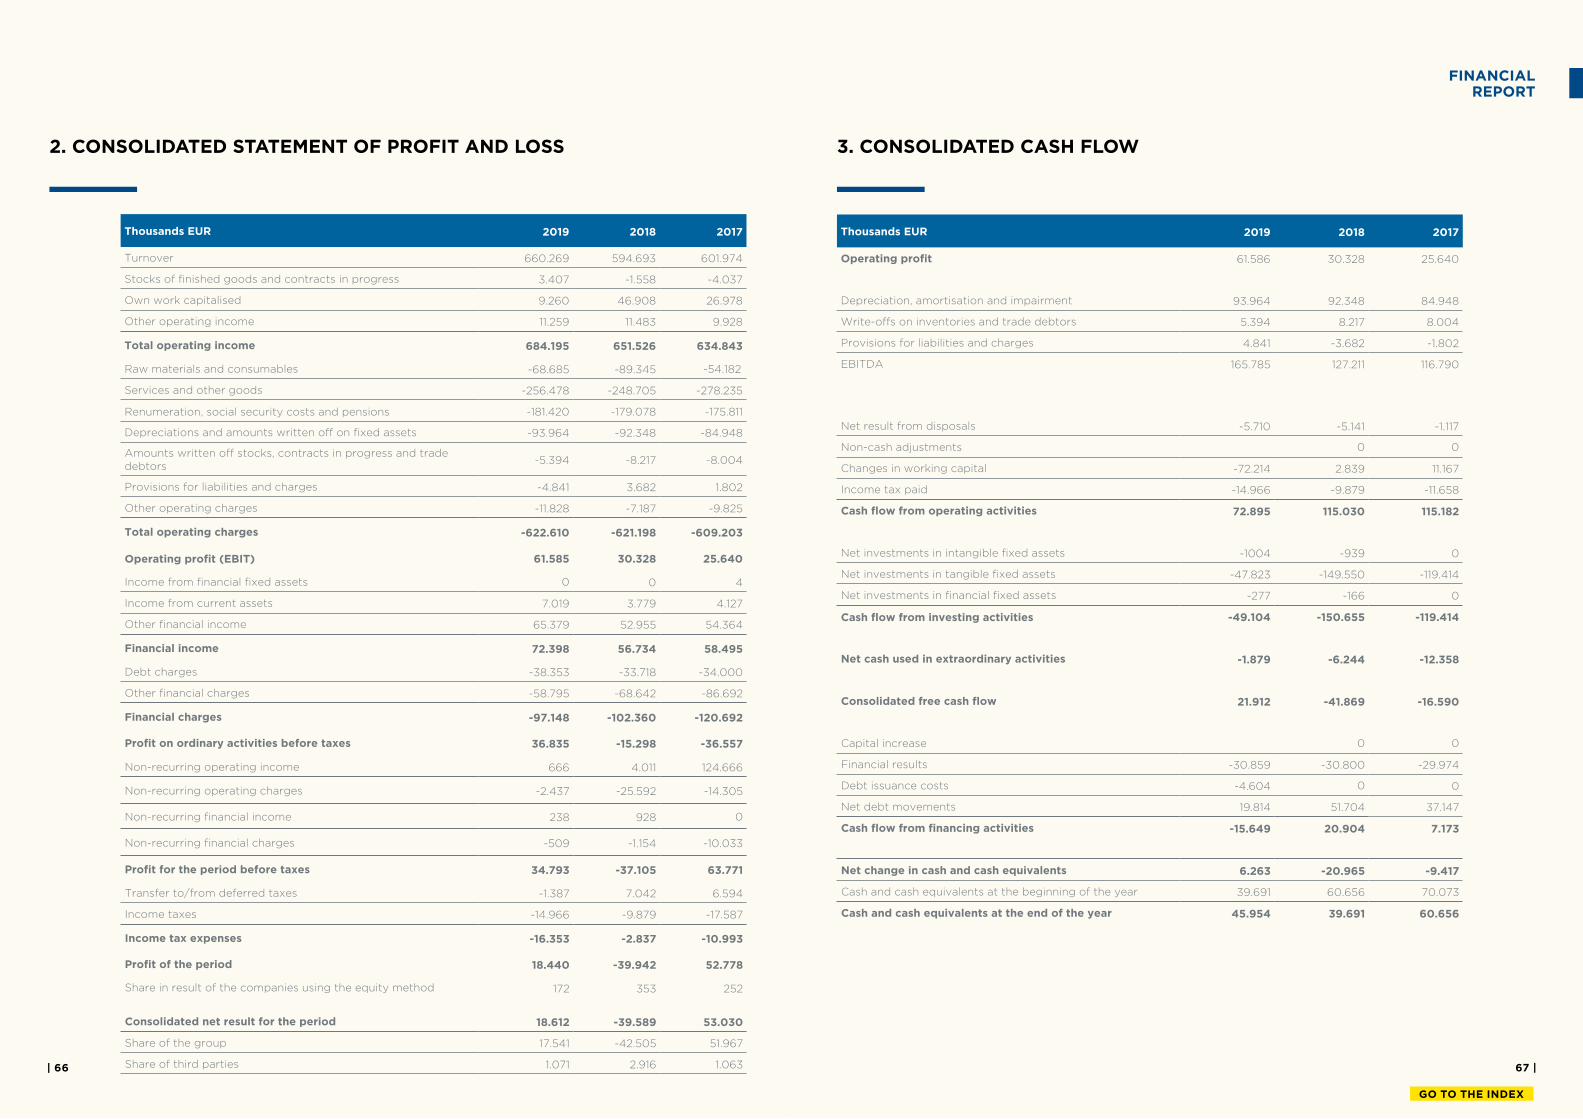
INCOME STATEMENT he Turnover (including WIP) increased by 11.9% from €593.1 million in 2018 to €663.6 million in 2019.
he turnover growth mainly resulted from the continued good performance on the TCO project, full ramp-up of Hinkley Point in the UK, and solid rental operations, in particular in Canada, USA, Mexico and Central and Eastern Europe where the strategic re-focus started bearing its fruits. he Own Turnover, deined as Turnover minus Subcontracting, increased by 16.8% from €439.2m in 2018 to €513.1 million in 2019 as the equipment from the front loaded capex program of previous years is now fully contributing to the turnover. he total operating charges remained stable at €622.6 million in 2019 compared to 621.2m in 2018. Purchases decreased from €89.3 million in 2018 to €68.7 million in 2019, mainly as a result of the completion of the construction of the SGC250 by the end of 2018, partially undone by the purchases of additional supporting equipment required for the TCO project in 2019. Other goods & services increased from €248.7 million in 2018 to €256.5 million in 2019 as a result of increased project-related travel & lodging and maintenance & repair of equipment. Personnel costs slightly increased by 1.3% from €179.1 million in 2018 to €181.4 million in 2019. his resulted in an all-time high EBITDA of €165.8 million in 2019, compared to €127.2 million in 2018, an increase of about 30%, on the back of close cost control and as a direct result of the increase in Own Turnover. Depreciation remained stable at €92.3m in 2018, compared to €94.0m in 2019. Provisions for doubtful debtors and impairments on contracts in progress reduced from €8.2 million in 2018 to 5.4 million in 2019. Provisions for risks and costs related to dispute settlement and litigations amounted
to €4.8 million. he Earnings Before Interest and Taxes (EBIT) improved from 30.3 million in 2018 to €61.6 million in 2019. In 2019, Net Financial Result was positively afected by favourable currency luctuations, both realized and unrealized, of €9.7 million compared to a negative impact of these currency luctuations of €12.6 million in 2018. Net Extraordinary Result remained limited to minus €2 million compared to minus €21.8 million in 2018, of which €19.2 million were related to additional depreciation charges resulting from the updated valuation rules. Income Tax Expenses increased from €2.8 million in 2018 to €16.4 million in 2019. Net Result of the company came out at a proit €18.4 million in 2019, compared to a loss of €39.9 million in 2018. As a reminder, the results or previous years were signiicantly impacted by:
• costs related to the restructuring of some regions (LATAM, SAFR, AU in 2016-2017); FX results (to a large extend non-realized translation results running through P&L); and the underperformance on a few wind farm projects in Oceania in 2018.
BALANCE SHEET he balance sheet total slightly decreased from €1,375.4 million at the end 2018 to €1,354.9 million at the end of 2019. Tangible Fixed Assets amounted to €1,025.7 million at the end of 2019 compared to €1,058.9 million at the end of 2018, hence representing 75% of the balance sheet total, and mainly consisted of high-end heavy lifting and complex transport equipment for which an active global market exists in terms of project work, rental services and second hand trading. Trade Receivables amounted to €169.9 million at the end of 2019 compared to €182.9 million at the end of 2018, which
relects the eforts made by our receivables collection teams. Working capital increased from €16.7 million at the end of 2018 to €87.5 million at the end of 2019, mainly as a result of the consumption of advance payments received on projects and the payment of long term suppliers. Net Financial Debt only slightly increased by 1.9% from €726.4 million at the end of 2018 to €740.0 million at the end of 2019, despite the signiicant working capital increase. In February 2020, the company successfully reinanced its 2022 maturing HY Bond by a new €300.0 million HY bond maturing in 2027. his resulted in a material extension of the debt maturity proile and created additional liquidity headroom for the group. In addition, the existing senior revolving credit facility was extended by two years.
CASH FLOW STATEMENT
he strong EBITDA performance of 2019 does not fully translate into an increased Cashlow from Operations as a result of the one-of working capital swing.
he Cashlow from Operations amounted €72.9 million in 2019 compared to €115.0 million in 2018, including a change in working capital of €-72.2 million in 2019 compared to €+2.8 million in 2018. Capital Expenditures amounted to €49.1 million in 2019, which is signiicantly lower than in previous years as the expansion capex program was materially completed. Capital Expenditures in 2019 mainly relate to the replacement existing mobile crane leet. Cash balance amounted to a healthy level of €46.0 million at the end of 2019. As a result of the strong inancial performance in 2019, leverage ratios decreased well ahead of the levels agreed with our inancing partners, which resulted in adequate covenant headroom at the end of 2019.
2019 STRONG FINANCIAL PERFORMANCE ON THE
BACK OF EXCELLENT PROJECT EXECUTION AND FOCUS
ON INCREASED EFFICIENCY IN RENTAL SERVICES.
MESSAGE FROM THE CFO
LUDO VERRIJKENCHIEF FINANCIAL OFFICER
63 |
GO TO THE INDEX
| 62
65 || 64
GO TO THE INDEX
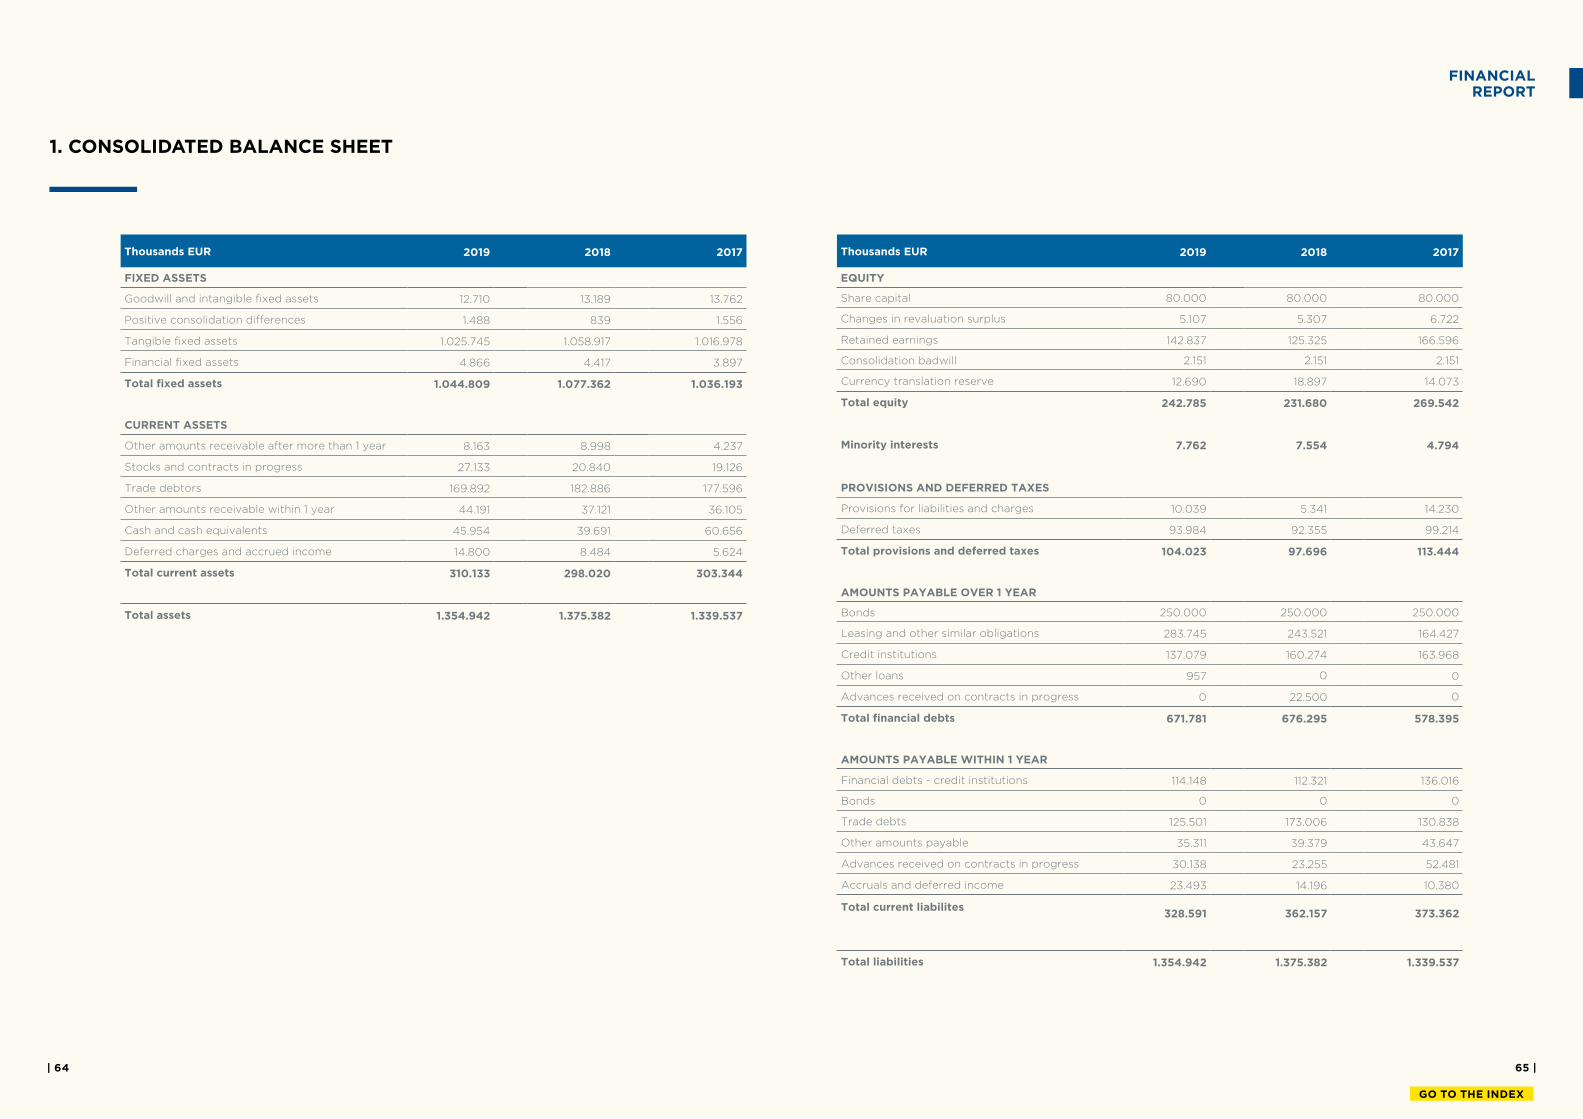
Thousands EUR 2019 2018 2017
FIXED ASSETS
Goodwill and intangible ixed assets 12.710 13.189 13.762
Positive consolidation diferences 1.488 839 1.556
Tangible ixed assets 1.025.745 1.058.917 1.016.978
Financial ixed assets 4.866 4.417 3.897
Total ixed assets 1.044.809 1.077.362 1.036.193
CURRENT ASSETS
Other amounts receivable after more than 1 year 8.163 8.998 4.237
Stocks and contracts in progress 27.133 20.840 19.126
Trade debtors 169.892 182.886 177.596
Other amounts receivable within 1 year 44.191 37.121 36.105
Cash and cash equivalents 45.954 39.691 60.656
Deferred charges and accrued income 14.800 8.484 5.624
Total current assets 310.133 298.020 303.344
Total assets 1.354.942 1.375.382 1.339.537
1. CONSOLIDATED BALANCE SHEET
Thousands EUR 2019 2018 2017
EQUITY
Share capital 80.000 80.000 80.000
Changes in revaluation surplus 5.107 5.307 6.722
Retained earnings 142.837 125.325 166.596
Consolidation badwill 2.151 2.151 2.151
Currency translation reserve 12.690 18.897 14.073
Total equity 242.785 231.680 269.542
Minority interests 7.762 7.554 4.794
PROVISIONS AND DEFERRED TAXES
Provisions for liabilities and charges 10.039 5.341 14.230
Deferred taxes 93.984 92.355 99.214
Total provisions and deferred taxes 104.023 97.696 113.444
AMOUNTS PAYABLE OVER 1 YEAR
Bonds 250.000 250.000 250.000
Leasing and other similar obligations 283.745 243.521 164.427
Credit institutions 137.079 160.274 163.968
Other loans 957 0 0
Advances received on contracts in progress 0 22.500 0
Total inancial debts 671.781 676.295 578.395
AMOUNTS PAYABLE WITHIN 1 YEAR
Financial debts - credit institutions 114.148 112.321 136.016
Bonds 0 0 0
Trade debts 125.501 173.006 130.838
Other amounts payable 35.311 39.379 43.647
Advances received on contracts in progress 30.138 23.255 52.481
Accruals and deferred income 23.493 14.196 10.380
Total current liabilites328.591 362.157 373.362
Total liabilities 1.354.942 1.375.382 1.339.537
FINANCIAL REPORT
67 || 66
GO TO THE INDEX
Thousands EUR 2019 2018 2017
Turnover 660.269 594.693 601.974
Stocks of inished goods and contracts in progress 3.407 -1.558 -4.037
Own work capitalised 9.260 46.908 26.978
Other operating income 11.259 11.483 9.928
Total operating income 684.195 651.526 634.843
Raw materials and consumables -68.685 -89.345 -54.182
Services and other goods -256.478 -248.705 -278.235
Renumeration, social security costs and pensions -181.420 -179.078 -175.811
Depreciations and amounts written of on ixed assets -93.964 -92.348 -84.948
Amounts written of stocks, contracts in progress and trade debtors
-5.394 -8.217 -8.004
Provisions for liabilities and charges -4.841 3.682 1.802
Other operating charges -11.828 -7.187 -9.825
Total operating charges -622.610 -621.198 -609.203
Operating proit (EBIT) 61.585 30.328 25.640
Income from inancial ixed assets 0 0 4
Income from current assets 7.019 3.779 4.127
Other inancial income 65.379 52.955 54.364
Financial income 72.398 56.734 58.495
Debt charges -38.353 -33.718 -34.000
Other inancial charges -58.795 -68.642 -86.692
Financial charges -97.148 -102.360 -120.692
Proit on ordinary activities before taxes 36.835 -15.298 -36.557
Non-recurring operating income 666 4.011 124.666
Non-recurring operating charges -2.437 -25.592 -14.305
Non-recurring inancial income 238 928 0
Non-recurring inancial charges -509 -1.154 -10.033
Proit for the period before taxes 34.793 -37.105 63.771
Transfer to/from deferred taxes -1.387 7.042 6.594
Income taxes -14.966 -9.879 -17.587
Income tax expenses -16.353 -2.837 -10.993
Proit of the period 18.440 -39.942 52.778
Share in result of the companies using the equity method 172 353 252
Consolidated net result for the period 18.612 -39.589 53.030
Share of the group 17.541 -42.505 51.967
Share of third parties 1.071 2.916 1.063
2. CONSOLIDATED STATEMENT OF PROFIT AND LOSS
Thousands EUR 2019 2018 2017
Operating proit 61.586 30.328 25.640
Depreciation, amortisation and impairment 93.964 92.348 84.948
Write-ofs on inventories and trade debtors 5.394 8.217 8.004
Provisions for liabilities and charges 4.841 -3.682 -1.802
EBITDA 165.785 127.211 116.790
Net result from disposals -5.710 -5.141 -1.117
Non-cash adjustments 0 0
Changes in working capital -72.214 2.839 11.167
Income tax paid -14.966 -9.879 -11.658
Cash low from operating activities 72.895 115.030 115.182
Net investments in intangible ixed assets -1004 -939 0
Net investments in tangible ixed assets -47.823 -149.550 -119.414
Net investments in inancial ixed assets -277 -166 0
Cash low from investing activities -49.104 -150.655 -119.414
Net cash used in extraordinary activities -1.879 -6.244 -12.358
Consolidated free cash low 21.912 -41.869 -16.590
Capital increase 0 0
Financial results -30.859 -30.800 -29.974
Debt issuance costs -4.604 0 0
Net debt movements 19.814 51.704 37.147
Cash low from inancing activities -15.649 20.904 7.173
Net change in cash and cash equivalents 6.263 -20.965 -9.417
Cash and cash equivalents at the beginning of the year 39.691 60.656 70.073
Cash and cash equivalents at the end of the year 45.954 39.691 60.656
3. CONSOLIDATED CASH FLOW
FINANCIAL REPORT
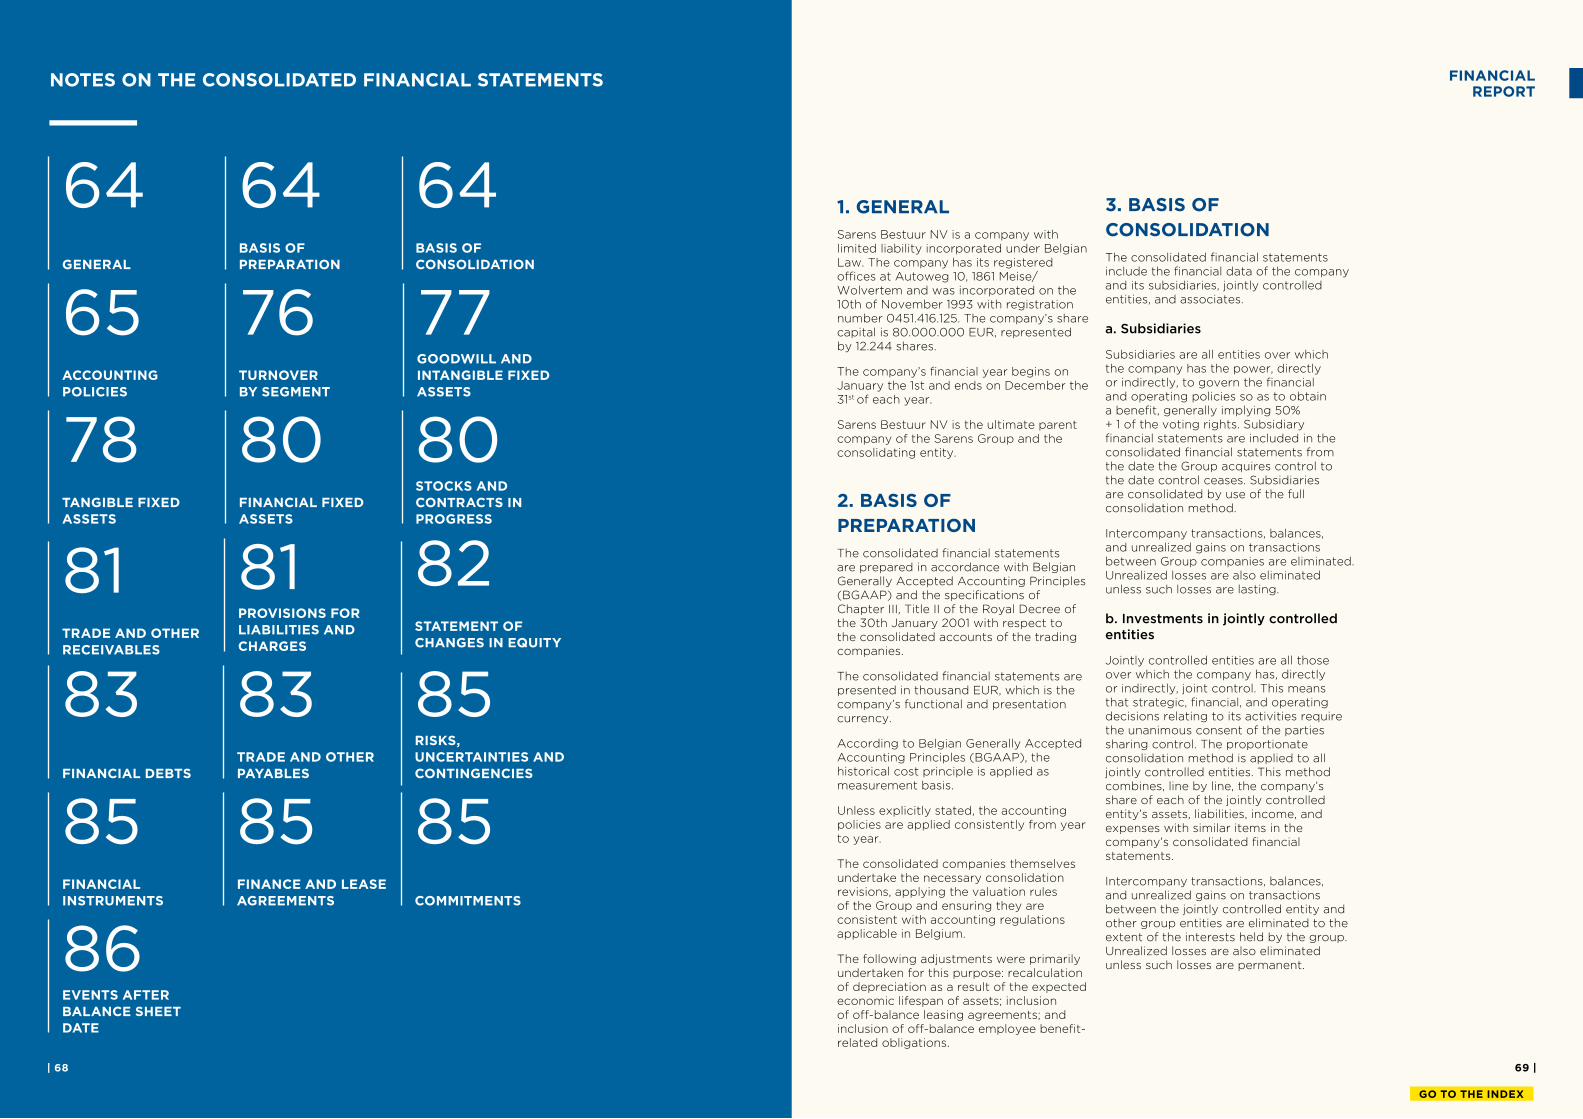
69 |
GO TO THE INDEX
| 68
NOTES ON THE CONSOLIDATED FINANCIAL STATEMENTS
64GENERAL
65ACCOUNTING POLICIES
77GOODWILL AND INTANGIBLE FIXED ASSETS
80STOCKS AND CONTRACTS IN PROGRESS
82STATEMENT OF CHANGES IN EQUITY
85RISKS, UNCERTAINTIES AND CONTINGENCIES
64BASIS OF PREPARATION
81TRADE AND OTHER RECEIVABLES
83FINANCIAL DEBTS
85FINANCIAL INSTRUMENTS
85COMMITMENTS
64BASIS OF CONSOLIDATION
76TURNOVER BY SEGMENT
80FINANCIAL FIXED ASSETS
78TANGIBLE FIXED ASSETS
81PROVISIONS FOR LIABILITIES AND CHARGES
83TRADE AND OTHER PAYABLES
85FINANCE AND LEASE AGREEMENTS
86EVENTS AFTER BALANCE SHEET DATE
1. GENERAL
Sarens Bestuur NV is a company with limited liability incorporated under Belgian Law. The company has its registered oices at Autoweg 10, 1861 Meise/Wolvertem and was incorporated on the 10th of November 1993 with registration number 0451.416.125. The company’s share capital is 80.000.000 EUR, represented by 12.244 shares.
The company’s inancial year begins on January the 1st and ends on December the 31st of each year.
Sarens Bestuur NV is the ultimate parent company of the Sarens Group and the consolidating entity.
2. BASIS OF
PREPARATION
The consolidated inancial statements are prepared in accordance with Belgian Generally Accepted Accounting Principles (BGAAP) and the speciications of Chapter III, Title II of the Royal Decree of the 30th January 2001 with respect to the consolidated accounts of the trading companies.
The consolidated inancial statements are presented in thousand EUR, which is the company’s functional and presentation currency.
According to Belgian Generally Accepted Accounting Principles (BGAAP), the historical cost principle is applied as measurement basis.
Unless explicitly stated, the accounting policies are applied consistently from year to year.
The consolidated companies themselves undertake the necessary consolidation revisions, applying the valuation rules of the Group and ensuring they are consistent with accounting regulations applicable in Belgium.
The following adjustments were primarily undertaken for this purpose: recalculation of depreciation as a result of the expected economic lifespan of assets; inclusion of of-balance leasing agreements; and inclusion of of-balance employee beneit-related obligations.
3. BASIS OF
CONSOLIDATION
The consolidated inancial statements include the inancial data of the company and its subsidiaries, jointly controlled entities, and associates. a. Subsidiaries
Subsidiaries are all entities over which the company has the power, directly or indirectly, to govern the inancial and operating policies so as to obtain a beneit, generally implying 50% + 1 of the voting rights. Subsidiary inancial statements are included in the consolidated inancial statements from the date the Group acquires control to the date control ceases. Subsidiaries are consolidated by use of the full consolidation method.
Intercompany transactions, balances, and unrealized gains on transactions between Group companies are eliminated. Unrealized losses are also eliminated unless such losses are lasting. b. Investments in jointly controlled entities
Jointly controlled entities are all those over which the company has, directly or indirectly, joint control. This means that strategic, inancial, and operating decisions relating to its activities require the unanimous consent of the parties sharing control. The proportionate consolidation method is applied to all jointly controlled entities. This method combines, line by line, the company’s share of each of the jointly controlled entity’s assets, liabilities, income, and expenses with similar items in the company’s consolidated inancial statements.
Intercompany transactions, balances, and unrealized gains on transactions between the jointly controlled entity and other group entities are eliminated to the extent of the interests held by the group. Unrealized losses are also eliminated unless such losses are permanent.
FINANCIAL REPORT
71 || 70
GO TO THE INDEX
c. Investments in associates
Associates are all entities over which the company has, directly or indirectly, a signiicant inluence and which are neither subsidiaries nor jointly controlled entities. This is presumed if the company holds at least 20% of the voting rights. Associates are consolidated by application of the equity method. The equity method is a method whereby the investment is initially recognized at cost and adjusted thereafter for the post-acquisition change in the group’s share of the net assets of the associate.
4. ACCOUNTING POLICIES
a. General
The accounting information disclosed in the consolidated inancial statements of Sarens Bestuur NV provides a true and fair view of its statement of inancial position and income statement, in conformity with BGAAP. However, inancial statements do not provide all the information that users may need to make economic decisions since they represent the inancial efects of past events and do not necessarily present non-inancial information.
Assets are recognized in the statement of inancial position when it is considered suiciently certain that future economic beneits will low to the entity and the cost of the asset can be measured reliably. Liabilities are recognized in the statement of inancial position when it is probable that the settlement of the liability will result in an outlow of resources embodying economic beneits, and the amount at which the settlement will take place can be measured reliably. In both circumstances probably means more likely than not.
Income is recognized in the income statement when an increase in future economic beneits related to an increase in an asset or a decrease of a liability has arisen that can be measured reliably. Expenses are recognized in the income statement when a decrease in future economic beneits related to a decrease in an asset or an increase of a liability has arisen that can be measured reliably.
If a transaction results in the termination of future economic beneits or when all risks relating to an asset or a liability are transferred to a third party, the asset or liability is derecognized in the statement of inancial position.
b. Use of estimates
The principle of substance over form is applied, whereby the ultimate goal is to include all details which are of any importance to forming an opinion on the assets, the inancial position, and the results of the company.
During the period of the inancial statements, management is required to form judgments, assumptions, and estimates, about the carrying amounts of assets and liabilities. The judgments, estimates and assumptions are reviewed on an on-going basis. Changes in estimates, are recognized in the period in which the revision is made and in future periods for which the revision has consequences. However, the resulting estimates will not always be equal to the actual results.
c. Foreign currencies
c.i. Foreign currency translation
Each entity of the Group reports in its own functional currency which is the currency, of the primary economic environment in which the entity operates. If a foreign operation reports in a functional currency diferent from the Group’s reporting currency, the inancial statements of the foreign operation are translated as follows:
• Assets and liabilities are translated at the closing exchange rate published by the European Central Bank;
• Income and expenses are translated at the average exchange rate for the year;
• Shareholder’s equity and its components, consolidation goodwill, and participations are translated at the historical exchange rate.
The resulting translation adjustments are recorded in shareholder’s equity under the caption “Translation Diferences”. When a foreign operation is partially disposed of or
sold, exchange diferences that were recorded under the caption “currency translation reserve” are recognized in the income statement as part of the gain or loss on sale.
c.ii. Foreign currency transactions
Foreign currency transactions are recognized during the period in the functional currency of each entity at the exchange rate applicable at the date of the transaction. The transaction date is the date at which the transaction irst qualiies for recognition.
Subsequently, monetary assets and liabilities denominated in foreign currencies are translated at the closing rate of the balance sheet date. Gains and losses resulting from the settlement of foreign currency transactions and from the translation of monetary assets (see above) are recognized in the income statement as a inancial result.
From 2013 onwards the group presents unrealized exchange diferences on intercompany loans of a permanent nature and for which the group has the intention to incorporate these in the capital of the subsidiary (quasi-equity), no longer as a inancial result but directly under the heading “currency translation reserve” in equity. The accumulated efect of this rule amounts to -10,1 million EUR per December 2019 and is recorded within the currency translation reserve.
Non-monetary assets and liabilities which are carried in terms of historical cost denominated in a foreign currency are measured using the exchange rate at the date of the transaction.
d. Consolidation diferences
d.i. Negative consolidation diferences (liabilities)/badwill
The negative diference between the purchase price of a new participating interest and the net book value of the net assets obtained upon the acquisition (the negative price when it comes to the acquisition of shares)
is included under this heading.
The initial consolidation diferences with respect to existing participating interests are compensated as long as a negative balance remains for the liabilities on the balance sheet.
The negative consolidation diferences in the consolidated annual accounts amount to 2,15 million EUR.
d.ii. Positive consolidation diferences/goodwill
The positive diference between the purchase price of a new participating interest and the net book value of the net assets obtained upon the acquisition (the additional price when it comes to the acquisition of shares) is included under this heading.
The positive consolidation diferences are amortized on a straight-line basis over a period of 5 years. Positive consolidation diferences are subject to impairment if economic conditions or technological developments have a negative impact on the entity’s future business.
e. Formation expenses
Formation expenses are recorded at cost and depreciated at 100%.
Speciic transaction-related costs on debt issuance are capitalized at cost and depreciated on a straight-line basis over the period of the loan agreement.
FINANCIAL REPORT
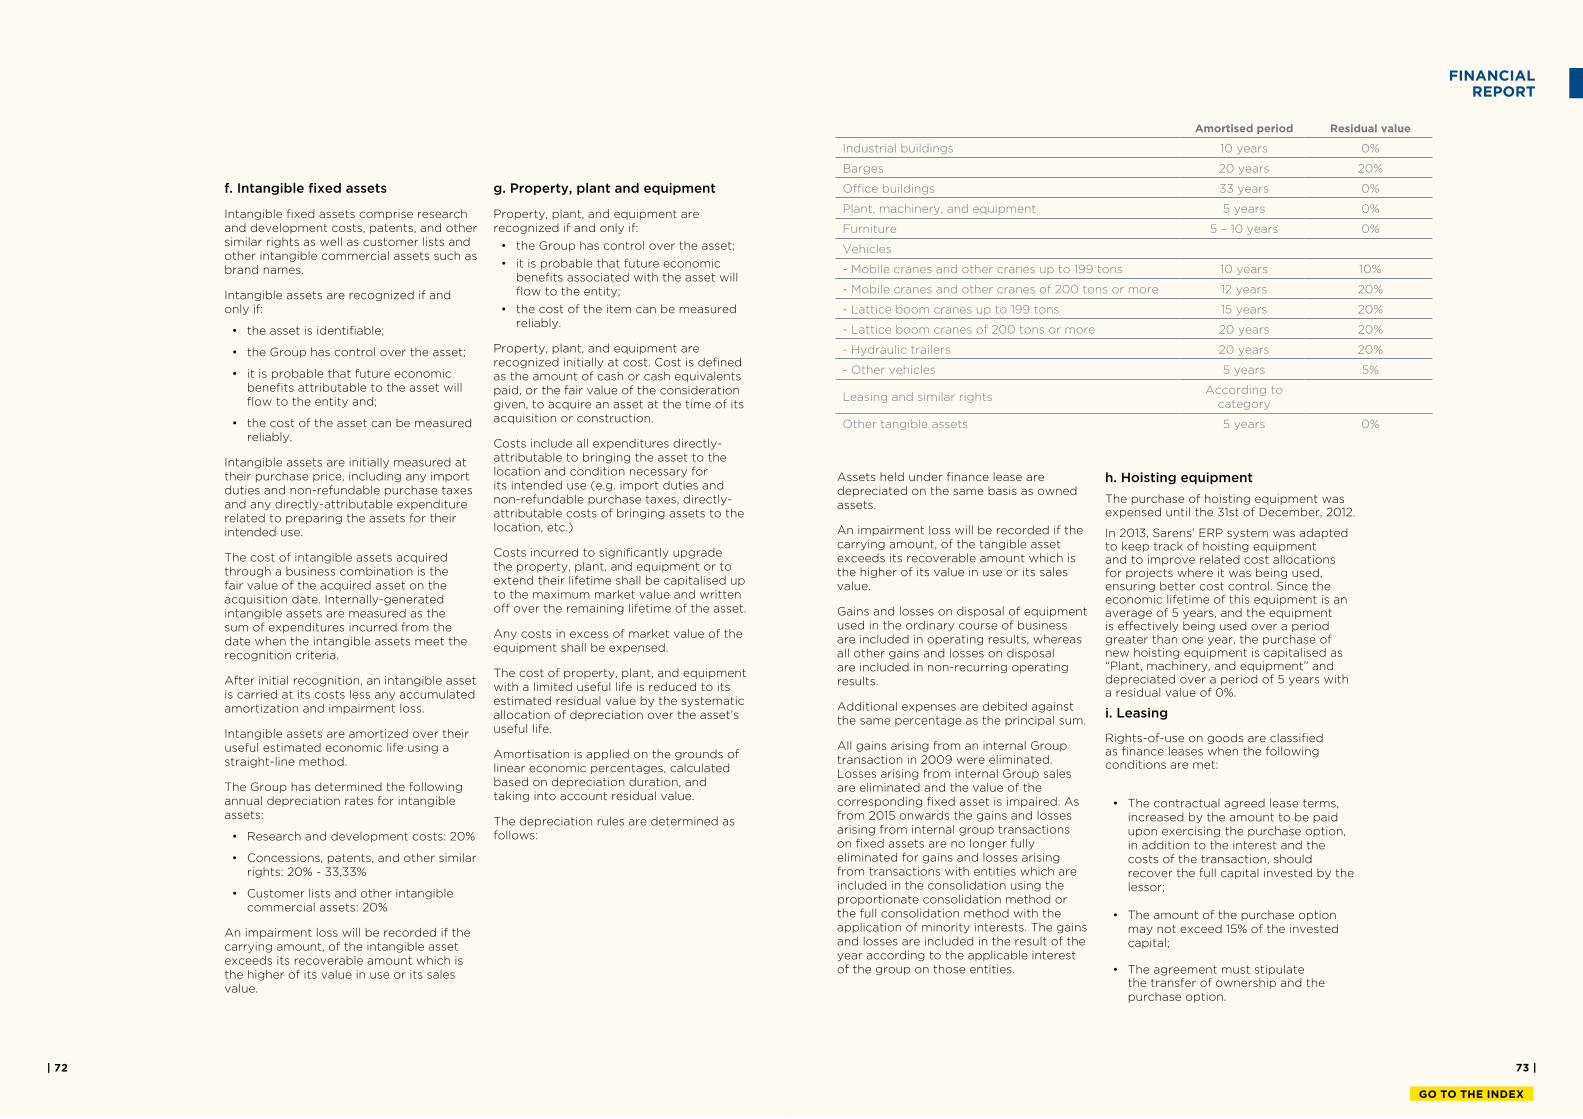
73 || 72
GO TO THE INDEX
f. Intangible ixed assets
Intangible ixed assets comprise research and development costs, patents, and other similar rights as well as customer lists and other intangible commercial assets such as brand names.
Intangible assets are recognized if and only if:
• the asset is identiiable;
• the Group has control over the asset;
• it is probable that future economic beneits attributable to the asset will low to the entity and;
• the cost of the asset can be measured reliably.
Intangible assets are initially measured at their purchase price, including any import duties and non-refundable purchase taxes and any directly-attributable expenditure related to preparing the assets for their intended use.
The cost of intangible assets acquired through a business combination is the fair value of the acquired asset on the acquisition date. Internally-generated intangible assets are measured as the sum of expenditures incurred from the date when the intangible assets meet the recognition criteria.
After initial recognition, an intangible asset is carried at its costs less any accumulated amortization and impairment loss.
Intangible assets are amortized over their useful estimated economic life using a straight-line method.
The Group has determined the following annual depreciation rates for intangible assets:
• Research and development costs: 20%
• Concessions, patents, and other similar rights: 20% - 33,33%
• Customer lists and other intangible commercial assets: 20%
An impairment loss will be recorded if the carrying amount, of the intangible asset exceeds its recoverable amount which is the higher of its value in use or its sales value.
g. Property, plant and equipment
Property, plant, and equipment are recognized if and only if:
• the Group has control over the asset;
• it is probable that future economic beneits associated with the asset will low to the entity;
• the cost of the item can be measured reliably.
Property, plant, and equipment are recognized initially at cost. Cost is deined as the amount of cash or cash equivalents paid, or the fair value of the consideration given, to acquire an asset at the time of its acquisition or construction.
Costs include all expenditures directly-attributable to bringing the asset to the location and condition necessary for its intended use (e.g. import duties and non-refundable purchase taxes, directly-attributable costs of bringing assets to the location, etc.)
Costs incurred to signiicantly upgrade the property, plant, and equipment or to extend their lifetime shall be capitalised up to the maximum market value and written of over the remaining lifetime of the asset.
Any costs in excess of market value of the equipment shall be expensed.
The cost of property, plant, and equipment with a limited useful life is reduced to its estimated residual value by the systematic allocation of depreciation over the asset’s useful life.
Amortisation is applied on the grounds of linear economic percentages, calculated based on depreciation duration, and taking into account residual value.
The depreciation rules are determined as follows:
Amortised period Residual value
Industrial buildings 10 years 0%
Barges 20 years 20%
Oice buildings 33 years 0%
Plant, machinery, and equipment 5 years 0%
Furniture 5 – 10 years 0%
Vehicles
- Mobile cranes and other cranes up to 199 tons 10 years 10%
- Mobile cranes and other cranes of 200 tons or more 12 years 20%
- Lattice boom cranes up to 199 tons 15 years 20%
- Lattice boom cranes of 200 tons or more 20 years 20%
- Hydraulic trailers 20 years 20%
- Other vehicles 5 years 5%
Leasing and similar rightsAccording to
category
Other tangible assets 5 years 0%
FINANCIAL REPORT
Assets held under inance lease are depreciated on the same basis as owned assets.
An impairment loss will be recorded if the carrying amount, of the tangible asset exceeds its recoverable amount which is the higher of its value in use or its sales value.
Gains and losses on disposal of equipment used in the ordinary course of business are included in operating results, whereas all other gains and losses on disposal are included in non-recurring operating results.
Additional expenses are debited against the same percentage as the principal sum.
All gains arising from an internal Group transaction in 2009 were eliminated. Losses arising from internal Group sales are eliminated and the value of the corresponding ixed asset is impaired. As from 2015 onwards the gains and losses arising from internal group transactions on ixed assets are no longer fully eliminated for gains and losses arising from transactions with entities which are included in the consolidation using the proportionate consolidation method or the full consolidation method with the application of minority interests. The gains and losses are included in the result of the year according to the applicable interest of the group on those entities.
h. Hoisting equipment
The purchase of hoisting equipment was expensed until the 31st of December, 2012.
In 2013, Sarens’ ERP system was adapted to keep track of hoisting equipment and to improve related cost allocations for projects where it was being used, ensuring better cost control. Since the economic lifetime of this equipment is an average of 5 years, and the equipment is efectively being used over a period greater than one year, the purchase of new hoisting equipment is capitalised as “Plant, machinery, and equipment” and depreciated over a period of 5 years with a residual value of 0%.
i. Leasing
Rights-of-use on goods are classiied as inance leases when the following conditions are met:
• The contractual agreed lease terms, increased by the amount to be paid upon exercising the purchase option, in addition to the interest and the costs of the transaction, should recover the full capital invested by the lessor;
• The amount of the purchase option may not exceed 15% of the invested capital;
• The agreement must stipulate the transfer of ownership and the purchase option.
75 || 74
GO TO THE INDEX
The Group has rights-of-use only on movable assets.
Rights-of-use on movable assets under which substantially all the risks and rewards of ownership are efectively retained by the lessor are classiied as operating leases. Lease payments under an operating lease are recognized as an expense.
j. Financial ixed assets
The Group classiies its inancial assets into the following categories:
• investments in associates;
• participating interests in other entities;
• other inancial ixed assets.
j.i. Investments in associates
Associates are all entities over which the Group has signiicant inluence but no control over strategic, inancial, and operating policies. This is presumed if the company holds at least 20% of the voting power. Investments in associates are accounted for using the equity method.
If the Group’s share of associate losses equals or exceeds its interests, the Group will discontinue recognizing its share of further losses. After the Group’s interest is reduced to nil, the Group recognizes a liability in cases where the Group incurred legal or constructive obligations or made payments on behalf of the associate.
The group’s share in the yearly proit or loss of the associate is included in the income statement under the caption “share of results in associates”.
j.ii. Participating interest in other entities
Participating interest in other entities refers to all entities over which the Group has no signiicant inluence but with which it wants to hold or build a long-term relationship.
Participating interest in other entities are initially recorded at acquisition cost and are subsequently measured at the lowest of their acquisition value or fair value, which is the amount at which the interest could be bought or sold in a transaction between knowledgeable and willing parties in an arm’s length transaction.
j.iii. Other inancial assets
Other inancial assets comprise mainly long-term paid guarantees. Other inancial assets are measured at their nominal value. The Group does not discount any interest-free, long-term receivables included in other inancial assets.
k. Inventories
The Group classiies its inventories into the following categories:
• raw materials and consumables, including tires, spare parts, fuel, consumables, and tools;
• goods purchased for resale, including all assets purchased with intent to resell;
• contracts in progress.
k.i. Raw materials, consumables and goods purchased
Raw materials, consumables, and goods purchased for resale are measured at the lower of cost of purchase, and net realizable value. Cost of purchase is based on the FIFO method, assuming that the goods purchased irst are sold irst. If the net realizable value is lower than the cost of purchase the Group immediately writes of the excess in proit or loss.
k.ii. Contracts in progress
Because of the nature of activities in which the group is involved, the date at which the contract activity is started and the date at which the activity is completed usually falls in a diferent accounting period. The Group uses the percentage of completion method in order to allocate contract revenue and contract costs to the accounting period in which the work is performed.
Therefore, the Group recognizes in inventories a gross amount, for all contracts in progress for which costs incurred plus recognized proits (or less recognized losses) exceed the progress billing. In case the estimated project outcome shows a loss, the Group recognizes a provision for the estimated future loss exceeding the project revenue.
l. Trade receivables
Trade receivables are measured at nominal value, less the appropriate impairments for amounts regarded as unrecoverable. At each reporting date
FINANCIAL REPORT
the Group assess whether there are indications that a trade receivable should be impaired. A trade receivable is impaired if it is probable that the entity will not, or will only partially, collect the amounts due.
m. Cash and cash equivalents
Cash and cash equivalents are valued at nominal value.
n. Prepayments and accrued income
The accrued income and deferred charges are reported pro rata temporis on the balance sheet date, based on the facts known.
o. Investment grants
Investment grants are reported after deduction of deferred taxes, which are included under the caption “Provisions and deferred taxes”.
p. Revaluation surplus
Until 2008, gains realised on the sale of tangible ixed assets within the Group were not eliminated because these transactions took place at arm’s length. The gains realized through these transactions were eliminated from the result of the year and reported as a revaluation surplus (included in equity). Despite the fact that these gains are taxed in the statutory accounts of the subsidiaries involved, no deferred tax asset was accounted for. At the moment ixed asset items are sold to a third party, the revaluation surplus will be released through the income statement.
As from 2009 all gains realized on the sale of tangible ixed assets have been eliminated on the income statement.
q. Amounts payable
These liabilities are valued at nominal value.
r. Accrued charges and deferred income
The accrued charges and deferred income are reported pro rata on the balance sheet date, based on the facts known.
s. Non-controlling interests
Non-controlling interests represent the
share of minority shareholders in the equity of subsidiaries that are not fully owned by the Group. Non-controlling interests are initially measured at the non-controlling shareholders proportion in the net assets of the acquired subsidiary. Subsequently, they are adjusted by the appropriate non-controlling interest share of proits or losses.
Minority interests represent the portion of the equity of the consolidated company that does not belong to the Group, but to third party shareholders. In case of losses, the loss assigned to the minority shareholder is limited to the initial contribution of the minority shareholder.
t. Provisions
Provisions are systematically created on the basis of the principles of prudence, honesty, and good faith.
Provisions are recognized when and only when:
• the Group has a current legal or constructive obligation as a result of a past event;
• it is probable that an outlow of resources embodying economic beneits will be required to settle the obligation; and
• a reliable estimate can be made of the amount of the obligation.
Provisions are reviewed at each balance sheet date and are adjusted to relect the best estimate of the minimum expenditure required to settle the present obligation.
u. Deferred taxes
Deferred taxes are the amount of income tax recoverable or payable in future periods with respect to:
• deductible or taxable temporary diferences;
• the carry-forward of unused tax losses; and
• the carry-forward of unused tax credits.
The Group recognizes only deferred tax liabilities in accordance with the prudence principle from BGAAP.
Deferred tax assets and liabilities are measured at the tax rate the Group’s company is subject to.
If a Group’s company has deferred tax assets and deferred tax liabilities, it
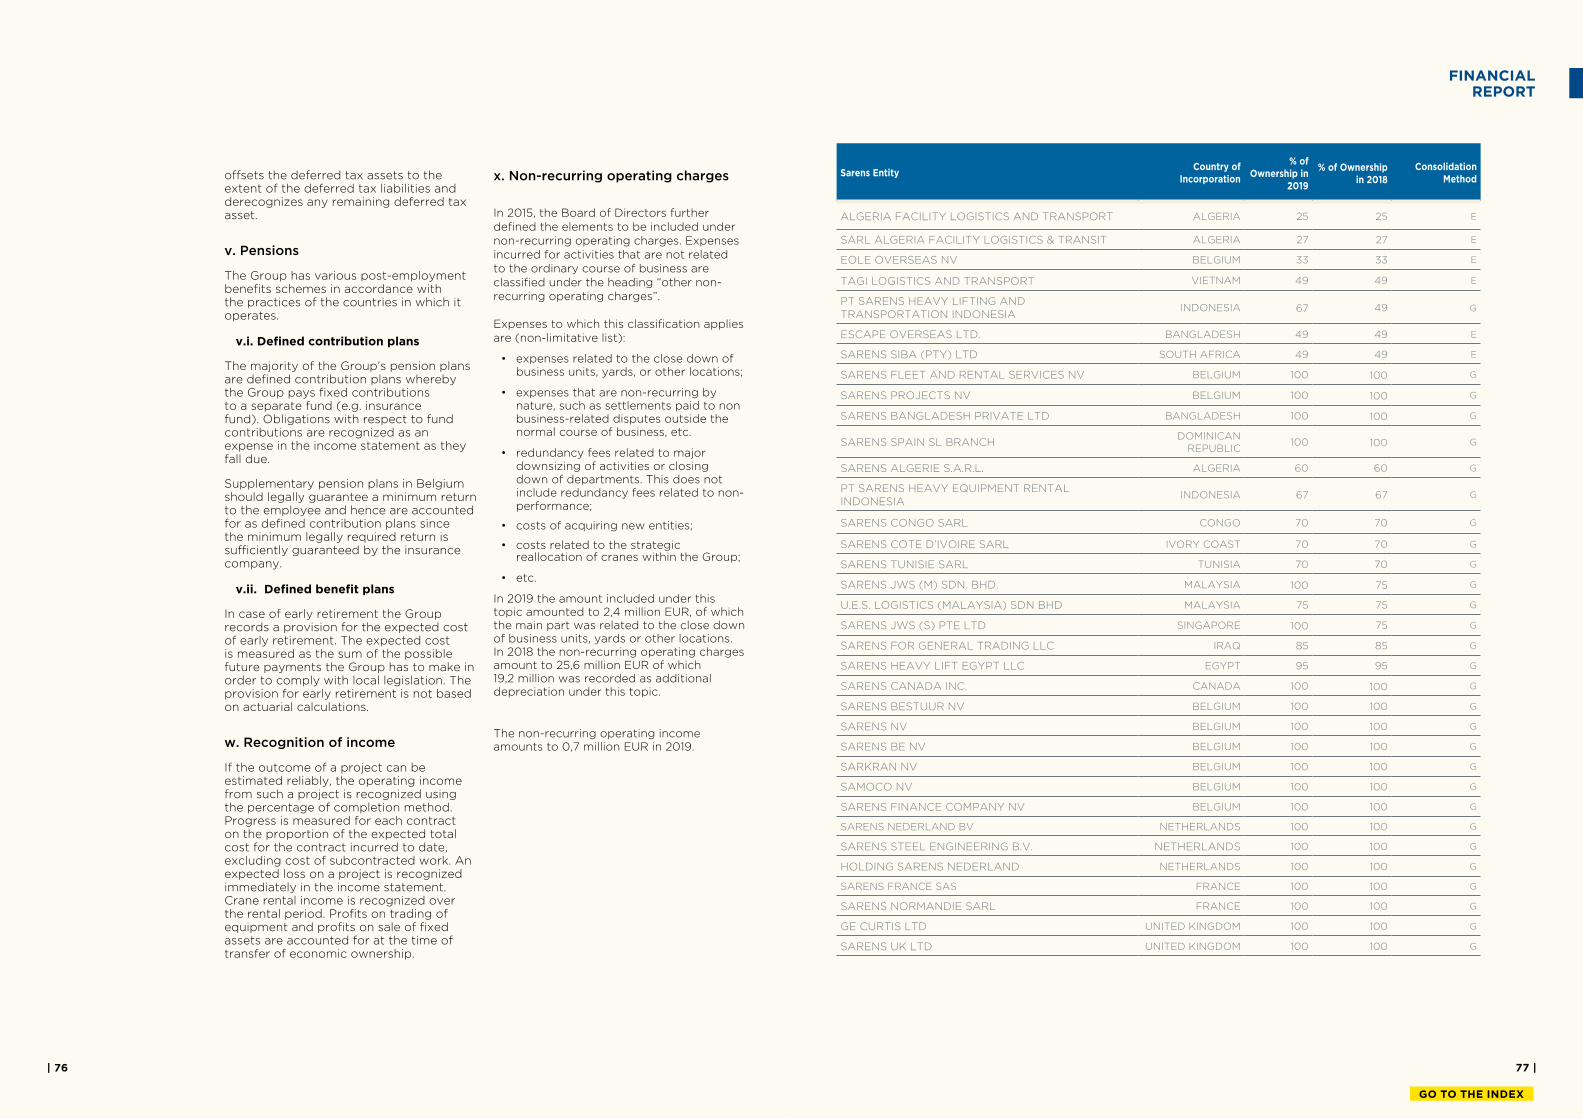
77 || 76
GO TO THE INDEX
ofsets the deferred tax assets to the extent of the deferred tax liabilities and derecognizes any remaining deferred tax asset.
v. Pensions
The Group has various post-employment beneits schemes in accordance with the practices of the countries in which it operates.
v.i. Deined contribution plans
The majority of the Group’s pension plans are deined contribution plans whereby the Group pays ixed contributions to a separate fund (e.g. insurance fund). Obligations with respect to fund contributions are recognized as an expense in the income statement as they fall due.
Supplementary pension plans in Belgium should legally guarantee a minimum return to the employee and hence are accounted for as deined contribution plans since the minimum legally required return is suiciently guaranteed by the insurance company.
v.ii. Deined beneit plans
In case of early retirement the Group records a provision for the expected cost of early retirement. The expected cost is measured as the sum of the possible future payments the Group has to make in order to comply with local legislation. The provision for early retirement is not based on actuarial calculations.
w. Recognition of income
If the outcome of a project can be estimated reliably, the operating income from such a project is recognized using the percentage of completion method. Progress is measured for each contract on the proportion of the expected total cost for the contract incurred to date, excluding cost of subcontracted work. An expected loss on a project is recognized immediately in the income statement. Crane rental income is recognized over the rental period. Proits on trading of equipment and proits on sale of ixed assets are accounted for at the time of transfer of economic ownership.
x. Non-recurring operating charges
In 2015, the Board of Directors further deined the elements to be included under non-recurring operating charges. Expenses incurred for activities that are not related to the ordinary course of business are classiied under the heading “other non-recurring operating charges”. Expenses to which this classiication applies are (non-limitative list):
• expenses related to the close down of business units, yards, or other locations;
• expenses that are non-recurring by nature, such as settlements paid to non business-related disputes outside the normal course of business, etc.
• redundancy fees related to major downsizing of activities or closing down of departments. This does not include redundancy fees related to non-performance;
• costs of acquiring new entities;
• costs related to the strategic reallocation of cranes within the Group;
• etc.
In 2019 the amount included under this topic amounted to 2,4 million EUR, of which the main part was related to the close down of business units, yards or other locations. In 2018 the non-recurring operating charges amount to 25,6 million EUR of which 19,2 million was recorded as additional depreciation under this topic.
The non-recurring operating income amounts to 0,7 million EUR in 2019.
Sarens EntityCountry of
Incorporation
% of Ownership in
2019
% of Ownership in 2018
Consolidation Method
ALGERIA FACILITY LOGISTICS AND TRANSPORT ALGERIA 25 25 E
SARL ALGERIA FACILITY LOGISTICS & TRANSIT ALGERIA 27 27 E
EOLE OVERSEAS NV BELGIUM 33 33 E
TAGI LOGISTICS AND TRANSPORT VIETNAM 49 49 E
PT SARENS HEAVY LIFTING AND TRANSPORTATION INDONESIA
INDONESIA 67 49 G
ESCAPE OVERSEAS LTD. BANGLADESH 49 49 E
SARENS SIBA (PTY) LTD SOUTH AFRICA 49 49 E
SARENS FLEET AND RENTAL SERVICES NV BELGIUM 100 100 G
SARENS PROJECTS NV BELGIUM 100 100 G
SARENS BANGLADESH PRIVATE LTD BANGLADESH 100 100 G
SARENS SPAIN SL BRANCHDOMINICAN
REPUBLIC100 100 G
SARENS ALGERIE S.A.R.L. ALGERIA 60 60 G
PT SARENS HEAVY EQUIPMENT RENTAL INDONESIA
INDONESIA 67 67 G
SARENS CONGO SARL CONGO 70 70 G
SARENS COTE D’IVOIRE SARL IVORY COAST 70 70 G
SARENS TUNISIE SARL TUNISIA 70 70 G
SARENS JWS (M) SDN. BHD. MALAYSIA 100 75 G
U.E.S. LOGISTICS (MALAYSIA) SDN BHD MALAYSIA 75 75 G
SARENS JWS (S) PTE LTD SINGAPORE 100 75 G
SARENS FOR GENERAL TRADING LLC IRAQ 85 85 G
SARENS HEAVY LIFT EGYPT LLC EGYPT 95 95 G
SARENS CANADA INC. CANADA 100 100 G
SARENS BESTUUR NV BELGIUM 100 100 G
SARENS NV BELGIUM 100 100 G
SARENS BE NV BELGIUM 100 100 G
SARKRAN NV BELGIUM 100 100 G
SAMOCO NV BELGIUM 100 100 G
SARENS FINANCE COMPANY NV BELGIUM 100 100 G
SARENS NEDERLAND BV NETHERLANDS 100 100 G
SARENS STEEL ENGINEERING B.V. NETHERLANDS 100 100 G
HOLDING SARENS NEDERLAND NETHERLANDS 100 100 G
SARENS FRANCE SAS FRANCE 100 100 G
SARENS NORMANDIE SARL FRANCE 100 100 G
GE CURTIS LTD UNITED KINGDOM 100 100 G
SARENS UK LTD UNITED KINGDOM 100 100 G
FINANCIAL REPORT
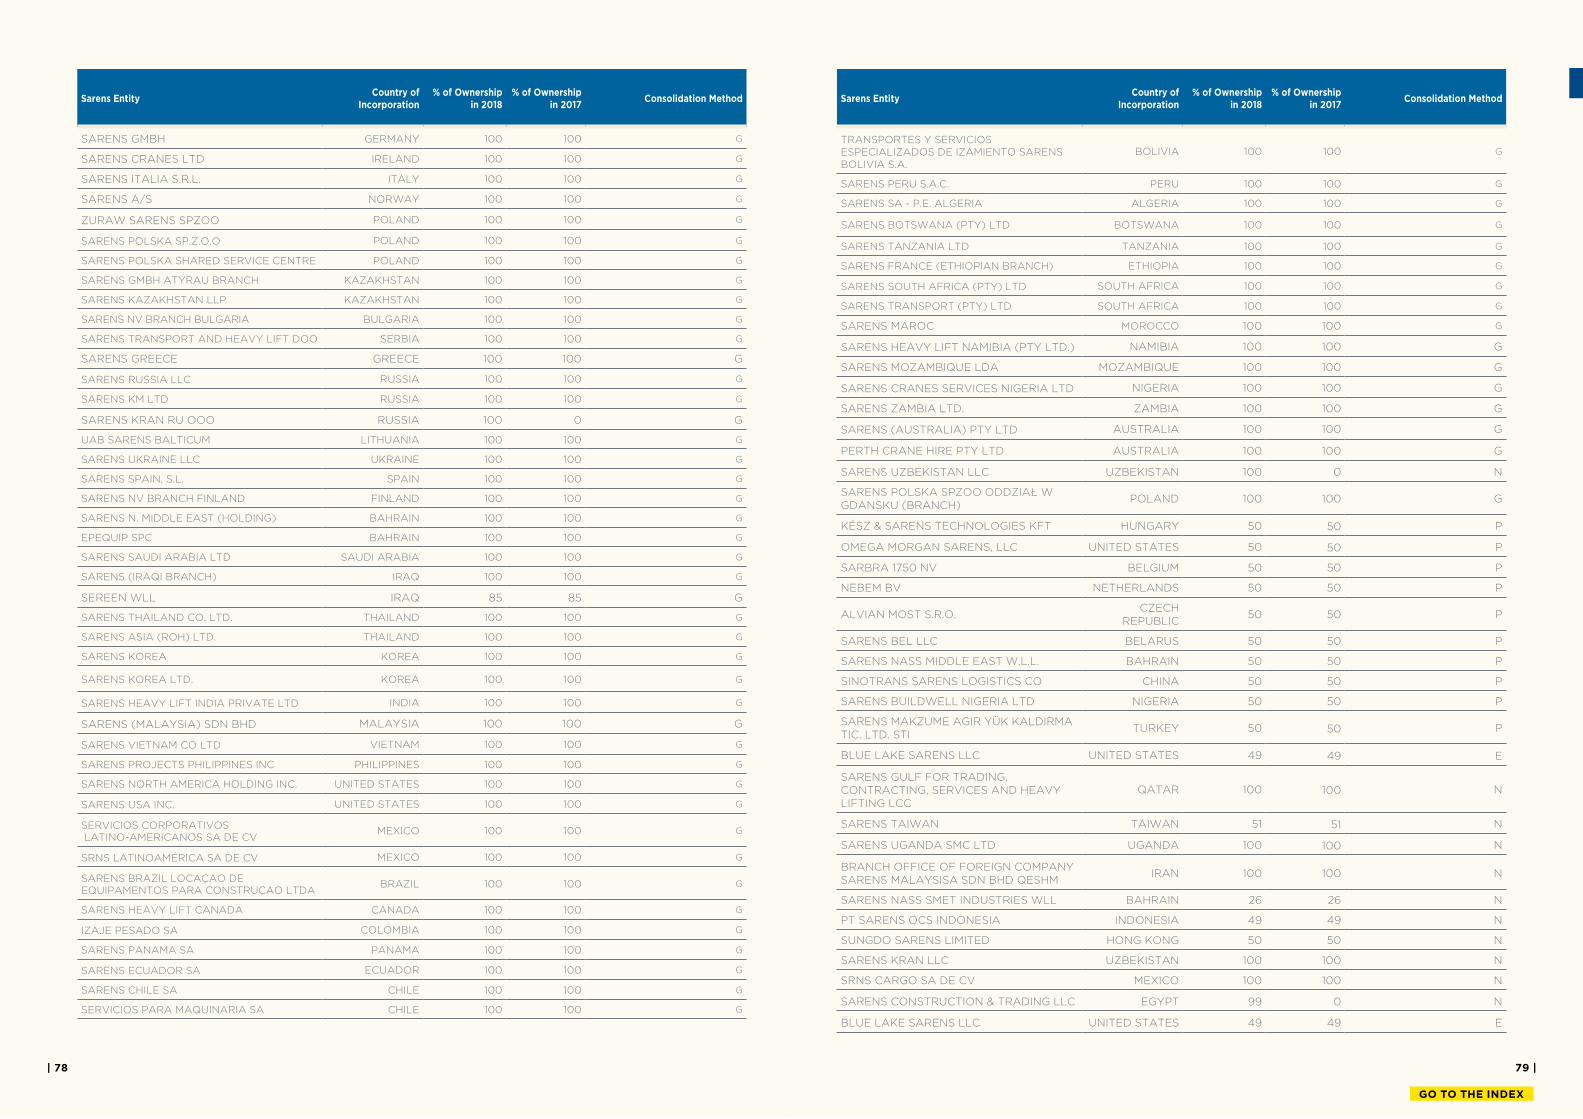
79 || 78
GO TO THE INDEX
Sarens EntityCountry of
Incorporation% of Ownership
in 2018% of Ownership
in 2017Consolidation Method
SARENS GMBH GERMANY 100 100 G
SARENS CRANES LTD IRELAND 100 100 G
SARENS ITALIA S.R.L. ITALY 100 100 G
SARENS A/S NORWAY 100 100 G
ZURAW SARENS SPZOO POLAND 100 100 G
SARENS POLSKA SP.Z.O.O POLAND 100 100 G
SARENS POLSKA SHARED SERVICE CENTRE POLAND 100 100 G
SARENS GMBH ATYRAU BRANCH KAZAKHSTAN 100 100 G
SARENS KAZAKHSTAN LLP KAZAKHSTAN 100 100 G
SARENS NV BRANCH BULGARIA BULGARIA 100 100 G
SARENS TRANSPORT AND HEAVY LIFT DOO SERBIA 100 100 G
SARENS GREECE GREECE 100 100 G
SARENS RUSSIA LLC RUSSIA 100 100 G
SARENS KM LTD RUSSIA 100 100 G
SARENS KRAN RU OOO RUSSIA 100 0 G
UAB SARENS BALTICUM LITHUANIA 100 100 G
SARENS UKRAINE LLC UKRAINE 100 100 G
SARENS SPAIN, S.L. SPAIN 100 100 G
SARENS NV BRANCH FINLAND FINLAND 100 100 G
SARENS N. MIDDLE EAST (HOLDING) BAHRAIN 100 100 G
EPEQUIP SPC BAHRAIN 100 100 G
SARENS SAUDI ARABIA LTD SAUDI ARABIA 100 100 G
SARENS (IRAQI BRANCH) IRAQ 100 100 G
SEREEN WLL IRAQ 85 85 G
SARENS THAILAND CO. LTD. THAILAND 100 100 G
SARENS ASIA (ROH) LTD. THAILAND 100 100 G
SARENS KOREA KOREA 100 100 G
SARENS KOREA LTD. KOREA 100 100 G
SARENS HEAVY LIFT INDIA PRIVATE LTD INDIA 100 100 G
SARENS (MALAYSIA) SDN BHD MALAYSIA 100 100 G
SARENS VIETNAM CO LTD VIETNAM 100 100 G
SARENS PROJECTS PHILIPPINES INC PHILIPPINES 100 100 G
SARENS NORTH AMERICA HOLDING INC. UNITED STATES 100 100 G
SARENS USA INC. UNITED STATES 100 100 G
SERVICIOS CORPORATIVOS LATINO-AMERICANOS SA DE CV
MEXICO 100 100 G
SRNS LATINOAMÉRICA SA DE CV MEXICO 100 100 G
SARENS BRAZIL LOCAÇAO DE EQUIPAMENTOS PARA CONSTRUÇAO LTDA
BRAZIL 100 100 G
SARENS HEAVY LIFT CANADA CANADA 100 100 G
IZAJE PESADO SA COLOMBIA 100 100 G
SARENS PANAMA SA PANAMA 100 100 G
SARENS ECUADOR SA ECUADOR 100 100 G
SARENS CHILE SA CHILE 100 100 G
SERVICIOS PARA MAQUINARIA SA CHILE 100 100 G
Sarens EntityCountry of
Incorporation% of Ownership
in 2018% of Ownership
in 2017Consolidation Method
TRANSPORTES Y SERVICIOS ESPECIALIZADOS DE IZAMIENTO SARENS BOLIVIA S.A.
BOLIVIA 100 100 G
SARENS PERU S.A.C. PERU 100 100 G
SARENS SA - P.E. ALGERIA ALGERIA 100 100 G
SARENS BOTSWANA (PTY) LTD BOTSWANA 100 100 G
SARENS TANZANIA LTD TANZANIA 100 100 G
SARENS FRANCE (ETHIOPIAN BRANCH) ETHIOPIA 100 100 G
SARENS SOUTH AFRICA (PTY) LTD SOUTH AFRICA 100 100 G
SARENS TRANSPORT (PTY) LTD SOUTH AFRICA 100 100 G
SARENS MAROC MOROCCO 100 100 G
SARENS HEAVY LIFT NAMIBIA (PTY LTD.) NAMIBIA 100 100 G
SARENS MOZAMBIQUE LDA MOZAMBIQUE 100 100 G
SARENS CRANES SERVICES NIGERIA LTD NIGERIA 100 100 G
SARENS ZAMBIA LTD. ZAMBIA 100 100 G
SARENS (AUSTRALIA) PTY LTD AUSTRALIA 100 100 G
PERTH CRANE HIRE PTY LTD AUSTRALIA 100 100 G
SARENS UZBEKISTAN LLC UZBEKISTAN 100 0 N
SARENS POLSKA SPZOO ODDZIAŁ W GDANSKU (BRANCH)
POLAND 100 100 G
KÉSZ & SARENS TECHNOLOGIES KFT HUNGARY 50 50 P
OMEGA MORGAN SARENS, LLC UNITED STATES 50 50 P
SARBRA 1750 NV BELGIUM 50 50 P
NEBEM BV NETHERLANDS 50 50 P
ALVIAN MOST S.R.O.CZECH
REPUBLIC50 50 P
SARENS BEL LLC BELARUS 50 50 P
SARENS NASS MIDDLE EAST W.L.L. BAHRAIN 50 50 P
SINOTRANS SARENS LOGISTICS CO CHINA 50 50 P
SARENS BUILDWELL NIGERIA LTD NIGERIA 50 50 P
SARENS MAKZUME AGIR YÜK KALDIRMA TIC. LTD. STI
TURKEY 50 50 P
BLUE LAKE SARENS LLC UNITED STATES 49 49 E
SARENS GULF FOR TRADING, CONTRACTING, SERVICES AND HEAVY LIFTING LCC
QATAR 100 100 N
SARENS TAIWAN TAIWAN 51 51 N
SARENS UGANDA SMC LTD UGANDA 100 100 N
BRANCH OFFICE OF FOREIGN COMPANY SARENS MALAYSISA SDN BHD QESHM
IRAN 100 100 N
SARENS NASS SMET INDUSTRIES WLL BAHRAIN 26 26 N
PT SARENS OCS INDONESIA INDONESIA 49 49 N
SUNGDO SARENS LIMITED HONG KONG 50 50 N
SARENS KRAN LLC UZBEKISTAN 100 100 N
SRNS CARGO SA DE CV MEXICO 100 100 N
SARENS CONSTRUCTION & TRADING LLC EGYPT 99 0 N
BLUE LAKE SARENS LLC UNITED STATES 49 49 E
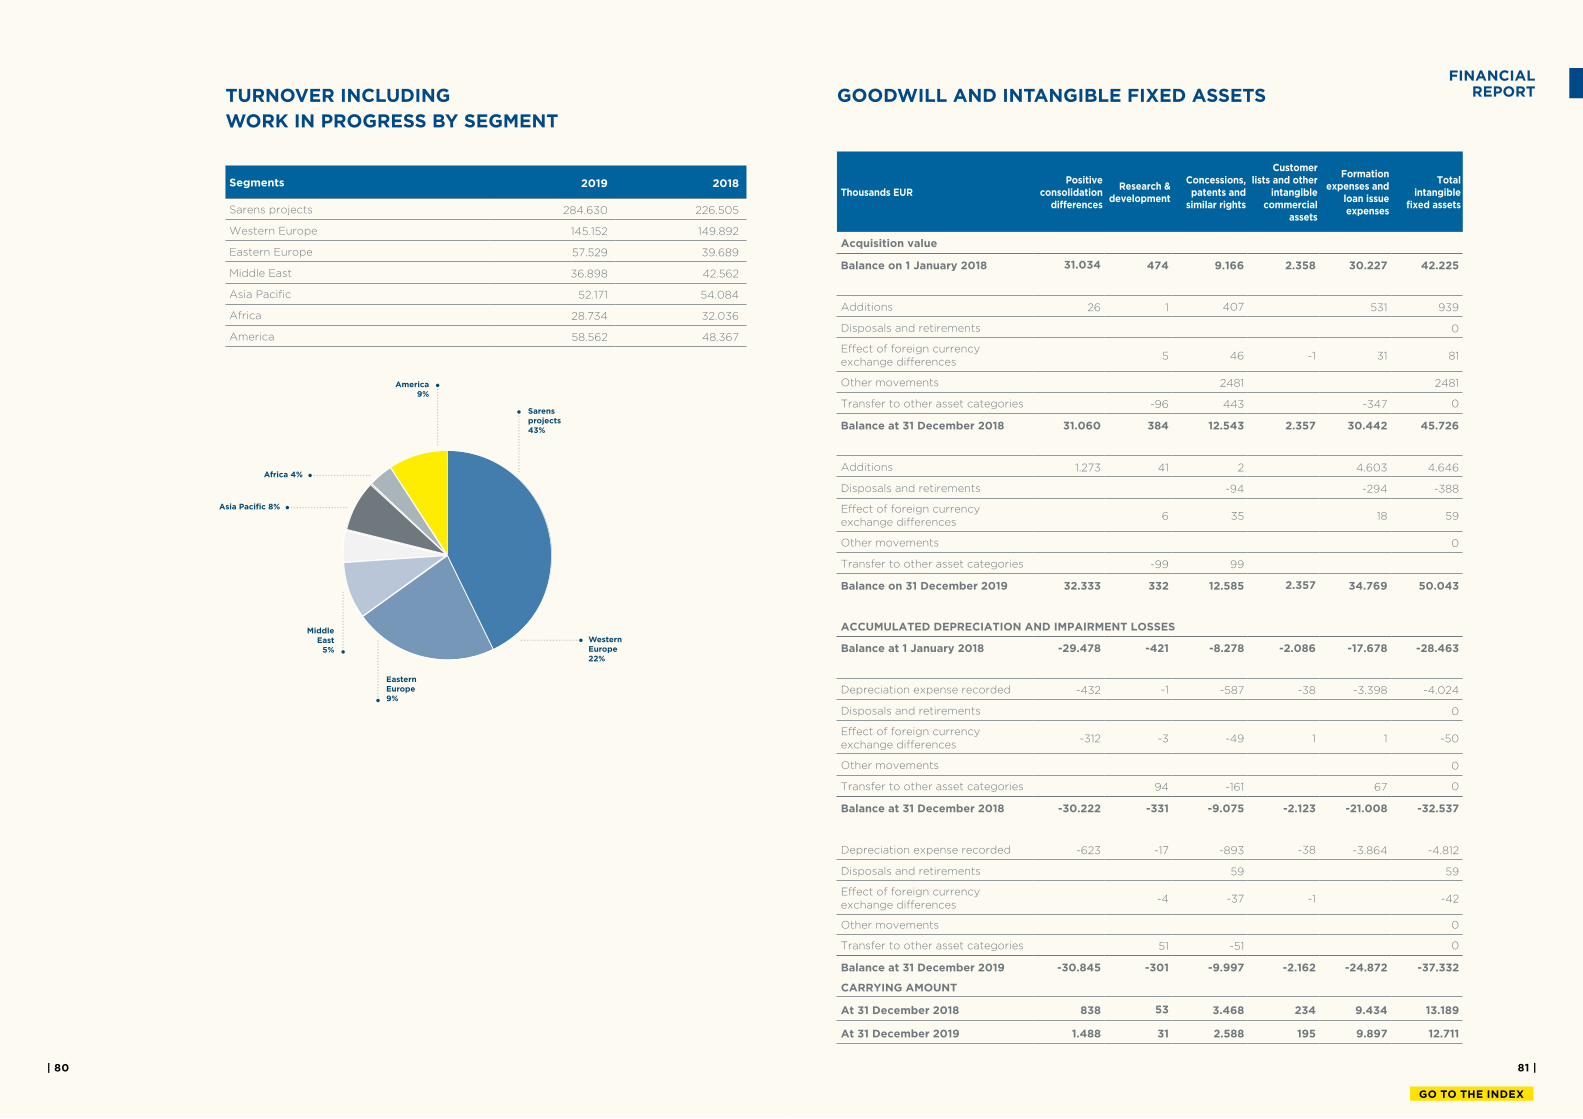
81 || 80
GO TO THE INDEX
TURNOVER INCLUDING
WORK IN PROGRESS BY SEGMENT
Segments 2019 2018
Sarens projects 284.630 226.505
Western Europe 145.152 149.892
Eastern Europe 57.529 39.689
Middle East 36.898 42.562
Asia Paciic 52.171 54.084
Africa 28.734 32.036
America 58.562 48.367
GOODWILL AND INTANGIBLE FIXED ASSETS
Thousands EURPositive
consolidation diferences
Research & development
Concessions, patents and
similar rights
Customer lists and other
intangible commercial
assets
Formation expenses and
loan issue expenses
Total intangible
ixed assets
Acquisition value
Balance on 1 January 2018 31.034 474 9.166 2.358 30.227 42.225
Additions 26 1 407 531 939
Disposals and retirements 0
Efect of foreign currency exchange diferences
5 46 -1 31 81
Other movements 2481 2481
Transfer to other asset categories -96 443 -347 0
Balance at 31 December 2018 31.060 384 12.543 2.357 30.442 45.726
Additions 1.273 41 2 4.603 4.646
Disposals and retirements -94 -294 -388
Efect of foreign currency exchange diferences
6 35 18 59
Other movements 0
Transfer to other asset categories -99 99
Balance on 31 December 2019 32.333 332 12.585 2.357 34.769 50.043
ACCUMULATED DEPRECIATION AND IMPAIRMENT LOSSES
Balance at 1 January 2018 -29.478 -421 -8.278 -2.086 -17.678 -28.463
Depreciation expense recorded -432 -1 -587 -38 -3.398 -4.024
Disposals and retirements 0
Efect of foreign currency exchange diferences
-312 -3 -49 1 1 -50
Other movements 0
Transfer to other asset categories 94 -161 67 0
Balance at 31 December 2018 -30.222 -331 -9.075 -2.123 -21.008 -32.537
Depreciation expense recorded -623 -17 -893 -38 -3.864 -4.812
Disposals and retirements 59 59
Efect of foreign currency exchange diferences
-4 -37 -1 -42
Other movements 0
Transfer to other asset categories 51 -51 0
Balance at 31 December 2019 -30.845 -301 -9.997 -2.162 -24.872 -37.332
CARRYING AMOUNT
At 31 December 2018 838 53 3.468 234 9.434 13.189
At 31 December 2019 1.488 31 2.588 195 9.897 12.711
FINANCIAL REPORT
America9%
Asia Paciic 8%
Africa 4%
Sarens projects 43%
Eastern Europe9%
Middle East
5%
Western Europe22%
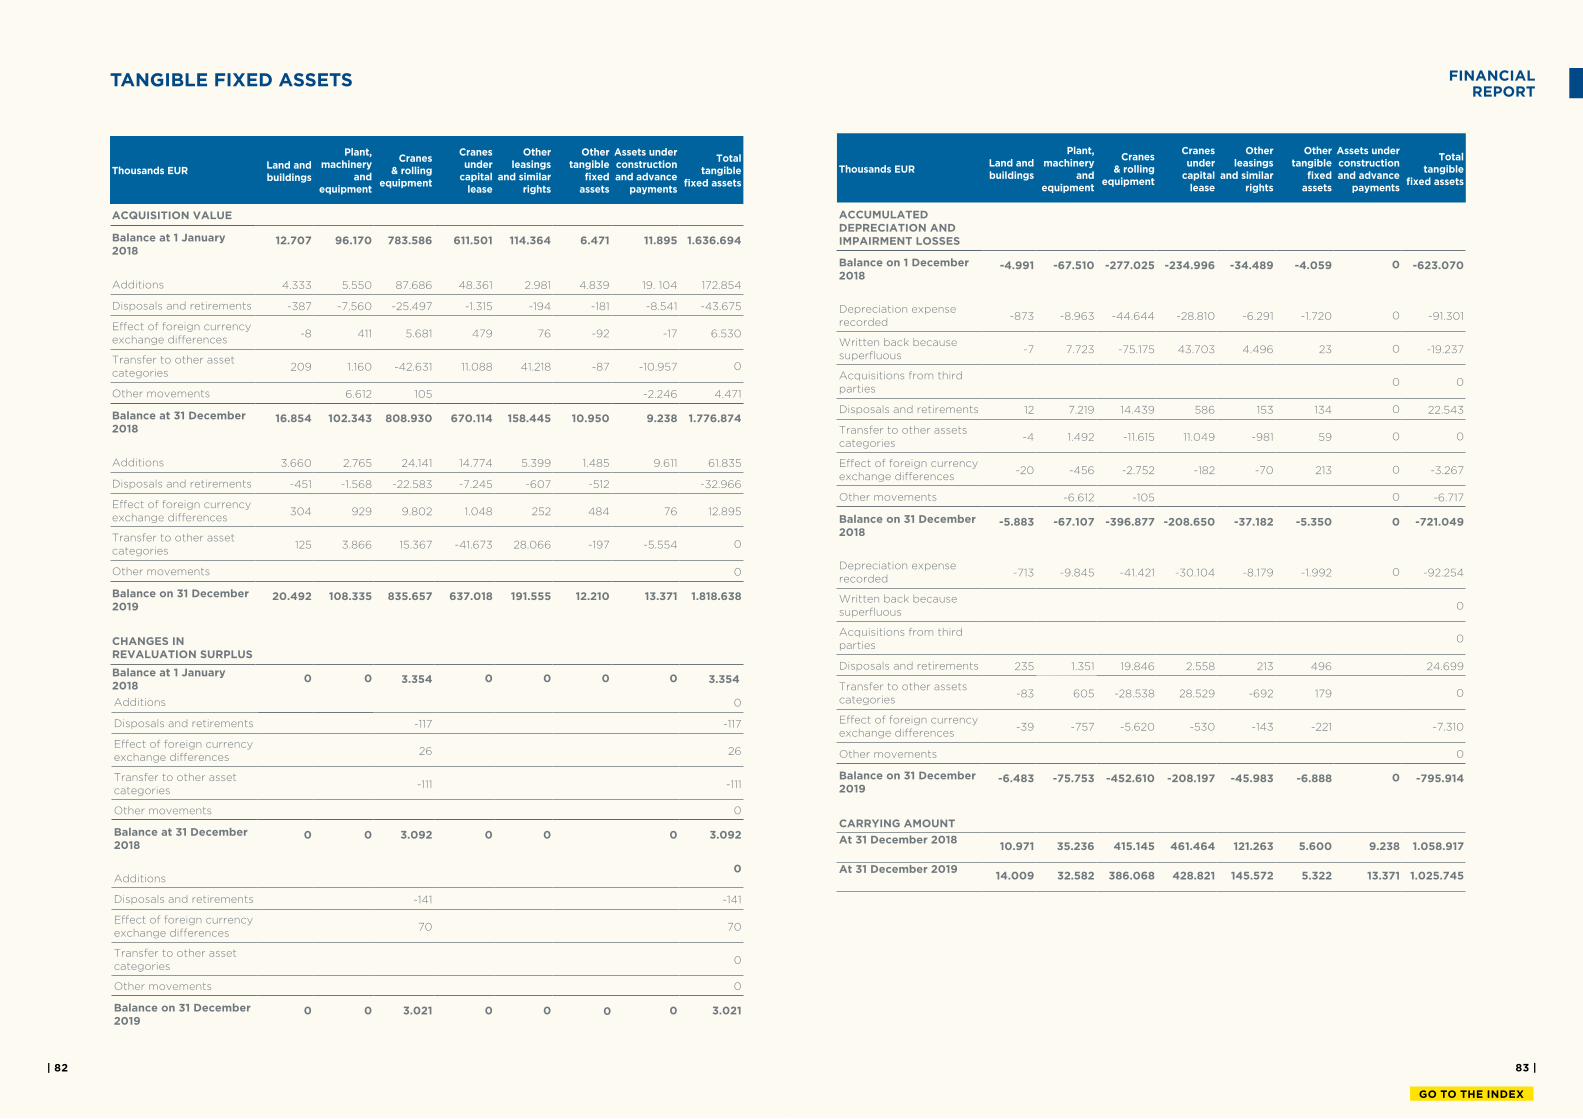
83 || 82
GO TO THE INDEX
TANGIBLE FIXED ASSETS
Thousands EURLand and buildings
Plant, machinery
and equipment
Cranes & rolling
equipment
Cranes under
capital lease
Other leasings
and similar rights
Other tangible
ixed assets
Assets under construction and advance
payments
Total tangible
ixed assets
ACQUISITION VALUE
Balance at 1 January 2018
12.707 96.170 783.586 611.501 114.364 6.471 11.895 1.636.694
Additions 4.333 5.550 87.686 48.361 2.981 4.839 19. 104 172.854
Disposals and retirements -387 -7.560 -25.497 -1.315 -194 -181 -8.541 -43.675
Efect of foreign currency exchange diferences
-8 411 5.681 479 76 -92 -17 6.530
Transfer to other asset categories
209 1.160 -42.631 11.088 41.218 -87 -10.957 0
Other movements 6.612 105 -2.246 4.471
Balance at 31 December 2018
16.854 102.343 808.930 670.114 158.445 10.950 9.238 1.776.874
Additions 3.660 2.765 24.141 14.774 5.399 1.485 9.611 61.835
Disposals and retirements -451 -1.568 -22.583 -7.245 -607 -512 -32.966
Efect of foreign currency exchange diferences
304 929 9.802 1.048 252 484 76 12.895
Transfer to other asset categories
125 3.866 15.367 -41.673 28.066 -197 -5.554 0
Other movements 0
Balance on 31 December 2019
20.492 108.335 835.657 637.018 191.555 12.210 13.371 1.818.638
CHANGES IN REVALUATION SURPLUS
Balance at 1 January 2018
0 0 3.354 0 0 0 0 3.354
Additions 0
Disposals and retirements -117 -117
Efect of foreign currency exchange diferences
26 26
Transfer to other asset categories
-111 -111
Other movements 0
Balance at 31 December 2018
0 0 3.092 0 0 0 3.092
Additions
Disposals and retirements -141 -141
Efect of foreign currency exchange diferences
70 70
Transfer to other asset categories
0
Other movements 0
Balance on 31 December 2019
0 0 3.021 0 0 0 3.021
0
FINANCIAL REPORT
Thousands EURLand and buildings
Plant, machinery
and equipment
Cranes & rolling
equipment
Cranes under
capital lease
Other leasings
and similar rights
Other tangible
ixed assets
Assets under construction and advance
payments
Total tangible
ixed assets
ACCUMULATED DEPRECIATION AND IMPAIRMENT LOSSES
Balance on 1 December 2018
-4.991 -67.510 -277.025 -234.996 -34.489 -4.059 0 -623.070
Depreciation expense recorded
-873 -8.963 -44.644 -28.810 -6.291 -1.720 0 -91.301
Written back because superluous
-7 7.723 -75.175 43.703 4.496 23 0 -19.237
Acquisitions from third parties
0 0
Disposals and retirements 12 7.219 14.439 586 153 134 0 22.543
Transfer to other assets categories
-4 1.492 -11.615 11.049 -981 59 0 0
Efect of foreign currency exchange diferences
-20 -456 -2.752 -182 -70 213 0 -3.267
Other movements -6.612 -105 0 -6.717
Balance on 31 December 2018
-5.883 -67.107 -396.877 -208.650 -37.182 -5.350 0 -721.049
Depreciation expense recorded
-713 -9.845 -41.421 -30.104 -8.179 -1.992 0 -92.254
Written back because superluous
0
Acquisitions from third parties
0
Disposals and retirements 235 1.351 19.846 2.558 213 496 24.699
Transfer to other assets categories
-83 605 -28.538 28.529 -692 179 0
Efect of foreign currency exchange diferences
-39 -757 -5.620 -530 -143 -221 -7.310
Other movements 0
Balance on 31 December 2019
-6.483 -75.753 -452.610 -208.197 -45.983 -6.888 0 -795.914
CARRYING AMOUNT
At 31 December 201810.971 35.236 415.145 461.464 121.263 5.600 9.238 1.058.917
At 31 December 201914.009 32.582 386.068 428.821 145.572 5.322 13.371 1.025.745
0
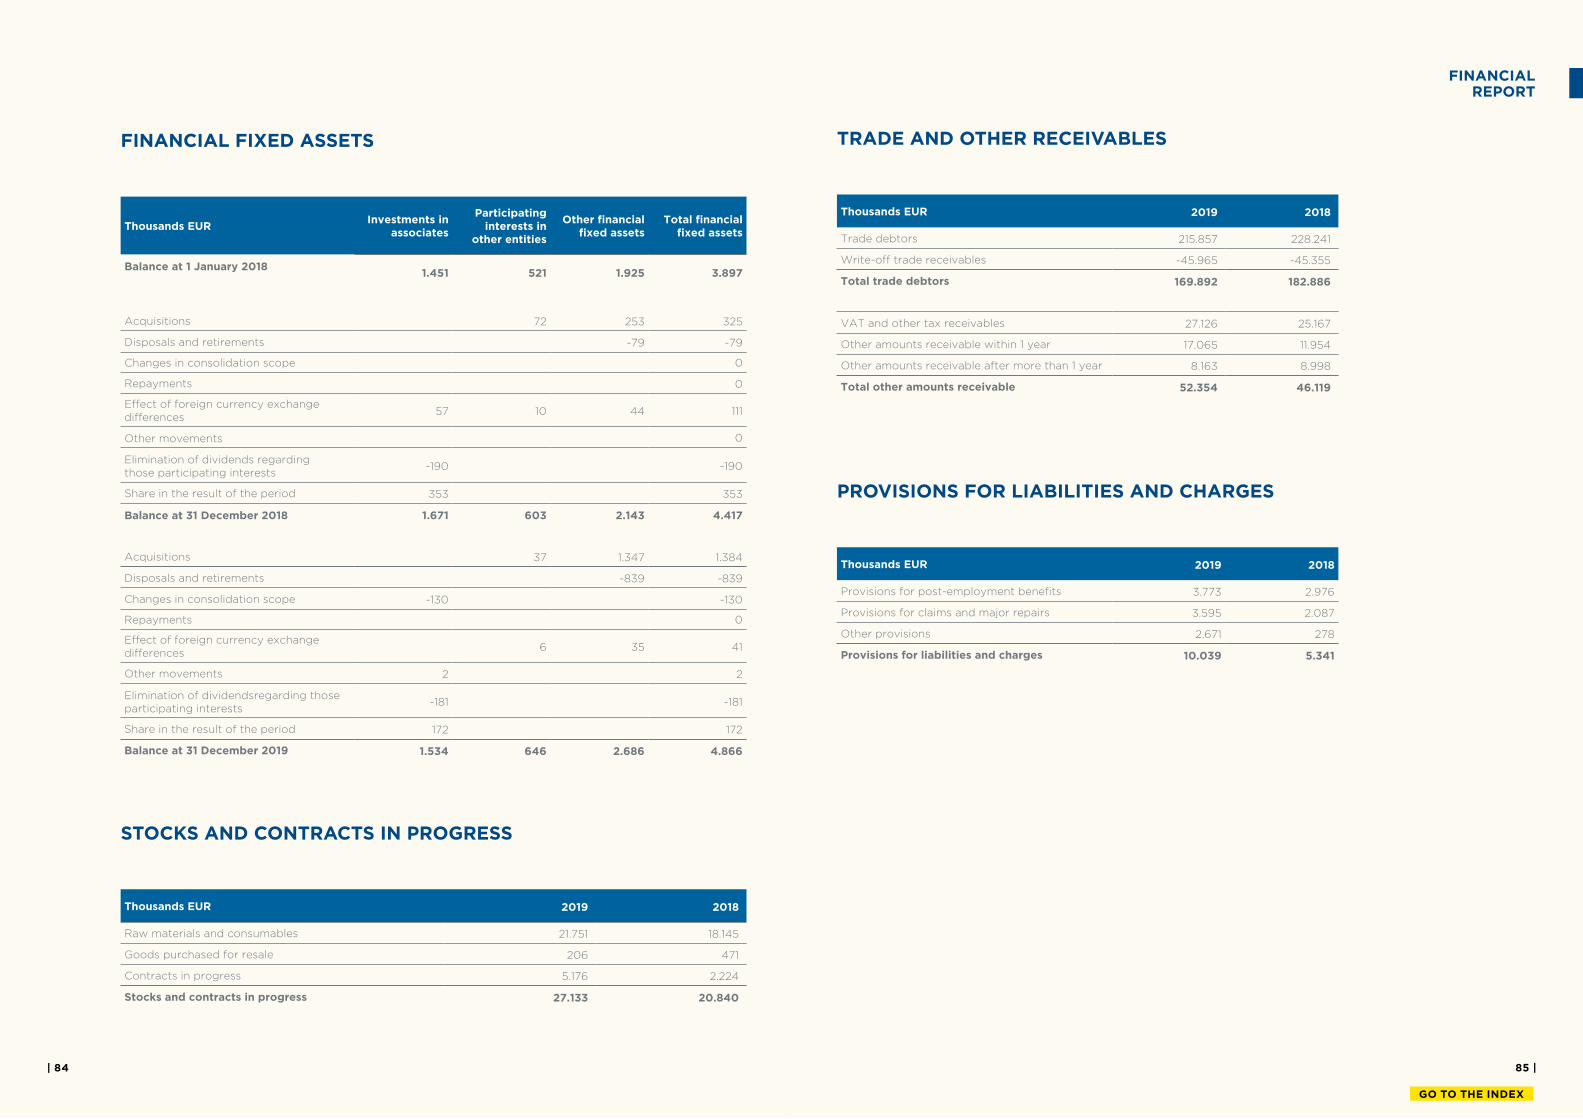
85 || 84
GO TO THE INDEX
FINANCIAL FIXED ASSETS
Thousands EURInvestments in
associates
Participating interests in
other entities
Other inancial ixed assets
Total inancial ixed assets
Balance at 1 January 20181.451 521 1.925 3.897
Acquisitions 72 253 325
Disposals and retirements -79 -79
Changes in consolidation scope 0
Repayments 0
Efect of foreign currency exchange diferences
57 10 44 111
Other movements 0
Elimination of dividends regarding those participating interests
-190 -190
Share in the result of the period 353 353
Balance at 31 December 2018 1.671 603 2.143 4.417
Acquisitions 37 1.347 1.384
Disposals and retirements -839 -839
Changes in consolidation scope -130 -130
Repayments 0
Efect of foreign currency exchange diferences
6 35 41
Other movements 2 2
Elimination of dividendsregarding those participating interests
-181 -181
Share in the result of the period 172 172
Balance at 31 December 2019 1.534 646 2.686 4.866
STOCKS AND CONTRACTS IN PROGRESS
Thousands EUR 2019 2018
Raw materials and consumables 21.751 18.145
Goods purchased for resale 206 471
Contracts in progress 5.176 2.224
Stocks and contracts in progress 27.133 20.840
TRADE AND OTHER RECEIVABLES
Thousands EUR 2019 2018
Trade debtors 215.857 228.241
Write-of trade receivables -45.965 -45.355
Total trade debtors 169.892 182.886
VAT and other tax receivables 27.126 25.167
Other amounts receivable within 1 year 17.065 11.954
Other amounts receivable after more than 1 year 8.163 8.998
Total other amounts receivable 52.354 46.119
PROVISIONS FOR LIABILITIES AND CHARGES
Thousands EUR 2019 2018
Provisions for post-employment beneits 3.773 2.976
Provisions for claims and major repairs 3.595 2.087
Other provisions 2.671 278
Provisions for liabilities and charges 10.039 5.341
FINANCIAL REPORT
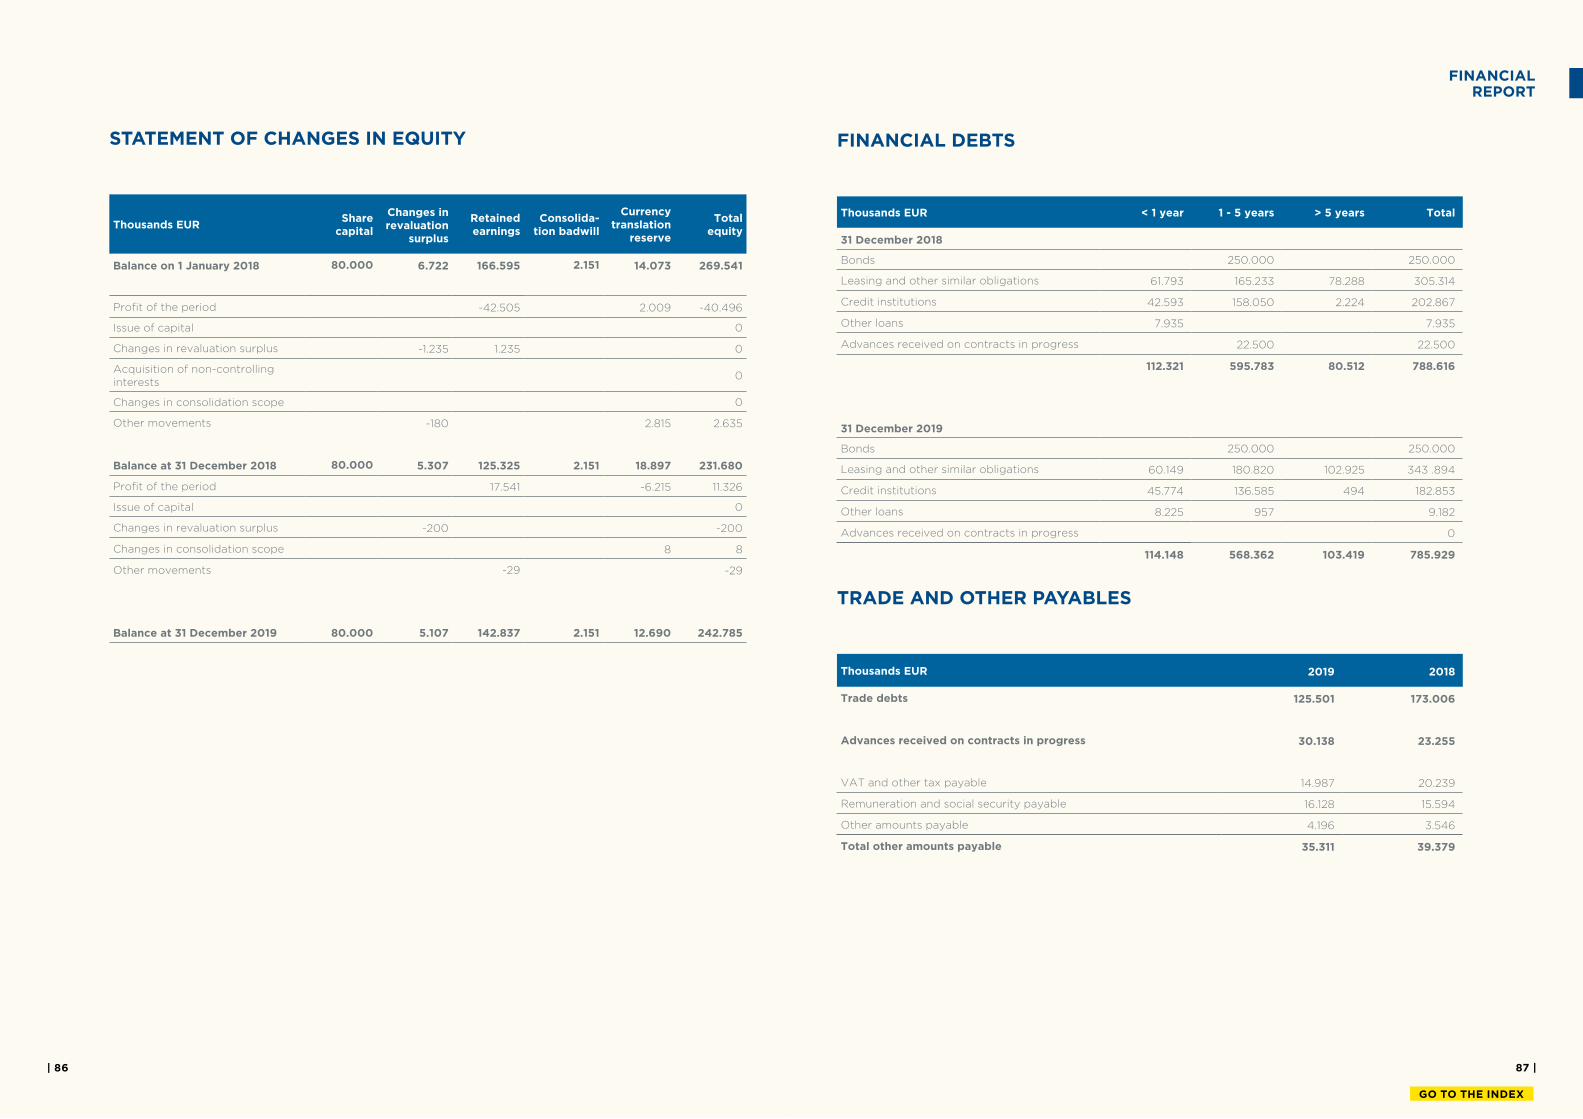
87 || 86
GO TO THE INDEX
STATEMENT OF CHANGES IN EQUITY
Thousands EURShare
capital
Changes in revaluation
surplus
Retained earnings
Consolida-tion badwill
Currency translation
reserve
Total equity
Balance on 1 January 2018 80.000 6.722 166.595 2.151 14.073 269.541
Proit of the period -42.505 2.009 -40.496
Issue of capital 0
Changes in revaluation surplus -1.235 1.235 0
Acquisition of non-controlling interests
0
Changes in consolidation scope 0
Other movements -180 2.815 2.635
Balance at 31 December 2018 80.000 5.307 125.325 2.151 18.897 231.680
Proit of the period 17.541 -6.215 11.326
Issue of capital 0
Changes in revaluation surplus -200 -200
Changes in consolidation scope 8 8
Other movements -29 -29
Balance at 31 December 2019 80.000 5.107 142.837 2.151 12.690 242.785
FINANCIAL DEBTS
Thousands EUR < 1 year 1 - 5 years > 5 years Total
31 December 2018
Bonds 250.000 250.000
Leasing and other similar obligations 61.793 165.233 78.288 305.314
Credit institutions 42.593 158.050 2.224 202.867
Other loans 7.935 7.935
Advances received on contracts in progress 22.500 22.500
112.321 595.783 80.512 788.616
31 December 2019
Bonds 250.000 250.000
Leasing and other similar obligations 60.149 180.820 102.925 343 .894
Credit institutions 45.774 136.585 494 182.853
Other loans 8.225 957 9.182
Advances received on contracts in progress 0
114.148 568.362 103.419 785.929
TRADE AND OTHER PAYABLES
Thousands EUR 2019 2018
Trade debts 125.501 173.006
Advances received on contracts in progress 30.138 23.255
VAT and other tax payable 14.987 20.239
Remuneration and social security payable 16.128 15.594
Other amounts payable 4.196 3.546
Total other amounts payable 35.311 39.379
FINANCIAL REPORT
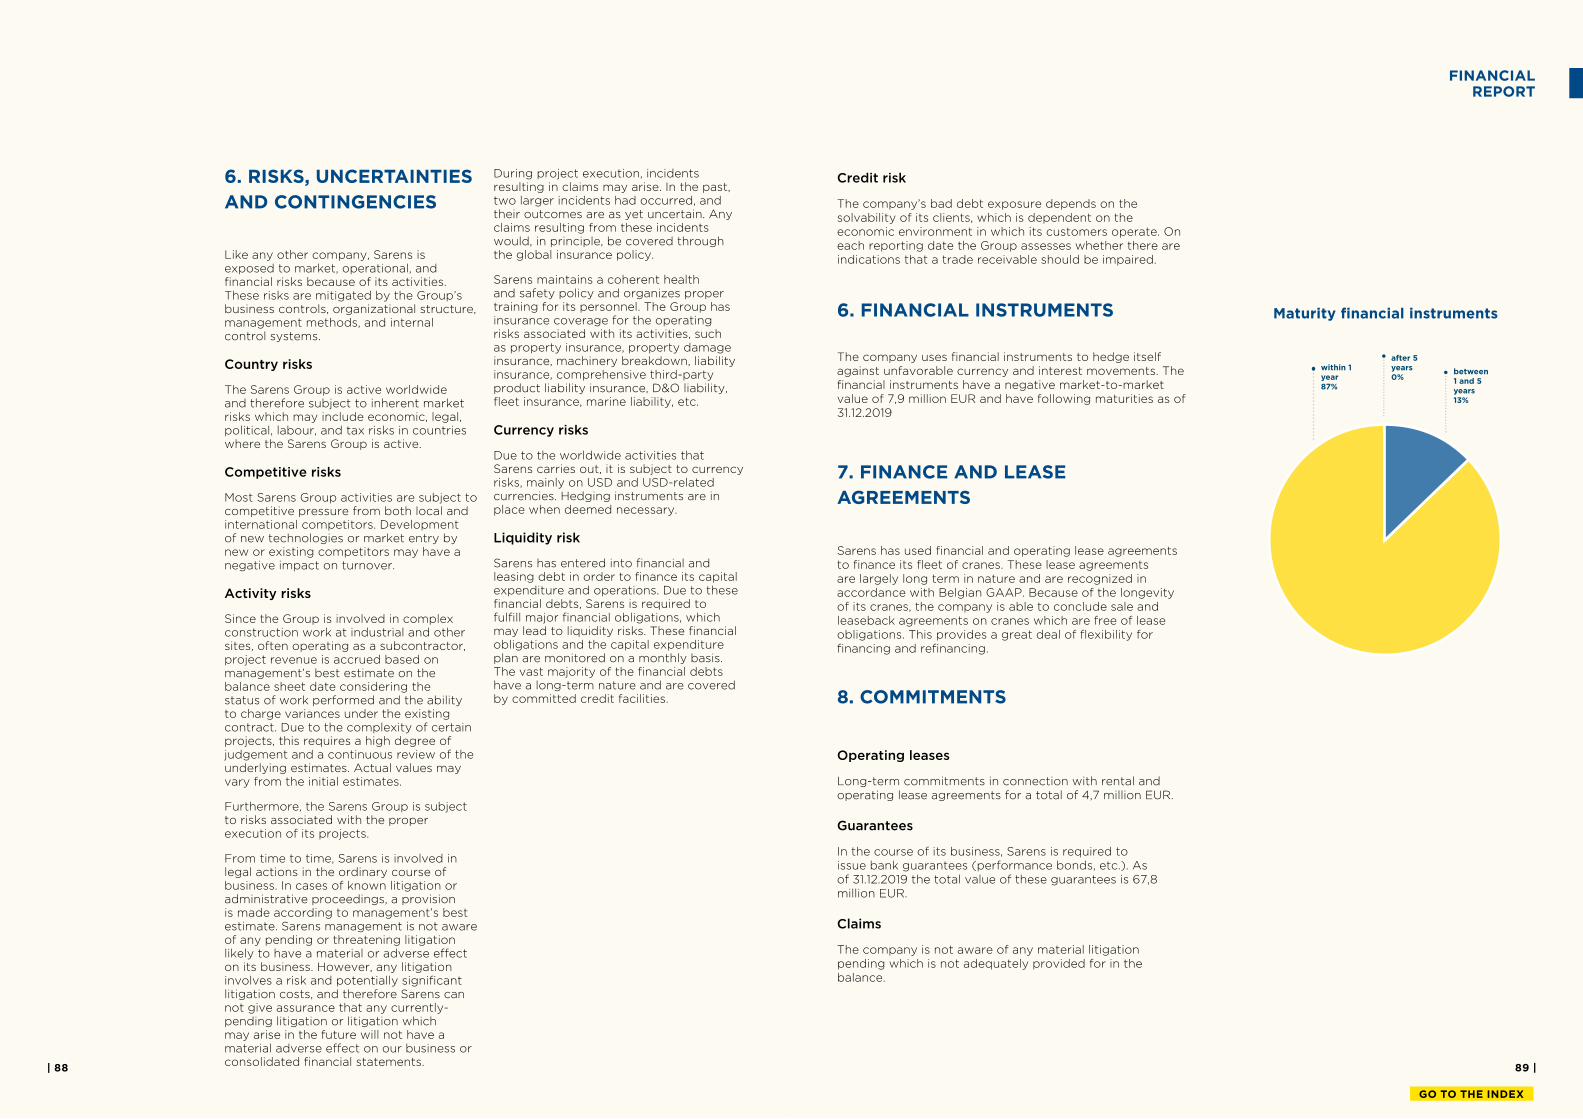
89 || 88
GO TO THE INDEX
6. RISKS, UNCERTAINTIES
AND CONTINGENCIES
Like any other company, Sarens is exposed to market, operational, and inancial risks because of its activities. These risks are mitigated by the Group’s business controls, organizational structure, management methods, and internal control systems.
Country risks
The Sarens Group is active worldwide and therefore subject to inherent market risks which may include economic, legal, political, labour, and tax risks in countries where the Sarens Group is active.
Competitive risks
Most Sarens Group activities are subject to competitive pressure from both local and international competitors. Development of new technologies or market entry by new or existing competitors may have a negative impact on turnover.
Activity risks
Since the Group is involved in complex construction work at industrial and other sites, often operating as a subcontractor, project revenue is accrued based on management’s best estimate on the balance sheet date considering the status of work performed and the ability to charge variances under the existing contract. Due to the complexity of certain projects, this requires a high degree of judgement and a continuous review of the underlying estimates. Actual values may vary from the initial estimates.
Furthermore, the Sarens Group is subject to risks associated with the proper execution of its projects.
From time to time, Sarens is involved in legal actions in the ordinary course of business. In cases of known litigation or administrative proceedings, a provision is made according to management’s best estimate. Sarens management is not aware of any pending or threatening litigation likely to have a material or adverse efect on its business. However, any litigation involves a risk and potentially signiicant litigation costs, and therefore Sarens can not give assurance that any currently-pending litigation or litigation which may arise in the future will not have a material adverse efect on our business or consolidated inancial statements.
During project execution, incidents resulting in claims may arise. In the past, two larger incidents had occurred, and their outcomes are as yet uncertain. Any claims resulting from these incidents would, in principle, be covered through the global insurance policy.
Sarens maintains a coherent health and safety policy and organizes proper training for its personnel. The Group has insurance coverage for the operating risks associated with its activities, such as property insurance, property damage insurance, machinery breakdown, liability insurance, comprehensive third-party product liability insurance, D&O liability, leet insurance, marine liability, etc.
Currency risks
Due to the worldwide activities that Sarens carries out, it is subject to currency risks, mainly on USD and USD-related currencies. Hedging instruments are in place when deemed necessary.
Liquidity risk
Sarens has entered into inancial and leasing debt in order to inance its capital expenditure and operations. Due to these inancial debts, Sarens is required to fulill major inancial obligations, which may lead to liquidity risks. These inancial obligations and the capital expenditure plan are monitored on a monthly basis. The vast majority of the inancial debts have a long-term nature and are covered by committed credit facilities.
Credit risk
The company’s bad debt exposure depends on the solvability of its clients, which is dependent on the economic environment in which its customers operate. On each reporting date the Group assesses whether there are indications that a trade receivable should be impaired.
6. FINANCIAL INSTRUMENTS
The company uses inancial instruments to hedge itself against unfavorable currency and interest movements. The inancial instruments have a negative market-to-market value of 7,9 million EUR and have following maturities as of 31.12.2019
7. FINANCE AND LEASE
AGREEMENTS
Sarens has used inancial and operating lease agreements to inance its leet of cranes. These lease agreements are largely long term in nature and are recognized in accordance with Belgian GAAP. Because of the longevity of its cranes, the company is able to conclude sale and leaseback agreements on cranes which are free of lease obligations. This provides a great deal of lexibility for inancing and reinancing.
8. COMMITMENTS
Operating leases
Long-term commitments in connection with rental and operating lease agreements for a total of 4,7 million EUR.
Guarantees
In the course of its business, Sarens is required to issue bank guarantees (performance bonds, etc.). As of 31.12.2019 the total value of these guarantees is 67,8 million EUR.
Claims
The company is not aware of any material litigation pending which is not adequately provided for in the balance.
FINANCIAL REPORT
between 1 and 5 years 13%
within 1 year 87%
Maturity inancial instruments
after 5 years 0%
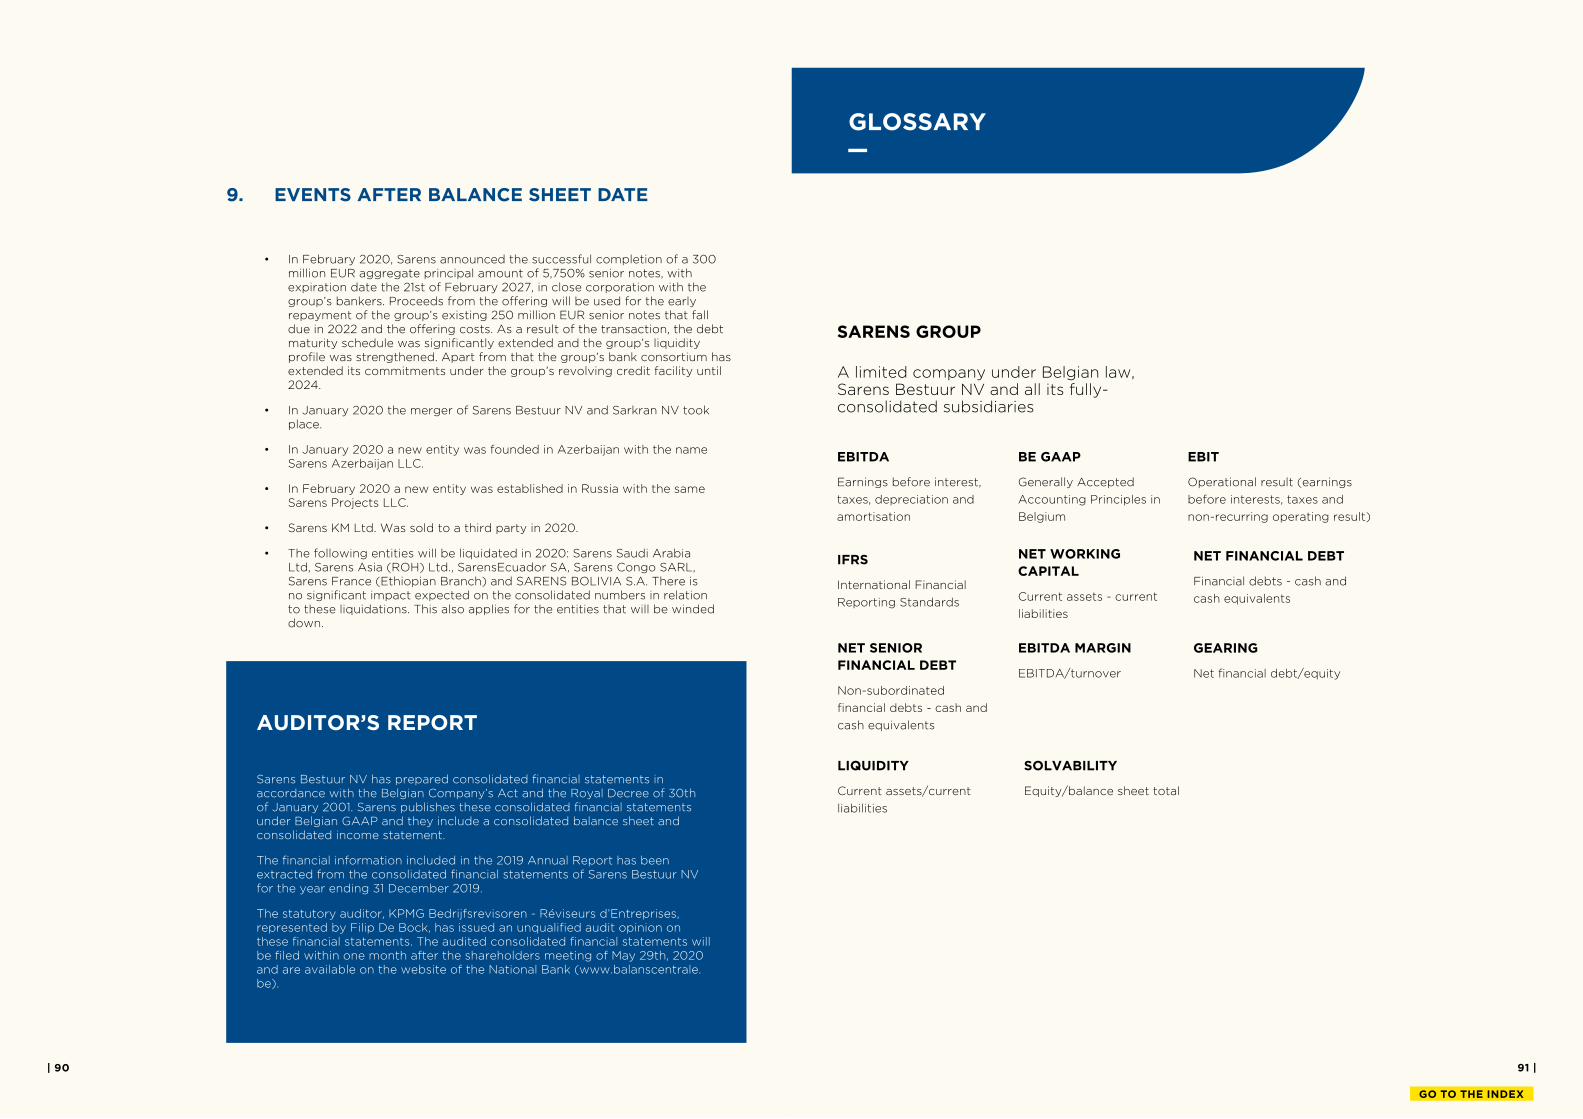
91 || 90
GO TO THE INDEX
9. EVENTS AFTER BALANCE SHEET DATE
• In February 2020, Sarens announced the successful completion of a 300 million EUR aggregate principal amount of 5,750% senior notes, with expiration date the 21st of February 2027, in close corporation with the group’s bankers. Proceeds from the offering will be used for the early repayment of the group’s existing 250 million EUR senior notes that fall due in 2022 and the offering costs. As a result of the transaction, the debt maturity schedule was significantly extended and the group’s liquidity profile was strengthened. Apart from that the group’s bank consortium has extended its commitments under the group’s revolving credit facility until 2024.
• In January 2020 the merger of Sarens Bestuur NV and Sarkran NV took place.
• In January 2020 a new entity was founded in Azerbaijan with the name Sarens Azerbaijan LLC.
• In February 2020 a new entity was established in Russia with the same Sarens Projects LLC.
• Sarens KM Ltd. Was sold to a third party in 2020.
• The following entities will be liquidated in 2020: Sarens Saudi Arabia Ltd, Sarens Asia (ROH) Ltd., SarensEcuador SA, Sarens Congo SARL, Sarens France (Ethiopian Branch) and SARENS BOLIVIA S.A. There is no significant impact expected on the consolidated numbers in relation to these liquidations. This also applies for the entities that will be winded down.
AUDITOR’S REPORT
Sarens Bestuur NV has prepared consolidated inancial statements in accordance with the Belgian Company’s Act and the Royal Decree of 30th of January 2001. Sarens publishes these consolidated inancial statements under Belgian GAAP and they include a consolidated balance sheet and consolidated income statement.
The inancial information included in the 2019 Annual Report has been extracted from the consolidated inancial statements of Sarens Bestuur NV for the year ending 31 December 2019.
The statutory auditor, KPMG Bedrijfsrevisoren - Réviseurs d’Entreprises, represented by Filip De Bock, has issued an unqualiied audit opinion on these inancial statements. The audited consolidated inancial statements will be iled within one month after the shareholders meeting of May 29th, 2020 and are available on the website of the National Bank (www.balanscentrale.be).
GLOSSARY
SARENS GROUP
A limited company under Belgian law, Sarens Bestuur NV and all its fully-consolidated subsidiaries
BE GAAP
Generally Accepted
Accounting Principles in
Belgium
NET SENIOR
FINANCIAL DEBT
Non-subordinated
inancial debts - cash and
cash equivalents
EBITDA MARGIN
EBITDA/turnover
EBIT
Operational result (earnings
before interests, taxes and
non-recurring operating result)
GEARING
Net inancial debt/equity
EBITDA
Earnings before interest,
taxes, depreciation and
amortisation
NET FINANCIAL DEBT
Financial debts - cash and
cash equivalents
IFRS
International Financial
Reporting Standards
NET WORKING
CAPITAL
Current assets - current
liabilities
LIQUIDITY
Current assets/current
liabilities
SOLVABILITY
Equity/balance sheet total
Sarens HeadquartersAutoweg 101861 Wolvertem - Belgium
T +32 (0) 52 319 319F +32 (0) 52 319 329
Related Documents