Annual Report 2018 maynepharma.com

Welcome message from author
This document is posted to help you gain knowledge. Please leave a comment to let me know what you think about it! Share it to your friends and learn new things together.
Transcript

Annual Report 2018maynepharma.com
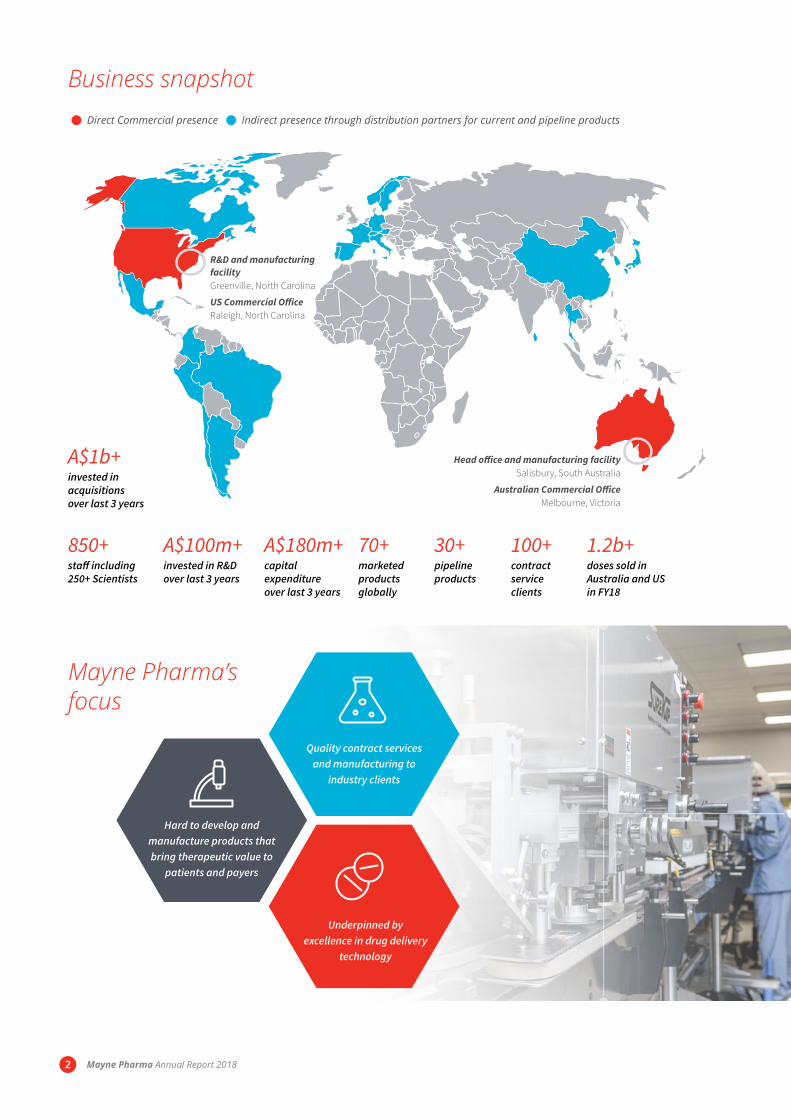
Business snapshot Direct Commercial presence Indirect presence through distribution partners for current and pipeline products
R&D and manufacturing facility Greenville, North Carolina
US Commercial Office Raleigh, North Carolina
Head office and manufacturing facility Salisbury, South Australia
Australian Commercial Office Melbourne, Victoria
100+contract service clients
30+pipeline products
70+marketed products globally
A$180m+capital expenditure over last 3 years
A$100m+invested in R&D over last 3 years
850+staff including 250+ Scientists
Mayne Pharma’s focus
A$1b+invested in acquisitions over last 3 years
1.2b+doses sold in Australia and US in FY18
Hard to develop and manufacture products that bring therapeutic value to
patients and payers
Underpinned by excellence in drug delivery
technology
Quality contract services and manufacturing to
industry clients
Mayne Pharma Annual Report 20182

What’s insideOverview
4 About Mayne Pharma
6 FY18 Business Highlights
8 Strategic priorities
10 Chairman’s Letter
12 Chief Executive Officer’s Review
16 Building our tomorrow – facilities
18 Building our tomorrow – pipeline
22 Global Leadership Team
Financial Report
25 Directors’ Report
37 Remuneration Report
44 Auditor’s Independence Declaration
45 Corporate Governance
46 Consolidated Statement of Profit and Loss
and other Comprehensive Income
47 Consolidated Statement of Financial Position
48 Consolidated Statement of Cash Flows
49 Consolidated Statement of Changes in Equity
50 Notes to the Consolidated Financial Statements
86 Directors’ Declaration
87 Independent Auditor’s Report
93 ASX Additional Information
94 Intellectual Property and Glossary
95 Corporate Information
Mayne Pharma Annual Report 2018 3

About Mayne Pharma
We believe that everyone deserves medicines that are
better, safe and more affordable. That’s why our people are
determined to create innovative products and services for our
changing world.
Mayne Pharma is an ASX-listed specialty pharmaceutical company focused on
the application of drug delivery expertise to commercialise branded and generic
pharmaceuticals, providing patients with access to better and more affordable
medicines. Mayne Pharma also provides contract development and manufacturing
services to more than 100 clients worldwide.
Business Overview
Mayne Pharma’s roots can be traced back to FH Faulding and Co Limited, for
many years, one of the largest and most prominent pharmaceutical companies
headquartered in South Australia. Mayne Pharma has a 30-year track record of
innovation and success in developing new oral drug delivery systems and these
technologies have been successfully commercialised in numerous products that
continue to be marketed around the world including Astrix®, Doryx®, Eryc®, Kapanol®,
and Lozanoc®.
Mayne Pharma has two product development and manufacturing facilities based in
Salisbury, Australia and Greenville, North Carolina, US with expertise in the formulation
of complex oral and topical dose forms including potent compounds, modified-release
products and inherently unstable compounds.
Key events shaping Mayne Pharma
Over the past five years, Mayne Pharma has grown its revenue from A$83m in FY13 to
A$530m in FY18 and adjusted EBITDA from A$18m to A$165m. This growth has been
driven by a number of strategic acquisitions, new product launches and an array of
commercial initiatives to drive sales growth and improve the cost base. The key events
that have shaped the development of Mayne Pharma and are expected to be key
drivers of future growth include:
Innovative & entrepreneurial... in approach and mindset across
all of our market segments and core
business activities
Partnership at the core... flexible and collaborative partner
that is great to work with and
solutions driven in both product and
service offerings
A great place to work... built on integrity and opportunities
for development
Delivering sustainable value to patients and prescribers... highly valued medicines delivered
efficiently and effectively to our
customers across a multi-channel
platform
Medical dermatology leadership... to provide innovative medical
dermatology solutions that meet the
needs of patients and physicians
Keeping our promises
to patients, for better
medicines and a better
tomorrow
2012 2013 2014
November 2012 Completed acquisition of Metrics, Inc. for US$115m
R&D Activity
M&A Activity
Commercial
July 2013 Completed acquisition of US based generic company Libertas Pharma Inc.
July 2013 Launched generic doxycycline DR tablets and erythromycin DR capsules in the US
February 2014 Completed acquisition of select brands from Forest Laboratories
August 2014 Launched SUBA-Itraconazole capsules in Australia
Mayne Pharma Annual Report 20184
About Mayne Pharma
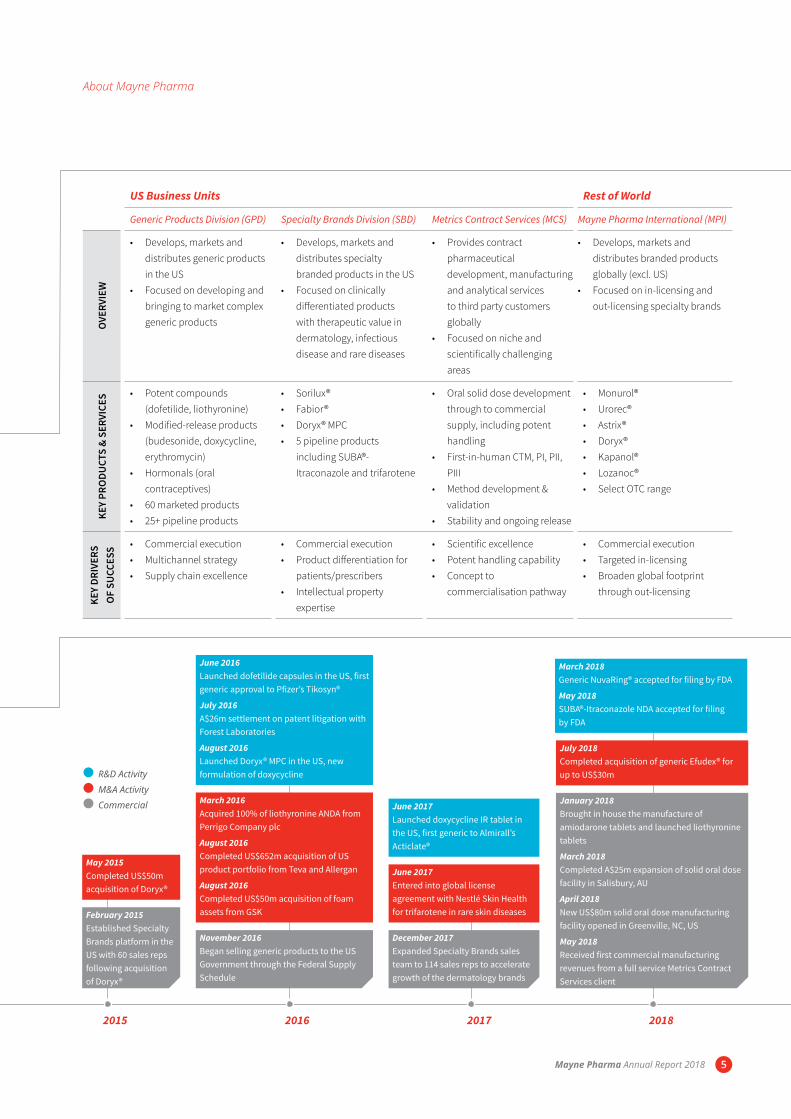
US Business Units Rest of World
Generic Products Division (GPD) Specialty Brands Division (SBD) Metrics Contract Services (MCS) Mayne Pharma International (MPI)
OVE
RVIE
W
• Develops, markets and distributes generic products in the US
• Focused on developing and bringing to market complex generic products
• Develops, markets and distributes specialty branded products in the US
• Focused on clinically differentiated products with therapeutic value in dermatology, infectious disease and rare diseases
• Provides contract pharmaceutical development, manufacturing and analytical services to third party customers globally
• Focused on niche and scientifically challenging areas
• Develops, markets and distributes branded products globally (excl. US)
• Focused on in-licensing and out-licensing specialty brands
KEY
PRO
DUCT
S &
SERV
ICES
• Potent compounds (dofetilide, liothyronine)
• Modified-release products (budesonide, doxycycline, erythromycin)
• Hormonals (oral contraceptives)
• 60 marketed products• 25+ pipeline products
• Sorilux®• Fabior® • Doryx® MPC• 5 pipeline products
including SUBA®-Itraconazole and trifarotene
• Oral solid dose development through to commercial supply, including potent handling
• First-in-human CTM, PI, PII, PIII
• Method development & validation
• Stability and ongoing release
• Monurol®• Urorec® • Astrix®• Doryx®• Kapanol®• Lozanoc® • Select OTC range
KEY
DRIV
ERS
OF
SUCC
ESS • Commercial execution
• Multichannel strategy• Supply chain excellence
• Commercial execution• Product differentiation for
patients/prescribers• Intellectual property
expertise
• Scientific excellence• Potent handling capability• Concept to
commercialisation pathway
• Commercial execution• Targeted in-licensing • Broaden global footprint
through out-licensing
2015 2016 2017 2018
May 2015 Completed US$50m acquisition of Doryx®
February 2015 Established Specialty Brands platform in the US with 60 sales reps following acquisition of Doryx®
June 2017 Entered into global license agreement with Nestlé Skin Health for trifarotene in rare skin diseases
December 2017 Expanded Specialty Brands sales team to 114 sales reps to accelerate growth of the dermatology brands
March 2016 Acquired 100% of liothyronine ANDA from Perrigo Company plc
August 2016 Completed US$652m acquisition of US product portfolio from Teva and Allergan
August 2016 Completed US$50m acquisition of foam assets from GSK
November 2016 Began selling generic products to the US Government through the Federal Supply Schedule
June 2016 Launched dofetilide capsules in the US, first generic approval to Pfizer’s Tikosyn®
July 2016 A$26m settlement on patent litigation with Forest Laboratories
August 2016 Launched Doryx® MPC in the US, new formulation of doxycycline
July 2018 Completed acquisition of generic Efudex® for up to US$30m
January 2018 Brought in house the manufacture of amiodarone tablets and launched liothyronine tablets
March 2018 Completed A$25m expansion of solid oral dose facility in Salisbury, AU
April 2018 New US$80m solid oral dose manufacturing facility opened in Greenville, NC, US
May 2018 Received first commercial manufacturing revenues from a full service Metrics Contract Services client
March 2018 Generic NuvaRing® accepted for filing by FDA
May 2018 SUBA®-Itraconazole NDA accepted for filing by FDA
R&D Activity
M&A Activity
Commercial June 2017 Launched doxycycline IR tablet in the US, first generic to Almirall’s Acticlate®
Mayne Pharma Annual Report 2018 5
AUGUST 2017
• Launched Urorec® (silodosin) capsule (8mg) in Australia indicated for the
relief of lower urinary tract symptoms associated with benign prostatic
hyperplasia in adult men
• European Medicines Agency granted SUBA-Itraconazole Orphan Drug
Designation for Basal Cell Carcinoma Nevus Syndrome (BCCNS) which
provides certain benefits to a drug developer including a 10-year period of
marketing exclusivity in Europe
NOVEMBER 2017
• Launched full range of generic Clozaril® (clozapine 25mg, 50mg, 100mg and
200mg) tablets in the US, indicated as an antipsychotic
DECEMBER 2017
• Completed expansion of Specialty Brands team to 114 sales representatives
to drive growth of Fabior®, Sorilux® and Doryx® MPC
• Launched Monurol® (fosfomycin trometamol) granules (3g) in Australia
indicated for the treatment of acute uncomplicated urinary tract infections in
females over 12 years old
• HedgePath Pharmaceuticals, Inc. completed recruitment for Phase IIb clinical
trial studying the effect of Mayne Pharma’s patented SUBA-Itraconazole
capsules in 38 BCCNS patients and reported interim results demonstrating
that the majority of Target Lesions (N=477) decreased in size (54% of Target
Lesions decreased by >30% and 27% completely disappeared)
JANUARY 2018
• Launched generic Cytomel® (liothyronine 5mcg, 25mcg and 50mcg) tablets
in the US indicated to treat hypothyroidism after ending a distribution
agreement
• Brought in house the manufacture of amiodarone 100mg and 400mg tablets
• Invested US$2.4m into HedgePath Pharmaceuticals Inc., a partly owned
subsidiary of Mayne Pharma, to progress the development of SUBA-
itraconazole as a potential treatment for cancer
FY18 Business Highlights
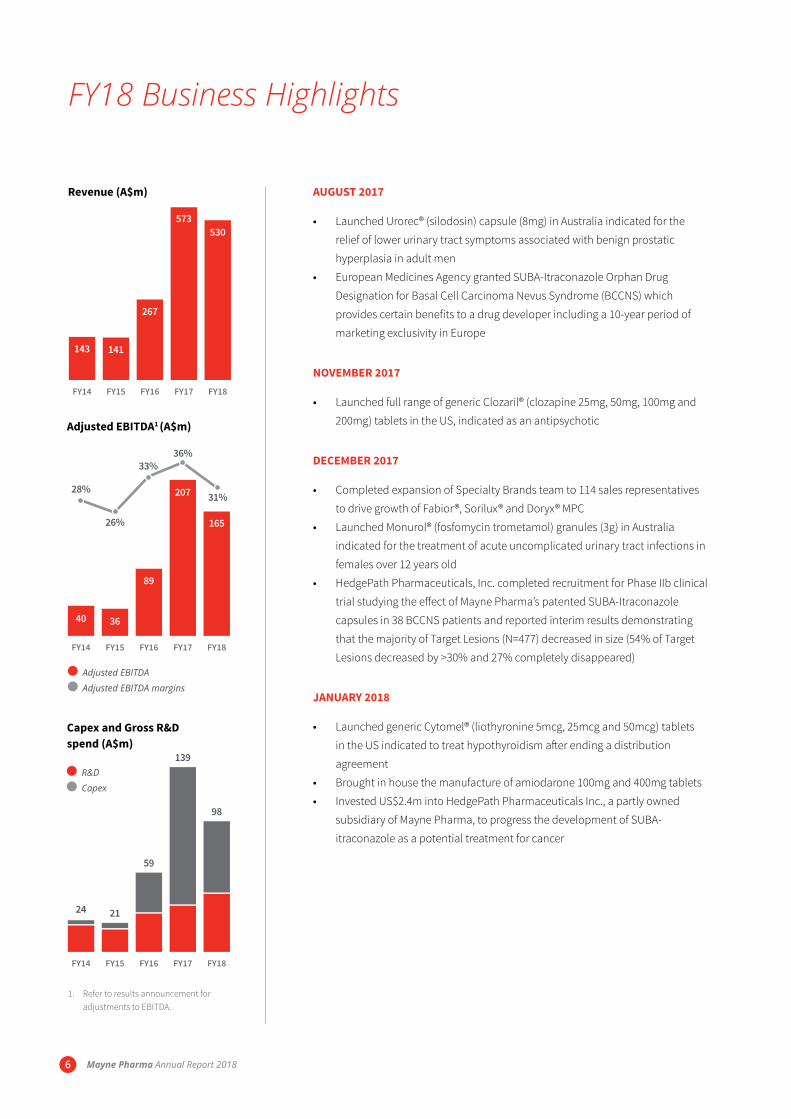
FY14
143
FY15
141
FY16
267
FY17
573
FY18
530
Revenue (A$m)
Adjusted EBITDA1 (A$m)
Adjusted EBITDA
Adjusted EBITDA margins
FY14
40
FY15
36
FY16
89
FY17
207
FY18
165
28%
26%
33%36%
31%
FY14
24
FY15
21
FY16
59
FY17
139
FY18
98
Capex and Gross R&D spend (A$m)
R&D
Capex
1. Refer to results announcement for adjustments to EBITDA.
Mayne Pharma Annual Report 20186
FEBRUARY 2018
• Launched voriconazole powder for injection (200mg) in
Australia to treat fungal and yeast infections
MARCH 2018
• First generic to market launch of methylphenidate
extended-release (ER) capsules (10mg) in the US, indicated
for attention deficit hyperactivity disorder
• Acquired generic butalbital / acetaminophen capsule
(50mg / 300mg) from Mikart, Inc. indicated to treat tension
headaches (migraines)
• Launched generic Monodox® (doxycycline monohydrate
50mg, 75mg and 100mg) capsules in the US, indicated
for the treatment of a number of infections, including
adjunctive therapy in severe acne
• Launched generic Quartette® (levonorgestrel and ethinyl
estradiol) tablets in the US, indicated for the prevention of
pregnancy
• Received filing acceptance from the US FDA for a generic
NuvaRing®, an intra vaginal hormonal contraceptive
delivery device combining etonogestrel / ethinyl estradiol
over a 3-week period
APRIL 2018
• Launched generic Cordarone® (amiodarone 200mg) tablets
in the US used to treat life-threatening recurrent ventricular
arrhythmia
• Officially opened the new US$80m solid oral dose
manufacturing facility in Greenville, North Carolina, US
which more than quadrupled Mayne Pharma’s US capacity
for solid oral dose pharmaceuticals and introduces new
capacity to manufacture potent compounds and new
capability to manufacture modified-release bead/pellet
products
• Completed tech transfer in-house of disopyramide capsules
to Greenville, first Teva acquired product transferred in-
house
FY18 Business Highlights
MAY 2018
• Completed A$25m investment in Salisbury to expand fluid
bed processing capacity, expand high sheer granulation
and tablet compression capacity and add new potent oral
solid dosage handling capability
• FDA acceptance of New Drug Application (NDA) for SUBA-
Itraconazole capsules to treat systemic fungal infections
• Completed tech transfer in-house of carbidopa / levodopa
tablets to Salisbury from a Teva site which is expected
to become Salisbury’s largest volume product providing
significant overhead recovery benefits
• Received filing acceptance from US FDA for generic Ranexa®
(ranolazine) extended-release tablets, indicated for the
treatment of chronic angina
• Received approval for generic Kapvay® (clonidine 0.1mg)
extended-release tablets from US FDA, indicated for the
treatment of attention deficit hyperactivity disorder as
monotherapy or as adjunct to stimulant medications
• Metrics Contract Services received first commercial
manufacturing revenues from a full service MCS client
Mayne Pharma Annual Report 2018 7
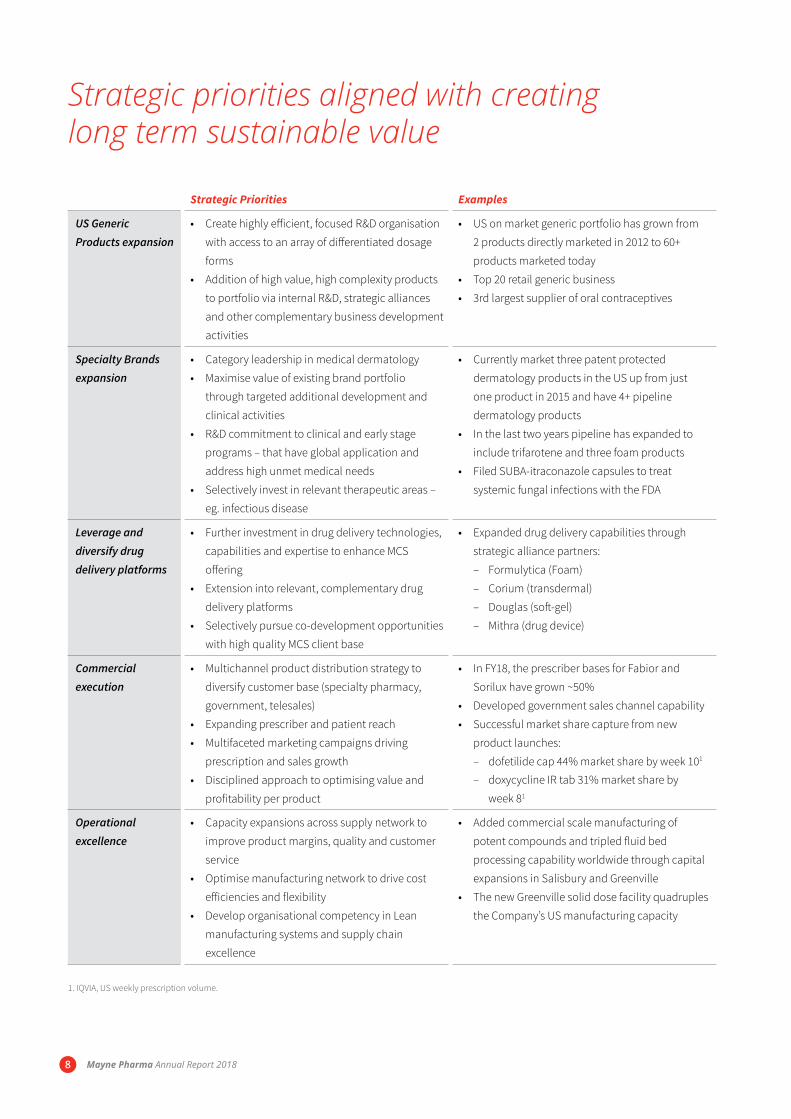
Strategic priorities aligned with creating long term sustainable value
Strategic Priorities Examples
US Generic Products expansion
• Create highly efficient, focused R&D organisation
with access to an array of differentiated dosage
forms
• Addition of high value, high complexity products
to portfolio via internal R&D, strategic alliances
and other complementary business development
activities
• US on market generic portfolio has grown from
2 products directly marketed in 2012 to 60+
products marketed today
• Top 20 retail generic business
• 3rd largest supplier of oral contraceptives
Specialty Brands expansion
• Category leadership in medical dermatology
• Maximise value of existing brand portfolio
through targeted additional development and
clinical activities
• R&D commitment to clinical and early stage
programs – that have global application and
address high unmet medical needs
• Selectively invest in relevant therapeutic areas –
eg. infectious disease
• Currently market three patent protected
dermatology products in the US up from just
one product in 2015 and have 4+ pipeline
dermatology products
• In the last two years pipeline has expanded to
include trifarotene and three foam products
• Filed SUBA-itraconazole capsules to treat
systemic fungal infections with the FDA
Leverage and diversify drug delivery platforms
• Further investment in drug delivery technologies,
capabilities and expertise to enhance MCS
offering
• Extension into relevant, complementary drug
delivery platforms
• Selectively pursue co-development opportunities
with high quality MCS client base
• Expanded drug delivery capabilities through
strategic alliance partners:
– Formulytica (Foam)
– Corium (transdermal)
– Douglas (soft-gel)
– Mithra (drug device)
Commercial execution
• Multichannel product distribution strategy to
diversify customer base (specialty pharmacy,
government, telesales)
• Expanding prescriber and patient reach
• Multifaceted marketing campaigns driving
prescription and sales growth
• Disciplined approach to optimising value and
profitability per product
• In FY18, the prescriber bases for Fabior and
Sorilux have grown ~50%
• Developed government sales channel capability
• Successful market share capture from new
product launches:
– dofetilide cap 44% market share by week 101
– doxycycline IR tab 31% market share by
week 81
Operational excellence
• Capacity expansions across supply network to
improve product margins, quality and customer
service
• Optimise manufacturing network to drive cost
efficiencies and flexibility
• Develop organisational competency in Lean
manufacturing systems and supply chain
excellence
• Added commercial scale manufacturing of
potent compounds and tripled fluid bed
processing capability worldwide through capital
expansions in Salisbury and Greenville
• The new Greenville solid dose facility quadruples
the Company’s US manufacturing capacity
1. IQVIA, US weekly prescription volume.
Mayne Pharma Annual Report 20188

Mayne Pharma Annual Report 2018 9
Dear Fellow Shareholders,
On behalf of the Mayne Pharma Board and Management, I am pleased to present
the 2018 annual report.
The Board and I would like to express our appreciation for your continued
commitment and investment in Mayne Pharma. FY18 has been an extraordinary
year as the US generic industry faced a tough deflationary period driven by
customer consolidation and the acceleration of approvals through the US FDA.
These changing market dynamics have impacted the whole generic industry
leading to many of our US peers reporting weaker results, restructuring their
operations, divesting assets and or announcing strategic reviews.
Financial performance & position
Mayne Pharma has also been impacted by these market dynamics, but I believe
our business model has allowed us to weather these market conditions better
than most of our peers. With a strong balance sheet, a diverse operating model
that also includes specialty brands and contract services, and an experienced
team of people to lead and execute on our strategies we have reported a
significantly stronger second half. The second half benefited from new product
launches, cost savings from in-house manufacture of select products, portfolio
optimisation, growing share of key marketed products, a stronger contract
services committed business pipeline and a stabilising generic market.
In terms of the full year, the Company reported FY18 revenue of A$530m, adjusted
EBITDA of A$165m1 and reported a net loss after tax of A$134m. These full year
results were impacted by a number of one-off items including non-cash intangible
asset impairment, extraordinary stock obsolescence, abnormal Doryx returns, a
restructuring charge to reduce the cost base and a charge to income tax expense
resulting from the US corporate federal tax rate change. These one-off items
largely impacted the results in the first half with minimal adjustments to reported
earnings in the second half.
The Company ended the year with cash of A$87m and outstanding borrowings of
A$374m. The Company has significant headroom under its bank covenants and
intends to maintain a conservative balance sheet to retain the flexibility to pursue
further growth initiatives including value accretive M&A. Pleasingly, operating cash
flow was an inflow of A$122m and the second half also generated free cash flow
after investing activities.
Chairman’s Letter
Roger Corbett AO, Chairman
1. Underlying result excludes certain specified expenses as outlined in the FY18 Results Presentation dated 24 August 2018.
FY18 was a
transformative year
following completion
of the new solid
oral dose facility in
Greenville, North
Carolina as well
as completion of
the manufacturing
expansion in Salisbury,
South Australia
Mayne Pharma Annual Report 201810
of the largest healthcare services and information technology
companies globally. Both Frank and Pat are US residents and
have distinguished careers in growing profitable, complex and
diverse businesses across multiple markets and channels.
Outlook
The US pharmaceutical market continues to be highly dynamic
with potential government policy changes and ongoing channel
shifts through vertical integration of the supply chain across
wholesalers, retailers, pharmaceutical benefit managers and
insurers. In addition, a number of major participants have
announced plans to complete strategic reviews, restructure
their operations or divest certain US assets.
The Company views this dynamic environment favourably and
remains focused on executing on its key strategic initiatives
which include bringing new products to market, optimising our
supply chain, exploiting new distribution channels, growing
share of marketed products, and further business development
activity.
The outlook is positive across the Group with a more stabilised
retail generic pricing environment, an established specialty
sales platform in US, anticipated new product launches,
the acquisition of generic Efudex® in July 2018, portfolio
optimisation and the pipeline of committed contract service
business expected to be key drivers of near and long-term
growth.
On behalf of the Board, I would like to thank the Mayne Pharma
team for their hard work and commitment to deliver on our
strategic goals. We will continue to maintain a conservative
balance sheet and drive organic growth and seek out value
enhancing business development opportunities, while
improving profitability and cashflow through an efficient
operating model.
Roger Corbett, AO
Chairman
Investing for growth
FY18 was a transformative year as the new solid oral dose
facility in Greenville, North Carolina and the manufacturing
expansion in Salisbury, South Australia were both completed.
The Company has invested more than A$150m over the last
three years to transform its manufacturing facilities to bring new
capacity and capability on line and support the mid to long-
term growth we are forecasting across our product portfolio,
as well as offering commercial contract manufacturing to our
contract service clients.
These expansions have begun to deliver benefits to the Group
with improved margins for the products transferred in-house
and the continued strong growth of Metrics Contract Services
which is now able to offer clients a comprehensive ‘concept to
commercialisation’ solution under one FDA site registration.
Metrics Contract Services has delivered three consecutive
years of double-digit revenue growth in USD terms and
recently received revenues from its first long-term commercial
manufacturing contract.
We also made significant investments over the year to advance
our product pipeline. The Company invested A$44m in research
and development, focusing on first-to-market generics, hard
to manufacture products, complex generic products and
advancing its pipeline of specialty brands. Pleasingly, the
Company filed eight products with the FDA including the NDA
for SUBA-Itraconazole anti-fungal capsule and the ANDA for a
generic NuvaRing, which is the largest contraceptive product in
the US. The Company launched six generic products in the US
and two specialty brands in Australia.
Board renewal
It is crucial we maintain the most effective blend of experience
and contemporary vision on our Board. As part of the Board
renewal process, I am delighted to welcome Frank Condella
and Pat Blake to the Board as Non-Executive Directors. Frank
brings more than 30 years of global pharmaceutical industry
experience from his time at Juniper Pharmaceuticals, IVAX (now
part of Teva), Faulding Pharmaceuticals and Roche. Pat brings
more than 30 years of global healthcare industry experience
including more than 20 years at McKesson Corporation, one
Chairman’s Letter
Mayne Pharma Annual Report 2018 11
Dear Fellow Shareholders,
Mayne Pharma has a clear strategy for growth, which centres on optimising our
current on-market product portfolio, developing our people, deepening our
investment in product development, expanding our manufacturing capabilities
and looking for new business development opportunities. We will continue to
focus on building our business in the United States, which is the world’s largest
pharmaceutical market.
Mayne Pharma has developed a meaningful presence in the US across its three
complementary business segments – contract services, generic products and
specialty brands and is now a top 20 retail generic business, one of the leading
medical dermatology companies and a top three supplier of oral contraceptives.
Our key achievements for FY18 include:
• Significantly improved trading in the second half of FY18 driven by the
rebound of generic products
• Positive operating cash flow of A$122m with 2HFY18 operating cash flow up
53% on 1HFY18
• Free cash flow of A$33m in 2HFY18
• Expanded Specialty Brands field sales team to 114 sales representatives
which has contributed to the growth of Fabior and Sorilux in the second half
• Launched six generic products in the US – generic Cytomel (liothyronine),
generic Monodox (doxycycline monohydrate), generic Cordarone
(amiodarone 200mg), generic Ritalin (methylphenidate 10mg), generic
Clozaril (clozapine) and generic Quartette (an oral contraceptive)
• Launched two specialty brands in Australia – Monurol (Fosfomycin) and
Urorec (silodosin)
• Filed eight products with the FDA including generic NuvaRing and a New Drug
Application for SUBA-Itraconazole anti-fungal capsule
• Metrics Contract Services delivered three consecutive years of double-digit
revenue growth in USD terms
• Received first commercial contract manufacturing revenues from a Metrics
Contract Services client
• Completed two strategic manufacturing investments in Salisbury, South
Australia and Greenville, North Carolina
• Completed tech transfer of amiodarone tablets and disopyramide capsules to
Greenville and carbidopa-levodopa tablets to Salisbury
Chief Executive Officer’s Review
Scott Richards, CEO
Mayne Pharma has
a clear strategy for
growth, which centres
on optimising our
current on-market
product portfolio,
developing our
people, deepening our
investment in product
development, expanding
our manufacturing
capabilities and
looking for new
business development
opportunities.
Mayne Pharma Annual Report 201812

Chief Executive Officer’s Review
trometamol) and Urorec (silodosin) also contributed to
the result. Rest of world sales grew 11% driven by Kapanol
(morphine sulfate) in Canada and SUBA-itraconazole. The
stronger gross margin reflects improving business mix and
renegotiation of supply agreements.
Pipeline
The Company continues to invest in its pipeline of generic and
branded products. The US pipeline contains over 30 products
in various stages of development targeting markets with sales
greater than US$5b1. During the year, the Company filed eight
products with the FDA including its NDA for SUBA-itraconazole
capsule and its ANDA for generic NuvaRing, received FDA
approval for five generic products and launched six generic
products in the US. In Australia, the Company launched two
specialty brands products.
The Company continues to progress the commercialisation
of its patented formulation of itraconazole for the treatment
of certain fungal conditions and as a potential treatment for
certain cancers. SUBA-Itraconazole is a proprietary, patented
formulation that enhances the solubility and absorption of
conventional itraconazole formulations.
Operating performance
In terms of the operating performance at a segment level,
the Generic Products Division sales were $386m, down 8%
on FY17 and gross profit was $177m. Dofetilide, liothyronine,
doxycycline, budesonide and carbidopa/levodopa were the key
drivers of growth, offset by pricing pressures largely focused in
the oral contraceptive portfolio. In US dollar terms, sales were
US$299m down 5% on pcp with the 2HFY18 sales and gross
profit up 12% and 78% respectively on the 1HFY18. The generic
portfolio performed strongly in the second half driven by six
new product launches, normalised levels of stock obsolescence,
improving business mix and cost savings from the transfer of
manufacturing of select products into Greenville and Salisbury
from third party manufacturers.
Specialty Brands Division reported sales of $45m and gross
profit was $38m. In US dollar terms, sales were US$35m with
2HFY18 sales up 121% on 1HFY18. The 1HFY18 results were
impacted by US$10m of abnormal Doryx returns which did not
recur in the second half. The expansion of the sales team to
114 specialty sales representatives in the first half has helped
drive growth in the underlying demand of these products,
as measured by dispensed prescriptions. Prescriptions for
Fabior were up 30% and Sorilux up 75% in the 2HFY18 versus
the 1HFY18 and the total number of prescribers writing these
products has been growing consistently since November 2017.
Metrics Contract Services delivered another strong result,
with revenue up 9% on pcp to A$63m and gross profit up 5%
to A$34m. In US dollar terms, sales were up 12% to US$49m
with MCS now delivering three years of double-digit annual
revenue growth, well ahead of industry growth rates. The strong
performance reflects MCS’s strong reputation in the marketplace
and the strategic investments made in Greenville over the last
three years in new manufacturing capacity and capability which
has enabled MCS to attract new business as well as create
a pipeline of potential commercial contract manufacturing
business.
Mayne Pharma International grew sales 7% to A$37m and
gross profit increased 18% to A$8m. Australian sales benefited
from increased sales of aspirin, injectables, itraconazole and
oxycodone. New product launches of Monurol (fosfomycin
1. IQVIA MAT Sales Jun 2018
Mayne Pharma Annual Report 2018 13

Over the next year, the Company expects to launch SUBA-
itraconazole to treat certain fungal infections in another six
countries, including the US assuming the product is approved
following the acceptance of the NDA in April 2018. If approved,
this product will be commercialised through the Specialty
Brands business unit calling on a range of primarily hospital-
based specialists that treat patients with, or at risk of certain
fungal infections. The Company expects to have the new sales
team in place during CY2019.
The SUBA-Itraconazole cancer program is being progressed
by HedgePath Pharmaceuticals, Inc. (HPPI), a partly owned
subsidiary (53.5% ownership) of Mayne Pharma. HPPI’s primary
goal is to bring to market SUBA-Itraconazole as a treatment
for Basal Cell Carcinoma in patients with Basal Cell Carcinoma
Nevus Syndrome (BCCNS, also known as Gorlin Syndrome).
The future
Mayne Pharma’s competitive strength lies in its integrated
operations from product development, through to
manufacturing and marketing of our products and services
around the world. Having both brand and generic product
platforms, together with contract services, diversifies and
de-risks our business model, enabling the Company to fully
leverage growth opportunities and changing market dynamics.
Future branded products can be marketed by the Specialty
Brands Division and as these products lose exclusivity, the
Company can participate in the related generic market. Metrics
Contract Services shares our extensive manufacturing and
testing facilities and enhances our return on investment in the
new Greenville facility with manufacture of client products.
We believe this diversified model is a significant competitive
advantage over other similar sized peers.
I am looking forward to the coming year, launching new
products and executing on our key strategic initiatives. I
would like to take this opportunity to thank the Board, the
Mayne Pharma Leadership Team, and all our employees for
their hard work, commitment and passion. We will continue
to shape our business to better align with the needs of our
customers, prescribers and patients. I am confident we have
a stronger business following the challenges we faced in 2017
and importantly we have the right team of people to lead and
execute on the various growth opportunities we have around
the world.
Scott Richards
Chief Executive Officer
Chief Executive Officers Review
Mayne Pharma Annual Report 201814

Mayne Pharma Annual Report 2018 15
Building our tomorrow – facilities
Over the last three years, Mayne Pharma has invested more than A$150m in capital
expenditure to expand its two manufacturing sites in Greenville, NC and Salisbury, SA to add
capacity and new capabilities. These strategic investments have already begun to deliver
benefits to the Group with improved product margins for the products transferred in-house
and the continued strong growth of Metrics Contract Services, which is now able to offer clients
a comprehensive ‘concept to commercialisation’ solution under one FDA site registration.
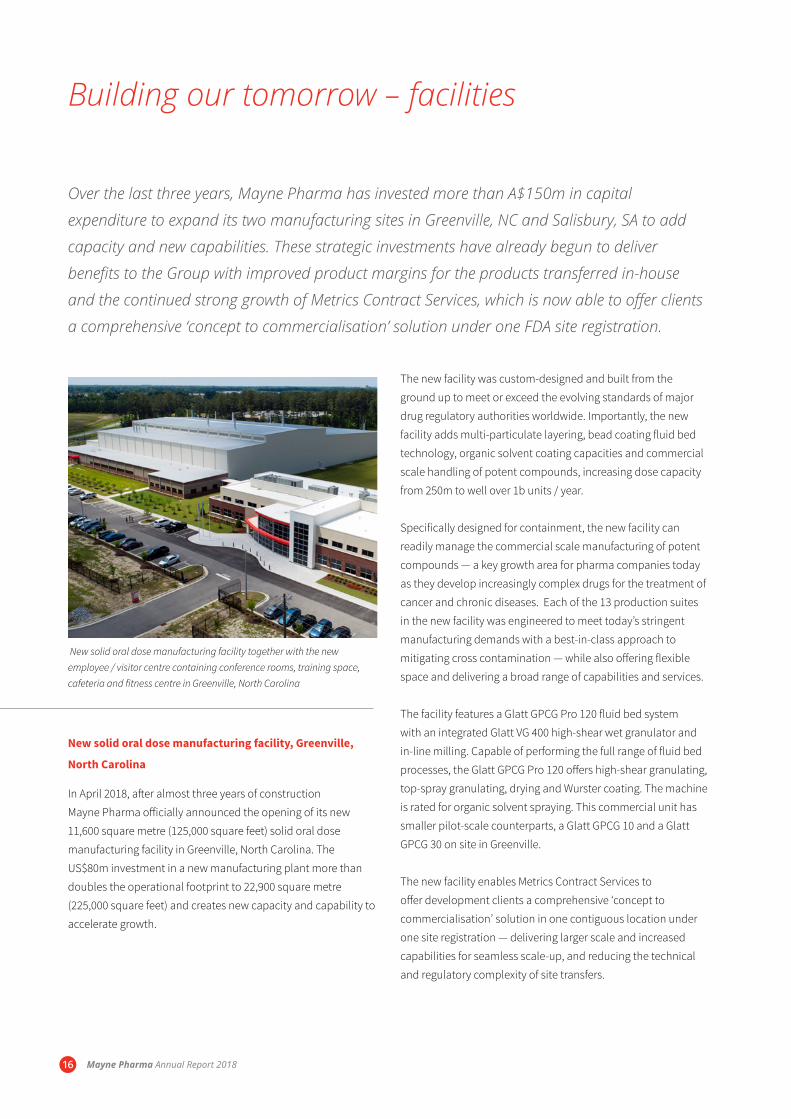
New solid oral dose manufacturing facility, Greenville,
North Carolina
In April 2018, after almost three years of construction
Mayne Pharma officially announced the opening of its new
11,600 square metre (125,000 square feet) solid oral dose
manufacturing facility in Greenville, North Carolina. The
US$80m investment in a new manufacturing plant more than
doubles the operational footprint to 22,900 square metre
(225,000 square feet) and creates new capacity and capability to
accelerate growth.
The new facility was custom-designed and built from the
ground up to meet or exceed the evolving standards of major
drug regulatory authorities worldwide. Importantly, the new
facility adds multi-particulate layering, bead coating fluid bed
technology, organic solvent coating capacities and commercial
scale handling of potent compounds, increasing dose capacity
from 250m to well over 1b units / year.
Specifically designed for containment, the new facility can
readily manage the commercial scale manufacturing of potent
compounds — a key growth area for pharma companies today
as they develop increasingly complex drugs for the treatment of
cancer and chronic diseases. Each of the 13 production suites
in the new facility was engineered to meet today’s stringent
manufacturing demands with a best-in-class approach to
mitigating cross contamination — while also offering flexible
space and delivering a broad range of capabilities and services.
The facility features a Glatt GPCG Pro 120 fluid bed system
with an integrated Glatt VG 400 high-shear wet granulator and
in-line milling. Capable of performing the full range of fluid bed
processes, the Glatt GPCG Pro 120 offers high-shear granulating,
top-spray granulating, drying and Wurster coating. The machine
is rated for organic solvent spraying. This commercial unit has
smaller pilot-scale counterparts, a Glatt GPCG 10 and a Glatt
GPCG 30 on site in Greenville.
The new facility enables Metrics Contract Services to
offer development clients a comprehensive ‘concept to
commercialisation’ solution in one contiguous location under
one site registration — delivering larger scale and increased
capabilities for seamless scale-up, and reducing the technical
and regulatory complexity of site transfers.
New solid oral dose manufacturing facility together with the new employee / visitor centre containing conference rooms, training space, cafeteria and fitness centre in Greenville, North Carolina
Mayne Pharma Annual Report 201816
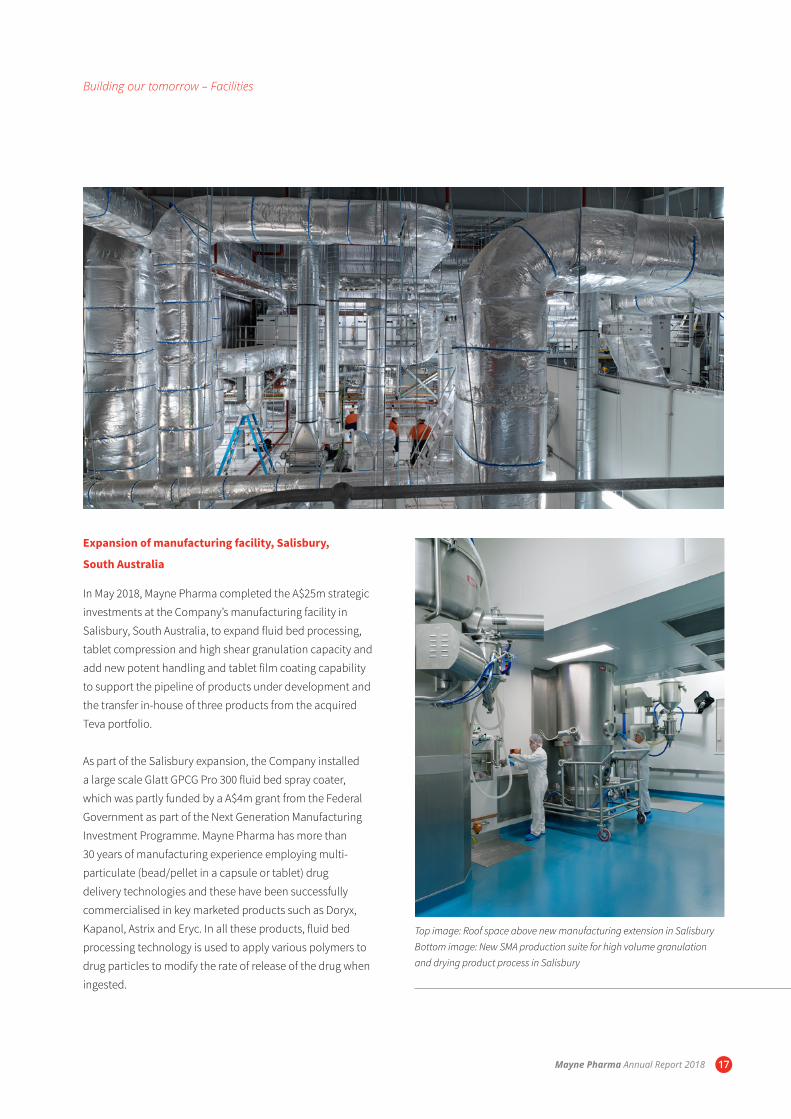
Expansion of manufacturing facility, Salisbury,
South Australia
In May 2018, Mayne Pharma completed the A$25m strategic
investments at the Company’s manufacturing facility in
Salisbury, South Australia, to expand fluid bed processing,
tablet compression and high shear granulation capacity and
add new potent handling and tablet film coating capability
to support the pipeline of products under development and
the transfer in-house of three products from the acquired
Teva portfolio.
As part of the Salisbury expansion, the Company installed
a large scale Glatt GPCG Pro 300 fluid bed spray coater,
which was partly funded by a A$4m grant from the Federal
Government as part of the Next Generation Manufacturing
Investment Programme. Mayne Pharma has more than
30 years of manufacturing experience employing multi-
particulate (bead/pellet in a capsule or tablet) drug
delivery technologies and these have been successfully
commercialised in key marketed products such as Doryx,
Kapanol, Astrix and Eryc. In all these products, fluid bed
processing technology is used to apply various polymers to
drug particles to modify the rate of release of the drug when
ingested.
Top image: Roof space above new manufacturing extension in Salisbury Bottom image: New SMA production suite for high volume granulation and drying product process in Salisbury
Building our tomorrow – Facilities
Mayne Pharma Annual Report 2018 17
Building our tomorrow – pipeline
Mayne Pharma continues to invest in the development
of new generic and branded products focusing on higher
value and niche product opportunities, first-to-market
generics, hard-to-manufacture products and complex
products.
Mayne Pharma’s development pipeline includes over 30 products targeting US
markets with sales greater than US$5b1. During FY18, the Company filed eight
products with the FDA including its NDA for SUBA-itraconazole capsule, received
FDA approval for five generic products and launched six generic products in the
US. In Australia, the Company launched two specialty brands products.
The Company has seven generic products pending approval with no generic
equivalents today targeting markets with sales of more than US$2b1. The most
significant of these is the Company’s filing of generic NuvaRing, an intra vaginal
hormonal contraceptive delivery device. Merck’s NuvaRing had total US sales of
US$890m1.
Over the last two years, Mayne Pharma has extended its drug delivery capabilities
through a number of strategic alliances with best-in-class pharmaceutical
developers and manufacturers. Mayne Pharma has current partnership
arrangements with:
• Corium for transdermal patches;
• Mithra for a women’s health hormonal device;
• Formulytica for foam technology; and
• Douglas Pharmaceuticals for soft gel products requiring specialised high
containment manufacturing.
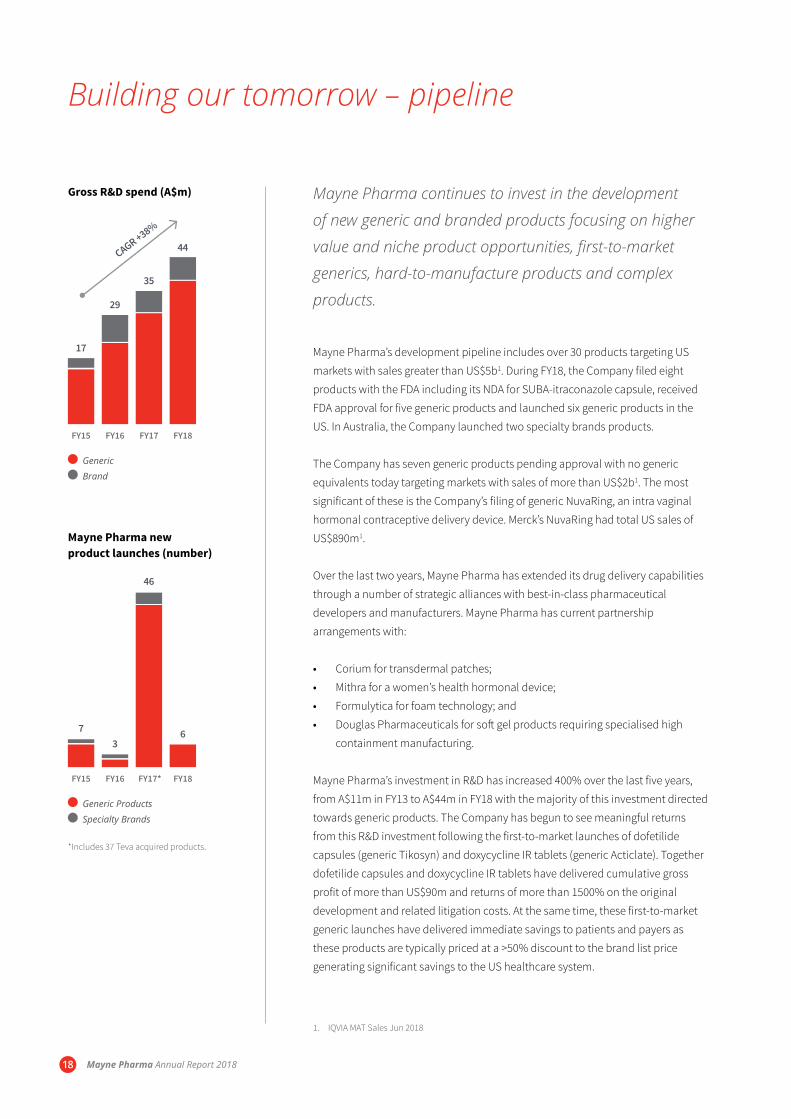
Mayne Pharma’s investment in R&D has increased 400% over the last five years,
from A$11m in FY13 to A$44m in FY18 with the majority of this investment directed
towards generic products. The Company has begun to see meaningful returns
from this R&D investment following the first-to-market launches of dofetilide
capsules (generic Tikosyn) and doxycycline IR tablets (generic Acticlate). Together
dofetilide capsules and doxycycline IR tablets have delivered cumulative gross
profit of more than US$90m and returns of more than 1500% on the original
development and related litigation costs. At the same time, these first-to-market
generic launches have delivered immediate savings to patients and payers as
these products are typically priced at a >50% discount to the brand list price
generating significant savings to the US healthcare system.
Gross R&D spend (A$m)
Generic
Brand
FY15
17
FY16
29
FY17
35
FY18
44CAGR +38%
Mayne Pharma new product launches (number)
Generic Products
Specialty Brands
FY15
7
FY16
3
FY17*
46
FY18
6
*Includes 37 Teva acquired products.
1. IQVIA MAT Sales Jun 2018
Mayne Pharma Annual Report 201818
In terms of specialty brands research and development, the
current areas of therapeutic focus are dermatology, infectious
diseases and rare diseases. These therapeutic areas were
selected based on the current portfolio, medical need and fit
with our specialty pharma commercial capabilities. In addition,
our core technologies are particularly suitable for these clinical
areas. Our branded research and development efforts today are
focused on bringing a clear clinical differentiation proposition
to patients and payers through improving an active substance
delivery format or repurposing an existing drug.
SUBA-Itraconazole
The Company continues to progress the commercialisation
of its patented formulation of itraconazole for the treatment
of certain fungal conditions and as a potential treatment for
certain cancers. SUBA-Itraconazole is a patented formulation,
which has improved absorption and significantly reduced
variability compared to conventional itraconazole capsules.
These benefits provide enhancements to patients and
prescribers with reduced intra- and inter-patient variability,
enabling a more predictable clinical response and a reduction
in the amount of active drug administered to deliver the
required therapeutic blood levels.
In Australia, SUBA-Itraconazole (Lozanoc) continues to perform
well capturing 34% volume share of the itraconazole market2.
Since launch in 2014, the overall itraconazole market has
grown 18% annually benefiting from increasing diagnosis and
treatment of fungal conditions as well as growing its share of
the anti-fungal market2. Over the coming year, the Company
expects to launch SUBA-itraconazole in another six countries,
including the US assuming the product is approved following
the acceptance of the NDA in April 2018. If approved, this
product will be commercialised through the Specialty Brands
business unit calling on a range of primarily hospital-based
specialists that treat patients with, or at risk of certain fungal
infections. The Company expects to have the new sales team in
place during CY2019.
Whilst itraconazole is used extensively to treat fungal infections
globally, the product appears to have notable anti-cancer
effects. In clinical studies, itraconazole administration has
been associated with improved disease control in patients
with advanced lung cancer, skin cancer and prostate cancer.
HedgePath Pharmaceuticals, Inc. (HPPI), a clinical stage
biopharmaceutical company is seeking to repurpose SUBA-
Itraconazole as a potential treatment for certain cancers and
is investigating the use of the product as an inhibitor of the
Hedgehog pathway.
2. IQVIA MAT units (tablet/capsules), Dec 2017
Building our tomorrow – Pipeline
Mayne Pharma Annual Report 2018 19

The Hedgehog signalling pathway is a major regulator of cellular
processes in vertebrates, including cell differentiation, tissue
polarity and cell proliferation. Based on published research,
HPPI believes that inhibiting the Hedgehog pathway could
delay or possibly inhibit the development of certain cancers in
humans.
HPPI’s primary goal is to bring to market SUBA-Itraconazole
as a treatment for Basal Cell Carcinoma in patients with Basal
Cell Carcinoma Nevus Syndrome (BCCNS, also known as Gorlin
Syndrome). Gorlin Syndrome is a serious condition for which
surgery is the standard of care. Repeated surgeries often result
in disfigurement and morbidity.
Trifarotene
In 2017, the Company entered into a new global licensing
agreement with Nestlé Skin Health (parent entity of leading
global dermatology and skin health franchise, Galderma)
to develop and commercialise trifarotene in rare disease
indications. Trifarotene is a new retinoid in a topical cream
formulation. It has a high selectivity for the type of retinoic
acid receptors (RAR) found specifically on the skin. Its retinoid
functionality and potent keratolytic properties make it a
potentially viable treatment for a number of rare diseases.
Building our tomorrow – Pipeline
In 2014, the US FDA granted Orphan Drug Designation for
trifarotene in the treatment of the skin disease congenital
ichthyosis, which is an umbrella term for a group of rare,
inherited forms of ichthyoses, a group of skin scaling disorders.
There are no treatments approved by the FDA in the United
States for moderate and severe subtypes of this disease.
Lamellar ichthyosis is one of the disorders that belong to the
congenital ichthyosis category. The disease manifests during
the first weeks of life and lasts throughout a patient’s lifetime
and can lead to disability, partial deafness, severe discomfort
and psycho-social impacts. Galderma completed a phase I
study in 2016 using trifarotene in treating patients with lamellar
ichthyosis which demonstrated the cream formulation to be
safe and well-tolerated.
The collaboration with Galderma highlights Mayne Pharma as
a trusted partner in dermatology as well as its emerging clinical
and development capabilities in the management of rare
diseases. The Company expects to commence a Phase II dose
finding study in FY19.
Mayne Pharma Annual Report 201820

Mayne Pharma Annual Report 2018 21

1
4
7
2
5
8
3
6
1. Scott RichardsChief Executive Officer and Managing Director
Scott joined Mayne Pharma in February 2012. He has more than 27 years’ international experience in the pharmaceutical industry and has worked in Europe, the US and Asia. Prior to joining Mayne Pharma, Scott spent ten years in Europe in a variety of leadership roles including President, Europe, Middle East and Africa and President, Global Commercial Operations for Mayne Pharma Limited (acquired by Hospira in 2007). He also served on the Group Management Board of Actavis for four years where he was responsible for the firm’s global injectable/hospital business operations. Prior to working in Europe, Scott spent 14 years with FH Faulding and Co (acquired by Mayne Nickless in 2001) in a variety of roles including leading Faulding Pharmaceuticals Asia Pacific operations together with spending five years with Faulding in the United States leading business development and portfolio management operations.
2. Nick FreemanGroup Chief Financial Officer and Company Secretary
Nick was appointed as Group Chief Financial Officer and Company Secretary in May 2017. Nick is a Chartered Accountant and has more than 25 years’ experience in the accounting and finance profession. He was formerly the CFO Australia at ANZ Bank and, prior to that, CFO New Zealand at ANZ Bank. He also held the position of Group Treasurer at Qantas Airways and was CFO at General Mills and Millers Retail. Nick has extensive experience in the areas of mergers and acquisitions, integration management, tax, financial planning and analysis and reporting, risk management, treasury and investor relations.
Global Leadership Team
Mayne Pharma Annual Report 201822
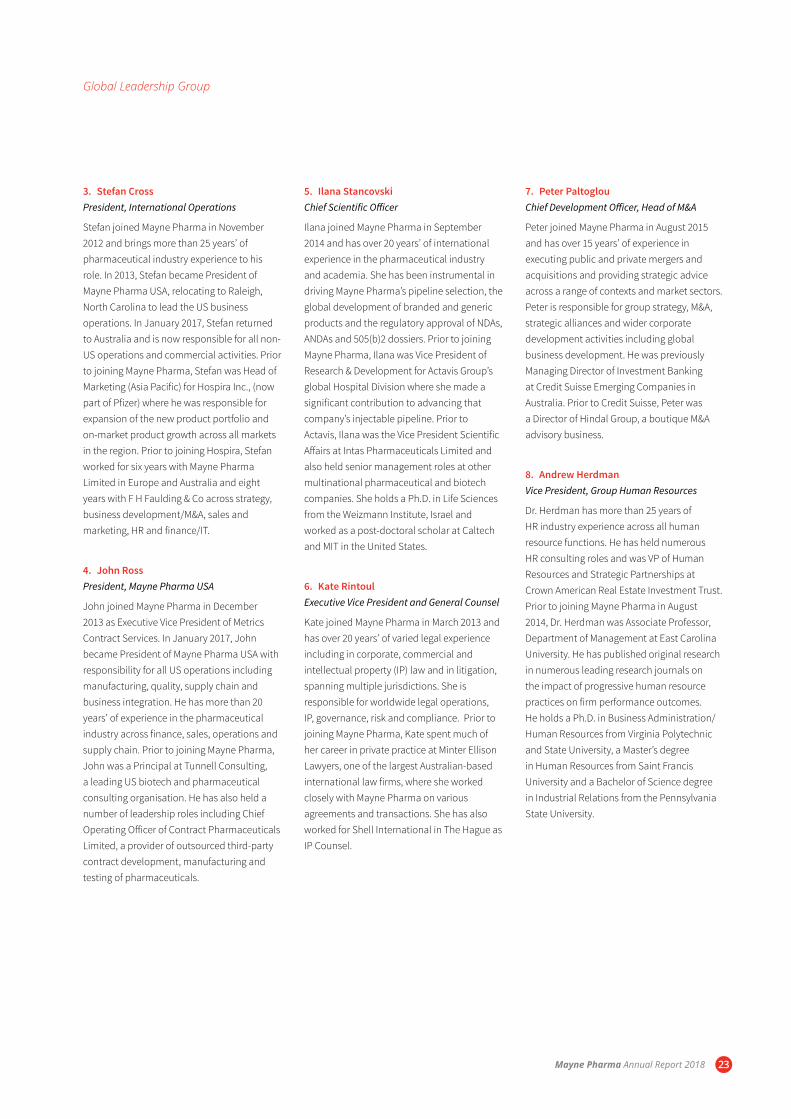
5. Ilana StancovskiChief Scientific Officer
Ilana joined Mayne Pharma in September 2014 and has over 20 years’ of international experience in the pharmaceutical industry and academia. She has been instrumental in driving Mayne Pharma’s pipeline selection, the global development of branded and generic products and the regulatory approval of NDAs, ANDAs and 505(b)2 dossiers. Prior to joining Mayne Pharma, Ilana was Vice President of Research & Development for Actavis Group’s global Hospital Division where she made a significant contribution to advancing that company’s injectable pipeline. Prior to Actavis, Ilana was the Vice President Scientific Affairs at Intas Pharmaceuticals Limited and also held senior management roles at other multinational pharmaceutical and biotech companies. She holds a Ph.D. in Life Sciences from the Weizmann Institute, Israel and worked as a post-doctoral scholar at Caltech and MIT in the United States.
6. Kate RintoulExecutive Vice President and General Counsel
Kate joined Mayne Pharma in March 2013 and has over 20 years’ of varied legal experience including in corporate, commercial and intellectual property (IP) law and in litigation, spanning multiple jurisdictions. She is responsible for worldwide legal operations, IP, governance, risk and compliance. Prior to joining Mayne Pharma, Kate spent much of her career in private practice at Minter Ellison Lawyers, one of the largest Australian-based international law firms, where she worked closely with Mayne Pharma on various agreements and transactions. She has also worked for Shell International in The Hague as IP Counsel.
3. Stefan CrossPresident, International Operations
Stefan joined Mayne Pharma in November 2012 and brings more than 25 years’ of pharmaceutical industry experience to his role. In 2013, Stefan became President of Mayne Pharma USA, relocating to Raleigh, North Carolina to lead the US business operations. In January 2017, Stefan returned to Australia and is now responsible for all non-US operations and commercial activities. Prior to joining Mayne Pharma, Stefan was Head of Marketing (Asia Pacific) for Hospira Inc., (now part of Pfizer) where he was responsible for expansion of the new product portfolio and on-market product growth across all markets in the region. Prior to joining Hospira, Stefan worked for six years with Mayne Pharma Limited in Europe and Australia and eight years with F H Faulding & Co across strategy, business development/M&A, sales and marketing, HR and finance/IT.
4. John RossPresident, Mayne Pharma USA
John joined Mayne Pharma in December 2013 as Executive Vice President of Metrics Contract Services. In January 2017, John became President of Mayne Pharma USA with responsibility for all US operations including manufacturing, quality, supply chain and business integration. He has more than 20 years’ of experience in the pharmaceutical industry across finance, sales, operations and supply chain. Prior to joining Mayne Pharma, John was a Principal at Tunnell Consulting, a leading US biotech and pharmaceutical consulting organisation. He has also held a number of leadership roles including Chief Operating Officer of Contract Pharmaceuticals Limited, a provider of outsourced third-party contract development, manufacturing and testing of pharmaceuticals.
7. Peter PaltoglouChief Development Officer, Head of M&A
Peter joined Mayne Pharma in August 2015 and has over 15 years’ of experience in executing public and private mergers and acquisitions and providing strategic advice across a range of contexts and market sectors. Peter is responsible for group strategy, M&A, strategic alliances and wider corporate development activities including global business development. He was previously Managing Director of Investment Banking at Credit Suisse Emerging Companies in Australia. Prior to Credit Suisse, Peter was a Director of Hindal Group, a boutique M&A advisory business.
8. Andrew HerdmanVice President, Group Human Resources
Dr. Herdman has more than 25 years of HR industry experience across all human resource functions. He has held numerous HR consulting roles and was VP of Human Resources and Strategic Partnerships at Crown American Real Estate Investment Trust. Prior to joining Mayne Pharma in August 2014, Dr. Herdman was Associate Professor, Department of Management at East Carolina University. He has published original research in numerous leading research journals on the impact of progressive human resource practices on firm performance outcomes. He holds a Ph.D. in Business Administration/Human Resources from Virginia Polytechnic and State University, a Master’s degree in Human Resources from Saint Francis University and a Bachelor of Science degree in Industrial Relations from the Pennsylvania State University.
Global Leadership Group
Mayne Pharma Annual Report 2018 23

Board of Directors
Left to right: Mr William (Phil) Hodges, Prof Bruce Robinson, Hon. Ron Best, Ms Nancy Dolan, Mr Ian Scholes, Mr Roger Corbett (Chairman), Mr Bruce Mathieson, Mr Scott Richards (CEO), Mr Frank Condella, Mr Patrick Blake.
Mayne Pharma Annual Report 201824
Mayne Pharma Annual Report 2018 25
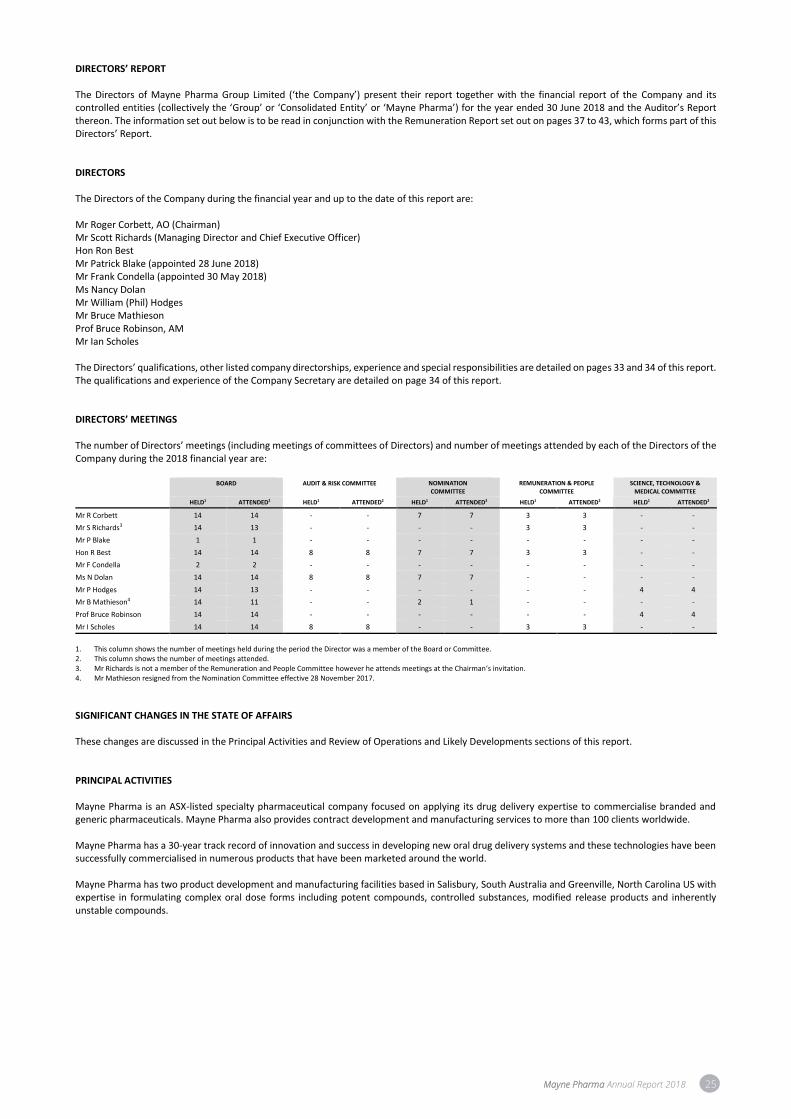
DIRECTORS’ REPORT The Directors of Mayne Pharma Group Limited (‘the Company’) present their report together with the financial report of the Company and its controlled entities (collectively the ‘Group’ or ‘Consolidated Entity’ or ‘Mayne Pharma’) for the year ended 30 June 2018 and the Auditor’s Report thereon. The information set out below is to be read in conjunction with the Remuneration Report set out on pages 37 to 43, which forms part of this Directors’ Report. DIRECTORS The Directors of the Company during the financial year and up to the date of this report are: Mr Roger Corbett, AO (Chairman) Mr Scott Richards (Managing Director and Chief Executive Officer) Hon Ron Best Mr Patrick Blake (appointed 28 June 2018) Mr Frank Condella (appointed 30 May 2018) Ms Nancy Dolan Mr William (Phil) Hodges Mr Bruce Mathieson Prof Bruce Robinson, AM Mr Ian Scholes The Directors’ qualifications, other listed company directorships, experience and special responsibilities are detailed on pages 33 and 34 of this report. The qualifications and experience of the Company Secretary are detailed on page 34 of this report. DIRECTORS’ MEETINGS The number of Directors’ meetings (including meetings of committees of Directors) and number of meetings attended by each of the Directors of the Company during the 2018 financial year are:
BOARD AUDIT & RISK COMMITTEE NOMINATION COMMITTEE
REMUNERATION & PEOPLE COMMITTEE
SCIENCE, TECHNOLOGY & MEDICAL COMMITTEE
HELD1 ATTENDED2 HELD1 ATTENDED2 HELD1 ATTENDED2 HELD1 ATTENDED2 HELD1 ATTENDED2
Mr R Corbett 14 14 - - 7 7 3 3 - -
Mr S Richards3 14 13 - - - - 3 3 - -
Mr P Blake 1 1 - - - - - - - -
Hon R Best 14 14 8 8 7 7 3 3 - -
Mr F Condella 2 2 - - - - - - - -
Ms N Dolan 14 14 8 8 7 7 - - - -
Mr P Hodges 14 13 - - - - - - 4 4
Mr B Mathieson4 14 11 - - 2 1 - - - -
Prof Bruce Robinson 14 14 - - - - - - 4 4
Mr I Scholes 14 14 8 8 - - 3 3 - -
1. This column shows the number of meetings held during the period the Director was a member of the Board or Committee. 2. This column shows the number of meetings attended. 3. Mr Richards is not a member of the Remuneration and People Committee however he attends meetings at the Chairman’s invitation. 4. Mr Mathieson resigned from the Nomination Committee effective 28 November 2017.
SIGNIFICANT CHANGES IN THE STATE OF AFFAIRS These changes are discussed in the Principal Activities and Review of Operations and Likely Developments sections of this report. PRINCIPAL ACTIVITIES Mayne Pharma is an ASX-listed specialty pharmaceutical company focused on applying its drug delivery expertise to commercialise branded and generic pharmaceuticals. Mayne Pharma also provides contract development and manufacturing services to more than 100 clients worldwide. Mayne Pharma has a 30-year track record of innovation and success in developing new oral drug delivery systems and these technologies have been successfully commercialised in numerous products that have been marketed around the world. Mayne Pharma has two product development and manufacturing facilities based in Salisbury, South Australia and Greenville, North Carolina US with expertise in formulating complex oral dose forms including potent compounds, controlled substances, modified release products and inherently unstable compounds.

26 Mayne Pharma Annual Report 2018
REVIEW OF OPERATIONS AND LIKELY DEVELOPMENTS Summary of financial performance Set out below is a summary of the financial performance attributable to Mayne Pharma shareholders for the 2018 financial year (FY18) compared to the prior corresponding period (‘pcp’). This summary includes non-IFRS financial information that is stated excluding certain non-operating income and expense items. The results are set out this way as the Directors consider them to be a meaningful comparison from period to period. Earnings before interest tax, depreciation and amortisation (‘EBITDA’) is used as a key measure of the earnings considered by management in operating the business and assessing performance.
SALES AND PROFIT
2018
$M
2017
$M
CHANGE ON PCP
$M
CHANGE ON PCP
%
Reported Revenue 530.3 572.6 (42.3) (7%)
Reported Gross profit 256.6 315.8 (59.2) (19%)
Reported Gross profit % 48.4% 55.1%
Adjusted EBITDA 165.3 206.5 (41.1) (20%)
Adjustments (1) (48.5) 17.7 (66.3)
Reported EBITDA 116.8 224.2 (107.4) (48%)
Impairments (184.4) (20.2) (164.2)
Depreciation / Amortisation (79.5) (73.3) (6.2) (8%)
Reported PBIT (147.1) 130.7 (277.8)
Net Interest (17.2) (12.1) (5.1)
Reported PBT (164.3) 118.6 (282.9)
Income tax expense 30.3 (30.0) 61.0
Reported NPAT attributable to Mayne Pharma shareholders (133.9) 88.6 (221.9)
1. Current year adjustments are included in the table below. Prior period adjustments to Reported EBITDA include $22.4m net patent litigation gains ($26.2m of patent settlement income less
$3.8m of litigation expenses relating to Mayne Pharma’s allegation that Merck’s Noxafil® product infringes a Mayne Pharma patent); $5.6m of transaction and other related costs; $5.3m credit for the revaluation of HPPI warrants; $1.5m of legal costs associated with the cost of drug pricing investigations and related litigation and $2.9m to remove the HedgePath Pharmaceuticals Inc. (HPPI) losses attributable to members of the Company.
The reconciliation of reported results and adjusted results for the current year is as follows:
SALES AND PROFIT
REPORTED ATTRIBUTABLE TO
MEMBERS JUNE 2018 (1)
$M
SBD - DORYX RETURNS (2)
$M
GPD – STOCK ADJUSTMENTS (3)
$M
RESTRUCTURING EXPENSES (4)
$M
ASSET IMPAIRMENTS (5)
$M
HPPI – MAYNE PHARMA’S SHARE
(6)
$M
DOJ(7)
$M
US TAX ITEMS (8)
$M
ADJUSTED JUNE 2018
$M
Revenue 530.3 12.4 - - - - - 542.7
Gross profit 256.6 12.4 17.3 3.1 - - - 289.3
Gross profit % 48.4% 53.3%
EBITDA 116.8 13.3 17.3 16.3 - 0.9 0.7 - 165.3
Depreciation / Amortisation (79.5) - - - - 0.4 - (79.1)
Asset impairments (184.4) - - - 184.4 - - -
PBIT (147.1) 13.3 17.3 16.3 184.4 1.3 0.7 - 86.2
Net Interest (17.2) - - - - - - (17.2)
PBT (164.3) 13.3 17.3 16.3 184.4 1.3 0.7 - 69.0
Income tax 30.3 (4.1) (5.3) (2.7) (43.9) (2.6) (0.2) 19.9 (8.7)
PAT (133.9) 9.2 12.0 13.6 140.5 (1.3) 0.5 19.9 60.3
1. The values in the above table are values attributable to members of Mayne Pharma and hence include only Mayne Pharma’s share of HPPI. The Consolidated Statement of Profit or Loss and
Other Comprehensive Income and supporting notes, such as Note 7 for income tax, include 100% of HPPI and hence differ from the above values. 2. SBD – Doryx® returns – represents the abnormal level of Doryx product returns and sample write-offs due the loss of exclusivity on Doryx 50mg and 200mg tablets in May 2016. 3. GPD – stock adjustments – represents the abnormal amount of inventory obsolescence, write-downs and sell through of short dated stock below cost. 4. Restructuring expenses – represents expense relating to the cancellation of specific employee shares ($7.4m), onerous supply chain contracts and other expense management initiatives to lower
the cost base. 5. Asset impairments – intangible asset impairments relating to the change in the current and projected market dynamics for generic products, occurring in 1H18. The amount disclosed in the
December interim result was $183.5m with the difference being the 2H18 exchange rate impact. 6. HPPI – Mayne Pharma’s share of HPPI’s EBITDA loss ($2.5m) less the fair value gain ($1.6m) on restatement of the value of Mayne Pharma’s HPPI warrants. HPPI tax includes Mayne’s share of
HPPI’s restatement of DTL due to the US tax rate change. 7. Drug pricing investigations and related litigation costs. 8. US tax items includes $13.3m for restatement of US related DTAs and DTLs (excluding HPPI) due to the US corporate tax rate changes and $6.6m for tax losses for a US subsidiary not recognised
as a deferred tax asset.
The non IFRS financial information is unaudited. Review of operations In contrast to the above tables which are based on financial performance attributable to Mayne Pharma shareholders, the following information is provided on a total group basis and hence includes 100% of the revenues and expenses incurred by HedgePath Pharmaceuticals Inc (‘HPPI’) where applicable. Mayne Pharma controls 53.5% of HPPI and has consolidated 100% of HPPI, in accordance with accounting standards, into the financial statements following this Directors Report. The Group recorded revenue of $530.3m, down 7% on pcp and gross profit was $256.5m down 19% on pcp. Gross profit margin as a percentage of revenue was 48.4% (2017: 55.1%) which reflects price deflation in the US generic market and a number of abnormal one-off items which include extraordinary stock obsolescence charges and abnormal Doryx® returns in the first half. Adjusting for these one-off items, the group gross profit margin would have been 53.3%. The reported loss before tax was $164.3m and the net loss after tax was $133.9m.
Mayne Pharma Annual Report 2018 27
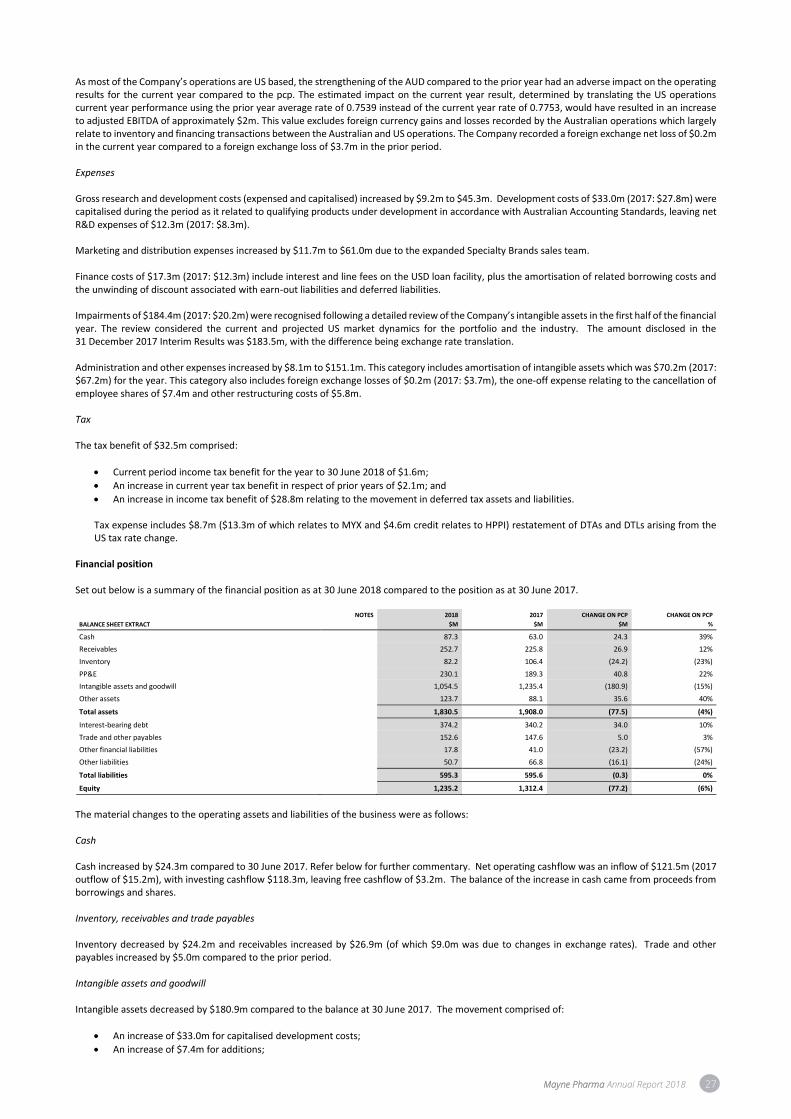
As most of the Company’s operations are US based, the strengthening of the AUD compared to the prior year had an adverse impact on the operating results for the current year compared to the pcp. The estimated impact on the current year result, determined by translating the US operations current year performance using the prior year average rate of 0.7539 instead of the current year rate of 0.7753, would have resulted in an increase to adjusted EBITDA of approximately $2m. This value excludes foreign currency gains and losses recorded by the Australian operations which largely relate to inventory and financing transactions between the Australian and US operations. The Company recorded a foreign exchange net loss of $0.2m in the current year compared to a foreign exchange loss of $3.7m in the prior period. Expenses Gross research and development costs (expensed and capitalised) increased by $9.2m to $45.3m. Development costs of $33.0m (2017: $27.8m) were capitalised during the period as it related to qualifying products under development in accordance with Australian Accounting Standards, leaving net R&D expenses of $12.3m (2017: $8.3m). Marketing and distribution expenses increased by $11.7m to $61.0m due to the expanded Specialty Brands sales team. Finance costs of $17.3m (2017: $12.3m) include interest and line fees on the USD loan facility, plus the amortisation of related borrowing costs and the unwinding of discount associated with earn-out liabilities and deferred liabilities. Impairments of $184.4m (2017: $20.2m) were recognised following a detailed review of the Company’s intangible assets in the first half of the financial year. The review considered the current and projected US market dynamics for the portfolio and the industry. The amount disclosed in the 31 December 2017 Interim Results was $183.5m, with the difference being exchange rate translation. Administration and other expenses increased by $8.1m to $151.1m. This category includes amortisation of intangible assets which was $70.2m (2017: $67.2m) for the year. This category also includes foreign exchange losses of $0.2m (2017: $3.7m), the one-off expense relating to the cancellation of employee shares of $7.4m and other restructuring costs of $5.8m. Tax The tax benefit of $32.5m comprised:
• Current period income tax benefit for the year to 30 June 2018 of $1.6m;
• An increase in current year tax benefit in respect of prior years of $2.1m; and
• An increase in income tax benefit of $28.8m relating to the movement in deferred tax assets and liabilities.
Tax expense includes $8.7m ($13.3m of which relates to MYX and $4.6m credit relates to HPPI) restatement of DTAs and DTLs arising from the US tax rate change.
Financial position Set out below is a summary of the financial position as at 30 June 2018 compared to the position as at 30 June 2017.
BALANCE SHEET EXTRACT
NOTES 2018
$M
2017
$M
CHANGE ON PCP
$M
CHANGE ON PCP
%
Cash 87.3 63.0 24.3 39%
Receivables 252.7 225.8 26.9 12%
Inventory 82.2 106.4 (24.2) (23%)
PP&E 230.1 189.3 40.8 22%
Intangible assets and goodwill 1,054.5 1,235.4 (180.9) (15%)
Other assets 123.7 88.1 35.6 40%
Total assets 1,830.5 1,908.0 (77.5) (4%)
Interest-bearing debt 374.2 340.2 34.0 10%
Trade and other payables 152.6 147.6 5.0 3%
Other financial liabilities 17.8 41.0 (23.2) (57%)
Other liabilities 50.7 66.8 (16.1) (24%)
Total liabilities 595.3 595.6 (0.3) 0%
Equity 1,235.2 1,312.4 (77.2) (6%)
The material changes to the operating assets and liabilities of the business were as follows: Cash Cash increased by $24.3m compared to 30 June 2017. Refer below for further commentary. Net operating cashflow was an inflow of $121.5m (2017 outflow of $15.2m), with investing cashflow $118.3m, leaving free cashflow of $3.2m. The balance of the increase in cash came from proceeds from borrowings and shares. Inventory, receivables and trade payables Inventory decreased by $24.2m and receivables increased by $26.9m (of which $9.0m was due to changes in exchange rates). Trade and other payables increased by $5.0m compared to the prior period. Intangible assets and goodwill Intangible assets decreased by $180.9m compared to the balance at 30 June 2017. The movement comprised of:
• An increase of $33.0m for capitalised development costs;
• An increase of $7.4m for additions;
28 Mayne Pharma Annual Report 2018
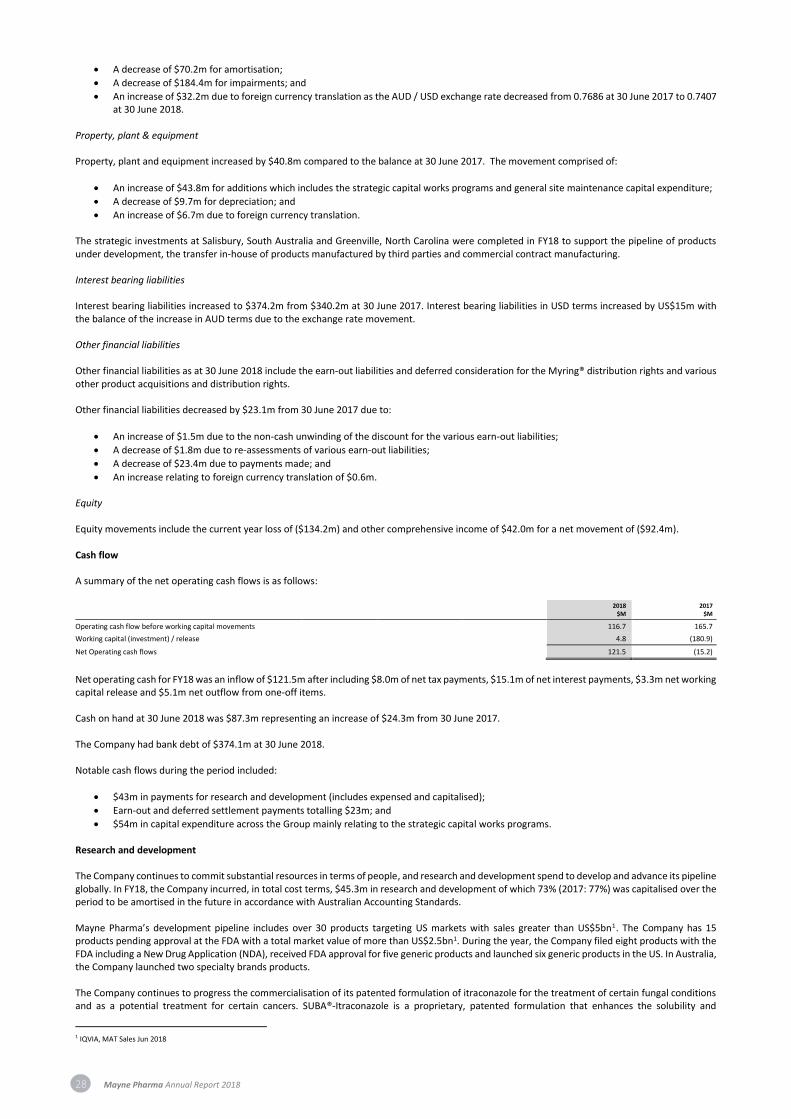
• A decrease of $70.2m for amortisation;
• A decrease of $184.4m for impairments; and
• An increase of $32.2m due to foreign currency translation as the AUD / USD exchange rate decreased from 0.7686 at 30 June 2017 to 0.7407 at 30 June 2018.
Property, plant & equipment Property, plant and equipment increased by $40.8m compared to the balance at 30 June 2017. The movement comprised of:
• An increase of $43.8m for additions which includes the strategic capital works programs and general site maintenance capital expenditure;
• A decrease of $9.7m for depreciation; and
• An increase of $6.7m due to foreign currency translation. The strategic investments at Salisbury, South Australia and Greenville, North Carolina were completed in FY18 to support the pipeline of products under development, the transfer in-house of products manufactured by third parties and commercial contract manufacturing. Interest bearing liabilities Interest bearing liabilities increased to $374.2m from $340.2m at 30 June 2017. Interest bearing liabilities in USD terms increased by US$15m with the balance of the increase in AUD terms due to the exchange rate movement. Other financial liabilities Other financial liabilities as at 30 June 2018 include the earn-out liabilities and deferred consideration for the Myring® distribution rights and various other product acquisitions and distribution rights. Other financial liabilities decreased by $23.1m from 30 June 2017 due to:
• An increase of $1.5m due to the non-cash unwinding of the discount for the various earn-out liabilities;
• A decrease of $1.8m due to re-assessments of various earn-out liabilities;
• A decrease of $23.4m due to payments made; and
• An increase relating to foreign currency translation of $0.6m. Equity Equity movements include the current year loss of ($134.2m) and other comprehensive income of $42.0m for a net movement of ($92.4m). Cash flow A summary of the net operating cash flows is as follows:
2018
$M 2017
$M
Operating cash flow before working capital movements 116.7 165.7
Working capital (investment) / release 4.8 (180.9)
Net Operating cash flows 121.5 (15.2)
Net operating cash for FY18 was an inflow of $121.5m after including $8.0m of net tax payments, $15.1m of net interest payments, $3.3m net working capital release and $5.1m net outflow from one-off items. Cash on hand at 30 June 2018 was $87.3m representing an increase of $24.3m from 30 June 2017. The Company had bank debt of $374.1m at 30 June 2018. Notable cash flows during the period included:
• $43m in payments for research and development (includes expensed and capitalised);
• Earn-out and deferred settlement payments totalling $23m; and
• $54m in capital expenditure across the Group mainly relating to the strategic capital works programs. Research and development The Company continues to commit substantial resources in terms of people, and research and development spend to develop and advance its pipeline globally. In FY18, the Company incurred, in total cost terms, $45.3m in research and development of which 73% (2017: 77%) was capitalised over the period to be amortised in the future in accordance with Australian Accounting Standards. Mayne Pharma’s development pipeline includes over 30 products targeting US markets with sales greater than US$5bn1. The Company has 15 products pending approval at the FDA with a total market value of more than US$2.5bn1. During the year, the Company filed eight products with the FDA including a New Drug Application (NDA), received FDA approval for five generic products and launched six generic products in the US. In Australia, the Company launched two specialty brands products. The Company continues to progress the commercialisation of its patented formulation of itraconazole for the treatment of certain fungal conditions and as a potential treatment for certain cancers. SUBA®-Itraconazole is a proprietary, patented formulation that enhances the solubility and
1 IQVIA, MAT Sales Jun 2018
Mayne Pharma Annual Report 2018 29
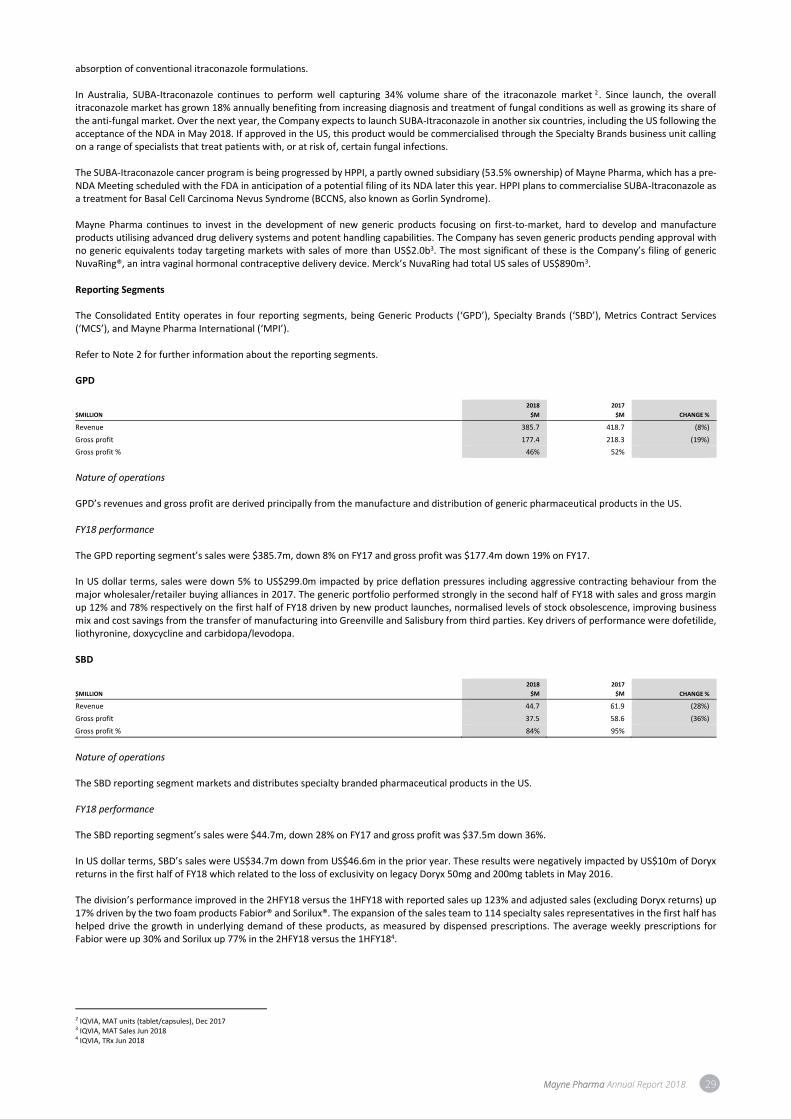
absorption of conventional itraconazole formulations. In Australia, SUBA-Itraconazole continues to perform well capturing 34% volume share of the itraconazole market 2. Since launch, the overall itraconazole market has grown 18% annually benefiting from increasing diagnosis and treatment of fungal conditions as well as growing its share of the anti-fungal market. Over the next year, the Company expects to launch SUBA-Itraconazole in another six countries, including the US following the acceptance of the NDA in May 2018. If approved in the US, this product would be commercialised through the Specialty Brands business unit calling on a range of specialists that treat patients with, or at risk of, certain fungal infections. The SUBA-Itraconazole cancer program is being progressed by HPPI, a partly owned subsidiary (53.5% ownership) of Mayne Pharma, which has a pre-NDA Meeting scheduled with the FDA in anticipation of a potential filing of its NDA later this year. HPPI plans to commercialise SUBA-Itraconazole as a treatment for Basal Cell Carcinoma Nevus Syndrome (BCCNS, also known as Gorlin Syndrome). Mayne Pharma continues to invest in the development of new generic products focusing on first-to-market, hard to develop and manufacture products utilising advanced drug delivery systems and potent handling capabilities. The Company has seven generic products pending approval with no generic equivalents today targeting markets with sales of more than US$2.0b3. The most significant of these is the Company’s filing of generic NuvaRing®, an intra vaginal hormonal contraceptive delivery device. Merck’s NuvaRing had total US sales of US$890m3. Reporting Segments The Consolidated Entity operates in four reporting segments, being Generic Products (‘GPD’), Specialty Brands (‘SBD’), Metrics Contract Services (‘MCS’), and Mayne Pharma International (‘MPI’). Refer to Note 2 for further information about the reporting segments. GPD
$MILLION
2018
$M
2017
$M CHANGE %
Revenue 385.7 418.7 (8%)
Gross profit 177.4 218.3 (19%)
Gross profit % 46% 52%
Nature of operations GPD’s revenues and gross profit are derived principally from the manufacture and distribution of generic pharmaceutical products in the US. FY18 performance The GPD reporting segment’s sales were $385.7m, down 8% on FY17 and gross profit was $177.4m down 19% on FY17. In US dollar terms, sales were down 5% to US$299.0m impacted by price deflation pressures including aggressive contracting behaviour from the major wholesaler/retailer buying alliances in 2017. The generic portfolio performed strongly in the second half of FY18 with sales and gross margin up 12% and 78% respectively on the first half of FY18 driven by new product launches, normalised levels of stock obsolescence, improving business mix and cost savings from the transfer of manufacturing into Greenville and Salisbury from third parties. Key drivers of performance were dofetilide, liothyronine, doxycycline and carbidopa/levodopa. SBD
$MILLION
2018
$M
2017
$M CHANGE %
Revenue 44.7 61.9 (28%)
Gross profit 37.5 58.6 (36%)
Gross profit % 84% 95%
Nature of operations The SBD reporting segment markets and distributes specialty branded pharmaceutical products in the US. FY18 performance The SBD reporting segment’s sales were $44.7m, down 28% on FY17 and gross profit was $37.5m down 36%. In US dollar terms, SBD’s sales were US$34.7m down from US$46.6m in the prior year. These results were negatively impacted by US$10m of Doryx returns in the first half of FY18 which related to the loss of exclusivity on legacy Doryx 50mg and 200mg tablets in May 2016. The division’s performance improved in the 2HFY18 versus the 1HFY18 with reported sales up 123% and adjusted sales (excluding Doryx returns) up 17% driven by the two foam products Fabior® and Sorilux®. The expansion of the sales team to 114 specialty sales representatives in the first half has helped drive the growth in underlying demand of these products, as measured by dispensed prescriptions. The average weekly prescriptions for Fabior were up 30% and Sorilux up 77% in the 2HFY18 versus the 1HFY184.
2 IQVIA, MAT units (tablet/capsules), Dec 2017 3 IQVIA, MAT Sales Jun 2018 4 IQVIA, TRx Jun 2018
30 Mayne Pharma Annual Report 2018
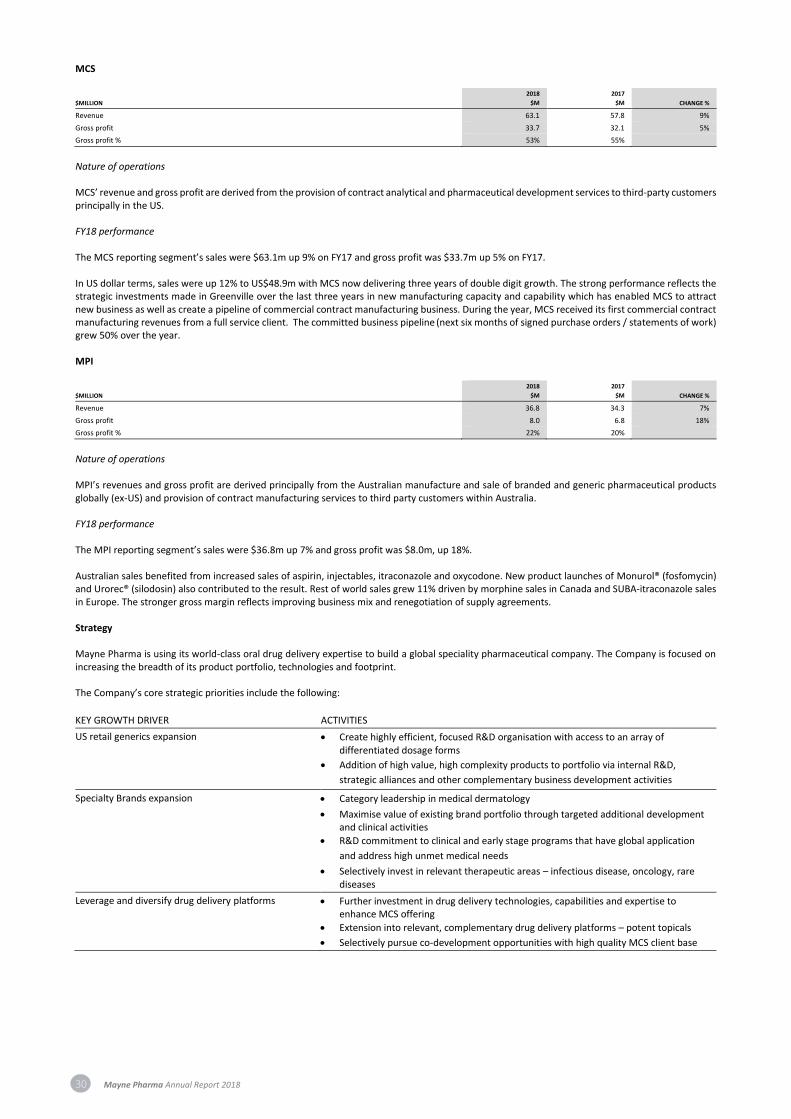
MCS
$MILLION
2018
$M
2017
$M CHANGE %
Revenue 63.1 57.8 9%
Gross profit 33.7 32.1 5%
Gross profit % 53% 55%
Nature of operations MCS’ revenue and gross profit are derived from the provision of contract analytical and pharmaceutical development services to third-party customers principally in the US. FY18 performance The MCS reporting segment’s sales were $63.1m up 9% on FY17 and gross profit was $33.7m up 5% on FY17. In US dollar terms, sales were up 12% to US$48.9m with MCS now delivering three years of double digit growth. The strong performance reflects the strategic investments made in Greenville over the last three years in new manufacturing capacity and capability which has enabled MCS to attract new business as well as create a pipeline of commercial contract manufacturing business. During the year, MCS received its first commercial contract manufacturing revenues from a full service client. The committed business pipeline (next six months of signed purchase orders / statements of work) grew 50% over the year. MPI
$MILLION
2018
$M
2017
$M CHANGE %
Revenue 36.8 34.3 7%
Gross profit 8.0 6.8 18%
Gross profit % 22% 20%
Nature of operations MPI’s revenues and gross profit are derived principally from the Australian manufacture and sale of branded and generic pharmaceutical products globally (ex-US) and provision of contract manufacturing services to third party customers within Australia. FY18 performance The MPI reporting segment’s sales were $36.8m up 7% and gross profit was $8.0m, up 18%. Australian sales benefited from increased sales of aspirin, injectables, itraconazole and oxycodone. New product launches of Monurol® (fosfomycin) and Urorec® (silodosin) also contributed to the result. Rest of world sales grew 11% driven by morphine sales in Canada and SUBA-itraconazole sales in Europe. The stronger gross margin reflects improving business mix and renegotiation of supply agreements. Strategy Mayne Pharma is using its world-class oral drug delivery expertise to build a global speciality pharmaceutical company. The Company is focused on increasing the breadth of its product portfolio, technologies and footprint. The Company’s core strategic priorities include the following:
KEY GROWTH DRIVER ACTIVITIES
US retail generics expansion • Create highly efficient, focused R&D organisation with access to an array of differentiated dosage forms
• Addition of high value, high complexity products to portfolio via internal R&D,
strategic alliances and other complementary business development activities
Specialty Brands expansion • Category leadership in medical dermatology
• Maximise value of existing brand portfolio through targeted additional development and clinical activities
• R&D commitment to clinical and early stage programs that have global application
and address high unmet medical needs
• Selectively invest in relevant therapeutic areas – infectious disease, oncology, rare diseases
Leverage and diversify drug delivery platforms • Further investment in drug delivery technologies, capabilities and expertise to enhance MCS offering
• Extension into relevant, complementary drug delivery platforms – potent topicals
• Selectively pursue co-development opportunities with high quality MCS client base
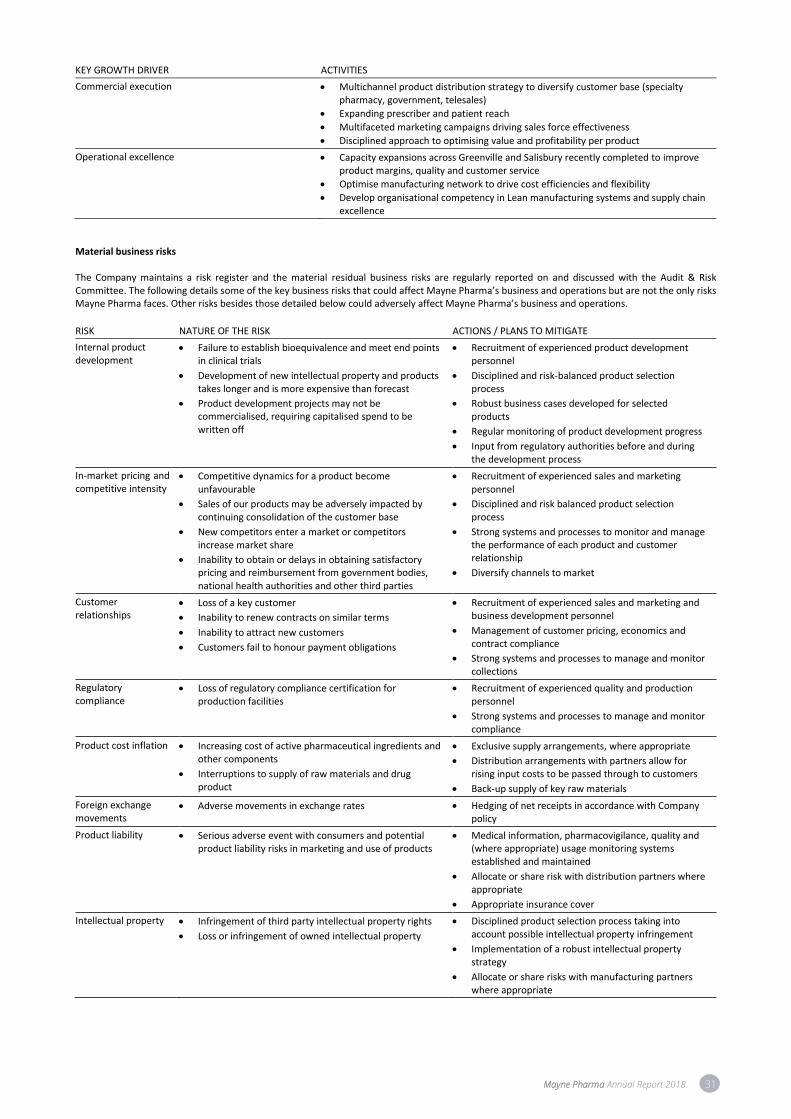
Mayne Pharma Annual Report 2018 31
KEY GROWTH DRIVER ACTIVITIES
Commercial execution • Multichannel product distribution strategy to diversify customer base (specialty pharmacy, government, telesales)
• Expanding prescriber and patient reach
• Multifaceted marketing campaigns driving sales force effectiveness
• Disciplined approach to optimising value and profitability per product
Operational excellence • Capacity expansions across Greenville and Salisbury recently completed to improve product margins, quality and customer service
• Optimise manufacturing network to drive cost efficiencies and flexibility
• Develop organisational competency in Lean manufacturing systems and supply chain excellence
Material business risks The Company maintains a risk register and the material residual business risks are regularly reported on and discussed with the Audit & Risk Committee. The following details some of the key business risks that could affect Mayne Pharma’s business and operations but are not the only risks Mayne Pharma faces. Other risks besides those detailed below could adversely affect Mayne Pharma’s business and operations.
RISK NATURE OF THE RISK ACTIONS / PLANS TO MITIGATE
Internal product development
• Failure to establish bioequivalence and meet end points in clinical trials
• Development of new intellectual property and products takes longer and is more expensive than forecast
• Product development projects may not be commercialised, requiring capitalised spend to be written off
• Recruitment of experienced product development personnel
• Disciplined and risk-balanced product selection process
• Robust business cases developed for selected products
• Regular monitoring of product development progress
• Input from regulatory authorities before and during the development process
In-market pricing and competitive intensity
• Competitive dynamics for a product become unfavourable
• Sales of our products may be adversely impacted by continuing consolidation of the customer base
• New competitors enter a market or competitors increase market share
• Inability to obtain or delays in obtaining satisfactory pricing and reimbursement from government bodies, national health authorities and other third parties
• Recruitment of experienced sales and marketing personnel
• Disciplined and risk balanced product selection process
• Strong systems and processes to monitor and manage the performance of each product and customer relationship
• Diversify channels to market
Customer relationships
• Loss of a key customer
• Inability to renew contracts on similar terms
• Inability to attract new customers
• Customers fail to honour payment obligations
• Recruitment of experienced sales and marketing and business development personnel
• Management of customer pricing, economics and contract compliance
• Strong systems and processes to manage and monitor collections
Regulatory compliance
• Loss of regulatory compliance certification for production facilities
• Recruitment of experienced quality and production personnel
• Strong systems and processes to manage and monitor compliance
Product cost inflation • Increasing cost of active pharmaceutical ingredients and other components
• Interruptions to supply of raw materials and drug product
• Exclusive supply arrangements, where appropriate
• Distribution arrangements with partners allow for rising input costs to be passed through to customers
• Back-up supply of key raw materials
Foreign exchange movements
• Adverse movements in exchange rates • Hedging of net receipts in accordance with Company policy
Product liability • Serious adverse event with consumers and potential product liability risks in marketing and use of products
• Medical information, pharmacovigilance, quality and (where appropriate) usage monitoring systems established and maintained
• Allocate or share risk with distribution partners where appropriate
• Appropriate insurance cover
Intellectual property • Infringement of third party intellectual property rights
• Loss or infringement of owned intellectual property
• Disciplined product selection process taking into account possible intellectual property infringement
• Implementation of a robust intellectual property strategy
• Allocate or share risks with manufacturing partners where appropriate
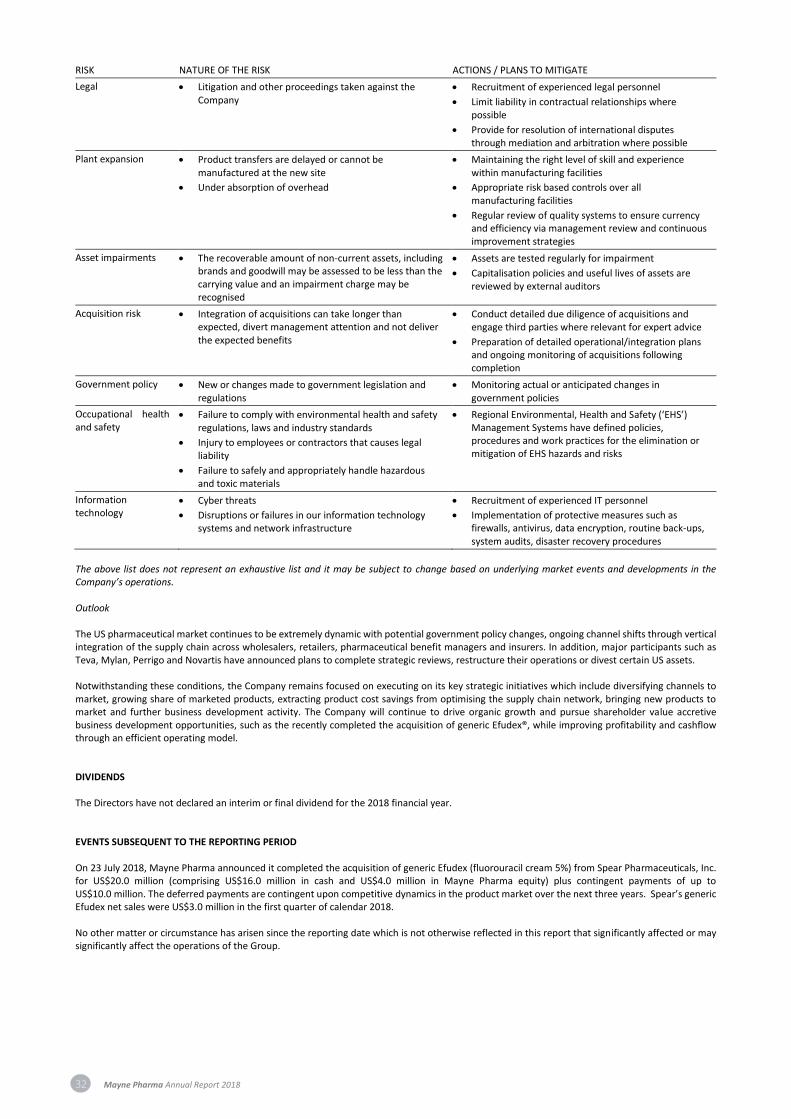
32 Mayne Pharma Annual Report 2018
RISK NATURE OF THE RISK ACTIONS / PLANS TO MITIGATE
Legal • Litigation and other proceedings taken against the Company
• Recruitment of experienced legal personnel
• Limit liability in contractual relationships where possible
• Provide for resolution of international disputes through mediation and arbitration where possible
Plant expansion • Product transfers are delayed or cannot be manufactured at the new site
• Under absorption of overhead
• Maintaining the right level of skill and experience within manufacturing facilities
• Appropriate risk based controls over all manufacturing facilities
• Regular review of quality systems to ensure currency and efficiency via management review and continuous improvement strategies
Asset impairments
• The recoverable amount of non-current assets, including brands and goodwill may be assessed to be less than the carrying value and an impairment charge may be recognised
• Assets are tested regularly for impairment
• Capitalisation policies and useful lives of assets are reviewed by external auditors
Acquisition risk • Integration of acquisitions can take longer than expected, divert management attention and not deliver the expected benefits
• Conduct detailed due diligence of acquisitions and engage third parties where relevant for expert advice
• Preparation of detailed operational/integration plans and ongoing monitoring of acquisitions following completion
Government policy • New or changes made to government legislation and regulations
• Monitoring actual or anticipated changes in government policies
Occupational health and safety
• Failure to comply with environmental health and safety regulations, laws and industry standards
• Injury to employees or contractors that causes legal liability
• Failure to safely and appropriately handle hazardous and toxic materials
• Regional Environmental, Health and Safety (‘EHS’) Management Systems have defined policies, procedures and work practices for the elimination or mitigation of EHS hazards and risks
Information technology
• Cyber threats
• Disruptions or failures in our information technology systems and network infrastructure
• Recruitment of experienced IT personnel
• Implementation of protective measures such as firewalls, antivirus, data encryption, routine back-ups, system audits, disaster recovery procedures
The above list does not represent an exhaustive list and it may be subject to change based on underlying market events and developments in the Company’s operations. Outlook The US pharmaceutical market continues to be extremely dynamic with potential government policy changes, ongoing channel shifts through vertical integration of the supply chain across wholesalers, retailers, pharmaceutical benefit managers and insurers. In addition, major participants such as Teva, Mylan, Perrigo and Novartis have announced plans to complete strategic reviews, restructure their operations or divest certain US assets. Notwithstanding these conditions, the Company remains focused on executing on its key strategic initiatives which include diversifying channels to market, growing share of marketed products, extracting product cost savings from optimising the supply chain network, bringing new products to market and further business development activity. The Company will continue to drive organic growth and pursue shareholder value accretive business development opportunities, such as the recently completed the acquisition of generic Efudex®, while improving profitability and cashflow through an efficient operating model. DIVIDENDS The Directors have not declared an interim or final dividend for the 2018 financial year. EVENTS SUBSEQUENT TO THE REPORTING PERIOD On 23 July 2018, Mayne Pharma announced it completed the acquisition of generic Efudex (fluorouracil cream 5%) from Spear Pharmaceuticals, Inc. for US$20.0 million (comprising US$16.0 million in cash and US$4.0 million in Mayne Pharma equity) plus contingent payments of up to US$10.0 million. The deferred payments are contingent upon competitive dynamics in the product market over the next three years. Spear’s generic Efudex net sales were US$3.0 million in the first quarter of calendar 2018. No other matter or circumstance has arisen since the reporting date which is not otherwise reflected in this report that significantly affected or may significantly affect the operations of the Group.
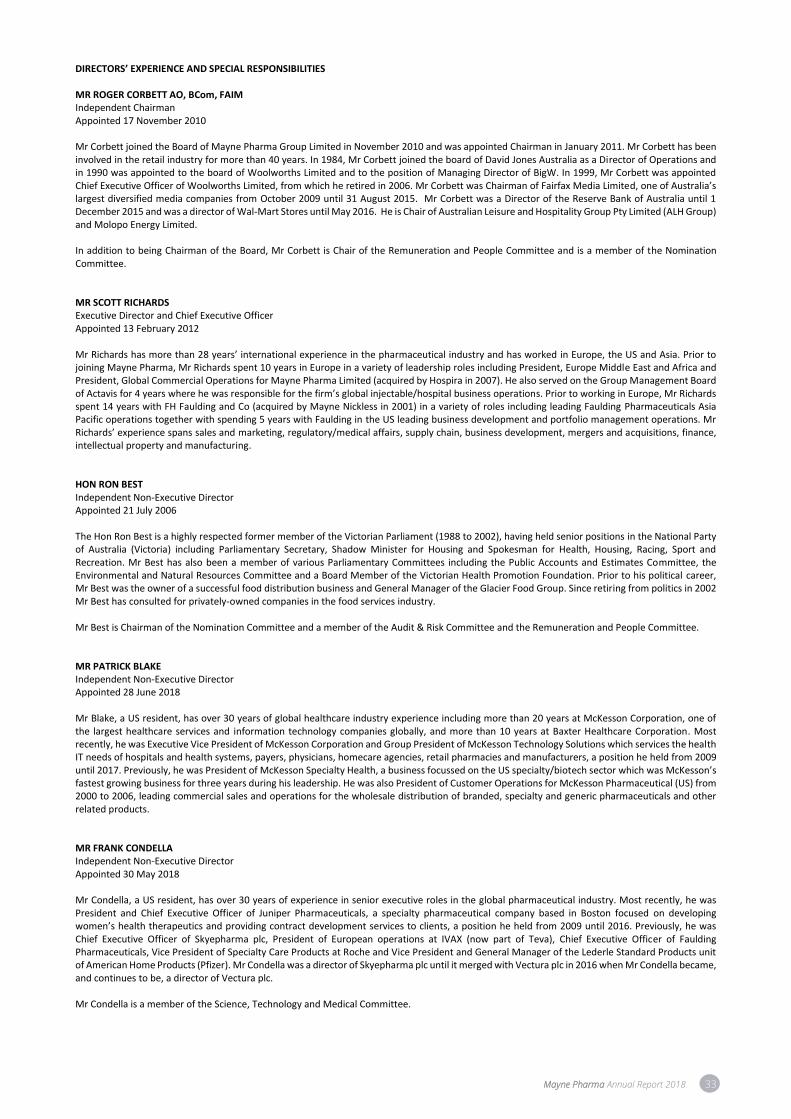
Mayne Pharma Annual Report 2018 33
DIRECTORS’ EXPERIENCE AND SPECIAL RESPONSIBILITIES MR ROGER CORBETT AO, BCom, FAIM Independent Chairman Appointed 17 November 2010 Mr Corbett joined the Board of Mayne Pharma Group Limited in November 2010 and was appointed Chairman in January 2011. Mr Corbett has been involved in the retail industry for more than 40 years. In 1984, Mr Corbett joined the board of David Jones Australia as a Director of Operations and in 1990 was appointed to the board of Woolworths Limited and to the position of Managing Director of BigW. In 1999, Mr Corbett was appointed Chief Executive Officer of Woolworths Limited, from which he retired in 2006. Mr Corbett was Chairman of Fairfax Media Limited, one of Australia’s largest diversified media companies from October 2009 until 31 August 2015. Mr Corbett was a Director of the Reserve Bank of Australia until 1 December 2015 and was a director of Wal-Mart Stores until May 2016. He is Chair of Australian Leisure and Hospitality Group Pty Limited (ALH Group) and Molopo Energy Limited. In addition to being Chairman of the Board, Mr Corbett is Chair of the Remuneration and People Committee and is a member of the Nomination Committee. MR SCOTT RICHARDS Executive Director and Chief Executive Officer Appointed 13 February 2012 Mr Richards has more than 28 years’ international experience in the pharmaceutical industry and has worked in Europe, the US and Asia. Prior to joining Mayne Pharma, Mr Richards spent 10 years in Europe in a variety of leadership roles including President, Europe Middle East and Africa and President, Global Commercial Operations for Mayne Pharma Limited (acquired by Hospira in 2007). He also served on the Group Management Board of Actavis for 4 years where he was responsible for the firm’s global injectable/hospital business operations. Prior to working in Europe, Mr Richards spent 14 years with FH Faulding and Co (acquired by Mayne Nickless in 2001) in a variety of roles including leading Faulding Pharmaceuticals Asia Pacific operations together with spending 5 years with Faulding in the US leading business development and portfolio management operations. Mr Richards’ experience spans sales and marketing, regulatory/medical affairs, supply chain, business development, mergers and acquisitions, finance, intellectual property and manufacturing. HON RON BEST Independent Non-Executive Director Appointed 21 July 2006 The Hon Ron Best is a highly respected former member of the Victorian Parliament (1988 to 2002), having held senior positions in the National Party of Australia (Victoria) including Parliamentary Secretary, Shadow Minister for Housing and Spokesman for Health, Housing, Racing, Sport and Recreation. Mr Best has also been a member of various Parliamentary Committees including the Public Accounts and Estimates Committee, the Environmental and Natural Resources Committee and a Board Member of the Victorian Health Promotion Foundation. Prior to his political career, Mr Best was the owner of a successful food distribution business and General Manager of the Glacier Food Group. Since retiring from politics in 2002 Mr Best has consulted for privately-owned companies in the food services industry. Mr Best is Chairman of the Nomination Committee and a member of the Audit & Risk Committee and the Remuneration and People Committee. MR PATRICK BLAKE Independent Non-Executive Director Appointed 28 June 2018 Mr Blake, a US resident, has over 30 years of global healthcare industry experience including more than 20 years at McKesson Corporation, one of the largest healthcare services and information technology companies globally, and more than 10 years at Baxter Healthcare Corporation. Most recently, he was Executive Vice President of McKesson Corporation and Group President of McKesson Technology Solutions which services the health IT needs of hospitals and health systems, payers, physicians, homecare agencies, retail pharmacies and manufacturers, a position he held from 2009 until 2017. Previously, he was President of McKesson Specialty Health, a business focussed on the US specialty/biotech sector which was McKesson’s fastest growing business for three years during his leadership. He was also President of Customer Operations for McKesson Pharmaceutical (US) from 2000 to 2006, leading commercial sales and operations for the wholesale distribution of branded, specialty and generic pharmaceuticals and other related products. MR FRANK CONDELLA Independent Non-Executive Director Appointed 30 May 2018 Mr Condella, a US resident, has over 30 years of experience in senior executive roles in the global pharmaceutical industry. Most recently, he was President and Chief Executive Officer of Juniper Pharmaceuticals, a specialty pharmaceutical company based in Boston focused on developing women’s health therapeutics and providing contract development services to clients, a position he held from 2009 until 2016. Previously, he was Chief Executive Officer of Skyepharma plc, President of European operations at IVAX (now part of Teva), Chief Executive Officer of Faulding Pharmaceuticals, Vice President of Specialty Care Products at Roche and Vice President and General Manager of the Lederle Standard Products unit of American Home Products (Pfizer). Mr Condella was a director of Skyepharma plc until it merged with Vectura plc in 2016 when Mr Condella became, and continues to be, a director of Vectura plc. Mr Condella is a member of the Science, Technology and Medical Committee.

34 Mayne Pharma Annual Report 2018
MS NANCY DOLAN, BA, LLB Independent Non-Executive Director Appointed 21 September 2016 Ms Dolan has over 30 years’ experience in the legal and commercial services sector. Ms Dolan is currently Chair of the Professional Conduct Oversight Committee at Chartered Accountants Australia and New Zealand. She has an honours degree in law from Victoria University of Wellington and an arts degree from the University of Canterbury in New Zealand. She was previously General Counsel and a Principal Officer at the University of Sydney, a Partner at PricewaterhouseCoopers responsible for legal affairs in the Asia Pacific region and a Partner at Mallesons Stephen Jacques (now King & Wood Mallesons). Ms Dolan was previously on the Advisory Board of the Sydney Medical School, on the Professional Standards Council for the Salvation Army, a member of the Advisory Committee for Salvos Legal and on the Salvation Army Advisory Board (Eastern Territory). Ms Dolan is a member of the Audit & Risk Committee. MR WILLIAM (PHIL) HODGES, MS, BSC Independent Non-Executive Director Appointed 15 November 2012 Mr Hodges has been involved in the pharmaceutical industry for over 30 years and founded the Metrics business in 1994. Since 1994, Mr Hodges oversaw the transition of Metrics from a start-up analytical laboratory with four employees to a specialty pharmaceutical company with a portfolio of niche generic products. Prior to starting Metrics, Mr Hodges spent 11 years at Burroughs Wellcome Co. (which became part of GSK) in the development and validation of analytical methods. Mr Hodges ceased his executive role as President of Metrics on 31 December 2013 but continues as a Non-Executive Director of Mayne Pharma Group Limited. He is Chair of Chesson Laboratories, Associates, Inc. Mr Hodges is a member of the Science, Technology and Medical Committee. MR BRUCE MATHIESON Independent Non-Executive Director Appointed 16 February 2007 Mr Mathieson is currently a Director and was the former Chief Executive Officer of ALH Group, a joint venture between Woolworths Limited and the Mathieson Family. The ALH Group owns approximately 325 hotels and 520 retail outlets across Australia and employs more than 16,000 staff. Mr Mathieson has operated in the hotel, leisure and hospitality industry since 1974 and is a well-respected member of the Australian business community. He has previously served as a Director of the Carlton Football Club. He is trained as an engineer and brings management and transactional experience from a number of industries to the Board. PROF BRUCE ROBINSON, AM, MD, MSC, FRACP, FAAHMS, FAICD Independent Non-Executive Director Appointed 26 August 2014 Professor Robinson, a practising Endocrinologist at Sydney’s Royal North Shore Hospital, is Former Dean of University of Sydney’s Sydney Medical School. Professor Robinson has been the head of the Cancer Genetics Unit at the Kolling Institute of Medical Research, Royal North Shore Hospital since 1989. Since 2001, Professor Robinson has been Chairman of Hoc Mai Foundation, a major program in medical and health education and exchange with Vietnam. He is a Non-Executive Director of Cochlear Limited, Firefly and QBiotics Group Limited. He is a Board Member of the Woolcock Institute, is Chair of National Health and Medical Research Council and Chair of the Medical Benefits Review Taskforce. Prof Robinson is Chairman of the Science, Technology and Medical Committee. MR IAN SCHOLES BCom, CA Independent Non-Executive Director Appointed 17 October 2007 Mr Scholes has extensive financial and corporate advisory experience, both in Australia and internationally. Mr Scholes held a number of senior roles within Merrill Lynch Australia, including Vice Chairman of Investment Banking. Previously Mr Scholes held the position of Executive General Manager at National Australia Bank Limited, running the corporate and institutional banking division. Mr Scholes is currently a Partner and Chief Executive Officer of Chord Capital Pty Ltd. Mr Scholes has previously held positions on the Board of St Vincent’s Health as Chairman of the St Vincent’s Foundation and was a former Director of SDI Limited. Mr Scholes is Chairman of the Audit & Risk Committee and a member of the Remuneration and People Committee. COMPANY SECRETARY Mr Nick Freeman, BCom, CA (Group CFO and Company Secretary) was appointed as the Company Secretary on 24 May 2017. Mr Freeman is a Chartered Accountant with 29 years’ experience in the accounting and finance profession. Mr Freeman has extensive experience in the areas of business development, mergers and acquisitions, integration management, tax, financial planning and reporting, risk management, treasury and investor relations.
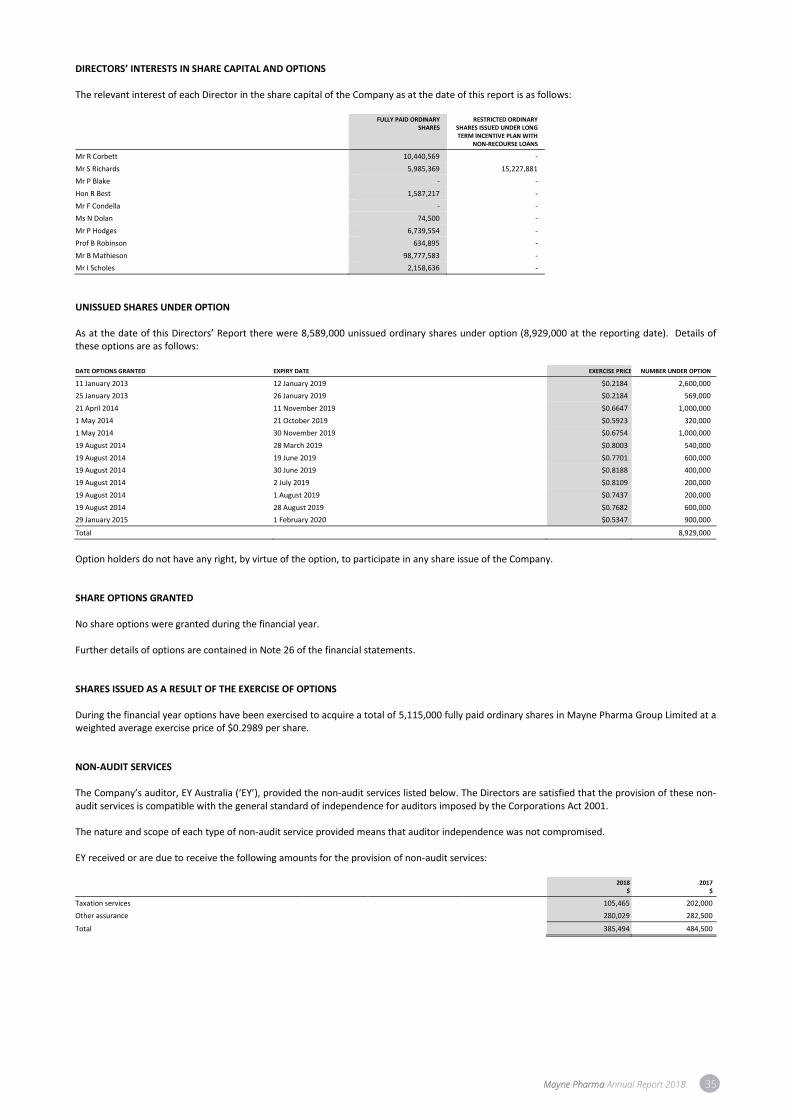
Mayne Pharma Annual Report 2018 35
DIRECTORS’ INTERESTS IN SHARE CAPITAL AND OPTIONS The relevant interest of each Director in the share capital of the Company as at the date of this report is as follows:
FULLY PAID ORDINARY SHARES
RESTRICTED ORDINARY SHARES ISSUED UNDER LONG TERM INCENTIVE PLAN WITH
NON-RECOURSE LOANS
Mr R Corbett 10,440,569 -
Mr S Richards 5,985,369 15,227,881
Mr P Blake - -
Hon R Best 1,587,217 -
Mr F Condella - -
Ms N Dolan 74,500 -
Mr P Hodges 6,739,554 -
Prof B Robinson 634,895 -
Mr B Mathieson 98,777,583 -
Mr I Scholes 2,158,636 -
UNISSUED SHARES UNDER OPTION As at the date of this Directors’ Report there were 8,589,000 unissued ordinary shares under option (8,929,000 at the reporting date). Details of these options are as follows: DATE OPTIONS GRANTED EXPIRY DATE EXERCISE PRICE NUMBER UNDER OPTION
11 January 2013 12 January 2019 $0.2184 2,600,000
25 January 2013 26 January 2019 $0.2184 569,000
21 April 2014 11 November 2019 $0.6647 1,000,000
1 May 2014 21 October 2019 $0.5923 320,000
1 May 2014 30 November 2019 $0.6754 1,000,000
19 August 2014 28 March 2019 $0.8003 540,000
19 August 2014 19 June 2019 $0.7701 600,000
19 August 2014 30 June 2019 $0.8188 400,000
19 August 2014 2 July 2019 $0.8109 200,000
19 August 2014 1 August 2019 $0.7437 200,000
19 August 2014 28 August 2019 $0.7682 600,000
29 January 2015 1 February 2020 $0.5347 900,000
Total 8,929,000
Option holders do not have any right, by virtue of the option, to participate in any share issue of the Company. SHARE OPTIONS GRANTED No share options were granted during the financial year. Further details of options are contained in Note 26 of the financial statements. SHARES ISSUED AS A RESULT OF THE EXERCISE OF OPTIONS During the financial year options have been exercised to acquire a total of 5,115,000 fully paid ordinary shares in Mayne Pharma Group Limited at a weighted average exercise price of $0.2989 per share. NON-AUDIT SERVICES The Company’s auditor, EY Australia (‘EY’), provided the non-audit services listed below. The Directors are satisfied that the provision of these non-audit services is compatible with the general standard of independence for auditors imposed by the Corporations Act 2001. The nature and scope of each type of non-audit service provided means that auditor independence was not compromised. EY received or are due to receive the following amounts for the provision of non-audit services:
2018
$ 2017
$
Taxation services 105,465 202,000
Other assurance 280,029 282,500
Total 385,494 484,500
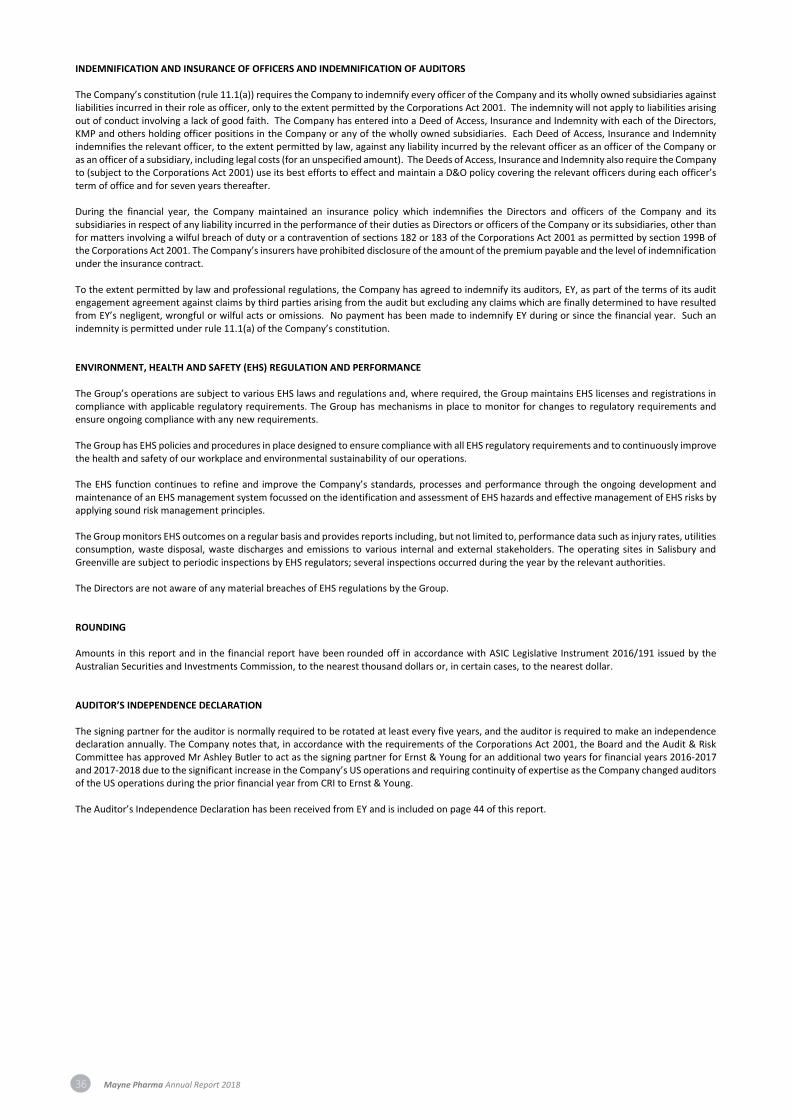
36 Mayne Pharma Annual Report 2018
INDEMNIFICATION AND INSURANCE OF OFFICERS AND INDEMNIFICATION OF AUDITORS The Company’s constitution (rule 11.1(a)) requires the Company to indemnify every officer of the Company and its wholly owned subsidiaries against liabilities incurred in their role as officer, only to the extent permitted by the Corporations Act 2001. The indemnity will not apply to liabilities arising out of conduct involving a lack of good faith. The Company has entered into a Deed of Access, Insurance and Indemnity with each of the Directors, KMP and others holding officer positions in the Company or any of the wholly owned subsidiaries. Each Deed of Access, Insurance and Indemnity indemnifies the relevant officer, to the extent permitted by law, against any liability incurred by the relevant officer as an officer of the Company or as an officer of a subsidiary, including legal costs (for an unspecified amount). The Deeds of Access, Insurance and Indemnity also require the Company to (subject to the Corporations Act 2001) use its best efforts to effect and maintain a D&O policy covering the relevant officers during each officer’s term of office and for seven years thereafter. During the financial year, the Company maintained an insurance policy which indemnifies the Directors and officers of the Company and its subsidiaries in respect of any liability incurred in the performance of their duties as Directors or officers of the Company or its subsidiaries, other than for matters involving a wilful breach of duty or a contravention of sections 182 or 183 of the Corporations Act 2001 as permitted by section 199B of the Corporations Act 2001. The Company’s insurers have prohibited disclosure of the amount of the premium payable and the level of indemnification under the insurance contract. To the extent permitted by law and professional regulations, the Company has agreed to indemnify its auditors, EY, as part of the terms of its audit engagement agreement against claims by third parties arising from the audit but excluding any claims which are finally determined to have resulted from EY’s negligent, wrongful or wilful acts or omissions. No payment has been made to indemnify EY during or since the financial year. Such an indemnity is permitted under rule 11.1(a) of the Company’s constitution. ENVIRONMENT, HEALTH AND SAFETY (EHS) REGULATION AND PERFORMANCE The Group’s operations are subject to various EHS laws and regulations and, where required, the Group maintains EHS licenses and registrations in compliance with applicable regulatory requirements. The Group has mechanisms in place to monitor for changes to regulatory requirements and ensure ongoing compliance with any new requirements. The Group has EHS policies and procedures in place designed to ensure compliance with all EHS regulatory requirements and to continuously improve the health and safety of our workplace and environmental sustainability of our operations. The EHS function continues to refine and improve the Company’s standards, processes and performance through the ongoing development and maintenance of an EHS management system focussed on the identification and assessment of EHS hazards and effective management of EHS risks by applying sound risk management principles. The Group monitors EHS outcomes on a regular basis and provides reports including, but not limited to, performance data such as injury rates, utilities consumption, waste disposal, waste discharges and emissions to various internal and external stakeholders. The operating sites in Salisbury and Greenville are subject to periodic inspections by EHS regulators; several inspections occurred during the year by the relevant authorities. The Directors are not aware of any material breaches of EHS regulations by the Group. ROUNDING Amounts in this report and in the financial report have been rounded off in accordance with ASIC Legislative Instrument 2016/191 issued by the Australian Securities and Investments Commission, to the nearest thousand dollars or, in certain cases, to the nearest dollar. AUDITOR’S INDEPENDENCE DECLARATION The signing partner for the auditor is normally required to be rotated at least every five years, and the auditor is required to make an independence declaration annually. The Company notes that, in accordance with the requirements of the Corporations Act 2001, the Board and the Audit & Risk Committee has approved Mr Ashley Butler to act as the signing partner for Ernst & Young for an additional two years for financial years 2016-2017 and 2017-2018 due to the significant increase in the Company’s US operations and requiring continuity of expertise as the Company changed auditors of the US operations during the prior financial year from CRI to Ernst & Young. The Auditor’s Independence Declaration has been received from EY and is included on page 44 of this report.
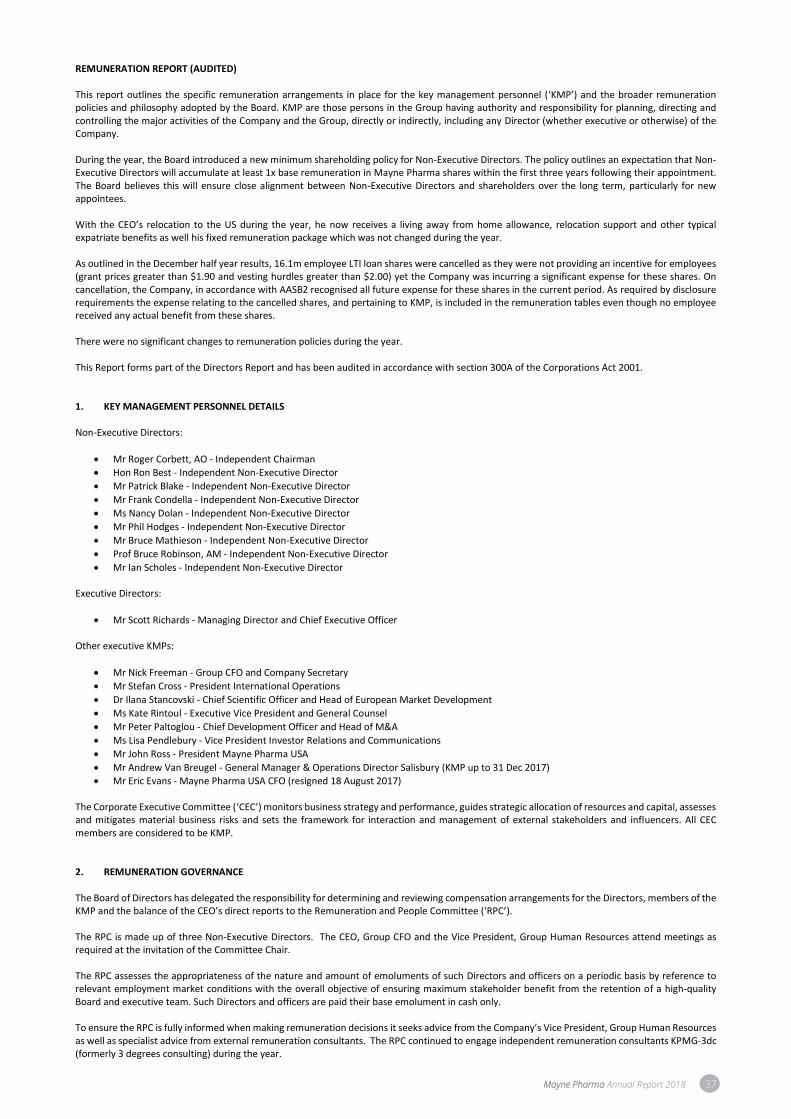
Mayne Pharma Annual Report 2018 37
REMUNERATION REPORT (AUDITED) This report outlines the specific remuneration arrangements in place for the key management personnel (‘KMP’) and the broader remuneration policies and philosophy adopted by the Board. KMP are those persons in the Group having authority and responsibility for planning, directing and controlling the major activities of the Company and the Group, directly or indirectly, including any Director (whether executive or otherwise) of the Company. During the year, the Board introduced a new minimum shareholding policy for Non-Executive Directors. The policy outlines an expectation that Non-Executive Directors will accumulate at least 1x base remuneration in Mayne Pharma shares within the first three years following their appointment. The Board believes this will ensure close alignment between Non-Executive Directors and shareholders over the long term, particularly for new appointees. With the CEO’s relocation to the US during the year, he now receives a living away from home allowance, relocation support and other typical expatriate benefits as well his fixed remuneration package which was not changed during the year. As outlined in the December half year results, 16.1m employee LTI loan shares were cancelled as they were not providing an incentive for employees (grant prices greater than $1.90 and vesting hurdles greater than $2.00) yet the Company was incurring a significant expense for these shares. On cancellation, the Company, in accordance with AASB2 recognised all future expense for these shares in the current period. As required by disclosure requirements the expense relating to the cancelled shares, and pertaining to KMP, is included in the remuneration tables even though no employee received any actual benefit from these shares. There were no significant changes to remuneration policies during the year. This Report forms part of the Directors Report and has been audited in accordance with section 300A of the Corporations Act 2001. 1. KEY MANAGEMENT PERSONNEL DETAILS Non-Executive Directors:
• Mr Roger Corbett, AO - Independent Chairman
• Hon Ron Best - Independent Non-Executive Director
• Mr Patrick Blake - Independent Non-Executive Director
• Mr Frank Condella - Independent Non-Executive Director
• Ms Nancy Dolan - Independent Non-Executive Director
• Mr Phil Hodges - Independent Non-Executive Director
• Mr Bruce Mathieson - Independent Non-Executive Director
• Prof Bruce Robinson, AM - Independent Non-Executive Director
• Mr Ian Scholes - Independent Non-Executive Director Executive Directors:
• Mr Scott Richards - Managing Director and Chief Executive Officer
Other executive KMPs:
• Mr Nick Freeman - Group CFO and Company Secretary
• Mr Stefan Cross - President International Operations
• Dr Ilana Stancovski - Chief Scientific Officer and Head of European Market Development
• Ms Kate Rintoul - Executive Vice President and General Counsel
• Mr Peter Paltoglou - Chief Development Officer and Head of M&A
• Ms Lisa Pendlebury - Vice President Investor Relations and Communications
• Mr John Ross - President Mayne Pharma USA
• Mr Andrew Van Breugel - General Manager & Operations Director Salisbury (KMP up to 31 Dec 2017)
• Mr Eric Evans - Mayne Pharma USA CFO (resigned 18 August 2017)
The Corporate Executive Committee (‘CEC’) monitors business strategy and performance, guides strategic allocation of resources and capital, assesses and mitigates material business risks and sets the framework for interaction and management of external stakeholders and influencers. All CEC members are considered to be KMP. 2. REMUNERATION GOVERNANCE The Board of Directors has delegated the responsibility for determining and reviewing compensation arrangements for the Directors, members of the KMP and the balance of the CEO’s direct reports to the Remuneration and People Committee (‘RPC’). The RPC is made up of three Non-Executive Directors. The CEO, Group CFO and the Vice President, Group Human Resources attend meetings as required at the invitation of the Committee Chair. The RPC assesses the appropriateness of the nature and amount of emoluments of such Directors and officers on a periodic basis by reference to relevant employment market conditions with the overall objective of ensuring maximum stakeholder benefit from the retention of a high-quality Board and executive team. Such Directors and officers are paid their base emolument in cash only. To ensure the RPC is fully informed when making remuneration decisions it seeks advice from the Company’s Vice President, Group Human Resources as well as specialist advice from external remuneration consultants. The RPC continued to engage independent remuneration consultants KPMG-3dc (formerly 3 degrees consulting) during the year.

38 Mayne Pharma Annual Report 2018
The fees payable for 2018 to KPMG-3dc for remuneration advice were $46,975 which included remuneration recommendations as defined under the Corporations Act 2001. The RPC is satisfied that the advice received from KPMG was free from undue influence from the KMP to whom the recommendations may have related as KPMG were engaged by, and reported directly to, the Chair of the RPC. Remuneration Report approval at the 2017 Annual General Meeting The FY17 Remuneration Report received strong shareholder support at the 2017 AGM with a vote of 93% in favour. A resolution covering the issue of shares under the Long-Term Incentive (‘LTI’) share loan scheme to the CEO also received strong support with 87% of votes in favour. 3. REMUNERATION POLICY In general, the Board links the nature and amount of KMP and other senior executives’ emoluments to the Company’s financial and operational performance. Given the nature of the industry in which the Company operates and the position it is in regarding the on-going development of new products, the review of performance can also give regard to elements such as the scientific progress and commercialisation of the Company’s projects, results of trials, progress with the development of relationships with sales and marketing partners, research institutions, and other collaborations. Remuneration paid to the Company’s Directors and senior executives is also determined with reference to the market level of remuneration for other listed development, pharmaceutical and manufacturing companies in Australia and the US. Specific roles are also benchmarked against similar roles in other listed companies with similar market capitalisation to Mayne Pharma. This assessment is undertaken with reference to published information provided by various executive search firms operating in the sector. 4. ELEMENTS OF KMP REMUNERATION Remuneration packages may contain the following key fixed and performance-based elements:
• Short-term benefit – salary/fees, annual leave and other benefits such as novated lease payments;
• Post-employment benefits – superannuation;
• Share-based payments – share options granted under the Company’s approved option plans and LTI shares granted under the non-recourse loan arrangements as disclosed in Note 26 to the financial statements;
• Long-term benefits – long service leave; and/or
• Termination payments. Fixed remuneration Managing Director and Officers Fixed remuneration consists of a base remuneration package, which generally includes salary and employer contributions to superannuation funds. Fixed remuneration levels for KMP and other senior executives are reviewed annually by the Board through a process that considers personal development, achievement of key performance objectives for the year, internal relativities, industry benchmarks wherever possible and CPI data. In assessing fixed remuneration, the Board has considered the increasing scale and complexity of the operations of Mayne Pharma, and the remuneration paid to comparable roles in other listed development, pharmaceutical and manufacturing companies in Australia and the US. Specific roles are also benchmarked against similar roles in other listed companies with similar market capitalisation to Mayne Pharma, both in Australia and the US. The CEO’s fixed remuneration during the period was $900,000. With the CEO’s relocation to the US during the year, he also receives a living away from home allowance, relocation support and other typical ex-pat benefits such as car lease, rental allowances, medical benefits and return flights to Australia. Non-Executive Directors Total remuneration for Non-Executive Directors is determined by resolution of shareholders. The maximum available aggregate cash remuneration approved for Non-Executive Directors at the 2015 Annual General Meeting is $1,200,000. Non-Executive Directors do not receive retirement benefits other than a superannuation guarantee contribution required by government regulation for Australian Directors, which is currently 9.5% of their fees, except where a Non-Executive Director elects to have their fees paid as contributions to a superannuation fund. During the year, the only change made to Director salaries was to align US and Australian Directors’ total remuneration. Until June 2018, US Directors were effectively paid less than Australian Directors as they did not receive the 9.5% superannuation guarantee contribution. From 1 June 2018, US Director Fees were increased from $120,000 to $131,400 annually. During the year, the Board introduced a new minimum shareholding policy. The policy outlines an expectation that Non-Executive Directors will accumulate at least 1x base remuneration in Mayne Pharma shares within the first three years following their appointment. The Board believes this will ensure close alignment between Non-Executive Directors and shareholders over the long term, particularly for new appointees. Non-Executive Directors may provide specific consulting advice to the Group upon direction from the Board. Remuneration for this work is made at market rates. No such consulting advice was provided to the Company during the year.
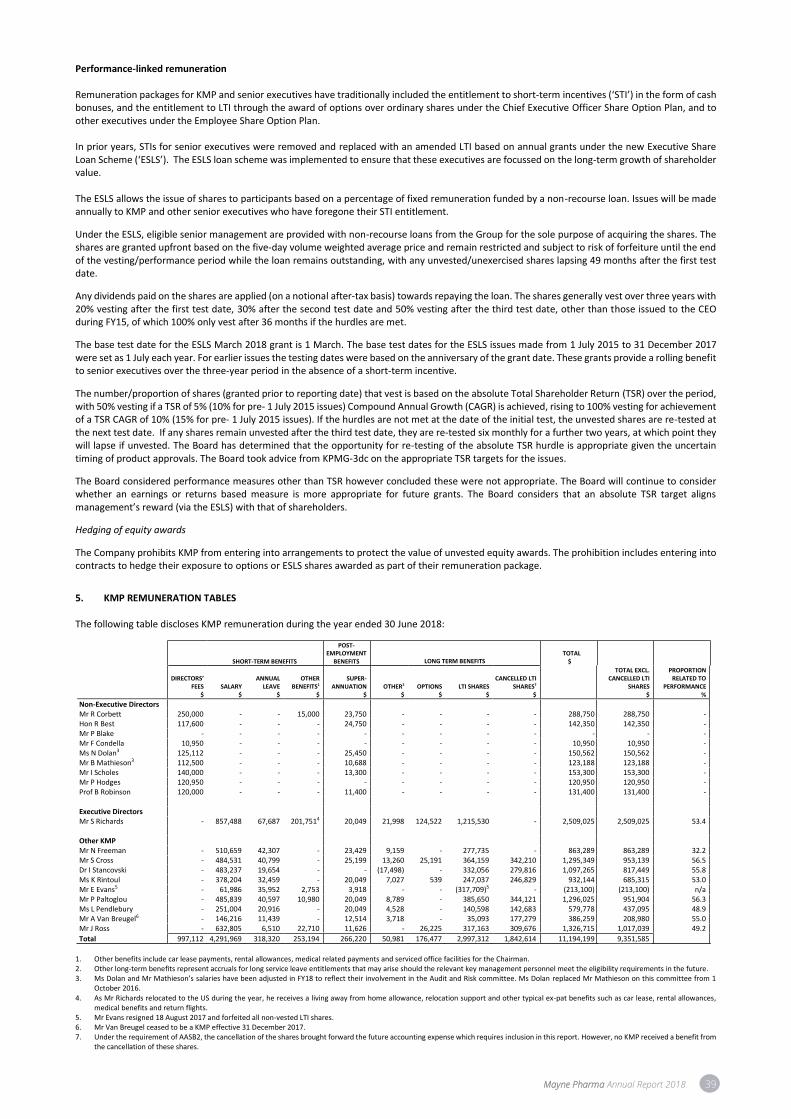
Mayne Pharma Annual Report 2018 39
Performance-linked remuneration Remuneration packages for KMP and senior executives have traditionally included the entitlement to short-term incentives (‘STI’) in the form of cash bonuses, and the entitlement to LTI through the award of options over ordinary shares under the Chief Executive Officer Share Option Plan, and to other executives under the Employee Share Option Plan. In prior years, STIs for senior executives were removed and replaced with an amended LTI based on annual grants under the new Executive Share Loan Scheme (‘ESLS’). The ESLS loan scheme was implemented to ensure that these executives are focussed on the long-term growth of shareholder value. The ESLS allows the issue of shares to participants based on a percentage of fixed remuneration funded by a non-recourse loan. Issues will be made annually to KMP and other senior executives who have foregone their STI entitlement.
Under the ESLS, eligible senior management are provided with non-recourse loans from the Group for the sole purpose of acquiring the shares. The shares are granted upfront based on the five-day volume weighted average price and remain restricted and subject to risk of forfeiture until the end of the vesting/performance period while the loan remains outstanding, with any unvested/unexercised shares lapsing 49 months after the first test date.
Any dividends paid on the shares are applied (on a notional after-tax basis) towards repaying the loan. The shares generally vest over three years with 20% vesting after the first test date, 30% after the second test date and 50% vesting after the third test date, other than those issued to the CEO during FY15, of which 100% only vest after 36 months if the hurdles are met.
The base test date for the ESLS March 2018 grant is 1 March. The base test dates for the ESLS issues made from 1 July 2015 to 31 December 2017 were set as 1 July each year. For earlier issues the testing dates were based on the anniversary of the grant date. These grants provide a rolling benefit to senior executives over the three-year period in the absence of a short-term incentive.
The number/proportion of shares (granted prior to reporting date) that vest is based on the absolute Total Shareholder Return (TSR) over the period, with 50% vesting if a TSR of 5% (10% for pre- 1 July 2015 issues) Compound Annual Growth (CAGR) is achieved, rising to 100% vesting for achievement of a TSR CAGR of 10% (15% for pre- 1 July 2015 issues). If the hurdles are not met at the date of the initial test, the unvested shares are re-tested at the next test date. If any shares remain unvested after the third test date, they are re-tested six monthly for a further two years, at which point they will lapse if unvested. The Board has determined that the opportunity for re-testing of the absolute TSR hurdle is appropriate given the uncertain timing of product approvals. The Board took advice from KPMG-3dc on the appropriate TSR targets for the issues.
The Board considered performance measures other than TSR however concluded these were not appropriate. The Board will continue to consider whether an earnings or returns based measure is more appropriate for future grants. The Board considers that an absolute TSR target aligns management’s reward (via the ESLS) with that of shareholders.
Hedging of equity awards
The Company prohibits KMP from entering into arrangements to protect the value of unvested equity awards. The prohibition includes entering into contracts to hedge their exposure to options or ESLS shares awarded as part of their remuneration package.
5. KMP REMUNERATION TABLES The following table discloses KMP remuneration during the year ended 30 June 2018:
SHORT-TERM BENEFITS
POST-EMPLOYMENT
BENEFITS
LONG TERM BENEFITS
TOTAL
$
DIRECTORS’ FEES
$ SALARY
$
ANNUAL LEAVE
$
OTHER BENEFITS1
$
SUPER-ANNUATION
$ OTHER2
$ OPTIONS
$
LTI SHARES $
CANCELLED LTI SHARES7
$
TOTAL EXCL. CANCELLED LTI
SHARES $
PROPORTION RELATED TO
PERFORMANCE %
Non-Executive Directors Mr R Corbett 250,000 - - 15,000 23,750 - - - - 288,750 288,750 - Hon R Best 117,600 - - - 24,750 - - - - 142,350 142,350 - Mr P Blake - - - - - - - - - - - - Mr F Condella 10,950 - - - - - - - - 10,950 10,950 - Ms N Dolan3 125,112 - - - 25,450 - - - - 150,562 150,562 - Mr B Mathieson3 112,500 - - - 10,688 - - - - 123,188 123,188 - Mr I Scholes 140,000 - - - 13,300 - - - - 153,300 153,300 - Mr P Hodges 120,950 - - - - - - - - 120,950 120,950 - Prof B Robinson 120,000 - - - 11,400 - - - - 131,400 131,400 - Executive Directors Mr S Richards - 857,488 67,687 201,7514 20,049 21,998 124,522 1,215,530 - 2,509,025 2,509,025 53.4 Other KMP Mr N Freeman - 510,659 42,307 - 23,429 9,159 - 277,735 - 863,289 863,289 32.2 Mr S Cross - 484,531 40,799 - 25,199 13,260 25,191 364,159 342,210 1,295,349 953,139 56.5 Dr I Stancovski - 483,237 19,654 - - (17,498) - 332,056 279,816 1,097,265 817,449 55.8 Ms K Rintoul - 378,204 32,459 - 20,049 7,027 539 247,037 246,829 932,144 685,315 53.0 Mr E Evans5 - 61,986 35,952 2,753 3,918 - - (317,709)5 - (213,100) (213,100) n/a Mr P Paltoglou - 485,839 40,597 10,980 20,049 8,789 - 385,650 344,121 1,296,025 951,904 56.3 Ms L Pendlebury - 251,004 20,916 - 20,049 4,528 - 140,598 142,683 579,778 437,095 48.9 Mr A Van Breugel6 - 146,216 11,439 - 12,514 3,718 - 35,093 177,279 386,259 208,980 55.0 Mr J Ross - 632,805 6,510 22,710 11,626 - 26,225 317,163 309,676 1,326,715 1,017,039 49.2
Total 997,112 4,291,969 318,320 253,194 266,220 50,981 176,477 2,997,312 1,842,614 11,194,199 9,351,585
1. Other benefits include car lease payments, rental allowances, medical related payments and serviced office facilities for the Chairman. 2. Other long-term benefits represent accruals for long service leave entitlements that may arise should the relevant key management personnel meet the eligibility requirements in the future. 3. Ms Dolan and Mr Mathieson’s salaries have been adjusted in FY18 to reflect their involvement in the Audit and Risk committee. Ms Dolan replaced Mr Mathieson on this committee from 1
October 2016. 4. As Mr Richards relocated to the US during the year, he receives a living away from home allowance, relocation support and other typical ex-pat benefits such as car lease, rental allowances,
medical benefits and return flights. 5. Mr Evans resigned 18 August 2017 and forfeited all non-vested LTI shares. 6. Mr Van Breugel ceased to be a KMP effective 31 December 2017. 7. Under the requirement of AASB2, the cancellation of the shares brought forward the future accounting expense which requires inclusion in this report. However, no KMP received a benefit from
the cancellation of these shares.
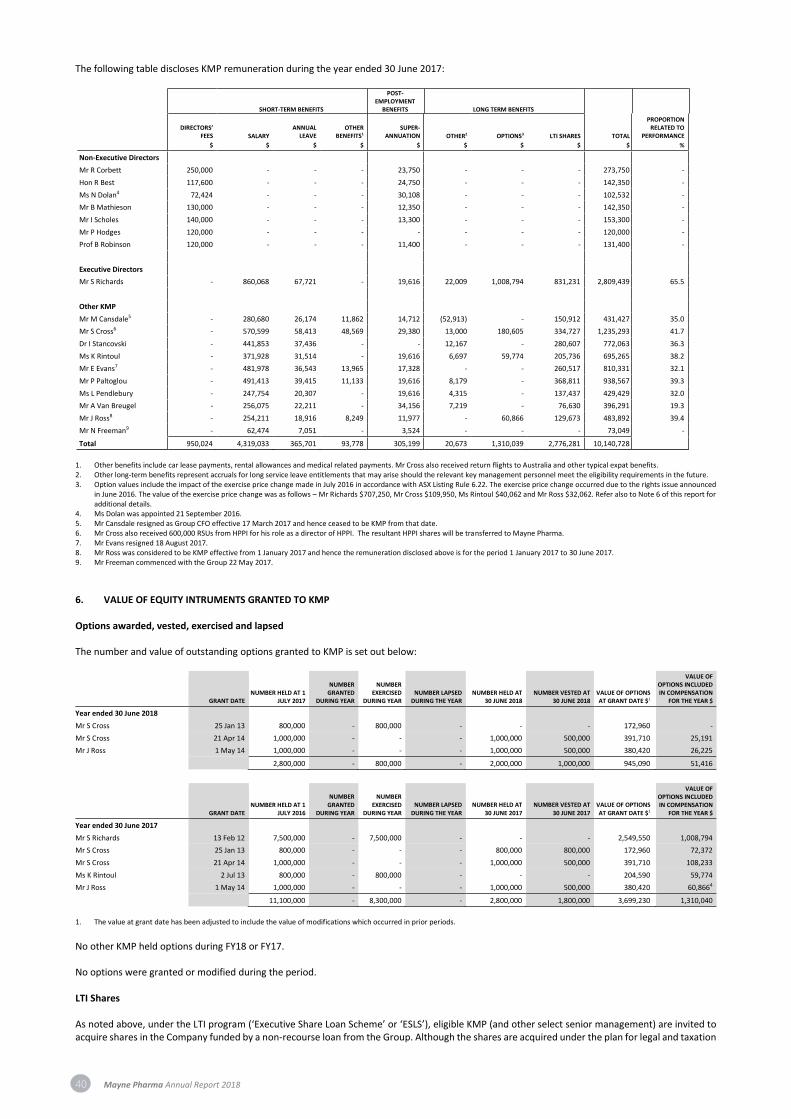
40 Mayne Pharma Annual Report 2018
The following table discloses KMP remuneration during the year ended 30 June 2017:
SHORT-TERM BENEFITS
POST-EMPLOYMENT
BENEFITS LONG TERM BENEFITS
DIRECTORS’ FEES
$
SALARY
$
ANNUAL LEAVE
$
OTHER BENEFITS1
$
SUPER-ANNUATION
$
OTHER2
$
OPTIONS3
$
LTI SHARES
$
TOTAL
$
PROPORTION RELATED TO
PERFORMANCE
%
Non-Executive Directors
Mr R Corbett 250,000 - - - 23,750 - - - 273,750 -
Hon R Best 117,600 - - - 24,750 - - - 142,350 -
Ms N Dolan4 72,424 - - - 30,108 - - - 102,532 -
Mr B Mathieson 130,000 - - - 12,350 - - - 142,350 -
Mr I Scholes 140,000 - - - 13,300 - - - 153,300 -
Mr P Hodges 120,000 - - - - - - - 120,000 -
Prof B Robinson 120,000 - - - 11,400 - - - 131,400 -
Executive Directors
Mr S Richards - 860,068 67,721 - 19,616 22,009 1,008,794 831,231 2,809,439 65.5
Other KMP
Mr M Cansdale5 - 280,680 26,174 11,862 14,712 (52,913) - 150,912 431,427 35.0
Mr S Cross6 - 570,599 58,413 48,569 29,380 13,000 180,605 334,727 1,235,293 41.7
Dr I Stancovski - 441,853 37,436 - - 12,167 - 280,607 772,063 36.3
Ms K Rintoul - 371,928 31,514 - 19,616 6,697 59,774 205,736 695,265 38.2
Mr E Evans7 - 481,978 36,543 13,965 17,328 - - 260,517 810,331 32.1
Mr P Paltoglou - 491,413 39,415 11,133 19,616 8,179 - 368,811 938,567 39.3
Ms L Pendlebury - 247,754 20,307 - 19,616 4,315 - 137,437 429,429 32.0
Mr A Van Breugel - 256,075 22,211 - 34,156 7,219 - 76,630 396,291 19.3
Mr J Ross8 - 254,211 18,916 8,249 11,977 - 60,866 129,673 483,892 39.4
Mr N Freeman9 - 62,474 7,051 - 3,524 - - - 73,049 -
Total 950,024 4,319,033 365,701 93,778 305,199 20,673 1,310,039 2,776,281 10,140,728
1. Other benefits include car lease payments, rental allowances and medical related payments. Mr Cross also received return flights to Australia and other typical expat benefits. 2. Other long-term benefits represent accruals for long service leave entitlements that may arise should the relevant key management personnel meet the eligibility requirements in the future. 3. Option values include the impact of the exercise price change made in July 2016 in accordance with ASX Listing Rule 6.22. The exercise price change occurred due to the rights issue announced
in June 2016. The value of the exercise price change was as follows – Mr Richards $707,250, Mr Cross $109,950, Ms Rintoul $40,062 and Mr Ross $32,062. Refer also to Note 6 of this report for additional details.
4. Ms Dolan was appointed 21 September 2016. 5. Mr Cansdale resigned as Group CFO effective 17 March 2017 and hence ceased to be KMP from that date. 6. Mr Cross also received 600,000 RSUs from HPPI for his role as a director of HPPI. The resultant HPPI shares will be transferred to Mayne Pharma. 7. Mr Evans resigned 18 August 2017. 8. Mr Ross was considered to be KMP effective from 1 January 2017 and hence the remuneration disclosed above is for the period 1 January 2017 to 30 June 2017. 9. Mr Freeman commenced with the Group 22 May 2017.
6. VALUE OF EQUITY INTRUMENTS GRANTED TO KMP Options awarded, vested, exercised and lapsed The number and value of outstanding options granted to KMP is set out below:
GRANT DATE
NUMBER HELD AT 1 JULY 2017
NUMBER GRANTED
DURING YEAR
NUMBER EXERCISED
DURING YEAR NUMBER LAPSED
DURING THE YEAR NUMBER HELD AT
30 JUNE 2018 NUMBER VESTED AT
30 JUNE 2018 VALUE OF OPTIONS AT GRANT DATE $1
VALUE OF OPTIONS INCLUDED IN COMPENSATION
FOR THE YEAR $
Year ended 30 June 2018
Mr S Cross 25 Jan 13 800,000 - 800,000 - - - 172,960 -
Mr S Cross 21 Apr 14 1,000,000 - - - 1,000,000 500,000 391,710 25,191
Mr J Ross 1 May 14 1,000,000 - - - 1,000,000 500,000 380,420 26,225
2,800,000 - 800,000 - 2,000,000 1,000,000 945,090 51,416
GRANT DATE
NUMBER HELD AT 1 JULY 2016
NUMBER GRANTED
DURING YEAR
NUMBER EXERCISED
DURING YEAR NUMBER LAPSED
DURING THE YEAR NUMBER HELD AT
30 JUNE 2017 NUMBER VESTED AT
30 JUNE 2017 VALUE OF OPTIONS AT GRANT DATE $1
VALUE OF OPTIONS INCLUDED IN COMPENSATION
FOR THE YEAR $
Year ended 30 June 2017
Mr S Richards 13 Feb 12 7,500,000 - 7,500,000 - - - 2,549,550 1,008,794
Mr S Cross 25 Jan 13 800,000 - - - 800,000 800,000 172,960 72,372
Mr S Cross 21 Apr 14 1,000,000 - - - 1,000,000 500,000 391,710 108,233
Ms K Rintoul 2 Jul 13 800,000 - 800,000 - - - 204,590 59,774
Mr J Ross 1 May 14 1,000,000 - - - 1,000,000 500,000 380,420 60,8664
11,100,000 - 8,300,000 - 2,800,000 1,800,000 3,699,230 1,310,040
1. The value at grant date has been adjusted to include the value of modifications which occurred in prior periods.
No other KMP held options during FY18 or FY17. No options were granted or modified during the period. LTI Shares As noted above, under the LTI program (‘Executive Share Loan Scheme’ or ‘ESLS’), eligible KMP (and other select senior management) are invited to acquire shares in the Company funded by a non-recourse loan from the Group. Although the shares are acquired under the plan for legal and taxation

Mayne Pharma Annual Report 2018 41
purposes, Australian Accounting Standards require the shares be treated as options for accounting purposes. As a result, the amounts receivable from KMP in relation to these loans are not recognised in the financial statements. The number of notional shares granted or cancelled to KMP under the ESLS during the current period is set out below:
GRANT DATE NUMBER OF SHARES ISSUED
/ (CANCELLED) EXERCISE PRICE / LOAN
VALUE $ EXPIRY DATE
Mr S Richards 7 Dec 2017 6,608,851 0.6169 31 July 2022
Mr S Cross 3 July 2017 1,297,861 1.1307 31 July 2022
Mr S Cross 28 Sep 2017 295,077 0.6631 31 July 2022
Mr S Cross 23 Mar 2018 2,102,110 0.7620 31 Mar 2023
Mr S Cross – shares cancelled 11 Aug 2016 (715,418) 2.0100 31 July 2021
Dr I Stancovski 3 July 2017 1,169,879 1.1307 31 July 2022
Dr I Stancovski 28 Sep 2017 332,474 0.6631 31 July 2022
Dr I Stancovski 23 Mar 2018 2,025,258 0.7620 31 Mar 2023
Dr I Stancovski – shares cancelled 11 Aug 2016 (584,979) 2.0100 31 July 2021
Ms K Rintoul 3 July 2017 1,031,965 1.1307 31 July 2022
Ms K Rintoul 28 Sep 2017 254,176 0.6631 31 July 2022
Ms K Rintoul 23 Mar 2018 1,672,400 0.7620 31 Mar 2023
Ms K Rintoul – shares cancelled 11 Aug 2016 (516,017) 2.0100 31 July 2021
Mr E Evans1 3 July 2017 992,470 1.1307 31 July 2022
Mr P Paltoglou 3 July 2017 1,278,871 1.1307 31 July 2022
Mr P Paltoglou 28 Sep 2017 314,989 0.6631 31 July 2022
Mr P Paltoglou 23 Mar 2018 2,091,695 0.7620 31 Mar 2023
Mr P Paltoglou – shares cancelled 11 Aug 2016 (719,413) 2.0100 31 July 2021
Ms L Pendlebury 3 July 2017 530,259 1.1307 31 July 2022
Ms L Pendlebury 28 Sep 2017 27,126 0.6631 31 July 2022
Ms L Pendlebury 23 Mar 2018 862,151 0.7620 31 Mar 2023
Ms L Pendlebury – shares cancelled 11 Aug 2016 (298,291) 2.0100 31 July 2021
Mr A Van Breugel2 3 July 2017 658,831 1.1307 31 July 2022
Mr A Van Breugel2 28 Sep 2017 33,703 0.6631 31 July 2022
Mr A Van Breugel – share cancelled 11 Aug 2016 (370,617) 2.0100 31 July 2021
Mr J Ross 3 July 2017 1,197,845 1.1307 31 July 2022
Mr J Ross 28 Sep 2017 442,778 0.6631 31 July 2022
Mr J Ross 23 Mar 2018 2,162,862 0.7620 31 Mar 2023
Mr J Ross – shares cancelled 11 Aug 2016 (498,004) 2.0100 31 July 2021
Mr J Ross– shares cancelled 25 Oct 2016 (186,779) 1.9139 31 July 2021
Mr N Freeman 3 July 2017 2,124,415 1.1307 31 July 2022
Mr N Freeman 23 Mar 2018 2,397,769 0.7620 31 Mar 2023
1. Mr Evans resigned 18 August 2017 and forfeited the above shares on leaving the Company. 2. Mr Van Breugel ceased to be a KMP effective 31 December 2017 and hence above table shows his grants and cancellation up to 31 December 2017.
There were no ESLS or SLS grants in July 2018. The number of notional shares granted to KMP under the ESLS during the prior comparable period is set out below:
GRANT DATE NUMBER OF SHARES ISSUED EXERCISE PRICE / LOAN
VALUE $ EXPIRY DATE
Mr S Richards 6 Dec 2016 2,242,005 1.5760 31 July 2021
Mr S Cross 11 Aug 2016 715,418 2.0100 31 July 2021
Dr I Stancovski 11 Aug 2016 584,979 2.0100 31 July 2021
Ms K Rintoul 11 Aug 2016 516,017 2.0100 31 July 2021
Mr E Evans 11 Aug 2016 556,600 2.0100 31 July 2021
Mr P Paltoglou 11 Aug 2016 719,413 2.0100 31 July 2021
Ms L Pendlebury 11 Aug 2016 298,291 2.0100 31 July 2021
Mr A Van Breugel 11 Aug 2016 370,617 2.0100 31 July 2021
Mr J Ross 11 Aug 2016 498,004 2.0100 31 July 2021
Mr J Ross 25 Oct 2016 186,779 1.9139 31 July 2021
Mr M Cansdale 11 Aug 2016 676,119 2.0100 31 July 2021
Except for Mr Richards (who retained the above shares) and Mr Evans (who forfeited the above shares on leaving the Company), all the above 2016 granted LTI shares were cancelled with effect 31 December 2017. 7. OPTIONS AND SHARES GRANTED SUBSEQUENT TO REPORTING DATE No options nor restricted shares were issued to KMP subsequent to report date. 8. SHARES ISSUED ON EXERCISE OF OPTIONS BY KMP The number of shares issued to KMP on the exercise of options during the year ended 30 June 2018 was as follows.
SHARES ISSUED
NUMBER
PAID PER SHARE
$
UNPAID PER SHARE
$
30 June 2018
Mr S Cross 800,000 0.2184 -
Total 800,000 -

42 Mayne Pharma Annual Report 2018
SHARES ISSUED
NUMBER
PAID PER SHARE
$
UNPAID PER SHARE
$
30 June 2017
Mr S Richards 7,500,000 0.1492 -
Ms K Rintoul 300,000 0.3927 -
Ms K Rintoul 500,000 0.2984 -
Total 8,300,000 -
9. SHARES HELD BY KMP Movements in shares The movement during FY17 and FY18 in the number of ordinary shares in the Company held, directly, indirectly or beneficially, by each KMP including their related parties at reporting date, is as follows:
HELD AT 30 JUNE 2016
NUMBER
RECEIVED DURING THE YEAR ON EXERCISE OF
OPTIONS AND / OR LTI SHARES GRANTED
NUMBER
OTHER CHANGES DURING THE YEAR
NUMBER
HELD AT 30 JUNE 2017
NUMBER
RECEIVED DURING THE YEAR ON EXERCISE OF
OPTIONS AND / OR LTI SHARES GRANTED
NUMBER
LTI SHARES CANCELLED
DURING THE YEAR
NUMBER
OTHER CHANGES DURING THE YEAR
NUMBER
HELD AT 30 JUNE 2018
NUMBER
Directors
Mr R Corbett 6,510,542 - 3,930,027 10,440,569 - - - 10,440,569
Mr S Richards 9,967,392 9,742,005 5,778,197 25,487,594 6,608,851 - (10,883,195) 21,213,250
Hon R Best 2,560,338 - (973,121) 1,587,217 - - - 1,587,217
Mr P Blake - - - - - - - -
Mr F Condella - - - - - - - -
Ms N Dolan - - 74,500 74,500 - - - 74,500
Mr B Mathieson 57,143,080 - 33,634,503 90,777,583 - - 8,000,000 98,777,583
Mr I Scholes 1,303,174 - 855,462 2,158,636 - - - 2,158,636
Mr P Hodges 6,839,667 - (100,113) 6,739,554 - - - 6,739,554
Prof B Robinson 257,971 - 376,924 634,895 - - - 634,895
84,582,164 9,742,005 43,576,379 137,900,548 6,608,851 - (2,883,195) 141,626,204
Other KMP
Mr N Freeman - - - - 4,522,184 - 76,071 4,598,255
Mr S Cross 1,457,153 715,418 682,715 2,855,286 4,495,048 (715,418) (800,000) 5,834,916
Dr I Stancovski 1,664,792 584,979 214,436 2,464,207 3,527,611 (584,979) - 5,406,839
Ms K Rintoul 666,533 1,316,017 (800,000) 1,182,550 2,958,541 (516,017) - 3,625,074
Mr E Evans 974,997 556,600 100,000 1,631,597 992,470 - (2,429,068) 194,999
Mr P Paltoglou 2,605,344 719,413 1,581,359 4,906,116 3,685,555 (719,413) (1,293,510) 6,578,748
Ms L Pendlebury 811,767 298,291 350,999 1,461,057 1,419,536 (298,291) 107,292 2,689,594
Mr A Van Breugel - 370,617 - 370,617 1,635,511 (370,617) - 1,635,511
Mr J Ross 908,131 684,783 100,003 1,692,917 3,803,485 (684,783) - 4,811,619
9,088,717 5,246,118 2,229,512 16,564,347 27,039,941 (3,889,518) (4,339,215) 35,375,555
93,670,881 14,988,123 45,805,891 154,464,895 33,648,792 (3,889,518) (7,222,410) 177,001,759
10. EMPLOYMENT CONTRACTS Remuneration and other key terms of employment for the CEO and other KMP are formalised in service agreements. The service agreements specify the components of remuneration, benefits, notice periods and termination provisions. The table below provides details on the CEO’s service agreement:
NAME TERM OF AGREEMENT BASE SALARY INCLUDING
SUPERANNUATION1 NOTICE PERIOD INCENTIVE ARRANGEMENTS TERMINATION BENEFITS
Mr S Richards Chief Executive Officer
On-going commencing
13 February 2012
$900,000 12 months Entitlement to participate in LTI share plan. The value of the LTI is based on 150% of fixed remuneration.
Nil if for serious misconduct. Otherwise, up to 12 months’ pay in lieu of notice.
If employment is terminated within six months of a change of control, entitled to a payment equal to 12 months’ pay.
1. Base salary quoted is for a 12-month period and is current and is reviewed annually by the Remuneration and People Committee. Note as Mr Richards relocated to the US during the year, he
also receives living away from home, relocation assistance and other typical expat benefits.
Other executive KMP are subject to ongoing service agreements with notice periods from 3 months to 6 months. Other KMP participate in the ESLS receiving an annual allocation of shares under the plan. ESLS participation is based on a LTI value of between 80% and 110% of fixed remuneration. These executives do not participate in the STI plan. To align the executive KMP interests with shareholder interests, all executive KMP are required to build and hold a specified minimum shareholding in the Company over time.
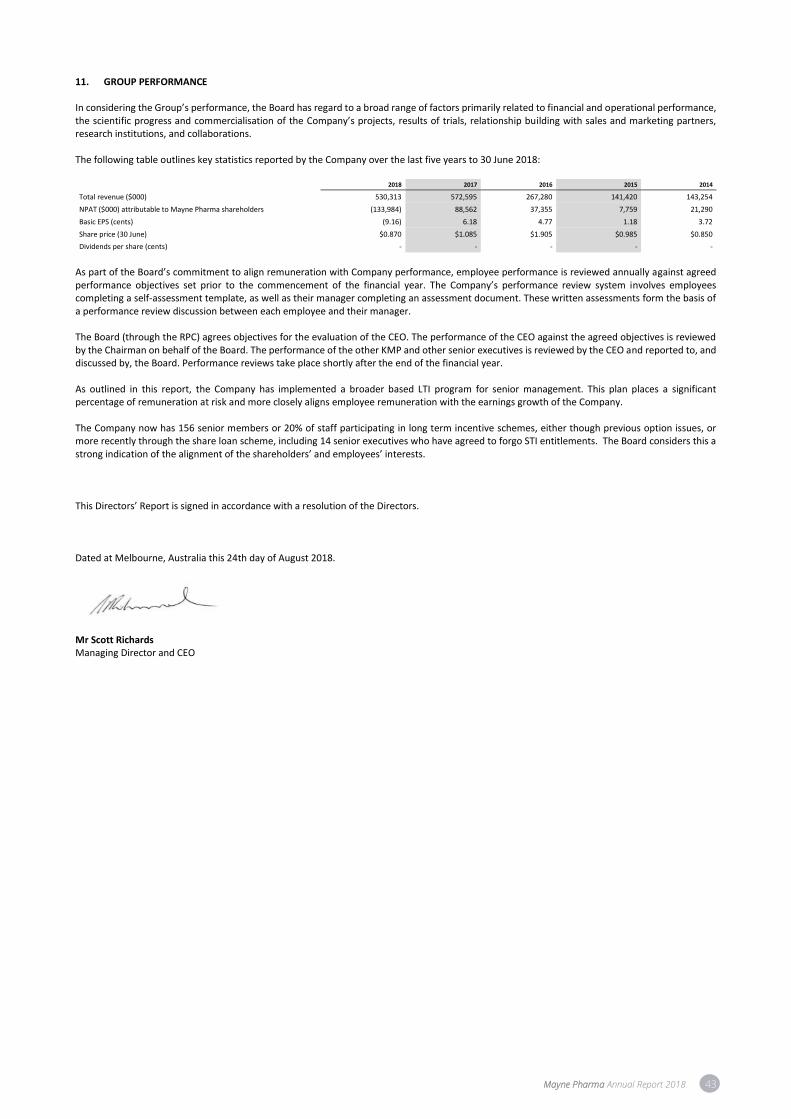
Mayne Pharma Annual Report 2018 43
11. GROUP PERFORMANCE In considering the Group’s performance, the Board has regard to a broad range of factors primarily related to financial and operational performance, the scientific progress and commercialisation of the Company’s projects, results of trials, relationship building with sales and marketing partners, research institutions, and collaborations. The following table outlines key statistics reported by the Company over the last five years to 30 June 2018:
2018 2017 2016 2015 2014
Total revenue ($000) 530,313 572,595 267,280 141,420 143,254
NPAT ($000) attributable to Mayne Pharma shareholders (133,984) 88,562 37,355 7,759 21,290
Basic EPS (cents) (9.16) 6.18 4.77 1.18 3.72
Share price (30 June) $0.870 $1.085 $1.905 $0.985 $0.850
Dividends per share (cents) - - - - -
As part of the Board’s commitment to align remuneration with Company performance, employee performance is reviewed annually against agreed performance objectives set prior to the commencement of the financial year. The Company’s performance review system involves employees completing a self-assessment template, as well as their manager completing an assessment document. These written assessments form the basis of a performance review discussion between each employee and their manager. The Board (through the RPC) agrees objectives for the evaluation of the CEO. The performance of the CEO against the agreed objectives is reviewed by the Chairman on behalf of the Board. The performance of the other KMP and other senior executives is reviewed by the CEO and reported to, and discussed by, the Board. Performance reviews take place shortly after the end of the financial year. As outlined in this report, the Company has implemented a broader based LTI program for senior management. This plan places a significant percentage of remuneration at risk and more closely aligns employee remuneration with the earnings growth of the Company. The Company now has 156 senior members or 20% of staff participating in long term incentive schemes, either though previous option issues, or more recently through the share loan scheme, including 14 senior executives who have agreed to forgo STI entitlements. The Board considers this a strong indication of the alignment of the shareholders’ and employees’ interests. This Directors’ Report is signed in accordance with a resolution of the Directors. Dated at Melbourne, Australia this 24th day of August 2018.
Mr Scott Richards Managing Director and CEO
44 Mayne Pharma Annual Report 2018
AUDIT INDEPENDENCE DECLARATION
Auditor’s Independence Declaration to the Directors of Mayne Pharma Group Limited
As lead auditor for the audit of Mayne Pharma Group Limited for the financial year ended 30 June 2018, I declare to the best of my knowledge and belief, there have been:
a) no contraventions of the auditor independence requirements of the Corporations Act 2001 in relation to the audit; and
b) no contraventions of any applicable code of professional conduct in relation to the audit.
This declaration is in respect of Mayne Pharma Group Limited and the entities it controlled during the financial year. Ernst & Young
Ashley Butler Partner Melbourne 24 August 2018 A member firm of Ernst & Young Global Limited Liability limited by a scheme approved under Professional Standards Legislation
Ernst & Young Tel: +61 3 9288 8000 8 Exhibition Street Fax: +61 3 8650 7777 Melbourne VIC 3000 Australia ey.com/au
GPO Box 67 Melbourne VIC 3001

Mayne Pharma Annual Report 2018 45
CORPORATE GOVERNANCE WEBSITE Important information relating to the Company’s corporate governance policies and practices are set out on the Company’s website at http://www.maynepharma.com/investor-relations/corporate-governance. The Company has adopted the ASX Corporate Governance Council 3rd Edition Corporate Governance Principles and Recommendations. The recommendations allow companies to publish Corporate Governance information on their websites rather than include the information in the Annual Report. The following documents are available on the Mayne Pharma website:
• Corporate Governance Statement;
• Board Charter;
• Audit & Risk Committee, Remuneration & People Committee, Nomination Committee and Science, Technology & Medical Committee Charters;
• Business Code of Conduct;
• Communications Policy;
• Continuous Disclosure Policy;
• Risk Management Framework;
• Workplace Gender Equality Agency Annual Compliance Report; and
• Securities Trading Policy.
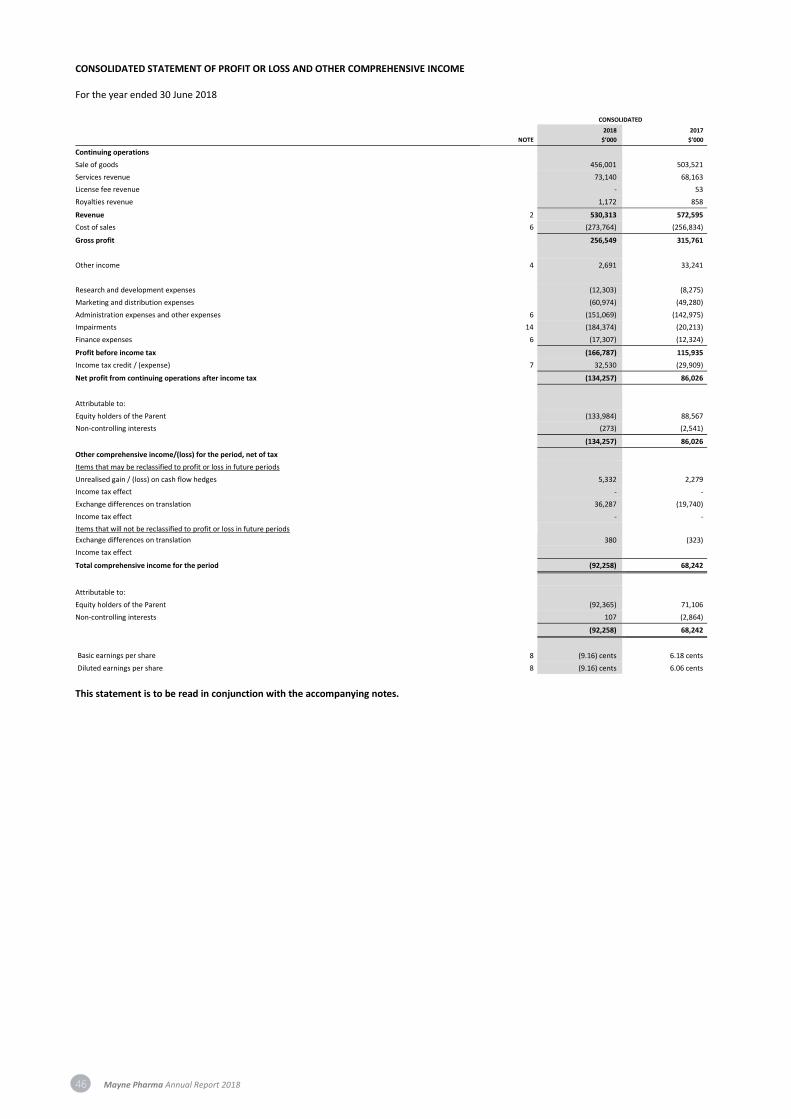
46 Mayne Pharma Annual Report 2018
CONSOLIDATED STATEMENT OF PROFIT OR LOSS AND OTHER COMPREHENSIVE INCOME For the year ended 30 June 2018
CONSOLIDATED
NOTE
2018
$’000
2017
$’000
Continuing operations
Sale of goods 456,001 503,521
Services revenue 73,140 68,163
License fee revenue - 53
Royalties revenue 1,172 858
Revenue 2 530,313 572,595
Cost of sales 6 (273,764) (256,834)
Gross profit 256,549 315,761
Other income 4 2,691 33,241
Research and development expenses (12,303) (8,275)
Marketing and distribution expenses (60,974) (49,280)
Administration expenses and other expenses 6 (151,069) (142,975)
Impairments 14 (184,374) (20,213)
Finance expenses 6 (17,307) (12,324)
Profit before income tax (166,787) 115,935
Income tax credit / (expense) 7 32,530 (29,909)
Net profit from continuing operations after income tax (134,257) 86,026
Attributable to:
Equity holders of the Parent (133,984) 88,567
Non-controlling interests (273) (2,541)
(134,257) 86,026
Other comprehensive income/(loss) for the period, net of tax
Items that may be reclassified to profit or loss in future periods
Unrealised gain / (loss) on cash flow hedges 5,332 2,279
Income tax effect - -
Exchange differences on translation 36,287 (19,740)
Income tax effect - -
Items that will not be reclassified to profit or loss in future periods
Exchange differences on translation 380 (323)
Income tax effect
Total comprehensive income for the period (92,258) 68,242
Attributable to:
Equity holders of the Parent (92,365) 71,106
Non-controlling interests 107 (2,864)
(92,258) 68,242
Basic earnings per share 8 (9.16) cents 6.18 cents
Diluted earnings per share 8 (9.16) cents 6.06 cents
This statement is to be read in conjunction with the accompanying notes.
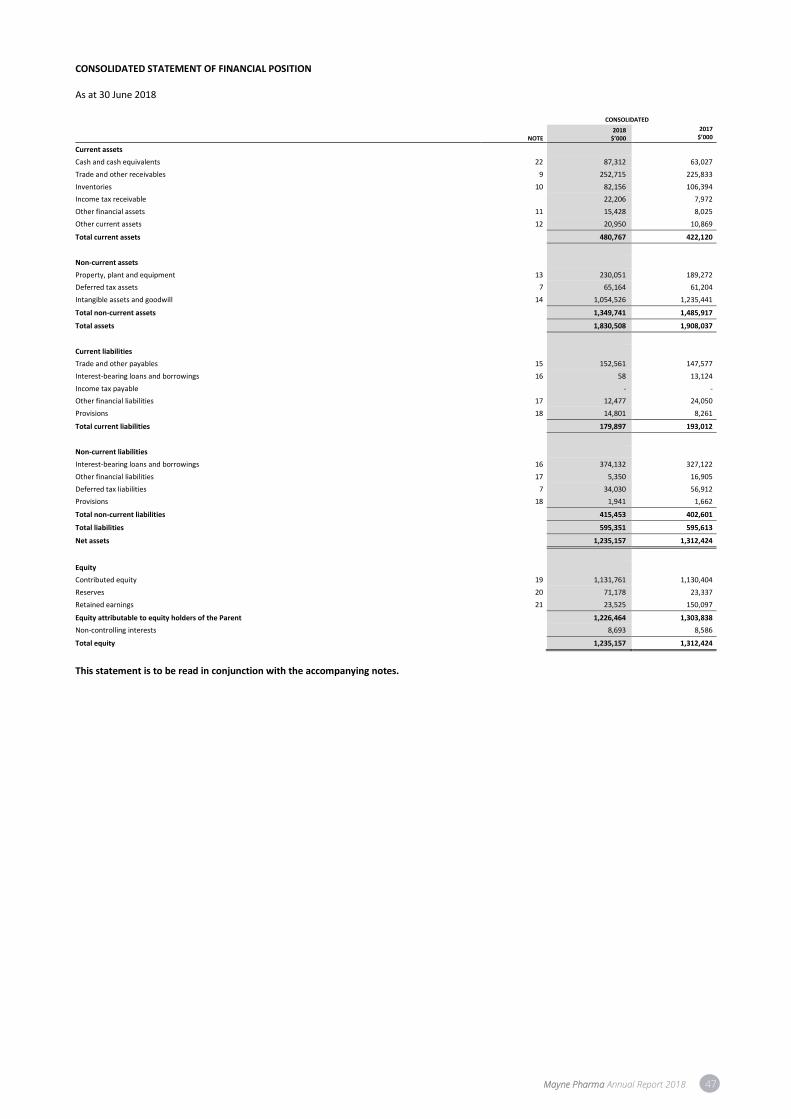
Mayne Pharma Annual Report 2018 47
CONSOLIDATED STATEMENT OF FINANCIAL POSITION As at 30 June 2018
CONSOLIDATED
NOTE 2018
$’000
2017 $’000
Current assets
Cash and cash equivalents 22 87,312 63,027
Trade and other receivables 9 252,715 225,833
Inventories 10 82,156 106,394
Income tax receivable 22,206 7,972
Other financial assets 11 15,428 8,025
Other current assets 12 20,950 10,869
Total current assets 480,767 422,120
Non-current assets
Property, plant and equipment 13 230,051 189,272
Deferred tax assets 7 65,164 61,204
Intangible assets and goodwill 14 1,054,526 1,235,441
Total non-current assets 1,349,741 1,485,917
Total assets 1,830,508 1,908,037
Current liabilities
Trade and other payables 15 152,561 147,577
Interest-bearing loans and borrowings 16 58 13,124
Income tax payable - -
Other financial liabilities 17 12,477 24,050
Provisions 18 14,801 8,261
Total current liabilities 179,897 193,012
Non-current liabilities
Interest-bearing loans and borrowings 16 374,132 327,122
Other financial liabilities 17 5,350 16,905
Deferred tax liabilities 7 34,030 56,912
Provisions 18 1,941 1,662
Total non-current liabilities 415,453 402,601
Total liabilities 595,351 595,613
Net assets 1,235,157 1,312,424
Equity
Contributed equity 19 1,131,761 1,130,404
Reserves 20 71,178 23,337
Retained earnings 21 23,525 150,097
Equity attributable to equity holders of the Parent 1,226,464 1,303,838
Non-controlling interests 8,693 8,586
Total equity 1,235,157 1,312,424
This statement is to be read in conjunction with the accompanying notes.
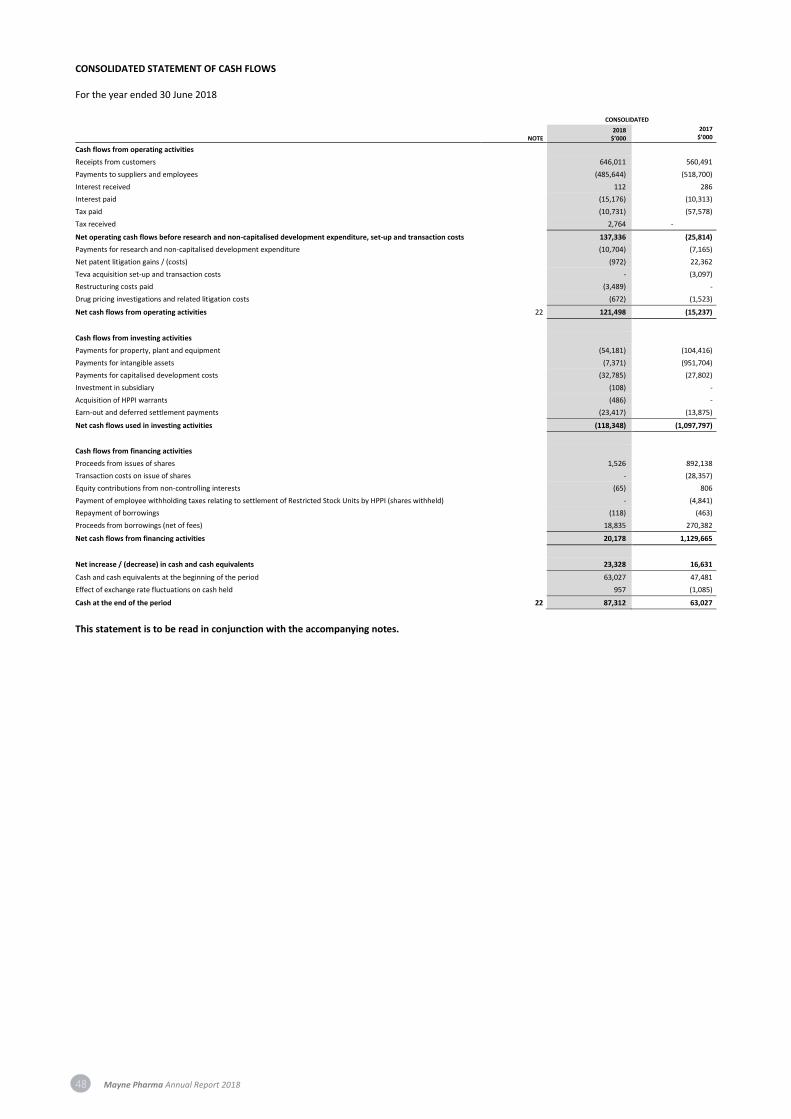
48 Mayne Pharma Annual Report 2018
CONSOLIDATED STATEMENT OF CASH FLOWS For the year ended 30 June 2018 CONSOLIDATED
NOTE 2018
$’000
2017 $’000
Cash flows from operating activities
Receipts from customers 646,011 560,491
Payments to suppliers and employees (485,644) (518,700)
Interest received 112 286
Interest paid (15,176) (10,313)
Tax paid (10,731) (57,578)
Tax received 2,764 -
Net operating cash flows before research and non-capitalised development expenditure, set-up and transaction costs 137,336 (25,814)
Payments for research and non-capitalised development expenditure (10,704) (7,165)
Net patent litigation gains / (costs) (972) 22,362
Teva acquisition set-up and transaction costs - (3,097)
Restructuring costs paid (3,489) -
Drug pricing investigations and related litigation costs (672) (1,523)
Net cash flows from operating activities 22 121,498 (15,237)
Cash flows from investing activities
Payments for property, plant and equipment (54,181) (104,416)
Payments for intangible assets (7,371) (951,704)
Payments for capitalised development costs (32,785) (27,802)
Investment in subsidiary (108) -
Acquisition of HPPI warrants (486) -
Earn-out and deferred settlement payments (23,417) (13,875)
Net cash flows used in investing activities (118,348) (1,097,797)
Cash flows from financing activities
Proceeds from issues of shares 1,526 892,138
Transaction costs on issue of shares - (28,357)
Equity contributions from non-controlling interests (65) 806
Payment of employee withholding taxes relating to settlement of Restricted Stock Units by HPPI (shares withheld) - (4,841)
Repayment of borrowings (118) (463)
Proceeds from borrowings (net of fees) 18,835 270,382
Net cash flows from financing activities 20,178 1,129,665
Net increase / (decrease) in cash and cash equivalents 23,328 16,631
Cash and cash equivalents at the beginning of the period 63,027 47,481
Effect of exchange rate fluctuations on cash held 957 (1,085)
Cash at the end of the period 22 87,312 63,027
This statement is to be read in conjunction with the accompanying notes.
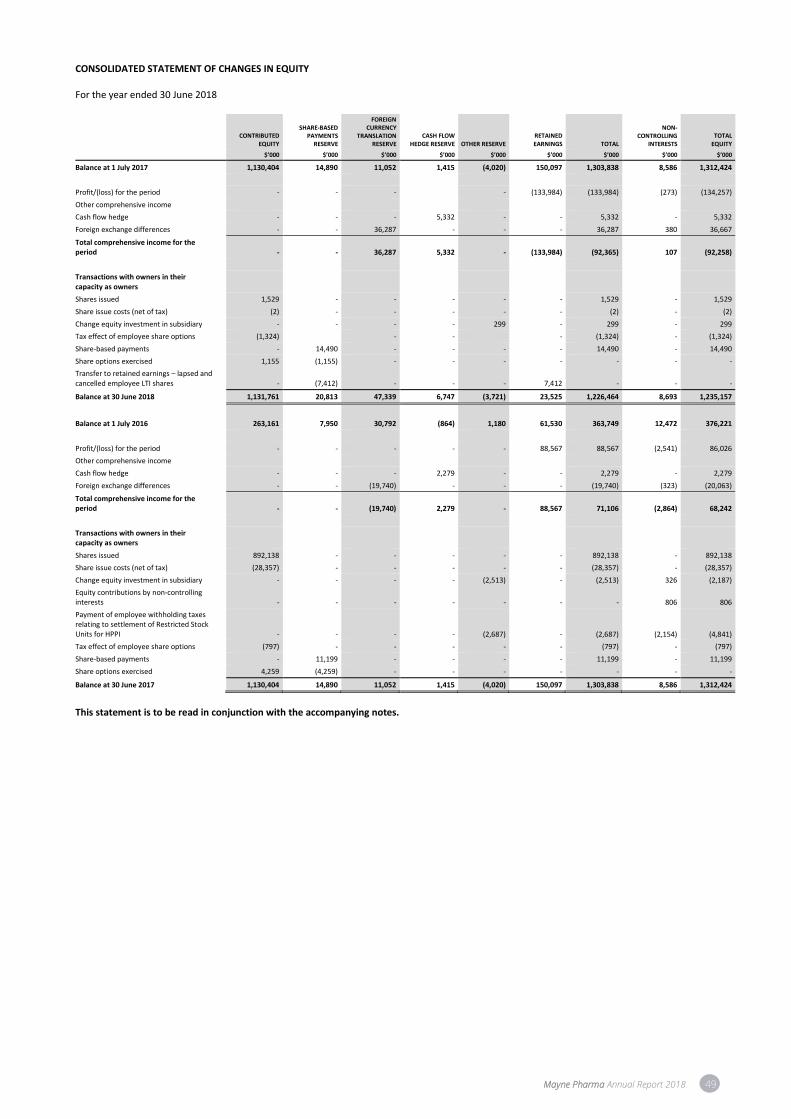
Mayne Pharma Annual Report 2018 49
CONSOLIDATED STATEMENT OF CHANGES IN EQUITY For the year ended 30 June 2018
CONTRIBUTED
EQUITY
SHARE-BASED PAYMENTS
RESERVE
FOREIGN CURRENCY
TRANSLATION RESERVE
CASH FLOW HEDGE RESERVE OTHER RESERVE
RETAINED EARNINGS TOTAL
NON-CONTROLLING
INTERESTS TOTAL
EQUITY
$’000 $’000 $’000 $’000 $’000 $’000 $’000 $’000 $’000
Balance at 1 July 2017 1,130,404 14,890 11,052 1,415 (4,020) 150,097 1,303,838 8,586 1,312,424
Profit/(loss) for the period - - - - (133,984) (133,984) (273) (134,257)
Other comprehensive income
Cash flow hedge - - - 5,332 - - 5,332 - 5,332
Foreign exchange differences - - 36,287 - - - 36,287 380 36,667
Total comprehensive income for the period - - 36,287 5,332 - (133,984) (92,365) 107 (92,258)
Transactions with owners in their capacity as owners
Shares issued 1,529 - - - - - 1,529 - 1,529
Share issue costs (net of tax) (2) - - - - - (2) - (2)
Change equity investment in subsidiary - - - - 299 - 299 - 299
Tax effect of employee share options (1,324) - - - (1,324) - (1,324)
Share-based payments - 14,490 - - - - 14,490 - 14,490
Share options exercised 1,155 (1,155) - - - - - - -
Transfer to retained earnings – lapsed and cancelled employee LTI shares - (7,412) - - - 7,412 - - -
Balance at 30 June 2018 1,131,761 20,813 47,339 6,747 (3,721) 23,525 1,226,464 8,693 1,235,157
Balance at 1 July 2016 263,161 7,950 30,792 (864) 1,180 61,530 363,749 12,472 376,221
Profit/(loss) for the period - - - - - 88,567 88,567 (2,541) 86,026
Other comprehensive income
Cash flow hedge - - - 2,279 - - 2,279 - 2,279
Foreign exchange differences - - (19,740) - - - (19,740) (323) (20,063)
Total comprehensive income for the period - - (19,740) 2,279 - 88,567 71,106 (2,864) 68,242
Transactions with owners in their capacity as owners
Shares issued 892,138 - - - - - 892,138 - 892,138
Share issue costs (net of tax) (28,357) - - - - - (28,357) - (28,357)
Change equity investment in subsidiary - - - - (2,513) - (2,513) 326 (2,187)
Equity contributions by non-controlling interests - - - - - - - 806 806
Payment of employee withholding taxes relating to settlement of Restricted Stock Units for HPPI - - - - (2,687) - (2,687) (2,154) (4,841)
Tax effect of employee share options (797) - - - - - (797) - (797)
Share-based payments - 11,199 - - - - 11,199 - 11,199
Share options exercised 4,259 (4,259) - - - - - - -
Balance at 30 June 2017 1,130,404 14,890 11,052 1,415 (4,020) 150,097 1,303,838 8,586 1,312,424
This statement is to be read in conjunction with the accompanying notes.
50 Mayne Pharma Annual Report 2018
NOTES TO THE CONSOLIDATED FINANCIAL STATEMENTS For the year ended 30 June 2018
NOTES TO THE CONSOLIDATED FINANCIAL STATEMENTS 50
NOTE 1 – ABOUT THIS REPORT 51
NOTE 2 – REPORTING SEGMENTS 53
NOTE 3 – FINANCIAL RISK MANAGEMENT OBJECTIVES AND POLICIES 56
NOTE 4 – OTHER INCOME 58
NOTE 5 – FAIR VALUE MEASUREMENT 58
NOTE 6 – EXPENSES 60
NOTE 7 – INCOME TAX 61
NOTE 8 – EARNINGS PER SHARE 63
NOTE 9 – TRADE AND OTHER RECEIVABLES 64
NOTE 10 – INVENTORIES 64
NOTE 11 – OTHER FINANCIAL ASSETS 65
NOTE 12 – OTHER ASSETS 65
NOTE 13 – PROPERTY, PLANT AND EQUIPMENT 66
NOTE 14 – INTANGIBLE ASSETS AND GOODWILL 67
NOTE 15 – TRADE AND OTHER PAYABLES 70
NOTE 16 – INTEREST-BEARING LOANS AND BORROWINGS 71
NOTE 17 – OTHER FINANCIAL LIABILITIES 72
NOTE 18 – PROVISIONS 73
NOTE 19 – CONTRIBUTED EQUITY 74
NOTE 20 – RESERVES 74
NOTE 21 – RETAINED EARNINGS 75
NOTE 22 – NOTES TO THE CONSOLIDATED STATEMENT OF CASH FLOWS 75
NOTE 23 – RELATED PARTY DISCLOSURES 76
NOTE 24 – KMP DISCLOSURES 77
NOTE 25 – AUDITOR’S REMUNERATION 78
NOTE 26 - SHARE-BASED PAYMENT PLANS 78
NOTE 27 – PARENT ENTITY DISCLOSURES 81
NOTE 28 – COMMITMENTS AND CONTINGENCIES 82
NOTE 29 – DIVIDENDS 82
NOTE 30 – BUSINESS COMBINATIONS 83
NOTE 31 – DEED OF CROSS GUARANTEE 83
NOTE 32 – EVENTS SUBSEQUENT TO THE REPORTING PERIOD 84
NOTE 33 – NEW AND REVISED ACCOUNTING STANDARDS 84
Mayne Pharma Annual Report 2018 51
NOTE 1 – ABOUT THIS REPORT Mayne Pharma Group Limited is a company limited by shares incorporated and domiciled in Australia, whose shares are publicly traded on the Australian Securities Exchange. The financial report for the year ended 30 June 2018 was authorised for issue by the Directors on 24 August 2018. The nature of the operations and principal activities of the Group are described in the Directors’ Report. A. Basis of preparation These financial statements are a general purpose financial report which has been prepared for a “for-profit” enterprise and in accordance with the requirements of the Corporations Act 2001, Australian Accounting Standards and other authoritative pronouncements of the Australian Accounting Standards Board. The financial report has been prepared on a historical cost basis except for certain financial instruments which have been measured at the fair value. The financial report complies with Australian Accounting Standards as issued by the Australian Accounting Standards Board and International Financial Reporting Standards (IFRS) as issued by the International Accounting Standards Board. The financial report is presented in Australian dollars and rounded to the nearest thousand dollars ($’000) unless otherwise stated. B. Basis of consolidation The consolidated financial statements comprise the financial statements of the Group and its subsidiaries as at 30 June 2018. Control is achieved when the Group is exposed, or has rights, to variable returns from its involvement with the investee and has the ability to affect those returns through its power over the investee. Specifically, the Group controls an investee if and only if the Group has:
• Power over the investee (i.e. existing rights that give it the current ability to direct the relevant activities of the investee);
• Exposure, or rights, to variable returns from its involvement with the investee; and
• The ability to use its power over the investee to affect its returns. When the Group has less than a majority of the voting or similar rights of an investee, the Group considers all relevant facts and circumstances in assessing whether it has power over an investee, including:
• The contractual arrangement with the other vote holders of the investee;
• Rights arising from other contractual arrangements; and
• The Group’s voting rights and potential voting rights. The Group re-assesses if it controls an investee if facts and circumstances indicate that there are changes to one or more of the three elements of control. Consolidation of a subsidiary begins when the Group obtains control over the subsidiary and ceases when the Group loses control of the subsidiary. Assets, liabilities, income and expenses of a subsidiary acquired or disposed of during the year are included in the statement of comprehensive income from the date the Group gains control until the date the Group ceases to control the subsidiary. Profit or loss and each component of other comprehensive income (OCI) are attributed to the equity holders of the parent of the Group and to the non-controlling interests, even if this results in the non-controlling interests having a deficit balance. When necessary, adjustments are made to the financial statements of subsidiaries to bring their accounting policies into line with the Group’s accounting policies. All intra-group assets and liabilities, equity, income, expenses and cash flows relating to transactions between members of the Group are eliminated in full on consolidation. A change in the ownership interest of a subsidiary, without a loss of control, is accounted for as an equity transaction. If the Group loses control over a subsidiary, it:
• De-recognises the assets (including goodwill) and liabilities of the subsidiary;
• De-recognises the carrying amount of any non-controlling interests;
• De-recognises the cumulative translation differences recorded in equity;
• Recognises the fair value of the consideration received;
• Recognises the fair value of any investment retained;
• Recognises any surplus or deficit in profit or loss; and
• Reclassifies the parent’s share of components previously recognised in OCI to profit or loss or retained earnings, as appropriate, as would be required if the Group had directly disposed of the related assets or liabilities.
C. Foreign currency The Group’s consolidated financial statements are presented in Australian dollars, which is also the Parent’s functional currency. The Group determines the functional currency for each entity and items included in the financial statements of each entity are measured using that functional currency. The functional currency for the US subsidiaries is US dollars. During the prior comparable period, a subsidiary, Mayne Pharma LLC, changed its functional currency from AUD to USD. The change of functional currency was due to the settlement of the Teva portfolio acquisition. After the Teva acquisition, the predominant revenues and expenses of Mayne Pharma LLC are denominated in USD. On consolidation, the assets and liabilities of foreign operations are translated into Australian dollars at the rate of exchange prevailing at the reporting date and their income statements are translated at exchange rates prevailing at the dates of the transactions. The exchange differences arising on translation for consolidation are recognised in equity though Other Comprehensive Income. On disposal of a foreign operation, the component of equity relating to that foreign operation is reclassified to profit or loss as part of the gain or loss on sale.
52 Mayne Pharma Annual Report 2018
Transactions in foreign currencies are initially recorded by the Group’s entities at their respective functional currency spot rates at the date the transaction first qualifies for recognition. Monetary assets and liabilities denominated in foreign currencies are translated at the functional currency spot rates of exchange at the reporting date. Differences arising on settlement or translation of monetary items are recognised in profit or loss except monetary items that are designated as part of the hedge of the Group’s net investment of a foreign operation. These are recognised in other comprehensive income until the net investment is disposed of, at which time, the cumulative amount is reclassified to profit or loss. Tax charges and credits attributable to exchange differences on those monetary items are also recorded in other comprehensive income. In substance, the Group’s net investment in a foreign operation includes loans advanced by the parent entity to the foreign operation where settlement of which is neither planned nor likely to occur within the foreseeable future. Exchange differences arising on such monetary items that form part of a reporting entity’s net investment in a foreign operation are recognised in profit or loss in the separate financial statements of the reporting entity. In the Group’s financial statements which include the foreign operation and the reporting entity, such exchange differences are recognised initially in other comprehensive income and reclassified from equity to profit or loss on disposal of the net investment. Non-monetary items that are measured in terms of historical cost in a foreign currency are translated using the exchange rates at the dates of the initial transactions. Non-monetary items measured at fair value in a foreign currency are translated using the exchange rates at the date when the fair value is determined. The gain or loss arising on translation of non-monetary items measured at fair value is treated in line with the recognition of gain or loss on change in fair value of the item (i.e. translation differences on items whose fair value gain or loss is recognised in other comprehensive income or profit or loss are also recognised in other comprehensive income or profit or loss, respectively). Any goodwill arising on the acquisition of a foreign operation and any fair value adjustments to the carrying amounts of assets and liabilities arising on the acquisition are treated as assets and liabilities of the foreign operation and translated at the spot rate of exchange at the reporting date. D. Other accounting policies Significant accounting policies that outline the measurement basis used and are relevant to the understanding of the financial statements are provided throughout the notes to the financial statements. E. Key judgements and estimates The preparation of the financial statements requires management to make judgements, estimates and assumptions that affect the reported amounts in the financial statements. Management continually evaluates these judgements and estimates in relation to assets, liabilities, contingent liabilities, revenue and expenses. Management bases these judgements and estimates on historical experience and on other various factors it believes to be reasonable under the circumstances, the result of which form the basis of the carrying values of assets and liabilities that are not apparent from other sources. Actual results may differ from these estimates under different assumptions and conditions. Material judgements and estimates are found in the following notes:
Note Significant judgements and estimates
• Note 2 - Reporting Segment information Revenue recognition
• Note 7 - Income tax Recognition of deferred tax assets and liabilities
• Note 10 - Inventories Obsolescence and net realisable value assessment
• Note 14 - Intangible assets Impairment reviews and assessment of useful lives
• Note 15 - Trade and Other Payables Customer rebates and discounts
• Note 17 - Other Financial Liabilities Fair value of liabilities
• Note 18 - Provisions Best estimates of expenditure to be settled
• Note 26 - Share-Based Payments Fair value of equity instruments F. Significant changes in the current reporting period Mayne Pharma, in the prior year, early adopted AASB 2016-5 Amendments to Australian Accounting Standards – Classification and Measurement of Share-based Payment Transactions AASB 2 which would otherwise be effective from 1 Jan 2018 whereby, as an exception to the requirements in paragraph 34 of IFRS 2, such transactions will be classified in their entirety as equity-settled share-based payment transactions if they would have been so classified in the absence of the net share settlement feature. Key to this is that this amendment applies to a narrow situation where the net settlement arrangement is designed to meet an entity's obligation, under tax laws or regulations. Paragraph 29 of IFRS 2 is applied to account for the withholding of shares to fund the payment for WHT. The payment made will be accounted for as a deduction from equity for the shares withheld, except to the extent that the payment exceeds the fair value at the net settlement date of the equity instruments withheld. This has been applied to settlement, by HPPI, of RSUs during the period which required the deduction of employee withholding of tax from the settlement. There were no changes in accounting policy during the year ended 30 June 2018, nor did the introduction of new accounting standards lead to any change in measurement or disclosure in these financial statements. See Note 33 for details on new accounting standards introduced this financial year. G. Reclassification of comparatives Where required, items in the 2017 comparative period have been reclassified to reflect the current presentation and enable better comparison between periods.
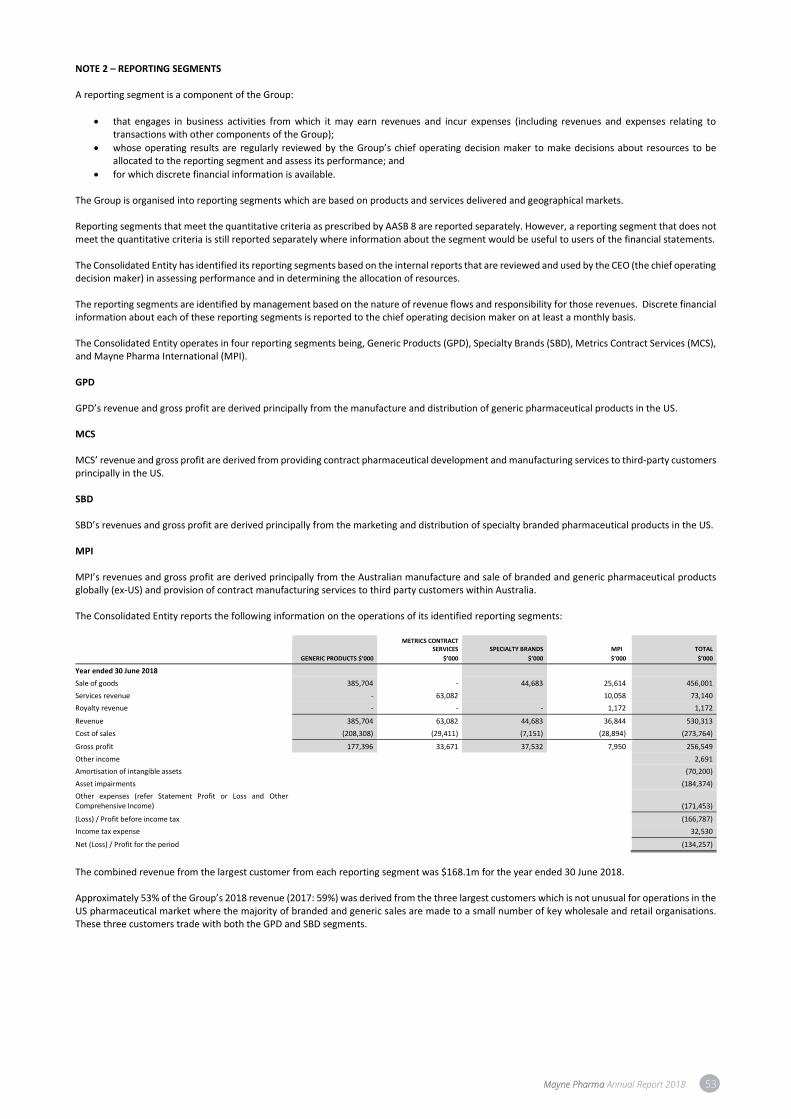
Mayne Pharma Annual Report 2018 53
NOTE 2 – REPORTING SEGMENTS A reporting segment is a component of the Group:
• that engages in business activities from which it may earn revenues and incur expenses (including revenues and expenses relating to transactions with other components of the Group);
• whose operating results are regularly reviewed by the Group’s chief operating decision maker to make decisions about resources to be allocated to the reporting segment and assess its performance; and
• for which discrete financial information is available. The Group is organised into reporting segments which are based on products and services delivered and geographical markets. Reporting segments that meet the quantitative criteria as prescribed by AASB 8 are reported separately. However, a reporting segment that does not meet the quantitative criteria is still reported separately where information about the segment would be useful to users of the financial statements. The Consolidated Entity has identified its reporting segments based on the internal reports that are reviewed and used by the CEO (the chief operating decision maker) in assessing performance and in determining the allocation of resources. The reporting segments are identified by management based on the nature of revenue flows and responsibility for those revenues. Discrete financial information about each of these reporting segments is reported to the chief operating decision maker on at least a monthly basis. The Consolidated Entity operates in four reporting segments being, Generic Products (GPD), Specialty Brands (SBD), Metrics Contract Services (MCS), and Mayne Pharma International (MPI). GPD GPD’s revenue and gross profit are derived principally from the manufacture and distribution of generic pharmaceutical products in the US. MCS MCS’ revenue and gross profit are derived from providing contract pharmaceutical development and manufacturing services to third-party customers principally in the US. SBD SBD’s revenues and gross profit are derived principally from the marketing and distribution of specialty branded pharmaceutical products in the US. MPI MPI’s revenues and gross profit are derived principally from the Australian manufacture and sale of branded and generic pharmaceutical products globally (ex-US) and provision of contract manufacturing services to third party customers within Australia. The Consolidated Entity reports the following information on the operations of its identified reporting segments:
GENERIC PRODUCTS $’000
METRICS CONTRACT SERVICES
$’000
SPECIALTY BRANDS
$’000
MPI
$’000
TOTAL
$’000
Year ended 30 June 2018
Sale of goods 385,704 - 44,683 25,614 456,001
Services revenue - 63,082 10,058 73,140
Royalty revenue - - - 1,172 1,172
Revenue 385,704 63,082 44,683 36,844 530,313
Cost of sales (208,308) (29,411) (7,151) (28,894) (273,764)
Gross profit 177,396 33,671 37,532 7,950 256,549
Other income 2,691
Amortisation of intangible assets (70,200)
Asset impairments (184,374)
Other expenses (refer Statement Profit or Loss and Other Comprehensive Income) (171,453)
(Loss) / Profit before income tax (166,787)
Income tax expense 32,530
Net (Loss) / Profit for the period (134,257)
The combined revenue from the largest customer from each reporting segment was $168.1m for the year ended 30 June 2018. Approximately 53% of the Group’s 2018 revenue (2017: 59%) was derived from the three largest customers which is not unusual for operations in the US pharmaceutical market where the majority of branded and generic sales are made to a small number of key wholesale and retail organisations. These three customers trade with both the GPD and SBD segments.

54 Mayne Pharma Annual Report 2018
GENERIC PRODUCTS $’000
METRICS CONTRACT SERVICES
$’000
SPECIALTY BRANDS
$’000
MPI
$’000
TOTAL
$’000
Year ended 30 June 2017
Sale of goods 418,650 - 61,862 23,009 503,521
Services revenue - 57,815 - 10,348 68,163
License fee revenue - - - 53 53
Royalty revenue - - - 858 858
Revenue 418,650 57,815 61,862 34,268 572,595
Cost of sales (200,372) (25,733) (3,292) (27,437) (256,834)
Gross profit 218,278 32,082 58,570 6,831 315,761
Other income 33,241
Amortisation of intangible assets (67,154)
Fair value movement in earn-out liability 517
Other expenses (refer Statement Profit or Loss and Other Comprehensive Income) (166,430)
Profit before income tax 115,935
Income tax expense (29,909)
Net Profit for the period 86,026
Geographical information
Revenue from external customers 2018
$’000 2017
$’000
Australia 28,013 26,224
United States 493,470 538,327
Korea 3,175 3,397
Other 5,655 4,647
Total external revenue 530,313 572,595
Non-current assets 2018
$’000 2017
$’000
Australia 132,322 124,436
United States 1,152,255 1,300,277
Total non-current assets 1,284,577 1,424,713
Non-current assets for this purpose consist of property, plant and equipment and intangible assets. Product information
Revenue by product group/service 2018
$’000 2017
$’000
Third party contract services and manufacturing 73,140 68,163
Generic and branded products 456,001 503,574
Other revenue 1,172 858
Total external revenue 530,313 572,595
Revenue recognition and measurement Sale of goods Revenue is recognised when the significant risks and rewards of ownership of the goods have passed to the buyer and the costs incurred or to be incurred in respect of the transaction can be measured reliably. Risks and rewards of ownership are considered passed to the buyer at the time of delivery of the goods to the customer or wholesalers. Deductions from revenue Consistent with pharmaceutical industry practices, Mayne Pharma’s gross sales are subject to various deductions which are primarily composed of rebates and discounts to retail customers, government agencies, wholesalers, health insurance companies and managed healthcare organisations. These deductions represent estimates of the related obligations, requiring use of judgement when estimating the effect of these sales deductions on gross sales for a reporting period. These adjustments are deducted from gross sales to arrive at net sales. The following summarizes the nature of some of these deductions and how the deductions are estimated. After recording these, net sales represent the Group’s best estimate of the cash that it expects to ultimately collect. The US market has the most complex arrangements related to revenue deductions. US specific healthcare plans and program rebates The United States Medicaid Drug Rebate Program is a partnership between Centers for Medicare and Medicaid Services (CMS), State Medicaid Agencies, and participating drug Manufacturers that helps to offset the Federal and State costs of most outpatient drugs dispensed to Medicaid patients. Calculating the rebates to be paid related to this program involves interpreting relevant regulations, which are subject to challenge or change in interpretative guidance by government authorities. Accruals for estimating Medicaid rebates are calculated using a combination of historical experience, product and population growth, product pricing and the mix of contracts and specific terms in the individual State agreements. The United States Federal Medicare Program offers assistance to Medicare eligible recipients by funding healthcare benefits to individuals aged 65 or older and those with certain disabilities, providing prescription drug benefits under Part D section of the program. This Part D benefit is provided and administered through private prescription drug plans. Accruals for estimating Medicare Part D rebates are calculated based on the terms of individual plan agreements, product sales and population growth, product pricing and the mix of contracts. We offer rebates to key managed healthcare and private plans to sustain and increase sales of our products. These programs provide a rebate after the plans have demonstrated they have met all terms and conditions set forth in their contract with the Group. These rebates are estimated based on the terms of individual agreements, historical
Mayne Pharma Annual Report 2018 55
experience, product pricing, and projected product growth rates. These accruals are adjusted based on established processes and experiences from filing data with individual states and plans. There is often a time lag of several months between the Group recording the revenue deductions and the final accounting for them. The Group offers rebates to key managed healthcare and private plans to sustain and increase sales of products. These programs provide a rebate after the plans have demonstrated they have met all terms and conditions set forth in the contracts with the Group. These rebates are estimated based on the terms of individual agreements, historical experience and product pricing. These provisions are adjusted based on established processes and experiences from filing data with individual states and plans. There is often a time lag of several months between the Group recording the revenue deductions and the final accounting for them. Non-healthcare plans and program charge-backs, rebates, returns and other deductions The Group offers rebates to purchasing organisations and other direct and indirect customers to sustain and increase market share for products. Since rebates are contractually agreed upon, the related provisions are estimated based on the terms of the individual agreements, historical experience, and projected product growth rates. Charge-backs occur where the Group has arrangements with indirect customers to sell products at prices that are lower than the price charged to wholesalers. A charge-back represents the difference between the invoice price to the wholesaler and the indirect customer’s contract price. The Group accounts for vendor charge-backs by reducing revenue for the estimate of charge-backs attributable to a sales transaction. Provisions for estimated charge-backs are calculated using a combination of factors such as historical experience, product growth rates, payments, product pricing, level of inventory in the distribution channel and the terms of individual agreements. When a product is sold providing a customer the right to return, the Group records a provision for estimated sales returns based on sales return policy and historical return rates. Other factors considered include actual product recalls, expected marketplace changes, the remaining shelf life of the product, and the expected entry of generic products. No value for returned inventory is recognised as all returned inventory is destroyed. The Group enters distribution service agreements with major wholesalers, which discourage the wholesalers from purchasing product greater than current customer demand. Where possible, the Group adjusts shipping patterns for products to maintain wholesalers’ inventory levels consistent with underlying patient demand. The Group offers cash discounts to customers to encourage prompt payment. Cash discounts are estimated and accrued at the time of invoicing and are deducted from revenue. Other sales discounts, such as co-pay discount cards, are offered in some markets. The estimated amounts of these discounts are recorded at the time of sale and are estimated utilizing historical experience and the specific terms for each program. If a discount for a probable future transaction is offered as part of a sales transaction, then an appropriate portion of revenue is deferred to cover this estimated obligation. The provisions for revenue deductions are adjusted periodically to reflect actual experience. To evaluate the adequacy of provision balances, the Group uses internal and external estimates of the inventory in transit, the level of inventory in the distribution and retail channels, actual claims data received and the time lag for processing rebate claims. External data sources include reports from wholesalers. Profit-sharing revenue represents the Group’s share of the net profit from the sale of generic pharmaceutical products based on agreements with distribution partners. Amounts are based on calculated profits net of cost of goods sold, distribution expenses, chargebacks, returns and related accruals as reported by the distribution partners. Product return allowances are calculated for products that may be returned due to expiration dates or recalls. The Group and its distribution partners do not expect any significant product returns that are not adequately covered by the reserve amounts calculated and recorded by the distribution partners. Services revenue Services revenue relates to manufacturing, development and analysis for third parties. Revenue is recognised when the work is complete and the work is billed or billable to the client. Royalties revenue Royalties arising from the manufacturing rights are recognised when earned in accordance with the substance of the agreement. Research and development income Research and development income is recognised when its recoverability can be regarded as assured when the specific milestones of the projects are met. License fee revenue Some of the Group’s revenues are generated from licensing agreements under which third parties have been granted rights to products and technologies. Consideration received, or expected to be received, that relates to the sale or out licensing of technologies or technological expertise is recognised in profit or loss as of the effective date of the agreement if all rights relating to the technologies and all obligations resulting from them have been relinquished under the contract terms. However, if rights to the technologies continue to exist or obligations resulting from them have yet to be fulfilled, the consideration received is deferred accordingly. Any consideration deferred is recorded as other liabilities and recognised in profit or loss over the estimated performance period stipulated in the agreement.

56 Mayne Pharma Annual Report 2018
NOTE 3 – FINANCIAL RISK MANAGEMENT OBJECTIVES AND POLICIES The Group’s principal financial instruments comprise cash, short-term deposits, receivables, payables, bank loans and interest rate swaps. The Group manages its exposure to key financial risks, including credit risk, interest rate risk, currency risk and liquidity risk in accordance with the Group’s financial risk management framework. The objective of the framework is to support the delivery of the Group’s financial targets whilst protecting future financial security. The main risks arising from the Group’s financial instruments are interest rate risk, foreign currency risk, credit risk and liquidity risk. The Group uses different methods to measure and manage different types of risks to which it is exposed. These include monitoring levels of exposure to interest rate and foreign exchange risk and assessments of market forecasts for interest rate and foreign exchange rates. Liquidity risk is monitored through the development of future rolling cash flow forecasts. Primary responsibility for identification and control of financial risks rests with the Board. The Board reviews and agrees policies for managing each of the risks identified below. Risk exposures and responses Interest rate risk The Group’s main interest rate risk arises from long term borrowings. Borrowings issued at variable rates expose the Group to cash flow interest rate risk. During the year the Group’s borrowings at variable rates were denoted in US dollars. At reporting date, approximately 54% of the Group’s borrowings were swapped to fixed interest. As at the end of the reporting period, the Group had the following variable rate borrowings outstanding:
2018
$’000 2017
$’000
Variable Interest-bearing loans and borrowings 378,020 344,733
Less Face value of interest rate swaps (202,511) (169,139)
Net variable interest rate exposure 175,509 175,594
The Group has partially hedged the USD interest rate exposure by entering into interest rate swap contracts. At 30 June 2018 the interest swaps had a face value of US$150m (2017: US$130m). Interest rate swaps with a face value of US$126.35m mature in June 2021 with the remaining interest rate swaps contracts (US$23.65m) maturing in June 2020. The cash flow hedges are considered highly effective. The variable interest rate risk on borrowings is partially off-set by the variable interest rate risk of cash at bank.
2018
$’000 2017
$’000
Cash at bank and on hand 87,312 63,027
The following sensitivity analysis is based on the interest rate risk exposures in existence at reporting date. At reporting date, if interest rates had moved, as illustrated in the table below, with all other variables held constant, net profit and equity would have been affected as follows: NET PROFIT/(LOSS) EQUITY
HIGHER/(LOWER) HIGHER/(LOWER)
2018 $’000
2017 $’000
2018 $’000
2017 $’000
US interest rates +0.5% (50 basis points) (491) (801) - -
AUD interest rates +0.5% (50 basis points) 45 35 - -
The movements are due to higher/lower interest expense on borrowings less/plus lower/higher interest revenue from cash balances. Possible movements in interest rates were determined based on the current observable market environment. Foreign currency risk The Group has significant transactional currency exposures arising from sales and purchases in currencies other than the functional currency of the parent entity. Approximately 94% of the Group’s revenues and 79% of the Group’s costs are denominated in currencies other than the functional currency of the parent entity. It is the Group’s general policy to enter into simple Forward Exchange Contracts or Participating Forward Exchange Contracts over a set percentage of the forecast net receipts of US dollars. The percentages used vary depending on the length of the forecast period (0-3 months and 4-6 months). The Group has not applied the hedge accounting rules and no mark-to-market valuation difference for the contracts has been recognised in the Statement of Profit or Loss at 30 June 2018 as it was not material (2017: nil). From time to time, the Company enters into FX contracts to manage the FX exposure of the Company relating to loans advanced to US subsidiaries denoted in USD. No FX contracts were outstanding at reporting date relating to intra-group loans. The Group also holds assets and liabilities in US dollars (USD), British pounds (GBP), Japanese yen (JPY), Canadian dollars (CAD) and Euro (EUR). The existence of both assets and liabilities denominated in USD provides a limited natural hedge against adverse currency movements for USD denoted exposures.
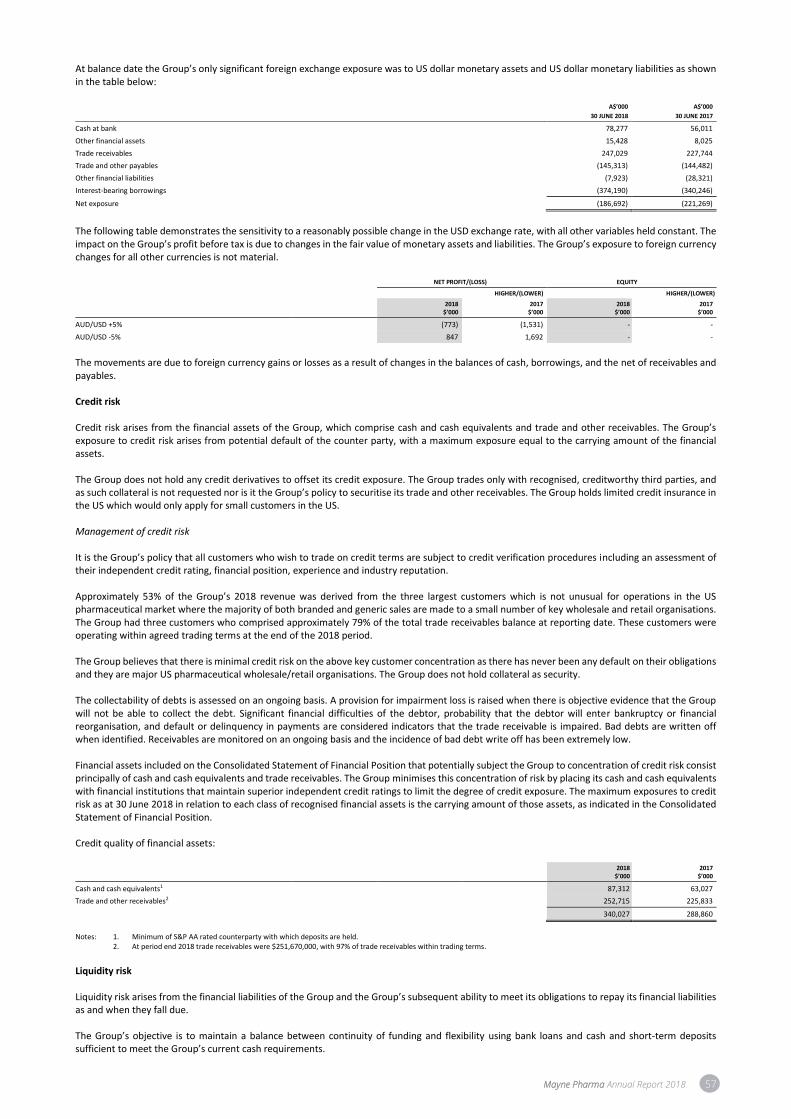
Mayne Pharma Annual Report 2018 57
At balance date the Group’s only significant foreign exchange exposure was to US dollar monetary assets and US dollar monetary liabilities as shown in the table below: A$’000
30 JUNE 2018
A$’000
30 JUNE 2017
Cash at bank 78,277 56,011
Other financial assets 15,428 8,025
Trade receivables 247,029 227,744
Trade and other payables (145,313) (144,482)
Other financial liabilities (7,923) (28,321)
Interest-bearing borrowings (374,190) (340,246)
Net exposure (186,692) (221,269)
The following table demonstrates the sensitivity to a reasonably possible change in the USD exchange rate, with all other variables held constant. The impact on the Group’s profit before tax is due to changes in the fair value of monetary assets and liabilities. The Group’s exposure to foreign currency changes for all other currencies is not material. NET PROFIT/(LOSS) EQUITY
HIGHER/(LOWER) HIGHER/(LOWER)
2018 $’000
2017 $’000
2018 $’000
2017 $’000
AUD/USD +5% (773) (1,531) - -
AUD/USD -5% 847 1,692 - -
The movements are due to foreign currency gains or losses as a result of changes in the balances of cash, borrowings, and the net of receivables and payables. Credit risk Credit risk arises from the financial assets of the Group, which comprise cash and cash equivalents and trade and other receivables. The Group’s exposure to credit risk arises from potential default of the counter party, with a maximum exposure equal to the carrying amount of the financial assets. The Group does not hold any credit derivatives to offset its credit exposure. The Group trades only with recognised, creditworthy third parties, and as such collateral is not requested nor is it the Group’s policy to securitise its trade and other receivables. The Group holds limited credit insurance in the US which would only apply for small customers in the US. Management of credit risk It is the Group’s policy that all customers who wish to trade on credit terms are subject to credit verification procedures including an assessment of their independent credit rating, financial position, experience and industry reputation. Approximately 53% of the Group’s 2018 revenue was derived from the three largest customers which is not unusual for operations in the US pharmaceutical market where the majority of both branded and generic sales are made to a small number of key wholesale and retail organisations. The Group had three customers who comprised approximately 79% of the total trade receivables balance at reporting date. These customers were operating within agreed trading terms at the end of the 2018 period. The Group believes that there is minimal credit risk on the above key customer concentration as there has never been any default on their obligations and they are major US pharmaceutical wholesale/retail organisations. The Group does not hold collateral as security. The collectability of debts is assessed on an ongoing basis. A provision for impairment loss is raised when there is objective evidence that the Group will not be able to collect the debt. Significant financial difficulties of the debtor, probability that the debtor will enter bankruptcy or financial reorganisation, and default or delinquency in payments are considered indicators that the trade receivable is impaired. Bad debts are written off when identified. Receivables are monitored on an ongoing basis and the incidence of bad debt write off has been extremely low. Financial assets included on the Consolidated Statement of Financial Position that potentially subject the Group to concentration of credit risk consist principally of cash and cash equivalents and trade receivables. The Group minimises this concentration of risk by placing its cash and cash equivalents with financial institutions that maintain superior independent credit ratings to limit the degree of credit exposure. The maximum exposures to credit risk as at 30 June 2018 in relation to each class of recognised financial assets is the carrying amount of those assets, as indicated in the Consolidated Statement of Financial Position. Credit quality of financial assets:
2018
$’000 2017
$’000
Cash and cash equivalents1 87,312 63,027
Trade and other receivables2 252,715 225,833
340,027 288,860
Notes: 1. Minimum of S&P AA rated counterparty with which deposits are held.
2. At period end 2018 trade receivables were $251,670,000, with 97% of trade receivables within trading terms.
Liquidity risk Liquidity risk arises from the financial liabilities of the Group and the Group’s subsequent ability to meet its obligations to repay its financial liabilities as and when they fall due. The Group’s objective is to maintain a balance between continuity of funding and flexibility using bank loans and cash and short-term deposits sufficient to meet the Group’s current cash requirements.

58 Mayne Pharma Annual Report 2018
The Board manages liquidity risk by monitoring, monthly, the total cash inflows and outflows expected over the budget and forecast period. The following table discloses the remaining contractual maturities for the Group’s liquid financial assets and liabilities based on undiscounted cash flows. The timing of cash flows for liabilities is based on the contractual terms of the underlying contract. LESS THAN
6 MONTHS $’000
6 TO 12 MONTHS $’000
1 TO 5 YEARS $’000
GREATER THAN 5 YEARS $’000
TOTAL $’000
30 June 2018 Liquid financial assets Cash and cash equivalents 87,312 - - - 87,312 Trade and other receivables 252,715 - - - 252,715
340,027 - - - 340,027
Financial liabilities Trade and other payables (152,561) - - - (152,561) Interest-bearing loans and borrowings (29) (29) (378,042) - (378,100) Other financial liabilities (798) (11,678) (6,335) (298) (19,109)
(153,388) (11,707) (384,377) (298) (549,770)
Net inflow/(outflow) 186,639 (11,707) (384,377) (298) (209,743)
LESS THAN
6 MONTHS
$’000
6 TO 12 MONTHS
$’000
1 TO 5 YEARS
$’000
GREATER THAN 5 YEARS
$’000
TOTAL
$’000
30 June 2017
Liquid financial assets
Cash and cash equivalents 63,027 - - - 63,027
Trade and other receivables 232,716 - - - 232,716
295,743 - - - 295,743
Financial liabilities
Trade and other payables (154,460) - - - (154,460)
Interest-bearing loans and borrowings (13,124) (83) (331,722) - (344,929)
Other financial liabilities (21,513) (2,760) (17,946) (358) (42,577)
(189,097) (2,843) (349,668) (358) (541,966)
Net inflow/(outflow) 106,646 (2,843) (349,668) (358) (246,223)
The Group has undrawn loan facilities of US$135m plus the undrawn working capital facilities of A$10m and US$5m available at reporting date. Refer Note 16. NOTE 4 – OTHER INCOME
2018
$’000 2017
$’000
Interest received 112 286
Rental from excess office space 192 188
Litigation settlement receipt - 26,175
Gain on remeasurement of HPPI warrants (refer Note 5) 1,622 5,307
Other 765 1,285
2,691 33,241
Interest revenue Revenue is recognised as interest accrues using the effective interest method. This is a method of calculating the amortised cost of a financial asset and allocating the interest revenue over the relevant period using the effective interest rate, which is the rate that exactly discounts estimated future cash receipts through the expected life of the financial asset to the net carrying amount of the financial asset. Lease revenue Rental income arising from the operating lease on a building at the Salisbury manufacturing site is accounted for on a straight-line basis over the lease term and included in other income due to its operating nature. NOTE 5 – FAIR VALUE MEASUREMENT Fair value measurement The Group measures financial instruments, such as derivatives, at fair value at each reporting date. Fair value is the price that would be received to sell an asset, or paid to transfer a liability, in an orderly transaction between market participants at the measurement date. The fair value measurement is based on the presumption that the transaction to sell the asset or transfer the liability takes place either:
• in the principal market for the asset or liability; or
• in the absence of a principal market, in the most advantageous market for the asset or liability. The principal or the most advantageous market must be accessible by the Group. The fair value of an asset or a liability is measured using the assumptions that market participants would use when pricing the asset or liability, if market participants act in their economic best interest. A fair value measurement of a non-financial asset considers a market participant's ability to generate economic benefits by using the asset in its highest and best use or by selling it to another market participant that would use the asset in its highest and best use.
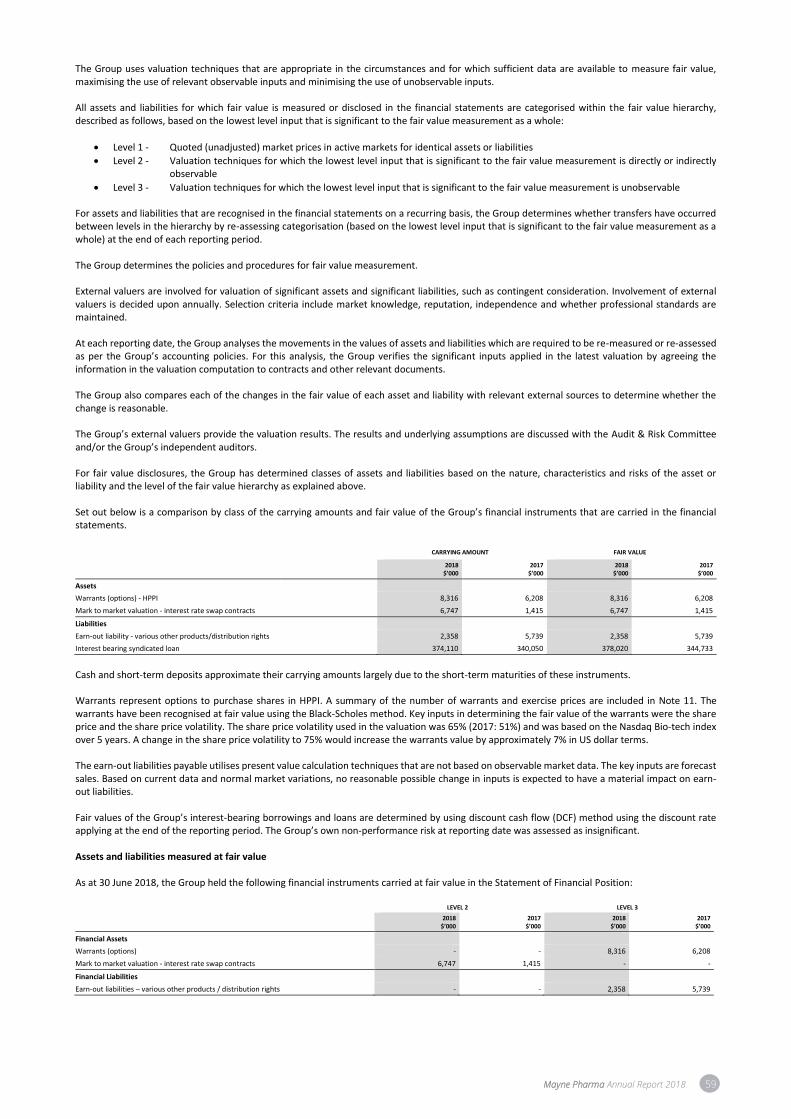
Mayne Pharma Annual Report 2018 59
The Group uses valuation techniques that are appropriate in the circumstances and for which sufficient data are available to measure fair value, maximising the use of relevant observable inputs and minimising the use of unobservable inputs. All assets and liabilities for which fair value is measured or disclosed in the financial statements are categorised within the fair value hierarchy, described as follows, based on the lowest level input that is significant to the fair value measurement as a whole:
• Level 1 - Quoted (unadjusted) market prices in active markets for identical assets or liabilities
• Level 2 - Valuation techniques for which the lowest level input that is significant to the fair value measurement is directly or indirectly observable
• Level 3 - Valuation techniques for which the lowest level input that is significant to the fair value measurement is unobservable For assets and liabilities that are recognised in the financial statements on a recurring basis, the Group determines whether transfers have occurred between levels in the hierarchy by re-assessing categorisation (based on the lowest level input that is significant to the fair value measurement as a whole) at the end of each reporting period. The Group determines the policies and procedures for fair value measurement. External valuers are involved for valuation of significant assets and significant liabilities, such as contingent consideration. Involvement of external valuers is decided upon annually. Selection criteria include market knowledge, reputation, independence and whether professional standards are maintained. At each reporting date, the Group analyses the movements in the values of assets and liabilities which are required to be re-measured or re-assessed as per the Group’s accounting policies. For this analysis, the Group verifies the significant inputs applied in the latest valuation by agreeing the information in the valuation computation to contracts and other relevant documents. The Group also compares each of the changes in the fair value of each asset and liability with relevant external sources to determine whether the change is reasonable. The Group’s external valuers provide the valuation results. The results and underlying assumptions are discussed with the Audit & Risk Committee and/or the Group’s independent auditors. For fair value disclosures, the Group has determined classes of assets and liabilities based on the nature, characteristics and risks of the asset or liability and the level of the fair value hierarchy as explained above. Set out below is a comparison by class of the carrying amounts and fair value of the Group’s financial instruments that are carried in the financial statements. CARRYING AMOUNT FAIR VALUE
2018
$’000 2017
$’000 2018
$’000 2017
$’000
Assets
Warrants (options) - HPPI 8,316 6,208 8,316 6,208
Mark to market valuation - interest rate swap contracts 6,747 1,415 6,747 1,415
Liabilities
Earn-out liability - various other products/distribution rights 2,358 5,739 2,358 5,739
Interest bearing syndicated loan 374,110 340,050 378,020 344,733
Cash and short-term deposits approximate their carrying amounts largely due to the short-term maturities of these instruments. Warrants represent options to purchase shares in HPPI. A summary of the number of warrants and exercise prices are included in Note 11. The warrants have been recognised at fair value using the Black-Scholes method. Key inputs in determining the fair value of the warrants were the share price and the share price volatility. The share price volatility used in the valuation was 65% (2017: 51%) and was based on the Nasdaq Bio-tech index over 5 years. A change in the share price volatility to 75% would increase the warrants value by approximately 7% in US dollar terms. The earn-out liabilities payable utilises present value calculation techniques that are not based on observable market data. The key inputs are forecast sales. Based on current data and normal market variations, no reasonable possible change in inputs is expected to have a material impact on earn-out liabilities. Fair values of the Group’s interest-bearing borrowings and loans are determined by using discount cash flow (DCF) method using the discount rate applying at the end of the reporting period. The Group’s own non-performance risk at reporting date was assessed as insignificant. Assets and liabilities measured at fair value As at 30 June 2018, the Group held the following financial instruments carried at fair value in the Statement of Financial Position: LEVEL 2 LEVEL 3
2018 $’000
2017 $’000
2018 $’000
2017 $’000
Financial Assets
Warrants (options) - - 8,316 6,208
Mark to market valuation - interest rate swap contracts 6,747 1,415 - -
Financial Liabilities
Earn-out liabilities – various other products / distribution rights - - 2,358 5,739
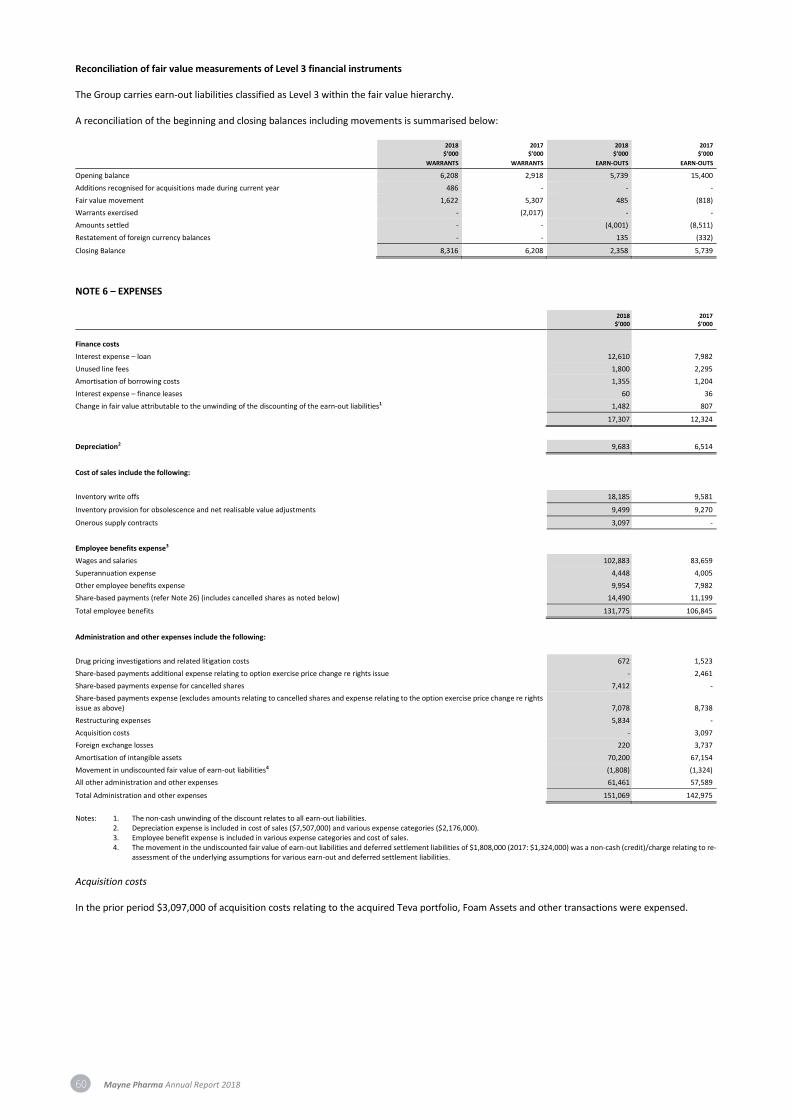
60 Mayne Pharma Annual Report 2018
Reconciliation of fair value measurements of Level 3 financial instruments The Group carries earn-out liabilities classified as Level 3 within the fair value hierarchy. A reconciliation of the beginning and closing balances including movements is summarised below: 2018
$’000
WARRANTS
2017 $’000
WARRANTS
2018 $’000
EARN-OUTS
2017 $’000
EARN-OUTS
Opening balance 6,208 2,918 5,739 15,400
Additions recognised for acquisitions made during current year 486 - - -
Fair value movement 1,622 5,307 485 (818)
Warrants exercised - (2,017) - -
Amounts settled - - (4,001) (8,511)
Restatement of foreign currency balances - - 135 (332)
Closing Balance 8,316 6,208 2,358 5,739
NOTE 6 – EXPENSES
2018
$’000 2017
$’000
Finance costs
Interest expense – loan 12,610 7,982
Unused line fees 1,800 2,295
Amortisation of borrowing costs 1,355 1,204
Interest expense – finance leases 60 36
Change in fair value attributable to the unwinding of the discounting of the earn-out liabilities1 1,482 807
17,307 12,324
Depreciation2 9,683 6,514
Cost of sales include the following:
Inventory write offs 18,185 9,581
Inventory provision for obsolescence and net realisable value adjustments 9,499 9,270
Onerous supply contracts 3,097 -
Employee benefits expense3
Wages and salaries 102,883 83,659
Superannuation expense 4,448 4,005
Other employee benefits expense 9,954 7,982
Share-based payments (refer Note 26) (includes cancelled shares as noted below) 14,490 11,199
Total employee benefits 131,775 106,845
Administration and other expenses include the following:
Drug pricing investigations and related litigation costs 672 1,523
Share-based payments additional expense relating to option exercise price change re rights issue - 2,461
Share-based payments expense for cancelled shares 7,412 -
Share-based payments expense (excludes amounts relating to cancelled shares and expense relating to the option exercise price change re rights issue as above) 7,078 8,738
Restructuring expenses 5,834 -
Acquisition costs - 3,097
Foreign exchange losses 220 3,737
Amortisation of intangible assets 70,200 67,154
Movement in undiscounted fair value of earn-out liabilities4 (1,808) (1,324)
All other administration and other expenses 61,461 57,589
Total Administration and other expenses 151,069 142,975
Notes: 1. The non-cash unwinding of the discount relates to all earn-out liabilities.
2. Depreciation expense is included in cost of sales ($7,507,000) and various expense categories ($2,176,000). 3. Employee benefit expense is included in various expense categories and cost of sales. 4. The movement in the undiscounted fair value of earn-out liabilities and deferred settlement liabilities of $1,808,000 (2017: $1,324,000) was a non-cash (credit)/charge relating to re-
assessment of the underlying assumptions for various earn-out and deferred settlement liabilities.
Acquisition costs In the prior period $3,097,000 of acquisition costs relating to the acquired Teva portfolio, Foam Assets and other transactions were expensed.
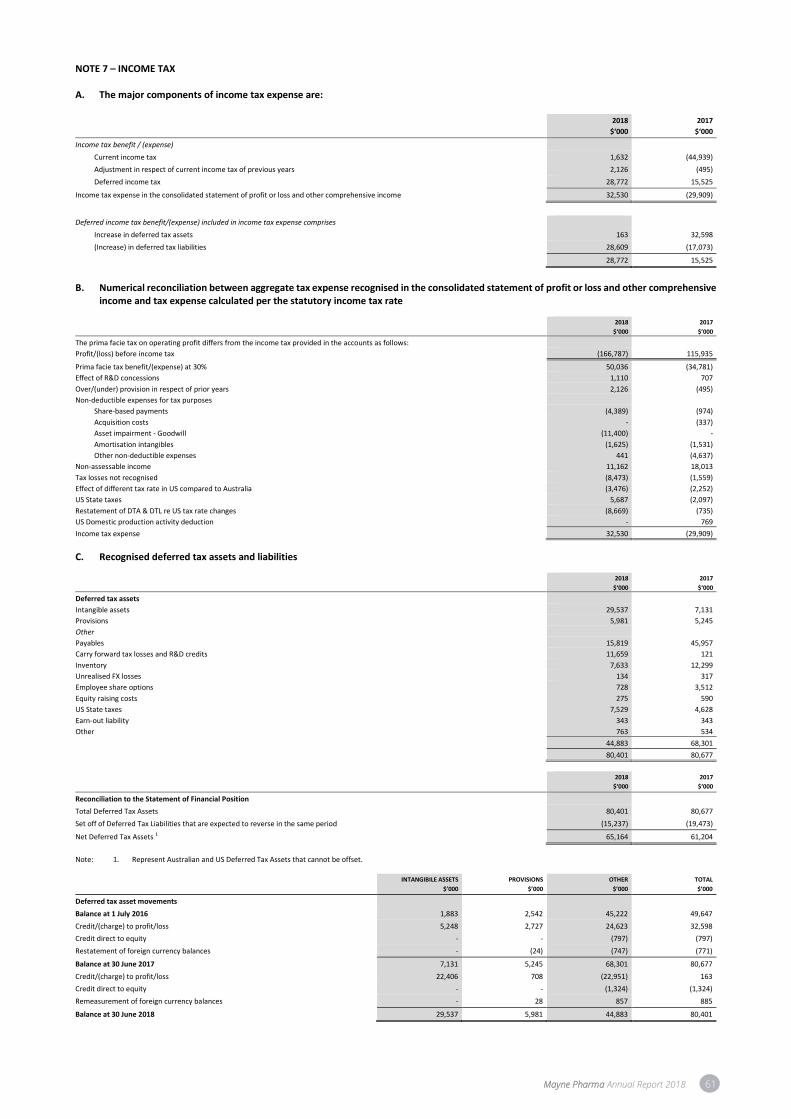
Mayne Pharma Annual Report 2018 61
NOTE 7 – INCOME TAX A. The major components of income tax expense are:
2018
$‘000
2017
$‘000
Income tax benefit / (expense)
Current income tax 1,632 (44,939)
Adjustment in respect of current income tax of previous years 2,126 (495)
Deferred income tax 28,772 15,525
Income tax expense in the consolidated statement of profit or loss and other comprehensive income 32,530 (29,909)
Deferred income tax benefit/(expense) included in income tax expense comprises
Increase in deferred tax assets 163 32,598
(Increase) in deferred tax liabilities 28,609 (17,073)
28,772 15,525
B. Numerical reconciliation between aggregate tax expense recognised in the consolidated statement of profit or loss and other comprehensive
income and tax expense calculated per the statutory income tax rate
2018
$‘000
2017
$’000
The prima facie tax on operating profit differs from the income tax provided in the accounts as follows:
Profit/(loss) before income tax (166,787) 115,935
Prima facie tax benefit/(expense) at 30% 50,036 (34,781)
Effect of R&D concessions 1,110 707
Over/(under) provision in respect of prior years 2,126 (495)
Non-deductible expenses for tax purposes
Share-based payments (4,389) (974)
Acquisition costs - (337)
Asset impairment - Goodwill (11,400) -
Amortisation intangibles (1,625) (1,531)
Other non-deductible expenses 441 (4,637)
Non-assessable income 11,162 18,013
Tax losses not recognised (8,473) (1,559)
Effect of different tax rate in US compared to Australia (3,476) (2,252)
US State taxes 5,687 (2,097)
Restatement of DTA & DTL re US tax rate changes (8,669) (735)
US Domestic production activity deduction - 769
Income tax expense 32,530 (29,909)
C. Recognised deferred tax assets and liabilities
2018
$‘000
2017
$‘000
Deferred tax assets
Intangible assets 29,537 7,131
Provisions 5,981 5,245
Other
Payables 15,819 45,957
Carry forward tax losses and R&D credits 11,659 121
Inventory 7,633 12,299
Unrealised FX losses 134 317
Employee share options 728 3,512
Equity raising costs 275 590
US State taxes 7,529 4,628
Earn-out liability 343 343
Other 763 534
44,883 68,301
80,401 80,677
2018
$‘000
2017
$‘000
Reconciliation to the Statement of Financial Position
Total Deferred Tax Assets 80,401 80,677
Set off of Deferred Tax Liabilities that are expected to reverse in the same period (15,237) (19,473)
Net Deferred Tax Assets 1 65,164 61,204
Note: 1. Represent Australian and US Deferred Tax Assets that cannot be offset.
INTANGIBILE ASSETS
$’000
PROVISIONS
$’000
OTHER
$’000
TOTAL
$’000
Deferred tax asset movements
Balance at 1 July 2016 1,883 2,542 45,222 49,647
Credit/(charge) to profit/loss 5,248 2,727 24,623 32,598
Credit direct to equity - - (797) (797)
Restatement of foreign currency balances - (24) (747) (771)
Balance at 30 June 2017 7,131 5,245 68,301 80,677
Credit/(charge) to profit/loss 22,406 708 (22,951) 163
Credit direct to equity - - (1,324) (1,324)
Remeasurement of foreign currency balances - 28 857 885
Balance at 30 June 2018 29,537 5,981 44,883 80,401
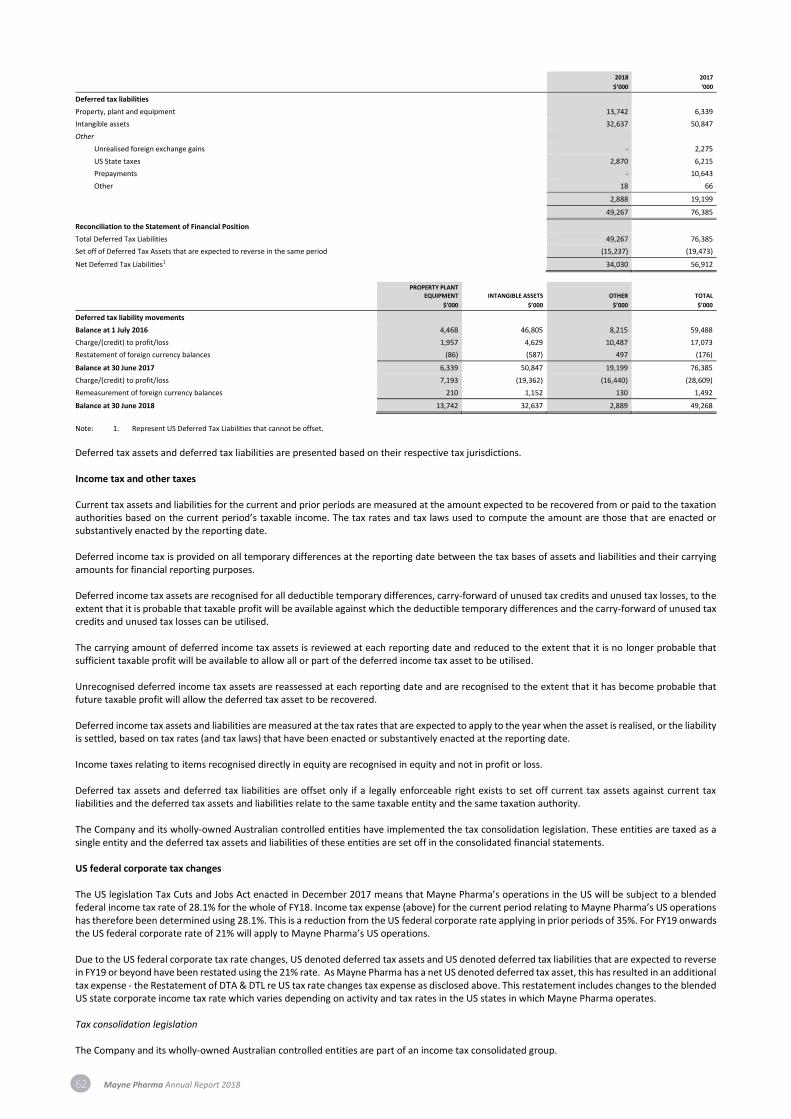
62 Mayne Pharma Annual Report 2018
2018
$‘000
2017
‘000
Deferred tax liabilities
Property, plant and equipment 13,742 6,339
Intangible assets 32,637 50,847
Other
Unrealised foreign exchange gains - 2,275
US State taxes 2,870 6,215
Prepayments - 10,643
Other 18 66
2,888 19,199
49,267 76,385
Reconciliation to the Statement of Financial Position
Total Deferred Tax Liabilities 49,267 76,385
Set off of Deferred Tax Assets that are expected to reverse in the same period (15,237) (19,473)
Net Deferred Tax Liabilities1 34,030 56,912
PROPERTY PLANT EQUIPMENT
$’000
INTANGIBLE ASSETS
$’000
OTHER
$’000
TOTAL
$’000
Deferred tax liability movements
Balance at 1 July 2016 4,468 46,805 8,215 59,488
Charge/(credit) to profit/loss 1,957 4,629 10,487 17,073
Restatement of foreign currency balances (86) (587) 497 (176)
Balance at 30 June 2017 6,339 50,847 19,199 76,385
Charge/(credit) to profit/loss 7,193 (19,362) (16,440) (28,609)
Remeasurement of foreign currency balances 210 1,152 130 1,492
Balance at 30 June 2018 13,742 32,637 2,889 49,268
Note: 1. Represent US Deferred Tax Liabilities that cannot be offset.
Deferred tax assets and deferred tax liabilities are presented based on their respective tax jurisdictions. Income tax and other taxes Current tax assets and liabilities for the current and prior periods are measured at the amount expected to be recovered from or paid to the taxation authorities based on the current period’s taxable income. The tax rates and tax laws used to compute the amount are those that are enacted or substantively enacted by the reporting date. Deferred income tax is provided on all temporary differences at the reporting date between the tax bases of assets and liabilities and their carrying amounts for financial reporting purposes. Deferred income tax assets are recognised for all deductible temporary differences, carry-forward of unused tax credits and unused tax losses, to the extent that it is probable that taxable profit will be available against which the deductible temporary differences and the carry-forward of unused tax credits and unused tax losses can be utilised. The carrying amount of deferred income tax assets is reviewed at each reporting date and reduced to the extent that it is no longer probable that sufficient taxable profit will be available to allow all or part of the deferred income tax asset to be utilised. Unrecognised deferred income tax assets are reassessed at each reporting date and are recognised to the extent that it has become probable that future taxable profit will allow the deferred tax asset to be recovered. Deferred income tax assets and liabilities are measured at the tax rates that are expected to apply to the year when the asset is realised, or the liability is settled, based on tax rates (and tax laws) that have been enacted or substantively enacted at the reporting date. Income taxes relating to items recognised directly in equity are recognised in equity and not in profit or loss. Deferred tax assets and deferred tax liabilities are offset only if a legally enforceable right exists to set off current tax assets against current tax liabilities and the deferred tax assets and liabilities relate to the same taxable entity and the same taxation authority. The Company and its wholly-owned Australian controlled entities have implemented the tax consolidation legislation. These entities are taxed as a single entity and the deferred tax assets and liabilities of these entities are set off in the consolidated financial statements.
US federal corporate tax changes The US legislation Tax Cuts and Jobs Act enacted in December 2017 means that Mayne Pharma’s operations in the US will be subject to a blended federal income tax rate of 28.1% for the whole of FY18. Income tax expense (above) for the current period relating to Mayne Pharma’s US operations has therefore been determined using 28.1%. This is a reduction from the US federal corporate rate applying in prior periods of 35%. For FY19 onwards the US federal corporate rate of 21% will apply to Mayne Pharma’s US operations. Due to the US federal corporate tax rate changes, US denoted deferred tax assets and US denoted deferred tax liabilities that are expected to reverse in FY19 or beyond have been restated using the 21% rate. As Mayne Pharma has a net US denoted deferred tax asset, this has resulted in an additional tax expense - the Restatement of DTA & DTL re US tax rate changes tax expense as disclosed above. This restatement includes changes to the blended US state corporate income tax rate which varies depending on activity and tax rates in the US states in which Mayne Pharma operates. Tax consolidation legislation The Company and its wholly-owned Australian controlled entities are part of an income tax consolidated group.
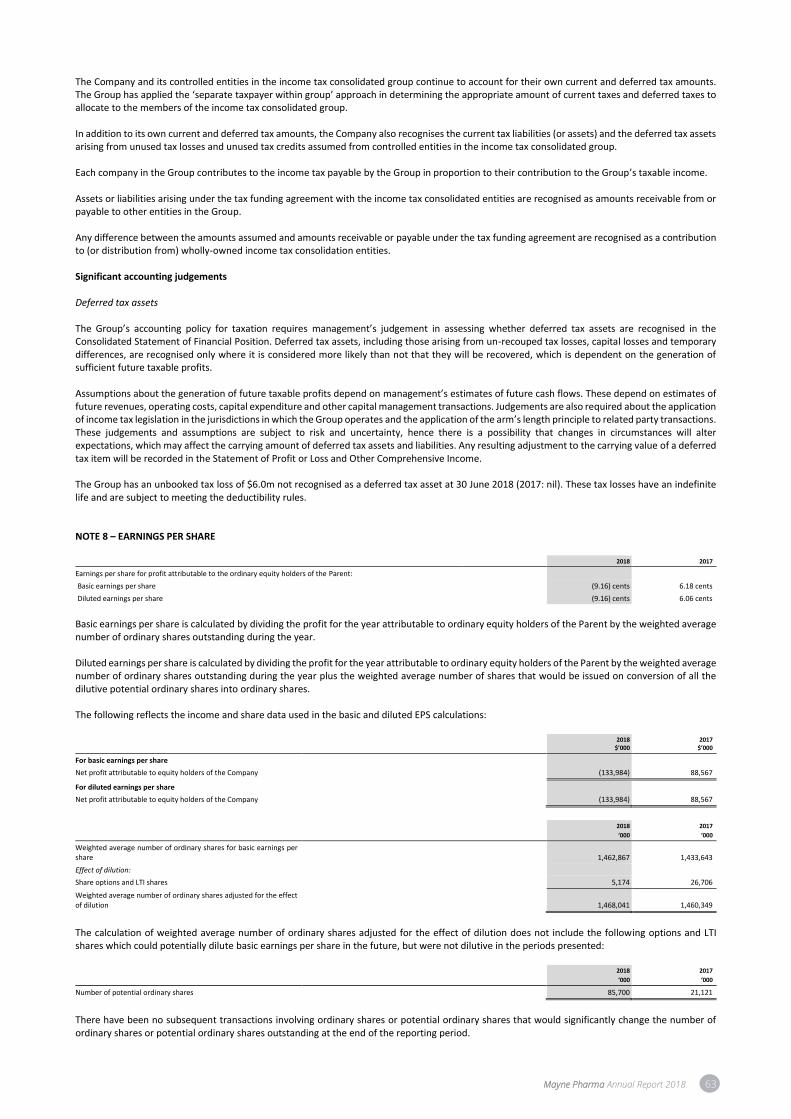
Mayne Pharma Annual Report 2018 63
The Company and its controlled entities in the income tax consolidated group continue to account for their own current and deferred tax amounts. The Group has applied the ‘separate taxpayer within group’ approach in determining the appropriate amount of current taxes and deferred taxes to allocate to the members of the income tax consolidated group. In addition to its own current and deferred tax amounts, the Company also recognises the current tax liabilities (or assets) and the deferred tax assets arising from unused tax losses and unused tax credits assumed from controlled entities in the income tax consolidated group. Each company in the Group contributes to the income tax payable by the Group in proportion to their contribution to the Group’s taxable income. Assets or liabilities arising under the tax funding agreement with the income tax consolidated entities are recognised as amounts receivable from or payable to other entities in the Group. Any difference between the amounts assumed and amounts receivable or payable under the tax funding agreement are recognised as a contribution to (or distribution from) wholly-owned income tax consolidation entities. Significant accounting judgements Deferred tax assets The Group’s accounting policy for taxation requires management’s judgement in assessing whether deferred tax assets are recognised in the Consolidated Statement of Financial Position. Deferred tax assets, including those arising from un-recouped tax losses, capital losses and temporary differences, are recognised only where it is considered more likely than not that they will be recovered, which is dependent on the generation of sufficient future taxable profits. Assumptions about the generation of future taxable profits depend on management’s estimates of future cash flows. These depend on estimates of future revenues, operating costs, capital expenditure and other capital management transactions. Judgements are also required about the application of income tax legislation in the jurisdictions in which the Group operates and the application of the arm’s length principle to related party transactions. These judgements and assumptions are subject to risk and uncertainty, hence there is a possibility that changes in circumstances will alter expectations, which may affect the carrying amount of deferred tax assets and liabilities. Any resulting adjustment to the carrying value of a deferred tax item will be recorded in the Statement of Profit or Loss and Other Comprehensive Income. The Group has an unbooked tax loss of $6.0m not recognised as a deferred tax asset at 30 June 2018 (2017: nil). These tax losses have an indefinite life and are subject to meeting the deductibility rules. NOTE 8 – EARNINGS PER SHARE 2018 2017
Earnings per share for profit attributable to the ordinary equity holders of the Parent:
Basic earnings per share (9.16) cents 6.18 cents
Diluted earnings per share (9.16) cents 6.06 cents
Basic earnings per share is calculated by dividing the profit for the year attributable to ordinary equity holders of the Parent by the weighted average number of ordinary shares outstanding during the year. Diluted earnings per share is calculated by dividing the profit for the year attributable to ordinary equity holders of the Parent by the weighted average number of ordinary shares outstanding during the year plus the weighted average number of shares that would be issued on conversion of all the dilutive potential ordinary shares into ordinary shares. The following reflects the income and share data used in the basic and diluted EPS calculations:
2018
$’000 2017
$’000
For basic earnings per share
Net profit attributable to equity holders of the Company (133,984) 88,567
For diluted earnings per share
Net profit attributable to equity holders of the Company (133,984) 88,567
2018
‘000
2017
‘000
Weighted average number of ordinary shares for basic earnings per share 1,462,867 1,433,643
Effect of dilution:
Share options and LTI shares 5,174 26,706
Weighted average number of ordinary shares adjusted for the effect of dilution 1,468,041 1,460,349
The calculation of weighted average number of ordinary shares adjusted for the effect of dilution does not include the following options and LTI shares which could potentially dilute basic earnings per share in the future, but were not dilutive in the periods presented:
2018
‘000
2017
‘000
Number of potential ordinary shares 85,700 21,121
There have been no subsequent transactions involving ordinary shares or potential ordinary shares that would significantly change the number of ordinary shares or potential ordinary shares outstanding at the end of the reporting period.
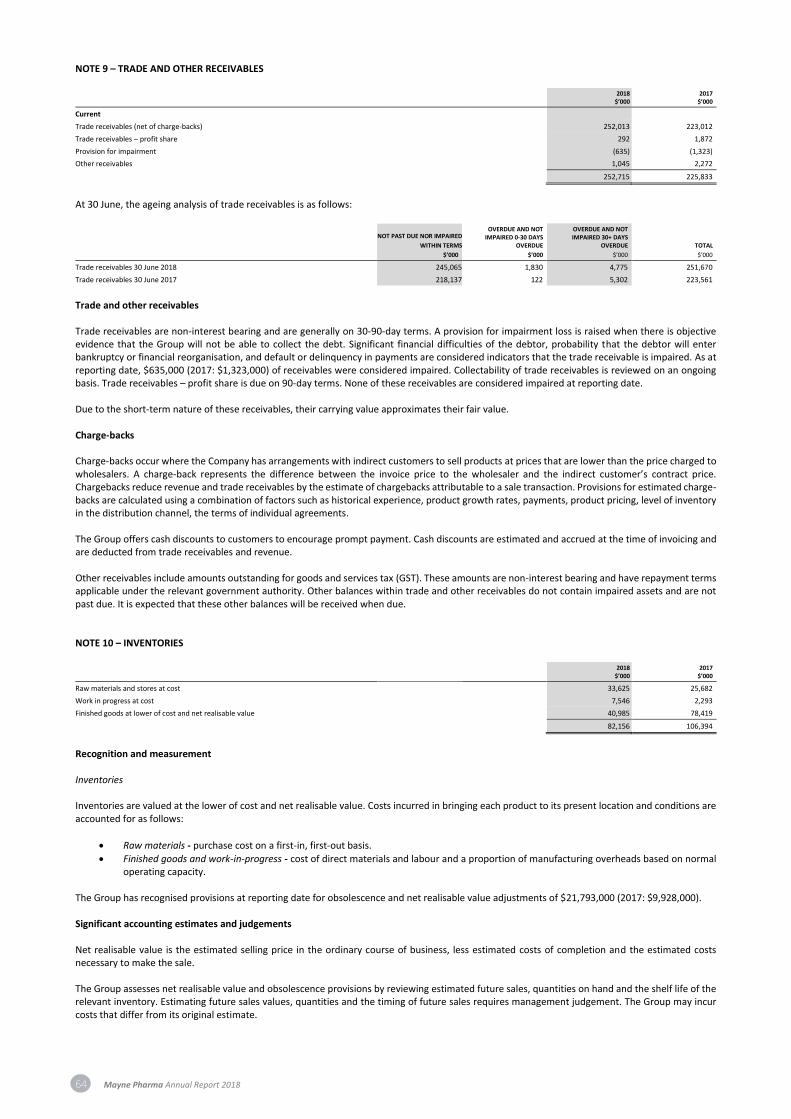
64 Mayne Pharma Annual Report 2018
NOTE 9 – TRADE AND OTHER RECEIVABLES
2018
$’000 2017
$’000
Current
Trade receivables (net of charge-backs) 252,013 223,012
Trade receivables – profit share 292 1,872
Provision for impairment (635) (1,323)
Other receivables 1,045 2,272
252,715 225,833
At 30 June, the ageing analysis of trade receivables is as follows:
NOT PAST DUE NOR IMPAIRED
WITHIN TERMS
$’000
OVERDUE AND NOT IMPAIRED 0-30 DAYS
OVERDUE
$’000
OVERDUE AND NOT IMPAIRED 30+ DAYS
OVERDUE
$’000
TOTAL
$’000
Trade receivables 30 June 2018 245,065 1,830 4,775 251,670
Trade receivables 30 June 2017 218,137 122 5,302 223,561
Trade and other receivables Trade receivables are non-interest bearing and are generally on 30-90-day terms. A provision for impairment loss is raised when there is objective evidence that the Group will not be able to collect the debt. Significant financial difficulties of the debtor, probability that the debtor will enter bankruptcy or financial reorganisation, and default or delinquency in payments are considered indicators that the trade receivable is impaired. As at reporting date, $635,000 (2017: $1,323,000) of receivables were considered impaired. Collectability of trade receivables is reviewed on an ongoing basis. Trade receivables – profit share is due on 90-day terms. None of these receivables are considered impaired at reporting date. Due to the short-term nature of these receivables, their carrying value approximates their fair value. Charge-backs Charge-backs occur where the Company has arrangements with indirect customers to sell products at prices that are lower than the price charged to wholesalers. A charge-back represents the difference between the invoice price to the wholesaler and the indirect customer’s contract price. Chargebacks reduce revenue and trade receivables by the estimate of chargebacks attributable to a sale transaction. Provisions for estimated charge-backs are calculated using a combination of factors such as historical experience, product growth rates, payments, product pricing, level of inventory in the distribution channel, the terms of individual agreements. The Group offers cash discounts to customers to encourage prompt payment. Cash discounts are estimated and accrued at the time of invoicing and are deducted from trade receivables and revenue. Other receivables include amounts outstanding for goods and services tax (GST). These amounts are non-interest bearing and have repayment terms applicable under the relevant government authority. Other balances within trade and other receivables do not contain impaired assets and are not past due. It is expected that these other balances will be received when due. NOTE 10 – INVENTORIES
2018
$’000 2017
$’000
Raw materials and stores at cost 33,625 25,682
Work in progress at cost 7,546 2,293
Finished goods at lower of cost and net realisable value 40,985 78,419
82,156 106,394
Recognition and measurement Inventories Inventories are valued at the lower of cost and net realisable value. Costs incurred in bringing each product to its present location and conditions are accounted for as follows:
• Raw materials - purchase cost on a first-in, first-out basis.
• Finished goods and work-in-progress - cost of direct materials and labour and a proportion of manufacturing overheads based on normal operating capacity.
The Group has recognised provisions at reporting date for obsolescence and net realisable value adjustments of $21,793,000 (2017: $9,928,000). Significant accounting estimates and judgements Net realisable value is the estimated selling price in the ordinary course of business, less estimated costs of completion and the estimated costs necessary to make the sale. The Group assesses net realisable value and obsolescence provisions by reviewing estimated future sales, quantities on hand and the shelf life of the relevant inventory. Estimating future sales values, quantities and the timing of future sales requires management judgement. The Group may incur costs that differ from its original estimate.
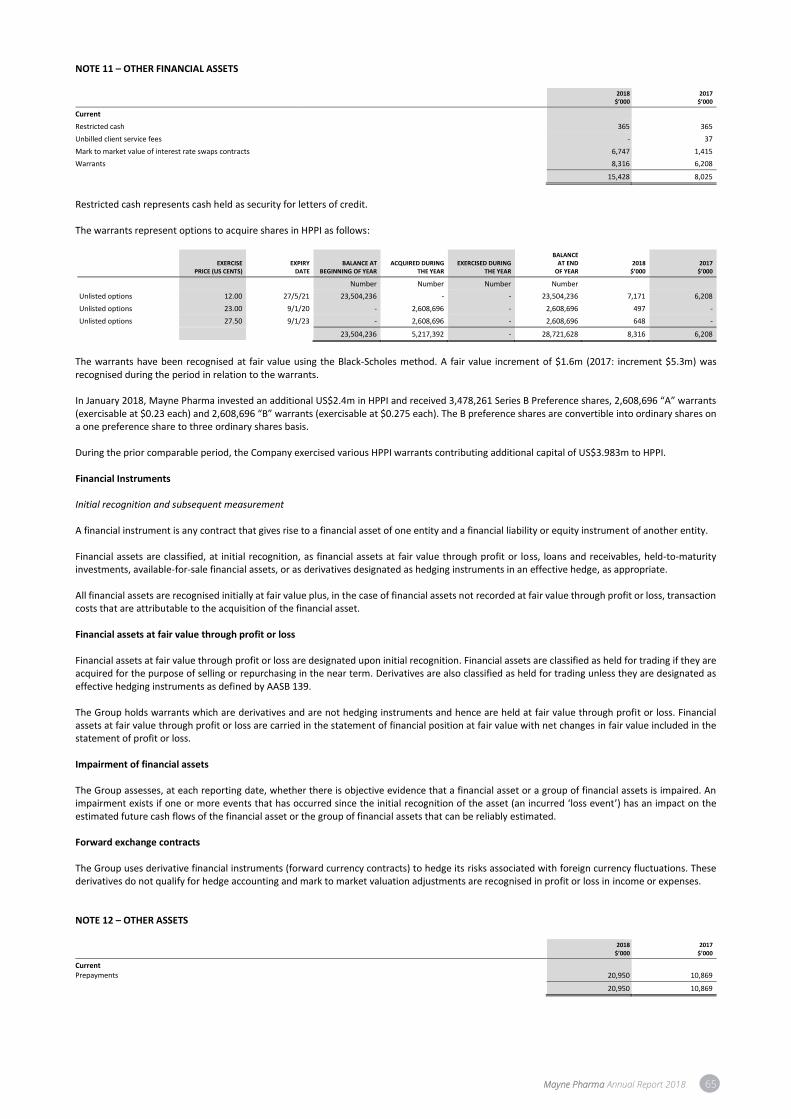
Mayne Pharma Annual Report 2018 65
NOTE 11 – OTHER FINANCIAL ASSETS
2018
$’000 2017
$’000
Current
Restricted cash 365 365
Unbilled client service fees - 37
Mark to market value of interest rate swaps contracts 6,747 1,415
Warrants 8,316 6,208
15,428 8,025
Restricted cash represents cash held as security for letters of credit. The warrants represent options to acquire shares in HPPI as follows:
EXERCISE
PRICE (US CENTS) EXPIRY
DATE BALANCE AT
BEGINNING OF YEAR ACQUIRED DURING
THE YEAR EXERCISED DURING
THE YEAR
BALANCE AT END
OF YEAR 2018
$’000 2017
$’000
Number Number Number Number
Unlisted options 12.00 27/5/21 23,504,236 - - 23,504,236 7,171 6,208
Unlisted options 23.00 9/1/20 - 2,608,696 - 2,608,696 497 -
Unlisted options 27.50 9/1/23 - 2,608,696 - 2,608,696 648 -
23,504,236 5,217,392 - 28,721,628 8,316 6,208
The warrants have been recognised at fair value using the Black-Scholes method. A fair value increment of $1.6m (2017: increment $5.3m) was recognised during the period in relation to the warrants. In January 2018, Mayne Pharma invested an additional US$2.4m in HPPI and received 3,478,261 Series B Preference shares, 2,608,696 “A” warrants (exercisable at $0.23 each) and 2,608,696 “B” warrants (exercisable at $0.275 each). The B preference shares are convertible into ordinary shares on a one preference share to three ordinary shares basis. During the prior comparable period, the Company exercised various HPPI warrants contributing additional capital of US$3.983m to HPPI. Financial Instruments Initial recognition and subsequent measurement A financial instrument is any contract that gives rise to a financial asset of one entity and a financial liability or equity instrument of another entity. Financial assets are classified, at initial recognition, as financial assets at fair value through profit or loss, loans and receivables, held-to-maturity investments, available-for-sale financial assets, or as derivatives designated as hedging instruments in an effective hedge, as appropriate. All financial assets are recognised initially at fair value plus, in the case of financial assets not recorded at fair value through profit or loss, transaction costs that are attributable to the acquisition of the financial asset. Financial assets at fair value through profit or loss Financial assets at fair value through profit or loss are designated upon initial recognition. Financial assets are classified as held for trading if they are acquired for the purpose of selling or repurchasing in the near term. Derivatives are also classified as held for trading unless they are designated as effective hedging instruments as defined by AASB 139. The Group holds warrants which are derivatives and are not hedging instruments and hence are held at fair value through profit or loss. Financial assets at fair value through profit or loss are carried in the statement of financial position at fair value with net changes in fair value included in the statement of profit or loss. Impairment of financial assets The Group assesses, at each reporting date, whether there is objective evidence that a financial asset or a group of financial assets is impaired. An impairment exists if one or more events that has occurred since the initial recognition of the asset (an incurred ‘loss event’) has an impact on the estimated future cash flows of the financial asset or the group of financial assets that can be reliably estimated. Forward exchange contracts The Group uses derivative financial instruments (forward currency contracts) to hedge its risks associated with foreign currency fluctuations. These derivatives do not qualify for hedge accounting and mark to market valuation adjustments are recognised in profit or loss in income or expenses. NOTE 12 – OTHER ASSETS 2018
$’000 2017
$’000
Current Prepayments 20,950 10,869
20,950 10,869
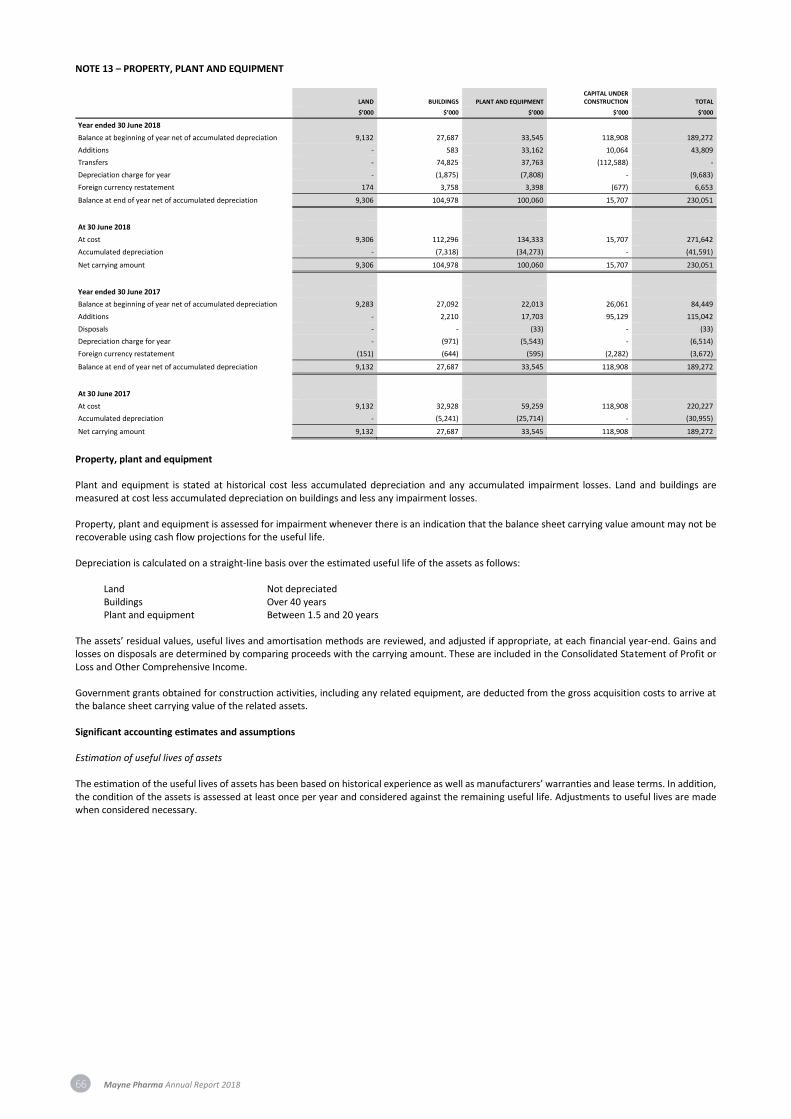
66 Mayne Pharma Annual Report 2018
NOTE 13 – PROPERTY, PLANT AND EQUIPMENT
LAND
BUILDINGS PLANT AND EQUIPMENT CAPITAL UNDER CONSTRUCTION
TOTAL
$’000 $’000 $’000 $’000 $’000
Year ended 30 June 2018
Balance at beginning of year net of accumulated depreciation 9,132 27,687 33,545 118,908 189,272
Additions - 583 33,162 10,064 43,809
Transfers - 74,825 37,763 (112,588) -
Depreciation charge for year - (1,875) (7,808) - (9,683)
Foreign currency restatement 174 3,758 3,398 (677) 6,653
Balance at end of year net of accumulated depreciation 9,306 104,978 100,060 15,707 230,051
At 30 June 2018
At cost 9,306 112,296 134,333 15,707 271,642
Accumulated depreciation - (7,318) (34,273) - (41,591)
Net carrying amount 9,306 104,978 100,060 15,707 230,051
Year ended 30 June 2017
Balance at beginning of year net of accumulated depreciation 9,283 27,092 22,013 26,061 84,449
Additions - 2,210 17,703 95,129 115,042
Disposals - - (33) - (33)
Depreciation charge for year - (971) (5,543) - (6,514)
Foreign currency restatement (151) (644) (595) (2,282) (3,672)
Balance at end of year net of accumulated depreciation 9,132 27,687 33,545 118,908 189,272
At 30 June 2017
At cost 9,132 32,928 59,259 118,908 220,227
Accumulated depreciation - (5,241) (25,714) - (30,955)
Net carrying amount 9,132 27,687 33,545 118,908 189,272
Property, plant and equipment Plant and equipment is stated at historical cost less accumulated depreciation and any accumulated impairment losses. Land and buildings are measured at cost less accumulated depreciation on buildings and less any impairment losses. Property, plant and equipment is assessed for impairment whenever there is an indication that the balance sheet carrying value amount may not be recoverable using cash flow projections for the useful life. Depreciation is calculated on a straight-line basis over the estimated useful life of the assets as follows:
Land Not depreciated Buildings Over 40 years Plant and equipment Between 1.5 and 20 years
The assets’ residual values, useful lives and amortisation methods are reviewed, and adjusted if appropriate, at each financial year-end. Gains and losses on disposals are determined by comparing proceeds with the carrying amount. These are included in the Consolidated Statement of Profit or Loss and Other Comprehensive Income. Government grants obtained for construction activities, including any related equipment, are deducted from the gross acquisition costs to arrive at the balance sheet carrying value of the related assets. Significant accounting estimates and assumptions Estimation of useful lives of assets The estimation of the useful lives of assets has been based on historical experience as well as manufacturers’ warranties and lease terms. In addition, the condition of the assets is assessed at least once per year and considered against the remaining useful life. Adjustments to useful lives are made when considered necessary.
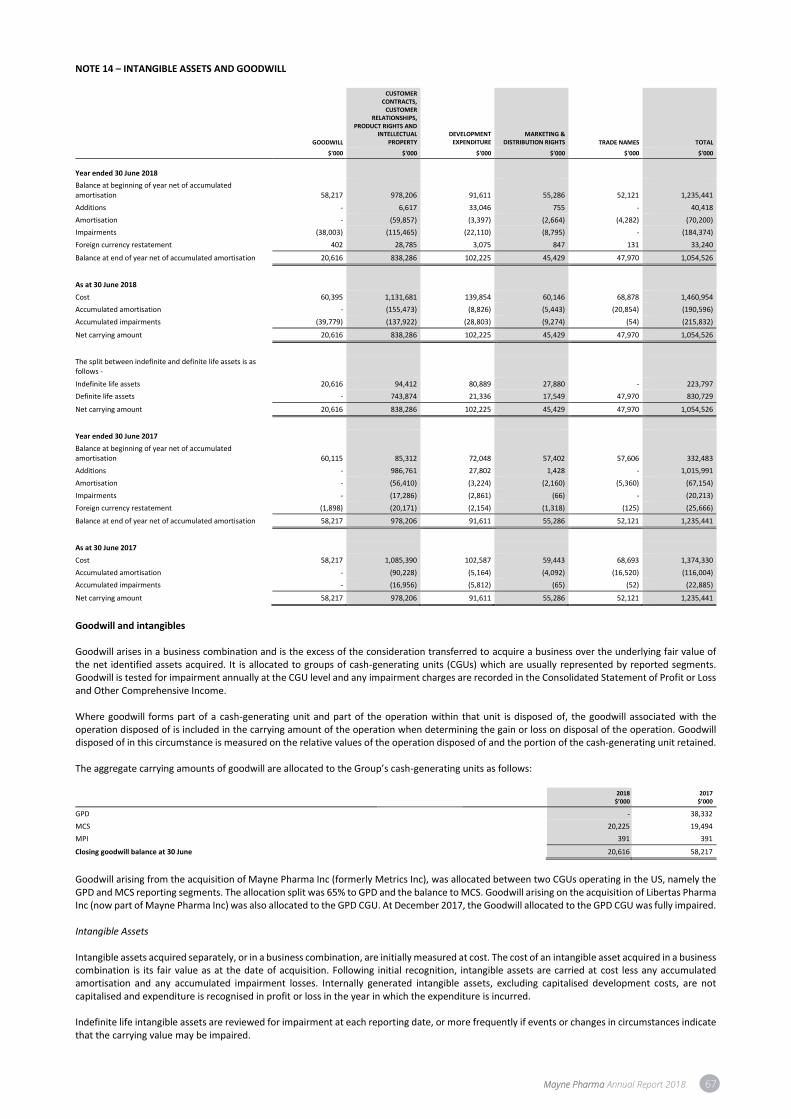
Mayne Pharma Annual Report 2018 67
NOTE 14 – INTANGIBLE ASSETS AND GOODWILL
GOODWILL
CUSTOMER CONTRACTS,
CUSTOMER RELATIONSHIPS,
PRODUCT RIGHTS AND INTELLECTUAL
PROPERTY DEVELOPMENT
EXPENDITURE MARKETING &
DISTRIBUTION RIGHTS TRADE NAMES TOTAL
$'000 $'000 $'000 $'000 $'000 $'000
Year ended 30 June 2018
Balance at beginning of year net of accumulated amortisation 58,217 978,206 91,611 55,286 52,121 1,235,441
Additions - 6,617 33,046 755 - 40,418
Amortisation - (59,857) (3,397) (2,664) (4,282) (70,200)
Impairments (38,003) (115,465) (22,110) (8,795) - (184,374)
Foreign currency restatement 402 28,785 3,075 847 131 33,240
Balance at end of year net of accumulated amortisation 20,616 838,286 102,225 45,429 47,970 1,054,526
As at 30 June 2018
Cost 60,395 1,131,681 139,854 60,146 68,878 1,460,954
Accumulated amortisation - (155,473) (8,826) (5,443) (20,854) (190,596)
Accumulated impairments (39,779) (137,922) (28,803) (9,274) (54) (215,832)
Net carrying amount 20,616 838,286 102,225 45,429 47,970 1,054,526
The split between indefinite and definite life assets is as follows -
Indefinite life assets 20,616 94,412 80,889 27,880 - 223,797
Definite life assets - 743,874 21,336 17,549 47,970 830,729
Net carrying amount 20,616 838,286 102,225 45,429 47,970 1,054,526
Year ended 30 June 2017
Balance at beginning of year net of accumulated amortisation 60,115 85,312 72,048 57,402 57,606 332,483
Additions - 986,761 27,802 1,428 - 1,015,991
Amortisation - (56,410) (3,224) (2,160) (5,360) (67,154)
Impairments - (17,286) (2,861) (66) - (20,213)
Foreign currency restatement (1,898) (20,171) (2,154) (1,318) (125) (25,666)
Balance at end of year net of accumulated amortisation 58,217 978,206 91,611 55,286 52,121 1,235,441
As at 30 June 2017 Cost 58,217 1,085,390 102,587 59,443 68,693 1,374,330
Accumulated amortisation - (90,228) (5,164) (4,092) (16,520) (116,004)
Accumulated impairments - (16,956) (5,812) (65) (52) (22,885)
Net carrying amount 58,217 978,206 91,611 55,286 52,121 1,235,441
Goodwill and intangibles Goodwill arises in a business combination and is the excess of the consideration transferred to acquire a business over the underlying fair value of the net identified assets acquired. It is allocated to groups of cash-generating units (CGUs) which are usually represented by reported segments. Goodwill is tested for impairment annually at the CGU level and any impairment charges are recorded in the Consolidated Statement of Profit or Loss and Other Comprehensive Income. Where goodwill forms part of a cash-generating unit and part of the operation within that unit is disposed of, the goodwill associated with the operation disposed of is included in the carrying amount of the operation when determining the gain or loss on disposal of the operation. Goodwill disposed of in this circumstance is measured on the relative values of the operation disposed of and the portion of the cash-generating unit retained. The aggregate carrying amounts of goodwill are allocated to the Group’s cash-generating units as follows:
2018
$’000 2017
$’000
GPD - 38,332
MCS 20,225 19,494
MPI 391 391
Closing goodwill balance at 30 June 20,616 58,217
Goodwill arising from the acquisition of Mayne Pharma Inc (formerly Metrics Inc), was allocated between two CGUs operating in the US, namely the GPD and MCS reporting segments. The allocation split was 65% to GPD and the balance to MCS. Goodwill arising on the acquisition of Libertas Pharma Inc (now part of Mayne Pharma Inc) was also allocated to the GPD CGU. At December 2017, the Goodwill allocated to the GPD CGU was fully impaired. Intangible Assets Intangible assets acquired separately, or in a business combination, are initially measured at cost. The cost of an intangible asset acquired in a business combination is its fair value as at the date of acquisition. Following initial recognition, intangible assets are carried at cost less any accumulated amortisation and any accumulated impairment losses. Internally generated intangible assets, excluding capitalised development costs, are not capitalised and expenditure is recognised in profit or loss in the year in which the expenditure is incurred. Indefinite life intangible assets are reviewed for impairment at each reporting date, or more frequently if events or changes in circumstances indicate that the carrying value may be impaired.
68 Mayne Pharma Annual Report 2018
Certain intangible assets other than goodwill (i.e. customer contracts, relationships, intellectual property, distribution rights and trade marks) have been assessed as having finite useful lives and, as such, are amortised over their useful lives. Intangible assets relating to the Metrics, Libertas and HPPI acquisitions are also amortised on a straight-line basis. The useful lives range from five to fifteen years, and are tested for impairment whenever there is an indication that the intangible asset may be impaired. The amortisation period and amortisation method for an intangible asset with a finite useful life is reviewed at least at each financial year-end. Changes in the expected useful life or the expected pattern of consumption of future economic benefits embodied in the asset are accounted for prospectively by changing the amortisation period or method, as appropriate, which is a change in an accounting estimate. The amortisation expense on intangible assets with definite lives is recognised in profit or loss in the expense category consistent with the function of the intangible asset. Certain marketing and distribution rights, development expenditure and other intellectual property are considered to have an indefinite life and hence are not amortised. These assets, considered on an individual asset basis, have been determined as indefinite life based on the expected life of the relevant product. The assessment of indefinite versus definite life is reviewed annually. Significant accounting judgements Research and development expenditure Research costs are expensed as incurred. Development expenditures on an individual project, and acquired research and development intangible assets, which are still under development and have not yet obtained approval, are recognised as an intangible asset when the Group can demonstrate:
• the technical feasibility of completing the intangible asset so that the asset will be available for use or sale;
• its intention to complete and its ability to use or sell the asset;
• how the asset will generate future economic benefits;
• the availability of resources to complete the asset; and
• the ability to measure reliably the expenditure during development. Following initial recognition of the development expenditure as an asset, the asset is carried at cost less any accumulated amortisation and accumulated impairment losses. Amortisation of the asset begins when development is complete and the asset is available for use. It is amortised over the period of expected future benefit. During the period of development, the asset is tested for impairment annually. Significant accounting estimates and assumptions Impairment of goodwill and intangible assets Intangible asset impairments recognised during the period totalled $184.4m, following a detailed review of the Company’s intangible assets. The review considered the current and projected US market dynamics for the portfolio and the industry, and consisted of the following: As disclosed in the first half:
• Pipeline products (includes development expenditure and acquired products not on market): $22.0m
• GPD - Women’s Health (acquired product rights and distribution rights): $87.2m
• GPD - Other (acquired product rights and distribution rights): $36.5m
• GPD Segment (Goodwill balance held at the segment CGU level): $37.8m Plus $0.9m FX variance in the second half. An asset is considered impaired when its balance sheet carrying amount exceeds its estimated recoverable amount, which is defined as the higher of its fair value less cost of disposal and its value in use. The Group applies the value in use method which utilises net present value techniques using post-tax cash flows and discount rates. The estimates used in calculating value-in-use are highly sensitive, and depend on assumptions specific to the nature of the Group’s activities with regard to;
• amount and timing of projected future cash flows;
• long-term sales forecasts;
• sales erosion rates after the end of patent or other intellectual property rights protection and timing of entry of generic competition;
• applicable tax rates;
• behaviour of competitors (launch of competing products, marketing initiatives, etc);
• selected discount and terminal growth rates; and
• in the case of unlaunched products:
o the outcome of R&D activities (compound efficacy, results of clinical trials, etc); o amount and timing of projected costs to develop in process research and development into commercially viable products; and o probability of obtaining regulatory approvals.
Due to the above factors, actual cash flows and values could vary significantly from forecasted future cash flows and related values derived from discounting techniques. Goodwill and Intangible Impairment Testing Methodology For impairment testing, Intangible Assets (other than Goodwill) are allocated to individual CGUs (which are the Therapeutic Groups or ‘TG’) which are then combined into the overall reporting segment CGUs of GPD, SBD, MCS and MPI. Goodwill testing is performed at the segment level. Assets not included in these CGUs are those related to HPPI’s intellectual property. Each segment or CGU to which the Goodwill or Intangible asset is so allocated represents the lowest level within the Group at which the asset is monitored for internal management purposes and separately identifiable cash flows are present and is not larger than a reporting segment.
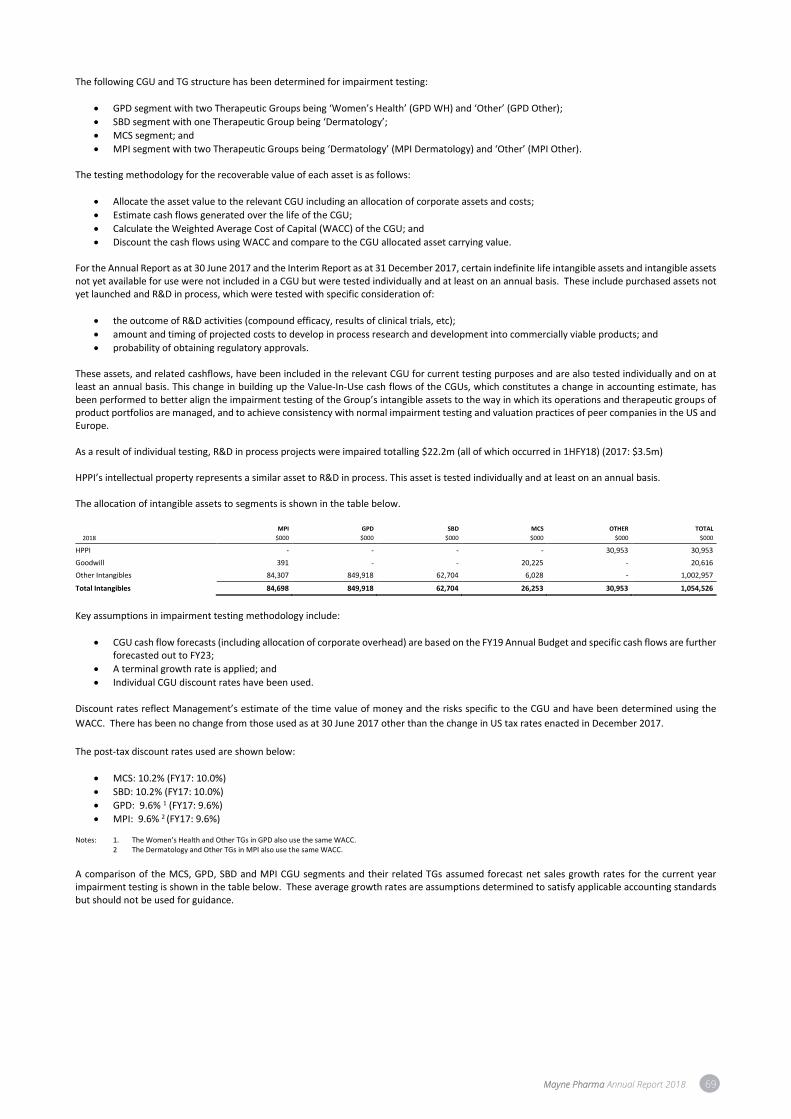
Mayne Pharma Annual Report 2018 69
The following CGU and TG structure has been determined for impairment testing:
• GPD segment with two Therapeutic Groups being ‘Women’s Health’ (GPD WH) and ‘Other’ (GPD Other);
• SBD segment with one Therapeutic Group being ‘Dermatology’;
• MCS segment; and
• MPI segment with two Therapeutic Groups being ‘Dermatology’ (MPI Dermatology) and ‘Other’ (MPI Other). The testing methodology for the recoverable value of each asset is as follows:
• Allocate the asset value to the relevant CGU including an allocation of corporate assets and costs;
• Estimate cash flows generated over the life of the CGU;
• Calculate the Weighted Average Cost of Capital (WACC) of the CGU; and
• Discount the cash flows using WACC and compare to the CGU allocated asset carrying value. For the Annual Report as at 30 June 2017 and the Interim Report as at 31 December 2017, certain indefinite life intangible assets and intangible assets not yet available for use were not included in a CGU but were tested individually and at least on an annual basis. These include purchased assets not yet launched and R&D in process, which were tested with specific consideration of:
• the outcome of R&D activities (compound efficacy, results of clinical trials, etc);
• amount and timing of projected costs to develop in process research and development into commercially viable products; and
• probability of obtaining regulatory approvals. These assets, and related cashflows, have been included in the relevant CGU for current testing purposes and are also tested individually and on at least an annual basis. This change in building up the Value-In-Use cash flows of the CGUs, which constitutes a change in accounting estimate, has been performed to better align the impairment testing of the Group’s intangible assets to the way in which its operations and therapeutic groups of product portfolios are managed, and to achieve consistency with normal impairment testing and valuation practices of peer companies in the US and Europe. As a result of individual testing, R&D in process projects were impaired totalling $22.2m (all of which occurred in 1HFY18) (2017: $3.5m) HPPI’s intellectual property represents a similar asset to R&D in process. This asset is tested individually and at least on an annual basis. The allocation of intangible assets to segments is shown in the table below.
2018
MPI
$000
GPD
$000
SBD
$000
MCS
$000
OTHER
$000
TOTAL
$000
HPPI - - - - 30,953 30,953
Goodwill 391 - - 20,225 - 20,616
Other Intangibles 84,307 849,918 62,704 6,028 - 1,002,957
Total Intangibles 84,698 849,918 62,704 26,253 30,953 1,054,526
Key assumptions in impairment testing methodology include:
• CGU cash flow forecasts (including allocation of corporate overhead) are based on the FY19 Annual Budget and specific cash flows are further forecasted out to FY23;
• A terminal growth rate is applied; and
• Individual CGU discount rates have been used. Discount rates reflect Management’s estimate of the time value of money and the risks specific to the CGU and have been determined using the
WACC. There has been no change from those used as at 30 June 2017 other than the change in US tax rates enacted in December 2017.
The post-tax discount rates used are shown below:
• MCS: 10.2% (FY17: 10.0%)
• SBD: 10.2% (FY17: 10.0%)
• GPD: 9.6% 1 (FY17: 9.6%)
• MPI: 9.6% 2 (FY17: 9.6%) Notes: 1. The Women’s Health and Other TGs in GPD also use the same WACC. 2 The Dermatology and Other TGs in MPI also use the same WACC.
A comparison of the MCS, GPD, SBD and MPI CGU segments and their related TGs assumed forecast net sales growth rates for the current year impairment testing is shown in the table below. These average growth rates are assumptions determined to satisfy applicable accounting standards but should not be used for guidance.
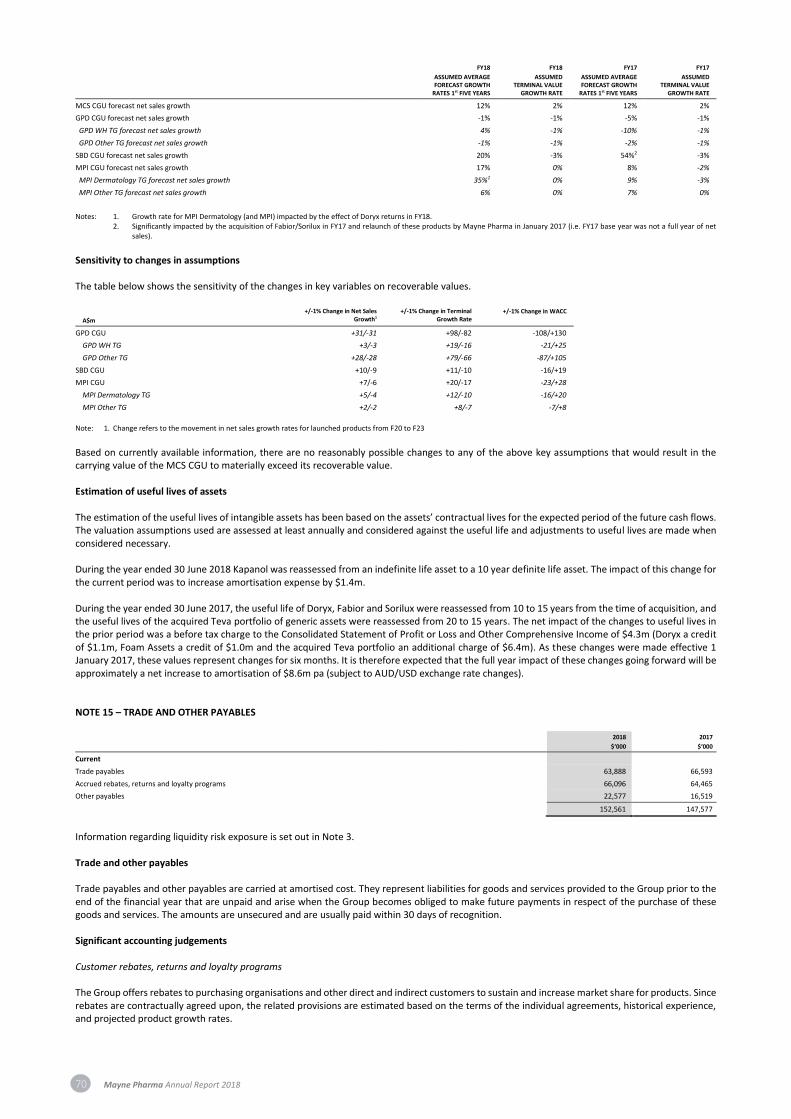
70 Mayne Pharma Annual Report 2018
FY18
ASSUMED AVERAGE FORECAST GROWTH
RATES 1st FIVE YEARS
FY18
ASSUMED TERMINAL VALUE
GROWTH RATE
FY17
ASSUMED AVERAGE FORECAST GROWTH
RATES 1st FIVE YEARS
FY17
ASSUMED TERMINAL VALUE
GROWTH RATE
MCS CGU forecast net sales growth 12% 2% 12% 2%
GPD CGU forecast net sales growth -1% -1% -5% -1%
GPD WH TG forecast net sales growth 4% -1% -10% -1%
GPD Other TG forecast net sales growth -1% -1% -2% -1%
SBD CGU forecast net sales growth 20% -3% 54%2 -3%
MPI CGU forecast net sales growth 17% 0% 8% -2%
MPI Dermatology TG forecast net sales growth 35%1 0% 9% -3%
MPI Other TG forecast net sales growth 6% 0% 7% 0%
Notes: 1. Growth rate for MPI Dermatology (and MPI) impacted by the effect of Doryx returns in FY18.
2. Significantly impacted by the acquisition of Fabior/Sorilux in FY17 and relaunch of these products by Mayne Pharma in January 2017 (i.e. FY17 base year was not a full year of net sales).
Sensitivity to changes in assumptions
The table below shows the sensitivity of the changes in key variables on recoverable values.
A$m
+/-1% Change in Net Sales Growth1
+/-1% Change in Terminal Growth Rate
+/-1% Change in WACC
GPD CGU +31/-31 +98/-82 -108/+130
GPD WH TG +3/-3 +19/-16 -21/+25
GPD Other TG +28/-28 +79/-66 -87/+105
SBD CGU +10/-9 +11/-10 -16/+19
MPI CGU +7/-6 +20/-17 -23/+28
MPI Dermatology TG +5/-4 +12/-10 -16/+20
MPI Other TG +2/-2 +8/-7 -7/+8
Note: 1. Change refers to the movement in net sales growth rates for launched products from F20 to F23
Based on currently available information, there are no reasonably possible changes to any of the above key assumptions that would result in the carrying value of the MCS CGU to materially exceed its recoverable value. Estimation of useful lives of assets The estimation of the useful lives of intangible assets has been based on the assets’ contractual lives for the expected period of the future cash flows. The valuation assumptions used are assessed at least annually and considered against the useful life and adjustments to useful lives are made when considered necessary. During the year ended 30 June 2018 Kapanol was reassessed from an indefinite life asset to a 10 year definite life asset. The impact of this change for the current period was to increase amortisation expense by $1.4m. During the year ended 30 June 2017, the useful life of Doryx, Fabior and Sorilux were reassessed from 10 to 15 years from the time of acquisition, and the useful lives of the acquired Teva portfolio of generic assets were reassessed from 20 to 15 years. The net impact of the changes to useful lives in the prior period was a before tax charge to the Consolidated Statement of Profit or Loss and Other Comprehensive Income of $4.3m (Doryx a credit of $1.1m, Foam Assets a credit of $1.0m and the acquired Teva portfolio an additional charge of $6.4m). As these changes were made effective 1 January 2017, these values represent changes for six months. It is therefore expected that the full year impact of these changes going forward will be approximately a net increase to amortisation of $8.6m pa (subject to AUD/USD exchange rate changes). NOTE 15 – TRADE AND OTHER PAYABLES
2018
$‘000
2017
$‘000
Current
Trade payables 63,888 66,593
Accrued rebates, returns and loyalty programs 66,096 64,465
Other payables 22,577 16,519
152,561 147,577
Information regarding liquidity risk exposure is set out in Note 3. Trade and other payables Trade payables and other payables are carried at amortised cost. They represent liabilities for goods and services provided to the Group prior to the end of the financial year that are unpaid and arise when the Group becomes obliged to make future payments in respect of the purchase of these goods and services. The amounts are unsecured and are usually paid within 30 days of recognition. Significant accounting judgements Customer rebates, returns and loyalty programs The Group offers rebates to purchasing organisations and other direct and indirect customers to sustain and increase market share for products. Since rebates are contractually agreed upon, the related provisions are estimated based on the terms of the individual agreements, historical experience, and projected product growth rates.
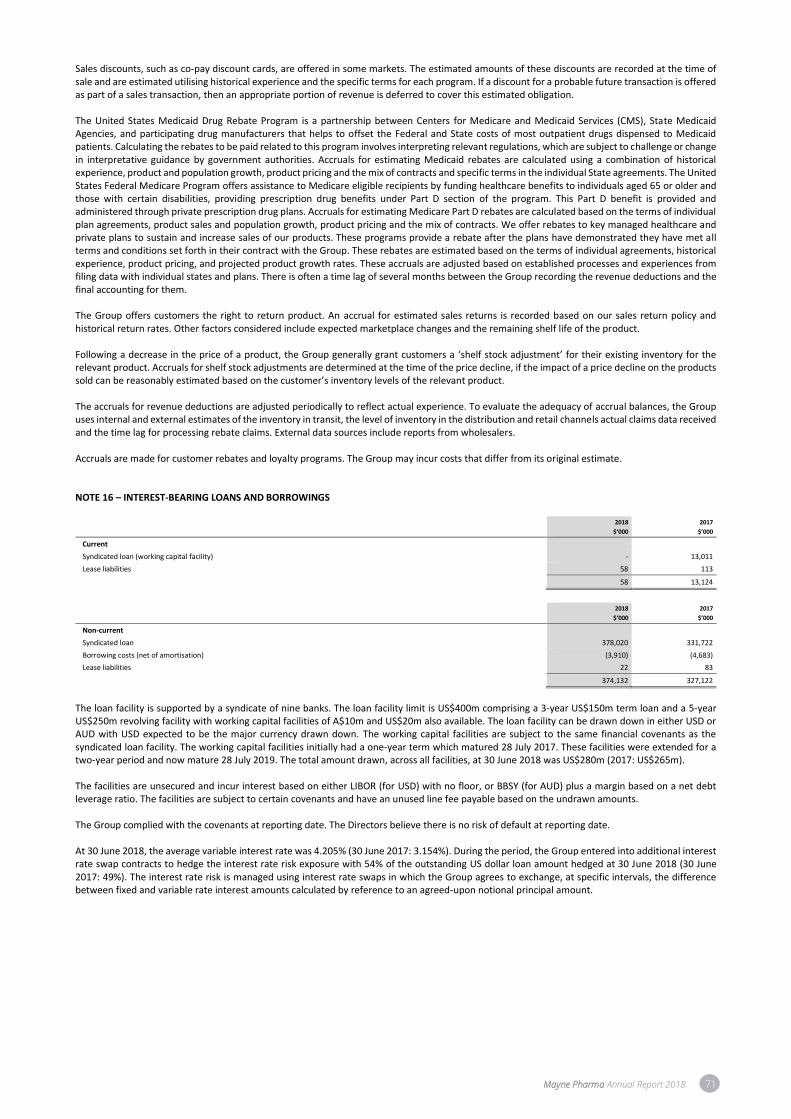
Mayne Pharma Annual Report 2018 71
Sales discounts, such as co-pay discount cards, are offered in some markets. The estimated amounts of these discounts are recorded at the time of sale and are estimated utilising historical experience and the specific terms for each program. If a discount for a probable future transaction is offered as part of a sales transaction, then an appropriate portion of revenue is deferred to cover this estimated obligation. The United States Medicaid Drug Rebate Program is a partnership between Centers for Medicare and Medicaid Services (CMS), State Medicaid Agencies, and participating drug manufacturers that helps to offset the Federal and State costs of most outpatient drugs dispensed to Medicaid patients. Calculating the rebates to be paid related to this program involves interpreting relevant regulations, which are subject to challenge or change in interpretative guidance by government authorities. Accruals for estimating Medicaid rebates are calculated using a combination of historical experience, product and population growth, product pricing and the mix of contracts and specific terms in the individual State agreements. The United States Federal Medicare Program offers assistance to Medicare eligible recipients by funding healthcare benefits to individuals aged 65 or older and those with certain disabilities, providing prescription drug benefits under Part D section of the program. This Part D benefit is provided and administered through private prescription drug plans. Accruals for estimating Medicare Part D rebates are calculated based on the terms of individual plan agreements, product sales and population growth, product pricing and the mix of contracts. We offer rebates to key managed healthcare and private plans to sustain and increase sales of our products. These programs provide a rebate after the plans have demonstrated they have met all terms and conditions set forth in their contract with the Group. These rebates are estimated based on the terms of individual agreements, historical experience, product pricing, and projected product growth rates. These accruals are adjusted based on established processes and experiences from filing data with individual states and plans. There is often a time lag of several months between the Group recording the revenue deductions and the final accounting for them. The Group offers customers the right to return product. An accrual for estimated sales returns is recorded based on our sales return policy and historical return rates. Other factors considered include expected marketplace changes and the remaining shelf life of the product. Following a decrease in the price of a product, the Group generally grant customers a ‘shelf stock adjustment’ for their existing inventory for the relevant product. Accruals for shelf stock adjustments are determined at the time of the price decline, if the impact of a price decline on the products sold can be reasonably estimated based on the customer’s inventory levels of the relevant product. The accruals for revenue deductions are adjusted periodically to reflect actual experience. To evaluate the adequacy of accrual balances, the Group uses internal and external estimates of the inventory in transit, the level of inventory in the distribution and retail channels actual claims data received and the time lag for processing rebate claims. External data sources include reports from wholesalers. Accruals are made for customer rebates and loyalty programs. The Group may incur costs that differ from its original estimate. NOTE 16 – INTEREST-BEARING LOANS AND BORROWINGS
2018
$‘000
2017
$’000
Current
Syndicated loan (working capital facility) - 13,011
Lease liabilities 58 113
58 13,124
2018
$‘000
2017
$’000
Non-current
Syndicated loan 378,020 331,722
Borrowing costs (net of amortisation) (3,910) (4,683)
Lease liabilities 22 83
374,132 327,122
The loan facility is supported by a syndicate of nine banks. The loan facility limit is US$400m comprising a 3-year US$150m term loan and a 5-year US$250m revolving facility with working capital facilities of A$10m and US$20m also available. The loan facility can be drawn down in either USD or AUD with USD expected to be the major currency drawn down. The working capital facilities are subject to the same financial covenants as the syndicated loan facility. The working capital facilities initially had a one-year term which matured 28 July 2017. These facilities were extended for a two-year period and now mature 28 July 2019. The total amount drawn, across all facilities, at 30 June 2018 was US$280m (2017: US$265m). The facilities are unsecured and incur interest based on either LIBOR (for USD) with no floor, or BBSY (for AUD) plus a margin based on a net debt leverage ratio. The facilities are subject to certain covenants and have an unused line fee payable based on the undrawn amounts. The Group complied with the covenants at reporting date. The Directors believe there is no risk of default at reporting date. At 30 June 2018, the average variable interest rate was 4.205% (30 June 2017: 3.154%). During the period, the Group entered into additional interest rate swap contracts to hedge the interest rate risk exposure with 54% of the outstanding US dollar loan amount hedged at 30 June 2018 (30 June 2017: 49%). The interest rate risk is managed using interest rate swaps in which the Group agrees to exchange, at specific intervals, the difference between fixed and variable rate interest amounts calculated by reference to an agreed-upon notional principal amount.

72 Mayne Pharma Annual Report 2018
Loan maturities are summarised as follows:
2018
$‘000
2017
‘000
Current - 13,011
Non-current 378,020 331,722
378,020 344,733
Due by 30 June 2018 - 13,011
Due by 30 June 2019 - -
Due by 30 June 2020 202,510 195,160
Due by 30 June 2021 - -
Due by 30 June 2022 175,510 136,562
378,020 344,733
There were no defaults or breaches on any loans during the year ended 30 June 2018.
Changes in liabilities arising from financing activities BALANCE 30 JUNE 2017 CASH FLOWS
FOREIGN EXCHANGE MOVEMENTS
BALANCE 30 JUNE 2018
$’000 $’000 $’000 $’000
Syndicated loan 344,733 19,396 13,891 378,020
Recognition and measurement Interest-bearing loans and borrowings Borrowings are classified as current liabilities unless the Group has an unconditional right to defer settlement of the liability for at least 12 months after the reporting date. After initial recognition, interest-bearing loans and borrowings are subsequently measured at amortised cost using the effective interest method. Fees paid on the establishment of loan facilities that are yield related are included as part of the carrying amount of the loans and borrowings. Leases The determination of whether an arrangement is or contains a lease is based on the substance of the arrangement and requires an assessment of whether the fulfilment of the arrangement is dependent on the use of a specific asset or asset and the arrangement conveys a right to use the asset. Finance leases, which transfer to the Group substantially all the risks and benefits incidental to ownership of the lease item are capitalised at the inception of the lease at the fair value of the leased asset or, if lower, at the present value of the minimum lease payments. Lease payments are apportioned between the finance charges and reduction of the lease liability to achieve a constant rate of interest on the remaining balance of the liability. Finance charges are recognised as an expense in profit or loss. NOTE 17 – OTHER FINANCIAL LIABILITIES
2018
$‘000
2017
$’000
Current
Earn-out liabilities – various products/distribution rights 916 3,980
Deferred consideration – various products/distribution rights 11,321 17,728
Completion of clinical studies obligation relating to acquired asset 240 2,342
12,477 24,050
2018
$‘000
2017
$’000
Non-Current
Completion of clinical studies obligation relating to acquired asset - 2,512
Earn-out liabilities – various products/distribution rights 1,442 1,759
Deferred consideration – various products/distribution rights 3,908 12,634
5,350 16,905
The consolidated entity has recognised various earn-out liabilities relating to various asset purchases. Most of the earn-outs are based on a percentage of net sales and typically payable on a quarterly to annual basis for a period of between two and five years. Deferred consideration recognised includes amounts which have contingent conditions such as FDA approvals and on market conditions (e.g. no entry of a new competitor into the relevant market). At balance date, the Group has assessed the amount expected to be paid for contingent amounts outlined in the asset purchase agreements. Earn-out liabilities Recognition and derecognition Earn-out liabilities of the Group are initially recognised on the consolidated statement of financial position as part of business combinations and intangible asset acquisitions at fair value. Financial liabilities are derecognised when they are extinguished. Subsequent measurement After initial recognition, earn-out liabilities are recognised at fair value through profit or loss and are remeasured each reporting period. Movements in the liability from these changes are recognised in profit or loss.

Mayne Pharma Annual Report 2018 73
Significant accounting estimates and assumptions Earn-out liabilities The earn-out liabilities have been determined based on contracted royalty rates payable on expected future cash flows. The estimation of the cash flows over a significant period, combined with the impact of currency movements and interest rates may result in substantial movements in the value of the liabilities recognised between reporting periods. The cash flows, assumed discount rate and forecast exchange rates are reviewed every six months to ensure the most accurate fair value of the liabilities is reported. Movements in the liabilities from changes in these assumptions and forecasts are reported in the consolidated statement of profit of loss and other comprehensive income. Earn-out liabilities represent the net present value of estimated future payments. Any changes in fair value for changes in the net present value of estimated future payments are recognised in the statement of profit or loss and other comprehensive income. The earn-out liabilities at reporting date include a charge representing the unwinding of the discounting of the earn-out liabilities of $1,482,000 (2017: $807,000) for the period. Deferred consideration liabilities Deferred consideration liabilities represent the net present value of future predetermined payments. At 30 June 2018 the deferred consideration amounts consist mainly of amounts which are subject to FDA approvals or similar milestone requirements. NOTE 18 – PROVISIONS
2018
$’000 2017
$’000
Current
Employee benefits 12,329 8,261
Restructuring provision 2,472 -
14,801 8,261
Non-Current
Employee benefits 1,591 1,312
Restoration 350 350
1,941 1,662
Provisions and employee benefits Provisions are recognised when the Group has a present obligation (legal or constructive) due to a past event, it is probable that an outflow of resources embodying economic benefits will be required to settle the obligation and a reliable estimate can be made of the amount of the obligation. Provisions are measured at the present value of management’s best estimate of the expenditure required to settle the present obligation at the reporting date. If the effect of the time value of money is material, provisions are discounted using a current pre-tax rate that reflects the time value of money and the risks specific to the liability. Employee leave benefits Liabilities for wages and salaries, including non-monetary benefits and annual leave expected to be settled within 12 months of the reporting date are recognised in respect of employees’ services up to the reporting date. They are measured at the amounts expected to be paid when the liabilities are settled. Liabilities for non-accumulating sick leave are recognised when the leave is taken and are measured at the rates paid or payable. Long service leave The liability for long service leave is recognised in the provision for employee benefits and measured as the present value of expected future payments to be made in respect of services provided by employees up to the reporting date using the projected unit credit method. Consideration is given to expected future wage and salary levels, experience of employee departures, and periods of service. Expected future payments are discounted using market yields at the reporting date on high quality corporate bonds with terms to maturity and currencies that match, as closely as possible, the estimated future cash outflows. Restoration provision The restoration provision represents the present value of anticipated costs for the future restoration of the Salisbury site. The outflows are expected to occur over 20 years. Significant accounting estimates and assumptions Restoration provision The provision represents the present value of anticipated costs for future restoration of the Salisbury site. The calculation of this provision requires assumptions such as application of environmental legislation, timing of restoration and cost estimates. These uncertainties may result in future actual expenditure differing from the amounts currently provided.

74 Mayne Pharma Annual Report 2018
NOTE 19 – CONTRIBUTED EQUITY Movements in contributed equity 2018
Number 2017
Number 2018
$’000 2017
$’000
Balance at beginning of year 1,510,929,673 810,046,346 1,130,404 263,161
Issued during the year:
Teva portfolio acquisition funding1 - 661,048,634 - 860,487
Tax effect of employee share options - - (1,324) (797)
Shares issued 35,000 - 52 -
Options exercised 5,115,000 15,406,000 2,629 7,427
LTI shares issued (restricted)2 73,593,458 26,771,758 - -
LTI shares forfeited (8,851,961) (2,343,065) - -
LTI shares cancelled (16,099,012) - - -
LTI shares exercised (and loan repaid) - - - 126
Balance at end of year 1,564,722,158 1,510,929,673 1,131,761 1,130,404
Notes: 1. Shares issued in pcp are net of $28.36m of equity raising costs (net of income tax).
2. The shares were granted under the ESLS and SLS (and are subject to risk of forfeiture).
Contributed equity Ordinary shares are classified as equity. Incremental costs directly attributable to the issue of new shares or options are shown in equity as a deduction from the proceeds. A. Terms and conditions of contributed equity Holders of ordinary shares are entitled to receive dividends as declared from time to time and are entitled to one vote per share at shareholders’ meetings. In the event of winding up of the Company, ordinary shareholders rank after all other shareholders and creditors and are fully entitled to any proceeds of liquidation. B. Capital management The primary objective of the Group in relation to capital management is to ensure that it maintains a strong credit rating and healthy capital ratios to support its business objectives and to maximise shareholder value. The Group manages its capital structure and adjusts it, considering changes in economic conditions and the Company’s strategy. To maintain or adjust the capital structure, the Company may return capital to shareholders or issue new shares. During the year ended 30 June 2018 the Company issued new shares and amended available debt facilities. No changes were made in the objectives, policies or processes during the years ended 30 June 2018 and 30 June 2017. The Group includes within net debt, interest-bearing loans and borrowings, trade and other payables, less cash and cash equivalents. The Group’s current policy is to maintain a net debt position within policy limits set by the Directors and that can be serviced by the Group’s cash flows.
2018
$’000 2017
$’000
Interest-bearing borrowings 374,190 340,246
Less cash and cash equivalents (87,312) (63,027)
Net debt 286,878 277,219
The Group is subject to capital requirements under the terms of the syndicated loan facility. NOTE 20 – RESERVES
2018
$’000 2017
$’000
Share-based payments reserve 20,813 14,890
Cash flow hedge reserve 6,747 1,415
Other reserve (3,721) (4,020)
Foreign currency translation reserve 47,339 11,052
71,178 23,337
Share-based payments reserve The share-based payments reserve records the value of share-based payments provided to employees, including KMP, as part of their remuneration.
2018
$’000 2017
$’000
Balance at beginning of year 14,890 7,950
Share-based payments expense 14,490 11,199
Transfer to contributed equity on exercise of options (1,155) (4,259)
Transfer to retained earnings on cancellation of employee shares (7,412) -
Balance at end of year 20,813 14,890
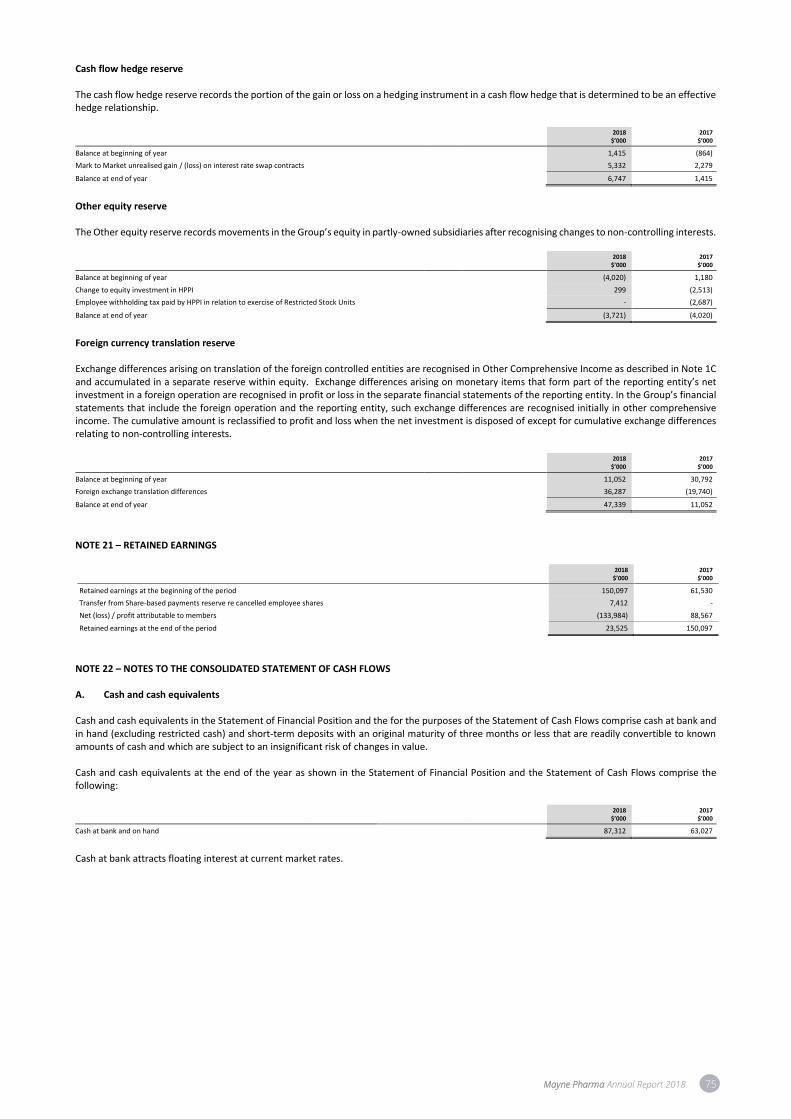
Mayne Pharma Annual Report 2018 75
Cash flow hedge reserve The cash flow hedge reserve records the portion of the gain or loss on a hedging instrument in a cash flow hedge that is determined to be an effective hedge relationship.
2018
$’000 2017
$’000
Balance at beginning of year 1,415 (864)
Mark to Market unrealised gain / (loss) on interest rate swap contracts 5,332 2,279
Balance at end of year 6,747 1,415
Other equity reserve The Other equity reserve records movements in the Group’s equity in partly-owned subsidiaries after recognising changes to non-controlling interests.
2018
$’000 2017
$’000
Balance at beginning of year (4,020) 1,180
Change to equity investment in HPPI 299 (2,513)
Employee withholding tax paid by HPPI in relation to exercise of Restricted Stock Units - (2,687)
Balance at end of year (3,721) (4,020)
Foreign currency translation reserve Exchange differences arising on translation of the foreign controlled entities are recognised in Other Comprehensive Income as described in Note 1C and accumulated in a separate reserve within equity. Exchange differences arising on monetary items that form part of the reporting entity’s net investment in a foreign operation are recognised in profit or loss in the separate financial statements of the reporting entity. In the Group’s financial statements that include the foreign operation and the reporting entity, such exchange differences are recognised initially in other comprehensive income. The cumulative amount is reclassified to profit and loss when the net investment is disposed of except for cumulative exchange differences relating to non-controlling interests.
2018
$’000 2017
$’000
Balance at beginning of year 11,052 30,792
Foreign exchange translation differences 36,287 (19,740)
Balance at end of year 47,339 11,052
NOTE 21 – RETAINED EARNINGS
2018
$’000 2017
$’000
Retained earnings at the beginning of the period 150,097 61,530
Transfer from Share-based payments reserve re cancelled employee shares 7,412 -
Net (loss) / profit attributable to members (133,984) 88,567
Retained earnings at the end of the period 23,525 150,097
NOTE 22 – NOTES TO THE CONSOLIDATED STATEMENT OF CASH FLOWS A. Cash and cash equivalents Cash and cash equivalents in the Statement of Financial Position and the for the purposes of the Statement of Cash Flows comprise cash at bank and in hand (excluding restricted cash) and short-term deposits with an original maturity of three months or less that are readily convertible to known amounts of cash and which are subject to an insignificant risk of changes in value. Cash and cash equivalents at the end of the year as shown in the Statement of Financial Position and the Statement of Cash Flows comprise the following:
2018
$’000 2017
$’000
Cash at bank and on hand 87,312 63,027
Cash at bank attracts floating interest at current market rates.
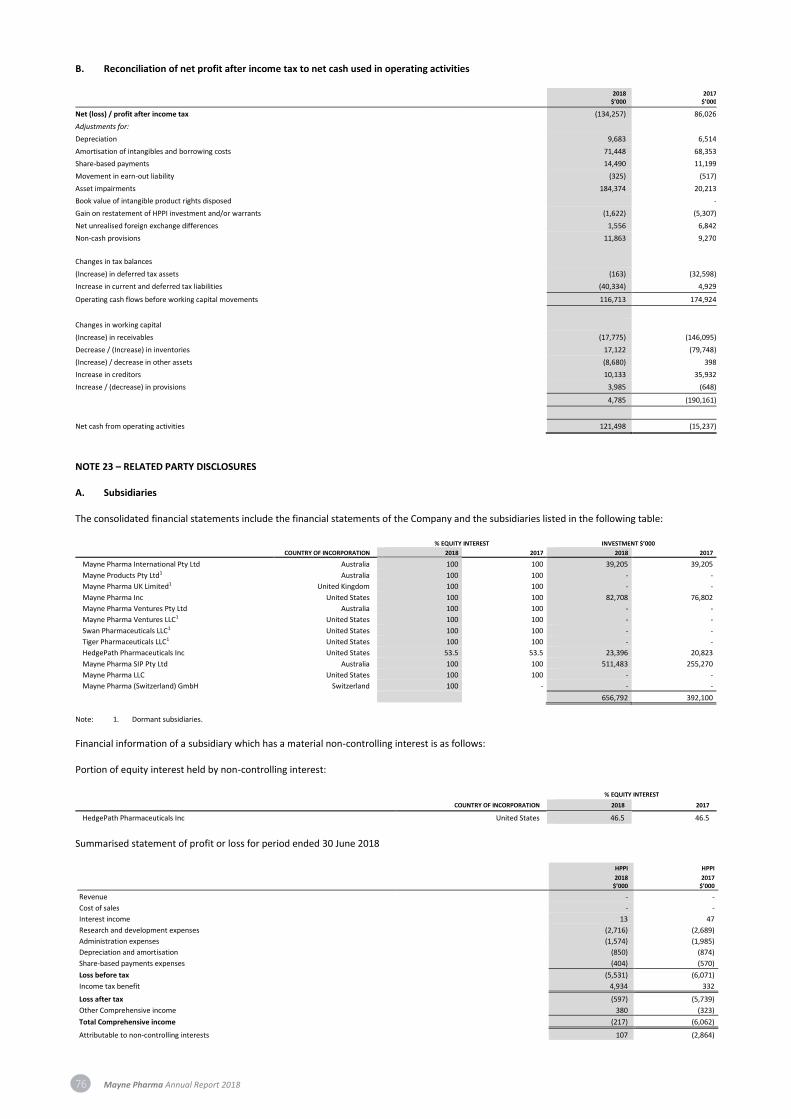
76 Mayne Pharma Annual Report 2018
B. Reconciliation of net profit after income tax to net cash used in operating activities
2018
$’000 2017
$’000
Net (loss) / profit after income tax (134,257) 86,026
Adjustments for:
Depreciation 9,683 6,514
Amortisation of intangibles and borrowing costs 71,448 68,353
Share-based payments 14,490 11,199
Movement in earn-out liability (325) (517)
Asset impairments 184,374 20,213
Book value of intangible product rights disposed -
Gain on restatement of HPPI investment and/or warrants (1,622) (5,307)
Net unrealised foreign exchange differences 1,556 6,842
Non-cash provisions 11,863 9,270
Changes in tax balances
(Increase) in deferred tax assets (163) (32,598)
Increase in current and deferred tax liabilities (40,334) 4,929
Operating cash flows before working capital movements 116,713 174,924
Changes in working capital
(Increase) in receivables (17,775) (146,095)
Decrease / (Increase) in inventories 17,122 (79,748)
(Increase) / decrease in other assets (8,680) 398
Increase in creditors 10,133 35,932
Increase / (decrease) in provisions 3,985 (648)
4,785 (190,161)
Net cash from operating activities 121,498 (15,237)
NOTE 23 – RELATED PARTY DISCLOSURES A. Subsidiaries The consolidated financial statements include the financial statements of the Company and the subsidiaries listed in the following table:
COUNTRY OF INCORPORATION
% EQUITY INTEREST INVESTMENT $’000
2018 2017 2018 2017
Mayne Pharma International Pty Ltd Australia 100 100 39,205 39,205
Mayne Products Pty Ltd1 Australia 100 100 - -
Mayne Pharma UK Limited1 United Kingdom 100 100 - -
Mayne Pharma Inc United States 100 100 82,708 76,802
Mayne Pharma Ventures Pty Ltd Australia 100 100 - -
Mayne Pharma Ventures LLC1 United States 100 100 - -
Swan Pharmaceuticals LLC1 United States 100 100 - -
Tiger Pharmaceuticals LLC1 United States 100 100 - -
HedgePath Pharmaceuticals Inc United States 53.5 53.5 23,396 20,823
Mayne Pharma SIP Pty Ltd Australia 100 100 511,483 255,270
Mayne Pharma LLC United States 100 100 - -
Mayne Pharma (Switzerland) GmbH Switzerland 100 - - -
656,792 392,100
Note: 1. Dormant subsidiaries.
Financial information of a subsidiary which has a material non-controlling interest is as follows: Portion of equity interest held by non-controlling interest:
COUNTRY OF INCORPORATION
% EQUITY INTEREST
2018 2017
HedgePath Pharmaceuticals Inc United States 46.5 46.5
Summarised statement of profit or loss for period ended 30 June 2018
HPPI
2018 $’000
HPPI
2017 $’000
Revenue - -
Cost of sales - -
Interest income 13 47
Research and development expenses (2,716) (2,689)
Administration expenses (1,574) (1,985)
Depreciation and amortisation (850) (874)
Share-based payments expenses (404) (570)
Loss before tax (5,531) (6,071)
Income tax benefit 4,934 332
Loss after tax (597) (5,739)
Other Comprehensive income 380 (323)
Total Comprehensive income (217) (6,062)
Attributable to non-controlling interests 107 (2,864)

Mayne Pharma Annual Report 2018 77
Summarised statement of financial position as at 30 June 2018
HPPI
2018 $’000
HPPI
2017 $’000
Cash at bank 1,074 2,138
Other current assets 525 544
Intangible assets 30,953 30,686
Trade and other payables (624) (442)
Deferred tax liabilities (6,935) (11,661)
Total equity 24,993 21,265
Attributable to equity holders of Mayne Pharma 12,301 10,565
Attributable to non-controlling interests 8,693 8,335
B. Ultimate parent Mayne Pharma Group Limited is the ultimate parent entity. C. KMP Details relating to KMP, including remuneration paid, are included in Note 24. D. Transactions with related parties The Company had no other transactions with KMP or other related parties during the financial years ended 30 June 2018 or 30 June 2017. Amounts owing to Directors, Director-related parties and other related parties at 30 June 2018 and 30 June 2017 were nil. NOTE 24 – KMP DISCLOSURES i. Directors and other KMP The Directors of Mayne Pharma Group Limited during the financial year were:
• Mr Roger Corbett, AO - Chairman
• Mr Scott Richards - Managing Director and Chief Executive Officer
• Hon Ron Best - Independent Non-Executive Director
• Mr Patrick Blake - Independent Non-Executive Director (appointed 28 June 2018)
• Mr Frank Condella - Independent Non-Executive Director (appointed 30 May 2018)
• Ms Nancy Dolan - Independent Non-Executive Director
• Mr William (Phil) Hodges - Independent Non-Executive Director
• Mr Bruce Mathieson - Independent Non-Executive Director
• Prof Bruce Robinson, AM - Independent Non-Executive Director
• Mr Ian Scholes - Independent Non-Executive Director Other KMP consisted of:
• Mr Nick Freeman - Group Chief Financial Officer and Company Secretary
• Mr Stefan Cross - President International Operations
• Dr Ilana Stancovski - Chief Scientific Officer and Head of European Market Development
• Ms Kate Rintoul - Executive Vice President and General Counsel
• Mr Eric Evans - Chief Financial Officer Mayne Pharma USA (resigned 18 August 2017)
• Mr Peter Paltoglou - Chief Development Officer and Head of M&A
• Ms Lisa Pendlebury - Vice President Investor Relations and Communications
• Mr Andrew Van Breugel - General Manager & Operations Director Salisbury (ceased to be KMP effective 31 December 2017)
• Mr John Ross - President Mayne Pharma USA (considered to be KMP from 1 January 2017) ii. Compensation of KMP
2018 $’000
2017 $’000
Short-term employee benefits 5,860 5,729
Post-employment benefits 266 305
Long-term benefits 51 21
Share-based payments excluding cancelled shares 3,174 4,086
Total excluding cancelled shares 9,351 10,141
Share-based payments expense relating to cancelled employee shares 1,843 -
11,194 10,141
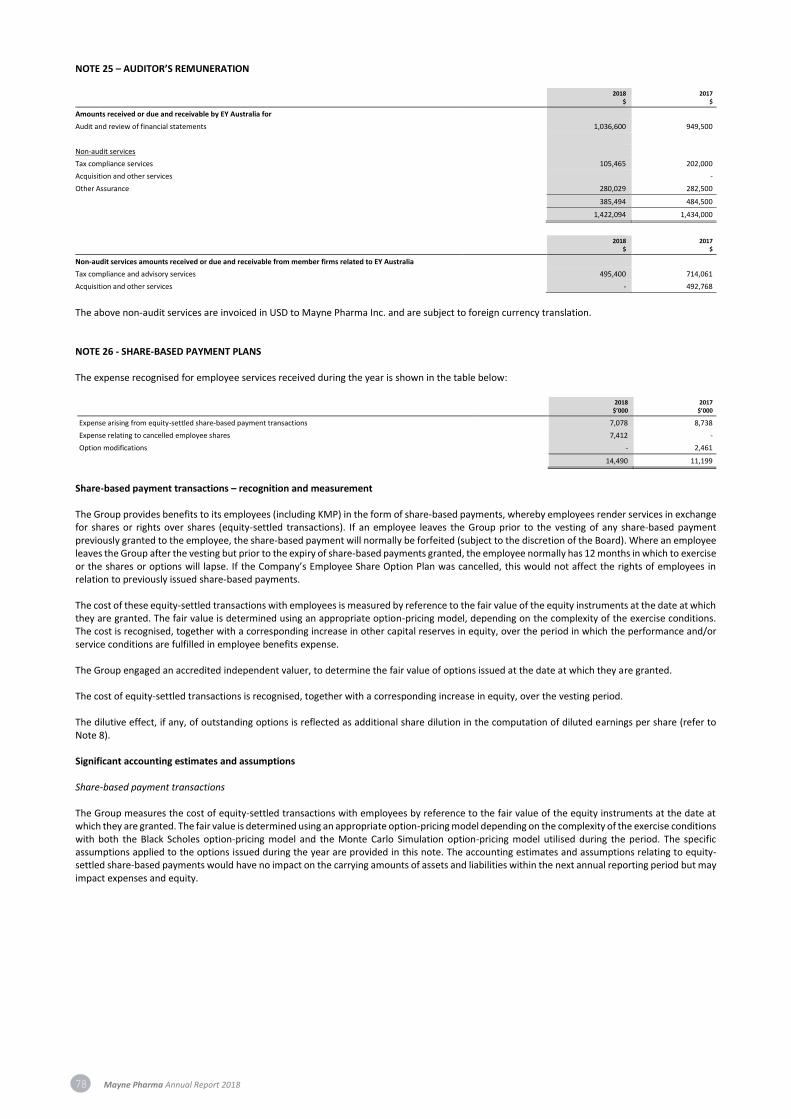
78 Mayne Pharma Annual Report 2018
NOTE 25 – AUDITOR’S REMUNERATION
2018
$ 2017
$
Amounts received or due and receivable by EY Australia for
Audit and review of financial statements 1,036,600 949,500
Non-audit services
Tax compliance services 105,465 202,000
Acquisition and other services -
Other Assurance 280,029 282,500
385,494 484,500
1,422,094 1,434,000
2018
$ 2017
$
Non-audit services amounts received or due and receivable from member firms related to EY Australia
Tax compliance and advisory services 495,400 714,061
Acquisition and other services - 492,768
The above non-audit services are invoiced in USD to Mayne Pharma Inc. and are subject to foreign currency translation. NOTE 26 - SHARE-BASED PAYMENT PLANS The expense recognised for employee services received during the year is shown in the table below:
2018
$’000 2017
$’000
Expense arising from equity-settled share-based payment transactions 7,078 8,738
Expense relating to cancelled employee shares 7,412 -
Option modifications - 2,461
14,490 11,199
Share-based payment transactions – recognition and measurement The Group provides benefits to its employees (including KMP) in the form of share-based payments, whereby employees render services in exchange for shares or rights over shares (equity-settled transactions). If an employee leaves the Group prior to the vesting of any share-based payment previously granted to the employee, the share-based payment will normally be forfeited (subject to the discretion of the Board). Where an employee leaves the Group after the vesting but prior to the expiry of share-based payments granted, the employee normally has 12 months in which to exercise or the shares or options will lapse. If the Company’s Employee Share Option Plan was cancelled, this would not affect the rights of employees in relation to previously issued share-based payments. The cost of these equity-settled transactions with employees is measured by reference to the fair value of the equity instruments at the date at which they are granted. The fair value is determined using an appropriate option-pricing model, depending on the complexity of the exercise conditions. The cost is recognised, together with a corresponding increase in other capital reserves in equity, over the period in which the performance and/or service conditions are fulfilled in employee benefits expense. The Group engaged an accredited independent valuer, to determine the fair value of options issued at the date at which they are granted. The cost of equity-settled transactions is recognised, together with a corresponding increase in equity, over the vesting period. The dilutive effect, if any, of outstanding options is reflected as additional share dilution in the computation of diluted earnings per share (refer to Note 8). Significant accounting estimates and assumptions Share-based payment transactions The Group measures the cost of equity-settled transactions with employees by reference to the fair value of the equity instruments at the date at which they are granted. The fair value is determined using an appropriate option-pricing model depending on the complexity of the exercise conditions with both the Black Scholes option-pricing model and the Monte Carlo Simulation option-pricing model utilised during the period. The specific assumptions applied to the options issued during the year are provided in this note. The accounting estimates and assumptions relating to equity-settled share-based payments would have no impact on the carrying amounts of assets and liabilities within the next annual reporting period but may impact expenses and equity.

Mayne Pharma Annual Report 2018 79
Share Options granted to employees
EXERCISE
PRICE EXPIRY
DATE
BALANCE AT BEGINNING OF YEAR
NUMBER
GRANTED DURING THE YEAR NUMBER
EXERCISED DURING THE YEAR NUMBER
OTHER MOVEMENTS DURING THE YEAR
NUMBER1
BALANCE AT END
OF YEAR NUMBER
OPTIONS EXERCISABLE AT END
OF YEAR NUMBER
Year ended 30 June 2018
Unlisted options $0.2184 12/01/19 4,295,000 - (1,695,000) - 2,600,000 2,600,000
Unlisted options $0.2184 26/01/19 2,449,000 - (1,880,000) - 569,000 569,000
Unlisted options $0.3184 1/07/19 500,000 - (500,000) - - -
Unlisted options $0.5923 21/10/19 320,000 - - - 320,000 120,000
Unlisted options $0.6647 11/11/19 1,000,000 - - - 1,000,000 500,000
Unlisted options $0.6754 30/11/19 1,000,000 - - - 1,000,000 500,000
Unlisted options $0.8003 28/03/19 600,000 - - (60,000) 540,000 510,000
Unlisted options $0.7701 19/06/19 600,000 - - - 600,000 510,000
Unlisted options $0.8188 30/06/19 700,000 - - (300,000) 400,000 200,000
Unlisted options $0.8109 2/07/19 400,000 - - (200,000) 200,000 200,000
Unlisted options $0.7437 1/08/19 200,000 - - - 200,000 -
Unlisted options $0.7682 28/08/19 600,000 - - - 600,000 300,000
Unlisted options $0.6447 17/12/19 600,000 - (300,000) (300,000) - -
Unlisted options $0.5347 1/02/20 2,690,000 - (740,000) (1,050,000) 900,000 600,000
15,954,000 - (5,115,000) (1,910,000) 8,929,000 6,609,000
Note: 1. Options were forfeited on the termination of employment.
No options were issued to executives under the ESOP during the year ended 30 June 2018.
EXERCISE
PRICE1 EXPIRY
DATE
BALANCE AT BEGINNING OF YEAR
NUMBER
GRANTED DURING THE YEAR
NUMBER
EXERCISED DURING
THE YEAR
NUMBER
OTHER MOVEMENTS DURING THE YEAR
NUMBER
BALANCE AT END
OF YEAR
NUMBER
OPTIONS EXERCISABLE AT END
OF YEAR
NUMBER
Year ended 30 June 2017
Unlisted options $0.1492 13/02/19 7,500,000 - (7,500,000) - - -
Unlisted options $0.2184 12/01/19 7,220,000 - (2,925,000) - 4,295,000 4,295,000
Unlisted options $0.2184 26/01/19 5,840,000 - (3,291,000) (100,000) 2 2,449,000 2,449,000
Unlisted options $0.2984 7/03/19 800,000 - (800,000) - - -
Unlisted options $0.3184 1/07/19 1,000,000 - (500,000) - 500,000 -
Unlisted options $0.5923 21/10/19 400,000 - (80,000) - 320,000 120,000
Unlisted options $0.6647 11/11/19 1,000,000 - - - 1,000,000 500,000
Unlisted options $0.6754 30/11/19 1,000,000 - - - 1,000,000 500,000
Unlisted options $0.8003 28/03/19 600,000 - - - 600,000 510,000
Unlisted options $0.7701 19/06/19 600,000 - - - 600,000 510,000
Unlisted options $0.8188 30/06/19 1,000,000 - (300,000) - 700,000 200,000
Unlisted options $0.8109 2/07/19 400,000 - - - 400,000 200,000
Unlisted options $0.7437 1/08/19 200,000 - - - 200,000 -
Unlisted options $0.7682 28/08/19 600,000 - - - 600,000 300,000
Unlisted options $0.6447 17/12/19 600,000 - - - 600,000 300,000
Unlisted options $0.5347 1/02/20 2,700,000 - (10,000) - 2,690,000 1,340,000
31,460,000 - (15,406,000) (100,000) 15,954,000 11,224,000
Notes: 1. The exercise prices were reduced by 9.43 cents each effective 22 July 2016 under ASX Listing Rule 6.22 following the entitlement issue announced 28 June 2016.
2. Options were forfeited on the termination of employment.
No options were issued to executives under the ESOP during the year ended 30 June 2017. Employee share option plan (ESOP) An employee share option plan is in place where Directors and employees of the Company may be issued with options over the ordinary shares of the Company. Shareholders last approved the plan at the AGM held on 9 November 2012. The options, issued for nil consideration, are issued in accordance with guidelines established by the Directors of the Company. Each employee option converts to one ordinary share in the Company upon exercise. The options carry neither rights to dividends nor voting rights. Options may be exercised at any time from the date of vesting to the date of their expiry. The exercise price is set by reference to the volume weighted average price at which the Company’s shares trade on the Australian Securities Exchange (ASX) across an agreed period. The contractual term varies across the various issues but generally ranges from three to six years and there are no cash settlement alternatives for employees. No options were issued during the year ended 30 June 2018 (2017: nil) under the ESOP and the plan is not expected to be utilised going forward.
2018
NUMBER OF OPTIONS
2018
WEIGHTED AVERAGE EXERCISE VALUE $
2017
NUMBER OF OPTIONS
2017
WEIGHTED AVERAGE EXERCISE VALUE $
Balance at beginning of year 15,954,000 0.4661 23,960,000 0.4127
Granted during the year - - - -
Exercised during financial year (5,115,000) 0.2989 (7,906,000) 0.2634
Forfeitures (1,910,000) 0.6339 (100,000) 0.3127
Balance at end of year 8,929,000 0.5260 15,954,000 0.4661
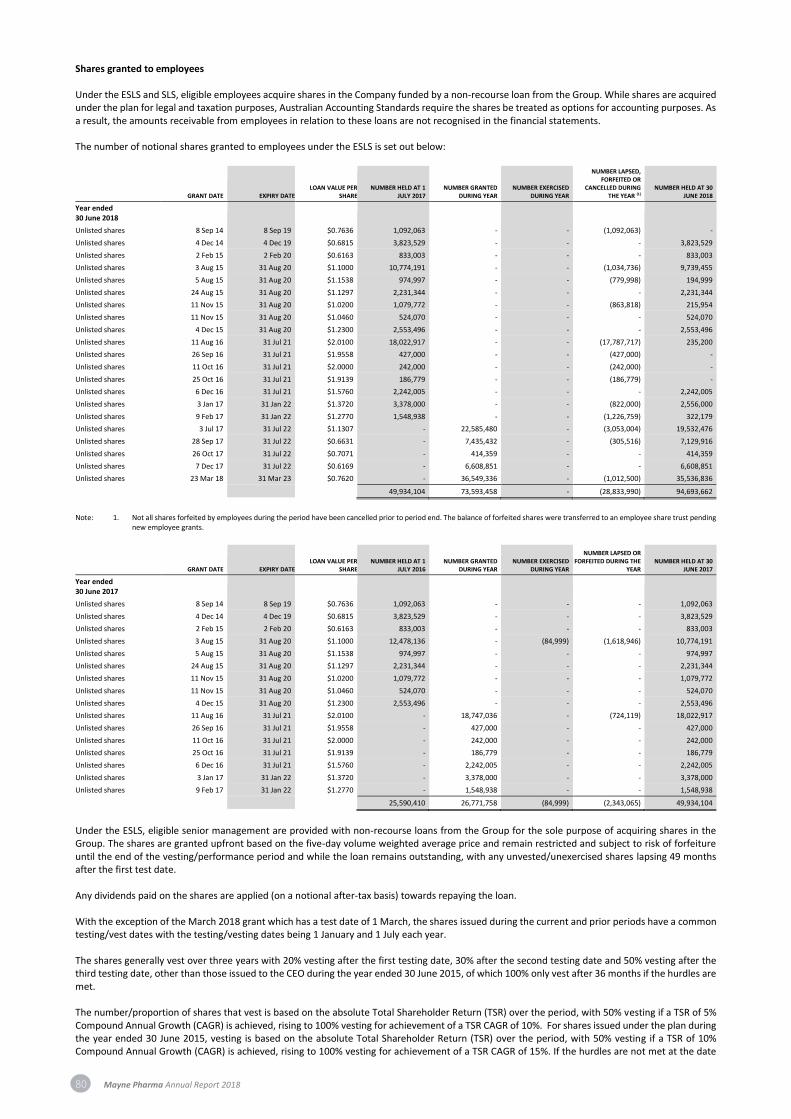
80 Mayne Pharma Annual Report 2018
Shares granted to employees Under the ESLS and SLS, eligible employees acquire shares in the Company funded by a non-recourse loan from the Group. While shares are acquired under the plan for legal and taxation purposes, Australian Accounting Standards require the shares be treated as options for accounting purposes. As a result, the amounts receivable from employees in relation to these loans are not recognised in the financial statements. The number of notional shares granted to employees under the ESLS is set out below:
GRANT DATE
EXPIRY DATE
LOAN VALUE PER SHARE
NUMBER HELD AT 1 JULY 2017
NUMBER GRANTED DURING YEAR
NUMBER EXERCISED DURING YEAR
NUMBER LAPSED, FORFEITED OR
CANCELLED DURING THE YEAR (1)
NUMBER HELD AT 30 JUNE 2018
Year ended 30 June 2018
Unlisted shares 8 Sep 14 8 Sep 19 $0.7636 1,092,063 - - (1,092,063) -
Unlisted shares 4 Dec 14 4 Dec 19 $0.6815 3,823,529 - - - 3,823,529
Unlisted shares 2 Feb 15 2 Feb 20 $0.6163 833,003 - - - 833,003
Unlisted shares 3 Aug 15 31 Aug 20 $1.1000 10,774,191 - - (1,034,736) 9,739,455
Unlisted shares 5 Aug 15 31 Aug 20 $1.1538 974,997 - - (779,998) 194,999
Unlisted shares 24 Aug 15 31 Aug 20 $1.1297 2,231,344 - - - 2,231,344
Unlisted shares 11 Nov 15 31 Aug 20 $1.0200 1,079,772 - - (863,818) 215,954
Unlisted shares 11 Nov 15 31 Aug 20 $1.0460 524,070 - - - 524,070
Unlisted shares 4 Dec 15 31 Aug 20 $1.2300 2,553,496 - - - 2,553,496
Unlisted shares 11 Aug 16 31 Jul 21 $2.0100 18,022,917 - - (17,787,717) 235,200
Unlisted shares 26 Sep 16 31 Jul 21 $1.9558 427,000 - - (427,000) -
Unlisted shares 11 Oct 16 31 Jul 21 $2.0000 242,000 - - (242,000) -
Unlisted shares 25 Oct 16 31 Jul 21 $1.9139 186,779 - - (186,779) -
Unlisted shares 6 Dec 16 31 Jul 21 $1.5760 2,242,005 - - - 2,242,005
Unlisted shares 3 Jan 17 31 Jan 22 $1.3720 3,378,000 - - (822,000) 2,556,000
Unlisted shares 9 Feb 17 31 Jan 22 $1.2770 1,548,938 - - (1,226,759) 322,179
Unlisted shares 3 Jul 17 31 Jul 22 $1.1307 - 22,585,480 - (3,053,004) 19,532,476
Unlisted shares 28 Sep 17 31 Jul 22 $0.6631 - 7,435,432 - (305,516) 7,129,916
Unlisted shares 26 Oct 17 31 Jul 22 $0.7071 - 414,359 - - 414,359
Unlisted shares 7 Dec 17 31 Jul 22 $0.6169 - 6,608,851 - - 6,608,851
Unlisted shares 23 Mar 18 31 Mar 23 $0.7620 - 36,549,336 - (1,012,500) 35,536,836
49,934,104 73,593,458 - (28,833,990) 94,693,662
Note: 1. Not all shares forfeited by employees during the period have been cancelled prior to period end. The balance of forfeited shares were transferred to an employee share trust pending
new employee grants.
GRANT DATE
EXPIRY DATE
LOAN VALUE PER SHARE
NUMBER HELD AT 1 JULY 2016
NUMBER GRANTED DURING YEAR
NUMBER EXERCISED DURING YEAR
NUMBER LAPSED OR FORFEITED DURING THE
YEAR NUMBER HELD AT 30
JUNE 2017
Year ended 30 June 2017
Unlisted shares 8 Sep 14 8 Sep 19 $0.7636 1,092,063 - - - 1,092,063
Unlisted shares 4 Dec 14 4 Dec 19 $0.6815 3,823,529 - - - 3,823,529
Unlisted shares 2 Feb 15 2 Feb 20 $0.6163 833,003 - - - 833,003
Unlisted shares 3 Aug 15 31 Aug 20 $1.1000 12,478,136 - (84,999) (1,618,946) 10,774,191
Unlisted shares 5 Aug 15 31 Aug 20 $1.1538 974,997 - - - 974,997
Unlisted shares 24 Aug 15 31 Aug 20 $1.1297 2,231,344 - - - 2,231,344
Unlisted shares 11 Nov 15 31 Aug 20 $1.0200 1,079,772 - - - 1,079,772
Unlisted shares 11 Nov 15 31 Aug 20 $1.0460 524,070 - - - 524,070
Unlisted shares 4 Dec 15 31 Aug 20 $1.2300 2,553,496 - - - 2,553,496
Unlisted shares 11 Aug 16 31 Jul 21 $2.0100 - 18,747,036 - (724,119) 18,022,917
Unlisted shares 26 Sep 16 31 Jul 21 $1.9558 - 427,000 - - 427,000
Unlisted shares 11 Oct 16 31 Jul 21 $2.0000 - 242,000 - - 242,000
Unlisted shares 25 Oct 16 31 Jul 21 $1.9139 - 186,779 - - 186,779
Unlisted shares 6 Dec 16 31 Jul 21 $1.5760 - 2,242,005 - - 2,242,005
Unlisted shares 3 Jan 17 31 Jan 22 $1.3720 - 3,378,000 - - 3,378,000
Unlisted shares 9 Feb 17 31 Jan 22 $1.2770 - 1,548,938 - - 1,548,938
25,590,410 26,771,758 (84,999) (2,343,065) 49,934,104
Under the ESLS, eligible senior management are provided with non-recourse loans from the Group for the sole purpose of acquiring shares in the Group. The shares are granted upfront based on the five-day volume weighted average price and remain restricted and subject to risk of forfeiture until the end of the vesting/performance period and while the loan remains outstanding, with any unvested/unexercised shares lapsing 49 months after the first test date. Any dividends paid on the shares are applied (on a notional after-tax basis) towards repaying the loan. With the exception of the March 2018 grant which has a test date of 1 March, the shares issued during the current and prior periods have a common testing/vest dates with the testing/vesting dates being 1 January and 1 July each year. The shares generally vest over three years with 20% vesting after the first testing date, 30% after the second testing date and 50% vesting after the third testing date, other than those issued to the CEO during the year ended 30 June 2015, of which 100% only vest after 36 months if the hurdles are met. The number/proportion of shares that vest is based on the absolute Total Shareholder Return (TSR) over the period, with 50% vesting if a TSR of 5% Compound Annual Growth (CAGR) is achieved, rising to 100% vesting for achievement of a TSR CAGR of 10%. For shares issued under the plan during the year ended 30 June 2015, vesting is based on the absolute Total Shareholder Return (TSR) over the period, with 50% vesting if a TSR of 10% Compound Annual Growth (CAGR) is achieved, rising to 100% vesting for achievement of a TSR CAGR of 15%. If the hurdles are not met at the date
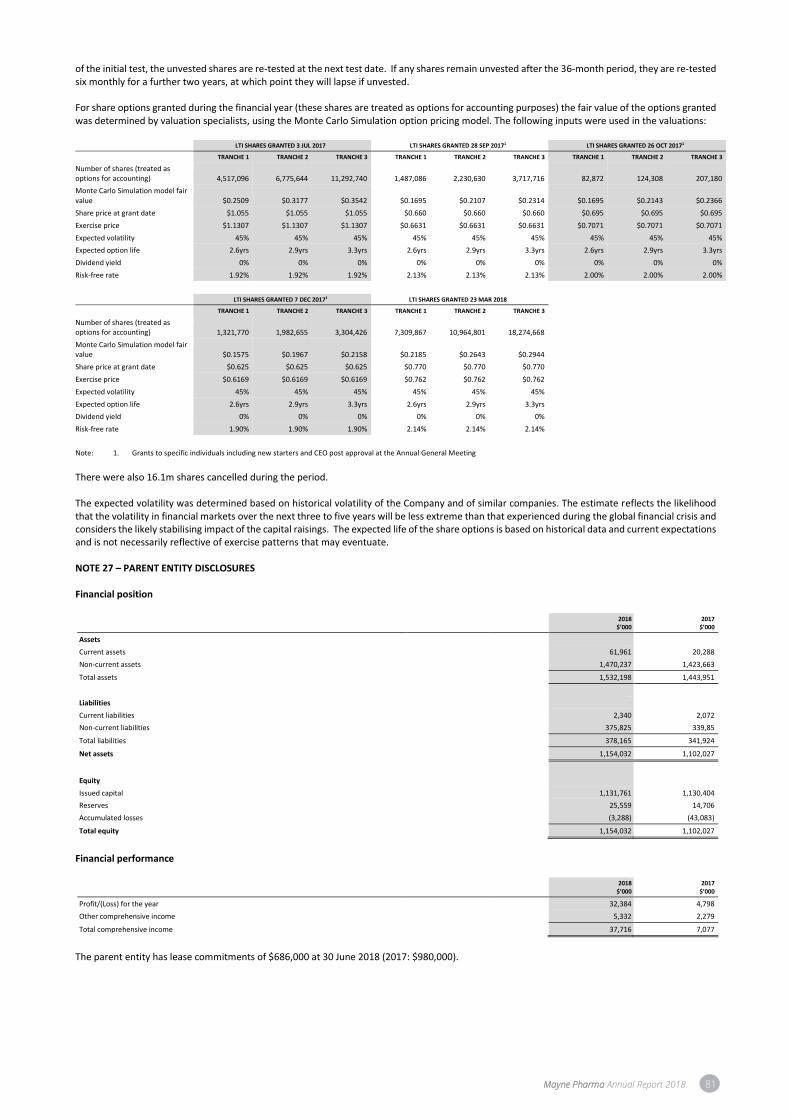
Mayne Pharma Annual Report 2018 81
of the initial test, the unvested shares are re-tested at the next test date. If any shares remain unvested after the 36-month period, they are re-tested six monthly for a further two years, at which point they will lapse if unvested. For share options granted during the financial year (these shares are treated as options for accounting purposes) the fair value of the options granted was determined by valuation specialists, using the Monte Carlo Simulation option pricing model. The following inputs were used in the valuations: LTI SHARES GRANTED 3 JUL 2017 LTI SHARES GRANTED 28 SEP 20171 LTI SHARES GRANTED 26 OCT 20171
TRANCHE 1 TRANCHE 2 TRANCHE 3 TRANCHE 1 TRANCHE 2 TRANCHE 3 TRANCHE 1 TRANCHE 2 TRANCHE 3
Number of shares (treated as options for accounting) 4,517,096 6,775,644 11,292,740 1,487,086 2,230,630 3,717,716 82,872 124,308 207,180
Monte Carlo Simulation model fair value $0.2509 $0.3177 $0.3542 $0.1695 $0.2107 $0.2314 $0.1695 $0.2143 $0.2366
Share price at grant date $1.055 $1.055 $1.055 $0.660 $0.660 $0.660 $0.695 $0.695 $0.695
Exercise price $1.1307 $1.1307 $1.1307 $0.6631 $0.6631 $0.6631 $0.7071 $0.7071 $0.7071
Expected volatility 45% 45% 45% 45% 45% 45% 45% 45% 45%
Expected option life 2.6yrs 2.9yrs 3.3yrs 2.6yrs 2.9yrs 3.3yrs 2.6yrs 2.9yrs 3.3yrs
Dividend yield 0% 0% 0% 0% 0% 0% 0% 0% 0%
Risk-free rate 1.92% 1.92% 1.92% 2.13% 2.13% 2.13% 2.00% 2.00% 2.00%
LTI SHARES GRANTED 7 DEC 20171 LTI SHARES GRANTED 23 MAR 2018
TRANCHE 1 TRANCHE 2 TRANCHE 3 TRANCHE 1 TRANCHE 2 TRANCHE 3
Number of shares (treated as options for accounting) 1,321,770 1,982,655 3,304,426 7,309,867 10,964,801 18,274,668
Monte Carlo Simulation model fair value $0.1575 $0.1967 $0.2158 $0.2185 $0.2643 $0.2944
Share price at grant date $0.625 $0.625 $0.625 $0.770 $0.770 $0.770
Exercise price $0.6169 $0.6169 $0.6169 $0.762 $0.762 $0.762
Expected volatility 45% 45% 45% 45% 45% 45%
Expected option life 2.6yrs 2.9yrs 3.3yrs 2.6yrs 2.9yrs 3.3yrs
Dividend yield 0% 0% 0% 0% 0% 0%
Risk-free rate 1.90% 1.90% 1.90% 2.14% 2.14% 2.14%
Note: 1. Grants to specific individuals including new starters and CEO post approval at the Annual General Meeting
There were also 16.1m shares cancelled during the period. The expected volatility was determined based on historical volatility of the Company and of similar companies. The estimate reflects the likelihood that the volatility in financial markets over the next three to five years will be less extreme than that experienced during the global financial crisis and considers the likely stabilising impact of the capital raisings. The expected life of the share options is based on historical data and current expectations and is not necessarily reflective of exercise patterns that may eventuate. NOTE 27 – PARENT ENTITY DISCLOSURES Financial position
2018 $’000
2017 $’000
Assets
Current assets 61,961 20,288
Non-current assets 1,470,237 1,423,663
Total assets 1,532,198 1,443,951
Liabilities
Current liabilities 2,340 2,072
Non-current liabilities 375,825 339,85
Total liabilities 378,165 341,924
Net assets 1,154,032 1,102,027
Equity
Issued capital 1,131,761 1,130,404
Reserves 25,559 14,706
Accumulated losses (3,288) (43,083)
Total equity 1,154,032 1,102,027
Financial performance
2018 $’000
2017 $’000
Profit/(Loss) for the year 32,384 4,798
Other comprehensive income 5,332 2,279
Total comprehensive income 37,716 7,077
The parent entity has lease commitments of $686,000 at 30 June 2018 (2017: $980,000).
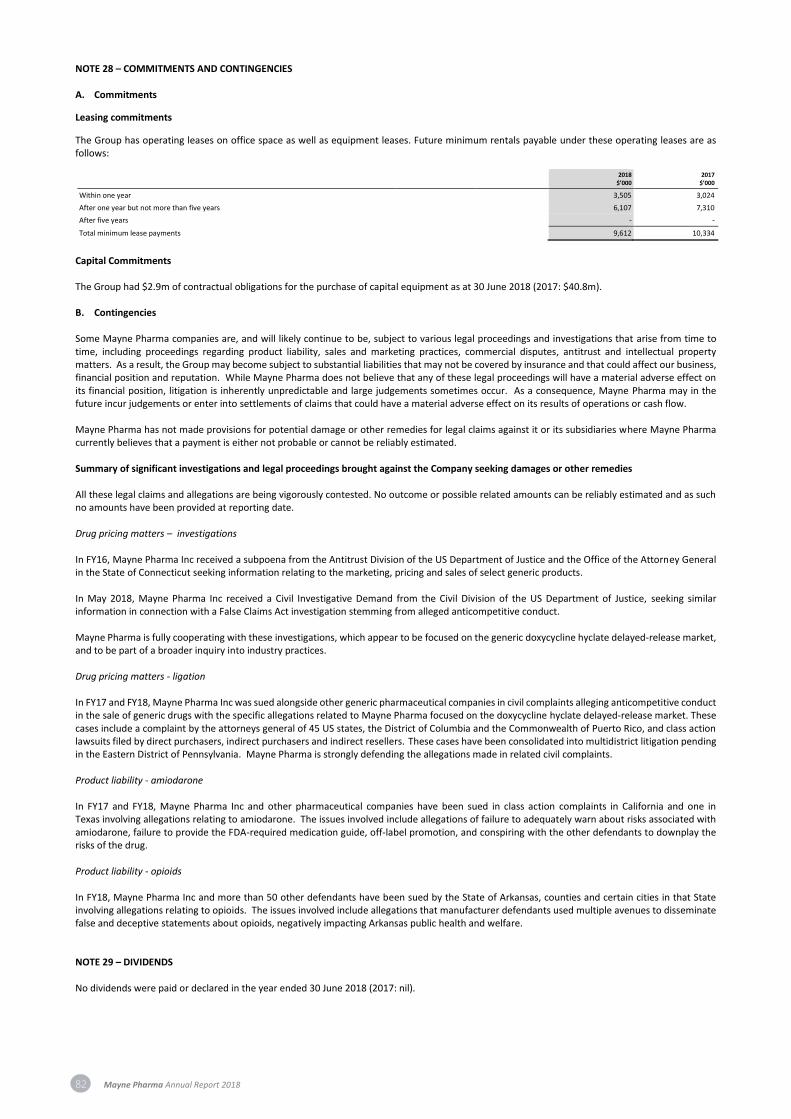
82 Mayne Pharma Annual Report 2018
NOTE 28 – COMMITMENTS AND CONTINGENCIES A. Commitments
Leasing commitments
The Group has operating leases on office space as well as equipment leases. Future minimum rentals payable under these operating leases are as follows:
2018 $’000
2017 $’000
Within one year 3,505 3,024
After one year but not more than five years 6,107 7,310
After five years - -
Total minimum lease payments 9,612 10,334
Capital Commitments The Group had $2.9m of contractual obligations for the purchase of capital equipment as at 30 June 2018 (2017: $40.8m). B. Contingencies Some Mayne Pharma companies are, and will likely continue to be, subject to various legal proceedings and investigations that arise from time to time, including proceedings regarding product liability, sales and marketing practices, commercial disputes, antitrust and intellectual property matters. As a result, the Group may become subject to substantial liabilities that may not be covered by insurance and that could affect our business, financial position and reputation. While Mayne Pharma does not believe that any of these legal proceedings will have a material adverse effect on its financial position, litigation is inherently unpredictable and large judgements sometimes occur. As a consequence, Mayne Pharma may in the future incur judgements or enter into settlements of claims that could have a material adverse effect on its results of operations or cash flow. Mayne Pharma has not made provisions for potential damage or other remedies for legal claims against it or its subsidiaries where Mayne Pharma currently believes that a payment is either not probable or cannot be reliably estimated. Summary of significant investigations and legal proceedings brought against the Company seeking damages or other remedies All these legal claims and allegations are being vigorously contested. No outcome or possible related amounts can be reliably estimated and as such no amounts have been provided at reporting date. Drug pricing matters – investigations In FY16, Mayne Pharma Inc received a subpoena from the Antitrust Division of the US Department of Justice and the Office of the Attorney General in the State of Connecticut seeking information relating to the marketing, pricing and sales of select generic products. In May 2018, Mayne Pharma Inc received a Civil Investigative Demand from the Civil Division of the US Department of Justice, seeking similar information in connection with a False Claims Act investigation stemming from alleged anticompetitive conduct. Mayne Pharma is fully cooperating with these investigations, which appear to be focused on the generic doxycycline hyclate delayed-release market, and to be part of a broader inquiry into industry practices. Drug pricing matters - ligation In FY17 and FY18, Mayne Pharma Inc was sued alongside other generic pharmaceutical companies in civil complaints alleging anticompetitive conduct in the sale of generic drugs with the specific allegations related to Mayne Pharma focused on the doxycycline hyclate delayed-release market. These cases include a complaint by the attorneys general of 45 US states, the District of Columbia and the Commonwealth of Puerto Rico, and class action lawsuits filed by direct purchasers, indirect purchasers and indirect resellers. These cases have been consolidated into multidistrict litigation pending in the Eastern District of Pennsylvania. Mayne Pharma is strongly defending the allegations made in related civil complaints. Product liability - amiodarone In FY17 and FY18, Mayne Pharma Inc and other pharmaceutical companies have been sued in class action complaints in California and one in Texas involving allegations relating to amiodarone. The issues involved include allegations of failure to adequately warn about risks associated with amiodarone, failure to provide the FDA-required medication guide, off-label promotion, and conspiring with the other defendants to downplay the risks of the drug. Product liability - opioids In FY18, Mayne Pharma Inc and more than 50 other defendants have been sued by the State of Arkansas, counties and certain cities in that State involving allegations relating to opioids. The issues involved include allegations that manufacturer defendants used multiple avenues to disseminate false and deceptive statements about opioids, negatively impacting Arkansas public health and welfare. NOTE 29 – DIVIDENDS No dividends were paid or declared in the year ended 30 June 2018 (2017: nil).
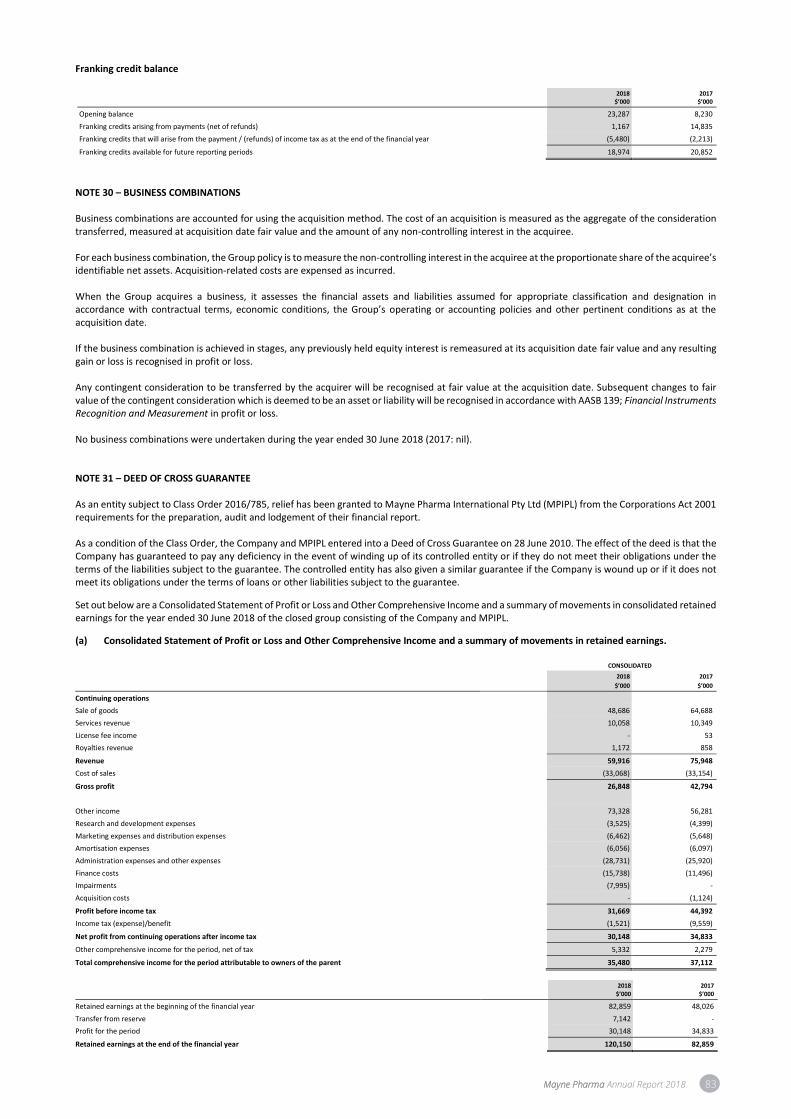
Mayne Pharma Annual Report 2018 83
Franking credit balance
2018 $’000
2017 $’000
Opening balance 23,287 8,230
Franking credits arising from payments (net of refunds) 1,167 14,835
Franking credits that will arise from the payment / (refunds) of income tax as at the end of the financial year (5,480) (2,213)
Franking credits available for future reporting periods 18,974 20,852
NOTE 30 – BUSINESS COMBINATIONS Business combinations are accounted for using the acquisition method. The cost of an acquisition is measured as the aggregate of the consideration transferred, measured at acquisition date fair value and the amount of any non-controlling interest in the acquiree. For each business combination, the Group policy is to measure the non-controlling interest in the acquiree at the proportionate share of the acquiree’s identifiable net assets. Acquisition-related costs are expensed as incurred. When the Group acquires a business, it assesses the financial assets and liabilities assumed for appropriate classification and designation in accordance with contractual terms, economic conditions, the Group’s operating or accounting policies and other pertinent conditions as at the acquisition date. If the business combination is achieved in stages, any previously held equity interest is remeasured at its acquisition date fair value and any resulting gain or loss is recognised in profit or loss. Any contingent consideration to be transferred by the acquirer will be recognised at fair value at the acquisition date. Subsequent changes to fair value of the contingent consideration which is deemed to be an asset or liability will be recognised in accordance with AASB 139; Financial Instruments Recognition and Measurement in profit or loss. No business combinations were undertaken during the year ended 30 June 2018 (2017: nil). NOTE 31 – DEED OF CROSS GUARANTEE As an entity subject to Class Order 2016/785, relief has been granted to Mayne Pharma International Pty Ltd (MPIPL) from the Corporations Act 2001 requirements for the preparation, audit and lodgement of their financial report. As a condition of the Class Order, the Company and MPIPL entered into a Deed of Cross Guarantee on 28 June 2010. The effect of the deed is that the Company has guaranteed to pay any deficiency in the event of winding up of its controlled entity or if they do not meet their obligations under the terms of the liabilities subject to the guarantee. The controlled entity has also given a similar guarantee if the Company is wound up or if it does not meet its obligations under the terms of loans or other liabilities subject to the guarantee.
Set out below are a Consolidated Statement of Profit or Loss and Other Comprehensive Income and a summary of movements in consolidated retained earnings for the year ended 30 June 2018 of the closed group consisting of the Company and MPIPL.
(a) Consolidated Statement of Profit or Loss and Other Comprehensive Income and a summary of movements in retained earnings. CONSOLIDATED
2018
$’000
2017
$’000
Continuing operations
Sale of goods 48,686 64,688
Services revenue 10,058 10,349
License fee income - 53
Royalties revenue 1,172 858
Revenue 59,916 75,948
Cost of sales (33,068) (33,154)
Gross profit 26,848 42,794
Other income 73,328 56,281
Research and development expenses (3,525) (4,399)
Marketing expenses and distribution expenses (6,462) (5,648)
Amortisation expenses (6,056) (6,097)
Administration expenses and other expenses (28,731) (25,920)
Finance costs (15,738) (11,496)
Impairments (7,995) -
Acquisition costs - (1,124)
Profit before income tax 31,669 44,392
Income tax (expense)/benefit (1,521) (9,559)
Net profit from continuing operations after income tax 30,148 34,833
Other comprehensive income for the period, net of tax 5,332 2,279
Total comprehensive income for the period attributable to owners of the parent 35,480 37,112
2018
$’000 2017
$’000
Retained earnings at the beginning of the financial year 82,859 48,026
Transfer from reserve 7,142 -
Profit for the period 30,148 34,833
Retained earnings at the end of the financial year 120,150 82,859

84 Mayne Pharma Annual Report 2018
(b) Consolidated Statement of Financial Position Set out below is a Consolidated Statement of Financial Position as at 30 June 2018 of the closed group consisting of the Company and MPIPL.
2018 $’000
2017 $’000
Current assets
Cash and cash equivalents 58,451 22,522
Trade and other receivables 6,293 7,059
Inventories 18,994 12,835
Income tax receivable 5,564 -
Other current assets 8,293 4,331
Total current assets 97,595 46,747
Non-current assets
Related party receivables 844,249 1,083,047
Investment in subsidiaries 587,232 332,066
Property, plant and equipment 51,996 39,462
Deferred tax assets 4,750 5,518
Intangible assets and goodwill 80,718 84,974
Total non-current assets 1,568,945 1,545,067
Total assets 1,666,540 1,591,814
Current liabilities
Trade and other payables 8,979 10,349
Interest-bearing loans and borrowings - 13,011
Provisions 3,362 3,664
Total current liabilities 12,341 27,024
Non-current liabilities
Interest-bearing loans and borrowings 374,110 327,039
Provisions 1,941 1,662
Deferred tax liabilities 7,360 8,119
Total non-current liabilities 383,411 336,820
Total liabilities 395,752 363,844
Net assets 1,270,788 1,227,970
Equity
Contributed equity 1,131,761 1,130,404
Reserves 18,877 14,707
Retained earnings/(accumulated losses) 120,150 82,859
Total equity 1,270,788 1,227,970
NOTE 32 – EVENTS SUBSEQUENT TO THE REPORTING PERIOD On 23 July 2018, Mayne Pharma announced it completed the acquisition of generic Efudex (fluorouracil cream 5%) from Spear Pharmaceuticals, Inc. for US$20.0 million (comprising US$16.0 million in cash and US$4.0 million in Mayne Pharma equity) plus contingent payments of up to US$10.0 million. The deferred payments are contingent upon competitive dynamics in the product market over the next three years. Spear’s generic Efudex net sales were US$3.0 million in the first quarter of calendar 2018. No other matter or circumstance has arisen since the reporting date which is not otherwise reflected in this report that significantly affected or may significantly affect the operations of the Group. NOTE 33 – NEW AND REVISED ACCOUNTING STANDARDS In the current year, the Group has adopted all new and revised Standards and Interpretations issued by the Australian Accounting Standards Board (the AASB) that are relevant to its operations and effective for the current annual reporting period. The adoption of these new and revised Standards and Interpretations did not have any material financial impact on the amounts recognised in the financial statements of the Group, however they may have impacted the disclosures presented in the financial statements. At the date of authorisation of the financial report, the following relevant Standards and Interpretations were issued but not yet effective:
(i) AASB 15 provides a single, principles-based five-step model to be applied to all contracts the Group has with its customers. Guidance is provided on topics such as the point at which revenue is recognised, accounting for variable consideration, costs of fulfilling and obtaining a contract and various related matters. New disclosures regarding revenue are also introduced. The Group has set up an implementation project plan and has appointed advisors to assist the Group’s management in assessing the impact of AASB 15. Preliminary work performed has focused on diagnosing the Group’s revenue streams against the requirements of the new standard but is not yet able to identify the specific areas within the Group which are expected to be impacted, nor is the Group able to make a quantitative determination as to the Standard’s impacts to its revenue streams. The Group expects to apply AASB 15 for the first time for the financial year ended 30 June 2019.
(ii) AASB 9 will change the classification and measurement of financial instruments, introduce new hedge accounting requirements including changes to hedge effectiveness testing, treatment of hedging costs, risk components that can be hedged and disclosures, and introduce a new expected loss impairment model that will require more timely recognition of expected credit losses. The Group expects to apply AASB 9 for the first time for the financial year ended 30 June 2019. The Group is currently assessing the impact of AASB 9. However, the Group does not expect it will have a material impact on the Group’s financial statements.

Mayne Pharma Annual Report 2018 85
(iii) AASB 16 Leases (effective 1 January 2019). This Standard requires lessees to account for all leases (including operating leases) in a similar way
to finance leases. At commencement of a lease, the Company will recognise a liability to make lease payments and an asset representing the right to use the underlying asset during the lease term. The Group has disclosed $9.6m of undiscounted operating lease commitments as at 30 June 2018 (refer to Note 28). Under AASB 16, the present value of these commitments would potentially be shown as a liability on the balance sheet together with an asset representing the right to use the underlying asset during the lease term. Depreciation of the lease asset and interest on the lease liability will be recognised over the lease term. The Group has not yet begun assessing the impact of AASB 16. However, the Standard is not expected to have a material impact on financial ratios for the syndicated loan facility as the Group does not consider the size of its operating lease commitments to be material.

86 Mayne Pharma Annual Report 2018
DIRECTORS’ DECLARATION In accordance with a resolution of the Directors of Mayne Pharma Group Limited, we state that: In the opinion of the Directors:
(a) The financial statements and notes of Mayne Pharma Group Limited for the financial year ended 30 June 2018 are in accordance with the
Corporations Act 2001, including:
(i) Giving a true and fair view of its financial position as at 30 June 2018 and performance for the financial year ended on that date; and (ii) Complying with Accounting Standards (including the Australian Accounting Interpretations) and Corporations Regulations 2001.
(b) There are reasonable grounds to believe that the Company will be able to pay its debts as and when they become due and payable. (c) There are reasonable grounds to believe that the members of the Closed Group identified in Note 31 will be able to meet any obligations or
liabilities to which they are or may become subject, by virtue of the Deed of Cross Guarantee. (d) The financial statements and notes also comply with the International Financial Reporting Standards as disclosed in Note 1A. This declaration has been made after receiving the declarations required to be made to the Directors in accordance with section 295A of the Corporations Act 2001 for the financial year ended 30 June 2018. On behalf of the Board
Mr Scott Richards Managing Director and CEO Dated at Melbourne, Australia this 24th day of August 2018.
Mayne Pharma Annual Report 2018 87
A member firm of Ernst & Young Global Limited Liability limited by a scheme approved under Professional Standards Legislation
INDEPENDENT AUDITOR’S REPORT
Independent Auditor's Report to the Members of Mayne Pharma Group Limited
Report on the Audit of the Financial Report
Opinion
We have audited the financial report of Mayne Pharma Group Limited (the Company) and its subsidiaries (collectively the Group), which comprises the consolidated statement of financial position as at 30 June 2018, the consolidated statement of profit or loss and other comprehensive income, consolidated statement of changes in equity and consolidated statement of cash flows for the year then ended, notes to the financial statements, including a summary of significant accounting policies, and the directors' declaration.
In our opinion, the accompanying financial report of the Group is in accordance with the Corporations Act 2001, including:
a) giving a true and fair view of the consolidated financial position of the Group as at 30 June 2018 and of its consolidated financial performance for the year ended on that date; and
b) complying with Australian Accounting Standards and the Corporations Regulations 2001.
Basis for Opinion
We conducted our audit in accordance with Australian Auditing Standards. Our responsibilities under those standards are further described in the Auditor’s Responsibilities for the Audit of the Financial Report section of our report. We are independent of the Group in accordance with the auditor independence requirements of the Corporations Act 2001 and the ethical requirements of the Accounting Professional and Ethical Standards Board’s APES 110 Code of Ethics for Professional Accountants (the Code) that are relevant to our audit of the financial report in Australia. We have also fulfilled our other ethical responsibilities in accordance with the Code.
We believe that the audit evidence we have obtained is sufficient and appropriate to provide a basis for our opinion.
Key Audit Matters
Key audit matters are those matters that, in our professional judgment, were of most significance in our audit of the financial report of the current year. These matters were addressed in the context of our audit of the financial report as a whole, and in forming our opinion thereon, but we do not provide a separate opinion on these matters. For each matter below, our description of how our audit addressed the matter is provided in that context.
We have fulfilled the responsibilities described in the Auditor’s Responsibilities for the Audit of the Financial Report section of our report, including in relation to these matters. Accordingly, our audit included the performance of procedures designed to respond to our assessment of the risks of material misstatement of the financial report. The results of our audit procedures, including the procedures performed to address the matters below, provide the basis for our audit opinion on the accompanying financial report.
Ernst & Young Tel: +61 3 9288 8000 8 Exhibition Street Fax: +61 3 8650 7777 Melbourne VIC 3000 Australia ey.com/au GPO Box 67 Melbourne VIC 3001
88 Mayne Pharma Annual Report 2018
A member firm of Ernst & Young Global Limited Liability limited by a scheme approved under Professional Standards Legislation
Chargebacks, rebates, returns and related accruals (“gross to net sales adjustments”)
Why significant How our audit addressed the key audit matter
In respect of the Group’s operations in the United States of America, distribution of products to its ultimate customer
occurs in many cases through wholesale distributors. The
ultimate net selling price is determined based on the
contractual arrangements that the Group has with its indirect
customers such as retail pharmacy chains and the ultimate
patient’s insurer or other payment programs, whom purchase
the Group’s products from the wholesale distributors.
Revenue for products sold is recognised when the risks and
rewards are passed upon shipment to the distributor. This
requires an estimate of the net selling price at that time, taking
into consideration different elements such as chargebacks,
rebates, returns and related accruals (collectively known as
‘gross-to-net’ sales adjustments). The estimate depends on
customer specific contract terms and regulations, as well as
customer forecast sales mix at its weighted average sales
prices, trade volumes, inventories held by the distributor and
historical trend of customer product returns. The dispensing of
the product to the patient (being the end users) and the final
determination of the actual selling price may be several months
later.
This is a significant area and a key audit matter as the estimation processes involve large volumes of data processed
through the contract management system and is highly
judgmental, and as such we focused our audit procedures on
these gross to net adjustments with particular focus on the
gross accrual recorded at balance date and trade receivables
(where chargebacks are recorded on a net basis).
The gross accrual accounted for against revenues amounted to
$143.4 million (equivalent to US$106.2 million) at reporting
date. The Group’s accounting policies and significant
accounting estimates for this key audit matter are disclosed in
Notes 9 and 15 of the financial report.
With respect to the contract management system that produced the underlying source data, we agreed a sample of
signed and authorised contracts to the details in the contract
management system to confirm the integrity and accuracy of
the data.
For each accrual we agreed the material estimates, on a sample
basis, to underlying supporting documentation such as actual
sales, settlements and/or reclassification between the elements
of gross-to-net sales adjustments. For each of the estimated
accruals, we tested the mathematical accuracy of the
calculations and assessed the integrity of the data used in the
calculations.
We assessed the inputs used in the calculations including
product returns, weighted average sales prices and inventory
levels which remain unsold by the distributor, taking into
account historical trends and specific circumstances at
reporting date, to the underlying supporting documentation.
Based on the historical data and trends our audit
procedures included the following:
Developed an expectation on expected gross to net
accrual balances and compared this to the recorded
accrual balances and where material variances were
identified we obtained supporting evidence.
Analysed and assessed actual claims made in previous
periods to evaluate the Group’s historical accuracy in
estimating the gross to net sales adjustments.
Agreed a sample of transactions processed in the
contract management system during the period to source
documents such as signed customer contracts and claim
details such as chargeback rates, product details,
wholesaler details.
Assessed claims made subsequent to balance date and
considered whether these were appropriately treated at
reporting date.
Analysed credit notes and payments (on a sample basis)
throughout the year and post year-end, and assessed the
impact to accruals recorded during the period.

Mayne Pharma Annual Report 2018 89
A member firm of Ernst & Young Global Limited Liability limited by a scheme approved under Professional Standards Legislation
Carrying value of intangible assets including goodwill
Why significant How our audit addressed the key audit matter
At 30 June 2018, the Group held $1,054.5 million in intangible assets including goodwill, customer contracts and
relationships, product rights and intellectual property, in-
process development expenditure, marketing and
distribution rights and trade names. These include both
finite and indefinite lived intangible assets as disclosed in
Note 14 of the financial report.
At a minimum, the Group performs an annual impairment assessment of indefinite lived intangible assets including
finite lived intangible assets if these are considered to
display indicators of impairment. These assets are assessed
either on an individual asset basis or in the Cash Generating
Unit (“CGUs”) to which the assets belong.
An impairment indicator existed at 31 December 2017 in
the form of industry-wide generic pharmaceutical pricing
pressures in the United States. The range of judgments and
assumptions relating to revenue growth, profit margins,
research and development and overhead costs, foreign
exchange and discount rates used in the Group’s
impairment assessments, results in this area being
considered a key audit matter.
In respect of in-process development expenditure, the
range of judgments and assumptions relating to project
milestone achievement, regulatory approval processes and
ongoing updates of market viability of individual projects,
results in this area being considered a key audit matter.
At 31 December 2017, the Group processed an
impairment charge of $184.4 million across
intangible assets, including goodwill.
The Group performed a further impairment
assessment at 30 June 2018.
Note 14 of the financial report provides disclosure of the Group’s impairment assessments and highlights the
impact of reasonably possible changes to key
assumptions as required by Australian Accounting
Standards.
We assessed the Group’s determination of impairment indicators and whether CGUs were appropriately determined. We tested the
mathematical accuracy of the Group’s value-in-use models and
evaluated the assumptions and methodologies used by the Group.
Where appropriate, we involved our valuation specialists to assist
with the execution of these procedures.
In respect of the Group’s impairment assessment of CGUs
containing indefinite and finite lived assets and in-process
development expenditure with impairment indicators, including
goodwill, our audit procedures included the following:
Assessed the key judgments and estimates contained within
the cash flows prepared by the Group with reference to
available supporting calculations and external data (where
available) including revenue growth rates, profit margins and
terminal growth rates.
Assessed the current year actual results in comparison to
the prior year Board approved budget in order to assess
forecast accuracy.
Assessed the appropriateness of the discount rates for each
CGU by comparing this to external market data of comparable
companies.
In respect of capitalised in-process development
expenditure:
assessed a sample of projects and their status against
plan, including milestone achievement for the period;
obtained and considered any regulator correspondence for the sample of projects selected;
reviewed the status reports produced by the Group’s
R&D Investment Committee for the period; and
assessed any updates made by the Group to the initial project feasibility assessments.
Considered the implied earnings multiples suggested by the
value-in-use models of each CGU against the earnings
multiples of other comparable companies for each respective
CGU.
Performed sensitivity analysis in respect of the key
assumptions to ascertain the extent to which changes in those
assumptions would either individually or collectively be
required for the intangible assets to be impaired.
We also assessed the adequacy of disclosures made in the financial
report as required by Australian Accounting Standards.
90 Mayne Pharma Annual Report 2018
A member firm of Ernst & Young Global Limited Liability limited by a scheme approved under Professional Standards Legislation
Capitalisation of in-process development expenditure
Why significant How our audit addressed the key audit matter
The Group held $102.2 million in capitalised in-process development expenditure at 30 June 2018.
The Group capitalises qualifying development
expenditure on the basis of its products being generic
alternatives to already proven and regulator approved,
in-market original medical therapies. Where these criteria are
not met, the Group expenses its research and development
activities.
The capitalisation of development expenditure was
considered a key audit matter as development activities are
subject to uncertainties and judgmental assumptions as to
the probability of scientific success, the timing of regulatory
approval processes, as well as the ongoing future market
viability of the relevant products from project initiation date
to approved product launch date.
Capitalised development costs are amortised once the
product is available for use; normally from when
regulatory approval is obtained.
Refer to Note 14 of the financial report for disclosure
relating to capitalised development costs.
We tested the mathematical accuracy of the Group’s capitalised development expenditure model and evaluated the key
assumptions and methodologies used by the Group. We
performed the following procedures in respect of the
development expenditure capitalised:
Assessed the nature and appropriateness of the costs
incurred that have been assessed by Group as directly
attributable to the development activities of the relevant
projects, and tested the consistency of the capitalisation
approach taken across the portfolio during the year and in
previous periods.
Agreed a sample of costs capitalised, including salaries and
overhead costs, to timesheets and other supporting
documentation and assessed whether these met the
capitalization criteria set out in Australian Accounting
Standards.
In respect of projects that are no longer considered viable,
we determined whether any carrying amount had been
appropriately written off, and
In respect of projects that have received regulatory
approval, we assessed the useful life and amortisation rate
allocated to these capitalised development costs.
We also assessed the adequacy of the related
disclosures made in the financial report.
Information Other than the Financial Report and Auditor’s Report
The directors are responsible for the other information. The other information comprises the information included in the Company’s 2018 Annual Report other than the financial report and our auditor’s report thereon. We obtained the Directors’ Report that is to be included in the Annual Report, prior to the date of this auditor’s report, and we expect to obtain the remaining sections of the Annual Report after the date of this auditor’s report. Our opinion on the financial report does not cover the other information and we do not and will not express any form of assurance conclusion thereon, with the exception of the Remuneration Report and our related assurance opinion. In connection with our audit of the financial report, our responsibility is to read the other information and, in doing so, consider whether the other information is materially inconsistent with the financial report or our knowledge obtained in the audit or otherwise appears to be materially misstated. If, based on the work we have performed on the other information obtained prior to the date of this auditor’s report, we conclude that there is a material misstatement of this other information, we are required to report that fact. We have nothing to report in this regard.

Mayne Pharma Annual Report 2018 91
A member firm of Ernst & Young Global Limited Liability limited by a scheme approved under Professional Standards Legislation
Responsibilities of the Directors for the Financial Report
The directors of the Company are responsible for the preparation of the financial report that gives a true and fair view in accordance with Australian Accounting Standards and the Corporations Act 2001 and for such internal control as the directors determine is necessary to enable the preparation of the financial report that gives a true and fair view and is free from material misstatement, whether due to fraud or error. In preparing the financial report, the directors are responsible for assessing the Group’s ability to continue as a going concern, disclosing, as applicable, matters relating to going concern and using the going concern basis of accounting unless the directors either intend to liquidate the Group or to cease operations, or have no realistic alternative but to do so.
Auditor's Responsibilities for the Audit of the Financial Report
Our objectives are to obtain reasonable assurance about whether the financial report as a whole is free from material misstatement, whether due to fraud or error, and to issue an auditor’s report that includes our opinion. Reasonable assurance is a high level of assurance, but is not a guarantee that an audit conducted in accordance with the Australian Auditing Standards will always detect a material misstatement when it exists. Misstatements can arise from fraud or error and are considered material if, individually or in the aggregate, they could reasonably be expected to influence the economic decisions of users taken on the basis of this financial report. As part of an audit in accordance with the Australian Auditing Standards, we exercise professional judgment and maintain professional scepticism throughout the audit. We also:
Identify and assess the risks of material misstatement of the financial report, whether due to fraud or error,
design and perform audit procedures responsive to those risks, and obtain audit evidence that is sufficient and
appropriate to provide a basis for our opinion. The risk of not detecting a material misstatement resulting from
fraud is higher than for one resulting from error, as fraud may involve collusion, forgery, intentional omissions,
misrepresentations, or the override of internal control.
Obtain an understanding of internal control relevant to the audit in order to design audit procedures that are
appropriate in the circumstances, but not for the purpose of expressing an opinion on the effectiveness of the
Group’s internal control.
Evaluate the appropriateness of accounting policies used and the reasonableness of accounting estimates and
related disclosures made by the directors.
Conclude on the appropriateness of the directors’ use of the going concern basis of accounting and, based on
the audit evidence obtained, whether a material uncertainty exists related to events or conditions that may
cast significant doubt on the Group’s ability to continue as a going concern. If we conclude that a material
uncertainty exists, we are required to draw attention in our auditor’s report to the related disclosures in the
financial report or, if such disclosures are inadequate, to modify our opinion. Our conclusions are based on the
audit evidence obtained up to the date of our auditor’s report. However, future events or conditions may
cause the Group to cease to continue as a going concern.
Evaluate the overall presentation, structure and content of the financial report, including the disclosures, and
whether the financial report represents the underlying transactions and events in a manner that achieves fair
presentation.
92 Mayne Pharma Annual Report 2018
A member firm of Ernst & Young Global Limited Liability limited by a scheme approved under Professional Standards Legislation
Obtain sufficient appropriate audit evidence regarding the financial information of the entities or business
activities within the Group to express an opinion on the financial report. We are responsible for the direction,
supervision and performance of the Group audit. We remain solely responsible for our audit opinion.
We communicate with the directors regarding, among other matters, the planned scope and timing of the audit and significant audit findings, including any significant deficiencies in internal control that we identify during our audit. We also provide the directors with a statement that we have complied with relevant ethical requirements regarding independence, and to communicate with them all relationships and other matters that may reasonably be thought to bear on our independence, and where applicable, related safeguards. From the matters communicated to the directors, we determine those matters that were of most significance in the audit of the financial report of the current year and are therefore the key audit matters. We describe these matters in our auditor’s report unless law or regulation precludes public disclosure about the matter or when, in extremely rare circumstances, we determine that a matter should not be communicated in our report because the adverse consequences of doing so would reasonably be expected to outweigh the public interest benefits of such communication.
Report on the Audit of the Remuneration Report
Opinion on the Remuneration Report
We have audited the Remuneration Report included in pages 37 to 43 of the directors' report for the year ended 30 June 2018. In our opinion, the Remuneration Report of Mayne Pharma Group Limited for the year ended 30 June 2018, complies with section 300A of the Corporations Act 2001. Responsibilities
The directors of the Company are responsible for the preparation and presentation of the Remuneration Report in accordance with section 300A of the Corporations Act 2001. Our responsibility is to express an opinion on the Remuneration Report, based on our audit conducted in accordance with Australian Auditing Standards. Ernst & Young
Ashley Butler Partner Melbourne 24 August 2018
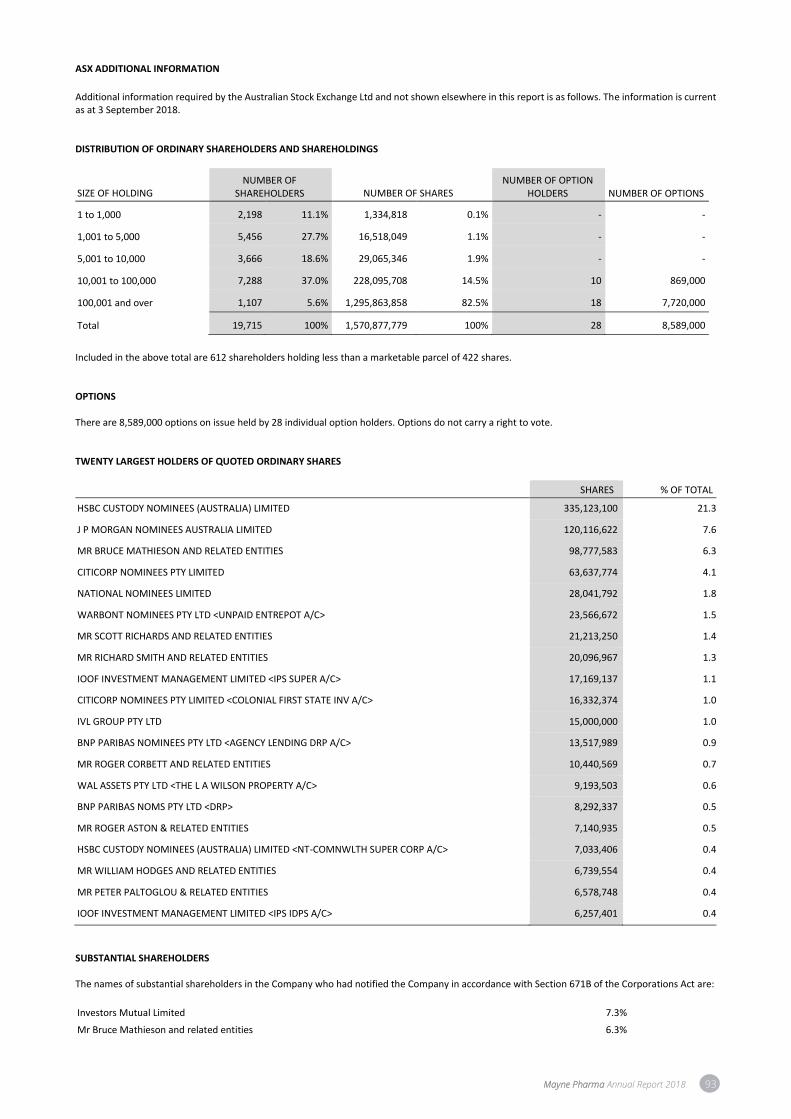
Mayne Pharma Annual Report 2018 93
ASX ADDITIONAL INFORMATION
Additional information required by the Australian Stock Exchange Ltd and not shown elsewhere in this report is as follows. The information is current as at 3 September 2018. DISTRIBUTION OF ORDINARY SHAREHOLDERS AND SHAREHOLDINGS
SIZE OF HOLDING NUMBER OF
SHAREHOLDERS NUMBER OF SHARES NUMBER OF OPTION
HOLDERS
NUMBER OF OPTIONS
1 to 1,000 2,198 11.1% 1,334,818 0.1% - -
1,001 to 5,000 5,456 27.7% 16,518,049 1.1% - -
5,001 to 10,000 3,666 18.6% 29,065,346 1.9% - -
10,001 to 100,000 7,288 37.0% 228,095,708 14.5% 10 869,000
100,001 and over 1,107 5.6% 1,295,863,858 82.5% 18 7,720,000
Total 19,715 100% 1,570,877,779 100% 28 8,589,000
Included in the above total are 612 shareholders holding less than a marketable parcel of 422 shares. OPTIONS There are 8,589,000 options on issue held by 28 individual option holders. Options do not carry a right to vote. TWENTY LARGEST HOLDERS OF QUOTED ORDINARY SHARES
SHARES % OF TOTAL
HSBC CUSTODY NOMINEES (AUSTRALIA) LIMITED 335,123,100 21.3
J P MORGAN NOMINEES AUSTRALIA LIMITED 120,116,622 7.6
MR BRUCE MATHIESON AND RELATED ENTITIES 98,777,583 6.3
CITICORP NOMINEES PTY LIMITED 63,637,774 4.1
NATIONAL NOMINEES LIMITED 28,041,792 1.8
WARBONT NOMINEES PTY LTD <UNPAID ENTREPOT A/C> 23,566,672 1.5
MR SCOTT RICHARDS AND RELATED ENTITIES 21,213,250 1.4
MR RICHARD SMITH AND RELATED ENTITIES 20,096,967 1.3
IOOF INVESTMENT MANAGEMENT LIMITED <IPS SUPER A/C> 17,169,137 1.1
CITICORP NOMINEES PTY LIMITED <COLONIAL FIRST STATE INV A/C> 16,332,374 1.0
IVL GROUP PTY LTD 15,000,000 1.0
BNP PARIBAS NOMINEES PTY LTD <AGENCY LENDING DRP A/C> 13,517,989 0.9
MR ROGER CORBETT AND RELATED ENTITIES 10,440,569 0.7
WAL ASSETS PTY LTD <THE L A WILSON PROPERTY A/C> 9,193,503 0.6
BNP PARIBAS NOMS PTY LTD <DRP> 8,292,337 0.5
MR ROGER ASTON & RELATED ENTITIES 7,140,935 0.5
HSBC CUSTODY NOMINEES (AUSTRALIA) LIMITED <NT-COMNWLTH SUPER CORP A/C> 7,033,406 0.4
MR WILLIAM HODGES AND RELATED ENTITIES 6,739,554 0.4
MR PETER PALTOGLOU & RELATED ENTITIES 6,578,748 0.4
IOOF INVESTMENT MANAGEMENT LIMITED <IPS IDPS A/C> 6,257,401 0.4
SUBSTANTIAL SHAREHOLDERS The names of substantial shareholders in the Company who had notified the Company in accordance with Section 671B of the Corporations Act are:
Investors Mutual Limited 7.3%
Mr Bruce Mathieson and related entities 6.3%
94 Mayne Pharma Annual Report 2018
INTELLECTUAL PROPERTY & GLOSSARY Astrix®, Doryx®, Eryc®, Fabior®, Kapanol®, Lozanoc®, Luxiq®, Magnoplasm®, Myxazole®, Olux-E®, Sorilux® and SUBA® are registered trademarks of the Consolidated Entity. Acticlate®, BUPAP®, Clozaril®, Cordarone®, Cytomel®, Efudex®, Kapvay®, Monodox®, Monurol®, Myring®, Noxafil®, Nuvaring®, Quartette®, Ranexa®, Tazorac® and Urorec® are registered trademarks of third parties. For further information on Mayne Pharma’s products, refer to the product section of the Company’s website, http://www.maynepharma.com/products/us-products/ or http://www.maynepharma.com/products/australian-products/. GLOSSARY ANDA – Abbreviated New Drug Application. An application to market a generic drug in the USA. Generic drug applications are called "abbreviated" because they are generally not required to include preclinical (animal) and clinical (human) data to establish safety and effectiveness. Instead, a generic applicant must scientifically demonstrate that its product is bioequivalent (i.e., performs in the same manner as the innovator drug). Once approved, an applicant may manufacture and market the generic drug product to provide a safe, effective, low cost alternative to the American public. API - Active Pharmaceutical Ingredient. An active ingredient is any component that provides pharmacological activity or other direct effect in the diagnosis, cure, mitigation, treatment, or prevention of disease, or to affect the structure or any function of the body of man or animals. BA – Bioavailability. A measure of the fraction of a drug that enters the systemic blood circulation after oral administration. BE – Bioequivalence. Two drug products are considered bioequivalent if they exhibit the "same" Cmax, Tmax and AUC in a properly powered pharmacokinetic study. In other words the two drug products have the plot of "drug concentration in plasma" against "time". The actual definition of "same" when applied to the pharmacokinetic parameters varies from country to country. If two drug products are bioequivalent then it is assumed that they are therapeutically equivalent. A bioequivalence study is the cornerstone of an ANDA or any generic drug application, because for the reasons given here, bioequivalence obviates the need to perform long and expensive clinical studies. DR - Delayed Release. A drug product (typically oral) that is not intended to release the drug substance immediately after ingestion. The delay is commonly related to change of pH in the gastrointestinal tract ("enteric coating") or less commonly may relate to a specific time after ingestion when the drug is released. Enteric coating is achieved by coating with polymers that are poorly soluble in low pH media (for example gastric fluid), but are soluble in media with pH values typically found lower in the intestine. FDA – US Food and Drug Administration. The US FDA is responsible for protecting public health by assuring the safety, efficacy and security of, amongst other things, human drugs. NDA - New Drug Application. When the sponsor of a new drug believes that enough evidence on the drug's safety and effectiveness has been obtained to meet FDA's requirements for marketing approval, the sponsor submits to FDA a new drug application (NDA). The application must contain data from specific technical viewpoints for review, including chemistry, pharmacology, medical, biopharmaceutics, and statistics. If the NDA is approved, the product may be marketed in the United States. OTC - Over-the-Counter pharmaceuticals. Products that are considered safe and effective by the FDA and TGA for use by the general public without a doctor's prescription. PIV - Paragraph IV filing. A type of filing to support the approval of an ANDA submitted while the originator product is covered by a patent. The filing asserts that either the patents supporting the originator product are invalid or that they are not applicable to the product that is the subject of the ANDA. PK – Pharmacokinetics. The study of the time course of the way the body handles drugs. There are four essential processes following a person’s ingestion of a tablet or other oral dosage form, collectively known as ADME processes (Absorption of the drug from the gut; Distribution of the drug into other body tissues; Metabolism of the drug to other chemicals (metabolites) and Elimination of the drug from the body). This time course is typically followed by taking blood samples from volunteers at time intervals following swallowing a tablet and measuring the amount of drug and / or metabolites in the plasma. A plot can be constructed of plasma concentration against time from which various PK parameters such as Cmax, Tmax and AUC can be derived. TGA – Therapeutic Goods Administration. The TGA is Australia's regulatory authority for therapeutic goods.
Corporate information
DIRECTORS
• Mr Roger Corbett, AO
(Chairman)
• Mr Scott Richards
(Managing Director and CEO)
• Hon. Ron Best
• Mr Patrick Blake
• Mr Frank Condella
• Mr Bruce Mathieson
• Mr Ian Scholes
• Mr William (Phil) Hodges
• Prof Bruce Robinson
• Ms Nancy Dolan
COMPANY SECRETARY
Mr Nick Freeman
INVESTOR RELATIONS
Ms Lisa Pendlebury (Vice President Investor
Relations & Communications)
Telephone: +61 3 8614 7777
REGISTERED OFFICE
1538 Main North Road, Salisbury South
South Australia 5106
Telephone: +61 8 8209 2666
PRINCIPAL PLACES OF BUSINESS
• 1538 Main North Road, Salisbury South
South Australia 5106
• 1240 Sugg Parkway, Greenville
North Carolina 27834 USA
AUDITORS
EY Australia8 Exhibition Street
Melbourne VIC 3000
SOLICITORS
Minter Ellison LawyersRialto Towers, 525 Collins Street
Melbourne VIC 3000
SHARE REGISTRY
Computershare Investor Services Pty LtdYarra Falls, 452 Johnston Street
Abbotsford VIC 3067
Telephone: (03) 9415 4184
Facsimile: (03) 9473 2500
BANKERS
Westpac150 Collins Street
Melbourne VIC 3000
ABN
76 115 832 963
DOMICILE AND COUNTRY OF
INCORPORATION
Australia
LEGAL FORM OF ENTITY
Public company listed on the Australian
Securities Exchange (MYX)
Mayne Pharma Annual Report 2018 95

Mayne Pharm
a Annual Report 2018
Mayne Pharma Group LimitedABN 76 115 832 963maynepharma.com
Related Documents