Annual Report 2018

Welcome message from author
This document is posted to help you gain knowledge. Please leave a comment to let me know what you think about it! Share it to your friends and learn new things together.
Transcript

Annual Report
2018

ANNUAL REPORT 20182 | ANNUAL REPORT 2018 | 3
Scanfil is a global contract manufacturer for the electronics industry
GENERAL
3 Scanfilinbrief
4 Keyfigures2018
6 CEO’sReview
10 Coremessages
12 ResponsibilityinScanfil
14 Responsiblebusiness
18 Customersandsuppliers
20 Environmentalandfinancialresponsibility
22 Scanfilasanemployerandworkcommunity
FINANCIAL INFORMATION
25 BoardofDirectors’report
30 Sharesandshareholders
32 Keyindicators
33 Definitionsofkeyrations
FINANCIAL STATEMETS
34 Consolidatedincomestatement
35 Consolidatedbalancesheet
36 Consolidatedcashflowstatement,
37 Statementofchangesinequity
38 Accountingprinciplesforconsolidatedfinancialstatements
42 Notestoconsolidatedfinancialstatements
73 Theparentcompany’sincomestatement
74 Theparentcompany’sbalancesheet
76 Theparentcompany’scashflowstatement
77 Theparentcompany’saccountingprinciples
77 Notestotheparentcompany’sfinancialstatements
84 Boardofdirectors’proposalforthedistributionofprofit
84 SignaturestotheBoardofDirector’sreportandfinancialstatemets
85 Auditor’sreport
88 Corporategovernancestatement2018
92 Boardofdirectors
93 Managementteam
94 Informationtoshareholders
Scanfil’s 2018 annual report is an integrated report, combining descriptions of business activities and corporate responsibility. We have previously published a separate annual report and a report on non-financial information. Now, we have combined these reports, since the fulfillment of corporate responsibility is an integral part of the development and success of our business activities.
During 2017, we defined the key themes of Scanfil’s corporate responsibility and corresponding key figures. The goal of responsibility reporting is to distribute more information about Scanfil’s activities, operating methods, goals and achievements to all stakeholders. At the same time, the report acts as a tool for the continuous development of responsibility.
Enjoy the read!
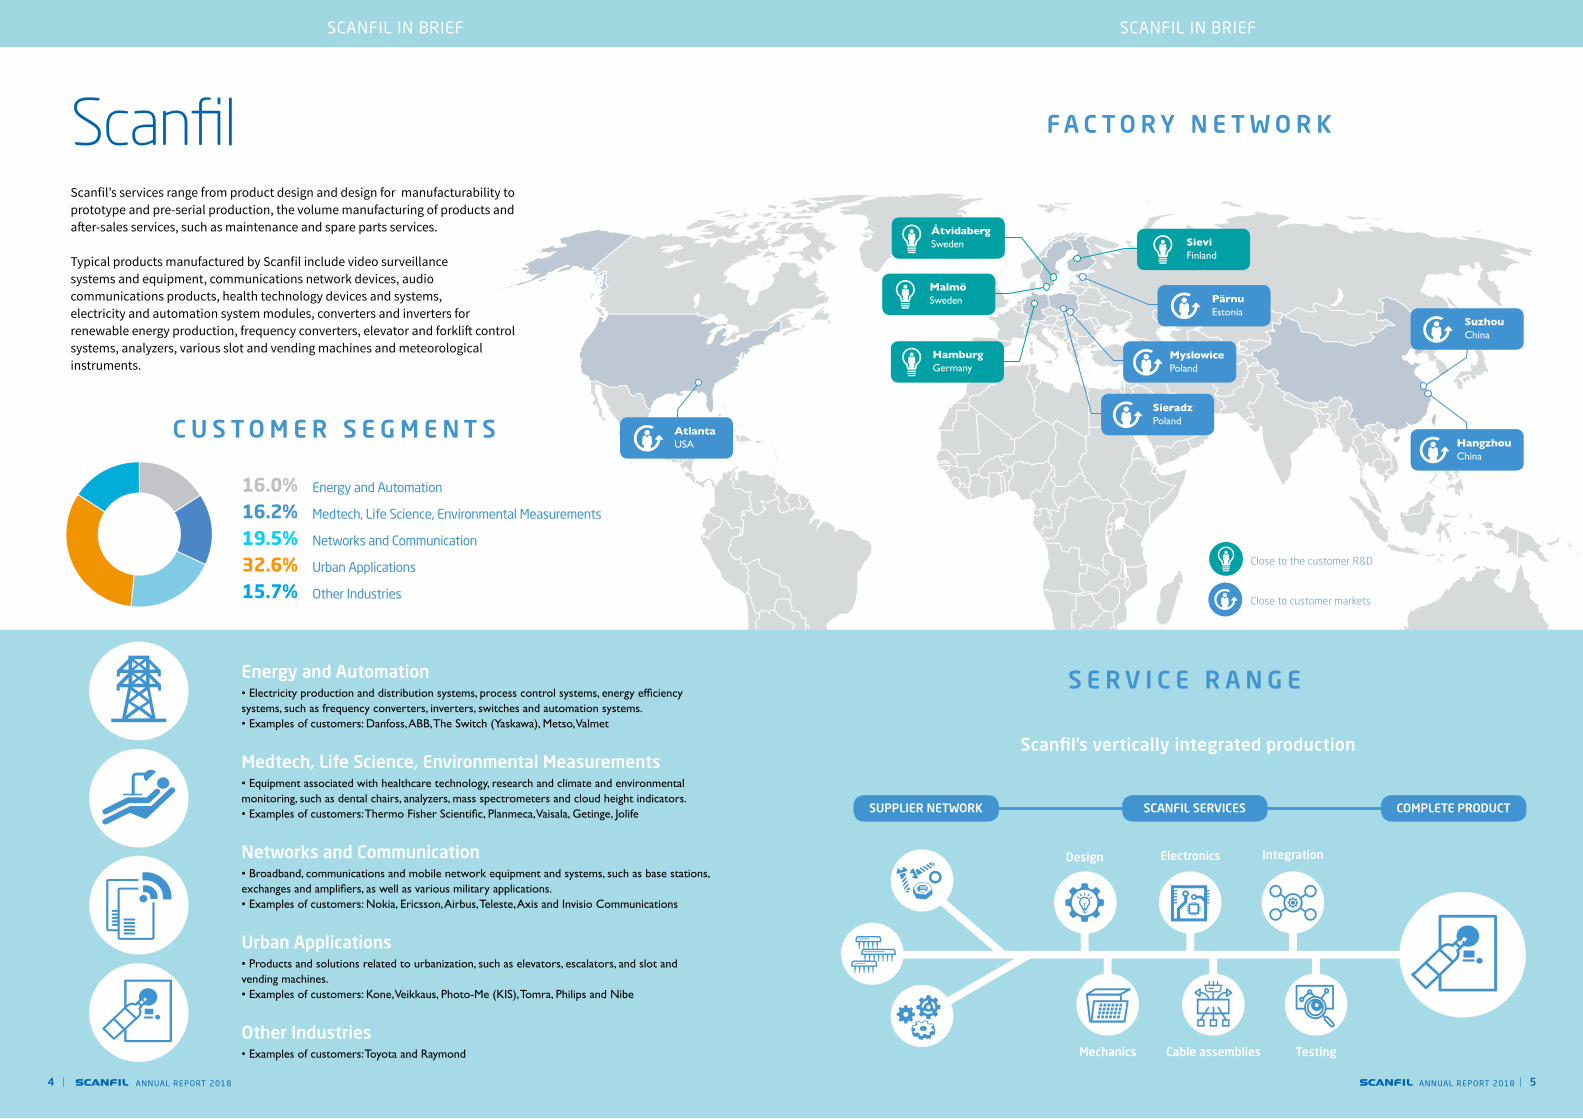
Scanfil plc is an international contract manufactu-rer and system supplier for the electronics industry. Its customers include international operators in the automation, energy, data transmission and health technology sectors, among other industries, and companies operating in fields related to urba-nization. Scanfil has a total of 10 factories in seven countries on three continents. Its factories in Fin-land, Sweden and Germany are located close to the R&D units of its customers, whereas its fac-tories in Estonia, Poland, China and the USA are close to customer markets.
Scanfil provides its customers with an extensive array of services, ranging from product design to product manufacturing, material procurement and logistics solutions. The key elements of Scanfil’s operations include a vertically integrated produc-tion system, including services and supply chain management over the entire lifecycle of customers’ products. These provide a solid foundation for Scanfil’s competitive advantages: speed, flexibility and reliability. Scanfil has over 40 years of expe-rience from demanding customer-driven contract manufacturing.
Scanfil’s shares are listed on the Nasdaq Helsinki stock exchange (SCANFL).
SCANFIL IN BRIEF INDEX
For the reader
ANNUAL REPORT 20184 | ANNUAL REPORT 2018 | 5
Energy and Automation
Medtech, Life Science, Environmental Measurements
Networks and Communication
Urban Applications
Other Industries
16,0%
16,2%
19,5%
32,6%
15,7%
| 54 |
SCANFIL IN BRIEFSCANFIL IN BRIEF
Atlanta USA
C U S T O M E R S E G M E N T S
S E R V I C E R A N G E
Scanfil F A C T O R Y N E T W O R K
Scanfil’s vertically integrated production
Mechanics Cable assemblies Testing
Design Electronics Integration
SUPPLIER NETWORK SCANFIL SERVICES COMPLETE PRODUCT
Scanfil’s services range from product design and design for manufacturability to prototype and pre-serial production, the volume manufacturing of products and after-sales services, such as maintenance and spare parts services.
Typical products manufactured by Scanfil include video surveillance systems and equipment, communications network devices, audio communications products, health technology devices and systems, electricity and automation system modules, converters and inverters for renewable energy production, frequency converters, elevator and forklift control systems, analyzers, various slot and vending machines and meteorological instruments.
Pärnu Estonia
Sievi Finland
Åtvidaberg Sweden
Malmö Sweden
HamburgGermany
Sieradz Poland
Myslowice Poland
Suzhou China
Hangzhou China
Close to the customer R&D
Close to customer markets
16.0%16.2%19.5%32.6%15.7%
Energy and Automation
Medtech, Life Science, Environmental Measurements
Networks and Communication
Urban Applications
Other Industries
ANNUAL REPORT 2018
Energy and Automation • Electricity production and distribution systems, process control systems, energy efficiency systems, such as frequency converters, inverters, switches and automation systems. • Examples of customers: Danfoss, ABB, The Switch (Yaskawa), Metso, Valmet
Medtech, Life Science, Environmental Measurements • Equipment associated with healthcare technology, research and climate and environmental monitoring, such as dental chairs, analyzers, mass spectrometers and cloud height indicators. • Examples of customers: Thermo Fisher Scientific, Planmeca, Vaisala, Getinge, Jolife
Networks and Communication • Broadband, communications and mobile network equipment and systems, such as base stations, exchanges and amplifiers, as well as various military applications. • Examples of customers: Nokia, Ericsson, Airbus, Teleste, Axis and Invisio Communications
Urban Applications • Products and solutions related to urbanization, such as elevators, escalators, and slot and vending machines. • Examples of customers: Kone, Veikkaus, Photo-Me (KIS), Tomra, Philips and Nibe
Other Industries • Examples of customers: Toyota and Raymond
ANNUAL REPORT 2018

ANNUAL REPORT 20186 | ANNUAL REPORT 2018 | 76 |
Capital expenditureScanfil continued its investment program in 2018. Investments mainly consisted of the completed plant expansion in Poland and the procurement of machinery and equipment in China and Poland. In Suzhou, Scanfil increased the machine capacity of electronics manufacturing and invested in production automation. A new painting line was deployed in Hangzhou. In Myslowice, Scanfil modernized equipment and increased the capacity of mechanics manufacturing. In addition, Scanfil invested in automated material handling at several factories, including Malmö, Åtvidaberg and Sieradz.
New customersScanfil started partnerships with a number of new customers, including Profound Medical, Coloreel and UMS Skeldar, and its sales to new customers increased significantly. New customers represent several customer segments and balance the distribution of sales to different segments and reduce customer- and segment-specific risks.
TechnologyScanfil launched the Smart Operations project in order to use automation and digitalization to significantly improve its operational and financial performance as well as quality. The project explores and introduces robotics in automation of electronics assembly and material handling.
Year 2018 in briefScanfil’s business development continued to be positive and profitable in 2018. Turnover stood at EUR 563.0 million, showing an increase of 6.3% from the previous year. Profitability also developed well and the operating profit increased by 20.8% compared with the previous year’s operating profit.
YEAR 2018 IN BRIEF KEY FIGURES
Key figures
ANNUAL REPORT 2018
0
100
200
300
400
500
600
508 530563
377
215189181
China
Estonia
Finland
Germany
Poland
Sweden
USA
29%
10%
3%
28%
17%
9%
3%
Turnover
meur
Personnel per country 31.12.2018
181
0,0
0,1
0,2
0,3
0,4
0,5
2012 2013 2014 2015 2016 2017 2018
0.25
0.400.45
0.21
0.140.10
Earnings per share
eur
0.24
EPS EPS, adjusted
2012 2013 2014 2015 2016 2017 2018
0
5
10
15
20
25
4.6
19.4 20.2
10.6
16.5
11.4
8.1
Return on investment
%
2012 2013 2014 2015 2016 2017 2018
0
5
10
15
20
25
30
35
40
16.2
11.88.1
Operating profit & operating profit %
2012 2013 2014 2015 2016 2017 2018
meur
31.3
37.8
19.64.5%
6.3%
4.4%
7.6%
6.7%5.9%
5.2%
22.3
OperatingProfit
Operating Profit,adjusted
181
0
10
20
30
40
50
60
70
80
40.7 40.747.7
33.4
70.664.1
57.7
Equity ratio
%
2012 2013 2014 2015 2016 2017 2018-10
01020304050607080
40.0 40.7
28.2
65.6
-9.9-9.8-1.8
Net debt
meur
2012 2013 2014 2015 2016 2017 2018
0,00
0,03
0,06
0,09
0,12
0,15
0.09
0.11
0.13
0.080.07
0.050.04
Dividend
eur
2012 2013 2014 2015 2016 2017 2018
Boards proposal
%

ANNUAL REPORT 20188 | ANNUAL REPORT 2018 | 98 |
Scanfil’s business developed positively in 2018. Turnover totaled EUR 563 million, growth 6.3% on the previous year. The increase in turnover was broadly supported by various customer segments and the top ten customers contributed about 61% of turnover. Operating profit was at a record level of EUR 37.8 million, and relative operating profit was 6.7% of turnover. Net cash flow from operations increased by 36% and return on equity was good, 21.5%. The equity ratio improved to 47.5% and net gearing decreased to 19.5%. We can be satisfied with the financial development of the past financial year.
The year was successful also in other key areas. Customer satisfaction developed favorably and, with regard to employee satisfaction, we were able to improve our results throughout. Based on the annual measurement, the loyalty of the personnel towards Scanfil as well as motivation and job satisfaction developed positively. After a strong investment year 2017, our investments were at the normal level, corresponding to about 2% of our turnover. We invested among others in electronics production lines in Suzhou, China and mechanics manufacturing technology in Myslowice, Poland.
Our factory network comprises ten factories in seven countries in Europe, North America, and Asia. Scanfil’s customer strategy and the roles of our factories are divided into two groups: factories serving mainly global customers close to customer markets (China, USA, Poland and Estonia) and factories focusing on local customers near customer product development (Finland, Sweden and Germany).
I am pleased to the implementation of the “close to customer R&D strategy,” especially in Sweden and Finland, where the results can be seen for example in strong new customer acquisitions. As a result, we now have a record amount of new customers whom we support already during the product design phase. Together with customers, through our design, industrialization and manufacturing services, we can ensure optimal product manufacturability and minimized the lead time from product idea to market launch. As the customer grows and the customer market becomes global, our manufacturing services scale
up through our global factory network, close to the customer’s market. At the moment, we are working to strengthen this business model also on the German market.
We renewed our organization in December. With the help of the new organization, we want to enhance the co-operation between our factories, thus further improving the overall optimization and efficiency of the factory network. We also want to create more customer value, for example through a broader service range and design services in particular. The new organizational model also emphasizes future production technologies and, in general, a greater focus on sales and growth, especially in the Nordics and Central Europe.
Our customers’ outlook and forecasts provide us with a good starting point for organic growth, both in terms of turnover and operating profit, also in 2019. We are focusing on organic growth, but we are also interested in the opportunities for business acquisitions, especially in the Nordic countries and Central Europe. Business acquisitions implemented in this decade have balanced our customer segments and expanded our customer base as well as significantly reduced Scanfil’s customer-
specific risks. We are also less and less dependent on economic cycles: defensive medtech and also various consumer applications are an important part of our sales.
I look forward to the future with confidence and enthusiasm. We are aiming at a turnover of EUR 600 million and 7% operating 2020. Our customer potential, the investments made to ensure growth, and the attitude and competence of our personnel provide a sound basis for achieving this goal.
I want to thank Scanfil’s personnel for their excellent work in 2018. I would also like to thank customers, suppliers, other partners and owners for their trust and good cooperation.
Petteri JokitaloCEO
CEO OVERVIEW 2018 CEO OVERVIEW 2018
CEO overview 2018
“2018 was a strong year for us. We
reached our financial targets and made a good progress in implementing our
strategy.”
ANNUAL REPORT 2018

ANNUAL REPORT 201810 | ANNUAL REPORT 2018 | 1110 | | 11
CORE MESSAGESCORE MESSAGES
Our values • Customer focused• Achieving together • Proactive• Engaged to perform
Core messages
Our competitive factorsScanfil’s strengths are agile operating culture, fast decision making and implementation, global factory network and broad service offering. Scanfil’s high-quality and cost-efficient vertically integrated production is one of its key competitive factors. Effective and measurable processes offer standardized operating methods for Scanfil’s global plant network.
Our missionScanfil helps its customers to succeed by providing effective and innovative solutions throughout the product lifecycle. We provide global manufacturing and delivery chain solutions, as well as comprehensive services, from product design to after-sales services. We improve and shorten the time between ideas, R&D and product launches.
Our visionWe are a trusted partner. We stand out through our excellent performance.
Our strategy and goals Scanfil’s goal is to help its customers in product design, in industrial and manufacturing processes, and in the launch of finished products within an optimal time. Our excellent performance, continuous improvement and demanding goals are visible in everything we do.
Scanfil mainly serves its global customers from factories that are located close to customer markets. These factories are located in Poland, Estonia, China and the USA. In Finland, Sweden and Germany, Scanfil serves customers whose R&D units are close to our factories.
Our new customer acquisition focuses on the Nordic countries and the German-speaking Central Europe. Our goal is to be the market leader in the Nordic countries and gain a significant market share in the German-speaking Central Europe.
Scanfil aims to have a turnover of EUR 600 million and an operating profit rate of 7% by 2020.
The goal is to pay one third of our annual results to our shareholders in dividends.
ANNUAL REPORT 2018 ANNUAL REPORT 2018
ANNUAL REPORT 201812 | ANNUAL REPORT 2018 | 13 | 13
RESPONSIBILITY AT SCANFILRESPONSIBILITY AT SCANFIL
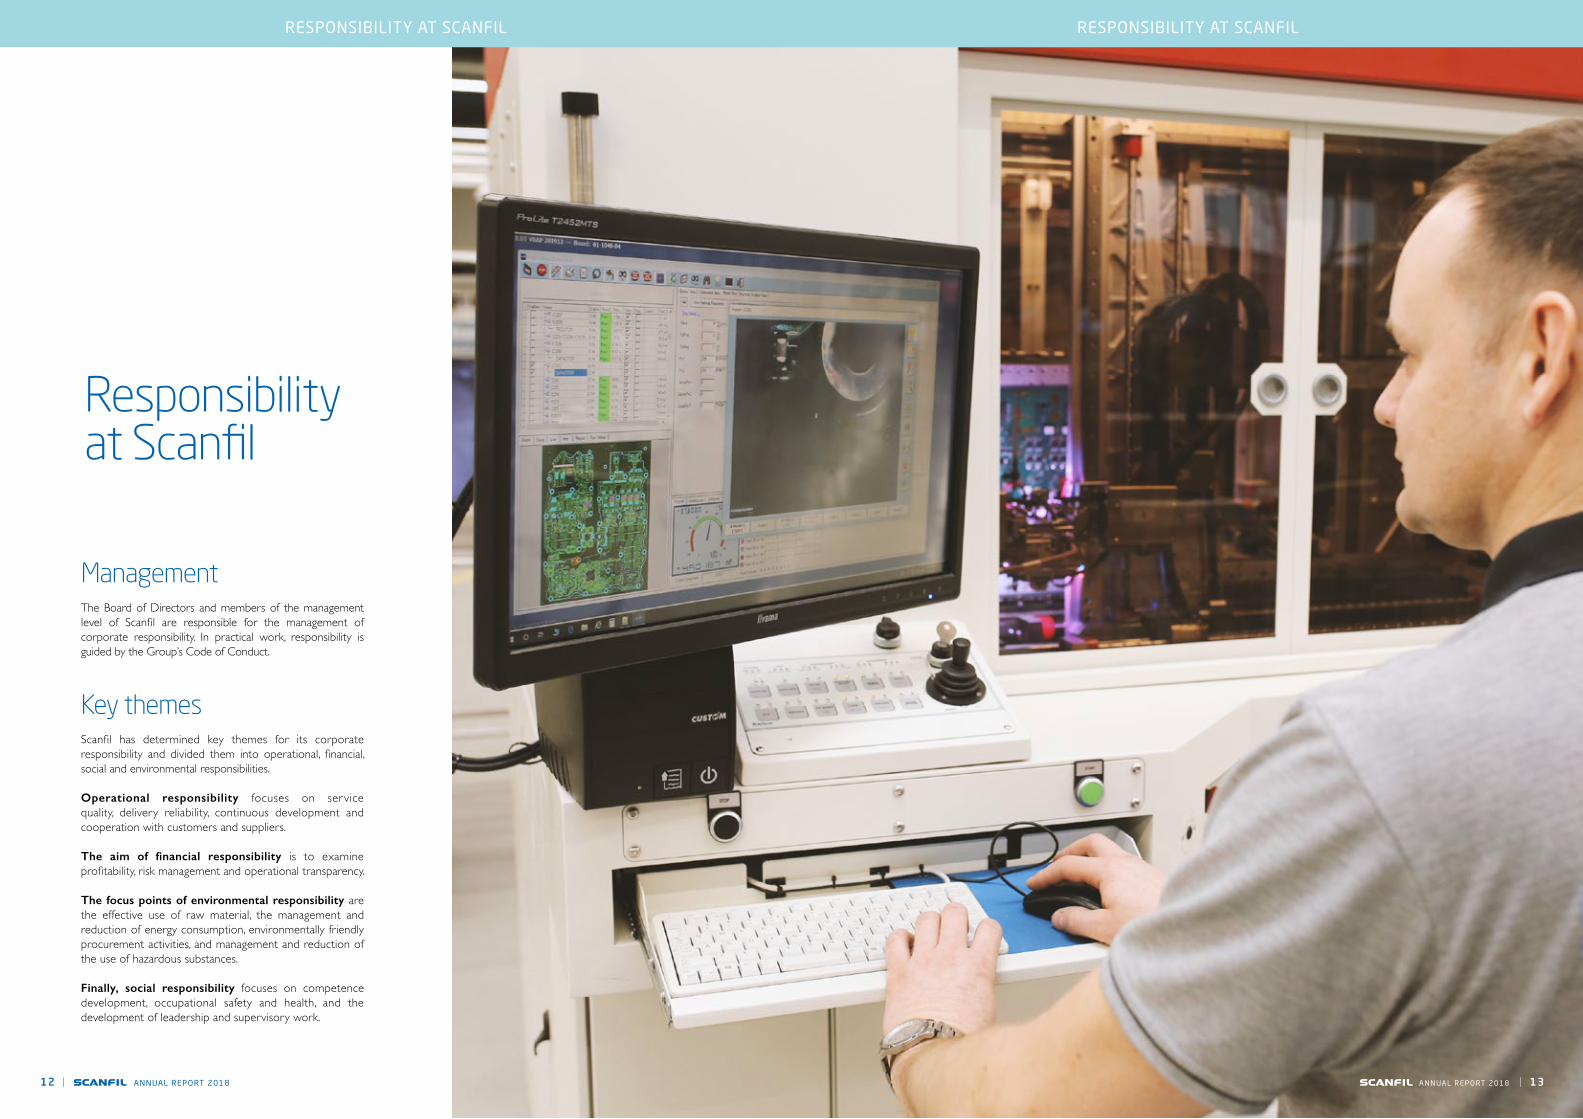
Management The Board of Directors and members of the management level of Scanfil are responsible for the management of corporate responsibility. In practical work, responsibility is guided by the Group’s Code of Conduct.
Key themesScanfil has determined key themes for its corporate responsibility and divided them into operational, financial, social and environmental responsibilities.
Operational responsibility focuses on service quality, delivery reliability, continuous development and cooperation with customers and suppliers.
The aim of financial responsibility is to examine profitability, risk management and operational transparency.
The focus points of environmental responsibility are the effective use of raw material, the management and reduction of energy consumption, environmentally friendly procurement activities, and management and reduction of the use of hazardous substances.
Finally, social responsibility focuses on competence development, occupational safety and health, and the development of leadership and supervisory work.
Responsibility at Scanfil
ANNUAL REPORT 2018

ANNUAL REPORT 201814 | ANNUAL REPORT 2018 | 1514 |
Global network of factoriesScanfil has built its factory network by dividing it into two types of factories: those that operate close to customers’ R&D units and those that are close to customer markets. Factories in the first group are located in Finland, Sweden and Germany, and their primary goal is to serve growing customers. Factories in the latter group are located in Poland, Estonia, China and the USA, and their operations are based on customer-driven operations and high-level performance.
Scanfil’s factories are led by a local management team, under the guidance of Group Management Team. By this, it is ensured that the global needs of the customers, group level targets and local needs are taken into account. Uniform operating methods and processes make it possible to transfer production between factories and within factories from one line to another.
Advanced systems guarantee a high level of quality and reliabilityHigh-quality and cost-efficient production is one of Scanfil’s key competitive factors. Scanfil’s competitiveness is based on its effective, fast and flexible production processes and high-quality products. The continuous development of production processes, the use of right technologies and the proven quality of the materials used are in a key position when it comes to the continuous improvement of cost-efficiency.
During 2018, key quality indicators improved significantly. As the most important result of development activities, customer quality improved significantly from the year before, measured by the DPPM (Defective Parts Per Million) indicator.
Factories completed projects to improve their performance in terms of quality and developed digital quality processes and tools
Quality, delivery reliability and continuous development
Implemented development proposals per year
8000
7000
6000
5000
4000
3000
2000
1000
02016 2017 2018
4500
5900
7000
OPERATIONAL RESPONSIBILITYOPERATIONAL RESPONSIBILITY
2016 2017 2018
Development of customer quality / DPPM(Defective Parts Per Million)
ANNUAL REPORT 2018
ANNUAL REPORT 201816 | ANNUAL REPORT 2018 | 1716 |
and high-quality production. The identification of risks helps to intervene in any problems in production at an early stage and to carry out preventive measures.
The implementation of 2019 development plans has already started. These focus on quality management, digital documentation and the deployment of an evaluation model for quality management at plants. Personnel’s competence development is also a significant factor in ensuring the quality of Scanfil’s operations.
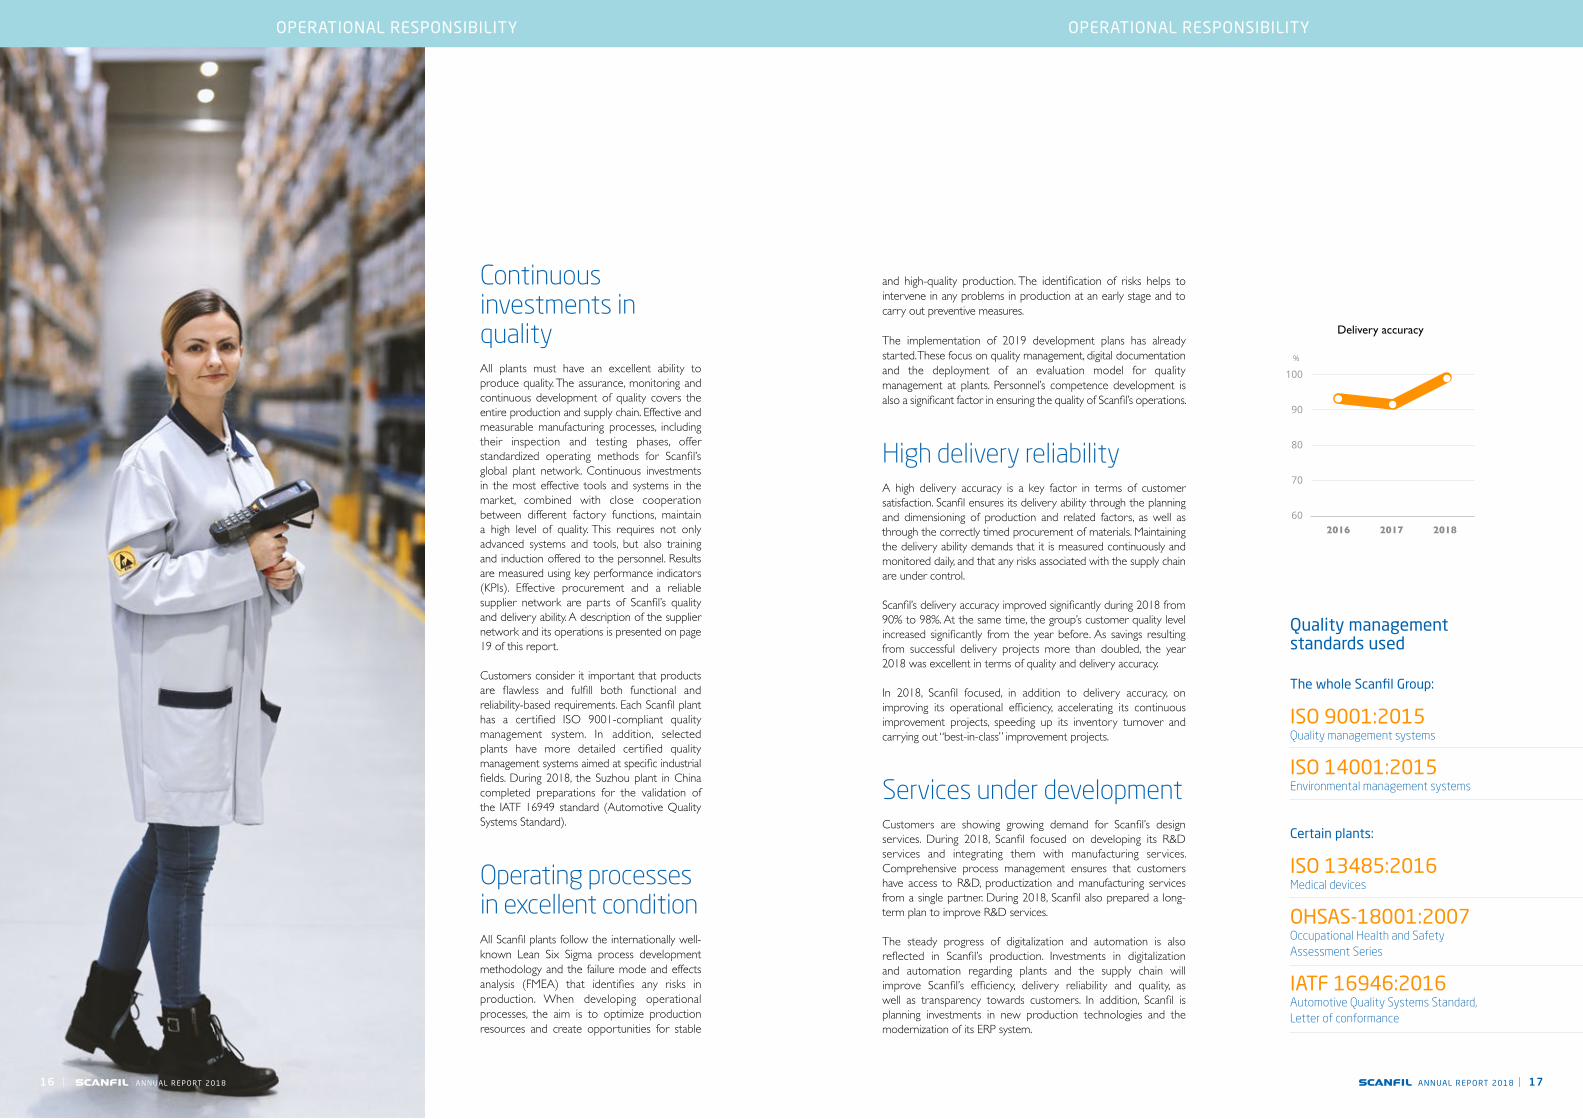
High delivery reliability A high delivery accuracy is a key factor in terms of customer satisfaction. Scanfil ensures its delivery ability through the planning and dimensioning of production and related factors, as well as through the correctly timed procurement of materials. Maintaining the delivery ability demands that it is measured continuously and monitored daily, and that any risks associated with the supply chain are under control.
Scanfil’s delivery accuracy improved significantly during 2018 from 90% to 98%. At the same time, the group’s customer quality level increased significantly from the year before. As savings resulting from successful delivery projects more than doubled, the year 2018 was excellent in terms of quality and delivery accuracy.
In 2018, Scanfil focused, in addition to delivery accuracy, on improving its operational efficiency, accelerating its continuous improvement projects, speeding up its inventory turnover and carrying out “best-in-class” improvement projects.
Services under developmentCustomers are showing growing demand for Scanfil’s design services. During 2018, Scanfil focused on developing its R&D services and integrating them with manufacturing services. Comprehensive process management ensures that customers have access to R&D, productization and manufacturing services from a single partner. During 2018, Scanfil also prepared a long-term plan to improve R&D services.
The steady progress of digitalization and automation is also reflected in Scanfil’s production. Investments in digitalization and automation regarding plants and the supply chain will improve Scanfil’s efficiency, delivery reliability and quality, as well as transparency towards customers. In addition, Scanfil is planning investments in new production technologies and the modernization of its ERP system.
Continuous investments in qualityAll plants must have an excellent ability to produce quality. The assurance, monitoring and continuous development of quality covers the entire production and supply chain. Effective and measurable manufacturing processes, including their inspection and testing phases, offer standardized operating methods for Scanfil’s global plant network. Continuous investments in the most effective tools and systems in the market, combined with close cooperation between different factory functions, maintain a high level of quality. This requires not only advanced systems and tools, but also training and induction offered to the personnel. Results are measured using key performance indicators (KPIs). Effective procurement and a reliable supplier network are parts of Scanfil’s quality and delivery ability. A description of the supplier network and its operations is presented on page 19 of this report.
Customers consider it important that products are flawless and fulfill both functional and reliability-based requirements. Each Scanfil plant has a certified ISO 9001-compliant quality management system. In addition, selected plants have more detailed certified quality management systems aimed at specific industrial fields. During 2018, the Suzhou plant in China completed preparations for the validation of the IATF 16949 standard (Automotive Quality Systems Standard).
Operating processes in excellent conditionAll Scanfil plants follow the internationally well-known Lean Six Sigma process development methodology and the failure mode and effects analysis (FMEA) that identifies any risks in production. When developing operational processes, the aim is to optimize production resources and create opportunities for stable
OPERATIONAL RESPONSIBILITYOPERATIONAL RESPONSIBILITY
2016 2017 2018
100
90
80
70
60
Delivery accuracy
%
The whole Scanfil Group:
ISO 9001:2015 Quality management systems
ISO 14001:2015 Environmental management systems
Certain plants:
ISO 13485:2016 Medical devices
OHSAS-18001:2007 Occupational Health and Safety Assessment Series
IATF 16946:2016 Automotive Quality Systems Standard, Letter of conformance
Quality management standards used
ANNUAL REPORT 2018

ANNUAL REPORT 201818 | ANNUAL REPORT 2018 | 1918 |
Scanfil’s success is based on satisfied long-term customers and close cooperation. Scanfil has nearly 100 customers from different industrial fields. Its customer portfolio is broad and balanced. The largest single customer accounts for 12% of Scanfil’s turnover, while the ten largest customers make up roughly 60%.
Scanfil’s competitive edge is based on its overall delivery ability, global plant network, skilled employees and sufficient resources. The current plant network and service range respond well to the needs of global and local customers. However, development is continued every day. During 2018, Scanfil specified the service range of its plant, depending on whether a plant is located close to customer markets or R&D units. The implementation of the
Customer satisfaction continued to increase
strategy of staying close to customers’ R&D proceeded well, particularly in Sweden, and the results materialized in a higher turnover at all plants.
The most significant investments in sales were carried out in Central Europe and Finland, and Scanfil was able to acquire new customers in both markets. Design services also showed good progress, with Scanfil starting cooperation with a number of global companies. Similarly, focus on the sale of electronics, product modules and finished products paid off.
Confidence in a key positionScanfil monitors the development of its operations by measuring its customer satisfaction regularly and in many ways. Daily cooperation offers indications of the level of satisfaction. What is more, particular focus is placed on delivery reliability and quality. Some customers give feedback on a quarterly or semi-annual basis. By collecting regular feedback, Scanfil is able to respond quickly and fix any defects. Customer satisfaction remained high in 2018.
Compliance with corporate responsibility is raised more often than before in discussions with customers. Scanfil has defined responsible operating principles that cover, for example, the equal treatment of people and prohibit corruption and bribery. The Group’s operating methods, such as transparent and cost-based pricing, reduce the possibility of non-compliant activities.
Potential in Central EuropeThe market is looking promising in 2019, and Scanfil is seeking growth in Central Europe in particular. Customer needs will focus more clearly on the ability of suppliers to offer services by means of a regional supply chain. Scanfil’s plant network is already able to respond to these needs. Scanfil’s design services also strengthen its competitiveness, as customers need to gain added value from their partners through the design of new products and the maintenance of existing products.
The significant increase in Scanfil’s turnover is an indication of its successful customer cooperation during 2018. A notable part of this increase came from long-term customers who outsourced larger entities to Scanfil. Scanfil also signed agreements with new customers. Scanfil continued and expanded its customer-specific development plans. This also helped to increase customer satisfaction. The positive economic development and, in particular, general growth in the electronics industry supported the increase in turnover, but also caused a global shortage of components. Regardless of these challenges, Scanfil was able to control the situation and maintain its delivery ability.
Scanfil has a broad network of regional and international suppliers and partners. During 2018, Scanfil aimed to reduce the size of the network by focusing its purchases on a few carefully selected suppliers. New suppliers also joined the network through new customer and product projects. In addition, Scanfil carried out various development actions to increase the quality and cost-efficiency of its suppliers. As a result, Scanfil’s competitiveness in terms of prices improved.
Careful selection of suppliersScanfil selects its suppliers carefully and engages in long-term cooperation with its key suppliers. Scanfil only uses approved suppliers that fulfil Scanfil’s strict criteria in terms of quality, delivery reliability and cost-efficiency. In addition to these factors, Scanfil ensures that its suppliers fulfill their financial and administrative obligations. Scanfil audits its suppliers systematically and monitors their compliance with the terms and conditions of agreements. It aims to prevent any misuse through the verification of orders, training and work rotation.
Once cooperation has started, quality assurance is carried out continuously. This means that incoming material is inspected, any non-conformities are kept under control, any errors in quality are corrected and the general performance of suppliers is evaluated. When new components or materials enter in production, Scanfil always uses a separate inspection process to ensure quality.
Making use of Scanfil’s global position and volume in procurement processes helps to maintain competitive prices and control the supplier network. This is why Scanfil aims to focus its purchases on a few selected suppliers.
As the procurement of raw material,other material and components, makes up two thirds of the turnover, effective procurement activities provide Scanfil a competitive edge. This means that the continuous development of the supplier network is a significant factor in maintaining competitiveness.
Broad supplier network
COOPERATION WITH CUSTOMERS AND SUPPLIERSCOOPERATION WITH CUSTOMERS AND SUPPLIERS
ANNUAL REPORT 2018
ANNUAL REPORT 201820 | ANNUAL REPORT 2018 | 21
All of Scanfil’s factories comply with the local legislation and have a certified ISO 14001-compliant environmental management system. The most recent version of the standard was adopted during 2018. Only a few deviations from the standard occurred in production. Scanfil reacted to these by taking corrective actions that were approved by the certification body Bureau Veritas.
In its production, Scanfil uses various metals, and it aims to continuously improve their usage rate. Steel is the most important raw material used by Scanfil. Its effective use is monitored closely in the production process. In addition to optimized use, Scanfil monitors the recycling of metals closely.
Clear achievements There are also about 200 different chemicals in use in production. During 2018, Scanfil inventoried the chemicals it uses and offered new type of training regarding their use in order to conduct an exposure-based risk analysis. Scanfil was able to reduce the need for chemicals. For example, the use of chemicals decreased by 66% at the Åtvidaberg plant during the year.
Certain products also require hazardous chemicals. Risks associated with these chemicals are already analyzed before their use, and these are handled following precise instructions and
Scanfil fulfills its social responsibility by seeing to its profitability, controlling its risks and communicating openly and transparently. Scanfil’s aim is to be a good corporate citizen and distribute its financial success equally between all of its stakeholders. Financial development is evaluated by comparing it with goals that are set on an annual level and in the long term.
Scanfil ensures its profitability by means of the continuous development of key competence and production and effective procurement activities. Taking care of the efficiency of Scanfil’s own operations and resources is also important in terms of productivity. Group-level decisions ensure benefits of scale and the optimal use of resources. Moreover, Scanfil’s factories are independent units responsible for their own results and they use individual processes and quality management systems.
Updated standards at all factories
Financial responsibility
precautions. In addition, proper training and drills are arranged in order to prepare for any accidents. Scanfil aims to identify replacement products for hazardous chemicals. During 2018, it joined the EU-driven LIFE/Fit for REACH project whose goal is to identify alternative chemicals.
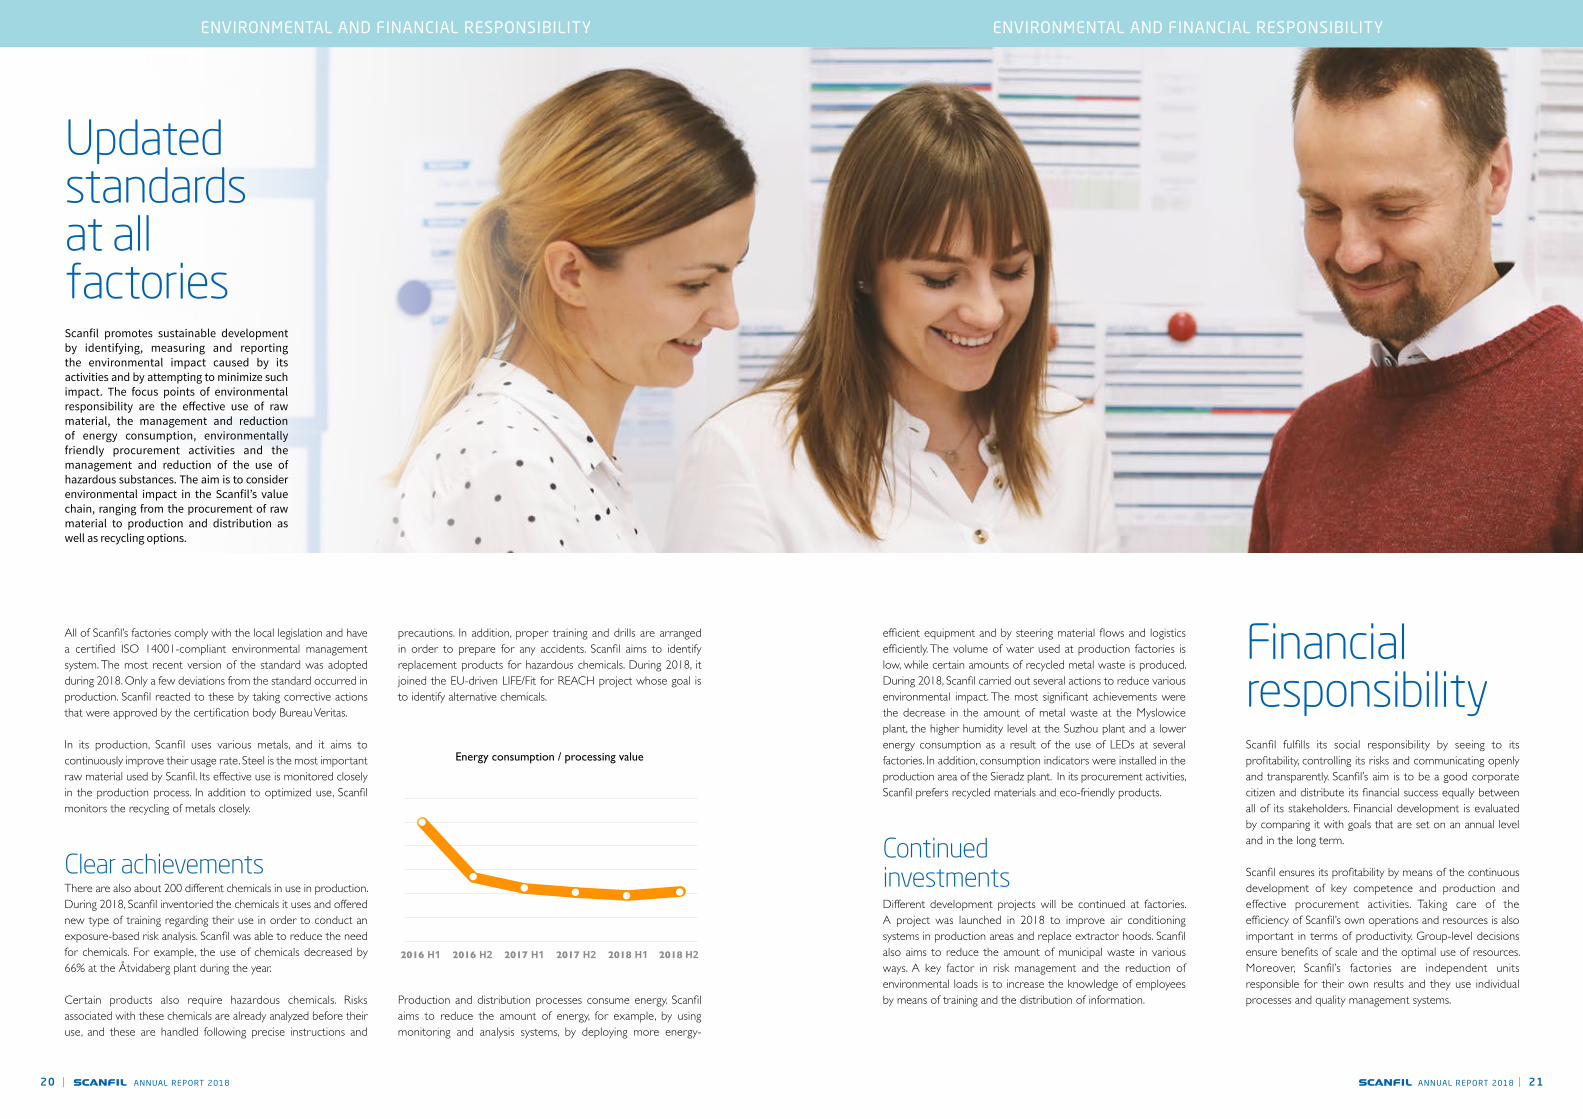
Production and distribution processes consume energy. Scanfil aims to reduce the amount of energy, for example, by using monitoring and analysis systems, by deploying more energy-
Scanfil promotes sustainable development by identifying, measuring and reporting the environmental impact caused by its activities and by attempting to minimize such impact. The focus points of environmental responsibility are the effective use of raw material, the management and reduction of energy consumption, environmentally friendly procurement activities and the management and reduction of the use of hazardous substances. The aim is to consider environmental impact in the Scanfil’s value chain, ranging from the procurement of raw material to production and distribution as well as recycling options.
ENVIRONMENTAL AND FINANCIAL RESPONSIBILITYENVIRONMENTAL AND FINANCIAL RESPONSIBILITY
efficient equipment and by steering material flows and logistics efficiently. The volume of water used at production factories is low, while certain amounts of recycled metal waste is produced. During 2018, Scanfil carried out several actions to reduce various environmental impact. The most significant achievements were the decrease in the amount of metal waste at the Myslowice plant, the higher humidity level at the Suzhou plant and a lower energy consumption as a result of the use of LEDs at several factories. In addition, consumption indicators were installed in the production area of the Sieradz plant. In its procurement activities, Scanfil prefers recycled materials and eco-friendly products.
Continued investmentsDifferent development projects will be continued at factories. A project was launched in 2018 to improve air conditioning systems in production areas and replace extractor hoods. Scanfil also aims to reduce the amount of municipal waste in various ways. A key factor in risk management and the reduction of environmental loads is to increase the knowledge of employees by means of training and the distribution of information.
Energy consumption / processing value
2016 H1 2016 H2 2017 H1 2017 H2 2018 H1 2018 H2

ANNUAL REPORT 201822 | ANNUAL REPORT 2018 | 2322 | | 23
Skilled and committed employees are one of the cornerstones of Scanfil’s success. Productive and close cooperation within the company and with all stakeholders is the key to profitable and continuously developing operations. Scanfil’s aim is to be a reliable employer and an encouraging working community where every individual has the opportunity to develop their personal skills and abilities. Scanfil’s key competence areas are customers, manufacturing, procurement and logistics, as well as their management, and the use of digitalization and automation. These competence areas are developed continuously both at corporate and individual levels. A significant part of training takes place through internal and external training, job rotation, on-the-job training and different development programs.
Close cooperation
At the end of 2018, Scanfil had 3,348 employees (up from 3,254 employees in 2017). Scanfil has factories in several countries on several continents. Of its personnel, 68% worked in Europe, 3% in the USA and 28% in China. The average age of Scanfil’s employees was 39 years. Of all employees, 44% were women and 56% were men.
The year 2018 was a success, also in terms of Scanfil’s personnel. The annual job satisfaction survey showed that the development actions taken were successful, as the score has gone up year after year. General job satisfaction continued to improve. Measured at the Group level, it increased by four percentage points. This score now exceeds the average score in the reference group, i.e. in the global electronics manufacturing sector. Satisfaction with work condition also improved similarly, by as much as five percentage points in terms of satisfaction with the nearest supervisor and by three percentage points as regards learning and development opportunities. The response rate increased to 89%. Scanfil will continue to actively improve its job satisfaction and the commitment of its employees. Its goal is to be in the top quarter within its reference group. Employees take active part in planning and implementing the company’s development activities.
SCANFIL AS AN EMPLOYER AND A WORKING COMMUNITYSCANFIL AS AN EMPLOYER AND A WORKING COMMUNITY
Development of job satisfaction results
2016 2017 2018
Job satisfaction and motivationCommitment
Active developmentPlanned development activities continued in terms of HR management. A high level of supervisory work is in a key position in maintaining wellbeing at work. This means that the skills of supervisors are developed continuously. During the year, supervisors were trained at many of Scanfil’s factories. Scanfil also invested in diversifying the skills of production employees and ensured the efficiency of production by offering training regarding the use of quality tools and Lean-based activities. In addition, actions were carried out to improve working conditions. Code of Conduct training was also arranged for the personnel.
The company’s employer image and the general availability of employees are high on average. The majority of people working at Scanfil are employed by the company, and external employees are used as necessary. Filling vacancies did not present any challenges in 2018. Between countries, there is high variation in the duration of employment relationships. In Finland and Sweden, employees are easily available on average and employment relationships are long. However, in China, for example, employee turnover is high, even though it is below the average in the local labor market.
Scanfil monitors any changes in occupational safety and health using specific indicators. The amount of sick leave is at a good level, as is the number of occupational accidents, even though there is variation between countries. Working conditions involve various loading factors. Different presses, tools and vacuums are used in production that pose safety risks if used incorrectly. To prevent these risks from materializing, Scanfil develops safety guidelines and looks for safer machines and models. In assembly and office
work, postures and work done sitting down present a challenge. Their negative impact is avoided by means of high ergonomics. All employees are encouraged to excerise and take care of their ability to work.
Human rights and equal treatment are basic values in Scanfil’s operations, and here no compromises can ever be made. Social responsibility focuses on competence development, occupational safety and health, and the development of leadership and supervisory work. Scanfil ensures the fulfillment of its social responsibility through its Code of Conduct, lawful working conditions and practices.
HR defined as a leading projectThe development of the personnel and HR management will also be in a significant position in this year’s plans, as it has been selected as one of the three leading group-level projects. In addition, Scanfil will carry out projects to develop the personnel and job satisfaction and to produce digital HR management tools. Competence development is another significant focus area, and Scanfil is about to launch its talent program to identify and develop different talent. The development of the performance appraisal process and the deployment of the Lean model in the office environment will be on the agenda in 2019.
ANNUAL REPORT 2018 ANNUAL REPORT 2018
ANNUAL REPORT 201824 | ANNUAL REPORT 2018 | 25
PARENT COMPANY’S FINANCIAL STATEMENTS 73
The parent company’s income statement 73 The parent company’s balance sheet 74 The parent company’s cash flow statement 76 The parent company’s accounting principles 77 Notes to the parent company’s financial statements 77
1. Personnelexpenses 77 2. Otheroperatingexpenses 78 3. Depreciationandamortization 78 4. Contributionsfromgroupcompanies 78 5. Incometaxes 78 6. Intangibleassets 79 7. Tangibleassets 79 8. HoldingsinGroupcompanies 80 9. ReceivablesfromGroupcompanies 80 10. Cashandcashequivalents 80 11. Equity 81 12. Loansfromfinancialinstitutions 81 13. LiabilitiestoGroupcompanies 82 14. Accruedliabilities 82 15. Commitmentsandcontingencies 82 16. Derivativecontracts 83 17. Otherrentalcontracts 83 18. Management’semployment-relatedbenefits 83
Board of directors’ proposal
for the distribution of profit 84 Signatures to the Board of Director’s report and financial statemets 84
AUDITOR’S REPORT 85
REPORT OF BOARD OF DIRECTORS 25SHARES AND SHAREHOLDERS 30KEY RATIOS 32DEFINITIONS OF KEY RATIOS 33CONSOLIDATED FINANCIAL STATEMENTS (IFRS) 34
Consolidated income statement 34 Consolidated balance sheet 35 Konsernin rahavirtalaskelma 36 Consolidated cash flow statement 37 Accounting principles for consolidated financial statements 38 Notes to consolidated financial statements 42
1. Items affecting the result 42 1.1 Turnoveranddetailsofbusinesssegments 42 1.2 Otheroperatingincome 45 1.3 Useofmaterialsandsupplies 46 1.4 Employeebenefitexpenses 46 1.5 Otheroperatingexpenses 48 1.6 Incometaxes 48 1.7 Earningspershare 50
2. Net working capital 51 2.1 Networkingcapital 51 2.2 Inventories 51 2.3 Tradeandotherreceivables 51 2.4 Tradeandotherliabilities 52
3. Non-current assets 53 3.1 Goodwill 53 3.2 Otherintangibleassets 54 3.3 Property,plantandequipment 56 3.4 Depreciation,amortizationandimpairment 57 3.5 Financeleases 57
4. Capital structure 59 4.1 Cashandcashequivalents 59 4.2 Financialincomeandexpenses 60 4.3 Financialliabilities 60 4.4 Bookvaluesandfairvaluesof financialassetsandliabilities 61 4.5 Derivativefinancialinstrumentsand hedgeaccounting 62 4.6 Hierarchyoffairvalues 63 4.7 Financialriskmanagement 64 4.8 Shareholders’equity 68 4.9 Managementofcapitalstructure 69
5. Other notes 69 5.1 Provisions 69 5.2 Otherleases 70 5.3 Securitiesprovided,contingent liabilitiesandotherliabilities 70 5.4 DetailsofrelatedpartiesandGroupstructure 71 5.5 Eventsafterthereportingperiod 72
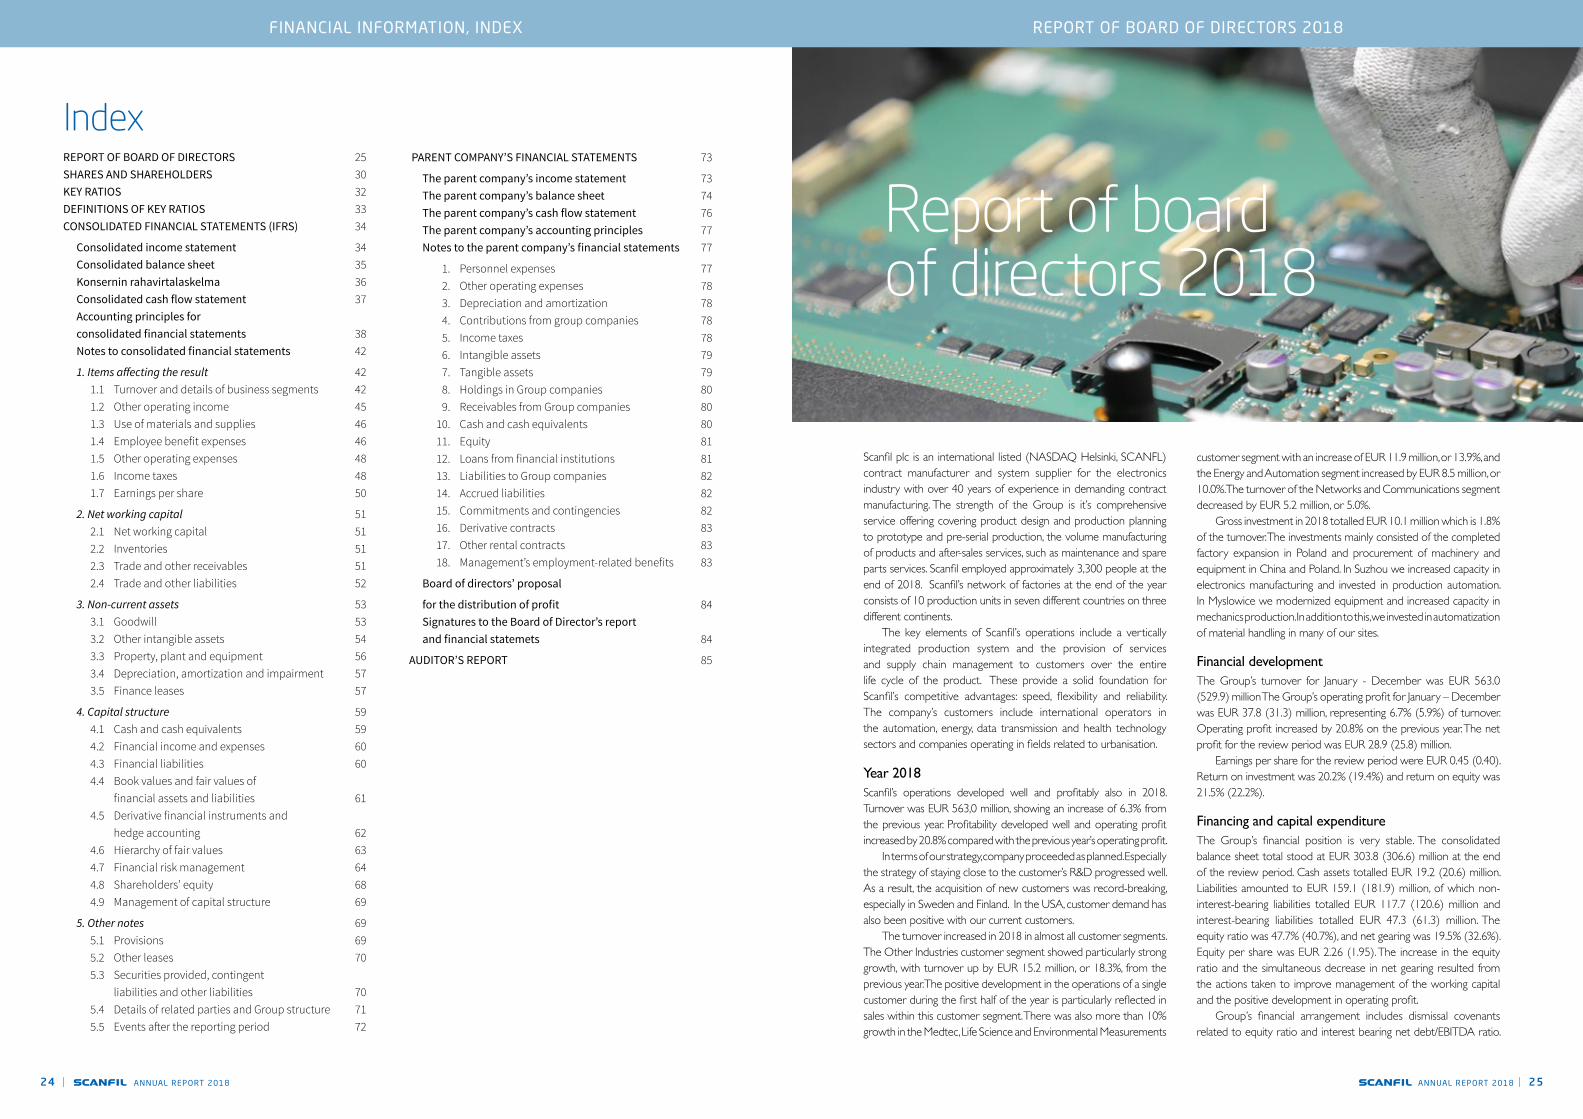
Scanfil plc is an international listed (NASDAQ Helsinki, SCANFL) contract manufacturer and system supplier for the electronics industry with over 40 years of experience in demanding contract manufacturing. The strength of the Group is it’s comprehensive service offering covering product design and production planning to prototype and pre-serial production, the volume manufacturing of products and after-sales services, such as maintenance and spare parts services. Scanfil employed approximately 3,300 people at the end of 2018. Scanfil’s network of factories at the end of the year consists of 10 production units in seven different countries on three different continents. The key elements of Scanfil’s operations include a vertically integrated production system and the provision of services and supply chain management to customers over the entire life cycle of the product. These provide a solid foundation for Scanfil’s competitive advantages: speed, flexibility and reliability. The company’s customers include international operators in the automation, energy, data transmission and health technology sectors and companies operating in fields related to urbanisation.
Year 2018Scanfil’s operations developed well and profitably also in 2018. Turnover was EUR 563,0 million, showing an increase of 6.3% from the previous year. Profitability developed well and operating profit increased by 20.8% compared with the previous year’s operating profit. In terms of our strategy, company proceeded as planned. Especially the strategy of staying close to the customer’s R&D progressed well. As a result, the acquisition of new customers was record-breaking, especially in Sweden and Finland. In the USA, customer demand has also been positive with our current customers. The turnover increased in 2018 in almost all customer segments. The Other Industries customer segment showed particularly strong growth, with turnover up by EUR 15.2 million, or 18.3%, from the previous year. The positive development in the operations of a single customer during the first half of the year is particularly reflected in sales within this customer segment. There was also more than 10% growth in the Medtec, Life Science and Environmental Measurements
customer segment with an increase of EUR 11.9 million, or 13.9%, and the Energy and Automation segment increased by EUR 8.5 million, or 10.0%. The turnover of the Networks and Communications segment decreased by EUR 5.2 million, or 5.0%. Gross investment in 2018 totalled EUR 10.1 million which is 1.8% of the turnover. The investments mainly consisted of the completed factory expansion in Poland and procurement of machinery and equipment in China and Poland. In Suzhou we increased capacity in electronics manufacturing and invested in production automation. In Myslowice we modernized equipment and increased capacity in mechanics production. In addition to this, we invested in automatization of material handling in many of our sites.
Financial developmentThe Group’s turnover for January - December was EUR 563.0 (529.9) million The Group’s operating profit for January – December was EUR 37.8 (31.3) million, representing 6.7% (5.9%) of turnover. Operating profit increased by 20.8% on the previous year. The net profit for the review period was EUR 28.9 (25.8) million. Earnings per share for the review period were EUR 0.45 (0.40). Return on investment was 20.2% (19.4%) and return on equity was 21.5% (22.2%).
Financing and capital expenditureThe Group’s financial position is very stable. The consolidated balance sheet total stood at EUR 303.8 (306.6) million at the end of the review period. Cash assets totalled EUR 19.2 (20.6) million. Liabilities amounted to EUR 159.1 (181.9) million, of which non-interest-bearing liabilities totalled EUR 117.7 (120.6) million and interest-bearing liabilities totalled EUR 47.3 (61.3) million. The equity ratio was 47.7% (40.7%), and net gearing was 19.5% (32.6%). Equity per share was EUR 2.26 (1.95). The increase in the equity ratio and the simultaneous decrease in net gearing resulted from the actions taken to improve management of the working capital and the positive development in operating profit. Group’s financial arrangement includes dismissal covenants related to equity ratio and interest bearing net debt/EBITDA ratio.
Report of board of directors 2018
REPORT OF BOARD OF DIRECTORS 2018FINANCIAL INFORMATION, INDEX
Index
ANNUAL REPORT 201826 | ANNUAL REPORT 2018 | 27
Engström and Christina Lindstedt as members of the Board of Directors. At its organizing meeting held on 25 April 2018 the new Board of Directors elected Harri Takanen as the Chairman of the Board of Directors. The Board further resolved to organize the Board committees as follows: the members of the Audit Committee are Harri Takanen, Jarkko Takanen and Christina Lindstedt and the members of the Nomination and Compensation Committee are Harri Takanen, Jarkko Takanen and Bengt Engström. M.Sc. (Eng) Petteri Jokitalo (1963) has acted as the company’s CEO during 1 January – 31 December 2018.
Risk managementThe Board of Directors of Scanfil plc is responsible for ensuring the appropriate organisation of the Group’s risk management and internal control and audit. The goal of Group’s risk management is to recognize and analyze the factors that have a negative effect on achieving the company’s goals in the short and long term, and to start procedures to minimize risks and to postpone or to remove them completely. Risk-management is part of business processes and management systems that are controlled by the board’s inspection committee. A weakening of the global economy and a decrease in the international demand for capital goods could have a negative effect on the development of the business operations of Scanfil’s customers and could subsequently reduce demand in the contract manufacturing market. In addition, Scanfil is exposed to risks resulting from exchange rate fluctuations in its business operations. For a description of financial risk management in the Scanfil Group, please refer to note 4.7 to the consolidated financial statements. The company’s risks and risk management are described on the company’s website under Corporate Governance and in the notes to the consolidated financial statements.
Group structureOn 31 December 2018, Scanfil Group comprised the parent company, Scanfil Oyj, and two wholly-owned sub-groups, Scanfil
EMS Oy (Finland) and Scanfil Sweden AB (Sweden). The Scanfil EMS sub-group comprises the parent company, Scanfil EMS Oy, and five wholly-owned subsidiaries operating in four different countries. The Scanfil Sweden AB sub-group comprises the parent company, Scanfil Sweden Ab, four wholly-owned subsidiaries operating in three different countries and five inactive subsidiaries that were not engaged in any production activities at the end of 2018. During the financial period, Scanfil Kft, Scanfil EMS Oy’s subsidiary in Hungary, merged with its parent company Scanfil EMS Oy by means of a cross-border subsidiary merger. In addition, the dissolution of four discontinued companies was completed through a voluntary liquidation procedure.
Research and developmentOwing to the nature of the company’s business, product development was mainly in cooperation with customers and Scanfil’s in-house product development program was not a significant part of the company’s cost structure.
Report on non-financial informationTaking care of responsible operations and their development is vital for Scanfil’s success. Monitoring and continuous development of corporate responsibility serves the needs of all of Scanfil’s stakeholders. Scanfil has determined the key factors for its corporate responsibility and divided them into operational, financial, social and environmental responsibilities. Operational responsibility focuses on product quality, delivery reliability, continuous development and cooperation with customers and suppliers. The aim of financial responsibility is to examine profitability, risk management and operational transparency. The focus points of environmental responsibility are the effective use of raw material, the management and reduction of energy consumption, environmentally friendly procurement activities, and management and reduction of the use of hazardous substances. Finally, social responsibility focuses on competence development, occupational safety and health, and the development of leadership and supervisory work.
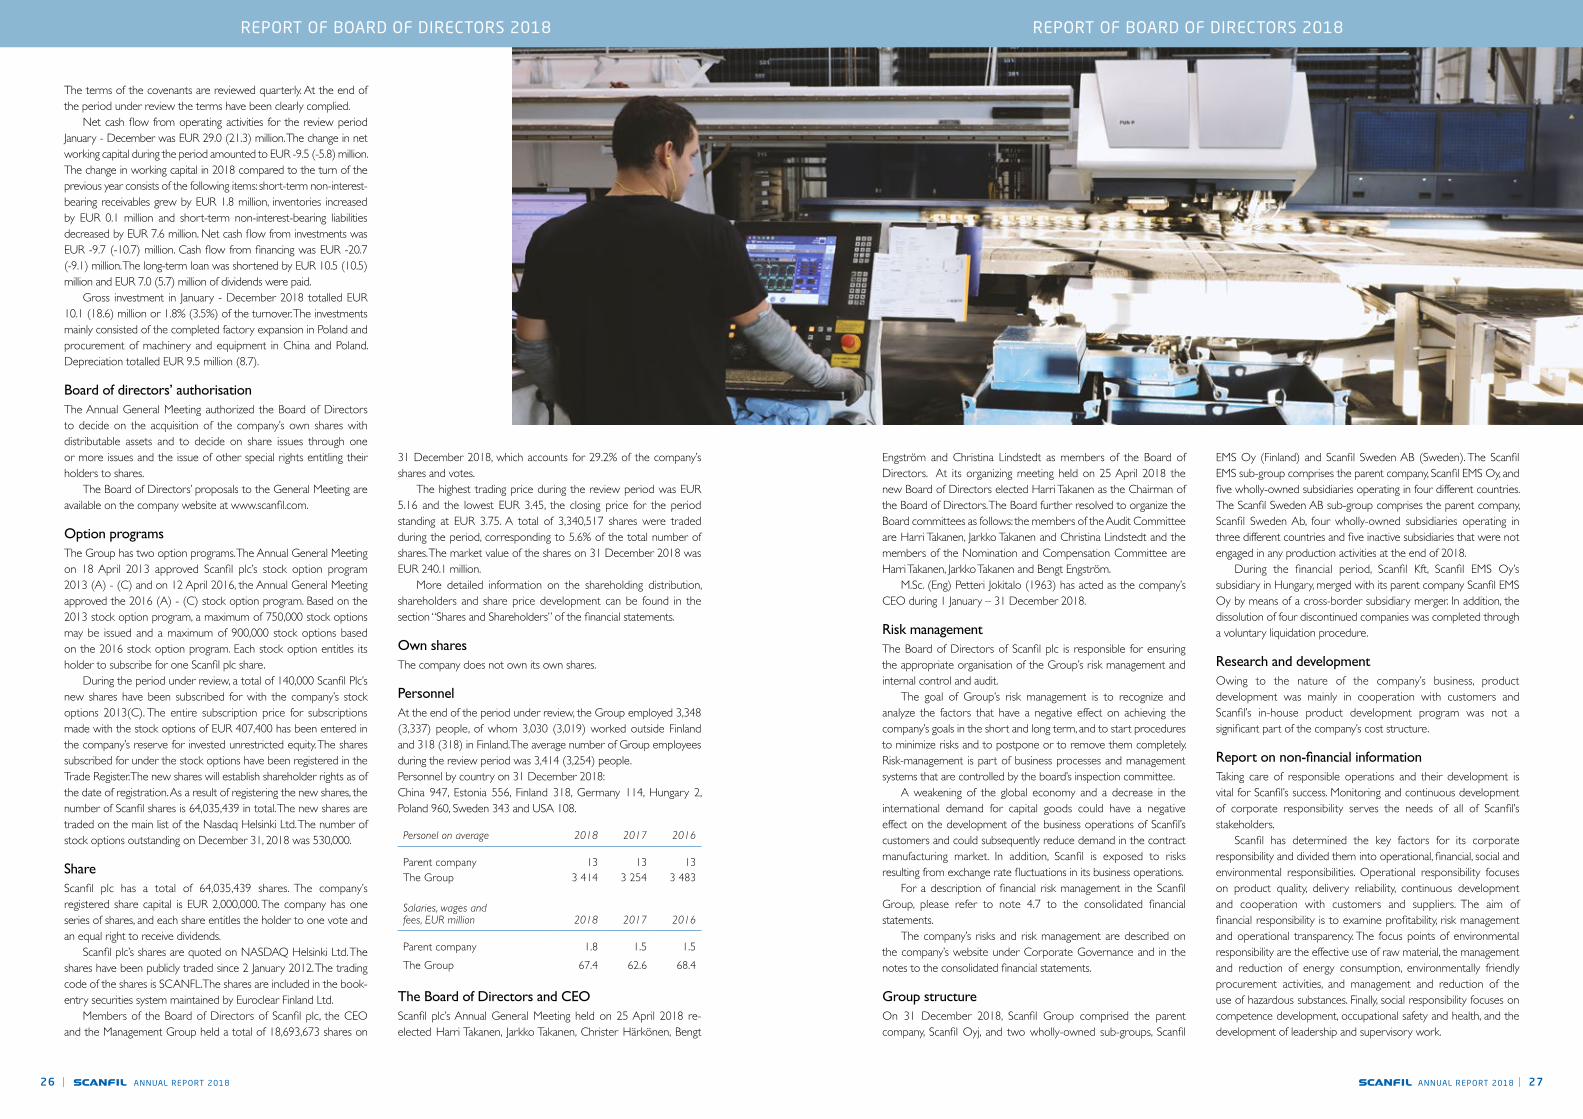
The terms of the covenants are reviewed quarterly. At the end of the period under review the terms have been clearly complied. Net cash flow from operating activities for the review period January - December was EUR 29.0 (21.3) million. The change in net working capital during the period amounted to EUR -9.5 (-5.8) million. The change in working capital in 2018 compared to the turn of the previous year consists of the following items: short-term non-interest-bearing receivables grew by EUR 1.8 million, inventories increased by EUR 0.1 million and short-term non-interest-bearing liabilities decreased by EUR 7.6 million. Net cash flow from investments was EUR -9.7 (-10.7) million. Cash flow from financing was EUR -20.7 (-9.1) million. The long-term loan was shortened by EUR 10.5 (10.5) million and EUR 7.0 (5.7) million of dividends were paid. Gross investment in January - December 2018 totalled EUR 10.1 (18.6) million or 1.8% (3.5%) of the turnover. The investments mainly consisted of the completed factory expansion in Poland and procurement of machinery and equipment in China and Poland. Depreciation totalled EUR 9.5 million (8.7).
Board of directors’ authorisationThe Annual General Meeting authorized the Board of Directors to decide on the acquisition of the company’s own shares with distributable assets and to decide on share issues through one or more issues and the issue of other special rights entitling their holders to shares. The Board of Directors’ proposals to the General Meeting are available on the company website at www.scanfil.com.
Option programsThe Group has two option programs. The Annual General Meeting on 18 April 2013 approved Scanfil plc’s stock option program 2013 (A) - (C) and on 12 April 2016, the Annual General Meeting approved the 2016 (A) - (C) stock option program. Based on the 2013 stock option program, a maximum of 750,000 stock options may be issued and a maximum of 900,000 stock options based on the 2016 stock option program. Each stock option entitles its holder to subscribe for one Scanfil plc share. During the period under review, a total of 140,000 Scanfil Plc’s new shares have been subscribed for with the company’s stock options 2013(C). The entire subscription price for subscriptions made with the stock options of EUR 407,400 has been entered in the company’s reserve for invested unrestricted equity. The shares subscribed for under the stock options have been registered in the Trade Register. The new shares will establish shareholder rights as of the date of registration. As a result of registering the new shares, the number of Scanfil shares is 64,035,439 in total. The new shares are traded on the main list of the Nasdaq Helsinki Ltd. The number of stock options outstanding on December 31, 2018 was 530,000.
ShareScanfil plc has a total of 64,035,439 shares. The company’s registered share capital is EUR 2,000,000. The company has one series of shares, and each share entitles the holder to one vote and an equal right to receive dividends. Scanfil plc’s shares are quoted on NASDAQ Helsinki Ltd. The shares have been publicly traded since 2 January 2012. The trading code of the shares is SCANFL. The shares are included in the book-entry securities system maintained by Euroclear Finland Ltd. Members of the Board of Directors of Scanfil plc, the CEO and the Management Group held a total of 18,693,673 shares on
31 December 2018, which accounts for 29.2% of the company’s shares and votes. The highest trading price during the review period was EUR 5.16 and the lowest EUR 3.45, the closing price for the period standing at EUR 3.75. A total of 3,340,517 shares were traded during the period, corresponding to 5.6% of the total number of shares. The market value of the shares on 31 December 2018 was EUR 240.1 million. More detailed information on the shareholding distribution, shareholders and share price development can be found in the section “Shares and Shareholders” of the financial statements.
Own sharesThe company does not own its own shares.
PersonnelAt the end of the period under review, the Group employed 3,348 (3,337) people, of whom 3,030 (3,019) worked outside Finland and 318 (318) in Finland. The average number of Group employees during the review period was 3,414 (3,254) people.Personnel by country on 31 December 2018:China 947, Estonia 556, Finland 318, Germany 114, Hungary 2, Poland 960, Sweden 343 and USA 108.
The Board of Directors and CEOScanfil plc’s Annual General Meeting held on 25 April 2018 re-elected Harri Takanen, Jarkko Takanen, Christer Härkönen, Bengt
Personel on average 2018 2017 2016
Parent company 13 13 13The Group 3 414 3 254 3 483
Salaries, wages and fees, EUR million 2018 2017 2016
Parent company 1.8 1.5 1.5The Group 67.4 62.6 68.4
REPORT OF BOARD OF DIRECTORS 2018REPORT OF BOARD OF DIRECTORS 2018

ANNUAL REPORT 201828 | ANNUAL REPORT 2018 | 29
invested in and production efficiency was ensured by training the use of quality tools and Lean thinking. In addition, measures were taken to improve working conditions. In addition, personnel were trained on Code of Conduct. The goal is that every employee becomes familiar with the Code of Conduct of Scanfil and to accept them. Scanfil monitors changes in occupational health and safety KPI. Sick leaves are at a good level as well as the number of work-related accidents, but the amount varies by country. During 2018 the sick leave percentage in the Group was 3.6%; the target was below 4%. The number of accidents was 31 when it was a year before 28. In the working conditions have different burdensome factors. In the production, there are presses, different kind of tools and vacuums that cause safety risks when not used correctly. To avoid above mentioned risks, new instructions are developed, and at the same time, new safer machines are looked for. In assembly work and office working posture and long sitting period cause most challenges. The negative impact of these is avoided with good ergonomics. The development of personnel and human resource management has been selected as one of the three group-level top projects during 2019.
HUMAN RIGHTSIn terms of its social responsibility, Scanfil focuses on competence development, occupational safety and health, and the development of leadership and supervisory work. Scanfil ensures the fulfillment of its social responsibility through its Code of Conduct, lawful working conditions and practices. Human rights and equal treatment are basic values in Scanfil’s operations, over which no compromises can ever be made. In addition to employees, they apply to all partners and define, among other things, the principles of respect for the individual and the prevention of forced and child labor and trafficking in human beings. The Code of Conduct also includes instructions on how to report any unethical or illegal actions or suspicions. Scanfil’s personnel survey also asks about possible unwanted behavior. In the management of the supply chain, compliance with ethical principles is ensured by audits. Compliance with laws and ethical principles is also monitored through internal control and audit. No discrepancies have been detected during 2018.
ANTI-CORRUPTION AND BRIBERYCompliance with corporate responsibility is increasingly highlighted when discussing with customers. Scanfil has defined its responsible policies that cover, for example, equal treatment of people and prohibit corruption and bribery. Also, the Group’s own practices, such as open and cost-based pricing, reduce opportunities for unlawful actions. Scanfil carries out its supplier choice carefully and seeks long-term collaboration with its major suppliers. Scanfil uses only approved suppliers that meet the high quality, delivery and cost-effectiveness criteria it sets. In addition to these factors, Scanfil checks that the suppliers fulfill their financial and administrative obligations. Scanfil audits its suppliers systematically and monitors compliance with contract terms and ethical principles. It also prevents possible abuses by checking orders, training, and job rotation. No action was taken against these practices during 2018. As part of its corporate responsibility management, Scanfil is also developing its anti-corruption and anti-corruption activities.
RISKSScanfil observes and follows potential risks. Potential risks relate to the order delivery chain and the ability of suppliers to respond to the actions of their own suppliers, occupational safety and zero tolerance of corruption and bribery throughout the value chain.
Board of Director’s proposals to the Annual General MeetingScanfil plc’s Annual General Meeting will be held on 24 April 2019 at the company’s head office in Sievi, Finland.
Dividend for 2018The parent company’s distributable funds are EUR 39,015,179.77 including retained earnings EUR 10,228,513.15. The Board of Directors proposes to the Annual General Meeting that a dividend of EUR 0.13 per share be paid for a total of EUR 8,324,607.07 for the financial year ending on 31 December 2018 .The dividend matching day is 26 April 2019. The dividend will be paid to those shareholders who, on the matching day, are entered in the Company’s Register of Shareholders, kept by Euroclear Finland Ltd. The dividend payment day is 6 May 2019. No significant changes have taken place in the company’s financial position since the end of the financial year. In the view of the Board of Directors, the proposed dividend pay-out will not put the company’s liquidity at risk. The proposal of Scanfil plc’s nomination committee to the General Meeting for the composition of Scanfil plc’s Board of Directors will be published in connection with the invitation to the General Meeting. The company publishes a notice of the Annual General Meeting later separately.
Future prospectsScanfil estimates, that its turnover for 2019 will be EUR 560 - 610 million and the operating profit will amount to EUR 36 - 41 million.
Long-term targetIn 2020, Scanfil aims to reach sales of EUR 600 million and 7% operating profit level thru organic growth.
Corporate Governance StatementThe Corporate Governance Statement is provided as a separate report and published at the same time with the financial statements.
The Board of Directors and members of the management of Scanfil are responsible for the management of corporate responsibility. In terms of its governance, Scanfil complies with Finnish laws and regulations, its Articles of Association, Nasdaq Helsinki’s rules and guidelines, and the Finnish Corporate Governance Code. In practical work, our responsible actions are guided by the group’s Code of Conduct. In addition, policies and operating principles approved by the Board of Directors or the Management Team guide Scanfil’s operations. Scanfil also requires that its partners comply with laws and agreements, and that they operate in accordance with Scanfil’s responsibility guidelines. The development of Scanfil’s operations and Scanfil’s achievements in the area of corporate responsibility are discussed in more detail in the first sections of the annual report. The management of risks associated with responsibility comprises part of the company’s comprehensive risk management, described in “Risk management”. Scanfil’s business description is at the beginning of the Board of Directors’ report.
ENVIRONMENT Scanfil promotes sustainable development by identifying, measuring and reporting the environmental impact caused by its activities and by attempting to minimize such impact. The aim is to consider environmental impact throughout the value chain, ranging from the procurement of raw material to production and distribution, including the impact caused by the use of products and solutions by their end users and any recycling options. All of Scanfil’s factories have a certified ISO 14001-compliant environmental management system. The most recent version of the standard was adopted during 2018. Only a few deviations from the standard occurred in production. Scanfil reacted to these by taking corrective actions that were approved by the certification body Bureau Veritas. In the production also ready components and chemicals are needed. In each factory, we have around 200 different chemicals in use. Parts of the materials in use are selected by the customer, and therefore Scanfil does not give out any KPIs concerning this. In the production of some products also classified as hazardous materials are needed. Concerning these materials, risk analyses have
been conducted already when these products have been taken into use. Also in the handling of these products precise instructions and safety measurements are followed. Proper training and rehearsal for possible accidents are carried out. Scanfil is working on replacing hazardous chemicals with compensatory products, and during 2018 Scanfil joined the European Union’s LIFE/Fit for REACH project, which target is to find alternative products. During 2018 the chemicals in use were mapped and training for exposure-based risk analysis was carried out. The usage for chemicals was successfully reduced and e.g. in Åtvidaberg factory, the use of chemicals was reduced by 66% within a year. The use of chemicals does not cause significant risks. Scanfil’s energy consumption in relation to products value add decreased by 4.7% compared to the previous year. In order to reduce environmental impact, many measures were taken during 2018. The impact is being followed in every factory. The most significant achievements were seen in Myslowice factory in the decrease of scrapped metal, improved air humidity in Suzhou factory as well as less energy consumption due to the increase of LED lamps. Also in Sieradz meters to monitor energy consumption were installed. In souring Scanfil also favored recycled and environmentally friendly products.
SOCIAL AND EMPLOYEE ISSUESScanfil’s aim is to be a reliable employer and an encouraging working community where every individual has the opportunity to develop their personal skills and abilities. Personnel and related key figures and salaries paid to the parent company and the Group’s employees are described in the section “Personnel” of the Board of Directors’ report. An annual job satisfaction survey is conducted among the personnel. Its results are used when defining development activities. In 2018, the response rate increased to 89%. General job satisfaction went up by four percentage points. In addition, satisfaction with working conditions, supervisors and opportunities for learning and development improved. Good management work is key to maintaining well-being at work, so we constantly aim to improve our supervisors’ skills. During the year, supervisor trainings were carried out at several Scanfil factories. For the multi-tasking of production workers was also
REPORT OF BOARD OF DIRECTORS 2018REPORT OF BOARD OF DIRECTORS 2018

ANNUAL REPORT 201830 | ANNUAL REPORT 2018 | 31
Information on shareholdersOn 31 December 2018, Scanfil plc had a total of 5,715 shareholders, 77.3% of whom owned a maximum of 1,000 shares in the company. The ten major shareholders owned 72.7% of the shares. Nominee-registered shares accounted for 2.0% of the shares.
Shares held by managementMembers of the Board of Directors of Scanfil plc, the CEO and the Management group held a total of 18,693,673 shares on 31 December 2018, which accounts for 29.2% of the company’s shares and votes.
Breakdown of share ownership Breakdown of share ownership by number of shares held at 31 Dec. 2018
Information on shareholders Major shareholders at 31 Dec. 2018
Number of shares
Number of shares
pcs
Percentage of owners
%
Total number of sharesand votes
pcs
Percentage of sharesand votes
%
1 - 200 2 256 39.48 284 016 0.44 201 - 1000 2 164 37.87 1 194 195 1.861001 - 5000 1 003 17.55 2 257 592 3.53
5001 - 10000 128 2.24 951 286 1.49 10001 - 9999999 164 2.87 59 348 350 92.68
5 715 100.00 64 035 439 100.00
Number of shareholders
share%
Number of shares
share%
Corporations 235 4.11 9 462 267 14.78Financial and insurance institutions 25 0.44 4 832 487 7.55Public entities 6 0.10 1 810 483 2.83Non-profit-making organisations 24 0.42 2 187 563 3.42Households 5 406 94.59 45 697 429 71.36Non-Finnish owners 19 0.33 45 210 0.07Total 5 715 100.00 64 035 439 100,00
of which nominee-registered 9 1 258 775 1.97
pcs
Share %of sharesand votes
1. Takanen Harri 9 776 664 15.27 2. Takanen Jarkko 8 511 169 13.29 3. Varikot Oy 7 606 442 11.88 4. Takanen Jorma Jussi 6 079 305 9.49 5. Tolonen Jonna 3 351 950 5.23 6. Pöllä Reijo 3 328 745 5.20 7. Laakkonen Mikko 2 531 187 3.95 8. Takanen Martti 1 947 018 3.04 9. Foundation of Riitta ja Jorma J. Takasen 1 900 000 2.9710. Sijoitusrahasto Aktia Capital 1 528 000 2.39
Breakdown of share ownership by owner category at 31 Dec. 2018
Shares and share capitalScanfil plc has a total of 64,035,439 shares. The company’s registered share capital is EUR 2,000,000. The company has one series of shares, and each share entitles the holder to one vote and an equal right to receive dividends. Scanfil plc’s shares are quoted on NASDAQ Helsinki Ltd. The shares have been publicly traded since 2 January 2012. The trading code of the shares is SCANFL. The shares are included in the book-entry securities system maintained by Euroclear Finland Ltd.
Board’s authorisations in forceBoard of Directors of Scanfil plc does not have any share issue authorisations or authorisations to issue convertible bonds or bonds with warrants. Scanfil plc’s Annual General Meeting on 25 April 2018 authorized the Board of Directors to decide on the acquisition of maximum of 5.000.000 Company’s own shares. The authorization will remain in force for 18 months after it is issued. The Meeting decided to authorize the Board of Directors to decide on share issues and the issue of other special rights entitling their holders to shares. The number of shares to be issued based on the authorisation can be no more than 13,000,000 shares. The Board shall decide on the terms and conditions of share issues and the issue of special rights entitling their holders to shares. The authorisation concerns both the issue of new shares and the transfer of treasury shares. Shares and special rights entitling their holders to shares can be issued in deviation from the shareholders’ pre-emptive rights (directed issue). The authorisation shall be valid until 30 June 2016.
The Annual General Meeting on 12 April 2016 decided to authorize the Board of Directors to decide on granting option rights to specific key people of Scanfil Group. The total number of option rights is 900,000 and they entitle the key personnel to subscribe for a combined total of 900,000 of the company’s new shares or shares in its possession.
Own sharesThe company does not own its own shares.
Dividend distribution policyThe company aims to pay a dividend annually. The level of dividends paid and the date of payment are affected, inter alia, by the Group’s result, financial position, need for capital and other possible factors. The aim is to distribute approximately one-third of the Group’s annual profit as dividend to shareholders.
DividendThe Board of Directors proposes to the Annual General Meeting that a dividend of EUR 0.13 per share be paid for a total of EUR 8,324,607.07 for the financial year ending on 31 December 2018.
Share price development, trading and market valueIn 2018, the number of Scanfil plc shares traded on NASDAQ Helsinki Ltd was 3,340,517, which accounts for 5.2% of all shares. The value of shares traded was EUR 14.9 million and the average price EUR 4.44. Market capitalisation was EUR 240.1 million at the end of 2018. The highest trading price was EUR 5.16 and the lowest EUR 3.45. The closing price was EUR 3.75.
Share price performance in 2018 compared to the general index.
SHARES AND SHAREHOLDERSSHARES AND SHAREHOLDERS

ANNUAL REPORT 201832 | ANNUAL REPORT 2018 | 33
Return on equity, % Net profit for the period x 100 Shareholders’ equity (average) Return on investment, % (Profit before taxes + interest and other financial expenses) x 100 Balance sheet total - non-interest-bearing liabilities (average) Gearing (%) (Interest-bearing liabilities - cash and other liquid financial assets) x 100 Shareholders’ equity Equity ratio (%) Shareholders’ equity x 100 Balance sheet total - advance payments received Earnings per share Net profit for the period Average adjusted number of shares during the year Shareholders’ equity per share Shareholders’ equity Adjusted number of shares at the end of the financial period Dividend per share Dividend to be distributed for the period (Board’s proposal) Number of shares at the end of year
Dividend per earnings (%) Dividend per share x 100 Earnings per share Effective dividend yield (%) Dividend per share x 100 Share price at the end of year
Price-to-earnings ratio (P/E) Share price at the end of year Earnings per share
Average share price Total share turnover Number of shares traded Market capitalisation Number of shares x last trading price of the financial period
2018 2017 2016 2015 2014 2013
Financial Key ratios Turnover, EUR m 563.0 529.9 508.0 377.3 214.5 188.5Turnover, growth from previous year, % 6.3 4.3 34.6 75.9 13.8 4.2Operating profit, EUR m 37.8 31.3 7.2 14.4 16.2 11.8Operating profit, % of turnover 6.7 5.9 1.4 3.8 7.6 6.3Profit/loss for the period, EUR m 28.9 25.8 0.1 8.4 12.3 8.2Profit/loss for the period, % of turnover 5.1 4.9 0.0 2.2 5.7 4.4
Return on equity, % 21.5 22.2 0.1 8.6 14.0 10.6Return on investment, % 20.2 19.4 4.6 10.6 16.5 11.4Interest-bearing liabilities, EUR m 47.3 61.3 60.1 87.8 9.3 18.3Gearing, % 19.5 32.6 36.9 65.4 -10.5 -12.2Equity ratio, % 47.7 40.7 40.7 33.4 70.6 64.1Gross investments in fixed assets, EUR m 10.1 18.6 5.5 54.3 8.2 4.0Gross investments in fixed assets, % of turnover 1.8 3.5 1.1 14.4 3.8 2.1Average number of employees for the period 3 414 3 254 3 483 2 690 1 773 1 673
Key indicators per share
Earnings per share, EUR 0.45 0.40 0.00 0.15 0.21 0.14Shareholders’ equity per share, EUR 2.26 1.95 1.70 1.74 1.64 1.39Dividend per share, EUR 0.13 0.11 0.09 0.08 0.07 0.05Dividend per earnings, % 28.7 27.2 6118.9 55.2 32.9 35.1Effective dividend yield, % 3.47 2.59 2.58 2.10 2.85 3.70Price-to-earnings ratio (P/E) 8.3 10.5 2 372.8 26.3 11.5 9.5
Share trading
No. of shares traded, thousands 3 341 3 296 9 424 5 202 5 131 2 864Percentage of total shares, % 5.2 5.2 14.8 9.01 8.88 4.96
Share performance
Lowest price for year, EUR 3.45 3.42 2.86 2.36 1.30 0.82Highest price for year, EUR 5.16 4.53 3.80 4.06 2.74 1.47Average price for year, EUR 4.44 3.92 3.41 2.92 1.95 1.11Price at the end of year, EUR 3.75 4.25 3.49 3.81 2.46 1.35Market value of share capital at 31 Dec.2009, EUR m 240.1 271.6 222.2 220.0 142.0 77.9
Share-issue adjusted number of shares
At the end of the period, thousands 64 035 63 895 63 670 57 730 57 730 57 730On average during the period, thousands 63 945 63 757 62 423 57 730 57 730 57 730
DEFINITIONS OF KEY RATIOSKEY RATIOS

ANNUAL REPORT 201834 | ANNUAL REPORT 2018 | 35
CONSOLIDATED INCOME STATEMENT, IFRS
1000 EUR Note 1.1.-31.12.2018 1.1.-31.12.2017
Turnover 1.1 563 032 529 860
Other operating income 1.2 786 2 703Changes in inventories of finished goods and work in progress -323 3 018
Use of materials and supplies 1.3 -382 741 -367 742Employee benefit expenses 1.4 -86 336 -80 020Depreciation and amortization 3.4 -9 527 -8 740Other operating expenses 1.5 -47 114 -47 795
Operating profit 37 776 31 283
Financial income 4.2 9 529 9 825Financial expense 4.2 -11 273 -8 505
Profit before tax 36 032 32 603
Income tax 1.6 -7 143 -6 795
Net profit for the period 28 890 25 808
Attributable to: The parent company owners 28 890 25 808
Earnings per share calculated on the profit attributableto shareholders of the parent company: undiluted and diluted earnings per share 1.7 0,45 0,40
Consolidated Statement of Comprehensive Income, IFRS
Net profit for the period 28 890 25 808
Other comprehensive income
Items that may later be recognizedin profit or loss Translation differences 4.9 -2 435 -4 900 Cash flow hedges 4.9 -158 438Other comprehensive income, net of tax -2 592 -4 461
Total comprehensive income 26 297 21 347
Total comprehensive income attributable to: The parent company owners 26 297 21 347
CONSOLIDATED BALANCE SHEET, IFRS
1000 EUR Note 31.12.2018 31.12.2017
ASSETS
Non-current assets
Property, plant and equipment 3.3 49 111 47 662Goodwill 3.1 10 117 10 384Other intangible assets 3.2 12 246 14 628Other investments 4.6 33 33Deferred tax assets 1.6 4 433 4 171
75 940 76 879Current assets
Inventories 2.2 99 196 100 658Trade and other receivables 2.3 107 558 106 001Advance payments 325 982Current tax 1 630 1 429Cash and cash equivalents 4.1 19 153 20 635
227 861 229 706
Total assets 303 801 306 585
EQUITY
Shareholder's equity and liabilities 4.9Share capital 2 000 2 000Reserve for invested unrestricted equity fund 28 443 28 036Fair value reserve -225 -68Other reserves 6 706 6 706Translation differences 4 257 6 691Retained earnings 103 564 81 318
144 744 124 683
Total equity 144 744 124 683
Non-current liabilities
Provisions 5.1 292 283Interest bearing liabilities 4.3 16 577 27 356Deferred tax liabilities 1.6 5 970 4 825
22 839 32 464
Current liabilities
Trade and other liabilities 2.4 103 500 113 058Current tax 1 837 2 245Provisions 5.1 120 176Interest bearing liabilities 4.3 30 761 33 959
136 218 149 438
Total liabilities 159 057 181 902
Total shareholder's equity and liabilities 303 801 306 585
CONSOLIDATED BALANCE SHEETCONSOLIDATED INCOME STATEMENT
ANNUAL REPORT 201836 | ANNUAL REPORT 2018 | 37
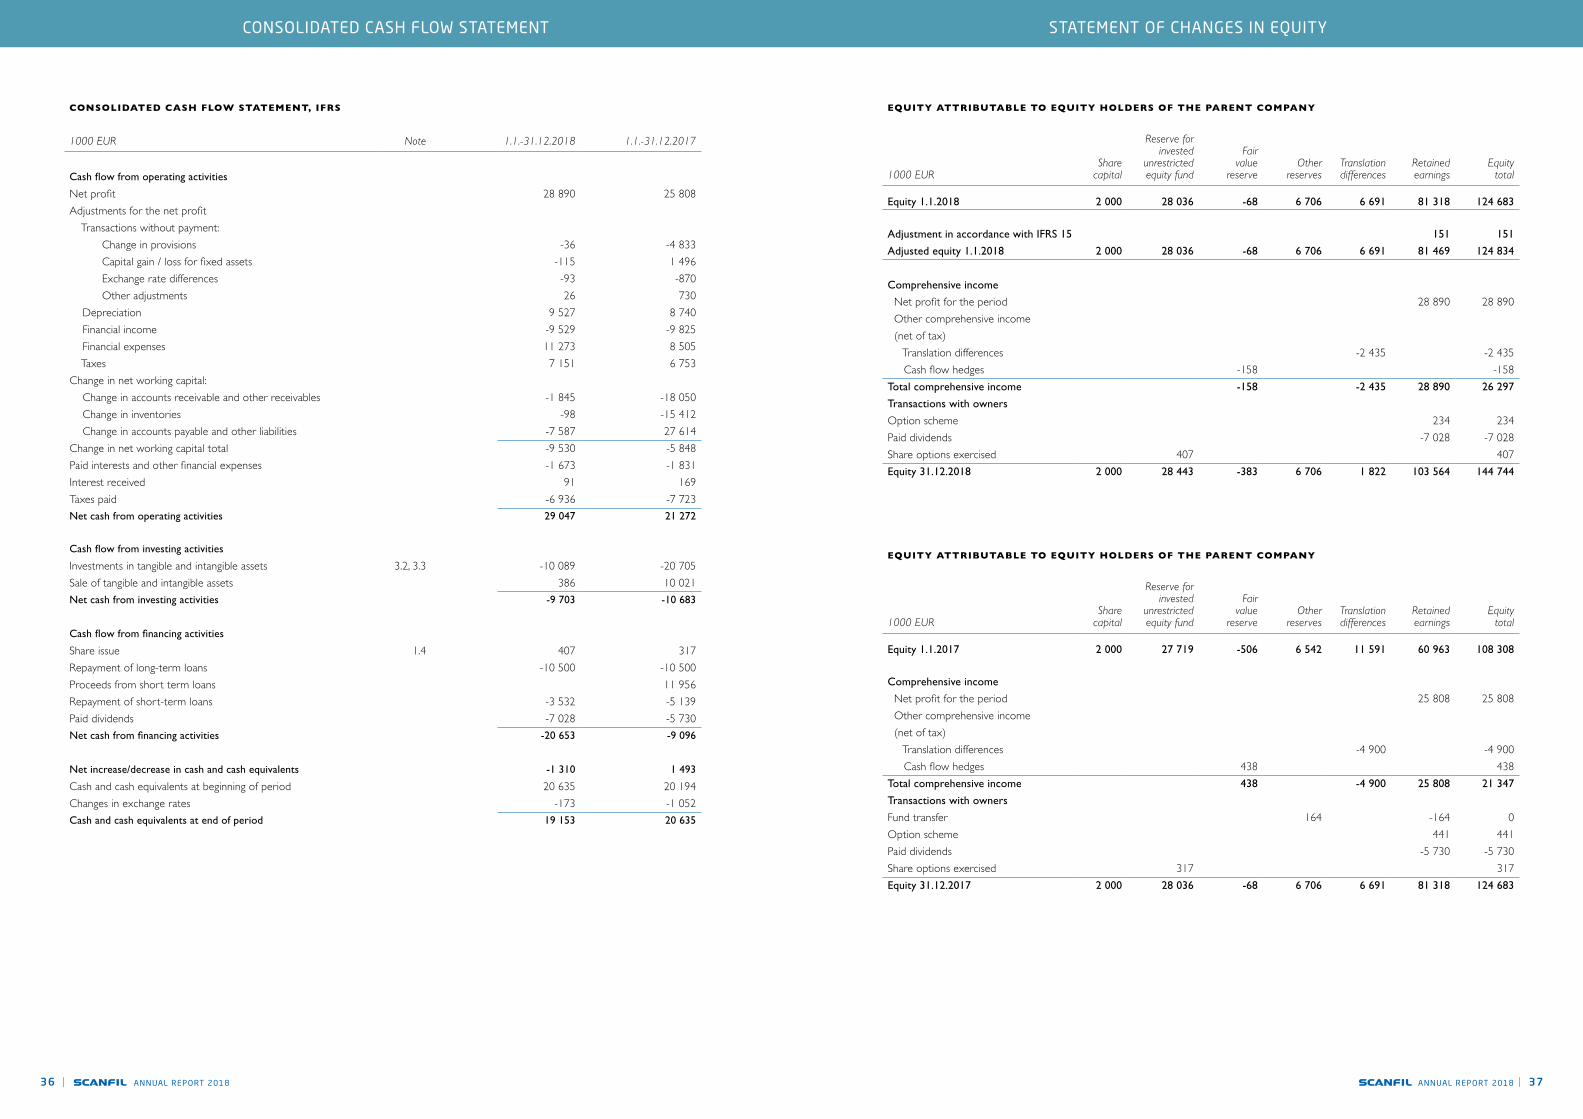
CONSOLIDATED CASH FLOW STATEMENT, IFRS
1000 EUR Note 1.1.-31.12.2018 1.1.-31.12.2017
Cash flow from operating activities
Net profit 28 890 25 808Adjustments for the net profit Transactions without payment: Change in provisions -36 -4 833 Capital gain / loss for fixed assets -115 1 496 Exchange rate differences -93 -870 Other adjustments 26 730 Depreciation 9 527 8 740 Financial income -9 529 -9 825 Financial expenses 11 273 8 505 Taxes 7 151 6 753Change in net working capital: Change in accounts receivable and other receivables -1 845 -18 050 Change in inventories -98 -15 412 Change in accounts payable and other liabilities -7 587 27 614Change in net working capital total -9 530 -5 848Paid interests and other financial expenses -1 673 -1 831Interest received 91 169Taxes paid -6 936 -7 723Net cash from operating activities 29 047 21 272
Cash flow from investing activities
Investments in tangible and intangible assets 3.2, 3.3 -10 089 -20 705Sale of tangible and intangible assets 386 10 021Net cash from investing activities -9 703 -10 683
Cash flow from financing activities
Share issue 1.4 407 317Repayment of long-term loans -10 500 -10 500Proceeds from short term loans 11 956Repayment of short-term loans -3 532 -5 139Paid dividends -7 028 -5 730Net cash from financing activities -20 653 -9 096
Net increase/decrease in cash and cash equivalents -1 310 1 493
Cash and cash equivalents at beginning of period 20 635 20 194Changes in exchange rates -173 -1 052Cash and cash equivalents at end of period 19 153 20 635
EQUITY ATTRIBUTABLE TO EQUITY HOLDERS OF THE PARENT COMPANY
1000 EURShare
capital
Reserve forinvested
unrestrictedequity fund
Fairvalue
reserveOther
reservesTranslationdifferences
Retainedearnings
Equitytotal
Equity 1.1.2018 2 000 28 036 -68 6 706 6 691 81 318 124 683
Adjustment in accordance with IFRS 15 151 151
Adjusted equity 1.1.2018 2 000 28 036 -68 6 706 6 691 81 469 124 834
Comprehensive income
Net profit for the period 28 890 28 890 Other comprehensive income (net of tax) Translation differences -2 435 -2 435 Cash flow hedges -158 -158Total comprehensive income -158 -2 435 28 890 26 297
Transactions with owners
Option scheme 234 234Paid dividends -7 028 -7 028Share options exercised 407 407Equity 31.12.2018 2 000 28 443 -383 6 706 1 822 103 564 144 744
EQUITY ATTRIBUTABLE TO EQUITY HOLDERS OF THE PARENT COMPANY
1000 EURShare
capital
Reserve forinvested
unrestrictedequity fund
Fairvalue
reserveOther
reservesTranslationdifferences
Retainedearnings
Equitytotal
Equity 1.1.2017 2 000 27 719 -506 6 542 11 591 60 963 108 308
Comprehensive income
Net profit for the period 25 808 25 808 Other comprehensive income (net of tax) Translation differences -4 900 -4 900 Cash flow hedges 438 438Total comprehensive income 438 -4 900 25 808 21 347
Transactions with owners
Fund transfer 164 -164 0Option scheme 441 441Paid dividends -5 730 -5 730Share options exercised 317 317Equity 31.12.2017 2 000 28 036 -68 6 706 6 691 81 318 124 683
STATEMENT OF CHANGES IN EQUITYCONSOLIDATED CASH FLOW STATEMENT

ANNUAL REPORT 201838 | ANNUAL REPORT 2018 | 39
NOTES TO CONSOLIDATED FINANCIAL STATEMENTS
Basic details of the group
Scanfil plc is a Finland-based public limited company domiciled in Sievi. The parent company Scanfil plc and the subgroups Scanfil EMS Oy and Scanfil Sweden AB make up Scanfil Group (hereinafter ‘Scanfil’ or ‘the group’). The shares of parent company Scanfil plc have been quoted on the Main List of Nasdaq Helsinki Ltd since January 2, 2012. Scanfil is an international contract manufacturer and system supplier for the electronics industry with 40 years of experience in demanding contract manufacturing. Scanfil provides its customers with an extensive array of services, ranging from product design to product manufacturing, material procurement and logistics solutions. Typical Scanfil products include mobile and communications network devices, automation system modules, frequency converters, elevator control systems, analyzers, various slot and vending machines, and devices related to medical technology and meteorology. Scanfil’s network of factories consists of 10 production units in Europe, Asia and North America. The total number of employees is approximately 3,400.
Accounting principles
Scanfil’s consolidated financial statements have been prepared in accordance with International Financial Reporting Standards (IFRS), applying the IAS and IFRS effective on December 31, 2018, as well as the SIC and IFRIC interpretations. “IFRS” refers to the standards and their interpretations in the Finnish Accounting Act and the provisions issued thereunder in accordance with the Regulation (EC) No 1606/2002 of the European Parliament and of the Council on the application of international accounting standards within the Community. The notes to the consolidated financial statements are also in compliance with Finnish accounting and corporate legislation. The consolidated financial statements have been prepared for the period January 1 – December 31, 2018. In its meeting held on February 20, 2019, the Board of Directors of Scanfil plc approved the consolidated financial statements for publication.
According to the Finnish Limited Liability Companies Act, the ordinary general meeting has the right to adopt, reject or amend the financial statements after their publication. Unless otherwise stated, the financial statements are presented in thousands of euros, and the information is based on historical costs of transactions, unless otherwise stated in the accounting principles. All individual figures and totals presented in the financial statements have been rounded, due to which the total sum of single figures may differ from the sum presented. The key figures were calculated using precise values.
Accounting principles for consolidated financial statements
The general accounting principles used for consolidated financial statements are described in this section. More detailed accounting principles are shown below in connection with each item. The table below shows the accounting principles used for the consolidated financial statements of Scanfil plc, the associated notes and references to the most important IFRS regulating the financial statement items.
Combination principles
SubsidiariesSubsidiaries are companies controlled by the group. Control emerges when the group controls more than one half of the votes or otherwise has control. The group has controlling interest in an entity when it has the right and ability to control significant operations in the entity and when it is exposed to or has the right to variable returns from the entity through its power over the entity. The existence of potential voting rights is also taken into account when estimating the criteria for control when the instruments entitling to potential voting rights can be realized at the time of the assessment. In Scanfil Group, all subsidiaries are wholly-owned, and control is created by the voting powers.Intra-group shareholdings have been eliminated using the
Accounting principle Note IFRS-standard
Net Sales and details of business segments 1.1 IFRS 15, IFRS 8, IAS 18Employee benefit expenses 1.4 IAS 19, IFRS 2Income taxes and deferred taxes 1.6 IAS 12Inventories 2.1 IAS 2Goodwill and impairment testing 3.1 IAS 36Intangible assets 3.2 IAS 38, IFRS 3Property, plant and equipment 3.3 IAS 16, IAS 23Finance leases and other leases 3.5, 5.2 IAS 17Financial income and expenses 4.2 IFRS 9, IAS 32, IAS 39, IFRS 7Financial liabilities and Cash and cash equivalents 4.1, 4.3 IFRS 9, IAS 32, IAS 39, IFRS 7, IFRS 13Provisions 5.1 IAS 37
Accounting principles for consolidated financial statements
acquisition cost method. Consideration transferred and the identifiable assets and assumed liabilities of the acquired company are measured at fair value at the time of the acquisition. Acquisition-related expenses, apart from expenses related to the issue of debt or equity securities, have been recorded as expenses. Consideration transferred does not include business operations handled separately from the acquisition. Their impact has been taken into account in connection with the acquisition through profit or loss. Any conditional additional purchase price is measured at fair value at the time of the acquisition and classified as either debt or equity. Additional purchase price classified as debt is measured at fair value at the balance sheet date of each reporting period, and the resulting profit or loss is recognized through profit or loss. Additional purchase price classified as equity is not re-valued. Acquired subsidiaries are consolidated from the moment the group has gained control, and divested subsidiaries until control ceases to exist. All intra-group transactions, receivables, liabilities and unrealized gains and internal profit distribution are eliminated upon preparing the consolidated financial statements. Unrealized losses are not eliminated when the loss is due to impairment. Shareholders’ equity attributable to non-controlling interest is presented as a separate item under shareholders’ equity in the balance sheet. There were no non-controlling interests during the financial periods 2017 and 2018. Should the group lose control of a subsidiary, the remaining holding is measured at fair value on the date of losing control, and the resulting difference is recognized through profit or loss. Acquisitions made prior to January 1, 2010 are handled in accordance with the regulations effective at the time.
Conversion of items in foreign currency
The figures concerning the result and financial position of group units are measured in the currency that is the currency of each unit’s main operating environment (the operating currency). The consolidated financial statements are presented in euros, which is the operating and reporting currency of the group’s parent company. Foreign currency-denominated transactions are recorded in the operating currency using the foreign exchange rates on the transaction date. In practice, a rate that is sufficiently close to the rate of the transaction date is often used. The resulting exchange rate differences are recognized through profit or loss. Foreign exchange gains and losses related to business operations are recognized as adjusted sales and purchase items. Rate differences in financing are presented under financial income and expenses.In the consolidated financial statements, the income statements of foreign group companies are translated into euros using the average annual rates published by the European Central Bank. The companies’ balance sheets are translated into euros using the rates in force on the balance sheet date. Translation differences owing to the different exchange rates used in the income statement and balance sheet as well as translation differences attributable to the use of the acquisition method and equity balances accrued after the acquisition have been recorded in group equity, and the change in translation difference are presented in the statement of comprehensive income.
Non-current assets classified as held for sale and discontinued operations
The assets and liabilities of major operations that are classified as held for sale or to be discontinued are presented separately in the balance sheet. The net operating result for discontinued operations and the net result arising from their sale or discontinuation are shown in the income statement separately from the profit or loss for continued operations. Non-current assets classified as held for sale or groups of assets to be disposed of are measured at the lower of carrying amount and fair value less costs to sell. The group did not have such items for the financial periods 2017 and 2018.
Operating profit
IAS 1 Presentation of Financial Statements does not specify the concept of operating profit. The group has defined it as follows: operating profit is the net sum of turnover plus other operating income less acquisition costs adjusted for the change in inventories of finished goods and work in progress as well as costs arising from production for own use, less employee benefit expenses, depreciation and any impairment losses and other operating expenses. All of the items in the income statement apart from those specified above are presented under operating profit. Exchange rate differences are included in the operating profit if they arise from operations-related items; otherwise, they are recognized in financial items.
Dividend
The dividend proposed to the Annual General Meeting by the Board of Directors has not been deducted from distributable equity prior to the AGM’s approval.
Accounting principles requiring the discretion of management and major uncertainty factors associated with the estimates
The preparation of financial statements in accordance with international accounting standards requires the company’s management to make estimates and assumptions that affect the contents of the financial statements. The estimates and assumptions made are based on previous experience and assumptions, which in turn are based on the circumstances prevailing at the time the financial statements are prepared and future prospects. Even though the estimates are based on the most recent information available and the management’s best judgment, the actual outcome may differ from the estimates.The following lists the most significant items that require the management’s assessment. The group annually performs testing for impairment of goodwill and other intangible rights. The recoverable amounts for cash-generating units have been determined with calculations based on value in use. These calculations require the use of estimates from the management. More information on impairment testing of goodwill is available in Note 3.1, “Goodwill”. Potential obsolescence included in the value of inventories is regularly examined and, if necessary, the value of inventories
ACCOUNTING PRINCIPLES FOR CONSOLIDATED FINANCIAL STATEMENTSACCOUNTING PRINCIPLES FOR CONSOLIDATED FINANCIAL STATEMENTS

ANNUAL REPORT 201840 | ANNUAL REPORT 2018 | 41
is depreciated to match their net realizable value. These examinations require estimates on the future demand for products. Estimates are also required when assessing the amount of provisions associated with business operations. Note 5.1, “Provisions”, presents the provisions made within the group. Estimates by the management are also included in the assessment of possible credit loss risks included in trade receivables. Furthermore, the management also uses its discretion when recognizing and measuring deferred tax assets.
New and amended standards applied during the financial year
Scanfil Group has observed the following new and amended standards from the beginning of 2018:• IAS 9 Financial Instruments and amendments made to it
(effective for the financial periods beginning on or after January 1, 2018). IFRS 9 has replaced IAS 39. The new standard includes revised guidance on the classification and measurement of financial instruments, including a new expected credit loss model for calculating impairment on financial assets, and the new general hedge accounting requirements. It also carries forward the guidance on recognition and derecognition of financial instruments from IAS 39. According to the new impairment model, impairment provisions must be recognized on the basis of expected credit losses. A simplified model must be applied to trade receivables, in which the estimated amount of credit losses is based on percentages defined on the basis of the age distribution of the receivables. The standard amendment did not have any significant impact on the consolidated financial statements.
• IFRS 15 Revenue from Contracts with Customers, Effective date of IFRS 15 and Clarifications to IFRS 15 (effective for the financial periods beginning on or after January 1, 2018). The new standard has replaced current IAS 18 and IAS 11 standards and related interpretations. In IFRS 15, a five-step model is applied to determine when to recognize revenue, and at what amount. Revenue is recognized when a company transfers control of goods or services to a customer either over time or at a point in time. The standard also introduces new disclosure requirements.
The group’s turnover is mainly generated from customer agreements, where the sales of goods are the only performance obligation in the contract. The group fulfils the performance obligation on a certain point in time when control of the asset is transferred to the customer. Typically, control is transferred when the goods are delivered in compliance with the terms of delivery. Typical Scanfil products include mobile and communications network devices, automation system modules, frequency converters, elevator control systems, analyzers, various slot and vending machines, and devices related to medical
technology and meteorology. The majority of the company’s revenue comes from sales of manufactured products. The group also provides its customers with services, such as prototype manufacturing, productization, component, storage and logistics services for products and after-sales services, including repair and updating services for products. A small part of revenue from services is recognized over time, mainly on the basis of working hours.
The adoption of the standard did not have any significant impact on the date on which the revenues of the group are recognized as income. The most significant difference from the recognition date in accordance with IAS 18 comes from the treatment of customers’ consignment stocks. Earlier, the recognition was carried out when the customer used the consignment stock. Contractual control is transferred to the customer when goods are transferred to the consignment stock and, consequently, sales are recognized as income when control is transferred. There is a minor impact on the recognition of penalties for late delivery and quantity discounts granted to customers. The penalties for late delivery have earlier been recognized as an expense, but they are recognized as a deduction of sales in compliance with IFRS 15. Quantity discounts have been recognized when the customer has been credited; now, the quantity discount is already estimated and recognized in compliance with IFRS 15 when the performance obligation is posted, provided that the customer is entitled to a discount.
The group used the cumulative effect approach when applying IFRS 15. The impact on the opening balance on January 1, 2018 was as follows:
- Retained earnings increased by EUR 0.2 million. - Inventories decreased by EUR 2.5 million, and accrued
income increased by EUR 3.0 million.
• Interpretation IFRIC 22 Foreign Currency Transactions and Advance Consideration* (effective for the financial periods beginning on or after January 1, 2018). When foreign currency consideration is paid or received in advance of the item it relates to – which may be an asset, an expense or income – IAS 21 The Effects of Changes in Foreign Exchange Rates is not clear on how to determine the transaction date for translating the related item. The interpretation clarifies that the transaction date is the date on which the company initially recognizes the prepayment or deferred income arising from the advance consideration. For transactions involving multiple payments or receipts, each payment or receipt gives rise to a separate transaction date. The amendment has no impact on Scanfil plc’s consolidated financial statements.
New and amended standards and interpretations to be applied in future financial periods
Scanfil has not yet applied the following new or revised standards and interpretations already published by the IASB. The group will adopt them as of the effective date of each standard and interpretation, or if the effective date is not the first day of the
financial period, as of the beginning of the first financial period after the effective date.
* = not yet endorsed for use by the European Union as of December 31, 2018.
• IFRS 16 Leases (effective for the financial periods beginning on or after January 1, 2019). The new standard replaces the current IAS 17 and related interpretations. IFRS 16 requires lessees to recognize lease agreements on the balance sheet as a lease liability and as a related asset item. The accounting
model is similar to current financial lease accounting in accordance with IAS 17. Lessor accounting remains mostly similar to current IAS 17.
Five of the group’s ten production plants operate in leased premises. In addition, the group has lease agreements on cars and other vehicles (mainly forklifts). Scanfil will use a simplified approach during the transition. The group will use exceptions that concern short-term lease agreements of at most 12 months and assets at a maximum value of USD 5,000, apart from leasing cars, for example, to which the 12-month exception does not apply. Therefore, nearly all
lease agreements will be recognized on the balance sheet at the time of the transition. The interest rate applied to the group’s loans in Finland, Sweden, Germany and Estonia will be used as the discount rate. Discount rates applied in other countries have been defined separately for each country.
Lease agreement liabilities and the asset item regarding the right of use on January 1, 2019, recognized on the balance sheet totals EUR 14.8 million. The adoption of the standard has an impact on key figures; the equity ratio is expected to decrease by approximately two percentage points and net gearing by 10 percentage points. The adoption is only expected to have a minor impact on net results.
• IFRIC 23 Uncertainty over Income Tax Treatments (effective
for the financial periods beginning on or after January 1, 2019). The interpretation brings clarity to the accounting for income tax treatments that have yet to be accepted by tax authorities. The key test is whether the tax authority will accept the company’s chosen tax treatment. When considering this, the assumption is that tax authorities will
have full knowledge of all relevant information in assessing a proposed tax treatment. The amendment has no impact on Scanfil plc’s consolidated financial statements.
• Amendments to IAS 28 Long-term Interests in Associates and Joint Ventures* (effective for the financial periods beginning on or after January 1, 2019). The amendments clarify that a company applies IFRS 9 to long-term interests in an associate or joint venture that form part of the net investment in the associate or joint venture. The amendment has no impact on Scanfil plc’s consolidated financial statements.
• Annual Improvements to IFRS*, 2015-2017 cycle (effective for financial years beginning on or after January 1, 2019). The annual improvements process provides a mechanism for minor and non-urgent amendments to IFRS to be grouped together and issued in one package annually. The amendments concern IFRS 3, IFRS 11, IAS 12 and IAS 23. The amendments have no impact on Scanfil plc’s consolidated financial statements.
Reconciliation calculation, 1000 EUR
Minimum leasing liabilities in financial statements of December 31, 2018 12 035 Impact of discount rate -1 145 Lease periods longer than minimum lease periods 5 371 New lease agreement, starting on February 1, 2019, included in lease agreement liabilities -1 422Fixed asset item in accordance with IFRS 16, January 1, 2019 14 839
ACCOUNTING PRINCIPLES FOR CONSOLIDATED FINANCIAL STATEMENTSACCOUNTING PRINCIPLES FOR CONSOLIDATED FINANCIAL STATEMENTS

ANNUAL REPORT 201842 | ANNUAL REPORT 2018 | 43
Revenue recognition
The group’s turnover mainly consists of customer agreements that only include the sale of goods. Typical products manufactured by Scanfil include video surveillance systems and equipment, communications network device, audio communications products, health technology devices and systems, electricity and automation system modules, renewable energy production converters and inverters, frequency converters, lift control systems, analyzers, various slot and vending machines, defense industry devices and meteorological instruments. IFRS 15 has replaced IAS 18 and IAS 11 and related interpretations for the financial period beginning on January 1, 2018. Revenue is recognized when a company transfers control of goods or services to a customer either over time or at a point in time. The group mainly fulfils the performance obligation at a certain point in time when control of an asset item is transferred to the customer. Typically, control is transferred when goods are delivered in compliance with the terms of delivery. Revenue arising from the sale of products is recognized when the significant risks and rewards of ownership, right of possession and actual control of the products sold have been transferred to the buyer. A small part of the group’s turnover comes from service sales. Service sales include prototype manufacturing, productization, component, storage and logistics services, as well as after-sales services, including repair and updating services for products. Some revenue from services is recognized over time in accordance with the completion of the services. With regard to customers’ consignment stocks, revenue is recognized when control is transferred to the customer, i.e. when goods are transferred to the consignment stock. Variable considerations include cash and quantity discounts and consequences of delayed deliveries, which are already estimated and recognized when the performance obligation is posted. Scanfil provides a product warranty on the basis of customer contracts. The warranty period typically ranges from 12 to 24 months, and it can be at most 36 months. The warranty is not a separate performance obligation. Payment terms are customer-specific, ranging from 30 to 90 days.
1. ITEMS AFFECTING THE RESULT
1.1 TURNOVER AND DETAILS OF BUSINESS SEGMENTS
ACCOUNTING PRINCIPLE
Breakdown of turnover by customer segment in 2017 and 2018
Revenue recognition in 2017Revenue arising from the sale of products is recognized when the significant risks and rewards of ownership, right of possession and actual control of the products sold have been transferred to the buyer. As a rule, this takes place when the products are delivered in accordance with the terms and conditions of agreement. Revenue from services is recognized for the accounting period in which the services are delivered to the customer. Sales-related exchange rate gains and losses, as well as any cash discounts, are recognized as adjusted sales items. The delivery costs of goods sold are included in other operating expenses. The most significant difference from the recognition date in accordance with IAS 18 comes from the treatment of customers’ consignment stocks. Earlier, the recognition was carried out when the customer used the consignment stock. According to IFRS 15, contractual control is transferred to the customer when goods are transferred to the consignment stock and, consequently, sales are recognized as income when control is transferred. Following the clarification of Scanfil Group’s structure, Scanfil has started using single business segment reporting from the beginning of 2017.
TurnoverThe company’s customers include international operators in the automation, energy, data transmission and health technology sectors, among other industries, and companies operating in fields related to urbanization.
Markets and customer segments
Scanfil has divided its customers into segments on the basis of their respective fields of activity and monitors the development of sales by customer segment. The customers are divided into the following segments: - Energy and Automation - Medtech, Life Science and Environmental Measurements - Networks and Communications - Urban Applications - Other Industries
Turnover by customer segment and quarter
EUR million 2017 Q1/2018 Q2/2018 Q3/2018 Q4/2018 2018
% of turnover
2018
Energy & Automation 84.7 22.4 23.9 23.5 23.5 93.2 16.6 %Medtec, Life Science, Environmental Measurements 86.0 25.2 24.6 22.9 25.2 97.9 17.4 %Networks&Communication 103.5 22.3 23.7 24.3 28.0 98.3 17.5 %Urban Applications 172.6 43.2 48.1 40.2 43.8 175.3 31.1 %Other Industries 83.1 26.6 31.4 20.6 19.7 98.3 17.5 %Total 529.9 139.6 151.7 131.5 140.2 563.0 100.0 %
Grouping of revenue
Revenue is grouped into product and service sales by customer segment. The majority, nearly 95%, of the company’s revenue comes from sales of manufactured products.
In 2018, the group’s turnover increased by 6.3% from the year before. The turnover increased in all customer segments, apart from in the Networks and Communications segment, where turnover decreased by 5.0%. The Other Industries customer segment showed particularly strong growth, with turnover going up by 18.3% from the previous year. The positive development of sales to new customers is reflected in sales within the customer segment. Growth also exceeded 10% in the Medtech, Life Science and Environmental Measurements customer segment (13.9%) and
the Energy and Automation customer segment (10.0%). However, the development of demand within customer segments showed high customer-specific variation. The largest customer accounted for 12% (13%) of the turnover, and the ten largest customers made up 60% (61%). The group’s revenue in 2018 reported in accordance with IFRS 15 stood at EUR 563.0 million and would have been EUR 562.5 million if reported in accordance with the principles of IAS 18 and IAS 11.
EUR millionSales of
goods
2018Sales of services Total
Sales of goods
2017Sales of services Total
Customer SegmentsEnergy & Automation 87.8 5.4 93.2 80.5 4.2 84.7Medtec, Life Science, Environmental Measurements 89.4 8.6 97.9 79.8 6.2 86.0Networks&Communication 87.6 10.7 98.3 94.0 9.5 103.5Urban Applications 169.1 6.3 175.3 167.2 5.4 172.6Other Industries 93.0 5.3 98.3 78.7 4.4 83.1Total 526.8 36.2 563.0 500.2 29.7 529.9
Timing of revenue recognitionGoods and services transferred at a point of time 526.8 33.3 560.1 500.2 26.6 526.7Services transferred over time 3.0 3.0 3.2 3.2Total 526.8 36.2 563.0 500.2 29.7 529.9
20172018
Urban Appilications
Network & Communication
Energy & Automation
Medtech, Life Science, Env.Measurements
Other Industries
NOTES TO THE CONSOLIDATED FINANCIAL STATEMENTSNOTES TO THE CONSOLIDATED FINANCIAL STATEMENTS
17 % 16 %
31 % 33 %
18 % 19 %17 % 16 %
17 % 16 %

ANNUAL REPORT 201844 | ANNUAL REPORT 2018 | 45
Major customers
Trade and other receivables
The same customers are not necessarily shown in the table above for the reporting period and for the comparison period.
1000 EUR 2018 2017
Trade receivables, which are included in ”Trade and other receivables” 97 257 99 552Contract assets 2 048 428Contract liabilities 269 219
1000 EUR
2018Contract
assets
2018Contract liabilities
Increase due to the arrangement with customer related to warehousing of components 1 328Transferred to trade receivables -285Increase in contract assets 577Transferred to trade receivables -219Increase in advances received from customer 269
Non-current 217 143Current 99 088 99 836Total 99 306 99 980
1000 EUR 2018 % of turnover 2017 % of turnover
Customer 1 68 899 12 66 692 13Customer 2 57 863 10 47 517 9Customer 3 42 960 8 41 860 8Total 169 722 156 069
Significant changes in the contract assets and the contract liabilities balances during the period are as follows.
1000 EUR 2018 2017
DomicileFinland 22 485 26 352Sweden 42 964 40 870Poland 87 235 91 407China 85 853 90 272Other 60 832 52 955Total 299 368 301 855
1000 EUR 2018 2017
Finland 110 809 102 883Sweden 120 121 114 481Germany 43 695 35 188Rest of Europe 137 415 123 831Asia 107 043 107 519USA 39 157 40 421Other 4 791 5 536Total 563 032 529 860
Other operating income, 1000 EUR 2018 2017
Proceeds from sale of property, plant and equipment 155 2 045Rental income 85 124Allowances and compensations 371 175Other 175 359Total 786 2 703
Information about the whole entity
Of the segment information, the assets are shown by their location and distribution of sales is shown by the location of customers.
Distribution of segment assetsThe segment assets mainly consist of goodwill, intangible and tangible assets, inventories, trade receivables as well as cash and cash equivalents.
1.2. OTHER OPERATING INCOME
ACCOUNTING PRINCIPLE
Income other than that associated with actual business operations is recognized under other operating income. Such items include capital gains from the sales of tangible fixed assets, rental income, insurance compensation payments and public subsidies. Rental income mainly consists of rents from business premises in China.
Government grants related to tangible and intangible assets are deducted from an asset’s acquisition cost, and the net acquisition cost is capitalized on the balance sheet. Other financial contributions are recognized in other operating income through profit or loss.
The capital gains from sales of tangible fixed assets include, in the comparative year, the capital gains of EUR 1.4 million from the industrial real estate property in Hungary, as well as
capital gains of EUR 0.6 million from the sales of machinery and equipment.
Assets on geographical areas
Turnover by location of customers
Contractual amounts recognized on the balance sheet
The table below presents contractual receivables, assets and liabilities recognized on the balance sheet.
NOTES TO THE CONSOLIDATED FINANCIAL STATEMENTSNOTES TO THE CONSOLIDATED FINANCIAL STATEMENTS
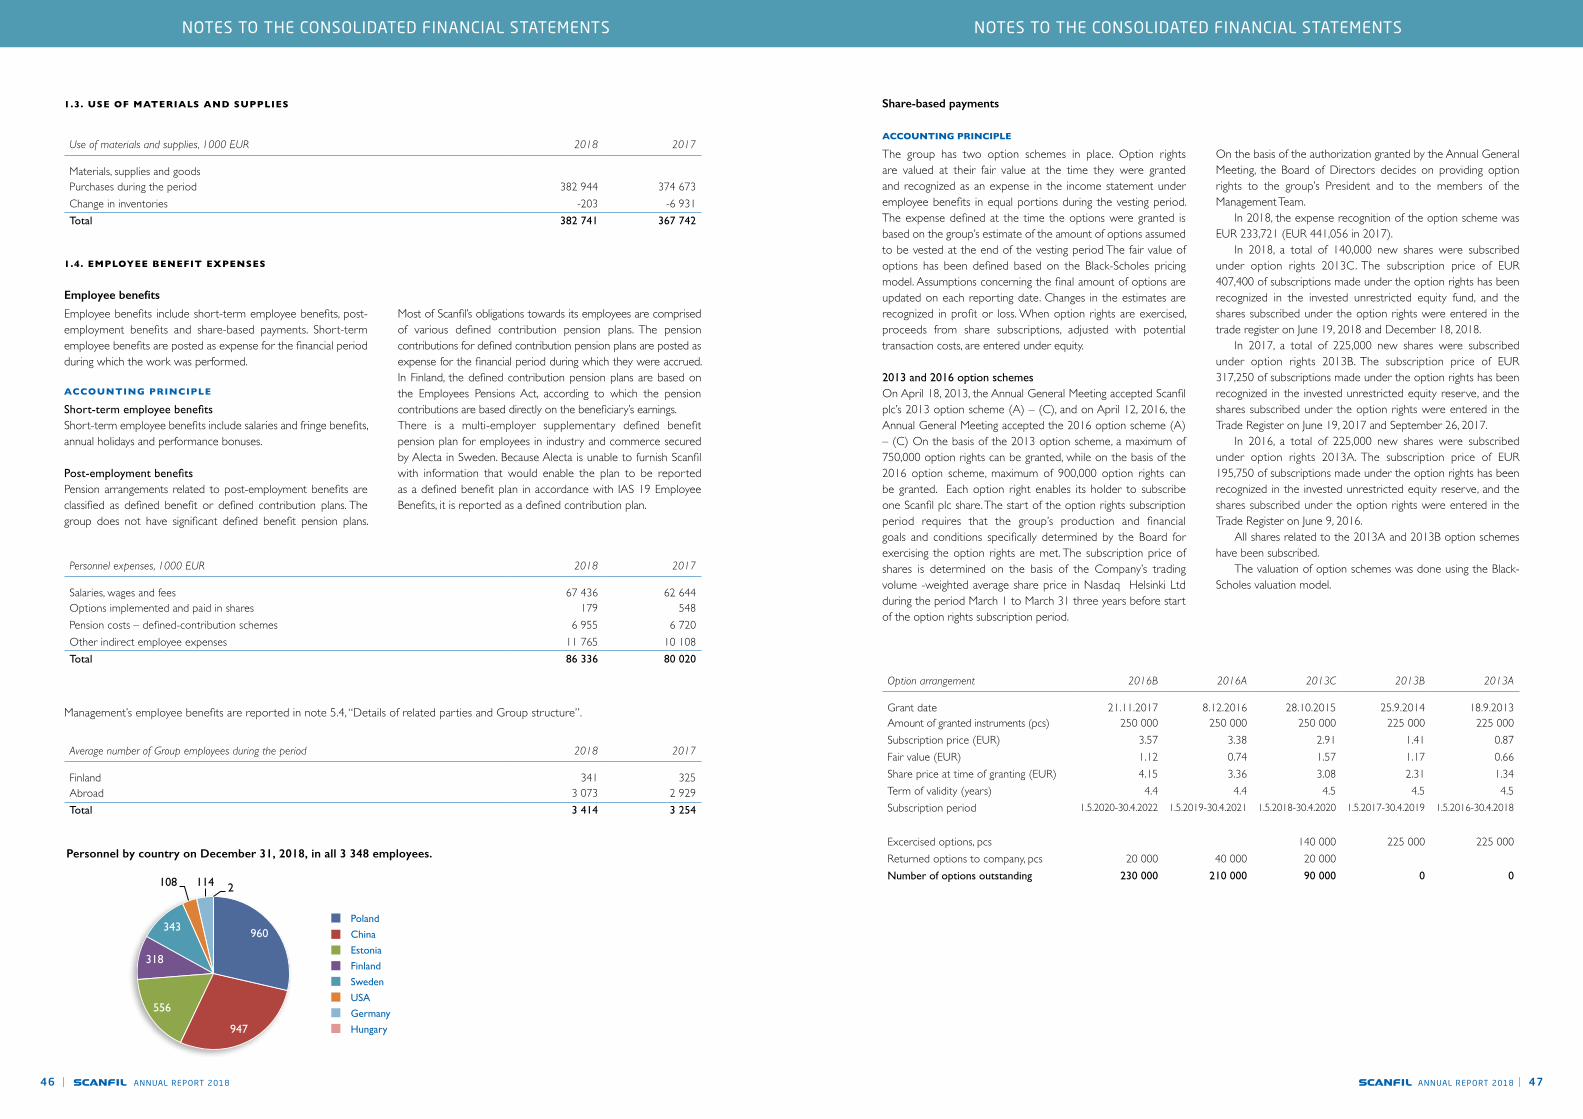
ANNUAL REPORT 201846 | ANNUAL REPORT 2018 | 47
Personnel expenses, 1000 EUR 2018 2017
Salaries, wages and fees 67 436 62 644Options implemented and paid in shares 179 548Pension costs – defined-contribution schemes 6 955 6 720Other indirect employee expenses 11 765 10 108Total 86 336 80 020
Average number of Group employees during the period 2018 2017
Finland 341 325Abroad 3 073 2 929Total 3 414 3 254
Use of materials and supplies, 1000 EUR 2018 2017
Materials, supplies and goodsPurchases during the period 382 944 374 673Change in inventories -203 -6 931Total 382 741 367 742
1.4. EMPLOYEE BENEFIT EXPENSES
Employee benefits
Employee benefits include short-term employee benefits, post-employment benefits and share-based payments. Short-term employee benefits are posted as expense for the financial period during which the work was performed.
ACCOUNTING PRINCIPLE
Short-term employee benefitsShort-term employee benefits include salaries and fringe benefits, annual holidays and performance bonuses.
Post-employment benefitsPension arrangements related to post-employment benefits are classified as defined benefit or defined contribution plans. The group does not have significant defined benefit pension plans.
Most of Scanfil’s obligations towards its employees are comprised of various defined contribution pension plans. The pension contributions for defined contribution pension plans are posted as expense for the financial period during which they were accrued. In Finland, the defined contribution pension plans are based on the Employees Pensions Act, according to which the pension contributions are based directly on the beneficiary’s earnings. There is a multi-employer supplementary defined benefit pension plan for employees in industry and commerce secured by Alecta in Sweden. Because Alecta is unable to furnish Scanfil with information that would enable the plan to be reported as a defined benefit plan in accordance with IAS 19 Employee Benefits, it is reported as a defined contribution plan.
Management’s employee benefits are reported in note 5.4, “Details of related parties and Group structure”.
1.3. USE OF MATERIALS AND SUPPLIES
Personnel by country on December 31, 2018, in all 3 348 employees.
Share-based payments
ACCOUNTING PRINCIPLE
The group has two option schemes in place. Option rights are valued at their fair value at the time they were granted and recognized as an expense in the income statement under employee benefits in equal portions during the vesting period. The expense defined at the time the options were granted is based on the group’s estimate of the amount of options assumed to be vested at the end of the vesting period The fair value of options has been defined based on the Black-Scholes pricing model. Assumptions concerning the final amount of options are updated on each reporting date. Changes in the estimates are recognized in profit or loss. When option rights are exercised, proceeds from share subscriptions, adjusted with potential transaction costs, are entered under equity.
2013 and 2016 option schemesOn April 18, 2013, the Annual General Meeting accepted Scanfil plc’s 2013 option scheme (A) – (C), and on April 12, 2016, the Annual General Meeting accepted the 2016 option scheme (A) – (C) On the basis of the 2013 option scheme, a maximum of 750,000 option rights can be granted, while on the basis of the 2016 option scheme, maximum of 900,000 option rights can be granted. Each option right enables its holder to subscribe one Scanfil plc share. The start of the option rights subscription period requires that the group’s production and financial goals and conditions specifically determined by the Board for exercising the option rights are met. The subscription price of shares is determined on the basis of the Company’s trading volume -weighted average share price in Nasdaq Helsinki Ltd during the period March 1 to March 31 three years before start of the option rights subscription period.
On the basis of the authorization granted by the Annual General Meeting, the Board of Directors decides on providing option rights to the group’s President and to the members of the Management Team. In 2018, the expense recognition of the option scheme was EUR 233,721 (EUR 441,056 in 2017). In 2018, a total of 140,000 new shares were subscribed under option rights 2013C. The subscription price of EUR 407,400 of subscriptions made under the option rights has been recognized in the invested unrestricted equity fund, and the shares subscribed under the option rights were entered in the trade register on June 19, 2018 and December 18, 2018. In 2017, a total of 225,000 new shares were subscribed under option rights 2013B. The subscription price of EUR 317,250 of subscriptions made under the option rights has been recognized in the invested unrestricted equity reserve, and the shares subscribed under the option rights were entered in the Trade Register on June 19, 2017 and September 26, 2017. In 2016, a total of 225,000 new shares were subscribed under option rights 2013A. The subscription price of EUR 195,750 of subscriptions made under the option rights has been recognized in the invested unrestricted equity reserve, and the shares subscribed under the option rights were entered in the Trade Register on June 9, 2016. All shares related to the 2013A and 2013B option schemes have been subscribed. The valuation of option schemes was done using the Black-Scholes valuation model.
Option arrangement 2016B 2016A 2013C 2013B 2013A
Grant date 21.11.2017 8.12.2016 28.10.2015 25.9.2014 18.9.2013Amount of granted instruments (pcs) 250 000 250 000 250 000 225 000 225 000Subscription price (EUR) 3.57 3.38 2.91 1.41 0.87Fair value (EUR) 1.12 0.74 1.57 1.17 0.66Share price at time of granting (EUR) 4.15 3.36 3.08 2.31 1.34Term of validity (years) 4.4 4.4 4.5 4.5 4.5Subscription period 1.5.2020-30.4.2022 1.5.2019-30.4.2021 1.5.2018-30.4.2020 1.5.2017-30.4.2019 1.5.2016-30.4.2018
Excercised options, pcs 140 000 225 000 225 000Returned options to company, pcs 20 000 40 000 20 000Number of options outstanding 230 000 210 000 90 000 0 0
Poland
China
Estonia
Finland
Sweden
USA
Germany
Hungary
NOTES TO THE CONSOLIDATED FINANCIAL STATEMENTSNOTES TO THE CONSOLIDATED FINANCIAL STATEMENTS
343
318
556
947
960
108 114 2
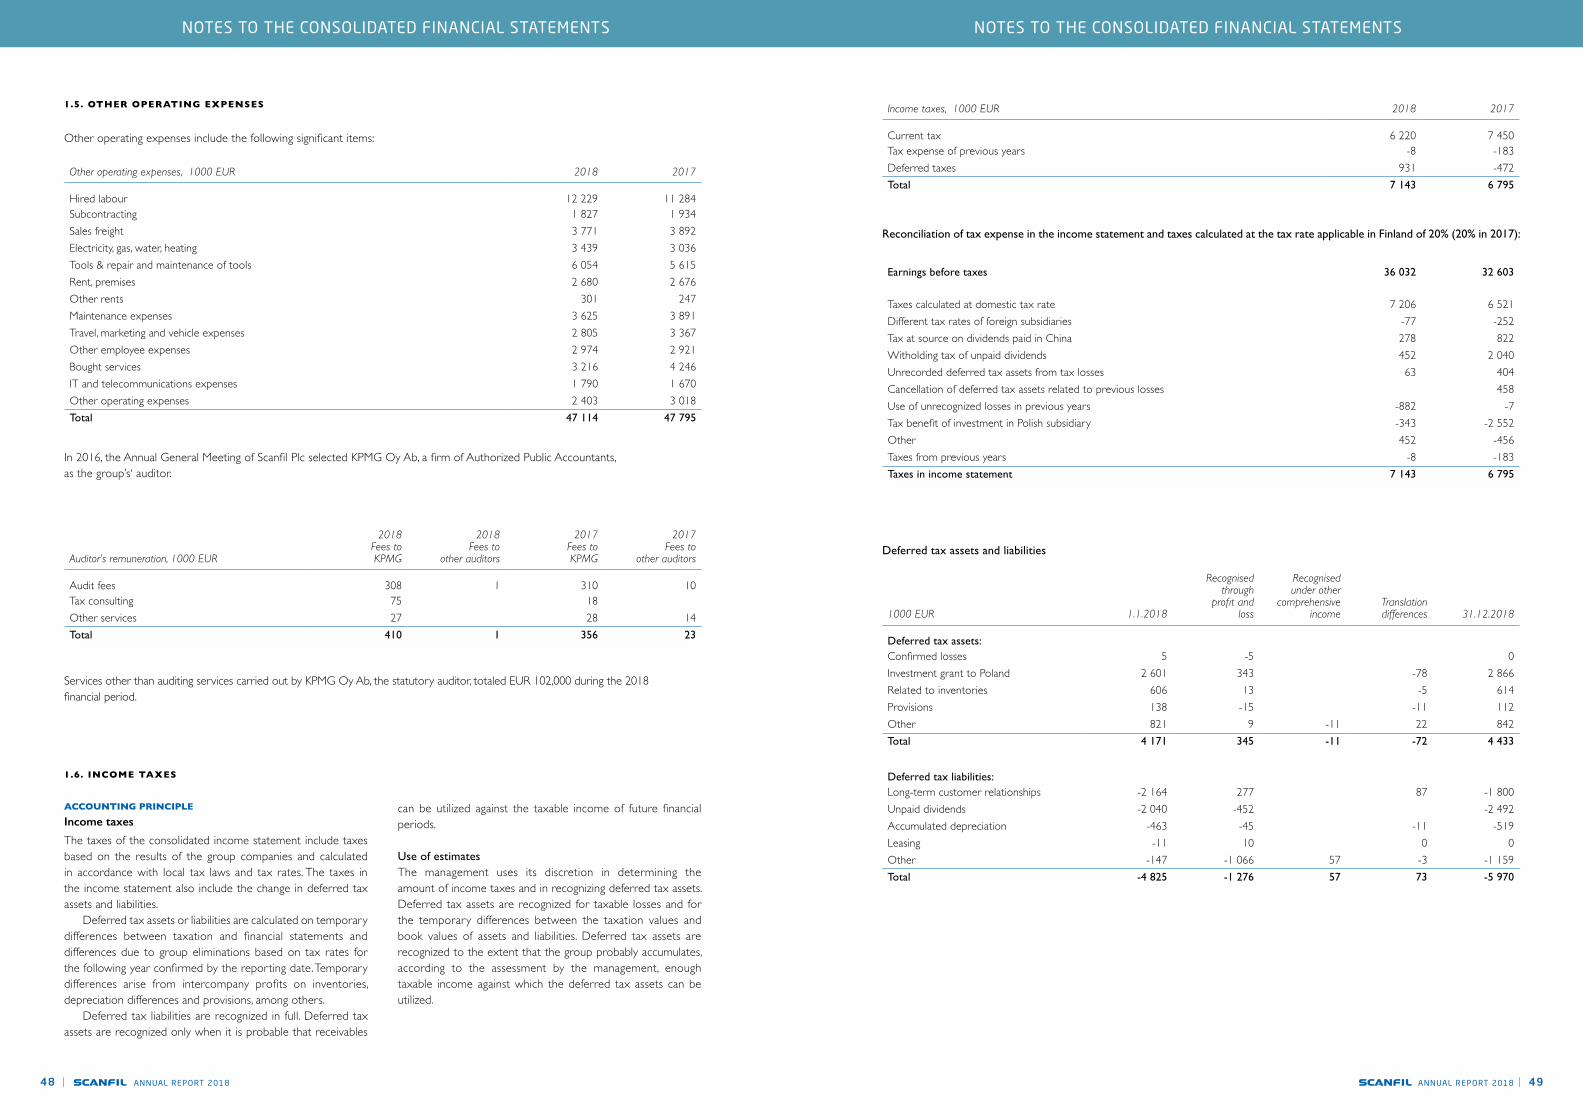
ANNUAL REPORT 201848 | ANNUAL REPORT 2018 | 49
1.6. INCOME TAXES
ACCOUNTING PRINCIPLE
Income taxes
The taxes of the consolidated income statement include taxes based on the results of the group companies and calculated in accordance with local tax laws and tax rates. The taxes in the income statement also include the change in deferred tax assets and liabilities. Deferred tax assets or liabilities are calculated on temporary differences between taxation and financial statements and differences due to group eliminations based on tax rates for the following year confirmed by the reporting date. Temporary differences arise from intercompany profits on inventories, depreciation differences and provisions, among others. Deferred tax liabilities are recognized in full. Deferred tax assets are recognized only when it is probable that receivables
can be utilized against the taxable income of future financial periods. Use of estimatesThe management uses its discretion in determining the amount of income taxes and in recognizing deferred tax assets. Deferred tax assets are recognized for taxable losses and for the temporary differences between the taxation values and book values of assets and liabilities. Deferred tax assets are recognized to the extent that the group probably accumulates, according to the assessment by the management, enough taxable income against which the deferred tax assets can be utilized.
Other operating expenses, 1000 EUR 2018 2017
Hired labour 12 229 11 284Subcontracting 1 827 1 934Sales freight 3 771 3 892Electricity, gas, water, heating 3 439 3 036Tools & repair and maintenance of tools 6 054 5 615Rent, premises 2 680 2 676Other rents 301 247Maintenance expenses 3 625 3 891Travel, marketing and vehicle expenses 2 805 3 367Other employee expenses 2 974 2 921Bought services 3 216 4 246IT and telecommunications expenses 1 790 1 670Other operating expenses 2 403 3 018Total 47 114 47 795
Other operating expenses include the following significant items:
In 2016, the Annual General Meeting of Scanfil Plc selected KPMG Oy Ab, a firm of Authorized Public Accountants, as the group’s‘ auditor.
Services other than auditing services carried out by KPMG Oy Ab, the statutory auditor, totaled EUR 102,000 during the 2018 financial period.
1.5. OTHER OPERATING EXPENSES
Auditor’s remuneration, 1000 EUR
2018Fees toKPMG
2018Fees to
other auditors
2017Fees toKPMG
2017Fees to
other auditors
Audit fees 308 1 310 10Tax consulting 75 18Other services 27 28 14Total 410 1 356 23
Income taxes, 1000 EUR 2018 2017
Current tax 6 220 7 450Tax expense of previous years -8 -183Deferred taxes 931 -472Total 7 143 6 795
Earnings before taxes 36 032 32 603
Taxes calculated at domestic tax rate 7 206 6 521Different tax rates of foreign subsidiaries -77 -252Tax at source on dividends paid in China 278 822Witholding tax of unpaid dividends 452 2 040Unrecorded deferred tax assets from tax losses 63 404Cancellation of deferred tax assets related to previous losses 458Use of unrecognized losses in previous years -882 -7Tax benefit of investment in Polish subsidiary -343 -2 552Other 452 -456Taxes from previous years -8 -183Taxes in income statement 7 143 6 795
Reconciliation of tax expense in the income statement and taxes calculated at the tax rate applicable in Finland of 20% (20% in 2017):
1000 EUR 1.1.2018
Recognisedthrough
profit andloss
Recognisedunder other
comprehensiveincome
Translationdifferences 31.12.2018
Deferred tax assets:Confirmed losses 5 -5 0Investment grant to Poland 2 601 343 -78 2 866Related to inventories 606 13 -5 614Provisions 138 -15 -11 112Other 821 9 -11 22 842Total 4 171 345 -11 -72 4 433
Deferred tax liabilities:Long-term customer relationships -2 164 277 87 -1 800Unpaid dividends -2 040 -452 -2 492Accumulated depreciation -463 -45 -11 -519Leasing -11 10 0 0Other -147 -1 066 57 -3 -1 159Total -4 825 -1 276 57 73 -5 970
Deferred tax assets and liabilities
NOTES TO THE CONSOLIDATED FINANCIAL STATEMENTSNOTES TO THE CONSOLIDATED FINANCIAL STATEMENTS
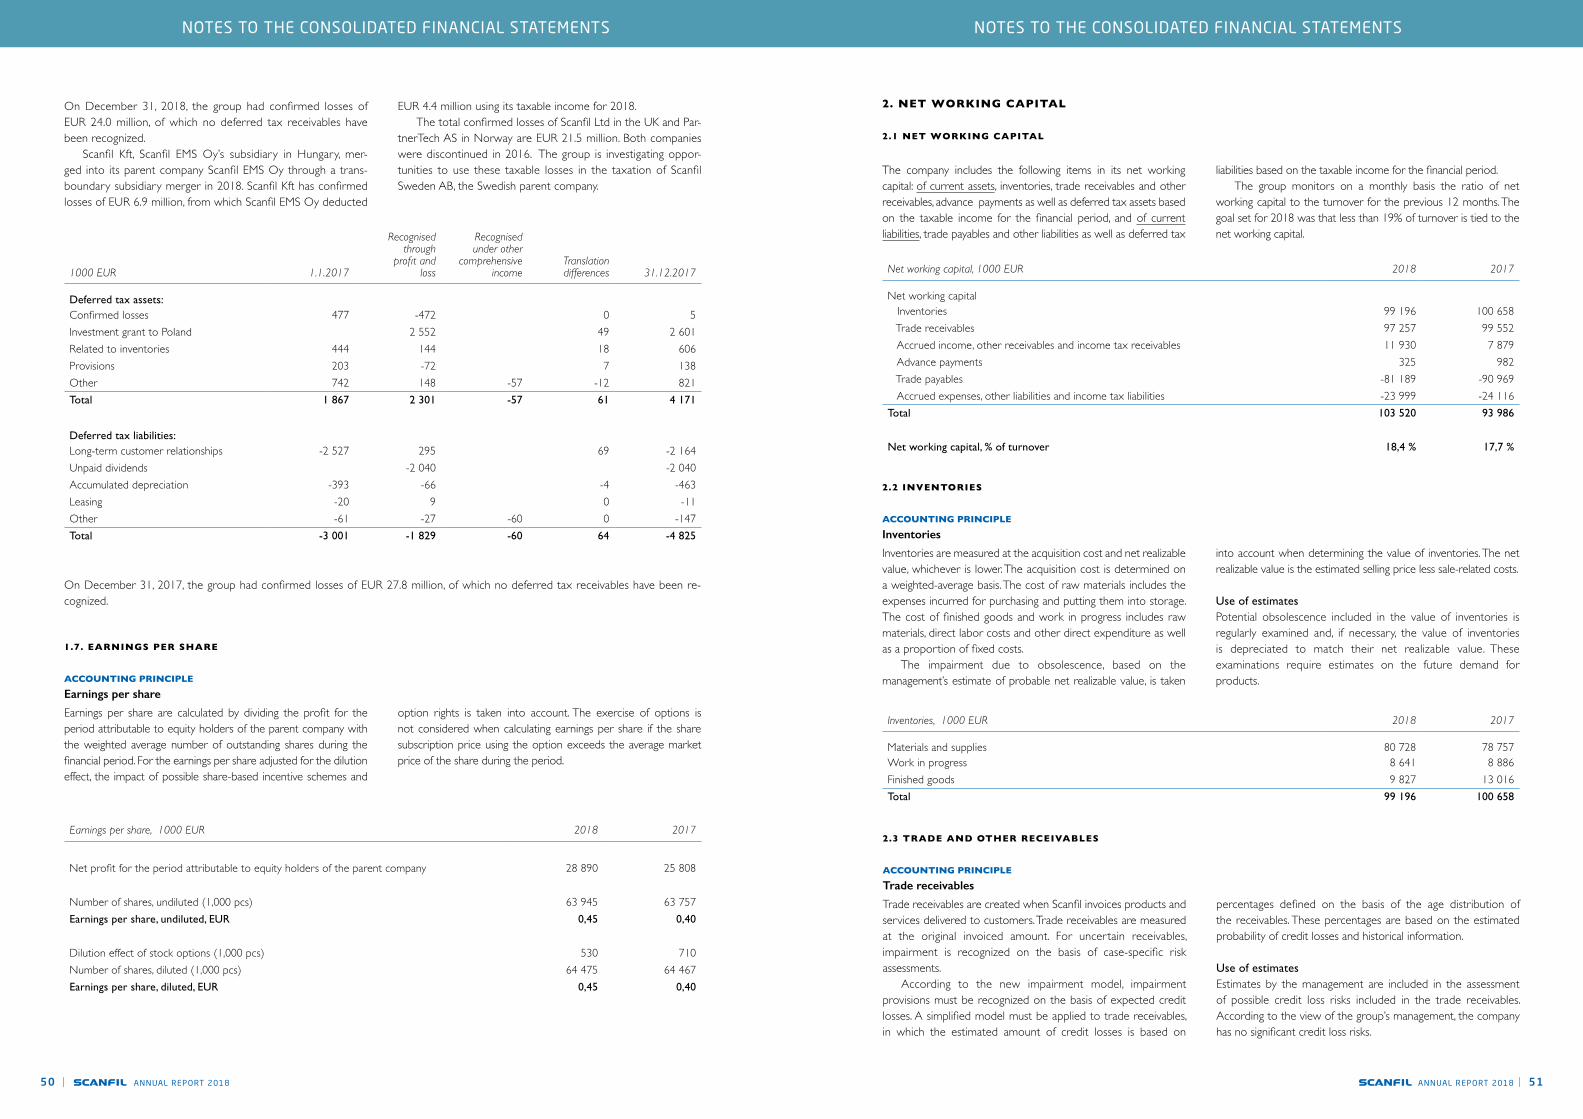
ANNUAL REPORT 201850 | ANNUAL REPORT 2018 | 51
Earnings per share, 1000 EUR 2018 2017
Net profit for the period attributable to equity holders of the parent company 28 890 25 808
Number of shares, undiluted (1,000 pcs) 63 945 63 757Earnings per share, undiluted, EUR 0,45 0,40
Dilution effect of stock options (1,000 pcs) 530 710Number of shares, diluted (1,000 pcs) 64 475 64 467Earnings per share, diluted, EUR 0,45 0,40
On December 31, 2018, the group had confirmed losses of EUR 24.0 million, of which no deferred tax receivables have been recognized. Scanfil Kft, Scanfil EMS Oy’s subsidiary in Hungary, mer-ged into its parent company Scanfil EMS Oy through a trans-boundary subsidiary merger in 2018. Scanfil Kft has confirmed losses of EUR 6.9 million, from which Scanfil EMS Oy deducted
On December 31, 2017, the group had confirmed losses of EUR 27.8 million, of which no deferred tax receivables have been re-cognized.
EUR 4.4 million using its taxable income for 2018. The total confirmed losses of Scanfil Ltd in the UK and Par-tnerTech AS in Norway are EUR 21.5 million. Both companies were discontinued in 2016. The group is investigating oppor-tunities to use these taxable losses in the taxation of Scanfil Sweden AB, the Swedish parent company.
1.7. EARNINGS PER SHARE
ACCOUNTING PRINCIPLE
Earnings per share
Earnings per share are calculated by dividing the profit for the period attributable to equity holders of the parent company with the weighted average number of outstanding shares during the financial period. For the earnings per share adjusted for the dilution effect, the impact of possible share-based incentive schemes and
option rights is taken into account. The exercise of options is not considered when calculating earnings per share if the share subscription price using the option exceeds the average market price of the share during the period.
2. NET WORKING CAPITAL
2.1 NET WORKING CAPITAL
The company includes the following items in its net working capital: of current assets, inventories, trade receivables and other receivables, advance payments as well as deferred tax assets based on the taxable income for the financial period, and of current liabilities, trade payables and other liabilities as well as deferred tax
liabilities based on the taxable income for the financial period. The group monitors on a monthly basis the ratio of net working capital to the turnover for the previous 12 months. The goal set for 2018 was that less than 19% of turnover is tied to the net working capital.
Net working capital, 1000 EUR 2018 2017
Net working capital Inventories 99 196 100 658 Trade receivables 97 257 99 552 Accrued income, other receivables and income tax receivables 11 930 7 879 Advance payments 325 982 Trade payables -81 189 -90 969 Accrued expenses, other liabilities and income tax liabilities -23 999 -24 116Total 103 520 93 986
Net working capital, % of turnover 18,4 % 17,7 %
2.2 INVENTORIES
ACCOUNTING PRINCIPLE
Inventories
Inventories are measured at the acquisition cost and net realizable value, whichever is lower. The acquisition cost is determined on a weighted-average basis. The cost of raw materials includes the expenses incurred for purchasing and putting them into storage. The cost of finished goods and work in progress includes raw materials, direct labor costs and other direct expenditure as well as a proportion of fixed costs. The impairment due to obsolescence, based on the management’s estimate of probable net realizable value, is taken
into account when determining the value of inventories. The net realizable value is the estimated selling price less sale-related costs.
Use of estimatesPotential obsolescence included in the value of inventories is regularly examined and, if necessary, the value of inventories is depreciated to match their net realizable value. These examinations require estimates on the future demand for products.
Inventories, 1000 EUR 2018 2017
Materials and supplies 80 728 78 757Work in progress 8 641 8 886Finished goods 9 827 13 016Total 99 196 100 658
2.3 TRADE AND OTHER RECEIVABLES
ACCOUNTING PRINCIPLE
Trade receivables
Trade receivables are created when Scanfil invoices products and services delivered to customers. Trade receivables are measured at the original invoiced amount. For uncertain receivables, impairment is recognized on the basis of case-specific risk assessments. According to the new impairment model, impairment provisions must be recognized on the basis of expected credit losses. A simplified model must be applied to trade receivables, in which the estimated amount of credit losses is based on
percentages defined on the basis of the age distribution of the receivables. These percentages are based on the estimated probability of credit losses and historical information.
Use of estimatesEstimates by the management are included in the assessment of possible credit loss risks included in the trade receivables. According to the view of the group’s management, the company has no significant credit loss risks.
1000 EUR 1.1.2017
Recognisedthrough
profit andloss
Recognisedunder other
comprehensiveincome
Translationdifferences 31.12.2017
Deferred tax assets:Confirmed losses 477 -472 0 5Investment grant to Poland 2 552 49 2 601Related to inventories 444 144 18 606Provisions 203 -72 7 138Other 742 148 -57 -12 821Total 1 867 2 301 -57 61 4 171
Deferred tax liabilities:Long-term customer relationships -2 527 295 69 -2 164Unpaid dividends -2 040 -2 040Accumulated depreciation -393 -66 -4 -463Leasing -20 9 0 -11Other -61 -27 -60 0 -147Total -3 001 -1 829 -60 64 -4 825
NOTES TO THE CONSOLIDATED FINANCIAL STATEMENTSNOTES TO THE CONSOLIDATED FINANCIAL STATEMENTS

ANNUAL REPORT 201852 | ANNUAL REPORT 2018 | 53
2.4 TRADE AND OTHER LIABILITIES
Trade and other receivables, 1000 EUR 2018 2017
Trade receivables 97 257 99 552Accrued income 5 713 2 042Value-added tax receivables 2 591 3 489Other receivables 1 996 919Total 107 558 106 001
Expected credit losses, December 31, 2018 Book value (gross)Estimated
credit lossesBad debt provision
Unmatured 87 603 0,01 % 9Matured 1 - 30 days 8 271 0,02 % 2 31 - 91 days 1 149 0,50 % 6 91 - 180 days 206 2,00 % 4 181 - 365 days 65 50,3 % 33 over 365 days 86 81,3 % 70Total 97 381 123
Trade and other payables, 1000 EUR 2018 2017
Trade payables 81 189 90 969Accrued liabilities 16 595 16 112Advance payments received 269 219Other creditors 5 447 5 759Total 103 500 113 058
The most significant items included in accrued liabilities:Employee expenses 12 786 11 489Interests 39 55Financial derivatives 301 371Other accrued liabilities 3 469 4 197Total 16 595 16 112
Age distribution of trade receivables, 1000 EUR 2018 2017
Unmatured 87 603 88 498Matured 1 - 30 days 8 271 9 287 31 - 90 days 1 149 1 330 91 - 180 days 206 578 181 - 365 days 65 -124 over 1 year 86 48Provision for bad debt -123 -65Total 97 257 99 552
At the end of the financial period, the credit loss provision recognized for covering uncertain receivables stood at EUR 0.1
(0.1) million. During the financial period, credit losses recognized from trade receivables were EUR 0.0 (0.1) million.
3. NON-CURRENT ASSETS
3.1. GOODWILL
ACCOUNTING PRINCIPLE
Goodwill
Business combinations are treated using the acquisition method. Goodwill is recognized at the amount by which the acquisition cost exceeds the group’s share of the value of acquired assets and liabilities at the time of acquisition. Goodwill is created in corporate transactions, and it reflects the value of the acquired business, market share and synergies. The book value of goodwill is tested by impairment testing. The group’s goodwill mainly consists of the acquisition of PartnerTech AB in 2015.
Impairment testingNo depreciation is made of goodwill; instead, goodwill is tested at least annually for possible impairment. For that, goodwill is allocated to cash generating units (CGUs). The recoverable amount of the CGU is calculated with value in use calculations. An impairment loss is recognized when the book value of an asset exceeds its recoverable amount. Impairment losses are immediately recognized as expenses in the income statement. Impairment losses recognized for goodwill cannot be later reversed.
Goodwill, 1000 EUR 2018 2017
Cost at 1 Jan. 10 384 10 587Exchange rate differences -267 -203Carrying amount at 31 Dec. 10 117 10 384
Allocation of goodwill and goodwill on consolidation to cash-generating units
Scanfil Oü 111 111Scanfil GmbH 3 602 3 602Scanfil Poland Sp. z o.o. 3 394 3 535Scanfil Vellinge AB 1 281 1 334Scanfil Åtvidaberg AB 1 729 1 801Total 10 117 10 384
Discount rate of cash flows before taxes 2018 2017
Scanfil GmbH 11,7 % 11,6 %Scanfil Poland Sp. z o.o. 11,6 % 11,9 %Scanfil Vellinge AB 10,9 % 11,0 %Scanfil Åtvidaberg AB 10,9 % 11,0 %
The recoverable amount of a CGU is based on the value in use of a cash-generating unit, which is the present value of the future cash flows the CGU is expected to accumulate. Determination of the value in use is based on the conditions and expectations in force at the time of testing. Future cash flows are determined for a five-year forecast period, and for the period following that, a growth rate of 2% has been assumed for cash flows. Preparing impairment testing calculations requires estimates of future cash flows. The turnover and profitability assumptions used for the forecasts are based on customer-specific forecasts and the management’s estimates of the development of demand and markets. The weighted average cost of capital (WACC) for the CGU has been used as the discount rate for cash flows. The risk-free
interest rate, risk factor (beta) and risk premium parameters used for determining the discount rate of interest are based on information obtained from the market. No need for impairment of goodwill was detected based on the impermanent testing. The recoverable amounts of all CGUs exceed their book values.
Sensitivity analysisA sensitivity analysis was performed for CGUs by changing calculation assumptions. The table below shows the change in assumption that would be required to make the recoverable amount equal to its book value.
NOTES TO THE CONSOLIDATED FINANCIAL STATEMENTSNOTES TO THE CONSOLIDATED FINANCIAL STATEMENTS
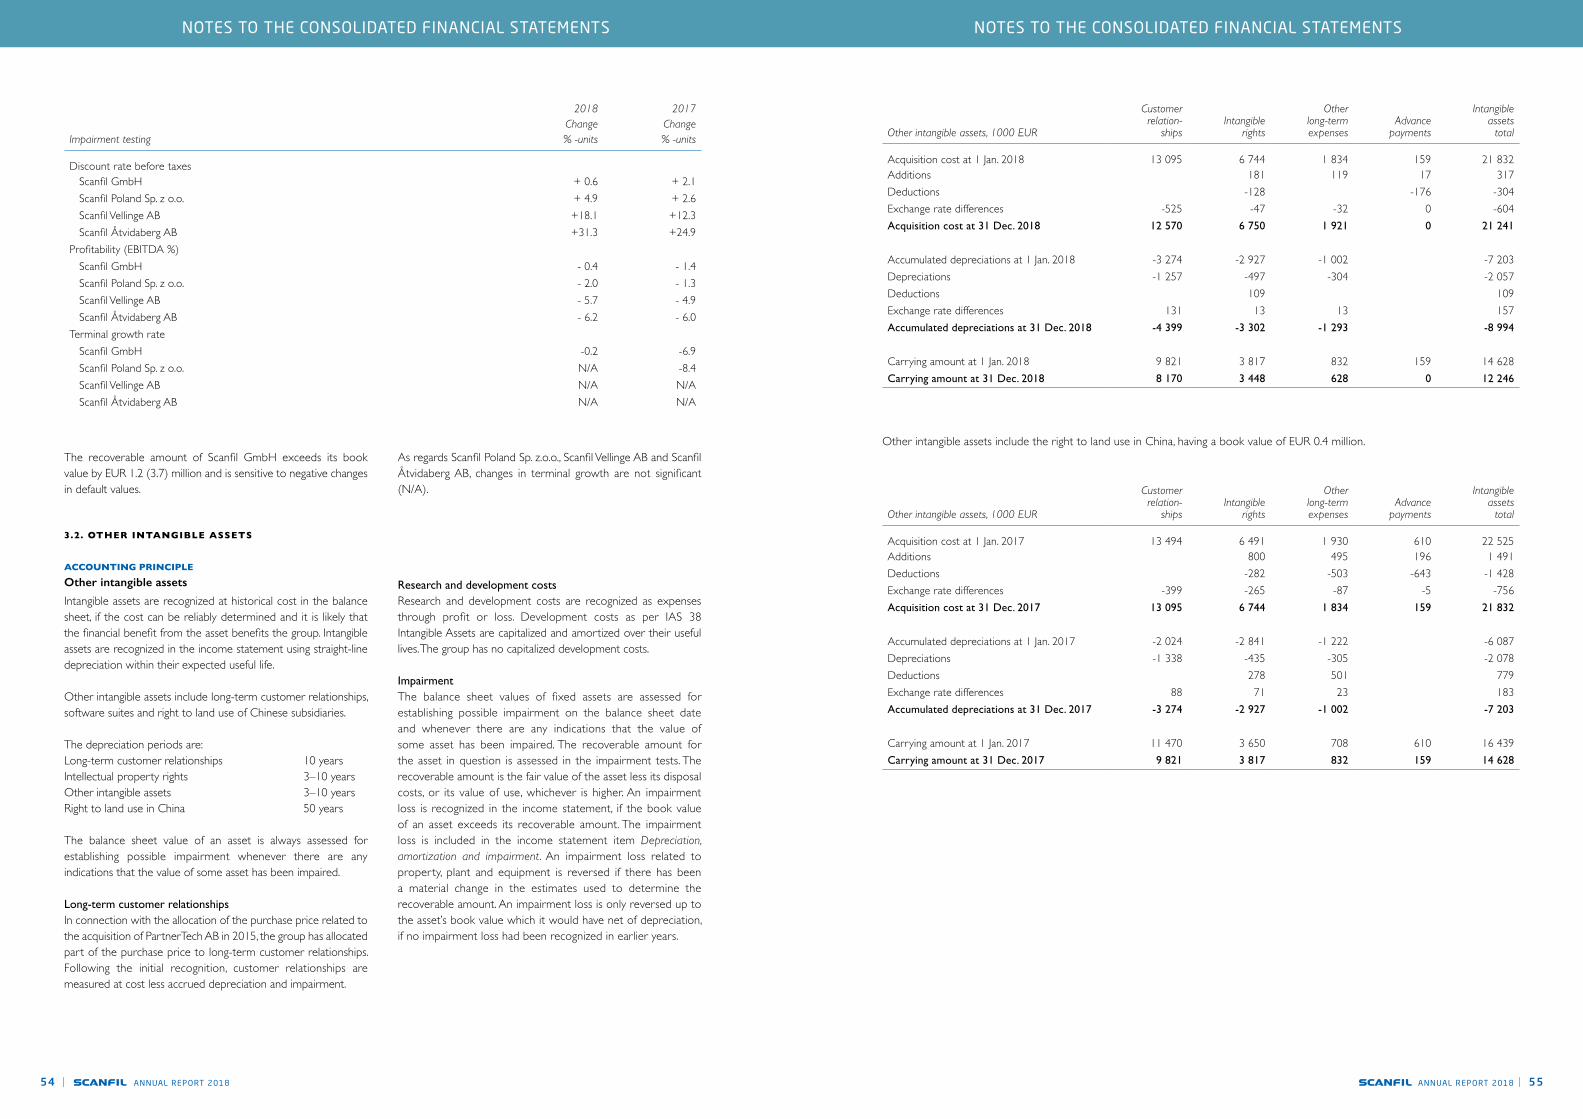
ANNUAL REPORT 201854 | ANNUAL REPORT 2018 | 55
3.2. OTHER INTANGIBLE ASSETS
ACCOUNTING PRINCIPLE
Other intangible assets
Intangible assets are recognized at historical cost in the balance sheet, if the cost can be reliably determined and it is likely that the financial benefit from the asset benefits the group. Intangible assets are recognized in the income statement using straight-line depreciation within their expected useful life.
Other intangible assets include long-term customer relationships, software suites and right to land use of Chinese subsidiaries.
The depreciation periods are: Long-term customer relationships 10 yearsIntellectual property rights 3–10 yearsOther intangible assets 3–10 yearsRight to land use in China 50 years
The balance sheet value of an asset is always assessed for establishing possible impairment whenever there are any indications that the value of some asset has been impaired.
Long-term customer relationshipsIn connection with the allocation of the purchase price related to the acquisition of PartnerTech AB in 2015, the group has allocated part of the purchase price to long-term customer relationships. Following the initial recognition, customer relationships are measured at cost less accrued depreciation and impairment.
Research and development costsResearch and development costs are recognized as expenses through profit or loss. Development costs as per IAS 38 Intangible Assets are capitalized and amortized over their useful lives. The group has no capitalized development costs.
Impairment The balance sheet values of fixed assets are assessed for establishing possible impairment on the balance sheet date and whenever there are any indications that the value of some asset has been impaired. The recoverable amount for the asset in question is assessed in the impairment tests. The recoverable amount is the fair value of the asset less its disposal costs, or its value of use, whichever is higher. An impairment loss is recognized in the income statement, if the book value of an asset exceeds its recoverable amount. The impairment loss is included in the income statement item Depreciation, amortization and impairment. An impairment loss related to property, plant and equipment is reversed if there has been a material change in the estimates used to determine the recoverable amount. An impairment loss is only reversed up to the asset’s book value which it would have net of depreciation, if no impairment loss had been recognized in earlier years.
Impairment testing
2018Change% -units
2017Change% -units
Discount rate before taxes Scanfil GmbH + 0.6 + 2.1 Scanfil Poland Sp. z o.o. + 4.9 + 2.6 Scanfil Vellinge AB +18.1 +12.3 Scanfil Åtvidaberg AB +31.3 +24.9Profitability (EBITDA %) Scanfil GmbH - 0.4 - 1.4 Scanfil Poland Sp. z o.o. - 2.0 - 1.3 Scanfil Vellinge AB - 5.7 - 4.9 Scanfil Åtvidaberg AB - 6.2 - 6.0Terminal growth rate Scanfil GmbH -0.2 -6.9 Scanfil Poland Sp. z o.o. N/A -8.4 Scanfil Vellinge AB N/A N/A Scanfil Åtvidaberg AB N/A N/A
The recoverable amount of Scanfil GmbH exceeds its book value by EUR 1.2 (3.7) million and is sensitive to negative changes in default values.
As regards Scanfil Poland Sp. z.o.o., Scanfil Vellinge AB and Scanfil Åtvidaberg AB, changes in terminal growth are not significant (N/A).
Other intangible assets, 1000 EUR
Customerrelation-
shipsIntangible
rights
Otherlong-termexpenses
Advancepayments
Intangibleassets
total
Acquisition cost at 1 Jan. 2018 13 095 6 744 1 834 159 21 832Additions 181 119 17 317Deductions -128 -176 -304Exchange rate differences -525 -47 -32 0 -604Acquisition cost at 31 Dec. 2018 12 570 6 750 1 921 0 21 241
Accumulated depreciations at 1 Jan. 2018 -3 274 -2 927 -1 002 -7 203Depreciations -1 257 -497 -304 -2 057Deductions 109 109Exchange rate differences 131 13 13 157Accumulated depreciations at 31 Dec. 2018 -4 399 -3 302 -1 293 -8 994
Carrying amount at 1 Jan. 2018 9 821 3 817 832 159 14 628Carrying amount at 31 Dec. 2018 8 170 3 448 628 0 12 246
Other intangible assets, 1000 EUR
Customerrelation-
shipsIntangible
rights
Otherlong-termexpenses
Advancepayments
Intangibleassets
total
Acquisition cost at 1 Jan. 2017 13 494 6 491 1 930 610 22 525Additions 800 495 196 1 491Deductions -282 -503 -643 -1 428Exchange rate differences -399 -265 -87 -5 -756Acquisition cost at 31 Dec. 2017 13 095 6 744 1 834 159 21 832
Accumulated depreciations at 1 Jan. 2017 -2 024 -2 841 -1 222 -6 087Depreciations -1 338 -435 -305 -2 078Deductions 278 501 779Exchange rate differences 88 71 23 183Accumulated depreciations at 31 Dec. 2017 -3 274 -2 927 -1 002 -7 203
Carrying amount at 1 Jan. 2017 11 470 3 650 708 610 16 439Carrying amount at 31 Dec. 2017 9 821 3 817 832 159 14 628
Other intangible assets include the right to land use in China, having a book value of EUR 0.4 million.
NOTES TO THE CONSOLIDATED FINANCIAL STATEMENTSNOTES TO THE CONSOLIDATED FINANCIAL STATEMENTS

ANNUAL REPORT 201856 | ANNUAL REPORT 2018 | 57
Property, plant and equipment, 1000 EUR Land
Buildings andconstructions
Machinery andequipments
Othertangible
assets
Advancepayments andconstructions
in progress
Tangibleassets
total
Acquisition cost at 1 Jan. 2018 832 35 916 67 279 -184 2 312 106 156Additions 2 485 8 402 2 030 12 918Deductions -64 -1 566 -3 047 -4 678Exchange rate differences -12 -529 -658 15 -65 -1 250Acquisition cost at 31 Dec. 2018 820 37 808 73 457 -169 1 230 113 146
Accumulated depreciations at 1 Jan. 2018 -14 631 -44 065 202 -58 494
Depreciations -2 144 -5 361 -1 -7 506Deductions 39 1 511 1 550Exchange rate differences 157 274 -15 416Accumulated depreciations at 31 Dec. 2018 -16 579 -47 641 186 -64 035
Carrying amount at 1 Jan. 2018 832 21 285 23 214 18 2 312 47 662Carrying amount at 31 Dec. 2018 820 21 229 25 816 17 1 230 49 111
During the financial period of January 1 – December 31, 2018, the gross investments in tangible and intangible assets totaled EUR 10.1 million. Investments mainly consisted of the completion of the expansion of the electronics plant in Poland, started in the previous year, and machinery and equipment purchases in China
and Poland. In Suzhou, Scanfil increased machinery capacity in electronics manufacturing and invested in production automation. In Myslowice, Scanfil modernized equipment and increased capacity in mechanics manufacturing. In addition, several plants invested in automated material handling.
3.3. PROPERTY, PLANT AND EQUIPMENT
ACCOUNTING PRINCIPLE
Property, plant and equipment
The main items included in this category are buildings, machinery, equipment, fixtures and fittings. They are stated in the balance sheet at historical cost less depreciation and any impairment losses. Depreciation is calculated from historical cost on a straight-line basis over the expected useful lives of the assets. No depreciation is made for land areas. The repair and maintenance costs of tangible fixed assets are recognized through profit or loss. The residual values and useful lives of assets are reviewed annually and adjusted, if appropriate, to indicate changes in expected financial benefits. An item of property, plant and equipment will no longer be depreciated when such an item is considered as being held for sale in accordance with IFRS 5, Non-current Assets Held for Sale and Discontinued Operations.
The depreciation periods are:Buildings and structures 10–25 yearsMachinery and equipment 3–10 yearsOther tangible assets 5–10 years
Regarding machinery and equipment, a depreciation period of 8–10 years is generally used for heavy machinery (such as sheet metalwork centers) and production lines (such as surface mounting lines). Otherwise, the depreciation period for machinery and equipment is usually five years. Production tools are depreciated over three years. The capital gains from property, plant and equipment are included in other operating income while the corresponding capital losses are included in other operating expenses. Government grants related to tangible and intangible assets are deducted from an asset’s acquisition cost, and the net acquisition cost is capitalized on the balance sheet.
Impairment The principle for determining impairment is shown in note 3.2, “Other intangible assets”.
Property, plant and equipment, 1000 EUR Land
Buildings andconstructions
Machinery andequipments
Othertangible
assets
Advancepayments andconstructions
in progress
Tangibleassets
total
Acquisition cost at 1 Jan. 2017 1 214 37 138 67 608 327 1 653 107 941Additions 10 364 12 262 0 1 645 24 271Deductions -404 -11 297 -11 515 -515 -1 059 -24 790Exchange rate differences 22 -289 -1 076 4 73 -1 265Acquisition cost at 31 Dec. 2017 832 35 916 67 279 -184 2 312 106 156
Accumulated depreciations at 1 Jan. 2017 -15 028 -52 026 -270 -67 324
Depreciations -2 099 -4 552 -12 -6 662Deductions 2 240 11 412 487 14 139Exchange rate differences 256 1 101 -4 1 353Accumulated depreciations at 31 Dec. 2017 -14 631 -44 065 202 -58 494
Carrying amount at 1 Jan. 2017 1 214 22 110 15 581 57 1 653 40 617Carrying amount at 31 Dec. 2017 832 21 285 23 214 18 2 312 47 662
3.4. DEPRECIATION, AMORTIZATION AND IMPAIRMENT
ACCOUNTING PRINCIPLE
The determination principles are shown in note 3.1. “Goodwill”, 3.2 “Other intellectual property rights” and 3.3 “Tangible rights”.
Depreciation, amortization and impairment, EUR
Depreciation by asset class, 1000 EUR 2018 2017
Intangible assets Intangible rights 516 435 Other long-term expenses 246 305 Long-term customer relationships 1 257 1 338Total 2 018 2 078
Property, plant and equipment
Buildings 2 144 2 099 Machinery and equipment 5 318 4 552 Other tangible assets 47 12Total 7 509 6 662
Total depreciation 9 527 8 740
3.5 FINANCE LEASES
ACCOUNTING PRINCIPLE
Leases
A lease is classified as a finance lease if it substantially transfers the risks and rewards incidental to ownership to the group. Assets acquired through finance leases are recognized in the consolidated balance sheet under assets and liabilities. Their depreciation is performed in the same way as for owned assets. Finance lease payments are recognized as financial expenses and reduction in liability.
During the financial period of January 1 – December 31, 2017, the gross investments in tangible and intangible assets totaled EUR 18.6 million. Expansion of the Sieradz electronics plant in Poland doubled its floor area. Scanfil increased its electronics manufacturing capacity by investing in new surface mounting lines at three plants. In addition,
Leases where the risks and rewards incidental to ownership remain with the lessor are processed as other leases, and the leases are recognized in the income statement as expenses over the lease period. Property, plant and equipment as well as intangible assets include assets acquired by finance leases as follows:
Scanfil invested in the Suzhou plant in China and, in Europe, in the Sieradz plant in Poland and the Malmö plant in Sweden. In 2017, Scanfil increased its manufacturing capacity of sheet metal mechanics at the Myslowice plant in Poland where sheet metal working centers and bending machines were purchased.
NOTES TO THE CONSOLIDATED FINANCIAL STATEMENTSNOTES TO THE CONSOLIDATED FINANCIAL STATEMENTS
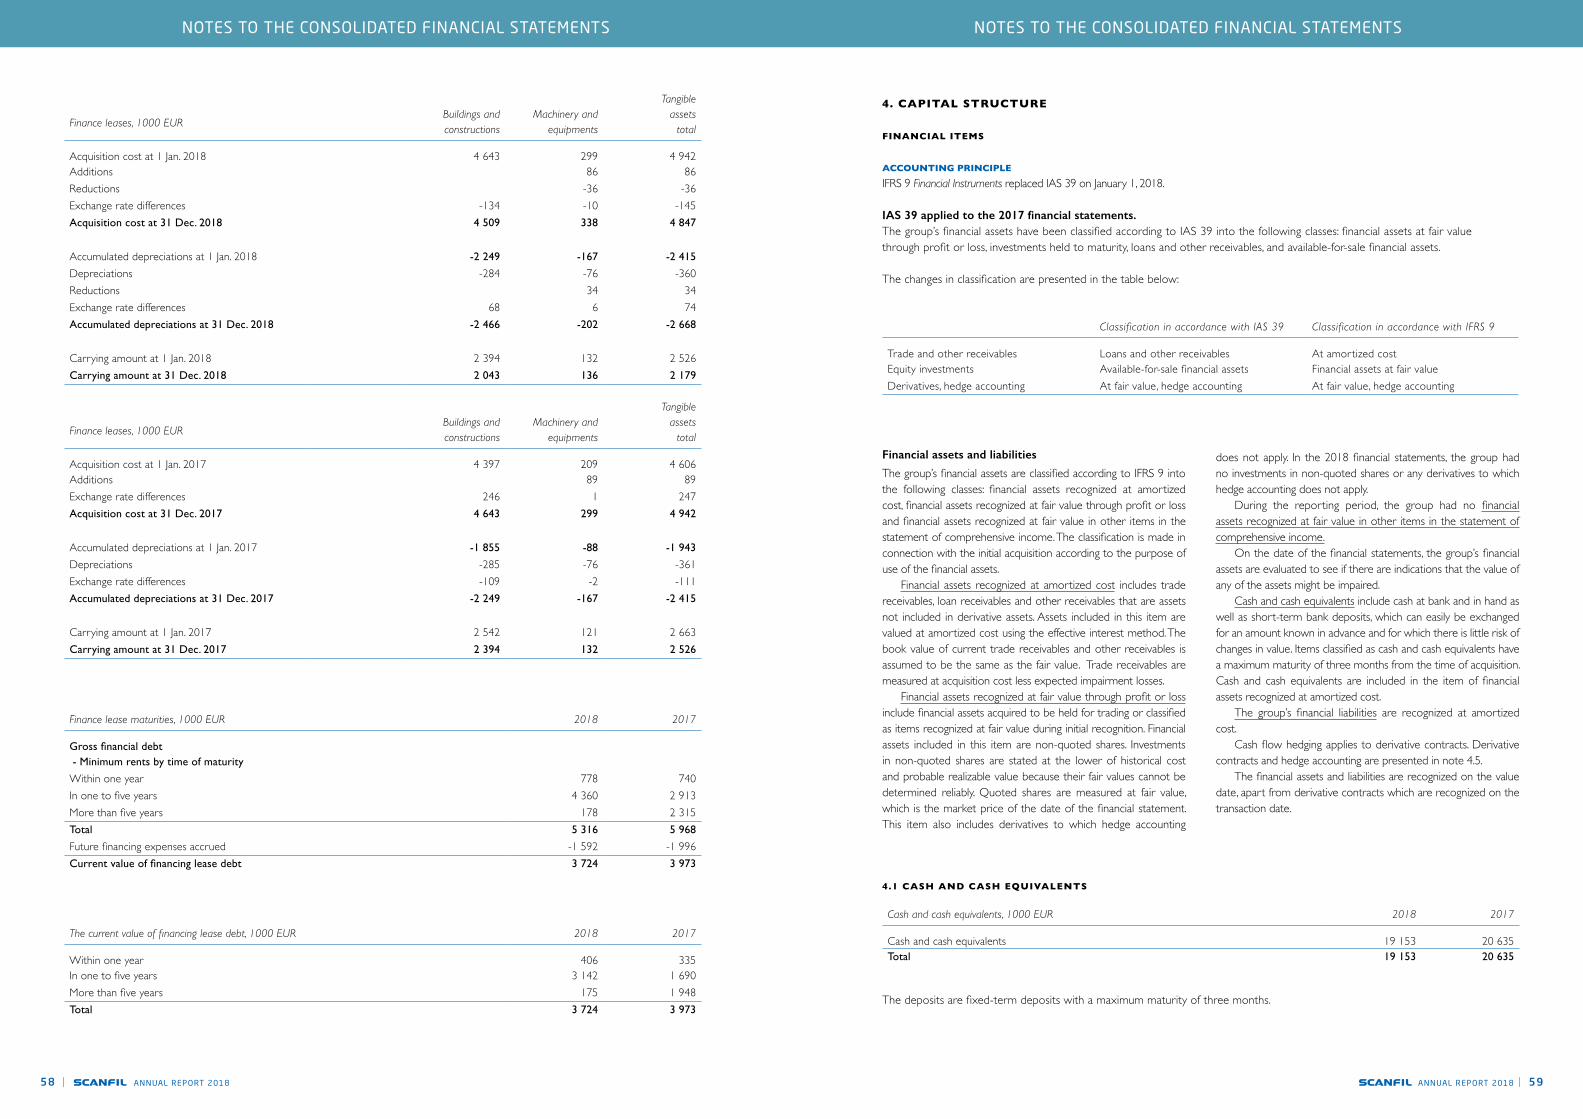
ANNUAL REPORT 201858 | ANNUAL REPORT 2018 | 59
Finance leases, 1000 EURBuildings andconstructions
Machinery andequipments
Tangibleassets
total
Acquisition cost at 1 Jan. 2018 4 643 299 4 942Additions 86 86Reductions -36 -36Exchange rate differences -134 -10 -145Acquisition cost at 31 Dec. 2018 4 509 338 4 847
Accumulated depreciations at 1 Jan. 2018 -2 249 -167 -2 415
Depreciations -284 -76 -360Reductions 34 34Exchange rate differences 68 6 74Accumulated depreciations at 31 Dec. 2018 -2 466 -202 -2 668
Carrying amount at 1 Jan. 2018 2 394 132 2 526Carrying amount at 31 Dec. 2018 2 043 136 2 179
Finance leases, 1000 EURBuildings andconstructions
Machinery andequipments
Tangibleassets
total
Acquisition cost at 1 Jan. 2017 4 397 209 4 606Additions 89 89Exchange rate differences 246 1 247Acquisition cost at 31 Dec. 2017 4 643 299 4 942
Accumulated depreciations at 1 Jan. 2017 -1 855 -88 -1 943
Depreciations -285 -76 -361Exchange rate differences -109 -2 -111Accumulated depreciations at 31 Dec. 2017 -2 249 -167 -2 415
Carrying amount at 1 Jan. 2017 2 542 121 2 663Carrying amount at 31 Dec. 2017 2 394 132 2 526
Finance lease maturities, 1000 EUR 2018 2017
Gross financial debt - Minimum rents by time of maturity
Within one year 778 740In one to five years 4 360 2 913More than five years 178 2 315Total 5 316 5 968
Future financing expenses accrued -1 592 -1 996Current value of financing lease debt 3 724 3 973
The current value of financing lease debt, 1000 EUR 2018 2017
Within one year 406 335In one to five years 3 142 1 690More than five years 175 1 948Total 3 724 3 973
Classification in accordance with IAS 39 Classification in accordance with IFRS 9
Trade and other receivables Loans and other receivables At amortized costEquity investments Available-for-sale financial assets Financial assets at fair valueDerivatives, hedge accounting At fair value, hedge accounting At fair value, hedge accounting
The deposits are fixed-term deposits with a maximum maturity of three months.
4.1 CASH AND CASH EQUIVALENTS
Cash and cash equivalents, 1000 EUR 2018 2017
Cash and cash equivalents 19 153 20 635Total 19 153 20 635
Financial assets and liabilities
The group’s financial assets are classified according to IFRS 9 into the following classes: financial assets recognized at amortized cost, financial assets recognized at fair value through profit or loss and financial assets recognized at fair value in other items in the statement of comprehensive income. The classification is made in connection with the initial acquisition according to the purpose of use of the financial assets. Financial assets recognized at amortized cost includes trade receivables, loan receivables and other receivables that are assets not included in derivative assets. Assets included in this item are valued at amortized cost using the effective interest method. The book value of current trade receivables and other receivables is assumed to be the same as the fair value. Trade receivables are measured at acquisition cost less expected impairment losses. Financial assets recognized at fair value through profit or loss include financial assets acquired to be held for trading or classified as items recognized at fair value during initial recognition. Financial assets included in this item are non-quoted shares. Investments in non-quoted shares are stated at the lower of historical cost and probable realizable value because their fair values cannot be determined reliably. Quoted shares are measured at fair value, which is the market price of the date of the financial statement. This item also includes derivatives to which hedge accounting
does not apply. In the 2018 financial statements, the group had no investments in non-quoted shares or any derivatives to which hedge accounting does not apply. During the reporting period, the group had no financial assets recognized at fair value in other items in the statement of comprehensive income. On the date of the financial statements, the group’s financial assets are evaluated to see if there are indications that the value of any of the assets might be impaired. Cash and cash equivalents include cash at bank and in hand as well as short-term bank deposits, which can easily be exchanged for an amount known in advance and for which there is little risk of changes in value. Items classified as cash and cash equivalents have a maximum maturity of three months from the time of acquisition. Cash and cash equivalents are included in the item of financial assets recognized at amortized cost. The group’s financial liabilities are recognized at amortized cost. Cash flow hedging applies to derivative contracts. Derivative contracts and hedge accounting are presented in note 4.5. The financial assets and liabilities are recognized on the value date, apart from derivative contracts which are recognized on the transaction date.
4. CAPITAL STRUCTURE
FINANCIAL ITEMS
ACCOUNTING PRINCIPLE
IFRS 9 Financial Instruments replaced IAS 39 on January 1, 2018.
IAS 39 applied to the 2017 financial statements. The group’s financial assets have been classified according to IAS 39 into the following classes: financial assets at fair value through profit or loss, investments held to maturity, loans and other receivables, and available-for-sale financial assets.
The changes in classification are presented in the table below:
NOTES TO THE CONSOLIDATED FINANCIAL STATEMENTSNOTES TO THE CONSOLIDATED FINANCIAL STATEMENTS
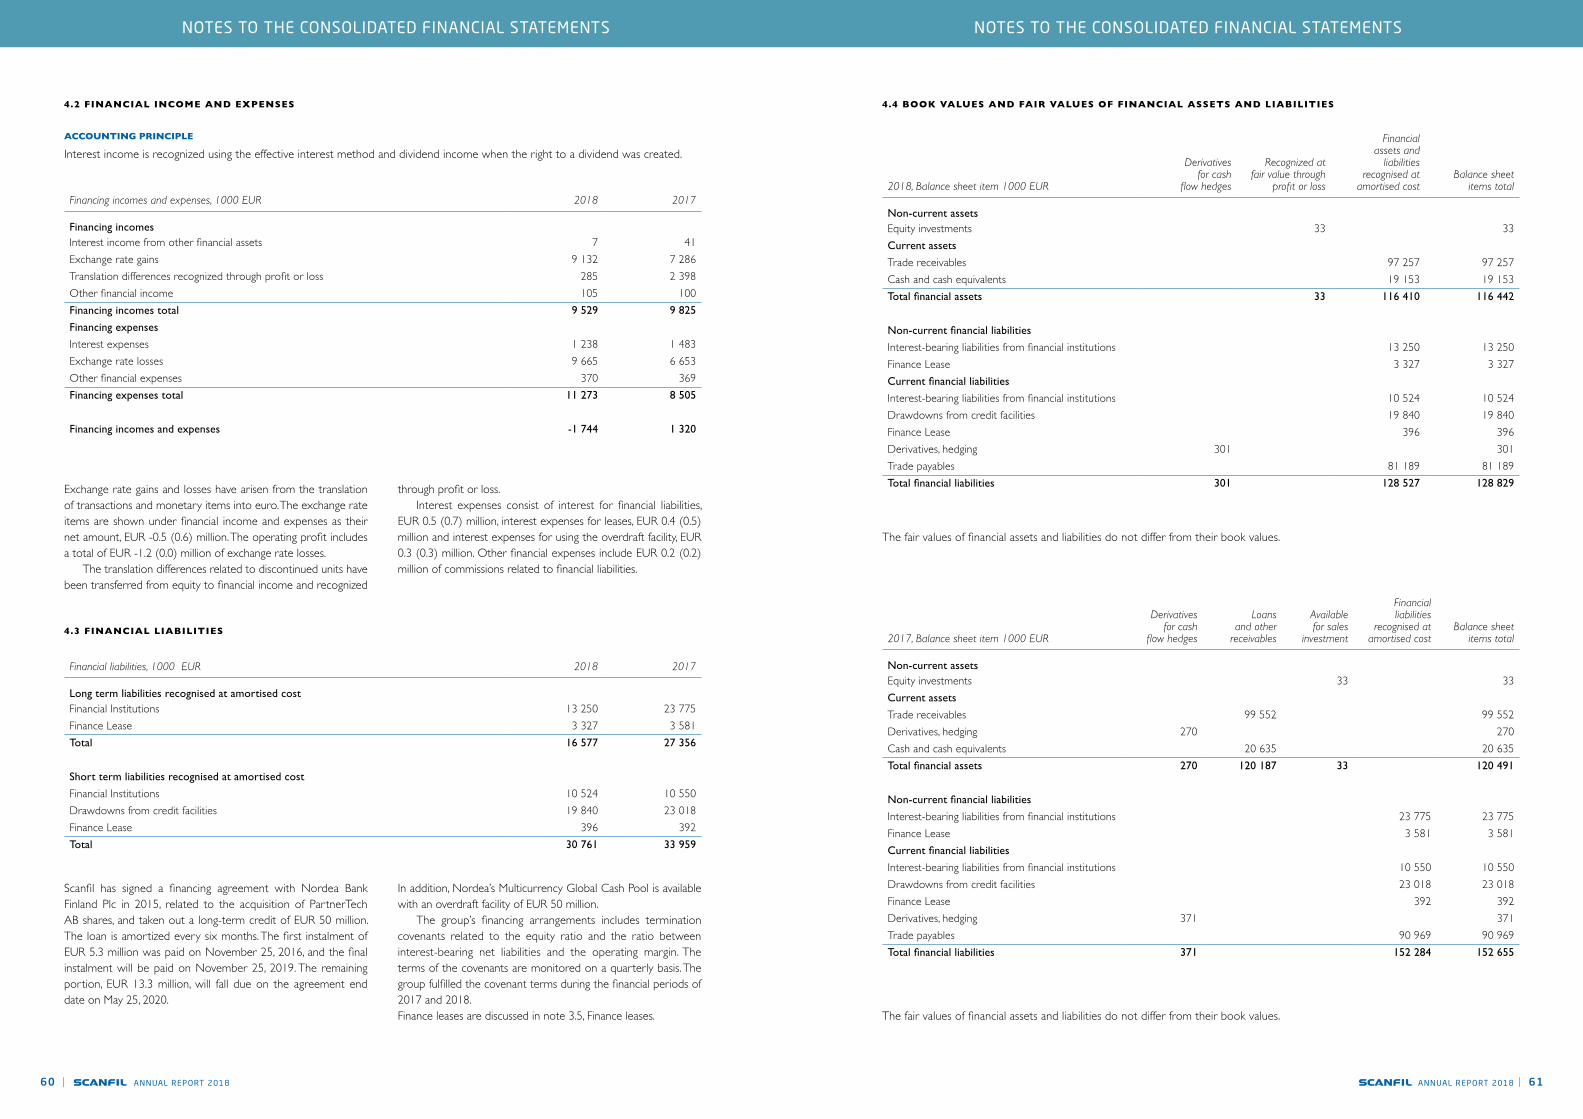
ANNUAL REPORT 201860 | ANNUAL REPORT 2018 | 61
4.2 FINANCIAL INCOME AND EXPENSES
ACCOUNTING PRINCIPLE
Interest income is recognized using the effective interest method and dividend income when the right to a dividend was created.
4.3 FINANCIAL LIABILITIES
Exchange rate gains and losses have arisen from the translation of transactions and monetary items into euro. The exchange rate items are shown under financial income and expenses as their net amount, EUR -0.5 (0.6) million. The operating profit includes a total of EUR -1.2 (0.0) million of exchange rate losses. The translation differences related to discontinued units have been transferred from equity to financial income and recognized
Scanfil has signed a financing agreement with Nordea Bank Finland Plc in 2015, related to the acquisition of PartnerTech AB shares, and taken out a long-term credit of EUR 50 million. The loan is amortized every six months. The first instalment of EUR 5.3 million was paid on November 25, 2016, and the final instalment will be paid on November 25, 2019. The remaining portion, EUR 13.3 million, will fall due on the agreement end date on May 25, 2020.
through profit or loss. Interest expenses consist of interest for financial liabilities, EUR 0.5 (0.7) million, interest expenses for leases, EUR 0.4 (0.5) million and interest expenses for using the overdraft facility, EUR 0.3 (0.3) million. Other financial expenses include EUR 0.2 (0.2) million of commissions related to financial liabilities.
In addition, Nordea’s Multicurrency Global Cash Pool is available with an overdraft facility of EUR 50 million. The group’s financing arrangements includes termination covenants related to the equity ratio and the ratio between interest-bearing net liabilities and the operating margin. The terms of the covenants are monitored on a quarterly basis. The group fulfilled the covenant terms during the financial periods of 2017 and 2018. Finance leases are discussed in note 3.5, Finance leases.
Financing incomes and expenses, 1000 EUR 2018 2017
Financing incomesInterest income from other financial assets 7 41Exchange rate gains 9 132 7 286Translation differences recognized through profit or loss 285 2 398Other financial income 105 100Financing incomes total 9 529 9 825
Financing expenses
Interest expenses 1 238 1 483Exchange rate losses 9 665 6 653Other financial expenses 370 369Financing expenses total 11 273 8 505
Financing incomes and expenses -1 744 1 320
Financial liabilities, 1000 EUR 2018 2017
Long term liabilities recognised at amortised costFinancial Institutions 13 250 23 775Finance Lease 3 327 3 581Total 16 577 27 356
Short term liabilities recognised at amortised cost
Financial Institutions 10 524 10 550Drawdowns from credit facilities 19 840 23 018Finance Lease 396 392Total 30 761 33 959
4.4 BOOK VALUES AND FAIR VALUES OF FINANCIAL ASSETS AND LIABILITIES
The fair values of financial assets and liabilities do not differ from their book values.
2018, Balance sheet item 1000 EUR
Derivatives for cash
flow hedges
Recognized at fair value through
profit or loss
Financial assets and
liabilities recognised at
amortised costBalance sheet
items total
Non-current assetsEquity investments 33 33Current assets
Trade receivables 97 257 97 257Cash and cash equivalents 19 153 19 153Total financial assets 33 116 410 116 442
Non-current financial liabilities
Interest-bearing liabilities from financial institutions 13 250 13 250Finance Lease 3 327 3 327Current financial liabilities
Interest-bearing liabilities from financial institutions 10 524 10 524Drawdowns from credit facilities 19 840 19 840Finance Lease 396 396Derivatives, hedging 301 301Trade payables 81 189 81 189Total financial liabilities 301 128 527 128 829
The fair values of financial assets and liabilities do not differ from their book values.
2017, Balance sheet item 1000 EUR
Derivatives for cash
flow hedges
Loans and other
receivables
Available for sales
investment
Financial liabilities
recognised at amortised cost
Balance sheet items total
Non-current assetsEquity investments 33 33Current assets
Trade receivables 99 552 99 552Derivatives, hedging 270 270Cash and cash equivalents 20 635 20 635Total financial assets 270 120 187 33 120 491
Non-current financial liabilities
Interest-bearing liabilities from financial institutions 23 775 23 775Finance Lease 3 581 3 581Current financial liabilities
Interest-bearing liabilities from financial institutions 10 550 10 550Drawdowns from credit facilities 23 018 23 018Finance Lease 392 392Derivatives, hedging 371 371Trade payables 90 969 90 969Total financial liabilities 371 152 284 152 655
NOTES TO THE CONSOLIDATED FINANCIAL STATEMENTSNOTES TO THE CONSOLIDATED FINANCIAL STATEMENTS

ANNUAL REPORT 201862 | ANNUAL REPORT 2018 | 63
ACCOUNTING PRINCIPLE
Derivative financial instruments and hedge accounting
Derivative financial instruments are initially recognized in accounting at fair value on the date when the group becomes a party to the related contract and later further valued at fair value. For derivative financial instruments to which hedge accounting is not applied, changes in value are immediately recognized through profit or loss. For derivative financial instruments to which hedge accounting is applied and which are considered effective hedging instruments, the impact on the result of changes in value is presented according to the hedge accounting model employed. The group applies cash flow hedge accounting to currency derivatives and the interest rate swap used to hedge a variable-rate loan. When initiating hedge accounting, the group documents the relationship between the hedged item and the hedging instruments, together with the group’s risk management objectives and hedging strategy. When initiating hedging and at least every time when preparing financial statements and interim financial statements, the group documents and evaluates the effectiveness of the hedging relationships by examining the ability of the hedging instrument to negate changes in the fair value or cash flows of the hedged item. Any change in the fair value of the effective portion of derivative financial instruments fulfilling the conditions of a cash flow hedge is recognized under other comprehensive income and presented in equity hedging reserve with tax consequence considered (included in “Fair value reserves”). Profits and losses accumulated from the hedging instrument to equity are recognized through profit or loss when the hedged item affects profit or loss.
Interest rate swapThe group uses an interest swap agreement to hedge a credit. The purpose of the hedge is to offer protection against interest rate fluctuations related to the variable-rate loan. Through hedging, the interest payments of the variable-rate euro-denominated loan are changed to have a fixed rate. Scanfil pays a fixed rate of 0.41% every quarter, in addition to the bank’s rate. The objective of the hedge is compliant with the group’s risk management principles. The effectiveness of the hedge can be reliably measured, and the hedge is expected to remain fully effective throughout the validity of the hedge. The terms and conditions of the hedged object and the hedging instrument correspond to each other. Effectiveness is evaluated every quarter, and the hedge has remained effective. The impact of the derivative on results is expected to materialize during the validity of the loan. On December 31, 2018, the rated amount of the interest swap agreement was EUR 23.8 million, and it will expire on May 25, 2020. The fair value of the derivative was EUR -0.2 million, including accumulated interest. The interest flows of the derivative will materialize at the same time as the interest flows of the loan.
Forward exchange contractsThe group uses forward exchange contracts for hedging against currency risks. The group applies cash flow hedge accounting to currency derivative contracts prepared for hedging purposes. Changes in fair value are recognized in other comprehensive income items adjusted for deferred taxes and presented in the fair value reserve under equity.
4.5. DERIVATIVE FINANCIAL INSTRUMENTS AND HEDGE ACCOUNTING
Interest and currency derivatives
1000 EUR Positive Negative NetNominal
value
Bookvalue,
liabilities
Changes infair values
(used inefficiency
testing)
2018 Interest rate swaps, hedge accounting 196 196 23 750 196 135 Forward exchange contracts, hedge accounting -43 149 105 9 138 105 -293Total 301 32 888 301
2018, 1000 EUR Tier 2 Tier 3
Assets measured at fair valueRecognized at fair value through profit or loss Equity investments 33
Liabilities measured at fair value
Derivatives, hedging 301Liabilities recognised at amortised cost
Financing loan 23 750 Finance Lease 3 724
2017, 1000 EUR Tier 2 Tier 3
Assets measured at fair valueAvailable-for-sale investments Equity investments 33Assets measured at fair value
Derivatives, hedging 270
Liabilities measured at fair value
Derivatives, hedging 371Liabilities recognised at amortised cost
Financing loan 34 250 Finance Lease 3 973
4.6. HIERARCHY OF FAIR VALUES
Forward exchange contracts are used to hedge expenses denominated in Polish zloty.
The company uses forward exchange contracts for hedging against currency risk and interest swaps for managing the interest rate risk. The table shows the interest rate derivatives at net values and currency derivatives at gross values.
Cash flow hedging, 1000 EUR
Hedginginstrument
nominal value
Hedginginstrument book
value, liabilities
Hedging instrumentincluded in
balance sheet item
2018 Interest rate swaps, hedge accounting 23 750 196 Other liabilities Forward exchange contracts, hedge accounting 21 659 105 Other liabilitiesTotal 45 409 301
Cash flow hedging, 1000 EUR
Hedging itembook value,
liabilities
Hedging itemincluded in
balance sheet item
Cash flow hedgingfair value
reserve
2018 Interest rate swaps, hedge accounting 23 750 Financial liabilities 135 Forward exchange contracts, hedge accounting -293Total 23 750 -158
NOTES TO THE CONSOLIDATED FINANCIAL STATEMENTSNOTES TO THE CONSOLIDATED FINANCIAL STATEMENTS
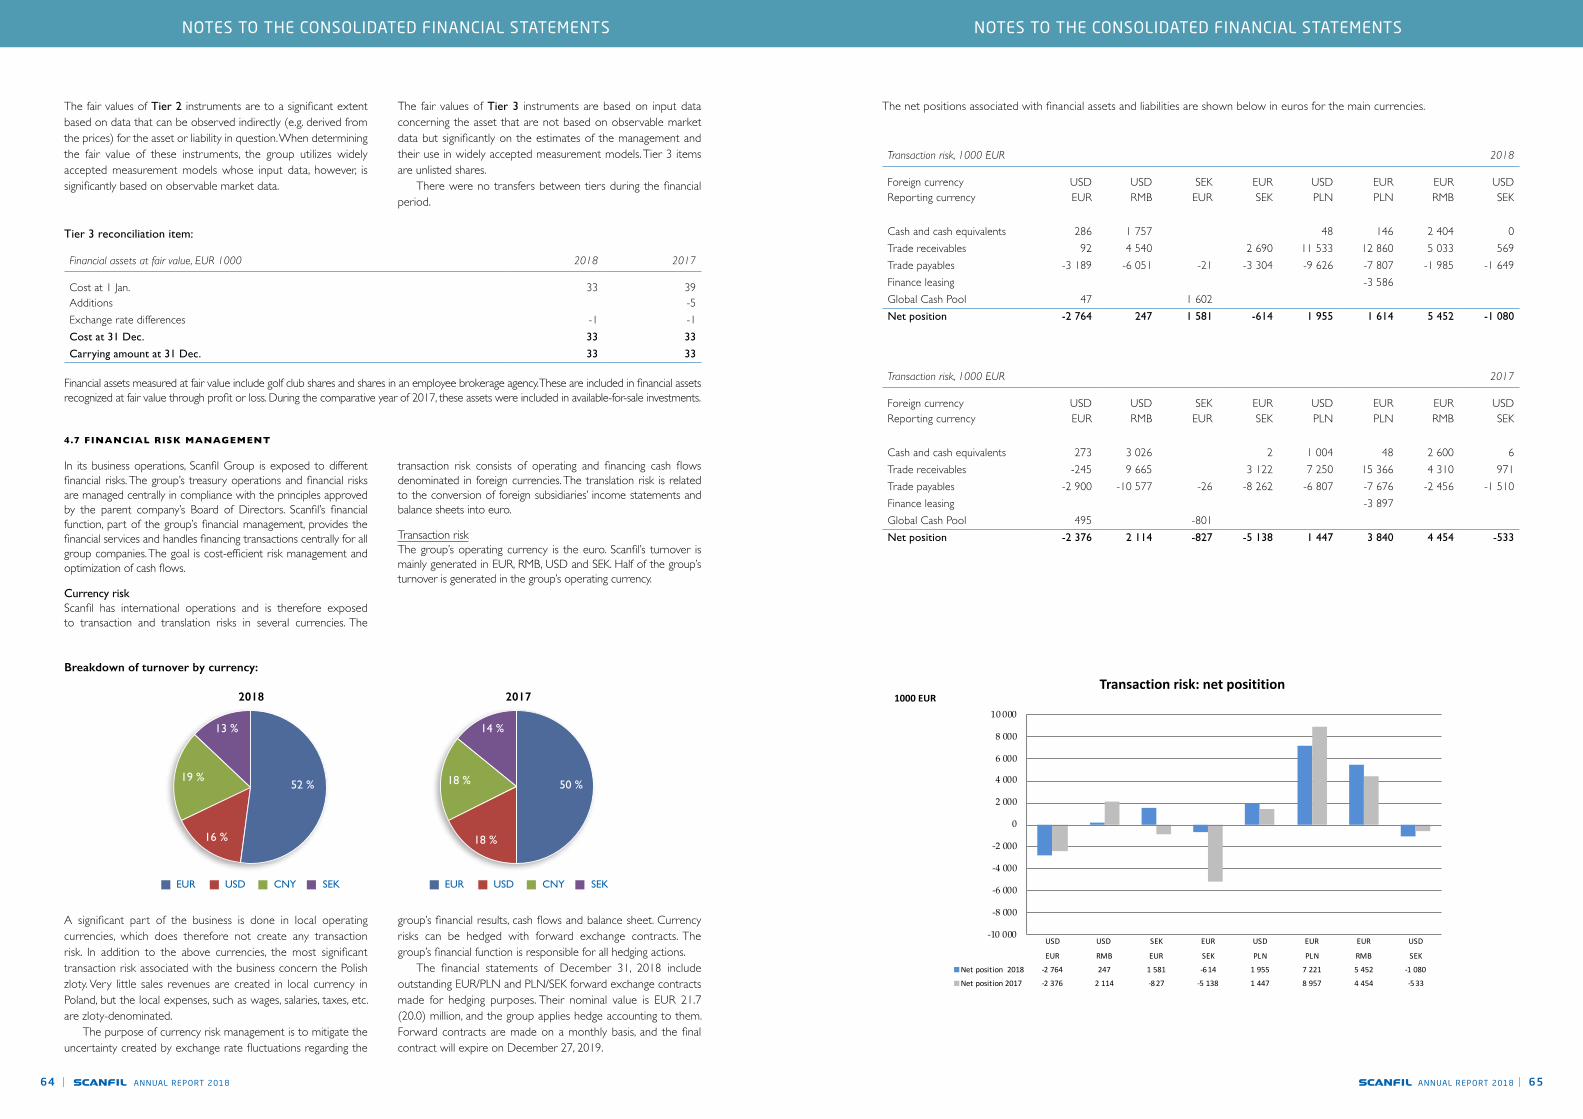
ANNUAL REPORT 201864 | ANNUAL REPORT 2018 | 65
USD USD SEK EUR USD EUR EUR USD
EUR RMB EUR SEK PLN PLN RMB SEK
Net position 2018 -2 764 247 1 581 -6 14 1 955 7 221 5 452 -1 080
Net position 2017 -2 376 2 114 -8 27 -5 138 1 447 8 957 4 454 -5 33
-10 000
-8 000
-6 000
-4 000
-2 000
0
2 000
4 000
6 000
8 000
10 0001000 EUR
Transaction risk: net positition
The fair values of Tier 2 instruments are to a significant extent based on data that can be observed indirectly (e.g. derived from the prices) for the asset or liability in question. When determining the fair value of these instruments, the group utilizes widely accepted measurement models whose input data, however, is significantly based on observable market data.
In its business operations, Scanfil Group is exposed to different financial risks. The group’s treasury operations and financial risks are managed centrally in compliance with the principles approved by the parent company’s Board of Directors. Scanfil’s financial function, part of the group’s financial management, provides the financial services and handles financing transactions centrally for all group companies. The goal is cost-efficient risk management and optimization of cash flows.
Currency riskScanfil has international operations and is therefore exposed to transaction and translation risks in several currencies. The
The fair values of Tier 3 instruments are based on input data concerning the asset that are not based on observable market data but significantly on the estimates of the management and their use in widely accepted measurement models. Tier 3 items are unlisted shares. There were no transfers between tiers during the financial period.
transaction risk consists of operating and financing cash flows denominated in foreign currencies. The translation risk is related to the conversion of foreign subsidiaries’ income statements and balance sheets into euro.
Transaction riskThe group’s operating currency is the euro. Scanfil’s turnover is mainly generated in EUR, RMB, USD and SEK. Half of the group’s turnover is generated in the group’s operating currency.
4.7 FINANCIAL RISK MANAGEMENT
A significant part of the business is done in local operating currencies, which does therefore not create any transaction risk. In addition to the above currencies, the most significant transaction risk associated with the business concern the Polish zloty. Very little sales revenues are created in local currency in Poland, but the local expenses, such as wages, salaries, taxes, etc. are zloty-denominated. The purpose of currency risk management is to mitigate the uncertainty created by exchange rate fluctuations regarding the
Financial assets measured at fair value include golf club shares and shares in an employee brokerage agency. These are included in financial assets recognized at fair value through profit or loss. During the comparative year of 2017, these assets were included in available-for-sale investments.
group’s financial results, cash flows and balance sheet. Currency risks can be hedged with forward exchange contracts. The group’s financial function is responsible for all hedging actions. The financial statements of December 31, 2018 include outstanding EUR/PLN and PLN/SEK forward exchange contracts made for hedging purposes. Their nominal value is EUR 21.7 (20.0) million, and the group applies hedge accounting to them. Forward contracts are made on a monthly basis, and the final contract will expire on December 27, 2019.
The net positions associated with financial assets and liabilities are shown below in euros for the main currencies.
Transaction risk, 1000 EUR 2018
Foreign currency USD USD SEK EUR USD EUR EUR USDReporting currency EUR RMB EUR SEK PLN PLN RMB SEK
Cash and cash equivalents 286 1 757 48 146 2 404 0Trade receivables 92 4 540 2 690 11 533 12 860 5 033 569Trade payables -3 189 -6 051 -21 -3 304 -9 626 -7 807 -1 985 -1 649Finance leasing -3 586Global Cash Pool 47 1 602Net position -2 764 247 1 581 -614 1 955 1 614 5 452 -1 080
Transaction risk, 1000 EUR 2017
Foreign currency USD USD SEK EUR USD EUR EUR USDReporting currency EUR RMB EUR SEK PLN PLN RMB SEK
Cash and cash equivalents 273 3 026 2 1 004 48 2 600 6Trade receivables -245 9 665 3 122 7 250 15 366 4 310 971Trade payables -2 900 -10 577 -26 -8 262 -6 807 -7 676 -2 456 -1 510Finance leasing -3 897Global Cash Pool 495 -801Net position -2 376 2 114 -827 -5 138 1 447 3 840 4 454 -533
Breakdown of turnover by currency:
Financial assets at fair value, EUR 1000 2018 2017
Cost at 1 Jan. 33 39Additions -5Exchange rate differences -1 -1Cost at 31 Dec. 33 33
Carrying amount at 31 Dec. 33 33
EUR EURUSD USDCNY CNYSEK SEK
20172018
Tier 3 reconciliation item:
NOTES TO THE CONSOLIDATED FINANCIAL STATEMENTSNOTES TO THE CONSOLIDATED FINANCIAL STATEMENTS
13 % 14 %
19 % 18 %
16 % 18 %
52 % 50 %
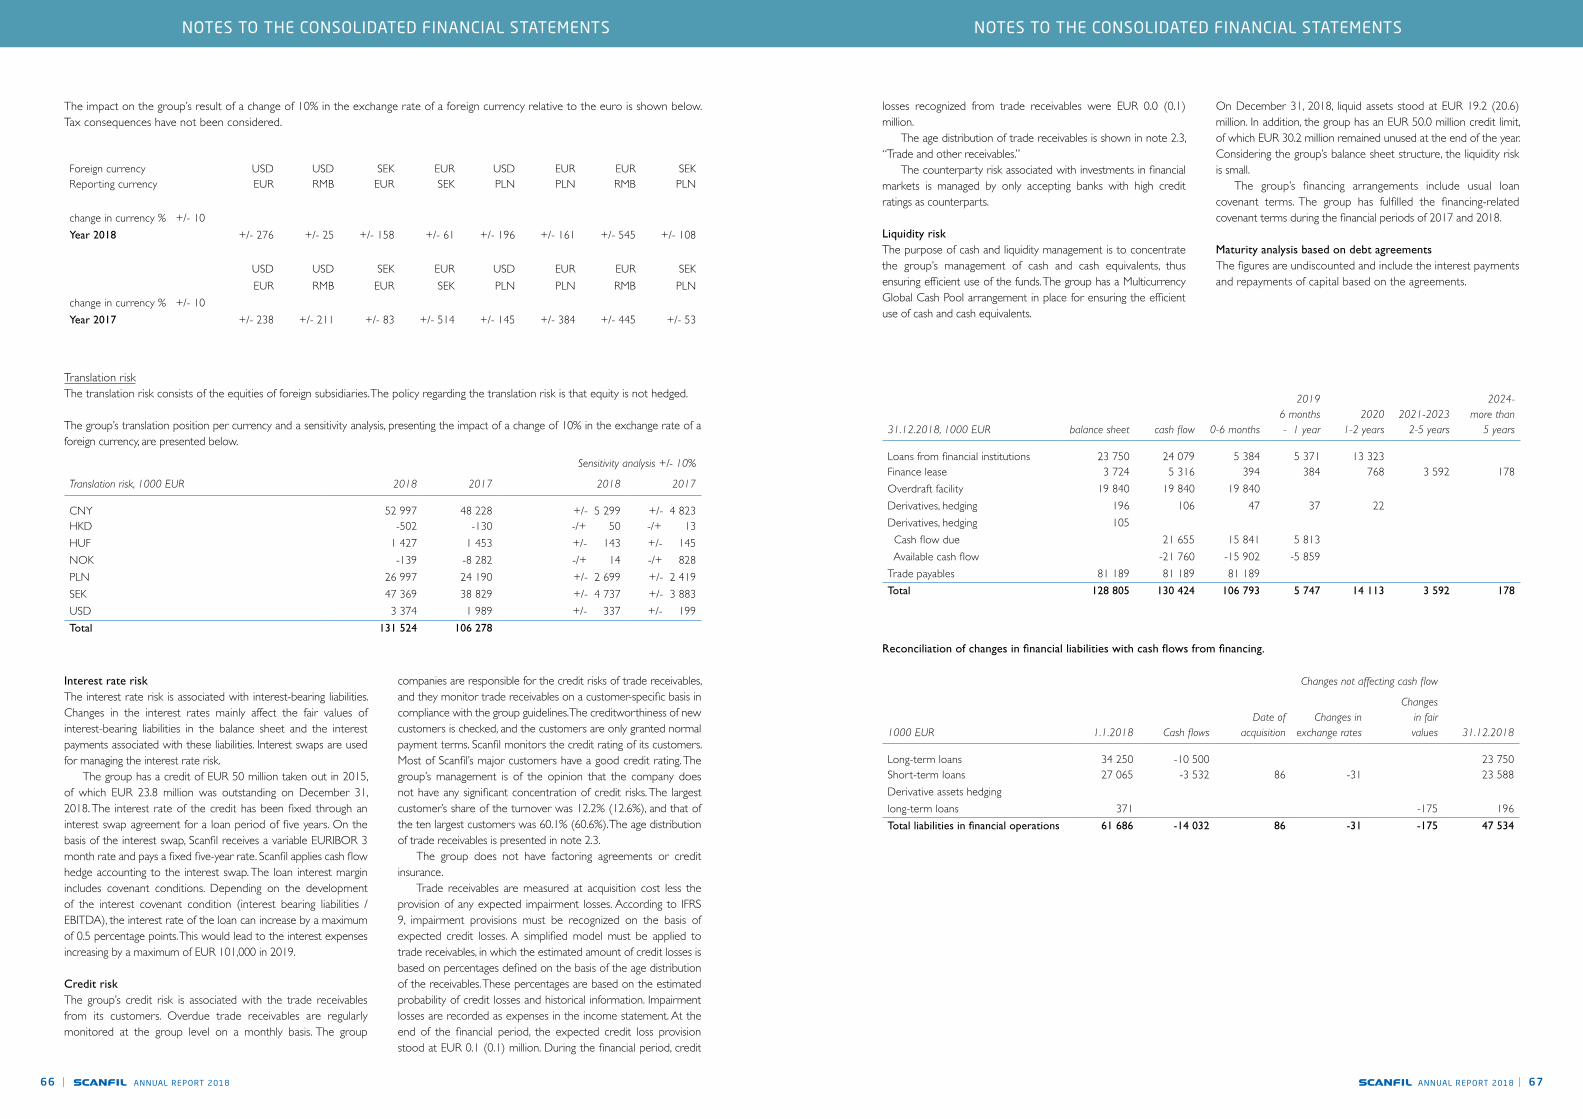
ANNUAL REPORT 201866 | ANNUAL REPORT 2018 | 67
The impact on the group’s result of a change of 10% in the exchange rate of a foreign currency relative to the euro is shown below. Tax consequences have not been considered.
Translation riskThe translation risk consists of the equities of foreign subsidiaries. The policy regarding the translation risk is that equity is not hedged.
The group’s translation position per currency and a sensitivity analysis, presenting the impact of a change of 10% in the exchange rate of a foreign currency, are presented below.
Sensitivity analysis +/- 10%
Translation risk, 1000 EUR 2018 2017 2018 2017
CNY 52 997 48 228 +/- 5 299 +/- 4 823HKD -502 -130 -/+ 50 -/+ 13HUF 1 427 1 453 +/- 143 +/- 145NOK -139 -8 282 -/+ 14 -/+ 828PLN 26 997 24 190 +/- 2 699 +/- 2 419SEK 47 369 38 829 +/- 4 737 +/- 3 883USD 3 374 1 989 +/- 337 +/- 199Total 131 524 106 278
Foreign currency USD USD SEK EUR USD EUR EUR SEKReporting currency EUR RMB EUR SEK PLN PLN RMB PLN
change in currency % +/- 10Year 2018 +/- 276 +/- 25 +/- 158 +/- 61 +/- 196 +/- 161 +/- 545 +/- 108
USD USD SEK EUR USD EUR EUR SEKEUR RMB EUR SEK PLN PLN RMB PLN
change in currency % +/- 10Year 2017 +/- 238 +/- 211 +/- 83 +/- 514 +/- 145 +/- 384 +/- 445 +/- 53
Interest rate riskThe interest rate risk is associated with interest-bearing liabilities. Changes in the interest rates mainly affect the fair values of interest-bearing liabilities in the balance sheet and the interest payments associated with these liabilities. Interest swaps are used for managing the interest rate risk. The group has a credit of EUR 50 million taken out in 2015, of which EUR 23.8 million was outstanding on December 31, 2018. The interest rate of the credit has been fixed through an interest swap agreement for a loan period of five years. On the basis of the interest swap, Scanfil receives a variable EURIBOR 3 month rate and pays a fixed five-year rate. Scanfil applies cash flow hedge accounting to the interest swap. The loan interest margin includes covenant conditions. Depending on the development of the interest covenant condition (interest bearing liabilities / EBITDA), the interest rate of the loan can increase by a maximum of 0.5 percentage points. This would lead to the interest expenses increasing by a maximum of EUR 101,000 in 2019.
Credit riskThe group’s credit risk is associated with the trade receivables from its customers. Overdue trade receivables are regularly monitored at the group level on a monthly basis. The group
companies are responsible for the credit risks of trade receivables, and they monitor trade receivables on a customer-specific basis in compliance with the group guidelines. The creditworthiness of new customers is checked, and the customers are only granted normal payment terms. Scanfil monitors the credit rating of its customers. Most of Scanfil’s major customers have a good credit rating. The group’s management is of the opinion that the company does not have any significant concentration of credit risks. The largest customer’s share of the turnover was 12.2% (12.6%), and that of the ten largest customers was 60.1% (60.6%). The age distribution of trade receivables is presented in note 2.3. The group does not have factoring agreements or credit insurance. Trade receivables are measured at acquisition cost less the provision of any expected impairment losses. According to IFRS 9, impairment provisions must be recognized on the basis of expected credit losses. A simplified model must be applied to trade receivables, in which the estimated amount of credit losses is based on percentages defined on the basis of the age distribution of the receivables. These percentages are based on the estimated probability of credit losses and historical information. Impairment losses are recorded as expenses in the income statement. At the end of the financial period, the expected credit loss provision stood at EUR 0.1 (0.1) million. During the financial period, credit
losses recognized from trade receivables were EUR 0.0 (0.1) million. The age distribution of trade receivables is shown in note 2.3, “Trade and other receivables.” The counterparty risk associated with investments in financial markets is managed by only accepting banks with high credit ratings as counterparts.
Liquidity riskThe purpose of cash and liquidity management is to concentrate the group’s management of cash and cash equivalents, thus ensuring efficient use of the funds. The group has a Multicurrency Global Cash Pool arrangement in place for ensuring the efficient use of cash and cash equivalents.
On December 31, 2018, liquid assets stood at EUR 19.2 (20.6) million. In addition, the group has an EUR 50.0 million credit limit, of which EUR 30.2 million remained unused at the end of the year. Considering the group’s balance sheet structure, the liquidity risk is small. The group’s financing arrangements include usual loan covenant terms. The group has fulfilled the financing-related covenant terms during the financial periods of 2017 and 2018.
Maturity analysis based on debt agreementsThe figures are undiscounted and include the interest payments and repayments of capital based on the agreements.
Reconciliation of changes in financial liabilities with cash flows from financing.
31.12.2018, 1000 EUR balance sheet cash flow 0-6 months
20196 months - 1 year
20201-2 years
2021-20232-5 years
2024-more than
5 years
Loans from financial institutions 23 750 24 079 5 384 5 371 13 323Finance lease 3 724 5 316 394 384 768 3 592 178Overdraft facility 19 840 19 840 19 840Derivatives, hedging 196 106 47 37 22Derivatives, hedging 105 Cash flow due 21 655 15 841 5 813 Available cash flow -21 760 -15 902 -5 859Trade payables 81 189 81 189 81 189Total 128 805 130 424 106 793 5 747 14 113 3 592 178
Changes not affecting cash flow
1000 EUR 1.1.2018 Cash flowsDate of
acquisitionChanges in
exchange rates
Changesin fairvalues 31.12.2018
Long-term loans 34 250 -10 500 23 750Short-term loans 27 065 -3 532 86 -31 23 588Derivative assets hedging long-term loans 371 -175 196Total liabilities in financial operations 61 686 -14 032 86 -31 -175 47 534
NOTES TO THE CONSOLIDATED FINANCIAL STATEMENTSNOTES TO THE CONSOLIDATED FINANCIAL STATEMENTS
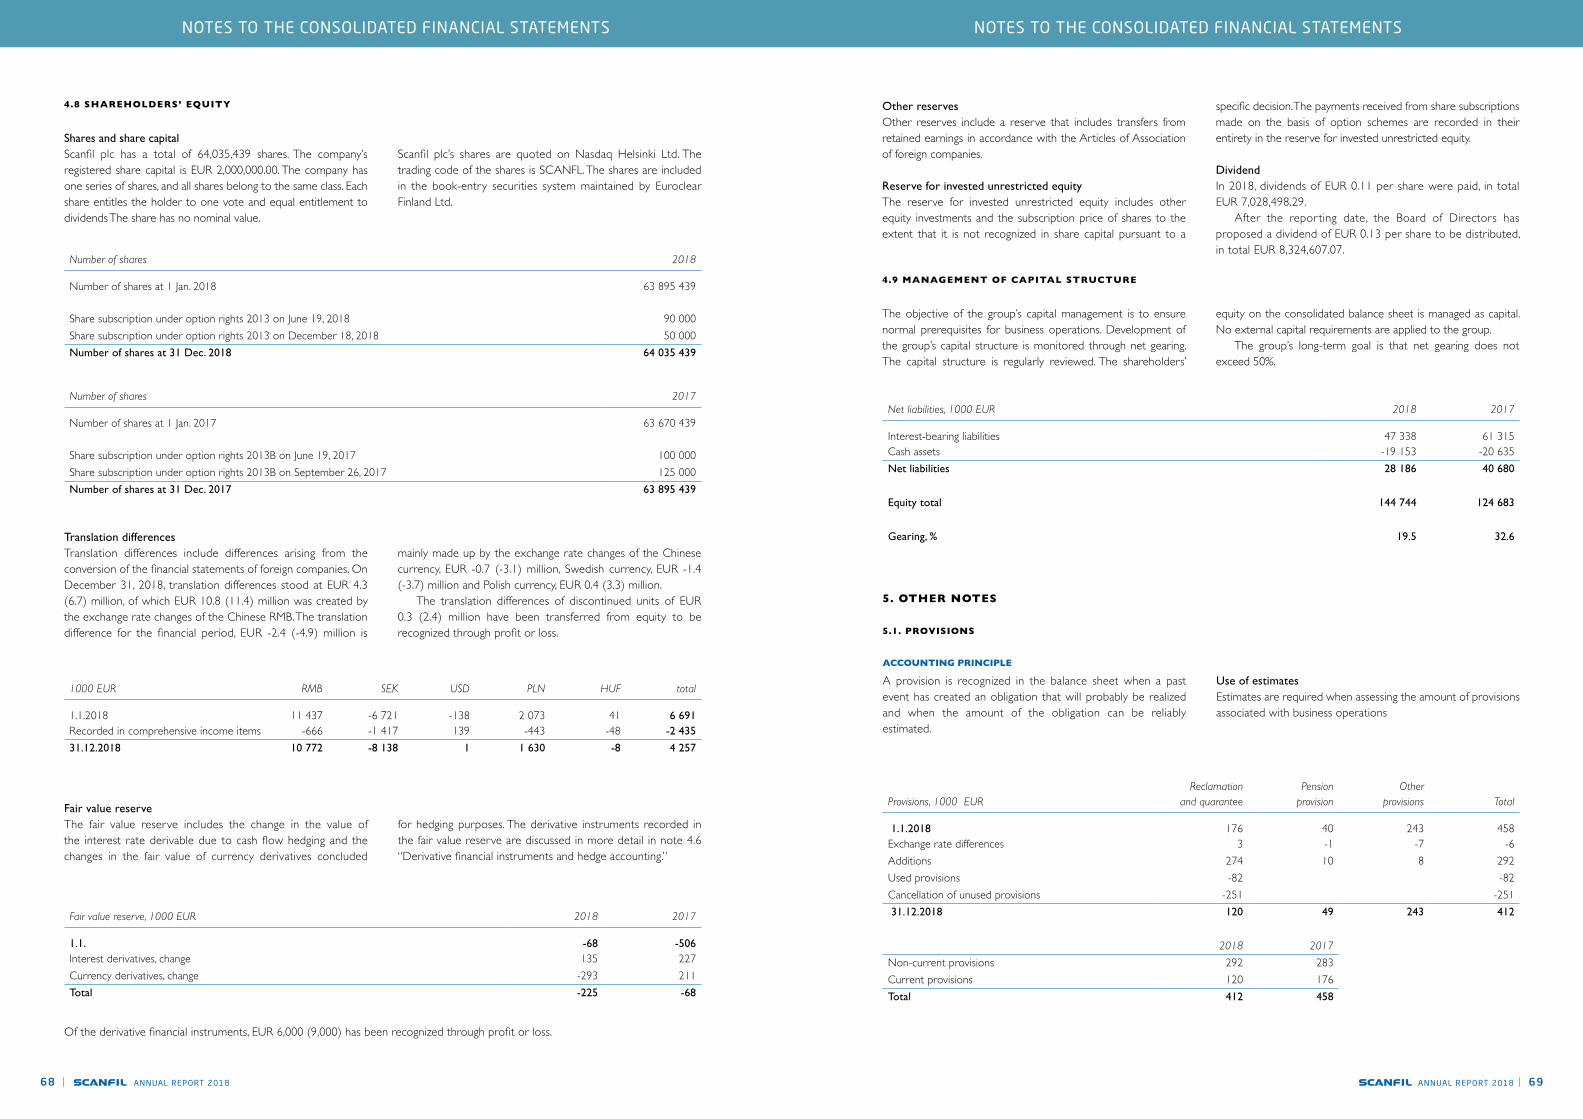
ANNUAL REPORT 201868 | ANNUAL REPORT 2018 | 69
Of the derivative financial instruments, EUR 6,000 (9,000) has been recognized through profit or loss.
Shares and share capitalScanfil plc has a total of 64,035,439 shares. The company’s registered share capital is EUR 2,000,000.00. The company has one series of shares, and all shares belong to the same class. Each share entitles the holder to one vote and equal entitlement to dividends The share has no nominal value.
Translation differencesTranslation differences include differences arising from the conversion of the financial statements of foreign companies. On December 31, 2018, translation differences stood at EUR 4.3 (6.7) million, of which EUR 10.8 (11.4) million was created by the exchange rate changes of the Chinese RMB. The translation difference for the financial period, EUR -2.4 (-4.9) million is
Fair value reserveThe fair value reserve includes the change in the value of the interest rate derivable due to cash flow hedging and the changes in the fair value of currency derivatives concluded
Scanfil plc’s shares are quoted on Nasdaq Helsinki Ltd. The trading code of the shares is SCANFL. The shares are included in the book-entry securities system maintained by Euroclear Finland Ltd.
mainly made up by the exchange rate changes of the Chinese currency, EUR -0.7 (-3.1) million, Swedish currency, EUR -1.4 (-3.7) million and Polish currency, EUR 0.4 (3.3) million. The translation differences of discontinued units of EUR 0.3 (2.4) million have been transferred from equity to be recognized through profit or loss.
for hedging purposes. The derivative instruments recorded in the fair value reserve are discussed in more detail in note 4.6 “Derivative financial instruments and hedge accounting.”
4.8 SHAREHOLDERS’ EQUITY
Number of shares 2018
Number of shares at 1 Jan. 2018 63 895 439
Share subscription under option rights 2013 on June 19, 2018 90 000Share subscription under option rights 2013 on December 18, 2018 50 000Number of shares at 31 Dec. 2018 64 035 439
Number of shares 2017
Number of shares at 1 Jan. 2017 63 670 439
Share subscription under option rights 2013B on June 19, 2017 100 000Share subscription under option rights 2013B on September 26, 2017 125 000Number of shares at 31 Dec. 2017 63 895 439
Fair value reserve, 1000 EUR 2018 2017
1.1. -68 -506Interest derivatives, change 135 227Currency derivatives, change -293 211Total -225 -68
1000 EUR RMB SEK USD PLN HUF total
1.1.2018 11 437 -6 721 -138 2 073 41 6 691Recorded in comprehensive income items -666 -1 417 139 -443 -48 -2 435
31.12.2018 10 772 -8 138 1 1 630 -8 4 257
Other reservesOther reserves include a reserve that includes transfers from retained earnings in accordance with the Articles of Association of foreign companies.
Reserve for invested unrestricted equityThe reserve for invested unrestricted equity includes other equity investments and the subscription price of shares to the extent that it is not recognized in share capital pursuant to a
specific decision. The payments received from share subscriptions made on the basis of option schemes are recorded in their entirety in the reserve for invested unrestricted equity.
DividendIn 2018, dividends of EUR 0.11 per share were paid, in total EUR 7,028,498.29. After the repor ting date, the Board of Directors has proposed a dividend of EUR 0.13 per share to be distributed, in total EUR 8,324,607.07.
The objective of the group’s capital management is to ensure normal prerequisites for business operations. Development of the group’s capital structure is monitored through net gearing. The capital structure is regularly reviewed. The shareholders’
equity on the consolidated balance sheet is managed as capital. No external capital requirements are applied to the group. The group’s long-term goal is that net gearing does not exceed 50%.
4.9 MANAGEMENT OF CAPITAL STRUCTURE
Net liabilities, 1000 EUR 2018 2017
Interest-bearing liabilities 47 338 61 315Cash assets -19 153 -20 635Net liabilities 28 186 40 680
Equity total 144 744 124 683
Gearing, % 19.5 32.6
Provisions, 1000 EURReclamation
and quaranteePension
provisionOther
provisions Total
1.1.2018 176 40 243 458Exchange rate differences 3 -1 -7 -6Additions 274 10 8 292Used provisions -82 -82Cancellation of unused provisions -251 -251 31.12.2018 120 49 243 412
2018 2017
Non-current provisions 292 283Current provisions 120 176Total 412 458
5. OTHER NOTES
5.1. PROVISIONS
ACCOUNTING PRINCIPLE
A provision is recognized in the balance sheet when a past event has created an obligation that will probably be realized and when the amount of the obligation can be reliably estimated.
Use of estimatesEstimates are required when assessing the amount of provisions associated with business operations
NOTES TO THE CONSOLIDATED FINANCIAL STATEMENTSNOTES TO THE CONSOLIDATED FINANCIAL STATEMENTS

ANNUAL REPORT 201870 | ANNUAL REPORT 2018 | 71
The complaint and warranty provision includes the estimated cost of repairing defective products that is related to customer complaints and warranty obligations, and any fees resulting from delayed deliveries. Other provisions are related to a benefit
Leases where the risks and rewards incidental to ownership remain with the lessor are processed as other leases, and the
Rental expenses mainly comprise the rents of the production facilities. Rent liabilities do not include VAT. The group uses
In addition to the aforementioned commitments, the following guarantees have been given: Scanfil plc has given absolute guarantees to Nordea Bank AB (publ) as security for payment of the liabilities which Scanfil Sweden AB has created from time to time towards Nordea Bank AB (publ) on the basis of derivative contracts concluded, as well as to Skandinaviska Enskilda Banken AB as a replacement for the securities earlier provided by Scanfil Sweden AB. The maximum liability to Skandinaviska Enskilda Banken AB is EUR 3.6 million.
The increase in the amount of bank guarantees is due to guarantees given to a customer in relation to a storage arrangement.
payable on the basis of years of service, which was locally agreed in Poland and is applicable to employees with a long history of service in the company.
leases are recognized in the income statement as expenses over the lease period.
leased premises in Sweden, Germany, the USA, and Myslowice in Poland as well as Vantaa and Oulu in Finland.
Scanfil EMS Oy has provided a guarantee of any obligations arising from the subsidiary’s delivery contracts with its customers. The guarantee is limited to a maximum of EUR 7.5 million and will expire seven years after the end of the last product agreement. Scanfil Sweden AB has lodged guarantees to some business partners of its subsidiaries regarding any liabilities arising from the business relationship.
Other leases, 1000 EUR 2018 2017
Group as lesseeMinimum rents payable based on other non-cancellable leases:Within one year 2 862 2 303In one to five years 7 385 5 074More thatn five years 1 788 1 624Total 12 035 9 001
1000 EUR 2018 2017
Business mortgages 110 000 110 000
Liabilities secured with mortgages, 1000 EUR
Interest-bearing liabilities from financial institutions 43 590 57 268
Guarantees given, 1000 EUR
On behalf of own company 8 068 1 953On behalf of Group company 186 192
Total 8 254 2 144
5.2. OTHER LEASES
Other leases
ACCOUNTING PRINCIPLE
5.3 SECURITIES PROVIDED, CONTINGENT LIABILITIES AND OTHER LIABILITIES
Securities provided:
The group’s related parties include, in addition to group companies, the key members of management, i.e., the members of the parent company’s Board of Directors and the group’s Management Team.
The management includes the parent company’s Board of Directors, CEO and Management Team members.
Harri Takanen has a voluntary pension insurance policy with a projected pension of some EUR 1,000 per month.The pension period is September 1, 2026 – August 31, 2033.
The salary information is payment-based.
5.4. DETAILS OF RELATED PARTIES AND GROUP STRUCTURE
Employee benefits for members of the management, 1000 EUR 2018 2017
Salaries and other short-term employee benefits 1 703 1 406Options implemented and paid in shares 179 548Post-employment benefits 2 2Option scheme 234 184
Total 2 118 2 140
Salaries paid to the President 2018 2017
Salaries and other short-term employee benefits 436 282Options implemented and paid in shares 35 361
Total 471 643
Statutory pension expenditure, TYEL 2018 2017
Petteri Jokitalo 81 52
Salaries paid to the Board members 2018 2017
Jarkko Takanen 29 24Harri Takanen 47 37Bengt Engström 26 23Christer Härkönen 25 23Christina Lindstedt 27 24
Total salaries of the Board Members 154 130
NOTES TO THE CONSOLIDATED FINANCIAL STATEMENTSNOTES TO THE CONSOLIDATED FINANCIAL STATEMENTS

ANNUAL REPORT 201872 | ANNUAL REPORT 2018 | 73
Scanfil plc’s subsidiary Scanfil EMS Oy has leased office premises from Kiinteistö Oy Pilot 1. The main shareholder of Jussi Real Estate Oy, the owner of Kiinteistö Oy Pilot 1, is Jussi Capital Oy. The main shareholders of Jussi Capital Oy are Scanfil plc’s Board members Harri Takanen and Jarkko Takanen. In 2018, the market rents paid totaled EUR 24,762 (EUR 19,836 in 2017).
No material events to be reported have occurred after the reporting period.
5.5 EVENTS AFTER THE REPORTING PERIOD
Group companies DomicileGroup´s
ownershipShare
of votes
Parentcompany´s ownership
Scanfil Oyj, parent company; FinlandScanfil EMS Oy Finland 100 % 100 % 100 %Scanfil GmbH Germany 100 % 100 % 100 %Scanfil Oü Estonia 100 % 100 % 100 %Scanfil (Suzhou) Co., Ltd. China 100 % 100 % 100 %Scanfil (Hangzhou) Co., Ltd. China 100 % 100 % 100 %Scanfil Poland Sp. z o.o. Poland 100 % 100 % 100 %Scanfil Sweden AB Sweden 100 % 100 % 100 %Scanfil Vellinge AB Sweden 100 % 100 % 100 %Scanfil Åtvidaberg AB Sweden 100 % 100 % 100 %Scanfil Atlanta Inc. USA 100 % 100 % 100 %Scanfil Business Services Kft Hungary 100 % 100 % 100 %PartnerTech AS Norway 100 % 100 % 100 %Scanfil Limited Great Britain 100 % 100 % 100 %PartnerTech China Limited China 100 % 100 % 100 %
THE PARENT COMPANY’S INCOME STATEMENT, FAS
1000 EUR Note 1.1.-31.12.2018 1.1.-31.12.2017
Other operating income 2 208 1 649
Personnel expenses Wages, salaries and fees -1 798 -1 487 Pensions and statutory indirect employee costs Pensions -291 -252 Statutory indirect employee costs -60 -29Personnel expenses total 1 -2 149 -1 768
Depreciation and reduction in value Depreciation according to plan -29 -29Depreciation and reduction in value total 3 -29 -29
Other operating expenses 2 -724 -784
Operating profit -695 -932
Financial income and expenses Financial income from group 8 000 6 000 Other interest and financial income From other 1 149 806 Interest expenses and financial expenses To group -331 -153 To other -1 036 -1 187Financial income and expenses total 7 782 5 466
Profit before appropriations and taxes 7 087 4 534
AppropriationsDepreciation difference increase 4 2Group contribution 4 1 500 3 700Appropriations total 1 504 3 702
Profit before tax 8 591 8 237
Income taxes Taxes for the financial year -117 Deferred taxes -2 2Income taxes total -120 2
Net profit for the period 8 472 8 239
THE PARENT COMPANY’S INCOME STATEMENTNOTES TO THE CONSOLIDATED FINANCIAL STATEMENTS
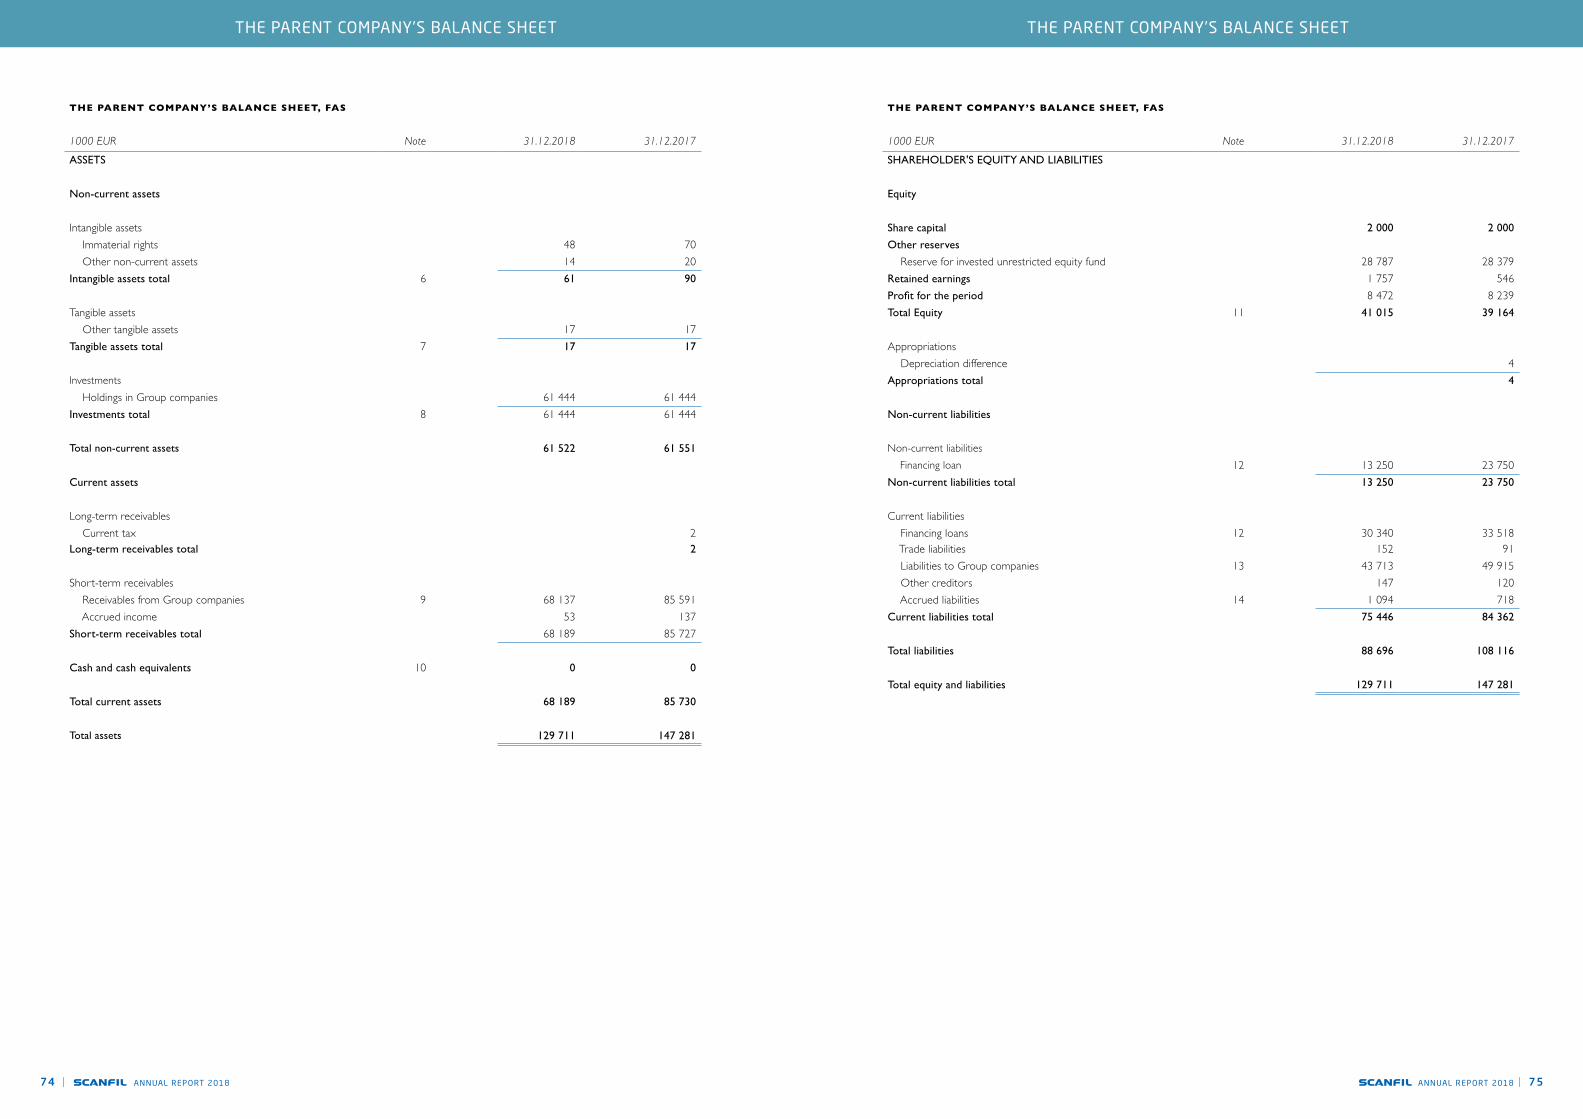
ANNUAL REPORT 201874 | ANNUAL REPORT 2018 | 75
THE PARENT COMPANY’S BALANCE SHEET, FAS
1000 EUR Note 31.12.2018 31.12.2017
ASSETS
Non-current assets
Intangible assets Immaterial rights 48 70 Other non-current assets 14 20Intangible assets total 6 61 90
Tangible assets Other tangible assets 17 17Tangible assets total 7 17 17
Investments Holdings in Group companies 61 444 61 444Investments total 8 61 444 61 444
Total non-current assets 61 522 61 551
Current assets
Long-term receivables Current tax 2Long-term receivables total 2
Short-term receivables Receivables from Group companies 9 68 137 85 591 Accrued income 53 137Short-term receivables total 68 189 85 727
Cash and cash equivalents 10 0 0
Total current assets 68 189 85 730
Total assets 129 711 147 281
THE PARENT COMPANY’S BALANCE SHEET, FAS
1000 EUR Note 31.12.2018 31.12.2017
SHAREHOLDER'S EQUITY AND LIABILITIES
Equity
Share capital 2 000 2 000
Other reserves
Reserve for invested unrestricted equity fund 28 787 28 379Retained earnings 1 757 546Profit for the period 8 472 8 239Total Equity 11 41 015 39 164
Appropriations Depreciation difference 4Appropriations total 4
Non-current liabilities
Non-current liabilities Financing loan 12 13 250 23 750Non-current liabilities total 13 250 23 750
Current liabilities Financing loans 12 30 340 33 518 Trade liabilities 152 91 Liabilities to Group companies 13 43 713 49 915 Other creditors 147 120 Accrued liabilities 14 1 094 718Current liabilities total 75 446 84 362
Total liabilities 88 696 108 116
Total equity and liabilities 129 711 147 281
THE PARENT COMPANY’S BALANCE SHEETTHE PARENT COMPANY’S BALANCE SHEET
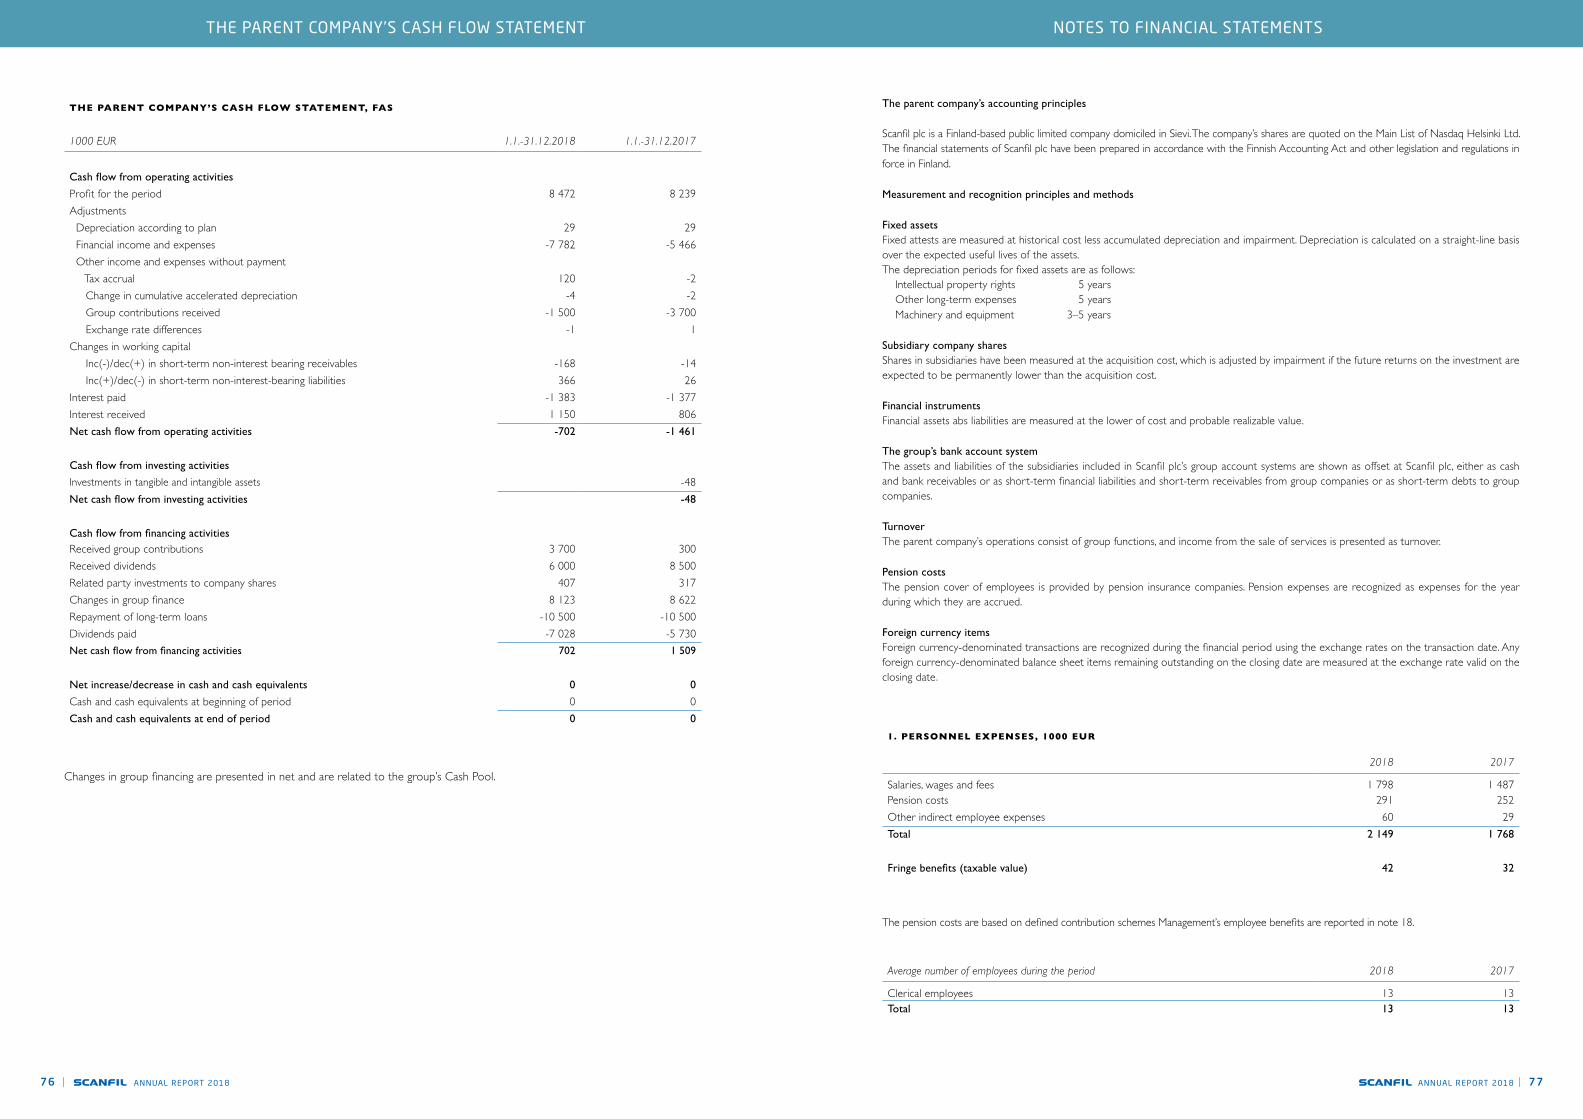
ANNUAL REPORT 201876 | ANNUAL REPORT 2018 | 77
THE PARENT COMPANY’S CASH FLOW STATEMENT, FAS
1000 EUR 1.1.-31.12.2018 1.1.-31.12.2017
Cash flow from operating activities
Profit for the period 8 472 8 239Adjustments Depreciation according to plan 29 29 Financial income and expenses -7 782 -5 466 Other income and expenses without payment Tax accrual 120 -2 Change in cumulative accelerated depreciation -4 -2 Group contributions received -1 500 -3 700 Exchange rate differences -1 1Changes in working capital Inc(-)/dec(+) in short-term non-interest bearing receivables -168 -14 Inc(+)/dec(-) in short-term non-interest-bearing liabilities 366 26Interest paid -1 383 -1 377Interest received 1 150 806Net cash flow from operating activities -702 -1 461
Cash flow from investing activities
Investments in tangible and intangible assets -48Net cash flow from investing activities -48
Cash flow from financing activitiesReceived group contributions 3 700 300Received dividends 6 000 8 500Related party investments to company shares 407 317Changes in group finance 8 123 8 622Repayment of long-term loans -10 500 -10 500Dividends paid -7 028 -5 730Net cash flow from financing activities 702 1 509
Net increase/decrease in cash and cash equivalents 0 0
Cash and cash equivalents at beginning of period 0 0Cash and cash equivalents at end of period 0 0
Changes in group financing are presented in net and are related to the group’s Cash Pool.
The parent company’s accounting principles Scanfil plc is a Finland-based public limited company domiciled in Sievi. The company’s shares are quoted on the Main List of Nasdaq Helsinki Ltd. The financial statements of Scanfil plc have been prepared in accordance with the Finnish Accounting Act and other legislation and regulations in force in Finland.
Measurement and recognition principles and methods Fixed assets Fixed attests are measured at historical cost less accumulated depreciation and impairment. Depreciation is calculated on a straight-line basis over the expected useful lives of the assets.The depreciation periods for fixed assets are as follows: Intellectual property rights 5 years Other long-term expenses 5 years Machinery and equipment 3–5 years Subsidiary company shares Shares in subsidiaries have been measured at the acquisition cost, which is adjusted by impairment if the future returns on the investment are expected to be permanently lower than the acquisition cost. Financial instruments Financial assets abs liabilities are measured at the lower of cost and probable realizable value. The group’s bank account system The assets and liabilities of the subsidiaries included in Scanfil plc’s group account systems are shown as offset at Scanfil plc, either as cash and bank receivables or as short-term financial liabilities and short-term receivables from group companies or as short-term debts to group companies. Turnover The parent company’s operations consist of group functions, and income from the sale of services is presented as turnover. Pension costs The pension cover of employees is provided by pension insurance companies. Pension expenses are recognized as expenses for the year during which they are accrued. Foreign currency items Foreign currency-denominated transactions are recognized during the financial period using the exchange rates on the transaction date. Any foreign currency-denominated balance sheet items remaining outstanding on the closing date are measured at the exchange rate valid on the closing date.
1. PERSONNEL EXPENSES, 1000 EUR
2018 2017
Salaries, wages and fees 1 798 1 487Pension costs 291 252Other indirect employee expenses 60 29Total 2 149 1 768
Fringe benefits (taxable value) 42 32
Average number of employees during the period 2018 2017
Clerical employees 13 13Total 13 13
The pension costs are based on defined contribution schemes Management’s employee benefits are reported in note 18.
NOTES TO FINANCIAL STATEMENTSTHE PARENT COMPANY’S CASH FLOW STATEMENT

ANNUAL REPORT 201878 | ANNUAL REPORT 2018 | 79
2. OTHER OPERATING EXPENSES, 1000 EUR
Other operating expenses include the following significant expense items: 2018 2017
Other operating expenses 724 784
Total 724 784
3. DEPRECIATION AND AMORTIZATION, 1000 EUR
Depreciation by asset class 2018 2017
Intangible assets Intangible rights 22 22 Other long-term expenses 6 6
Total 29 29
Total depreciation 29 29
4. CONTRIBUTIONS FROM GROUP COMPANIES, 1000 EUR
2018 2017
Group contribution from Scanfil EMS Oy 1 500 3 700
Total 1 500 3 700
5. INCOME TAXES, 1000 EUR
2018 2017
Income taxes from group contribution 300 740Income taxes from actual operations -183 -742
Total 117 -2
Auditor's remuneration
Auditor's remunerations of the Chartered Accountants 35 45Tax advisor 40 13Other services 26 21Total 101 79
Other operating costs mainly consist of legal and consultation expenses, traveling expenses and statutory expenses of a listed company.
6. INTANGIBLE ASSETS, 1000 EUR
Intangible
rights
Otherlong-termexpenses
Intangibleassets
total
Acquisition cost at 1 Jan. 2018 110 32 143AdditionsAcquisition cost at 31 Dec. 2018 110 32 143
Accumulated depreciations at 1 Jan. 2018 -41 -12 -53Depreciations -22 -6 -29Accumulated depreciations at 31 Dec. 2018 -63 -18 -81
Carrying amount at 1 Jan. 2018 70 20 90Carrying amount at 31 Dec. 2018 48 14 61
7. TANGIBLE ASSETS, 1000 EUR
Othertangible
assets
Tangibleassets
total
Acquisition cost at 1 Jan. 2018 17 17Acquisition cost at 31 Dec. 2018 17 17
Carrying amount at 1 Jan. 2018 17 17Carrying amount at 31 Dec. 2018 17 17
Othertangible
assets
Tangibleassets
total
Acquisition cost at 1 Jan. 2017 17 17Acquisition cost at 31 Dec. 2017 17 17
Carrying amount at 1 Jan. 2017 17 17Carrying amount at 31 Dec. 2017 17 17
Intangible
rights
Otherlong-termexpenses
Intangibleassets
total
Acquisition cost at 1 Jan. 2017 63 32 95Additions 48 48Acquisition cost at 31 Dec. 2017 110 32 143
Accumulated depreciations at 1 Jan. 2017 -19 -5 -24Depreciations -22 -6 -29Accumulated depreciations at 31 Dec. 2017 -41 -12 -53
Carrying amount at 1 Jan. 2017 44 27 71Carrying amount at 31 Dec. 2017 70 20 90
NOTES TO FINANCIAL STATEMENTSNOTES TO FINANCIAL STATEMENTS
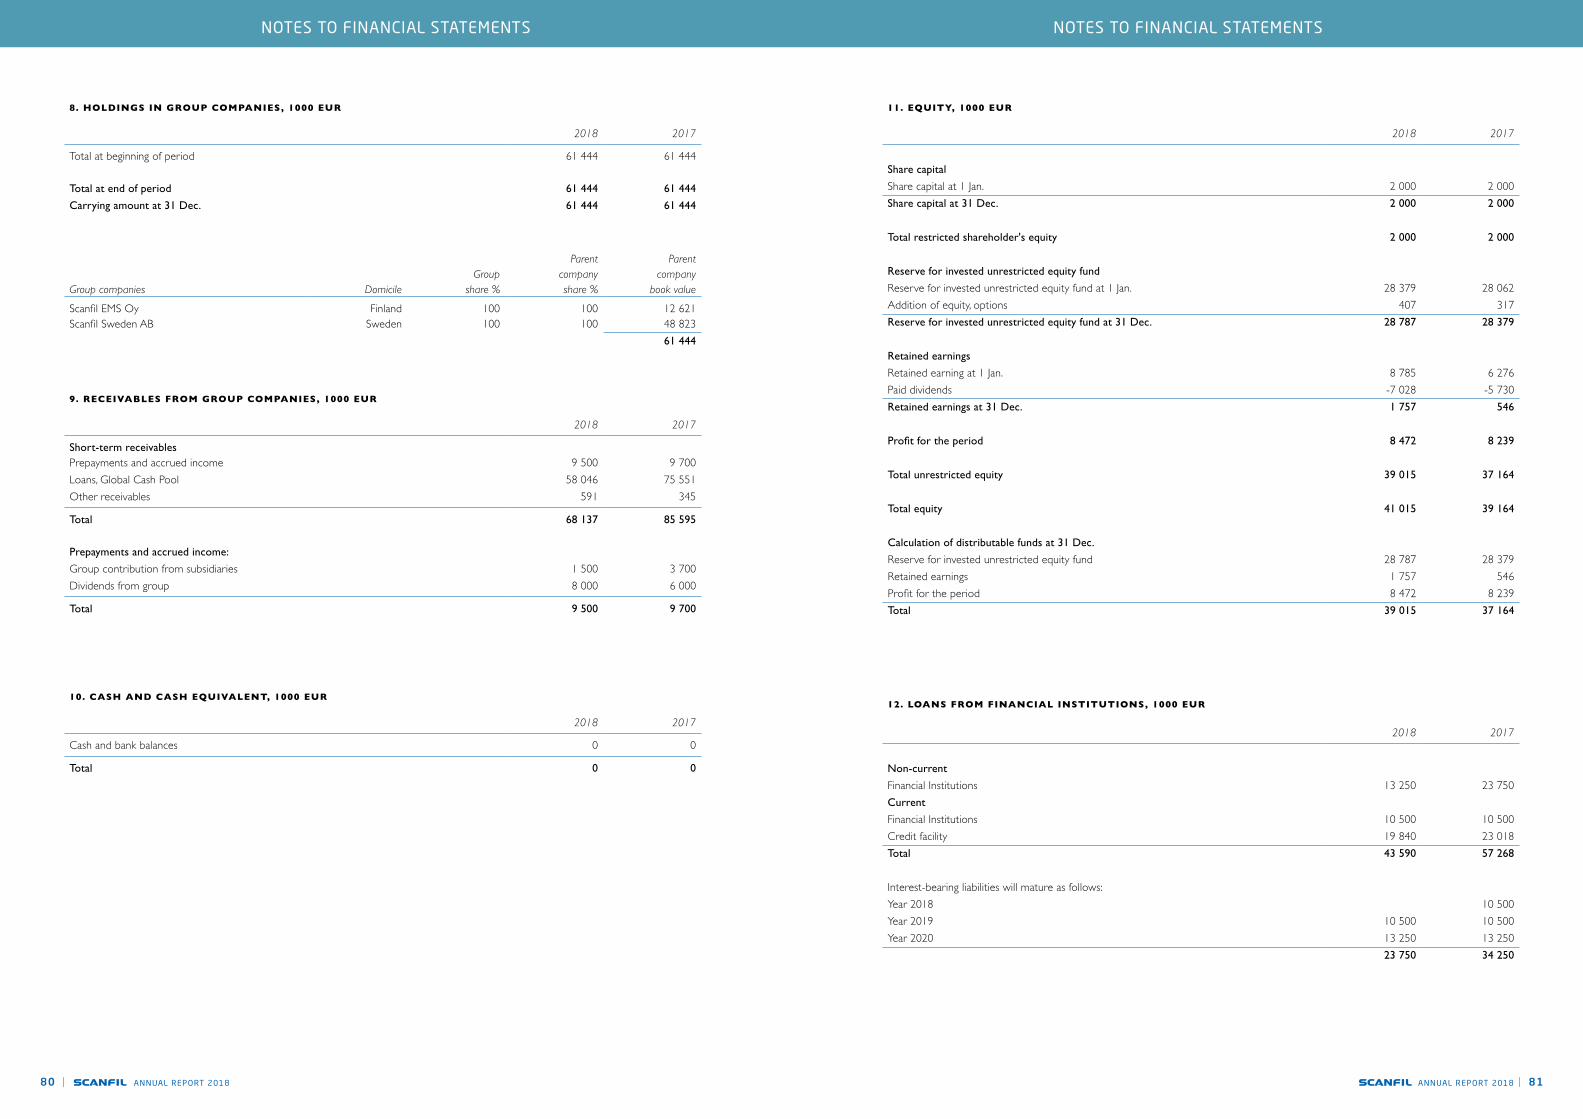
ANNUAL REPORT 201880 | ANNUAL REPORT 2018 | 81
Group companies Domicile
Groupshare %
Parentcompany share %
Parentcompany
book value
Scanfil EMS Oy Finland 100 100 12 621Scanfil Sweden AB Sweden 100 100 48 823
61 444
8. HOLDINGS IN GROUP COMPANIES, 1000 EUR
2018 2017
Total at beginning of period 61 444 61 444
Total at end of period 61 444 61 444
Carrying amount at 31 Dec. 61 444 61 444
9. RECEIVABLES FROM GROUP COMPANIES, 1000 EUR
2018 2017
Short-term receivablesPrepayments and accrued income 9 500 9 700Loans, Global Cash Pool 58 046 75 551Other receivables 591 345
Total 68 137 85 595
Prepayments and accrued income:
Group contribution from subsidiaries 1 500 3 700Dividends from group 8 000 6 000
Total 9 500 9 700
10. CASH AND CASH EQUIVALENT, 1000 EUR
2018 2017
Cash and bank balances 0 0
Total 0 0
11. EQUITY, 1000 EUR
2018 2017
Share capital
Share capital at 1 Jan. 2 000 2 000Share capital at 31 Dec. 2 000 2 000
Total restricted shareholder's equity 2 000 2 000
Reserve for invested unrestricted equity fund
Reserve for invested unrestricted equity fund at 1 Jan. 28 379 28 062Addition of equity, options 407 317Reserve for invested unrestricted equity fund at 31 Dec. 28 787 28 379
Retained earnings
Retained earning at 1 Jan. 8 785 6 276Paid dividends -7 028 -5 730Retained earnings at 31 Dec. 1 757 546
Profit for the period 8 472 8 239
Total unrestricted equity 39 015 37 164
Total equity 41 015 39 164
Calculation of distributable funds at 31 Dec.
Reserve for invested unrestricted equity fund 28 787 28 379Retained earnings 1 757 546Profit for the period 8 472 8 239Total 39 015 37 164
12. LOANS FROM FINANCIAL INSTITUTIONS, 1000 EUR
2018 2017
Non-current
Financial Institutions 13 250 23 750Current
Financial Institutions 10 500 10 500Credit facility 19 840 23 018Total 43 590 57 268
Interest-bearing liabilities will mature as follows:Year 2018 10 500Year 2019 10 500 10 500Year 2020 13 250 13 250
23 750 34 250
NOTES TO FINANCIAL STATEMENTSNOTES TO FINANCIAL STATEMENTS
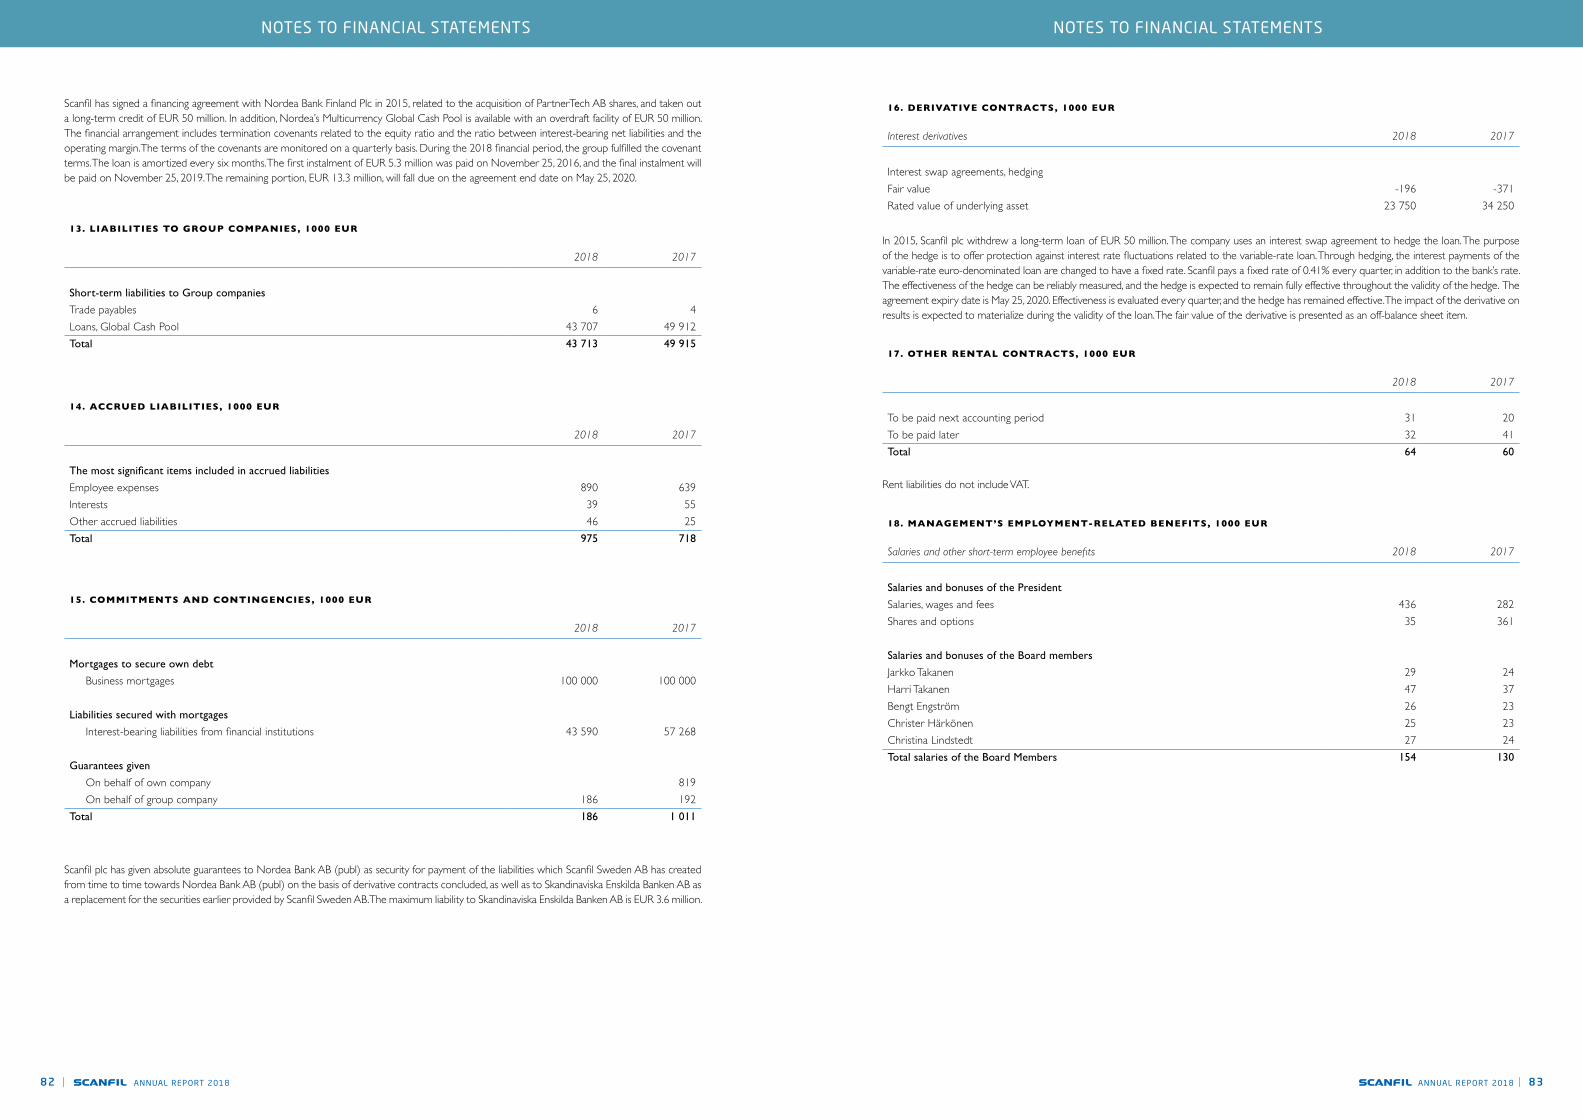
ANNUAL REPORT 201882 | ANNUAL REPORT 2018 | 83
13. LIABILITIES TO GROUP COMPANIES, 1000 EUR
2018 2017
Short-term liabilities to Group companies
Trade payables 6 4Loans, Global Cash Pool 43 707 49 912Total 43 713 49 915
14. ACCRUED LIABILITIES, 1000 EUR
2018 2017
The most significant items included in accrued liabilities
Employee expenses 890 639Interests 39 55Other accrued liabilities 46 25Total 975 718
15. COMMITMENTS AND CONTINGENCIES, 1000 EUR
2018 2017
Mortgages to secure own debt
Business mortgages 100 000 100 000
Liabilities secured with mortgages
Interest-bearing liabilities from financial institutions 43 590 57 268
Guarantees given
On behalf of own company 819 On behalf of group company 186 192Total 186 1 011
Scanfil has signed a financing agreement with Nordea Bank Finland Plc in 2015, related to the acquisition of PartnerTech AB shares, and taken out a long-term credit of EUR 50 million. In addition, Nordea’s Multicurrency Global Cash Pool is available with an overdraft facility of EUR 50 million. The financial arrangement includes termination covenants related to the equity ratio and the ratio between interest-bearing net liabilities and the operating margin. The terms of the covenants are monitored on a quarterly basis. During the 2018 financial period, the group fulfilled the covenant terms. The loan is amortized every six months. The first instalment of EUR 5.3 million was paid on November 25, 2016, and the final instalment will be paid on November 25, 2019. The remaining portion, EUR 13.3 million, will fall due on the agreement end date on May 25, 2020.
Scanfil plc has given absolute guarantees to Nordea Bank AB (publ) as security for payment of the liabilities which Scanfil Sweden AB has created from time to time towards Nordea Bank AB (publ) on the basis of derivative contracts concluded, as well as to Skandinaviska Enskilda Banken AB as a replacement for the securities earlier provided by Scanfil Sweden AB. The maximum liability to Skandinaviska Enskilda Banken AB is EUR 3.6 million.
16. DERIVATIVE CONTRACTS, 1000 EUR
Interest derivatives 2018 2017
Interest swap agreements, hedgingFair value -196 -371Rated value of underlying asset 23 750 34 250
17. OTHER RENTAL CONTRACTS, 1000 EUR
2018 2017
To be paid next accounting period 31 20To be paid later 32 41Total 64 60
18. MANAGEMENT’S EMPLOYMENT-RELATED BENEFITS, 1000 EUR
Salaries and other short-term employee benefits 2018 2017
Salaries and bonuses of the President
Salaries, wages and fees 436 282Shares and options 35 361
Salaries and bonuses of the Board members
Jarkko Takanen 29 24Harri Takanen 47 37Bengt Engström 26 23Christer Härkönen 25 23Christina Lindstedt 27 24Total salaries of the Board Members 154 130
In 2015, Scanfil plc withdrew a long-term loan of EUR 50 million. The company uses an interest swap agreement to hedge the loan. The purpose of the hedge is to offer protection against interest rate fluctuations related to the variable-rate loan. Through hedging, the interest payments of the variable-rate euro-denominated loan are changed to have a fixed rate. Scanfil pays a fixed rate of 0.41% every quarter, in addition to the bank’s rate. The effectiveness of the hedge can be reliably measured, and the hedge is expected to remain fully effective throughout the validity of the hedge. The agreement expiry date is May 25, 2020. Effectiveness is evaluated every quarter, and the hedge has remained effective. The impact of the derivative on results is expected to materialize during the validity of the loan. The fair value of the derivative is presented as an off-balance sheet item.
Rent liabilities do not include VAT.
NOTES TO FINANCIAL STATEMENTSNOTES TO FINANCIAL STATEMENTS
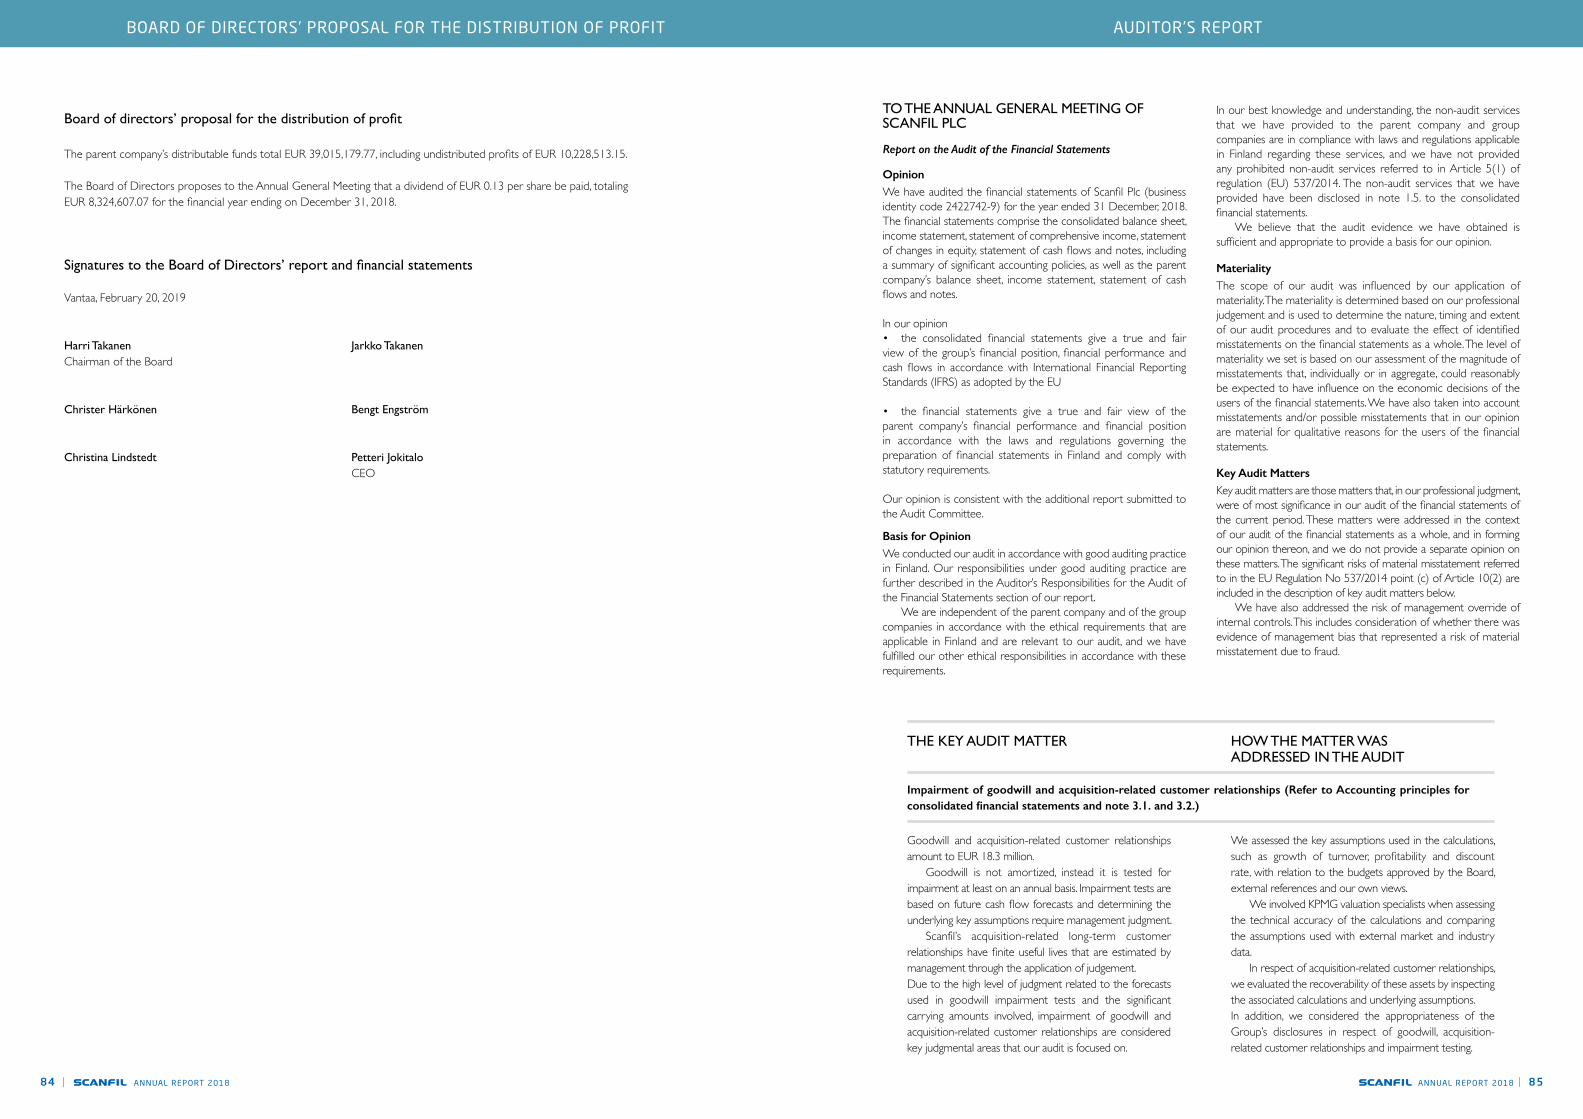
ANNUAL REPORT 201884 | ANNUAL REPORT 2018 | 85
Board of directors’ proposal for the distribution of profit
The parent company’s distributable funds total EUR 39,015,179.77, including undistributed profits of EUR 10,228,513.15. The Board of Directors proposes to the Annual General Meeting that a dividend of EUR 0.13 per share be paid, totaling EUR 8,324,607.07 for the financial year ending on December 31, 2018.
Signatures to the Board of Directors’ report and financial statements
Vantaa, February 20, 2019
Harri Takanen Jarkko TakanenChairman of the Board
Christer Härkönen Bengt Engström
Christina Lindstedt Petteri Jokitalo CEO
TO THE ANNUAL GENERAL MEETING OF SCANFIL PLC
Report on the Audit of the Financial Statements
OpinionWe have audited the financial statements of Scanfil Plc (business identity code 2422742-9) for the year ended 31 December, 2018. The financial statements comprise the consolidated balance sheet, income statement, statement of comprehensive income, statement of changes in equity, statement of cash flows and notes, including a summary of significant accounting policies, as well as the parent company’s balance sheet, income statement, statement of cash flows and notes.
In our opinion• the consolidated financial statements give a true and fair view of the group’s financial position, financial performance and cash flows in accordance with International Financial Reporting Standards (IFRS) as adopted by the EU
• the financial statements give a true and fair view of the parent company’s financial performance and financial position in accordance with the laws and regulations governing the preparation of financial statements in Finland and comply with statutory requirements.
Our opinion is consistent with the additional report submitted to the Audit Committee.
Basis for OpinionWe conducted our audit in accordance with good auditing practice in Finland. Our responsibilities under good auditing practice are further described in the Auditor’s Responsibilities for the Audit of the Financial Statements section of our report. We are independent of the parent company and of the group companies in accordance with the ethical requirements that are applicable in Finland and are relevant to our audit, and we have fulfilled our other ethical responsibilities in accordance with these requirements.
In our best knowledge and understanding, the non-audit services that we have provided to the parent company and group companies are in compliance with laws and regulations applicable in Finland regarding these services, and we have not provided any prohibited non-audit services referred to in Article 5(1) of regulation (EU) 537/2014. The non-audit services that we have provided have been disclosed in note 1.5. to the consolidated financial statements. We believe that the audit evidence we have obtained is sufficient and appropriate to provide a basis for our opinion.
MaterialityThe scope of our audit was influenced by our application of materiality. The materiality is determined based on our professional judgement and is used to determine the nature, timing and extent of our audit procedures and to evaluate the effect of identified misstatements on the financial statements as a whole. The level of materiality we set is based on our assessment of the magnitude of misstatements that, individually or in aggregate, could reasonably be expected to have influence on the economic decisions of the users of the financial statements. We have also taken into account misstatements and/or possible misstatements that in our opinion are material for qualitative reasons for the users of the financial statements.
Key Audit MattersKey audit matters are those matters that, in our professional judgment, were of most significance in our audit of the financial statements of the current period. These matters were addressed in the context of our audit of the financial statements as a whole, and in forming our opinion thereon, and we do not provide a separate opinion on these matters. The significant risks of material misstatement referred to in the EU Regulation No 537/2014 point (c) of Article 10(2) are included in the description of key audit matters below. We have also addressed the risk of management override of internal controls. This includes consideration of whether there was evidence of management bias that represented a risk of material misstatement due to fraud.
THE KEY AUDIT MATTER HOW THE MATTER WAS ADDRESSED IN THE AUDIT
Impairment of goodwill and acquisition-related customer relationships (Refer to Accounting principles for consolidated financial statements and note 3.1. and 3.2.)
Goodwill and acquisition-related customer relationships amount to EUR 18.3 million. Goodwill is not amortized, instead it is tested for impairment at least on an annual basis. Impairment tests are based on future cash flow forecasts and determining the underlying key assumptions require management judgment. Scanfil’s acquisition-related long-term customer relationships have finite useful lives that are estimated by management through the application of judgement.Due to the high level of judgment related to the forecasts used in goodwill impairment tests and the significant carrying amounts involved, impairment of goodwill and acquisition-related customer relationships are considered key judgmental areas that our audit is focused on.
We assessed the key assumptions used in the calculations, such as growth of turnover, profitability and discount rate, with relation to the budgets approved by the Board, external references and our own views. We involved KPMG valuation specialists when assessing the technical accuracy of the calculations and comparing the assumptions used with external market and industry data. In respect of acquisition-related customer relationships, we evaluated the recoverability of these assets by inspecting the associated calculations and underlying assumptions.In addition, we considered the appropriateness of the Group’s disclosures in respect of goodwill, acquisition-related customer relationships and impairment testing.
AUDITOR’S REPORTBOARD OF DIRECTORS’ PROPOSAL FOR THE DISTRIBUTION OF PROFIT

ANNUAL REPORT 201886 | ANNUAL REPORT 2018 | 87
Valuation of inventories (Refer to Accounting principles for consolidated financial statements and note 2.2.)
Inventory management, stock-taking practices and determination of cost are the key elements in inventory valuation. The Group’s inventories amounted to EUR 99.2 million representing 33 percent of the consolidated total assets as at 31 December 2018. Inventory valuation involves the exercise of judgement by management surrounding determination of cost and any impaired inventories.Due to management judgments and the significant
carrying amount involved, valuation of inventories is considered a key audit matter. We assessed the appropriateness of the inventory valuation principles applied. Our audit procedures comprised testing of controls over inventory management and the accuracy of inventory amounts. We also performed substantive procedures to evaluate the accuracy of inventory valuation. We attended stock takes in order to assess the process effectiveness.
Revenue recognition (Refer to Accounting principles for consolidated financial statements and note 1.1.)
The number of sales transactions processed in the IT systems is significant and pricing responsibilities for products and services are decentralized. Due to the nature of the industry, the effectiveness of the internal controls over the IT systems and pricing are critical in respect of the accuracy of revenue recognition. Revenue is recognized when Scanfil has satisfied performance obligations in the contract either at a point in time or over the time for services. As the revenue of the group consists mainly of the sale of products the revenue is recognized at a point in time when the control is transferred to a customer in accordance with the terms and conditions of the agreement. Application of consistent revenue recognition principles is considered a key audit matter.
We assessed the appropriateness of the revenue recognition principles applied. As part of our audit procedures we tested internal controls over registration of sales transactions, recording related revenues and approval of changes. Our substantive procedures included testing of inclusion of relevant transactions in the appropriate period, comparing invoice details to the received payments and assessing the appropriateness of the bad debt provision recognized. We have also evaluated and tested the documentation prepared by the Company on the assessment of the effect of IFRS 15 Revenue from Contracts with Customers, which was effective as of January 1, 2018.
Responsibilities of the Board of Directors and the Managing Director for the Financial Statements
The Board of Directors and the Managing Director are responsible for the preparation of consolidated financial statements that give a true and fair view in accordance with International Financial Reporting Standards (IFRS) as adopted by the EU, and of financial statements that give a true and fair view in accordance with the laws and regulations governing the preparation of financial statements in Finland and comply with statutory requirements. The Board of Directors and the Managing Director are also responsible for such internal control as they determine is necessary to enable the preparation of financial statements that are free from material misstatement, whether due to fraud or error. In preparing the financial statements, the Board of Directors and the Managing Director are responsible for assessing the parent company’s and the group’s ability to continue as going concern, disclosing, as applicable, matters relating to going concern and using the going concern basis of accounting. The financial statements are prepared using the going concern basis of accounting unless there is an intention to liquidate the parent company or the group or cease operations, or there is no realistic alternative but to do so.
Auditor’s Responsibilities for the Audit of Financial Statements
Our objectives are to obtain reasonable assurance on whether the financial statements as a whole are free from material misstatement, whether due to fraud or error, and to issue an auditor’s report that includes our opinion. Reasonable assurance is a high level of assurance, but is not a guarantee that an audit conducted in accordance with good auditing practice will always detect a material misstatement when it exists. Misstatements can arise from fraud or error and are considered material if, individually or in aggregate, they could reasonably be expected to influence the economic decisions of users taken on the basis of the financial statements. As part of an audit in accordance with good auditing practice, we exercise professional judgment and maintain professional skepticism throughout the audit. We also:
• Identify and assess the risks of material misstatement of the financial statements, whether due to fraud or error, design and perform audit procedures responsive to those risks, and obtain audit evidence that is sufficient and appropriate to provide a basis for our opinion. The risk of not detecting a material misstatement
resulting from fraud is higher than for one resulting from error, as fraud may involve collusion, forgery, intentional omissions, misrepresentations, or the override of internal control.
• Obtain an understanding of internal control relevant to the audit in order to design audit procedures that are appropriate in the circumstances, but not for the purpose of expressing an opinion on the effectiveness of the parent company’s or the group’s internal control.
• Evaluate the appropriateness of accounting policies used and the reasonableness of accounting estimates and related disclosures made by management.
• Conclude on the appropriateness of the Board of Directors’ and the Managing Director’s use of the going concern basis of accounting and based on the audit evidence obtained, whether a material uncertainty exists related to events or conditions that may cast significant doubt on the parent company’s or the group’s ability to continue as a going concern. If we conclude that a material uncertainty exists, we are required to draw attention in our auditor’s report to the related disclosures in the financial statements or, if such disclosures are inadequate, to modify our opinion. Our conclusions are based on the audit evidence obtained up to the date of our auditor’s report. However, future events or conditions may cause the parent company or the group to cease to continue as a going concern.
• Evaluate the overall presentation, structure and content of the financial statements, including the disclosures, and whether the financial statements represent the underlying transactions and events so that the financial statements give a true and fair view.
• Obtain sufficient appropriate audit evidence regarding the financial information of the entities or business activities within the group to express an opinion on the consolidated financial statements. We are responsible for the direction, supervision and performance of the group audit. We remain solely responsible for our audit opinion.
We communicate with those charged with governance regarding, among other matters, the planned scope and timing of the audit and significant audit findings, including any significant deficiencies in internal control that we identify during our audit. We also provide those charged with governance with a statement that we have complied with relevant ethical requirements regarding independence, and communicate with them all relationships and other matters that may reasonably be thought to bear on our independence, and where applicable, related safeguards. From the matters communicated with those charged with governance, we determine those matters that were of most significance in the audit of the financial statements of the current period and are therefore the key audit matters. We describe these matters in our auditor’s report unless law or regulation precludes public disclosure about the matter or when,
in extremely rare circumstances, we determine that a matter should not be communicated in our report because the adverse consequences of doing so would reasonably be expected to outweigh the public interest benefits of such communication.
Other Reporting Requirements
Information on our audit engagement
We have acted as auditors appointed by the Annual General Meeting as of January 1, 2012, at which point the parent company was established as a result of a demerger of Sievi Capital Plc. Since 1999 we have acted as auditors in Sievi Capital Plc, which became a public interest entity as a result of a listing in 2000.
Other Information
The Board of Directors and the Managing Director are responsible for the other information. The other information comprises the report of the Board of Directors and the information included in the Annual Report, but does not include the financial statements and our auditor’s report thereon. Our opinion on the financial statements does not cover the other information. In connection with our audit of the financial statements, our responsibility is to read the other information and, in doing so, consider whether the other information is materially inconsistent with the financial statements or our knowledge obtained in the audit, or otherwise appears to be materially misstated. With respect to the report of the Board of Directors, our responsibility also includes considering whether the report of the Board of Directors has been prepared in accordance with the applicable laws and regulations. In our opinion, the information in the report of the Board of Directors is consistent with the information in the financial statements and the report of the Board of Directors has been prepared in accordance with the applicable laws and regulations. If, based on the work we have performed, we conclude that there is a material misstatement of the other information, we are required to report that fact. We have nothing to report in this regard.
Helsinki 27 February 2019
KPMG OY AB
Kirsi JantunenAuthorised Public Accountant, KHT
AUDITOR’S REPORTAUDITOR’S REPORT
ANNUAL REPORT 2018 | 89ANNUAL REPORT 201888 |
Scanfil plc is a publicly listed company, managed in accordance with the company’s Articles of Association, the Finnish Companies Act and other legislation relating to the company. In addition, the company follows the Finnish Corporate Governance Code (2015) issued by the Securities Market Association. The Board of Directors has evaluated the independence of its members according to which the majority of members are independent of the company (Jarkko Takanen, Bengt Engström and Christina Lindstedt) and independent of the significant shareholders of the company (Christer Härkönen, Bengt Engström and Christina Lindstedt). The majority of the members of Board’s two committees are independent of the company and one member of the Audit Committee is independent of the significant shareholders of the company. This statement has been reviewed by Scanfil plc’s Board of Directors. Scanfil plc’s auditing firm has verified that the summary description of the internal control and risk management associated with the financial reporting process is consistent with the financial statements. This Corporate Governance Statement is available on the company website at www.scanfil.com under Investors. The Finnish Corporate Governance Code is available to the public at www.cgfinland.fi.
BOARD OF DIRECTORSUnder the Companies Act, the Board of Directors is responsible for the management of the company and the proper organization of operations. The members of the Board of Directors are elected by the Annual General Meeting. According to the Articles of Association, Scanfil plc’s Board of Directors shall include a minimum of three and a maximum of seven regular members. The Board of Directors elects a Chairman from among its members. The Board of Directors is responsible for deciding on the business strategy, significant matters related to investments, organization and finance, as well as supervising the company’s management and operations. The Board of Directors shall also ensure that supervision of the company’s accounts and asset management is properly organized.
Composition of the Board of Directors
The following Board members were elected by the Annual General Meeting held on April 25, 2018:
Harri TakanenChairman of the Board of Directors. Born 1968, M.Sc. (Tech.). Member of the Board of Directors of Scanfil plc since April 18, 2013. Professional board member. Not independent of the company and its major shareholders. Holds 9,776,664 shares in Scanfil plc.
Jarkko Takanen Member of the Board since January 1, 2012. Born 1967, B.Sc.(Prod.Eng.), Commercial College Diploma in Management Accountancy. CEO of Jussi Capital Oy. Independent of the company, not independent of major shareholders. Holds 8,511,169 shares in Scanfil plc.
Christer HärkönenMember of the Board since April 8, 2014. Born 1957, M.Sc. (Tech.). CEO of DimWei Group Oy. Not independent of the company, independent of its major shareholders. Does not hold Scanfil plc shares. Christer Härkönen has been involved in the Scanfil and PartnerTech integration process between 1 January and 30 April 2017 on Group level project tasks.
Bengt Engström Member of the Board since August 20, 2015. Born 1953, M.Sc. (Eng.). Has held several management-level positions in Sweden and internationally, including Whirlpool, Bofors AB, Duni AB and Fujitsu. Independent of the company and major shareholders. Holds 12,829 shares in Scanfil plc.
Christina LindstedtMember of the Board since April 12, 2016. Born 1968, holds a Master’s Degree of Business Administration and Commercial law. Managing Director of XploreBiz AB. Background from several international business leadership roles at AB Electrolux and Sony, based in Sweden and internationally. Independent of the company and major shareholders. Holds 6,000 shares in Scanfil plc.
The entities over which the Board members exercise control do not own Scanfil shares.
The term of office of the Board members expires at the close of the first Annual General Meeting following the one in which they were elected.
Activity of the Board
The Board of Directors had a total of 18 meetings in 2018, some of which were telephone meetings. The members’ average attendance rate for meetings was 94%. The duties and responsibilities of the Board of Directors of Scanfil plc are based on the Finnish Limited Liability Companies Act, other applicable legislation, the Articles of Association, good governance recommendations and the Board’s charter. The Board carries out an annual review of its operations and regular reviews of the work of the CEO and the Management Team. The Scanfil Board of Directors has confirmed the charter, which lists the following key duties for the Board:
• confirming the company’s business strategy and monitoring its implementation • confirming the annual key business targets and monitoring Scanfil Group’s performance • deciding on strategically significant investments in the Group • discussing and approving financial statements and interim reports • appointing and dismissing the CEO and determining their terms of employment and remuneration • deciding on incentive systems for managers and employees • monitoring the company’s key operational risks and their management • confirming the company’s values and operating principles.
Diversity Principles for the Board of Directors
Scanfil plc operates in the international contract manufacturing market and its customers include global companies in various industries. For the Board to be effective, its members must possess experience from several different industries, be well versed in international business and have insight into the global trends that affect the development of the contract manufacturing market. The Nomination Committee should consider the education and professional and international experience of the candidates, as well as their individual characteristics, when preparing the proposal for the Board’s composition. The aim is to form a diverse Board with a sufficient number of members, who are able to take responsibility for developing the company’s operations and strategy in its line of business, and who are competent to manage the duties and responsibilities of the Board. Scanfil plc aims to have a sufficiently diverse gender and age distribution of the Board of Directors.
Board Committees
The Board of Directors has established two committees: a Nomination and Compensation Committee and an Audit Committee. The task of the Nomination and Compensation Committee is to prepare matters related to the appointment and remuneration of the members of the Board of Directors and, when necessary, find suitable members for it. The Committee has three members: Harri Takanen (Chairman), Jarkko Takanen and Bengt Engström. The committee convened three times in 2018. The attendance rate of its members was 100%. The Audit Committee is responsible for monitoring the financial reporting process and the reporting of financial statements and interim reports, as well as monitoring the functionality of internal control and risk management in the company. It also evaluates the appropriateness of auditing and prepares the proposal for the appointment of an auditor. The committee has three members: Jarkko Takanen (chairman),Harri Takanen and Christina Lindstedt. The committee convened four times in 2018. The attendance rate of its members was 100%.
CEOThe Board of Directors decides on the appointment and dismissal of the CEO and the terms and conditions of his employment. The CEO is covered by the performance and profit bonus systems decided upon separately by the Board of Directors. Petteri Jokitalo, M.Sc. (Eng.), has been the CEO of the company between 1 January and 31 December 2018. Petteri Jokitalo holds 242,000 shares in Scanfil plc and he has the following option rights: option program 2013(C) for 70,000 shares, 2016(A) for 110,000 shares and 2016(B) for 110,000 shares. The CEO’s duties are determined in accordance with the Companies Act. The CEO is in charge of the company’s operative management in accordance with the guidelines and orders given by the Board of Directors. The CEO shall ensure that the company’s accounting practices comply with legislation and that asset management is organized in a reliable manner. The CEO is the chairman of the company’s Management Team.
The CEO has a separate service contract that is valid until further notice with a mutual notice period of six months. Should the company terminate the service contract made with the CEO, an amount equivalent to the monetary salary of 12 months will be paid to the CEO as a severance package in accordance with the terms and conditions of his service contract. The CEO’s retirement age is the statutory retirement age.
OTHER MANAGEMENTThe principal duty of the Management Team is to assist the CEO in the company’s operative management. The Team’s other duties include matters relating to long-term planning, the planning and monitoring of investments and the allocation of resources to key operations.
Timo Sonninen, Vice President, SalesTimo Sonninen (b. 1966), BSc (Eng.), is responsible for the company’s global customers and business development. Timo Sonninen holds 93,000 shares in Scanfil plc and he has the following option rights: option program 2016(A) for 20,000 shares and 2016(B) for 20,000 shares.
Kristoffer Asklöv, Vice President, Strategy and Business Development as of 1.12.2018Kristoffer Asklöv (b. 1977), M.Sc. (Mech.Eng.) ) is responsible for Strategic Initiatives and Development Services. Earlier he acted in GMT as Vice President responsible for the operation of the Sievi, Åtvidaberg, Vellinge, Atlanta and Hamburg plants. Kristoffer Asklöv holds 23,000 shares in Scanfil plc and he has the following option rights: option program 2016(A) for 20,000 shares and 2016(B) for 20,000.
Tomi Takanen, Vice President, Operations until 30.11.2018Tomi Takanen (b. 1972), B.Sc. (Production Economics), was responsible for the operation of the Pärnu and Sieradz plants.Tomi Takanen holds 70,113 shares (30.11.2018) in Scanfil plc and he has the following option rights: option program 2016(A) for 20,000 shares and 2016(B) for 20,000 shares.
Markku Kosunen, CTO as of 1.12.2018Markku Kosunen (b. 1967), technology undergraduate, is responsible for ICT and ERP, Quality processes and systems, production technology and investments. Earlier he acted in GMT as Vice President responsible for the operation of Myslowice plant. He holds 27,861 shares in Scanfil plc and has the following option rights: option program 2013(C) for 20,000 shares, 2016(A) for 20,000 shares and 2016(B) for 20,000 shares.
Mats Lundin, Vice President, Supply Chain until 30.11.2018Mats Lundin (b. 1959), MSc (Eng.), was responsible for the company’s Supply Chain activities.He holds 14,554 shares in Scanfil plc. His option rights from option programs 2016(A) for 20,000 shares and 2016(B) for 20,000 shares were restored to company on 14 December 2018.
CORPORATE GOVERNANCE STATEMENT 2018CORPORATE GOVERNANCE STATEMENT 2018
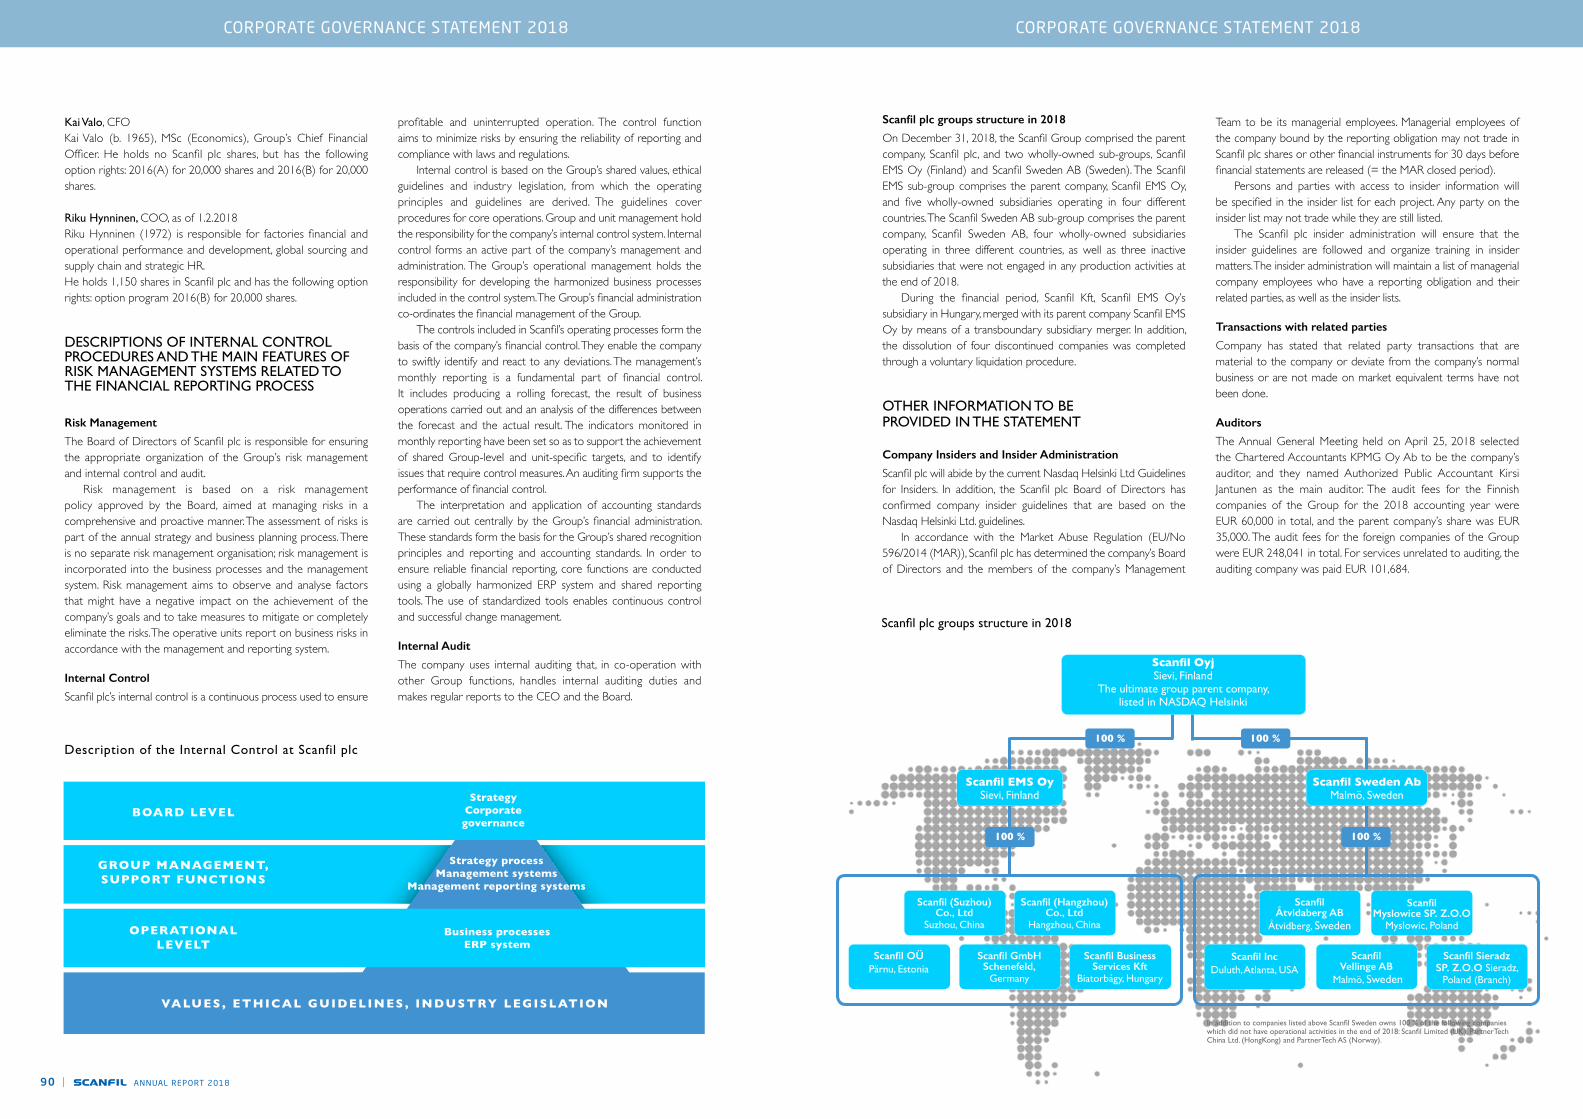
ANNUAL REPORT 201890 | ANNUAL REPORT 2018 | 91
Kai Valo, CFOKai Valo (b. 1965), MSc (Economics), Group’s Chief Financial Officer. He holds no Scanfil plc shares, but has the following option rights: 2016(A) for 20,000 shares and 2016(B) for 20,000 shares.
Riku Hynninen, COO, as of 1.2.2018Riku Hynninen (1972) is responsible for factories financial and operational performance and development, global sourcing and supply chain and strategic HR.He holds 1,150 shares in Scanfil plc and has the following option rights: option program 2016(B) for 20,000 shares.
DESCRIPTIONS OF INTERNAL CONTROL PROCEDURES AND THE MAIN FEATURES OF RISK MANAGEMENT SYSTEMS RELATED TO THE FINANCIAL REPORTING PROCESS
Risk Management
The Board of Directors of Scanfil plc is responsible for ensuring the appropriate organization of the Group’s risk management and internal control and audit. Risk management is based on a risk management policy approved by the Board, aimed at managing risks in a comprehensive and proactive manner. The assessment of risks is part of the annual strategy and business planning process. There is no separate risk management organisation; risk management is incorporated into the business processes and the management system. Risk management aims to observe and analyse factors that might have a negative impact on the achievement of the company’s goals and to take measures to mitigate or completely eliminate the risks. The operative units report on business risks in accordance with the management and reporting system.
Internal Control
Scanfil plc’s internal control is a continuous process used to ensure
profitable and uninterrupted operation. The control function aims to minimize risks by ensuring the reliability of reporting and compliance with laws and regulations. Internal control is based on the Group’s shared values, ethical guidelines and industry legislation, from which the operating principles and guidelines are derived. The guidelines cover procedures for core operations. Group and unit management hold the responsibility for the company’s internal control system. Internal control forms an active part of the company’s management and administration. The Group’s operational management holds the responsibility for developing the harmonized business processes included in the control system. The Group’s financial administration co-ordinates the financial management of the Group. The controls included in Scanfil’s operating processes form the basis of the company’s financial control. They enable the company to swiftly identify and react to any deviations. The management’s monthly reporting is a fundamental part of financial control. It includes producing a rolling forecast, the result of business operations carried out and an analysis of the differences between the forecast and the actual result. The indicators monitored in monthly reporting have been set so as to support the achievement of shared Group-level and unit-specific targets, and to identify issues that require control measures. An auditing firm supports the performance of financial control. The interpretation and application of accounting standards are carried out centrally by the Group’s financial administration. These standards form the basis for the Group’s shared recognition principles and reporting and accounting standards. In order to ensure reliable financial reporting, core functions are conducted using a globally harmonized ERP system and shared reporting tools. The use of standardized tools enables continuous control and successful change management.
Internal Audit
The company uses internal auditing that, in co-operation with other Group functions, handles internal auditing duties and makes regular reports to the CEO and the Board.
Description of the Internal Control at Scanfil plc
BOARD LEVEL
GROUP MANAGEMENT,SUPPORT FUNCTIONS
Business processesERP system
OPERATIONALLEVELT
VALUES , ETHICAL GUIDELINES , INDUSTRY LEGISLATION
Strategy processManagement systems
Management reporting systems
StrategyCorporate governance
Scanfil plc groups structure in 2018
On December 31, 2018, the Scanfil Group comprised the parent company, Scanfil plc, and two wholly-owned sub-groups, Scanfil EMS Oy (Finland) and Scanfil Sweden AB (Sweden). The Scanfil EMS sub-group comprises the parent company, Scanfil EMS Oy, and five wholly-owned subsidiaries operating in four different countries. The Scanfil Sweden AB sub-group comprises the parent company, Scanfil Sweden AB, four wholly-owned subsidiaries operating in three different countries, as well as three inactive subsidiaries that were not engaged in any production activities at the end of 2018. During the financial period, Scanfil Kft, Scanfil EMS Oy’s subsidiary in Hungary, merged with its parent company Scanfil EMS Oy by means of a transboundary subsidiary merger. In addition, the dissolution of four discontinued companies was completed through a voluntary liquidation procedure.
OTHER INFORMATION TO BE PROVIDED IN THE STATEMENT
Company Insiders and Insider Administration
Scanfil plc will abide by the current Nasdaq Helsinki Ltd Guidelines for Insiders. In addition, the Scanfil plc Board of Directors has confirmed company insider guidelines that are based on the Nasdaq Helsinki Ltd. guidelines. In accordance with the Market Abuse Regulation (EU/No 596/2014 (MAR)), Scanfil plc has determined the company’s Board of Directors and the members of the company’s Management
Team to be its managerial employees. Managerial employees of the company bound by the reporting obligation may not trade in Scanfil plc shares or other financial instruments for 30 days before financial statements are released (= the MAR closed period). Persons and parties with access to insider information will be specified in the insider list for each project. Any party on the insider list may not trade while they are still listed. The Scanfil plc insider administration will ensure that the insider guidelines are followed and organize training in insider matters. The insider administration will maintain a list of managerial company employees who have a reporting obligation and their related parties, as well as the insider lists.
Transactions with related parties
Company has stated that related party transactions that are material to the company or deviate from the company’s normal business or are not made on market equivalent terms have not been done.
Auditors
The Annual General Meeting held on April 25, 2018 selected the Chartered Accountants KPMG Oy Ab to be the company’s auditor, and they named Authorized Public Accountant Kirsi Jantunen as the main auditor. The audit fees for the Finnish companies of the Group for the 2018 accounting year were EUR 60,000 in total, and the parent company’s share was EUR 35,000. The audit fees for the foreign companies of the Group were EUR 248,041 in total. For services unrelated to auditing, the auditing company was paid EUR 101,684.
Scanfil plc groups structure in 2018
100 %
Scanfil OyjSievi, Finland
The ultimate group parent company, listed in NASDAQ Helsinki
100 % 100 %
Scanfil Sweden AbMalmö, Sweden
Scanfil (Suzhou) Co., Ltd
Suzhou, China
Scanfil (Hangzhou) Co., Ltd
Hangzhou, China
Scanfil BusinessServices Kft
Biatorbágy, Hungary
Scanfil GmbHSchenefeld,
Germany
Scanfil OÜPärnu, Estonia
Scanfil EMS OySievi, Finland
Scanfil Sieradz SP. Z.O.O Sieradz,
Poland (Branch)
Scanfil Inc Duluth, Atlanta, USA
Scanfil Vellinge AB
Malmö, Sweden
Scanfil Myslowice SP. Z.O.O
Myslowic, Poland
Scanfil Åtvidaberg AB
Åtvidberg, Sweden
100 %
In addition to companies listed above Scanfil Sweden owns 100 % of the following companies which did not have operational activities in the end of 2018: Scanfil Limited (UK), PartnerTech China Ltd. (HongKong) and PartnerTech AS (Norway).
CORPORATE GOVERNANCE STATEMENT 2018CORPORATE GOVERNANCE STATEMENT 2018

ANNUAL REPORT 201892 | ANNUAL REPORT 2018 | 93
MANAGEMENT TEAMBOARD OF DIRECTORS
Harri TakanenChairman of the Board of DirectorsHarri Takanen (born 1968), Member of Board since 2013, Professional Board Member. Harri Takanen has worked for Sievi Capital plc as CEO 2007 - 2011. He was CEO of Scanfil plc and Scanfil EMS ltd. during 1.1.2012-31.3.2013. He has served Scanfil Group since 1994, for example as Director of operations in China, Scanfil (Hangzhou) Co., ltd’s Managing Director, Technology Director, Director of Customer Relations, Customer Service Manager and Plant Manager of Sievi mechanics. Harri Takanen holds Master’s degree in Engineering. Not independent of the company and major shareholders. • Holds 9,776,664 shares in Scanfil plc. (31 Dec. 2018)• Chairman of Board of Directors: Titanium Oyj• Member of Board of Directors: iLOQ Oy, Jussi Capital Oy
Bengt EngströmBengt Engström (born 1953), Member of the Board since 2015. Bengt Engström has held a number of executive positions at several companies, both in Sweden and globally, for example at Whirlpool, Bofors AB, Duni AB and Fujitsu. Bengt Engtströn holds a Mechanical Engineer’s degree. Independent of the company and major shareholders.• Holds 12,829 shares in Scanfil plc. (31 Dec. 2018)• Chairman of Board of Directors: Nordic Flanges, Scandinavian Executive AB, Real Holding Ab, Bengström AB, Bengström Förvaltning AB.• Member of Board of Directors: Opticos AB, KHT Executive School, Bure Equity AB, ScandiNova AB ,
Christer HärkönenChrister Härkönen (born 1957), Member of Board since 2014, CEO at DimWei Group Oy. Härkönen acted as Director of Sandvik
Mining and Construction in Sweden and Holland during years 2010-2013. Between 2005 – 2010 he led the RFID business of UPM Oyj. Between 1996 – 2005 he worked in executive positions in Elcoteq Oyj to where he transferred from Fujitsu ICL. Härkönen started his career at Nokia in 1984 and moved in 1991 with the sale of business operations to Fujitsu ICL . Christer Härkönen holds a Master’s degree in Engineering. Not independent of the company and independent of major shareholders. Does not hold Scanfil plc shares. • Member of Board of Directors: Arnon Oy, Koto Automation Oy
Christina LindstedtChristina Lindstedt (born 1968), Member of the Board since 2016. Managing Director at XploreBiz AB and as a Partner of Stockholm Business Angels. Christina Lindstedt has held a number of executive positions at AB Electrolux, Sony Ericsson and Sony, both in Sweden and globally. Primarily she has served as a Business/Product area head for businesses such as eg; smartphones, washing machines, automatic lawn mowing and New Business Areas. In addition, she has been responsible for establishing global sourcing operations in China. Christina Lindstedt holds a Master’s Degree of Business Administration and Commercial law. Independent of the company and major shareholders. • Holds 6,000 shares in Scanfil plc. (31 Dec. 2018)• Member of Board of Directors: Qlean Air Scandinavia AB, Minalyze AB, Swedish Lorry Parts
Jarkko TakanenJarkko Takanen (1967) a member of Board of Directors since 2012, Managing Director of Jussi Capital Oyj. He has worked for Sievi Capital Group during 1995 – 2004 among others as Customer Service Manager, Plant Manager, Quality Manager, IT Manager and Director of Sourcing and Logistics. As Managing Director of Belgian subsidiary Scanfil N.V. he acted between 1 April 2003 and 30 June 2004. Jarkko Takanen holds a Bachelor’s Degree in Production Engineer and a Commercial College Diploma in Management Accountancy. Independent of the company, not independent of major shareholders. • Holds 8,511,169 shares in Scanfil plc. (31 Dec. 2018)• Chairman of Board of Directors: Indoor Group Oy
Scanfil OyjBoard of Directors
and management of the delivery capability of several different mobile network product families in Italy and Finland. Riku Hynninen holds Master’s degree in Industrial Economics and Engineering.
Markku KosunenCTOMarkku Kosunen (1967) is responsible for ICT and ERP, Quality processes and systems, production technology and investments since 1 December 2018. Earlier he acted in GMT as Vice President responsible for the operation of Myslowice plant and as Director of Operations. Before joining Scanfil Group he has worked in Mecanova Oy as Vice President of Business Development 2005 - 2007, Director of Operations during 2008 - 2010 and in different management positions in mechanics plants of Flextronics and Ojala-yhtymä in Finland during 1993-2005. Markku Kosunen is a technology undergraduate.
Timo Sonninen Vice President, SalesTimo Sonninen (1966) is responsible for the company’s global customers and business development. Previously he has worked in Efore Oyj as Vice President, Operations, in Suzhou, China 2006 – 2013. Prior to that he has worked at Incap Oyj during 1991 – 2006 among others as Director of Operations, Business Director of Electronics Production and Plant Director of Vuokatti Plant. Timo Sonninen holds a Bachelor’s Degree in Engineering.
Kai ValoCFOMr. Kai Valo (1965) is the Group CFO since 14 October 2016. During 2015 – 2016 Kai was the CFO for Norpe Group. Prior to that he was in Lite-On Mobile Group Director of Finance and Control in Beijing, China 2009 – 2015. Before that (during 1999 – 2008) he had several finance related management positions in Perlos. Kai holds a Master’s Degree in Economics.
From January 1 to November 30, 2018, Tomi Takanen, Vice President, Operations, and Mats Lund, Vice President, Supply Chain, also served on the Management Team.
Petteri JokitaloCEOPetteri Jokitalo (1963), company’s CEO since 1 April 2013. Earlier Petteri Jokitalo has worked in Scanfil EMS Oy as Director of Sales and Marketing 2012 – 2013, in Meka Pro Oy as Managing Director during 2007 – 2011, in Scanfil Oyj in management tasks of sales and business development during 2003 – 2007 and in international tasks in Nokia Networks during 1998 – 2003. Petteri Jokitalo holds Master’s Degree in Engineering.
Kristoffer AsklövVice President, Strategy and Business DevelopmentKristoffer Asklöv (1977) is responsible for Strategic Initiatives and Development Services. Earlier he acted in GMT as Vice President responsible for the operation of the Sievi, Åtvidaberg, Vellinge, Atlanta and Hamburg plants. Before that he has worked as Managing Director of PartnerTech’s factory in Åtvidaberg as well as Operations Manager, Program Manager and Production Manager within PartnerTech. Prior to this he worked for Toyota Material Handling. Kristoffer Asklöv holds a Master’s degree in Mechanical Engineering.
Riku HynninenCOO, as of 1.2.2018Riku Hynninen (1972) is responsible for factories financial and operational performance and development, global sourcing and supply chain and strategic HR. He has previously worked at Nokia Corporation (1995 – 2018), in charge of developing the production technology for mobile network business, creating new product delivery capability, and product portfolio lifecycle management (2014 - 2018). Prior to that he has been responsible among others the technical functions of the Nokia Suzhou factory and the creation
Scanfil OyjManagement team
From left to right: Jarkko Takanen, Bengt Engström, Harri Takanen, Christer Härkönen, Christina Lindstedt From left to right: Riku Hynninen, Kristoffer Asklöv, Petteri Jokitalo, Timo Sonninen, Markku Kosunen, Kai Valo

ANNUAL REPORT 201894 | ANNUAL REPORT 2018 | 95
Annual General Meeting
Scanfil plc’s Annual General Meeting (AGM) will be held on Wednesday 24 April 2019 in the Company’s main office at Yritystie 6, Sievi. The AGM will discuss the matters listed in the notice of the meeting, in accordance with the company’s Articles of Association. In addition, the meeting agenda will be published on the company’s website at www.scanfil.com.
Distribution of profits
The Boardof Directors proposes to the Annual General Meeting that a dividend of EUR 0.13 per share be paid for a total of EUR 8,324,607.07 for the financial year ending on 31 December 2018 .The dividend matching day is 24 April 2019 and the dividend payment date 6 May 2019. The dividend will be paid to shareholders who are registered in the Register of Shareholders maintained by Euroclear Finland Ltd on the matching date.
Financial information
In 2019, Scanfil plc will publish the following financial reviews:Financial statements 15 February 2019Annual report week 12/2019Interim report for January–March 25 April 2019Interim report for January–June 9 August 2018Interim report for January–September 26October 2018
Information to shareholders
The financial reviews will be released in Finnish and English. They will be published on the company’s website at www.scanfil.com.The publications may also be ordered from Scanfil plc, Yritystie 6, FI-85410 Sievi, Finland or by calling +358 8 4882 111.
Register of Shareholders
Each shareholder is requested to notify the bank, brokerage firm or Euroclear Finland Ltd, which manages the shareholder’s book entry account, as the account operator selected by the shareholder of any changes in its name or address.
INFORMATION TO SHAREHOLDERS

STA
TII
VI.
FI
Yritystie 6FI-85410 SIEVI FINLAND
Tel. +358 8 48 82 111
www.scanfil.com
Related Documents