ANNUAL REPORT 2017/18 DUBE TRADEPORT CORPORATION

Welcome message from author
This document is posted to help you gain knowledge. Please leave a comment to let me know what you think about it! Share it to your friends and learn new things together.
Transcript
ANNUAL REPORT 2017/18DUBE TRADEPORT CORPORATION
VISI
ON
MISSION
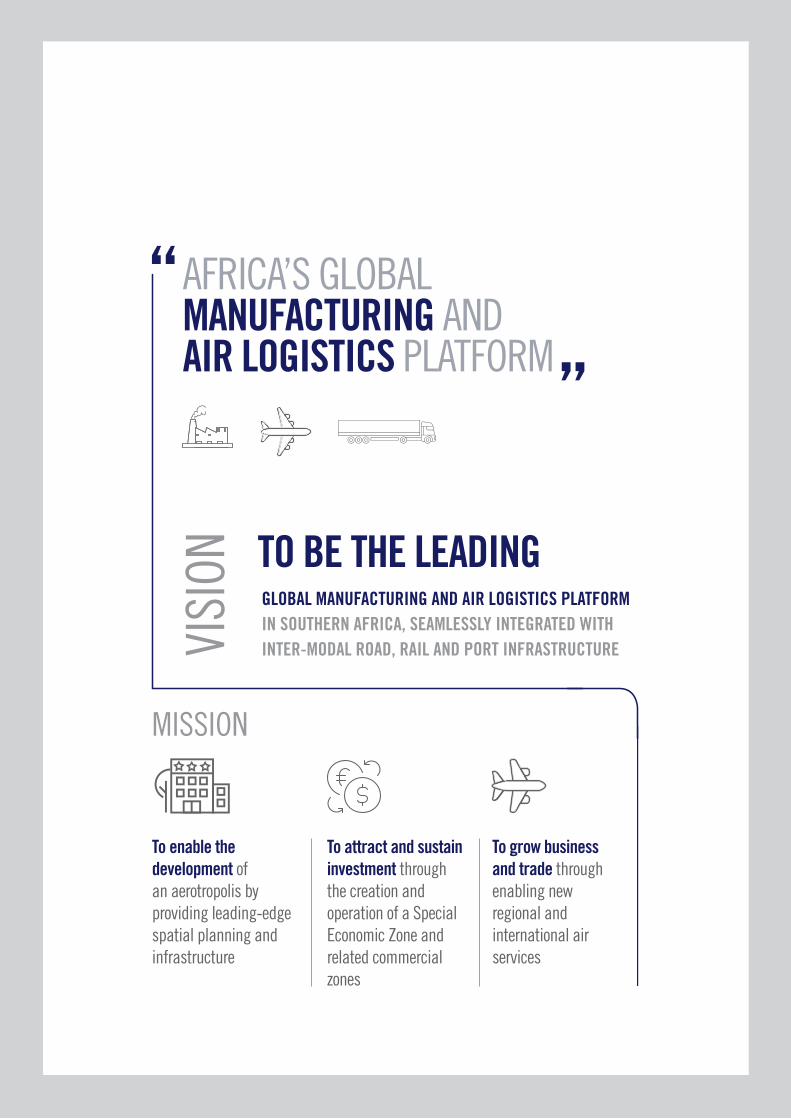
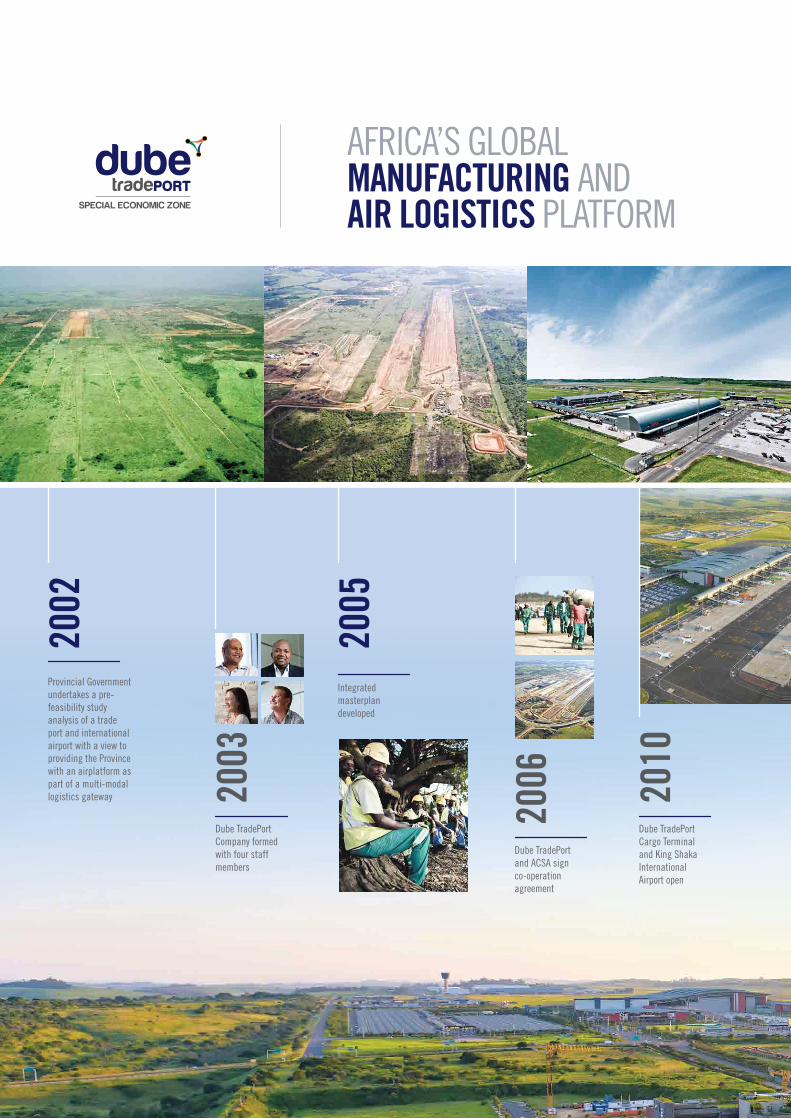
AFRICA’S GLOBAL MANUFACTURING AND AIR LOGISTICS PLATFORM
TO BE THE LEADINGGLOBAL MANUFACTURING AND AIR LOGISTICS PLATFORM IN SOUTHERN AFRICA, SEAMLESSLY INTEGRATED WITH INTER-MODAL ROAD, RAIL AND PORT INFRASTRUCTURE
To enable the development of an aerotropolis by providing leading-edge spatial planning and infrastructure
To attract and sustain investment through the creation and operation of a Special Economic Zone and related commercial zones
To grow business and trade through enabling new regional and international air services
CONTENTS
Foreword
Profile of Dube TradePort Corporation
Corporation Structure, Accounting Authority and Executive Management
Overview of Dube TradePort Special Economic Zone
Chairperson’s Statement
Chief Executive Officer’s Review
Corporate Governance Report
Corporate Services Report
Annual Performance Report
- Programme 1 – Administration
- Programme 2 – Cargo Development
- Programme 3 – Property
- Programme 4 – Dube AgriZone
- Programme 5 – Information Communication Technology (Dube iConnect)
- Programme 6 – Development Planning and Infrastructure
- Programme 7 - Dube TradePort Special Economic Zone
General Information
Annual Financial Statements
Links:
• Stakeholder Engagement
• Dube TradePort Corporation Annual Performance Plan 2017/18
• Dube TradePort Corporation Strategic Plan 2015-2020
• State of the Environment Report
02
04
05
06
12
15
20
30
36
37
40
41
43
44
45
47
50
51
DUBE TRADEPORT CORPORATION ANNUAL REPORT 2017/1802
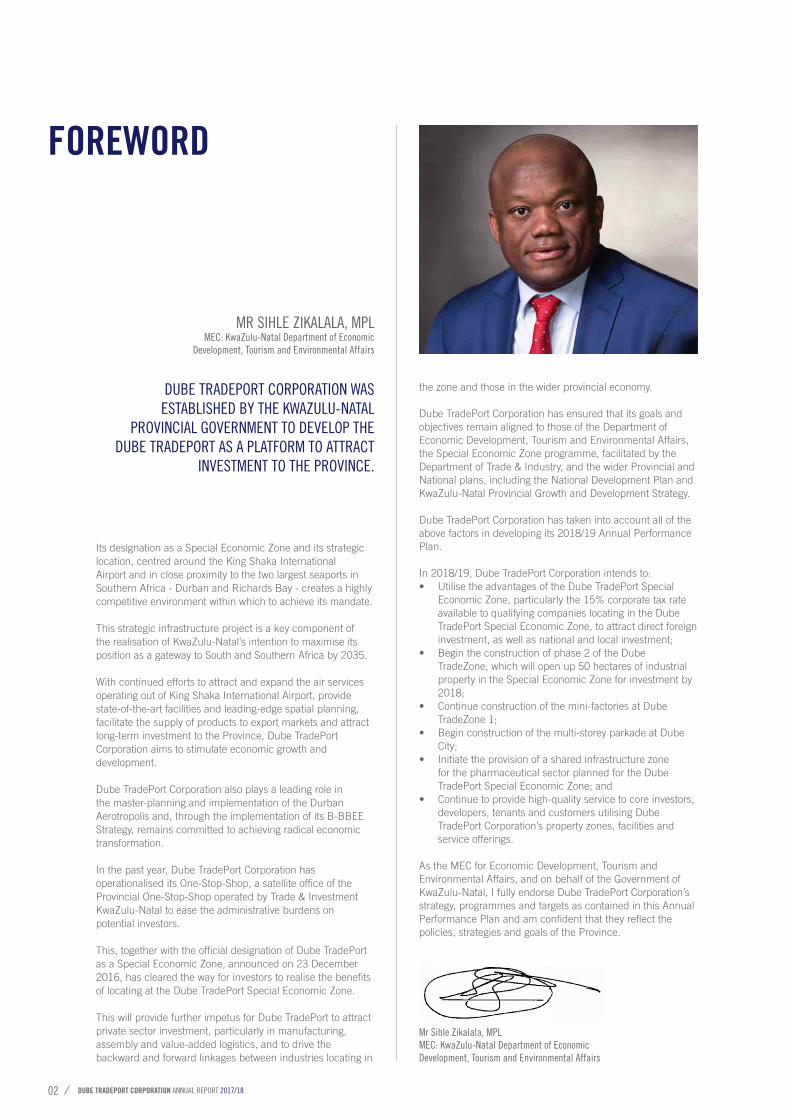
Mr Sihle Zikalala, MPLMEC: KwaZulu-Natal Department of Economic Development, Tourism and Environmental Affairs
Its designation as a Special Economic Zone and its strategic location, centred around the King Shaka International Airport and in close proximity to the two largest seaports in Southern Africa - Durban and Richards Bay - creates a highly competitive environment within which to achieve its mandate.
This strategic infrastructure project is a key component of the realisation of KwaZulu-Natal’s intention to maximise its position as a gateway to South and Southern Africa by 2035.
With continued efforts to attract and expand the air services operating out of King Shaka International Airport, provide state-of-the-art facilities and leading-edge spatial planning, facilitate the supply of products to export markets and attract long-term investment to the Province, Dube TradePort Corporation aims to stimulate economic growth and development.
Dube TradePort Corporation also plays a leading role in the master-planning and implementation of the Durban Aerotropolis and, through the implementation of its B-BBEE Strategy, remains committed to achieving radical economic transformation.
In the past year, Dube TradePort Corporation has operationalised its One-Stop-Shop, a satellite office of the Provincial One-Stop-Shop operated by Trade & Investment KwaZulu-Natal to ease the administrative burdens on potential investors.
This, together with the official designation of Dube TradePort as a Special Economic Zone, announced on 23 December 2016, has cleared the way for investors to realise the benefits of locating at the Dube TradePort Special Economic Zone.
This will provide further impetus for Dube TradePort to attract private sector investment, particularly in manufacturing, assembly and value-added logistics, and to drive the backward and forward linkages between industries locating in
the zone and those in the wider provincial economy.
Dube TradePort Corporation has ensured that its goals and objectives remain aligned to those of the Department of Economic Development, Tourism and Environmental Affairs, the Special Economic Zone programme, facilitated by the Department of Trade & Industry, and the wider Provincial and National plans, including the National Development Plan and KwaZulu-Natal Provincial Growth and Development Strategy.
Dube TradePort Corporation has taken into account all of the above factors in developing its 2018/19 Annual Performance Plan.
In 2018/19, Dube TradePort Corporation intends to:• Utilise the advantages of the Dube TradePort Special
Economic Zone, particularly the 15% corporate tax rate available to qualifying companies locating in the Dube TradePort Special Economic Zone, to attract direct foreign investment, as well as national and local investment;
• Begin the construction of phase 2 of the Dube TradeZone, which will open up 50 hectares of industrial property in the Special Economic Zone for investment by 2018;
• Continue construction of the mini-factories at Dube TradeZone 1;
• Begin construction of the multi-storey parkade at Dube City;
• Initiate the provision of a shared infrastructure zone for the pharmaceutical sector planned for the Dube TradePort Special Economic Zone; and
• Continue to provide high-quality service to core investors, developers, tenants and customers utilising Dube TradePort Corporation’s property zones, facilities and service offerings.
As the MEC for Economic Development, Tourism and Environmental Affairs, and on behalf of the Government of KwaZulu-Natal, I fully endorse Dube TradePort Corporation’s strategy, programmes and targets as contained in this Annual Performance Plan and am confident that they reflect the policies, strategies and goals of the Province.
FOREWORD
MR SIHLE ZIKALALA, MPLMEC: KwaZulu-Natal Department of Economic
Development, Tourism and Environmental Affairs
DUBE TRADEPORT CORPORATION WAS ESTABLISHED BY THE KWAZULU-NATAL
PROVINCIAL GOVERNMENT TO DEVELOP THE DUBE TRADEPORT AS A PLATFORM TO ATTRACT
INVESTMENT TO THE PROVINCE.
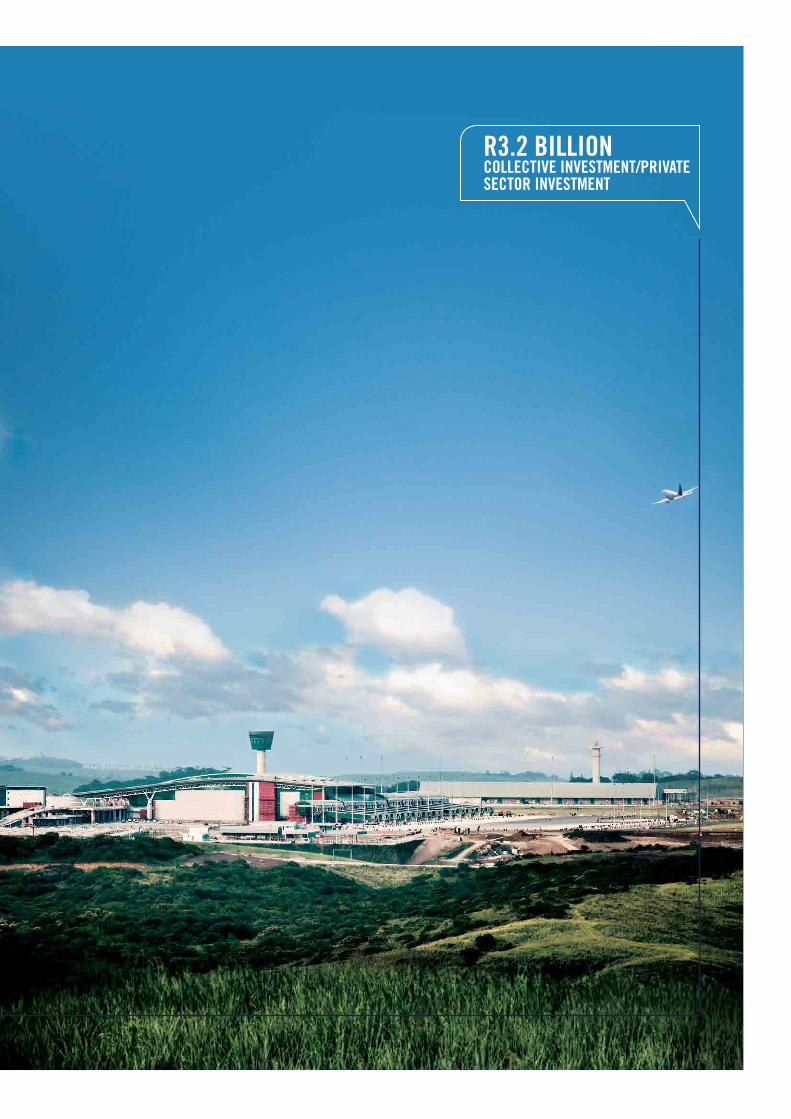
R3.2 BILLION COLLECTIVE INVESTMENT/PRIVATE SECTOR INVESTMENT
DUBE TRADEPORT CORPORATION ANNUAL REPORT 2017/1804
PROFILE OF DUBE TRADEPORT CORPORATION
VISIONTo be the leading global manufacturing and air logistics platform in Southern Africa, seamlessly integrated with inter-modal road, rail and port infrastructure.
MISSION• To enable the development of an aerotropolis by providing leading-edge spatial planning and infrastructure;• To attract and sustain investment through the creation and operation of a Special Economic Zone and related commercial zones; and• To grow business and trade through enabling new regional and international air services.
VALUESIn conducting its day-to-day business activities with honesty and integrity, Dube TradePort Corporation is mindful of the need to adhere to a further clear set of values, which include:
• Professional Excellence: Being passionate about value- adding professionalism;• Ubuntu: Creating open, honest relationships built on trust, mutual respect, dignity and fairness;• Empowerment: Actively embracing the economic, transformational and developmental agendas of stakeholders;• Innovation and Creativity: Succeeding through innovative, creative and adaptable teams; and• Service Excellence: Providing unsurpassed service excellence of which our clients may be proud.
STRATEGIC GOALSDube TradePort Corporation’s strategic outcome-orientated goals are as follows:
• To drive the development of a sustainable aerotropolis to create new economic opportunities within the region; • To operate a world-class and globally competitive Special Economic Zone, supported by high-end infrastructure;• To secure private sector investment in targeted logistics, agri-processing, manufacturing, commercial and services sectors;
• To provide high quality competitive and sustainable services to those utilising Dube TradePort Corporation’s cargo terminal, property zones, facilities and commercial operations;• To sustain and grow cargo and air services;• To pursue financial sustainability by driving revenue growth and increasing operational efficiencies;• To maintain effective corporate governance and human capital management; and• To ensure the efficacy of supply chain management for radical economic transformation.
CODE OF BUSINESS CONDUCTDube TradePort Corporation has in place a Code of Business Conduct, underpinning the business culture of the organisation and its members of staff. Principles contained in the Code of Business Conduct include:
• Upholding the values of the organisation in all dealings with customers, suppliers and stakeholders;• Treating all people with respect and dignity, while fostering a productive environment free of harassment, intimidation and discrimination;• Being professional at all times;• Refraining from using any position of power afforded by the organisation for the furtherance of self-interest or the interests of family or friends;• Avoiding being compromised by allowing personal interests to influence business decisions, or by any conflict of interest;• Honouring the content and spirit of any and all business transactions and agreements;• Addressing any and all instances of crime, bribery, corruption or inducements by adopting a policy of zero tolerance against offenders;• Displaying the highest levels of confidentiality;• Maintaining records in an appropriate manner and complying with all policies, procedures and internal control systems; and• Embracing a culture of tolerance regarding diversity, especially as it applies to culture, religion and sexual orientation.
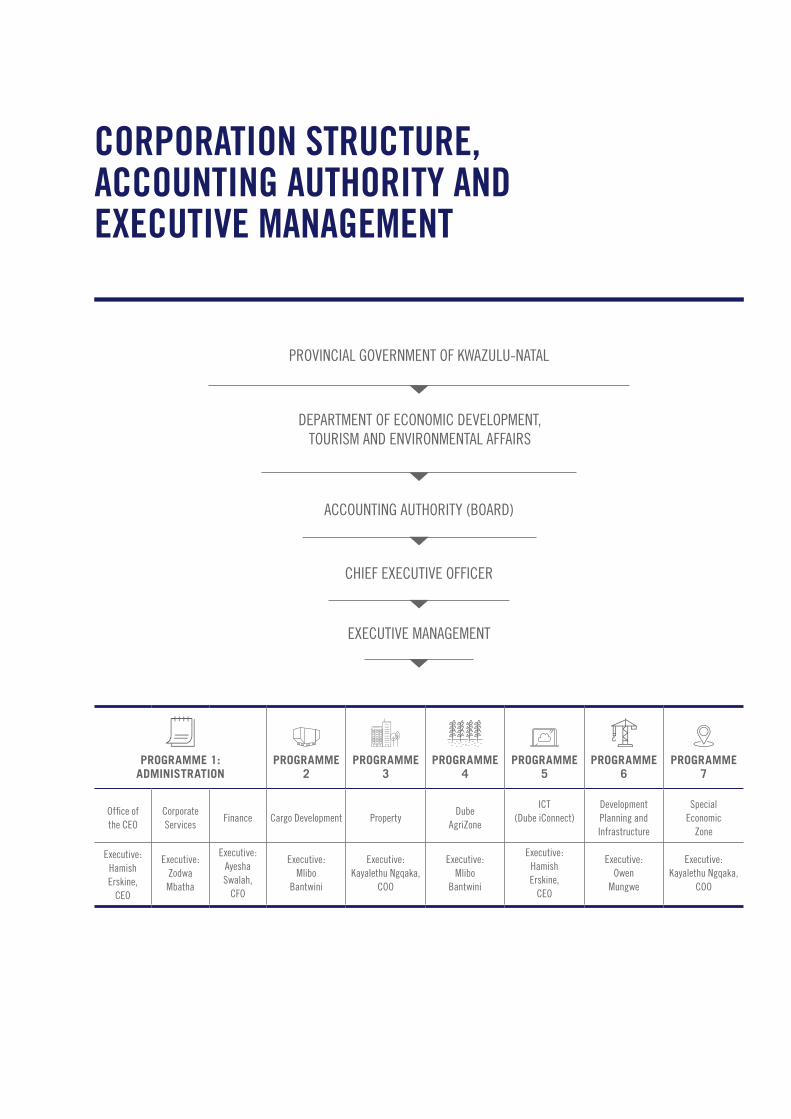
PROGRAMME 1: ADMINISTRATION
PROGRAMME 2
PROGRAMME 3
PROGRAMME 4
PROGRAMME 5
PROGRAMME 6
PROGRAMME 7
Office of the CEO
Corporate Services
Finance Cargo Development PropertyDube
AgriZone
ICT (Dube iConnect)
Development Planning and Infrastructure
Special Economic
Zone
Executive: Hamish Erskine,
CEO
Executive: Zodwa Mbatha
Executive: Ayesha Swalah,
CFO
Executive: Mlibo
Bantwini
Executive: Kayalethu Ngqaka,
COO
Executive: Mlibo
Bantwini
Executive: Hamish Erskine,
CEO
Executive: Owen
Mungwe
Executive: Kayalethu Ngqaka,
COO
CORPORATION STRUCTURE, ACCOUNTING AUTHORITY AND EXECUTIVE MANAGEMENT
PROVINCIAL GOVERNMENT OF KWAZULU-NATAL
DEPARTMENT OF ECONOMIC DEVELOPMENT, TOURISM AND ENVIRONMENTAL AFFAIRS
ACCOUNTING AUTHORITY (BOARD)
CHIEF EXECUTIVE OFFICER
EXECUTIVE MANAGEMENT
DUBE TRADEPORT CORPORATION ANNUAL REPORT 2017/1806
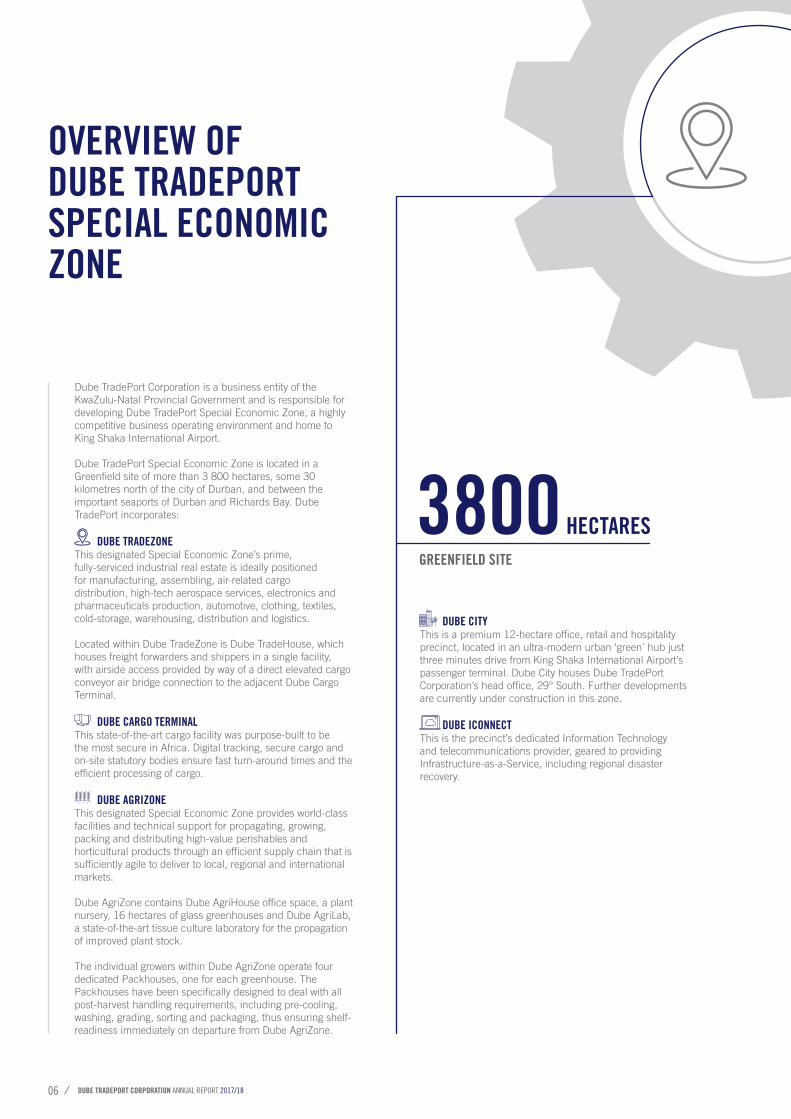
Dube TradePort Corporation is a business entity of theKwaZulu-Natal Provincial Government and is responsible for developing Dube TradePort Special Economic Zone, a highly competitive business operating environment and home to King Shaka International Airport.
Dube TradePort Special Economic Zone is located in a Greenfield site of more than 3 800 hectares, some 30 kilometres north of the city of Durban, and between the important seaports of Durban and Richards Bay. Dube TradePort incorporates:
DUBE TRADEZONEThis designated Special Economic Zone’s prime, fully-serviced industrial real estate is ideally positioned for manufacturing, assembling, air-related cargo distribution, high-tech aerospace services, electronics and pharmaceuticals production, automotive, clothing, textiles, cold-storage, warehousing, distribution and logistics.
Located within Dube TradeZone is Dube TradeHouse, which houses freight forwarders and shippers in a single facility, with airside access provided by way of a direct elevated cargo conveyor air bridge connection to the adjacent Dube Cargo Terminal.
DUBE CARGO TERMINAL This state-of-the-art cargo facility was purpose-built to be the most secure in Africa. Digital tracking, secure cargo and on-site statutory bodies ensure fast turn-around times and the efficient processing of cargo.
DUBE AGRIZONE This designated Special Economic Zone provides world-class facilities and technical support for propagating, growing, packing and distributing high-value perishables and horticultural products through an efficient supply chain that is sufficiently agile to deliver to local, regional and international markets.
Dube AgriZone contains Dube AgriHouse office space, a plant nursery, 16 hectares of glass greenhouses and Dube AgriLab, a state-of-the-art tissue culture laboratory for the propagation of improved plant stock.
The individual growers within Dube AgriZone operate four dedicated Packhouses, one for each greenhouse. The Packhouses have been specifically designed to deal with all post-harvest handling requirements, including pre-cooling, washing, grading, sorting and packaging, thus ensuring shelf-readiness immediately on departure from Dube AgriZone.
DUBE CITY This is a premium 12-hectare office, retail and hospitality precinct, located in an ultra-modern urban ‘green’ hub just three minutes drive from King Shaka International Airport’s passenger terminal. Dube City houses Dube TradePort Corporation’s head office, 29° South. Further developments are currently under construction in this zone.
DUBE ICONNECTThis is the precinct’s dedicated Information Technology and telecommunications provider, geared to providing Infrastructure-as-a-Service, including regional disaster recovery.
OVERVIEW OF DUBE TRADEPORTSPECIAL ECONOMIC ZONE
3800 HECTARESGREENFIELD SITE
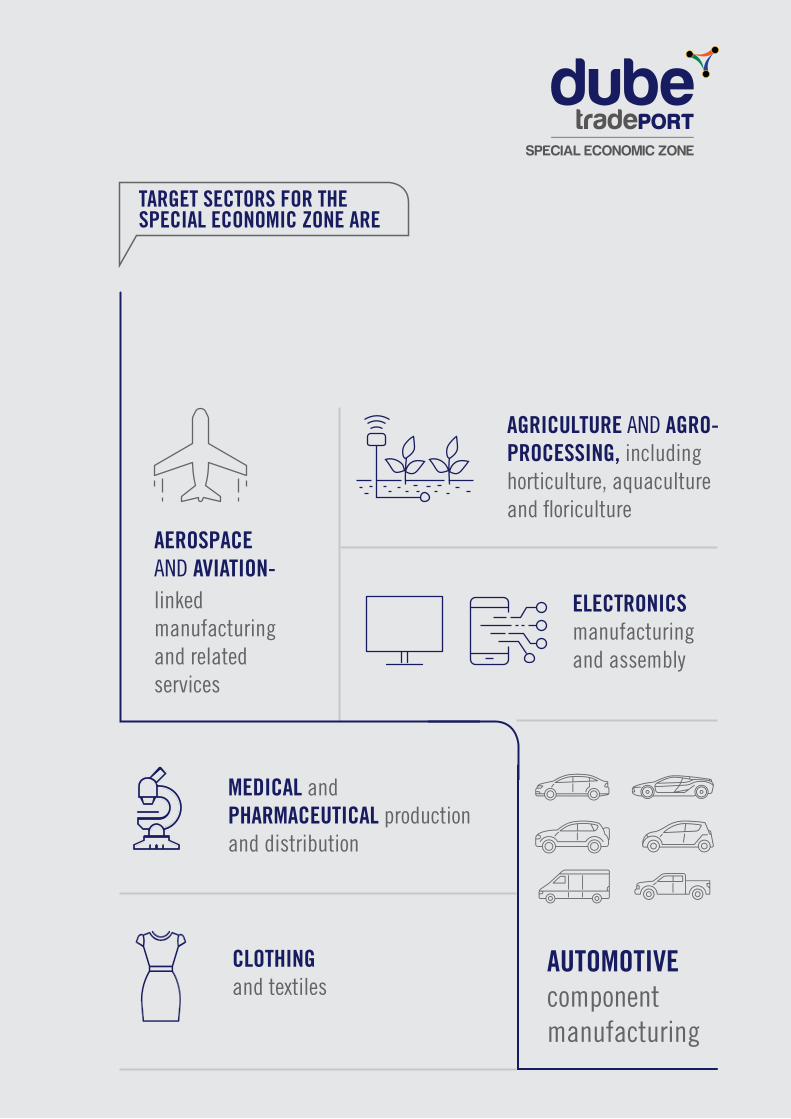
TARGET SECTORS FOR THE SPECIAL ECONOMIC ZONE ARE
CLOTHING and textiles
AEROSPACE AND AVIATION-linked manufacturing and related services
AGRICULTURE AND AGRO-PROCESSING, including horticulture, aquaculture and floriculture
ELECTRONICS manufacturing and assembly
AUTOMOTIVE component manufacturing
MEDICAL and PHARMACEUTICAL production and distribution
DUBE TRADEPORT CORPORATION ANNUAL REPORT 2017/1808
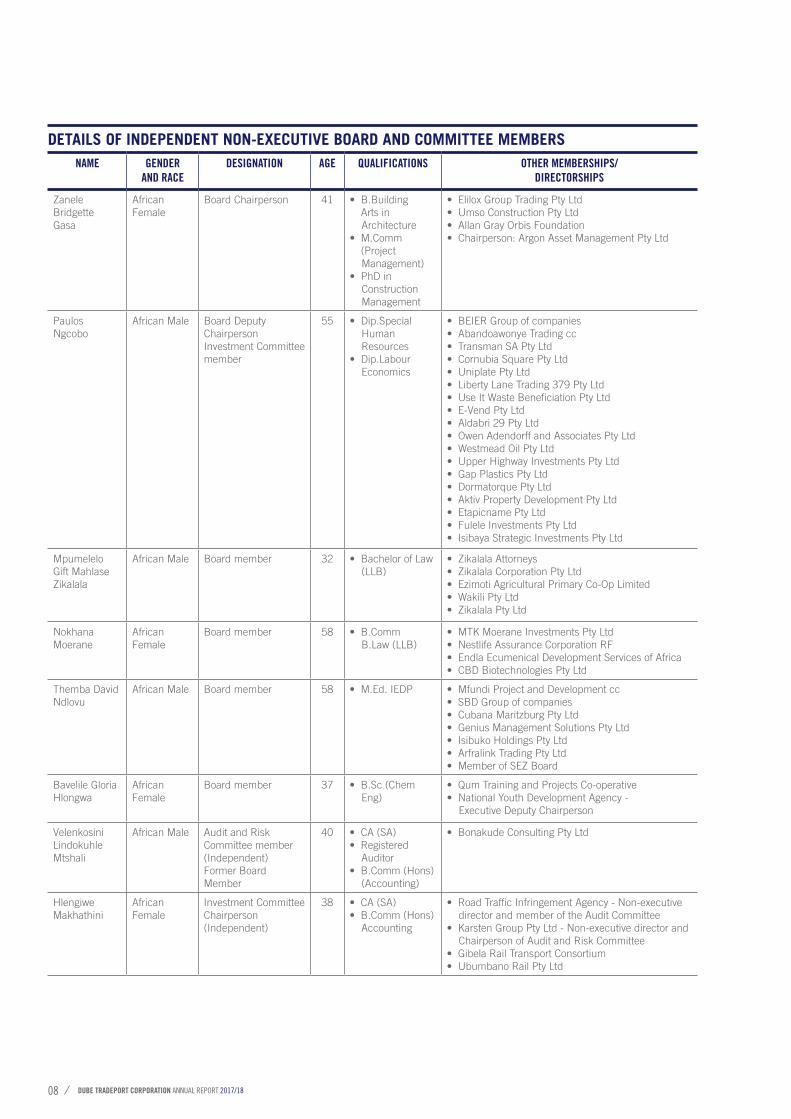
NAME GENDER AND RACE
DESIGNATION AGE QUALIFICATIONS OTHER MEMBERSHIPS/DIRECTORSHIPS
Zanele Bridgette Gasa
African Female
Board Chairperson 41 • B.Building • • • Arts in Architecture• M.Comm • (Project Management)• PhD in Construction Management
• Elilox Group Trading Pty Ltd• Umso Construction Pty Ltd• Allan Gray Orbis Foundation• Chairperson: Argon Asset Management Pty Ltd
PaulosNgcobo
African Male Board Deputy ChairpersonInvestment Committee member
55 • Dip.Special Human Resources• Dip.Labour Economics
• BEIER Group of companies• Abandoawonye Trading cc• Transman SA Pty Ltd• Cornubia Square Pty Ltd• Uniplate Pty Ltd• Liberty Lane Trading 379 Pty Ltd• Use It Waste Beneficiation Pty Ltd• E-Vend Pty Ltd• Aldabri 29 Pty Ltd• Owen Adendorff and Associates Pty Ltd• Westmead Oil Pty Ltd• Upper Highway Investments Pty Ltd• Gap Plastics Pty Ltd• Dormatorque Pty Ltd• Aktiv Property Development Pty Ltd• Etapicname Pty Ltd• Fulele Investments Pty Ltd• Isibaya Strategic Investments Pty Ltd
Mpumelelo Gift Mahlase Zikalala
African Male Board member 32 • Bachelor of Law (LLB)
• Zikalala Attorneys• Zikalala Corporation Pty Ltd• Ezimoti Agricultural Primary Co-Op Limited• Wakili Pty Ltd• Zikalala Pty Ltd
Nokhana Moerane
African Female
Board member 58 • B.Comm B.Law (LLB)
• MTK Moerane Investments Pty Ltd• Nestlife Assurance Corporation RF• Endla Ecumenical Development Services of Africa• CBD Biotechnologies Pty Ltd
Themba David Ndlovu
African Male Board member 58 • M.Ed. IEDP • Mfundi Project and Development cc• SBD Group of companies• Cubana Maritzburg Pty Ltd• Genius Management Solutions Pty Ltd• Isibuko Holdings Pty Ltd• Arfralink Trading Pty Ltd• Member of SEZ Board
Bavelile Gloria Hlongwa
African Female
Board member 37 • B.Sc (Chem Eng)
• Qum Training and Projects Co-operative• National Youth Development Agency - Executive Deputy Chairperson
Velenkosini Lindokuhle Mtshali
African Male Audit and Risk Committee member (Independent)Former Board Member
40 • CA (SA)• Registered Auditor• B.Comm (Hons) (Accounting)
• Bonakude Consulting Pty Ltd
Hlengiwe Makhathini
African Female
Investment Committee Chairperson(Independent)
38 • CA (SA)• B.Comm (Hons) Accounting
• Road Traffic Infringement Agency - Non-executive director and member of the Audit Committee• Karsten Group Pty Ltd - Non-executive director and Chairperson of Audit and Risk Committee• Gibela Rail Transport Consortium• Ubumbano Rail Pty Ltd
DETAILS OF INDEPENDENT NON-EXECUTIVE BOARD AND COMMITTEE MEMBERS
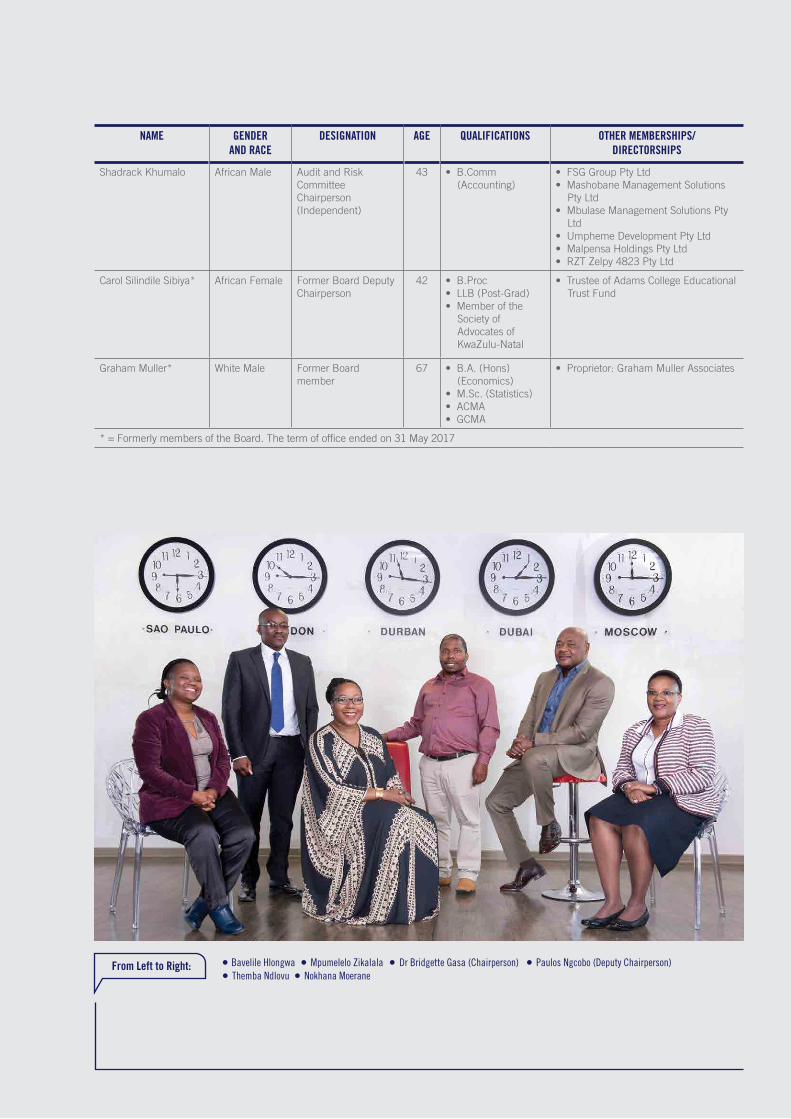
NAME GENDER AND RACE
DESIGNATION AGE QUALIFICATIONS OTHER MEMBERSHIPS/DIRECTORSHIPS
Shadrack Khumalo African Male Audit and Risk Committee Chairperson (Independent)
43 • B.Comm (Accounting)
• FSG Group Pty Ltd• Mashobane Management Solutions Pty Ltd• Mbulase Management Solutions Pty Ltd• Umpheme Development Pty Ltd• Malpensa Holdings Pty Ltd• RZT Zelpy 4823 Pty Ltd
Carol Silindile Sibiya* African Female Former Board Deputy Chairperson
42 • B.Proc• LLB (Post-Grad)• Member of the Society of Advocates of KwaZulu-Natal
• Trustee of Adams College Educational Trust Fund
Graham Muller* White Male Former Boardmember
67 • B.A. (Hons) (Economics)• M.Sc. (Statistics)• ACMA• GCMA
• Proprietor: Graham Muller Associates
* = Formerly members of the Board. The term of office ended on 31 May 2017
From Left to Right: Bavelile Hlongwa Dr Bridgette Gasa (Chairperson)Themba Ndlovu Nokhana Moerane
Mpumelelo Zikalala Paulos Ngcobo (Deputy Chairperson)
DUBE TRADEPORT CORPORATION ANNUAL REPORT 2017/1810
2002
2005
200620
03
2010
Provincial Government undertakes a pre-feasibility study analysis of a trade port and international airport with a view to providing the Province with an airplatform as part of a multi-modal logistics gateway
Integrated masterplan developed
Dube TradePort and ACSA sign co-operation agreement
Dube TradePort Company formed with four staff members
Dube TradePort Cargo Terminal and King Shaka International Airport open
AFRICA’S GLOBAL MANUFACTURING AND AIR LOGISTICS PLATFORM
2017
/18
2012
2017
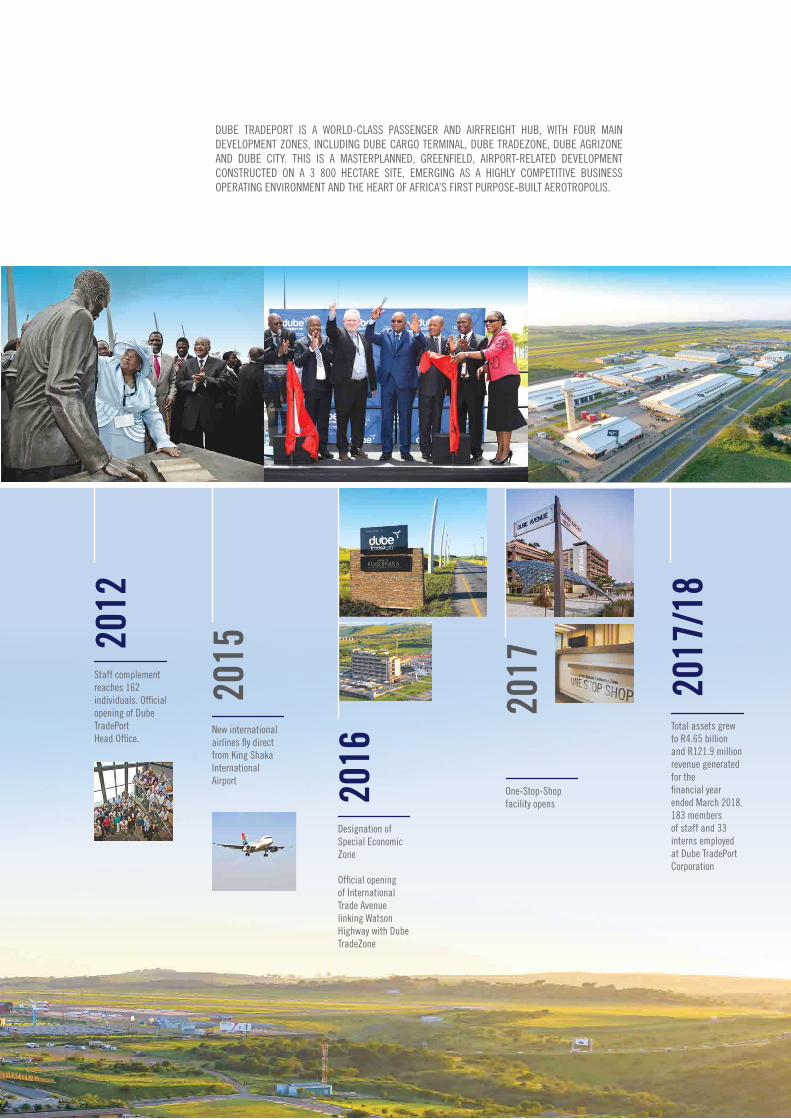
Total assets grew to R4.65 billion and R121.9 million revenue generated for the financial year ended March 2018.183 members of staff and 33 interns employed at Dube TradePort Corporation
Staff complement reaches 162 individuals. Official opening of Dube TradePort Head Office.
One-Stop-Shop facility opens20
16
Designation of Special Economic Zone Official opening of International Trade Avenue linking Watson Highway with Dube TradeZone
DUBE TRADEPORT IS A WORLD-CLASS PASSENGER AND AIRFREIGHT HUB, WITH FOUR MAIN DEVELOPMENT ZONES, INCLUDING DUBE CARGO TERMINAL, DUBE TRADEZONE, DUBE AGRIZONE AND DUBE CITY. THIS IS A MASTERPLANNED, GREENFIELD, AIRPORT-RELATED DEVELOPMENT CONSTRUCTED ON A 3 800 HECTARE SITE, EMERGING AS A HIGHLY COMPETITIVE BUSINESS OPERATING ENVIRONMENT AND THE HEART OF AFRICA’S FIRST PURPOSE-BUILT AEROTROPOLIS.
2015
New international airlines fly direct from King Shaka International Airport
DUBE TRADEPORT CORPORATION ANNUAL REPORT 2017/1812
The organisation’s ability to continually deliver clean audits is an important signal to potential investors, who seek assurance that they are dealing with a credible partner and, most importantly, a partner which values efficient resource management. Our track-record of business veracity has laid the solid foundation upon which we have built mutually-beneficial relationships with both domestic and international investors; investors who actively sought us out and selected Dube TradePort as the ideal home for their operations.
In essence, good governance forms the cornerstone of the trust, respect and goodwill we bring to our stakeholders and which, in return, has paid handsome dividends in terms of every aspect of our day-to-day business.
Dube TradePort Corporation is tasked with delivering against a long-term mandate geared around attracting investment into KwaZulu-Natal; investment which has a direct impact on the creation of sustainable employment opportunities, the delivery of efficient, world-class infrastructure and the provision of effective support services.
Since becoming a Special Economic Zone, Dube TradePort has derived considerable interest from prospective investors, drawn from a wide spectrum of industries, including many which match perfectly with our targeted priority sectors. This has greatly bolstered our ability to deliver on our mandate.
Such Special Economic Zone status has enabled us to broaden the implementation of our drive to deepen local industrialisation by encouraging investment within Dube TradePort for the manufacture and assembly of a range of goods which, because of our unique location, may be rapidly and efficiently distributed to markets on the African continent, which boasts a combined Gross Domestic Product of US$2,6 trillion and a population exceeding 1 billion people.
Dube TradePort is home to King Shaka International Airport, a facility which supports the development of the
Special Economic Zone as a springboard for investors who recognise its potential for reaching deep into Africa and beyond. Durban, traditionally a hub for the processing and value adding of chemicals and petro-chemicals, food and beverages, together with agricultural products, will be greatly augmented by Dube TradePort Special Economic Zone’s infrastructure, trained talent, packaging and logistics solutions for the effective handling of high-value goods, including pharmaceuticals and electronics.
Driving air services has been - and continues to be - an increasingly important facet of our business, through which we are able to add value to investors and, in so doing, move towards the successful achievement of our vision. We are intent on developing Dube TradePort into a leading global manufacturing and air logistics platform within Southern Africa and the continued growth of air services will prove to be our strength in enabling seamless connectivity.
We have made significant inroads in this endeavour. Building on the range of regional and long-haul carriers already operating direct routes into King Shaka International Airport, the year under review was remarkable for the significant progress made towards securing a direct, non-stop British Airways route between London Heathrow and Durban. The introduction of long-haul flights into Durban from both Europe and India will be driven by a combination of business and leisure travellers, while the roll-out of African routes is regarded as extremely important in view of the increased intra-Africa trade focus and the emergent business opportunities they present.
All important to Dube TradePort Corporation has been the securing of private sector investment, valued at an impressive R1.7 billion, and the facilitation of some 429 new employment opportunities within the precinct. We are especially pleased to have attracted major business enterprises with the capability of landing breakthrough investments, such as Samsung Electronics SA for the assembly of television sets and monitors for export to the SADC region, as well as East and West Africa.
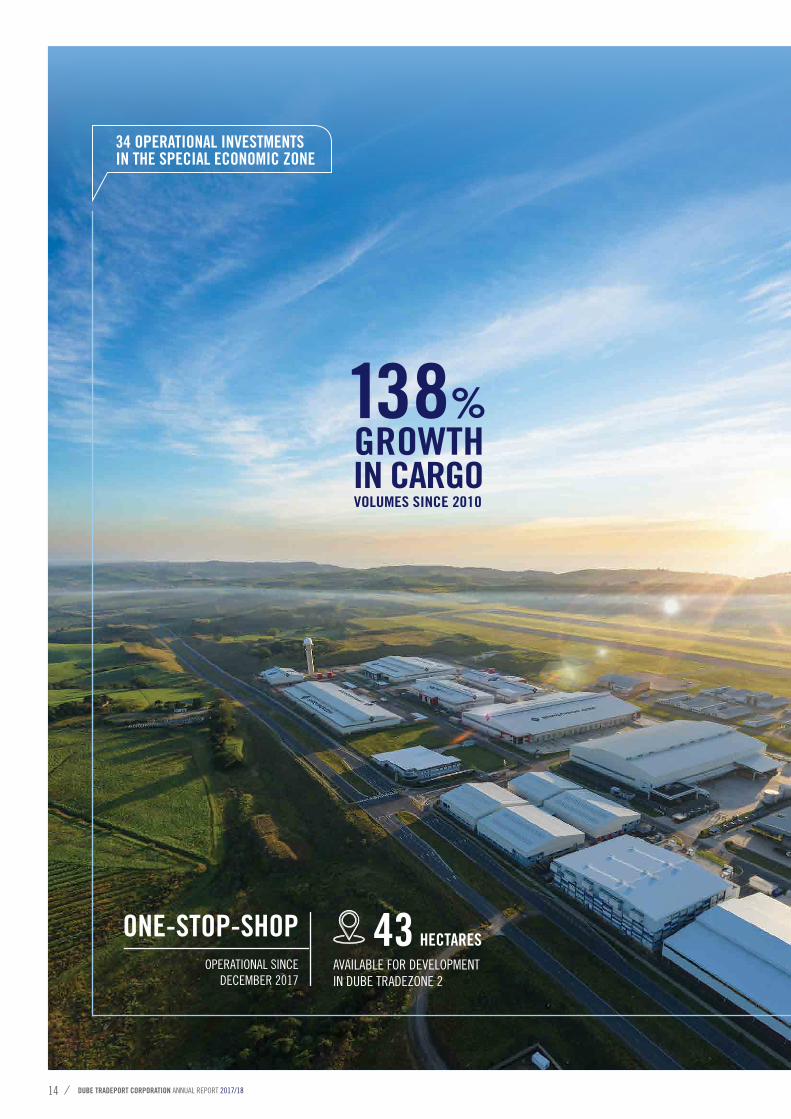
Importantly, increased air services have given effect to significant growth in air cargo volumes. International cargo, handled by Dube Cargo Terminal, increased by 12.7% which mirrors the positive trend it has displayed during the past seven years, since the airport’s inception in 2010. In that time cargo volumes have grown by 138%.
Turning to our property portfolio, revenue growth achieved during the past financial year is indicative of the competitive nature of the value proposition we offer both tenants and developers. Similarly, revenue growth in the telecommunications and internet services business, operated
CHAIRPERSON’S STATEMENT
DR ZANELE BRIDGETTE GASAChairperson of the Board of Dube TradePort Corporation
DUBE TRADEPORT CORPORATION’S POSITIVE AND MOST ENCOURAGING PERFORMANCE DURING THE 2017/18 FINANCIAL YEAR IS TESTAMENT TO THE IMPORTANCE WE ATTACH TO ABSOLUTE ADHERENCE TO A SOUND
GOVERNANCE REGIME, REGARDED ESSENTIAL FOR THE INTEGRITY OF OUR ORGANISATION AND THE OPERATIONAL
TRANSPARENCY WE ESPOUSE.
429NEW EMPLOYMENTOPPORTUNITIES CREATED BY INVESTORS ON SITE
by Dube iConnect, demonstrated our highly competent originations ability regarding the provision to business of a host of value-added services which are part-and-parcel of our world-class operating environment, inclusive of a state-of-the-art cloud computing platform for hosting data and services.
Dube TradePort Corporation has thrown its weight behind the push for radical economic transformation and, in so doing, we re-affirmed the further development of our Broad-Based Black Economic Empowerment Strategy. To this end, a number of targets and transformational goals were contained in our Annual Performance Plan, focusing on especially - though not exclusively - black industrialists and property developers.
The year under review witnessed our implementation, in earnest, of the strategy, which entailed identifying mechanisms to ensure the meaningful empowerment of emerging enterprises and laying the groundwork necessary to meet small business needs.
During the review period we trained representatives from various small, medium and micro enterprises in a number of disciplines, from financial and project management to health and safety issues. In addition, we introduced an enterprise development concept in the further recognition of the need to empower small businesses through deriving an equitable share of work undertaken by our service providers. We have accordingly set-out to contract with suppliers which have enterprise development partnerships, ensuring that such emergent partners secure between a 15% and 45% split on the contracts we sign with suppliers.
During the 2017/18 financial year more than 60% of Dube TradePort Corporation’s procurement expenditure went to targeted businesses including EME’s and QSE’s, black-owned and black women-owned businesses.
However, to harness the full potential of our people, we believe that socio-economic development really begins at the grass-roots community level. Corporate social investment is something we take most seriously, empowering ordinary people with the opportunity to learn, grow and develop the requisite skills and experience to become meaningful stakeholders in the economy.
Dube TradePort Corporation has invested a total of R4.4 million in bursaries, targeting the scarce skills environment of engineering and science at tertiary level, and expending R590 000 in the 2017/18 financial year alone. An additional R2.1 million was invested in our internship programme and other training interventions aimed at graduates, ensuring their future employability.
Our social investment programme also extended to assisting a number of primary and high schools. During the period under review we invested R1.0 million installing solar power and providing school uniforms and learning aids to schools in our area.
In conclusion, I take the opportunity to sincerely thank the Provincial Government of KwaZulu-Natal and, in particular, the MEC for Economic Development, Tourism and Environmental Affairs, Mr Sihle Zikalala, MPL, for their steadfast support and guidance during the past financial year. We are most grateful for your leadership.
I also extend my heartfelt appreciation to my fellow Board members for their collective business acumen and individual knowledge and experience in forging Dube TradePort Corporation’s strategic direction. Your insights have played a telling role in taking our organisation forward. Equally, I must acknowledge our Chief Executive Officer, Mr Hamish Erskine,
his executive team and our members of staff, all of whom have displayed remarkable dedication to the task at hand and, ultimately, in ensuring that our organisation continues to deliver against its mandate. On behalf of the Board, we greatly appreciate your invaluable contribution.
Let’s now all build on the successes we have achieved, redoubling our efforts in the pursuit of our ultimate goal... the realisation of the Dube TradePort Corporation’s long-term master plan.
Dr Zanele Bridgette GasaChairperson
DUBE TRADEPORT CORPORATION ANNUAL REPORT 2017/1814
43 HECTARESAVAILABLE FOR DEVELOPMENT IN DUBE TRADEZONE 2
34 OPERATIONAL INVESTMENTS IN THE SPECIAL ECONOMIC ZONE
ONE-STOP-SHOPOPERATIONAL SINCE
DECEMBER 2017
VOLUMES SINCE 2010
138GROWTH IN CARGO
%
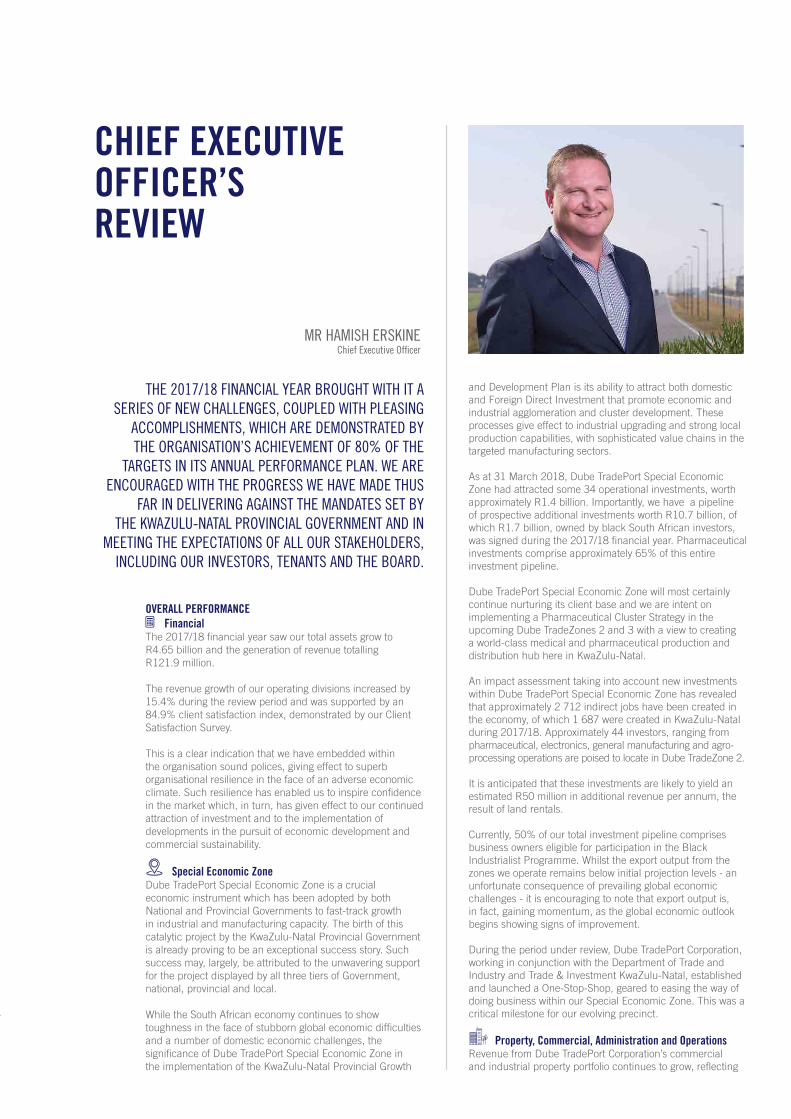
CHIEF EXECUTIVE OFFICER’S REVIEW
MR HAMISH ERSKINEChief Executive Officer
OVERALL PERFORMANCEFinancial
The 2017/18 financial year saw our total assets grow to R4.65 billion and the generation of revenue totallingR121.9 million.
The revenue growth of our operating divisions increased by 15.4% during the review period and was supported by an 84.9% client satisfaction index, demonstrated by our Client Satisfaction Survey.
This is a clear indication that we have embedded within the organisation sound polices, giving effect to superb organisational resilience in the face of an adverse economic climate. Such resilience has enabled us to inspire confidence in the market which, in turn, has given effect to our continued attraction of investment and to the implementation of developments in the pursuit of economic development and commercial sustainability.
Special Economic ZoneDube TradePort Special Economic Zone is a crucial economic instrument which has been adopted by both National and Provincial Governments to fast-track growth in industrial and manufacturing capacity. The birth of this catalytic project by the KwaZulu-Natal Provincial Government is already proving to be an exceptional success story. Such success may, largely, be attributed to the unwavering support for the project displayed by all three tiers of Government, national, provincial and local.
While the South African economy continues to show toughness in the face of stubborn global economic difficulties and a number of domestic economic challenges, the significance of Dube TradePort Special Economic Zone in the implementation of the KwaZulu-Natal Provincial Growth
and Development Plan is its ability to attract both domestic and Foreign Direct Investment that promote economic and industrial agglomeration and cluster development. These processes give effect to industrial upgrading and strong local production capabilities, with sophisticated value chains in the targeted manufacturing sectors.
As at 31 March 2018, Dube TradePort Special Economic Zone had attracted some 34 operational investments, worth approximately R1.4 billion. Importantly, we have a pipeline of prospective additional investments worth R10.7 billion, of which R1.7 billion, owned by black South African investors, was signed during the 2017/18 financial year. Pharmaceutical investments comprise approximately 65% of this entire investment pipeline.
Dube TradePort Special Economic Zone will most certainly continue nurturing its client base and we are intent on implementing a Pharmaceutical Cluster Strategy in the upcoming Dube TradeZones 2 and 3 with a view to creating a world-class medical and pharmaceutical production and distribution hub here in KwaZulu-Natal.
An impact assessment taking into account new investments within Dube TradePort Special Economic Zone has revealed that approximately 2 712 indirect jobs have been created in the economy, of which 1 687 were created in KwaZulu-Natal during 2017/18. Approximately 44 investors, ranging from pharmaceutical, electronics, general manufacturing and agro-processing operations are poised to locate in Dube TradeZone 2.
It is anticipated that these investments are likely to yield an estimated R50 million in additional revenue per annum, the result of land rentals.
Currently, 50% of our total investment pipeline comprises business owners eligible for participation in the Black Industrialist Programme. Whilst the export output from the zones we operate remains below initial projection levels - an unfortunate consequence of prevailing global economic challenges - it is encouraging to note that export output is, in fact, gaining momentum, as the global economic outlook begins showing signs of improvement.
During the period under review, Dube TradePort Corporation, working in conjunction with the Department of Trade and Industry and Trade & Investment KwaZulu-Natal, established and launched a One-Stop-Shop, geared to easing the way of doing business within our Special Economic Zone. This was a critical milestone for our evolving precinct.
Property, Commercial, Administration and OperationsRevenue from Dube TradePort Corporation’s commercial and industrial property portfolio continues to grow, reflecting
THE 2017/18 FINANCIAL YEAR BROUGHT WITH IT A SERIES OF NEW CHALLENGES, COUPLED WITH PLEASING
ACCOMPLISHMENTS, WHICH ARE DEMONSTRATED BY THE ORGANISATION’S ACHIEVEMENT OF 80% OF THE
TARGETS IN ITS ANNUAL PERFORMANCE PLAN. WE ARE ENCOURAGED WITH THE PROGRESS WE HAVE MADE THUS
FAR IN DELIVERING AGAINST THE MANDATES SET BY THE KWAZULU-NATAL PROVINCIAL GOVERNMENT AND IN
MEETING THE EXPECTATIONS OF ALL OUR STAKEHOLDERS, INCLUDING OUR INVESTORS, TENANTS AND THE BOARD.
DUBE TRADEPORT CORPORATION ANNUAL REPORT 2017/1816
an increase of 20% in the 2017/18 financial year. Dube TradePort Corporation has welcomed 11 new property tenants during the period under review, along with a number of newly operational companies within Dube TradePort Special Economic Zone.
The construction and set-up of a new semi-knock down production facility for Mahindra was undertaken during the review period, becoming operational in May 2018. Located in Dube TradeZone 1, the plant will produce 200 vehicles every month.
In addition, a lease was concluded with Sabipharm, a majority black-owned bio-pharmaceutical company, for the development of a production facility and which will become the first major private sector investment within our new pharmaceutical cluster.
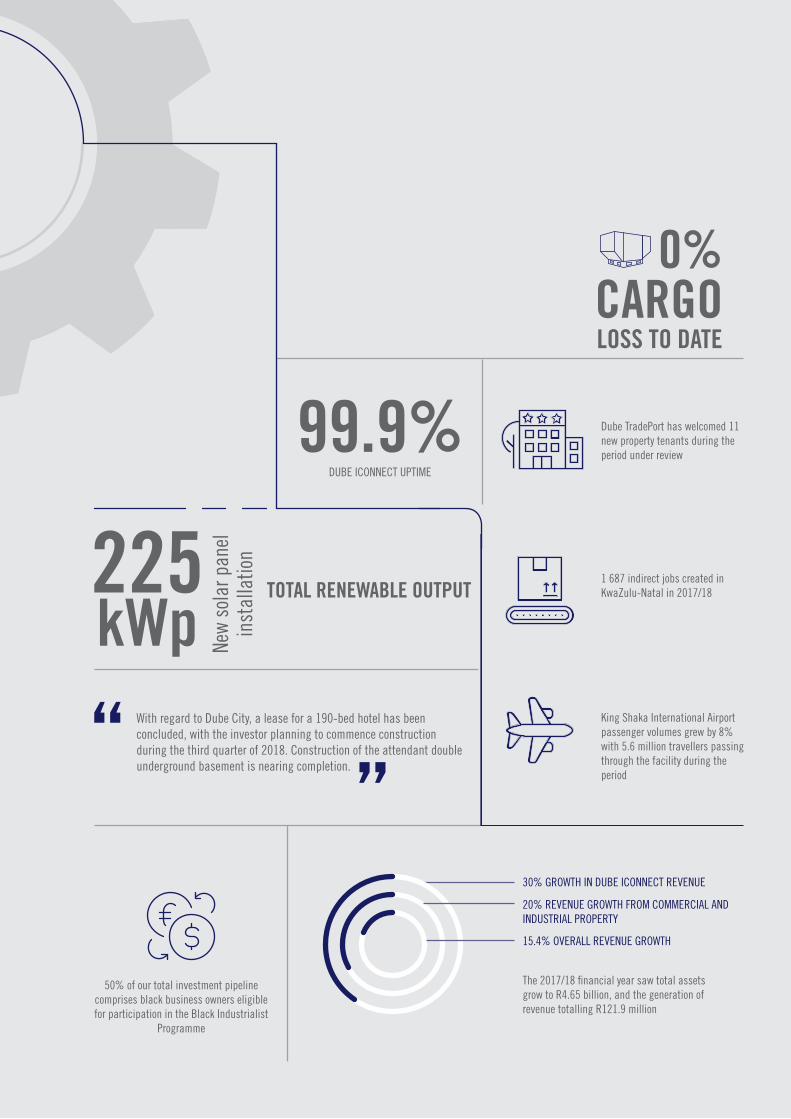
With regard to Dube City, a lease for a 190-bed hotel has been concluded, with the investor planning to commence construction during the third quarter of 2018. Construction of the attendant double underground basement is nearing completion.
Dube AgriZoneThe critical cornerstone of our Dube AgriZone operations has been our commitment to driving innovations that facilitate the ease of doing business within the precinct.
Early in the 2017/18 financial year we commissioned two new solar plants, with a combined power output of 225kWp, for the supply of renewable energy to the greenhouses within Dube AgriZone. This innovative intervention has effectively reduced dependence on the grid by more than 20%, translating into a direct operational cost saving of an average of R323 633 a year for businesses operating within these facilities.
Water management is another area in which we have continually endeavoured to promote efficiencies and savings. This, we believe, is especially important in an agricultural precinct, such as Dube AgriZone. We, accordingly, undertook a review of the entire water management system here, employing international best practice, to identify a range of available opportunities to appreciably improve the system.
Various interventions are currently being implemented and we are confident that they will deliver sound results and will have a profoundly positive impact on the businesses operating within our precinct.
We also set about evaluating suitable proposals to operate a further 23% of the remaining lettable space within our greenhouses (Block A) and feel sure that following the extensive evaluation of prospective tenants, we will be in a position to announce a suitable operator during the
first quarter of the 2018/19 financial year. Pleasingly, the prospect of a second phase of development within Dube AgriZone has sparked considerable interest from local and international agricultural investors alike.
Importantly, there are those in the agro-processing space who recognise the huge opportunities which exist in linking with the local value chain, in the form of primary producers, and this has resulted in the signing of two Memoranda of Understanding with prospective new tenants.
Previously experienced issues at Dube AgriLab have largely been resolved, with production increases exceeding the 20% year-on-year mark during the 2017/18 financial year. We have also witnessed increasing interest in our plant tissue culture services by local producers of sub-tropical crops. Crucially, the profile of our service has also shown steady growth, best evidenced by the recent export of ornamental plants to the Netherlands.
In addition, the hardening facility has played a major role in increasing production, contributing to the development of mother stock for emerging farmers in the surrounding areas.
Dube Cargo TerminalThe 2017/18 financial year saw Dube Cargo Terminal continue on an impressive growth trajectory, demonstrating KwaZulu-Natal’s largely untapped market potential for the uplift of airfreight.
Uptake has increased thanks, in no small measure, to the growth of direct air services into the Province. Indeed, the period under review saw marked growth in both domestic and international cargo volumes at 4.7% and 12.7% respectively. This resulted in revenue growth of 9.2% compared against the previous year and was 28.8% above target.
I am pleased to report that cargo volumes are forecast to show continued growth in the 2018/19 financial year, as shippers and freight forwarders begin utilising still more of the available capacity on the airlines flying to and from Durban.
Our Dube Cargo Terminal operations were specifically focused on driving efficiencies and maintaining high levels of service to airlines and customers. It is particularly pleasing to share the fact that Dube Cargo Terminal maintained a 100% service level rate with its customer airlines and, even more impressively, retained its record of zero cargo loss since the commencement of operations back in 2010, whilst meeting all regulations required by the South African Civil Aviation Authority.
In this regard, upgrades to scanning equipment were undertaken during the period under review, including the
(CONTINUED)
CHIEF EXECUTIVE OFFICER’S REVIEW
installation of another dual view scanner, a move which was in line with international air cargo standards. Similarly, Dube AiRoad has also made great strides in the road freight space, by seamlessly connecting air and road transport modes and, in so doing, expanding its customer base. Particularly strong growth was realised during the second half of the review period, compared against the previous year.
Durban DirectThe hard work put into route development, designed to encourage the introduction of additional air services into Durban, has begun paying handsome dividends.
Passenger volumes at King Shaka International Airport grew by 8% during the 2017/18 financial year, with 5.6 million travellers passing through the facility, in spite of the prevailing difficult economic conditions. We regard this as yet another important milestone, one of which we may be justifiably proud and one which will spur us to even greater efforts to attract additional airlines to Durban.
Crucially, we have also witnessed positive growth in international passenger numbers, with volumes growing by 2% year-on-year. Indeed, since the opening of the airport in 2010, international passenger numbers have grown by a remarkable 102%.
Now is not the time to rest on our laurels, however. Looking to the future it is pleasing to note that Air Mauritius intends offering a three-flights-a-week service between Durban and the Indian Ocean island during the forthcoming 2018/19 financial year. In addition, Qatar Airways is poised to substitute its current Boeing 787 aircraft to that of a Boeing 777, adding an additional 416 seats per week to the Durban market.
Dube iConnectDube iConnect, our dedicated information technology and telecommunications provider, performed admirably during the period under review, growing revenue by an outstanding 30%. The increase was driven, largely, by a significant increase in revenues derived from Dube iConnect Resellers.
However, it would be true to say that a significant proportion of such revenue growth may be attributed to improved uptake of both Data Centre services and internet connectivity services provided to tenants located within the Dube TradePort precinct.
During the past several years, Dube iConnect’s Infrastructure-as-a-Service platform was principally focused on signing-up resellers. The review period saw these efforts translate into our resellers also making increased use of Dube iConnect services in, especially, the internet and last mile telecommunication space.
In addition, we were extremely pleased to learn that some 30 small, medium and micro enterprises working with Dube iConnect were selected to become part of Broadband Infraco’s connectivity programme, SA Connect. This development clearly demonstrates the efficacy of our plans to provide opportunities for such emergent enterprises to access the high-end technology services space.
Here they have a very real opportunity to win significant business accounts and to compete on a level playing-field with established service providers, using Dube iConnect’s Infrastructure-as-a-Service platform.
Development Planning and Infrastructure During the 2017/18 financial year, our Development Planning and Infrastructure programme has focused on continuing
efforts to increase development nodes for the ongoing growth of the Dube TradePort project.
These activities stemmed from a decision to extend the organisation’s mandate beyond that of implementing the Durban aerotropolis master plan, to include the development of an Automotive Supplier Park, to be located at Illovo on the Province’s south coast.
In the wake of Provincial approval of the Durban Aerotropolis Master Plan, we have worked to implement a number of critical and strategic projects, including the Public Transport Link Solution to King Shaka International Airport and the Umdloti Regional Waste-Water Treatment Works, both of which have been registered with National Treasury as Public-Private Partnership initiatives.
In addition, a feasibility study into an aviation-linked project, being the provision of a Maintenance, Repair and Overhaul facility, was also undertaken.
A number of other statutory planning applications were also successfully lodged with various authorities and included eThekwini Municipality’s approval of an amended Special Zone 10 Airport Scheme, resulting in increased mixed land use for both King Shaka International Airport and Dube TradePort Corporation.
Dube TradeZone 2’s rezoning application to the Local Municipality was submitted and a final decision is currently awaited. The green light will enable our organisation to access an additional 43 hectares of land for industrial site development.
In addition, the Department of Agriculture, Forestry and Fisheries provided its consent for the release of Support Zone 2 from the constraints of the Agricultural Land Act, No. 70 of 1970.
An undoubted highlight of the year under review was the achievement of a positive environmental authorisation from the Department of Environmental Affairs for Support Zone 2. This approval has paved the way for Dube TradePort Corporation to lodge a rezoning application pertaining to this precinct in terms of eThekwini Municipality’s SPLUMA by-laws of 2016 and, thereafter, to commence with the servicing of sites.
DUBE TRADEPORT CORPORATION ANNUAL REPORT 2017/1818
Regrettably, however, we experienced delays with regard to our proposed Dube AgriZone 2 and TradeZone 3 (uShukela) developments. It was also necessary to re-lodge our Basic Assessment Report for the uShukela Development in December 2017 to align with new legislation.
We also faced two infrastructure delivery setbacks during the past financial year. Unfortunately, Dube TradeZone 2 bulk earthworks was legally challenged and whilst the courts ruled in our favour, we suffered a delay in the project. Equally, the delivery of the double basement project in Dube City was also delayed, the result of the lead contractor in this joint venture responsible for its construction experiencing major financial difficulties.
On a more positive note, construction projects successfully concluded included the Dube TradeZone 1 guard-houses and the establishment of the One-Stop-Shop facility. Work also commenced on removing a hill on the site set to include the proposed Maintenance, Repair and Overhaul facility, a set of Mini Factories and the AirChef’s Tenant 2 installation.
Corporate Services Dube TradePort Corporation continues striving towards being an employer of choice and we recognise that one of our key strengths remains our staff. We currently employ 183 members of staff and 33 interns, without whom the performance of the past year would not have been possible. We continue to invest in training as a means of developing key talent as a priority. During the review period, we spent an equivalent of 3.3% of our total payroll cost on training. We are firm supporters of the philosophy that internally developed talent is preferable and have, accordingly, developed a talent management strategy to ensure our focus on our talent is maintained. We have also enhanced our employee programmes, making them more responsive to the main factors affecting employee productivity, which has allowed us to become a more caring employer. For many years now, our payroll had been outsourced and during the review period we successfully converted our payroll function to one undertaken in-house.
Mr Hamish ErskineChief Executive OfficerDube TradePort Corporation
84.9 %CLIENT SATISFACTION DEMONSTRATED BY OUR CLIENT SATISFACTION SURVEY
Employment equity remains an ongoing focus with 90% of all employees being drawn from historically disadvantaged groups. We have also recorded the sterling 91% achievement of our broader employment equity targets, as articulated in our Employment Equity Plan.
CONCLUSION I take this opportunity, on behalf of my executive colleagues, to thank most sincerely the members of our new Board for the leadership and strategic direction they have lent to the growth and development of our organisation, driving it confidently into the future.
I am also pleased to echo the sentiments expressed by our Chairperson in thanking Mr Sihle Zikalala, MEC for Economic Development, Tourism and Environmental Affairs, for his invaluable support and the wisdom behind his guidance.
Last, but not least, I am most grateful to the executive management and all our members of staff for their unstinting commitment to the task at hand.
Together, we have made great strides during the 2017/18 financial year and together we have the expertise, skill and enthusiasm to take Dube TradePort Corporation to an altogether new business level, making Dube TradePort Special Economic Zone a truly world-class investment destination.
(CONTINUED)
CHIEF EXECUTIVE OFFICER’S REVIEW
TOTAL RENEWABLE OUTPUT
New
sola
r pan
el
15.4% OVERALL REVENUE GROWTH
20% REVENUE GROWTH FROM COMMERCIAL AND INDUSTRIAL PROPERTY
The 2017/18 financial year saw total assets grow to R4.65 billion, and the generation of revenue totalling R121.9 million
Dube TradePort has welcomed 11 new property tenants during the period under review
1 687 indirect jobs created in KwaZulu-Natal in 2017/18
King Shaka International Airport passenger volumes grew by 8% with 5.6 million travellers passing through the facility during the period
50% of our total investment pipeline comprises black business owners eligible for participation in the Black Industrialist
Programme
30% GROWTH IN DUBE ICONNECT REVENUE
99.9%
225 kWp
DUBE ICONNECT UPTIME
inst
alla
tion
With regard to Dube City, a lease for a 190-bed hotel has been concluded, with the investor planning to commence construction during the third quarter of 2018. Construction of the attendant double underground basement is nearing completion.
LOSS TO DATE
0%CARGO
DUBE TRADEPORT CORPORATION ANNUAL REPORT 2017/1820
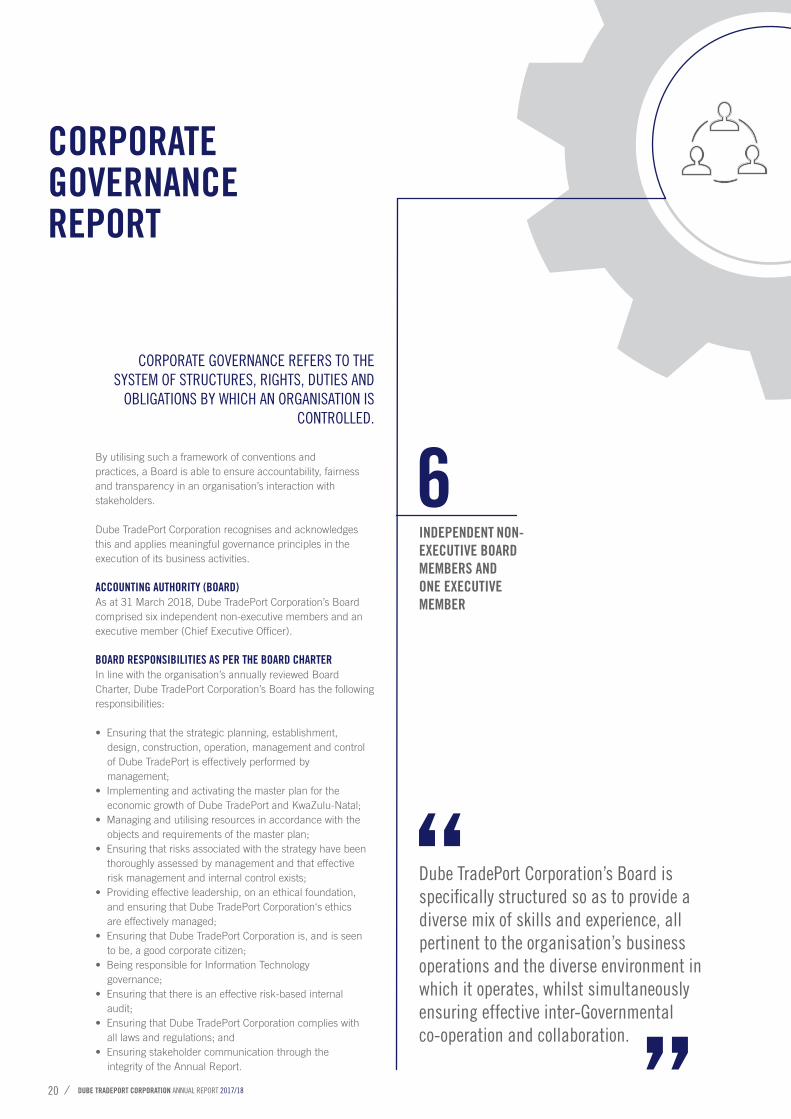
By utilising such a framework of conventions and practices, a Board is able to ensure accountability, fairness and transparency in an organisation’s interaction with stakeholders.
Dube TradePort Corporation recognises and acknowledges this and applies meaningful governance principles in the execution of its business activities.
ACCOUNTING AUTHORITY (BOARD)As at 31 March 2018, Dube TradePort Corporation’s Board comprised six independent non-executive members and an executive member (Chief Executive Officer).
BOARD RESPONSIBILITIES AS PER THE BOARD CHARTERIn line with the organisation’s annually reviewed Board Charter, Dube TradePort Corporation’s Board has the following responsibilities:
• Ensuring that the strategic planning, establishment, design, construction, operation, management and control of Dube TradePort is effectively performed by management;• Implementing and activating the master plan for the economic growth of Dube TradePort and KwaZulu-Natal;• Managing and utilising resources in accordance with the objects and requirements of the master plan;• Ensuring that risks associated with the strategy have been thoroughly assessed by management and that effective risk management and internal control exists;• Providing effective leadership, on an ethical foundation, and ensuring that Dube TradePort Corporation‘s ethics are effectively managed;• Ensuring that Dube TradePort Corporation is, and is seen to be, a good corporate citizen;• Being responsible for Information Technology governance;• Ensuring that there is an effective risk-based internal audit;• Ensuring that Dube TradePort Corporation complies with all laws and regulations; and• Ensuring stakeholder communication through the integrity of the Annual Report.
6INDEPENDENT NON-EXECUTIVE BOARD MEMBERS AND ONE EXECUTIVE MEMBER
Dube TradePort Corporation’s Board is specifically structured so as to provide a diverse mix of skills and experience, all pertinent to the organisation’s business operations and the diverse environment in which it operates, whilst simultaneously ensuring effective inter-Governmental co-operation and collaboration.
CORPORATE GOVERNANCE REFERS TO THE SYSTEM OF STRUCTURES, RIGHTS, DUTIES AND
OBLIGATIONS BY WHICH AN ORGANISATION IS CONTROLLED.
CORPORATE GOVERNANCE REPORT
Prior to 01 April 2011, Dube TradePort Corporation operated as a Non-Profit Company (formerly referred to as a Section 21 Company) registered under the Companies Act.
However, from 01 April 2011, Dube TradePort Corporation became a Schedule 3C Provincial Public Entity, formalised in September 2011 in line with the publication of a notice in the Government Gazette.
The KwaZulu-Natal Dube TradePort Corporation Act, No. 2 of 2010, allowed for the establishment, management, staffing and financing of Dube TradePort Corporation as a Public Entity, and the winding-up of the Dube TradePort Non-Profit Company. Furthermore, the Act provided for Dube TradePort Corporation to be the successor in law of Dube TradePort Non-Profit Company Proprietary Limited.
The Non-Profit Company was concluded on 31 August 2013.
KwaZulu-Natal’s Member of the Executive Council for Economic Development, Tourism and Environmental Affairs, Mr Sihle Zikalala, and Dube TradePort Corporation’s Chairperson annually sign a Shareholders Compact, which describes the responsibilities of each of the signatories.
PUBLIC FINANCE MANAGEMENT ACTThe Dube TradePort Corporation Board is regarded as the Accounting Authority in terms of the Public Finance Management Act, No. 1 of 1999 (PFMA).
The Act is also applicable to its subsidiary, La Mercy JV Property Investments Proprietary Limited, which is held jointly by Dube TradePort Corporation (60%) and Airports Company South Africa SOC Limited (40%), and which is deemed to be a Schedule 3C Provincial Public Entity.
The PFMA regulates financial management and governance, together with the responsibilities of the Board.
The organisation ensures that the members of its Board and its complement of staff are familiar with the provisions of the PFMA through induction and other regular training interventions.
FOURTH REPORT ON CORPORATE GOVERNANCE (KING IV)Dube TradePort Corporation acknowledges the need to remain committed to the highest standards of corporate governance and the inculcation of ethical and moral business behaviour amongst all its members of staff.
The King IV Report on Corporate Governance, effective from 01 April 2017, represents South Africa’s principal corporate governance framework.
Accordingly, Dube TradePort Corporation has committed itself to complete adherence to the principles contained in the King IV Report on Corporate Governance.
Dube TradePort Corporation has commenced the transition from following the recommendations contained in King III to implementing the principles espoused in the King IV Report on Corporate Governance.
An assessment was performed by an independent service provider and Dube TradePort Corporation is already in substantive alignment with such principles.
Every endeavour is being made to implement and commence reporting on areas in which improvement is required.
Organisational policies and procedures are regularly developed and introduced as Dube TradePort Corporation grows and matures. Existing policies and procedures are regularly reviewed and enhanced by Committees of the
Board. All new policies are approved by the Board prior to implementation.
THE BOARD AND COMMITTEESDube TradePort Corporation employs a unitary Board structure, with a majority of independent, non-executive members.
Board members are appointed by the organisation’s shareholder, being KwaZulu-Natal’s Member of the Executive Council for Economic Development, Tourism and Environmental Affairs. The diversity of the Board members’ skills is further augmented in the Audit and Risk, Remuneration and Human Resources, and Investment Committees, the result of the inclusion of external members whose participation, while not being members of the Board, is permissible in terms of the PFMA.
Board members may be appointed for a term of up to five years, in terms of the KwaZulu-Natal Dube TradePort Corporation Act, No. 2, of 2010.
The independent non-executive members of the Board collectively bring a wealth of expertise from their own specialist fields, ensuring that the Board’s discussions on strategy, policy and performance are lively, constructive and robust.
The Act requires that Board members display skills in the areas of financial management, the tourism industry, the transport sector, the economic development sector and any other skill, experience or qualification that, in the discretion exercised by the KwaZulu-Natal Member of the Executive Committee for Economic Development, Tourism and Environmental Affairs, may be of benefit to Dube TradePort Corporation.
The term of office for former members of the Board ended on 07 March 2017.
However, the KwaZulu-Natal Member of the Executive Council for Economic Development, Tourism and Environmental Affairs extended the term of office until a new Board could be appointed.
The current Board was appointed, with effect from 01 June 2017, for an initial one-year term of office.
Dr Bridgette Gasa was reappointed to lead the new Board, thus ensuring continuity and stability during the hand-over process.
Further, institutional knowledge was retained with Mr Paulos Ngcobo - who previously served as an independent member of the Remuneration and Human Resources Committee - being appointed to serve as Deputy Chairperson of the Board and by the Chairpersons of the Audit and Risk and Investment Committees continuing to serve Dube TradePort Corporation in their respective capacities.
The Board consists of a diverse and transformed group, comprising six black independent non-executive Board members (three of whom are female) and one white executive male member.
Various committees of the Board assist the Board in fulfilling its stated objectives and responsibilities. Committee roles and responsibilities are detailed in each committee’s formal Terms of Reference. The Audit and Risk Committee undertakes additional responsibilities, as required in terms of the PFMA.
The Terms of Reference of each Board committee are
DUBE TRADEPORT CORPORATION ANNUAL REPORT 2017/1822
reviewed annually, thus ensuring continuous relevance and allowing for the inclusion of legislative changes or best practice.
Board and committee meetings are convened by formal notice to the members.
Meeting packs containing detailed memoranda and management reports are distributed by the Company Secretary in advance of scheduled meetings and Board committee members are afforded ample opportunity to study the material presented and to request additional information from management, where necessary.
Board and committee members have unrestricted access to management.
The focus for the forthcoming year will be to ensure that the Board Charter and Terms of Reference of each of the committees is aligned to the principles contained in King IV.
BOARD RESPONSIBILITIESThe Board is responsible for strong ethical leadership and, as the custodian of corporate governance, accepts responsibility for ensuring that the entity conducts its business in line with ethically sound governance principles, which extend beyond mere legislative and regulatory compliance.
The Board attempts to lead by example and sets the tone for an ethical organisational culture.
The Board also assumes responsibility for approving and adopting strategic plans and for providing management with sound leadership, in line with Dube TradePort Corporation’s values, whilst understanding that strategy, risk, performance and sustainability are inseparable.
This is achieved through the annual review of key policies and ensures that the organisation’s obligations to key stakeholders are effectively met.
The Board Charter is reviewed annually. For more information regarding specific Board responsibilities, please refer to: www.dubetradeport.co.za/Corp_Gov
During the year under review, the following training initiatives were provided to Board members:
• Board induction; and• Aerotropolis master plan.
The Board receives feedback from the Audit and Risk Committee and is satisfied that policies have been designed and implemented, underpinning an effective system of internal control and internal financial control.
BOARD INDUCTIONThe entire Board and the independent Chairpersons of the committees attended a Board Induction, during which members of the executive management team discussed the strategy and vision.
Board members also participated in a site visit designed to enhance their understanding of operations and to confirm the implementation of the master plan throughout the precinct.
CHAIRPERSON AND CHIEF EXECUTIVE OFFICERThe role of the Chairperson of the Board is to take responsibility, together with members of the Board, for the organisation’s strategic direction, its policies and its procedures. The Board is currently led by Dr Bridgette Gasa.
The role of the Chief Executive Officer is to take responsibility for the effective management of Dube TradePort Corporation and the implementation of the strategy, policy and directives of the Board. The roles of the Chairperson of the Board and the Chief Executive Officer are separate and clearly defined, such that no one individual has unfettered powers of decision-making. In any instance where the Chairperson may be conflicted, the Deputy Chairperson will be available to lead the Board.
The Chief Executive Officer is appointed for a five-year term. Mr Hamish Erskine has no other professional commitments outside Dube TradePort Corporation.
DELEGATION OF AUTHORITYA comprehensive Delegation of Authority framework is in place, ensuring the timely and effective implementation of the Board’s strategy.
This Delegation of Authority framework does not, however, relieve the Board of its responsibilities and the Board retains the prerogative to withdraw any given Delegation of Authority at any time. The Delegation of Authority document is reviewed at least annually, or whenever required.
BOARD EVALUATIONThe Board conducts annual assessments of the performance of the Accounting Authority and structure.
Such assessments are conducted by way of self-evaluation by each member. The assessment of performance is inclusive of the conduct of all members who serve on the various committees.
The combined results of these questionnaires are shared with all participants in order to identify and assist in addressing any areas where challenges are being experienced.
A summary report of these performance assessments is shared with the KwaZulu-Natal Member of the Executive Council for Economic Development, Tourism and Environmental Affairs.
In addition, recommendations flowing from the evaluation of the implementation of King IV principles undertaken during the year by an independent service provider are analysed and utilised to further improve the operation of the Board and to align its practises to the principles contained in the King IV Report on Corporate Governance.
The performance of the Company Secretary is reviewed by the Chief Executive Officer. The performance of the Chief Executive Officer is reviewed by the Chairperson of the Board. DECLARATIONS OF BOARD MEMBERS’ INTERESTSAs with all employees of Dube TradePort Corporation, Board members are required to complete declaration of interest forms annually.
In addition, interests are required to be declared prior to any and all meetings of the Board (and committees of the Board) where conflicts of interest might potentially arise.
In the case of a conflict being noted, such conflict is interrogated and, where necessary, the conflicted person is recused from the meeting.
STANDARDS OF BOARD MEMBERS’ CONDUCTBoard members conduct themselves with care, skill and diligence, as required by the fiduciary and general duties of Accounting Authorities, as stipulated in the PFMA.
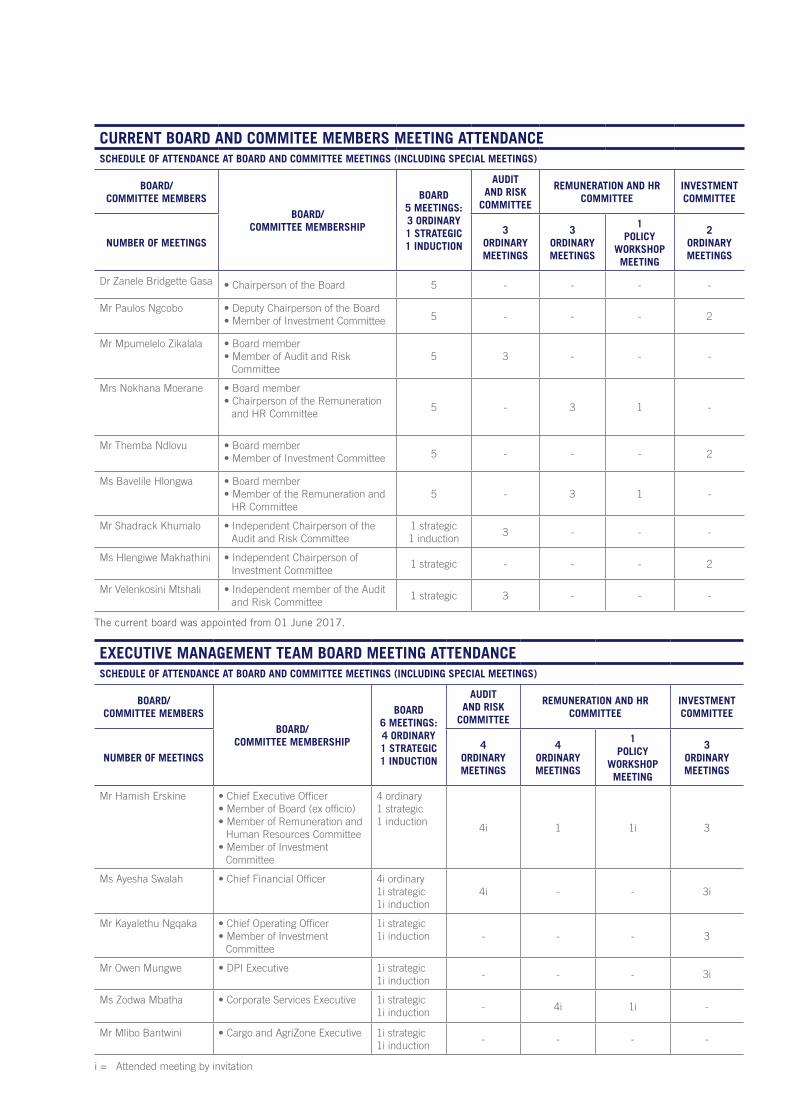
CURRENT BOARD AND COMMITEE MEMBERS MEETING ATTENDANCESCHEDULE OF ATTENDANCE AT BOARD AND COMMITTEE MEETINGS (INCLUDING SPECIAL MEETINGS)
BOARD/COMMITTEE MEMBERS
BOARD/COMMITTEE MEMBERSHIP
BOARD5 MEETINGS:3 ORDINARY1 STRATEGIC1 INDUCTION
AUDIT AND RISK
COMMITTEE
REMUNERATION AND HR COMMITTEE
INVESTMENT COMMITTEE
NUMBER OF MEETINGS3
ORDINARY MEETINGS
3 ORDINARY MEETINGS
1 POLICY
WORKSHOP MEETING
2 ORDINARY MEETINGS
Dr Zanele Bridgette Gasa • Chairperson of the Board 5 - - - -
Mr Paulos Ngcobo • Deputy Chairperson of the Board• Member of Investment Committee 5 - - - 2
Mr Mpumelelo Zikalala • Board member• Member of Audit and Risk
Committee5 3 - - -
Mrs Nokhana Moerane • Board member• Chairperson of the Remuneration
and HR Committee5 - 3 1 -
Mr Themba Ndlovu • Board member • Member of Investment Committee 5 - - - 2
Ms Bavelile Hlongwa • Board member• Member of the Remuneration and
HR Committee5 - 3 1 -
Mr Shadrack Khumalo • Independent Chairperson of the Audit and Risk Committee
1 strategic1 induction
3 - - -
Ms Hlengiwe Makhathini • Independent Chairperson of Investment Committee
1 strategic - - - 2
Mr Velenkosini Mtshali • Independent member of the Audit and Risk Committee
1 strategic 3 - - -
The current board was appointed from 01 June 2017.
i = Attended meeting by invitation
EXECUTIVE MANAGEMENT TEAM BOARD MEETING ATTENDANCE SCHEDULE OF ATTENDANCE AT BOARD AND COMMITTEE MEETINGS (INCLUDING SPECIAL MEETINGS)
BOARD/COMMITTEE MEMBERS
BOARD/COMMITTEE MEMBERSHIP
BOARD6 MEETINGS:4 ORDINARY1 STRATEGIC1 INDUCTION
AUDIT AND RISK
COMMITTEE
REMUNERATION AND HR COMMITTEE
INVESTMENT COMMITTEE
NUMBER OF MEETINGS4
ORDINARY MEETINGS
4 ORDINARY MEETINGS
1 POLICY
WORKSHOP MEETING
3 ORDINARY MEETINGS
Mr Hamish Erskine • Chief Executive Officer• Member of Board (ex officio)• Member of Remuneration and
Human Resources Committee• Member of Investment
Committee
4 ordinary1 strategic1 induction
4i 1 1i 3
Ms Ayesha Swalah • Chief Financial Officer 4i ordinary1i strategic1i induction
4i - - 3i
Mr Kayalethu Ngqaka • Chief Operating Officer• Member of Investment
Committee
1i strategic1i induction - - - 3
Mr Owen Mungwe • DPI Executive 1i strategic1i induction
- - - 3i
Ms Zodwa Mbatha • Corporate Services Executive 1i strategic1i induction - 4i 1i -
Mr Mlibo Bantwini • Cargo and AgriZone Executive 1i strategic1i induction
- - - -
DUBE TRADEPORT CORPORATION ANNUAL REPORT 2017/1824
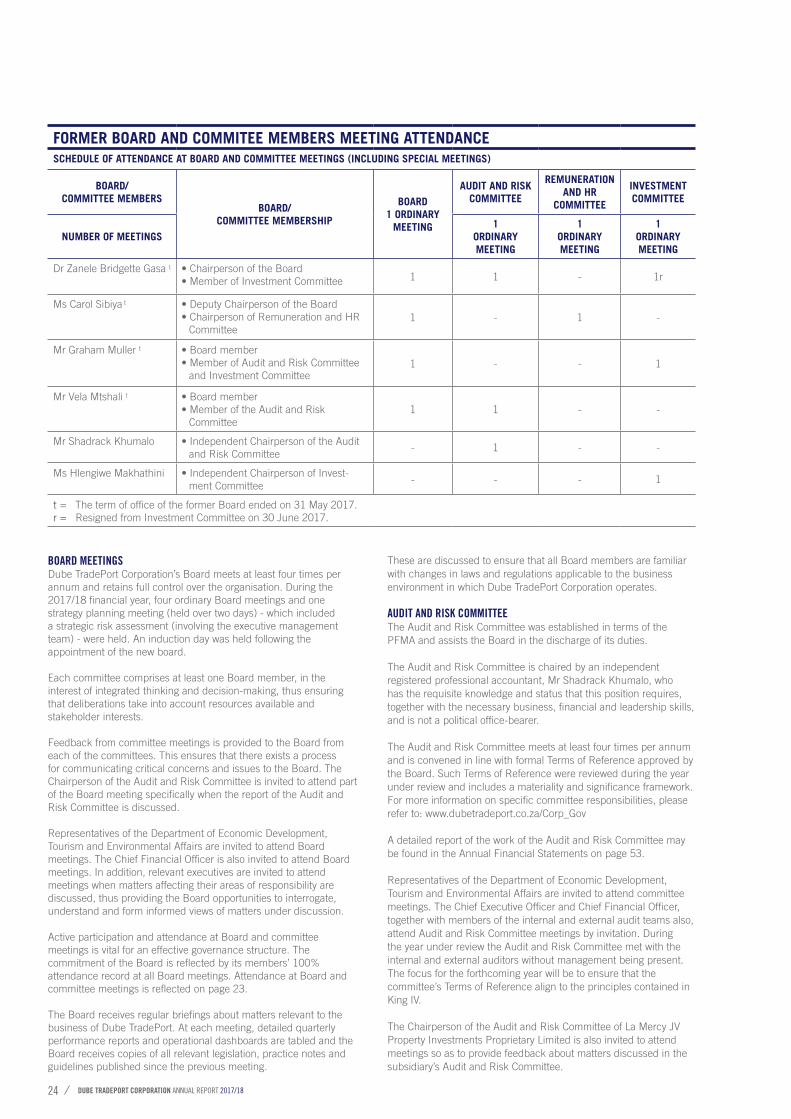
FORMER BOARD AND COMMITEE MEMBERS MEETING ATTENDANCESCHEDULE OF ATTENDANCE AT BOARD AND COMMITTEE MEETINGS (INCLUDING SPECIAL MEETINGS)
BOARD/COMMITTEE MEMBERS
BOARD/COMMITTEE MEMBERSHIP
BOARD1 ORDINARY
MEETING
AUDIT AND RISK COMMITTEE
REMUNERATION AND HR
COMMITTEE
INVESTMENT COMMITTEE
NUMBER OF MEETINGS1
ORDINARY MEETING
1 ORDINARY MEETING
1 ORDINARY MEETING
Dr Zanele Bridgette Gasa t • Chairperson of the Board • Member of Investment Committee 1 1 - 1r
Ms Carol Sibiya t • Deputy Chairperson of the Board• Chairperson of Remuneration and HR
Committee1 - 1 -
Mr Graham Muller t • Board member• Member of Audit and Risk Committee
and Investment Committee1 - - 1
Mr Vela Mtshali t • Board member• Member of the Audit and Risk
Committee1 1 - -
Mr Shadrack Khumalo • Independent Chairperson of the Audit and Risk Committee
- 1 - -
Ms Hlengiwe Makhathini • Independent Chairperson of Invest-ment Committee
- - - 1
t = The term of office of the former Board ended on 31 May 2017. r = Resigned from Investment Committee on 30 June 2017.
BOARD MEETINGS Dube TradePort Corporation’s Board meets at least four times per annum and retains full control over the organisation. During the 2017/18 financial year, four ordinary Board meetings and one strategy planning meeting (held over two days) - which included a strategic risk assessment (involving the executive management team) - were held. An induction day was held following the appointment of the new board.
Each committee comprises at least one Board member, in the interest of integrated thinking and decision-making, thus ensuring that deliberations take into account resources available and stakeholder interests. Feedback from committee meetings is provided to the Board from each of the committees. This ensures that there exists a process for communicating critical concerns and issues to the Board. The Chairperson of the Audit and Risk Committee is invited to attend part of the Board meeting specifically when the report of the Audit and Risk Committee is discussed.
Representatives of the Department of Economic Development, Tourism and Environmental Affairs are invited to attend Board meetings. The Chief Financial Officer is also invited to attend Board meetings. In addition, relevant executives are invited to attend meetings when matters affecting their areas of responsibility are discussed, thus providing the Board opportunities to interrogate, understand and form informed views of matters under discussion.
Active participation and attendance at Board and committee meetings is vital for an effective governance structure. The commitment of the Board is reflected by its members’ 100% attendance record at all Board meetings. Attendance at Board and committee meetings is reflected on page 23.
The Board receives regular briefings about matters relevant to the business of Dube TradePort. At each meeting, detailed quarterly performance reports and operational dashboards are tabled and the Board receives copies of all relevant legislation, practice notes and guidelines published since the previous meeting.
These are discussed to ensure that all Board members are familiar with changes in laws and regulations applicable to the business environment in which Dube TradePort Corporation operates.
AUDIT AND RISK COMMITTEEThe Audit and Risk Committee was established in terms of the PFMA and assists the Board in the discharge of its duties.
The Audit and Risk Committee is chaired by an independent registered professional accountant, Mr Shadrack Khumalo, who has the requisite knowledge and status that this position requires, together with the necessary business, financial and leadership skills, and is not a political office-bearer.
The Audit and Risk Committee meets at least four times per annum and is convened in line with formal Terms of Reference approved by the Board. Such Terms of Reference were reviewed during the year under review and includes a materiality and significance framework. For more information on specific committee responsibilities, please refer to: www.dubetradeport.co.za/Corp_Gov
A detailed report of the work of the Audit and Risk Committee may be found in the Annual Financial Statements on page 53.
Representatives of the Department of Economic Development, Tourism and Environmental Affairs are invited to attend committee meetings. The Chief Executive Officer and Chief Financial Officer, together with members of the internal and external audit teams also, attend Audit and Risk Committee meetings by invitation. During the year under review the Audit and Risk Committee met with the internal and external auditors without management being present. The focus for the forthcoming year will be to ensure that the committee’s Terms of Reference align to the principles contained in King IV.
The Chairperson of the Audit and Risk Committee of La Mercy JV Property Investments Proprietary Limited is also invited to attend meetings so as to provide feedback about matters discussed in the subsidiary’s Audit and Risk Committee.
INTERNAL CONTROLThe Dube TradePort Corporation Board is accountable for the organisation’s system of internal control and has delegated the implementation and management of this responsibility appropriately.
The organisation’s system of internal control ensures that significant risks are appropriately managed and provides reasonable assurance that:
• Policies (including financial policies) have been developed and are reviewed annually to ensure that the system of internal controls (including internal financial controls) are seamlessly integrated into the processes of Dube TradePort Corporation;• Business objectives will be achieved;• Operations are efficient and effective;• Management of financial information is reliable;• Dube TradePort Corporation’s assets and information are appropriately safeguarded; and• There is compliance with applicable laws and regulations.
Based on feedback from the Board’s committees, external independent assurance providers and management, the Board considers the system of internal controls and internal financial controls to be effective.
INTERNAL AUDITThe organisation’s internal audit function provides for independent assurance in terms of the adequacy and effectiveness of the system of internal control, in order to manage the significant risks faced by the organisation.
During 2016/17, Ernst and Young Inc. was appointed to provide the internal audit function. The annual audit coverage plan is developed through the application of a risk-based approach and is reviewed and approved by the Audit and Risk Committee annually. The plan also includes non-financial reviews in operational areas across the organisation. Key audit findings are reported to the Audit and Risk Committee by internal audit at the conclusion of each review.
Since the internal audit function is conducted by an external service provider, it is considered to be both objective and independent. This status is further maintained through its reporting functionally to the Audit and Risk Committee.
The quality of internal audit services are assured, as Ernst and Young Inc. conducts internal audit peer file reviews on a regular basis and which are independently conducted by internal and external quality teams. In addition, the firm is recognised by relevant associations, such as the South African Institute of Chartered Accountants, the Institute of Internal Auditors of South Africa and the Information Systems Audit and Control Association. Ernst and Young Inc. also has in place a Global Code of Conduct, which provides an ethical framework and contains guidelines for decision-making and behaviour.
Dube TradePort Corporation’s Internal Audit Charter does not permit a service provider to undertake the internal audit function for more than two consecutive three-year terms, following which the service provider is required to take a mandatory three-year cooling off period before again becoming eligible to provide the service to Dube TradePort Corporation. Furthermore, the firm providing the internal audit function to Dube TradePort Corporation is not permitted to provide any other services to the entity.
Ernst and Young Inc. has provided a written assessment of the status of internal financial controls, based on the reviews they have conducted thus far.
RISK MANAGEMENTThe Board is both responsible and accountable for the governance of risk and, in this regard, has delegated the implementation and day-to-day management of this responsibility appropriately. Risk management is regarded as a key business discipline which:
• Protects the organisation against uncertainties and hazards which could prevent the achievement of business objectives;
• Considers the exploitation of opportunities which may improve the performance of the organisation; and
• Focuses on strategic, financial and operational risks.
The Board reviews strategic risks, together with executive management on an annual basis and as part of the annual strategic session. For more information on the critical strategic risks Dube TradePort Corporation faces, refer to: www.dubetradeport.co.za/Annual_Reports
The Board also annually reviews the risk appetite it is prepared to accept for the organisation, as well as providing guidance on risk tolerance. During the period under review, management did not exceed the Board’s risk appetite or risk tolerance in any of its activities.
Dube TradePort Corporation has the following Board-approved interventions in place: a Risk Management Framework (including the Risk Policy statement), based on the Committee of Sponsoring Organisations of the Treadway Commission framework, a Fraud Prevention Plan and a Fraud Prevention Policy and Response Plan. All employees receive training on these policies during their induction to the organisation. Management and the Board consider risk management at Dube TradePort Corporation to be a maturing process. Management focuses extremely closely on the ongoing implementation and bedding-in of its risk management and internal control system. There is a risk reporting system in place and on a quarterly basis the Audit and Risk Committee reviews the risks pertaining to different operational areas. The Board, through the Audit and Risk Committee,
DUBE TRADEPORT CORPORATION ANNUAL REPORT 2017/1826
receives reports on the changes in the risk profile across the entity and, thus, gains assurance of the effectiveness of risk management. The Audit and Risk Committee also reviews all legal matters, high-risk contracts and insurance matters.
During the year under review, the Business Continuity Policy and Plan was reviewed by the Audit and Risk Committee and approved by the Board and during the 2018/19 financial year the plan will be tested.
COMBINED ASSURANCEThe Audit and Risk Committee receives assurance that reviews are carried out by independent, external assurance providers in operational areas including: environmental reviews, health and safety reviews, South African Civil Aviation Authority (SACAA) audits and both client and tenant satisfaction surveys. The results of such reviews conducted by independent, external assurance providers are shared, at least annually, with the Audit and Risk Committee.
The committee is satisfied that the overall assurance received by the entity is effective.
COMPLIANCEWhile the Board is ultimately responsible for overseeing the entity’s compliance with laws, regulations and standards, it has delegated to management the responsibility for the implementation of an effective legislative compliance process.
Several of the reviews conducted by independent, external assurance providers are required by legislation, including reviews by internal and external auditors, audits by the Independent Communications Authority of South Africa (ICASA), environmental compliance reviews and audits by SACAA. The Board, through the Audit and Risk Committee, is able to gain comfort that Dube TradePort Corporation is compliant with statutory and legislative requirements.
Dube TradePort Corporation has not breached any material regulatory requirements and has not failed any statutory obligations of which it is aware.
INFORMATION AND TECHNOLOGY GOVERNANCEAn Information Communication and Technology Governance Steering Committee, comprising senior managers representing divisions across the entity, meets on a quarterly basis to review existing Information Technology Policies and to draft new policies, as required. In line with Dube TradePort Corporation’s governance framework, all new policies were approved by the Board and thereafter the annual or biannual review of existing policies was undertaken by the Audit and Risk Committee, as per approved delegations.
Dube TradePort Corporation experienced a ransomware attack during the course of the 2017/18 financial year and has subsequently introduced further controls to mitigate against this type of attack in the future. Given the importance of information and technology to Dube TradePort Corporation, at each meeting of the Audit and Risk Committee, matters relating to information and technology are discussed with management.
A future focus is the development and implementation of Enterprise Architecture capability. The Enterprise Architecture capability being developed will consider and address the following key attributes:
• Alignment to the existing Business and Information Communication and Technology Strategy;• Alignment to proven industry best practice frameworks
(including King IV, TOGAF and CoBIT);• Support for technology growth; • Address skills and competency challenges; • Give consideration to the speed of change inherent in the technology environment; and• Alignment to the Information Communication Technology Risk Management Framework and Security Frameworks, which are being developed.
REMUNERATION AND HUMAN RESOURCES COMMITTEEDube TradePort Corporation’s Remuneration and Human Resources Committee meets at least twice annually and is convened in line with formal Terms of Reference that are reviewed annually and approved by the Board.
For more information on specific committee responsibilities, please refer to: www.dubetradeport.co.za/Corp_Gov
The Remuneration and Human Resources Committee met four times during the 2017/18 financial year. The Chief Executive Officer attends meetings as a member of the committee and the Corporate Services Executive attends by invitation. They recuse themselves during any discussion pertaining to their performance or remuneration.
Although King IV recommends that the Chief Executive Officer is not a member of the Remuneration and Human Resources Committee, the Board is of the opinion that the Chief Executive Officer is able to add valuable experience and organisational insight to this committee.
There were no significant changes in the Remuneration Policy during the year under review.
The Committee undertook the following activities during this period:
• Conducted the annual review of the Remuneration and Human Resources Committee’s Term of Reference to ensure relevance;• Approved annual salary increases and bonus calculations relevant to performance in the 2017/18 financial year;• Received the quarterly reports on human resource
performance and corporate social activities;• Reviewed and approved various human resources policies and reviewed and recommended new policies to the Board;• Received feedback on management’s interactions with the National Education Health and Allied Workers’ Union; • Participated in the strategic risk assessment; and• Reviewed the human resources risk register.
The focus for the forthcoming year will be on ensuring that the committee’s Terms of Reference are aligned to the principles contained in King IV.
REMUNERATION PHILOSOPHYRemuneration of staff and executives:Dube TradePort Corporation aspires to fair, responsible and transparent remuneration in order to achieve its strategic outcomes, as recommended in the King IV Report on Corporate Governance. The entity believes that its existing remuneration practises ensure that it is materially aligned to the principles espoused by the King IV Report. The remuneration philosophy of Dube TradePort Corporation will be reviewed and improved over time, in line with best practice guidelines.
During the 2016/17 financial year, a service provider was engaged to review and grade positions, in line with the Paterson grading system. The remuneration for each position was then benchmarked to ensure comparable remuneration with the market. Each year Dube TradePort Corporation uses an independent service provider (during the 2017/18 financial year PricewaterhouseCoopers RemChannel was
engaged) to gain an understanding of remuneration trends and practises. The Remuneration Policy may be found at www.dubetradeport.co.za/Corp_Gov. Remuneration of Board members:The Board members fees are set by the KwaZulu-Natal Member of the Executive Council for Economic Development, Tourism and Environmental Affairs.
The remuneration of Board and committee members is not dependent on the performance of Dube TradePort Corporation.
For full disclosure of the amounts paid to staff, executives and Board members, please refer to note 21 in the Annual Financial Statements.
INVESTMENT COMMITTEEThe Investment Committee is convened in terms of formal Terms of Reference that are reviewed annually and approved by the Board. The Committee acts as an advisory committee to the Board.
The Board reappointed Ms Hlengiwe Makhathini as Chairperson of the committee.
The committee met three times during the year. The Chief Executive Officer and Chief Operating Officer attend meetings as members of the committee, whilst the Chief Financial Officer attends by invitation.
The committee undertook the following activities during the year under review:
• Reviewed and recommended the Pharmaceutical and Medical Cluster Strategy for the Special Economic Zone for approval by the Board;• Reviewed the Economic Investment Tool for use to enhance
its decision-making processes; • Reviewed and recommended several applications from investors to become Special Economic Zone Enterprises for approval by the Board; and• Reviewed certain inward investment proposals and advised the Board accordingly.
The focus for the forthcoming year will be to ensure that the committee’s Terms of Reference are aligned to the principles contained in King IV.
COMPANY SECRETARYThe Company Secretary plays a key role in the governance of the entity and an environment exists where the Company Secretary is able to execute her duties relating to the Board and the rest of the entity in such a way as to ensure that Board procedures and relevant regulations are adhered to. The Company Secretary attends all Board and Board committee meetings. Board members have unlimited access to the services of the Company Secretary.
The performance of the Company Secretary is currently reviewed by the Chief Executive Officer.
CODE OF CONDUCTDube TradePort Corporation applies a policy of zero tolerance towards unethical activities and the organisation’s Code of Conduct governs the behaviour of all employees. Members of staff receive training regarding the Code of Conduct during their induction and are all expected to sign an annual declaration that they understand the contents of the code and that any contravention of the code will result in consequences which may include disciplinary action.
The Code of Conduct includes the following areas:
• Values of Dube TradePort Corporation;• General behaviour at work and tolerance and respect for all;• Declaration of conflict of interests;• Acceptance of gifts and gratuities;• Zero tolerance of fraud and corruption, sexual harassment and intimidation;• Politics in the work place;• Due care and attention to work undertaken;• Care of and attention to assets; and• Electronic communication and protection of confidential information.
The Code of Conduct is being translated into isiZulu and will be made available to employees in both English and isiZulu.
SUPPLIERS’ CODE OF CONDUCTDube TradePort Corporation has developed a Suppliers’ Code of Conduct and all suppliers are invited to sign this code.
GENERAL DECLARATIONS OF INTERESTAs previously stated, all employees are obliged to declare their interests, in line with the requirements of the PFMA. In addition, all members of staff involved in the scoping, evaluation or adjudication of the procurement process are required to declare any interests, prior to each engagement in such a process. As a further control measure to mitigate against any influence by suppliers, Dube TradePort Corporation has a Gift Policy in place.
ACCESS TO INFORMATIONThe Board regards access to information as one of the cornerstones of good governance. It has, accordingly, ensured access, collectively as the Board and as individual members, to company information, records, documents and property, thus enabling it to effectively execute its responsibilities. The provision made for access to information applies to the overall Board, as well as the Committees of the Board.
ETHICAL LEADERSHIPAs previously stated, the Board is responsible for strong, ethical leadership and receives reports on ethics initiatives within the organisation. The ethics framework within Dube TradePort Corporation comprises the continuous review of
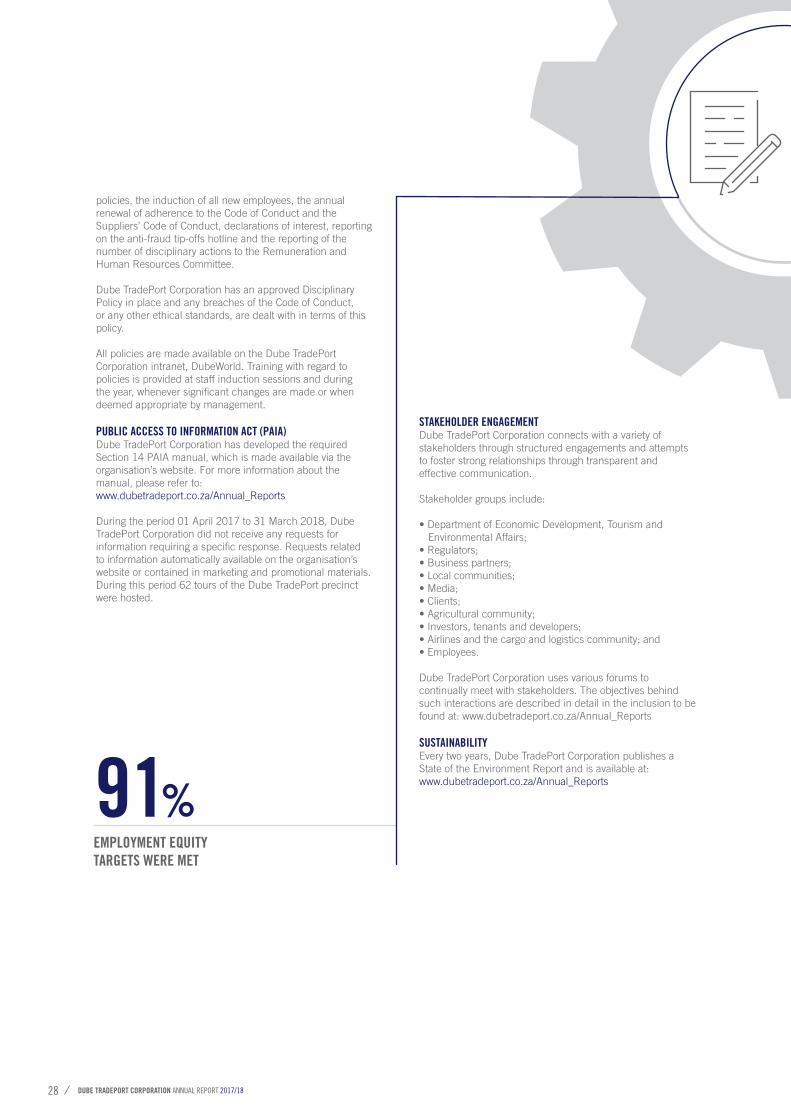
DUBE TRADEPORT CORPORATION ANNUAL REPORT 2017/1828
policies, the induction of all new employees, the annual renewal of adherence to the Code of Conduct and the Suppliers’ Code of Conduct, declarations of interest, reporting on the anti-fraud tip-offs hotline and the reporting of the number of disciplinary actions to the Remuneration and Human Resources Committee.
Dube TradePort Corporation has an approved Disciplinary Policy in place and any breaches of the Code of Conduct, or any other ethical standards, are dealt with in terms of this policy.
All policies are made available on the Dube TradePort Corporation intranet, DubeWorld. Training with regard to policies is provided at staff induction sessions and during the year, whenever significant changes are made or when deemed appropriate by management.
PUBLIC ACCESS TO INFORMATION ACT (PAIA)Dube TradePort Corporation has developed the required Section 14 PAIA manual, which is made available via the organisation’s website. For more information about the manual, please refer to: www.dubetradeport.co.za/Annual_Reports
During the period 01 April 2017 to 31 March 2018, Dube TradePort Corporation did not receive any requests for information requiring a specific response. Requests related to information automatically available on the organisation’s website or contained in marketing and promotional materials. During this period 62 tours of the Dube TradePort precinct were hosted.
STAKEHOLDER ENGAGEMENTDube TradePort Corporation connects with a variety of stakeholders through structured engagements and attempts to foster strong relationships through transparent and effective communication.
Stakeholder groups include:
• Department of Economic Development, Tourism and Environmental Affairs;• Regulators;• Business partners;• Local communities;• Media;• Clients;• Agricultural community;• Investors, tenants and developers;• Airlines and the cargo and logistics community; and• Employees.
Dube TradePort Corporation uses various forums to continually meet with stakeholders. The objectives behind such interactions are described in detail in the inclusion to be found at: www.dubetradeport.co.za/Annual_Reports
SUSTAINABILITYEvery two years, Dube TradePort Corporation publishes a State of the Environment Report and is available at:www.dubetradeport.co.za/Annual_Reports91%
EMPLOYMENT EQUITY TARGETS WERE MET
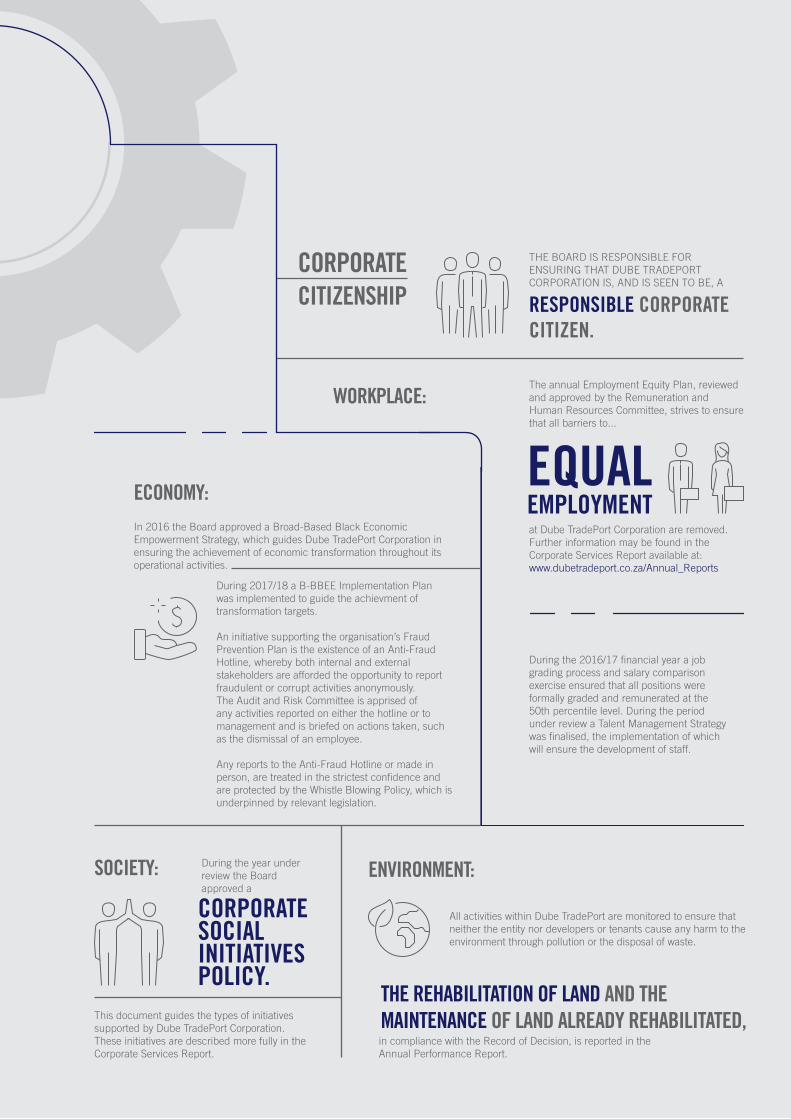
All activities within Dube TradePort are monitored to ensure that neither the entity nor developers or tenants cause any harm to the environment through pollution or the disposal of waste.
CORPORATE
The annual Employment Equity Plan, reviewed and approved by the Remuneration and Human Resources Committee, strives to ensure that all barriers to...
During the 2016/17 financial year a job grading process and salary comparison exercise ensured that all positions were formally graded and remunerated at the 50th percentile level. During the period under review a Talent Management Strategy was finalised, the implementation of which will ensure the development of staff.
During 2017/18 a B-BBEE Implementation Plan was implemented to guide the achievment of transformation targets. An initiative supporting the organisation’s Fraud Prevention Plan is the existence of an Anti-Fraud Hotline, whereby both internal and external stakeholders are afforded the opportunity to report fraudulent or corrupt activities anonymously. The Audit and Risk Committee is apprised of any activities reported on either the hotline or to management and is briefed on actions taken, such as the dismissal of an employee.
Any reports to the Anti-Fraud Hotline or made in person, are treated in the strictest confidence and are protected by the Whistle Blowing Policy, which is underpinned by relevant legislation.
This document guides the types of initiatives supported by Dube TradePort Corporation. These initiatives are described more fully in the Corporate Services Report.
WORKPLACE:
SOCIETY: ENVIRONMENT:
THE BOARD IS RESPONSIBLE FOR ENSURING THAT DUBE TRADEPORT CORPORATION IS, AND IS SEEN TO BE, A
RESPONSIBLE CORPORATE CITIZEN.
ECONOMY:
CITIZENSHIP
at Dube TradePort Corporation are removed. Further information may be found in the Corporate Services Report available at: www.dubetradeport.co.za/Annual_Reports
EQUALEMPLOYMENT
In 2016 the Board approved a Broad-Based Black Economic Empowerment Strategy, which guides Dube TradePort Corporation in ensuring the achievement of economic transformation throughout its operational activities.
CORPORATE SOCIAL INITIATIVES POLICY.
During the year under review the Board approved a
in compliance with the Record of Decision, is reported in the Annual Performance Report.
THE REHABILITATION OF LAND AND THE MAINTENANCE OF LAND ALREADY REHABILITATED,
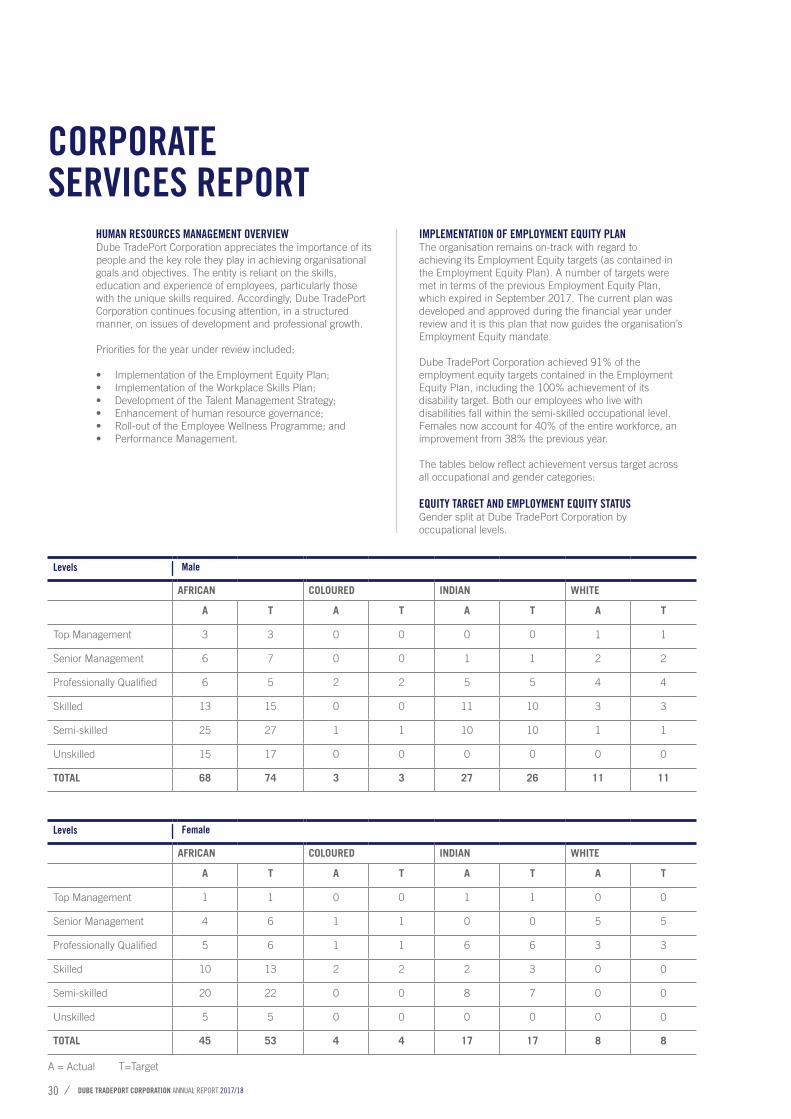
DUBE TRADEPORT CORPORATION ANNUAL REPORT 2017/1830
HUMAN RESOURCES MANAGEMENT OVERVIEWDube TradePort Corporation appreciates the importance of its people and the key role they play in achieving organisational goals and objectives. The entity is reliant on the skills, education and experience of employees, particularly those with the unique skills required. Accordingly, Dube TradePort Corporation continues focusing attention, in a structured manner, on issues of development and professional growth.
Priorities for the year under review included:
• Implementation of the Employment Equity Plan;• Implementation of the Workplace Skills Plan;• Development of the Talent Management Strategy;• Enhancement of human resource governance;• Roll-out of the Employee Wellness Programme; and• Performance Management.
IMPLEMENTATION OF EMPLOYMENT EQUITY PLANThe organisation remains on-track with regard to achieving its Employment Equity targets (as contained in the Employment Equity Plan). A number of targets were met in terms of the previous Employment Equity Plan, which expired in September 2017. The current plan was developed and approved during the financial year under review and it is this plan that now guides the organisation’s Employment Equity mandate. Dube TradePort Corporation achieved 91% of the employment equity targets contained in the Employment Equity Plan, including the 100% achievement of its disability target. Both our employees who live with disabilities fall within the semi-skilled occupational level. Females now account for 40% of the entire workforce, an improvement from 38% the previous year.
The tables below reflect achievement versus target across all occupational and gender categories:
EQUITY TARGET AND EMPLOYMENT EQUITY STATUSGender split at Dube TradePort Corporation by occupational levels.
CORPORATE SERVICES REPORT
Levels
AFRICAN COLOURED INDIAN WHITE
A T A T A T A T
Top Management 3 3 0 0 0 0 1 1
Senior Management 6 7 0 0 1 1 2 2
Professionally Qualified 6 5 2 2 5 5 4 4
Skilled 13 15 0 0 11 10 3 3
Semi-skilled 25 27 1 1 10 10 1 1
Unskilled 15 17 0 0 0 0 0 0
TOTAL 68 74 3 3 27 26 11 11
Male
A = Actual T=Target
Levels
AFRICAN COLOURED INDIAN WHITE
A T A T A T A T
Top Management 1 1 0 0 1 1 0 0
Senior Management 4 6 1 1 0 0 5 5
Professionally Qualified 5 6 1 1 6 6 3 3
Skilled 10 13 2 2 2 3 0 0
Semi-skilled 20 22 0 0 8 7 0 0
Unskilled 5 5 0 0 0 0 0 0
TOTAL 45 53 4 4 17 17 8 8
Female
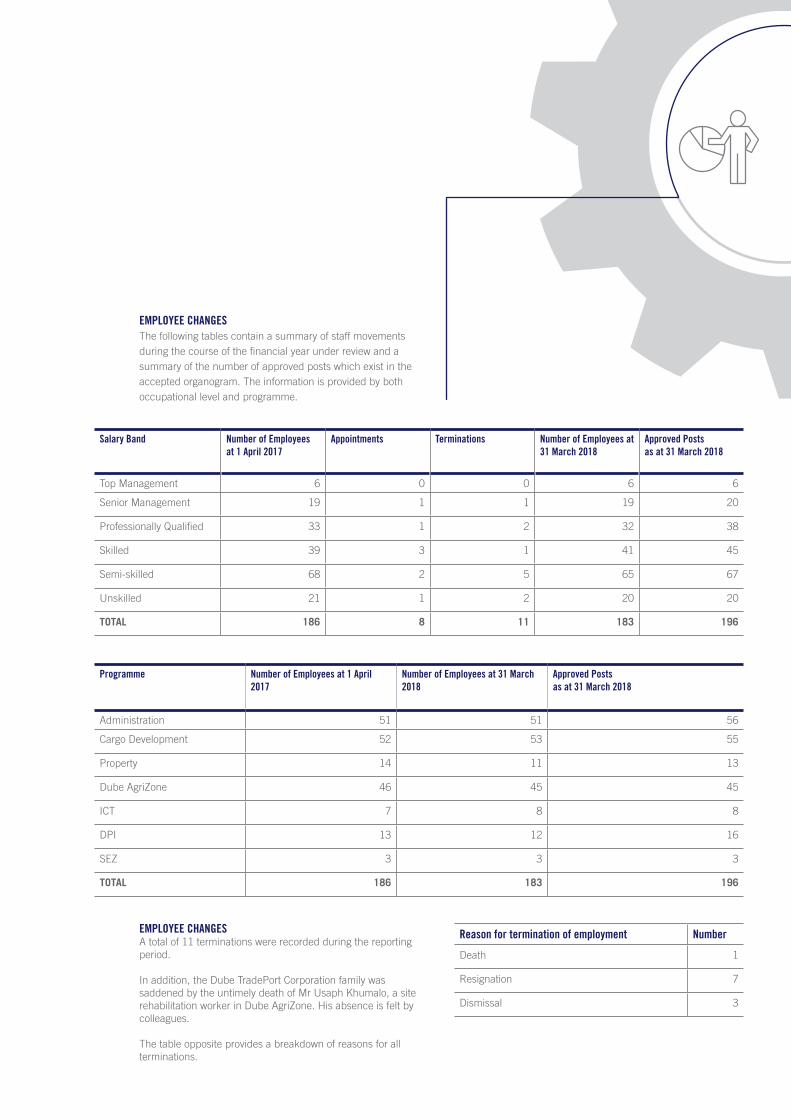
EMPLOYEE CHANGESThe following tables contain a summary of staff movements during the course of the financial year under review and a summary of the number of approved posts which exist in the accepted organogram. The information is provided by both occupational level and programme.
EMPLOYEE CHANGESA total of 11 terminations were recorded during the reportingperiod.
In addition, the Dube TradePort Corporation family wassaddened by the untimely death of Mr Usaph Khumalo, a siterehabilitation worker in Dube AgriZone. His absence is felt bycolleagues.
The table opposite provides a breakdown of reasons for allterminations.
Salary Band Number of Employees at 1 April 2017
Appointments Terminations Number of Employees at 31 March 2018
Approved Postsas at 31 March 2018
Top Management 6 0 0 6 6
Senior Management 19 1 1 19 20
Professionally Qualified 33 1 2 32 38
Skilled 39 3 1 41 45
Semi-skilled 68 2 5 65 67
Unskilled 21 1 2 20 20
TOTAL 186 8 11 183 196
Programme Number of Employees at 1 April 2017
Number of Employees at 31 March 2018
Approved Postsas at 31 March 2018
Administration 51 51 56
Cargo Development 52 53 55
Property 14 11 13
Dube AgriZone 46 45 45
ICT 7 8 8
DPI 13 12 16
SEZ 3 3 3
TOTAL 186 183 196
Reason for termination of employment Number
Death 1
Resignation 7
Dismissal 3
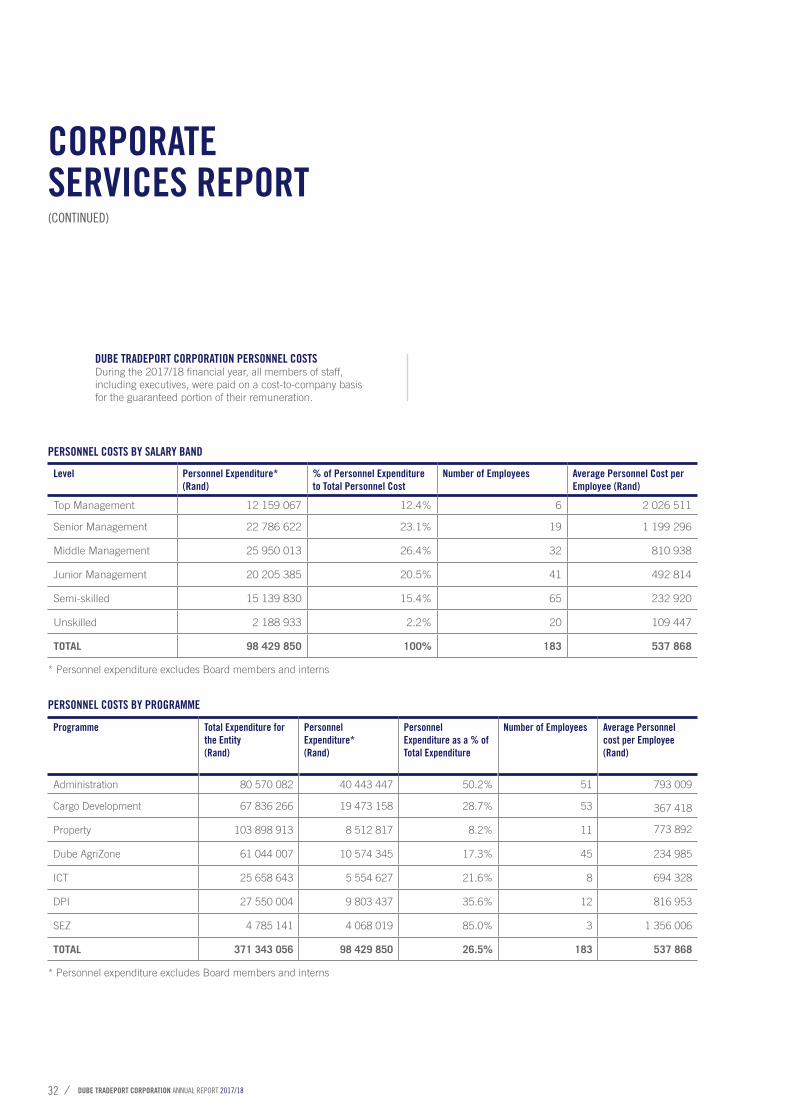
DUBE TRADEPORT CORPORATION ANNUAL REPORT 2017/1832
DUBE TRADEPORT CORPORATION PERSONNEL COSTSDuring the 2017/18 financial year, all members of staff, including executives, were paid on a cost-to-company basis for the guaranteed portion of their remuneration.
* Personnel expenditure excludes Board members and interns
PERSONNEL COSTS BY SALARY BAND
CORPORATE SERVICES REPORT
* Personnel expenditure excludes Board members and interns
PERSONNEL COSTS BY PROGRAMME
Level Personnel Expenditure*(Rand)
% of Personnel Expenditure to Total Personnel Cost
Number of Employees Average Personnel Cost per Employee (Rand)
Top Management 12 159 067 12.4% 6 2 026 511
Senior Management 22 786 622 23.1% 19 1 199 296
Middle Management 25 950 013 26.4% 32 810 938
Junior Management 20 205 385 20.5% 41 492 814
Semi-skilled 15 139 830 15.4% 65 232 920
Unskilled 2 188 933 2.2% 20 109 447
TOTAL 98 429 850 100% 183 537 868
Programme Total Expenditure for the Entity(Rand)
Personnel Expenditure*(Rand)
Personnel Expenditure as a % of Total Expenditure
Number of Employees Average Personnel cost per Employee (Rand)
Administration 80 570 082 40 443 447 50.2% 51 793 009
Cargo Development 67 836 266 19 473 158 28.7% 53 367 418 Property 103 898 913 8 512 817 8.2% 11 773 892
Dube AgriZone 61 044 007 10 574 345 17.3% 45 234 985
ICT 25 658 643 5 554 627 21.6% 8 694 328
DPI 27 550 004 9 803 437 35.6% 12 816 953
SEZ 4 785 141 4 068 019 85.0% 3 1 356 006
TOTAL 371 343 056 98 429 850 26.5% 183 537 868
(CONTINUED)
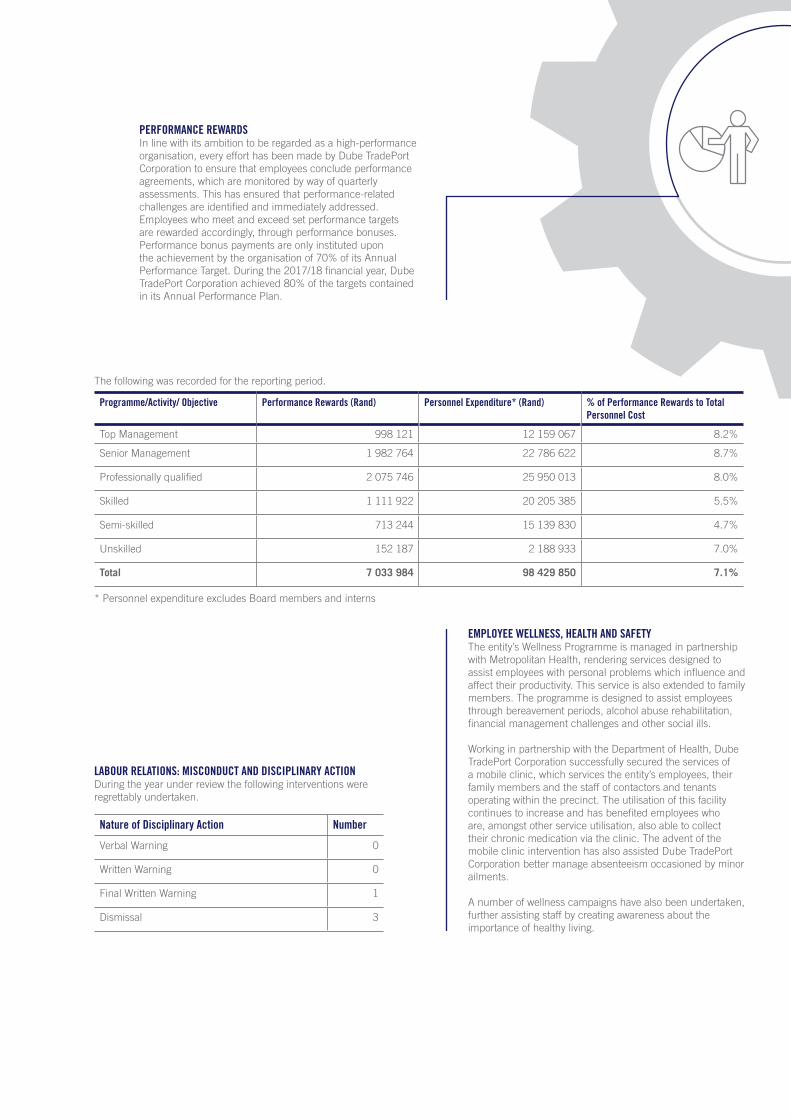
PERFORMANCE REWARDSIn line with its ambition to be regarded as a high-performance organisation, every effort has been made by Dube TradePort Corporation to ensure that employees conclude performance agreements, which are monitored by way of quarterly assessments. This has ensured that performance-related challenges are identified and immediately addressed. Employees who meet and exceed set performance targets are rewarded accordingly, through performance bonuses. Performance bonus payments are only instituted upon the achievement by the organisation of 70% of its Annual Performance Target. During the 2017/18 financial year, Dube TradePort Corporation achieved 80% of the targets contained in its Annual Performance Plan.
The following was recorded for the reporting period.
* Personnel expenditure excludes Board members and interns
Programme/Activity/ Objective Performance Rewards (Rand) Personnel Expenditure* (Rand) % of Performance Rewards to Total Personnel Cost
Top Management 998 121 12 159 067 8.2%
Senior Management 1 982 764 22 786 622 8.7%
Professionally qualified 2 075 746 25 950 013 8.0%
Skilled 1 111 922 20 205 385 5.5%
Semi-skilled 713 244 15 139 830 4.7%
Unskilled 152 187 2 188 933 7.0%
Total 7 033 984 98 429 850 7.1%
LABOUR RELATIONS: MISCONDUCT AND DISCIPLINARY ACTIONDuring the year under review the following interventions were regrettably undertaken.
Nature of Disciplinary Action Number
Verbal Warning 0
Written Warning 0
Final Written Warning 1
Dismissal 3
EMPLOYEE WELLNESS, HEALTH AND SAFETYThe entity’s Wellness Programme is managed in partnership with Metropolitan Health, rendering services designed to assist employees with personal problems which influence and affect their productivity. This service is also extended to family members. The programme is designed to assist employees through bereavement periods, alcohol abuse rehabilitation, financial management challenges and other social ills.
Working in partnership with the Department of Health, Dube TradePort Corporation successfully secured the services of a mobile clinic, which services the entity’s employees, their family members and the staff of contactors and tenants operating within the precinct. The utilisation of this facility continues to increase and has benefited employees who are, amongst other service utilisation, also able to collect their chronic medication via the clinic. The advent of the mobile clinic intervention has also assisted Dube TradePort Corporation better manage absenteeism occasioned by minor ailments.
A number of wellness campaigns have also been undertaken, further assisting staff by creating awareness about the importance of healthy living.
DUBE TRADEPORT CORPORATION ANNUAL REPORT 2017/1834
CORPORATE SERVICES REPORT(CONTINUED)
IMPLEMENTATION OF WORKPLACE SKILLS PLANThe Skills Development Act requires that employers develop skills that are industry-related and in short supply. This enables employees to maximise their potential and optimise their careers.
Dube TradePort Corporation promotes the continuous professional and personal development of its members of staff. Total investment in training during the 2017/18 financial year amounted to R3.6 million. Further, Dube TradePort Corporation continues to provide financial aid to employees wishing to pursue qualifications, if such qualifications are in line with Dube TradePort Corporation’s requirements.
CORPORATE SOCIAL INVESTMENTDube TradePort Corporation prides itself on being a responsible corporate citizen, as encouraged by the King IV Report on Corporate Governance. This is best evidenced by the entity’s determination to support and empower KwaZulu-Natal communities, especially those located in rural or disadvantaged areas.
Various corporate social investment initiatives and programmes are utilised to deliver much-needed support to communities immediately surrounding the Dube TradePort precinct. During the 2017/18 financial year, a number of young people from poor family backgrounds benefited by receiving bursaries, school uniforms and opportunities to gain invaluable work experience. The organisation’s key focus areas include education and skills development, environmental sustainability and socio-economic development, with the intention of facilitating employment creation and the empowerment of small businesses and co-operatives. Initiatives aimed specifically at empowering women, the youth and people living with disabilities remained a primary target during the review period.
Emerging Farmers:Emerging farmers, the majority of whom are women and primary breadwinners, benefit directly from a Market Day arrangement, through which Dube TradePort Corporation supports small farmers from surrounding areas by linking them with potential clients. Many of these farmers grow organic fresh produce and, on a weekly basis, these small-scale operators sell their produce to Dube TradePort staff members. This initiative has had the secondary benefit of encouraging members of staff to eat more healthily.
During the review period, Dube TradePort Corporation sponsored 10 small-scale farmers, mainly women, to attend a Goat Agri-processing Conference, where small and medium-scale farmers were exposed to a range of business opportunities and innovations associated with goat farming.
Internships and Apprenticeships:Dube TradePort Corporation’s internship programme is an initiative which has been significantly instrumental in providing much-needed work experience to a wide range of graduates from different fields of study. A total of 35 interns and trainees were signed into the programme, inclusive of 20 interns, 10 short-terms trainees and five young people participating in long-term in-service training. A total of R2.1million was expended on Dube TradePort Corporation’s 2017/18 internship programme.
Bursary Scheme:The entity initiated a Bursary Scheme in 2013, with more than 60 students from financially disadvantaged backgrounds having benefited to date. The scheme aims to assist students studying towards engineering, the built environment, information technology and agriculture, being fields in which the country is suffering a skills shortage. The 2017/18 financial year saw 11 students benefit from Dube TradePort Corporation’s R590 000 investment in its bursary scheme.
School Uniform programme:Working in close partnership with a range of stakeholders, Dube TradePort Corporation identified a number of deserving schools in the Tongaat, Inanda, Umlazi, Verulam and Ndwedwe areas, making available school uniforms to some 1 300 needy learners during the period under review. This reflected a 4% increase in the number of beneficiaries over the previous financial year. The organisation’s total investment in this initiative amounted to R707 000 and included learners from two schools for the disabled.
Ohlange High School Project:Dube TradePort Corporation continued its work with Ohlange High School in an effort to improve the quality of education provided to the school’s learners. During the course of the financial year under review, the organisation concentrated on painting dormitory and classroom walls, which were in state of disrepair, as well as providing school uniforms to a number of needy students.
In addition, a career exhibition day was staged at the school during which interested learners were informed about a number of career development opportunities available at Dube TradePort Corporation.

INVESTMENT BURSARY SCHEME
R590 000
THE ORGANISATION’S TOTAL INVESTMENTR707 000SCHOOL UNIFORM PROGRAMME
DUBE TRADEPORT CORPORATION ANNUAL REPORT 2017/1836
PROGRAMMES SUB-PROGRAMMES
Programme 1Administration
• Office of the Chief Executive Officer• Finance• Corporate Services
Programme 2Cargo Development
• Cargo Operations• Air Cargo Business Development
Programme 3Property
• Commercial• Operations
Programme 4Dube AgriZone
• Dube AgriZone Services• Sustainable Farming Initiatives• Tissue Culture Facility (Dube AgriLab)• Landscaping and Rehabilitation• Dube AgriZone Expansion
Programme 5Information Communication and Technology (Dube iConnect)
• Commercial• Operations
Programme 6Development Planning and Infrastructure
• Planning• Environment• Infrastructure and Development
Programme 7Special Economic Zone
Dube TradePort Special Economic Zone
The following tables detail the performance of each programme (and their respective sub-programmes) for the 2017/18 financial year, against targets reflected in the Annual Performance Plan for the year:
IN ORDER TO EFFICIENTLY MEET ITS MANDATE, DUBE TRADEPORT CORPORATION OPERATES A SEVEN-PROGRAMME STRUCTURE. THE ORGANISATION’S
PROGRAMMES INCLUDE:
ANNUAL PERFORMANCE REPORT
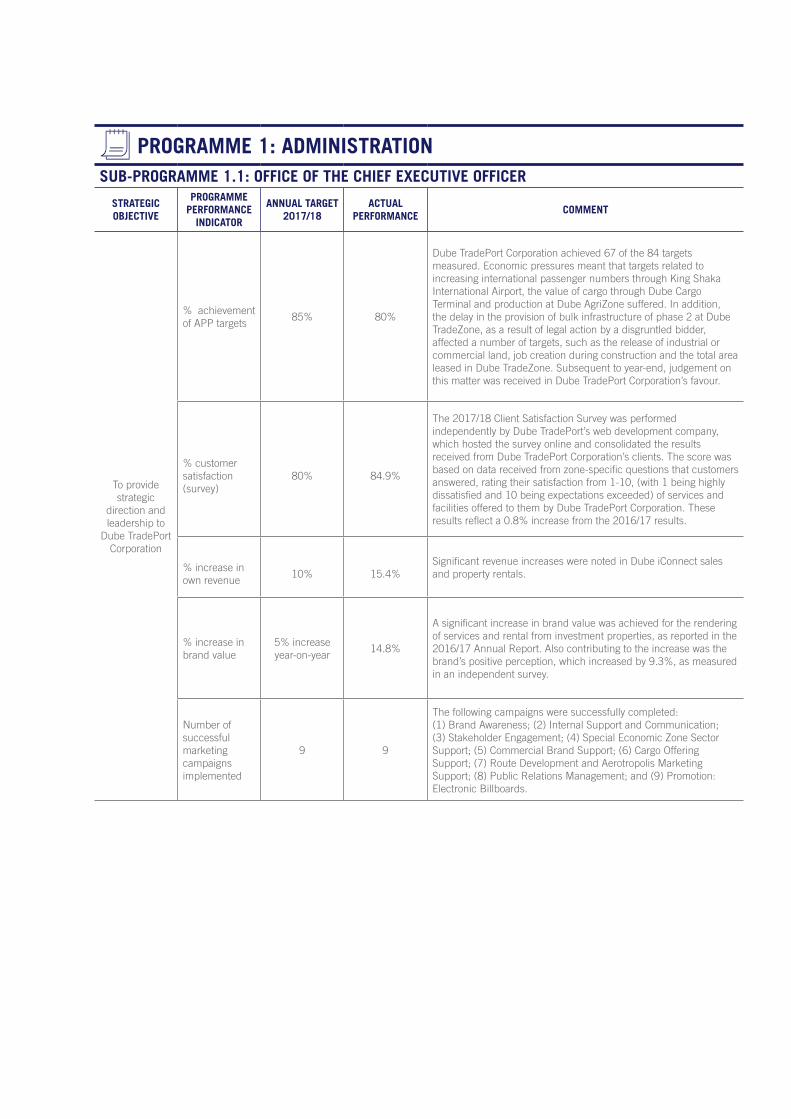
PROGRAMME 1: ADMINISTRATIONSUB-PROGRAMME 1.1: OFFICE OF THE CHIEF EXECUTIVE OFFICER
STRATEGIC OBJECTIVE
PROGRAMME PERFORMANCE
INDICATOR
ANNUAL TARGET 2017/18
ACTUAL PERFORMANCE
COMMENT
To provide strategic
direction and leadership to
Dube TradePort Corporation
% achievement of APP targets
85% 80%
Dube TradePort Corporation achieved 67 of the 84 targets measured. Economic pressures meant that targets related to increasing international passenger numbers through King Shaka International Airport, the value of cargo through Dube Cargo Terminal and production at Dube AgriZone suffered. In addition, the delay in the provision of bulk infrastructure of phase 2 at Dube TradeZone, as a result of legal action by a disgruntled bidder, affected a number of targets, such as the release of industrial or commercial land, job creation during construction and the total area leased in Dube TradeZone. Subsequent to year-end, judgement on this matter was received in Dube TradePort Corporation’s favour.
% customer satisfaction (survey)
80% 84.9%
The 2017/18 Client Satisfaction Survey was performed independently by Dube TradePort’s web development company, which hosted the survey online and consolidated the results received from Dube TradePort Corporation’s clients. The score was based on data received from zone-specific questions that customers answered, rating their satisfaction from 1-10, (with 1 being highly dissatisfied and 10 being expectations exceeded) of services and facilities offered to them by Dube TradePort Corporation. These results reflect a 0.8% increase from the 2016/17 results.
% increase in own revenue
10% 15.4%Significant revenue increases were noted in Dube iConnect sales and property rentals.
% increase in brand value
5% increase year-on-year
14.8%
A significant increase in brand value was achieved for the rendering of services and rental from investment properties, as reported in the 2016/17 Annual Report. Also contributing to the increase was the brand’s positive perception, which increased by 9.3%, as measured in an independent survey.
Number of successful marketing campaigns implemented
9 9
The following campaigns were successfully completed:(1) Brand Awareness; (2) Internal Support and Communication; (3) Stakeholder Engagement; (4) Special Economic Zone Sector Support; (5) Commercial Brand Support; (6) Cargo Offering Support; (7) Route Development and Aerotropolis Marketing Support; (8) Public Relations Management; and (9) Promotion: Electronic Billboards.
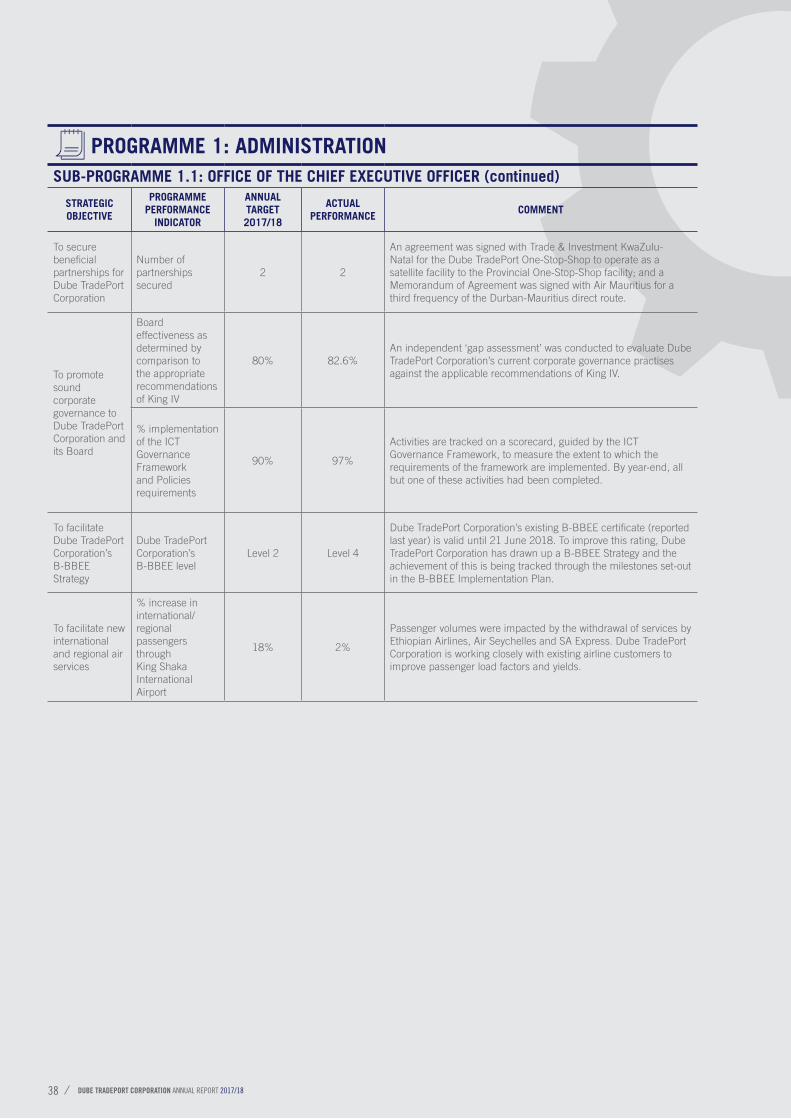
PROGRAMME 1: ADMINISTRATIONSUB-PROGRAMME 1.1: OFFICE OF THE CHIEF EXECUTIVE OFFICER (continued)
STRATEGIC OBJECTIVE
PROGRAMME PERFORMANCE
INDICATOR
ANNUAL TARGET 2017/18
ACTUAL PERFORMANCE
COMMENT
To secure beneficial partnerships for Dube TradePort Corporation
Number of partnerships secured
2 2
An agreement was signed with Trade & Investment KwaZulu-Natal for the Dube TradePort One-Stop-Shop to operate as a satellite facility to the Provincial One-Stop-Shop facility; and a Memorandum of Agreement was signed with Air Mauritius for a third frequency of the Durban-Mauritius direct route.
To promote sound corporate governance to Dube TradePort Corporation and its Board
Board effectiveness as determined by comparison to the appropriate recommendations of King IV
80% 82.6%An independent ‘gap assessment’ was conducted to evaluate Dube TradePort Corporation’s current corporate governance practises against the applicable recommendations of King IV.
% implementation of the ICT Governance Framework and Policies requirements
90% 97%
Activities are tracked on a scorecard, guided by the ICT Governance Framework, to measure the extent to which the requirements of the framework are implemented. By year-end, all but one of these activities had been completed.
To facilitate Dube TradePort Corporation’s B-BBEE Strategy
Dube TradePort Corporation’s B-BBEE level
Level 2 Level 4
Dube TradePort Corporation’s existing B-BBEE certificate (reported last year) is valid until 21 June 2018. To improve this rating, Dube TradePort Corporation has drawn up a B-BBEE Strategy and the achievement of this is being tracked through the milestones set-out in the B-BBEE Implementation Plan.
To facilitate new international and regional air services
% increase in international/regional passengers through King Shaka International Airport
18% 2%
Passenger volumes were impacted by the withdrawal of services by Ethiopian Airlines, Air Seychelles and SA Express. Dube TradePort Corporation is working closely with existing airline customers to improve passenger load factors and yields.
DUBE TRADEPORT CORPORATION ANNUAL REPORT 2017/1838
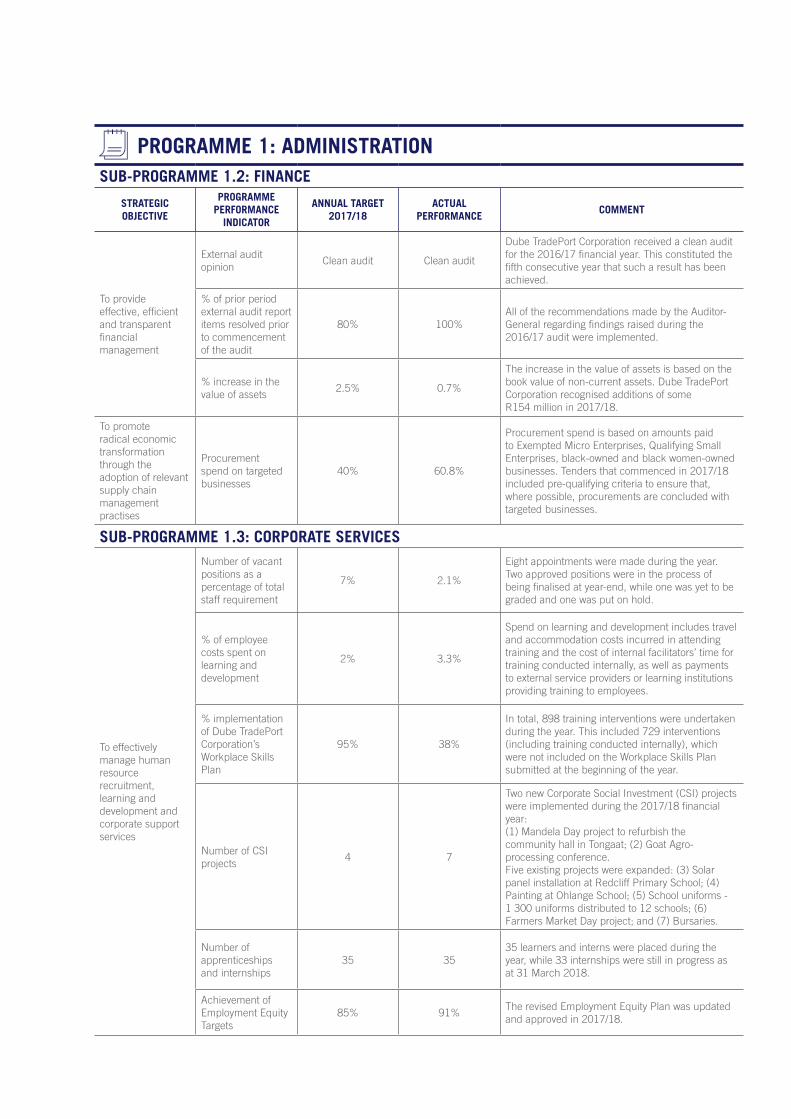
PROGRAMME 1: ADMINISTRATIONSUB-PROGRAMME 1.2: FINANCE
STRATEGIC OBJECTIVE
PROGRAMME PERFORMANCE
INDICATOR
ANNUAL TARGET 2017/18
ACTUAL PERFORMANCE
COMMENT
To provide effective, efficient and transparent financial management
External audit opinion
Clean audit Clean audit
Dube TradePort Corporation received a clean audit for the 2016/17 financial year. This constituted the fifth consecutive year that such a result has been achieved.
% of prior period external audit report items resolved prior to commencement of the audit
80% 100%All of the recommendations made by the Auditor-General regarding findings raised during the 2016/17 audit were implemented.
% increase in the value of assets
2.5% 0.7%
The increase in the value of assets is based on the book value of non-current assets. Dube TradePort Corporation recognised additions of some R154 million in 2017/18.
To promote radical economic transformation through the adoption of relevant supply chain management practises
Procurement spend on targeted businesses
40% 60.8%
Procurement spend is based on amounts paid to Exempted Micro Enterprises, Qualifying Small Enterprises, black-owned and black women-owned businesses. Tenders that commenced in 2017/18 included pre-qualifying criteria to ensure that, where possible, procurements are concluded with targeted businesses.
SUB-PROGRAMME 1.3: CORPORATE SERVICES
To effectively manage human resource recruitment, learning and development and corporate support services
Number of vacant positions as a percentage of total staff requirement
7% 2.1%
Eight appointments were made during the year. Two approved positions were in the process of being finalised at year-end, while one was yet to be graded and one was put on hold.
% of employee costs spent on learning and development
2% 3.3%
Spend on learning and development includes travel and accommodation costs incurred in attending training and the cost of internal facilitators’ time for training conducted internally, as well as payments to external service providers or learning institutions providing training to employees.
% implementation of Dube TradePort Corporation’s Workplace Skills Plan
95% 38%
In total, 898 training interventions were undertaken during the year. This included 729 interventions (including training conducted internally), which were not included on the Workplace Skills Plan submitted at the beginning of the year.
Number of CSI projects
4 7
Two new Corporate Social Investment (CSI) projects were implemented during the 2017/18 financial year: (1) Mandela Day project to refurbish the community hall in Tongaat; (2) Goat Agro-processing conference.Five existing projects were expanded: (3) Solar panel installation at Redcliff Primary School; (4) Painting at Ohlange School; (5) School uniforms - 1 300 uniforms distributed to 12 schools; (6) Farmers Market Day project; and (7) Bursaries.
Number of apprenticeships and internships
35 3535 learners and interns were placed during the year, while 33 internships were still in progress as at 31 March 2018.
Achievement of Employment Equity Targets
85% 91%The revised Employment Equity Plan was updated and approved in 2017/18.
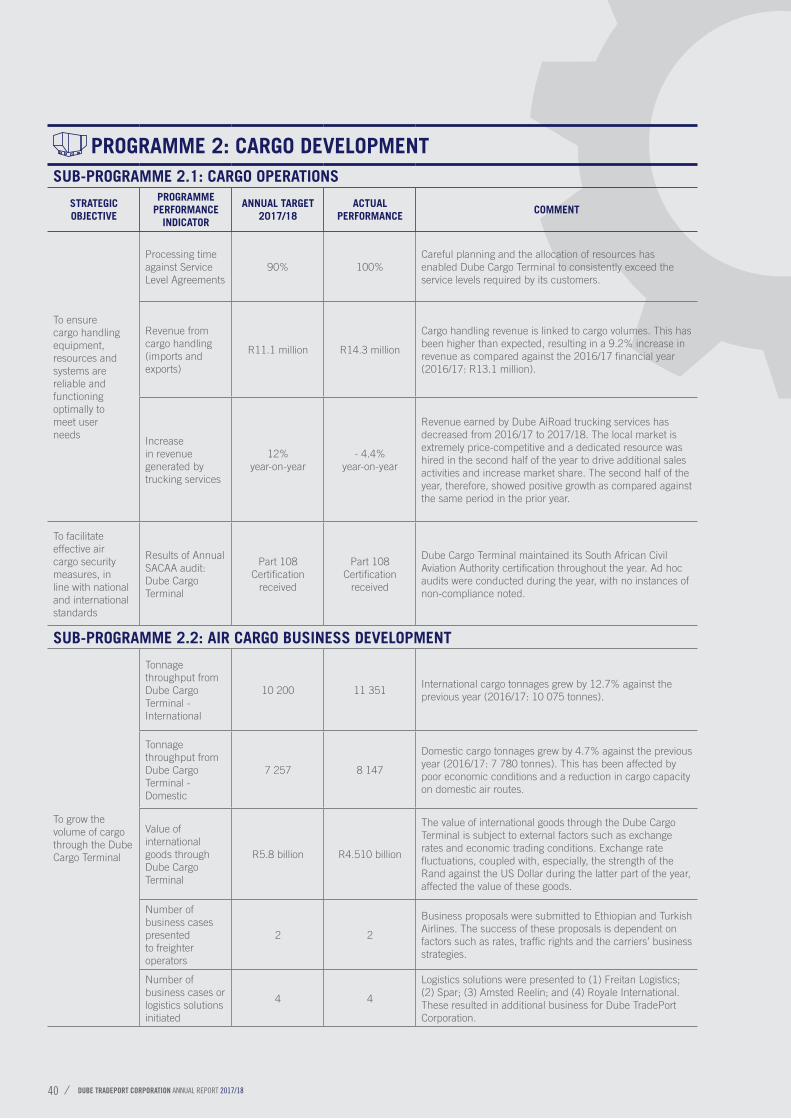
PROGRAMME 2: CARGO DEVELOPMENTSUB-PROGRAMME 2.1: CARGO OPERATIONS
STRATEGIC OBJECTIVE
PROGRAMME PERFORMANCE
INDICATOR
ANNUAL TARGET 2017/18
ACTUAL PERFORMANCE
COMMENT
To ensure cargo handling equipment, resources and systems are reliable and functioning optimally to meet user needs
Processing time against Service Level Agreements
90% 100%Careful planning and the allocation of resources has enabled Dube Cargo Terminal to consistently exceed the service levels required by its customers.
Revenue from cargo handling (imports and exports)
R11.1 million R14.3 million
Cargo handling revenue is linked to cargo volumes. This has been higher than expected, resulting in a 9.2% increase in revenue as compared against the 2016/17 financial year (2016/17: R13.1 million).
Increase in revenue generated by trucking services
12% year-on-year
- 4.4% year-on-year
Revenue earned by Dube AiRoad trucking services has decreased from 2016/17 to 2017/18. The local market is extremely price-competitive and a dedicated resource was hired in the second half of the year to drive additional sales activities and increase market share. The second half of the year, therefore, showed positive growth as compared against the same period in the prior year.
To facilitate effective air cargo security measures, in line with national and international standards
Results of Annual SACAA audit: Dube Cargo Terminal
Part 108 Certification
received
Part 108 Certification
received
Dube Cargo Terminal maintained its South African Civil Aviation Authority certification throughout the year. Ad hoc audits were conducted during the year, with no instances of non-compliance noted.
SUB-PROGRAMME 2.2: AIR CARGO BUSINESS DEVELOPMENT
To grow the volume of cargo through the Dube Cargo Terminal
Tonnage throughput from Dube Cargo Terminal - International
10 200 11 351International cargo tonnages grew by 12.7% against the previous year (2016/17: 10 075 tonnes).
Tonnage throughput from Dube Cargo Terminal - Domestic
7 257 8 147
Domestic cargo tonnages grew by 4.7% against the previous year (2016/17: 7 780 tonnes). This has been affected by poor economic conditions and a reduction in cargo capacity on domestic air routes.
Value of international goods through Dube Cargo Terminal
R5.8 billion R4.510 billion
The value of international goods through the Dube Cargo Terminal is subject to external factors such as exchange rates and economic trading conditions. Exchange rate fluctuations, coupled with, especially, the strength of the Rand against the US Dollar during the latter part of the year, affected the value of these goods.
Number of business cases presented to freighter operators
2 2
Business proposals were submitted to Ethiopian and Turkish Airlines. The success of these proposals is dependent on factors such as rates, traffic rights and the carriers’ business strategies.
Number of business cases or logistics solutions initiated
4 4
Logistics solutions were presented to (1) Freitan Logistics; (2) Spar; (3) Amsted Reelin; and (4) Royale International. These resulted in additional business for Dube TradePort Corporation.
DUBE TRADEPORT CORPORATION ANNUAL REPORT 2017/1840
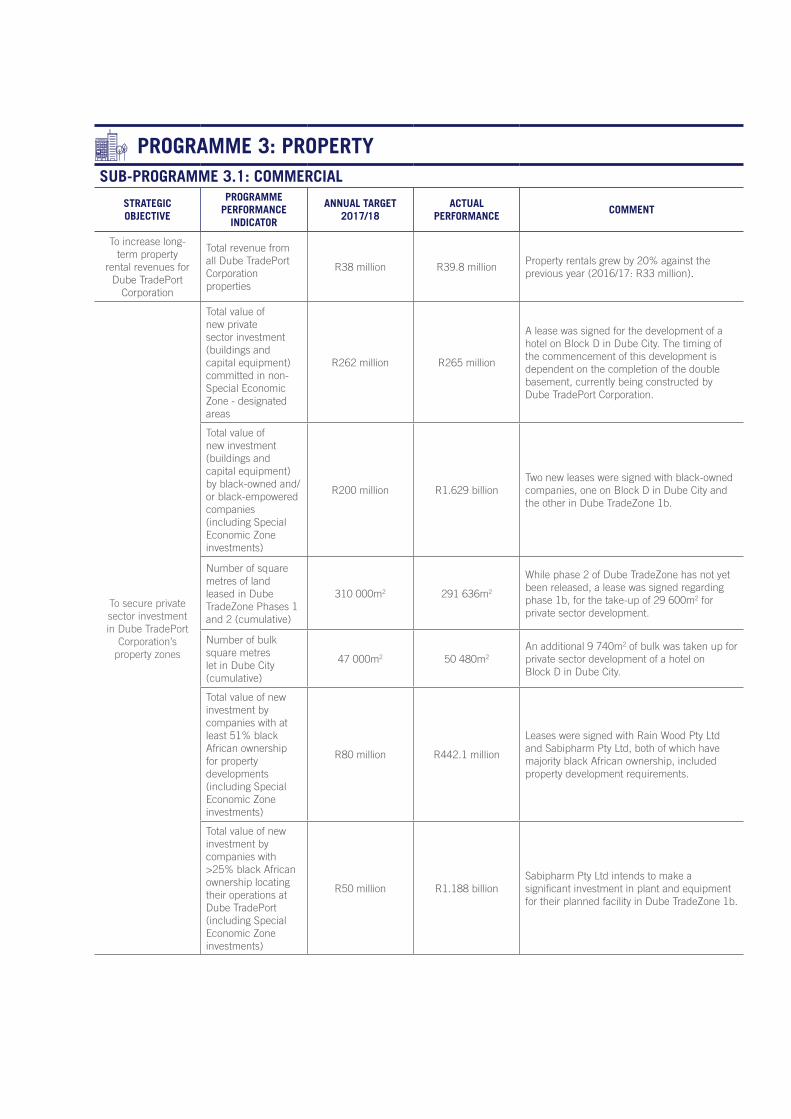
PROGRAMME 3: PROPERTYSUB-PROGRAMME 3.1: COMMERCIAL
STRATEGIC OBJECTIVE
PROGRAMME PERFORMANCE
INDICATOR
ANNUAL TARGET 2017/18
ACTUAL PERFORMANCE
COMMENT
To increase long-term property
rental revenues for Dube TradePort
Corporation
Total revenue from all Dube TradePort Corporation properties
R38 million R39.8 millionProperty rentals grew by 20% against the previous year (2016/17: R33 million).
To secure private sector investment in Dube TradePort
Corporation’s property zones
Total value of new private sector investment (buildings and capital equipment) committed in non-Special Economic Zone - designated areas
R262 million R265 million
A lease was signed for the development of a hotel on Block D in Dube City. The timing of the commencement of this development is dependent on the completion of the double basement, currently being constructed by Dube TradePort Corporation.
Total value of new investment (buildings and capital equipment) by black-owned and/or black-empowered companies (including Special Economic Zone investments)
R200 million R1.629 billionTwo new leases were signed with black-owned companies, one on Block D in Dube City and the other in Dube TradeZone 1b.
Number of square metres of land leased in Dube TradeZone Phases 1 and 2 (cumulative)
310 000m2 291 636m2
While phase 2 of Dube TradeZone has not yet been released, a lease was signed regarding phase 1b, for the take-up of 29 600m2 for private sector development.
Number of bulk square metres let in Dube City (cumulative)
47 000m2 50 480m2
An additional 9 740m2 of bulk was taken up for private sector development of a hotel on Block D in Dube City.
Total value of new investment by companies with at least 51% black African ownership for property developments (including Special Economic Zone investments)
R80 million R442.1 million
Leases were signed with Rain Wood Pty Ltd and Sabipharm Pty Ltd, both of which have majority black African ownership, included property development requirements.
Total value of new investment by companies with >25% black African ownership locating their operations at Dube TradePort (including Special Economic Zone investments)
R50 million R1.188 billionSabipharm Pty Ltd intends to make a significant investment in plant and equipment for their planned facility in Dube TradeZone 1b.
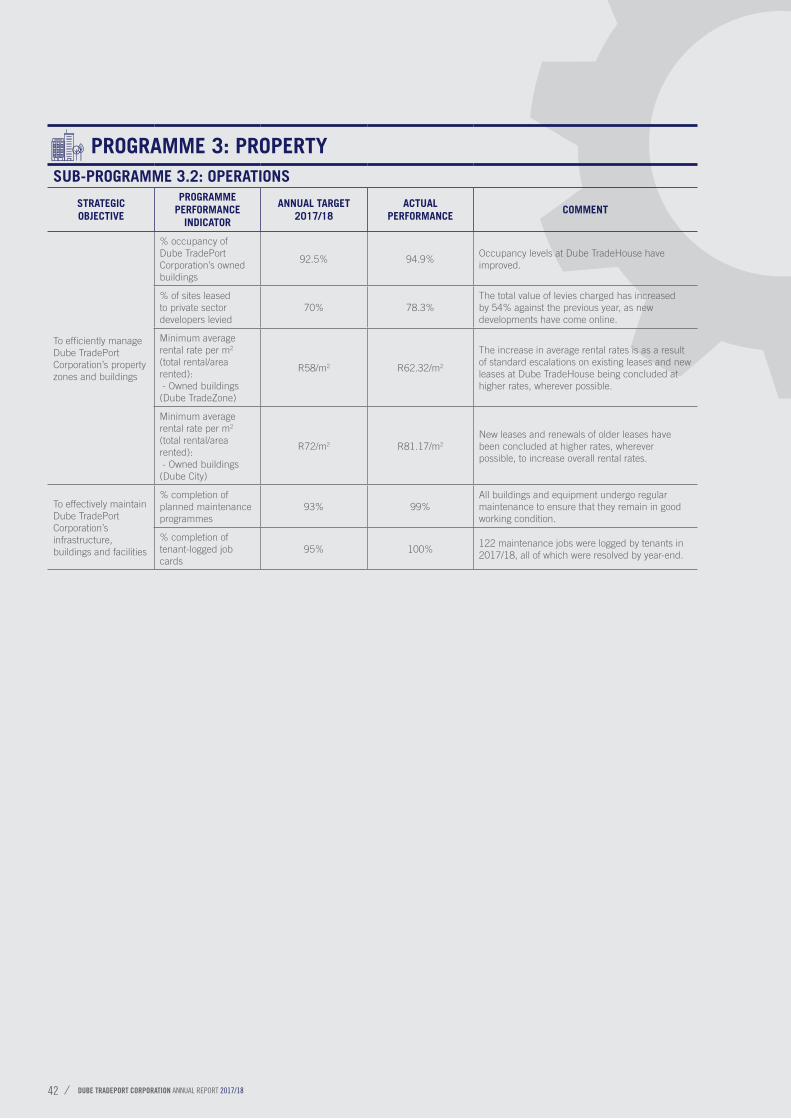
PROGRAMME 3: PROPERTYSUB-PROGRAMME 3.2: OPERATIONS
STRATEGIC OBJECTIVE
PROGRAMME PERFORMANCE
INDICATOR
ANNUAL TARGET 2017/18
ACTUAL PERFORMANCE
COMMENT
To efficiently manage Dube TradePort Corporation’s property zones and buildings
% occupancy of Dube TradePort Corporation’s owned buildings
92.5% 94.9%Occupancy levels at Dube TradeHouse have improved.
% of sites leased to private sector developers levied
70% 78.3%The total value of levies charged has increased by 54% against the previous year, as new developments have come online.
Minimum average rental rate per m2 (total rental/area rented): - Owned buildings (Dube TradeZone)
R58/m2 R62.32/m2
The increase in average rental rates is as a result of standard escalations on existing leases and new leases at Dube TradeHouse being concluded at higher rates, wherever possible.
Minimum average rental rate per m2 (total rental/area rented): - Owned buildings (Dube City)
R72/m2 R81.17/m2
New leases and renewals of older leases have been concluded at higher rates, wherever possible, to increase overall rental rates.
To effectively maintain Dube TradePort Corporation’s infrastructure, buildings and facilities
% completion of planned maintenance programmes
93% 99%All buildings and equipment undergo regular maintenance to ensure that they remain in good working condition.
% completion of tenant-logged job cards
95% 100%122 maintenance jobs were logged by tenants in 2017/18, all of which were resolved by year-end.
DUBE TRADEPORT CORPORATION ANNUAL REPORT 2017/1842
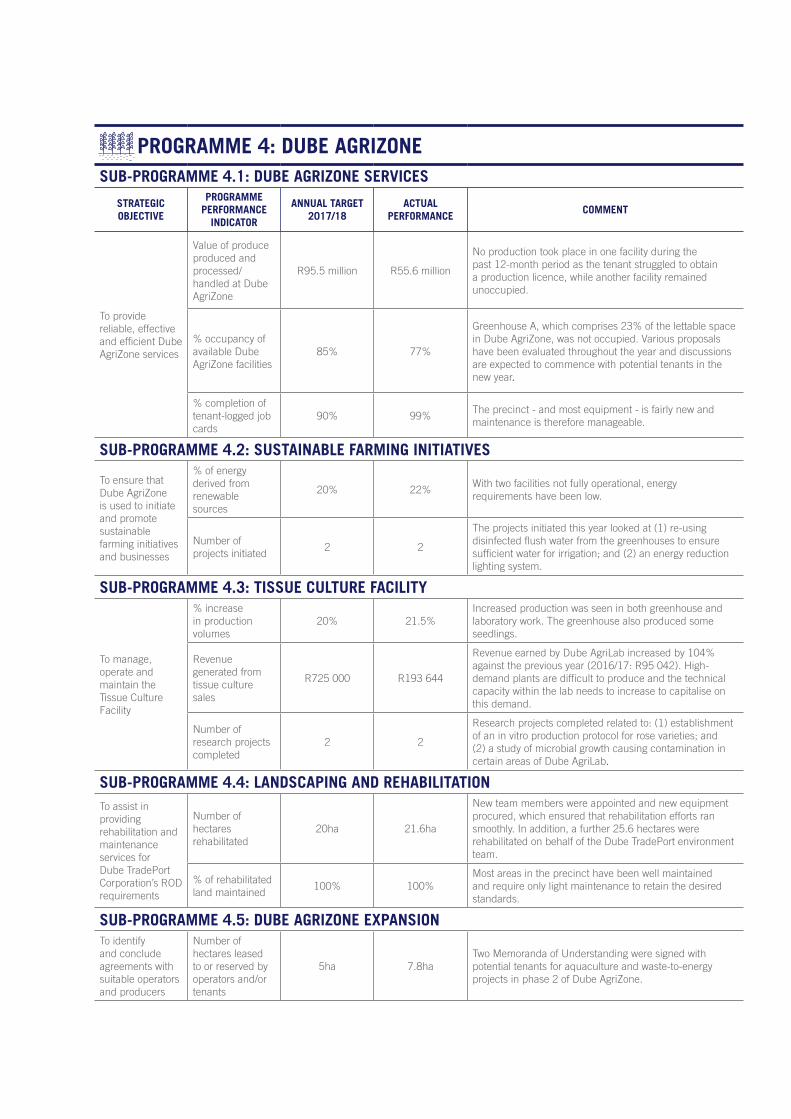
PROGRAMME 4: DUBE AGRIZONESUB-PROGRAMME 4.1: DUBE AGRIZONE SERVICES
STRATEGIC OBJECTIVE
PROGRAMME PERFORMANCE
INDICATOR
ANNUAL TARGET 2017/18
ACTUAL PERFORMANCE
COMMENT
To provide reliable, effective and efficient Dube AgriZone services
Value of produce produced and processed/handled at Dube AgriZone
R95.5 million R55.6 million
No production took place in one facility during the past 12-month period as the tenant struggled to obtain a production licence, while another facility remained unoccupied.
% occupancy of available Dube AgriZone facilities
85% 77%
Greenhouse A, which comprises 23% of the lettable space in Dube AgriZone, was not occupied. Various proposals have been evaluated throughout the year and discussions are expected to commence with potential tenants in the new year.
% completion of tenant-logged job cards
90% 99%The precinct - and most equipment - is fairly new and maintenance is therefore manageable.
SUB-PROGRAMME 4.2: SUSTAINABLE FARMING INITIATIVES
To ensure that Dube AgriZone is used to initiate and promote sustainable farming initiatives and businesses
% of energy derived from renewable sources
20% 22%With two facilities not fully operational, energy requirements have been low.
Number of projects initiated
2 2
The projects initiated this year looked at (1) re-using disinfected flush water from the greenhouses to ensure sufficient water for irrigation; and (2) an energy reduction lighting system.
SUB-PROGRAMME 4.3: TISSUE CULTURE FACILITY
To manage, operate and maintain the Tissue Culture Facility
% increase in production volumes
20% 21.5%Increased production was seen in both greenhouse and laboratory work. The greenhouse also produced some seedlings.
Revenue generated from tissue culture sales
R725 000 R193 644
Revenue earned by Dube AgriLab increased by 104% against the previous year (2016/17: R95 042). High-demand plants are difficult to produce and the technical capacity within the lab needs to increase to capitalise on this demand.
Number of research projects completed
2 2
Research projects completed related to: (1) establishment of an in vitro production protocol for rose varieties; and (2) a study of microbial growth causing contamination in certain areas of Dube AgriLab.
SUB-PROGRAMME 4.4: LANDSCAPING AND REHABILITATIONTo assist in providing rehabilitation and maintenance services for Dube TradePort Corporation’s ROD requirements
Number of hectares rehabilitated
20ha 21.6ha
New team members were appointed and new equipment procured, which ensured that rehabilitation efforts ran smoothly. In addition, a further 25.6 hectares were rehabilitated on behalf of the Dube TradePort environment team.
% of rehabilitated land maintained
100% 100%Most areas in the precinct have been well maintained and require only light maintenance to retain the desired standards.
SUB-PROGRAMME 4.5: DUBE AGRIZONE EXPANSIONTo identify and conclude agreements with suitable operators and producers
Number of hectares leased to or reserved by operators and/or tenants
5ha 7.8haTwo Memoranda of Understanding were signed with potential tenants for aquaculture and waste-to-energy projects in phase 2 of Dube AgriZone.
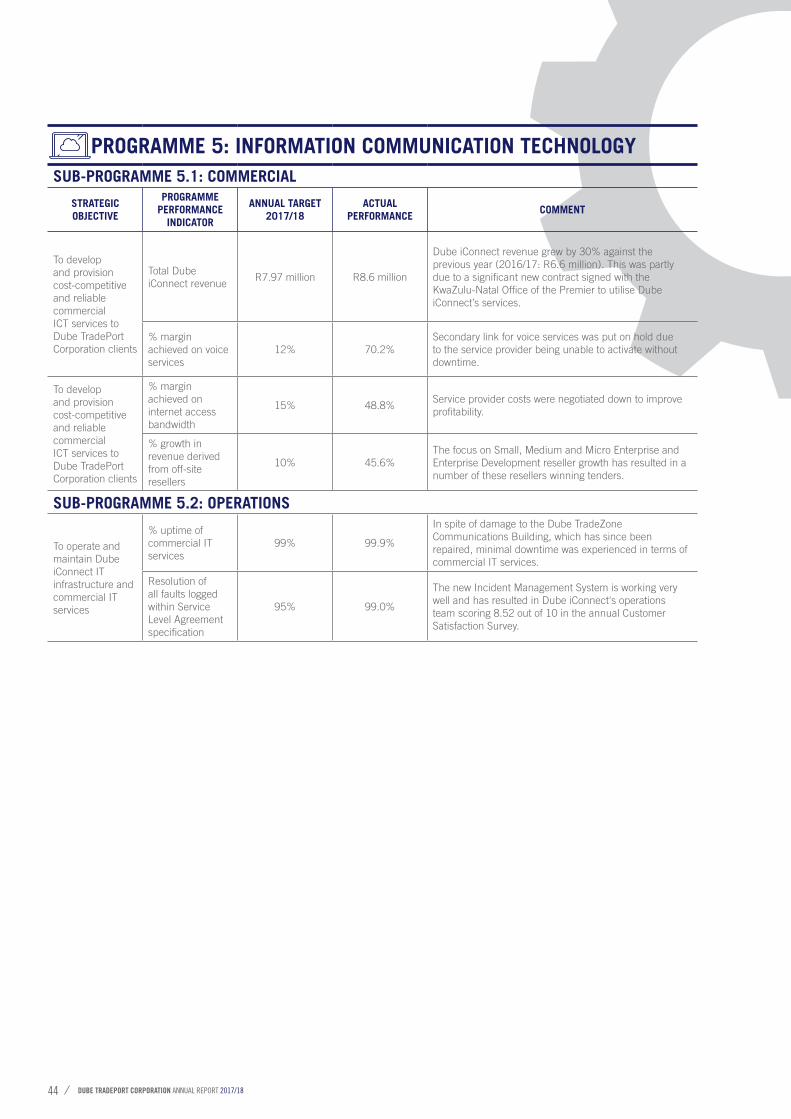
DUBE TRADEPORT CORPORATION ANNUAL REPORT 2017/1844
PROGRAMME 5: INFORMATION COMMUNICATION TECHNOLOGYSUB-PROGRAMME 5.1: COMMERCIAL
STRATEGIC OBJECTIVE
PROGRAMME PERFORMANCE
INDICATOR
ANNUAL TARGET 2017/18
ACTUAL PERFORMANCE
COMMENT
To develop and provision cost-competitive and reliable commercial ICT services to Dube TradePort Corporation clients
Total Dube iConnect revenue
R7.97 million R8.6 million
Dube iConnect revenue grew by 30% against the previous year (2016/17: R6.6 million). This was partly due to a significant new contract signed with the KwaZulu-Natal Office of the Premier to utilise Dube iConnect’s services.
% margin achieved on voice services
12% 70.2%Secondary link for voice services was put on hold due to the service provider being unable to activate without downtime.
To develop and provision cost-competitive and reliable commercial ICT services to Dube TradePort Corporation clients
% margin achieved on internet access bandwidth
15% 48.8%Service provider costs were negotiated down to improve profitability.
% growth in revenue derived from off-site resellers
10% 45.6%The focus on Small, Medium and Micro Enterprise and Enterprise Development reseller growth has resulted in a number of these resellers winning tenders.
SUB-PROGRAMME 5.2: OPERATIONS
To operate and maintain Dube iConnect IT infrastructure and commercial IT services
% uptime of commercial IT services
99% 99.9%
In spite of damage to the Dube TradeZone Communications Building, which has since been repaired, minimal downtime was experienced in terms of commercial IT services.
Resolution of all faults logged within Service Level Agreement specification
95% 99.0%
The new Incident Management System is working very well and has resulted in Dube iConnect's operations team scoring 8.52 out of 10 in the annual Customer Satisfaction Survey.
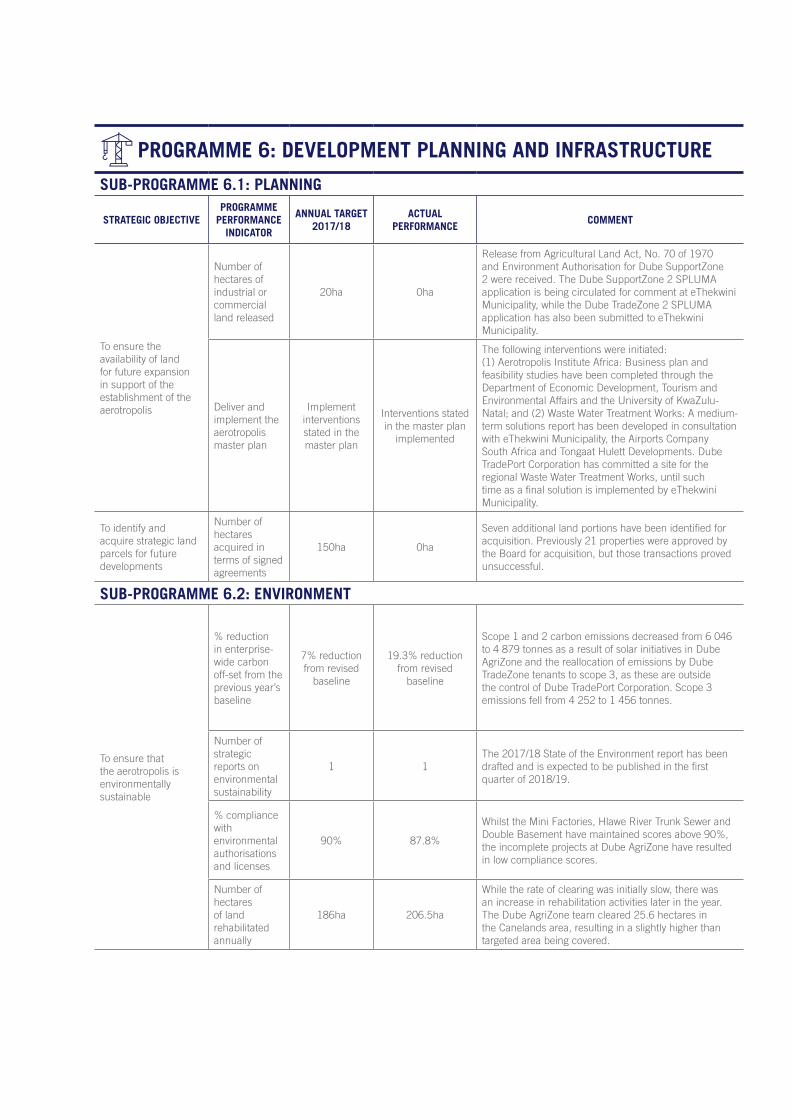
PROGRAMME 6: DEVELOPMENT PLANNING AND INFRASTRUCTURE
SUB-PROGRAMME 6.1: PLANNING
STRATEGIC OBJECTIVEPROGRAMME
PERFORMANCE INDICATOR
ANNUAL TARGET 2017/18
ACTUAL PERFORMANCE
COMMENT
To ensure the availability of land for future expansion in support of the establishment of the aerotropolis
Number of hectares of industrial or commercial land released
20ha 0ha
Release from Agricultural Land Act, No. 70 of 1970 and Environment Authorisation for Dube SupportZone 2 were received. The Dube SupportZone 2 SPLUMA application is being circulated for comment at eThekwini Municipality, while the Dube TradeZone 2 SPLUMA application has also been submitted to eThekwini Municipality.
Deliver and implement the aerotropolis master plan
Implement interventions stated in the master plan
Interventions stated in the master plan
implemented
The following interventions were initiated: (1) Aerotropolis Institute Africa: Business plan and feasibility studies have been completed through the Department of Economic Development, Tourism and Environmental Affairs and the University of KwaZulu-Natal; and (2) Waste Water Treatment Works: A medium-term solutions report has been developed in consultation with eThekwini Municipality, the Airports Company South Africa and Tongaat Hulett Developments. Dube TradePort Corporation has committed a site for the regional Waste Water Treatment Works, until such time as a final solution is implemented by eThekwini Municipality.
To identify and acquire strategic land parcels for future developments
Number of hectares acquired in terms of signed agreements
150ha 0ha
Seven additional land portions have been identified for acquisition. Previously 21 properties were approved by the Board for acquisition, but those transactions proved unsuccessful.
SUB-PROGRAMME 6.2: ENVIRONMENT
To ensure that the aerotropolis is environmentally sustainable
% reduction in enterprise-wide carbon off-set from the previous year’s baseline
7% reduction from revised
baseline
19.3% reduction from revised
baseline
Scope 1 and 2 carbon emissions decreased from 6 046 to 4 879 tonnes as a result of solar initiatives in Dube AgriZone and the reallocation of emissions by Dube TradeZone tenants to scope 3, as these are outside the control of Dube TradePort Corporation. Scope 3 emissions fell from 4 252 to 1 456 tonnes.
Number of strategic reports on environmental sustainability
1 1The 2017/18 State of the Environment report has been drafted and is expected to be published in the first quarter of 2018/19.
% compliance with environmental authorisations and licenses
90% 87.8%
Whilst the Mini Factories, Hlawe River Trunk Sewer and Double Basement have maintained scores above 90%, the incomplete projects at Dube AgriZone have resulted in low compliance scores.
Number of hectares of land rehabilitated annually
186ha 206.5ha
While the rate of clearing was initially slow, there was an increase in rehabilitation activities later in the year. The Dube AgriZone team cleared 25.6 hectares in the Canelands area, resulting in a slightly higher than targeted area being covered.
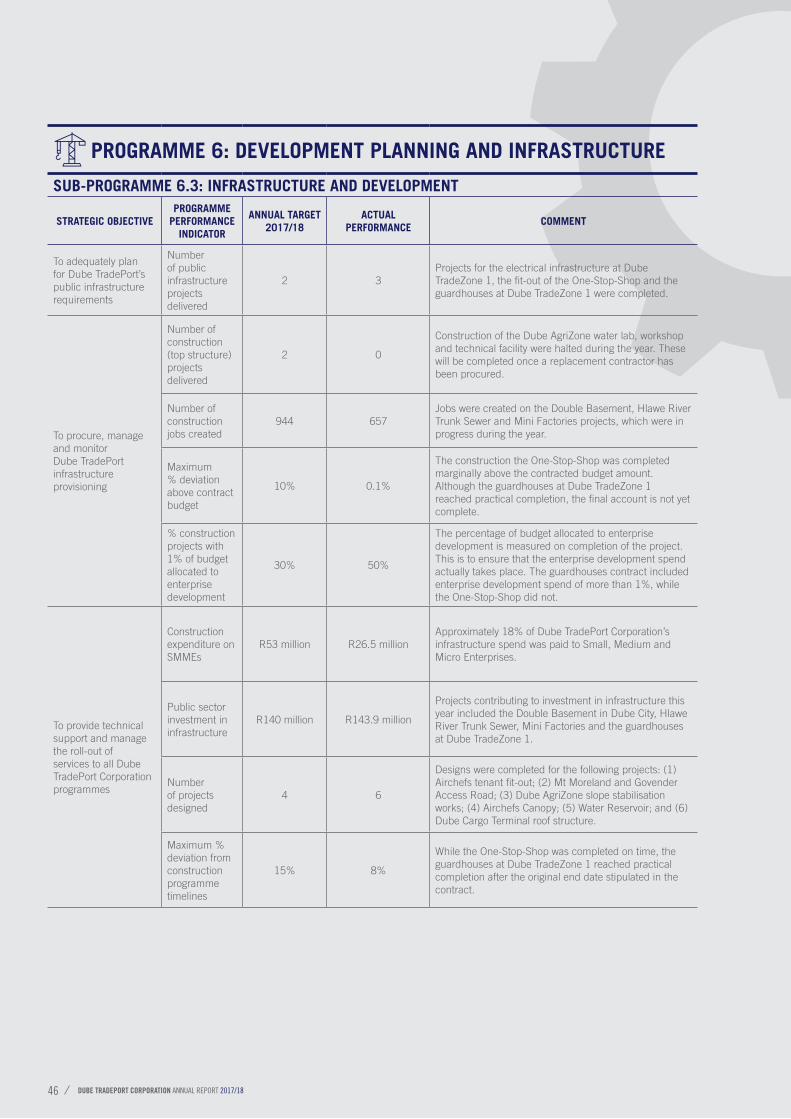
PROGRAMME 6: DEVELOPMENT PLANNING AND INFRASTRUCTURE
SUB-PROGRAMME 6.3: INFRASTRUCTURE AND DEVELOPMENT
STRATEGIC OBJECTIVEPROGRAMME
PERFORMANCE INDICATOR
ANNUAL TARGET 2017/18
ACTUAL PERFORMANCE
COMMENT
To adequately plan for Dube TradePort’s public infrastructure requirements
Number of public infrastructure projects delivered
2 3Projects for the electrical infrastructure at Dube TradeZone 1, the fit-out of the One-Stop-Shop and the guardhouses at Dube TradeZone 1 were completed.
To procure, manage and monitor Dube TradePort infrastructure provisioning
Number of construction (top structure) projects delivered
2 0
Construction of the Dube AgriZone water lab, workshop and technical facility were halted during the year. These will be completed once a replacement contractor has been procured.
Number of construction jobs created
944 657Jobs were created on the Double Basement, Hlawe River Trunk Sewer and Mini Factories projects, which were in progress during the year.
Maximum % deviation above contract budget
10% 0.1%
The construction the One-Stop-Shop was completed marginally above the contracted budget amount. Although the guardhouses at Dube TradeZone 1 reached practical completion, the final account is not yet complete.
% construction projects with 1% of budget allocated to enterprise development
30% 50%
The percentage of budget allocated to enterprise development is measured on completion of the project. This is to ensure that the enterprise development spend actually takes place. The guardhouses contract included enterprise development spend of more than 1%, while the One-Stop-Shop did not.
To provide technical support and manage the roll-out of services to all Dube TradePort Corporation programmes
Construction expenditure on SMMEs
R53 million R26.5 millionApproximately 18% of Dube TradePort Corporation’s infrastructure spend was paid to Small, Medium and Micro Enterprises.
Public sector investment in infrastructure
R140 million R143.9 million
Projects contributing to investment in infrastructure this year included the Double Basement in Dube City, Hlawe River Trunk Sewer, Mini Factories and the guardhouses at Dube TradeZone 1.
Number of projects designed
4 6
Designs were completed for the following projects: (1) Airchefs tenant fit-out; (2) Mt Moreland and Govender Access Road; (3) Dube AgriZone slope stabilisation works; (4) Airchefs Canopy; (5) Water Reservoir; and (6) Dube Cargo Terminal roof structure.
Maximum % deviation from construction programme timelines
15% 8%
While the One-Stop-Shop was completed on time, the guardhouses at Dube TradeZone 1 reached practical completion after the original end date stipulated in the contract.
DUBE TRADEPORT CORPORATION ANNUAL REPORT 2017/1846
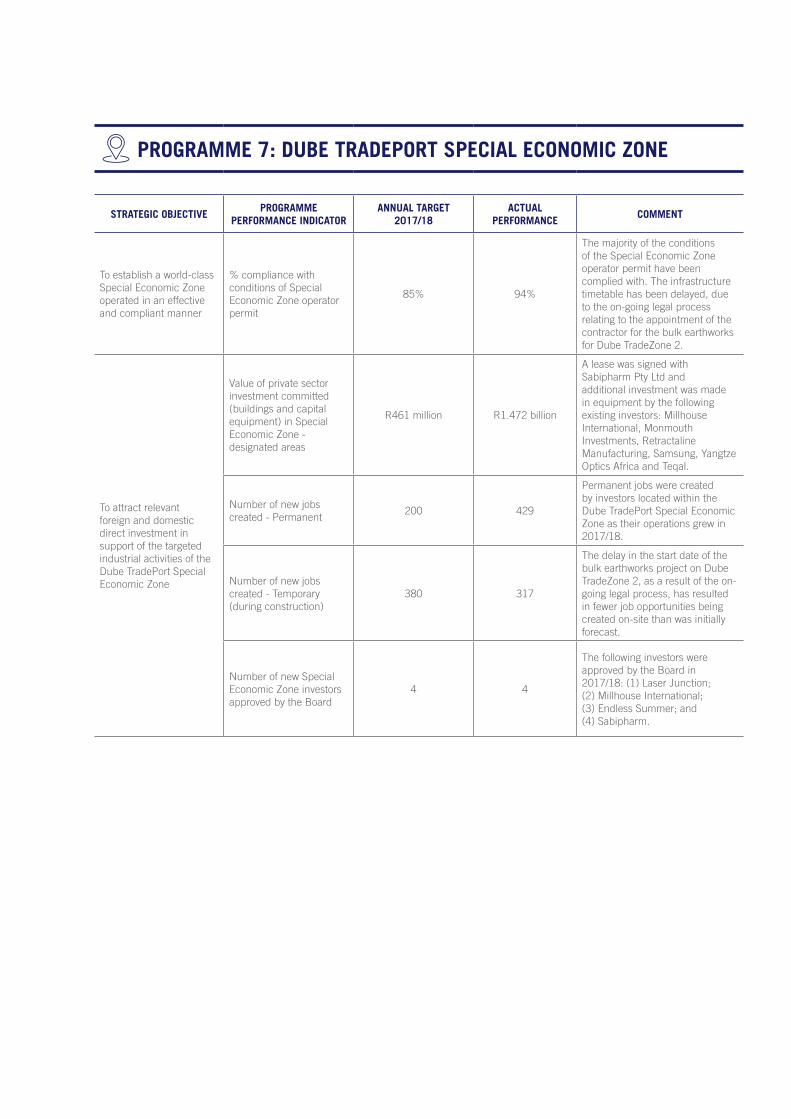
PROGRAMME 7: DUBE TRADEPORT SPECIAL ECONOMIC ZONE
STRATEGIC OBJECTIVEPROGRAMME
PERFORMANCE INDICATORANNUAL TARGET
2017/18ACTUAL
PERFORMANCECOMMENT
To establish a world-class Special Economic Zone operated in an effective and compliant manner
% compliance with conditions of Special Economic Zone operator permit
85% 94%
The majority of the conditions of the Special Economic Zone operator permit have been complied with. The infrastructure timetable has been delayed, due to the on-going legal process relating to the appointment of the contractor for the bulk earthworks for Dube TradeZone 2.
To attract relevant foreign and domestic direct investment in support of the targeted industrial activities of the Dube TradePort Special Economic Zone
Value of private sector investment committed (buildings and capital equipment) in Special Economic Zone - designated areas
R461 million R1.472 billion
A lease was signed with Sabipharm Pty Ltd and additional investment was made in equipment by the following existing investors: Millhouse International, Monmouth Investments, Retractaline Manufacturing, Samsung, Yangtze Optics Africa and Teqal.
Number of new jobs created - Permanent
200 429
Permanent jobs were created by investors located within the Dube TradePort Special Economic Zone as their operations grew in 2017/18.
Number of new jobs created - Temporary (during construction)
380 317
The delay in the start date of the bulk earthworks project on Dube TradeZone 2, as a result of the on-going legal process, has resulted in fewer job opportunities being created on-site than was initially forecast.
Number of new Special Economic Zone investors approved by the Board
4 4
The following investors were approved by the Board in 2017/18: (1) Laser Junction; (2) Millhouse International; (3) Endless Summer; and (4) Sabipharm.
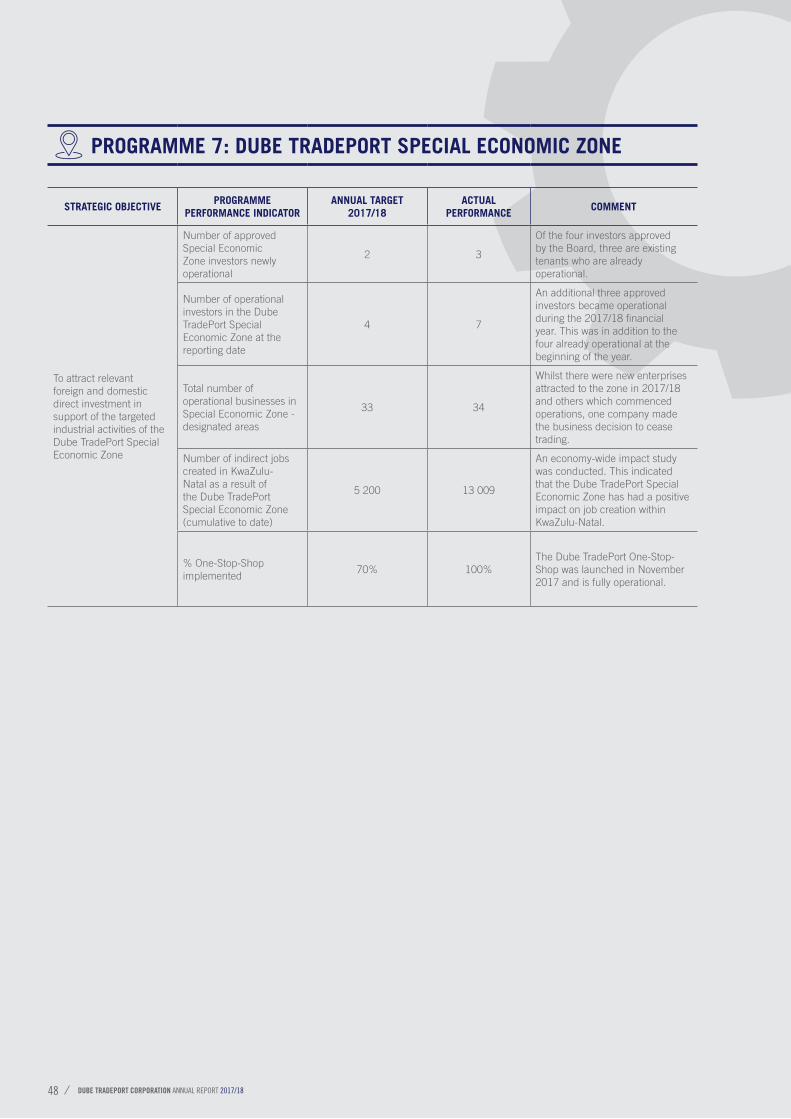
PROGRAMME 7: DUBE TRADEPORT SPECIAL ECONOMIC ZONE
STRATEGIC OBJECTIVEPROGRAMME
PERFORMANCE INDICATORANNUAL TARGET
2017/18ACTUAL
PERFORMANCECOMMENT
To attract relevant foreign and domestic direct investment in support of the targeted industrial activities of the Dube TradePort Special Economic Zone
Number of approved Special Economic Zone investors newly operational
2 3
Of the four investors approved by the Board, three are existing tenants who are already operational.
Number of operational investors in the Dube TradePort Special Economic Zone at the reporting date
4 7
An additional three approved investors became operational during the 2017/18 financial year. This was in addition to the four already operational at the beginning of the year.
Total number of operational businesses in Special Economic Zone - designated areas
33 34
Whilst there were new enterprises attracted to the zone in 2017/18 and others which commenced operations, one company made the business decision to cease trading.
Number of indirect jobs created in KwaZulu-Natal as a result of the Dube TradePort Special Economic Zone (cumulative to date)
5 200 13 009
An economy-wide impact study was conducted. This indicated that the Dube TradePort Special Economic Zone has had a positive impact on job creation within KwaZulu-Natal.
% One-Stop-Shop implemented
70% 100%The Dube TradePort One-Stop-Shop was launched in November 2017 and is fully operational.
DUBE TRADEPORT CORPORATION ANNUAL REPORT 2017/1848
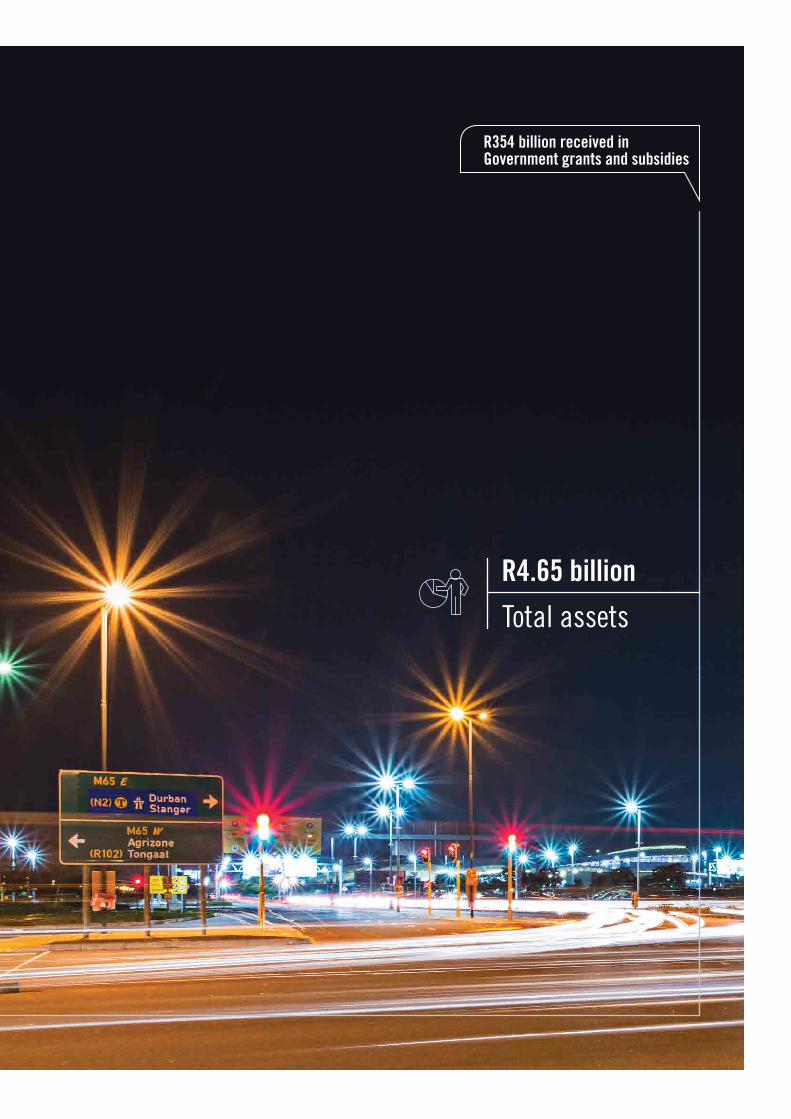
R354 billion received in Government grants and subsidies
R4.65 billion
Total assets
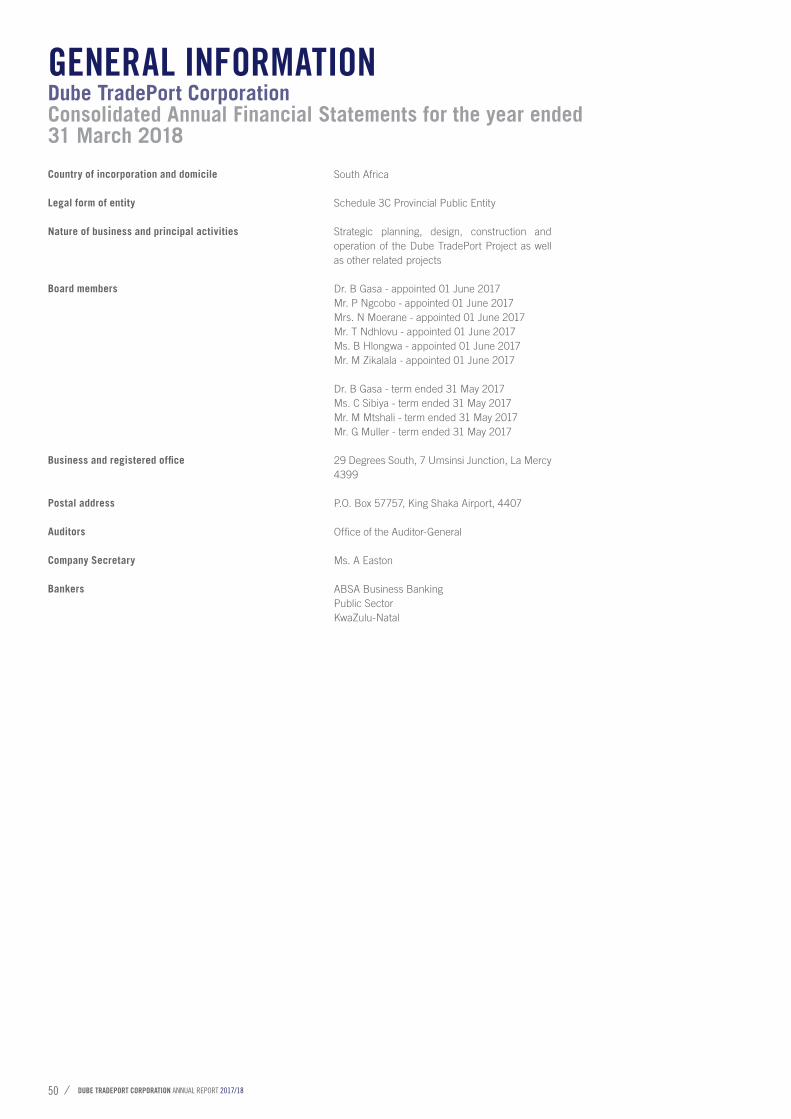
DUBE TRADEPORT CORPORATION ANNUAL REPORT 2017/1850
Country of incorporation and domicile
Legal form of entity
Nature of business and principal activities
Board members
Business and registered office
Postal address
Auditors
Company Secretary
Bankers
South Africa
Schedule 3C Provincial Public Entity
Strategic planning, design, construction and operation of the Dube TradePort Project as well as other related projects
Dr. B Gasa - appointed 01 June 2017Mr. P Ngcobo - appointed 01 June 2017Mrs. N Moerane - appointed 01 June 2017Mr. T Ndhlovu - appointed 01 June 2017Ms. B Hlongwa - appointed 01 June 2017Mr. M Zikalala - appointed 01 June 2017
Dr. B Gasa - term ended 31 May 2017Ms. C Sibiya - term ended 31 May 2017Mr. M Mtshali - term ended 31 May 2017Mr. G Muller - term ended 31 May 2017
29 Degrees South, 7 Umsinsi Junction, La Mercy4399
P.O. Box 57757, King Shaka Airport, 4407
Office of the Auditor-General
Ms. A Easton
ABSA Business BankingPublic SectorKwaZulu-Natal
Dube TradePort CorporationConsolidated Annual Financial Statements for the year ended 31 March 2018
GENERAL INFORMATION
The reports and statements set out below comprise the consolidated annual financial statements presented to the Provincial Legislature:
For the year ended 31 March 2018ANNUAL FINANCIAL STATEMENTS
INDEX
Accounting Authority's (Board's) Responsibilities and Approval................................................................................................................... 52
Audit and Risk Committee Report................................................................................................................................................................. 53
Report of the Auditor-General........................................................................................................................................................................ 54
Report of the Accounting Authority (Board)................................................................................................................................................... 57
Statement of Financial Position....................................................................................................................................................................... 58
Statement of Financial Performance............................................................................................................................................................... 59
Statement of Changes in Net Assets............................................................................................................................................................... 60
Cash Flow Statement...................................................................................................................................................................................... 61
Statement of Comparison of Budget and Actual Amounts............................................................................................................................ 62
Notes to the Consolidated Annual Financial Statements................................................................................................................................. 64
DUBE TRADEPORT CORPORATION ANNUAL REPORT 2017/1852
The Board in its role as the Accounting Authority is required by the Public Finance Management Act, (Act No. 1 of 1999), to maintain adequate accounting records and is responsible for the content and integrity of the consolidated annual financial statements and related financial information included in this report. It is the responsibility of the Board to ensure that the consolidated annual financial statements fairly present the state of affairs of the economic entity as at the end of the financial year and the results of its operations and cash flows for the period then ended. The external auditors are engaged to express an independent opinion on the consolidated annual financial statements and were given unrestricted access to all financial records and related data.
The consolidated annual financial statements have been prepared in accordance with Standards of Generally Recognised Accounting Practice (GRAP) including any interpretations, guidelines and directives issued by the Accounting Standards Board.
The consolidated annual financial statements are based upon appropriate accounting policies consistently applied and supported by reasonable and prudent judgements and estimates.
The Board acknowledges that it is ultimately responsible for the system of internal financial control established by the economic entity and places considerable importance on maintaining a strong control environment. To enable the Board to meet these responsibilities, the Board sets standards for internal control aimed at reducing the risk of error or deficit in a cost -effective manner. The standards include the proper delegation of responsibilities within a clearly defined framework, effective accounting
procedures and adequate segregation of duties to ensure an acceptable level of risk. These controls are monitored throughout the economic entity and all employees are required to maintain the highest ethical standards in ensuring the economic entity’s business is conducted in a manner that, in all reasonable circumstances, is above reproach. The focus of risk management in the economic entity is on identifying, assessing, managing and monitoring all known forms of risk across the economic entity. The Board maintained a reporting system that enabled it to monitor changes in the entity’s risk profile and gain assurance that risk management was effective. While operating risk cannot be fully eliminated, the economic entity endeavours to minimise it by ensuring that appropriate infrastructure, controls, systems and ethical behaviour are applied and managed within predetermined procedures and constraints.
The Board is of the opinion, based on the information and explanations given by management, that the system of internal financial control is effective and provides reasonable assurance that the financial records may be relied on for the preparation of the consolidated annual financial statements. However, any system of internal financial control can provide only reasonable, and not absolute, assurance against material misstatement or loss.
The Board has reviewed the entity’s cash flow forecast for the year ending 31 March 2019 and, in the light of this review and the current financial position, it is satisfied that the economic entity has or has access to adequate resources to continue in operational existence for the foreseeable future.
The economic entity is wholly dependent on
the Department of Economic Development, Tourism and Environmental Affairs for continued funding of operations. The annual financial statements are prepared on the basis that the economic entity is a going concern and that the Department of Economic Development, Tourism and Environmental Affairs has neither the intention nor the need to liquidate or curtail materially the scale of the economic entity.
The external auditors are responsible for independently reviewing and reporting on the entity’s consolidated annual financial statements. The consolidated annual financial statements have been examined by the economic entity’s external auditors and their report is presented on pages 54 to 56.
The annual financial statements set out on pages 57 to 108, which have been prepared on the going concern basis, were approved by the Accounting Authority on 31 May 2018 and were signed on its behalf by:
........................................................Mr Hamish ErskineChief Executive Officer
For the year ended 31 March 2018
ACCOUNTING AUTHORITY’S (BOARD'S)RESPONSIBILITIES AND APPROVAL
........................................................Dr Zanele Bridgette GasaChairperson of the Board
AUDIT AND RISK
The members of the Audit and Risk Committee are appointed by the Dube TradePort Corporation Board. In terms of Treasury Regulations and the King IV Report on Corporate Governance, the Chairperson of the Audit and Risk Committee, appointed in January 2008, is independent.
On 31 May 2017, the term of office of the former members of the Audit and Risk Committee ended and the new Committee comprising Mssrs. Vela Mtshali and Mpumelelo Zikalala, were appointed by the Board.
The primary role of the Audit and Risk Committee is to assist the Board in discharging its responsibilities to safeguard Dube TradePort Corporation’s assets, maintain adequate accounting records and develop and maintain effective systems of internal control. In reviewing the findings of internal audit nothing has come to the attention of the Committee to indicate any material breakdown in the internal controls, including the internal financial controls, of the group.
During the year, the Audit and Risk Committee met four times and undertook the following activities:• Reviewed the Audit and Risk Committee’s
Term of Reference to ensure relevance;• Internal Audit Function
- Reviewed Internal Audit Charter and approved the 2017/18 Internal Audit Plan and Budget;
- Reviewed the findings of internal audit as presented at the end of each internal audit cycle; and
- Met with internal audit without the presence of management.
• External Audit Function - Reviewed and approved
the audited annual financial statements for the period ended
31 March 2017; - Reviewed external audit report
tabled for the period ended 31 March 2017 for submission to the Dube TradePort Corporation Board;
- Met with the Office of the Auditor-General to ensure that there are no unresolved issues of concern; and
- Met with the Office of the Auditor-General without the presence of management.
• Risk Management and Fraud Prevention - Various financial and IT policies
were reviewed; - Received information on
assurance of other independent assurance providers as part of the Combined Assurance Plan;
- Reviewed the Risk Management Framework;
- Reviewed the Delegations of Authority;
- Received reports of calls to the Anti-fraud Hotline;
- Took part in the strategic risk assessment; and
- The insurance claims and high risk contracts were reviewed each quarter.
• Performance Information - Reviewed interim financial
statements for the six months ended 30 September 2017;
- Reviewed management accounts for the period under review; and
- Reviewed quarterly performance reports for the period under review.
In undertaking the abovementioned activities, the Audit and Risk Committee fulfilled its mandate as set out in the Committee’s
Terms of Reference in all material aspects. The Audit and Risk Committee considers the Chief Financial Officer to have the required expertise and capability.
The Board report on the effectiveness of internal controls is included elsewhere in the annual report. The Audit and Risk Committee supports the opinion of the Board in this regard.
The Chairperson of the Audit and Risk Committee of the subsidiary La Mercy JV Property Investments Proprietary Limited was invited to give feedback from meetings of the subsidiary’s Audit and Risk Committee.
The Chairperson of the Audit and Risk Committee is invited to provide feedback from the Committee meetings at the subsequent meetings of the Board of Dube TradePort Corporation.
I would like to take this opportunity to thank the Audit and Risk Committee members for the excellent role that they have played in shaping the governance environment of Dube TradePort Corporation. I look forward to the next year as we work towards full compliance with the Public Finance Management Act, No. 1 of 1999, and the related regulatory environment that governs a Schedule 3C Provincial Public Entity and compliance with the recommendations of the King IV Report on Corporate Governance.
For the year ended 31 March 2018.
................................Mr Shadrack KhumaloChairperson: Audit and Risk Committee
COMMITTEE REPORT
DUBE TRADEPORT CORPORATION ANNUAL REPORT 2017/1854
REPORT OF THE AUDITOR-GENERALTo the KwaZulu-Natal Provincial Legislature on Dube TradePort Corporation
REPORT ON THE AUDIT OF THE CONSOLIDATED AND SEPARATE FINANCIAL STATEMENTSOPINION1. I have audited the consolidated and
separate financial statements of the Dube TradePort Corporation and its subsidiary (the group) set out on pages 57 to 108, which comprise the consolidated and separate statement of financial position as at 31 March 2018, the consolidated and separate statement of financial performance, statement of changes in net assets, cash flow statement and statement of comparison of budget information with actual information for the year then ended, as well as the notes to the consolidated and separate financial statements, including a summary of significant accounting policies.
2. In my opinion, the consolidated and separate financial statements present fairly, in all material respects, the consolidated and separate financial position of the group as at 31 March 2018, and its financial performance and cash flows for the year then ended in accordance with the South African Standards of Generally Recognised Accounting Practice (SA Standards of GRAP) and the requirements of the Public Finance Management Act of South Africa, 1999 (Act No. 1 of 1999) (PFMA).
BASIS FOR OPINION3. I conducted my audit in accordance with
the International Standards on Auditing (ISAs). My responsibilities under those standards are further described in the Auditor-General’s responsibilities for the audit of the consolidated and separate financial statements section of this auditor’s report.
4. I am independent of the group in accordance with the International Ethics Standards Board for Accountants’ Code of ethics for professional accountants (IESBA code) and the ethical requirements that are relevant to my audit in South Africa. I have fulfilled my other ethical responsibilities in accordance with these requirements and the IESBA code.
5. I believe that the audit evidence I have obtained is sufficient and appropriate to provide a basis for my opinion.
RESPONSIBILITIES OF ACCOUNTING AUTHORITY FOR THE CONSOLIDATED AND SEPARATE FINANCIAL STATEMENTS6. The accounting authority is responsible
for the preparation and fair presentation of the consolidated and separate financial
statements in accordance with SA Standards of GRAP and the requirements of the PFMA, and for such internal control as the accounting authority determines is necessary to enable the preparation of consolidated and separate financial statements that are free from material misstatement, whether due to fraud or error.
7. In preparing the consolidated and separate financial statements, the accounting authority is responsible for assessing the group’s ability to continue as a going concern, disclosing, as applicable, matters relating to going concern and using the going concern basis of accounting unless the accounting authority either intends to liquidate the group or to cease operations, or has no realistic alternative but to do so.
AUDITOR-GENERAL’S RESPONSIBILITIES FOR THE AUDIT OF THE CONSOLIDATED AND SEPARATE FINANCIAL STATEMENTS8. My objectives are to obtain reasonable
assurance about whether the consolidated and separate financial statements as a whole are free from material misstatement, whether due to fraud or error, and to issue an auditor’s report that includes my opinion. Reasonable assurance is a high level of assurance, but is not a guarantee that an audit conducted in accordance with the ISAs will always detect a material misstatement when it exists. Misstatements can arise from fraud or error and are considered material if, individually or in aggregate, they could reasonably be expected to influence the economic decisions of users taken on the basis of these consolidated and separate financial statements.
9. A further description of my responsibilities for the audit of the consolidated and separate financial statements is included in the annexure to this auditor’s report.
REPORT ON THE AUDIT OF THE ANNUAL PERFORMANCE REPORTINTRODUCTION AND SCOPE10. In accordance with the Public Audit
Act of South Africa, 2004 (Act No. 25 of 2004) (PAA) and the general notice issued in terms thereof, I have a responsibility to report material findings on the reported performance information against predetermined objectives for selected programmes presented in the annual performance report. I performed procedures to identify findings, but not to gather evidence to express assurance.
11. My procedures address the reported
performance information, which must be based on the approved performance planning documents of the group. I have not evaluated the completeness and appropriateness of the performance indicators/measures included in the planning documents. My procedures also did not extend to any disclosures or assertions relating to planned performance strategies and information in respect of future periods that may be included as part of the reported performance information. Accordingly, my findings do not extend to these matters.
12. I evaluated the usefulness and reliability
of the reported performance information in accordance with the criteria developed from the performance management and reporting framework, as defined in the general notice, for the following selected programmes presented in the annual performance report of the group for the year ended 31 March 2018:
PROGRAMMES
PAGES IN THE ANNUAL
PERFORMANCE REPORT
Programme 6 – Development Planning and Infrastructure
45-46
Programme 7 – Special Economic Zone
47-48
13. I performed procedures to determine whether the reported performance information was properly presented and whether performance was consistent with the approved performance planning documents. I performed further procedures to determine whether the indicators and related targets were measurable and relevant, and assessed the reliability of the reported performance information to determine whether it was valid, accurate and complete.
14. I did not raise any material findings on the usefulness and reliability of the reported performance information for the above selected programmes.
OTHER MATTER15. I draw attention to the matter below.
ACHIEVEMENT OF PLANNED TARGETS16. The annual performance report on pages
36 to 48 contains information on the achievement of planned targets for the year and explanations provided for the
under/over achievement of a significant number of targets.
Report on the audit of compliance with legislation.INTRODUCTION AND SCOPE17. In accordance with the PAA and the general
notice issued in terms thereof, I have a responsibility to report material findings on the compliance of the group with specific matters in key legislation. I performed procedures to identify findings but not to gather evidence to express assurance.
18. I did not raise material findings on compliance with the specific matters in key legislation set out in the general notice issued in terms of the PAA.
OTHER INFORMATION19. The accounting authority is responsible for
the other information. The other information comprises the information included in the annual report. The other information does not include the consolidated and separate financial statements, the auditor’s report and those selected programmes presented in the annual performance report that have been specifically reported in this auditor’s report.
20. My opinion on the consolidated and separate financial statements and findings on the reported performance information and compliance with legislation do not cover the other information and I do not express an audit opinion or any form of assurance conclusion thereon.
21. In connection with my audit, my responsibility is to read the other information and, in doing so, consider whether the other information is materially inconsistent with the consolidated and separate financial statements and the selected programmes presented in the annual performance report, or my knowledge obtained in the audit, or otherwise appears to be materially misstated.
22. The other information I obtained prior to the date of this auditor’s report is the draft foreward, chairperson’s statement, chief executive officer’s review, corporate governance report and corporate services report.
23. If, based on the work I have performed on
the other information that I obtained prior to the date of this auditor’s report, I conclude that there is a material misstatement in this other information, I am required to report
that fact. I have nothing to report in this regard.
24. After I receive and read the audit committee report and if I conclude that there is a material misstatement, I am required to communicate the matter to those charged with governance and request that the other information be corrected. If the other information is not corrected, I may have to retract this auditor’s report and re-issue an amended report as appropriate. However, if it is corrected this will not be necessary.
INTERNAL CONTROL DEFICIENCIES25. I considered internal control relevant to
my audit of the consolidated and separate financial statements, reported performance information and compliance with applicable legislation; however, my objective was not to express any form of assurance on it.
26. I did not identify any significant deficiencies in internal control.
OTHER REPORTS27. I draw attention to the following
engagements conducted by various parties that had, or could have, an impact on the matters reported in the group’s consolidated and separate financial statements, reported performance information, compliance with applicable legislation and other related matters. These reports did not form part of my opinion on the consolidated and separate financial statements or my findings on the reported performance information or compliance with legislation.
28. An assurance engagement report for the period ended the 31 March 2017 was issued to the Independent Communication Authority of South Africa (ICASA) on compliance with the Electronics Communications Act, 2005 (Act No.36 of 2005) relating to the universal service and access fund.
........................................Auditor-GeneralPietermaritzburg31 July 2018
DUBE TRADEPORT CORPORATION ANNUAL REPORT 2017/1856
ANNEXURE – AUDITOR-GENERAL’S RESPONSIBILITY FOR THE AUDIT 1. As part of an audit in accordance with the
ISAs, I exercise professional judgement and maintain professional scepticism throughout my audit of the consolidated and separate financial statements, and the procedures performed on reported performance information for selected programmes and on the entity’s compliance with respect to the selected subject matters.
FINANCIAL STATEMENTS2. In addition to my responsibility for the audit
of the consolidated and separate financial statements as described in this auditor’s report, I also:
• Identify and assess the risks of material misstatement of the consolidated and separate financial statements whether due to fraud or error, design and perform audit procedures responsive to those risks, and obtain audit evidence that is sufficient and appropriate to provide a basis for my opinion;
The risk of not detecting a material misstatement resulting from fraud is higher than for one resulting from error, as fraud may involve collusion, forgery, intentional omissions, misrepresentations, or the override of internal control;
• Obtain an understanding of internal control relevant to the audit in order to design audit procedures that are appropriate in the circumstances, but not for the purpose of expressing an opinion on the effectiveness of the entity’s internal control;
• Evaluate the appropriateness of accounting policies used and the reasonableness of accounting estimates and related disclosures made by the accounting authority;
• Conclude on the appropriateness of the accounting authority’s use of the going concern basis of accounting in the preparation of the consolidated and separate financial statements.
I also conclude, based on the audit evidence obtained, whether a material uncertainty exists related to events or conditions that may cast significant doubt on the group’s ability to continue as a going concern. If I conclude that a material uncertainty exists, I am required to draw attention in my auditor’s report to the related disclosures in the consolidated and separate financial statements about the material uncertainty or, if such disclosures are inadequate, to modify
the opinion on the consolidated and separate financial statements.
My conclusions are based on the information available to me at the date of this auditor’s report. However, future events or conditions may cause an entity to cease continuing as a going concern; and
• Evaluate the overall presentation, structure and content of the consolidated and separate financial statements, including the disclosures, and whether the consolidated and separate financial statements represent the underlying transactions and events in a manner that achieves fair presentation.
COMMUNICATION WITH THOSE CHARGED WITH GOVERNANCE3. I communicate with the accounting
authority regarding, among other matters, the planned scope and timing of the audit and significant audit findings, including any significant deficiencies in internal control that I identify during my audit.
4. I also confirm to the accounting authority
that I have complied with relevant ethical requirements regarding independence, and communicate all relationships and other matters that may reasonably be thought to have a bearing on my independence and, where applicable, related safeguards.
REPORT OF THE AUDITOR-GENERALTo the KwaZulu-Natal Provincial Legislature on Dube TradePort Corporation (continued)
REPORT OF THE ACCOUNTING AUTHORITY (BOARD)For the year ended 31 March 2018
The Accounting Authority (Board) presents its report on the activities of the group for the period ended 31 March 2018.
Dube TradePort Corporation has been created as an implementation vehicle and service delivery company by the Provincial Government of KwaZulu-Natal. It is responsible for the strategic planning, design, construction and operation of the Dube TradePort Project as well as other related projects. Key components of the Dube TradePort are the King Shaka International Airport, a TradeZone, an AgriZone and Dube City.
1. LEGAL ENTITY, NATURE OF BUSINESS AND OPERATIONS
Dube TradePort Corporation is a listed Provincial Public Entity (Schedule 3C) as contemplated by the Public Finance Management Act, No. 1 of 1999 (PFMA). The KwaZulu-Natal Dube TradePort Corporation Act, No. 2 of 2010, was promulgated on 21 October 2010 and subsequently Dube TradePort Corporation was registered as a Schedule 3C Public Entity (in the Government Gazette dated 30 September 2011) with an effective date of 01 April 2011.
The voluntary winding up and deregistration process of the Dube TradePort Non-Profit Company and transition to the public entity was completed on 31 August 2013 when all assets, liabilities, rights, duties and obligations were transferred to, and vested in, Dube TradePort Corporation. Prior to this date Dube TradePort conducted its operating activities as a Non-Profit Company (previously known as a Section 21 Company), registered as such in terms of the Companies Act, No. 81 of 2008. The company registration number was 2002/002810/08.
During 2014, Dube TradeZone and Dube AgriZone were designated Industrial Development Zones (IDZs); during 2015/16 the Special Economic Zone Act, No. 16 of 2014, and regulations were promulgated. The regulations provided for a three-year transition period for the conversion from IDZ to Special Economic Zone (SEZ). In the Government Gazette dated 23 December 2016, Dube TradeZone and Dube AgriZone of Dube TradePort were officially designated as a Special Economic Zone.
2. RELEVANT LEGISLATION GOVERNING DUBE TRADEPORT CORPORATION OPERATIONS
Dube TradePort Corporation abides by the obligations of the PFMA and Treasury Regulations as contained in the Grant Funding Agreement with the Department of Economic Development, Tourism and Environmental Affairs.
3. STATEMENT OF RESPONSIBILITYOn 31 May 2017 the term of office of the
previous Board ended and on 1 June 2017, the new Board commenced a one-year term of office. The new Board comprises: Chairperson Dr. Bridgette Gasa, Deputy Chairperson Mr. Paulos Ngcobo, Ms. Nokhana Moerane, Ms. Bavelile Hlongwa and Messrs. Themba Ndhlovu and Mpumelelo Zikalala. The Board members (in their role as the Accounting Authority) acknowledge that they are ultimately responsible for the system of internal financial control, established by the group and place considerable importance on maintaining a strong control environment.
Dube TradePort Corporation and its subsidiary have maintained satisfactory accounting records and an effective system of internal controls (including internal financial controls) to ensure the integrity of the underlying information. Appropriate accounting policies, supported by sound material judgements and estimates, have been consistently applied. Nothing has come to the attention of the Board to indicate that any material breakdown in the functioning of the controls, procedures and systems has occurred during the year under review. As part of Dube TradePort’s governance process, Board members are required to disclose all interests in contracts awarded by Dube TradePort and interests in any businesses which may cause a conflict of interest.
During the year under review, none of the Board members of Dube TradePort had any interest in contracts awarded by Dube TradePort and none of their business interests were deemed to lead to a conflict. The Board is also responsible for the maintenance of adequate accounting records, the preparation and integrity of the financial statements and related information. The auditors are responsible to report on the fair presentation of the consolidated annual financial statements. The consolidated annual financial statements have been prepared in accordance with the Generally Recognised Accounting Practice (GRAP). This responsibility includes:• Designing, implementing and maintaining
internal control relevant to the preparation and fair presentation of financial statements that are free from material misstatement, whether due to fraud or error;
• Selecting and applying appropriate accounting policies; and
• Making accounting estimates that are reasonable in the circumstances.
The opinion of the Board in this regard is reflected in the previous section (Accounting Authority’s Responsibilities and Approval).
4. JOINT VENTUREIn fulfilling one of the requirements of the Co-operation Agreement (signed between Dube TradePort Corporation and the Airports
Company South Africa SOC Limited, (ACSA)), Dube TradePort entered into a joint venture with ACSA whereby Dube TradePort owns 60% of La Mercy JV Property Investments Proprietary Limited. The application of GRAP dictates that Dube TradePort accounts for its interest in La Mercy JV Property Investments Proprietary Limited as a subsidiary. The main object of the JV Company (La Mercy JV Property Investments Proprietary Limited) is that of a property holding, development and letting company, the intention being to develop the joint venture area in accordance with the Development Framework Plan and the master plan.
The financial year end of La Mercy JV Property Investments Proprietary Limited is 31 March and the results of the operations of the JV Company have been included in the consolidated annual financial statements of Dube TradePort Corporation.
5. FINANCIAL RESULTSThe results of operations for the year under review are set out in the annual financial statements which reflect both the consolidated and entity results. Dube TradePort Corporation is using the current cost-cutting environment to review all expenditure, (both capital and operational) to ensure that savings are effected wherever possible, without impacting on the quality of service delivery. Dube TradePort Corporation continues to be funded by Provincial Government and remains a going concern.
6. COMMITMENTSDube TradePort Corporation has entered into a number of commitments ranging from infrastructure development and construction of specialised buildings to the procurement of specialised equipment and plant.
7. LEGAL MATTERSAt year-end Dube TradePort Corporation was awaiting judgement in two legal matters. An unsucessful tenderer appealed the outcome of two separate procurements for which they had tendered. The matter was heard in the High Court in September 2017 and the Judge reserved her judgement. Should the Judge find against Dube TradePort Corporation, the entity would be obliged to pay the costs of the opposing party. The estimated costs would be approximately R400 000.
8. EVENTS SUBSEQUENT TO YEAR END
An unsuccessful tenderer appealed the outcome of a procurement for which they had tendered. The matter was heard in the High Court in March 2018. On 21 May 2018 the Judge awarded judgement in favour of Dube TradePort Corporation. The judgement was awarded with costs.
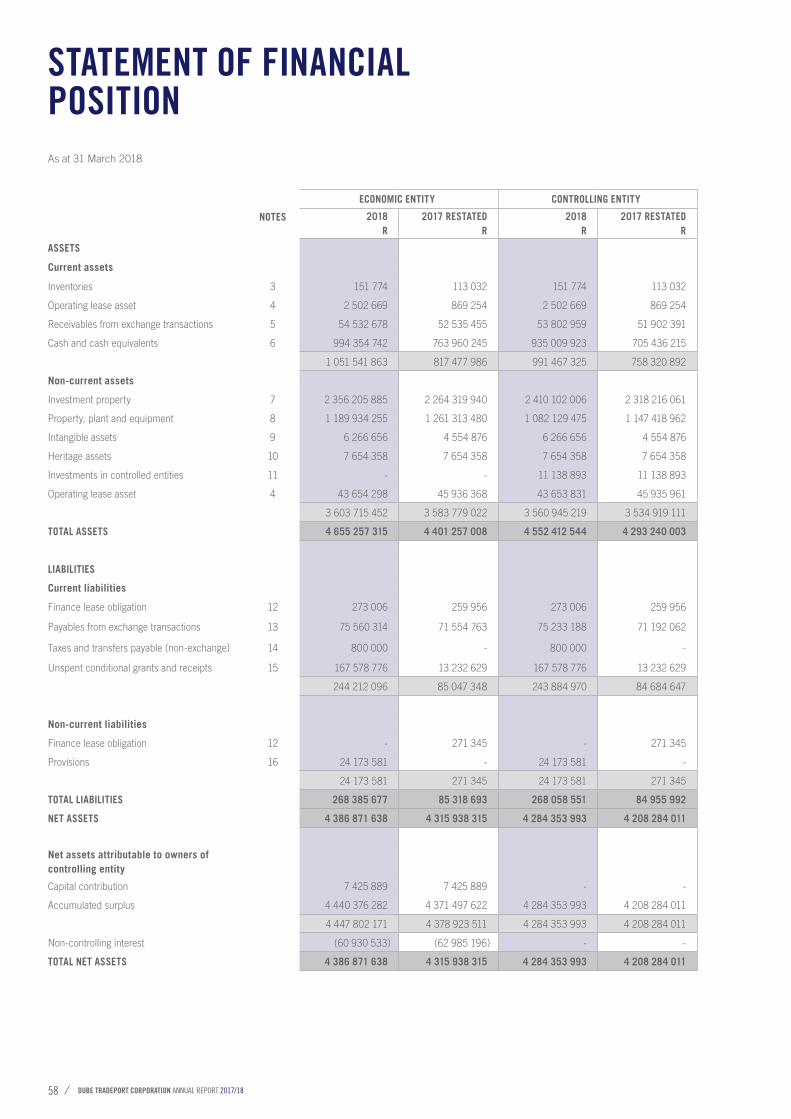
DUBE TRADEPORT CORPORATION ANNUAL REPORT 2017/1858
STATEMENT OF FINANCIAL POSITION
ECONOMIC ENTITY CONTROLLING ENTITY
NOTES 2018R
2017 RESTATEDR
2018R
2017 RESTATEDR
ASSETS
Current assets
Inventories 3 151 774 113 032 151 774 113 032
Operating lease asset 4 2 502 669 869 254 2 502 669 869 254
Receivables from exchange transactions 5 54 532 678 52 535 455 53 802 959 51 902 391
Cash and cash equivalents 6 994 354 742 763 960 245 935 009 923 705 436 215
1 051 541 863 817 477 986 991 467 325 758 320 892
Non-current assets
Investment property 7 2 356 205 885 2 264 319 940 2 410 102 006 2 318 216 061
Property, plant and equipment 8 1 189 934 255 1 261 313 480 1 082 129 475 1 147 418 962
Intangible assets 9 6 266 656 4 554 876 6 266 656 4 554 876
Heritage assets 10 7 654 358 7 654 358 7 654 358 7 654 358
Investments in controlled entities 11 - - 11 138 893 11 138 893
Operating lease asset 4 43 654 298 45 936 368 43 653 831 45 935 961
3 603 715 452 3 583 779 022 3 560 945 219 3 534 919 111
TOTAL ASSETS 4 655 257 315 4 401 257 008 4 552 412 544 4 293 240 003
LIABILITIES
Current liabilities
Finance lease obligation 12 273 006 259 956 273 006 259 956
Payables from exchange transactions 13 75 560 314 71 554 763 75 233 188 71 192 062
Taxes and transfers payable (non-exchange) 14 800 000 - 800 000 -
Unspent conditional grants and receipts 15 167 578 776 13 232 629 167 578 776 13 232 629
244 212 096 85 047 348 243 884 970 84 684 647
Non-current liabilities
Finance lease obligation 12 - 271 345 - 271 345
Provisions 16 24 173 581 - 24 173 581 -
24 173 581 271 345 24 173 581 271 345
TOTAL LIABILITIES 268 385 677 85 318 693 268 058 551 84 955 992
NET ASSETS 4 386 871 638 4 315 938 315 4 284 353 993 4 208 284 011
Net assets attributable to owners ofcontrolling entity
Capital contribution 7 425 889 7 425 889 - -
Accumulated surplus 4 440 376 282 4 371 497 622 4 284 353 993 4 208 284 011
4 447 802 171 4 378 923 511 4 284 353 993 4 208 284 011
Non-controlling interest (60 930 533) (62 985 196) - -
TOTAL NET ASSETS 4 386 871 638 4 315 938 315 4 284 353 993 4 208 284 011
As at 31 March 2018
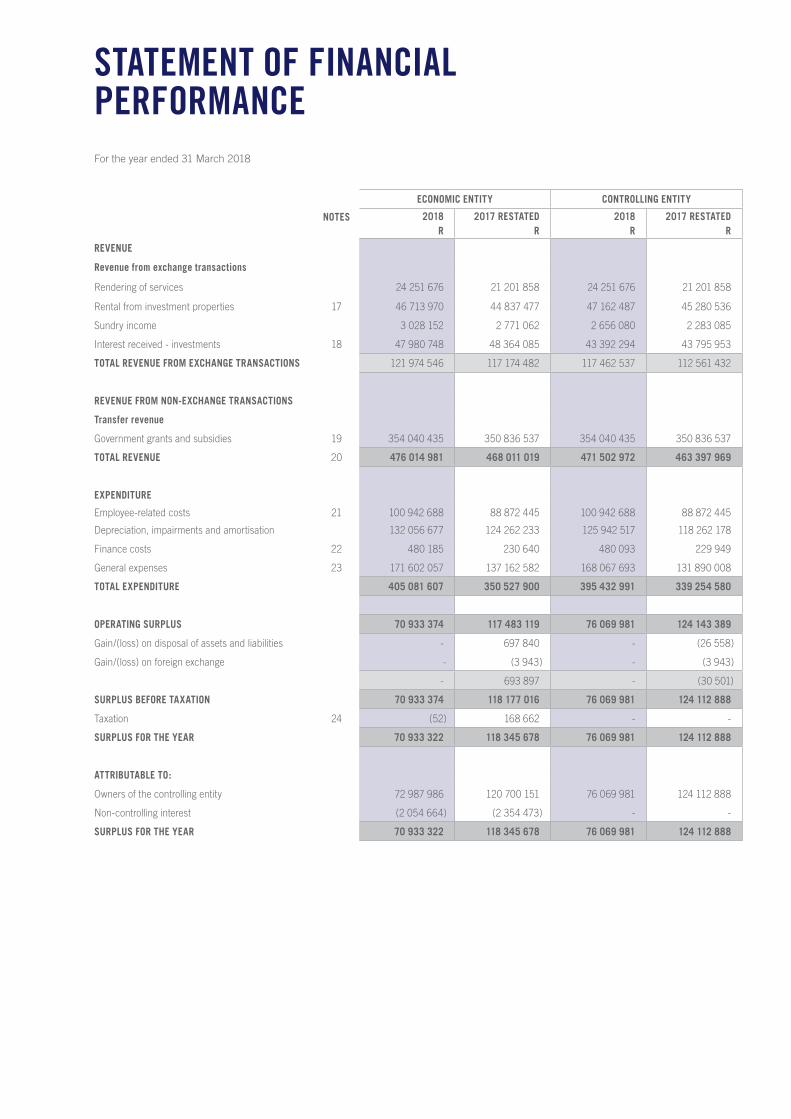
STATEMENT OF FINANCIAL PERFORMANCE
ECONOMIC ENTITY CONTROLLING ENTITY
NOTES 2018R
2017 RESTATEDR
2018R
2017 RESTATEDR
REVENUE
Revenue from exchange transactions
Rendering of services 24 251 676 21 201 858 24 251 676 21 201 858
Rental from investment properties 17 46 713 970 44 837 477 47 162 487 45 280 536
Sundry income 3 028 152 2 771 062 2 656 080 2 283 085
Interest received - investments 18 47 980 748 48 364 085 43 392 294 43 795 953
TOTAL REVENUE FROM EXCHANGE TRANSACTIONS 121 974 546 117 174 482 117 462 537 112 561 432
REVENUE FROM NON-EXCHANGE TRANSACTIONS
Transfer revenue
Government grants and subsidies 19 354 040 435 350 836 537 354 040 435 350 836 537
TOTAL REVENUE 20 476 014 981 468 011 019 471 502 972 463 397 969
EXPENDITURE
Employee-related costs 21 100 942 688 88 872 445 100 942 688 88 872 445
Depreciation, impairments and amortisation 132 056 677 124 262 233 125 942 517 118 262 178
Finance costs 22 480 185 230 640 480 093 229 949
General expenses 23 171 602 057 137 162 582 168 067 693 131 890 008
TOTAL EXPENDITURE 405 081 607 350 527 900 395 432 991 339 254 580
OPERATING SURPLUS 70 933 374 117 483 119 76 069 981 124 143 389
Gain/(loss) on disposal of assets and liabilities - 697 840 - (26 558)
Gain/(loss) on foreign exchange - (3 943) - (3 943)
- 693 897 - (30 501)
SURPLUS BEFORE TAXATION 70 933 374 118 177 016 76 069 981 124 112 888
Taxation 24 (52) 168 662 - -
SURPLUS FOR THE YEAR 70 933 322 118 345 678 76 069 981 124 112 888
ATTRIBUTABLE TO:
Owners of the controlling entity 72 987 986 120 700 151 76 069 981 124 112 888
Non-controlling interest (2 054 664) (2 354 473) - -
SURPLUS FOR THE YEAR 70 933 322 118 345 678 76 069 981 124 112 888
For the year ended 31 March 2018
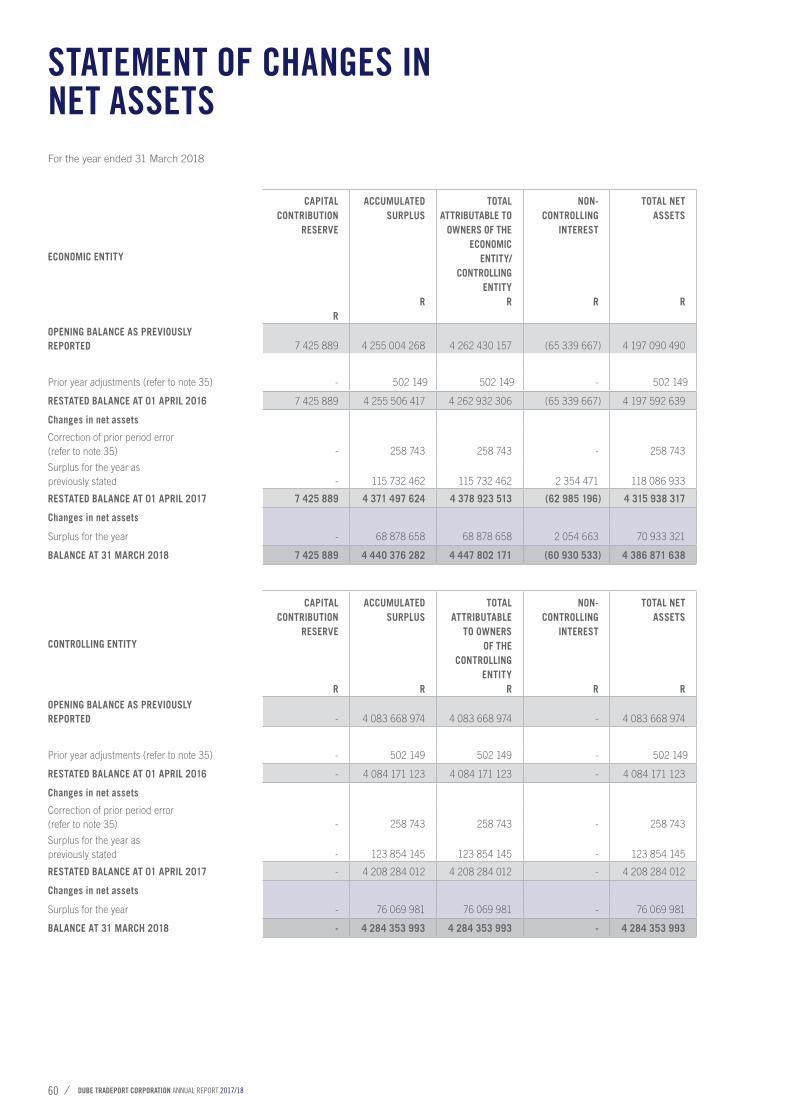
DUBE TRADEPORT CORPORATION ANNUAL REPORT 2017/1860
STATEMENT OF CHANGES IN NET ASSETS
ECONOMIC ENTITY
CAPITALCONTRIBUTION
RESERVE
R
ACCUMULATEDSURPLUS
R
TOTALATTRIBUTABLE TO
OWNERS OF THEECONOMIC
ENTITY/CONTROLLING
ENTITYR
NON-CONTROLLING
INTEREST
R
TOTAL NETASSETS
R
OPENING BALANCE AS PREVIOUSLYREPORTED 7 425 889 4 255 004 268 4 262 430 157 (65 339 667) 4 197 090 490
Prior year adjustments (refer to note 35) - 502 149 502 149 - 502 149
RESTATED BALANCE AT 01 APRIL 2016 7 425 889 4 255 506 417 4 262 932 306 (65 339 667) 4 197 592 639
Changes in net assets
Correction of prior period error(refer to note 35) - 258 743 258 743 - 258 743
Surplus for the year aspreviously stated - 115 732 462 115 732 462 2 354 471 118 086 933
RESTATED BALANCE AT 01 APRIL 2017 7 425 889 4 371 497 624 4 378 923 513 (62 985 196) 4 315 938 317
Changes in net assets
Surplus for the year - 68 878 658 68 878 658 2 054 663 70 933 321
BALANCE AT 31 MARCH 2018 7 425 889 4 440 376 282 4 447 802 171 (60 930 533) 4 386 871 638
CONTROLLING ENTITY
CAPITALCONTRIBUTION
RESERVE
R
ACCUMULATEDSURPLUS
R
TOTALATTRIBUTABLE
TO OWNERS OF THE
CONTROLLINGENTITY
R
NON-CONTROLLING
INTEREST
R
TOTAL NETASSETS
ROPENING BALANCE AS PREVIOUSLYREPORTED - 4 083 668 974 4 083 668 974 - 4 083 668 974
Prior year adjustments (refer to note 35) - 502 149 502 149 - 502 149
RESTATED BALANCE AT 01 APRIL 2016 - 4 084 171 123 4 084 171 123 - 4 084 171 123
Changes in net assets
Correction of prior period error(refer to note 35) - 258 743 258 743 - 258 743
Surplus for the year aspreviously stated - 123 854 145 123 854 145 - 123 854 145
RESTATED BALANCE AT 01 APRIL 2017 - 4 208 284 012 4 208 284 012 - 4 208 284 012
Changes in net assets
Surplus for the year - 76 069 981 76 069 981 - 76 069 981
BALANCE AT 31 MARCH 2018 - 4 284 353 993 4 284 353 993 - 4 284 353 993
For the year ended 31 March 2018
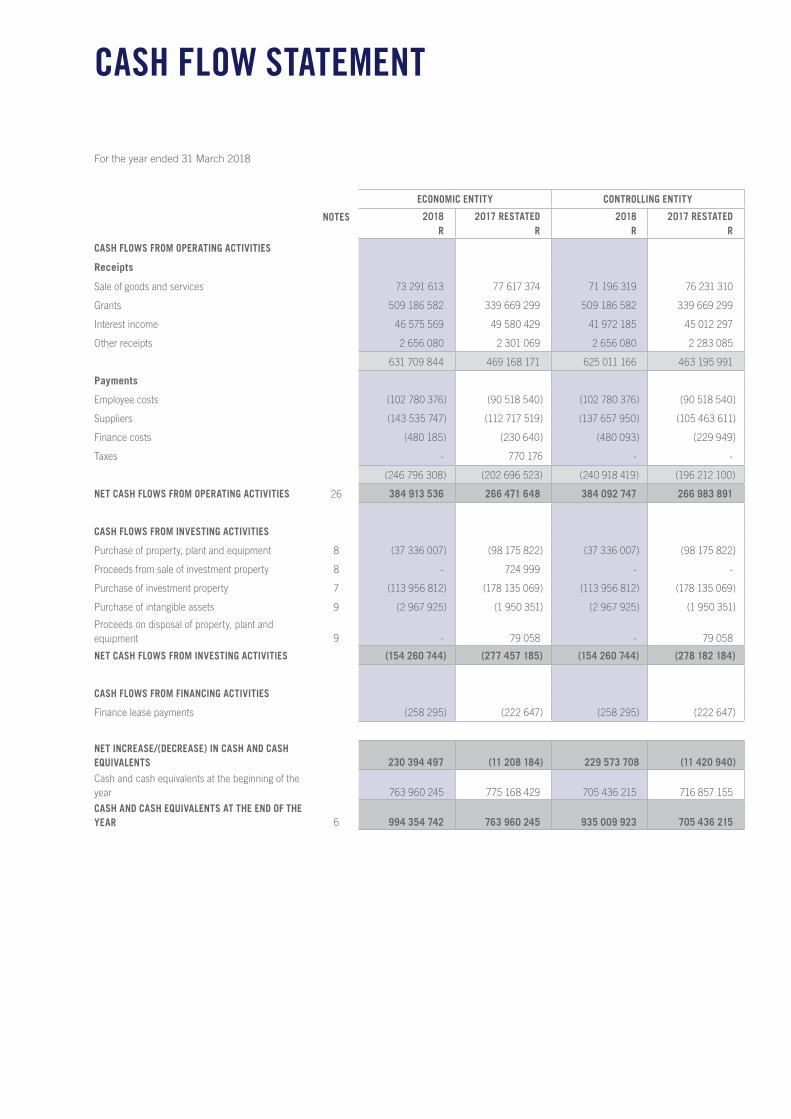
CASH FLOW STATEMENT
ECONOMIC ENTITY CONTROLLING ENTITY
NOTES 2018R
2017 RESTATEDR
2018R
2017 RESTATEDR
CASH FLOWS FROM OPERATING ACTIVITIES
Receipts
Sale of goods and services 73 291 613 77 617 374 71 196 319 76 231 310
Grants 509 186 582 339 669 299 509 186 582 339 669 299
Interest income 46 575 569 49 580 429 41 972 185 45 012 297
Other receipts 2 656 080 2 301 069 2 656 080 2 283 085
631 709 844 469 168 171 625 011 166 463 195 991
Payments
Employee costs (102 780 376) (90 518 540) (102 780 376) (90 518 540)
Suppliers (143 535 747) (112 717 519) (137 657 950) (105 463 611)
Finance costs (480 185) (230 640) (480 093) (229 949)
Taxes - 770 176 - -
(246 796 308) (202 696 523) (240 918 419) (196 212 100)
NET CASH FLOWS FROM OPERATING ACTIVITIES 26 384 913 536 266 471 648 384 092 747 266 983 891
CASH FLOWS FROM INVESTING ACTIVITIES
Purchase of property, plant and equipment 8 (37 336 007) (98 175 822) (37 336 007) (98 175 822)
Proceeds from sale of investment property 8 - 724 999 - -
Purchase of investment property 7 (113 956 812) (178 135 069) (113 956 812) (178 135 069)
Purchase of intangible assets 9 (2 967 925) (1 950 351) (2 967 925) (1 950 351)
Proceeds on disposal of property, plant and equipment 9 - 79 058 - 79 058
NET CASH FLOWS FROM INVESTING ACTIVITIES (154 260 744) (277 457 185) (154 260 744) (278 182 184)
CASH FLOWS FROM FINANCING ACTIVITIES
Finance lease payments (258 295) (222 647) (258 295) (222 647)
NET INCREASE/(DECREASE) IN CASH AND CASHEQUIVALENTS 230 394 497 (11 208 184) 229 573 708 (11 420 940)
Cash and cash equivalents at the beginning of the year 763 960 245 775 168 429 705 436 215 716 857 155
CASH AND CASH EQUIVALENTS AT THE END OF THE YEAR 6 994 354 742 763 960 245 935 009 923 705 436 215
For the year ended 31 March 2018
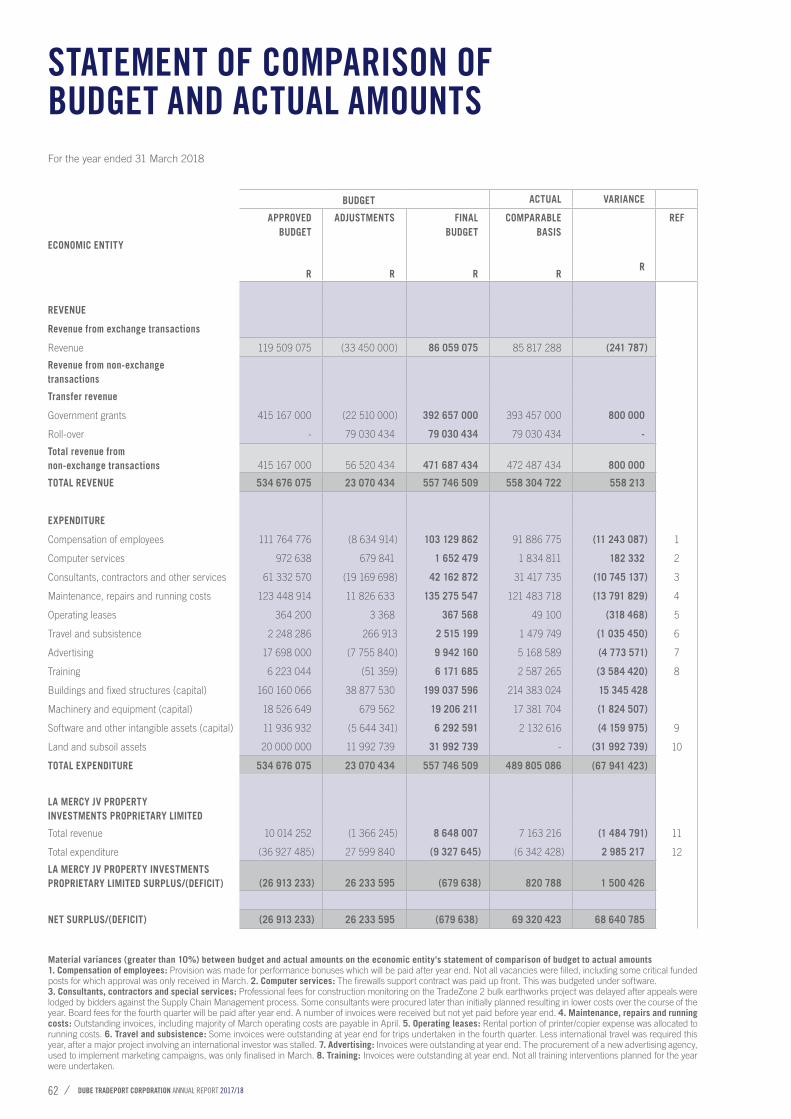
DUBE TRADEPORT CORPORATION ANNUAL REPORT 2017/1862
Material variances (greater than 10%) between budget and actual amounts on the economic entity's statement of comparison of budget to actual amounts1. Compensation of employees: Provision was made for performance bonuses which will be paid after year end. Not all vacancies were filled, including some critical funded posts for which approval was only received in March. 2. Computer services: The firewalls support contract was paid up front. This was budgeted under software. 3. Consultants, contractors and special services: Professional fees for construction monitoring on the TradeZone 2 bulk earthworks project was delayed after appeals were lodged by bidders against the Supply Chain Management process. Some consultants were procured later than initially planned resulting in lower costs over the course of the year. Board fees for the fourth quarter will be paid after year end. A number of invoices were received but not yet paid before year end. 4. Maintenance, repairs and running costs: Outstanding invoices, including majority of March operating costs are payable in April. 5. Operating leases: Rental portion of printer/copier expense was allocated to running costs. 6. Travel and subsistence: Some invoices were outstanding at year end for trips undertaken in the fourth quarter. Less international travel was required this year, after a major project involving an international investor was stalled. 7. Advertising: Invoices were outstanding at year end. The procurement of a new advertising agency, used to implement marketing campaigns, was only finalised in March. 8. Training: Invoices were outstanding at year end. Not all training interventions planned for the year were undertaken.
STATEMENT OF COMPARISON OF BUDGET AND ACTUAL AMOUNTS
BUDGET ACTUAL VARIANCE
ECONOMIC ENTITY
APPROVEDBUDGET
R
ADJUSTMENTS
R
FINALBUDGET
R
COMPARABLEBASIS
RR
REF
REVENUE
Revenue from exchange transactions
Revenue 119 509 075 (33 450 000) 86 059 075 85 817 288 (241 787)
Revenue from non-exchangetransactions
Transfer revenue
Government grants 415 167 000 (22 510 000) 392 657 000 393 457 000 800 000
Roll-over - 79 030 434 79 030 434 79 030 434 -
Total revenue fromnon-exchange transactions 415 167 000 56 520 434 471 687 434 472 487 434 800 000
TOTAL REVENUE 534 676 075 23 070 434 557 746 509 558 304 722 558 213
EXPENDITURE
Compensation of employees 111 764 776 (8 634 914) 103 129 862 91 886 775 (11 243 087) 1
Computer services 972 638 679 841 1 652 479 1 834 811 182 332 2
Consultants, contractors and other services 61 332 570 (19 169 698) 42 162 872 31 417 735 (10 745 137) 3
Maintenance, repairs and running costs 123 448 914 11 826 633 135 275 547 121 483 718 (13 791 829) 4
Operating leases 364 200 3 368 367 568 49 100 (318 468) 5
Travel and subsistence 2 248 286 266 913 2 515 199 1 479 749 (1 035 450) 6
Advertising 17 698 000 (7 755 840) 9 942 160 5 168 589 (4 773 571) 7
Training 6 223 044 (51 359) 6 171 685 2 587 265 (3 584 420) 8
Buildings and fixed structures (capital) 160 160 066 38 877 530 199 037 596 214 383 024 15 345 428
Machinery and equipment (capital) 18 526 649 679 562 19 206 211 17 381 704 (1 824 507)
Software and other intangible assets (capital) 11 936 932 (5 644 341) 6 292 591 2 132 616 (4 159 975) 9
Land and subsoil assets 20 000 000 11 992 739 31 992 739 - (31 992 739) 10
TOTAL EXPENDITURE 534 676 075 23 070 434 557 746 509 489 805 086 (67 941 423)
LA MERCY JV PROPERTY INVESTMENTS PROPRIETARY LIMITED
Total revenue 10 014 252 (1 366 245) 8 648 007 7 163 216 (1 484 791) 11
Total expenditure (36 927 485) 27 599 840 (9 327 645) (6 342 428) 2 985 217 12
LA MERCY JV PROPERTY INVESTMENTS PROPRIETARY LIMITED SURPLUS/(DEFICIT) (26 913 233) 26 233 595 (679 638) 820 788 1 500 426
NET SURPLUS/(DEFICIT) (26 913 233) 26 233 595 (679 638) 69 320 423 68 640 785
For the year ended 31 March 2018
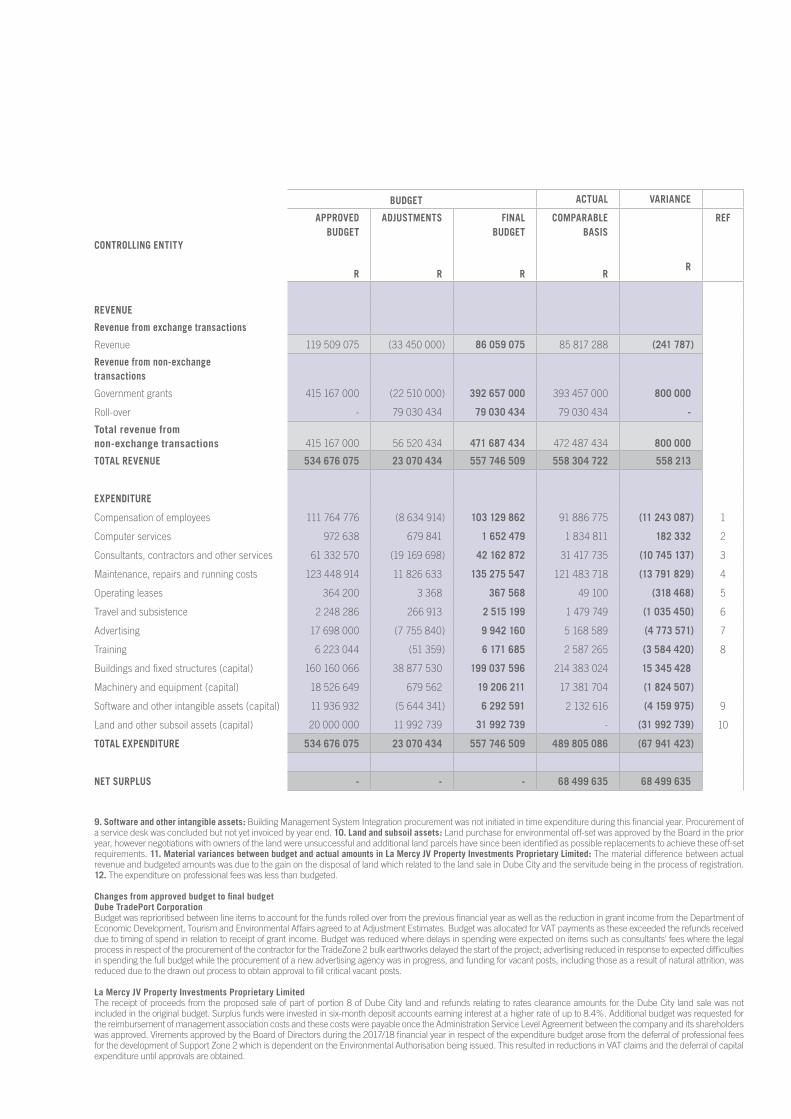
9. Software and other intangible assets: Building Management System Integration procurement was not initiated in time expenditure during this financial year. Procurement of a service desk was concluded but not yet invoiced by year end. 10. Land and subsoil assets: Land purchase for environmental off-set was approved by the Board in the prior year, however negotiations with owners of the land were unsuccessful and additional land parcels have since been identified as possible replacements to achieve these off-set requirements. 11. Material variances between budget and actual amounts in La Mercy JV Property Investments Proprietary Limited: The material difference between actual revenue and budgeted amounts was due to the gain on the disposal of land which related to the land sale in Dube City and the servitude being in the process of registration. 12. The expenditure on professional fees was less than budgeted.
Changes from approved budget to final budgetDube TradePort CorporationBudget was reprioritised between line items to account for the funds rolled over from the previous financial year as well as the reduction in grant income from the Department of Economic Development, Tourism and Environmental Affairs agreed to at Adjustment Estimates. Budget was allocated for VAT payments as these exceeded the refunds received due to timing of spend in relation to receipt of grant income. Budget was reduced where delays in spending were expected on items such as consultants' fees where the legal process in respect of the procurement of the contractor for the TradeZone 2 bulk earthworks delayed the start of the project; advertising reduced in response to expected difficulties in spending the full budget while the procurement of a new advertising agency was in progress, and funding for vacant posts, including those as a result of natural attrition, was reduced due to the drawn out process to obtain approval to fill critical vacant posts.
La Mercy JV Property Investments Proprietary LimitedThe receipt of proceeds from the proposed sale of part of portion 8 of Dube City land and refunds relating to rates clearance amounts for the Dube City land sale was not included in the original budget. Surplus funds were invested in six-month deposit accounts earning interest at a higher rate of up to 8.4%. Additional budget was requested for the reimbursement of management association costs and these costs were payable once the Administration Service Level Agreement between the company and its shareholders was approved. Virements approved by the Board of Directors during the 2017/18 financial year in respect of the expenditure budget arose from the deferral of professional fees for the development of Support Zone 2 which is dependent on the Environmental Authorisation being issued. This resulted in reductions in VAT claims and the deferral of capital expenditure until approvals are obtained.
BUDGET ACTUAL VARIANCE
CONTROLLING ENTITY
APPROVEDBUDGET
R
ADJUSTMENTS
R
FINALBUDGET
R
COMPARABLEBASIS
RR
REF
REVENUE
Revenue from exchange transactions
Revenue 119 509 075 (33 450 000) 86 059 075 85 817 288 (241 787)
Revenue from non-exchangetransactions
Government grants 415 167 000 (22 510 000) 392 657 000 393 457 000 800 000
Roll-over - 79 030 434 79 030 434 79 030 434 -
Total revenue fromnon-exchange transactions 415 167 000 56 520 434 471 687 434 472 487 434 800 000
TOTAL REVENUE 534 676 075 23 070 434 557 746 509 558 304 722 558 213
EXPENDITURE
Compensation of employees 111 764 776 (8 634 914) 103 129 862 91 886 775 (11 243 087) 1
Computer services 972 638 679 841 1 652 479 1 834 811 182 332 2
Consultants, contractors and other services 61 332 570 (19 169 698) 42 162 872 31 417 735 (10 745 137) 3
Maintenance, repairs and running costs 123 448 914 11 826 633 135 275 547 121 483 718 (13 791 829) 4
Operating leases 364 200 3 368 367 568 49 100 (318 468) 5
Travel and subsistence 2 248 286 266 913 2 515 199 1 479 749 (1 035 450) 6
Advertising 17 698 000 (7 755 840) 9 942 160 5 168 589 (4 773 571) 7
Training 6 223 044 (51 359) 6 171 685 2 587 265 (3 584 420) 8
Buildings and fixed structures (capital) 160 160 066 38 877 530 199 037 596 214 383 024 15 345 428
Machinery and equipment (capital) 18 526 649 679 562 19 206 211 17 381 704 (1 824 507)
Software and other intangible assets (capital) 11 936 932 (5 644 341) 6 292 591 2 132 616 (4 159 975) 9
Land and other subsoil assets (capital) 20 000 000 11 992 739 31 992 739 - (31 992 739) 10
TOTAL EXPENDITURE 534 676 075 23 070 434 557 746 509 489 805 086 (67 941 423)
NET SURPLUS - - - 68 499 635 68 499 635
DUBE TRADEPORT CORPORATION ANNUAL REPORT 2017/1864
1. ACCOUNTING POLICIESPRESENTATION OF CONSOLIDATED ANNUAL FINANCIAL STATEMENTS
The consolidated annual financial statements have been prepared in accordance with the Standards of Generally Recognised Accounting Practice (GRAP), issued by the Accounting Standards Board in accordance with Section 91(1) of the Public Finance Management Act, No. 1 of 1999.
Accrual basis These consolidated annual financial statements have been prepared on an accrual basis of accounting and are in accordance with historical cost convention as the basis of measurement, unless specified otherwise. They are presented in South African Rand and rounded off to the nearest Rand.
OffsettingAssets and liabilities, revenue and expenses have not been offset, except where offsetting is required or permitted by GRAP. A summary of the significant accounting policies, which have been consistently applied in the preparation of these consolidated annual financial statements, is disclosed below. These accounting policies are consistent with the previous period.
1.1 GOING CONCERN ASSUMPTION
These consolidated annual financial statements have been prepared based on the expectation that the economic entity will continue to operate as a going concern for at least the next 12 months.
1.2 CONSOLIDATIONBasis of consolidationThe consolidated annual financial statements incorporate the financial statements of the controlling entity and the controlled entity.
Control exists when the controlling entity has the power to govern the financial and operating policies of another entity so as to obtain benefits from its activities. An investment in an entity is accounted for in accordance with the Standard of GRAP 104 on Financial Instruments from the date that it ceases to be a controlled entity, unless it becomes an associate or a jointly controlled entity, in which case it is accounted for as such.
The carrying amount of the investment at the date that the entity ceases to be a controlled entity is regarded as the fair value on initial recognition of a financial asset in accordance with the Standard of GRAP 104 on Financial Instruments. The consolidated annual financial statements of the
controlling entity and its controlled entities used in the preparation of the consolidated annual financial statements are prepared as at the same date.
Adjustments are made when necessary to the consolidated annual financial statements of the controlled entities to bring their accounting policies in line with those of the controlling entity. All the intra-entity transactions, balances, revenues and expenses are eliminated in full on consolidation.
Non-controlling interest in the net assets of the economic entity are identified and recognised separately from the controlling entity’s interest therein, and are recognised within net assets.
Surplus or deficit of the statement of financial performance is attributed to the owners of the controlling entity and to the non-controlling interests. Total surplus or deficit is attributed to the owners of the controlling entity and to the non-controlling interests even if this results in non-controlling interests having a negative balance. Minority interests in the surplus or deficit of the economic entity are separately disclosed.
1.3 SIGNIFICANT JUDGEMENTS AND SOURCES OF ESTIMATION UNCERTAINTY
In preparing the consolidated annual financial statements, management is required to make estimates and assumptions that affect the amounts represented in the consolidated annual financial statements and related disclosures. Use of available information and the application of judgement is inherent in the formation of estimates. Actual results in the future could differ from these estimates which may be material to the consolidated annual financial statements. Significant judgements include:
Receivables from exchange transactions and loans and receivablesManagement assesses its trade receivables and loans and receivables for impairment at the end of each reporting period. In determining whether an impairment loss should be recorded in surplus or deficit, management uses observable data indicating a measurable decrease in the estimated future cash flows from a financial asset.
Where there is evidence of an impairment loss, the loss is recognised in the surplus and deficit for the year. The impairment is measured as the difference between the debtors’ carrying amount and the present value of estimated future cash flows discounted at the effective interest rate, computed at the time of initial
recognition.
Impairment testingManagement reviews and tests the carrying value of assets when events or changes in circumstances suggest that the carrying amount may not be recoverable. Assets are grouped at the lowest level for which identifiable cash flows are largely independent of cash flows of other assets and liabilities. If there are indications that impairment may have occurred, estimates are prepared of expected future cash flows for each group of assets.
Review of residual values and useful livesManagement reviews the useful lives and residual values of all assets on a yearly basis. Management applies judgement in determining if these remain reasonable or need to be reassessed. If reassessment is required, this change is accounted for in the current and future periods and treated as a change in estimate. Refer to note 29.
1.4 INVESTMENT PROPERTY
Investment property is property (land or a building − or part of a building − or both) held to earn rentals or for capital appreciation or both, rather than for: • Use in the production or supply of goods
or services; or • Administrative purposes; or • Sale in the ordinary course of operations.
Initial recognitionInvestment property is recognised as an asset when it is probable that the future economic benefits or service potential that are associated with the investment property will flow to the economic entity, and the cost or fair value of the investment property can be measured reliably.
Inital measurement Investment property is initially recognised at cost. Transaction costs are included in the initial measurement. Where investment property is acquired through a non-exchange transaction, its cost is its fair value as at the date of acquisition.
Subsequent measurementCosts include costs incurred initially and costs incurred subsequently to add to, or to replace a part of, or service a property. If a replacement part is recognised in the carrying amount of the investment property, the carrying amount of the replaced part is derecognised.
Investment property is carried at cost less accumulated depreciation and any
NOTES TO THE CONSOLIDATED ANNUAL FINANCIAL STATEMENTSFor the year ended 31 March 2018
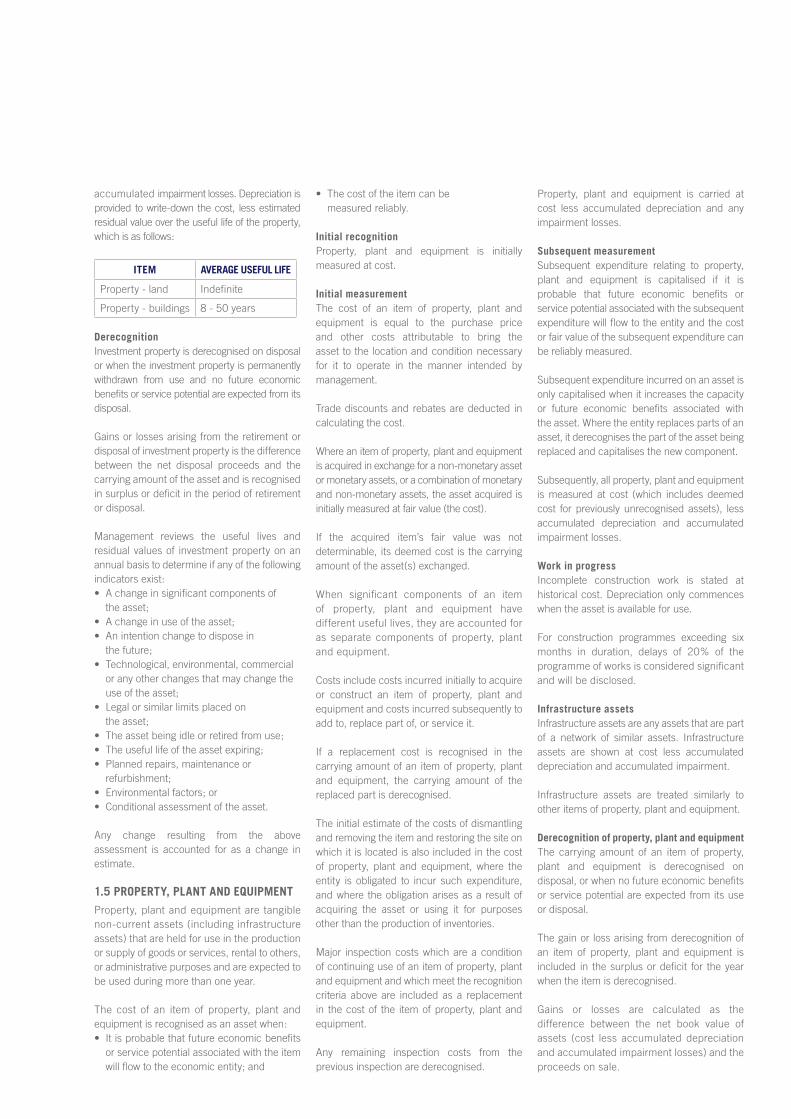
accumulated impairment losses. Depreciation is provided to write-down the cost, less estimated residual value over the useful life of the property, which is as follows:
ITEM AVERAGE USEFUL LIFE
Property - land Indefinite
Property - buildings 8 - 50 years
DerecognitionInvestment property is derecognised on disposal or when the investment property is permanently withdrawn from use and no future economic benefits or service potential are expected from its disposal.
Gains or losses arising from the retirement or disposal of investment property is the difference between the net disposal proceeds and the carrying amount of the asset and is recognised in surplus or deficit in the period of retirement or disposal.
Management reviews the useful lives and residual values of investment property on an annual basis to determine if any of the following indicators exist:• A change in significant components of
the asset;• A change in use of the asset;• An intention change to dispose in
the future;• Technological, environmental, commercial
or any other changes that may change the use of the asset;
• Legal or similar limits placed on the asset;
• The asset being idle or retired from use;• The useful life of the asset expiring;• Planned repairs, maintenance or
refurbishment;• Environmental factors; or• Conditional assessment of the asset.
Any change resulting from the above assessment is accounted for as a change in estimate.
1.5 PROPERTY, PLANT AND EQUIPMENT
Property, plant and equipment are tangible non-current assets (including infrastructure assets) that are held for use in the production or supply of goods or services, rental to others, or administrative purposes and are expected to be used during more than one year.
The cost of an item of property, plant and equipment is recognised as an asset when:• It is probable that future economic benefits
or service potential associated with the item will flow to the economic entity; and
• The cost of the item can be measured reliably.
Initial recognition Property, plant and equipment is initially measured at cost.
Initial measurementThe cost of an item of property, plant and equipment is equal to the purchase price and other costs attributable to bring the asset to the location and condition necessary for it to operate in the manner intended by management.
Trade discounts and rebates are deducted in calculating the cost.
Where an item of property, plant and equipment is acquired in exchange for a non-monetary asset or monetary assets, or a combination of monetary and non-monetary assets, the asset acquired is initially measured at fair value (the cost).
If the acquired item’s fair value was not determinable, its deemed cost is the carrying amount of the asset(s) exchanged.
When significant components of an item of property, plant and equipment have different useful lives, they are accounted for as separate components of property, plant and equipment.
Costs include costs incurred initially to acquire or construct an item of property, plant and equipment and costs incurred subsequently to add to, replace part of, or service it.
If a replacement cost is recognised in the carrying amount of an item of property, plant and equipment, the carrying amount of the replaced part is derecognised.
The initial estimate of the costs of dismantling and removing the item and restoring the site on which it is located is also included in the cost of property, plant and equipment, where the entity is obligated to incur such expenditure, and where the obligation arises as a result of acquiring the asset or using it for purposes other than the production of inventories.
Major inspection costs which are a condition of continuing use of an item of property, plant and equipment and which meet the recognition criteria above are included as a replacement in the cost of the item of property, plant and equipment.
Any remaining inspection costs from the previous inspection are derecognised.
Property, plant and equipment is carried at cost less accumulated depreciation and any impairment losses.
Subsequent measurement Subsequent expenditure relating to property, plant and equipment is capitalised if it is probable that future economic benefits or service potential associated with the subsequent expenditure will flow to the entity and the cost or fair value of the subsequent expenditure can be reliably measured.
Subsequent expenditure incurred on an asset is only capitalised when it increases the capacity or future economic benefits associated with the asset. Where the entity replaces parts of an asset, it derecognises the part of the asset being replaced and capitalises the new component.
Subsequently, all property, plant and equipment is measured at cost (which includes deemed cost for previously unrecognised assets), less accumulated depreciation and accumulated impairment losses.
Work in progress Incomplete construction work is stated at historical cost. Depreciation only commences when the asset is available for use.
For construction programmes exceeding six months in duration, delays of 20% of the programme of works is considered significant and will be disclosed.
Infrastructure assetsInfrastructure assets are any assets that are part of a network of similar assets. Infrastructure assets are shown at cost less accumulated depreciation and accumulated impairment.
Infrastructure assets are treated similarly to other items of property, plant and equipment.
Derecognition of property, plant and equipment The carrying amount of an item of property, plant and equipment is derecognised on disposal, or when no future economic benefits or service potential are expected from its use or disposal.
The gain or loss arising from derecognition of an item of property, plant and equipment is included in the surplus or deficit for the year when the item is derecognised.
Gains or losses are calculated as the difference between the net book value of assets (cost less accumulated depreciation and accumulated impairment losses) and the proceeds on sale.
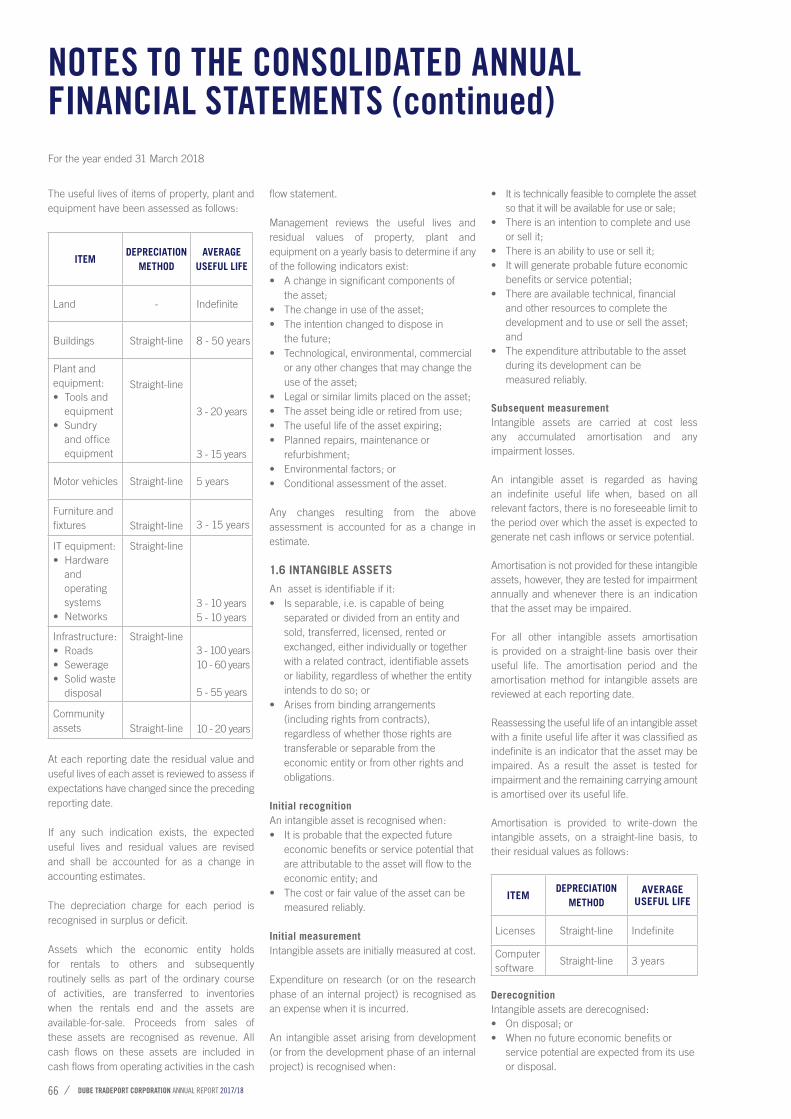
DUBE TRADEPORT CORPORATION ANNUAL REPORT 2017/1866
NOTES TO THE CONSOLIDATED ANNUAL FINANCIAL STATEMENTS (continued)For the year ended 31 March 2018
The useful lives of items of property, plant and equipment have been assessed as follows:
ITEMDEPRECIATION
METHODAVERAGE
USEFUL LIFE
Land - Indefinite
Buildings Straight-line 8 - 50 years
Plant and equipment:• Tools and
equipment• Sundry
and office equipment
Straight-line
3 - 20 years
3 - 15 years
Motor vehicles Straight-line 5 years
Furniture and fixtures Straight-line 3 - 15 years
IT equipment:• Hardware
and operating systems
• Networks
Straight-line
3 - 10 years5 - 10 years
Infrastructure:• Roads• Sewerage• Solid waste
disposal
Straight-line3 - 100 years10 - 60 years
5 - 55 years
Community assets Straight-line 10 - 20 years
At each reporting date the residual value and useful lives of each asset is reviewed to assess if expectations have changed since the preceding reporting date.
If any such indication exists, the expected useful lives and residual values are revised and shall be accounted for as a change in accounting estimates.
The depreciation charge for each period is recognised in surplus or deficit.
Assets which the economic entity holds for rentals to others and subsequently routinely sells as part of the ordinary course of activities, are transferred to inventories when the rentals end and the assets are available-for-sale. Proceeds from sales of these assets are recognised as revenue. All cash flows on these assets are included in cash flows from operating activities in the cash
flow statement.
Management reviews the useful lives and residual values of property, plant and equipment on a yearly basis to determine if any of the following indicators exist:• A change in significant components of
the asset;• The change in use of the asset;• The intention changed to dispose in
the future;• Technological, environmental, commercial
or any other changes that may change the use of the asset;
• Legal or similar limits placed on the asset;• The asset being idle or retired from use;• The useful life of the asset expiring;• Planned repairs, maintenance or
refurbishment;• Environmental factors; or• Conditional assessment of the asset.
Any changes resulting from the above assessment is accounted for as a change in estimate.
1.6 INTANGIBLE ASSETS
An asset is identifiable if it:• Is separable, i.e. is capable of being
separated or divided from an entity and sold, transferred, licensed, rented or exchanged, either individually or together with a related contract, identifiable assets or liability, regardless of whether the entity intends to do so; or
• Arises from binding arrangements (including rights from contracts), regardless of whether those rights are transferable or separable from the economic entity or from other rights and obligations.
Initial recognitionAn intangible asset is recognised when: • It is probable that the expected future
economic benefits or service potential that are attributable to the asset will flow to the economic entity; and
• The cost or fair value of the asset can be measured reliably.
Initial measurement Intangible assets are initially measured at cost. Expenditure on research (or on the research phase of an internal project) is recognised as an expense when it is incurred.
An intangible asset arising from development (or from the development phase of an internal project) is recognised when:
• It is technically feasible to complete the asset so that it will be available for use or sale;
• There is an intention to complete and use or sell it;
• There is an ability to use or sell it;• It will generate probable future economic
benefits or service potential;• There are available technical, financial
and other resources to complete the development and to use or sell the asset; and
• The expenditure attributable to the asset during its development can be measured reliably.
Subsequent measurement Intangible assets are carried at cost less any accumulated amortisation and any impairment losses.
An intangible asset is regarded as having an indefinite useful life when, based on all relevant factors, there is no foreseeable limit to the period over which the asset is expected to generate net cash inflows or service potential.
Amortisation is not provided for these intangible assets, however, they are tested for impairment annually and whenever there is an indication that the asset may be impaired.
For all other intangible assets amortisation is provided on a straight-line basis over their useful life. The amortisation period and the amortisation method for intangible assets are reviewed at each reporting date.
Reassessing the useful life of an intangible asset with a finite useful life after it was classified as indefinite is an indicator that the asset may be impaired. As a result the asset is tested for impairment and the remaining carrying amount is amortised over its useful life.
Amortisation is provided to write-down the intangible assets, on a straight-line basis, to their residual values as follows:
ITEMDEPRECIATION
METHODAVERAGE
USEFUL LIFE
Licenses Straight-line Indefinite
Computer software
Straight-line 3 years
DerecognitionIntangible assets are derecognised: • On disposal; or• When no future economic benefits or
service potential are expected from its use or disposal.
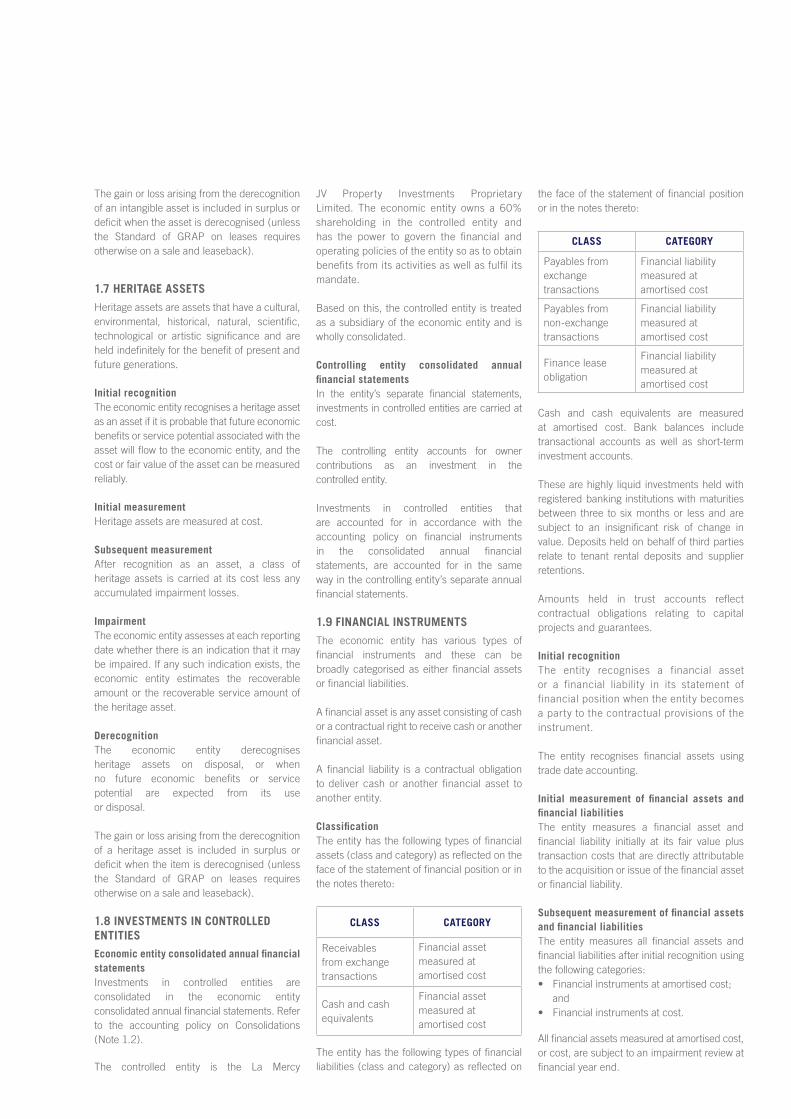
The gain or loss arising from the derecognition of an intangible asset is included in surplus or deficit when the asset is derecognised (unless the Standard of GRAP on leases requires otherwise on a sale and leaseback).
1.7 HERITAGE ASSETS
Heritage assets are assets that have a cultural, environmental, historical, natural, scientific, technological or artistic significance and are held indefinitely for the benefit of present and future generations.
Initial recognitionThe economic entity recognises a heritage asset as an asset if it is probable that future economic benefits or service potential associated with the asset will flow to the economic entity, and the cost or fair value of the asset can be measured reliably.
Initial measurementHeritage assets are measured at cost.
Subsequent measurementAfter recognition as an asset, a class of heritage assets is carried at its cost less any accumulated impairment losses.
ImpairmentThe economic entity assesses at each reporting date whether there is an indication that it may be impaired. If any such indication exists, the economic entity estimates the recoverable amount or the recoverable service amount of the heritage asset.
DerecognitionThe economic entity derecognises heritage assets on disposal, or when no future economic benefits or service potential are expected from its use or disposal.
The gain or loss arising from the derecognition of a heritage asset is included in surplus or deficit when the item is derecognised (unless the Standard of GRAP on leases requires otherwise on a sale and leaseback).
1.8 INVESTMENTS IN CONTROLLED ENTITIESEconomic entity consolidated annual financial statementsInvestments in controlled entities are consolidated in the economic entity consolidated annual financial statements. Refer to the accounting policy on Consolidations (Note 1.2).
The controlled entity is the La Mercy
JV Property Investments Proprietary Limited. The economic entity owns a 60% shareholding in the controlled entity and has the power to govern the financial and operating policies of the entity so as to obtain benefits from its activities as well as fulfil its mandate.
Based on this, the controlled entity is treated as a subsidiary of the economic entity and is wholly consolidated.
Controlling entity consolidated annual financial statementsIn the entity’s separate financial statements, investments in controlled entities are carried at cost.
The controlling entity accounts for owner contributions as an investment in the controlled entity.
Investments in controlled entities that are accounted for in accordance with the accounting policy on financial instruments in the consolidated annual financial statements, are accounted for in the same way in the controlling entity’s separate annual financial statements.
1.9 FINANCIAL INSTRUMENTS
The economic entity has various types of financial instruments and these can be broadly categorised as either financial assets or financial liabilities.
A financial asset is any asset consisting of cash or a contractual right to receive cash or another financial asset.
A financial liability is a contractual obligation to deliver cash or another financial asset to another entity.
ClassificationThe entity has the following types of financial assets (class and category) as reflected on the face of the statement of financial position or in the notes thereto:
CLASS CATEGORY
Receivables from exchange transactions
Financial asset measured at amortised cost
Cash and cash equivalents
Financial asset measured at amortised cost
The entity has the following types of financial liabilities (class and category) as reflected on
the face of the statement of financial position or in the notes thereto:
CLASS CATEGORY
Payables from exchange transactions
Financial liability measured at amortised cost
Payables from non-exchange transactions
Financial liability measured at amortised cost
Finance lease obligation
Financial liability measured at amortised cost
Cash and cash equivalents are measured at amortised cost. Bank balances include transactional accounts as well as short-term investment accounts.
These are highly liquid investments held with registered banking institutions with maturities between three to six months or less and are subject to an insignificant risk of change in value. Deposits held on behalf of third parties relate to tenant rental deposits and supplier retentions.
Amounts held in trust accounts reflect contractual obligations relating to capital projects and guarantees.
Initial recognitionThe entity recognises a financial asset or a financial liability in its statement of financial position when the entity becomes a party to the contractual provisions of the instrument.
The entity recognises financial assets using trade date accounting.
Initial measurement of financial assets and financial liabilitiesThe entity measures a financial asset and financial liability initially at its fair value plus transaction costs that are directly attributable to the acquisition or issue of the financial asset or financial liability.
Subsequent measurement of financial assets and financial liabilitiesThe entity measures all financial assets and financial liabilities after initial recognition using the following categories:• Financial instruments at amortised cost;
and• Financial instruments at cost.
All financial assets measured at amortised cost, or cost, are subject to an impairment review at financial year end.
DUBE TRADEPORT CORPORATION ANNUAL REPORT 2017/1868
NOTES TO THE CONSOLIDATED ANNUAL FINANCIAL STATEMENTS (continued)For the year ended 31 March 2018
Impairment and uncollectibility of financial assetsAt the end of each reporting period the entity assesses whether there is any objective evidence that a financial asset or group of financial assets is impaired. Financial assets are measured at amortised cost.
If there is objective evidence that an impairment loss on financial assets measured at amortised cost has been incurred, the amount of the loss is measured as the difference between the asset’s carrying amount and the present value of estimated future cash flows (excluding future credit losses that have not been incurred) discounted at the financial asset’s original effective interest rate. The carrying amount of the asset is reduced through the use of an allowance account. The amount of the loss is recognised in surplus or deficit.
If, in a subsequent period, the amount of the impairment loss decreases and the decrease can be related objectively to an event occurring after the impairment was recognised, the previously recognised impairment loss is reversed by adjusting an allowance account. The reversal does not result in a carrying amount of the financial asset that exceeds what the amortised cost would have been, had the impairment not been recognised at the date the impairment is reversed. The amount of the reversal is recognised in surplus or deficit.
DERECOGNITION
Financial assetsThe entity derecognises a financial asset only when:• The contractual rights to the cash flows
from the financial asset expire, are settled or waived;
• The entity transfers to another party substantially all of the risks and rewards of ownership of the financial asset; or
• The entity, despite having retained some significant risks and rewards of ownership of the financial asset, has transferred control of the asset to another party and the other party has the practical ability to sell the asset in its entirety to an unrelated third party, and is able to exercise that ability unilaterally and without needing to impose additional restrictions on the transfer. In this case, the entity: - Derecognises the asset; and - Recognises separately any rights and obligations created or retained in the transfer.
On derecognition of a financial asset in its entirety, the difference between the carrying
amount and the sum of the consideration received is recognised in surplus or deficit.
Financial liabilitiesThe entity removes a financial liability (or a part of a financial liability) from its statement of financial position when it is extinguished − i.e. when the obligation specified in the contract is discharged, cancelled, expired or waived.
The difference between the carrying amount of a financial liability (or part of a financial liability) extinguished or transferred to another party and the consideration paid, including any non-cash assets transferred or liabilities assumed, is recognised in surplus or deficit. Any liabilities that are waived, forgiven or assumed by another entity by way of a non-exchange transaction are accounted for in accordance with the Standard of GRAP on Revenue from Non-exchange Transactions (Taxes and Transfers).
1.10 TAX
Current tax assets and liabilitiesAlthough the controlling entity is exempt from income tax, it is still subject to all other indirect taxes such as Value Added Tax (VAT), customs tax, Securities Transfer Tax (STT) and Capital Gains Tax (CGT). The subsidiary, La Mercy JV Property Investments Proprietary Limited is subject to income tax.
Current tax for current and prior periods is, to the extent unpaid, recognised as a liability. If the amount already paid in respect of current and prior periods exceeds the amount due for those periods, the excess is recognised as an asset.
Current tax liabilities/(assets) for the current and prior periods are measured at the amount expected to be paid to/(recovered from) the tax authorities, using the tax rates (and tax laws) that have been enacted or substantively enacted by the end of the reporting period.
Deferred tax assets and liabilitiesA deferred tax liability is recognised for all taxable temporary differences, except to the extent that the deferred tax liability arises from the initial recognition of an asset or liability in a transaction which at the time of the transaction affects neither accounting surplus nor taxable profit/(tax loss).
A deferred tax asset is recognised for all deductible temporary differences to the extent that it is probable that taxable surplus will be available against which the deductible temporary difference can be utilised. A deferred tax asset is not recognised when it arises from the initial recognition of an asset or liability in
a transaction at the time of the transaction, or affects neither accounting surplus nor taxable profit/(tax loss).
A deferred tax asset is recognised for the carry -forward of unused tax losses and unused STC credits to the extent that it is probable that future taxable surplus will be available against which the unused tax losses and unused STC credits can be utilised.
Deferred tax assets and liabilities are measured at the tax rates that are expected to apply to the period when the asset is realised or the liability is settled, based on tax rates (and tax laws) that have been enacted or substantively enacted by the end of the reporting period.
Tax expensesCurrent and deferred taxes are recognised as income or expense and included in surplus or deficit for the period, except to the extent that the tax arises from:• A transaction or event which is recognised,
in the same or a different period, to net assets; or
• Business combination.
Current tax and deferred taxes are charged or credited to net assets if the tax relates to items that are credited or charged, in the same or a different period, to net assets.
Value Added TaxRevenue, expenses and assets are recognised net of the amounts of Value Added Tax. The net amount of Value Added Tax recoverable from, or payable to, the taxation authority is included as part of receivables or payables in the statement of financial position.
1.11 LEASES
A lease is classified as a finance lease if it transfers substantially all the risks and rewards incidental to ownership. A lease is classified as an operating lease if it does not transfer substantially all the risks and rewards incidental to ownership. When a lease includes both land and building elements, each element is assessed separately.
Finance leases - lesseeFinance leases are recognised as assets and liabilities in the statement of financial position at amounts equal to the fair value of the leased property or, if lower, the present value of the minimum lease payments. The corresponding liability to the lessor is included in the statement of financial position as a finance lease obligation.The discount rate used in calculating the present value of the minimum lease payments
is the interest rate implicit in the lease.
Minimum lease payments are apportioned between the finance charge and reduction of the outstanding liability. The finance charge is allocated to each period during the lease term so as to produce a constant periodic rate of return on the remaining balance of the liability.Any contingent rents are expensed in the period in which they are incurred.
Operating leases - lessorOperating lease revenue is recognised on a straight-line basis over the lease term.
The difference between the amounts recognised as income and the contractual amounts receivable over the lease term are recognised as an operating lease asset or liability. Income for leases is disclosed under revenue in the statement of financial performance.
Operating leases - lesseeOperating lease payments are recognised as an expense on a straight-line basis over the lease term.
The difference between the amounts recognised as expenses and the contractual amounts payable over the lease term are recognised as an operating lease asset or liability.
1.12 INVENTORIES
Inventories are initially measured at cost except where inventories are acquired through a non-exchange transaction, when their costs are their fair value as at the date of acquisition.
Subsequently inventories are measured at the lower of cost and net realisable value.
Inventories are measured at the lower of cost and current replacement cost where they are held for:• Distribution at no charge or for a nominal
charge; or• Consumption in the production process of
goods to be distributed at no charge or for a nominal charge.
Net realisable value is the estimated selling price in the ordinary course of operations less the estimated costs of completion and the estimated costs necessary to make the sale, exchange or distribution.
Current replacement cost is the cost incurred to acquire the asset on the reporting date. The cost of inventories comprises all costs of purchase, costs of conversion and other costs
incurred in bringing the inventories to their present location and condition.
The cost of inventories is assigned using the first-in, first-out (FIFO) formula. The same cost formula is used for all inventories having a similar nature and use to the economic entity.
When inventories are sold, the carrying amounts of those inventories are recognised as an expense in the period in which the related revenue is recognised.
If there is no related revenue, the expenses are recognised when the goods are distributed or related services are rendered.
The amount of any write-down of inventories to net realisable value or current replacement cost and all losses of inventories are recognised as an expense in the period the write-down or loss occurs.
The amount of any reversal of any write-down of inventories, arising from an increase in net realisable value or current replacement cost, shall be recognised as a reduction in the amount of inventories recognised as an expense in the period in which the reversal occurs.
A new assessment is made of net realisable value in each subsequent period. When the circumstances that previously caused inventories to be written-down below cost no longer exist or when there is clear evidence of an increase in net realisable value because of changed economic circumstances, the amount of the write-down is reversed (i.e. the reversal is limited to the amount of the original write-down) so that the new carrying amount is the lower of the cost and the revised net realisable value.
1.13 IMPAIRMENT OF CASH-GENERATING ASSETS
Cash-generating assets are assets managed with the objective of generating a commercial return. An asset generates a commercial return when it tends to generate positive inflows.
If an active market exists for the output produced by an asset or group of assets, that asset or group of assets shall be identified as a cash-generating unit, even if some or all of the output is used internally.
The main criteria used by the entity to determine cash-generating assets is that the asset should generate rentals and service revenue. Carrying amount is the amount at which an asset is recognised in the statement of financial position
after deducting any accumulated depreciation and accumulated impairment losses thereon.
A cash-generating unit is the smallest identifiable group of assets managed with the objective of generating a commercial return that generates cash inflows from continuing use that are largely independent of the cash inflows from other assets or groups of assets.
Recoverable amount of an asset or a cash-generating unit is the higher of its fair value less costs to sell and its value in use.
IdentificationManagement assesses at each reporting date whether there is any indication that a cash-generating asset may be impaired. If any such indication exists, the economic entity estimates the recoverable amount of the asset.
When the carrying amount of a cash-generating asset exceeds its recoverable amount, it is impaired.
Value in useValue in use of a cash-generating asset is the present value of the estimated future cash flows expected to be derived from the continuing use of an asset and from its disposal at the end of its useful life.
When estimating the value in use of an asset, the economic entity estimates the future cash inflows and outflows to be derived from continuing use of the asset and from its ultimate disposal and the economic entity applies the appropriate discount rate to those future cash flows.
Recognition and measurement (individual asset)If the recoverable amount of a cash-generating asset is less than its carrying amount, the carrying amount of the asset is reduced to its recoverable amount. This reduction is an impairment loss.
An impairment loss is recognised immediately in surplus or deficit.
When the amount estimated for an impairment loss is greater than the carrying amount of the cash-generating asset to which it relates, the economic entity recognises a liability only to the extent that is a requirement in the Standard of GRAP. After the recognition of an impairment loss, the depreciation/(amortisation) charge for the cash-generating asset is adjusted in future periods to allocate the cash-generating asset’s revised carrying amount, less its residual value (if any), on a
DUBE TRADEPORT CORPORATION ANNUAL REPORT 2017/1870
systematic basis over its remaining useful life.
1.14 IMPAIRMENT OF NON-CASH-GENERATING ASSETS
Non-cash-generating assets are assets other than cash-generating assets.
Recoverable amount is the higher of a non-cash-generating asset’s fair value less costs to sell and its value in use.
IdentificationThe economic entity assesses at each reporting date whether there is any indication that a non-cash-generating asset may be impaired. If any such indication exists, the economic entity estimates the recoverable service amount of the asset.
When the carrying amount of a non-cash-generating asset exceeds its recoverable service amount, it is impaired.
Recoverable service amount is the higher of an asset’s fair value less costs to sell and its value in use.
Value in useValue in use of non-cash-generating assets is the present value of the non-cash-generating assets’ remaining service potential.
The present value of the remaining service potential of a non-cash-generating asset is determined using the following approach.
Depreciated replacement cost approachThe present value of the remaining service potential of a non-cash-generating asset is determined as the depreciated replacement cost of the asset. The replacement cost of an asset is the cost to replace the asset’s gross service potential. This cost is depreciated to reflect the asset in its present condition. An asset may be replaced either through reproduction (replication) of the existing asset or through replacement of its gross service potential. The depreciated replacement cost is measured as the reproduction or replacement cost of the asset, whichever is lower, less accumulated depreciation calculated on the basis of such cost, to reflect the already consumed or expired service potential of the asset.
Recognition and measurementIf the recoverable service amount of a non-cash-generating asset is less than its carrying amount, the carrying amount of the asset is reduced to its recoverable service amount. This reduction is an impairment loss.
An impairment loss is recognised immediately
in surplus or deficit.
After the recognition of an impairment loss, the depreciation/(amortisation) charge for the non-cash-generating asset is adjusted in future periods to allocate the non-cash-generating asset’s revised carrying amount, less its residual value (if any), on a systematic basis over its remaining useful life.
1.15 COMMITMENTS
Items are classified as commitments when an entity has committed itself to future transactions that will normally result in the outflow of cash. Disclosures are required in respect of unrecognised contractual commitments. Refer to note 27.
1.16 SHARE CAPITAL AND CONTRIBUTED CAPITAL
Since La Mercy JV Property Investments Proprietary Limited has been classified as a deemed Schedule 3C public entity on 1 September 2013, it is not permitted to receive loans as outlined in section 66 of the PFMA. Consequently, from this date all expenditure has been funded via capital contributions (equity) in proportion to the existing shareholding. Dube TradePort Corporation’s portion has been eliminated in the consolidated annual financial statements.
1.17 EMPLOYEE BENEFITS
Short-term employee benefitsShort-term employee benefits are employee benefits (other than termination benefits) that are due to be settled within 12 months after the end of the period in which the employees render the related service.
Short-term employee benefits include items such as:• Wages, salaries and social security
contributions;• Short-term compensated absences (such
as paid annual leave and paid sick leave) where the compensation for the absences is due to be settled within 12 months after the end of the reporting period in which the employees render the related employee service;
• Bonus, incentive and performance-related payments payable within 12 months after the end of the reporting period in which the employees render the related service; and
• Non-monetary benefits for current employees.
When an employee has rendered service to the entity during a reporting period, the entity recognises the undiscounted amount of short-term employee benefits expected to be paid in
exchange for that service:• As a liability (accrued expense), after
deducting any amount already paid. If the amount already paid exceeds the undiscounted amount of the benefits, the entity recognises that excess as an asset (prepaid expense) to the extent that the prepayment will lead to, for example, a reduction in future payments or a cash refund; and
• As an expense, unless another Standard requires or permits the inclusion of the benefits in the cost of an asset.
The expected cost of compensated absences is recognised as an expense as the employees render services that increase their entitlement or, in the case of non-accumulating absences, when the absence occurs. The entity measures the expected cost of accumulating compensated absences as the additional amount that the entity expects to pay as a result of the unused entitlement that has accumulated at the reporting date.
The entity recognises the expected cost of bonus, incentive and performance-related payments when the entity has a present legal or constructive obligation to make such payments as a result of past events and a reliable estimate of the obligation can be made. A present obligation exists when the entity has no realistic alternative but to make the payments.
1.18 PROVISIONS AND CONTINGENCIES
Provisions are recognised when:• The economic entity has a present
obligation as a result of a past event;• It is probable that an outflow of resources
embodying economic benefits or service potential will be required to settle the obligation; and
• A reliable estimate can be made of the obligation.
The amount of a provision is the best estimate of the expenditure expected to be required to settle the present obligation at the reporting date.
Provisions are reviewed at each reporting date and adjusted to reflect the current best estimate. Provisions are reversed if it is no longer probable that an outflow of resources embodying economic benefits or service potential will be required, to settle the obligation.
Where the effect of the time value of money is material, the amount of a provision is the present value of the expenditures expected to be required to settle the obligation.
Where discounting is used, the carrying amount of a provision increases in each period to reflect
NOTES TO THE CONSOLIDATED ANNUAL FINANCIAL STATEMENTS (continued)
the passage of time. This increase is recognised as an interest expense. A provision is used only for expenditures for which the provision was originally recognised.
Provisions are not recognised for future operating deficits. If an entity has a contract that is onerous, the present obligation (net of recoveries) under the contract is recognised and measured as a provision.
Contingent assets and liabilities are not recognised, however it is disclosed in the notes to the annual financial statements. Refer to note 37.
1.19 REVENUE FROM EXCHANGE TRANSACTIONS
Revenue is the gross inflow of economic benefits or service potential during the reporting period when those inflows result in an increase in net assets, other than increases relating to contributions from owners.
Revenue from the sale of goods is recognised when all the following conditions have been satisfied:• The entity has transferred to the purchaser
the significant risks and rewards of ownership of the goods;
• The entity retains neither continuing managerial involvement to the degree usually associated with ownership nor effective control over the goods sold;
• The amount of revenue can be measured reliably;
• It is probable that the economic benefits or service potential associated with the transaction will flow to the entity; and
• The costs incurred or to be incurred in respect of the transaction can be measured reliably.
MeasurementRevenue is measured at the fair value of the consideration received or receivable, net of Value Added Tax (VAT).
RentalsRevenue from the rental of properties classified as operating leases is recognised on a straight-line basis over the term of the lease agreement, where such lease periods span over more than one financial year.
Rendering of servicesRendering of services includes the following:• Supply of IT services within the
Dube TradePort precinct; and• Cargo handling services.When the outcome of the transaction involving the rendering of services cannot be estimated reliably, revenue is recognised only to the extent of the expenses incurred that are recoverable.
Service revenue is recognised only once the service is rendered.
Sale of plantsSale of plants includes the following:• Propagation of plants at the Tissue
Culture facility. Revenue from the sale of plants is recognised when all the following conditions have been satisfied:• The economic entity has transferred to the
purchaser the significant risks and rewards of ownership of the goods;
• The economic entity retains neither continuing managerial involvement to the degree usually associated with ownership nor effective control over the goods sold;
• The amount of revenue can be measured reliably;
• It is probable that the economic benefits or service potential associated with the transaction will flow to the entity; and
• The costs incurred or to be incurred in respect of the transaction can be measured reliably.
Finance incomeInterest is recognised, in surplus or deficit, using the effective interest rate method.
1.20 REVENUE FROM NON-EXCHANGE TRANSACTIONS
In a non-exchange transaction, an entity either receives value from another entity without directly giving approximately equal value in exchange, or gives value to another entity without directly receiving approximately equal value in exchange.
Revenue comprises gross inflows of economic benefits or service potential received and receivable by an entity, which represents an increase in net assets, other than increases relating to contributions from owners.
Government grantsIncome received from conditional grants, donations and funding are recognised as revenue to the extent that the economic entity has complied with any of the criteria, conditions or obligations embodied in the agreement.
A liability is recognised to the extent and when the criteria, conditions or obligations have not been met.
RecognitionAn inflow of resources from a non-exchange transaction recognised as an asset is recognised as revenue, except to the extent that a liability is also recognised in respect of the same inflow. As the entity satisfies a present obligation recognised as a liability in respect
of an inflow of resources from a non-exchange transaction recognised as an asset, it reduces the carrying amount of the liability recognised and recognises an amount of revenue equal to that reduction.
MeasurementRevenue from a non-exchange transaction is measured at the amount of the increase in net assets recognised by the entity.
When, as a result of a non-exchange transaction, the entity recognises an asset, it also recognises revenue equivalent to the amount of the asset measured at its fair value as at the date of acquisition, unless it is also required to recognise a liability. Where a liability is required to be recognised it will be measured as the best estimate of the amount required to settle the obligation at the reporting date, and the amount of the increase in net assets, if any, recognised as revenue. When a liability is subsequently reduced, because a condition is satisfied, the reduction in the liability is recognised as revenue.
1.21 COST OF SALES
When inventories are sold, the carrying amount of those inventories is recognised as an expense in the period in which the related revenue is recognised. The amount of any write-down of inventories to net realisable value and all deficits of inventories are recognised as an expense in the period the write-down or loss occurs. The amount of any reversal of any write-down of inventories, arising from an increase in net realisable value, is recognised as a reduction in the amount of inventories recognised as an expense in the period in which the reversal occurs. The related cost of providing revenue-generating services recognised as revenue in the current period is included in cost of sales.
1.22 TRANSLATION OF FOREIGN CURRENCIES
Foreign currency transactionsA foreign currency transaction is recorded, on
initial recognition in Rands, by applying the spot exchange rate between the functional currency and the foreign currency at the date of the transaction to the foreign currency amount.
Exchange differences arising on the settlement of monetary items or on translating monetary items at rates different from those at which they were translated on initial recognition during the period or in previous consolidated annual financial statements are recognised in surplus or deficit in the period in which they arise.
When a gain or loss on a non-monetary item is recognised directly in net assets, any exchange component of that gain or loss is recognised directly in net assets. When a gain or loss on a
DUBE TRADEPORT CORPORATION ANNUAL REPORT 2017/1872
non-monetary item is recognised in surplus or deficit, any exchange component of that gain or loss is recognised in surplus or deficit.
Cash flows arising from transactions in a foreign currency are recorded in Rands by applying the exchange rate between the Rand and the foreign currency at the date of the cash flow.
1.23 COMPARATIVE FIGURES
Where necessary, comparative figures have been reclassified to conform to changes in presentation in the current year.
Refer to note 34.
1.24 FRUITLESS AND WASTEFUL EXPENDITURE
Fruitless and wasteful expenditure is expenditure which was made in vain and would have been avoided had reasonable care been exercised.
All expenditure relating to fruitless and wasteful expenditure is recognised as an expense in the statement of financial performance in the year that the expenditure was incurred.
The expenditure is classified in accordance with the nature of the expense, and where recovered, it is subsequently accounted for as revenue in the statement of financial performance.
Refer to note 31.
1.25 IRREGULAR EXPENDITURE
Irregular expenditure, as defined in section 1 of the PFMA, is expenditure other than unauthorised expenditure, incurred in contravention of, or that is not in accordance with, a requirement of any applicable legislation, including:(a) This Act; or(b) The State Tender Board Act, No. 86 of 1968, or any regulations made in terms of the Act; or(c) Any provincial legislation providing for procurement procedures in that Provincial Government.
Irregular expenditure that was incurred and identified during the current financial year and which was condoned before year end and/or before finalisation of the financial statements is reflected in the notes to the
annual financial statements.
Irregular expenditure that was incurred and identified during the current financial year and for which condonement is being awaited at year end is recorded in the irregular expenditure register and the occurance is reflected in the
notes to the annual financial statements.
If liability for the irregular expenditure can be attributed to a person, a debt account must be created if such a person is liable in law. Immediate steps must thereafter be taken to recover the amount from the person concerned. If recovery is not possible, the Accounting Officer or Accounting Authority may write-off the amount as debt impairment and disclose such in the relevant note to the annual financial statements.
If the irregular expenditure has not been condoned and no person is liable in law, the expenditure related thereto must remain against the relevant programme/expenditure item, and be disclosed as such in the note to the annual financial statements.
Where irregular expenditure was incurred in the previous financial year and is only condoned in the following financial year the occurance is reflected in the notes to the annual financial statements.
Refer to note 32.
1.26 SEGMENT INFORMATION
A segment is an activity of an entity:• That generates economic benefits or
service potential (including economic benefits or service potential relating to transactions between activities of the same entity);
• Whose results are regularly reviewed by management to make decisions about resources to be allocated to that activity and in assessing its performance; and
• For which separate financial information is available.
Reportable segments are the actual segments which are reported on in the segment report. They are the segments identified above or alternatively an aggregation of two or more of those segments where the aggregation criteria are met.
Refer to note 41.
MeasurementThe amount of each segment item reported is the measure reported to management for the purposes of making decisions about allocating resources to the segment and assessing its performance.
Adjustments and eliminations made in preparing the entity’s financial statements and allocations of revenues and expenses are included in determining reported segment surplus or deficit only if they are included in the measure of the segment’s surplus or deficit that
is used by management. Information relating to segmental assets and liabilities has not been disclosed as this is not regularly provided to management for review.
1.27 BUDGET INFORMATION
The approved budget is prepared on a cash basis and presented by economic classification linked to performance outcome objectives.
The budget information prepared in the annual financial statements relates to both Dube TradePort Corporation and the La Mercy JV Property Investments Proprietary Limited.
The approved budget covers the fiscal period from 01 April 2017 to 31 March 2018.
The budget for the economic entity includes all the entity’s approved budgets under its control.
The consolidated annual financial statements and the budget are not on the same basis of accounting; therefore a comparison with the budgeted amounts for the reporting period have been included in the statement of comparison of budget and actual amounts.
Variances between budget and actual amounts greater than 10% is considered to be material and explanations provided for disclosure purposes.
Comparative information is not required.
1.28 RELATED PARTIESThe economic entity operates in an economic sector currently dominated by entities directly or indirectly owned by the South African Government.
As a consequence of the constitutional independence of the three spheres of government in South Africa, only entities within the provincial sphere of government are considered to be related parties.
Management is that body of persons responsible for planning, directing and controlling the activities of the economic entity, including those charged with the governance of the economic entity in accordance with legislation, in instances where they are required to perform such functions.Close members of the family of management are considered to be those family members who may be expected to influence, or be influenced by, that management in their dealings with the
economic entity.
A person or a close member of that person’s family is related to the reporting entity if that person:• Has control or joint control over the
NOTES TO THE CONSOLIDATED ANNUAL FINANCIAL STATEMENTS (continued)
reporting entity;• Has significant influence over the reporting
entity; or• Is a member of management of the entity
or controlling entity.
Only transactions with related parties not at arm’s length or not in the ordinary course of business are disclosed.
1.29 EVENTS AFTER REPORTING DATE
Events after reporting date are those events, both favourable and unfavourable, that occur between the reporting date and the date when the annual financial statements are authorised for issue. Two types of events can be identified:• Those that provide evidence of conditions
that existed at the reporting date (adjusting events after the reporting date); and
• Those that are indicative of conditions that arose after the reporting date (non-adjusting events after the reporting date).
The economic entity will adjust the amount recognised in the annual financial statements to reflect adjusting events after the reporting date once the event occurred.
The economic entity will disclose the nature of the event and an estimate of its financial effect or a statement that such estimate cannot be made in respect of all material non-adjusting events, where non-disclosure could influence the economic decisions of users taken on the basis of the annual financial statements.
2. NEW STANDARDS AND INTERPRETATIONS
2.1 STANDARDS AND INTERPRETATIONS ISSUED, BUT NOT YET EFFECTIVE
GRAP 35: Consolidated Financial StatementsThe objective of this Standard is to establish principles for the presentation and preparation of consolidated financial statements when an entity controls one or more other entities.
To meet this objective, the Standard:• Requires an entity (the controlling
entity) that controls one or more other entities (controlled entities) to present consolidated financial statements;
• Defines the principle of control, and establishes control as the basis for consolidation;
• Sets out how to apply the principle of control to identify whether an entity controls another entity and therefore
must consolidate that entity;• Sets out the accounting requirements for
the preparation of consolidated financial statements; and
• Defines an investment entity and sets out
an exception to consolidating particular controlled entities of an investment entity.
It furthermore covers definitions, control, accounting requirements, investment entities: fair value requirement, transitional provisions and effective date.
The effective date of the Standard is not yet set by the Minister of Finance. The economic entity expects to adopt the Standard for the first time when the Minister sets the effective date for the Standard. The impact of this Standard is currently being assessed.
GRAP 38: Disclosure of Interests in Other EntitiesThe objective of this Standard is to require an entity to disclose information that enables users of its financial statements to evaluate:• The nature of, and risks associated
with, its interests in controlled entities, unconsolidated controlled entities, joint arrangements and associates, and structured entities that are not consolidated; and
• The effects of those interests on its financial position, financial performance and cash flows.
It furthermore covers definitions, disclosing information about interests in other entities, significant judgements and assumptions, investment entity status, interests in controlled entities, interests in joint arrangements and associates, interests in structured entities that are not consolidated, non-qualitative ownership interests, controlling interests acquired with the intention of disposal, transitional provisions and effective date.
The effective date of the Standard is not yet set by the Minister of Finance.
The economic entity expects to adopt the Standard for the first time when the Minister sets the effective date for the Standard. It is unlikely that the Standard will have a material impact on the economic entity’s consolidated annual financial statements.
GRAP 20: Related PartiesThe objective of this Standard is to ensure that a reporting entity’s consolidated annual financial statements contain the disclosures necessary to draw attention to the possibility that its financial position and surplus or deficit may have been affected by the existence of related parties and by transactions and outstanding balances with such parties. An entity that prepares and presents financial statements under the accrual basis of accounting (in this Standard referred to as the reporting entity)
shall apply this Standard in:• Identifying related party relationships and
transactions;• Identifying outstanding balances, including
commitments, between an entity and its related parties;
• Identifying the circumstances in which disclosure of the items above is required; and
• Determining the disclosures to be made about those items.
This Standard requires disclosure of related party relationships, transactions and outstanding balances, including commitments in the consolidated and separate financial statements of the reporting entity in accordance with the Standard of GRAP on Consolidated and Separate Financial Statements. This Standard also applies to individual consolidated annual financial statements.
Disclosure of related party transactions, outstanding balances, inclusive of commitments and relationships with related parties may affect users’ assessments of the financial position and performance of the reporting entity and its ability to deliver agreed services, including assessments of the risks and opportunities facing the entity.
This disclosure also ensures that the reporting entity is transparent about its dealings with related parties.
The Standard states that a related party is a person or an entity with the ability to control or jointly control the other party, or exercise significant influence over the other party, or vice versa, or an entity that is subject to common control, or joint control.
As a minimum, the following are regarded as related parties of the reporting entity:• A person or a close member of that
person’s family is related to the reporting entity if that person:
- Has control or joint control over the reporting entity; - Has significant influence over the reporting entity; - Is a member of the management of the entity or its controlling entity. • An entity is related to the reporting entity if any of the following conditions apply: - The entity is a member of the same economic entity (which means that each controlling entity, controlled entity and fellow controlled entity is related to the others); - One entity is an associate or joint venture of the other entity (or an associate or joint venture of a member
DUBE TRADEPORT CORPORATION ANNUAL REPORT 2017/1874
of an economic entity of which the other entity is a member); - Both entities are joint ventures of the same third party; - One entity is a joint venture of a third entity and the other entity is an associate of the third entity; - The entity is a post-employment benefit plan for the benefit of
employees of either the entity or an entity related to the entity. If the reporting entity is itself such a plan, the sponsoring employers are related to the entity;
- The entity is controlled or jointly controlled by a person identified above;
and - A person identified above has significant influence over that entity or is a member of the management of
that entity (or its controlling entity).
The Standard furthermore states that related party transaction is a transfer of resources, services or obligations between the reporting entity and a related party, regardless of whether a price is charged.
The Standard elaborates on the definitions and identification of:• Close member of the family of a person;• Management;• Related parties;• Remuneration; and• Significant influence.
The Standard sets out the requirements, inter alia, for the disclosure of:• Control;• Related party transactions; and• Remuneration of management.
The effective date of the Standard set by the Minister of Finance is 01 April 2019.
The entity has already used the Standard to develop its accounting policy.
It is unlikely that the Standard will have a material impact on the economic entity’s consolidated annual financial statements.
GRAP 108: Statutory ReceivablesThe objective of this Standard is to prescribe accounting requirements for the recognition, measurement, presentation and disclosure of statutory receivables.
It furthermore covers definitions, recognition, derecognition, measurement, presentation and disclosure and transitional provisions, as well as the effective date.
The effective date of the Standard set by the
Minister of Finance is 01 April 2019.
It is unlikely that the Standard will have a material impact on the economic entity’s consolidated annual financial statements.
IGRAP 18: Interpretation of the Standard of GRAP on Recognition and Derecognition of LandThis Interpretation of the Standards of GRAP applies to the initial recognition and derecognition of land in an entity’s financial statements. It also considers joint control of land by more than one entity.
When an entity concludes that it controls the land after applying the principles in this Interpretation of the Standards of GRAP, it applies the applicable Standard of GRAP, i.e. the Standard of GRAP on Inventories, Investment Property (GRAP 16), Property, Plant and Equipment (GRAP 17) or Heritage Assets.
As this Interpretation of the Standards of GRAP does not apply to the classification, initial and subsequent measurement, presentation and disclosure requirements of land, the entity applies the applicable Standard of GRAP to account for the land once control of the land has been determined.
An entity also applies the applicable Standards of GRAP to the derecognition of land when it concludes that it does not control the land after applying the principles in this Interpretation of the Standards of GRAP.
In accordance with the principles in the Standards of GRAP, buildings and other structures on the land are accounted for separately.
These assets are accounted for separately as the future economic benefits or service potential embodied in the land differs from those included in buildings and other structures. The recognition and derecognition of buildings and other structures are not addressed in this Interpretation of the Standards of GRAP.
The effective date of the interpretation is for years beginning on or after 01 April 2019.The economic entity expects to adopt the interpretation for the first time in the 2020 consolidated annual financial statements. The impact of this interpretation is currently being assessed.
GRAP 12 (as amended 2016): InventoriesAmendments to the Standard of GRAP on Inventories resulted from inconsistencies in measurement requirements in GRAP 23 and other asset-related Standards of GRAP in
relation to the treatment of transaction costs. Other changes resulted from changes made to IPSAS 12 on Inventories (IPSAS 12) as a result of the IPSASB Improvements to IPSAS 2015 issued in March 2016.
The most significant changes to the Standard are:• General improvements: To clarify the
treatment of transaction costs and other costs incurred on assets acquired
in non-exchange transactions to be in line with the principle in GRAP 23 (paragraph 12);• IPSASB amendments: To align terminology
in GRAP 12 with that in IPSAS 12. The term “ammunition” in IPSAS 12 was replaced with the term “military inventories” and provides a description of what it comprises in accordance with Government Finance Statistics terminology.
The effective date of the amendment is for years beginning on or after 01 April 2018.
The economic entity expects to adopt the amendment for the first time in the 2019 consolidated annual financial statements.
It is unlikely that the amendment will have a material impact on the economic entity’s consolidated annual financial statements.
GRAP 16 (as amended 2016): Investment PropertyThe most significant changes to the Standard are:• To clarify the treatment of transaction
costs and other costs incurred on assets acquired in non-exchange transactions to be in line with the principle in GRAP 23 (paragraph 12).
• To clarify the measurement principle when assets may be acquired in exchange for a non-monetary asset or assets, or a combination of monetary and non-monetary assets.
• The effective date of the amendment is for years beginning on or after 01 April 2018.
• The economic entity expects to adopt the amendment for the first time in the 2019 consolidated annual financial statements.
• It is unlikely that the amendment will have a material impact on the economic entity’s consolidated annual financial statements.
GRAP 17 (as amended 2016): Property, Plant and EquipmentThe amendments to GRAP 16 and 17 are as follows:
The most significant changes to the Standard are:
NOTES TO THE CONSOLIDATED ANNUAL FINANCIAL STATEMENTS (continued)
• To clarify the treatment of transaction costs and other costs incurred on assets acquired in non-exchange transactions to be in line with the principle in GRAP 23 (paragraph 12).
• To clarify the measurement principle when assets may be acquired in exchange for a non-monetary asset or assets, or a combination of monetary and non-monetary assets and to clarify acceptable methods of depreciating assets.
The effective date of the amendment is for years beginning on or after 01 April 2018.
The economic entity expects to adopt the amendment for the first time in the 2019 consolidated annual financial statements. It is unlikely that the amendment will have a material impact on the economic entity’s consolidated annual financial statements.
GRAP 21 (as amended 2016): Impairment of Non-cash-generating AssetsThe most significant changes to the Standard are:• IPSASB amendments: To update the Basis
of conclusions and Comparison with IPSASs to reflect the IPSASB recent decision on the impairment of revalued assets.
The effective date of the amendment is for years beginning on or after 01 April 2018.
The economic entity expects to adopt the amendment for the first time in the 2019 consolidated annual financial statements. It is unlikely that the amendment will have a material impact on the economic entity’s consolidated annual financial statements.
GRAP 26 (as amended 2016): Impairment of Cash-generating AssetsThe most significant changes to the Standard are:• IPSASB amendments: To update the Basis
of conclusions and Comparison with IPSAS to reflect the IPSASB recent decision on the impairment of revalued assets.
The effective date of the amendment is for years beginning on or after 01 April 2018. The economic entity expects to adopt the amendment for the first time in the 2019 consolidated annual financial statements.
It is unlikely that the amendment will have a material impact on the economic entity’s consolidated annual financial statements.
GRAP 31 (as amended 2016): Intangible AssetsAmendments to the Standard of GRAP on Intangible Assets resulted from inconsistencies
in measurement requirements in GRAP 23 and other asset-related Standards of GRAP in relation to the treatment of transaction costs.
Other changes resulted from changes made to IPSAS 31 on Intangible Assets (IPSAS 31) as a result of the IPSASB Improvements to IPSAS 2014 issued in January 2015.
The most significant changes to the Standard are:• General improvements: To add the
treatment of transaction costs and other costs incurred on assets acquired in non-exchange transactions to be in line with the principle in GRAP 23 (paragraph 12) and to clarify the measurement principle when assets may be acquired in exchange for a non-monetary asset or assets, or a combination of monetary and non-monetary assets;
• IPSASB amendments: To clarify the revaluation methodology of the carrying amount and accumulated depreciation when an item of intangible assets is revalued and to clarify acceptable methods of depreciating assets.
The effective date of the amendment is for years beginning on or after 01 April 2018.
The economic entity expects to adopt the amendment for the first time in the 2019 consolidated annual financial statements.
It is unlikely that the amendment will have a material impact on the economic entity’s consolidated annual financial statements.
GRAP 103 (as amended 2016): Heritage AssetsAmendments to the Standard of GRAP on Heritage Assets resulted from inconsistencies in measurement requirements in GRAP 23 and other asset-related Standards of GRAP in relation to the treatment of transaction costs.
Other changes resulted from editorial changes to the original text.
The most significant changes to the Standard are:• General improvements: To clarify the
treatment of transaction costs and other costs incurred on assets acquired in non-exchange transactions to be in line with the principle in GRAP 23 (paragraph 12), and to clarify the measurement principle when assets may be acquired in exchange for a non-monetary asset or assets, or a combination of monetary and non-monetary assets.
The effective date of the amendment is for years beginning on or after 01 April 2018.
The economic entity expects to adopt the amendment for the first time in the 2019 consolidated annual financial statements.
It is unlikely that the amendment will have a material impact on the economic entity’s consolidated annual financial statements.
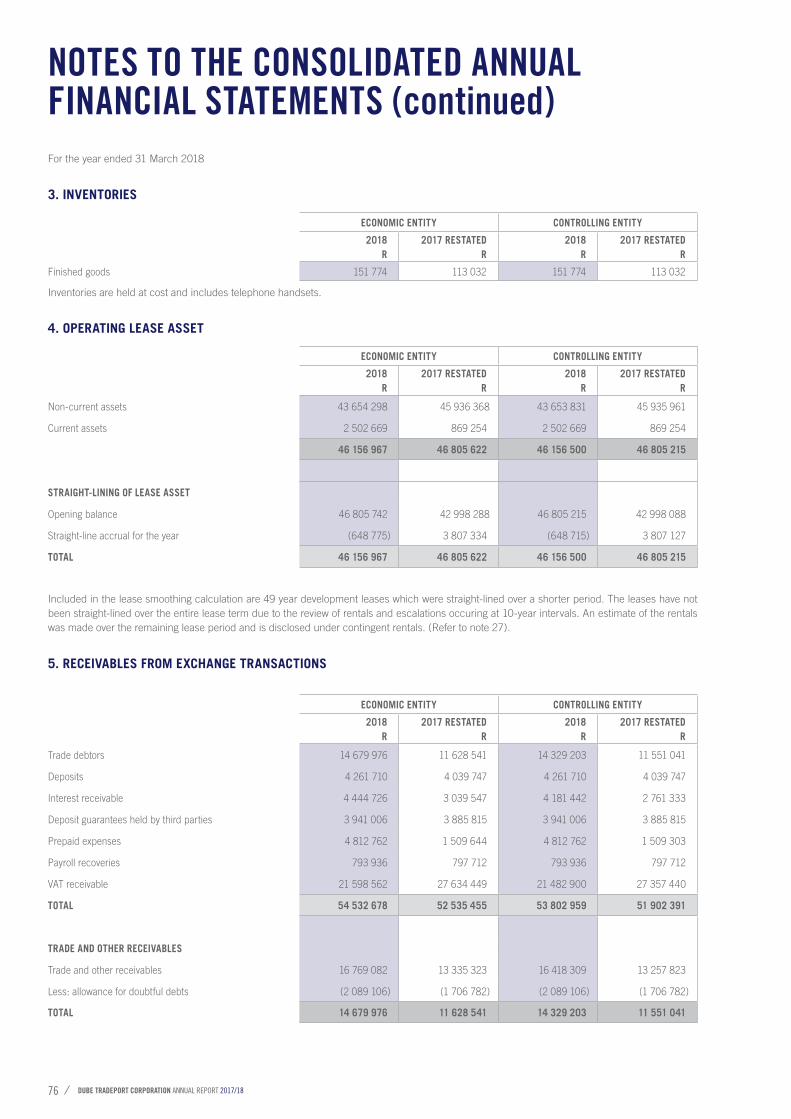
DUBE TRADEPORT CORPORATION ANNUAL REPORT 2017/1876
For the year ended 31 March 2018
Inventories are held at cost and includes telephone handsets.
3. INVENTORIES
ECONOMIC ENTITY CONTROLLING ENTITY
2018R
2017 RESTATEDR
2018R
2017 RESTATEDR
Non-current assets 43 654 298 45 936 368 43 653 831 45 935 961
Current assets 2 502 669 869 254 2 502 669 869 254
46 156 967 46 805 622 46 156 500 46 805 215
STRAIGHT-LINING OF LEASE ASSET
Opening balance 46 805 742 42 998 288 46 805 215 42 998 088
Straight-line accrual for the year (648 775) 3 807 334 (648 715) 3 807 127
TOTAL 46 156 967 46 805 622 46 156 500 46 805 215
4. OPERATING LEASE ASSET
ECONOMIC ENTITY CONTROLLING ENTITY
2018R
2017 RESTATEDR
2018R
2017 RESTATEDR
Trade debtors 14 679 976 11 628 541 14 329 203 11 551 041
Deposits 4 261 710 4 039 747 4 261 710 4 039 747
Interest receivable 4 444 726 3 039 547 4 181 442 2 761 333
Deposit guarantees held by third parties 3 941 006 3 885 815 3 941 006 3 885 815
Prepaid expenses 4 812 762 1 509 644 4 812 762 1 509 303
Payroll recoveries 793 936 797 712 793 936 797 712
VAT receivable 21 598 562 27 634 449 21 482 900 27 357 440
TOTAL 54 532 678 52 535 455 53 802 959 51 902 391
TRADE AND OTHER RECEIVABLES
Trade and other receivables 16 769 082 13 335 323 16 418 309 13 257 823
Less: allowance for doubtful debts (2 089 106) (1 706 782) (2 089 106) (1 706 782)
TOTAL 14 679 976 11 628 541 14 329 203 11 551 041
5. RECEIVABLES FROM EXCHANGE TRANSACTIONS
ECONOMIC ENTITY CONTROLLING ENTITY
2018R
2017 RESTATEDR
2018R
2017 RESTATEDR
Finished goods 151 774 113 032 151 774 113 032
NOTES TO THE CONSOLIDATED ANNUAL FINANCIAL STATEMENTS (continued)
Included in the lease smoothing calculation are 49 year development leases which were straight-lined over a shorter period. The leases have not been straight-lined over the entire lease term due to the review of rentals and escalations occuring at 10-year intervals. An estimate of the rentals was made over the remaining lease period and is disclosed under contingent rentals. (Refer to note 27).
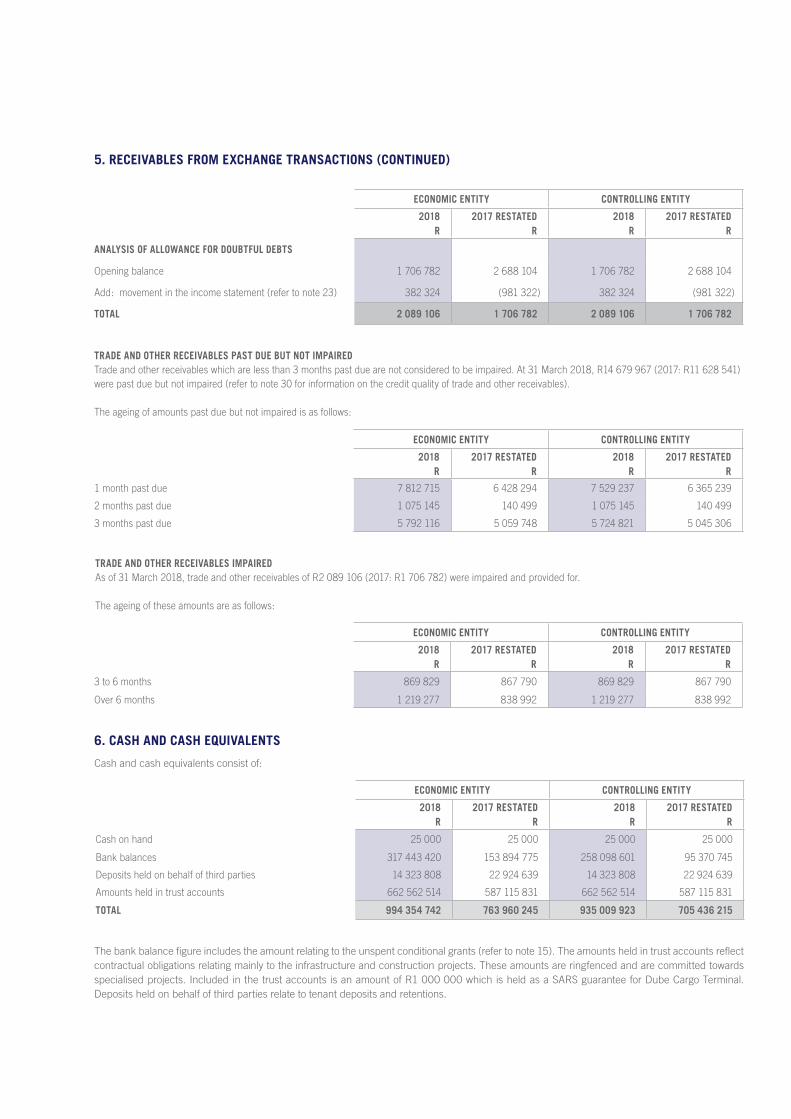
ECONOMIC ENTITY CONTROLLING ENTITY
2018R
2017 RESTATEDR
2018R
2017 RESTATEDR
ANALYSIS OF ALLOWANCE FOR DOUBTFUL DEBTS
Opening balance 1 706 782 2 688 104 1 706 782 2 688 104
Add: movement in the income statement (refer to note 23) 382 324 (981 322) 382 324 (981 322)
TOTAL 2 089 106 1 706 782 2 089 106 1 706 782
TRADE AND OTHER RECEIVABLES IMPAIREDAs of 31 March 2018, trade and other receivables of R2 089 106 (2017: R1 706 782) were impaired and provided for.
The ageing of these amounts are as follows:
6. CASH AND CASH EQUIVALENTS
ECONOMIC ENTITY CONTROLLING ENTITY
2018R
2017 RESTATEDR
2018R
2017 RESTATEDR
1 month past due 7 812 715 6 428 294 7 529 237 6 365 239
2 months past due 1 075 145 140 499 1 075 145 140 499
3 months past due 5 792 116 5 059 748 5 724 821 5 045 306
The bank balance figure includes the amount relating to the unspent conditional grants (refer to note 15). The amounts held in trust accounts reflect contractual obligations relating mainly to the infrastructure and construction projects. These amounts are ringfenced and are committed towards specialised projects. Included in the trust accounts is an amount of R1 000 000 which is held as a SARS guarantee for Dube Cargo Terminal. Deposits held on behalf of third parties relate to tenant deposits and retentions.
ECONOMIC ENTITY CONTROLLING ENTITY
2018R
2017 RESTATEDR
2018R
2017 RESTATEDR
Cash on hand 25 000 25 000 25 000 25 000
Bank balances 317 443 420 153 894 775 258 098 601 95 370 745
Deposits held on behalf of third parties 14 323 808 22 924 639 14 323 808 22 924 639
Amounts held in trust accounts 662 562 514 587 115 831 662 562 514 587 115 831
TOTAL 994 354 742 763 960 245 935 009 923 705 436 215
ECONOMIC ENTITY CONTROLLING ENTITY
2018R
2017 RESTATEDR
2018R
2017 RESTATEDR
3 to 6 months 869 829 867 790 869 829 867 790
Over 6 months 1 219 277 838 992 1 219 277 838 992
Cash and cash equivalents consist of:
TRADE AND OTHER RECEIVABLES PAST DUE BUT NOT IMPAIRED Trade and other receivables which are less than 3 months past due are not considered to be impaired. At 31 March 2018, R14 679 967 (2017: R11 628 541) were past due but not impaired (refer to note 30 for information on the credit quality of trade and other receivables).
The ageing of amounts past due but not impaired is as follows:
5. RECEIVABLES FROM EXCHANGE TRANSACTIONS (CONTINUED)
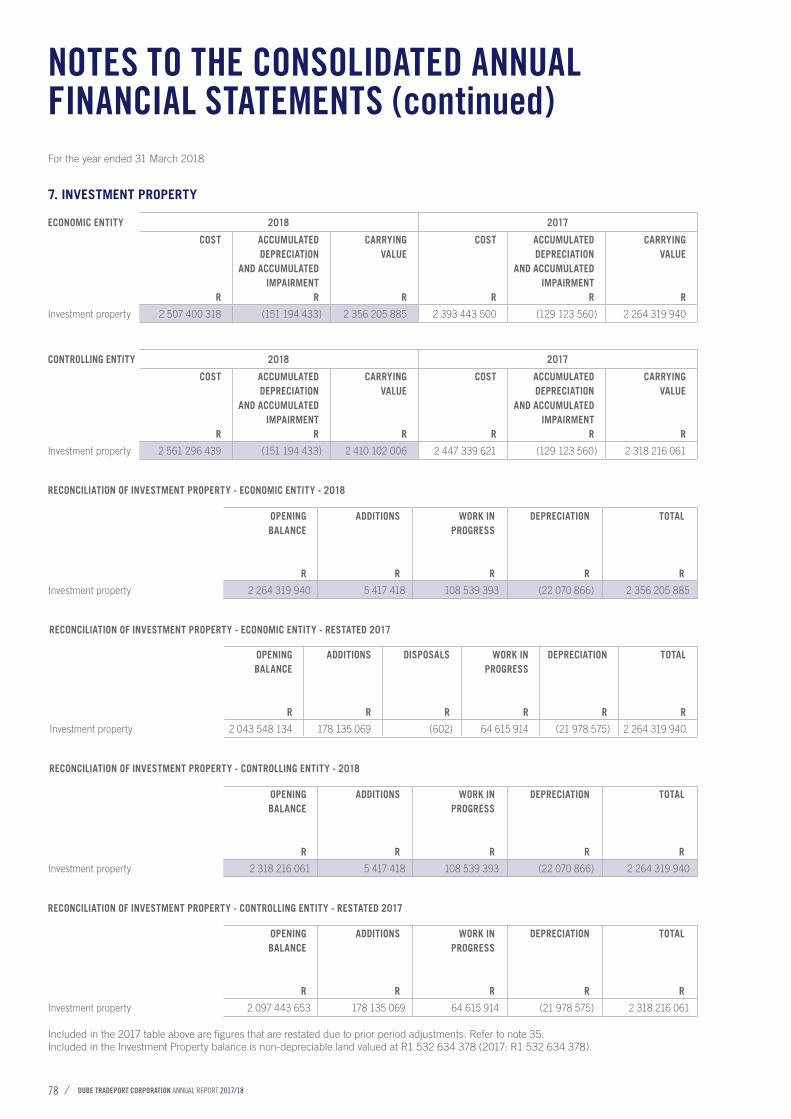
DUBE TRADEPORT CORPORATION ANNUAL REPORT 2017/1878
For the year ended 31 March 2018
7. INVESTMENT PROPERTY
RECONCILIATION OF INVESTMENT PROPERTY - ECONOMIC ENTITY - RESTATED 2017
OPENING BALANCE
R
ADDITIONS
R
DISPOSALS
R
WORK INPROGRESS
R
DEPRECIATION
R
TOTAL
R
Investment property 2 043 548 134 178 135 069 (602) 64 615 914 (21 978 575) 2 264 319 940
RECONCILIATION OF INVESTMENT PROPERTY - CONTROLLING ENTITY - RESTATED 2017
ECONOMIC ENTITY 2018 2017
COST
R
ACCUMULATEDDEPRECIATION
AND ACCUMULATEDIMPAIRMENT
R
CARRYING VALUE
R
COST R
ACCUMULATEDDEPRECIATION
AND ACCUMULATEDIMPAIRMENT
R
CARRYINGVALUE
R
Investment property 2 507 400 318 (151 194 433) 2 356 205 885 2 393 443 500 (129 123 560) 2 264 319 940
CONTROLLING ENTITY 2018 2017
COST
R
ACCUMULATEDDEPRECIATION
AND ACCUMULATEDIMPAIRMENT
R
CARRYING VALUE
R
COST R
ACCUMULATEDDEPRECIATION
AND ACCUMULATEDIMPAIRMENT
R
CARRYINGVALUE
R
Investment property 2 561 296 439 (151 194 433) 2 410 102 006 2 447 339 621 (129 123 560) 2 318 216 061
RECONCILIATION OF INVESTMENT PROPERTY - ECONOMIC ENTITY - 2018
OPENINGBALANCE
R
ADDITIONS
R
WORK INPROGRESS
R
DEPRECIATION
R
TOTAL
R
Investment property 2 264 319 940 5 417 418 108 539 393 (22 070 866) 2 356 205 885
NOTES TO THE CONSOLIDATED ANNUAL FINANCIAL STATEMENTS (continued)
Included in the 2017 table above are figures that are restated due to prior period adjustments. Refer to note 35.Included in the Investment Property balance is non-depreciable land valued at R1 532 634 378 (2017: R1 532 634 378).
RECONCILIATION OF INVESTMENT PROPERTY - CONTROLLING ENTITY - 2018
OPENINGBALANCE
R
ADDITIONS
R
WORK INPROGRESS
R
DEPRECIATION
R
TOTAL
R
Investment property 2 318 216 061 5 417 418 108 539 393 (22 070 866) 2 264 319 940
OPENINGBALANCE
R
ADDITIONS
R
WORK INPROGRESS
R
DEPRECIATION
R
TOTAL
R
Investment property 2 097 443 653 178 135 069 64 615 914 (21 978 575) 2 318 216 061
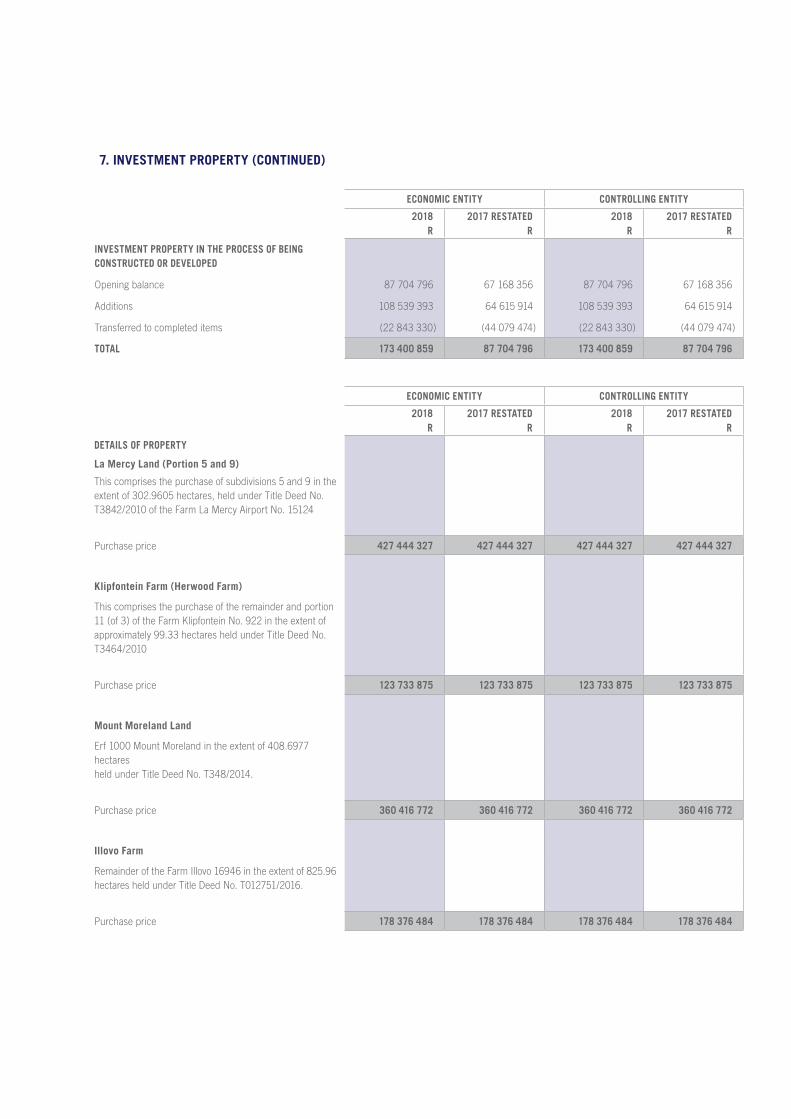
7. INVESTMENT PROPERTY (CONTINUED)
ECONOMIC ENTITY CONTROLLING ENTITY
2018R
2017 RESTATEDR
2018R
2017 RESTATEDR
DETAILS OF PROPERTY
La Mercy Land (Portion 5 and 9)
This comprises the purchase of subdivisions 5 and 9 in the extent of 302.9605 hectares, held under Title Deed No. T3842/2010 of the Farm La Mercy Airport No. 15124
Purchase price 427 444 327 427 444 327 427 444 327 427 444 327
Klipfontein Farm (Herwood Farm)
This comprises the purchase of the remainder and portion 11 (of 3) of the Farm Klipfontein No. 922 in the extent of approximately 99.33 hectares held under Title Deed No. T3464/2010
Purchase price 123 733 875 123 733 875 123 733 875 123 733 875
Mount Moreland Land
Erf 1000 Mount Moreland in the extent of 408.6977 hectares held under Title Deed No. T348/2014.
Purchase price 360 416 772 360 416 772 360 416 772 360 416 772
Illovo Farm
Remainder of the Farm Illovo 16946 in the extent of 825.96 hectares held under Title Deed No. T012751/2016.
Purchase price 178 376 484 178 376 484 178 376 484 178 376 484
ECONOMIC ENTITY CONTROLLING ENTITY
2018R
2017 RESTATEDR
2018R
2017 RESTATEDR
INVESTMENT PROPERTY IN THE PROCESS OF BEING CONSTRUCTED OR DEVELOPED
Opening balance 87 704 796 67 168 356 87 704 796 67 168 356
Additions 108 539 393 64 615 914 108 539 393 64 615 914
Transferred to completed items (22 843 330) (44 079 474) (22 843 330) (44 079 474)
TOTAL 173 400 859 87 704 796 173 400 859 87 704 796
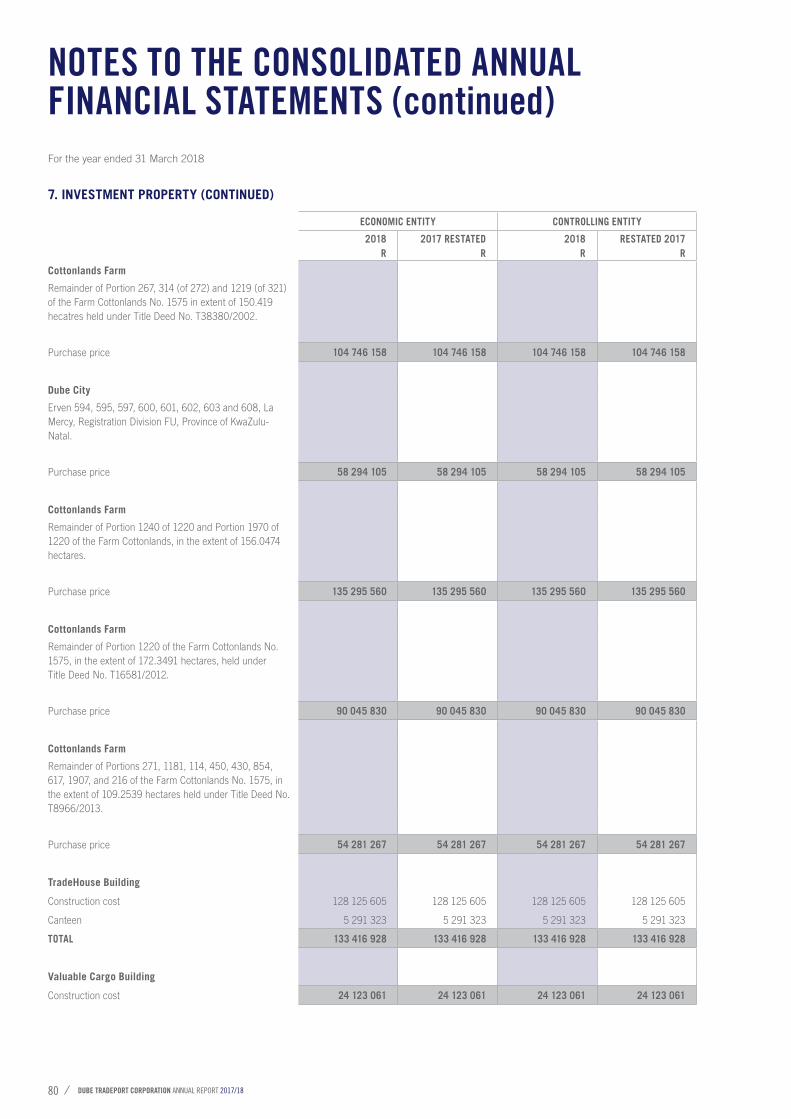
DUBE TRADEPORT CORPORATION ANNUAL REPORT 2017/1880
ECONOMIC ENTITY CONTROLLING ENTITY
2018R
2017 RESTATEDR
2018R
RESTATED 2017R
Cottonlands Farm
Remainder of Portion 267, 314 (of 272) and 1219 (of 321) of the Farm Cottonlands No. 1575 in extent of 150.419 hecatres held under Title Deed No. T38380/2002.
Purchase price 104 746 158 104 746 158 104 746 158 104 746 158
Dube City
Erven 594, 595, 597, 600, 601, 602, 603 and 608, La Mercy, Registration Division FU, Province of KwaZulu- Natal.
Purchase price 58 294 105 58 294 105 58 294 105 58 294 105
Cottonlands Farm
Remainder of Portion 1240 of 1220 and Portion 1970 of 1220 of the Farm Cottonlands, in the extent of 156.0474 hectares.
Purchase price 135 295 560 135 295 560 135 295 560 135 295 560
Cottonlands Farm
Remainder of Portion 1220 of the Farm Cottonlands No. 1575, in the extent of 172.3491 hectares, held under Title Deed No. T16581/2012.
Purchase price 90 045 830 90 045 830 90 045 830 90 045 830
Cottonlands Farm
Remainder of Portions 271, 1181, 114, 450, 430, 854, 617, 1907, and 216 of the Farm Cottonlands No. 1575, in the extent of 109.2539 hectares held under Title Deed No. T8966/2013.
Purchase price 54 281 267 54 281 267 54 281 267 54 281 267
TradeHouse Building
Construction cost 128 125 605 128 125 605 128 125 605 128 125 605
Canteen 5 291 323 5 291 323 5 291 323 5 291 323
TOTAL 133 416 928 133 416 928 133 416 928 133 416 928
Valuable Cargo Building
Construction cost 24 123 061 24 123 061 24 123 061 24 123 061
7. INVESTMENT PROPERTY (CONTINUED)
For the year ended 31 March 2018
NOTES TO THE CONSOLIDATED ANNUAL FINANCIAL STATEMENTS (continued)
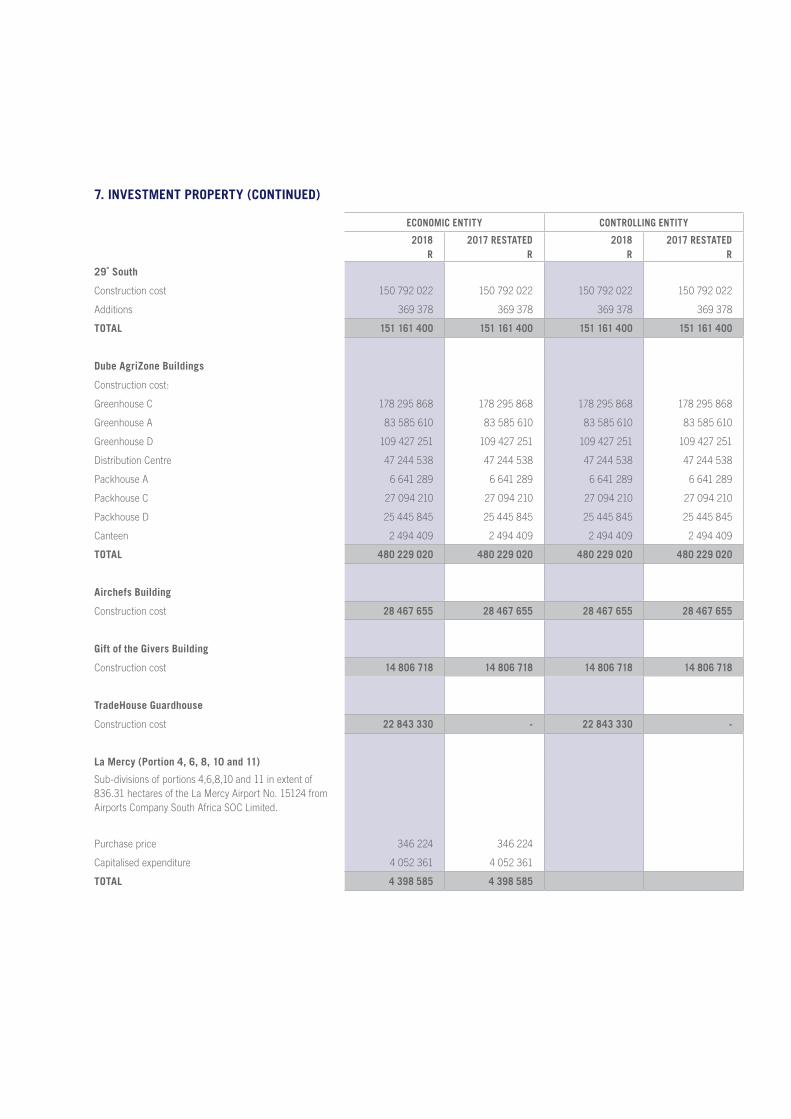
7. INVESTMENT PROPERTY (CONTINUED)
ECONOMIC ENTITY CONTROLLING ENTITY
2018R
2017 RESTATEDR
2018R
2017 RESTATEDR
29˚ South
Construction cost 150 792 022 150 792 022 150 792 022 150 792 022
Additions 369 378 369 378 369 378 369 378
TOTAL 151 161 400 151 161 400 151 161 400 151 161 400
Dube AgriZone Buildings
Construction cost:
Greenhouse C 178 295 868 178 295 868 178 295 868 178 295 868
Greenhouse A 83 585 610 83 585 610 83 585 610 83 585 610
Greenhouse D 109 427 251 109 427 251 109 427 251 109 427 251
Distribution Centre 47 244 538 47 244 538 47 244 538 47 244 538
Packhouse A 6 641 289 6 641 289 6 641 289 6 641 289
Packhouse C 27 094 210 27 094 210 27 094 210 27 094 210
Packhouse D 25 445 845 25 445 845 25 445 845 25 445 845
Canteen 2 494 409 2 494 409 2 494 409 2 494 409
TOTAL 480 229 020 480 229 020 480 229 020 480 229 020
Airchefs Building
Construction cost 28 467 655 28 467 655 28 467 655 28 467 655
Gift of the Givers Building
Construction cost 14 806 718 14 806 718 14 806 718 14 806 718
TradeHouse Guardhouse
Construction cost 22 843 330 - 22 843 330 -
La Mercy (Portion 4, 6, 8, 10 and 11)
Sub-divisions of portions 4,6,8,10 and 11 in extent of 836.31 hectares of the La Mercy Airport No. 15124 from Airports Company South Africa SOC Limited.
Purchase price 346 224 346 224
Capitalised expenditure 4 052 361 4 052 361
TOTAL 4 398 585 4 398 585
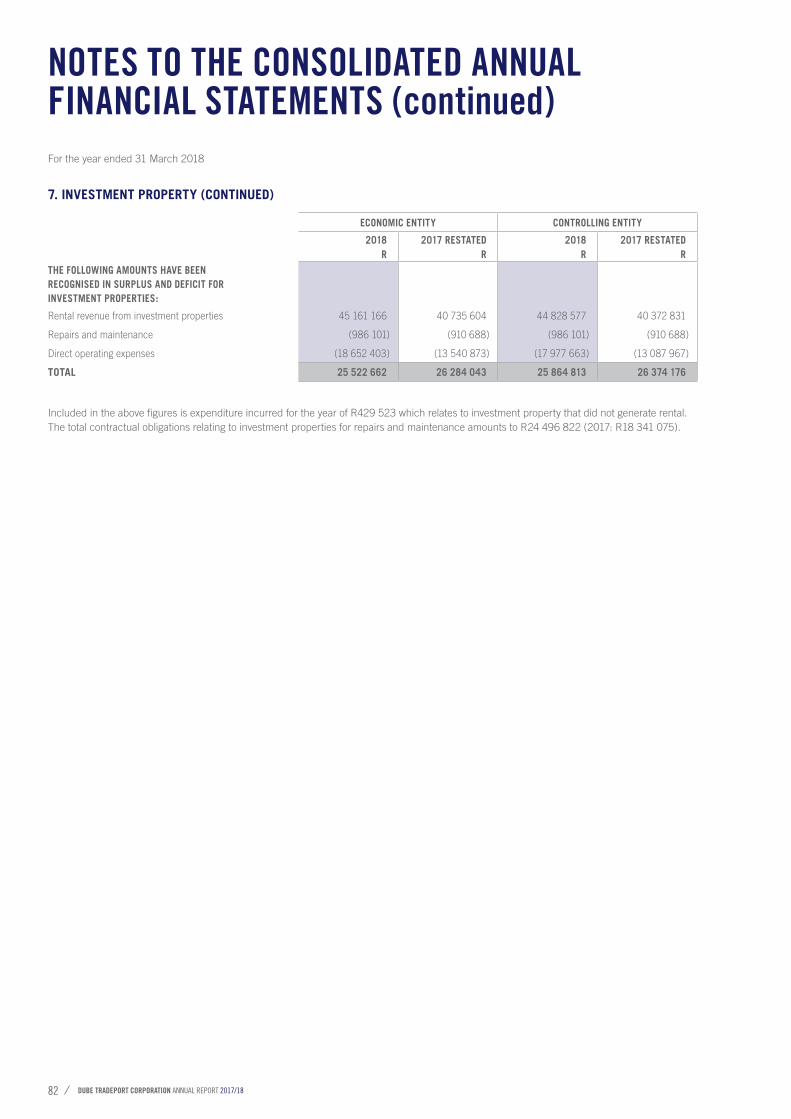
DUBE TRADEPORT CORPORATION ANNUAL REPORT 2017/1882
Included in the above figures is expenditure incurred for the year of R429 523 which relates to investment property that did not generate rental.The total contractual obligations relating to investment properties for repairs and maintenance amounts to R24 496 822 (2017: R18 341 075).
For the year ended 31 March 2018
NOTES TO THE CONSOLIDATED ANNUAL FINANCIAL STATEMENTS (continued)
7. INVESTMENT PROPERTY (CONTINUED)
ECONOMIC ENTITY CONTROLLING ENTITY
2018R
2017 RESTATEDR
2018R
2017 RESTATEDR
THE FOLLOWING AMOUNTS HAVE BEENRECOGNISED IN SURPLUS AND DEFICIT FORINVESTMENT PROPERTIES:
Rental revenue from investment properties 45 161 166 40 735 604 44 828 577 40 372 831
Repairs and maintenance (986 101) (910 688) (986 101) (910 688)
Direct operating expenses (18 652 403) (13 540 873) (17 977 663) (13 087 967)
TOTAL 25 522 662 26 284 043 25 864 813 26 374 176
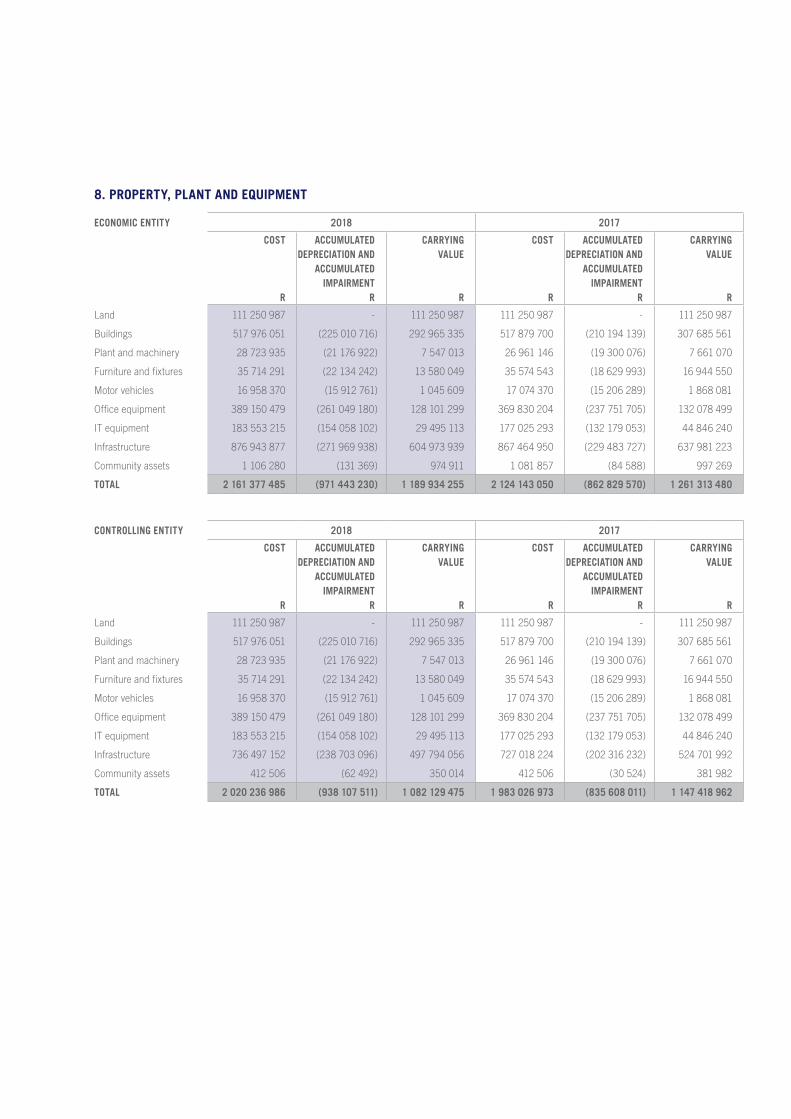
8. PROPERTY, PLANT AND EQUIPMENT
ECONOMIC ENTITY 2018 2017
COST
R
ACCUMULATED DEPRECIATION AND
ACCUMULATED IMPAIRMENT
R
CARRYING VALUE
R
COST
R
ACCUMULATED DEPRECIATION AND
ACCUMULATED IMPAIRMENT
R
CARRYING VALUE
R
Land 111 250 987 - 111 250 987 111 250 987 - 111 250 987
Buildings 517 976 051 (225 010 716) 292 965 335 517 879 700 (210 194 139) 307 685 561
Plant and machinery 28 723 935 (21 176 922) 7 547 013 26 961 146 (19 300 076) 7 661 070
Furniture and fixtures 35 714 291 (22 134 242) 13 580 049 35 574 543 (18 629 993) 16 944 550
Motor vehicles 16 958 370 (15 912 761) 1 045 609 17 074 370 (15 206 289) 1 868 081
Office equipment 389 150 479 (261 049 180) 128 101 299 369 830 204 (237 751 705) 132 078 499
IT equipment 183 553 215 (154 058 102) 29 495 113 177 025 293 (132 179 053) 44 846 240
Infrastructure 876 943 877 (271 969 938) 604 973 939 867 464 950 (229 483 727) 637 981 223
Community assets 1 106 280 (131 369) 974 911 1 081 857 (84 588) 997 269
TOTAL 2 161 377 485 (971 443 230) 1 189 934 255 2 124 143 050 (862 829 570) 1 261 313 480
CONTROLLING ENTITY 2018 2017
COST
R
ACCUMULATED DEPRECIATION AND
ACCUMULATED IMPAIRMENT
R
CARRYING VALUE
R
COST
R
ACCUMULATED DEPRECIATION AND
ACCUMULATED IMPAIRMENT
R
CARRYING VALUE
R
Land 111 250 987 - 111 250 987 111 250 987 - 111 250 987
Buildings 517 976 051 (225 010 716) 292 965 335 517 879 700 (210 194 139) 307 685 561
Plant and machinery 28 723 935 (21 176 922) 7 547 013 26 961 146 (19 300 076) 7 661 070
Furniture and fixtures 35 714 291 (22 134 242) 13 580 049 35 574 543 (18 629 993) 16 944 550
Motor vehicles 16 958 370 (15 912 761) 1 045 609 17 074 370 (15 206 289) 1 868 081
Office equipment 389 150 479 (261 049 180) 128 101 299 369 830 204 (237 751 705) 132 078 499
IT equipment 183 553 215 (154 058 102) 29 495 113 177 025 293 (132 179 053) 44 846 240
Infrastructure 736 497 152 (238 703 096) 497 794 056 727 018 224 (202 316 232) 524 701 992
Community assets 412 506 (62 492) 350 014 412 506 (30 524) 381 982
TOTAL 2 020 236 986 (938 107 511) 1 082 129 475 1 983 026 973 (835 608 011) 1 147 418 962
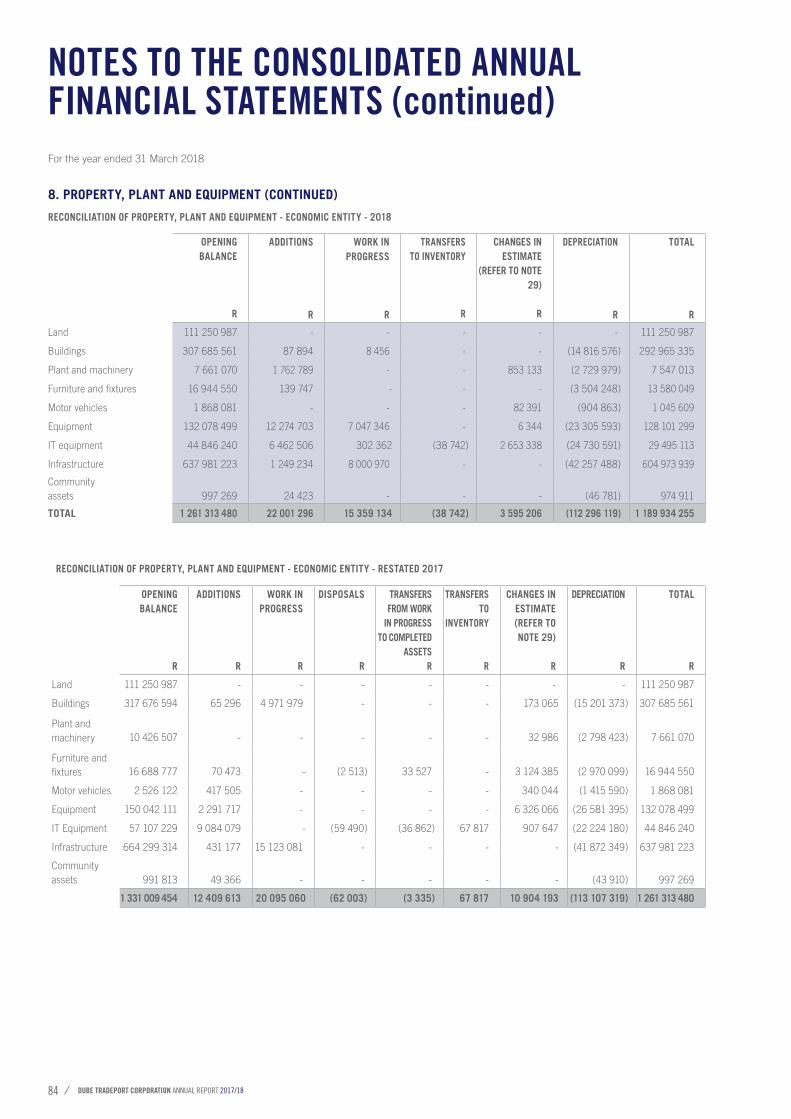
DUBE TRADEPORT CORPORATION ANNUAL REPORT 2017/1884
RECONCILIATION OF PROPERTY, PLANT AND EQUIPMENT - ECONOMIC ENTITY - 2018
RECONCILIATION OF PROPERTY, PLANT AND EQUIPMENT - ECONOMIC ENTITY - RESTATED 2017
OPENING BALANCE
R
ADDITIONS
R
WORK IN PROGRESS
R
TRANSFERSTO INVENTORY
R
CHANGES IN ESTIMATE
(REFER TO NOTE 29)
R
DEPRECIATION
R
TOTAL
R
Land 111 250 987 - - - - - 111 250 987
Buildings 307 685 561 87 894 8 456 - - (14 816 576) 292 965 335
Plant and machinery 7 661 070 1 762 789 - - 853 133 (2 729 979) 7 547 013
Furniture and fixtures 16 944 550 139 747 - - - (3 504 248) 13 580 049
Motor vehicles 1 868 081 - - - 82 391 (904 863) 1 045 609
Equipment 132 078 499 12 274 703 7 047 346 - 6 344 (23 305 593) 128 101 299
IT equipment 44 846 240 6 462 506 302 362 (38 742) 2 653 338 (24 730 591) 29 495 113
Infrastructure 637 981 223 1 249 234 8 000 970 - - (42 257 488) 604 973 939
Communityassets 997 269 24 423 - - - (46 781) 974 911
TOTAL 1 261 313 480 22 001 296 15 359 134 (38 742) 3 595 206 (112 296 119) 1 189 934 255
For the year ended 31 March 2018
8. PROPERTY, PLANT AND EQUIPMENT (CONTINUED)
NOTES TO THE CONSOLIDATED ANNUAL FINANCIAL STATEMENTS (continued)
OPENINGBALANCE
R
ADDITIONS
R
WORK IN PROGRESS
R
DISPOSALS
R
TRANSFERS FROM WORK
IN PROGRESS TO COMPLETED
ASSETSR
TRANSFERSTO
INVENTORY
R
CHANGES IN ESTIMATE (REFER TO NOTE 29)
R
DEPRECIATION
R
TOTAL
R
Land 111 250 987 - - - - - - - 111 250 987
Buildings 317 676 594 65 296 4 971 979 - - - 173 065 (15 201 373) 307 685 561
Plant and machinery 10 426 507 - - - - - 32 986 (2 798 423) 7 661 070
Furniture and fixtures 16 688 777 70 473 - (2 513) 33 527 - 3 124 385 (2 970 099) 16 944 550
Motor vehicles 2 526 122 417 505 - - - - 340 044 (1 415 590) 1 868 081
Equipment 150 042 111 2 291 717 - - - - 6 326 066 (26 581 395) 132 078 499
IT Equipment 57 107 229 9 084 079 - (59 490) (36 862) 67 817 907 647 (22 224 180) 44 846 240
Infrastructure 664 299 314 431 177 15 123 081 - - - - (41 872 349) 637 981 223
Communityassets 991 813 49 366 - - - - - (43 910) 997 269
1 331 009 454 12 409 613 20 095 060 (62 003) (3 335) 67 817 10 904 193 (113 107 319) 1 261 313 480
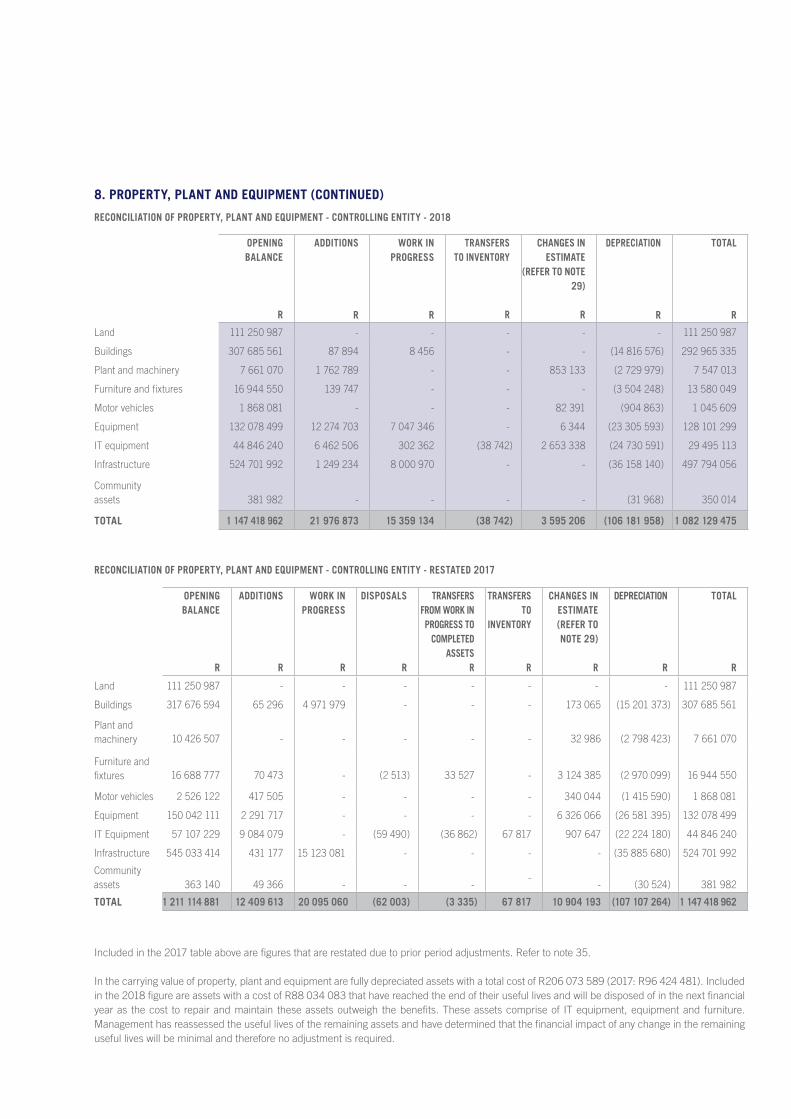
8. PROPERTY, PLANT AND EQUIPMENT (CONTINUED)
RECONCILIATION OF PROPERTY, PLANT AND EQUIPMENT - CONTROLLING ENTITY - 2018
RECONCILIATION OF PROPERTY, PLANT AND EQUIPMENT - CONTROLLING ENTITY - RESTATED 2017
Included in the 2017 table above are figures that are restated due to prior period adjustments. Refer to note 35.
In the carrying value of property, plant and equipment are fully depreciated assets with a total cost of R206 073 589 (2017: R96 424 481). Included in the 2018 figure are assets with a cost of R88 034 083 that have reached the end of their useful lives and will be disposed of in the next financial year as the cost to repair and maintain these assets outweigh the benefits. These assets comprise of IT equipment, equipment and furniture. Management has reassessed the useful lives of the remaining assets and have determined that the financial impact of any change in the remaining useful lives will be minimal and therefore no adjustment is required.
OPENING BALANCE
R
ADDITIONS
R
WORK IN PROGRESS
R
TRANSFERSTO INVENTORY
R
CHANGES IN ESTIMATE
(REFER TO NOTE 29)
R
DEPRECIATION
R
TOTAL
R
Land 111 250 987 - - - - - 111 250 987
Buildings 307 685 561 87 894 8 456 - - (14 816 576) 292 965 335
Plant and machinery 7 661 070 1 762 789 - - 853 133 (2 729 979) 7 547 013
Furniture and fixtures 16 944 550 139 747 - - - (3 504 248) 13 580 049
Motor vehicles 1 868 081 - - - 82 391 (904 863) 1 045 609
Equipment 132 078 499 12 274 703 7 047 346 - 6 344 (23 305 593) 128 101 299
IT equipment 44 846 240 6 462 506 302 362 (38 742) 2 653 338 (24 730 591) 29 495 113
Infrastructure 524 701 992 1 249 234 8 000 970 - - (36 158 140) 497 794 056
Communityassets 381 982 - - - - (31 968) 350 014
TOTAL 1 147 418 962 21 976 873 15 359 134 (38 742) 3 595 206 (106 181 958) 1 082 129 475
OPENINGBALANCE
R
ADDITIONS
R
WORK IN PROGRESS
R
DISPOSALS
R
TRANSFERS FROM WORK IN PROGRESS TO
COMPLETED ASSETS
R
TRANSFERSTO
INVENTORY
R
CHANGES IN ESTIMATE (REFER TO NOTE 29)
R
DEPRECIATION
R
TOTAL
R
Land 111 250 987 - - - - - - - 111 250 987
Buildings 317 676 594 65 296 4 971 979 - - - 173 065 (15 201 373) 307 685 561
Plant and machinery 10 426 507 - - - - - 32 986 (2 798 423) 7 661 070
Furniture and fixtures 16 688 777 70 473 - (2 513) 33 527 - 3 124 385 (2 970 099) 16 944 550
Motor vehicles 2 526 122 417 505 - - - - 340 044 (1 415 590) 1 868 081
Equipment 150 042 111 2 291 717 - - - - 6 326 066 (26 581 395) 132 078 499
IT Equipment 57 107 229 9 084 079 - (59 490) (36 862) 67 817 907 647 (22 224 180) 44 846 240
Infrastructure 545 033 414 431 177 15 123 081 - - - - (35 885 680) 524 701 992
Communityassets 363 140 49 366 - - -
-- (30 524) 381 982
TOTAL 1 211 114 881 12 409 613 20 095 060 (62 003) (3 335) 67 817 10 904 193 (107 107 264) 1 147 418 962
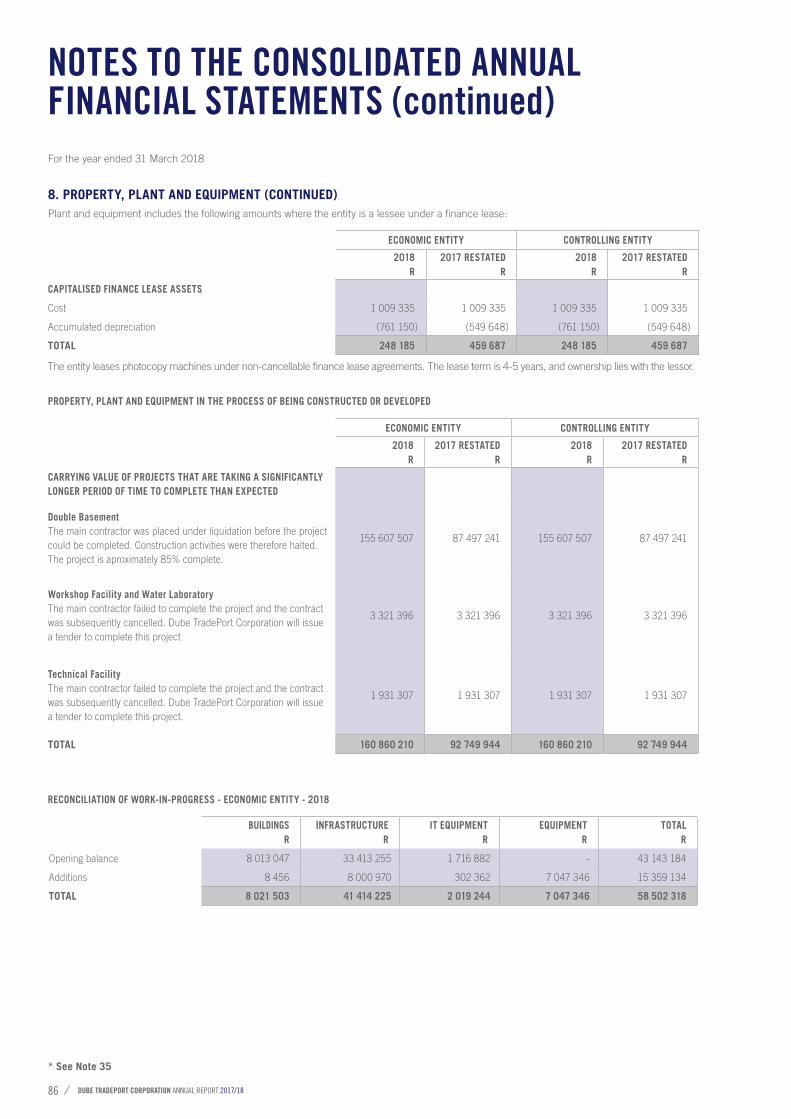
DUBE TRADEPORT CORPORATION ANNUAL REPORT 2017/1886
For the year ended 31 March 2018
8. PROPERTY, PLANT AND EQUIPMENT (CONTINUED)Plant and equipment includes the following amounts where the entity is a lessee under a finance lease:
The entity leases photocopy machines under non-cancellable finance lease agreements. The lease term is 4-5 years, and ownership lies with the lessor.
ECONOMIC ENTITY CONTROLLING ENTITY
2018R
2017 RESTATEDR
2018R
2017 RESTATEDR
CAPITALISED FINANCE LEASE ASSETS
Cost 1 009 335 1 009 335 1 009 335 1 009 335
Accumulated depreciation (761 150) (549 648) (761 150) (549 648)
TOTAL 248 185 459 687 248 185 459 687
NOTES TO THE CONSOLIDATED ANNUAL FINANCIAL STATEMENTS (continued)
ECONOMIC ENTITY CONTROLLING ENTITY
2018R
2017 RESTATEDR
2018R
2017 RESTATEDR
CARRYING VALUE OF PROJECTS THAT ARE TAKING A SIGNIFICANTLY LONGER PERIOD OF TIME TO COMPLETE THAN EXPECTED
Double Basement The main contractor was placed under liquidation before the project could be completed. Construction activities were therefore halted. The project is aproximately 85% complete.
155 607 507 87 497 241 155 607 507 87 497 241
Workshop Facility and Water Laboratory The main contractor failed to complete the project and the contract was subsequently cancelled. Dube TradePort Corporation will issue a tender to complete this project
3 321 396 3 321 396 3 321 396 3 321 396
Technical Facility The main contractor failed to complete the project and the contract was subsequently cancelled. Dube TradePort Corporation will issue a tender to complete this project.
1 931 307 1 931 307 1 931 307 1 931 307
TOTAL 160 860 210 92 749 944 160 860 210 92 749 944
PROPERTY, PLANT AND EQUIPMENT IN THE PROCESS OF BEING CONSTRUCTED OR DEVELOPED
RECONCILIATION OF WORK-IN-PROGRESS - ECONOMIC ENTITY - 2018
BUILDINGSR
INFRASTRUCTURER
IT EQUIPMENTR
EQUIPMENTR
TOTAL R
Opening balance 8 013 047 33 413 255 1 716 882 - 43 143 184
Additions 8 456 8 000 970 302 362 7 047 346 15 359 134
TOTAL 8 021 503 41 414 225 2 019 244 7 047 346 58 502 318
* See Note 35
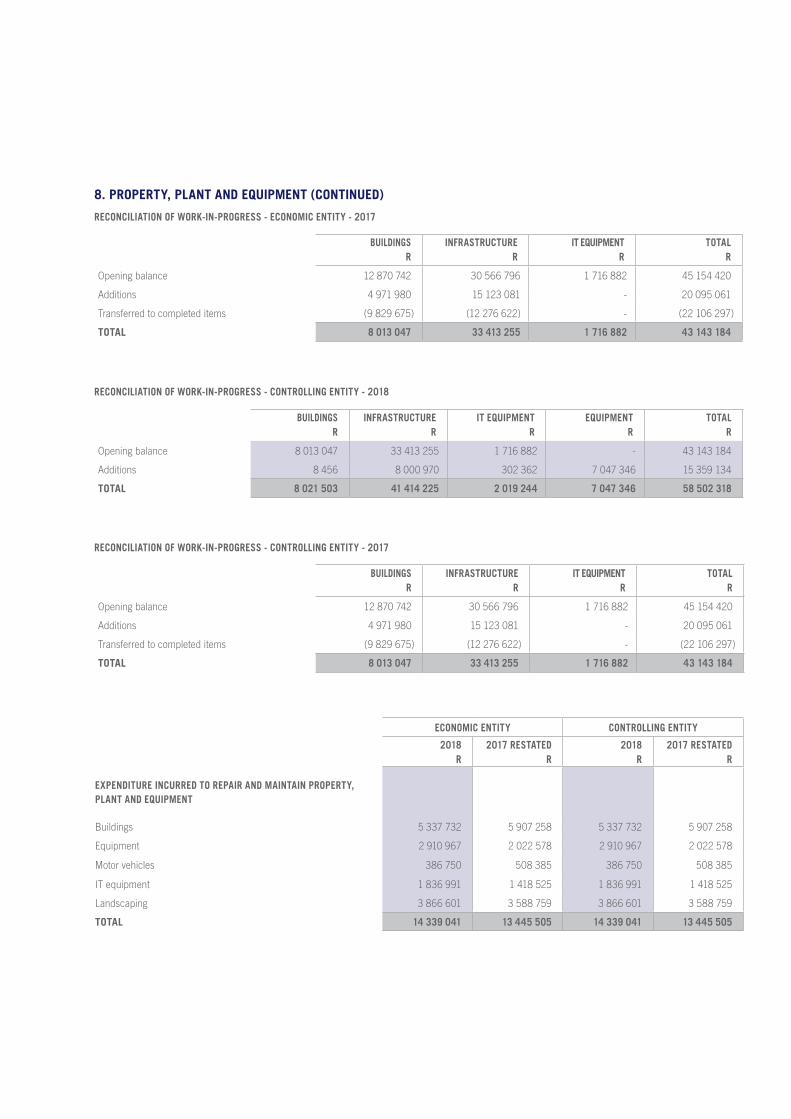
8. PROPERTY, PLANT AND EQUIPMENT (CONTINUED)
ECONOMIC ENTITY CONTROLLING ENTITY
2018R
2017 RESTATEDR
2018R
2017 RESTATEDR
EXPENDITURE INCURRED TO REPAIR AND MAINTAIN PROPERTY, PLANT AND EQUIPMENT
Buildings 5 337 732 5 907 258 5 337 732 5 907 258
Equipment 2 910 967 2 022 578 2 910 967 2 022 578
Motor vehicles 386 750 508 385 386 750 508 385
IT equipment 1 836 991 1 418 525 1 836 991 1 418 525
Landscaping 3 866 601 3 588 759 3 866 601 3 588 759
TOTAL 14 339 041 13 445 505 14 339 041 13 445 505
RECONCILIATION OF WORK-IN-PROGRESS - CONTROLLING ENTITY - 2018
BUILDINGSR
INFRASTRUCTURER
IT EQUIPMENTR
EQUIPMENTR
TOTAL R
Opening balance 8 013 047 33 413 255 1 716 882 - 43 143 184
Additions 8 456 8 000 970 302 362 7 047 346 15 359 134
TOTAL 8 021 503 41 414 225 2 019 244 7 047 346 58 502 318
RECONCILIATION OF WORK-IN-PROGRESS - ECONOMIC ENTITY - 2017
BUILDINGSR
INFRASTRUCTURER
IT EQUIPMENTR
TOTAL R
Opening balance 12 870 742 30 566 796 1 716 882 45 154 420
Additions 4 971 980 15 123 081 - 20 095 061
Transferred to completed items (9 829 675) (12 276 622) - (22 106 297)
TOTAL 8 013 047 33 413 255 1 716 882 43 143 184
RECONCILIATION OF WORK-IN-PROGRESS - CONTROLLING ENTITY - 2017
BUILDINGSR
INFRASTRUCTURER
IT EQUIPMENTR
TOTAL R
Opening balance 12 870 742 30 566 796 1 716 882 45 154 420
Additions 4 971 980 15 123 081 - 20 095 061
Transferred to completed items (9 829 675) (12 276 622) - (22 106 297)
TOTAL 8 013 047 33 413 255 1 716 882 43 143 184
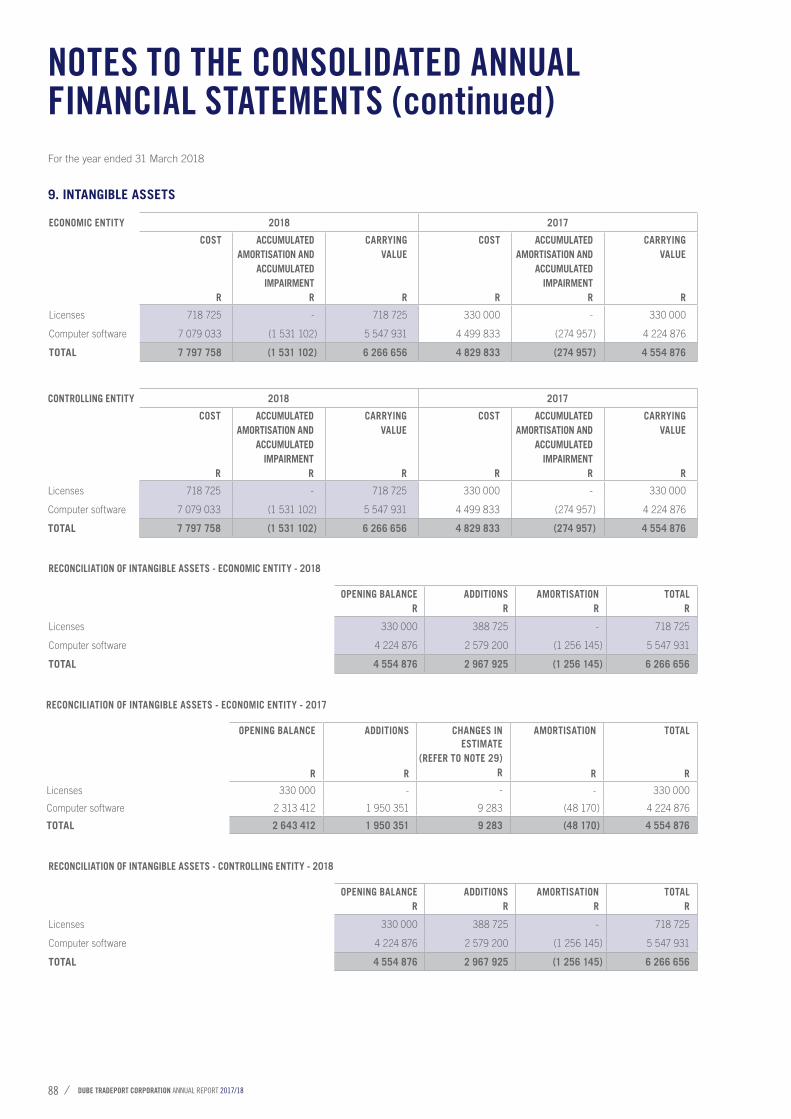
DUBE TRADEPORT CORPORATION ANNUAL REPORT 2017/1888
For the year ended 31 March 2018
NOTES TO THE CONSOLIDATED ANNUAL FINANCIAL STATEMENTS (continued)
9. INTANGIBLE ASSETS
RECONCILIATION OF INTANGIBLE ASSETS - ECONOMIC ENTITY - 2017
OPENING BALANCE
R
ADDITIONS
R
CHANGES IN ESTIMATE
(REFER TO NOTE 29)R
AMORTISATION
R
TOTAL
R
Licenses 330 000 - - - 330 000
Computer software 2 313 412 1 950 351 9 283 (48 170) 4 224 876
TOTAL 2 643 412 1 950 351 9 283 (48 170) 4 554 876
RECONCILIATION OF INTANGIBLE ASSETS - ECONOMIC ENTITY - 2018
OPENING BALANCER
ADDITIONSR
AMORTISATIONR
TOTALR
Licenses 330 000 388 725 - 718 725
Computer software 4 224 876 2 579 200 (1 256 145) 5 547 931
TOTAL 4 554 876 2 967 925 (1 256 145) 6 266 656
RECONCILIATION OF INTANGIBLE ASSETS - CONTROLLING ENTITY - 2018
OPENING BALANCER
ADDITIONSR
AMORTISATIONR
TOTALR
Licenses 330 000 388 725 - 718 725
Computer software 4 224 876 2 579 200 (1 256 145) 5 547 931
TOTAL 4 554 876 2 967 925 (1 256 145) 6 266 656
CONTROLLING ENTITY 2018 2017
COST
R
ACCUMULATED AMORTISATION AND
ACCUMULATED IMPAIRMENT
R
CARRYINGVALUE
R
COST
R
ACCUMULATED AMORTISATION AND
ACCUMULATED IMPAIRMENT
R
CARRYING VALUE
R
Licenses 718 725 - 718 725 330 000 - 330 000
Computer software 7 079 033 (1 531 102) 5 547 931 4 499 833 (274 957) 4 224 876
TOTAL 7 797 758 (1 531 102) 6 266 656 4 829 833 (274 957) 4 554 876
ECONOMIC ENTITY 2018 2017
COST
R
ACCUMULATED AMORTISATION AND
ACCUMULATED IMPAIRMENT
R
CARRYINGVALUE
R
COST
R
ACCUMULATED AMORTISATION AND
ACCUMULATED IMPAIRMENT
R
CARRYING VALUE
R
Licenses 718 725 - 718 725 330 000 - 330 000
Computer software 7 079 033 (1 531 102) 5 547 931 4 499 833 (274 957) 4 224 876
TOTAL 7 797 758 (1 531 102) 6 266 656 4 829 833 (274 957) 4 554 876
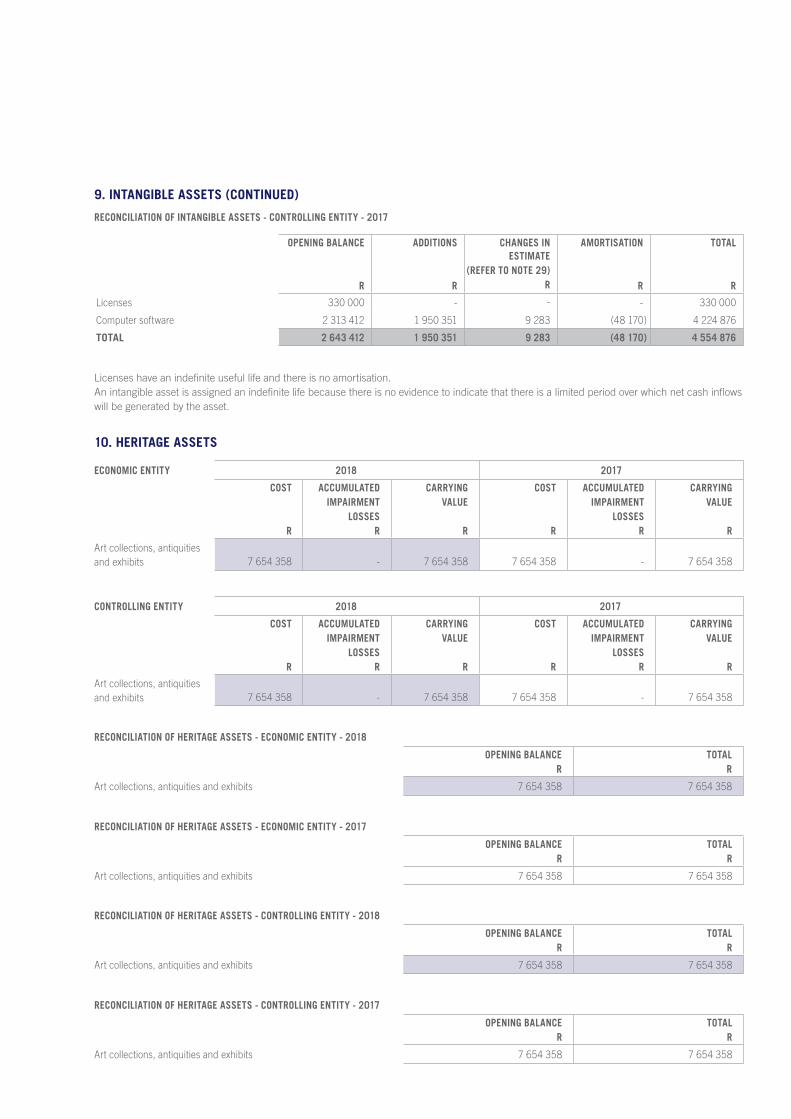
9. INTANGIBLE ASSETS (CONTINUED)
ECONOMIC ENTITY 2018 2017
COST
R
ACCUMULATED IMPAIRMENT
LOSSES R
CARRYINGVALUE
R
COST
R
ACCUMULATED IMPAIRMENT
LOSSES R
CARRYINGVALUE
R
Art collections, antiquities and exhibits 7 654 358 - 7 654 358 7 654 358 - 7 654 358
CONTROLLING ENTITY 2018 2017
COST
R
ACCUMULATED IMPAIRMENT
LOSSES R
CARRYINGVALUE
R
COST
R
ACCUMULATED IMPAIRMENT
LOSSES R
CARRYINGVALUE
R
Art collections, antiquities and exhibits 7 654 358 - 7 654 358 7 654 358 - 7 654 358
RECONCILIATION OF HERITAGE ASSETS - ECONOMIC ENTITY - 2018
OPENING BALANCER
TOTALR
Art collections, antiquities and exhibits 7 654 358 7 654 358
RECONCILIATION OF HERITAGE ASSETS - ECONOMIC ENTITY - 2017
OPENING BALANCER
TOTALR
Art collections, antiquities and exhibits 7 654 358 7 654 358
RECONCILIATION OF HERITAGE ASSETS - CONTROLLING ENTITY - 2018
OPENING BALANCER
TOTALR
Art collections, antiquities and exhibits 7 654 358 7 654 358
RECONCILIATION OF HERITAGE ASSETS - CONTROLLING ENTITY - 2017
OPENING BALANCER
TOTALR
Art collections, antiquities and exhibits 7 654 358 7 654 358
10. HERITAGE ASSETS
RECONCILIATION OF INTANGIBLE ASSETS - CONTROLLING ENTITY - 2017
OPENING BALANCE
R
ADDITIONS
R
CHANGES IN ESTIMATE
(REFER TO NOTE 29)R
AMORTISATION
R
TOTAL
R
Licenses 330 000 - - - 330 000
Computer software 2 313 412 1 950 351 9 283 (48 170) 4 224 876
TOTAL 2 643 412 1 950 351 9 283 (48 170) 4 554 876
Licenses have an indefinite useful life and there is no amortisation.An intangible asset is assigned an indefinite life because there is no evidence to indicate that there is a limited period over which net cash inflows will be generated by the asset.
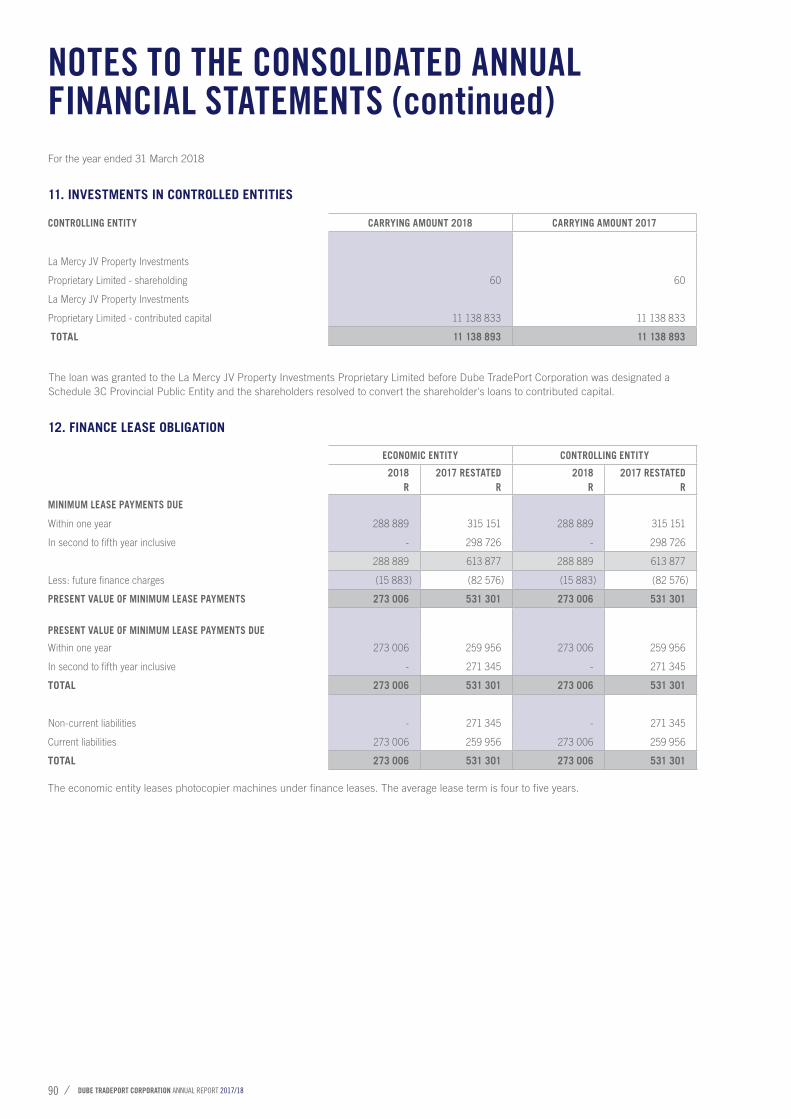
DUBE TRADEPORT CORPORATION ANNUAL REPORT 2017/1890
For the year ended 31 March 2018
NOTES TO THE CONSOLIDATED ANNUAL FINANCIAL STATEMENTS (continued)
11. INVESTMENTS IN CONTROLLED ENTITIES
The loan was granted to the La Mercy JV Property Investments Proprietary Limited before Dube TradePort Corporation was designated a Schedule 3C Provincial Public Entity and the shareholders resolved to convert the shareholder's loans to contributed capital.
CONTROLLING ENTITY CARRYING AMOUNT 2018 CARRYING AMOUNT 2017
La Mercy JV Property Investments
Proprietary Limited - shareholding 60 60
La Mercy JV Property Investments
Proprietary Limited - contributed capital 11 138 833 11 138 833
TOTAL 11 138 893 11 138 893
12. FINANCE LEASE OBLIGATION
ECONOMIC ENTITY CONTROLLING ENTITY
2018R
2017 RESTATEDR
2018R
2017 RESTATEDR
MINIMUM LEASE PAYMENTS DUE
Within one year 288 889 315 151 288 889 315 151
In second to fifth year inclusive - 298 726 - 298 726
288 889 613 877 288 889 613 877
Less: future finance charges (15 883) (82 576) (15 883) (82 576)
PRESENT VALUE OF MINIMUM LEASE PAYMENTS 273 006 531 301 273 006 531 301
PRESENT VALUE OF MINIMUM LEASE PAYMENTS DUE
Within one year 273 006 259 956 273 006 259 956
In second to fifth year inclusive - 271 345 - 271 345
TOTAL 273 006 531 301 273 006 531 301
Non-current liabilities - 271 345 - 271 345
Current liabilities 273 006 259 956 273 006 259 956
TOTAL 273 006 531 301 273 006 531 301
The economic entity leases photocopier machines under finance leases. The average lease term is four to five years.
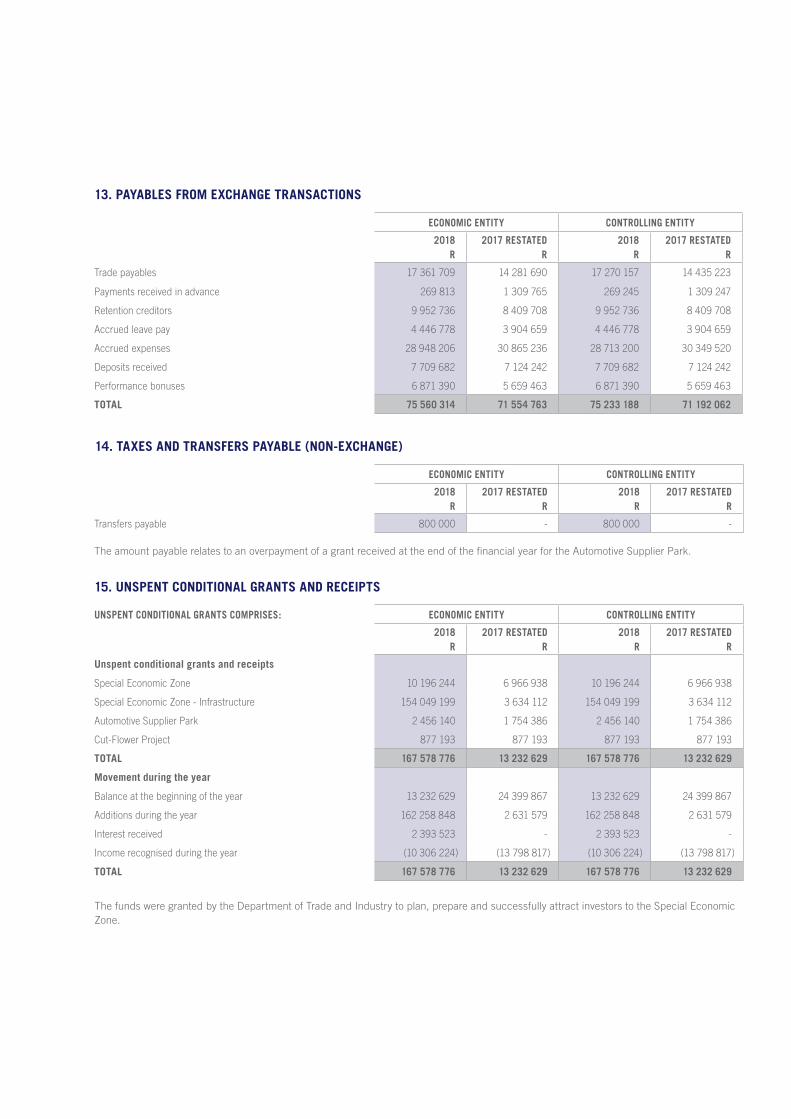
ECONOMIC ENTITY CONTROLLING ENTITY
2018R
2017 RESTATEDR
2018R
2017 RESTATEDR
Transfers payable 800 000 - 800 000 -
UNSPENT CONDITIONAL GRANTS COMPRISES: ECONOMIC ENTITY CONTROLLING ENTITY
2018R
2017 RESTATEDR
2018R
2017 RESTATEDR
Unspent conditional grants and receipts
Special Economic Zone 10 196 244 6 966 938 10 196 244 6 966 938
Special Economic Zone - Infrastructure 154 049 199 3 634 112 154 049 199 3 634 112
Automotive Supplier Park 2 456 140 1 754 386 2 456 140 1 754 386
Cut-Flower Project 877 193 877 193 877 193 877 193
TOTAL 167 578 776 13 232 629 167 578 776 13 232 629
Movement during the year
Balance at the beginning of the year 13 232 629 24 399 867 13 232 629 24 399 867
Additions during the year 162 258 848 2 631 579 162 258 848 2 631 579
Interest received 2 393 523 - 2 393 523 -
Income recognised during the year (10 306 224) (13 798 817) (10 306 224) (13 798 817)
TOTAL 167 578 776 13 232 629 167 578 776 13 232 629
The funds were granted by the Department of Trade and Industry to plan, prepare and successfully attract investors to the Special Economic Zone.
15. UNSPENT CONDITIONAL GRANTS AND RECEIPTS
14. TAXES AND TRANSFERS PAYABLE (NON-EXCHANGE)
ECONOMIC ENTITY CONTROLLING ENTITY
2018R
2017 RESTATEDR
2018R
2017 RESTATEDR
Trade payables 17 361 709 14 281 690 17 270 157 14 435 223
Payments received in advance 269 813 1 309 765 269 245 1 309 247
Retention creditors 9 952 736 8 409 708 9 952 736 8 409 708
Accrued leave pay 4 446 778 3 904 659 4 446 778 3 904 659
Accrued expenses 28 948 206 30 865 236 28 713 200 30 349 520
Deposits received 7 709 682 7 124 242 7 709 682 7 124 242
Performance bonuses 6 871 390 5 659 463 6 871 390 5 659 463
TOTAL 75 560 314 71 554 763 75 233 188 71 192 062
13. PAYABLES FROM EXCHANGE TRANSACTIONS
The amount payable relates to an overpayment of a grant received at the end of the financial year for the Automotive Supplier Park.
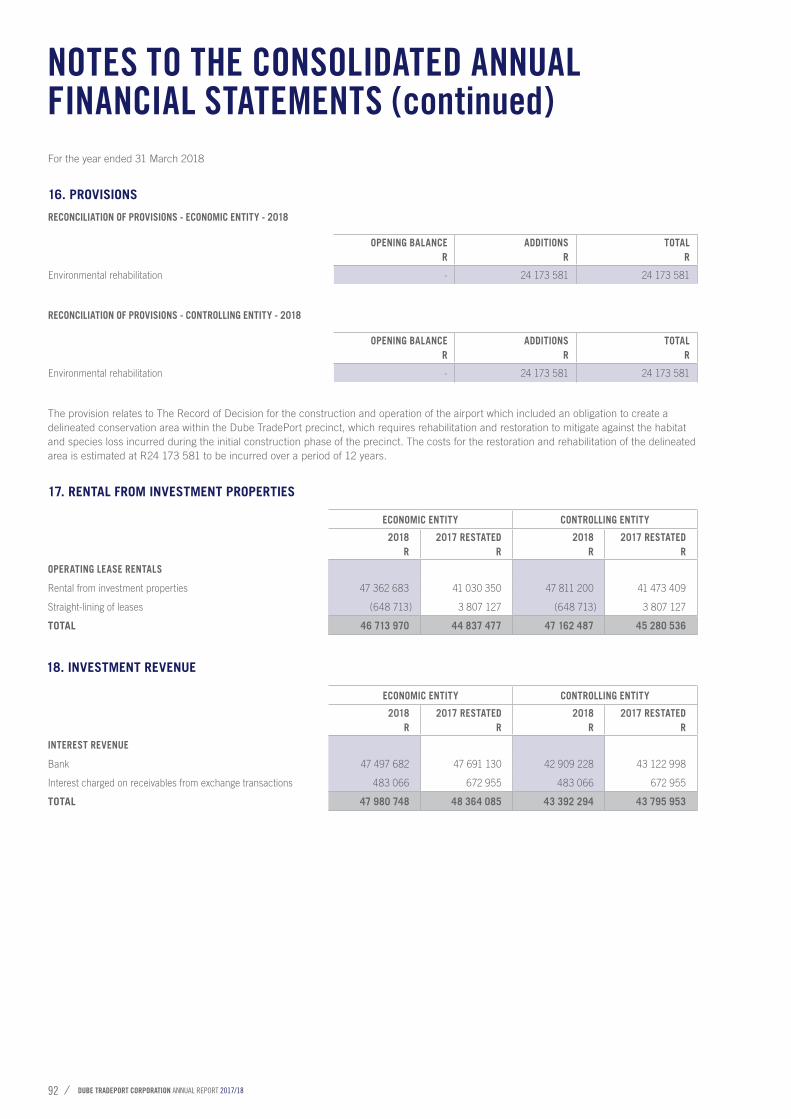
DUBE TRADEPORT CORPORATION ANNUAL REPORT 2017/1892
For the year ended 31 March 2018
NOTES TO THE CONSOLIDATED ANNUAL FINANCIAL STATEMENTS (continued)
16. PROVISIONS
17. RENTAL FROM INVESTMENT PROPERTIES
ECONOMIC ENTITY CONTROLLING ENTITY
2018R
2017 RESTATEDR
2018R
2017 RESTATEDR
OPERATING LEASE RENTALS
Rental from investment properties 47 362 683 41 030 350 47 811 200 41 473 409
Straight-lining of leases (648 713) 3 807 127 (648 713) 3 807 127
TOTAL 46 713 970 44 837 477 47 162 487 45 280 536
18. INVESTMENT REVENUE
ECONOMIC ENTITY CONTROLLING ENTITY
2018R
2017 RESTATEDR
2018R
2017 RESTATEDR
INTEREST REVENUE
Bank 47 497 682 47 691 130 42 909 228 43 122 998
Interest charged on receivables from exchange transactions 483 066 672 955 483 066 672 955
TOTAL 47 980 748 48 364 085 43 392 294 43 795 953
RECONCILIATION OF PROVISIONS - ECONOMIC ENTITY - 2018
OPENING BALANCER
ADDITIONSR
TOTALR
Environmental rehabilitation - 24 173 581 24 173 581
RECONCILIATION OF PROVISIONS - CONTROLLING ENTITY - 2018
OPENING BALANCER
ADDITIONSR
TOTALR
Environmental rehabilitation - 24 173 581 24 173 581
The provision relates to The Record of Decision for the construction and operation of the airport which included an obligation to create a delineated conservation area within the Dube TradePort precinct, which requires rehabilitation and restoration to mitigate against the habitat and species loss incurred during the initial construction phase of the precinct. The costs for the restoration and rehabilitation of the delineated area is estimated at R24 173 581 to be incurred over a period of 12 years.
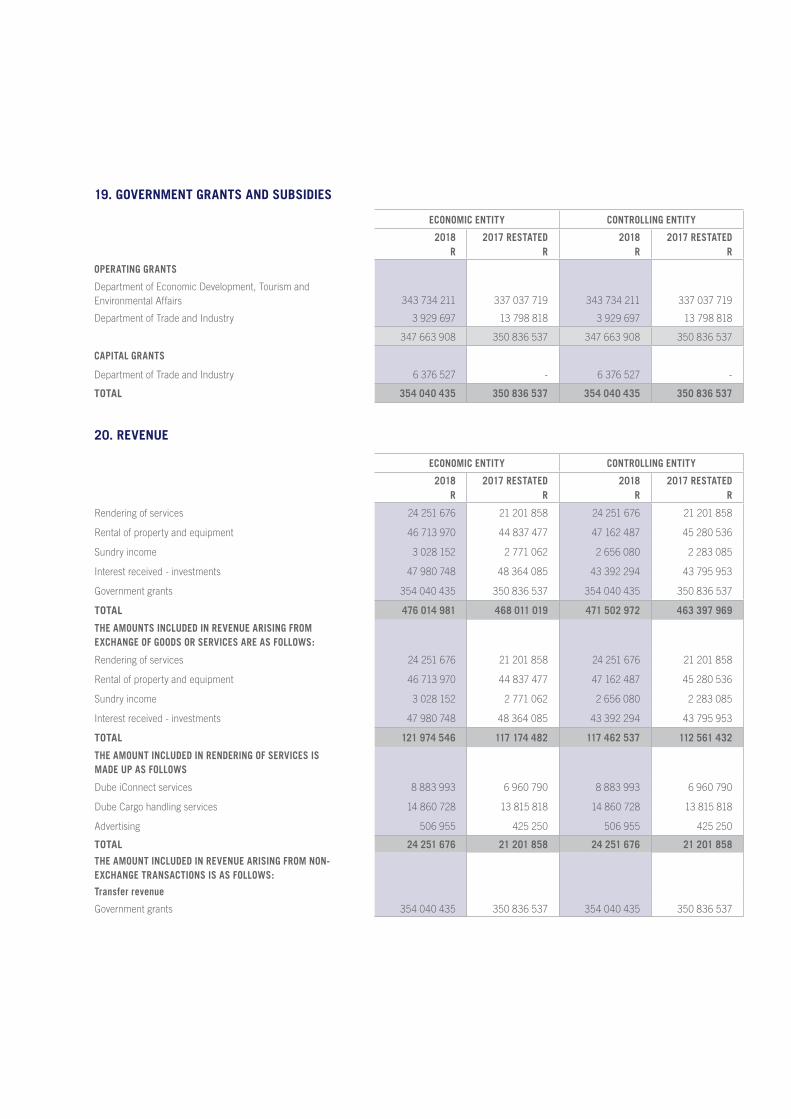
19. GOVERNMENT GRANTS AND SUBSIDIES
ECONOMIC ENTITY CONTROLLING ENTITY
2018R
2017 RESTATEDR
2018R
2017 RESTATEDR
OPERATING GRANTS
Department of Economic Development, Tourism and Environmental Affairs 343 734 211 337 037 719 343 734 211 337 037 719
Department of Trade and Industry 3 929 697 13 798 818 3 929 697 13 798 818
347 663 908 350 836 537 347 663 908 350 836 537
CAPITAL GRANTS
Department of Trade and Industry 6 376 527 - 6 376 527 -
TOTAL 354 040 435 350 836 537 354 040 435 350 836 537
ECONOMIC ENTITY CONTROLLING ENTITY
2018R
2017 RESTATEDR
2018R
2017 RESTATEDR
Rendering of services 24 251 676 21 201 858 24 251 676 21 201 858
Rental of property and equipment 46 713 970 44 837 477 47 162 487 45 280 536
Sundry income 3 028 152 2 771 062 2 656 080 2 283 085
Interest received - investments 47 980 748 48 364 085 43 392 294 43 795 953
Government grants 354 040 435 350 836 537 354 040 435 350 836 537
TOTAL 476 014 981 468 011 019 471 502 972 463 397 969
THE AMOUNTS INCLUDED IN REVENUE ARISING FROMEXCHANGE OF GOODS OR SERVICES ARE AS FOLLOWS:
Rendering of services 24 251 676 21 201 858 24 251 676 21 201 858
Rental of property and equipment 46 713 970 44 837 477 47 162 487 45 280 536
Sundry income 3 028 152 2 771 062 2 656 080 2 283 085
Interest received - investments 47 980 748 48 364 085 43 392 294 43 795 953
TOTAL 121 974 546 117 174 482 117 462 537 112 561 432
THE AMOUNT INCLUDED IN RENDERING OF SERVICES ISMADE UP AS FOLLOWS
Dube iConnect services 8 883 993 6 960 790 8 883 993 6 960 790
Dube Cargo handling services 14 860 728 13 815 818 14 860 728 13 815 818
Advertising 506 955 425 250 506 955 425 250
TOTAL 24 251 676 21 201 858 24 251 676 21 201 858
THE AMOUNT INCLUDED IN REVENUE ARISING FROM NON-EXCHANGE TRANSACTIONS IS AS FOLLOWS:
Transfer revenue
Government grants 354 040 435 350 836 537 354 040 435 350 836 537
20. REVENUE
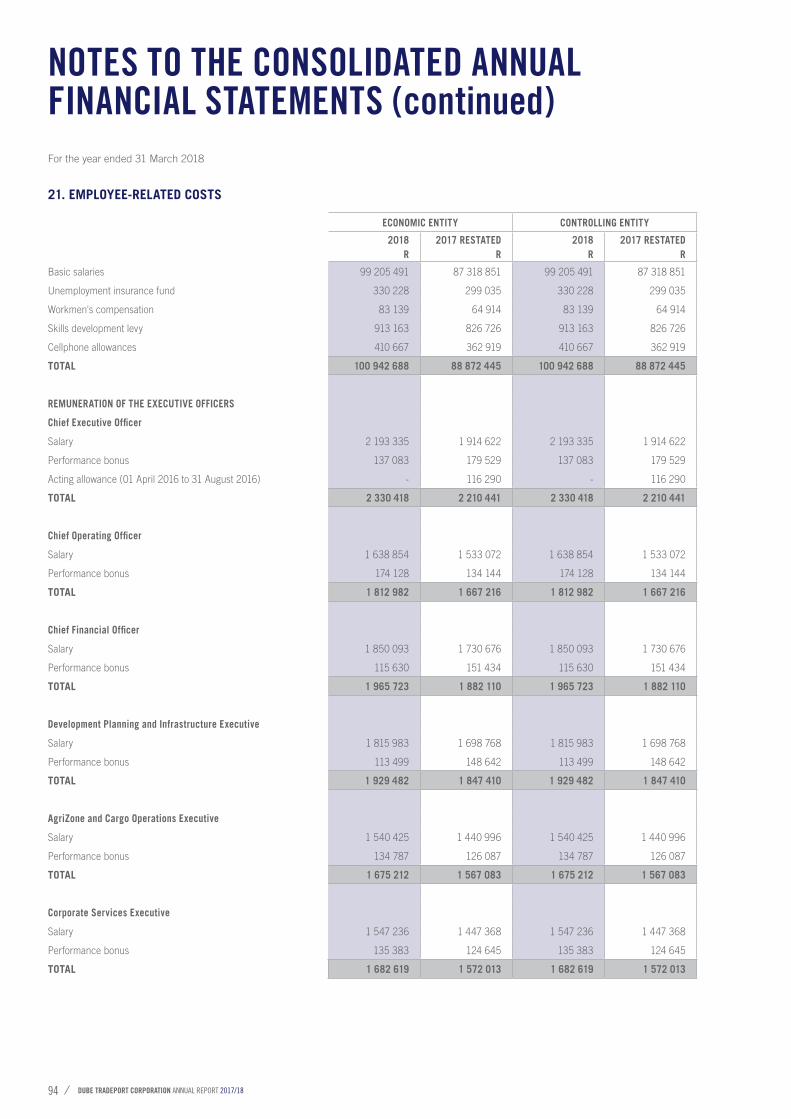
DUBE TRADEPORT CORPORATION ANNUAL REPORT 2017/1894
For the year ended 31 March 2018
NOTES TO THE CONSOLIDATED ANNUAL FINANCIAL STATEMENTS (continued)
ECONOMIC ENTITY CONTROLLING ENTITY
2018R
2017 RESTATEDR
2018R
2017 RESTATEDR
Basic salaries 99 205 491 87 318 851 99 205 491 87 318 851
Unemployment insurance fund 330 228 299 035 330 228 299 035
Workmen's compensation 83 139 64 914 83 139 64 914
Skills development levy 913 163 826 726 913 163 826 726
Cellphone allowances 410 667 362 919 410 667 362 919
TOTAL 100 942 688 88 872 445 100 942 688 88 872 445
REMUNERATION OF THE EXECUTIVE OFFICERS
Chief Executive Officer
Salary 2 193 335 1 914 622 2 193 335 1 914 622
Performance bonus 137 083 179 529 137 083 179 529
Acting allowance (01 April 2016 to 31 August 2016) - 116 290 - 116 290
TOTAL 2 330 418 2 210 441 2 330 418 2 210 441
Chief Operating Officer
Salary 1 638 854 1 533 072 1 638 854 1 533 072
Performance bonus 174 128 134 144 174 128 134 144
TOTAL 1 812 982 1 667 216 1 812 982 1 667 216
Chief Financial Officer
Salary 1 850 093 1 730 676 1 850 093 1 730 676
Performance bonus 115 630 151 434 115 630 151 434
TOTAL 1 965 723 1 882 110 1 965 723 1 882 110
Development Planning and Infrastructure Executive
Salary 1 815 983 1 698 768 1 815 983 1 698 768
Performance bonus 113 499 148 642 113 499 148 642
TOTAL 1 929 482 1 847 410 1 929 482 1 847 410
AgriZone and Cargo Operations Executive
Salary 1 540 425 1 440 996 1 540 425 1 440 996
Performance bonus 134 787 126 087 134 787 126 087
TOTAL 1 675 212 1 567 083 1 675 212 1 567 083
Corporate Services Executive
Salary 1 547 236 1 447 368 1 547 236 1 447 368
Performance bonus 135 383 124 645 135 383 124 645
TOTAL 1 682 619 1 572 013 1 682 619 1 572 013
21. EMPLOYEE-RELATED COSTS
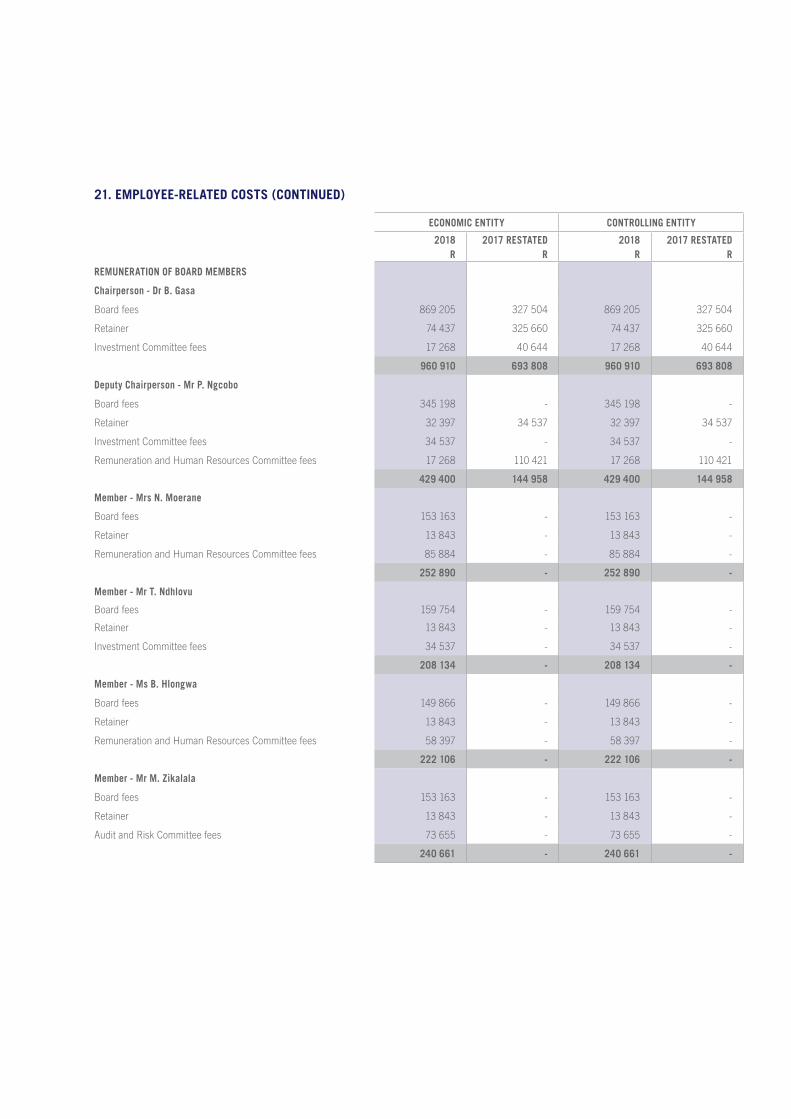
21. EMPLOYEE-RELATED COSTS (CONTINUED)
ECONOMIC ENTITY CONTROLLING ENTITY
2018R
2017 RESTATEDR
2018R
2017 RESTATEDR
REMUNERATION OF BOARD MEMBERS
Chairperson - Dr B. Gasa
Board fees 869 205 327 504 869 205 327 504
Retainer 74 437 325 660 74 437 325 660
Investment Committee fees 17 268 40 644 17 268 40 644
960 910 693 808 960 910 693 808
Deputy Chairperson - Mr P. Ngcobo
Board fees 345 198 - 345 198 -
Retainer 32 397 34 537 32 397 34 537
Investment Committee fees 34 537 - 34 537 -
Remuneration and Human Resources Committee fees 17 268 110 421 17 268 110 421
429 400 144 958 429 400 144 958
Member - Mrs N. Moerane
Board fees 153 163 - 153 163 -
Retainer 13 843 - 13 843 -
Remuneration and Human Resources Committee fees 85 884 - 85 884 -
252 890 - 252 890 -
Member - Mr T. Ndhlovu
Board fees 159 754 - 159 754 -
Retainer 13 843 - 13 843 -
Investment Committee fees 34 537 - 34 537 -
208 134 - 208 134 -
Member - Ms B. Hlongwa
Board fees 149 866 - 149 866 -
Retainer 13 843 - 13 843 -
Remuneration and Human Resources Committee fees 58 397 - 58 397 -
222 106 - 222 106 -
Member - Mr M. Zikalala
Board fees 153 163 - 153 163 -
Retainer 13 843 - 13 843 -
Audit and Risk Committee fees 73 655 - 73 655 -
240 661 - 240 661 -
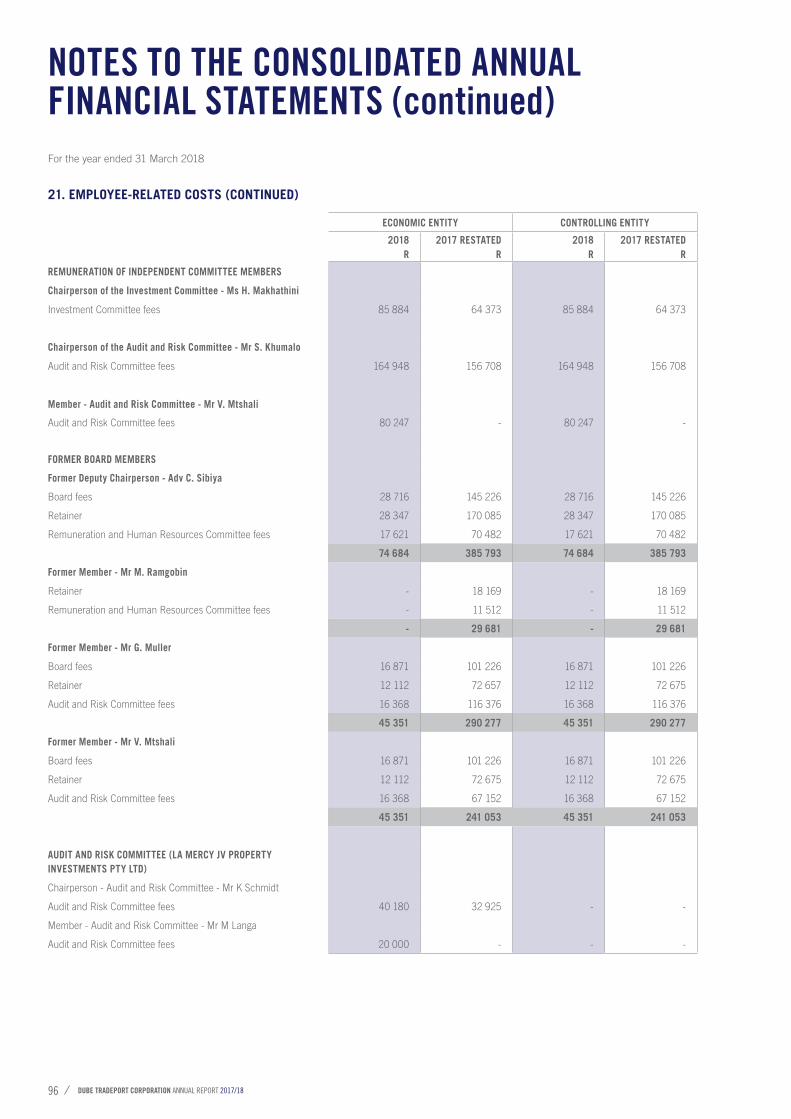
DUBE TRADEPORT CORPORATION ANNUAL REPORT 2017/1896
For the year ended 31 March 2018
NOTES TO THE CONSOLIDATED ANNUAL FINANCIAL STATEMENTS (continued)
21. EMPLOYEE-RELATED COSTS (CONTINUED)
ECONOMIC ENTITY CONTROLLING ENTITY
2018R
2017 RESTATEDR
2018R
2017 RESTATEDR
REMUNERATION OF INDEPENDENT COMMITTEE MEMBERS
Chairperson of the Investment Committee - Ms H. Makhathini
Investment Committee fees 85 884 64 373 85 884 64 373
Chairperson of the Audit and Risk Committee - Mr S. Khumalo
Audit and Risk Committee fees 164 948 156 708 164 948 156 708
Member - Audit and Risk Committee - Mr V. Mtshali
Audit and Risk Committee fees 80 247 - 80 247 -
FORMER BOARD MEMBERS
Former Deputy Chairperson - Adv C. Sibiya
Board fees 28 716 145 226 28 716 145 226
Retainer 28 347 170 085 28 347 170 085
Remuneration and Human Resources Committee fees 17 621 70 482 17 621 70 482
74 684 385 793 74 684 385 793
Former Member - Mr M. Ramgobin
Retainer - 18 169 - 18 169
Remuneration and Human Resources Committee fees - 11 512 - 11 512
- 29 681 - 29 681
Former Member - Mr G. Muller
Board fees 16 871 101 226 16 871 101 226
Retainer 12 112 72 657 12 112 72 675
Audit and Risk Committee fees 16 368 116 376 16 368 116 376
45 351 290 277 45 351 290 277
Former Member - Mr V. Mtshali
Board fees 16 871 101 226 16 871 101 226
Retainer 12 112 72 675 12 112 72 675
Audit and Risk Committee fees 16 368 67 152 16 368 67 152
45 351 241 053 45 351 241 053
AUDIT AND RISK COMMITTEE (LA MERCY JV PROPERTY INVESTMENTS PTY LTD)
Chairperson - Audit and Risk Committee - Mr K Schmidt
Audit and Risk Committee fees 40 180 32 925 - -
Member - Audit and Risk Committee - Mr M Langa
Audit and Risk Committee fees 20 000 - - -
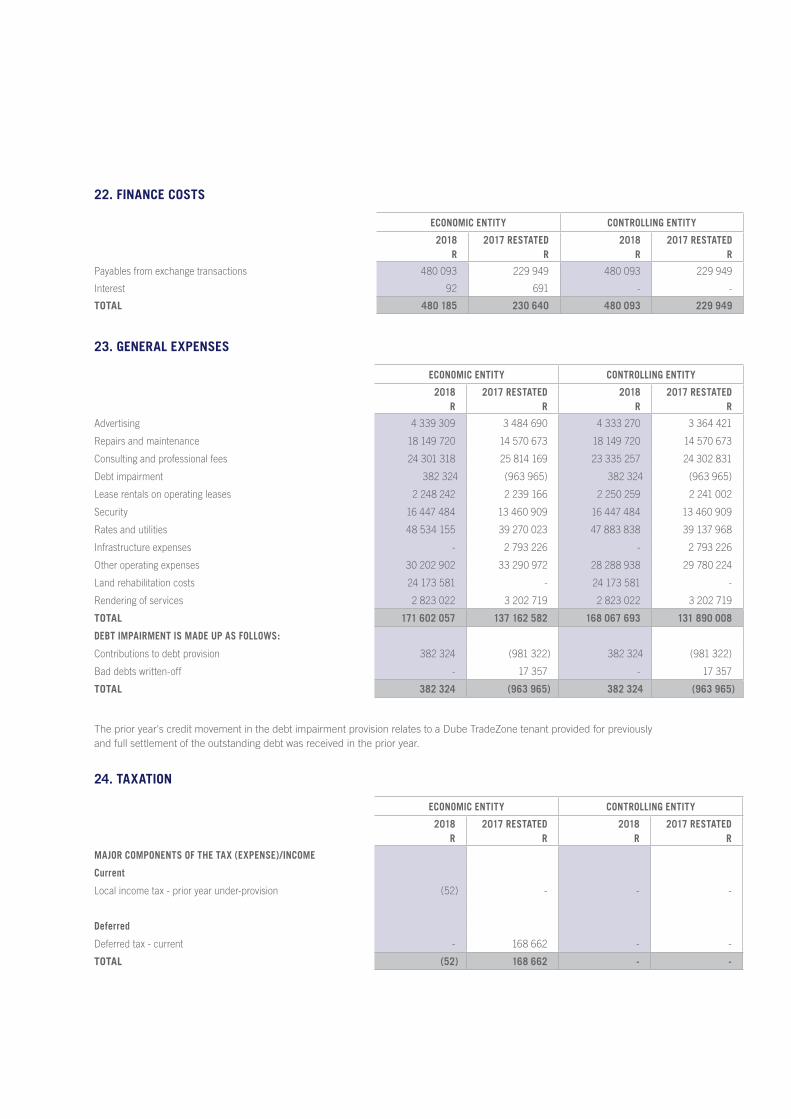
ECONOMIC ENTITY CONTROLLING ENTITY
2018R
2017 RESTATEDR
2018R
2017 RESTATEDR
Payables from exchange transactions 480 093 229 949 480 093 229 949
Interest 92 691 - -
TOTAL 480 185 230 640 480 093 229 949
22. FINANCE COSTS
ECONOMIC ENTITY CONTROLLING ENTITY
2018R
2017 RESTATEDR
2018R
2017 RESTATEDR
Advertising 4 339 309 3 484 690 4 333 270 3 364 421
Repairs and maintenance 18 149 720 14 570 673 18 149 720 14 570 673
Consulting and professional fees 24 301 318 25 814 169 23 335 257 24 302 831
Debt impairment 382 324 (963 965) 382 324 (963 965)
Lease rentals on operating leases 2 248 242 2 239 166 2 250 259 2 241 002
Security 16 447 484 13 460 909 16 447 484 13 460 909
Rates and utilities 48 534 155 39 270 023 47 883 838 39 137 968
Infrastructure expenses - 2 793 226 - 2 793 226
Other operating expenses 30 202 902 33 290 972 28 288 938 29 780 224
Land rehabilitation costs 24 173 581 - 24 173 581 -
Rendering of services 2 823 022 3 202 719 2 823 022 3 202 719
TOTAL 171 602 057 137 162 582 168 067 693 131 890 008
DEBT IMPAIRMENT IS MADE UP AS FOLLOWS:
Contributions to debt provision 382 324 (981 322) 382 324 (981 322)
Bad debts written-off - 17 357 - 17 357
TOTAL 382 324 (963 965) 382 324 (963 965)
23. GENERAL EXPENSES
The prior year's credit movement in the debt impairment provision relates to a Dube TradeZone tenant provided for previouslyand full settlement of the outstanding debt was received in the prior year.
ECONOMIC ENTITY CONTROLLING ENTITY
2018R
2017 RESTATEDR
2018R
2017 RESTATEDR
MAJOR COMPONENTS OF THE TAX (EXPENSE)/INCOME
Current
Local income tax - prior year under-provision (52) - - -
Deferred
Deferred tax - current - 168 662 - -
TOTAL (52) 168 662 - -
24. TAXATION
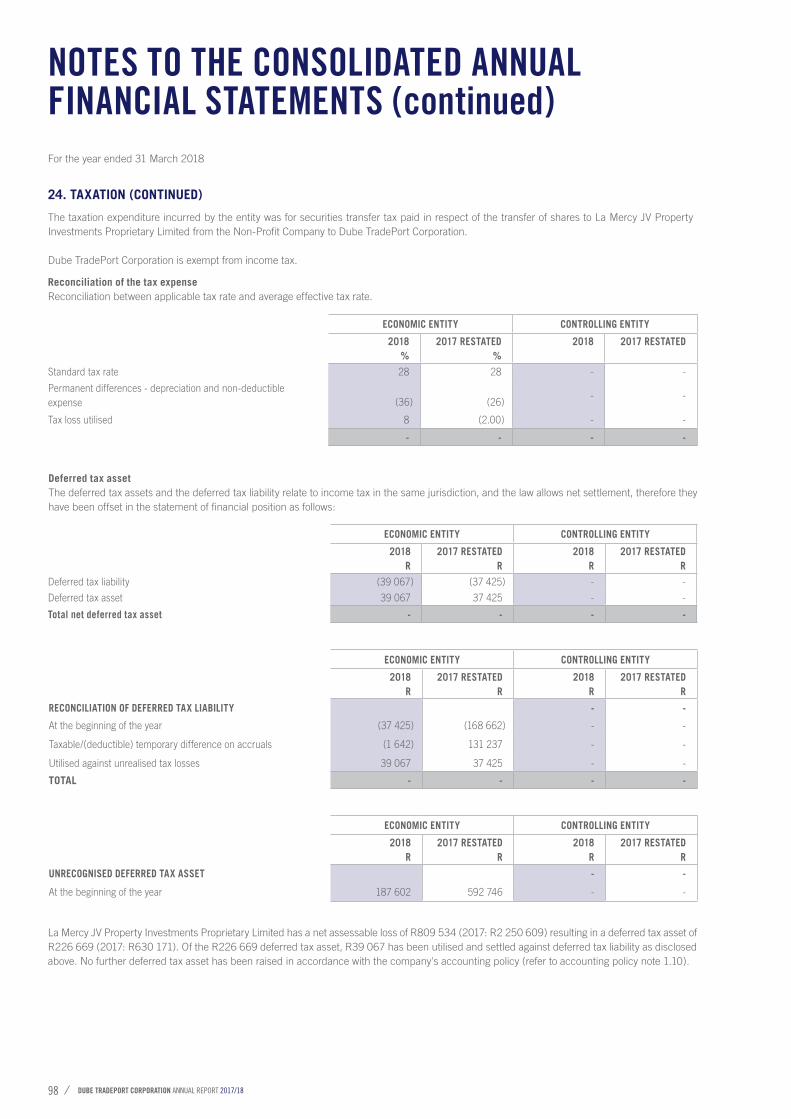
DUBE TRADEPORT CORPORATION ANNUAL REPORT 2017/1898
For the year ended 31 March 2018
NOTES TO THE CONSOLIDATED ANNUAL FINANCIAL STATEMENTS (continued)
The taxation expenditure incurred by the entity was for securities transfer tax paid in respect of the transfer of shares to La Mercy JV Property Investments Proprietary Limited from the Non-Profit Company to Dube TradePort Corporation.
Dube TradePort Corporation is exempt from income tax.
La Mercy JV Property Investments Proprietary Limited has a net assessable loss of R809 534 (2017: R2 250 609) resulting in a deferred tax asset of R226 669 (2017: R630 171). Of the R226 669 deferred tax asset, R39 067 has been utilised and settled against deferred tax liability as disclosed above. No further deferred tax asset has been raised in accordance with the company's accounting policy (refer to accounting policy note 1.10).
Reconciliation of the tax expenseReconciliation between applicable tax rate and average effective tax rate.
Deferred tax assetThe deferred tax assets and the deferred tax liability relate to income tax in the same jurisdiction, and the law allows net settlement, therefore they have been offset in the statement of financial position as follows:
24. TAXATION (CONTINUED)
ECONOMIC ENTITY CONTROLLING ENTITY
2018%
2017 RESTATED %
2018
2017 RESTATED
Standard tax rate 28 28 - -
Permanent differences - depreciation and non-deductible expense (36) (26)
- -
Tax loss utilised 8 (2.00) - -
- - - -
ECONOMIC ENTITY CONTROLLING ENTITY
2018R
2017 RESTATEDR
2018R
2017 RESTATEDR
Deferred tax liability (39 067) (37 425) - -
Deferred tax asset 39 067 37 425 - -
Total net deferred tax asset - - - -
ECONOMIC ENTITY CONTROLLING ENTITY
2018R
2017 RESTATEDR
2018R
2017 RESTATEDR
RECONCILIATION OF DEFERRED TAX LIABILITY - -
At the beginning of the year (37 425) (168 662) - -
Taxable/(deductible) temporary difference on accruals (1 642) 131 237 - -
Utilised against unrealised tax losses 39 067 37 425 - -
TOTAL - - - -
ECONOMIC ENTITY CONTROLLING ENTITY
2018R
2017 RESTATEDR
2018R
2017 RESTATEDR
UNRECOGNISED DEFERRED TAX ASSET - -
At the beginning of the year 187 602 592 746 - -
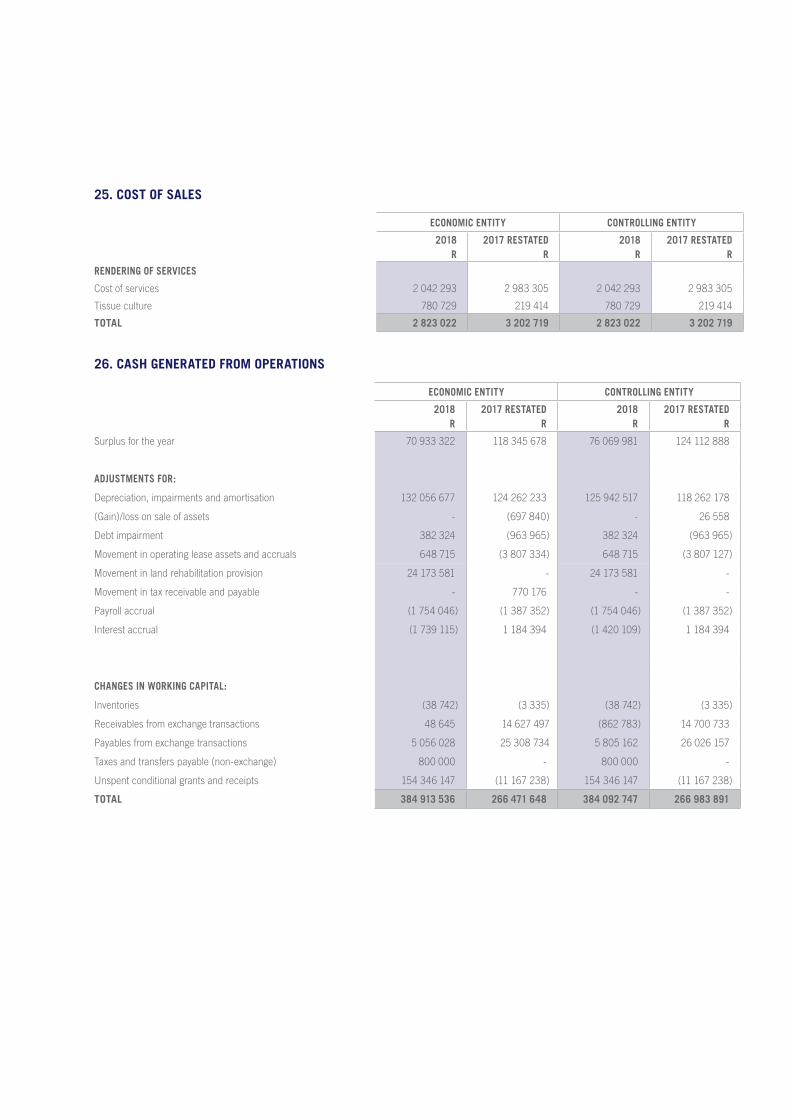
ECONOMIC ENTITY CONTROLLING ENTITY
2018R
2017 RESTATEDR
2018R
2017 RESTATEDR
Surplus for the year 70 933 322 118 345 678 76 069 981 124 112 888
ADJUSTMENTS FOR:
Depreciation, impairments and amortisation 132 056 677 124 262 233 125 942 517 118 262 178
(Gain)/loss on sale of assets - (697 840) - 26 558
Debt impairment 382 324 (963 965) 382 324 (963 965)
Movement in operating lease assets and accruals 648 715 (3 807 334) 648 715 (3 807 127)
Movement in land rehabilitation provision 24 173 581 - 24 173 581 -
Movement in tax receivable and payable - 770 176 - -
Payroll accrual (1 754 046) (1 387 352) (1 754 046) (1 387 352)
Interest accrual (1 739 115) 1 184 394 (1 420 109) 1 184 394
CHANGES IN WORKING CAPITAL:
Inventories (38 742) (3 335) (38 742) (3 335)
Receivables from exchange transactions 48 645 14 627 497 (862 783) 14 700 733
Payables from exchange transactions 5 056 028 25 308 734 5 805 162 26 026 157
Taxes and transfers payable (non-exchange) 800 000 - 800 000 -
Unspent conditional grants and receipts 154 346 147 (11 167 238) 154 346 147 (11 167 238)
TOTAL 384 913 536 266 471 648 384 092 747 266 983 891
26. CASH GENERATED FROM OPERATIONS
ECONOMIC ENTITY CONTROLLING ENTITY
2018R
2017 RESTATEDR
2018R
2017 RESTATEDR
RENDERING OF SERVICES
Cost of services 2 042 293 2 983 305 2 042 293 2 983 305
Tissue culture 780 729 219 414 780 729 219 414
TOTAL 2 823 022 3 202 719 2 823 022 3 202 719
25. COST OF SALES
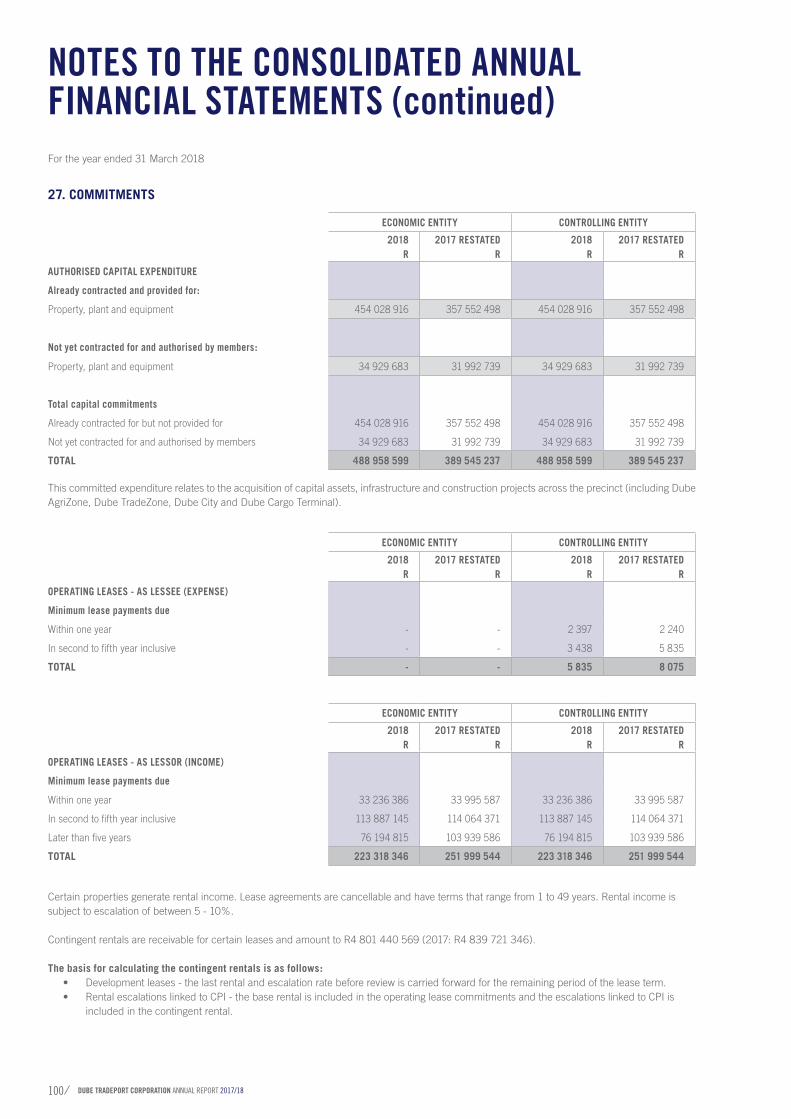
DUBE TRADEPORT CORPORATION ANNUAL REPORT 2017/18100
For the year ended 31 March 2018
NOTES TO THE CONSOLIDATED ANNUAL FINANCIAL STATEMENTS (continued)
Certain properties generate rental income. Lease agreements are cancellable and have terms that range from 1 to 49 years. Rental income is subject to escalation of between 5 - 10%.
Contingent rentals are receivable for certain leases and amount to R4 801 440 569 (2017: R4 839 721 346).
The basis for calculating the contingent rentals is as follows:• Development leases - the last rental and escalation rate before review is carried forward for the remaining period of the lease term.• Rental escalations linked to CPI - the base rental is included in the operating lease commitments and the escalations linked to CPI is
included in the contingent rental.
ECONOMIC ENTITY CONTROLLING ENTITY
2018R
2017 RESTATEDR
2018R
2017 RESTATEDR
OPERATING LEASES - AS LESSEE (EXPENSE)
Minimum lease payments due
Within one year - - 2 397 2 240
In second to fifth year inclusive - - 3 438 5 835
TOTAL - - 5 835 8 075
ECONOMIC ENTITY CONTROLLING ENTITY
2018R
2017 RESTATEDR
2018R
2017 RESTATEDR
OPERATING LEASES - AS LESSOR (INCOME)
Minimum lease payments due
Within one year 33 236 386 33 995 587 33 236 386 33 995 587
In second to fifth year inclusive 113 887 145 114 064 371 113 887 145 114 064 371
Later than five years 76 194 815 103 939 586 76 194 815 103 939 586
TOTAL 223 318 346 251 999 544 223 318 346 251 999 544
This committed expenditure relates to the acquisition of capital assets, infrastructure and construction projects across the precinct (including Dube AgriZone, Dube TradeZone, Dube City and Dube Cargo Terminal).
ECONOMIC ENTITY CONTROLLING ENTITY
2018R
2017 RESTATEDR
2018R
2017 RESTATEDR
AUTHORISED CAPITAL EXPENDITURE
Already contracted and provided for:
Property, plant and equipment 454 028 916 357 552 498 454 028 916 357 552 498
Not yet contracted for and authorised by members:
Property, plant and equipment 34 929 683 31 992 739 34 929 683 31 992 739
Total capital commitments
Already contracted for but not provided for 454 028 916 357 552 498 454 028 916 357 552 498
Not yet contracted for and authorised by members 34 929 683 31 992 739 34 929 683 31 992 739
TOTAL 488 958 599 389 545 237 488 958 599 389 545 237
27. COMMITMENTS
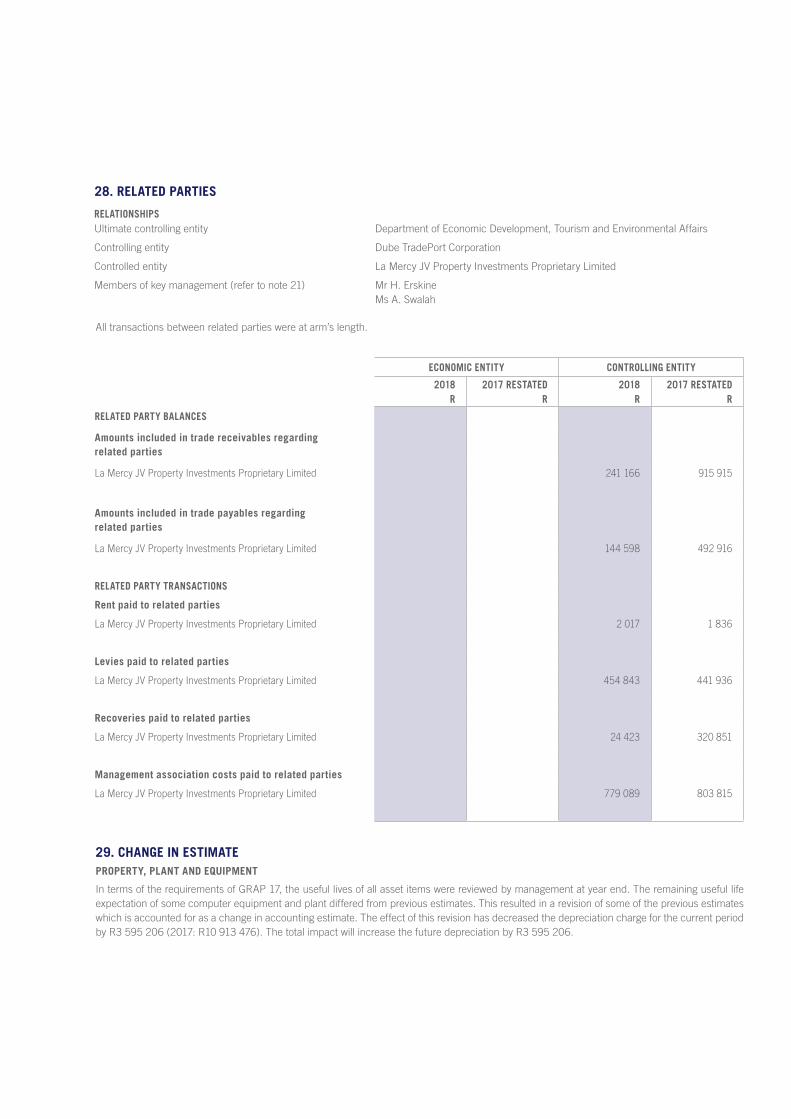
ECONOMIC ENTITY CONTROLLING ENTITY
2018R
2017 RESTATEDR
2018R
2017 RESTATEDR
RELATED PARTY BALANCES
Amounts included in trade receivables regarding related parties
La Mercy JV Property Investments Proprietary Limited 241 166 915 915
Amounts included in trade payables regarding related parties
La Mercy JV Property Investments Proprietary Limited 144 598 492 916
RELATED PARTY TRANSACTIONS
Rent paid to related parties
La Mercy JV Property Investments Proprietary Limited 2 017 1 836
Levies paid to related parties
La Mercy JV Property Investments Proprietary Limited 454 843 441 936
Recoveries paid to related parties
La Mercy JV Property Investments Proprietary Limited 24 423 320 851
Management association costs paid to related parties
La Mercy JV Property Investments Proprietary Limited 779 089 803 815
28. RELATED PARTIES
RELATIONSHIPSUltimate controlling entity Department of Economic Development, Tourism and Environmental Affairs
Controlling entity Dube TradePort Corporation
Controlled entity La Mercy JV Property Investments Proprietary Limited
Members of key management (refer to note 21) Mr H. ErskineMs A. Swalah
All transactions between related parties were at arm’s length.
29. CHANGE IN ESTIMATEPROPERTY, PLANT AND EQUIPMENT
In terms of the requirements of GRAP 17, the useful lives of all asset items were reviewed by management at year end. The remaining useful life expectation of some computer equipment and plant differed from previous estimates. This resulted in a revision of some of the previous estimates which is accounted for as a change in accounting estimate. The effect of this revision has decreased the depreciation charge for the current period by R3 595 206 (2017: R10 913 476). The total impact will increase the future depreciation by R3 595 206.
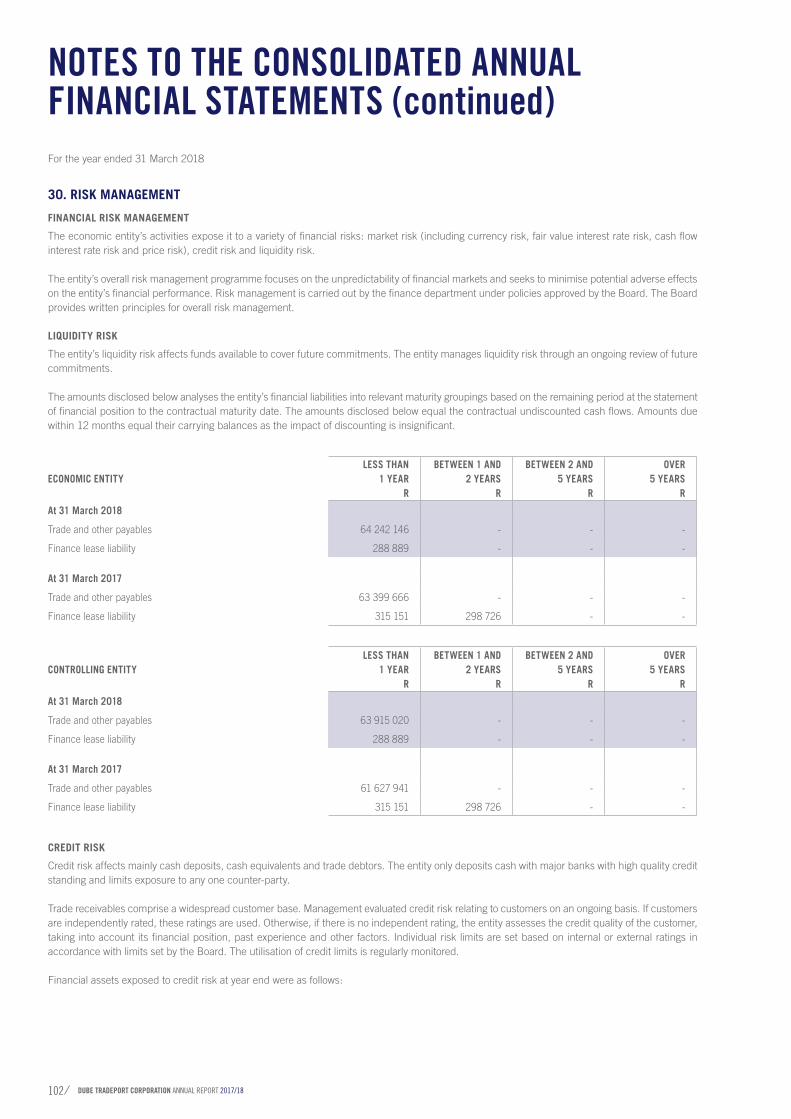
DUBE TRADEPORT CORPORATION ANNUAL REPORT 2017/18102
For the year ended 31 March 2018
NOTES TO THE CONSOLIDATED ANNUAL FINANCIAL STATEMENTS (continued)
CREDIT RISK
Credit risk affects mainly cash deposits, cash equivalents and trade debtors. The entity only deposits cash with major banks with high quality credit standing and limits exposure to any one counter-party.
Trade receivables comprise a widespread customer base. Management evaluated credit risk relating to customers on an ongoing basis. If customers are independently rated, these ratings are used. Otherwise, if there is no independent rating, the entity assesses the credit quality of the customer, taking into account its financial position, past experience and other factors. Individual risk limits are set based on internal or external ratings in accordance with limits set by the Board. The utilisation of credit limits is regularly monitored.
Financial assets exposed to credit risk at year end were as follows:
ECONOMIC ENTITYLESS THAN
1 YEARR
BETWEEN 1 AND 2 YEARS
R
BETWEEN 2 AND5 YEARS
R
OVER 5 YEARS
R
At 31 March 2018
Trade and other payables 64 242 146 - - -
Finance lease liability 288 889 - - -
At 31 March 2017
Trade and other payables 63 399 666 - - -
Finance lease liability 315 151 298 726 - -
CONTROLLING ENTITYLESS THAN
1 YEARR
BETWEEN 1 AND 2 YEARS
R
BETWEEN 2 AND5 YEARS
R
OVER 5 YEARS
R
At 31 March 2018
Trade and other payables 63 915 020 - - -
Finance lease liability 288 889 - - -
At 31 March 2017
Trade and other payables 61 627 941 - - -
Finance lease liability 315 151 298 726 - -
30. RISK MANAGEMENT
FINANCIAL RISK MANAGEMENT
The economic entity’s activities expose it to a variety of financial risks: market risk (including currency risk, fair value interest rate risk, cash flow interest rate risk and price risk), credit risk and liquidity risk.
The entity’s overall risk management programme focuses on the unpredictability of financial markets and seeks to minimise potential adverse effects on the entity’s financial performance. Risk management is carried out by the finance department under policies approved by the Board. The Board provides written principles for overall risk management.
LIQUIDITY RISK
The entity’s liquidity risk affects funds available to cover future commitments. The entity manages liquidity risk through an ongoing review of future commitments.
The amounts disclosed below analyses the entity’s financial liabilities into relevant maturity groupings based on the remaining period at the statement of financial position to the contractual maturity date. The amounts disclosed below equal the contractual undiscounted cash flows. Amounts due within 12 months equal their carrying balances as the impact of discounting is insignificant.
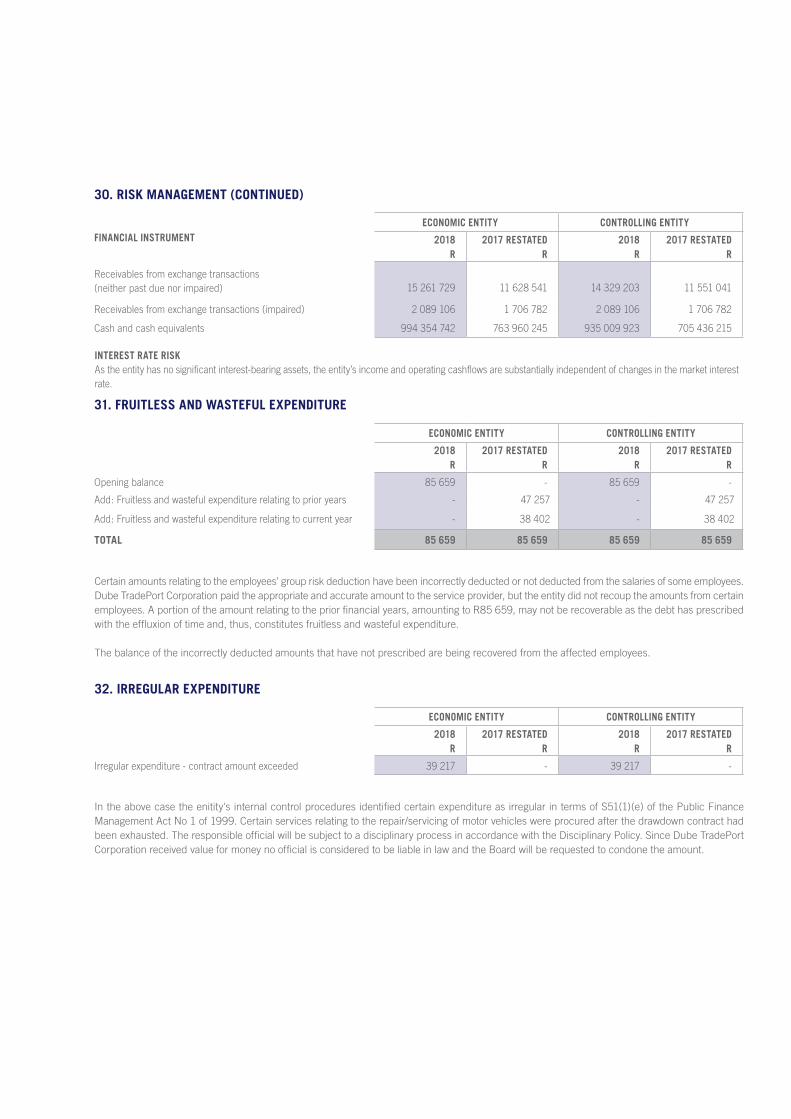
30. RISK MANAGEMENT (CONTINUED)
31. FRUITLESS AND WASTEFUL EXPENDITURE
ECONOMIC ENTITY CONTROLLING ENTITY
2018 R
2017 RESTATEDR
2018 R
2017 RESTATEDR
Opening balance 85 659 - 85 659 -
Add: Fruitless and wasteful expenditure relating to prior years - 47 257 - 47 257
Add: Fruitless and wasteful expenditure relating to current year - 38 402 - 38 402
TOTAL 85 659 85 659 85 659 85 659
In the above case the enitity's internal control procedures identified certain expenditure as irregular in terms of S51(1)(e) of the Public Finance Management Act No 1 of 1999. Certain services relating to the repair/servicing of motor vehicles were procured after the drawdown contract had been exhausted. The responsible official will be subject to a disciplinary process in accordance with the Disciplinary Policy. Since Dube TradePort Corporation received value for money no official is considered to be liable in law and the Board will be requested to condone the amount.
ECONOMIC ENTITY CONTROLLING ENTITY
2018 R
2017 RESTATEDR
2018 R
2017 RESTATEDR
Irregular expenditure - contract amount exceeded 39 217 - 39 217 -
32. IRREGULAR EXPENDITURE
FINANCIAL INSTRUMENTECONOMIC ENTITY CONTROLLING ENTITY
2018 R
2017 RESTATEDR
2018 R
2017 RESTATEDR
Receivables from exchange transactions (neither past due nor impaired) 15 261 729 11 628 541 14 329 203 11 551 041
Receivables from exchange transactions (impaired) 2 089 106 1 706 782 2 089 106 1 706 782
Cash and cash equivalents 994 354 742 763 960 245 935 009 923 705 436 215
INTEREST RATE RISKAs the entity has no significant interest-bearing assets, the entity’s income and operating cashflows are substantially independent of changes in the market interest rate.
Certain amounts relating to the employees’ group risk deduction have been incorrectly deducted or not deducted from the salaries of some employees. Dube TradePort Corporation paid the appropriate and accurate amount to the service provider, but the entity did not recoup the amounts from certain employees. A portion of the amount relating to the prior financial years, amounting to R85 659, may not be recoverable as the debt has prescribed with the effluxion of time and, thus, constitutes fruitless and wasteful expenditure.
The balance of the incorrectly deducted amounts that have not prescribed are being recovered from the affected employees.
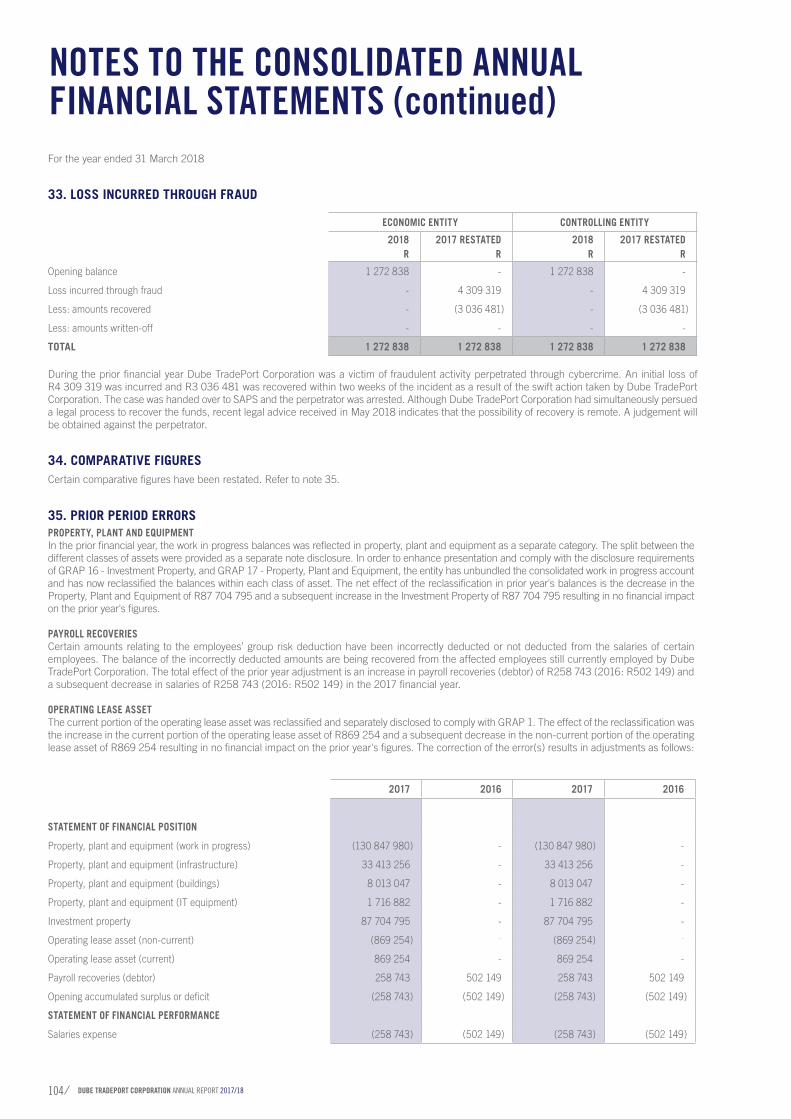
DUBE TRADEPORT CORPORATION ANNUAL REPORT 2017/18104
For the year ended 31 March 2018
NOTES TO THE CONSOLIDATED ANNUAL FINANCIAL STATEMENTS (continued)
35. PRIOR PERIOD ERRORSPROPERTY, PLANT AND EQUIPMENTIn the prior financial year, the work in progress balances was reflected in property, plant and equipment as a separate category. The split between the different classes of assets were provided as a separate note disclosure. In order to enhance presentation and comply with the disclosure requirements of GRAP 16 - Investment Property, and GRAP 17 - Property, Plant and Equipment, the entity has unbundled the consolidated work in progress account and has now reclassified the balances within each class of asset. The net effect of the reclassification in prior year's balances is the decrease in the Property, Plant and Equipment of R87 704 795 and a subsequent increase in the Investment Property of R87 704 795 resulting in no financial impact on the prior year's figures.
PAYROLL RECOVERIESCertain amounts relating to the employees’ group risk deduction have been incorrectly deducted or not deducted from the salaries of certain employees. The balance of the incorrectly deducted amounts are being recovered from the affected employees still currently employed by Dube TradePort Corporation. The total effect of the prior year adjustment is an increase in payroll recoveries (debtor) of R258 743 (2016: R502 149) and a subsequent decrease in salaries of R258 743 (2016: R502 149) in the 2017 financial year.
OPERATING LEASE ASSETThe current portion of the operating lease asset was reclassified and separately disclosed to comply with GRAP 1. The effect of the reclassification was the increase in the current portion of the operating lease asset of R869 254 and a subsequent decrease in the non-current portion of the operating lease asset of R869 254 resulting in no financial impact on the prior year's figures. The correction of the error(s) results in adjustments as follows:
2017 2016 2017 2016
STATEMENT OF FINANCIAL POSITION
Property, plant and equipment (work in progress) (130 847 980) - (130 847 980) -
Property, plant and equipment (infrastructure) 33 413 256 - 33 413 256 -
Property, plant and equipment (buildings) 8 013 047 - 8 013 047 -
Property, plant and equipment (IT equipment) 1 716 882 - 1 716 882 -
Investment property 87 704 795 - 87 704 795 -
Operating lease asset (non-current) (869 254) - (869 254) -
Operating lease asset (current) 869 254 - 869 254 -
Payroll recoveries (debtor) 258 743 502 149 258 743 502 149
Opening accumulated surplus or deficit (258 743) (502 149) (258 743) (502 149)
STATEMENT OF FINANCIAL PERFORMANCE
Salaries expense (258 743) (502 149) (258 743) (502 149)
During the prior financial year Dube TradePort Corporation was a victim of fraudulent activity perpetrated through cybercrime. An initial loss of R4 309 319 was incurred and R3 036 481 was recovered within two weeks of the incident as a result of the swift action taken by Dube TradePort Corporation. The case was handed over to SAPS and the perpetrator was arrested. Although Dube TradePort Corporation had simultaneously persued a legal process to recover the funds, recent legal advice received in May 2018 indicates that the possibility of recovery is remote. A judgement will be obtained against the perpetrator.
ECONOMIC ENTITY CONTROLLING ENTITY
2018 R
2017 RESTATEDR
2018 R
2017 RESTATEDR
Opening balance 1 272 838 - 1 272 838 -
Loss incurred through fraud - 4 309 319 - 4 309 319
Less: amounts recovered - (3 036 481) - (3 036 481)
Less: amounts written-off - - - -
TOTAL 1 272 838 1 272 838 1 272 838 1 272 838
33. LOSS INCURRED THROUGH FRAUD
34. COMPARATIVE FIGURESCertain comparative figures have been restated. Refer to note 35.
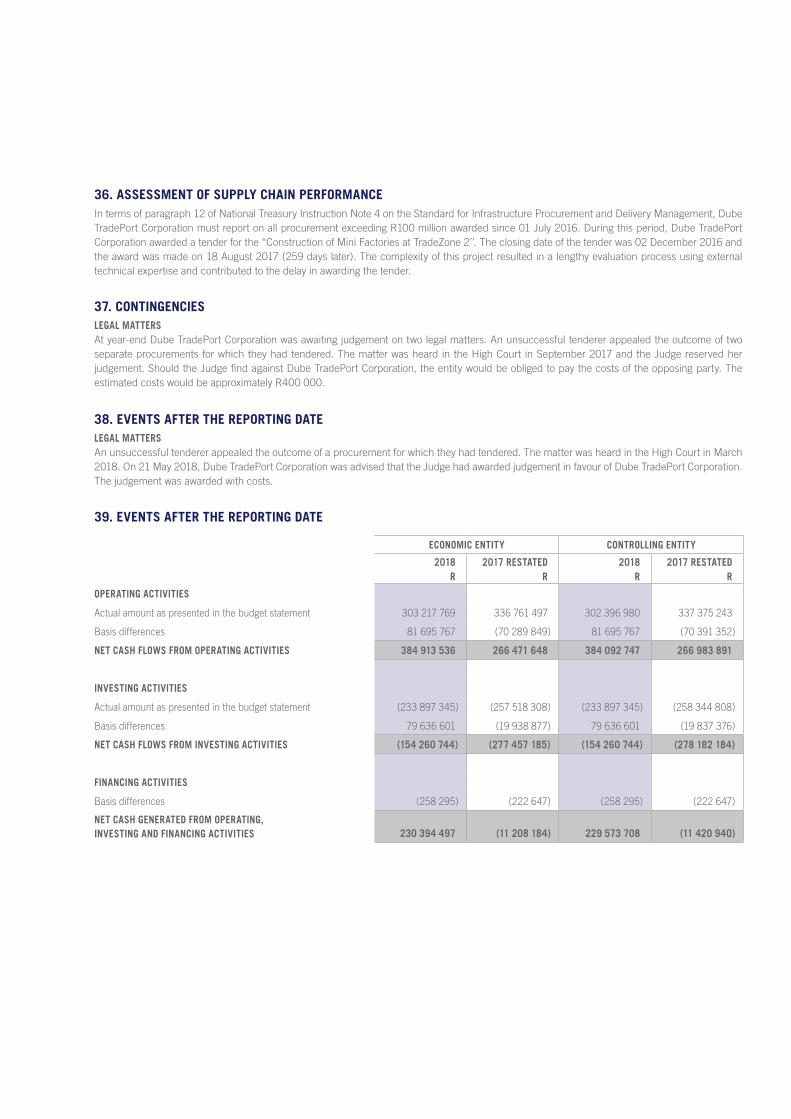
ECONOMIC ENTITY CONTROLLING ENTITY
2018R
2017 RESTATEDR
2018R
2017 RESTATEDR
OPERATING ACTIVITIES
Actual amount as presented in the budget statement 303 217 769 336 761 497 302 396 980 337 375 243
Basis differences 81 695 767 (70 289 849) 81 695 767 (70 391 352)
NET CASH FLOWS FROM OPERATING ACTIVITIES 384 913 536 266 471 648 384 092 747 266 983 891
INVESTING ACTIVITIES
Actual amount as presented in the budget statement (233 897 345) (257 518 308) (233 897 345) (258 344 808)
Basis differences 79 636 601 (19 938 877) 79 636 601 (19 837 376)
NET CASH FLOWS FROM INVESTING ACTIVITIES (154 260 744) (277 457 185) (154 260 744) (278 182 184)
FINANCING ACTIVITIES
Basis differences (258 295) (222 647) (258 295) (222 647)
NET CASH GENERATED FROM OPERATING,INVESTING AND FINANCING ACTIVITIES 230 394 497 (11 208 184) 229 573 708 (11 420 940)
36. ASSESSMENT OF SUPPLY CHAIN PERFORMANCEIn terms of paragraph 12 of National Treasury Instruction Note 4 on the Standard for Infrastructure Procurement and Delivery Management, Dube TradePort Corporation must report on all procurement exceeding R100 million awarded since 01 July 2016. During this period, Dube TradePort Corporation awarded a tender for the “Construction of Mini Factories at TradeZone 2’’. The closing date of the tender was 02 December 2016 and the award was made on 18 August 2017 (259 days later). The complexity of this project resulted in a lengthy evaluation process using external technical expertise and contributed to the delay in awarding the tender.
37. CONTINGENCIESLEGAL MATTERSAt year-end Dube TradePort Corporation was awaiting judgement on two legal matters. An unsuccessful tenderer appealed the outcome of two separate procurements for which they had tendered. The matter was heard in the High Court in September 2017 and the Judge reserved her judgement. Should the Judge find against Dube TradePort Corporation, the entity would be obliged to pay the costs of the opposing party. The estimated costs would be approximately R400 000.
38. EVENTS AFTER THE REPORTING DATELEGAL MATTERSAn unsuccessful tenderer appealed the outcome of a procurement for which they had tendered. The matter was heard in the High Court in March 2018. On 21 May 2018, Dube TradePort Corporation was advised that the Judge had awarded judgement in favour of Dube TradePort Corporation. The judgement was awarded with costs.
39. EVENTS AFTER THE REPORTING DATE
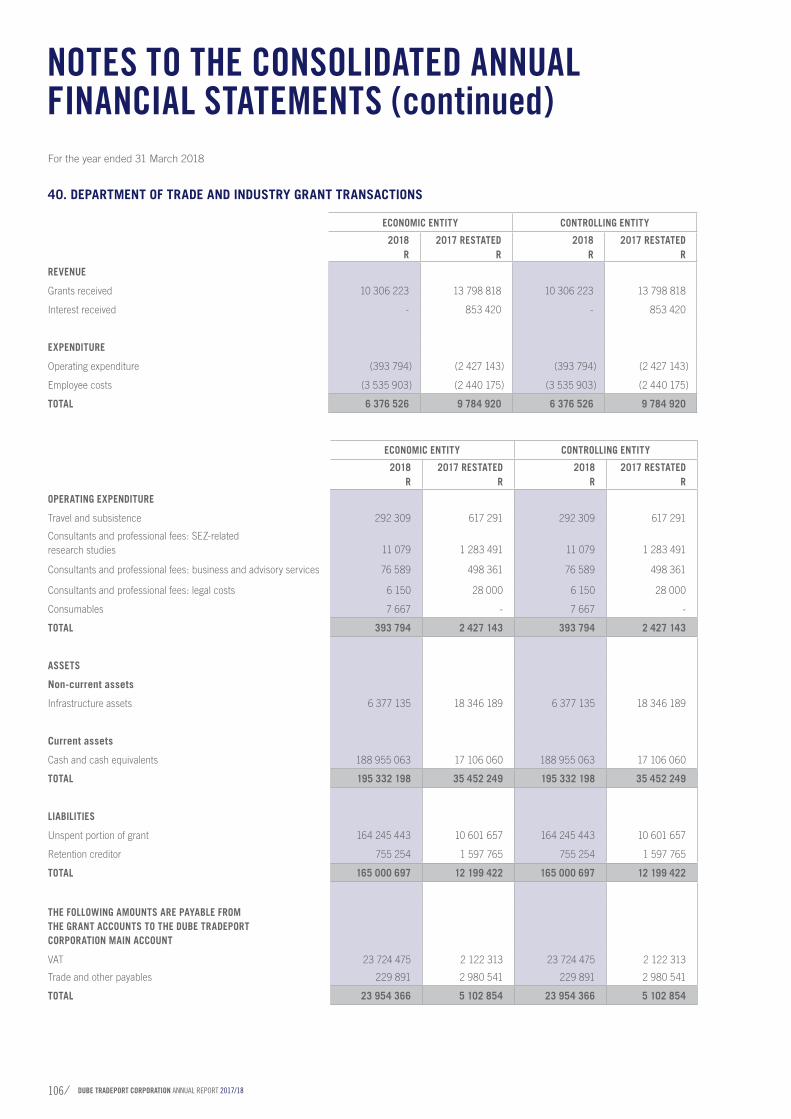
DUBE TRADEPORT CORPORATION ANNUAL REPORT 2017/18106
For the year ended 31 March 2018
NOTES TO THE CONSOLIDATED ANNUAL FINANCIAL STATEMENTS (continued)
ECONOMIC ENTITY CONTROLLING ENTITY
2018R
2017 RESTATEDR
2018R
2017 RESTATEDR
OPERATING EXPENDITURE
Travel and subsistence 292 309 617 291 292 309 617 291
Consultants and professional fees: SEZ-relatedresearch studies 11 079 1 283 491 11 079 1 283 491
Consultants and professional fees: business and advisory services 76 589 498 361 76 589 498 361
Consultants and professional fees: legal costs 6 150 28 000 6 150 28 000
Consumables 7 667 - 7 667 -
TOTAL 393 794 2 427 143 393 794 2 427 143
ASSETS
Non-current assets
Infrastructure assets 6 377 135 18 346 189 6 377 135 18 346 189
Current assets
Cash and cash equivalents 188 955 063 17 106 060 188 955 063 17 106 060
TOTAL 195 332 198 35 452 249 195 332 198 35 452 249
LIABILITIES
Unspent portion of grant 164 245 443 10 601 657 164 245 443 10 601 657
Retention creditor 755 254 1 597 765 755 254 1 597 765
TOTAL 165 000 697 12 199 422 165 000 697 12 199 422
THE FOLLOWING AMOUNTS ARE PAYABLE FROMTHE GRANT ACCOUNTS TO THE DUBE TRADEPORTCORPORATION MAIN ACCOUNT
VAT 23 724 475 2 122 313 23 724 475 2 122 313
Trade and other payables 229 891 2 980 541 229 891 2 980 541
TOTAL 23 954 366 5 102 854 23 954 366 5 102 854
40. DEPARTMENT OF TRADE AND INDUSTRY GRANT TRANSACTIONS
ECONOMIC ENTITY CONTROLLING ENTITY
2018R
2017 RESTATEDR
2018R
2017 RESTATEDR
REVENUE
Grants received 10 306 223 13 798 818 10 306 223 13 798 818
Interest received - 853 420 - 853 420
EXPENDITURE
Operating expenditure (393 794) (2 427 143) (393 794) (2 427 143)
Employee costs (3 535 903) (2 440 175) (3 535 903) (2 440 175)
TOTAL 6 376 526 9 784 920 6 376 526 9 784 920
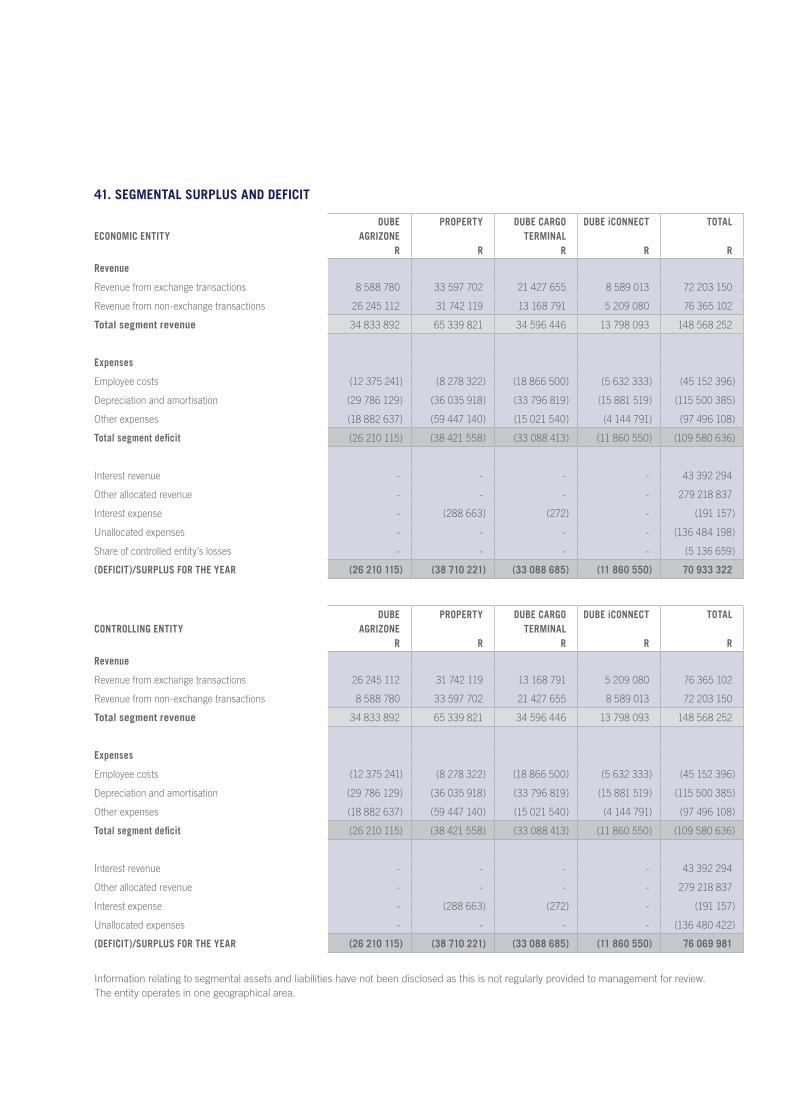
41. SEGMENTAL SURPLUS AND DEFICIT
ECONOMIC ENTITYDUBE
AGRIZONE R
PROPERTY R
DUBE CARGO TERMINAL
R
DUBE iCONNECT R
TOTAL R
Revenue
Revenue from exchange transactions 8 588 780 33 597 702 21 427 655 8 589 013 72 203 150
Revenue from non-exchange transactions 26 245 112 31 742 119 13 168 791 5 209 080 76 365 102
Total segment revenue 34 833 892 65 339 821 34 596 446 13 798 093 148 568 252
Expenses
Employee costs (12 375 241) (8 278 322) (18 866 500) (5 632 333) (45 152 396)
Depreciation and amortisation (29 786 129) (36 035 918) (33 796 819) (15 881 519) (115 500 385)
Other expenses (18 882 637) (59 447 140) (15 021 540) (4 144 791) (97 496 108)
Total segment deficit (26 210 115) (38 421 558) (33 088 413) (11 860 550) (109 580 636)
Interest revenue - - - - 43 392 294
Other allocated revenue - - - - 279 218 837
Interest expense - (288 663) (272) - (191 157)
Unallocated expenses - - - - (136 484 198)
Share of controlled entity’s losses - - - - (5 136 659)
(DEFICIT)/SURPLUS FOR THE YEAR (26 210 115) (38 710 221) (33 088 685) (11 860 550) 70 933 322
Information relating to segmental assets and liabilities have not been disclosed as this is not regularly provided to management for review.The entity operates in one geographical area.
CONTROLLING ENTITYDUBE
AGRIZONE R
PROPERTY R
DUBE CARGO TERMINAL
R
DUBE iCONNECT R
TOTAL R
Revenue
Revenue from exchange transactions 26 245 112 31 742 119 13 168 791 5 209 080 76 365 102
Revenue from non-exchange transactions 8 588 780 33 597 702 21 427 655 8 589 013 72 203 150
Total segment revenue 34 833 892 65 339 821 34 596 446 13 798 093 148 568 252
Expenses
Employee costs (12 375 241) (8 278 322) (18 866 500) (5 632 333) (45 152 396)
Depreciation and amortisation (29 786 129) (36 035 918) (33 796 819) (15 881 519) (115 500 385)
Other expenses (18 882 637) (59 447 140) (15 021 540) (4 144 791) (97 496 108)
Total segment deficit (26 210 115) (38 421 558) (33 088 413) (11 860 550) (109 580 636)
Interest revenue - - - - 43 392 294
Other allocated revenue - - - - 279 218 837
Interest expense - (288 663) (272) - (191 157)
Unallocated expenses - - - - (136 480 422)
(DEFICIT)/SURPLUS FOR THE YEAR (26 210 115) (38 710 221) (33 088 685) (11 860 550) 76 069 981
DUBE TRADEPORT CORPORATION ANNUAL REPORT 2017/18108
For the year ended 31 March 2018
NOTES TO THE CONSOLIDATED ANNUAL FINANCIAL STATEMENTS (continued)
MANAGEMENT HAS IDENTIFIED THE FOLLOWING FOUR REPORTABLE SEGMENTS BASED ON REVENUE GENERATING POTENTIAL:
Dube AgriZone - operates a cluster of facilities to support the stimulation of the perishables sector in KwaZulu-Natal. This includes the greenhouses and packhouses, a tissue culture facility and a nursery. Goods and services delivered include provision of facilities, propagation of tissue cultures and growing of indigenous plants.
Property - secures private sector investment, operates and maintains the various property zones within the precinct. Information presented is disaggregated. Services include provision of facilities and utilities.
Dube Cargo Terminal - operates a cargo terminal and trucking services in line with international standards. In this programme, services provided include cargo handling, storage and transportation of goods.
Dube iConnect - operates and maintains state-of-the-art IT infrastructure and provides commercial ICT services. Segment information presented is aggregated. Services include provision of hosting platforms infrastructure and software services, disaster recovery and backup services, etc.
41. SEGMENTAL SURPLUS AND DEFICIT (CONTINUED)

DUBE TRADEPORT CORPORATION ANNUAL REPORT 2017/18110
www.dubetradeport.co.za
Related Documents


