Welcome message from author
This document is posted to help you gain knowledge. Please leave a comment to let me know what you think about it! Share it to your friends and learn new things together.
Transcript


Fresenius Kabi OncOlOgy limited | 13
dear shareholders,
the board of directors is pleased to present the report on the Company’s business and operations for the financial year ended march 31, 2018.
FINANCIAL PERFORMANCE
Key aspects of Company’s financial performance for the financial year ended March 31, 2018 are summarized below:
(` in lakh)
Particulars For the year ended
March 31, 2018
For the year ended
March 31, 2017
turnover (including other income) 73,437.27 64,632.48
Profit/(Loss) before Tax and Exceptional items
5,855.81 1,068.99
Exceptional Items 4,013.33 854.00
Profit/ (Loss) before tax 1,842.48 214.99
Less: Provision for Taxation(i) Current tax expenses(ii) Deferred tax charge/ (credit)
840.41(956.32)
-456.57
Profit/(Loss) after tax 1,958.39 (241.58)
Other comprehensive Income/(Loss) (43.48) 23.14
Total comprehensive Income/ (loss) for the year
1,914.91 (218.44)
Add: Balance of Profit/(Loss) & Other comprehensive Income/(Loss) brought forward from previous year
(29,914.06) (29,695.62)
Appropriation to:general reservebalance carried over to the balance sheet
-(27,999.15)
-(29,914.06)
DIVIDEND
Considering the on-going capacity expansion projects and future growth plans, the Directors have decided to plough back the profits of the Company for financial year 2017-18. Accordingly, the board does not recommend any dividend payment for the year ended march 31, 2018. the directors believe that this decision will contribute to the future growth of the Company and enhancement of shareholders’ wealth in the long run.
BUSINESS PERFORMANCE AND OPERATIONS
the management is committed to its pledge of implementing industry best practices at all levels. The Company’s channelized efforts and sustained measures in this direction have resulted in significant growth in revenues and profits before exceptional items and tax as compared to the previous financial year.
Financial snapshots:
revenue increased from ` 64,632.48 lakhs in Fy 2016-17 to ` 73,437.27 lakhs in FY 2017-18, a positive growth of ` 8,804.79 lakhs (13.62%).
Profit before tax and exceptional item in Fy 2017-18 is ` 5,855.81 lakhs as compared to a profit of ` 1,068.99 lakhs in Fy 2016-17.
The Company generated net profit after tax for the FY 2017-18, to the tune of ` 1,958.39 lakhs, as against net loss of ` 241.58 lakhs in Fy 2016-17.
GLOBAL & DOMESTIC INDUSTRY OUTLOOK AND TRENDS IN ONCOLOGY
The year 2017 was rewarding for pharmaceutical and biotechnology industry, with the sector witnessing some positive developments that led to a much-awaited recovery. A key reason for the industry’s improved performance was the willingness of investors to look beyond the drug pricing controversy and focus on fundamentals instead. the approval of the first gene cell therapy was a major breakthrough.
On the heels of a recovery, global prescription drug sales are forecast to grow at an impressive annual compound rate of 6.5% in the next few years. Worldwide sales are expected to be US$ 1.06 trillion in 2022. This growth is in contrast to the 2.2% compounded annual growth rate (CAGR) in 2012-2016, but still under the 8.4% CAGR before the global financial crisis in 2004-2008.
The industry will continue to look to emerging markets for growth, albeit not as aggressively as in the past. Among the top 20 pharmaceutical markets in the world, 8 are from emerging countries, supported by an increasing middle class. China is expected to reach the top three in the near future. However, constraints could come from government incentives that reduce medication reimbursements and health care costs.
Worldwide pharmaceutical and biotech R&D is forecast to grow at 2.4% per year upto 2022, slightly lower than the 2.5% annual growth between 2008 and 2016. Total R&D spend is expected to reach US$181 billion in 2022, compared to us$156.7 billion in 2016-17.
Global generic drug sales are expected to make up 29.2% of the total pharmaceutical sales worldwide in 2022, compared to approximately 28% in 2017. Emerging markets and the united states are expected to drive demand for generics as they continue to cut health care costs. Generics now make up more than 80% of the volume of drugs dispensed around the world, and that percentage will continue to grow as more drugs lose patent protection. many of the bigger products coming off patent are biologics.
BOARD’S REPORT

Raising the Bar
14 | 15th annual rePOrt 2017-18
Global spending on cancer medicines continued to rise with therapeutic and supportive care use at $133 billion globally in 2017, up from $96 billion in 2013. spending on cancer medicines is heavily concentrated among a handful of therapies, with the top 35 drugs accounting for 80% of total spending, while over half of cancer drugs have less than $90 million in annual sales.
Advances in technology and the use of information will act as driving forces that will impact oncology treatment and costs over the next decade. Overall, the global market for oncology therapeutic medicines may reach as much as us$200 billion by 2022, averaging 10-13% growth over the next few years.
India is the largest supplier of generic drugs globally with the Indian generics accounting for 20% of global exports in terms of volume. Of late, consolidation has become an important characteristic of the indian pharmaceutical market as the industry is highly fragmented.
indian pharmaceutical sector is estimated to account for 3.1% – 3.6% of the global pharmaceutical industry in value terms and 10% in volume terms. It is expected to grow to US$100 billion by 2025. The market is expected to grow to US$55 billion by 2020, thereby emerging as the sixth largest pharmaceutical market globally by absolute size. Branded generics dominate the pharmaceuticals market, constituting nearly 80% of the market share (in terms of revenues).
India’s pharmaceutical exports are expected to grow by 30 per cent over the next two-three years to reach US$ 20 billion by 2020, according to the Pharmaceuticals Export Promotion Council of India (PHARMEXCIL). Export of pharmaceutical items reached ` 696.84 billion (us$ 10.76 billion) during april 2017 – January 2018.
india’s market for drugs to treat cancer has outstripped that of all other leading countries in recent years and is set to go on doing so. rising at nearly 19 per cent a year from 2013 to 2017, it is expected to grow at an only slightly slower rate over the next few years.
KEY UPDATES
During the Financial Year under review, the Company’s plants situated at Kalyani, West Bengal and Kishanpura, Himachal Pradesh, were inspected by US FDA where in US FDA officials brought to the attention of the company’s management certain observations, related to investigation procedures, through warning letter(s).
the company has responded to the observations made by us Fda and is also regularly updating us Fda about the remedial and corrective measures implemented in both the plants, addressing the issues raised in the above-stated warning letters.
us Fda has not issued any import alert therefore the supplies of the approved products are uninterruptedly continuing to the us market.
In addition to this, the Baddi plant of the Company also underwent audit from the medicines and Healthcare Products regulatory Agency (MHRA). Final report and revert from MHRA is awaited.
During 2017-18, the management took many initiatives with respect to employee engagement and morale boosting, for its employees working at the Baddi plants. Multiple training sessions were also conducted to ensure that employees felt connected and responsible towards their duties to the company and to the society.
With a view to automate & digitise all I&D results recording & monitoring processes, the Company has initiated implementation of electronic lab notebook (elnb) process which would replace the existing paper based system with software based recording of the laboratory work in accordance with 21 CFR (Code of Federal Regulations) Part 11. Digitization of results and outcome recording & monitering process at the I&D Centre, would provide the Company a giant leap towards automation of its processes and practices.
Many initiatives towards automation of plant processes were undertaken at the Kalyani plant of the company during the year under review, which included, inter-alia, 10-DAB upgradation project. Also, the Company commenced installation of a new multiproduct facility at the plant.
Production of several new products was initiated from the Kalyani plant post completion of all validations.
During the year, the Kalyani plant of the Company was also conferred with following awards and accolades:
Greentech Environment Award – Silver; by the Greentech Foundation;
Indian Manufacturing Excellence Award – Silver; by Frost & Sullivan and FICCI;
“Bronze Award” - Suraksha Puraskar for the year 2017; by nsci (national safety council of india).
During the year under review, the Kalyani plant of the Company received Compliance Certification from below mentioned National & International authorities:
1. CDSCO, India: Confirmation for active substances imported into the EU (GMP of WHO/ICHQ7).
2. Directorate of Drug Control, West Bengal:
GMP (Schedule M) compliance certificate.
GLP (Schedule L1) compliance certificate.
3. TGA, Australia: A2 categorization for our GMP status.
4. EDQM, Europe:
Certificate of GMP compliance from AIFA-Italy.
Attestation of inspection from EDQM for Paclitaxel.

Fresenius Kabi OncOlOgy limited | 15
INITIATIVES TAKEN TO INCREASE EXPORTS DEVELOPMENT OF NEW EXPORT MARKETS FOR PRODUCTS AND EXPORT PLANS
The Company continues to play a lead role within the generic oncology space. Key strategic elements of this leadership strategy include portfolio extension and management, product differentiation, gaining entry into key institutions, new product development and speedy roll-out – all of this with the focus to provide our customers with safe, convenient and affordable drugs.
‘Speed to market’, together with ‘cost competitiveness’ remains one of our key objectives with regard to product development and product launch. this is being achieved by close internal coordination between concerned departments within the Company, like Innovation & Development (I&D), Intellectual Property, medical affairs, regulatory affairs and others.
Experience gained in generic Oncology drug manufacturing & marketing gives us the competitive advantage for some of the core cytotoxics that are used worldwide. While priority focus is always on roll-out of products via complete backward integration, semi-integrated options too are explored. A diverse product portfolio, thereby, can help us cut down the time taken to launch new products and we can leverage the first-mover advantage.
adding to the continuous portfolio built-up, in europe for example the Company launched in 2017 a key Oncology molecule for the current treatment options for chronic lymphocytic leukaemia. the company has lined up more launches in europe and emerging markets in coming years.
in order to further strengthen the company’s image among the international Oncology societies, Fresenius Kabi continues to take active part in various international conferences and scientific meetings relevant to the field of Oncology. Some of these knowledge platforms include the ESMO conference (european society of medical Oncology), the eaHP conference (european association of Hospital Pharmacists) and the isOPP conference (international society of Oncology Pharmacy Practitioners) among others.
With all the aforementioned efforts, we expect to increase our export earnings in near future.
SHARE CAPITAL
During the year under review there is no change in share capital of the Company in comparison to previous financial year 2016-17.
BOARD OF DIRECTORS
Resignations/Change in designation
Mr. Karsten Peter Lerch
Mr. Karsten Peter Lerch, Whole Time Director & CFO of the Company, resigned from the position of Chief Financial Officer (CFO) w.e.f. December 31, 2017, due to personal exigencies in his home country.
Since he was a Director on the Board of the Company in addition to being in whole-time employment, he was functioning as Whole-time Director of the Company.
consequent to his resignation from the position of cFO, he also ceases to be in the whole-time employment of the Company. However, he continues to hold the position of a Director on the Board. His role and position thus changed to a Non-Executive Director on the Board of the Company w.e.f. January 1, 2018.
The Board places on record its sincere appreciation towards the valuable contribution and guidance provided by mr. lerch during his tenure as Director & CFO of the Company.
Mr. Rakesh Bhargava
mr. rakesh bhargava had relinquished his position as Non-Executive Chairman of the Board of Directors w.e.f. April 30, 2018, citing personal reasons. However, he continues as a Non-Executive Director of the Company w.e.f. May 1, 2018.
the board places on record its sincere appreciation and gratitude towards the significant contribution made by him in the growth of the Company during his tenure as Non-Executive chairman.
Appointments/Re-appointments
During the financial year 2017-18 no appointment or re-appointment of any new/ existing Director has been made. However, post closure of financial year 2017-18 but before the approval of Board’s report, below mentioned changes in nature of directorship and appointment/ re-appointment have been approved by the Board of Directors, subject to approval of the shareholders in the forthcoming Annual General Meeting:
Ms. Maria Gobbi
the present term of ms. maria gobbi, as managing director of the company, is due for completion on June 30, 2018 and Ms. Gobbi had informed that she was desirous of devoting her complete focus and time on her new global role. Thus, she has communicated her decision not to seek extension of her term for the position of managing director of the company on completion of her present term on June 30, 2018. However, she will continue as a Non-Executive Director of the Company w.e.f. July 1, 2018.
Pursuant to articles of association (aoa) of the company, as the Managing Director, the directorship of Ms. Gobbi was not liable to retire by rotation, as required under Sections 149 & 152 of the Companies Act, 2013. However, post completion of her term on June 30, 2018, she ceases to be the managing director. therefore, her status accordingly changes to a non-Executive Director, liable to retire by rotation.
Mr. Arvind Kumar Sharma
Consequent to non-renewal of Ms. Maria Gobbi’s term as Managing Director of the Company and also in view of the legal requirement for appointment of a managing director,

Raising the Bar
16 | 15th annual rePOrt 2017-18
Mr. Arvind Kumar Sharma, currently working as Chief Operating Officer (COO) of the Company, has been identified as her successor for the position of managing director.
Since, Mr. Sharma was not a Director, he was appointed as an Additional Director on the Board w.e.f. July 1, 2018, in accordance with the provisions of Section 161 of the Companies Act, 2013.
mr. arvind Kumar sharma has also been designated as the managing director of the company for a term of 3 years, effective July 1, 2018, subject to approval of shareholders. To oversee and manage the affairs of the Company in an efficient and proper manner.
Brief Profile of Mr. Arvind Kumar Sharma
Mr. Arvind Kumar Sharma has over 30 years of experience in the manufacturing of bulk Pharmaceutical chemicals (APIs) & Bio-pharmaceuticals. He completed B. Tech in biochemical engineering from H.b.t.i., Kanpur and m. tech in biotechnology from Jadavpur university, calcutta. He has also undergone workshops and trainings on Good Manufacturing Practices, i.e. training on ICH Guidelines as per ICHQ7A and continuous training on basic gmP guidelines, dmF Operations and Validations, industrial safety and intellectual Property protection on contract manufacturing.
During his rich experience, he has worked in leadership positions with specialist pharmaceutical companies. His area of expertise spans across manufacturing excellence, operations improvement, planning and systems development and workflow planning. Mr. Sharma has been associated with the Company since June, 2013 and has been leading the Kalyani plant operations by implementing engineering process workflow improvements and supervising remediation projects. He has also been leading operations of Baddi plants since July, 2017.
Mr. Arvind Kumar Sharma will hold office only upto the date of forthcoming annual general meeting. He is eligible for appointment as a director and the board recommends his appointment in the forthcoming annual general meeting as a director and subsequently as the managing director for a term of 3 years w.e.f. July 1, 2018.
Mr. Nikhil Kulshreshtha
Mr. Nikhil Kulshreshtha, Director & Secretary, was appointed as a Whole-time Director of the Company w.e.f. July 1, 2015, for a tenure of 3 years. Thus, his present term would complete on June 30, 2018.
During his term as the Whole-time Director, he was responsible for legal, compliances, secretarial, internal audit, Hr and administrative functions of the company.
Mr. Kulshreshtha has been associated with the Company since July, 2007 and functioning as the Chief Administrative Officer (CAO), in addition to efficiently discharging the responsibilities
as company secretary of the company, under section 203 read with Section 204 of the Companies Act, 2013.
In view of the above facts and pursuant to future plans of the company, the board recommends his re-appointment in the forthcoming Annual General Meeting as the Whole-time director, liable to retire by rotation, for another term of 3 years w.e.f. July 1, 2018, with the designation of “Director & Secretary”.
Mr. Dilip G. Shah
Mr. Dilip G. Shah has been associated with the Company since August, 2008. He was appointed as the Non-Executive independent director of the company, under provisions of the Companies Act, 1956. However, post notification and enforcement of the companies act, 2013, the independent Directors were provided a window of maximum 10 years for continued appointment (effective april 1, 2014, irrespective of the term of appointment under the companies act, 1956), bifurcated into two terms of maximum 5 years each. Thus, his first term is scheduled to end on March 31, 2019.
Mr. Shah has more than 50 years of rich experience in the pharmaceutical industry. He is also member of many industry associations and reputed organizations, in addition to being the secretary-general of the indian Pharmaceutical alliance (iPa) (an association of 15 large research based national companies) and the co-chairman of the Ficci’s committee on Pharmaceuticals. He is also the editor of asia and india Journal of generic medicines, u.K.
mr. shah is also the chairman of the audit committee and member of the nomination and remuneration committee and stakeholders relationship committee of the board of directors of the company.
Taking into account Mr. Shah’s qualification, rich experience and his long standing association with the Company, the Board recommends his re-appointment as Non-Executive independent director of the company, for the second term of 5 (five) years effective from April 1, 2019.
Mr. Rajiv Lochan Jain
Mr. Rajiv Lochan Jain has been associated with the Company since October, 2013. He was appointed as the Non-Executive independent director of the company, for a term of 5 years effective april 1, 2014, post enforcement of applicable provisions under the Companies Act, 2013 and his first term, is scheduled to end on march 31, 2019.
mr. Jain has been actively involved in governance and operations related discussions/ decisions of the Board. Mr. Jain has approximately 35 years of experience in the fast moving consumer goods, chemicals and finance industries.
currently, he advises global and local companies on their entry and growth strategies for India.

Fresenius Kabi OncOlOgy limited | 17
mr. Jain is also member of the audit committee, the nomination and remuneration committee and the corporate social responsibility committee of the board of directors of the company.
Taking into account Mr. Jain’s qualification, diversified & rich experience, knowledge and his long standing association with the company, the board recommends his re-appointment as Non-Executive Independent Director of the Company, for the second term of 5 (five) years effective from April 1, 2019.
DIRECTOR RETIRING BY ROTATION
Dr. Michael Schönhofen
in terms of provisions of section 152 of the companies act, 2013, Dr. Michael Schönhofen, Non-Executive Director of the Company, would retire by rotation at the forthcoming Annual general meeting and being eligible, offers himself for re-appointment.
Dr. Schönhofen has been associated with the Fresenius group since 1991 in various functions and responsibilities. He is currently working as “President – Pharmaceuticals Division” with Fresenius Kabi AG, Germany, and is also a member of the management board of Fresenius Kabi ag, germany. dr. Schönhofen has been associated with the Company since year 2008 as a Non-Executive Director. The Board of Directors recommends his re-appointment.
KEY MANAGERIAL PERSONNEL
Chief Financial Officer (CFO)
mr. Karsten Peter lerch resigned from the position of cFO w.e.f. December 31, 2017 and Mr. Sandeep Kumar Chotia was appointed as the new CFO of the Company w.e.f. February 7, 2018.
Brief profile of Mr. Sandeep Kumar Chotia
mr. chotia is a member of the institute of chartered accountants of india (icai). He started his professional career in 2002 and has worked with companies having national and international presence.
His rich work experience includes, inter-alia, setting up of financial management and monitoring processes, treasury & fund management, preparation of accounts, reconciliation of statements and compilation of Balance Sheet, P&L account and MIS, financial strategy, planning and overseeing all elements of financial control and cost control.
STATUTORY AUDITORS
As per Section 139 of the Companies Act, 2013 read with the companies (audit and auditors) rules, 2014, the members of the company at their 14th annual general meeting held on 21st August, 2017 approved the appointment of M/s VMT & Co. LLP, chartered accountants (icai registration no. – n500048), as the statutory auditors of the company for a term of 5 years
i.e. from the conclusion of 14th annual general meeting till the conclusion of 19th annual general meeting of the company.
The Statutory Auditors of the Company, M/s VMT & Co. LLP, Chartered Accountants confirmed their willingness and eligibility for the financial year 2018-19. They have also confirmed that their appointment for financial year 2018-19 will be within the limits prescribed under section 141(3) (g) of the companies act, 2013.
AUDITOR’S REPORT
The Board has duly examined the Statutory Auditor’s report and clarifications, wherever necessary, have been included in the notes to accounts section of the annual report.
The Report given by M/s VMT & Co. LLP, Chartered Accountants on the financial statements of the Company for the financial year 2017-18 is part of the annual report. there has been no qualification, reservation or adverse remark or disclaimer in their report.
During the year under review, the Auditors had not reported any matter under section 143 (12) of the act, therefore, no detail is required to be disclosed under section 134 (3) (ca) of the act.
FIXED DEPOSITS
The Company has not invited/accepted any Fixed Deposits during the year under review. Consequently, no amount of principal or interest on fixed deposits was outstanding on the balance sheet date.
COMMITTEES OF THE BOARD
in terms of the provisions of the companies act, 2013, read with rules made thereunder, the Company has constituted the following Committees:
a) Audit Committee
in terms of the provisions of section 177 and other applicable provisions of the Companies Act, 2013, read with rules made thereunder, the company has constituted an audit committee of directors.
the composition of the audit committee during the Fy 2017-18 is given below:
Member Director Category Status
mr. dilip g. shahNon-Executive (independent)
chairman
mr. steffen georg roser Non-Executive member
Mr. Rajiv Lochan JainNon-Executive (independent)
member
the role and terms of reference of the audit committee covers the areas mentioned in section 177 of the companies act, 2013, besides other matters as may be referred by the board of directors.

Raising the Bar
18 | 15th annual rePOrt 2017-18
b) Stakeholders’ Relationship Committee
in terms of the provisions of section 178 and other applicable provisions of the Companies Act, 2013, read with rules made thereunder, the company has constituted a stakeholders’ relationship committee of directors.
the composition of the stakeholders’ relationship committee during FY 2017-18 is given below:
Member Director Category Status
mr. rakesh bhargava Non- Executive chairman
mr. dilip g. shahNon-Executive (independent)
member
ms. maria gobbi managing director member
The Stakeholders’ Relationship Committee is empowered to perform all the functions of the board in relation to resolving the shareholders’ grievances. It primarily focuses on:
• Review of investors’ complaints and their redressal; and
• Review and approval of the queries/requests received from the investors/shareholders.
c) Nomination and Remuneration Committee:
in terms of the provisions of section 178 and other applicable provisions of the Companies Act, 2013, read with rules made thereunder, the company has constituted a nomination and remuneration committee of directors.
the composition of the nomination and remuneration Committee during FY 2017-18 is given below:
Member Director Category Status
dr. michael schönhofen Non-Executive chairman
mr. dilip g. shah Non-Executive (independent)
member
Mr. Rajiv Lochan Jain Non-Executive (independent)
member
the role and terms of reference of the nomination and remuneration committee cover the areas mentioned in section 178 of the companies act, 2013, besides other matters as may be referred by the board of directors.
the committee has also adopted and implemented a policy named “appointment, remuneration and evaluation Policy” for Directors, Key Managerial Personnel (KMPs) and sr. management Personnel in terms of the requirements of section 178 of the companies act, 2013. a copy of the policy is attached as Annexure – I of this report and is also available on the website of the Company at the link: http://www.fresenius-kabi-oncology.com/userfiles/FKOL-Appointment-Nomination-and-remuneration-Policy.pdf
d) Corporate Social Responsibility (CSR) Committee
in terms of the provisions of section 135 and other applicable provisions of the Companies Act, 2013, read with rules made
thereunder, the company has constituted a csr committee of directors.
composition of the csr committee during Fy 2017-18 is given below:
Member Director Category Status
ms. maria gobbi managing director chairperson
mr. rakesh bhargava Non-Executive member
Mr. Rajiv Lochan Jain Non-Executive (independent)
member
The content of the CSR policy along with the update of CSR projects undertaken and statement of expenses incurred during the FY 2017-18 thereon is provided as Annexure – II of this report.
SECRETARIAL AUDIT
Pursuant to the provisions of section 204 of the companies act, 2013 and the companies (appointment and remuneration of managerial Personnel) rules, 2014, the company had appointed M/s Kiran Sharma & Co., a firm of Company Secretaries in Practice (“Secretarial Auditors”) to undertake the Secretarial Audit of the Company for the financial year 2017-18. The Secretarial Auditors have successfully carried out and completed the secretarial audit of the company for the Fy 2017-18.
The Secretarial Audit Report is annexed as Annexure - III of this report and it does not contain any qualification, reservation or adverse remark.
COST AUDIT
Pursuant to provisions of the companies act, 2013, the company is maintaining the cost records.
In terms of the exemption granted under the provisions of the Companies Act, 2013, read with Companies (Cost Records and audit) rules 2014, as amended from time to time, the company is not required to get its cost records audited by the cost auditors. accordingly, the cost records of the company for Fy 2017-18, have not been audited by the cost auditors.
VIGIL MECHANISM
in terms of the requirements of the companies act, 2013, a Vigil mechanism has been established by the company under the supervision of the audit committee of the company. a dedicated process and reporting mechanism has been devised under the Vigil mechanism Policy, formulated and implemented for this purpose.
For prompt and judicious redressal of the grievances/ complaints of the employees and directors of the company, a nodal officer has also been designated for acting as a link between Audit Committee and the complainant(s).
Under this policy, the Nodal Officer is also required to:
Provide a quarterly update to the audit committee about the grievances/ complaints received from employees and Directors of the Company and redressal thereof; and

Fresenius Kabi OncOlOgy limited | 19
ensure access of the audit committee chairman to the concerned employee/ Director of the Company in exceptional cases.
During the financial year 2017-18, no complaint was received under the provisions of vigil mechanism policy.
DISCLOSURE UNDER THE SEXUAL HARASSMENT OF WOMEN AT WORKPLACE (PREVENTION, PROHIBITION AND REDRESSAL) ACT, 2013
We have zero tolerance towards sexual harassment and any act of sexual harassment invites serious disciplinary action. In line with this, Company has formulated a Prevention of Sexual Harassment Policy. under this policy, employees can report sexual harassment at the workplace.
the company has constituted local complaints committee (LCC) at its offices/plants, which are being headed by women, to redress complaint(s) under the act, if any. this is supported by the Prevention of Sexual Harassment Policy which ensures a free and fair enquiry process.
During the financial year ended March 31, 2018, the ICC did not receive any complaint pertaining to sexual harassment at workplace.
GENERAL BODY MEETINGS
The last three Annual General Meetings were held as under:
Financial Year Location Date Time
2014 – 15 air Force auditorium, Subroto Park, New Delhi
august 20, 2015
10:00 a.m.
2015 – 16 air Force auditorium, Subroto Park, New Delhi
august 26, 2016
4:00 P.m.
2016 – 17 air Force auditorium, Subroto Park, New Delhi
august 21, 2017
4:00 P.m.
the Fifteenth annual general meeting of the company shall be held on thursday, august 9, 2018 at 10.00 am at air Force Auditorium, Subroto Park, New Delhi.
the members are requested to refer to the notice of the annual general meeting for the detailed agenda and program.
REGISTRAR AND TRANSFER AGENT (RTA):
The details of RTA are given below:
For share transfer / dematerialization of shares, payment of dividend and any other query relating to the shares of the Company
link intime india Private limited,registrar and transfer agent,44, community centre, 2nd Floor, naraina industrial area, Phase-I, Near PVR Naraina, New Delhi – 110 028Tel No.: +91 11 41410592 - 94 Fax No.: +91 11 41410591 Email: [email protected]: www.linkintime.co.in
ADDRESS FOR CORRESPONDENCE:
For queries of Analysts, FIIs, Institutions, Mutual Funds, Banks and Investors assistance
mr. nikhil Kulshreshtha,Director & Secretary Fresenius Kabi Oncology limited,echelon institutional area, Plot no – 11, sector - 32,gurugram-122001, Haryana, india, Tel No. +91 124 488 5000 Fax No.: +91 124 488 5101Email: [email protected]: www.fresenius-kabi-oncology.com
TRANSFER OF UNPAID DIVIDEND TO IEPF (Investor Education and Protection Fund)
in terms of section 125 of the companies act, 2013, read with the Investor Education and Protection Fund Authority (accounting, audit, transfer and refund) rules, 2016, during the year ended march 31, 2018, there is no fund outstanding which is required to be deposited to the Investors Education and Protection Fund (iePF).
DIRECTORS’ RESPONSIBILITY STATEMENT
Pursuant to the requirements of section 134 (3) (c) and (5) of the Companies Act, 2013, it is hereby confirmed that:
(a) in the preparation of annual accounts, the applicable accounting standards have been followed;
(b) the directors have selected such accounting policies and applied them consistently and made judgments and estimates that are reasonable and prudent so as to give a true and fair view of the state of affairs of the Company at the end of the financial year and of the profit and loss of the Company for that period;
(c) the Directors have taken proper and sufficient care for the maintenance of adequate accounting records in accordance with the provisions of this Act for safeguarding the assets of the company and for preventing and detecting fraud and other irregularities;
(d) the directors have prepared the annual accounts on a going concern basis; and
(e) the directors have devised proper systems to ensure compliance with the provisions of all applicable laws and that such systems are adequate and operating effectively.
ANNEXURES TO THE BOARD’S REPORT
in terms of the requirements of section 134(3) of the Companies Act, 2013, following documents/ information have also been annexed to the Board’s Report:
1. in terms of sub section (1) of section 178 of the companies act, 2013, company’s policy on directors’ appointment and remuneration, including criteria for determining qualifications, positive attributes, independence of directors and other matters provided under sub section (3) of section 178 (Annexure – I),

Raising the Bar
20 | 15th annual rePOrt 2017-18
2. detail about the policy formulated and implemented by the company on corporate social responsibility and initiatives taken during the year (Annexure – II),
3. secretarial audit report for Fy 2017-18 (Annexure – III),
4. no. of meetings of the board of directors (Annexure –IV),
5. statement on declaration given by the independent directors under sub section (6) of section 149 (Annexure – V),
6. Particulars of loans, guarantees or investments under Section 186: No such transaction during the year,
7. Particulars of contracts or arrangements with related parties referred to in sub section (1) of Section 188: No such transaction during the year,
8. conservation of energy, technology absorption and foreign exchange earnings and outgo (Annexure - VI),
9. a statement indicating development and implementation of a risk management policy for the company including identification therein of elements of risk, if any, which in the opinion of the Board may threaten the existence of the company (Annexure - VII),
10. The details in respect of adequacy of internal financial controls with reference to the Financial Statements. (Annexure - VIII),
11. Extracts of the Annual Return as provided under sub section (3) of section 92 (Annexure - IX).
ACKNOWLEDGEMENT / APPRECIATION
The Directors wish to place on record their appreciation to the company’s customers, vendors, investors and bankers for their continued support during the year. the directors also thank the employees for the efficient contribution made by them at all levels. Our consistent growth has been made possible by their whole-hearted efforts, solidarity, co-operation and support.
the directors also thank the government of india, particularly the ministry of corporate affairs, department of Pharmaceuticals, CBIC, CBDT including the Income Tax department, the ministry of commerce, the ministry of Finance, the reserve bank of india and other government agencies for their support and look forward to their continued support in future.
For and on behalf of the Board of Directors
maria gobbiGurugram Chairperson & Managing Director June 5, 2018 din - 07005222

Fresenius Kabi OncOlOgy limited | 21
ANNEXURE – I
APPOINTMENT, REMUNERATION AND EVALUATION POLICY
This Policy is in compliance with Section 178 of the Companies Act, 2013 read with applicable rules made thereunder.
this appointment, remuneration and evaluation Policy (the “Policy”) applies to the Board of Directors (“Board”), Key Managerial Personnel (“KMP”) and the Senior Management Personnel of Fresenius Kabi Oncology ltd. (FKOl).
Definition
a) Nomination and Remuneration Committee (NRC): It means a committee of directors constituted under the requirements of Companies Act, 2013, read with rules made thereunder.
b) “Key Managerial Personnel (KMP): KMP means and includes:
i. the Chief Executive Officer or the Managing Director or the Manager;
ii. the Company Secretary; iii. the Whole-time Director; iv. the Chief Financial Officer; and v. such other officer as may be prescribed.
c) “Senior Management Personnel” (SMP):
The expression ‘‘Senior Management Personnel’’ means personnel of the Company who are members of its core management team excluding Board of Directors, comprising all members of management one level below the Executive Directors, including the functional heads.
1. Objective
the nomination and remuneration committee shall provide a policy framework for:
a. Identifying persons who are qualified to become Directors and who may be appointed in senior management in accordance with the criteria laid down, recommend to the Board for their appointment and removal;
b. Carrying out evaluation of every Director’s performance;
c. Identifying the criteria for determining qualifications, positive attributes and independence of a Director;
d. Finalizing the remuneration for the Directors, Key Managerial Personnel and Senior Management Personnel;
e. Assessing the independence of Independent Directors; and
f. Such other key issues/matters as may be referred by the Board or as may be necessary in view of the provisions of the companies act, 2013 and rules made thereunder.
2. Accountability
the board is ultimately responsible for the appointment of directors and Key managerial Personnel.
However, the Board, in terms of requirements of Companies act, 2013 and rules made thereunder, has delegated responsibility for assessing and selecting the candidates for the role of directors, Key managerial Personnel and the senior management Personnel of the company to the Nomination and Remuneration Committee which makes nominations & recommendations to the Board.
3. Appointment of Directors and KMPs/Senior Management Personnel
a) Directors
enhancing the competencies of the board and providing strategic inputs to the management of the Company should be the main criteria/focus area while selecting directors of the company.
the proposed person should be assessed against a range of criteria which includes but not limited to:
Personality, Skills and Knowledge
• Knowledge and experience relevant to the business of the Company;
• Understanding of and experience in performing his/her roles and responsibilities;
• Independence of judgment; • Qualification(s); and • Past performance and credentials.
Behaviour & Conduct
• Ability to work individually as well as a member of team;
• Ability to represent the Company; • Interaction and relationship with the other
members of the Board, KMPs and key stakeholders; • Board room conduct; • Communication skills; and • ethics and Values.
independence of directors
independence of directors shall be decided on the basis of criteria provided under the relevant provisions of the Companies Act, 2013, read with rules made thereunder, and any modification/amendments done from time to time. a declaration of independence shall also be taken from the independent directors before their induction on the board of directors.
b) KMP/Senior Management Personnel
KmP and senior management Personnel shall be identified by the Company and informed to the nomination and remuneration committee from time-to-time. Their individual job descriptions shall also be updated from time-to-time based on the business and legal requirements.
ANNEXURES FORMING PART OF THE BOARD’S REPORT
Raising the Bar
22 | 15th annual rePOrt 2017-18
4. Letters of Appointment
The Company will issue a formal letter of appointment to each Director, KMP/Senior Management Personnel which will, inter alia, contain the terms of appointment and the role assigned by the company and get it accepted and signed by the concerned individual.
5. Remuneration of Directors, Key Managerial Personnel and Senior Management Personnel
While fixing the remuneration, the guiding principle should be that the level and composition of remuneration should be reasonable and sufficient to attract, retain and motivate directors, Key management Personnel and other senior management Personnel.
the directors, Key management Personnel and other Senior Management Personnel’s remuneration/salary shall be based and determined on the individual person’s responsibilities and performance and in accordance with the limits as prescribed statutorily, if any.
The Non-Executive Directors, which term shall mean and include Independent Directors, may be paid/ reimbursed travelling, local transportation, boarding & lodging expenses incurred by each of them for attending meeting(s) of the Board of Directors and/or its Committees. Provided that, any Director who is in employment with any FK Group Company, shall not be eligible for payment/reimbursement of such expenses.
In addition to the above, the Non-Executive Independent Directors may be also paid sitting fees and/or commission (subject to availability of net profits as may be available pursuant to applicable provisions of the companies act, 2013 and rules prescribed thereunder) for attending meetings(s) of the Board of Directors and/or its Committees. However, the quantum of amount of the sitting fees and commission to be paid shall be recommended by the nomination and remuneration committee and approved by the board of directors from time to time.
individual remuneration packages for directors, KmPs and Senior Management Personnel of the Company will be determined taking into account relevant factors, including but not limited to:
• Qualification and experience; • Level of engagement in the affairs of the Company; • Market conditions; • Financial and commercial health of the Company; • Practice being followed in comparable companies; and • Prevailing laws and government/other guidelines.
remuneration structure
a) Base Compensation (fixed salaries):
It should be competitive and reflective of the individual’s role, responsibility and experience in relation to performance of day-to-day activities, usually reviewed on an annual basis; (includes salary,
allowances and other statutory/non-statutory benefits which are normal part of remuneration package in line with market practices).
b) Variable salary:
the nrc may at its discretion, structure any portion of remuneration to link rewards to corporate and individual performance, fulfillment of specified improvement targets or the attainment of certain financial or other objectives set in this regard.
c) Any other component /benefits as may be recommended by the management and approved by the nrc committee.
6. Evaluation/ Assessment of Directors:
The evaluation/assessment of the Directors is to be conducted on an annual basis. The following criteria may assist in determining how effective the performances of the Directors have been:
a) Vision and clarity of roles & responsibility:
The Individual Director should have awareness of fiduciary and statutory requirements and a clearly articulated vision. this includes clarity of role as a member of the board of the company.
b) Board Processes:
the quality of board processes such as decision making (i.e. how directors ensure they are well informed to be able to make the decisions in the best interest of the company and its stakeholders).
c) Engagement with Management:
How well the board engages with the management to ensure it is well supported and able to meet the needs of its members.
d) Board dynamics:
at the heart are the board dynamics. it is the quality of individual relationships and dialogues that directly influence the quality of decision making and relationships with key stakeholders.
e) Frequency of participation:
The Individual should make himself /herself available for attending the board meetings of the company and be available for providing his/her guidance and support in case of need.
Evaluation on the aforesaid parameters will be conducted by the Independent Directors for each of the Executive/ Non-Independent Directors and Chairman/Chairperson of the board in a separate meeting of the independent directors.
The Executive Director/Non-Independent Directors along with the Independent Directors will evaluate/assess each of the independent directors on the aforesaid parameters. Only the Independent Director being evaluated will not participate in the said evaluation discussion.

Fresenius Kabi OncOlOgy limited | 23
ANNEXURE – II
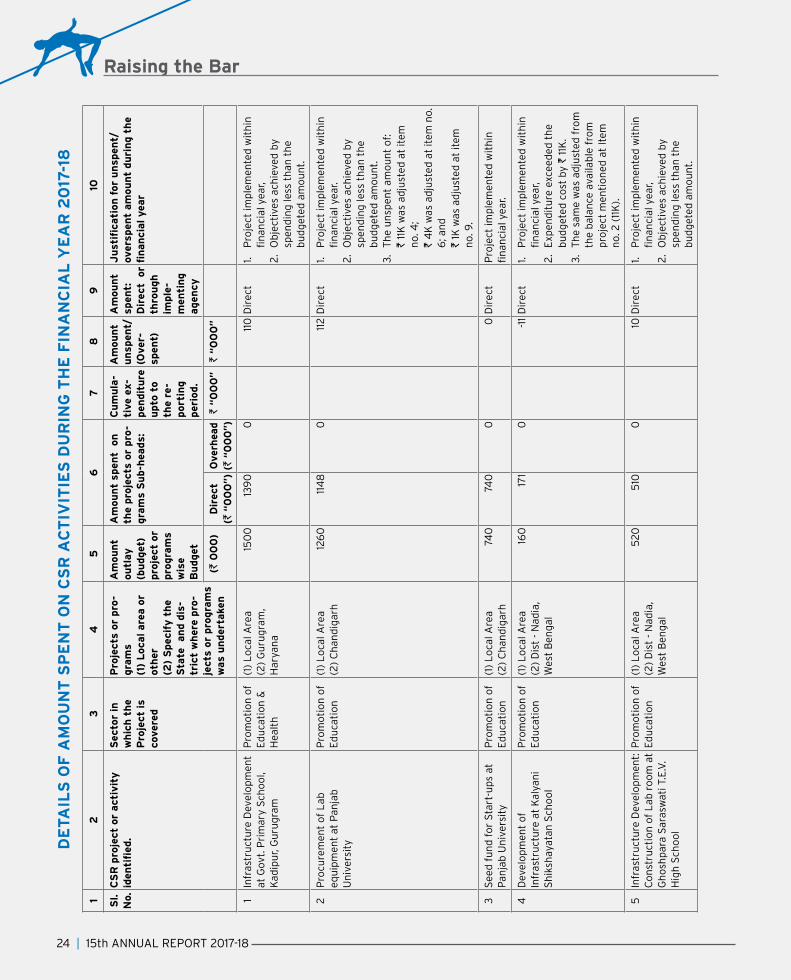
ANNUAL REPORT ON CSR ACTIVITIES (FY 2017-18)
1. A brief outline of the Company’s CSR Policy including overview of projects or programs proposed to be undertaken and a reference to the web-link to the CSR Policy and projects or programs
A. A brief outline of the Company’s CSR Policy
We at Fresenius Kabi Oncology Ltd. own social responsibilities with equal passion and commitment. We leverage our expertise and resources in identifying community needs, take focused initiatives to address those needs and assess their impact. While we touch several lives in multiple ways, our CSR focus utmost remains on two main areas (i) Education; and (ii) Health. Since initiation of formal CSR activities, we have been engaging with the communities that surround our operations and have successfully completed interventions like infrastructure development, construction and maintenance of toilets and classrooms, scholarships for meritorious students, provision for clean drinking water, provision for lab equipments and development of labs etc. at various schools/university. We strongly believe that these initiatives will help in improving health and education standards in schools. We have faith that through such sustained efforts we will be successful in touching the lives of people around us.
B. Overview of Projects or programs proposed to be undertaken under CSR Policy
Following general areas have been shortlisted for carrying out CSR activities by the Company:
i. Promoting preventive health care and sanitation and making available safe drinking water;
ii. Promoting education, including special education and employment enhancing vocation skills especially among children, women, elderly, and the differently abled and livelihood enhancement projects;
iii. Promoting gender equality; empowering women; setting up homes and hostels for women and orphans; setting up old age homes; day care centers and such other facilities for senior citizens and measures for reducing inequalities faced by socially and economically backward groups;
iv. ensuring environmental sustainability, ecological balance, protection of flora and fauna, animal welfare, agro forestry, conservation of natural resources and maintaining quality of soil, air and water;
v. contribution to the Prime minister’s national relief Fund or any other fund set up by the central government for socio-economic development and relief and welfare of the Scheduled Castes, the Scheduled Tribes, other backward classes, minorities and women;
vi. contributions or funds provided to technology incubators located within academic institutions which are approved by the central government.
C. Web link for CSR policy and projects or programs:
http://www.fresenius-kabi-oncology.com/userfiles/Policy-on-the-corporate-social-responsibility.pdf
2. The composition of the CSR Committee as on March 31, 2018
Sr. No.
Name (Designation in the Board)
Designation in the Committee
1. ms. maria gobbi (managing director)
chairperson
2. mr. rakesh bhargava (Non – Executive Director)
member
3. Mr. Rajiv Lochan Jain (Non – Executive Independent director)
member
3. Average Net Profit/ (Loss) of the Company as per last three financial years
(` 7,305.06 lakh)
4. Prescribed CSR expenditure i.e. 2% of average Net Profit as mentioned at Item No. 3 above:
N.A. as the Company has incurred losses while calculating average Net Profit/ (Loss)
5. Details of CSR spend during the financial year (as on March 31, 2018):
total amount to be spent for the financial year
` 50.00 lakhs
amount unspent, if any ` 2.33 lakhs
Manner in which the amount spent during the financial year
details given below
6. Responsibility Statement
the responsibility statement of the corporate social responsibility (csr) committee of the board of directors of the Company is reproduced below:
‘the implementation and monitoring of corporate social Responsibility (CSR) Policy, is in compliance with CSR objectives and policy of the Company.’
Raising the Bar
24 | 15th annual rePOrt 2017-18
DE
TAIL
S O
F A
MO
UN
T S
PE
NT
ON
CS
R A
CT
IVIT
IES
DU
RIN
G T
HE
FIN
AN
CIA
L Y
EA
R 2
017
-18
12
34
56
78
910
Sl.
No.
CS
R p
roje
ct o
r act
ivit
y
iden
tifi
ed.
Sec
tor
in
wh
ich
th
e P
roje
ct is
cover
ed
Pro
ject
s or
pro
-gra
ms
(1)
Loca
l are
a o
r ot
her
(2
) S
pec
ify
th
e S
tate
an
d d
is-
tric
t w
her
e pro
-je
cts
or
pro
gra
ms
was
un
der
take
n
Am
ou
nt
ou
tlay
(b
udget
) pro
ject
or
pro
gra
ms
wis
e B
udget
Am
ou
nt
spen
t o
n
the
pro
ject
s or
pro
-gra
ms
Su
b-h
eads:
Cu
mu
la-
tive
ex-
pen
dit
ure
u
pto
to
the
re-
port
ing
per
iod.
Am
ou
nt
un
spen
t/
(Over
-sp
ent)
Am
ou
nt
spen
t:
Dir
ect
or
thro
ugh
im
ple
-m
enti
ng
agen
cy
Ju
stifi
cati
on
for
un
spen
t/ov
ersp
ent
am
ou
nt
du
rin
g t
he
fin
an
cial yea
r
(` 0
00
)D
irec
t( `
“0
00
”)O
verh
ead
( `
“0
00
”)`
“00
0”
` “0
00
”
1in
fras
tru
ctu
re d
evel
op
men
t
at g
ovt.
Pri
mar
y s
cho
ol,
Kad
ipu
r, g
uru
gra
m
Pro
mo
tio
n o
f E
du
cati
on
&
Hea
lth
(1)
lo
cal a
rea
(2)
gu
rug
ram
, H
arya
na
150
013
90
0
110
dir
ect
1. P
roje
ct im
ple
men
ted
wit
hin
fi
nan
cial
yea
r,2
. O
bje
ctiv
es a
chie
ved
by
spen
din
g le
ss t
han
th
e b
ud
get
ed a
mo
un
t.
2P
rocu
rem
ent
of l
ab
equ
ipm
ent
at P
anja
b
un
iver
sity
Pro
mo
tio
n o
f e
du
cati
on
(1)
lo
cal a
rea
(2)
ch
and
igar
h12
60
114
80
11
2d
irec
t1.
Pro
ject
imp
lem
ente
d w
ith
in
fin
anci
al y
ear.
2
. O
bje
ctiv
es a
chie
ved
by
spen
din
g le
ss t
han
th
e b
ud
get
ed a
mo
un
t.3.
T
he
un
spen
t am
ou
nt
of:
` 11
K w
as a
dju
sted
at
item
n
o. 4
;`
4K
was
ad
just
ed a
t it
em n
o.
6; a
nd
` 1K
was
ad
just
ed a
t it
em
no.
9.
3s
eed
fu
nd
fo
r s
tart
-ups
at
Pan
jab
Un
iver
sity
Pro
mo
tio
n o
f e
du
cati
on
(1)
lo
cal a
rea
(2)
ch
and
igar
h74
074
00
0
dir
ect
Pro
ject
imp
lem
ente
d w
ith
in
fin
anci
al y
ear.
4d
evel
op
men
t of
in
fras
tru
ctu
re a
t K
alya
ni
sh
iksh
ayat
an s
cho
ol
Pro
mo
tio
n o
f e
du
cati
on
(1)
lo
cal a
rea
(2)
dis
t -
nad
ia,
Wes
t B
eng
al
160
171
0
-11
dir
ect
1. P
roje
ct im
ple
men
ted
wit
hin
fi
nan
cial
yea
r, 2
. E
xpen
dit
ure
exc
eed
ed t
he
bu
dg
eted
co
st b
y `
11K
.3.
T
he
sam
e w
as a
dju
sted
fro
m
the
bala
nce
ava
ilab
le f
rom
p
roje
ct m
enti
on
ed a
t It
em
no.
2 (
11K
).
5In
fras
tru
ctu
re D
evel
op
men
t:
co
nst
ruct
ion
of
lab
ro
om
at
Gh
osh
para
Sar
asw
ati T
.E.V
. H
igh
sch
oo
l
Pro
mo
tio
n o
f e
du
cati
on
(1)
lo
cal a
rea
(2)
dis
t -
nad
ia,
Wes
t B
eng
al
520
510
0
10
dir
ect
1. P
roje
ct im
ple
men
ted
wit
hin
fi
nan
cial
yea
r, 2
. O
bje
ctiv
es a
chie
ved
by
spen
din
g le
ss t
han
th
e b
ud
get
ed a
mo
un
t.

Fresenius Kabi OncOlOgy limited | 25
6In
fras
tru
ctu
re D
evel
op
men
t:
co
nst
ruct
ion
of
Toile
t &
Bat
hro
om
fo
r th
e vo
cati
on
al t
rain
ing
stu
den
ts
at P
asch
im b
ang
a a
nd
ha
alo
k s
amit
y (b
lind
sch
oo
l)
Pro
mo
tio
n o
f e
du
cati
on
(1)
lo
cal a
rea
(2)
dis
t -
nad
ia,
Wes
t B
eng
al
200
204
0
-4d
irec
t1.
Pro
ject
imp
lem
ente
d w
ith
in
fin
anci
al y
ear,
2.
Exp
end
itu
re e
xcee
ded
th
e b
ud
get
ed c
ost
by
` 4
K.
3.
Th
e sa
me
was
ad
just
ed f
rom
th
e ba
lan
ce a
vaila
ble
fro
m
pro
ject
men
tio
ned
at
Item
n
o. 2
(4
K).
7m
eal s
po
nso
red
to
th
e re
sid
ent
blin
d s
tud
ents
of
Pas
chim
ban
ga
an
dh
a a
lok
sam
ity
(blin
d s
cho
ol)
Pro
mo
tio
n o
f E
du
cati
on
&
Hea
lth
(1)
lo
cal a
rea
(2)
dis
t -
nad
ia,
Wes
t B
eng
al
150
135
0
15d
irec
t1.
Pro
ject
imp
lem
ente
d w
ith
in
fin
anci
al y
ear.
2.
Ob
ject
ives
ach
ieve
d b
y sp
end
ing
less
th
an b
ud
get
ed
amo
un
t.
8s
cho
lars
hip
s to
stu
den
ts o
f G
ho
shpa
ra S
aras
wat
i T.E
.V.
Hig
h s
cho
ol
Pro
mo
tio
n o
f e
du
cati
on
(1)
lo
cal a
rea
(2)
dis
t -
nad
ia,
Wes
t B
eng
al
100
98
0
2d
irec
tP
roje
ct im
ple
men
ted
as
on
m
arch
31,
2018
.
9in
fras
tru
ctu
re d
evel
op
men
t at
Bija
y L
axm
i Net
aji H
ind
i V
idya
laya
Pro
mo
tio
n o
f E
du
cati
on
&
Hea
lth
(1)
lo
cal a
rea
(2)
dis
t -
nad
ia,
Wes
t B
eng
al
370
371
0
-1d
irec
t1.
Pro
ject
imp
lem
ente
d w
ith
in
fin
anci
al y
ear.
2.
Th
ere
was
an
ove
rru
n o
f `
1K.
3.
co
st o
verr
un
of
` 1K
was
ad
just
ed f
rom
th
e ba
lan
ce
avai
lab
le a
t it
em n
o. 2
(1K
).
T
OTA
L
5
00
04
76
70
02
33
Raising the Bar
26 | 15th annual rePOrt 2017-18
ANNEXURE – III
SECRETARIAL AUDIT REPORT
FORM NO. MR - 3FOR THE FINANCIAL YEAR FROM APRIL 1, 2017 TO MARCH 31, 2018
[Pursuant to section 204(1) of the Companies Act, 2013 and Rule No. 9 of the Companies
(Appointment and Remuneration of Managerial Personnel) Rules, 2014]
viii. Equal Remuneration Act, 1976;
ix. Factories Act, 1948;
x. Indian Stamp Act, 1999;
xi. Industrial Dispute Act, 1947;
xii. environment Protection act, 1986 and other environmental laws read with Bio-Medical Waste Management Rules, 2016 and e-waste (Management and Handling) Rules, 2016;
xiii. Maternity Benefits Act, 1961;
xiv. Minimum Wages Act, 1948;
xv. Payment of Bonus Act, 1965;
xvi. Payment of Wages Act, 1936;
xvii. contract labour (regulation and abolition) act, 1970 read with CLRA State Rules;
xviii. Payment of Gratuity Act, 1972 read with Payment of Gratuity State Rules;
xix. Employees State Insurance Act, 1948 read with Employees State Insurance (Central) Rules, 1950; Employees State Insurance (General) Regulations, 1950;
xx. Employee’s Compensation Act, 1923 r/w The Workmen’s Compensation Rules, 1924 and Workmen’s Compensation Returns, 1935;
xxi. The Public Liability Insurance Act, 1991 read with The Public Liability Insurance Rules, 1991;
xxii. Delhi Shops and Establishments Act, 1954 read with Delhi Shops and Establishments Rules, 1954;
xxiii. Punjab Shops and Commercial Establishments Act, 1958 read with Punjab Shops and Commercial Establishments Rules, 1958;
xxiv. the boilers act, 1923 and indian boiler regulations, 1950;
xxv. Hazardous Wastes (Management and Handling) Rules 1989 and Amendment Rules, 2003;
xxvi. The Drugs and Cosmetics Act, 1940 r/w The Drugs and Cosmetics Rules, 1945 with applicable orders including:
a) the narcotic drugs and Psychotropic substances (Regulation of Controlled Substances) Order, 1993;
to,
the members,
Fresenius Kabi Oncology limited
i have conducted the secretarial audit of the compliance(s) of applicable statutory provisions and the adherence to good corporate practices by Fresenius Kabi Oncology limited (hereinafter called “the Company”). Secretarial Audit was conducted in a manner that provided me a reasonable basis for evaluating the corporate conducts/ statutory compliances and expressing my opinion thereon.
Based on the verification of the Company’s books, documents, minute books, forms and returns filed and other records maintained by the company and also the information provided by the company, its officers, agents and authorized representatives during the conduct of secretarial audit, i hereby report that in my opinion, the company has, during the audit period covering the financial year from April 1, 2017 to March 31, 2018, complied with the statutory provisions listed hereunder and also that the company has proper board-processes and compliance-mechanism in place to the extent, in the manner and subject to the reporting made hereinafter.
I have examined the books, documents, minute books, forms and returns filed and other records maintained by the Company for the financial year from April 1, 2017 to March 31, 2018, inter-alia, according to the provisions of:
i. The Companies Act, 2013 (the Act) read with the companies (amendment) act, 2017 and the rules made thereunder;
ii. Foreign Exchange Management Act, 1999 and the rules and regulations made thereunder to the extent of Foreign direct investment, Overseas direct investment and External Commercial Borrowings;
iii. Industries Development and Regulation Act, 1951;
iv. The Depositories Act, 1996 read with the Securities and Exchange Board of India (Depositories and Participants) regulations, 1996.
v. The Income Tax Act, 1961 read with rules;
vi. the Foreign trade (development and regulation) act, 1992 r/w Foreign Trade Policy & Procedures (EOU);
vii. the employees Provident Funds and miscellaneous Provisions Act, 1952 along with the Central Scheme, 1952;
Fresenius Kabi OncOlOgy limited | 27
b) Drugs and Magic Remedies (Objectionable Advertisements) Act, 1954 read with Rule;
c) The Essential Commodities Act, 1955 read with the Drugs (Price Control) Order, 2013;
d) The National Pharmaceuticals Pricing Policy, 2012;
e) Destructive Insects and Pests Act, 1914 read with the Plant Quarantine (Regulation of Import into India) Order, 2003;
xxvii. Food Safety and Standards Act, 2006 read with rules made thereunder;
xxviii. The Electricity Act, 2003 read with Rules and Regulations;
xxix. Motor Vehicles Act, 1988 read with rules made thereunder;
xxx. Legal Metrology Act, 2009, read with applicable rules made thereunder;
xxxi. Explosives Act, 1884 read with Gas Cylinder Rules, 2016;
xxxii. The Petroleum Act, 1934 read with Petroleum Rules, 1976;
xxxiii. Atomic Energy Act, 1962 read with Atomic Energy (Radiation Protection) Rules, 2004;
xxxiv. The Information Technology Act, 2000 read with applicable rules made thereunder;
xxxv. The Sexual Harassment of Women at Workplace (Prevention, Prohibition and redressal) act, 2013
xxxvi. The Central Sales Tax Act 1956;*
xxxvii. Central Sales Tax (Registration & Turnover) Rules, 1957;*
xxxviii. Central Excise Act, 1944 read with rules and regulations;*
xxxix. Chapter V of the Finance Act, 1994 read with Rules;*
xl. State Value Added Tax Act read with Rules;*
xli. Medicinal And Toilet Preparations Excise Duties Act, 1955 r/w Medicinal And Toilet Preparations Excise Duties Rules, 1956;*
xlii. Customs Act, 1962, Customs Tariff Act, 1975 read with Customs Rules and Regulations;
xliii. Research & Development Cess Act, 1986;*
xliv. The Central Goods and Services Tax Act, 2017# and the Integrated Goods and Services Tax Act, 2017# read with:
a. Central Goods and Services Tax (CGST) Rules, 2017
b. Himachal Pradesh Goods and Services Tax Act, 2017 and the Himachal Pradesh goods and Services Tax Rules, 2017
c. West Bengal Goods and Services Tax Act, 2017 and the West Bengal Goods and Services Tax Rules, 2017
d. Haryana Goods and Services Tax Act, 2017 and the Haryana Goods and Services Tax Rules, 2017.
* applicable till June 30, 2017
# effective from July 1, 2017
I have also examined compliance with the applicable clauses of Secretarial Standards with regard to the meetings of the board of directors (ss-1) and general meetings (ss-2) issued by the institute of company secretaries of india (icsi).
During the year under review the Company has complied with the provisions of the Act, Rules, Regulations, Guidelines, standards etc. mentioned above.
I further report that:
the board of directors of the company is duly constituted with proper balance of Executive Directors, Non-Executive directors and independent directors. the changes in the composition of the board of directors that took place during the period under review were carried out in compliance with the provisions of the act.
adequate notice is given to all the directors to schedule the Board Meetings, agenda and detailed notes on agenda were sent at least seven days in advance, and a system exists for seeking and obtaining further information and clarifications on the agenda items before the meeting and for meaningful participation at the meeting.
Majority decision is carried through while the dissenting members’ views, if any, are captured and recorded as part of the minutes.
I further report that there are adequate systems and processes in the company which is commensurate with the size and operations of the company to monitor and ensure compliance with applicable laws, rules, regulations and guidelines.
I further report that during the audit period:
There were no instances of:
a. Public/ Right/ Preferential Issue of shares/debentures/sweat equity, etc.
b. Redemption/buyback of securities.
c. Major decisions taken by the members in pursuance to section 180 of the companies act, 2013.
d. Merger/amalgamation/reconstruction etc.
e. Foreign technical collaborations.
Place: New Delhi Kiran Sharma & Co.Date: May 17, 2018 Company Secretaries
Sd/-Kiran Sharma
Proprietor FCS No.: 4942 C P No.: 3116
Raising the Bar
28 | 15th annual rePOrt 2017-18
ANNEXURE –IV
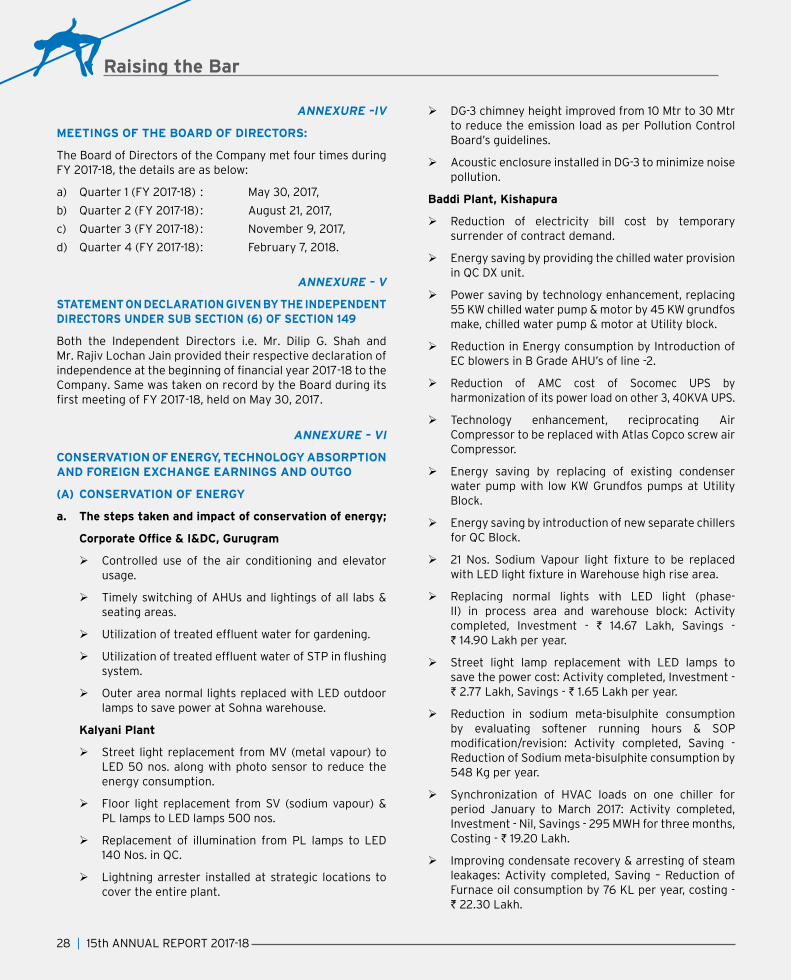
MEETINGS OF THE BOARD OF DIRECTORS:
the board of directors of the company met four times during FY 2017-18, the details are as below:
a) Quarter 1 (FY 2017-18) : May 30, 2017,
b) Quarter 2 (FY 2017-18) : August 21, 2017,
c) Quarter 3 (FY 2017-18) : November 9, 2017,
d) Quarter 4 (FY 2017-18) : February 7, 2018.
ANNEXURE – V
STATEMENT ON DECLARATION GIVEN BY THE INDEPENDENT DIRECTORS UNDER SUB SECTION (6) OF SECTION 149
both the independent directors i.e. mr. dilip g. shah and Mr. Rajiv Lochan Jain provided their respective declaration of independence at the beginning of financial year 2017-18 to the Company. Same was taken on record by the Board during its first meeting of FY 2017-18, held on May 30, 2017.
ANNEXURE – VI
CONSERVATION OF ENERGY, TECHNOLOGY ABSORPTION AND FOREIGN EXCHANGE EARNINGS AND OUTGO
(A) CONSERVATION OF ENERGY
a. The steps taken and impact of conservation of energy;
Corporate Office & I&DC, Gurugram
controlled use of the air conditioning and elevator usage.
Timely switching of AHUs and lightings of all labs & seating areas.
Utilization of treated effluent water for gardening.
Utilization of treated effluent water of STP in flushing system.
Outer area normal lights replaced with LED outdoor lamps to save power at Sohna warehouse.
Kalyani Plant
street light replacement from mV (metal vapour) to LED 50 nos. along with photo sensor to reduce the energy consumption.
Floor light replacement from SV (sodium vapour) & Pl lamps to led lamps 500 nos.
replacement of illumination from Pl lamps to led 140 Nos. in QC.
lightning arrester installed at strategic locations to cover the entire plant.
dg-3 chimney height improved from 10 mtr to 30 mtr to reduce the emission load as per Pollution control board’s guidelines.
Acoustic enclosure installed in DG-3 to minimize noise pollution.
Baddi Plant, Kishapura
reduction of electricity bill cost by temporary surrender of contract demand.
Energy saving by providing the chilled water provision in QC DX unit.
Power saving by technology enhancement, replacing 55 KW chilled water pump & motor by 45 KW grundfos make, chilled water pump & motor at Utility block.
reduction in energy consumption by introduction of EC blowers in B Grade AHU’s of line -2.
reduction of amc cost of socomec uPs by harmonization of its power load on other 3, 40KVA UPS.
technology enhancement, reciprocating air Compressor to be replaced with Atlas Copco screw air compressor.
Energy saving by replacing of existing condenser water pump with low KW Grundfos pumps at Utility block.
Energy saving by introduction of new separate chillers for QC Block.
21 Nos. Sodium Vapour light fixture to be replaced with LED light fixture in Warehouse high rise area.
Replacing normal lights with LED light (phase-II) in process area and warehouse block: Activity completed, investment - ` 14.67 lakh, savings - ` 14.90 lakh per year.
Street light lamp replacement with LED lamps to save the power cost: Activity completed, Investment - ` 2.77 lakh, savings - ` 1.65 lakh per year.
reduction in sodium meta-bisulphite consumption by evaluating softener running hours & SOP modification/revision: Activity completed, Saving - reduction of sodium meta-bisulphite consumption by 548 Kg per year.
Synchronization of HVAC loads on one chiller for period January to March 2017: Activity completed, Investment - Nil, Savings - 295 MWH for three months, costing - ` 19.20 lakh.
Improving condensate recovery & arresting of steam leakages: Activity completed, Saving – Reduction of Furnace oil consumption by 76 Kl per year, costing - ` 22.30 lakh.

Fresenius Kabi OncOlOgy limited | 29
b. The steps taken by the Company for utilizing alternate sources of energy:
the company is committed to environment sustenance and working on the usage of solar power for street lights at its Kishanpura Plant and Kalyani Plant as well as for administration building in Kalyani Plant.
c. The capital investment on energy conservation equipments:
Approx. ` 10 Lakh incurred at Kalyani Plant; and
Approx. ` 40 lakh incurred at Kishanpura Plant.
(B) TECHNOLOGY ABSORPTION
1. Efforts made towards technology absorption, adaptation and innovation:
• Implemented a process automation (phase-1) project for 10DAB plant. In this project automation is done for centralized operations of 4 units (2 wiped film evaporator, one distillation column & one falling film evaporator). these units are running for most of the time in a month at Kalyani Plant.
• Variation approval for filtered bulk hold time of product Oxaliplatin injection 5mg/ml for EU market from 24 hrs (from end of first filtration to end of filling) to 60 hrs i.e. from end of first filtration to start of filling is 36 hrs & start of filling to end of filling is 24 hrs.
• Regulatory assessment was performed and gets approval for the removal of SIP/PHT/VLT process from manufacturing tanks.
• Extension of alliance business to cover additional products/ markets.
• submissions of regulatory dossiers in different countries worldwide.
• Product internationalisation.
• Regulatory Intelligence Reports: Preparation of regulatory intelligence reports for all regions, i.e., Europe, US and PhM countries, to define regulatory strategy and timelines for the projects in pre-feasibility and feasibility stages.
• BREXIT (Britain Exit from the European Union): As a result of breXit, the regulatory activities like rms transfer, maH transfer have already been initiated and completed for majority of products to meet the deadline of March 30, 2019, when UK will become the “third country”.
2. Benefits derived as a result of the above efforts:
• Approval for increase in filtered bulk hold time obtained so as to minimize the events related to
filtered bulk hold time and minimize the manufacturing tank preparation time for next batch manufacturing.
• Centralized operations are done, manual operations needed from multiple floors for each unit are avoided.
• manual intervention is limited.
• Consistent & repeatable performance is established.
• All reports & data logging are generated by system for these 4 units. system is 21 cFr Part 11 compliant.
• Solvent losses from vents are minimized on account of utility failures as system stops distillation in such cases.
• Data logging will further help in identifying improvement opportunities in system.
• Extension of alliance business to include the additional products and additional regions will provide significant revenue boost in coming years.
• International regulatory filings and approvals - dosage forms:
Markets New Filings New Approvals
us 2 1
eu 0 8
emerging countries
2 10
• internationalisation of the product in different countries will expand the overseas business and improve global competitiveness.
• Regulatory Intelligence Function supports in defining the strategy or any regulatory action proactively in pre-feasibility or feasibility phase which further would have an impact on the go ahead of the project to the next phase. this ensures complete regulatory evaluation of the product and anticipates any questions / challenges which may be faced during the development and / or filing stages of the product life cycle.
• BREXIT: The steps taken so far would help us to ensure that the necessary changes have been made in the marketing authorisation to meet the deadline of March 29, 2019. This will allow for the continued marketing of medicine in the european economic Area (EEA) after Brexit.
3. Imported technology
Following are the details of technology imported during the last 3 years, reckoned from the beginning of the financial year:
a) Technology Imported: 40 weighing scale with printing facility

Raising the Bar
30 | 15th annual rePOrt 2017-18
b) Year of import: 2017-18
c) Has technology been fully absorbed: Yes
d) If not fully absorbed, areas where this has not taken place, reasons therefore and future plans of action: N.A.
4. Expenditure on Research & Development (R&D):
The details of expenditure incurred by the Company on R&D are as under:
Sr. No. Particulars Amount (` in Lakhs)
a. capital 1,263.15
b. recurring 12,682.50
c. total 13,945.65
d. Total R&D as a percentage of total turnover
19.02%
(C) FOREIGN EXCHANGE EARNINGS AND OUTGO
Total foreign exchange used and earned:
AAmount (` in Lakhs)
• Foreign Exchange Earnings : 57,540.89
• Foreign Exchange Outgo : 21,681.47
ANNEXURE – VII
A STATEMENT INDICATING DEVELOPMENT AND IMPLEMENTATION OF A RISK MANAGEMENT POLICY FOR THE COMPANY INCLUDING IDENTIFICATION THEREIN OF ELEMENTS OF RISK, IF ANY, WHICH IN THE OPINION OF THE BOARD, MAY THREATEN THE EXISTENCE OF THE COMPANY
The Company values the importance of identification, management and moderation of risks associated with business and product portfolio. risk management is an inherent part of business and is synonymous to growth. Thus, the Company continuously strives to foster a high awareness of business risks, manage and monitor it through effective internal control mechanism, thereby promoting a culture of transparency in its operations. adhering to the resolution for effectively managing its risks, the company has implemented a risk Management Framework (“RMF”) governed by a standard operating procedure that is developed and put in place.
the company’s audit committee has overall responsibility for the establishment and oversight of company’s rmF. as per RMF, Company has laid down an organization structure for identifying, prioritizing and mitigating the risks. The Board of Directors have designated the Chief Financial Officer as the “Risk Officer” of the Company.
Such risk management policies and systems are reviewed regularly to reflect changes in market condition and the
company’s activities. the company through its training and management standards and procedures aims to maintain a disciplined and constructive control environment in which all employees understand their roles and obligations.
the company is committed to its pledge of managing the operational, financial and other business risks while ensuring that business, social and commercial objectives are also met. the company has thus, during the Fy 2017-18, implemented a business Partner due-diligence (bPdd) mechanism to assess, identify, measure and monitor risk(s) that may arise from association with a business partner.
As of now, the Company does not foresee any potential risks which may threaten the existence of the Company.
ANNEXURE – VIII
THE DETAILS IN RESPECT OF ADEqUACY OF INTERNAL FINANCIAL CONTROLS WITH REFERENCE TO THE FINANCIAL STATEMENTS
Internal Control Systems and Risk Management
risk-taking is an inherent trait of any enterprise. it is essential for growth or creation of value in a Company. At the same time, it is important that the risks are properly managed and controlled, so that the Company can achieve its objectives effectively and efficiently.
Internal Financial Control Framework
Provisions of the companies act, 2013 require a company to lay down Internal Financial Controls (IFC) and to ensure that these are adequate and operating effectively. internal financial controls, here, means the procedures adopted by the Company for ensuring the orderly and efficient conduct of its business including adherence to company’s policies, the safeguarding of its assets, the prevention and detection of frauds and errors, the accuracy and completeness of the accounting records and the timely preparation of reliable financial information.
The above requirement has the following elements:
1. Orderly and efficient conduct of business;
2. Safeguarding of assets;
3. Adherence to Company’s policies;
4. Prevention and detection of frauds & errors; and
5. accuracy and completeness of the accounting records and timely preparation of reliable financial information.
The internal financial controls system is in place for the Company and incorporates all the five elements as mentioned above. In addition, the Company has a transparent framework for periodic evaluation of the internal financial controls in the form of internal audit exercise carried throughout the year, thereby reinforcing the commitment to adopt effective corporate governance practices.
Fresenius Kabi OncOlOgy limited | 31
Policy and procedure adopted by the company to adhere to IFC elements is given below:
Orderly and Efficient Conduct of Business
The Company has a well laid down organisational structure which defines the authority-responsibility relationship. The Company has a formal financial planning and budgeting system in place encompassing short term as well as long term planning. in order to ensure that decisions are made and action is taken at an appropriate level, the board of directors of the Company has formulated the Delegation of Authority matrix which has been designed to ensure that there is judicious balance of authority and responsibility. the adherence to Delegation of Authority matrix is part of internal audit plan. the company has also designed and implemented key checks, controls and review procedures for important financial, legal and administrative processes, so as to ensure transparent governance of business procedures.
Safeguarding of its Assets
the company has taken an all industrial risk policy for all of its plants as well as corporate office to safeguard its assets. The Company also carries out a physical verification of its assets.
Adherence to the Company’s Policies
The Company has two tier policies and procedures viz. Entity level controls and Process level controls. the entity level controls include a comprehensive code of conduct and code of Ethics. The Company also has a Whistle Blower Policy in place and any employee of the Company can directly write to the Nodal Officer designated under the Whistle Blower Policy. The Company also has process level controls which cover a wide range of key operating financial and compliance related areas like accounting, Order to cash, Procurement to Payment, Inventory and Production, Treasury, Legal, Forex, Fixed Assets, Direct and Indirect Tax, R&D etc.
Prevention and Detection of Frauds and Errors
Due to the presence of Code of Ethics and Whistle Blower Policy, it is generally expected that serious frauds will not take place. in order to prevent and detect frauds and errors, perpetual internal audit activity is carried out with assistance of co-sourced internal audit partners. action points and suggestions made by them are discussed and presented to the audit committee.
Subsequently, follow-up audits are also carried out by in-house internal audit team to ensure implementation of the suggestions.
Accuracy and Completeness of the Accounting Records and Timely Preparation of Reliable Financial Information
the company has a documented and updated accounting Manual based on the existing Indian Generally Accepted accounting Principles. the accounting manual contains detailed guidelines on all aspects of accounting applicable to the Company and has been prepared in line with all applicable accounting standards, guidance notes and expert opinions. This helps in ensuring that the accounts and finance team is well updated on the applicable accounting requirements. The financial information is verified by the statutory auditors as per the requirements of companies act, 2013.
In view of the above, adequate internal financial control tools and procedures are in place in the company for ensuring orderly and efficient conduct of its business. During the year relevant controls were also tested and no material weaknesses in the design or operations were observed.
As part of Statutory Auditors’ Report for financial year 2017-18, the auditors have also, inter-alia, confirmed that the company has, in all material respects, an adequate internal financial control system over financial reporting and such internal financial control system was operating effectively as on march 31, 2018.
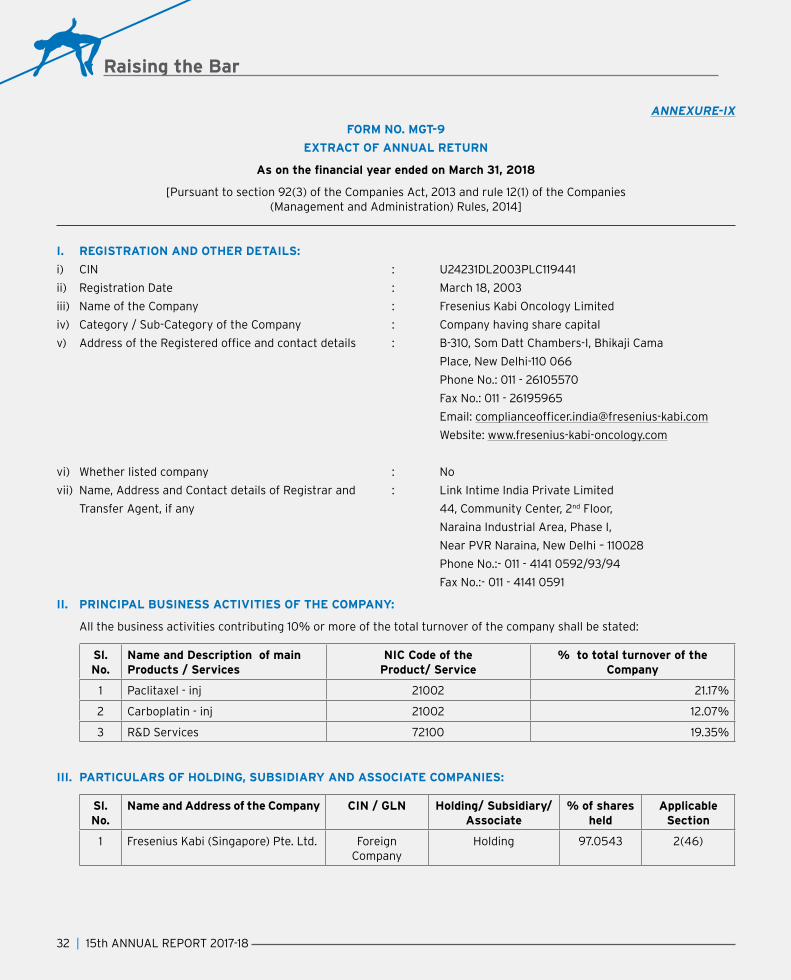
Raising the Bar
32 | 15th annual rePOrt 2017-18
ANNEXURE-IX
FORM NO. MGT-9
EXTRACT OF ANNUAL RETURN
As on the financial year ended on March 31, 2018
[Pursuant to section 92(3) of the companies act, 2013 and rule 12(1) of the companies (management and administration) rules, 2014]
I. REGISTRATION AND OTHER DETAILS:
i) CIN : U24231DL2003PLC119441
ii) Registration Date : March 18, 2003
iii) Name of the Company : Fresenius Kabi Oncology Limited
iv) Category / Sub-Category of the Company : Company having share capital
v) Address of the Registered office and contact details : B-310, Som Datt Chambers-I, Bhikaji Cama
Place, New Delhi-110 066
Phone No.: 011 - 26105570
Fax No.: 011 - 26195965
Email: [email protected]
Website: www.fresenius-kabi-oncology.com
vi) Whether listed company : No
vii) Name, Address and Contact details of Registrar and : Link Intime India Private Limited
transfer agent, if any 44, community center, 2nd Floor,
naraina industrial area, Phase i,
Near PVR Naraina, New Delhi – 110028
Phone No.:- 011 - 4141 0592/93/94
Fax No.:- 011 - 4141 0591
II. PRINCIPAL BUSINESS ACTIVITIES OF THE COMPANY:
All the business activities contributing 10% or more of the total turnover of the company shall be stated:
Sl. No.
Name and Description of main Products / Services
NIC Code of the Product/ Service
% to total turnover of the Company
1 Paclitaxel - inj 21002 21.17%
2 Carboplatin - inj 21002 12.07%
3 R&D Services 72100 19.35%
III. PARTICULARS OF HOLDING, SUBSIDIARY AND ASSOCIATE COMPANIES:
Sl. No.
Name and Address of the Company CIN / GLN Holding/ Subsidiary/ Associate
% of shares held
ApplicableSection
1 Fresenius Kabi (singapore) Pte. ltd. Foreign company
Holding 97.0543 2(46)
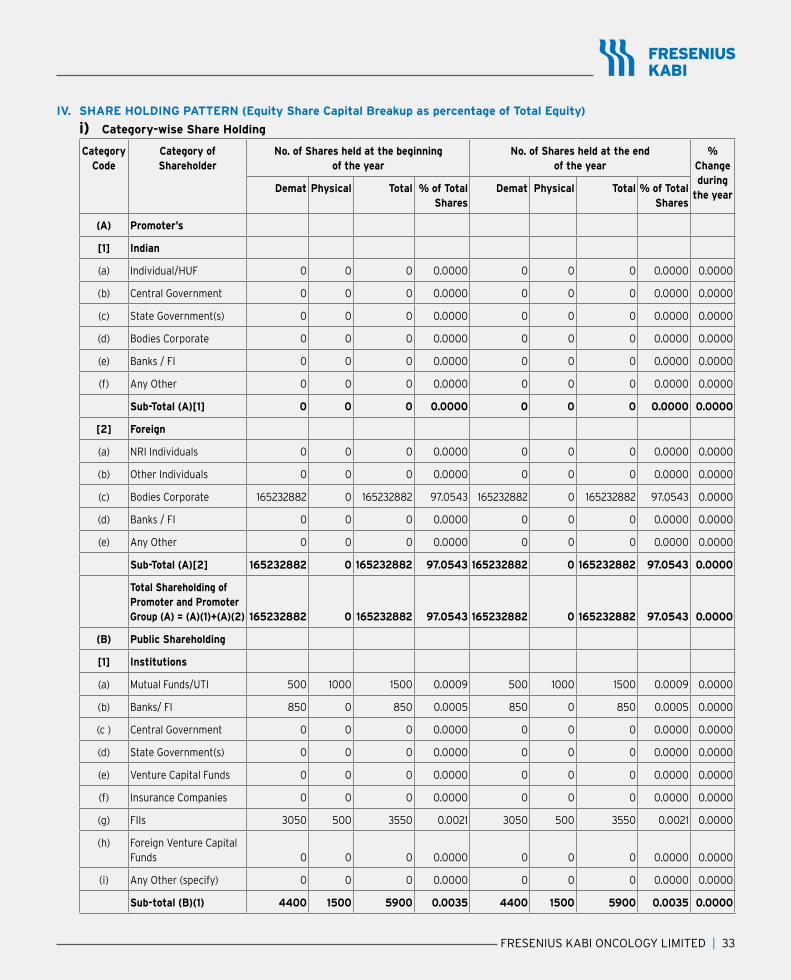
Fresenius Kabi OncOlOgy limited | 33
IV. SHARE HOLDING PATTERN (Equity Share Capital Breakup as percentage of Total Equity)
i) Category-wise Share Holding
Category Code
Category of Shareholder
No. of Shares held at the beginning of the year
No. of Shares held at the end of the year
% Change during
the yearDemat Physical Total % of Total
SharesDemat Physical Total % of Total
Shares
(A) Promoter’s
[1] Indian
(a) Individual/HUF 0 0 0 0.0000 0 0 0 0.0000 0.0000
(b) central government 0 0 0 0.0000 0 0 0 0.0000 0.0000
(c) state government(s) 0 0 0 0.0000 0 0 0 0.0000 0.0000
(d) bodies corporate 0 0 0 0.0000 0 0 0 0.0000 0.0000
(e) Banks / FI 0 0 0 0.0000 0 0 0 0.0000 0.0000
(f) any Other 0 0 0 0.0000 0 0 0 0.0000 0.0000
Sub-Total (A)[1] 0 0 0 0.0000 0 0 0 0.0000 0.0000
[2] Foreign
(a) nri individuals 0 0 0 0.0000 0 0 0 0.0000 0.0000
(b) Other individuals 0 0 0 0.0000 0 0 0 0.0000 0.0000
(c) bodies corporate 165232882 0 165232882 97.0543 165232882 0 165232882 97.0543 0.0000
(d) Banks / FI 0 0 0 0.0000 0 0 0 0.0000 0.0000
(e) any Other 0 0 0 0.0000 0 0 0 0.0000 0.0000
Sub-Total (A)[2] 165232882 0 165232882 97.0543 165232882 0 165232882 97.0543 0.0000
Total Shareholding of Promoter and Promoter Group (A) = (A)(1)+(A)(2) 165232882 0 165232882 97.0543 165232882 0 165232882 97.0543 0.0000
(B) Public Shareholding
[1] Institutions
(a) Mutual Funds/UTI 500 1000 1500 0.0009 500 1000 1500 0.0009 0.0000
(b) Banks/ FI 850 0 850 0.0005 850 0 850 0.0005 0.0000
(c ) central government 0 0 0 0.0000 0 0 0 0.0000 0.0000
(d) state government(s) 0 0 0 0.0000 0 0 0 0.0000 0.0000
(e) Venture capital Funds 0 0 0 0.0000 0 0 0 0.0000 0.0000
(f) insurance companies 0 0 0 0.0000 0 0 0 0.0000 0.0000
(g) Fiis 3050 500 3550 0.0021 3050 500 3550 0.0021 0.0000
(h) Foreign Venture capital Funds 0 0 0 0.0000 0 0 0 0.0000 0.0000
(i) any Other (specify) 0 0 0 0.0000 0 0 0 0.0000 0.0000
Sub-total (B)(1) 4400 1500 5900 0.0035 4400 1500 5900 0.0035 0.0000

Raising the Bar
34 | 15th annual rePOrt 2017-18
Category Code
Category of Shareholder
No. of Shares held at the beginning of the year
No. of Shares held at the end of the year
% Change during
the yearDemat Physical Total % of Total
SharesDemat Physical Total % of Total
Shares
[2] Non-Institutions
(a) a) bodies corporate
i) indian 93119 35763 128882 0.0757 87614 35763 123377 0.0725 -0.0032
ii) Overseas 0 0 0 0.0000 0 0 0 0.0000 0.0000
(b) b) individuals-
i. individual shareholders holding nominal share capital upto ` 1 lakh 3281549 891761 4173310 2.4513 3311436 879886 4191322 2.4619 +0.0106
ii. individual shareholders holding nominal share capital in excess of ` 1 lakh 0 0 0 0.0000 0 0 0 0.0000 0.0000
(c) any Other (specify)
i) Trust & Foundation 725 100 825 0.0005 725 100 825 0.0005 0.0000
ii) nri 255690 213507 469197 0.2756 245183 212007 457190 0.2685 -0.0071
iii) Fresenius Kabi Oncology limited - unclaimed suspense account 236861 0 236861 0.1391 236361 0 236361 0.1388 -0.0003
Sub-total (B)(2) 3867944 1141131 5009075 2.9422 3881319 1127756 5009075 2.9422 0.0000
Total Public Shareholding (B) = (B)(1) + (B)(2) 3872344 1142631 5014975 2.9457 3885719 1129256 5014975 2.9457 0.0000
TOTAL (A) + (B) 169105226 1142631 170247857 100.0000 169118601 1129256 170247857 100.0000 0.0000
(C) Shares held by Custodians for GDRs & ADRs 0 0 0 0.0000 0 0 0 0.0000 0.0000
GRAND TOTAL (A)+(B)+(C) 169105226 1142631 170247857 100.0000 169118601 1129256 170247857 100.0000 0.0000
ii) Shareholding of Promoters
Sl. No.
Shareholder’s Name
Shareholding at the beginning of the year
Shareholding at the end of the year
No. of Shares
% of total Shares of the
Company
% of Shares Pledged /
encumbered to total shares
No. of Shares
% of total Shares of the
Company
% of Shares Pledged /
encumbered to total shares
% change in shareholding
during the year
1 Fresenius Kabi (singapore) Pte. ltd.
165232882 97.0543 0 165232882 97.0543 0 0.0000
Total 165232882 97.0543 0 165232882 97.0543 0 0.0000
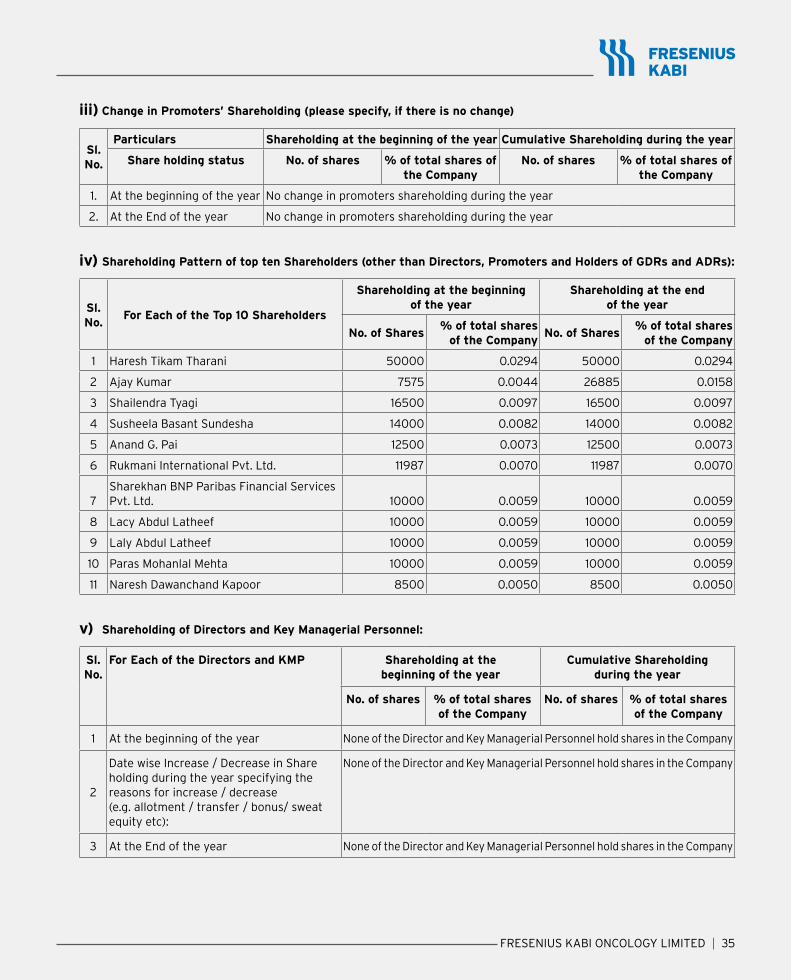
Fresenius Kabi OncOlOgy limited | 35
iii) Change in Promoters’ Shareholding (please specify, if there is no change)
Sl. No.
Particulars Shareholding at the beginning of the year Cumulative Shareholding during the year
Share holding status No. of shares % of total shares of the Company
No. of shares % of total shares of the Company
1. at the beginning of the year no change in promoters shareholding during the year
2. at the end of the year no change in promoters shareholding during the year
iv) Shareholding Pattern of top ten Shareholders (other than Directors, Promoters and Holders of GDRs and ADRs):
Sl. No.
For Each of the Top 10 Shareholders
Shareholding at the beginning of the year
Shareholding at the end of the year
No. of Shares% of total shares
of the CompanyNo. of Shares
% of total shares of the Company
1 Haresh tikam tharani 50000 0.0294 50000 0.0294
2 Ajay Kumar 7575 0.0044 26885 0.0158
3 shailendra tyagi 16500 0.0097 16500 0.0097
4 susheela basant sundesha 14000 0.0082 14000 0.0082
5 anand g. Pai 12500 0.0073 12500 0.0073
6 rukmani international Pvt. ltd. 11987 0.0070 11987 0.0070
7sharekhan bnP Paribas Financial services Pvt. ltd. 10000 0.0059 10000 0.0059
8 lacy abdul latheef 10000 0.0059 10000 0.0059
9 laly abdul latheef 10000 0.0059 10000 0.0059
10 Paras mohanlal mehta 10000 0.0059 10000 0.0059
11 Naresh Dawanchand Kapoor 8500 0.0050 8500 0.0050
v) Shareholding of Directors and Key Managerial Personnel:
Sl. No.
For Each of the Directors and KMP Shareholding at thebeginning of the year
Cumulative Shareholdingduring the year
No. of shares % of total shares of the Company
No. of shares % of total shares of the Company
1 at the beginning of the year none of the director and Key managerial Personnel hold shares in the company
2
Date wise Increase / Decrease in Share holding during the year specifying the reasons for increase / decrease(e.g. allotment / transfer / bonus/ sweatequity etc):
none of the director and Key managerial Personnel hold shares in the company
3 at the end of the year none of the director and Key managerial Personnel hold shares in the company

Raising the Bar
36 | 15th annual rePOrt 2017-18
V. INDEBTEDNESS
Indebtedness of the Company including interest outstanding/accrued but not due for paymentamount (` in lakh)
Particulars Secured Loans excluding deposits
UnsecuredLoans
Deposits TotalIndebtedness
Indebtedness at the beginning of the financial year
i) Principal amount 1,046.49 51,033.41 nil 52,079.90
ii) interest due but not paid nil nil nil nil
iii) interest accrued but not due 6.21 609.06 nil 615.27
Total (i+ii+iii) 1,052.70 51,642.47 Nil 52,695.17
Change in Indebtedness during the financial year· addition· reduction
nil(1,048.85)
nil(3,687.65)
nilnil
nil(4,736.50)
Net Change (1,048.85) (3,687.65) Nil (4,736.50)
Indebtedness at the end of the financial year
i) Principal amount 2.91 47,444.19 nil 47,447.10
ii) interest due but not paid nil nil nil nil
iii) interest accrued but not due 0.94 510.63 nil 511.57
Total (i+ii+iii) 3.85 47,954.82 Nil 47,958.67
VI. REMUNERATION OF DIRECTORS AND KEY MANAGERIAL PERSONNEL
A. Remuneration to Managing Director, Whole-time Directors and/or Manager:amount (` in lakh)
Sl. No. Particulars of Remuneration Name of MD / WTD / Manager Total AmountMs. Maria
Gobbi, Managing
Director
Mr. Nikhil Kulshreshtha,
Director & Secretary
Mr. Karsten Peter Lerch, Director & CFO (April 1,
2017 to December 31, 2017)
1. gross salary
(a) salary as per provisions contained in section 17(1) of the Income-tax Act, 1961
(b) Value of perquisites u/s 17(2) of the Income-tax Act, 1961
(c) Profits in lieu of salary under section 17(3) of the Income- tax Act, 1961
31.55
1.70
nil
135.15
0.39
nil
103.42
44.97
nil
270.12
47.06
nil
2. stock Option nil nil nil nil
3. Sweat Equity nil nil nil nil
4. commission- as % of profit- others, specify…
nilnil
nilnil
nilnil
nilnil
5. Others, please specify – Ex-gratia nil 65.55 nil 65.55
Total (A) 33.25 201.09 148.39 382.73
ceiling as per the act Not applicable for FY 2017-18. Please refer to the notes mentioned below.
Notes:
1. Considering the inadequate profits for payment of remuneration to Managing Director and Whole-time Director(s) of the Company, the same was made in terms of provisions contained under Schedule V of the Companies Act, 2013.
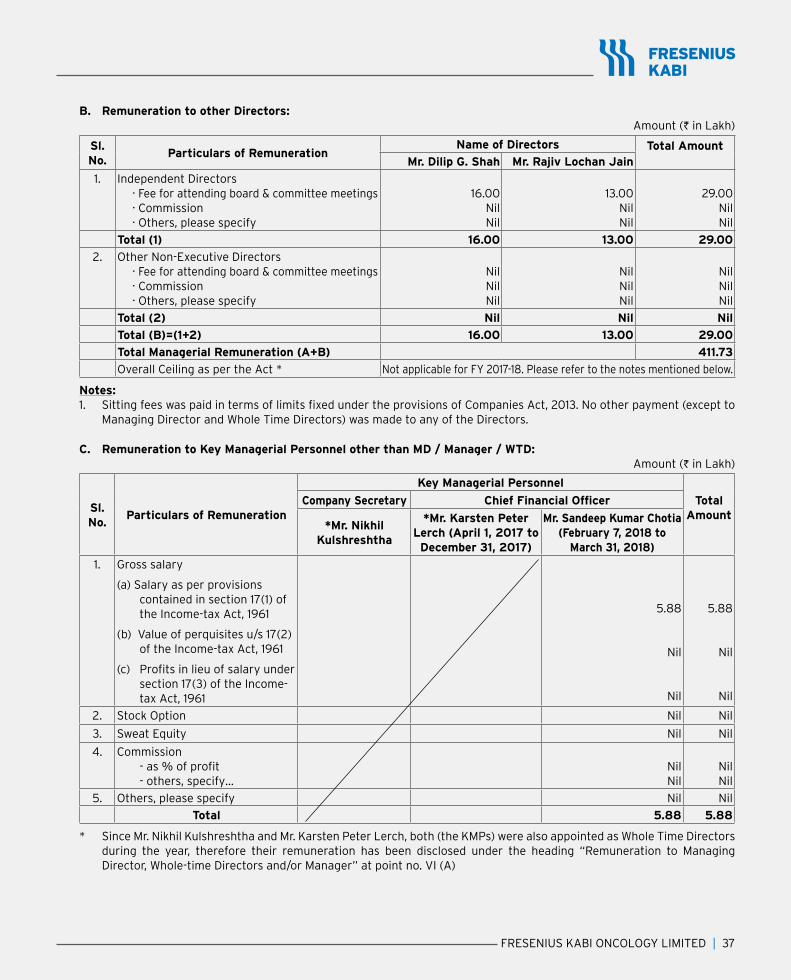
Fresenius Kabi OncOlOgy limited | 37
B. Remuneration to other Directors:amount (` in lakh)
Sl. No.
Particulars of RemunerationName of Directors Total Amount
Mr. Dilip G. Shah Mr. Rajiv Lochan Jain
1. independent directors· Fee for attending board & committee meetings· commission· Others, please specify
16.00nilnil
13.00nilnil
29.00nilnil
Total (1) 16.00 13.00 29.00
2. Other Non-Executive Directors· Fee for attending board & committee meetings· commission· Others, please specify
nil nil nil
nil nil nil
nil nil nil
Total (2) Nil Nil Nil
Total (B)=(1+2) 16.00 13.00 29.00
Total Managerial Remuneration (A+B) 411.73
Overall ceiling as per the act * Not applicable for FY 2017-18. Please refer to the notes mentioned below.
Notes:1. Sitting fees was paid in terms of limits fixed under the provisions of Companies Act, 2013. No other payment (except to
Managing Director and Whole Time Directors) was made to any of the Directors.
C. Remuneration to Key Managerial Personnel other than MD / Manager / WTD:amount (` in lakh)
Sl. No.
Particulars of Remuneration
Key Managerial Personnel
Total Amount
Company Secretary Chief Financial Officer
*Mr. Nikhil Kulshreshtha
*Mr. Karsten Peter Lerch (April 1, 2017 to
December 31, 2017)
Mr. Sandeep Kumar Chotia(February 7, 2018 to
March 31, 2018)
1. gross salary
(a) salary as per provisions contained in section 17(1) of the Income-tax Act, 1961
(b) Value of perquisites u/s 17(2) of the Income-tax Act, 1961
(c) Profits in lieu of salary under section 17(3) of the income-tax Act, 1961
5.88
nil
nil
5.88
nil
nil
2. stock Option nil nil
3. Sweat Equity nil nil
4. commission- as % of profit- others, specify…
nilnil
nilnil
5. Others, please specify nil nil
Total 5.88 5.88
* Since Mr. Nikhil Kulshreshtha and Mr. Karsten Peter Lerch, both (the KMPs) were also appointed as Whole Time Directors during the year, therefore their remuneration has been disclosed under the heading “remuneration to managing Director, Whole-time Directors and/or Manager” at point no. VI (A)

Raising the Bar
38 | 15th annual rePOrt 2017-18
VII. PENALTIES / PUNISHMENT/ COMPOUNDING OF OFFENCES:
Type Section of the Companies Act
Brief Description
Details of Penalty / Punishment / Compounding fees paid
Authority (RD / NCLT / Court)
Appeal made, if any (give details)
COMPANY
Penalty
nonePunishment
compounding
DIRECTORS
Penalty
nonePunishment
compounding
OTHER OFFICERS IN DEFAULT
Penalty
nonePunishment
compounding
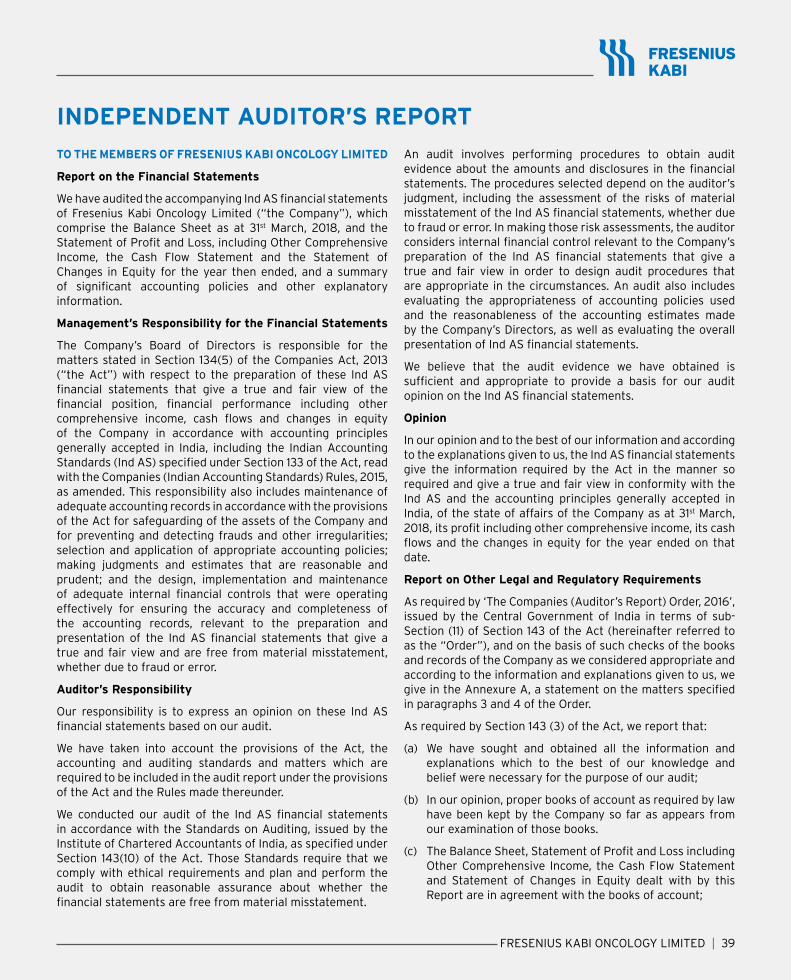
Fresenius Kabi OncOlOgy limited | 39
INDEPENDENT AUDITOR’S REPORT
TO THE MEMBERS OF FRESENIUS KABI ONCOLOGY LIMITED
Report on the Financial Statements
We have audited the accompanying Ind AS financial statements of Fresenius Kabi Oncology Limited (“the Company”), which comprise the balance sheet as at 31st march, 2018, and the Statement of Profit and Loss, including Other Comprehensive Income, the Cash Flow Statement and the Statement of changes in equity for the year then ended, and a summary of significant accounting policies and other explanatory information.
Management’s Responsibility for the Financial Statements
the company’s board of directors is responsible for the matters stated in section 134(5) of the companies act, 2013 (“the Act”) with respect to the preparation of these Ind AS financial statements that give a true and fair view of the financial position, financial performance including other comprehensive income, cash flows and changes in equity of the Company in accordance with accounting principles generally accepted in india, including the indian accounting Standards (Ind AS) specified under Section 133 of the Act, read with the Companies (Indian Accounting Standards) Rules, 2015, as amended. this responsibility also includes maintenance of adequate accounting records in accordance with the provisions of the act for safeguarding of the assets of the company and for preventing and detecting frauds and other irregularities; selection and application of appropriate accounting policies; making judgments and estimates that are reasonable and prudent; and the design, implementation and maintenance of adequate internal financial controls that were operating effectively for ensuring the accuracy and completeness of the accounting records, relevant to the preparation and presentation of the Ind AS financial statements that give a true and fair view and are free from material misstatement, whether due to fraud or error.
Auditor’s Responsibility
Our responsibility is to express an opinion on these Ind AS financial statements based on our audit.
We have taken into account the provisions of the Act, the accounting and auditing standards and matters which are required to be included in the audit report under the provisions of the act and the rules made thereunder.
We conducted our audit of the Ind AS financial statements in accordance with the Standards on Auditing, issued by the Institute of Chartered Accountants of India, as specified under Section 143(10) of the Act. Those Standards require that we comply with ethical requirements and plan and perform the audit to obtain reasonable assurance about whether the financial statements are free from material misstatement.
an audit involves performing procedures to obtain audit evidence about the amounts and disclosures in the financial statements. the procedures selected depend on the auditor’s judgment, including the assessment of the risks of material misstatement of the Ind AS financial statements, whether due to fraud or error. in making those risk assessments, the auditor considers internal financial control relevant to the Company’s preparation of the Ind AS financial statements that give a true and fair view in order to design audit procedures that are appropriate in the circumstances. an audit also includes evaluating the appropriateness of accounting policies used and the reasonableness of the accounting estimates made by the Company’s Directors, as well as evaluating the overall presentation of Ind AS financial statements.
We believe that the audit evidence we have obtained is sufficient and appropriate to provide a basis for our audit opinion on the Ind AS financial statements.
Opinion
in our opinion and to the best of our information and according to the explanations given to us, the Ind AS financial statements give the information required by the act in the manner so required and give a true and fair view in conformity with the ind as and the accounting principles generally accepted in india, of the state of affairs of the company as at 31st march, 2018, its profit including other comprehensive income, its cash flows and the changes in equity for the year ended on that date.
Report on Other Legal and Regulatory Requirements
as required by ‘the companies (auditor’s report) Order, 2016’, issued by the central government of india in terms of sub-section (11) of section 143 of the act (hereinafter referred to as the “Order”), and on the basis of such checks of the books and records of the Company as we considered appropriate and according to the information and explanations given to us, we give in the Annexure A, a statement on the matters specified in paragraphs 3 and 4 of the Order.
As required by Section 143 (3) of the Act, we report that:
(a) We have sought and obtained all the information and explanations which to the best of our knowledge and belief were necessary for the purpose of our audit;
(b) In our opinion, proper books of account as required by law have been kept by the company so far as appears from our examination of those books.
(c) The Balance Sheet, Statement of Profit and Loss including Other Comprehensive Income, the Cash Flow Statement and Statement of Changes in Equity dealt with by this Report are in agreement with the books of account;

Raising the Bar
40 | 15th annual rePOrt 2017-18
(d) In our opinion, the aforesaid Ind AS financial statements comply with the Accounting Standards under Section 133 of the Act read with Companies (Indian Accounting Standards) Rules, 2015, as amended;
(e) On the basis of written representations received from the directors as on 31st march, 2018, and taken on record by the Board of Directors, none of the directors is disqualified as on 31st march, 2018, from being appointed as a director in terms of Section 164(2) of the Act;
(f) With respect to the adequacy of the internal financial controls over financial reporting of the Company and the operating effectiveness of such controls, refer to our separate report in Annexure B to this report;
(g) With respect to the other matters to be included in the Auditors’ Report in accordance with Rule 11 of the companies (audit and auditors) rules, 2014, in our opinion and to the best of our information and according to the explanations given to us:
i. the company has disclosed the impact of pending litigations on its financial position in its Ind AS financial statements – Refer Note 34 of the Notes to the Ind AS financial statements;
ii. the company did not have any long-term contracts including derivative contracts for which there were any material foreseeable losses; and
iii. the company does not have any dues that are required to be transferred to the investor education and Protection Fund.
Other Matter
The comparative financial information of the Company for the year ended 31st March, 2017 in accordance with Ind AS, included in these Ind AS financial statements, have been audited by the predecessor auditor. the report of the predecessor auditor on the comparative financial information for the year ended 31st March, 2017 expressed an unmodified opinion.
For VMT & Co. LLP
Firm registration no. n500048
chartered accountants
Vanit Kumar Mittal
Place: Gurugram Partner
Date: 5th June, 2018 membership no. 505709
Annexure A to the Independent Auditor’s report of even date to the members of FRESENIUS KABI ONCOLOGY LIMITED on the financial statements as of and for the year ended 31st March, 2018
i. (a) The Company has maintained proper records showing full, including quantitative details and situation, of fixed assets.
(b) All the fixed assets have not been physically verified by the management during the year but there is regular program of verification, which, in our opinion, is reasonable having regard to the size of the Company and nature of its assets. no material discrepancies have been noticed on such verification.
(c) According to the information and explanations given by the management, the title deeds of immovable properties, included in property, plant and equipment, are held in the name of the company. (in respect of certain immovable properties including building, and disclosed as fixed asset in the financial statements, the arrangement, in the nature of lease, are in the name of the Company, where the Company is the beneficiary in the agreement.)
ii. The management has conducted the physical verification of inventory at reasonable interval during the year by the management and no material discrepancies were noticed on such physical verification.
iii. According to the information and explanations given to us, the company has not granted any loans, secured or unsecured to companies, firms, Limited Liability Partnerships, or other parties covered in the register maintained under section 189 of the act. accordingly, the provisions of clause 3(iii) (a), (b) and (c) of the Order are not applicable to the company and hence, not commented upon.
iv. in our opinion and according to the information and explanation given to us, the Company has not advanced any loans to directors/ to a company in which the director is interested to which the provisions of Section 185 of the companies act, 2013 apply and hence, not commented upon. As per the information and explanation provided to us, the Company has complied with Section 186 of the companies act, 2013 in respect of loans given to employees. the company has made no investment or furnished guarantee within the meaning of Section 186 of the companies act, 2013.
v. the company has not accepted any deposits from the public within the meaning of Sections 73 to 76 of the Act and the companies (acceptance of deposit) rules, 2014 (as amended). accordingly, the provisions of clause 3(v) of the Order are not applicable to the company.
vi. We have broadly reviewed the books of accounts maintained by company pursuant to the rules made by the
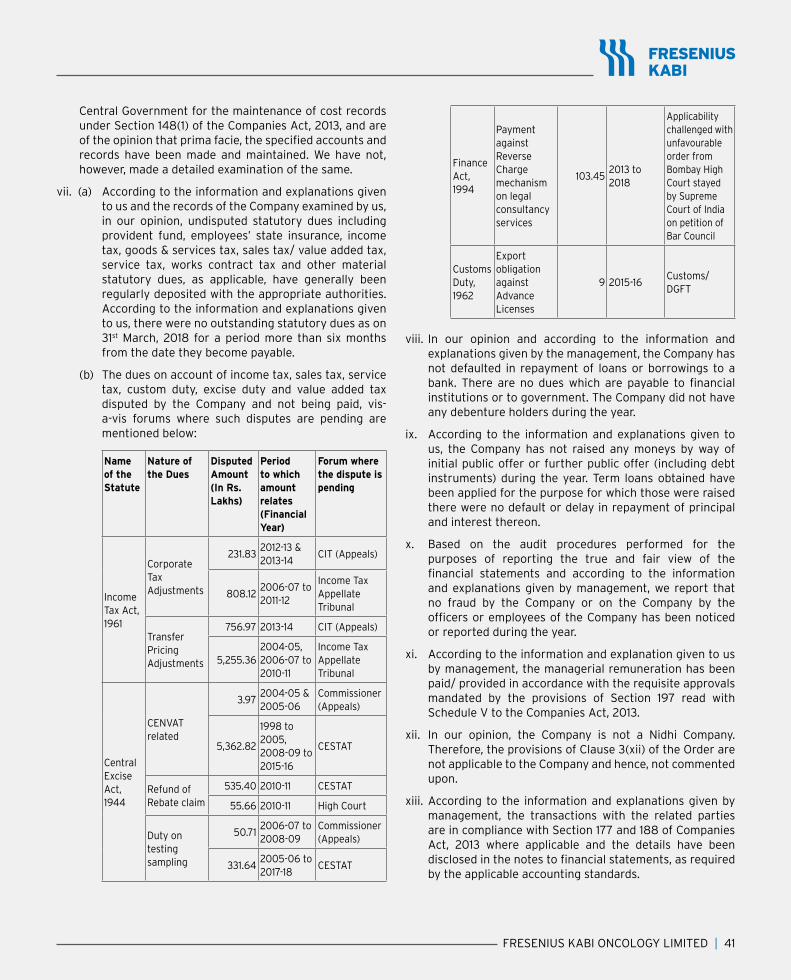
Fresenius Kabi OncOlOgy limited | 41
central government for the maintenance of cost records under section 148(1) of the companies act, 2013, and are of the opinion that prima facie, the specified accounts and records have been made and maintained. We have not, however, made a detailed examination of the same.
vii. (a) According to the information and explanations given to us and the records of the Company examined by us, in our opinion, undisputed statutory dues including provident fund, employees’ state insurance, income tax, goods & services tax, sales tax/ value added tax, service tax, works contract tax and other material statutory dues, as applicable, have generally been regularly deposited with the appropriate authorities. According to the information and explanations given to us, there were no outstanding statutory dues as on 31st March, 2018 for a period more than six months from the date they become payable.
(b) The dues on account of income tax, sales tax, service tax, custom duty, excise duty and value added tax disputed by the company and not being paid, vis-a-vis forums where such disputes are pending are mentioned below:
Name of the Statute
Nature of the Dues
Disputed Amount (In Rs. Lakhs)
Period to which amount relates(Financial Year)
Forum where the dispute is pending
income Tax Act, 1961
corporate Tax Adjustments
231.832012-13 & 2013-14
cit (appeals)
808.122006-07 to 2011-12
Income Tax appellate tribunal
transfer Pricing Adjustments
756.97 2013-14 cit (appeals)
5,255.362004-05, 2006-07 to 2010-11
Income Tax appellate tribunal
central Excise act, 1944
cenVat related
3.972004-05 & 2005-06
commissioner (appeals)
5,362.82
1998 to 2005, 2008-09 to 2015-16
cestat
refund of rebate claim
535.40 2010-11 cestat
55.66 2010-11 High court
duty on testing sampling
50.712006-07 to 2008-09
commissioner (appeals)
331.642005-06 to 2017-18
cestat
Finance act, 1994
Payment against reverse charge mechanism on legal consultancy services
103.452013 to 2018
applicability challenged with unfavourable order from bombay High court stayed by supreme court of india on petition of bar council
customs duty, 1962
Export obligation against advance licenses
9 2015-16Customs/ dgFt
viii. in our opinion and according to the information and explanations given by the management, the Company has not defaulted in repayment of loans or borrowings to a bank. There are no dues which are payable to financial institutions or to government. the company did not have any debenture holders during the year.
ix. According to the information and explanations given to us, the Company has not raised any moneys by way of initial public offer or further public offer (including debt instruments) during the year. term loans obtained have been applied for the purpose for which those were raised there were no default or delay in repayment of principal and interest thereon.
x. Based on the audit procedures performed for the purposes of reporting the true and fair view of the financial statements and according to the information and explanations given by management, we report that no fraud by the company or on the company by the officers or employees of the Company has been noticed or reported during the year.
xi. According to the information and explanation given to us by management, the managerial remuneration has been paid/ provided in accordance with the requisite approvals mandated by the provisions of Section 197 read with schedule V to the companies act, 2013.
xii. In our opinion, the Company is not a Nidhi Company. Therefore, the provisions of Clause 3(xii) of the Order are not applicable to the company and hence, not commented upon.
xiii. According to the information and explanations given by management, the transactions with the related parties are in compliance with Section 177 and 188 of Companies Act, 2013 where applicable and the details have been disclosed in the notes to financial statements, as required by the applicable accounting standards.

Raising the Bar
42 | 15th annual rePOrt 2017-18
xiv. According to the information and explanations given by management, the company has not made any preferential allotment or private placement of shares or fully or partly convertible debentures during the year under review. Accordingly, the provisions of Clause 3(xiv) of the Order are not applicable to the company and hence, not commented upon.
xv. According to the information and explanations given by management, the company has not entered into any non-cash transactions with its directors or persons connected with him as referred to in Section 192 of the Companies act, 2013.
xvi. According to the information and explanations given by management, the company is not required to be registered under section 45-ia of the reserve bank of india act, 1934. accordingly, the provisions of clause 3(xvi) of the Order are not applicable to the Company.
For VMT & Co. LLP
Firm registration no. n500048
chartered accountants
Vanit Kumar Mittal
Place: Gurugram Partner
Date: 5th June, 2018 membership no. 505709
Annexure B to the Independent Auditor’s report of even date to the members of FRESENIUS KABI ONCOLOGY LIMITED on the financial statements for the year ended 31st March, 2018
report on the internal Financial controls under clause (i) of sub-section 3 of section 143 of the companies act, 2013 (“the Act”)
We have audited the internal financial controls over financial reporting of Fresenius Kabi Oncology Limited (“the Company”) as of 31st March, 2018 in conjunction with our audit of the financial statements of the Company for the year ended on that date.
Management’s Responsibility for Internal Financial Controls
the company’s management is responsible for establishing and maintaining internal financial controls based on the internal control over financial reporting criteria established by the company considering the essential components of internal control stated in the guidance note on audit of internal Financial controls Over Financial reporting issued by the institute of chartered accountants of india (‘icai’).
these responsibilities include the design, implementation and maintenance of adequate internal financial controls that were operating effectively for ensuring the orderly and efficient conduct of its business, including adherence to company’s policies, the safeguarding of its assets, the prevention and detection of frauds and errors, the accuracy and completeness of the accounting records, and the timely preparation of reliable financial information, as required under the companies act, 2013.
Auditors’ Responsibility
Our responsibility is to express an opinion on the Company’s internal financial controls over financial reporting based on our audit. We have conducted our audit in accordance with the guidance note on audit of internal Financial controls Over Financial Reporting (the “Guidance Note”) and the Standards on Auditing as specified under Section 143(10) of the Companies Act, 2013, to the extent applicable to an audit of internal financial controls and, both issued by the institute of chartered accountants of india. those standards and the Guidance Note require that we comply with ethical requirements and plan and perform the audit to obtain reasonable assurance about whether adequate internal financial controls over financial reporting was established and maintained and if such controls operated effectively in all material respects.
Our audit involves performing procedures to obtain audit evidence about the adequacy of the internal financial controls system over financial reporting and their operating effectiveness. Our audit of internal financial controls over financial reporting included obtaining an understanding of internal financial controls over financial reporting, assessing the risk that a material weakness exists, and testing and evaluating the design and operating effectiveness of internal control based on the assessed risk. the procedures selected depend on the auditors’ judgement, including the assessment of the risks of material misstatement of the financial statements, whether due to fraud or error.
We believe that the audit evidence we have obtained is sufficient and appropriate to provide a basis for our audit opinion on the internal financial controls system over financial reporting.
Meaning of Internal Financial Controls Over Financial Reporting
A company’s internal financial control over financial reporting is a process designed to provide reasonable assurance regarding the reliability of financial reporting and the preparation of financial statements for external purposes in accordance with generally accepted accounting principles. A company’s internal financial control over financial reporting includes those policies and procedures that (1) pertain to the maintenance of records that, in reasonable detail, accurately and fairly reflect the transactions and dispositions of the

Fresenius Kabi OncOlOgy limited | 43
assets of the Company; (2) provide reasonable assurance that transactions are recorded as necessary to permit preparation of financial statements in accordance with generally accepted accounting principles, and that receipts and expenditures of the Company are being made only in accordance with authorisations of management and directors of the Company; and (3) provide reasonable assurance regarding prevention or timely detection of unauthorised acquisition, use, or disposition of the company’s assets that could have a material effect on the financial statements.
Inherent Limitations of Internal Financial Controls Over Financial Reporting
Because of the inherent limitations of internal financial controls over financial reporting, including the possibility of collusion or improper management override of controls, material misstatements due to error or fraud may occur and not be detected. Also, projections of any evaluation of the internal financial controls over financial reporting to future periods are subject to the risk that the internal financial control over financial reporting may become inadequate because of changes in conditions, or that the degree of compliance with the policies or procedures may deteriorate.
Opinion
in our opinion, the company has, in all material respects, an adequate internal financial controls system over financial reporting and such internal financial controls over financial reporting were operating effectively as at 31st march, 2018, based on the internal control over financial reporting criteria established by the company considering the essential components of internal control stated in the guidance note on audit of internal Financial controls Over Financial reporting issued by the institute of chartered accountants of india.
For VMT & Co. LLP
Firm registration no. n500048
chartered accountants
Vanit Kumar Mittal
Place: Gurugram Partner
Date: 5th June, 2018 membership no. 505709

Raising the Bar
44 | 15th annual rePOrt 2017-18
(` in lakhs)
Particulars Note No. As at 31st March, 2018
As at 31st March, 2017
ASSETS
Non-Current Assets
Property, Plant and equipment 3 46,827.04 49,325.53
Capital Work-In-Progress 4 3,754.87 4,464.06
Other intangible assets 5 44.77 100.91
Financial assets
(i) investments 6 3.00 3.00
(ii) Others 7 628.22 508.32
Deferred Tax Assets (Net) 19 507.70 -
Other non-current assets 8 682.81 622.58
Total Non Current Assets 52,448.41 55,024.40
Current Assets
inventories 9 38,223.20 39,950.19
Financial assets
(i) trade receivables 10 16,215.76 14,274.42
(ii) cash and cash equivalents 11 17.56 149.36
(iii) bank balance other than (ii) above 12 146.45 676.73
(iv) loans 13 14.05 15.08
(v) Others 14 167.16 586.93
Other current assets 15 15,841.09 11,265.94
Total Current Assets 70,625.27 66,918.65
TOTAL ASSETS 123,073.68 121,943.05
Balance Sheet
As at 31st March, 2018

Fresenius Kabi OncOlOgy limited | 45
Balance Sheet
As at 31st March, 2018 (` in lakhs)
Particulars Note No. As at 31st March, 2018
As at 31st March, 2017
EqUITY AND LIABILITIES
Equity
equity share capital 16 1,702.48 1,702.48
Other equity 44,114.56 42,132.57
Total Equity 45,817.04 43,835.05
Liabilities
Non Current Liabilities
Financial liabilities
(i) Borrowings 17 30,845.95 30,845.95
Provisions 18 711.04 715.24
Deferred Tax Liabilities (Net) 19 - 471.63
Other non-current liabilities 20 3,030.13 2,929.74
Total Non Current Liabilities 34,587.12 34,962.56
Current Liabilities
Financial liabilities
(i) Borrowings 21 16,601.15 21,233.95
(ii) trade Payables 22 16,802.26 16,088.79
(iii) Others 23 6,497.19 3,896.39
Other current liabilities 24 1,201.45 1,136.56
Provisions 18 1,310.07 745.02
Current Tax Liabilities (Net) 25 257.40 44.73
Total Current Liabilities 42,669.52 43,145.44
Total Liabilities 77,256.64 78,108.00
TOTAL EqUITY AND LIABILITIES 123,073.68 121,943.05
company’s information and accounting Policy 1 & 2
the accompanying notes are an integral part this is the balance sheet referredof these financial statements. to in our report of even date
For and on behalf of the Board of Directors of FRESENIUS KABI ONCOLOGY LIMITED
Maria Gobbi Karsten Lerch Nikhil Kulshreshtha Sandeep Kumar Chotia Chairperson & Managing Director Director Director & Secretary Chief Financial Officer DIN: 07005222 DIN: 07433486 DIN: 07178027
Place: Gurugram, India Date: 5th June, 2018
For VMT & Co. LLPchartered accountantsFirm registration no. n500048
Vanit Kumar MittalPartnermembership no. 505709
Place: Gurugram, India Date: 5th June, 2018
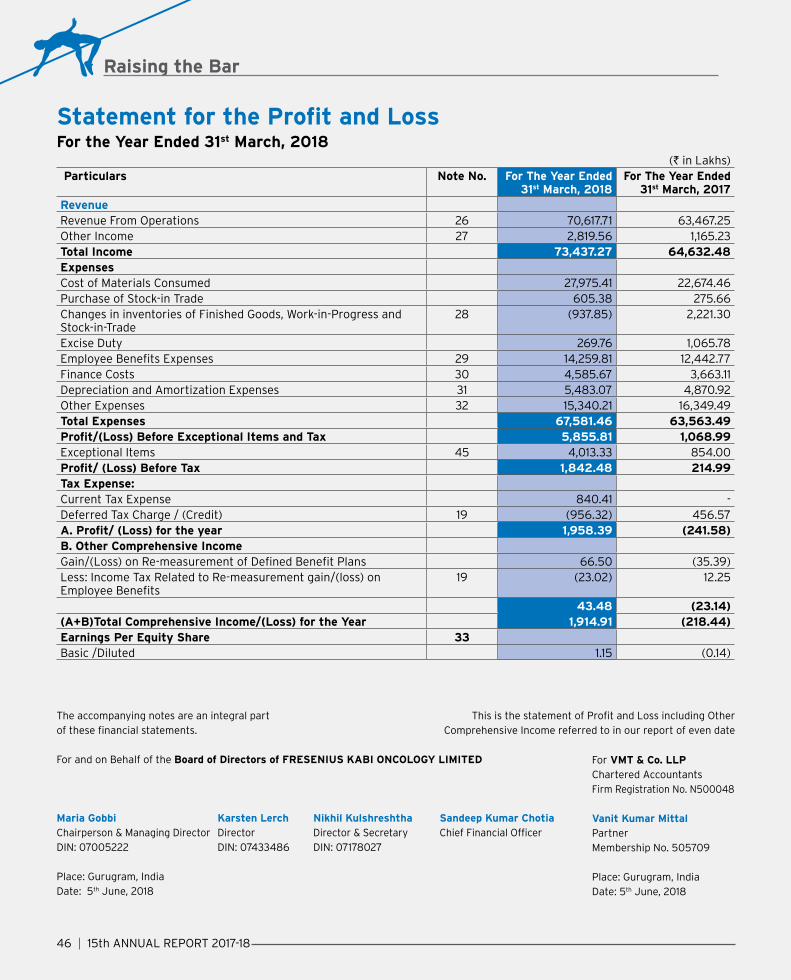
Raising the Bar
46 | 15th annual rePOrt 2017-18
(` in lakhs) Particulars Note No. For The Year Ended
31st March, 2018 For The Year Ended
31st March, 2017 Revenuerevenue From Operations 26 70,617.71 63,467.25 Other income 27 2,819.56 1,165.23 Total Income 73,437.27 64,632.48 Expensescost of materials consumed 27,975.41 22,674.46 Purchase of stock-in trade 605.38 275.66 Changes in inventories of Finished Goods, Work-in-Progress and stock-in-trade
28 (937.85) 2,221.30
Excise Duty 269.76 1,065.78 Employee Benefits Expenses 29 14,259.81 12,442.77 Finance costs 30 4,585.67 3,663.11 Depreciation and Amortization Expenses 31 5,483.07 4,870.92 Other Expenses 32 15,340.21 16,349.49 Total Expenses 67,581.46 63,563.49 Profit/(Loss) Before Exceptional Items and Tax 5,855.81 1,068.99 Exceptional Items 45 4,013.33 854.00 Profit/ (Loss) Before Tax 1,842.48 214.99 Tax Expense:Current Tax Expense 840.41 - Deferred Tax Charge / (Credit) 19 (956.32) 456.57 A. Profit/ (Loss) for the year 1,958.39 (241.58)B. Other Comprehensive IncomeGain/(Loss) on Re-measurement of Defined Benefit Plans 66.50 (35.39)Less: Income Tax Related to Re-measurement gain/(loss) on Employee Benefits
19 (23.02) 12.25
43.48 (23.14)(A+B)Total Comprehensive Income/(Loss) for the Year 1,914.91 (218.44)Earnings Per Equity Share 33Basic /Diluted 1.15 (0.14)
Statement for the Profit and Loss For the Year Ended 31st March, 2018
the accompanying notes are an integral part of these financial statements.
For and on behalf of the Board of Directors of FRESENIUS KABI ONCOLOGY LIMITED
Maria Gobbi Karsten Lerch Nikhil Kulshreshtha Sandeep Kumar Chotia Chairperson & Managing Director Director Director & Secretary Chief Financial Officer DIN: 07005222 DIN: 07433486 DIN: 07178027
Place: Gurugram, India Date: 5th June, 2018
For VMT & Co. LLPchartered accountantsFirm registration no. n500048
Vanit Kumar MittalPartnermembership no. 505709
Place: Gurugram, India Date: 5th June, 2018
This is the statement of Profit and Loss including Other comprehensive income referred to in our report of even date
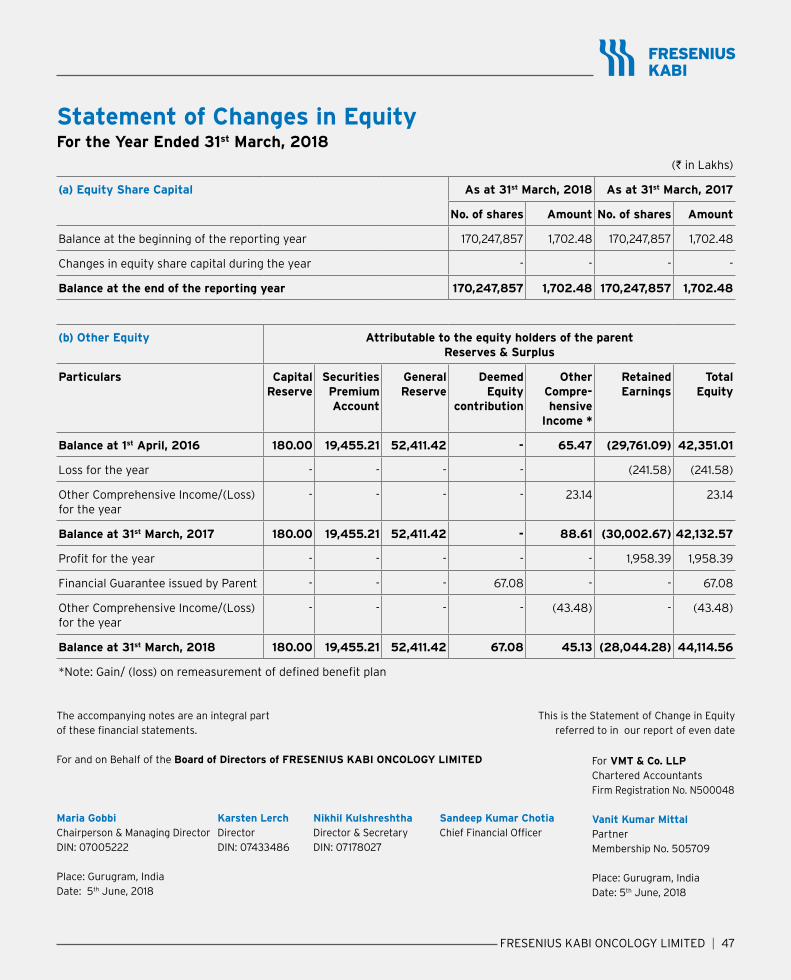
Fresenius Kabi OncOlOgy limited | 47
Statement of Changes in Equity For the Year Ended 31st March, 2018
(` in lakhs)
(a) Equity Share Capital As at 31st March, 2018 As at 31st March, 2017
No. of shares Amount No. of shares Amount
balance at the beginning of the reporting year 170,247,857 1,702.48 170,247,857 1,702.48
changes in equity share capital during the year - - - -
Balance at the end of the reporting year 170,247,857 1,702.48 170,247,857 1,702.48
(b) Other Equity Attributable to the equity holders of the parent Reserves & Surplus
Particulars Capital Reserve
Securities Premium Account
General Reserve
Deemed Equity
contribution
Other Compre-hensive
Income *
Retained Earnings
Total Equity
Balance at 1st April, 2016 180.00 19,455.21 52,411.42 - 65.47 (29,761.09) 42,351.01
loss for the year - - - - (241.58) (241.58)
Other Comprehensive Income/(Loss) for the year
- - - - 23.14 23.14
Balance at 31st March, 2017 180.00 19,455.21 52,411.42 - 88.61 (30,002.67) 42,132.57
Profit for the year - - - - - 1,958.39 1,958.39
Financial guarantee issued by Parent - - - 67.08 - - 67.08
Other Comprehensive Income/(Loss) for the year
- - - - (43.48) - (43.48)
Balance at 31st March, 2018 180.00 19,455.21 52,411.42 67.08 45.13 (28,044.28) 44,114.56
*Note: Gain/ (loss) on remeasurement of defined benefit plan
the accompanying notes are an integral part of these financial statements.
For and on behalf of the Board of Directors of FRESENIUS KABI ONCOLOGY LIMITED
Maria Gobbi Karsten Lerch Nikhil Kulshreshtha Sandeep Kumar Chotia Chairperson & Managing Director Director Director & Secretary Chief Financial Officer DIN: 07005222 DIN: 07433486 DIN: 07178027
Place: Gurugram, India Date: 5th June, 2018
For VMT & Co. LLPchartered accountantsFirm registration no. n500048
Vanit Kumar MittalPartnermembership no. 505709
Place: Gurugram, India Date: 5th June, 2018
this is the statement of change in equityreferred to in our report of even date

Raising the Bar
48 | 15th annual rePOrt 2017-18
(` in lakhs)
Particulars For the Year Ended 31st March, 2018
For the Year Ended 31st March, 2017
A. Cash flow from operating activities
Net Profit before tax 1,842.48 214.99
Adjustment for :-
Depreciation and Amortization Expenses 5,483.08 4,870.92
impairment loss 2,448.54 -
government grant (331.99) (300.42)
Loss on Sale & Disposal of Fixed Assets 122.98 242.86
Unrealised Foreign Currency (Gain) / Loss 180.80 (1,426.38)
Interest on Borrowings 4,096.59 3,503.98
Provision of bad debt 45.26 238.33
dividend income (0.36) (0.30)
interest income (114.20) (170.14)
Operating Profit Before Working Capital Changes 13,773.18 7,173.84
Movements in Working Capital :-
(Increase)/ Decrease in Inventories 1,726.99 (1,509.58)
(Increase)/ Decrease in Trade Receivables (1,700.80) (1,593.56)
(Increase)/ Decrease in Other Assets (4,805.74) (3,125.69)
Increase / (Decrease) in Trade Payables 499.79 22.05
Increase / (Decrease) in Other Payable 2,297.62 (4,841.71)
Cash Generated From/ (Used in) Operations 11,791.04 (3,874.65)
Income Tax Paid, Net (627.74) (37.41)
Net Cash Generated From /(Used in) Operating Activities (A) 11,163.30 (3,912.06)
B. Cash Flow From Investing Activities
Payment Against Acquisition of Fixed Assets (3,713.99) (3,996.85)
Proceeds From Sale of Fixed Assets 29.21 46.14
net movement in Other bank balances 530.28 (499.03)
term deposit more then 12 months 108.39 1,021.99
dividend received 0.36 0.30
interest received 242.97 158.38
Net Cash Used in Investing Activities (B) (2,802.78) (3,269.07)
Statement of Cash Flows For the Year Ended 31st March, 2018Statement of Cash Flow (Pursuant to Ind AS-7)
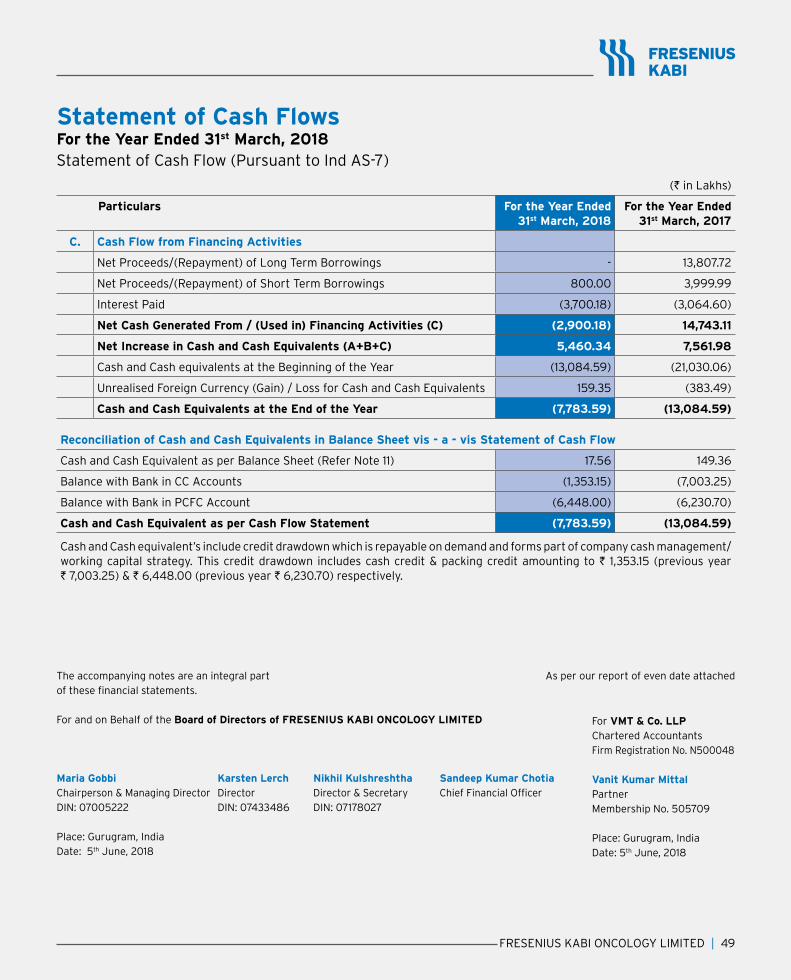
Fresenius Kabi OncOlOgy limited | 49
(` in lakhs)
Particulars For the Year Ended 31st March, 2018
For the Year Ended 31st March, 2017
C. Cash Flow from Financing Activities
Net Proceeds/(Repayment) of Long Term Borrowings - 13,807.72
Net Proceeds/(Repayment) of Short Term Borrowings 800.00 3,999.99
interest Paid (3,700.18) (3,064.60)
Net Cash Generated From / (Used in) Financing Activities (C) (2,900.18) 14,743.11
Net Increase in Cash and Cash Equivalents (A+B+C) 5,460.34 7,561.98
cash and cash equivalents at the beginning of the year (13,084.59) (21,030.06)
Unrealised Foreign Currency (Gain) / Loss for Cash and Cash Equivalents 159.35 (383.49)
Cash and Cash Equivalents at the End of the Year (7,783.59) (13,084.59)
Reconciliation of Cash and Cash Equivalents in Balance Sheet vis - a - vis Statement of Cash Flow
cash and cash equivalent as per balance sheet (refer note 11) 17.56 149.36
Balance with Bank in CC Accounts (1,353.15) (7,003.25)
Balance with Bank in PCFC Account (6,448.00) (6,230.70)
Cash and Cash Equivalent as per Cash Flow Statement (7,783.59) (13,084.59)
Cash and Cash equivalent’s include credit drawdown which is repayable on demand and forms part of company cash management/ working capital strategy. This credit drawdown includes cash credit & packing credit amounting to ` 1,353.15 (previous year ` 7,003.25) & ` 6,448.00 (previous year ` 6,230.70) respectively.
Statement of Cash Flows For the Year Ended 31st March, 2018Statement of Cash Flow (Pursuant to Ind AS-7)
the accompanying notes are an integral part of these financial statements.
For and on behalf of the Board of Directors of FRESENIUS KABI ONCOLOGY LIMITED
Maria Gobbi Karsten Lerch Nikhil Kulshreshtha Sandeep Kumar Chotia Chairperson & Managing Director Director Director & Secretary Chief Financial Officer DIN: 07005222 DIN: 07433486 DIN: 07178027
Place: Gurugram, India Date: 5th June, 2018
For VMT & Co. LLPchartered accountantsFirm registration no. n500048
Vanit Kumar MittalPartnermembership no. 505709
Place: Gurugram, India Date: 5th June, 2018
as per our report of even date attached
Raising the Bar
50 | 15th annual rePOrt 2017-18
Notes to the Financial Statementsfor the year ended 31st march, 2018
1) Company information
Fresenius Kabi Oncology Ltd. (“the Company”) a domestic public limited Company with registered office situated at B-3 10, Somdutt Chambers 1 Bhikhaji Cama Place. The Company is the direct subsidiary of Fresenius Kabi (Singapore) Pte, a body Corporate incorporated in Singapore, which owns 97.05% stake in the Company. The Company belongs to group of a German pharmaceutical conglomerate named Fresenius SE & Co KGaA which is among leading players of generic products especially in Oncological sphere across a globe. It has three manufacturing facilities in the country, two at Baddi, Himachal Pradesh and one at Kalyani, West Bengal. Its Research & Development Centre is situated in the premises of Head Office. Exports to group companies constitute a significant share of annual turnover of the Company.
2.1 Significant Accounting Policies
2.1.1 Basis for Preparation of Accounts
The financial statements of the company have been prepared and presented in accordance with Indian Accounting Standards (“Ind AS”) notified under the Companies (Indian Accounting Standards) Rules, 2015 and Companies (indian accounting standards) amendment rules, 2016.
Assets and liabilities have been classified as current or non-current as per the company’s normal operating cycle and other criteria set out in schedule – iii to the companies act, 2013.
These financial statements have been prepared on the historical cost convention and on an accrual basis, except for the following material items in the balance sheet:
• certain financial assets are measured either at fair value or at amortised cost depending on the classification;
• employee defined benefit assets/(liability) are recognised as the net total of the fair value of plan assets, plus actuarial losses, less actuarial gains and the present value of the defined benefit obligation;
• long-term borrowings, except obligations under finance leases, are measured at amortised cost using the effective interest rate method.
• Derivative financial instrument are measured at fair value.
All financial information presented in Indian rupees has been rounded to the nearest Lakhs of Rupees.
2.1.2 Use of Estimates
Ind-AS enjoins management to make estimates and assumptions related to financial statements that affect reported amount of assets, liabilities, revenue, expenses and contingent liabilities pertaining to the financial year. Actual result could differ from such estimates. Any revision in accounting estimates is recognized prospectively in the period of change and material revision including its impact on financial statement, is reported in the notes to accounts in the year of revision of accounting.
2.2 Recognition of Income and Expenses
Sale of Goods
Revenue is recognised when the significant risks and rewards of ownership have been transferred to the buyer, recovery of the consideration is probable, the associated costs and possible return of goods can be estimated reliably, there is no continuing management involvement with the goods and the amount of revenue can be measured reliably. Revenue from the sale of goods includes excise duty and is measured at the fair value of the consideration received or receivable, net of returns, sales tax and applicable trade discounts and allowances. Revenue includes shipping and handling costs billed to the customer. Sales recognized are net of sales tax, service tax, GST rebates and discount.
Services
Revenue from services rendered, which primarily relate to contract research services and other support services, is recognised in the statement of Profit and Loss as the underlying services are performed.

Fresenius Kabi OncOlOgy limited | 51
Export Incentives
Export incentives are recognised when there is reasonable assurance that the Company will comply with the conditions attached to them and the incentives will be received.
The Company is entitled to various export incentives
a) Export entitlements from government authorities under the Merchandise Exports from India Scheme (MEIS) and Duty Draw Back scheme are recognised in the Statement of Profit and Loss when the right to receive credit as per the terms of the scheme is established in respect of the exports made by the Company, and where there is no significant uncertainty regarding the ultimate collection of the relevant export proceeds. Accordingly, income is recognised based on the sales recognised during the financial year.
b) Export entitlements from government authorities under the Service Exports from India Scheme (SEIS) are recognised in the Statement of Profit and Loss when the right to receive credit as per the terms of the scheme is established in respect of the exports made by the Company. Accordingly, income is recognised only on filing of the claims for availing this benefit with the directorate general of Foreign trade.
c) Duty waived on import of capital goods is added to the cost of capital assets and said grant (amount of duty waived) is accounted for as deferred income amortizable during life span of the concerned asset on straight line basis.
Other Income
Other incomes have been recognized on accrual basis in financial statement except for cash flow information.
2.3 Property, Plants and Equipments
these tangible assets are held for use in production, supply of goods or services or for administrative purposes. these are recognized and carried under cost model i.e. cost less accumulated depreciation and impairment loss, if any.
a) Cost includes freight, duties, taxes and other expenses directly incidental to acquisition, bringing the asset to the location and installation including site restoration up to the time when the asset is ready for intended use. Such Costs also include Borrowing Cost if the recognition criteria are met.
b) gains and losses upon disposal of an item of property, plant and equipment are determined by comparing the proceeds from disposal with the carrying amount of property, plant and equipment and are recognised in the Statement of Profit and Loss.
c) the cost of replacing part of an item of property, plant and equipment is recognised in the carrying amount of the item if it is probable that the future economic benefits embodied within the part will flow to the Company and its cost can be measured reliably. The costs of repairs and maintenance are recognised in the Statement of Profit and loss as incurred.
d) Depreciation has been provided on straight line method in terms of expected life span of assets specified in Schedule – II of the Companies Act, 2013 or as determined by management. The residual value and useful life is reviewed annually and any deviation is accounted for as a change in estimate.
e) Components relevant to fixed assets, where significant, are separately depreciated on straight line basis in terms of their life span assessed by technical evaluation in item specific context.
f) For New Projects, all direct expenses and direct overheads (excluding services of non-exclusion nature provided by employees in Company’s regular payroll) are capitalized till the assets are ready for intended use.
g) Advances paid towards the acquisition of property, plant and equipment outstanding at each reporting date is disclosed as capital advances under other current /non- current assets as applicable. The cost of property, plant and equipment not ready to use before such date are disclosed under capital work-in-progress. Assets not ready for use are not depreciated.
2.4 Intangible Assets:
Patent/ Product Rights
Patents and product development rights that are acquired by the Company and that have finite useful lives are measured at cost less accumulated amortisation and accumulated impairment losses.

Raising the Bar
52 | 15th annual rePOrt 2017-18
Product Development
Intangible assets with finite useful life are subjected to test of impairment whenever there is an indication that the intangible assets may be impaired. Intangible assets with infinite useful life are tested for impairment annually.
Intangible assets with finite useful life are amortized over the useful economic life on a straight line basis. In case of Patents and Trade Marks, the useful life is taken to be 10 years and in case of Software, the useful life is taken as 5 years.
2.5 Impairment of Non Financial Assets:.
The carrying amounts of the Company’s non-financial assets, other than inventories and deferred tax assets are reviewed at each reporting date to determine whether there is any indication of impairment. If any such indication exists, then the asset’s recoverable amount is estimated. For intangible assets that have indefinite lives or that are not yet available for use, an impairment test is performed each year at 31 march.
The recoverable amount of an asset or cash-generating unit (as defined below) is the greater of its value in use and its fair value less costs to sell. In assessing value in use, the estimated future cash flows are discounted to their present value using a pre-tax discount rate that reflects current market assessments of the time value of money and the risks specific to the asset or the cash-generating unit.
For the purpose of impairment testing, assets are grouped together into the smallest group of assets that generates cash inflows from continuing use that are largely independent of the cash inflows of other assets or groups of assets (the “cash-generating unit”).
An impairment loss is recognised in the Statement of Profit and Loss if the estimated recoverable amount of an asset or its cash-generating unit is lower than its carrying amount.
Impairment losses, other than those recognized on goodwill, that have been recognised in prior periods are assessed at each reporting date for any indications that the loss has decreased or no longer exists. An impairment loss is reversed if there has been a change in the estimates used to determine the recoverable amount. an impairment loss is reversed only to the extent that the asset’s carrying amount does not exceed the carrying amount that would have been determined, net of depreciation or amortisation, if no impairment loss had been recognised.
2.6 Government subsidy / grant:
Government Grant is recognized only when there is a reasonable assurance that the entity will comply with the conditions attaching to them and the grants will be received.
a) Subsidies related to assets are recognized as deferred income which is recognized in the Statement of Profit & Loss on systematic basis over the useful life of the assets.
Purchase of assets and receipts of related grants are separately disclosed in Statement of Cash Flow.
b) Grants related to income are treated as other income in Statement of Profit & Loss subject to due disclosure about the nature of grant.
c) Duty waived on import of capital goods is added to the cost of capital assets and said grant (amount of duty waived) is accounted for as deferred income amortizable during life span of the concerned asset on straight line basis.
2.7 Financial instruments:
A financial instrument is any contract that gives rise to a financial asset of one entity and a financial liability or equity instrument of another entity.
(2.7.1) Financial Assets:
Initial Recognition and Measurement
All financial assets are recognized initially at fair value plus, in the case of financial assets not recorded at fair value through profit and loss, transaction costs that are attributable to the acquisition of the financial assets.
Financial assets are classified, at initial recognition, as financial assets measured at fair value or as financial assets measured at amortized cost.
Fresenius Kabi OncOlOgy limited | 53
Subsequent Measurement
For purpose of subsequent measurement financial assets are classified in two broad categories:-
• Financial assets at fair value
• Financial assets at amortized cost
Where assets that measured at fair value, gains and losses are either recognized entirely in the Statement of Profit and Loss, or recognized in other comprehensive income.
A financial asset that meets the following two conditions is measured at amortized cost.
• Business Model Test: The objective of the Company’s business model is to hold the financial asset to collect the contractual cash flows.
• Cash flow characteristics test: The contractual terms of the financial asset give rise on specified dates to cash flows that are solely payment of principal and interest on the principal amount outstanding.
A financial asset that meets the following two conditions is measured at fair value through OCI:-
• Business Model Test: The financial asset is held within a business model whose objective is achieved by both collecting contractual cash flows and selling financial assets.
• Cash flow characteristics test: The contractual terms of the financial asset give rise on specified dates to cash flows that are solely payment of principal and interest on the principal amount outstanding.
All other financial asset is measured at fair value through profit and loss.
All equity investments are measured at fair value in the Balance Sheet, with value changes recognized in the Statement of Profit and Loss, except for those equity investment for which the entity has elected irrevocable option to present value changes in Oci.
Derecognition of financial assets
A financial asset (or, where applicable, a part of a financial asset or part of a group of similar financial assets) is primarily derecognized (i.e., removed from the Company’s balance sheet) when:
• The rights to receive cash flows from the asset have expired, or
• The Company has transferred its rights to receive cash flows from the asset or has assumed an obligation to pay the received cash flows in full without material delay to a third party under a ‘pass-through’ arrangement; and either (a) the Company has transferred substantially all the risks and rewards of the asset, or (b) the Company has neither transferred nor retained substantially all the risks and rewards of the asset, but has transferred control of the asset.
When the Company has transferred its rights to receive cash flows from an asset or has entered into a pass-through arrangement, it evaluates if and to what extent it has retained the risks and rewards of ownership. When it has neither transferred nor retained substantially all of the risks and rewards of the asset, nor transferred control of the asset, the Company continues to recognise the transferred asset to the extent of the Company’s continuing involvement. In that case, the company also recognises an associated liability. the transferred asset and the associated liability are measured on a basis that reflects the rights and obligations that the Company has retained.
Impairment of financial assets
In accordance with Ind AS 109, the Company applies expected credit loss (ECL) model for measurement and recognition of impairment loss on the trade receivables or any contractual right to receive cash or another financial asset that result from transactions that are within the scope of Ind AS 18.
For this purpose, the Company follows ‘simplified approach’ for recognition of impairment loss allowance on the trade receivable balances. The application of simplified approach does not require the Company to track changes in credit risk. Rather, it recognizes impairment loss allowance based on lifetime ECLs at each reporting date, right from its initial recognition.
Raising the Bar
54 | 15th annual rePOrt 2017-18
As a practical expedient, the Company uses a provision matrix to determine impairment loss allowance on portfolio of its trade receivables. The provision matrix is based on its historically observed default rates over the expected life of the trade receivables and is adjusted for forward-looking estimates. At every reporting date, the historical observed default rates are updated and changes in the forward-looking estimates are analysed.
(2.7.2) Financial Liabilities:
All financial liabilities are initially recognized at fair value and, in the case of loans and borrowings and payables, net of directly attributable transaction costs.
Financial liabilities are classified as measured at amortized cost or fair value through profit and loss (FVTPL). A financial liability is classified as FVTPL if it is classified as held for trading, or it is derivative or is designated as such on initial recognition . Financial liabilities at FVtPl are measured at fair value and net gain or losses, including any interest expense, are recognized in Statement of Profit and Loss. Other financial liabilities are subsequently measured at amortized cost using the effective interest method. Interest expense and foreign exchange gains and losses are recognized in Statement of Profit and Loss.
The Company’s financial liabilities include trade and other payables, loans and borrowings including bank overdrafts, financial guarantee contracts and derivative financial instruments.
Derecognition
A financial liability is derecognised when the obligation under the liability is discharged or cancelled or expires. When an existing financial liability is replaced by another from the same lender on substantially different terms, or the terms of an existing liability are substantially modified, such an exchange or modification is treated as the derecognition of the original liability and the recognition of a new liability. The difference in the respective carrying amounts is recognised in the Statement of Profit and Loss.
2.8 Financial Guarantee:
A financial guarantee contract is a contract that requires the issuer to make specified payments to reimburse the holder for a loss it incurs because a specified debtor fails to make payments when due in accordance with the terms of a debt instrument.
Financial guarantee contracts issued by the company are measured at their fair values and recognised as income in the Statement of Profit and Loss.
Where guarantees in relation to loans or other payables of group companies are provided for no compensation, the fair value are accounted for as contributions and recognised as part of cost of investment. Consequently, the beneficiary accounts for such guarantee by recognizing a deemed equity contribution and recognising a finance cost for obtaining such a guarantee.
2.9 Fair value measurement:
The Company measures financial instruments, such as derivatives at fair value at each balance sheet date.
Fair value is the price that would be received to sell an asset or paid to transfer a liability in an orderly transaction between market participants at the measurement date. The fair value measurement is based on the presumption that the transaction to sell the asset or transfer the liability takes place either:
• in the principal market for the asset or liability, or
• in the absence of a principal market, in the most advantageous market for the asset or liability.
the principal or the most advantageous market must be accessible by the company.
The fair value of an asset or a liability is measured using the assumptions that market participants would use when pricing the asset or liability, assuming that market participants act in their economic best interest.
The fair value measurement of a non –financial asset takes into account a market participant’s ability to generate economic benefits by using the asset in its highest and best use or by selling it to another market participant that would use the asset in its highest and best use.

Fresenius Kabi OncOlOgy limited | 55
The Company uses valuation techniques that are appropriate in the circumstances and for which sufficient data are available to measure fair value, maximizing the use of relevant observable inputs and minimizing the use of unobservable inputs.
All assets and liabilities for which fair value is measured or disclosed in the financial statements are categorized within the fair value hierarchy, described as follows, based on the lowest level input that is significant to the fair value measurement as a whole:
Level 1- Quoted prices (unadjusted) in active markets for identical assets or liabilities.
Level 2- Inputs other than quoted prices included within Level 1 that are observable for the asset or liability, either directly (i.e. as per prices) or indirectly (i.e. derived from prices).
Level 3- input for the assets or liabilities that are not based on observable market data (unobservable inputs).
For assets and liabilities that are recognized in the financial statement on a recurring basis, the Company determines whether transfers have occurred between levels in the hierarchy by re-assessing categorization (based on the lowest level input that is significant to the fair value measurement as a whole) at the end of each reporting period.
2.10 Leases:
At the inception of each lease, the lease arrangement is classified as either a finance lease or an operating lease, based on the substance of the lease arrangement. an arrangement that does not take legal form of lease rent but conveys right to use an asset in return for payment or series of payment, is also accounted for as either finance lease or an operating lease.
Finance Leases
A finance lease is recognised as an asset and a liability at the commencement of the lease, at the lower of the fair value of the asset and the present value of the minimum lease payments. initial direct costs, if any, are also capitalised and, subsequent to initial recognition, the asset is accounted for in accordance with the accounting policy applicable to that asset. Minimum lease payments made under finance leases are apportioned between the finance expense and the reduction of the outstanding liability. The finance expense is allocated to each period during the lease term so as to produce a constant periodic rate of interest on the remaining balance of the liability.
depreciation on leasehold assets is provided on straight line method over the period of lease.
Operating Leases
Leases other than finance leases are operating leases, and the leased assets are not recognised on the Company’s Balance Sheet. Payments made under operating leases are recognised in the Statement of Profit and Loss on a straight-line basis over the term of the lease, in case the lease increments are not in line with the general inflation rate.
2.11 Inventories:
Inventories consist of raw materials, stores and spares, work-in-progress and finished goods and are measured at the lower of cost and net realisable value.
Cost includes expenditures incurred in acquiring the inventories, production or conversion costs and other costs incurred in bringing them to their existing location and condition. In the case of finished goods and work-in-progress, cost includes an appropriate share of overheads based on normal operating capacity. stores and spares, that do not qualify to be recognised as property, plant and equipment, consists of packing materials, engineering spares (such as machinery spare parts) and consumables, which are used in operating machines or consumed as indirect materials in the manufacturing process. The basis of measurement of cost is as follows:
a) Raw material, Packing Material; Moving Weighted Average Basis.
b) Stores & spares: Moving weighted average basis.
c) Work-in-progress: Cost of input plus overhead upto the stage of completion.
d) Finished Goods: Cost of input plus appropriate overhead.
Net realizable value is the estimated selling price in the ordinary course of business, less the estimated costs of completion and selling expenses.

Raising the Bar
56 | 15th annual rePOrt 2017-18
Taxus Baccata Leaves which are matured and plucked classified as planation inventory in the financial statements, are designated as agricultural produce as per ind as 41 and are measured at their fair value less cost to sell as at each reporting date. Any changes in fair value are recognised in the Statement of Profit and Loss in the year in which they arise
the fair valuation so arrived at becomes the cost of inventory under ind as 2.
2.12 Employee Benefits:
Short-term employee benefits
Short-term employee benefits include wages and salaries, including non-monetary benefits that are expected to be settled wholly within 12 months after the end of the period in which the employees render the related services, are expensed as the related service is provided. A liability is recognised for the amount expected to be paid if the Company has a present legal or constructive obligation to pay this amount as a result of past service provided by the employee and the obligation can be estimated reliably. The liabilities are presented as current employee benefit obligations in the Balance Sheet.
esi is provided on the basis of actual liability accrued and paid to authorities.
Long Term Employee Benefit
The Company’s net obligation in respect of other long-term employee benefits is the amount of future benefit that employees have earned in return for their service in the current and previous periods.
The Company’s current policies permit certain categories of its employees to accumulate and carry forward a portion of their unutilized compensated absences and utilise them in future periods or receive cash in lieu thereof in accordance with the terms of such policies. The Company measures the expected cost of accumulating compensated absences as the additional amount that the company incurs as a result of the unused entitlement that has accumulated at the balance sheet date. Such measurement is based on actuarial valuation as at the balance sheet date carried out by a qualified actuary. Remeasurements are recognised in the Statement of Profit and Loss in the period in which they arise.
Defined contribution plans
The Company’s contributions to defined contribution plans are charged to the Statement of Profit and Loss as and when the services are received from the employees. The Company contributes to a superannuation fund and also makes contribution on account of employee Provident Fund and employee state insurance.
Defined Benefit Plans
Gratuity Liability on the basis of actuarial valuation as per Ind AS 19. Liability recognized in the Balance Sheet in respect of gratuity is the present value of the defined benefit obligation at the end of each reporting period less the fair value of plan assets. The defined benefit obligation is calculated annually by actuary using the projected unit credit method. The present value of defined benefit is determined by discounting the estimated future cash outflows by reference to market yield at the end of each reporting period on government bonds that have terms approximate to the terms of the related obligation. The interest cost is calculated by applying the discount rate to the net balance of the defined benefit obligation and the fair value of plan assets. The cost is included in employee benefit expense in the Statement of Profit and Loss. Actuarial gain / loss arising from experience adjustments and changes in actuarial assumptions are credited / debited to “other comprehensive Income” forming part of other equity.
2.13 Income Tax:
Income tax expense consists of current and deferred tax. Income tax expense is recognised in the Statement of Profit and Loss except to the extent that it relates to items recognised directly in equity, in which case it is recognised in equity. Current tax is the expected tax payable on the taxable income for the year, using tax rates enacted or substantively enacted at the reporting date, and any adjustment to tax payable in respect of previous years. The liability of company on account of Income Tax is estimated considering the provisions of the income Tax Act, 1961.
Deferred tax is provided using balance sheet approach on temporary differences at the reporting date as difference between the tax base and the carrying amount of assets and liabilities. Deferred tax is recognized subject to the probability that taxable profit will be available against which the temporary differences can be reversed.
Deferred tax assets and liabilities are measured at the tax rates that are expected to apply in the year when the asset is realized or the liability is settled, based on tax rates (and tax laws) that have been enacted or substantively enacted at the reporting date.

Fresenius Kabi OncOlOgy limited | 57
Deferred tax relating to items recognized outside profit or loss recognized outside profit or loss (either in other comprehensive income or in equity).
Deferred tax assets and deferred tax liabilities are offset if a legally enforceable right exists to set off current tax assets against current tax liabilities and the deferred taxes relate to the same taxable entity and the same taxation authority.
2.14 Provision Contingent Liability and Contingent Assets:
a provision is recognised if, as a result of a past event, the company has a present legal or constructive obligation that can be estimated reliably, and it is probable that an outflow of economic benefits will be required to settle the obligation. If the effect of the time value of money is material, provisions are determined by discounting the expected future cash flows at a pre-tax rate that reflects current market assessments of the time value of money and the risks specific to the liability. Where discounting is used, the increase in the provision due to the passage of time is recognised as a finance cost.
Restructuring Provisions
A provision for restructuring is recognised when the Company has approved a detailed and formal restructuring plan, and the restructuring either has commenced or has been announced publicly. Future operating costs are not provided.
Contingent Liabilities
A disclosure for a contingent liability is made when there is a possible obligation or a present obligation that may, but probably will not, require an outflow of resources. Where there is a possible obligation or a present obligation in respect of which the likelihood of outflow of resources is remote, no provision or disclosure is made.
Disputes liabilities and claims against the Company including claims raised by fiscal authorities (e.g. Sales Tax, Income Tax Excise etc.) pending in appeal / court for which no reliable estimated can be made and or involves uncertainty of the outcome of the amount of the obligation or which are remotely poised for crystallization are not provided for in accounts but disclosed in notes to accounts.
Contingent Assets
Contingent assets are not recognised in the financial statements. However, contingent assets are assessed continually and if it is virtually certain that an inflow of economic benefits will arise, the asset and related income are recognised in the period in which the change occurs.
2.15 Foreign Currency Translation:
The company’s financial statements are presented in `, which is also the company’s functional currency.
a) Transactions in foreign currencies are recognized at rate of foreign currency ruling on the date of transactions. Gain / Loss arising on account of rise or fall in foreign currencies vis-à-vis functional currency between the date of transaction and that of payment is charged to Statement of Profit & Loss.
b) Monetary Assets in foreign currencies are translated into functional currency at the exchange rate ruling at the reporting date and the resultant gain or loss, is accounted for in the Statement of Profit & Loss.
c) Non-Monetary items which are carried at historical cost denominated in a foreign currency reported using the exchange rate at the date of the transaction.
d) Impact of exchange fluctuation is separately disclosed in notes to accounts.
2.16 Operating Segments:
the chief Operating decision maker monitors the operating results of its business segments separately for the purpose of making decisions about resource allocation and performance assessment. segment performance is evaluated based on profit and loss and is measured consistently with profit and loss in the financial statements.
The Operating segments have been identified on the basis of the nature of products/services.
a) Segment revenue includes sales and other income directly identifiable with the segment including inter-segment revenue.
b) Expenses that are directly identifiable with the segments are considered for determining the segment results. Expenses which relate to the Company as a whole and not allocable to segments are included under unallocable expenditure.
Raising the Bar
58 | 15th annual rePOrt 2017-18
c) Income which relates to the Company as a whole and not allocable to segments is included in unallocable income.
d) Segment result includes margins on inter-segment and sales which are reduced in arriving at the7profit before tax of the company.
e) Segment assets and liabilities include those directly identifiable with the respective segments. Unallocable assets and liabilities represent the assets and liabilities that relate to the Company as a whole and not allocable to any segment.
2.17 Earnings Per Share:
The Company presents basic and diluted earnings per share (“EPS”) data for its ordinary shares Basic Earnings per share is calculated by dividing the net profit for the period attributable to equity shareholders by the weighted average number of equity shares outstanding during the period.
For the purpose of calculating diluted earnings per share, the net profit for the period attributed to equity shareholders and the weighted average number of shares outstanding during the period is adjusted for the effects of all dilutive potential equity shares, if any.
2.18 Borrowing Cost
Borrowing cost consists of interest and other costs also includes exchange differences to the extent regarded as an adjustment to the borrowing costs. A qualifying asset is an asset that necessarily requires a substantial period of time to get ready for its intended use or sale. All other borrowing cost are recognized as expense in the period in which they are incurred. Borrowing cost that are directly attributable to the acquisition , construction, or production of a qualifying asset are capitalized as a part of the cost of such asset till such time the asset is ready for its intended use or sale.
2.19 Cash and Cash equivalent
For the purpose of presentation in the balance sheet, cash and cash equivalents includes cash in hand, deposits held at call with financial institutions, other short-term, highly liquid investments with original maturities of three months or less that are readily convertible to known amounts of cash and which are subject to an insignificant risk of changes in value.
For the purpose of statement of cash flow, working capital borrowing, repayable on demand, which form integral part of cash management has been included in cash and cash equivalent.
2.20 Biological Assets
Biological Assets which are held to bear agricultural produce are classified as Bearer plants. Taxus Bacatta bushes which have attained harvestable stage to produce taxus bacatta leaves are recognised as Bearer biological assets. Cost incurred for new plantations and additional costs incurred till the time these bushes attain harvestable age are capitalised. Such cost includes cost of land preparation, new planting and maintenance till maturity. Bearer plants attain a harvestable stage in about 3-5 years.
the matured bearer plants is depreciated over their estimated useful life. bearer biological assets are carried at cost less accumulated depreciation and accumulated impairment loss, if any. Subsequent expenditure on bearer assets are expensed unless it is probable that future economic benefits associated with the item will flow to the Company and the cost of the item can be measured reliably.
Leaves from Taxus Bacatta bushes which have attained required chemical properties, after the point of harvest, are recognized as agriculture produce and recognized, at fair value less cost to sell, as plantation inventory. The Company believes that leaves which have not matured does to have any fair value considering the chemical properties contained therein.
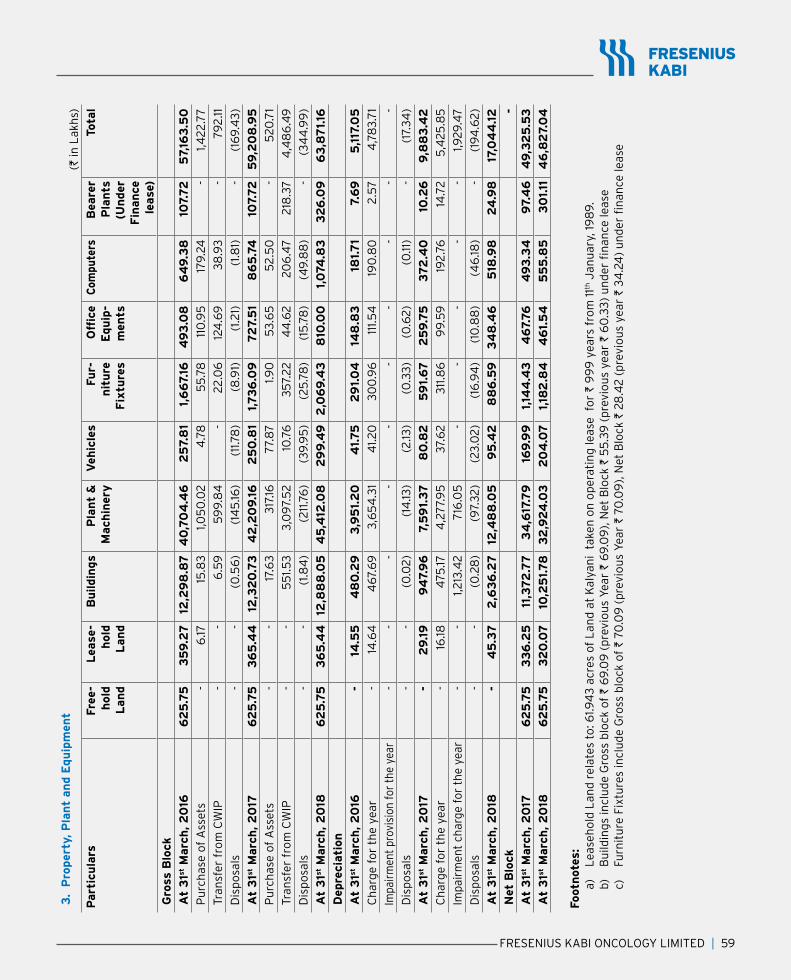
Fresenius Kabi OncOlOgy limited | 59
3. P
roper
ty, P
lant
an
d E
qu
ipm
ent
(` in
lak
hs)
Part
icu
lars
F
ree-
hold
L
an
d
Lea
se-
hold
L
an
d
Bu
ildin
gs
Pla
nt
&
Mach
iner
y
Veh
icle
s F
ur-
nit
ure
F
ixtu
res
Offi
ce
Equ
ip-
men
ts
Com
pute
rs
Bea
rer
Pla
nts
(U
nder
F
inan
ce
lease
)
Tot
al
Gro
ss B
lock
At
31st
Marc
h, 2
016
6
25
.75
3
59
.27
1
2,2
98
.87
4
0,7
04
.46
2
57.
81
1,6
67.
16
49
3.0
8
64
9.3
8
10
7.7
2
57,
163
.50
Pu
rch
ase
of a
sset
s -
6
.17
15
.83
1
,05
0.0
2
4.7
8
55
.78
1
10.9
5
179
.24
-
1
,422
.77
Tra
nsf
er f
rom
CW
IP
--
6.5
9
59
9.8
4
- 2
2.0
6
124
.69
3
8.9
3
-
79
2.11
dis
po
sals
-
-
(0
.56
) (
145
.16)
(11
.78
) (
8.9
1) (
1.21)
(1.8
1) -
(
169
.43
)
At
31st
Marc
h, 2
017
6
25
.75
3
65
.44
1
2,3
20
.73
4
2,2
09
.16
2
50
.81
1,7
36
.09
7
27.
51
86
5.7
4
10
7.7
2
59
,20
8.9
5
Pu
rch
ase
of a
sset
s -
- 1
7.6
3
317
.16
77.
87
1
.90
5
3.6
5
52
.50
-
5
20.7
1
Tra
nsf
er f
rom
CW
IP
--
55
1.53
3
,09
7.5
2
10
.76
3
57.
22
44
.62
2
06
.47
2
18.3
7
4,4
86
.49
dis
po
sals
-
- (
1.84
) (
211
.76
) (
39.9
5)
(25
.78
) (
15.7
8)
(4
9.8
8)
-
(3
44
.99
)
At
31st
Marc
h, 2
018
6
25
.75
3
65
.44
12
,88
8.0
5
45
,412
.08
2
99
.49
2
,06
9.4
3
810
.00
1
,074
.83
3
26
.09
6
3,8
71.
16
Dep
reci
ati
on
At
31st
Marc
h, 2
016
-
1
4.5
5
48
0.2
9
3,9
51.
20
4
1.75
2
91.
04
1
48
.83
1
81.
71
7.6
9
5,1
17.0
5
ch
arg
e fo
r th
e ye
ar
-
14
.64
4
67.
69
3
,65
4.3
1 4
1.20
3
00
.96
1
11.5
4
19
0.8
0
2.5
7
4,7
83.
71
impa
irm
ent
prov
isio
n fo
r th
e ye
ar
- -
-
-
-
-
-
-
-
-
dis
po
sals
-
- (
0.0
2)
(14
.13)
(2
.13)
(0
.33
) (
0.6
2)
(0
.11)
-
(17
.34
)
At
31st
Marc
h, 2
017
-
29
.19
9
47.
96
7
,59
1.3
7
80
.82
5
91.
67
2
59
.75
3
72
.40
1
0.2
6
9,8
83
.42
ch
arg
e fo
r th
e ye
ar
- 1
6.18
4
75.17
4
,277
.95
3
7.6
2
311
.86
9
9.5
9
19
2.7
6
14
.72
5
,425
.85
impa
irm
ent
char
ge f
or t
he y
ear
--
1,2
13.4
2
716
.05
-
--
--
1,9
29.4
7
dis
po
sals
-
-
(0
.28
) (
97.
32)
(23
.02
) (
16.9
4)
(10
.88
) (
46
.18)
-
(19
4.6
2)
At
31st
Marc
h, 2
018
-
45
.37
2
,63
6.2
7
12
,48
8.0
5
95
.42
8
86
.59
3
48
.46
5
18.9
8
24
.98
1
7,0
44
.12
Net
Blo
ck
-
At
31st
Marc
h, 2
017
62
5.7
5
33
6.2
5
11,
37
2.7
7
34
,617
.79
1
69
.99
1
,14
4.4
3
46
7.76
4
93
.34
9
7.4
6
49
,32
5.5
3
At
31st
Marc
h, 2
018
6
25
.75
3
20
.07
1
0,2
51.
78
3
2,9
24
.03
2
04
.07
1
,18
2.8
4
46
1.5
4
55
5.8
5
30
1.11
4
6,8
27.
04
Foot
not
es:
a)
Lea
seh
old
Lan
d r
elat
es t
o: 6
1.94
3 a
cres
of
Lan
d a
t K
alya
ni
take
n o
n o
per
atin
g le
ase
fo
r `
99
9 y
ears
fro
m 1
1th J
anu
ary,
19
89
. b)
b
uild
ing
s in
clu
de
gro
ss b
lock
of
` 6
9.0
9 (
pre
vio
us
year
` 6
9.0
9),
net
blo
ck `
55
.39
(p
revi
ou
s ye
ar `
60
.33
) u
nd
er fi
nan
ce le
ase
c)
Fu
rnit
ure
Fix
ture
s in
clu
de
Gro
ss b
lock
of
` 70
.09
(p
revi
ou
s ye
ar `
70
.09
), n
et b
lock
` 2
8.4
2 (
pre
vio
us
year
` 3
4.2
4)
un
der
fin
ance
leas
e

Raising the Bar
60 | 15th annual rePOrt 2017-18
4: CAPITAL WORK-IN-PROGRESS
(` in lakhs)
Particulars PPE & Other Intangible
Bearer Plantation in progress (Under
Finance lease)
Total
At 31st March, 2016 2,708.03 330.77 3,038.80
additions 2,104.70 154.05 2,258.75
transfer (792.11) - (792.11)
discard (41.38) - (41.38)
At 31st March, 2017 3,979.24 484.82 4,464.06
additions 4,387.57 3.44 4,391.01
transfer (4,269.20) (218.37) (4,487.57)
discard (93.56) (93.56)
impairment charge for the year (519.07) (519.07)
At 31st March, 2018 3,484.98 269.89 3,754.87
refer note 46
5: OTHER INTANGIBLE ASSETS (` in lakhs)
Particulars Product Development
Patent/ Product Rights
Total
Gross Block
At 31st March, 2016 180.80 93.69 274.49
additions - - -
At 31st March, 2017 180.80 93.69 274.49
additions - 1.09 1.09
At 31st March, 2018 180.80 94.78 275.58
Amortization and Impairment
At 31st March, 2016 60.39 25.98 86.37
Amortization for the year 60.14 27.07 87.21
At 31st March, 2017 120.53 53.05 173.58
Amortization for the year 30.13 27.10 57.23
At 31st March, 2018 150.66 80.15 230.81
Net Block
At 31st March, 2017 60.27 40.64 100.91
At 31st March, 2018 30.14 14.63 44.77
NON CURRENT ASSETS
6: FINANCIAL ASSETS- INVESTMENTS (` in lakhs)
Particulars As at
31st March, 2018 As at
31st March, 2017
unquoted
investments in equity instruments carried at FVtPl
Investments - Shivalik Waste Management Limited (30,000; previous year 30,000; Number of Equity Shares of ` 10 each) 3.00 3.00
Total 3.00 3.00
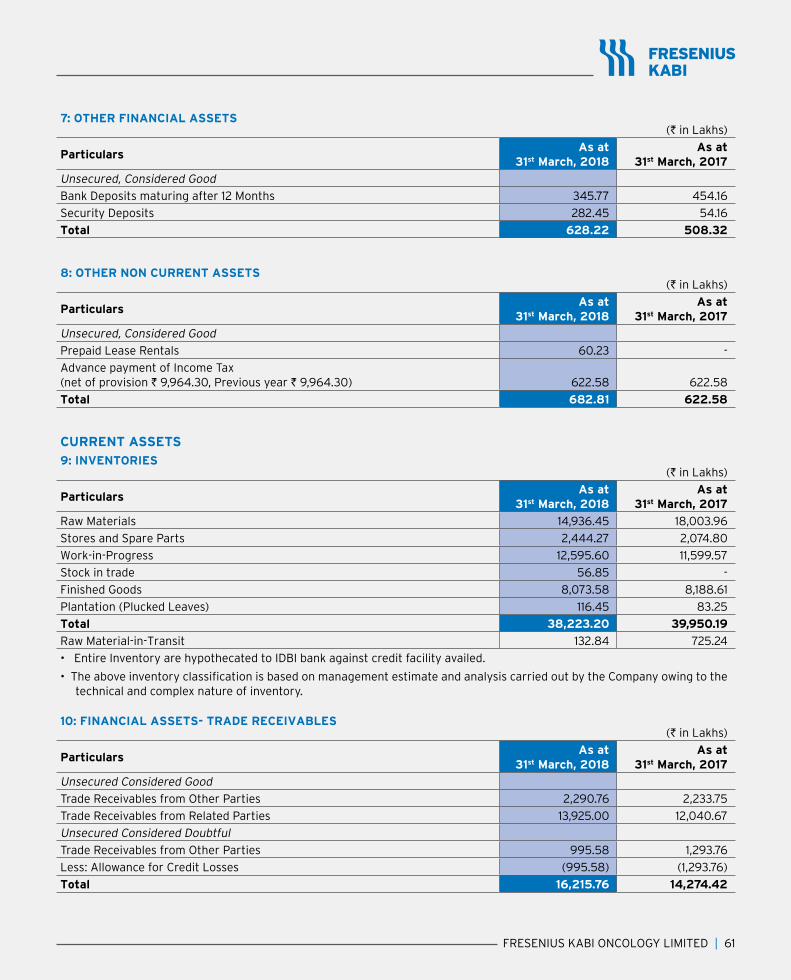
Fresenius Kabi OncOlOgy limited | 61
7: OTHER FINANCIAL ASSETS (` in lakhs)
Particulars As at
31st March, 2018 As at
31st March, 2017
unsecured, considered good
bank deposits maturing after 12 months 345.77 454.16
security deposits 282.45 54.16
Total 628.22 508.32
8: OTHER NON CURRENT ASSETS (` in lakhs)
Particulars As at
31st March, 2018 As at
31st March, 2017
unsecured, considered good
Prepaid lease rentals 60.23 -
Advance payment of Income Tax (net of provision ` 9,964.30, Previous year ` 9,964.30) 622.58 622.58
Total 682.81 622.58
CURRENT ASSETS
9: INVENTORIES (` in lakhs)
Particulars As at
31st March, 2018 As at
31st March, 2017
Raw Materials 14,936.45 18,003.96
stores and spare Parts 2,444.27 2,074.80
Work-in-Progress 12,595.60 11,599.57
stock in trade 56.85 -
Finished goods 8,073.58 8,188.61
Plantation (Plucked leaves) 116.45 83.25
Total 38,223.20 39,950.19
Raw Material-in-Transit 132.84 725.24
• Entire Inventory are hypothecated to IDBI bank against credit facility availed.
• The above inventory classification is based on management estimate and analysis carried out by the Company owing to the technical and complex nature of inventory.
10: FINANCIAL ASSETS- TRADE RECEIVABLES (` in lakhs)
Particulars As at
31st March, 2018 As at
31st March, 2017
unsecured considered good
trade receivables from Other Parties 2,290.76 2,233.75
trade receivables from related Parties 13,925.00 12,040.67
unsecured considered doubtful
trade receivables from Other Parties 995.58 1,293.76
Less: Allowance for Credit Losses (995.58) (1,293.76)
Total 16,215.76 14,274.42

Raising the Bar
62 | 15th annual rePOrt 2017-18
11: CASH AND CASH EqUIVALENTS (` in lakhs)
Particulars As at
31st March, 2018 As at
31st March, 2017
cash on hand 0.13 0.43
balances in current accounts 17.43 148.93
Total 17.56 149.36
12: BANK BALANCE OTHER THAN CASH AND CASH EqUIVALENTS (` in lakhs)
Particulars As at
31st March, 2018 As at
31st March, 2017
Deposits with original maturing after three month but before one year 146.45 676.73
Total 146.45 676.73
13: LOANS (` in lakhs)
Particulars As at
31st March, 2018 As at
31st March, 2017
(Unsecured & Considered Good)
loans to employees 14.05 15.08
Total 14.05 15.08
14: OTHER FINANCIAL ASSETS (` in lakhs)
Particulars As at
31st March, 2018 As at
31st March, 2017
(Unsecured & Considered Good)
security deposit 3.00 293.04
Accrued Interest on Fixed Deposits 164.03 292.81
Other receivables 0.13 1.08
Total 167.16 586.93
15: OTHER CURRENT ASSETS (` in lakhs)
Particulars As at
31st March, 2018 As at
31st March, 2017
trade advances 1,105.30 955.58
capital advances 204.26 456.29
Balances with Government Authorities 11,982.87 8,251.58
Export Incentive Receivable 2,252.99 1,216.78
advance to employee 14.72 68.23
Prepaid Expenses 256.85 306.36
Prepaid lease rentals 24.10 11.12
Total 15,841.09 11,265.94
Note: There are no dues from director and / or from officers.
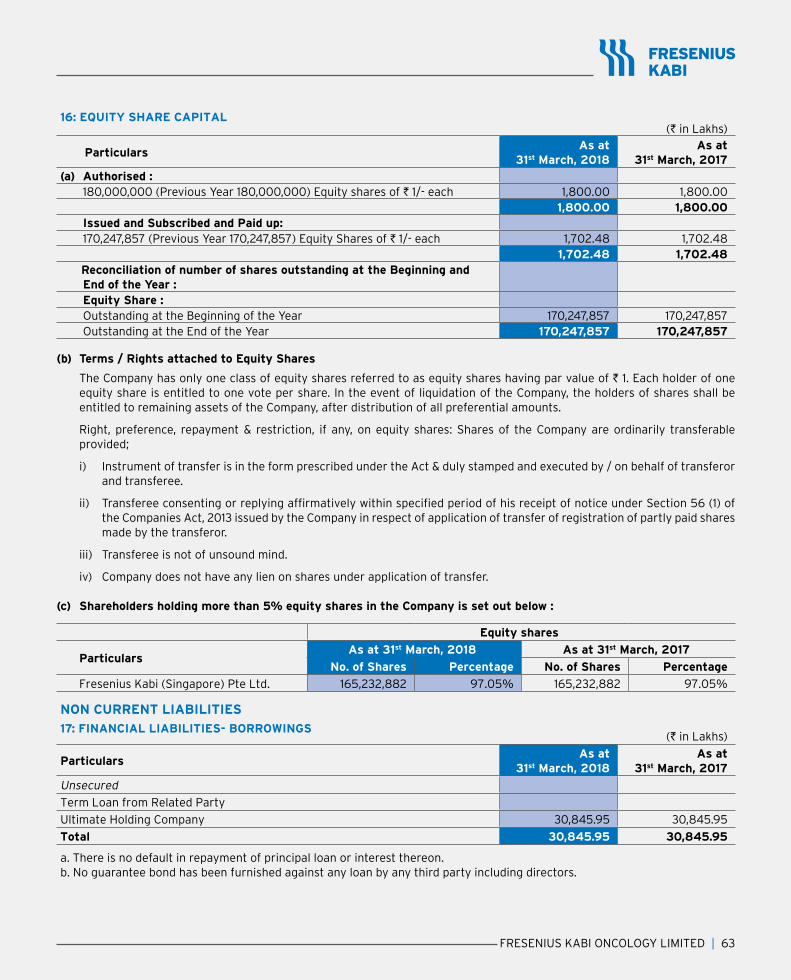
Fresenius Kabi OncOlOgy limited | 63
16: EqUITY SHARE CAPITAL (` in lakhs)
Particulars As at
31st March, 2018 As at
31st March, 2017(a) Authorised :
180,000,000 (Previous year 180,000,000) equity shares of ` 1/- each 1,800.00 1,800.00 1,800.00 1,800.00
Issued and Subscribed and Paid up: 170,247,857 (Previous year 170,247,857) equity shares of ` 1/- each 1,702.48 1,702.48
1,702.48 1,702.48 Reconciliation of number of shares outstanding at the Beginning and
End of the Year :Equity Share :Outstanding at the beginning of the year 170,247,857 170,247,857Outstanding at the end of the year 170,247,857 170,247,857
(b) Terms / Rights attached to Equity Shares
the company has only one class of equity shares referred to as equity shares having par value of ` 1. each holder of one equity share is entitled to one vote per share. in the event of liquidation of the company, the holders of shares shall be entitled to remaining assets of the company, after distribution of all preferential amounts.
Right, preference, repayment & restriction, if any, on equity shares: Shares of the Company are ordinarily transferable provided;
i) Instrument of transfer is in the form prescribed under the Act & duly stamped and executed by / on behalf of transferor and transferee.
ii) Transferee consenting or replying affirmatively within specified period of his receipt of notice under Section 56 (1) of the companies act, 2013 issued by the company in respect of application of transfer of registration of partly paid shares made by the transferor.
iii) transferee is not of unsound mind.
iv) company does not have any lien on shares under application of transfer.
(c) Shareholders holding more than 5% equity shares in the Company is set out below :
Equity shares
ParticularsAs at 31st March, 2018 As at 31st March, 2017
No. of Shares Percentage No. of Shares Percentage
Fresenius Kabi (singapore) Pte ltd. 165,232,882 97.05% 165,232,882 97.05%
NON CURRENT LIABILITIES
17: FINANCIAL LIABILITIES- BORROWINGS (` in lakhs)
Particulars As at
31st March, 2018 As at
31st March, 2017
unsecured
term loan from related Party
ultimate Holding company 30,845.95 30,845.95
Total 30,845.95 30,845.95
a. there is no default in repayment of principal loan or interest thereon.b. no guarantee bond has been furnished against any loan by any third party including directors.
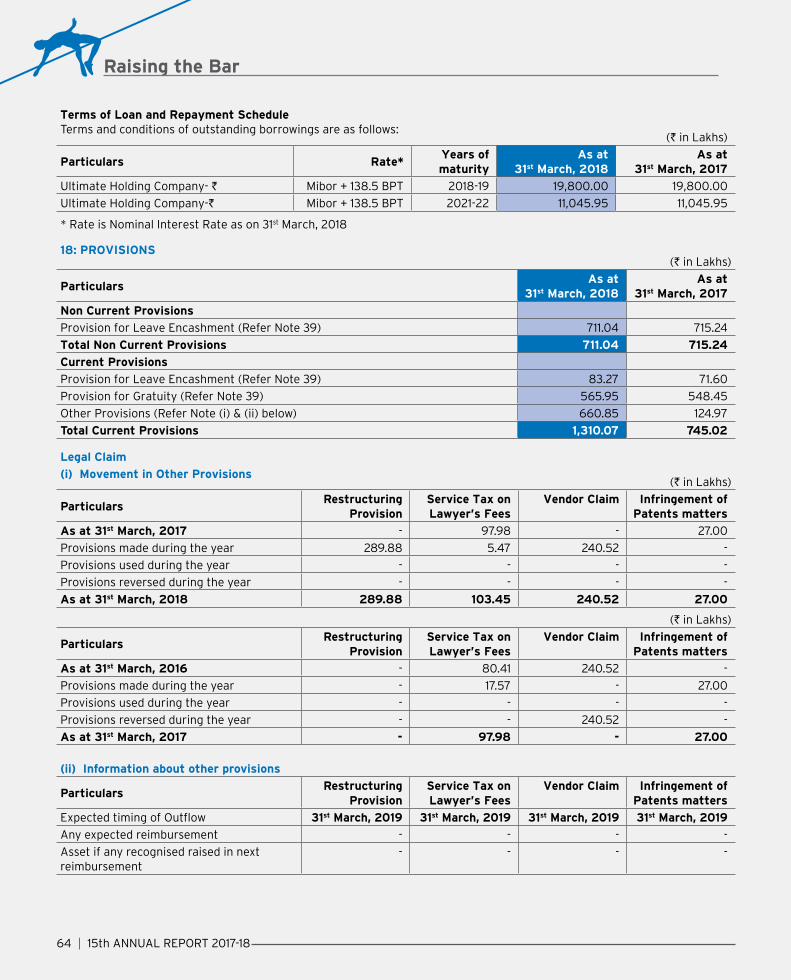
Raising the Bar
64 | 15th annual rePOrt 2017-18
Terms of Loan and Repayment Schedule Terms and conditions of outstanding borrowings are as follows:
(` in lakhs)
Particulars Rate* Years of maturity
As at 31st March, 2018
As at 31st March, 2017
ultimate Holding company- ` Mibor + 138.5 BPT 2018-19 19,800.00 19,800.00
ultimate Holding company-` Mibor + 138.5 BPT 2021-22 11,045.95 11,045.95
* rate is nominal interest rate as on 31st march, 2018
18: PROVISIONS (` in lakhs)
Particulars As at
31st March, 2018 As at
31st March, 2017
Non Current Provisions
Provision for leave encashment (refer note 39) 711.04 715.24
Total Non Current Provisions 711.04 715.24
Current Provisions
Provision for leave encashment (refer note 39) 83.27 71.60
Provision for gratuity (refer note 39) 565.95 548.45
Other Provisions (Refer Note (i) & (ii) below) 660.85 124.97
Total Current Provisions 1,310.07 745.02
Legal Claim
(i) Movement in Other Provisions (` in lakhs)
ParticularsRestructuring
ProvisionService Tax on Lawyer’s Fees
Vendor Claim Infringement of Patents matters
As at 31st March, 2017 - 97.98 - 27.00
Provisions made during the year 289.88 5.47 240.52 -
Provisions used during the year - - - -
Provisions reversed during the year - - - -
As at 31st March, 2018 289.88 103.45 240.52 27.00
(` in lakhs)
ParticularsRestructuring
ProvisionService Tax on Lawyer’s Fees
Vendor Claim Infringement of Patents matters
As at 31st March, 2016 - 80.41 240.52 -
Provisions made during the year - 17.57 - 27.00
Provisions used during the year - - - -
Provisions reversed during the year - - 240.52 -
As at 31st March, 2017 - 97.98 - 27.00
(ii) Information about other provisions
ParticularsRestructuring
ProvisionService Tax on Lawyer’s Fees
Vendor Claim Infringement of Patents matters
Expected timing of Outflow 31st March, 2019 31st March, 2019 31st March, 2019 31st March, 2019
Any expected reimbursement - - - -
Asset if any recognised raised in next reimbursement
- - - -

Fresenius Kabi OncOlOgy limited | 65
19: DEFERRED TAX LIABILITIES
A. Amounts Recognised in Profit or Loss (` in lakhs)
Particulars 31st March, 2018 31st March, 2017
Current Tax Expense
current year 840.41 -
840.41 -
Deferred Tax Expense / (Income)
Property, Plant and equipment (971.45) 170.92
lease equalisation reserve 17.00 34.00
impairment of trade receivables 103.20 110.26
Provision for leave encashment (2.59) (9.06)
Provision for gratuity (6.06) 30.40
Other Provisions (185.47) 67.82
unabsorbed loss 89.05 52.23
(956.32) 456.57
Other Comprehensive Income
Tax (Expense)/ Income on Remeasurement of Defined Benefit Liability (23.02) 12.25
Total Tax Expense (Income) (138.93) 468.82
(` in lakhs) Particulars 31st March, 2018 31st March, 2017
Remeasurement of Defined Benefit Liability
Before tax 66.50 (35.39)
Tax Expense/ (Income) (23.02) 12.25
Net of tax 43.48 (23.14)
C. Reconciliation of Effective Tax Rate (` in lakhs)
ParticularsFor the year ended
31st March, 2018 For the year ended
31st March, 2017
Profit Before Tax from Continuing Operations 1,842.48 214.99
Tax using the Company’s Domestic Tax Rate 840.41 -
Increase in Tax Rate: - -
Tax Effect of amounts which are not deductible (taxable) in calculating taxable income - -
Property, Plant and equipment (971.45) 170.92
lease equalisation reserve 17.00 34.00
impairment of trade receivables 103.20 110.26
Provision for leave encashment (2.59) (9.06)
Provision for gratuity (6.06) 30.40
Other Provisions (185.47) 67.82
unabsorbed loss 89.05 52.23
(115.91) 456.57
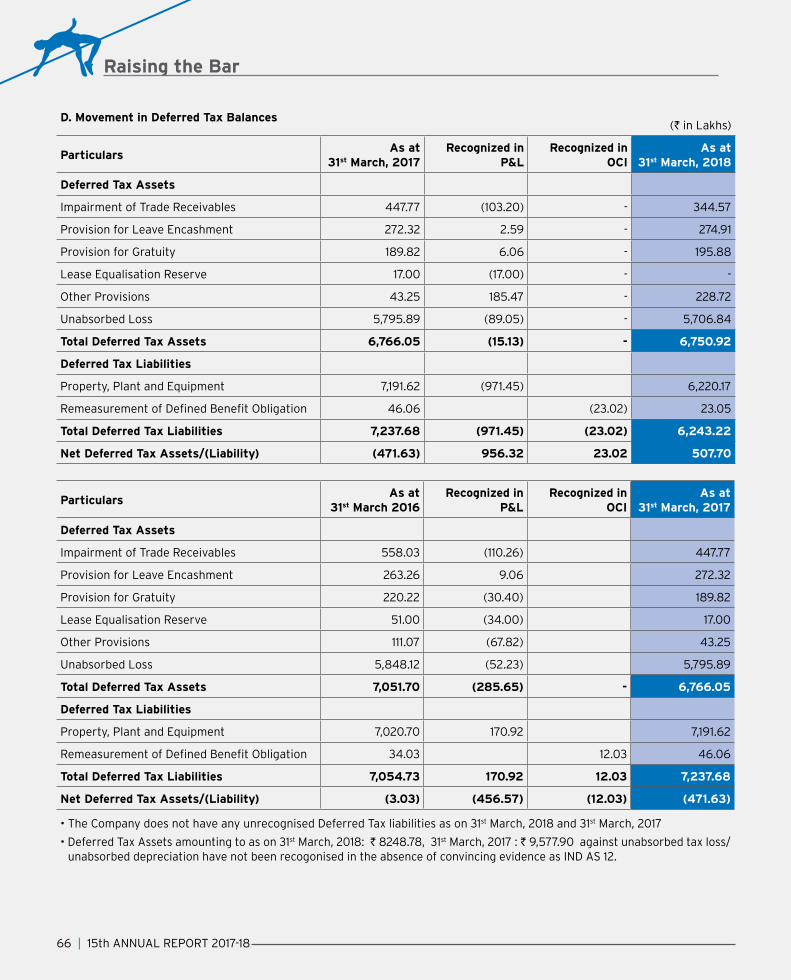
Raising the Bar
66 | 15th annual rePOrt 2017-18
D. Movement in Deferred Tax Balances (` in lakhs)
Particulars As at
31st March, 2017 Recognized in
P&L Recognized in
OCI As at
31st March, 2018
Deferred Tax Assets
impairment of trade receivables 447.77 (103.20) - 344.57
Provision for leave encashment 272.32 2.59 - 274.91
Provision for gratuity 189.82 6.06 - 195.88
lease equalisation reserve 17.00 (17.00) - -
Other Provisions 43.25 185.47 - 228.72
unabsorbed loss 5,795.89 (89.05) - 5,706.84
Total Deferred Tax Assets 6,766.05 (15.13) - 6,750.92
Deferred Tax Liabilities
Property, Plant and equipment 7,191.62 (971.45) 6,220.17
Remeasurement of Defined Benefit Obligation 46.06 (23.02) 23.05
Total Deferred Tax Liabilities 7,237.68 (971.45) (23.02) 6,243.22
Net Deferred Tax Assets/(Liability) (471.63) 956.32 23.02 507.70
Particulars As at
31st March 2016 Recognized in
P&L Recognized in
OCI As at
31st March, 2017
Deferred Tax Assets
impairment of trade receivables 558.03 (110.26) 447.77
Provision for leave encashment 263.26 9.06 272.32
Provision for gratuity 220.22 (30.40) 189.82
lease equalisation reserve 51.00 (34.00) 17.00
Other Provisions 111.07 (67.82) 43.25
unabsorbed loss 5,848.12 (52.23) 5,795.89
Total Deferred Tax Assets 7,051.70 (285.65) - 6,766.05
Deferred Tax Liabilities
Property, Plant and equipment 7,020.70 170.92 7,191.62
Remeasurement of Defined Benefit Obligation 34.03 12.03 46.06
Total Deferred Tax Liabilities 7,054.73 170.92 12.03 7,237.68
Net Deferred Tax Assets/(Liability) (3.03) (456.57) (12.03) (471.63)
• The Company does not have any unrecognised Deferred Tax liabilities as on 31st march, 2018 and 31st march, 2017
• Deferred Tax Assets amounting to as on 31st March, 2018: ` 8248.78, 31st March, 2017 : ` 9,577.90 against unabsorbed tax loss/unabsorbed depreciation have not been recogonised in the absence of convincing evidence as ind as 12.

Fresenius Kabi OncOlOgy limited | 67
20: OTHER NON-CURRENT LIABILITIES (` in lakhs)
Particulars As at
31st March, 2018 As at
31st March, 2017
deferred income 3,030.13 2,929.74
Total 3,030.13 2,929.74
CURRENT LIABILITIES 21: FINANCIAL LIABILITIES- BORROWINGS
(` in lakhs)
Particulars As at
31st March, 2018 As at
31st March, 2017
secured
cash credits 2.91 1,046.49
unsecured loan
cash credits 1,350.24 5,956.76
Packing credit (Foreign currency) 6,448.00 6,230.70
Working Capital Demand Loan 8,800.00 8,000.00
Total 16,601.15 21,233.95
Footnote:a. there is no default in repayment of principal loan or interest thereon.b. secured component of cash credit from one bank is covered by hypothecation of inventories.c. Unsecured Loans from five banks are covered by guarantee bond furnished by ultimate holding company. d. Packing credit loans for the year ended 31st march, 2018, comprised of euro denominated loans carrying interest rates of
euribOr plus 50 to 125 bps, Packing credit loans for the year ended 31st march, 2017, comprised of eur denominated loans carrying interest rates of EURIBOR plus 50 to 200 bps. These are repayable within 6 months from the date of drawdown.
22: TRADE PAYABLES (` in lakhs)
Particulars As at
31st March, 2018 As at
31st March, 2017
Other creditors 16,802.26 16,088.79
Total 16,802.26 16,088.79
For related party payable please refer note 38For dues to micrO and small enterprises refer note 42
23: OTHER FINANCIAL LIABILITIES (` in lakhs)
Particulars As at
31st March, 2018 As at
31st March, 2017
Interest Accrued but not due on Borrowings 1,011.69 615.28
creditors for capital items 937.96 298.56
employee related dues 594.64 370.75
bonus Payable 280.24 275.31
Accrued for Expenses 3,593.77 2,311.65
Other Payables 78.89 24.84
Total 6,497.19 3,896.39

Raising the Bar
68 | 15th annual rePOrt 2017-18
24: OTHER CURRENT LIABILITIES (` in lakhs)
Particulars As at
31st March, 2018 As at
31st March, 2017
advances from customers 8.57 108.19
statutory dues 843.60 399.81
deferred income 349.28 579.44
lease equalisation reserve - 49.12
Total 1,201.45 1,136.56
25: CURRENT TAX LIABILITIES (NET) (` in lakhs)
Particulars As at
31st March, 2018 As at
31st March, 2017
Income Tax (Net of Advance Tax ` 3,463.87 previous year ` 2,836.13)
257.40 44.73
Total 257.40 44.73
26: REVENUE FROM OPERATIONS (` in lakhs)
Particulars For the Year Ended
31st March, 2018 For the Year Ended
31st March, 2017
A. Sales of Products and Services
sale of goods 49,000.48 45,398.21
Sale of Services:
Contract R&D Services Provided 13,082.13 13,786.86
Other services 5,536.83 2,083.33
Total 67,619.44 61,268.40
B. Other Operating Income
scrap sales 143.49 110.99
government grant 331.99 300.42
Export Incentives 2,522.79 1,787.44
Total 2,998.27 2,198.85
Total 70,617.71 63,467.25
27: OTHER INCOME (` in lakhs)
Particulars For the Year Ended
31st March, 2018 For the Year Ended
31st March, 2017
dividend income 0.36 0.30
reversal of impairment on trade receivables 136.36 1.00
Liabilities and Provisions Written back 322.76 240.52
interest income 114.20 170.14
Reimbursement of Expenses 2,242.20 352.00
Exchange Gain - 357.25
miscellaneous income 3.68 44.02
Total 2,819.56 1,165.23

Fresenius Kabi OncOlOgy limited | 69
28: CHANGES IN INVENTORIES OF FINISHED GOODS, WORK IN PROGRESS AND STOCK IN TRADE (` in lakhs)
Particulars For the Year Ended
31st March, 2018 For the Year Ended
31st March, 2017
Opening Stock:
Finished goods 8,188.61 8,748.09
Work-in-Progress 11,599.57 13,261.39
stock in trade - -
Less:
Closing Stock:
Finished goods 8,073.58 8,188.61
Work-in-Progress 12,595.60 11,599.57
stock in trade 56.85 -
Changes In Inventories:
Finished goods 115.03 559.48
Work-in-Progress (996.03) 1,661.82
stock in trade (56.85) -
(937.85) 2,221.30
29: EMPLOYEE BENEFITS EXPENSE (` in lakhs)
Particulars For the Year Ended
31st March, 2018 For the Year Ended
31st March, 2017
Salaries, Wages and Bonus 12,497.24 10,802.41
contribution to Provident and Other Funds 806.65 749.94
Workmen and Staff Welfare Expenses 955.92 890.42
Total 14,259.81 12,442.77
30: FINANCE COST (` in lakhs)
Particulars For the Year Ended
31st March, 2018 For the Year Ended
31st March, 2017
interest 4,096.59 3,503.98
bank charges 168.79 133.13
Currency Fluctuation Effect on Borrowing Cost 320.29 26.00
Total 4,585.67 3,663.11
31: DEPRECIATION AND AMORTIzATION EXPENSE (` in lakhs)
Particulars For the Year Ended
31st March, 2018 For the Year Ended
31st March, 2017
depreciation on Property, Plant and equipment 5,425.84 4,783.71
Amortization of Intangible Assets 57.23 87.21
Total 5,483.07 4,870.92
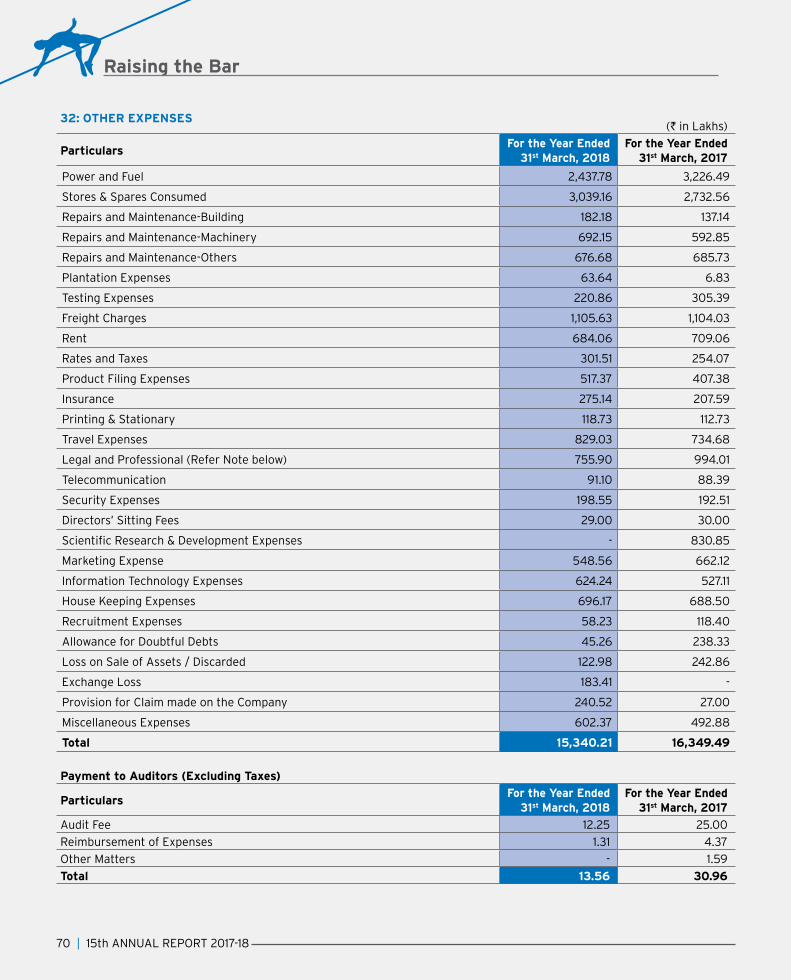
Raising the Bar
70 | 15th annual rePOrt 2017-18
32: OTHER EXPENSES (` in lakhs)
Particulars For the Year Ended
31st March, 2018 For the Year Ended
31st March, 2017
Power and Fuel 2,437.78 3,226.49
Stores & Spares Consumed 3,039.16 2,732.56
repairs and maintenance-building 182.18 137.14
repairs and maintenance-machinery 692.15 592.85
repairs and maintenance-Others 676.68 685.73
Plantation Expenses 63.64 6.83
Testing Expenses 220.86 305.39
Freight charges 1,105.63 1,104.03
rent 684.06 709.06
Rates and Taxes 301.51 254.07
Product Filing Expenses 517.37 407.38
insurance 275.14 207.59
Printing & Stationary 118.73 112.73
Travel Expenses 829.03 734.68
Legal and Professional (Refer Note below) 755.90 994.01
telecommunication 91.10 88.39
Security Expenses 198.55 192.51
directors’ sitting Fees 29.00 30.00
Scientific Research & Development Expenses - 830.85
Marketing Expense 548.56 662.12
Information Technology Expenses 624.24 527.11
House Keeping Expenses 696.17 688.50
Recruitment Expenses 58.23 118.40
Allowance for Doubtful Debts 45.26 238.33
Loss on Sale of Assets / Discarded 122.98 242.86
Exchange Loss 183.41 -
Provision for claim made on the company 240.52 27.00
Miscellaneous Expenses 602.37 492.88
Total 15,340.21 16,349.49
Payment to Auditors (Excluding Taxes)
Particulars For the Year Ended
31st March, 2018 For the Year Ended
31st March, 2017
audit Fee 12.25 25.00
Reimbursement of Expenses 1.31 4.37
Other matters - 1.59
Total 13.56 30.96

Fresenius Kabi OncOlOgy limited | 71
33: EARNING PER SHARE (` in lakhs)
Particulars For the Year Ended
31st March, 2018 For the Year Ended
31st March, 2017
Profit/ (Loss) for the year 1,958.39 (241.58)
Weighted average number of equity shares of ` 1/- each 170,247,857 170,247,857
EPS - Basic / Diluted 1.15 (0.14)
Note: There are no potentially dilutive instrument issued by the Company, hence Basic and Diluted EPS is same
34: CONTINGENT LIABILITIES The Company is involved in disputes, lawsuits, claims, governmental and/or regulatory inspections, inquiries, investigations
and proceedings, including commercial matters that arise from time to time in the ordinary course of business. Often, these issues are subject to uncertainties and therefore the probability of a loss, if any, being sustained and an estimate of the amount of any loss is difficult to ascertain. Consequently, for a majority of these claims, it is not possible to make a reasonable estimate of the expected financial effect, if any, that will result from ultimate resolution of the proceedings.
although there can be no assurance regarding the outcome of any of the legal proceedings or investigations referred to in this note, the Company does not expect them to have a materially adverse effect on its financial position, as it believes that the likelihood of loss in excess of amounts accrued (if any) is not probable. However, if one or more of such proceedings were to result in judgments against the Company, such judgments could be material to its results of operations in a given period. In these cases, the Company discloses information with respect to the nature and facts of the case. The more significant matters are discussed below.
(` in lakhs)
34: (i) Particulars Estimated
Timing of Settlement
Possibility of any Re-
imbursement
As at 31st March
2018
As at 31st March
2017
a) Claims against the Company not acknowledged as debts
a) Excise Duty in Dispute un-certain remote 6,340.20 6,256.61
b) Income Tax in Dispute un-certain remote 6,843.14 1,514.09
c) Other
legal and administrative matters un-certain remote 415.24 297.20
Import Duty demand against export obligation un-certain remote 9.00 540.00
b) guarantee furnished by company to goverment agencies un-certain remote 2,717.36 4,966.03
34: (ii) in november 2014, Fresenius Kabi Oncology limited (FKOl) received a subpoena from the u.s. department of Justice (DOJ), U.S Attorney for the District of Nevada. The subpoena requests documents in connection with the January, 2013 inspection by the u.s. Food and drug administration (Fda) of FKOl’s plant for active Pharmaceutical ingredients (aPi) in Kalyani, West Bengal, India. The Inspection resulted in a warning letter from the FDA in July, 2013. The subpoena marks the DOJ’s criminal and/or civil investigation in this connection and seeks information from throughout the Fresenius Group. through an ancillary subpoena of January, 2016, the dOJ has requested additional historic information and data. through further ancillary subpoenas of June, 2016 and november, 2016, the dOJ has requested further information from Fresenius Kabi USA and Fresenius Kabi AG without changing the focus of the investigation. Fresenius Kabi fully cooperates with the governmental investigation. Fresenius Kabi has entered into a Tolling Agreement with the DOJ, thereby waiving its statute of limitation defense until July, 2018.
34: (iii) The Company had received a warning letter from the U.S. FDA in July, 2013 following inspection of site carried out in January 2013 relating to current Good Manufacturing Practice (“cGMP”) deviations at its active pharmaceutical ingredient (“API”) manufacturing facility at D-35, Industrial Area ,Kalyani , District Nadia, West Bengal (India).
The Company again received warning letter dated 4th December, 2017 following re-inspection of this site during May-17. The contents of the warning letter arose from Form 483 observations by U.S. FDA.
Also, Company’s drug manufacturing facility at Kishanpura Village, Baddi, Gurumajra, Himachal Pradesh, India received warning letter dated 18th December, 2017 following inspection of this site during April, 2017 relating to deviation from current Good Manufacturing Practice (“cGMP”).

Raising the Bar
72 | 15th annual rePOrt 2017-18
The warning letter does not restrict production or shipment of the Company’s products from these facilities and do not stipulate the import alert therefore the supplies of the approved products are continued to the US market. However, the new products regulatory application approvals are still under hold due to the pending clearance of site’s GMP status.
Subsequent to the issuance of the warning letter, the Company promptly instituted corrective actions and submitted a comprehensive remediation response to the warning letter to the U.S. FDA, followed by periodic written updates and regular meetings with the U.S. FDA.
(` in lakhs)
34: (iv) ParticularsAs at
31st March, 2018As at
31st March, 2017CommitmentsEstimated amount of contracts remaining to be executed on capital account and not provided for.
1,362.22 1,351.09
35: (i) CIF VALUE OF IMPORTS (` in lakhs)
ParticularsFor the year Ended
31st March, 2018For the year Ended
31st March, 2017Raw Materials (Including Packing Material) 15,779.33 19,747.71Stores & Spares 1,435.58 1,122.21capital goods 1,759.78 650.70Total 18,974.69 21,520.62
35: (ii) EARNING IN FOREIGN EXCHANGE: (` in lakhs)
ParticularsFor the year Ended
31st March, 2018For the year Ended
31st March, 2017sale of goods 38,921.92 38,695.11sale of services 18,618.96 15,834.04Total 57,540.88 54,529.15
36:(i) company has incurred ` 47.66 lakhs (Previous year ` 2.23 Lakhs) voluntarily towards corporate social responsibility during the year. Company is not obligated to incurred expenditure under Section 135 due to inadequacy of profit during the last three year. These Expenses have been shown as part of Miscellaneous Expenses under Other Expenses.
(ii) The process of receiving balance confirmation from trade receivable/trade payable and their reconcilliation is an ongoing process. The balance of certain trade receivable and trade payable are subjects to reconcillation and confirmation as at 31st march, 2018.
37: FINANCIAL INSTRUMENTS – FAIR VALUES AND RISK MANAGEMENT
I. Fair Value Measurements (` in lakhs)
Particulars As at
31st March, 2018Carrying Amount
As at 31st March, 2017
Carrying Amount
Financial Assets Measured at Fair Value
Non-current
investments in equity instruments 3.00 3.00
Financial Assets Measured at Amortized Cost
Non-Current
Other non-current Financial assets 628.22 508.32
Current
trade receivables 16,215.76 14,274.42
cash and cash equivalents 17.56 149.36
bank balances other than above 146.45 676.73
loans (short term) 14.05 15.08
Other current Financial assets 167.16 586.93
17,192.20 16,213.84
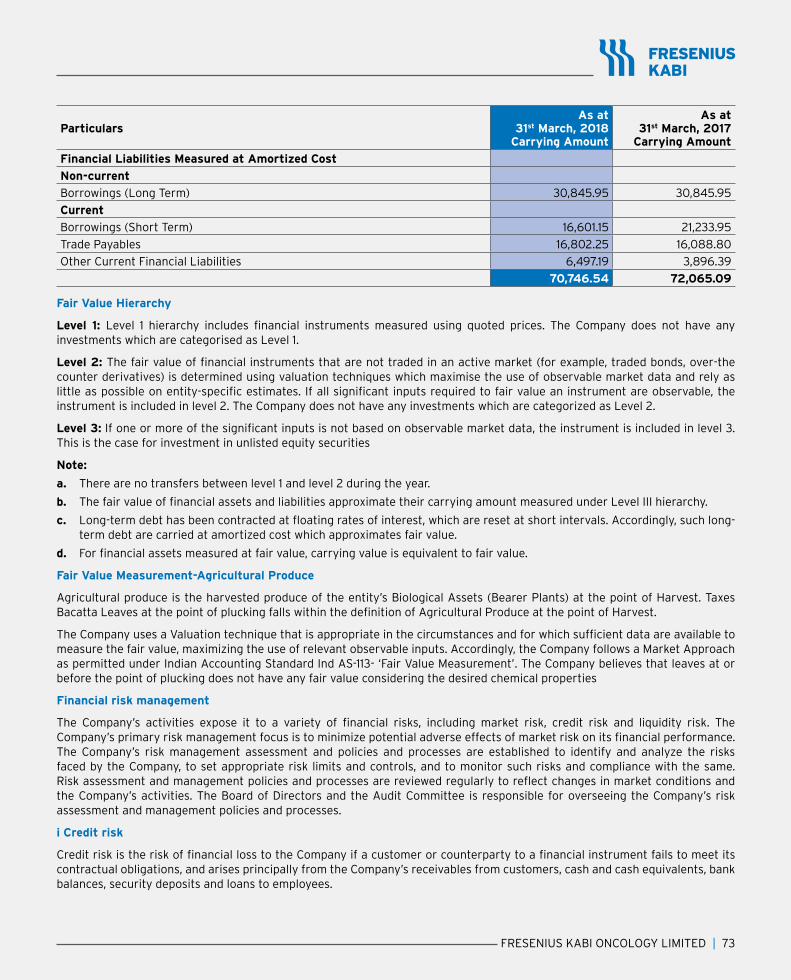
Fresenius Kabi OncOlOgy limited | 73
Particulars As at
31st March, 2018Carrying Amount
As at 31st March, 2017
Carrying Amount
Financial Liabilities Measured at Amortized Cost
Non-current
Borrowings (Long Term) 30,845.95 30,845.95
Current
Borrowings (Short Term) 16,601.15 21,233.95
trade Payables 16,802.25 16,088.80
Other current Financial liabilities 6,497.19 3,896.39
70,746.54 72,065.09
Fair Value Hierarchy
Level 1: Level 1 hierarchy includes financial instruments measured using quoted prices. The Company does not have any investments which are categorised as Level 1.
Level 2: The fair value of financial instruments that are not traded in an active market (for example, traded bonds, over-the counter derivatives) is determined using valuation techniques which maximise the use of observable market data and rely as little as possible on entity-specific estimates. If all significant inputs required to fair value an instrument are observable, the instrument is included in level 2. The Company does not have any investments which are categorized as Level 2.
Level 3: If one or more of the significant inputs is not based on observable market data, the instrument is included in level 3. this is the case for investment in unlisted equity securities
Note:
a. There are no transfers between level 1 and level 2 during the year.
b. The fair value of financial assets and liabilities approximate their carrying amount measured under Level III hierarchy.
c. Long-term debt has been contracted at floating rates of interest, which are reset at short intervals. Accordingly, such long-term debt are carried at amortized cost which approximates fair value.
d. For financial assets measured at fair value, carrying value is equivalent to fair value.
Fair Value Measurement-Agricultural Produce
Agricultural produce is the harvested produce of the entity’s Biological Assets (Bearer Plants) at the point of Harvest. Taxes Bacatta Leaves at the point of plucking falls within the definition of Agricultural Produce at the point of Harvest.
The Company uses a Valuation technique that is appropriate in the circumstances and for which sufficient data are available to measure the fair value, maximizing the use of relevant observable inputs. Accordingly, the Company follows a Market Approach as permitted under indian accounting standard ind as-113- ‘Fair Value measurement’. the company believes that leaves at or before the point of plucking does not have any fair value considering the desired chemical properties
Financial risk management
The Company’s activities expose it to a variety of financial risks, including market risk, credit risk and liquidity risk. The Company’s primary risk management focus is to minimize potential adverse effects of market risk on its financial performance. The Company’s risk management assessment and policies and processes are established to identify and analyze the risks faced by the Company, to set appropriate risk limits and controls, and to monitor such risks and compliance with the same. Risk assessment and management policies and processes are reviewed regularly to reflect changes in market conditions and the company’s activities. the board of directors and the audit committee is responsible for overseeing the company’s risk assessment and management policies and processes.
i Credit risk
Credit risk is the risk of financial loss to the Company if a customer or counterparty to a financial instrument fails to meet its contractual obligations, and arises principally from the company’s receivables from customers, cash and cash equivalents, bank balances, security deposits and loans to employees.
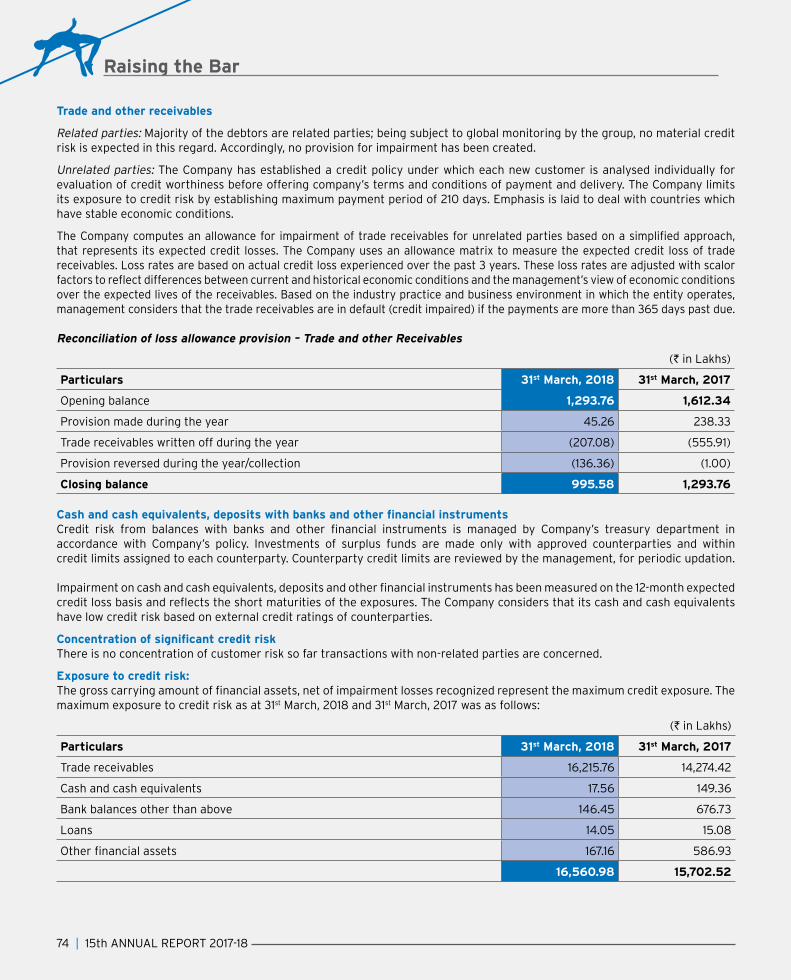
Raising the Bar
74 | 15th annual rePOrt 2017-18
Trade and other receivables
Related parties: Majority of the debtors are related parties; being subject to global monitoring by the group, no material credit risk is expected in this regard. Accordingly, no provision for impairment has been created.
Unrelated parties: The Company has established a credit policy under which each new customer is analysed individually for evaluation of credit worthiness before offering company’s terms and conditions of payment and delivery. The Company limits its exposure to credit risk by establishing maximum payment period of 210 days. Emphasis is laid to deal with countries which have stable economic conditions.
The Company computes an allowance for impairment of trade receivables for unrelated parties based on a simplified approach, that represents its expected credit losses. The Company uses an allowance matrix to measure the expected credit loss of trade receivables. Loss rates are based on actual credit loss experienced over the past 3 years. These loss rates are adjusted with scalor factors to reflect differences between current and historical economic conditions and the management’s view of economic conditions over the expected lives of the receivables. Based on the industry practice and business environment in which the entity operates, management considers that the trade receivables are in default (credit impaired) if the payments are more than 365 days past due.
Reconciliation of loss allowance provision – Trade and other Receivables
(` in lakhs)
Particulars 31st March, 2018 31st March, 2017
Opening balance 1,293.76 1,612.34
Provision made during the year 45.26 238.33
Trade receivables written off during the year (207.08) (555.91)
Provision reversed during the year/collection (136.36) (1.00)
Closing balance 995.58 1,293.76
Cash and cash equivalents, deposits with banks and other financial instrumentsCredit risk from balances with banks and other financial instruments is managed by Company’s treasury department in accordance with Company’s policy. Investments of surplus funds are made only with approved counterparties and within credit limits assigned to each counterparty. Counterparty credit limits are reviewed by the management, for periodic updation.
Impairment on cash and cash equivalents, deposits and other financial instruments has been measured on the 12-month expected credit loss basis and reflects the short maturities of the exposures. The Company considers that its cash and cash equivalents have low credit risk based on external credit ratings of counterparties.
Concentration of significant credit riskThere is no concentration of customer risk so far transactions with non-related parties are concerned.
Exposure to credit risk:The gross carrying amount of financial assets, net of impairment losses recognized represent the maximum credit exposure. The maximum exposure to credit risk as at 31st march, 2018 and 31st March, 2017 was as follows:
(` in lakhs)
Particulars 31st March, 2018 31st March, 2017
trade receivables 16,215.76 14,274.42
cash and cash equivalents 17.56 149.36
bank balances other than above 146.45 676.73
loans 14.05 15.08
Other financial assets 167.16 586.93
16,560.98 15,702.52

Fresenius Kabi OncOlOgy limited | 75
ii. Liquidity Risk
Liquidity risk is the risk that the Company will encounter difficulty in meeting the obligations associated with its financial liabilities that are settled in cash or exchange of another financial asset. The Company’s approach to managing liquidity is to ensure, as far as possible, that it will have sufficiency of liquidity to meet its liabilities when they are due, under both normal and stressed conditions, without incurring unacceptable losses or risking damage to the Company’s reputation. The Company mitigates liquidity risk by way of formulation of cash budget and comparison of actual cash flows with budget on a continious basis.
(a) Financing arrangements as at 31st march, 2018 and 31st march, 2017, the company had unutilised credit limits from banks of ` 16,394.00 lakhs and
` 9,659.10 lakhs respectively.
(b) Maturities of financial liabilities The following are the remaining contractual maturities of financial liabilities at the reporting date. The amounts are gross
and undiscounted, and include contractual interest payments and exclude the impact of netting agreements.
(` in lakhs)
Particulars 31st March, 2018Contractual cash flows
< 1 year 2 to 5 Years 5 years <
Non-derivative financial liabilities
Borrowings (Long Term) 30,845.95 - 30,845.95 -
Borrowings (Short Term) 16,601.15 16,601.15 - -
trade Payables 16,802.25 16,802.26 - -
Other current financial liabilities 6,497.19 6,497.19 - -
Total non-derivative liabilities 70,746.55 39,900.60 30,845.95 -
Particulars 31st March, 2017Contractual cash flows
< 1 year 2 to 5 Years 5 years <
Non-derivative financial liabilities
Borrowings (Long Term) 30,845.95 - 30,845.95 -
Borrowings (Short Term) 21,233.95 21,233.95 - -
trade Payables 16,088.79 16,088.79 - -
Other current financial liabilities 3,896.39 3,896.39 - -
Total non-derivative liabilities 72,065.08 41,219.13 30,845.95 -
iii. Market Risk
Market risk is the risk that changes in market prices – such as foreign exchange rates and interest rates – will affect the Company’s income or the value of its holdings of financial instruments. The objective of market risk management is to manage and control market risk exposures within acceptable parameters, while optimising the return. The Company does not uses derivatives to manage market risk.
a. Foreign Currency risk
The Company is exposed to foreign exchange risk arising from foreign currency transactions, primarily with respect to the US Dollar (USD) and Euro (EUR). Foreign exchange risk arises from future commercial transactions and recognised assets and liabilities denominated in a currency that is not the company’s functional currency (inr). Majority of the currency risk on receivables for the Company is confined to group transactions only and therefore has no bearing in global context on the group. A significant portion of the Company’s revenues are in these foreign currencies, while a significant portion of its costs are in Indian rupees. As a result, if the value of the Indian rupee depreciates relative to these foreign currencies, the company’s revenues measured in indian rupees may increase.

Raising the Bar
76 | 15th annual rePOrt 2017-18
(` in lakhs)
Particulars As at 31 March, 2018 As at 31 March, 2017
Transaction Currency --> Euro USD Euro USD
Financial Assets
trade receivables 10,926.31 2,548.27 9,767.85 3,300.85
Financial Liabilities
Borrowings 6,448.00 - 6,230.70 -
trade Payables 12,440.18 1,685.73 10,599.51 916.88
Net Statement of Financial Position Exposure (7,961.87) 862.54 (7,062.36) 2,383.97
Conversion Rates 80.60 65.00 69.23 64.83
(` in lakhs)
Particulars As at 31 March, 2018 As at 31 March, 2017
Transaction Currency --> GBP SEK GBP SEK
Financial Assets
trade receivables - -
Financial Liabilities
Borrowings - -
trade Payables 121.30 - 135.10 32.98
Net Statement of Financial Position Exposure (121.30) - (135.10) (32.98)
Conversion Rates 92.14 - 80.95 7.25
Sensitivity Analysis
As below, possible strengthening/ weakening of INR against USD, EURO, GBP & SEK at 31st March would have affected the measurement of financial instruments denominated in a foreign currency and affected equity and profit or loss by the amounts shown below. This analysis assumes that all other variables, in particular interest rates, remain constant.
(` in lakhs)
ParticularsProfit or Loss After Tax
Strong Weak
31st March, 2018
usd (2% movement) 11.28 (11.28)
eur(2%movement) (104.13) 104.13
gbP(2%movement) (1.59) 1.59
31st March, 2017
usd (2% movement) 31.18 (31.18)
eur(2%movement) (92.36) 92.36
gbP(2%movement) (1.77) 1.77
seK(2%movement) (0.43) 0.43

Fresenius Kabi OncOlOgy limited | 77
b. Interest Rate Risk
The Company’s main interest rate risk arises from long-term borrowings with variable rates, which expose the Company to cash flow interest rate risk.Any rise in market rate of interest effective effecting valuation of financial instruments, financial assets and financial liabilities have been regularly analysed for mitigational measure.
Exposure to interest rate risk
The interest rate profile of the Group’s interest-bearing financial instruments as reported to the management of the Group is as follows.
(` in lakhs)
ParticularsNominal Amount
31st March, 2018 31st March, 2017
Financial Liabilities
Variable-Rate Instruments
Short Term Borrowings 16,601.15 21,233.95
Long term Borrowings 30,845.95 30,845.95
Financial Assets
Fixed-Rate Instruments
Fixed Deposits 492.22 1,130.89
46,954.88 50,949.01
Profit or Loss, Net of Tax
Particulars 50 BP Increase 50 BP Decrease
31st March, 2018
Variable-rate instruments (155.13) 155.13
31st March, 2017
Variable-rate instruments (170.28) 170.28
Fair value sensitivity analysis for fixed-rate instruments
The Company does not account for any fixed-rate financial assets or financial liabilities at fair value through profit or loss. Therefore, a change in interest rates at the reporting date would not affect profit or loss.
iv. Fiscal Risk
The Company does not foresee any material fiscal risk pertaining to its overseas transactions with related parties in respect of which its application for advance pricing agreement is pending before fiscal authorities for years even though authorities make any upward revision of prices. Though overseas transactions with related parties for many years are conducted as per application made for advance pricing agreement, impact of any upward revision of prices of any of the items of out- put is unlikely to give rise to any additional financial liability considering huge carry forward loss and unabsorbed depreciation as per company’s income tax return.
v. Commodity rate risk
Exposure to market risk with respect to commodity prices primarily arises from the Company’s purchases of the raw material components for active pharmaceutical ingredients that includes purchases of platinum. These are commodity products, whose prices may fluctuate significantly over short periods of time. The cost of the Company’s raw materials generally fluctuate in line with commodity cycles, although the prices of raw materials used in the Company’s active pharmaceutical ingredients business are generally more volatile. Cost of raw materials forms a large portion of the Company’s cost of revenues. Commodity price risk exposure is evaluated and managed through operating procedures and sourcing policies. As of 31st march, 2018, the company had not entered into any material derivative contracts to hedge exposure to fluctuations in commodity prices.
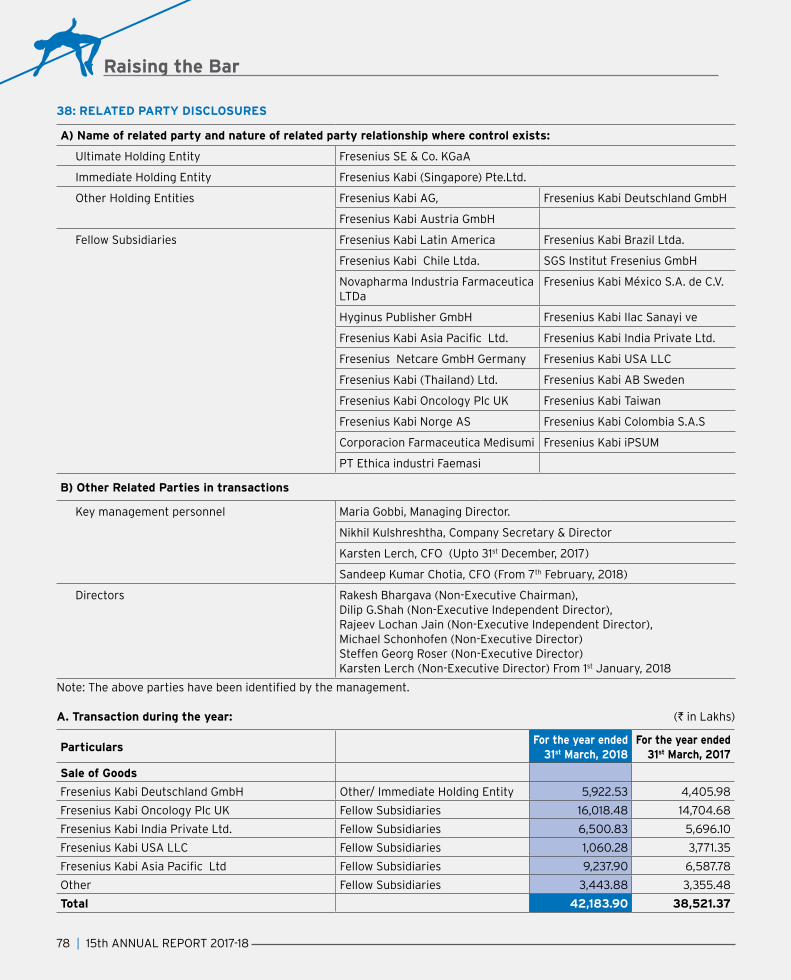
Raising the Bar
78 | 15th annual rePOrt 2017-18
38: RELATED PARTY DISCLOSURES
A) Name of related party and nature of related party relationship where control exists:
ultimate Holding entity Fresenius SE & Co. KGaA
immediate Holding entity Fresenius Kabi (singapore) Pte.ltd.
Other Holding entities Fresenius Kabi ag, Fresenius Kabi deutschland gmbH
Fresenius Kabi austria gmbH
Fellow Subsidiaries Fresenius Kabi latin america Fresenius Kabi Brazil Ltda.
Fresenius Kabi chile ltda. sgs institut Fresenius gmbH
novapharma industria Farmaceutica ltda
Fresenius Kabi México S.A. de C.V.
Hyginus Publisher gmbH Fresenius Kabi ilac sanayi ve
Fresenius Kabi Asia Pacific Ltd. Fresenius Kabi india Private ltd.
Fresenius netcare gmbH germany Fresenius Kabi usa llc
Fresenius Kabi (thailand) ltd. Fresenius Kabi AB Sweden
Fresenius Kabi Oncology Plc uK Fresenius Kabi Taiwan
Fresenius Kabi norge as Fresenius Kabi colombia s.a.s
corporacion Farmaceutica medisumi Fresenius Kabi iPsum
Pt ethica industri Faemasi
B) Other Related Parties in transactions
Key management personnel maria gobbi, managing director.
Nikhil Kulshreshtha, Company Secretary & Director
Karsten lerch, cFO (upto 31st december, 2017)
sandeep Kumar chotia, cFO (From 7th February, 2018)
directors Rakesh Bhargava (Non-Executive Chairman), Dilip G.Shah (Non-Executive Independent Director), Rajeev Lochan Jain (Non-Executive Independent Director), Michael Schonhofen (Non-Executive Director) Steffen Georg Roser (Non-Executive Director) Karsten Lerch (Non-Executive Director) From 1st January, 2018
Note: The above parties have been identified by the management.
A. Transaction during the year: (` in lakhs)
ParticularsFor the year ended
31st March, 2018For the year ended
31st March, 2017
Sale of Goods
Fresenius Kabi deutschland gmbH Other/ Immediate Holding Entity 5,922.53 4,405.98
Fresenius Kabi Oncology Plc uK Fellow Subsidiaries 16,018.48 14,704.68
Fresenius Kabi india Private ltd. Fellow Subsidiaries 6,500.83 5,696.10
Fresenius Kabi usa llc Fellow Subsidiaries 1,060.28 3,771.35
Fresenius Kabi Asia Pacific Ltd Fellow Subsidiaries 9,237.90 6,587.78
Other Fellow subsidiaries 3,443.88 3,355.48
Total 42,183.90 38,521.37

Fresenius Kabi OncOlOgy limited | 79
ParticularsFor the year ended
31st March, 2018For the year ended
31st March, 2017
Service provided
Fresenius Kabi deutschland gmbH Other/ Immediate Holding Entity 18,539.77 15,416.27
Pt ethica industri Faemasi Fellow Subsidiary 79.19 326.56
Other Fellow Subsidiaries - 127.41
Total 18,618.96 15,870.24
Purchase
Fresenius Kabi india Pvt. ltd. Fellow subsidiary 0.97 0.52
Fresenius Kabi iPsum Fellow Subsidiary 47.13 -
Total 48.10 0.52
Receiving of Services
Fresenius Kabi deutschland gmbH Other/ Immediate Holding Entity 937.21 1,277.08
Fresenius Kabi netcare Fellow Subsidiary 395.52 448.01
Other Fellow Subsidiaries 73.03 182.53
Total 1,405.76 1,907.62
Reimbursement of Expenses Received
Fresenius Kabi deutschland gmbH Other/ Immediate Holding Entity 2,479.95 98.63
Fresenius Kabi ag Other/ Immediate Holding Entity 0.49 0.81
Fresenius Kabi usa llc Fellow Subsidiary - 130.34
Fresenius Kabi brasil ltda Fellow Subsidiary 59.83 77.37
Fresenius Kabi netcare Fellow Subsidiary 40.18 81.19
Other Fellow subsidiaries 9.46 18.81
Total 2,589.91 407.15
Reimbursement of Expenses Paid
Fresenius Kabi deutschland gmbH Other/ Immediate Holding Entity 104.65 87.81
Fresenius Kabi austria gmbH Other/ Immediate Holding Entity - 6.94
Fresenius Kabi Oncology Plc uK Fellow Subsidiaries 203.05 172.74
Other Fellow subsidiaries 16.53 131.30
Total 324.23 398.79
Remuneration of Key Management Personnel
Salaries, wages and bonus (Refer Note below) 295.90 307.77
contribution to provident and other funds 38.74 55.43
director sitting Fees 29.00 30.00
Total 363.64 393.20
Interest Expense
Fresenius Kabi ag Other/ immediate Holding entity 2,402.77 2,179.85
Fresenius Kabi deutschland gmbH Other/ Immediate Holding Entity 526.62 -
Fresenius Kabi (singapore) Pte. ltd. immediate Holding entity 9.32
Total 2,929.39 2,189.17
Loan Taken
Fresenius Kabi ag Other/ Immediate Holding Entity - 13,800.00
Total - 13,800.00
(` in lakhs)

Raising the Bar
80 | 15th annual rePOrt 2017-18
B. Balance Outstanding: (` in lakhs)
For the year ended 31st March, 2018
For the year ended 31st March, 2017
Loan Outstanding
Fresenius Kabi ag Other/ Immediate Holding Entity 30,845.95 30,845.95
Total 30,845.95 30,845.95
Account Receivable
Fresenius Kabi deutschland gmbH Other/ Immediate Holding Entity 4,186.16 3,736.56
Fresenius Kabi Asia Pacific Ltd Fellow Subsidiaries 2,775.76 1,256.89
Fresenius Kabi india Pvt. ltd. Fellow Subsidiaries 2,751.90 1,987.37
Fresenius Kabi chile ltda. Fellow Subsidiaries 1,488.43 954.86
Fresenius Kabi Oncology Plc Fellow Subsidiaries 1,485.07 3,337.94
Fresenius Kabi usa, llc Fellow Subsidiaries 434.87 121.87
Fresenius Kabi colombia s.a.s Fellow Subsidiaries 323.14 341.15
Fresenius Kabi latin america Fellow Subsidiaries 314.43 -
Other Fellow Subsidiaries 165.23 304.00
Total 13,924.99 12,040.64
Account Payable
Fresenius Kabi deutschland gmbH Other/ Immediate Holding Entity 11,339.24 9,793.73
Other Fellow Subsidiaries 257.12 618.16
Total 11,596.36 10,411.89
Interest Payable
Fresenius Kabi ag Other/ Immediate Holding Entity 502.03 587.50
Fresenius Kabi deutschland gmbH Other/ Immediate Holding Entity 500.11 -
Total 1,002.14 587.50
gauranties furnished against bank loan obtained by company Holding entity 27,140.34 21,664.50
Note : All outstanding balances are unsecured and repayable/receivable in cash.
Some of the Key Management Personnel of the Company are also covered under the Company’s Gratuity Plan / company’s leave policy along with the other employees of the Company. Proportionate amounts of gratuity/leave accrued under the Company’s gratuity plan/leave policy have not been separately computed or included in the above disclosure.
39: DISCLOSURE IN RESPECT OF EMPLOYEE BENEFITS UNDER INDIAN ACCOUNTING STANDARD (IND AS) – 19 “EMPLOYEE BENEFITS” ARE GIVEN BELOW:
i) Defined Contribution Plan Employers’ contribution towards provident fund amounting to ̀ 345.79 lakhs (Previous year ̀ 298.15 Lakhs ) is recognized
as an expense and included in Employee Benefit Expenses Note No 3 (29).
ii) Defined Benefit Plan Gratuity The Company provides for gratuity, a defined benefit retirement plan covering eligible employees. The gratuity plan
provides lump sum payments to vested employees at retirement, death, incapacitation or termination of employment, of an amount equivalent to 15 days salary for each completed year of service. Vesting occurs on completion of 5 continuous years of service as per Indian law. However, no vesting condition applies in case of death.
The company makes contributions to LIC, through a trust which is funded defined benefit plan for qualifying employees. Expected contributions to gratuity plans for the year 2018-19 are ` 155.66 lakhs.
(iii) Long-Term Employee Benefit Plan Leave Encashment Employee is entitled to leave encashment to the extent of accumulated leave for a period not exceeding 60 days. Quantum
of benefit remains in terms of salary and concerned employee at the point of availment of benefit on his part.
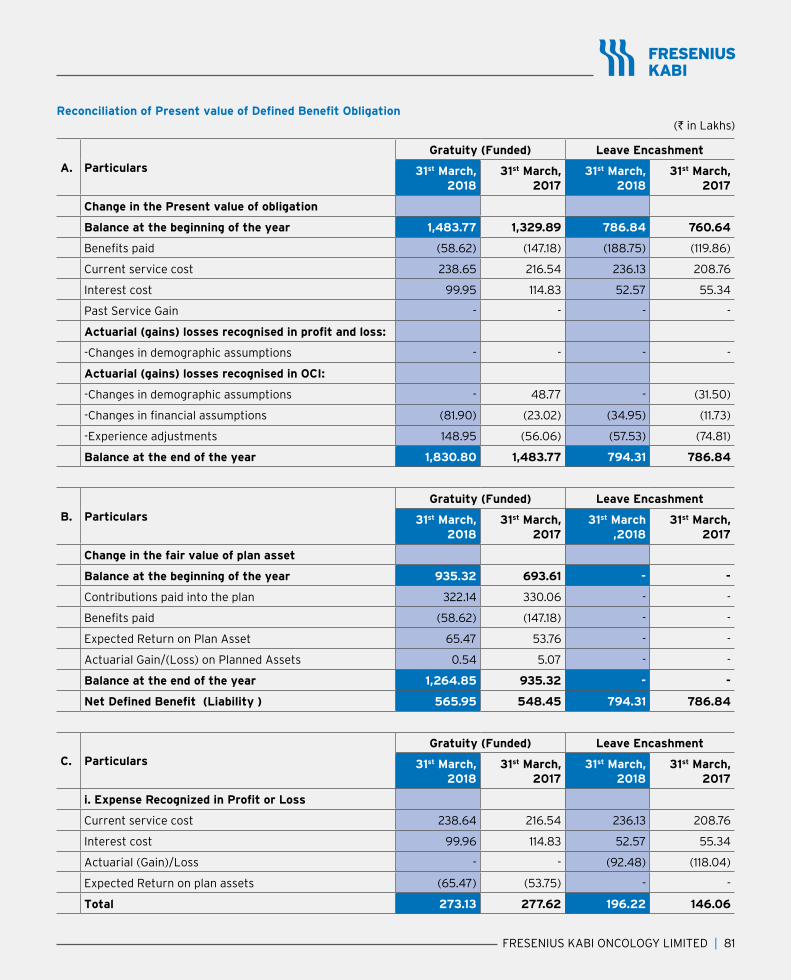
Fresenius Kabi OncOlOgy limited | 81
Reconciliation of Present value of Defined Benefit Obligation(` in lakhs)
A. Particulars
Gratuity (Funded) Leave Encashment
31st March, 2018
31st March, 2017
31st March, 2018
31st March, 2017
Change in the Present value of obligation
Balance at the beginning of the year 1,483.77 1,329.89 786.84 760.64
Benefits paid (58.62) (147.18) (188.75) (119.86)
current service cost 238.65 216.54 236.13 208.76
interest cost 99.95 114.83 52.57 55.34
Past service gain - - - -
Actuarial (gains) losses recognised in profit and loss:
-changes in demographic assumptions - - - -
Actuarial (gains) losses recognised in OCI:
-changes in demographic assumptions - 48.77 - (31.50)
-Changes in financial assumptions (81.90) (23.02) (34.95) (11.73)
-Experience adjustments 148.95 (56.06) (57.53) (74.81)
Balance at the end of the year 1,830.80 1,483.77 794.31 786.84
B. Particulars
Gratuity (Funded) Leave Encashment
31st March, 2018
31st March, 2017
31st March ,2018
31st March, 2017
Change in the fair value of plan asset
Balance at the beginning of the year 935.32 693.61 - -
contributions paid into the plan 322.14 330.06 - -
Benefits paid (58.62) (147.18) - -
Expected Return on Plan Asset 65.47 53.76 - -
Actuarial Gain/(Loss) on Planned Assets 0.54 5.07 - -
Balance at the end of the year 1,264.85 935.32 - -
Net Defined Benefit (Liability ) 565.95 548.45 794.31 786.84
C. Particulars
Gratuity (Funded) Leave Encashment
31st March, 2018
31st March, 2017
31st March, 2018
31st March, 2017
i. Expense Recognized in Profit or Loss
current service cost 238.64 216.54 236.13 208.76
interest cost 99.96 114.83 52.57 55.34
Actuarial (Gain)/Loss - - (92.48) (118.04)
Expected Return on plan assets (65.47) (53.75) - -
Total 273.13 277.62 196.22 146.06

Raising the Bar
82 | 15th annual rePOrt 2017-18
Particulars
Gratuity (Funded) Leave Encashment
31st March, 2018
31st March, 2017
31st March, 2018
31st March, 2017
ii.Remeasurements Recognised in Other Comprehensive Income:
Actuarial (gains) losses recognised in OCI:
- changes in demographic assumptions - 48.77 - -
- changes in financial assumptions (81.90) (23.02) - -
- experience adjustments 148.95 (56.08) - -
Return on plan assets excluding interest income (0.55) (5.07) - -
Total 66.50 (35.39) - -
D. Particulars
Gratuity (Funded) Leave Encashment
31st March, 2018
31st March, 2017
31st March, 2018
31st March, 2017
Amount recognised in the Balance Sheet (A – B)
short term provision 565.95 548.45 83.27 71.60
long term provision - - 711.04 715.24
Total 565.95 548.45 794.31 786.84
Plan Assets Plan Assets comprise of the following:
Particulars31st March,
201831st March,
201731st March,
2016
equities 0% 0% 0%
bonds 0% 0% 0%
gilts 0% 0% 0%
Pooled assets with an insurance company 100% 100% 100%
Others 0% 0% 0%
Total 100% 100% 100%
E. Plan AssetsFresenius Kabi Oncology limited assets are managed by the life insurance corporation of india, the total assets held as on 31st march, 2018 is ` 1,264.84 Lakhs with a funding ratio of 69.08% which is higher than the industry average of 50%.
F. Actuarial Assumptions Gratuity (Funded) Leave Encashment
31st March, 2018 31st March, 2017 31st March, 2018 31st March, 2017
Economic assumptions:
discount rate (Per annum) 7.55% 7.00% 7.55% 7.00%
Future salary increase 14.00% 14.00% 14.00% 14.00%
Demographic assumptions:
retirement age(years) 60 60 60 60
mortality rates inclusive of provision for disability**
ialm (2006-08)
Withdrawal Rate (%) 12.00% 12.00%

Fresenius Kabi OncOlOgy limited | 83
The weighted average duration of the defined benefit plan obligation at the end of the reporting period is 7.67 years (31st March, 2017: 7.71 years).
G. Sensitivity analysis of the defined benefit obligation
a) Impact of the change in discount rate (` in lakhs)
ParticularsGratuity Leave Encashment
31st March, 2018 31st March, 2017 31st March, 2018 31st March, 2017
Present Value of Obligation at the end of the period
1,830.80 1,483.76 794.31 786.84
discount rate-100 basis points 1,984.57 1,614.43 859.96 853.40
Discount rate+100 basis points 1,696.75 1,370.35 737.19 729.00
b) Impact of the change in salary increase
ParticularsGratuity Leave Encashment
31st March, 2018 31st March, 2017 31st March, 2018 31st March, 2017
Present Value of Obligation at the end of the period
1,830.80 1,483.76 794.31 786.84
rate-100 basis points 1,702.82 1,375.99 740.86 733.01
Rate+100 basis points 1,973.95 1,604.71 855.42 848.45
The above sensitivity analyses are based on a change in an assumption while holding all other assumptions constant. In practice, this is unlikely to occur, and changes in some of the assumptions may be correlated. When calculating the sensitivity of the defined benefit obligation to significant actuarial assumptions the same method (present value of the defined benefit obligation calculated with the projected unit credit method at the end of the reporting period ) has been applied as when calculating the defined benefit liability recognised in the Balance Sheet.the methods and types of assumptions used in preparing the sensitivity analysis did not change compared to the prior period.
H. Risk Exposure
Investment Risk-the funds are invested by lic and they provide returns basis the prevalent bond yields, lic on an annual basis requests for contributions to the fund, while the contribution requested may not be on the same interest rate as the bond yields provided, basis the past experience it is low risk.
Interest Risk-LIC does not provide market value of assets, rather maintains a running statement with interest rates declared annually- the fall in interest rate in not therefore offset by increase in value of bonds, hence may pose a risk.
Longevity Risk-Since the gratuity payment happens at the retirement age of 60, longevity impact is very low at this age, hence this is a non risk.
Salary Risk-The liability is calculated taking into account the salary increase, basis our past experience with fresenius-kabi salary increases with the assumptions used, they are in line, hence this risk is low.
I. Maturity Profile of defined benefit obligation (` in lakhs)
ParticularsYear Ended 31st March, 2018 Year Ended 31st March, 2017
Gratuity (funded) Gratuity (funded)
year 1 155.66 111.61
year 2-5 712.66 551.63
beyond 5 962.48 820.53

Raising the Bar
84 | 15th annual rePOrt 2017-18
40: SEGMENT REPORTING
An operating segment is a component of the Company that engages in business activities from which it may earn revenues and incur expenses, including revenues and expenses that relate to transactions with any of the company’s components, and for which discrete financial information is available. All operating segments’ and operating results are reviewed regularly by the company’s managing director to make decisions about resources to be allocated to the segments and assess their performance.
The Company has three reportable segments, as described below which are the Company’s strategic business units. These business units offer different products and services and are managed separately because they require different technology and marketing strategies. For each of the business units, the Managing Director conducts monthly/quarterly review of the consolidated MIS which consists of the discrete financial information in respect of each of the business units.
A. The following summary describes the operations in each of the reportable segments: (` in lakhs)
Reportable Segments Operations
bulk drug Producing bulk drugs, considerable share of which is for captive consumption
Formulation Producing generic products
Contract R&D Developing next generation cytotoxic, cytostatic and targeted therapies
segment information is presented in respect of the company’s key operating segments. the operating segments are based on the company’s management and internal reporting structure.
The Company’s Managing Director has been identified as the Chief Operating Decision Maker (‘CODM’), since she is responsible for all major decision w.r.t. the preparation and execution of business plan, preparation of budget, planning, alliance, joint venture, merger and acquisition, and expansion of any new facility.
The Management reviews the operating results of “manufacturing of Bulk drugs, formulation and research and development activities” at Company level to assess its performance. Accordingly, there are 3 Reportable Segments for the Company which are “Formulation”, ”Bulk Drug” and “Contract R&D”, hence specific disclosures have been made.
(` in lakhs)
ParticularsFor the Year Ended 31st March, 2018 For the Year Ended 31st March, 2017
Formulation Bulk DrugContract
R&DTotal Formulation Bulk Drug
Contract R&D
Total
Revenue:External Revenue 47,218.21 3,752.71 14,204.17 65,175.10 42,571.90 4,742.93 13,799.27 61,114.10
inter-segment revenue (22,565.39) 23,210.92 (645.53) - (20,663.88) 20,663.88 - -
Total Revenue 24,652.82 26,963.63 13,558.64 65,175.10 21,908.02 25,406.81 13,799.27 61,114.10
Results:segment result 3,284.34 405.90 2,797.59 6,487.83 2,224.15 2,211.74 2,230.43 6,666.32
unallocated corporate income 6,019.97 2,508.72
Unallocated corporate expenses 3,431.83 5,333.28
Operating profit 9,075.97 3,841.76
Finance charges 3,220.16 2,772.77
Profit from ordinary activities 5,855.81 1,068.99
Exceptional (loss) / income 2,219.35 1,793.98 - 4,013.33 854.00 854.00
Net Profit 1,842.48 214.99
Income tax (Current & Deferred) 115.91 (456.57)
Net Profit (After Tax) 1,958.39 (241.58)

Fresenius Kabi OncOlOgy limited | 85
Other information: (` in lakhs)
ParticularsFor the Year Ended 31st March, 2018 For the Year Ended 31st March, 2017
Formulation Bulk DrugContract
R&DTotal Formulation Bulk Drug
Contract R&D
Total
Other information: segment assets 64,093.93 43,022.74 11,251.26 118,367.93 66,122.33 41,650.23 9,043.61 116,816.16
unallocated corporate assets 4,705.75 5,126.89
Total assets 123,073.68 121,943.05
segment liabilities 6,718.45 26,442.69 2,575.22 35,736.36 6,514.80 22,800.45 2,087.09 31,402.34
corporate liability 41,520.28 46,705.66
Total Liabilities 77,256.64 78,108.00
Capital Expenditure 1,442.72 1,865.84 1,447.78 4,756.34 1,874.37 483.20 1,015.67 3,373.24
Unallocated Capital Expenditure 155.40 308.28
depreciation 2,373.44 1,846.57 1,046.38 5,266.39 2,194.56 1,464.30 953.58 4,612.45
unallocated depreciation 159.45 171.26
Non cash expenses other than depreciation (amortisation of intangible assets)
57.23 - - 57.23 87.21 87.21
B. Geographical Information
The formulation, bulk drug and contract R&D segments are managed in India but majority of the revenue from sale of good and services is generated from abroad. Major customers and vendors are located in Germany, Netherlands, UK, etc.
the geographical information analyses the company’s revenues and non current assets by the company’s country of domicile (i.e. india) and other countries. in presenting the geographical information, segment revenue has been based on the geographic location of customers and segment assets which have been based on the geographical location of assets.
(` in lakhs)
i) Revenues 31st March, 2018 31st March, 2017
India (A) 11,200.64 8,938.11
Other Countries:
germany 24,462.30 19,822.25
united states of america 1,145.20 3,927.20
united Kingdom 16,018.38 14,704.68
Hong Kong 9,392.39 6,668.04
Pakistan 2,124.15 1,327.72
chile 1,964.43 1,827.45
egypt 448.86 1,042.82
colombia 416.82 742.16
Others 3,444.54 4,466.82
Total Other Countries (B) 59,417.07 54,529.14
Total (A+B) 70,617.71 63,467.25
ii) Non-current Assets 31st March, 2018 31st March, 2017
india 52,448.41 55,024.40
Other Countries: - -
Total 52,448.41 55,024.40
* Non-current assets exclude financial instruments, deferred tax assets and post-employment benefit assets.

Raising the Bar
86 | 15th annual rePOrt 2017-18
C. Major Customer- Details of Revenue from Single customer exceeding 10% of total revenue of the Company
revenue from one customer of the company’s formulation segment based in uK is ` 16,018.48 Lakhs which is more than 10% of the company’s total revenue.
41: LEASES
A. The Company’s significant leasing arrangements are in respect of operating leases of premises for offices and residential accommodation. These leasing arrangements, which are not non-cancellable, are typically for a period of 2 months to 66 months and are usually renewable on mutually agreeable terms. The minimum future lease payment are based on actual contracted payment. The future minimum lease payable is:
(` in lakhs)
Future Minimum Lease PaymentAs at
31st March, 2018As at
31st March, 2017
up to 1 year 678.73 682.88
later than one year and not later than 5 years 1,698.02 353.99
later than Five years - 41.00
Total 2,376.75 1,077.87
during the year, the company has recognised ` 684.06 (Previous year ` 709.06) relating to all leases in the statement of Profit and Loss.
b. the company has taken 61.943 acres land on lease in Kalyani for 999 years. the company has made an upfront payment of amount ` 278.09 lakhs and no further annual rentals are paid.
42: DUE TO MICRO & SMALL ENTERPRISES WITHIN THE MEANING OF MICRO, SMALL & MEDIUM ENTERPRISES DEVELOPMENT ACT, 2006 SHOWN UNDER CREDITORS FOR GOODS
The Company identifies suppliers belonging to Micro and Small category under MSMED Act, 2006 on the basis of declaration to the effect made by such parties in their invoices / challans as mandated for them under Statute. Considering absence of such declaration from any of the vendors, due towards such parties have been deemed as Nil (previous year Nil).
43: RESTRUCTURING PROGRAMME
during the year, the company announced a restructuring program, to drive improvement in operating income margins and consolidate operations at Baddi, Himachal Pradesh. The program targets an improvement in profitability from a reduction in the cost of goods sold and general and administrative expenses. Restructuring costs has been accrued (charged to provisions) as the company has approved a detailed and formal restructuring plan and the restructuring has been announced publicly and hence, such costs qualify for recognition in accordance with Ind AS 37. Provisions for severance payments and related employment termination costs related to affected employees amounting to ` 289.88 Lakhs has been recognized and the same has been presented as ‘Exceptional items – Restructuring Provisions. Retention and other payments that depend on future service are recognized over the required service period. Restructuring costs relating to ongoing activities, such as relocation, training and information systems, do not qualify for provisioning under Ind AS 37 and are expensed when incurred.
44: DISCLOSURE AS PER IND AS 36 ‘IMPAIRMENT OF ASSETS’
As required by Ind AS 36, an assessment of impairment of assets was carried out and based on such assessment, the Company has accounted impairment losses as under:
A The Company has two manufacturing plants based out of Baddi, Himachal Pradesh. As part of detailed restructuring plan finalised by the Company, a detailed plans to shift operations from one of the Baddi based plants to the other plant. The Company has already started taking necessary steps to shift the operations during the current financial year and expects to complete the shifting during financial year 2018-19 (Refer Note 43 on the Restructuring Programme). This restructuring exercise planned by the Company triggers an internal indicator since the management has taken a significant decision to rationalise the production facilities in Baddi and this decision affects the manner in which these assets will be used by the Company. Impairment resulting from the restructuring programme, will cause the non-current assets to be measured at the higher of fair value less cost to sell or its value in use (representing the recoverable value). the fair value less cost to sell has been determined by an independent valuer. The Company believes that value in use does not materially exceed its
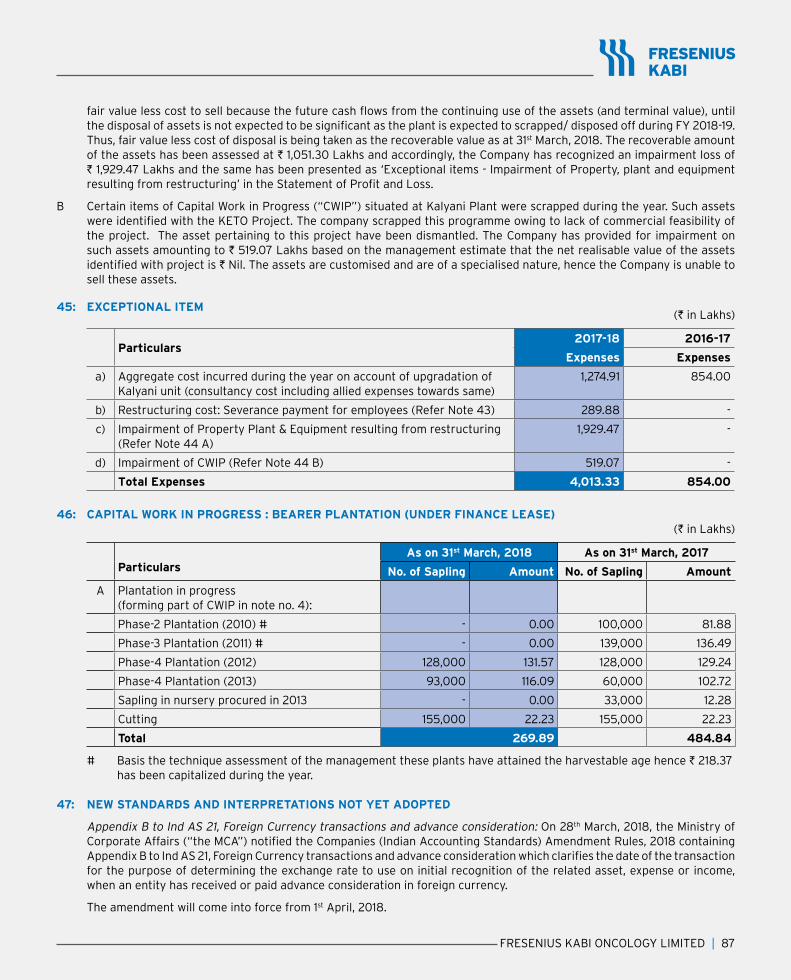
Fresenius Kabi OncOlOgy limited | 87
fair value less cost to sell because the future cash flows from the continuing use of the assets (and terminal value), until the disposal of assets is not expected to be significant as the plant is expected to scrapped/ disposed off during FY 2018-19. thus, fair value less cost of disposal is being taken as the recoverable value as at 31st march, 2018. the recoverable amount of the assets has been assessed at ` 1,051.30 Lakhs and accordingly, the Company has recognized an impairment loss of ` 1,929.47 Lakhs and the same has been presented as ‘Exceptional items - Impairment of Property, plant and equipment resulting from restructuring’ in the Statement of Profit and Loss.
B Certain items of Capital Work in Progress (“CWIP”) situated at Kalyani Plant were scrapped during the year. Such assets were identified with the KETO Project. The company scrapped this programme owing to lack of commercial feasibility of the project. The asset pertaining to this project have been dismantled. The Company has provided for impairment on such assets amounting to ` 519.07 lakhs based on the management estimate that the net realisable value of the assets identified with project is ` nil. the assets are customised and are of a specialised nature, hence the company is unable to sell these assets.
45: EXCEPTIONAL ITEM (` in lakhs)
Particulars2017-18 2016-17
Expenses Expenses
a) aggregate cost incurred during the year on account of upgradation of Kalyani unit (consultancy cost including allied expenses towards same)
1,274.91 854.00
b) Restructuring cost: Severance payment for employees (Refer Note 43) 289.88 -
c) Impairment of Property Plant & Equipment resulting from restructuring (refer note 44 a)
1,929.47 -
d) Impairment of CWIP (Refer Note 44 B) 519.07 -
Total Expenses 4,013.33 854.00
46: CAPITAL WORK IN PROGRESS : BEARER PLANTATION (UNDER FINANCE LEASE)(` in lakhs)
ParticularsAs on 31st March, 2018 As on 31st March, 2017
No. of Sapling Amount No. of Sapling Amount
a Plantation in progress (forming part of CWIP in note no. 4):
Phase-2 Plantation (2010) # - 0.00 100,000 81.88
Phase-3 Plantation (2011) # - 0.00 139,000 136.49
Phase-4 Plantation (2012) 128,000 131.57 128,000 129.24
Phase-4 Plantation (2013) 93,000 116.09 60,000 102.72
sapling in nursery procured in 2013 - 0.00 33,000 12.28
cutting 155,000 22.23 155,000 22.23
Total 269.89 484.84
# basis the technique assessment of the management these plants have attained the harvestable age hence ` 218.37 has been capitalized during the year.
47: NEW STANDARDS AND INTERPRETATIONS NOT YET ADOPTED
Appendix B to Ind AS 21, Foreign Currency transactions and advance consideration: On 28th march, 2018, the ministry of Corporate Affairs (“the MCA”) notified the Companies (Indian Accounting Standards) Amendment Rules, 2018 containing Appendix B to Ind AS 21, Foreign Currency transactions and advance consideration which clarifies the date of the transaction for the purpose of determining the exchange rate to use on initial recognition of the related asset, expense or income, when an entity has received or paid advance consideration in foreign currency.
The amendment will come into force from 1st april, 2018.

Raising the Bar
88 | 15th annual rePOrt 2017-18
Ind AS 115, Revenue from Contract with Customers: On 28th March, 2018, the MCA notified the Ind AS 115. The core principle of new standard is that an entity should recognise revenue to depict the transfer of promised goods or services to customers in an amount that reflects the consideration to which the entity expects to be entitled in exchange for those goods or services. Further, the new standard requires enhanced disclosures about the nature, amount, timing and uncertainty of revenue and cash flows arising from the entity’s contracts with customers.
The standard permits two possible methods of transition:
- Retrospective Approach: Under this approach the standard will be applied retrospectively to each prior reporting period presented in accordance with Ind AS 8, Accounting Policies, Changes in Accounting Estimates and Errors.
- Retrospectively with cumulative effect of initially applying the standard recognised at the date of initial application (cumulative catch up approach).
The effective date of adoption of Ind AS 115 is financial period beginning on or after 1st april, 2018.
The Company will adopt the standard on 1st april, 2018 by using the cumulative catch-up transition method and accordingly, comparatives for the year ended 31st March, 2018 will not be retrospectively adjusted. The Company is currently evaluating the impact of the above mentioned pronouncements.
For and on behalf of the Board of Directors of FRESENIUS KABI ONCOLOGY LIMITED
Maria Gobbi Karsten Lerch Nikhil Kulshreshtha Sandeep Kumar Chotia Chairperson & Managing Director Director Director & Secretary Chief Financial Officer DIN: 07005222 DIN: 07433486 DIN: 07178027
Place: Gurugram, India Date: 5th June, 2018
For VMT & Co. LLPchartered accountantsFirm registration no. n500048
Vanit Kumar MittalPartnermembership no. 505709
Place: Gurugram, India Date: 5th June, 2018


Related Documents