GALE PACIFIC LIMITED 2016 ANNUAL REPORT 01 Annual Report 2016

Welcome message from author
This document is posted to help you gain knowledge. Please leave a comment to let me know what you think about it! Share it to your friends and learn new things together.
Transcript

GALE PACIFIC LIMITED 2016 ANNUAL REPORT 01
Annual Report 2016

GALE PACIFIC LIMITED 2016 ANNUAL REPORT
Contents
IFC Corporate Directory
1 Company Introduction
2 Results at a Glance
3 Chairman’s Letter
6 Group Managing Director’s Review
9 Operational Report
12 Executive Leadership
14 Corporate Governance
15 Directors’ Report
30 Financial Report
2016 Annual General Meeting
The Annual General Meeting will be held at 11am on Friday 28 October 2016 at the Grand Hyatt, 123 Collins Street, Melbourne.
Corporate DirectoryGale Pacific Limited ABN 80 082 263 778
Directors David Allman (Chairman) Nick Pritchard (Group Managing Director) Peter Landos (Non Executive Director) John Murphy (Non Executive Director)
Company Secretary Sophie Karzis
Registered Office 145 Woodlands Drive, Braeside, Victoria, 3195 T + 613 9518 3333
Principal Places of BusinessAustralia 145 Woodlands Drive, Braeside, VIC, 3195 Tel: +61 3 9518 3333
New Zealand Unit 9, 39 Apollo Drive, Rosedale, Auckland, 0632 Tel: +64 9 479 9119
China 777 Hengshan West Road, Beilun, Ningbo, 315800 Tel: +86 574 5626 8888
USA Suite 1704, 285 West Central Parkway, Altamonte Springs, Florida 32714 Tel: +1 407 333 1038
UAE PO Box 17696, Jebel Ali, Dubai Tel: +971 4 881 7114
Solicitors Norton Gledhill Level 23, 459 Collins Street, Melbourne, Victoria, 3000 T + 613 9614 8933
Auditors Deloitte Touche Tohmatsu 550 Bourke Street, Melbourne, Victoria, 3000 T + 613 9671 7000
Stock Exchange Listing Gale Pacific Limited shares are listed on the Australian Securities Exchange (ASX code: GAP)
Share Registry Computershare Yarra Falls, 452 Johnston Street, Abbotsford, Victoria, 3067 T + 613 9415 4000
Website Address www.galepacific.com
GALE PACIFIC LIMITED 2016 ANNUAL REPORT 1GALE PACIFIC LIMITED 2016 ANNUAL REPORT 1
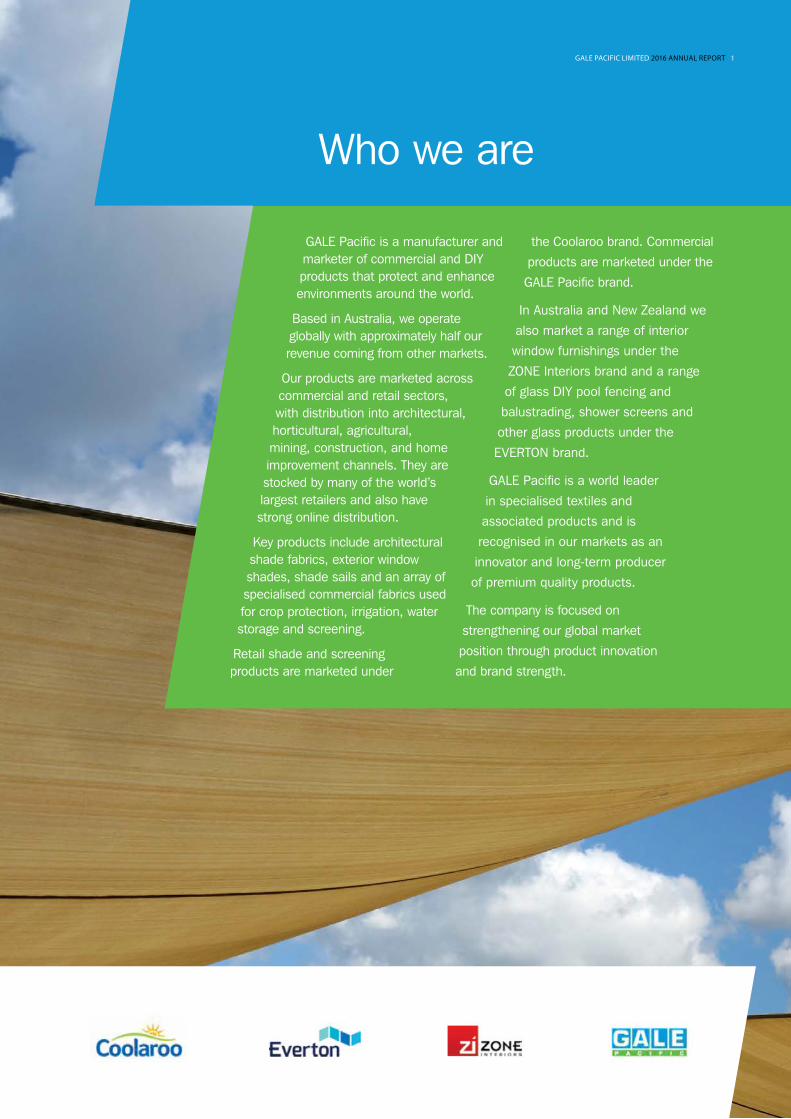
Who we are
GALE Pacific is a manufacturer and marketer of commercial and DIY products that protect and enhance environments around the world.
Based in Australia, we operate globally with approximately half our revenue coming from other markets.
Our products are marketed across commercial and retail sectors, with distribution into architectural, horticultural, agricultural, mining, construction, and home improvement channels. They are stocked by many of the world’s largest retailers and also have strong online distribution.
Key products include architectural shade fabrics, exterior window shades, shade sails and an array of specialised commercial fabrics used for crop protection, irrigation, water storage and screening.
Retail shade and screening products are marketed under
the Coolaroo brand. Commercial
products are marketed under the
GALE Pacific brand.
In Australia and New Zealand we
also market a range of interior
window furnishings under the
ZONE Interiors brand and a range
of glass DIY pool fencing and
balustrading, shower screens and
other glass products under the
EVERTON brand.
GALE Pacific is a world leader
in specialised textiles and
associated products and is
recognised in our markets as an
innovator and long-term producer
of premium quality products.
The company is focused on
strengthening our global market
position through product innovation
and brand strength.
2 GALE PACIFIC LIMITED 2016 ANNUAL REPORT
Results at a glance
2 GALE PACIFIC LIMITED 2016 ANNUAL REPORT
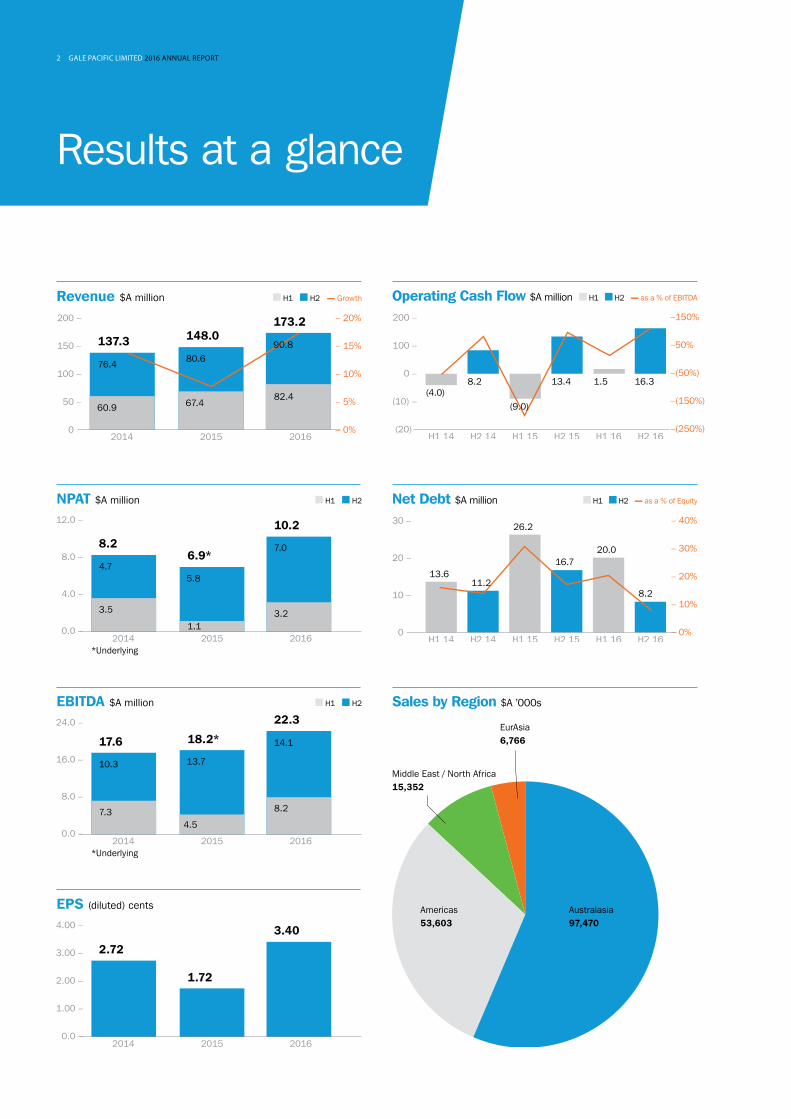
76.480.6
137.3 148.0173.2
60.9 67.482.4
90.8
Revenue $A million
200 –
150 –
100 –
50 –
0
– 20%
– 15%
– 10%
– 5%
– 0%
H1 H2 Growth
2014 2015 2016
(4.0)8.2 13.4 1.5 16.3
(9.0)
Operating Cash Flow $A million
200 –
100 –
0 –
(10) –
(20)
–150%
–50%
–(50%)
–(150%)
–(250%)
H1 H2 as a % of EBITDA
H1 14 H2 14 H1 15 H2 15 H1 16 H2 16
10.3 13.7
17.6 18.2*
22.3
7.34.5
8.2
14.1
*Underlying
EBITDA $A million
24.0 –
16.0 –
8.0 –
0.0 –2014 2015 2016
H1 H2
Australasia97,470
Americas53,603
Middle East / North Africa15,352
EurAsia6,766
Sales by Region $A ’000s
4.75.8
8.26.9*
10.2
3.5
*Underlying
1.13.2
7.0
NPAT $A million
12.0 –
8.0 –
4.0 –
0.0 –
H1 H2
2014 2015 2016
13.611.2
20.016.7
8.2
26.2
Net Debt $A million
30 –
20 –
10 –
0
– 40%
– 30%
– 20%
– 10%
– 0%
H1 H2 as a % of Equity
H1 14 H2 14 H1 15 H2 15 H1 16 H2 16
2.72
1.72
3.40
EPS (diluted) cents
4.00 –
3.00 –
2.00 –
1.00 –
0.0 –2014 2015 2016
GALE PACIFIC LIMITED 2016 ANNUAL REPORT 3
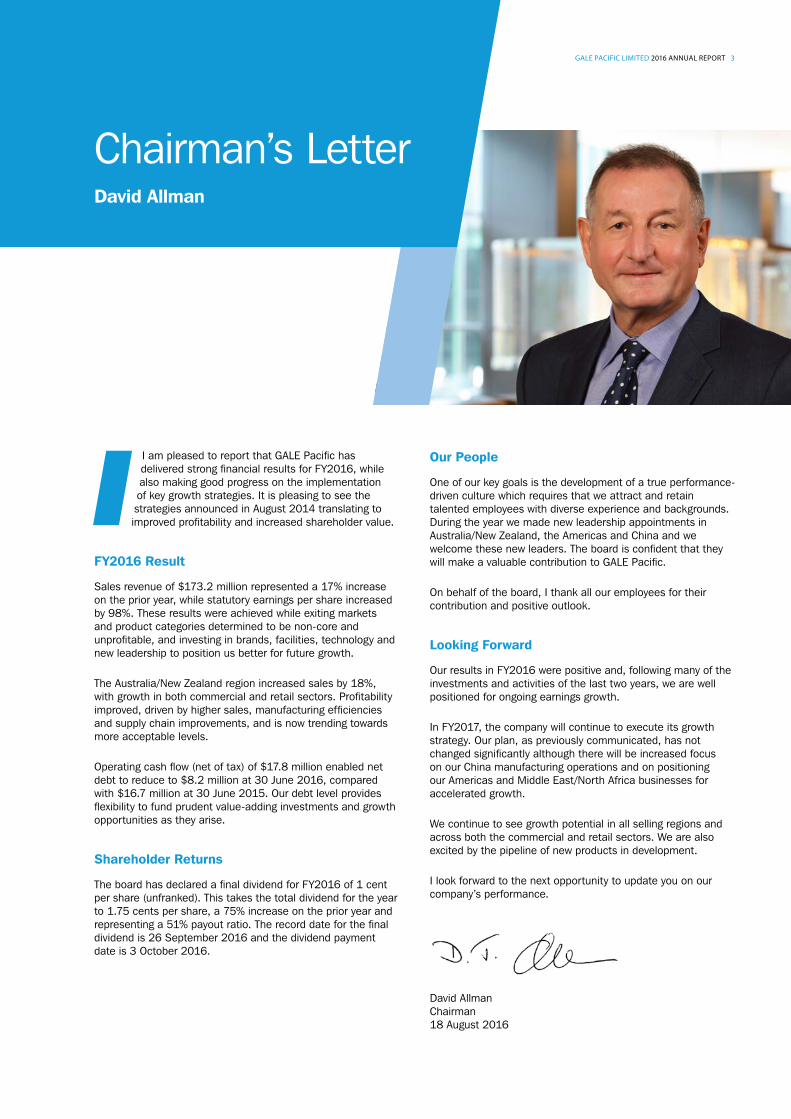
Chairman’s LetterDavid Allman
I am pleased to report that GALE Pacific has delivered strong financial results for FY2016, while also making good progress on the implementation of key growth strategies. It is pleasing to see the strategies announced in August 2014 translating to improved profitability and increased shareholder value.
FY2016 Result
Sales revenue of $173.2 million represented a 17% increase on the prior year, while statutory earnings per share increased by 98%. These results were achieved while exiting markets and product categories determined to be non-core and unprofitable, and investing in brands, facilities, technology and new leadership to position us better for future growth.
The Australia/New Zealand region increased sales by 18%, with growth in both commercial and retail sectors. Profitability improved, driven by higher sales, manufacturing efficiencies and supply chain improvements, and is now trending towards more acceptable levels.
Operating cash flow (net of tax) of $17.8 million enabled net debt to reduce to $8.2 million at 30 June 2016, compared with $16.7 million at 30 June 2015. Our debt level provides flexibility to fund prudent value-adding investments and growth opportunities as they arise.
Shareholder Returns
The board has declared a final dividend for FY2016 of 1 cent per share (unfranked). This takes the total dividend for the year to 1.75 cents per share, a 75% increase on the prior year and representing a 51% payout ratio. The record date for the final dividend is 26 September 2016 and the dividend payment date is 3 October 2016.
Our People
One of our key goals is the development of a true performance-driven culture which requires that we attract and retain talented employees with diverse experience and backgrounds. During the year we made new leadership appointments in Australia/New Zealand, the Americas and China and we welcome these new leaders. The board is confident that they will make a valuable contribution to GALE Pacific.
On behalf of the board, I thank all our employees for their contribution and positive outlook.
Looking Forward
Our results in FY2016 were positive and, following many of the investments and activities of the last two years, we are well positioned for ongoing earnings growth.
In FY2017, the company will continue to execute its growth strategy. Our plan, as previously communicated, has not changed significantly although there will be increased focus on our China manufacturing operations and on positioning our Americas and Middle East/North Africa businesses for accelerated growth.
We continue to see growth potential in all selling regions and across both the commercial and retail sectors. We are also excited by the pipeline of new products in development.
I look forward to the next opportunity to update you on our company’s performance.
David Allman Chairman 18 August 2016
4 GALE PACIFIC LIMITED 2016 ANNUAL REPORT
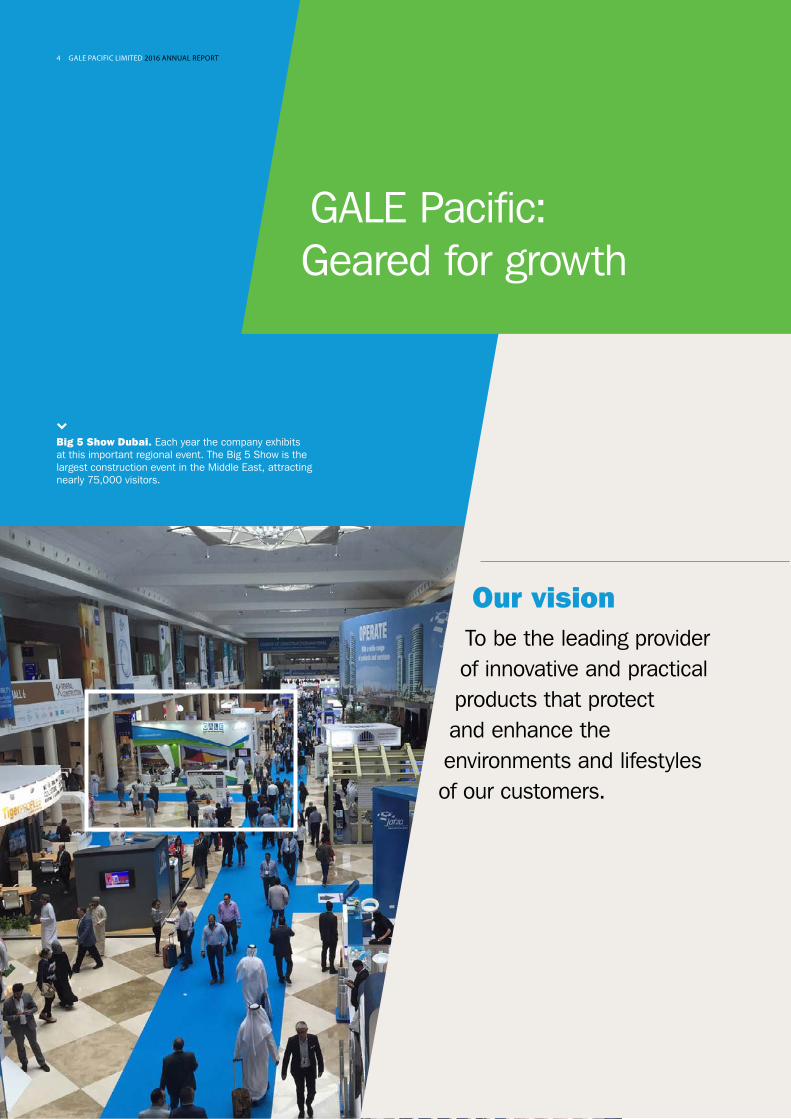
Big 5 Show Dubai. Each year the company exhibits at this important regional event. The Big 5 Show is the largest construction event in the Middle East, attracting nearly 75,000 visitors.
Our visionTo be the leading provider of innovative and practical products that protect and enhance the environments and lifestyles of our customers.
GALE Pacific: Geared for growth
4 GALE PACIFIC LIMITED 2016 ANNUAL REPORT
GALE PACIFIC LIMITED 2016 ANNUAL REPORT 5
Our visionTo be the leading provider of innovative and practical products that protect and enhance the environments and lifestyles of our customers.
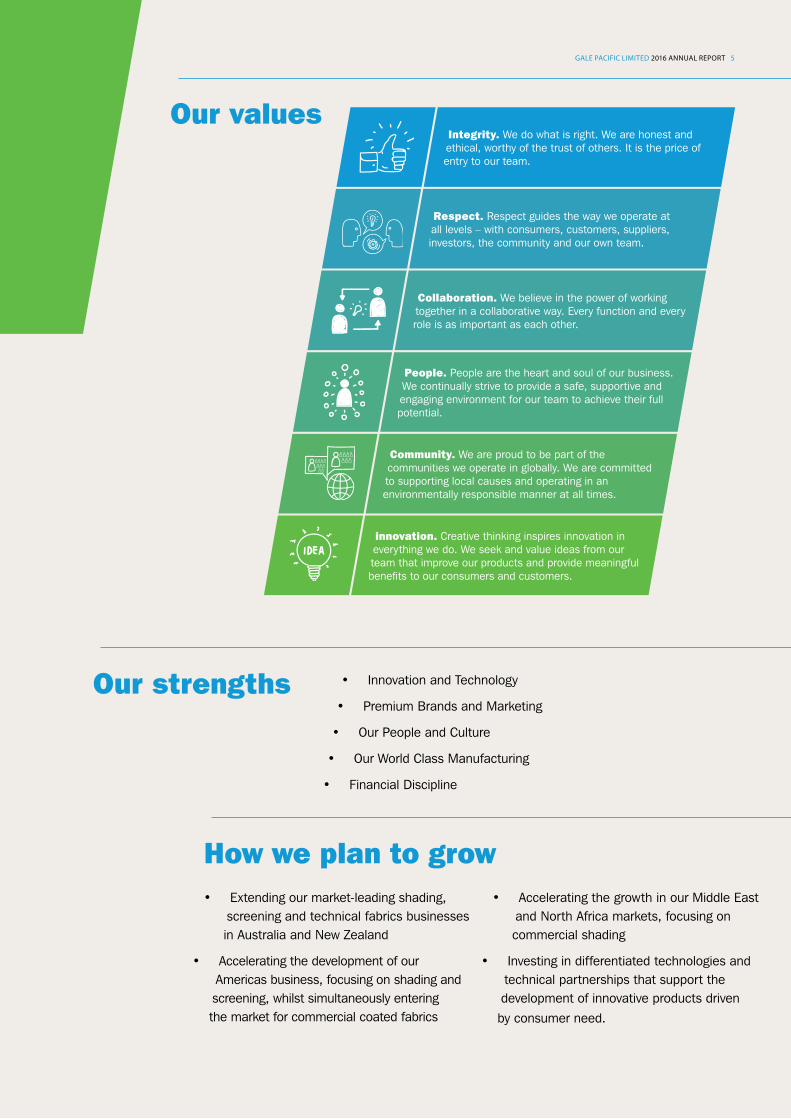
• Extending our market-leading shading, screening and technical fabrics businesses in Australia and New Zealand
• Accelerating the development of our Americas business, focusing on shading and screening, whilst simultaneously entering the market for commercial coated fabrics
• Accelerating the growth in our Middle East and North Africa markets, focusing on commercial shading
• Investing in differentiated technologies and technical partnerships that support the development of innovative products driven by consumer need.
Integrity. We do what is right. We are honest and ethical, worthy of the trust of others. It is the price of entry to our team.
Respect. Respect guides the way we operate at all levels – with consumers, customers, suppliers, investors, the community and our own team.
Collaboration. We believe in the power of working together in a collaborative way. Every function and every role is as important as each other.
People. People are the heart and soul of our business. We continually strive to provide a safe, supportive and engaging environment for our team to achieve their full potential.
Community. We are proud to be part of the communities we operate in globally. We are committed to supporting local causes and operating in an environmentally responsible manner at all times.
innovation. Creative thinking inspires innovation in everything we do. We seek and value ideas from our team that improve our products and provide meaningful benefits to our consumers and customers.
• Innovation and Technology
• Premium Brands and Marketing
• Our People and Culture
• Our World Class Manufacturing
• Financial Discipline
Our values
Our strengths
How we plan to grow
GALE PACIFIC LIMITED 2016 ANNUAL REPORT 5
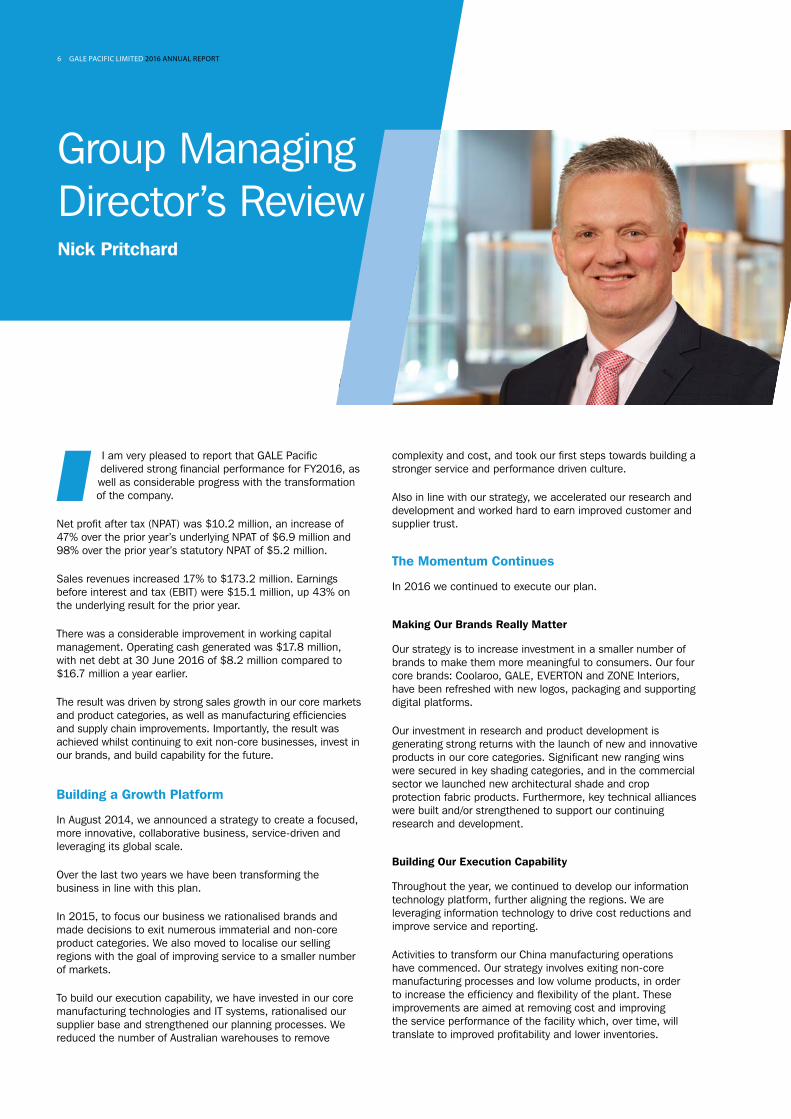
Group Managing Director’s ReviewNick Pritchard
I am very pleased to report that GALE Pacific delivered strong financial performance for FY2016, as well as considerable progress with the transformation of the company.
Net profit after tax (NPAT) was $10.2 million, an increase of 47% over the prior year’s underlying NPAT of $6.9 million and 98% over the prior year’s statutory NPAT of $5.2 million.
Sales revenues increased 17% to $173.2 million. Earnings before interest and tax (EBIT) were $15.1 million, up 43% on the underlying result for the prior year.
There was a considerable improvement in working capital management. Operating cash generated was $17.8 million, with net debt at 30 June 2016 of $8.2 million compared to $16.7 million a year earlier.
The result was driven by strong sales growth in our core markets and product categories, as well as manufacturing efficiencies and supply chain improvements. Importantly, the result was achieved whilst continuing to exit non-core businesses, invest in our brands, and build capability for the future.
Building a Growth Platform
In August 2014, we announced a strategy to create a focused, more innovative, collaborative business, service-driven and leveraging its global scale.
Over the last two years we have been transforming the business in line with this plan.
In 2015, to focus our business we rationalised brands and made decisions to exit numerous immaterial and non-core product categories. We also moved to localise our selling regions with the goal of improving service to a smaller number of markets.
To build our execution capability, we have invested in our core manufacturing technologies and IT systems, rationalised our supplier base and strengthened our planning processes. We reduced the number of Australian warehouses to remove
complexity and cost, and took our first steps towards building a stronger service and performance driven culture.
Also in line with our strategy, we accelerated our research and development and worked hard to earn improved customer and supplier trust.
The Momentum Continues
In 2016 we continued to execute our plan.
Making Our Brands Really Matter
Our strategy is to increase investment in a smaller number of brands to make them more meaningful to consumers. Our four core brands: Coolaroo, GALE, EVERTON and ZONE Interiors, have been refreshed with new logos, packaging and supporting digital platforms.
Our investment in research and product development is generating strong returns with the launch of new and innovative products in our core categories. Significant new ranging wins were secured in key shading categories, and in the commercial sector we launched new architectural shade and crop protection fabric products. Furthermore, key technical alliances were built and/or strengthened to support our continuing research and development.
Building Our Execution Capability
Throughout the year, we continued to develop our information technology platform, further aligning the regions. We are leveraging information technology to drive cost reductions and improve service and reporting.
Activities to transform our China manufacturing operations have commenced. Our strategy involves exiting non-core manufacturing processes and low volume products, in order to increase the efficiency and flexibility of the plant. These improvements are aimed at removing cost and improving the service performance of the facility which, over time, will translate to improved profitability and lower inventories.
6 GALE PACIFIC LIMITED 2016 ANNUAL REPORT

In procurement, the business made great strides to rationalise our supplier base and focus on working more collaboratively with a smaller number of sophisticated suppliers. Strong supplier relationships are key to our success and we are pleased with the achievements in this area.
Simplify and Align the Business
In Australia, we continued to reduce the number of warehouses to remove supply chain complexity and cost. We successfully relocated our retail products warehouse to a new facility which helped to generate immediate transport cost and service improvements.
Whilst recognising the uniqueness of our markets, we are targeting collaboration and alignment wherever sensible. Throughout the year, we continued to remove duplication and implement more globally aligned processes to support our growth.
Focused Business Expansion
During the year, we continued to refine our product, geographic and channel strategies.
In addition to continuing to exit various non-core product categories, we decided to withdraw from non-core markets. Whilst fortunate to have organic growth potential in multiple geographies and channels, we increased company-wide disciplines to focus on all aspects of our core business.
In May 2016, a new, long-term, multi-currency banking facility was secured. This facility provides us with both access to capital and flexibility to pursue growth initiatives in our international markets.
Developing the Team for Growth
Late in the year, we made a number of key senior management changes aimed at building capability and leading our growth strategy.
In line with our plan to reduce cost and improve service at our manufacturing operations, Cliff Zhang was appointed to lead our China manufacturing transformation. Cliff brings considerable manufacturing leadership experience in world-class businesses and we look forward to benefiting from his contribution to GALE Pacific.
We are excited about the growth opportunity in the Americas region, specifically in the United States, Canada and Mexico. To lead accelerated growth in this key region, Lindsay Klebenow was appointed President/General Manager – Americas.
In Australia and New Zealand, Craig Fuller commenced as General Manager, leading the continued improvement of our largest business region.
These leadership appointments were important in building a higher performance culture aligned to our business strategy.
Throughout the year, we also made investments to strengthen our technical capability. Technical centres in Australia and China were built, and training protocols were established to support our leadership and technical competence worldwide.
Health and Safety
We have a steadfast commitment to ensuring GALE Pacific is a safe place to work.
Our safety performance across our business was strong. I am encouraged by the improvements we are seeing in ‘Hazard and Near Miss’ reporting, a solid indicator of a positive safety culture.
During the year, we invested in dedicated health and safety leadership to build our capability and accelerate improvements across all regions. Given the importance of health and safety, this new role reports directly to me.
In 2016, we conducted our first global safety culture survey across all employees. The findings from this survey will help to drive the health and safety strategy in the future. We will conduct this culture survey on an annual basis enabling us to measure our safety performance more effectively.
Manufacturing. Extrusion coating plant – Braeside, Victoria, Australia. GALE Pacific manufactures technically complex fabrics at its extrusion coating plant. The company continues to invest in its core manufacturing technologies.
Landmark Recycled. In 2016, in conjunction with Deakin University, GALE Pacific pioneered a fabric made from recycled grain covers, solving a significant ‘end of life’ disposal issue for grain handlers. GALE Pacific’s patent pending technology presents a considerable opportunity. The new Recycled Landmark was launched in Australia in June.
GALE PACIFIC LIMITED 2016 ANNUAL REPORT 7

8 GALE PACIFIC LIMITED 2016 ANNUAL REPORT
Looking Forward
The next phase of our business is exciting. Whilst our transformation is not yet complete, we now have an opportunity to move into a different mode.
Our next phase will focus on:
• China Manufacturing Transformation – reducing complexity in the plant, building technical capability, more sophisticated procurement and creating a greater service orientation.
• Americas – developing a manufacturing and logistics infrastructure to support faster growth, focusing on core retail categories and designing a plan for commercial sector growth.
• Middle East/North Africa – investing in additional sales resources to capitalise on the market opportunity.
• Research & Development - continuing our innovation initiatives, working closely with global technical partners who will help bring our ideas to reality.
• Focus – accelerating our exit from non-core product categories and sharpening our focus on a smaller number of geographic regions and channels, based on market insights.
• Marketing – global transition to our new branding frameworks and investing in building more global digital platforms to engage with our consumers more fully.
We are confident that GALE Pacific is well positioned to deliver consistent sales and earnings growth.
Our People
All our employees, irrespective of geography, seniority or job function are guided by GALE Pacific’s values, as listed on page 5.
Our employees around the world have made a significant contribution to a successful year for GALE Pacific and I would like to thank all of them for their efforts. They have responded particularly well to the challenges of a fast-changing business and I am grateful for their ongoing commitment to improve the company’s performance.
Thank you, too, to our customers, our suppliers and our shareholders for your continued support of GALE Pacific.
Nick Pritchard Group Managing Director 18 August 2016
Melbourne Retail Products Distribution Centre – Dandenong South, Victoria, Australia. During the year the company relocated retail warehousing operations to a new facility supporting service and cost improvements.
Manufacturing – Throughout the year the company invested in important technical upgrades to improve product performance and deliver manufacturing efficiencies.
Specialty Textiles Association Trade Show – Gold Coast, June 2016. At this show the company launched its new Commercial Heavy architectural shade fabric, designed specifically for large structures.
GALE PACIFIC LIMITED 2016 ANNUAL REPORT 9
Operational ReportFY2016
A$ millionFY2015
A$ millionChange
%
Revenue 173.2 148.0 17
Underlying EBITDA 22.3 18.2 22
Underlying EBIT 15.1 10.6 43
Underlying profit before tax 13.5 8.7 55
Underlying profit after tax 10.2 6.9 47
Statutory profit/loss before tax 13.5 6.2 117
Statutory profit/loss after tax 10.2 5.2 98
Net cash provided by operating activities 17.8 4.4 307
Net debt 8.2 16.7 (51)
Diluted earnings per share 3.40 cents 1.72 cents 98
Dividends per share 1.75 cents 1.0 cent 75
Australia/New Zealand
FY2016 A$ million
FY2015 A$ million
Change %
Revenue 97.5 82.7 18
Underlying EBITDA 3.6 3.2 12
Sales grew through both the retail and commercial channels.
In the retail sector, the Company secured considerable new distribution for core product categories, including portable sun
shelters, umbrellas and synthetic grass. The prior year’s investment in the establishment of the EVERTON brand for glass
products, and its relaunch, resulted in solid growth in the category and returned it to profitability.
In the commercial sector, growth was achieved as a result of new products and service improvements.
Throughout the year there was ongoing focus on achieving further improvements in the supply chain. These resulted in improved
inventory turns, supplier rationalisation and improvements in trading terms, as well as transport and labour savings.
Restructuring initiatives strengthened the team’s capability and separated commercial and retail sector responsibilities,
positioning them for further growth.
Americas
FY2016 A$ million
FY2015 A$ million
Change %
Revenue 53.6 43.4 24
EBITDA 4.9 5.0 (1)
Demand for GALE’s products in the Americas was strong and new retail business was secured in the core window shades
category. The region’s performance, however, was impacted by supply chain challenges that restricted its ability to service
market requirements effectively.
The Company invested in new supply chain leadership, strengthened the planning function and made warehousing and
manufacturing improvements. These changes, combined with the cost savings and service improvements in the China
operations, have established a solid platform for profitable future growth.
10 GALE PACIFIC LIMITED 2016 ANNUAL REPORT
Late in the year, GALE appointed a new President/General Manager for the region with the goal of accelerating growth in the
retail sector and building a strategy for commercial market expansion. A provision for the cost of the leadership transition is
included in the FY2016 accounts.
GALE has significant opportunities in this region and, after making appropriate changes, attention is turning to investing more
heavily in the Americas to capitalise on these opportunities.
Middle East/North Africa
FY2016 A$ million
FY2015 A$ million
Change %
Revenue 15.4 14.4 7
EBITDA 3.1 3.3 (4)
Market conditions in the region were particularly challenging throughout the year. Low oil prices and political volatility combined
to put pressure on regional cash flows. Demand for GALE products remained strong, but ongoing focus on the quality of the
customer base resulted in lower sales growth.
During the year, there was a soft launch of GALE’s new Commercial Heavy architectural fabric, with a number of initial projects.
There is considerable potential demand for higher performing architectural fabrics in the region, and new product development
initiatives have been deliberately focused in this area.
The Middle East/North Africa market continues to be highly attractive. Investments in this area will be limited largely to new
products (inventory) and additional sales resources.
China Manufacturing & Eurasia
FY2016 A$ million
FY2015 A$ million
Change %
Revenue 6.8 7.5 (10)%
Intersegment Sales (eliminated when consolidating group results) 58.4 43.0 36%
EBITDA 12.6 10.6 19%
Sales to the Eurasia region were slightly lower compared to the prior period, reflecting the transition to higher margin
commercial fabrics. Unfavourable legacy trading arrangements were addressed and a platform was created for sustained
profitable growth.
The formation of a regionally-based sales and support team was completed, with roles transferred from Australia, and a decision
was taken to focus on a smaller number of geographic regions and channels.
At the Company’s Chinese manufacturing operations, facilities and plant were upgraded and efficiency remained high, with
gains in quality and waste reduction. There was higher demand for knitted and woven fabrics from all selling regions which also
contributed to improved capacity utilisation.
The strategy to treat the Chinese manufacturing facility as a cost centre focused on quality, cost reduction and service remains,
as shown by the improvement in key performance indicators.
Balance Sheet
Net debt at 30 June 2016 was $8.2 million, compared with $20.0 million at 31 December 2015 and $16.7 million at
30 June 2015. The decrease in debt during the year reflected strong sales growth, continued improvements in the supply chain
and improvements in global inventory management.
Group working capital increased compared with the prior corresponding period as a result of unfavourable exchange rate
translation. Notwithstanding this, there were improvements in all major working capital metrics. Efforts to rationalise the
Company’s supplier base resulted in significant improvements in trading terms and positive cash generation throughout
the period.
GALE PACIFIC LIMITED 2016 ANNUAL REPORT 11
The Company continues to be focused on disciplined inventory management, with increases in inventory turns and decreases in
aged inventory.
Cash Generation and Working Capital
Group working capital increased vs prior corresponding period as a result of unfavourable exchange rate translation.
Notwithstanding currency, we have seen improvements in all major working capital metrics. Efforts to rationalise our supplier
base has resulted in significant improvements in trading terms translating to positive cash generation throughout the period.
The company continues to be focused on disciplined inventory management demonstrated by increases in inventory turns and
decreases in aged inventory. Despite challenges in the middle east region, the company’s receivables metrics remain on track
with good progress in the Americas particularly.
Operating cash flow for the period was $17.8m a 4 times improvement over prior year driven by profitable growth and
improvements in working capital management. The company’s positive cash position provides GALE Pacific with significant
opportunity to enable the growth strategy detailed above.
Reconciliation of Underlying Results to Statutory Results for Prior Corresponding Period
In the prior corresponding period, the company incurred non-recurring costs related to restructuring and the re-launch of the
company’s pool fencing and balustrade ranges. The following table reconciles the underlying results to the statutory results.
EBITDA A$ million
EBIT A$ million
Profit before tax
A$ millionProfit after tax
A$ million
Statutory 15.7 8.0 6.2 5.2
Restructuring costs 0.3 0.3 0.3 0.2
Product re-launch costs 2.2 2.2 2.2 1.5
Underlying 18.2 10.6 8.7 6.9
Underlying profit, EBITDA and EBIT are the Statutory profit, EBITDA and EBIT respectively adjusted for non recurring costs related
to restructuring and the re-launch of the company’s pool fencing and balustrade ranges. The Company believes that underlying
profit, EBITDA and EBIT provide a better understanding of its financial performance and allows for a more relevant comparison of
financial performance between financial periods.
Underlying profit, EBITDA and EBIT are useful as they remove significant items that are material items of revenue or expense that
are unrelated to the underlying performance of the business thereby facilitating a more representative comparison of financial
performance between financial periods.
Underlying profit is presented with reference to the Australian Securities and Investments Commission Regulatory Guide 230
“Disclosing non-IFRS financial information” issued in December 2011. The Company’s policy for reporting underlying profit is
consistent with this guidance. The Directors had the consistency of the application of the policy reviewed by the external auditor.
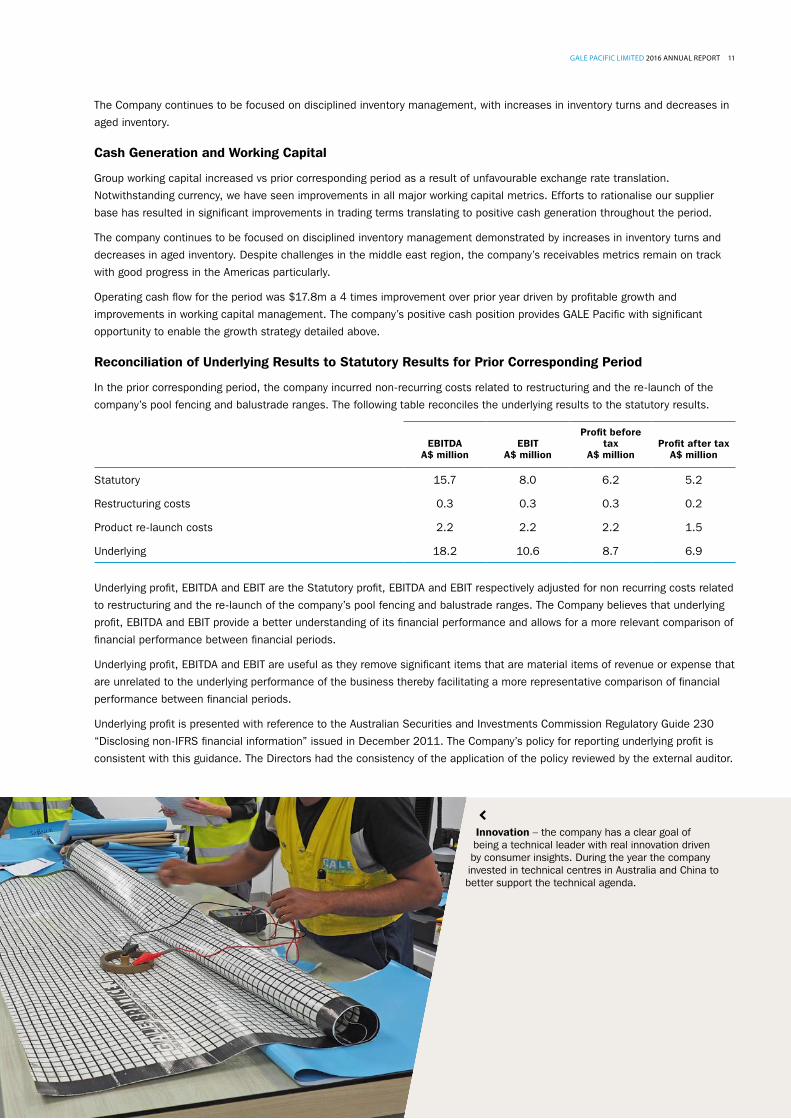
Innovation – the company has a clear goal of being a technical leader with real innovation driven by consumer insights. During the year the company invested in technical centres in Australia and China to better support the technical agenda.
12 GALE PACIFIC LIMITED 2016 ANNUAL REPORT
Executive Leadership
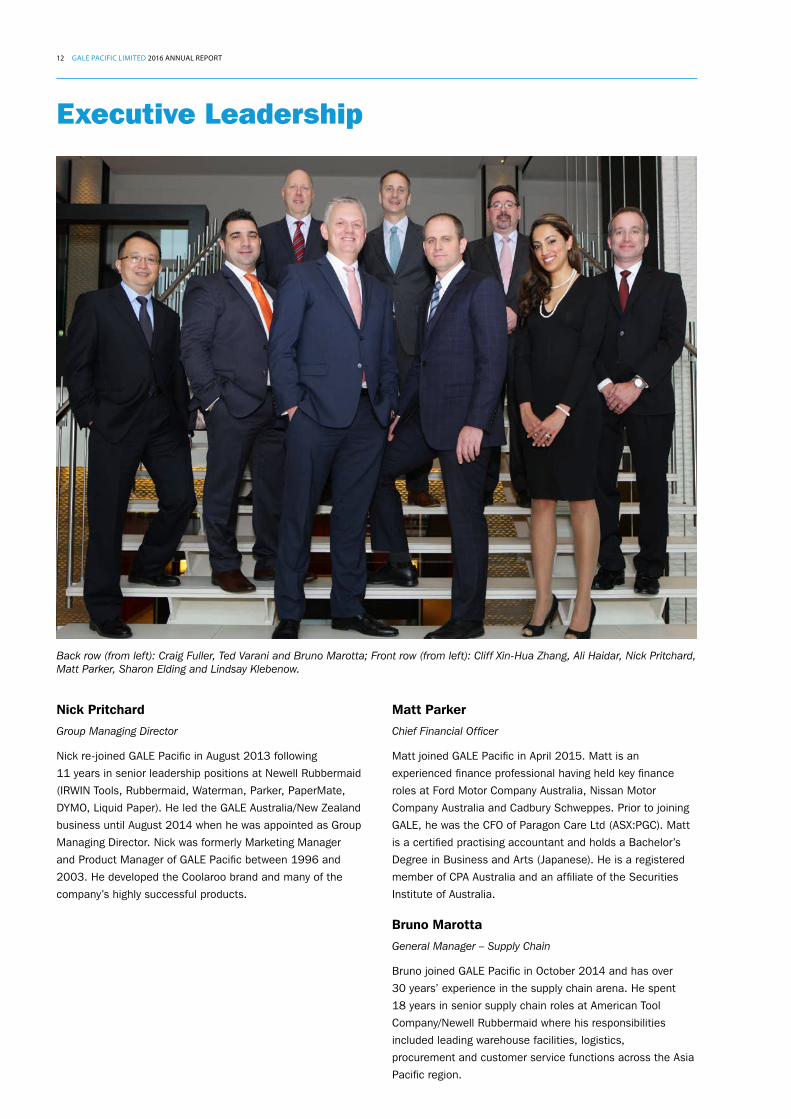
Back row (from left): Craig Fuller, Ted Varani and Bruno Marotta; Front row (from left): Cliff Xin-Hua Zhang, Ali Haidar, Nick Pritchard, Matt Parker, Sharon Elding and Lindsay Klebenow.
Nick Pritchard
Group Managing Director
Nick re-joined GALE Pacific in August 2013 following
11 years in senior leadership positions at Newell Rubbermaid
(IRWIN Tools, Rubbermaid, Waterman, Parker, PaperMate,
DYMO, Liquid Paper). He led the GALE Australia/New Zealand
business until August 2014 when he was appointed as Group
Managing Director. Nick was formerly Marketing Manager
and Product Manager of GALE Pacific between 1996 and
2003. He developed the Coolaroo brand and many of the
company’s highly successful products.
Matt Parker
Chief Financial Officer
Matt joined GALE Pacific in April 2015. Matt is an
experienced finance professional having held key finance
roles at Ford Motor Company Australia, Nissan Motor
Company Australia and Cadbury Schweppes. Prior to joining
GALE, he was the CFO of Paragon Care Ltd (ASX:PGC). Matt
is a certified practising accountant and holds a Bachelor’s
Degree in Business and Arts (Japanese). He is a registered
member of CPA Australia and an affiliate of the Securities
Institute of Australia.
Bruno Marotta
General Manager – Supply Chain
Bruno joined GALE Pacific in October 2014 and has over
30 years’ experience in the supply chain arena. He spent
18 years in senior supply chain roles at American Tool
Company/Newell Rubbermaid where his responsibilities
included leading warehouse facilities, logistics,
procurement and customer service functions across the Asia
Pacific region.

GALE PACIFIC LIMITED 2016 ANNUAL REPORT 13
Sharon Elding
Manager – People and Culture
Sharon joined GALE Pacific in March 2014 after relocating
from Singapore. She is an experienced HR practitioner who
acquired regional HR experience at BOSCH South-East Asia
and Hyflux, a global environmental solutions company listed
on the Singapore Stock Exchange. Sharon holds a Bachelor
of Science (Biomedical) and a Postgraduate Diploma in
Human Capital Management. She is a registered Certified
Professional with the Australian Human Resources Institute.
Cliff Xin-Hua Zhang
General Manager - Manufacturing
Cliff joined GALE Pacific in May 2016. He is an experienced
manufacturing leader having held senior manufacturing and
product quality roles at Bosch Power Tools over twelve years,
and operations, logistics and production roles at Andrews
Telecommunications, Honeywell CATIC Engine Co. and
Solectron Technology Co., Ltd., a U.S.-based manufacturer
of electronics products. Cliff has a Bachelor of Science,
Mechanical Engineering, from Nanjing University of Science
& Technology, China.
Ali Haidar
General Manager – Middle East North Africa
Ali joined GALE Pacific in August 2004 and has 12 years’
experience in sales and marketing at GALE with a strong
record of business development in the region. He has led
GALE Pacific’s profitable growth in the Middle East and was
recently given responsibility to lead the company’s focused
expansion in the Middle East/North Africa region.
Ted Varani
General Manager – Eurasia
Ted joined GALE Pacific in April 2015. Originally from
the USA, for the past 20 years he has been involved
in international sales, cross-border management and
entrepreneurialism based out of the USA, Japan, France
and China. Ted has been involved in projects in the fields
of predictive analytics, mobile apps, public utilities, and
medical devices, with a notable period of 9 years within
the Veolia Group where he served as worldwide Business
Development Manager as well as General Manager of a
US $50M Chinese subsidiary.
Lindsay Klebenow
General Manager – Americas
Lindsay joined GALE Pacific in June 2016. He is an
experienced general management, sales and marketing
professional serving roles at Culligan, Newell Rubbermaid,
and Stanley Black & Decker. Prior to GALE, Lindsay was a
business unit General Manager at Elkay, a North American
manufacturer of kitchen cabinetry, sinks and water fountains
and bottle fillers. Lindsay holds a Bachelors’ degree in
mechanical engineering technology from Purdue University
and an MBA from Ashland University.
Craig Fuller
General Manager – Australia/New Zealand
Craig joined GALE Pacific in March 2016 and has more than
25 years’ experience in sales, marketing, engineering and
general management across industrial and retail markets,
including building products and consumer durables. He spent
12 years at Alesco Corporation where he held key roles,
including as General Manager of Robinhood and General
Manager of Ingram Corporation. In addition to this Craig
held the role of National Operations Manager at Bunnings
Trade. Craig holds a Masters of Business Administration, an
Honours Degree in Civil Engineering and is a Member of the
Institution of Engineers.
The DIY pool fencing category was returned to growth and profitability during the year following the prior year’s investment in the creation of the Everton brand.
Large scale tension structures require fabrics with a suitable combination of weight, strength, elongation and UV stability (life). The company recently launched its first architectural fabric in many years. Suitable for large scale structures, the fabric has consistent elongation in both directions – very difficult to achieve, but eagerly sought by engineers and fabricators due to its suitability for large, unsupported structures and its ‘set and forget’ advantages. Commercial Heavy will be marketed in all geographic regions.

14 GALE PACIFIC LIMITED 2016 ANNUAL REPORT
Corporate GovernanceThe Company’s Directors and management are committed
to conducting the Group’s business in an ethical manner
and in accordance with the highest standards of corporate
governance. The Company has adopted and substantially
complies with the ASX Corporate Governance Principles
and Recommendations (Third Edition) (Recommendations)
to the extent appropriate to the size and nature of the
Group’s operations.
The Company has prepared a statement which sets out
the corporate governance practices that were in operation
throughout the financial year for the Company, identifies any
Recommendations that have not been followed, and provides
reasons for not following such Recommendations (Corporate
Governance Statement).
In accordance with ASX Listing Rules 4.10.3 and 4.7.4, the
Corporate Governance Statement will be available for review
on GALE Pacific’s website (www.galepacific.com), and will be
lodged together with an Appendix 4G with ASX at the same
time that this Annual Report is lodged with ASX.
The Appendix 4G will particularise each Recommendation
that needs to be reported against by GALE Pacific, and will
provide shareholders with information as to where relevant
governance disclosures can be found.
The Company’s corporate governance policies and
charters are all available on GALE Pacific’s website
(www.galepacific.com).
ZONE Interiors Window Furnishings – a completely refreshed program has now positioned this category for growth. New packaging, new products, and a completely transformed website (zoneinteriors.com.au) combine to inspire shoppers and make product selection easy.
GALE’s renowned Commercial 95 shade fabric is used for sun protection and aesthetics around the world.

GALE PACIFIC LIMITED 2016 ANNUAL REPORT 15
Directors’ Report
From left: Peter Landos (Non Executive Director), Nick Pritchard (Group Managing Director), Matt Parker (Chief Financial Officer), David Allman (Chairman), John Murphy (Non Executive Director), Sophie Karzis (Company Secretary)
David Allman, B.Sc.
Chairman and Non Executive Director since November 2009
David was Managing Director of McPherson’s Limited from
1995 to 2009 and prior to that was Managing Director of
Cascade Group Limited for 7 years. Before this David held
senior positions with Elders IXL Limited and Castlemaine
Tooheys Limited. David holds a degree in engineering and
prior to obtaining general management positions held
managerial roles in production management, finance and
marketing. David is Chairman of Muir Engineering Pty Ltd.
In the three years prior to 30 June 2016 David was also a
director of McPherson’s Group Limited.
David is Chairman of the Company’s Nomination
Committee and is a member of the Audit and Risk and
Remuneration Committees.
Nick Pritchard, B Bus. (Marketing)
Group Managing Director appointed 22 August 2014
Nick joined GALE Pacific in August 2013 as Managing
Director of the Australia/New Zealand region. He was
appointed to the position of Group Managing Director
in August 2014. Prior to joining GALE, Nick held senior
leadership positions at Newell Brands (Newell Rubbermaid)
for 11 years, most recently, Vice-President/General
Manager – Australia & New Zealand, where he led all
business segments. Nick has considerable local and
international experience leading a highly profitable, high
growth organisation.
Peter Landos, B.Econ., CA
Non Executive Director since May 2014
Peter is the Chief Operating Officer of the Thorney
Investment Group of Companies with which he has been
since September 2000, having previously worked at
Macquarie Bank Limited. Peter has extensive business and
corporate experience specialising in advising boards and
management in mergers and acquisitions, divestments,

16 GALE PACIFIC LIMITED 2016 ANNUAL REPORT
business restructurings and capital markets. He is also a
Non Executive Chairman of Adacel Technologies Limited.
In the three years prior to 30 June 2016 Peter was also a
director of McPherson’s Group Limited, Rattoon Holdings
Limited and Adacel Technologies Limited.
Peter is a member of the Company’s Nomination, Risk, Audit
and Remuneration Committees.
John Murphy, CA, FCPA, B.Comm, M.Comm
Non Executive Director since August 2007
John was the Managing Director of Investec Wentworth
Private Equity Limited from 2002 until 30 September 2011.
Also on that date he changed from being an executive to a
non executive director of Investec Bank (Australia) Limited.
John is currently a director of Ariadne Australia Limited.
In the three years prior to 30 June 2016 John was
also a director of Clearview Wealth Limited, Kresta
Holdings Limited, Redflex Holdings Limited and Vocus
Communications Limited.
John is the Chairman of the Company’s Remuneration
Committee, the Audit and Risk Committee and is a member
of the Nomination Committee.
George Richards, CPA (Retired 30 October 2015)
Non Executive Director from May 2004 to 30 October 2015
Ms Sophie Karzis, B Juris LLB
Company Secretary since June 2004
Sophie is a practising lawyer with over 15 years’ experience
as a corporate and commercial lawyer, company secretary
and general counsel for a number of private and public
companies. Sophie is principal of Corporate Counsel,
a corporate law practice with a focus on equity capital
markets, mergers and acquisitions, corporate governance for
ASX-listed entities, as well as the more general aspects of
corporate and commercial law. She is currently the company
secretary of a number of ASX-listed and unlisted entities, and
is a member of the Law Institute of Victoria as well as the
Governance Institute of Australia.
The Directors of Gale Pacific Limited (“the Company”)
present their annual financial report for the Company and its
controlled entities (“the Group”) for the financial year ended
30 June 2016.
State of Affairs
There were no significant changes in the state of affairs of
the Group during the financial year.
Events Subsequent to Balance Date
Apart from the dividend declared as discussed above, no
other matter or circumstance has arisen since 30 June 2016
that has significantly affected, or may significantly affect the
Group’s operations, the results of those operations, or the
Group’s state of affairs in future financial years.
Likely Developments
Disclosure of information regarding likely developments in the
operations of the Group in future financial years has been
made in part in the Chairman’s Letter of this Annual Report.
Environmental Regulation and Performance
The Group’s operations are not subject to any significant
environmental regulations under the Commonwealth or
State legislation. The Directors believe that the Group
has adequate systems in place for the management of
its environmental requirements and is not aware of any
breach of those environmental requirements as they apply to
the Group.
Dividends
Dividends paid to members during the financial year were
as follows:
2015/2016 ($’000)
Final ordinary dividend for the year ended
30 June 2015 of 1.00 cent per share paid
on 1 December 2015 2,975
Interim ordinary dividend for the half year
ended 31 December 2015 of 0.75 cents
per share paid on 1 April 2016 2,231
In addition to the above dividends, on the 18 of August
2016 the Directors declared a dividend of 1 cent per share
to the holders of fully paid ordinary shares in respect of the
year ended 30 June 2016, payable on 3rd October 2016
to shareholders on the register at 26 September 2016.
Directors’ Report continued
GALE PACIFIC LIMITED 2016 ANNUAL REPORT 17
The final dividend will be unfranked. This dividend has not been included as a liability in these financial statements. The total
estimated dividend to be paid is $2,974,744.
For the full year, the dividend of 1.75 cents per share has been declared on earnings of 3.44 cents per share.
Share Based Payments
Performance Rights
The number of performance rights on issue at the date of this report is 3,602,405. No amount is payable on the vesting of a
performance right. Each performance right entitles the holder to one (1) ordinary share in GALE Pacific Limited in the event that
the performance right is exercised. Performance rights carry no rights to dividends and no voting rights.
3,022,000 performance rights were granted to executives and the Group Managing Director on 9 October 2015. The
performance rights will vest subject to a continuation of employment to 30 June 2018 and the satisfying of relevant
performance hurdles based on the Group’s diluted earnings per share over the three year period from 1 July 2015 to
30 June 2018. None of these performance rights can vest until 30 June 2018 and expire on 1 December 2018.
As at 30 June 2016, 1,783,733 performance rights lapsed during the year to 30 June 2016 as the relevant personnel ceased
employment with the Company.
The performance rights are subject to a continuation of employment for three years and then the satisfying of relevant
performance hurdles based on improvements in the Group’s diluted earnings per share over the three year period.
Further details of the options and performance rights movements during the reporting period are disclosed in the
Remuneration Report.
Directors’ Shareholdings
The following table sets out each Director’s relevant interest in shares, options and performance rights in shares of the Company
as at the date of this report.
Directors
Fully Paid Ordinary Shares Options
Performance Rights
D Allman 2,400,000 Nil Nil
P Landos Nil Nil Nil
J Murphy 4,416,599 Nil Nil
N Pritchard 212,804 Nil 1,778,385
Directors’ Meetings
The table below sets out the attendance by Directors.
Directors’ MeetingsAudit and Risk Committee
MeetingsRemuneration Committee
MeetingsNomination Committee
Meetings
Directors
No of Meetings Eligible to
Attend Attended
No of Meetings Eligible to
Attend Attended
No of Meetings Eligible to
Attend Attended
No of Meetings Eligible to
Attend Attended
D Allman 11 10 3 3 1 1 2 2
P Landos 11 11 3 3 1 1 2 2
J Murphy 11 11 3 3 1 1 2 2
G Richards1 5 5 1 1 1 1 – –
N Pritchard 11 11 – – – – – –
1. G Richards retired 30 October 2015
18 GALE PACIFIC LIMITED 2016 ANNUAL REPORT
The members of the Audit and Risk Committee are David Allman, Peter Landos and John Murphy. The Chairman of the Audit and
Risk Committee is John Murphy.
The members of the Remuneration Committee are David Allman, Peter Landos and John Murphy. The Chairman of the
Remuneration Committee is John Murphy.
The members of the Nomination Committee are David Allman, Peter Landos and John Murphy. The Chairman of the Nomination
Committee is David Allman.
Remuneration Report
This report contains the remuneration arrangements in place for Directors and Executives of the Group.
The Remuneration Committee reviews the remuneration packages of all Directors and Executive Officers on an annual basis and
makes recommendations to the Board. Remuneration packages are reviewed with due regard to performance and other relevant
factors, and advice is sought from external advisors in relation to their structure.
The Group’s remuneration policy is based on the following principles:
• Provide competitive rewards to attract high quality executives;
• Provide an equity incentive for senior executives that will provide an incentive to executives to align their interests with those of the Group and its shareholders; and
• Ensure that rewards are referenced to relevant employment market conditions.
Remuneration packages contain the following key elements:
• Primary benefits – salary/fees;
• Benefits, including the provision of motor vehicles and incentive schemes, including performance rights; and
• Performance rights, if the performance criteria and any Board discretion are satisfied, entitle an executive to be issued shares in the Company at no cost to the executive. Shares are issued subsequently after the time all performance rights vesting conditions are met
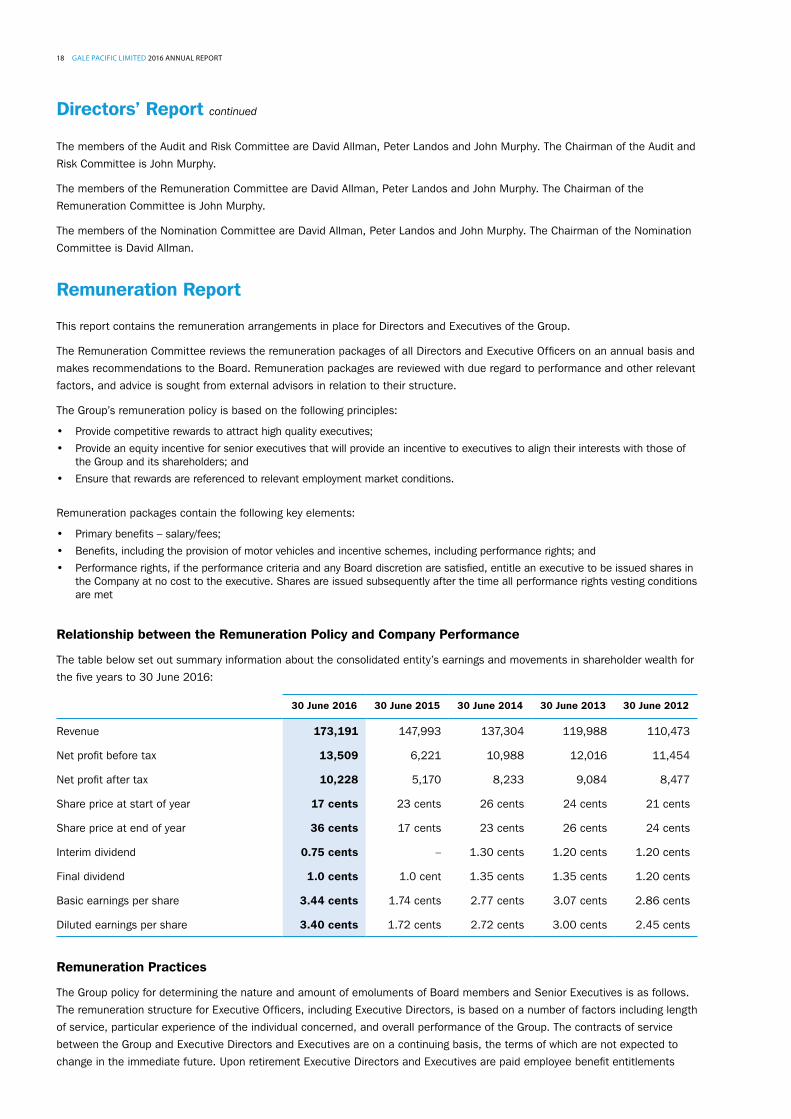
Relationship between the Remuneration Policy and Company Performance
The table below set out summary information about the consolidated entity’s earnings and movements in shareholder wealth for
the five years to 30 June 2016:
30 June 2016 30 June 2015 30 June 2014 30 June 2013 30 June 2012
Revenue 173,191 147,993 137,304 119,988 110,473
Net profit before tax 13,509 6,221 10,988 12,016 11,454
Net profit after tax 10,228 5,170 8,233 9,084 8,477
Share price at start of year 17 cents 23 cents 26 cents 24 cents 21 cents
Share price at end of year 36 cents 17 cents 23 cents 26 cents 24 cents
Interim dividend 0.75 cents – 1.30 cents 1.20 cents 1.20 cents
Final dividend 1.0 cents 1.0 cent 1.35 cents 1.35 cents 1.20 cents
Basic earnings per share 3.44 cents 1.74 cents 2.77 cents 3.07 cents 2.86 cents
Diluted earnings per share 3.40 cents 1.72 cents 2.72 cents 3.00 cents 2.45 cents
Remuneration Practices
The Group policy for determining the nature and amount of emoluments of Board members and Senior Executives is as follows.
The remuneration structure for Executive Officers, including Executive Directors, is based on a number of factors including length
of service, particular experience of the individual concerned, and overall performance of the Group. The contracts of service
between the Group and Executive Directors and Executives are on a continuing basis, the terms of which are not expected to
change in the immediate future. Upon retirement Executive Directors and Executives are paid employee benefit entitlements
Directors’ Report continued
GALE PACIFIC LIMITED 2016 ANNUAL REPORT 19
accrued to date of retirement. Payment of bonuses, and
other incentive payments are made at the discretion of the
Remuneration Committee to Key Executives of the Group
based predominantly on an objective review of the Group’s
financial performance, the individuals’ achievement of stated
financial and non financial targets and any other factors
the Committee deems relevant. Non Executive Directors
receive a fee for being Directors of the Company and do not
participate in performance based remuneration.
Remuneration Structure
In accordance with best practice corporate governance, the
structure of Non Executive Directors and Senior Managers
remuneration is separate and distinct.
Non Executive Director Remuneration
Objective
The Board seeks to set remuneration at a level which
provides the Company with the ability to attract and retain
directors of relevant experience and skill, whilst incurring
costs which are acceptable to shareholders.
Structure
The Company’s Constitution and the Australian Securities
Exchange Listing Rules specify that the aggregate
remuneration of Non Executive Directors shall be determined
from time to time by a general meeting. An amount not
exceeding the amount determined is then divided between
the Directors as agreed. The last determination was at the
Annual General Meeting held on 26 October 2012 when
shareholders’ approved the Company’s constitution which
provides for an aggregate remuneration of $500,000
per annum. The amount of the aggregate remuneration
and the manner in which it is apportioned is reviewed
periodically. The Board considers fees paid to Non Executive
Directors of comparable companies when undertaking this
review process.
Each Non Executive Director receives a fee for being
a Director of the Company and does not participate in
performance based remuneration.
Senior Manager and Executive Director Remuneration
Objective
The Group aims to reward executives with a level and mix
of remuneration commensurate with their position and
responsibilities within the Group. The objective of the
remuneration policy is:
• Reward executives for Group and individual performance;
• Align the interests of the executives with those of the shareholders; and
• Ensure that total remuneration is competitive by market standards.
Structure
In determining the level and make up of executive
remuneration, the Remuneration Committee reviews reports
detailing market levels of remuneration for comparable roles.
Remuneration consists of fixed and variable elements.
(a) Share Based Payments
The Group maintains a performance rights scheme
for certain staff and executives, including the Group
Managing Director, as approved by shareholders at an
annual general meeting. These schemes are designed
to reward key personnel when the Group meets
performance hurdles increasing the diluted earnings per
share and relate to:
• Improvement in earnings per share; and
• Improvement in return to shareholders.
The number of unissued ordinary shares under the
performance rights scheme at 30 June 2016 was
3,602,405. 2,364,138 of these shares were granted on
11 December 2014 and will not vest until the time of the
company’s 2017 annual report is released on the ASX
(on or around 1st October 2017). A further 3,022,000
of these shares were granted on the 9th of October
2015 and will not vest until the time of the company’s
2018 annual report is released on the ASX (on or around
1st October 2018). In the period between July 1st
2015 and June 30th 2016, 1,783,733 shares lapsed
as the relevant personnel ceased employment with the
company. Each performance right entitles the holder
to one (1) ordinary share in Gale Pacific Limited and is
subject to satisfying the relevant performance hurdles
based on improvements in the Group’s diluted earnings
per share.
Options and performance rights issued to executives
during the year were issued in accordance with the
Group’s remuneration policy which:
• Reward executives for Group and individual performance;
• Align the interests of the executives with those of the shareholders; and
• Ensure that total remuneration is competitive by market standards.
(b) Cash Bonuses
One year short term performance cash bonus payments
are awarded in accordance with the company’s
remuneration policy. The budget targets for each
business unit and the company overall are established
each year by the Board. The performance criteria include
sales and earnings before interest and tax growth and
working capital management. For corporate executives,
the performance criteria include growth in earnings
before interest and tax and profit after tax.
20 GALE PACIFIC LIMITED 2016 ANNUAL REPORT
Key Management Personnel of the Group who held office during the year
Directors
D Allman (Chairman Non Executive)
P Landos (Non Executive)
J Murphy (Non Executive)
G Richards (Non Executive) (Retired 29 September 2015)
N Pritchard (Group Managing Director)
Executives
M Parker (Chief Financial Officer)
C Fuller (General Manager – Australia & New Zealand)
L Klebenow (General Manager – Americas)
C Zhang (General Manager – Manufacturing)
B Marotta (General Manager – Supply Chain)
A Haidar (General Manager – Middle East & North Africa)
T Varani (General Manager – EurAsia)
The following table discloses the remuneration of the Directors of the Company:
2015/2016 Short Term Benefits
Post Employ-
ment
Share Based
Payments
Termina-tion
Benefits Total Performance Related
Directors
Salary & Fees
$Bonus
$
Non Monetary
$Super
$Rights
$ $ $ Total % Rights %
Executive Directors
N Pritchard2 420,000 – – 30,000 111,611 – 561.611 20% 20%
Non-Executive Directors
D Allman 92,720 – – 32,280 – – 125,000
G Richards3 16,667 – – 5,833 – – 22,500
J Murphy 83,508 – – 8,158 – – 91,666
P Landos 68,493 – – 6,507 – – 75,000
Total 681,388 – – 82,778 111,611 – 875,777 13% 13%
2. Mr Pritchard commenced employment as Managing Director – Australia & New Zealand on 19 August 2013 and became a Director on 22 August 2014.3. Mr Richards retired 29 September 2015
Directors’ Report continued
GALE PACIFIC LIMITED 2016 ANNUAL REPORT 21
2014/2015 Short Term Benefits
Post Employ-
ment
Share Based
Payments
Termina-tion
Benefits Total Performance Related
Directors
Salary & Fees
$Bonus
$
Non Monetary
$Super
$Rights
$ $ $ Total % Rights %
Executive Directors
N Pritchard 343,263 – – 25,000 32,683 – 400,946 8.2% 8.2%
P McDonald4 362,059 – – 12,500 – 235,813 610,372 – –
Non-Executive Directors
D Allman 114,220 – – 10,845 – – 125,065 – –
G Richards 50,000 – – 35,000 – – 85,000 – –
J Murphy 77,626 – – 7,374 – – 85,000 – –
P Landos 68,493 – – 6,507 – – 75,000 – –
Total 1,015,661 – – 97,226 32,683 235,813 1,381,383 2.3% 2.3%
4. Mr McDonald resigned from the company on 22 August 2014.
The following table discloses the remuneration of the Group’s key management personnel:
2015/2016 Short Term Benefits
Post Employ-
ment
Share Based
Payments
Termina-tion
Benefits Total Performance Related
Key
Management
Personnel
Salary & Fees
$Bonus
$
Non Monetary
$Super
$Rights
$ $ $ Total % Rights %
B Wang1 109,377 102,529 14,911 514 – 287,082 514,413
M Denney2 365,836 106,597 29,138 – – – 501,571
M Parker3 245,000 – – 23,275 18,260 – 286,535 6% 6%
B Marotta4 228,883 – – 21,744 36,945 – 287,572 13% 13%
E Varani5 240,490 – 6,195 – 11,184 – 257,869 4% 4%
A Haidar6 178,890 – 46,036 – 17,219 – 242,144 7% 7%
S Elding7 131,553 – – 12,497 13,583 – 157,633 9% 9%
A Richardson8 79,514 – – 7,554 – – 87,068
C Fuller9 70,192 – – 6,668 – – 76,860
C Zhang10 23,923 – 11,186 694 – – 35,803
L Klebenow11 21,061 – – – – – 21,061
Total 1,694,719 209,126 107,465 72,947 97,191 287,082 2,468,530 4% 4%
1. Mr Wang was the General Manager – China, remunerated in Chinese renminbi converted to Australian dollars in the above table. Mr Wang resigned 21 October 2015.2. Mr Denney was the General Manager – Americas, remunerated in United States dollars converted to Australian dollars in the table above. Mr Denney resigned 10 May 2016.3. Mr Parker is the Chief Financial Officer. He is located in Australia and remunerated in Australian dollars.4. Mr Marotta is General Manager – Supply Chain. He is located in Australia and remunerated in Australian dollars.5. Mr Varani is the General Manager – EurAsia. He is based in Shanghai and remunerated in United States dollars converted to Australian dollars in the table above.6. Mr Haidar is the General Manager – Middle East and North Africa and is based in Dubai. He is remunerated in United States dollars converted to Australian dollars in the
table above.7. Ms Elding is the Manager – People and Culture. She is located in Australia and remunerated in Australian dollars.8. Mr A Richardson was the General Manager, Australia and New Zealand located in Australia. Mr Richardson resigned 16 October 2015.9. Mr Fuller is the General Manager, Australia and New Zealand. He is located in Australia and remunerated in Australian dollars. Commenced on the 22nd of March 201610. Mr Zhang is the General Manager – Manufacturing and is based in China and remunerated in Chinese renminbi converted to Australia dollars in the above table.
Commenced on 3rd May 201611. Mr Klebenow is the General Manager – Americas and is remunerated in United States dollars converted to Australian dollars in the table above.
Commenced on 6th June 2016
22 GALE PACIFIC LIMITED 2016 ANNUAL REPORT
2014/2015 Short Term Benefits
Post Employ-
ment
Share Based
Payments
Termina-tion
Benefits Total Performance Related
Key
Management
Personnel
Salary & Fees
$Bonus
$
Non Monetary
$Super
$Rights
$ $ $ Total % Rights %
M Denney 319,933 94,381 18,202 – 12,985 – 445,501 24.1% 2.9%
B Wang 223,724 32,221 22,763 – 9,359 – 288,067 14.4% 3.2%
A Richardson 229,669 – – 21,819 13,110 – 264,598 5.0% 5.0%
H Abbey12 185,235 – – 22,502 – 39,795 247,532 – –
A Haidar 138,697 29,127 39,184 – 3,753 – 210,761 15.6% 1.8%
B Marotta 158,513 – – 16,057 10,919 – 185,489 5.8% 5.8%
A Scott13 101,053 – – 5,805 – – 106,858 – –
M Parker 57,795 – – 5,490 – – 63,285 – –
N Pritchard 47,170 – – 5,000 – – 52,170 – –
E Varani 32,588 – 6,953 – – – 39,541 – –
Total 1,494,377 155,729 87,102 76,673 50,126 39,795 1,903,802 10.8% 2.6%
12. Mr Abbey was the Chief Financial Officer. He resigned from the company on 27 March 2015.13. Mr Scott was the General Manager International Sales and Marketing and was located in Australia. Mr Scott resigned from the company on 31 October 2014.
Directors’ and Executives’ Equity Holdings: Fully Paid Ordinary Shares
2015/2016
Balance 30 June 2015
No.
Granted as Compensation
No.
Received on Exercise of
Options No.
Other Movements
No.
Balance 30 June 2016
No.
Executive Directors
N Pritchard 212,804 – – – 212,804
Non-Executive Directors
J Murphy 3,316,599 – – 1,100,000 4,416,599
D Allman 1,443,804 – – 956,196 2,400,000
G Richards1 491,899 – – – 491,899
Executives
M Denney 800,000 – – (300,000) 500,000
B Wang 1,500,000 – – (1,500,000) –
Total 7,765,106 – – 256,196 8,021,302
1. Mr Richards retired 29 September 2015
Directors’ Report continued
GALE PACIFIC LIMITED 2016 ANNUAL REPORT 23
2014/2015
Balance 30 June 2015
No.
Granted as Compensation
No.
Received on Exercise of
Options No.
Other Movements
No.
Balance 30 June 2015
No.
Executive Directors
N Pritchard – – – 212,804 212,804
Non-Executive Directors
J Murphy 2,816,599 – – 500,000 3,316,599
D Allman 1,000,000 – – 443,804 1,443,804
G Richards 491,899 – – – 491,899
Executives
M Denney 1,500,000 – – – 1,500,000
B Wang 800,000 – – – 800,000
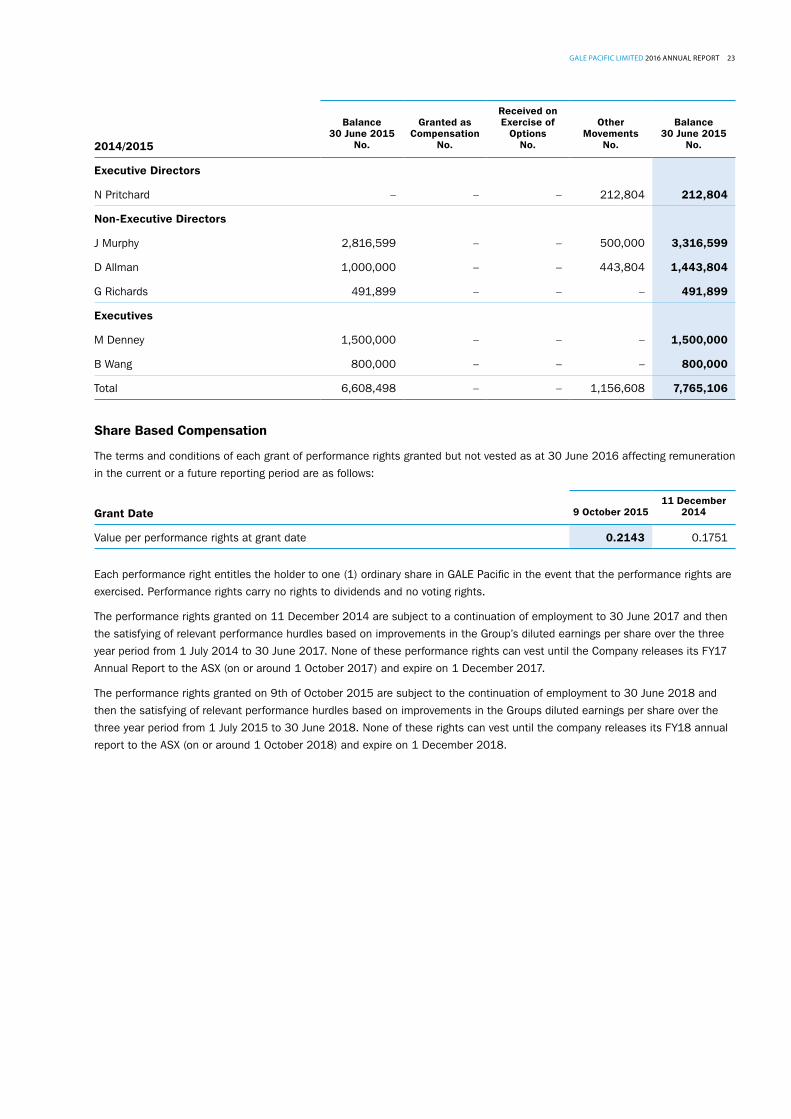
Total 6,608,498 – – 1,156,608 7,765,106
Share Based Compensation
The terms and conditions of each grant of performance rights granted but not vested as at 30 June 2016 affecting remuneration
in the current or a future reporting period are as follows:
Grant Date 9 October 201511 December
2014
Value per performance rights at grant date 0.2143 0.1751
Each performance right entitles the holder to one (1) ordinary share in GALE Pacific in the event that the performance rights are
exercised. Performance rights carry no rights to dividends and no voting rights.
The performance rights granted on 11 December 2014 are subject to a continuation of employment to 30 June 2017 and then
the satisfying of relevant performance hurdles based on improvements in the Group’s diluted earnings per share over the three
year period from 1 July 2014 to 30 June 2017. None of these performance rights can vest until the Company releases its FY17
Annual Report to the ASX (on or around 1 October 2017) and expire on 1 December 2017.
The performance rights granted on 9th of October 2015 are subject to the continuation of employment to 30 June 2018 and
then the satisfying of relevant performance hurdles based on improvements in the Groups diluted earnings per share over the
three year period from 1 July 2015 to 30 June 2018. None of these rights can vest until the company releases its FY18 annual
report to the ASX (on or around 1 October 2018) and expire on 1 December 2018.

24 GALE PACIFIC LIMITED 2016 ANNUAL REPORT
Directors’ and Executives’ Equity Holdings, Compensation Options and Performance Rights: Granted and Vested during the year
Terms and Conditions for Each Grant
2015/2016Vested Number
Granted Number Grant Date
Value Per Option/Right
at Grant Date
Exercise Price Expiry Date
First Exercise
Date
Last Exercise
Date
Executive Directors (Performance Rights)
N Pritchard – 913,000 09/10/2015 $0.2143 Nil 01/12/2018 01/10/2018 01/10/2018
Non-Executive Directors
None
Management Personnel (Performance Rights)
Other Management – 2,109,000 09/10/2015 $0.2143 Nil 01/12/2018 01/10/2018 01/10/2018
Total – 3,022,000
Terms and Conditions for Each Grant
2014/2015Vested Number
Granted Number Grant Date
Value Per Option/Right
at Grant Date
Exercise Price Expiry Date
First Exercise
Date
Last Exercise
Date
Executive Directors (Performance Rights)
N Pritchard – 865,385 11/12/2014 $0.1751 nil 1/12/2017 20/09/2017 20/09/2017
Non-Executive Directors
None
Management Personnel (Performance Rights)
Other Management – 1,498,753 11/12/2014 $0.1751 nil 1/12/2017 20/09/2017 20/09/2017
Total – 2,364,138
Directors’ Report continued
GALE PACIFIC LIMITED 2016 ANNUAL REPORT 25
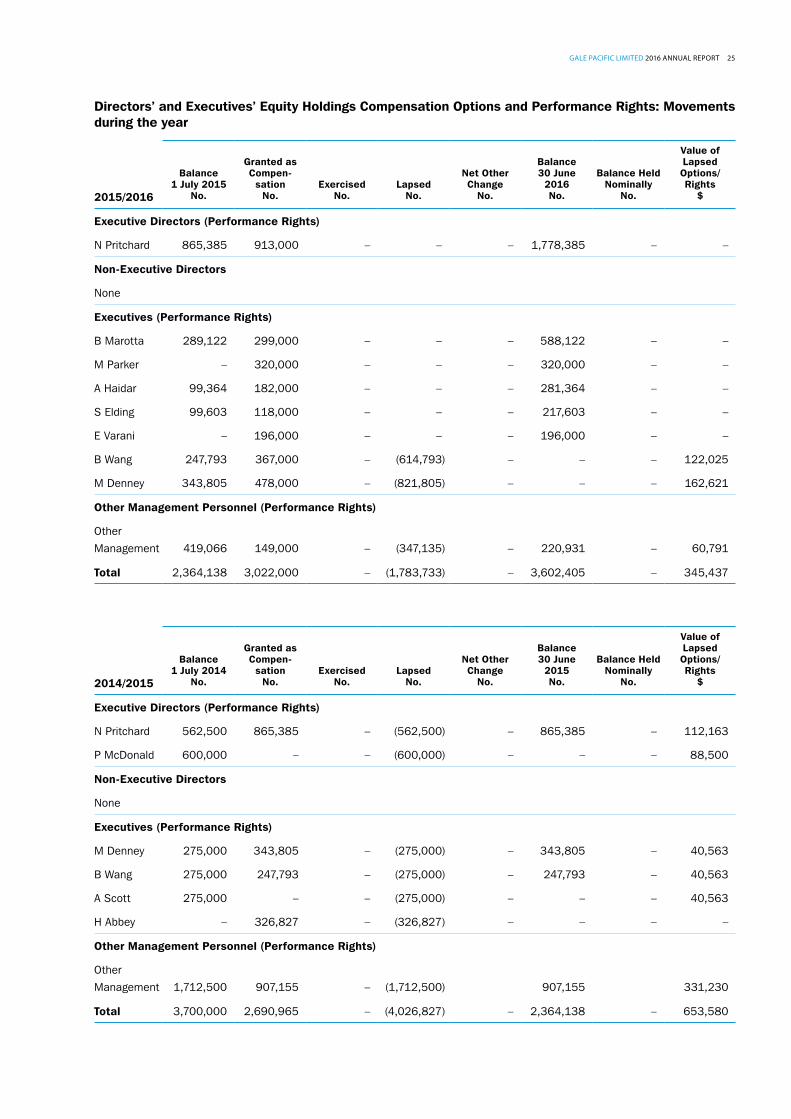
Directors’ and Executives’ Equity Holdings Compensation Options and Performance Rights: Movements during the year
2015/2016
Balance 1 July 2015
No.
Granted as Compen-
sation No.
Exercised No.
Lapsed No.
Net Other Change
No.
Balance 30 June
2016 No.
Balance Held Nominally
No.
Value of Lapsed Options/Rights
$
Executive Directors (Performance Rights)
N Pritchard 865,385 913,000 – – – 1,778,385 – –
Non-Executive Directors
None
Executives (Performance Rights)
B Marotta 289,122 299,000 – – – 588,122 – –
M Parker – 320,000 – – – 320,000 – –
A Haidar 99,364 182,000 – – – 281,364 – –
S Elding 99,603 118,000 – – – 217,603 – –
E Varani – 196,000 – – – 196,000 – –
B Wang 247,793 367,000 – (614,793) – – – 122,025
M Denney 343,805 478,000 – (821,805) – – – 162,621
Other Management Personnel (Performance Rights)
Other
Management 419,066 149,000 – (347,135) – 220,931 – 60,791
Total 2,364,138 3,022,000 – (1,783,733) – 3,602,405 – 345,437
2014/2015
Balance 1 July 2014
No.
Granted as Compen-
sation No.
Exercised No.
Lapsed No.
Net Other Change
No.
Balance 30 June
2015 No.
Balance Held Nominally
No.
Value of Lapsed Options/Rights
$
Executive Directors (Performance Rights)
N Pritchard 562,500 865,385 – (562,500) – 865,385 – 112,163
P McDonald 600,000 – – (600,000) – – – 88,500
Non-Executive Directors
None
Executives (Performance Rights)
M Denney 275,000 343,805 – (275,000) – 343,805 – 40,563
B Wang 275,000 247,793 – (275,000) – 247,793 – 40,563
A Scott 275,000 – – (275,000) – – – 40,563
H Abbey – 326,827 – (326,827) – – – –
Other Management Personnel (Performance Rights)
Other
Management 1,712,500 907,155 – (1,712,500) 907,155 331,230
Total 3,700,000 2,690,965 – (4,026,827) – 2,364,138 – 653,580
26 GALE PACIFIC LIMITED 2016 ANNUAL REPORT
Employment Agreements
Executives serve under terms and conditions contained in
a standard executive employment agreement, that allows
for termination under certain conditions with two to three
months’ notice. The agreements include restraints of trade
on the employee as well as confidentiality and intellectual
property agreements.
Indemnity and Insurance of Officers
The Company has indemnified the directors and executives
of the Company for costs incurred, in their capacity as a
director or executive, for which they may be held personally
liable, except where there is a lack of good faith.
During the financial year, the Company paid a premium in
respect of a contract to insure the directors and executives
of the Company against a liability to the extent permitted
by the Corporations Act 2001. The contract of insurance
prohibits disclosure of the nature of the liability and the
amount of the premium.
Indemnity and Insurance of Auditor
The Company has not, during or since the end of the
financial year, indemnified or agreed to indemnify the auditor
of the Company or any related entity against a liability
incurred by the auditor.
During the financial year, the Company has not paid a
premium in respect of a contract to insure the auditor of the
Company or any related entity.
Proceedings on Behalf of the Company
No person has applied to the Court under section 237 of
the Corporations Act 2001 for leave to bring proceedings on
behalf of the Company, or to intervene in any proceedings
to which the Company is a party for the purpose of taking
responsibility on behalf of the Company for all or part of
those proceedings.
Non Audit Services
Details of the amounts paid or payable to the auditor for
non-audit services provided during the financial year by the
auditor are outlined in note 31 to the financial statements.
The Directors are satisfied that the provision of non-audit
services during the financial year, by the auditor (or by
another person or firm on the auditor’s behalf), is compatible
with the general standard of independence for auditors
imposed by the Corporations Act 2001.
The Directors are of the opinion that the services as
disclosed in note 30 to the financial statements do
not compromise the external auditor’s independence
requirements of the Corporations Act 2001 for the
following reasons:
• all non-audit services have been reviewed and approved to ensure that they do not impact the integrity and objectivity of the auditor; and
• none of the services undermine the general principles relating to auditor independence as set out in APES 110 Code of Ethics for Professional Accountants issued by the Accounting Professional and Ethical Standards Board, including reviewing or auditing the auditor’s own work, acting in a management or decision-making capacity for the Company, acting as advocate for the Company or jointly sharing economic risks and rewards.
Officers of the Company who are Former Partners of Deloitte Touche Tohmastsu
There are no officers of the Company who are former
partners of Deloitte Touche Tohmastsu.
Rounding of Amounts
The Company is of a kind referred to in Class Order 98/100,
issued by the Australian Securities and Investments
Commission, relating to ‘rounding-off’. Amounts in this report
have been rounded off in accordance with that Class Order
to the nearest thousand dollars, or in certain cases, the
nearest dollar.
Auditor’s Independence Declaration
A copy of the auditor’s independence declaration as required
under section 307C of the Corporations Act 2001 is set out
on the following page.
Auditor
Deloitte Touche Tohmastsu continues in office in accordance
with section 327 of the Corporations Act 2001.
This report is made in accordance with a resolution of
Directors, pursuant to section 298(2)(a) of the Corporations
Act 2001.
Directors’ Report continued
GALE PACIFIC LIMITED 2016 ANNUAL REPORT 27
Auditor’s Independence Declaration
Liability limited by a scheme approved under Professional Standards Legislation. Member of Deloitte Touche Tohmatsu Limited
18 August 2016
Dear Board Members Gale Pacific Limited
In accordance with section 307C of the Corporations Act 2001, I am pleased to provide the following declaration of independence to the directors of Gale Pacific Limited.
As lead audit partner for the audit of the financial statements of Gale Pacific Limited for the financial year ended 30 June 2016, I declare that to the best of my knowledge and belief, there have been no contraventions of:
(i) the auditor independence requirements of the Corporations Act 2001 in relation tothe audit; and
(ii) any applicable code of professional conduct in relation to the audit.
Yours sincerely
DELOITTE TOUCHE TOHMATSU
Stephen Roche Partner Chartered Accountants
The Board of DirectorsGale Pacific Limited145 Woodlands DriveBRAESIDE VIC 3195
Deloitte Touche TohmatsuABN 74 490 121 060
550 Bourke StreetMelbourne VIC 3000GPO Box 78Melbourne VIC 3001 Australia
Tel: +61 (0) 3 9671 7000Fax: +61 (0) 3 9671 7001www.deloitte.com.au

28 GALE PACIFIC LIMITED 2016 ANNUAL REPORT
Independent Auditor’s Report
Independent Auditor’s Report to the members of Gale Pacific Limited
Report on the Financial Report
We have audited the accompanying financial report of Gale Pacific Limited which comprises the consolidated statement of financial position as at 30 June 2016, the consolidated statement of profit or loss, the consolidated statement of comprehensive income, the consolidated statement of cash flows and the consolidated statement of changes in equity for the year ended on that date, notes comprising a summary of significant accounting policies and other explanatory information, and the directors’ declaration of the consolidated entity, comprising the company and the entities it controlled at the year’s end or from time to time during the financial year as set out on pages 30 to 63.
Directors’ Responsibility for the Financial Report
The directors of the company are responsible for the preparation of the financial report that gives a true and fair view in accordance with Australian Accounting Standards and the Corporations Act 2001and for such internal control as the directors determine is necessary to enable the preparation of the financial report that gives a true and fair view and is free from material misstatement, whether due to fraud or error. In Note 1, the directors also state, in accordance with Accounting Standard AASB 101 Presentation of Financial Statements, that the consolidated financial statements comply with International Financial Reporting Standards.
Auditor’s Responsibility
Our responsibility is to express an opinion on the financial report based on our audit. We conducted our audit in accordance with Australian Auditing Standards. Those standards require that we comply with relevant ethical requirements relating to audit engagements and plan and perform the audit to obtain reasonable assurance whether the financial report is free from material misstatement.
An audit involves performing procedures to obtain audit evidence about the amounts and disclosures in the financial report. The procedures selected depend on the auditor’s judgement, including the assessment of the risks of material misstatement of the financial report, whether due to fraud or error. In making those risk assessments, the auditor considers internal control, relevant to the company’s preparation of the financial report that gives a true and fair view, in order to design audit procedures that are appropriate in the circumstances, but not for the purpose of expressing an opinion on the effectiveness of the company’s internal control. An audit also includes evaluating the appropriateness of accounting policies used and the reasonableness of accounting estimates made by the directors, as well as evaluating the overall presentation of the financial report.
We believe that the audit evidence we have obtained is sufficient and appropriate to provide a basis for our audit opinion.
Liability limited by a scheme approved under Professional Standards Legislation. Member of Deloitte Touche Tohmatsu Limited
Deloitte Touche TohmatsuABN 74 490 121 060
550 Bourke StreetMelbourne VIC 3000GPO Box 78Melbourne VIC 3001 Australia
Tel: +61 (0) 3 9671 7000Fax: +61 (0) 3 9671 7001www.deloitte.com.au
GALE PACIFIC LIMITED 2016 ANNUAL REPORT 29
Auditor’s Independence Declaration
In conducting our audit, we have complied with the independence requirements of the Corporations Act 2001. We confirm that the independence declaration required by the Corporations Act 2001,which has been given to the directors of Gale Pacific Limited, would be in the same terms if given to the directors as at the time of this auditor’s report.
Opinion
In our opinion:
(a) the financial report of Gale Pacific Limited is in accordance with the Corporations Act 2001,including:
(i) giving a true and fair view of the consolidated entity’s financial position as at 30 June 2016and of its performance for the year ended on that date; and
(ii) complying with Australian Accounting Standards and the Corporations Regulations 2001; and
(b) the consolidated financial statements also comply with International Financial ReportingStandards as disclosed in Note 1.
Report on the Remuneration Report
We have audited the Remuneration Report included in pages 18 to 25 of the directors’ report for the year ended 30 June 2016. The directors of the company are responsible for the preparation and presentation of the Remuneration Report in accordance with section 300A of the Corporations Act 2001. Our responsibility is to express an opinion on the Remuneration Report, based on our audit conducted in accordance with Australian Auditing Standards.
Opinion
In our opinion the Remuneration Report of Gale Pacific Limited for the year ended 30 June 2016,complies with section 300A of the Corporations Act 2001.
DELOITTE TOUCHE TOHMATSU
Stephen Roche Partner Chartered Accountants Melbourne, 18 August 2016

30 GALE PACIFIC LIMITED 2016 ANNUAL REPORT
Gale Pacific LimitedStatement of profit or loss and other comprehensive incomeFor the year ended 30 June 2016
ConsolidatedNote 2016 2015
$'000 $'000
The above statement of profit or loss and other comprehensive income should be read in conjunction with the accompanying notes
RevenueSale of goods 173,191 147,993
Other income 5 5,234 2,554
ExpensesRaw materials and consumables used (96,863) (76,393)Employee benefits expense 6 (28,511) (29,545)Depreciation and amortisation expense 6 (7,180) (7,636)Marketing and advertising (3,200) (4,502)Occupancy costs (5,160) (3,534)Warehouse and related costs (11,178) (11,100)Other expenses (11,203) (9,796)Finance costs 6 (1,621) (1,820)
Profit before income tax expense 13,509 6,221
Income tax expense 7 (3,281) (1,051)
Profit after income tax expense for the year attributable to the owners of Gale Pacific Limited 10,228 5,170
Other comprehensive income
Items that may be reclassified subsequently to profit or lossNet change in the fair value of cash flow hedges taken to equity, net of tax 19 (1,949) 1,462 Foreign currency translation 19 (1,523) 11,447
Other comprehensive income for the year, net of tax (3,472) 12,909
Total comprehensive income for the year attributable to the owners of Gale Pacific Limited 6,756 18,079
Cents Cents
Basic earnings per share 8 3.44 1.74 Diluted earnings per share 8 3.40 1.72

GALE PACIFIC LIMITED 2016 ANNUAL REPORT 31
Gale Pacific LimitedStatement of financial positionAs at 30 June 2016
ConsolidatedNote 2016 2015
$'000 $'000
The above statement of financial position should be read in conjunction with the accompanying notes
Assets
Current assetsCash and cash equivalents 9 24,563 17,769 Trade and other receivables 10 30,226 27,081 Inventories 11 44,577 39,229 Derivative financial instrument - cash flow hedges - 1,363 Income tax refundable 7 - 3,147 Prepayments 969 819 Total current assets 100,335 89,408
Non-current assetsPrepayments 357 - Property, plant and equipment 12 30,414 34,872 Intangibles 13 25,210 25,311 Deferred tax 7 4,068 - Total non-current assets 60,049 60,183
Total assets 160,384 149,591 Liabilities
Current liabilitiesTrade and other payables 14 19,598 12,887 Borrowings 15 13,192 33,641 Derivative financial instrument - cash flow hedges 1,421 - Current tax liabilities 7 2,771 2,179 Employee benefits 1,832 1,758 Provisions 16 318 62 Total current liabilities 39,132 50,527
Non-current liabilitiesBorrowings 17 19,523 783 Deferred tax 7 2,000 397 Employee benefits 106 96 Total non-current liabilities 21,629 1,276
Total liabilities 60,761 51,803 Net assets 99,623 97,788 EquityIssued capital 18 71,485 71,485 Reserves 19 (988) 1,598 Retained profits 29,126 24,705
Total equity 99,623 97,788
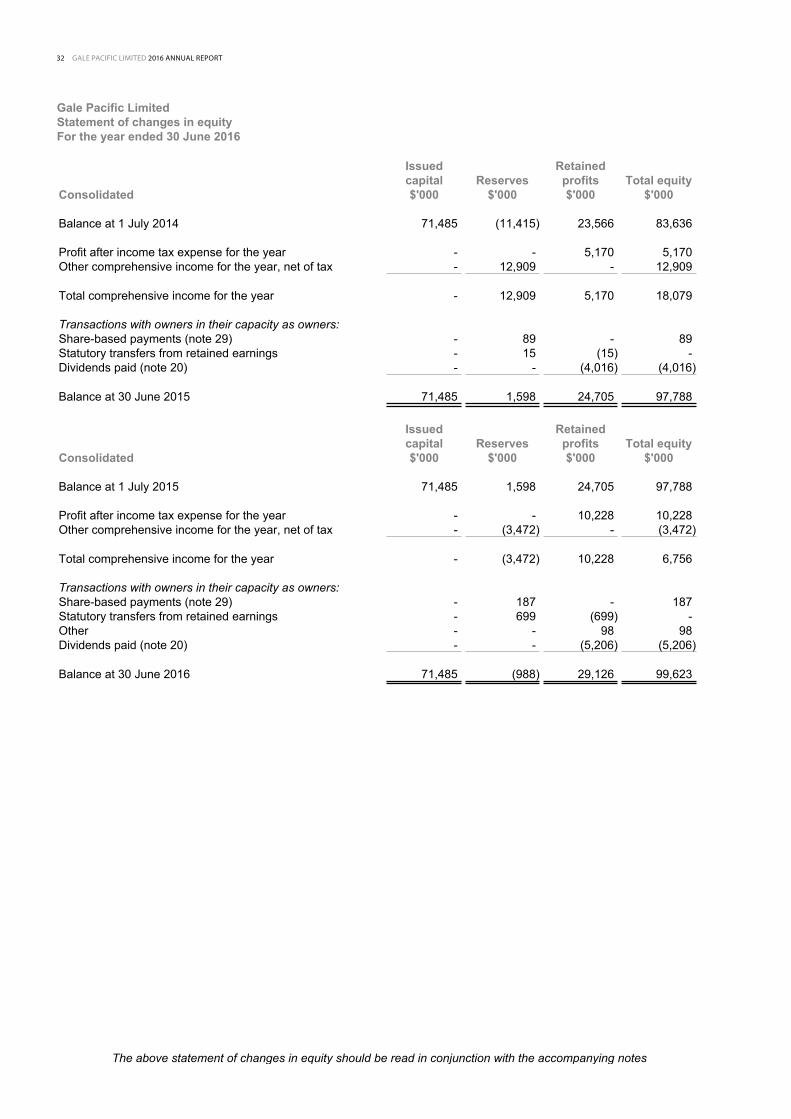
32 GALE PACIFIC LIMITED 2016 ANNUAL REPORT
Gale Pacific LimitedStatement of changes in equityFor the year ended 30 June 2016
The above statement of changes in equity should be read in conjunction with the accompanying notes
Issued Retainedcapital Reserves profits Total equity
Consolidated $'000 $'000 $'000 $'000
Balance at 1 July 2014 71,485 (11,415) 23,566 83,636
Profit after income tax expense for the year - - 5,170 5,170 Other comprehensive income for the year, net of tax - 12,909 - 12,909
Total comprehensive income for the year - 12,909 5,170 18,079
Transactions with owners in their capacity as owners:Share-based payments (note 29) - 89 - 89 Statutory transfers from retained earnings - 15 (15) - Dividends paid (note 20) - - (4,016) (4,016)
Balance at 30 June 2015 71,485 1,598 24,705 97,788
Issued Retainedcapital Reserves profits Total equity
Consolidated $'000 $'000 $'000 $'000
Balance at 1 July 2015 71,485 1,598 24,705 97,788
Profit after income tax expense for the year - - 10,228 10,228 Other comprehensive income for the year, net of tax - (3,472) - (3,472)
Total comprehensive income for the year - (3,472) 10,228 6,756
Transactions with owners in their capacity as owners:Share-based payments (note 29) - 187 - 187 Statutory transfers from retained earnings - 699 (699) - Other - - 98 98 Dividends paid (note 20) - - (5,206) (5,206)
Balance at 30 June 2016 71,485 (988) 29,126 99,623
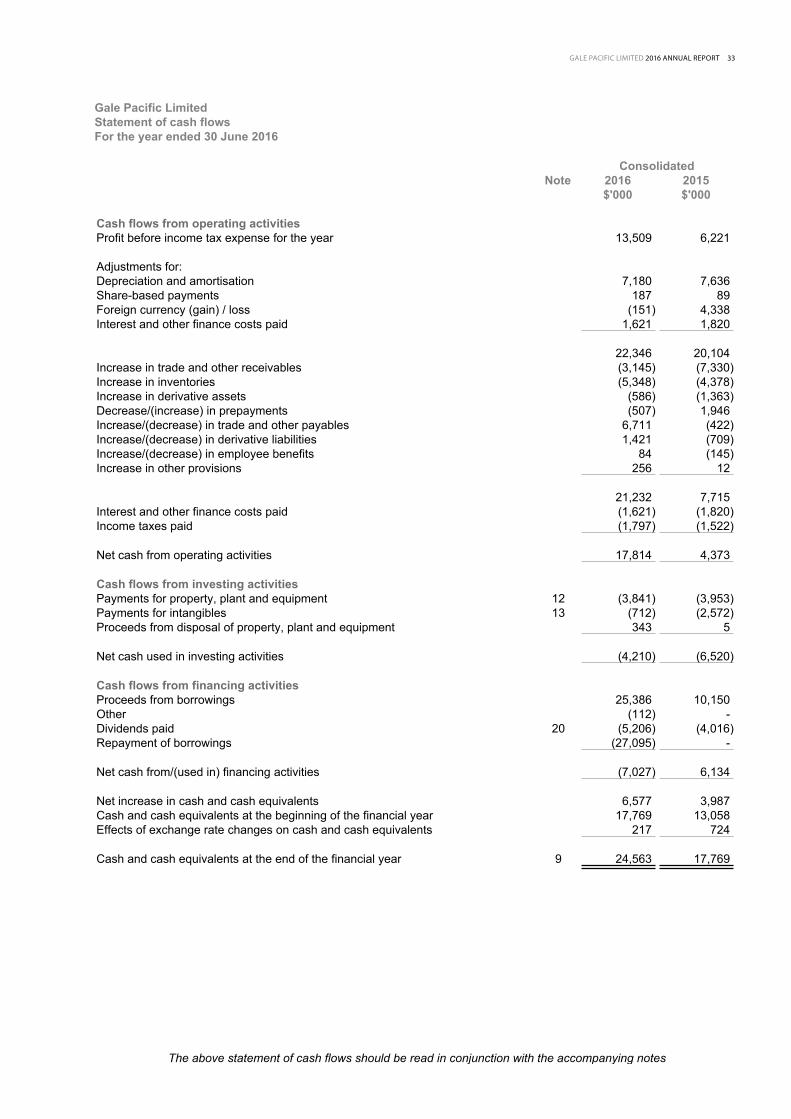
GALE PACIFIC LIMITED 2016 ANNUAL REPORT 33
Gale Pacific LimitedStatement of cash flowsFor the year ended 30 June 2016
ConsolidatedNote 2016 2015
$'000 $'000
The above statement of cash flows should be read in conjunction with the accompanying notes
Cash flows from operating activitiesProfit before income tax expense for the year 13,509 6,221
Adjustments for:Depreciation and amortisation 7,180 7,636 Share-based payments 187 89 Foreign currency (gain) / loss (151) 4,338 Interest and other finance costs paid 1,621 1,820
22,346 20,104 Increase in trade and other receivables (3,145) (7,330)Increase in inventories (5,348) (4,378)Increase in derivative assets (586) (1,363)Decrease/(increase) in prepayments (507) 1,946 Increase/(decrease) in trade and other payables 6,711 (422)Increase/(decrease) in derivative liabilities 1,421 (709)Increase/(decrease) in employee benefits 84 (145)Increase in other provisions 256 12
21,232 7,715 Interest and other finance costs paid (1,621) (1,820)Income taxes paid (1,797) (1,522)
Net cash from operating activities 17,814 4,373 Cash flows from investing activitiesPayments for property, plant and equipment 12 (3,841) (3,953)Payments for intangibles 13 (712) (2,572)Proceeds from disposal of property, plant and equipment 343 5
Net cash used in investing activities (4,210) (6,520) Cash flows from financing activitiesProceeds from borrowings 25,386 10,150 Other (112) - Dividends paid 20 (5,206) (4,016)Repayment of borrowings (27,095) -
Net cash from/(used in) financing activities (7,027) 6,134 Net increase in cash and cash equivalents 6,577 3,987 Cash and cash equivalents at the beginning of the financial year 17,769 13,058 Effects of exchange rate changes on cash and cash equivalents 217 724
Cash and cash equivalents at the end of the financial year 9 24,563 17,769

34 GALE PACIFIC LIMITED 2016 ANNUAL REPORT
Gale Pacific LimitedNotes to the financial statements30 June 2016
Note 1. General information The financial report covers Gale Pacific Limited ('Company' or 'parent entity') and controlled entities as a consolidated entity (referred to as the 'Group'). The financial statements are presented in Australian dollars, which is Gale Pacific Limited's functional and presentation currency. Gale Pacific Limited is a listed public company limited by shares, incorporated and domiciled in Australia. Its registered office and principal place of business is: 145 Woodlands DriveBraeside, VIC 3195 A description of the nature of the Group's operations is included in the directors' report, which is not part of the financial statements. The entity’s principal activities are the manufacture of branded screening and shading products for domestic, commercial and industrial applications The financial statements were authorised for issue, in accordance with a resolution of directors, on 18 August 2016. The directors have the power to amend and reissue the financial statements. Note 2. Significant accounting policies The principal accounting policies adopted in the preparation of the financial statements are set out either in the respective notes or below. These policies have been consistently applied to all the years presented, unless otherwise stated. New, revised or amending Accounting Standards and Interpretations adoptedThe Group has adopted all of the new, revised or amending Accounting Standards and Interpretations issued by the Australian Accounting Standards Board ('AASB') that are mandatory for the current reporting period. The adoption of these Accounting Standards and Interpretations did not have any significant impact on the financial performance or position of the Group. Any new, revised or amending Accounting Standards or Interpretations that are not yet mandatory have not been early adopted. Statement of ComplianceThese financial statements are general purpose financial statements which have been prepared in accordance with the Corporations Act 2001, Accounting Standards and Interpretations, and comply with other requirements of the law. The financial statements comprise the consolidated financial statements of the Group.
For the purposes of preparing the consolidated financial statements, the Company is a for-profit entity.
Accounting Standards include Australian Accounting Standards. Compliance with Australian Accounting Standards ensures that the financial statements and notes of the company and the Group comply with International Financial Reporting Standards (‘IFRS’). Basis of PreparationThe consolidated financial statements have been prepared on the basis of historical cost, except for certain properties and financial instruments that are measured at revalued amounts or fair values at the end of each reporting period, as explained in the accounting policies below.
Historical cost is generally based on the fair values of the consideration given in exchange forgoods and services. All amounts are presented in Australian dollars, unless otherwise noted. Principles of consolidationThe consolidated financial statements incorporate the assets and liabilities of all subsidiaries of Gale Pacific Limited as at 30 June 2016 and the results of all subsidiaries for the year then ended. Subsidiaries are all those entities over which the Group has control. The Group controls an entity when the Group is exposed to, or has rights to, variable returns from its involvement with the entity and has the ability to affect those returns through its power to direct the activities of the entity. Subsidiaries are consolidated from the date on which control is transferred to the Group. They are de-consolidated from the date that control ceases.
GALE PACIFIC LIMITED 2016 ANNUAL REPORT 35
Gale Pacific LimitedNotes to the financial statements30 June 2016 Note 2. Significant accounting policies (continued)
Intercompany transactions, balances and unrealised gains on transactions between entities in the Group are eliminated. Unrealised losses are also eliminated unless the transaction provides evidence of the impairment of the asset transferred. Accounting policies of subsidiaries have been changed where necessary to ensure consistency with the policies adopted by the Group. The acquisition of subsidiaries is accounted for using the acquisition method of accounting. A change in ownership interest, without the loss of control, is accounted for as an equity transaction, where the difference between the consideration transferred and the book value of the share of the non-controlling interest acquired is recognised directly in equity attributable to the parent. Where the Group loses control over a subsidiary, it derecognises the assets including goodwill, liabilities and non-controlling interest in the subsidiary together with any cumulative translation differences recognised in equity. The Group recognises the fair value of the consideration received and the fair value of any investment retained together with any gain or loss in profit or loss. Foreign currencies and translations Foreign currency transactionsForeign currency transactions are translated into the entity's functional currency using the exchange rates prevailing at the dates of the transactions. Foreign exchange gains and losses resulting from the settlement of such transactions and from the translation at financial year-end exchange rates of monetary assets and liabilities denominated in foreign currencies are recognised in profit or loss. Foreign operationsThe assets and liabilities of foreign operations are translated into Australian dollars using the exchange rates at the reporting date. The revenues and expenses of foreign operations are translated into Australian dollars using the average exchange rates, which approximate the rates at the dates of the transactions, for the period. All resulting foreign exchange differences are recognised in other comprehensive income through the foreign currency reserve in equity. On the disposal of a foreign operation (i.e. a disposal of the Group’s entire interest in a foreign operation, or a disposal involving loss of control over a subsidiary that includes a foreign operation, loss of joint control over a jointly controlled entity that includes a foreign operation, or loss of significant influence over an associate that includes a foreign operation), the cumulative amount in the foreign currency translation reserve in respect of that operation is then recognised in profit or loss Monetary items forming net investment in foreign operationsThe Group classifies monetary items of a non-current nature where settlement is not planned in the foreseeable future as part of the net investment in foreign operations. All foreign exchange differences on these items are recognised in other comprehensive income through the foreign currency reserve in equity. As and when settlements occur, the cumulative amount in the foreign currency translation reserve is then recognised in profit or loss. Revenue recognitionRevenue is recognised when it is probable that the economic benefit will flow to the Group and the revenue can be reliably measured. Revenue is measured at the fair value of the consideration received or receivable. Sale of goodsSale of goods revenue is recognised at the point of sale, which is where the customer has taken delivery of the goods, the risks and rewards are transferred to the customer and there is a valid sales contract. Amounts disclosed as revenue are net of sales returns and trade discounts. Government grantWhere a government grant, including Strategic Investment Plan income ('SIP'), is received or receivable relating to development costs that have been expensed, the grant is recognised as revenue. Where a grant is received or receivable relating to research and development costs that have been deferred, the grant is deducted from the carrying amount of the deferred costs. Other revenueOther revenue is recognised when it is received or when the right to receive payment is established. Current and non-current classificationAssets and liabilities are presented in the statement of financial position based on current and non-current classification.
36 GALE PACIFIC LIMITED 2016 ANNUAL REPORT
Gale Pacific LimitedNotes to the financial statements30 June 2016
Note 2. Significant accounting policies (continued)
An asset is classified as current when: it is either expected to be realised or intended to be sold or consumed in the Group's normal operating cycle; it is held primarily for the purpose of trading; it is expected to be realised within 12 months after the reporting period; or the asset is cash or cash equivalent unless restricted from being exchanged or used to settle a liability for at least 12 months after the reporting period. All other assets are classified as non-current.
A liability is classified as current when: it is either expected to be settled in the Group's normal operating cycle; it is held primarily for the purpose of trading; it is due to be settled within 12 months after the reporting period; or there is no unconditional right to defer the settlement of the liability for at least 12 months after the reporting period. All other liabilities are classified as non-current.
Deferred tax assets and liabilities are always classified as non-current.
Derivative financial instrumentsDerivatives are initially recognised at fair value on the date a derivative contract is entered into and are subsequently remeasured to their fair value at each reporting date. The accounting for subsequent changes in fair value depends on whether the derivative is designated as a hedging instrument, and if so, the nature of the item being hedged.
Derivatives are classified as current or non-current depending on the expected period of realisation.
Cash flow hedgesCash flow hedges are used to cover the Group's exposure to variability in cash flows that is attributable to particular risks associated with a recognised asset or liability or a firm commitment which could affect profit or loss. The effective portion of the gain or loss on the hedging instrument is recognised in other comprehensive income through the cash flow hedges reserve in equity, whilst the ineffective portion is recognised in profit or loss. Amounts taken to equity are transferred out of equity and included in the measurement of the hedged transaction when the forecast transaction occurs.
Cash flow hedges are tested for effectiveness on a regular basis both retrospectively and prospectively to ensure that each hedge is effective and continues to be designated as a cash flow hedge. If the forecast transaction is no longer expected to occur, the amounts recognised in equity are transferred to profit or loss.
If the hedging instrument is sold, terminated, expires, exercised without replacement or rollover, or if the hedge becomes ineffective and is no longer a designated hedge, the amounts previously recognised in equity remain in equity until the forecast transaction occurs.
LeasesThe determination of whether an arrangement is or contains a lease is based on the substance of the arrangement and requires an assessment of whether the fulfilment of the arrangement is dependent on the use of a specific asset or assets and the arrangement conveys a right to use the asset.
A distinction is made between finance leases, which effectively transfer from the lessor to the lessee substantially all the risks and benefits incidental to the ownership of leased assets, and operating leases, under which the lessor effectively retains substantially all such risks and benefits.
Operating lease payments, net of any incentives received from the lessor, are charged to profit or loss on a straight-line basis over the term of the lease. The Group has no finance leases.
Impairment of assetsGoodwill, other intangible assets that have an indefinite useful life, and assets not yet ready for use as intended by management, are not subject to amortisation and are tested annually for impairment, or more frequently if events or changes in circumstances indicate that they might be impaired. Other non-financial assets are reviewed for impairment whenever events or changes in circumstances indicate that the carrying amount may not be recoverable. An impairment loss is recognised for the amount by which the asset's carrying amount exceeds its recoverable amount. Where the asset does not generate independent cash flows, the Group estimates the recoverable amount of the cash generating unit ('CGU') to which the asset belongs.
Recoverable amount is the higher of fair value less cost of disposal and value-in-use. In assessing value-in-use, the estimated future cash flows are discounted to their present value using a pre-tax discount rate that reflects current market assessments of the time value of money and the risks specific to the asset for which the estimates of future cash flows have not been adjusted. In assessing fair value less cost of disposal, recognised valuation methodologies are applied, utilising current and forecast financial information as appropriate, benchmarked against relevant market data.

GALE PACIFIC LIMITED 2016 ANNUAL REPORT 37
Gale Pacific LimitedNotes to the financial statements30 June 2016 Note 2. Significant accounting policies (continued)
Employee benefitsShort-term employee benefitsLiabilities for wages and salaries, including non-monetary benefits, annual leave and long service leave expected to be settled wholly within 12 months of the reporting date is measured at the amounts expected to be paid when the liabilities are settled. Long-term employee benefitsThe liability for annual leave and long service leave not expected to be settled within 12 months of the reporting date are measured as the present value of expected future payments to be made in respect of services provided by employees up to the reporting date using the projected unit credit method. Consideration is given to expected future wage and salary levels, experience of employee departures and periods of service. Expected future payments are discounted using market yields at the reporting date on corporate bonds with terms to maturity and currency that match, as closely as possible, the estimated future cash outflows.
Defined contribution superannuation expenseContributions to defined contribution superannuation plans are expensed in the period in which they are incurred. Rounding of amountsThe Company is of a kind referred to in ASIC Corporations (Rounding in Financial/Directors’ Reports) Instrument 2016/191, issued by the Australian Securities and Investments Commission, relating to 'rounding-off'. Amounts in this report have been rounded off in accordance with that Instrument to the nearest thousand dollars, or in certain cases, the nearest dollar. Note 3. Critical accounting judgements, estimates and assumptions The preparation of the financial statements requires management to make judgements, estimates and assumptions that affect the reported amounts in the financial statements. Management continually evaluates its judgements and estimates in relation to assets, liabilities, contingent liabilities, revenue and expenses. Management bases its judgements, estimates and assumptions on historical experience and on other various factors, including expectations of future events, management believes to be reasonable under the circumstances. The resulting accounting judgements and estimates will seldom equal the related actual results. The judgements, estimates and assumptions that have a significant risk of causing a material adjustment to the carrying amounts of assets and liabilities (refer to the respective notes) within the next financial year are discussed below. Share-based payment transactionsThe Group measures the cost of equity-settled transactions with employees by reference to the fair value of the equity instruments at the date at which they are granted. The fair value is determined by using the Binomial model taking into account the terms and conditions upon which the instruments were granted. The accounting estimates and assumptions relating to equity-settled share-based payments would have no impact on the carrying amounts of assets and liabilities within the next annual reporting period but may impact profit or loss and equity. Provision for impairment of inventoriesThe provision for impairment of inventories assessment requires a degree of estimation and judgement. The level of the provision is assessed by taking into account the recent sales experience, the ageing of inventories and other factors that affect inventory obsolescence. GoodwillThe Group tests annually, or more frequently if events or changes in circumstances indicate impairment, whether goodwill has suffered any impairment, in accordance with the accounting policy stated in note 2. The recoverable amounts of cash-generating units have been determined based on value-in-use calculations. These calculations require the use of assumptions, including estimated discount rates based on the current cost of capital and growth rates of the estimated future cash flows. Income taxThe Group is subject to income taxes in the jurisdictions in which it operates. Significant judgement is required in determining the provision for income tax. There are many transactions and calculations undertaken during the ordinary course of business for which the ultimate tax determination is uncertain. Where the final tax outcome of these matters is different from the carrying amounts, such differences will impact the current and deferred tax provisions in the period in which such determination is made.

38 GALE PACIFIC LIMITED 2016 ANNUAL REPORT
Gale Pacific LimitedNotes to the financial statements30 June 2016 Note 3. Critical accounting judgements, estimates and assumptions (continued)
Recovery of deferred tax assetsDeferred tax assets are recognised for deductible temporary differences and tax losses only if the Group considers it is probable that future taxable amounts will be available to utilise those temporary differences and losses. Derivative financial instrumentsForward foreign exchange contracts, designated as cash flow hedges, are measured at fair value. Reliance is placed on future cash flows and judgement is made on a regular basis, through prospective and retrospective testing, including at the reporting date, that the hedges are still highly effective. Note 4. Operating segments Identification of reportable operating segmentsThe Group is organised into four operating segments identified by geographic location and identity of the service line manager, together with Corporate. These operating segments are based on the internal reports that are reviewed and used by the Group Managing Director (who is identified as the Chief Operating Decision Maker ('CODM')) in assessing performance and in determining the allocation of resources. There is no aggregation of operating segments.
The Group operates predominantly in one business segment, being branded shading, screening and home improvement products. The CODM reviews revenue and segment earnings, before interest, tax, depreciation and amortisation ('EBITDA'). The accounting policies adopted for internal reporting to the CODM are consistent with those adopted in the financial statements. Discrete financial information about each of these segments is reported on a monthly basis. The operating segments are as follows:Australasia Manufacturing and distribution facilities are located in Australia, and distribution facilities
are located in New Zealand. Sales offices are located in all states in Australia and in New Zealand.
China Manuf. and EurAsia Manufacturing facilities are located in Beilun, China which supply to the Group’s sales and marketing operations throughout the world.
Americas Sales offices are located in Florida and custom blind assembly and distribution facilities are located in California which service the North American region.
Middle East and North Africa ('MENA')
A sales office and distribution facility is located in the United Arab Emirates to service this market.
The 'Other Segments' represents Corporate and Intersegment eliminations. Major customersDuring the year ended 30 June 2016 approximately 36% (2015: 35%) of the Group's external revenue was derived from sales to one (2015: one) customer in the Australasian region.
GALE PACIFIC LIMITED 2016 ANNUAL REPORT 39
Gale Pacific LimitedNotes to the financial statements30 June 2016 Note 4. Operating segments (continued)
Operating segment information
China Manuf. and Other
Australasia EurAsia America MENA segments TotalConsolidated - 2016 $'000 $'000 $'000 $'000 $'000 $'000
RevenueSales to external customers 97,470 6,766 53,603 15,352 - 173,191 Intersegment sales 3,077 58,451 37 20 (61,585) - Total sales revenue 100,547 65,217 53,640 15,372 (61,585) 173,191 Total revenue 100,547 65,217 53,640 15,372 (61,585) 173,191
Segment EBITDA 3,578 12,620 4,920 3,148 (1,956) 22,310 Depreciation and amortisation (7,180)Finance costs (1,621)Profit before income tax expense 13,509 Income tax expense (3,281)Profit after income tax expense 10,228 Segment results include:Depreciation and amortisation (813) (4,547) (1,321) (3) (496) (7,180)Finance costs (190) (1,037) (452) (88) 146 (1,621)
AssetsSegment assets 58,544 36,089 32,203 10,738 22,810 160,384 Total assets 160,384
LiabilitiesSegment liabilities 15,168 13,109 5,680 674 26,130 60,761 Total liabilities 60,761
40 GALE PACIFIC LIMITED 2016 ANNUAL REPORT
Gale Pacific LimitedNotes to the financial statements30 June 2016 Note 4. Operating segments (continued)
China Manuf. and Other
Australasia EurAsia Americas MENA segments TotalConsolidated - 2015 $'000 $'000 $'000 $'000 $'000 $'000
RevenueSales to external customers 82,742 7,486 43,360 14,405 - 147,993 Intersegment sales 2,768 43,084 44 16 (45,912) - Total sales revenue 85,510 50,570 43,404 14,421 (45,912) 147,993 Total revenue 85,510 50,570 43,404 14,421 (45,912) 147,993
Segment EBITDA 1,013 10,572 4,952 3,288 (4,148) 15,677 Depreciation and amortisation (7,636)Finance costs (1,820)Profit before income tax expense 6,221 Income tax expense (1,051)Profit after income tax expense 5,170 Segment results include:Depreciation and amortisation (1,002) (5,345) (761) (2) (526) (7,636)Finance costs - (849) (368) (119) (484) (1,820)
AssetsSegment assets 50,698 41,165 31,721 10,588 15,419 149,591 Total assets 149,591
LiabilitiesSegment liabilities 7,154 13,278 4,522 736 26,113 51,803 Total liabilities 51,803 Accounting policy for operating segmentsOperating segments are presented using the 'management approach', where the information presented is on the same basis as the internal reports provided to the CODM. The CODM is responsible for the allocation of resources to operating segments and assessing their performance. Note 5. Other income
Consolidated2016 2015$'000 $'000
Net foreign exchange gain 4,219 1,099 Other income (including sales of scrap material from manufacturing) 1,015 1,455
Other income 5,234 2,554

GALE PACIFIC LIMITED 2016 ANNUAL REPORT 41
Gale Pacific LimitedNotes to the financial statements30 June 2016
Note 6. Expenses
Consolidated2016 2015$'000 $'000
Profit before income tax includes the following specific expenses:
DepreciationProperty, plant and equipment (note 12) 6,165 6,855
AmortisationIntangible assets (note 13) 1,015 781
Total depreciation and amortisation 7,180 7,636
Employee benefit expenseEmployment costs and benefits 28,324 29,456 Share-based payment expense 187 89
Total employee benefit expense 28,511 29,545
Finance costsInterest and finance charges paid/payable 1,621 1,820
Rental expense relating to operating leasesMinimum lease payments 4,505 3,029 Note 7. Income tax
Consolidated2016 2015$'000 $'000
Income tax expenseCurrent tax 3,719 2,027 Deferred tax - origination and reversal of temporary differences (325) (763)Adjustment recognised for prior periods (113) (213)
Aggregate income tax expense 3,281 1,051
Deferred tax included in income tax expense comprises:Increase in deferred tax assets (325) (763)
Numerical reconciliation of income tax expense and tax at the statutory rateProfit before income tax expense 13,509 6,221
Tax at the statutory tax rate of 30% 4,053 1,866
Tax effect amounts which are not deductible/(taxable) in calculating taxable income:Non allowable/(non assessable) items 340 1,132
4,393 2,998 Adjustment recognised for prior periods (113) (213)Difference in overseas tax rates (999) (1,734)
Income tax expense 3,281 1,051

42 GALE PACIFIC LIMITED 2016 ANNUAL REPORT
Gale Pacific LimitedNotes to the financial statements30 June 2016 Note 7. Income tax (continued)
Consolidated2016 2015$'000 $'000
Amounts charged/(credited) directly to equityDeferred tax assets (835) 610
Consolidated2016 2015$'000 $'000
Deferred tax asset/(liability)Deferred tax asset comprises temporary differences attributable to:
Amounts recognised in P&L:Tax losses 1,450 - Property, plant and equipment (642) 156 Foreign exchange (1,183) (1,327)Capitalised costs (957) (354)Provisions (223) (31)Impairment of receivables 14 3 Other financial liabilities 304 269 Employee benefits 717 498 Franking Deficit Credit 1,590 - Other 998 389
Deferred tax asset/(liability) 2,068 (397)
Movements:Opening balance (397) (550)Credited to profit or loss 325 763 Credited/(charged) to equity 835 (610)Transfer from Current Tax Liability 1,305 -
Closing balance 2,068 (397)
Consolidated2016 2015$'000 $'000
Income tax refundableIncome tax refundable - 3,147
Consolidated2016 2015$'000 $'000
Provision for income taxProvision for income tax 2,771 2,179 Accounting policy for income taxThe tax currently payable is based on taxable profit for the financial year. Taxable profit differs from profit as reported in the statement of comprehensive income because of items of income or expense that are taxable or deductible in other years and items that are never taxable or deductible. The Group’s liability for current tax is calculated using tax rates that have been enacted or substantively enacted by the end of the reporting period.

GALE PACIFIC LIMITED 2016 ANNUAL REPORT 43
Gale Pacific LimitedNotes to the financial statements30 June 2016 Note 7. Income tax (continued)
Deferred tax assets and liabilities are recognised for temporary differences at the tax rates expected to be applied when the assets are recovered or liabilities are settled, based on those tax rates that are enacted or substantively enacted, except for:● When the deferred income tax asset or liability arises from the initial recognition of goodwill or an asset or liability in
a transaction that is not a business combination and that, at the time of the transaction, affects neither the accounting nor taxable profits; or
● When the taxable temporary difference is associated with interests in subsidiaries, associates or joint ventures, and the timing of the reversal can be controlled and it is probable that the temporary difference will not reverse in the foreseeable future.
Deferred tax assets are recognised for deductible temporary differences and unused tax losses only if it is probable that future taxable amounts will be available to utilise those temporary differences and losses. The carrying amount of recognised and unrecognised deferred tax assets are reviewed at each reporting date. Deferred tax assets recognised are reduced to the extent that it is no longer probable that future taxable profits will be available for the carrying amount to be recovered. Previously unrecognised deferred tax assets are recognised to the extent that it is probable that there are future taxable profits available to recover the asset. Deferred tax assets and liabilities are offset only where there is a legally enforceable right to offset current tax assets against current tax liabilities and deferred tax assets against deferred tax liabilities; and they relate to the same taxable authority on either the same taxable entity or different taxable entities which intend to settle simultaneously. Gale Pacific Limited (the 'head entity') and its wholly-owned Australian subsidiaries have formed an income tax consolidated group under the tax consolidation regime. The head entity and each subsidiary in the tax consolidated group continue to account for their own current and deferred tax amounts. The tax consolidated group has applied the 'separate taxpayer within group' approach in determining the appropriate amount of taxes to allocate to members of the tax consolidated group. In addition to its own current and deferred tax amounts, the head entity also recognises the current tax liabilities (or assets) and the deferred tax assets arising from unused tax losses and unused tax credits assumed from each subsidiary in the tax consolidated group. Assets or liabilities arising under tax funding agreements with the tax consolidated entities are recognised as amounts receivable from or payable to other entities in the tax consolidated group. The tax funding arrangement ensures that the intercompany charge equals the current tax liability or benefit of each tax consolidated group member, resulting in neither a contribution by the head entity to the subsidiaries nor a distribution by the subsidiaries to the head entity. Note 8. Earnings per share
Consolidated2016 2015$'000 $'000
Profit after income tax attributable to the owners of Gale Pacific Limited 10,228 5,170
Number Number
Weighted average number of ordinary shares used in calculating basic earnings per share 297,474,396 297,474,396 Adjustments for calculation of diluted earnings per share:
Performance rights 3,768,003 2,352,479
Weighted average number of ordinary shares used in calculating diluted earnings per share 301,242,399 299,826,875
Cents Cents
Basic earnings per share 3.44 1.74 Diluted earnings per share 3.40 1.72 Accounting policy for earnings per share

44 GALE PACIFIC LIMITED 2016 ANNUAL REPORT
Gale Pacific LimitedNotes to the financial statements30 June 2016 Note 8. Earnings per share (continued)
Basic earnings per shareBasic earnings per share is calculated by dividing the profit attributable to the owners of Gale Pacific Limited, excluding any costs of servicing equity other than ordinary shares, by the weighted average number of ordinary shares outstanding during the financial year, adjusted for bonus elements in ordinary shares issued during the financial year. Diluted earnings per shareDiluted earnings per share adjusts the figures used in the determination of basic earnings per share to take into account the after income tax effect of interest and other financing costs associated with dilutive potential ordinary shares and the weighted average number of shares assumed to have been issued for no consideration in relation to dilutive potential ordinary shares. Note 9. Current assets - cash and cash equivalents
Consolidated2016 2015$'000 $'000
Cash on hand 12 17 Cash at bank 24,413 17,619 Cash on deposit 138 133
24,563 17,769 Accounting policy for cash and cash equivalentsCash and cash equivalents includes cash on hand, deposits held at call with financial institutions, other short-term, highly liquid investments with original maturities of three months or less that are readily convertible to known amounts of cash and which are subject to an insignificant risk of changes in value. Note 10. Current assets - trade and other receivables
Consolidated2016 2015$'000 $'000
Trade receivables 29,649 26,987 Less: Provision for impairment of receivables (80) (97)
29,569 26,890
Other receivables 657 191
30,226 27,081 The Group has recognised a loss of $66,000 (2015: $33,000) in profit or loss in respect of impairment of receivables for the year ended 30 June 2016. The ageing of the impaired receivables provided for above are as follows:
Consolidated2016 2015$'000 $'000
Over 6 months overdue 80 97
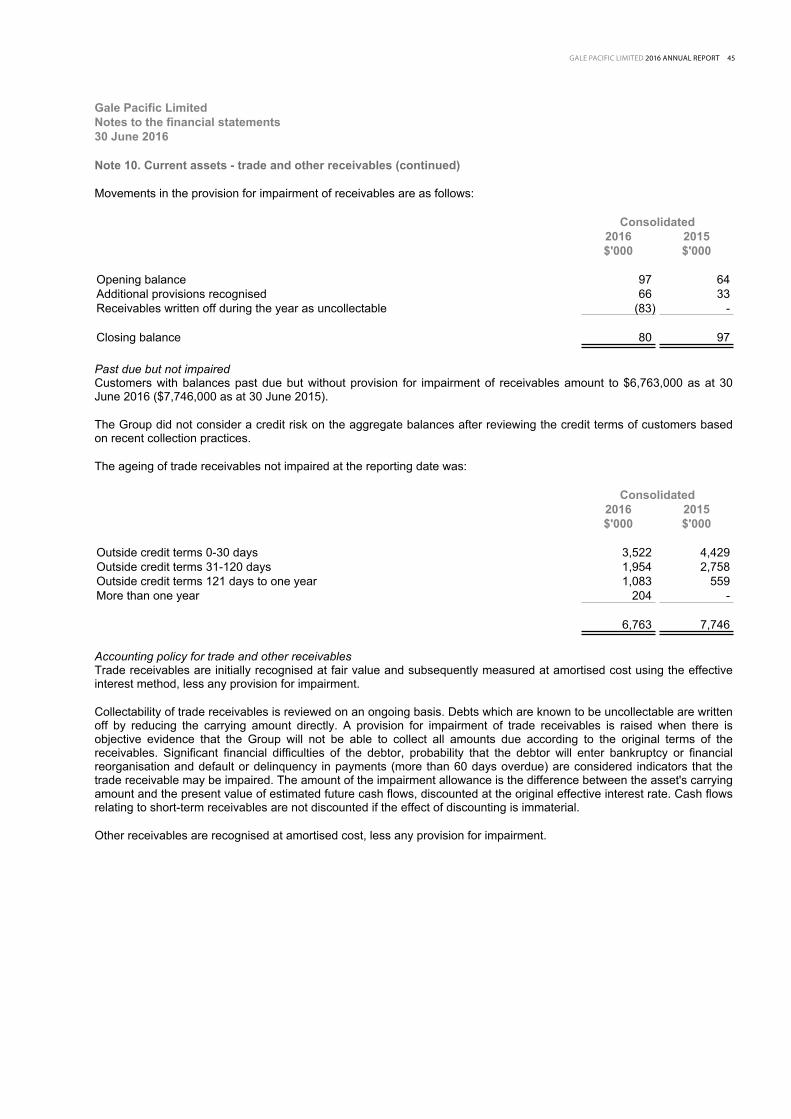
GALE PACIFIC LIMITED 2016 ANNUAL REPORT 45
Gale Pacific LimitedNotes to the financial statements30 June 2016 Note 10. Current assets - trade and other receivables (continued)
Movements in the provision for impairment of receivables are as follows:
Consolidated2016 2015$'000 $'000
Opening balance 97 64 Additional provisions recognised 66 33 Receivables written off during the year as uncollectable (83) -
Closing balance 80 97 Past due but not impairedCustomers with balances past due but without provision for impairment of receivables amount to $6,763,000 as at 30 June 2016 ($7,746,000 as at 30 June 2015). The Group did not consider a credit risk on the aggregate balances after reviewing the credit terms of customers based on recent collection practices. The ageing of trade receivables not impaired at the reporting date was:
Consolidated2016 2015$'000 $'000
Outside credit terms 0-30 days 3,522 4,429 Outside credit terms 31-120 days 1,954 2,758 Outside credit terms 121 days to one year 1,083 559 More than one year 204 -
6,763 7,746 Accounting policy for trade and other receivablesTrade receivables are initially recognised at fair value and subsequently measured at amortised cost using the effective interest method, less any provision for impairment. Collectability of trade receivables is reviewed on an ongoing basis. Debts which are known to be uncollectable are written off by reducing the carrying amount directly. A provision for impairment of trade receivables is raised when there is objective evidence that the Group will not be able to collect all amounts due according to the original terms of the receivables. Significant financial difficulties of the debtor, probability that the debtor will enter bankruptcy or financial reorganisation and default or delinquency in payments (more than 60 days overdue) are considered indicators that the trade receivable may be impaired. The amount of the impairment allowance is the difference between the asset's carrying amount and the present value of estimated future cash flows, discounted at the original effective interest rate. Cash flows relating to short-term receivables are not discounted if the effect of discounting is immaterial. Other receivables are recognised at amortised cost, less any provision for impairment.

46 GALE PACIFIC LIMITED 2016 ANNUAL REPORT
Gale Pacific LimitedNotes to the financial statements30 June 2016
Note 11. Current assets - inventories
Consolidated2016 2015$'000 $'000
Raw materials - at cost 5,723 4,445
Work in progress - at cost 4,508 675
Finished goods - at cost 35,283 35,454 Less: Provision for impairment (937) (1,345)
34,346 34,109
44,577 39,229 Accounting policy for inventoriesRaw materials, work in progress and finished goods are stated at the lower of cost and net realisable value on a 'first in first out' basis. Cost comprises of direct materials and delivery costs, direct labour, import duties and other taxes, an appropriate proportion of variable and fixed overhead expenditure based on normal operating capacity, and, where applicable, transfers from cash flow hedging reserves in equity. Costs of purchased inventory are determined after deducting rebates and discounts received or receivable. Net realisable value is the estimated selling price in the ordinary course of business less the estimated costs of completion and the estimated costs necessary to make the sale. Note 12. Non-current assets - property, plant and equipment
Consolidated2016 2015$'000 $'000
Buildings and leasehold improvements - at cost 14,125 10,209 Less: Accumulated depreciation (5,162) (2,819)
8,963 7,390
Plant and equipment - at cost 102,949 119,800 Less: Accumulated depreciation (82,199) (93,135)
20,750 26,665
Motor vehicles - at cost 374 484 Less: Accumulated depreciation (247) (322)
127 162
Capital work-in-progress - at cost 574 655
30,414 34,872
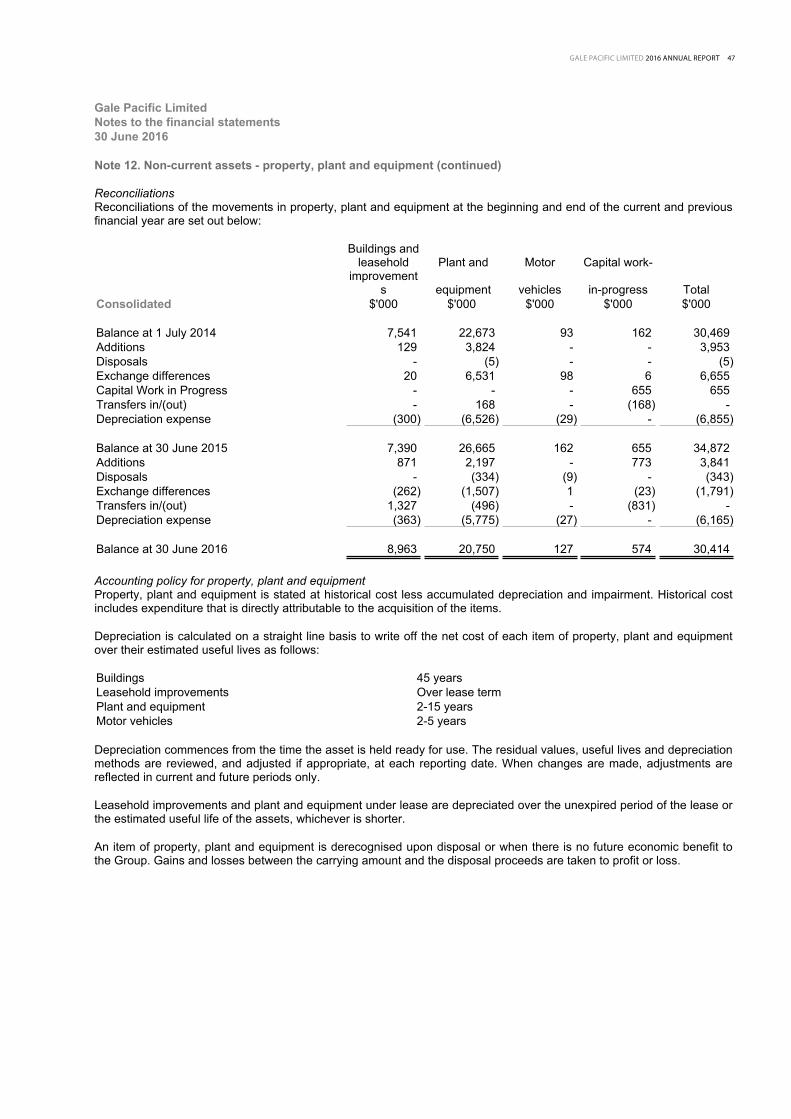
GALE PACIFIC LIMITED 2016 ANNUAL REPORT 47
Gale Pacific LimitedNotes to the financial statements30 June 2016 Note 12. Non-current assets - property, plant and equipment (continued)
ReconciliationsReconciliations of the movements in property, plant and equipment at the beginning and end of the current and previous financial year are set out below:
Buildings and leasehold Plant and Motor Capital work-
improvements equipment vehicles in-progress Total
Consolidated $'000 $'000 $'000 $'000 $'000
Balance at 1 July 2014 7,541 22,673 93 162 30,469 Additions 129 3,824 - - 3,953 Disposals - (5) - - (5)Exchange differences 20 6,531 98 6 6,655 Capital Work in Progress - - - 655 655 Transfers in/(out) - 168 - (168) - Depreciation expense (300) (6,526) (29) - (6,855)
Balance at 30 June 2015 7,390 26,665 162 655 34,872 Additions 871 2,197 - 773 3,841 Disposals - (334) (9) - (343)Exchange differences (262) (1,507) 1 (23) (1,791)Transfers in/(out) 1,327 (496) - (831) - Depreciation expense (363) (5,775) (27) - (6,165)
Balance at 30 June 2016 8,963 20,750 127 574 30,414 Accounting policy for property, plant and equipmentProperty, plant and equipment is stated at historical cost less accumulated depreciation and impairment. Historical cost includes expenditure that is directly attributable to the acquisition of the items. Depreciation is calculated on a straight line basis to write off the net cost of each item of property, plant and equipment over their estimated useful lives as follows: Buildings 45 yearsLeasehold improvements Over lease termPlant and equipment 2-15 yearsMotor vehicles 2-5 years Depreciation commences from the time the asset is held ready for use. The residual values, useful lives and depreciation methods are reviewed, and adjusted if appropriate, at each reporting date. When changes are made, adjustments are reflected in current and future periods only. Leasehold improvements and plant and equipment under lease are depreciated over the unexpired period of the lease or the estimated useful life of the assets, whichever is shorter. An item of property, plant and equipment is derecognised upon disposal or when there is no future economic benefit to the Group. Gains and losses between the carrying amount and the disposal proceeds are taken to profit or loss.
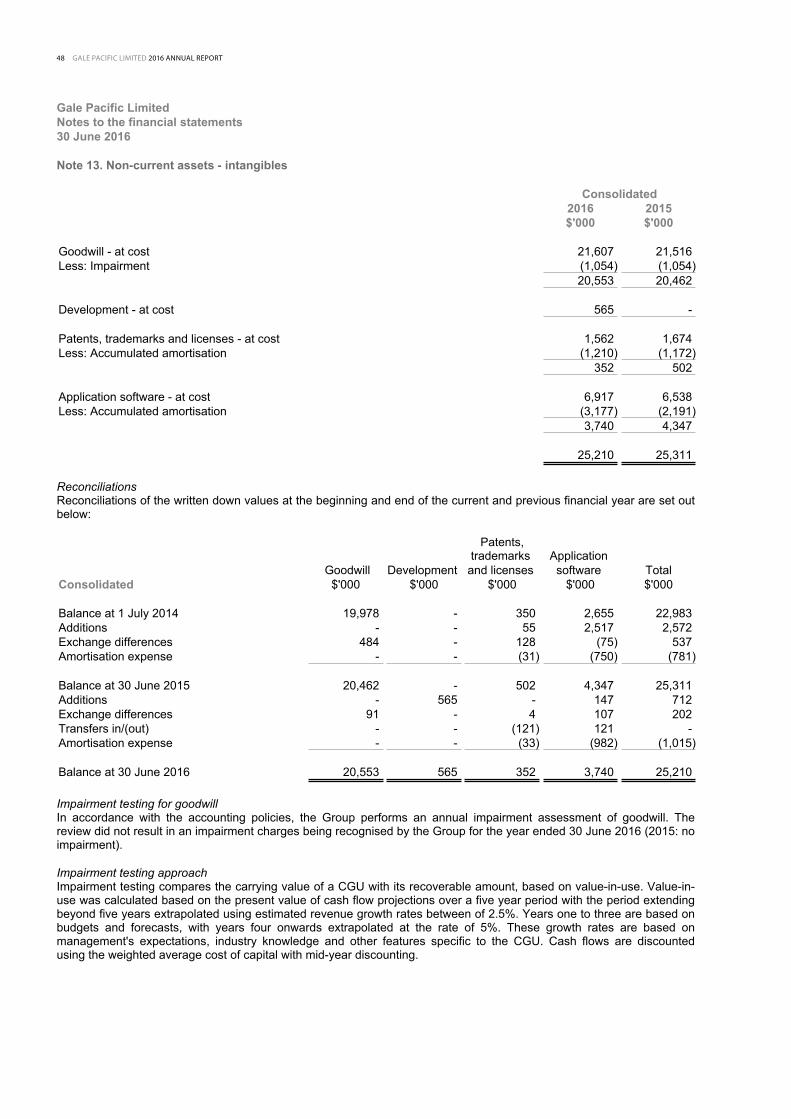
48 GALE PACIFIC LIMITED 2016 ANNUAL REPORT
Gale Pacific LimitedNotes to the financial statements30 June 2016
Note 13. Non-current assets - intangibles
Consolidated2016 2015$'000 $'000
Goodwill - at cost 21,607 21,516 Less: Impairment (1,054) (1,054)
20,553 20,462
Development - at cost 565 -
Patents, trademarks and licenses - at cost 1,562 1,674 Less: Accumulated amortisation (1,210) (1,172)
352 502
Application software - at cost 6,917 6,538 Less: Accumulated amortisation (3,177) (2,191)
3,740 4,347
25,210 25,311 ReconciliationsReconciliations of the written down values at the beginning and end of the current and previous financial year are set out below:
Patents, trademarks Application
Goodwill Development and licenses software TotalConsolidated $'000 $'000 $'000 $'000 $'000
Balance at 1 July 2014 19,978 - 350 2,655 22,983 Additions - - 55 2,517 2,572 Exchange differences 484 - 128 (75) 537 Amortisation expense - - (31) (750) (781)
Balance at 30 June 2015 20,462 - 502 4,347 25,311 Additions - 565 - 147 712 Exchange differences 91 - 4 107 202 Transfers in/(out) - - (121) 121 - Amortisation expense - - (33) (982) (1,015)
Balance at 30 June 2016 20,553 565 352 3,740 25,210 Impairment testing for goodwillIn accordance with the accounting policies, the Group performs an annual impairment assessment of goodwill. The review did not result in an impairment charges being recognised by the Group for the year ended 30 June 2016 (2015: no impairment). Impairment testing approachImpairment testing compares the carrying value of a CGU with its recoverable amount, based on value-in-use. Value-in-use was calculated based on the present value of cash flow projections over a five year period with the period extending beyond five years extrapolated using estimated revenue growth rates between of 2.5%. Years one to three are based on budgets and forecasts, with years four onwards extrapolated at the rate of 5%. These growth rates are based on management's expectations, industry knowledge and other features specific to the CGU. Cash flows are discounted using the weighted average cost of capital with mid-year discounting.
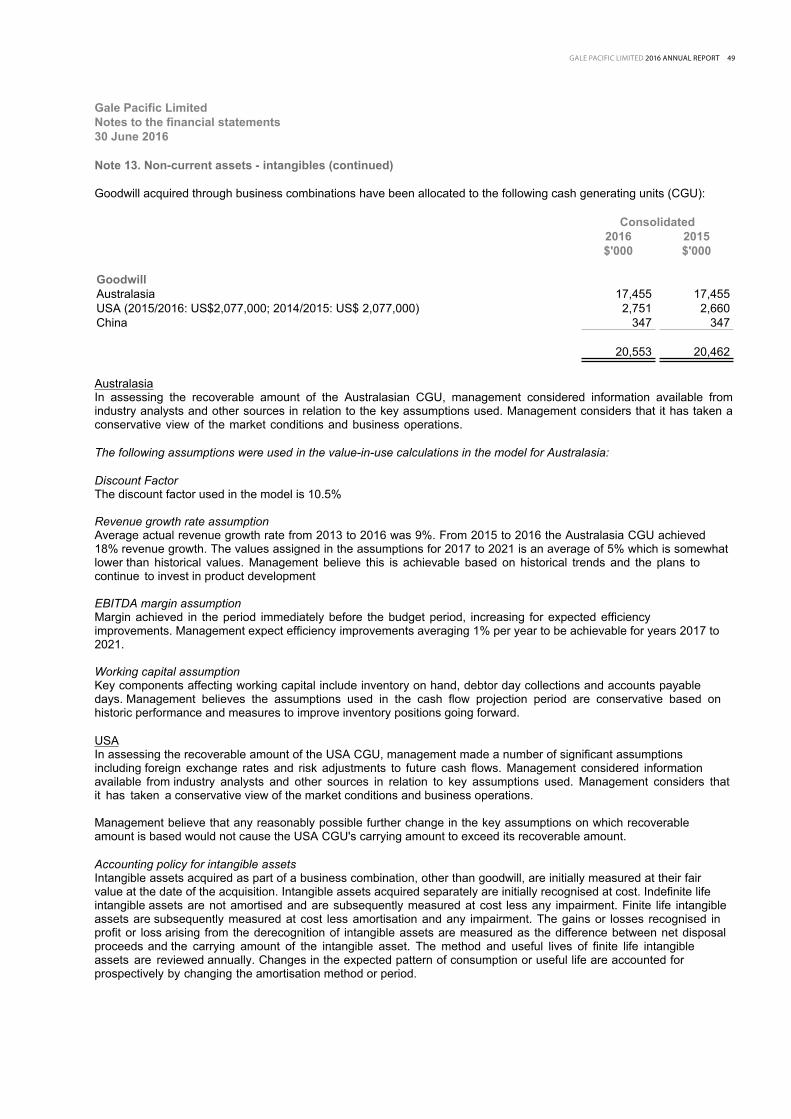
GALE PACIFIC LIMITED 2016 ANNUAL REPORT 49
Gale Pacific LimitedNotes to the financial statements30 June 2016
Note 13. Non-current assets - intangibles (continued)
Goodwill acquired through business combinations have been allocated to the following cash generating units (CGU):
Consolidated2016 2015$'000 $'000
GoodwillAustralasia 17,455 17,455 USA (2015/2016: US$2,077,000; 2014/2015: US$ 2,077,000) 2,751 2,660 China 347 347
20,553 20,462
Australasia In assessing the recoverable amount of the Australasian CGU, management considered information available from industry analysts and other sources in relation to the key assumptions used. Management considers that it has taken a conservative view of the market conditions and business operations.
The following assumptions were used in the value-in-use calculations in the model for Australasia:
Discount Factor The discount factor used in the model is 10.5%
Revenue growth rate assumption Average actual revenue growth rate from 2013 to 2016 was 9%. From 2015 to 2016 the Australasia CGU achieved 18% revenue growth. The values assigned in the assumptions for 2017 to 2021 is an average of 5% which is somewhat lower than historical values. Management believe this is achievable based on historical trends and the plans to continue to invest in product development
EBITDA margin assumption Margin achieved in the period immediately before the budget period, increasing for expected efficiency improvements. Management expect efficiency improvements averaging 1% per year to be achievable for years 2017 to 2021.
Working capital assumption Key components affecting working capital include inventory on hand, debtor day collections and accounts payable days. Management believes the assumptions used in the cash flow projection period are conservative based on historic performance and measures to improve inventory positions going forward.
USAIn assessing the recoverable amount of the USA CGU, management made a number of significant assumptions including foreign exchange rates and risk adjustments to future cash flows. Management considered information available from industry analysts and other sources in relation to key assumptions used. Management considers that it has taken a conservative view of the market conditions and business operations.
Management believe that any reasonably possible further change in the key assumptions on which recoverable amount is based would not cause the USA CGU's carrying amount to exceed its recoverable amount.
Accounting policy for intangible assetsIntangible assets acquired as part of a business combination, other than goodwill, are initially measured at their fair value at the date of the acquisition. Intangible assets acquired separately are initially recognised at cost. Indefinite life intangible assets are not amortised and are subsequently measured at cost less any impairment. Finite life intangible assets are subsequently measured at cost less amortisation and any impairment. The gains or losses recognised in profit or loss arising from the derecognition of intangible assets are measured as the difference between net disposal proceeds and the carrying amount of the intangible asset. The method and useful lives of finite life intangible assets are reviewed annually. Changes in the expected pattern of consumption or useful life are accounted for prospectively by changing the amortisation method or period.
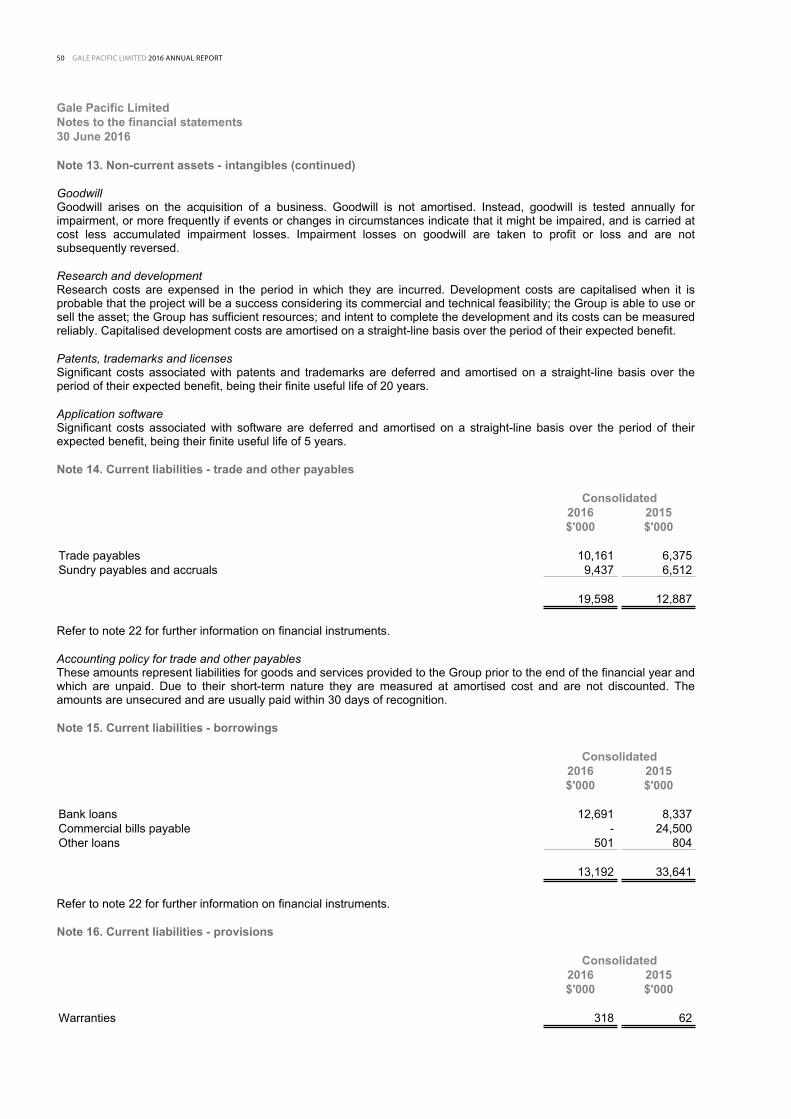
50 GALE PACIFIC LIMITED 2016 ANNUAL REPORT
Gale Pacific LimitedNotes to the financial statements30 June 2016 Note 13. Non-current assets - intangibles (continued)
GoodwillGoodwill arises on the acquisition of a business. Goodwill is not amortised. Instead, goodwill is tested annually for impairment, or more frequently if events or changes in circumstances indicate that it might be impaired, and is carried at cost less accumulated impairment losses. Impairment losses on goodwill are taken to profit or loss and are not subsequently reversed. Research and developmentResearch costs are expensed in the period in which they are incurred. Development costs are capitalised when it is probable that the project will be a success considering its commercial and technical feasibility; the Group is able to use or sell the asset; the Group has sufficient resources; and intent to complete the development and its costs can be measured reliably. Capitalised development costs are amortised on a straight-line basis over the period of their expected benefit. Patents, trademarks and licensesSignificant costs associated with patents and trademarks are deferred and amortised on a straight-line basis over the period of their expected benefit, being their finite useful life of 20 years. Application softwareSignificant costs associated with software are deferred and amortised on a straight-line basis over the period of their expected benefit, being their finite useful life of 5 years. Note 14. Current liabilities - trade and other payables
Consolidated2016 2015$'000 $'000
Trade payables 10,161 6,375 Sundry payables and accruals 9,437 6,512
19,598 12,887 Refer to note 22 for further information on financial instruments. Accounting policy for trade and other payablesThese amounts represent liabilities for goods and services provided to the Group prior to the end of the financial year and which are unpaid. Due to their short-term nature they are measured at amortised cost and are not discounted. The amounts are unsecured and are usually paid within 30 days of recognition. Note 15. Current liabilities - borrowings
Consolidated2016 2015$'000 $'000
Bank loans 12,691 8,337 Commercial bills payable - 24,500 Other loans 501 804
13,192 33,641 Refer to note 22 for further information on financial instruments. Note 16. Current liabilities - provisions
Consolidated2016 2015$'000 $'000
Warranties 318 62

GALE PACIFIC LIMITED 2016 ANNUAL REPORT 51
Gale Pacific LimitedNotes to the financial statements30 June 2016 Note 16. Current liabilities - provisions (continued)
WarrantiesThe provision represents the estimated warranty claims in respect of products sold which are still under warranty at the reporting date. The provision is estimated based on historical warranty claim information, sales levels and any recent trends that may suggest future claims could differ from historical amounts.
WarrantiesConsolidated - 2016 $'000
Carrying amount at the start of the year 62 Additional provision recognised 409 Claims (153)
Carrying amount at the end of the year 318 Accounting policy for provisionsProvisions are recognised when the Group has a present (legal or constructive) obligation as a result of a past event, it is probable the Group will be required to settle the obligation, and a reliable estimate can be made of the amount of the obligation. The amount recognised as a provision is the best estimate of the consideration required to settle the present obligation at the reporting date, taking into account the risks and uncertainties surrounding the obligation. If the time value of money is material, provisions are discounted using a current pre-tax rate specific to the liability. The increase in the provision resulting from the passage of time is recognised as a finance cost in profit or loss. Note 17. Non-current liabilities - borrowings
Consolidated2016 2015$'000 $'000
Bank loans 19,280 - Other loans 243 783
19,523 783 Refer to note 22 for further information on financial instruments. Total secured liabilitiesThe total secured liabilities (current and non-current) are as follows:
Consolidated2016 2015$'000 $'000
Bank loans 31,971 8,337 Commercial bills payable - 24,500
31,971 32,837 Assets pledged as securityThe bank loans are secured by a fixed and floating charge (or equivalent foreign charge) over all the assets and undertakings, including uncalled capital of each entity in the Group. Accounting policy for borrowingsLoans and borrowings are initially recognised at the fair value of the consideration received, net of transaction costs. They are subsequently measured at amortised cost using the effective interest method.
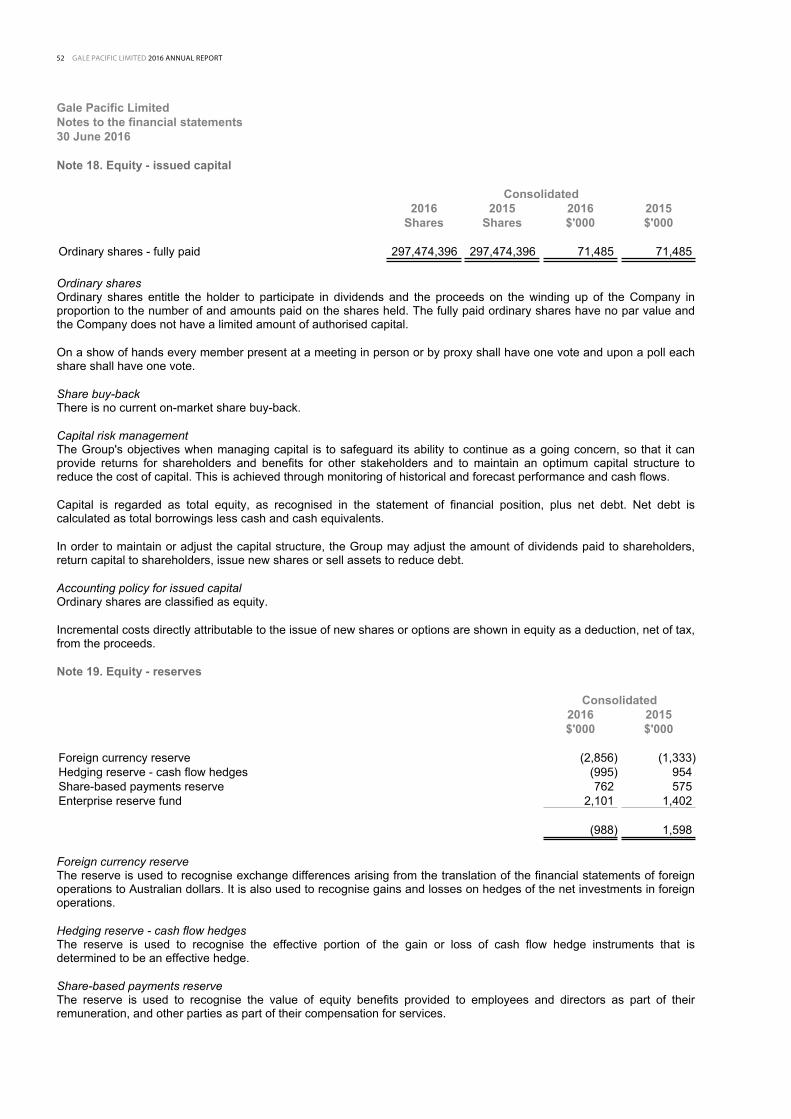
52 GALE PACIFIC LIMITED 2016 ANNUAL REPORT
Gale Pacific LimitedNotes to the financial statements30 June 2016
Note 18. Equity - issued capital
Consolidated2016 2015 2016 2015
Shares Shares $'000 $'000
Ordinary shares - fully paid 297,474,396 297,474,396 71,485 71,485 Ordinary sharesOrdinary shares entitle the holder to participate in dividends and the proceeds on the winding up of the Company in proportion to the number of and amounts paid on the shares held. The fully paid ordinary shares have no par value and the Company does not have a limited amount of authorised capital. On a show of hands every member present at a meeting in person or by proxy shall have one vote and upon a poll each share shall have one vote. Share buy-backThere is no current on-market share buy-back. Capital risk managementThe Group's objectives when managing capital is to safeguard its ability to continue as a going concern, so that it can provide returns for shareholders and benefits for other stakeholders and to maintain an optimum capital structure to reduce the cost of capital. This is achieved through monitoring of historical and forecast performance and cash flows. Capital is regarded as total equity, as recognised in the statement of financial position, plus net debt. Net debt is calculated as total borrowings less cash and cash equivalents. In order to maintain or adjust the capital structure, the Group may adjust the amount of dividends paid to shareholders, return capital to shareholders, issue new shares or sell assets to reduce debt. Accounting policy for issued capitalOrdinary shares are classified as equity. Incremental costs directly attributable to the issue of new shares or options are shown in equity as a deduction, net of tax, from the proceeds. Note 19. Equity - reserves
Consolidated2016 2015$'000 $'000
Foreign currency reserve (2,856) (1,333)Hedging reserve - cash flow hedges (995) 954 Share-based payments reserve 762 575 Enterprise reserve fund 2,101 1,402
(988) 1,598 Foreign currency reserveThe reserve is used to recognise exchange differences arising from the translation of the financial statements of foreign operations to Australian dollars. It is also used to recognise gains and losses on hedges of the net investments in foreign operations. Hedging reserve - cash flow hedgesThe reserve is used to recognise the effective portion of the gain or loss of cash flow hedge instruments that is determined to be an effective hedge. Share-based payments reserveThe reserve is used to recognise the value of equity benefits provided to employees and directors as part of their remuneration, and other parties as part of their compensation for services.
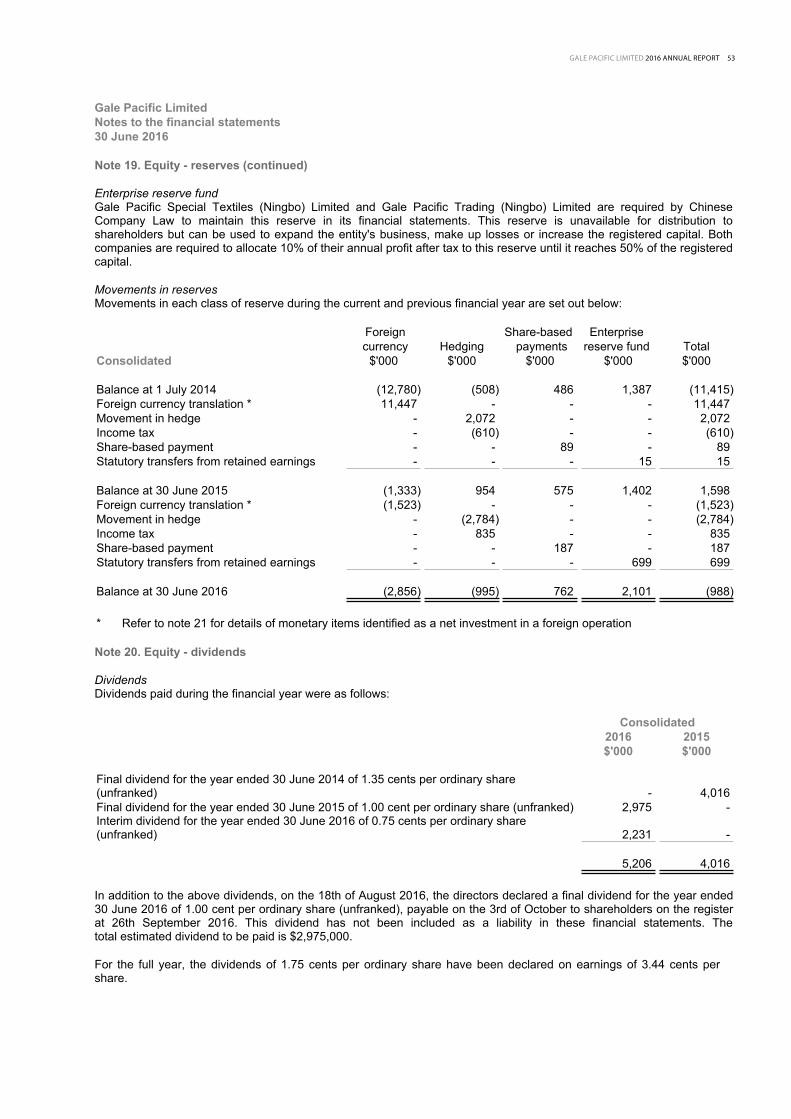
GALE PACIFIC LIMITED 2016 ANNUAL REPORT 53
Gale Pacific LimitedNotes to the financial statements30 June 2016
Note 19. Equity - reserves (continued)
Enterprise reserve fund Gale Pacific Special Textiles (Ningbo) Limited and Gale Pacific Trading (Ningbo) Limited are required by Chinese Company Law to maintain this reserve in its financial statements. This reserve is unavailable for distribution to shareholders but can be used to expand the entity's business, make up losses or increase the registered capital. Both companies are required to allocate 10% of their annual profit after tax to this reserve until it reaches 50% of the registered capital.
Movements in reservesMovements in each class of reserve during the current and previous financial year are set out below:
Foreign Share-based Enterprise currency Hedging payments reserve fund Total
Consolidated $'000 $'000 $'000 $'000 $'000
Balance at 1 July 2014 (12,780) (508) 486 1,387 (11,415)Foreign currency translation * 11,447 - - - 11,447 Movement in hedge - 2,072 - - 2,072 Income tax - (610) - - (610)Share-based payment - - 89 - 89Statutory transfers from retained earnings - - - 15 15
Balance at 30 June 2015 (1,333) 954 575 1,402 1,598 Foreign currency translation * (1,523) - - - (1,523)Movement in hedge - (2,784) - - (2,784)Income tax - 835 - - 835 Share-based payment - - 187 - 187Statutory transfers from retained earnings - - - 699 699
Balance at 30 June 2016 (2,856) (995) 762 2,101 (988)
* Refer to note 21 for details of monetary items identified as a net investment in a foreign operation
Note 20. Equity - dividends
DividendsDividends paid during the financial year were as follows:
Consolidated2016 2015$'000 $'000
Final dividend for the year ended 30 June 2014 of 1.35 cents per ordinary share (unfranked) - 4,016Final dividend for the year ended 30 June 2015 of 1.00 cent per ordinary share (unfranked) 2,975 - Interim dividend for the year ended 30 June 2016 of 0.75 cents per ordinary share (unfranked) 2,231 -
5,206 4,016
In addition to the above dividends, on the 18th of August 2016, the directors declared a final dividend for the year ended 30 June 2016 of 1.00 cent per ordinary share (unfranked), payable on the 3rd of October to shareholders on the register at 26th September 2016. This dividend has not been included as a liability in these financial statements. The total estimated dividend to be paid is $2,975,000.
For the full year, the dividends of 1.75 cents per ordinary share have been declared on earnings of 3.44 cents per share.

54 GALE PACIFIC LIMITED 2016 ANNUAL REPORT
Gale Pacific LimitedNotes to the financial statements30 June 2016 Note 20. Equity - dividends (continued)
Franking credits
Consolidated2016 2015$'000 $'000
Franking credits available for subsequent financial years based on a tax rate of 30% - 197 The above amounts represent the balance of the franking account as at the end of the financial year, adjusted for:● franking credits that will arise from the payment of the amount of the provision for income tax at the reporting date● franking debits that will arise from the payment of dividends recognised as a liability at the reporting date● franking credits that will arise from the receipt of dividends recognised as receivables at the reporting date Accounting policy for dividendsDividends are recognised when declared during the financial year and no longer at the discretion of the Company. Note 21. Monetary items identified as a net investment in a foreign operation In 2006/2007, the Group reclassified a portion of its related party balances as net investments in foreign operations, being monetary items of a non-current nature where settlement is not planned in the foreseeable future, with all foreign exchange differences on these items recognised in other comprehensive income through the foreign currency reserve in equity. In 2008/2009, a portion of the net investment in Gale Pacific Special Textiles (Ningbo) Limited was converted to equity and additional balances in Gale Pacific (New Zealand) Limited and Gale Pacific USA, Inc. were reclassified as net investments in foreign operations. In 2014/2015, the balances relating to the portion of the net investment in Gale Pacific Special Textiles (Ningbo) Limited was de-classified as it was deemed that settlement of these balances is planned in the foreseeable future.
In 2015/2016, the balances relating to the portion of net investment in Gale Pacific USA Inc. was de-classified as it was deemed that settlement of these balances is planned in the foreseeable future. In 2015/2016, a portion of the balances relating to Gale Pacific (New Zealand) Limited was declassified as it was deemed that settlement of a portion of those balances is planned in the foreseeable future.
Details of the monetary items classified as net investments in a foreign operations are as follows:
Consolidated2016 2015$'000 $'000
Related party receivable to the Company from Gale Pacific (New Zealand) Limited 5,049 6,800 Related party receivable to the Company from Gale Pacific USA, Inc. - 9,473
Monetary items identified as a net investment in a foreign operation 5,049 16,273 The foreign exchange gain arising during the financial year on monetary items forming part of the net investment in related party, recognised in foreign currency translation reserve is detailed in note 19. Note 22. Financial instruments Financial risk management objectivesThe Group's activities expose it to a variety of financial risks: market risk, credit risk and liquidity risk.
The Group’s financial risk management processes and procedures seek to minimise the potential adverse effects on the Group’s financial performance that may occur due to the unpredictability of financial markets. Risk management policies are reviewed regularly to reflect changes in market conditions and the Group’s activities.

GALE PACIFIC LIMITED 2016 ANNUAL REPORT 55
Gale Pacific LimitedNotes to the financial statements30 June 2016 Note 22. Financial instruments (continued)
Derivative financial instruments are used by the Group to limit exposure to exchange rate risk associated with foreign currency transactions. Transactions to reduce foreign currency exposure are undertaken without the use of collateral as the Group only deals with reputable institutions with sound financial positions. The Group does not enter into or trade financial instruments, including derivative financial instruments, for speculative purposes. Market risk Foreign currency riskThe Group undertakes certain transactions denominated in foreign currency and is exposed to foreign currency risk through foreign exchange rate fluctuations. The Group enters into foreign exchange contracts to buy and sell specified amounts of foreign currency in the future at stipulated exchange rates. The objective of entering into forward exchange contracts is to protect the Group against exchange rate movements for both contracted and anticipated future sales and purchases undertaken in foreign currencies. There was no cash flow hedge ineffectiveness during the reporting period. The Group adopts hedge accounting and classifies forward exchange contracts as cash flow hedges where these contracts are hedging highly probable forecasted transactions and they are timed to mature when the cash flow from the underlying transaction is scheduled to occur. Cash flows are expected to occur during the next financial year. The maturity, settlement amounts and the average contractual exchange rates of the Group's outstanding forward foreign exchange contracts at the reporting date were as follows:
Sell Australian dollars Average exchange rates2016 2015 2016 2015$'000 $'000
Buy US dollars/sell Australian dollarsMaturity:Less than 6 months 28,831 15,867 0.7096 0.8225 6 - 12 months 8,371 4,732 0.7168 0.7819 The carrying amount of the Group's foreign currency denominated financial assets and financial liabilities at the reporting date were as follows:
Assets Liabilities2016 2015 2016 2015
Consolidated $'000 $'000 $'000 $'000
US dollars 20,514 24,483 4,043 790 New Zealand dollars 1,564 454 229 126 Chinese renminbi 6,489 478 1,668 2,381 UAE dirham 890 1,129 - -
29,457 26,544 5,940 3,297 The Group had net assets denominated in foreign currencies of $23,519,000 (assets of $29,457,000 less liabilities of $5,940,000 as at 30 June 2016 (2015: $23,246,000 (assets of $26,544,000 less liabilities of $3,297,000)). Based on this exposure, had the Australian dollars strengthened by 10% / weakened by 10% (2015: strengthened by 10% / weakened by 10%) against these foreign currencies with all other variables held constant, the Group's profit before tax for the year would have been $308,000 higher/lower (2015: $80 lower/ higher) and equity would have been $1,746,000 higher/lower (2015: $2,326,000 higher/lower). The percentage change is the expected overall volatility of the significant currencies, which is based on management's assessment of reasonable possible fluctuations taking into consideration movements over the last 12 months each year and the spot rate at each reporting date. Price riskThe Group is not exposed to any significant price risk.

56 GALE PACIFIC LIMITED 2016 ANNUAL REPORT
Gale Pacific LimitedNotes to the financial statements30 June 2016 Note 22. Financial instruments (continued)
Interest rate riskThe Group is exposed to interest rate risk as entities in the Group borrow and deposit funds at both fixed and variable interest rates. Effective weighted average interest rates on classes of financial liabilities are disclosed under liquidity risk. The Group does not have material long term borrowings and does not use interest rate swaps to manage the risk of interest rate changes. As at the reporting date, the Group had the following variable rate bank balances and borrowings outstanding:
2016 2015Weighted average
interest rate Balance
Weighted average
interest rate BalanceConsolidated % $'000 % $'000
Cash and cash equivalents - 24,563 - 17,752 Bank loans 3.65% (31,971) 4.89% (8,337)Commercial bills payable - - 2.89% (24,500)Other loans 6.96% (744) 6.96% (1,587)
Net exposure to cash flow interest rate risk (8,152) (16,672) An analysis by remaining contractual maturities in shown in 'liquidity and interest rate risk management' below. An official increase/decrease in interest rates of 100 basis points would have an adverse/favourable effect on profit before tax of $327,000 per annum. The percentage change is based on the expected volatility of interest rates using market data and analysts forecasts. Credit riskCredit risk refers to the risk that a counterparty will default on its contractual obligations resulting in financial loss to the Group. Before accepting any new customer, the Group uses internal resources and criteria to assess the potential customer’s credit quality and defines credit limits by customer. The maximum exposure to credit risk at the reporting date to recognised financial assets is the carrying amount, net of any provisions for impairment of those assets, as disclosed in the statement of financial position and notes to the financial statements. The Group does not hold any collateral. Liquidity riskLiquidity risk is the risk that the Group will not be able to meet its financial obligations as they fall due. The Group’s approach to managing liquidity is to ensure, as far as possible, that it will always have sufficient liquidity to meet its liabilities when due, under both normal and stressed conditions, without incurring unacceptable losses or risking damage to the Group’s reputation. The Group manages liquidity risk by maintaining adequate cash reserves and available borrowing facilities by continuously monitoring actual and forecast cash flows and matching the maturity profiles of financial assets and liabilities.
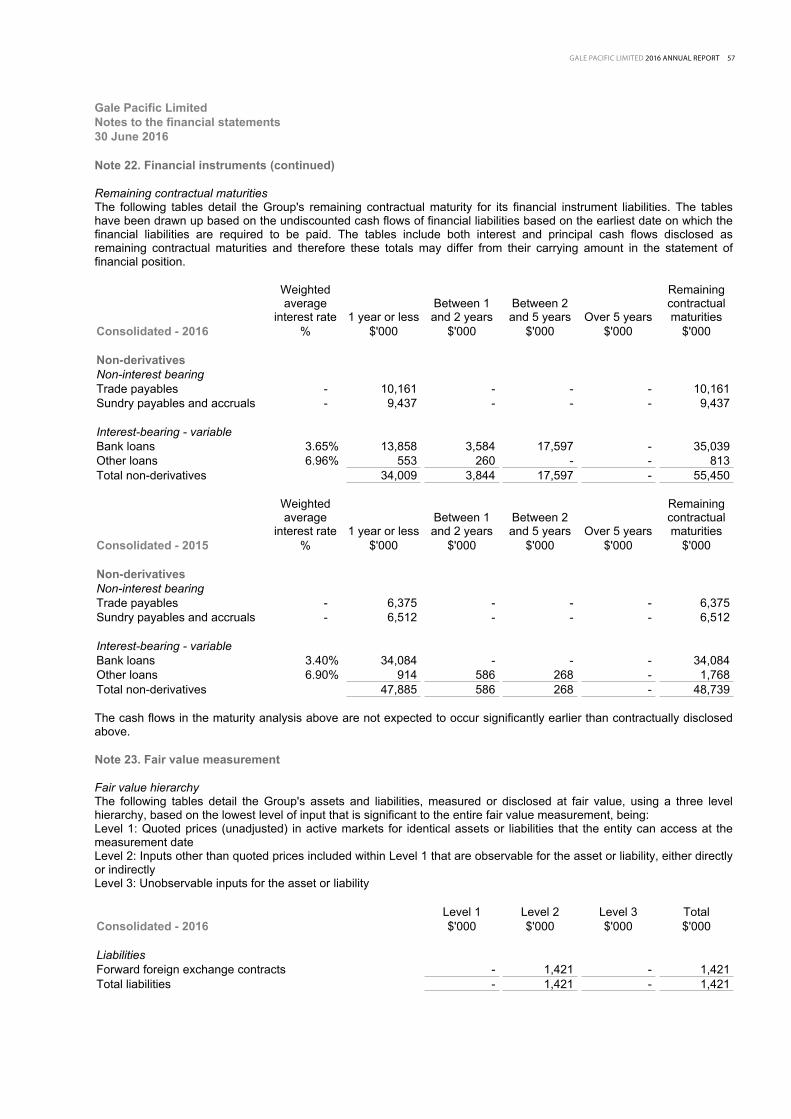
GALE PACIFIC LIMITED 2016 ANNUAL REPORT 57
Gale Pacific LimitedNotes to the financial statements30 June 2016 Note 22. Financial instruments (continued)
Remaining contractual maturitiesThe following tables detail the Group's remaining contractual maturity for its financial instrument liabilities. The tables have been drawn up based on the undiscounted cash flows of financial liabilities based on the earliest date on which the financial liabilities are required to be paid. The tables include both interest and principal cash flows disclosed as remaining contractual maturities and therefore these totals may differ from their carrying amount in the statement of financial position.
Weighted average
interest rate 1 year or lessBetween 1 and 2 years
Between 2 and 5 years Over 5 years
Remaining contractual maturities
Consolidated - 2016 % $'000 $'000 $'000 $'000 $'000
Non-derivativesNon-interest bearingTrade payables - 10,161 - - - 10,161 Sundry payables and accruals - 9,437 - - - 9,437
Interest-bearing - variableBank loans 3.65% 13,858 3,584 17,597 - 35,039 Other loans 6.96% 553 260 - - 813 Total non-derivatives 34,009 3,844 17,597 - 55,450
Weighted average
interest rate 1 year or lessBetween 1 and 2 years
Between 2 and 5 years Over 5 years
Remaining contractual maturities
Consolidated - 2015 % $'000 $'000 $'000 $'000 $'000
Non-derivativesNon-interest bearingTrade payables - 6,375 - - - 6,375 Sundry payables and accruals - 6,512 - - - 6,512
Interest-bearing - variableBank loans 3.40% 34,084 - - - 34,084 Other loans 6.90% 914 586 268 - 1,768 Total non-derivatives 47,885 586 268 - 48,739 The cash flows in the maturity analysis above are not expected to occur significantly earlier than contractually disclosed above. Note 23. Fair value measurement Fair value hierarchyThe following tables detail the Group's assets and liabilities, measured or disclosed at fair value, using a three level hierarchy, based on the lowest level of input that is significant to the entire fair value measurement, being:Level 1: Quoted prices (unadjusted) in active markets for identical assets or liabilities that the entity can access at the measurement dateLevel 2: Inputs other than quoted prices included within Level 1 that are observable for the asset or liability, either directly or indirectlyLevel 3: Unobservable inputs for the asset or liability
Level 1 Level 2 Level 3 TotalConsolidated - 2016 $'000 $'000 $'000 $'000
LiabilitiesForward foreign exchange contracts - 1,421 - 1,421 Total liabilities - 1,421 - 1,421
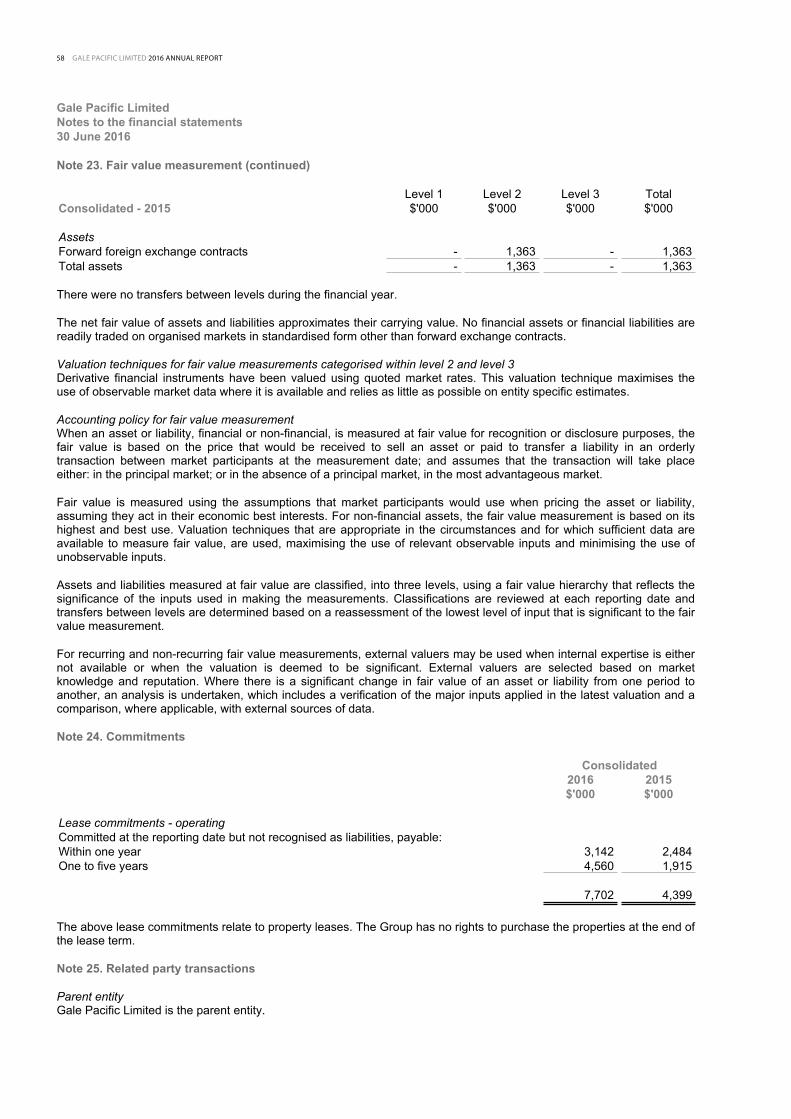
58 GALE PACIFIC LIMITED 2016 ANNUAL REPORT
Gale Pacific LimitedNotes to the financial statements30 June 2016 Note 23. Fair value measurement (continued)
Level 1 Level 2 Level 3 TotalConsolidated - 2015 $'000 $'000 $'000 $'000
AssetsForward foreign exchange contracts - 1,363 - 1,363 Total assets - 1,363 - 1,363 There were no transfers between levels during the financial year. The net fair value of assets and liabilities approximates their carrying value. No financial assets or financial liabilities are readily traded on organised markets in standardised form other than forward exchange contracts. Valuation techniques for fair value measurements categorised within level 2 and level 3Derivative financial instruments have been valued using quoted market rates. This valuation technique maximises the use of observable market data where it is available and relies as little as possible on entity specific estimates. Accounting policy for fair value measurementWhen an asset or liability, financial or non-financial, is measured at fair value for recognition or disclosure purposes, the fair value is based on the price that would be received to sell an asset or paid to transfer a liability in an orderly transaction between market participants at the measurement date; and assumes that the transaction will take place either: in the principal market; or in the absence of a principal market, in the most advantageous market. Fair value is measured using the assumptions that market participants would use when pricing the asset or liability, assuming they act in their economic best interests. For non-financial assets, the fair value measurement is based on its highest and best use. Valuation techniques that are appropriate in the circumstances and for which sufficient data are available to measure fair value, are used, maximising the use of relevant observable inputs and minimising the use of unobservable inputs. Assets and liabilities measured at fair value are classified, into three levels, using a fair value hierarchy that reflects the significance of the inputs used in making the measurements. Classifications are reviewed at each reporting date and transfers between levels are determined based on a reassessment of the lowest level of input that is significant to the fair value measurement. For recurring and non-recurring fair value measurements, external valuers may be used when internal expertise is either not available or when the valuation is deemed to be significant. External valuers are selected based on market knowledge and reputation. Where there is a significant change in fair value of an asset or liability from one period to another, an analysis is undertaken, which includes a verification of the major inputs applied in the latest valuation and a comparison, where applicable, with external sources of data. Note 24. Commitments
Consolidated2016 2015$'000 $'000
Lease commitments - operatingCommitted at the reporting date but not recognised as liabilities, payable:Within one year 3,142 2,484 One to five years 4,560 1,915
7,702 4,399 The above lease commitments relate to property leases. The Group has no rights to purchase the properties at the end of the lease term. Note 25. Related party transactions Parent entityGale Pacific Limited is the parent entity.

GALE PACIFIC LIMITED 2016 ANNUAL REPORT 59
Gale Pacific LimitedNotes to the financial statements30 June 2016 Note 25. Related party transactions (continued)
SubsidiariesInterests in subsidiaries are set out in note 28. Key management personnelDisclosures relating to key management personnel are set out in note 26 and the remuneration report included in the directors' report. Receivable from and payable to related partiesThe following balances are outstanding at the reporting date in relation to transactions with related parties:
Consolidated2016 2015
$ $
Current payables:Accrued director fees and superannuation contributions - 2,493 Loans to/from related partiesThere were no loans to or from related parties at the current and previous reporting date. Terms and conditionsAll transactions were made on normal commercial terms and conditions and at market rates. Note 26. Key management personnel disclosures CompensationThe aggregate compensation made to directors and other members of key management personnel of the Group is set out below:
Consolidated2016 2015
$ $
Short-term employee benefits 2,692,699 2,752,869 Post-employment benefits 155,724 173,899 Termination benefits 287,082 275,608 Share-based payments 208,802 82,809
3,344,307 3,285,185 Note 27. Parent entity information Set out below is the supplementary information about the parent entity. Statement of profit or loss and other comprehensive income
Parent2016 2015$'000 $'000
Profit after income tax 4,706 6,567
Total comprehensive income 2,757 8,029
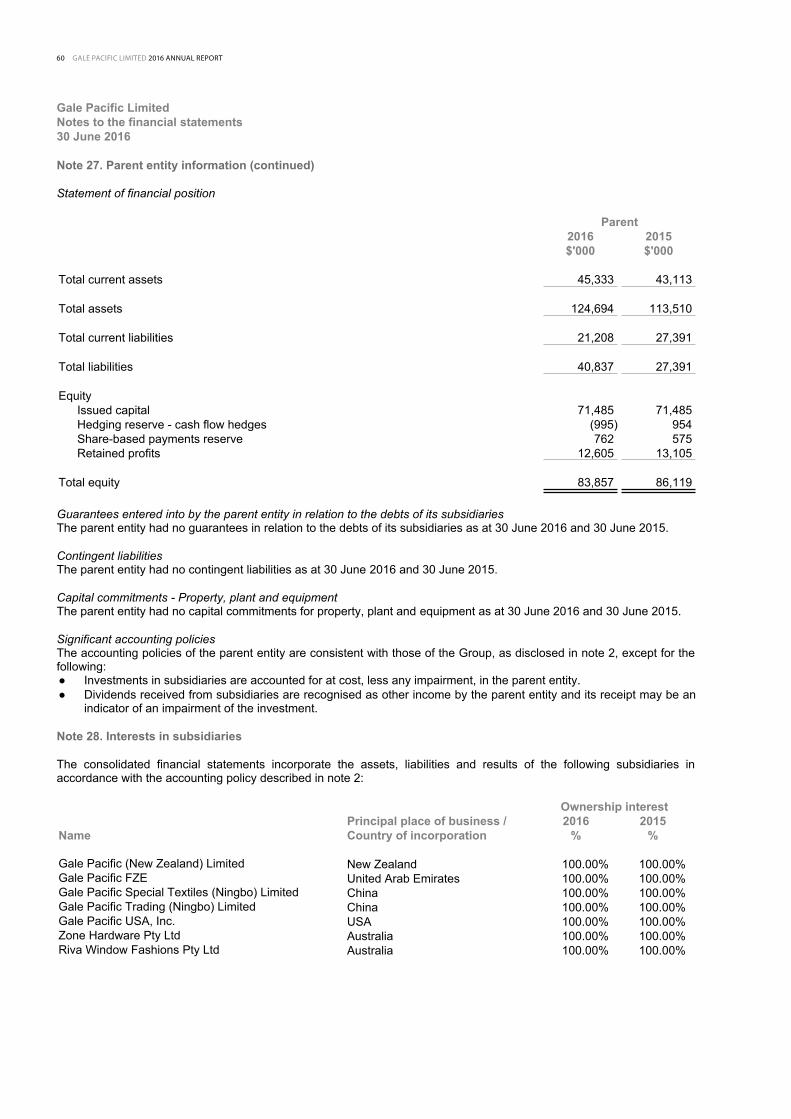
60 GALE PACIFIC LIMITED 2016 ANNUAL REPORT
Gale Pacific LimitedNotes to the financial statements30 June 2016 Note 27. Parent entity information (continued)
Statement of financial position
Parent2016 2015$'000 $'000
Total current assets 45,333 43,113
Total assets 124,694 113,510
Total current liabilities 21,208 27,391
Total liabilities 40,837 27,391
EquityIssued capital 71,485 71,485 Hedging reserve - cash flow hedges (995) 954 Share-based payments reserve 762 575 Retained profits 12,605 13,105
Total equity 83,857 86,119 Guarantees entered into by the parent entity in relation to the debts of its subsidiariesThe parent entity had no guarantees in relation to the debts of its subsidiaries as at 30 June 2016 and 30 June 2015. Contingent liabilitiesThe parent entity had no contingent liabilities as at 30 June 2016 and 30 June 2015. Capital commitments - Property, plant and equipmentThe parent entity had no capital commitments for property, plant and equipment as at 30 June 2016 and 30 June 2015. Significant accounting policiesThe accounting policies of the parent entity are consistent with those of the Group, as disclosed in note 2, except for the following:● Investments in subsidiaries are accounted for at cost, less any impairment, in the parent entity.● Dividends received from subsidiaries are recognised as other income by the parent entity and its receipt may be an
indicator of an impairment of the investment. Note 28. Interests in subsidiaries The consolidated financial statements incorporate the assets, liabilities and results of the following subsidiaries in accordance with the accounting policy described in note 2:
Ownership interestPrincipal place of business / 2016 2015
Name Country of incorporation % %
Gale Pacific (New Zealand) Limited New Zealand 100.00% 100.00% Gale Pacific FZE United Arab Emirates 100.00% 100.00% Gale Pacific Special Textiles (Ningbo) Limited China 100.00% 100.00% Gale Pacific Trading (Ningbo) Limited China 100.00% 100.00% Gale Pacific USA, Inc. USA 100.00% 100.00% Zone Hardware Pty Ltd Australia 100.00% 100.00% Riva Window Fashions Pty Ltd Australia 100.00% 100.00%

GALE PACIFIC LIMITED 2016 ANNUAL REPORT 61
Gale Pacific LimitedNotes to the financial statements30 June 2016
Note 29. Share-based payments The Group maintains a performance rights scheme for certain staff and executives, including executive directors, as approved by shareholders at an annual general meeting. The scheme is designed to reward key personnel when the Group meets performance hurdles relating to:● Improvement in earnings per share; and● Improvement in return to shareholders. Each performance right entitles the holder one ordinary share in the Company when exercised and is subject to the satisfying of relevant performance hurdles based on improvements in the Group’s diluted earnings per share. Performance rights issued to executives during the financial year were issued in accordance with the Group’s remuneration policy which: ● Reward executives for Group and individual performance;● Align the interests of the executives with those of the shareholders; and● Ensure that total remuneration is competitive by market standards.
Refer to note 6 for the amount expensed to profit or loss during the financial year. Set out below are summaries of performance rights granted under the plan: 2016 Balance at Expired/ Balance at Grant the start of forfeited/ the end of Grant date Expiry date price the year Granted Exercised other the year
11/12/2014 01/12/2017 $0.18 2,364,138 - - (1,783,733) 580,405 09/10/2015 01/12/2018 $0.21 - 3,022,000 - - 3,022,000
2,364,138 3,022,000 - (1,783,733) 3,602,405 2015 Balance at Expired/ Balance at Grant the start of forfeited/ the end of Grant date Expiry date price the year Granted Exercised other the year
30/06/2014 30/06/2014 $0.15 2,125,000 - - (2,125,000) - 30/06/2014 30/06/2014 $0.15 600,000 - - (600,000) - 30/06/2014 30/06/2014 $0.15 975,000 - - (975,000) - 11/12/2014 01/12/2017 $0.18 - 2,690,965 - (326,827) 2,364,138
3,700,000 2,690,965 - (4,026,827) 2,364,138 There were no performance rights exercisable at the reporting dated (30 June 2016). For performance rights granted during the current financial year, the valuation model inputs used to determine the fair value at the grant date, using the binominal option pricing, are as follows:
Share price Exercise Expected Dividend Risk-free Fair valueGrant date Expiry date at grant date price volatility yield interest rate at grant date
09/10/2015 01/12/2018 $0.26 $0.00 - 80.00% 1.80% $0.214 Accounting policy for share-based paymentsEquity-settled share-based compensation benefits are provided to certain employees including executive directors. Equity-settled transactions are awards of performance rights over shares, that are provided to employees in exchange for the rendering of services. The cost of equity-settled transactions is measured at fair value on grant date. Fair value is independently determined using the Binomial option pricing model that takes into account the exercise price, the term of the option, the impact of dilution, the share price at grant date and expected price volatility of the underlying share, the expected dividend yield and the risk free interest rate for the term of the option, together with non-vesting conditions that do not determine whether the Group receives the services that entitle the employees to receive payment. No account is taken of any other vesting conditions.
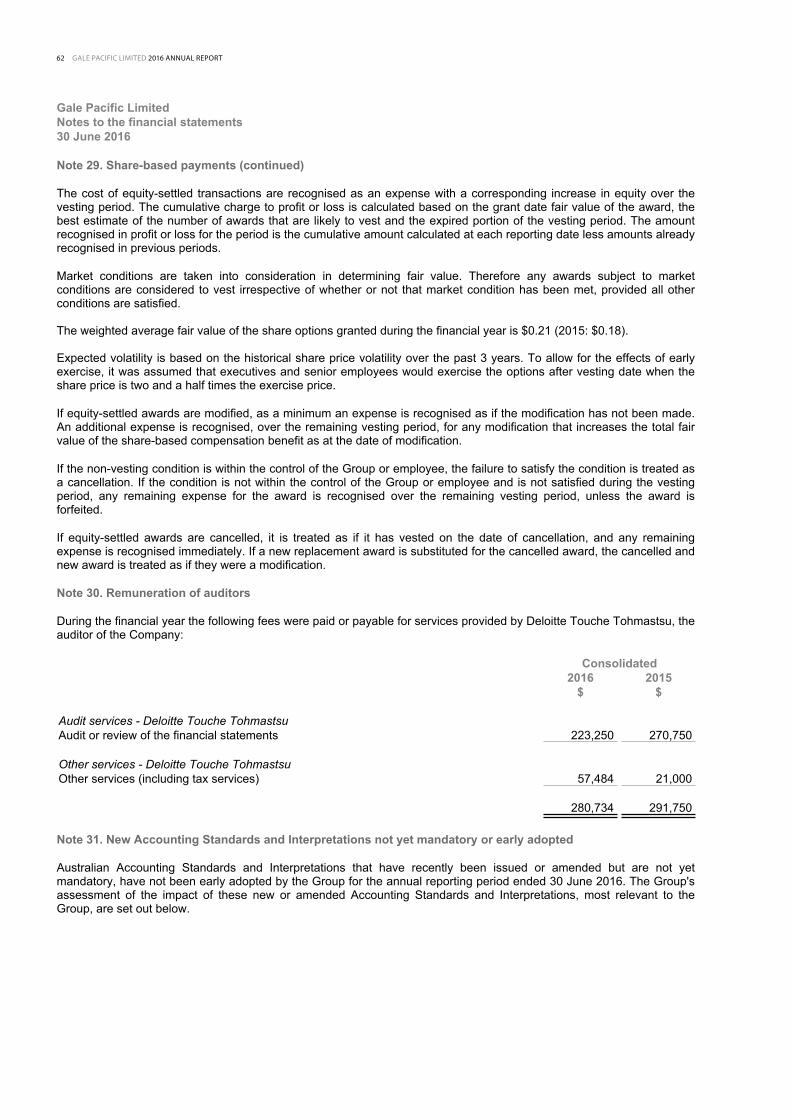
62 GALE PACIFIC LIMITED 2016 ANNUAL REPORT
Gale Pacific LimitedNotes to the financial statements30 June 2016
Note 29. Share-based payments (continued)
The cost of equity-settled transactions are recognised as an expense with a corresponding increase in equity over the vesting period. The cumulative charge to profit or loss is calculated based on the grant date fair value of the award, the best estimate of the number of awards that are likely to vest and the expired portion of the vesting period. The amount recognised in profit or loss for the period is the cumulative amount calculated at each reporting date less amounts already recognised in previous periods.
Market conditions are taken into consideration in determining fair value. Therefore any awards subject to market conditions are considered to vest irrespective of whether or not that market condition has been met, provided all other conditions are satisfied.
The weighted average fair value of the share options granted during the financial year is $0.21 (2015: $0.18).
Expected volatility is based on the historical share price volatility over the past 3 years. To allow for the effects of early exercise, it was assumed that executives and senior employees would exercise the options after vesting date when the share price is two and a half times the exercise price.
If equity-settled awards are modified, as a minimum an expense is recognised as if the modification has not been made. An additional expense is recognised, over the remaining vesting period, for any modification that increases the total fair value of the share-based compensation benefit as at the date of modification.
If the non-vesting condition is within the control of the Group or employee, the failure to satisfy the condition is treated as a cancellation. If the condition is not within the control of the Group or employee and is not satisfied during the vesting period, any remaining expense for the award is recognised over the remaining vesting period, unless the award is forfeited.
If equity-settled awards are cancelled, it is treated as if it has vested on the date of cancellation, and any remaining expense is recognised immediately. If a new replacement award is substituted for the cancelled award, the cancelled and new award is treated as if they were a modification.
Note 30. Remuneration of auditors
During the financial year the following fees were paid or payable for services provided by Deloitte Touche Tohmastsu, the auditor of the Company:
Consolidated2016 2015
$ $
Audit services - Deloitte Touche TohmastsuAudit or review of the financial statements 223,250 270,750
Other services - Deloitte Touche TohmastsuOther services (including tax services) 57,484 21,000
280,734 291,750
Note 31. New Accounting Standards and Interpretations not yet mandatory or early adopted
Australian Accounting Standards and Interpretations that have recently been issued or amended but are not yet mandatory, have not been early adopted by the Group for the annual reporting period ended 30 June 2016. The Group's assessment of the impact of these new or amended Accounting Standards and Interpretations, most relevant to the Group, are set out below.

GALE PACIFIC LIMITED 2016 ANNUAL REPORT 63
Gale Pacific LimitedNotes to the financial statements30 June 2016
Note 31. New Accounting Standards and Interpretations not yet mandatory or early adopted (continued)
AASB 9 Financial InstrumentsThis standard is applicable to annual reporting periods beginning on or after 1 January 2018. The standard replaces all previous versions of AASB 9 and completes the project to replace AASB 39 'Financial Instruments: Recognition and Measurement'. AASB 9 introduces new classification and measurement models for financial assets and makes minor amendments for financial liabilities. New simpler hedge accounting requirements are intended to more closely align the accounting treatment with the risk management activities of the entity. New impairment requirements will use an 'expected credit loss' model to recognise an allowance. The Group will adopt this standard from 1 July 2018 but the impact of its adoption is yet to be assessed by the Group.
AASB 15 Revenue from Contracts with CustomersThis standard is applicable to annual reporting periods beginning on or after 1 January 2018. The standard provides a single standard for revenue recognition. The core principle of the standard is that an entity will recognise revenue to depict the transfer of promised goods or services to customers in an amount that reflects the consideration to which the entity expects to be entitled in exchange for those goods or services. The Group will adopt this standard from 1 July 2018 but the impact of its adoption is yet to be assessed by the Group
AASB 16 LeasesThis standard is applicable to annual reporting periods beginning on or after 1 January 2019. The standard will eliminate the classifications of operating leases and finance leases for lessees. Subject to exceptions (short-term leases of 12 months or less and leases of low-value assets), a 'right-of-use' asset will be capitalised in the statement of financial position, measured as the present value of the unavoidable future lease payments to be made over the lease term. A liability corresponding to the capitalised lease will also be recognised, adjusted for lease prepayments, lease incentives received, initial direct costs incurred and an estimate of any future restoration, removal or dismantling costs. Straight-line operating lease expense recognition will be replaced with a depreciation charge for the leased asset and an interest expense on the recognised lease liability. In the earlier periods of the lease, the expenses associated with the lease under AASB 16 will be higher when compared to lease expenses under AASB 117 ‘Leases’. However EBITDA results will be improved as the operating expense is replaced by interest expense and depreciation in profit or loss under AASB 16. For lessor accounting, the standard does not substantially change how a lessor accounts for leases. The Group will adopt this standard from 1 July 2019 but the impact of its adoption is yet to be assessed by the Group.
Other amending accounting standardsOther amending accounting standards issued are not considered to have a significant impact on the financial statements of the Group as their amendments provide either clarification of existing accounting treatment or editorial amendments.
Note 32. Events after the reporting period
Apart from the dividend declared as disclosed in note 20, no other matter or circumstance has arisen since 30 June 2016 that has significantly affected, or may significantly affect the Group's operations, the results of those operations, or the Group's state of affairs in future financial years.
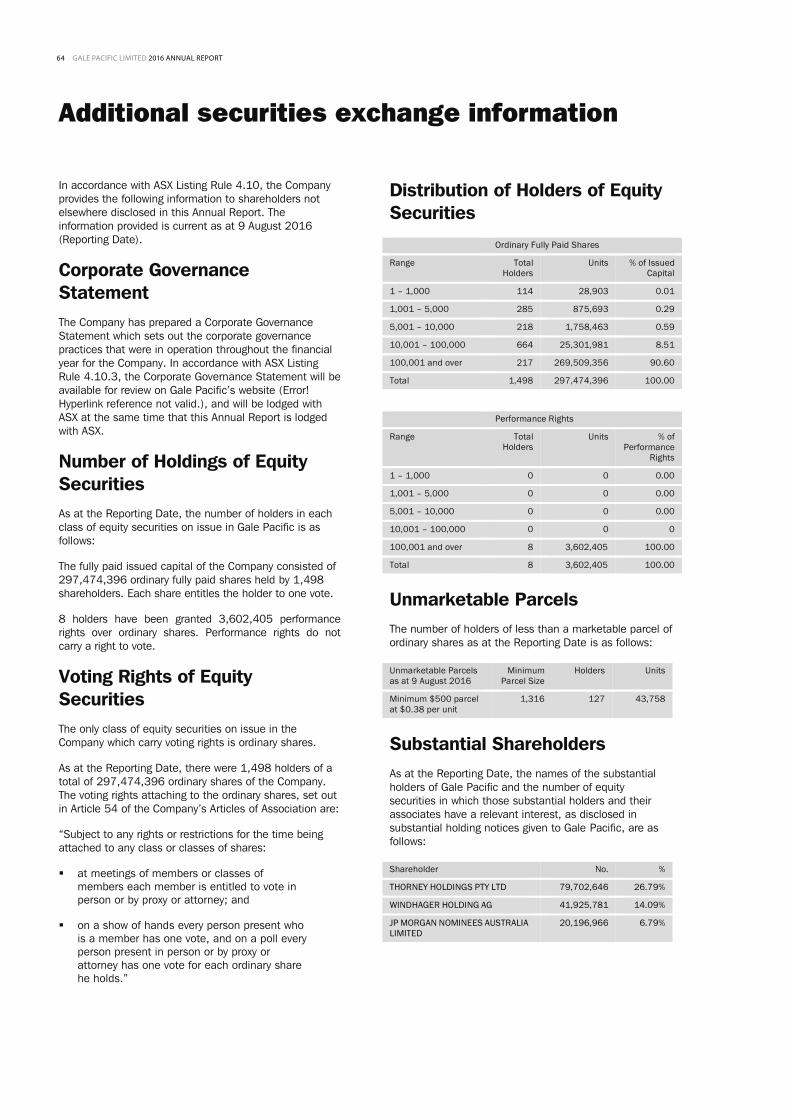
64 GALE PACIFIC LIMITED 2016 ANNUAL REPORT
Additional securities exchange information
In accordance with ASX Listing Rule 4.10, the Company provides the following information to shareholders not elsewhere disclosed in this Annual Report. The information provided is current as at 9 August 2016 (Reporting Date).
Corporate Governance Statement The Company has prepared a Corporate Governance Statement which sets out the corporate governance practices that were in operation throughout the financial year for the Company. In accordance with ASX Listing Rule 4.10.3, the Corporate Governance Statement will be available for review on Gale Pacific’s website (Error! Hyperlink reference not valid.), and will be lodged with ASX at the same time that this Annual Report is lodged with ASX.
Number of Holdings of Equity Securities As at the Reporting Date, the number of holders in each class of equity securities on issue in Gale Pacific is as follows:
The fully paid issued capital of the Company consisted of 297,474,396 ordinary fully paid shares held by 1,498 shareholders. Each share entitles the holder to one vote.
8 holders have been granted 3,602,405 performance rights over ordinary shares. Performance rights do not carry a right to vote.
Voting Rights of Equity Securities The only class of equity securities on issue in the Company which carry voting rights is ordinary shares.
As at the Reporting Date, there were 1,498 holders of a total of 297,474,396 ordinary shares of the Company. The voting rights attaching to the ordinary shares, set out in Article 54 of the Company’s Articles of Association are:
“Subject to any rights or restrictions for the time being attached to any class or classes of shares:
at meetings of members or classes ofmembers each member is entitled to vote inperson or by proxy or attorney; and
on a show of hands every person present whois a member has one vote, and on a poll everyperson present in person or by proxy orattorney has one vote for each ordinary sharehe holds.”
Distribution of Holders of Equity Securities
Ordinary Fully Paid Shares
Range Total Holders
Units % of Issued Capital
1 – 1,000 114 28,903 0.01
1,001 – 5,000 285 875,693 0.29
5,001 – 10,000 218 1,758,463 0.59
10,001 – 100,000 664 25,301,981 8.51
100,001 and over 217 269,509,356 90.60
Total 1,498 297,474,396 100.00
Performance Rights
Range Total Holders
Units % of Performance
Rights
1 – 1,000 0 0 0.00
1,001 – 5,000 0 0 0.00
5,001 – 10,000 0 0 0.00
10,001 – 100,000 0 0 0
100,001 and over 8 3,602,405 100.00
Total 8 3,602,405 100.00
Unmarketable Parcels The number of holders of less than a marketable parcel of ordinary shares as at the Reporting Date is as follows:
Unmarketable Parcels as at 9 August 2016
Minimum Parcel Size
Holders Units
Minimum $500 parcel at $0.38 per unit
1,316 127 43,758
Substantial Shareholders As at the Reporting Date, the names of the substantial holders of Gale Pacific and the number of equity securities in which those substantial holders and their associates have a relevant interest, as disclosed in substantial holding notices given to Gale Pacific, are as follows:
Shareholder No. %
THORNEY HOLDINGS PTY LTD 79,702,646 26.79%
WINDHAGER HOLDING AG 41,925,781 14.09%
JP MORGAN NOMINEES AUSTRALIALIMITED
20,196,966 6.79%
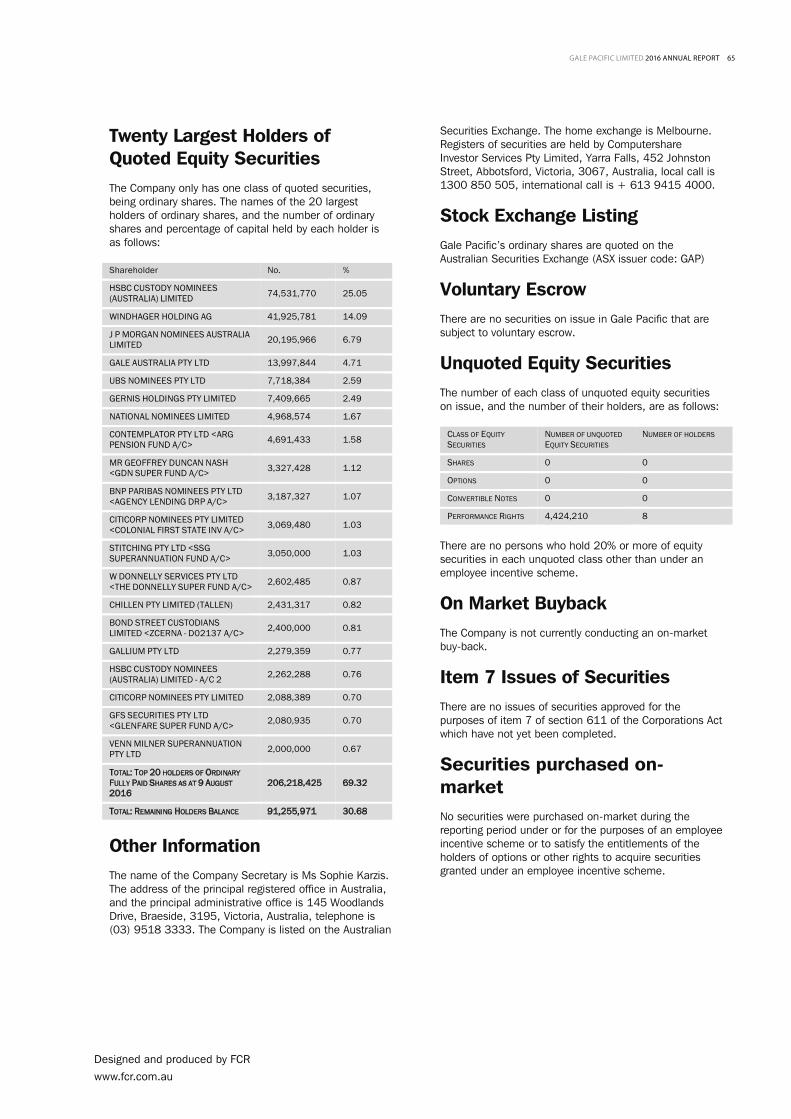
GALE PACIFIC LIMITED 2016 ANNUAL REPORT 6511 GALE PACIFIC LIMITED 2016 ANNUAL REPORT
Twenty Largest Holders of Quoted Equity Securities The Company only has one class of quoted securities, being ordinary shares. The names of the 20 largest holders of ordinary shares, and the number of ordinary shares and percentage of capital held by each holder is as follows:
Shareholder No. %
HSBC CUSTODY NOMINEES(AUSTRALIA) LIMITED 74,531,770 25.05
WINDHAGER HOLDING AG 41,925,781 14.09
J P MORGAN NOMINEES AUSTRALIALIMITED 20,195,966 6.79
GALE AUSTRALIA PTY LTD 13,997,844 4.71
UBS NOMINEES PTY LTD 7,718,384 2.59
GERNIS HOLDINGS PTY LIMITED 7,409,665 2.49
NATIONAL NOMINEES LIMITED 4,968,574 1.67
CONTEMPLATOR PTY LTD <ARGPENSION FUND A/C> 4,691,433 1.58
MR GEOFFREY DUNCAN NASH <GDN SUPER FUND A/C> 3,327,428 1.12
BNP PARIBAS NOMINEES PTY LTD<AGENCY LENDING DRP A/C> 3,187,327 1.07
CITICORP NOMINEES PTY LIMITED<COLONIAL FIRST STATE INV A/C> 3,069,480 1.03
STITCHING PTY LTD <SSGSUPERANNUATION FUND A/C> 3,050,000 1.03
W DONNELLY SERVICES PTY LTD<THE DONNELLY SUPER FUND A/C> 2,602,485 0.87
CHILLEN PTY LIMITED (TALLEN) 2,431,317 0.82
BOND STREET CUSTODIANSLIMITED <ZCERNA - D02137 A/C> 2,400,000 0.81
GALLIUM PTY LTD 2,279,359 0.77
HSBC CUSTODY NOMINEES(AUSTRALIA) LIMITED - A/C 2 2,262,288 0.76
CITICORP NOMINEES PTY LIMITED 2,088,389 0.70
GFS SECURITIES PTY LTD<GLENFARE SUPER FUND A/C> 2,080,935 0.70
VENN MILNER SUPERANNUATIONPTY LTD 2,000,000 0.67
TOTAL: TOP 20 HOLDERS OF ORDINARY FULLY PAID SHARES AS AT 9 AUGUST 2016
206,218,425 69.32
TOTAL: REMAINING HOLDERS BALANCE 91,255,971 30.68
Other Information The name of the Company Secretary is Ms Sophie Karzis. The address of the principal registered office in Australia, and the principal administrative office is 145 Woodlands Drive, Braeside, 3195, Victoria, Australia, telephone is (03) 9518 3333. The Company is listed on the Australian
Securities Exchange. The home exchange is Melbourne. Registers of securities are held by Computershare Investor Services Pty Limited, Yarra Falls, 452 Johnston Street, Abbotsford, Victoria, 3067, Australia, local call is 1300 850 505, international call is + 613 9415 4000.
Stock Exchange Listing Gale Pacific’s ordinary shares are quoted on the Australian Securities Exchange (ASX issuer code: GAP)
Voluntary Escrow There are no securities on issue in Gale Pacific that are subject to voluntary escrow.
Unquoted Equity Securities The number of each class of unquoted equity securities on issue, and the number of their holders, are as follows:
CLASS OF EQUITY SECURITIES
NUMBER OF UNQUOTEDEQUITY SECURITIES
NUMBER OF HOLDERS
SHARES 0 0
OPTIONS 0 0
CONVERTIBLE NOTES 0 0
PERFORMANCE RIGHTS 4,424,210 8
There are no persons who hold 20% or more of equity securities in each unquoted class other than under an employee incentive scheme.
On Market Buyback The Company is not currently conducting an on-market buy-back.
Item 7 Issues of Securities There are no issues of securities approved for the purposes of item 7 of section 611 of the Corporations Act which have not yet been completed.
Securities purchased on-market No securities were purchased on-market during the reporting period under or for the purposes of an employee incentive scheme or to satisfy the entitlements of the holders of options or other rights to acquire securities granted under an employee incentive scheme.
Designed and produced by FCR
www.fcr.com.au

www.galepacific.com.au
Related Documents