ANNUAL REPORT 2015

Welcome message from author
This document is posted to help you gain knowledge. Please leave a comment to let me know what you think about it! Share it to your friends and learn new things together.
Transcript

Des
igne
d by
AU
SD
_16
89
2
AU
SDR
ILL LIMITED
A
NN
UA
L REP
OR
T 2015
ANNUAL REPORT 2015
FOLLOW US AT AUSDRILL.COM.AU

Financial performance for the year ���������������������������������������������������02Operating and financial review ����������������������������������������������������������03Financial statements ����������������������������������������������������������������������������� 21Directors’ report ����������������������������������������������������������������������������������������� 22Auditor’s Independence Declaration ���������������������������������������������������36Corporate governance statement ���������������������������������������������������������37Consolidated income statement ����������������������������������������������������������38Consolidated statement of comprehensive income �����������������������39Consolidated statement of financial position ������������������������������������40Consolidated statement of changes in equity ������������������������������������41Consolidated statement of cash flows�������������������������������������������������42Notes to the consolidated financial statements ������������������������������� 43Directors’ declaration ���������������������������������������������������������������������������� 108Independent auditor’s report ��������������������������������������������������������������� 109Shareholder information �������������������������������������������������������������������������111Financial table �������������������������������������������������������������������������������������������113
CONTINUING TO IMPROVE OUR
BUSINESS
ROLL OUT OF “ONE SAFE - ALL SAFE” SAFETY INITIATIVE
FINANCIAL TABLE 113
11 12 13 14 15REVENUESales Revenue $’000 834,641 1,059,107 1,128,559 826,305 765,773Interest Received $’000 4,572 3,134 2,724 1,555 1,867Dividends Received $’000 - - - - -
Total $’000 839,213 1,062,241 1,131,283 827,860 767,640
PROFIT/(LOSS)EBITDA* $’000 195,490 288,436 272,746 173,656 114,694Depreciation and amortisation expense $’000 82,509 116,144 123,695 99,177 77,463EBIT* $’000 112,981 172,292 149,051 74,479 37,231Net Interest Expense $’000 13,470 19,805 39,548 40,049 35,118Operating profit before income tax* $’000 99,511 152,487 109,503 34,430 2,113Impairment expense $’000 (53) - (47) (77,893) (202,798)Profit / (loss) before income tax $’000 99,458 152,487 109,456 (43,463) (200,685)Income tax expense $’000 26,141 40,280 19,057 396 (25,065)Profit / (loss) from discontinued operation $’000 - - - - -
Profit / (loss) for the year $’000 73,317 112,207 90,399 (43,859) (175,620)Number of Ordinary Shares at Year End 000’s 301,453 304,397 312,277 312,277 312,277Weighted Number of Ordinary Shares 000’s 270,568 302,935 308,173 312,277 312,277Basic earnings / (loss) per share cents 27.13 37.28 29.63 (13.64) (56.24)Diluted earnings / (loss) per share cents 26.92 36.97 28.98 (13.64) (56.24)
STATEMENT OF FINANCIAL POSITIONTotal Assets $’000 1,069,736 1,342,615 1,539,396 1,367,736 1,130,034Total Liabilities $’000 414,793 601,854 722,010 615,568 576,741Shareholders’ Equity $’000 654,943 740,761 817,386 752,168 553,293Net tangible assets per share dollar 2.06 2.33 2.39 2.37 1.77
CASH FLOWSGross cash flows from operating activities $’000 136,102 205,407 263,966 192,371 138,486Net cash flows from operating activities $’000 117,349 156,784 187,290 142,117 117,936Net cash flows from investing activities $’000 (154,565) (195,640) (330,281) (56,223) (738)Net cash flows from financing activities $’000 36,739 23,551 93,328 (101,209) (104,693)Closing cash balance $’000 140,714 124,188 78,826 62,695 77,865Gross debt $’000 223,612 366,411 551,255 463,587 443,273Net debt $’000 82,898 242,223 472,429 400,892 365,408
DIVIDENDSTotal Dividends per share (Interim & Final declared) cents 12.00 14.50 12.00 4.50 1.0Total Dividends paid $’000 30,183 39,357 44,498 24,981 9,369
NET DEBT / TOTAL CAPITAL % 11 25 37 35 40
EBIT TO SALES REVENUE % 13.53 16.27 13.20 9.01 4.86
EMPLOYEES AT YEAR END # 4,362 6,003 5,703 4,578 4,080
* EBITDA, EBIT and operating profit before income tax excludes impairment expense and discontinued operation�

OPERATING AND FINANCIAL REVIEW 01
BETTER CAPITAL AND INVENTORY MANAGEMENT
4 OPERATING AREAS SERVING THE MINING LIFE CYCLE
SAFE ALL SAFE IS THE AUSDRILL WAY
1
COUNTRIES AND MULTIPLE MINE SITES
8
INTEGRATED MINING SERVICES BUSINESSES
17
YEARS UNEARTHING OPPORTUNITIES GLOBALLY
28
REPAYING SECURED DEBT
DRIVING EFFICIENCY THROUGH THE STRATEGIC SOURCING PROGRAM AND BUSINESS CONSOLIDATIONS
PEOPLE WORKING AS ONE FAMILY
4,000OVER

OPERATING AND FINANCIAL REVIEW02
SALES REVENUE($M)
OPERATING PROFIT BEFORE TAX *1 ($M)
* Exclude the effects of any significant items 1 Refer notes page 19
EBITDA*1
($M)
FINANCIAL PERFORMANCE FOR THE YEAR
EBIT1
$37.2m*-50.0%
$114.7m*EBITDA1
-34.0%
SALES REVENUE
-7.3%
$765.8m
1400
1200
1000
800
600
400
200
011 12 13 14 15
350
300
250
200
150
100
50
011 12 13 14 15
160
140
120
100
80
60
40
20
011 12 13 14 15
-93.9%
OPERATING PROFIT BEFORE TAX
$2.1m*

OPERATING AND FINANCIAL REVIEW 03
OPERATING AND FINANCIAL REVIEW
(1) Based on FY2015 sales revenue including inter-segment sales - figures may not add due to rounding
AUSDRILL REVENUE BY GEOGRAPHY(1)AUSDRILL REVENUE BY BUSINESS ACTIVITY(1)
Contract Mining Africa 32.3%
Other 3.9%
Drill and Blast 16.3%
Equipment Hire 14.8%
Exploration 9.0%
Manufacturing 10.3%
Waterwell Drilling 3.7%
Supply Logistics 5.0%
Coal Seam Gas 4.6%
Production 67.2%
Other 23.8%
Explor. 9.0%
Ghana 17.7%
Mali 9.4%
Other 2.5%
Australia 63.1%
Guinea 7.3%
Australia 63.1%
Other 2.5%
Africa 34.4%
HIGHLIGHTS
●● Relationships extended with a number of key global clients with contract awards and renewals in both Australia and Africa.
●● Awarded a USD$223 million contract to provide open pit mining services over the next five years to Perseus Mining in Ghana.
●● Selected as a preferred equipment supplier by Peabody Energy Australia for its mines in key Australian coal regions.
●● Extended into new markets with Energy Drilling Australia (EDA) winning its first contract to deliver services to Heritage Oil in Papua New Guinea.
●● Improved safety performance across the Group.
●● Board strengthened with appointment of highly experienced mining engineer Mark Hine as a non-executive director.
●● Strong operational cash flow generation of $117.9 million in challenging market.
●● Group’s capital structure underpinned with successful refinancing of senior bank facilities.
●● Financial position of the Group remains strong with increased cash reserves of $77.9 million exceeding secured debt of $47.9 million.
●● Modest operating profit before tax in a challenging environment.
PRINCIPAL ACTIVITIES
Ausdrill’s key focus is providing a broad range of services to mining clients. Ausdrill (Company or Group) has invested in people, businesses and equipment over more than 25 years to ensure it can successfully deliver services across every stage of the mining lifecycle, with a particular focus on production. It is a strategy that has delivered strong returns for the Company to date, and one which management believes will continue to deliver in the years ahead.
In Australia the services offered include drill and blast, grade control, water well drilling and equipment sales, hire and parts. In Africa, the Group offers load and haul and crusher feed services in addition to all the production-related services that the Group provides in Australia.
These service offerings are complemented by significant in-house manufacturing capabilities that produce drilling rigs, light weight dump truck trays, parts and consumables, as well as supply and logistics services, which are used in the delivery of Ausdrill’s core services, and sold to external clients.
In addition to the above services, the Group offers mineral analytics and exploration drilling services. The combined services and production capabilities enable the Group to deliver a diversified range of vertically integrated services and products to clients. The Group also has established capability to provide exploration and production drilling services to the onshore oil and gas sector in Australia and PNG.
The Australian operations are primarily based in Western Australia, with a presence in Queensland, South Australia and New South Wales. Ausdrill’s African operations are primarily located in Ghana, with a presence in Mali, Burkina Faso, Guinea and Tanzania. The Group provides specialist underground mining services (high speed decline development and production) through its 50-50 joint venture with Barminco Limited, African Underground Mining Services.
The following charts show the percentages of sales revenue by business activity and by geography.

OPERATING AND FINANCIAL REVIEW04
AUSDRILL’S OPERATING BUSINESSES ARE GROUPED INTO THE FOLLOWING PRINCIPAL OPERATING SEGMENTS: MINING SERVICES AUSTRALIA; CONTRACT MINING SERVICES AFRICA; MANUFACTURING; SUPPLY & LOGISTICS; AND OTHER. REVENUE SHOWN IN THE CHART BELOW IS FOR THE YEAR ENDED 30 JUNE 2015 (FY15) AFTER INTER-SEGMENT ELIMINATION.
REVENUE(1)
$45m
Drill and blast
Grade control
Waterwell drilling
Equipment sales, hire and parts
Explosives supply
Exploration drilling
Mineral analysis
Exploration/production drilling services for onshore oil and gas
Manufacture of drill rigs
Manufacture of drill rods, hammers, bits and consumables
Manufacture of drill pipes
Manufacture of truck trays
(1) Excludes intercompany sales (2) Figures may not add due to rounding
Supply and logistics for external clients
Construction services for the utility, telecommunications and power industries
Support function for offshore operations
Contract mining services including: • Drill and blast
• Grade control
• Load and haul
• Crusher feed
• Equipment hire and parts
Exploration drilling
Underground development and production services
Mineral analysis
REVENUE(1)
$276m
REVENUE(1)
$58m
REVENUE(1)
$387m
51%(2)
MINING SERVICES AUSTRALIA CONTRACT MINING SERVICES AFRICA
MANUFACTURING SUPPLY & LOGISTICS AND OTHER
36%(2)
8%(2) OTHER 2%(2)
S&L 4%(2)

OPERATING AND FINANCIAL REVIEW 05
As a result of the Group’s strategy to build long-term relationships with key industry participants, Ausdrill’s clients are predominantly established gold and iron ore mining companies. For the year ended 30 June 2015, approximately 73% of mining services revenues were generated from the provision of mining services to gold mining companies and approximately 17% to iron ore mining companies, in each case, primarily for work on producing mines. The mining services that the Group provides are essential to continued production and therefore the mine owners’ ability to generate revenue.
Ausdrill’s clients include many of the world’s leading resources companies such as AngloGold, BHP Billiton, Barrick, Rio Tinto, Gold Fields and Randgold. These companies are typically large, publicly-listed multinational corporations with annual mining revenue of more than US$500 million and have the financial strength to develop major mines on their own. Ausdrill’s growth in its chosen markets has been influenced by its long-standing relationships with these clients (in some instances, extending over more than 20 years) and continued engagement with them as they pursue their strategies to develop and extract resources from deposits in Australia and Africa.
REVENUE
Sales Revenue for the Group decreased by 7% or $60.5 million. The reduction in activities was principally evident in the Contract Mining Services segment and is due to the cessation of drill & blast contracts in the iron ore sector as well as lower levels of activity in waterwell and exploration drilling that occurred at the same time as the fall in the iron ore price. In addition, mining companies continue to lower costs by optimising mining volumes and deferring expenditure as much as possible as they endeavour to offset the impact of lower commodity prices.
Sales Revenue excludes Ausdrill’s 50% share of revenue generated by the AUMS joint ventures being $110.1 million (2014: $136.8 million). AUMS is equity accounted and only Ausdrill’s 50% share of net profits are included in the consolidated income statement.
EXPENSES
The Group’s three largest expense categories are Materials, Labour, and Depreciation and amortisation which represent 86% (2014: 85.0%) of all expenses (excluding impairment).
Materials expenses increased by 8% or $23.8 million due to the higher proportion of product in the manufacturing business being imported, a high level of recharges in the energy drilling business, an increasing proportion of sales in the BTP business from service exchange programmes as well as a higher level of maintenance costs incurred on the hire fleet at a time of low utilisation and in preparation for the delivery of a major contract for Peabody Energy Australia.
12 months to June 2015 12 months to June 2014
$ million Statutory Non-IFRS Statutory Non-IFRS
% change from previous corresponding
period
Sales Revenue 765.8 765.8 826.3 826.3 (7.3%)
EBITDA1 2 114.7* 173.7* (34.0%)
EBIT1 2 37.2* 74.5* (50.0%)
Operating Profit1 3 before tax 2.1* 34.4* (93.9%)
Operating Profit/(Loss) after tax (175.6) (43.9)
* Figures exclude the effects of any significant items
Ausdrill has reported a decrease in revenue and earnings largely as a result of the continuation of challenging conditions for companies operating in the mining services industry in Australia and Africa.
GROUP FINANCIAL PERFORMANCE

OPERATING AND FINANCIAL REVIEW06
Labour expenses decreased by 9% or $25.9 million, reflecting the decline in activity associated with the slowdown in the mining industry.
Depreciation and amortisation expenses decreased by 22% or $21.7 million, as a result of the lower utilisation of equipment associated with the slow-down in the mining industry as well as the impact of the impairment charge taken at the December 2014 half year.
EARNINGS
EBITDA (excluding significant items) decreased from $173.7 million to $114.7 million for the year ended 30 June 2015 and the EBITDA margin (excluding equity accounted profits) decreased from 20.8% to 13.3%. The EBITDA margin has been impacted by the under performance of the waterwell, energy drilling operations and the equipment hire and parts businesses. EBITDA was also impacted by a large bad debt provision against Western Desert Resources of $7.5 million and a foreign exchange loss of $7.7 million (last year a gain of $5.8 million was reported). The equity accounted profits from joint ventures increased from $1.4 million in 2014 to $13 million.
EBIT (excluding impairment) decreased from $74.5 million to $37.3 million for the year ended 30 June 2015 and the EBIT margin (excluding equity accounted profits and impairment) has decreased from 8.8% to 3.2%, which reflects the impact of under-performing operations.
The Operating Profit before tax (excluding significant items) decreased from $34.4 million to $2.1 million for the year ended 30 June 2015 as a result of the lower margins experienced in the current year.
The reported loss after tax for the year of $175.6 million includes the effects of impairment charges made in the current year totalling $202.8 million on a pre-tax basis and is summarised as follows:
Item A$m
Tangible asset impairment: – write down of plant and equipment 192.5
Intangible asset impairment 10.3
Net Profit Before Tax Impact 202.8
The above items are highlighted as they are non-operating expenses and are not expected to be recurring.
Accounting standards require that at the end of each reporting period an entity must consider whether there are any indicators which may suggest the entity’s assets could be impaired and if so impairment testing should be performed. Given the current lower levels of activity in the mining sector (leading to a higher level of idle equipment) and the Company’s market capitalisation being lower than the book value of equity, management considered that for the year ended 30 June 2015 a review of tangible assets should be undertaken to test for impairment.
The Group’s longer-range business forecasts used for the testing of recoverable amounts as required under accounting standards are based on certain assumptions and discount rates. If any of the forecast assumptions are not achieved, or it is necessary for a higher discount rate to be used in the Group’s impairment testing, then the Group may be required to book a further impairment expense at that time.
The impairment testing for the year ending 30 June 2015 resulted in an impairment charge in the current year and full details of the methodology and assumptions used are set out in note 3 to the financial statements.
Reconciliation of non-IFRS Financial Information A$m
Loss after tax as reported (175.6)
Add back:
Impairment expense 202.8
Deduct:
Tax credit (25.1)
Operating Profit before tax 2.1
Net Interest Expense 35.1
EBIT 37.2
Depreciation and amortisation expense 77.5
EBITDA 114.7
Operating profit is reported by Ausdrill to provide a greater understanding of the underlying business performance of the Company. Operating profit excludes significant items of income or expense which are either individually or in the aggregate material to Ausdrill and are either outside the ordinary course of business or are part of the ordinary course of business but are unusual due to their size and nature.

OPERATING AND FINANCIAL REVIEW 07
SEGMENT PERFORMANCE
The Group’s operations are delivered through five business segments: Mining Services Australia; Contract Mining Services Africa; Manufacturing; Supply & Logistics; and Other. Within each of these business segments, the Group operates under a number of brands to provide services and products to clients.
MINING SERVICES: AUSTRALIA
Segment Performance
Sales revenueEarnings before interest and tax
$ million 2015 2014 2015 2014
Mining Services Australia 393.8 473.8 5.5* 41.0*
*Figures exclude the effects of any significant items
Mining Services Australia has reported a further decline in profits directly as a result of the challenges experienced in the mining industry with most commodities showing a further decline in prices over the year. This in turn has meant that mining companies have continued to focus on reducing their spending on exploration and capital expenditure programmes; revising production schedules for ore and waste volumes; and deferring all non-essential expenditures.
DRILL AND BLAST
The provision of drill and blast services to the production phase of the mining cycle represents the foundation on which Ausdrill was built, and this continues to be an integral part of our service offering. In more recent years this business has been augmented by the provision of grade control services.
During FY15 the business was successful in securing the following works in Western Australia:
●● renegotiation of a three year sub-contract extension to provide drill and blast services to Piacentini & Son at the Ravensthorpe nickel mine;
●● award of a new four year sub-contract to provide drilling and blasting services to Piacentini & Son at Alcoa’s Huntly and Willowdale mine sites;
●● award of a new two year sub-contract to provide drilling and blasting services to Thiess at the Rocky’s Reward nickel project, commencing in August 2015;
●● award of a new two year sub-contract to Macmahon to provide drilling services at its Tropicana gold project;
●● deployment of five drills to Karara Iron Ore mine site for ongoing support to Downer EDI; and
●● at the Kalgoorlie Superpit in the Western Australian Goldfields, contract documentation for both blast hole drilling and grade control services was finalised and executed.
During the past year the business continued to experience the effects of the downturn in the mining industry and in particular the loss of work in the Pilbara, mainly as a result of major mining companies moving to perform a greater range of activities in-house. Clients are still under cost pressures, resulting in a reduction of work across the board. The business was also impacted by the provision for a doubtful debt against Western Desert Resources of $7.5 million.
The business operates 156 rigs comprising top hammer drills, rotary and blast hole drills, purpose built probe drills and reverse circulation (RC) grade control drills. Whilst retiring some of the older rigs, the business continues to upgrade with purpose-built machines where more technical drilling is required.
BTP GROUP
This business provides clients with non-OEM equipment parts, equipment hire and used equipment. The BTP Group comprises two operating divisions:
●● BTP Parts, one of Australia’s largest non-OEM supplier of reconditioned and exchange parts for mining and earthmoving equipment; and
●● BTP Equipment, which has an extensive fleet of excavators, dump trucks, dozers, graders and ancillary equipment such as water carts to hire. In addition this business trades in used equipment and sells earth moving equipment to the mining and construction industries.
Industry sentiment has remained weak over the past year. Clients continued with cost reduction and capital management programmes which involved deferral of equipment maintenance and replacement, where possible. The lower overall activity increased market competitiveness which resulted in impairment to the carrying values of BTP’s assets. BTP is focusing on restructuring the business and improving its competitiveness to meet the market and continues to expand geographically into Africa and Asia to diversify its revenue base.
The Peabody hire contract win, secured in April 2015, will see a significant portion of BTP’s rental units in use. Under this contract BTP will supply approximately 68 units of mining equipment to Peabody mine sites in key Australian coal precincts in the Hunter Valley and the Bowen Basin. The supply will be based on a combination of dry hire and fully maintained dry hire. Margins have declined due to the high level of excess capacity in the industry, however, BTP continues to enjoy a broad spread of high quality clients from contractors to large international mining companies.
BTP Parts is a market leader in innovation of not only component rebuilds and supply, but also the development of transportation stands. Its unique equipment rebuild, component rebuild, used parts and repair and maintenance offerings are genuinely valued by its client base. Looking forward, BTP expects to benefit from an increase in the iron ore and coal production phase that will see a resurgence of the equipment maintenance cycle.
EXPLORATION
The Australian exploration drilling business is conducted through two businesses, one based in Kalgoorlie which primarily focuses on gold and base metals in the Goldfields region of Western Australia (Ausdrill), and the other based in Perth and servicing the North West of Western Australia (ANW). These exploration businesses operate 51 rigs comprising rotary air blast (RAB), reverse circulation (RC) and diamond drill rigs, as well as 13 water well rigs.
Despite the downturn, the business was successful in the award of a further three years (plus two one year options) to carry out exploration services for Gold Fields at Kambalda and Granny Smith. The fleet of purpose-built lake drill rigs was utilised at these sites for the majority of the year, with the inclusion of two additional lake air core rigs, one lake reverse circulation (RC) rig and one diamond drill rig. Exploration drilling services were also provided to Northern Star Resources and La Mancha Resources in the Goldfields.

OPERATING AND FINANCIAL REVIEW08
KEY CONTRACTS
The key contracts in place at 30 June 2015 for the Mining Services Australia segment are:
Client Project Location Services Provided
BHP Billiton All Pilbara sites Pilbara, WA Drill and blast, equipment hire, consumables
BHP Billiton Exploration Pilbara, WA Exploration drilling
KCGM Superpit Goldfields, WA Production drilling, grade control
Gold Fields Kambalda & Agnew Goldfields, WA Exploration drilling
Gold Fields St Ives Goldfields, WA Exploration drilling
OZ Minerals Prominent Hill Copper Gold Prominent Hill, SA Blast hole drilling
Ensham Resources Ensham Coal Ensham, QLD Production drilling
First Quantum Ravensthorpe Nickel Ravensthorpe, WA Grade control
Piacentini & Son Ravensthorpe Nickel Ravensthorpe, WA Drill and blast
Piacentini & Son Huntly and Willowdale Aluminium Huntly, WA Drill and blast
La Mancha Resources White Foil Gold Goldfields, WA Exploration drilling, drill & blast, grade control
Macmahon Tropicana Gold Goldfields, WA Drill and blast
Northern Star Resources Exploration Kundana, WA Exploration drilling
Peabody Energy Australia East Coast Coal sites NSW, QLD Equipment hire
Thiess Rocky’s Reward Nickel Goldfields, WA Drill and blast
During the year ANW renegotiated the BHP Billiton Iron Ore contract for exploration and water well services for a further five years and was successful with continued works for Consolidated Minerals and Doray Minerals whilst work at Rio Tinto was scaled back significantly in the last 6 months.
Operational performance has generally been severely impacted by the lower level of demand from the iron ore industry as mining companies adjust to the lower iron ore price.
On 1 July 2015, the business of Connector Drilling was integrated into ANW to enable the sharing of business support functions with a view to optimising administrative and operational efficiencies.
SYNEGEX
Synegex manufactures and supplies explosives to internal and external clients and, in the past year, has seen the benefits of increased revenue from current supply contracts.
Synegex has continued to build its business strength through contracted supply of essential raw materials, improved bulk explosives products and handling equipment. Over the past 12 months Synegex secured explosives supply to Bootu Creek manganese mine in the Northern Territory and an extension for explosive supply services to Piacentini & Son at its Ravensthorpe nickel mine in Western Australia.
MINANALYTICAL LABORATORY SERVICES
MinAnalytical Laboratory Services offers a range of high quality analytical services for the mineral exploration and mining Industry and is NATA accredited in accordance to ISO17025:2005. Based in Canning Vale, Western Australia, MinAnalytical has a team of dedicated people with many years’ industry experience utilising the latest technology.
MinAnalytical has seen growth in both gold and base metal analysis despite the difficult economic climate and boasts a section of high profile clients from explorers to miners. However, the downturn in the iron ore price and subsequent drop in iron
ore exploration has seen a significant reduction in XRF analysis and that is not expected to improve in the foreseeable future.
ENERGY DRILLING AUSTRALIA (EDA)Energy Drilling Australia is a Queensland based drilling services company, serving the conventional and unconventional oil and gas markets, as well as the coal seam gas (CSG) markets; operating in Queensland, South Australia and the Northern Territory, as well as an inaugural international project in Papua New Guinea (PNG). The fleet consists of four drilling rigs and three service rigs.
FY15 saw EDA commission Rig 4 for Senex Energy (which was unfortunately terminated early), successfully complete the Statoil contract with Rig 2 and successfully complete the Senex contract with Rig 3, which then went on to work for Strike Energy. In addition, EDA secured a contract in PNG with Heritage Oil & Gas for Rig 2, the first international programme for EDA and, after delays in country due to wet weather and difficulties with road access, the two wells were drilled according to schedule.
These projects provided significant challenges across the operational and regulatory aspects of our business while achieving recordable injury free campaigns for Statoil and Heritage and an LTI free year. During FY15, EDA was re-audited for 4801/14001/9001 certification with zero non-conformances identified, and as a result all three certifications are now aligned and EDA is operating under an Integrated Management System.
The year also saw EDA become involved with Heritage’s Community Social Responsibility project in PNG, which involves visiting local villages in conjunction with health care providers to work in areas such as health care, drug and alcohol counselling, education for women and children and personal health and hygiene.
The prospects for FY16 remain challenging, with both the conventional and unconventional oil and gas sectors remaining oversupplied and under-utilised. During FY16 EDA is tendering for work in South Australia, Western Australia and for another project in Papua New Guinea.

OPERATING AND FINANCIAL REVIEW 09
CONTRACT MINING SERVICES: AFRICA
Segment Performance
Sales revenueEarnings before interest and tax
$ million 2015 2014 2015 2014
Contract Mining Services Africa 276.4 251.1 40.6* 35.5
*Figures exclude the effects of any significant items
The African contract mining services business has reported an increase in revenues largely as a result of the effects of the lower Australian dollar whilst Segment performance has benefited by the stronger contribution from the AUMS Joint Venture. The effect of a lower average Australian vs US Dollar exchange rate during the year has had an 8% positive impact on reported revenues and profits compared to the prior year.
AFRICAN MINING SERVICES (AMS)
In Ghana, AMS:
●● was successful in securing a new contract with Perseus at its Edikan – Eastern pits gold project for three years, with an option to extend for a further two years; and
●● secured a one year contract extension for mining works at the Iduapriem mine, owned and operated by AngloGold Ashanti (AGA). Due to the significant increase in volumes expected for Phase 2 of this project, AMS will increase the supply of equipment required to almost double that of Phase 1.
In Mali, AMS:
●● secured a two year exploration drilling contract with B2Gold (formerly Papillon Resources) at its Fekola gold project; and
●● had a significant contract variation leading to a reduction in mining volumes at the Syama gold mine, owned and operated by Resolute Mining Limited. Resolute advised AMS that work on the Stage 2 Cutback would cease and open pit contract mining would concentrate solely on the satellite pits, as Resolute had brought forward its plans for underground mining.
In Burkina Faso, AMS:
●● has provided mining equipment to Nordgold for work on its Bissa Gold and Taparko Gold projects; and
●● maintained a presence, but the fleet of exploration drilling rigs is currently idle.
In Guinea, AMS:
●● successfully completed its first year of contract mining works at the Siguiri mine, owned and operated by AngloGold Ashanti.
While exploration drilling remains slow, AMS is continuing to pursue a number of contract mining opportunities. Tender activity remains high in West Africa and other parts of Africa.
AMS operates 300 major equipment units including dump trucks, excavators, loaders, blast hole drills and grade control drills and 22 exploration drills in West Africa.
AUSDRILL TANZANIA
Ausdrill Tanzania provides drilling, blasting and exploration services to the East African mining industry, as well as exploration services to the region. The business operates eight rigs which are currently idle. The business is actively looking for opportunities in the region.
KEY CONTRACTS
The key contracts in place at 30 June 2015 for the Contract Mining Services Africa segment are:
Client Project Location Services Provided
Resolute Syama Gold Mali Open pit mining
B2Gold Fekola Gold Mali Exploration drilling
Perseus Edikan Gold Ghana Open pit mining
Endeavour Nzema Gold Ghana Open pit mining
AngloGold Ashanti Iduapriem Gold Ghana Open pit mining
Ghana Manganese Company Nsuta Manganese Ghana Equipment hire
AngloGold Ashanti Siguiri Gold Guinea Open pit mining
Nordgold Bissa Gold Burkina Faso Equipment hire
Nordgold Taparko Gold Burkina Faso Equipment hire

OPERATING AND FINANCIAL REVIEW10
KEY CONTRACTS
The key clients and contracts in place at 30 June 2015 for the AUMS joint ventures are:
Client Project Location Services Provided
Randgold Gara, Loulo operation (Concluding October 2015) Mali Underground mining services
Randgold Yalea, Loulo operation (Concluding October 2015) Mali Underground mining services
Nantou Perkoa Zinc Burkina Faso Underground mining services
Roxgold Yaramoko (Commencing July 2015) Burkina Faso Underground mining services
Kinross Paboase (Concluded June 2015) Ghana Underground mining services
Newmont Subika Ghana Underground mining services
Resolute Bibiani Ghana Underground mining services
MANUFACTURING
Segment Performance
Sales revenueEarnings before interest and tax
$ million 2015 2014 2015 2014
Manufacturing 88.5 91.9 (0.5)* 1.0
*Figures exclude the effects of any significant items
Ausdrill’s manufacturing businesses comprise Drilling Tools Australia, Remet Engineers, Drill Rigs Australia and DT HiLoad. This segment has recorded a decline in revenues and profits due to lower sales of drilling consumables to the mining sector.
External clients accounted for $57.7 million (2014: $54.9 million) of the segment sales during the 12 months to 30 June 2015.
DRILLING TOOLS AUSTRALIA (DTA)
DTA manufactures and sells a full range of drilling consumables and drill rig spares to internal clients and an established and growing external client base both in Australia and internationally. The business was established in 2004 and has reported excellent growth since then, but has not been immune to the slowdown in the mining sector in recent years. DTA is growing its reputation for providing engineered solutions to enhance drill rig productivity and reduce risk of injury to drillers and mine site personnel. The combination of skilled industry professionals and significant local engineering capability are key points of difference in the market and are catalysts that allow DTA to demonstrate its ability to value add as a supply chain partner.
The Queensland operation performed above expectations in the first half of the year, however this tapered off in the last quarter as the oil and gas sector slowed. The BOP (blow out preventer) service centre, working under a licensed agreement with Integrated Equipment in the USA, has proved a valuable resource to the Australian onshore oil and gas industry, providing a much needed API Certified mechanical servicing and re-certification facility for well-head control equipment. This part of the business has been growing steadily throughout the year. Exclusive sales and service agreements with USA manufacturers of well control equipment and spare parts keeps it well placed to benefit as the sector gets back on track in the year ahead.
DTA’s supply of drill string consumables and peripheral equipment to BHP Billiton’s mining operations across the Pilbara is entering its third year of a five year supply agreement and the relationship continues to add value to both businesses. DTA is pursuing further growth opportunities in South America and continues to develop its African presence as it strengthens its position as a major service and engineered solutions provider in the mining consumables sector.
DT HILOAD
DT HiLoad manufactures heavy duty light weight mining truck trays sold under the Hercules brand.
The market demand for mining trucks remained depressed during the year due to mining companies holding back on major capital expenditure and parking up trucks at sites globally. Some clients invested in Hercules trays to take advantage of efficiency gains provided by the Hercules trays. Work on developing new markets and increased activity was pursued successfully with original equipment manufacturers, as well as with the pin fitment tool for changing truck trays.
AFRICAN UNDERGROUND MINING SERVICES (AUMS)
Ausdrill has a 50% interest in the AUMS joint venture, with Barminco holding the other 50%. This business provides underground mining services for clients in Ghana, Mali and Burkina Faso.
The Company’s share of revenue from AUMS has decreased from A$136.8 million in the year to June 2014 to A$110.1 million
in the year to June 2015, with net profit after tax increasing from A$1.4 million to A$13.0 million (being Ausdrill’s 50% share). The cessation of operations at the Chirano gold mines in Ghana in the prior year and slightly reduced volumes at Loulo resulted in reduced revenues. However the reduction of inefficiencies, tighter control on costs and weakening $A has resulted in higher profits in FY15. The contract at the Loulo operations is now scheduled for completion in October 2015.

OPERATING AND FINANCIAL REVIEW 11
DRILL RIGS AUSTRALIA (DRA)
DRA manufactures drill rigs and drill support equipment mainly for internal requirements. The business manufactures exploration rigs (including diamond, reverse circulation, multi-purpose and rotary air blast rigs), and grade control rigs. DRA also manufactures the Rock Commander, an excavator-based rig providing high levels of productivity in difficult and unstable terrain. DRA intends to broaden the range of Rock Commander drills it manufactures which will have application to the iron ore industry.
DRA’s latest project, the DRA/Rock Sapper 315, is currently undergoing testing, with positive results being achieved for both production and maintenance. Consequently, DRA is confident this rig will be put into production drilling in the near term.
DRA faces challenging times over the next 12 months due to a lower market demand for its drill rigs, however, the business continues to receive component rebuild work from major clients such as Newcrest, BHP Billiton and CP Mining. Until there is an upturn in the mining industry, DRA will be reliant on repair and rebuild type work and is adapting its business to suit the current climate.
SUPPLY & LOGISTICS
Segment Performance
Sales revenueEarnings before interest
and tax
$ million 2015 2014 2015 2014
Supply & Logistics 42.1 41.2 2.2 1.0
Supply Direct achieved satisfactory results in FY15 with another strong performance from the African sector, particularly the South African business which has seen sustained growth throughout the year. The business has established a bonded warehouse in South Africa to support the Group as it establishes a stronger foothold across the African continent.
OTHER
Segment Performance
Sales revenueEarnings before interest
and tax
$ million 2015 2014 2015 2014
All Other Segments 18.7 17.4 (10.4) (4.0)
The Other segment comprises corporate costs, foreign exchange gains and losses, as well as the Diamond Communications business.
The profit for the year includes foreign exchange losses of $7.7 million (2014: gain of $5.8 million).
DIAMOND COMMUNICATIONS
Diamond Communications reported satisfactory results for the year ended 30 June 2015.
The business has experienced strong growth across the communications sector with a large proportion of its work in long haul projects. Wideband projects have increased in Western Australia and South Australia on the back of Diamond’s in-house delivery model. Diamond’s strategy is to be a full end-to-end provider in this market utilizing its construction and design capability, as proven with other clients.
Diamond was successful in winning several larger construction projects during FY15 under the Telstra Panel contract, keeping its larger machinery fully utilized.
Numerous projects were completed under the Western Power SUPP contract and Local Area Enhancement projects. Pilot cable work has experienced growth during the year.
Diamond continues to work with the Trident team on the Perth to Onslow optical fibre and is completing the design from the beach landing in City Beach through to Osborne Park.
The business achieved ISO 4801 accreditation this year that will assist in the delivery of an even higher standard service to its clients.
DURING FY15
CONTINUING TO FOCUS ON REPAYING SECURED DEBT, WHICH WAS REDUCED BY
$100.1m

OPERATING AND FINANCIAL REVIEW12
GROUP FINANCIAL POSITION
Capital, funding and liquidity are managed at the corporate level, with the individual businesses focussed on working capital and operating cash flow management. The following commentary on the financial position relates to the Ausdrill Limited Group.
Cash flows
A summary of the cash flows for the Group is as follows:
$ million 2015 2014
Cash flows from:
- operating activities 117.9 142.1
- investing activities (0.7) (56.2)
- financing activities (104.7) (101.2)
Net Cash flow for the year 12.5 (15.3)
Opening Cash 62.7 78.8
Exchange rate effect on cash 2.6 (0.8)
Closing Cash 77.9 62.7
Cash flows from operating activities
Operating cash flow for the year declined to $117.9 million from $142.1 million in 2014, reflecting the lower activity levels. The EBITDA conversion ratio has however remained strong due to a continued focus on working capital reduction.
$ million 2015 2014
EBIT 37.3* 74.5*
Add: Depreciation and amortisation 77.5 99.2
EBITDA 114.7* 173.7*
Operating cash flow 117.9 142.1
Add: Net Interest paid 31.4 29.7
Tax Paid/(Refunded) (7.1) 21.9
Adjusted Operating Cash Flow 141.8 193.8
EBITDA conversion 123.6% 111.6%
* Excluding significant items
Cash flows from investing activities
The Group’s business requires significant amounts of capital expenditure that is often a front ended investment, given the contracting nature of its operations. When the Group enters into new contracts, it may need to acquire new capital equipment, typically mining equipment which has a useful life of between seven and 10 years. Capital expenditure is also required to maintain such capital equipment over its useful life. Consequently, during periods of high or rapid growth in revenues, the capital requirements of the Group increase. Historically, capital expenditures have been funded by a combination of operating cash flow, debt and equity.
As a result of the slow-down in the mining industry Ausdrill’s strategy has been to reduce capital expenditure to a minimum. As a result the level of capital expenditure is lower than the level of depreciation and is likely to remain so in the next year.
The following table shows Ausdrill’s acquisitions of property, plant and equipment and other non-current assets funded from all sources (excluding intangibles, but including hire purchase arrangements) by geography and segment for the periods indicated.
$ million 2015 2014
Australia
Drill & Blast, Exploration, Connector and EDA 5.8 39.7
Equipment Sales, Hire and Parts 7.5 9.6
13.3 49.3
Africa
Ghana 10.3 10.0
Mali 1.9 1.4
Guinea 1.5 -
Burkina Faso 0.3 -
14.0 11.4
Manufacturing 0.2 1.0
Supply & Logistics 0.1 -
Other 0.8 3.0
28.5 64.7
Less proceeds from asset sales (5.9) (10.2)
Net capital expenditure 22.6 54.5

OPERATING AND FINANCIAL REVIEW 13
Revolving Cash Advance Facility - undrawn
Cash flows from financing activities
Net financing cash outflows were $104.7 million in the year ended 30 June 2015, an increase of $3.5 million, compared to an outflow $101.2 million in 2014. In the current year the Group continued to focus on its debt reduction strategy as a result of the lower levels of activity and hence debt repayments of $100.1 million (excluding insurance premium funding) have been made during the year. Dividend payments of $9.4 million were made during the year.
Working capital
The Group’s working capital comprises current trade and other receivables, inventories and current trade and other payables.
The following table shows the principal elements of working capital for the periods indicated.
$ million 2015 2014
Current trade and other receivables 141.8 157.6
Inventories 226.8 233.1
Current trade and other payables (106.3) (111.9)
Net working capital 262.3 278.8
Increase/(decrease) in net working capital (16.5) (33.7)
The Group’s year end working capital balance has decreased as a result of the lower levels of activity and the result would have been more favourable were it not for the lower Australian Dollar and the consequent increase in values on translation of the African operations of approximately $19.8 million. The levels of inventory are being closely monitored as the Group’s target of realising cash savings from lower inventory hold levels remains a priority.
Dividends
The level of dividends is primarily based on the earnings, cash flows and business requirements of the Group. Historically, the Company has paid dividends to its shareholders twice a year, in April and October. During the year ended 30 June 2015 the Company paid total cash dividends of $9.4 million.
The Ausdrill Limited Dividend Reinvestment Plan (DRP) is not currently in operation following the decision on 19 September 2013 by the Board to suspend the DRP until further notice.
Given the current operating conditions, the Board has not declared a final dividend for FY15.
Debt, gearing and other financing arrangements
At 30 June 2015, the Group had total debt of $438.6 million (excluding prepaid borrowing costs and insurance premium funding). Cash and cash equivalents totalled $77.9 million, resulting in net debt of $360.7 million.
In December 2014 the Group refinanced its revolving cash advance facility. The facility was reduced from $300 million to $125 million, matures in March 2018 and bears interest at a margin over the Australian bank bill swap rate for borrowings in Australian dollars and LIBOR for borrowings in US dollars. The facility was also amended to only include secured debt in the debt coverage ratio covenant.
In November 2012, the Group issued unsecured notes to the value of US$300 million. These notes have a seven year term and have a fixed interest rate of 6.875% paid semi-annually.
The following table shows net debt and gearing ratios.
$ million 2015 2014
Revolving cash advance facility 25.0 75.0
Asset finance and other loans 22.9 70.4
US$300 million unsecured notes 390.7 318.2
Total borrowings(1) 438.6 463.6
Cash and cash equivalents (77.9) (62.7)
Net debt 360.7 400.9
Total equity 553.3 752.2
Total capital 914.0 1,153.1
Gearing ratio 39.5% 34.8%
(1) Excludes pre-paid borrowing costs of $9.5 million and Insurance premium funding of $4.7 million.
The US$ denominated borrowings of the Group include the US$300 million unsecured notes and hire purchase and asset financing arrangements of US$11 million. These borrowings are translated at the year-end exchange rate of A$1.00: US$0.7679 and, as a result of the strengthening A$ over the year, an amount of $75.1 million has been included in the foreign currency translation reserve in relation to borrowings. This gain is partially offset by the translation loss arising from the translation of US$ assets in Africa.
The Group’s senior debt facilities contain certain financial covenants that have been complied with during the year.
Ausdrill’s debt structure provides the necessary liquidity for its operations and the maturity profile is set out below:
400.0
A$
Mill
ion
350.0
300.0
250.0
200.0
150.0
100.0
50.0
0.0FY2016 FY2017 FY2018 FY2019 FY2020
Revolving Cash Advance Facility - drawn
Asset Finance Africa (USD)
Asset Finance Australia
US$300 Million Unsecured notes

OPERATING AND FINANCIAL REVIEW14
BALANCE SHEET
The net assets of the Group decreased by 26% to $553.3 million during FY15. This decrease was substantially reflected in non-current assets which decreased by $215.0 million due to the impairment charge and depreciation exceeding capital expenditure.
Cash and cash equivalents increased by $15.2 million or 24% to $77.9 million.
Trade and other receivables decreased by $15.9 million or 10.1% to $141.8 million and reflect the lower level of sales during the year.
Inventories decreased by $6.2 million or 2.7% to $226.8 million.
The net value of Property, Plant and Equipment decreased by $217.4 million due to the impairment charge and depreciation exceeding capital expenditure.
Trade and other payables decreased slightly from $111.9 million to $106.3 million.
As a consequence of the strategy to deleverage the business, the net debt of the Group (gross debt excluding prepaid costs and insurance premium funding less cash) decreased from $400.9 million at 30 June 2014 to $360.7 million at 30 June 2015. The gearing ratio has however increased from 34.8% to 39.5% as a result of the impairment charge but remains within planned levels.
Total drawn borrowings of $438.6 million represent 76% of liabilities, decreasing by $25 million. Current borrowings decreased by $29 million as the Group continued to amortise existing hire purchase and finance lease liabilities.
Provisions of $10 million (long service leave) decreased by $0.8 million and represent less than 2% of liabilities.
Shareholder equity decreased due to the current year loss of $175.6 million. The translation of foreign operations (principally Ausdrill’s African business) had a $19 million adverse effect over the year.
The return on average capital employed has decreased to 3.7% for the year to 30 June 2015 compared to 6.1% in the previous year and reflects the slowdown in the mining industry. (This is calculated as follows: EBIT divided by the sum of average receivables, inventory, plant and equipment, investment in associates, intangibles less payables).
The financial position of the Group remains at expected levels with a gearing ratio (net debt to net debt plus equity) of 39.5%, cash of $77 million, and interest cover (EBITDA/Net Cash Interest) of 3.7 times and the net secured debt to EBITDA ratio is negative as cash exceeded secured debt. The Group’s net tangible asset position has decreased from $2.37 per share to $1.77 per share.
PEOPLE
The Group’s Australian operations have been significantly affected by the downturn in the resources sector, and inevitably this is reflected in employee numbers.
At 30 June 2015, the number of employees within the Group worldwide, including jointly owned entities, stood at 4,080 – a decrease of 10.9% on the number (4,578) at the corresponding period last year. However, to emphasize the impact on Australian operations, employee numbers reduced from 1,772 in July 2014 to 1,388 at 30 June 2015 – a decrease of 21.7%, which has mostly arisen due to redundancies.
The Group retains a core of highly experienced long serving employees that forms the backbone of the Company and which it relies on to concentrate our efforts to remain efficient and competitive in a very difficult economic climate.
Our efforts are focussed on obtaining greater efficiency by reducing duplication and adopting shared services solutions, where possible. Most employees understand the difficulties faced by various parts of the Group and have shown support for the efforts to retain the Group’s competitive advantage and maintain its capability to take part in an upswing in the resources sector.
FY2008 FY2009 FY2010 FY2011 FY2012 FY2013 FY2014 FY2015
2,072
2,531
3,366
4,362
6,003
Africa
AUMS JV
4,578
Aust
4,080
5,703

OPERATING AND FINANCIAL REVIEW 15
SAFETY, TRAINING AND QUALITY
While safety is a focus of every employee, the Group’s Health, Safety, Environment, Training and Quality (HSETQ) team has specific responsibilities to provide the training and systems to achieve a safe and healthy working environment for all employees, contractors and visitors.
The Ausdrill Group has reconfirmed its commitment to providing a safe workplace where all employees, contractors and visitors are free from injury or harm by introducing all employees to the One Safe All Safe programme. The roll out of the programme commenced in May 2015 and training of all members of the leadership team is due to be completed by December 2015.
With a further two business units now certified against AS4801 and another two preparing for certification before the year’s end, the Group is well on the way to having a standardised Safety Management System across all business units that is world class, one which will give Ausdrill a competitive advantage over its peers in the mining services sector.
The risk team has maintained its focus on reducing risks in the business by firstly identifying the HSEQ risks and then controlling them. To monitor the effectiveness of these controls, they are entered and tracked through an electronic safety data management system (MYOSH) that has been further customised over the past year to allow easier tracking and sharing of information.
The Group’s injury management team continues to support injured workers return to full fitness and facilitate a timely return to work. Due to reduced claims and costs over the past few years, the Company returned to a standard insurance policy this year with a premium rate well below the industry average.
The training team continued developing online training modules moving beyond induction topics to now include systems training and operational topics. Frontline Management and Supervisor courses have been on hold this year due to low turnover and limited recruitment, however, 450 employees will be completing classroom training for the One Safe All Safe programme. Business units are developing position profiles for all employees that will be entered in the data management system.
The third year of the internal HSE audit programme has seen an increase in compliance across all business units with further refinements in the audit tool to include components of AS4801. Our certified lead auditor has developed an audit tool for our African sites and we will be auditing those sites in the coming year.
STATISTICS
Overall FY15 has seen a positive safety performance from the Ausdrill Group.
We experienced slight reductions in the injury frequency rates for LTIFR, MTIFR and All Injury Frequency rates. There was, however, a small increase to the RWIFR and a work group has been assigned the task of investigating why the increase has occurred and to develop initiatives to reverse this trend.
25.0
20.0
15.0
10.0
5.0
0.0
June 09
Dec 09
June 10
Dec 10
Jun 11
Dec 11
June 12
Dec 12
June 13
Dec 13
June 14
Dec 14
June 15
12 Month Rolling TRIFR
12 Month Rolling MTIFR
12 Month Rolling LTIFR
12 Month Rolling RWIFR
THE AUSDRILL GROUP HAS RECONFIRMED ITS COMMITMENT TO PROVIDING A SAFE WORKPLACE WHERE ALL EMPLOYEES, CONTRACTORS AND VISITORS ARE FREE FROM INJURY OR HARM BY INTRODUCING ALL EMPLOYEES TO THE ONE SAFE ALL SAFE PROGRAM.

OPERATING AND FINANCIAL REVIEW16
GROUP BUSINESS STRATEGIES AND PROSPECTS FOR FUTURE YEARS
STRATEGIESAusdrill’s longer term strategy is to further strengthen its market positions in the mining services industry in Australia and Africa by:
Effective Marketing of Ausdrill’s service offering
Ausdrill plans to refine its marketing of the production-related service offering to increase the value of the services the Group brings to clients and further embed Ausdrill within client operations. The Group believes that its vertical integration and broad service offering will contribute to an even more resilient business characterised by strong, defensible market positions in higher margin specialist services.
Continuing to deliver high quality products and services to drive enhanced client productivity and competitive advantage
Ausdrill plans to offer additional products and services that are targeted at increasing client productivity in production- related activities. Ausdrill’s focus on innovation, automation and adherence to stringent standards in the parts and manufacturing business will assist in the valuable role of delivering essential services to clients. High quality materials and services will lower cost and time for clients and drive an increasing return on their capital by lowering the need for repair and maintenance at clients’ mines. An increase in the level of automation in products and services will also increase productivity for mine operators and help Ausdrill become the mining services provider of choice for clients.
Maintaining and improving strong safety standards and record across Ausdrill’s operations
In ensuring the success of the business and welfare of employees, Ausdrill places a strong importance on safety. Major mining clients generally require service providers to qualify to their safety standards before the service providers are eligible to tender for projects. These requirements act as a barrier to entry to tendering for major projects. The Group has a long-standing dedication to implementing and adhering to clients’ safety standards that is recognized by key clients and Ausdrill will continue to seek ways to maintain and improve the safety of drilling services and products. All staff members are required to undergo compulsory training so that they can develop the skills and attitude to ensure workplace health and safety. The Group will continue to work in partnership with employees and sub-contractors to improve safety standards.
Supporting existing clients’ growth ambitions into new geographies where the opportunity meets our internal requirements
Ausdrill plans to strengthen ties with existing major mining company clients by following them into new geographies where such opportunities meet internal requirements regarding financial, safety and reputation considerations. Considerations will include the geological features of the site, the geopolitical stability of the area where the mine will be located as well as the infrastructure and environmental concerns. The Group will seek long term contracts at mines with production phases that are anticipated to be long-lived that will increase earnings visibility and reduce costs by delaying the need for redeployment of capital and personnel. Clients will continue to be major mining companies that have a robust business and outlook. The Group has a successful track record of this strategy in Africa and believes that this strategy is an effective way to strengthen client relationships and provide growth opportunities.
Pursue a Conservative Financial Policy
Ausdrill intends to maintain a prudent and sustainable capital structure that allows financial and operational flexibility across a range of economic environments and cycles. The Group believes that prudent risk management policies are represented by the enhanced debt structure and gearing (net debt to net debt plus equity) of 39.5% and net debt (excluding prepaid cost and insurance premium funding) to EBITDA of 3.1 times as at June 30, 2015. The Group will leverage long-standing relationships with clients to ensure that working capital and capital expenditure is deployed in a way that maximises return on capital while maintaining prudent reserves as necessary.
PROSPECTSAusdrill’s prospects of achieving the stated strategic objectives are subject to the uncertainties that exist in the broader mining industry in Australia and globally, many of which are beyond Ausdrill’s reasonable control.
RISKSThe following section describes certain factors and trends that have the potential to have a material adverse impact on the financial condition and results of operations. Results of operations are impacted by both global and local factors. These factors may arise individually, simultaneously or in combination.
The factors identified below are not necessarily listed in order of importance and are not intended as an exhaustive list of all the risks and uncertainties associated with Ausdrill’s business. Additional risks and uncertainties not presently known to management, or that management currently considers to be immaterial or manageable, may adversely affect Ausdrill’s business.
Level of New Mining Services Contracts and Contract Renewals
Mining services provided under contracts Mining services provided under contracts represent a large part of revenues for services provided for contract mining, drill & blast, grade control, equipment hire, water well drilling and exploration services. Under most of the Group’s mining services contracts the mine operator contracts us to undertake work in accordance with a work schedule. The Group’s mining services contracts, other than equipment hire contracts and exploration, are typically for terms between three and five years. Some contracts, typically exploration contracts, have a shorter term, generally of one year while equipment rental contracts have varying terms from three months to two years.
Generally, in the mining industry, most contracts can be terminated for convenience by the client at short notice and without penalty with the client paying for all work completed to date, unused material and in most cases demobilisation from the sites and redundancies. As a result, there can be no assurance that work in hand will be realised as revenue in any future period. The Group is selective in the contracts that it enters into to allow for options to extend where possible to maximise the contract period and the return on capital.
Consequently, results from operations are affected by the number of new contracts the Group commences work under during a period, the number of existing contracts that are renewed during a period and the number of contracts that expire without renewal or extension or which are otherwise terminated during a period.

OPERATING AND FINANCIAL REVIEW 17
Contracts are at risk of termination or non-renewal due to the client having no further need for the service such as when the mine has reached the end of its planned life or the operator ceases production because changes in the underlying commodity price or mining costs have rendered continued production from the mine uneconomic. Contracts are also at risk of termination or non-renewal as a result of competition if the client seeks to use an alternative mining services provider to provide the service or if the client decides to bring the contracted services in house. The Group has historically had a strong record of securing contract extensions.
Production Levels at Customers’ Mines
Mining services provided in relation to the production phase (including development and rehabilitation work) of a mine represent a large part of sales revenue. Revenues are associated with and influenced by long term decisions of mine owners to continue producing at their current levels. The Group derives most revenues from mines which are already in production and the majority of other services, such as manufacturing, logistics and assaying, complement production-related services. Under most of the Group’s mining services contracts, a portion of the revenue is earned through a variable component, primarily based on a unit of production agreed in the contract. Consequently, mining services revenues are linked to the volume of materials moved or drilled and not to the short-term price of the underlying commodity or short-term fluctuations in the profitability of the underlying mines. Mines in the production phase of their life cycle typically generate stable revenues because production volumes have historically been relatively stable, even during commodity downturns. A downturn in expenditure in the mining sector typically impacts existing production projects last, with areas such as exploration and infrastructure construction services typically cut first. In the year ended 30 June 2015, approximately 9% of total sales revenue was generated from the provision of services to exploration stage projects. Consequently, the Group has limited exposure to the exploration activities market which has been volatile as the level of activity is generally linked to market sentiment surrounding the outlook for commodity prices and also the ability of smaller junior mining companies to fund such activities from capital which is often raised in the equity markets.
The price of gold has fallen substantially since the peak in 2012 which has put production at risk at higher cost mines. As the amount of gold produced globally in any single year constitutes a very small portion of the total potential supply of gold, variations in current production do not necessarily have a significant impact on the global supply of gold or on its price.
In the year ended 30 June 2015, approximately 73% of mining services revenues were generated from the provision of mining services to gold mining companies and approximately 17% to iron ore mining companies, in each case, for work on producing mines. Consequently, the Group’s activity levels and results of operations are dependent on productions levels at clients’ mines and it remaining economic to continue production at current gold and iron ore mines. Growth is dependent on mine operators seeking to expand production at existing mines or bring new mines into production.
The Group’s clients in the gold and iron ore sector are predominantly large lower cost producers. In the gold sector, clients include AngloGold Ashanti, Barrick, Endeavour Mining, Gold Fields, Oz Minerals, Randgold, and Resolute Mining. Clients in the iron ore sector include BHP Billiton, Kimberley Metals Group and Rio Tinto. Iron ore produced from these mines is amongst the most cost competitive seaborne iron ore fines in the world on a delivered to China basis.
Scale of operations and mix of activities
The scale of operations and the mix of activities that the Group undertakes during a period also impacts results of operations. The scale of operations has grown steadily in recent years through a mix of organic growth and acquisitions. The mix of activities the Group undertakes for clients during a period also impacts results of operations due to the differing margins on business segments. The activity mix depends in part on client demand for the Group’s existing products and services as well as the ability to offer new products and services that the Group develops or acquires.
Currency fluctuations
The Group denominates its consolidated financial statements in Australian dollars. Broadly speaking, the Australian operations are Australian dollar denominated and the African operations are U.S. dollar denominated. The Group is exposed to fluctuations in the value of the Australian dollar versus other currencies, because the Group’s consolidated financial results are reported in Australian dollars. If the Group generates sales or earnings or has assets and liabilities in other currencies, the translation into Australian dollars for financial reporting purposes can result in a significant increase or decrease in the amount of those sales or earnings and net assets. In the 2015 financial year, the Group received approximately 36% of total revenue in currencies other than the Australian dollar, predominantly in U.S. dollars, Ghanaian cedi and West African francs. The Group does not generally hedge translated foreign currency exchange rate exposure. Fluctuations in foreign currency exchange rates may also make period to period comparisons of results of operations difficult. As the operations in Africa grow, foreign exchange translation risk may increase.
The African operations often bid on contracts in US dollars but a portion may be paid in local currency and is therefore exposed to transaction risk. If the US dollar strengthens against the local currency during the term of the contract, the revenue the Group earns may be affected where rise and fall mechanisms in the contracts are not perfectly correlated. Where the Group earns revenue in a local currency it is exposed to exchange rate risk from time of invoice to the time of converting the local currency back to U.S. dollars. In addition, the Group purchases capital equipment in various currencies.
The Group does not generally hedge its normal operating foreign exchange exposures; however, the Group does sometimes hedge trade receivables that are generated where products are exported from Australia and those receivables are denominated in a currency that is foreign to functional currency. The Group may also hedge large capital expenditure items acquired in foreign currency. In respect of other monetary assets and liabilities held in currencies other than Australian dollars, the group ensures that the net exposure is kept to an acceptable level by matching foreign denominated financial assets with financial liabilities and vice versa. The Group does not engage in any speculative trading activities.
Labour costs and availability
Labour represents a significant portion of operating expenses. In order to compete for work and to service clients, the Group needs to be able to continue to attract and retain skilled employees.

OPERATING AND FINANCIAL REVIEW18
Increased risk of doing business in Africa
Ausdrill’s African operations are subject to business risks, including health risks such as the Ebola outbreak (2014), political instability, war or civil disturbance, expropriation, import and export restrictions, exchange controls, inflationary economies, currency risks, risks related to the restrictions on repatriation of earnings or proceeds from liquidated assets of foreign subsidiaries, workforce instability, harsh environmental conditions and remote locations. New mining projects by Ausdrill’s clients are increasingly occurring in countries where these risks are significant, which means an increasing portion of Ausdrill’s business may be subject to these risks. Ultimately, these risks may cause Ausdrill to cease doing business in certain high growth markets.
Uninsured risks
Ausdrill’s operations are subject to many hazards inherent in the mining services industry, including blowouts, cratering, explosions, fires, loss of hole, damages or lost equipment and damage or loss from inclement weather or natural disasters. Any of these hazards could result in personal injury or death, damage to or destruction of equipment and facilities, suspension of operations, environmental damage and damage to the property of others. Additionally, warranty and indemnity provisions in Ausdrill’s mining services contracts could leave Ausdrill exposed to the risk and liability associated with the services performed under such contracts. Ausdrill seeks protection for certain of these risks through insurance. However, it cannot ensure that such insurance or any indemnification it may receive from third parties will adequately protect the Company against liability from all of the consequences of the hazards described above. The occurrence of an event not fully insured or indemnified against, or the failure of a third party or an insurer to meet its indemnification or insurance obligations, could result in substantial losses. In addition, insurance may not be available to cover any or all of these risks, or, even if available, may not be adequate. Insurance premiums or other costs may rise significantly in the future, so as to make such insurance prohibitively expensive or uneconomic. In future insurance renewals, the Company may choose to increase its self-insurance retentions (and thus assume a greater degree of risk) in order to reduce costs associated with increased insurance premiums.
Ausdrill’s operations may be subject to delays in obtaining equipment and supplies and the availability of transportation for the purpose of mobilizing rigs and other equipment, particularly where rigs or mines are located in remote areas with limited infrastructure support. In addition, the Company’s operations are subject to adverse weather conditions, natural disasters and mine accidents or unscheduled stoppages or closings. If Ausdrill’s operations are interrupted or suspended for a prolonged period as a result of any such events, its revenues could be adversely affected.

OPERATING AND FINANCIAL REVIEW 19
OUTLOOK5
The Group is maintaining its strategy of providing a complete mining service solution to the mining industry. The mining industry continues to experience a period of uncertainty in relation to future levels of demand and prices received for commodities. The mining services industry is facing a period of intense competition due to an oversupply of service providers and equipment.
In response to these market conditions, Ausdrill has established an Executive Committee that is mandated to improve the Ausdrill business and deliver value to all stakeholders across a number of initiatives, including:
●● Strong focus on safety with the roll out of “One Safe All Safe” initiative across the Group
●● Continuing to focus on repaying secured debt, which was reduced by $100.1 million during FY2015
●● Efficiency gains of $45 million per annum over three years with $24 million per annum already identified over the next two years in the following areas:
– Strategic Sourcing Program
– Business Consolidations
●● Reviewing working capital particularly inventory levels to ensure that it is commensurate with current levels of activity
●● Restricting capital expenditure to replacement needs or identified growth opportunities
Ausdrill is of the view that provided there is not a significant fall in commodity prices from current levels, the mining downturn may have bottomed out or be close to the bottom. However, it anticipates that any recovery will be slow with challenging market conditions continuing in FY2016. The gold price (in Australian dollars) currently favours the Australian mining industry and provides a platform for an increased level of activity in the near term.
The outlook for the resources industry is expected to improve over the medium term in both Australia and Africa where Ausdrill has a long established presence and local know-how and, as a consequence, Ausdrill remains very well placed for a recovery.
1. EBITDA, EBIT and Operating profit are non-IFRS financial measures which Ausdrill uses in managing its business. The section at Earnings on page 5 of the Operating and Financial Review in the Annual Report reconciles these non-IFRS financial measures to the most appropriate IFRS measure.
2. “EBITDA” is “Earnings before interest, tax, depreciation and amortisation, and significant items”; and “EBIT” is “Earnings before interest and tax and significant items”.
3. “Operating profit” is profit /(loss) before significant items.4. Statutory profit / (loss) is profit / (loss) after tax.5. Disclaimer: These materials include forward looking statements
concerning projected earnings, revenue, growth, outlook or other matters for the financial year ending 30 June 2016 or beyond. Forward-looking statements can generally be identified by the use of forward-looking words such as “may”, “will”, “expect”, “intend”, “plan”, “estimate”, “anticipate”,
“believe”, “continue”, “objectives”, “outlook”, “guidance” or other similar words and include statements regarding certain plans, strategies and objectives of management, trends and outlook. These forward-looking statements involve known and unknown risks, uncertainties and other factors that may cause Ausdrill’s actual results, performance and achievements or industry results to differ materially from any future results, performance or achievements, or industry results, expressed or implied by these forward-looking statements.
Forward-looking statements are based upon management’s good faith assumptions relating to the financial, market, regulatory and other relevant environments that will exist and affect Ausdrill’s business and operations in the future. Ausdrill cannot give any assurance that the assumptions upon which management based its forward-looking
statements will prove to be correct, or that Ausdrill’s business and operations will not be affected in any substantial manner by other factors not currently foreseeable by management or beyond its control. Any forward-looking statements contained in these materials speak only as of the date of these materials. Subject to any continuing obligations under applicable law or any relevant stock exchange listing rules, Ausdrill disclaims any obligation or undertaking to publicly update or revise any forward-looking statement contained in these materials or to reflect any change in management’s expectations with regard thereto after the date hereof of any change in events, conditions or circumstances on which any such statement is based. No representation or warranty, express or implied, is given as to the accuracy, completeness, likelihood of achievement or reasonableness of any forecasts, projections or prospects referred to in these materials.

OPERATING AND FINANCIAL REVIEW20
DIRECTORS
Terence Edward O’Connor AM QC Chairman
Ronald George Sayers Managing Director
Terrence John Strapp
Mark Anthony Connelly
Donald James Argent
Mark Andrew Hine
SECRETARY
Efstratios V Gregoriadis
Domenic Mark Santini
CHIEF FINANCIAL OFFICER
José Martins
PRINCIPAL REGISTERED OFFICE IN AUSTRALIA
6-12 Uppsala Place Canning Vale Western Australia 6155
SHARE REGISTER
Computershare Investor Services Pty Ltd Level 11, 172 St Georges Terrace Perth Western Australia 6000
AUDITOR
PwC Level 15, 125 St Georges Terrace Perth Western Australia 6000
SOLICITORS
Clifford Chance Level 7, 190 St Georges Terrace Perth Western Australia 6000
King & Wood Mallesons Level 30, 250 St Georges Terrace Perth Western Australia 6000
BANKERS
Commonwealth Bank of Australia Level 3, 150 St Georges Terrace Perth Western Australia 6000
STOCK EXCHANGE LISTINGS
Ausdrill Limited shares are listed on the Australian Stock Exchange.
ASX CODE
ASL
WEBSITE
www.ausdrill.com.au
CORPORATE DIRECTORY

21FINANCIAL REPORT
Directors’ report ������������������������������������������������������������������������22
Auditor’s Independence Declaration ����������������������������������36
Corporate governance statement ���������������������������������������37
Consolidated income statement �����������������������������������������38
Consolidated statement of comprehensive income ������39
Consolidated statement of financial position �������������������40
Consolidated statement of changes in equity ������������������41
Consolidated statement of cash flows�������������������������������42
Notes to the consolidated financial statements ��������������43
Directors’ declaration �����������������������������������������������������������108
Independent auditor’s report ����������������������������������������������109
Shareholder information ��������������������������������������������������������111
Financial table ������������������������������������������������������������������������� 113
FINANCIAL REPORT
These financial statements are consolidated financial statements for the Group consisting of Ausdrill Limited and its subsidiaries� A list of major subsidiaries is included in note 14� The financial statements are presented in the Australian currency�
Ausdrill Limited is a company limited by shares, incorporated and domiciled in Australia� Its registered office and principal place of business is:
Ausdrill Limited 6-12 Uppsala Place Canning Vale Western Australia 6155
The financial statements was authorised for issue by the directors on 26 August 2015� The directors have the power to amend and reissue the financial statements�
All press releases, financial report and other information are available at our Shareholders’ Centre on our website: www�ausdrill�com�au
30 JUNE 2015

22 DIRECTORS' REPORT
Your directors present their report on the consolidated entity consisting of Ausdrill Limited and the entities it controlled at the end of, or during, the year ended 30 June 2015� Throughout the report, the consolidated entity is referred to as the Group�
DIRECTORS AND COMPANY SECRETARY
The following persons were directors of Ausdrill Limited during the whole of the financial year and up to the date of this report:
Terence Edward O’Connor AM QC (Chairman) Ronald George Sayers (Managing Director) Terrence John Strapp Donald James Argent Mark Anthony Connelly
Mark Andrew Hine was appointed as a director on 24 February 2015 and continues in office at the date of this report�
Wallace Macarthur King AO (Deputy Chairman) was a director from the beginning of the financial period until his resignation on 28 October 2014�
The Company Secretaries of the Company are Efstratios V Gregoriadis and Domenic Mark Santini�
Efstratios (Strati) Gregoriadis B�A�, L�L�B�, M�B�A joined the Company in February 2011 in the position of Group General Counsel / Company Secretary� Prior to joining the Company Mr Gregoriadis held the role of Group General Counsel / Company Secretary and has held various other positions as a lawyer in private legal practice�
Mr Santini is a Certified Practising Accountant who was appointed as Company Secretary in August 2007� He is also the Group Financial Controller of the Company� During the ten years prior to joining the Company, Mr Santini held various commercial roles with public and private companies�
DIVIDENDS - AUSDRILL LIMITED
Dividends paid to members during the financial year were as follows:
15 14$’000 $’000
Final ordinary dividend for the year ended 30 June 2014 of 2�0 cents (2013: 5�5 cents) per fully paid share paid on 17 October 2014� 6,246 17,175Interim ordinary dividend for the year ended 30 June 2015 of 1�0 cent (2014: 2�5 cents) per fully paid share paid on 31 March 2015� 3,123 7,806
9,369 24,981
The directors have recommended not to pay a final ordinary dividend�
REVIEW OF OPERATIONS
Information on the operations and financial position of the Group and its business strategies and prospects is set out in the operating and financial review on page 2 to 19 of this annual report�
SIGNIFICANT CHANGES IN THE STATE OF AFFAIRS
There were no significant changes in the state of affairs of the consolidated entity during the financial year ended 30 June 2015�
EVENTS SINCE THE END OF THE FINANCIAL YEAR
No other matter or circumstance has arisen since 30 June 2015 that has significantly affected the group’s operations, results or state of affairs, or may do so in future years�
LIKELY DEVELOPMENTS AND EXPECTED RESULTS OF OPERATIONS
Additional comments on expected results of certain operations of the Group are included in this annual report under the review of operations and activities on page 2 to 19�
ENVIRONMENTAL REGULATION
The Group is not subject to any significant environmental regulations but is committed to reducing the impact of its operations on the environment� Our clients have obligations under environmental regulations� The Group complies with its contractual obligations in this regard�

23DIRECTORS' REPORT CONTINUED
INFORMATION ON DIRECTORS
The following information is current as at the date of this report�
Terence Edward O’Connor AM QC LLB (WA). Non-executive Chairman. Age 77�
Experience and expertise
Mr Terry O’Connor is a Barrister� He is a graduate of the University of Western Australia, and was formerly a partner in the legal firm Stone James Stephen Jaques (now King & Wood Mallesons)� Mr O’Connor has been a director of a number of public companies� He was formerly the Chairman of the Anti Corruption Commission, the Chancellor of the University of Notre Dame Australia and a Commissioner of the Australian Football League� Mr O’Connor has held the position of Chairman since 1993�
Other current directorships
Non-executive director of EBM Insurance Brokers Limited from 1990�
Former directorships in last 3 years
None�
Special responsibilities
Chairman of the Board� Chairman of the Remuneration Committee� Member of the Audit and Risk Committee�
Interests in shares and options
1,004,285 ordinary shares�
Ronald George Sayers Managing Director. Age 63�
Experience and expertise
Mr Ron Sayers was re-appointed as Managing Director in December 2000� Mr Sayers founded Ausdrill in 1987 and was Managing Director until May 1997� He was formerly the branch manager of a large mining supply group and has been involved with the mining industry for over 40 years�
Other current directorships
None�
Former directorships in last 3 years
None�
Special responsibilities
Managing Director�
Interests in shares and options
36,846,782 ordinary shares�
Terrence John Strapp CPA, SF Fin., MAICD Non-executive director. Age 71�
Experience and expertise
Mr Terry Strapp was appointed as a non-executive director on 21 July 2005�
Mr Strapp has extensive experience in banking, finance and corporate risk management and has been actively involved in the mining industry for over 30 years� He is a Certified Practising Accountant (CPA), a Senior Fellow of the Financial Services Institute of Australasia and a member of the Australian Institute of Company Directors�
Other current directorships
Non-executive director of GR Engineering Limited from 2011�
Former directorships in last 3 years
None�
Special responsibilities
Chairman of the Audit and Risk Committee� Member of the Remuneration Committee (up to 3 June 2015)�
Interests in shares and options
400,000 ordinary shares�

DIRECTORS' REPORT CONTINUED24
INFORMATION ON DIRECTORS (CONTINUED)
Mr Mark Anthony Connelly BBus MAICD Non-executive director. Age 52�
Experience and expertise
Mr Mark Connelly was appointed as a non-executive director on 25 July 2012�
Mark Connelly has more than 28 years of experience in the mining industry, and has held senior executive positions with Newmont Mining Corporation and Inmet Mining Corporation� He is the former Managing Director and Chief Executive Officer of Papillon Resources Limited, a Mali-based gold developer which merged with B2Gold Corp in 2014�
He was Chief Operating Officer of Endeavour Mining Corporation following its merger with Adamus Resources, where he was Managing Director and CEO� Mark has extensive experience in financing, development, construction and operation of mining projects in a variety of commodities including gold, base metals and other resources in West Africa, Australia, North America and Europe�
Other current directorships
Director of B2Gold Corp since 2014� Director and Chairman of Toro Gold plc since 2014� Director of Saracen Mineral Holdings Limited since 2015� Director and Chairman of West African Resources Limited since 2015�
Former directorships in last 3 years
Managing Director of Papillon Resources Limited from 2012 until 2014� Director of Manas Resources Limited from 2013 to 2015� Director of Endeavour Mining Corporation from 2011 to 2012�
Special responsibilities
Member of the Audit and Risk Committee� Member of the Remuneration Committee�
Interests in shares and options
None�
Donald James Argent BCom, CPA, FAICD Non-executive director. Age 68�
Experience and expertise
Mr Donald Argent was appointed as a non-executive director on 25 July 2012�
Mr Argent was the Director Finance and Administration for the Thiess Group, one of the largest integrated engineering and service providers in Australia and South East Asia� He joined Thiess Pty Ltd in 1985 following six years service with Thiess Holdings Ltd in the late 1970’s, and, until he retired in July 2011, played an instrumental part in the growth of Thiess from a family-run business to a leading Australian construction, mining and services company�
Mr Argent holds a Bachelor of Commerce degree, is a Certified Practicing Accountant and a Fellow of the Australian Institute of Company Directors�
Other current directorships
Non-executive director of Sedgman Limited since 2006�
Former directorships in last 3 years
None�
Special responsibilities
None�
Interests in shares and options
40,000 ordinary shares�

25DIRECTORS' REPORT CONTINUED
INFORMATION ON DIRECTORS (CONTINUED)
Mr Mark Andrew Hine MAICD, MAusIMM Non-executive director. Age 57�
Experience and expertise
Mr Mark Hine was appointed as a non-executive director on 24 February 2015�
Mr Hine is a mining engineer� He graduated from the Western Australia School of Mines and is a member of the Australian Institute of Company Directors and the Australian Institute of Mining and Metallurgy� He has extensive mining experience with over 25 years of senior management roles in both surface and underground mining operations�
He has held a number of senior positions in the mining industry including Chief Operating Officer at Griffin Mining Ltd, Chief Operating Officer at Focus Minerals Ltd, Chief Executive Officer at Golden West Resources Ltd, Executive General Manager Mining at Macmahon Contractors Pty Ltd, Chief Executive officer at Queensland Industrial Minerals Ltd, General Manager at Consolidated Rutile Ltd and General Manager of Pasminco, Broken Hill / Elura Mines�
Other current directorships
None�
Former directorships in last 3 years
None�
Special responsibilities
Member of the Remuneration Committee�
Interests in shares and options
75,000 ordinary shares�
Wallace Macarthur King AO, BE, MEngSc, Hon DSc, Hon FIEAust, CPEng, FAICD, FAIM, FAIB, FTSE Non-executive director and Deputy Chairman until 28 October 2015. Age 71�
Experience and expertise
Mr King is a Civil Engineer and has worked in the construction industry for over 40 years� He was Chief Executive Officer of Leighton Holdings Limited, a company with substantial operations in Australia, Asia and the Middle East, from 1987 until his retirement on 31 December 2010�
Mr King is an Honorary Fellow of the Institution of Engineers Australia, a Foundation Fellow of the Australian Institute of Company Directors, and a Fellow of the Australian Institute of Management, the Australian Institute of Building and the Australian Academy of Technological Sciences and Engineering�
Mr King resigned as a non-executive director and Deputy Chairman on 28 October 2014�
Other current directorships
Non-executive director of Asia Resource Minerals plc from June 2014� Non-executive director and Deputy Chairman of Sundance Resources from May 2014� Non-executive director of Coca-Cola Amatil Limited from 2002� Deputy Chairman of University of New South Wales Foundation Limited� Director of Kimberley Foundation Australia Limited and Garvan Research Foundation�
Former directorships in last 3 years
None�
Special responsibilities
Deputy Chairman� Member of the Remuneration Committee�
Interests in shares and options
310,285 ordinary shares�

DIRECTORS' REPORT CONTINUED26
MEETINGS OF DIRECTORS
The numbers of meetings of the Company’s board of directors and of each board committee held during the year ended 30 June 2015 and the numbers of meetings attended by each director were:
Meetings of committees
Full meetings of directors Audit RemunerationA B A B A B
Terence Edward O’Connor 12 13 7 8 2 2Ronald George Sayers 11 13 * * * *Terrence John Strapp 12 13 7 8 1 2Wallace Macarthur King (resigned 28 October 2014) 3 5 * * 1 1Donald James Argent 10 13 * * * *Mark Anthony Connelly 10 13 6 8 1 2Mark Andrew Hine 4 4 * * 1 1
A = Number of meetings attended B = Number of meetings held during the time the director held office or was a member of the committee during the year * = Not a member of the relevant committee
REMUNERATION REPORT
The directors present the Ausdrill Limited 2015 remuneration report, outlining key aspects of our remuneration policy and framework, and remuneration awarded this year�
The report is structured as follows:
(a) Key management personnel (KMP) covered in this report (b) Remuneration policy and governance (c) Elements of remuneration (d) Link between remuneration and performance (e) Remuneration expenses for executive KMP (f) Contractual arrangements for executive KMP (g) Non-executive director arrangements (h) Additional statutory information
(a) Key management personnel covered in this report
Non-executive and executive directors (see pages 23 - 25 for details about each director)T E O’Connor W M King (until 28 October 2014)R G Sayers M A ConnellyT J Strapp D J ArgentM A Hine (from 24 February 2015)
Other key management personnel
Name Position
A J McCulloch Chief Operating Officer Australian OperationsC Tuckwell Chief Operating Officer African Operations (until 30 June 2014)J Kavanagh Chief Operating Officer African Operations (from 25 June 2014)J E Martins Chief Financial OfficerM C Crocker Group Engineering Manager
Changes since the end of the reporting period
A J McCulloch resigned from the position of Chief Operating Officer Australian Operations on 10 July 2015�
A G Broad was appointed as Chief Operating Officer Australian Operations on 3 August 2015�
R J Coates was appointed as Executive General Manager - Australian Mining Operations on 6 July 2015�

27DIRECTORS' REPORT CONTINUED
REMUNERATION REPORT (CONTINUED)
(b) Remuneration policy and governance
Our Remuneration Committee is made up of independent non-executive directors� The committee reviews and determines our remuneration policy and structure annually to ensure it remains aligned to business needs, and meets our remuneration principles� From time to time, the committee also engages external remuneration consultants to assist with this review� In particular, the Committee aims to ensure that remuneration practices are:
�� competitive and reasonable, enabling the company to attract and retain key talent�� aligned to the company’s strategic and business objectives and the creation of shareholder value�� transparent and easily understood, and�� acceptable to shareholders�
The Remuneration Committee is a committee of the Board� It is primarily responsible for making recommendations to the Board on:
�� non-executive director fees,�� remuneration levels of executive directors and other key management personnel,�� the over-arching executive remuneration framework, and�� operation of the incentive plans which apply to executive directors and senior executives (the executive team), including key performance
indicators and performance hurdles�
The remuneration framework, elements and link to performance are covered below�
(c) Elements of remuneration
The executive pay and reward framework has three components:
�� base pay and benefits, including superannuation,�� short-term performance incentives, and�� long-term incentives through participation in the Ausdrill Employee Option Plan�
Base pay and benefits
Executives receive their base pay and benefits structured as a total employment cost package which may be delivered as a combination of cash and prescribed non-financial benefits at the executives’ discretion�
Executives are offered a competitive fixed base pay� The remuneration committee obtain relevant comparative information and seek independent advice to ensure base pay is set to reflect the market for a comparable role� Base pay for executives is reviewed annually to ensure the executive’s pay is competitive with the market� An executive’s pay is also reviewed on promotion�
There are no guaranteed base pay increases included in any executives’ contracts�
Executives can elect to receive a fully maintained motor vehicle as a component of their base pay�
Superannuation
Retirement benefits are delivered under the Superannuation Guarantee Legislation�
Short-term performance incentives
Cash bonus
The amount of the cash bonus paid to senior executives and middle level management varies between $75,000 to a maximum of $150,000, inclusive of superannuation, according to the individual’s position� The cash bonus is at the discretion of the Managing Director and Remuneration Committee and is dependent on the overall financial performance of the Group� If earnings per share is accretive on a year on year basis then the cash bonus becomes payable in the following financial year�
It is the Board’s view that, given the varied businesses which comprise the Group and the nature of the Group’s operations, it is most beneficial to shareholders and to the management concerned to have the STI linked to EPS being accretive� This promotes a high level of co-operation and cohesiveness amongst the various managers and businesses, encouraging them to maximise the use of services provided by the other group businesses, and striving for improvement within the Group� Historically, the STI has operated effectively in this way within Ausdrill, and as such, the Board does not believe that any change is necessary nor that it would be of overall benefit to Ausdrill to link the STI to specific KPIs for individuals�
New executives are eligible to receive the cash bonus, if payable, in the financial year following the commencement of their employment with the Group� There is no cash bonus payable where an executive’s employment terminates prior to the end of the financial year�
Service bonus
The amount of the service bonus payable to all employees, excluding the executive director, is $1,000 per year of service plus superannuation� If earnings per share is accretive on a year on year basis then the service bonus to employees becomes payable in the following financial year�
The Remuneration Committee and Board retains the right to vary the above incentives in exceptional circumstances� Any variation and the reasons for it are disclosed�

DIRECTORS' REPORT CONTINUED28
REMUNERATION REPORT (CONTINUED)
(c) Elements of remuneration (continued)
Long-term incentives
The Board completed a review of the LTIP in 2014� The review included benchmarking of Ausdrill’s LTI policy against a “benchmark group” comprised of sector competitors� The review sought to ensure that the balance between rewarding performance and motivating and retaining existing senior executives was effective and reflected the Company’s business strategies� Accordingly the review focused on the composition and operation of the performance conditions� The following changes were made as a result of the review:
�� Introduction of an additional performance hurdle, Total Shareholder Return (TSR), so that the exercise of options will be subject to the achievement of this hurdle relative to a peer group (previously the only hurdle was remaining in the employment of Ausdrill at the end of the vesting period);
�� Introduction of a TSR performance vesting scale consistent with previous SAR’s issued to the managing director and sector competitors (previously none); and
�� Introduction of TSR measures applying to each third of the options granted to each senior executive (previously none)�
Participation in the plan is at the Board’s discretion and no individual has a contractual right to participate in the plan or to receive any guaranteed benefits�
Options will be issued in three (equal) tranches as follows:
�� Tranche 1 (one third of the options) will become exercisable after the second anniversary of their date of issue;�� Tranche 2 (a further one third of the options) will become exercisable after the third anniversary of their date of issue; and�� Tranche 3 (the remaining one third of the options) will become exercisable after the fourth anniversary of their date of issue�
Options are granted under the plan for no consideration� Options are granted for a five year period� Vesting will occur based on the Company’s ranking within the peer group, as follows:
TSR Rank Proportion of options that vest
Less than 50% percentile 0%50th percentile 50%Between 50th and 75th percentile Pro-rata (sliding scale) percentageAt or above 75th percentile 100%
For the options granted on 7 October 2013, the peer group includes the following companies:
�� Austin Engineering Limited�� Brierty Limited�� Emeco Holdings Limited�� MACA Limited�� Monadelphous Group Limited�� Sedgman Limited�� WDS Limited
�� Boart Longyear Limited�� Downer EDI Limited�� Imdex Limited�� Macmahon Holdings Limited�� NRW Holdings Limited�� Transfield Services Limited
Ausdrill Share Appreciation Rights (SARs)
As the SARs have passed their vesting date, the SARs have now lapsed�
(d) Link between remuneration and performance
The table below sets out summary information about the consolidated entity’s earnings and movements in shareholder wealth for the five years to June 2015�
30 June 2015 30 June 2014 30 June 2013 30 June 2012 30 June 2011
$000 $000 $000 $000 $000
Revenue 767,640 827,860 1,131,283 1,062,241 839,213Operating profit before income tax* 2,113 34,430 109,456 152,487 99,458Net profit after tax (175,620) (43,859) 90,399 112,207 73,317Share price at start of year ($ per share) 0.86 0.86 3.42 3.31 1.65Share price at end of year ($ per share) 0.39 0.86 0.86 3.42 3.31Basic (loss)/earnings (cents per share) (56.24) (13.64) 29.63 37.28 27.13Diluted (loss)/earnings (cents per share) (56.24) (13.64) 28.98 36.97 26.92
* Does not include impairment expense

29DIRECTORS' REPORT CONTINUED
REMUNERATION REPORT (CONTINUED)
(e) Remuneration expenses for executive KMP
The following table shows details of the remuneration expense recognised for the Group’s executive key management personnel for the current and previous financial year measured in accordance with the requirements of the accounting standards�
Amounts of remuneration
Figure 1: Executive remuneration
Fixed remuneration Variable remuneration
Name YearCash
salary
Non- monetary
benefits
Long service
leave
Post- employment
benefitsCash
bonus *
Rights to deferred
shares Options Total
$ $ $ $ $ $ $ $
Executive directorsR G Sayers 2015 810,888 25,000 12,123 35,000 - - - 883,011
2014 808,956 25,000 4,116 35,000 - 1,021,935 - 1,895,007
Other key management personnel (Group)C Tuckwell 1 2015 - - - - - - - -
2014 592,648 84,524 - - - - 18,720 695,892J Kavanagh 2 2015 621,052 127,116 - - - - - 748,168
2014 - - - - - - - -A J McCulloch 3 2015 301,359 25,000 7,232 38,882 - - 25,687 398,160
2014 301,359 25,000 7,563 38,105 - - 18,720 390,747J E Martins 2015 418,021 - 10,754 37,802 - - 35,443 502,020
2014 339,465 - 4,955 25,000 - - 36,447 405,867M C Crocker 2015 248,578 25,000 2,980 23,615 - - 17,124 317,297
2014 248,578 25,000 8,767 22,993 - - 12,480 317,818Total executive directors 2015 2,399,898 202,116 33,089 135,299 - - 78,254 2,848,656and other KMP 2014 2,291,006 159,524 25,401 121,098 - 1,021,935 86,367 3,705,331Total NED 2015 423,562 - - 58,853 - - - 482,415remuneration 2014 460,500 - - 63,900 - - 122,497 646,897Total KMP 2015 2,823,460 202,116 33,089 194,152 - - 78,254 3,331,071remuneration expense 2014 2,751,506 159,524 25,401 184,998 - 1,021,935 208,864 4,352,228
1 Mr C Tuckwell resigned as Chief Operating Officer African Operations on 30 June 2014�
2 Mr J Kavanagh was appointed as Chief Operating Officer African Operations on 25 June 2014� During the year ended 30 June 2015, Mr Kavanagh was paid out $87,719 of accrued leave entitlements�
3 Mr A J McCulloch resigned as Chief Operating Officer Australian Operations on 10 July 2015�
* There will be no cash and service bonus payable for the year ended 30 June 2015� There was no cash and service bonus paid for the year ended 30 June 2014�
(f) Contractual arrangements with executive KMPs
Remuneration and other terms of employment for key management personnel are also formalised in service agreements� Each of these agreements provide for other benefits including car allowances and participation, when eligible, in the Ausdrill Limited Employee Option Plan�
All key management personnel are employed on standard letters of appointment that provide for annual reviews of base salary and between 4 and 12 weeks of termination by either party unless noted below:
NameTerm of agreement
Base salary including superannuation Termination benefit
R G Sayers, Managing Director On-going 843,956*
Contract can be terminated by either party with 12 months notice or payment in lieu�
A G Broad, Chief Operating Officer Australian Operations (from 3 August 2015) On-going 477,420 -A J McCulloch, Chief Operating Officer Australian Operations (until 10 July 2015) - 339,465 -J Kavanagh, Chief Operating Officer African Operations On-going 533,333 -J E Martins, Chief Financial Officer On-going 477,420 -R J Coates, Executive General Manager – Australian Mining Operations (from 6 July 2015) On-going 340,242 -M C Crocker, Group Engineering Manager On-going 271,571 -
* From 1 July 2015, Mr Sayers’s base salary including superannuation will be reduced to $761,299�

DIRECTORS' REPORT CONTINUED30
REMUNERATION REPORT (CONTINUED)
(g) Non-executive director arrangements
On appointment to the board, all non-executive directors enter into a service agreement with the company in the form of a letter of appointment� The letter summarises the board policies and terms, including remuneration, relevant to the officer or director�
Fees and payments to non-executive directors reflect the demands which are made on, and the responsibilities of, the directors� Non-executive directors’ fees and payments are reviewed annually by the Board� The Board ensures non-executive directors’ fees and payments are appropriate and in line with the market� The Chairman’s fees are determined independently to the fees of non-executive directors based on comparative roles in the external market�
The current base fees were last reviewed with effect from 1 July 2015� The Chairman and other non-executive directors who chair a committee receive additional yearly fees�
Non-executive directors’ fees are determined within an aggregate directors’ fee pool limit, which is periodically recommended for approval by shareholders� The maximum pool currently stands at $800,000 per annum and was approved by shareholders at the annual general meeting on 27 November 2009�
The following fees have applied: From 1 July 2015From 1 July 2010 to
30 June 2015
Base feesChairman $108,000 $120,000Deputy chairman $90,000 $100,000Other non-executive directors $72,000 $80,000
Additional feesAudit and risk committee - Chairman $9,000 $10,000Remuneration committee - Chairman $9,000 $10,000
Figure 2: Non-executive director remuneration
Name Year Base feeAudit
committeeNomination committee
Remuneration committee
Super- annuation Options Total
$ $ $ $ $ $
T E O’Connor 2015 120,000 - - 10,000 12,350 - 142,3502014 120,000 - - 10,000 12,025 - 142,025
WM King (until 28 October 2014) 2015 32,671 - - - 3,104 - 35,7752014 100,000 - - - 9,250 122,497 231,747
T J Strapp 2015 80,000 10,000 - - 8,550 - 98,5502014 80,000 10,000 - - 8,325 - 98,325
D J Argent 2015 63,000 - - - 24,600 - 87,6002014 60,500 - - - 26,900 - 87,400
M A Connelly 2015 80,000 - - - 7,600 - 87,6002014 80,000 - - - 7,400 - 87,400
M A Hine (from 24 February 2015) 2015 27,891 - - - 2,650 - 30,5412014 - - - - - - -
Total non-executive 2015 403,562 10,000 - 10,000 58,854 - 482,416director remuneration 2014 440,500 10,000 - 10,000 63,900 122,497 646,897

31DIRECTORS' REPORT CONTINUED
REMUNERATION REPORT (CONTINUED)
(h) Additional statutory information
(i) Relative proportions of fixed vs variable remuneration expense
The following table shows the relative proportions of remuneration that are linked to performance and those that are fixed, based on the amounts disclosed as statutory remuneration expense in figure 1 on page 29 above:
Figure 3: Relative proportion of fixed vs variable remuneration expense
Name Fixed remuneration At risk - STI At risk - LTI *
2015 %
2014 %
2015 %
2014 %
2015 %
2014 %
Executive directorsR G Sayers 100 46 - - - 54
Other key management personnel of the groupC Tuckwell - 97 - - - 3J Kavanagh 100 - - - - -A J McCulloch 94 95 - - 6 5J E Martins 93 91 - - 7 9M C Crocker 95 96 - - 5 4
* Since the long-term incentives are provided exclusively by way of options and rights, the percentages disclosed also reflect the value of remuneration consisting of options and rights, based on the value of options and rights expensed during the year�
(ii) Terms and conditions of the share-based payment arrangements
Options
The terms and conditions of each grant of options affecting remuneration in the current or a future reporting period are as follows:
Grant date Vesting and exercise date Expiry date Exercise price
Value per option at grant
date % Vested
29 November 2010 29 November 2012 29 November 2015 $2.20 $0.94 100%29 November 2010 29 November 2013 29 November 2015 $2.30 $0.94 100%29 November 2010 29 November 2014 29 November 2015 $2.40 $0.94 100%3 February 2011 3 February 2013 3 February 2016 $3.20 $0.84 100%3 February 2011 3 February 2014 3 February 2016 $3.35 $0.84 100%3 February 2011 3 February 2015 3 February 2016 $3.50 $0.85 100%9 March 2011 9 March 2013 9 March 2016 $3.55 $0.99 100%9 March 2011 9 March 2014 9 March 2016 $3.70 $0.99 100%9 March 2011 9 March 2015 9 March 2016 $3.85 $1.00 100%21 July 2011 21 July 2013 21 July 2016 $3.55 $0.77 100%21 July 2011 21 July 2014 21 July 2016 $3.65 $0.79 100%21 July 2011 21 July 2015 21 July 2016 $3.85 $0.79 n/a7 October 2013 7 October 2015 7 October 2018 $1.70 $0.12 n/a7 October 2013 7 October 2016 7 October 2018 $1.70 $0.12 n/a7 October 2013 7 October 2017 7 October 2018 $1.70 $0.12 n/a
Options granted under the plan carry no dividend or voting rights�
When exercisable, each option is convertible into one ordinary share� Options may not be exercised during the period of four weeks prior to the release of the half-yearly and annual financial results of the Group to the market�
Details of options over ordinary shares in the Company provided as remuneration to each director of Ausdrill Limited and each of the key management personnel of the Group are set out below� When exercisable, each option is convertible into one ordinary share of Ausdrill Limited� Further information on the options is set out in note 19 to the financial statements�

DIRECTORS' REPORT CONTINUED32
REMUNERATION REPORT (CONTINUED)
(h) Additional statutory information (continued)
(iii) Reconciliation of options and ordinary shares held by KMP
Figure 4: Options
The table below shows a reconciliation of options held by each KMP from the beginning to the end of FY 2015� There were no vested options as at 1 July 2014� All vested options were exercisable�
2015Balance at the start of
the year Vested ForfeitedBalance at the end
of the year
Name & Grant datesVested and exercisable Unvested
Granted as compensation Number % Exercised Number %
Other changes
Vested and exercisable Un-vested
W M King -29 June 2011 250,000 - - - - - 250,000 100 - - -29 June 2011 250,000 - - - - - 250,000 100 - - -29 June 2011 - 500,000 - - - - 500,000 100 - - -
A J McCulloch7 October 2013 - 200,000 - - - - - - - - 200,0007 October 2013 - 200,000 - - - - - - - - 200,0007 October 2013 - 200,000 - - - - - - - 200,000
M C Crocker7 October 2013 - 133,333 - - - - - - - - 133,3337 October 2013 - 133,333 - - - - - - - - 133,3337 October 2013 - 133,334 - - - - - - - - 133,334
J E Martins -29 November 2010 100,000 - - - - - - - - 100,000 -29 November 2010 100,000 - - - - - - - - 100,000 -29 November 2010 - 133,334 - 133,334 100 - - - - 133,334 -7 October 2013 - 200,000 - - - - - - - - 200,0007 October 2013 - 200,000 - - - - - - - - 200,0007 October 2013 - 200,000 - - - - - - - - 200,000
C Tuckwell7 October 2013 - 200,000 - - - - 200,000 100 - - -7 October 2013 - 200,000 - - - - 200,000 100 - - -7 October 2013 - 200,000 - - - - 200,000 100 - - -
Figure 5: Shareholdings
2015
NameBalance at the start
of the year
Received during the year on the exercise
of options
Received on vesting of rights deferred
sharesOther changes during the year
Balance at the end of the year
Ordinary sharesT E O’Connor 1,004,285 - - - 1,004,285R G Sayers 36,846,782 - - - 36,846,782W M King 310,285 - - - 310,285T J Strapp 400,000 - - - 400,000D J Argent 40,000 - - - 40,000M A Hine - - - 75,000 75,000
None of the shares above are held nominally by the directors or any of the other key management personnel�

33DIRECTORS' REPORT CONTINUED
REMUNERATION REPORT (CONTINUED)
(h) Additional statutory information (continued)
(iv) Loans to key management personnel
No loans have been made to directors of Ausdrill Limited or related entities�
Details of loans made to key management personnel of the Group are set out below�
Name
Balance at the start of the year
$
Interest paid and payable for the year
$Interest not charged
$
Balance at the end of the year
$
Highest indebtedness during
the year $
J Kavanagh - - - 150,000 150,000
Loans outstanding at the end of the current year include an unsecured loan to a key management personnel of $150,000 which was made in June 2015 and is repayable in full in 6 months� Interest is payable on this loan at the rate of 8% per annum�
The amounts shown for interest not charged in the tables above represent the difference between the amount paid and payable for the year and the amount of interest that would have been charged on an arm’s-length basis� As this loan was made in June 2015, this amount is negligible�
No write-downs or allowances for doubtful receivables have been recognised in relation to any loans made to key management personnel�
(v) Other transactions with key management personnel
Mr R G Sayers, a director of Ausdrill Limited, is a shareholder of FMR Investments Pty Ltd, which provided aviation services to Ausdrill International and Management Services Pty Ltd, a subsidiary of Ausdrill Ltd� The services were provided on normal commercial terms and conditions�
Ausdrill Limited has rented an office building from Mr R G Sayers for the past year� The rental agreement is based on normal commercial terms and conditions and is reviewed annually�
A director, Mr M A Connelly, is a director of B2Gold Corp� B2Gold Corp� through its subsidiary Songhoi Resources Sarl entered into an exploration drilling contract with an Ausdrill Limited subsidiary, African Mining Services Mali Sarl� Further B2Gold Corp� through its subsidiary Kiaka Gold Sarl entered into an exploration drilling contract with an Ausdrill Limited subsidiary, African Mining Services Burkina Faso Sarl� Both contracts are based on normal commercial terms and conditions and Mr Connelly is not party to any contract negotiations for either party�
Aggregate amounts of each of the above types of other transactions with key management personnel of Ausdrill Limited:
15 14$’000 $’000
(i) Amounts recognised as revenueExploration drilling services 2,338,041 927,224
(ii) Amounts recognised as expenseRent of office buildings 358,032 358,032Aviation services - 41,450
358,032 399,482
(iii) Amounts recognised as assets and liabilities
At the end of the reporting period the following aggregate amounts were recognised in relation to the above transactions:
Current assets 416,500 454,043
(iv) Voting of shareholders at last year’s annual general meeting
In 2014, 98�7% of the votes on the remuneration report were in favour of the report� The Company did not receive any specific feedback at the AGM on its remuneration practices�

DIRECTORS' REPORT CONTINUED34
SHARES UNDER OPTION
Unissued ordinary shares of Ausdrill Limited under option at the date of this report are as follows:
Date options granted Expiry date Issue price of sharesNumber under
option
29 November 2010 29 November 2015 $2.20 100,00029 November 2010 29 November 2015 $2.30 100,00029 November 2010 29 November 2015 $2.40 100,0003 February 2011 3 February 2016 $3.20 66,6663 February 2011 3 February 2016 $3.35 66,6673 February 2011 3 February 2016 $3.50 66,6679 March 2011 9 March 2016 $3.55 33,3339 March 2011 9 March 2016 $3.70 33,3339 March 2011 9 March 2016 $3.85 33,33421 July 2011 21 July 2016 $3.55 66,66621 July 2011 21 July 2016 $3.65 66,66721 July 2011 21 July 2016 $3.85 66,6677 October 2013 7 October 2018 $1.70 3,399,9807 October 2013 7 October 2018 $1.70 3,399,9807 October 2013 7 October 2018 $1.70 3,400,040
11,000,000
No option holder has any right under the options to participate in any other share issue of the Company or any other entity�
Shares issued on the exercise of options
No ordinary shares of Ausdrill Limited were issued during the year ended 30 June 2015 on the exercise of options granted under the Ausdrill Limited Employee Option Plan� No further shares have been issued since that date�
INDEMNIFICATION
Under the Company’s constitution and subject to section 199A of the Corporations Act 2001, the Company indemnifies each of the Directors, each of the Company Secretaries and every other person who is an officer of the Company and its wholly-owned subsidiaries against:
�� any liability incurred as an officer of the Company (as the case may be) by that person to any person other than the Company or a related body corporate of the Company, unless that liability arises out of conduct involving a lack of good faith or is a liability for a pecuniary penalty order under certain provisions of the Corporations Act 2001; and
�� costs and expenses incurred in defending civil or criminal proceedings subject to certain conditions�
The above indemnity is a continuing indemnity and applies in respect of all acts done by a person while an officer of the Company or its wholly-owned subsidiaries even though the person is not an officer at the time the claim is made�
The Company has entered into a Deed of Indemnity, Access and Insurance (“Deed”) with each current and former officer of the Company and its subsidiaries, including each Director and Company Secretary and persons who previously held those roles� Under each Deed, to the extent permitted by law and to the extent and in the amount that the officer is not indemnified under any other indemnity, including an indemnity contained in any insurance policy, the Company indemnifies the relevant officer against all liabilities of any kind (including liabilities for legal expenses) incurred by the officer arising out of:
�� the discharge of his or her duties as an officer of the Company or a subsidiary of the Company, or as an officer of any corporation in which the Company holds securities (“Related Corporation”) where the officer is representing the interests of the Company in relation to the Related Corporation; and
�� the conduct of the business of the Company or a subsidiary of the Company, or a Related Corporation where the officer is representing the interests of the Company in relation to that Related Corporation�
No amount has been paid under any of these indemnities during the financial year under review�
INSURANCE OF OFFICERS
During the financial year, the Company has paid a premium in respect of insuring the directors and officers of the Company and the Group� The insurance contract prohibits disclosure of the premium or the nature of liabilities insured against under the policy�
PROCEEDINGS ON BEHALF OF THE COMPANY
No person has applied to the Court under section 237 of the Corporations Act 2001 for leave to bring proceedings on behalf of the Company or to intervene in any proceedings to which the Company is a party, for the purpose of taking responsibility on behalf of the Company for all or part of those proceedings�
No proceedings have been brought or intervened in on behalf of the Company with leave of the Court under section 237 of the Corporations Act 2001�

35DIRECTORS' REPORT CONTINUED
NON-AUDIT SERVICES
The Company may decide to employ the auditor on assignments additional to their statutory audit duties where the auditor’s expertise and experience with the Company and/or the Group are important�
Details of the amounts paid or payable to the auditor (PwC) for audit and non-audit services provided during the year are set out in note 20 to the financial statements�
The board of directors has considered the position and, in accordance with advice received from the audit and risk committee, is satisfied that the provision of the non-audit services is compatible with the general standard of independence for auditors imposed by the Corporations Act 2001� The directors are satisfied that the provision of non-audit services by the auditor did not compromise the auditor independence requirements of the Corporations Act 2001 for the following reasons:
�� all non-audit services have been reviewed by the audit and risk committee to ensure they do not impact the impartiality and objectivity of the auditor
�� none of the services undermine the general principles relating to auditor independence as set out in APES 110 Code of Ethics for Professional Accountants�
AUDITOR’S INDEPENDENCE DECLARATION
The auditor’s independence declaration as required under section 307C of the Corporations Act 2001 is set out on page 36�
ROUNDING OF AMOUNTS
The Company is of a kind referred to in Class Order 98/100, issued by the Australian Securities and Investments Commission, relating to the ‘rounding off’ of amounts in the directors’ report� Amounts in the directors’ report have been rounded off in accordance with that Class Order to the nearest thousand dollars, or in certain cases, to the nearest dollar�
This report is made in accordance with a resolution of directors�
Ronald George Sayers
Managing Director
Perth
26 August 2015

36 AUDITOR’S INDEPENDENCE DECLARATION
AUDITOR’S INDEPENDENCE DECLARATION
As lead auditor for the audit of Ausdrill Limited for the year ended 30 June 2015, I declare that to the best of my knowledge and belief, there have been:
a) no contraventions of the auditor independence requirements of the Corporations Act 2001 in relation to the audit; and
b) no contraventions of any applicable code of professional conduct in relation to the audit�
This declaration is in respect of Ausdrill Limited and the entities it controlled during the period�
Justin Carroll Perth Partner 26 August 2015 PricewaterhouseCoopers
PricewaterhouseCoopers, ABN 52 780 433 757Brookfield Place, 125 St Georges Terrace, PERTH WA 6000, GPO Box D198, PERTH WA 6840T: +61 8 9238 3000, F: +61 8 9238 3999, www.pwc.com.au
Liability limited by a scheme approved under Professional Standards Legislation.

37CORPORATE GOVERNANCE STATEMENT
Ausdrill Limited and the board are committed to achieving and demonstrating the highest standards of corporate governance� Ausdrill Limited has reviewed its corporate governance practices against the Corporate Governance Principles and Recommendations (3rd edition) published by the ASX Corporate Governance Council�
The 2015 corporate governance statement is dated as at 30 June 2015 and reflects the corporate governance practices in place throughout the 2015 financial year� The 2015 corporate governance statement was approved by the board on 26 August 2015� A description of the Group’s current corporate governance practices is set out in the Group’s corporate governance statement which can be viewed at www�ausdrill�com�au�

38 CONSOLIDATED INCOME STATEMENT
FOR THE YEAR ENDED 30 JUNE 2015
15 14Notes $’000 $’000
Revenue from continuing operations 2 767,640 827,860Other income 4(a) 9,999 10,140Materials (313,777) (289,995)Labour (266,461) (292,751)Rental and hire (13,021) (13,542)Depreciation and amortisation expense 4(b) (77,463) (99,177)Finance costs 4(b) (36,985) (41,604)Net foreign exchange losses 4(b) (7,686) -Other expenses (73,145) (67,946)Share of net profit of joint ventures accounted for using the equity method 14(b) 13,012 1,445Impairment of goodwill and other intangible assets 7(d) (10,314) (61,429)Impairment of property, plant and equipment 7(b) (192,484) (16,464)
Loss before income tax (200,685) (43,463)Income tax benefit/(expense) 5 25,065 (396)
Loss for the year (175,620) (43,859)
Loss is attributable to:Equity holders of Ausdrill Limited (175,620) (42,592)Non-controlling interests - (1,267)
Loss for the year (175,620) (43,859)
Cents Cents
Loss per share for loss attributable to the ordinary equity holders of the Company:Basic (loss) per share 21 (56.24) (13.64)Diluted (loss) per share 21 (56.24) (13.64)
The above consolidated income statement should be read in conjunction with the accompanying notes.

39
15 14Notes $’000 $’000
(Loss) for the year (175,620) (43,859)
Other comprehensive income
Items that may be reclassified to profit or lossExchange differences on translation of foreign operations 8(b) (19,176) 2,286
Items that will not be reclassified to profit or lossGain/(loss) on revaluation of land and buildings, net of tax 8(b) 5,982 (33)(Loss) on revaluation of available-for-sale financial assets, net of tax 8(b) (1,147) (38)
Other comprehensive (loss)/income for the year, net of tax (14,341) 2,215
Total comprehensive (loss) for the year (189,961) (41,644)
Total comprehensive (loss) for the year is attributable to:Equity holders of Ausdrill Limited (189,961) (40,377)Non-controlling interests - (1,267)
Total comprehensive (loss) for the year (189,961) (41,644)
The above consolidated statement of comprehensive income should be read in conjunction with the accompanying notes.
CONSOLIDATED STATEMENT OF COMPREHENSIVE INCOME
FOR THE YEAR ENDED 30 JUNE 2015

40 CONSOLIDATED STATEMENT OF FINANCIAL POSITION
AS AT 30 JUNE 2015
15 14Notes $’000 $’000
ASSETSCurrent assetsCash and cash equivalents 6(a) 77,865 62,695Trade and other receivables 6(b) 141,784 157,648Inventories 7(a) 226,869 233,074Current tax receivables 5,544 21,323
Total current assets 452,062 474,740
Non-current assetsReceivables 6(b) 2,609 6,735Joint ventures accounted for using the equity method 14(b) 67,599 67,592Available-for-sale financial assets 6(c) 7,013 3,819Property, plant and equipment 7(b) 559,719 777,162Deferred tax assets 7(c) 41,032 27,081Intangible assets 7(d) - 10,607
Total non-current assets 677,972 892,996
Total assets 1,130,034 1,367,736
LIABILITIES
Current liabilitiesTrade and other payables 6(d) 106,307 111,926Borrowings 6(e) 26,422 50,467Current tax liabilities 1,892 326Provisions 7(e) 8,820 9,084
Total current liabilities 143,441 171,803
Non-current liabilitiesBorrowings 6(e) 407,367 402,844Deferred tax liabilities 7(c) 24,744 39,149Provisions 7(e) 1,189 1,772
Total non-current liabilities 433,300 443,765
Total liabilities 576,741 615,568
Net assets 553,293 752,168
EQUITYContributed equity 8(a) 526,447 526,447Other reserves 8(b) (11,181) 2,705Retained earnings 8(c) 38,027 223,016
Capital and reserves attributable to owners of Ausdrill Limited 553,293 752,168
Total equity 553,293 752,168
The above consolidated statement of financial position should be read in conjunction with the accompanying notes.

41CONSOLIDATED STATEMENT OF CHANGES IN EQUITY
FOR THE YEAR ENDED 30 JUNE 2015
Attributable to owners of Ausdrill Limited
Contributed equity
Other reserves
Retained earnings Total
Non- controlling
interestsTotal
equity
Notes $’000 $’000 $’000 $’000 $’000 $’000
Balance at 1 July 2013 526,447 2,329 290,589 819,365 (1,979) 817,386
(Loss) for the year - - (42,592) (42,592) (1,267) (43,859)
Other comprehensive income - 2,215 - 2,215 - 2,215
Total comprehensive (loss) for the period - 2,215 (42,592) (40,377) (1,267) (41,644)
Transactions with owners in their capacity as owners:Non-controlling interests on acquisition of subsidiary 8(b) - (3,266) - (3,266) 3,246 (20)Dividends paid 12(b) - - (24,981) (24,981) - (24,981)Employee share options - value of employee services 8(b) - 1,427 - 1,427 - 1,427
- (1,839) (24,981) (26,820) 3,246 (23,574)
Balance at 30 June 2014 526,447 2,705 223,016 752,168 - 752,168
(Loss) for the year - - (175,620) (175,620) - (175,620)
Other comprehensive (loss) - (14,341) - (14,341) - (14,341)
Total comprehensive (loss) for the period - (14,341) (175,620) (189,961) - (189,961)
Transactions with owners in their capacity as owners:Dividends paid 12(b) - - (9,369) (9,369) - (9,369)Employee share options - value of employee services 8(b) - 455 - 455 - 455
- 455 (9,369) (8,914) - (8,914)
Balance at 30 June 2015 526,447 (11,181) 38,027 553,293 - 553,293
The above consolidated statement of changes in equity should be read in conjunction with the accompanying notes.

42
15 14Notes $’000 $’000
Cash flows from operating activitiesReceipts from customers (inclusive of goods and services tax) 830,232 912,205Payments to suppliers and employees (inclusive of goods and services tax) (691,746) (719,834)
138,486 192,371
Receipts from finance customers 2,649 -Interest received 1,707 1,555Interest and other costs of finance paid (33,063) (31,325)Income taxes refunded/(paid) 7,141 (21,930)Management fee received from joint ventures 1,016 1,446Net cash inflow from operating activities 9(a) 117,936 142,117
Cash flows from investing activitiesPayment for purchase of business, net of cash acquired 13 - (20)Payments for property, plant and equipment (28,494) (64,719)Payments for available-for-sale financial assets (6,398) (4,624)Proceeds from sale of property, plant and equipment 5,921 10,212Proceeds from sale of available-for-sale financial assets 3,819 1,018Repayment of loans from joint ventures 6,683 2,805Payment of development costs (113) (895)Distributions received from associates 17,844 -
Net cash (outflow) from investing activities (738) (56,223)
Cash flows from financing activitiesProceeds from secured borrowings 12,500 47,500Repayment of secured borrowings (94,100) (78,005)Repayment of hire purchase and lease liabilities (18,459) (46,473)Proceeds from unsecured borrowings 6,757 -Dividends paid to company’s shareholders 12(b) (9,369) (24,981)Repayment of unsecured borrowings (2,074) -Return of bank guarantee 52 750
Net cash (outflow) from financing activities (104,693) (101,209)
Net increase (decrease) in cash and cash equivalents 12,505 (15,315)
Cash and cash equivalents at the beginning of the financial year 62,695 78,826Effects of exchange rate changes on cash and cash equivalents 2,665 (816)Cash and cash equivalents at end of year 6(a) 77,865 62,695
Non-cash investing and financing activities 9(b)
The above consolidated statement of cash flows should be read in conjunction with the accompanying notes.
CONSOLIDATED STATEMENT OF CASH FLOWS
FOR THE YEAR ENDED 30 JUNE 2015

43
CONTENTS OF THE NOTES TO THE CONSOLIDATED FINANCIAL STATEMENTS
HOW NUMBERS ARE CALCULATED 44
1 Segment information 452 Revenue 483 Individually significant items 484 Other income and expense items 525 Income tax (benefit)/expense 536 Financial assets and financial liabilities 547 Non-financial assets and liabilities 598 Equity 669 Cash flow information 68
RISK 69
10 Critical accounting estimates and judgements 7011 Financial risk management 7012 Capital management 77
GROUP STRUCTURE 78
13 Business combination 7914 Interests in other entities 79
UNRECOGNISED ITEMS 82
15 Contingencies 8316 Commitments 8317 Events occurring after the reporting period 83
OTHER INFORMATION 84
18 Related party transactions 8519 Share-based payments 8720 Remuneration of auditors 8921 Earnings per share 9022 Assets pledged as security 9123 Deed of cross guarantee 9224 Parent entity financial information 9525 Summary of significant accounting policies 96
NOTES TO THE CONSOLIDATED FINANCIAL STATEMENTS
FOR THE YEAR ENDED 30 JUNE 2015

NOTES TO THE CONSOLIDATED FINANCIAL STATEMENTS CONTINUED44
HOW NUMBERS ARE CALCULATED
This section provides additional information about those individual line items in the financial statements that the directors consider most relevant in the context of the operations of the entity, including:
(a) accounting policies that are relevant for an understanding of the items recognised in the financial statements� These cover situations where the accounting standards either allow a choice or do not deal with a particular type of transaction
(b) analysis and sub-totals, including segment information
(c) information about estimates and judgements made in relation to particular items�
1 Segment information 452 Revenue 483 Individually significant items 484 Other income and expense items 525 Income tax (benefit)/expense 536 Financial assets and financial liabilities 547 Non-financial assets and liabilities 598 Equity 669 Cash flow information 68

NOTES TO THE CONSOLIDATED FINANCIAL STATEMENTS CONTINUED 45
1 SEGMENT INFORMATION
(a) Description of segments
Management has determined the operating segments based on the internal reports reviewed by the Board that are used to make strategic decisions� The Board assesses the performance of the operating segments based on revenue, EBIT, EBITDA and profit or loss before tax�
The operating segments are identified by the Board based on the nature of the services provided� The Board considers the business from a geographic perspective, similarity of the services provided and the nature of risks and returns associated with each business� The entity is organised into the following divisions by service type:
Mining Services Australia:
The provision of mining services including drilling and blasting, in-pit grade control, exploration drilling, earthmoving, waterwell drilling, energy drilling, equipment hire, equipment parts and sales and mineral analysis in Australia�
Contract Mining Services Africa:
The provision of mining services including drilling and blasting, in pit grade control, exploration drilling and earthmoving in Africa�
Manufacturing:
The manufacture of drilling rods and consumables, drill rigs and dump truck tray bodies�
Supply and Logistics:
The provision of mining supplies and logistics services�
All other segments:
Operating segments which do not meet the aggregation criteria for the current segments� This segment also includes Group central functions like treasury, financing and administration�
Intersegment eliminations:
Represents transactions which are eliminated on consolidation�

NOTES TO THE CONSOLIDATED FINANCIAL STATEMENTS CONTINUED46
1 SEGMENT INFORMATION (CONTINUED)
(b) Segment information provided to the Board
The segment information provided to the Board for the reportable segments for the year ended 30 June 2015 is as follows:
2015
Mining Services Australia
Contract Mining
Services Africa
#Manu- facturing
*Supply & Logistics
All other segments
Inter- segment
Eliminations Consolidated
$’000 $’000 $’000 $’000 $’000 $’000 $’000
Segment revenueSales to external customers 386,607 276,433 57,703 26,681 18,349 - 765,773Intersegment sales 7,149 - 30,794 15,437 362 (53,742) -Total sales revenue 393,756 276,433 88,497 42,118 18,711 (53,742) 765,773Other revenue 442 236 54 85 29,811 (28,761) 1,867Total segment revenue 394,198 276,669 88,551 42,203 48,522 (82,503) 767,640
Segment EBITDA 44,724 72,733 3,833 2,255 (8,851) - 114,694Depreciation expense 39,163 32,167 4,055 79 1,593 - 77,057Amortisation expense 101 - 305 - - - 406Goodwill impairment - - 10,314 - - - 10,314Impairment of assets 115,798 67,000 9,686 - - - 192,484Segment EBIT (110,338) (26,434) (20,527) 2,176 (10,444) - (165,567)Interest income (442) (236) (54) (85) (29,811) 28,761 (1,867)Interest expense 17,902 10,811 3,561 324 33,148 (28,761) 36,985Segment result (127,798) (37,009) (24,034) 1,937 (13,781) - (200,685)Income tax expense 25,065(Loss) for the year (175,620)Segment assets 874,277 487,114 77,090 17,999 579,343 (905,789) 1,130,034
Segment liabilities 242,801 233,253 53,768 12,280 840,233 (805,594) 576,741
Other segment informationInvestments in joint ventures - 67,599 - - - - 67,599Share of net profits from joint ventures - 13,012 - - - - 13,012Acquisition of property, plant and equipment, intangibles and other non-current assets 13,314 14,042 341 122 7,186 - 35,005
# This segment operates in the Australian region� * This segment predominantly operates in the African region�

NOTES TO THE CONSOLIDATED FINANCIAL STATEMENTS CONTINUED 47
1 SEGMENT INFORMATION (CONTINUED)
(b) Segment information provided to the Board (continued)
The segment information provided to the Board for the reportable segments for the year ended 30 June 2014 is as follows:
2014
Mining Services Australia
Contract Mining
Services Africa
#Manu- facturing
*Supply & Logistics
All other segments
Inter- segment
Eliminations Consolidated
$’000 $’000 $’000 $’000 $’000 $’000 $’000
Segment revenueSales to external customers 472,107 251,057 54,910 30,864 17,367 - 826,305Intersegment sales 1,672 - 36,990 10,374 55 (49,091) -Total sales revenue 473,779 251,057 91,900 41,238 17,422 (49,091) 826,305Other revenue 28,826 386 64 124 31,184 (59,029) 1,555Total segment revenue 502,605 251,443 91,964 41,362 48,606 (108,120) 827,860
Segment EBITDA 98,973 68,984 6,702 1,111 (2,114) - 173,656Depreciation expense 57,862 33,500 5,062 115 1,887 - 98,426Amortisation expense 142 - 609 - - - 751Goodwill impairment 61,429 - - - - - 61,429Impairment of assets 16,464 - - - - - 16,464Segment EBIT (36,924) 35,484 1,031 996 (4,001) - (3,414)Interest income (28,826) (386) (64) (124) (31,184) 59,029 (1,555)Interest expense 19,905 14,919 3,677 525 61,607 (59,029) 41,604Segment result (28,002) 20,951 (2,582) 595 (34,425) - (43,463)Income tax expense (396)(Loss) for the year (43,859)
Segment assets 1,097,576 505,144 109,482 14,668 625,608 (984,742) 1,367,736
Segment liabilities 271,017 246,842 63,074 10,307 817,661 (793,333) 615,568
Other segment informationInvestments in joint ventures - 67,592 - - - - 67,592Share of net profits from joint ventures - 1,445 - - - - 1,445Acquisition of property, plant and equipment, intangibles and other non-current assets 49,323 11,389 1,937 9 7,580 - 70,238
# This segment operates in the Australian region� * This segment predominantly operates in the African region�
Included in all other segments on this and the previous page are assets and liabilities of the Group’s central treasury, financing and administration function, with receivables and investments of $487�0 million (2014: $560�3 million) and payables of $414�9 million (2014: $412�6 million), which are of an intergroup nature that represent funding arrangements in different operating segments within the Group�
(c) Other segment information
(i) Segment revenue
Sales between segments are carried out at arm’s length and are eliminated on consolidation� The revenue from external parties reported to the Board is measured in a manner consistent with that in the consolidated income statement�
Segment revenue reconciles to total revenue from continuing operations as follows:
15 14$’000 $’000
Total segment revenue 765,773 826,305Interest revenue 1,867 1,555Total revenue from continuing operations (note 2) 767,640 827,860

NOTES TO THE CONSOLIDATED FINANCIAL STATEMENTS CONTINUED48
2 REVENUE
15 14$’000 $’000
From continuing operationsSales revenueSale of goods 79,450 79,571Services 686,323 746,734
765,773 826,305
Other revenueInterest - Related Parties 160 357Interest - Others 1,707 1,198
1,867 1,555
767,640 827,860
(a) Revenue recognition
Revenue is recognised for the major business activities using the methods outlined below�
(i) Contract services
Sales are recognised monthly on the basis of units of production at agreed contract rates�
(ii) Mining supplies and manufactured goods
Sales are recorded when goods have been despatched to a customer pursuant to a sales order and the associated risks have passed to the customer�
(iii) Other revenue
See note 25(e) for the recognition and measurement of other revenue�
3 INDIVIDUALLY SIGNIFICANT ITEMS
The following items are significant to the financial performance of the group, and so are listed separately here�
15 14Notes $’000 $’000
Impairment of non-current assetsPlant and equipment 3(a) 192,484 16,464
Impairment of intangible assetsImpairment of goodwill and other intangible assets 3(a) 10,314 61,429
(i) Impairment of non-current assets
The Company experienced challenging market conditions during the six months to 31 December 2014 and as a result of a number of factors, including falling commodity prices, adverse weather conditions in key operating regions and the continuation of a challenging environment for the resources industry, tested for impairment� In the six months to 30 June 2015 the Company has again assessed whether or not, in the past 6 months, any further indicators of impairment have arisen and if there were any material changes to the assumptions made as part of the 31 December 2014 impairment review which could result in further impairment for any cash generating unit (CGU)�
The Company has made estimates associated with the recoverable amount of its cash generating units (CGU) to determine whether there was any impairment in relation to their carrying value� Determining a CGU’s recoverable amount was completed via the following methods:
(a) Assets are firstly considered individually to determine whether there is any impairment related to specific assets due to factors such as technical obsolescence, declining market value, physical condition or saleability within a reasonable timeframe;
(b) For certain CGU’s the recoverability of its assets is completed via a fair value less costs of disposal calculation;
(c) For certain CGU’s the recoverability of its assets is completed via a value in use methodology�
The recoverable amount of a CGU is calculated as the higher of its fair value less costs of disposal or its value in use� The Company has sourced an external valuation where a fair value less costs of disposal has been adopted� In the instances where this has been adopted, the valuation technique and fair value hierarchy is noted below�

NOTES TO THE CONSOLIDATED FINANCIAL STATEMENTS CONTINUED 49
3 INDIVIDUALLY SIGNIFICANT ITEMS (CONTINUED)
(i) Impairment of non-current assets (continued)
The recoverable amount of a CGU determined by a value in use calculation requires the use of assumptions� Cash flow projections are calculated using EBITDA, changes in working capital and capital expenditure to determine a “free cash flow” estimate� These projections are based on actual operating results, a Board approved FY15 business plan and subsequent financial forecasts prepared by management� Future cash flows are extrapolated by applying conservative growth rates for each segment and terminal growth rates not exceeding 3%� The methodology is consistent with that used at 30 June 2014�
Key assumptions used for value in use calculations
The calculation of value in use for the CGUs is most sensitive to the following assumptions:
(a) EBITDA/sales margins
(b) Discount rates
(c) Growth rates used to extrapolate cash flows beyond the forecast period
EBITDA margin
EBITDA margin is based on management’s best estimate of the CGU’s performance, taking into account past performance with changes where appropriate for expected market conditions and efficiency improvements�
Working capital has been adjusted, in particular inventory levels, to return to and reflect what would be considered a normal operating level to support the underlying business�
Capital expenditure
Capital expenditure with an emphasis on replacement capital only, has been kept to a minimum as idle machinery will gradually return to work to sustain the assumed levels of activity� The resulting expenditure has been compared against the annual depreciation charge to ensure that it is reasonable�
Growth rate estimates and discount rates
For impairment testing undertaken at 30 June 2015
CGU Growth Rate
FY16 FY17 FY18 FY19 - FY20 Terminal YearPost Tax
Discount RatePre Tax
Discount Rate
Ausdrill Northwest CGU (9.4%) 24.0%–25.0% 20.3%-21.2% 2.0%-3.0% 2.0%-3.0% 10.3%-11.4% 15.2% - 16.6%BTP Equipment (BTPE) CGU 3.1% 2.0%-3.0% 2.0%-3.0% 2.0%-3.0% 2.0%-3.0% 10.3%-11.4% 14.0% - 15.3%Manufacturing CGU 6.1% 2.0%-3.0% 2.0%-3.0% 2.0%-3.0% 2.0%-3.0% 10.3%-11.4% 14.3% - 15.8%
For impairment testing undertaken at 31 December 2014
CGU Growth Rate
FY15 FY16 FY17 FY18 - FY19 Terminal YearPost Tax
Discount RatePre Tax
Discount Rate
Kalgoorlie & Synegex CGU (35.3%) (10.3-11.3%) 2.0%-3.0% 2.0%-3.0% 2.0%-3.0% 11.1%-11.7% 15.7%-16.1%Ausdrill Northwest CGU (22.7%) 1.1% 24.8%-25.1% 2.0%-3.0% 2.0%-3.0% 11.1%-11.7% 15.4%-16.1%BTP Equipment (BTPE) CGU (32.0%) 0.0% 0.0% 2.0%-3.0% 2.0%-3.0% 11.1%-11.7% 16.6%-17.3%Contract Mining Services Africa (CMSA) CGU 19.4% 8.7% 26.2% 2.0% 2.0% 11.7%-12.3% 15.9%-16.7%
Kalgoorlie & Synegex CGU
This CGU is included in the Mining Services Australia (MSA) operating segment� Impairment testing at 31 December 2014 resulted in this CGU being impaired� Its estimated recoverable amount was $132,500,000� As a result a plant and equipment impairment charge of $20,000,000 was made� At 30 June 2015 there were no further indicators of impairment therefore no impairment testing was performed�
Ausdrill Northwest CGU
This CGU is included in the MSA operating segment� Impairment testing at 31 December 2014 resulted in this CGU being impaired� Its estimated recoverable amount was $61,500,000� As a result a plant and equipment impairment charge of $43,000,000 was made� At 30 June 2015 there were further indicators of impairment for this CGU� Impairment testing was performed and resulted in no further impairment�

NOTES TO THE CONSOLIDATED FINANCIAL STATEMENTS CONTINUED50
3 INDIVIDUALLY SIGNIFICANT ITEMS (CONTINUED)
(i) Impairment of non-current assets (continued)
BTPE CGU
This CGU is included in the MSA operating segment� Impairment testing at 31 December 2014 resulted in this CGU being impaired� Its estimated recoverable amount was $46,500,000� As a result a plant and equipment impairment charge of $20,000,000 was made� At 30 June 2015 there were further indicators of impairment for this CGU� Impairment testing was performed and resulted in no further impairment�
Further a review was undertaken of the value of the idle hire equipment of BTP Equipment by testing their carrying values against the net present value of expected rental streams over the remaining useful lives of the individual assets� Consideration was given to the analysis of the limited observed orderly sales transactions for equipment in the market� In the absence of an orderly market, a review was also undertaken of the value of idle equipment with a comparison to market values, where available, historical sales, or if new, to current quotes for the same equipment� This review has resulted in an impairment charge of $12,457,000 at 31 December 2014� A further review of idle equipment was undertaken at 30 June 2015 and resulted in a further impairment of $3,932,000�
CMSA CGU
This CGU is a reportable operating segment� Impairment testing at 31 December 2014 resulted in this CGU being impaired� Its estimated recoverable amount was $321,500,000� As a result a plant and equipment impairment charge of $67,000,000 was made� At 30 June 2015 there were no further indicators of impairment therefore no impairment testing was performed�
Manufacturing CGU
This CGU is a reportable operating segment� Impairment testing at 31 December 2014 resulted in this CGU being impaired� (See note 3 (ii) below� At 30 June 2015 there were further indicators of impairment for this CGU� Impairment testing was performed and resulted in no further impairment�
MinAnalytical CGU
This CGU is included in the MSA operating segment� As at 30 June 2015 the remaining carrying amount of this CGU’s assets were impaired� As a result a plant and equipment impairment charge of $1,584,000 was made�
Impact of reasonably possible changes in key assumptions
As all of these CGU’s are written down to their recoverable amounts at 30 June 2015, any future adverse change in the key assumptions will result in further impairment�
Fair Value less Costs of Disposal
Energy Drilling Australia (EDA) CGU
This CGU is included in the MSA operating segment� Impairment testing at 31 December 2014 resulted in this CGU being impaired� Its estimated recoverable amount was $42,500,000� To determine the recoverable amount of this CGU the Company engaged an independent external valuer to undertake a fair market valuation� The market approach, a Level 2 input in the fair value hierarchy, was employed for this valuation as credible comparisons were on hand to support this approach� As a result a plant and equipment impairment charge of $13,796,000 was made� At 30 June 2015 there were no further indicators of impairment therefore no impairment testing was performed�
Ausdrill Underground Mining Services Australia (AUMSA) CGU
This CGU is included in the MSA operating segment� Impairment testing at 31 December 2014 resulted in this CGU being impaired� Its estimated recoverable amount was $12,613,000� To determine the recoverable amount of this CGU the Company engaged an independent external valuer to undertake a fair market valuation� The cost approach, a Level 2 input in the fair value hierarchy, was employed for this valuation� This approach begins with the replacement cost new and deducts all forms of depreciation to determine an estimate of value� It considers the maximum value of a property to a knowledgeable buyer would be the amount currently required to construct a new one of equal utility, adjusting the differences in age, condition and any other forms of depreciation and obsolescence factors� As a result a plant and equipment impairment charge of $868,000 was made� At 30 June 2015 there were no further indicators of impairment therefore no impairment testing was performed�

NOTES TO THE CONSOLIDATED FINANCIAL STATEMENTS CONTINUED 51
3 INDIVIDUALLY SIGNIFICANT ITEMS (CONTINUED)
(ii) Impairment of goodwill and other intangible assets
Goodwill has been allocated to cash generating units (CGU), each of which is a reportable segment, for impairment testing as follows:
Manufacturing Segment
30 June 30 June
2015 2014
Carrying amount of goodwill - 5,603
As a result of the continued downturn, trading conditions which have remained subdued due to lower demand from the mining industry for capital goods and demand for drilling consumables that have been impacted by the lower level of activity in the drill and blast segment, the Company has reassessed the recoverable amount of its CGU’s goodwill and other intangibles� This has resulted in an impairment charge of $20,000,000 of which has been allocated as follows: $4,700,000 against customer contracts and other intangibles, $5,600,000 against goodwill and $9,700,000 against plant and equipment� Its recoverable amount was $65,500,000�
The recoverable amount of a CGU is determined based on a value in use calculation which requires the use of assumptions� Cash flow projections are calculated using EBITDA, changes in working capital and capital expenditure to get to a “free cash flow” estimate� These projections are based on actual operating results, a Board approved FY15 business plan and subsequent financial forecasts prepared by management� Future cash flows are extrapolated by applying conservative growth rates for each segment and terminal growth rates not exceeding 3%� The methodology is consistent with that used at 30 June 2014�
Key assumptions used for value in use calculations
The calculation of value in use for the CGUs is most sensitive to the following assumptions:
a) EBITDA/sales margins
b) Discount rates
c) Growth rates used to extrapolate cash flows beyond the forecast period
Growth rate estimates and discount rates
For impairment testing undertaken at 31 December 2014
CGU Growth Rate
FY15 FY16 FY17 FY18 - FY19 Terminal YearPost Tax
Discount RatePre Tax
Discount Rate
Manufacturing CGU 4.4% 1.0% 2.0%-5.1% 2.0%-3.0% 2.0%-3.0% 11.1%-11.7% 14.9%-15.5%
EBITDA margin
EBITDA margin is based on management’s best estimate of the CGU’s performance, taking into account past performance with changes where appropriate for expected market conditions and efficiency improvements�
Working capital has been adjusted, in particular inventory levels, to return to and reflect what would be considered a normal operating level to support the underlying business�
Capital expenditure
Capital expenditure, with an emphasis on replacement capital only, has been kept to a minimum as idle machinery will gradually return to work to sustain the assumed levels of activity� The resulting expenditure has been compared against the annual depreciation charge to ensure that it is reasonable�
Impact of reasonably possible changes in key assumptions
As the Manufacturing CGU is written down to its recoverable amount at 30 June 2015, any future adverse changes in the key assumptions will result in further impairment� The Company recognises that the volatility of the current economic climate and competitive pressures in the manufacturing industry has an impact on growth rate assumptions�

NOTES TO THE CONSOLIDATED FINANCIAL STATEMENTS CONTINUED52
4 OTHER INCOME AND EXPENSE ITEMS
This note provides a breakdown of the items included in “other income” and an analysis of expenses by nature� Information about specific profit and loss items is disclosed in the related balance sheet notes�
(a) Other income
15 14$’000 $’000
Gain on sale of property, plant and equipment 550 -Management fee received from joint ventures 1,016 1,446Other 6,339 2,610Foreign exchange gain (net) - 5,816Gain on sale of available-for-sale financial assets 2,094 268
9,999 10,140(b) Breakdown of expenses by nature �
DepreciationBuildings 1,523 1,368Plant and equipment 75,534 97,058
Total depreciation 77,057 98,426
AmortisationCustomer contracts 264 142Other intangible assets 142 609
Total amortisation 406 751
Finance costsHire purchase interest 1,362 3,771Interest paid 31,700 33,862Debt restructuring cost 638 448Amortised borrowing cost 3,285 3,523
Finance cost expensed 36,985 41,604
Net loss on disposal of property, plant and equipment - 1,048
Rental expense relating to operating leases 8,132 8,522
Impairment losses - financial assetsTrade receivables provisions/(reversals) 4,139 (3,381)Other receivables - 695
4,139 (2,686)
Impairment of other assetsPlant and equipment 192,484 16,464
Impairment of acquisitionImpairment of goodwill and other intangible assets 10,314 61,429
Net foreign exchange losses 7,686 -

NOTES TO THE CONSOLIDATED FINANCIAL STATEMENTS CONTINUED 53
5 INCOME TAX (BENEFIT)/EXPENSE
This note provides an analysis of the group’s income tax expense, shows what amounts are recognised directly in equity and how the tax (benefit)/expense is affected by non-assessable and non-deductible items� It also explains significant estimates made in relation to the group’s tax position�
(a) Income tax (benefit)/expense
15 14Notes $’000 $’000
Current tax 4,950 2,358Deferred tax (29,282) (648)Adjustments for current tax of prior periods (733) (1,314)
(25,065) 396
Deferred income tax (revenue)/expense included in income tax expense comprises:Decrease/(increase) in deferred tax assets 7(c)(i) (9,502) 3,148(Decrease)/increase in deferred tax liabilities 7(c)(ii) (19,780) (3,796)
(29,282) (648)
(b) Numerical reconciliation of income tax (benefit)/expense to prima facie tax payable
(Loss) from continuing operations before income tax expense (200,685) (43,463)Tax at the Australian tax rate of 30% (2014 - 30%) (60,206) (13,039)Tax effect of amounts which are not deductible (taxable) in calculating taxable income:
Goodwill impairment 2,356 18,429Share of net (profit) of joint ventures (3,903) (434)Share-based payments 136 445Amortisation of intangibles 49 98Other foreign permanent differences (1,315) (2,889)Other non deductible items (470) 1,925
(63,353) 4,535
Difference in overseas tax rates 8,195 (3,474)(Over) provision in prior years (733) (1,314)Current year tax losses not recognised 21,771 1,082Deferred tax assets not recognised 30,235 -Effect of currency translation on tax base (14,196) 892Adjustment for withdrawal of tax exemption - 2,240Deferred tax recognised on undistributed profits for foreign subsidiaries and joint ventures (6,984) (3,565)
38,288 (4,139)Income tax (benefit)/expense (25,065) 396
(c) Amounts recognised directly in equity
Aggregate current and deferred tax arising in the reporting period and not recognised in net profit or loss or other comprehensive income but directly debited or credited to equity:
Deferred tax - credited directly to equity (926) 16
(d) Unrecognised temporary differences
(i) Temporary differences for which deferred tax assets have not been recognised:Unused tax losses for which no deferred tax asset has been recognised 78,334 4,693Other temporary differences 100,784 -
179,118 4,693Unrecognised deferred tax assets relating to the above temporary differences 53,735 1,408
(ii) Temporary differences relating to investments in subsidiaries for which deferred tax liabilities have not been recognised:Undistributed earnings 89,413 95,729
89,413 95,729Unrecognised deferred tax liabilities relating to the above temporary differences 6,966 9,573

NOTES TO THE CONSOLIDATED FINANCIAL STATEMENTS CONTINUED54
5 INCOME TAX (BENEFIT)/EXPENSE (CONTINUED)
(d) Unrecognised temporary differences (continued)
Ausdrill Limited has undistributed earnings of $89,413,000 (2014: $95,729,000) which, if paid out of as dividends, would be unfranked and therefore subject to tax in the hands of the recipient� An assessable temporary difference exists, but no deferred tax liability has been recognised as the parent entity is able to control the timing of distributions from the subsidiary and is not expected to distribute these profits in the foreseeable future�
6 FINANCIAL ASSETS AND FINANCIAL LIABILITIES
This note provides information about the group’s financial instruments, including:
�� an overview of all financial instruments held by the group�� specific information about each type of financial instrument�� accounting policies�� information about determining the fair value of the instruments, including judgements and estimation uncertainty involved�
The Group holds the following financial instruments:
Assets at FVTOCI
Financial assets at amortised cost Total
Notes $’000 $’000 $’000
Financial assets 2015Cash and cash equivalents 6(a) - 77,865 77,865Trade and other receivables* 6(b) - 135,319 135,319Available-for-sale financial assets 6(c) 7,013 - 7,013
7,013 213,184 220,197
2014Cash and cash equivalents 6(a) - 62,695 62,695Trade and other receivables* 6(b) - 153,393 153,393Available-for-sale financial assets 6(c) 3,819 - 3,819
3,819 216,088 219,907* excluding prepayments�
Liabilities at amortised cost Total
Notes $’000 $’000
Financial liabilities 2015Trade and other payables 6(d) 106,307 106,307Borrowings 6(e) 433,789 433,789
540,096 540,096
2014Trade and other payables 6(d) 111,926 111,926Borrowings 6(e) 453,311 453,311
565,237 565,237
The Group’s exposure to various risks associated with the financial instruments is discussed in note 11� The maximum exposure to credit risk at the end of the reporting period is the carrying amount of each class of financial assets mentioned above�
(a) Cash and cash equivalents
15 14$’000 $’000
Current assetsCash at bank and in hand 77,865 62,695
(i) Reconciliation to cash at the end of the yearThe above figures reconcile to the amount of cash shown in the statement of cash flows at the end of the financial year as follows:
Balance as above 77,865 62,695Balances per consolidated statement of cash flows 77,865 62,695

NOTES TO THE CONSOLIDATED FINANCIAL STATEMENTS CONTINUED 55
6 FINANCIAL ASSETS AND FINANCIAL LIABILITIES (CONTINUED)
(a) Cash and cash equivalents (continued)
(ii) Risk exposure
The Group’s exposure to interest rate risk and foreign exchange risk is discussed in note 11� The maximum exposure to credit risk at the end of the reporting period is the carrying amount of each class of cash and cash equivalents mentioned above�
(b) Trade and other receivables
2015 2014
Current Non-current Total Current Non-current Total
$’000 $’000 $’000 $’000 $’000 $’000
Trade receivables 108,882 - 108,882 121,529 - 121,529Provision for impairment of receivables (see note 11(b)) (14,364) - (14,364) (15,434) - (15,434)
94,518 - 94,518 106,095 - 106,095
Loans to key management personnel 150 - 150 - - -Loans to joint ventures - - - - 6,683 6,683Other receivables (ii) 38,042 2,609 40,651 40,563 52 40,615Prepayments 9,074 - 9,074 10,990 - 10,990
141,784 2,609 144,393 157,648 6,735 164,383
Further information relating to loans to related parties and key management personnel is set out in note 18�
(i) Classification as trade and other receivables
Trade receivables are amounts due from customers for goods sold or services performed in the ordinary course of business� Loans and other receivables are non-derivative financial assets with fixed or determinable payments that are not quoted in an active market� If collection of the amounts is expected in one year or less they are classified as current assets� If not, they are presented as non-current assets� Trade receivables are generally due for settlement not more than 90 days from the date of recognition and therefore are all classified as current� The Group’s impairment and other accounting policies for trade and other receivables are outlined in notes 11(b) and 25(k) respectively�
(ii) Other receivables
This amount includes operating expense rebates, accrued revenue and an amount recoverable from a third party for damages sustained in a fire�
(iii) Foreign exchange and interest rate risk
Information about the Group’s exposure to foreign currency risk and interest rate risk in relation to trade and other receivables is provided in note 11�
(iv) Fair value and credit risk
Due to the short-term nature of these receivables, their carrying amount is assumed to be the same as their fair value� For the non-current receivables, the fair values are also not significantly different to their carrying amounts�
(v) Impairment and risk exposure
Information about the impairment of trade and other receivables, their credit quality and the group’s exposure to credit risk, foreign currency risk and interest rate risk can be found in note 11(a)�
(c) Available-for-sale financial assets
Available-for-sale financial assets include the following classes of financial assets:
15 14$’000 $’000
Non-current assetsListed securities
Equity securities 5,013 1,819Unlisted securities
Convertible note 2,000 2,000
7,013 3,819

NOTES TO THE CONSOLIDATED FINANCIAL STATEMENTS CONTINUED56
6 FINANCIAL ASSETS AND FINANCIAL LIABILITIES (CONTINUED)
(c) Available-for-sale financial assets (continued)
(i) Classification of financial assets as available-for-sale
Investments are designated as available-for-sale financial assets if they do not have fixed maturities and fixed or determinable payments, and management intends to hold them for the medium to long-term� Financial assets that are not classified into any of the other categories (at FVTPL, loans and receivables or held-to-maturity investments) are also included in the available-for-sale category�
The financial assets are presented as non-current assets unless they mature, or management intends to dispose of them within 12 months of the end of the reporting period�
(ii) Impairment indicators for available-for-sale financial assets
A security is considered to be impaired if there has been a significant or prolonged decline in the fair value below its cost� See note 25(m) for further details about the group’s impairment policies for financial assets�
(iii) Amounts recognised in profit or loss and other comprehensive income
During the year, the following gains/(losses) were recognised in profit or loss and other comprehensive income�
15 14$’000 $’000
Gains/(losses) recognised in other comprehensive income (1,639) (55)
(iv) Non-current assets pledged as security
Refer to note 22 for information on non-current assets pledged as security by the Group�
(v) Fair value, impairment and risk exposure
Information about the methods and assumptions used in determining fair value is provided in note 6(f) below� None of the available-for-sale financial assets are either past due or impaired�
All available-for-sale financial assets are denominated in Australian and Great British Pound currency� For an analysis of the sensitivity of available-for-sale financial assets to price and interest rate risk refer to note 11(a)�
(d) Trade and other payables
15 14$’000 $’000
Current liabilitiesTrade payables 46,412 47,202Other creditors and accruals 59,895 64,724
106,307 111,926
Trade payables are unsecured and are usually paid within 45 to 60 days of recognition�
The carrying amounts of trade and other payables are assumed to be the same as their fair values, due to their short-term nature�
(e) Borrowings
2015 2014
Current Non-current Total Current Non-current Total
$’000 $’000 $’000 $’000 $’000 $’000
SecuredBank loans 14,255 25,141 39,396 31,798 86,623 118,421Prepaid borrowing costs - (1,500) (1,500) - (2,230) (2,230)Hire purchase liabilities 7,484 1,034 8,518 18,669 8,262 26,931Total secured borrowings 21,739 24,675 46,414 50,467 92,655 143,122
UnsecuredUSD notes - 390,676 390,676 - 318,235 318,235Prepaid borrowing costs - (7,984) (7,984) - (8,046) (8,046)Insurance Premium Funding 4,683 - 4,683 - - -Total unsecured borrowings 4,683 382,692 387,375 - 310,189 310,189Total borrowings 26,422 407,367 433,789 50,467 402,844 453,311

NOTES TO THE CONSOLIDATED FINANCIAL STATEMENTS CONTINUED 57
6 FINANCIAL ASSETS AND FINANCIAL LIABILITIES (CONTINUED)
(e) Borrowings (continued)
(i) Secured liabilities and assets pledged as security
At 30 June 2015, the Group had the following facilities that were not utilised at balance date:
15 14$’000 $’000
Total unutilised facilities - Bank Loans 99,581 227,371
Bank loans
On 15 December 2014 Ausdrill Limited refinanced its senior bank facilitates, and secured a new dual currency $125,000,000 syndicated debt facility� The new debt facility, which matures in March 2018, is with a number of leading lending institutions in the Australian banking market�
The facility provided funding to refinance all amounts outstanding under the Company’s previous $300,000,000 syndicated debt facility and contains increased flexibility and covenant headroom�
Each of the Australian subsidiaries of Ausdrill Limited provides a cross-guarantee in respect of each other’s obligations� The guarantee and indemnity is included in the common terms deed and is market standard�
In addition, bank loans includes asset financing arrangements with a range of banks and financiers which are secured by the specific assets financed�
USD notes
On 12 November 2012, Ausdrill completed an offering of US$300 million in aggregate principal amount of 6�875% Guaranteed Senior Unsecured Notes due 2019 in an offering to qualified institutional buyers in the United States pursuant to Rule 144A under the United States Securities Act of 1993, and to certain persons outside the United States in offshore transactions in reliance on Regulation S under the Securities Act�
Hire purchase and lease facilities
Hire purchase facilities are secured by the specific assets financed�
Covenants on financing facilities
The Group’s financing facilities contain undertakings including an obligation to comply at all times with certain financial covenants which require the Group to operate within certain financing ratio threshold levels as well as ensuring that subsidiaries that contribute minimum threshold amounts of Group EBITDA and Group Total Tangible Assets are guarantors under various facilities�
All banking covenants have been complied with at reporting date�
Refinancing requirements
Where existing facilities approach maturity, the Group will seek to renegotiate with existing and new financers to extend the maturity date of those facilities� The Group’s earnings profile, credit rating, state of the economy, conditions in financial markets and other factors may influence the outcome of those negotiations�
Credit ratings
The Group currently has a credit rating of Ba3 (Outlook Stable) from Moody’s and a credit rating of BBB- (Outlook Stable) from Standard & Poor’s� Where a credit rating is reduced or placed on negative watch, customers and suppliers may be less willing to contract with the Group� Banks and other lending institutions may demand more stringent terms (including increased pricing) on debt facilities to reflect the higher credit risk profile�

NOTES TO THE CONSOLIDATED FINANCIAL STATEMENTS CONTINUED58
6 FINANCIAL ASSETS AND FINANCIAL LIABILITIES (CONTINUED)
(e) Borrowings (continued)
(ii) Hire purchase liabilities
15 14$’000 $’000
Within one year 7,752 19,919Later than one year but not later than two years 1,060 7,496Later than two years but no later than five years - 1,060Total minimum hire purchase commitments 8,812 28,475Future finance charges (294) (1,544)
8,518 26,931Hire purchase liabilities:Current 7,484 18,669Non-current 1,034 8,262
Total lease liabilities 8,518 26,931
(iii) Fair value
For the majority of the borrowings, the fair values are not materially different to their carrying amounts, since the interest payable on those borrowings is either close to current market rates or the borrowings are of a short-term nature� Material differences are identified only for the following borrowings:
2015 2014
Carrying amount Fair value Discount rate Carrying amount Fair value Discount rate
$’000 $’000 % $’000 $’000 %
On-balance sheet Non-traded financial liabilitiesUSD notes 390,676 325,176 11.43 318,235 298,174 8.59
The fair values of non-current borrowings are based on discounted cash flows using the rates disclosed in the table above�
(iv) Risk exposures
Information about the Group’s exposure to interest rate and foreign currency changes is provided in note 11�
(f) Recognised fair value measurements
(i) Fair value hierarchy
This section explains the judgements and estimates made in determining the fair values of the financial instruments that are recognised and measured at fair value in the financial statements� To provide an indication about the reliability of the inputs used in determining fair value, the group has classified its financial instruments into the three levels prescribed under the accounting standards� An explanation of each level follows underneath the table�
At 30 June 2015 Level 1 Level 2 Level 3 Total
$’000 $’000 $’000 $’000
Financial assetsAvailable-for-sale financial assets
Australian listed equity securities 3,834 - - 3,834GBP listed equity securities 1,179 - - 1,179
Total financial assets 5,013 - - 5,013
At 30 June 2014Financial assetsAvailable-for-sale financial assets
Australian listed equity securities 1,819 - - 1,819GBP listed equity securities - - - -
Total financial assets 1,819 - - 1,819

NOTES TO THE CONSOLIDATED FINANCIAL STATEMENTS CONTINUED 59
6 FINANCIAL ASSETS AND FINANCIAL LIABILITIES (CONTINUED)
(f) Recognised fair value measurements (continued)
(i) Fair value hierarchy (continued)
The group’s policy is to recognise transfers into and transfers out of fair value hierarchy levels as at the end of the reporting period�
Level 1: The fair value of financial instruments traded in active markets (such as publicly traded derivatives, and trading and available-for-sale securities) is based on quoted market prices at the end of the reporting period� The quoted market price used for financial assets held by the Group is the current bid price� These instruments are included in level 1�
Level 2: The fair value of financial instruments that are not traded in an active market (for example, over-the-counter derivatives) is determined using valuation techniques which maximise the use of observable market data and rely as little as possible on entity specific estimates� If all significant inputs required to fair value an instrument are observable, the instrument is included in level 2�
Level 3: If one or more of the significant inputs is not based on observable market data, the instrument is included in level 3� This is the case for unlisted equity securities�
(ii) Valuation techniques used to determine fair values
Specific valuation techniques used to value financial instruments include:
�� The use of quoted market prices or dealer quotes for similar instruments�
7 NON-FINANCIAL ASSETS AND LIABILITIES
This note provides information about the Group’s non-financial assets and liabilities, including:
�� specific information about each type of non-financial asset and non-financial liability
- inventories (note 7(a))
- property, plant and equipment (note 7(b))
- deferred tax balances (note 7(c))
- intangible assets (note 7(d))
- provisions (note 7(e))
�� accounting policies
�� information about determining the fair value of the assets and liabilities, including judgements and estimation uncertainty involved�
(a) Inventories
15 14$’000 $’000
Current assetsWork in progress 16,380 14,238Finished goods 28,883 34,595Consumables and store items 181,606 184,241
226,869 233,074
(i) Assigning costs to inventories
The costs of individual items of inventory are determined using weighted average costs� See note 25(l) for the group’s other accounting policies for inventories�
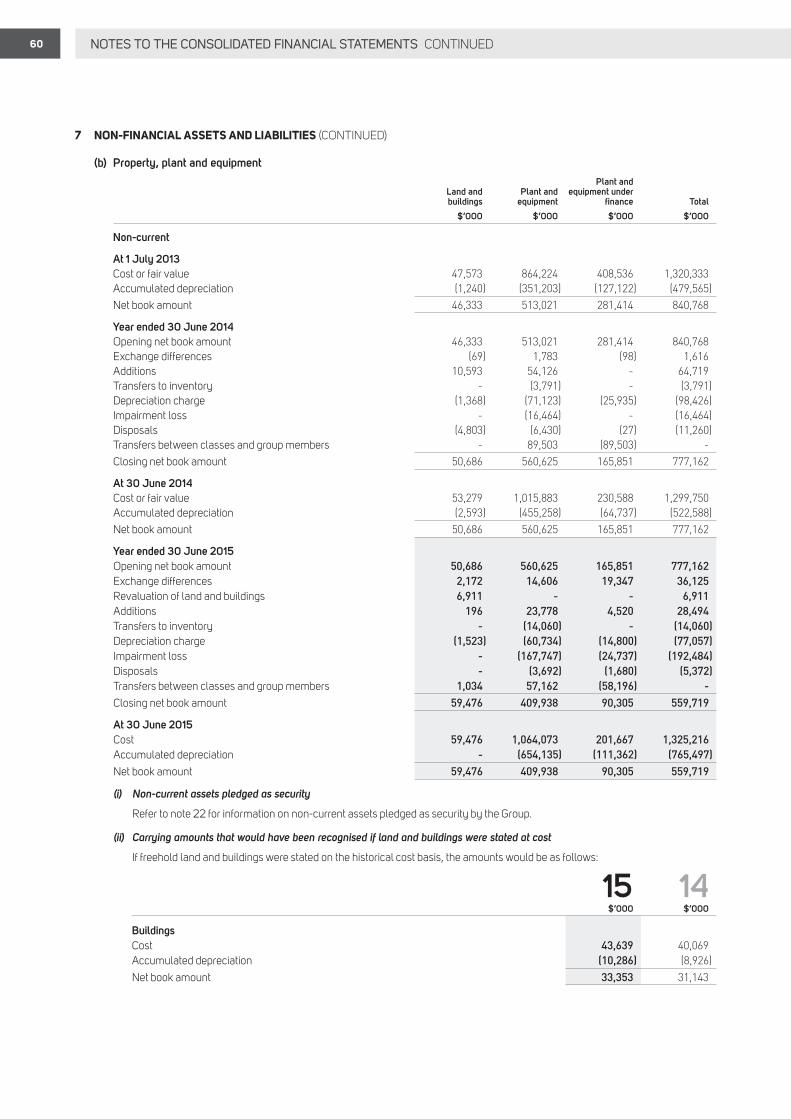
NOTES TO THE CONSOLIDATED FINANCIAL STATEMENTS CONTINUED60
7 NON-FINANCIAL ASSETS AND LIABILITIES (CONTINUED)
(b) Property, plant and equipment
Land and buildings
Plant and equipment
Plant and equipment under
finance Total
$’000 $’000 $’000 $’000
Non-current
At 1 July 2013Cost or fair value 47,573 864,224 408,536 1,320,333Accumulated depreciation (1,240) (351,203) (127,122) (479,565)Net book amount 46,333 513,021 281,414 840,768
Year ended 30 June 2014Opening net book amount 46,333 513,021 281,414 840,768Exchange differences (69) 1,783 (98) 1,616Additions 10,593 54,126 - 64,719Transfers to inventory - (3,791) - (3,791)Depreciation charge (1,368) (71,123) (25,935) (98,426)Impairment loss - (16,464) - (16,464)Disposals (4,803) (6,430) (27) (11,260)Transfers between classes and group members - 89,503 (89,503) -Closing net book amount 50,686 560,625 165,851 777,162
At 30 June 2014Cost or fair value 53,279 1,015,883 230,588 1,299,750Accumulated depreciation (2,593) (455,258) (64,737) (522,588)Net book amount 50,686 560,625 165,851 777,162
Year ended 30 June 2015Opening net book amount 50,686 560,625 165,851 777,162Exchange differences 2,172 14,606 19,347 36,125Revaluation of land and buildings 6,911 - - 6,911Additions 196 23,778 4,520 28,494Transfers to inventory - (14,060) - (14,060)Depreciation charge (1,523) (60,734) (14,800) (77,057)Impairment loss - (167,747) (24,737) (192,484)Disposals - (3,692) (1,680) (5,372)Transfers between classes and group members 1,034 57,162 (58,196) -Closing net book amount 59,476 409,938 90,305 559,719
At 30 June 2015Cost 59,476 1,064,073 201,667 1,325,216Accumulated depreciation - (654,135) (111,362) (765,497)Net book amount 59,476 409,938 90,305 559,719
(i) Non-current assets pledged as security
Refer to note 22 for information on non-current assets pledged as security by the Group�
(ii) Carrying amounts that would have been recognised if land and buildings were stated at cost
If freehold land and buildings were stated on the historical cost basis, the amounts would be as follows:
15 14$’000 $’000
BuildingsCost 43,639 40,069Accumulated depreciation (10,286) (8,926)Net book amount 33,353 31,143

NOTES TO THE CONSOLIDATED FINANCIAL STATEMENTS CONTINUED 61
7 NON-FINANCIAL ASSETS AND LIABILITIES (CONTINUED)
(b) Property, plant and equipment (continued)
(iii) Revaluation, depreciation methods and useful lives
Land is not depreciated� Depreciation on major plant and equipment and components is calculated on machine hours worked over their estimated useful life� Depreciation on other assets is calculated using the straight-line method to allocate their cost or revalued amounts, net of their residual values, over their estimated useful lives, as follows:
�� Buildings 5 - 25 years�� Plant and equipment 2 - 10 years
See note 25(n) for the other accounting policies relevant to property, plant and equipment�
(iv) Impairment loss
Refer to note 3(a) for details�
(v) Significant estimates - valuations of land and buildings
Information about the valuation of land and buildings is provided in note 7(i) below�
(c) Deferred tax balances
(i) Deferred tax assets
15 14Notes $’000 $’000
The balance comprises temporary differences attributable to:Employee benefits 11,072 9,358Foreign tax credits 110 110Accruals 1,312 3,408Doubtful debts 4,524 4,437Depreciation 14,911 -
31,929 17,313
OtherBorrowing and business expenses 627 1,185Unrealised foreign exchange 1,235 5,967Available-for-sale financial assets 508 16Sub-total other 2,370 7,168
Total deferred tax assets 34,299 24,481
Adjustment of deferred tax liabilities pursuant to set-off provisions 7(c)(ii) 6,733 2,600
Net deferred tax assets 41,032 27,081

NOTES TO THE CONSOLIDATED FINANCIAL STATEMENTS CONTINUED62
7 NON-FINANCIAL ASSETS AND LIABILITIES (CONTINUED)
(c) Deferred tax balances (continued)
(i) Deferred tax assets (continued)
15 14$’000 $’000
Deferred tax assets expected to be recovered within 12 months 20,982 23,134Deferred tax assets expected to be recovered after more than 12 months 13,317 1,347
34,299 24,481
Employee Benefits Depreciation Accruals
Doubtful debts Other Total
$’000 $’000 $’000 $’000 $’000 $’000
At 1 July 2013 9,354 - 6,115 4,524 7,620 27,613(Charged)/credited - to profit or loss 4 - (2,707) (87) (358) (3,148)(Charged)/credited - directly to equity - - - - 16 16At 30 June 2014 9,358 - 3,408 4,437 7,278 24,481(Charged)/credited - to profit or loss 1,714 14,911 (2,096) 87 (5,114) 9,502(Charged)/credited - directly to equity - - - - 316 316At 30 June 2015 11,072 14,911 1,312 4,524 2,480 34,299
(ii) Deferred tax liabilities
15 14Notes $’000 $’000
The balance comprises temporary differences attributable to:Foreign entities distributable profits 7,119 13,646Inventories 3,248 2,168Depreciation - 9,078Revaluation of land and buildings 7,195 5,779
17,562 30,671
OtherReceivables 325 4,980Unrealised foreign exchange - 788Prepayments 124 110Sub-total other 449 5,878
Total deferred tax liabilities 18,011 36,549
Adjustment of deferred tax liabilities pursuant to set-off provisions 7(c)(i) 6,733 2,600Net deferred tax liabilities 24,744 39,149
Deferred tax liabilities expected to be settled within 12 months 3,697 9,862Deferred tax liabilities expected to be settled after more than 12 months 14,314 26,687
18,011 36,549

NOTES TO THE CONSOLIDATED FINANCIAL STATEMENTS CONTINUED 63
7 NON-FINANCIAL ASSETS AND LIABILITIES (CONTINUED)
(c) Deferred tax balances (continued)
(ii) Deferred tax liabilities (continued)
Foreign entities
distributable profits Inventories
Revaluation of land & buildings Depreciation Other Total
$’000 $’000 $’000 $’000 $’000 $’000
At 1 July 2013 17,375 6,155 5,781 7,070 3,966 40,347Charged/(credited) - profit or loss (3,729) (3,987) - 2,008 1,912 (3,796)Charged/(credited) - directly to equity - - (2) - - (2)At 30 June 2014 13,646 2,168 5,779 9,078 5,878 36,549Charged/(credited) - profit or loss (6,527) 1,080 174 (9,078) (5,429) (19,780)Charged/(credited) - directly to equity - - 1,242 - - 1,242At 30 June 2015 7,119 3,248 7,195 - 449 18,011
The deferred tax liability charged for revaluation of land & buildings in the current year includes currency translation differences of $22,551 (2014: $1,623)�
(d) Non-current assets - Intangible assets
Goodwill
Other intangible
assetsCustomer contracts Total
$’000 $’000 $’000 $’000
At 1 July 2013Cost 67,662 3,991 17,210 88,863Accumulation amortisation and impairment (630) (2,114) (14,227) (16,971)Net book amount 67,032 1,877 2,983 71,892
Year ended 30 June 2014Opening net book amount 67,032 1,877 2,983 71,892Additions internal development - 895 - 895Impairment charge (61,429) - - (61,429)Amortisation charge* - (282) (469) (751)Closing net book amount 5,603 2,490 2,514 10,607
At 30 June 2014Cost 67,662 4,886 17,210 89,758Accumulation amortisation and impairment (62,059) (2,396) (14,696) (79,151)Net book amount 5,603 2,490 2,514 10,607
Year ended 30 June 2015Opening net book amount 5,603 2,490 2,514 10,607Additions internal development - 113 - 113Impairment charge (5,603) (2,461) (2,250) (10,314)Amortisation charge* - (142) (264) (406)Closing net book amount - - - -
At 30 June 2015Cost 67,662 4,999 17,210 89,871Accumulated amortisation and impairment (67,662) (4,999) (17,210) (89,871)Net book amount - - - -
* Amortisation of $405,964 (2014: $750,826) is included in depreciation and amortisation expense in profit or loss�
(i) Customer contracts
The customer contracts were acquired as part of a business combination� They are recognised at their fair value at the date of acquisition and are subsequently amortised on a straight-line based on the timing of projected cash flows of the contracts over their estimated useful lives�

NOTES TO THE CONSOLIDATED FINANCIAL STATEMENTS CONTINUED64
7 NON-FINANCIAL ASSETS AND LIABILITIES (CONTINUED)
(e) Provisions
2015 2014
CurrentNon-
current Total CurrentNon-
current Total
Notes $’000 $’000 $’000 $’000 $’000 $’000
Employee benefits - long service leave 8,820 1,189 10,009 9,084 1,772 10,856
(i) Information about individual provisions and significant estimates
Employee benefits
The provision for employee benefits relates to the group’s liability for long service leave�
(f) Recognised fair value measurements
(i) Fair value hierarchy
This note explains the judgements and estimates made in determining the fair values of the non-financial assets that are recognised and measured at fair value in the financial statements� To provide an indication about the reliability of the inputs used in determining fair value, the Group has classified its financial assets and liabilities into the three levels prescribed under the accounting standards� An explanation of each level is provided in note 6(f)�
Level 1 Level 2 Level 3 Total
At 30 June 2015 $’000 $’000 $’000 $’000
AssetsLand and buildingsOffice buildings - - 9,383 9,383Industrial sites - - 50,093 50,093Total non-financial assets - - 59,476 59,476
At 30 June 2014AssetsLand and buildingsOffice buildings - - 5,130 5,130Industrial sites - - 45,556 45,556Total non-financial assets - - 50,686 50,686
There were no transfers between any levels for recurring fair value measurements during the year�
(ii) Valuation techniques used to determine level 3 fair values
The Group obtains independent valuations for its freehold land and buildings (classified as property, plant and equipment) at least every three years�
At the end of each reporting period, the directors update their assessment of the fair value of each property, taking into account the most recent independent valuations� The directors determine a property’s value within a range of reasonable fair value estimates�
The best evidence of fair value is current prices in an active market for similar properties� Where such information is not available the directors consider information from a variety of sources including:
�� capitalised income projections based upon a property’s estimated net market income, and a capitalisation rate derived from an analysis of market evidence�
�� current prices in an active market for properties of different nature or recent prices of similar properties in less active markets, adjusted to reflect those differences

NOTES TO THE CONSOLIDATED FINANCIAL STATEMENTS CONTINUED 65
7 NON-FINANCIAL ASSETS AND LIABILITIES (CONTINUED)
(f) Recognised fair value measurements (continued)
(iii) Fair value measurements using significant unobservable inputs (level 3)
The following table presents the changes in level 3 items for the periods ended 30 June 2015 and 30 June 2014 for recurring fair value measurements:
Office buildings Industrial sites Total
Consolidated entity $’000 $’000 $’000
Opening balance 1 July 2013 - 46,333 46,333Acquisitions 5,246 5,347 10,593Disposals - (4,803) (4,803)Depreciation and impairment (116) (1,252) (1,368)Losses recognised in other comprehensive income - (69) (69)
Closing balance 30 June 2014 5,130 45,556 50,686
Acquisitions 20 176 196Depreciation and impairment (400) (1,123) (1,523)Revaluation 3,495 3,416 6,911Transfer in - 1,034 1,034Gains recognised in other comprehensive income 1,138 1,034 2,172Closing balance 30 June 2015 9,383 50,093 59,476
(iv) Valuation inputs and relationships to fair value
The following table summarises the quantitative information about the significant unobservable inputs used in level 3 fair value measurements�
Fair value atRange of inputs (probability-
weighted average)
Description
30 June 2015
$’000
30 June 2014
$’000Valuation Technique
Unobservable inputs* 2015 2014
Relationship of unobservable inputs
to fair value
Industrial Sites -Australia
41,415 40,956 Income capitalisation
Capitalisation rate 7�75%-17�5% (8�99%)
7�75%-15% (9�3%)
The higher the capitalisation rate, the
lower the fair value
Market rental value per (m2)
$35-$81 per m2($53)
$33-$69 per m2($53)
The higher the market rate, the higher the fair
value
Industrial Sites -Ghana
8,678 4,600 Direct comparison
m2
Selection of industrial sites
with similar approximate
utility
$37-$1158 per m2 ($339)
$2-$534 per m2($134)
The higher the rate per square metre , the higher the fair value
Office Sites -Ghana
9,383 - Direct comparison
m2
Selection of industrial sites
with similar approximate
utility
$2,256 per m2 ($2,256)
- The higher the rate per square metre , the higher the fair value
* There were no significant inter-relationships between unobservable inputs that materially affect fair values�
Includes office building in Ghana (2014: $5,130,000) completed in December 2013� The fair value was taken to be approximate to its historical cost less depreciation to 30 June 2014�
(v) Valuation processes
The Group engages external, independent and qualified valuers to determine the fair value of the Group’s Land and Buildings every three years� As at 30 June 2015, the fair values of the Industrial Sites properties have been determined by members of the Australian Property Institute, and the Ghana Institute of Surveyors�
The main level 3 inputs used by the Group are derived and evaluated as follows:
�� Industrial Sites - discount rates, terminal yields, expected vacancy rates and values per square metre are estimated by members if the Australian Property Institute, and the Ghana Institute of Surveyors based on comparable transactions and industry data�
�� Historical Cost for recently completed Buildings

NOTES TO THE CONSOLIDATED FINANCIAL STATEMENTS CONTINUED66
8 EQUITY
(a) Contributed equity
(i) Share capital
2015 2014 2015 2014
Shares Shares $’000 $’000
Fully paid ordinary shares 312,277,224 312,277,224 526,447 526,447
(ii) Ordinary shares
Ordinary shares entitle the holder to participate in dividends and the proceeds on winding up of the Company in proportion to the number of and amounts paid on the shares held�
On a show of hands every holder of ordinary shares present at a meeting in person or by proxy, is entitled to one vote, and upon a poll each share is entitled to one vote�
Ordinary shares have no par value and the Company does not have a limited amount of authorised capital�
(iii) Dividend reinvestment plan
The Company has a dividend reinvestment plan under which holders of ordinary shares may elect to have all or part of their dividend entitlements satisfied by the issue of new ordinary shares rather than by being paid in cash� The Board has determined that the dividend reinvestment plan will be suspended until further notice and that all dividends be paid in cash�
(iv) Options
Information relating to the Ausdrill Limited Employee Option Plan, including details of options issued, exercised and lapsed during the financial year and options outstanding at the end of the financial year, is set out in note 19�
(b) Other reserves
The following table shows a breakdown of the balance sheet line item ‘other reserves’ and the movements in these reserves during the year� A description of the nature and purpose of each reserve is provided below the table�
Revaluation surplus
Available- for-sale
financial assets
Share- based payments
Transactions with non-
controlling interests
Foreign currency
translation Total
Consolidated entity Notes $’000 $’000 $’000 $’000 $’000 $’000
Balance at 1 July 2013 15,331 - 3,903 602 (17,507) 2,329Revaluation - gross 7(b), 6(c) - (55) - - - (55)Deferred tax 7(c) - 17 - - - 17Currency translation differences (33) - - - 2,286 2,253
Other comprehensive income (33) (38) - - 2,286 2,215Transactions with owners in their capacity as owners
Share-based payment expenses 19 - - 1,427 - - 1,427Transactions with NCI - - - (3,266) - (3,266)
At 30 June 2014 15,298 (38) 5,330 (2,664) (15,221) 2,705
Balance at 1 July 2014 15,298 (38) 5,330 (2,664) (15,221) 2,705Revaluation - gross 7(b), 6(c) 6,911 (1,639) - - - 5,272Deferred tax 7(c) (1,395) 492 - - - (903)Currency translation differences 466 - - - (19,176) (18,710)
Other comprehensive income 5,982 (1,147) - - (19,176) (14,341)Transactions with owners in their capacity as owners
Share-based payment expenses 19 - - 455 - - 455
At 30 June 2015 21,280 (1,185) 5,785 (2,664) (34,397) (11,181)

NOTES TO THE CONSOLIDATED FINANCIAL STATEMENTS CONTINUED 67
8 EQUITY (CONTINUED)
(b) Other reserves (continued)
(i) Nature and purpose of other reserves
Revaluation surplus- property, plant and equipment
The property, plant and equipment revaluation surplus is used to record increments and decrements on the revaluation of non-current assets� In the event of a sale of an asset, any balance in the reserve in relations to the asset is transferred to retained earnings; see accounting policy note 25(n) for details�
Available-for-sale financial assets
Changes in the fair value and exchange differences arising on translation of investments that are classified as available-for-sale financial assets (e�g� equities), are recognised in other comprehensive income and accumulated in a separate reserve within equity� Amounts are reclassified to profit or loss when the associated assets are sold or impaired, see accounting policy note 25(m) for details�
Share based payments reserve
The share-based payments reserve is used to recognise the fair value of options issued to employees that are expensed in the statement of comprehensive income each year�
Foreign currency translation
Exchange differences arising on translation of the foreign controlled entities are recognised in other comprehensive income and accumulated in a separate reserve within equity� The cumulative amount is reclassified to profit or loss when the net investment is disposed of�
The Group’s share of exchange differences arising on translation of foreign joint ventures are recognised in other comprehensive income and are accumulated in this reserve�
Transactions with non-controlling interests
This reserve is used to record the differences described in note 25(b)(iv) which may arise as a result of transactions with non-controlling interests that do not result in a loss of control�
(c) Retained earnings
Movements in retained profits were as follows:
15 14Notes $’000 $’000
Balance 1 July 223,016 290,589Net (loss) for the year (175,620) (42,592)Dividends 12(b) (9,369) (24,981)
Balance 30 June 38,027 223,016

NOTES TO THE CONSOLIDATED FINANCIAL STATEMENTS CONTINUED68
9 CASH FLOW INFORMATION
(a) Reconciliation of profit or loss after income tax to net cash inflow from operating activities
15 14$’000 $’000
(Loss) for the year (175,620) (43,859)Depreciation and amortisation 77,463 99,177Impairment of goodwill and other intangibles 10,314 61,429Impairment of other receivables - 695Impairment of property, plant and equipment 192,484 16,464(Gain)/loss on sale of non-current assets (550) 1,048(Gains) on sale of available-for-sale financial assets (2,094) (268)Net exchange differences (2,102) 644Bad debts and provision for doubtful debts 4,139 (3,381)Share of (profits) of joint ventures (13,012) (1,445)Non-cash employee benefits expense - shared based payments 455 1,427Interest receivable (160) -
Change in operating assets and liabilities:Decrease in trade debtors 18,603 31,336Decrease in inventories 15,832 24,449(Increase)/decrease in deferred tax assets (14,325) 636Decrease/(increase) in other operating assets 2,111 (2,205)Increase/(decrease) in trade creditors 7,360 (20,924)Increase/(decrease) in provision for income taxes payable 16,086 (21,407)(Decrease) in deferred tax liabilities (19,685) (763)Increase/(decrease) in other provisions 637 (936)Net cash inflow from operating activities 117,936 142,117
(b) Non-cash investing and financing activities
Acquisition of plant and equipment by means of finance leases or hire purchases - -Issue of shares under company dividend reinvestment plan - -
- -

NOTES TO THE CONSOLIDATED FINANCIAL STATEMENTS CONTINUED 69
RISK
This section of the notes discusses the group’s exposure to various risks and shows how these could affect the group’s financial position and performance�
10 Critical accounting estimates and judgements 7011 Financial risk management 7012 Capital management 77

NOTES TO THE CONSOLIDATED FINANCIAL STATEMENTS CONTINUED70
10 CRITICAL ACCOUNTING ESTIMATES AND JUDGEMENTS
The preparation of financial statements requires the use of accounting estimates which, by definition, will seldom equal the actual results� Management also needs to exercise judgement in applying the group’s accounting policies�
This note provides an overview of the areas that involved a higher degree of judgement or complexity, and of items which are more likely to be materially adjusted due to estimates and assumptions turning out to be wrong� Detailed information about each of these estimates and judgements is included in notes 1 to 10 together with information about the basis of calculation for each affected line item in the financial statements� In addition, this note also explains where there have been actual adjustments this year as a result of an error and of changes to previous estimates�
(a) Significant estimates and judgements
The areas involving significant estimates or judgements are:
�� Estimated fair value of certain available-for-sale financial assets - note 6(c)�� Estimation of fair values of land and buildings - note 7(b)�� Estimated of useful life of property, plant and equipment - note 7(b)�� Estimated goodwill impairment - note 7(d)�� Estimated useful life of intangible asset - note 7(d)�� Estimation of fair values of contingent liabilities and contingent purchase consideration in a business combination - note 13�� Recognition of revenue - note 2�� Recognition of deferred tax asset for carried forward tax losses - note 7(c)�� Impairment of available-for-sale financial assets - note 6(c)�� Consolidation decisions and classification of joint arrangements - note 14
Estimates and judgements are continually evaluated and are based on historical experience and other factors, including expectations of future events that may have a financial impact on the entity and that are believed to be reasonable under the circumstances�
(b) Critical judgements in applying accounting policies
There have been no critical judgements used in preparing the Group’s financial statements for the year ended 30 June 2015�
11 FINANCIAL RISK MANAGEMENT
This note explains the Group’s exposure to financial risks and how these risks could affect the Group’s future financial performance� Current year profit and loss information has been included where relevant to add further context�
Risk Exposure arising from Measurement Management
Market risk - foreign exchange
Future commercial transactions
Recognised financial assets and liabilities not denominated in AUD
Cash flow forecasting
Sensitivity analysis
Forward foreign exchange contracts
Market risk - interest rate
Long-term borrowings at variable rates Sensitivity analysis Interest rate swaps
Market risk - security prices
Investments in equity securities Sensitivity analysis Portfolio diversion
Credit risk Cash and cash equivalents, trade receivables, derivative financial instruments and available-for-sale debt instruments
Aging analysis
Credit rating
Credit limits, retention of title over goods sold, letters of credits
Borrowings and other liabilities
Borrowings and other liabilities Rolling cash flow forecasts Availability of committed credit lines and borrowing facilities
The Group’s key management personnel report to the Audit and Risk Committee and Board regularly on the progress and objectives of the risks and the associated corporate governance policy objectives�
The Group’s financial risk management is carried out by a central treasury department (group treasury) under policies approved by the board of directors� Group treasury identifies, evaluates and hedges financial risks in close co-operation with the group’s operating units� The board provides written principles for overall risk management, as well as policies covering specific areas, such as foreign exchange risk, interest rate risk, credit risk, use of derivative financial instruments and non-derivative financial instruments, and investment of excess liquidity�

NOTES TO THE CONSOLIDATED FINANCIAL STATEMENTS CONTINUED 71
11 FINANCIAL RISK MANAGEMENT (CONTINUED)
(a) Market risk
The Group hedges large capital expenditure items acquired in foreign currency that are to be declared over a period of up to 2 years�
In respect of other monetary assets and liabilities held in currencies other than the AUD, the Group ensures that the net exposure is kept to an acceptable level by matching foreign denominated financial assets with matching financial liabilities and vice versa�
(i) Foreign exchange risk
Exposure
The Group’s exposure to foreign currency risk at the end of the reporting period, expressed in Australian dollar, was as follows:
30 June 2015
USD $’000
GHS $’000
GBP $’000
EUR $’000
TZS $’000
ZMW $’000
ZAR $’000
CAD $’000
CFA $’000
SGD $’000
PGK $’000
Cash 2,597 517 1 11,952 2 13 - - - - -Trade receivables 27,202 - - 35,996 - 24 1,699 65 - - -Available-for-sale financial assets - - 1,523 - - - - - - - -Trade payables (57,269) (3,327) - (1,425) (4) - (43) (1) (1,408) - (33)Borrowings (49,442) - - (35,125) - - - - (33) - -
30 June 2014
USD $’000
GHS $’000
GBP $’000
EUR $’000
TZS $’000
ZMW $’000
ZAR $’000
CAD $’000
CFA $’000
SGD $’000
PGK $’000
Cash 3,520 2,106 2 126 62 177 - - - - -Trade receivables 18,255 - - 48,856 - 24 - 61 - - -Trade payables (50,324) (4,455) (21) (802) (70) - (27) (1) (1,721) (36) -Borrowings (29,830) - - (49,141) - - - - (5,571) - -
Amounts recognised in profit or loss and other comprehensive income
During the year, the following foreign-exchange related amounts were recognised in profit or loss and other comprehensive income:
15 14$’000 $’000
Amounts recognised in profit or lossNet foreign exchange gain/(loss) included in other income/other expenses (7,686) 5,816Total net foreign exchange gains/(losses) recognised in profit or loss before income tax for the period (7,686) 5,816
Net gain (losses) recognised in other comprehensive income (note 8(b))Translation of foreign operations (19,176) 2,286

NOTES TO THE CONSOLIDATED FINANCIAL STATEMENTS CONTINUED72
11 FINANCIAL RISK MANAGEMENT (CONTINUED)
(a) Market risk (continued)
(i) Foreign exchange risk (continued)
Sensitivity analysis
A 10 percent strengthening of the Australian dollar against the following currencies at 30 June would have increased (decreased) equity and pre-tax profit or loss by the amounts shown below� This analysis assumes that all other variables, in particular interest rates, remain constant� The analysis is performed on the same basis for 2014�
Profit or Loss
A$’000
30 June 2015USD 3,139GHS 255GBP (139)EUR (2,696)TZS -ZMW 1,320ZAR (168)CAD (6)CFA 131SGD -PGK 3
1,839
30 June 2014USD 5,305GHS 214GBP 2EUR (2,770)TZS 1ZMW (18)ZAR 2CAD (5)CFA 663SGD 3PGK -
3,397
A 10 percent weakening of the Australian dollar against the above currencies at 30 June would have had the equal but opposite effect on the above currencies to the amounts shown above, on the basis that all other variables remain constant� The Group’s exposure to other foreign exchange movements is not material�
(ii) Cash flow and fair value interest rate risk
The Group’s fixed rate borrowings and receivables are carried at amortised cost� They are therefore not subject to interest rate risk as defined in AASB 7, since neither the carrying amount nor the future cash flows will fluctuate because of a change in market interest rates�
The Group’s main interest rate risks arise from cash, cash equivalents and long-term borrowings� Cash, cash equivalents and borrowings issued at variable rates expose the Group to cash flow interest rate risk� Borrowings issued at fixed rates expose the Group to fair value interest rate risk� During 2015 and 2014, the Group’s borrowings at variable rate were denominated in Australian Dollars�
Refer to note 11(c) Liquidity Risk for cash, cash equivalents and variable rate exposure�

NOTES TO THE CONSOLIDATED FINANCIAL STATEMENTS CONTINUED 73
11 FINANCIAL RISK MANAGEMENT (CONTINUED)
(a) Market risk (continued)
(ii) Cash flow and fair value interest rate risk (continued)
Instruments used by the group
As at the end of the reporting period, the Group had the following variable rate borrowings:
Consolidated entity 30 June 2015 30 June 2014
Weighted average
interest rate %
Balance $’000
% of total
loans
Weighted average
interest rate %
Balance $’000
% of total
loans
Bank loans 6.9% 25,000 4.8% 5.3% 77,154 17.0%Net exposure to cash flow interest rate risk 25,000 77,154
Sensitivity
At 30 June 2015, if interest rates had changed by +/- 100 basis points (bps) from the year-end rates with all other variables held constant, pre-tax profit for the year would have been $250,000 higher/lower (2014 - change of 100 bps: $771,540 higher/lower), mainly as a result of higher/lower interest income from these variable interest rate financial assets�
(iii) Price risk
Exposure
The Group’s exposure to equity securities price risk arises from investments held by the group and classified in the balance sheet as available-for-sale�
The majority of the Group’s equity securities are publicly traded on the ASX�
Sensitivity analysis
The table below summarises the impact of an increase/decrease of the available-for-sale financial assets on the Group’s equity for the year� The analysis is based on the assumption that the available-for-sale financial assets had increased by 10% or decreased by 10% with all other variables held constant�
Consolidated entityImpact on other
components of equity
15 14$’000 $’000
Available-for-sale assets - increase 10% 491 267Available-for-sale assets - decrease 10% (351) (127)
Other components of equity would increase/decrease as a result of gains/losses on equity securities classified as available-for-sale� As the fair value of the available-for-sale financial assets would still be above cost, no impairment loss would be recognised in profit or loss as a result of the decrease in the index�
Amounts recognised in profit or loss and other comprehensive income
The amounts recognised in other comprehensive income in relation to the various investments held by the Group are disclosed in note 6�
(b) Credit risk
(i) Risk management
Credit risk is managed on a group basis� Credit risk is the risk of financial loss to the Group if a customer or counterparty to a financial instrument fails to meet its contractual obligations, and arises principally from the Group’s receivables from customers and investment securities� Credit risk also arises from cash and cash equivalents� The Group limits its exposure to credit risk from cash and cash equivalents by only investing in counterparties that have an acceptable credit rating�

NOTES TO THE CONSOLIDATED FINANCIAL STATEMENTS CONTINUED74
11 FINANCIAL RISK MANAGEMENT (CONTINUED)
(b) Credit risk (continued)
(ii) Credit quality
The Group’s maximum exposure to credit risk for receivables at the reporting date by geographic region was:
15 14$’000 $’000
(AUD)Australia 56,468 94,418Africa 78,230 77,708Asia 528 528Europe 93 93
135,319 153,393Trade receivablesCounterparties with external credit rating (Moody’s)A1 7,029 15,179A2 992 1,194A3 777 6,041Ba1 1,543 1,983Ba2 1,067 -Baa2 4,638 6,099Baa3 15,422 4,127B3 - 661Caa1 2 45
31,470 35,329Counterparties without external credit rating *Group 1 16,051 10,425Group 2 87,798 105,390Group 3 - 2,249
103,849 118,064Total trade receivables 135,319 153,393
The Group’s maximum exposure to credit risk for cash at bank and short term deposits was:Cash at bank and short-term bank deposits (AUD)AA 104 145AA- 52,846 46,031A 481 643BBB 1,024 1,681B 23,410 -B- - 14,195
77,865 62,695
* Group 1 - new customers (less than 6 months) Group 2 - existing customers (more than 6 months) with no defaults in the past Group 3 - existing customers (more than 6 months) with some defaults in the past� All defaults were fully recovered�

NOTES TO THE CONSOLIDATED FINANCIAL STATEMENTS CONTINUED 75
11 FINANCIAL RISK MANAGEMENT (CONTINUED)
(b) Credit risk (continued)
(iii) Impaired trade receivables
Individual receivables which are known to be uncollectible are written off by reducing the carrying amount directly� The other receivables are assessed collectively to determine whether there is objective evidence that an impairment has been incurred but not yet been identified� For these receivables the estimated impairment losses are recognised in a separate provision for impairment� The Group considers that there is evidence of impairment if any of the following indicators are present:
�� significant financial difficulties of the debtor�� probability that the debtor will enter bankruptcy or financial reorganisation, and�� default or delinquency in payments (more than 90 days overdue)�
Receivables for which an impairment provision was recognised are written off against the provision when there is no expectation of recovering additional cash�
Impairment losses are recognised in profit or loss within other expenses� Subsequent recoveries of amounts previously written off are credited against other expenses� See note 3 for information about how impairment losses are calculated�
As at 30 June 2015, current trade receivables of the Group with a nominal value of $15,371,597 (2014: $16,542,264) were impaired� The increase in impaired trade receivables relates to clients which are in unexpectedly difficult economic situations� The amount of the provision for impaired receivables was $14,364,212 (2014: $15,434,040)� The Group expects that a portion of the receivables is to be recovered�
The ageing of these receivables is as follows:
15 14$’000 $’000
3 to 6 months 692 4,694Over 6 months 14,680 11,848
15,372 16,542
Movements in the provision for impairment of trade receivables that are assessed for impairment collectively are as follows:
At 1 July 15,434 18,640Provision for impairment recognised during the year 4,139 (2,686)Receivables written off during the year as uncollectable (5,609) (445)Unused amounts reversed (including currency impact) 400 (75)At 30 June 14,364 15,434
The creation and release of the provision for impaired receivables has been included in other expenses in the income statement� Amounts charged to the allowance account are generally written off when there is no expectation of recovering additional cash�
(iv) Past due but not impaired
As at 30 June 2015, trade receivables of $26,768,084 (2014: $42,611,085) were past due but not impaired� These relate to a number of independent customers for whom there is no recent history of default� The ageing analysis of these trade receivables is as follows:
15 14$’000 $’000
Up to 2 months 22,106 40,959Over 2 months 4,662 1,652
26,768 42,611
The other classes within trade and other receivables do not contain impaired assets and are not past due� Based on the credit history of these other classes, it is expected that these amounts will be received when due�

NOTES TO THE CONSOLIDATED FINANCIAL STATEMENTS CONTINUED76
11 FINANCIAL RISK MANAGEMENT (CONTINUED)
(c) Liquidity risk
Prudent liquidity risk management implies maintaining sufficient cash and marketable securities, the availability of funding through an adequate amount of committed credit facilities and the ability to close out market positions� The Group manages liquidity risk by continuously monitoring forecast and actual cash flows and matching the maturity profiles of financial assets and liabilities� Due to the dynamic nature of the underlying businesses, the group aims at maintaining flexibility in funding by keeping committed credit lines available with a variety of counterparties�
(i) Financing arrangements
The Group had access to the following undrawn borrowing facilities at the end of the reporting period:
15 14$’000 $’000
Floating rate- Bank loans 100,419 227,371
100,419 227,371
Maturities of financial liabilities
The tables below analyses the Group’s financial liabilities into relevant maturity groupings based on the remaining period at the reporting date to the contractual maturity date� The amounts disclosed in the table are the contractual undiscounted cash flows�
Contractual maturities of financial liabilities
Less than 6 months
6 - 12 months
Between 1 and 2 years
Between 2 and 5 years
Over 5 years
Total contractual cash flows
Carrying amount
liabilities
Group - at 30 June 2015 $’000 $’000 $’000 $’000 $’000 $’000 $’000
Non-interest bearing 106,307 - - - - 106,307 106,307Variable rate 628 621 1,245 25,935 - 28,429 25,000Fixed rate 35,030 18,770 28,051 457,823 - 539,674 408,789Total 141,965 19,391 29,296 483,758 - 674,410 540,096
Group - at 30 June 2014Non-interest bearing 111,566 - - - - 111,566 111,566Variable rate 3,456 2,935 76,390 - - 82,781 75,575Fixed rate 38,531 34,427 41,251 66,804 329,174 510,187 377,736Total 153,553 37,362 117,641 66,804 329,174 704,534 564,877
Details about the financial guarantee contracts are provided in note 24� The amounts disclosed in the table are the maximum amounts allocated to the earliest period in which the guarantee could be called� The parent entity does not expect these payments to eventuate�

NOTES TO THE CONSOLIDATED FINANCIAL STATEMENTS CONTINUED 77
12 CAPITAL MANAGEMENT
(a) Risk management
The Group’s objectives when managing its capital are to safeguard its ability to continue as a going concern, so it can continue to provide returns for shareholders and benefits for other stakeholders and to maintain an optimal capital structure to reduce the cost of capital�
In order to maintain or adjust the capital structure, the Group may adjust the amount of dividends paid to shareholders, return capital to shareholders, issue new shares or sell assets to reduce debt�
Consistently with others in the industry, the Group monitors capital on the basis of the gearing ratio� The ratio is calculated as net debt divided by total capital� Net debt is calculated as total borrowings, as shown in the statement of financial position, less cash and cash equivalents� Total capital is calculated as ‘equity’ as shown in the statement of financial position plus net debt�
The gearing ratios at 30 June 2015 and 30 June 2014 were as follows:
15 14$’000 $’000
Total borrowings* 443,273 463,587Less: cash and cash equivalents (77,865) (62,695)Net debt 365,408 400,892Total equity 553,293 752,168Total capital 918,701 1,153,060
* Excludes prepaid borrowing costs�
Gearing ratio 40% 35%
See note 6(e) for information on financial covenants on borrowing�
(b) Dividends
(i) Ordinary shares
15 14$’000 $’000
Final dividend for the year ended 30 June 2014 of 2�0 cents (2013: 5�5 cents) per fully paid share 6,246 17,175Interim dividend for the year ended 30 June 2015 of 1�0 cent (2014: 2�5 cents) per fully paid share 3,123 7,806Total dividends provided for or paid 9,369 24,981
Dividends paid in cash or satisfied by the issue of shares under the dividend reinvestment plan during the years ended 30 June 2015 and 2014 were as follows:Paid in cash 9,369 24,981Satisfied by issue of shares - -
9,369 24,981
(ii) Dividends not recognised at the end of the reporting period
The directors have recommended not to pay a final dividend�
(iii) Franked dividends
Franking credits available for subsequent reporting periods based on a tax rate of 30% (2014 - 30%) 41,967 45,982
The above amounts are calculated from the balance of the franking account as at the end of the reporting period, adjusted for franking credits and debits that will arise from the settlement of liabilities or receivables for income tax and dividends after the end of the year�

NOTES TO THE CONSOLIDATED FINANCIAL STATEMENTS CONTINUED78
GROUP STRUCTURE
This section provides information which will help users understand how the group structure affects the financial position and performance of the group as a whole� In particular, there is information about:
�� changes to the structure that occurred during the year as a result of business combinations and the disposal of a discontinued operation;�� transactions with non-controlling interests; and�� interests in joint operations�
A list of significant subsidiaries is provided in note 14� This note also discloses details about the group’s equity accounted investments�
13 Business combination 7914 Interests in other entities 79

NOTES TO THE CONSOLIDATED FINANCIAL STATEMENTS CONTINUED 79
13 BUSINESS COMBINATION
(a) Prior period
On 1 March 2014, Ausdrill Limited acquired the remaining 20% of the issued shares of MinAnalytical Holdings Pty Ltd for a purchase consideration of $20,000� The carrying amount of the non-controlling interests in MinAnalytical Holdings Pty Ltd on the date of acquisition was ($3,266,253)� The group recognised an increase in non-controlling interests of $3,266,253 and a decrease in equity attributable to owners of the parent of $3,266,253� Details of the business combination were disclosed in note 13 of the group’s annual financial statements for the year ended 30 June 2014�
14 INTERESTS IN OTHER ENTITIES
(a) Material subsidiaries
The consolidated financial statements incorporate the assets, liabilities and results of the following principal subsidiaries in accordance with the accounting policy described in note 25(b):
Name of entityCountry of incorporation Class of shares Equity holding **
2015 %
2014 %
African Mining Services Burkina Faso Sarl Burkina Faso Ordinary 100 100African Mining Services (Ghana) Pty Ltd Australia Ordinary 100 100African Mining Services Mali Sarl Mali Ordinary 100 100African Mining Services Guinea Sarl Guinea Ordinary 100 100Ausdrill (Ghana) Pty Ltd Australia Ordinary 100 100Ausdrill International & Management Services Pty Ltd Australia Ordinary 100 100Ausdrill International Pty Ltd Australia Ordinary 100 100Ausdrill Northwest Pty Ltd Australia Ordinary 100 100Ausdrill Properties Pty Ltd Australia Ordinary 100 100Ausdrill Tanzania Limited Tanzania Ordinary 100 100Ausdrill Utilities Pty Ltd Australia Ordinary 100 100Ausdrill Underground Mining Services Pty Ltd* Australia Ordinary 100 100Brandrill Limited Australia Ordinary 100 100BTP Equipment Pty Ltd Australia Ordinary 100 100BTP Parts Pty Ltd Australia Ordinary 100 100Connector Drilling Pty Ltd Australia Ordinary 100 100Diamond Communications Pty Ltd Australia Ordinary 100 100Drill Rigs Australia Pty Ltd Australia Ordinary 100 100Drilling Tools Australia Pty Ltd Australia Ordinary 100 100DT HiLoad Australia Pty Ltd Australia Ordinary 100 100Energy Drilling Australia Pty Ltd Australia Ordinary 100 100Golden Plains Pty Ltd Australia Ordinary 100 100Logistics Direct Australia Pty Ltd Australia Ordinary 100 100Logistics Direct Pty Ltd Ghana Ordinary 100 100MinAnalytical Holdings Pty Ltd Australia Ordinary 100 100MinAnalytical Laboratory Services Pty Ltd Australia Ordinary 100 100Mining Technology and Supplies Ltd Ghana Ordinary 100 100Remet Engineers Pty Ltd Australia Ordinary 100 100Supply Direct Pty Ltd Australia Ordinary 100 100Supply Direct South Africa Pty Ltd Australia Ordinary 100 100Synegex Holdings Pty Ltd Australia Ordinary 100 100West African Mining Services Ltd Ghana Ordinary 100 100AMCG Ghana Ordinary 100 100
* Ausdrill Underground Mining Services Pty Ltd was formerly Ausminco Mining & Equipment Supplies Pty Ltd�
** All controlled entities are directly controlled by Ausdrill Limited with the exception of:
African Mining Services Mali Sarl, African Mining Services (Ghana) Pty Ltd, West African Mining Services Limited and Ausdrill Tanzania Limited which are 100% owned by Ausdrill International Pty Ltd�
African Mining Services Burkina Faso Sarl and African Mining Services Guinea Sarl are 100% owned by African Mining Services (Ghana) Pty Ltd�
Mining Technology and Supplies Limited which is 100% owned by West African Mining Services Limited�
Supply Direct Pty Ltd which is 100% owned by Golden Plains Pty Ltd�

NOTES TO THE CONSOLIDATED FINANCIAL STATEMENTS CONTINUED80
14 INTERESTS IN OTHER ENTITIES (CONTINUED)
(a) Material subsidiaries (continued)
Supply Direct South Africa Pty Ltd, Logistics Direct Australia Pty Ltd and Logistics Direct Limited are 100% owned by Supply Direct Pty Ltd�
DT HiLoad Australia Pty Ltd is 100% owned by Ausdrill Limited�
MinAnalytical Laboratory Services Pty Ltd is 100% owned by MinAnalytical Holdings Pty Ltd, a company formed by Ausdrill Limited in October 2010�
Ausdrill Limited carries on business in Australia�
African Mining Services (Ghana) Pty Ltd, Ausdrill (Ghana) Pty Ltd, West African Mining Services Limited, Mining Technology and Supplies Limited and Logistics Direct Limited carry or carried on business in Ghana�
Ausdrill Tanzania Limited carries on business in Tanzania� Ausdrill Utilities Pty Ltd has a branch which carries on business in Zambia�
African Mining Services Mali Sarl carries on business in Mali�
African Mining Services Burkina Faso Sarl carries on business in Burkina Faso�
African Mining Services Guinea Sarl carries on business in Guinea�
Supply Direct South Africa Pty Ltd carries on business in South Africa� Supply Direct Pty Ltd has a branch which carries on business in the United Kingdom�
Steps have been taken for the voluntary liquidation of West African Mining Services Limited and Mining Technology and Supplies Ltd�
(b) Interests in joint ventures
Set out below are the joint ventures of the Group as at 30 June 2015 which, in the opinion of the directors, are material to the Group� The entities listed below have share capital consisting solely of ordinary shares, which are held directly by the Group� The country of incorporation or registration is also their principal place of business, and the proportion of ownership interest is the same as the proportion of voting rights held�
Name of entity
Place of business/ country of incorporation % of ownership interest
Nature of relationship
Measurement method Carrying amount
2015 %
2014 %
2015 $’000
2014 $’000
African Underground Mining Services
Ghana, Mali and Burkina Faso 50 50
Joint ventures
Equity method 67,599 67,592
African Underground Mining Services is not a consolidated entity of Ausdrill Limited because Ausdrill Limited is not able to govern the activities of this entity so as to obtain benefits from it�

NOTES TO THE CONSOLIDATED FINANCIAL STATEMENTS CONTINUED 81
14 INTERESTS IN OTHER ENTITIES (CONTINUED)
(b) Interests in joint ventures (continued)
(i) Summarised financial information for joint ventures
The tables on the following page provide summarised financial information for those joint ventures that are material to the Group� The information disclosed reflects the amounts presented in the financial statements of the relevant joint ventures and not Ausdrill Limited’s share of those amounts� They have been amended to reflect adjustments made by the entity when using the equity method, including fair value adjustments and modifications for differences in accounting policy�
African Underground Mining Services
15 14Summarised balance sheet $’000 $’000
Current assetsCash and other cash equivalents 41,050 31,742Other current assets 106,474 112,756
Total current assets 147,524 144,498Non-current assets 39,226 49,700
Current liabilitiesFinancial liabilities (excluding trade payables) 462 5,632Other current liabilities 27,358 38,414
Total current liabilities 27,820 44,046
Non-current liabilitiesFinancial liabilities (excluding trade payables) - 13,800Other non-current liabilities (3,626) 1,168
Total non-current liabilities (3,626) 14,968
Net assets 135,198 135,184
Reconciliation to carrying amounts:Balance at 1 July 135,184 130,924Profit for the period 26,024 2,890Other comprehensive income 13,168 1,370Equity distribution (39,178) -Balance at 30 June 135,198 135,184
Group share in % 50.0% 50.0%Group’s share in $ 67,599 67,592Carrying amount 67,599 67,592
Summarised statement of comprehensive income
Revenue 220,200 273,588Interest income 1,892 736Depreciation and amortisation (25,914) (38,838)Interest expense (1,816) (4,668)Income tax expense (6,674) (1,172)
Profit from continuing operations 26,024 2,890
Profit for the period 26,024 2,890Other comprehensive income 13,168 1,370Total comprehensive income 39,192 4,260

NOTES TO THE CONSOLIDATED FINANCIAL STATEMENTS CONTINUED82
UNRECOGNISED ITEMS
This section of the notes provides information about items that are not recognised in the financial statements as they do not (yet) satisfy the recognition criteria�
In addition to the items and transactions disclosed below, there are also:
(a) Unrecognised tax amounts – see note 5
(b) Non-cash investing and financing transactions – see note 9(b)�
15 Contingencies 8316 Commitments 8317 Events occurring after the reporting period 83

NOTES TO THE CONSOLIDATED FINANCIAL STATEMENTS CONTINUED 83
15 CONTINGENCIES
(a) Contingent liabilities
In the course of its normal business, the group occasionally receives claims arising from its operating activities� In the opinion of the Directors, all such matters are covered by insurance or, if not covered, are without merit or are of such a kind or involve such amounts that would not have a material adverse effect on the operating results or financial position of the group if settled unfavourably�
For information about guarantees given by entities within the Group, including the parent entity, please refer to note 24�
(b) Contingent assets
The Group has lodged claims in relation to two matters which at the date of this report are unresolved with one being subject to litigation and the other to mediation� The directors are confident that favourable outcomes will be achieved� However, the contingent assets have not been recognised as receivables at 30 June 2015 as receipt of these amounts are dependent on the outcome of the arbitration process and the litigation�
16 COMMITMENTS
(a) Capital commitments
Significant capital expenditure contracted for at the end of the reporting period but not recognised as liabilities is as follows:
15 14$’000 $’000
Property, plant and equipmentPayable:Within one year 743 6,084
The capital commitments are to be funded from cash and available finance facilities�
(b) Non-cancellable operating leases
The Group leases various offices, warehouses and retail stores under non-cancellable operating leases expiring within two to eight years� The leases have varying terms, escalation clauses and renewal rights� On renewal, the terms of the leases are renegotiated� Excess warehouse space is sub-let to third parties also under non-cancellable operating leases�
Commitments for minimum lease payments in relation to non-cancellable operating leases are payable as follows:Within one year 7,920 9,115Later than one year but not later than five years 6,617 9,921Later than five years 36 30
14,573 19,066
17 EVENTS OCCURRING AFTER THE REPORTING PERIOD
There are no matters or circumstances that have arisen since the end of the financial year which significantly affected or may significantly affect the operations of the Consolidated entity, the results of those operations, or the state of affairs of the Consolidated entity in subsequent financial years�

NOTES TO THE CONSOLIDATED FINANCIAL STATEMENTS CONTINUED84
OTHER INFORMATION
This section of the notes includes other information that must be disclosed to comply with the accounting standards and other pronouncements, but that is not immediately related to individual line items in the financial statements�
18 Related party transactions 8519 Share-based payments 8720 Remuneration of auditors 8921 Earnings per share 9022 Assets pledged as security 9123 Deed of cross guarantee 9224 Parent entity financial information 9525 Summary of significant accounting policies 96

NOTES TO THE CONSOLIDATED FINANCIAL STATEMENTS CONTINUED 85
18 RELATED PARTY TRANSACTIONS
(a) Parent entities
The ultimate parent entity of the Group is Ausdrill Limited�
(b) Subsidiaries
Interests in subsidiaries are set out in note 14(a)�
(c) Key management personnel compensation
15 14$ $
Short-term employee benefits 3,025,576 2,911,030Post-employment benefits 194,152 184,998Long-term benefits 33,089 25,401Share-based payments 78,254 1,230,799
3,331,071 4,352,228
Detailed remuneration disclosures are provided in the remuneration report on pages 26 to 33�
(d) Transactions with other related parties
The following transactions occurred with related parties:
Sales of goods and servicesAssociates 10,190,149 11,279,162Entities controlled by key management personnel 2,338,041 927,224
Interest received / receivableAssociates 159,517 357,163
Management fee received / receivableAssociates 1,015,743 1,446,313
Purchase of goodsRent of office buildings 358,032 358,032Aviation services - 41,450
(i) Purchases from entities controlled by key management personnel
The Group acquired the following goods and services from entities that are controlled by members of the Group key management personnel:
�� rental of an office building�� provision of exploration drilling services�� aviation services
(e) Outstanding balances arising from sales / purchases of goods and services
The following balances are outstanding at the end of the reporting period in relation to transactions with related parties:
Current receivables (sales of goods and services)Joint ventures 4,758,825 3,034,459Entities controlled by key management personnel 416,500 453,043
Non-current receivables (loans)Joint ventures - 6,682,932

NOTES TO THE CONSOLIDATED FINANCIAL STATEMENTS CONTINUED86
18 RELATED PARTY TRANSACTIONS (CONTINUED)
(f) Loans to/from related parties
15 14$ $
Loans to joint venturesBalance at 1 July 6,682,932 9,487,871Loans repaid (6,682,932) (2,804,939)Interest charged 159,517 357,163Interest received (159,517) (357,163)Balance at 30 June - 6,682,932
Loans to key management personnelBeginning of the year - -Loans advanced 150,000 -Loans repayments made - -Interest charged - -Interest paid - -End of year 150,000 -
(g) Terms and conditions
All transactions were made on normal commercial terms and conditions and at market rates, except that there are no fixed terms for the repayment of loans between the parties� The average interest rate on loans during the year was 5�29% (2014: 5�19%)�
The loans to key management personnel are repayable in full within 6 months and are unsecured� Interest is payable at the rate of 8% per annum�

NOTES TO THE CONSOLIDATED FINANCIAL STATEMENTS CONTINUED 87
19 SHARE-BASED PAYMENTS
(a) Employee Option Plan
The Employee Option Plan is designed to provide long-term incentives for senior managers and above (excluding executive directors) to deliver long-term shareholder returns� Under the plan, participants are granted options which only vest if certain performance standards are met� Participation in the plan is at the Board’s discretion and no individual has a contractual right to participate in the plan or to receive any guaranteed benefits�
The amount of options that will vest depends on Ausdrill Limited’s total return to shareholders (TSR), including share price growth, dividends and capital returns, ranking with a peer group of selected companies that are listed on the ASX over a period of time� Once vested, the options remain exercisable for a period of 5 years from their issue date� Options are granted under the plan for no consideration�
Options granted under the plan carry no dividend or voting rights�
Set out below are summaries of options granted under the plan:
2015 2014
Average exercise price
per share option
Number of options
Average exercise price
per share option
Number of options
As at 1 July $1.99 12,600,000 $2.97 3,433,341Granted during the year - - $1.70 12,500,000Forfeited during the year $3.27 (1,600,000) $1.92 (3,333,341)As at 30 June $1.80 11,000,000 $1.99 12,600,000Vested and exercisable at closing balance $3.01 733,333 $3.59 966,665
No options expired during the periods covered by the above tables�
Share options outstanding at the end of the year have the following expiry date and exercise prices�
Grant date Expiry date Exercise priceShare options
30 June 2015Share options 30 June 2014
29/11/2010 29/11/2015 $2.20 100,000 100,00029/11/2010 29/11/2015 $2.30 100,000 100,00029/11/2010 29/11/2015 $2.40 100,000 100,00003/02/2011 03/02/2016 $3.20 66,666 66,66603/02/2011 03/02/2016 $3.35 66,667 66,66703/02/2011 03/02/2016 $3.50 66,667 66,66709/03/2011 09/03/2016 $3.55 33,333 33,33309/03/2011 09/03/2016 $3.70 33,333 33,33309/03/2011 09/03/2016 $3.85 33,334 33,33421/07/2011 21/07/2016 $3.55 66,666 66,66621/07/2011 21/07/2016 $3.65 66,667 66,66721/07/2011 21/07/2016 $3.85 66,667 66,66729/06/2011 01/07/2016 $4.21 - 250,00029/06/2011 01/07/2016 $4.21 - 250,00029/06/2011 01/07/2016 $4.21 - 500,00007/10/2013 07/10/2018 $1.70 3,399,980 3,599,97807/10/2013 07/10/2018 $1.70 3,399,980 3,599,97807/10/2013 07/10/2018 $1.70 3,400,040 3,600,044
11,000,000 12,600,000
Weighted average remaining contractual life of options outstanding at end of period 3.08 years 3.93 years

NOTES TO THE CONSOLIDATED FINANCIAL STATEMENTS CONTINUED88
19 SHARE-BASED PAYMENTS (CONTINUED)
(a) Employee Option Plan (continued)
(i) Fair value of options granted
There were no options granted during the year ended 30 June 2015 (2014: 12,500,000)�
The assessed fair value at grant date of options granted during the year ended 30 June 2014 was 11�85 cents per option� The fair value at grant date is independently determined using a Monte Carlo simulation valuation model that incorporates the probability of the relative TSR vesting condition�
(a) Options are granted for a five year period for no consideration and vest based on Ausdrill TSR rating with a peer group of selected companies as follows:
�� Tranche 1 (one third of the options) will become exercisable after the second anniversary of their date of issue;�� Tranche 2 (a further one third of the options) will become exercisable after the third anniversary of their date of issue; and�� Tranche 3 (the remaining one third of the options) will become exercisable after the fourth anniversary of their date
of issue�
(b) exercise price: $1�70
(c) grant date: 7 October 2013
(d) expiry date: 7 October 2018
(e) share price at grant date: $1�34
(f) expected price volatility of the company’s shares: 27�46%
(g) expected dividend yield: 7%
(h) risk-free interest rate: 3�09%
The expected price volatility is based on the historic volatility (based on the remaining life of the options), adjusted for any expected changes to future volatility due to publicly available information�
Where options are issued to employees of subsidiaries within the Group, the subsidiaries compensate Ausdrill Limited for the amount recognised as expense in relation to these options�
(b) Share Appreciation Rights
There were no share appreciation rights granted during the year ended 30 June 2015 (2014: nil)�
(c) Expenses arising from share-based payment transactions
Total expenses arising from share-based payment transactions recognised during the period as part of employee benefit expense were as follows:
15 14$’000 $’000
Options issued under employee option plan 455 405Share appreciation rights - 1,022
455 1,427

NOTES TO THE CONSOLIDATED FINANCIAL STATEMENTS CONTINUED 89
20 REMUNERATION OF AUDITORS
During the year the following fees were paid or payable for services provided by the auditor of the parent entity, its related practices and non-related audit firms:
(a) PricewaterhouseCoopers Australia
15 14$ $
(i) Audit and other assurance servicesAudit and review of financial statements 771,802 903,156Total remuneration for audit and other assurance services 771,802 903,156
(ii) Taxation servicesTax compliance services 260,307 199,143
(iii) Other servicesAdvisory and accounting consulting services - 31,896
Total remuneration of PricewaterhouseCoopers Australia 1,032,109 1,134,195
(b) Network firms of PricewaterhouseCoopers Australia
(i) Audit and other assurance servicesAudit and other assurance services 181,254 222,920
(ii) Taxation servicesTax compliance services 164,317 112,431
(iii) Other servicesAdvisory and accounting consulting services 38,877 54,810
Total remuneration of network firms of PricewaterhouseCoopers Australia 384,448 390,161
(c) Non PricewaterhouseCoopers audit firms
(i) Audit and other assurance servicesAudit and review of financial statements 67,748 93,550
(ii) Taxation servicesTax compliance services - 28,385
(iii) Other servicesAdvisory and accounting consulting services - 14,498
- -Total remuneration of non PricewaterhouseCoopers audit firms 67,748 136,433Total auditors’ remuneration 1,484,305 1,660,789
It is the Group policy to employ PricewaterhouseCoopers on assignments additional to their statutory audit duties where PricewaterhouseCoopers expertise and experience with the Group are important� These assignments are principally tax advice and due diligence reporting on acquisitions, or where PricewaterhouseCoopers is awarded assignments on a competitive basis� It is the Group’s policy to seek competitive tenders for all major consulting projects�

NOTES TO THE CONSOLIDATED FINANCIAL STATEMENTS CONTINUED90
21 EARNINGS PER SHARE
(a) Basic earnings per share
15 14Cents Cents
Total basic (loss)/earnings per share attributable to the ordinary equity holders of the Company (56.24) (13.64)
(b) Diluted earnings per share
From continuing operations attributable to the ordinary equity holders of the company (56.24) (13.64)
(c) Reconciliation of earnings used in calculating earnings per share
15 14$’000 $’000
Basic and diluted earnings per share(Loss) attributable to the ordinary equity holders of the Company used in calculating basic earnings per share:From continuing operations (175,620) (42,592)
(d) Weighted average number of shares used as denominator
15 14Number Number
Weighted average number of ordinary shares used as the denominator in calculating basic earnings per share 312,277,224 312,277,224Adjustments for calculation of diluted earnings per share:Effect of share options on issue - -Weighted average number of ordinary and potential ordinary shares used as the denominator in calculating diluted earnings per share 312,277,224 312,277,224
(e) Information on the classification of securities
(i) Options
Options granted to employees are considered to be potential ordinary shares and have been included in the determination of diluted earnings per share to the extent to which they are dilutive� The options have not been included in the determination of basic earnings per share� Details relating to the options are set out in note 19�

NOTES TO THE CONSOLIDATED FINANCIAL STATEMENTS CONTINUED 91
22 ASSETS PLEDGED AS SECURITY
The carrying amounts of assets pledged as security for current and non-current borrowings are:
15 14$’000 $’000
Current
Floating chargeCash and cash equivalents 56,566 48,585Receivables 70,359 102,912Inventory 149,260 166,571Total current assets pledged as security 276,185 318,068
Non-current
Hire purchase / Finance leasePlant and equipment 35,612 58,518
Secured bank loansPlant and equipment 54,692 107,334
Floating chargePlant and equipment 285,194 435,682Freehold land and buildings 41,415 44,644Receivables - 6,735Investment 74,612 74,700
401,221 561,761Total non-current assets pledged as security 491,525 727,613Total assets pledged as security 767,710 1,045,681

NOTES TO THE CONSOLIDATED FINANCIAL STATEMENTS CONTINUED92
23 DEED OF CROSS GUARANTEE
Ausdrill Limited and the entities noted below are parties to a deed of cross guarantee under which each company guarantees the debts of the others� By entering into the deed, the wholly-owned entities have been relieved from the requirement to prepare a financial report and directors’ report under Class Order 98/1418 (as amended) issued by the Australian Securities and Investments Commission�
The closed group consists of Ausdrill Limited and the following entities:
African Mining Services (Ghana) Pty Ltd;
Ausdrill International Pty Ltd;
Ausdrill Finance Pty Ltd;
Ausdrill Limited;
Ausdrill Northwest Pty Ltd;
Ausdrill Properties Pty Ltd;
Ausdrill Utilities Pty Ltd;
Ausdrill Underground Mining Services Pty Ltd;
Brandrill Limited;
BTP Parts Pty Ltd;
BTP Equipment Pty Ltd;
Connector Drilling Pty Ltd;
Diamond Communications Pty Ltd;
Drill Rigs Australia Pty Ltd;
Drilling Tools Australia Pty Ltd;
DT HiLoad Australia Pty Ltd;
Energy Drilling Australia Pty Ltd;
Golden Plains Pty Ltd;
Remet Engineers Pty Ltd;
Supply Direct Pty Ltd; and
Synegex Holdings Pty Ltd�
(a) Consolidated income statement, consolidated statement of comprehensive income and summary of movements in consolidated retained earnings
The above companies represent a ‘closed group’ for the purposes of the Class Order, and as there are no other parties to the deed of cross guarantee that are controlled by Ausdrill Limited, they also represent the ‘extended closed group’�
Set out below is a consolidated income statement, a consolidated statement of comprehensive income and a summary of movements in consolidated retained earnings for the year ended 30 June 2015 of the closed group�

NOTES TO THE CONSOLIDATED FINANCIAL STATEMENTS CONTINUED 93
23 DEED OF CROSS GUARANTEE (CONTINUED)
(a) Consolidated statement of comprehensive income and summary of movements in consolidated retained earnings (continued)
15 14$’000 $’000
Consolidated income statement
Revenue from continuing operations 624,365 714,490Other income 5,792 5,641Materials (272,173) (252,634)Labour (206,842) (247,579)Rental and hire (10,331) (11,225)Depreciation and amortisation expense (61,354) (86,557)Management Fees (5,793) (9,521)Finance costs (36,148) (40,033)Other expenses from ordinary activities (42,883) (54,454)Share of net profits of joint ventures accounted for using the equity method 13,012 1,445Impairment of goodwill and other intangible assets (10,314) (61,429)Impairment of property, plant and equipment (153,268) (12,331)(Loss) before income tax (155,937) (54,187)Income tax expense 14,858 109(Loss) for the year (141,079) (54,078)
Consolidated statement of comprehensive income
Other comprehensive income(Loss) for the year (141,079) (54,078)
Items that may be reclassified to profit or lossExchange differences on translation of foreign operations (18,573) (91)
Items that will not be reclassified to profit or lossGain/(loss) on revaluation of land and buildings 5,982 (33)(Loss) on revaluation of available-for-sale assets (1,147) (38)
Other comprehensive (loss) for the period, net of tax (13,738) (162)Total comprehensive (loss) for the year (154,817) (54,240)
Summary of movements in consolidated retained earningsRetained earnings at the beginning of the financial year 183,351 262,410(Loss) for the year (141,079) (54,078)Dividends provided for or paid (9,369) (24,981)Retained earnings at the end of the financial year 32,903 183,351

NOTES TO THE CONSOLIDATED FINANCIAL STATEMENTS CONTINUED94
23 DEED OF CROSS GUARANTEE (CONTINUED)
(b) Consolidated statement of financial position
Set out below is a consolidated statement of financial position as at 30 June 2015 of the closed group�
15 14$’000 $’000
Current assetsCash and cash equivalents 58,866 45,391Trade and other receivables 99,175 133,079Inventories 182,066 194,631Current tax assets 232 18,345Total current assets 340,339 391,446
Non-current assetsReceivables 140,517 130,420Investments accounted for using the equity method 102,110 97,685Available-for-sale financial assets 7,013 3,819Property, plant and equipment 464,146 639,296Deferred tax assets 33,327 27,075Intangible assets - 10,607Total non-current assets 747,113 908,902Total assets 1,087,452 1,300,348
Current liabilitiesTrade and other payables 79,386 89,763Borrowings 18,277 49,247Current tax liabilities 66 -Provision 9,674 8,642Total current liabilities 107,403 147,652
Non-current liabilitiesBorrowings 407,762 402,840Deferred tax liabilities 21,176 34,479Provisions 1,064 1,598Total non-current liabilities 430,002 438,917Total liabilities 537,405 586,569Net assets 550,047 713,779
EquityContributed equity 526,447 526,447Reserves (9,303) 3,981Retained earnings 32,903 183,351Total equity 550,047 713,779

NOTES TO THE CONSOLIDATED FINANCIAL STATEMENTS CONTINUED 95
24 PARENT ENTITY FINANCIAL INFORMATION
(a) Summary financial information
The individual financial statements for the parent entity show the following aggregate amounts:
15 14$’000 $’000
Balance sheetCurrent assets 52,032 73,928Non-current assets 453,133 611,370Total assets 505,165 685,298Current liabilities 26,831 17,586Non-current liabilities 23,671 21,098Total liabilities 50,502 38,684
Shareholders’ equityIssued capital 526,447 526,447
ReservesAsset revaluation reserve 704 563Share-based payments reserve 5,785 5,331
Pre-2015 Reserve 104,904 -Retained earnings (183,177) 114,273Total equity 454,663 646,614(Loss)/profit for the year (183,177) 84,112Total comprehensive income (183,037) 84,112
(b) Guarantees entered into by the parent entity
The parent entity has given unsecured guarantees in respect of:
(i) leased and hire purchased equipment of subsidiaries amounting to $3,983,809 (2014: $14,867,289)
(ii) funding of subsidiaries for acquisition of plant and equipment amounting to $14,395,328 (2014: $43,420,058)
In addition, there are cross guarantees given by Ausdrill Limited as described in note 23� No deficiencies exist in any of these companies�
(c) Contingent liabilities of the parent entity
The parent entity did not have any contingent liabilities as at 30 June 2015 or 30 June 2014� For information about guarantees given by the parent entity, please see above�
(d) Contractual commitments for the acquisition of property, plant or equipment
As at 30 June 2015, the parent entity had contractual commitments for the acquisition of property, plant or equipment totalling $237,785 (30 June 2014: nil)� These commitments are not recognised as liabilities as the relevant assets have not yet been received�
(e) Pre-2015 Reserve
Each reserve of the parent entity has the same nature and purpose as described for the consolidated group (in note 8(b))� In addition the parent entity on 30 June 2015 established a separate reserve for the purpose of paying future dividends� This reserve is referred to as the “Pre-2015 Reserve”� On the date of establishment an amount of $114,273,000 was transferred from retained earnings to this reserve�

NOTES TO THE CONSOLIDATED FINANCIAL STATEMENTS CONTINUED96
25 SUMMARY OF SIGNIFICANT ACCOUNTING POLICIES
This note provides a list of all significant accounting policies adopted in the preparation of these consolidated financial statements� These policies have been consistently applied to all the years presented, unless otherwise stated� The financial statements are for the consolidated entity consisting of Ausdrill Limited and its subsidiaries�
(a) Basis of preparation
These general purpose financial statements have been prepared in accordance with Australian Accounting Standards, and Interpretations issued by the Australian Accounting Standards Board, Urgent Issues Group Interpretations and the Corporations Act 2001� Ausdrill Limited is a for-profit entity for the purpose of preparing the financial statements�
(i) Compliance with IFRS
The consolidated financial statements of Ausdrill Limited and its subsidiaries also comply with International Financial Reporting Standards (IFRS) as issued by the International Accounting Standards Board (IASB)�
(ii) New and amended standards adopted by the group
The Group has adopted all new and amended Australian Standards and Interpretations mandatory for reporting periods beginning on or after 1 July 2014, including:
�� AASB 2012-3 Amendments to Australian Accounting Standards - Disclosures - Offsetting Financial Assets and Financial Liabilities
�� Interpretation 21 Levies�� AASB 2013-3 Amendments to AASB 136 - Recoverable Amount Disclosures for Non-Financial Assets�� AASB 2013 - 5 Amendments to Australian Accounting Standards - Investment Entities [AASB 1, AASB 3, AASB 7, AASB 10,
AASB 12, AASB 107, AASB 112, AASB 124, AASB 127, AASB 132, AASB 134 & AASB 139]�� AASB 1031 Materiality�� AASB 2013 - 9 Amendments to Australian Accounting Standards - Conceptual Framework, Materiality and Financial
Instruments�� AASB 2014-1 Part A - Annual Improvements 2010-2012 Cycle Amendments to Australian Accounting Standards - Part A
Annual Improvements to IFRSs 2010- 2012 Cycle�� AASB 2014-1 Part A - Annual Improvements 2011-2013 Cycle Amendments to Australian Accounting Standards - Part A
Annual Improvements to IFRSs 2011- 2013 Cycle
The adoption of these standards and interpretations did not have any material effect on the financial position or performance of the Group�
(iii) New standards and interpretations not yet adopted
Certain new accounting standards and interpretations have been published that are not mandatory for 30 June 2015 reporting periods and have not been early adopted by the Group�
The potential effects of the following standards and interpretations have not yet been fully determined:
Reference SummaryApplication date of standard
Application date for Group
AASB 9 Financial Instruments AASB 9 contains accounting requirement for financial instruments, replacing AASB 139� The standard:
(a) contains a simpler model for classification and measurement of financial assets;
(b) a single, forward looking ‘expected loss’ impairment model that will require more timely recognition of expected credit losses;
(c) a substantially reformed approach to hedge accounting including changes to hedge effectiveness testing, treatment of hedging costs, risk components that can be hedged and disclosures�
1 January 2018 1 July 2018
AASB 2014-3 Amendments to Australian Accounting Standards - Accounting for Acquisitions of Interests in Joint Operations
This standard sets out the guidance on the accounting for acquisition of interests in joint operations in which the activity constitutes a business�
1 January 2016 1 July 2016
AASB 2014-4 Clarification of Acceptable Methods of Depreciation and Amortisation (Amendments to AASB 116 and AASB 138)
This standard clarifies the use of revenue-based methods to calculate depreciation on property, plant and equipment is not appropriate�
1 January 2016 1 July 2016

NOTES TO THE CONSOLIDATED FINANCIAL STATEMENTS CONTINUED 97
Reference SummaryApplication date of standard
Application date for Group
AASB 15 Revenue from Contracts with Customers
The core principle of AASB 15 is that an entity recognises revenue to depict the transfer of promised goods or services to customers in an amount that reflects the consideration to which the entity expects to be entitled in exchange for those goods or services� An entity recognises revenue in accordance with that core principle by applying the following steps: Step 1: Identify the contract(s) with a customer Step 2: Identify the performance obligations in the contract Step 3: Determine the transaction price Step 4: Allocate the transaction price to the performance obligations in the contract Step 5: Recognise revenue when (or as) the entity satisfies a performance obligation Guidance is provided on topics such as the point in which revenue is recognised, accounting for variable consideration, costs of fulfilling and obtaining a contract and various related matters� New disclosures about revenue are also introduced� The Group has commenced a detailed review of its contracts with customers to determine the impact, if any, of AASB 15 to revenue recognition of the Group� At the date of this report, that assessment is ongoing and it has not been possible to quantify the effect of AASB 15�
1 January 2017 1 July 2017
AASB 2014-10 Amendments to Australian Accounting Standards - Sale or Contribution of Assets between an Investor and its Associate or Joint Venture
AASB 2014-10 amends AASB 10 and AASB 128 to address an inconsistency between the requirements in AASB 10 and those in AASB 128 (August 2011), in dealing with the sale or contribution of assets between an investor and its associate or joint venture�
1 January 2016 1 July 2016
AASB 2015-1 Amendments to Australian Accounting Standards - Annual Improvements to Australian Accounting Standards 2012- 2014 Cycle
This standard provides clarification amendments to AASB 5, AASB 7, AASB 9 and AASB 134�
1 January 2016 1 July 2016
AASB 2015-2 Amendments to Australian Accounting Standards - Disclosure Initiative: Amendments to AASB 101
The Standard makes amendments to AASB 101 arising from the IASB’s Disclosure Initiative project� The amendments are designed to further encourage companies to apply professional judgment in determining what information to disclose in the financial statements�
1 January 2016 1 July 2016
AASB 2015-3 Amendments to Australian Accounting Standards arising from the Withdrawal of AASB 1031 Materiality
The Standard completes the AASB’s project to remove Australian guidance on materiality from Australian Accounting Standards�
1 July 2015 1 July 2015
AASB 2015-5 Amendments to Australian Accounting Standards - Investment Entities: Applying the Consolidation Exception
This makes amendments to AASB 10, AASB 12 and AASB 128 arising from the IASB’s narrow scope amendments associated with Investment Entities�
1 July 2015 1 July 2015
25 SUMMARY OF SIGNIFICANT ACCOUNTING POLICIES (CONTINUED)
(a) Basis of preparation (continued)
(iii) New standards and interpretations not yet adopted (continued)

NOTES TO THE CONSOLIDATED FINANCIAL STATEMENTS CONTINUED98
25 SUMMARY OF SIGNIFICANT ACCOUNTING POLICIES (CONTINUED)
(a) Basis of preparation (continued)
(iv) Historical cost convention
These financial statements have been prepared on a historical cost basis except for the following:
�� revaluation of land and buildings, and�� available-for-sale financial assets, financial assets and liabilities (including derivative instruments) at fair value through profit
or loss�
(b) Principles of consolidation
(i) Subsidiaries
Subsidiaries are all entities (including structured entities) over which the Group has control� The Group controls an entity when the Group is exposed to, or has rights to, variable returns from its involvement with the entity and has the ability to affect those returns through its power to direct the activities of the entity� Subsidiaries are fully consolidated from the date on which control is transferred to the Group� They are deconsolidated from the date that control ceases�
The acquisition method of accounting is used to account for all business combinations by the Group (refer to note 25(h))�
Intercompany transactions, balances and unrealised gains on transactions between Group companies are eliminated� Unrealised losses are also eliminated unless the transaction provides evidence of the impairment of the asset transferred� Accounting policies of subsidiaries have been changed where necessary to ensure consistency with the policies adopted by the Group�
Non-controlling interests in the results and equity of subsidiaries are shown separately in the consolidated statement of comprehensive income, consolidated statement of changes in equity and consolidated statement of financial position respectively�
(ii) Joint arrangements
Under AASB 11 Joint Arrangements investments in joint arrangements are classified as either joint operations or joint ventures� The classification depends on the contractual rights and obligations of each investor, rather than the legal structure of the joint arrangement� Ausdrill Limited has only joint ventures�
Joint ventures
Interests in joint ventures are accounted for using the equity method (see (iii) below), after initially being recognised at cost in the consolidated statement of financial position�
(iii) Equity method
Under the equity method of accounting, the investments are initially recognised at cost and adjusted thereafter to recognise the Group’s share of the post-acquisition profits or losses of the investee in profit or loss, and the Group’s share of movements in other comprehensive income of the investee in other comprehensive income� Dividends received or receivable from joint ventures are recognised as a reduction in the carrying amount of the investment�
When the Group’s share of losses in an equity-accounted investment equals or exceeds its interest in the entity, including any other unsecured long-term receivables, the Group does not recognise further losses, unless it has incurred obligations or made payments on behalf of the other entity�
Unrealised gains on transactions between the Group and its joint ventures are eliminated to the extent of the Group’s interest in these entities� Unrealised losses are also eliminated unless the transaction provides evidence of an impairment of the asset transferred� Accounting policies of equity accounted investees have been changed where necessary to ensure consistency with the policies adopted by the Group�
The Group treats transactions with non-controlling interests that do not result in a loss of control as transactions with equity owners of the Group� A change in ownership interest results in an adjustment between the carrying amounts of the controlling and non-controlling interests to reflect their relative interests in the subsidiary� Any difference between the amount of the adjustment to non-controlling interests and any consideration paid or received is recognised in a separate reserve within equity attributable to owners of Ausdrill Limited�

NOTES TO THE CONSOLIDATED FINANCIAL STATEMENTS CONTINUED 99
25 SUMMARY OF SIGNIFICANT ACCOUNTING POLICIES (CONTINUED)
(b) Principles of consolidation (continued)
(iv) Changes in ownership interests
When the Group ceases to have control, joint control or significant influence, any retained interest in the entity is remeasured to its fair value with the change in carrying amount recognised in profit or loss� The fair value is the initial carrying amount for the purposes of subsequently accounting for the retained interest as a joint venture or financial asset� In addition, any amounts previously recognised in other comprehensive in respect of that entity are accounted for as if the Group has directly disposed of the related assets or liabilities� This may mean that amounts previously recognised in other comprehensive income are reclassified to profit or loss�
If the ownership interest in a joint venture is reduced but joint control or significant influence is retained, only a proportionate share of the amounts previously recognised in other comprehensive income are reclassified to profit or loss where appropriate�
(c) Segment reporting
Operating segments are reported in a manner consistent with the internal reporting provided to the chief operating decision maker� The chief operating decision maker, who is responsible for allocating resources and assessing performance of the operating segments, has been identified as the Board�
(d) Foreign currency translation
(i) Functional and presentation currency
Items included in the financial statements of each of the Group’s entities are measured using the currency of the primary economic environment in which the entity operates (‘the functional currency’)� The consolidated financial statements are presented in Australian dollars, which is Ausdrill Limited’s functional and presentation currency�
(ii) Transactions and balances
Foreign currency transactions are translated into the functional currency using the exchange rates at the dates of the transactions� Foreign exchange gains and losses resulting from the settlement of such transactions and from the translation of monetary assets and liabilities denominated in foreign currencies at year end exchange rates are generally recognised in profit or loss� They are deferred in equity if they are attributable to part of the net investment in a foreign operation�
Non-monetary items that are measured at fair value in a foreign currency are translated using the exchange rates at the date when the fair value was determined� Translation differences on assets and liabilities carried at fair value are reported as part of the fair value gain or loss� For example, translation differences on non-monetary assets and liabilities such as equities held at fair value through profit or loss are recognised in profit or loss as part of the fair value gain or loss and translation differences on non-monetary assets such as equities classified as available-for-sale financial assets are recognised in other comprehensive income�
(iii) Group companies
The results and financial position of foreign operations (none of which has the currency of a hyperinflationary economy) that have a functional currency different from the presentation currency are translated into the presentation currency as follows:
�� assets and liabilities for each statement of financial position presented are translated at the closing rate at end of the reporting period;
�� income and expenses for each income statement and statement of comprehensive income are translated at average exchange rates (unless this is not a reasonable approximation of the cumulative effect of the rates prevailing on the transaction dates, in which case income and expenses are translated at the dates of the transactions), and
�� all resulting exchange differences are recognised in other comprehensive income�
On consolidation, exchange differences arising from the translation of any net investment in foreign entities, and of borrowings and other financial instruments designated as hedges of such investments, are recognised in other comprehensive income� When a foreign operation is sold or any borrowings forming part of the net investment are repaid, exchange differences are reclassified to profit or loss, as part of the gain or loss on sale�
Goodwill and fair value adjustments arising on the acquisition of a foreign entity are treated as assets and liabilities of the foreign entity and translated at the closing rate�

NOTES TO THE CONSOLIDATED FINANCIAL STATEMENTS CONTINUED100
25 SUMMARY OF SIGNIFICANT ACCOUNTING POLICIES (CONTINUED)
(e) Revenue recognition
Revenue is measured at the fair value of the consideration received or receivable� Amounts disclosed as revenue are net of returns, trade allowances and duties and taxes paid�
The Group recognises revenue when the amount of revenue can be reliably measured, it is probable that future economic benefits will flow to the entity and specific criteria have been met for each of the Group’s activities as described below� The Group bases its estimates on historical results, taking into consideration the type of customer, the type of transaction and the specifics of each arrangement�
The specific accounting policies for the group’s main types of revenue are explained in note 2� Revenue for other business activities is recognised on the following basis:
(i) Interest income
Interest income is recognised using the effective interest method� When a receivable is impaired, the Group reduces the carrying amount to its recoverable amount, being the estimated future cash flow discounted at the original effective interest rate of the instrument, and continues unwinding the discount as interest income� Interest income on impaired loans is recognised using the original effective interest rate�
(f) Income tax
The income tax expense or revenue for the period is the tax payable on the current period’s taxable income based on the national income tax rate for each jurisdiction adjusted by changes in deferred tax assets and liabilities attributable to temporary differences between the tax base of assets and liabilities and their carrying amount in the financial statements, and to unused tax losses�
The current income tax charge is calculated on the basis of the tax laws enacted or substantively enacted at the end of the reporting period in the countries where the Company’s subsidiaries and associates operate and generate taxable income� Management periodically evaluates positions taken in tax returns with respect to situations in which applicable tax regulation is subject to interpretation� It establishes provisions where appropriate on the basis of amounts expected to be paid to the tax authorities�
Deferred income tax is provided in full, using the liability method, on temporary differences arising between the tax bases of assets and liabilities and their carrying amounts in the consolidated financial statements� However, deferred income tax is not accounted for if it arises from initial recognition of an asset or liability in a transaction other than a business combination that at the time of the transaction affects neither accounting nor taxable profit or loss� Deferred income tax is determined using tax rates (and laws) that have been enacted or substantially enacted by the end of the statement of financial position date and are expected to apply when the related deferred income tax asset is realised or the deferred income tax liability is settled�
Deferred tax assets are recognised only if it is probable that future taxable amounts will be available to utilise those temporary differences and losses�
Deferred tax liabilities and assets are not recognised for temporary differences between the carrying amount and tax bases of investments in foreign operations where the company is able to control the timing of the reversal of the temporary differences and it is probable that the differences will not reverse in the foreseeable future�
Deferred tax assets and liabilities are offset when there is a legally enforceable right to offset current tax assets and liabilities and when the deferred tax balances relate to the same taxation authority� Current tax assets and tax liabilities are offset where the entity has a legally enforceable right to offset and intends either to settle on a net basis, or to realise the asset and settle the liability simultaneously�
Ausdrill Limited and its wholly-owned Australian controlled entities have implemented the tax consolidation legislation� As a consequence, these entities are taxed as a single entity and the deferred tax assets and liabilities of these entities are set off in the consolidated financial statements�
Current and deferred tax is recognised in profit or loss, except to the extent that it relates to items recognised in other comprehensive income or directly in equity� In this case, the tax is also recognised in other comprehensive income or directly in equity, respectively�
(i) Investment allowances and similar tax incentives
Companies within the Group may be entitled to claim special tax deductions for investments in qualifying assets or in relation to qualifying expenditure (eg the Research and Development Tax Incentive regime in Australia or other investment allowances)� The Group accounts for such allowances as tax credits, which means that the allowance reduces income tax payable and current tax expense� A deferred tax asset is recognised for unclaimed tax credits that are carried forward as deferred tax assets�

NOTES TO THE CONSOLIDATED FINANCIAL STATEMENTS CONTINUED 101
25 SUMMARY OF SIGNIFICANT ACCOUNTING POLICIES (CONTINUED)
(g) Leases
Leases of property, plant and equipment where the Group, as lessee, has substantially all the risks and rewards of ownership are classified as finance leases (note 7(b))� Finance leases are capitalised at the lease’s inception at the fair value of the leased property, plant and equipment or, if lower, the present value of the minimum lease payments� The corresponding rental obligations, net of finance charges, are included in other short-term and long-term payables� Each lease payment is allocated between the liability and finance cost� The finance cost is charged to the income statement over the lease period so as to produce a constant periodic rate of interest on the remaining balance of the liability for each period� The property, plant and equipment acquired under finance leases is depreciated over the shorter of the asset’s useful life and the lease term�
Leases in which a significant portion of the risks and rewards of ownership are not transferred to the Group as lessee are classified as operating leases (note 6(e))� Payments made under operating leases (net of any incentives received from the lessor) are charged to income statement on a straight-line basis over the period of the lease�
Lease income from operating leases is recognised in income on a straight-line basis over the lease term�
(h) Business combinations
The acquisition method of accounting is used to account for all business combinations, regardless of whether equity instruments or other assets are acquired� The consideration transferred for the acquisition of a subsidiary comprises the
�� fair values of the assets transferred
�� liabilities incurred to the former owners of the acquired business
�� equity interests issued by the Group
�� fair value of any asset or liability resulting from a contingent consideration arrangement, and
�� fair value of any pre-existing equity interest in the subsidiary�
Identifiable assets acquired and liabilities and contingent liabilities assumed in a business combination are, with limited exceptions, measured initially at their fair values at the acquisition date� The Group recognises any non-controlling interest in the acquired entity on an acquisition-by-acquisition basis either at fair value or at the non-controlling interest’s proportionate share of the acquired entity’s net identifiable assets�
Acquisition-related costs are expensed as incurred�
The excess of the
�� consideration transferred,
�� amount of any non-controlling interest in the acquired entity, and
�� acquisition-date fair value of any previous equity interest in the acquired entity
over the fair value of the net identifiable assets acquired is recorded as goodwill� If those amounts are less than the fair value of the net identifiable assets of the subsidiary acquired, the difference is recognised directly in profit or loss as a bargain purchase�
Where settlement of any part of cash consideration is deferred, the amounts payable in the future are discounted to their present value as at the date of exchange� The discount rate used is the entity’s incremental borrowing rate, being the rate at which a similar borrowing could be obtained from an independent financier under comparable terms and conditions�
Contingent consideration is classified either as equity or a financial liability� Amounts classified as a financial liability are subsequently remeasured to fair value with changes in fair value recognised in profit or loss�
If the business combination is achieved in stages, the acquisition date carrying value of the acquirer’s previously held equity interest in the acquiree is remeasured to fair value at the acquisition date� Any gains or losses arising from such remeasurement are recognised in profit or loss�
(i) Impairment of assets
Goodwill and intangible assets that have an indefinite useful life are not subject to amortisation and are tested annually for impairment, or more frequently if events or changes in circumstances indicate that they might be impaired� Other assets are reviewed for impairment whenever events or changes in circumstances indicate that the carrying amount may not be recoverable� An impairment loss is recognised for the amount by which the asset’s carrying amount exceeds its recoverable amount� The recoverable amount is the higher of an asset’s fair value less costs to sell and value-in-use� For the purposes of assessing impairment, assets are grouped at the lowest levels for which there are separately identifiable cash inflows which are largely independent of the cash inflows from other assets or groups of assets (cash-generating units)� Non-financial assets other than goodwill that suffered an impairment are reviewed for possible reversal of the impairment at each reporting period�

NOTES TO THE CONSOLIDATED FINANCIAL STATEMENTS CONTINUED102
25 SUMMARY OF SIGNIFICANT ACCOUNTING POLICIES (CONTINUED)
(j) Cash and cash equivalents
For the purpose of presentation in the statement of cash flows, cash and cash equivalents includes cash on hand, deposits held at call with financial institutions, other short-term, highly liquid investments with original maturities of three months or less that are readily convertible to known amounts of cash and which are subject to an insignificant risk of changes in value, and bank overdrafts� Bank overdrafts are shown within borrowings in current liabilities in the statement of financial position�
(k) Trade receivables
Trade receivables are recognised initially at fair value and subsequently measured at amortised cost, less provision for impairment� See note 6(b) for further information about the Group’s accounting for trade receivables and note 11(b) for a description of the Group’s impairment policies�
(l) Inventories
(i) Consumables and store items, work in progress and finished goods
Consumables and store items, work in progress and finished goods are stated at the lower of cost and net realisable value� Cost comprises direct materials, direct labour and an appropriate proportion of variable and fixed overhead expenditure, the latter being allocated on the basis of normal operating capacity� Costs are assigned to individual items of inventory on the basis of weighted average costs� Net realisable value is the estimated selling price in the ordinary course of business less the estimated costs of completion and the estimated costs necessary to make the sale�
(m) Investments and other financial assets
Classification
The Group classifies its investments in the following categories:
�� loans and receivables,
�� available-for-sale financial assets�
The classification depends on the purpose for which the investments were acquired� Management determines the classification of its investments at initial recognition and, in the case of assets classified as held-to-maturity, re-evaluates this designation at the end of each reporting period� See note 6 for details about each type of financial asset�
(i) Loans and receivables
Loans and receivables are non-derivative financial assets with fixed or determinable payments that are not quoted in an active market� They arise when the Group provides money, goods or services directly to a debtor with no intention of selling the receivable� They are included in current assets, except for those with maturities greater than 12 months after statement of financial position date which are classified as non-current assets� Loans and receivables are included in trade and other receivables (note 6(b))�
(ii) Available-for-sale financial assets
Available-for-sale financial assets, comprising principally marketable equity securities, are non-derivatives that are either designated in this category or not classified in any of the other categories� They are included in non-current assets unless the investment matures or management intends to dispose of the investment within 12 months of the end of the reporting period� Investments are designated as available-for-sale if they do not have fixed maturities and fixed or determinable payments and management intends to hold them for the medium to long-term�
Financial assets - recognition and derecognition
Regular way purchases and sales of financial assets are recognised on trade-date - the date on which the Group commits to purchase or sell the asset� Investments are initially recognised at fair value plus transaction costs for all financial assets not carried at fair value through profit or loss� Financial assets carried at fair value through profit or loss are initially recognised at fair value and transaction costs are expensed in profit or loss� Financial assets are derecognised when the rights to receive cash flows from the financial assets have expired or have been transferred and the Group has transferred substantially all the risks and rewards of ownership�
When securities classified as available-for-sale are sold, the accumulated fair value adjustments recognised in other comprehensive income are reclassified to profit or loss as gains and losses from investment securities�

NOTES TO THE CONSOLIDATED FINANCIAL STATEMENTS CONTINUED 103
25 SUMMARY OF SIGNIFICANT ACCOUNTING POLICIES (CONTINUED)
(m) Investments and other financial assets (continued)
Subsequent measurement
Loans and receivables are carried at amortised cost using the effective interest method�
Available-for-sale financial assets are subsequently carried at fair value�
Changes in the fair value of monetary securities denominated in a foreign currency and classified as available-for-sale are analysed between translation differences resulting from changes in amortised cost of the security and other changes in the carrying amount of the security� The translation differences related to changes in the amortised cost are recognised in profit or loss, and other changes in carrying amount are recognised in other comprehensive income� Changes in the fair value of other monetary and non-monetary securities classified as available-for-sale are recognised in other comprehensive income�
Details on how the fair value of financial instruments is determined are disclosed in note 6(f)�
Impairment
The Group assesses at the end of each reporting period whether there is objective evidence that a financial asset or a group of financial assets is impaired� A financial asset or a group of financial assets is impaired and impairment losses are incurred only if there is objective evidence of impairment as a result of one or more events that occurred after the initial recognition of the asset (a ‘loss event’) and that loss event (or events) has an impact on the estimated future cash flows of the financial asset or group of financial assets that can be reliably estimated� In the case of equity investments classified as available-for-sale, a significant or prolonged decline in the fair value of the security below its cost is considered an indicator that the assets are impaired�
(i) Assets carried at amortised cost
For loans and receivables, the amount of the loss is measured as the difference between the asset’s carrying amount and the present value of estimated future cash flows (excluding future credit losses that have not been incurred) discounted at the financial asset’s original effective interest rate� The carrying amount of the asset is reduced and the amount of the loss is recognised in profit or loss� If a loan or held-to-maturity investment has a variable interest rate, the discount rate for measuring any impairment loss is the current effective interest rate determined under the contract� As a practical expedient, the Group may measure impairment on the basis of an instrument’s fair value using an observable market price�
If, in a subsequent period, the amount of the impairment loss decreases and the decrease can be related objectively to an event occurring after the impairment was recognised (such as an improvement in the debtor’s credit rating), the reversal of the previously recognised impairment loss is recognised in profit or loss�
Impairment testing of trade receivables is described in note 11(b)�
(ii) Assets classified as available-for-sale
If there is objective evidence of impairment for available-for-sale financial assets, the cumulative loss - measured as the difference between the acquisition cost and the current fair value, less any impairment loss on that financial asset previously recognised in profit or loss - is removed from equity and recognised in profit or loss�
Impairment losses on equity instruments that were recognised in profit or loss are not reversed through profit or loss in a subsequent period�
(n) Property, plant and equipment
The Group’s accounting policy for land and buildings is explained in note 7(b)� All other plant and equipment is stated at historical cost less depreciation� Historical cost includes expenditure that is directly attributable to the acquisition of the items�
Subsequent costs are included in the asset’s carrying amount or recognised as a separate asset, as appropriate, only when it is probable that future economic benefits associated with the item will flow to the Group and the cost of the item can be measured reliably� All other repairs and maintenance are charged to profit or loss during the reporting period in which they are incurred�
Increases in the carrying amounts arising on revaluation of land and buildings are credited, net of tax, in other comprehensive income and accumulated in reserves in shareholders’ equity� To the extent that the increase reverses a decrease previously recognised in profit or loss, the increase is first recognised in profit or loss� Decreases that reverse previous increases of the same asset are first recognised in other comprehensive income to the extent of the remaining surplus attributable to the asset; all other decreases are charged to income statement�
The depreciation methods and periods used by the group are disclosed in note 7(b)�
The assets’ residual values and useful lives are reviewed, and adjusted if appropriate, at the end of each reporting period�
An asset’s carrying amount is written down immediately to its recoverable amount if the asset’s carrying amount is greater than its estimated recoverable amount (note 25(i))�
Gains and losses on disposals are determined by comparing proceeds with carrying amount� These gains or losses are included in profit or loss�

NOTES TO THE CONSOLIDATED FINANCIAL STATEMENTS CONTINUED104
25 SUMMARY OF SIGNIFICANT ACCOUNTING POLICIES (CONTINUED)
(o) Intangible assets
(i) Goodwill
Goodwill is measured as described in note 25(h)� Goodwill on acquisitions of subsidiaries is included in intangible assets� Goodwill on acquisitions of associates is included in investments in associates� Goodwill is not amortised� Instead, goodwill is tested for impairment annually, or more frequently if events or changes in circumstances indicate that it might be impaired, and is carried at cost less accumulated impairment losses� Gains and losses on the disposal of an entity include the carrying amount of goodwill relating to the entity sold�
Goodwill is allocated to cash-generating units for the purpose of impairment testing� The allocation is made to those cash-generating units or groups of cash-generating units that are expected to benefit from the business combination in which the goodwill arose, identified according to operating segments (note 1)�
(ii) Research and development
Expenditure on research activities, undertaken with the prospect of obtaining new scientific or technical knowledge and understanding, is recognised in the income statement as an expense when it is incurred�
Expenditure on development activities, being the application of research findings or other knowledge to a plan or design for the production of new or substantially improved products or services before the start of commercial production or use, is capitalised if the product or service is technically and commercially feasible and adequate resources are available to complete development� The expenditure capitalised comprises all directly attributable costs, including costs of materials, services, direct labour and an appropriate proportion of overheads� Other development expenditure is recognised in the income statement as an expense as incurred� Capitalised development expenditure is stated at cost less accumulated amortisation� Amortisation is calculated using the straight-line method to allocate the cost over the period of the expected benefit�
(iii) Designs and drawings
Designs and drawings acquired as part of a business combination are recognised separately from goodwill� The designs and drawings are carried at their fair value at the date of acquisition less accumulated amortisation and impairment losses� Amortisation is calculated based on the projected technical life of the design and drawings, which is expected to be five years�
(p) Trade and other payables
These amounts represent liabilities for goods and services provided to the Group prior to the end of financial year which are unpaid� The amounts are unsecured and are usually paid within 45 to 60 days of recognition� Trade and other payables are presented as current liabilities unless payment is not due within 12 months from the reporting date� They are recognised initially at their fair value and subsequently measured at amortised cost using the effective interest method�
(q) Borrowings
Borrowings are initially recognised at fair value, net of transaction costs incurred� Borrowings are subsequently measured at amortised cost� Any difference between the proceeds (net of transaction costs) and the redemption amount is recognised in profit or loss over the period of the borrowings using the effective interest method� Fees paid on the establishment of loan facilities are recognised as transaction costs of the loan to the extent that it is probable that some or all of the facility will be drawn down� In this case, the fee is deferred until the draw down occurs� To the extent there is no evidence that it is probable that some or all of the facility will be drawn down, the fee is capitalised as a prepayment for liquidity services and amortised over the period of the facility to which it relates�
Borrowings are removed from the statement of financial position when the obligation specified in the contract is discharged, cancelled or expired� The difference between the carrying amount of a financial liability that has been extinguished or transferred to another party and the consideration paid, including any non-cash assets transferred or liabilities assumed, is recognised in other income and other expenses�
Borrowings are classified as current liabilities unless the Group has an unconditional right to defer settlement of the liability for at least 12 months after the reporting period�
(r) Borrowing costs
Borrowing costs incurred for the construction of any qualifying asset are capitalised during the period of time that is required to complete and prepare the asset for its intended use or sale� Other borrowing costs are expensed�

NOTES TO THE CONSOLIDATED FINANCIAL STATEMENTS CONTINUED 105
25 SUMMARY OF SIGNIFICANT ACCOUNTING POLICIES (CONTINUED)
(s) Provisions
Provisions for legal claims are recognised when the Group has a present legal or constructive obligation as a result of past events, it is probable that an outflow of resources will be required to settle the obligation and the amount has been reliably estimated� Provisions are not recognised for future operating losses�
Where there are a number of similar obligations, the likelihood that an outflow will be required in settlement is determined by considering the class of obligations as a whole� A provision is recognised even if the likelihood of an outflow with respect to any one item included in the same class of obligations may be small�
Provisions are measured at the present value of management’s best estimate of the expenditure required to settle the present obligation at the statement of financial position date� The discount rate used to determine the present value reflects current market assessments of the time value of money and the risks specific to the liability� The increase in the provision due to the passage of time is recognised as interest expense�
(t) Employee benefits
(i) Short-term obligations
Liabilities for wages and salaries, including non-monetary benefits, annual leave and accumulating sick leave expected to be settled within 12 months after the end of the period in which the employees render the related service are recognised in respect of employee’s services up to the end of the reporting period and are measured at the amounts expected to be paid when the liabilities are settled� The liability for annual leave is recognised in the other payables� All other short-term employee benefit obligations are presented as other payables�
(ii) Other long-term employee benefit obligations
The liabilities for long service leave and annual leave are not expected to be settled wholly within 12 months after the end of the period in which the employees render the related service� They are therefore measured as the present value of expected future payments to be made in respect of services provided by employees up to the end of the reporting period using the projected unit credit method� Consideration is given to expected future wage and salary levels, experience of employee departures and periods of service� Expected future payments are discounted using market yields at the end of the reporting period of high quality corporate bonds with terms and currencies that match, as closely as possible, the estimated future cash outflows� Remeasurements as a result of experience adjustments and changes in actuarial assumptions are recognised in profit or loss�
The obligations are presented as current liabilities in the balance sheet if the entity does not have an unconditional right to defer settlement for at least twelve months after the reporting date, regardless of when the actual settlement is expected to occur�
(iii) Share-based payments
Share-based compensation benefits are provided to employees via the Ausdrill Limited Employee Option Plan and an employee share scheme� Information relating to these schemes is set out in note 19�
The fair value of options granted under the Ausdrill Limited Employee Option Plan is recognised as an employee benefit expense with a corresponding increase in equity�
The fair value at grant date is independently determined using a Black-Scholes or Monte Carlo option pricing model that takes into account the exercise price, the term of the option, the vesting and performance criteria, the impact of dilution, the non-tradable nature of the option, the share price at grant date and expected price volatility of the underlying share, the expected dividend yield and the risk free interest rate for the term of the option�
(u) Contributed equity
Ordinary shares are classified as equity�
Incremental costs directly attributable to the issue of new shares are shown in equity as a deduction, net of tax, from the proceeds� Incremental costs directly attributable to the issue of new shares for the acquisition of a business are not included in the cost of the acquisition as part of the purchase consideration�
(v) Maintenance and repairs
Maintenance, repair costs and minor renewals are charged as expenses as incurred� Significant costs incurred in overhauling plant and equipment are capitalised and depreciated over the remaining useful life of the asset or the component in accordance with note 25(n)�

NOTES TO THE CONSOLIDATED FINANCIAL STATEMENTS CONTINUED106
25 SUMMARY OF SIGNIFICANT ACCOUNTING POLICIES (CONTINUED)
(w) Dividends
Provision is made for the amount of any dividend declared, being appropriately authorised and no longer at the discretion of the entity, on or before the end of the reporting period but not distributed at the end of the reporting period�
(x) Earnings per share
(i) Basic earnings per share
Basic earnings per share is calculated by dividing:
�� the profit attributable to equity holders of the Company, excluding any costs of servicing equity other than ordinary shares
�� by the weighted average number of ordinary shares outstanding during the financial year, adjusted for bonus elements in ordinary shares issued during the year�
(ii) Diluted earnings per share
Diluted earnings per share adjusts the figures used in the determination of basic earnings per share to take into account:
�� the after income tax effect of interest and other financing costs associated with dilutive potential ordinary shares, and
�� the weighted average number of shares assumed to have been issued for no consideration in relation to dilutive potential ordinary shares�
(y) Goods and Services Tax (GST)
Revenues, expenses and assets are recognised net of the amount of associated GST, unless the GST incurred is not recoverable from the taxation authority� In this case it is recognised as part of the cost of acquisition of the asset or as part of the expense�
Receivables and payables are stated inclusive of the amount of GST receivable or payable� The net amount of GST recoverable from, or payable to, the taxation authority is included with other receivables or payables in the statement of financial position�
Cash flows are presented on a gross basis� The GST components of cash flows arising from investing or financing activities which are recoverable from, or payable to the taxation authority, are presented as operating cash flows�
(z) Rounding of amounts
The Company is of a kind referred to in Class Order 98/100, issued by the Australian Securities and Investments Commission, relating to the ‘rounding off’ of amounts in the financial statements� Amounts in the financial statements have been rounded off in accordance with that Class Order to the nearest thousand dollars, or in certain cases, the nearest dollar�
(aa) Parent entity financial information
The financial information for the parent entity, Ausdrill Limited, disclosed in note 24 has been prepared on the same basis as the consolidated financial statements, except as set out below�
(i) Investments in subsidiaries, associates and joint venture entities
Investments in subsidiaries, associates and joint venture entities are accounted for at cost in the financial statements of Ausdrill Limited� Dividends received from associates are recognised in the parent entity’s profit or loss when its right to receive the dividend is established�

NOTES TO THE CONSOLIDATED FINANCIAL STATEMENTS CONTINUED 107
25 SUMMARY OF SIGNIFICANT ACCOUNTING POLICIES (CONTINUED)
(aa) Parent entity financial information (continued)
(ii) Tax consolidation legislation
Ausdrill Limited and its wholly-owned Australian controlled entities have implemented the tax consolidation legislation�
The head entity, Ausdrill Limited, and the controlled entities in the tax consolidated group account for their own current and deferred tax amounts� These tax amounts are measured as if each entity in the tax consolidated group continues to be a stand alone taxpayer in its own right�
In addition to its own current and deferred tax amounts, Ausdrill Limited also recognises the current tax liabilities (or assets) and the deferred tax assets arising from unused tax losses and unused tax credits assumed from controlled entities in the tax consolidated group�
The entities have also entered into a tax funding agreement under which the wholly-owned entities fully compensate Ausdrill Limited for any current tax payable assumed and are compensated by Ausdrill Limited for any current tax receivable and deferred tax assets relating to unused tax losses or unused tax credits that are transferred to Ausdrill Limited under the tax consolidation legislation� The funding amounts are determined by reference to the amounts recognised in the wholly-owned entities’ financial statements�
The amounts receivable/payable under the tax funding agreement are due upon receipt of the funding advice from the head entity, which is issued as soon as practicable after the end of each financial year� The head entity may also require payment of interim funding amounts to assist with its obligations to pay tax instalments�
Assets or liabilities arising under tax funding agreements with the tax consolidated entities are recognised as current amounts receivable from or payable to other entities in the Group�
Any difference between the amounts assumed and amounts receivable or payable under the tax funding agreement are recognised as a contribution to (or distribution from) wholly owned tax consolidated entities�
(iii) Financial guarantees
Where the parent entity has provided financial guarantees in relation to loans and payables of subsidiaries for no compensation, the fair values of these guarantees are accounted for as contributions and recognised as part of the cost of the investment�
(iv) Share based payments
The grant by the Company of options over its equity instruments to the employees of subsidiary undertakings in the Group is treated as a capital contribution to that subsidiary undertaking� The fair value of employee services received, measured by reference to the grant date fair value, is recognised over the vesting period as an increase to investment in subsidiary undertakings, with a corresponding credit to equity�

108 DIRECTORS’ DECLARATION
In the directors’ opinion:
(a) the financial statements and notes set out on pages 38 to 107 are in accordance with the Corporations Act 2001, including:
(i) complying with Accounting Standards, the Corporations Regulations 2001 and other mandatory professional reporting requirements, and
(ii) giving a true and fair view of the consolidated entity’s financial position as at 30 June 2015 and of its performance for the financial year ended on that date, and
(b) there are reasonable grounds to believe that the Company will be able to pay its debts as and when they become due and payable, and
(c) at the date of this declaration, there are reasonable grounds to believe that the members of the extended closed group identified in note 23 will be able to meet any obligations or liabilities to which they are, or may become, subject by virtue of the deed of cross guarantee described in note 23�
Note 25(a) confirms that the financial statements also comply with International Financial Reporting Standards as issued by the International Accounting Standards Board�
The directors have been given the declarations by the chief executive officer and chief financial officer required by section 295A of the Corporations Act 2001�
This declaration is made in accordance with a resolution of the directors�
Ronald George Sayers
Managing Director
Perth
26 August 2015

109INDEPENDENT AUDITOR’S REPORT
INDEPENDENT AUDITOR’S REPORT TO THE MEMBERS OF AUSDRILL LIMITED
Report on the financial report
We have audited the accompanying financial report of Ausdrill Limited (the company), which comprises the consolidated statement of financial position as at 30 June 2015, the consolidated income statement and consolidated statement of comprehensive income, consolidated statement of changes in equity and consolidated statement of cash flows for the year ended on that date, a summary of significant accounting policies, other explanatory notes and the directors’ declaration for Ausdrill Group (the consolidated entity)� The consolidated entity comprises the company and the entities it controlled at year’s end or from time to time during the financial year�
Directors’ responsibility for the financial report
The directors of the company are responsible for the preparation of the financial report that gives a true and fair view in accordance with Australian Accounting Standards and the Corporations Act 2001 and for such internal control as the directors determine is necessary to enable the preparation of the financial report that is free from material misstatement, whether due to fraud or error� In Note 25(a), the directors also state, in accordance with Accounting Standard AASB 101 Presentation of Financial Statements, that the financial statements comply with International Financial Reporting Standards�
Auditor’s responsibility
Our responsibility is to express an opinion on the financial report based on our audit� We conducted our audit in accordance with Australian Auditing Standards� Those standards require that we comply with relevant ethical requirements relating to audit engagements and plan and perform the audit to obtain reasonable assurance whether the financial report is free from material misstatement�
An audit involves performing procedures to obtain audit evidence about the amounts and disclosures in the financial report� The procedures selected depend on the auditor’s judgement, including the assessment of the risks of material misstatement of the financial report, whether due to fraud or error� In making those risk assessments, the auditor considers internal control relevant to the consolidated entity’s preparation and fair presentation of the financial report in order to design audit procedures that are appropriate in the circumstances, but not for the purpose of expressing an opinion on the effectiveness of the entity’s internal control� An audit also includes evaluating the appropriateness of accounting policies used and the reasonableness of accounting estimates made by the directors, as well as evaluating the overall presentation of the financial report�
We believe that the audit evidence we have obtained is sufficient and appropriate to provide a basis for our audit opinion�
Independence
In conducting our audit, we have complied with the independence requirements of the Corporations Act 2001�
PricewaterhouseCoopers, ABN 52 780 433 757Brookfield Place, 125 St Georges Terrace, PERTH WA 6000, GPO Box D198, PERTH WA 6840T: +61 8 9238 3000, F: +61 8 9238 3999, www.pwc.com.au
Liability limited by a scheme approved under Professional Standards Legislation.

110 INDEPENDENT AUDITOR’S REPORT CONTINUED
INDEPENDENT AUDITOR’S REPORT TO THE MEMBERS OF AUSDRILL LIMITED (CONTINUED)
Auditor’s opinion
In our opinion:
(a) the financial report of Ausdrill Limited is in accordance with the Corporations Act 2001, including:
(i) giving a true and fair view of the consolidated entity's financial position as at 30 June 2015 and of its performance for the year ended on that date; and
(ii) complying with Australian Accounting Standards (including the Australian Accounting Interpretations), the Corporations Regulations 2001 and Report on the Remuneration Report�
(b) the financial report and notes also comply with International Financial Reporting Standards as disclosed in Note 25(a)�
Report on the Remuneration Report
We have audited the remuneration report included in pages 26 to 33 of the directors’ report for the year ended 30 June 2015� The directors of the company are responsible for the preparation and presentation of the remuneration report in accordance with section 300A of the Corporations Act 2001� Our responsibility is to express an opinion on the remuneration report, based on our audit conducted in accordance with Australian Auditing Standards�
Auditor’s opinion
In our opinion, the remuneration report of Ausdrill Limited for the year ended 30 June 2015 complies with section 300A of the Corporations Act 2001�
PricewaterhouseCoopers
Justin Carroll Perth Partner 26 August 2015 PricewaterhouseCoopers

111SHAREHOLDER INFORMATION
A. DISTRIBUTION OF EQUITY SECURITIES
Analysis of numbers of equity security holders by size of holding as at 31 July 2015:
Ordinary shares
Holding Number of Holders Shares
1 - 1,000 2,676 1,012,4751,001 - 5,000 2,982 8,042,5135,001 - 10,000 1,438 11,209,21010,001 - 100,000 2,083 59,693,767100,001 and over 189 232,319,259
9,368 312,277,224
There were 3,441 holders of less than a marketable parcel of 1,667 ordinary shares�
B. EQUITY SECURITY HOLDERS
The names of the twenty largest holders of quoted equity securities as at 31 July 2015 are listed below:
Name Ordinary shares
Number heldPercentage of issued shares
1� HSBC Custody Nominees (Australia) Limited 39,483,184 12.64% 2� Cherry Garden Nominees Pty Ltd 36,301,664 11.62% 3� JP Morgan Nominees Australia Limited 29,099,561 9.32% 4� Citicorp Nominees Pty Ltd 23,940,344 7.67% 5� Bremerton Pty Ltd <The Bartlett Family Fund A/C> 16,781,061 5.37% 6� National Nominees Limited 12,431,038 3.98% 7� ABN AMRO Clearing Sydney Nominees Pty Ltd 3,435,520 1.10% 8� CTS Funds Pty Ltd <Civic Super Fund> 3,139,665 1.01% 9� HSBC Custody Nominees (Australia) Limited <NT-Comnwlth Super Corp A/C> 3,061,149 0.98% 10� Mr Brian Gregory & Mrs Wendy Joy Wright <BG Wright Super Fund> 2,584,380 0.83% 11� Mrs Patricia Gladys Wright 2,466,233 0.79% 12� BNP Paribas Noms Pty Ltd 2,314,916 0.74% 13� Mr Garry Patrick & Mrs Devryn Lee Connell <Connell Contractors S/F A/C> 2,305,476 0.74% 14� Royale Blue Pty Ltd 2,267,000 0.73% 15� Mr Frederick G Moir & Mr Kevin V Benson <Moir Super Fund No 4> 2,000,018 0.64% 16� Mr Peter M Bartlett & Mrs Julie L Bartlett <Bremerton P/L S/Fund> 1,552,793 0.50% 17� Yolena Pty Ltd <B & N Murphy Family A/C> 1,354,800 0.43% 18� CS Fourth Nominees Pty Ltd 1,345,990 0.43% 19� Mrs PG Wright & Mr MG Wright & Mr JG Wright <PG Wright Super Fund A/C> 1,221,500 0.39% 20� Mr TE O’Connor & Mrs EA O’Connor <TE O’Connor Super Fund> 1,004,285 0.32% Total held by the twenty largest shareholders 188,090,577 60.23%�

112
C. SUBSTANTIAL HOLDERS
Substantial holders in the company are set out below as at 31 July 2015:
Ordinary shares
Number held Percentage
1� Cherry Garden Nominees Pty Ltd / Ronald George Sayers 36,846,762 11.80% 2� FMR LLC 21,512,564 6.89% 3� Bremerton Group / PM & JL Bartlett 18,961,255 6.07%
D. VOTING RIGHTS
Every member present at a meeting of the company in person or by proxy shall have one vote and upon a poll each share shall have one vote�
SHAREHOLDER INFORMATION CONTINUED

113FINANCIAL TABLE
11 12 13 14 15REVENUESales Revenue $’000 834,641 1,059,107 1,128,559 826,305 765,773Interest Received $’000 4,572 3,134 2,724 1,555 1,867Dividends Received $’000 - - - - -Total $’000 839,213 1,062,241 1,131,283 827,860 767,640
PROFIT/(LOSS)EBITDA* $’000 195,490 288,436 272,746 173,656 114,694Depreciation and amortisation expense $’000 82,509 116,144 123,695 99,177 77,463EBIT* $’000 112,981 172,292 149,051 74,479 37,231Net Interest Expense $’000 13,470 19,805 39,548 40,049 35,118Operating profit before income tax* $’000 99,511 152,487 109,503 34,430 2,113Impairment expense $’000 (53) - (47) (77,893) (202,798)Profit / (loss) before income tax $’000 99,458 152,487 109,456 (43,463) (200,685)Income tax expense $’000 26,141 40,280 19,057 396 (25,065)Profit / (loss) from discontinued operation $’000 - - - - -Profit / (loss) for the year $’000 73,317 112,207 90,399 (43,859) (175,620)Number of Ordinary Shares at Year End 000’s 301,453 304,397 312,277 312,277 312,277Weighted Number of Ordinary Shares 000’s 270,568 302,935 308,173 312,277 312,277Basic earnings / (loss) per share cents 27.13 37.28 29.63 (13.64) (56.24)Diluted earnings / (loss) per share cents 26.92 36.97 28.98 (13.64) (56.24)
STATEMENT OF FINANCIAL POSITIONTotal Assets $’000 1,069,736 1,342,615 1,539,396 1,367,736 1,130,034Total Liabilities $’000 414,793 601,854 722,010 615,568 576,741Shareholders’ Equity $’000 654,943 740,761 817,386 752,168 553,293Net tangible assets per share dollar 2.06 2.33 2.39 2.37 1.77
CASH FLOWSGross cash flows from operating activities $’000 136,102 205,407 263,966 192,371 138,486Net cash flows from operating activities $’000 117,349 156,784 187,290 142,117 117,936Net cash flows from investing activities $’000 (154,565) (195,640) (330,281) (56,223) (738)Net cash flows from financing activities $’000 36,739 23,551 93,328 (101,209) (104,693)Closing cash balance $’000 140,714 124,188 78,826 62,695 77,865Gross debt $’000 223,612 366,411 551,255 463,587 443,273Net debt $’000 82,898 242,223 472,429 400,892 365,408
DIVIDENDSTotal Dividends per share (Interim & Final declared) cents 12.00 14.50 12.00 4.50 1.0Total Dividends paid $’000 30,183 39,357 44,498 24,981 9,369
NET DEBT / TOTAL CAPITAL % 11 25 37 35 40
EBIT TO SALES REVENUE % 13.53 16.27 13.20 9.01 4.86
EMPLOYEES AT YEAR END # 4,362 6,003 5,703 4,578 4,080
* EBITDA, EBIT and operating profit before income tax excludes impairment expense and discontinued operation�

Des
igne
d by
AU
SD
_16
89
2
AU
SDR
ILL LIMITED
A
NN
UA
L REP
OR
T 2015
ANNUAL REPORT 2015
FOLLOW US AT AUSDRILL.COM.AU
Related Documents