ANNUAL REPORT 2014

Welcome message from author
This document is posted to help you gain knowledge. Please leave a comment to let me know what you think about it! Share it to your friends and learn new things together.
Transcript

ANNUALREPORT2014
٢٠١٤

His Highness
Sheikh Tamim Bin Hamad Bin Khalifa Al-Thani
Emir of the State of Qatar

CONTENT
Company Profile
Financial Highlights
Investment Rationale
Chairman’s Report
Vice Chairman’s Report
Managing Director’s Report
Corporate Governance
Board of Directors
Executive Management and General Managers
Organisational Chart
Functional Chart
Corporate Social Responsibility
Operations Review
Industrial Manufacturing Division
Trading and Distribution Division
Property Division
Managed Services Division
Financial Statements
060810121416182022242526283034404246
A a m a l A n n u a l R e p o r t 2 0 1 4 A a m a l C o m p a n y Q . S . C . 9
Company Snapshot
x Incorporated in 2001 in Qatar and listed on the Qatar Exchange in 2007
x Geographical focus on Qatar at present with intentions to expand further in the Gulf region
x Operations across 23 business units with market leading positions in key sectors including: industrial manufacturing, property, trading in pharmaceuticals and medical equipment and managed services
x Strategy focused on three pillars for sustained, profitable growth: i) Increasing focus on industrial manufacturing and related high growth sectors ii) Continued growth, diversification and innovation across other existing businesses to enhance market position and optimise performance iii) Continued application of clear and disciplined operational and financial principles underlying our strategic growth initiatives
x Uniquely positioned to benefit from increased private and public sector demand, particularly for infrastructure development, as Qatar is transformed into an advanced and self-sustaining economy. The award of the 2022 FIFA World Cup to Qatar and the National Vision 2030 is anticipated to accelerate this capital investment as infrastructure projects are commissioned and new projects come on stream
x Current market capitalisation of QAR 11bn* (US$ 3bn), making Aamal Company one of the largest diversified companies listed on the Qatar Exchange
x Al Faisal Holding Company is the major shareholder
*As on 3 March 2015
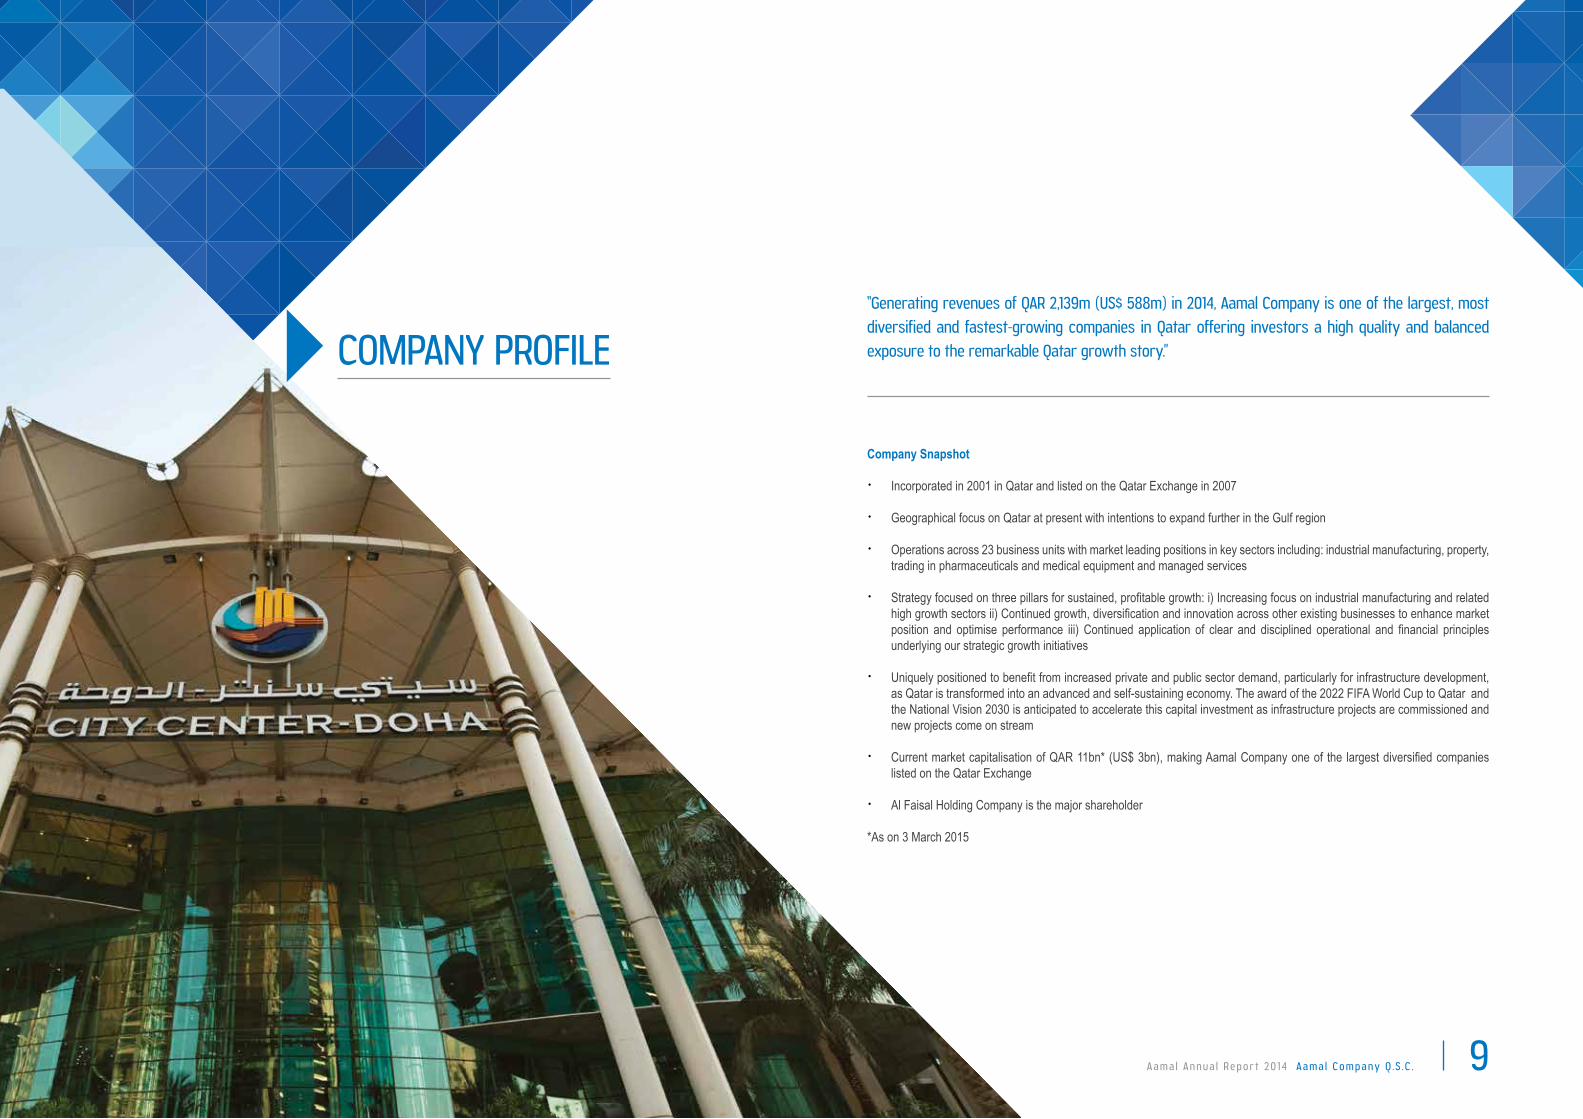
COMPANY PROFILE“Generating revenues of QAR 2,139m (US$ 588m) in 2014, Aamal Company is one of the largest, most
diversified and fastest-growing companies in Qatar offering investors a high quality and balanced
exposure to the remarkable Qatar growth story.”
A a m a l A n n u a l R e p o r t 2 0 1 4 A a m a l C o m p a n y Q . S . C . 11
FINANCIAL HIGHLIGHTS
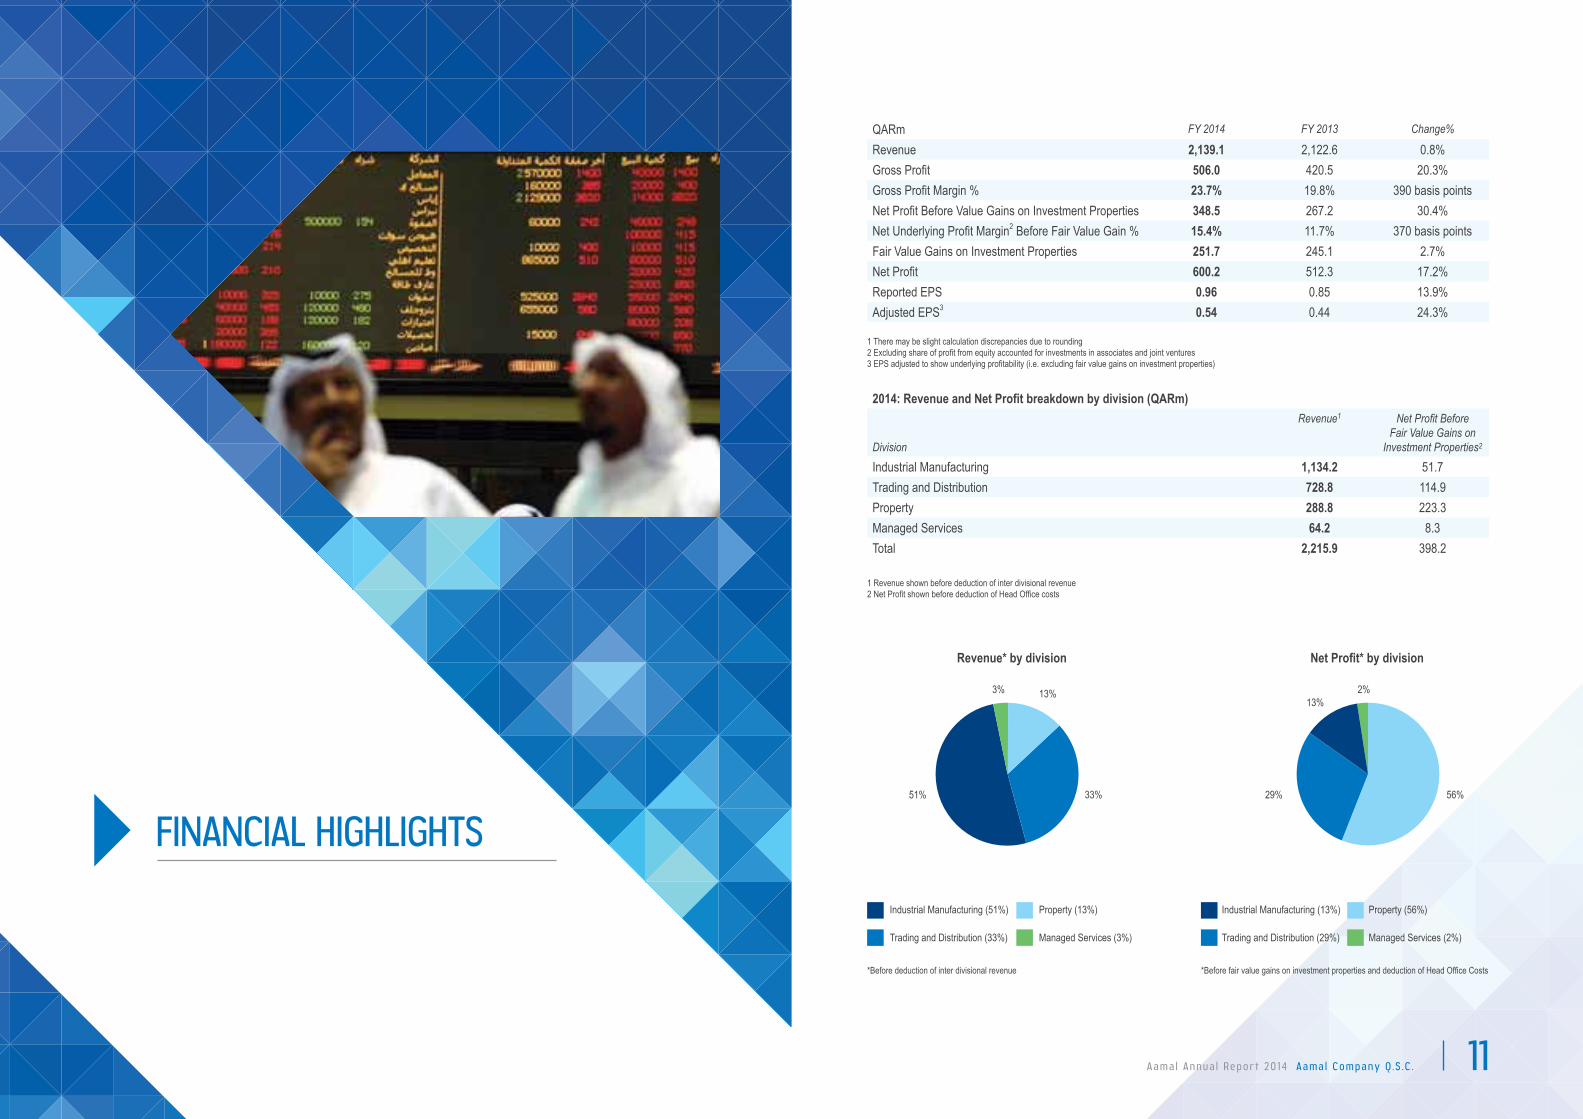
QARm FY 2014 FY 2013 Change%
Revenue 2,139.1 2,122.6 0.8%Gross Profit 506.0 420.5 20.3%Gross Profit Margin % 23.7% 19.8% 390 basis pointsNet Profit Before Value Gains on Investment Properties 348.5 267.2 30.4%Net Underlying Profit Margin2 Before Fair Value Gain % 15.4% 11.7% 370 basis pointsFair Value Gains on Investment Properties 251.7 245.1 2.7%Net Profit 600.2 512.3 17.2%Reported EPS 0.96 0.85 13.9%Adjusted EPS3 0.54 0.44 24.3%
1 There may be slight calculation discrepancies due to rounding2 Excluding share of profit from equity accounted for investments in associates and joint ventures3 EPS adjusted to show underlying profitability (i.e. excluding fair value gains on investment properties)
2014: Revenue and Net Profit breakdown by division (QARm)
Division
Revenue1 Net Profit Before Fair Value Gains on
Investment Properties2
Industrial Manufacturing 1,134.2 51.7Trading and Distribution 728.8 114.9Property 288.8 223.3Managed Services 64.2 8.3Total 2,215.9 398.2
1 Revenue shown before deduction of inter divisional revenue2 Net Profit shown before deduction of Head Office costs
Revenue* by division Net Profit* by division
Industrial Manufacturing (51%)
Trading and Distribution (33%)
Property (13%)
Managed Services (3%)
Industrial Manufacturing (13%)
Trading and Distribution (29%)
Property (56%)
Managed Services (2%)
*Before deduction of inter divisional revenue *Before fair value gains on investment properties and deduction of Head Office Costs
33%
13%3%
51% 29% 56%
13%2%
A a m a l A n n u a l R e p o r t 2 0 1 4 A a m a l C o m p a n y Q . S . C 13
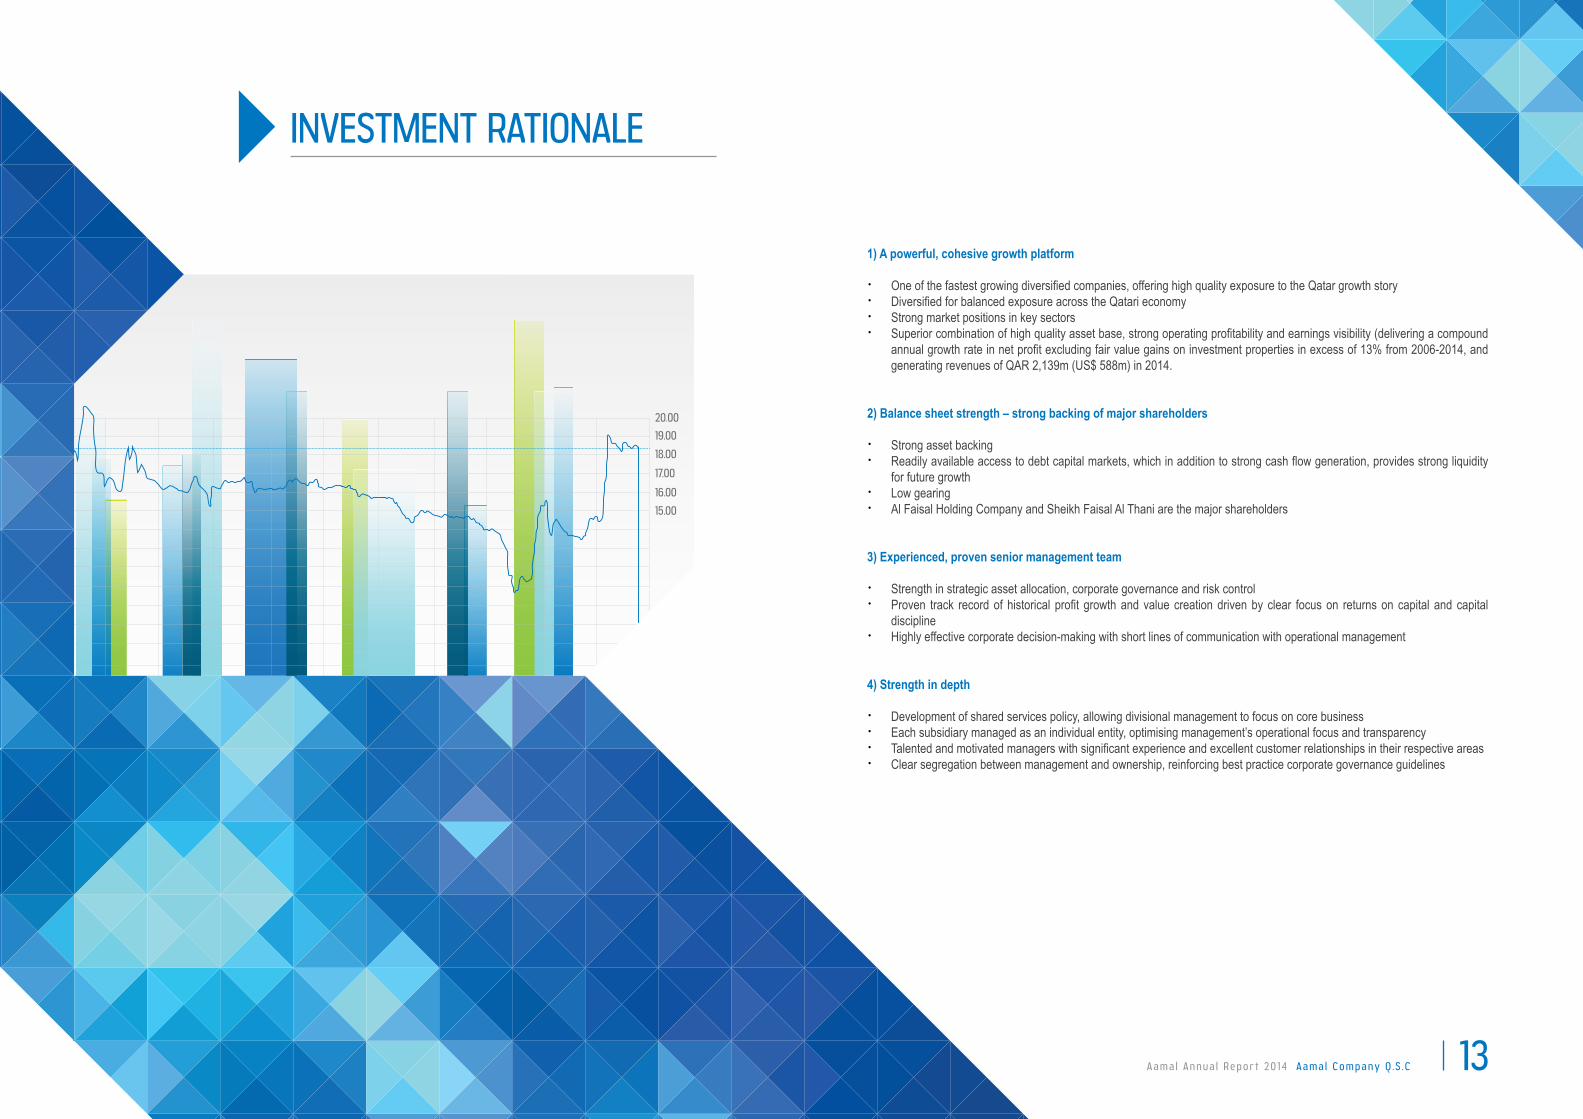
INVESTMENT RATIONALE
1) A powerful, cohesive growth platform
x One of the fastest growing diversified companies, offering high quality exposure to the Qatar growth story x Diversified for balanced exposure across the Qatari economy x Strong market positions in key sectors x Superior combination of high quality asset base, strong operating profitability and earnings visibility (delivering a compound
annual growth rate in net profit excluding fair value gains on investment properties in excess of 13% from 2006-2014, and generating revenues of QAR 2,139m (US$ 588m) in 2014.
2) Balance sheet strength – strong backing of major shareholders
x Strong asset backing x Readily available access to debt capital markets, which in addition to strong cash flow generation, provides strong liquidity
for future growth x Low gearing x Al Faisal Holding Company and Sheikh Faisal Al Thani are the major shareholders
3) Experienced, proven senior management team
x Strength in strategic asset allocation, corporate governance and risk control x Proven track record of historical profit growth and value creation driven by clear focus on returns on capital and capital
discipline x Highly effective corporate decision-making with short lines of communication with operational management
4) Strength in depth
x Development of shared services policy, allowing divisional management to focus on core business x Each subsidiary managed as an individual entity, optimising management’s operational focus and transparency x Talented and motivated managers with significant experience and excellent customer relationships in their respective areas x Clear segregation between management and ownership, reinforcing best practice corporate governance guidelines
20.00
19.00
18.00
17.00
16.00
15.00

Esteemed Shareholders
On behalf of the Board of Directors, I am very pleased to report excellent results for 2014. We have managed to grow our total net profit by over 17% to exceed QAR 600 million for the first time, with
earnings per share rising by almost 14%. Excluding the net fair value gains on investment properties which were largely flat at QAR 251.7 million, net profit was up by 30%. Today’s results extend Aamal’s proud and
long-established track record of profit growth and value creation underpinned by a clear focus on efficient capital allocations and returns.
Summary of financial results - breakdown by division:(nb. there may be slight differences due to rounding)
QAR m 2014 2013 Change %
Industrial Manufacturing 1,134.2 1,261.2 (10.1)%Trading and Distribution 728.8 585.8 24.4%Property 288.8 261.6 10.4%Managed Services 64.2 86.3 (25.6)%less: inter-divisional revenue (76.8) (72.2)
TOTAL 2,139.1 2,122.7 0.8%
QAR m 2014 2013 Change %
Industrial Manufacturing 51.7 22.6 128.3%Trading and Distribution 114.9 86.5 32.8%Property (ex-fair value gains on investment properties) 223.3 200.8 11.2%Fair value gains on investment properties 251.7 245.1 2.7%Managed Services 8.3 5.2 60.1%less: Head Office costs (49.7) (47.9) 3.8%
TOTAL 600.2 512.3 17.2%
As well as a record year for financial performance, we achieved a number of significant operational milestones. First, we established Aamal Optical Supplies in partnership with Qatar Optics, one of the leading companies in this sector, which is involved in the import, manufacture and distribution of prescription lenses and contact lenses. It is also the intention to open a specialised optical medical center in the near future that will diversify operations and revenue channels further, and allow us to capitalise on opportunities in this fast-growing sector.
Another important milestone was the start of commercial production at Advanced Pipes Company following construction of its state of the art factory in Mesaieed. A total of QAR 200 million (US$ 55m) has been invested in establishing this new facility which specialises in the manufacture of concrete pipe products to supply infrastructure and pipeline projects both in Qatar and across the region.
As Qatar continues to prosper and diversify its industrial base under the wise leadership of H.H. the Emir of Qatar Sheikh, Tamim Bin Hamad Al Thani, Aamal remains very much at the vanguard of this growth. It is the ‘best in class’ in terms of the products and services it is able to offer, and continues to be the partner of choice for those blue chip companies wishing to enter Qatar, bringing market leading knowledge and skills with them.
Faisal Bin Qassim Al ThaniChairman
REVENUE
NET PROFIT
CHAIRMAN’S REPORT

Aamal has achieved exemplary financial and operational results for 2014, evidencing the Company’s ability to seize opportunities offered by Qatar’s growing and flourishing economy, as well as its ability to do so profitably by focusing on revenue growth alongside operational efficiency and cost control, and in line with the Company’s balanced strategy for risk assessment and management. Aamal’s key strengths lie in its clear vision and strategy that are closely aligned with Qatar’s national strategy for economic development. Aamal has succeeded in building a solid base with its industrial manufacturing division, whilst developing further the other sectors in which it operates. Looking at the Company’s performance alongside the performance of the overall Qatari economy, we believe that our strategy of diversifying revenue sources is in line with the country’s strategy for economic growth and plans for development; that is, aiming to diversify the economy away from over-dependence on the hydrocarbon sector towards transforming Qatar into a center for manufacturing and services which will help to underpin the country’s long term prosperity. Besides, Aamal seeks to build on opportunities resulting from the MSCI upgrade of Qatar from frontier market to emerging market status. This upgrade has undoubtedly raised the appeal of those companies listed on the Qatar Exchange to international investors, leading to an enhancement in investor confidence and an increase in liquidity. Accordingly, Aamal has applied to raise the level of permitted foreign ownership to 49%, aiming to attract private capital from non-Qatari nationals both abroad and from the increasing number resident within Qatar, who may wish to participate in a company that is able to offer directly, a high quality and balanced exposure to the remarkable Qatar growth story. Together, these factors give cause for continuing confidence in the Company’s future performance. I am sure that Aamal will continue to prosper whilst focusing on delivering the best results for all stakeholders first and foremost. Our leading positions in the sectors in which we operate as well as our strong financial position enable us to offer comprehensive and balanced growth opportunities within Qatar, one of the fastest growing economies in the world.
Mohammed Bin Faisal Al ThaniVice Chairman
VICE CHAIRMAN’S REPORT
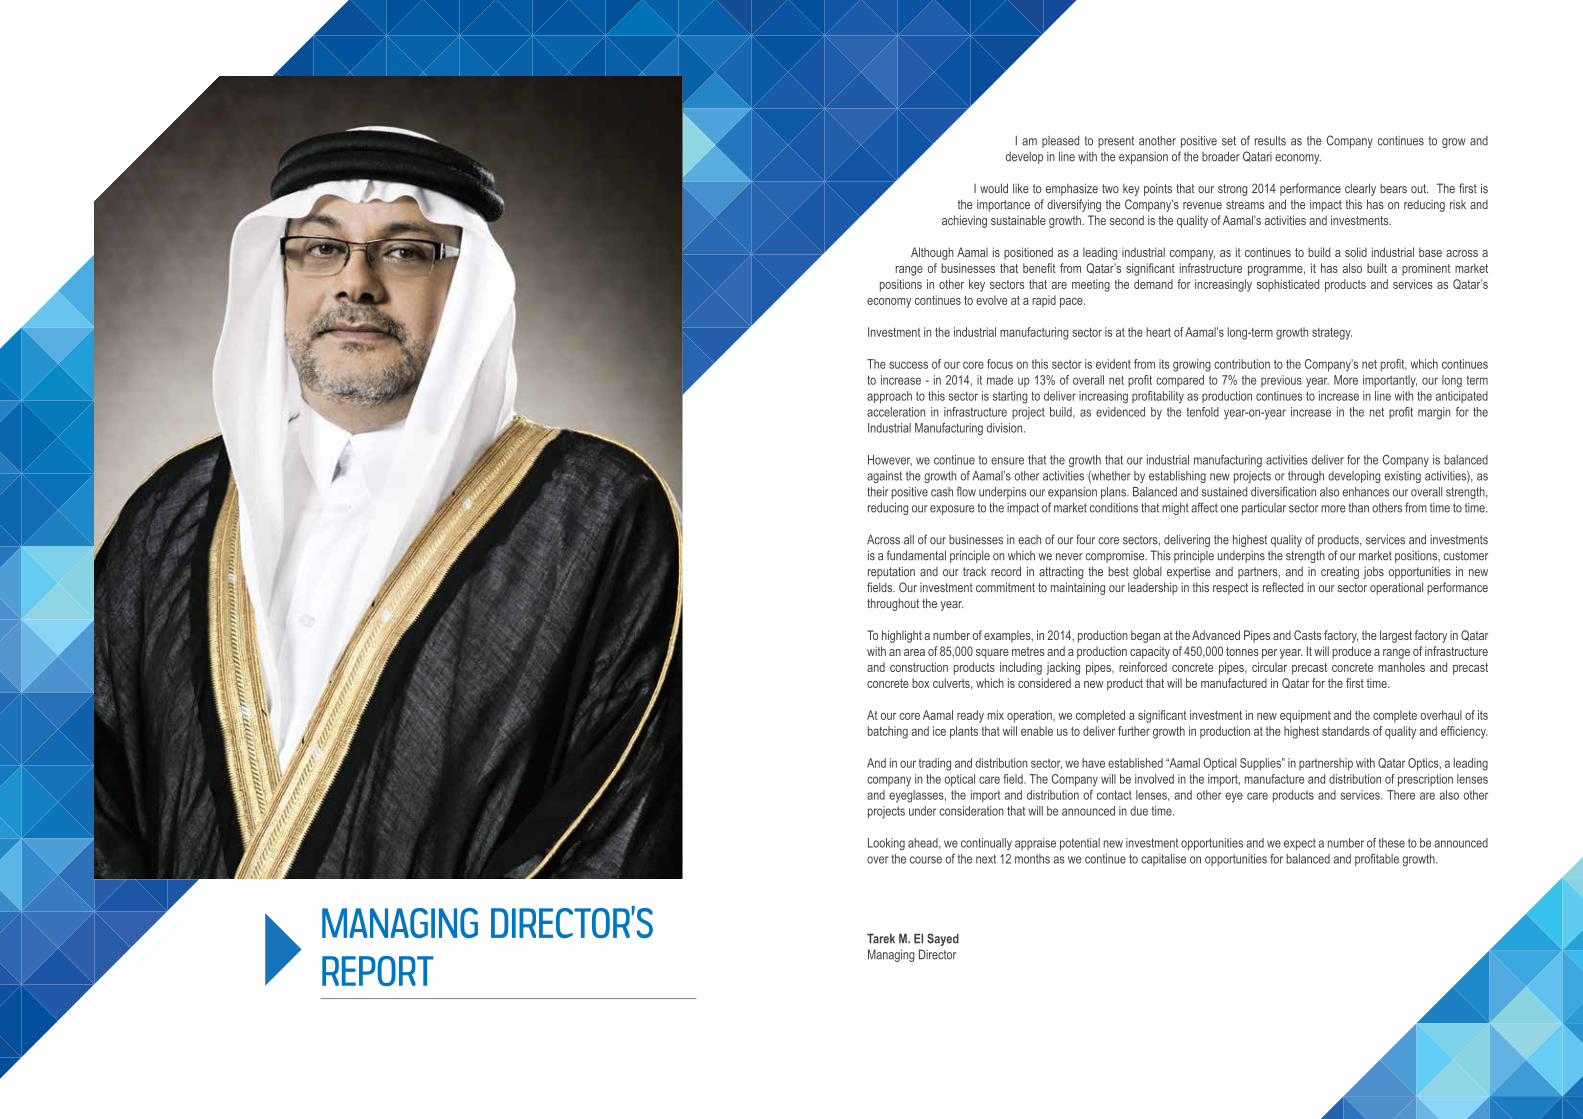
MANAGING DIRECTOR’SREPORT
I am pleased to present another positive set of results as the Company continues to grow and develop in line with the expansion of the broader Qatari economy.
I would like to emphasize two key points that our strong 2014 performance clearly bears out. The first is the importance of diversifying the Company’s revenue streams and the impact this has on reducing risk and
achieving sustainable growth. The second is the quality of Aamal’s activities and investments.
Although Aamal is positioned as a leading industrial company, as it continues to build a solid industrial base across a range of businesses that benefit from Qatar’s significant infrastructure programme, it has also built a prominent market
positions in other key sectors that are meeting the demand for increasingly sophisticated products and services as Qatar’s economy continues to evolve at a rapid pace.
Investment in the industrial manufacturing sector is at the heart of Aamal’s long-term growth strategy.
The success of our core focus on this sector is evident from its growing contribution to the Company’s net profit, which continues to increase - in 2014, it made up 13% of overall net profit compared to 7% the previous year. More importantly, our long term approach to this sector is starting to deliver increasing profitability as production continues to increase in line with the anticipated acceleration in infrastructure project build, as evidenced by the tenfold year-on-year increase in the net profit margin for the Industrial Manufacturing division.
However, we continue to ensure that the growth that our industrial manufacturing activities deliver for the Company is balanced against the growth of Aamal’s other activities (whether by establishing new projects or through developing existing activities), as their positive cash flow underpins our expansion plans. Balanced and sustained diversification also enhances our overall strength, reducing our exposure to the impact of market conditions that might affect one particular sector more than others from time to time.
Across all of our businesses in each of our four core sectors, delivering the highest quality of products, services and investments is a fundamental principle on which we never compromise. This principle underpins the strength of our market positions, customer reputation and our track record in attracting the best global expertise and partners, and in creating jobs opportunities in new fields. Our investment commitment to maintaining our leadership in this respect is reflected in our sector operational performance throughout the year.
To highlight a number of examples, in 2014, production began at the Advanced Pipes and Casts factory, the largest factory in Qatar with an area of 85,000 square metres and a production capacity of 450,000 tonnes per year. It will produce a range of infrastructure and construction products including jacking pipes, reinforced concrete pipes, circular precast concrete manholes and precast concrete box culverts, which is considered a new product that will be manufactured in Qatar for the first time.
At our core Aamal ready mix operation, we completed a significant investment in new equipment and the complete overhaul of its batching and ice plants that will enable us to deliver further growth in production at the highest standards of quality and efficiency. And in our trading and distribution sector, we have established “Aamal Optical Supplies” in partnership with Qatar Optics, a leading company in the optical care field. The Company will be involved in the import, manufacture and distribution of prescription lenses and eyeglasses, the import and distribution of contact lenses, and other eye care products and services. There are also other projects under consideration that will be announced in due time.
Looking ahead, we continually appraise potential new investment opportunities and we expect a number of these to be announced over the course of the next 12 months as we continue to capitalise on opportunities for balanced and profitable growth.
Tarek M. El SayedManaging Director
A a m a l A n n u a l R e p o r t 2 0 1 4 A a m a l C o m p a n y Q . S . C 21
Board committees
The Board of Directors has formed five committees: 1) Audit Committee; 2) Nomination Committee; 3) Corporate Governance Committee; 4) Compensation Committee; and 5) Executive Committee. The dedicated committees meet regularly to assess operational effectiveness and ensure that the Company is performing in line with the set objectives.
Segregation of responsibility
In accordance with the highest standards of good Corporate Governance, the Board has decided to segregate the executive management duties from the Board.
The executives operate from a well-defined rule authorisation matrix and have various quantitative and qualitative targets set for them.
The executive management acts upon authorities approved by the Board of Directors. The Company policies and procedures are reviewed and updated regularly.
Relations with shareholders
Aamal Company is committed to maintaining an active and open dialogue with its shareholders through a planned programme of investor relations activities centred on the financial reporting calendar. Our website has a dedicated Investor Relations section to provide further information for all investors or potential investors while our Investor Relations team provides a channel for any other queries to be answered.
Support systems
The Company uses the Oracle system as the primary Group IT System.
“Aamal’s Board and Management are committed to meeting the expectations of
stakeholders in practicing sound corporate governance. Aamal Company views
corporate governance as an important factor in delivering success.”
CORPORATE GOVERNANCE

w w w.a a m a l . c o m .q a A n n u a l R e p o r t 2 0 1 422 A a m a l A n n u a l R e p o r t 2 0 1 4 A a m a l C o m p a n y Q . S . C 23
Mr. Bader A. Al FehaniBoard Member
Sheikh Faisal Bin Qassim Al ThaniChairman
Sheikh Mohamed Bin Faisal Al ThaniVice-Chairman
Sheikh Abdullah Al ThaniBoard Member
Mr. Tarek M. El SayedManaging Director
Sheikh Turki Bin Faisal Al ThaniBoard Member
BOARD OF DIRECTORS
w w w.a a m a l . c o m .q a A n n u a l R e p o r t 2 0 1 424 A a m a l A n n u a l R e p o r t 2 0 1 4 A a m a l C o m p a n y Q . S . C 25
Sameer Abu HannunAdvanced Pipes and Casts Company
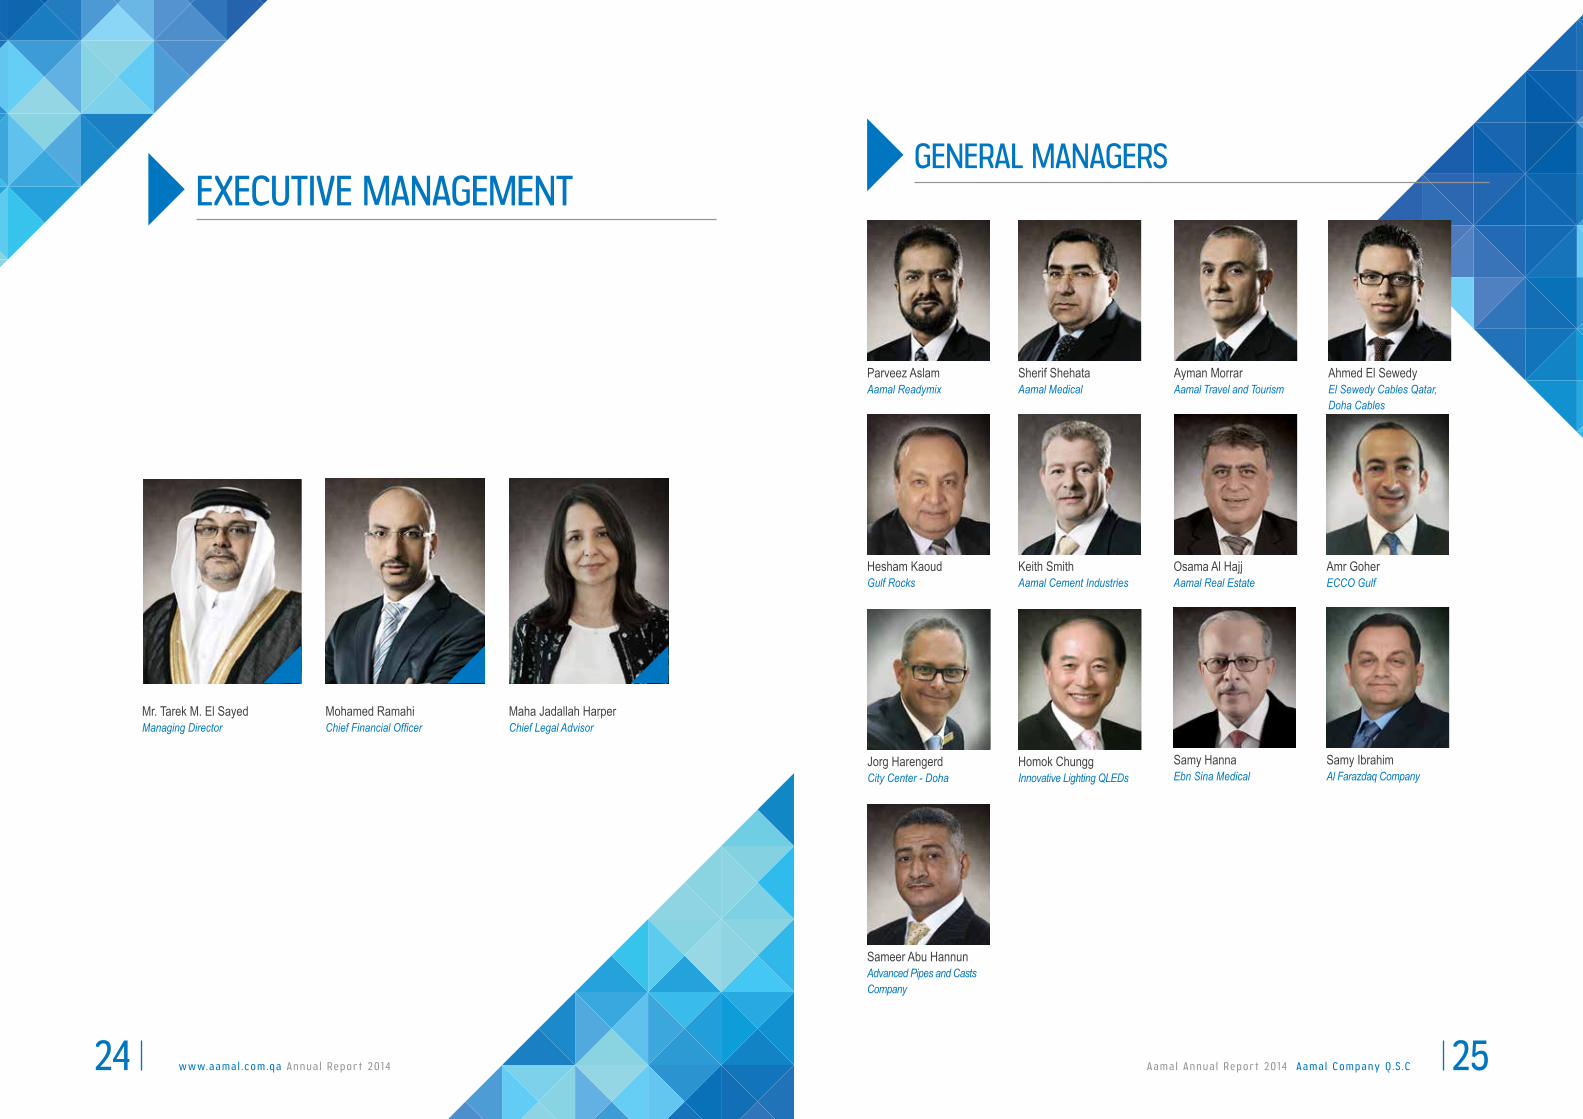
GENERAL MANAGERS
Mr. Tarek M. El SayedManaging Director
Mohamed RamahiChief Financial Officer
Maha Jadallah HarperChief Legal Advisor
Parveez AslamAamal Readymix
Sherif ShehataAamal Medical
Ayman MorrarAamal Travel and Tourism
Ahmed El SewedyEl Sewedy Cables Qatar, Doha Cables
Hesham KaoudGulf Rocks
Keith SmithAamal Cement Industries
Osama Al HajjAamal Real Estate
Amr GoherECCO Gulf
Jorg HarengerdCity Center - Doha
Homok ChunggInnovative Lighting QLEDs
Samy HannaEbn Sina Medical
Samy IbrahimAl Farazdaq Company
EXECUTIVE MANAGEMENT
w w w.a a m a l . c o m .q a A n n u a l R e p o r t 2 0 1 426 A a m a l A n n u a l R e p o r t 2 0 1 4 A a m a l C o m p a n y Q . S . C . 27
Aamal Readymix
Advanced Pipesand Casts Company
Senyar IndustriesQatar Holding
Doha Cables
Elsewedy CablesQatar
Doha Transformers
Innovative Lighting
Ci-San Trading
Gulf Rocks
Aamal CementIndustries
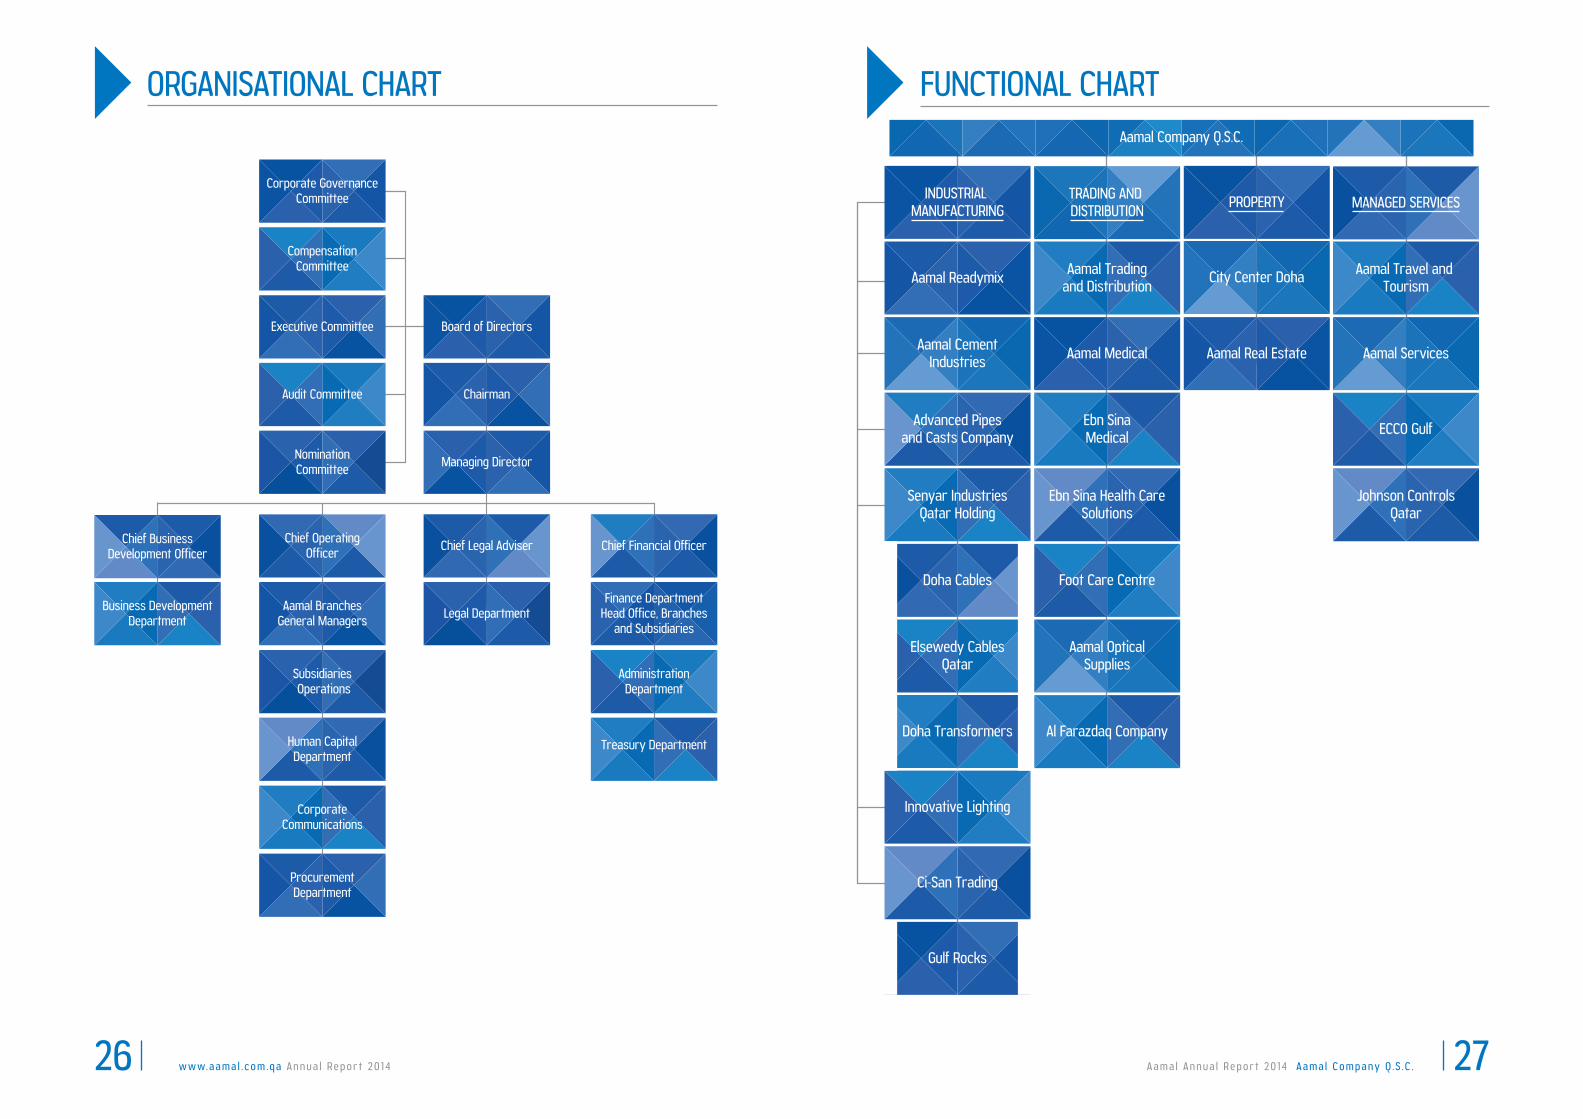
INDUSTRIAL MANUFACTURING
TRADING AND DISTRIBUTION
Aamal Tradingand Distribution
Aamal Medical
Ebn SinaMedical
Ebn Sina Health CareSolutions
Foot Care Centre
Al Farazdaq Company
Aamal OpticalSupplies
PROPERTY
City Center Doha
Aamal Real Estate
MANAGED SERVICES
Aamal Travel and Tourism
Aamal Services
ECCO Gulf
Johnson ControlsQatar
Aamal Company Q.S.C.
ORGANISATIONAL CHART FUNCTIONAL CHART
Corporate GovernanceCommittee
Chairman
Managing Director
Board of Directors
CompensationCommittee
Executive Committee
Audit Committee
NominationCommittee
Chief OperatingOfficer
Chief BusinessDevelopment Officer
Business DevelopmentDepartment
Aamal BranchesGeneral Managers
Human CapitalDepartment
CorporateCommunications
ProcurementDepartment
Legal Department
Chief Financial Officer
Finance DepartmentHead Office, Branches
and Subsidiaries
Treasury Department
Subsidiaries Operations
Chief Legal Adviser
AdministrationDepartment
A a m a l A n n u a l R e p o r t 2 0 1 4 A a m a l C o m p a n y Q . S . C 29
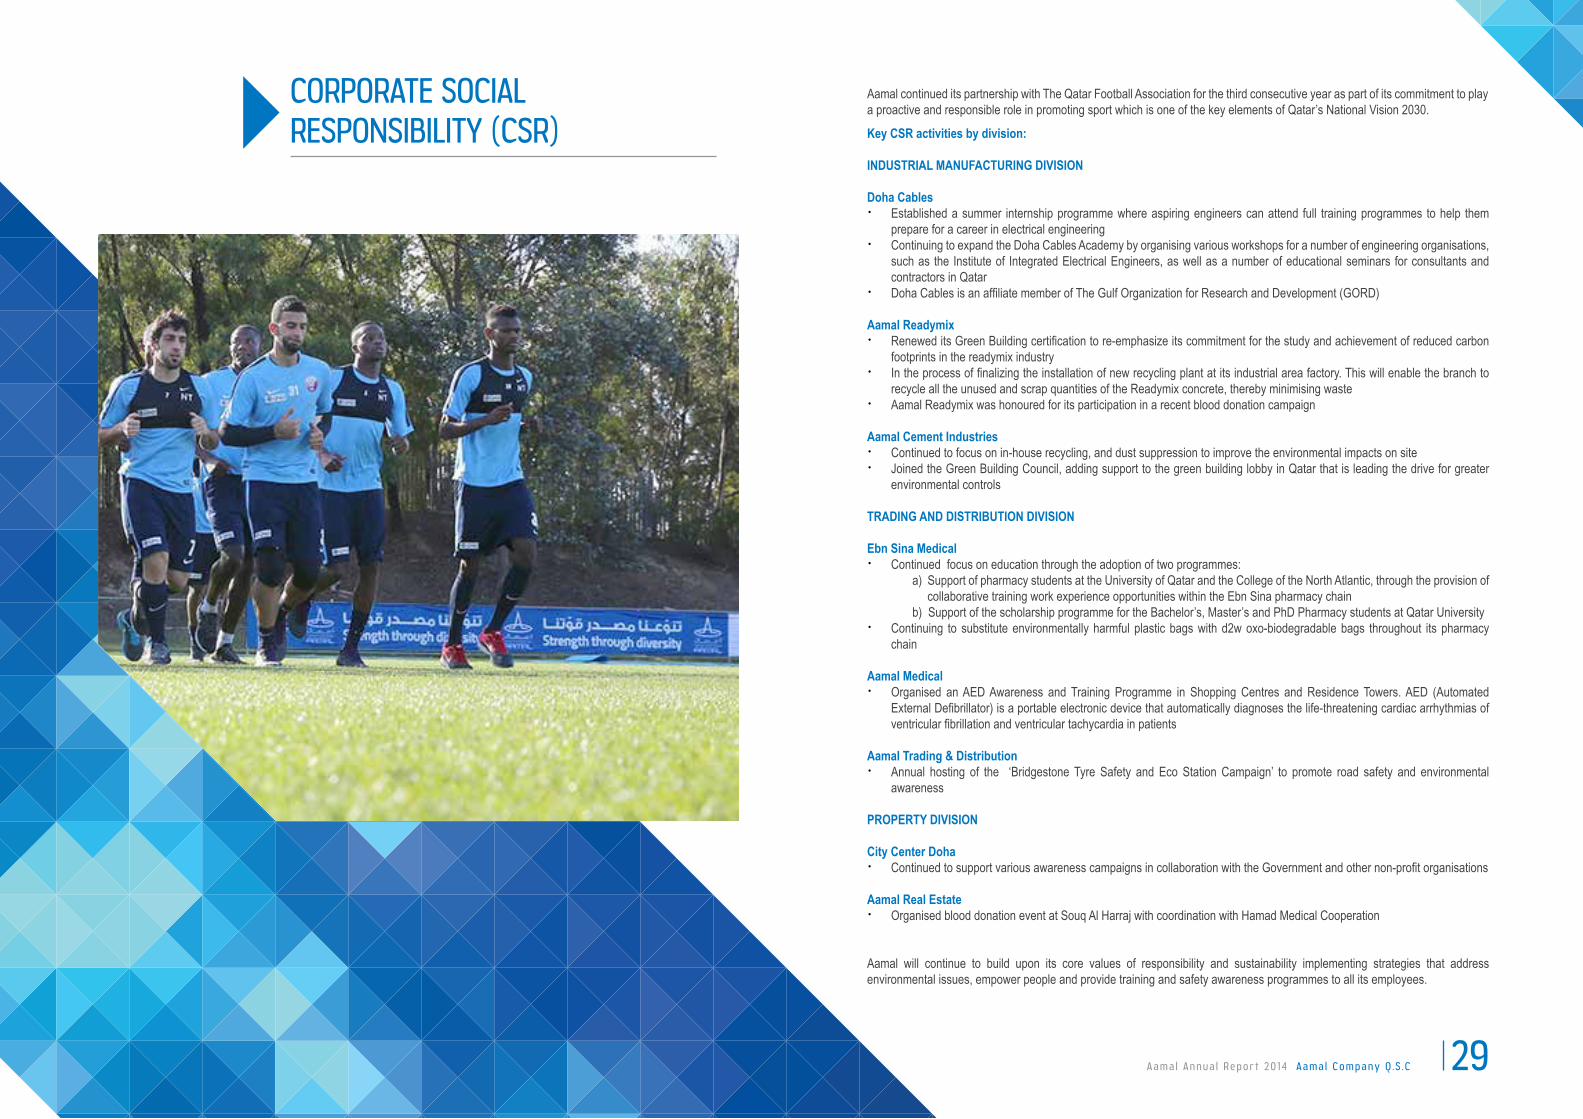
CORPORATE SOCIAL RESPONSIBILITY (CSR)
Aamal continued its partnership with The Qatar Football Association for the third consecutive year as part of its commitment to play a proactive and responsible role in promoting sport which is one of the key elements of Qatar’s National Vision 2030.
Key CSR activities by division:
INDUSTRIAL MANUFACTURING DIVISION
Doha Cables x Established a summer internship programme where aspiring engineers can attend full training programmes to help them
prepare for a career in electrical engineering x Continuing to expand the Doha Cables Academy by organising various workshops for a number of engineering organisations,
such as the Institute of Integrated Electrical Engineers, as well as a number of educational seminars for consultants and contractors in Qatar
x Doha Cables is an affiliate member of The Gulf Organization for Research and Development (GORD)
Aamal Readymix x Renewed its Green Building certification to re-emphasize its commitment for the study and achievement of reduced carbon
footprints in the readymix industry x In the process of finalizing the installation of new recycling plant at its industrial area factory. This will enable the branch to
recycle all the unused and scrap quantities of the Readymix concrete, thereby minimising waste x Aamal Readymix was honoured for its participation in a recent blood donation campaign
Aamal Cement Industries x Continued to focus on in-house recycling, and dust suppression to improve the environmental impacts on site x Joined the Green Building Council, adding support to the green building lobby in Qatar that is leading the drive for greater
environmental controls
TRADING AND DISTRIBUTION DIVISION
Ebn Sina Medical x Continued focus on education through the adoption of two programmes:
a) Support of pharmacy students at the University of Qatar and the College of the North Atlantic, through the provision of collaborative training work experience opportunities within the Ebn Sina pharmacy chain
b) Support of the scholarship programme for the Bachelor’s, Master’s and PhD Pharmacy students at Qatar University x Continuing to substitute environmentally harmful plastic bags with d2w oxo-biodegradable bags throughout its pharmacy
chain
Aamal Medical x Organised an AED Awareness and Training Programme in Shopping Centres and Residence Towers. AED (Automated
External Defibrillator) is a portable electronic device that automatically diagnoses the life-threatening cardiac arrhythmias of ventricular fibrillation and ventricular tachycardia in patients
Aamal Trading & Distribution x Annual hosting of the ‘Bridgestone Tyre Safety and Eco Station Campaign’ to promote road safety and environmental
awareness
PROPERTY DIVISION
City Center Doha x Continued to support various awareness campaigns in collaboration with the Government and other non-profit organisations
Aamal Real Estate x Organised blood donation event at Souq Al Harraj with coordination with Hamad Medical Cooperation
Aamal will continue to build upon its core values of responsibility and sustainability implementing strategies that address environmental issues, empower people and provide training and safety awareness programmes to all its employees.

w w w.a a m a l . c o m .q a A n n u a l R e p o r t 2 0 1 430 A a m a l A n n u a l R e p o r t 2 0 1 4 A a m a l C o m p a n y Q . S . C 31
QAR m 2014 2013 Change %
Revenue 1,134.2 1,261.2 (10.1)%Net profit: fully consolidated activities 33.6 4.1 711.4%Net underlying profit margin % 3.0% 0.3% +270 bpsNet profit: share of equity accounted for investee net profits 18.1 18.5 (2.0)%Total net profit 51.7 22.6 128.3 %
For the year ended 31 December 2014, the Industrial Manufacturing Division generated 51% of the Company's revenues, and 13% of its net profit. Net profit grew by 128.3% to QAR 51.7 million, driven principally by a 270 basis point improvement in the net margin to 3.0%
The improvement was due mainly to an acceleration in infrastructure project build in Qatar, translating into an increase in demand for various products offered by this division.
An important milestone reached was the start of the commercial production at the Advanced Pipes and Casts Company in the last quarter of 2014; initial trading signs have been very positive with the winning of several key orders and we foresee positive performance for this unit during 2015.
Aamal Industrial Manufacturing operations currently include:
a. Senyar Industries Qatar Holding: production and distribution of electric cables, equipment and tools, as well as the distribution of electro-mechanical equipment;
b. Aamal Readymix: production of high quality ready-mixed concrete;c. Aamal Cement Industries: production of interlocking paving stones, concrete blocks and tiles;d. Ci-San Trading: importation and supply of high quality gabbro aggregates through Gulf Rocks; e. Innovative Lighting Company: trading and supplying of LED and other lighting products; andf. Advanced Pipes and Casts Company: manufacturer of pipes
Senyar Industries Qatar Holding
A 50:50 joint venture between Aamal and El Sewedy Electric Company, an Egyptian company listed on the Egyptian Exchange and producer of integrated cables and electrical products (such as transformers, tools and energy and water measurement and management). Senyar’s operations include:
Doha CablesThe first and largest cables manufacturing facility in Qatar, Doha Cables commenced operations in May 2010 specialising in the manufacturing of power cables, special cables, winding wires and cables accessories. Annual manufacturing production capacity is 40,000 tonnes of cable. Doha Cables is 85% interest owned by Senyar (El Sewedy Cables Qatar (of which Senyar owns 55%) owns a 12.5% interest, with an unaffiliated third party the remaining 2.5%). Effective ownership by Aamal in Doha Cables is thus 45.9%).
In 2014, Doha Cables has achieved LPCB certification for Fire Resistant Cables, and it has been approved by Kahramaa up to 66kV and has successfully passed the 132kV loop type test held at KEMA laboratories, the world renowned testing, inspection and certification organisation.
INDUSTRIAL MANUFACTURINGDIVISION

w w w.a a m a l . c o m .q a A n n u a l R e p o r t 2 0 1 432 A a m a l A n n u a l R e p o r t 2 0 1 4 A a m a l C o m p a n y Q . S . C . 33
El Sewedy Cables Qatar commenced operations in 2006, specialising in the distribution of electro-mechanical equipment and cables for Doha Cables and third party manufacturers. A 49% stake (with 55% share of profits/losses) was acquired by Senyar from El Sewedy Electric Company in January 2010 with unaffiliated third parties owning the remaining 51%. Effective ownership by Aamal in El Sewedy Cables Qatar is 27.5% and is equity accounted for as an Associate.
Aamal Readymix
An entity 100% owned by Aamal. It commenced operations in 1994 and is one of the largest producers of quality ready-mixed concrete in Qatar with an annual production capacity of 600,000 cubic metres.
In 2014, Aamal Readymix has acquired 60 pieces of new equipment and fleet including trailer heads, trailer boxes, transit mixers, concrete pumps (62 metres in boom length), wheel loaders and water tankers
The branch re-opened its batching plants at Lusail after the complete renovation and overhaul of its batching plant and ice plant. Also, a new office and new Quality Control lab was built at the Lusail plant. Certifications of compliance with IMS standards, TUV ISO 9001:2008, ISO 14001:2004 and BS OHSAS 18001:2007 were renewed. The batching plants at the industrial area and Lusail were certified by NRCMA (National Readymix Concrete Association) for its compliance with the international standards of readymix concrete production and quality control.
Aamal Cement Industries W.L.L.
Aamal Company owns 99%. It commenced production of decorative interlocking paving stones and concrete blocks in 2010 with an annual production capacity of approximately 25 million blocks or two million square metres of paving stones. The plant has one of the largest block and pavement making machines in Qatar.
In 2014, Aamal Cement Industries continued to its increase its product offering as it successfully introduced four new curb stone products to the market and is expected to add six more in 2015.
Established in 2009 to build a transformers factory to produce primarily oil-filled and dry transformers. This project is still under development.
El Sewedy Cables Qatar
Doha Transformers

w w w.a a m a l . c o m .q a A n n u a l R e p o r t 2 0 1 434 A a m a l A n n u a l R e p o r t 2 0 1 4 A a m a l C o m p a n y Q . S . C . 35
Ci-San Trading W.L.L.
Innovative Lighting W.L.L.
Gulf Rocks is the sole trading entity of this joint venture established in 2008 with Masraf Al Rayyan, to evaluate investments in various sectors such as industrial, real estate, and trading opportunities in both local and international markets. Effective ownership by Aamal is 74.5%; in 2012, Ci-San Trading purchased 51% with Aamal directly acquiring the remaining 49%.
Gulf Rocks itself was established in 2000 by Al Faisal Holding, and is a leading importer and provider of high quality gabbro aggregates, which is widely used in concrete products.
Aamal owns 70% of Innovative Lighting ‘QLEDs’. Established in 2012 as a joint venture with C&C Lightway of South Korea, Innovative Lighting currently trades in and distributes light emitting diodes (“LEDs”) and other lighting products (indoor, outdoor and façade) for the Qatari market and other GCC countries.
Advanced Pipes & Casts Company W.L.L.
Aamal owns 50% of Advanced Pipes and Casts Company. Established in July 2010 as a joint venture between the Company and a Saudi Arabian subsidiary of the Lokma Group, a leading pipe manufacturer in the Middle East.
In 2014, the factory commenced commercial production at its 85,000 square metre facility at Mesaieed with an annual production capacity of 450,000 tonnes. It produces a range of infrastructure and construction products including jacking pipes, reinforced concrete pipes, circular precast concrete manholes and precast concrete box culverts, a first for Qatar in manufacturing terms.

A a m a l A n n u a l R e p o r t 2 0 1 4 A a m a l C o m p a n y Q . S . C . 37w w w.a a m a l . c o m .q a A n n u a l R e p o r t 2 0 1 436
QAR m 2014 2013 Change %
Revenue 728.8 585.8 24.4%Net Profit 114.9 86.5 32.8%Net Profit Margin 15.8% 14.8% +100 basis points
For the year ended 31 December 2014, the Trading and Distribution generated 33% of the Company's revenues, and 29% of its net profit. The Trading and Distribution division net profit rose by 32.8% to QAR 114.9m along with an improvement of 100 basis points in the net margin to 15.8%.
The major contributors to this growth have been Aamal Medical and to a lesser degree, Ebn Sina Medical, due to increased demand from both the private and public medical sectors, underpinned by the significant increase in government spending to develop the medical sector in Qatar.
During 2014, a new business entity was established called Aamal Optical Supplies, a joint venture with Qatar Optics, one of Qatar’s leading companies in the optometry industry, in which Aamal has a 51% interest. The establishment of this new business is in keeping with the development of Qatar’s healthcare system through the setting-up of the Qatar National Health Strategy for 2011-2016, designed to ensure that the population has increasing access to world-class treatment facilities.
Aamal Trading and Distribution operations currently include:
a. Ebn Sina Medical: the leading pharmaceutical distribution company in Qatarb. Aamal Medical: a leading medical equipment supplierc. Aamal Trading & Distribution: a leading distributor of automotive products d. Foot Care Centre: provider of a range of foot care services and productse. Ebn Sina Health Care Solutions: a modern chain of pharmacies located in City Center Dohaf. Aamal Optical Supplies W.L.L.: an importer, manufacturer and supplier of optical supplies and servicesg. Al Farazdaq Company: provider of printing solutions and trader of office supply products
Ebn Sina Medical
Aamal owns 100% of Ebn Sina Medical, the Qatari leading provider of pharmaceutical, hospital supplies and consumer health products, representing 50+ international reputable healthcare manufacturers from more than 20 countries including Roche, AstraZeneca, Novartis Pharma, B-Braun, Boston Scientific and Nuxe. Ebn Sina Medical also operates a retail chain including a pharmacy and three Foot Care Centre that provide a range of clinical foot care services, foot care products and specialist footwear. In 2014, Ebn Sina Medical has signed four contracts with leading multinational pharmaceuticals and consumer companies. Also, it has registered with the Supreme Council of Health, eight new pharmaceutical and herbal companies as well as more than 45 new products. Despite price reductions of 30% to 40% for medicines during 2014, Ebn Sina Medical managed to achieve more than 8% growth in the private market and more than 12% growth in both the retail pharmacy and the Foot Care Centers. Ebn Sina Medical has succeeded to complete the renewal of ISO 9001- 2008 Certification, up to June 2017.
Ebn Sina Health Care Solutions
Aamal has a 100% interest in Ebn Sina Health Care Solutions and was formerly known as Good Life Pharmacy. The renaming was done in order to capitalise on the strong Ebn Sina brand as expansion plans for this pharmacy chain are undertaken.
TRADING & DISTRIBUTIONDIVISION
w w w.a a m a l . c o m .q a A n n u a l R e p o r t 2 0 1 438 A a m a l A n n u a l R e p o r t 2 0 1 4 A a m a l C o m p a n y Q . S . C . 39
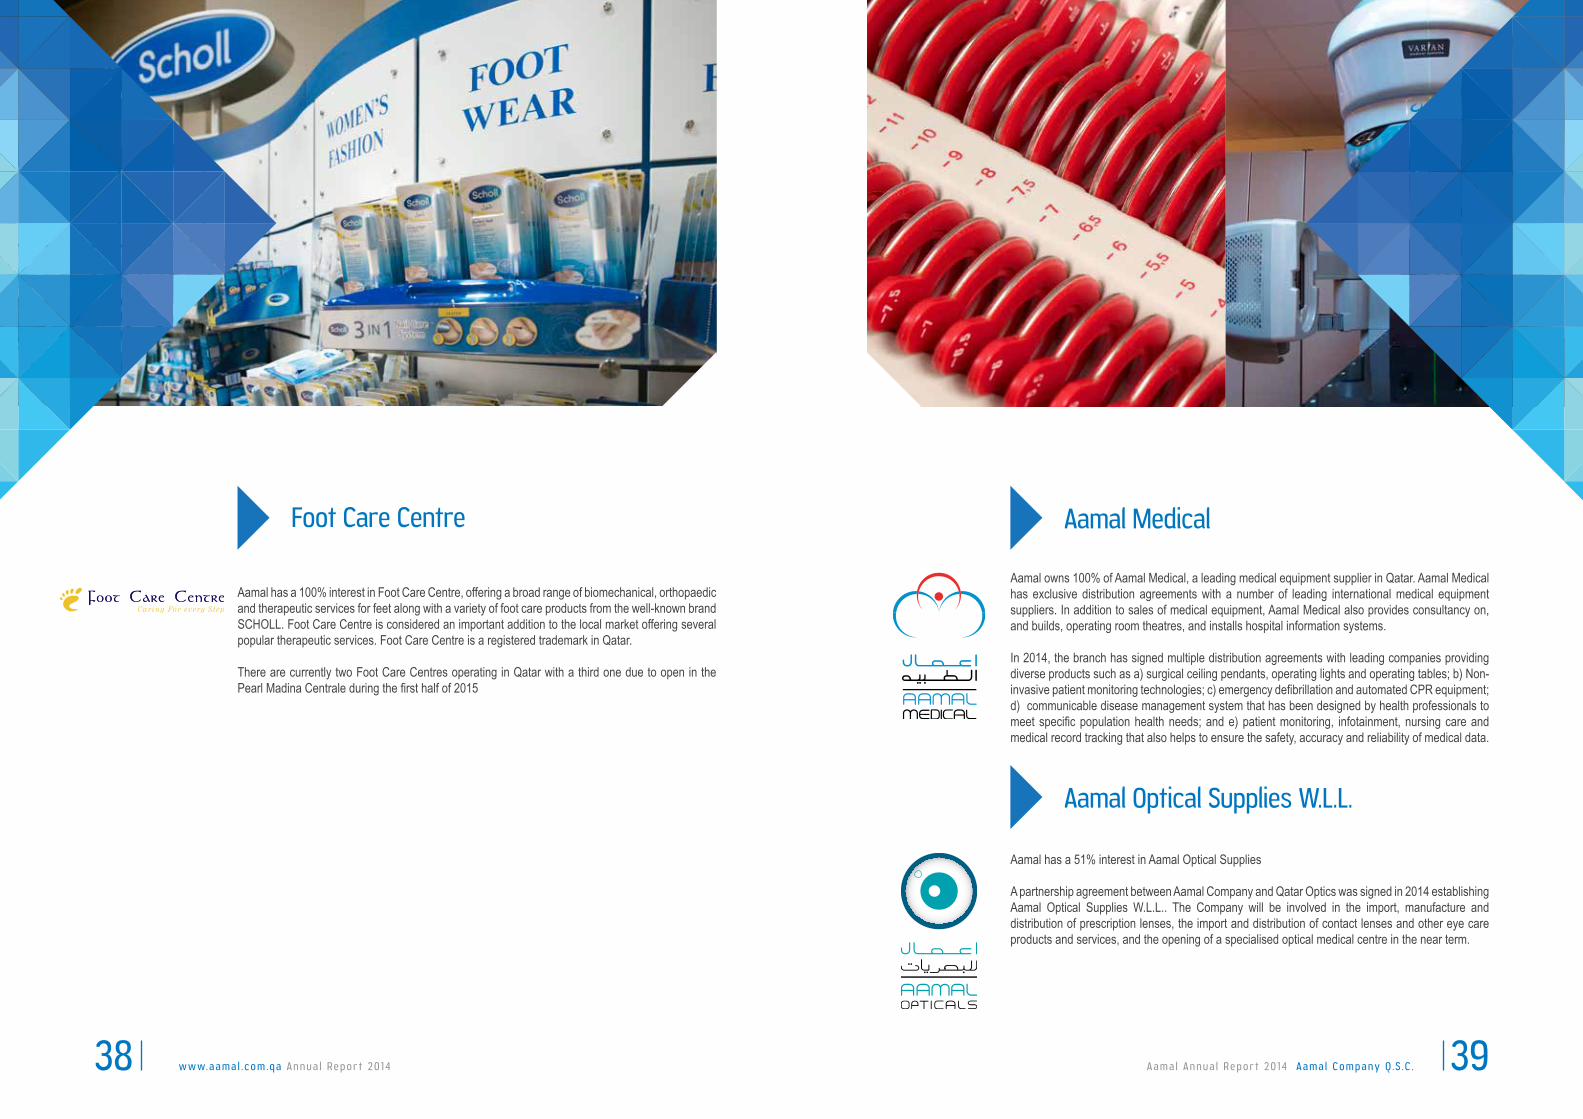
Aamal has a 100% interest in Foot Care Centre, offering a broad range of biomechanical, orthopaedic and therapeutic services for feet along with a variety of foot care products from the well-known brand SCHOLL. Foot Care Centre is considered an important addition to the local market offering several popular therapeutic services. Foot Care Centre is a registered trademark in Qatar.
There are currently two Foot Care Centres operating in Qatar with a third one due to open in the Pearl Madina Centrale during the first half of 2015
Foot Care Centre Aamal Medical
Aamal owns 100% of Aamal Medical, a leading medical equipment supplier in Qatar. Aamal Medical has exclusive distribution agreements with a number of leading international medical equipment suppliers. In addition to sales of medical equipment, Aamal Medical also provides consultancy on, and builds, operating room theatres, and installs hospital information systems. In 2014, the branch has signed multiple distribution agreements with leading companies providing diverse products such as a) surgical ceiling pendants, operating lights and operating tables; b) Non-invasive patient monitoring technologies; c) emergency defibrillation and automated CPR equipment; d) communicable disease management system that has been designed by health professionals to meet specific population health needs; and e) patient monitoring, infotainment, nursing care and medical record tracking that also helps to ensure the safety, accuracy and reliability of medical data.
Aamal has a 51% interest in Aamal Optical Supplies
A partnership agreement between Aamal Company and Qatar Optics was signed in 2014 establishing Aamal Optical Supplies W.L.L.. The Company will be involved in the import, manufacture and distribution of prescription lenses, the import and distribution of contact lenses and other eye care products and services, and the opening of a specialised optical medical centre in the near term.
Aamal Optical Supplies W.L.L.
w w w.a a m a l . c o m .q a A n n u a l R e p o r t 2 0 1 440 A a m a l A n n u a l R e p o r t 2 0 1 4 A a m a l C o m p a n y Q . S . C . 41
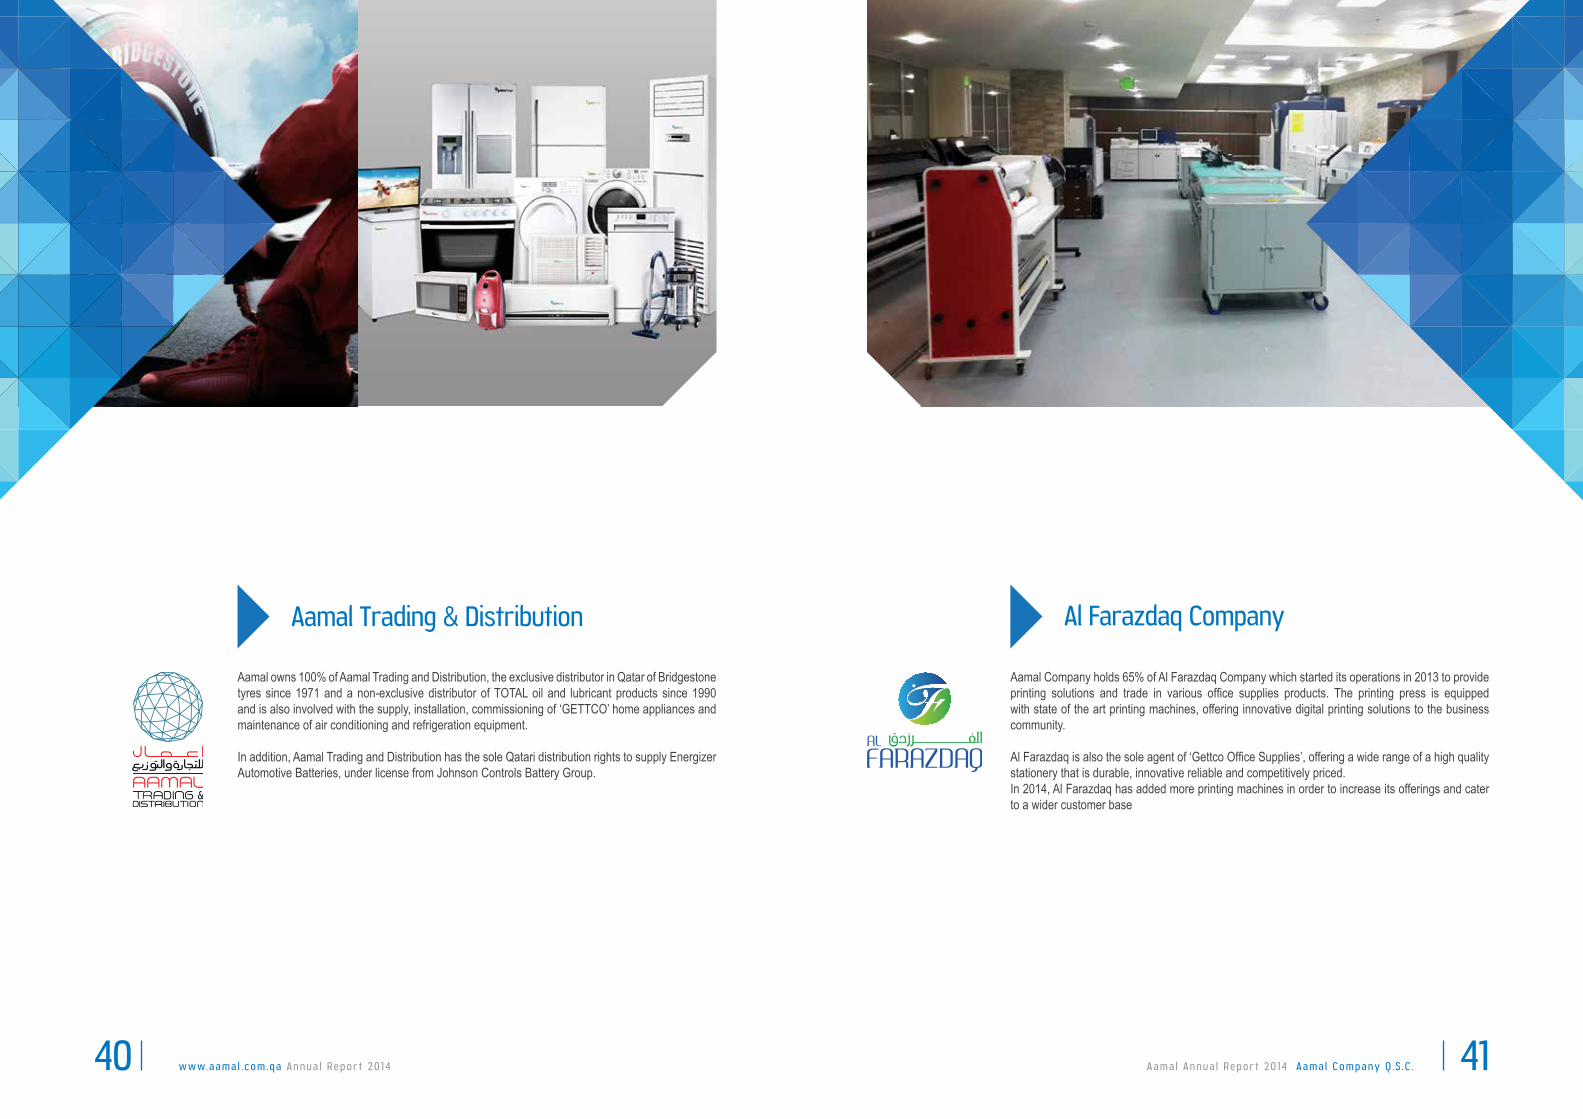
Aamal Trading & Distribution
Aamal owns 100% of Aamal Trading and Distribution, the exclusive distributor in Qatar of Bridgestone tyres since 1971 and a non-exclusive distributor of TOTAL oil and lubricant products since 1990 and is also involved with the supply, installation, commissioning of ‘GETTCO’ home appliances and maintenance of air conditioning and refrigeration equipment.
In addition, Aamal Trading and Distribution has the sole Qatari distribution rights to supply Energizer Automotive Batteries, under license from Johnson Controls Battery Group.
Al Farazdaq Company
Aamal Company holds 65% of Al Farazdaq Company which started its operations in 2013 to provide printing solutions and trade in various office supplies products. The printing press is equipped with state of the art printing machines, offering innovative digital printing solutions to the business community.
Al Farazdaq is also the sole agent of ‘Gettco Office Supplies’, offering a wide range of a high quality stationery that is durable, innovative reliable and competitively priced.In 2014, Al Farazdaq has added more printing machines in order to increase its offerings and cater to a wider customer base

A a m a l A n n u a l R e p o r t 2 0 1 4 A a m a l C o m p a n y Q . S . C . 43w w w.a a m a l . c o m .q a A n n u a l R e p o r t 2 0 1 442
City Center Doha
Aamal owns 100% of City Center Doha, inaugurated in 2000, one of the first shopping malls in Doha and remains the largest, based upon its net leasable area. Widely regarded as the premier mall in Qatar, City Center Doha has 372 shops, 62 kiosks, a 14-screen cinema, family entertainment facility and an indoor ice skating rink.
In 2014, good progress had been made towards securing the necessary permissions for Phase 2 of the redevelopment of the mall.
Aamal Real Estate
Aamal owns 100% of Aamal Real Estate which comprises a) the Souq Najma (Al Haraj) which was built in 1993 as a traditional Middle Eastern souq comprising of 347 shops, 25 kiosks and 24 residential flats; b) the Markhiya residential complex; and c) four other residential buildings.
In 2014, Aamal Real Estate completed the renovation of three of these four residential buildings, comprising a total of 30 apartments in the Bin Mahmoud area, that were all successfully rented out to new tenants.
QAR m 2014 2013 Change %
Revenue 288.8 261.6 10.4%Net Profit* 223.3 200.8 11.2%Net profit margin 77.3% 76.8% +50 basis points
*Net profit before fair value gains on investment properties
For the year ended 31 December 2014, the Property Division generated 13% of the Company's revenues, and 56% of its net profit, excluding fair value gains on investment properties. Net profit for the Property division rose by 11.2% to QAR 223.3 million year-on-year with the net margin increasing by 50 basis points to 77.3%.
Main components to this growth were first, the completion of renovations to three buildings owned by Aamal Real Estate, comprising 30 apartments, which have now all subsequently been rented out; and secondly, the annual rental increases for properties owned by the Company.
Occupancy rate at both City Center and Aamal Real Estate remained at a high level of 95%, with 5% held back as a strategic reserve in order to allow for active management
Fair value gains on investment properties for the year were QAR 251.7 million (2013: QAR 245.1million).
Aamal Property division owns and leases retail and residential properties through two subsidiaries: City Center Doha, the largest shopping mall in Doha, and Aamal Real Estate.
PROPERTY DIVISION
A a m a l A n n u a l R e p o r t 2 0 1 4 A a m a l C o m p a n y Q . S . C . 45w w w.a a m a l . c o m .q a A n n u a l R e p o r t 2 0 1 444
QAR m 2014 2013 Change %
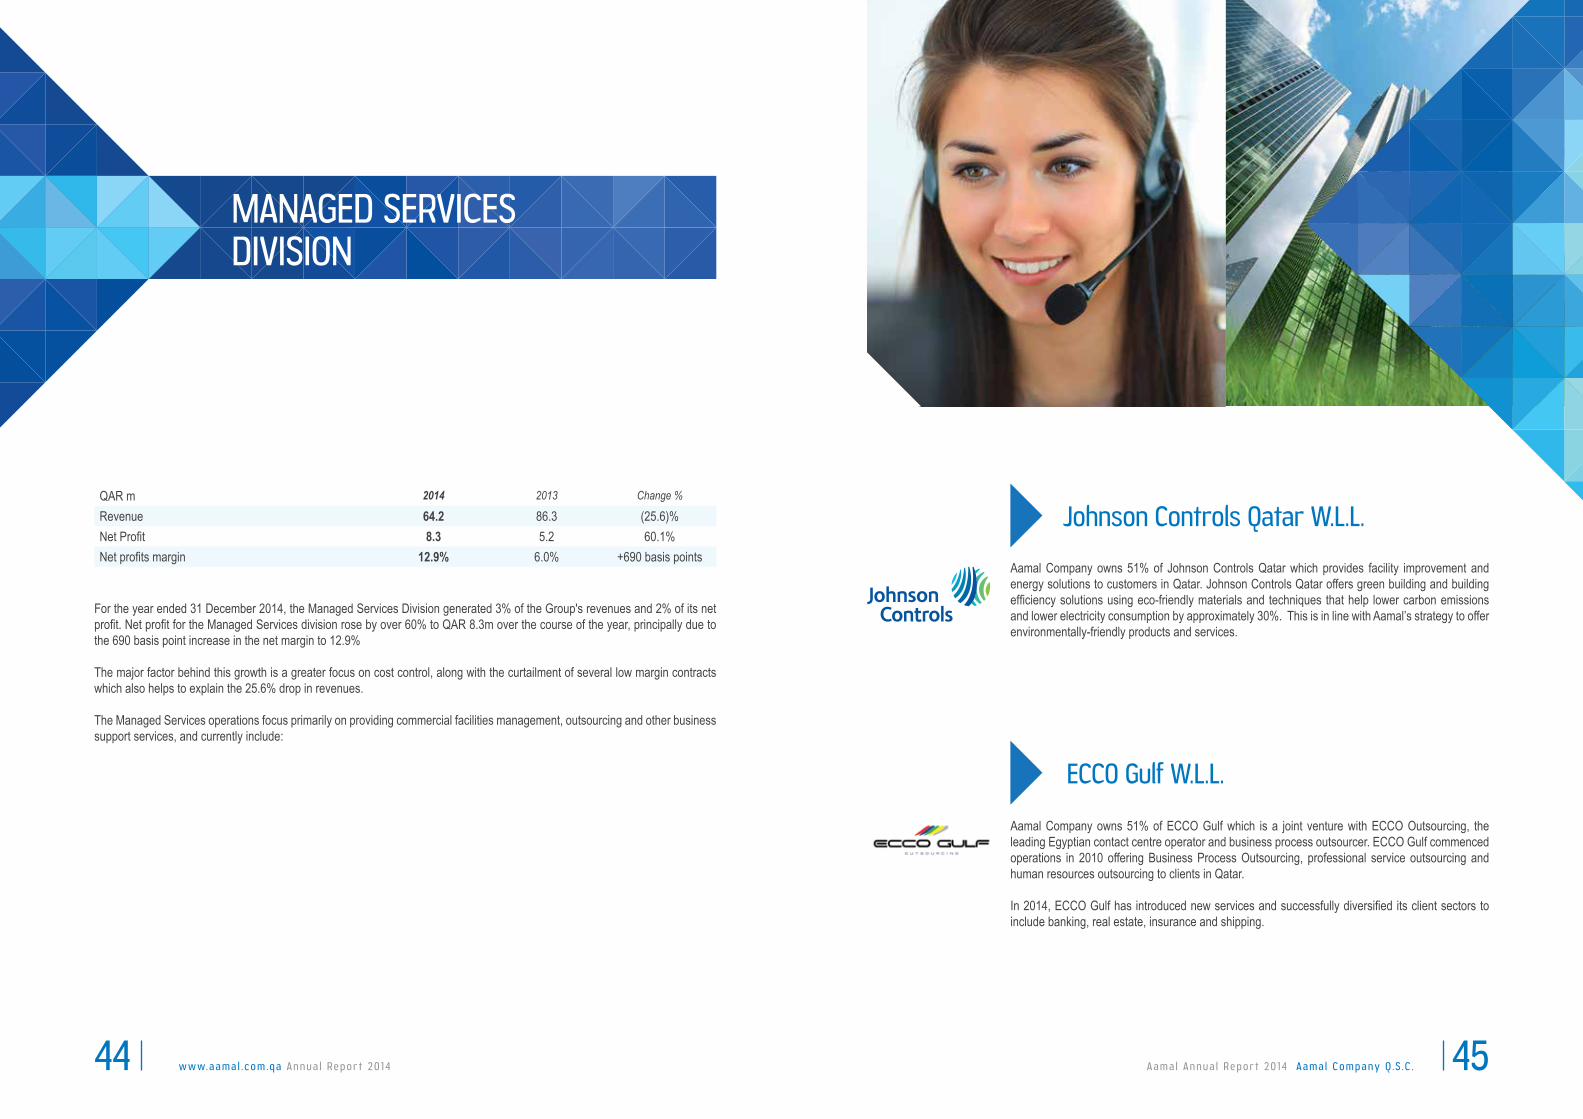
Revenue 64.2 86.3 (25.6)%Net Profit 8.3 5.2 60.1%Net profits margin 12.9% 6.0% +690 basis points
For the year ended 31 December 2014, the Managed Services Division generated 3% of the Group's revenues and 2% of its net profit. Net profit for the Managed Services division rose by over 60% to QAR 8.3m over the course of the year, principally due to the 690 basis point increase in the net margin to 12.9%
The major factor behind this growth is a greater focus on cost control, along with the curtailment of several low margin contracts which also helps to explain the 25.6% drop in revenues.
The Managed Services operations focus primarily on providing commercial facilities management, outsourcing and other business support services, and currently include:
Johnson Controls Qatar W.L.L.
Aamal Company owns 51% of Johnson Controls Qatar which provides facility improvement and energy solutions to customers in Qatar. Johnson Controls Qatar offers green building and building efficiency solutions using eco-friendly materials and techniques that help lower carbon emissions and lower electricity consumption by approximately 30%. This is in line with Aamal’s strategy to offer environmentally-friendly products and services.
ECCO Gulf W.L.L.
Aamal Company owns 51% of ECCO Gulf which is a joint venture with ECCO Outsourcing, the leading Egyptian contact centre operator and business process outsourcer. ECCO Gulf commenced operations in 2010 offering Business Process Outsourcing, professional service outsourcing and human resources outsourcing to clients in Qatar.
In 2014, ECCO Gulf has introduced new services and successfully diversified its client sectors to include banking, real estate, insurance and shipping.
MANAGED SERVICESDIVISION

w w w.a a m a l . c o m .q a A n n u a l R e p o r t 2 0 1 446 A a m a l A n n u a l R e p o r t 2 0 1 4 A a m a l C o m p a n y Q . S . C . 47
Aamal Services
Aamal owns 100% of Aamal Services which provides a wide range of services, including cleaning, hotel and hospitality services, waste collection and disposal (including medical waste and solid waste), ground maintenance and landscaping, pest control and fleet/car washing.
Aamal Travel and Tourism
Aamal owns 100% of Aamal Travel and Tourism, which is an International Air Transport Association (IATA) accredited travel agency providing a range of travel services, including airline reservations and ticketing, worldwide hotel bookings and holiday packages.
Aamal Travel has officially joined “Lufthansa City Center International” network of 688 Travel Agencies in 88 countries around the world; this strategic move will enable Aamal Travel to exchange knowledge and business with the network partners around the world.
Accordingly, the branch trade name was rebranded to “Aamal Travel Lufthansa City Center”, becoming the first Lufthansa City Center partner in Qatar.

AAMAL COMPANY Q.S.C.Consolidated Financial Statements31 December 2014
w w w.a a m a l . c o m .q a A n n u a l R e p o r t 2 0 1 450 A a m a l A n n u a l R e p o r t 2 0 1 4 A a m a l C o m p a n y Q . S . C . 51
INDEPENDENT AUDITORS’ REPORTTO THE SHAREHOLDERS OF AAMAL COMPANY Q.S.C.
Report on the consolidated financial statementsWe have audited the accompanying consolidated financial statements of Aamal Company Q.S.C. (the “Company”), which comprise the consolidated statement of financial position as at 31 December 2014, and the consolidated statements of income, profit or loss and other comprehensive income, cash flows and changes in equity for the year then ended, and notes, comprising a summary of significant accounting policies and other explanatory information.
Board of Directors’ responsibility for the consolidated financial statementsThe Board of Directors is responsible for the preparation and fair presentation of these consolidated financial statements in accordance with International Financial Reporting Standards and, for such internal control as the Board of Directors determines is necessary to enable the preparation of consolidated financial statements that are free from material misstatement, whether due to fraud or error.
Auditors’ responsibilityOur responsibility is to express an opinion on these consolidated financial statements based on our audit. We conducted our audit in accordance with International Standards on Auditing. Those standards require that we comply with ethical requirements and plan and perform the audit to obtain reasonable assurance about whether the consolidated financial statements are free from material misstatement.
An audit involves performing procedures to obtain audit evidence about the amounts and disclosures in the consolidated financial statements. The procedures selected depend on our judgement, including the assessment of the risks of material misstatement of the consolidated financial statements, whether due to fraud or error. In making those risk assessments, we consider internal control relevant to the entity’s preparation and fair presentation of the consolidated financial statements in order to design audit procedures that are appropriate in the circumstances, but not for the purpose of expressing an opinion on the effectiveness of the entity’s internal control. An audit also includes evaluating the appropriateness of accounting policies used and the reasonableness of accounting estimates made by the Board of Directors, as well as evaluating the overall presentation of the consolidated financial statements.
We believe that the audit evidence we have obtained is sufficient and appropriate to provide a basis for our audit opinion.
OpinionIn our opinion, the consolidated financial statements present fairly, in all material respects, the consolidated financial position of the Company as at 31 December 2014 and its consolidated financial performance and consolidated cash flows for the year then ended in accordance with International Financial Reporting Standards.
Report on other legal and regulatory requirementsWe have obtained all the information and explanations which we consider necessary for the purposes of our audit. The Company has maintained proper accounting records and its consolidated financial statements are in agreement therewith. We confirm that physical count of inventories was carried out in accordance with established principles. We have reviewed the accompanying report of the Board of Directors and confirm that the financial information contained therein is in agreement with the books and records of the Company. We are not aware of any violations of the provisions of the Qatar Commercial Companies Law No. 5 of 2002 or the terms of the Company’s Articles of Association during the year which might have had a material adverse effect on the business of the Company or on its consolidated financial position as at 31 December 2014.
3 February 2015 Gopal BalasubramaniamDoha KPMGState of Qatar Qatar Auditors Registry Number 251
w w w.a a m a l . c o m .q a A n n u a l R e p o r t 2 0 1 452 A a m a l A n n u a l R e p o r t 2 0 1 4 A a m a l C o m p a n y Q . S . C . 53
Sheikh Faisal Bin Qassim Al-ThaniChairman
Tarek Mahmoud El SayedManaging Director
Mohammad RamahiChief Financial Officer
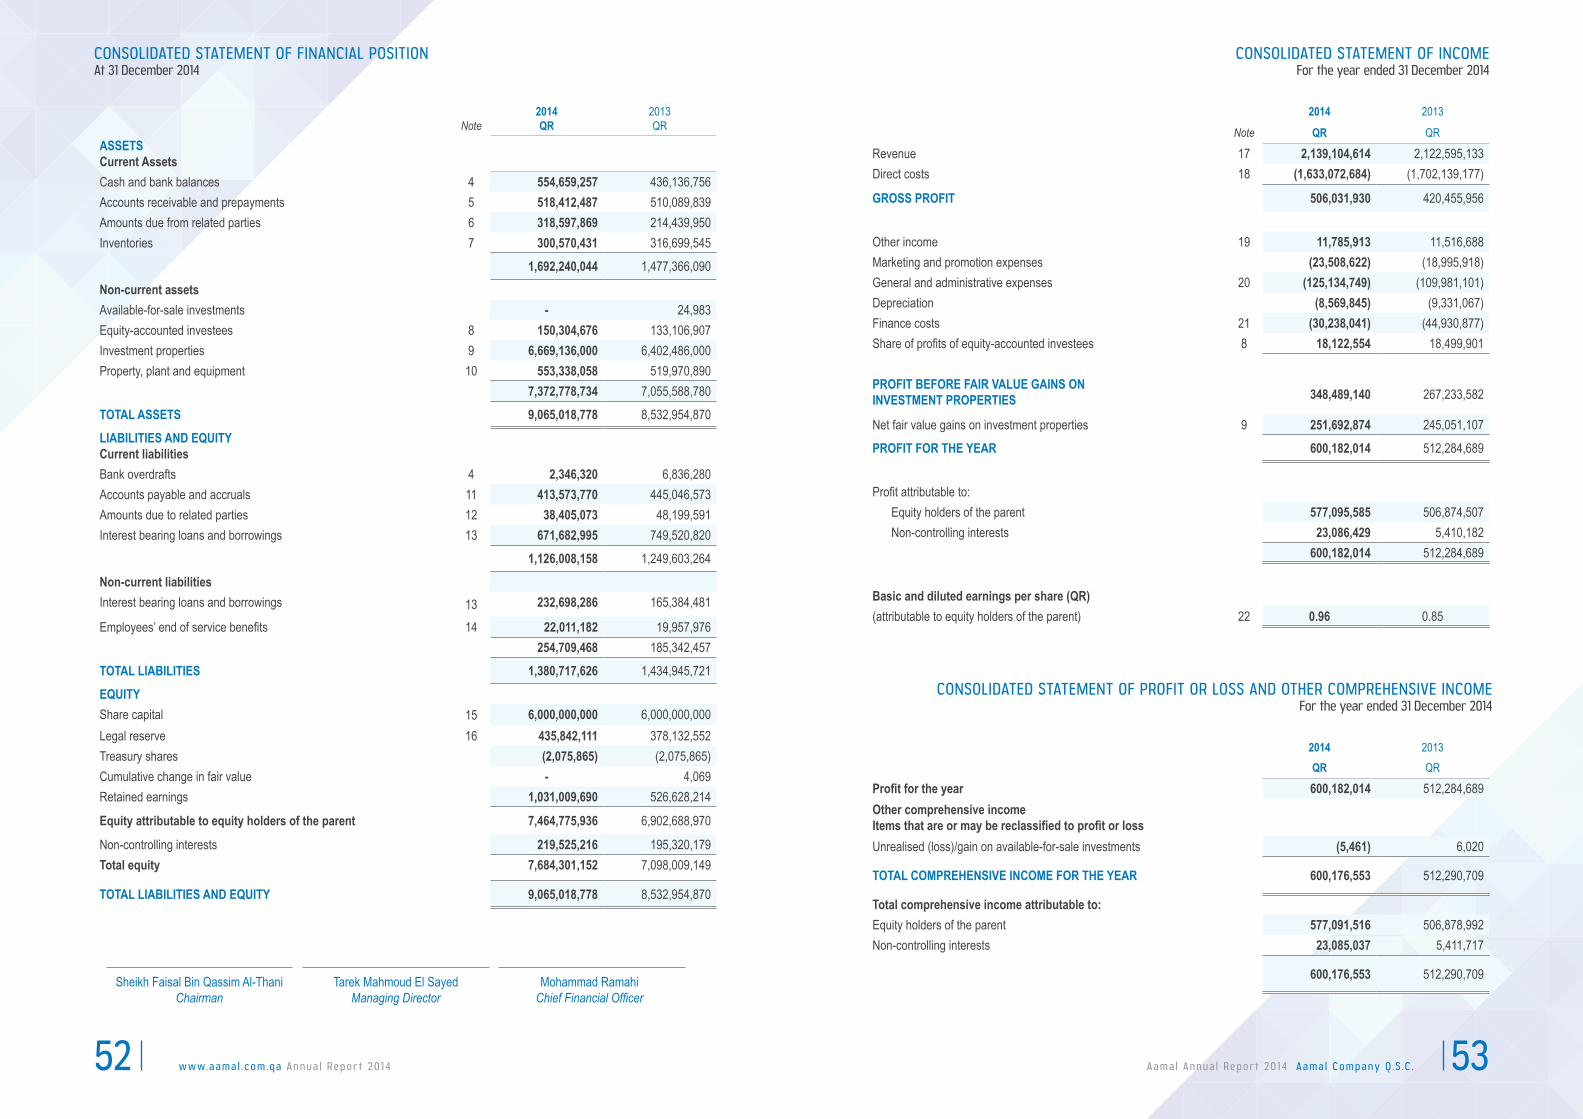
CONSOLIDATED STATEMENT OF FINANCIAL POSITIONAt 31 December 2014
Note2014QR
2013QR
ASSETSCurrent AssetsCash and bank balances 4 554,659,257 436,136,756Accounts receivable and prepayments 5 518,412,487 510,089,839Amounts due from related parties 6 318,597,869 214,439,950Inventories 7 300,570,431 316,699,545
1,692,240,044 1,477,366,090
Non-current assetsAvailable-for-sale investments - 24,983Equity-accounted investees 8 150,304,676 133,106,907Investment properties 9 6,669,136,000 6,402,486,000Property, plant and equipment 10 553,338,058 519,970,890
7,372,778,734 7,055,588,780
TOTAL ASSETS 9,065,018,778 8,532,954,870
LIABILITIES AND EQUITYCurrent liabilitiesBank overdrafts 4 2,346,320 6,836,280Accounts payable and accruals 11 413,573,770 445,046,573Amounts due to related parties 12 38,405,073 48,199,591Interest bearing loans and borrowings 13 671,682,995 749,520,820
1,126,008,158 1,249,603,264
Non-current liabilitiesInterest bearing loans and borrowings 13 232,698,286 165,384,481
Employees’ end of service benefits 14 22,011,182 19,957,976254,709,468 185,342,457
TOTAL LIABILITIES 1,380,717,626 1,434,945,721
EQUITYShare capital 15 6,000,000,000 6,000,000,000Legal reserve 16 435,842,111 378,132,552Treasury shares (2,075,865) (2,075,865)Cumulative change in fair value - 4,069Retained earnings 1,031,009,690 526,628,214
Equity attributable to equity holders of the parent 7,464,775,936 6,902,688,970
Non-controlling interests 219,525,216 195,320,179Total equity 7,684,301,152 7,098,009,149
TOTAL LIABILITIES AND EQUITY 9,065,018,778 8,532,954,870
CONSOLIDATED STATEMENT OF INCOMEFor the year ended 31 December 2014
2014 2013
Note QR QR
Revenue 17 2,139,104,614 2,122,595,133Direct costs 18 (1,633,072,684) (1,702,139,177)
GROSS PROFIT 506,031,930 420,455,956
Other income 19 11,785,913 11,516,688Marketing and promotion expenses (23,508,622) (18,995,918)General and administrative expenses 20 (125,134,749) (109,981,101)Depreciation (8,569,845) (9,331,067)Finance costs 21 (30,238,041) (44,930,877)Share of profits of equity-accounted investees 8 18,122,554 18,499,901
PROFIT BEFORE FAIR VALUE GAINS ON INVESTMENT PROPERTIES 348,489,140 267,233,582
Net fair value gains on investment properties 9 251,692,874 245,051,107
PROFIT FOR THE YEAR 600,182,014 512,284,689
Profit attributable to:Equity holders of the parent 577,095,585 506,874,507Non-controlling interests 23,086,429 5,410,182
600,182,014 512,284,689
Basic and diluted earnings per share (QR)(attributable to equity holders of the parent) 22 0.96 0.85
CONSOLIDATED STATEMENT OF PROFIT OR LOSS AND OTHER COMPREHENSIVE INCOMEFor the year ended 31 December 2014
2014 2013QR QR
Profit for the year 600,182,014 512,284,689Other comprehensive incomeItems that are or may be reclassified to profit or lossUnrealised (loss)/gain on available-for-sale investments (5,461) 6,020
TOTAL COMPREHENSIVE INCOME FOR THE YEAR 600,176,553 512,290,709
Total comprehensive income attributable to:Equity holders of the parent 577,091,516 506,878,992Non-controlling interests 23,085,037 5,411,717
600,176,553 512,290,709

w w w.a a m a l . c o m .q a A n n u a l R e p o r t 2 0 1 454 A a m a l A n n u a l R e p o r t 2 0 1 4 A a m a l C o m p a n y Q . S . C . 55
CONSOLIDATED STATEMENT OF CASH FLOWSFor the year ended 31 December 2014
2014 2013Note QR QR
OPERATING ACTIVITIESProfit for the year 600,182,014 512,284,689Adjustment for:
Net fair value gains on investment properties 9 (251,692,874) (245,051,107)Depreciation 10 44,137,864 42,495,449Provision for employees’ end of service benefits 14 4,520,855 4,056,969Allowance for impairment of trade accounts receivable 20 2,694,547 2,294,590Profit on disposal of property, plant and equipment 19 (287,032) (737,647)Provision for slow moving inventories 7 78,431 2,380,617Interest income 19 (3,315,399) (2,824,216)Finance costs 21 30,238,041 44,930,877Gain on sale of available-for-sale investments (6,550) -Share of profit of equity-accounted investees 8 (18,122,554) (18,499,901)
Operating profit before working capital changes: 408,427,343 341,330,320Inventories 16,050,683 82,822,711Accounts receivable and prepayments (11,017,195) (30,102,654)Accounts payable and accruals (46,477,353) 53,120,387Net movement in amounts due from and due to related parties (113,952,437) (44,382,753)
Cash from operations 253,031,041 402,788,011Finance costs paid (30,540,830) (45,056,522)End of service benefits paid 14 (2,467,649) (2,210,756)
Net cash from operating activities 220,022,562 355,520,733
INVESTING ACTIVITIESInterest income received 19 3,315,399 2,824,216Proceeds from disposal of property, plant and equipment 1,036,890 1,274,457Proceeds from sale of available-for-sale investments 26,072 -Dividends received from a joint venture 924,785 11,992,985Additions to investment properties 9 (14,957,126) (9,568,047)Additions to property, plant and equipment 10 (77,952,101) (147,870,074)
Net cash used in investing activities (87,606,081) (141,346,463)
FINANCING ACTIVITIESNet movement in interest bearing loans and borrowings (10,524,020) (149,939,995)Contributions from non-controlling interests 1,120,000 70,000
Net cash used in financing activities (9,404,020) (149,869,995)
INCREASE IN CASH AND CASH EQUIVALENTS 123,012,461 64,304,275Cash and cash equivalents at 1 January 429,300,476 364,996,201
CASH AND CASH EQUIVALENTS AT 31 DECEMBER 4 552,312,937 429,300,476
Shar
eca
pital
Lega
lre
serv
eTr
easu
ry
shar
es
Cum
ulativ
e ch
ange
in fa
ir va
lue
Reta
ined
earn
ings
Tota
lNo
n-co
ntro
lling
inter
ests
Tota
lEq
uity
QRQR
QRQR
QRQR
QRQR
Balan
ce at
31 D
ecem
ber 2
012
5,445
,000,0
0032
7,445
,101
(2,07
5,865
)(4
16)
638,2
48,27
56,4
08,61
7,095
189,8
38,46
26,5
98,45
5,557
Bonu
s sha
res i
ssue
d55
5,000
,000
--
-(5
55,00
0,000
)-
--
Profi
t for t
he ye
ar
--
--
506,8
74,50
750
6,874
,507
5,410
,182
512,2
84,68
9Ot
her c
ompr
ehen
sive i
ncom
e for
the y
ear
--
-4,4
85-
4,485
1,535
6,020
Tran
sfer t
o leg
al re
serve
-50
,687,4
51-
-(5
0,687
,451)
--
-Co
ntribu
tion f
rom
non-
contr
olling
inter
est
--
--
--
70,00
070
,000
Contr
ibutio
n to s
ocial
and s
ports
activ
ities f
und
--
--
(12,8
07,11
7)(1
2,807
,117)
-(1
2,807
,117)
Balan
ce at
31 D
ecem
ber 2
013
6,000
,000,0
0037
8,132
,552
(2,07
5,865
)4,0
6952
6,628
,214
6,902
,688,9
7019
5,320
,179
7,098
,009,1
49Pr
ofit fo
r the
year
-
--
-57
7,095
,585
577,0
95,58
523
,086,4
2960
0,182
,014
Othe
r com
preh
ensiv
e inc
ome f
or th
e yea
r-
--
(4,06
9)-
(4,06
9)(1
,392)
(5,46
1)Tr
ansfe
r to l
egal
rese
rve-
57,70
9,559
--
(57,7
09,55
9)-
--
Contr
ibutio
n fro
m no
n-co
ntroll
ing in
teres
t-
--
--
-1,1
20,00
01,1
20,00
0Co
ntribu
tion t
o soc
ial an
d spo
rts ac
tivitie
s fun
d -
--
-(1
5,004
,550)
(15,0
04,55
0)-
(15,0
04,55
0)
Balan
ce at
31 D
ecem
ber 2
014
6,000
,000,0
0043
5,842
,111
(2,07
5,865
)-
1,031
,009,6
907,4
64,77
5,936
219,5
25,21
67,6
84,30
1,152
Attri
buta
ble to
equ
ity h
older
s of t
he p
aren
t
CONSOLIDATED STATEMENT OF CHANGES IN EQUITY For the year ended 31 December 2014

w w w.a a m a l . c o m .q a A n n u a l R e p o r t 2 0 1 456 A a m a l A n n u a l R e p o r t 2 0 1 4 A a m a l C o m p a n y Q . S . C . 57
1 CORPORATE INFORMATION AND PRINCIPAL ACTIVITIES
Aamal was formed on 13 January 2001 as a private shareholding company with limited liability (W.L.L.) under the Commercial Registration Number 23245 in the State of Qatar. On 12 July 2007, the private shareholders resolved to transform Aamal into a Qatari Shareholding Company (Q.S.C.) (the “Company”). Accordingly, the Company was listed on Qatar Exchange on 5 December 2007. The Company’s registered office is at P.O. Box 22477, Doha, State of Qatar.
The Company is organised into a head office (Aamal) and branches and operates in the State of Qatar. The following table sets out the principal activities of the branches:
The consolidated financial statements were authorised for issue by the representatives of the Board of Directors of Aamal Company Q.S.C. on 3 February 2015.
NOTES TO THE CONSOLIDATED FINANCIAL STATEMENTSFor the year ended 31 December 2014
Branch Principal activitiesCity Center Qatar Branch Leasing the facilities of the retail outlet complex in City Center Doha.Aamal Real Estate Branch Residential and commercial real estate investment and property rental.Aamal Readymix Branch Production and sale of readymix concrete.Ebn Sina Medical Branch Wholesale and retail distribution of pharmaceuticals and general consumable
products.Aamal Medical Branch Wholesale distribution of medical equipment.Aamal Trading and Distribution Branch Sale of tyres, lubricants, batteries and home appliances.Aamal Services Branch Providing facilities management and cleaning services. Aamal Travels Branch Operating a travel agency.Aamal for Industrial Projects Branch Industrial investments.Ebn Sina Heath Care Solutions City Center Pharmacy (Good Life Pharmacy Branch)
Sale of pharmaceuticals, baby care products, medicine and general consum-able products.
Foot Care Centre Branch Sale of footwear, clinical activities and general commercial trading products.
2 BASIS OF CONSOLIDATION
The consolidated financial statements comprise the financial statements of Aamal Company Q.S.C. (the “Company”) and its subsidiaries, associates and joint controlled entity (together referred to as the “Group”).
SubsidiariesSubsidiaries are entities controlled by the Group. The Group controls an entity when it is exposed to, or has rights to, variable returns of its involvement with the entity and has the ability to affect those returns through its power over the entity. The financial statements of subsidiaries are included in the consolidated financial statements from the date on which control commences until the date on which control ceases. When the Group loses control over a subsidiary, it dereognises the assets and liabilities of the subsidiary, and any related non-controlling interest and other components of equity. Any resulting gain or loss is recognised in consolidated statement of income. Any interest retained in the former subsidiary is measured at fair value when control is lost.
Set out below are the Group’s principal subsidiaries at 31 December 2014. Unless otherwise stated, the subsidiaries as listed below have share capital consisting solely of ordinary shares, which are held directly by the group and the proportion of ownership interests held equals to the voting rights held by Group. The country of incorporation or registration is also their principal place of business:
2 BASIS OF CONSOLIDATION (continued)
NOTES TO THE CONSOLIDATED FINANCIAL STATEMENTSFor the year ended 31 December 2014
Company name Country of incorporation Principal activity
Proportion of ownership held by the
GroupNon controllinginterest
Aamal Cement Industries W.L.L.
Qatar Development and management of factories and the production of curb stone, interlock slabs and cement bricks.
99% 1%
IMO Qatar Company W.L.L. Qatar Construction and repair of power plant, establishment and management of industrial enterprises and acting as a representative for the international companies.
60% 40%
Senyar Industries Qatar Holding W.L.L.
Qatar Management of subsidiaries and associates, owning of patents, businesses and subletting them and provision of investment portfolio management for its subsidiaries and associates. Under the shareholders agreement signed between the Group and the other shareholders, the Group is able to appoint the chairman and two other members to the Board of Directors (out of six members) and is able to govern the financial and operating policies of Senyar Industries Qatar Holding W.L.L. Accordingly, the company is considered as a subsidiary of the Group.
50% 50%
Doha Cables Qatar W.L.L. Qatar Maintenance and manufacture of electric cables, equipment and tools. Doha Cables Qatar W.L.L. is 91.875% (effectively) owned by Senyar Industries Qatar Holding W.L.L., a subsidiary of the Group. The Group has the power, indirectly through Senyar Industries Qatar Holding W.L.L., to govern financial and operating policies of Doha Cables Qatar W.L.L. and accordingly the company was considered as a subsidiary of the Group.
45.9% 54.1%
Ecco Gulf Company W.L.L. Qatar Offers professional and business process outsourcing and call center services.
51% 49%
Advanced Pipes and Casts Company W.L.L.
Qatar Manufacturing of wide cement and glass reinforced pipes systems for infrastructure and pipeline projects. The Group has the power to govern the financial and operating policies of Advanced Pipes and Casts Company W.L.L. by virtue of a shareholders’ agreement. Thus the Company has been considered as a subsidiary of the Group.
50% 50%
Johnson Controls Qatar W.L.L.
Qatar Provision of facilities management services, energy services and building maintenance and cleaning services to corporate clients.
51% 49%
Ci-San Trading W.L.L. Qatar Selling, buying, renting and developing real estate, investment in shares, management of real estate properties, owning the patent and trademark and trading in equipment and vehicles. The Group has the power to govern the financial and operating policies of Ci-San by virtue of a shareholders’ agreement.
50% 50%
Gulf Rocks Qatar Retail distribution of aggregates. 74.5% 25.5%Innovative Lighting Company W.L.L.
Qatar Trading of Light Emitting Diode (LED) Lamps and other lighting products.
70% 30%

w w w.a a m a l . c o m .q a A n n u a l R e p o r t 2 0 1 458 A a m a l A n n u a l R e p o r t 2 0 1 4 A a m a l C o m p a n y Q . S . C . 59
2 BASIS OF CONSOLIDATION (continued)
Subsidiaries (continued)
Company name Country of incorporation Principal activity
Proportion of ownership held by the
GroupNon controllinginterest
Al Farazdaq Company W.L.L. Qatar Trading of office supplies and providing printing and laminating services.
65% 35%
Aamal Optical Supplies W.L.L.
Qatar Trading of optical supplies 51% 49%
Non-controlling interestsNon-controlling interests are measured at their proportionate share of the acquiree’s identifiable net assets at the acquision date. Changes in the Group’s interest in a subsidiary that do not result in a loss of control are accounted for as equity transactions.
Transactions eliminated on consolidationIntra-group balances and transactions, and any unrealised income and expenses arising from intra-group transactions, are eliminated. Unrealised gains arising from transactions with equity-accounted investees are eliminated against the investment to the extent of the Group’s interest in the investee. Unreaslised losses are eliminated in the same way as unrealised gains, but only to the extent that there is no evidence of impairment.
Interests in joint arrangements and associatesDetails of each of the Group’s material joint ventures and associates at the end of the reporting period are as follows
Company name Country of incorporation Principal activity
Proportion of ownership and voting power held by the Group
El Sewedy Cables Qatar W.L.L.
Qatar Trading in electro-mechanical equipment and providing related services. El Sewedy Cables Qatar W.L.L. is 49% owned (with 55% share of profits / (losses) by Senyar Industries Qatar Holding W.L.L., a subsidiary of the Group. However due to a revised shareholders agreement, the entity has become a joint venture effective from 1 January 2012 which is accounted for under the equity method.
55%
Frijns Structural Steel Middle East W.L.L.
Qatar Entity is engaged in steel fabrications. Group measure the associate under equity method.
20%
NOTES TO THE CONSOLIDATED FINANCIAL STATEMENTSFor the year ended 31 December 2014
NOTES TO THE CONSOLIDATED FINANCIAL STATEMENTSFor the year ended 31 December 2014
3.2 CHANGES IN ACCOUNTING POLICIES
The accounting policies adopted are consistent with those of the previous financial year except for the following standards effective for the annual period beginning on or after 1 January 2014. These standards and amendments, did not have any material impact to the Group.
Amendments to IFRS 10, IFRS 12 and IAS 27 “Investment Entities”The amendments to IFRS 10 define an investment entity and require a reporting entity that meets the definition of an investment entity not to consolidate its subsidiaries but instead to measure its subsidiaries at fair value through profit or loss in its consolidated and separate financial statements.
Consequential amendments have been made to IFRS 12 and IAS 27 to introduce new disclosure requirements for investment entities.
Amendments to IAS 32 Offsetting Financial Assets and Financial LiabilitiesThe amendments to IAS 32 clarify the requirements relating to the offset of financial assets and financial liabilities. Specifically, the amendments clarify the meaning of ‘currently has a legally enforceable right of set-off’ and ‘simultaneous realisation and settlement’. The amendments have been applied retrospectively.
Amendments to IAS 36 Recoverable Amount Disclosures for Non-Financial AssetsThe amendments to IAS 36 remove the requirement to disclose the recoverable amount of a cash-generating unit (CGU) to which goodwill or other intangible assets with indefinite useful lives had been allocated when there has been no impairment or reversal of impairment of the related CGU. Furthermore, the amendments introduce additional disclosure requirements applicable to when the recoverable amount of an asset or a CGU is measured at fair value less costs of disposal. These new disclosures include the fair value hierarchy, key assumptions and valuation techniques used which are in line with the disclosure required by IFRS 13 Fair Value Measurements.
Amendments to IAS 39 Novation of Derivatives and Continuation of Hedge AccountingThe amendments to IAS 39 provide relief from the requirement to discontinue hedge accounting when a derivative designated as a hedging instrument is novated under certain circumstances. The amendments also clarify that any change to the fair value of the derivative designated as a hedging instrument arising from the novation should be included in the assessment and measurement of hedge effectiveness. The amendments have been applied retrospectively.
IFRIC 21 LeviesIFRIC 21 on Levies (amendments to IAS 32) provide guidance on the accounting for levies in the financial statements of the entity that is paying the levy.
3 BASIS OF PREPARATION AND SUMMARY OF SIGNIFICANT ACCOUNTING POLICIES
The consolidated financial statements have been prepared in accordance with International Financial Reporting Standards (IFRS), and the applicable requirements of Qatar Commercial Companies’ Law No. 5 of 2002.
The consolidated financial statements have been presented in Qatari Riyals (QR), which is the Company’s functional and presentation currency and have been rounded to the nearest Qatari Riyal. The consolidated financial statements are prepared under the historical cost convention modified to include the measurement at fair value of investment properties and available-for-sale investments.
3.1 BASIS OF PREPARATION

w w w.a a m a l . c o m .q a A n n u a l R e p o r t 2 0 1 460 A a m a l A n n u a l R e p o r t 2 0 1 4 A a m a l C o m p a n y Q . S . C . 61
3.3 IASB STANDARDS AND INTERPRETATIONS ISSUED BUT NOT ADOPTED
The following IASB standards/amendments have been issued but are not yet mandatory, and have not been early adopted by the Group:
The Group is considering the implications of the above standards, and the timing of adoption by the Group.
3.4 SUMMARY OF SIGNIFICANT ACCOUNTING POLICIES
Business combinationsThe Group accounts for business combinations using the acquisition method when control is trnasferred to the Group. The consideration transferred in the acquisition is generally measured at fair value, as are the identifiable net assets acquired. Any goodwill that arises is tested annually for impairment. Any gain on a bargain purchase is recognised in profit or loss immediately. Transaction costs are expensed as incurred, except if reltated to the issue of debt or equity securities.
The consideration transferred does not include amounts related to the settlement of pre-existing relationships. Such amounts are recognised in profit or loss.
Any contingent consideration payable is measured at fair value at the acquisition date. If the contingent consdieration is classified as equity, then it is not remeasured and settlement is accounted for within equity. Otherwise, subsequent changes in the fair value of the contingent consderation are recognised in profit or loss.
Cash and cash equivalents For the purpose of the consolidated statement of cash flows, cash and cash equivalents consist of cash and bank balances and short term bank deposits with an original maturity of three months or less, net of outstanding bank overdrafts.
Accounts receivableAccounts receivable are stated at original invoice amount less an allowance for any uncollectible amounts. An estimate for doubtful debts is made when collection of the full amount is no longer probable. Bad debts are written off when there is no possibility of recovery.
InventoriesInventories are stated at the lower of cost and net realisable value. Costs are those expenses incurred in bringing each product to its present location and condition.
3 BASIS OF PREPARATION AND SUMMARY OF SIGNIFICANT ACCOUNTING POLICIES (continued)
Standard/Interpretation Content Effective date
IFRS 9 Financial Instruments (new standard) 1 January 2018IFRS 15 Revenue from Contracts with Customers (new standard) 1 January 2017IFRS 11 Accounting for Acquisitions of Interests in Joint Operations (amendment) 1 January 2016IAS 16 and IAS 38 Clarification of Acceptable Methods of Depreciation and Amortisation
(amendments)1 January 2016
Goods for resale/work in progress - Cost of direct materials and labour plus attributable overheads based on a normal level of activity.
Raw material and spare parts - Purchase cost on a weighted average basis.
NOTES TO THE CONSOLIDATED FINANCIAL STATEMENTSFor the year ended 31 December 2014
NOTES TO THE CONSOLIDATED FINANCIAL STATEMENTSFor the year ended 31 December 2014
Net realisable value is based on estimated selling price less any further costs expected to be incurred to completion and disposal.
Interests in equity-accounted investeesThe Groups, interest in equity-accounted investees comprise interest in associates and joint venture.
Associates are those entities in which the Group has significant influence, but not control or joint control, over the financial and operating policies. A joint venture is an arrangement in which the Group has joint control, whereby the Group has rights to the net assets of the arrangement, rather than rights to its assets and obligations for its liabilities.
Interests in associates and the joint venture are accounted for using the equity method. They are recognised initially at cost, which includes transaction costs. Subsequent to initial recognition, the consolidated financial statements include the Group’s share of the profit or loss and other comprehensive income of equity-accounted investees, until the date on which significant influence or joint control ceases.
The reporting dates of the equity-accounted investees and the Group are identical and the equity-accounted investees’ accounting policies conform to those used by the Group for like transactions and events in similar circumstances.
Investment propertiesLand and buildings are considered as investment properties only when they are being held to earn rentals or for capital appreciation or for both.
Investment properties are measured initially at cost, including transaction costs and borrowing costs that are directly attributable to construction of the asset. The carrying amount includes the cost of replacing part of an existing investment property at the time that cost is incurred if the recognition criteria are met; and excludes the costs of day-to-day servicing of an investment property. Subsequent to initial recognition, investment properties are stated at fair value, which reflects market conditions at the reporting date. Gains or losses arising from changes in the fair values of investment properties are included in the consolidated statement of income in the year in which they arise.
Investment properties are derecognised when either they have been disposed off or when the investment property is permanently withdrawn from use and no future economic benefit is expected from its disposal. Any gains or losses on the retirement or disposal of an investment property are recognised in the consolidated statement of income in the year of retirement or disposal.
Property under construction is dealt with under IAS 40 and recorded at cost less accumulated impairment losses until either its fair value becomes reliably determinable or construction is completed (whichever is earlier). At that time, it is reclassified as investment property and a fair value adjustment is recognised in the consolidated statement of income.
Transfers are made to or from investment property only when there is a change in use. For a transfer from investment property to owner occupied property, the deemed cost for subsequent accounting is the fair value at the date of change in use. If owner occupied property becomes an investment property, the difference between the carrying value and the fair value at the date of transfer is recognised as a revaluation reserve in the equity and is released to the consolidated statement of income upon disposal of such property.
3.4 SUMMARY OF SIGNIFICANT ACCOUNTING POLICIES (continued)
3 BASIS OF PREPARATION AND SUMMARY OF SIGNIFICANT ACCOUNTING POLICIES (continued)

w w w.a a m a l . c o m .q a A n n u a l R e p o r t 2 0 1 462 A a m a l A n n u a l R e p o r t 2 0 1 4 A a m a l C o m p a n y Q . S . C . 63
Property, plant and equipmentProperty, plant and equipment is stated at cost including borrowing costs that are eligible for capitalisation and excluding the costs of day-to-day servicing, less accumulated depreciation and any impairment in value.
Depreciation is provided on a straight-line basis on all property, plant and equipment. The rates of depreciation are based upon the following estimated useful lives:
The carrying amounts are reviewed for impairment when events or changes in circumstances indicate that the carrying value may not be recoverable. If any such indication exists and where the carrying values exceed the estimated recoverable amount, the assets are written down to their recoverable amount, being the higher of their fair value less costs to sell and their value in use.
Expenditure incurred to replace a component of an item of property, plant and equipment that is accounted for separately is capitalised and the carrying amount of the component that is replaced is written off. Other subsequent expenditure is capitalised only when it increases future economic benefits of the related item of property, plant and equipment. All other expenditure is recognised in the consolidated statement of income as the expense is incurred.
An item of property, plant and equipment is derecognised upon disposal or when no future economic benefits are expected from its use or disposal. Any gain or loss arising on derecognition of the asset is included in the consolidated statement of income in the year the asset is derecognised.
The asset’s residual values, useful lives and method of depreciation are reviewed, and adjusted if appropriate, at each financial year end.
Borrowing costsBorrowing costs directly attributable to the acquisition, construction or production of an asset that necessarily takes substantial period of time to get ready for its intended use or sale are capitalised as part of the cost of the respective assets. All other borrowing costs are expensed in the year they incur. Borrowing costs consist of the interest and other costs that the Group incurs in connection with the borrowing of funds.
Accounts payable and accrualsLiabilities are recognised for amounts to be paid in the future for goods or services received, whether billed by the supplier or not.
Interest bearing loans and borrowingsInterest bearing loans and borrowings are recognised initially at fair value of the amounts borrowed, less directly attributable transaction costs. Subsequent to initial recognition, interest bearing loans and borrowings are measured at amortised cost using the effective interest method, with any differences between the cost and final settlement values being recognized in the consolidated statement of income over the period of borrowings. Instalments due within one year at amortised cost are shown as a current liability.
Gains or losses are recognised in the consolidated statement of income when the liabilities are derecognised. Interest relating to interest bearing loans and borrowings is expensed in the year in which it is incurred except those qualify for capitalisation.
3 BASIS OF PREPARATION AND SUMMARY OF SIGNIFICANT ACCOUNTING POLICIES (continued)
3.4 SUMMARY OF SIGNIFICANT ACCOUNTING POLICIES (continued)
Buildings 20 years Leasehold improvements 2-8 years Truck mixers and motor vehicles 4-15 years Plant and machinery 8-25 years Furniture, fixtures and office equipment 3-5 years Computers and related software 3-5 years Capital work in progress Not depreciated
NOTES TO THE CONSOLIDATED FINANCIAL STATEMENTSFor the year ended 31 December 2014
NOTES TO THE CONSOLIDATED FINANCIAL STATEMENTSFor the year ended 31 December 2014
Tenant depositsTenant deposit liabilities are initially recognised at fair value and subsequently measured at amortised cost where material. Any difference between the initial fair value and the nominal amount is included as a component of rental income and recognised on a straight-line basis over the lease term.
Decognition of financial assets and liabilities
a) Financial assets
A financial asset (or, where applicable a part of a financial asset or part of a group of similar financial assets) is derecognised where:
• The rights to receive cash flows from the asset have expired;• The Group has transferred its rights to receive cash flows from the asset or has assumed an obligation to pay the received cash
flows in full without material delay to a third party under a ‘pass-through’ arrangement; and either (a) the Group has transferred substantially all the risks and rewards of the asset, or (b) the Group has neither transferred nor retained substantially all the risks and rewards of the asset, but has transferred control of the asset.
When the Group has transferred its rights to receive cash flows from an asset or has entered into a pass-through arrangement, and has neither transferred nor retained substantially all of the risks and rewards of the asset nor transferred control of the asset, the asset is recognised to the extent of the Group’s continuing involvement in the asset.
In that case, the Group also recognises an associated liability. The transferred asset and the associated liability are measured on a basis that reflects the rights and obligations that the Group has retained. Continuing involvement that takes the form of a guarantee over the transferred asset is measured at the lower of the original carrying amount of the asset and the maximum amount of consideration that the Group could be required to repay.
b) Financial liabilities
A financial liability is derecognised when the obligation under the liability is discharged or cancelled or expires. Where an existing financial liability is replaced by another from the same lender on substantially different terms, or the terms of an existing liability are substantially modified, such an exchange or modification is treated as a derecognition of the original liability and the recognition of a new liability, and the difference in the respective carrying amounts is recognised in the consolidated statement of income.
Impairment and uncollectibility of financial assetsAn assessment is made at each reporting date to determine whether there is objective evidence that a specific financial asset may be impaired. If such evidence exists, any impairment loss is recognised in the consolidated statement of income. Impairment is determined as follows:
a. For assets carried at fair value, impairment is the difference between cost and fair value;b. For assets carried at cost, impairment is the difference between cost and the present value of future cash flows discounted at
the current market rate of return for a similar financial asset.c. For assets carried at amortised cost, impairment is the difference between carrying amount and the present value of future
cash flows discounted at the original effective interest rate.
ProvisionsProvisions are recognised when the Group has an obligation (legal or constructive) arising from a past event, and the costs to settle the obligation are both probable and able to be reliably measured.
3.4 SUMMARY OF SIGNIFICANT ACCOUNTING POLICIES (continued)
3 BASIS OF PREPARATION AND SUMMARY OF SIGNIFICANT ACCOUNTING POLICIES (continued)

w w w.a a m a l . c o m .q a A n n u a l R e p o r t 2 0 1 464 A a m a l A n n u a l R e p o r t 2 0 1 4 A a m a l C o m p a n y Q . S . C . 65
Employees’ end of service benefitsThe Group provides end of service benefits to all employees in accordance with employment contracts and Qatar Labour Law. The entitlement to these benefits is based upon the employees’ final salary and length of service, subject to the completion of a minimum service period. The expected costs of these benefits are accrued over the period of employment.
Revenue Revenue is recognised to the extent that it is probable that the economic benefits will flow to the Group and the revenue can be reliably measured. Revenue is measured at the fair value of the consideration received excluding discounts, rebates and duty. The following specific recognition criteria must also be met before revenue is recognised:
Sale of goodsSales are recognised when significant risks and rewards of ownership of the goods have passed to the buyer and the amount of revenue can be measured reliably.
Rental incomeRental income from investment properties is accounted for on a time proportion basis over the period of tenancy. Incentives for leases to enter into lease agreements are spread evenly over the lease term, even if the payments are not made on such basis. Income arising from expenses recharged to tenants is recognised in the year in which the expenses can be contractually received. Service charges and other such receipts are included gross of related costs in revenues as the Group acts as principal in this regard. Premiums received to terminate leases are recognised in the consolidated statement of income when they arise.
Service incomeService income is recognised when the service is rendered and the outcome of the transactions can be estimated reliably.
Commission Commission is accounted for on an accrual basis, when the right to receive the income is established.
Income on travel agenciesIncome on travel agencies is accounted for in the year in which the airline tickets are sold.
Interest incomeInterest income is recognised as the interest accrues using the effective interest rate method.
Foreign currenciesTransactions in foreign currencies are recorded at the rate ruling at the date of the transaction. Monetary assets and liabilities denominated in foreign currencies are retranslated at the rate of exchange ruling at the reporting date. All differences are recognised in the statement of income.
Use of estimatesThe preparation of the Group’s consolidated financial statements in conformity with International Financial Reporting Standards (IFRS) requires management to make estimates and assumptions that affect the reported amounts of assets and liabilities and disclosure of contingent assets and liabilities at the reporting date and the reported amounts of revenues and expenses during the reporting period. Although these estimates are based on management’s best knowledge of current events and actions, actual results may ultimately differ from those estimates. (Significant assumptions, accounting judgments and estimates used in preparing these consolidated financial statements are disclosed in Note 30).
The estimates and underlying assumptions are reviewed regularly. Revisions to accounting estimates are recognised in the period in which the estimate is revised if the revision affects only that period or in the period of the revision and future periods if the revision affects both current and future periods.
3 BASIS OF PREPARATION AND SUMMARY OF SIGNIFICANT ACCOUNTING POLICIES (continued)
3.4 SUMMARY OF SIGNIFICANT ACCOUNTING POLICIES (continued)
NOTES TO THE CONSOLIDATED FINANCIAL STATEMENTSFor the year ended 31 December 2014
NOTES TO THE CONSOLIDATED FINANCIAL STATEMENTSFor the year ended 31 December 2014
Fair valuesA number of Group’s accounting policies and disclosures require the measurement of fair values, for both financial and non-financial assets and liabilities. The Group has an established control framework with respect to the measurement of fair values. When measuring the fair value of an asset or a liability, the Group uses market observable data for the valuation. Fair values are categorised into different levels in a fair value hierarchy based on the inputs used in the valuation techniques as follows.
a. Level 1 – Unadjusted quoted prices in active markets for identical assets and liabilities,b. Level 2 – Other observable inputs not included within level 1 of the fair value hierarchyc. Level 3 – Unobservable inputs (including entity’s own data, which are adjusted if necessary to reflect the assumptions market
participants would use in the circumstances.)
The Group recognises transfers between levels of the fair value hierarchy at the end of the reporting period during which the change has occurred.
Treasury sharesWhen share capital recognized in equity is repurchased (by the Company or any of its subsidiaries), the amount of the consideration paid, which includes directly attributable costs, is recognized as a deduction from equity. When treasury shares are sold or reissued subsequently, the amount received is recognized as an increase in equity, and the resulting surplus or deficit on the transaction is presented in share premium.
3.4 SUMMARY OF SIGNIFICANT ACCOUNTING POLICIES (continued)
3 BASIS OF PREPARATION AND SUMMARY OF SIGNIFICANT ACCOUNTING POLICIES (continued)
For the purpose of consolidated statement of cash flows, cash and cash equivalents comprise the following balances:
The short term bank deposits are made for varying periods between one day and three months, depending on the immediate cash requirements of the Group, and earn interest at the respective short term deposit rates.
4 CASH AND CASH EQUIVALENTS
5 ACCOUNTS RECEIVABLE AND PREPAYMENTS
2014QR
2013QR
Cash and bank accounts 200,575,677 330,333,904Short term bank deposits 354,083,580 105,802,852Cash and bank balances 554,659,257 436,136,756
Bank overdrafts (2,346,320) (6,836,280)
Cash and cash equivalents 552,312,937 429,300,476
2014QR
2013QR
Trade accounts receivable 435,448,524 437,912,979Less: Impairment of trade accounts receivable (27,267,833) (26,901,412)
408,180,691 411,011,567Advances to suppliers and prepayments 55,455,801 50,787,921Retention receivables 47,886,103 36,217,081Other receivables 6,889,892 12,073,270
518,412,487 510,089,839

w w w.a a m a l . c o m .q a A n n u a l R e p o r t 2 0 1 466 A a m a l A n n u a l R e p o r t 2 0 1 4 A a m a l C o m p a n y Q . S . C . 67
As at 31 December 2014, trade accounts receivable amounting to QR 27,267,833 (2013: QR 26,901,412) were impaired. Movements in the allowance for impairment of trade accounts receivable were as follows:
2014QR
2013QR
At 1 January 26,901,412 24,984,025Charge for the year (Note 20) 2,694,547 2,294,590Amounts written off (2,262,731) (19,949)Unused amounts reversed (65,395) (357,254)
At 31 December 27,267,833 26,901,412
5 ACCOUNTS RECEIVABLE AND PREPAYMENTS (continued)
As at 31 December, the ageing of unimpaired trade accounts receivable was as follows:
Unimpaired receivables are expected, on the basis of past experience, to be fully recoverable. It is not the practice of the Group to obtain collateral over receivables.
Total
Neither past due nor impaired
Past due but not impaired
Up to 30 days
31-60 days
61-90days
91-120days
>120days
QR QR QR QR QR QR QR
2014 408,180,691 222,197,686 73,174,740 25,964,086 23,817,278 10,564,995 52,461,9062013 411,011,567 251,981,960 32,312,165 21,140,966 19,351,043 26,076,888 60,148,545
6 AMOUNTS DUE FROM RELATED PARTIES
Name 2014QR
2013QR
Al Faisal Holding Company W.L.L. 155,825,487 154,124,064El Sewedy Cables Qatar W.L.L. 129,179,996 34,644,615Al Jazi Real Estate Investment Company W.L.L.- Al Jazi Real Estate Branch 678,817 1,445,012El Sewedy Electric Egypt W.L.L. 4,359,010 9,538,116Maintenance Management Group Qatar W.L.L. 1,048,749 4,014,727EL Sewedy Cables - Dubai 2,887,101 -Al Faisal International Trade and Investment Company W.L.L. - 80,012Al-Arabia Land Transporting Company W.L.L. 352,135 311,650El Sewedy Holding Egypt 57,627 -Gettco International - 204,450Frijns Structural Steel Middle East W.L.L. 55,104 27,916Al Farman for Investment & International Trading Company W.L.L. 158,645 152,170Qatar Bahrain International Cinema W.L.L. 78,302 33,500Gulf English School 44,557 6,259Al Rayyan Tourism Investment Company W.L.L. 18,714,551 7,589,624Other related parties 5,157,788 2,267,835
318,597,869 214,439,950
Notesa. Transactions with related parties are carried out through open account and Directors do not consider any receivables to be
past due or impaired.b. Related party transactions are disclosed in Note 25.
NOTES TO THE CONSOLIDATED FINANCIAL STATEMENTSFor the year ended 31 December 2014
NOTES TO THE CONSOLIDATED FINANCIAL STATEMENTSFor the year ended 31 December 2014
7 INVENTORIES
The Group has the following investments in equity-accounted investees.
Group’s share of profits from the equity-accounted investees are as follows:
Movements in the provision for obsolete and slow moving inventories were as follows:
8 EQUITY-ACCOUNTED INVESTEES
2014QR
2013 QR
Goods for resale 176,135,660 165,499,699Raw materials and spare parts 55,494,154 38,388,307Work in progress 8,649,899 19,944,678Goods in transit 62,473,125 96,718,553
302,752,838 320,551,237
Less: Provision for obsolete and slow moving inventories (2,182,407) (3,851,692)
300,570,431 316,699,545
2014QR
2013QR
At 1 January 3,851,692 3,145,826Charge for the year (Note 18) 78,431 2,380,617Reversals (1,227,254) (535,695)Amounts written off (520,462) (1,139,056)
At 31 December 2,182,407 3,851,692
2014QR
2013QR
Interests in joint venture 144,371,432 129,462,184Interests in associates 5,933,244 3,644,723
At 31 December 150,304,676 133,106,907
Profit share from investment in joint venture 15,834,033 17,330,368Profit share from investment in associates 2,288,521 1,169,533
18,122,554 18,499,901
Country of incorporation Relationship Proportion of ownership and voting power held
by the Group2014 2013
El Sewedy Cables Qatar W.L.L. Qatar Joint venture 55% 55%Frijns Structural Steel Middle East W.L.L. Qatar Associate 20% 20%
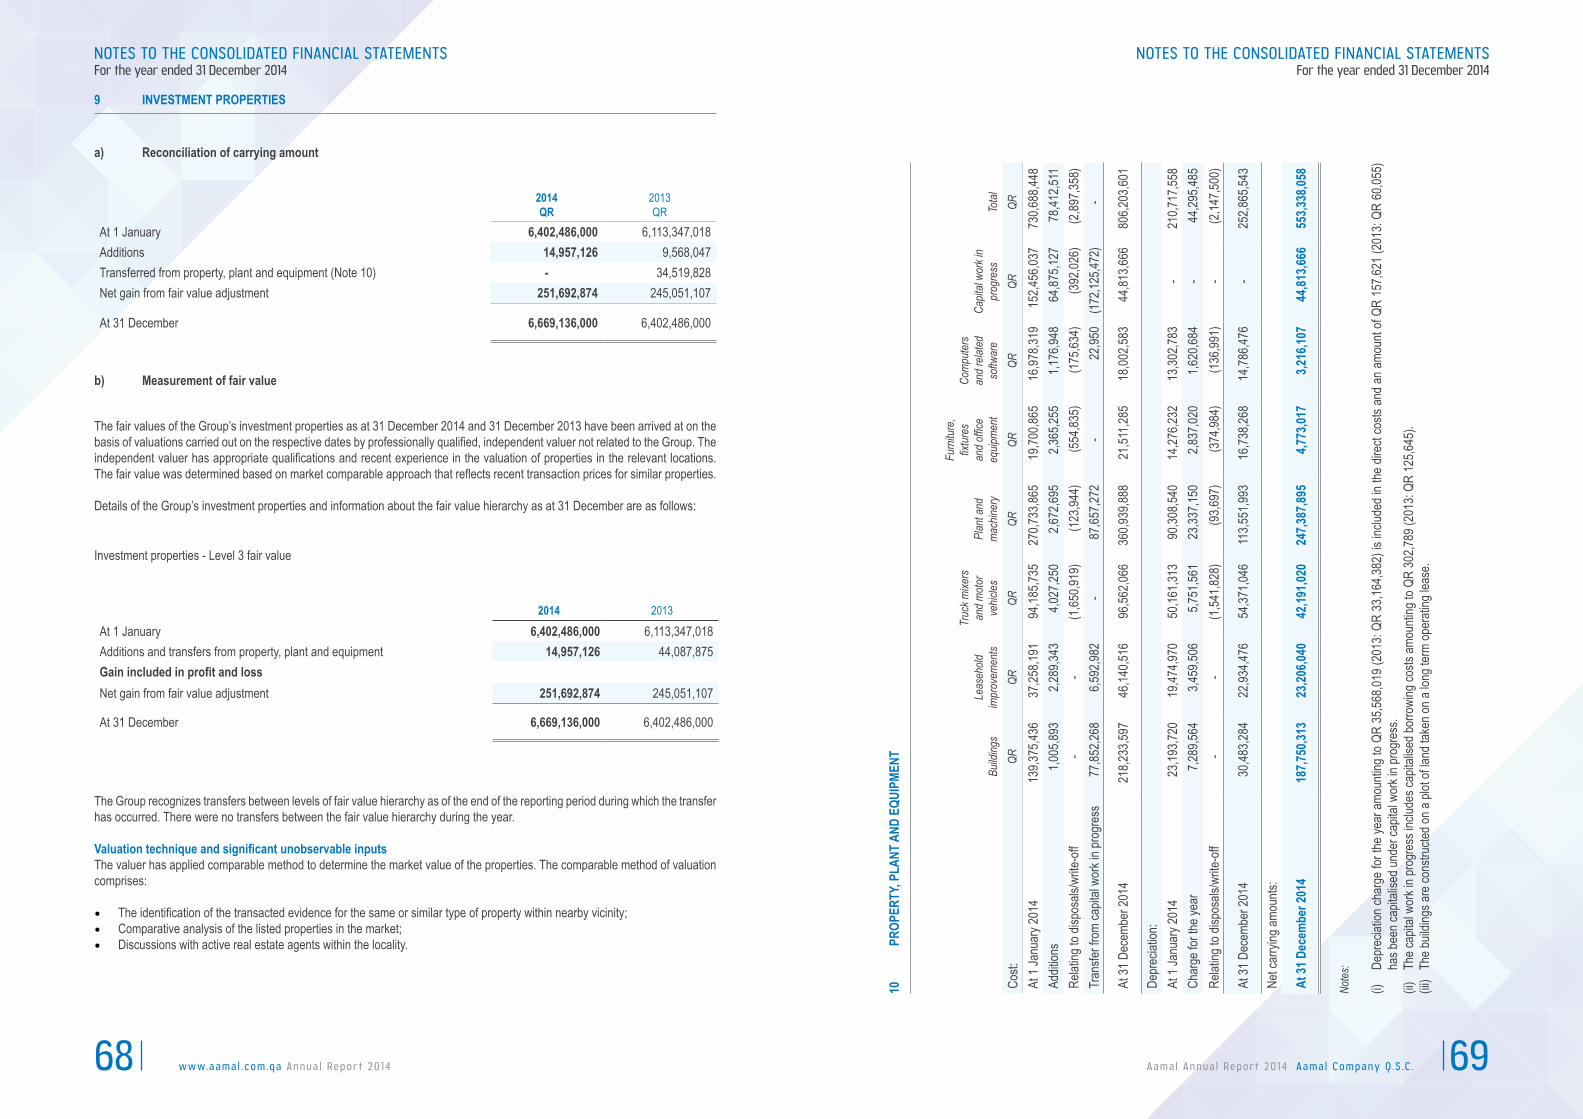
w w w.a a m a l . c o m .q a A n n u a l R e p o r t 2 0 1 468 A a m a l A n n u a l R e p o r t 2 0 1 4 A a m a l C o m p a n y Q . S . C . 69
a) Reconciliation of carrying amount
9 INVESTMENT PROPERTIES
2014QR
2013QR
At 1 January 6,402,486,000 6,113,347,018Additions 14,957,126 9,568,047Transferred from property, plant and equipment (Note 10) - 34,519,828Net gain from fair value adjustment 251,692,874 245,051,107
At 31 December 6,669,136,000 6,402,486,000
b) Measurement of fair value
The fair values of the Group’s investment properties as at 31 December 2014 and 31 December 2013 have been arrived at on the basis of valuations carried out on the respective dates by professionally qualified, independent valuer not related to the Group. The independent valuer has appropriate qualifications and recent experience in the valuation of properties in the relevant locations. The fair value was determined based on market comparable approach that reflects recent transaction prices for similar properties.
Details of the Group’s investment properties and information about the fair value hierarchy as at 31 December are as follows:
Investment properties - Level 3 fair value
2014 2013
At 1 January 6,402,486,000 6,113,347,018Additions and transfers from property, plant and equipment 14,957,126 44,087,875Gain included in profit and lossNet gain from fair value adjustment 251,692,874 245,051,107
At 31 December 6,669,136,000 6,402,486,000
The Group recognizes transfers between levels of fair value hierarchy as of the end of the reporting period during which the transfer has occurred. There were no transfers between the fair value hierarchy during the year.
Valuation technique and significant unobservable inputsThe valuer has applied comparable method to determine the market value of the properties. The comparable method of valuation comprises:
• The identification of the transacted evidence for the same or similar type of property within nearby vicinity;• Comparative analysis of the listed properties in the market;• Discussions with active real estate agents within the locality.
NOTES TO THE CONSOLIDATED FINANCIAL STATEMENTSFor the year ended 31 December 2014
NOTES TO THE CONSOLIDATED FINANCIAL STATEMENTSFor the year ended 31 December 2014
10
PROP
ERTY
, PLA
NT A
ND E
QUIP
MENT
Note
s:
(i)
Depr
eciat
ion ch
arge
for t
he ye
ar a
moun
ting
to QR
35,5
68,01
9 (2
013:
QR 3
3,164
,382)
is in
clude
d in
the d
irect
costs
and
an
amou
nt of
QR 1
57,62
1 (2
013:
QR 6
0,055
) ha
s bee
n cap
italis
ed un
der c
apita
l wor
k in p
rogr
ess.
(ii)
The c
apita
l wor
k in p
rogr
ess i
nclud
es ca
pitali
sed b
orro
wing
costs
amou
nting
to Q
R 30
2,789
(201
3: QR
125,6
45).
(iii)
The b
uildin
gs ar
e con
struc
ted on
a plo
t of la
nd ta
ken o
n a lo
ng te
rm op
erati
ng le
ase.
Build
ings
Leas
ehold
im
prov
emen
ts
Truc
k mixe
rs
and
mot
or
vehic
lesPl
ant a
nd
mac
hiner
y
Furn
iture
, fix
ture
s an
d of
fice
equip
men
t
Com
pute
rs
and
relat
ed
softw
are
Capit
al wo
rk in
pr
ogre
ssTo
tal
Cost:
QRQR
QRQR
QRQR
QRQR
At 1
Janu
ary 2
014
139,3
75,43
637
,258,1
9194
,185,7
3527
0,733
,865
19,70
0,865
16,97
8,319
152,4
56,03
773
0,688
,448
Addit
ions
1,005
,893
2,289
,343
4,027
,250
2,672
,695
2,365
,255
1,176
,948
64,87
5,127
78,41
2,511
Relat
ing to
disp
osals
/write
-off
--
(1,65
0,919
)(1
23,94
4)(5
54,83
5)(1
75,63
4)(3
92,02
6)(2
,897,3
58)
Tran
sfer f
rom
capit
al wo
rk in
prog
ress
77,85
2,268
6,592
,982
-87
,657,2
72-
22,95
0(1
72,12
5,472
)-
At 31
Dec
embe
r 201
421
8,233
,597
46,14
0,516
96,56
2,066
360,9
39,88
821
,511,2
8518
,002,5
8344
,813,6
6680
6,203
,601
Depr
eciat
ion:
At 1
Janu
ary 2
014
23,19
3,720
19,47
4,970
50,16
1,313
90,30
8,540
14,27
6,232
13,30
2,783
-21
0,717
,558
Char
ge fo
r the
year
7,289
,564
3,459
,506
5,751
,561
23,33
7,150
2,837
,020
1,620
,684
-44
,295,4
85Re
lating
to di
spos
als/w
rite-o
ff -
-(1
,541,8
28)
(93,6
97)
(374
,984)
(136
,991)
-(2
,147,5
00)
At 31
Dec
embe
r 201
430
,483,2
8422
,934,4
7654
,371,0
4611
3,551
,993
16,73
8,268
14,78
6,476
-25
2,865
,543
Net c
arryi
ng am
ounts
:
At 31
Dec
embe
r 201
418
7,750
,313
23,20
6,040
42,19
1,020
247,3
87,89
54,7
73,01
73,2
16,10
744
,813,6
6655
3,338
,058
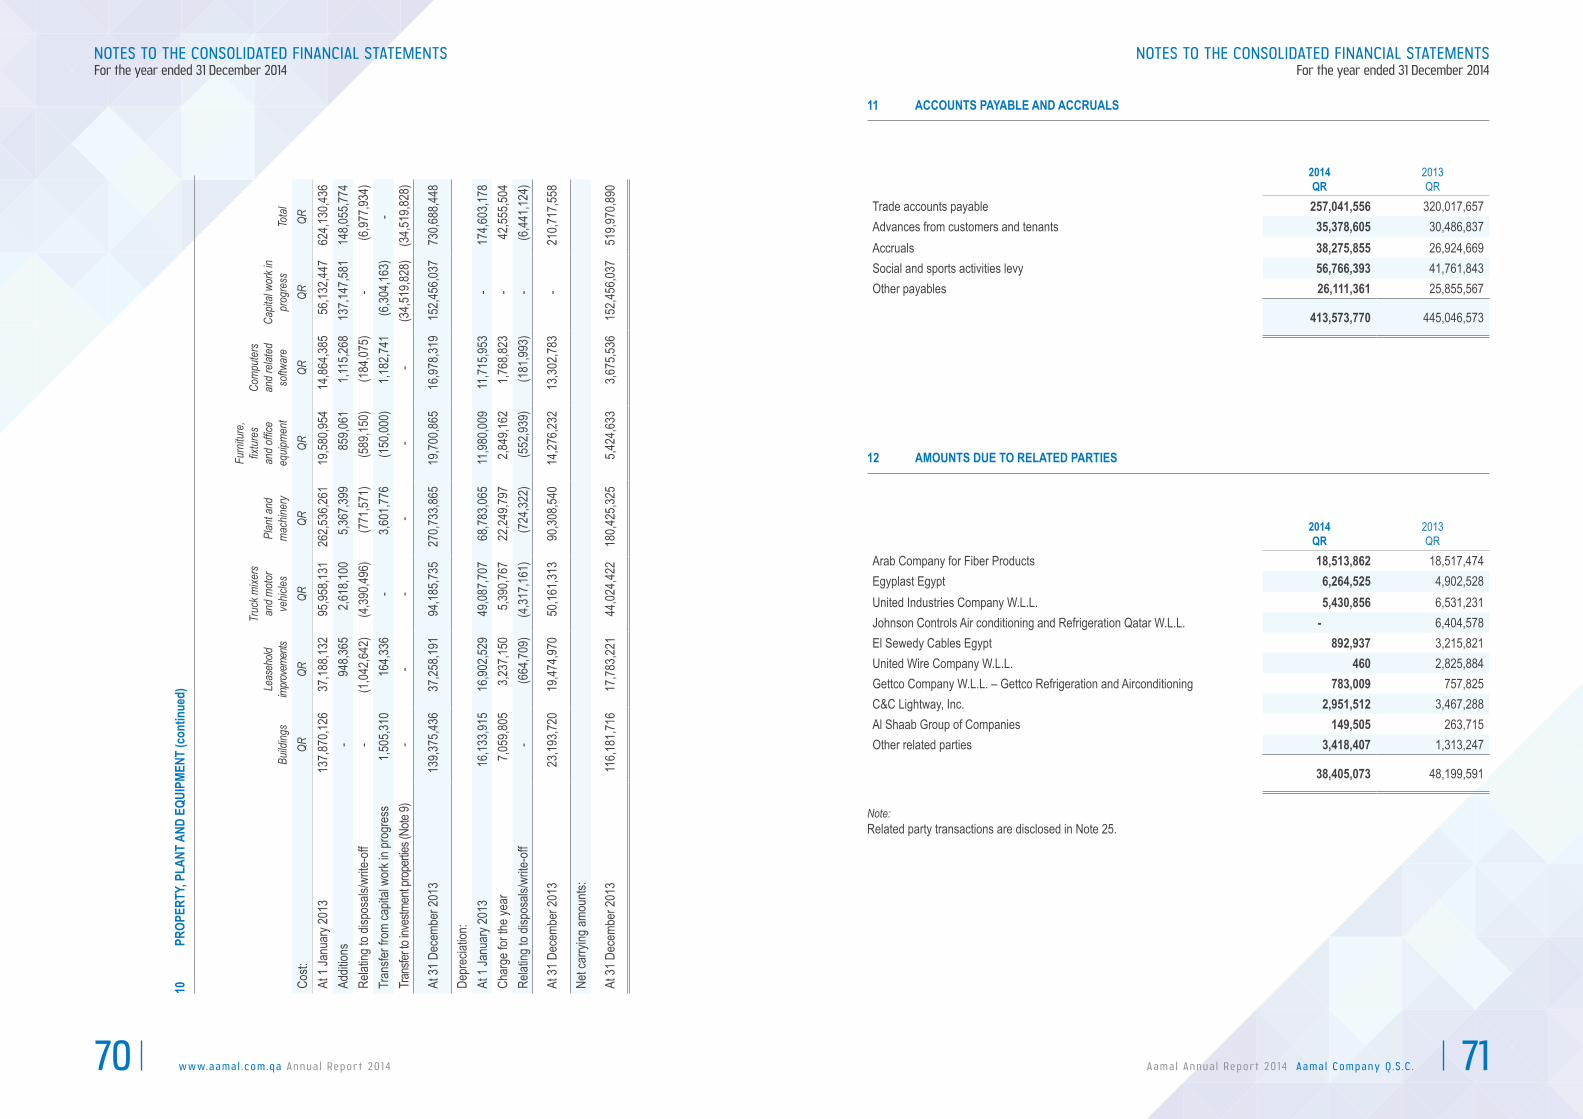
w w w.a a m a l . c o m .q a A n n u a l R e p o r t 2 0 1 470 A a m a l A n n u a l R e p o r t 2 0 1 4 A a m a l C o m p a n y Q . S . C . 71
10
PROP
ERTY
, PLA
NT A
ND E
QUIP
MENT
(con
tinue
d)
Build
ings
Leas
ehold
im
prove
ments
Truc
k mixe
rs
and
mot
or
vehic
lesPl
ant a
nd
mac
hiner
y
Furn
iture
, fix
ture
s an
d of
fice
equip
men
t
Com
pute
rs
and
relat
ed
softw
are
Capit
al wo
rk in
pr
ogre
ssTo
tal
Cost:
QRQR
QRQR
QRQR
QRQR
At 1
Janu
ary 2
013
137,8
70,12
637
,188,1
3295
,958,1
3126
2,536
,261
19,58
0,954
14,86
4,385
56,13
2,447
624,1
30,43
6Ad
dition
s-
948,3
652,6
18,10
05,3
67,39
985
9,061
1,115
,268
137,1
47,58
114
8,055
,774
Relat
ing to
disp
osals
/write
-off
-(1
,042,6
42)
(4,39
0,496
)(7
71,57
1)(5
89,15
0)(1
84,07
5)-
(6,97
7,934
)Tr
ansfe
r fro
m ca
pital
work
in pr
ogre
ss1,5
05,31
016
4,336
-3,6
01,77
6(1
50,00
0)1,1
82,74
1(6
,304,1
63)
-Tra
nsfer
to in
vestm
ent p
ropert
ies (N
ote 9)
--
--
--
(34,5
19,82
8)(3
4,519
,828)
At 31
Dec
embe
r 201
313
9,375
,436
37,25
8,191
94,18
5,735
270,7
33,86
519
,700,8
6516
,978,3
1915
2,456
,037
730,6
88,44
8
Depr
eciat
ion:
At 1
Janu
ary 2
013
16,13
3,915
16,90
2,529
49,08
7,707
68,78
3,065
11,98
0,009
11,71
5,953
-17
4,603
,178
Char
ge fo
r the
year
7,059
,805
3,237
,150
5,390
,767
22,24
9,797
2,849
,162
1,768
,823
-42
,555,5
04Re
lating
to di
spos
als/w
rite-o
ff-
(664
,709)
(4,31
7,161
)(7
24,32
2)(5
52,93
9)(1
81,99
3)-
(6,44
1,124
)
At 31
Dec
embe
r 201
323
,193,7
2019
,474,9
7050
,161,3
1390
,308,5
4014
,276,2
3213
,302,7
83-
210,7
17,55
8
Net c
arryi
ng am
ounts
:
At 31
Dec
embe
r 201
311
6,181
,716
17,78
3,221
44,02
4,422
180,4
25,32
55,4
24,63
33,6
75,53
615
2,456
,037
519,9
70,89
0
NOTES TO THE CONSOLIDATED FINANCIAL STATEMENTSFor the year ended 31 December 2014
11 ACCOUNTS PAYABLE AND ACCRUALS
12 AMOUNTS DUE TO RELATED PARTIES
Note:Related party transactions are disclosed in Note 25.
2014QR
2013QR
Trade accounts payable 257,041,556 320,017,657Advances from customers and tenants 35,378,605 30,486,837Accruals 38,275,855 26,924,669Social and sports activities levy 56,766,393 41,761,843Other payables 26,111,361 25,855,567
413,573,770 445,046,573
2014QR
2013QR
Arab Company for Fiber Products 18,513,862 18,517,474Egyplast Egypt 6,264,525 4,902,528United Industries Company W.L.L. 5,430,856 6,531,231Johnson Controls Air conditioning and Refrigeration Qatar W.L.L. - 6,404,578El Sewedy Cables Egypt 892,937 3,215,821United Wire Company W.L.L. 460 2,825,884Gettco Company W.L.L. – Gettco Refrigeration and Airconditioning 783,009 757,825C&C Lightway, Inc. 2,951,512 3,467,288Al Shaab Group of Companies 149,505 263,715Other related parties 3,418,407 1,313,247
38,405,073 48,199,591
NOTES TO THE CONSOLIDATED FINANCIAL STATEMENTSFor the year ended 31 December 2014
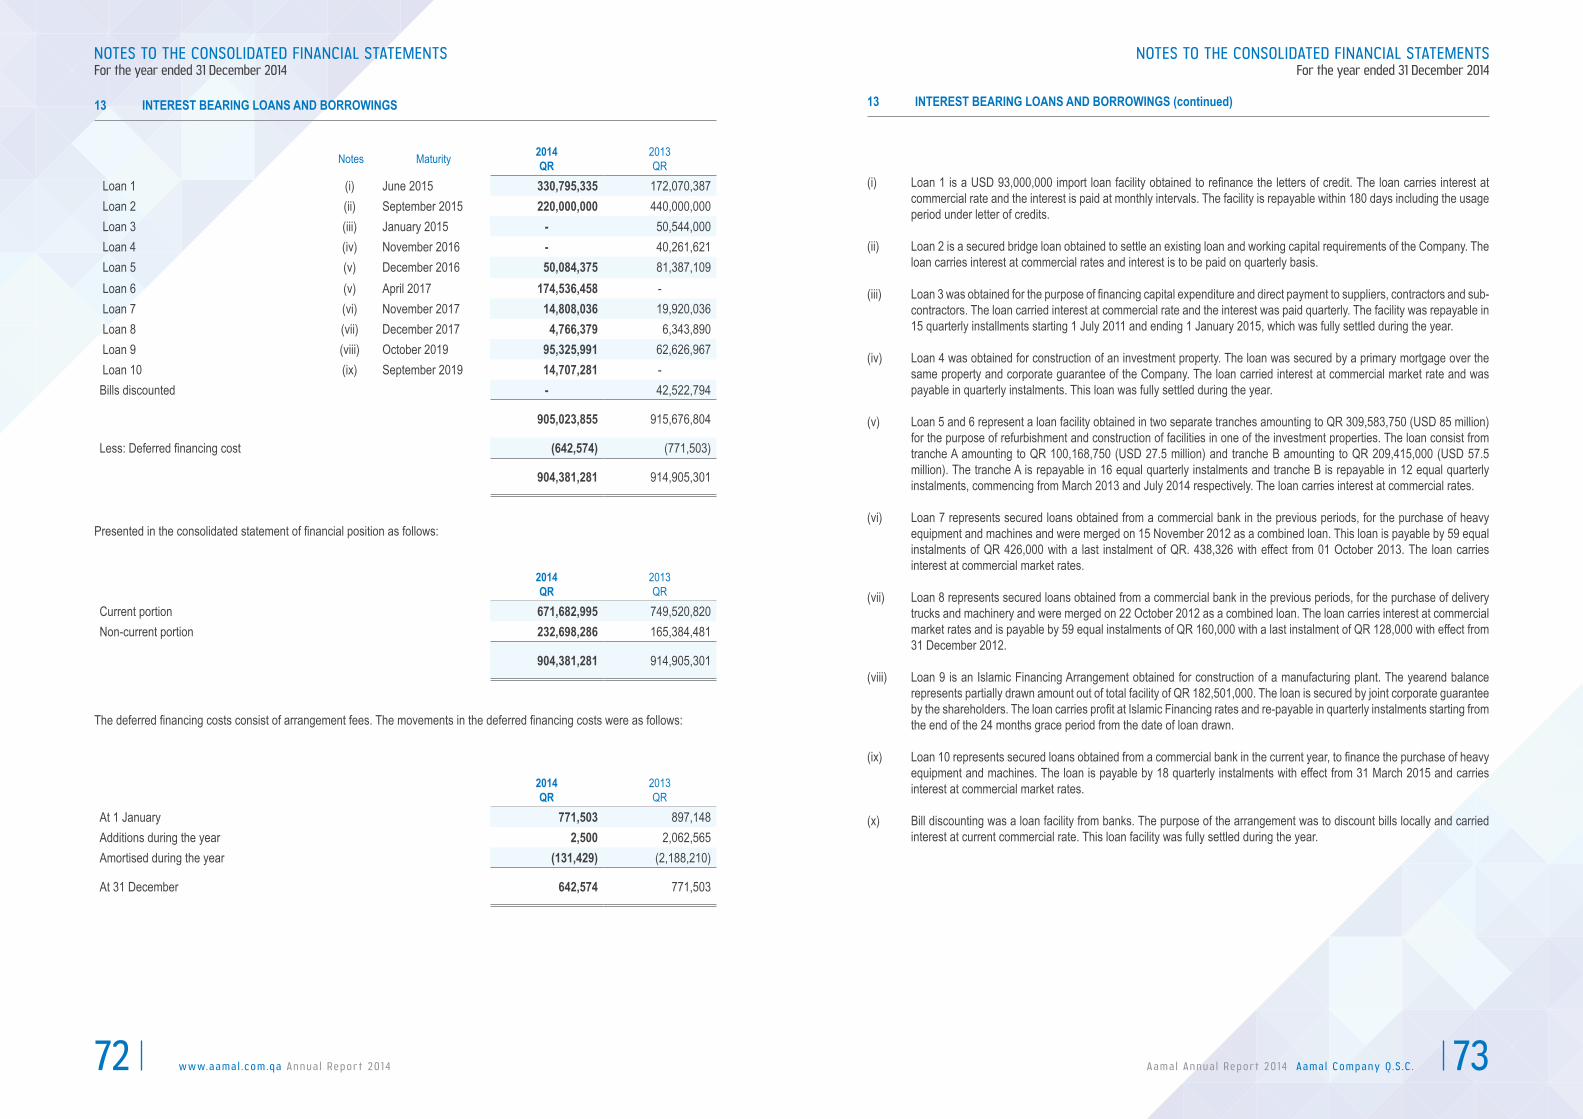
w w w.a a m a l . c o m .q a A n n u a l R e p o r t 2 0 1 472 A a m a l A n n u a l R e p o r t 2 0 1 4 A a m a l C o m p a n y Q . S . C . 73
13 INTEREST BEARING LOANS AND BORROWINGS
Notes Maturity 2014QR
2013QR
Loan 1 (i) June 2015 330,795,335 172,070,387 Loan 2 (ii) September 2015 220,000,000 440,000,000 Loan 3 (iii) January 2015 - 50,544,000 Loan 4 (iv) November 2016 - 40,261,621 Loan 5 (v) December 2016 50,084,375 81,387,109 Loan 6 (v) April 2017 174,536,458 - Loan 7 (vi) November 2017 14,808,036 19,920,036 Loan 8 (vii) December 2017 4,766,379 6,343,890 Loan 9 (viii) October 2019 95,325,991 62,626,967 Loan 10 (ix) September 2019 14,707,281 -Bills discounted - 42,522,794
905,023,855 915,676,804
Less: Deferred financing cost (642,574) (771,503)
904,381,281 914,905,301
Presented in the consolidated statement of financial position as follows:
The deferred financing costs consist of arrangement fees. The movements in the deferred financing costs were as follows:
2014QR
2013QR
Current portion 671,682,995 749,520,820Non-current portion 232,698,286 165,384,481
904,381,281 914,905,301
2014QR
2013QR
At 1 January 771,503 897,148Additions during the year 2,500 2,062,565Amortised during the year (131,429) (2,188,210)
At 31 December 642,574 771,503
NOTES TO THE CONSOLIDATED FINANCIAL STATEMENTSFor the year ended 31 December 2014
(i)
(ii)
(iii)
(iv)
(v)
(vi)
(vii)
(viii)
(ix)
(x)
Loan 1 is a USD 93,000,000 import loan facility obtained to refinance the letters of credit. The loan carries interest at commercial rate and the interest is paid at monthly intervals. The facility is repayable within 180 days including the usage period under letter of credits.
Loan 2 is a secured bridge loan obtained to settle an existing loan and working capital requirements of the Company. The loan carries interest at commercial rates and interest is to be paid on quarterly basis.
Loan 3 was obtained for the purpose of financing capital expenditure and direct payment to suppliers, contractors and sub-contractors. The loan carried interest at commercial rate and the interest was paid quarterly. The facility was repayable in 15 quarterly installments starting 1 July 2011 and ending 1 January 2015, which was fully settled during the year.
Loan 4 was obtained for construction of an investment property. The loan was secured by a primary mortgage over the same property and corporate guarantee of the Company. The loan carried interest at commercial market rate and was payable in quarterly instalments. This loan was fully settled during the year.
Loan 5 and 6 represent a loan facility obtained in two separate tranches amounting to QR 309,583,750 (USD 85 million) for the purpose of refurbishment and construction of facilities in one of the investment properties. The loan consist from tranche A amounting to QR 100,168,750 (USD 27.5 million) and tranche B amounting to QR 209,415,000 (USD 57.5 million). The tranche A is repayable in 16 equal quarterly instalments and tranche B is repayable in 12 equal quarterly instalments, commencing from March 2013 and July 2014 respectively. The loan carries interest at commercial rates.
Loan 7 represents secured loans obtained from a commercial bank in the previous periods, for the purchase of heavy equipment and machines and were merged on 15 November 2012 as a combined loan. This loan is payable by 59 equal instalments of QR 426,000 with a last instalment of QR. 438,326 with effect from 01 October 2013. The loan carries interest at commercial market rates.
Loan 8 represents secured loans obtained from a commercial bank in the previous periods, for the purchase of delivery trucks and machinery and were merged on 22 October 2012 as a combined loan. The loan carries interest at commercial market rates and is payable by 59 equal instalments of QR 160,000 with a last instalment of QR 128,000 with effect from 31 December 2012.
Loan 9 is an Islamic Financing Arrangement obtained for construction of a manufacturing plant. The yearend balance represents partially drawn amount out of total facility of QR 182,501,000. The loan is secured by joint corporate guarantee by the shareholders. The loan carries profit at Islamic Financing rates and re-payable in quarterly instalments starting from the end of the 24 months grace period from the date of loan drawn.
Loan 10 represents secured loans obtained from a commercial bank in the current year, to finance the purchase of heavy equipment and machines. The loan is payable by 18 quarterly instalments with effect from 31 March 2015 and carries interest at commercial market rates.
Bill discounting was a loan facility from banks. The purpose of the arrangement was to discount bills locally and carried interest at current commercial rate. This loan facility was fully settled during the year.
13 INTEREST BEARING LOANS AND BORROWINGS (continued)
NOTES TO THE CONSOLIDATED FINANCIAL STATEMENTSFor the year ended 31 December 2014
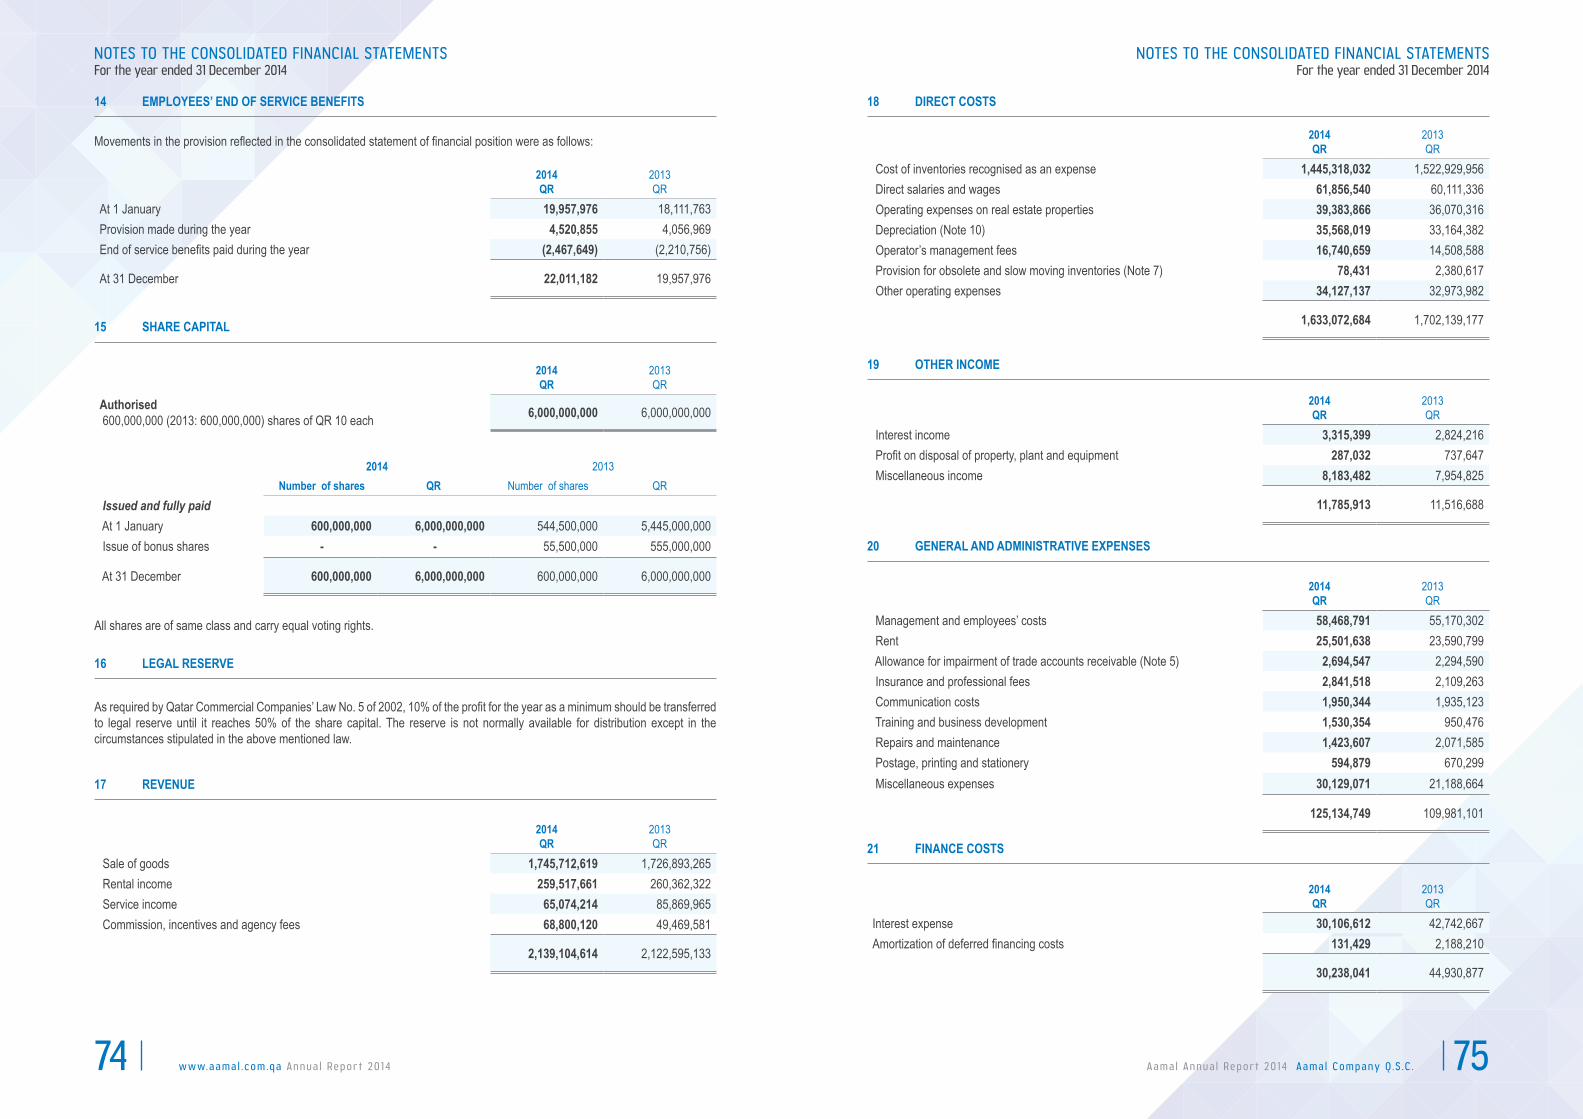
w w w.a a m a l . c o m .q a A n n u a l R e p o r t 2 0 1 474 A a m a l A n n u a l R e p o r t 2 0 1 4 A a m a l C o m p a n y Q . S . C . 75
Movements in the provision reflected in the consolidated statement of financial position were as follows:
All shares are of same class and carry equal voting rights.
As required by Qatar Commercial Companies’ Law No. 5 of 2002, 10% of the profit for the year as a minimum should be transferred to legal reserve until it reaches 50% of the share capital. The reserve is not normally available for distribution except in the circumstances stipulated in the above mentioned law.
14 EMPLOYEES’ END OF SERVICE BENEFITS
2014QR
2013QR
At 1 January 19,957,976 18,111,763Provision made during the year 4,520,855 4,056,969End of service benefits paid during the year (2,467,649) (2,210,756)
At 31 December 22,011,182 19,957,976
15 SHARE CAPITAL
2014 2013 Number of shares QR Number of shares QR
Issued and fully paid At 1 January 600,000,000 6,000,000,000 544,500,000 5,445,000,000 Issue of bonus shares - - 55,500,000 555,000,000
At 31 December 600,000,000 6,000,000,000 600,000,000 6,000,000,000
2014QR
2013QR
Authorised 600,000,000 (2013: 600,000,000) shares of QR 10 each 6,000,000,000 6,000,000,000
16 LEGAL RESERVE
17 REVENUE
2014QR
2013QR
Sale of goods 1,745,712,619 1,726,893,265 Rental income 259,517,661 260,362,322 Service income 65,074,214 85,869,965 Commission, incentives and agency fees 68,800,120 49,469,581
2,139,104,614 2,122,595,133
NOTES TO THE CONSOLIDATED FINANCIAL STATEMENTSFor the year ended 31 December 2014
18 DIRECT COSTS
2014QR
2013QR
Cost of inventories recognised as an expense 1,445,318,032 1,522,929,956 Direct salaries and wages 61,856,540 60,111,336 Operating expenses on real estate properties 39,383,866 36,070,316 Depreciation (Note 10) 35,568,019 33,164,382 Operator’s management fees 16,740,659 14,508,588 Provision for obsolete and slow moving inventories (Note 7) 78,431 2,380,617 Other operating expenses 34,127,137 32,973,982
1,633,072,684 1,702,139,177
19 OTHER INCOME
2014QR
2013QR
Interest income 3,315,399 2,824,216 Profit on disposal of property, plant and equipment 287,032 737,647 Miscellaneous income 8,183,482 7,954,825
11,785,913 11,516,688
20 GENERAL AND ADMINISTRATIVE EXPENSES
2014QR
2013QR
Management and employees’ costs 58,468,791 55,170,302 Rent 25,501,638 23,590,799 Allowance for impairment of trade accounts receivable (Note 5) 2,694,547 2,294,590 Insurance and professional fees 2,841,518 2,109,263 Communication costs 1,950,344 1,935,123 Training and business development 1,530,354 950,476 Repairs and maintenance 1,423,607 2,071,585 Postage, printing and stationery 594,879 670,299 Miscellaneous expenses 30,129,071 21,188,664
125,134,749 109,981,101
21 FINANCE COSTS
2014QR
2013QR
Interest expense 30,106,612 42,742,667Amortization of deferred financing costs 131,429 2,188,210
30,238,041 44,930,877
NOTES TO THE CONSOLIDATED FINANCIAL STATEMENTSFor the year ended 31 December 2014
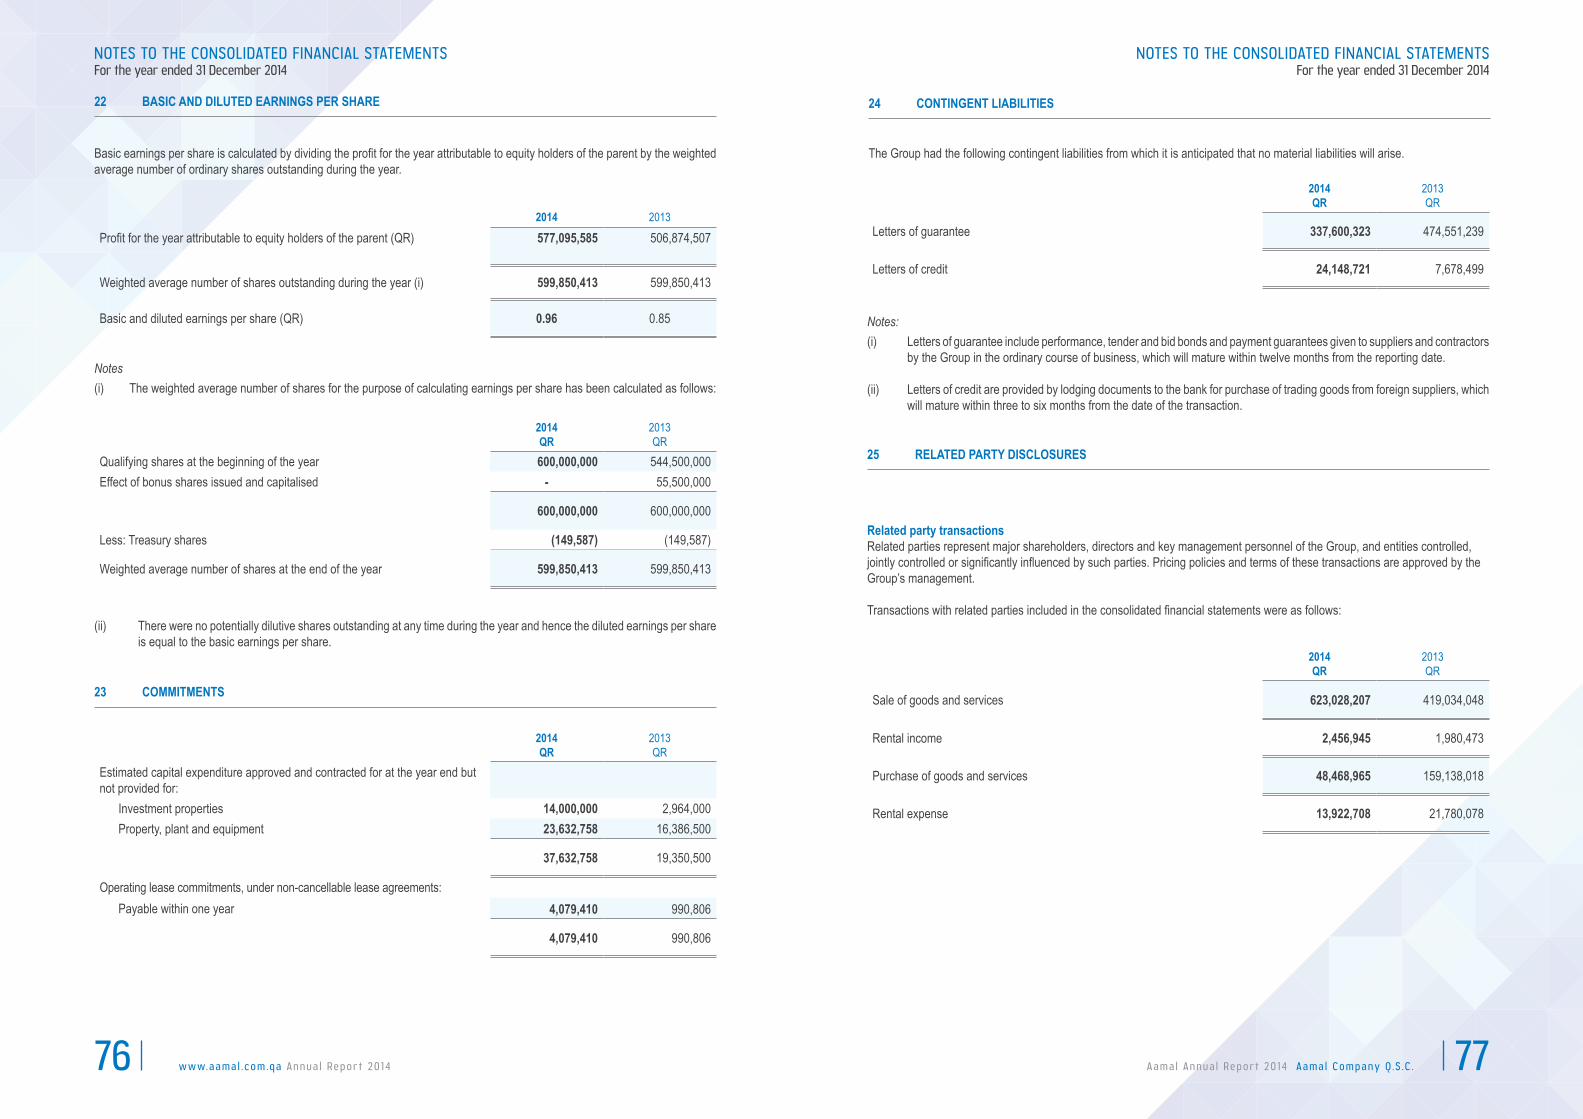
w w w.a a m a l . c o m .q a A n n u a l R e p o r t 2 0 1 476 A a m a l A n n u a l R e p o r t 2 0 1 4 A a m a l C o m p a n y Q . S . C . 77
Basic earnings per share is calculated by dividing the profit for the year attributable to equity holders of the parent by the weighted average number of ordinary shares outstanding during the year.
Notes(i) The weighted average number of shares for the purpose of calculating earnings per share has been calculated as follows:
There were no potentially dilutive shares outstanding at any time during the year and hence the diluted earnings per share is equal to the basic earnings per share.
(ii)
22 BASIC AND DILUTED EARNINGS PER SHARE
2014 2013
Profit for the year attributable to equity holders of the parent (QR) 577,095,585 506,874,507
Weighted average number of shares outstanding during the year (i) 599,850,413 599,850,413
Basic and diluted earnings per share (QR) 0.96 0.85
2014QR
2013QR
Qualifying shares at the beginning of the year 600,000,000 544,500,000Effect of bonus shares issued and capitalised - 55,500,000
600,000,000 600,000,000
Less: Treasury shares (149,587) (149,587)
Weighted average number of shares at the end of the year 599,850,413 599,850,413
23 COMMITMENTS
2014QR
2013QR
Estimated capital expenditure approved and contracted for at the year end but not provided for:
Investment properties 14,000,000 2,964,000Property, plant and equipment 23,632,758 16,386,500
37,632,758 19,350,500
Operating lease commitments, under non-cancellable lease agreements:Payable within one year 4,079,410 990,806
4,079,410 990,806
NOTES TO THE CONSOLIDATED FINANCIAL STATEMENTSFor the year ended 31 December 2014
The Group had the following contingent liabilities from which it is anticipated that no material liabilities will arise.
(i)
(ii)
Letters of guarantee include performance, tender and bid bonds and payment guarantees given to suppliers and contractors by the Group in the ordinary course of business, which will mature within twelve months from the reporting date.
Letters of credit are provided by lodging documents to the bank for purchase of trading goods from foreign suppliers, which will mature within three to six months from the date of the transaction.
Notes:
2014QR
2013QR
Letters of guarantee 337,600,323 474,551,239
Letters of credit 24,148,721 7,678,499
24 CONTINGENT LIABILITIES
Related party transactionsRelated parties represent major shareholders, directors and key management personnel of the Group, and entities controlled, jointly controlled or significantly influenced by such parties. Pricing policies and terms of these transactions are approved by the Group’s management.
Transactions with related parties included in the consolidated financial statements were as follows:
25 RELATED PARTY DISCLOSURES
2014QR
2013QR
Sale of goods and services 623,028,207 419,034,048
Rental income 2,456,945 1,980,473
Purchase of goods and services 48,468,965 159,138,018
Rental expense 13,922,708 21,780,078
NOTES TO THE CONSOLIDATED FINANCIAL STATEMENTSFor the year ended 31 December 2014

w w w.a a m a l . c o m .q a A n n u a l R e p o r t 2 0 1 478 A a m a l A n n u a l R e p o r t 2 0 1 4 A a m a l C o m p a n y Q . S . C . 79
Related party balancesAmounts due from and due to related parties are disclosed in Notes 6 and 12 respectively. These balances do not carry interest and are repayable on mutually agreed dates, generally within one year.
The Group did not record any impairment of receivables relating to amounts due from related parties in either year. This assessment is undertaken each financial year through examining the financial position of the related party and the market in which the related party operates.
ParentThe Group’s ultimate parent is Al Faisal Holding Company W.L.L.
Compensation of key management personnelThe remuneration of key management during the year was as follows:
2014QR
2013QR
Short-term benefits 8,835,615 7,904,794Employees’ end of service benefits 753,514 408,934
9,589,129 8,313,728
25 RELATED PARTY DISCLOSURES (continued)
The Board of Directors of the Company proposed bonus shares of 5% of the share capital amounting to QR 300,000,000 (30,000,000 shares) (2013: Nil) and cash dividend of 10% of the share capital amounting to QR 600,000,000 from the retained earnings as at 31 December 2014 (2013: Nil).
26 DIVIDEND
27 SEGMENT INFORMATION
For management purposes, the Group is organised into business units based on their nature of activities and has four reportable segments and the Head Office as follows:
For management purposes, the Group is organised into business units based on their nature of activities and has four reportable segments and the Head Office as follows:
Property: The segment consists of City Center Qatar Branch and Aamal Real Estate Branch which are involved in leasing the facilities of retail outlet complex, real estate investments and property rental businesses.
NOTES TO THE CONSOLIDATED FINANCIAL STATEMENTSFor the year ended 31 December 2014
Trading and distribution:The segment involves wholesale and/or retail distribution of pharmaceutical and consumable items, home appliances, medical equipment, tyres and lubricants and industrial printing. The segment includes the following entities:
• Ebn Sina Medical Branch• Aamal Medical Branch • Aamal Trading and Distribution Branch• Foot Care Center Branch• Ebn Sina Health Care Solutions City Center Pharmacy (Good Life Pharmacy Branch)• Al Farazdaq Company W.L.L.• Aamal Optical Supplies Company W.L.L.
Industrial manufacturing: The segment involves manufacturing, wholesale and/or retail distribution of electric cables and tools, aggregates, ready-mix concrete and cement blocks and provision of services in relation to industrial investment, repair and construction of power plants, trading of LED lighting products and management of industrial enterprises. The segment includes the following entities:
• Aamal Cement Industries W.L.L.• Aamal Readymix Branch• Doha Cables Qatar W.L.L. • Senyar Industries Qatar Holding W.L.L.• Advanced Pipes and Casts Company W.L.L.• Gulf Rocks Company W.L.L.• Ci-San Trading Company W.L.L.• Innovative Lighting Company W.L.L.
Managed services: The segment involves provision of housekeeping and cleaning services, facilities management services, energy services, call centre services, building maintenance and acting as travel agents. The segment includes the following entities:
• Aamal Service Branch • Aamal Travels Branch• Ecco Gulf Co. W.L.L.• Johnson Controls Qatar W.L.L.
Head Office:It provides corporate services to the branches and subsidiaries of the Group.
The managing director of the Group monitors the operating results of its business units separately for the purpose of making decisions about resource allocation and performance assessment. Segment performance is evaluated based on operating profit or loss of these segments. Transfer pricing between operating segments are on arm’s length basis in a manner similar to transactions with third parties.
27 SEGMENT INFORMATION (continued)
NOTES TO THE CONSOLIDATED FINANCIAL STATEMENTSFor the year ended 31 December 2014

w w w.a a m a l . c o m .q a A n n u a l R e p o r t 2 0 1 480 A a m a l A n n u a l R e p o r t 2 0 1 4 A a m a l C o m p a n y Q . S . C . 81
27
SEGM
ENT
INFO
RMAT
ION
(con
tinue
d)
Oper
atin
g se
gmen
ts:
The o
pera
ting s
egme
nt, af
ter el
imina
tion o
f inter
-bra
nch a
nd in
ter-co
mpan
y tra
nsac
tions
, is pr
esen
ted as
follo
ws:
NOTES TO THE CONSOLIDATED FINANCIAL STATEMENTSFor the year ended 31 December 2014
For t
he ye
ar en
ded
31 D
ecem
ber 2
014
Prop
erty
Trad
ing a
nd
distri
butio
nIn
dustr
ial
man
ufac
turin
gM
anag
ed se
rvice
sHe
ad O
ffice
Elim
inatio
nsTo
tal
QRQR
QRQR
QRQR
QR
Reve
nues
- Exte
rnal
partie
s28
2,767
,713
723,6
67,62
4 1,
068,9
44,11
5 63
,725,1
62
--
2,139
,104,6
14- I
nter s
egme
nts5,9
82,76
3 5,
137,8
89
65,22
3,136
472,8
00
-(7
6,816
,588)
-
288,7
50,47
6 72
8,805
,513
1,13
4,167
,251
64,19
7,962
-
(76,8
16,58
8)2,1
39,10
4,614
Oper
ating
resu
lts 22
3,323
,839
114,8
87,35
6 51
,683,9
89
8,25
4,874
(4
9,660
,918)
-
348,4
89,14
0 Fa
ir valu
e gain
s 25
1,692
,874
-
-
-
-
-
251,6
92,87
4
Profi
t/(lo
ss) f
or th
e yea
r 47
5,016
,713
114,8
87,35
6 51
,683,9
89
8,25
4,874
(4
9,660
,918)
-
600,1
82,01
4
Depr
eciat
ion 1,
487,9
84
4,16
8,646
35
,387,3
74
1,91
3,213
1,
338,2
68
-
44,29
5,485
(i)
Note
:
(i)
Inter
-segm
ent r
even
ues a
re el
imina
ted on
cons
olida
tion.
For t
he ye
ar e
nded
31
Dece
mbe
r 201
3Pr
oper
tyTr
ading
and
dis
tribu
tion
Indu
strial
m
anuf
actu
ring
Man
aged
serv
ices
Head
Offic
eEl
imina
tions
Tota
lQR
QRQR
QRQR
QRQR
Reve
nues
- Exte
rnal
partie
s26
0,360
,172
578,9
09,98
31,2
31,52
2,768
51,80
2,210
--
2,122
,595,1
33- I
nter s
egme
nts1,2
53,91
46,8
43,11
829
,639,8
7334
,450,5
21-
(72,1
87,42
6) (i)
-
261,6
14,08
658
5,753
,101
1,261
,162,6
4186
,252,7
31-
(72,1
87,42
6)2,1
22,59
5,133
Oper
ating
resu
lts20
0,811
,944
86,49
2,834
22,63
6,250
5,157
,436
(47,8
64,88
2)-
267,2
33,58
2Fa
ir valu
e gain
s24
5,051
,107
--
--
-24
5,051
,107
Profi
t / (L
oss)
for th
e yea
r44
5,863
,051
86,49
2,834
22,63
6,250
5,157
,436
(47,8
64,88
2)-
512,2
84,68
9
Depr
eciat
ion2,0
66,29
04,3
45,43
833
,049,0
891,7
60,30
51,3
34,38
2-
42,55
5,504
27
SEGM
ENT I
NFOR
MATI
ON (c
ontin
ued)
Oper
atin
g se
gmen
ts: (
cont
inue
d)
NOTES TO THE CONSOLIDATED FINANCIAL STATEMENTSFor the year ended 31 December 2014

w w w.a a m a l . c o m .q a A n n u a l R e p o r t 2 0 1 482 A a m a l A n n u a l R e p o r t 2 0 1 4 A a m a l C o m p a n y Q . S . C . 83
27
SEGM
ENT I
NFOR
MATI
ON (c
ontin
ued)
Asse
ts an
d lia
bilit
ies:
NOTES TO THE CONSOLIDATED FINANCIAL STATEMENTSFor the year ended 31 December 2014
At 31
Dec
embe
r 201
4Pr
oper
tyTr
ading
and
dis
tribu
tion
Indu
strial
m
anuf
actu
ring
Man
aged
serv
ices
Head
Offic
eEl
imina
tions
Tota
lQR
QRQR
QRQR
QRQR
Curre
nt as
sets
390,9
18,92
249
7,691
,381
630,9
82,72
856
,053,6
8238
1,327
,953
(264,7
34,62
2)
1,692
,240,0
44No
n-cu
rrent
asse
ts6,6
89,12
0,245
14,71
1,495
658,9
51,63
14,6
74,23
67,5
93,35
3(2
,272,2
26)
7,372
,778,7
34
Tota
l ass
ets
7,080
,039,1
6751
2,402
,876
1,289
,934,3
5960
,727,9
1838
8,921
,306
(267
,006,8
48)
9,065
,018,7
78
Curre
nt lia
bilitie
s31
8,607
,747
153,0
55,09
262
1,534
,737
16,44
4,125
281,0
99,08
7(26
4,732
,630)
1,1
26,00
8,158
Non-
curre
nt lia
bilitie
s 13
0,826
,815
8,215
,884
110,4
01,60
33,4
71,61
01,7
93,55
6-
254,7
09,46
8
Tota
l liab
ilities
449,4
34,56
216
1,270
,976
731,9
36,34
019
,915,7
3528
2,892
,643
(264
,732,6
30)
1,380
,717,6
26
Capit
al ex
pend
iture
(ii)
27,06
6,263
6,880
,155
57,15
8,174
2,246
,493
18,55
2-
93,36
9,637
(i) (i) (i)
27
SEGM
ENT
INFO
RMAT
ION
(con
tinue
d)
Asse
ts an
d lia
bilit
ies: (
cont
inue
d)
Note
:
(i)
Inter
-segm
ent b
alanc
es ar
e elim
inated
on co
nsoli
datio
n.(ii)
Ca
pital
expe
nditu
res c
onsis
t of a
dditio
ns to
prop
erty,
plan
t and
equip
ment
and i
nves
tmen
t pro
pertie
s
NOTES TO THE CONSOLIDATED FINANCIAL STATEMENTSFor the year ended 31 December 2014
At 3
1 De
cem
ber 2
013
Prop
erty
Trad
ing a
nd
distri
butio
nIn
dustr
ial
man
ufac
turin
gM
anag
ed se
rvice
sHe
ad O
ffice
Elim
inatio
nsTo
tal
QRQR
QRQR
QRQR
QR
Curre
nt as
sets
227,5
52,33
836
2,906
,431
620,8
07,97
961
,349,4
1550
6,386
,922
(301,6
36,99
5)
1,477
,366,0
90No
n-cu
rrent
asse
ts6,4
11,86
8,160
12,60
4,763
622,3
86,23
84,3
48,87
66,6
24,54
8(2
,243,8
05)
7,055
,588,7
80
Total
asse
ts6,6
39,42
0,498
375,5
11,19
41,2
43,19
4,217
65,69
8,291
513,0
11,47
0(30
3,880
,800)
8,532
,954,8
70
Curre
nt lia
bilitie
s28
0,995
,335
113,5
11,16
063
4,402
,777
26,07
0,802
496,2
60,18
5(30
1,636
,995)
1,2
49,60
3,264
Non-
curre
nt lia
bilitie
s 72
,701,5
628,0
08,48
510
0,016
,943
3,181
,668
1,433
,799
-18
5,342
,457
Total
liabil
ities
353,6
96,89
712
1,519
,645
734,4
19,72
029
,252,4
7049
7,693
,984
(301
,636,9
95)
1,434
,945,7
21
Capit
al ex
pend
iture
(ii)
47,02
4,050
8,290
,870
100,7
43,00
81,3
97,74
216
8,151
-15
7,623
,821
(i) (i) (ii)

w w w.a a m a l . c o m .q a A n n u a l R e p o r t 2 0 1 484 A a m a l A n n u a l R e p o r t 2 0 1 4 A a m a l C o m p a n y Q . S . C . 85
Objectives and policiesThe Group’s principal financial liabilities comprise interest bearing loans and borrowings, bank overdrafts, amounts due to related parties and trade accounts payable. The main purpose of these financial liabilities is to raise finance for the Group’s operations. The Group has various financial assets such as trade accounts receivable, amounts due from related parties, bank balances, retention receivable and other receivables, which arise directly from its operations.
The main risks arising from the Group’s financial instruments are market risk, credit risk and liquidity risk. The Board of Directors reviews and agrees policies for managing each of these risks, which are summarised below.
Market riskMarket risk is the risk that changes in market prices, such as interest rates and foreign currency exchange rates will affect the Group’s profit, equity or value of its holding of financial instruments. The objective of market risk management is to manage and control the market risk exposure within acceptable parameters, while optimising return.
Equity price riskEquity price risk is the risk that the Group’s earnings will be affected as a result of fluctuations in fair value of equity instruments. Equity price risk arises from available-for-sale investments. However the Group’s exposure to equity price risk is minimal as it doesn’t hold significant available-for-sale investments.
Interest rate riskThe Group’s financial assets and liabilities that are subject to interest rate risk comprise bank deposits, interest bearing loans and borrowings and bank overdrafts. At the reporting date, the interest rate profile of the Group’s interest bearing financial instruments was as follows:
28 FINANCIAL RISK MANAGEMENT
2014QR
2013QR
Fixed interest rate instruments:Financial assets - 113,035,962Financial liabilities (94,683,417) (122,037,121)
(94,683,417) (9,001,159)
Floating interest rate instruments:Financial assets 376,877,117 127,024,345Financial liabilities (942,012,968) (786,934,709)
(565,135,851) (659,910,364)
The Group’s exposure to the risk of changes in market interest rates relates primarily to the Group’s financial assets and liabilities with floating interest rates.
The following table demonstrates the sensitivity of the consolidated statement of income to reasonably possible changes in interest rates by 25 basis points, with all other variables held constant. The sensitivity of the consolidated statement of income is the effect of the assumed changes in interest rates for one year, based on the floating rate financial assets and financial liabilities held at 31 December. The effect of decreases in interest rates is expected to be equal and opposite to the effect of the increases shown.
Changes in basis points
Effect on profit QR
2014Floating interest rate instruments +25 b.p. (1,412,840)
2013Floating interest rate instruments +25 b.p. (1,649,776)
NOTES TO THE CONSOLIDATED FINANCIAL STATEMENTSFor the year ended 31 December 2014
Foreign currency riskForeign currency risk is the risk that the value of the financial instruments will fluctuate due to changes in foreign exchange rates.
Trade accounts payable and accrued expenses include amounts due in foreign currencies, mainly US Dollars, UAE Dirhams, Great Britain Pounds (GBP) and Euros, of which the Group has a currency risk primarily on the balances payable in Euros and GBP amounting to QR 52,640,528 (2013: QR 14,400,634).
The Group does not hedge its foreign currency exposure. As both Qatari Riyal and UAE Dirhams are pegged to the US Dollar, balances in US Dollars and UAE Dirhams are not considered to represent significant currency risk to the Group.
The table below indicates the Group’s foreign currency exposure on its monetary assets and liabilities. The analysis calculates the effect of a reasonably possible movement of the QR currency rate against the Euro and GBP, with all other variables held constant, on the consolidated statement of income (due to the fair value of currency sensitive monetary assets and liabilities). The effect of decreases in foreign currency exchange rates is expected to be equal and opposite to the effect of the increases shown.
28 FINANCIAL RISK MANAGEMENT (continued)
Increase in foreign cur-rency rate to the QR
Effecton profit
QR2014 +5% (2,632,026)
2013 +5% (720,032)
Credit riskCredit risk is the risk that one party to a financial instrument will fail to discharge an obligation and cause the other party to incur a financial loss. The Group’s exposure to credit risk is indicated by the carrying amount of its financial assets, which consist principally of trade accounts receivable, retention receivable, amounts due from related parties, other receivables and bank balances.
The Group sells its products and provides services to various parties. It is the Group’s policy that all customers who wish to obtain on credit terms are subject to credit verification procedures to ensure credit worthiness. Each new customer is analysed individually for creditworthiness before the delivery of products or services. Customers that fail to meet the creditworthiness may transact with the Group only on prepayment basis. Property rentals are mostly received in advance or contracted with post dated cheques. In addition, receivable balances are monitored on an ongoing basis and the purchase limits are established for each credit customer, which are reviewed regularly based on the level of past transactions and settlement. The Group’s maximum exposure with regard to trade accounts receivable, net of allowance reflected at the reporting date, was as follows:
Business segment: 2014QR
2013QR
Property 14,083,250 15,478,832Trading and distribution 240,890,368 194,343,597Industrial manufacturing 129,982,358 183,119,753Managed services 23,224,715 18,069,385
408,180,691 411,011,567
NOTES TO THE CONSOLIDATED FINANCIAL STATEMENTSFor the year ended 31 December 2014

w w w.a a m a l . c o m .q a A n n u a l R e p o r t 2 0 1 486 A a m a l A n n u a l R e p o r t 2 0 1 4 A a m a l C o m p a n y Q . S . C . 87
28 FINANCIAL RISK MANAGEMENT (continued)
With respect to credit risk arising from the other financial assets of the Group, the Group’s exposure to credit risk arises from default of the counterparty, with a maximum exposure equal to the carrying amount of these instruments as follows:
2014QR
2013QR
Bank balances 554,659,257 436,136,756Amounts due from related parties 318,597,869 214,439,950Retention and other receivables 54,775,995 48,290,351
928,033,121 698,867,057
Credit risk (continued)The group reduces the exposure of credit risk arising from other financial assets by maintaining bank accounts in reputed banks and providing services only to creditworthy related parties.
The management considers the bank balances and amounts due from related parties as high grade financial assets and trade accounts receivable and other receivables as standard grade financial assets. When a financial asset is identified to be impaired, the management downgrades such assets to impaired category and provides adequate allowances.
Liquidity riskLiquidity risk is the risk that the Group will not be able to meet its financial obligations as they fall due. The Group’s approach to managing liquidity risk is to ensure, as far as possible, that it will always have sufficient liquidity to meet its liabilities when due, under both normal and stressed conditions, without incurring unacceptable losses or risking damage to the Group’s reputation and is to maintain a balance between continuity of funding and flexibility through the use of bank overdrafts and bank loans and borrowings.
The Group monitors its risk to a shortage of funds using a recurring liquidity planning tool. This tool considers the maturity of financial assets (e.g. accounts receivable) and projected cash flows from operations. The Group’s terms of sales or services require amounts to be paid within 30-90 days from the invoiced date.
NOTES TO THE CONSOLIDATED FINANCIAL STATEMENTSFor the year ended 31 December 2014
28 FINANCIAL RISK MANAGEMENT (continued)
28
FINA
NCIA
L RI
SK M
ANAG
EMEN
T (c
ontin
ued)
Liqu
idity
risk
(con
tinue
d)
On d
eman
dQR
Less
than
3 mo
nths
QR3
to 1
2 m
onth
s QR
1 to
5 ye
ars
QR>
5 ye
ars
QRTo
tal
QR
2014
Inter
est b
earin
g loa
ns an
d bor
rowi
ngs
-37
3,027
,786
297,2
15,20
924
5,395
,308
6,355
,957
921,9
94,26
0Ba
nk ov
erdr
afts
2,346
,320
--
--
2,346
,320
Trad
e acc
ounts
paya
ble-
128,4
96,70
927
,622,2
2110
0,922
,626
-25
7,041
,556
Othe
r pay
ables
-74
,982,6
265,0
34,74
32,8
60,38
5-
82,87
7,754
Amou
nts du
e to r
elated
partie
s-
25,86
2,892
11,78
4,356
757,8
25-
38,40
5,073
2,346
,320
602,3
70,01
334
1,656
,529
349,9
36,14
46,3
55,95
71,3
02,66
4,963
On d
eman
dQR
Less
than
3 mo
nths
QR3
to 1
2 m
onth
s QR
1 to
5 ye
ars
QR>
5 ye
ars
QRTo
tal
QR
2013
Inter
est b
earin
g loa
ns an
d bor
rowi
ngs
-52
2,324
,473
239,3
33,32
816
0,092
,748
25,26
1,598
947,0
12,14
7Ba
nk ov
erdr
afts
6,836
,280
--
--
6,836
,280
Trad
e acc
ounts
paya
ble-
303,6
38,79
216
,378,8
65-
-32
0,017
,657
Othe
r pay
ables
-47
,406,8
3020
,210,5
80-
-67
,617,4
10Am
ounts
due t
o rela
ted pa
rties
-25
,305,4
8022
,894,1
11-
-48
,199,5
91
6,836
,280
898,6
75,57
529
8,816
,884
160,0
92,74
825
,261,5
981,3
89,68
3,085
NOTES TO THE CONSOLIDATED FINANCIAL STATEMENTSFor the year ended 31 December 2014

w w w.a a m a l . c o m .q a A n n u a l R e p o r t 2 0 1 488 A a m a l A n n u a l R e p o r t 2 0 1 4 A a m a l C o m p a n y Q . S . C . 89
Capital managementThe Board’s policy is to maintain a strong capital base so as to maintain investor, creditor and market confidence and to sustain future development of the business. The Board of Directors monitors the capital, which the Group defines as total shareholders’ equity, excluding non-controlling interests and the level of dividends to ordinary shareholders.
The Board also seeks to maintain a balance between the higher returns that might be possible with higher levels of borrowings and the advantages and security afforded by a sound capital position. The Group’s target is to achieve a return on shareholders’ equity (excluding non-controlling interests) greater than the weighted average interest expense on interest bearing loans and borrowings. 8
The Group manages its capital structure and makes adjustments to it, in light of changes in economic and business conditions and shareholders’ expectation. No changes were made in the objectives, policies or processes during the years ended 31 December 2014 and 31 December 2013.
The Group monitors the capital using a gearing ratio, which is debt divided by capital plus debt. The Group’s policy is to keep the gearing ratio below 40%. The Group includes within debt, interest bearing loans and borrowings, less cash and cash equivalents. Capital includes equity attributable to the equity holders of the parent.
Financial instruments comprise financial assets and financial liabilities.
Financial assets consist of bank balances, short term bank deposits, amounts due from related parties, retention and other receivables and trade accounts receivable. Financial liabilities consist of bank overdrafts, interest bearing loans and borrowings, amounts due to related parties and trade accounts payable.
The fair values of these financial instruments except for interest bearing loans and borrowings approximate their carrying values due to the short term maturities of these instruments.
The fair value of interest bearing loans and borrowings are estimated based on discounted cash flows using interest rate currently available for the debt or similar terms and remaining maturities.
28 FINANCIAL RISK MANAGEMENT (continued)
2014QR
2013QR
Interest bearing loans and borrowings 904,381,281 914,905,301 Less: Cash and cash equivalents (552,312,937) (429,300,476)
Net debt 352,068,344 485,604,825
Total capital 7,464,775,936 6,902,688,970
Capital and net debt 7,816,844,280 7,388,293,795
Gearing ratio 4.5% 6.6%
29 FAIR VALUES OF FINANCIAL INSTRUMENTS
NOTES TO THE CONSOLIDATED FINANCIAL STATEMENTSFor the year ended 31 December 2014
30 SIGNIFICANT ASSUMPTIONS, ACCOUNTING JUDGEMENTS AND ESTIMATES
Impairment of accounts receivableAn estimate of the collectible amount of trade accounts receivable is made when collection of the full amount is no longer probable. For individually significant amounts, this estimation is performed on an individual basis. Amounts which are not individually significant, but which are past due, are assessed collectively and an allowance applied according to the length of time past due, based on historical recovery rates.
Impairment of inventoriesInventories are held at the lower of cost and net realisable value. When inventories become old or obsolete, an estimate is made of their net realisable value. For individually significant amounts this estimation is performed on an individual basis. Amounts which are not individually significant, but which are old or obsolete, are assessed collectively and a provision is applied according to the inventory type and the degree of ageing or obsolescence, based on anticipated selling prices.
Impairment of goodwillGoodwill embedded in the cost of acquisition of subsidiaries and equity-accounted investees are tested for impairment annually. The calculations of value in use for cash generating units relating to real estate projects are most sensitive to the following assumptions:
Gross margin: Gross margins are based on average values achieved in the period preceding the start of the budgetperiod. These are increased over the budget period for anticipated efficiency improvements.
Discount rates: Discount rates represent the current market assessment of the risks specific to each cash generating unit, regarding the time value of money and individual risks of the underlying assets which have not been incorporated in the cash flow estimates. The discount rate calculation is based on the specific circumstances of the Group and its operating segments and derived from its weighted average cost of capital (WACC). The WACC takes into account both debt and equity. The cost of equity is derived from the expected return on investment by the Group’s investors. The cost of debt is based on the borrowings the Group is obliged to service. Segment-specific risk is incorporated by applying individual beta factors. The beta factors are evaluated annually based on publicly available marked data.
Fair value of investment propertiesThe fair value of investment properties is determined by external, independent property valuers, having appropriate recognised professional qualifications and recent experience in the location and category of the property being valued.
Useful lives of property, plant and equipmentThe Group’s management determines the estimated useful lives of its property, plant and equipment for calculating depreciation. This estimate is determined after considering the expected usage of the asset, physical wear and tear, technical or commercial obsolescence.
Going concernThe Group’s management has made an assessment of the Group’s ability to continue as a going concern and is satisfied that the Group has the resources to continue in business for the foreseeable future. Furthermore, the management is not aware of any material uncertainties that may cast significant doubt upon the Group’s ability to continue as a going concern. Therefore, the consolidated financial statements continue to be prepared on a going concern basis.
Certain subsidiaries of the Group, which have non-GCC ownership, are subject to income tax under Qatar Income Tax Law No. 21 of 2009. The income tax is charged on the share of profits attributable to non-GCC shareholders. For the purpose of these consolidated financial statements, the income tax liability of the foreign shareholders has been excluded, given that the non-GCC shareholders have agreed, under the shareholder agreements signed with the Group, to bear the full liability and make necessary payments.
31 INCOME TAX
NOTES TO THE CONSOLIDATED FINANCIAL STATEMENTSFor the year ended 31 December 2014
Related Documents