Making the world a better place to sit ANNUAL REPORT 2013

Welcome message from author
This document is posted to help you gain knowledge. Please leave a comment to let me know what you think about it! Share it to your friends and learn new things together.
Transcript

Making the world a better place to sit
AnnuAl RepoRt 2013

AnnuAl RepoRt 2013
Important events in 2013
Among the leaders in Europe
About Scandinavian Business Seating
The cEo’s report
corporate Management
corporate Governance
Scandinavian Business Seating chases new growth
Growth through clear differentiation
HÅG
RH
RBM
Directors’ report for 2013
consolidated annual accounts
Annual accounts Scandinavian Business Seating Group AS
Auditor’s report
corporate responsibility report
contacts
CONTENT
01
06
14
20
28
36
48
90
119
04
10
16
26
32
40
80
92

ImPORTANT EVENTS IN 2013
Increased market orientationthe office furniture market saw stable development in 2013. Sales performance in the different markets has varied according to the state of the market, and the group recorded a decline of just below 1 % in sales, compared with 2012. this is consid-ered satisfactory, particularly in relation to the challenges in the european markets. the reorganisation in the sales area, with the introduction of a new organisational model in the sales companies, was completed in 2013. this has given a clearer organisational model, with more defined roles and responsibili-ties, and a distinction between the Key Account Management teams (major projects) and the more dealer-focused teams.
New productsthe new HÅG SoFi, RH Mereo and RBM noor products were first launched at the Stockholm Furniture Fair in February 2013, and have received a very warm welcome on the market. the products have already managed to receive several awards and international recognition.
Still committed to AsiaIn 2013, the subsidiary in Singapore showed a positive devel-opment, and further potential in the region has been identi-fied. last year the group began the work of establishing own companies in Shanghai and Hong Kong.
Establishment in SwitzerlandIn June, the group established a subsidiary in Switzerland, Scandinavian Business Seating AG. on 1 July 2013, the group took over the dealer agreements and employees from our dis-tributor in Switzerland, and brought them to the new company. the running of our operation in Switzerland showed a positive development during the last half of 2013. Better margins and operating profitthe group has continued the work of increasing the efficiency of the entire value chain. A more structured procurement organisation, greater efficiency in the production processes and effective management of production capacity made a great contribution to margins in 2013. the operating profit was also positively affected by strict privatising and a focused approach to activities and fixed costs.
HÅG SoFi

RH Mereo
EBITAOperating revenues
Revenues and results (MNOK)
0
200
400
600
800
1 000
1 200
1 400
2013201220112010200920080
50
100
150
200
250
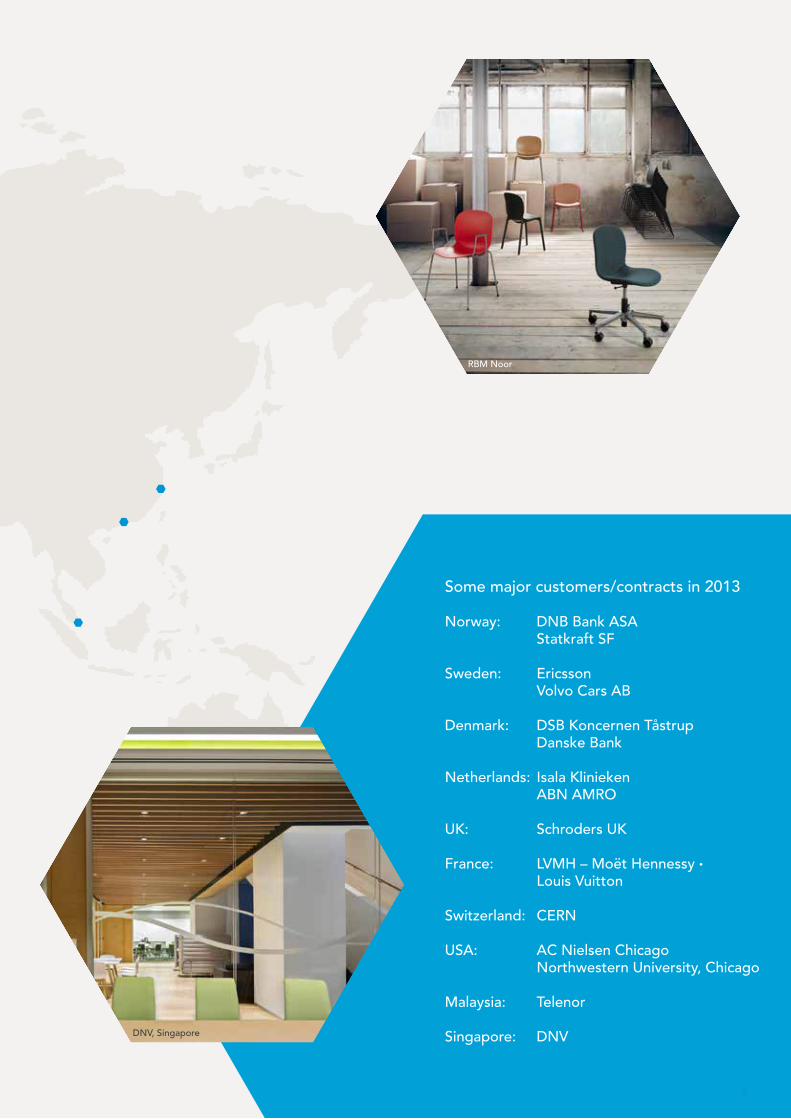
Some major customers/contracts in 2013
Norway: DNB Bank ASA Statkraft SF
Sweden: Ericsson Volvo Cars AB
Denmark: DSB Koncernen Tåstrup Danske Bank
Netherlands: Isala Klinieken ABN AMRO
UK: Schroders UK
France: LVMH – Moët Hennessy · Louis Vuitton
Switzerland: CERN
USA: AC Nielsen Chicago Northwestern University, Chicago
Malaysia: Telenor
Singapore: DNVDNV, Singapore
RBM Noor
3
ANNUAL REPORT 2013 ScANdiNAviAN BUSiNESS SEATiNg ThE ORgANiSATiON
RBM Low Back Bella/ RBM Allround bord
RBM Flip and Fold/HÅG Capisco
HÅG Capisco/HÅG SoFi – Deloitte, Norway
HÅG Futu
RH Support
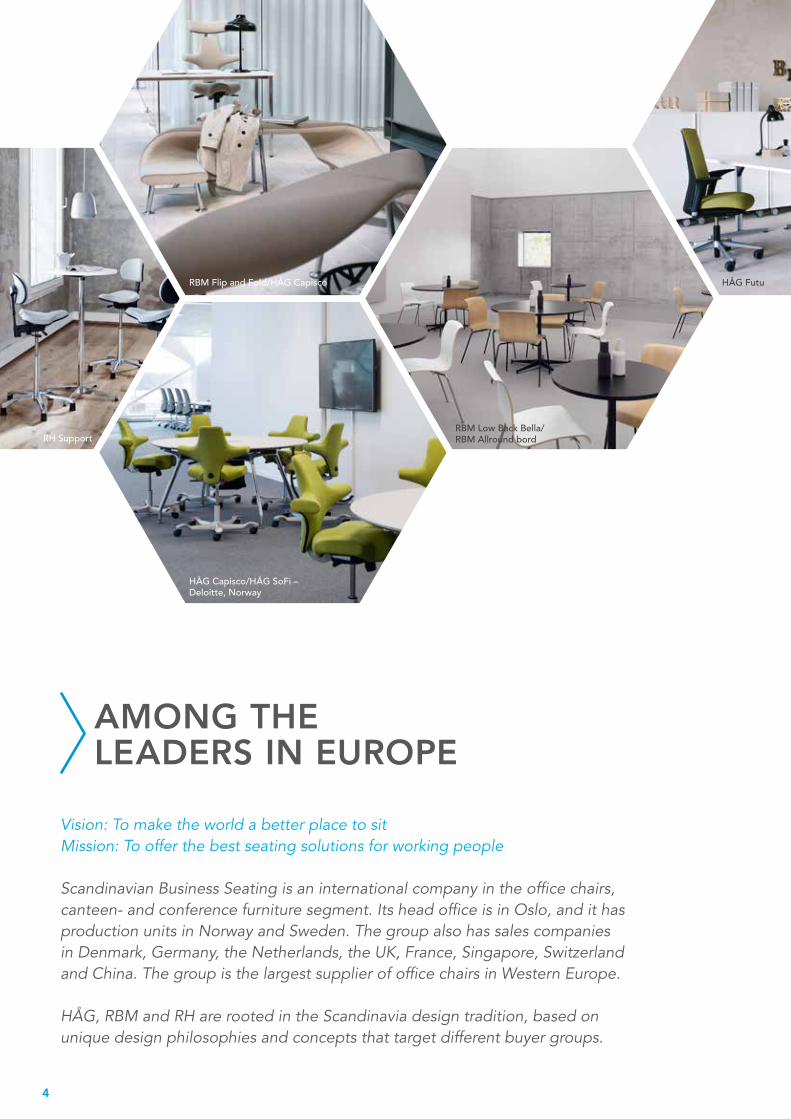
Vision: To make the world a better place to sitMission: To offer the best seating solutions for working people
Scandinavian Business Seating is an international company in the office chairs, canteen- and conference furniture segment. Its head office is in Oslo, and it has production units in Norway and Sweden. The group also has sales companies in Denmark, Germany, the Netherlands, the UK, France, Singapore, Switzerland and China. The group is the largest supplier of office chairs in Western Europe.
HÅG, RBM and RH are rooted in the Scandinavia design tradition, based on unique design philosophies and concepts that target different buyer groups.
AMONG THE LEADERS IN EUROPE
4
Nor
way
Swed
en
Den
mar
k
Ger
man
y
Be-
Ne-
Lux
UK
Expo
rt
Fran
ce
Switz
erla
nd
Asi
a
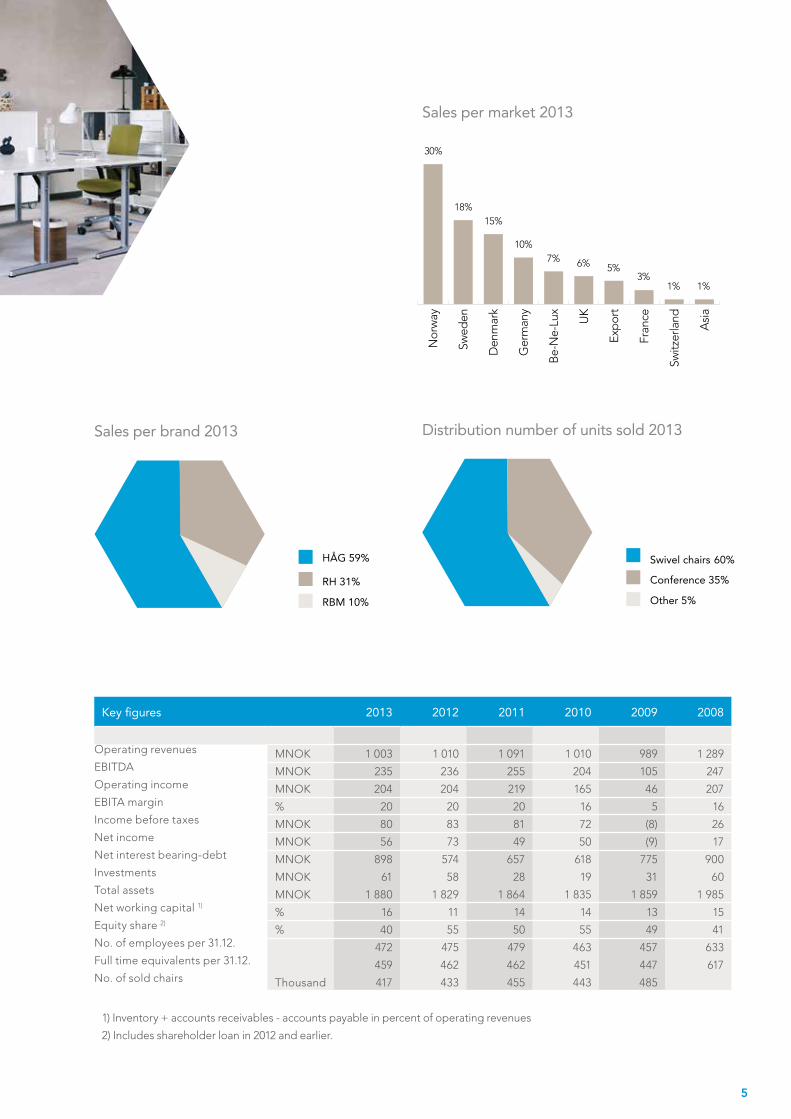
Sales per market 2013
Sales per brand 2013
HÅG 59%
RH 31%
RBM 10%
Distribution number of units sold 2013
Swivel chairs 60%
Conference 35%
Other 5%
30%
18%15%
10%7% 6% 5%
3%1%1%HÅG Futu
Key figures 2013 2012 2011 2010 2009 2008
Operating revenues MNOK 1 003 1 010 1 091 1 010 989 1 289EBITDA MNOK 235 236 255 204 105 247Operating income MNOK 204 204 219 165 46 207EBITA margin % 20 20 20 16 5 16Income before taxes MNOK 80 83 81 72 (8) 26Net income MNOK 56 73 49 50 (9) 17Net interest bearing-debt MNOK 898 574 657 618 775 900Investments MNOK 61 58 28 19 31 60Total assets MNOK 1 880 1 829 1 864 1 835 1 859 1 985Net working capital 1)
% 16 11 14 14 13 15Equity share 2)
% 40 55 50 55 49 41No. of employees per 31.12. 472 475 479 463 457 633Full time equivalents per 31.12. 459 462 462 451 447 617No. of sold chairs Thousand 417 433 455 443 485
1) Inventory + accounts receivables - accounts payable in percent of operating revenues
2) Includes shareholder loan in 2012 and earlier.
5

ABOUT ScANDINAvIAN BUSINESS SEATING
Scandinavian Business Seating is the market leader in Scandinavia for the design, development and produc-tion of office chairs and seating for private and public office environments. Over the course of the last few years, the group has also cemented its position as the largest manufacturer of office chairs in Western Europe, in terms of value.
The group, which comprises Scandinavian Business Seating Group AS and its subsidiaries, owns the Scandinavian brands HÅG, RBM and RH, which all operate in the premium seg-ment of the office chair market.
Scandinavian Business Seating, with 470 employees, is ded-icated to realising the company’s vision: Making the world a better place to sit! The group has its head office in Oslo and production units at Røros in Norway and Nässjö in Sweden. In addition, the group has its own sales companies in Denmark, Germany, the Netherlands, the UK, France, Switzerland, Singapore and China, as well as a large network of independ-ent dealers and partners in other important markets for the company.
Ownership structureThe group was founded in June 2007 and changed its name to Scandinavian Business Seating in autumn 2008. All three merged companies were strong privately-owned start-ups with long traditions and extensive experience of developing, pro-ducing and marketing office chairs in Europe. HÅG has existed since 1943, RBM since 1975 and RH since 1977. The Swedish private equity conglomerate Ratos AB, which is listed on Nas-daq OMX Stockholm, acquired RH, RBM and HÅG in 2007.
Ratos owns companies in a range of industries and is one of Europe’s largest listed private equity conglomerates. Ratos had 18 companies in its portfolio in 2013, with 21 000 employ-ees, sales of SEK 42 billion and an operating income of SEK 3 billion. Ratos’s business concept is to generate, over time, the highest possible return through the professional, active and responsible exercise of its ownership role in companies. In ad-dition to a solid capital base, Ratos also contributes extensive experience and expertise to strategic, industrial, structural and financial processes at the companies it owns.
Market positionScandinavian Business Seating’s main market is Scandinavia, which accounts for 63 per cent of its total sales. Sales to other European markets account for around 31 per cent of total sales, with Germany, the Netherlands and the UK constituting the largest markets.
Office chairs and seating solutions account for about 40 percent of the total office furniture market in Western Europe, which is estimated to be worth around NOK 22 billion per annum. Today, the group is the market leader in office chairs in Scan-dinavia, with a market share of 34 per cent. Over the course of the last few years, the group has also bolstered its position as the largest manufacturer of office chairs in Western Europe, in terms of value. Scandinavian Business Seating is well posi-tioned in terms of price, function, design, environment and geographical cover to win new market shares within all its market segments.
6
ANNUAL REPORT 2013 ScANdiNAviAN BUSiNESS SEATiNg ThE ORgANiSATiON

HÅG SoFi
RH Mereo
The company´s three brands, HÅG, RBM og RH, are based on Scandinavian values and characteristics.
RBM Noor/RBM Twisted Little Star table
7
ANNUAL REPORT 2013 ScANdiNAviAN BUSiNESS SEATiNg ThE ORgANiSATiON

Business strategyScandinavian Business Seating has clear ambitions to expand still further, thereby cementing and strengthening its position as the leading office chair specialist in Europe. We abide by our motto of “different and better”, working with innovative new products and pursuing an offensive marketing strategy, inspired by two distinct market trends –health and the envi-ronment.
Sales and distributionThe group’s products are distributed via a network of inde-pendent dealers. The main markets are served by dedicated companies in Norway, Sweden, Denmark, Germany, the UK, the Netherlands, France, Switzerland and Singapore. The group has established a common export unit, Global Partner Organisation (GPO), for sales to other markets. GPO’s remit includes marketing and selling the company’s three brands to customers in the USA, Europe and the rest of the world via partners and importers. The company also enjoys close co-operation with interior designers, ergonomists and purchas-ers, who, together with our own organisation, provide good dialogue with and service for our end users.
Research and developmentInnovation and design are prerequisites for international success in our industry. Scandinavian Business Seating has a strong research and development culture, backed up by tradition and experience, within the spheres of design, ergonomics and the environment. Research and development work is deemed a top priority, both at brand and group level, with R&D facilities in Oslo and Røros in Norway and at Nässjö in Sweden.
We make the world a better place to sit!Nature did not design people to sit still in office chairs. We need movement and variation and for the person and worksta-tion to interact well in order to perform at our best and, at the same time, protect our health and the environment. Once we realise how much time we spend seated in office chairs, meet-ing chairs or other seating solutions, it becomes clear that the world deserves good chairs to sit on. Scandinavian Business Seating therefore wants to facilitate better performance at work by fulfilling the following mission: To offer the best seat-ing solutions for working people. Our vision, which is also our guiding light, is: To make the world a better place to sit.
Corporate social responsibilityAn overarching concept at Scandinavian Business Seating is that we have a clear responsibility above and beyond making money that involves protecting our shared environment and demonstrating corporate social responsibility and social accountability in areas where our activities come into contact with communities, locally and globally. We wish to achieve this through products and processes that are as resource efficient and environmentally-sound as possible, while also being safe in terms of health. We also work in a targeted man-ner to create a good working environment, with employees who are aware of their responsibilities as regards health and the environment. We provide our employees with training in environmental management systems, and we keep up to date with and comply with relevant laws and regulations within the quality and environment field.
Strong brands – HÅG, RBM and RHThe group’s three brands, HÅG, RBM and RH, are based on Scandinavian values and characteristics. At the same time they each occupy a niche in the office chair market, with dis-tinct design philosophies and concepts that meet the varying needs of the market and customers. Our seating solutions therefore focus strongly on ◆ visual design◆ ergonomics◆ environment◆ quality
A brand is all about the product’s function and user experi-ences, visual design and identity, and the story conveyed by the product.
All our products project a common Scandinavian identity:◆ User-oriented, functional design with optimum use of materials.◆ The right quality at the right price.◆ Balance between ergonomics, the environment and aesthetics, characterised by elegance and simplicity.◆ The most environmentally-correct products at this time.
It is the case that the above result in products that stand out in a market moving in so many different product directions.
8
ANNUAL REPORT 2013 ScANdiNAviAN BUSiNESS SEATiNg ThE ORgANiSATiON

ERGONOMIcS
qUALITy
ENvIRONMENT
vISUALDESIGN
9
ANNUAL REPORT 2013 ScANdiNAviAN BUSiNESS SEATiNg ThE ORgANiSATiON

THE cEO'S REPORT
Well positioned for growth, good profitability and new market sharesDespite stable and somewhat negative growth in the overall market, Scandinavian Business Seating achieved good results in 2013 through our improvement and development projects, and the largest product launches in the company's history. This makes us well positioned for growth, good profitability and new market shares, regardless of how the overall market develops in the time ahead.
Scandinavian Business Seating is the market leader in Scandinavia for the development, design and production of chairs for offices, canteens and conference rooms. The office furniture market in Europe showed more stable development in 2013 following negative growth in 2012. As Europe is our main market, this led to good profitability in 2013. The total turnover is in line with 2012, with growth in Denmark, the UK, France, Switzerland, the USA and Asia. We are noting a stable development in Germany, a negative development in the Netherlands, and a weak decline in Norway, Sweden and Finland due to a fewer number of major projects in the mar-ket. We have nevertheless taken a larger share of the project market in Norway.
Strengthened positionScandinavian Business Seating has reinforced its market posi-tion and also in 2013 has a significant share of the industry's total profitability. The good result is due to stable sales and an effective combination of sourcing and automation of our assembly. We also still note good effects of the past restruc-turing processes.
During 2013 we focused on growth and continuing to increase our market shares in the main markets. Despite a very chal-lenging market in Europe, we have succeeded at achieving growth in individual markets. We have also executed the
largest product launches ever in the history of the company, with three new main product series for all three of our brands, HÅG, RH and RBM. This has helped improve our position in the markets, and secure our leading position as an office chair specialist. Our commitment to the Asian market was further strengthened during the year. We have succeeded at establishing a presence, and have identified key potential for our product solutions in this region. We have also established a new subsidiary in Switzerland.
The company has conducted several projects for operational improvement that have yielded results. This has resulted in better margins and a stronger foundation for continued profitable growth and development. Scandinavian Business Seating now appears to be a company with the financial and organisational clout to take market shares and grow in the markets.
The successful product launches make us well-equipped to tackle different market scenarios, whether dealing with a mar-ket that is still volatile or a market with stronger growth.
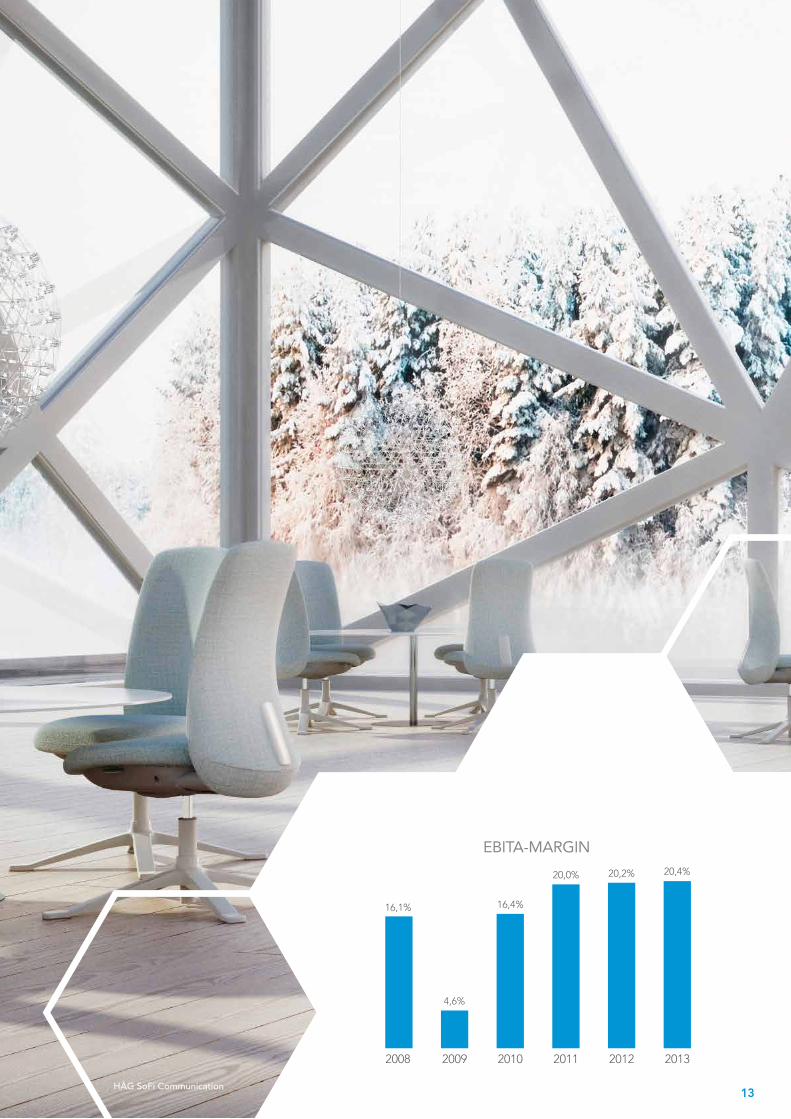
Sales were slightly lower than the previous year in a market that on the whole saw negative growth in certain European markets. Despite the stable/negative development in the overall market, we achieved good results and reinforced our position for future good profitability through our improve-ment and development projects. The earnings before interest, tax and amortisation (EBITA) were 20.4 %, which is on the same level as last year. The good operating margin is due to our continued focus on the main markets and defined target markets (Asia and the USA), combined with operational improvement.
Lars I. Røiri
10
ANNUAL REPORT 2013 ScANdiNAviAN BUSiNESS SEATiNg ThE ORgANiSATiON
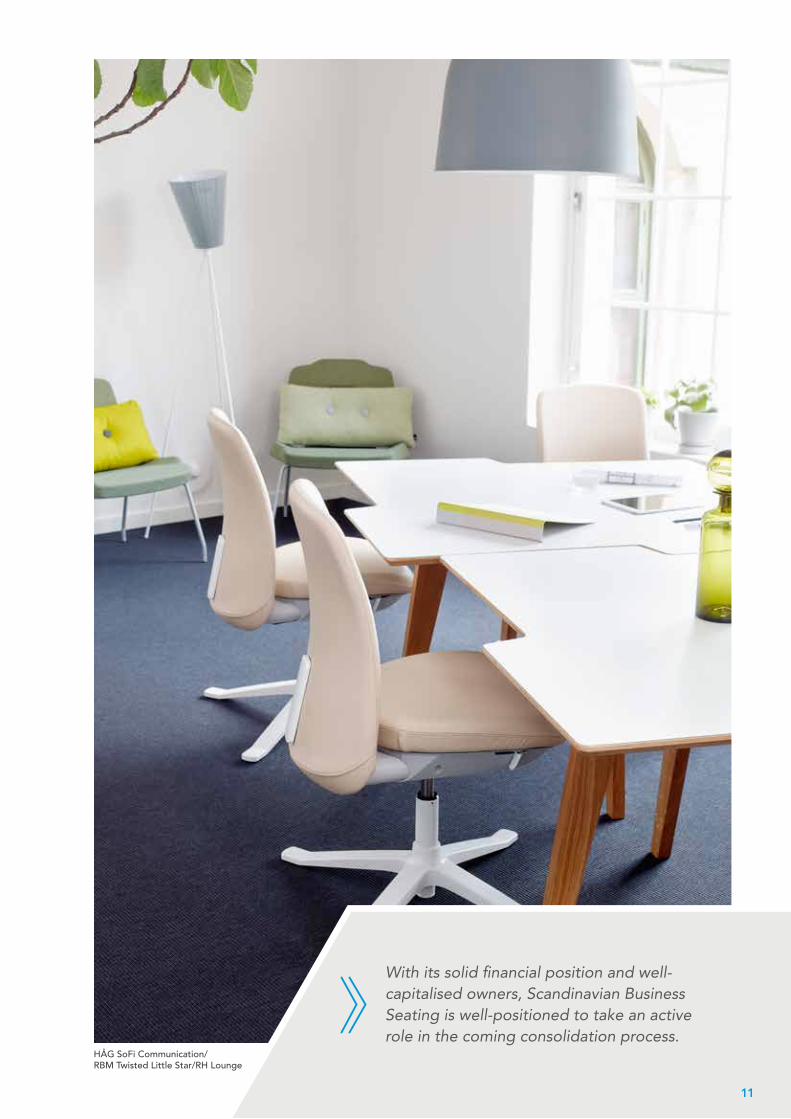
With its solid financial position and well-capitalised owners, Scandinavian Business Seating is well-positioned to take an active role in the coming consolidation process.
HÅG SoFi Communication/ RBM Twisted Little Star/RH Lounge
11
ANNUAL REPORT 2013 ScANdiNAviAN BUSiNESS SEATiNg ThE ORgANiSATiON

Favourable future prospectsWe anticipate the total market development in 2014 to remain uncertain but, as in 2013 with greater variations from market to market. The company's significant exposure in Scandinavia, and particularly Norway, is positive for the group because the macroeconomic prospects for Scandinavia are positive. As for Europe otherwise, we expect a strengthening of our market positions in 2014, partly due to our new products, which were well received on the market in 2013.
An increasingly stable and positive overall market in the medium term means that we continue to expect increased consolidation within the industry, following a lengthy period of very little activity. The market is still very fragmented, and consolidation will probably occur at the manufacturer level in particular. With its solid financial position and well-capitalised owners, Scandinavian Business Seating is well-positioned to take an active role in the coming consolidation process.As a major player in the industry, we strengthened our rela-tionships with customers and suppliers in 2013. Our strat-egy continues to focus on building closer partnerships and promoting long-term collaboration with our most important customers and suppliers. At the same time, we will continue the work of developing and increasing the efficiency of the work processes, when there is still room for improvement and further optimisation.
Scandinavian Business Seating will also continue our offensive focus on product development in 2014. This is an important part of our strategy to ensure that we expand our position as one of Europe's leading names within the development, design and production of seating solutions for office environ-ments. In 2013, we reinforced our position towards the goal to become the leading office chair specialist in the European markets. We will provide the best, most competitive seating solutions by "making the world a better place to sit".
2014 will give us substantial scope for strengthening the com-pany and reinforcing our market position, which will involve: ◆ growing in the European markets by selectively investing in
more resources in individual markets, and further develop-ing our sales and distribution process for increased sales productivity.
◆ actively developing our organisation, partner model and markets in Asia.
◆ keeping a high commitment and investment level in product development.
◆ developing and launching our future e-business model.
The environment and corporate social responsibilityThe group has focused on the environment for over 20 years. This can be seen in product solutions, choice of materials and processes that lead to lower greenhouse gas emissions, less use of chemicals and lower resource consumption. These atti-tudes are visible in everything from product development to production and sale, both in-house and through the require-ments we make on the rest of the value chain. We are pleased to see that also this work yields results and a competitive advantage. In 2013, we received the Norwegian Design Coun-cil's Environment Award for our new HÅG SoFi office chair. The group issues an annual corporate responsibility report based on the internationally recognised Global Reporting Initiative format. In addition to discussing environmental per-formance and goals, the report accounts for how the group works with suppliers in low-cost countries and how we handle our corporate social responsibility for both internal and exter-nal interested parties.
The group had 470 employees at the end of 2013. They are organised in an efficient matrix structure. We are an organi-sation with highly-skilled workers, and have further increased our expertise in key fields. In 2013, the organisation yet again proved its strength and competence through three major launches and several development projects. This is why it is not a cliché to state that our workers and our organisation are our main competitive advantage going ahead.
Scandinavian Business Seating is well-positioned for further growth and profitability, with a clear focus on creating the best possible growth potential for the group.
Lars I. RøiriCEO
12
ANNUAL REPORT 2013 ScANdiNAviAN BUSiNESS SEATiNg ThE ORgANiSATiON
HÅG SoFi Communication
201320122011201020092008
4,6%
16,1% 16,4%
20,0% 20,2% 20,4%
EBITA-MARGIn
13
ANNUAL REPORT 2013 ScANdiNAviAN BUSiNESS SEATiNg ThE ORgANiSATiON
1
2
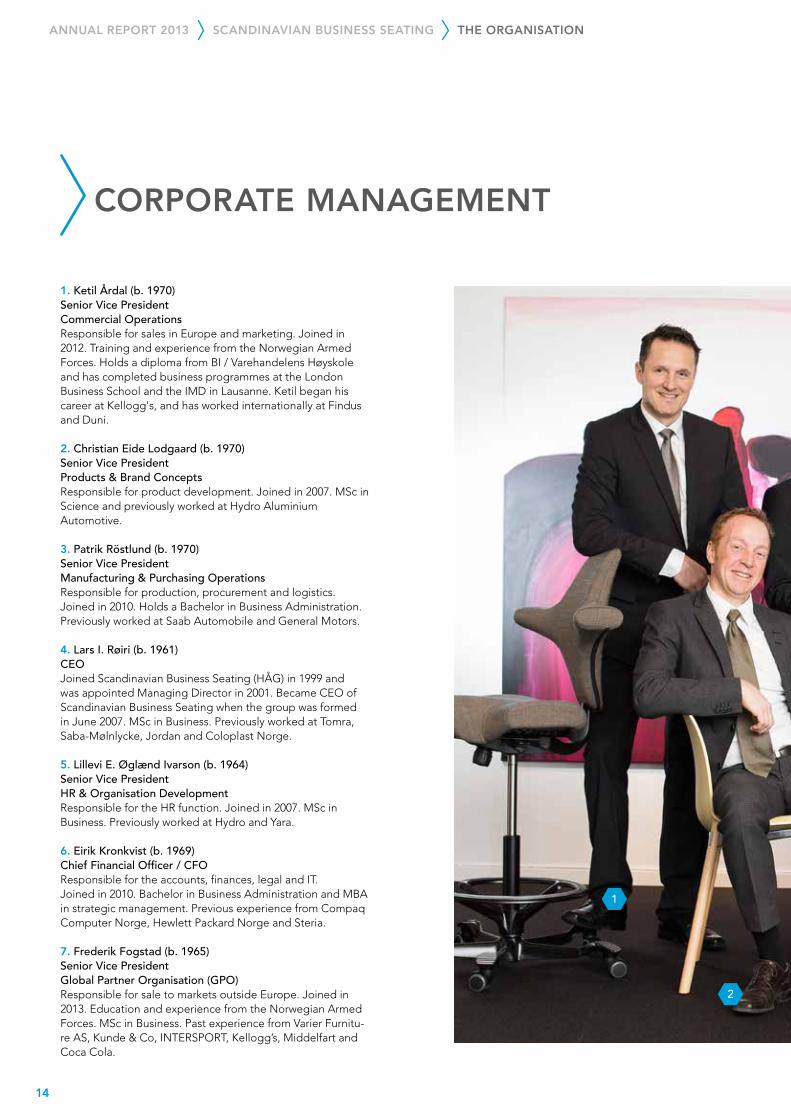
cORPORATE MANAGEMENT
1. Ketil Årdal (b. 1970)Senior Vice President Commercial OperationsResponsible for sales in Europe and marketing. Joined in 2012. Training and experience from the Norwegian Armed Forces. Holds a diploma from BI / Varehandelens Høyskole and has completed business programmes at the London Business School and the IMD in Lausanne. Ketil began his career at Kellogg's, and has worked internationally at Findus and Duni.
2. Christian Eide Lodgaard (b. 1970)Senior Vice President Products & Brand Concepts Responsible for product development. Joined in 2007. MSc in Science and previously worked at Hydro Aluminium Automotive.
3. Patrik Röstlund (b. 1970)Senior Vice President Manufacturing & Purchasing OperationsResponsible for production, procurement and logistics. Joined in 2010. Holds a Bachelor in Business Administration. Previously worked at Saab Automobile and General Motors.
4. Lars I. Røiri (b. 1961)CEOJoined Scandinavian Business Seating (HÅG) in 1999 and was appointed Managing Director in 2001. Became CEO of Scandinavian Business Seating when the group was formed in June 2007. MSc in Business. Previously worked at Tomra, Saba-Mølnlycke, Jordan and Coloplast Norge.
5. Lillevi E. Øglænd Ivarson (b. 1964) Senior Vice PresidentHR & Organisation Development Responsible for the HR function. Joined in 2007. MSc in Business. Previously worked at Hydro and Yara.
6. Eirik Kronkvist (b. 1969)Chief Financial Officer / CFOResponsible for the accounts, finances, legal and IT. Joined in 2010. Bachelor in Business Administration and MBA in strategic management. Previous experience from Compaq Computer Norge, Hewlett Packard Norge and Steria.
7. Frederik Fogstad (b. 1965)Senior Vice President Global Partner Organisation (GPO)Responsible for sale to markets outside Europe. Joined in 2013. Education and experience from the Norwegian Armed Forces. MSc in Business. Past experience from Varier Furnitu-re AS, Kunde & Co, INTERSPORT, Kellogg’s, Middelfart and Coca Cola.
14
ANNUAL REPORT 2013 ScANdiNAviAN BUSiNESS SEATiNg ThE ORgANiSATiON

4
3
5
7
6
15
ANNUAL REPORT 2013 ScANdiNAviAN BUSiNESS SEATiNg ThE ORgANiSATiON

cORPORATE GOvERNANcE
The company complies with the Norwegian recom-mendations regarding corporate governance. As the company is not listed on the stock exchange, its corporate governance has been tailored to the company’s situation. 94 % of the company’s shares are owned by the Swedish listed investment company, Ratos AB. The remaining shares are owned by a large number of executives and board members.
Scandinavian Business Seating has defined its values. Together with the company's corporate culture, this forms the basis on which the board and management believes that Scandinavian Business Seating should be managed. The company's most important success factor has been its ability to develop, produce and market new seating solutions for office environments. Innovation, a cost-efficient procurement function, flexible production, familiarity with the market, and effective sales work are key success factors for Scandinavian Business Seating. Scandinavian Business Seating strives to maintain high ethical standards in its business practices. All of the companies and employees must comply with the relevant laws and regulations in the country in which they work. The company practises values-driven management based on its values. The company has drawn up guidelines for ethics and corporate social responsibility.
BusinessThe objects clause in Scandinavian Business Seating’s articles of association stipulates that: “The company’s activities are the production and sale of office furniture, including chairs. This also comprises directly or indirectly owning other com-panies that perform such activities, the provision of admin-istrative services and other services to such companies, and anything else naturally related to this.”
Scandinavian Business Seating designs, develops, produces and markets seating solutions for office environments. Growth and good profitability will be created through a high degree of innovation, modern Scandinavian design, good ergonomic solutions and a people and environment-oriented approach to the products.
The group's executive management team currently has seven members. They cover the group's main processes in the value chain: CEO, R&D, production and procurement, sales and marketing, HR and finance/IT. The group's executive management team is constantly tailored to suit the compa-ny's strategic and operational development. The CEO has day-to-day responsibility for Scandinavian Business Seating's activities and manages the organisation within the framework set by the board.
Equity and dividendsThe company's equity share as at 31.12.2013 was 40 %. No dividends will be paid in the short and medium term, as avail-able liquidity will primarily be used to invest and repay debt. The board does not have a mandate to increase capital.
Equal treatment of shareholders and transactions with close associatesScandinavian Business Seating has two share classes. Each A (ordinary) share is worth one vote, while B-shares do not have a vote. The company has laid down guidelines that require the board to be notified when board members or the CEO have significant interests in a transaction entered into by the company.
16
ANNUAL REPORT 2013 ScANdiNAviAN BUSiNESS SEATiNg ThE ORgANiSATiON

General meetingsScandinavian Business Seating’s supreme body is the general meeting. The ordinary general meeting must be held every year by the end of March.
Nomination committeeA nomination committee has not been established for the election of shareholder-elected board members. As a result of the ownership structure, it has been natural that the work related to the composition of the board’s shareholder-elected members be handled by the largest shareholder, Ratos AB.
Corporate assembly and board: composition and independenceThe company's articles of associations state that the board must consist of one to ten people, as determined by the general meeting, with the addition of board members that the employees may be entitled to elect. The current board of Scandinavian Business Seating has five members, all of whom are shareholder-elected. The board’s chair is selected by the general meeting. The board is broadly made up of technical, marketing and financial expertise. There are no limits on the terms of board members, as the board’s composition is reg-
ularly reviewed. The CEO is not a member of the board, but regularly attends the board meetings. Scandinavian Business Seating Group AS has no employees, and is a holding company. The employee's representatives sit on the boards of the operating companies Scandinavian Business Seating AS and Scandinavian Business Seating AB.
A dedicated group committee has been established to secure good and open dialogue between the management and the employee-elected representatives across the organisation and geographical location. The committee has permanent members from the sites (two from Røros, two from Nässjö, and one from Oslo), as well as members from the manage-ment and the HR department. Three meetings are normally held each year.
Scandinavian Business Seating and its underlying subsidiaries do not have their own corporate assemblies. An agreement has been concluded on extra board representation from the employees of Scandinavian Business Seating AS. The board of Scandinavian Business Seating AB also has employee representatives.
Group CEOLars I. Røiri
Manufacturing & Purchasing OperationsPatrik Röstlund
Commercial OperationsKetil Årdal
Products & Brand ConceptsChristian Eide Lodgaard
Finance, IT, Legal & RiskEirik Kronkvist
HR & Organisation DevelopmentLillevi Ivarson
Global Partner Organisation (GPO) Frederik Fogstad
ORGANISATIONAL STRUCTURE:
FUNCTIONALRESPONSIBILITY
COMMERCIALRESPONSIBILITY
17
ANNUAL REPORT 2013 ScANdiNAviAN BUSiNESS SEATiNg ThE ORgANiSATiON

The boards of Scandinavian Business Seating's other subsidi-aries consist of the CEO of Scandinavian Business Seating, as chairman of the board, and members of the group's executive management team.
The work of the boardThe board has overall responsibility for the management and control of the company. The management group updates the company’s three-year strategy plan every year on behalf of the board. This plan also contains the company’s financial target figures. The board approves general strategies and sets strategic and financial goals, which are maintained in the company's three year strategy plan and in the annual budget. Outside board meetings, the board serves as advisers to the management group.
Six board meetings are held according to a fixed meeting and work plan. They are linked to the approval of quarterly figures and regular strategy work. The board has rules of procedure, and annually assesses its work. The board appoints the com-pany’s CEO. The CEO performs his or her work pursuant to a job description, the company’s budget and strategy plan, and contact with the board.
The board has a dedicated audit committee made up of selected members of the board. This committee prepares business for review before final decisions are made at the board meeting. The committee performs tasks related to financial reporting, the annual accounts, internal control, and has contact with the company’s auditor. The board annually reviews and approves the company’s policies.
Risk management and internal controlEvery month, and as needed, the CEO reports on the com-pany’s position and financial performance to the board in writing.
Scandinavian Business Seating systematically revises its strategies based on a three-year rolling plan. Every year an extended group of key managers is involved in this work before the strategies are represented to the board. All employees are involved later and are informed of the content and the consequences for their areas of responsibility. The final, revised strategy provides the basis for the coming year's goals and priorities in the company's business plan. The strategy plan must be plain and simple, and provide clear guidelines for every function in the organisation. The ISO 9001 and ISO 14001 general management/quality system is reviewed and evaluated annually. The group’s interest and currency strategy is set by the board, provides guidelines to
secure a good financial structure and to reduce risk in relation to fluctuations in the interest levels and exchange rates.
Scandinavian Business Seating has a number of internal controllers who are organised under a group controller who reports to the CFO. The group has also drawn up a framework for risk management – a so-called Enterprise Risk Manage-ment framework. This framework determines how to work to identify, handle and follow up business risk at the group. The key strategic and operational risk is followed up closely through action plans and regular reporting. The board is regularly briefed on this work.
Remuneration of the boardThe board’s remuneration is reported in note 22 of the com-pany’s consolidated annual report. The board’s remuneration is fixed by the general meeting every year. The board’s remu-neration is not linked to performance. The board members hold no options in the company. The board members have shares in the controlling company Scandinavian Business Seating AS. The list can be found in note 22.
Remuneration of executivesThe remuneration of the CEO and other group management is reported in note 22 of the company’s annual report. The board fixes the terms of the CEO based on a proposal from the chairman of the board. There is no fixed bonus system for executives. However, various forms of bonus schemes are practised, where financial performance and qualitative goals are the most important indicators.
AuditorThe financial positions of almost all of the group’s companies are audited by the auditing firm Ernst & Young. The com-pany’s central finance department cooperates with Ernst & Young in Norway to ensure good and coordinated auditing in all of the group’s units. The auditor’s fees are reported in note 9 of the company s consolidated annual report. Informa-tion is provided at the general meeting about the breakdown of the auditor's remuneration into auditing and other services. The auditor regularly attends audit committee meetings, and attends board meetings that review the annual accounts.
Audits of health, safety and the environment and the mainte-nance of ISO certifications are carried out by Veritas auditors.
18
ANNUAL REPORT 2013 ScANdiNAviAN BUSiNESS SEATiNg ThE ORgANiSATiON

HÅG Sideways
RH Lounge
RBM Ana 19
ANNUAL REPORT 2013 ScANdiNAviAN BUSiNESS SEATiNg ThE ORgANiSATiON

ScANDINAvIAN BUSINESS SEATING cHASES NEW GROWTH
Encouraged by all of the company's positive achieve-ments during the past few years, and the fact that the company has taken the correct steps in a challenging market situation, the management of Scandinavian Business Seating appears offensive, proactive and with great self-confidence at the beginning of a new year. With a newly-trimmed sales organisation, three new product series that have been well received on the market, good profitability and satisfied custom-ers, the main drivers of continued growth, increased profitability and new market shares are in place.
"It has taken us several years to get where we are now. When competitors have had to make cuts during difficult times in recent years, we have had enough profitability to invest and build for the future. Without needing major new investments, we now have significant potential for volume growth as a result of the investments that have already been made in product development, new product launches, a completely new sales organisation, a better foothold in new markets and revitalisation of existing markets," says Scandinavian Business Seating CEO Lars Røiri.
Differentiation"We have committed to the most profitable segment of the office furniture industry: office, canteen and conference chairs, which is the largest segment in the industry, the segment with the most frequent replacement, and the segment where it is possible to differentiate oneself from the competition, as we have succeeded at our differentiation and our three brands HÅG, RH and RBM. During the past six years in particular, our product development has increased our focus on visual design, quality, health/ergonomics and environ-mentally-friendly and sustainable production and products,
so that we can now proudly say that we are industry leaders in documentation of sustainable production and sustainable products. We have incorporated this into our whole design philosophy and our design process. This has turned out to be a profitable venture, which is now paying off. In most tender processes we see an increasing demand for documentation of the environmental impact of the products," says Røiri.
Product development and sales"Despite our recently having launched three new product series, for which we have great hopes in all of our markets, we are definitely not resting on our laurels. Product develop-ment is the main driver of continued growth. We will therefore continue to invest at the same level as earlier in this area, which means that it is still our goal to invest five per cent of our annual turnover in product development. This means that the market can expect new products in office, meeting room and canteen chairs from Scandinavian Business Seating every single year in the near term," says Røiri.
He further has great expectations towards the results of the reorganisation that has taken place in the group's sales and marketing work, where the main focus is now on using the same sales method around the world, with a focus on project sales that yield volumes. This means visiting more customers, dealers and partners, and becoming an even better partner to them. This must take place through active participation on major projects, transfer of competence to the end-customer, training and development of the dealership network, selective focus on those who want to become large and professional, early and direct dialogue with the customer to solve and meet the customer's needs and, not least, close contact with both the network of dealers, contractors and architects to identify projects and generate leads at an early stage of the process.
20
ANNUAL REPORT 2013 ScANdiNAviAN BUSiNESS SEATiNg ThE ORgANiSATiON
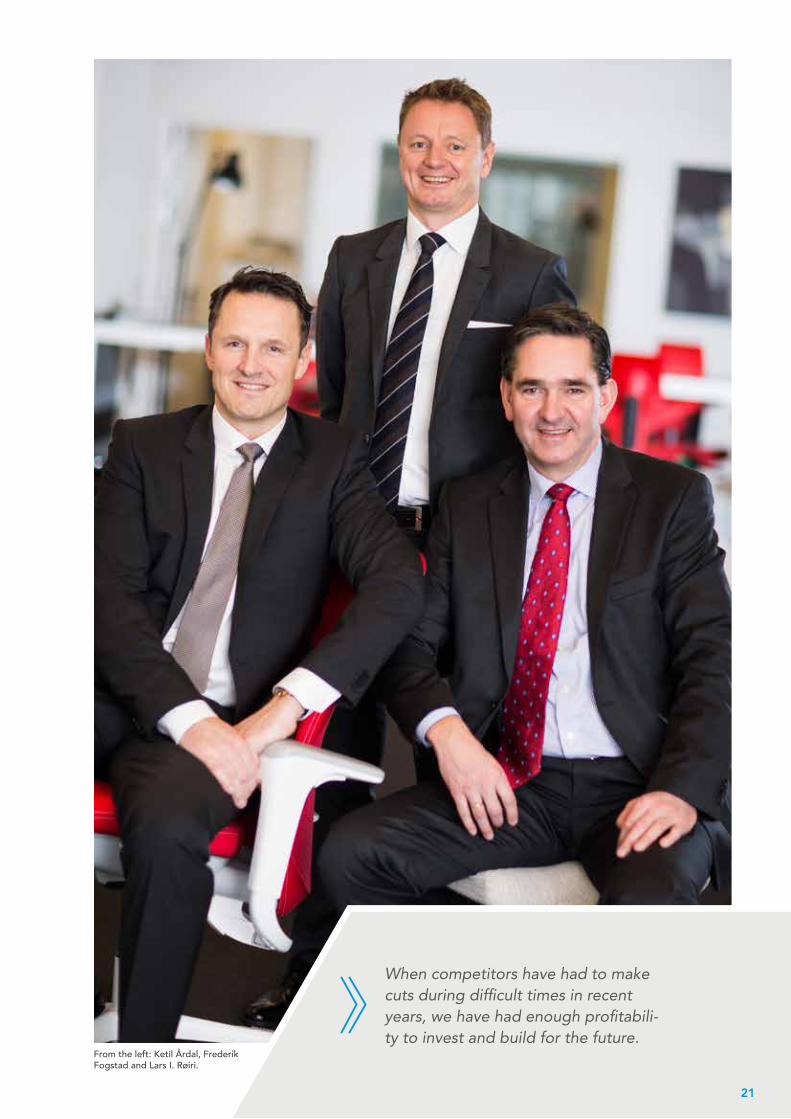
From the left: Ketil Årdal, Frederik Fogstad and Lars I. Røiri.
When competitors have had to make cuts during difficult times in recent years, we have had enough profitabili-ty to invest and build for the future.
21
ANNUAL REPORT 2013 ScANdiNAviAN BUSiNESS SEATiNg ThE ORgANiSATiON

Europe and the USA"During the past few years, we have managed to take market shares in a challenging European market. This puts us in a good position when we now see that the European market is gradually improving. We still have a strong position in Scandinavia, which has been the best corner of the world after the financial crisis, with continued strong potential in both Sweden and Denmark. We also have a solid foothold in Germany, the United Kingdom, the Netherlands, France and Switzerland. We judge the opportunities to be good for organic growth in these markets, especially after we have put a better and more efficient sales organisation in place," says Røiri.
He receives support for this view from Ketil Årdal, who has a seat on the corporate management, with responsibility for the markets in Europe.
"Going ahead, it is motivating that we have managed to take market shares in a challenging European market. We have managed this by professionalizing the sales and marketing work, establishing own subsidiaries with their own showrooms in the main markets (Benelux, the United Kingdom, Germany and Switzerland), establishing KAM functions with a focus on the project market and through a clear strategy and plan for transferring competence to our dealers. This has allowed us to move closer to our end-customers. I also see that we have managed to exploit all of the commercial synergies by fully integrating all sales and marketing work with our other business models. This allows us to avoid fragmentation and suboptimalization of the sales work," says Årdal, who is also pleased that the new product launches have been successful in both Scandinavia and the European market.
"It was the dynamic philosophy behind the chairs, the func-tionality and user-friendliness, that led us to choose HÅG. HÅG chairs prepare us for a flexible future where no person has their own workspace, and where chairs intuitively can be understood and used by employees". (Edwin Swart, Product and Contract Manager, ABN AMRO, Central Facility Services)
"What is most important going ahead will be to keep and reinforce our good position and our market shares, both in Scandinavia and in the rest of Europe. With new people and new sales competence in place in key markets, we will now have to focus on working both smarter and better in the market, and delivering results following from the new form of work," says Årdal, who is also pleased that the company has gradually succeeded at revitalising parts of the US market, in which it has had a presence for a long time, but where the competition from US companies is strong.
Asian hub strategy "We have also consciously committed to new markets in Asia," says Fredrik Fogstad, who sits on the corporate man-agement, with responsibility for Asia and markets in which the company does not have subsidiaries.
UK Showroom. Clerkenwell, London22
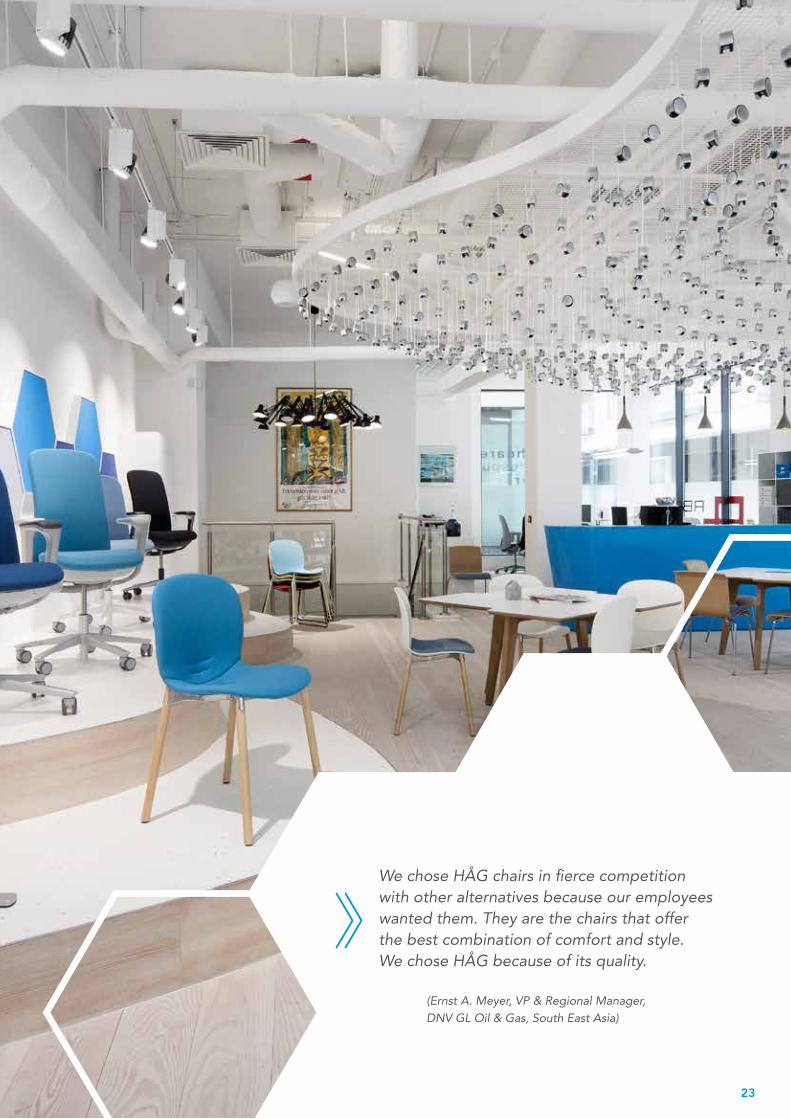
We chose HÅG chairs in fierce competition with other alternatives because our employees wanted them. They are the chairs that offer the best combination of comfort and style. We chose HÅG because of its quality.
(Ernst A. Meyer, VP & Regional Manager, DNV GL Oil & Gas, South East Asia)
23

HÅG SoFi Communication
"There is significant growth in the large Asian market, where growth during the past few years has been 5–10 per cent in our industry. By way of comparison, the overall market in Europe has not moved during the same period, with some variations from market to market. There is also a large seg-ment in Asia for products in the medium and high end mar-ket; segments that are concerned with and demand quality, brands and design from Europe; something we represent," says Fogstad.
"Effectively profiting from the growth in the region going ahead requires a clear focus in the operational efforts, which is why we have a conscious hub strategy, where we want to establish ourselves in large population centres like Shanghai, Hong Kong, Singapore, Beijing and other 'highly potent' metropolises and development areas, also in South Korea. We have therefore made conscious choices based on resource use and options for a return."
"We chose HÅG chairs due to the good ergonomics of the chairs and how this can contribute to employees' health and productivity. Reliable logistics, deliveries and installation at the right time were also key factors in a challenging region like Myanmar. Telenor has had good experience with HÅG
chairs since 2001, which made the choice simple also this time. The 10-year guarantee says it all." (Petter Russ, Product Manager, Telenor Real Estate, International)
We established ourselves in Singapore already two years ago, and now have a KAM function for the project market, sales staff, a showroom and customer service at this hub. We are setting up operations in Shanghai with Chinese employees, copying the Singapore model. We are very conscious of hiring people with a large network of architects, designers, contrac-tors and others who can quickly help us enter into a dialogue with the project market and the end-customer, who ultimately makes decisions on our products and deliverables. The plan is then to set up operations this year in Hong Kong following the same model. We have had a good start in several of these places in that we have made deliveries to several of our Nor-wegian customers once they have established operations in these locations, says Fogstad, who believes that the strongest drivers for continued growth in Asia will be that Scandinavian Business Seating has a focus on and faith in what it does, and sells what it has and who it is. This means globalising and being faithful to the company's values and 'cornerstones' (quality, the environment, ergonomics and design), and telling
24
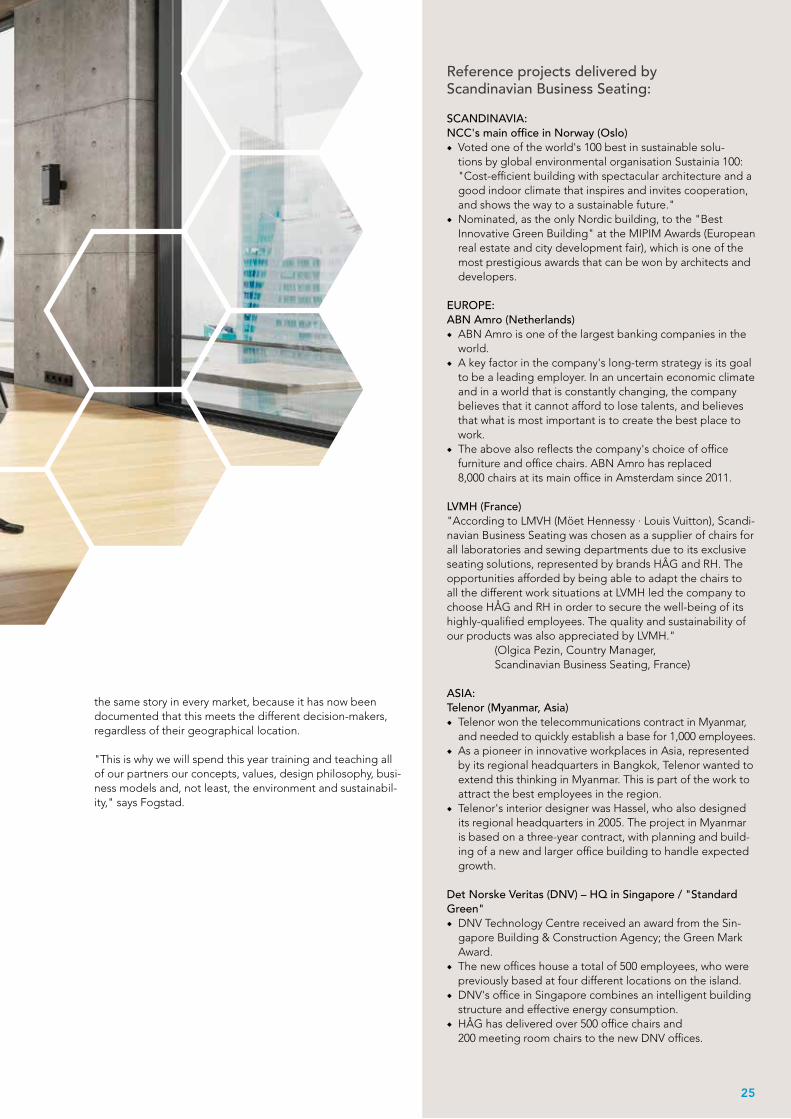
Reference projects delivered by Scandinavian Business Seating:
SCANDINAVIA:NCC's main office in Norway (Oslo) ◆ Voted one of the world's 100 best in sustainable solu-
tions by global environmental organisation Sustainia 100: "Cost-efficient building with spectacular architecture and a good indoor climate that inspires and invites cooperation, and shows the way to a sustainable future."
◆ Nominated, as the only Nordic building, to the "Best Innovative Green Building" at the MIPIM Awards (European real estate and city development fair), which is one of the most prestigious awards that can be won by architects and developers.
EUROPE:ABN Amro (Netherlands) ◆ ABN Amro is one of the largest banking companies in the
world. ◆ A key factor in the company's long-term strategy is its goal
to be a leading employer. In an uncertain economic climate and in a world that is constantly changing, the company believes that it cannot afford to lose talents, and believes that what is most important is to create the best place to work.
◆ The above also reflects the company's choice of office furniture and office chairs. ABN Amro has replaced 8,000 chairs at its main office in Amsterdam since 2011.
LVMH (France)"According to LMVH (Möet Hennessy · Louis Vuitton), Scandi-navian Business Seating was chosen as a supplier of chairs for all laboratories and sewing departments due to its exclusive seating solutions, represented by brands HÅG and RH. The opportunities afforded by being able to adapt the chairs to all the different work situations at LVMH led the company to choose HÅG and RH in order to secure the well-being of its highly-qualified employees. The quality and sustainability of our products was also appreciated by LVMH." (Olgica Pezin, Country Manager, Scandinavian Business Seating, France)
ASIA:Telenor (Myanmar, Asia)
◆ Telenor won the telecommunications contract in Myanmar, and needed to quickly establish a base for 1,000 employees.
◆ As a pioneer in innovative workplaces in Asia, represented by its regional headquarters in Bangkok, Telenor wanted to extend this thinking in Myanmar. This is part of the work to attract the best employees in the region.
◆ Telenor's interior designer was Hassel, who also designed its regional headquarters in 2005. The project in Myanmar is based on a three-year contract, with planning and build-ing of a new and larger office building to handle expected growth.
Det Norske Veritas (DNV) – HQ in Singapore / "Standard Green" ◆ DNV Technology Centre received an award from the Sin-
gapore Building & Construction Agency; the Green Mark Award.
◆ The new offices house a total of 500 employees, who were previously based at four different locations on the island.
◆ DNV's office in Singapore combines an intelligent building structure and effective energy consumption.
◆ HÅG has delivered over 500 office chairs and 200 meeting room chairs to the new DNV offices.
the same story in every market, because it has now been documented that this meets the different decision-makers, regardless of their geographical location.
"This is why we will spend this year training and teaching all of our partners our concepts, values, design philosophy, busi-ness models and, not least, the environment and sustainabil-ity," says Fogstad.
25
GROWTH THROUGH cLEAR DIffERENTIATION
Scandinavian Business Seating builds all of our work around our four cornerstones: quality, the environ-ment, ergonomics and visual design. This means that we can present HÅG, RH and RBM on a foundation of quality and environmental thinking, while highlighting a solid differentiation between the brands based on a unique history of dynamic ergonomics and clear visual design.
The differentiation makes sense to our buyer group's preferences, and significantly contributes to the work to take more market shares in the countries in which we operate.
The same history in every stageWe have spent considerable resources on training our employees to understand why we bring out new and inno-vative products faster than our competitors, what innovation means in terms of functionality and benefits, and how we will bring the products onto the market in a way that creates demand.
Our employees are gathered and united around the story of our cornerstones, and create enthusiasm through a focus on the clear benefits to all people who sit. Every day. Again and again.
Having a strategic focus on building competence both inter-nally and externally has given us a major competitive edge in our markets. On the whole, this has led to the creation of a pan-European understanding and a momentum that is paving the way for further growth.
Digital ventureThe Sales & Training Portal is the first of several digital tools that have come from our comprehensive work to improve our digital sales platform. In the time ahead, we will launch a number of new tools on all types of digital platforms that will make it easier to build added value into our brands – and even easier for our customers to come into direct contact with our concepts and products.
An appealing, engaging and clear presentation of our con-cepts, products and world-class Scandinavian design will help increase our appeal and interest among our target groups. It will be even more important to continue to create interest, an opinion, value and trust in our brands among all of our target groups.
26
ANNUAL REPORT 2013 ScANdiNAviAN BUSiNESS SEATiNg ThE ORgANiSATiON

27
ANNUAL REPORT 2013 ScANdiNAviAN BUSiNESS SEATiNg ThE ORgANiSATiON

HÅG SoFi
28

29
HÅG
The HÅG movementHÅG was founded in 1943 and has been manufactured in Røros, Norway since 1957. In the early 1970s, HÅG went against conventional wisdom and chose a different approach to ergonomic sitting: HÅG established what is still a unique ergonomic philosophy of balanced sitting, which is based on the conviction that people are not made to sit still, but for variation and movement.
HÅG is one of the strongest brands in the office chair market in Scandinavia and one of the top 10 in Europe. This position has been achieved thanks to the brand's unique approach to sitting. Every time we develop a new HÅG product, we bring consid-erable innovation, while remaining true to HÅG's still unique philosophy: HÅG inBalance® keeps you in balanced, contin-uous movement without needing to think about it. We call it "the HÅG movement".
A HÅG chair is designed for the active worker, and ensures that people are alert throughout the working day. Consistent Scandinavian design, accessible functionality and pioneering environmental thinking come together as a greater whole:
Furniture2013 focused on launching and implementing the new HÅG SoFi office chair, which was first shown at Orgatec in Cologne in 2012. With a formidable presentation and reception at the Stockholm Furniture Fair as a beginning, the good start continued in our other markets. The common denominator here is that the HÅG SoFi attends to the user's need for visual and perceived comfort, and provides a good user experience. Through fully-upholstered organic forms and integrated han-dles, the HÅG SoFi appears to be a piece of furniture more than other office chairs. It creates calm and a sense of home at work.
Good designThe HÅG SoFi received the Award for Design Excellence and the Environmental Award for sustainable production from the Norwegian Design Council in 2013. This makes HÅG the brand that has won the most awards from the Norwegian Design Council throughout the years. HÅG's products have received a number of international awards over the years, including the Red Dot Design Award and the iF Design Award.
At its best ageThe HÅG Capisco chair has won a number of prizes for its properties and its characteristic design. After almost 30 years on the market, more HÅG Capisco chairs were produced and delivered in 2013 than ever before. The semi-sitting concept represented by this model was designed and developed by Peter Opsvik in the 1980s, and is as unique and is actually more attractive today than ever before. The product has been a pioneer in environmentally-friendly design and still has a very good environmental profile, compared with its compet-itors. As the first office chair in the world, it was awarded the Nordic Swan label in 2010, and has also met the new stricter requirements for this environmental label.
Environmental pioneer For many years the HÅG brand has distinguished itself inter-nationally through a conscious commitment to the environ-ment and corporate social responsibility. HÅG's office chairs were among the first in Europe to be certified by the US GREENGUARD Environmental Institute. All HÅG collections are also certified according to ISO 14025-EDP (Environmental Product Declaration). This is a certification that shows that HÅG chairs stand out by having the lowest CO2 emissions in the industry.
30
ANNUAL REPORT 2013 ScANdiNAviAN BUSiNESS SEATiNg ThE ORgANiSATiON
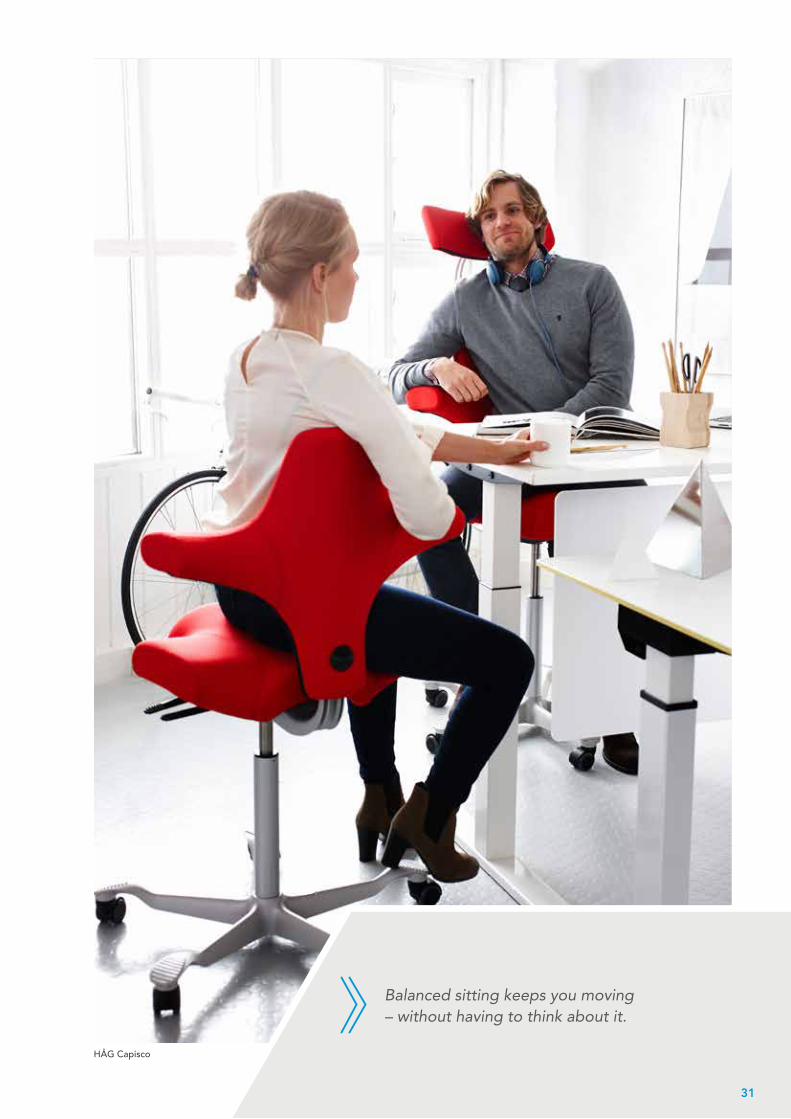
HÅG Capisco
Balanced sitting keeps you moving– without having to think about it.
31
ANNUAL REPORT 2013 ScANdiNAviAN BUSiNESS SEATiNg ThE ORgANiSATiON
32
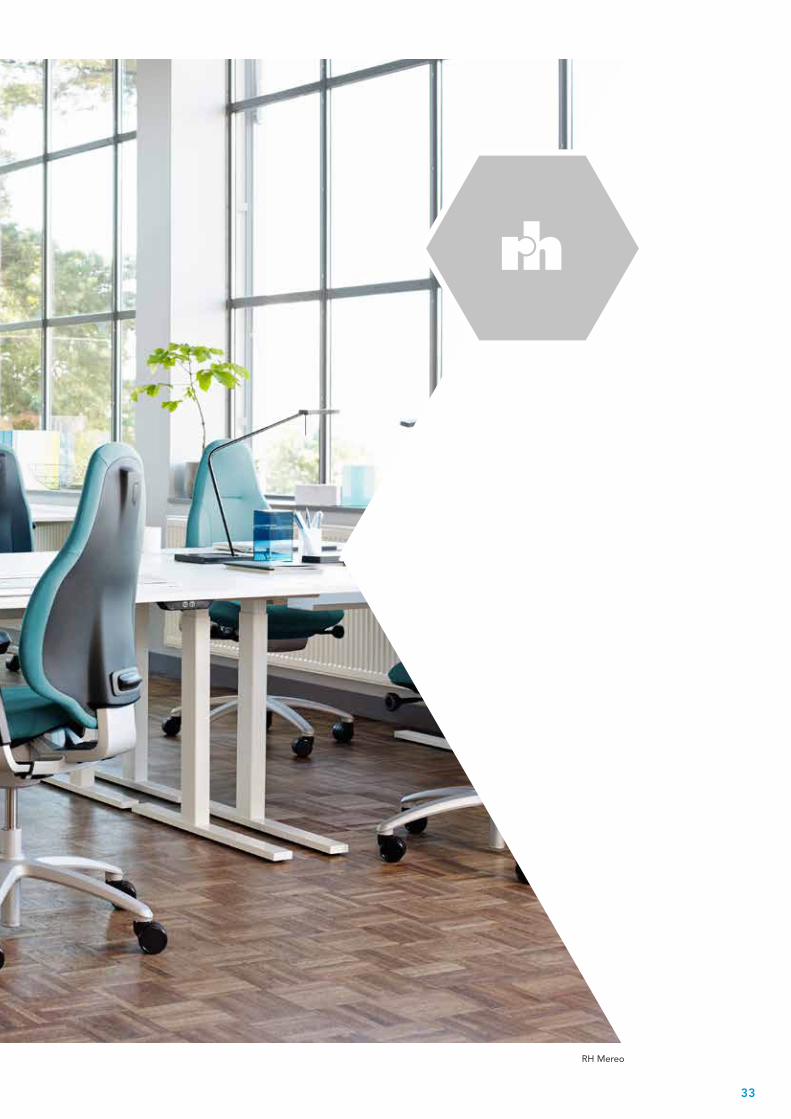
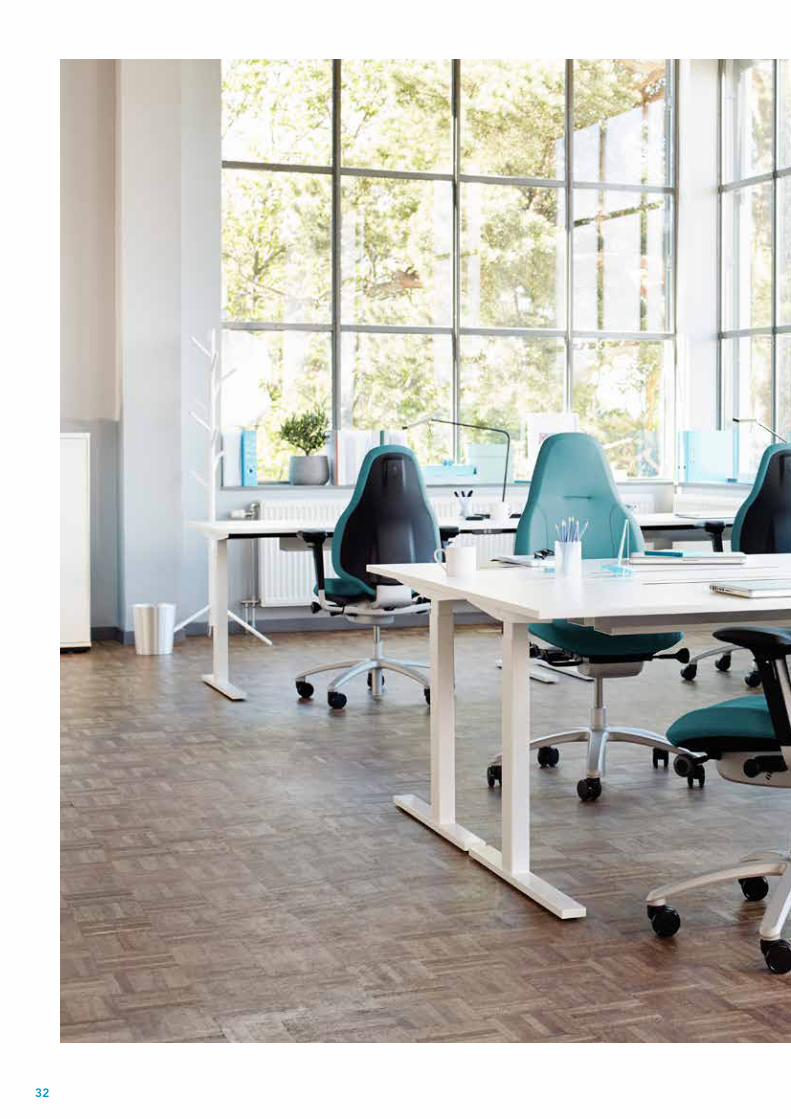
RH Mereo
33

RH
Designed for human performanceWith roots back to 1977, RH is an integral part of the Swed-ish design tradition. When the first RH chair was launched, it attracted warranted attention because it took users seriously. Today, the RH chair is recognised by ergotherapists, physio-therapists and other professionals for its unique ergonomic philosophy. It is based on the importance of an upright sitting position, support and movement. These are qualities that increase the users' job satisfaction, and thus also the employ-ees' efficiency and productivity. From the very beginning, RH's philosophy has been to combine ergonomics and functional design. The strong brand concept "Designed for Human Performance" was incorporated later, to underline the fact that good design and correct ergonomics lead to documenta-ble improvement in performance for organisations that use our products. This has helped make RH office and work chairs market leaders in several European countries, especially in RH's main segments – offices, health care and industry – where users make particularly high requirements on function and design.
Innovation and designAll RH chairs have been developed with a focus on function-ality. RH products are accordingly comfortable ergonomic chairs that offer many adjustment possibilities and are durable. Despite the advanced construction and maximum performance, they are easy to understand and use, with clear pictograms and intuitive handles and grips. The 2PP™ princi-ple was developed for RH. This is a two-point principle that helps the body maintain an upright sitting position and gives good support, while the chair's unique frictionless movement encourages motion. This technology is the basis for all chair series from RH.
Great success with the new RH MereoThe RH Mereo chair family was launched at the Stockholm Furniture Fair in February 2013. The chair became a
fantastic success for the RH brand following production start in August 2013, and has already won a number of major contracts, and become the standard chair for many companies. Our aim in developing the RH Mereo was that the chair would meet the requirements of the dynamic and flexible offices of the future. Our focus was therefore to develop a chair that can be quickly and easily adjusted to the needs of the individual, without compromising ergonomics or performance. The RH Mereo is a product that offers a high level of individual seating comfort, dynamic ergonomics, user friendliness and flexibility that has not been seen on the market before. Extensive use of recycled aluminium instead of steel in many structural parts, together with a high percentage of recycled plastic in large components such as the seat and back, helps give the RH Mereo a world-class carbon footprint.
World-class ergonomics The aim for RH is that the ergonomics and design of the products contribute to increasing the efficiency of the organ-isations that use the products. In 2013, RH received the FIRA Ergonomics Excellence Award for its chairs for the 13th year running. RH is the only brand to have received the award since it was established. This is a strong testament to the RH brand's commitment to first-class ergonomics.
Environmental commitmentThe RH brand focuses on new solutions to protect the environment. This is achieved through Scandinavian Business Seating's commitment to high-quality products and sustaina-ble production processes. The company is certified according to the ISO 14001 environmental standards. Many other com-ponents of the RH chair series are also made using recycled materials. RH was among the first office chair manufacturers whose products were certified in accordance with the interna-tional EPD system (Environmental Product Declaration).
34
ANNUAL REPORT 2013 ScANdiNAviAN BUSiNESS SEATiNg ThE ORgANiSATiON
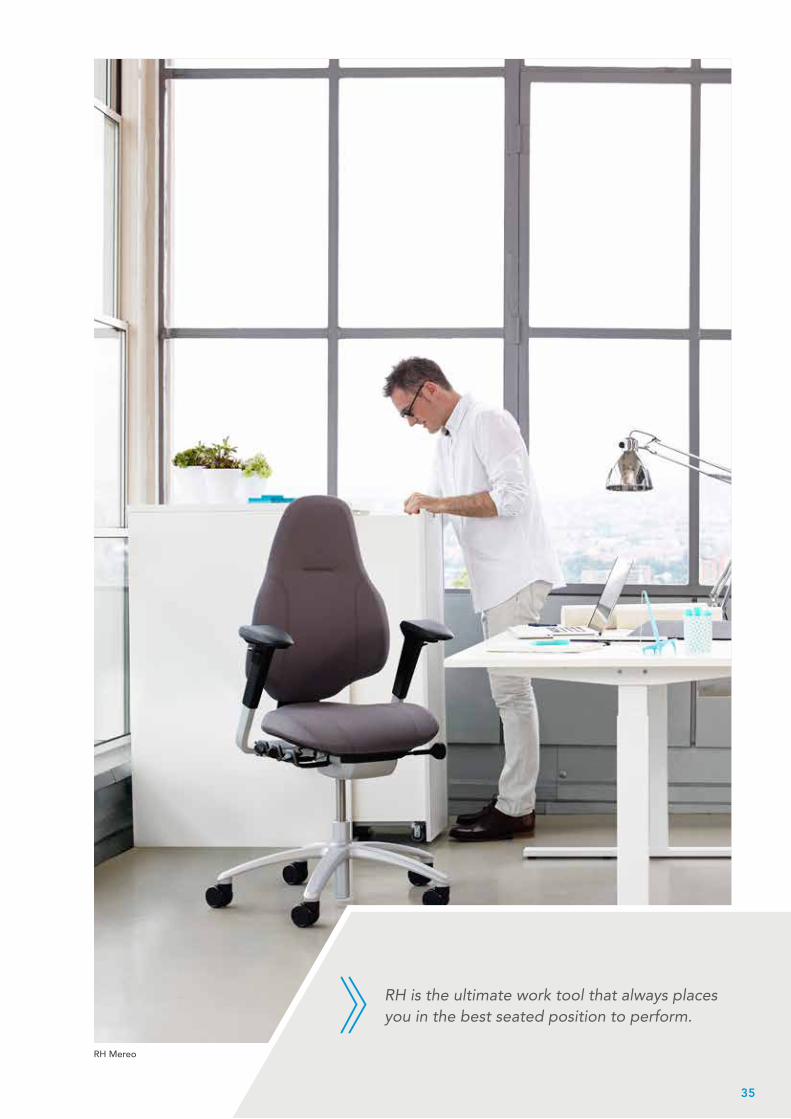
RH is the ultimate work tool that always places you in the best seated position to perform.
RH Mereo
35
ANNUAL REPORT 2013 ScANdiNAviAN BUSiNESS SEATiNg ThE ORgANiSATiON

RBM Noor
36

37
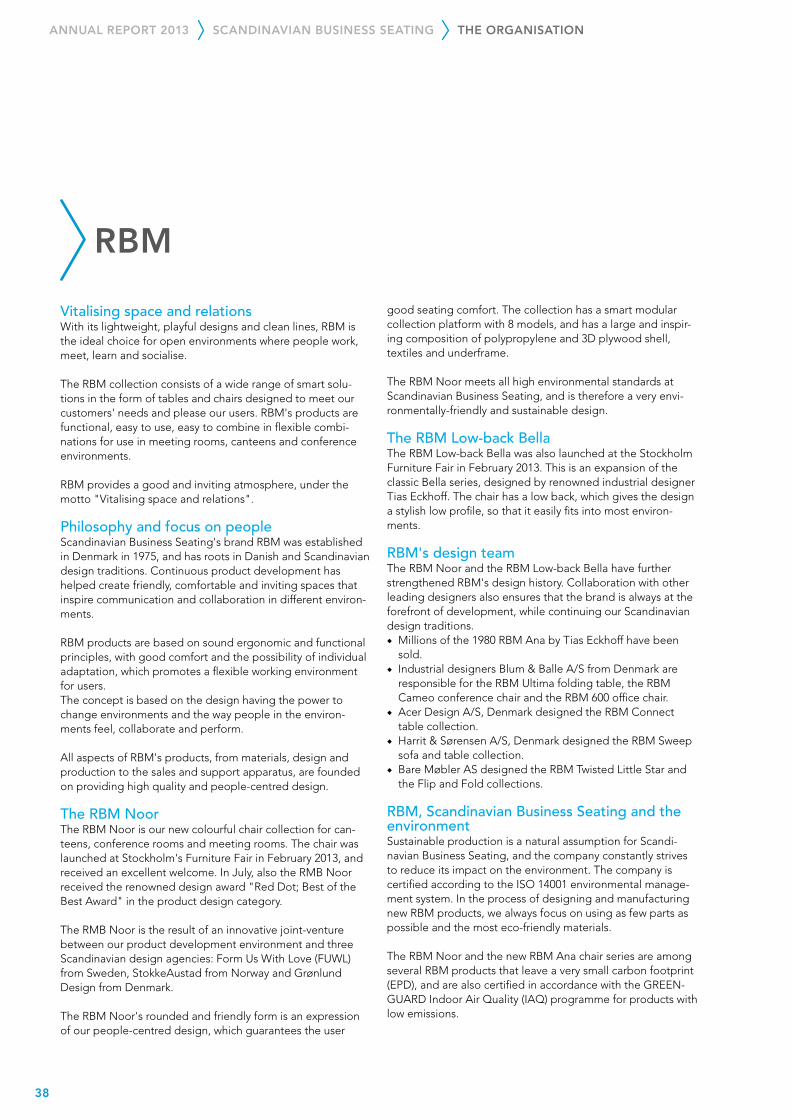
RBM
Vitalising space and relations With its lightweight, playful designs and clean lines, RBM is the ideal choice for open environments where people work, meet, learn and socialise.
The RBM collection consists of a wide range of smart solu-tions in the form of tables and chairs designed to meet our customers' needs and please our users. RBM's products are functional, easy to use, easy to combine in flexible combi-nations for use in meeting rooms, canteens and conference environments.
RBM provides a good and inviting atmosphere, under the motto "Vitalising space and relations".
Philosophy and focus on peopleScandinavian Business Seating's brand RBM was established in Denmark in 1975, and has roots in Danish and Scandinaviandesign traditions. Continuous product development has helped create friendly, comfortable and inviting spaces that inspire communication and collaboration in different environ-ments.
RBM products are based on sound ergonomic and functional principles, with good comfort and the possibility of individual adaptation, which promotes a flexible working environment for users.The concept is based on the design having the power to change environments and the way people in the environ-ments feel, collaborate and perform.
All aspects of RBM's products, from materials, design and production to the sales and support apparatus, are founded on providing high quality and people-centred design.
The RBM NoorThe RBM Noor is our new colourful chair collection for can-teens, conference rooms and meeting rooms. The chair was launched at Stockholm's Furniture Fair in February 2013, and received an excellent welcome. In July, also the RMB Noor received the renowned design award "Red Dot; Best of the Best Award" in the product design category.
The RMB Noor is the result of an innovative joint-venture between our product development environment and three Scandinavian design agencies: Form Us With Love (FUWL) from Sweden, StokkeAustad from Norway and Grønlund Design from Denmark.
The RBM Noor's rounded and friendly form is an expression of our people-centred design, which guarantees the user
good seating comfort. The collection has a smart modular collection platform with 8 models, and has a large and inspir-ing composition of polypropylene and 3D plywood shell, textiles and underframe.
The RBM Noor meets all high environmental standards at Scandinavian Business Seating, and is therefore a very envi-ronmentally-friendly and sustainable design.
The RBM Low-back Bella The RBM Low-back Bella was also launched at the Stockholm Furniture Fair in February 2013. This is an expansion of the classic Bella series, designed by renowned industrial designer Tias Eckhoff. The chair has a low back, which gives the design a stylish low profile, so that it easily fits into most environ-ments.
RBM's design teamThe RBM Noor and the RBM Low-back Bella have further strengthened RBM's design history. Collaboration with other leading designers also ensures that the brand is always at the forefront of development, while continuing our Scandinavian design traditions. ◆ Millions of the 1980 RBM Ana by Tias Eckhoff have been
sold. ◆ Industrial designers Blum & Balle A/S from Denmark are
responsible for the RBM Ultima folding table, the RBM Cameo conference chair and the RBM 600 office chair.
◆ Acer Design A/S, Denmark designed the RBM Connect table collection.
◆ Harrit & Sørensen A/S, Denmark designed the RBM Sweep sofa and table collection.
◆ Bare Møbler AS designed the RBM Twisted Little Star and the Flip and Fold collections.
RBM, Scandinavian Business Seating and the environmentSustainable production is a natural assumption for Scandi-navian Business Seating, and the company constantly strives to reduce its impact on the environment. The company is certified according to the ISO 14001 environmental manage-ment system. In the process of designing and manufacturing new RBM products, we always focus on using as few parts as possible and the most eco-friendly materials.
The RBM Noor and the new RBM Ana chair series are among several RBM products that leave a very small carbon footprint (EPD), and are also certified in accordance with the GREEN-GUARD Indoor Air Quality (IAQ) programme for products with low emissions.
38
ANNUAL REPORT 2013 ScANDINAvIAN BUSINESS SEATING THE ORGANISATION

RBM Noor/RBM Eniment table
RBM is all about positive meetings and joyful moments between people. Space and relations.
39
ANNUAL REPORT 2013 ScANDINAvIAN BUSINESS SEATING THE ORGANISATION

Scandinavian Business Seating is the market leader in Scandinavia for the design, development and production of seating solutions for office environ-ments. Scandinavian Business Seating is a brand name supplier and markets HÅG, RH and RBM. The group’s head office is in Oslo and production takes place at its factories in Røros, Norway and Nässjö, Sweden. The group also has sales companies in Sweden, Denmark, Germany, the Netherlands, the UK, France and Singa-pore.
Scandinavian Business Seating Group AS is the parent company of the group. It is a holding company for three companies: Scandinavian Business Seating AS in Norway, Scandinavian Business Seating AB in Sweden and Scandinavi-an Business Seating A/S in Denmark. The company’s activities include direct or indirect ownership of other companies en-gaged in the production and sale of office furniture, including chairs, the provision of administrative and other services to such companies, and anything else naturally associated with this.
Going concernThe group has good levels of profitability and equity. In ac-cordance with section 3-3 of the Accounting Act, it is hereby confirmed that the prerequisites for the going concern as-sumption exist and accordingly the financial statements have been prepared based on the going concern principle.
Market and general conditionsThe office furniture market has seen a more stable develop-ment in 2013 than was the case in 2012. During the first half year, market development was level, due to the unrest in the Eurozone, but from autumn onward the group noticed a positive trend in some markets, such as Denmark, Sweden, Germany and the UK. From a sales point of view, the most
challenging markets in 2013 were Benelux, Sweden, Germany and Southern Europe.
Sales performance in the different markets has been varied, and the group recorded a decline of -0.8 % in total sales in 2013 compared with 2012, which is considered to be sat-isfactory in view of the challenges that have existed in the European markets.
For the year as a whole, there was a reduction of sales in Scandinavia of one per cent, compared with the previous year. Norway was the only Scandinavian market that did not show an increase compared with 2012. This is due to there being fewer large projects in the Norwegian market in 2013. In the group’s European subsidiaries, there was an increase of two per cent in sales compared with the previous year. The other export markets saw sales grow by one per cent compared with the previous year.
In 2013 the number of units sold fell by 3.8 %. The proportion of revenues from each brand remains unchanged from 2012. New orders in Q4 2013 were 19% higher than the same peri-od in 2012 after a relatively slow post-summer start.
At the end of Q4 2013, the group concluded the acquisition of the importer in Switzerland. The acquisition was an asset agreement with the purchase of dealer contracts. Scandinavi-an Business Seating AG was established on 1 July 2013. Sales in Switzerland showed a positive trend in the third and fourth quarters.
In November 2013, Scandinavian Business Seating Ltd opened its new showroom in Clerkenwell, London. This is an important part of the efforts in the UK, where the group intends to strengthen its position through Key Account Man-agement focus on the project market in London.
REPORT fROM THE BOARD Of DIREcTORS 2013
40
ANNUAL REPORT 2013 ScANDINAvIAN BUSINESS SEATING DIREcTORS’ REPORT

HÅG H09 Inspiration
41
ANNUAL REPORT 2013 ScANDINAvIAN BUSINESS SEATING DIREcTORS’ REPORT
The group has strengthened its efforts in Asia in 2013. In Q4 the process of establishing a subsidiary in China, Scandinavian Business Seating (Shanghai) Co. Ltd., was begun. The es-tablishment of a Shanghai office will supplement the group’s existing office in Singapore in serving the Asian market.
Income statementThe operating income for the period for Scandinavian Busi-ness Seating Group AS was NOK -5.6 million, compared with NOK -3.1 million in 2012. After net financial income of NOK 51.9 million, the income before tax was NOK 46.3 million. Net income for the year was NOK 33.5 million compared with NOK 18.5 million in 2012. The company’s income consists of group contributions and interest income from the subsidiaries.
Operating revenues for the group in 2013 were NOK 1,091 million compared with NOK 1,010 million in 2012. Operat-ing income (EBITA) for the period were NOK 204.4 million compared with NOK 203.7 million in 2012. The operating margin in 2013 was 20.4%, an improvement of 0.2 percentage points from the previous year. In 2013 the group had positive contributions from effective production, effective control of direct material, freight costs and the level of fixed costs. The development of prices of raw materials has made a positive contribution to margins in 2013.
Net financial expenses were NOK 124.9 million compared with NOK 121.1 million in 2012. The increase is due to higher inter-est expenses compared with the previous year. Income before tax was NOK 79.6 million compared with NOK 82.6 million the previous year. Net income was NOK 56.4 million, a decrease of NOK 16.7 million from 2012.
Balance sheet and liquidityTotal investments in 2013 amounted to NOK 61.5 million com-pared with NOK 58.1 million in 2012. Most of the investment was in connection with tools and moulds for new products and production equipment.Investments were made up of investment in fixed assets of NOK 43.0 million, acquisition of subsidiaries of NOK 7.0 mil-lion and recognised development costs of NOK 11.5 million.
The group has had good liquidity throughout the year. At year-end 2013 net interest-bearing debt amounted to NOK 898 million, an increase of NOK 320 million since year-end 2012. During the course of 2013 the group has repaid NOK 1,075 million of long term liabilities, of which NOK 385 million relates to repayment of a subordinated loan and NOK 690 million was for repayment of a bank loan. The group’s bank agreement was refinanced in December 2013 and a new long-term loan of NOK 950 million was taken up.
Total cash flow from operating activities amounted to NOK 134.8 million. Differences in relation to the operating income are mainly due to depreciation, taxes paid and changes in working capital.
Total assets at year-end amounted to NOK 1,864 million, an increase of NOK 51 million from year-end 2012. The equity ratio was 40% at the end of 2013 compared with 55% at the end of 2012. The company’s current liabilities at year-end were 21% of total liabilities, an increase of five percentage points on the year before. The total debt-equity ratio was 60% compared to 45% in 2012. The changes are mainly due to repayment of loans shareholders in 2013, which were classified as equity in 2012.
The greater part of the interest cost in connection with the subordinated loan from shareholders was not paid out, but was converted to equity in connection with a capital increase adopted by the general meeting of 31 December 2013. Debt financing is subject to requirements concerning the achieve-ment of key figures linked to the result and solvency. The company was within these requirements at year end 2013.
At the start of 2014 the group has total credit of NOK 1,053 million. This consists of borrowings of NOK 953 million and an overdraft limit of NOK 100 million. Available funds in the form of unused credit and bank deposits amounted to NOK 144 million at year end.
Increase of capital from conversion of liability into equityThe group’s financing structure was changed in December 2013, as a result of which the shareholder loan was replaced by a bank loan. NOK 385,000,000 of the shareholder loan was repaid and the remainder was converted into equity. This was done in connection with the refinancing of the group, by which the liability of the parent company Scandinavian Busi-ness Seating Holding AS to the shareholders was repaid in full or converted into B shares (preferential shares).
The board found it appropriate to convert the liability to the parent company Scandinavian Business Seating Holding AS into equity, so as to ensure that Scandinavian Business Seating Group AS was not affected by the new interest cut-off rules. The general meeting of 31.12.13 voted to increase the share capital of Scandinavian Business Seating Group AS through the conversion of loans from shareholders. Liabilities totalling NOK 365.7 million were converted into equity in Scandinavian Business Seating Group AS. This amount consisted of share-holder loans including accrued but unpaid interest as at the date of the general meeting of NOK 78.4 million.
Amendment to the articles of associationAs a result of the capital increase, article 4 has been amended to read as follows: “The share capital is NOK 206,200,000, made up of 10,310,000,000 shares each with a face value of NOK 0.02.”
Research and developmentIn line with the group’s differentiation strategy and product focus, there has been a strong emphasis on innovation and
42
ANNUAL REPORT 2013 ScANDINAvIAN BUSINESS SEATING DIREcTORS’ REPORT
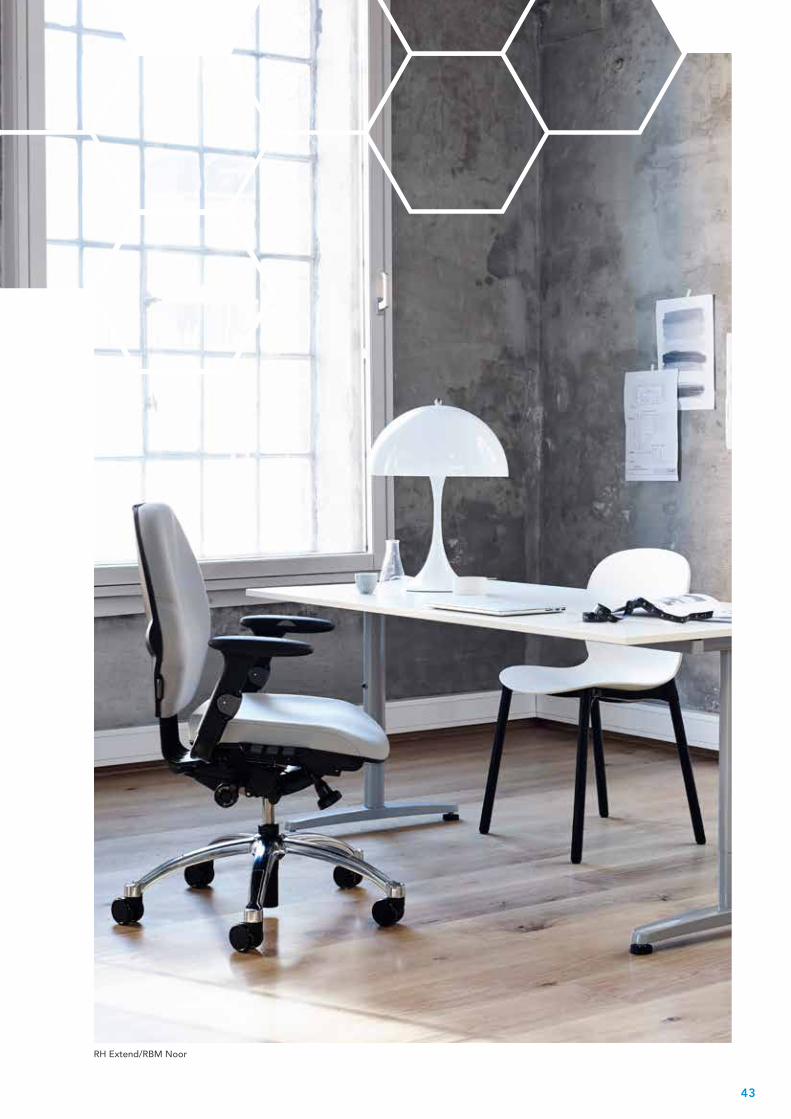
RH Extend/RBM Noor
43
ANNUAL REPORT 2013 ScANDINAvIAN BUSINESS SEATING DIREcTORS’ REPORT
product development. Four new products were launched in 2013 and are in production. The RH Mereo chair series rep-resents a lift for the RH brand and appeals to the project and multi-use market. HÅG SoFi is a completely new work chair in the main product range of the HÅG brand, with an innovative new armrest function, which sets the standard for user-per-ceived quality and refined design. RBM Noor is an extensive collection of canteen, conference and meeting room chairs with an individual but friendly design, good comfort and unique combination possibilities and environmental prop-erties. RBM Low-back Bella was also launched. All products were well received by the media, their target group and the market generally. Altogether four patents were registered and four design awards were won by the new products.
Improvement work in 2013 has been focused on stronger organisation and processes for future development projects and product maintenance. Development expenses amount-ing to NOK 11.5 million were capitalised by the group in 2013 in line with IFRS.
Financial riskJust under 70% of sales revenues are invoiced in currencies other than NOK. A large proportion of the company’s financial
risk is therefore linked to fluctuations in exchange rates, especially with respect to SEK, DKK and EUR. The majority of raw material purchases are made in NOK, SEK and EUR. To reduce exchange rate risk, currency derivatives are used. The company’s balance sheet is exposed to exchange rate fluctua-tions in EUR, since loans in SEK exceed receivables in SEK, an exposure which is not hedged.
Credit risk associated with counterparts being unable to meet their financial obligations is regarded as acceptable. The majority of the company’s sales are in Northern and Central Europe. Sales are made to our own sales companies and to dealers and importers the group has worked with for some time. Historically, losses from receivables have been limited and accounted for 0.02 % of revenues in 2013. Gross accounts receivable as per 31.12.2013 amounted to NOK 168 million. The company regards its liquidity as good. No decision has been made to implement measures which will change the liquidity risk.
Scandinavian Business Seating has centralised its financing function which has responsibility for financing, currency risk, interest rate risk, credit risk and liquidity management.
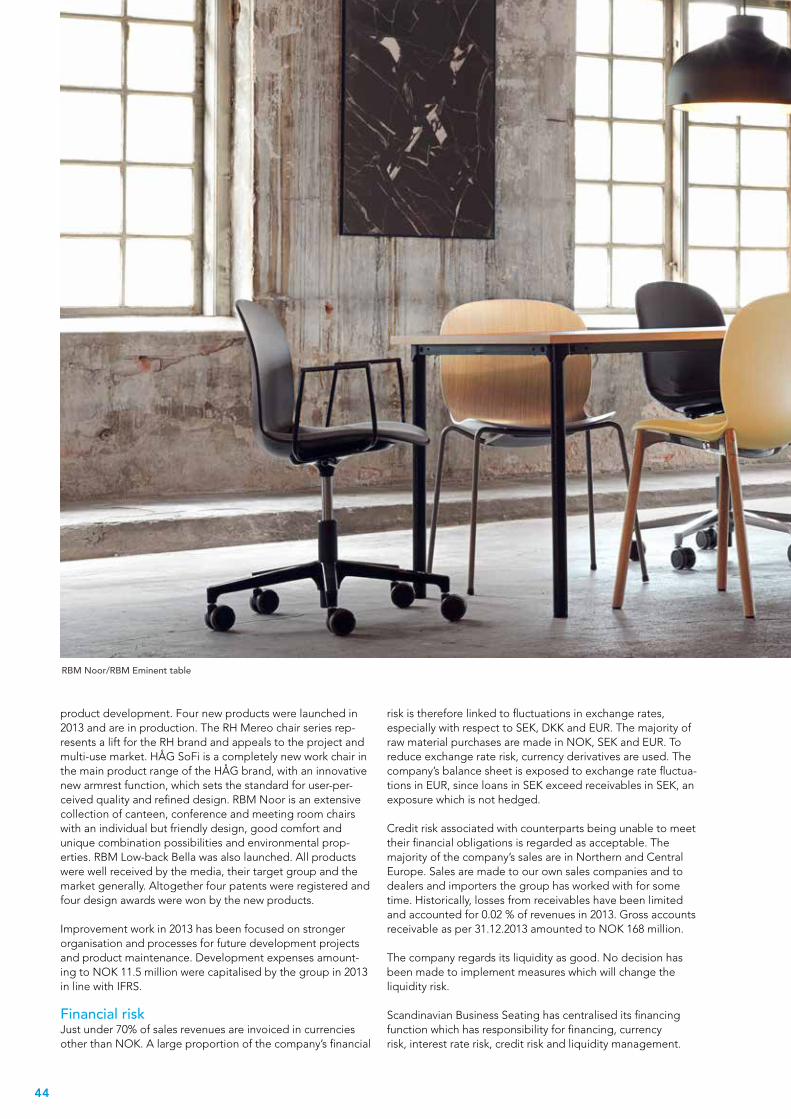
RBM Noor/RBM Eminent table
44

The Board has adopted guidelines for financial risk management, which have been set out in policies.
Production, logistics and purchasing Work during the past year on streamlining purchasing has had effects on materials costs, transport costs and warehouse values. Considerable resources were invested in the factories in Røros and Nässjö so as to optimise production for the new products that were launched in 2013. With effect from December 2013, organisational changes were made in that the organisations for purchasing and production/logistics were merged together under common management. Work on optimising the new organisation will proceed in 2014, which is expected to have a positive effect on efficiency, as well as improving service levels to the mar-kets. Work on improving quality, reducing tie-up of capital, balanced logistics costs and optimising materials costs will also have a high priority in 2014.
Working environment, equality and discrimination
The holding company, Scandinavian Business Seating Group AS, has no em-
ployees. The company contracts administrative services from the subsidiaries.
The group has been working for many years at strengthening and further developing the company’s culture and working environment. Systematic working environment surveys with subsequent specific follow-up plans in the line ensure a good working environment and clear value creation in the group. The company’s core values, focus on leadership, competence development, equality of opportunity, health and safety, the environment and organisational conditions are all important factors in securing and steadily improving a good working environment.
2013 has been marked by organisational changes in the commercial area. The market organisations have been further strengthened with more resources i both dealer sales and Key Account Management. Good, clear training of new employ-ees has a high priority, so that they can easily find their place in the group, with a good understanding of the processes and strategies at an early stage of their employment. SB Seating Academy has been at the centre of a number of competence building measures in both sales and management. There is a
45

good, trustful relationship between the company and trade unions. This is an important area for dialogue and informa-tion.
At Scandinavian Business Seating everyone, regardless of gender, age and background, must have equal opportunities for employment and development. Furthermore, women and men performing the same work will in principle be paid the same salary, prior to assessing work performance. In the case of new appointments and with the composition of teams/departments, every effort must be made for a working envi-ronment with variation in gender, age and background. The group actively works to prevent discrimination due to age, gender, disability, ethnic background, national origin, skin colour, religion or personal beliefs.
At year-end 2013, the group had 472 employees, of which 309 were men and 163 women, equivalent to 34% of the workforce. The company’s board has one female member, a proportion of women equivalent to 20%. There is one female member of the group’s executive management, a proportion of women equivalent to 14%.
There were fifteen work-related injuries in the company dur-ing the course of 2013. These injuries resulted in a total of 71 days absence.
External environmentScandinavian Business Seating has been focusing on the environment for more than 20 years, in both its processes and its products. It has long been clear to the company that it is important to take the entire life cycle into consideration, since more than 90 per cent of the products’ impact on the envi-ronment occurs before the components arrive at the group’s factories.
The goal has always been to develop ever better prod-ucts with a smaller carbon footprint, a higher proportion of recycled materials and totally without chemicals that might be hazardous to health or the environment. The best results are achieved with products with low weight, few parts, good materials and a long lifetime. The products must also be easy to dismantle and recycle. The new HÅG SoFi office chair received the Norwegian Design Council’s Environment Award in 2013. Scandinavian Business Seating makes active use of the EPD (Environmental Product Declaration) to document the prod-ucts’ environmental performance. The EPDs provide informa-tion that includes quantifying the greenhouse gas emissions caused by the product’s entire life cycle: from the extraction of the raw materials, via processing, transport and produc-tion, to its use and disposal. This is a key indicator both for customers who wish to minimise the environmental impact of their purchases and for the group’s own development of in-creasingly better products. The group’s most important chair collections also have the American GREENGUARD certificate, which guarantees that the products contribute to a healthy in-door environment by not emitting hazardous gases. The HÅG Capisco was the first office chair to fulfil the requirements for the Nordic Swan label.
The group’s environmental management system is certified according to ISO 14001. An annual review is performed of which conditions have a significant effect on the environment and the group’s environment goals are concentrated on these. Work in 2013 concentrated on reducing energy con-sumption, the use of chemicals and waste.
The group issues an annual corporate responsibility report based on the internationally recognised Global Reporting Initiative format. The report covers the work the group does to improve its environmental performance and the results that are achieved.
Changes in management and the boardIn order to strengthen the company’s presence in all markets, organisational changes on the commercial side were made. Frederik Fogstad, Senior Vice President GPO, became a member of group management with effect from 1 December 2013. Torbjørn Iversen left the company with effect from 1 January 2014. Patrik Röstlund took over as Senior Vice Presi-dent Manufacturing & Purchasing Operations with effect from 1 December 2013. Board member Olav Kjell Holtan died at the beginning of March 2014.
Future prospectsThere is normally considerable uncertainty attached to estimates and assumptions of future conditions. However the market for office furnishings is expected to continue to have a careful progression in demand during 2014. Variations are expected from market to market, but with good opportunities to capture market share. So far in 2014, new orders in the main markets have been at the same level as last year.
Order back-log at the end of 2013 will ensure sufficient ca-pacity utilisation at the start of 2014. The company expects a normal cyclical start to 2014, with a stable development of the price of raw materials in the first quarter. In 2014 the group will continue its focus on activities to ensure sales growth in the shorter and longer term in the markets in which the group is established. There is also increased activ-ity, and new opportunities, in the Asian market. These sales promotion activities are expected to have a positive effect on orders over the coming months. The group has good control over its activities and fixed costs. Processes and preparedness for rapid changes in connection with cutting activity levels, investments and general expenses are in place in case there is a drop in demand.
Allocation of profitThe board proposes that the profit for the year of NOK 29 886 000 for Scandinavian Business Seating Group AS is allocated as follows:
Oslo, 18 March 2014
Transferred to other equity TNOK 29 886
Total TNOK 29 886
46
ANNUAL REPORT 2013 ScANDINAvIAN BUSINESS SEATING DIREcTORS’ REPORT

Ebbe Pelle Jacobsen
Chairman of the Board
Oscar Hermansson
Sven-Gunnar Schough
Henrik Lundh
Anne Breiby
Lars I. Røiri
CEO
THE BOARD Of DIREcTORS Of ScANDINAvIAN BUSINESS SEATING GROUP AS
47
ANNUAL REPORT 2013 ScANDINAvIAN BUSINESS SEATING DIREcTORS’ REPORT

48
AnnuAl RepoRt 2013 ScAndinAviAn BuSineSS SeAting conSolidAted AnnuAl AccountS
conSolidAted income StAtementNOK 1 000 Notes 01.01.-31.12.2013 01.01.-31.12.2012
total operating revenues 4 1 002 554 1 010 515
Cost of goods sold 316 666 323 249
Inventory movements, in-house production 14 (5 558) 2 738
Cost of labour 9 270 252 259 481
Depreciation 3, 5, 11 30 611 31 948
Write down 3, 5, 11 897
Other operating costs 12 185 266 189 392
total operating costs 798 135 806 808
operating income 204 420 203 707
Financial income 17 77 776 84 670
Financial expense 17 124 293 133 719
Interest expenses to company within the Group 78 350 72 032
net financial income/(expense) (124 867) (121 080)
income before tax 79 553 82 627
Income tax expense 13 23 165 9 564
net income 56 388 73 064
Consolidated statement of comprehensive income
Net income 56 388 73 064
Actuarial changes pensions 371
Exchange differences on translation of foreign operations (13 453) 1 536
total comprehensive income for the period 43 306 74 600
information concerning:
Earnings per share (NOK) 21 0,005 0,007Fully diluted earnings per share (NOK) 21 0,005 0,007
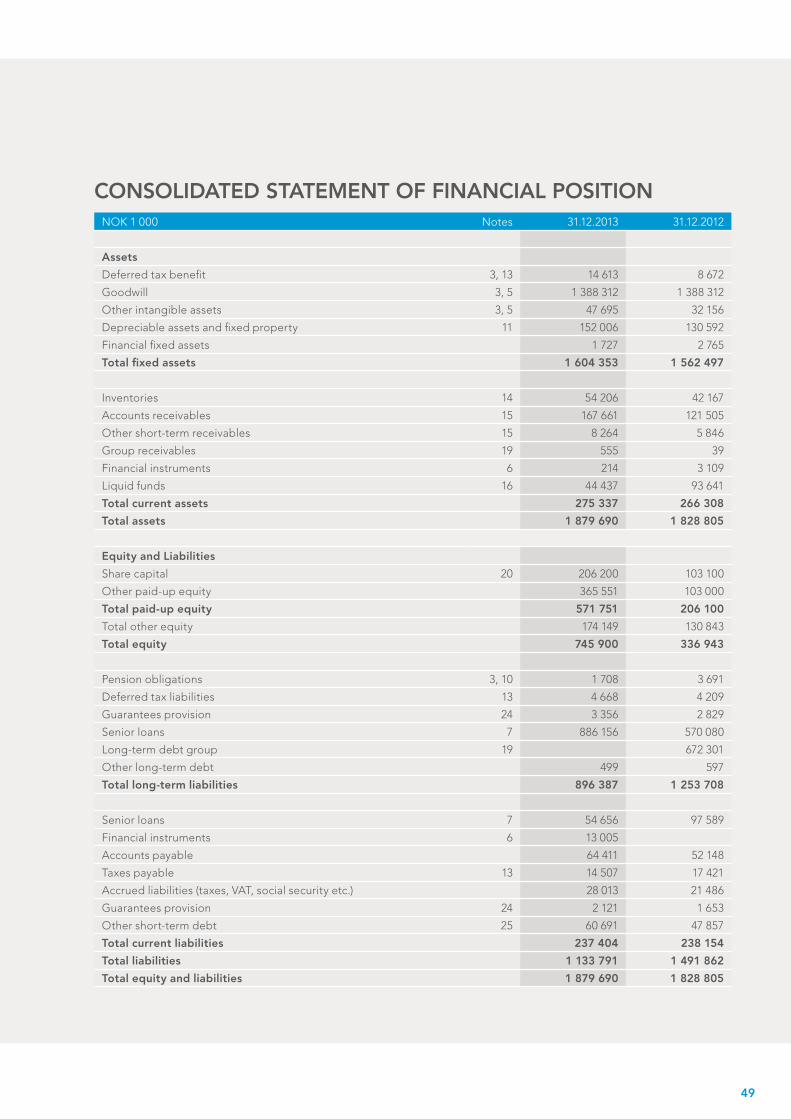
49
conSolidAted StAtement of finAnciAl poSitionNOK 1 000 Notes 31.12.2013 31.12.2012
Assets
Deferred tax benefit 3, 13 14 613 8 672
Goodwill 3, 5 1 388 312 1 388 312
Other intangible assets 3, 5 47 695 32 156
Depreciable assets and fixed property 11 152 006 130 592
Financial fixed assets 1 727 2 765
total fixed assets 1 604 353 1 562 497
Inventories 14 54 206 42 167
Accounts receivables 15 167 661 121 505
Other short-term receivables 15 8 264 5 846
Group receivables 19 555 39
Financial instruments 6 214 3 109
Liquid funds 16 44 437 93 641
total current assets 275 337 266 308
total assets 1 879 690 1 828 805
equity and liabilities
Share capital 20 206 200 103 100
Other paid-up equity 365 551 103 000
total paid-up equity 571 751 206 100
Total other equity 174 149 130 843
total equity 745 900 336 943
Pension obligations 3, 10 1 708 3 691
Deferred tax liabilities 13 4 668 4 209
Guarantees provision 24 3 356 2 829
Senior loans 7 886 156 570 080
Long-term debt group 19 672 301
Other long-term debt 499 597
total long-term liabilities 896 387 1 253 708
Senior loans 7 54 656 97 589
Financial instruments 6 13 005
Accounts payable 64 411 52 148
Taxes payable 13 14 507 17 421
Accrued liabilities (taxes, VAT, social security etc.) 28 013 21 486
Guarantees provision 24 2 121 1 653
Other short-term debt 25 60 691 47 857
total current liabilities 237 404 238 154
total liabilities 1 133 791 1 491 862
total equity and liabilities 1 879 690 1 828 805

AnnuAl RepoRt 2013 ScAndinAviAn BuSineSS SeAting noteS gRoup
50
conSolidAted StAtement of cASh flowSNOK 1 000 Notes 01.01.-31.12.2013 01.01.-31.12.2012
operating activities
Profit before tax *) 79 553 82 627
Depreciation of assets 5 ,11 30 611 31 948
Write-downs of assets 5 ,11 897
Unrealised exchange rate difference 4 886 4 673
Other 7 959 (7 459)
Paid tax 13 (31 254) (12 876)
cash flow from operating activities before change in working capital 92 652 98 913
cash flow from change in working capital
Change in inventories (9 701) 5 483
Change in operating receivables (33 956) 46 311
Change in payables 2 827 (4 670)
Change in operating liabilities 83 019 57 867
cash flow from operating activities 134 841 203 904
investing activities
Acquisition of subsidiaries (6 966)
Acquisition of tangible assets 11 (42 995) (42 922)
Capitalised development expenditures 5 (11 518) (15 219)
cash flow from investing activities (61 479) (58 141)
financing activities
Short or longterm borrowing 7 950 000
Repayment of amount borrowed 7, 19 (1 075 283) (81 140)
Dividends paid (64 500)
cash flow from financing activities (125 283) (145 640)
cash flow for the year (51 921) 123
Opening balance - liquid funds 93 641 94 393Exchange rate difference in liquid funds 2 717 (875)
closing balance - liquid funds 44 437 93 641
Liquid funds booked as bank deposit 44 437 93 641
*) Includes:
Interest income 1 937 3 056
Interest expenses 35 278 46 262
Unrealised exchange rate difference includes a loss of TNOK 15 900 on unrealised forward exhange contracts (TNOK -853).

51
conSolidAted StAtement of chAngeS in equity
noteS gRoup
NOK 1 000Share capital
Other paid-up equity
Total paid-up equity
Foreign currency
translation differences
Retained earnings
Total other equity
Total equity
equity 01.01.12 103 100 103 000 206 100 (3 077) 123 821 120 744 326 844
Net income 73 063 73 063 73 063
Dividend (64 500) (64 500) (64 500)
Exchange differences 1 536 1 536 1 536
equity 31.12.12 103 100 103 000 206 100 (1 541) 132 384 130 843 336 943
Net income 56 388 56 388 56 388
Issue 1) 103 100 262 551 365 651 365 651
Actuarial changes pensions 371 371 371
Exchange differences (13 453) (13 453) (13 453)
equity 31.12.13 206 200 365 551 571 751 (14 994) 189 143 174 149 745 900
1) The capital increase was approved at the Annual General Meeting on 31 December 2013 and registered in the Norwegian Register of Business Enterprises on 18 February 2014.
Scandinavian Business Seating Group AS and its subsidiaries develops, produces and distributes seating solutions for the office market through independent retail chains, importers and dealers. The mother company, Scandinavian Business Seating Group AS, is registered in Norway and has its head office at Majorstuen in Oslo.
The group has production facilities in Norway (Røros) and Sweden (Nässjö). The group primarily sells its products in Europe. An overview of the group’s companies is provided in note 18. The group’s ultimate parent company is Ratos AB, which is listed on the NASDAQ OMX, Stockholm Stock Exchange. The consolidated accounts were approved by the board of directors for Scandinavian Business Seating Group AS on 18.03.2014.
Basic policiesScandinavian Business Seating’s consolidated accounts for the 2013 financial year were prepared in accordance with international financial reporting standards (IFRS) and interpre-tations published by the International Accounting Standards Board (IASB) approved by EU.
The group presents its annual financial statements in NOK, which is also the parent company’s functional currency. All figures are stated in NOK thousands, unless otherwise is spe-cifically stated. The financial statements have been prepared on an historic costs basis with the exception of pensions and financial instruments, which have been assessed at fair value. The group has in 2013 implemented the changes in IAS 19 Employee Benefits. There are only a few of the group’s Nor-wegian employees who have benefit-based pension scheme, and the implementation have had minimal impact on the annual accounts.
Consolidation policiesThe consolidated accounts include Scandinavian Business Seating Group AS and companies in which Scandinavian Business Seating Group AS has a determining influence with respect to the entity’s financial and operational strategy, nor-mally through owning more than half of the capital entitled to vote. Subsidiaries are consolidated from the moment control has been transferred to the group and excluded from consoli-dation when such control ceases.
Intragroup transactions and outstanding balances within the group, including internal profits and unrealised gains and losses, have been eliminated. The consolidated accounts have been prepared on the basis of an assumption of uniform accounting policies for equal transactions and other events in
Note 1 – GeNeral iNformatioN
Note 2 – aCCouNtiNG poliCies

AnnuAl RepoRt 2013 ScAndinAviAn BuSineSS SeAting noteS gRoup
52
equal circumstances. All companies follow the same financial year. There are no minority interests in the group.
The financial statements of the individual units in the group are valued in the currency that is primarily utilized in the economic area in which the unit operates (the functional currency). The balance sheet is translated using the exchange rate on the balance sheet date, while the income statement is translated using the average exchange rate for the account-ing period. Translation differences that arise due to this are included in the translation differences reserve in equity. Major single transactions are converted separately to spot rate.
the use of estimates and judgementsPreparation of the annual financial statements in conformity with IFRS often requires the management to exercise judge-ment and make use of estimates. Estimates are based on his-torical information and judgements are largely made on the basis of management’s knowledge of the market and various indicators. Certain accounting policies are regarded as being particularly important to the company’s financial position, as they are largely determined on the basis of judgements and estimates. These will typically be:
• Goodwill impairment tests (see note 5)• Estimates of pension liabilities (see note 10)• Guarantee provisions (see note 2)• Capitalising development costs (see note 5)
segment informationAn operating segment is that part of the business which generates operating income and incurs costs, and in which the operating result for the segment is regularly reviewed by the management to decide which resources need to be allocated to it. A segment for which reporting is mandatory is a grouping of segments with similar economic characteris-tics. The group supplies similar products under three brand names: HÅG, RBM and RH. Risk and returns for the three brands do not differ significantly. The three brands have the same management and financial monitoring structure, and the management does not monitor operating results for each of the brands. The group segment is based on one man-datory reporting segment. Sales distribution per country is included in note 4.
Business amalgamationThe acquisition method is used when recognising business amalgamations. When new business and companies are ac-quired the cost price must be allocated by identifiable assets and liabilities on the basis of estimated fair value. The acqui-sition costs upon acquisition are valued at fair value of: assets that are paid as remuneration upon the acquisition, issued equity instruments, liabilities assumed by transferring control. Added values upon acquisition in excess of fair value for the net assets in the acquired business valued on the date control is transferred, are classified as goodwill. If the acquisition
costs are less than the net assets, the difference is recognized through profit and loss at the time of the acquisition.
fixed assetsFixed assets are valued at their acquisition cost less accu-mulated depreciation and write-downs. The acquisition cost includes costs directly linked to the acquisition of the asset. Subsequent costs are allocated to the assets’ balance sheet recognised value or recognised in the balance sheet sepa-rately when it is likely that future financial benefits will flow to the group and the expense can be valued reliably. Other repair and maintenance costs are recognised through profit and loss in the period the expense is incurred. In cases where increased earnings can be demonstrated due to repair/main-tenance, the costs associated with this will be recognised in the balance sheet as asset supply.
When assets are sold or disposed of the cost price and the accumulated depreciation is reversed in the accounts and any loss or gain from the transaction is recognised through profit and loss. Depreciation is calculated using linear method over the following periods:
• Property and other real estate 10-25 years• Machinery and equipment 6-8 years• Movable property, inventory and vehicles 3-10 years
The depreciation period and method, as well as the residual value, will be assessed annually to ensure the method and period used concurs with the financial realities associated with the asset. The group has construction in progress. This is primarily linked to investment in tools and machinery for products which are being developed. Operating equipment is therefore activated and depreciated when the product is launched/completed. This will only be done for tools and ma-chinery for products under development if it is almost certain that future financial benefits related to sales will accrue to the group and this can be measured reliably.
intangible assetsIntangible assets are recognised in the balance sheet when likely future financial benefits that can be ascribed to the as-set owned by the group can be demonstrated and the assets’ cost price can be valued reliably. Intangible assets associated with business amalgamations are activated at fair value. The subsequent valuation is based on cost price less amortization and write-downs. The recoverable amount is calculated annu-ally and when there are indications of a fall in value.
Intangible assets with fixed lifetimes are amortised over the lifetime of the asset. Amortisation is applied using a linear method over the estimated financial lifetime. The amortisa-tion estimate and amortisation method are assessed each year on the basis of the financial realities that exist.
53
GoodwillGoodwill is recognised as the difference of the group’s pro-curement costs in relation to the overtaking enterprise’s net actual value of the recognisable assets, liabilities and subordi-nated liabilities at the time of acquisition.
Goodwill is tested for impairment once a year (31 December) and when there are indications of a fall in value. The impair-ment is assessed by comparing the recoverable amount per cash flow generating unit with the value recognised in the bal-ance sheet. A cash-generating unit is the smallest identifiable group of assets that generates cash inflows that are largely independent of the cash inflows from other assets or groups of assets. If the recoverable amount per cash flow generating unit is lower than the value recognised in the balance sheet the asset is written down through profit and loss. Historic write-down amounts are not reversed.
The group’s goodwill is linked to the acquisition of the sub-sidiaries Scandinavian Business Seating AS in Norway and Scandinavian Business Seating Holding AB in Sweden. Calcu-lations of future cash flows take account of expected market developments and expected general price developments for the group’s products in the relevant markets.
Research and development (internally accumulated)Costs associated with research are recognised through profit and loss when they are incurred. Costs associated with devel-opment are recognised through profit and loss when they are incurred unless the following criteria are fully met:
• the products or process is clearly defined and the cost elements can be identified and valued reliably,
• the technical solution for the products has been demon-strated,
• the product or process will be sold or used in the business,• the asset will generate future financial benefits, and• sufficient technical, financial and other resources exist to
complete the project.
When all the criteria are fulfilled, the costs associated with de-velopment start to be recognised in the balance sheet. Costs recognised as costs in earlier accounting periods are not rec-ognised in the balance sheet. Development costs recognised in the balance sheet are amortised linearly over the estimated lifetime of the finished products. The amortisation period will normally not exceed six years.
Recoverable amount of development costs recognised in the balance sheet will be estimated when there are indications of a fall in value or the need for previous periods’ writedowns no longer exists.
Other intangible assetsThe group has recognised customer contracts in the balance sheet. The customer contracts are acquired in connection
with the group’s establishment of a subsidiary in Switzerland. The contracts are recorded at cost and amortisation is applied using a linear method over the estimated lifetime.
financial instruments and loansCurrency exposure associated with the group’s operations is continuously hedged by the expected net cash flows in currency associated with operational factors being hedged through forward contracts, though only for a limited time horizon and only to the extent it is estimated that it is certain that these expected cash flows will be realised. The manner which the company utilises currency derivatives does not qualify as hedge accounting and is financial hedging in which unrealised losses and gains by changes in value are recog-nised through profit and loss as losses and gains on currency and recognised in the balance sheet at fair value. The group therefore does not use hedge accounting. Realised gains or losses on forward contracts are classified as sale in the consol-idated income statement.
Accounts receivable are valued at estimated fair value, which is the original invoice amount less a provision for a decrease in value. The provision is made when there is objective evidence that the group cannot collect the total outstanding amount pursuant to the original invoice amount.
Liquid funds are valued at fair value as per 31 December. For balances in foreign currency, the currency rate as per 31 De-cember is used for the valuation. The Scandinavian Business Seating group has established a group account system (cash pool system) of which Scandinavian Business Seating Group AS is according to the agreement the group account holder. The bank can settle each withdrawal and the available bal-ance against each other such that the net balance represents the outstanding balance between the bank and Scandina-vian Business Seating Group AS. The group recognises the net balance of the accounts included in the group account system.
Loans are recognised at the original loan amount. Loan costs are activated and distributed through profit and loss in line with the loan’s repayment period. Loans are recognised at amortised cost when effective interest rates are used in which the difference between net proceeds and the redemption value is recognised through profit and loss over the term of the loan. Loan costs are recognised in the balance sheet and charged to the result in line with the repayment plan.
stockStock, including semi-fabricated products, is recognised at the lowest of cost price and net sales price. Net sales price is valued as the market price in normal operations less the cost of completion, marketing and distribution. Costs are estab-lished using the FIFO method. The processed stock includes variable costs and fixed costs that can be allocated to goods based on normal capacity. Redundant stock is written-down in its entirety.

AnnuAl RepoRt 2013 ScAndinAviAn BuSineSS SeAting noteS gRoup
54
obsoletenessThe stock is assessed for obsolescence. Obsolescence arises when the stock contains faulty components or components for products which are no longer for sale, and thus do not represent any value to the group. Provisions for obsolescence are reversed in those instances when the components are nonetheless able to be used in production. In the opposite case, the components are destroyed (used provision ref. note 14).
Cash flow statementThe cash flow statement is prepared using the indirect meth-od.
equityShare capitalOrdinary shares are classified as equity. Expenses directly associated with the issuing of new shares or options, less de-ductions for tax, are recognised as a reduction in the received remuneration in equity.
Translation differences reserveTranslation differences arise in connection with currency differences in the consolidation of foreign units. Currency differences in cash items (liabilities or receivables) that in reality are part of a company’s net investment in a foreign unit are treated as translation differences. When foreign units are sold the accumulated translation differences associated with the unit from the same period as the gain or loss from the sale is recognised are reversed and recognised through profit and loss.
income taxThe tax costs consist of payable tax and changes in deferred tax. Deferred tax/tax assets are calculated for all differences between the accounting and tax-related values of assets and liabilities with the exception of goodwill from the integration of undertakings.
Deferred tax assets are recognised when it is likely the com-pany will have sufficient taxable profit to utilise the tax assets. On every balance sheet date the group conducts a review of the deferred tax assets and the value recognised. The com-panies recognise earlier unrecognised deferred tax assets to the extent it has become likely that the company can utilise the deferred tax assets. Similarly the company will reduce the deferred tax assets to the extent the company no longer believes it can utilise the deferred tax assets.
The deferred tax and deferred tax assets are valued on the basis of the expected future tax rate for the companies in the group in which temporary differences have arisen. The de-ferred tax and deferred tax assets are recognized independ-ent of when the differences will be reversed. The deferred tax and deferred tax assets are recognized at nominal value and classified as financial non-current assets in the balance sheet.
Payable tax and deferred tax are recognised directly against equity to the extent that these relate to matters that are recognised directly against equity.
provisions for obligationsProvisions are recognised when the group has a present obligation (legal or constructive) as a result of past events, it is probable that an outflow of resources will be required to settle the obligation and the amount has been reliably estimated.
Guarantee provisionsProvisions associated with guarantee work for concluded sales are valued at the estimated cost for such work. The es-timate is calculated on the basis of historic figures for service work and guarantee repairs. Recognised guarantee provi-sions correspond to an estimate of the future costs the group expects to incur from such repairs to already concluded sales. The liabilities based on historic data expected to be incurred within one year are classified as current liabilities, while those expected to be incurred in more than one year are classified as non-current liabilities in the balance sheet. Continuous guarantee costs associated with repairs are recognised through profit and loss as goods costs, while service work is recognised through profit and loss as other operating costs in the income statement.
pensionsThe group’s companies have pension schemes that cover all employees. The costs associated with the pension agree-ments appear as personnel costs in the accounts. The group’s employees are members of collective defined contribution pension schemes. Payments linked to the contribution plans are recognised as a cost in the period to which the contribu-tions relate. Some employees in Norway with partial disability still have a defined-benefit scheme. The costs associated with these schemes on based on a linear carrying forward of pension earnings against probable accumulated liabilities at the time of accrual. A linear accrual model distributes the future accumulated liabilities linearly over the accrual period, and regards the employees’ accrued pensions’ rights in the period as a pensions cost. Any introduction of a new, or changes to an existing, benefits-based pension scheme results in changes to the pension liabilities. The introduction of new schemes or changes to existing schemes that appear with retrospective effect and which result in the employees having immediately earned a paid up policy (or a changed paid up policy) are recognised through profit and loss imme-diately. The effect of accrued pension benefits is divided over the remaining average accrual period. In the case of contri-bution plans, payments have been made to the insurance company. Once the contribution has been paid there are not further payment liabilities. Payments linked to the contribu-tion plans are recognized as a cost in the period to which the contributions relate. AFP is a benefit-based multi-employer plan in which the financing share attached to the premium is
55
included as a defined contribution scheme. The own share linked to the scheme is booked as a cost on a current basis. The pension earning period coincides with the period of employment. An annual deviation (known as the estimate deviations) arises between estimated and actual accruals on pension funds and between estimated and actual pension lia-bilities. This is due to deviations and changes in the precon-ditions. Estimate deviations are recognised as other income and costs in the total comprehensive income for the period it occurs. Level changes are recognised in the income state-ment as a single event unless the change is conditional on the employees remaining in the company. In the event of the latter, the change is amortised over the remaining pension earning period.
operational leasesThe leasing of assets in which the lessor retains the material proportion of risk and control are classified as operational leasing. Other lease agreements are treated as financial leas-es. The group only has operational leases. Lease payments are classified as an operating cost and recognized through profit and loss over the term of the contract.
recognition of incomeIncome is valued at the fair value of the remuneration, net after deductions for value added tax and discounts. Intra-group sales are eliminated. Income is recognized when the income can be reliably valued, it is likely the financial benefits associated with the transaction will flow to the group, and the particular criteria mentioned below are met. Sales are not regarded as being able to be valued reliably before all conditions associated with the sale have been met.
Sales of goodsThe group sells seating furniture through independent retail chains, dealers and importers. Income from sales of goods are recognised through profit and loss once the risk and ownership associated with the sold goods have been trans-ferred to the buyer and the group no longer has the right of disposal or control associated with these goods. In the vast majority of cases this happens upon delivery from production. The products are often sold with discounts and return rights in the event to defects. Sales are recognized on the basis of the agreed price less any discounts.
Freight earningsThe group has income from freight linked to the transporta-tion of goods, which is recognised as income on an ongoing basis in line with the earnings from the sale of goods.
Government grantsGovernment grants are recognised at fair value when it is reasonably certain that the grant will be received and that the group will fulfil the criteria associated with the grant. Govern-ment grants associated with future costs are recognised in the balance sheet and recognized through profit and loss as a
cost reduction in the period that results in the best composi-tion of the costs they are meant to compensate for.
management reportingSee annual report chapter regarding corporate governance.
approved ifrss and ifriCs with future effective dates
Standards and interpretations that are issued up to the date of issuance of the consolidated financial statements, but not yet effective, are disclosed below. The Group’s intention is to adopt the relevant new and amended standards and interpre-tations when they become effective, subject to EU approval before the consolidated financial statements are issued.
ias 19 employee BenefitsThe amendment introduces the option to recognise contri-butions from employees or third parties as a reduction in the service cost in the same period in which they are payable if, and only if, they are linked solely to the employee’s service rendered in that period. The amendment will not have any impact on the Group’s financial position or performance.
ias 27 separate financial statementsAs a consequence of the issuance of IFRS 10 Consolidated Financial Statements, IFRS 11 Joint Arrangements and IFRS 12 Disclosure of Interests in Other Entities, the IASB has amended IAS 27. IAS 27 now only deals with accounting in the separate financial statements. The title of the standard is amended accordingly. Within the EU/EEA area, the amend-ments are effective for annual periods beginning on or after 1 January 2014. The amendment will not have any impact on the Group’s financial position or performance.
ias 36 impairment of assetsIAS 36 is amended to address the disclosure of information about the recoverable amount of impaired assets if that amount is based on fair value less costs of disposal. These amendments are issued to align the disclosure requirements in IAS 36 with the IASB’s original intention when consequen-tial amendments to IAS 36 were made as a result of the issuance of IFRS 13 Fair Value Measurement. The amend-ments are effective for annual periods beginning on or after 1 January 2014. The amendment will not have any impact on the Group’s financial position or performance.
ifrs 9 financial instruments: Classification and measurementIFRS 9, as issued, reflects the two first phases of IASB’s work on the replacement of IAS 39, which are classification and measurement of financial assets and financial liabilities and hedge accounting. Third and last phase of this project will address amortised cost measurement and impairment of

AnnuAl RepoRt 2013 ScAndinAviAn BuSineSS SeAting noteS gRoup
56
financial assets. The mandatory effective date of IFRS 9 has been removed to allow sufficient time for entities to prepare to apply the new Standard. The IASB have decided that a new date should be decided upon when the entire IFRS 9 project is closer to completion. The Group will evaluate potential effects of IFRS 9 as soon as the final standard, in-cluding all phases, is issued. The effect of the implementation is uncertain.
ifrs 10 Consolidated financial statementsIFRS 10 replaces the portion of IAS 27 Consolidated and Sep-arate Financial Statements that addresses the accounting for consolidated financial statements and SIC-12 Consolidation – Special Purpose Entities. IFRS 10 establishes a single control model that applies to all entities including special purpose entities. The changes introduced by IFRS 10 will require management to exercise significant judgement to determine which entities are controlled and therefore are required to be consolidated by a parent, compared with the requirements that were in IAS 27. In accordance with IFRS 10, an investor controls another entity when it is exposed, or has rights, to variable returns from its involvement with the other entity, and has the ability to affect those returns through its power over the entity. Within the EU/EEA area, IFRS 10 is effective for annual periods starting on or after 1 January 2014. The amendment will not have any impact on the Group’s financial position or performance.
ifriC interpretation 21 leviesIFRIC 21 is an interpretation of IAS 37 Provisions, Contingent Liabilities and Contingent Assets. IAS 37 sets out criteria for the recognition of a liability, one of which is the requirement for the entity to have a present obligation as a result of a past event (known as an obligating event). The Interpretation clarifies that the obligating event that gives rise to a liability to pay a levy is the activity described in the relevant legisla-tion that triggers the payment of the levy. The Interpretation includes guidance illustrating how the Interpretation should be applied. The amendment will not have any impact on the Group’s financial position or performance.
annual improvements 2010 – 2012
ifrs 2 share-based paymentPerformance condition and service condition are defined in order to clarify various issues, including the following:• A performance condition must contain a service condition• A performance target must be met while the counterparty
is rendering service• A performance target may relate to the operations or
activities of an entity, or to those of another entity in the same group
• A performance condition may be a market or non-market condition
• If the counterparty, regardless of the reason, ceases to provide service during the vesting period, the service con-dition is not satisfied
ifrs 3 Business CombinationsContingent consideration in a business acquisition that is not classified as equity is subsequently measured at fair value through profit or loss whether or not it falls within the scope of IFRS 9 Financial Instruments.
ifrs 8 operating segmentsOperating segments may be combined/aggregated if aggre-gation is consistent with the core principle of the standard, if the segments have similar economic characteristics and if they are similar in other qualitative respects. If they are com-bined, the entity must disclose the economic characteristics (e.g., sales and gross margins) used to assess whether the segments are ‘similar’. The reconciliation of segment assets to total assets is only required to be disclosed if the recon-ciliation is reported to the chief operating decision maker, similar to the required disclosure for segment liabilities.
ifrs 13 fair Value measurementThe IASB clarified that short-term receivables and payables with no stated interest rates can be held at invoice amounts when the effect of discounting is immaterial.
ias 16 property, plant and equipment and ias 38 intangible assetsThe amendment to IAS 16.35(a) and IAS 38.80(a) clarifies that revaluation can be performed, as follows:
• Adjust the gross carrying amount of the asset to market value Or
• Determine the market value of the carrying amount and ad-just the gross carrying amount proportionately so that the resulting carrying amount equals the market value
The IASB also clarified that accumulated depreciation/amor-tisation is the difference between the gross carrying amount and the carrying amount of the asset (i.e., gross carrying amount – accumulated depreciation/amortisation = carrying amount). The amendment to IAS 16.35(b) and IAS 38.80(b) clarifies that the accumulated depreciation/amortisation is eliminated so that the gross carrying amount and carrying amount equal the market value.
ias 24 related party DisclosuresThe amendment clarifies that a management entity – an entity that provides key management personnel services – is a related party subject to the related party disclosures. In addition, an entity that uses a management entity is required to disclose the expenses incurred for management services. The effect of implementation is uncertain.

57
annual improvements 2011 – 2013
ifrs 13 fair Value measurementThe portfolio exception in IFRS 13 can be applied to financial assets, financial liabilities and other contracts.
In preparing the annual financial statements, estimates and assessments have been made which affect the reported values of assets, liabilities, revenues, expenses and the dis-closures of potential obligations. These estimates have been made largely on the basis of management’s subjective judge-ments and assumption about the future. Future events can result in changes to these estimates. Changes are recognised in the financial statements when new estimates can be relia-bly determined. The company’s critical accounting estimates relate to the following items:
tangible fixed assetsBy acquisition, tangible fixed assets are estimated at fair value, which corresponds to the market value. The expected useful life of the company’s production equipment is largely affected by the volume of production. With an expected reduction in demand for the company’s products, the lifetime of the production equipment will be somewhat longer than we have seen over the last several years. The current depreci-ation period is from 6 to 8 years, while sales forecasts indicate a useful economic life of 5 to 10 years. The carrying value of tangible fixed assets are MNOK 152 (MNOK 131).
intangible assetsThe carrying value of goodwill in the company is tested annu-ally for impairment. Management bases its cash flow forecasts on estimated rates of growth. Estimated rates of growth are derived from judgements made by management of how mac-roeconomic conditions, the company’s market position and its growth ambitions will affect future growth. The assumptions used to test goodwill for impairment are based on estimates that are uncertain. The company has been cautious in its pro-jections of future cash flows in order to reduce the uncertainty in these estimates. Sensitivity analyses have been performed on projected earnings and the discount rate which show that there is a substantial margin compared with book values. Management’s judgements are based on historical data and its market knowledge. The business is substantially affected by the economic cycle in its main markets. This is particularly relevant in Scandinavia and Central Europe. The carrying value of goodwill is MNOK 1 388 (MNOK 1 388).
Net pension obligationsNet pension obligations are determined using calculations by actuaries based on assumptions which include the discount rate, future salary growth, pension regulations, forecast returns on pension plan assets and demographic indica-tors of disability and mortality. The assumptions are made using observable market prices and historical trends for the company and society in general. Significant variability in the assumptions, particularly in the level of interest rates, can have a material effect on the calculated amounts of pension liabilities and expenses. The carrying value of net pension obligations is MNOK 1.7 (MNOK 3.7).
Deferred taxesThere is uncertainty in relation to interpretations of complex tax regulations, amendments to tax legislation, and the size and timing of future taxable income. Given the extensive scope of international business conditions and the long-term nature and complexity of existing contracts, differences between actual performance and the assumptions that have been made, or future changes in these assumptions, it may be necessary to adjust tax revenues and expenses which have already been recorded. See note 13 for further information about taxes.
Note 3 – estimate uNCertaiNty

AnnuAl RepoRt 2013 ScAndinAviAn BuSineSS SeAting noteS gRoup
58
Sales Fixed assets
Figures in MNOK 2013 2012 2013 2012
Norway 304 329 95 85
Sweden 185 180 52 43
Denmark 152 139 1 1
Germany, UK, France, NL 268 276 4 2
Others 93 86
total 1 003 1 011 152 131
Sales (MNOK) Number (1 000)
2013 2012 2013 2012
Office chairs 802 804 252 258
Conference chairs 140 175 165 175
Others 60 32
total 1 003 1 011 417 433
Note 4 – seGmeNt iNformatioN
Business segmentsScandinavian Business Seating’s business segmentation is based on the company’s internal organisation structure and focus from the company’s management. The group is run as a single company with different products with the same target group. No assignment of costs to the various product areas is made.
Scandinavian Business Seating is a niche supplier which de-velops, produces and sells seating for working environments.
The company’s customer structure consists of a very large number of dealers in all the main markets. Outside the main markets, importers buy direct from Scandinavian Business Seating and sell on to dealers and end-customers. The size of our customers varies significantly. However, there are no customers big enough to make the company vulnerable
should they decide to terminate the business relationship. There are no individual customers or groups of customers which account for more than ten percent of total sales within the group. Consequently, the group has a reporting segment, which is business seating for public and private sector work-ing environments.
The management closely monitors sales trends on the various markets, which is reflected in the reports generated based on follow-up. Geographic sales distribution as shown below re-flects the distribution used in following up the various market areas. There are insignificant differences between the various geographic main areas with regard to growth potential, risk profile and future potential. In addition, sales are monitored to the main product groups within seating for working envi-ronments.

59
NOK 1 000 Goodwill DevelopmentOther
intangibleTotal
fiscal year 2012
Booked value 01.01.12 1 388 312 21 474 58 1 409 844
Investment 15 148 15 148
Conversion differences (112) (1) (113)
Write down (2) (2)
This year's depreciation (4 409) (4 409)
Booked value 31.12.12 1 388 312 32 101 55 1 420 468
per 31.12.12
Cost price 1 388 312 57 715 55 1 446 082
Accumulated depreciation /write-downs (25 614) (25 614)
Booked value 31.12.12 1 388 312 32 101 55 1 420 468
fiscal year 2013
Booked value 01.01.13 1 388 312 32 101 55 1 420 468
Investment 11 842 7 725 19 567
Conversion differences 1 570 (204) 1 366
Write down (842) (55) (897)
This year's depreciation (3 800) (696) (4 496)
Booked value 31.12.13 1 388 312 40 871 6 825 1 436 008
per 31.12.13
Cost price 1 388 312 68 804 7 583 1 464 699
Accumulated depreciation /write-downs (27 933) (758) (28 691)
Booked value 31.12.13 1 388 312 40 871 6 825 1 436 008
Economic life Indefinite 6-10 years 5 years
Remaining economic life 1-9 years 4 years
The Group has no other intangible assets except goodwill that have indefinite lifetime.
Depreciations on intangible assets are booked purely as depreciations.
Amortization of acquired customer contracts are recognized as impairment.
Note 5 – iNtaNGiBle assets

AnnuAl RepoRt 2013 ScAndinAviAn BuSineSS SeAting noteS gRoup
60
research and developmentThe group performs its own research and development within the field of seating solutions. External parties within a number of fields are used as part of this work. The group has several external designers who work on product development. In most cases the designers are compensated for their work in the form of royalties on sales of the individual product. A not inconsiderable proportion of the total R&D costs are royalties from sales that are recognised as costs in the individual year. Costs incurred in the period and which satisfy the criteria for the product development of future seating solutions are recognised in the balance sheet.
An impairment test is performed every year. The test uses the same preconditions for growth and return on investment (WACC) as for goodwill. Costs for ongoing R&D activities as per 31 December are expected to have future earnings that exceed the value recognised in the balance sheet and ex-pected future costs. The group had at the end of the year two major R&D projects ongoing. These expected completion of launch in the second half of 2016. The group receives gov-ernment grants for research and development. The support recognised during the period amounted to:
2013 2012
Research Counsil of Norway 1 171
Training grant 112 46
total 112 1 217
R&D costs in the period 38 075 34 402
Funds from the Research Council of Norway are disbursed in relation to the degree of completion of the project they are meant to support. All conditions for such support have been fulfilled.
Goodwill
Goodwill distributed per enterprise purchase:
Purchase in 2007
Scandinavian Business Seating AS (former HÅG AS) 1 079 676
Scandinavian Business Seating Holding AB (former RHRBM Holding AB) 308 636
total goodwill 1 388 312
other intangible assetsOther intangible assets constitute customer files and rights associated with lease agreements. Amortisation takes place
Scandinavian Business Seating has accumulated goodwill of TNOK 1 388 312. Goodwill is allocated in connection with purchase transactions in 2007. Goodwill is recognised as the excess of the amount paid and the acquiring company’s net fair value of the identifiable assets, liabilities and contingent liabilities at the time of acquisition.
The group has identified one cash flow generating unit for 2013. The group operates as a single company with different products with the same target group. No allocation of costs to the different product areas was made.
Goodwill is tested for impairment. The book value of good-will is the residual value from business combinations. Good-will is tested by comparing the present value of the discount-ed stream of future cash flows and the book value. Cash flow projections are based on extrapolating figures for 2015 and 2016 from estimates in the company’s and the group’s senior management strategy plan for 2014. A constant growth rate has been applied throughout the time period of the cash flow projections.
over the individual asset’s expected lifetime. In the case of leases this will be the same as the duration of the lease.

61
2013 2012
WACC before tax + 2% 12,62% 11,61%
Impairment margin 806 882
Marginal value WACC before tax 16,70% 15,51%
Long term growth 0% 0%
Impairment margin 718 776
extrapolation of this year’s eBitA
Impairment margin 466 913
impairment tests of goodwillThe conducted impairment tests of goodwill show that there is no need to write-down recognised goodwill. The compa-ny is of the opinion that the assumptions used in the tests are best estimate and, besides taking account of a normal level of long-term uncertainty in relation to the company’s development, also take account the uncertainty in the current financial market.
assumptionsWhen determining the fair value of goodwill, the following assumptions are considered to be the most sensitive to fair value measurements:
SalesSales estimates, which have a material effect on figures in the income statement and cash flows, have taken into account that the company is recovering from a recession with expec-tations of a higher growth rate over the next three years than the long-term average. The long-term growth has been fixed at three per cent, reflecting the long-term rate of inflation plus a very conservative growth rate.
Gross marginsThe group expects sound gross margins in the years ahead. There are continuous improvement projects in procurement and logistics, as well as production optimization. The group has, over the past years, shown that these projects had an effect and it is expected that this will also apply to future.
WACCA lower risk-free interest rate used reduces the WACC com-pared with 2012. The cash flow is discounted with interest (WACC) before tax. A tax rate of 27 per cent is used when cal-culating the WACC before tax. This is a simplification of the theoretically correct method. The group’s goodwill is linked to cash flows from countries with differing tax percentages.
sensitivitySensitivity calculations were conducted for the three compa-nies with different parameters (WACC and long-term growth). The cash flows are also extrapolated using EBITA at 2013 lev-el. These show that the conclusions, with reasonable changes to the assumptions, do not change in relation to the fact that the group can justify its recognised goodwill.
The simplification does not result in any material effects. The WACC rate used is 7.75 % after tax, corresponding to 10.62% before tax.
The group has applied the following assumptions for estimating WACC:• The long term risk-free interest rate is equivalent to the
interest rate on 10 year government bonds as this corre-sponds with the time horizon on the relevant cash flows.
• The risk premium is 5 per cent based on market research undertaken by the Norwegian Society of Financial Analysts and the recommendation from its members.
• Beta is 1.5% due to the cyclical nature of the industry• Corporate Spread is 4%, where 1.25% reflects the current
uncertainty in the borrowing market plus the NIBOR/STI-BOR spread against a long-term risk-free interest rate.
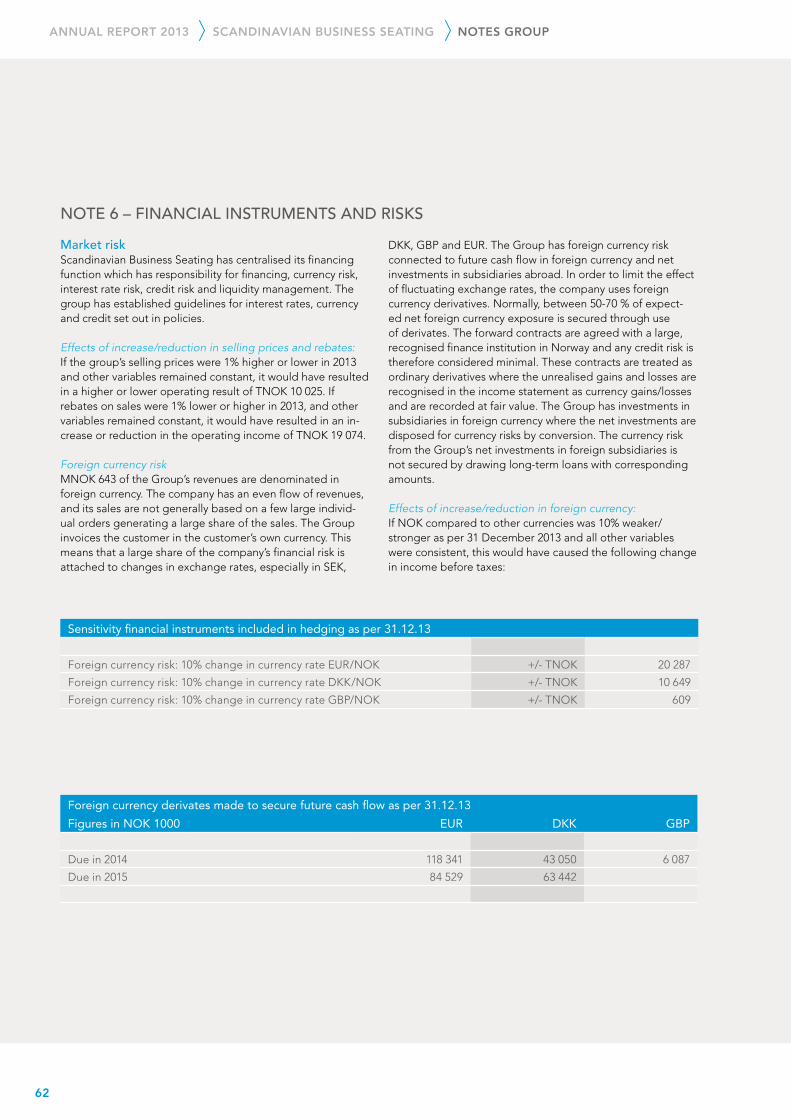
AnnuAl RepoRt 2013 ScAndinAviAn BuSineSS SeAting noteS gRoup
62
market riskScandinavian Business Seating has centralised its financing function which has responsibility for financing, currency risk, interest rate risk, credit risk and liquidity management. The group has established guidelines for interest rates, currency and credit set out in policies.
Effects of increase/reduction in selling prices and rebates:If the group’s selling prices were 1% higher or lower in 2013 and other variables remained constant, it would have resulted in a higher or lower operating result of TNOK 10 025. If rebates on sales were 1% lower or higher in 2013, and other variables remained constant, it would have resulted in an in-crease or reduction in the operating income of TNOK 19 074.
Foreign currency riskMNOK 643 of the Group’s revenues are denominated in foreign currency. The company has an even flow of revenues, and its sales are not generally based on a few large individ-ual orders generating a large share of the sales. The Group invoices the customer in the customer’s own currency. This means that a large share of the company’s financial risk is attached to changes in exchange rates, especially in SEK,
DKK, GBP and EUR. The Group has foreign currency risk connected to future cash flow in foreign currency and net investments in subsidiaries abroad. In order to limit the effect of fluctuating exchange rates, the company uses foreign currency derivatives. Normally, between 50-70 % of expect-ed net foreign currency exposure is secured through use of derivates. The forward contracts are agreed with a large, recognised finance institution in Norway and any credit risk is therefore considered minimal. These contracts are treated as ordinary derivatives where the unrealised gains and losses are recognised in the income statement as currency gains/losses and are recorded at fair value. The Group has investments in subsidiaries in foreign currency where the net investments are disposed for currency risks by conversion. The currency risk from the Group’s net investments in foreign subsidiaries is not secured by drawing long-term loans with corresponding amounts.
Effects of increase/reduction in foreign currency:If NOK compared to other currencies was 10% weaker/stronger as per 31 December 2013 and all other variables were consistent, this would have caused the following change in income before taxes:
Sensitivity financial instruments included in hedging as per 31.12.13
Foreign currency risk: 10% change in currency rate EUR/NOK +/- TNOK 20 287
Foreign currency risk: 10% change in currency rate DKK/NOK +/- TNOK 10 649
Foreign currency risk: 10% change in currency rate GBP/NOK +/- TNOK 609
Foreign currency derivates made to secure future cash flow as per 31.12.13
Figures in NOK 1000 EUR DKK GBP
Due in 2014 118 341 43 050 6 087
Due in 2015 84 529 63 442
Note 6 – fiNaNCial iNstrumeNts aND risks
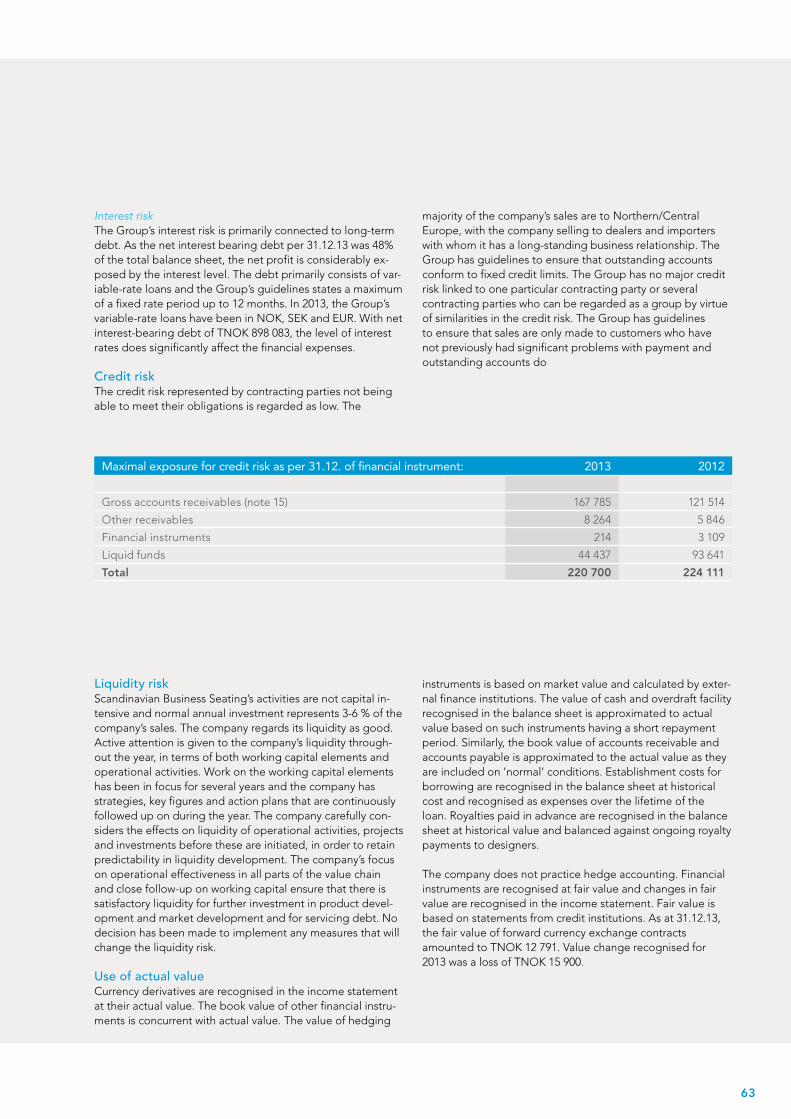
63
Maximal exposure for credit risk as per 31.12. of financial instrument: 2013 2012
Gross accounts receivables (note 15) 167 785 121 514
Other receivables 8 264 5 846
Financial instruments 214 3 109
Liquid funds 44 437 93 641
total 220 700 224 111
Interest riskThe Group’s interest risk is primarily connected to long-term debt. As the net interest bearing debt per 31.12.13 was 48% of the total balance sheet, the net profit is considerably ex-posed by the interest level. The debt primarily consists of var-iable-rate loans and the Group’s guidelines states a maximum of a fixed rate period up to 12 months. In 2013, the Group’s variable-rate loans have been in NOK, SEK and EUR. With net interest-bearing debt of TNOK 898 083, the level of interest rates does significantly affect the financial expenses.
Credit riskThe credit risk represented by contracting parties not being able to meet their obligations is regarded as low. The
liquidity riskScandinavian Business Seating’s activities are not capital in-tensive and normal annual investment represents 3-6 % of the company’s sales. The company regards its liquidity as good. Active attention is given to the company’s liquidity through-out the year, in terms of both working capital elements and operational activities. Work on the working capital elements has been in focus for several years and the company has strategies, key figures and action plans that are continuously followed up on during the year. The company carefully con-siders the effects on liquidity of operational activities, projects and investments before these are initiated, in order to retain predictability in liquidity development. The company’s focus on operational effectiveness in all parts of the value chain and close follow-up on working capital ensure that there is satisfactory liquidity for further investment in product devel-opment and market development and for servicing debt. No decision has been made to implement any measures that will change the liquidity risk.
use of actual valueCurrency derivatives are recognised in the income statement at their actual value. The book value of other financial instru-ments is concurrent with actual value. The value of hedging
instruments is based on market value and calculated by exter-nal finance institutions. The value of cash and overdraft facility recognised in the balance sheet is approximated to actual value based on such instruments having a short repayment period. Similarly, the book value of accounts receivable and accounts payable is approximated to the actual value as they are included on ’normal’ conditions. Establishment costs for borrowing are recognised in the balance sheet at historical cost and recognised as expenses over the lifetime of the loan. Royalties paid in advance are recognised in the balance sheet at historical value and balanced against ongoing royalty payments to designers.
The company does not practice hedge accounting. Financial instruments are recognised at fair value and changes in fair value are recognised in the income statement. Fair value is based on statements from credit institutions. As at 31.12.13, the fair value of forward currency exchange contracts amounted to TNOK 12 791. Value change recognised for 2013 was a loss of TNOK 15 900.
majority of the company’s sales are to Northern/Central Europe, with the company selling to dealers and importers with whom it has a long-standing business relationship. The Group has guidelines to ensure that outstanding accounts conform to fixed credit limits. The Group has no major credit risk linked to one particular contracting party or several contracting parties who can be regarded as a group by virtue of similarities in the credit risk. The Group has guidelines to ensure that sales are only made to customers who have not previously had significant problems with payment and outstanding accounts do

AnnuAl RepoRt 2013 ScAndinAviAn BuSineSS SeAting noteS gRoup
64
Fair value hierarchy
NOK 1 000Fair valueHeld fortrading
Loans and receivables
Book value Fair valueFair value
level*)
non-current assets
Shares in other companies 122 122 122 3
Other financial assets 106 106 106
total 122 106 228 228
current assets
Accounts receivables 167 661 167 661 167 661
Financial instruments 214 214 214 1
Liquid funds 44 437 44 437 44 437
total 214 212 098 212 312 212 312
long-term liabilites
Senior loans 886 156 886 156 886 156
total 886 156 886 156 886 156
current liabilities
Senior loans 54 656 54 656 54 656
Accounts payable 64 411 64 411 64 411
Financial instruments 13 005 13 005 13 005 1
total 13 005 119 067 132 072 132 072
*) The following hierarchy is used for determining and disclosing the fair value of financial instruments by valuation technique:level 1: Quoted prices in active markets for identical assets or liabilities.level 2: Other techniques for which all inputs which have a significant effect on the recorded fair value are observable, either directly or indirectly.level 3: Techniques which use inputs that have a significant effect on the recorded fair value that are not based on observable market data.

65
Note 7 – mortGaGes aND GuaraNtees
The group’s bank agreement was refinanced in December 2013. The old loan was repaid and during 2013 the group has paid off TNOK 690 283 of the bank loan. The remaining cost relating to the repaid bank loan were expensed.
A new long term bank loan agreement for TNOK 952 558 was signed as part of the refinancing. The bank loan is in NOK, SEK and EUR. The repayment period is six years and the loan becomes due in its entirety in 2019. The costs of the loan will be capitalised and expensed over the lifetime of the loan. The assets pledged as security are shares which Scandinavian Business Seating Group AS has in its subsidiaries, proper-ties in Sundveien AS and Fastighets AB Stolhuset, as well as Scandinavian Business Seating Group AS’ shares recorded in the parent company Scandinavian Business Seating Holding AS.
The interest is variable and normally tied for three months at a time. The average interest rates in 2013 was for the NOK-loan 1.68% and the SEK-loan 1.15% plus margin. There are terms linked to the loan in the form of certain key figures based on the result and solvency ratio which must be fulfilled. The company fulfilled the terms in the loan agreement as at 31.12.2013. Interest rates correspond to the total of relevant IBOR and an interest margin based on the key performance
NOK 1 000 2013 2012
long-term debt
Bank loans 952 558 678 933
Capitalised loan costs (11 746) (11 264)
Booked value of assets mortgaged:
Shares in subsidiaries 1 783 235 1 211 459
Property in Sundveien AS and Fastighets AB Stolhuset 34 682 41 171
maturity dates amortisation and interests
Within 1 year 97 777 144 339
From 2 to 5 years 451 252 639 393
5 years or later 570 099
Interest rate and currency rates as per 31.12. is used for calculating future amortisation and interests.
Booked value of loans per currency:
NOK 558 545 522 402
SEK 297 738 145 267
EUR 84 529
total 940 812 667 669
indicator NIBD/EBITDA. The margin is set according to an incremental scale in relation to key performance indicators achieved.
At the end of 2013, the Group had a total credit facili-ty of TNOK 1 052 558 consisting of long-term debt of TNOK 952 558 and a bank overdraft limit of TNOK 100 000. Liquid resources in the form of unused credit facilities and cash at bank per 31.12.13 amounted to TNOK 144 437, which constitutes about 14% of the turnover for the year.
The company is currently experiencing good profitability. The external borrowing carried out in the company is based on the company continuing to be profitable and appear a solid company. One goal is therefore to maintain the group’s profitability and measures are continuously implemented to adapt cost levels to the changing income picture. Besides the company’s strategy for future growth and prof-itability, the management specifically follows up the specific requirements stipulated in the agreement with our main banker. Those parts of the business that particularly influence the development of these requirements (covenants) are subject to special follow up. Bank covenants are valued at the end of every quarter.
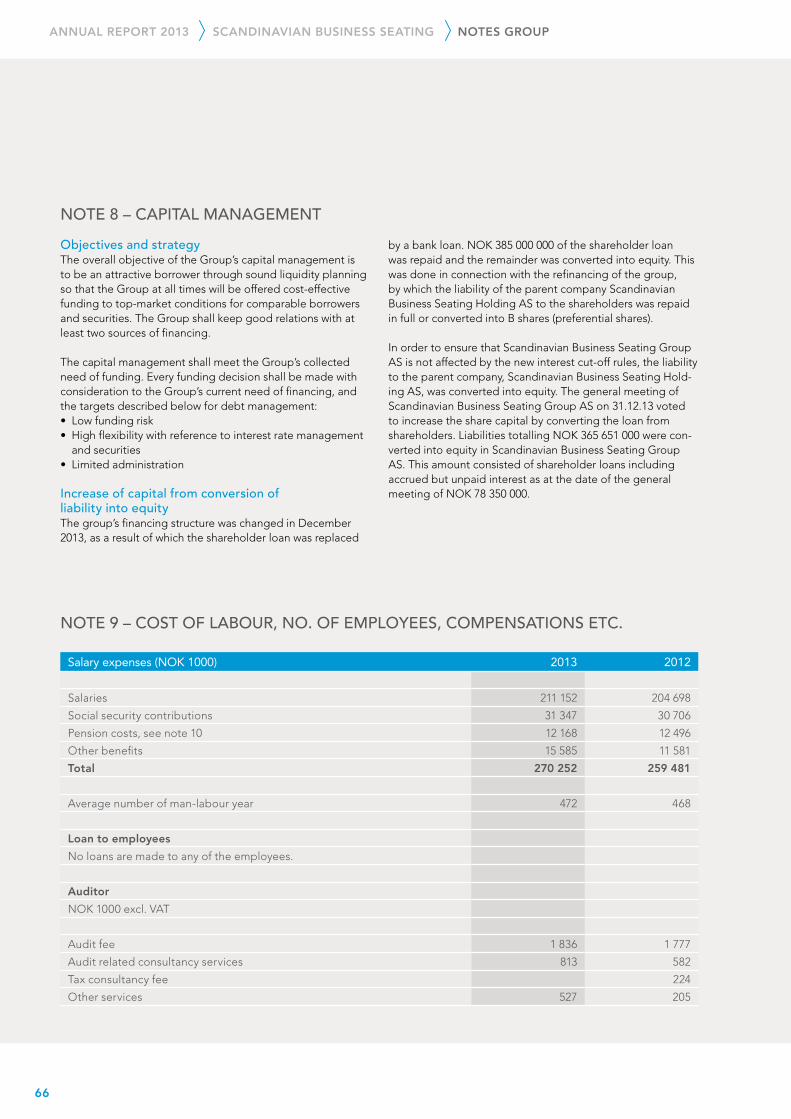
AnnuAl RepoRt 2013 ScAndinAviAn BuSineSS SeAting noteS gRoup
66
objectives and strategyThe overall objective of the Group’s capital management is to be an attractive borrower through sound liquidity planning so that the Group at all times will be offered cost-effective funding to top-market conditions for comparable borrowers and securities. The Group shall keep good relations with at least two sources of financing.
The capital management shall meet the Group’s collected need of funding. Every funding decision shall be made with consideration to the Group’s current need of financing, and the targets described below for debt management:• Low funding risk• High flexibility with reference to interest rate management
and securities• Limited administration
increase of capital from conversion of liability into equityThe group’s financing structure was changed in December 2013, as a result of which the shareholder loan was replaced
by a bank loan. NOK 385 000 000 of the shareholder loan was repaid and the remainder was converted into equity. This was done in connection with the refinancing of the group, by which the liability of the parent company Scandinavian Business Seating Holding AS to the shareholders was repaid in full or converted into B shares (preferential shares). In order to ensure that Scandinavian Business Seating Group AS is not affected by the new interest cut-off rules, the liability to the parent company, Scandinavian Business Seating Hold-ing AS, was converted into equity. The general meeting of Scandinavian Business Seating Group AS on 31.12.13 voted to increase the share capital by converting the loan from shareholders. Liabilities totalling NOK 365 651 000 were con-verted into equity in Scandinavian Business Seating Group AS. This amount consisted of shareholder loans including accrued but unpaid interest as at the date of the general meeting of NOK 78 350 000.
Salary expenses (NOK 1000) 2013 2012
Salaries 211 152 204 698
Social security contributions 31 347 30 706
Pension costs, see note 10 12 168 12 496
Other benefits 15 585 11 581
total 270 252 259 481
Average number of man-labour year 472 468
loan to employees
No loans are made to any of the employees.
Auditor
NOK 1000 excl. VAT
Audit fee 1 836 1 777
Audit related consultancy services 813 582
Tax consultancy fee 224
Other services 527 205
Note 8 – Capital maNaGemeNt
Note 9 – Cost of laBour, No. of employees, CompeNsatioNs etC.

67
The group has pension agreements covering all employees. The group’s Norwegian companies are required to have an occupational pension scheme in accordance with legislation on compulsory occupational pensions. The company’s pen-sion scheme fulfils the requirements of this legislation.
On 01.12.2012, the pension agreements of all Norwegian employees were changed from a defined-benefit to a contributory scheme. This change meant that there was a non-recurring effect on the group’s pension costs in 2012 of MNOK 7.5. As of 01.12.2012, employees with partial disability still have a defined-benefit scheme, the main elements of which are 60% of final pay and a 30-year earning period. The scheme also covers survivors and full disability pension. As of 31.12.2013, this scheme had 16 members. No guarantees have been given to the employees that the pension benefits will automatically be changed as a result of a reduction in National Insurance benefits. The collective pension agree-ment has been funded by the accumulation of funds with an
insurance company. The fund invests in shares, bonds, the capital market, real estate and hedge funds. Future return is estimated based on historical return on these investments. The future return is uncertain and is dependent of interest level, development on the stock exchange and administration of the risks. The pension liability has been calculated using a straight-line pension-earning basis. Unrealised gains and loss-es resulting from changes in actuarial assumptions are distrib-uted over the estimated remaining average pension-earning period. The company’s unsecured scheme comprises an agreement-based early retirement scheme (AFP) and a for-mer President & CEO’s pension agreement, which is financed via the company’s operations. For the group’s companies in other countries, defined contribution pension plans for all employees are established. Provisions have been made for the group’s share of under-coverage of the old occupational pension scheme.
NOK 1 000 2013 2012 2011 2010 2009
Components of pension costs Covered Not covered Covered Not
covered Covered Not covered Covered Not
coveredNot
covered Covered
Benefits earned during the year 75 9 384 7 850 7 719 303 7 930 345
Interests costs 41 30 2 432 38 3 134 91 3 101 149 3 036 150
Return on pension plan assets (2 482) (3 235) (2 836) (3 414)
Effect of changes in actuarial assumption (7 226) (200) 731 (151) 1 154 (714) 1 017 100
Employer's contribution 17 3 1 316 5 1 093 12 1 126 62 1 065 68
Administration costs 100 547 554 505 434
net pension costs defined benefit plan 233 33 3 971 (157) 10 126 (48) 10 768 (200) 10 068 663
Pension costs defined-contribution plan 11 902 8 682 8 543 9 364 11 604
net pension costs 233 11 935 3 971 8 525 10 126 8 495 10 768 9 164 10 068 12 267
pension assets and obligations
Estimated obligations (6 420) (661) (5 178) (1 303) (94 053) (1 865) (78 814) (3 933) (70 881) (3 456)
Assets of the plan at fair value 5 555 3 629 56 718 57 590 48 254
Effect of changes in actuarial assumption (707) 214 33 321 217 17 663 206 23 025 369
Employer's contribution (122) (60) (218) (128) (5 264) (230) (2 992) (354) (3 191) (488)
net pension plan assets/ (-obligations) (987) (721) (2 474) (1 217) (9 278) (1 878) (6 552) (4 080) (2 793) (3 575)
Note 10 – peNsioN Costs, -assets aND -oBliGatioNs

AnnuAl RepoRt 2013 ScAndinAviAn BuSineSS SeAting noteS gRoup
68
Commonly used insurance assumptions have been used as the basis for the actuarial assumptions made for demographic factors and retirements. The standardised assumptions with regard to mortality and disability trends were prepared by the Association of Norwegian Insurance Companies. The estimates are based on K2013 with enhanced disability tariff IR73 and enhanced life expectancy. The discount rate tracks the interest rate for government bonds. The financial rate of return on the funds was 5.8% (4.53%) in 2012.
2013 2012 2011 2010
Change in pension obligations CoveredNot
coveredCovered
Not covered
CoveredNot
coveredCovered
Not covered
Net obligation 01.01. (2 474) (1 217) (11 472) 24 (7 346) (3 286) (2 793) (3 575)
Pension cost in the income statement (233) (33) (3 971) 157 (10 126) 48 (10 769) 200
The periods premium payments 931 8 964 6 000 5 700
Premium payments and other changes 789 529 4 005 (1 398) 3 262 516 89
net obligation 31.12. (987) (721) (2 474) (1 217) (11 472) 24 (7 346) (3 286)
pension fund investment profile:
Shares 11%
Capital bonds 35%
Property 15%
Bonds 9%
Money market 5%
Other 25%
total 100%
Actuary calculation is made annually using the following assumption (p.a.) 2013 2012 2011 2010 2009
Discount rate 4,10% 3,50% 2,60% 4,00% 4,40%
Expected increase in salaries 3,75% 3,25% 3,50% 4,00% 4,25%
Expected G-increase 3,50% 3,00% 3,25% 3,75% 4,00%
Expected growth in running pensions 0,00% 0,00% 0,10% 1,30% 1,30%
Expected return on pension plan assets 4,40% 3,60% 4,10% 5,00% 5,60%
Transfer to AFP at 62 years of age 0,00% 0,00% 0,00% 0,00% 25,00%
Return on pension funds are expected to stay unchanged in 2013. Future returns are uncertain and dependent on interest rates, stock market fluctuations and risk management. Con-tributions to the pension scheme for 2013 are calculated to TNOK 250. Total recognised obligation includes an old AFP scheme with TNOK 500. The obligation is booked inclusive the Group’s portion of the schemes’ under financing.
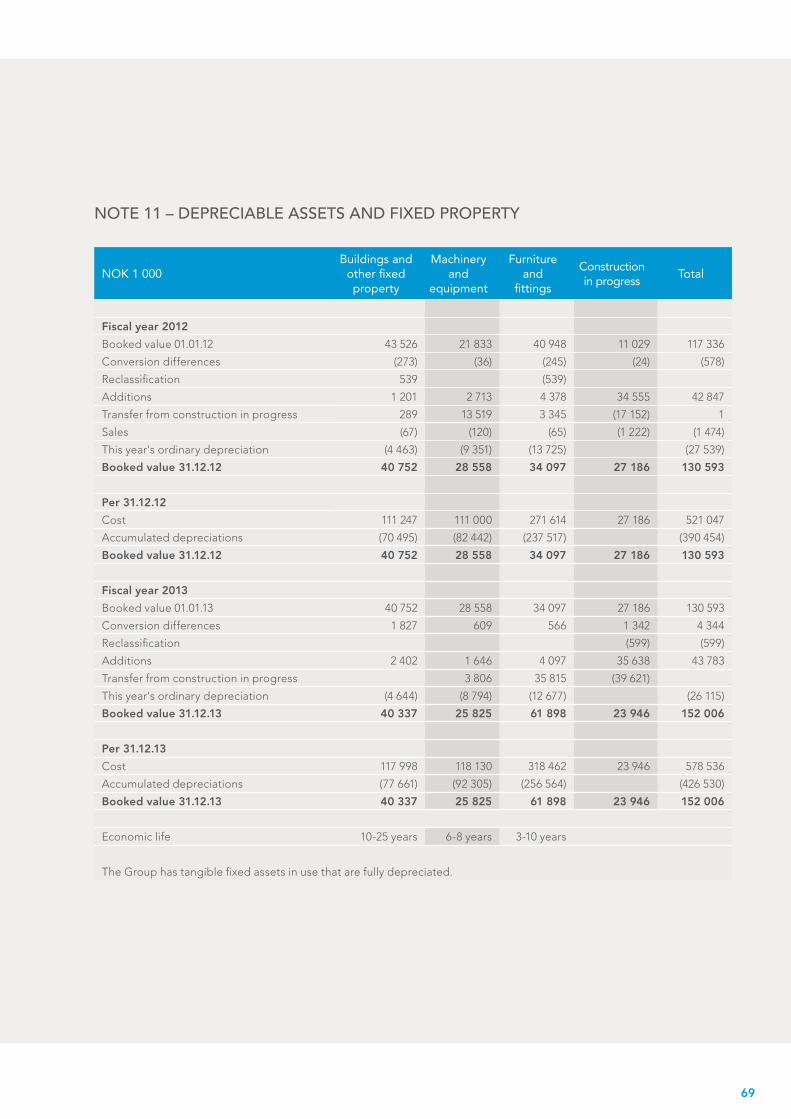
69
Note 11 – DepreCiaBle assets aND fixeD property
NOK 1 000Buildings and
other fixed property
Machinery and
equipment
Furniture and
fittings
Constructionin progress
Total
fiscal year 2012
Booked value 01.01.12 43 526 21 833 40 948 11 029 117 336
Conversion differences (273) (36) (245) (24) (578)
Reclassification 539 (539)
Additions 1 201 2 713 4 378 34 555 42 847
Transfer from construction in progress 289 13 519 3 345 (17 152) 1
Sales (67) (120) (65) (1 222) (1 474)
This year's ordinary depreciation (4 463) (9 351) (13 725) (27 539)
Booked value 31.12.12 40 752 28 558 34 097 27 186 130 593
per 31.12.12
Cost 111 247 111 000 271 614 27 186 521 047
Accumulated depreciations (70 495) (82 442) (237 517) (390 454)
Booked value 31.12.12 40 752 28 558 34 097 27 186 130 593
fiscal year 2013
Booked value 01.01.13 40 752 28 558 34 097 27 186 130 593
Conversion differences 1 827 609 566 1 342 4 344
Reclassification (599) (599)
Additions 2 402 1 646 4 097 35 638 43 783
Transfer from construction in progress 3 806 35 815 (39 621)
This year's ordinary depreciation (4 644) (8 794) (12 677) (26 115)
Booked value 31.12.13 40 337 25 825 61 898 23 946 152 006
per 31.12.13
Cost 117 998 118 130 318 462 23 946 578 536
Accumulated depreciations (77 661) (92 305) (256 564) (426 530)
Booked value 31.12.13 40 337 25 825 61 898 23 946 152 006
Economic life 10-25 years 6-8 years 3-10 years
The Group has tangible fixed assets in use that are fully depreciated.

AnnuAl RepoRt 2013 ScAndinAviAn BuSineSS SeAting noteS gRoup
70
NOK 1 000 2013 2012
Premises costs 27 306 28 097
Marketing costs 27 149 25 363
Travelling costs 12 519 10 710
Fees 19 546 26 112
Freight 40 556 44 730
Royalty 15 085 14 998
Car expenses 16 182 15 234
Other operating costs 26 925 24 149
total other operating costs 185 266 189 392
Note 12 – other operatiNG Costs

71
The major components of income tax expense are:
NOK 1 000 2013 2012
Taxes payable on this years result 26 055 20 242
Changes in deferred taxes and deferred tax benefit (Norway) (4 220) 1 623
Changes in deferred taxes and deferred tax benefit (other countries) (1 263) 451
Taxes previous years 2 593 (12 752)
income tax expense reported in the income statement 23 165 9 564
By using the Norwegian tax rate, the taxes differ from booked figures as a result of the following:
Income before taxes 79 553 82 627
Taxes 28% 22 275 23 136
Taxes due to:
Change in assessment previous years 2 593 (12 752)
Permanent differences 571 (2 050)
Changed tax rate Norway 421
Other: differences in tax rates, currency etc. (2 695) 1 230
income tax expense reported in the income statement 23 165 9 564
Specification of the basis of deferred taxes:
Temporary differences included in the provision for deferred taxes:
Fixed assets 26 531 23 767
Intangible assets (20 162) (14 300)
Current assets 14 (733)
Obligations and other differences 17 997 1 827
Carry forward losses 8 473
Pension obligations not covered 2 044 5 377
total 34 897 15 938
net deferred tax 9 945 4 463
Deferred tax and deferred tax benefit are booked as gross value in the balance sheet statement.
Deferred tax benefit 14 613 8 672
Deferred tax (4 668) (4 209)
total 9 945 4 463
Note 13 – taxes

AnnuAl RepoRt 2013 ScAndinAviAn BuSineSS SeAting noteS gRoup
72
Deferred tax assets are mainly linked to temporary differ-ences in non-current assets and pension obligations. There is a high degree of probability that the group will generate taxable profits in subsequent periods against which these
deferred tax assets can be utilised. The benefits of the de-ferred tax assets will flow to the company and have therefore been recorded at their full value.
Inventories consist of the following items:
NOK 1 000 2013 2012
Raw materials 28 991 22 510
Work in progress 9 121 7 822
Finished goods 16 094 11 835
total inventories 54 206 42 167
Change in inventories 12 039 (6 170)
dead stock allocation
Balance 01.01. 1 084 693
Provisions 1 093 587
Provision used (589) (196)
Balance 31.12 1 588 1 084
Write-down of inventory booked as cost amounts to TNOK 3 412 (TNOK 196).
The amount is classified as cost of goods sold.
2013 2012
Reconciliation of deferred tax
Opening net balance as of 01.01. 4 463 8 796
Tax expense during the period recognised in profit or loss 5 486 (2 720)
Other: differences in tax rates, currency etc. (4) (1 613)
closing net balance 31.12. 9 945 4 463
Reconciliation of current income tax for the year ended 31.12.
Current income tax charge 26 055 20 242
Tax payment, not settled 1 085 5 886
Prepaid income tax (12 633) (8 707)
closing balance 31.12. 14 507 17 421
Note 14 – iNVeNtories
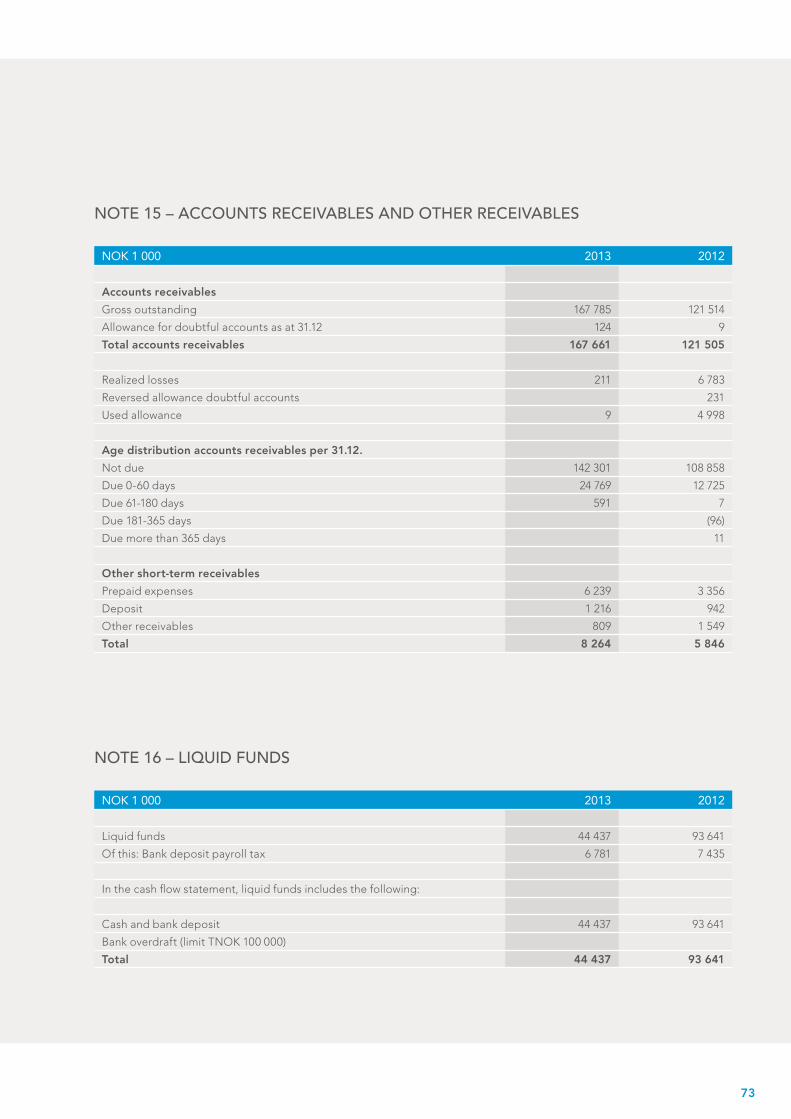
73
NOK 1 000 2013 2012
Accounts receivables
Gross outstanding 167 785 121 514
Allowance for doubtful accounts as at 31.12 124 9
total accounts receivables 167 661 121 505
Realized losses 211 6 783
Reversed allowance doubtful accounts 231
Used allowance 9 4 998
Age distribution accounts receivables per 31.12.
Not due 142 301 108 858
Due 0-60 days 24 769 12 725
Due 61-180 days 591 7
Due 181-365 days (96)
Due more than 365 days 11
other short-term receivables
Prepaid expenses 6 239 3 356
Deposit 1 216 942
Other receivables 809 1 549
total 8 264 5 846
NOK 1 000 2013 2012
Liquid funds 44 437 93 641
Of this: Bank deposit payroll tax 6 781 7 435
In the cash flow statement, liquid funds includes the following:
Cash and bank deposit 44 437 93 641
Bank overdraft (limit TNOK 100 000)
total 44 437 93 641
Note 15 – aCCouNts reCeiVaBles aND other reCeiVaBles
Note 16 – liquiD fuNDs

AnnuAl RepoRt 2013 ScAndinAviAn BuSineSS SeAting noteS gRoup
74
NOK 1 000 2013 2012
financial income
Interest income 1 937 3 056
Net foreign exchange gain 75 819 81 459
Other financial income 20 155
total 77 776 84 670
financial expense
Interest expense bank loan etc. 35 278 46 262
Net foreign exchange loss 75 098 82 477
Other financial expenses 13 917 4 980
total 124 293 133 719
The Group has foreign currency translation reserve booked against other comprehensive income. A reconciliation of this is shown in the consolidated statement of changes in equity.
Company Business location Ownership Company’s share
Scandinavian Business Seating Holding AB Nässjö 100% 100%
Scandinavian Business Seating AS Oslo 100% 100%
Scandinavian Business Seating GmbH Neuss 100% 100%
Scandinavian Business Seating BV Dordrecht 100% 100%
HÅG Inc Greensboro, NC 100% 100%
Scandinavian Business Seating AB Nässjö 100% 100%
Scandinavian Business Seating Sarl Paris 100% 100%
Ergonomiprodukter i Bodafors AB Nässjö 100% 100%
Scandinavian Business Seating A/S København 100% 100%
Sundveien AS Oslo 100% 100%
Fastighets AB Stolhuset Nässjö 100% 100%
Scandinavian Business Seating Ltd. London 100% 100%
Scandinavian Business Seating Asia PTE Ltd. Singapore 100% 100%
Scandinavian Business Seating AG Othmarsingen 100% 100%
Note 17 – aGGreGateD fiNaNCial iNCome/expeNse
Note 18 – CompaNies iN the Group
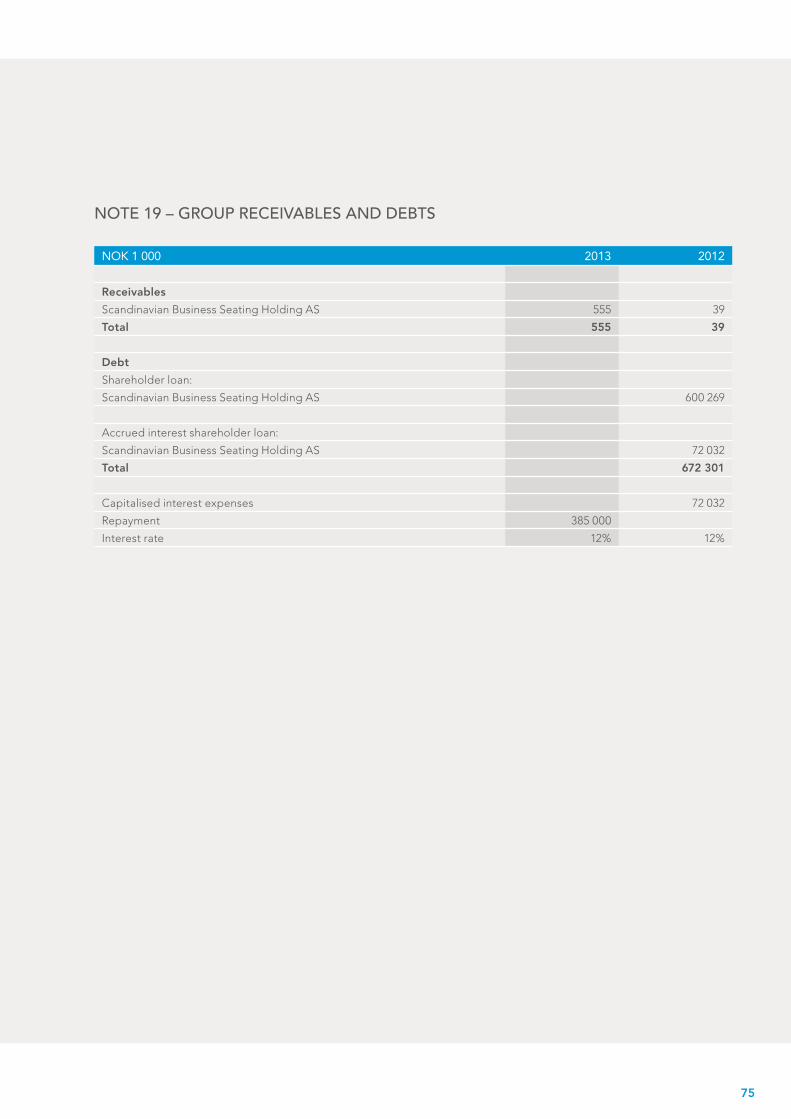
75
NOK 1 000 2013 2012
Receivables
Scandinavian Business Seating Holding AS 555 39
total 555 39
debt
Shareholder loan:
Scandinavian Business Seating Holding AS 600 269
Accrued interest shareholder loan:
Scandinavian Business Seating Holding AS 72 032
total 672 301
Capitalised interest expenses 72 032
Repayment 385 000
Interest rate 12% 12%
Note 19 – Group reCeiVaBles aND DeBts

AnnuAl RepoRt 2013 ScAndinAviAn BuSineSS SeAting noteS gRoup
76
Scandinavian Business Seating Group AS has a total of 10 310 000 000 shares at a nominal value of NOK 0.02 per share. The share capital is NOK 206 200 000. An increase in capital through conversion of a shareholder loan including accrued interest was adopted at the company’s general meeting on 31 December 2013 and registered in the Register of Business Enterprises on 18 February 2014. The capital increase was performed by increasing the nominal value of the company’s 10 310 000 000 shares from NOK 0.01
94% of the shares in Scandinavian Business Seating Holding AS (the parent company) are owned by Ratos AB and the re-maining 6% are owned by management and board members. There are no restrictions on trading shares in Scandinavian Business Seating Holding AS.
In order to achieve a more manageable number of shares in Scandinavian Business Seating Holding AS, the general meet-ing of the company on 27 December 2013 implemented a share consolidation at a ratio of 1 030:1, so that 1 030 existing
by NOK 0.01 to NOK 0.02, so that the total increase in share capital was NOK 103 100 000. The difference between nomi-nal share capital increase and total subscription amount was assigned to share premium. The total subscription amount was NOK 365 651 000.
Scandinavian Business Seating Group AS has one share class in which each share has one vote. There are no restrictions on trading shares in Scandinavian Business Seating Group AS.
shares in the company became 1 new share. The face value of the share was changed from NOK 0.01 to NOK 10.30.
Scandinavian Business Seating Holding AS has a total of 10 000 000 A shares (ordinary shares) and 34 299 100 B shares (preferential shares), each with a face value of NOK 10.30 per share. Shares within each share class are equal. A shares and B shares are equal, with the exception of article 5-7 in the company’s articles of association.
The major shareholders in Scandinavian Business Seating Group AS at year end:
Shareholder No. of A-shares No. of B-shares Portion
Spin International AB (Ratos AB) 8 499 961 33 225 947 94,2%
Other shareholders < 1% 1 500 039 1 073 153 5,8%
total 10 000 000 34 299 100 100,0%
Shareholders of Scandinavian Business Seating Group AS at year end:
Shareholder Share capital No. of shares
Scandinavian Business Seating Holding AS TNOK 206 200 10 310 000 000
No. of outstanding shares per 31.12.12 10 310 000 000
No. of outstanding shares per 31.12.13 10 310 000 000
2013 2012
Earnings per share (NOK) 0,005 0,007
Fully diluted earnings per share (NOK) 0,005 0,007
Net income (NOK 1 000) 56 388 73 064
Median number of outstanding shares 10 310 000 000 10 310 000 000
Median number of outstanding shares (fully diluted) 10 310 000 000 10 310 000 000
Note 21 – earNiNGs per share
Note 20 – share Capital

77
The parent company, Scandinavian Business Seating Holding AS, owns shares in Scandinavian Business Seating Group AS which have been pledged as security for financing relating to Scandinavian Business Seating Group AS.
The CEO has an agreement for full pay for up to 24 months in the event of termination of employment by the company. There is no agreement for any remuneration in the event of the chair of the board leaving the position. No loans have been given to any employees of the company or closely re-lated parties as of year end. Neither does the company have any other transactions with closely related parties.
In accordance with the current bonus scheme for man-agement and senior employees, the group has allocated TNOK 1 313 as of 31.12.13. The bonus will be due for pay-ment in 2014. There are no option programmes or agree-ments of share-based payment in the company.
The Group’s related parties consist of members of the board and the management.
Payments to executives (NOK 1000) CEORest of
Group ManagementBoard
Board of Directors fee 873
Salaries 2 987 10 154
Bonuses 536 922
Other benefits 201 1 068
Pension costs 68 877
Shares owned by management and board members in the mother company Scandinavian Business Seating Holding AS per 31.12.13:
No. of A-shares No. of B-shares
group management
Lars Ivar Røiri (Røiri Invest AS) 219 901 159 662
Lillevi Ivarson (Tunset AS) 54 976 39 916
Eirik Kronkvist 32 069 23 284
Patrik Röstlund 32 069 23 284
Christian Lodgaard 10 996 7 984
Board
Ebbe Pelle Jacobsen, Chairman of the Board 73 301 53 221
Sven-Gunnar Schough 58 086 230 924
Anne Breiby (Kjerby AS) 14 661 58 283
Olav Kjell Holtan (Holtan Management AS) 14 661 10 645
Note 22 – relateD parties

AnnuAl RepoRt 2013 ScAndinAviAn BuSineSS SeAting noteS gRoup
78
The Group has entered into leasing agreements for cars, of-fices and IT-equipment, where office rental are the major part. Most of the leasing agreements have an option to renew. There exist no condition to take up these options. The rental
The company has made a provision of TNOK 5 477 for warranty claims for chairs sold in the past five years. The provision has not been discounted, as the effect of such discounting is insignificant. The warranty costs are estimated to be paid out over the next five years with the main empha-sis being early on in the five-year period. Approximately 40% of the amount is expected to be used within one year. The provision has been calculated on the basis of historical figures and the age distribution of complaints costs. The level of the
agreements do not contain restrictions of the company’s divi-dend policy or financing opportunity. The rental costs of 2013 comprise TNOK 24 855. Future minimum rental for non-termi-nable lasing agreements falls due as follows:
provision has been adjusted to the turnover for the past five years. In addition, an evaluation has been made of whether there are other specific events that are of importance to the size of the provision.
On parts there are a 10 years guarantee on HÅG-products, a five years guarantee on RH -products and RBM products give six years guarantee. RBM-products also gives a half year guarantee on service work.
NOK 1 000 2013 2012
Balance 01.01. 4 483 6 200
Provisions 3 242 330
Provision used (2 248) (2 047)
Balance 31.12. 5 477 4 483
NOK 1 000 2013 2012
Accrued salary expenses 25 859 27 563
Other accrued expenses 34 832 20 294
total other short-term debt 60 691 47 857
NOK 1 000 2013 2012
Within 1 year 19 184 18 394
1 to 5 years 33 756 46 933
After 5 years 9 772 20 341
total 62 712 85 668
Note 23 – operatioNal leasiNG aGreemeNts
Note 24 – GuaraNtees proVisioN
Note 25 – other short-term DeBt

79
Ebbe Pelle JacobsenChairman of the Board
Oscar Hermansson
Sven-Gunnar Schough
Henrik Lundh
Anne Breiby
Lars I. RøiriCEO
No events have occurred after the balance sheet date, with or without accounting consequences, which are of such significance they could affect the presented accounts.
Note 26 – eVeNts after the BalaNCe sheet Date
31 December 2013
Oslo, 18 March 2014

80
AnnuAl RepoRt 2013 ScAndinAviAn BuSineSS SeAting AnnuAl AccountS SB SeAting gRoup AS
income StAtement ScAndinAviAn BuSineSS SeAting gRoup AS
NOK 1 000 Notes 01.01.-31.12.2013 01.01.-31.12.2012
total operating revenues
Cost of labour 2 895 1 069
Other operating costs 2, 3 4 724 2 852
total operating costs 5 619 3 921
operating income (5 619) (3 921)
Financial income 4 210 924 210 901
Financial expense 4 (164 024) (181 032)
net financial income/(expense) 46 900 29 869
income before taxes 41 281 25 949
Income tax expense 5 11 394 7 427
net income 29 886 18 521

81
BAlAnce Sheet ScAndinAviAn BuSineSS SeAting gRoup AS
NOK 1 000 Notes 31.12.2013 31.12.2012
Assets
Shares in subsidiaries 6 1 211 459 1 211 459
Capitalised loan costs 9 402 9 011
Shareholder loan 7, 8 328 355 293 078
total fixed assets 1 549 217 1 513 549
Group receivables 7 137 719 132 055
Capitalised loan costs 2 344 2 253
Other receivables 87 19
Cash and liquid funds
total current assets 140 150 134 327
total assets 1 689 367 1 647 876
equity and liabilities
Share capital 9 206 200 103 100
Other paid-up equity 9 365 551 103 000
total paid-up equity 571 751 206 100
Retained earnings 9 54 781 24 895
total equity 626 532 230 995
Senior loans 8 895 558 579 091
Shareholder loan 7, 8 672 301
total long-term liabilities 895 558 1 251 392
Senior loans 8 99 842
Bank overdraft 80 671 57 804
Taxes payable 5 11 556 7 266
Accounts payable 226
Group payable 7 2 450
Other short-term debt 15 373 577
total current liabilities 167 276 165 489
total liabilities 1 062 835 1 416 881
total equity and liabilities 1 689 367 1 647 876
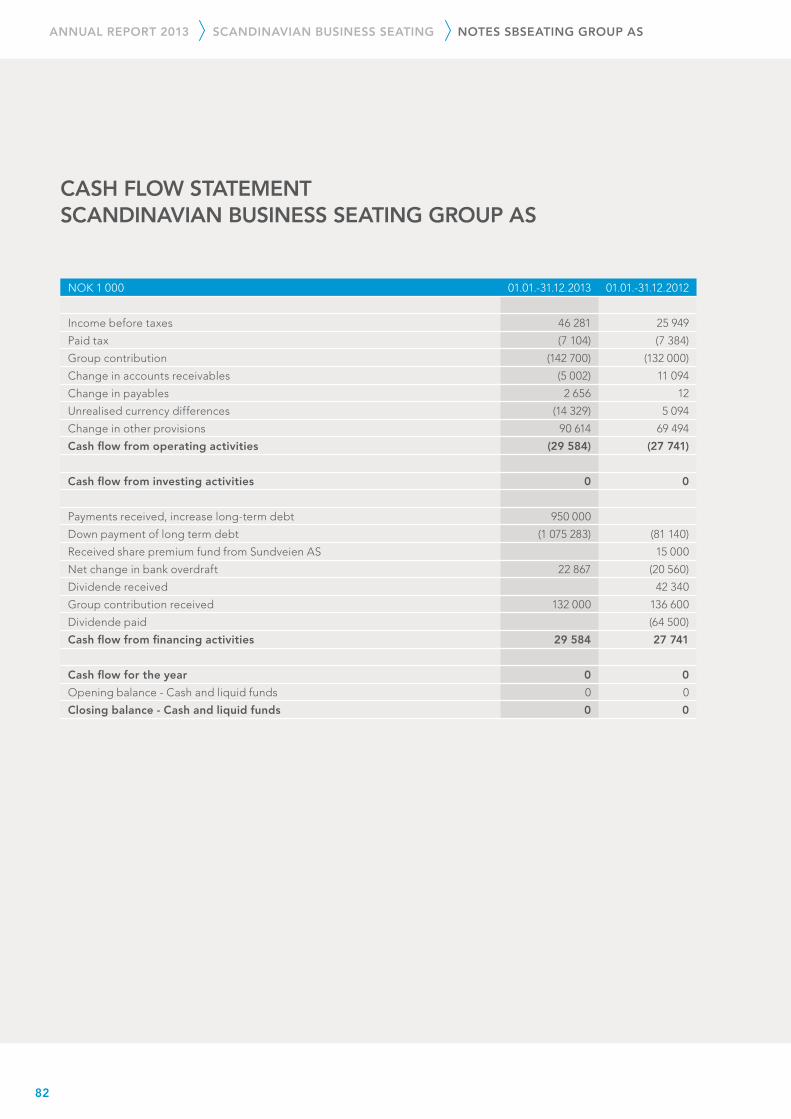
82
AnnuAl RepoRt 2013 ScAndinAviAn BuSineSS SeAting noteS SBSeAting gRoup AS
NOK 1 000 01.01.-31.12.2013 01.01.-31.12.2012
Income before taxes 46 281 25 949
Paid tax (7 104) (7 384)
Group contribution (142 700) (132 000)
Change in accounts receivables (5 002) 11 094
Change in payables 2 656 12
Unrealised currency differences (14 329) 5 094
Change in other provisions 90 614 69 494
cash flow from operating activities (29 584) (27 741)
cash flow from investing activities 0 0
Payments received, increase long-term debt 950 000
Down payment of long term debt (1 075 283) (81 140)
Received share premium fund from Sundveien AS 15 000
Net change in bank overdraft 22 867 (20 560)
Dividende received 42 340
Group contribution received 132 000 136 600
Dividende paid (64 500)
cash flow from financing activities 29 584 27 741
cash flow for the year 0 0
Opening balance - Cash and liquid funds 0 0
closing balance - cash and liquid funds 0 0
cASh flow StAtement ScAndinAviAn BuSineSS SeAting gRoup AS

83
The financial statements have been prepared in accordance with the provisions of the Accounting Act and good account-ing practice in Norway.
use of estimatesThe management has used estimates and assumptions that have affected the income statement and the valuation of assets and liabilities, as well as assets and liabilities that are uncertain on the balance sheet date, in the preparation of the annual accounts pursuant to good accounting practice.
Currency Transactions in foreign currencies are translated at the ex-change rate at the time of the transaction. Monetary items in foreign currencies are translated to NOK at the exchange rate on the balance sheet date. Non-monetary items measured at the historic exchange rate expressed in foreign currency are translated to NOK using the exchange rate at the time of the transaction. Non-monetary items that are measured at fair value expressed in foreign currency are translated at the ex-change rate set on the balance sheet date. Foreign currency changes are recognised through profit and loss during the accounting period. taxTax consists of payable tax and changes in deferred tax. Deferred tax/tax assets are calculated for all differences between the accounting and tax related values of assets and liabilities. Deferred tax is calculated using 27% of the basis of the temporary differences that exist between accounting and tax related values, as well as the tax related deficit that can be carried forward at the end of the accounting year. Net deferred tax assets are recognised to the extent it is probable they can be used in the future.
Payable tax and deferred tax are recognised directly against equity to the extent that the tax items relate to equity trans-actions.
Classification and stating of balance sheet items Current assets and current liabilities encompass items that fall due for payment within one year of the acquisition date, and items linked to the product cycle. Other items are classified as non-current assets/non-current liabilities.
Current assets are stated at the lower of cost and fair value. Current liabilities are recognised at their nominal amount on the date they were established.
Non-current assets are stated at acquisition cost less depreci-ation and write-downs. Non-current liabilities are recognised in the balance sheet at their nominal amount on the date they were established.
subsidiaries/associated companiesSubsidiaries and associated companies are valued in ac-cordance with the cost method in the financial statements. Investments are stated at the cost of the shares unless they have had to be written down. They are written down to fair value when the fall in value is due to causes that it cannot be assumed will be transient and this is regarded as necessary pursuant to good accounting practice. Impairment charges are reversed when the basis for impairment not longer exists.
Dividends, group contributions and other contributions are recognised in the same year they are allocated in the subsidi-ary. If dividends/group contributions exceed the post-acquisi-tion detained share of earnings, the excess amount repre-sents repaid invested capital and distributions are deducted from the value of the investment recognised in the balance sheet of the parent company.
receivablesTrade and other receivables are stated in the balance sheet at their nominal value less provisions for expected bad debts. Bad debt provisions are made on the basis of individual as-sessments of the individual receivables. In addition to this an unspecified provision is made to cover expected bad debts from other trade receivables.
Cash flow statementThe cash flow statement was prepared using the indirect method. Cash and cash equivalents include cash, bank de-posits and other short-term, liquid placements.
ConsolidationScandinavian Business Seating Group AS is 100% owned by Scandinavian Business Seating Holding AS. The group’s supreme parent company is Ratos AB. Ratos AB is a privately owned, Swedish investment company listed on the NASDAQ OMX, Stockholm Stock Exchange. Scandinavian Business Seating Group presents the consolidated financial statements for the group.
Note 1 – aCCouNtiNG poliCies
noteS ScAndinAviAn BuSineSS SeAting gRoup AS

84
AnnuAl RepoRt 2013 ScAndinAviAn BuSineSS SeAting noteS SBSeAting gRoup AS
NOK 1 000 2013 2012
Salaries
Social security contributions
Pension costs
Other benefits 895 1 069
total 895 1 069
Average number of man-labour year
Auditor (NOK 1000 excl. VAT)
Audit fee 130 122
Audit related consultancy services 187 430
Tax consultancy fee 76 79
Other services 6 45
Payments to executives (NOK 1000)
Board of Directors fee, Chairman of the Board 490 490
There are no employees in Scandinavian Business Seating Group AS.
CEO received the following payments from Scandinavian Business Seating AS (NOK 1000)
Salaries 2 987 2 223
Bonus 536 900
Other benefits 201 215
Pension costs 68 353
The CEO has, if the company gives notice of cessation of employment, an agreement of up till 24 months salary paid. At yearend, no loans are made to any of the employees or related parties in the company. The company is not obliged to have compulsory collective pension plans according to the Norwegian law of compulsory collective pension.
NOK 1 000 2013 2012
Fees 4 488 2 709
Other operating costs 237 143
total operating costs 4 724 2 852
Note 2 – Cost of laBour, No. of employees, CompeNsatioNs etC.
Note 3 – other operatiNG Costs

85
NOK 1 000 2013 2012
financial income
Interest income 214 704
Interest income group 19 791 21 717
Foreign exchange gain 53 218 56 480
Group contribution 137 700 132 000
total 210 924 210 901
financial expense
Interest expense 33 677 44 793
Interest expense group 78 350 72 032
Foreign exchange loss 38 389 59 681
Other financial expenses 13 608 4 526
total 164 024 181 032
NOK 1 000 2013 2012
income tax expense
Taxes payable this years result 11 556 7 266
Taxes previos year (162) 162
income tax expense 11 394 7 427
taxes payable
Income before taxes 41 281 25 949
Permanent differences (10)
Basis taxes payable 41 271 25 949
28% taxes 11 556 7 266
Income before taxes 41 281 25 949
28% taxes 11 559 7 266
Taxes due to:
Received dividende, group contribution (3)
Taxes previos year (162) 162
taxes 11 394 7 427
Note 4 – aGGreGateD fiNaNCial iNCome/expeNse
Note 5 – taxes

86
AnnuAl RepoRt 2013 ScAndinAviAn BuSineSS SeAting noteS SBSeAting gRoup AS
Note 6 – shares iN suBsiDiaries
SelskapBusinesslocation
Time of acquisition
OwnershipCompany's
shareEquity Net income
Scandinavian Business Seating AS Oslo 2007 100% 100% 135 137 28 968
Scandinavian Business Seating Holding AB Nässjö 2007 100% 100% 194 464 18 393
Sundveien AS Oslo 2009 100% 100% 18 325 345
Figures for equity and the result for the year are from the latest authorised annual financial statements, for the year 2012. The book value of shares in subsidiary companies is TNOK 1 211 459. Management has assessed whether impairment indicators exist for long-lived assets. The subsidiaries, with the exception of Sundveien AS, are parent companies in the group which show good profitability and are well positioned to distribute dividends. The underlying values in the subsidiaries are substantially higher than the recorded book values. The decline in value is deemed to be temporary and management does not consider it necessary to write down the value of the assets.
Scandinavian BusinessSeating Holding AB
Scandinavian BusinessSeating AS
Scandinavian BusinessSeating Holding AS
Sundveien AS Total
NOK 1 000 2013 2012 2013 2012 2013 2012 2013 2012 2013 2012
Receivables
Shareholder loan 328 355 293 078 328 355 293 078
Group contribution 135 000 130 000 2 700 2 000 137 700 132 000
Group receivables 19 55 19 55
total 328 355 293 078 135 019 130 055 2 700 2 000 466 074 425 134
debts
Shareholder loan 600 269 600 269
Accured interest shareholder loan 72 032 72 032
Group payable 2 450 2 450
total 2 450 672 301 2 450 672 301
Note 7 – reCeiVaBles aND DeBts with CompaNies withiN the same Group aND with relateD CompaNies

87
2013 2012
Receivables due in more than one year
Shareholder loan 328 355 293 078
total 328 355 293 078
long-term debt due later than 5 years
Shareholder loan 672 301
total 672 301
Gjeld sikret ved pant 1 052 558 828 933
Assets mortgaged:
Shares 1 211 459 1 211 459
total 1 211 459 1 211 459
Note 8 – reCeiVaBles aND DeBts
The senior loan is in NOK, SEK and EUR and was refinanced in December 2013. The down payment period is six years and is due in 2019. The cost of the loan will be capitalised and expensed over the lifetime of the loan. The interest is variable and normally tied for three months at a time. The average interest rates in 2013 was for the NOK-loan 1.68% and the SEK-loan 1.15% plus margin. There are terms linked to the loan in the form of certain key figures based on the result and solvency ratio which must be fulfilled. The company fulfilled the covenants in the loan agreement as at 31.12.2013. Interest rates correspond to the total of relevant IBOR and an interest margin based on the key performance indicator NIBD/EBIT-DA. The margin is set according to an incremental scale in relation to dey performance indicatros achieved.
At the end of 2013, the company had a total credit line of TNOK 1 052 558, consisting of long-term debt of TNOK 952 558 and a bank overdraft limit of TNOK 100 000.

88
AnnuAl RepoRt 2013 ScAndinAviAn BuSineSS SeAting noteS SBSeAting gRoup AS
No events have occurred after the balance sheet date, with or without accounting consequences, which are of such significance they could affect the presented accounts.
Note 10 – eVeNts after the BalaNCe sheet Date
Note 9 – equity
NOK 1 000 Share capitalOther
paid-up equityTotal
paid-up equityRetainedearnings
Totalequity
equity per 31.12.12 103 100 103 000 206 100 24 895 230 995
Net income 29 886 29 886
Issue 1) 103 100 262 551 365 651 365 651
equity per 31.12.13 206 200 365 551 571 751 54 781 626 532
1) An increase in capital through conversion of a shareholder loan including accrued interest was adopted at the company’s general meeting on 31 December 2013 and registered in the Register of Business Enterprises on 18 February 2014. The capital increase was performed by increasing the nominal value of the company’s 10 310 000 000 shares from NOK 0.01 by NOK 0.01 to NOK 0.02, so that the total increase in share capital was NOK 103 100 000. The difference between nominal share capital increase and total subscription amount was assigned to share premium. Scandinavian Business Seating Group AS has totally 10 310 000 000 shares of nominell value of NOK 0.02 per share.Scandinavian Business Seating Group AS has one class of shares and each share gives one vote.
Shareholders in Scandinavian Business Seating Group AS at year-end No. of shares Scandinavian Business Seating Holding AS 10 310 000 000
Scandinavian Business Seating Holding AS is a subsidiary of Ratos AB. Ratos publishes a consolidated financial statement. The annual report is available by request at the company’s office in Stockholm.
89
NOK 1 000 Share capitalOther
paid-up equityTotal
paid-up equityRetainedearnings
Totalequity
equity per 31.12.12 103 100 103 000 206 100 24 895 230 995
Net income 29 886 29 886
Issue 1) 103 100 262 551 365 651 365 651
equity per 31.12.13 206 200 365 551 571 751 54 781 626 532
1) An increase in capital through conversion of a shareholder loan including accrued interest was adopted at the company’s general meeting on 31 December 2013 and registered in the Register of Business Enterprises on 18 February 2014. The capital increase was performed by increasing the nominal value of the company’s 10 310 000 000 shares from NOK 0.01 by NOK 0.01 to NOK 0.02, so that the total increase in share capital was NOK 103 100 000. The difference between nominal share capital increase and total subscription amount was assigned to share premium. Scandinavian Business Seating Group AS has totally 10 310 000 000 shares of nominell value of NOK 0.02 per share.Scandinavian Business Seating Group AS has one class of shares and each share gives one vote.
Shareholders in Scandinavian Business Seating Group AS at year-end No. of shares Scandinavian Business Seating Holding AS 10 310 000 000
Scandinavian Business Seating Holding AS is a subsidiary of Ratos AB. Ratos publishes a consolidated financial statement. The annual report is available by request at the company’s office in Stockholm.
Ebbe Pelle JacobsenChairman of the Board
Oscar Hermansson
Sven-Gunnar Schough
Henrik Lundh
Anne Breiby
Lars I. RøiriCEO
31 December 2013
Oslo, 18 March 2014

90
AnnuAl RepoRt 2013 ScAndinAviAn BuSineSS SeAting AuditoR’S RepoRt

91
92
ANNUAL REPORT 2013 ScANdiNAviAN BUSiNESS SEATiNg cORPORATE SOciAL RESPONSiBiLiTY
People are not designed to sit still. We need move-ment and variation in order to perform at our best. In 2013, the topic "Sitting is the new smoking" received much attention in the media. The assertion is based on scientific findings from several countries that show that sitting for long periods of time is more harmful than previously thought. This is an interesting find-ing, and we are pleased by the increased interest in solutions that reduce sedentary lifestyles. At the same time, this confirms that Scandinavian Business Seat-ing's long-term focus on variation and movement, and "making the world a better place to sit", is probably the greatest contribution we can make towards a bet-ter society with greater productivity and fewer strain injuries.
At Scandinavian Business Seating we have the overall idea that we have a responsibility beyond making money, namely to take care of nature and the people involved. We aspire
to be an environmentally conscious player whose products, services and processes generate minimal greenhouse gas emissions, do not present a risk to health, and result in min-imal waste. The group must also be a responsible player in society with employees who act as good ambassadors. These attitudes must be visible in everything we do, throughout the value chain.
The GRI reportIn addition to the formal annual report, Scandinavian Business Seating has reported separately since 2010 on important areas of finance, the environment and social responsibility in accordance with the guidelines of the Global Reporting Initia-tive (GRI). The report you are now reading is an expression of our desire for openness about how we practice our corporate social responsibility. The delivery chain for our products is our primary focus; in other words everything related to development, manufacturing and distribution of all of our brands.
We WeRe noT made To sIT sTIll

93
ANNUAL REPORT 2013 ScANdiNAviAN BUSiNESS SEATiNg cORPORATE SOciAL RESPONSiBiLiTY
HÅG Capisco

94
ANNUAL REPORT 2013 ScANdiNAviAN BUSiNESS SEATiNg cORPORATE SOciAL RESPONSiBiLiTY
1 economyA ResultB Market proximityC Indirect economic influence
2 environmentA MaterialsB EnergyC WaterD BiodiversityE Discharges, emissions, wasteF Environmental effect of products and servicesG Compliance with statutes and regulationsH TransportI General / expences / investments
3 societyA The workplaceB Human rights (incl. child labour)C Corporate social responsibility (incl. local communities)D Product responsibility
1A
1B 1C
2A 2B
2C 2D
2E
2F2G
2H
2I3A
3B
3C
3D
High importance
High importance
Interested/external parties
Ow
n ju
dg
emen
t
Low importance
ASPECTS
SignifiCAnT indiCATorS
We have also placed emphasis on the report addressing areas where we have access to data and can affect the result.
One important element of a GRI report is determining which indicators should be reported. We have systematically iden-tified the viewpoints of both internal and external interested parties. On this basis, we have chosen a set of indicators that we believe are important for both our business and society. As is apparent from the table above, most environmental aspects are important to us and our surroundings. In addition, our target groups consider our relationship with society to
be particularly important. We naturally agree with this, not least as an important company in several local communities in Scandinavia and in connection with our use of subcontractors in low-cost countries. External parties have also mentioned product liability as an important area. We see this as positive, and it has been incorporated as an important element of all of our brands.
This year's report addressed 35 indicators, and thus meets the requirements of level B. See also the cross-reference table on page 116.
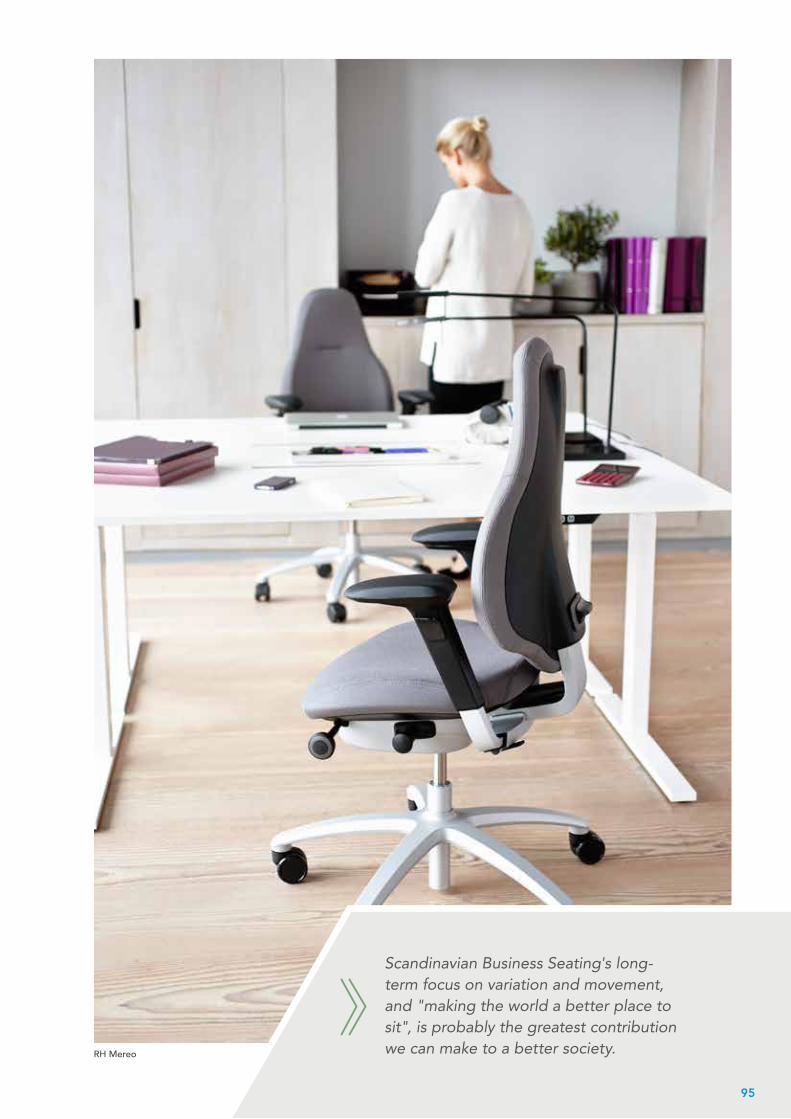
95
ANNUAL REPORT 2013 ScANdiNAviAN BUSiNESS SEATiNg cORPORATE SOciAL RESPONSiBiLiTY
Scandinavian Business Seating's long-term focus on variation and movement, and "making the world a better place to sit", is probably the greatest contribution we can make to a better society.RH Mereo

96
ANNUAL REPORT 2013 ScANdiNAviAN BUSiNESS SEATiNg cORPORATE SOciAL RESPONSiBiLiTY
interested parties Mutual influence forum for dialogue Topic 2013 – frequency of
dialogue
Ow
ners
Investment company Ratos AB owns 85 per cent of Scandinavian Business Seating. Ratos' purpose is to achieve the greatest possible profitability, and influence Scandinavian Busi-ness Seating through governing, shareholder-elected bodies. For its part, Scandinavian Business Seating influences Ratos' total profitability through its operations.
Ratos AB sits on Scandinavian Business Seating's board and the companies' mutual influence follows from Scandinavian Business Seating's “Corporate Governance Policy”, which is published in the company's quality and environmental manage-ment system (TQM).
The topic has been the company's prof-itability and general operations.
Em
plo
yees
79 per cent of our employees are in Norway and Sweden, while the rest are employed by the other sales companies. Scandinavian Business Seating exercises significant influ-ence over the employees via their wage and working conditions. In addition to this comes the employ-ees' surroundings, family, etc. The employees exercise significant in-fluence over Scandinavian Business Seating through their productivity, creativity and general efforts.
The employees are heard via various formal bodies linked to the trade unions, board work, working environ-ment committees, etc. In Sweden the employees have two representatives on the board, in Norway they have three. 52 per cent of our employees are members of a trade union. In addition to this comes the dialogue on the company's HR policy and the organisation's structure, with associat-ed reporting systems.
In 2013, we followed up the action plans that were drawn up after last year's working environment survey. We have also formalised and expanded the introduction programme for new employees. Among other things, this means that more people than ever are going to Røros, Norway and Nässjö, Sweden as part of their training.
Cus
tom
ers
Customers can be divided into two groups: dealers and end-customers. Scandinavian Business Seating fo-cuses here on the individual dealer’s efforts to achieve its targets.
As the face of Scandinavian Busi-ness Seating towards the customer, dealers exercise significant influence over Scandinavian Business Seating's general reputation. Scandinavian Business Seating also depends on the individual dealer's efforts to achieve their goals. On the other hand, the dealers are dependent on good pro-cesses and products to achieve their own targets.
Different customer satisfaction surveys are conducted regularly, as well as in-depth interviews with selected dealers.
Sup
plie
rs
Scandinavian Business Seating's supplier portfolio can be divided into two main categories: direct materials (DM) and indirect materials and services (IM&S). Transport is included in IM&S.
Upstream and downstream suppliers exercise significant influence over Scandinavian Business Seating on a general basis. In 2013 we chiefly focused on DM suppliers.
After our ethical guidelines for suppli-ers (Code of Conduct) were updated to include human rights, working condi-tions, the environment and corruption, in 2013 we had a special focus on, and follow-up of, suppliers in low-cost countries (China and Eastern Europe).
Loca
l co
mm
uniti
es
The local communities are defined as Nässjö and Røros. However, this report particularly focuses on Røros due to Scandinavian Business Seating’s special position in a small community.
Scandinavian Business Seating has long been an important actor in the local community in Røros. As one of the region's largest employers, the company holds an important position in the local community. The connec-tion with Røros is also important for the HÅG brand.
Scandinavian Business Seating has con-tributed financially to culture and sports projects in the local community, in ad-dition to the statutory taxes and duties. There is no formal forum for dialogue between the local community and the company, but there is close cooperation on matters that affect both parties, for example the scheduled flight between Røros and Oslo.
Oth
er m
atte
rs Scandinavian Business Seating is a member of the Norwegian organisa-tion Ethical Trading Initiative Norway (ETIN) and collaborates with other environmental organisations as needed.
In 2013, we benefited greatly from col-laboration with environmental organisa-tion Zero to chart possible manufactur-ers of bio-based polypropylene.
inTErESTEd PArTiES MATrix

97
ANNUAL REPORT 2013 ScANdiNAviAN BUSiNESS SEATiNg cORPORATE SOciAL RESPONSiBiLiTY
HÅG Conventio Wing
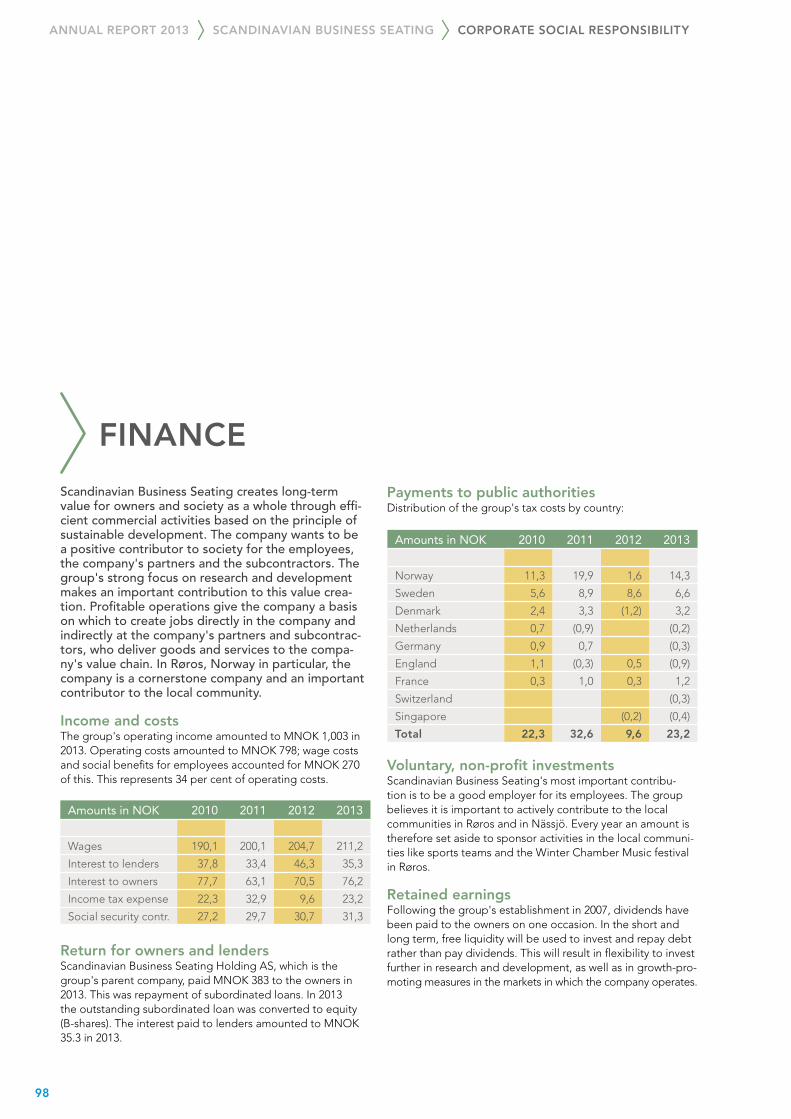
98
ANNUAL REPORT 2013 ScANdiNAviAN BUSiNESS SEATiNg cORPORATE SOciAL RESPONSiBiLiTY
Amounts in noK 2010 2011 2012 2013
Norway 11,3 19,9 1,6 14,3
Sweden 5,6 8,9 8,6 6,6
Denmark 2,4 3,3 (1,2) 3,2
Netherlands 0,7 (0,9) (0,2)
Germany 0,9 0,7 (0,3)
England 1,1 (0,3) 0,5 (0,9)
France 0,3 1,0 0,3 1,2
Switzerland (0,3)
Singapore (0,2) (0,4)
Total 22,3 32,6 9,6 23,2
Amounts in noK 2010 2011 2012 2013
Wages 190,1 200,1 204,7 211,2
Interest to lenders 37,8 33,4 46,3 35,3
Interest to owners 77,7 63,1 70,5 76,2
Income tax expense 22,3 32,9 9,6 23,2
Social security contr. 27,2 29,7 30,7 31,3
FInance
Scandinavian Business Seating creates long-term value for owners and society as a whole through effi-cient commercial activities based on the principle of sustainable development. The company wants to be a positive contributor to society for the employees, the company's partners and the subcontractors. The group's strong focus on research and development makes an important contribution to this value crea-tion. Profitable operations give the company a basis on which to create jobs directly in the company and indirectly at the company's partners and subcontrac-tors, who deliver goods and services to the compa-ny's value chain. In Røros, Norway in particular, the company is a cornerstone company and an important contributor to the local community.
Income and costsThe group's operating income amounted to MNOK 1,003 in 2013. Operating costs amounted to MNOK 798; wage costs and social benefits for employees accounted for MNOK 270 of this. This represents 34 per cent of operating costs.
Return for owners and lendersScandinavian Business Seating Holding AS, which is the group's parent company, paid MNOK 383 to the owners in 2013. This was repayment of subordinated loans. In 2013 the outstanding subordinated loan was converted to equity (B-shares). The interest paid to lenders amounted to MNOK 35.3 in 2013.
Payments to public authoritiesDistribution of the group's tax costs by country:
Voluntary, non-profit investmentsScandinavian Business Seating's most important contribu-tion is to be a good employer for its employees. The group believes it is important to actively contribute to the local communities in Røros and in Nässjö. Every year an amount is therefore set aside to sponsor activities in the local communi-ties like sports teams and the Winter Chamber Music festival in Røros.
Retained earningsFollowing the group's establishment in 2007, dividends have been paid to the owners on one occasion. In the short and long term, free liquidity will be used to invest and repay debt rather than pay dividends. This will result in flexibility to invest further in research and development, as well as in growth-pro-moting measures in the markets in which the company operates.
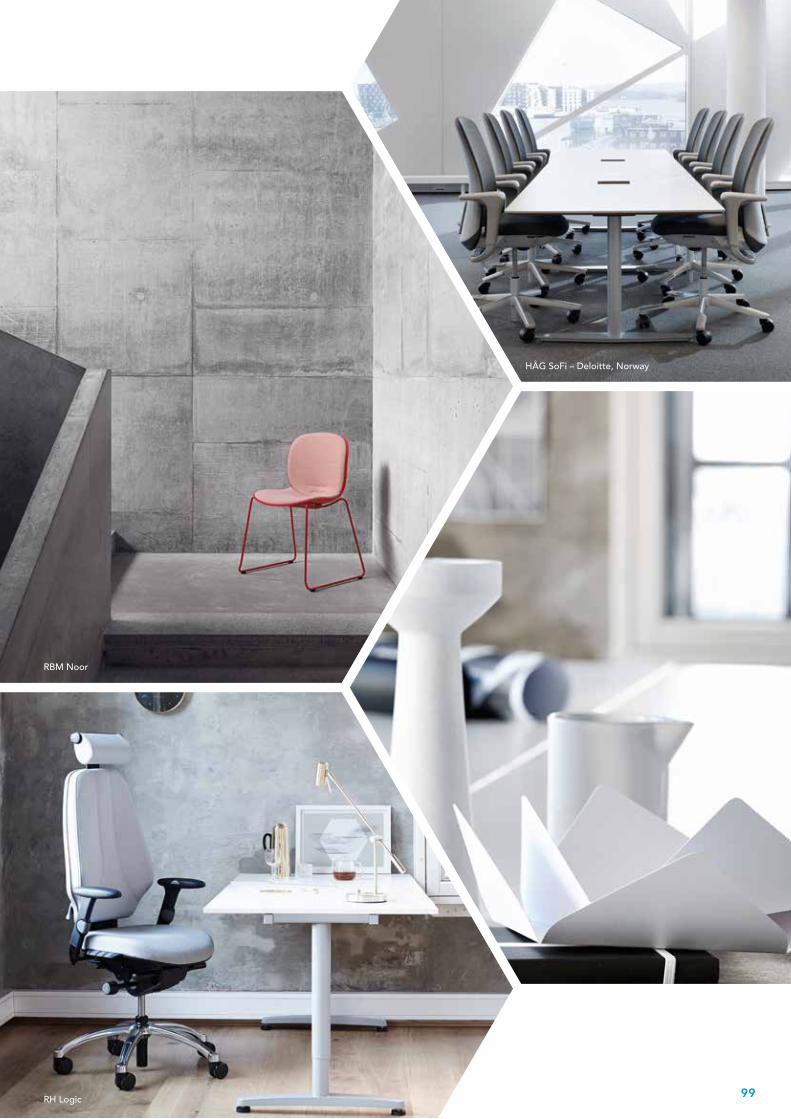
99
ANNUAL REPORT 2013 ScANdiNAviAN BUSiNESS SEATiNg cORPORATE SOciAL RESPONSiBiLiTY
RBM Noor
RH Logic
HÅG SoFi – Deloitte, Norway

100
ANNUAL REPORT 2013 ScANdiNAviAN BUSiNESS SEATiNg cORPORATE SOciAL RESPONSiBiLiTY
Scandinavian Business Seating has had the environ-ment on the agenda for over 20 years. During the first few years, we focused most on energy efficiency and reduced use of non-renewable materials. In recent years there has also been much focus on chemicals that are hazardous to health and the environment. We have gradually acquired substantial knowledge about environmentally-friendly solutions, materials and pro-cesses. The result is seen in the present resource-effi-cient products (with a low carbon footprint), contain-ing as few chemicals as possible, and which are also prepared for simple disassembly and recycling.
As part of the work with ISO 14001, we have defined our most important environmental issues, and have accordingly estab-lished a set of strategic environmental goals: ◆ The average energy consumption per product throughout
the entire life cycle will be reduced by 40 per cent (based on 2005 figures) before 2020.
◆ The share of recycled materials in products must be increased from the present level of 30 per cent, to an aver-age 60 per cent until 2020.
◆ Neither environmental nor health hazardous chemicals will be used in the manufacture of our products.
◆ Scandinavian Business Seating will contribute to ensuring that our products end their life cycles being disassembled, and that over 90 per cent of the components undergo recycling or energy recovery.
The annual environmental targets will contribute to the achievement of the long-term goals, and are addressed in the relevant following chapters. In 2013, we focused on reduced energy consumption, increased use of recycled materials, reduced consumption of hazardous chemicals, and sorting and reducing waste. The environmental and social responsi-bility work is performed by a separate unit of the company's product development department. The Senior Vice President R&D represents the area in the executive management.
climate, chemicals and resourcesAt Scandinavian Business Seating we have found it appropri-ate to divide our environmental focus into three focus areas: climate, chemicals and resources. The best solutions lie in the intersection between all three. We call this “full breadth”. We also take consideration of the environmental consequences throughout the life cycle, not just from factory gate in to factory gate out. We call this “full depth”. By taking both full
breadth and full depth into consideration, we are certain that we constantly improve the overall environmental perfor-mance of our products and that we avoid less than optimum solutions.
ClimateThe products' climate effects, represented by greenhouse gas emissions, are closely connected with energy consumption. We have therefore decided to measure and communicate the products' carbon footprints using an Environmental Prod-uct Declaration (EPD). This quantifies the greenhouse gas emissions caused by a product throughout its life cycle: from extraction of the raw materials, via processing, transport and production, to use and disposal. Greenhouse gas emissions are a key indicator both for customers who wish to minimise the environmental impact of their purchases and for our own search for increasingly better products. The table on page 109 shows that all of our collections perform well in compari-son with our competitors.
At the same time, climate-efficient products are just part of the general picture. How we run our factories and offices is also of significance. Starting with this year's report, we will therefore show the group's greenhouse gas emissions in the form of environmental accounts based on the Greenhouse Gas Protocol (GHG Protocol).
Use of chemicalsAs a manufacturer of “body-hugging” products, it is impor-tant to know the effect of the chemical use in products and processes on users and the people involved in the processes. The area has received increasing attention during the past few years, and many customers make detailed demands regarding use of chemicals in products. The furniture industry uses chemicals as fire retardants, in paints and glue, and for production of textiles, foam and other plastics.
At Scandinavian Business Seating, we work constantly to detect and replace unwanted chemicals, without reducing the qualities of the products. To ensure that our chairs do not contain chemicals that could harm users or the indoor climate, we have decided to test our most important collec-tions against the requirements of the American Greenguard Environmental Institute. In practice, Greenguard has a zero tolerance policy regarding emissions of formaldehyde and volatile organic compounds.
THe enVIRonmenT

101
ANNUAL REPORT 2013 ScANdiNAviAN BUSiNESS SEATiNg cORPORATE SOciAL RESPONSiBiLiTY
The present resource-efficient products contain as few chemicals as possible, have a low carbon footprint, and are also prepared for simple disassembly and recycling.
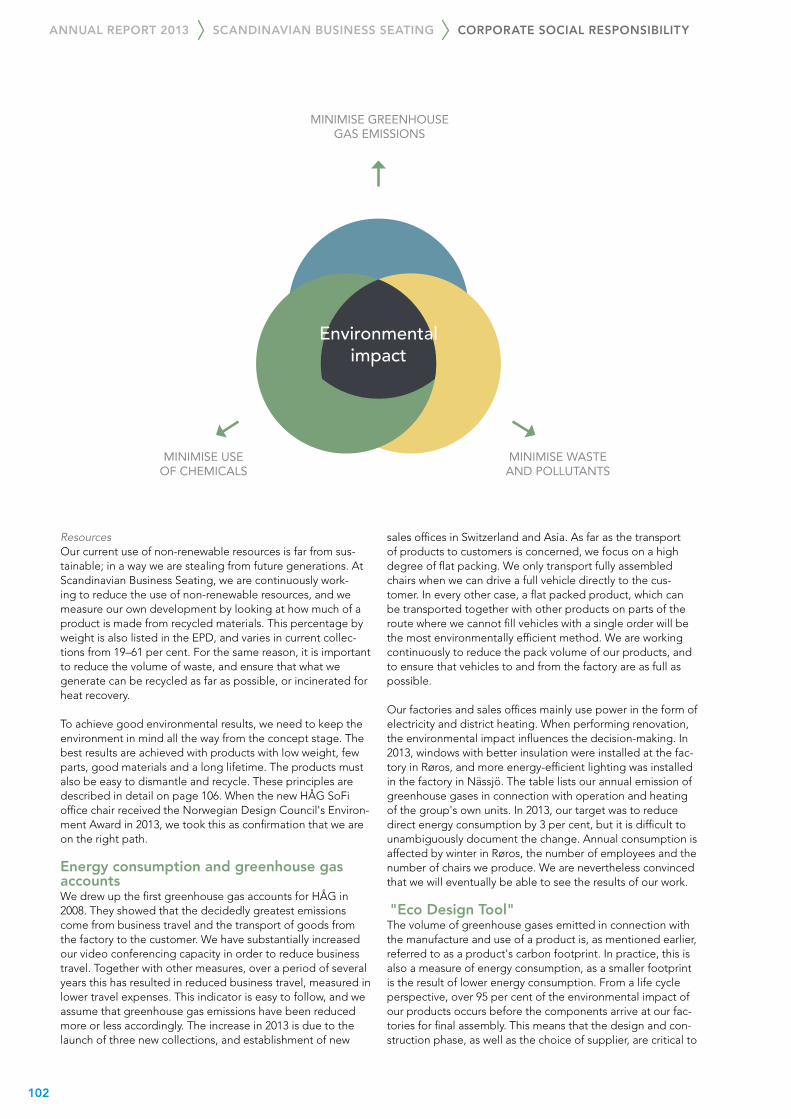
102
ANNUAL REPORT 2013 ScANdiNAviAN BUSiNESS SEATiNg cORPORATE SOciAL RESPONSiBiLiTY
Environmental impact
MiniMiSE uSE of ChEMiCAlS
MiniMiSE grEEnhouSE gAS EMiSSionS
MiniMiSE wASTE And PolluTAnTS
ResourcesOur current use of non-renewable resources is far from sus-tainable; in a way we are stealing from future generations. At Scandinavian Business Seating, we are continuously work-ing to reduce the use of non-renewable resources, and we measure our own development by looking at how much of a product is made from recycled materials. This percentage by weight is also listed in the EPD, and varies in current collec-tions from 19–61 per cent. For the same reason, it is important to reduce the volume of waste, and ensure that what we generate can be recycled as far as possible, or incinerated for heat recovery.
To achieve good environmental results, we need to keep the environment in mind all the way from the concept stage. The best results are achieved with products with low weight, few parts, good materials and a long lifetime. The products must also be easy to dismantle and recycle. These principles are described in detail on page 106. When the new HÅG SoFi office chair received the Norwegian Design Council's Environ-ment Award in 2013, we took this as confirmation that we are on the right path.
energy consumption and greenhouse gas accountsWe drew up the first greenhouse gas accounts for HÅG in 2008. They showed that the decidedly greatest emissions come from business travel and the transport of goods from the factory to the customer. We have substantially increased our video conferencing capacity in order to reduce business travel. Together with other measures, over a period of several years this has resulted in reduced business travel, measured in lower travel expenses. This indicator is easy to follow, and we assume that greenhouse gas emissions have been reduced more or less accordingly. The increase in 2013 is due to the launch of three new collections, and establishment of new
sales offices in Switzerland and Asia. As far as the transport of products to customers is concerned, we focus on a high degree of flat packing. We only transport fully assembled chairs when we can drive a full vehicle directly to the cus-tomer. In every other case, a flat packed product, which can be transported together with other products on parts of the route where we cannot fill vehicles with a single order will be the most environmentally efficient method. We are working continuously to reduce the pack volume of our products, and to ensure that vehicles to and from the factory are as full as possible.
Our factories and sales offices mainly use power in the form of electricity and district heating. When performing renovation, the environmental impact influences the decision-making. In 2013, windows with better insulation were installed at the fac-tory in Røros, and more energy-efficient lighting was installed in the factory in Nässjö. The table lists our annual emission of greenhouse gases in connection with operation and heating of the group's own units. In 2013, our target was to reduce direct energy consumption by 3 per cent, but it is difficult to unambiguously document the change. Annual consumption is affected by winter in Røros, the number of employees and the number of chairs we produce. We are nevertheless convinced that we will eventually be able to see the results of our work. "eco design Tool"The volume of greenhouse gases emitted in connection with the manufacture and use of a product is, as mentioned earlier, referred to as a product's carbon footprint. In practice, this is also a measure of energy consumption, as a smaller footprint is the result of lower energy consumption. From a life cycle perspective, over 95 per cent of the environmental impact of our products occurs before the components arrive at our fac-tories for final assembly. This means that the design and con-struction phase, as well as the choice of supplier, are critical to

103
ANNUAL REPORT 2013 ScANdiNAviAN BUSiNESS SEATiNg cORPORATE SOciAL RESPONSiBiLiTY
EnErgY ConSuMPTionShEAdQuArTEr And SAlES offiCES
EnErgY ConSuMPTionS ProduCTion røroS And nÄSSjÖ
TrAVEl CoSTS (MnoK)
2010
2010
2008
2011
2011
2009 2010
2012
2012
2011 2012
2013
2013
Gas
Remote heating
Electricity
250
200
150
100
50
0
800
700
600
500
400
300
200
100
0
20
18
16
14
12
10
8
6
4
2
0
tCO2e
tCO2e
Oil
Remote heating
Electricity
2013
a product's environmental performance. Detailed data on how the choice of material and construction affects the environmental performance has now been collated in a tool that we call our “Eco-design tool”. This has become an important aid in the development of new eco-friendly products. The environmental performance of established products can also be improved. This can be done, for example, by changing materials, suppliers or by increasing the percentage of recycled materials. Several years ago, the environmental performance of several of our products was improved by about 30 per cent simply by moving production of aluminium star bases from China to Scandinavia.
Use of chemicalsAt Scandinavian Business Seating, we have a dedicated list of chemicals that are hazardous to health and the environment that we do not want to use in our products or processes. This “negative list” is updated every year, and all of our suppliers of direct materials must under-take in writing to meet our requirements. The negative list is stricter than both current industry requirements and national requirements.
In addition to making requirements, we actively check their compliance. Accordingly, in 2013 there were two cases where renowned subsuppliers, who make deliver-ies to a large section of the European furniture industry, used hazardous chemicals in connection with surface treatment of the components. The processes have now been changed so that these chemicals can be avoided, to the satisfaction of both ourselves and the industry.
In order to be certain that our chairs do not emit hazard-ous gases, they are tested and certified in accordance with the GREENGUARD indoor climate requirements, as mentioned earlier. A list of the collections that have been tested can be found on page 114.
Recycled materialsThe only materials that cannot be recycled, and thus in theory are impossible to replace with recycled qualities in today's products are foam and wool textiles. It should be possible to recycle all other materials, but at present

104
ANNUAL REPORT 2013 ScANdiNAviAN BUSiNESS SEATiNg cORPORATE SOciAL RESPONSiBiLiTY
waste (tonn) 2010 2011 2012 2013
Material recycling 320,4 260,4 353,2 293,1
Incineration with energy recovery 138,6 112,9 90,8 95,6
Disposal 0,5 0,4 0,1 0,4
Total waste 459,5 373,7 444,1 389,1
hazardous waste (kg) 2010 2011 2012 2013
Waste oil 800 0 0 214
Oil contaminated soil 3 720 3 242 2 248 1 322
Oil filters 200 135 0 648
Organic solvents 200 0 0 0
Paint, glue, lacquer 9 567 1 665 3 251 10 775
Spray paint 0 0 35 0
Fluorescent tubes 99 100 0 0
Lead batteries 125 0 0 17
Slag, dust 351 182 155 34
Oil emulsions, waste water 13 929 0 0 1 000
Process water 48 200 68 000 69 500 47 300
Halogenated organic waste 0 0 1 183 0
EE-waste 148 598 699 1 151
Ribbons 69 60 77 52
Not specified waste 0 0 0 217
Total hazardous waste 77 408 73 982 77 148 62 730
wASTE MAnAgEMEnT
only steel, aluminium and polypropylene plastic are commer-cially available as recycled. The use of recycled material is also limited by availability and quality.
Recycled materials are good because they both reduce our use of non-renewable materials and because this results in lower energy consumption / greenhouse gas emissions. By replacing virgin aluminium with recycled aluminium, we for example save over 90 per cent of the energy required to cast a chair's star base. The use of recycled plastic also brings great gains. The saving for polypropylene (PP) is approxi-mately 60 per cent from using 100 per cent recycled material. As regards steel, we will never be able to use 100 per cent recycled material. The proportion will depend on the manu-facturing process. Parts that undergo advanced deep drawing may for example only contain about 20–30 per cent recycled materials before the steel loses its flow properties. Even so, the savings compared to the use of virgin materials are con-siderable. Scandinavian Business Seating is actively working to increase the percentage of recycled materials in all of its products. The average share shown in the table on page 105 is the total of recycled steel and aluminium, and is based on figures from the EPDs.
Water consumption and discharges to waterWater consumption is not defined as a significant environ-mental aspect in either Røros or Nässjö, and no activities have therefore been prioritised to reduce consumption.
There is a surface treatment facility in Røros where the metal components are washed before powder coating. The washing process uses different types of cleaning agents. The process water is purified before release into the public sewage sys-tem. The separated waste is treated as hazardous waste, and is delivered to an authorised reception facility.
Waste and emissions to airFor many years, the waste from our production units has been sorted and either recycled or incinerated for heat recovery. In 2012, we also began sorting waste from the main office in Oslo. In 2013, we achieved our goal of a 10 per cent reduc-tion, compared with the previous year.
Production environments, especially mechanical production in Røros, generate a certain amount of hazardous waste. This normally occurs for short periods of time in connection with various maintenance procedures and will therefore show an increase during given periods. All hazardous waste is declared pursuant to the requirements of the Waste Regulations, and delivered to an approved reception facility. Here the waste is sorted, and most of it is delivered for incineration for heat recycling. The table shows the hazardous waste delivered from the production units during the past few years.
At some point in time, our chairs will also become waste. However, due to their high quality and timeless design, most of our products lead such a long and itinerant life that it is not

105
ANNUAL REPORT 2013 ScANdiNAviAN BUSiNESS SEATiNg cORPORATE SOciAL RESPONSiBiLiTY
PRoPoRTIoN oF RECyCLED MATERIALS (%)
35
30
25
20
15
10
5
0
2013
2012
2011
2010
2009
Work ChairsVisit- and
Conference Chairs
possible to organise their collection and disassembly. We nevertheless put much care into ensuring that our products are easy to take apart and sort for recycling. An average of over 95 per cent of the materials in our chairs is recyclable. Given the return systems in use today, however, only just over 60 per cent of the material is recycled.
Scandinavian Business Seating is a member of the Nor-wegian take-back scheme Grønt Punkt and equivalent schemes in other markets. According to its website, Grønt Punkt collects and recovers around 88 per cent of all pack-aging.
Our factories do not pollute the soil, water or air, and cause no noise or odour problems for their surroundings.
BiodiversityScandinavian Business Seating's factory in Røros is located next to the Kvitsanden protected landscape area, about 2 km west of the centre of Røros. The Kvitsanden protected landscape area consists of a special shifting sands area containing both stable and mobile sand dunes. The area is an important element of the landscape, and has a very high conservation value. At Scandinavian Business Seating's fac-tory in Røros, we are particularly aware of our environmental obligations, and have drawn up procedures to prevent all pollution of the local environment.
HÅG Capisco chair in parts

106
ANNUAL REPORT 2013 ScANdiNAviAN BUSiNESS SEATiNg cORPORATE SOciAL RESPONSiBiLiTY
1. loW WeIGHT
4. lonG lIFe
2. FeW comPonenTs
3. HIGH-QUalITY maTeRIals
5. cRadle-To-cRadle closed lIFe cYcle
mInImIsed enVIRon- menTal ImPacT
II
III
I
loWesT PossIBle caRBon FooTPRInT
no ToXIc cHemIcals
RedUce Use oF non-ReneWaBle
maTeRIals
At Scandinavian Business Seating, we want all of our products to document good environmentalperformance in all three of our focus areas: climate, health and resources. After working on this for many years, we know what is needed. our experience is summarised in five focus areas with the keywords: low weight, few components, high-quality materials, long service life, and products designed for disassembly and recycling.
1. Low weightLow weight means fewer materials and less use of resources. The correct materials for the job and weight-optimisation are major factors in this context.
2. Few componentsThe best solutions are almost always the simplest. We invest major resources in refining new ideas before they go into pro-duction. Fewer components mean fewer tools, less transport
and simpler assembly. This in turn means our solutions are often more resource-efficient than traditional products.
3. High quality materialsIn today's society, we use much more than our share of the Earth's non-renewable resources. Our lifestyles are far from sustainable. Our goal at Scandinavian Business Seating is therefore to increase the use of recycled materials. Over 95 per cent of the materials are recycled in today's products. The only components that are not normally recycled are wool textiles and foam. In this area, as well, we are continuously looking for better solutions. For example, we have replaced foam with more environmentally-friendly solutions in several of our newest models.
Good materials should also mean healthy products. For this reason we try to avoid all chemicals that are hazardous to health and the environment, both in-house and earlier in the value chain.
enVIRonmenTallY eFFIcIenT PRodUcTs

107
ANNUAL REPORT 2013 ScANdiNAviAN BUSiNESS SEATiNg cORPORATE SOciAL RESPONSiBiLiTY
We want all of our products to be able to document good environmental performance in all three of our focus areas: Climate, health and resources.
RBM Noor/RBM Allround table

NEPD nr: 212Approved according to ISO14025, §8.1.4: 17.06.2011Valid until: 17.06.2016
Verification of data:
Declaration compiled by:
PCR:
About EPD:
Information about the producer:HÅG asaFridtjof Nansens vei 12
EPDs from other program operators than the Norwegian EPD Foundation may not be comparable.
Product Category Rules for Seating solution (The Norwegian EPD Foundation, 2008). PCR approved by the Norwegian EPD Foundation's verification committee. See also "Methodological Decisions ".
Independent verification of data and other environmental information has been carried out by Senior Research Scientist Hanne Møller in accordance with ISO14025, §8.1.3.
MSc. Camilla Skjerve-Nielssen and Siv.ing. Kari-Anne Lyng
Figure 1
HÅG Capisco Puls 8010
Environmental Declaration ISO 14025/ISO 21930
Environmental Indicators. Use Cradle to
Fridtjof Nansens vei 12Postboks 5055, MajorstuenN-0301 OSLO, NorwayOrg.nr.: NO-928902749ISO 14001 certified by Dovre Sertifisering (NO-S-0000016).
Information about the product:Functional unit:
Scope of assessment:
Year of study:Data:Expected market area:Company contact:
Product Specification Table 1
0,2
Specific data: 2006 to 2008, Specific database data: Late 1990s to 2006. (See Figure 5)Europe & U.S.A.Carl P. Aaser, Tel: + 47 22 59 59 10, e-mail: [email protected]
This environmental declaration covers the product's life cycle from raw material extraction until the finished seating solution, incl. use & maintenance. The user phase is represented by a use scenario in Southern Germany. A scenario for disposal is presented.
Office Chair Seating solution, produced and maintained for 15 years.
2011
HÅG's Environmental Management System includes procedures for collection of LCA data and EPD development.
Mass kg/seating solution
Share%
% included in the analysis
% from suppliers with a certified Environmental Management System*
% of components
with EPD*
System boundaries(see the last page for
more information)Hazardous content
Steel 3,9 27 % A-GAluminium 2,9 21 % A-GOther metals 0 0 %PUR 0,2 1 % A-GPlastics 3,9 27 % A-GPVC 0 0 %Textiles: wool, polyester 0,08 1 % A-GCardboard (packaging) 1,8 13 % A-GVarious 1,5 11 % A-GTotal 14,2 100 % 98,3 % 54 % 0 %
The sitting solution meets the following minimum emissions requirements in the Greenguards certification: Formaldehyde: < 0.025 ppm (< 0.03 mg/m³) (Greenguard certificate).
It has not been possible to obtain data on the content of brominated flame retardents & heavy metals. These chemicals have not been detected in HÅGs production.
* In % of analysed mass, input to the assembly department at HÅG
Environmental Indicators.
Global warming: 31 1 kg CO2-eq.Energy consumption: 607 37 MJAmount of recycled materials: 48 %Guarantee period: 10 yr
Use phase
Cradle to
gate
108
ANNUAL REPORT 2013 ScANdiNAviAN BUSiNESS SEATiNg cORPORATE SOciAL RESPONSiBiLiTY
Long lifetimeThe longer a product lasts, the longer it will take before it has to be replaced by a new one. Long service life therefore helps reduce global resource and energy consumption. We are aware that all of our products must have a long service life, multiple settings, a timeless design, are of high quality, and contain parts that can be replaced when worn. We are one of few manufacturers that provide products with a 10-year guarantee.
"From cradle to cradle" Instead of thinking traditionally about a product, from “cradle to grave”, we think from “cradle to cradle”. This means that
at the end of their life cycle, all materials can easily begin a new life in new products. That is why we make all of our products so that they can easily be dismantled without the need for special tools. All plastic parts are marked for sorting and recycling.
We know that by choosing the best solutions in all these five areas, the result is a sustainable product with a low carbon footprint, low content of hazardous chemicals and limited use of non-renewable resources. This is our strength: The big picture!
EPD/environmental declaration

109
ANNUAL REPORT 2013 ScANdiNAviAN BUSiNESS SEATiNg cORPORATE SOciAL RESPONSiBiLiTY
HÅ
GC
onve
ntio
Win
g
HÅ
G C
onve
ntio
951
1
HÅ
G S
idew
ays
SAVO
Stu
dio
32
HÅ
G C
apis
co P
uls
8010
HÅ
G C
apis
co 8
106
HÅ
G H
05 5
370
HÅ
G H
03 3
20
Ora
nge
Box
Joy
HÅ
G F
utu
HÅ
G H
04 4
400
HÅ
G H
04 4
470
EFG
Tea
m S
piri
t 2
Ora
nge
Box
X10
SAVO
EO
S H
L
HÅ
G H
09 9
230
HÅ
G H
05 5
300
Ora
ngeb
ox A
ra
New
RH
Act
iv
RH E
xten
d
RH L
ogic
EFG
Sp
lice
Ora
ngeb
ox
Ora
ngeb
ox S
pin
a
SAVO
S3
Stee
lcas
e Pl
ease
Stee
lcas
e Th
ink
SAVO
Ikon
3 L
N
SAVO
XO
ML
Ora
ngeb
ox G
68
Ora
ngeb
ox G
64
Con
nect
ion
Eco
Scandinavian Business Seating
Competitors
CArbon fooTPrinT bY ModEl
24 26 29 29 31 36 3744 50 51 53 54 57 57 59 60 61 64 66 67 73 79 82 86 90 91
106 108 109
168
247
285300
250
200
150
100
50
0
kgCO2

110
ANNUAL REPORT 2013 ScANdiNAviAN BUSiNESS SEATiNg cORPORATE SOciAL RESPONSiBiLiTY
coRPoRaTe socIal ResPonsIBIlITY
Scandinavian Business Seating wants to create a secure and good working environment, both in-house and with our suppliers and partners. We also want to behave as a responsible actor towards our customers and society. We support and follow the principles of the United Nations Global Compact.
At Scandinavian Business Seating, we have chosen to focus particularly on three points:
1. The workplaces in Norway and Sweden and with our Wes-tern European suppliers.Everyone who is connected with our product delivery chain must have safe and good working conditions and we will actively counter all forms of corruption and unhealthy compe-tition.
2. Suppliers in low-cost countries.Scandinavian Business Seating has a number of suppliers in low-cost countries (Eastern Europe and China), and has special focus on these suppliers meeting the requirements in international regulations concerning human rights and working conditions. We have also established environmental requirements, and have a zero tolerance policy on corruption.
3. The local community – RørosScandinavian Business Seating is one of the largest workpla-ces in Røros. This creates both opportunities and obligations.
Scandinavian Business Seating's ethical guidelines for both its own employees and suppliers (Code of Conduct) state that we want employees to conduct themselves as good ambas-sadors, and treat their colleagues and fellow human beings with respect and courtesy. We clearly distance ourselves from corruption and bribes, and we support the work for free competition and fair trade. Our ethical guidelines for suppliers were updated in 2012 and are now in line with the guidelines in the United Nations Global Compact.
Follow-up of employees, the workplace, human rights, social responsibility and product responsibility is shared between the group's Human Relations (HR) department and the department for the environment and corporate social responsibility. The HR department is represented in corporate management by the HR Director, while the department for the environment and corporate social responsibility is repre-
sented by the Senior Vice President R&D. The year's activities and achieved targets in the individual focus areas will be apparent from the subsequent review.
Workforce At year-end 2013, the group had 472 employees; of which 309 were men and 163 women. This means that 34 per cent of the workforce are women. 20 per cent of the board of Scandi-navian Business Seating are women, and 14 per cent of the group's executive management team are women.
Scandinavian Business Seating AS – Norway Three employee representatives sit on the board. Board elections are held every second year. The company does not have a corporate assembly, but an agreement was reached on extra board representation for the employees. Four board meetings are normally held each calendar year. The CEO, CFO and HR Director have been elected as shareholder representatives of the company.
Scandinavian Business Seating AB – SwedenTwo employee representatives sit on the board. Other board members are the CEO, CFO, HR Director and the general ma-nager of Scandinavian Business Seating AB, who also acts as the board's secretary. Four meetings are normally held each year.
The boards of Scandinavian Business Seating's other subsidi-aries consist of the CEO of Scandinavian Business Seating, as chairman of the board, and members of the group's executive management team.
employee turnover We had a turnover of 9 per cent in 2013; a slight increase compared with 2012. This is equivalent to 43 people; 18 of whom were women.
employee benefitsScandinavian Business Seating wants to be a company that offers its employees good employee benefits. The schemes vary from country to country. In Norway and Sweden (which represent about 80 per cent of the workforce), all employees are covered by tariff agreements.

111
ANNUAL REPORT 2013 ScANdiNAviAN BUSiNESS SEATiNg cORPORATE SOciAL RESPONSiBiLiTY
Sick leave røros oslo nässjö
2009 7,93 1,78 2,68
2010 6,24 1,80 2,20
2011 5,22 2,26 3,13
2012 6,00 2,60 3,92
2013 6,00 2,80 2,52
RBM Noor

112
ANNUAL REPORT 2013 ScANdiNAviAN BUSiNESS SEATiNg cORPORATE SOciAL RESPONSiBiLiTY
Trade union work 52 per cent of workers in Norway and Sweden are organised in trade unions, which is an increase compared with 2012. The factory in Røros has one part-time employee representative in 70 per cent of a full-time position. Both factories have regular monthly meetings between the employee representative and the company. Freedom of association and collective bar-gaining rights are a matter of course, and apply to all of the group's units regardless of country. No instances have been recorded of attempts to set aside freedom of association and collective bargaining rights. A total of 198 employees are trade union members.
Scandinavian Business Seating's success depends on the performance of its employees. The best way of creating motivation is through active involvement. In areas that have a collective pay agreement, the involvement of employee representatives is stipulated by the agreements, which state that employees must be involved and information provided at as early a stage as possible in the decision-making processes, giving employee representatives a genuine opportunity to influence decisions.
Procedures for local hiringScandinavian Business Seating has found that in many con-nections it is appropriate to recruit from the local community. This gives greater stability to the workforce and is especially relevant in Røros, where we have found that it can be difficult to retain highly-skilled employees. Around 60 per cent of the managers in Røros and Nässjö had local ties in 2013. Scan-dinavian Business Seating is a member of the “Fjelltrainee” training scheme in the Røros region.
Knowledge and skills Analysis of competence is an important instrument in order to develop our employees and the company, and Scandinavian Business Seating works systematically to review our employ-ees' knowledge and skills, as part of the annual development interview. Based on the company's strategic goals, we also look at the general competence that is required at any given time to further develop the company. All workers must pos-sess this knowledge, but with varying skills levels, depending on the position. Together, the general and special depart-mental qualification requirements will provide the foundation for each department's training plans.
Scandinavian Business Seating has its own ”Academy”, which is responsible for internal development programmes in management development, sale and project development. Competence development and training is also an integrated part of change processes and strategic initiatives, such as the launch of new products. In cases where internal programmes do not meet the needs, external provision is used, and is paid for by Scandinavian Business Seating.
Hse and sick leave Preventive HSE work is an important part of the work to achieve the general goal that "all employees should also return home in the same state of health as when they arrived at work". Scandinavia Business Seating does systematic and preventive HSE work, and the work is organised through formal bodies, and in accordance with statutory legislation. An annual HSE plan is drawn up, and activities were carried
out according to plan in 2013. We have working environment committees in Oslo and in Røros, in which both the company and employees are represented. In Nässjö, several people participate in the formal HSE committee, which meets accor-ding to a fixed schedule. We also have safety deputies in the organisation that attend to the employees' interests in cases regarding the working environment. The safety deputies are regularly involved in the planning and implementation of me-asures that are relevant to the working environment. All safety deputies receive training, so that they are secure in their role. Two safety rounds are conducted every year, and the findings are reported to an incident system and followed up there. Th-ere is a statutory industrial safety organisation in Røros. There were no major incidents in 2013 that required its participation.
Everyone at Scandinavia Business Seating has been trai-ned on systematic work with the working environment. The training includes the structure of our HSE system, evaluation procedures when an alarm is triggered, typical risks for diffe-rent groups of employees, use of safety equipment, and each employee's responsibility for its use.
Chemicals used in production are under constant risk assess-ment and assessment for substitution. The goal is to avoid all chemicals that may be hazardous to health. This work has yielded good results, and in 2013 no hazardous chemicals were used in the manufacturing.
Preventive risk assessments are conducted in connection with new processes, new equipment and changes to tasks. Risk assessments are also carried out after near-accidents and accidents. Internal courses on risk analysis were held for employees in 2013.
All personal injuries are recorded and followed up. There has been an increase in the number of cases recorded during the past year. This is related to a focus in 2013 on preventive HSE work and on recording HSE matters. However, in Røros there was a decline from 2012 to 2013 in the number of accidents recorded. In Røros in 2013, we achieved an H-value of 7.9 and an F1-value of 158. Nässjö did not record any accidents in 2013. Today we only record sick leave in Norway and Sweden. Work-related illnesses are not recorded, as the individual's clinical picture is usually complex. Specific work has been con-ducted for many years to reduce sick leave. We closely follow up employees who are at risk of needing sick leave and those who are on sick leave. Procedures have also been devised for adapting tasks and ensuring that employees can return to work quickly. Sick leave in Røros and Oslo is at the same level as in 2012, while there was a reduction in sick leave in Nässjö. See the table on page 111.
Both the company and its sports teams encourage employees to participate in physical activity and in 2013 several success-ful activities were conducted in Røros and Oslo.
discrimination Scandinavian Business Seating's goal is to be a workplace with full equality between women and men. Everyone, regard-less of gender, age and background, has the same opportu-nities for employment and development. The basic principle is that men and women who perform the same tasks should
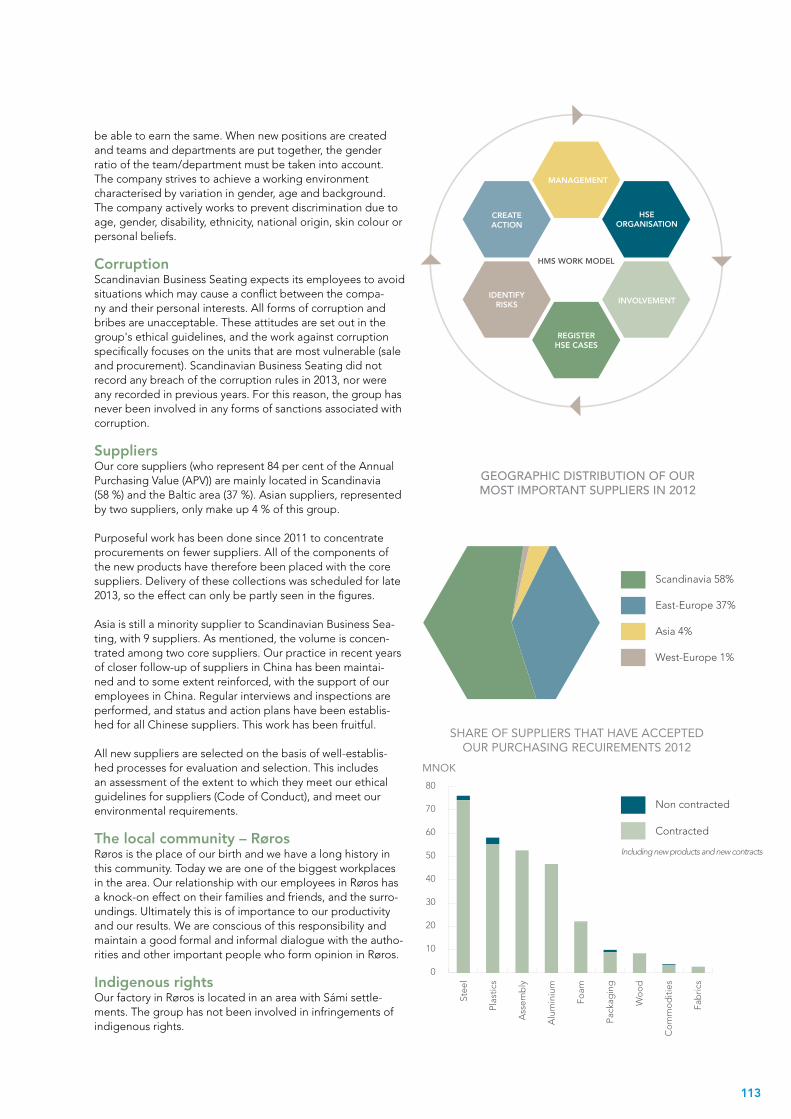
manaGemenT
InVolVemenT
Hse oRGanIsaTIon
ReGIsTeR Hse cases
cReaTe acTIon
IdenTIFY RIsKs
Hms WoRK model
113
ANNUAL REPORT 2013 ScANdiNAviAN BUSiNESS SEATiNg cORPORATE SOciAL RESPONSiBiLiTY
ShArE of SuPPliErS ThAT hAVE ACCEPTEd our PurChASing rECuirEMEnTS 2012
GEoGRAPHIC DISTRIBUTIoN oF oUR MoST IMPoRTANT SUPPLIERS IN 2012
Including new products and new contracts
Stee
l
Plas
tics
Ass
emb
ly
Alu
min
ium
Foam
Pack
agin
g
Wo
od
Co
mm
od
ities
Fab
rics
MnoK
Scandinavia 58%
East-Europe 37%
Asia 4%
West-Europe 1%
Non contracted
Contracted
80
70
60
50
40
30
20
10
0
be able to earn the same. When new positions are created and teams and departments are put together, the gender ratio of the team/department must be taken into account. The company strives to achieve a working environment characterised by variation in gender, age and background. The company actively works to prevent discrimination due to age, gender, disability, ethnicity, national origin, skin colour or personal beliefs.
corruption Scandinavian Business Seating expects its employees to avoid situations which may cause a conflict between the compa-ny and their personal interests. All forms of corruption and bribes are unacceptable. These attitudes are set out in the group's ethical guidelines, and the work against corruption specifically focuses on the units that are most vulnerable (sale and procurement). Scandinavian Business Seating did not record any breach of the corruption rules in 2013, nor were any recorded in previous years. For this reason, the group has never been involved in any forms of sanctions associated with corruption.
suppliersOur core suppliers (who represent 84 per cent of the Annual Purchasing Value (APV)) are mainly located in Scandinavia (58 %) and the Baltic area (37 %). Asian suppliers, represented by two suppliers, only make up 4 % of this group.
Purposeful work has been done since 2011 to concentrate procurements on fewer suppliers. All of the components of the new products have therefore been placed with the core suppliers. Delivery of these collections was scheduled for late 2013, so the effect can only be partly seen in the figures.
Asia is still a minority supplier to Scandinavian Business Sea-ting, with 9 suppliers. As mentioned, the volume is concen-trated among two core suppliers. Our practice in recent years of closer follow-up of suppliers in China has been maintai-ned and to some extent reinforced, with the support of our employees in China. Regular interviews and inspections are performed, and status and action plans have been establis-hed for all Chinese suppliers. This work has been fruitful.
All new suppliers are selected on the basis of well-establis-hed processes for evaluation and selection. This includes an assessment of the extent to which they meet our ethical guidelines for suppliers (Code of Conduct), and meet our environmental requirements.
The local community – Røros Røros is the place of our birth and we have a long history in this community. Today we are one of the biggest workplaces in the area. Our relationship with our employees in Røros has a knock-on effect on their families and friends, and the surro-undings. Ultimately this is of importance to our productivity and our results. We are conscious of this responsibility and maintain a good formal and informal dialogue with the autho-rities and other important people who form opinion in Røros.
Indigenous rights Our factory in Røros is located in an area with Sámi settle-ments. The group has not been involved in infringements of indigenous rights.

114
ANNUAL REPORT 2013 ScANdiNAviAN BUSiNESS SEATiNg cORPORATE SOciAL RESPONSiBiLiTY
En
133
5
En
137
61
En
172
9
En
161
39
iEC
613
40 (E
Sd)
gS,
lg
A
bS
5459
nP
r 1
813
Ans
i bifm
a
En
153
72
En
125
21
Mö
bel
fakt
a
EP
d, i
So 1
4025
no
rdic
Sw
an
lab
el
gr
EE
ng
uA
rd
hÅg ChAir ModElHÅG Capisco t t t t t t t t t
HÅG Capisco Puls t t t t t t t
HÅG H03 t t t t t t
HÅG H04 t t t t t t t
HÅG H04 Communication t t t t t
HÅG H04 Communication w/star base t t t
HÅG H05 t t t t t t t
HÅG H05 Communication t t t t t
HÅG Futu t t t t t t t t
HÅG Futu Communication t t
HÅG SoFi t t t t
HÅG SoFi CommunicationHÅG H09 t t t t t t t
HÅG H09 meeting t t t
HÅG Conventio t t t t t t
HÅG Conventio w/star base t t t
HÅG Conventio Wing t t t t t t
HÅG Conventio Wing w/star base t t
HÅG Sideways t t t
rh ChAir ModElRH Activ t t t t t t
RH Mereo t t
RH Extend t t t t t t
RH Logic t t t t t t
RH Support t t
rbM ChAir ModElRBM 300 t t
RBM 500 t t
RBM 600 t
RBM 700 t
RBM 800 t
RBM Noor t t t
RBM Ana t t
RBM Ballet t
RBM Bella t t
RBM Low-back Bella t t
RBM Cameo t
RBM Sweep t
rbM TAblE ModElRBM Allround t
RBM Ultima t
RBM Standard folding table t t
RBM Twisted Little Star t
RBM u-Connect t t
RBM e-Connect t t
RBM Eminent t
RBM Sweep table t
CErTifiCATES And dEClArATionS
115
ANNUAL REPORT 2013 ScANdiNAviAN BUSiNESS SEATiNg cORPORATE SOciAL RESPONSiBiLiTY
PRodUcT lIaBIlITY
All of Scandinavian Business Seating's products are de-veloped, tested and approved in accordance with relevant furniture standards that cover safety, strength and stability considerations. All products are approved in accordance with the relevant European EN standards. Several of the products are also tested and approved pursuant to the German GS mark (Geprüfte Sicherheit), the British BS 5459-2 standard, which is used to test chairs intended for intensive use (24 hours/7 days a week) and the American ANSI/BIfma standard.
In order to ensure that our products do not harm the indoor climate by emitting hazardous gases, they are tested pursuant to the requirements of the American Greenguard Environmental Institute. The most important collections from HÅG, RH and RBM have been approved.
In 2010, the HÅG Capisco was the first office chair to be awar-ded the Nordic Swan label.
All products have labels that provide information on the exis-ting certification. The chairs are also delivered with detailed user manuals and instructions for safe use, maintenance and cleaning.
HÅG Capisco

116
ANNUAL REPORT 2013 ScANdiNAviAN BUSiNESS SEATiNg cORPORATE SOciAL RESPONSiBiLiTY
The Global Reporting Initiative (GRI) is a network-based orga-nisation that pioneered the world’s most widely used sustainability reporting framework.
Below a list of the GRI indicatiors, with reference to where the topics are discussed in the report.
In our report 35 indicators are addressed. This fulfils the requi-rements for level B in accordance with GRI’s classification.
NR - not relevantNA - not addressedPA - partly addressed
GloBal RePoRTInG InITaTIVe IndeKs
Profile
1 strategy and analysis
1.1Statement from the most senior decision-maker of the organisation.
12
1.2 Description of key impacts, risks, and opportunities. 12
2 organisational Profile
2.1 Name of the organisation. 1
2.2 Primary brands, products, and/or services. 28-39
2.3Operational structure of the organisation, including main divisions, operating companies, subsidiaries, and joint ventures.
17,119
2.4 Location of organisation’s headquarters. 119
2.5
Number of countries where the organisation operates, and names of countries with either major operations or that are specifically relevant to the sustainability issues covered in the report.
119
2.6 Nature of ownership and legal form. 6
2.7Markets served (including geographic breakdown, sectors served, and types of customers/beneficiaries).
6-8
2.8 Scale of the reporting organisation. 6
2.9Significant changes during the reporting period regar-ding size, structure, or ownership.
NR
2.10 Awards received in the reporting period. 1
3 Report Parameters
3.1 Reporting period: 2013
3.2 Date of most recent previous report: May 2012
3.3 Annual Reporting Cycle
3.4Contact point for questions regarding the report or its contents
118
3.5 Process for defining report content. 92-94
3.6Boundary of the report (e.g., countries, divisions, sub-sidiaries, leased facilities, joint ventures, suppliers). See GRI Boundary Protocol for further guidance.
94-96
3.7State any specific limitations on the scope or boundary of the report (see completeness principle for explanati-on of scope).
94-96
3.8
Basis for reporting on joint ventures, subsidiaries, leased facilities, outsourced operations, and other entities that can significantly affect comparability from period to period and/or between organisations.
NR
3.9
Data measurement techniques and the bases of calcula-tions, including assumptions and techniques underlying estimations applied to the compilation of the Indicators and other information in the report. Explain any deci-sions not to apply, or to substantially diverge from, the GRI Indicator Protocols.
94
3.10
Explanation of the effect of any re-statements of infor-mation provided in earlier reports, and the reasons for such re-statement (e.g.,mergers/acquisitions, change of base years/periods, nature of business, measurement methods).
NR
3.11Significant changes from previous reporting periods in the scope, boundary, or measurement methods applied in the report.
NR
3.12Table identifying the location of the Standard Disclosu-res in the report. 116-118
3.13Policy and current practice with regard to seeking exter-nal assurance for the report. NR
4Governance, commitments and engage-ment
4.1
Governance structure of the organisation, including committees under the highest governance body responsible for specific tasks, such as setting strategy or organisational oversight.
16-19
4.2Indicate whether the Chair of the highest governance body is also an executive officer. 17
4.3For organisations that have a unitary board structure, state the number of members of the highest governance body that are independent and/or non-executive members.
17
4.4Mechanisms for shareholders and employees to provide recommendations or direction to the highest governance body.
17
indi-cator
description Pageindi-cator
description Page

117
ANNUAL REPORT 2013 ScANdiNAviAN BUSiNESS SEATiNg cORPORATE SOciAL RESPONSiBiLiTY
4.5
Linkage between compensation for members of the hig-hest governance body, senior managers, and executives (including departure arrangements), and the organisa-tion’s performance (including social and environmental performance).
18
4.6Processes in place for the highest governance body to ensure conflicts of interest are avoided. 18
4.7
Process for determining the qualifications and expertise of the members of the highest governance body for guiding the organisation’s strategy on economic, en-vironmental, and social topics.
17
4.8
Internally developed statements of mission or values, codes of conduct, and principles relevant to economic, environmental, and social performance and the status of their implementation.
92, 98
4.9
Procedures of the highest governance body for overse-eing the organisation’s identification and management of economic, environmental, and social performance, including relevant risks and opportunities, and adheren-ce or compliance with internationally agreed standards, codes of conduct, and principles.
16-18
4.10Processes for evaluating the highest governance body’s own performance, particularly with respect to economic, environmental, and social performance.
18
4.11 Explanation of whether and how the precautionary approach or principle is addressed by the organisation.
92
4.12Externally developed economic, environmental, and social charters, principles, or other initiatives to which the organisation subscribes or endorses.
110
4.13
Memberships in associations (such as industry associations) and/or national/international advocacy organisations in which the organisation: * Has positions in governance bodies; * Participates in projects or committees; * Provides substantive funding beyond routine membership dues; or * Views membership as strategic.
96
4.14 List of stakeholder groups engaged by the organisation. 96
4.15 Basis for identification and selection of stakeholders with whom to engage.
94
4.16Approaches to stakeholder engagement, including frequency of engagement by type and by stakeholder group.
96
4.17
Key topics and concerns that have been raised through stakeholder engagement, and how the organisation has responded to those key topics and concerns, including through its reporting.
96
Performance indicator
Finance
management approach 16
EC1
Direct economic value generated and distributed, including revenues, operating costs, employee compen-sation, donations and other community investments, retained earnings, and payments to capital providers and governments.
98
EC2Financial implications and other risks and opportunities for the organisation’s activities due to climate change.
NA
EC3Coverage of the organisation’s defined benefit plan obligations.
67
EC4Significant financial assistance received from govern-ment.
60
EC5Range of ratios of standard entry level wage compa-red to local minimum wage at significant locations of operation.
NA
EC6Policy, practices, and proportion of spending on local-ly-based suppliers at significant locations of operation.
NA
EC7Procedures for local hiring and proportion of senior ma-nagement hired from the local community at significant locations of operation.
112
EC8Development and impact of infrastructure investments and services provided primarily for public benefit through commercial, in-kind, or pro bono engagement.
NA
EC9Understanding and describing significant indirect econ-omic impacts, including the extent of impacts.
NA
environmental
management approach 100
EN1 Materials used by weight or volume. NA
EN2Percentage of materials used that are recycled input materials.
105
EN3 Direct energy consumption by primary energy source. 103
EN4 Indirect energy consumption by primary source. NA
EN5Energy saved due to conservation and efficiency impro-vements.
NA
EN6Initiatives to provide energy-efficient or renewable energy based products and services, and reductions in energy requirements as a result of these initiatives.
PA 106
EN7Initiatives to reduce indirect energy consumption and reductions achieved.
NA
EN8 Total water withdrawal by source. PA104
EN9Water sources significantly affected by withdrawal of water.
NA
EN10Percentage and total volume of water recycled and reused.
NA
EN11Location and size of land owned, leased, managed in, or adjacent to, protected areas and areas of high biodiver-sity value outside protected areas.
PA 105
EN12Description of significant impacts of activities, products, and services on biodiversity in protected areas and areas of high biodiversity value outside protected areas.
NA
EN13 Habitats protected or restored. NA
EN14Strategies, current actions, and future plans for mana-ging impacts on biodiversity.
NA
EN15Number of IUCN Red List species and national con-servation list species with habitats in areas affected by operations, by level of extinction risk.
NA
EN16Total direct and indirect greenhouse gas emissions by weight.
103
EN17Other relevant indirect greenhouse gas emissions by weight.
NA
EN18Initiatives to reduce greenhouse gas emissions and reductions achieved.
NA
EN19 Emissions of ozone-depleting substances by weight. NA
EN20NOx, SOx, and other significant air emissions by type and weight.
NA
EN21 Total water discharge by quality and destination. PA 104
EN22 Total weight of waste by type and disposal method. 104
EN23 Total number and volume of significant spills. None registered
EN24
Weight of transported, imported, exported, or treated waste deemed hazardous under the terms of the Basel Convention Annex I, II, III, and VIII, and percentage of transported waste shipped internationally.
104
EN25
Identity, size, protected status, and biodiversity value of water bodies and related habitats significantly affected by the reporting organisation’s discharges of water and runoff.
PA 105
EN26Initiatives to mitigate environmental impacts of products and services, and extent of impact mitigation.
105
EN27Percentage of products sold and their packaging materi-als that are reclaimed by category.
PA 105
EN28Monetary value of significant fines and total number of non-monetary sanctions for non-compliance with environmental laws and regulations.
None registered
EN29
Significant environmental impacts of transporting products and other goods and materials used for the organisation’s operations, and transporting members of the workforce.
PA 102
indi-cator
description Pageindi-cator
description Page

118
ANNUAL REPORT 2013 ScANdiNAviAN BUSiNESS SEATiNg cORPORATE SOciAL RESPONSiBiLiTY
EN30 Total environmental protection expenditures and investments by type. NA
labor practices and decent work
management approach 110
LA1 Total workforce by employment type, employment contract, and region.
PA 110
LA2 Total number and rate of employee turnover by age group, gender, and region.
110
LA3 Benefits provided to full-time employees that are not provided to temporary or part-time employees, by major operations.
110
LA4 Percentage of employees covered by collective bargai-ning agreements.
110-112
LA5 Minimum notice period(s) regarding significant ope-rational changes, including whether it is specified in collective agreements.
NA
LA6 Percentage of total workforce represented in formal joint management-worker health and safety committees that help monitor and advise on occupational health and safety programs.
110
LA7 Percentage of total workforce represented in formal joint management-worker health and safety committees that help monitor and advise on occupational health and safety programs.
112
LA8 Percentage of total workforce represented in formal joint management-worker health and safety committees that help monitor and advise on occupational health and safety programs.
NA
LA9 Health and safety topics covered in formal agreements with trade unions.
112
LA10 Average hours of training per year per employee by employee category.
NA
LA11 Programs for skills management and lifelong learning that support the continued employability of employees and assist them in managing career endings.
112
LA12 Percentage of employees receiving regular performance and career development reviews.
NA
LA13 Composition of governance bodies and breakdown of employees per category according to gender, age group, minority group membership, and other indicators of diversity.
110
LA14 Ratio of basic salary of men to women by employee category.
NA
Human rights
management approach 110
HR1Percentage and total number of significant investment agreements that include human rights clauses or that have undergone human rights screening.
NA
HR2Percentage of significant suppliers and contractors that have undergone screening on human rights and actions taken.
113
HR3
Total hours of employee training on policies and procedures concerning aspects of human rights that are relevant to operations, including the percentage of employees trained.
NA
HR4Total number of incidents of discrimination and actions taken.
112
HR5
Operations identified in which the right to exercise freedom of association and collective bargaining may be at significant risk, and actions taken to support these rights.
NA
HR6Operations identified as having significant risk for inci-dents of child labor, and measures taken to contribute to the elimination of child labor.
NA
HR7
Operations identified as having significant risk for incidents of forced or compulsory labor, and measures to contribute to the elimination of forced or compulsory labor.
NA
HR8Percentage of security personnel trained in the organi-sation’s policies or procedures concerning aspects of human rights that are relevant to operations.
NA
HR9Total number of incidents of violations involving rights of indigenous people and actions taken.
113
society
management approach 110
SO1
Nature, scope, and effectiveness of any programs and practices that assess and manage the impacts of ope-rations on communities, including entering, operating, and exiting.
PA 110
SO2Percentage and total number of business units analysed for risks related to corruption.
113
SO3Percentage of employees trained in organisation’s anti-corruption policies and procedures.
113
SO4 Actions taken in response to incidents of corruption. 113
SO5Public policy positions and participation in public policy development and lobbying.
NA
SO6Total value of financial and in-kind contributions to political parties, politicians, and related institutions by country.
None registered
SO7Total number of legal actions for anti-competitive behavior, anti-trust, and monopoly practices and their outcomes.
None registered
SO8Monetary value of significant fines and total number of non-monetary sanctions for non-compliance with laws and regulations.
None registered
Product responsibility
management approach 110
PR1
Life cycle stages in which health and safety impacts of products and services are assessed for improvement, and percentage of significant products and services categories subject to such procedures.
PA 115
PR2
Total number of incidents of non-compliance with regulations and voluntary codes concerning health and safety impacts of products and services during their life cycle, by type of outcomes.
NA
PR3Type of product and service information required by procedures, and percentage of significant products and services subject to such information requirements.
115
PR4Total number of incidents of non-compliance with re-gulations and voluntary codes concerning product and service information and labeling, by type of outcomes.
None registered
PR5Practices related to customer satisfaction, including results of surveys measuring customer satisfaction.
NA
PR6Programs for adherence to laws, standards, and voluntary codes related to marketing communications, including advertising, promotion, and sponsorship.
NA
PR7
Total number of incidents of non-compliance with regulations and voluntary codes concerning marketing communications, including advertising, promotion, and sponsorship by type of outcomes.
None registered
PR8Total number of substantiated complaints regarding breaches of customer privacy and losses of customer data.
None registered
PR9Monetary value of significant fines for non-compliance with laws and regulations concerning the provision and use of products and services.
None registered
indi-cator
description Pageindi-cator
description Page
For comments and questions relating to Scandinavian Business Seating’s report on corporate responsibility, please contact Vice President Environment, Carl Peter Aaser: [email protected]
Head quarter Scandinavian Business Seating Group AS Fridtjof nansens vei 12 | p.B. 5055 Majorstuen | no-0301 oslo | norway tel: +47 22 59 59 00 | sbseating.com Sales offices Scandinavian Business Seating AS Fridtjof nansens vei 12 | p.B. 5055 Majorstuen | no-0301 oslo | norway tel: +47 22 59 59 00 Scandinavian Business Seating AB Rosenlundsgatan 29 C | Box 17198 | Se-104 62 Stockholm | Sweden tel: +46 (0)752 45 50 50 Scandinavian Business Seating A/S nordhuset, Kajakvej 2 | DK-2770 Kastrup | Denmark tel: +45 99 50 55 00 Scandinavian Business Seating GmbH Sperberweg 8 | De-41468 neuss | Germany tel: +49 (0)2131 1510-0 Scandinavian Business Seating BV Guldenweg 17 | postbus 42 | nl-4870 AA etten-leur | netherlands tel: +31 (0)76 504 25 35 Scandinavian Business Seating Ltd. upper tulse Hill trading estate | 5 Somers place | london SW2 2Al | uK tel: +44 (0)208 683 9930 Scandinavian Business Seating Sarl Central parc | 1 Allée du Sanglier | FR-93421 Villepinte | France tel: +33 (0)148 61 99 12 Scandinavian Business Seating AG panoramaweg 33 | CH-5504 othmarsingen | Switzerland tel: +41 (0)62 885 06 60 Scandinavian Business Seating Asia PTE Ltd. 36-38B pagoda Street | level 3 | Singapore 059197 tel: +65 6225 6632 | [email protected] Scandinavian Business Seating (Shanghai) Co., Ltd. Room 318 | no 58, taicang Road | Shanghai 200021 | China tel: +86 21 6103 6890
Production Scandinavian Business Seating AS Sundveien | no-7366 Røros | norway tel: +47 72 40 72 00
Scandinavian Business Seating AB Vallgatan 1 | Box 294 | Se-571 23 nässjö | Sweden tel: +46 (0)380 55 53 00 For other markets, contact Global partner organisation (Gpo) at the head quarter.
Photo:
Birgit Fauske – birgitfauske.no
per Gunnarsson – pgfotograf.com
Rolf Ørjan Høgset – rolfie.no
pål laukli – tinagent.com
Moment Studio – moment.no
Rift (3D) – rift.no
Jonas lindström – jlindstroem.com
pelle Wahlgren – studiowahlgren.com
egon Gade – egongade.com
l. Hargreaves – leonhargreaves.com
Interior styling:
Annette ekjord
Christine Hærra
J. Kråkvik/A. D’orazio
Susanne Swegen
Design:
Marketing & Brand Communication,
Scandinavian Business Seating
Print:
KlS Grafisk Hus A/S
Thank you:
657.no
DKno Skandinavisk Design
eske interiør og design
Granit
Hay
Illums Bolighus
Kalmar Konstmuseum
Kvadrat
norway Designs
pukebergs Glasbruk
pur norsk
Verket interiør

Scandinavian Business Seating owns the brands HÅG, RH and RBM and is aScandinavian market leader in the design and manufacturing of seating for privateand public office environments. Together all employees work to realisethe company’s vision – To make the world a better place to sit.
Scandinavian Business Seating has its head office in Oslo and production units inRøros, Norway and Nässjö, Sweden. Additionally the company has sales companiesin Denmark, Sweden, Germany, the Netherlands, UK, France, Singapore, Switzerland and China.
Related Documents