
Welcome message from author
This document is posted to help you gain knowledge. Please leave a comment to let me know what you think about it! Share it to your friends and learn new things together.
Transcript


Balance SheetAs at 30 June 2013
30 June 30 JuneNote 2013 2012
ASSETS (Rupees in '000)
Non-Current Assets
Property, plant and equipment 4 6,143,804 6,517,521
Long term deposits 5 15,003 15,063
6,158,807 6,532,584
Current Assets
Stores and spares 6 83,546 69,809
Stock-in-trade 7 489,369 1,152,216
Trade debts 8 179,542 127,693
Loan and advances 9 26,545 19,404
Trade deposits 10 1,300 1,144
Other receivables 11 123,893 56,202
Advance tax - net of provision 12 12,051 22,723
Cash and bank balances 13 215,216 29,190
1,131,462 1,478,381
TOTAL ASSETS 7,290,269 8,010,965
EQUITY AND LIABILITIES
Share Capital and Reserves
Share capital 14 554,844 554,844
Share premium 109,437 109,437
General reserves 40,000 40,000
Unappropriated profit 465,476 259,194
Total equity 1,169,757 963,475
Surplus on revaluation of property, plant and equipment 15 3,438,666 3,680,023
Non-Current Liabilities
Long term financing 16 — 28,378
Liabilities against assets subject to finance lease 17 28,795 50,019
Deferred liabilities 18 1,719,098 1,834,681
1,747,893 1,913,078
Current Liabilities
Trade and other payables 19 845,441 1,193,299
Short term sponsors' advances 20 23,581 54,231
Short term borrowings 21 — 134,519
Current portion of non-current liabilities 22 50,964 54,844
Accrued mark-up 13,967 17,496
933,953 1,454,389
TOTAL EQUITY AND LIABILITIES 7,290,269 8,010,965
Contingencies and commitments 23
The annexed notes from 1 to 39 form an integral part of these financial statements.
Hafiz Abdul Majid Hafiz Abdul SamiChief Executive Director
28
Huffaz Seamless Pipe Industries Limited Annual Report 2013
Commitment Towards Quality

Profit and Loss AccountFor the year ended 30 June 2013
30 June 30 JuneNote 2013 2012
(Rupees in '000)
Net sales 24 2,182,211 2,052,162
Cost of sales 25 (2,129,008) (2,031,700)
Gross profit 53,203 20,462
Selling and distribution cost 26 (20,709) (22,421)
Administrative expenses 27 (49,261) (47,570)
(69,970) (69,991)
(16,767) (49,529)
Other operating charges 28 (27,065) (80,326)
Other operating income 29 902 4,577
(42,930) (125,278)
Finance cost 30 (58,431) (76,490)
Loss before taxation (101,361) (201,768)
Taxation 31 66,286 69,268
Loss after taxation (35,075) (132,500)
.................. (Rupees) ...................
Loss per share - basic and diluted 33 (0.63) (2.39)
..............(Rupees in '000)...............
Earnings Before Interest, Tax, Depreciation and
Amortisation (EBITDA) 417,836 261,604
The annexed notes from 1 to 39 form an integral part of these financial statements.
Hafiz Abdul Majid Hafiz Abdul SamiChief Executive Director
29
Huffaz Seamless Pipe Industries Limited Annual Report 2013
Commitment Towards Quality

Statement of Comprehensive IncomeFor the year ended 30 June 2013
30 June 30 June2013 2012
(Rupees in '000)
Loss after taxation (35,075) (132,500)
Other comprehensive income — —
Total comprehensive income for the year (35,075) (132,500)
The annexed notes from 1 to 39 form an integral part of these financial statements.
Hafiz Abdul Majid Hafiz Abdul SamiChief Executive Director
30
Huffaz Seamless Pipe Industries Limited Annual Report 2013
Commitment Towards Quality

Cash Flow StatementFor the year ended 30 June 2013
30 June 30 JuneNote 2013 2012
CASH FLOWS FROM OPERATING ACTIVITIES (Rupees in '000)
Loss before taxation (101,361) (201,768)
Adjustments for:
Depreciation 460,766 386,882
Finance costs 58,431 76,490
Workers' Welfare Fund 5,171 1,552
Provision of staff gratuity and leave encashment 14,870 15,700
Total adjustments 539,238 480,624
Operating profit before working capital changes 437,877 278,856
Changes in working capital
Decrease / (increase) in current assets
Stores and spare parts (13,737) (22,123)
Stock in trade 662,847 (405,619)
Trade debts (51,849) 64,287
Advances, trade deposits, prepayments and other receivables (74,988) 61,449
Total decrease / (increase) in current assets 522,273 (302,006)
(Decrease) / increase in current liabilities
Trade and other payables (306,463) 175,703
Cash generated from operations 653,687 152,553
Finance costs paid (61,960) (61,544)
Leave encashment paid (192) (598)
Gratuity paid (1,985) (4,364)
Workers' Welfare Fund (1,552) (2,333)
Taxes paid (50,922) (20,886)
Total (116,611) (89,725)
Net cash generated from operating activities 537,076 62,828
CASH FLOWS FROM INVESTING ACTIVITIES
Addition to property, plant and equipment (87,049) (108,135)
Long term deposits 60 717
Net cash used in investing activities (86,989) (107,418)
CASH FLOWS FROM FINANCING ACTIVITIES
Payment made for assets subject to finance lease (17,997) (13,818)
Musharka facility paid (35,485) (28,379)
Short term borrowings - net (80,385) 72,190
Short term Sponsors' advances paid (30,650) (3,723)
Dividend paid (45,410) (38,225)
Net cash used in financing activities (209,927) (11,955)
Net increase / (decrease) in cash and cash equivalent 240,160 (56,545)
Cash and cash equivalents at beginning of the year (24,944) 31,601
Cash and cash equivalent at end of the year 215,216 (24,944)
Cash and bank balances 13 215,216 29,190
Bank overdraft 21 — (54,134)
215,216 (24,944)
The annexed notes from 1 to 39 form an integral part of these financial statements.
Hafiz Abdul Majid Hafiz Abdul SamiChief Executive Director
31
Huffaz Seamless Pipe Industries Limited Annual Report 2013
Commitment Towards Quality

Statement of Changes in EquityFor the year ended 30 June 2013
Issued,
Subscribed and Share General Unappropriated
Particulars paid up capital Premium Reserve Profit Total
................................................... Rs. ‘000’...................................................
Balance as at 1 July 2011 554,844 109,437 40,000 285,424 989,705
Total comprehensive income for the
year ended 30 June 2012
Loss after taxation — — — (132,500) (132,500)
Transactions with owners
Interim cash dividend @ 15%
(i.e.: Rs. 1.5 per share) for the
six months period ended
31 December 2011 — — — (83,226) (83,226)
Transfer from surplus on revaluation of
property, plant and equipment - net of
deferred tax — — — 189,496 189,496
Balance as at 30 June 2012 554,844 109,437 40,000 259,194 963,475
Total comprehensive income for the
year ended 30 June 2013
Loss after taxation — — — (35,075) (35,075)
Transfer from surplus on revaluation of
property, plant and equipment - net of
deferred tax — — — 241,357 241,357
Balance as at 30 June 2013 554,844 109,437 40,000 465,476 1,169,757
The annexed notes from 1 to 39 form an integral part of these financial statements.
Hafiz Abdul Majid Hafiz Abdul SamiChief Executive Director
32
Huffaz Seamless Pipe Industries Limited Annual Report 2013
Commitment Towards Quality

Notes to the Financial StatementsFor the year ended 30 June 2013
1. STATUS AND NATURE OF BUSINESS
Huffaz Seamless Pipe Industries Limited (“the Company”) was incorporated in Pakistan on 9 October 1983 as apublic company limited by shares. The shares of the Company are quoted on the Karachi and Lahore StockExchanges. The principal object and business of the Company is manufacturing and selling of seamless steel pipesand tubes (tubular products).The Company also has a coating facility capable of applying three layer high densitypolyethylene coating, polypropylene coating and tape coating on steel pipes. The Registered Office of theCompany is situated at 207-210, Mashriq Center, Block 14, Gulshan-e-Iqbal, Karachi and the Factory of theCompany is located at Nooriabad, District Dadu, Sindh.
2. BASIS OF PREPARATION
2.1 Statement of compliance
These financial statements have been prepared in accordance with approved accounting standards asapplicable in Pakistan. Approved accounting standards comprise of such International Financial ReportingStandards (IFRS) issued by the International Accounting Standards Board and Islamic Financial AccountingStandards (IFAS) issued by The Institute of Chartered Accountants of Pakistan (ICAP) as are notified underthe Companies Ordinance, 1984, provisions of and directives issued under the Companies Ordinance, 1984.In case requirements differ, the provisions of, or directives issued under the Companies Ordinance, 1984shall prevail.
2.2 Basis of measurement
These financial statements have been prepared under the historical cost convention except that theobligation under employees benefits which are measured at present value and the factory land, building andplant and machinery which are stated at revalued amount.
2.3 Functional and presentation currency
These financial statements are presented in Pakistan Rupees which is also the Company's functionalcurrency and has been rounded to the nearest thousand.
2.4 Use of estimates and judgements
The preparation of financial statements in conformity with approved accounting standards, as applicable inPakistan, requires management to make judgements, estimates and assumptions that affect the applicationof accounting policies and the reported amounts of assets, liabilities, income and expenses. The estimatesand associated assumptions are based on historical experience and various other factors that are believed tobe reasonable under the circumstances, the results of which form the basis of making the judgements aboutthe carrying values of assets and liabilities that are not readily apparent from other sources. Actual resultsmay differ from these estimates.
Estimates and underlying assumptions are reviewed on an ongoing basis. Revisions to accounting estimatesare recognised in the period in which the estimate is revised if the revision affects only that period, or in theperiod of the revision and future periods if the revision affects both current and future periods.
Judgments made by management in the application of approved accounting standards, as applicable inPakistan, that have significant effect on the financial statements and estimates with a significant risk ofmaterial adjustments in the future years are as follows:
2.4.1 Property, plant and equipment
The Company’s management determines the estimated useful lives and related depreciationcharge for its plant and equipment. The estimates for revalued amounts of different classes ofproperty, plant and equipment are based on a valuation carried out by external professional valuerof the Company. The Company reviews the value of the assets for possible impairment on anannual basis. Any change in the estimates in future years might affect the carrying amounts of therespective items of property, plant and equipments with a corresponding effect on the depreciationcharge and impairment.
2.4.2 Stock-in-trade and stores and spares
The Company reviews the net realizable value of stock in trade and stores and spares to assessany diminution in the respective carrying values. Any change in the estimates in future years mightaffect the carrying amounts of stock in trade and stores and spares with a corresponding effect onamortization charge and impairment. Net realizable value is determined with respect to estimatedselling price less estimated expenditure to make the sale.
33
Huffaz Seamless Pipe Industries Limited Annual Report 2013
Commitment Towards Quality

2.4.3 Trade debts and other receivables
Impairment loss against doubtful trade and other debts is made on judgemental basis, for whichprovision may differ in the future years based on the actual experience. The difference in provisionif any, would be recognised in the future years.
2.4.4 Staff retirement benefits
Certain actuarial assumptions have been adopted as disclosed in these financial statements foractuarial valuation of unfunded gratuity schemes (note 18.1) and compensated absences.Changes in these assumptions may effect the liability under the scheme in current and future years.
2.4.5 Income taxes
In making the estimates for income taxes currently payable by the Company, the managementconsiders the current income tax law and the decisions of appellate authorities on certain issues inthe past.
2.5 Standards, interpretations and amendments to published approved accounting standards that areeffective in the current year
During the year certain amendments to Standards or new interpretations became effective however, they didnot have any material effect on the financial statements of the Company.
New / revised accounting standards, amendments to published accounting standards, andinterpretations that are not yet effective
The following new standards, amendments to existing standards and interpretations of approved accountingstandards will be effective for accounting periods beginning on or after 01 July 2013:
— IAS 19 Employee Benefits (amended 2011) - (effective for annual periods beginning on or after 1January 2013). The amended IAS 19 includes the amendments that require actuarial gains andlosses to be recognised immediately in other comprehensive income; this change will remove thecorridor method and eliminate the ability for entities to recognise all changes in the defined benefitobligation and in plan assets in profit or loss, which currently is allowed under IAS 19; and that theexpected return on plan assets recognised in profit or loss is calculated based on the rate used todiscount the defined benefit obligation. The Company's policy is to account for actuarial gains andlosses using the corridor method and with the change, unrecognized actuarial gains amounting toRs. 4.130 million at 30 June 2013 will be recognized in other comprehensive income.
— IAS 27 Separate Financial Statements (2011) - (effective for annual periods beginning on or after 1January 2013). IAS 27 (2011) supersedes IAS 27 (2008). Three new standards IFRS 10 -Consolidated Financial Statements, IFRS 11- Joint Arrangements and IFRS 12-Disclosure ofInterest in Other Entities dealing with IAS 27 would be applicable effective 1 January 2013. IAS 27(2011) carries forward the existing accounting and disclosure requirements for financialstatements, with some minor clarifications. The amendments have no impact on financialstatements of the Company.
— IAS 28 Investments in Associates and Joint Ventures (2011) - (effective for annual periodsbeginning on or after 1 January 2013). IAS 28 (2011) supersedes IAS 28 (2008). IAS 28 (2011)makes the amendments to apply IFRS 5 to an investment, or a portion of an investment, in anassociate or a joint venture that meets the criteria to be classified as held for sale; and on cessationof significant influence or joint control, even if an investment in an associate becomes aninvestment in a joint venture. The amendments have no impact on financial statements of theCompany.
— Offsetting Financial Assets and Financial Liabilities (Amendments to IAS 32) - (effective for annualperiods beginning on or after 1 January 2014). The amendments address inconsistencies incurrent practice when applying the offsetting criteria in IAS 32 Financial Instruments: Presentation.The amendments clarify the meaning of „currently has a legally enforceable right of set-off; and thatsome gross settlement systems may be considered equivalent to net settlement.
— Offsetting Financial Assets and Financial Liabilities (Amendments to IFRS 7) — (effective forannual periods beginning on or after 1 January 2013). The amendments to IFRS 7 contain newdisclosure requirements for financial assets and liabilities that are offset in the statement offinancial position or subject to master netting agreement or similar arrangement.
— Annual Improvements 2009–2011 (effective for annual periods beginning on or after 1 January2013). The new cycle of improvements contains amendments to the following four standards, withconsequential amendments to other standards and interpretations:
34
Huffaz Seamless Pipe Industries Limited Annual Report 2013
Commitment Towards Quality

— IAS 1 Presentation of Financial Statements is amended to clarify that only one comparative period -which is the preceding period – is required for a complete set of financial statements. If an entitypresents additional comparative information, then that additional information need not be in theform of a complete set of financial statements. However, such information should be accompaniedby related notes and should be in accordance with IFRS. Furthermore, it clarifies that the „thirdstatement of financial position, when required, is only required if the effect of restatement ismaterial to statement of financial position.
— IAS 16 Property, Plant and Equipment is amended to clarify the accounting of spare parts, stand-byequipment and servicing equipment. The definition of “property, plant and equipment” in IAS 16 isnow considered in determining whether these items should be accounted for under that standard. Ifthese items do not meet the definition, then they are accounted for as consumable spares underIAS 2 - Inventories. The amendment in IAS 16 would result in reclassification of certain plantspecific spares as property, plant and equipment when the amended standard becomesapplicable. As at 30 June 2013 the Company has initiated the exercise of identifying capital storesand consumable spares. Hence the impact cannot be quantified.
— IAS 32 Financial Instruments: Presentation - is amended to clarify that IAS 12 Income Taxesapplies to the accounting for income taxes relating to distributions to holders of an equity instrumentand transaction costs of an equity transaction. The amendment removes a perceived inconsistencybetween IAS 32 and IAS 12.
— IAS 34 Interim Financial Reporting is amended to align the disclosure requirements for segmentassets and segment liabilities in interim financial reports with those in IFRS 8 Operating segmentsIAS 34 now requires the disclosure of a measure of total assets and liabilities for a particularreportable segment. In addition, such disclosure is only required when the amount is regularlyprovided to the chief operating decision maker and there has been a material change from theamount disclosed in the last annual financial statements for that reportable segment.
— IFRIC 20 - Stripping cost in the production phase of a surface mining (effective for annual periodsbeginning on or after 1 January 2013). The interpretation requires production stripping cost in asurface mine to be capitalized if certain criteria are met. The amendments have no impact onfinancial statements of the Company.
— IFRIC 21- Levies “an Interpretation on the accounting for levies imposed by governments”(effective for annual periods beginning on or after 1 January 2014). The amendment has no impacton financial statements of the Company.
— IAS 39 Financial Instruments: Recognition and Measurement- Novation of Derivatives andContinuation of Hedge Accounting (Amendments to IAS 39) (effective for annual periods beginningon or after 1 January 2014). The amendment has no impact on financial statements of thecompany.
— Amendment to IAS 36 “Impairment of Assets” Recoverable Amount Disclosures for Non-FinancialAssets (effective for annual periods beginning on or after 1 January 2014). The amendment has noimpact on financial statements of the Company.
3. SUMMARY OF SIGNIFICANT ACCOUNTING POLICIES
The accounting policies set out below have been applied consistently to all the periods presented in these financialstatements.
3.1 Property, plant and equipment
3.1.1 Owned assets
Initial recognition
The cost of an item of property, plant and equipment is recognized as an asset if it is probable thatfuture economic benefits associated with the item will flow to the entity and the cost of such item canbe measured reliably. Recognition of the cost in the carrying amount of an item of property, plantand equipment ceases when the item is in the location and condition necessary for it to be capableof operating in the manner intended by the Management.
Measurement
Property, plant and equipments are stated at cost less accumulated depreciation and impairmentlosses, if any, except that factory building and plant machinery are stated at revalued amount lessaccumulated depreciation and impairment losses, if any, while land is stated at revalued amountless impairment loss, if any.
Capital work-in-progress is stated at cost accumulated to the balance sheet date less impairmentlosses, if any.
35
Huffaz Seamless Pipe Industries Limited Annual Report 2013
Commitment Towards Quality

Subsequent costs are included in the asset's carrying amount or recognized as a separate asset,as appropriate, only when it is probable that future economic benefits associated with the item willflow to the entity and its cost can be reliably measured. Cost incurred to replace a component of anitem of property, plant and equipment is capitalized and the asset so replaced is derecognised.Normal repairs and maintenance are charged to the profit and loss account during the period inwhich they are incurred.
Depreciation is charged on reducing balance method. Depreciation on addition is charged from themonth wherein the assets is available for use, while in case of disposal, it is charged upto the monthof disposal.
Depreciation methods, useful lives and residual values of each part of property, plant andequipment that is significant in relation to the total cost of the asset are reviewed, and adjusted ifappropriate, at each balance sheet date.
Surplus on revaluation of land, factory buildings, plant and machinery and coating sheds is creditedto the surplus on revaluation account. Revaluation is carried out with sufficient regularity to ensurethat the carrying amount of assets does not differ materially from the fair value. To the extent of theincremental depreciation charged on the revalued assets, the related surplus on revaluation ofproperty, plant and equipment (net of deferred taxation) is transferred directly to retainedearnings/unappropriated profit.
Gain and loss on disposal of assets, if any, are included in income currently. When revalued assetsare sold, any related amount included in the revaluation reserve is transferred to retained earnings.
3.1.2 Leased Assets
Initial recognition
Finance leases, which transfer to the Company substantially all the risks and benefits incidental toownership of the leased item, are capitalized at the inception of the lease at the fair value of leasedassets or, if lower, at the present value of the minimum lease payments. In calculating the presentvalue of the minimum lease payments, the discount factor is the effective interest rate.
Measurement
Assets subject to finance lease are stated at revalued amounts less accumulated depreciation andimpairment losses, if any. The related obligations of the lease are accounted for as liabilities.Assets acquired under finance lease are depreciated over the useful life of the assets commencingfrom the year in which the leased assets are put into operation. Depreciation policy is the same asfor the owned assets.
Surplus on revaluation of leased assets is credited to the surplus on revaluation account.Revaluation is carried out with sufficient regularity to ensure that the carrying amount of assetsdoes not differ materially from the fair value. To the extent of the incremental depreciation chargedon the revalued assets, the related surplus on revaluation of property, plant and equipment (net ofdeferred taxation) is transferred directly to retained earnings / unappropriated profit.
Gain and loss on disposal of assets, if any, are included in income currently. When revalued assetsare sold, any related amount included in the revaluation reserve is transferred to retained earnings.
In respect of tangible fixed assets held under operating lease, the annual rentals are charged toincome of the year.
Leased assets obtained under Ijarah agreement are not recognised in the company's balancesheet and are treated as operating lease based on Islamic Financial Accounting Standard (IFAS) 2issued by the Institute of Chartered Accountants of Pakistan (ICAP) and notified by Securities andExchange Commission of Pakistan (SECP) vide S.R.O. 43(1)/2007 dated 22 May 2007. Paymentsmade under operating lease are charged to profit and loss account on a straight line basis over thelease term.
3.2 Intangible assets
Intangible assets (comprising of computer softwares) are stated at cost less accumulated amortization andimpairment losses, if any. Intangible assets are amortised in three years on straight line basis.
Cost that are directly associated with identifiable software products and have probable economic benefitbeyond one year are recognised as intangible assets.
Cost associated with maintaining computer software products are recognised as an expense when incurred.
In respect of additions and deletions of intangible assets during the year, amortization is charged from themonth of acquisition and up to the month preceding the deletion, respectively.
36
Huffaz Seamless Pipe Industries Limited Annual Report 2013
Commitment Towards Quality

3.3 Stores and spares
Stores and spares are stated at lower of weighted average cost and net realisable value, less provision forimpairment, if any. Items in transit are valued at cost comprising invoice value plus other charges incurredthereon.
Provision for obsolete and slow moving stores, spares and loose tools is determined based onmanagement's estimate regarding their future usability.
Net realisable value signifies the estimated selling price in the ordinary course of business less the estimatedcosts necessary to be incurred to make the sale.
3.4 Stock-in-trade
These are valued at lower of cost and net realizable value. Cost is determined under the weighted averagebasis. Cost of work-in-process and finished goods consists of direct materials, labour and applicableproduction overheads. Net realizable value signifies the estimated selling price in the ordinary course of thebusiness less estimated cost of completion and selling expenses.
Items in-transit are valued at cost comprising invoice value plus other charges paid thereon up to the balancesheet date.
Scrap is valued at estimated realizable value.
3.5 Trade debts and other receivables
Trade debts and other receivables are recognized initially at fair value and subsequently measured atamortized cost less provision for impairment, if any. A provision for impairment is established when there isan objective evidence that the Company will not be able to collect all amounts due according to the originalterms of receivables. Trade debts and other receivables considered irrecoverable are written off.
3.6 Staff retirement benefits
Defined benefit plan
The Company operates an unfunded gratuity scheme covering all its permanent employees. The benefitsunder the gratuity scheme are payable on retirement or earlier cessation of service in lump sum. The benefitis equal to one month’s last salary drawn for each year of eligible service or part thereof, subject to aminimum of one year of service. The actuarial valuation was carried out during the year 2013 by using the'Projected Unit Credit Method'. Gains and losses on actuarial valuation, if any, are included in incomecurrently.
Compensated absences
The liability for accumulated compensated absences of employees is recognized in the period in whichemployees render services that increases their entitlement to future compensated absences.
3.7 Trade and other payables
Liabilities for trade and other payables are recognized and carried at cost which is the fair value of theconsideration to be paid in the future for goods and services received, whether or not billed to the Company.
3.8 Revenue recognition
Revenue from sale of goods is measured at fair value of the consideration received or receivable. TheCompany records revenue from sale of goods on dispatch of goods to its customers.
3.9 Taxation
Current
Provision for current taxation is based on taxable income at the current rates of taxation after taking intoaccount the available tax credits and tax rebates available if any.
Deferred
Deferred tax is recognised using the balance sheet liability method in respect of all temporary differencesarising from differences between the carrying amount of assets and liabilities in the financial statements andtheir tax base. This is recognised on the basis of the expected manner of the realization or settlement of thecarrying amount of assets and liabilities using the tax rates enacted or substantially enacted at the balancesheet date. Deferred tax assets are recognised to the extent that it is probable that future taxable profit will beavailable against which the deductible temporary differences can be utilised. Deferred tax assets arereduced to the extent that is no longer probable that the related tax benefit will be realised. The Company alsorecognises deferred tax liability on surplus on revaluation of fixed assets which is adjusted and the relatedsurplus in accordance with the requirements of International Accounting Standard 12 'Income Taxes'.
37
Huffaz Seamless Pipe Industries Limited Annual Report 2013
Commitment Towards Quality

3.10 Cash and cash equivalents
Cash and cash equivalents comprise cash and bank balances. Short term running finances that arerepayable on demand and form an integral part of the Companys cash management are included as acomponent of cash and cash equivalents for the purpose of the statement of cash flows.
3.11 Foreign currency translations
Transactions in foreign currencies are initially accounted for in Pakistan Rupees at the foreign exchangerates prevailing on the dates of transactions. Monetary assets and liabilities in foreign currencies aretranslated into Pakistan Rupees at the rates of exchange prevailing on the balance sheet date except for theliabilities covered under forward exchange contracts, if any, which are translated at contracted rates.Exchange rate differences are taken to the profit or loss account.
3.12 Financial instruments
All financial assets and liabilities are recognized at the time when the Company becomes a party to thecontractual provision of the instruments. A financial asset is de-recognized when the Company loses controlof its contractual rights that comprise the financial assets. A financial liability is de-recognized when it isextinguished. Any gain or loss on derecognition of the financial assets or liabilities is taken to profit and lossaccount.
3.13 Provisions
A provision is recognized in the balance sheet when the Company has a legal or constructive obligation as aresult of past event, it is probable that an outflow of resource embodying economic benefits will be required tosettle the obligation and reliable estimate can be made to the amount of obligation.
3.14 Borrowing costs
Borrowing costs are recognised as an expense in the period in which these are incurred, except that thosewhich are directly attributable to the acquisition, construction or production of a qualifying asset (i.e. an assetthat necessarily takes a substantial period of time to get ready for its intended use or sale) are capitalised aspart of the cost of that asset.
3.15 Finance cost
Finance cost are recognized using the effective interest rate method and comprise foreign currency lossesand interest expense on borrowings.
3.16 Offsetting of financial assets and liabilities
A financial asset and a financial liability is off set and the net amount is reported in the balance sheet if theCompany has a legally enforceable right to set off the recognized amounts and intends either to settle on anet basis or to realize the asset and settle the liability simultaneously.
3.17 Impairment
Financial assets
A financial asset is assessed at each balance sheet date to determine whether there is any objectiveevidence that it is impaired. A financial asset is considered to be impaired if objective evidence indicates thatone or more events have had a negative effect on the estimated future cash flows of that asset.
Individually significant financial assets are tested for impairment on an individual basis. The remainingfinancial assets are assessed collectively in groups that share similar credit risk characteristics.
All impairment losses are recognised in profit or loss. An impairment loss is reversed if the reversal can berelated objectively to an event occurring after the impairment loss was recognised.
Non-financial assets
The carrying amount of the assets are reviewed at each balance sheet date to determine whether there isany indication of impairment. If such indication exists, the asset's recoverable amount is estimated in order todetermine the extent of impairment loss, if any. Impairment losses are recognised as expense in profit andloss account. The recoverable amount is the higher of an asset's fair value less costs to sell and value in use.
3.18 Segment reporting
Operating segments are reported in a manner consistent with the internal reporting structure. Managementmonitors the operating result of its products (i.e. Production of seamless pipes and Coating) separately forthe purpose of making decisions regarding resource allocation and performance assessment.
3.19 Dividend distribution
Dividend distribution to the Company's shareholders is recognized as a liability in the year in which it isapproved by the shareholders in the General Meeting.
38
Huffaz Seamless Pipe Industries Limited Annual Report 2013
Commitment Towards Quality
C o s t / R e v a l u a t i o n D e p r e c i a t i o n
30 June 30 June2013 2012
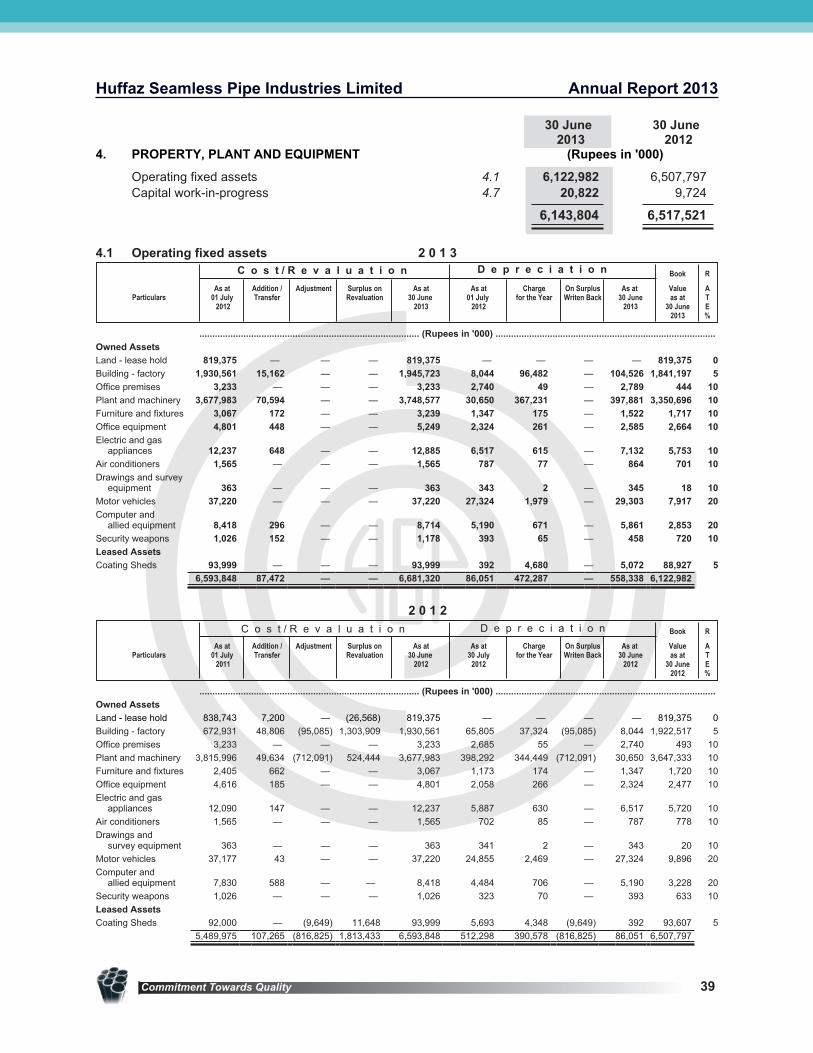
4. PROPERTY, PLANT AND EQUIPMENT (Rupees in '000)
Operating fixed assets 4.1 6,122,982 6,507,797
Capital work-in-progress 4.7 20,822 9,724
6,143,804 6,517,521
4.1 Operating fixed assets 2 0 1 3
Book R
ParticularsAs at
01 July2012
Addition /Transfer
Adjustment Surplus onRevaluation
As at30 June
2013
As at01 July
2012
Chargefor the Year
On SurplusWriten Back
As at30 June
2013
Valueas at
30 June2013
ATE%
..................................................................................... (Rupees in '000) .....................................................................................
Owned Assets
Land - lease hold 819,375 — — — 819,375 — — — — 819,375 0
Building - factory 1,930,561 15,162 — — 1,945,723 8,044 96,482 — 104,526 1,841,197 5
Office premises 3,233 — — — 3,233 2,740 49 — 2,789 444 10
Plant and machinery 3,677,983 70,594 — — 3,748,577 30,650 367,231 — 397,881 3,350,696 10
Furniture and fixtures 3,067 172 — — 3,239 1,347 175 — 1,522 1,717 10
Office equipment 4,801 448 — — 5,249 2,324 261 — 2,585 2,664 10
Electric and gasappliances 12,237 648 — — 12,885 6,517 615 — 7,132 5,753 10
Air conditioners 1,565 — — — 1,565 787 77 — 864 701 10
Drawings and surveyequipment 363 — — — 363 343 2 — 345 18 10
Motor vehicles 37,220 — — — 37,220 27,324 1,979 — 29,303 7,917 20
Computer andallied equipment 8,418 296 — — 8,714 5,190 671 — 5,861 2,853 20
Security weapons 1,026 152 — — 1,178 393 65 — 458 720 10
Leased Assets
Coating Sheds 93,999 — — — 93,999 392 4,680 — 5,072 88,927 5
6,593,848 87,472 — — 6,681,320 86,051 472,287 — 558,338 6,122,982
2 0 1 2
Book R
ParticularsAs at
01 July2011
Addition /Transfer
Adjustment Surplus onRevaluation
As at30 June
2012
As at30 July
2012
Chargefor the Year
On SurplusWriten Back
As at30 June
2012
Valueas at
30 June2012
ATE%
..................................................................................... (Rupees in '000) .....................................................................................
Owned Assets
Land - lease hold 838,743 7,200 — (26,568) 819,375 — — — — 819,375 0
Building - factory 672,931 48,806 (95,085) 1,303,909 1,930,561 65,805 37,324 (95,085) 8,044 1,922,517 5
Office premises 3,233 — — — 3,233 2,685 55 — 2,740 493 10
Plant and machinery 3,815,996 49,634 (712,091) 524,444 3,677,983 398,292 344,449 (712,091) 30,650 3,647,333 10
Furniture and fixtures 2,405 662 — — 3,067 1,173 174 — 1,347 1,720 10
Office equipment 4,616 185 — — 4,801 2,058 266 — 2,324 2,477 10
Electric and gasappliances 12,090 147 — — 12,237 5,887 630 — 6,517 5,720 10
Air conditioners 1,565 — — — 1,565 702 85 — 787 778 10
Drawings andsurvey equipment 363 — — — 363 341 2 — 343 20 10
Motor vehicles 37,177 43 — — 37,220 24,855 2,469 — 27,324 9,896 20
Computer andallied equipment 7,830 588 — — 8,418 4,484 706 — 5,190 3,228 20
Security weapons 1,026 — — — 1,026 323 70 — 393 633 10
Leased Assets
Coating Sheds 92,000 — (9,649) 11,648 93,999 5,693 4,348 (9,649) 392 93,607 5
5,489,975 107,265 (816,825) 1,813,433 6,593,848 512,298 390,578 (816,825) 86,051 6,507,797
39
Huffaz Seamless Pipe Industries Limited Annual Report 2013
Commitment Towards Quality
C o s t / R e v a l u a t i o n D e p r e c i a t i o n

30 June 30 June2013 2012
(Rupees in '000)
4.2 Allocation of depreciation
Cost of sales 25.1 459,584 385,597
Administrative expenses 27 1,182 1,285
Capital work in progress 11,521 3,696
472,287 390,578
4.3 Revaluations of leasehold land and factory building of the Company were carried out in June 2007 and January2009 by M/s. Iqbal A Nanjee & Co., an independent professional valuator, on the basis of present market values.Repeat revaluation was carried out in June 2012 by M/s. Harvester Services (Private) Limited on the basis ofpresent market values which resulted in a deficit of Rs. 26.568 million and surplus of Rs. 1,303.909 million onleasehold land and factory building, respectively. Out of the revaluation surplus, an amount of Rs. 804.378 million,Rs. 1,339.667 million remains undepreciated on leasehold land and factory building respectively as on 30 June2013.
4.4 Revaluation of plant and machinery of the Company was carried out in June 2010 by M/s. Harvester Services(Private) Limited, an independent professional valuator, on the basis of present market values. Repeat revaluationwas carried out in June 2012 by the same valuator on the basis of present market values resulting in a surplus of Rs.524.444 million. Out of the revaluation surplus, an amount of Rs. 2,702.063 million remains undepreciated as on 30June 2013.
4.5 Revaluation of coating sheds was carried out in June 2012 by M/s. Harvester Services (Private) Limited, anindependent professional valuator, on the basis of present market values resulting in a surplus of Rs. 11.648million. Out of the revaluation surplus, an amount of Rs. 11.019 million remains undepreciated as on 30 June 2013.
4.6 Had there been no revaluation, the related figures of land, buildings and plant & machinery as at 30 June 2013 and30 June 2012 would have been as follows:
30 June 30 June2013 2012
(Rupees in '000)
Land - lease hold 14,997 14,997
Building - factory 501,529 512,341
Plant and machinery 648,633 645,041
Coating sheds 77,908 82,008
4.7 Capital work-in-progressCost
As at 01 Additions (Transfers) As at 30 JuneJuly 2012 2013
.................................... (Rupees in '000) ...................................
Building - Head Office and Factory 290 27,236 (14,362) 13,164
Plant and Machinery 9,434 37,457 (39,233) 7,658
9,724 64,693 (53,595) 20,822
30 June 30 June2013 2012
5. LONG TERM DEPOSITS (Rupees in '000)
Long term deposits 5.1 15,003 15,063
5.1 This includes amount of Rs. 9.2 million (30 June 2012: Rs. 9.2 million) against finance lease.
6. STORES AND SPARES
Stores 81,829 67,509
Spare parts and loose tools 1,717 2,300
83,546 69,809
40
Huffaz Seamless Pipe Industries Limited Annual Report 2013
Commitment Towards Quality

30 June 30 June2013 2012
(Rupees in '000)
7. STOCK-IN-TRADE
Raw material 34,565 394,543
Work-in-process 91,687 310,895
Finished goods 7.1 297,467 375,312
Rejection / scrap material 65,650 71,466
489,369 1,152,216
7.1 During the year, the Company recognised a write-down of Rs. 5.080 million (30 June 2012: Rs. 64.527 million)against certain finished goods to adjust their carrying values to their net realisable values.
8. TRADE DEBTS - unsecured
Considered good 8.1 179,542 127,693
8.1 This includes Rs 0.258 million (30 June 2012: Rs. 5.253 million) due from related parties.
8.1.1 The above balances are mark-up free and unsecured. The aging of above related party balances atthe balance sheet date is as follows:
Not past due 258 5,253
9. LOANS AND ADVANCES - considered good
Advances to suppliers - unsecured 21,612 16,080
Advances to employees for expenses 2,281 905
Loans and advances to employees 9.1 2,652 2,419
26,545 19,404
9.1 This includes interest free medical loan provided to employees.
10. TRADE DEPOSITS
Trade deposits - considered good 1,300 1,144
11. OTHER RECEIVABLES
Advance sales tax 449 85
Federal excise duty - refundable — 116
Letter of credit 89,521 25,504
Margin against guarantee 33,923 30,497
123,893 56,202
12. ADVANCE TAX - NET OF PROVISION
Tax receivable as at 1 July 22,723 38,559
Tax payments 50,922 23,219
73,645 61,778
Provision for taxation (61,594) (39,055)
12,051 22,723
13. CASH AND BANK BALANCES
Cash in hand 88 51
With banks in current accounts 215,057 29,065
With a bank in foreign currency current accounts 71 74
215,216 29,190
41
Huffaz Seamless Pipe Industries Limited Annual Report 2013
Commitment Towards Quality

14. SHARE CAPITAL
30 June 30 June 30 June 30 June2013 2012 2013 2012
(Number of shares) (Rupees in '000)
Authorised
70,000,000 70,000,000 Ordinary Shares of Rs. 10 each 700,000 700,000
Issued, subscribed and paid up
12,200,278 12,200,278 Ordinary Shares of Rs. 10 eachfully paid in cash 122,003 122,003
38,906,565 38,906,565 Ordinary Shares of Rs. 10 eachissued as bonus shares 389,066 389,066
4,377,460 4,377,460 Issued right shares fully paid in cash 43,775 43,775
55,484,303 55,484,303 554,844 554,844
14.1 The above includes shares having face value of Rs. 101.213 million (30 June 2012: Rs. 101.213million) held by the foreign sponsors of the Company.
15. SURPLUS ON REVALUATION OF PROPERTY, PLANT AND EQUIPMENT
15.1 This represent surplus arising on revaluation of leasehold land, factory building and plant & machinerynet of deferred tax thereon.
30 June 30 June2013 2012
(Rupees in '000)
Leasehold land
Opening balance 804,378 830,946
Less: Revaluation deficit during the year — (26,568)
804,378 804,378
Factory building and plant and machinery
Opening balance 4,424,069 2,875,600
Surplus on revaluation of plant and machinery carried outduring the year — 524,444
Surplus on revaluation of Factory Building carried outduring the year — 1,303,909
Surplus on revaluation of Leased Coating sheds carried outduring the year — 11,648
Transferred to unappropriated profit in respect ofincremental depreciation charged during the year - net of
deferred tax (241,357) (189,496)
Related deferred tax liability on incremental depreciationcharged during the year (129,961) (102,036)
4,052,751 4,424,069
Related deferred tax liability at beginning of the year (1,548,424) (1,006,460)
Related to revaluation made during the year — (644,000)
Related to incremental depreciation charged during the year 129,961 102,036
(1,418,463) (1,548,424)
3,438,666 3,680,023
42
Huffaz Seamless Pipe Industries Limited Annual Report 2013
Commitment Towards Quality

30 June 30 June2013 2012
(Rupees in '000)
16. LONG TERM FINANCING
Secured
Musharaka facility 28,366 63,851
Current portion shown under current liabilities 22 (28,366) (35,473)
— 28,378
16.1 This represents long term financing of Rs. 127.703 million obtained under the diminishing musharaka basis tofinance imported plant and machinery. Principal is repayable in eighteen quarterly instalments from 5 March2010. Mark-up is payable quarterly at 6 months KIBOR plus 1.5% determined semi-annually. The facility issecured against exclusive charge of Rs. 170 million over the Coating Plant.
30 June 30 June2013 2012
17. LIABILITIES AGAINST ASSETS SUBJECT (Rupees in '000)
TO FINANCE LEASE
Balance as at 1 July 69,390 83,208
Repayments during the year (17,997) (13,818)
51,393 69,390
Payable within one year shown under current liabilities 22 (22,598) (19,371)
28,795 50,019
17.1 Lease payments due are as under :
2013 2012
Principal FinanceChargesAllocatedto future
TotalLeaseRental
Principal FinanceChargesAllocatedto future
TotalLeaseRental
........................................................ (Rupees in '000) .....................................................
Not later than one year 22,598 4,367 26,965 19,371 8,365 27,736
Later than one year but not laterfive years
28,795 1,148 29,943 50,019 6,118 56,137
51,393 5,515 56,908 69,390 14,483 83,873
This represents lease arrangements for coating sheds repayable latest by 9 April 2015. Financing rate at 6 monthsKIBOR plus 3% per annum have been used as discounting factor. Registration charges, license fee, rent, rates,taxes, insurance costs and any other levies by the Federal or Provincial governments are to be borne by the lessee.
30 June 30 June2013 2012
(Rupees in '000)
18. DEFERRED LIABILITIES
Staff gratuity 18.1 83,418 71,121
Deferred taxation - net 18.2 1,635,680 1,763,560
1,719,098 1,834,681
43
Huffaz Seamless Pipe Industries Limited Annual Report 2013
Commitment Towards Quality

18.1 Staff retirement benefits - defined benefit plans
The details of the actuarial valuation under the projected unit credit method as at 30 June 2013 for unfundedgratuity scheme is as follows:
30 June 30 June2013 2012
Discount rate 10.50% 13%
Expected rate of salary increase 10.50% 13%
Average expected remaining working life time of employees 15 years 13 years
30 June 30 June2013 2012
(Rupees in '000)Reconciliation of payable to defined benefit obligations
Present value of defined benefit obligations 79,000 62,947
Unrecognised actuarial gain 4,130 8,174
Benefits due but not paid 288 —
83,418 71,121
Changes in present value of defined benefit obligations
Obligation as at 1 July 62,947 61,898
Interest cost 8,183 8,666
Current service cost 6,243 6,503
Benefits paid (1,985) (4,364)
Actuarial loss / (gain) 3,900 (9,756)
Benefits due but not paid (288) —
Obligation as at 30 June 79,000 62,947
Amount recognized in profit and loss account
Current service cost 6,243 6,503
Interest cost 8,183 8,666
Net actuarial gain (144) —
14,282 15,169
Recognised liability
Balance as on 1 July (71,121) (60,316)
Expense recognised (14,282) (15,169)
Payments during the year 1,985 4,364
Company's liability at 30 June (83,418) (71,121)
Changes in Actuarial Gains
Unrecognised actuarial gains / (losses) 8,174 (1,582)
Actuarial (losses) / gains arising during the year (3,900) 9,756
Actuarial gains charged during the year (144) —
4,130 8,174
Historical information 2013 2012 2011 2010 2009
......................................... (Rupees in '000) ......................................
Present value of the defined
benefit obligation 79,000 62,947 61,898 46,671 42,015
Experience adjustment arising on
plan liabilities losses / (gains) 3,900 (9,756) 7,010 (2,764) (2,663)
The estimated profit and loss charge for the year ended 30 June 2014 has been calculated according to revisedIAS-19, the charge is of Rs 16.061 million, in respect of both current service cost and interest cost.
44
Huffaz Seamless Pipe Industries Limited Annual Report 2013
Commitment Towards Quality

30 June 30 June2013 2012
(Rupees in '000)
18.2 Deferred taxation - net
Taxable temporary difference arising in respect of:
Accelerated tax depreciation 251,741 243,997
Surplus on revaluation of property, plant and equipment 1,418,463 1,548,425
Finance lease arrangement 9,280 4,536
1,679,484 1,796,958
Deductible temporary differences arising in respect of:
Defined benefit plan's obligation (29,196) (24,892)
Provision for compensated absences (3,096) (2,957)
Others (11,512) (5,549)
(43,804) (33,398)
1,635,680 1,763,560
19. TRADE AND OTHER PAYABLES
Trade creditors 21,434 19,747
Accrued liabilities 17,722 36,003
Sales tax payable 19.1 88,012 7,716
Tax deducted at source 8,972 8,363
Workers' profit participation fund 19.2 195,676 174,322
Workers' welfare fund 5,171 1,552
Unclaimed dividend 18,249 63,659
Bills payable 235,626 597,650
Advance from customers 245,313 273,976
Provision for compensated absences 8,845 8,449
Others 421 1,862
845,441 1,193,299
19.1 This includes default surcharge of Rs. 4.278 million determined in accordance with section 34 (1) (a) ofSales Tax Act, 1990.
30 June 30 June2013 2012
19.2 Workers' Profit Participation Fund (Rupees in '000)
Balance as at 1 July 174,322 151,716
Interest on funds utilized in the Company's business 21,354 22,606
Balance at the end of the year 195,676 174,322
20. SHORT TERM SPONSORS' ADVANCES - Unsecured
This represents unsecured and interest free advance from sponsors repayable on demand.
21. SHORT TERM BORROWINGS
Financing against import of material 21.1 — 80,385
Bank overdraft 21.2 — 54,134
— 134,519
21.1 The Company has a financing facility of Rs. 150 million (2012: Rs. 150 million) which includes Finance againstimport of material of Rs. 100 million and Murabaha facility of Rs. 50 million, respectively. This arrangement issecured against pledge of imported stock and by way of joint hypothecation over fixed assets of the Company.The rate of mark-up ranges from 3 months KIBOR plus 2% - 2.5% (2012: 3 months KIBOR plus 2% - 2.5%) perannum . The facilities are available for various periods expiring upto 04 July 2014.
21.2 This represents temporary bank overdraft availed from a bank and was immediately repaid subsequent to theyear end.
21.3 The facility for opening letters of credit and guarantees as at 30 June 2013 amounted to Rs. 900 million (2012: Rs.1,295 million) of which the amount remaining unutilised as at that date was Rs. 279.178 million (2012: Rs. 930.57million).
45
Huffaz Seamless Pipe Industries Limited Annual Report 2013
Commitment Towards Quality

30 June 30 June2013 2012
22. CURRENT PORTION OF NON-CURRENT LIABILITIES (Rupees in '000)
Current portion of long term financing 16 28,366 35,473
Current portion of liabilities against assets subject tofinance lease 17 22,598 19,371
50,964 54,844
23. CONTINGENCIES AND COMMITMENTS
23.1 Contingencies
23.1.1 Guarantees as at 30 June 2013 amounting to Rs. 62.048 million (30 June 2012: Rs. 122.671 million) have beenfurnished in favour of various customers. Guarantee amounting to Rs 17.073 million (30 June 2012: Rs. 12.458million) had expired. However these have not been released till 30 June 2013.
23.2 Commitments23.2.1 Commitments under letters of credit as at 30 June 2013 amounted to Rs. 202.712 million (30 June 2012: Rs.
241.76 million).23.2.2 Aggregate commitments for rentals under Ijarah agreements as at 30 June 2013 are as follows:
Not later than one year 744 744Over one year to five year 718 1,462
1,462 2,205
24 Net SalesSales - local 2,486,420 2,234,321
- export 25,123 83,474
2,511,543 2,317,795
Less: Sales tax (329,332) (265,633)
2,182,211 2,052,162
25. COST OF SALESOpening stock of finished goods 375,312 319,665Cost of goods manufactured 25.1 2,051,163 2,087,347
2,426,475 2,407,012
Closing stock of finished goods (297,467) (375,312)
2,129,008 2,031,700
25.1 Cost of goods manufacturedRaw material consumed 25.1.1 1,008,150 1,400,627Store and spare parts consumed 89,083 94,133Gas consumed 75,001 87,852Processing expense (outside factory) — 16,845Power, fuel and water 58,596 55,777Salaries, wages, and other benefits 25.1.2 103,268 109,818Rent, rates and taxes 2,528 425Insurance 768 1,842Repairs and maintenance 2,455 2,858Carriage and cartage 1,212 2,525Depreciation 4.2 459,584 385,597Others 25,494 13,598
1,826,139 2,171,897
Rejection / scrap materialOpening 71,466 86,185Closing (65,650) (71,466)
5,816 14,719
Work in process
Opening 310,895 211,626Closing (91,687) (310,895)
219,208 (99,269)
2,051,163 2,087,347
46
Huffaz Seamless Pipe Industries Limited Annual Report 2013
Commitment Towards Quality

30 June 30 June2013 2012
(Rupees in '000)
25.1.1 Raw material consumed
Opening stock 394,543 129,121
Purchases 648,172 1,666,049
1,042,715 1,795,170
Closing stock (34,565) (394,543)
1,008,150 1,400,627
25.1.2 Salaries, wages and other benefits include Rs. 9.032 million (2012: Rs. 10.192 million) in respect ofstaff retirement benefits.
26. SELLING AND DISTRIBUTION COST
Salaries, wages and other benefits 26.1 3,960 4,019
Sales promotion and other expenses 61 —
Travelling and conveyance 442 424
Bad debts written off 12,889 8,987
Insurance 257 21
Carriage outward 1,130 3,864
Other expenses 1,970 5,106
20,709 22,421
26.1 Salaries, wages and other benefits include Rs. 0.652 million (2012: Rs. 0.557 million) in respect of staffretirement benefits.
27. ADMINISTRATIVE EXPENSES
Salaries, wages and other benefits 27.1 27,018 26,741
Travelling and conveyance 6,126 4,219
Legal and professional charges 822 3,863
Fees and subscription 1,168 2,491
Telephone, telex and postage 1,334 2,102
Vehicle running and maintenance 1,987 2,087
Auditors' remuneration 27.2 1,154 1,269
Printing and stationary 970 1,056
Depreciation 4.2 1,182 1,285
Utilities 917 659
Rent, rates and taxes 586 646
Repairs and maintenance 363 381
Advertisement 109 89
Entertainment 59 12
Default surcharge on sales tax 19.1 4,278 —
Others 1,188 670
49,261 47,570
27.1 Salaries and other benefits includes Rs. 4.598 million (2012: Rs. 4.419 million) in respect of staff retirementbenefits.
27.2 Auditors' remuneration
Annual audit fee 660 660
Half yearly review 240 240
Other services including certifications 180 204
Out of pocket expenses 74 165
1,154 1,269
47
Huffaz Seamless Pipe Industries Limited Annual Report 2013
Commitment Towards Quality

30 June 30 June2013 2012
(Rupees in '000)
28. OTHER OPERATING CHARGES
Workers' Welfare Fund 5,171 1,552
Exchange loss 21,894 78,774
27,065 80,326
29. OTHER OPERATING INCOME
Scrap sales 446 378
Others 456 4,199
902 4,577
30. FINANCE COST
Lease financial charges 6,707 10,575
Musharka rent 5,523 10,389
Interest on workers' profit participation fund 19.2 21,354 22,606
Mark-up on Short term borrowings 21,170 28,195
Bank charges 3,677 4,725
58,431 76,490
31. TAXATION
Current
– for the year 55,575 27,446
– for prior years 6,019 11,609
61,594 39,055
Deferred (127,880) (108,323)
(66,286) (69,268)
31.1 The return of income have been filed up to and including tax year 2012 (corresponding to financial yearended 30 June 2012), while income tax assessments have been finalized up to and including tax year 2012.
31.2 Relationship between tax expenses and accounting profit
Loss before taxation (101,361) (201,768)
Tax at the applicable rate of 35% (2012: 35%) (35,476) (70,619)
Rebates Under Sec 65A and 65 B of IncomeTax Ordinance 2001 (34,087) -
Tax effect of expenses that are not allowable indetermining taxable income — 349
Net tax effect of export sales charged at adifferent rate (829) (10,607)
Effect of prior year charges 6,019 11,609
Others (1,913) -
(66,286) (69,268)
48
Huffaz Seamless Pipe Industries Limited Annual Report 2013
Commitment Towards Quality

32. TRANSACTIONS WITH RELATED PARTIES
Related parties comprise of associated companies, directors of the Company, companies in which directors alsohold directorship, related group companies, key management personnel and staff retirement benefit funds.
Transactions with related parties are as follows:
Name Nature of Nature of transaction 30 June 30 Junerelationship 2013 2012
(Rupees in '000)
Hafiz Abdul Waheed Associatedand Brothers company Sale of goods 201,018 165,438
Receipts in respect ofsale of goods 200,760 165,424
Huffaz Corporation Associated Sale of goods 62,229 108,900company
Receipts in respect of 67,482 114,853sale of goods
Directors Related party Sponsors' advances received 1,050 31,194
Sponsors' advances repaid 31,700 34,916
Balance as at 30 June in relation to transactions with parties are as follows:
Name Nature of Nature of transactionrelationship
Hafiz Abdul Waheed Associated Balance as at the date ofand Brothers company balance sheet 258 —
Huffaz Corporation Associated Balance as at the date ofcompany balance sheet — 5,253
Directors Related party Balance as at the date ofbalance sheet 23,581 54,231
33. LOSS PER SHARE - basic and diluted
Loss after taxation for the year (35,075) (132,500)
(Number in '000)
Weighted average number of Ordinary Shares 55,484 55,484
(Rupees)
Loss per share - basic and diluted (0.63) (2.39)
34. REMUNERATION OF CHIEF EXECUTIVE, DIRECTORS AND EXECUTIVES
Chief Executive Directors Executives
Particulars 2013 2012 2013 2012 2013 2012
..............................................Rupees in '000...............................................
Managerial remuneration 5,019 5,019 1,719 1,068 4,459 3,646
House rent 2,259 2,259 773 480 2,007 1,641
Utilities — — 172 106 446 365
Gratuity 606 606 250 138 576 471
7,884 7,884 2,914 1,792 7,488 6,123
Number of persons 1 1 1 1 5 6
34.1 In addition to the above Chief Executive, Director, Executive and certain other employees areprovided with free use of Company maintained vehicles in accordance with the Company's policy.
34.2 During the year Rs nil (2012: Rs 80,000) was paid to Directors for attending the Board of Directors'meeting.
49
Huffaz Seamless Pipe Industries Limited Annual Report 2013
Commitment Towards Quality

35. CAPACITY AND PRODUCTION
2013 2012
Particulars Capacity Production Capacity Production.........................................Metric Ton.............................................
Seamless Tubular Products 32,000 13,826 32,000 13,958
Machinery & Machinery Components 3,500 455 3,500 764
Coating of Seamless Tubular Products 50,000 5,197 50,000 1,617
The above represents name plate capacities. The production capacity of the plant varies as this depends onthe relative proportions of the various types of seamless pipes and tubes produces.
36. NUMBER OF EMPLOYEES
The total number of employees as at year end were 305 and average number of employees were 320.
37. SEGMENT REPORTING
37.1 Reportable Segments:
The company's reportable segment under IFRS 8 are as follows:
– Seamless Segment.
– Coating Segment.
Performance is measured based on respective segment results. Information regarding the Company'sreportable segment is presented below:
37.2 Segment revenue and results
Following is an analysis of the company's revenue and results by reportable segment:
Seamless Coating TotalSegment Segment
For the year ended 30 June 2013 ................................. Rs ‘000 ............................
Sales 1,986,876 195,335 2,182,211
Cost of sales (1,976,834) (152,174) (2,129,008)
Gross profit 10,042 43,161 53,203
For the year ended 30 June 2012
Sales 1,991,418 60,744 2,052,162
Cost of sales (1,906,414) (125,286) (2,031,700)
Gross profit / (loss) 85,004 (64,542) 20,462
Reconciliation of segment results with profit after tax is as follows:
30 June 30 June2013 2012
(Rupees in '000)
Total results for reportable segments 53,203 20,462
Selling, distribution and administrative expenses (69,970) (69,991)
Other operating expenses (27,065) (80,326)
Other operating income 902 4,577
Financial charges (58,431) (76,490)
Taxation 66,286 69,268
Loss for the year (35,075) (132,500)
50
Huffaz Seamless Pipe Industries Limited Annual Report 2013
Commitment Towards Quality

37.3 Segment assets and liabilities Seamless Coating TotalSegment Segment
As at 30 June 2013 ................................. Rs ‘000 ............................
Segment assets 5,247,158 1,380,196 6,627,354
Segment liabilities 881,875 80,873 962,748
As at 30 June 2012
Segment assets 6,420,522 1,376,908 7,797,430
Segment liabilities 1,399,545 133,241 1,532,786
Reconciliation of segment assets and segment liabilities with total assets and liabilities in the balancesheet is as follows:
30 June 30 June2013 2012
(Rupees in '000)
Total for reportable segment assets 6,627,354 7,797,430
Unallocated assets 662,915 213,535
Total assets as per balance sheet 7,290,269 8,010,965
Total for reportable segment liabilities 962,748 1,532,786
Unallocated liabilities 1,719,098 1,834,681
Total liabilities as per balance sheet 2,681,846 3,367,467
37.4 Segment revenue reported above are revenue generated from external customers. There were no inter-segmentsales during the year, (June 2012 : nil).
37.5 Segment assets reported above comprise of property, plant and equipment, long term deposits and stock in trade.
37.6 98.8% (2012: 96%) gross sales of the Company relates to customers in Pakistan.
37.7 All non-current assets of the Company as at 30 June 2013 are located in Pakistan.
37.8 Revenue from major customer of seamless segment represents an aggregate amount of Rs 449 million (2012: Rsnil) of total seamless segment revenue of Rs 1,986.876 million (2012: 1,991.418 million). Further, revenue frommajor customer of coating segment represents an aggregate amount of Rs 80.78 million (2012 Rs: nil) out of totalcoating segment revenue of Rs 195.335 million (2012: Rs 60.744 million).
37.9 The accounting policies of the reportable segment are the same as the company's accounting policies described innote 3 to the financial statements.
38. FINANCIAL INSTRUMENTS
Financial risk management
The Board of Directors of the Company has overall responsibility for the establishment and oversight of theCompany's risk management framework. The Company has exposure to the following risks from its use of financialinstruments:
– Credit risk– Liquidity risk– Market risk
38.1 Credit risk
Credit risk is the risk that one party to a financial instrument will fail to discharge an obligation and cause the otherparty to incur a financial loss, without taking into account the fair value of any collateral. Concentration of credit riskarises when a number of financial instruments or contracts are entered into with the same party, or when counterparties are engaged in similar business activities, or activities in the same geographic region, or have similareconomic features that would cause their ability to meet contractual obligations to be similarly affected by changesin economics, political or other conditions. Concentrations of credit risk indicate the relative sensitivity of theCompany's performance to developments affecting a particular industry.
The carrying amount of financial assets represents the maximum credit exposure. To reduce the exposure to creditrisk the Company has developed a policy of obtaining advance payments from its customers. Except for customersrelating to the Government and certain small and medium sized enterprises, the management strictly adheres tothis policy. For any balances receivable from such small and medium sized enterprises, the management
51
Huffaz Seamless Pipe Industries Limited Annual Report 2013
Commitment Towards Quality

continuously monitors the credit exposure towards them and makes provisions against those balances considereddoubtful of recovery. Cash is held only with banks with high quality credit worthiness.
The maximum exposure to credit risk at the reporting date is as follows:
2013 2012
Balance Maximum Balance Maximumsheet exposure sheet exposure
.................................. (Rupees in '000) .................................
Trade debts 179,542 179,542 127,693 127,693
Deposits and Margin againstletter of credit 50,226 50,226 16,207 16,207
Bank balances 215,216 215,128 29,190 29,139
444,984 444,896 173,090 173,039
The maximum exposure to credit risk for trade debts at the balance sheet date by type of customer is as follows:
30 June 30 June2013 2012
(Rupees in '000)
Dealers and distributors 81,100 68,951
End-user customers 98,442 58,742
179,542 127,693
As at the year end the Company's most significant customers included a distributor from whom Rs. 26.068million was due (2012: Rs. 28.680 million) and an end-user from whom Rs. 54.790 million was due (2012: Rs.nil).
The aging of trade debt balances at the balance sheet date was as follows:
2013 2012
Gross Impairment Gross Impairment
..................................... (Rupees in '000) .................................
Less than 90 days 156,337 — 106,213 —
91 to 180 days old 1,894 — 15,047 —
181 to 365 days old 21,311 — 5,514 —
More than one year — — 919 —
179,542 — 127,693 —
Based on the past experience, consideration of financial position, past track records and recoveries, the Company
believes that trade debts do not require any impairment. None of the other financial assets are past due or impaired.
38.2 Liquidity risk
Liquidity risk is the risk that the Company will encounter difficulty in meeting its financial obligations as they fall due.Liquidity risk arises because of the possibility that the Company could be required to pay its liabilities earlier thanexpected or difficulty in raising funds to meet commitments associated with financial liabilities as they fall due. TheCompanys approach to managing liquidity is to ensure, as far as possible, that it will always have sufficient liquidityto meet its liabilities when due, under both normal and stressed conditions, without incurring unacceptable losses orrisking damage to the Company's reputation.
The following are the contractual maturities of financial liabilities, including interest payments:
52
Huffaz Seamless Pipe Industries Limited Annual Report 2013
Commitment Towards Quality

2013
CarryingAmount
Contractualcash flows
Six monthsor less
Six to twelvemonths
Two to fiveyears
More thanfive years
Non-Derivative .........................................................(Rupees in '000)...........................................................
Financial liabilities
Long term financing andmarkup payable
28,690 (30,419) (15,622) (14,797) — —
Liabilities against assetssubject to finance lease
52,183 (56,907) (14,520) (12,446) (29,943) —
Short term sponsors advances 23,581 (23,581) — (23,581) — —
Trade and other payables 302,297 (302,297) (302,297) — — —
Short-term borrowings andmark up payable
12,853 (12,853) (12,853) — — —
419,604 (426,056) (149,615) (246,500) (29,943) —
2012
CarryingAmount
Contractualcash flows
Six monthsor less
Six to twelvemonths
Two to fiveyears
More thanfive years
Non-Derivative .........................................................(Rupees in '000)...........................................................
Financial liabilities
Long term financing andmarkup payable
66,564 (74,647) (27,056) (16,815) (30,776) —
Liabilities against assetssubject to finance lease
70,656 (74,674) (14,935) (12,801) (46,938) —
Short term sponsors advances 54,231 (54,231) — (54,231) — —
Trade and other payables 727,370 (727,370) (727,370) — — —
Short-term borrowings andmark up payable
148,036 (148,036) (13,517) (134,519) — —
1,066,857 (1,078,958) (587,202) (414,042) (77,714) —
The contractual cash flows relating to the above financial liabilities have been determined on the basis of mark-uprates effective as at 30 June (and includes both principal and interest payable thereon). The rates of mark-uphave been disclosed in notes 16, 17 and 21 to these financial statements.
38.3 Market risk
Market risk is the risk that the value of the financial instrument may fluctuate as a result of changes in marketinterest rates or the market price due to a change in credit rating of the issuer or the instrument, change in marketsentiments, speculative activities, supply and demand of securities and liquidity in the market. Market riskcomprises of currency risk, interest rate risk and other price risk. The Company is exposed to currency risk andinterest rate risk only.
38.3.1 Currency risk
Foreign currency risk is the risk that the value of a financial asset or liability will fluctuate due to a change in foreignexchange rates. It arises mainly where receivables and payables exist due to transactions entered into foreigncurrencies.
The Company is exposed to currency risk on trade debts, import bills payable, foreign currency bank accountsand sales that are denominated in a foreign currency (primarily U.S. Dollar). The Companys exposure to foreigncurrency risk is as follows:
2013 2012Rupees in US Dollars Rupees in US Dollars
'000 in '000 '000 in '000
Foreign currency bank accounts 71 0.723 74 0.788
Import bills payable (235,626) (2,387) (597,650) (6,318)
Gross balance sheet exposure (235,555) (2,386) (597,576) (6,318)
Outstanding letter of credit (87,171) (882) (241,760) (2,620)
Net exposure (322,726) (3,268) (839,336) (8,938)
53
Huffaz Seamless Pipe Industries Limited Annual Report 2013
Commitment Towards Quality

Following are the significant exchange rates applied during the year:
Average rates Balance sheet date rate2013 2012 2013 2012
...................(Rupees).................. ...................(Rupees)...................
US Dollars 97.57 92.27 98.80 94.48
Sensitivity analysis
A five percent change in Rupee against US Dollar at 30 June would have increased / (decreased) equity and(decreased)/ increased loss by Rs.7.655 million (2012: Rs. 29.121 million). This analysis assumes that all othervariables, in particular interest rates, remaining constant. The analysis is performed on the same basis for2012.
Above exposure is payable by the Company in Rupees at the rate on which these are settled by the Company.Currently, the Company does not obtain forward cover against the net exposure due to existing restrictions bythe State Bank of Pakistan on obtaining cover against borrowing in US Dollars under FE 25.
38.3.2 Interest rate risk
Interest rate risk is the risk that the fair value or future cash flows of a financial instrument will fluctuate becauseof changes in market interest rates. Majority of the interest rate exposure arises from short and long termborrowings from banks. At the balance sheet date the interest rate profile of the Companys interest-bearingfinancial instrument was as follows:
Carrying amount
2013 2012
Variable rate instruments (Rupees in '000)
Financial liabilities 79,759 865,410
All borrowings bear variable interest rate and are indexed to KIBOR. Borrowing is generally determined on thebasis of business needs.
Cash flow sensitivity analysis for variable rate instruments
A change of 100 basis points in interest rates at the reporting date would have increased / (decreased) theequity and (decreased) / increased loss as of 30 June 2013 by Rs. 0.518 million (2012: Rs. 1.123 million). Thisanalysis assumes that all other variables, in particular foreign currency rates, remain constant. The analysis isperformed on the same basis for 2012.
38.3.3 Fair value of financial assets and liabilities
Fair value is the amount for which an asset could be exchanged, or a liability settled, between knowledgeablewilling parties in an arm's length transaction. Consequently differences can arise between carrying values andthe fair value estimates.
The carrying amounts of all financial assets and liabilities reflected in the financial statements approximate theirfair values.
38.3.4 Capital risk management
The objective of the Company when managing capital is to safeguard its ability to continue as a going concernso that it can continue to provide returns for shareholders and benefits for other stakeholders; and to maintain astrong capital base to support the sustained development of its businesses.
The Company manages its capital structure by monitoring return on net assets and makes adjustments to it inthe light of changes in economic conditions. In order to maintain or adjust the capital structure, the Companymay adjust the amount of dividend to the shareholders or issue bonus / new shares.
The Company is not subject to externally imposed capital requirements.
39. DATE OF AUTHORIZATION FOR ISSUE
These financial statements have been authorized for issue on 31 December 2013 by the Board of Directors ofCompany.
Hafiz Abdul Majid Hafiz Abdul SamiChief Executive Director
54
Huffaz Seamless Pipe Industries Limited Annual Report 2013
Commitment Towards Quality

Pattern of ShareholdingAs on 30 June 2013
No. of Having SharesShareholders From To Shares Held Percentage
342 1 100 8943 0.0161425 101 500 130793 0.2357208 501 1000 159688 0.2878336 1001 5000 845717 1.524279 5001 10000 596880 1.075835 10001 15000 433219 0.780829 15001 20000 517300 0.932312 20001 25000 273975 0.493813 25001 30000 365125 0.65813 30001 35000 99818 0.1799
15 35001 40000 567453 1.02274 40001 45000 165484 0.29833 45001 50000 140257 0.25283 50001 55000 153283 0.27632 55001 60000 114728 0.20682 60001 65000 126305 0.22761 65001 70000 69052 0.12451 70001 75000 74750 0.13473 75001 80000 231307 0.41693 80001 85000 250210 0.45103 85001 90000 263748 0.47541 90001 95000 90703 0.16352 100001 105000 206139 0.37152 105001 110000 215731 0.38882 110001 115000 227386 0.40981 115001 120000 119993 0.21632 120001 125000 248265 0.44752 140001 145000 287940 0.51901 145001 150000 148722 0.26801 155001 160000 159171 0.28692 165001 170000 334047 0.60212 170001 175000 344143 0.62031 180001 185000 183076 0.33003 185001 190000 568278 1.02422 190001 195000 385274 0.69443 200001 205000 604239 1.08901 225001 230000 227388 0.40981 240001 245000 243301 0.43851 260001 265000 261492 0.47133 270001 275000 812910 1.46511 275001 280000 276675 0.49872 285001 290000 575480 1.03721 310001 315000 311256 0.56105 345001 350000 1726446 3.11161 375001 380000 379190 0.68341 385001 390000 389426 0.70193 400001 405000 1208520 2.17811 420001 425000 423800 0.76381 425001 430000 428745 0.77272 435001 440000 877716 1.58191 485001 490000 487500 0.87861 565001 570000 568258 1.02421 570001 575000 574040 1.03461 605001 610000 606371 1.09291 625001 630000 627212 1.13041 745001 750000 747350 1.34701 785001 790000 788782 1.42161 830001 835000 833761 1.50271 860001 865000 862258 1.55411 925001 930000 929447 1.67521 1060001 1065000 1060359 1.91111 1065001 1070000 1067213 1.92341 1085001 1090000 1088021 1.96101 1360001 1365000 1362396 2.45551 1380001 1385000 1381175 2.48931 1775001 1780000 1775453 3.19991 1820001 1825000 1822612 3.28491 2215001 2220000 2216551 3.99491 2755001 2760000 2756992 4.96901 3020001 3025000 3021317 5.44541 3525001 3530000 3525755 6.35451 4635001 4640000 4636615 8.35661 4890001 4895000 4891378 8.8158
1,596 Company Total 55,484,303 100.0000
55
Huffaz Seamless Pipe Industries Limited Annual Report 2013
Commitment Towards Quality

Categories of ShareholdersAs at 30 June 2013
{as per the requirements of Clause xvi(j) of Code of Corporate Governance-2012}
PercentageofNo of Shares Shareholding
1 Associated companies, undertakings andrelated parties (name wise detail) — —
2 Mutual funds (name wise detail)
2.1 M/S First Crescent Modaraba 375 0.0007
2.2 Golden Arrow Selected Stocks Fund Limited 428,745 0.7727
2.3 CDC - Trustee AKD Opportunity Fund 276,675 0.4987
705,795 1.2721
3 Directors their spouces and minor children (name wise detail)
3.1 Hafiz Abdul Majid 4,636,615 8.3566
Mrs. Fareeda Majid W/o Hafiz Abdul Majid 1,822,612 3.2849
3.2 Hafiz Abdul Haseeb 2,224,768 4.0098
Hafsa Haseeb W/o Hafiz Abdul Haseeb 24,691 0.0445
3.3 Hafiz Abdul Waheed 5,820,825 10.4910
Mrs. Najma Waheed W/o Hafiz Abdul Waheed 3,363,363 6.0618
3.4 Yusuf Mohamed Yusuf Najibi 3,525,755 6.3545
Mrs. Bilquees Ahmed W/o Arshad Ahmed 879,485 1.5851
3.5 Mr. Arshad Ahmad 2,262,953 4.0785
3.6 Mr. Mohammad Hafiz 574,040 1.0346
3.7 Mr. A. Aziz Eshaq A. Rehman 3,021,317 5.4454
3.8 Mr. Nabeel Abdul Rehman Arif 345,287 0.6223
3.9 Hafiz Abdul Sami 938,468 1.6914
3.10 Hafiz Abdul Aleem 896,072 1.6150
3.11 Syed Arsalan Sadiq - Independent Director 2,058 0.0000
30,338,309 54.6754
4 Executives — —
5 Public sector companies and corporations
5.1 National Bank of Pakistan-Trustee Department NI(U)T Fund 1,362,396 2.4555
5.2 National Investment Trust Limited 35,085 0.0632
1,397,481 2.5187
6 Banks, Development financial institutions, Non-bankingfinance companies, insurance companies, takaful, modarabasand pension funds
6.1 IDBP (ICP Unit) 7,230 0.0130
6.2 National Bank of Pakistan 1,033 0.0019
8,263 0.0149
7 Sharehoders holding five percent or more votingrights (name wise detail) — —
8 Others 23,034,455 41.5190
TOTAL 55,484,303 100.0000
56
Huffaz Seamless Pipe Industries Limited Annual Report 2013
Commitment Towards Quality


Related Documents


![[Report] Layout Inv Anhuynh](https://static.cupdf.com/doc/110x72/577c82d61a28abe054b27eb2/report-layout-inv-anhuynh.jpg)