Annual Report 2012 (Jan-Dec) April 26, 2013 Japan CRO Association

Welcome message from author
This document is posted to help you gain knowledge. Please leave a comment to let me know what you think about it! Share it to your friends and learn new things together.
Transcript

Annual Report 2012 (Jan-Dec)
April 26, 2013 Japan CRO Association

Sales and Employees 2008-2012
2
Note) Count and estimate data of 40 companies in 2007, 39 in 2008, 33 in 2009, 26 in 2010 and 2011, 26
in 2012 and 2013
103 113 113 119133
144
9,0279,838 10,126
10,807
12,47313,350
0
2,000
4,000
6,000
8,000
10,000
12,000
14,000
16,000
0
20
40
60
80
100
120
140
160
2008 2009 2010 2011 2012 2013
Sales
Employees
(Employee No.) (Sales Unit: Bln.¥)
Estimate
(Year)
3
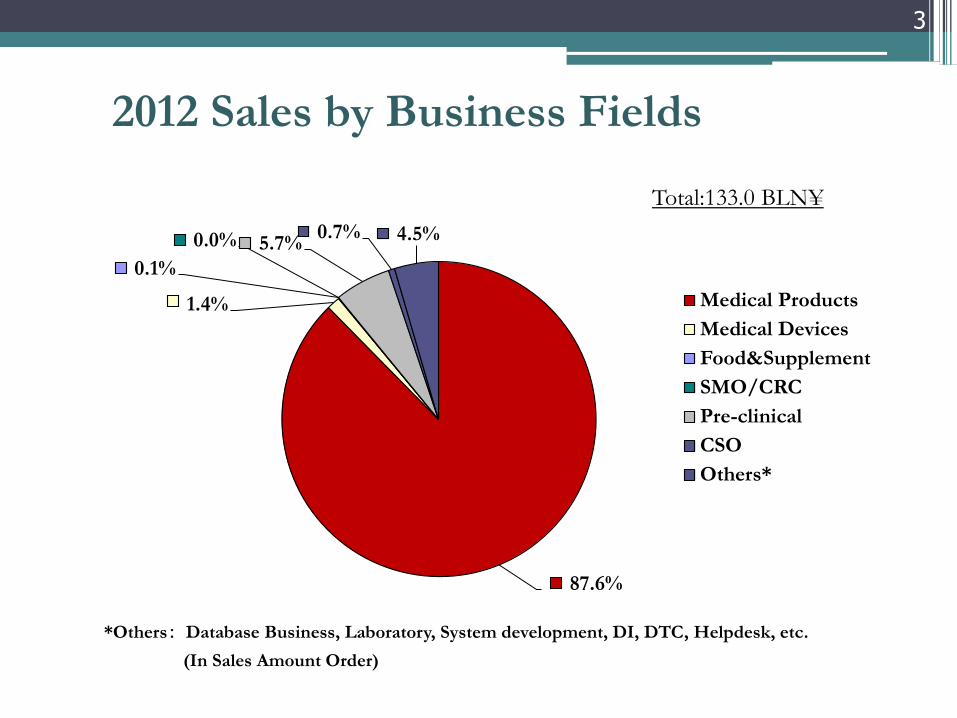
Total:133.0 BLN¥
2012 Sales by Business Fields
*Others: Database Business, Laboratory, System development, DI, DTC, Helpdesk, etc.
(In Sales Amount Order)
87.6%
1.4%
0.1%
0.0% 5.7% 0.7% 4.5%
Medical Products
Medical Devices
Food&Supplement
SMO/CRC
Pre-clinical
CSO
Others*

4
0
20,000
40,000
60,000
80,000
100,000
120,000
140,000
2008 2009 2010 2011 2012
Others
Pre-clinical
SMO/CRC
Food&Nutrition
-SupplementMedical Devices
Medical
Products
86.4% 77.3
%
86.2 %
87.6 %
81.2 %
Sales by Business fields 2008-2012
(Sales Unit:1 Mil.¥)
(Year)

5
Total: 118. 4 BLN¥
2012 Medical Products/Devices/Food & Nutrition-
Supplement Sales by Business Services
*Others : Delivery and storage of Study drug, Safety Management, Randomization, BE,
Translation, and etc. (In Sales Amount Order)
53.5%
23.3%
3.0%
1.0%
19.3%
Monitoring
DM/Bio.Stat.
Registration of enrolling subjects
Medical Writing
Others*

6
0
20
40
60
80
100
120
140
2008 2009 2010 2011 2012
Others
Medical Writing
Registration of
enrolling subjects
DM/Bio.Stat.
Monitoring
(Sales Unit: 1 BLN¥)
61.1%
64.6% 53.0
% 53.2%
22.5%
23.2%
21.0%
23.1%
19.5%
19.3%
10.9%
10.4%
53.5%
23.3%
19.3%
Medical Products/Devices/Food & Nutrition-
Supplement Sales by Clinical Services 2008-2012
(Year)
7
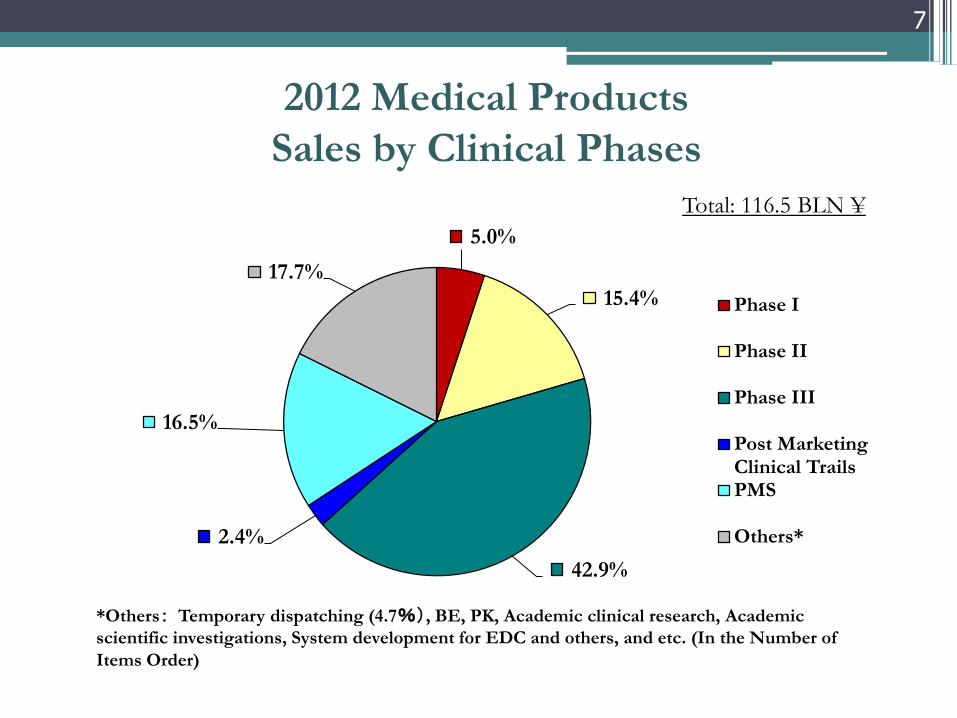
Total: 116.5 BLN ¥
2012 Medical Products
Sales by Clinical Phases
*Others: Temporary dispatching (4.7%), BE, PK, Academic clinical research, Academic
scientific investigations, System development for EDC and others, and etc. (In the Number of
Items Order)
5.0%
15.4%
42.9%
2.4%
16.5%
17.7%
Phase I
Phase II
Phase III
Post Marketing Clinical Trails PMS
Others*

8
0
20
40
60
80
100
120
140
2008 2009 2010 2011 2012
Others
Post Marketing Clinical Trials. etc
Phase III
Phase II
Phase I
(Sales Unit: 1 BLN¥)
16.9%
14.1%
15.4%
19.9%
16.0%
19.3%
43.6%
42.9%
37.6%
42.0%
42.5%
16.3%
18.9%
25.4%
22.4%
5.3% 5.5% 5.0% 4.3% 5.2%
15.8%
20.7%
17.7%
12.8%
14.4%
Medical Products Sales
by Clinical Phases 2008-2012
(Year)

36.5%
21.7% 3.2%
2.0%
5.7%
30.9% CRA
DM
Bio.Stat.
Regulatory/ Consulting Administration
Others
9
2012 Employees by Business Services
Total No. of employees: 12,473

10
0
2,000
4,000
6,000
8,000
10,000
12,000
14,000
2008 2009 2010 2011 2012
Others
Administration
Regulatory/
Consulting
CRC
DM/Bio.Stat.
CRA
(Unit:No. of employees)
42.1%
36.5%
41.4%
41.5%
38.6%
25.1%
24.5%
21.7%
23.6%
23.7%
24.0%
27.8%
30.9%
23.9%
23.2%
Employees by Business Services 2008-2012
(Year)

11
2012 Total No. of employees :12,473
0%
10%
20%
30%
40%
50%
60%
70%
80%
90%
100%
2008 2009 2010 2011 2012
78% 79% 82% 81% 77%
22% 21% 18% 19% 23%
Part-timer Full-time
Employment Pattern 2008-2012
(Year)

13.2%
32.2%
9.9%
9.3%
35.4% Monitoring
DM/Bio.Stat.
Registration of enrolling subjects
Medical Writing
Others*
12
2012 Medical Products/Devices/Food & Nutrition-
Supplement Outsourced Projects by Business Services
☆1 Project =1 service per protocol, not including any projects associating temporary dispatching
Total No. : 8,458 projects
*Others: Delivery and storage of Study drug, Validation of an analytical procedure , Safety
Management, Randomization, System development for EDC and others, and etc. (In the
Number of Items Order)

13
0
1,000
2,000
3,000
4,000
5,000
6,000
7,000
8,000
9,000
2008 2009 2010 2011 2012
Others
Medical Writing
Registration ofenrolling subjects
DM/Bio. Stat.
Monitoring
(Unit:No. of projects)
13.5%
14.7%
13.2%
14.7%
15.5%
33.6%
32.1%
32.2%
22.8%
34.6%
45.3%
31.9%
35.4% 34.9
%
34.4%
Medical Products/Devices/Food & Supplement
Projects by Business Services 2008-2012
(Year)

10.9%
12.0%
22.9%
2.4% 22.0%
29.8% Phase I
Phase II
Phase III
Post Marketing Clinical Trials PMS etc.
Others*
14
Total No. of projects:7,975
2012 Medical Products Projects by Clinical Phases
☆1 Project =1 service per protocol, not including any projects associating temporary dispatching
*Others: Support Service of Application, Central laboratory, Bioequivalent studies, application of MF and
generic medicines, Interior Administrative Services, Investigators –initiated trials, Academic clinical research,
Academic scientific investigations, System development for EDC and others, Safety report management, Quality
control related and etc. (In the Number of Items Order)

0
1,000
2,000
3,000
4,000
5,000
6,000
7,000
8,000
9,000
2008 2009 2010 2011 2012
Others
PMS etc.
Post Marketing Clinical Trials
Phase III
Phase II
Phase I
15
(Unit: No. of projects)
13.4% 12.3% 12.0% 13.8% 11.9%
24.8%
22.8%
24.4%
19.6% 21.6% 24.7%
27.0%
22.9% 26.2% 29.9%
23.6%
26.9%
29.8%
28.0% 23.6%
13.5% 11.0% 10.9% 12.4% 13.0%
Medical Products Projects
by Clinical Phases 2008-2012
(Year)

0
20
40
60
80
100
120
140
160
180
200 Total
Multi-national studies*
Applying EDC
16
(Units:No. of projects)
2012 Monitoring Projects* by Therapeutic Area • 811 projects as available data
• ** Multi-National Studies: Studies conducted in multi countries simultaneously with the
same protocol.
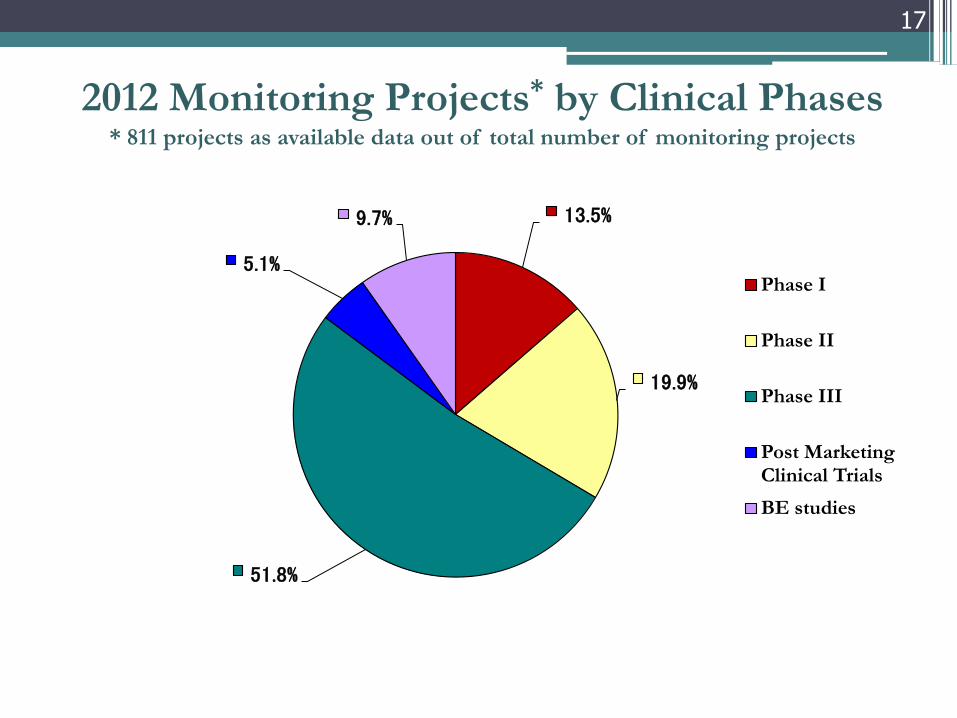
13.5%
19.9%
51.8%
5.1%
9.7%
Phase I
Phase II
Phase III
Post Marketing Clinical Trials
BE studies
17
2012 Monitoring Projects* by Clinical Phases * 811 projects as available data out of total number of monitoring projects

0
20,000
40,000
60,000
80,000
100,000
120,000
JCROA Members Affiliated Companies
118,442
24,648
6
18,309
7,613
5,719
6,959 29,751
Medical products, Devices, Food
SMO/CRC
Pre-clinical
Others
18
(Unit:1 Mil. ¥)
•Affiliated Companies: To have capital ties with the JCROA Members.
•Others do not include business that does not associate with pharmaceutical development such as pharmacies,
real estate.
Sales: JPY133,020Mil.
(Total No. of Employees:12,473)
Sales: JPY78,427 Mil.
( Total No. of Employees:6,835 )
2012 Sales and Employees
JCROA Members vs. Affiliated Companies*

19
102.5113 113.2
119.2133
51.4 50 42.1 50
78.4
90279838 10126
10807
12473
7104
5185 49105881
6835
0
2,000
4,000
6,000
8,000
10,000
12,000
0
20
40
60
80
100
120
140
2008 2009 2010 2011 2012
JCROA Sales
Affiliated Sales
Affiliated Employees
JCROA Employees
(Unit:1 BLN¥) (Unit:Employees No.)
CRO/Affiliated
Market Size
169.1(16,688)
211 .4 (19,342)
153.9(16,131)
163.0(15,023)
155.3(15,036)
Total Sales & Employees for
JCROA Members/Affiliated Companies* 2008-2012
1 BLN¥
(Employees No.)
Related Documents