ANN UAL REP ORT I pay tribute to all staff for their superb efforts in 2011. They rise to the challenges of modern education, delivering to as well as, supporting our students, making Whitireia a true learning community. Despite changes in funding policy and the environment, Whitireia continues to perform and achieve outstanding results. . “ “ ” ” 1st POLYTECHNIC FOR STUDENT SUCCESS Whitireia were rated number one for qualification completion in August 2011, in the Performance of Teriary Education Organisations Report published by the Tertiary Education Commission. “ ” ANNUAL REPORT 2011

Annual Report 2011
Mar 27, 2016
Financial statements and statement of service performance for Whitireia Polytechnic and group.
Welcome message from author
This document is posted to help you gain knowledge. Please leave a comment to let me know what you think about it! Share it to your friends and learn new things together.
Transcript

WH
ITIREIA
NEW
ZEALA
ND
AN
NU
AL R
EPO
RT 20
11
EDUCATIONleading andilluminating
OU
R
communitiesthrough tertiary
www.whitireia.ac.nz
0800 944 847
ANNUALREPORT
I pay tributeto all stafffor their superbefforts in 2011.They rise to the challenges of modern education,delivering to as well as, supporting our students, making Whitireia a true learning community.
Despite changes in funding policy and the environment, Whitireia continues to perform and achieve outstanding results..
“
“
”
”
1st Polytechnicfor student success
Whitireia were rated number one for qualification completion in August 2011, in the Performance of Teriary Education Organisations Report published by the Tertiary Education Commission.
“
”
AnnuAl rePort 2011

ValuesManaakiEncouraging co-operation in learning and resource sharing to promote individual confidence and group harmony through a positive and supportive learning environment
IdentityCreating a learning environment where all people feel they belong because their uniqueness is valued and promoted
EquityAchieving more equal outcomes by providing significant learning and education success for those who have previously lacked such opportunities
ResponsivenessBeing flexible, creative and open to change, to better meet individual, industry and community learning needs
SuccessBeing an effective organisation with a clear sense of purpose, striving for excellence and creating an environment where all have the right to succeed
IntegrityMaintaining the highest ethical standards and permitting public scrutiny to ensure the maintenance of those standards
AccountabilityMonitoring and reporting on the maintenance of educational quality standards and on the responsible use of public resources
VisionWhitireia will lead and illuminate its communities through tertiary education
Matters relating to the electronic presentation of the audited financial statements and statement of performance
This audit report relates to the financial statements and the statement of service performance of Whitireia Community Polytechnic (the polytechnic) and group for the year ended 31 December 2011 included on the polytechnic and group’s website. The polytechnic and group’s Council is responsible for the maintenance and integrity of the polytechnic and group’s website. We have not been engaged to report on the integrity of the polytechnic and group’s website. We accept no responsibility for any changes that may have occurred to the financial statements and statement of service performance since they were initially presented on the website.
The audit report refers only to the financial statements and statement of service performance named above. It does not provide an opinion on any other information which may have been hyperlinked to or from the financial statements and statement of service performance. If readers of this report are concerned with the inherent risks arising from electronic data communication they should refer to the published hard copy of the audited financial statements and statement of service performance as well as the related audit report dated 16 May 2011 to confirm the information included in the audited financial statements and statement of service performance presented on this website.

02 Snapshotof2011
04 CouncilChairReport
06 ChiefExecutiveReport
10 CouncilandSeniorManagement
11 Highlights
12 EducationalPerformance
14 Achievements
21 ObjectivesandKeyPerformanceIndicators
38 PerformanceMeasuresDefinitions
41 FinancialStatements
42 StatementofFinancialPerformance
43 StatementofComprehensiveIncome
43 StatementofChangesinEquity
44 StatementofFinancialPosition
45 StatementofCashFlows
47 NotestotheFinancialStatements
83 ReportoftheAuditor-General
01
WHITIREIA NEW ZEALAND ANNUAL REPORT 2011
Contents

02
SNAPSHOT OF 2011
7953 STUDENTS ENROLLED
122 PROGRAMMES OFFERED
fiveGRADUATION CEREMONIES
2142DIPLOMASAWARDED
CERTIFICATESAWARDED
DEGREESAWARDED
450366
POSTGRADUATECERTIFICATESAWARDED
162
51%
10%
5%
34%STUDENTS
STUDYLEVELS 1-8
LEVELS 1-5LEVEL 7
LEVE
L 6
LEVE
L 8
ENROLLED DIRECTLY FROM SECONDARY SCHOOL2121 STUDENTS
215 EXECUTIVE & SUPPORT STAFF294 ACADEMIC STAFF
40% 60%
MALE FEMALE

03
WHITIREIA NEW ZEALAND ANNUAL REPORT 2011
31% INTERNATIONAL STUDENTS
69% DOMESTIC STUDENTS
4 7
LOCA
TIONS
CAMP
USES
1686PARTICIPATED IN TERTIARY EXPLORATION SESSIONS
YEAR 10 STUDENTS
STUDENTS PARTICIPATED IN GATEWAY PROGRAMMES101 SECONDARY SCHOOLPARTICIPATED IN STAR PROGRAMMES977 STUDENTS
�e Performance of Tertiary Education Organisations Report ranked Whitireia in the number 1 position for qualification completion. Ranked 1st against 19 other Polytechnics and Institutes of Technology in New Zealand
POLYTECHNIC FOR STUDENT SUCCESS
STSCHOLARSHIPS AWARDED35 FOUNDATION
18 SECONDARY SCHOOL LEAVER FEE SCHOLARSHIPS AWARDED
43%19%
21%17%
PACIFIC ISLANDER
ASIAN & OTHER
STUDENTETHNICITY
MA -ORI
NEW ZEALAND
EUROPEAN

COUNCIL CHAIR // HON ROGER SOWRY ONZM
Whitireia students achieved very high levels of educational success in 2011, as this report shows. Whitireia students had the highest rate of qualification completion of all twenty institutions in the ITP sector in 2010.
“
”

WHITIREIA NEW ZEALAND ANNUAL REPORT 2011
05
Kia ora koutou
I’m delighted to introduce the 2011 Annual Report for Whitireia Community Polytechnic, Te Kura Matatini o Whitireia. In summary, 2011 was an excellent year for Whitireia on many fronts.
We continued to provide quality applied vocational education for some 7,953 students, or 4,589 equivalent full-time students (EFTS), from our various communities. The main growth was in international student numbers, which reached 1,400 EFTS in 2011.
Whitireia students achieved very high levels of educational success in 2011, as this report shows. They had the highest rate of qualification completion of all 20 institutions in the ITP sector in 2010. Our students were even more successful in 2011, with increased levels of course completion and qualification completion. Congratulations to all students and staff for this excellent result!
Pleasingly we produced a financial surplus of $2.7 million* on close to $59 million of revenue and made significant improvements to our longer term financial viability.
An exciting development in 2011 was the Students First strategic partnership with Wellington Institute of Technology (WelTec). This innovative partnership is a first for the tertiary education sector in New Zealand. Its aim is to provide a high-quality network of applied and vocational education at the tertiary level for the greater Wellington region and beyond. This partnership
progressed further in November 2011, when the Minister of Tertiary Education announced the establishment of a combined Governing Council and a combined Academic Board for the two institutions as from January 2012. We expect the new Council and Academic Board will lead significant progress for the benefit of all students in 2012.
Another significant development in 2011, was the establishment of Whitireia New Zealand Limited as a subsidiary of Whitireia. This new organisation further integrates two Private Training Establishments (PTEs) into Whitireia, the New Zealand Radio Training School and Whitireia Performing Arts Company Limited.
Major new building developments were completed in 2011. These included the Media Training Centre in Cuba Street, Wellington which was opened in May 2011, the Performance Centre in Vivian Street, Wellington which opened in June 2011 and a major refurbishment of the Auckland campus in Queen Street, Auckland which was opened in September 2011. A new campus was also developed for the Kāpiti region in time for classes to start in February 2012. All of these developments are bringing new life and increased numbers of students to the teaching programmes delivered in these regions.
There were many achievements in 2011 as noted in this report. The graduation of our students is always a highlight and Te Rauparaha Arena in Porirua City is a fantastic venue for these large celebrations of student success.
While 2011 has been an excellent year, we face many challenges over the next few years delivering our distinctive contribution within a capped domestic funding environment. Not the least of these is how to fund the many capital developments needed from our own resources. We have excellent staff and a very supportive community and the completion and success rates of our students demonstrate we represent excellent value for money in the total tertiary network. We are well placed to continue to deliver quality vocational programmes and educational outcomes that will make a difference to students employment opportunities and their lives.
As Chair of the new Council of Whitireia and WelTec, I look forward to a very positive and constructive year in 2012. The new Council will continue to debate the issues that affect our institutions with passion, vigour and a sound commitment to community needs. Thank you to all Councillors for contributing your knowledge and time to Whitireia and the new partnership with WelTec.
On behalf of Council I would like to thank Don Campbell for his leadership in 2011 and the many positive achievements. I would also like to thank the management team and the staff for their continued support and dedication.
Noho ora mai
Hon Roger Sowry ONZMCouncil Chair
*surplus after non-operating items

CHIEf ExECUtIvE // DON CAMpbELL
I am delighted to report on the performance of Whitireia Community polytechnic for 2011 , our 25th year as a quality tertiary education provider.
“
”

WHITIREIA NEW ZEALAND ANNUAL REPORT 2011
07
Tena- koutou katoaIntroductionI am delighted to report on the performance of Whitireia Community Polytechnic for 2011, our 25th year as a quality tertiary education provider. It was a great year with many tangible achievements to celebrate as we continued to “lead and illuminate our communities through tertiary education” in Porirua, Kāpiti, Wellington and Auckland.
Whitireia provided quality vocational tertiary education to 4,589 equivalent full-time students (EFTS) in 2011. The main growth came from increased numbers of international students, 1,400 EFTS, and also from growth in the Youth Guarantee Scheme for younger students.
This provided revenue close to $59 million and a financial surplus of $2.7 million*, a very pleasing result which represents 4.6% of gross income.
Educational SuccessFor any educational institution, student achievement and performance are always the highlights of any year. In 2010, Whitireia was ranked first in the ITP sector for students who successfully complete qualifications including degrees, diplomas and certificates. Our students continued to achieve very high rates of educational success in 2011, as this report shows, and the Whitireia rates for successful course and qualification completion increased even further from 2010 to 2011.
Large graduations at Te Rauparaha Arena in Porirua City, were great celebrations of student success last year.
Performance in 2011In addition to high levels of educational performance in 2011, Whitireia achieved a financial surplus of $2.7 million*, which was a significant increase over budget, due mainly to increased international revenue and tight control of expenditure.
Whitireia is recognised as a leading provider of tertiary education for culturally diverse communities. This is reflected in growth of students of Māori, Pacific and international origin. The proportion of students in degrees and higher level programmes continued to increase in 2011, as did the number of students under the age of 25 years. These are Government priorities for the tertiary sector, and Whitireia has been very successful in meeting these priorities.
A very important role for us is to enhance the pool of skilled people for industry and to help lift the productivity of business. Whitireia graduates reported high levels of employment or progress to further study in 2011, while an employer survey indicated high levels of satisfaction with Whitireia graduates.
Our success is of course a reflection of staff performance. In acknowledging this I pay tribute to all staff for their superb efforts in 2011. Our staff do “lead and illuminate their communities” in their respective fields and this is widely acknowledged. Staff are incredibly important in our success. They rise to the many challenges in modern education, delivering as well as supporting our students, and making Whitireia a true learning community.
Strategic Partnership A Strategic Partnership with Wellington Institute of Technology (WelTec) was an important development last year. This led to the establishment of a combined Governing Council and Academic Board for the two institutions, from January 2012. The partnership will draw on the strengths of both institutions to give students easier access to a diverse range of programmes. It will create distinctive Centres of Excellence that will work closely with industry, provide a single stronger voice for vocational tertiary education and become a one-stop shop for industry in greater Wellington. We look forward to working closely with WelTec in 2012 to achieve an ambitious set of objectives.
25th Birthday Celebrations 2011 was our 25th year of operation, a significant milestone which was marked by high profile activities. A series of campus developments saw new building openings including the Media Training Centre in Cuba Street, Wellington, by the Minister of Tertiary Education, Hon Steven Joyce, the Performance Centre in Vivian Street, Wellington, by the Minister of Arts, Culture and Heritage, Hon Christopher Finlayson, a refurbished Auckland campus in Queen Street, by MP for Auckland Central, Nikki Kaye, and the start of a new Kāpiti campus development in Paraparaumu. We also held Matariki and scholarship celebrations, a series of Education Forums and a 25th birthday event with student performances to showcase our success. A 25th publication will be published in 2012 to mark a great first 25 years of existence.
*surplus after non-operating items

08
Tertiary ReformsA capped funding environment has effectively been in place since 2006 when Adult and Community Education (ACE) funding was severely reduced. This presents considerable challenges around reallocation of resources to meet changing workforce priorities.
In response to Government priorities, Whitireia has increased the proportion of students under the age of 25. We have increased the proportion of students at Level 4 and above and we have increased the number of Māori and Pacific students. We have improved programme success rates and have lifted profitability and improved efficiency of delivery.
We have also continued to be well connected to our community which is diverse and multi-ethnic but for whom current funding models are not well suited. More work is needed on this, to ensure current structural disadvantages to success, are addressed.
Looking AheadA major challenge for Whitireia and the strategic partnership with WelTec, will be to fund our capital development needs over the next few years, to provide a series of modern, well equipped and flexible campuses. This requires strong financial performance and, for Whitireia, will most likely require borrowing for the first time.
A key project signed off by Council in December was a new $16.5 million building, which will include state-of-the-art simulation suites, classrooms and flexible learning environments. It will result in some disruption to
the Porirua campus in 2012 and will be completed in time for the 2013 academic year.
There will be challenges in the international space, as the environment remains highly competitive and changes in immigration regulations may well have unintended consequences for us.
A second challenge is to continue to grow international student numbers and profitability whilst ensuring our domestic students needs and success rates are maintained. This may be difficult in a very competitive ITP sector.
A third challenge, is to deliver planned student numbers and the budgeted surplus. Further developments will include building better educational links and relationships, new collaborative arrangements, shaping and sharpening our strategic focus and all the while continuing to engage with our communities.
The fourth and most important challenge will be to ensure continued high success rates along with excellent educational outcomes for students, employers and our communities.
I am delighted at the progress we have made in adapting to the new tertiary environment, adjusting our programme portfolio, mix and level, significantly improving our profitability, our responsiveness to community and industry and the ability to meet and exceed challenging targets.
The last five years have seen significant changes in the external environment and we have changed and adapted extremely well as an organisation.
Conclusion I thank all staff and management, including Deputy Chief Executives, who have responded well to the changing external environment and helped prepare us for the current and future changes. We are strong and well regarded but we do have a lot of work to do both in helping to create a simpler and better tertiary sector and in continuing to transform our organisation for the new environment.
Finally I wish to thank Council for their strong and supportive leadership and sound understanding of our community, the tertiary environment and the place Whitireia has in the tertiary sector. The Council has led the strategic partnership with WelTec, and we look forward to exciting developments to provide a strong network of applied tertiary education for greater Wellington and the country. My special thanks to Hon Roger Sowry ONZM, as Chair and Dr Alan Barker as Deputy Chair for their support, guidance and leadership.
Noho ora mai
Don CampbellChief Executive

WHITIREIA NEW ZEALAND ANNUAL REPORT 2011
$2.7m*
$59m2011
7,953
4,589
Financialsurplus
Revenue
Students
Equivalentfull-timestudents(EFTS)
”
“Our25thyearofoperation,andasignificantmilestonewhichwasmarkedbyhighprofileactivities.Weopenedanumberofnewcampuses,heldMatarikiandscholarshipcelebrations,aseriesofEducationForumsandaspecial25thbirthdayeventwithstudentperformancestoshowcaseoursuccess.
CHIEf ExECUtIvE // DON CAMpbELL
*surplus after non-operating items

10
Council and Senior Management
Whitireia CouncilHon Roger Sowry ONZMCouncil Chair
Dr Alan BarkerDeputy Chair / Ministerial
Dennis SharmanMinisterial
Suzanne Snively ONZMMinisterial
Aka ArthurCommunity Representative
Gregory FortuinCommunity Representative
Dr Kabini SangaCommunity Representative
Ron WilkinsonCommunity Representative
Senior ManagementDon Campbell Chief ExecutiveMBS (Hons), BA (Econ), Dip Tchg, FNZIM
Susan Cauchi Deputy Chief Executive (Academic)MA (Hons), DipNZLS
Arthur Graves Deputy Chief Executive (Strategic) (resigned December 2011)PGDipArts, BA
Lawrence Arps Deputy Chief Executive (Operations) MEdAdmin, BEd
Damien Banks Business Development Manager, KāpitiBMS (Mktg), NZDipBus
Trish Brimblecombe Project ManagerMComms, BA, DipBS
Helen Gardiner Dean, Faculty of Service IndustriesBA, Dip Tchg, CTC, ANZIM
Kaye Jujnovich Dean, Faculty of ArtsMEd (Hons), Adv Dip Tchg, H Dip Tchg, Dip Tchg
Willis Katene Director, Te Kupenga and Dean Te Wānanga MāoriMMMgt, BA (Hons), Dip ART
Gerry McCullough Dean, Faculty of BusinessBA (Maths), FAETC
Paul Maguiness General Manager, InternationalMBS, BCA
Stephen Porteners Manager, Business Information Centre (resigned July 2011)BSc
Mark Raisin Chief Financial Officer BBS
Tim Renner Director, Communications and Marketing (Domestic)MA (Hons), BA (Eng and Hist), MBA, MCIM, Chartered Marketer
Dr Margaret Southwick QSM Dean, Faculty of HealthPhD, NZRN
Nick Wempe Manager, Business Information Centre (from October 2011)BA (Hons), Dip Ed, Dip Tchg
Stephen Wickens Dean, Faculty of TradesBA (Hons), Dip Ed, Dip Tchg
Glenys Williams Manager, Academic QualityMA (TESOL), BEd, Dip Tchg, CALT

11
WHITIREIA NEW ZEALAND ANNUAL REPORT 2011
Highlights
Whitireia and WelTec strategic partnership and the approval of a combined Governing Council and Academic Board
Official opening of the Performance Centre and Media Training Centre in Wellington City and the redeveloped Auckland Campus
Memorandum of Understanding signed with Habitat for Humanity to collaborate in the building of new homes
Memorandum of Agreement signed with Vikings Rugby Club, Porirua City
Performing Arts students participation in a dance festival in Italy for six weeks
Performing Arts students awarded a six week paid contract with Museum of New Zealand Te Papa Tongarewa to offer three half hour Māori shows on Friday’s, Saturday’s and Sunday’s for the duration of the Rugby World Cup 2011
The commencement of the new Kāpiti campus development in Paraparaumu
1,400 international equivent full-time students (EFTS) studied at Whitireia in 2011, an increase of 84 EFTS from 2010
Resolution of the Academic Staff Collective Employment Agreement (TEU bargining round)
Dr Margaret Southwick QSM reappointed
Chair of the New Zealand Nursing Council
A two staged campus redevelopment
programme for the main Porirua Campus
is approved and work commenced
Two staff were awarded PhD’s
Research outputs increased by over
70% from 2010
Successful establishment and growth of
Youth Guarantee programmes for 16-17
year old students
Māori, Pacific and Youth strategies
formalised and endorsed by Council
Implementation of SMART library service
Australian accreditation of the Whitireia
Bachelor of Health Science (Paramedic)
programme commenced
The successful accreditation of the
Bachelor of Applied Business Studies
(BABS) Finance major by the NZICA for the
Associate Chartered Accountant pathway
The completion of the World Health
Organisation Vanuatu project by Wendy
Scott and Dr Margaret Southwick QSM
Science in Schools Project for Pacific
secondary school students implemented
A 2011 International Arts Fellowship was awarded to Carmel McClone, to study Shakespeare at the Globe Theatre in London
Brand identities established for the, Performance Centre, Media Training Centre, Kāpiti and Whitireia Theatre
Two Te Reo Māori tutors were invited to participate at the highly regarded Te Panekiretanga o te Reo Māori – The Institute of Excellence in Māori Language
Visual Arts and Design Tutor, Owen Mapp, was invited to exhibit and present two papers at the International Council of Archae-zoology sub group, the ‘Worked Bone Research Group’ at Salzburg University, Austria
The Whitireia Nursing Journal, marked its 18th year of uninterrupted publication
Whakairo tutor, James Molnar and students were involved in the carving of two waka for the Wharewaka on Wellington’s waterfront
Visual Arts and Design Tutor, Deb Donnelly’s, representation on behalf of New Zealand, at the International Shibori Symposium in Hong Kong
Successful development, growth and strengthing of our industry relationships throughout 2011
25 YEAR
S
WhitiREiA cElEbRAtEd 25 YEARS AS A quAlitY tERtiARY EducAtion inStitutE WERE publiShEd bY StAff in 2011$16.5M upgRAdE AppRovEd bY council
fivE bookSpoRiRuA cAMpuS

12
Educational performance
Whitireia has nine degree programmes and five postgraduate qualifications, which contribute to the relatively high proportion (71%) of students who studied in degree and diploma programmes at Level 4 and above, on the National Qualifications Framework in 2011. At the same time, Whitireia continued to offer lower-level programmes, which lead directly to employment, as well as foundation programmes, that lead to degree and diploma level study.
International Students Whitireia has a high proportion of international students. In 2011, the Polytechnic had 1,400 international student EFTS, making up 30% of the total student population. 860 of these students studied at the Auckland campus and 540 at other Whitireia campuses.
Whitireia provides a wide range of student support, pastoral care and English language programmes for international students. This contributes to high levels of success for this group of students. In 2011, international students achieved a successful course completion rate of 78% while 78% successfully gained a qualification.
Student Participation In 2011, Whitireia taught 7,953 individual students and 4,589 equivent full-time
students (EFTS). These students studied mainly at Whitireia campuses in Porirua, Wellington City, Kāpiti and Auckland.
Whitireia has a diverse student population with students from over 30 ethnic groups and nationalities.
In summary:
The main goal of the Whitireia Strategic Plan is
‘to improve educational
outcomes and success for
students.’ As this Annual Report shows,
Whitireia successfully
achieved this main goal in 2011.
The following commentary
provides further information,
about important aspects of the
Polytechnics overall performance.
43%38%
19%
NewZealandEuropean
MāoriandPacific
AsianandOther
The majority of these students study in higher level programmes.
13
WHITIREIA NEW ZEALAND ANNUAL REPORT 2011
Community Engagement Whitireia has a wide range of links to employers, professional organisations, iwi and community groups, e.g. Whitireia has a long-standing relationship with the local iwi, Ngāti Toa, and it has developed programmes to foster Māori achievement e.g. the Bachelor of Nursing (Māori). Strong links between Whitireia and Pacific communities have led to well-established programmes for Tongan students, while a new initiative to provide Pacific scholarships in trades was introduced this year. Whitireia ran two offerings of the National Certificate in Horticulture (Introductory) (Level 2) for students with disabilities in association with Asert Trust/ Ti Rito Gardens. Programme Advisory Committees provide advice for teaching programmes and include employers, industry leaders and community representatives. Whitireia staff are actively involved in professional and industry organisations, such as the New Zealand Nursing Council. Well-attended regional Education Forums for all those interested in education were run by Whitireia throughout 2011. All these links assist Whitireia in providing tertiary education that meets the needs of students, families, employers, industry and communities.
Research The reputation of tertiary institutions is greatly enhanced by the research produced and the academic qualifications of its staff. 2011 was a very productive year for research activities at Whitireia, with the awarding of one Doctor of Philosophy (PhD), one Doctor of Nursing (DN), and six Master’s degrees to staff members.
Overall, Whitireia staff produced 166 research outputs including 5 books and 43 publications such as chapters in books and published journal articles. A total of 43 creative outputs included public art exhibitions and theatre performances. Over 67 staff delivered conference papers and presentations. 2011, saw research outputs increase by over 70%.
The knowledge and expertise of Whitireia staff continued to be sought-after as they were approached to complete commissioned work, with 14 external contracts or grants for artistic or research projects. In 2011, these have included a wide range of projects including the evaluation of educational initiatives, Pacific housing needs, families of prisoners, cultural issues, artistic performance, the creation of educational resources, and a grant from the prestigious Technology and Transfer Project.
The Performance Based Research Fund (PBRF) Quality Evaluation was a focus for the Polytechnic last year. The PBRF reviewed tertiary education research at universities, polytechnics and other tertiary education organisations for the six year period from 1 January 2006 to 31 December 2011. We look forward to PBRF results in 2012.
16670%
Totalresearchoutputs
Increaseinresearchoutputsfor2011

14
Achievements
In 2011, Whitireia continued to
excel at providing quality, industry related training
to its community. Students when surveyed, were
very satisfied with the programmes
they enrolled in and the support they
received to meet their study needs.
Each year, Whitireia conducts a survey of graduates and their employers. In 2011, 86% of our surveyed graduates indicated they are either in employment or are participating in further education. The majority of our graduates commented that they would recommend the programme they completed to future students.
Employers contacted in the employer survey indicated that they are very satisfied with the job skills Whitireia graduates brought to their businesses and the qualifications graduates obtain are relevant to their industry needs.
Students overall programme satisfaction
20%
0%
40%
60%
80%
100%
Students receiving helpful feedback
on work
Graduates in employment
and/or futher study
Graduates recommend programme of study to others
Meeting the needs of students and graduates
This translated into 79% of students successfully completing their courses and 72% successfully completing their qualifications in 2011.

15
WHITIREIA NEW ZEALAND ANNUAL REPORT 2011
Whitireia ProfileWhitireia provided quality education to a total of 4,589 equivent full-time
students (EFTS) and 7,953 individual students in 2011. Student levels increased in 2011, due in part to growth in international student and Youth Guarantee Scheme student numbers.
Whitireia New Zealand Limited which now accounts for the New Zealand Radio Training School and Whitireia Performing Arts Company Limited, contributed 120 EFTS to the total for 2011.
Whitireia continues to diversify its income streams in response to the Government funding cap.
Source of funding
Whitireia group EFTS profile
Tuition fees 28%
Other fees 19%
Other income 5%
Government grants 48%
Youth Guarantee Scheme students 4%
Student component funding students 63%
Other domestic students 3%
International students 30%

COMMUNITIES THROUGH TERTIARY EDUCATION
LEADING AND
ILLUMINATINGOUR

17
the commercial broadcasing programme has not only given me skills, but has also provided me with the confidence to pursue a career in radio.
MARShAll WoodS // CeRTIfICATe In CoMMeRCIAl BRoAdCASTIng

“Ehara taku toa he taki taki, he toa taki tini. My success should not be bestowed onto me alone, as it is not an individual success but success of a collective. the support from Whitireia has made my learning experience very rewarding. the invaluable skills I have learnt have broadened my future opportunities. the skills taught at Whitireia can be applied to any business environment.”
donnA-MARIA MunRo // BACheloR of APPlIed BuSIneSS STudIeS

“the outdoor adventure programme at Whitireia is fantastic. We get to study in the beauty of New Zealand’s natural environment. the practical side of this programme is great and there is a lot of it!”
hone KIngI // CeRTIfICATe In ouTdooR AdVenTuRe

20
“Whitireia is such an amazing place. It has given me the opportunity to meet awesome people and to gain the skills and knowledge I need to become a successful Māori nurse.”
CouRTney Kenny // BACheloR of nuRSIng MāoRI

21
WHITIREIA NEW ZEALAND ANNUAL REPORT 2011
Objectives and Key Performance IndicatorsKey Performance Indicators for Whitireia Students Whitireia has established objectives 1-3 for the Polytechnic as a whole. These objectives and performance figures apply to all Whitireia students. This includes, international students and other students who are not funded directly by the Tertiary Education Commission (TEC), as well as domestic students, who are funded by TEC through Government Student Achievement Component (SAC) funding.
Whitireia Educational Performance Whitireia has established the following objectives and key performance indicators to measure the Polytechnics performance against its strategic objectives and Government priorities for tertiary education. These objectives are aligned with the Whitireia Community Polytechnic Investment Plan for 2011-2013 which was agreed with TEC in 2010.
TEC has provided provisional 2011 educational performance figures for domestic students enrolled in Institutes of Technology and Polytechnics (ITPs) as at 30 January 2012. TEC’s provisional data has been used in this report where it is available and relevant. Otherwise, the latest Polytechnic information as at 2 March 2012 has been used, including the latest qualification completion rates, which were not finalised at the time of TEC data collection, in January 2012.

22
objective 1Whitireia students successfully complete their coursesPerformance achievement: this objective was achieved. In 2011, Whitireia achieved a course completion rate of 79%. This exceeded the target of 75% of all students to complete courses or papers leading towards a qualification.
In addition, Whitireia course completion rates have increased over the last four years, as the graph below demonstrates.
Factors that contributed to this successful educational performance include excellent teaching staff, student support services and quality management systems. Whitireia also has a polytechnic-wide focus on improving educational performance. For example, the main goal of the Whitireia Strategic Plan and Business Plan is “to improve educational outcomes for students.” To meet this goal, student performance is evaluated at all levels in the organisation, and improvement plans are prepared, implemented and monitored. The Governing Council, Academic Board and faculties annually consider the academic performance of all programmes and implement steps for improvement. If completion rates are below target, action plans are prepared and implemented to improve student performance.
The Polytechnics total programme portfolio changes every year, as some new programmes are introduced and others are no longer offered. If programmes have low student success rates and improvements do not occur, then those programmes are likely to be discontinued. This process has contributed to the steady increase in course completion rates (and also qualification completion rates) in recent years.
The Whitireia focus on student success and quality improvement continued to contribute to student outcomes in 2011.
2008 2009 2010 2011
Increase overall rate of successful course completions
72% 76% 77% 79%
75% 79%
Target:
Achieved:
2008 2009 2010 20110%
20%
40%
60%
80%
100%
Whitireia students successfully complete their courses
23
WHITIREIA NEW ZEALAND ANNUAL REPORT 2011
57%72%
Target:
Achieved:
objective 2 Whitireia students successfully complete their qualificationsPerformance achievement: this objective was achieved. In 2011, Whitireia achieved a qualification completion rate of 72%. This exceeded the target of 57% of all students to complete a qualification and gain a degree, diploma or certificate qualification.
Whitireia students are very successful in completing their qualifications and gaining degrees, diplomas and certificates. In 2010, for example, Whitireia had the highest qualification completion rate in the ITP sector according to published Tertiary Education Commission (TEC) data.
For 2011, Whitireia has already achieved its targets for students to complete their qualifications successfully. This figure is still not finalised, as the Polytechnic has a careful validation and checking process to ensure that students have completed all the requirements for the award of a qualification and this process is still underway for some degrees.
This high rate of success for Whitireia students reflects the organisations focus on improving educational outcomes for students and its quality systems. It also reflects excellent commitment from all teachers to student achievement, strong Polytechnic links with employers and industry and a high level of pastoral care for students.
The Polytechnics total programme portfolio changes every year, as some new programmes are introduced and others are no longer offered. Programme portfolio planning based on educational performance has contributed to the increase in qualification completion rates as shown in the graph on page 24.
Whitireia has implemented a new self-evaluation and quality improvement process throughout the organisation since 2009, with a focus on improving educational outcomes for students. The 2011 results show that success rates for students have indeed increased and the self-evaluation and quality improvement process may have contributed to increasing success for students.
Improved systems for the timely recording of student achievement have also improved reports to TEC, on which the following figures are based.

24
2008 2009 2010 2011
Increase overall qualification completion rate
56% 59% 71% 72%*
Note: results for 2008 -2010 are final. 2011 results are provisional and not yet final.
2008 2009 2010 20110%
20%
40%
60%
80%
100%
Whitireia students successfully complete their qualifications

25
WHITIREIA NEW ZEALAND ANNUAL REPORT 2011
objective 3 Whitireia graduates gain relevant employment or progress to further studyTarget – increase progress of surveyed graduates to employment
Performance achievement: the objective was not achieved. During 2011, 71% of surveyed graduates from 2010 were in paid employment. The target was based on students in paid employment and/or further study. With the inclusion of students engaged in further study, the actual achievement was 86%, which exceeds the target.
Whitireia conducts an annual survey of graduates to assess whether the expectations of graduates have been fulfilled. (Refer to Performance Measures Definitions for more information). Feedback from graduates is analysed and incorporated into plans for improvement to ensure programmes continue to meet or exceed student and employer requirements.
In 2011, as in previous years, a high proportion of graduates gained employment (71% of surveyed graduates) or progressed to further study after they left Whitireia. The proportion of graduates in employment and/or study has remained similar over the last three years.
2008 2009 2010 2011
Increase progress of surveyed graduates to employment
76% 72% 68% 71%
85%71%
Target:
Achieved:
2008 2009 2010 20110%
20%
40%
60%
80%
100%
Whitireia graduates gain relevant employment or progress to further study

26
Key Performance Indicators from the Tertiary education Commission The following key performance indicators have been set by the Tertiary Education Commission (TEC). These student performance indicators apply only to domestic students who are eligible for Government Student Achievement Component (SAC) funding i.e. around 52% of all individual students or 61% of all equivalent full-time students (EFTS) at Whitireia. These figures do not include international students or others who are not funded by TEC through Government SAC funding.
TEC has provided provisional 2011 educational performance figures for domestic students enrolled in Institutes of Technology and Polytechnics (ITPs) as at 30 January 2012. TEC has also provided initial rankings for 20 organisations in the ITP sector. TEC’s provisional data has been used in this report where it is relevant. Otherwise the latest Polytechnic information as at 2 March 2012 has been used, including the latest qualification completion rates which were not finalised at the time of TEC data collection in January 2012.

27
WHITIREIA NEW ZEALAND ANNUAL REPORT 2011
MāoristudyingatLevel4andabove
Participation of Target groups of Students Performance achievement: targets were achieved for the participation of all target groups, except, that a slightly lower (1%) proportion of Pacific and Māori students studied at Levels 1-3 and a slightly higher proportion studied at Level 4 and above. Whitireia regards this shift to higher levels of study as a positive development.
The following indicators measure the participation of target groups of students i.e Māori, Pacific and younger students as a percentage of all domestic students equivalent full-time students (EFTS). They also show whether these students are studying in lower level courses i.e. Levels 1-3 on the National Qualifications Framework (NQF) or higher level course programmes i.e. Levels 4-8 on the NQF.
As shown in the following table and graph, Whitireia has achieved its objectives for diverse groups of domestic students to participate in tertiary education, and also for more students from target student groups to study in higher level programmes at Level 4 and above on the NQF.
Participation of target groups of students (domestic students with SAC EFTS)
Key performance indicator 2011target
2011achievement
Māori studying at Levels 1-3 7% 6%
Māori studying at Level 4 and above 13% 15%
Pacific studying at Levels 1-3 6% 5%
Pacific studying at Level 4 and above 12% 13%
Under 25 studying at Levels 1-3 11% 12%
Under 25 studying at Level 4 and above 26% 34%
The proportion of SAC EFTS enrolled
who are Māori
Levels 1-3 Level 4 and above
10%
0%
20%
30%
40%
The proportion of SAC EFTS enrolled
who are Pacific
The proportion of SAC EFTS enrolled who are under 25
2011 participation
13%15%
Target:
Achieved:
12%13%
Target:
Achieved:
PacificstudyingatLevel4andabove

28
educational Performance of domestic Students Successful course completion Performance achievement: all targets were achieved. 80% of domestic students successfully completed their courses in 2011, and targets were achieved at all levels of study.
These indicators measure the proportion of all domestic students enrolled in 2011 who successfully completed and passed courses or papers leading to a recognised qualification.
Whitireia achieved all targets for domestic students to complete their courses. As the following figures show, course completions were highest for students in programmes at Level 4 and above.
According to provisional TEC data, Whitireia has the fourth highest course completion rate in the ITP sector for 2011. Final TEC data for 2011 is expected in August 2012.
Successful course completion (for domestic students with SAC EFTS)
Key performance indicator 2011target
2011 achievement
Successful course completion rate (overall) 75% 80%
Successful course completion rate Levels 1-3 69% 74%
Successful course completion rate Level 4 and above
76% 81%
75% 80%
Target
Achieved
Successful coursecompletion rate
20%
0%
40%
60%
80%
100%
Successful coursecompletion rate
Levels 1-3
Successful coursecompletion rate
Level 4 and above
Course completion for domestic students with SAC EFTS
Successfulcoursecompletion(overall)

29
WHITIREIA NEW ZEALAND ANNUAL REPORT 2011
Successful qualification completion Performance achievement: all targets were achieved. 70% of domestic students successfully completed their qualifications in 2011, and targets were achieved at all levels of study.
These indicators measure the proportion of all domestic students enrolled in 2011, who successfully completed a recognised qualification such as a degree, diploma or certificate.
Although qualification completion rates have not been fully finalised, the target for domestic students to complete qualifications has already been achieved for 2011. By January this year, 67% of students had successfully completed qualifications. By 1 March, the qualification completion rate was 70% and this could rise a little as more degree awards are finalised.
High qualification completion rates for domestic students reflect high rates of qualification completions for all Whitireia students, as outlined in Objective 2 of this report.
Whitireia has the third highest qualification completion rate in the ITP sector, according to provisional TEC data. Final TEC data for 2011 is expected in August 2012.
Successful qualification completion (for domestic students with SAC EFTS)
Key performance indicator 2011target
2011 achievement
Qualification completion rate (overall) 57% 70%*
Qualification completion rate Levels 1-3 50% 69%*
Qualification completion rate Level 4 and above
60% 70%*
*2011 results are provisional and not yet final
Qualificationcompletion rate
20%
0%
40%
60%
80%
100%
Qualificationcompletion rate
Levels 1-3
Qualificationcompletion rate
Level 4 and above
Qualification completion for domestic students with SAC EFTS
57%70%
Target :
Achieved :
Successfulqualificationcompletion(overall)
*

30
Student retention and progressionPerformance achievement: targets for overall student retention were achieved, with a student retention rate of 64%*.
The student retention rate measures the percentage of individual domestic students enrolled in one year who successfully completed a qualification or re-enrolled at Whitireia in the following year.
An important component of student retention rates is the number of students who successfully completed qualifications in the previous year. An increase in qualification completions at Whitireia, as outlined in Objective 2, has contributed to this higher retention rate in 2011.
Whitireia has the second highest retention rate in the ITP sector, according to provisional TEC data. Final TEC data for 2011 is expected in August 2012.
Student retention and progression (domestic students with SAC EFTS)
Key performance indicator 2011target
2011 achievement
Student retention rate (overall) 50% 64%*
Student progression rate (overall) 35% 30%*
Student progression Levels 1-3 35% 28%*
*2011 results are provisional and not yet final
Student retention rate
20%
0%
40%
60%
80%
100%
Student progression
Student progression Levels 1-3
Student retention and progression for domestic students with SAC EFTS
50% 64%
Target:
Achieved:
Studentrentention(overall)
35%30%
Target:
Achieved:
Studentprogression(overall)
*
*

31
WHITIREIA NEW ZEALAND ANNUAL REPORT 2011
Student progression rates measure the percentage of Whitireia domestic students who completed a qualification in one year and then, within the next 12 months, enrolled in a higher level qualification at the same or different institution.
A possible explanation for not achieving the progression target is that Whitireia has relatively high rates of qualification completion, and these graduates are likely to gain employment. Therefore, graduates do not necessarily re-enrol for study in the following year, as measured by this progression rate.
According to provisional TEC data, Whitireia ranks eighth in the ITP sector for student progression. Final TEC data for 2011 is expected in August 2012.
32
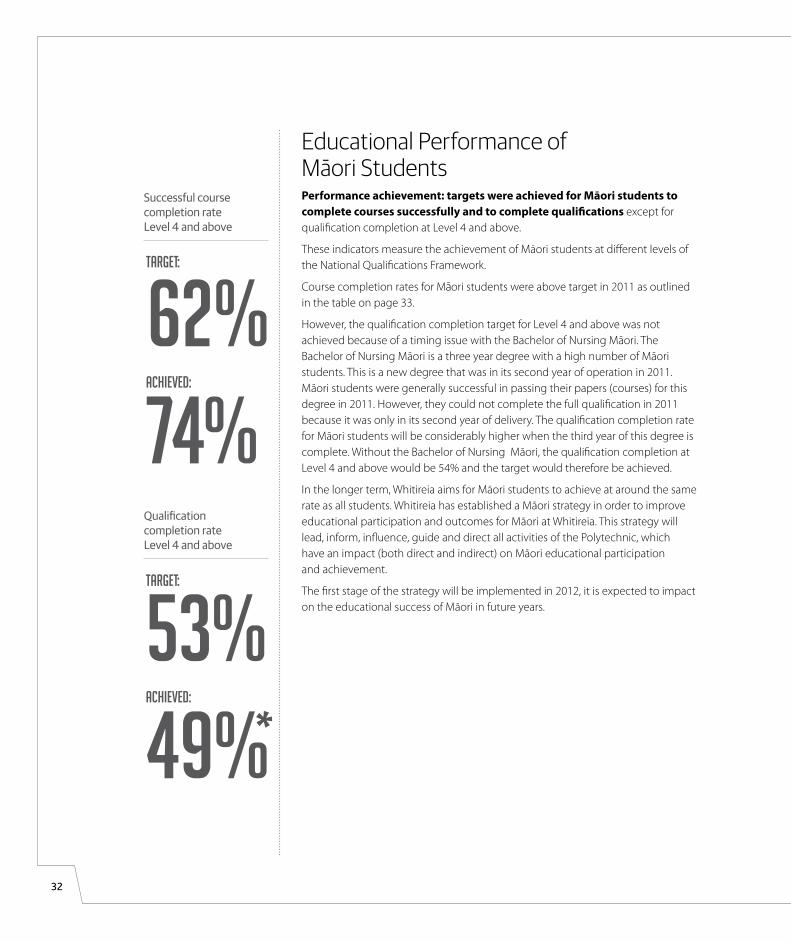
educational Performance of Māori StudentsPerformance achievement: targets were achieved for Māori students to complete courses successfully and to complete qualifications except for qualification completion at Level 4 and above.
These indicators measure the achievement of Māori students at different levels of the National Qualifications Framework.
Course completion rates for Māori students were above target in 2011 as outlined in the table on page 33.
However, the qualification completion target for Level 4 and above was not achieved because of a timing issue with the Bachelor of Nursing Māori. The Bachelor of Nursing Māori is a three year degree with a high number of Māori students. This is a new degree that was in its second year of operation in 2011. Māori students were generally successful in passing their papers (courses) for this degree in 2011. However, they could not complete the full qualification in 2011 because it was only in its second year of delivery. The qualification completion rate for Māori students will be considerably higher when the third year of this degree is complete. Without the Bachelor of Nursing Māori, the qualification completion at Level 4 and above would be 54% and the target would therefore be achieved.
In the longer term, Whitireia aims for Māori students to achieve at around the same rate as all students. Whitireia has established a Māori strategy in order to improve educational participation and outcomes for Māori at Whitireia. This strategy will lead, inform, influence, guide and direct all activities of the Polytechnic, which have an impact (both direct and indirect) on Māori educational participation and achievement.
The first stage of the strategy will be implemented in 2012, it is expected to impact on the educational success of Māori in future years.
62% 74%
Target:
Achieved:
SuccessfulcoursecompletionrateLevel4andabove
53%49%
Target:
Achieved:
QualificationcompletionrateLevel4andabove
*

33
WHITIREIA NEW ZEALAND ANNUAL REPORT 2011
Educational performance of Māori students with SAC EFTS
Key performance indicator 2011target
2011 achievement
Successful course completion rate Levels 1-3 58% 59%
Successful course completion rate Level 4 and above
62% 74%
Qualification completion rate Levels 1-3 41% 52%*
Qualification completion rate Level 4 and above
53% 49%*
*2011 results are provisional and not yet final
Successful coursecompletion rate
Levels 1-3
20%
0%
40%
60%
80%
100%
Successful coursecompletion rate
Level 4 and above
Qualificationcompletion rate
Levels 1-3
Qualificationcompletion rate
Level 4 and above
Educational performance for Māori students with SAC EFTS

34
educational Performance of Pacific Students Performance achievement: all targets were achieved for Pacific students to complete courses and complete qualifications successfully.
These indicators measure the achievement of Pacific students at different levels of the National Qualifications Framework.
All targets were achieved in 2011, Pacific students achieved above target in higher and lower level programmes.
Although Pacific students have achieved at relatively high levels at Whitireia, the Polytechnic aims to improve educational outcomes for Pacific students. A Pacific strategy has been established with four targeted goals:
Goal 1: Improved educational outcomes
Goal 2: Effective learning environment
Goal 3: Foster Pacific identity and leadership
Goal 4: Develop collaborative partnerships
The strategy will be introduced in 2012, it is expected to improve Pacific educational achievement in future years.
Key performance indicator 2011target
2011achievement
Successful course completion rate Levels 1-3 58% 74%
Successful course completion rate Level 4 and above
62% 73%
Qualification completion rate Levels 1-3 41% 69%*
Qualification completion rate Level 4 and above
53% 58%*
*2011 results are provisional and not yet final
62%73%
Target:
Achieved:
SuccessfulcoursecompletionrateLevel4andabove
Successful coursecompletion rate
Levels 1-3
20%
0%
40%
60%
80%
100%
Successful coursecompletion rate
Level 4 and above
Qualificationcompletion rate
Levels 1-3
Qualificationcompletion rate
Level 4 and above
Educational performance of Pacific students with SAC EFTS
53%58%
Target:
Achieved:
QualificationcompletionrateLevel4andabove
*

35
WHITIREIA NEW ZEALAND ANNUAL REPORT 2011
educational Performance of Students under 25 Performance achievement: all targets were achieved for students under 25 years of age to complete courses and complete qualifications successfully.
These indicators measure the achievement of students under 25 years at different levels of the National Qualifications Framework.
All targets were achieved in 2011, young students achieved above target in higher and lower level programmes.
In the longer term, Whitireia aims to further improve educational outcomes for these students. Whitireia has developed a Youth strategy with the following goals:
• Young people aged 16-19 participate in programmes at Whitireia in increasing numbers
• More young people aged under 25 achieve qualifications at Level 4 and above at Whitireia
• Young Māori and Pacific people participate at the same rate as, and achieve as well as, other students
The first stage of this strategy will be introduced in 2012, it is expected to impact on the educational success of students under the age of 25 in future years.
Key performance indicator 2011target
2011achievement
Successful course completion rate Levels 1-3 63% 71%
Successful course completion rate Level 4 and above
73% 78%
Qualification completion rate Levels 1-3 50% 66%*
Qualification completion rate Level 4 and above
48% 58%*
*2011 results are provisional and not yet final
73%78%
Target:
Achieved:
SuccessfulcoursecompletionrateLevel4andabove
Educational performance of students under 25 with SAC EFTS
Successful coursecompletion rate
Levels 1-3
20%
0%
40%
60%
80%
100%
Successful coursecompletion rate
Level 4 and above
Qualificationcompletion rate
Levels 1-3
Qualificationcompletion rate
Level 4 and above
48%58%
Target:
Achieved:
QualificationcompletionrateLevel4andabove
*

36
educational Performance: embedded literacy and numeracyPerformance achievement: the target was achieved. 98% of courses at Levels 1-3 offered embedded literacy and numeracy in 2011.
This indicator measures the teaching of literacy and numeracy as an integral part of teaching in vocational qualifications at Levels 1-3.
Whitireia has had a literacy and numeracy plan for the last five years, and the successful implementation of this plan has led to high rates of embedded literacy and numeracy in Whitireia courses at Levels 1-3.
Key performance indicator 2011target
2011achievement
Proportion of Levels 1-3 courses offered that contain embedded literacy and numeracy
90% 98%
financialKey performance indicator 2011
target2011
achievement
TEO risk rating against the Financial Monitoring Framework
Low Low
% of income from non-government sources 54% 55%
Surplus % 1.9% 4.6%
90%98%
Target:
Achieved:
1.9%4.6%
Target SURPLUS:
Achieved SURPLUS:
EmbeddedliteracyandnumeracyincoursesatLevels1-3

37
WHITIREIA NEW ZEALAND ANNUAL REPORT 2011
1.00%
0%
-1.00%
-2.00%
2.00%
3.00%
4.00%
6.00%
7.00%
2008 – 2011 percentage of surplus
2008 2009 2010 2011
Surplus % -1.1% 3.1% 6.5% 4.6%
The group financial suplus of $2.7 million (4.6% of gross income), for 2011, was derived from the following:
• Group operating surplus $2.6 million
• plus loss on revaluation of Lindale campus $80,000
• less gain on revaluation of Commerce Crescent $5,000
• plus increase in sick leave provision $54,000
• plus increase in lease make-good provision $19,000
• Group surplus excluding non-operating items $2.7 million
Extent of improvements in attributes as per Capital Assets Management Services Improvement Plan
TargetShift to moderate for levels of service attribute
Achieved The original assessment was conducted by a third party on behalf of TEC. At the time of writing this Annual Report no further assessment has been undertaken.
Progress has been made in this area through the following:
• Capital and asset management procedures revised
• Working with service areas to document the services provided and the levels to which they will be provided
• A new campus plan has been developed which identifies how improvements can be made to the student experience
• A Capital Assets Manager has been appointed to oversee the development plan and to further drive the improvement in capital asset management services (CAMS).
38
performance Measures DefinitionsPerformance measures that the Council considers will enable the preparation of a Statement of Service Performance for the purposes of Section 159YD.2 (a) of the Education Act 1989 are listed below.
Students enrolledUsually expressed as equivalent full-time students (EFTS) for the Polytechnic
Students with Student Achievement Component (SAC) fundingStudents recorded in the SDR with funding code “01”
Māori studentsStudents at the time of enrolment who have identified themselves as Māori
Pacific studentsStudents at the time of enrolment who have identified themselves as Pacific
Students under 25 yearsIn successful course completion, students who are aged 24 years or younger as at 1 July 2011 as provided by Tertiary Education Commission (TEC) Workspace.
In qualification completion, students who are aged 24 or younger as at 8 February 2012 when information was extracted from AwareLite. This differs from TEC rules of students who are aged 24 years or younger as at 1 July 2011, due to a system issue of the software provider.
ParticipationThis measures the proportion of EFTS delivered for target groups of students in a calendar year
Participation formulaTotal EFTS delivered for a group of interest (i.e. Māori) in 2011
Total EFTS delivered in 2011
Successful course completion rateSuccessful course completion rate relates to courses, papers or modules that lead to a recognised qualification. The rate is an EFTS weighted metric that takes into account the workload of the course and EFTS delivered during the total period of the course enrolment.
Successful course completion rate formulaEFTS delivered for the total number of successfully completed course enrolments ending in 2011
EFTS delivered for the total number of course enrolments ending in 2011
x 100
x 100

39
WHITIREIA NEW ZEALAND ANNUAL REPORT 2011
Qualification completion rateA qualification is completed when a student successfully completes all the requirements for the award of a qualification, such as a degree, diploma or certificate. The rate is an EFTS weighted metric that takes into account the relative size of the different qualifications. The 2011 qualification completion figures given in this report were those at 2 March 2012. These figures are still provisional and are likely to increase as more awards are validated and recorded. This report also refers to TEC’s provisional figures as at 30 January 2012 where these are available and relevant.
Qualification completion rate formula(Sum of qualification completions in 2011 multiplied by EFTS value of the qualification)
EFTS delivered for the total number of course enrolments ending in 2011
Student retention rateThis measure is based on the proportion of individual students (not EFTS) enrolled in one year who either re-enrol in any course in the following year or successfully complete their qualification.
Student retention rate formulaStudents re-enrolled in 2011 or completed in 2011 or 2010
Students with some portion of an enrolment in 2010
Student progression This measures the progression of students who complete a qualification and move on within 12 months to pursue a qualification at a higher level either at Whitireia or another tertiary education provider in New Zealand. This data is not finalised at present and will be supplied by TEC in July 2012. For Levels 1-3, the indicator measures student re-enrolment at Level 4 or above
Student progression formula:Number of students enrolled at a higher qualification level within 12 months following the qualification completion
Number of students completing a qualification at Levels 1-3 in previous year
x 100
x 100
x 100

40
Levels of study This refers to Levels 1-10 on the National Qualifications Framework (NQF). For more information visit the NZQA website: http://www.nzqa.govt.nz/studying-in-new-zealand/nzqf/nzqf-levels
Percentage of income from non-government sources
FormulaIncome from total non-government sources
Total income received
Surplus percentage
FormulaTotal revenue
Total operational expenses
Graduate satisfaction survey
The survey was carried out over a period of three weeks in May 2011 by phoning all domestic graduates. 49% of the 1,840 domestic graduates participated in this graduate phone survey. Results were entered into a database, analysed and reported back to Deans, Programme Managers, Executive and Whitireia Council.
Embedded literacy and numeracy
Courses in NQF Levels 1-3 that are offered to SAC funded students within programmes at NQF Levels 1-3
FormulaNumber of “Y” LLN flag courses at NQF Levels 1-3 within programmes at NQF Levels 1-3
Total number of courses at NQF Levels 1-3 within programmes at NQF Levels 1-3
x 100
x 100
x 100

WHITIREIA NEW ZEALAND ANNUAL REPORT 2011
The accompanying accounting policies and notes form an integral part of these financial statements
Financial Statements
WHITIREIA NEW ZEALAND ANNUAL REPORT 2011
4141

42
financial Statements
Note Polytechnic Group
Actual Budget Actual Actual Actual2011 2011 2010 2011 2010$'000 $'000 $'000 $'000 $'000
Revenue
Government grants 2 25,862 25,353 26,390 26,458 26,886
Tuition fees 2 25,954 26,348 23,977 26,899 24,939
Interest income 856 450 707 880 726
Revenue from other operating activities 2 5,006 4,798 3,472 4,254 3,619
Change in fair value of investment property 11 5 0 20 5 20
Total revenue 57,683 56,949 54,566 58,496 56,190
Operating expenses
Personnel costs 3 29,950 29,307 27,628 30,460 28,725
Depreciation expenses 9 3,184 3,706 3,198 3,179 3,259
Amortisation expenses 10 276 181 198 276 198
Impairment of held for sale asset 12 80 0 0 80 0
Course related expenses 3,040 3,240 2,751 3,063 2,828
Occupancy costs 4,881 4,553 4,033 4,881 4,354
Project expenditure 5,189 5,896 5,287 5,239 5,425
Trading activities 425 382 357 425 358
Other expenses 4 8,153 7,883 7,341 8,313 7,599
Total operating expenses 55,178 55,148 50,793 55,916 52,746
Surplus before taxation 2,505 1,801 3,773 2,580 3,444
Taxation 19 0 0 0 0 0
Surplus after taxation 2,505 1,801 3,773 2,580 3,444
Statement of Financial Performancefor the year ended 31 December 2011
The accompanying accounting policies and notes form an integral part of these financial statements

43
WHITIREIA NEW ZEALAND ANNUAL REPORT 2011
Statement of Comprehensive Incomefor the year ended 31 December 2011
Statement of Changes in Equityfor the year ended 31 December 2011
Note Polytechnic Group
Actual Budget Actual Actual Actual2011 2011 2010 2011 2010$’000 $’000 $’000 $’000 $’000
Surplus / (deficit) 2,505 1,801 3,773 2,580 3,444
Other comprehensive income
Loss on property revaluations 18 (3,015) (2,620) (3,015) (2,620)
Total other comprehensive income (3,015) 0 (2,620) (3,015) (2,620)
Total comprehensive income (510) 1,801 1,153 (435) 824
Note Polytechnic Group
Actual Budget Actual Actual Actual2011 2011 2010 2011 2010$’000 $’000 $’000 $’000 $’000
Balance at 1 January 64,254 67,899 62,651 63,823 62,549
Comprehensive income
Surplus / (deficit) 2,505 1,801 3,773 2,580 3,444
Other comprehensive income (3,015) 0 (2,620) (3,015) (2,620)
Total comprehensive income (510) 1,801 1,153 (435) 824
Non-comprehensive income items
Capital contributions from the Crown 0 0 450 0 450
Reclassification of reserves from Whitireia Foundation
0 0 0 125 0
Total non-comprehensive income items 0 0 450 125 450
Balance at 31 December 18 63,744 69,700 64,254 63,513 63,823
The accompanying accounting policies and notes form an integral part of these financial statements

44
Note Polytechnic Group
Actual Budget Actual Actual Actual2011 2011 2010 2011 2010$’000 $’000 $’000 $’000 $’000
Assets
Current assetsCash and cash equivalents 5 6,312 3,312 6,541 6,434 7,168
Debtors and other receivables 6 6,726 3,402 3,184 6,729 3,219
Inventories 7 91 97 172 91 172
Prepayments 73 0 0 73 0
Taxation 19 0 0 0 11 0
Loan to controlled entities 23 0 1,067 1,226 0 0
Financial assets in the nature of investments 8 7,000 7,000 11,000 7,339 11,316
Total current assets 20,202 14,878 22,123 20,677 21,875
Non-current assetsFinancial assets in the nature of investments 8 1,356 756 756 10 10
Property, plant and equipment 9 61,411 67,908 55,751 61,376 55,842
Intangible assets 10 538 234 213 1,298 973
Investment properties 11 280 255 275 280 275
Property held for sale 12 1,570 0 1,650 1,570 1,650
Total non-current assets 65,155 69,153 58,645 64,534 58,750
Total assets 85,357 84,031 80,768 85,211 80,625
LiabilitiesCurrent liabilitiesCreditors and other payables 13 3,227 1,919 2,925 3,307 3,021
Special accounts 14 51 0 96 51 216
Revenue received in advance 15 12,128 9,779 10,401 12,128 10,401
Employee entitlements 16 2,951 2,342 2,721 2,988 2,793
Provisions 17 233 0 0 233 0
Loan from controlled entity 23 32 0 0 0 0
Total current liabilities 18,622 14,040 16,143 18,707 16,431
Non-current liabilitiesEmployee entitlements 16 270 291 293 270 293
Provisions 17 2,721 0 78 2,721 78
Total non-current liabilities 2,991 291 371 2,991 371
Total liabilities 21,613 14,331 16,514 21,698 16,802
Net assets 63,744 69,700 64,254 63,513 63,823
EquityGeneral funds 18 45,868 46,189 43,363 45,625 42,919
Property revaluation reserve 18 17,876 23,511 20,891 17,876 20,891
Restricted reserves 18 0 0 0 12 13
Total equity 63,744 69,700 64,254 63,513 63,823
Statement of Financial Positionas at 31 December 2011
The accompanying accounting policies and notes form an integral part of these financial statements

45
WHITIREIA NEW ZEALAND ANNUAL REPORT 2011
Note Polytechnic Group
Actual Budget Actual Actual Actual2011 2011 2010 2011 2010$’000 $’000 $’000 $’000 $’000
Cash flows from operating activities
Receipt of Government grants 25,101 25,353 26,382 25,724 26,878
Receipt of student tuition fees 25,374 26,348 24,363 26,319 25,423
Receipt of other ancilliary income 5,116 4,797 3,492 3,738 3,639
Interest received 930 450 668 954 759
Taxation paid 0 0 0 (11) 0
GST 248 (844) 293 229 242
Payment to employees (29,743) (29,319) (27,042) (30,288) (28,105)
Payments to suppliers (21,303) (21,941) (19,654) (21,536) (20,395)
Net cash flows from operating activities 5,723 4,844 8,502 5,129 8,441
Cash flows from investing activities
Purchase of property, plant and equipment (9,351) (12,100) (2,502) (9,239) (2,590)
Purchase of intangible assets (601) 0 (95) (601) (855)
Purchase of financial assets in the nature of investments
0 0 (6,082) 0 (5,017)
Proceeds from sale of property, plant and equipment
0 0 509 0 509
Sales of financial assets in the nature of investments
4,000 6,057 0 3,977 0
Net cash flows used in investing activities (5,952) (6,043) (8,170) (5,863) (7,953)
Cash flows from financing activities
Capital contribution 0 0 450 0 450
Net cash flows from financing activities 0 0 450 0 450
Net (decrease) / increase in cash and cash equivalents
(229) (1,199) 782 (734) 938
Cash and cash equivalents at the beginning of the period
6,541 4,511 5,759 7,168 6,230
Cash and cash equivalents at the end of the period 5 6,312 3,312 6,541 6,434 7,168
Statement of Cash Flowsfor the year ended 31 December 2011
The GST (net) component of operating activities reflects the net GST paid and received with the Inland Revenue Department. The GST (net) component has been presented on a net basis, as the gross amounts do not provide meaningful information for financial statement purposes, and to be consistent with other primary financial statements.
The accompanying accounting policies and notes form an integral part of these financial statements
46
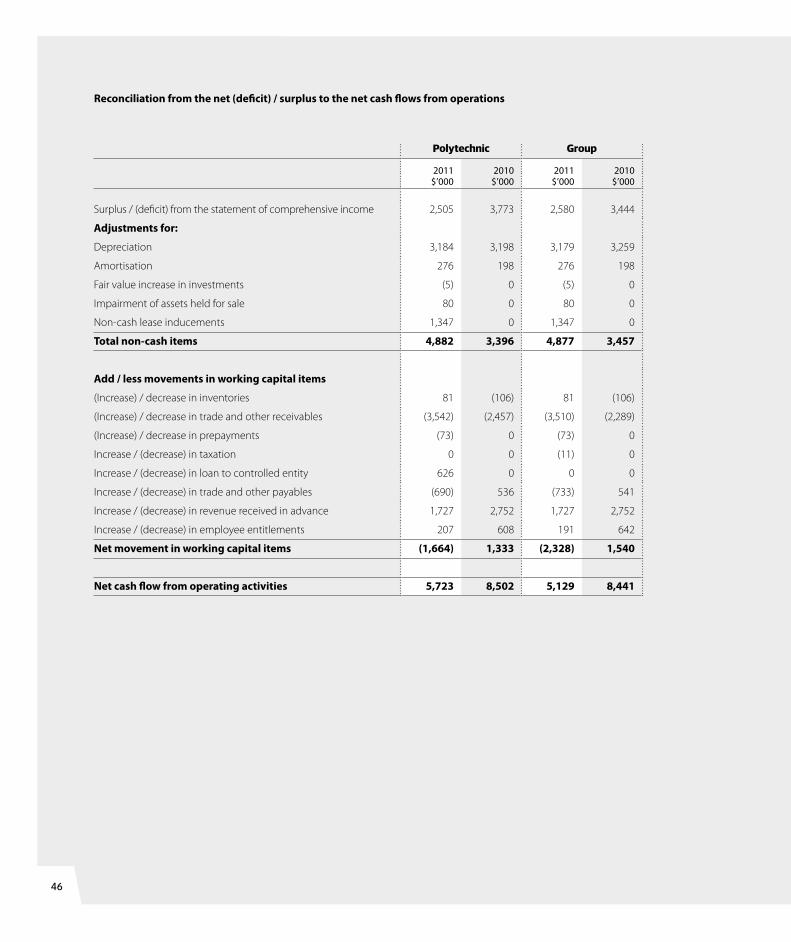
Polytechnic Group
2011 2010 2011 2010$’000 $’000 $’000 $’000
Surplus / (deficit) from the statement of comprehensive income 2,505 3,773 2,580 3,444
Adjustments for:
Depreciation 3,184 3,198 3,179 3,259
Amortisation 276 198 276 198
Fair value increase in investments (5) 0 (5) 0
Impairment of assets held for sale 80 0 80 0
Non-cash lease inducements 1,347 0 1,347 0
Total non-cash items 4,882 3,396 4,877 3,457
Add / less movements in working capital items
(Increase) / decrease in inventories 81 (106) 81 (106)
(Increase) / decrease in trade and other receivables (3,542) (2,457) (3,510) (2,289)
(Increase) / decrease in prepayments (73) 0 (73) 0
Increase / (decrease) in taxation 0 0 (11) 0
Increase / (decrease) in loan to controlled entity 626 0 0 0
Increase / (decrease) in trade and other payables (690) 536 (733) 541
Increase / (decrease) in revenue received in advance 1,727 2,752 1,727 2,752
Increase / (decrease) in employee entitlements 207 608 191 642
Net movement in working capital items (1,664) 1,333 (2,328) 1,540
Net cash flow from operating activities 5,723 8,502 5,129 8,441
Reconciliation from the net (deficit) / surplus to the net cash flows from operations
47
WHITIREIA NEW ZEALAND ANNUAL REPORT 2011
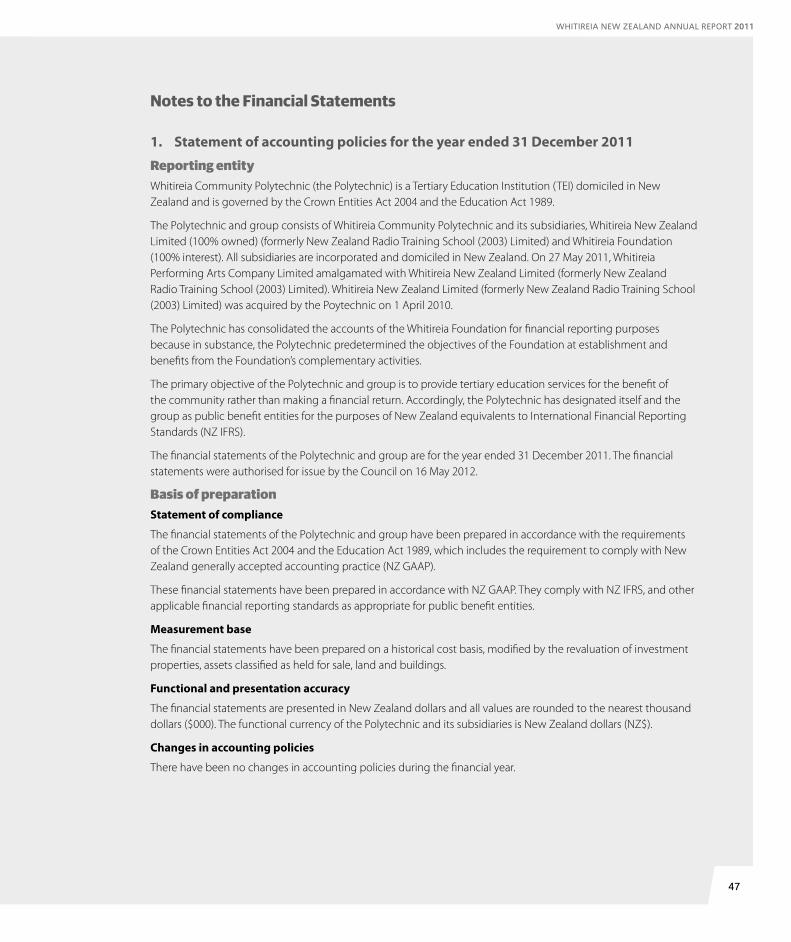
Notes to the Financial Statements
1. Statement of accounting policies for the year ended 31 December 2011
Reporting entityWhitireia Community Polytechnic (the Polytechnic) is a Tertiary Education Institution (TEI) domiciled in New Zealand and is governed by the Crown Entities Act 2004 and the Education Act 1989.
The Polytechnic and group consists of Whitireia Community Polytechnic and its subsidiaries, Whitireia New Zealand Limited (100% owned) (formerly New Zealand Radio Training School (2003) Limited) and Whitireia Foundation (100% interest). All subsidiaries are incorporated and domiciled in New Zealand. On 27 May 2011, Whitireia Performing Arts Company Limited amalgamated with Whitireia New Zealand Limited (formerly New Zealand Radio Training School (2003) Limited). Whitireia New Zealand Limited (formerly New Zealand Radio Training School (2003) Limited) was acquired by the Poytechnic on 1 April 2010.
The Polytechnic has consolidated the accounts of the Whitireia Foundation for financial reporting purposes because in substance, the Polytechnic predetermined the objectives of the Foundation at establishment and benefits from the Foundation’s complementary activities.
The primary objective of the Polytechnic and group is to provide tertiary education services for the benefit of the community rather than making a financial return. Accordingly, the Polytechnic has designated itself and the group as public benefit entities for the purposes of New Zealand equivalents to International Financial Reporting Standards (NZ IFRS).
The financial statements of the Polytechnic and group are for the year ended 31 December 2011. The financial statements were authorised for issue by the Council on 16 May 2012.
basis of preparationStatement of compliance
The financial statements of the Polytechnic and group have been prepared in accordance with the requirements of the Crown Entities Act 2004 and the Education Act 1989, which includes the requirement to comply with New Zealand generally accepted accounting practice (NZ GAAP).
These financial statements have been prepared in accordance with NZ GAAP. They comply with NZ IFRS, and other applicable financial reporting standards as appropriate for public benefit entities.
Measurement base
The financial statements have been prepared on a historical cost basis, modified by the revaluation of investment properties, assets classified as held for sale, land and buildings.
Functional and presentation accuracy
The financial statements are presented in New Zealand dollars and all values are rounded to the nearest thousand dollars ($000). The functional currency of the Polytechnic and its subsidiaries is New Zealand dollars (NZ$).
Changes in accounting policies
There have been no changes in accounting policies during the financial year.

48
New and amended standards adopted by the group
The following amendment to standards is mandatory for the first time for the financial year beginning 1 January 2011.
• NZ IAS 24 Related party disclosures (revised 2009), replaces NZ IAS 24 Related party disclosures (issued 2004). NZ IAS 24 (revised) will be applied for the first time in the Polytechnic and group’s 31 December 2011 financial statements. The revised standard:
• Removes the previous disclosure concessions applied by the Polytechnic for arms-length transactions between the Polytechnic and entities controlled or significantly influenced by the Crown. The effect of the revised standard is more information is required to be disclosed about transactions between the Polytechnic and entities controlled or significantly influenced by the Crown.
• Clarifies that related party transactions include commitments with related parties.
Standards, amendments and interpretations issued that are not yet effective and have not been early adopted
Standards, amendments and interpretations issued that are not yet effective and have not been early adopted, and are relevant to the Polytechnic and group are:
• NZ IFRS 9 Financial Instruments is the first step in the process to replace NZ IAS 39 Financial Instruments: Recognition and Measurement. NZ IFRS 9 uses a single approach to determine whether a financial asset is measured at amortised cost or fair value, replacing the many different rules in NZ IAS 39. The approach in NZ IFRS 9 is based on how an entity manages its financial instruments (its business model) and the contractual cash flow characteristics of the financial assets. The financial liability requirements are the same as those of NZ IAS 39, except for when an entity elects to designate a financial liability at fair value through the surplus/deficit. The new standard is required to be adopted for the year ended 31 December 2014. The Polytechnic and group has not yet assessed the effect of the new standard and expects it will not be early adopted.
• FRS-44 New Zealand Additional Disclosures and Amendments to NZ IFRS to harmonise with IFRS and Australian Accounting Standards (Harmonisation Amendments) – these were issued in May 2011 with the purpose of harmonising Australia and New Zealand’s accounting standards with source IFRS and to eliminate many of the differences between the accounting standards in each jurisdiction. The amendments must first be adopted for the year ended 31 December 2012. The Polytechnic has not yet assessed the effects of FRS-44 and the Harmonisation Amendments.
As the External Reporting Board is to decide on a new accounting standards framework for public benefit entities, it is expected that all new NZ IFRS and amendments to existing NZ IFRS with a mandatory effective date for annual reporting periods commencing on or after 1 January 2012 will not be applicable to public benefit entities. This means that the financial reporting requirements for public benefit entities are expected to be effectively frozen in the short-term. Accordingly, no disclosure has been made about new or amended NZ IFRS that exclude public benefit entities from their scope.

49
WHITIREIA NEW ZEALAND ANNUAL REPORT 2011
Significant accounting policies
Basis of consolidation
The group financial statements are prepared by adding together like items of assets, liabilities, equity, income, expenses and cash flows on a line-by-line basis. All significant intragroup balances, transactions, income and expenses are eliminated on consolidation.
SubsidiariesThe Polytechnic consolidates in the group financial statements all entities where the Polytechnic has the capacity to control the financing and operating policies of an entity so as to obtain benefits from the activities of the entity. This power exists where the Polytechnic controls the majority voting power on the governing body or where such policies have been irreversibly predetermined by the Polytechnic or where the determination of such policies is unable to materially impact the level of potential ownership benefits that arise from the activities of the subsidiary.
Inter-company transactions, balances and unrealised gains on transactions between group entities are eliminated. Unrealised losses are also eliminated. Accounting policies of subsidiaries have been changed where necessary to ensure consistency with the policies adopted by the group.
The cost of a business combination is measured as the aggregate of the fair values, at the date of exchange, of assets given, liabilities incurred or assumed, in exchange for control of the subsidiary plus any costs directly attributable to the business combination excluding transaction costs.
Any excess of the cost of the business combination over the Polytechnics interest in the net fair value of the identifiable assets, liabilities and contingent liabilities is recognised as goodwill. If the Polytechnics interest in the net fair value of the identifiable assets, liabilities and contingent liabilities recognised exceeds the cost of the business combination, the difference will be recognised immediately in the surplus or deficit as a bargain purchase.
Investments in subsidiaries are carried at cost in the Polytechnics parent entity financial statements.
Revenue
Revenue is measured at the fair value of consideration received or receivable.
Government grants and research incomeGovernment grants and research income are recognised as revenue upon entitlement.
Student tuition feesStudent tuition fees are recognised as revenue on a course percentage of completion basis. The percentage of completion is measured by reference to the days of the course completed as a proportion of total course days.
Sale of goodsRevenue from sale of goods is recognised when the product is sold to the customer.
Interest and dividendsInterest income is recognised using the effective interest method.
Dividends are recognised when the right to receive payment has been established.
Leases
Finance leasesA finance lease is a lease that transfers to the lessee substantially all the risks and rewards incidental to ownership of an asset, whether or not title is eventually transferred.

50
At the commencement of the lease term, finance leases are recognised as assets and liabilities in the statement of financial position at the lower of the fair value of the leased item or the present value of the minimum lease payments.
The finance charge is charged to the surplus or deficit over the lease period so as to produce a constant periodic rate of interest on the remaining balance of the liability.
The amount recognised as an asset is depreciated over its useful life. If there is no certainty as to whether the Polytechnic and group will obtain ownership at the end of the lease term, the asset is fully depreciated over the shorter of the lease term and its useful life.
Operating leaseAn operating lease is a lease that does not transfer substantially all the risks and rewards incidental to ownership of an asset. Lease payments net of lease inducements under an operating lease are recognised as an expense on a straight-line basis over the lease term.
Cash and cash equivalents
Cash and cash equivalents includes cash on hand, deposits held at call with banks other short-term highly liquid investments with original maturities of three months or less.
Debtors and other receivables
Short-term debtors and other short-term receivables are recorded at fair value less any provision for impairment.
Foreign currency transactions
Foreign currency transactions are translated into NZ$ (the functional currency) using the exchange rates prevailing at the dates of the transactions. Foreign exchange gains and losses resulting from the settlement of such transactions and from the translation at year end of monetary assets and liabilities denominated in foreign currencies are recognised in the surplus or deficit.
Other financial assets
Financial assets are initially recognised at fair value plus transaction costs unless they are carried at fair value through surplus or deficit in which case the transaction costs are recognised in the surplus or deficit.
Financial assets are de-recognised when the rights to receive cash flows from the financial assets have expired or have been transferred and the Polytechnic and group has transferred substantially all the risks and rewards of ownership.
Financial assets are classified, for the purposes of measurement, as loans and other receivables. Classification of the financial asset depends on the purpose for which the instruments were acquired.
Loans and receivables are non-derivative financial assets with fixed or determinable payments that are not quoted in an active market. They are included in current assets, except for maturities greater than 12 months after the balance date, which are included in non-current assets. Related party receivables that are repayable on demand are classified as a non-current asset because repayment of the receivable is not expected within 12 months of the balance date.
After initial recognition loans and receivables are measured at amortised cost using the effective interest method less any provision for impairment. Gains and losses when the asset is impaired or de-recognised are recognised in the surplus or deficit.

51
WHITIREIA NEW ZEALAND ANNUAL REPORT 2011
Impairment of financial assets
At each balance date, the Polytechnic and group assesses whether there is any objective evidence that a financial asset or group of assets is impaired. Any impairment losses are recognised in surplus or deficit.
Loans and receivables (including cash and cash equivalents and debtors and other receivables)Impairment of a loan or a receivable is established when there is objective evidence that the Polytechnic and group will not be able to collect amounts due according to the original terms of the debt. Significant financial difficulties of the debtor, probability that the debtor will enter into bankruptcy and the default in payments are considered indicators that the asset is impaired. The amount of the impairment is the difference between the asset’s carrying amount and the present value of estimated future cash flows, discounted using the original effective interest rate. For debtors and other receivables, the carrying amount of the asset is reduced through the use of an allowance account, and the amount of the loss is recognised in the surplus or deficit. When the receivable is uncollectible, it is written-off against the allowance account. Overdue receivables that have been renegotiated are reclassified as current (i.e. not past due). For other financial assets, impairment losses are recognised directly against the instruments carrying amount.
Inventories
Inventories held for distribution or consumption in the provision of services that are not supplied in a commercial basis are measured at cost (using the FIFO method), adjusted when applicable, for any loss of service potential. Where inventories are acquired at no cost or for nominal consideration, the cost is the current replacement cost at the date of acquisition.
The amount of any write-down for the loss of service potential or from cost to net realisable value is recognised in the surplus or deficit in the period of the write-down.
Property, plant and equipment
Property, plant and equipment consists of the following asset classes land, buildings, plant and machinery, motor vehicles, computer hardware, furniture and fittings and artwork, library collection, office equipment, teaching equipment, leasehold improvements, communication systems and signage.
Land is measured at fair value and buildings are measured at fair value less accumulated depreciation and impairment losses. All other asset classes are measured at cost or valuation, less any accumulated depreciation and impairment losses.
RevaluationsLand and buildings are revalued with sufficient regularity to ensure that the carrying amount does not differ materially from fair value at least every two years.
The carrying values of revalued assets are assessed bi-annually by independent valuers to ensure that they do not differ materially from fair value. If there is evidence supporting a material difference, then the off-cycle asset classes are revalued.
Land and buildings revaluation movements are accounted for on a class of asset basis.
The net revaluation results are credited or debited to other comprehensive income and is accumulated to an asset revaluation reserve in equity for that class of asset. Where this would result in a debit balance in the asset revaluation reserve, this balance is not recognised in other comprehensive income but is recognised in the surplus or deficit. Any subsequent increase on revaluation that reverses a previous decrease in value recognised in the surplus or deficit will be recognised first in the surplus or deficit up to the amount previously expensed, and then recognised in other comprehensive income.

52
AdditionsThe cost of an item of property, plant and equipment is recognised as an asset if, and only if, it is probable that future economic benefits or service potential associated with the item will flow to the Polytechnic and group and the cost of the item can be measured reliably.
Work in progress is recognised at cost less impairment and is not depreciated.
In most instances, an item of property, plant and equipment is initially recognised at its cost. Where an asset is acquired at no cost, or for a nominal cost, it is recognised at fair value as at the date of acquisition.
DisposalsGains and losses on disposals are determined by comparing the disposal proceeds with the carrying amount of the asset. Gains and losses on disposals are reported net in the surplus or deficit.
When revalued assests land and buildings are sold, the amounts included in property revaluation reserves in respect of those land and building assets are transferred to general funds.
DepreciationDepreciation is provided on a straight-line basis on all property, plant and equipment other than land and work in progress at rates that will write off the cost, (or valuation) of the assets to their residual values over their useful lives.
The useful lives and associated depreciation rates of major classes of assets have been estimated as follows:
Asset class Life Rate
Buildings 10 - 50 years 2% - 10% per annum
Plant and machinery 8 - 10 years 10% - 12.5% per annum
Motor vehicles 5 years 20% per annum
Computer hardware 5 years (2010: 4 years) 20% (2010: 25%) per annum
Furniture and fittings 10 years 10% per annum
Library collection 5 - 8 years 12.5% per annum
Office equipment 5 years 20% per annum
Teaching equipment 5 years 20% per annum
Leasehold improvements 1 - 12 years 8% - 100% per annum
Communication systems 4 years (2010: 5 years) 25% (2010: 20%) per annum
Signage 4 years 25% per annum
Leasehold improvements are depreciated over the unexpired period of the lease or the estimated useful lives of the improvements, whichever is the shorter. The unexpired period of the lease includes any rights of renewal where management considers it reasonably certain that these rights be exercised.
The residual value and useful life of an asset is reviewed and adjusted if applicable, at each financial year end.

53
WHITIREIA NEW ZEALAND ANNUAL REPORT 2011
Intangible assets
Software acquisition and developmentAcquired computer software licenses are capitalised on the basis of the costs incurred to acquire and bring to use to specific software.
Costs that are directly associated with the development of software for internal use, are recognised as an intangible asset. Direct costs include the software development employee costs and an appropriate portion of relevant overheads.
Staff training costs are recognised as an expense when incurred.
Costs associated with maintaining computer software are recognised as an expense when incurred.
Course development costsCourse development costs relate to development of educational courses and are capitalised if purchased wholly from other institutes of learning. No courses have been purchased as such, at balance date.
AmortisationThe carrying value of an intangible asset with a finite life is amortised on a straight-line basis over its useful life. Amortisation begins when the asset is available for use and ceases at the date that the asset is de-recognised. The amortisation charge for each period is recognised in the surplus or deficit.
The useful lives and associated amortisation rates of major classes of intangible assets have been estimated as follows:
Asset Class Life Rate
Computer software 3 years (2010: 5 years) 33% (2010: 20%) per annum
The amortisation period and amortisation method for each class of intangible asset having a finite life is reviewed at each financial year end. If the expected useful life or expected pattern of consumption is different from the previous assessment, changes are made accordingly.
Gains or losses arising from de-recognition of an intangible asset are measured as the difference between the net disposal proceeds and the carrying amount of the asset and are recognised in the surplus or deficit when the asset is de-recognised.
Impairment of property, plant and equipment and intangible assets
Intangible assets that have an indefinite useful life, or not yet available for use, are not subject to amortisation and are tested annually for impairment. Assets that have a finite useful life are reviewed for indicators of impairment at each balance date. When there is an indicator of impairment the asset’s recoverable amount is estimated. An impairment loss is recognised for the amount by which the asset’s carrying amount exceeds its recoverable amount. The recoverable amount is the higher of an asset’s fair value less costs to sell and value in use.
Value in use is depreciated replacement cost for an asset where the future economic benefits and service potential are not primarily dependent on the asset’s ability to generate net cash inflows and where the Polytechnic and group would, if deprived of the asset, replace its remaining future economic benefits or service potential.
The value in use for cash-generating assets is the present value of expected future cash flows.

54
If an asset’s carrying amount exceeds its recoverable amount, the asset is impaired and the carrying amount is written-down to the recoverable amount. For revalued assets the impairment loss is recognised in other comprehensive income to the extent the impairment loss does not exceed the amount in the revaluation reserve in equity for that same class of asset. Where that results in a debit balance in the revaluation reserve, the balance is recognised in the surplus or deficit.
For assets not carried at a revalued amount, the total impairment loss is recognised in the surplus or deficit.
The reversal of an impairment loss on a revalued asset is credited to other comprehensive income and increases the asset revaluation reserve for that class of asset. However, to the extent that an impairment loss for that class of asset was previously recognised in the surplus or deficit, a reversal of the impairment loss is also recognised in the surplus or deficit.
For assets not carried at a revalued amount the reversal of an impairment loss is recognised in the surplus or deficit.
Investment properties
Properties held for sale or leased to third parties under operating leases are classified as investment property unless the property is held to meet service delivery objectives, rather than to earn rentals or for capital appreciation. Property held to meet service delivery objectives is classified as property, plant and equipment.
Investment property is measured initially at its cost, including transaction cost.
Subsequent to initial recognition, investment properties is measured at fair value as determined annually by an independent valuer.
Gains and losses arising from a change in the fair value of investment properties are recognised in the surplus or deficit.
Creditors and other payables
Creditors and other payables are initially measured at fair value and subsequently measured at amortised cost using the effective interest method.
Employee entitlements
Short-term employee entitlementsEmployee benefits that are due and settled within 12 months after the end of the period in which the employee renders the related service are measured at nominal values based on accrued entitlements at current rates of pay.
These include salaries and wages and annual leave earned but not yet taken at balance date and sick leave.
A liability for sick leave is recognised to the extent that absences in the coming year are expected to be greater than the sick leave entitlements earned in the coming year. The amount is calculated based on the unused sick leave entitlement that can be carried forward at balance date, to the extent it will be used by staff to cover those future absences.

55
WHITIREIA NEW ZEALAND ANNUAL REPORT 2011
Long-term employee entitlementsEmployee benefits that are due to be settled beyond 12 months after the end of period in which the employee renders the related service, such as long service leave and retirement gratuities, have been calculated on an actuarial basis. The calculations are based on:
• Likely future entitlements accruing to staff, based on years of service, years to entitlement, the likelihood that staff will reach the point of entitlement and contractual entitlement information, and
• The present value of the estimated future cash flows.
Expected future payments are discounted using market yields on Government Bonds at balance date with terms to maturity that match, as closely as possible, the estimated future cash outflows for entitlements. The inflation factor is based on the expected long-term increase in remuneration for employees.
Presentation of employee entitlementsSick leave, annual leave, vested long service leave, and non-vested long service leave and retirement gratuities expected to be settled within 12 months of the balance date, are classified as a current liability. All other employee entitlements are classified as a non-current liability.
Superannuation schemes
Defined contribution schemesObligations for contributions to KiwiSaver and the Government Superannuation Fund are accounted for as defined contribution schemes recognised as an expense in the surplus or deficit as incurred.
Provisions
A provision is recognised for future expenditure of uncertain amount or timing when there is a present obligation (either legal or constructive) as a result of a past event, it is probable that expenditures will be required to settle the obligation and a reliable estimate can be made of the amount of the obligation.
Provisions are measured at the present value of the expenditures expected to be required to settle the obligation using a pre-tax discount rate that reflects current market assessments of the time value of money and the risks specific to the obligation. The increase in the provision due to the passage of time is recognised as an interest expense and is included as “finance costs”.
Equity
Equity is measured as the difference between total assets and total liabilities. Equity is dis-aggregated and classified into a number of components. The components of equity are:
• General funds;
• Property revaluation reserves;
• Fair value through comprehensive income reserves; and
• Restricted reserves.
Restricted reservesRestricted reserves are a component of equity generally representing a particular use to which various parts of equity have been assigned. Reserves may be legally restricted or created by the Polytechnic. Transfers from these reserves may be made only for certain specified purposes or when certain specified conditions are met.
Property revaluation reservesThis reserve relates to the revaluation of property, plant and equipment to fair value.

56
Goods and Services Tax (GST)
All items in the financial statements are stated exclusive of GST, except for debtors and other receivables and creditors and other payables, which are presented on a GST inclusive basis. Where GST is not recoverable as input tax then it is recognised as part of the related asset or expense.
The net amount of GST recoverable from, or payable to, the Inland Revenue Department (IRD) is included as part of receivables or payables in the statement of financial position.
The net GST paid to, or received from, the IRD, including GST relating to investing and financing activities, is classified as net operating cash flow in the statement of cash flows.
Commitments and contingencies are disclosed exclusive of GST.
Income Tax
Whitireia Community Polytechnic is exempt from income tax, pursuant to section 55BA of the Income Tax Act 2007. Whitireia Foundation is exempt from income tax, pursuant to sections CW 41 and 42 of the Income Tax Act 2007. However, Whitireia New Zealand Limited does not qualify for any exemption from income tax.
The tax expense for the period comprises current and deferred tax. Tax is recognised in the income statement, except to the extent that it relates to items recognised in other comprehensive income or directly in equity. In this case, the tax is also recognised in other comprehensive income or directly in equity, respectively.
The current income tax charge is calculated on the basis of the tax laws enacted or substantively enacted at the balance date where operations result in generating taxable income. Management periodically evaluates positions taken in tax returns with respect to situations in which applicable tax regulation is subject to interpretation. It establishes provisions where appropriate on the basis of amounts expected to be paid to the tax authorities.
Deferred income tax is recognised, using the liability method, on temporary differences arising between the tax bases of assets and liabilities and their carrying amounts in the consolidated financial statements. However, deferred tax liabilities are not recognised if they arise from the initial recognition of goodwill; deferred income tax is not accounted for if it arises from initial recognition of an asset or liability in a transaction other than a business combination that at the time of the transaction affects neither accounting nor taxable profit or loss. Deferred income tax is determined using tax rates (and laws) that have been enacted or substantially enacted by balance sheet date and are expected to apply when the related deferred income tax asset is realised or the deferred income tax liability is settled.
Budget figures
The budget figures are those that are approved by the Council at the start of the financial year. The budget figures have been prepared in accordance with NZ GAAP, using accounting policies that are consistent with those adopted by the Council in the preparation of the financial statements.
Comparative balances
Sundry expenses, equipment lease costs, motor vehicle expenses, bank charges, export education levy, postage, immigration visa fees, international contacts activities and consumables have been separately disclosed in the current year. As a result, comparative balances relating to sundry expenses, equipment lease costs, motor vehicle expenses, bank charges, export education levy, postage, immigration visa fees, international contacts activities and consumables have been reclassified to align with current year classifications. The net effect on the statement of financial performance is nil as the adjustment was to shift $602,000 from other operating expenses to sundry expenses, equipment lease costs, motor vehicle expenses, bank charges, export education levy, postage, immigration visa fees, international contacts activities, consumables for the Polytechnic and $592,000 from other

57
WHITIREIA NEW ZEALAND ANNUAL REPORT 2011
operating expenses to sundry expenses, equipment lease costs, motor vehicle expenses, bank charges, export education levy, postage, immigration visa fees, international contacts activities and consumables for the group (Refer note 4).
Change in fair value of investment properties has been separately disclosed in the current year. As a result, comparative balances relating to change in fair value of investment property have been reclassified to align with current year classifications. The net effect on the statement of financial performance is nil as the adjustment was to shift $20,000 from revenue from other operating activities to change in fair value of investment properties.
Critical accounting estimates and assumptions
In preparing these financial statements the group has made estimates and assumptions concerning the future. These estimates and assumptions may differ from the subsequent actual results. Estimates and assumptions are continually evaluated and are based on historical experience and other factors, including expectations of future events that are believed to be reasonable under the circumstances. The estimates and assumptions that have a significant risk of causing a material adjustment to the carrying amounts of assets and liabilities within the next financial year are discussed below:
Property revaluationsNote 9 provides information about the estimates and assumptions exercised in the measurement of revalued land and buildings.
Estimated impairment of goodwillThe group tests annually whether goodwill has suffered any impairment, in accordance with the stated accounting policy. The recoverable amounts of cash-generating units have been determined based on value-in-use calculations. These calculations require the use of estimates (Refer note 10).
Critical judgements in applying accounting policies
Management have exercised the following critical judgements in applying accounting policies for the year ended 31 December 2011:
Crown owned land and buildingsProperty in the legal name of the Crown that is occupied by the Polytechnic and group is recognised as an asset in the statement of financial position. The Polytechnic and group consider it has assumed all the normal risks and rewards of ownership of this property despite legal ownership not being transferred and accordingly it would be misleading to exclude these assets from the financial statements.
Distinction between revenue and capital contributionsMost Crown funding received is operational in nature and is provided by the Crown under the authority of an expense appropriation and is recognised as revenue. Where funding is received from the Crown under the authority of a capital appropriation, the Polytechnic and group accounts for the funding as a capital contribution directly in equity. Information about capital contributions recognised in equity is disclosed in note 18.
Breach of statutory deadline
The Crown Entities Act requires the audit of the Annual Report to be completed within four months after the financial year end. This requirement was not achieved due to delays in finalising the annual financial statements.

58
2. IncomePolytechnic Group
2011 2010 2011 2010$’000 $’000 $’000 $’000
i. Government grants
Student achievement component (SAC) funding 19,512 18,010 20,108 18,506
Tertiary Education Organisation Capability (TEOC) funding 5,223 6,261 5,223 6,261
Performance-based research funding 73 143 73 143
Other grants 1,054 1,976 1,054 1,976
Total government grants 25,862 26,390 26,458 26,886
ii. Tuition feesPolytechnic Group
2011 2010 2011 2010$’000 $’000 $’000 $’000
Fees from domestic students 11,044 10,276 11,989 11,239
Fees from international students 14,910 13,701 14,910 13,700
Total tuition fees 25,954 23,977 26,899 24,939
iii. Other incomePolytechnic Group
2011 2010 2011 2010$’000 $’000 $’000 $’000
Rental income 113 121 113 89
Donations received 0 0 48 38
Bookshop income 382 367 382 367
Education service contracts 3,069 1,625 2,253 1,841
Gain on sale of property, plant and equipment 1 0 3 0
Other income 1,441 1,359 1,455 1,284
Total other income 5,006 3,472 4,254 3,619
3. Personnel CostsPolytechnic Group
2011 2010 2011 2010$’000 $’000 $’000 $’000
Academic salaries 16,119 14,119 16,284 14,795
General salaries and wages 13,576 12,679 13,955 13,093
Defined contribution plan employer contributions 48 68 49 70
Increase / (decrease) in employee entitlements 207 762 172 767
Total personnel costs 29,950 27,628 30,460 28,725
Employer contributions to defined contribution plans include contributions to KiwiSaver and the Government Superannuation Fund.

59
WHITIREIA NEW ZEALAND ANNUAL REPORT 2011
4. Other ExpensesPolytechnic Group
2011 2010 2011 2010$’000 $’000 $’000 $’000
Fees to principal auditor:
- audit fees for financial statement audit 95 85 130 136
- audit fees for prior year 0 12 0 12
Advertising and public relations 799 704 820 740
Bad debts expensed 221 95 221 95
Bank charges 83 74 84 76
Catering 204 200 210 202
Commissions 2,246 2,013 2,246 2,013
Consultants and legal fees 448 336 452 344
Consumables 53 47 53 50
Councillors fees 146 105 146 105
Equipment lease 172 0 172 0
Export education levy 63 58 63 58
Fees and subscriptions 242 266 245 268
Graduation costs 126 125 132 131
Immigration visa fees 59 38 59 38
Information technology 1,088 980 1,103 994
Insurance premiums 180 174 183 177
Interest paid 2 0 3 0
International contacts activities 57 85 57 85
Motor vehicle expenses 85 37 96 53
New Zealand Qualifications Authority 0 82 0 0
Office costs 367 462 392 501
Postage 63 57 67 61
Professional development fees 152 163 153 164
Repairs and maintenance - information technology 62 47 62 47
Staff awards 0 12 0 12
Sundry expenses 195 165 203 171
Travel and accomodation 677 577 691 594
Whitireia scholarships 103 137 103 137
Other operating expenses 165 205 167 335
Total other expenses 8,153 7,341 8,313 7,599
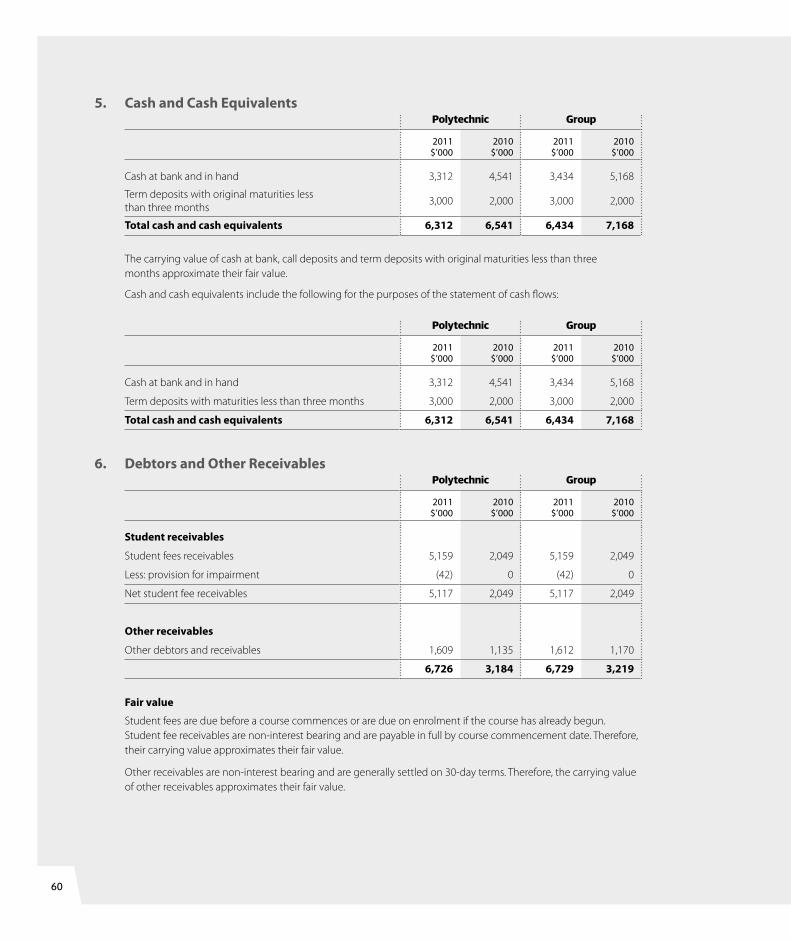
60
5. Cash and Cash EquivalentsPolytechnic Group
2011 2010 2011 2010$’000 $’000 $’000 $’000
Cash at bank and in hand 3,312 4,541 3,434 5,168
Term deposits with original maturities less than three months
3,000 2,000 3,000 2,000
Total cash and cash equivalents 6,312 6,541 6,434 7,168
The carrying value of cash at bank, call deposits and term deposits with original maturities less than three months approximate their fair value.
Cash and cash equivalents include the following for the purposes of the statement of cash flows:
Polytechnic Group
2011 2010 2011 2010$’000 $’000 $’000 $’000
Cash at bank and in hand 3,312 4,541 3,434 5,168
Term deposits with maturities less than three months 3,000 2,000 3,000 2,000
Total cash and cash equivalents 6,312 6,541 6,434 7,168
6. Debtors and Other ReceivablesPolytechnic Group
2011 2010 2011 2010$’000 $’000 $’000 $’000
Student receivables
Student fees receivables 5,159 2,049 5,159 2,049
Less: provision for impairment (42) 0 (42) 0
Net student fee receivables 5,117 2,049 5,117 2,049
Other receivables
Other debtors and receivables 1,609 1,135 1,612 1,170
6,726 3,184 6,729 3,219
Fair value
Student fees are due before a course commences or are due on enrolment if the course has already begun. Student fee receivables are non-interest bearing and are payable in full by course commencement date. Therefore, their carrying value approximates their fair value.
Other receivables are non-interest bearing and are generally settled on 30-day terms. Therefore, the carrying value of other receivables approximates their fair value.

61
WHITIREIA NEW ZEALAND ANNUAL REPORT 2011
7. InventoriesPolytechnic Group
2011 2010 2011 2010$’000 $’000 $’000 $’000
Held for resale 86 167 86 167
Materials and consumables 5 5 5 5
Total inventories 91 172 91 172
ImpairmentThe ageing profile of student fee receivables at year end is detailed below:
Polytechnic Group
Gross Impairment Net Gross Impairment Net$’000 $’000 $’000 $’000 $’000 $’000
2011
Not past due 2,152 0 2,152 2,152 0 2,152
Past due 1 – 30 days 285 0 285 285 0 285
Past due 31 – 60 days 54 0 54 54 0 54
Past due 61 – 90 days 108 42 66 108 42 66
Past due over 90 days 2,560 0 2,560 2,560 0 2,560
Total 5,159 42 5,117 5,159 42 5,117
Due to large number of student fee receivables, the impairment assessment is performed on a collective basis, based upon an analysis of past collection history and debt write-offs. Due to this information being included for the first time in these financial statements, comparative amounts are not available.
Movements in the provision for impairment of student fee receivables are as follows:
Polytechnic Group
2011 2010 2011 2010$’000 $’000 $’000 $’000
At 1 January 0 0 0 0
Additional provisions made during the year 42 0 42 0
At 31 December 42 0 42 0

62
8. Financial Assets in the Nature of InvestmentsPolytechnic Group
2011 2010 2011 2010$’000 $’000 $’000 $’000
Effective interest
rate % MaturityCurrent
Deposits with banks
Westpac 4.3% Various 3,000 0 3,000 0
ASB - Foundation 4.5% 2-Oct-12 0 0 339 316
Bank of New Zealand 4.9% Various 4,000 7,000 4,000 7,000
Kiwibank 5.0% Various 0 4,000 0 4,000
7,000 11,000 7,339 11,316
Non-current
Investment in controlled entity (at cost) 1,346 746 0 0
Shares in unlisted entities (at cost) 10 10 10 10
1,356 756 10 10
The deposit with banks classified as current assets are those with original maturing periods of greater than three months and less than twelve months.
The investment in controlled entity is for Whitireia New Zealand Limited (100% owned).
On 27 May 2011, Whitireia Performing Arts Company Limited amalgamated with Whitireia New Zealand Limited through a short form amalgamation pursuant to section 222 of the Companies Act (1993). The primary purpose of the amalgamation was to simplify the Whitireia Community Polytechnics group structure.

63
WHITIREIA NEW ZEALAND ANNUAL REPORT 2011
9.Pr
oper
ty, P
lant
and
Equ
ipm
ent
Land
&
build
ings
Com
pute
r ha
rdw
are
Furn
itur
e,
fitti
ngs
& a
rtw
ork
Libr
ary
colle
ctio
nPl
ant &
m
achi
nery
Mot
or
vehi
cles
Offi
ce
equi
pmen
tTe
achi
ng
equi
pmen
t
Leas
ehol
d im
prov
e-m
ents
Com
mun
i-ca
tion
sy
stem
sSi
gnag
eW
ork
in
prog
ress
Tota
l po
lyte
chni
c
$’00
0$’
000
$’00
0$’
000
$’00
0$’
000
$’00
0$’
000
$’00
0$’
000
$’00
0$’
000
$’00
0
Poly
tech
nic
Cost
/ v
alua
tion
Cost
/ v
alua
tion
at
1 Ja
nuar
y 20
1151
,488
5,12
51,
825
2,24
474
768
438
72,
036
1,96
370
014
047
367
,812
Add
ition
s du
ring
the
year
192
681
482
160
237
4012
239
44,
555
110
5,06
011
,934
Dis
posa
ls d
urin
g th
e ye
ar0
(110
)0
0(1
)0
(2)
0(3
)0
0(2
0)(1
36)
Reva
luat
ions
(5,4
31)
00
00
00
00
00
0(5
,431
)
Tran
sfer
s(6
32)
112
00
00
(108
)10
886
50
0(3
45)
0
Cost
/ va
luat
ion
at
31 D
ecem
ber 2
011
45,6
175,
808
2,30
72,
404
983
724
399
2,53
87,
380
711
140
5,16
874
,179
Acc
umul
ated
dep
reci
atio
n
Acc
umul
ated
dep
reci
atio
n at
1
Janu
ary
2011
(1,2
02)
(3,4
35)
(1,1
90)
(1,3
93)
(521
)(5
00)
(339
)(1
,436
)(1
,302
)(6
11)
(132
)0
(12,
061)
Curr
ent y
ear d
epre
ciat
ion
(1,1
63)
(754
)(1
44)
(225
)(6
6)(8
1)(2
5)(2
80)
(390
)(4
8)(8
)0
(3,1
84)
Dis
posa
ls d
urin
g th
e ye
ar0
104
00
00
00
00
00
104
Reva
luat
ions
2,41
60
00
00
00
00
00
2,41
6
Tran
sfer
s(5
1)0
340
40
00
(29)
(1)
00
(43)
Acc
umul
ated
dep
reci
atio
n at
31
Dec
embe
r 201
10
(4,0
85)
(1,3
00)
(1,6
18)
(583
)(5
81)
(364
)(1
,716
)(1
,721
)(6
60)
(140
)0
(12,
768)
00
0
Net
boo
k va
lue
45,6
171,
723
1,00
778
640
014
335
822
5,65
951
05,
168
61,4
11

64 9.Pr
oper
ty, P
lant
and
Equ
ipm
ent
Land
&
build
ings
Com
pute
r ha
rdw
are
Furn
itur
e,
fitti
ngs
& a
rtw
ork
Libr
ary
colle
ctio
nPl
ant &
m
achi
nery
Mot
or
vehi
cles
Offi
ce
equi
pmen
tTe
achi
ng
equi
pmen
t
Leas
ehol
d im
prov
e-m
ents
Com
mun
i-ca
tion
sy
stem
sSi
gnag
eW
ork
in
prog
ress
Tota
l po
lyte
chni
c
$’00
0$’
000
$’00
0$’
000
$’00
0$’
000
$’00
0$’
000
$’00
0$’
000
$’00
0$’
000
$’00
0
Poly
tech
nic
Cost
/ v
alua
tion
Cost
/ v
alua
tion
at
1 Ja
nuar
y 20
1053
,747
5,86
81,
343
1,92
865
955
424
11,
982
3,15
578
915
76
70,4
29
Add
ition
s du
ring
the
year
794
525
128
226
7676
063
022
047
32,
383
Dis
posa
ls d
urin
g th
e ye
ar(5
10)
(1,0
63)
00
00
00
00
00
(1,5
73)
Reva
luat
ions
(823
)0
00
00
00
(1,1
80)
00
0(2
,003
)
Recl
assi
ficat
ions
(1,7
20)
(408
)30
15
3553
145
(9)
(18)
(115
)(2
1)0
(1,7
52)
Writ
e-do
wn
00
00
(23)
00
00
00
(6)
(29)
Writ
e-up
020
353
850
11
06
44
035
7
Cost
/ Va
luat
ion
at 3
1 D
ecem
ber 2
010
51,4
885,
125
1,82
52,
244
747
684
387
2,03
61,
963
700
140
473
67,8
12
Acc
umul
ated
dep
reci
atio
n
Acc
umul
ated
Dep
reci
atio
n at
1
Janu
ary
2010
0(4
,161
)(8
61)
(1,1
82)
(354
)(3
96)
(135
)(1
,332
)0
(656
)(1
07)
0(9
,184
)
Curr
ent y
ear d
epre
ciat
ion
(1,2
01)
(753
)(1
21)
(205
)(6
7)(7
8)(3
9)(2
56)
(381
)(5
3)(4
4)0
(3,1
98)
Dis
posa
ls d
urin
g th
e ye
ar0
1,06
20
00
00
00
00
01,
062
Reva
luat
ions
(2)
00
00
00
0(9
92)
00
0(9
94)
Recl
assi
ficat
ions
133
8(2
05)
(5)
(138
)(3
4)(1
56)
158
1110
520
095
Writ
e-do
wn
079
00
388
00
530
00
178
Writ
e-up
00
(3)
(1)
00
(9)
(6)
7(7
)(1
)0
(20)
Acc
umul
ated
dep
reci
atio
n at
31
Dec
embe
r 201
0(1
,202
)(3
,435
)(1
,190
)(1
,393
)(5
21)
(500
)(3
39)
(1,4
36)
(1,3
02)
(611
)(1
32)
0(1
2,06
1)
Net
boo
k va
lue
50,2
861,
690
635
851
226
184
4860
066
189
847
355
,751

65
WHITIREIA NEW ZEALAND ANNUAL REPORT 2011
9.Pr
oper
ty, P
lant
and
Equ
ipm
ent
Land
&
build
ings
Com
pute
r ha
rdw
are
Furn
itur
e,
fitti
ngs
& a
rtw
ork
Libr
ary
colle
ctio
nPl
ant &
m
achi
nery
Mot
or
vehi
cles
Offi
ce
equi
pmen
tTe
achi
ng
equi
pmen
t
Leas
ehol
d im
prov
e-m
ents
Com
mun
i-ca
tion
sy
stem
sSi
gnag
eW
ork
in
prog
ress
Tota
l po
lyte
chni
c
$’00
0$’
000
$’00
0$’
000
$’00
0$’
000
$’00
0$’
000
$’00
0$’
000
$’00
0$’
000
$’00
0
Gro
upCo
st /
val
uatio
n
Cost
/ v
alua
tion
at
1 Ja
nuar
y 20
1151
,488
5,22
31,
856
2,24
474
768
443
82,
161
1,98
470
014
047
368
,138
Add
ition
s du
ring
the
year
192
575
459
160
185
4075
277
4,49
910
05,
060
11,5
32
Dis
posa
ls d
urin
g th
e ye
ar(1
10)
00
(1)
0(2
)0
(3)
00
(20)
(136
)
Reva
luat
ions
(5,4
31)
00
00
00
00
00
0(5
,431
)
Tran
sfer
s ou
t(6
32)
112
00
00
(108
)10
890
00
0(3
45)
35
Cost
/ va
luat
ion
at
31 D
ecem
ber 2
011
45,6
175,
800
2,31
52,
404
931
724
403
2,54
67,
380
710
140
5,16
874
,138
Acc
umul
ated
dep
reci
atio
n
Acc
umul
ated
Dep
reci
atio
n at
1
Janu
ary
2011
(1,2
02)
(3,5
26)
(1,2
03)
(1,3
93)
(521
)(5
00)
(377
)(1
,524
)(1
,307
)(6
11)
(132
)0
(12,
296)
Curr
ent y
ear d
epre
ciat
ion
(1,1
63)
(752
)(1
45)
(225
)(6
0)(8
1)(2
5)(2
82)
(390
)(4
8)(8
)0
(3,1
79)
Dis
posa
ls d
urin
g th
e ye
ar10
449
00
037
885
00
028
3
Reva
luat
ions
2,41
691
00
00
00
00
00
2,50
7
Tran
sfer
s(5
1)0
00
40
00
(29)
(1)
00
(77)
Acc
umul
ated
dep
reci
atio
n at
31
Dec
embe
r 201
10
(4,0
83)
(1,2
99)
(1,6
18)
(577
)(5
81)
(365
)(1
,718
)(1
,721
)(6
60)
(140
)0
(12,
762)
Net
boo
k va
lue
45,6
171,
717
1,01
678
635
414
338
828
5,65
950
05,
168
61,3
76

66 9.Pr
oper
ty, P
lant
and
Equ
ipm
ent
Land
&
build
ings
Com
pute
r ha
rdw
are
Furn
itur
e,
fitti
ngs
& a
rtw
ork
Libr
ary
colle
ctio
nPl
ant &
m
achi
nery
Mot
or
vehi
cles
Offi
ce
equi
pmen
tTe
achi
ng
equi
pmen
t
Leas
ehol
d im
prov
e-m
ents
Com
mun
i-ca
tion
sy
stem
sSi
gnag
eW
ork
in
prog
ress
Tota
l po
lyte
chni
c
$’00
0$’
000
$’00
0$’
000
$’00
0$’
000
$’00
0$’
000
$’00
0$’
000
$’00
0$’
000
$’00
0
Gro
upCo
st /
val
uatio
n
Cost
/ v
alua
tion
at
1 Ja
nuar
y 20
1053
,747
5,86
81,
347
1,92
865
955
424
12,
032
3,20
378
915
76
70,5
31
Add
ition
s du
ring
the
year
794
623
155
226
7676
5113
821
220
473
2,65
5
Dis
posa
ls d
urin
g th
e ye
ar(5
10)
(1,0
63)
00
00
00
(48)
00
0(1
,621
)
Reva
luat
ions
(823
)0
00
00
00
(1,1
80)
00
0(2
,003
)
Recl
assi
ficat
ions
(1,7
20)
(408
)30
15
3553
145
(9)
(18)
(115
)(2
1)0
(1,7
52)
Writ
e-do
wn
00
00
(23)
00
00
00
(6)
(29)
Writ
e-up
020
353
850
11
06
44
035
7
Cost
/ va
luat
ion
at
31 D
ecem
ber 2
010
51,4
885,
223
1,85
62,
244
747
684
438
2,16
11,
984
700
140
473
68,1
38
Acc
umul
ated
dep
reci
atio
n
Acc
umul
ated
dep
reci
atio
n at
1
Janu
ary
2010
0(4
,161
)(8
61)
(1,1
82)
(354
)(3
96)
(135
)(1
,334
)(3
2)(6
56)
(107
)0
(9,2
18)
Curr
ent y
ear d
epre
ciat
ion
(1,2
01)
(767
)(1
25)
(205
)(6
7)(7
8)(4
4)(2
73)
(402
)(5
3)(4
4)0
(3,2
59)
Dis
posa
ls d
urin
g th
e ye
ar0
1,06
20
00
00
048
00
01,
110
Reva
luat
ions
(2)
00
00
00
0(9
92)
00
0(9
94)
Adj
ustm
ent o
n co
nsol
idat
ion
0(7
7)(9
)0
00
(33)
(69)
00
00
(188
)
Recl
assi
ficat
ions
133
8(2
05)
(5)
(138
)(3
4)(1
56)
158
1110
520
095
Writ
e-do
wn
079
00
388
00
530
00
178
Writ
e-up
00
(3)
(1)
00
(9)
(6)
7(7
)(1
)0
(20)
Acc
umul
ated
dep
reci
atio
n at
31
Dec
embe
r 201
0(1
,202
)(3
,526
)(1
,203
)(1
,393
)(5
21)
(500
)(3
77)
(1,5
24)
(1,3
07)
(611
)(1
32)
0(1
2,29
6)
Net
boo
k va
lue
50,2
861,
697
653
851
226
184
6163
767
789
847
355
,842

67
WHITIREIA NEW ZEALAND ANNUAL REPORT 2011
Valuation
LandLand is valued at fair value using market based evidence based on its highest and best use with reference to comparable land values. Adjustments have been made to the ‘unencumbered’ land value for campus land where there is a designation against the land or the use of the land is restricted because of reserve or endowment status. These adjustments are intended to reflect the negative impact on the value of land where the owner is unable to use the land more intensely.
Restrictions on the Polytechnic and group’s ability to sell land would normally not impair the value of the land because the Polytechnic and group has operational use of the land for the foreseeable future and will substantially receive the full benefits of outright ownership.
The most recent valuation of land was performed by a registered independent valuer, Bayleys Valuations Limited, and the valuation is effective as at 31 December 2011.
BuildingsSpecialised buildings (e.g. campuses) are valued at fair value using optimised depreciated replacement cost because no reliable data is available for buildings designed for education delivery purposes.
Optimised depreciated replacement cost is determined using a number of significant assumptions. Significant assumptions include:
• The replacement asset is based on the reproduction cost of the specific assets with adjustments where appropriate for obsolescence due to over design or surplus capacity.
• The replacement cost is derived from recent construction contracts of similar assets and Property Institute of New Zealand cost information.
• Estimating the remaining useful life of assets.
• Straight-line depreciation has been applied in determining the depreciated replacement cost value of the asset.
The most recent valuation of buildings was performed by a registered independent valuer, Bayleys Valuations Limited, and the valuation is effective as at 31 December 2011.
The total fair value of property valued by Bayleys Valuations Limited at 31 December 2011 totalled $47,467,000.
Restrictions on title
Under the Education Act 1989, the Polytechnic and group is required to obtain the consent from the Ministry of Education to dispose of or sell off property where the value of the property exceeds an amount determined by the Minister.
There are also various restrictions in the form of historic designations, reserve and endowment encumbrances attached to land. The Polytechnic and group does not consider it practical to disclose in detail the value of land subject to these restrictions.
The total amount of property, plant and equipment in the course of construction is $4,873,630 (2010: $Nil) at 31 December 2011.

68
10. Intangible AssetsPolytechnic Group
Software GoodwillWork in
progress Total Software GoodwillWork in
progress Total$’000 $’000 $’000 $’000 $’000 $’000 $’000 $’000
Balance at 1 January 2011
Cost 1,577 0 0 1,577 1,577 760 0 2,337
Accumulated amortisation and impairment (1,364) 0 0 (1,364) (1,364) 0 0 (1,364)
Opening carrying amount 213 0 0 213 213 760 0 973
Year ended 31 December 2011
Additions 380 0 221 601 380 0 221 601
Disposal 0 0 0 0 0 0 0 0
Amortisation (276) 0 0 (276) (276) 0 0 (276)
Closing carrying amount 317 0 221 538 317 760 221 1,298
Balance at 31 December 2011
Cost 1,957 0 221 2,178 1,957 760 221 2,938
Accumulated amortisation and impairment (1,640) 0 0 (1,640) (1,640) 0 0 (1,640)
Closing carrying amount 317 0 221 538 317 760 221 1,298
Balance at 1 January 2010
Cost 1,482 0 0 1,482 1,482 0 0 1,482
Accumulated amortisation and impairment (1,166) 0 0 (1,166) (1,166) 0 0 (1,166)
Opening carrying amount 316 0 0 316 316 0 0 316
Year ended 31 December 2010
Additions 95 0 0 95 95 760 0 855
Disposal 0 0 0 0 0 0 0 0
Amortisation (198) 0 0 (198) (198) 0 0 (198)
Closing carrying amount 213 0 0 213 213 760 0 973
Balance at 31 December 2010
Cost 1,577 0 0 1,577 1,577 760 0 2,337
Accumulated amortisation and impairment (1,364) 0 0 (1,364) (1,364) 0 0 (1,364)
Closing carrying amount 213 0 0 213 213 760 0 973
There are no restrictions over the title of intangible assets. No intangible assets are pledged as security for liabilities.

69
WHITIREIA NEW ZEALAND ANNUAL REPORT 2011
GoodwillGoodwill of $760,000 (2010: $760,000) has been allocated to the cash generating unit (CGU) of Whitireia New Zealand Limited (2010: New Zealand Radio Training School (2003) Limited). The synergies of the business combination in which the goodwill arose are expected to be realised only by the assets of Whitireia New Zealand Limited (2010: New Zealand Radio Training School (2003) Limited).
The recoverable amount of the CGU has been determined based on value in use calculations. These calculations use cash flow projections based on financial budgets approved by the Council and cover a five-year period. Cash flows beyond the five-year period have been extrapolated using an estimated growth rate.
Key assumptions used for the goodwill value in use calculation:
• Funding received from the Government relating to the level of EFTS funded will remain unchanged for the foreseeable future
• Budgeted gross margin – 20%
• Weighted average growth rate – 0%
• Pre-tax discount rate – 8%
These assumptions have been used for the analysis of the CGU of Whitireia New Zealand Limited (2010: New Zealand Radio Training School (2003) Limited). The Polytechnic has determined budgeted gross margin based on past performance and its expectations for the market. The weighted average growth rate used is consistent with the forecasts included in industry reports. The discount rate used is pretax and reflects specific risks relevant to the CGU.
The Polytechnic believes that a reasonable possible change in any of the key assumptions would not cause the carrying amount of goodwill to exceed the recoverable amount.
11. Investment PropertiesPolytechnic Group
2011 2010 2011 2010$’000 $’000 $’000 $’000
Opening balance as at 1 January (fair value) 275 255 275 255
Net gain from fair value adjustment 5 20 5 20
Closing balance as at 31 December 280 275 280 275
Commerce Crescent property is stated at fair value. Investment properties were valued on 31 December 2011 by Bayleys Valuations Limited, independent registered valuer. Bayleys Valuations Limited is a member of the New Zealand Institute of Valuers (Inc.).
The valuations undertaken were based on an open market value, supported by market evidence in which assets could be exchanged between a knowledgeable willing buyer and a knowledgeable willing seller in an arm’s length transaction at the date of the valuation.

70
13. Creditors and Other PayablesPolytechnic Group
2011 2010 2011 2010$’000 $’000 $’000 $’000
Trade payables 556 716 556 720
Accruals 1,586 1,372 1,666 1,445
GST 1,085 837 1,085 856
Total creditors and other payables 3,227 2,925 3,307 3,021
Creditors and other payables are non-interest bearing and are normally settled on 30-day terms, therefore the carrying value of creditors and other payables approximates their fair value.
14. Special Accounts
Special accounts represents funds held by Whitireia on behalf of others and funds provided to Whitireia by various organisations for specific projects.
Polytechnic Group
2011 2010 2011 2010$’000 $’000 $’000 $’000
Homestay Trust 0 4 0 4
Whitireia International Homestay Trust 19 86 19 86
Activities account 11 5 11 5
Whitireia Foundation 0 0 0 120
Other accounts 21 1 21 1
Total special accounts 51 96 51 216
12. Property Held For SaleFollowing a review of the Polytechnics requirements, property currently located at Kāpiti was identified as being in excess of the Polytechnics requirements. It was therefore determined that a buyer would be sought for the property. The property is currently subject to an active marketing plan where buyers are being sought. It is expected to be disposed of during the next 12 months at a value equivalent to the current stated valuation.
During the year the carrying value of the property was reduced by $80,000 in line with current market expectations. The change in value has been recognised in the statement of financial performance for the year ended 31 December 2011.
Lindale complex property was valued on 31 December 2011 by Bayleys Valuations Limited, independent registered valuer. Bayleys Valuations Limited is a member of the New Zealand Institute of Valuers (Inc.).

71
WHITIREIA NEW ZEALAND ANNUAL REPORT 2011
15. Revenue Received in AdvancePolytechnic Group
2011 2010 2011 2010$’000 $’000 $’000 $’000
Student fees 12,110 9,622 12,110 9,622
Other revenue received in advance 18 779 18 779
Total revenue received in advance 12,128 10,401 12,128 10,401
16. Employee EntitlementsPolytechnic Group
2011 2010 2011 2010$’000 $’000 $’000 $’000
Current portion
Accrued pay 358 346 361 352
Annual leave 2,461 2,297 2,495 2,363
Sick leave 132 78 132 78
Long service leave 0 0 0 0
Total current portion 2,951 2,721 2,988 2,793
Non-current portion
Long service leave 131 146 131 146
Retirement gratuities 139 147 139 147
Total non-current portion 270 293 270 293
Total employee entitlements 3,221 3,014 3,258 3,086
Employees are entitled to annual leave pay, long service leave pay and retirement gratuities. Annual leave entitlements expected to be settled within 12 months of the balance sheet date are measured at the current rates of pay and classified as current liabilities. Entitlements related to long service leave and retirement gratuities have been calculated at present value of future cash flows.
The provision is affected by a number of assumptions including expected length of service, attrition rate and salary increase.

72
17. ProvisionsPolytechnic Group
2011 2010 2011 2010$’000 $’000 $’000 $’000
Current portion
Lease inducements 233 0 233 0
233 0 233 0
Non-current portion
Lease make-good 97 78 97 78
Lease inducements 2,624 0 2,624 0
2,721 78 2,721 78
Total provisions 2,954 78 2,954 78
2011 2010
Lease make-good
Lease in-ducements Total
Lease make-good
Lease in-ducements Total
$’000 $’000 $’000 $’000 $’000 $’000
Polytechnic and group
Balance at 1 January 78 0 78 76 0 76
Additional provisions made 19 2,857 2,876 2 0 2
Balance at 31 December 97 2,857 2,954 78 0 78
Lease make-good
In respect of its leased property, the Polytechnic and group is required at the expiry of the lease term to make-good any damage caused to the premises from installed fixtures and fittings and to remove any fixtures and fittings installed by the Polytechnic and group. In many cases, the Polytechnic and group has the option to renew these leases, which impacts on the expected outflows to make-good these premises. Information about the Polytechnic and group lease arrangements is disclosed in note 22.
Lease inducements
In respect of leased property, the Polytechnic and group entered into a number of agreements to lease properties where an initial inducement was made by the lessor. These inducements included rent free holidays, contributions to fitout and cash incentives. These amounts have been recognised as a provision in the financial statements to be amortised over the lease term (Refer note 22).

73
WHITIREIA NEW ZEALAND ANNUAL REPORT 2011
18. EquityPolytechnic Group
2011 2010 2011 2010$’000 $’000 $’000 $’000
General funds
Balance at 1 January 43,363 39,140 42,919 39,024
Surplus / (deficit) for the year 2,505 3,773 2,580 3,445
Capital contributions from the Crown 0 450 0 450
Transfers from restricted reserves 0 0 126 0
Balance at 31 December 45,868 43,363 45,625 42,919
Property revaluation reserves
Balance at 1 January 20,891 23,511 20,891 23,511
Land net revaluation loss (1,690) 0 (1,690) 0
Buildings net revaluation (loss)/gain (1,274) (2,620) (1,274) (2,620)
Infrastructure net revaluation loss (51) 0 (51) 0
Balance at 31 December 17,876 20,891 17,876 20,891
Restricted reserves
Balance at 1 January 0 0 13 14
Appropriation of net surplus 0 0 1 1
Application of trusts and bequests 0 0 (2) (2)
Balance at 31 December 0 0 12 13
Property revaluation reserves
Property revaluation reserves consist of:Polytechnic Group
2011 2010 2011 2010$’000 $’000 $’000 $’000
Land 14,001 15,691 14,001 15,691
Buildings 2,053 3,327 2,053 3,327
Improvements 1,822 1,873 1,822 1,873
Total property revaluation reserves 17,876 20,891 17,876 20,891

74
19. Taxation
Polytechnic Group
2011 2010 2011 2010$’000 $’000 $’000 $’000
Component of tax expense
Current tax expense 0 0 0 0
Adjustment to current tax in prior years 0 0 0 0
Income Tax expense 0 0 0 0
Relationship between tax and accounting profit
Net surplus (deficit) before tax 2,505 3,773 2,580 3,444
Tax at 28% (2010:30%) 701 1,132 722 1,033
Plus (less) tax effect of:
Non-deductable expenditure 0 0 2 0
Revenue exempt from tax (701) (1,132) (701) (1,033)
Deferred tax not recognised 0 0 (10) 0
Tax losses not recognised 0 0 (13) 0
Tax expense 0 0 0 0
The group has an unrecognised deferred tax asset of $20,375 in relation to deductible temporary differences.
The group has an unrecognised deferred tax asset of $28,413 in relation to tax losses carried forward.

75
WHITIREIA NEW ZEALAND ANNUAL REPORT 2011
20. Financial Risk Management Objectives and PoliciesThe group’s principal financial instruments comprise bank deposits, cash and short-term deposits.
The group has various other financial instruments such as trade debtors and trade creditors, which arise directly from its operations.
Foreign currency riskThe group has transactional currency exposures. Such exposures largely arise from purchases by the Polytechnics library in currencies other than the institutes’ functional currency. The group’s exposure to foreign currency risk is minimal.
Commodity price riskThe group’s exposure to commodity price risk is minimal.
Credit riskWith the exception of student fees the group trades only with recognised, creditworthy third parties.
Receivable balances are monitored on an ongoing basis with the result that the group’s exposure to bad debts is not significant.
With respect to the credit risk arising from the other financial assets of the group, which comprise cash and cash equivalents and available-for-sale financial assets, the group’s exposure to credit risk arises from default of the counter party, with a maximum exposure equal to the carrying amount of these instruments.
There are no significant concentrations of credit risk within the group.
Interest rate riskThe tables below illustrate the potential effect on the surplus or deficit and equity (excluding general funds) for reasonably possible market movements, with all other variables held constant, based on financial instrument exposures at balance date.
2011 2010
$’000 $’000
-50 bps +150bps -50 bps +150bps
Interest rate risk surplusOther
equity surplusOther
equity surplusOther
equity surplusOther
equity
Institute
Financial assets
Cash and cash equivalents
(32) 0 95 0 (33) 0 98 0
Financial assets in the nature of investments
(35) 0 105 0 (55) 0 165 0
Total sensitivity (67) 0 200 0 (88) 0 263 0
Group
Financial assets
Cash and cash equivalents
(32) 0 97 0 (36) 0 108 0
Financial assets in the nature of investments
(37) 0 110 0 (57) 0 170 0
Total sensitivity (69) 0 207 0 (93) 0 278 0
The interest rate sensitivity is based on a reasonable possible movement in interest rates, with all other variables held constant, measured as a basis points (bps) movement. For example a decrease in 50 bps is equivalent to a decrease in interest rates of 0.5%.

76
Credit quality of financial assets
The credit quality of financial assets that are neither past due nor impaired can be assessed by reference to Standard and Poor’s credit ratings (if available) or to historical information about counterparty default rates:
Polytechnic Group
2011 2010 2011 2010$’000 $’000 $’000 $’000
Counterparties with credit ratings
Cash at bank and term deposits
AA 13,312 17,540 13,773 18,102
Total cash at bank and term deposits 13,312 17,540 13,773 18,102
Counterparties without credit ratings
Loans to related parties
Existing counterparty without defaults in the past 0 1,226 0 0
Total loans to related parties 0 1,226 0 0
Debtors and other receivables
Existing counterparty with no defaults in the past 6,726 3,184 6,729 3,905
Total debtors and other receivables 6,726 3,184 6,729 3,905
Liquidity risk
Liquidity risk is the risk that the group will encounter difficulty raising liquid funds to meet commitments as they fall due. Prudent liquidity risk management implies maintaining sufficient cash, the availability of funding through an adequate amount of committed credit facilities and the ability to close out market positions. The group aims to maintain flexibility in funding by arranging committed credit lines when required.
In meeting its liquidity requirements, the group maintains a target level of investments that must mature within specified timeframes.
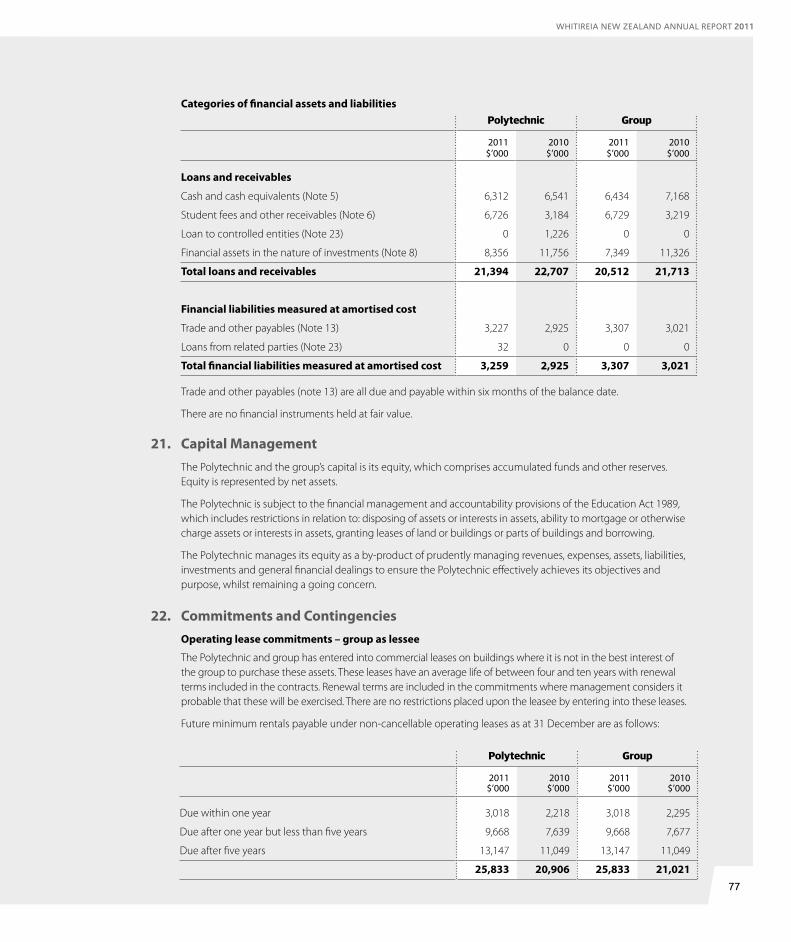
77
WHITIREIA NEW ZEALAND ANNUAL REPORT 2011
Categories of financial assets and liabilitiesPolytechnic Group
2011 2010 2011 2010$’000 $’000 $’000 $’000
Loans and receivables
Cash and cash equivalents (Note 5) 6,312 6,541 6,434 7,168
Student fees and other receivables (Note 6) 6,726 3,184 6,729 3,219
Loan to controlled entities (Note 23) 0 1,226 0 0
Financial assets in the nature of investments (Note 8) 8,356 11,756 7,349 11,326
Total loans and receivables 21,394 22,707 20,512 21,713
Financial liabilities measured at amortised cost
Trade and other payables (Note 13) 3,227 2,925 3,307 3,021
Loans from related parties (Note 23) 32 0 0 0
Total financial liabilities measured at amortised cost 3,259 2,925 3,307 3,021
Trade and other payables (note 13) are all due and payable within six months of the balance date.
There are no financial instruments held at fair value.
21. Capital ManagementThe Polytechnic and the group’s capital is its equity, which comprises accumulated funds and other reserves. Equity is represented by net assets.
The Polytechnic is subject to the financial management and accountability provisions of the Education Act 1989, which includes restrictions in relation to: disposing of assets or interests in assets, ability to mortgage or otherwise charge assets or interests in assets, granting leases of land or buildings or parts of buildings and borrowing.
The Polytechnic manages its equity as a by-product of prudently managing revenues, expenses, assets, liabilities, investments and general financial dealings to ensure the Polytechnic effectively achieves its objectives and purpose, whilst remaining a going concern.
22. Commitments and ContingenciesOperating lease commitments – group as lessee
The Polytechnic and group has entered into commercial leases on buildings where it is not in the best interest of the group to purchase these assets. These leases have an average life of between four and ten years with renewal terms included in the contracts. Renewal terms are included in the commitments where management considers it probable that these will be exercised. There are no restrictions placed upon the leasee by entering into these leases.
Future minimum rentals payable under non-cancellable operating leases as at 31 December are as follows:
Polytechnic Group
2011 2010 2011 2010$’000 $’000 $’000 $’000
Due within one year 3,018 2,218 3,018 2,295
Due after one year but less than five years 9,668 7,639 9,668 7,677
Due after five years 13,147 11,049 13,147 11,049
25,833 20,906 25,833 21,021

78
Polytechnic
2011 2010$’000 $’000
Porirua campus redevelopment 16,417 0
Kāpiti campus redevelopment 1,148 0
17,565 0
Legal claims
There are no outstanding legal claims (2010: Nil).
Other contingent liabilities
The Polytechnic and group has no contingent liabilities.
Contingent assets
The Polytechnic and group has no contingent assets.
23. Related Party DisclosureTerms and conditions of transactions with related parties
Providing of ancillary services to and purchases from related parties is made in arm’s length transactions at both normal market prices and normal commercial terms.
Outstanding balances at 31 December 2011 and 2010 are unsecured and settlement occurs in cash.
Polytechnic
2011 2010Subsidiary $’000 $’000
Whitireia Performing Arts Company Limited
Services provided by the Polytechnic 174 180
Services provided to the Polytechnic 0 93
Unsecured loans payable to the Polytechnic 0 669
Whitireia New Zealand Limited (formerly New Zealand Radio Training School)
Services provided by the Polytechnic 720 112
Unsecured loans payable to the Polytechnic 0 557
Unsecured loans payable by the Polytechnic 32 0
Transactions between Whitireia and its subsidiary include loans and advances to subsidiary. These loans and advances are unsecured, interest free with no fixed terms of repayment.
For the year ended 31 December 2011, the group has not raised any provisions for doubtful debts relating to amounts owed by related parties as the payment history has been excellent (2010: $nil). This assessment is undertaken each financial year through examining the financial position of the related party and the market in which the related party operates in. When assessed as required, the group raises such a provision.
Capital commitments
At 31 December the Polytechnic had the following commitments:

79
WHITIREIA NEW ZEALAND ANNUAL REPORT 2011
Crown / Government
Whitireia is a wholly owned entity of the Crown. The Government influences the roles of Whitireia as well as significant source of revenue, as disclosed in note 2.
In conducting its activities, Whitireia is required to pay various taxes and levies (such as GST, FBT, PAYE and ACC levies) to the Crown and entities related to the Crown. The payment of these taxes and levies is based on the standard terms and conditions that apply to all tax and levy payers. Whitireia is exempt from paying income tax and FBT.
Whitireia purchases goods and services from entities related to the Crown and it also provides services to entities related to the Crown. The purchase and provision of goods and services to government-related entities for the year ended 31 December 2011 totalled $843,000 (2010: 754,000) and have all been conducted on an arms’ length basis. These purchases included the purchase of electricity from Meridian, Genesis and Mercury, air travel from Air New Zealand, procurement services from the Ministry of Economic Development and external audit services from Audit New Zealand.
Related party transactions
During the year the Polytechnic purchased consultancy services from Martin Jenkins, a consultancy firm, in which Deputy Chair of Council Dr Alan Barker is a partner. These services cost $24,328 (2010: $4,933) and were supplied on normal commercial terms. There were no unpaid invoices at year end.
During the year the Polytechnic purchased services from CityLink, an IT firm, in which Council Chair Hon Roger Sowry ONZM is a Director. These services cost $94,704 (2010: Nil) and were supplied on normal commercial terms. There was an outstanding invoice of $4,577 at year end (2010: Nil).
During the year the Polytechnic provided a scholarship to the Chapman Tripp Theatre Awards for which Council member Suzanne Snively ONZM is a Trustee. This cost $1,150 (2010: $Nil) and was supplied on normal commercial terms. There were no unpaid invoices at year end.
During the year the Polytechnic purchased professional services from WelTec, an education provider, which has four Ministerial appointees to Council in common. These services cost $24,530 (2010: $898). During the year the Polytechnic supplied services to WelTec for $120,042 (2010: $13,928). All transactions were supplied on normal commercial terms. There was $119 payable (2010: Nil) and $150 receivable (2010: Nil) at year end.
During the year the Polytechnic paid membership levies to Skills for New Zealand (ITPNZ), a representative body for Polytechnics, in which Council member Dennis Sharman is the Chair. These services cost $49,450 (2010: $48,375) and were supplied on normal commercial terms. There were no unpaid invoices at year end.
During the year the Polytechnic purchased professional services from The Open Polytechnic of New Zealand, an education provider, at which Deputy Chair of Council Dr Alan Barker is Deputy Chair of Council. These services cost $3,845 (2010: $7,456). During the year the Polytechnic supplied services to The Open Polytechnic of New Zealand for $777 (2010: $986). All transactions were supplied on normal commercial terms. There were no unpaid invoices at year end (2010: $432 receivable and $1,360 payable).
During 2010 the Polytechnic purchased training services and equipment hireage from Stephen Wickens & Associates Limited, a training firm, in which Trades Faculty Dean Stephen Wickens is a Director. These services cost $1,485 and were supplied on normal commercial terms. There were no unpaid invoices at year end.
During 2010 the Polytechnic provided services to Career Services Rapuara, a Crown entity, in which Deputy Chief Executive Arthur Graves was the Chair. These services were for $2,573. All transactions were supplied on normal commercial terms. There were no unpaid invoices at year end.

80
Key management personnel compensationPolytechnic Group
2011 2010 2011 2010$’000 $’000 $’000 $’000
Salaries and other short-term employment benefits 808 733 808 733
Post employment benefits 37 19 37 19
Total key management personnel compensation 845 752 845 752
Key management personnel includes the Chair, Councillors, Chief Executive and three senior management personnel (2010: two senior management).
24. Councillors FeesCrown Entities Act 2004
2011 2010$ $
Arthur T 14,400 10,440
Fortuin G 14,400 10,720
Sowry R (Chair) 31,761 22,956
Marshall B M 0 1,400
Mareko C 0 560
Nicols A D 0 840
Sharman D R 14,400 17,572
Snively S 14,400 13,395
Wilkinson R K 14,400 11,320
Falepau L 0 1,400
Hilliard M 0 1,400
Ryder L 0 1,120
Barker A 18,000 12,000
Sanga K 24,000 0
145,761 105,123

81
WHITIREIA NEW ZEALAND ANNUAL REPORT 2011
25. Employee RemunerationPolytechnic Group
2011 2010 2011 2010$’000 $’000 $’000 $’000
100,000 - 109,999 2 2 2 2
110,000 - 119,999 9 8 9 8
130,000 - 139,999 1 0 1 0
140,000 - 149,999 0 0 0 0
160,000 - 169,999 1 1 1 1
260,000 - 269,999 0 0 0 0
270,000 - 279,999 1 1 1 1
Total employees 14 12 14 12
26. Events After Balance DateIn November 2011 the Minister for Tertiary Education approved a combined Governing Council for Whitireia and the Wellington Institute of Technology from January 2012.
The Polytechnic purchased the assets of two Private Training Establishments for $534,000 after balance date. The Polytechnics subsidiary, Whitireia New Zealand Limited, purchased the future revenue streams of two Private Training Establishments after balance date.
Except as already disclosed, there were no other events that have occurred between 31 December 2011 and the date of this report.
27. Explanations of Major Variances Against BudgetThe major variances against budget were due to additional funding for Youth Guarantee and campus redevelopments occurring later than expected.
The Polytechnic undertook a significant programme of campus redevelopments, culminating in the approval to redevelop the main campus in Porirua. The timing of the campus redevelopments resulted in higher interest income and lower depreciation expenditure.
Accounts receivable has increased as a result of invoicing students for courses starting in 2012 with a corresponding increase in income in advance.

82
STATEMENT OF RESPONSIBILITY
The Council and management are responsible for the preparation of Whitireia Community Polytechnic and group’s financial statements and statement of service performance and for the judgements made in them.
The Council and management of the Whitireia Community Polytechnic have the responsibility for establishing and maintaining a system of internal control designed to provide reasonable assurance as to the integrity and reliability of financial reporting.
In the Council and management’s opinion, these financial statements and statement of service performance fairly reflect the financial position and operations of the Whitireia Community Polytechnic and group for the year ended 31 December 2011.
Signed by.
Chairperson of Council Chief Executive16 May 2012 16 May 2012

83
WHITIREIA NEW ZEALAND ANNUAL REPORT 2011
Independent Auditor’s Report
To the readers ofWhitireia Community Polytechnic and group’s
financial statements and statement of service performancefor the year ended 31 December 2011
The Auditor-General is the auditor of Whitireia Community Polytechnic (the Polytechnic) and group. The Auditor-General has appointed me, Clint Ramoo, using the staff and resources of Audit New Zealand, to carry out the audit of the financial statements and statement of service performance of the Polytechnic and group on her behalf.
We have audited:
• the financial statements of the Whitireia Community Polytechnic and group on pages 41 to 81, that comprise the statement of financial position as at 31 December 2011, the statement of financial performance, statement of comprehensive income, statement of changes in equity and statement of cash flows for the year ended on that date and the notes to the financial statements that include accounting policies and other explanatory information; and
• the statement of service performance of the Polytechnic and group on pages 22 to 37.
Opinion
In our opinion:
• the financial statements of the Polytechnic and group on pages 41 to 81:
• comply with generally accepted accounting practice in New Zealand; and
• fairly reflect the Polytechnic and group’s:
• financial position as at 31 December 2011; and
• financial performance and cash flows for the year ended on that date;
• the statement of service performance of the Polytechnic and group on pages 22 to 37 fairly reflects the Polytechnic and group’s service performance achievements measured against the performance targets adopted for the year ended 31 December 2011.
Our audit was completed on 16 May 2012. This is the date at which our opinion is expressed.
The basis of our opinion is explained below. In addition, we outline the responsibilities of the Council and our responsibilities, and we explain our independence.
Basis of opinionWe carried out our audit in accordance with the Auditor-General’s Auditing Standards, which incorporate the International Standards on Auditing (New Zealand). Those standards require that we comply with ethical requirements and plan and carry out our audit to obtain reasonable assurance about whether the financial statements and statement of service performance are free from material misstatement.
Material misstatements are differences or omissions of amounts and disclosures that would affect a reader’s overall understanding of the financial statements and statement of service performance. If we had found material misstatements that were not corrected, we would have referred to them in our opinion.

An audit involves carrying out procedures to obtain audit evidence about the amounts and disclosures in the financial statements and statement of service performance. The procedures selected depend on our judgement, including our assessment of risks of material misstatement of the financial statements and statement of service performance, whether due to fraud or error. In making those risk assessments; we consider internal control relevant to the Polytechnic and group’s preparation of the financial statements and statement of service performance that fairly reflect the matters to which they relate. We consider internal control in order to design audit procedures that are appropriate in the circumstances but not for the purpose of expressing an opinion on the effectiveness of the Polytechnic and group’s internal control.
An audit also involves evaluating:
• the appropriateness of accounting policies used and whether they have been consistently applied;
• the reasonableness of the significant accounting estimates and judgements made by the Council;
• the adequacy of all disclosures in the financial statements and statement of service performance; and
• the overall presentation of the financial statements and statement of service performance.
We did not examine every transaction, nor do we guarantee complete accuracy of the financial statements and statement of service performance. We have obtained all the information and explanations we have required and we believe we have obtained sufficient and appropriate audit evidence to provide a basis for our audit opinion.
Responsibilities of the Council
The Council is responsible for preparing financial statements that:
• comply with generally accepted accounting practice in New Zealand; and
• fairly reflect the Polytechnic and group’s financial position, financial performance and cash flows.
The Council is also responsible for preparing a statement of service performance that fairly reflects the Polytechnic and group’s service performance achievements.
The Council is responsible for such internal control as it determines is necessary to enable the preparation of financial statements and a statement of service performance that are free from material misstatement, whether due to fraud or error.
The Council’s responsibilities arise from the Education Act 1989 and the Crown Entities Act 2004.
Responsibilities of the Auditor
We are responsible for expressing an independent opinion on the financial statements and statement of service performance and reporting that opinion to you based on our audit. Our responsibility arises from section 15 of the Public Audit Act 2001 and the Crown Entities Act 2004.
Independence
When carrying out the audit, we followed the independence requirements of the Auditor-General, which incorporate the independence requirements of the New Zealand Institute of Chartered Accountants.
Other than the audit, we have no relationship with or interests in the Polytechnic or any of its subsidiaries.
Clint Ramoo Audit New Zealand On behalf of the Auditor-General Wellington, New Zealand
84

ValuesManaakiEncouraging co-operation in learning and resource sharing to promote individual confidence and group harmony through a positive and supportive learning environment
IdentityCreating a learning environment where all people feel they belong because their uniqueness is valued and promoted
EquityAchieving more equal outcomes by providing significant learning and education success for those who have previously lacked such opportunities
ResponsivenessBeing flexible, creative and open to change, to better meet individual, industry and community learning needs
SuccessBeing an effective organisation with a clear sense of purpose, striving for excellence and creating an environment where all have the right to succeed
IntegrityMaintaining the highest ethical standards and permitting public scrutiny to ensure the maintenance of those standards
AccountabilityMonitoring and reporting on the maintenance of educational quality standards and on the responsible use of public resources
VisionWhitireia will lead and illuminate its communities through tertiary education
Matters relating to the electronic presentation of the audited financial statements and statement of performance
This audit report relates to the financial statements and the statement of service performance of Whitireia Community Polytechnic (the Polytechnic) and group for the year ended 31 December 2011 included on the Polytechnic and group’s website. The Polytechnic and group’s Council is responsible for the maintenance and integrity of the Polytechnic and group’s website. We have not been engaged to report on the integrity of the Polytechnic and group’s website. We accept no responsibility for any changes that may have occurred to the financial statements and statement of service performance since they were initially presented on the website.
The audit report refers only to the financial statements and statement of service performance named above. It does not provide an opinion on any other information which may have been hyperlinked to or from the financial statements and statement of service performance. If readers of this report are concerned with the inherent risks arising from electronic data communication they should refer to the published hard copy of the audited financial statements and statement of service performance as well as the related audit report dated 16 May 2012 to confirm the information included in the audited financial statements and statement of service performance presented on this website.

WH
ITIREIA
NEW
ZEALA
ND
AN
NU
AL R
EPO
RT 20
11
EDUCATIONleading andilluminating
OU
R
communitiesthrough tertiary
www.whitireia.ac.nz
0800 944 847
ANNUALREPORT
I pay tributeto all stafffor their superbefforts in 2011.They rise to the challenges of modern education,delivering to as well as, supporting our students, making Whitireia a true learning community.
Despite changes in funding policy and the environment, Whitireia continues to perform and achieve outstanding results..
“
“
”
”
1st Polytechnicfor student success
Whitireia were rated number one for qualification completion in August 2011, in the Performance of Teriary Education Organisations Report published by the Tertiary Education Commission.
“
”
AnnuAl rePort 2011
Related Documents