ANNUAL REPORT 2010/11 OUR QUEST FOR SERVICE EXCELLENCE CONTINUES

Welcome message from author
This document is posted to help you gain knowledge. Please leave a comment to let me know what you think about it! Share it to your friends and learn new things together.
Transcript
ANNUAL REPORT2010/11
OUR QUEST FORSERVICE EXCELLENCECONTINUES

CONTENTS PAgE
Facts and Figures 1
Key Statistics 2
Technical Performance 3
‘From Power Station to Customer’ 4
SEC Power Generation 5
Board of Directors 6
Executive Management 7
The History of SEC 8
Chairman’s Review 9
Managing Director’s Report 12
Corporate Environmental Sustainability 23
Earth Hour Arrives in Swaziland 24
Consolidated Financial Statements 27
VISION
To be a mojor player in the energy sector development, nationally and regionally.
MISSION
To meet the needs of our customers in a sufficiently profitable and environmentally sound way through providing a reliable and safe power supply of acceptable quality.
CORE VALUES
• Service Excellence• Honesty and Integrity• Respect• Social Responsibility

1
FACTS AND FIGURESYear ended 31 March 2011
INCOME STATEMENT 2011 2010 2009 2008 2007
energy Sales (GWh) 976.8 1018.6 981.9 977.1 943.5
Sales revenue (e’000) 973,444 799,482 560,512 485,756 447,592
Other Income (e’000) 16,061 9,200 6,433 2,566 4,253
989,505 808,682 566,945 488,322 451,845
Operating expenses 682,088 613,730 468,662 358,430 332,902
depreciation 60,091 47,073 46,491 34,665 43,722
amortisation of Grants (5,119) (6,775) (5,992) (4,520) (7,095)
net Financial cost/(Income) 18,542 (27,205) (4,117) 44,495 1,797
Share of (Profit)/Loss in Joint Venture (20,417) (18,330) (15,693) 4,626 (3,672)
Taxation 51,674 43,610 15,399 5,529 19,153
Total costs 786,859 652,103 504,750 443,225 386,807
Profit 202,646 156,579 62,195 45,097 65,038
BALANCE SHEET 2011E’000
2010E’000
2009E’000
2008E’000
2007E’000
Fixed assets (net) 1,028,328 882,574 698,808 557,268 521,290
capital Work in Progress 60,804 38,571 117,265 203,782 137,331
Investment in Joint Venture 137,737 141,262 157,801 118,876 122,020
Unrealised Foreign currency hedging Gains 26,238 33,949 63,083 62,721 28,613
counterpart & electrification Funds 45,683 26,238 26,536 18,604 15,153
retirement Benefits asset 3,612 1,887 250 - -
Prepayments 40,000 - - - -
current assets 487,982 367,882 237,397 253,596 276,554
Total assets 1,830,374 1,492,363 1,301,140 1,214,847 1,100,961
current Liabilities (254,641) (220,263) (198,548) (193,667) (145,519)
1,575,733 1,272,100 1,102,592 1,021,180 955,442
Funds Employed:
Long-term Loans 284,539 227,949 209,561 227,608 237,268
embedded derivative Liability 18,360 12,215 24,979 17,000 -
deferred Income 109,788 105,978 106,796 111,465 114,166
Other deferred Income 45,682 26,238 26,536 18,604 15,155
Funds employed
Unrealised Foreign currency hedging Losses 4,549 4,852 5,171 5,179 7,073
employee retirement Liability - - 5,430 16,810
deferred Tax Liability 145,655 113,400 68,265 52,666 71,889
Shareholder’s Funds 967,160 781,468 661,284 583,228 493,081
1,575,733 1,272,100 1,102,592 1,021,180 955,442
2 Sec annual report 2010/2011
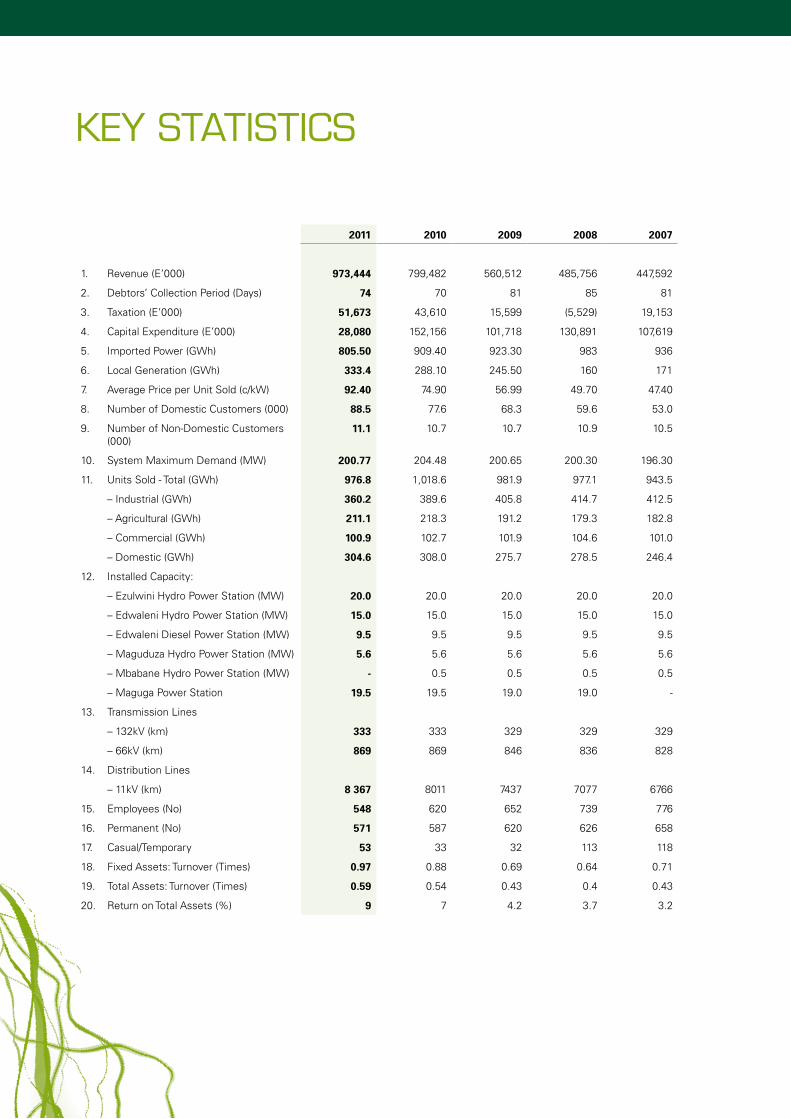
KEy STATISTICS
2011 2010 2009 2008 2007
1. revenue (e’000) 973,444 799,482 560,512 485,756 447,592
2. debtors’ collection Period (days) 74 70 81 85 81
3. Taxation (e’000) 51,673 43,610 15,599 (5,529) 19,153
4. capital expenditure (e’000) 28,080 152,156 101,718 130,891 107,619
5. Imported Power (GWh) 805.50 909.40 923.30 983 936
6. Local Generation (GWh) 333.4 288.10 245.50 160 171
7. average Price per Unit Sold (c/kW) 92.40 74.90 56.99 49.70 47.40
8. number of domestic customers (000) 88.5 77.6 68.3 59.6 53.0
9. number of non-domestic customers (000)
11.1 10.7 10.7 10.9 10.5
10. System Maximum demand (MW) 200.77 204.48 200.65 200.30 196.30
11. Units Sold - Total (GWh) 976.8 1,018.6 981.9 977.1 943.5
– Industrial (GWh) 360.2 389.6 405.8 414.7 412.5
– agricultural (GWh) 211.1 218.3 191.2 179.3 182.8
– commercial (GWh) 100.9 102.7 101.9 104.6 101.0
– domestic (GWh) 304.6 308.0 275.7 278.5 246.4
12. Installed capacity:
– ezulwini hydro Power Station (MW) 20.0 20.0 20.0 20.0 20.0
– edwaleni hydro Power Station (MW) 15.0 15.0 15.0 15.0 15.0
– edwaleni diesel Power Station (MW) 9.5 9.5 9.5 9.5 9.5
– Maguduza hydro Power Station (MW) 5.6 5.6 5.6 5.6 5.6
– Mbabane hydro Power Station (MW) - 0.5 0.5 0.5 0.5
– Maguga Power Station 19.5 19.5 19.0 19.0 -
13. Transmission Lines
– 132kV (km) 333 333 329 329 329
– 66kV (km) 869 869 846 836 828
14. distribution Lines
– 11kV (km) 8 367 8011 7437 7077 6766
15. employees (no) 548 620 652 739 776
16. Permanent (no) 571 587 620 626 658
17. casual/Temporary 53 33 32 113 118
18. Fixed assets: Turnover (Times) 0.97 0.88 0.69 0.64 0.71
19. Total assets: Turnover (Times) 0.59 0.54 0.43 0.4 0.43
20. return on Total assets (%) 9 7 4.2 3.7 3.2

3
TECHNICAL PERFORMANCE
2011 2010 2009 2008 2007
1. System requirements (GWh) Sent Out 1138.1 1186.3 1162.8 1143.6 1105.7
2. Units Sold (GWh) 976.8 1018.6 991.9 977.1 943.5
3. System Losses (%) 14.2 14.9 15.5 14.6 14.6
4. Sec Internal Generation (GWh) 333.4 288.1 246.14 160.2 173.1
5. Sec internal Generation (%) 29 24 21 14 15
6. System Maximum demand (MW) 200.77 204.48 200.65 200.3 196.3
Ratios and Statistics
1. net Income to revenue (%) 20.8 19.3 9.8 9.3 7.9
2. Operating Income to revenue 25.9 19.2 10.5 16.3 18.4
3. return on equity 21 20 8.3 7.7 7.3
4. return on capital employed 11.1 10.5 4.2 3.3 3.7
5. return on Operating assets 12.3 12 7.9 8 7.9
Debt Management Ratios
1. debt/equity 0.33 0.33 0.4 0.54 0.49
2. annual debt Service (Times) 11 7 4.2 3.3 2
Liquidity Ratios
1. current ratio 1.9 1.7 1.2 1.3 1.8
2. acid Test ratio 1.6 1.3 0.9 1 0.9
Training
1. number of Graduate Trainees 8 21 30 25 5
2. number of Trainees Sponsored 28 357 388 557 545
3. Training expenditure (e’000) 3,619 3,675 3,300 2,997 2,324
Other
1. consumer Price Index (%) 5.5 6.6 11.8 9.5 6
2. Sec Tariff Increase (%) 16 28.2 21 4.3 3.8

4 Sec annual report 2010/2011
FROM POwER STATION TO CUSTOMER
POwEr STATIONS. Input: Water**– 880,279 Mldiesel – 10,660 l** all water used is released back to river streams unpolluted.
Output:Total electricity generated – 333.4 GWhTotal electricity sold – 976.8 GWhThe balance of electricity is imported into the country.
Maguga Power Station
TrANSMISSION HIgH VOLTAgE LINESalternating current (ac) - 400kVdirect current (dc) - 132kV
Sikhuphe Substation
TrANSMISSION SuBSTATIONSSubstation high-voltage lines: 132, 66kVdistribution: 11kV
CuSTOMErSOur customer base consists of industrial, agricultural, commercial and domestic.Industrial: 360, 2 GWhagricultural – 211, 1 GWhcommercial – 110, 9 GWhdomestic 304.6 GWh
TrANSfOrMErSThe voltage levels
of electricity are
stepped down to
meet distribution
requirements.
(11kV stepped
down to 400V)
an Sec customer’s house (domestic) Summerfield Botanical Gardens in Matsapha (commercial)
5
HOw SEC GENERATES ELECTRICITy POwEr STATIONS
Sec mainly operates four hydropower stations; Maguga hydropower Station, ezulwini hydropower Station, edwaleni hydropower
Station, and Maguduza hydropower Station. These all serve as peaking and emergency power stations. They are not a constant
supply of electricity for normal daily consumption, which is a function of base load power stations like thermal power stations. This
is due to the fact that there is limited dam/storage capacity, variable & unreliable rainfall patterns & intensity. Subsequently, there
is insufficient water to run hydro turbines continuously all year round and ultimately supply the country’s total energy demand.
These stations have a combined installed generation capacity of 60.4 MW, and contribute (Sec’s internal generation) 29% of the
total energy consumed in the country. The rest is imported largely from eskom in South africa, and a portion of it from edM in
Mozambique.
Sec’s installed hydro capacity is distributed amongst the four power stations as follows:
1. Maguga hydropower Station – 2 x 9.9 MW hydro Units.
2. ezulwini hydropower Station – 2 x 10.0 MW hydro Units.
3. edwaleni hydropower Station – 4 x 2.5 MW & 1 x 5.0 MW hydro Units.
4. Maguduza hydropower Station – 1 x 5.6 MW hydro Units.
wATEr SuPPLy rESErVOIrS
The three power stations, ezulwini, edwaleni and Maguduza are cascaded, with the Luphohlo dam as their key water supply.
The dam is built upon and is supplied by the Lusushwana river. Water supplied by the dam to the ezulwini hydropower Station is
utilised further down by the edwaleni hydropower Station, and finally by the Maguduza hydropower Station.
The Maguga hydropower Station is supplied by the Maguga dam, which is operated by the Komati Basin Water authority (KOBWa).
The dam is built upon and supplied by the Komati river. Since the primary function of the Maguga/driekoppies dam System is
to supply water for irrigation downstream of the dam, the Maguga hydropower Station operation is guided by “hydropower
Operating Guidelines” agreed upon, and signed by both Sec and KOBWa.
HydrOPOwEr THEOry
hydropower is a conventional renewable energy source which is clean, free from pollution and generally has a positive effect
on the environment. One key operational advantage of hydropower stations is that they are capable of generating power within
minutes.
a hydropower station utilises the potential energy of water stored in a dam higher than the power station by converting it into
electric energy. The water flows through a high pressure conduit referred to as a penstock, into a water turbine, through a turbine
runner, and discharged back into the river. as the water flows through the turbine runner, it spins the turbine shaft which drives
the generator connected to it, thereby generating electricity. The electricity is then fed into the transmission network.

6 Sec annual report 2010/2011
BOARD OF DIRECTORS
From right to left:
1. S’THOfENI gININdzA (44)Chairman• Ba economics – UnISWa
• Ma economics – Ottawa canada
• Business Leadership – Stanford
University
2. PIuS N. guMBI (40)Managing Director• Meng, Beng (hons) – UK
• executive development Programme
– Stanford University
• Member of the Institute of
engineering and Technology – UK
3. TIMOTHy r.T. NHLEkO (58)Non-Executive Director• MBa – Florida International
University, Miami, Florida, USa
• Ba economics – University of
Botswana and Swaziland
• diploma in Banking – Institute of
Bankers, Sa
4. dr wINILE NHLENgETHwA (55)Deputy Chairman• Phd – Manchester University
• MSn (nursing) – howard University
• Ba (nursing) – howard University
• dip. (reproductive health)
5. MrS LINdA NkwANyANA (34)Non-Executive Director• human resource Management
(Mangosuthu Technikon)
• B-Tech degree human resource
Management (UnISa)
6. MS HLOBSILE NdzIMANdzE (36)Non-Executive Director• Ba (Law)
• LLB (UnISWa)
• Legislative drafting (Ghana Law
School)
7. PrINCESS MSINdVOSE (51)Non-Executive Director• BSc degree
• Business administration
(Management) – northrop
University, Los angeles, USa
8. HENry d. SHONgwE (53)Non-Executive Director• MSc Mechanical engineering – UK
• BSc hons in energy Studies – UK
9. dr MIkE MATSEBuLA (62)Non- Executive Director• Ba (economics and accounting),
1972 – UBLS
• Ma economics, 1975 – Manitoba,
Winnipeg, canada
• Phd economics, 1981, Queen’s,
Ontario, canada
10. BHANgASE P.M. zwANE (50)Legal Advisor and Company Secretary• Master of Laws (Wits) – energy
Law, Banking & Finance Law,
competition Law and Intellectual
Property Law
• Bachelor of Laws (UnISWa) (Old
UBS/edinburgh University, UK Joint
Programme)
• attorney, notary Public,
conveyancer (of the courts of
Swaziland and South africa)

7
EXECUTIVE MANAGEMENTPIuS N. guMBI (40)Managing Director• Meng, Beng (hons) – UK• executive development Programme – Stanford University• Member of the Institute of engineering and Technology – UK• responsibilities – corporate Strategy and Vision – capital allocation – Team Building
BANELE NyAMANE CA (SA) (32)General Manager Finance• Bachelor of commerce (accounting) – UnISWa• honours degree in accounting Science (cTa) – UnISa• Post Graduate diploma in auditing – aPT• chartered accountant, South africa, ca (Sa) – SaIca• associate chartered accountant, aca, IcaeW• chartered accountant, Swaziland, ca (Sd) – SIa• responsibilities – Finance – Information Technology – Procurement
MESHACk M. kuNENE (51)General Manager Operations• Beng (electrical and electronics engineering)• executive development Programme – Stanford University• Member of the South african Institute of electrical engineering• responsibilities – engineering – Transport – Projects
SkHuMBuzO S. TSABEdzE (47)General Manager – Customer Service• BSc – UnISWa• Master of arts (Info. Science) – UK• Master of Business Leadership – UnISa• chartered Marketer – Sa• responsibilities – customer Service – environment and Safety – Infrastructure development – SherQ
MAx MkHONTA (42)General Manager Corporate Services• Ba Social Science – UnISWa• Bachelor of administration in human resource Management
(honours degree) – UKZn• responsibilities – corporate communications – Legal Services – Facilities Management – human capital Management and development – Industrial relations

8 Sec annual report 2010/2011
THE HISTORy OF SEC
1920s – 1950sThe first electric light to light up the
night in Swaziland was installed at
Mlilwane with a 52.5 kVa hydro-turbine
by James Weighton reilly. reilly later
installed this plant on the Mbabane
river, below where the Swazi Inn
was later built, to supply Mbabane
with light. he subsequently sold it
to Mercer cox, who then sold it to
the Swaziland Government. Mickey
reilly also brought electricity to
Bremersdorp (present-day Manzini),
where he created a roaring trade
selling single light points to the town,
and in particular to the families howe
and Stewart whose rivalry caused
them to compete with each other.
This escalated not only the price of
electricity, but also the number of light
points sold!
8 JuNE 1955The process began for the Government
of Swaziland to buy the Bremersdorp
electricity Supply from the Swaziland
Power company for £50,000.
1963The Swaziland electricity Board
was officially launched and work
commenced on the construction of
edwaleni hydro-electric Power Station.
19 SEPTEMBEr 1964The edwaleni hydro-electric Power
Station was inaugurated by Mr. h. F
Oppenheimer in the presence of his
Majesty King Sobhuza II.
1975hhelehhele 132/66kV Substation was
constructed.
1980Work commenced on the construction
of the Luphohlo Power Station.
1985Luphohlo Power Station was
commissioned bringing the total
installed internal generation to 51MW.
1987eskom III Incomer was constructed
from normandie to Kalanga.
1989nhlangano II and Kalanga 132/66kV
Substations were constructed. This
was a great relief to the eskom I and
II 132kV Incomers which were now
operating at full capacity.
1989Mhlosheni and hluti 33/11kV
Substations were constructed.
2000Motraco 400kV joint venture as well
as the edwaleni II 400/132kV 500MVa
(2by 250MVa) Substation was
commissioned. This project, combined
with the commissioning of a number
of other 132/66kV substations brought
a marked improvement to the quality
of supply. hhelehhele and Stonehenge
Substations were brown field projects
whilst Mkhinkomo II was a green field
development.
2003 – 2010a number of green field as well as new
66/11kV substations were constructed
resulting in improved capacity in
these substations. These substations
included Big Bend, Bhalegane, Sihhoye,
Kent rock, Pine Valley, Lobamba, and
Manzini north Substations.
dECEMBEr 2007The Swaziland electricity Board
changed its name and became the
Swaziland electricity company.
13 MAy 2011The Maguga hydro-electric Power
Station was inaugurated by his Majesty
King Mswati III.
Background: Edwaleni Power Station under construction – 1963.Left: Edwaleni Power Station – 2011.

9
CHAIRMAN’S REVIEw
It gives me great pleasure to present the Swaziland Electricity
Company’s Annual Report for the financial year ended 31 March
2011. whilst the world’s economies were recovering from the
global financial crisis, Swaziland has been faced with enormous
challenges as a result of the decline in SACU revenues.
Considering the economic challenges faced by the country, the
Company is dealing with a potential decline in business as a
result of major customers opting for self-generation. This is due
to the high increases in tariffs over the past three years, as well
as the decline in the industrial base.
ECONOMIC rEVIEw
The majority of economies around the world, the Sadc region in particular, recorded increases in GdP over the year under review,
whilst Swaziland remained stagnant. This was a result of the recovery from the global financial crisis. Our country’s economy has
come under severe pressure as a result of the significant decrease in SacU revenue. This has seen the country’s deficit increasing
and has forced Government to cut down on certain capital projects and expenditure.
Government’s declining spending patterns have affected the Small and Medium entities which relied heavily on Government projects.
The reduction in economic activity has also had a negative effect on our business growth in the year under review. The closure of
two big companies during the last financial year has unfortunately had a negative impact on our business. This is reflected in the
4.1% decrease in our sales volume. despite negative macroeconomic challenges, the company has performed exceptionally well.
The efforts of his Majesty King Mswati III, Parliament and Government, who worked tirelessly to ensure that this painful phase
passed quickly, are gratefully noted. Our company will also play a major role in assisting with the economic recovery and as a Board
we are committed to delivering on this task effectively.
SAfETy ANd ENVIrONMENT
Swaziland electricity company (Sec) remains committed to the issues of safety for its employees, contractors and the public
at large. I am happy to report that during the year, we reviewed our Safety, health, environment, risk and Quality (SherQ)
structures to ensure that we remain consistently alert to the challenges posed by our increasing network.
It is lamentable that during the year two fatalities were recorded; involving a contractor and a member of the public. as a Board
we are confident that Management will continue to work tirelessly to ensure that these unfortunate incidents do not re-occur.
rESTruCTurINg
during the year under review, the Board approved a restructuring exercise to ensure that the company will remain sustainable
into the future. emerging challenges include the increasing domestic network, which puts a strain on the quality of supply as
well as the decline in large customers. This is due to a proportion of them closing down, others opting for self-generation as
well as a decline in the industrial base. I would like to express my sincere gratitude to all stakeholders, labour organisations and

10 Sec annual report 2010/2011
Management for working together to bring this exercise to a close. The Board acknowledges the very challenging nature of the
exercise in the short term but is confident that it will bear fruit in the long term.
Other elements of the restructuring remain ongoing, in particular the remuneration review, whose objective is to address concerns
about manpower costs. We remain positive that once all the ongoing initiatives are implemented, they will assist the company to
remain sustainable in these arduous economic times.
BuSINESS rEVIEw
The process of converting our customers from the post paid to prepaid system is close to completion. although it experienced
some challenges in the beginning, the Board is proud to witness that Management and employees have worked tirelessly to
ensure that all of our valued customers are serviced properly. I am confident that the company has overcome all the challenges
it has been confronted with and I am delighted with the reception from clients about this product.
In an effort to keep improving our efficiency and service to our customers, the Board has approved the establishment of four
new depots. These depots will assist the company in bringing service closer to its customers and also in responding to incidents
promptly. This will be complemented by the establishment of a call centre, which is partially operating.
In response to his Majesty King Mswati III’s call to lead the country towards attaining first world status, the company has
continued to invest heavily in capital projects. during the year under review, e228 million was spent on new projects, some of
which were still in progress at year end. This will ensure stability in power supply.
It is regrettable that no progress has been made on the Thermal Power Station Project due to a delay in obtaining the Mining
and exploration Licence from the relevant body. We remain hopeful that this will occur soon as all the company’s necessary
preparations have been concluded.
fINANCIAL PErfOrMANCE
during the year under review, the company recorded a total comprehensive income of e190 million which is an increase of 58%
compared to the previous year. a major contributor to this increase is the revenue from customer contributions recognised in
terms of IFrIc 18. revenue increased by 22% to e973 million and this is attributed to the tariff increase. The stability of the local
currency, the Lilangeni against the US dollar and the euro helped the company to keep foreign exchange losses to a minimum.
revenue per employee was e1.7 million, increasing from e1.2 million in the previous year and the impact of the drive to improve
efficiency is beginning to bear fruit.
The balance sheet remains strong with a net gearing ratio of 1:10. I am happy to report that for the first time in the history of the
company, the directors recommended a dividend declaration of e6 million which was approved by the shareholder. The directors
have also proposed another dividend declaration for the year under review, which is still subject to shareholder approval.
The company’s investment in the associate MOTracO is beginning to produce results. during the year under review, this
associate declared a dividend of US$1.5 million and as per the financing agreement for this investment, 50% of the dividend was
remitted to the financier.
BOArd Of dIrECTOrS
during the year, the Board continued to adhere to its terms of reference and subscribe to the principles of good corporate
governance. The Board of directors executes some of its responsibilities through Board Sub-committees which include the audit
and risk, Finance, Technical and remuneration Sub-committees. The Board attended relevant training and forums during the year
which will help it to keep in touch with the constantly changing economic environment.
Two members of the board, Mr. S Motsa and Mr. F Graham retired during the year under review and were replaced by Ms. h
ndzimandze and Mrs. L nkwanyana. I would like to extend my gratitude to the retired members for their enormous contribution to
the success of Sec during the period that they served on the Board. I also welcome the new members and hope they will work
tirelessly to succour the company into the future.
11
The term of office of a number of our members comes to a conclusion on 31 October 2011. Looking back to 2007, when these
valuable members joined the Board, we pride ourselves on a number of achievements during this period. a major achievement
was bringing industrial harmony to the company. Since 2008, there has not been conflict between Management and the labour
formations. This was achieved through Management’s role and existing policies not being interfered with by the Board. I would
also like to show my appreciation for the role played by the Union and Staff association in ensuring the accomplishment of this
achievement.
Other achievements by the Board include the strong financial performance of the company, strong management leadership and
the stability of power supply in the country.
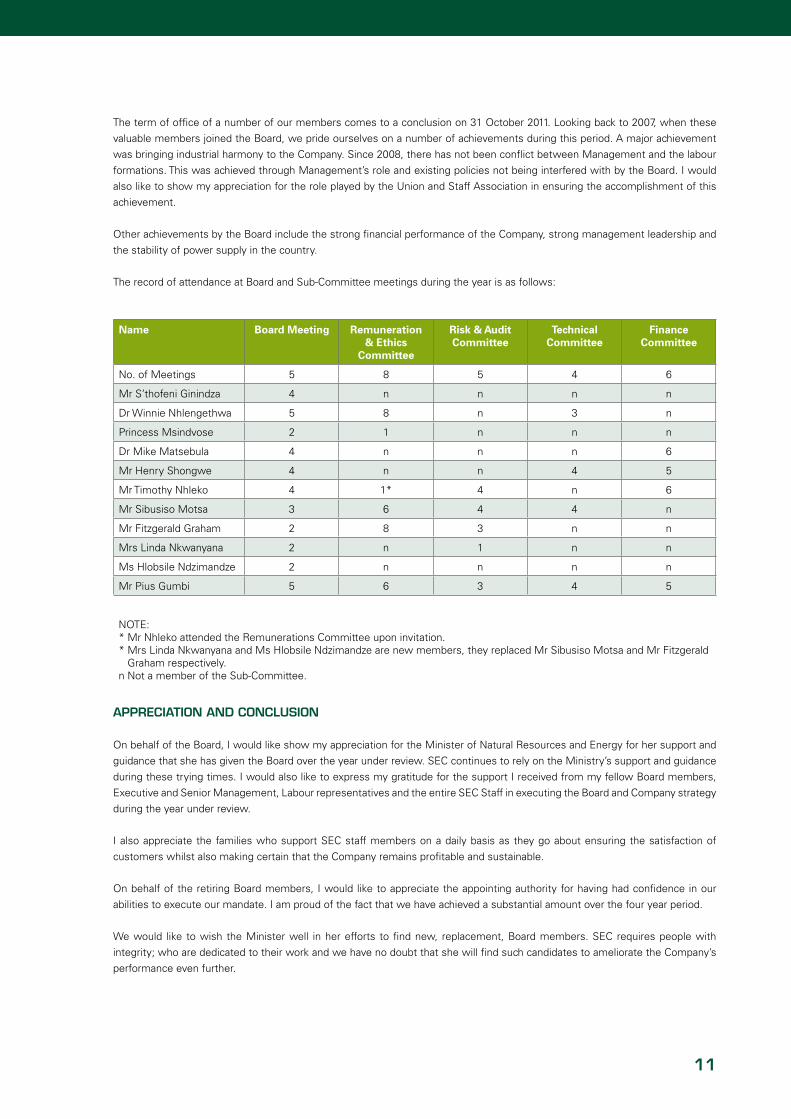
The record of attendance at Board and Sub-committee meetings during the year is as follows:
Name Board Meeting Remuneration & Ethics
Committee
Risk & Audit Committee
Technical Committee
Finance Committee
no. of Meetings 5 8 5 4 6
Mr S’thofeni Ginindza 4 n n n n
dr Winnie nhlengethwa 5 8 n 3 n
Princess Msindvose 2 1 n n n
dr Mike Matsebula 4 n n n 6
Mr henry Shongwe 4 n n 4 5
Mr Timothy nhleko 4 1* 4 n 6
Mr Sibusiso Motsa 3 6 4 4 n
Mr Fitzgerald Graham 2 8 3 n n
Mrs Linda nkwanyana 2 n 1 n n
Ms hlobsile ndzimandze 2 n n n n
Mr Pius Gumbi 5 6 3 4 5
nOTe: * Mr nhleko attended the remunerations committee upon invitation. * Mrs Linda nkwanyana and Ms hlobsile ndzimandze are new members, they replaced Mr Sibusiso Motsa and Mr Fitzgerald
Graham respectively.n not a member of the Sub-committee.
APPrECIATION ANd CONCLuSION
On behalf of the Board, I would like show my appreciation for the Minister of natural resources and energy for her support and
guidance that she has given the Board over the year under review. Sec continues to rely on the Ministry’s support and guidance
during these trying times. I would also like to express my gratitude for the support I received from my fellow Board members,
executive and Senior Management, Labour representatives and the entire Sec Staff in executing the Board and company strategy
during the year under review.
I also appreciate the families who support Sec staff members on a daily basis as they go about ensuring the satisfaction of
customers whilst also making certain that the company remains profitable and sustainable.
On behalf of the retiring Board members, I would like to appreciate the appointing authority for having had confidence in our
abilities to execute our mandate. I am proud of the fact that we have achieved a substantial amount over the four year period.
We would like to wish the Minister well in her efforts to find new, replacement, Board members. Sec requires people with
integrity; who are dedicated to their work and we have no doubt that she will find such candidates to ameliorate the company’s
performance even further.

12 Sec annual report 2010/2011
MANAGING DIRECTOR’S REPORT
The Company’s revenue increased by 22% during the year under
review while revenue from unit sales increased by 18%, which
is 2% higher than the tariff increase awarded by the regulator.
The 2% extra is attributed to the large industrial customers who
curtailed their operations but were still paying for the highest
peak demand recorded in the previous year. Cost of sales only
increased by 10% and this is attributed to the increase in
internal generation.
CuSTOMEr SErVICE
In the year under review, Sec’s customer complement grew by 13%, bringing the total number to 99,631 from a previous
customer base of 88,182. Sec continued to roll out the Prepayment Project resulting in 83.4% of Sec customers migrating to
prepaid supply.
customer growth by tariff category continued to be dominated by the domestic sector which constitutes 89% of Sec’s customers.
Growth was not realised in the industrial and irrigation sector in the year under review. This was due to the slow economic growth
rate. conversely, we witnessed a reduction in load as we lost one of our major industrial customers in the Lubombo region.
Customer Growth
100,000
90,000
80,000
70,000
60,000
50,000
40,000
30,000
20,000
10,000
0
2006 2007 2008 2009 2010 2011
customers 58,716 63,798 70,517 79,055 88,182 99,631
13
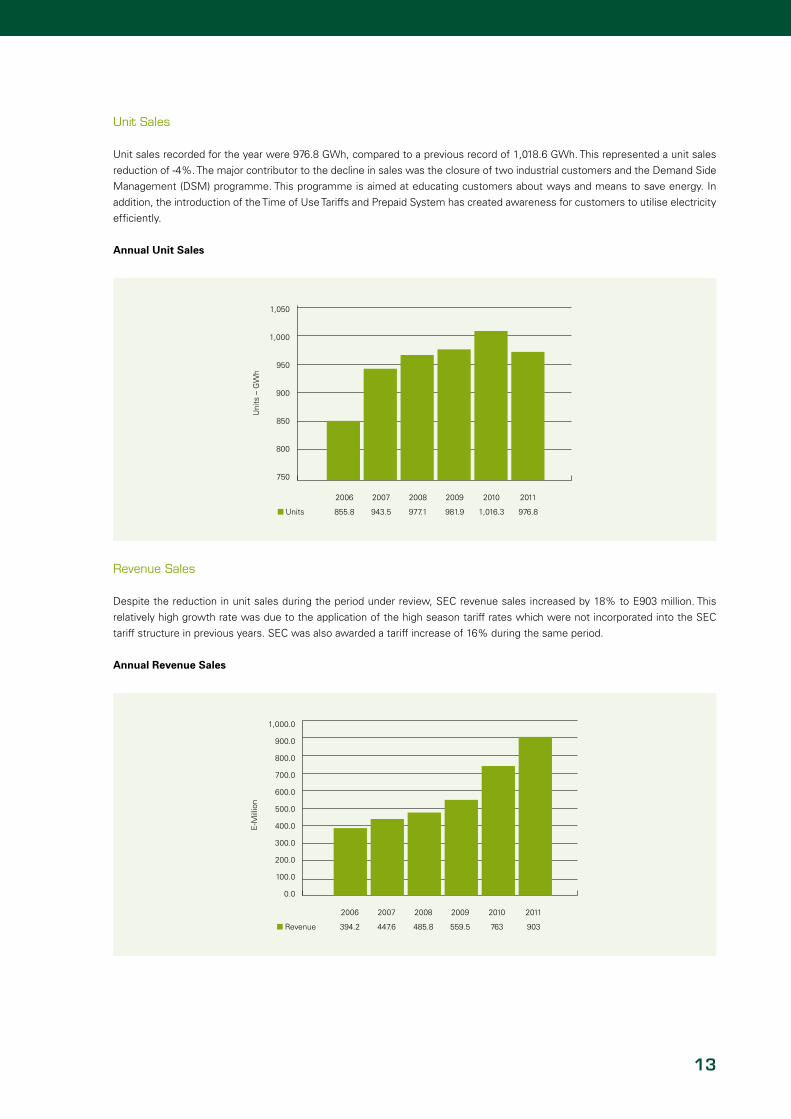
Unit Sales
Unit sales recorded for the year were 976.8 GWh, compared to a previous record of 1,018.6 GWh. This represented a unit sales
reduction of -4%. The major contributor to the decline in sales was the closure of two industrial customers and the demand Side
Management (dSM) programme. This programme is aimed at educating customers about ways and means to save energy. In
addition, the introduction of the Time of Use Tariffs and Prepaid System has created awareness for customers to utilise electricity
efficiently.
Annual Unit Sales
1,050
1,000
950
900
850
800
750
2006 2007 2008 2009 2010 2011
Units 855.8 943.5 977.1 981.9 1,016.3 976.8
Revenue Sales
despite the reduction in unit sales during the period under review, Sec revenue sales increased by 18% to e903 million. This
relatively high growth rate was due to the application of the high season tariff rates which were not incorporated into the Sec
tariff structure in previous years. Sec was also awarded a tariff increase of 16% during the same period.
Annual Revenue Sales
1,000.0
900.0
800.0
700.0
600.0
500.0
400.0
300.0
200.0
100.0
0.0
2006 2007 2008 2009 2010 2011
revenue 394.2 447.6 485.8 559.5 763 903
e-M
illio
nU
nits
– G
Wh

14 Sec annual report 2010/2011
The Prepayment Project
The prepayment project was divided into two phases. The first phase began in 2008, in the Manzini region under contract with
Itron Metering Solutions and completion was in 2010. The second phase started in October 2010 in the hhohho, Lubombo and
Shiselweni regions. The second phase was managed in-house and work was allocated to eleven contractors registered within
the Swaziland electricity company’s commercial department.
The total number of customers on the prepaid system is 86,447. The chart below indicates the number of customers that are
utilising prepaid meters per region:
Figure 1: Customers on the Prepaid System by Region
ShISeLWenI; 7775
ManZInI; 37426
hhOhhO; 26353
LUBOMBO; 14893
When the prepaid electricity project was conceived, its main purpose was to minimise non-technical losses due to meter reading
and data capturing errors. however, there are many benefits that the system can offer customers, including accurate billing. The
prepaid electricity meter allows the customer to monitor their household consumption at their own convenience. Therefore, the
customer can precisely budget for their household electricity needs on a monthly basis. The customer also has equanimity as a
result of the prepaid electricity meter system, this is due to the fact that they utilise what has already been paid for instead of
living on credit. For the discreet customer this has provided a high degree of privacy since there are no intrusions by meter readers
arriving at irregular intervals.
The Swaziland electricity company has also established some value-add services within the portfolio of services. These services
include the introduction of third party vendors and PIn vouchers. These services have allowed the customer the freedom to
buy electricity at the most convenient point of sale. The aim is to reduce the travelling cost and time for customers to reach the
nearest point of sale, inevitably increasing the customer’s worth. PIn vouchers are even more convenient because they can be
used for any meter, but only one meter for one PIn voucher.
This valuable project is expected to cost the Swaziland electricity company in the region of e70 million. however, it does provide
major benefits, such as reliable customer consumption per unit installed. customers do not have to wait for a bill before they
realise how much their electricity costs are, but can now budget better and save wherever possible.
Safety, Health, Environment, Risk and Quality (SHERQ)
Sec has continued to commit itself to ensuring that it prioritises health, safety and environmental standards. all SherQ
committees were re-established and the new Sec Occupational health and Safely Policy was signed off during the period under
review. Unlike the previous year, we recorded a significant reduction in fatal injuries, though regrettably experienced two fatalities
– a contractor who was working on the power lines and a member of the public. We continue to educate the public on the aspects
of safe use of electricity to minimise incidents of accidental electrocution.
15
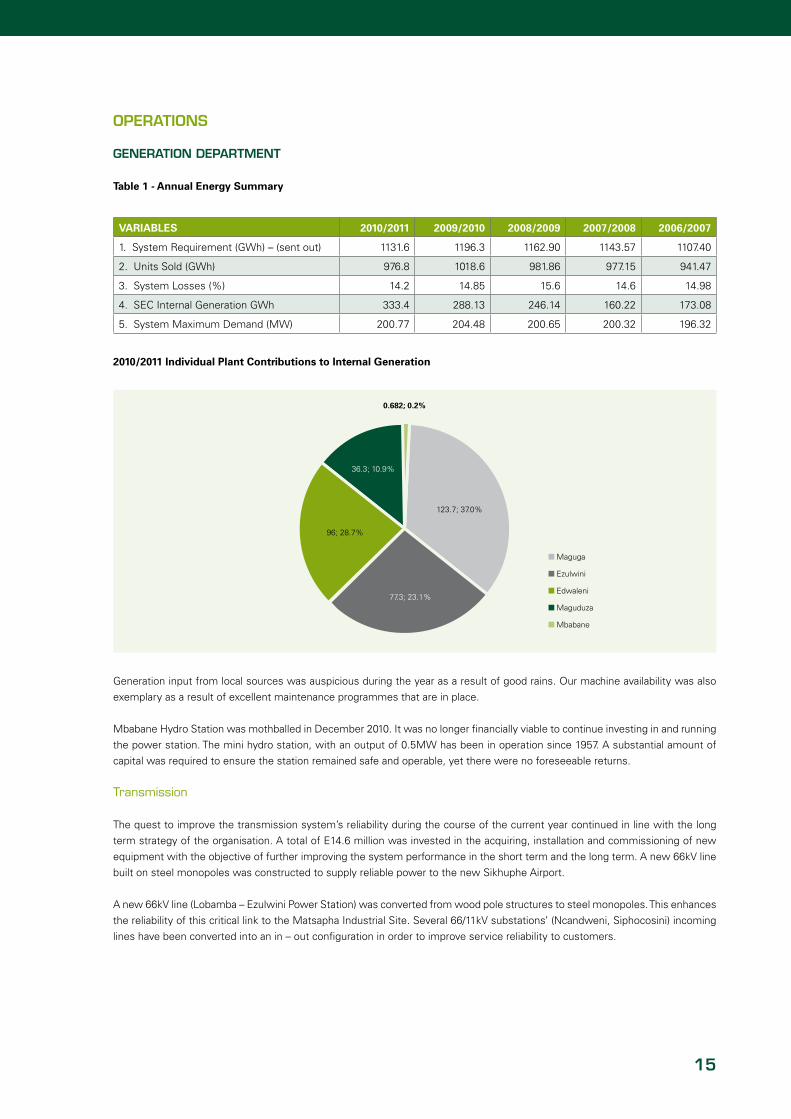
OPErATIONS
gENErATION dEPArTMENT
Table 1 - Annual Energy Summary
VARIABLES 2010/2011 2009/2010 2008/2009 2007/2008 2006/2007
1. System requirement (GWh) – (sent out) 1131.6 1196.3 1162.90 1143.57 1107.40
2. Units Sold (GWh) 976.8 1018.6 981.86 977.15 941.47
3. System Losses (%) 14.2 14.85 15.6 14.6 14.98
4. Sec Internal Generation GWh 333.4 288.13 246.14 160.22 173.08
5. System Maximum demand (MW) 200.77 204.48 200.65 200.32 196.32
2010/2011 Individual Plant Contributions to Internal Generation
0.682; 0.2%
36.3; 10.9%
96; 28.7%
77.3; 23.1%
123.7; 37.0%
Maguga
ezulwini
edwaleni
Maguduza
Mbabane
Generation input from local sources was auspicious during the year as a result of good rains. Our machine availability was also
exemplary as a result of excellent maintenance programmes that are in place.
Mbabane hydro Station was mothballed in december 2010. It was no longer financially viable to continue investing in and running
the power station. The mini hydro station, with an output of 0.5MW has been in operation since 1957. a substantial amount of
capital was required to ensure the station remained safe and operable, yet there were no foreseeable returns.
Transmission
The quest to improve the transmission system’s reliability during the course of the current year continued in line with the long
term strategy of the organisation. a total of e14.6 million was invested in the acquiring, installation and commissioning of new
equipment with the objective of further improving the system performance in the short term and the long term. a new 66kV line
built on steel monopoles was constructed to supply reliable power to the new Sikhuphe airport.
a new 66kV line (Lobamba – ezulwini Power Station) was converted from wood pole structures to steel monopoles. This enhances
the reliability of this critical link to the Matsapha Industrial Site. Several 66/11kV substations’ (ncandweni, Siphocosini) incoming
lines have been converted into an in – out configuration in order to improve service reliability to customers.

16 Sec annual report 2010/2011
Mbabane Hydro Power Station
School Children Visiting Ezulwini Power Station
Historic Machinery at Mbabane Hydro Power Station Ezulwini Dual Steel Monopole

17
Substations
The company has, over the last five years, been involved in infrastructure development throughout the country. The projects for
2011 included the construction of new substations in Mayiwane and Lawuba and the completion of Manzini north.
Manzini north Project was completed on schedule and commissioned in July 2010. The substation is expected to improve the
quality of supply in the sub-region. The final cost for the project was within budget at e41 million.
Mayiwane Substation and the feeder line from Sihhoye were awarded to consolidated Power Projects (Pty) Ltd in October 2010
and the construction work began with the feeder line in February 2011. The total contract amount for this project is e27 million.
This project is expected to be completed by december 2011.
System Operations & Control
Systems Outlook
The figure below shows the energy demand throughout the financial year 2010-2011.
SEC System Maximum Demands 2010 - 2011
210
200
190
180
170
160
150
apr
-10
May
-10
Jun-
10
Jul-1
0
aug
-10
Sep
-10
Oct
-10
nov
-10
dec
-10
Jan-
11
Feb-
11
Mar
-11
MW
Photographs of a Remote Terminal Unit (RTU) Cabinet at Manzini North Substation

18 Sec annual report 2010/2011
Tele-Communications
Two projects have been undertaken in a bid to increase radio coverage for Sec. These include the Mdumezulu high Site which will
improve channels 4, 6, and 7 coverage once completed, as well as Mahlangatsha high Site which will address the coverage for
channel 5. The department is also in the process of phasing out both voice and data radios which are now obsolete in the system.
Distribution Planning
The Planning Section conducted a distribution System Study
Project for the Stonehenge and Malkerns depot areas. an action
plan was engineered to implement the recommendations of
the study. adopted as a result of the study was a method of
mitigating lightning protection on the distribution System. This
method employs the use of lightning arrestors and effective
earthing of the system to protect transformers from lightning.
It is envisaged that there will be great improvement in the
performance of the system in terms of supply continuity. Service
to our valued customers will also be more reliable.
Photograph of a Well-Installed Distribution Transformer
COrPOrATE SErVICES
Part of Sec’s strategic focus is to ensure effective and efficient performances by all employees. Our intention is to consistently
provide customer satisfaction and impact the bottom line positively. One of the critical ways to ensure success within this objective
is by training and developing staff in order for them to reach their full potential. during the 2010/2011 financial year, Sec continued to
sponsor employee training and development under the auspices and patronage of the Training and development department utilising
Sec, PeU and MOTracO funds. employees were exposed to training interventions both within Swaziland and outside the country.
Sec has focused upon developing customer care skills by conducting a series of workshops for our permanent and contracted
frontline staff. customer care workshops were undertaken during the year.
The number of permanent employees who are given the opportunity to acquire much needed skills and knowledge through short,
medium and long term training and development in the form of seminars, workshops, conferences, part-time and full-time studies
has increased.
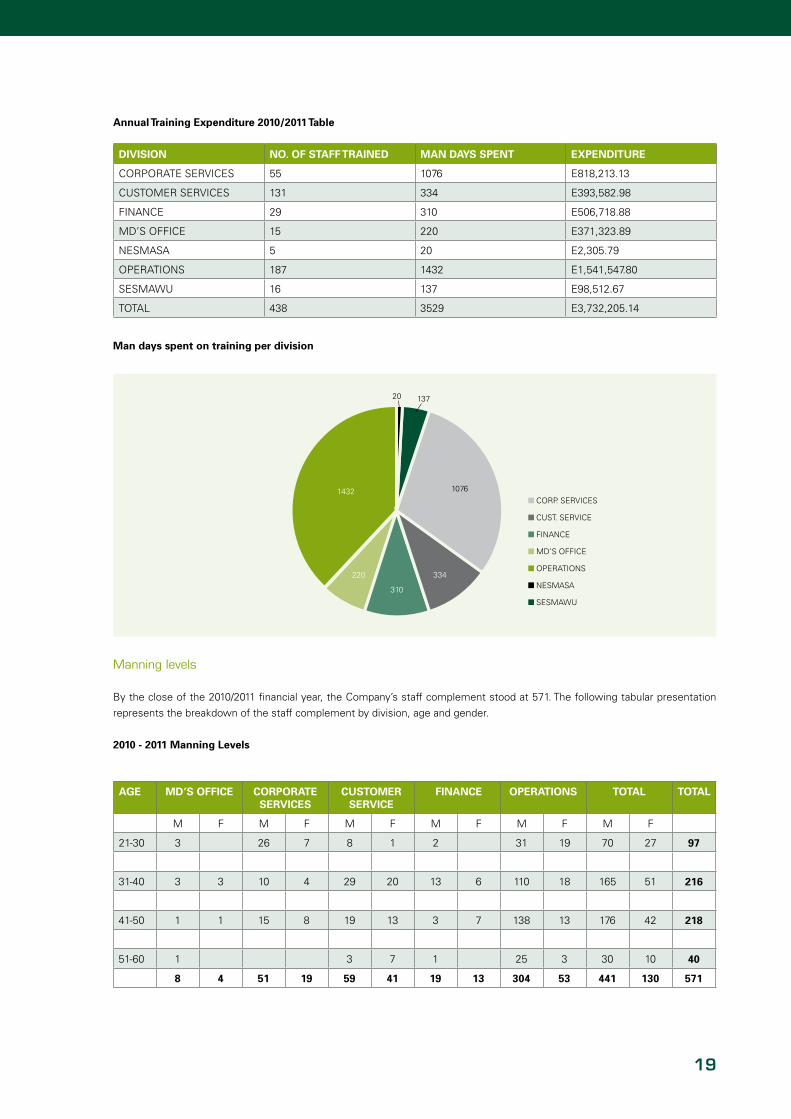
a total of e3,7 million was spent on training in the 2010/2011 financial year. This is reflected in the table, pie chart and bar charts
below; showing the breakdown and relationships amongst the divisions of expenditure.
19
Annual Training Expenditure 2010/2011 Table
DIVISION NO. OF STAFF TRAINED MAN DAYS SPENT EXPENDITURE
cOrPOraTe SerVIceS 55 1076 e818,213.13
cUSTOMer SerVIceS 131 334 e393,582.98
FInance 29 310 e506,718.88
Md’S OFFIce 15 220 e371,323.89
neSMaSa 5 20 e2,305.79
OPeraTIOnS 187 1432 e1,541,547.80
SeSMaWU 16 137 e98,512.67
TOTaL 438 3529 e3,732,205.14
Man days spent on training per division
cOrP. SerVIceS
cUST. SerVIce
FInance
Md’S OFFIce
OPeraTIOnS
neSMaSa
SeSMaWU
137
1076
334
310
220
1432
20
Manning levels
By the close of the 2010/2011 financial year, the company’s staff complement stood at 571. The following tabular presentation
represents the breakdown of the staff complement by division, age and gender.
2010 - 2011 Manning Levels
AGE MD’S OFFICE CORPORATE SERVICES
CUSTOMER SERVICE
FINANCE OPERATIONS TOTAL TOTAL
M F M F M F M F M F M F
21-30 3 26 7 8 1 2 31 19 70 27 97
31-40 3 3 10 4 29 20 13 6 110 18 165 51 216
41-50 1 1 15 8 19 13 3 7 138 13 176 42 218
51-60 1 3 7 1 25 3 30 10 40
8 4 51 19 59 41 19 13 304 53 441 130 571

20 Sec annual report 2010/2011
Turnover
The company’s voluntary turnover was 10.9% and its involuntary turnover was 1.19%. The high voluntary turnover is as a result
of the generous early retirement Scheme which has witnessed 58 employees voluntarily leaving; they felt that they had made a
meaningful contribution to Sec and it was time for them to move on.
Performance Management System (PMS)
The company continues to cement the development of a high performance culture and all senior management positions have new
performance targets aligned to the company’s strategic plan of achieving customer excellence. The Performance Management
System has also been reviewed to incorporate strategic people management functions in order to enhance managers’ leadership
capabilities. all stakeholders have adopted the improvements of the system. additional initiatives aimed at addressing the
incentive part of the PMS System will be finalized in the coming financial year.
Corporate Social Investment (CSI)
The company continued to invest in cSI activities, fully recognizing the need to remain sensitive to the broader socio-economic
challenges facing the community we operate in. Specific efforts aimed at improving the overall cSI impact will be implemented
in the coming financial year.
fINANCE dIVISION
Financial Review
25
20
15
10
5
0
return on equity (%)
return on capital
employed (%)
current ratio (ratio)
debt/equity (ratio)
2011
2010
Statement of Comprehensive Income
The company’s revenue increased by 22% during the year under review while revenue from unit sales increased by 18%, which
is 2% higher than the tariff increase awarded by the regulator. The 2% extra is attributed to the large industrial customers who
curtailed their operations but were still paying for the highest peak demand recorded in the previous year. cost of sales only
increased by 10% and this is attributed to the increase in internal generation.
revenue from customer contributions increased by 94% compared to the previous year. This is due to the fact that for the year
ended 2010, the revenue was only recognised for nine months as IFrc 18 was effective from 1st of July 2009. In terms of
taxation, this is treated as a permanent difference.
Other income increased by 78% to e16 million. disposal of assets, which included properties and vehicles, contributed e3 million.
The company also successfully recovered a long outstanding VaT refund amounting to e1.2 million.

21
administrative expenses increased by 19% to e137 million; e40 million of this amount was used for the early retirement Scheme
undertaken during the year. e13 million of this amount was accrued at year end. This is because all necessary requirements had
been met at year end and the employees exited at the end of april 2011.
Finance costs reflect a debit amount of e19 million which is a decrease of 166% when compared to last year’s e27 million credit.
Last year’s credit balance was attributed to the strengthening of the Lilangeni against the euro and US dollar. during the year
under review, our local currency has maintained its strength.
The company’s current tax liability is e17 million which is a part of the e52 million disclosed. The balance is deferred tax liability.
The company anticipates that it will continue reflecting a deferred tax liability as it invests large amounts of money into capital
projects.
Statement of Financial Position
The company’s total assets increased by 22% from last year’s e1.5 billion. This is due to the increase in retained income. net
borrowings increased by e60 million. This was arrived at after deducting repayments from the e75 million that was drawn down
from PSPF. The company’s net debt to equity ratio remains healthy.
The e40 million prepayment relates to the co-generation partnership the company entered into with Ubombo Sugar Limited,
where the company will pay e150 million for an exclusive right to buy excess power. Both parties signed a 15 year power purchase
agreement.
Statement of Cash Flow
net cash generated from operations increased by 69% to e282 million. This is a strong indication of the company’s capability
to turn profits into cash. cash utilised in investing activities was e265 million which is reflective of the company’s activities that
require massive investment into infrastructure.
Information Technology
all systems used by the company are managed in-house. all but one of the systems achieved more than 98% availability.
during the year under review, the system used for vending prepaid electricity experienced a high downtime which was replicated
on the back-up system. This posed a huge inconvenience to the company’s customers as they could not buy tokens when the
system was down. a major upgrade of the system was undertaken after year end and the system is now stable.
The company has embarked upon rolling out a new system that will automatically read meters remotely. This will be for all the
major customers and will improve the turnaround times in billing.
Commercial Services
Obsolete stock amounting to e2 million was written off during the year and will be sold off as scrap. These are items that are no
longer utilised within the system. The department continued to explore various ways of reducing the inventory holdings. These
efforts remain pending and are anticipated to be implemented in the coming financial year.


23
CORPORATE ENVIRONMENTAL SUSTAINABILITySwaziland electricity company realises that environmental issues are a global concern and are startlingly real. Thus, the company
has adopted sustainable business practices. Businesses worldwide are moving towards a sustainable model. Sec is also taking
steps in this direction. The company is implementing an environmental policy that keeps with their commitment to sustainability.
The company possesses an environmental department whose functions are to handle environmental and socio-economic issues
pertaining to the operations of Sec. This ensures that Sec operates within the provisions of Swaziland’s environmental regulations
and the company’s environmental policy. Other functions of this valuable department include: developing environmental guidelines
and environmental operational plans for Sec regarding various aspects. These include advising other divisions within the company
about environmental and social issues; representing Sec on environmental and social issues within national and international
fora; liaising with Government ministries and other institutions responsible for the management of the environment, conducting
environmental impact assessments for Sec projects, recommending mitigation measures and monitoring implementation of
recommended mitigation measures. The department is also responsible for supervising consultants hired to do environmental
work for Sec projects pertaining to power generation, transmission and distribution.
Sec always listens to their customers and the Swazi public at large about their concerns on environmental issues. customer
concerns are investigated and addressed whenever the need arises.
Sec has in the recent past presented itself as an environmental steward. The company is implementing a demand-side
management programme and this is extended to our customers. as part of this programme, on 26 March 2011, the company
was involved in the earth hour 2011 initiative, where the demand for electricity decreased by 10% from normal consumption.
Public sensitisation to energy efficiency was made by utilising the various forms of media; newspapers, television, radio and
in schools. Various stakeholders dealing with energy efficiency issues were involved. The company is informing the public on
environmental initiatives and promoting mutual understanding with its customers. Part of Sec’s campaign to encourage the
public to save electricity included tips for the public to implement:
ENErgy SAVINg TIPS
• Switch lights off when they are not in use.
• Use internal lights when necessary.
• Use natural light as much as possible.
• Switch off your printer, laptops and all other hardware if not in use.
• Switch off all electrical appliances when not in use.
• Use energy saving light bulbs.
Sec will continue with its commitment to sustainable development and expects inevitable new challenges. currently there is
an issue surrounding the phasing out of PcBs. The company conducted an inventory on substation transformers and it was
discovered that none of the transformers contained PcBs more than the maximum concentration allowed in oil. The company
went to the extent of constructing a shed where used transformers could be stored. This meets the UneP standards. The
company will therefore be sensitive to societal changes, and make environmental considerations a permanent part of its activities.
Therefore, the quality of life for our customers shall be improved while we also make positive contributions to our environment
and, most importantly, to our precious planet.

24 Sec annual report 2010/2011
EARTH HOUR ARRIVES IN SwAzILAND
“LIVE BEyOND THE HOUR”
On 26th March 2011 between the hours 8:30pm and 9:30pm, Swaziland fell into darkness and candles lit across the nation, a
demonstration of the country’s support for climate change awareness.
earth hour started in 2007 in Sydney, australia when 2.2 million individuals and more than 2,000 businesses turned their lights
off for one hour to take a stand against climate change. In 2010, a record 128 countries and territories joined the global display of
climate action. Iconic buildings and landmarks from asia Pacific to europe and africa to the americas ‘switched off’. People across
the world and from all walks of life turned off their lights and came together in celebration and contemplation of the one thing we
all have in common, our planet. In 2011, Swaziland joined the ranks of this great initiative.
earth hour is organized by World Wildlife Foundation, one of the world’s largest and most respected independent conservation
organizations. Their mission is to stop the degradation of the earth’s natural environment and build a future where people live in
harmony with nature.
On the 1st of February, 2011, the governing international organizing body for the ‘earth hour’ received an impassioned e-mail
from a 15 year old boy in Swaziland named nathi Mzileni, who, after being astonished by the country’s non-participation in 2010,
established an environmental organization determined to get his home nation on the earth hour map in 2011.
The earth hour Global team was so moved by nathi’s passion and commitment to conservation that they recognized him for his
initiative.
“While young nathi is not an official earth hour co-ordinator, the earth hour Global Team was so moved by his passion and
commitment to conservation that we are making him an honorary member of the Global earth hour network, and will support
his efforts to make earth hour happen for the first time in Swaziland,” stated the Global Team.
Swaziland electricity company did not hesitate to spearhead this worthwhile campaign, inspired by one of their own citizens, and
proceeded to throw all their weight behind making it a great success. Sec’s Managing director, Pius Gumbi gave an interview on
this subject, sensitising the public to the plight of climate change before earth hour took place. Mr Gumbi implored the public to
use electricity responsibly and sparingly even after the commemoration of the earth hour.
Gumbi said Sec does not focus on generating profits at the expense of the lives of its customers and, in particular, the planet that
humankind has a responsibility to preserve and protect. Sec has about 97 000 customers, and the number is growing daily with
the roll-out of the rural electrification project.
The Managing director said his prayer is for electricity consumers to look beyond 8.30pm to 9.30pm during which every citizen
of the world is expected to switch off lights in unoccupied rooms and non-essential appliances.
“The earth hour concept is not about switching off for only the stipulated period, but it’s just a reminder that it should become
a culture for every person who cares about the environment to use electricity conservatively. can you imagine how much
contribution we can make as a nation if we were to use electricity sparingly daily?” he remarked.
Mr Gumbi added; “Let it be understood that we’re not saying people should put their lives on hold and be deprived of the use of
electrical gadgets and tools. This should come voluntarily from all concerned, particularly Sec customers.”

25
The Managing director stated that of major concern was the depletion of natural resources such as coal and oil in the production
of energy. he recalled that the earth hour concept was as a result of a number of initiatives such as the Kyoto Protocol signed by
nation states in which they committed to making significant input in the avoidance of carbon emissions, which impact negatively
on climate change.
asked if he was worried about whether Sec would lose considerable revenue by encouraging its customers to use less power,
Gumbi said; “Our company wants to rise above short-term issues and concentrate on long-term gains, which are in the interest
of our customers. The benefits of using less electricity far outweigh any financial gains.”
he said Sec encourages its customers to use alternative sources of energy such as solar panels, adding that those who can afford
to should acquire solar-heated geysers.
On what Sec is doing to conserve the environment, Gumbi said they were complying with the country’s environmental legislation
as stipulated by the Swaziland environment authority (Sea).
Members of the public on Saturday 26th March 2011, joined the rest of the world in commemorating the earth hour global
initiative.
The Swaziland electricity company (Sec), together with its partners and 200 members of the public, assembled at the Public
Service Pensions Fund (PSPF) building in Mbabane to commemorate the earth hour between 8.30pm and 9.30pm.
The country’s major electricity supplier was joined by the Swaziland environment authority (Sea), renewable energy association
of Swaziland, nedbank as well as the Ministries of natural resources, energy and housing. One of the highlights of the
commemoration was the showing of a documentary on the earth hour. The programme required that all households and
businesses turned off their non-essential lights and electronic appliances for an hour in an effort to raise awareness about the
need to take drastic action on climate change.
all Sec customers and the nation at large were requested to participate in this event to minimize the impacts of climate change.
electricity consumers were requested to switch off non-essential electronic gadgets such as radios, TVs, ovens, computers,
geysers, heaters, chargers and stoves.
The event was a great success! during the earth hour Swaziland citizens saved 13.04 megawatts hours of electricity, a 9.6%
reduction from the average daily usage of our tiny kingdom with a population of slightly above 1 million.
as part of its support to the earth hour campaign, Sec measured the reduction in electricity used from its national control centre
in Mbabane.
Swaziland electricity company is proud of its major role in this great endeavour and will continue to support the earth hour into
the future.

Statement of directors’ responsibility 28
Independent auditor’s report 29
directors’ report 30
consolidated statement of comprehensive income 33
consolidated statement of financial position 34
consolidated statement of changes in equity 35
consolidated statement of cash flows 36
notes to the consolidated financial statements 37
CONTENTS
SwAzILANd ELECTrICITy COMPANy LIMITEd
CONSOLIdATEd fINANCIAL STATEMENTSFOr The Year ended 31 March 2011
27

28 Sec annual report 2010/2011
STATEMENT Of rESPONSIBILITy By THE BOArd Of dIrECTOrS
FOr The Year ended 31 March 2011
The directors are responsible for the preparation, integrity and fair presentation of the consolidated financial statements of the
Swaziland electricity company Limited. The consolidated financial statements presented on pages 30 to 100 have been prepared
in accordance with Swaziland and International Financial reporting Standards, and include amounts based on judgements
and estimates made by management. The directors also prepared the other information included in the annual report and are
responsible for both its accuracy and its consistency with the consolidated financial statements.
The directors are also responsible for the Swaziland electricity company Limited’s internal financial controls. These are designed
to provide reasonable, but not absolute assurance as to the reliability of the consolidated financial statements, and to adequately
safeguard, verify and maintain accountability of the assets, and to prevent and detect misstatement and loss. nothing has come
to the attention of the directors to indicate that any material breakdown in the functioning of these controls, procedures and any
system has occurred during the year under review.
The going concern basis has been adopted in preparing the consolidated financial statements. The directors have no reason to
believe that the Swaziland electricity company Limited will not be a going concern in the foreseeable future based on forecasts
and available cash resources. These consolidated financial statements support the viability of the Swaziland electricity company
Limited.
The consolidated financial statements have been audited by the independent accounting firm, Pricewaterhousecoopers, which
was given unrestricted access to all financial records and related data, including minutes of the directors and committees of
the company. The directors believe that all representations made to the independent auditors during their audit are valid and
appropriate. Pricewaterhousecoopers’ audit report is presented on page 29.
The annual consolidated financial statements which appear on pages 30 to 100 have been approved by the Board of directors
and are signed on its behalf by:
________________________ ______________________
dIrecTOr dIrecTOr
30 June 2011 30 June 2011
________________________ ______________________
daTe daTe
29
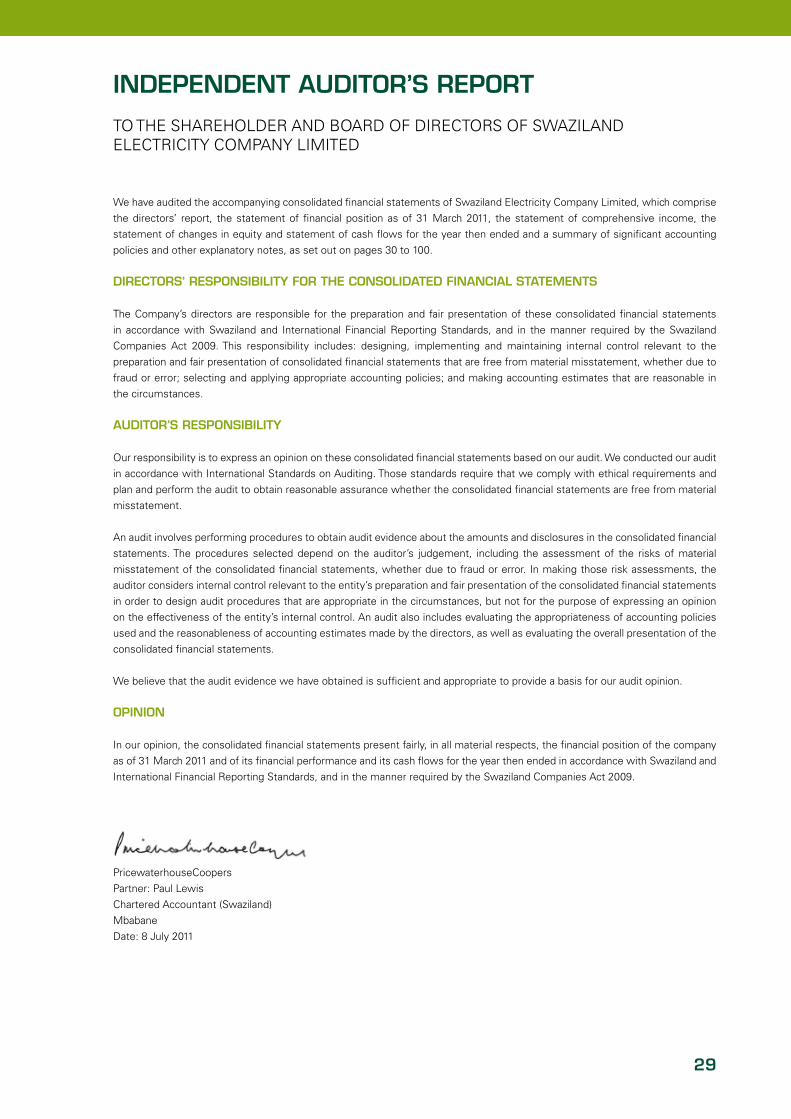
INdEPENdENT AudITOr’S rEPOrT
TO The SharehOLder and BOard OF dIrecTOrS OF SWaZILand eLecTrIcITY cOMPanY LIMITed
We have audited the accompanying consolidated financial statements of Swaziland electricity company Limited, which comprise
the directors’ report, the statement of financial position as of 31 March 2011, the statement of comprehensive income, the
statement of changes in equity and statement of cash flows for the year then ended and a summary of significant accounting
policies and other explanatory notes, as set out on pages 30 to 100.
dIrECTOrS’ rESPONSIBILITy fOr THE CONSOLIdATEd fINANCIAL STATEMENTS
The company’s directors are responsible for the preparation and fair presentation of these consolidated financial statements
in accordance with Swaziland and International Financial reporting Standards, and in the manner required by the Swaziland
companies act 2009. This responsibility includes: designing, implementing and maintaining internal control relevant to the
preparation and fair presentation of consolidated financial statements that are free from material misstatement, whether due to
fraud or error; selecting and applying appropriate accounting policies; and making accounting estimates that are reasonable in
the circumstances.
AudITOr’S rESPONSIBILITy
Our responsibility is to express an opinion on these consolidated financial statements based on our audit. We conducted our audit
in accordance with International Standards on auditing. Those standards require that we comply with ethical requirements and
plan and perform the audit to obtain reasonable assurance whether the consolidated financial statements are free from material
misstatement.
an audit involves performing procedures to obtain audit evidence about the amounts and disclosures in the consolidated financial
statements. The procedures selected depend on the auditor’s judgement, including the assessment of the risks of material
misstatement of the consolidated financial statements, whether due to fraud or error. In making those risk assessments, the
auditor considers internal control relevant to the entity’s preparation and fair presentation of the consolidated financial statements
in order to design audit procedures that are appropriate in the circumstances, but not for the purpose of expressing an opinion
on the effectiveness of the entity’s internal control. an audit also includes evaluating the appropriateness of accounting policies
used and the reasonableness of accounting estimates made by the directors, as well as evaluating the overall presentation of the
consolidated financial statements.
We believe that the audit evidence we have obtained is sufficient and appropriate to provide a basis for our audit opinion.
OPINION
In our opinion, the consolidated financial statements present fairly, in all material respects, the financial position of the company
as of 31 March 2011 and of its financial performance and its cash flows for the year then ended in accordance with Swaziland and
International Financial reporting Standards, and in the manner required by the Swaziland companies act 2009.
Pricewaterhousecoopers
Partner: Paul Lewis
chartered accountant (Swaziland)
Mbabane
date: 8 July 2011

30 Sec annual report 2010/2011
dIrECTOr’S rEPOrT
FOr The Year ended 31 March 2011
1. NATurE Of BuSINESS
The Swaziland electricity company is engaged in the business of generation, transmission and distribution of electricity in the
country. customers include agricultural, industrial, commercial and residential households.
The Swaziland electricity company is governed by the three enabling legislations namely; The electricity company act, 2007, The
energy regulatory act, 2007 as well as the Public enterprises Unit (control and Monitoring) act, 1989.
2. BuSINESS ISSuES
The company is heavily reliant on agricultural and large industrial customers for its revenue stream. The top two customers of the
company are currently pursuing self generation options as a result of significant increases in the price of electricity around the
region and in the country.
The company is partnering with one of the customers, Ubombo Sugar Limited (USL) to buy excess power to be generated by USL.
costs of imports continued to increase as a result of eskom and electricidade de Mozambique (edM) tariff increases, eskom’s
overall increases for the same period were 25.8%.
Revenue and expenditure
electricity sales turnover for the period under review amounted to e903.1 million representing an increase of 18% from the
previous year’s figure of e763.4 million. actual energy sold during the year was 976.8 GWh (2010: 1 018.6 GWh) resulting in a
decline in energy sales of 4.1%.
The 18% increase in revenue for the year is as a result of the tariff increase applied during the year of 16%. costs of sales for the
year were e453.5 million (2010:410.7 million). The increased cost of sales was attributable to the eskom tariff increase as well as
edM high cost of imports.
a change in accounting policy in the prior year resulted in additional revenue of e70.4 million (2010: e36.1million), representing
contributions from customers towards the construction of electricity infrastructure, being recognised during the year. Total
revenue for the year is therefore e973.4 million compared to e799.5 last year, representing an increase of 22%.
3. TECHNICAL PErfOrMANCE
Internal generation for the year stood at 333.4 GWh representing 29% of total units sent out, an improvement from the previous
year’s figure of 24%. The increased generation output was a result of good rains experienced during the year leading to increased
generation spell. The company’s imports for both edM and eskom were 805.5 GWh (909.4 GWh) and the cost of these imports
were e331 million (2010 : 297 million).The increased cost of imports were as a result of high tariff escalations imposed by eskom
and edM. Wheeling charges decreased slightly to e16.1 million (2009: e17.4 million) due to a fairly stable exchange rate between
the local unit and the US dollar.
The volume of imports reduced from 909.4 GWh the previous year to 805.5 GWh during the year due to increased local generation.
Total units sent out during the period were 1 138.1 GWh, units sold were 976.8 GWh resulting in system losses of 14.2% (2010:
14.9%). Management continues to focus on reducing system losses.
4. CAPITAL ExPENdITurE
capital projects total cost incurred during the year amounted to e228.1 million (2010: 152.1 million). The Prepayment Project
to install pre-paid meters in the country commenced in 2009 and an amount of e74.7 million had been incurred to date on this
project. capital expenditure on the Transmission and distribution network and other capital projects amounted to e190.7 million.

31
6. CASH fLOw fOr THE yEAr
cash and cash equivalents at the end of the financial year increased to e208.5 million from e131.0 million the previous year. The increase
is due to a second and last loan drawn down of e75 million from the Public Service Pension Fund (PSPF). an amount of e110 million was
reserved for the payment of the prepayment as disclosed in note 44.
7. JOINT VENTurE
during the year under review the joint venture company declared its first dividend. The company’s share was $1.5 million (e10 270 500).
as per the financing agreement related to this investment, 50% of the dividend was remitted to eIB.
8. COrPOrATE gOVErNANCE ISSuES
Corporate Governance
In compliance with good corporate governance principles, the company has operated and maintained the following Board committees:
audit and risk committee, Finance committee, remunerations committee, and the Technical committee. These committees remained
effective throughout the accounting period.
Environmental Responsibility
In compliance with the relevant legislation all projects undertaken by the Board are carried out after full compliance with the environmental
act of 2002. hazardous substances are disposed of in full compliance with safety standards and environmental requirements as
stipulated by the act.
Social Responsibility
The company is fully committed to minimize the impact of hIV/aIdS on its staff in order to save lives and ensure long term sustainability
of the company. The company has continued to support initiatives by charity and similar organisations in their quest to eliminate poverty
and the hIV/aIdS impact on company in general.
9. SHArE CAPITAL
The share capital of the company amount to e433, 493,841.00 made up of 433,493,841 shares of e1 each.
10. dIVIdENd
The directors recommended and paid a dividend of e6 million in respect of the financial year ended 31 March 2010.
11. dIrECTOrS
The directors are appointed by the Minister responsible for natural resources and energy. The following directors served on the board
during period under review:
Non-executive directors
Chairperson AppointedMr. S’thofeni Ginindza 01 november 2007
Deputy Chairperson
dr. Winnie nhlengethwa 01 november 2007
dIrECTOr’S rEPOrT (continued)
FOr The Year ended 31 March 2011
32 Sec annual report 2010/2011
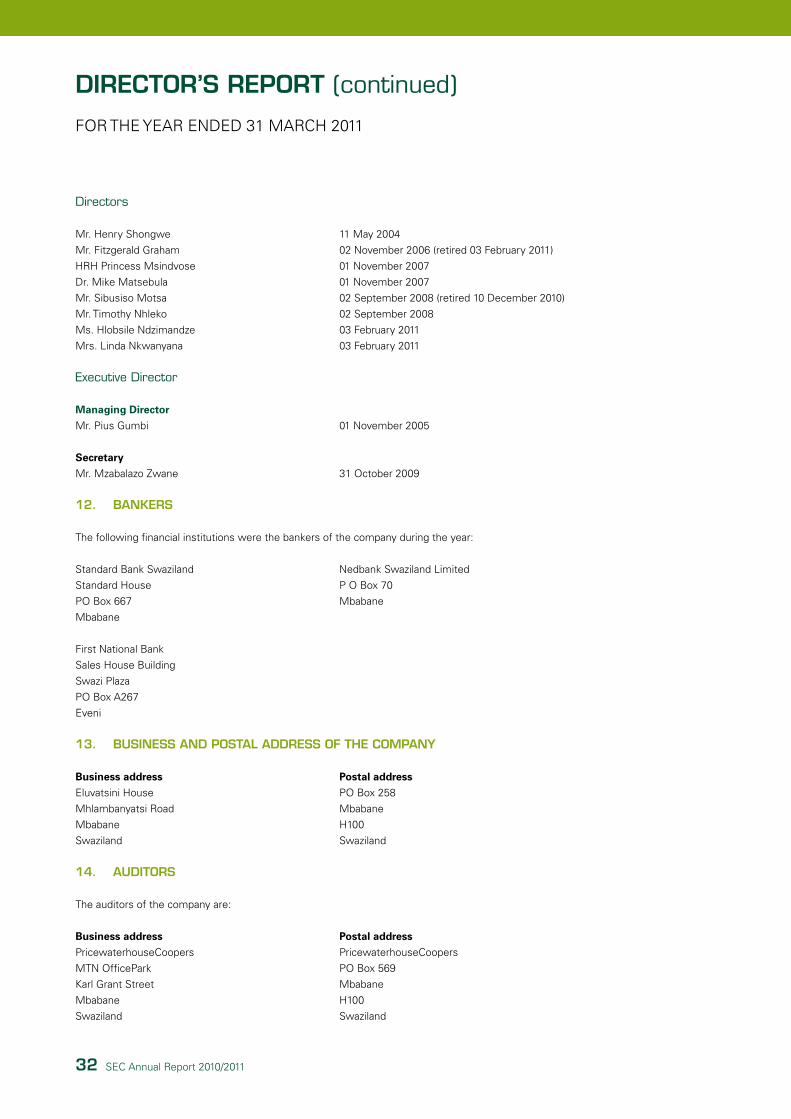
Directors
Mr. henry Shongwe 11 May 2004
Mr. Fitzgerald Graham 02 november 2006 (retired 03 February 2011)
hrh Princess Msindvose 01 november 2007
dr. Mike Matsebula 01 november 2007
Mr. Sibusiso Motsa 02 September 2008 (retired 10 december 2010)
Mr. Timothy nhleko 02 September 2008
Ms. hlobsile ndzimandze 03 February 2011
Mrs. Linda nkwanyana 03 February 2011
Executive Director
Managing DirectorMr. Pius Gumbi 01 november 2005
SecretaryMr. Mzabalazo Zwane 31 October 2009
12. BANkErS
The following financial institutions were the bankers of the company during the year:
Standard Bank Swaziland nedbank Swaziland Limited
Standard house P O Box 70
PO Box 667 Mbabane
Mbabane
First national Bank
Sales house Building
Swazi Plaza
PO Box a267
eveni
13. BuSINESS ANd POSTAL AddrESS Of THE COMPANy
Business address Postal addresseluvatsini house PO Box 258
Mhlambanyatsi road Mbabane
Mbabane h100
Swaziland Swaziland
14. AudITOrS
The auditors of the company are:
Business address Postal addressPricewaterhousecoopers Pricewaterhousecoopers
MTn OfficePark PO Box 569
Karl Grant Street Mbabane
Mbabane h100
Swaziland Swaziland
dIrECTOr’S rEPOrT (continued)
FOr The Year ended 31 March 2011
33
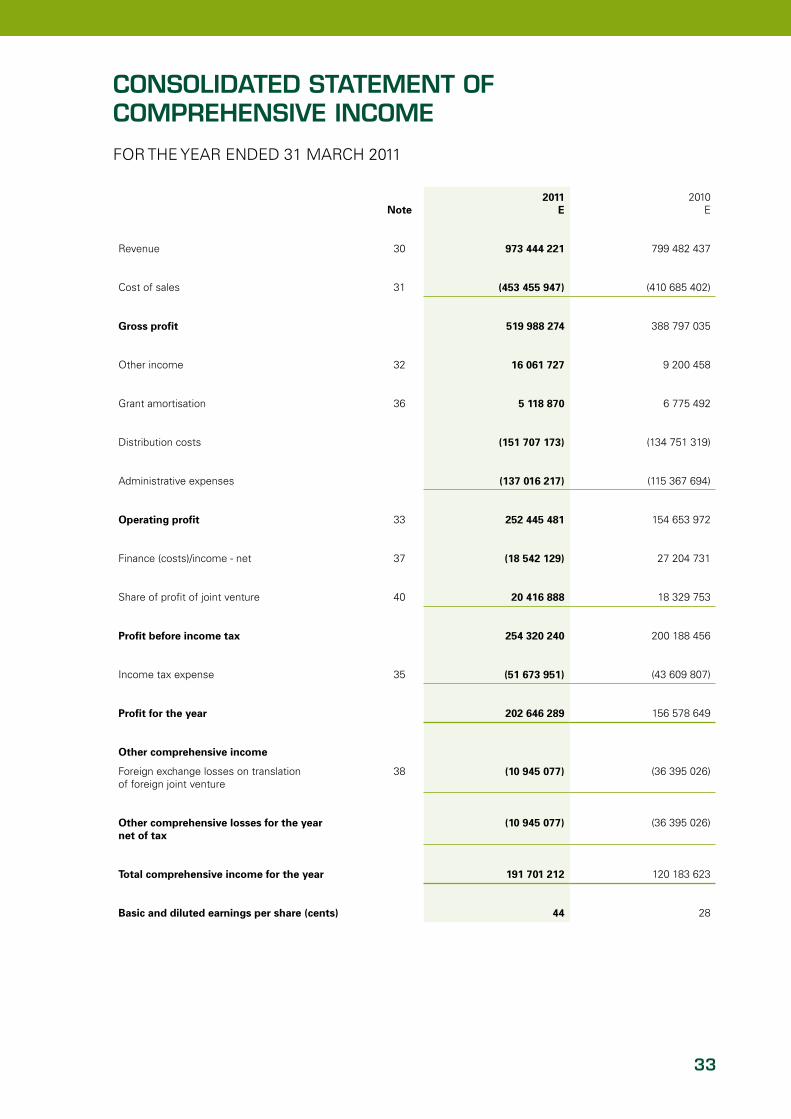
CONSOLIdATEd STATEMENT Of COMPrEHENSIVE INCOME
FOr The Year ended 31 March 2011
Note2011
E2010
e
revenue 30 973 444 221 799 482 437
cost of sales 31 (453 455 947) (410 685 402)
Gross profit 519 988 274 388 797 035
Other income 32 16 061 727 9 200 458
Grant amortisation 36 5 118 870 6 775 492
distribution costs (151 707 173) (134 751 319)
administrative expenses (137 016 217) (115 367 694)
Operating profit 33 252 445 481 154 653 972
Finance (costs)/income - net 37 (18 542 129) 27 204 731
Share of profit of joint venture 40 20 416 888 18 329 753
Profit before income tax 254 320 240 200 188 456
Income tax expense 35 (51 673 951) (43 609 807)
Profit for the year 202 646 289 156 578 649
Other comprehensive income
Foreign exchange losses on translation of foreign joint venture
38 (10 945 077) (36 395 026)
Other comprehensive losses for the year net of tax
(10 945 077) (36 395 026)
Total comprehensive income for the year 191 701 212 120 183 623
Basic and diluted earnings per share (cents) 44 28

34 Sec annual report 2010/2011
CONSOLIdATEd STATEMENT Of fINANCIAL POSITION
aS aT 31 March 2011
Note 2011E
2010e
Assets
Non current assets
Property, plant and equipment 39 1 089 132 323 921 145 323
Investment in joint venture 40 137 727 295 141 262 254
derivative financial instruments 53 26 238 488 33 948 954
Other assets 41 45 682 979 26 237 588
retirement benefit asset 54 3 611 531 1 887 368
Prepayment 44 40 000 000 -
1 342 392 616 1 124 481 487
Current assets
Inventories 42 69 748 087 69 762 614
Trade and other receivables 43 209 739 232 167 105 612
cash and cash equivalents 45 208 494 908 131 013 121
487 982 227 367 881 347
Total assets 1 830 374 843 1 492 362 834
Equity
Capital and reserve attributable to equity holders of the company
Share capital 46 433 493 841 433 493 841
Foreign exchange translation reserves 47 5 317 015 16 262 092
retained earnings 528 349 711 331 711 647
967 160 567 781 467 580
Liabilities
Non current liabilities
Borrowings 51 284 538 511 227 948 951
embedded derivative liability 51a 18 359 769 12 215 136
deferred grant income 48 109 788 001 105 977 552
Other deferred income 49 45 682 979 26 237 588
derivative financial instruments 53 4 549 080 4 852 244
deferred income tax liabilities 55 145 655 123 113 400 466
608 573 463 490 631 937
Current liabilities
current income tax liabilities 29 371 054 12 688 029
Borrowings 51 35 824 652 29 105 739
Trade and other payables 56 126 931 596 141 270 762
Provisions for other employee benefits 52 41 593 306 24 539 668
deferred revenue 50 20 920 205 12 659 119
254 640 813 220 263 317
Total liabilities 863 214 276 710 895 254
Total equity and liabilities 1 830 374 843 1 492 362 834

35
CONSOLIdATEd STATEMENT Of CHANgES IN EQuITy
FOr The Year ended 31 March 2011
NoteShare Capital
E
Foreign exchange
translation reserves
E
Retained Earnings
ETotal
E
Balance at 31 March 2011
Balance at 01 april 2010 433 493 841 16 262 092 331 711 647 781 467 580
Profit for the year - - 202 646 289 202 646 289
dividends paid - - (6 008 225) (6 008 225)
exchange differences on translating foreign operations 38 - (10 945 077) - (10 945 077)
Balance at 31 March 2011 433 493 841 5 317 015 528 349 711 967 160 567
Balance at 31 March 2010
Balance at 01 april 2009 433 493 841 52 657 118 175 132 998 661 283 957
Profit for the year - - 156 578 649 156 578 649
exchange differences on translating foreign operations 38 - (36 395 026) - (36 395 026)
Balance at 31 March 2010 433 493 841 16 262 092 331 711 647 781 467 580

36 Sec annual report 2010/2011
CONSOLIdATEd STATEMENT Of CASH fLOwS
FOr The Year ended 31 March 2011
Note 2011E
2010e
Cash flows from operating activities
cash generated by operations 57.1 283 251 955 163 242 016
Tax paid - -
Interest received 37 12 540 644 17 661 434
Interest paid 37 (13 587 387) (13 605 604)
Net cash generated by operating activities 282 205 212 167 297 846
Cash flows from investing activities
Prepayment 44 (40 000 000) -
additions to property, plant and equipment to maintain operating capacity
57.2 (228 080 497) (152 155 594)
Proceeds from disposal of property, plant and equipment
57.3 3 292 611 242 350
Proceeds from held-to-maturity investment 44 - 22 855 563
Net cash utilised in investing activities (264 787 886) (129 057 681)
Cash flows from financing activities
Grants received 48 8 929 319 4 612 836
net borrowings raised 59 904 340 56 621 909
employer contributions to plan asset 54 (8 757 949) (9 462 612)
Net cash utilised in financing activities 60 257 710 51 772 133
net increase in cash and cash equivalents 77 493 036 90 012 298
cash and cash equivalents at beginning of the year 131 001 872 40 989 574
cash and cash equivalents at end of the year 45 208 494 908 131 001 872

37
NOTES TO THE CONSOLIdATEd fINANCIAL STATEMENTS
FOr The Year ended 31 March 2011
1. gENErAL INfOrMATION
Swaziland electricity company generates, purchases, transmits and distributes electricity to agricultural, industrial, commercial,
mining and residential customers throughout the Kingdom of Swaziland. Swaziland electricity company is governed by The
electricity company act, 2007, The energy regulatory authority act, 2007 and The Public enterprises (control and Monitoring)
act, 1989. The company comprises Swaziland electricity company and its joint venture Motraco.
Motraco’s principal role is the supply of energy to Mozal aluminium Smelters in Mozambique and the wheeling of electric energy
to the electricidade de Mozambique, Swaziland electricity company and eskom South africa.
Swaziland electricity company is a limited liability company incorporated and domiciled in Swaziland.
2. SuMMAry Of SIgNIfICANT ACCOuNTINg POLICIES
The principal accounting policies applied in the preparation of these consolidated financial statements are set out below. These
policies have been consistently applied to all the years presented, unless otherwise stated.
2.1 Statement of compliance and basis of preparation
The consolidated financial statements of Swaziland electricity company Limited have been prepared in accordance with
International Financial reporting Standards, IFrIc Interpretations and the Swaziland companies act of 2009. The financial
statements have been prepared under the historical cost convention, as modified by the revaluation of land and buildings,
available-for-sale financial assets, and financial assets and financial liabilities (including derivative instruments) at fair value through
profit or loss.
The preparation of financial statements in conformity with IFrS requires the use of certain critical accounting estimates. It also
requires management to exercise its judgement in the process of applying the company’s accounting policies. The areas involving
a higher degree of judgement or complexity, or areas where assumptions and estimates are significant to the consolidated
financial statements are disclosed in note 28.
2.1.1 Going-concern basis
The company meets its day-to-day working capital requirements through the use of its cash reserves and bank facilities. The
company’s forecasts and projections, taking account of reasonable possible changes in trading performance, show that the
company should be able operate within the level of its current resources and facilities. after making enquiries, the directors have a
reasonable expectation that the company has adequate resources to continue in operational existence for the foreseeable future.
The company therefore continues to adopt the going concern basis in preparing its consolidated financial statements.
2.1.2 Changes in accounting policy and disclosures
(a) Newandamendedstandardsadoptedbythecompany
The following new standards and amendments to standards are mandatory for the first time for the financial year beginning
1 January 2010.
IFrS 3 (revised), ‘Business combinations’, and consequential amendments to IaS27, ‘consolidated and separate financial statements’,
IaS 28, ‘Investments in associates’, and IaS 31, ‘Interests in joint ventures’, are effective prospectively to business combinations for
which the acquisition date is on or after the beginning of the first annual reporting period beginning on or after 1 July 2009.

38 Sec annual report 2010/2011
NOTES TO THE CONSOLIdATEd fINANCIAL STATEMENTS (continued)
FOr The Year ended 31 March 2011
The revised standard continues to apply the acquisition method to business combinations but with some significant changes
compared with IFrS 3. For example, all payments to purchase a business are recorded at fair value at the acquisition date, with
contingent payments classified as debt subsequently remeasured through the statement of comprehensive income. There is a
choice on an acquisition-by-acquisition basis to measure the non-controlling interest in the acquiree either at fair value or at the
non-controlling interest’s proportionate share of the acquiree’s net assets. all acquisition-related costs are expensed.
IaS 27 (revised) requires the effects of all transactions with non-controlling interests to be recorded in equity if there is no change
in control and these transactions will no longer result in goodwill or gains and losses. The standard also specifies the accounting
when control is lost. any remaining interest in the entity is remeasured to fair value, and a gain or loss is recognised in profit or
loss.
(b) Standards,amendmentsandinterpretationstoexistingstandardsthatarenotyeteffectiveandhavenotbeenearlyadoptedbythecompany
The following standards and amendments to existing standards have been published and are mandatory for the company’s
accounting periods beginning on or after 1 January 2010 or later periods, but the company has not early adopted them.
IFrIc 17, ‘distribution of non-cash assets to owners’ (effective on or after 1 July 2009). The interpretation was published in
november 2008. This interpretation provides guidance on accounting for arrangements whereby an entity distributes non-cash
assets to shareholders either as a distribution of reserves or as dividends. IFrS 5 has also been amended to require that assets
are classified as held for distribution only when they are available for distribution in their present condition and the distribution is
highly probable.
IaS 1 (amendment), ‘Presentation of financial statements’. The amendment clarifies that the potential settlement of a liability by
the issue of equity is not relevant to its classification as current or non current. By amending the definition of current liability,
the amendment permits a liability to be classified as non-current (provided that the entity has an unconditional right to defer
settlement by transfer of cash or other assets for at least 12 months after the accounting period) notwithstanding the fact that the
entity could be required by the counterparty to settle in shares at any time.
IaS 36 (amendment), ‘Impairment of assets’, effective 1 January 2010. The amendment clarifies that the largest cash-generating
unit (or group of units) to which goodwill should be allocated for the purposes of impairment testing is an operating segment,
as defined by paragraph 5 of IFrS 8, ‘Operating segments’ (that is, before the aggregation of segments with similar economic
characteristics).
IFrS 5 (amendment), ‘non-current assets held for sale and discontinued operations’. The amendment clarifies that IFrS 5
specifies the disclosures required in respect of non-current assets (or disposal groups) classified as held for sale or discontinued
operations. It also clarifies that the general requirement of IaS 1 still apply, in particular paragraph 15 (to achieve a fair presentation)
and paragraph 125 (sources of estimation uncertainty) of IaS 1.
(c) New standards, amendments and interpretations issued but not effective for the financial year beginning1January2010andnotearlyadopted
IFrS 9, ‘Financial instruments’, addresses the classification, measurement and derecognition of financial assets and financial
liabilities. The standard is not applicable until 1 January 2013 but is available for early adoption. When adopted, the standard will
affect in particular the company’s accounting for its available-for-sale financial assets, as IFrS 9 only permits the recognition of fair
value gains and losses in other comprehensive income if they relate to equity investments that are not held for trading. Fair value
gains and losses on available-for-sale debt investments, for example, will therefore have to be recognised directly in profit or loss.
There will be no impact on the company’s accounting for financial liabilities, as the new requirements only affect the accounting
for financial liabilities that are designated at fair value through profit or loss, and the company does not have any such liabilities.
The derecognition rules have been transferred from IaS 39, ‘Financial instruments: recognition and measurement’, and have not
been changed. The company has not yet decided when to adopt IFrS 9.
39
revised IaS 24 (revised), ‘related party disclosures’, issued in november 2009. It supersedes IaS 24, ‘related party disclosures’,
issued in 2003. IaS 24 (revised) is mandatory for periods beginning on or after 1 January 2011. earlier application, in whole or in
part, is permitted. The revised standard clarifies and simplifies the definition of a related party and removes the requirement for
government-related entities to disclose details of all transactions with the government and other government-related entities.
The company will apply the revised standard from 1 January 2011. When the revised standard is applied, the company and the
parent will need to disclose any transactions between its subsidiaries and its associates.
IFrIc 19, ‘extinguishing financial liabilities with equity instruments’, effective 1 July 2010. The interpretation clarifies the accounting
by an entity when the terms of a financial liability are renegotiated and result in the entity issuing equity instruments to a creditor
of the entity to extinguish all or part of the financial liability (debt for equity swap). It requires a gain or loss to be recognised in
profit or loss, which is measured as the difference between the carrying amount of the financial liability and the fair value of the
equity instruments issued. If the fair value of the equity instruments issued cannot be reliably measured, the equity instruments
should be measured to reflect the fair value of the financial liability extinguished.
IFrIc 18, ‘Transfers of assets from customers’ (effective 1 July 2009). This Interpretation clarifies the accounting treatment for
transfers of property, plant and equipment received from customers. This Interpretation applies to agreements with customers
in which the entity receives cash from a customer when that amount of cash must be used only to construct or acquire an item
of property, plant and equipment and the entity must then use the item of property, plant and equipment either to connect the
customer to a network or to provide the customer with ongoing access to a supply of goods and services, or to do both.
3. CONSOLIdATION
Joint venture
Joint ventures are contractual arrangements whereby two or more parties undertake an economic activity that is subject to joint
control.
Investments in joint ventures are accounted for using the equity method of accounting and are initially recognised at cost in the
consolidated financial statements of the company. The company’s investment in joint ventures includes goodwill (net of any
accumulated impairment loss) identified on acquisition.
The company’s share of its joint ventures post acquisition profits or losses are recognised in the statement of comprehensive
income, and its share of post-acquisition movement in reserves is recognised in reserves. The cumulative post acquisition
movements are adjusted against the carrying amount of the investment. When the company’s share of losses in joint venture
equals or exceeds its interest in the joint venture, including any other unsecurable receivables, the company does not recognise
further losses, unless it has incurred obligations or made payments on behalf of the joint venture.
Unrealised gains on transactions between the company and its joint ventures are eliminated to the extent of the company’s
interest in the joint ventures. Unrealised losses are also eliminated, unless the transaction provides evidence of an impairment of
the asset transferred. accounting policies of joint ventures have been changed where necessary to ensure consistency with the
policies adopted by the company.
changes in the fair value of monetary securities denominated in foreign currency classified as available for sale are analysed
between translation differences resulting from changes in the amortised cost of the security and other changes in the carrying
amount of the security. Translation differences related to changes in amortised cost are recognised in profit or loss, and other
changes in carrying amount are recognised in equity.
Translation differences on non-monetary financial assets and liabilities such as equities held at fair value through profit or loss are
recognised in profit or loss as part of the fair value gain or loss. Translation differences on non-monetary financial assets such as
equities classified as available for sale are included in the available-for-sale reserve in equity.
NOTES TO THE CONSOLIdATEd fINANCIAL STATEMENTS (continued)
FOr The Year ended 31 March 2011

40 Sec annual report 2010/2011
NOTES TO THE CONSOLIdATEd fINANCIAL STATEMENTS (continued)
FOr The Year ended 31 March 2011
4. dIVIdENd dISTrIBuTION
dividend distribution to the company’s shareholders is recognised as a liability in the company’s financial statements in the
period in which dividends are approved.
5. PrOPErTy, PLANT ANd EQuIPMENT
Items of property, plant and equipment are stated at cost less accumulated depreciation and impairment losses. Where parts of
an item of property, plant and equipment have different useful lives, they are accounted for as separate items of property, plant
and equipment.
Freehold land is not depreciated.
Buildings on freehold land, plant, equipment and motor vehicles are depreciated on a straight line basis over their current
anticipated useful lives.
The rates of depreciation used are based on the following estimated current useful lives:
canal, weirs, conduits and valves 50 years
dam and spillway 50 years
Luphohlo civil works 50 years
Buildings and staff housing 40 years
Generation plant 40 years
Leasehold buildings 30 years
Substations, transformers and switchgear 25 years
distribution and transmission 25 years
radio and communication equipment 10 years
computer equipment 3 years
Motor vehicles 5 years
Office furniture and equipment 10 years
The costs of improvements to leasehold buildings are written off over the lesser of the periods of the leases or their useful lives.
Site works and roads, servitudes, small plant, tools and instruments are fully depreciated in the year of acquisition.
The basis of depreciation, useful lives and residual values are assessed annually.
The costs of distribution and transmission assets are stated after deducting consumers’ contributions up to 30 June 2009.
Work-in-progress on capital projects is included at cost and is not depreciated until the relevant asset is brought into use.
Borrowing costs incurred in financing work-in-progress on qualifying capital projects are included in the cost of the project until
the project is commissioned.
The cost of self-constructed assets includes the cost of materials, direct labour and an appropriate proportion of construction
overheads of normal capacity.
The company recognises in the carrying amount of an item of property, plant and equipment the cost of replacing part of such
an item when that cost is incurred if it is probable that the future economic benefits embodied with the item will flow to the
company and the cost of the item can be measured reliably. all other costs are recognised in the statement of comprehensive
income as an expense.

41
Profits and losses on disposals are determined by comparing proceeds with the carrying amount. These gains and losses are
included in the statement of comprehensive income within other income.
6. CAPITALISATION Of BOrrOwINg COSTS
Borrowing costs attributable to the construction of qualifying assets less all investment income on the borrowings are capitalised
as part of the cost of those assets over the period of construction to the extent that the assets are financed by financial
instruments. The capitalisation rate applied is the weighted average of the net borrowing costs applicable to the net borrowings
of the company. Where active development is interrupted for extended periods, capitalisation is suspended. all other borrowing
costs are recognised as an expense in the statement of comprehensive income in the period in which they are incurred.
7. IMPAIrMENT Of ASSETS
The carrying amounts of assets stated in the statement of financial position, other than inventories and deferred tax assets, are
reviewed at each statement of financial position date to determine whether there is any indication of impairment. If any such
indication exists, the recoverable amount of the asset is estimated as the higher of the fair value less costs to sell and its value
in use. an impairment loss is recognised in the statement of comprehensive income whenever the carrying amount exceeds the
recoverable amount.
In assessing value in use, the expected future cash flows are discounted to their present value using a pretax discount rate
that reflects current market assessments of the time value of money and the risks specific to the asset. For an asset that does
not generate cash inflows largely independent of those from other assets, the recoverable amount is determined for the cash-
generating unit to which the asset belongs. a cash generating unit is the smallest identifiable asset group that generates cash
flows that largely are independent from other assets and groups. Impairment losses are recognised in profit or loss. Impairment
losses in respect of cash-generating units are allocated to assets in the cash-generating unit on a pro rata basis.
a previously recognised impairment loss is only reversed if there has been a change in the estimates used to determine the
recoverable amount and if there is an indication that the impairment loss may have been reversed. The reversal is limited to an
amount equal to the carrying amount that would have been determined, net of depreciation and amortisation, had no impairment
loss been recognised in previous years.
8. SHArE CAPITAL
Shares are classified as equity when there is no contractual obligation to transfer cash or other financial assets. Incremental costs
directly attributable to the issue of equity instruments are shown in equity as a deduction from the proceeds, net of tax.
When such shares are subsequently sold, reissued or otherwise disposed of, any consideration received is included in ‘Total
shareholders’ equity’, net of any directly attributable incremental transaction costs and related income tax effects.
9. fINANCIAL ASSETS
The company classifies its financial assets in the following categories: at fair value through profit or loss, loans and receivables,
and available for sale. The classification depends on the purpose for which the financial assets were acquired. Management
determines the classification of its financial assets at initial recognition.
Financial assets at fair value through profit or loss are financial assets held for trading. a financial asset is classified in this category
if acquired principally for the purpose of selling in the short-term.
NOTES TO THE CONSOLIdATEd fINANCIAL STATEMENTS (continued)
FOr The Year ended 31 March 2011

42 Sec annual report 2010/2011
NOTES TO THE CONSOLIdATEd fINANCIAL STATEMENTS (continued)
FOr The Year ended 31 March 2011
(1) Financial assets at fair value through profit or loss
derivatives are also categorised as held for trading unless they are designated as hedges. assets in this category are classified
as current assets.
(2) Loans and receivables
Loans and receivables are non-derivative financial assets with fixed or determinable payments that are not quoted in an active
market. They are included in current assets, except for maturities greater than 12 months after the statement of financial position
date. These are classified as non-current assets. The company’s loans and receivables comprise ‘trade and other receivables’ and
cash and cash equivalents in the statement of financial position (notes 43 and 45).
(3) Held-to-maturity investments
held-to-maturity investments are non-derivative financial assets with fixed or determinable payments and fixed maturities that the
company’s management has the positive intention and ability to hold to maturity.
These assets are recognised initially at fair value and subsequently measured at amortised cost using the effective interest rate
method less any required impairment.
(4) Available-for-sale financial assets
available-for-sale financial assets are non-derivatives that are either designated in this category or not classified in any of the other
categories. They are included in non-current assets unless management intends to dispose of the investment within 12 months
of the statement of financial position date.
regular purchases and sales of financial assets are recognised on the trade-date, the date on which the company commits
to purchase or sell the asset. Investments are initially recognised at fair value plus transaction costs for all financial assets not
carried at fair value through profit or loss. Financial assets carried at fair value through profit or loss are initially recognised at fair
value, and transaction costs are expensed in the statement of comprehensive income. Financial assets are derecognised when
the rights to receive cash flows from the investments have expired or have been transferred and the company has transferred
substantially all risks and rewards of ownership. available-for-sale financial assets and financial assets at fair value through profit or
loss are subsequently carried at fair value. Loans and receivables are carried at amortised cost using the effective interest method.
Gains or losses arising from changes in the fair value of the ‘financial assets at fair value through profit or loss’ category are
presented in the statement of comprehensive income within ‘other (losses)/gains – net’ in the period in which they arise. dividend
income from financial assets at fair value through profit or loss is recognised in the statement of comprehensive income as part
of other income when the company’s right to receive payments is established.
changes in the fair value of monetary securities denominated in a foreign currency and classified as available for sale are analysed
between translation differences resulting from changes in amortised cost of the security and other changes in the carrying
amount of the security.
The translation differences on monetary securities are recognised in profit or loss; translation differences on non-monetary
securities are recognised in equity. changes in the fair value of monetary and non-monetary securities classified as available for
sale are recognised in equity.
When securities classified as available for sale are sold or impaired, the accumulated fair value adjustments recognised in equity
are included in the statement of comprehensive income as ‘gains and losses from investment securities’.

43
Interest on available-for-sale securities calculated using the effective interest method is recognised in the statement of
comprehensive income as part of other income. dividends on available-for-sale equity instruments are recognised in the statement
of comprehensive income as part of other income when the company’s right to receive payments is established.
derivatives are initially recognised at fair value on the date a derivative contract is entered into and are subsequently remeasured
at their fair value. The method of recognising the resulting gain or loss depends on whether the derivative is designated as a
hedging instrument, and if so, the nature of the item being hedged. The company designates certain derivatives as either:
(a) hedges of the fair value of recognised assets or liabilities or a firm commitment (fair
value hedge);
(b) hedges of a particular risk associated with a recognised asset or liability or a highly
probable forecast transaction (cash flow hedge); or
(c) hedges of a net investment in a foreign operation (net investment hedge).
The company documents at the inception of the transaction the relationship between hedging instruments and hedged items, as
well as its risk management objectives and strategy for undertaking various hedging transactions. The company also documents
its assessment, both at hedge inception and on an ongoing basis, of whether the derivatives that are used in hedging transactions
are highly effective in offsetting changes in fair values or cash flows of hedged items.
The fair values of various derivative instruments used for hedging purposes are disclosed in note 53. Movements on the hedging
reserve in shareholders’ equity are shown in note 47. The full fair value of a hedging derivative is classified as a non-current
asset or liability when the remaining hedged item is more than 12 months, and as a current asset or liability when the remaining
maturity of the hedged item is less than 12 months. Trading derivatives are classified as a current asset or liability.
(a) Fairvaluehedge
changes in the fair value of derivatives that are designated and qualify as fair value hedges are recorded in the statement of
comprehensive income, together with any changes in the fair value of the hedged asset or liability that are attributable to the
hedged risk. The company only applies fair value hedge accounting for hedging fixed interest risk on borrowings. The gain or
loss relating to the effective portion of interest rate swaps hedging fixed rate borrowings is recognised in the statement of
comprehensive income within ‘finance costs’. The gain or loss relating to the ineffective portion is recognised in the statement of
comprehensive income within ‘other gains/(losses) – net’. changes in the fair value of the hedge fixed rate borrowings attributable
to interest rate risk are recognised in the statement of comprehensive income within ‘finance costs’.
If the hedge no longer meets the criteria for hedge accounting, the adjustment to the carrying amount of a hedged item for which
the effective interest method is used is amortised to profit or loss over the period to maturity.
(b) Cashflowhedge
The effective portion of changes in the fair value of derivatives that are designated and qualify as cash flow hedges is recognised
in equity. The gain or loss relating to the ineffective portion is recognised immediately in the statement of comprehensive income
within ‘other gains/(losses) – net’.
amounts accumulated in equity are recycled in the statement of comprehensive income in the periods when the hedged item
affects profit or loss (for example, when the forecast sale that is hedged takes place). The gain or loss relating to the effective
portion of interest rate swaps hedging variable rate borrowings is recognised in the statement of comprehensive income within
‘finance costs’. The gain or loss relating to the ineffective portion is recognised in the statement of comprehensive income within
‘other gains/(losses) – net’. however, when the forecast transaction that is hedged results in the recognition of a non-financial
asset (for example, inventory or fixed assets), the gains and losses previously deferred in equity are transferred from equity and
included in the initial measurement of the cost of the asset. The deferred amounts are ultimately recognised in cost of goods sold
in the case of inventory or in depreciation in the case of fixed assets.
NOTES TO THE CONSOLIdATEd fINANCIAL STATEMENTS (continued)
FOr The Year ended 31 March 2011

44 Sec annual report 2010/2011
NOTES TO THE CONSOLIdATEd fINANCIAL STATEMENTS (continued)
FOr The Year ended 31 March 2011
When a hedging instrument expires or is sold, or when a hedge no longer meets the criteria for hedge accounting, any cumulative
gain or loss existing in equity at that time remains in equity and is recognised when the forecast transaction is ultimately
recognised in the statement of comprehensive income. When forecast transaction is no longer expected to occur, the cumulative
gain or loss that was reported in equity is immediately transferred to the statement of comprehensive income within ‘other gains/
(losses) – net’.
(c) Netinvestmenthedge
hedges of net investments in foreign operations are accounted for similarly to cash flow hedges.
any gain or loss on the hedging instrument relating to the effective portion of the hedge is recognised in equity. The gain or
loss relating to the ineffective portion is recognised immediately in the statement of comprehensive income within ‘other gains/
(losses) – net’.
Gains and losses accumulated in equity are included in the statement of comprehensive income when the foreign operation is
partially disposed of or sold.
(d) Derivativesatfairvaluethroughprofitorlossandaccountedforatfairvaluethroughprofitorloss
certain derivative instruments do not qualify for hedge accounting. changes in the fair value of any these derivative instruments
are recognised immediately in the statement of comprehensive income within ‘other gains/(losses) – net’.
10. rEVENuE rECOgNITION
revenue comprises the fair value of the consideration received or receivable for the sale of goods and services in the ordinary
course of the company’s activities. revenue is shown, estimated returns, rebates and discounts.
The company recognises revenue when the amount of revenue can be reliably measured, it is probable that future economic
benefits will flow to the entity and specific criteria have been met for each of the company’s activities as described below. The
amount of revenue is not considered to be reliably measured until all contingencies relating to the sale have been resolved. The
company bases its estimates on historical results, taking into consideration the type of customer, the type of transaction and the
specifics of each arrangement.
revenue is recognised as follows:
(a) ElectricityRevenue
electricity revenue is recognised when electricity is consumed by the customer.
revenue from customer contributions is recognised when the customer has been fully connected to the electricity grid and the
lines energised.
(b) Saleofservices
Sale of services is recognised in the accounting period in which the services are rendered, by reference to the completion of
the specific transaction assessed on the basis of the actual service provided as a proportion of the total services to be provided.
(c) Otherrevenue/income
Other revenue is recognised when the significant risks and rewards of ownership are transferred to the buyer and the amount of
revenue can be measured reliably.

45
11. fINANCE INCOME
Finance income comprises interest receivable on loans, advances, trade receivables and income from financial market
investments. Interest is only recognised where it is probable that the economic benefits associated with the transaction will flow
to the company. Finance income is recognised on a time-proportionate basis that takes into account the effective yield on assets.
12. fINANCE COST
Finance cost comprises interest payable on borrowings calculated using the effective interest rate method as well as interest
resulting from the unwinding of discount on provisions.
13. dIVIdENd INCOME
dividend income is recognised when the right to receive payment is established.
14. dIVIdENd dISTrIBuTIONS
dividend distribution to the company’s shareholder is recognised as a liability in the company’s consolidated financial statements
in the period in which the dividends are approved by the company’s shareholder.
15. OTHEr rESErVES
(a) Insurancereserve
The insurance reserve was held to cover potential uninsurable or self-insured losses not covered externally. The value of the
reserve was based on management’s assessment of the possible exposure.
(b) Reserveformajormaintenance
The reserve for major maintenance was held to cover future major maintenance costs and such costs were apportioned over
the periods between the planned maintenance dates. The value of the reserve was based on management’s assessment of
future maintenance requirements. all movements were between reserves in equity and had no impact on the statement of
comprehensive income.
16. fINANCIAL rISk MANAgEMENT
(1) Financial risk factors
The company’s activities expose it to a variety of financial risks including currency risk, fair value interest risk and price risk. The
company’s overall risk management programme focuses on the unpredictability of financial markets and seeks to minimise
potential adverse effects on the financial performance of the company. The company uses derivative financial instruments to
hedge certain risk exposures.
risk management is carried out by management under policies approved by the Board of directors. Management identifies,
evaluates and hedges financial risks in close co-operation with the company operating units. The Board provides written principles
for overall risk management, as well as written policies covering specific areas such as interest rate risk, credit risk and investing
excess liquidity.
NOTES TO THE CONSOLIdATEd fINANCIAL STATEMENTS (continued)
FOr The Year ended 31 March 2011

46 Sec annual report 2010/2011
(a) Market risk
(i) Foreignexchangerisk
Foreign exchange risk is the risk that the value of financial instrument will fluctuate as a result of changes in foreign exchange
rates.
The company operates internationally and is exposed to foreign exchange risk arising from various currency exposures, primarily
with the euro. Foreign exchange risk arises from future long term repayments recognised as liabilities.
To manage the foreign currency exchange risk arises from future long term loans repayments, recognised liabilities, and the
company use cross currency interest rate swaps.
a change of +/-10% in exchange rates at the reporting date would have increased (decreased) profit or loss and foreign borrowings
by the amounts shown below:
Borrowings EStatement of financial position
EIncome statement
Increase in exchange rate by 10% (34 853 231) (34 853 231)
decrease in exchange rate by 10% 34 853 231 34 853 231
(ii) Pricerisk
Price risk includes equity price risk.
Equity price risk is the risk that the value of a financial instrument will fluctuate as a result of changes in market prices.
The company is currently not exposed to equity price risk because at the statement of financial position date there were no
investments held by the company and classified either as available for sale or at fair value through profit and loss.
(iii) Cashflowandfairvalueinterestraterisk
Cash flow and interest rate risk is the risk that the value and cash flow of a financial instrument will fluctuate due to changes in
market interest rates.
as the company has significant interest-bearing assets, the company’s income and operating cash flows are substantially
independent of changes in the market interest rates. The company has no policies in place to hedge against fluctuating interest
rate.
The company’s interest rate risk arises from long-term borrowings. Borrowings issued at variable rates expose the company to
cash flow interest rate risk. Borrowings and long-term loans issued at fixed rates expose the company to fair value interest rate
risk. currently there are no loans issued at fixed interest rate, however, linked to prime lending rate and as such the company is
not exposed to fair value interest rate risk.
during 2010 and 2011, the company’s borrowings at variable rates were denominated in the Swaziland Lilangeni and euros.
The company analyses its interest rate exposure on a dynamic basis. Various scenarios are simulated taking into consideration
refinancing, renewal of existing positions, alternative financing and hedging.
NOTES TO THE CONSOLIdATEd fINANCIAL STATEMENTS (continued)
FOr The Year ended 31 March 2011

47
Based on these scenarios, the company calculates the impact on profit and loss of a defined interest rate shift. The scenarios are
run only for liabilities that represent the major interest-bearing positions.
a change of 50 basis points in interest rates at the reporting date would have increased (decreased) profit or loss by the amounts
shown below. This analysis assumes that all other variables remain constant. The analysis is performed on the same basis for
2011:
Profit or loss EStatement of financial position
EIncome statement
Increase of 50 basis points (210 813) (210 813)
decrease of 50 basis points 210 813 210 813
The simulation is done on a quarterly basis to verify that the maximum loss potential is within the limit given by the management.
The table below gives an indication of the company’s monetary sensitivity to changes in interest rates.
ECash at bank
EBorrowings
Base amounts 208 494 908 320 363 163
Interest plus 1% 210 579 857 323 566 795
Interest less 1% 206 409 959 317 159 531
(b) Credit risk
Credit risk is the risk that a counterparty to a financial instrument will fail to discharge an obligation and cause the Company to
incur a financial loss.
The company has exposure to credit risk, which is the risk that a counterpart will be unable to pay amounts in full when due.
Key areas where the company is exposed to credit risk are:
• Trade and other receivables
• Other assets
• derivative financial instruments
• cash and cash equivalents
• deposits with banks and other financial institutions.
The company structures the levels of credit risk it accepts by placing limits on its exposure to a single counterpart, or company’s
of counterparties. Such risks are subject to an annual or more frequent review.
The major concentration of credit risk arises from the company’s receivables and investment securities in relation to the nature
of customers and issuers. no collateral is required in respect of financial assets. reputable financial institutions are used for
investing and cash handling purposes.
Mechanisms are in place to monitor the risk of default by individual loan holders. exposures to individual loan holders and
company of loan holders are collected within the ongoing monitoring of the controls associated with regulatory solvency. Where
there exists significant exposure to individual loan holders, or homogenous group of loan holders, a financial analysis carried out
by the company.
Quality control and risk department makes regular reviews to assess the degree of compliance with the company procedures on
credit and the overall control environment.
NOTES TO THE CONSOLIdATEd fINANCIAL STATEMENTS (continued)
FOr The Year ended 31 March 2011

48 Sec annual report 2010/2011
at statement of financial position date there were no significant concentrations of credit risk. The maximum exposure to credit
risk is represented by the carrying value of each financial asset in the statement of financial position.
The table below analyses the company’s financial liabilities and net-settled derivative financial liabilities into relevant maturity
groupings based on the remaining period at the statement of financial position to the contractual maturity date. The amounts
disclosed in the table are the contractual undiscounted cash flows. Balances due within 12 months equal their carrying balances
as the impact of discounting is not significant.
Less than1 year
E
Between 2and 5 years
EOver 5 years
ETotal
E
31 March 2011
Financial Liabilities:
Trade and other payables 126 931 596 - - 126 931 596
Bank overdraft 28 645 - - 28 645
Shareholders loan 11 240 181 - - 11 240 181
Foreign borrowings 9 402 326 26 093 981 122 894 031 158 390 338
Local borrowings 15 153 499 60 550 500 75 000 000 150 703 999
162 756 247 86 644 481 197 894 031 447 294 759
31 March 2010
Financial Liabilities:
Trade and other payables 141 270 762 - - 141 270 762
Bank overdraft 11 249 - - 11 249
Shareholders loan 11 240 181 - - 11 240 181
Foreign borrowings 9 333 884 18 667 769 140 210 158 168 211 811
Local borrowings 8 520 424 16 174 025 52 897 000 77 591 449
170 376 500 34 841 794 193 107 158 398 325 452
(2) Capital risk management
The company’s objectives when managing capital are to safeguard the company’s ability to continue as a going concern in order
to provide returns and benefits for shareholders and to maintain an optimal capital structure to reduce the cost of capital.
In order to maintain or adjust the capital structure, the company may adjust the amount of dividends paid to shareholders, return
capital to shareholders, issue new shares or sell assets to reduce debt or enter into further financing as applicable.
The company monitors capital on the basis of the gearing ratio. This ratio is calculated as net debt divided by total capital. net debt
is calculated as total borrowings (including ‘current and non-current borrowings’ as shown in the statement of financial position)
less cash and cash equivalents. Total capital is calculated as ‘equity’ as shown in the statement of financial position plus net debt.
NOTES TO THE CONSOLIdATEd fINANCIAL STATEMENTS (continued)
FOr The Year ended 31 March 2011

49
during 2011, the company’s strategy was to maintain the gearing ratio (before interest accrual is taken into account) within 25%
and 50%. The gearing ratios before interest accrual at 31 March 2011 and 2010 were as follows:
Note2011
E2010
e
Total Borrowings 51 320 363 163 257 054 690
Less: cash and cash equivalents 45 (208 494 908) (131 013 121)
net debt 111 868 255 126 041 569
Total equity 967 160 567 781 647 580
Total capital 1 079 028 822 907 689 149
Gearing ratio 1:10 1:7
The increase in gearing ratio is primarily due to the valuation of foreign currency denominated long term loans. This is as a
result of the appreciation of the Lilangeni against the euro. Furthermore, there has been a significant increase on cash and cash
equivalents as at 31 March 2011 compared to the previous year.
(3) Fair value estimation
The fair value of financial instruments traded in active market (such as trading and available for sale securities) is based on quoted
market prices at the statement of financial position date. The quoted market price used for financial assets held by the company
is the current bid price.
The carrying value of trade receivables and payables are assumed to approximate their fair values due to the short-term nature
of trade receivables. The fair value of financial liabilities for disclosure purposes is estimated by discounting the future contractual
cash flows at the current market interest rate that is available to the company for similar financial instruments.
For financial assets and liabilities with maturity of less than one year, the face value less any estimated credit adjustments are
assumed to approximate their fair values.
17. TAxATION
Deferred income taxes
deferred income tax is provided in full, using the liability method, on temporary differences arising between the tax bases of
assets and liabilities and their carrying amounts in the consolidated financial statements. currently enacted tax rates are used in
the determination of deferred income tax.
deferred tax assets are recognised to the extent that it is probable that future taxable profits will be available against which the
temporary differences can be utilised. deferred tax liabilities and deferred tax assets are recognised for all temporary difference
arising from the following differences:
i) The excess of book values of fixed assets over their written down values for tax purposes;
ii) The excess of book values of finance leases over their written down values for tax purposes;
iii) Income and expenditure in the consolidated financial statements of the current year dealt with in other years for tax purposes.
NOTES TO THE CONSOLIdATEd fINANCIAL STATEMENTS (continued)
FOr The Year ended 31 March 2011
50 Sec annual report 2010/2011
Current Tax
The charge for the current tax is the amount of income taxes payable in respect of the taxable profits for the current period. It is
calculated using tax rates that have been enacted or substantially enacted by the statement of financial position date.
18. INVENTOrIES
Inventories are stated at the lower of cost and net realisable value. net realisable value is the estimated selling price in the
ordinary course of business, less the estimated costs of completion and selling expenses. cost is determined on the weighted
average basis and includes expenditure incurred in acquiring inventories and bring them to their existing location and condition.
19. PrOVISIONS
Provisions are recognised when the company has a present legal or constructive obligation as a result of past events, it is
probable that an outflow of resources will be required to settle the obligation, and a reliable estimate of the amount can be made.
Where the company expects a provision to be reimbursed, for example under an insurance contract, the reimbursement is
recognised as a separate asset but only when the reimbursement is virtually certain.
The company recognises a provision for onerous contracts when the expected benefits to be derived from a contract are less
than the unavoidable costs of meeting the obligations under the contract.
restructuring provisions comprise lease termination penalties and employee termination payments, and are recognised in the
period in which the company becomes legally or constructively committed to payment. costs related to the ongoing activities of
the company are not provided in advance.
20. CASH ANd CASH EQuIVALENTS
cash and cash equivalents are carried in the statement of financial position at cost. For the purposes of the cash flow statement,
cash and cash equivalents comprise cash on hand, deposits held with banks, other short term high liquid investments with
original maturities of three months or less, and bank overdrafts.
Bank overdrafts are included within borrowings in current liabilities on the statement of financial position.
21. TrAdE rECEIVABLES
Trade receivables are recognised initially at fair value and subsequently measured at amortised cost using the effective interest
method, less provision for impairment. a provision for impairment of trade receivables is established when there is objective
evidence that the company will not be able to collect all amounts due according to the original terms of receivables. The amount
of the provision is the difference between the asset’s carrying amount and the present value of estimated future cash flows,
discounted at the effective interest rate. The amount of the provision is recognised in the statement of comprehensive income.
22. BOrrOwINgS
Borrowings are recognised initially at the fair value of proceeds received, net of transaction costs incurred, when they become
party to the contractual provisions. Borrowings are subsequently stated at amortised cost using the effective interest rate
method; any difference between the proceed (net of transaction value) and the redemption value is recognised in the statement
of comprehensive income over the period of the borrowings.
NOTES TO THE CONSOLIdATEd fINANCIAL STATEMENTS (continued)
FOr The Year ended 31 March 2011

51
23. EMPLOyEE BENEfITS
(a) Short-termemployeebenefits
The cost of all short-term employee benefits is recognised during the period in which the employee renders the related service.
The provision for employee entitlements to salaries and annual leave represent the amount that the company has a present
obligation to pay, as a result of employees’ services provided up to the statement of financial position date. The provision has been
calculated at undiscounted amounts based on current salary rates.
(b) Pensionobligations
The company operates a defined contribution plan. The company pays contributions to a privately administered pension plan
on a mandatory, contractual or voluntary basis. Once the contributions have been paid, the company has no further payment
obligations. The regular contributions constitute net periodic costs for the year in which they are due and as such are included in
staff costs.
(c) Definedbenefitplans
The company’s net obligation in respect of defined benefit pension plans is calculated by estimating the amount of future benefit
that employees have earned in return for their service in the current and prior periods; that benefit is discounted to determine the
present value, and the fair value of any plan assets is deducted. The discount rate is the yield at statement of financial position
date on high quality bonds that have maturity dates approximating the terms of the company’s obligations. The calculation is
performed by a qualified actuary using the projected unit credit method. The actuarial valuations are carried out on a yearly basis.
When the benefits of a plan are improved, the portion of the increased benefit relating to past service by employees is recognised
as an expense in the statement of comprehensive income on a straight-line basis over the average period until the benefits
become vested. To the extent that the benefits vest immediately, the expense is recognised immediately in the statement of
comprehensive income.
In calculating the company’s obligation in respect of a plan, to the extent that any cumulative unrecognised in actuarial gain or
loss exceeds ten percent of the greater of the present value of the defined benefit obligation and the fair value of plan assets, it
is recognised in the statement of comprehensive income over the expected average remaining working lives of the employees
participating in the plan. Otherwise, the actuarial gain or loss is not recognised.
Where the calculation results in a benefit to the company, the recognised asset is limited to the net total of any unrecognised
actuarial losses and past service costs and the present value of any future refunds from the plan or reduction in future contributions
to the plan.
(d) Terminationbenefits
Termination benefits are payable whenever an employee’s employment is terminated before the normal retirement date or
whenever an employee accepts voluntary redundancy in exchange for these benefits. The company recognises termination
benefits when it is demonstrably committed to either terminate the employment of current employees according to a detailed
formal plan without possibility of withdrawal or to provide termination benefits as a result of an offer made to encourage voluntary
redundancy. Benefits falling due more than 12 months after statement of financial position date are discounted to present value.
NOTES TO THE CONSOLIdATEd fINANCIAL STATEMENTS (continued)
FOr The Year ended 31 March 2011

52 Sec annual report 2010/2011
(e) Performancebonus
a liability for employee benefits in the form of performance bonus is recognised in current provisions when there is no alternative
but to settle the liability, and at least one of the following conditions is met;
• there is a formal plan and the amounts to be paid are determined before the time of issuing the consolidated financial
statements; or
• past practice has created a valid expectation by employees that they will receive a bonus and the amount can be determined
before the time of issuing the consolidated financial statements.
Liabilities for bonus plans are expected to be settled within 12 months and are measured at the amounts expected to be paid
when they are settled.
(f) Statutoryobligations
Provision is not made for statutory termination obligations in terms of the employment act, 1980. It is considered that the
company’s contribution to the Pension Fund which can be recovered against such statutory obligations, at present, exceed any
such liability.
24. grANTS rECEIVEd
Grants, including non-monetary grants at fair value, are recognised when there is reasonable assurance that the company will
comply with the conditions attached to the grant and that the grant will be received.
Property, plant and equipment acquired from the proceeds of grants is depreciated in accordance with the company’s property,
plant and equipment accounting policy. Grants utilised to acquire property, plant and equipment are initially recognised as deferred
income and subsequently recognised as in the statement of comprehensive income on a systematic and rational basis over the
useful lives of the assets.
Grants received to defray operating expenditure are recognised in the statement of comprehensive income when the expenditure
has been incurred.
Government and donor grants
Grants received by the company from Government and donors to acquire assets are shown as deferred income and the relevant
assets are brought to account at their actual cost.
Rural electrification fund
Funds contributed by Government, donors and consumers to rural electricity projects are held in the rural electrification Fund until
expended, at which time these funds are transferred to consumer contributions and netted off the cost of related distribution or
transmission assets.
Counterpart fund
contributions received from interest differential on the Swaziland loan no. 4 and the european Investment Bank loan and interest
received on deposits are held in the counterpart Fund until expended. capital items funded from the counterpart Fund are
transferred to grants received and the relevant assets are brought to account at their actual cost.
NOTES TO THE CONSOLIdATEd fINANCIAL STATEMENTS (continued)
FOr The Year ended 31 March 2011
53
25. TrANSfErS frOM CuSTOMErS
Accounting policy for transfers received before 1 July 2009
cash contributions made by the company’s customers to fund part of the installation equipment required to connect them
to the electricity network were deducted in arriving at the carrying amount of the installation equipment. The statement of
comprehensive income effect of the capital contributions is consequently recognised by way of a reduced depreciation expense.
Accounting policy for transfers received after 1 July 2009
cash contributions made by the company’s customers to fund part of the installation equipment required to connect them to
the electricity network are recognised as revenue in the statement of comprehensive income as soon as the connections are
completed. The contributed assets are recognised initially at fair value, and the related income is recognised immediately or
if there is a future service obligation, over the relevant service period. electricity connection contributions for assets not yet
completed are deferred and recognised as a liability in the statement of financial position.
26. dErECOgNITION Of fINANCIAL ASSETS ANd LIABILITIES
Financial assets are derecognised when the contractual right to receive cash flows from the assets has expired; or when the
company has transferred its contractual right to receive the cash flows of the financial assets, and either:
• Substantially all the risks and rewards of ownership have been transferred; or
• The company has neither retained nor transferred substantially all the risks and rewards, but has not retained control.
Financial liabilities are derecognised when they are extinguished, that is when the obligation is discharged, cancelled or expires.
27. OffSETTINg fINANCIAL ASSETS ANd fINANCIAL LIABILITIES
Financial assets and financial liabilities are offset and the net amount reported in the statement of financial position when there is
a legally enforceable right to offset the recognised amounts and there is an intention to settle on a net basis, or realise the asset
and settle the liability simultaneously.
NOTES TO THE CONSOLIdATEd fINANCIAL STATEMENTS (continued)
FOr The Year ended 31 March 2011

54 Sec annual report 2010/2011
28. CrITICAL ACCOuNTINg ESTIMATES ANd JudgEMENTS
The company makes estimates and assumptions that affect the reported amounts of assets and liabilities within the financial
year. estimates and judgments are continually evaluated and are based on historical experience and other factors, including
expectations of future events that are believed to be reasonable under the circumstances. The major area where management
has used its judgment and accounting estimates are with regards to:
(a) Provisionforpostemploymentbenefitsdisclosedundernote54
an actuary was appointed to perform the valuation to determine the company’s obligation in this regard. The assumptions and
judgments used by the actuary were considered by the company and were deemed reasonable in light of the prevailing and
anticipated future economic conditions.
(b) Valuationofembeddedderivative
The company has used estimated future cash flows and market interest rates to estimate the value of the embedded derivative
related to the eIB Motraco equity Loan (note 51a). The estimates used are management’s best estimates.
(c) Estimatedimpairmentoftradeandreceivables
The company tests annually whether trade and other receivables suffered any impairment in accordance with the accounting
policy stated in 21. The recoverable amounts of trade and other receivables have been determined based on discount cash
inflows. These calculations require the use of estimates (note 43).
(d) Depreciation
The company charges depreciation as an expense on items of property, plant and equipment (note 39) based on the useful lives
of the different items of property, plant and equipment. The useful lives are management’s best estimates. Management reviews
the useful lives of assets on an annual basis.
(e) Incometaxes
Significant judgement is required in determining the provision for income taxes. The company recognises liabilities for anticipated
tax based on estimates of whether additional taxes will be due. Where the final tax income of these matters is different from the
amounts that were initially recorded, such differences will impact the current and deferred income tax assets and liabilities in the
period in which such determination is made.
29. COMPArATIVE fIgurES
Where necessary, comparative figures have been adjusted to conform with changes in presentation in the current year.
NOTES TO THE CONSOLIdATEd fINANCIAL STATEMENTS (continued)
FOr The Year ended 31 March 2011

55
30. rEVENuE 2011E
2010e
The analysis of electricity revenue is as follows:
domestic and Small commercial 360 999 886 320 664 729
Irrigation, Industrial, and Large commercial 531 463 193 436 781 591
Other 10 596 511 5 973 597
contributions from customers towards infrastructure 70 384 631 36 062 520
973 444 221 799 482 437
31. COST Of SALES
cost of sales consists of electricity purchases, electricity wheeling charges and generation costs.
electricity purchases 331 007 325 296 995 923
electricity wheeling charges 16 071 918 17 416 256
electricity generation cost 25 398 425 23 379 001
electricity transmission costs 80 978 279 72 894 222
453 455 947 410 685 402
32. OTHEr INCOME
rental income 1 166 206 1 222 933
Profit on disposal of property, plant and equipment 3 290 153 232 102
Profit on sale of scrap 2 458 726 693
Bad debt recovery 21 031 35 705
reconnection fees 3 409 131 3 067 601
Other income (discounts, VaT refund) 7 863 024 3 352 332
Tampering charges 215 454 146 952
Tender fees 94 270 416 140
16 061 727 9 200 458
NOTES TO THE CONSOLIdATEd fINANCIAL STATEMENTS (continued)
FOr The Year ended 31 March 2011

56 Sec annual report 2010/2011
33. INCOME frOM OPErATION BEfOrE INCOME TAx 2011E
2010e
Income from operations before income tax is arrived at after taking into account the following items:
auditors remuneration – audit fees 1 005 258 883 519
current year annual audit fees 297 222 260 030
Prior year annual audit fees 708 036 623 489
1 005 258 883 519
depreciation on property, plant and equipment (note 39) 60 091 039 47 073 111
net impairment charges and other credit risk
electricity receivable impairment charges (note 43) - 12 390 836
Bad debts recovered (note 32) (21 031) (35 705)
(21 031) 12 355 131
director expenses 383 075 467 834
donations 203 247 169 812
Legal fees 644 317 1 091 571
Insurance expenses 7 209 146 7 002 665
Motor vehicle expenses 11 275 426 12 268 828
Professional fees and consultancy 3 165 949 3 651 867
repairs and maintenance 39 407 855 34 601 201
employee compensation and benefits (note 34) 177 744 510 174 163 534
Travelling and disbursements expense 1 828 267 1 548 452
NOTES TO THE CONSOLIdATEd fINANCIAL STATEMENTS (continued)
FOr The Year ended 31 March 2011

57
NOTES TO THE CONSOLIdATEd fINANCIAL STATEMENTS (continued)
FOr The Year ended 31 March 2011
34. EMPLOyEE BENEfIT ExPENSE 2011E
2010e
Salaries and wages 93 791 710 83 591 690
Pension costs – defined benefit plan (note 54) 7 033 786 7 825 243
early retirement plan 27 747 912 21 891 402
Other employment benefits and costs 49 171 102 60 855 199
177 744 510 174 163 534
The average number of persons employed by the company during the year was 548 (2010: 620). during the year 17 employees left the company as part of the early retirement programme.
35. INCOME TAx ExPENSE
current tax – Swaziland normal taxation 16 683 025 -
deferred tax (note 55) 34 990 926 43 609 807
Income tax expense 51 673 951 43 609 807
The tax on the company’s profit before tax differs from the theoretical amount that would arise using the weighted average tax rate applicable to the company’s profit as follows:
Profit before tax 254 320 240 200 188 456
Tax calculated at company tax rate 76 296 072 60 056 537
Tax effects of: Legal fees 193 294 327 471
donations 60 974 50 944
Utilisation of tax losses - (5 375 748)
capital foreign exchange gains and losses (664 605) (2 186 246)
net income from joint venture (6 125 066) (5 498 926)
Grant amortised (1 535 661) (1 629 410)
non-deductible portion of interest on eIB Motraco loan (1 530 526) 3 179 375
Fair value adjustment on eIB loan embedded derivative 1 843 390 (3 829 291)
Fair Value adjustment on interest rate and currency swaps 2 222 190 661 685
Withholding tax on Motraco unremitted earnings 2 029 278 8 672 172
contributions from customers towards infrastructure (21 115 389) (10 818 756)
Tax charge 51 673 951 43 609 807

58 Sec annual report 2010/2011
NOTES TO THE CONSOLIdATEd fINANCIAL STATEMENTS (continued)
FOr The Year ended 31 March 2011
35. INCOME TAx ExPENSE (CONTINuEd) 2011E
2010e
Other comprehensive income (continued):
Accumulated foreign exchange gains on translation of Motraco Investment
Before tax (6 051 189) 7 630 158
deferred tax effect 2 736 269 (1 526 032)
after tax (3 314 920) 6 104 126
Total tax charge on statement of comprehensive income 48 937 682 45 135 839
36. grANT AMOrTISATION
Grants realized during the year (note 48) 5 118 870 5 431 367
Grants received to defray operating expenditure - 1 344 125
5 118 870 6 775 492
37. fINANCE INCOME ANd COSTS
Finance costs
Interest in foreign currency denominated eIB loan which contains an embedded derivative
(9 347 316) (3 280 596)
Interest – other foreign currency denominated loans (5 809 198) (9 980 923)
Interest – local currency denominated loans (7 778 189) (3 624 681)
(22 934 703) (16 886 200)
Finance income
Interest on investments 8 537 955 6 331 883
Interest on accounts receivable 4 002 689 3 074 140
12 540 644 9 406 023
(10 394 059) (7 480 177)

59
NOTES TO THE CONSOLIdATEd fINANCIAL STATEMENTS (continued)
FOr The Year ended 31 March 2011
37. fINANCE INCOME ANd COSTS (CONTINuEd) 2011E
2010e
Foreign Exchange Gains
net foreign exchange gains 5 403 864 50 735 966
Fair value (loss)/gain – EIB loan embedded derivative (6 144 633) 12 764 304
Net fair value losses on other derivatives
Swaps
– foreign exchange derivatives (7 710 466) (27 472 592)
– interest rate derivatives 303 165 (1 342 770)
(7 407 301) (28 815 362)
Net foreign exchange gains – net (8 148 070) 34 684 908
Finance (costs)/income – net (18 542 129) 27 204 731
38. fOrEIgN ExCHANgE LOSSES ON TrANSLATION Of fOrEIgN OPErATION
net foreign exchange losses – Motraco Joint Venture (note 47) (13 681 346) (34 868 994)
Tax effect 2 736 269 (1 526 032)
After tax effect foreign exchange losses (10 945 077) (36 395 026)

60 Sec annual report 2010/2011
NO
TES T
O T
HE
CO
NSO
LId
ATE
d f
INA
NCIA
L STA
TEM
ENTS
(co
ntin
ued)
FOr
Th
e Y
ea
r e
nd
ed
31
Ma
rc
h 2
011
39
. Pr
OPEr
Ty, PLA
NT
AN
d E
Qu
IPM
ENT
AS
AT
31
MA
RC
H 2
011
Car
ryin
gam
ou
nt
at01
Ap
ril 2
010
Ad
dit
ion
sD
isp
osa
lsTr
ansf
ers
Dep
reci
atio
nfo
r th
e ye
ar
Net
car
ryin
gA
mo
un
t at
31 M
ar. 2
011
Co
st a
t31
Mar
. 201
1
Acc
umul
ated
Dep
reci
atio
n at
31 M
ar. 2
011
ee
ee
ee
ee
dam
and
Spi
llway
17 1
88 7
42-
--
(723
737
)16
465
006
36 1
81 9
68(1
9 71
6 96
2)
Pow
er s
tatio
n ci
vil w
orks
361
801
--
-(7
0 07
6)29
1 77
51
746
852
(1 4
55 0
77)
Free
hold
land
1 41
0 93
1-
--
-1
410
931
1 41
0 93
1-
Bui
ldin
gs a
nd s
taff
hou
sing
20 0
90 2
57-
-2
862
998
(702
706
)22
250
549
30 8
79 7
91(8
629
241
)
Leas
ehol
d bu
ildin
gs-
--
--
-74
277
(74
277)
can
al, w
eirs
, con
duits
and
val
ves
12 2
10 9
06-
--
(562
775
)11
648
131
26 8
86 1
02(1
5 23
7 97
1)
Gen
erat
ion
plan
t92
882
970
--
734
912
(2 5
97 4
54)
91 0
20 4
2710
4 59
7 77
2(1
3 57
7 34
4)
Sub
stat
ions
, tra
nsfo
rmer
s an
d S
witc
hgea
r 30
3 11
0 19
8-
-45
955
30
0(1
6 77
3 30
7)33
2 29
2 19
146
1 72
1 40
0(1
29 4
29 2
08)
dis
trib
utio
n an
d tr
ansm
issi
on41
1 11
2 54
9-
-13
5 62
6 02
4(2
7 63
9 80
2)51
9 09
8 77
169
0 56
2 59
8(1
71 4
63 8
26)
Mot
or v
ehic
les
840
268
-(2
458
)11
707
833
(1 9
12 0
45)
10 6
33 5
9835
841
902
(25
208
303)
rad
io a
nd c
omm
unic
atio
n eq
uipm
ent
12 0
66 8
35-
-2
017
829
(5 1
89 8
00)
8 89
4 86
470
488
413
(61
593
548)
com
pute
r eq
uipm
ent
10 4
66 4
26-
-4
586
718
(3 4
34 1
26)
11 6
19 0
1944
929
967
(33
310
948)
Site
wor
ks a
nd r
oads
, ser
vitu
des,
fu
rnitu
re, s
mal
l pla
nt, t
ools
and
in
stru
men
ts
832
147
--
2 35
6 43
8(4
85 2
61)
2 7
03 3
2434
307
461
(31
604
137)
cap
ital
wor
k-in
-pro
gres
s38
571
292
228
080
497
-(2
05 8
48 0
53)
-60
803
736
60 8
03 7
36-
921
145
323
228
080
497
(2 4
58)
-(6
0 09
1 03
9)1
089
132
323
1 60
0 43
3 16
8(5
11 3
00
844)

61
39
. Pr
OPEr
Ty, PLA
NT
AN
d E
Qu
IPM
ENT
(CO
NTI
Nu
Ed)
AS
AT
31
MA
RC
H 2
011
Car
ryin
gam
ou
nt
at01
Ap
ril 2
010
Ad
dit
ion
sTr
ansf
ers
Net
car
ryin
gA
mo
un
t at
31 M
ar. 2
011
Co
st a
t31
Mar
. 201
1
cap
ital
wor
k-in
-pro
gres
s co
mpr
ises
:-
- rur
al e
lect
rifica
tion
Pro
ject
1 43
3 80
11
136
407
(2 5
70 2
08)
--
- Oth
er p
roje
cts
(mai
ntai
ned)
Ope
ratin
g –
capa
city
11 2
87 5
1413
6 84
8 76
5(1
07 0
08 5
23)
41 1
27 7
5641
127
756
- Pre
paym
ent
Pro
ject
-37
362
308
(37
362
308)
--
- Sik
huph
e In
tern
at S
uppl
y S
yste
m
-5
977
848
-5
977
848
5 97
7 84
8
- Man
zini
nor
th S
ubst
atio
n &
Lin
es25
849
978
5 33
4 36
8(3
1 18
4 34
6)-
-
env
ironm
enta
l Sur
vey
-9
210
106
-9
210
106
9 21
0 10
6
rur
al e
lect
rifica
tion
– P
hase
9-
2 11
3 78
7(2
037
273
)76
514
76 5
14
Mic
row
ave
radi
o pr
ojec
t-
4 41
1 51
2-
4 41
1 51
24
411
512
Ser
vice
s-
24 5
54 7
05(2
4 55
4 70
5)-
-
Par
titio
ns-
1 13
0 69
0(1
130
690
)-
-
38 5
71 2
9322
8 08
0 49
7(2
05 8
48 0
53)
60 8
03 7
3660
803
736
NO
TES T
O T
HE
CO
NSO
LId
ATE
d f
INA
NCIA
L STA
TEM
ENTS
(co
ntin
ued)
FOr
Th
e Y
ea
r e
nd
ed
31
Ma
rc
h 2
011
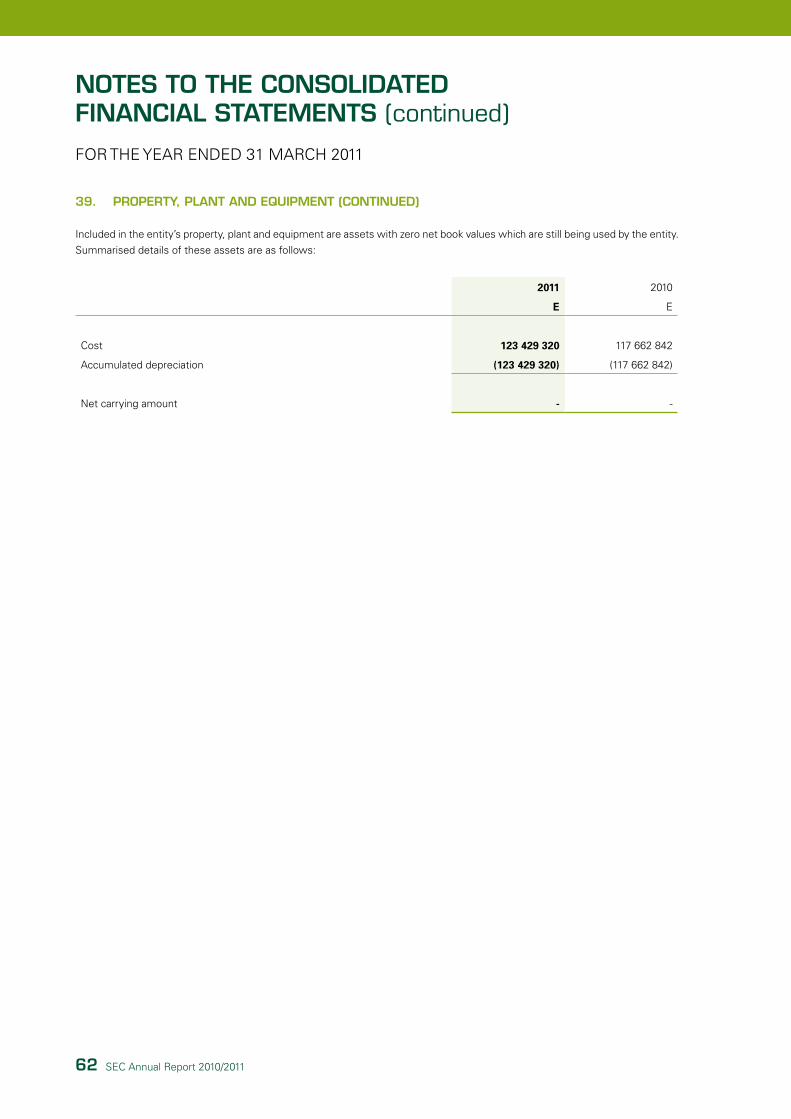
62 Sec annual report 2010/2011
NOTES TO THE CONSOLIdATEd fINANCIAL STATEMENTS (continued)
FOr The Year ended 31 March 2011
39. PrOPErTy, PLANT ANd EQuIPMENT (CONTINuEd)
Included in the entity’s property, plant and equipment are assets with zero net book values which are still being used by the entity.
Summarised details of these assets are as follows:
2011 2010
E e
cost 123 429 320 117 662 842
accumulated depreciation (123 429 320) (117 662 842)
net carrying amount - -
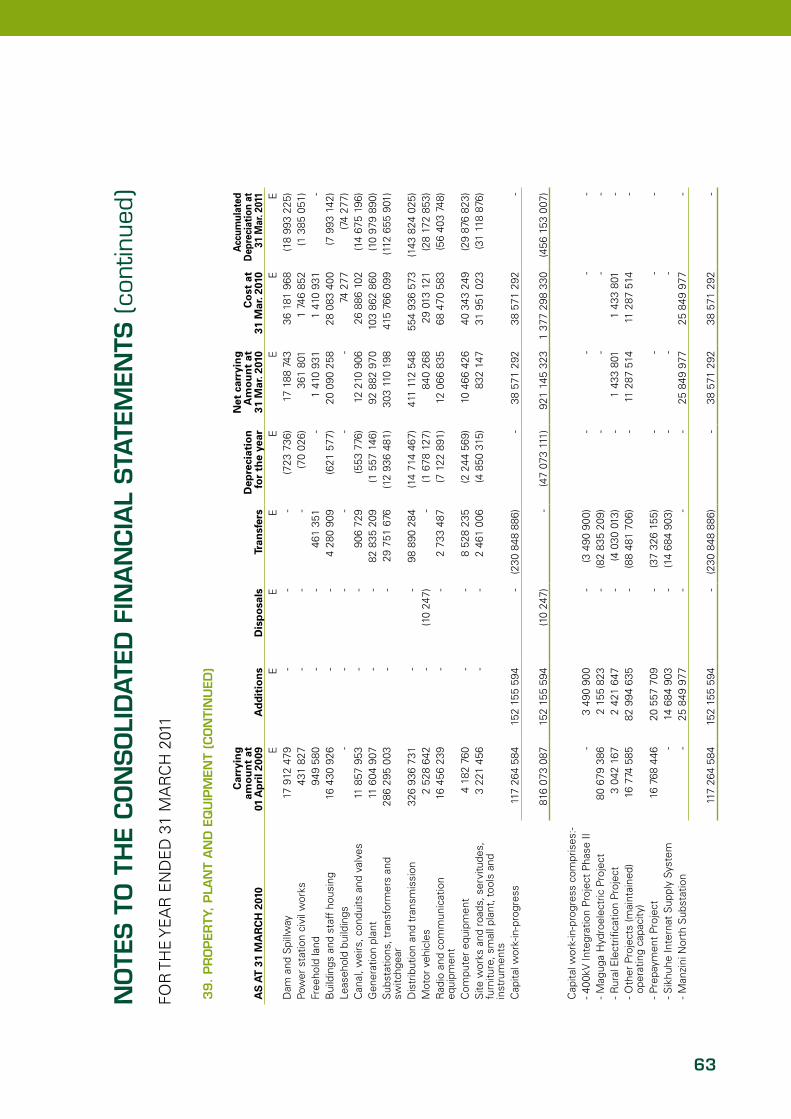
63
39
. Pr
OPEr
Ty, PLA
NT
AN
d E
Qu
IPM
ENT
(CO
NTI
Nu
Ed)
AS
AT
31
MA
RC
H 2
010
Car
ryin
gam
ou
nt
at01
Ap
ril 2
009
Ad
dit
ion
sD
isp
osa
lsTr
ansf
ers
Dep
reci
atio
nfo
r th
e ye
ar
Net
car
ryin
gA
mo
un
t at
31 M
ar. 2
010
Co
st a
t31
Mar
. 201
0
Acc
umul
ated
Dep
reci
atio
n at
31 M
ar. 2
011
ee
ee
ee
ee
dam
and
Spi
llway
17 9
12 4
79-
--
(723
736
)17
188
743
36 1
81 9
68(1
8 99
3 22
5)Po
wer
sta
tion
civi
l wor
ks43
1 82
7-
--
(70
026)
361
801
1 74
6 85
2(1
385
051
)Fr
eeho
ld la
nd94
9 58
0-
-46
1 35
1-
1 41
0 93
11
410
931
-B
uild
ings
and
sta
ff h
ousi
ng16
430
926
--
4 28
0 90
9(6
21 5
77)
20 0
90 2
5828
083
40
0(7
993
142
)Le
aseh
old
build
ings
--
--
--
74 2
77(7
4 27
7)c
anal
, wei
rs, c
ondu
its a
nd v
alve
s11
857
953
--
906
729
(553
776
)12
210
906
26 8
86 1
02(1
4 67
5 19
6)G
ener
atio
n pl
ant
11 6
04 9
07-
-82
835
209
(1 5
57 1
46)
92 8
82 9
7010
3 86
2 86
0(1
0 97
9 89
0)S
ubst
atio
ns, t
rans
form
ers
and
switc
hgea
r28
6 29
5 0
03-
-29
751
676
(1
2 93
6 48
1)30
3 11
0 19
841
5 76
6 09
9(1
12 6
55 9
01)
dis
trib
utio
n an
d tr
ansm
issi
on32
6 93
6 73
1-
-98
890
284
(14
714
467)
411
112
548
554
936
573
(143
824
025
)M
otor
veh
icle
s2
528
642
-(1
0 24
7)-
(1 6
78 1
27)
840
268
29 0
13 1
21(2
8 17
2 85
3)r
adio
and
com
mun
icat
ion
equi
pmen
t16
456
239
--
2 73
3 48
7(7
122
891
)12
066
835
68 4
70 5
83(5
6 40
3 74
8)
com
pute
r eq
uipm
ent
4 18
2 76
0-
-8
528
235
(2 2
44 5
69)
10 4
66 4
2640
343
249
(29
876
823)
Site
wor
ks a
nd r
oads
, ser
vitu
des,
fu
rnitu
re, s
mal
l pla
nt, t
ools
and
in
stru
men
ts
3 22
1 45
6-
-2
461
006
(4 8
50 3
15)
832
147
31 9
51 0
23
(31
118
876)
cap
ital
wor
k-in
-pro
gres
s11
7 26
4 58
415
2 15
5 59
4-
(230
848
886
)-
38 5
71 2
9238
571
292
-
816
073
087
152
155
594
(10
247)
-(4
7 07
3 11
1)92
1 14
5 32
31
377
298
330
(456
153
007
)
cap
ital
wor
k-in
-pro
gres
s co
mpr
ises
:-- 4
00k
V In
tegr
atio
n P
roje
ct P
hase
II-
3 49
0 90
0-
(3 4
90 9
00)
--
--
- Mag
uga
hyd
roel
ectr
ic P
roje
ct80
679
386
2 15
5 82
3-
(82
835
209)
--
--
- rur
al e
lect
rifica
tion
Pro
ject
3 04
2 16
72
421
647
-(4
030
013
)-
1 43
3 80
11
433
801
-- O
ther
Pro
ject
s (m
aint
aine
d)
oper
atin
g ca
paci
ty)
16 7
74 5
8582
994
635
-(8
8 48
1 70
6)-
11 2
87 5
14
11 2
87 5
14-
- Pre
paym
ent
Pro
ject
16 7
68 4
4620
557
709
-(3
7 32
6 15
5)-
--
-- S
ikhu
he In
tern
at S
uppl
y S
yste
m
-14
684
903
-(1
4 68
4 90
3)-
--
- Man
zini
nor
th S
ubst
atio
n-
25 8
49 9
77-
--
25 8
49 9
7725
849
977
-
117
264
584
152
155
594
-(2
30 8
48 8
86)
-38
571
292
38 5
71 2
92-
NO
TES T
O T
HE
CO
NSO
LId
ATE
d f
INA
NCIA
L STA
TEM
ENTS
(co
ntin
ued)
FOr
Th
e Y
ea
r e
nd
ed
31
Ma
rc
h 2
011
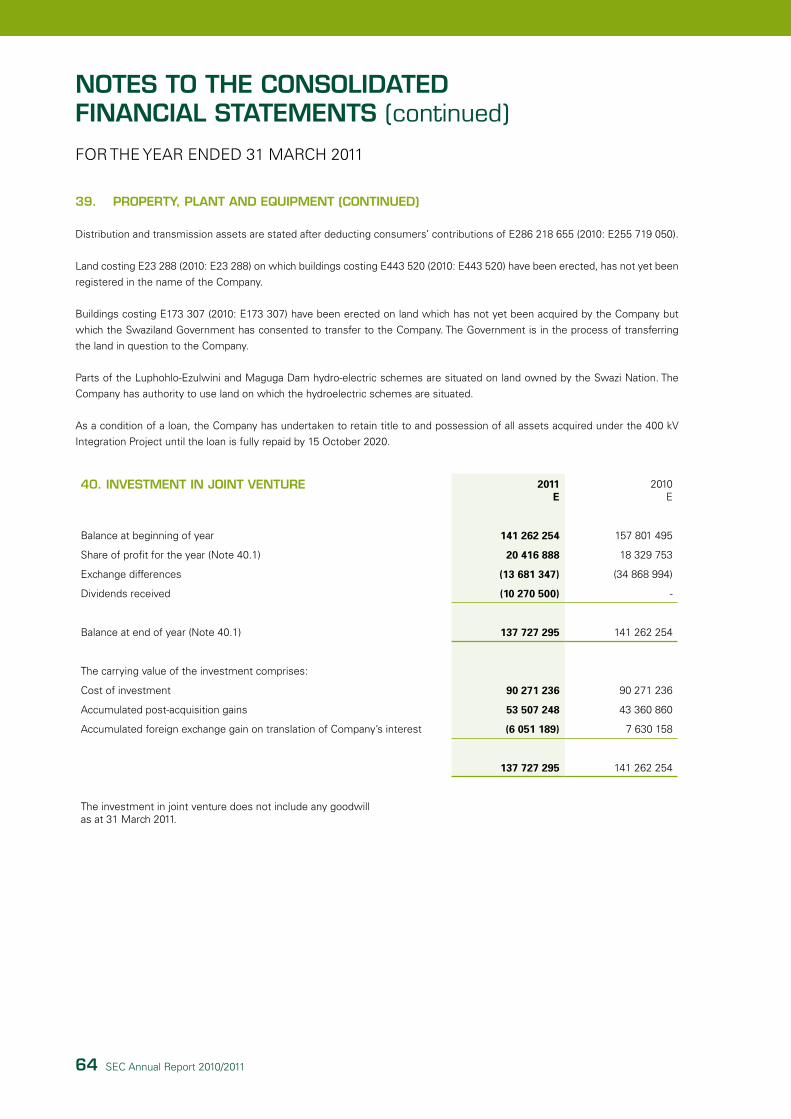
64 Sec annual report 2010/2011
NOTES TO THE CONSOLIdATEd fINANCIAL STATEMENTS (continued)
FOr The Year ended 31 March 2011
39. PrOPErTy, PLANT ANd EQuIPMENT (CONTINuEd)
distribution and transmission assets are stated after deducting consumers’ contributions of e286 218 655 (2010: e255 719 050).
Land costing e23 288 (2010: e23 288) on which buildings costing e443 520 (2010: e443 520) have been erected, has not yet been
registered in the name of the company.
Buildings costing e173 307 (2010: e173 307) have been erected on land which has not yet been acquired by the company but
which the Swaziland Government has consented to transfer to the company. The Government is in the process of transferring
the land in question to the company.
Parts of the Luphohlo-ezulwini and Maguga dam hydro-electric schemes are situated on land owned by the Swazi nation. The
company has authority to use land on which the hydroelectric schemes are situated.
as a condition of a loan, the company has undertaken to retain title to and possession of all assets acquired under the 400 kV
Integration Project until the loan is fully repaid by 15 October 2020.
40. INVESTMENT IN JOINT VENTurE 2011E
2010e
Balance at beginning of year 141 262 254 157 801 495
Share of profit for the year (note 40.1) 20 416 888 18 329 753
exchange differences (13 681 347) (34 868 994)
dividends received (10 270 500) -
Balance at end of year (note 40.1) 137 727 295 141 262 254
The carrying value of the investment comprises:
cost of investment 90 271 236 90 271 236
accumulated post-acquisition gains 53 507 248 43 360 860
accumulated foreign exchange gain on translation of company’s interest (6 051 189) 7 630 158
137 727 295 141 262 254
The investment in joint venture does not include any goodwill as at 31 March 2011.

65
40. INVESTMENT IN JOINT VENTurE (CONTINuEd)
40.1 In terms of a shareholders’ agreement signed on 20 May 2000, the company agreed to acquire a one third interest in a
Mozambiquean company Motraco-companhia de Transmissao de Mozambique S.a.r.L. (“Motraco”).
The authorized share capital of Motraco is US$39.5 million (e373.6 million). at 31 March 2011 share subscription requests totalling
US$13 166 667 (e97.8 million) had been made by Motraco and the subscriptions have been paid in full. The company’s 33%
interest in Motraco was translated at average and closing exchange rates of e7.07 and e6.77 (2010:e7.83 and e7.43) respectively.
Aggregateamount
US$
Company’s33%
interestUS$
Company’s33%
InterestE
Statement of financial position – 31 December 2010
non current assets 103 176 425 34 392 142 232 982 685
current assets 48 603 515 16 201 172 109 751 597
Total assets 151 779 940 50 593 314 342 734 282
non current liabilities (53 931 021) (17 977 007) (121 782 548)
current liabilities (36 856 361) (12 285 454) (83 224 439)
Total liabilities (90 787 382) (30 262 461) (205 006 987)
Net asset value 60 992 558 20 330 853 137 727 295
Statement of comprehensive income – year ended 31 December 2010
revenue 22 790 078 7 596 693 53 706 845
Gross profit 12 729 431 4 243 144 29 998 037
net finance costs (2 959 948) (986 649) (6 975 381)
Tax (1 105 737) (368 579) (2 605 768)
Profit for the year 8 663 746 2 887 916 20 416 888
NOTES TO THE CONSOLIdATEd fINANCIAL STATEMENTS (continued)
FOr The Year ended 31 March 2011

66 Sec annual report 2010/2011
NOTES TO THE CONSOLIdATEd fINANCIAL STATEMENTS (continued)
FOr The Year ended 31 March 2011
40. INVESTMENT IN JOINT VENTurE (CONTINuEd)
40.1 The company’s share of the results of its principal joint venture, which is unlisted, and its share of the assets (including
goodwill and liabilities) are as follows:
Aggregateamount
US$
Company’s33%
interestUS$
Company’s33%
interestE
Statement of financial position – 31 December 2009
non current assets 104 407 444 34 802 481 258 537 193
current assets 34 917 718 11 639 239 86 464 417
Total assets 139 325 162 46 441 720 345 001 610
non current liabilities (61 416 392) (20 472 131) (152 082 227)
current liabilities (20 861 172) (6 953 724) (51 657 129)
Total liabilities (82 277 564) (27 425 855) (203 739 356)
Net asset value 57 047 598 19 015 865 141 262 254
Statement of comprehensive income – year ended 31 December 2009
revenue 22 110 473 7 370 158 57 689 971
Gross profit 12 037 341 4 012 447 31 407 453
net finance costs (4 530 316) (1 510 105) (11 820 362)
Tax (481 892) (160 631) (1 257 338)
Profit for the year 7 025 133 2 341 711 18 329 753

67
NOTES TO THE CONSOLIdATEd fINANCIAL STATEMENTS (continued)
FOr The Year ended 31 March 2011
41. OTHEr ASSETS 2011E
2010e
Other assets comprise balances for rural electrification and counterpart funds at bank contributed by the Swaziland Government and the republic of china through the Swaziland Government for the rural electrification Project.
rural electrification funds (note 41.1) 30 333 301 11 753 867
counterpart funds (note 41.3) 15 238 118 14 477 209
Probec call account (note 41.2) 111 560 6 512
45 682 979 26 237 588
41.1 Rural electrification fund
The analysis of the balance on the fund at 31 March 2011 is as follows:
cumulative contributions received from the Swaziland Government 18 453 425 17 710 663
cumulative contributions received from consumers 18 375 18 375
cumulative contributions received from republic of china through the Government of Swaziland for the rural electrification project 62 269 111 36 049 250
80 740 911 53 778 288
Total interest received to date 6 326 991 5 780 861
deduct costs of projects capitalized (56 734 601) (47 805 282)
30 333 301 11 753 867
The analysis of movements fund bank balances during the year is as follows:
Fund balance at beginning of year 11 753 867 12 757 784
add interest received for the year 546 130 673 294
To finance capital expenditure (8 929 319) (4 612 836)
Fund received from the republic of china through the Government of Swaziland for the rural electrification project 26 962 623 2 935 625
Fund balance at the end of the year 30 333 301 11 753 867

68 Sec annual report 2010/2011
NOTES TO THE CONSOLIdATEd fINANCIAL STATEMENTS (continued)
FOr The Year ended 31 March 2011
41.2 Probec call account 2011E
2010e
This relates to money received by the company from Probec to assist low income groups in Sadc with improved access to sustainable and affordable electricity. during the year the financing agreement came to an end. The project will now be financed by the government of Swaziland. The balance of the account as at 31 March 2011 was e111 560 (2010: e6 512).
41.3 Counterpart fund
The analysis of the balance on the fund at 31 March 2011 is as follows:
Balance at beginning of the year 14 477 209 13 470 728
contributions received from interest differential on loans to the company (refer notes (i) and (ii) below)
- 130 425
Interest received on deposits 760 909 876 056
15 238 118 14 477 209
Balance at end of year 15 238 118 14 477 209
(i) Swaziland Government Loan No.4In terms of the agreements for Swaziland Loan no.4 (from Kreditanstalt fur Wiederaufbau, Germany, and lent by the Swaziland Government), the difference between interest calculated at 2% and interest charged at 3% on the loan is not to be paid to lenders, but is to be used by the company for projects particularly worthy of promotions from the aspect of development policy. The balance at year end is set to be used by the company for this purpose. The loan was settled by March 2011.
(ii) European Investment Bank – 400 KV Integration Project In terms of the agreements for european Investment Bank – 400 KV Integration Project loan, the difference between interest calculated at 3% and interest charged at 5.57% on the loans is not to be paid to lenders, but is to be used by the company for projects particularly worthy of promotions from the aspect of development policy. capital items funded from the counterpart fund are transferred to grants received and the relevant assets are brought to account at their actual cost.
42. INVENTOrIES
Stores 70 346 709 72 361 236
Write-down for obsolete stock (598 622) (2 598 622)
Net realisable value 69 748 087 69 762 614
The company sold scrapped inventory to independent retailers amounting e2 458 (2010: e726 693). The amount received has been included as “other income” in the statement of comprehensive income.

69
NOTES TO THE CONSOLIdATEd fINANCIAL STATEMENTS (continued)
FOr The Year ended 31 March 2011
43. TrAdE ANd OTHEr rECEIVABLES 2011E
2010e
electricity receivables 183 741 455 184 361 730
Provision for impairment of electricity receivables (32 127 988) (56 820 916)
net electricity receivable 151 613 467 127 540 814
Other receivables (refer to 43.1) 50 428 707 27 216 560
Provision for impairment of other receivables (4 225 735) (4 225 735)
net other receivables 46 202 972 22 990 825
Prepayments 11 922 793 16 573 973
58 125 765 39 564 798
209 739 232 167 105 612
43.1 Other receivables include the following:
capital contribution debtors 32 461 606 14 111 190
Staff debtors 864 000 1 120 535
Projects prepayments 5 469 517 1 344 124
Other sundry debtors 11 633 584 10 640 711
50 428 707 27 216 560
The fair values of trade and other receivables are as follows:
net electricity receivable 151 613 467 127 540 814
net other receivable 46 202 972 22 990 825
Prepayments 11 922 793 16 573 973
209 739 232 167 105 612
The above values of trade and other receivables approximate fair value. There is no concentration of credit risk with respect to trade and other receivables, as the company has a large number of customers that are industry dispersed. The company’s historical experience in collection of trade and other receivables falls within the recorded allowances. due to these factors, management believes that no additional credit risk beyond amounts provided for collection losses is inherent in the company’s trade and other receivables. The maximum exposure to credit risk at the reporting date is the fair value of each class of trade and other receivables mentioned above.
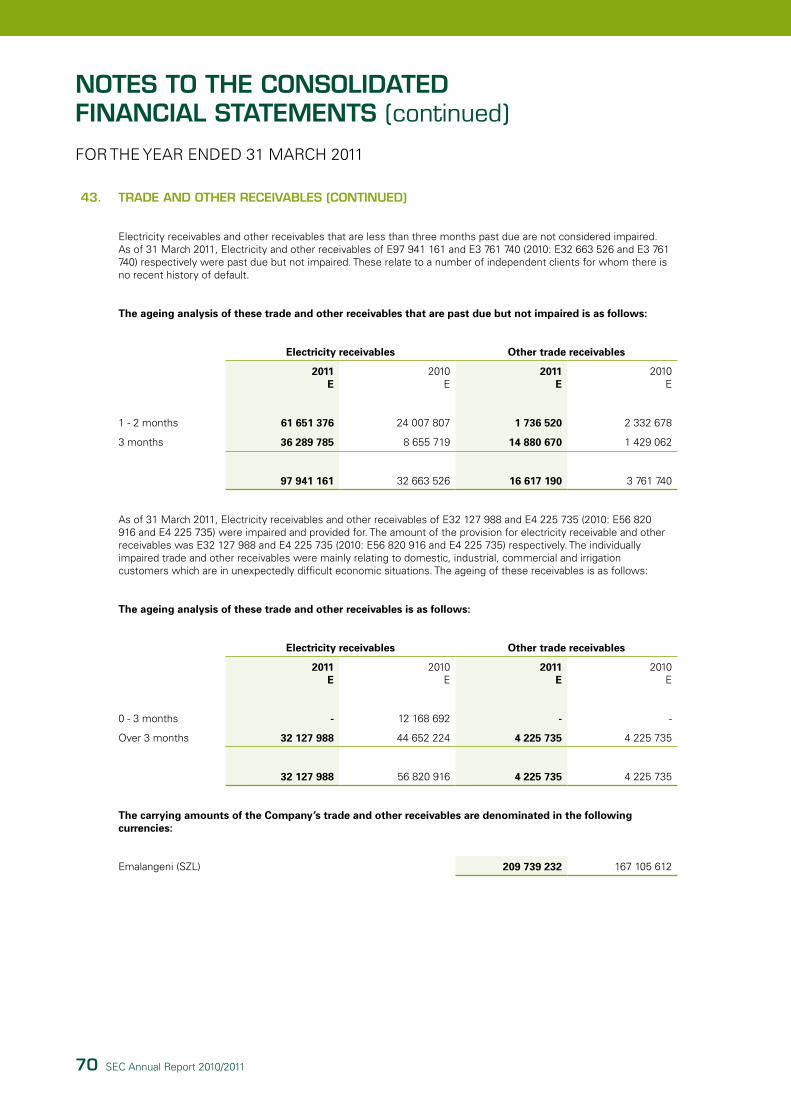
70 Sec annual report 2010/2011
NOTES TO THE CONSOLIdATEd fINANCIAL STATEMENTS (continued)
FOr The Year ended 31 March 2011
43. TrAdE ANd OTHEr rECEIVABLES (CONTINuEd)
electricity receivables and other receivables that are less than three months past due are not considered impaired. as of 31 March 2011, electricity and other receivables of e97 941 161 and e3 761 740 (2010: e32 663 526 and e3 761 740) respectively were past due but not impaired. These relate to a number of independent clients for whom there is no recent history of default.
The ageing analysis of these trade and other receivables that are past due but not impaired is as follows:
Electricity receivables Other trade receivables
2011E
2010e
2011E
2010e
1 - 2 months 61 651 376 24 007 807 1 736 520 2 332 678
3 months 36 289 785 8 655 719 14 880 670 1 429 062
97 941 161 32 663 526 16 617 190 3 761 740
as of 31 March 2011, electricity receivables and other receivables of e32 127 988 and e4 225 735 (2010: e56 820 916 and e4 225 735) were impaired and provided for. The amount of the provision for electricity receivable and other receivables was e32 127 988 and e4 225 735 (2010: e56 820 916 and e4 225 735) respectively. The individually impaired trade and other receivables were mainly relating to domestic, industrial, commercial and irrigation customers which are in unexpectedly difficult economic situations. The ageing of these receivables is as follows:
The ageing analysis of these trade and other receivables is as follows:
Electricity receivables Other trade receivables
2011E
2010e
2011E
2010e
0 - 3 months - 12 168 692 - -
Over 3 months 32 127 988 44 652 224 4 225 735 4 225 735
32 127 988 56 820 916 4 225 735 4 225 735
The carrying amounts of the Company’s trade and other receivables are denominated in the following currencies:
emalangeni (SZL) 209 739 232 167 105 612

71
NOTES TO THE CONSOLIdATEd fINANCIAL STATEMENTS (continued)
FOr The Year ended 31 March 2011
43. TrAdE ANd OTHEr rECEIVABLES (CONTINuEd)
Movements on the Company’s provision for impairment of electricity receivables and other receivables are as follows:
Electricity receivables Other trade receivables
2011E
2010e
2011E
2010e
at 1 april 2010 56 820 916 44 430 080 4 225 735 4 225 735
Provision for trade and other receivables impairment
- 12 390 836 - -
Trade and other receivables written off during the year as uncollectible
(20 640 560) - - -
Unused amounts reversed
(4 052 368) - - -
at 31 March 2011 32 127 988 56 820 916 4 225 735 4 225 735
amounts charged to the allowance account are generally written off, when there is no expectation of recovering additional cash. The other classes within trade and other receivables do not contain impaired assets.
44. PrEPAyMENT 2011E
2010e
Ubombo Sugar Limited Power Purchase agreement Prepayment 40 000 000 -
Swaziland electricity company Limited has purchased an exclusive right to buy surplus electricity from Ubombo Sugar Limited (USL). The total cost of that exclusive right will amount to e150 000 000. as at 31 March 2011 the entity had paid e40 000 000 to Ubombo Sugar Limited. The contract period is 15 years, that is, up to 30 april 2026. however, either party can elect to terminate the contract early after 8 years with a portion of e150 000 000 being refunded based on the number of years of the 15 that were not taken up.
USL needs to lodge a performance security in favour of Sec to the value of e150 000 000. This will be achieved by issuing mortgage bond sureties over USL property up to the total value of the payment received. For every year that elapses the performance security can be reduced to the unamortized portion of the e150 000 000. as at 31 March 2011 USL had issued guarantee provided by its parent company, Illovo Sugar Limited for an amount of e40 000 000.
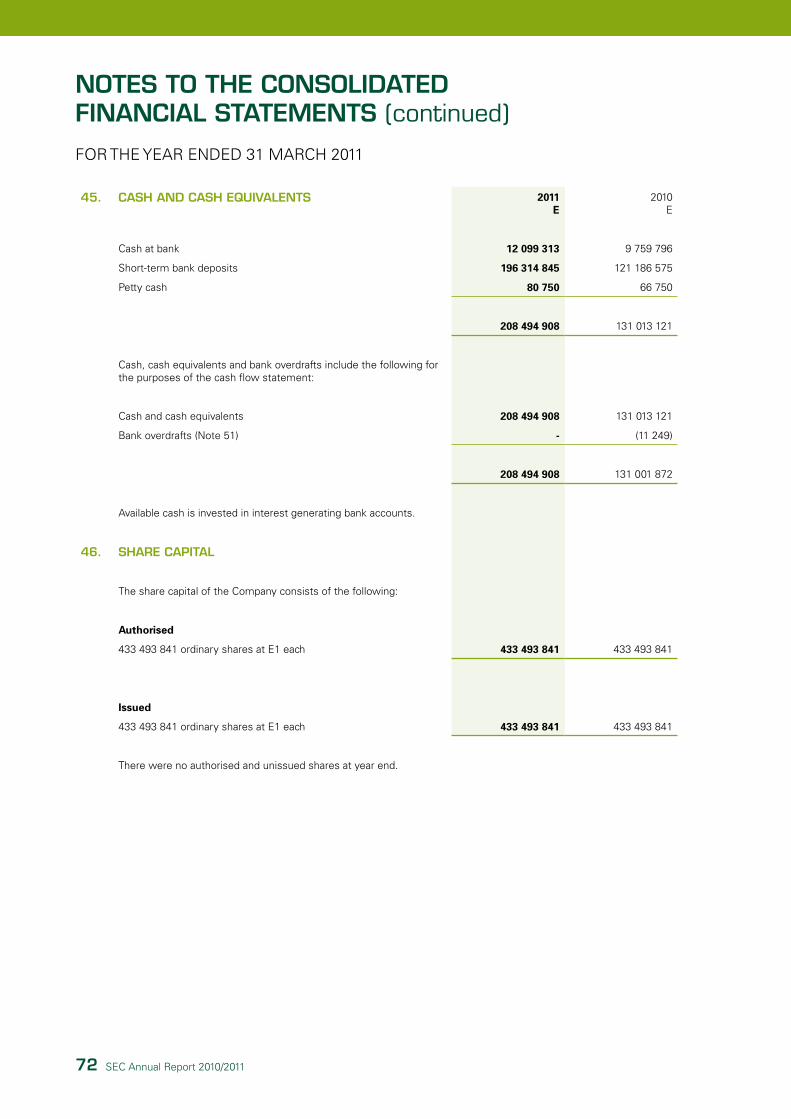
72 Sec annual report 2010/2011
NOTES TO THE CONSOLIdATEd fINANCIAL STATEMENTS (continued)
FOr The Year ended 31 March 2011
45. CASH ANd CASH EQuIVALENTS 2011E
2010e
cash at bank 12 099 313 9 759 796
Short-term bank deposits 196 314 845 121 186 575
Petty cash 80 750 66 750
208 494 908 131 013 121
cash, cash equivalents and bank overdrafts include the following for the purposes of the cash flow statement:
cash and cash equivalents 208 494 908 131 013 121
Bank overdrafts (note 51) - (11 249)
208 494 908 131 001 872
available cash is invested in interest generating bank accounts.
46. SHArE CAPITAL
The share capital of the company consists of the following:
Authorised
433 493 841 ordinary shares at e1 each 433 493 841 433 493 841
Issued
433 493 841 ordinary shares at e1 each 433 493 841 433 493 841
There were no authorised and unissued shares at year end.

73
NOTES TO THE CONSOLIdATEd fINANCIAL STATEMENTS (continued)
FOr The Year ended 31 March 2011
47. fOrEIgN ExCHANgE TrANSLATION rESErVE 2011E
2010e
Foreign exchange translation reserve 5 317 015 16 262 092
The foreign exchange translation reserve arises from the translation of Motraco, a Joint Venture company, which is a Mozambican registered company that uses the US dollar as its reporting currency (refer to note 40).
48. dEfErrEd grANT INCOME 2011E
2010e
Balance at beginning of year 105 977 552 106 796 083
Grants realised in statement of comprehensive income (note 36) (5 118 870) (5 431 367)
rural electrification grant received 8 929 319 4 612 836
109 788 001 105 977 552
49. OTHEr dEfErrEd INCOME
Other deferred income comprises unutilised balances of rural electrification and counterpart funds at bank contributed by Swaziland Government and republic of china through the Government of Swaziland for the rural electrification Project.
rural electrification funds (note 41) 30 333 301 11 753 867
counterpart funds (note 41) 15 238 118 14 477 209
Probec call account (note 41) 111 560 6 512
45 682 979 26 237 588

74 Sec annual report 2010/2011
NOTES TO THE CONSOLIdATEd fINANCIAL STATEMENTS (continued)
FOr The Year ended 31 March 2011
50. dEfErrEd rEVENuE 2011E
2010e
deferred electricity revenue (50.1) 11 547 496 2 368 183
deferred contributions from customers towards infrastructure (50.2) 9 372 709 10 290 936
20 920 205 12 659 119
50.1 Deferred electricity revenue
deferred electricity revenue comprises unearned prepaid electricity revenue from domestic and small commercial customers. The company utilizes an internally generated model to establish an estimate of unearned revenue from prepaid customers.
50.2 Deferred contributions from customers towards infrastructure
deferred contributions from customers towards infrastructure relate to fees for connection received in advance from prospective electricity customers. These fees are recognised as revenue when the connections are completed.
51. BOrrOwINgS
Current
Bank overdrafts (note 45) 28 645 11 249
Shareholder’s loan (note 51.1) 11 240 181 11 240 181
current portion of long term borrowings (note 51.2) 24 555 826 17 854 309
35 824 652 29 105 739
Non current
Long term borrowings (note 51.2) 284 538 511 227 948 951
Total borrowings 320 363 163 257 054 690

75
NOTES TO THE CONSOLIdATEd fINANCIAL STATEMENTS (continued)
FOr The Year ended 31 March 2011
51. BOrrOwINgS (CONTINuEd) 2011E
2010e
51.1 Shareholder’s loan
Liability for the civil works component of the Maguga dam hydroelectric Project. 11 240 181 11 240 181
The e11.2 million above was paid by the Government of Swaziland during the construction of the Maguga dam hydroelectric Project. There is uncertainty regarding the treatment of this amount but it is currently disclosed as borrowings and is payable to the Government of Swaziland. It is not certain what precise charge, if any, will be levied on the company by the Government of Swaziland as there are no specified terms regarding the amount.
51.2 Long term borrowings
current portion 24 555 826 17 854 309
non current portion 284 538 511 227 948 951
Total long term loans (note 51) 309 094 337 245 803 260
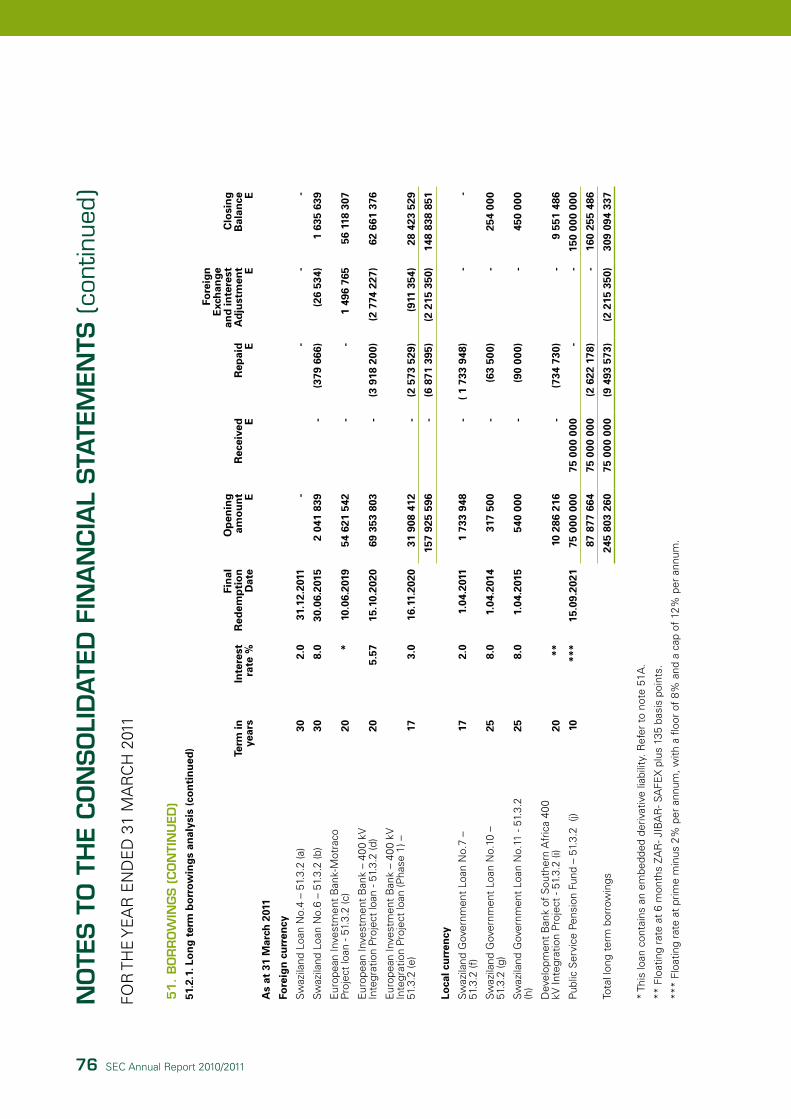
76 Sec annual report 2010/2011
51
. B
Or
rO
wIN
gS (CO
NTI
Nu
Ed)
51.2
.1. L
on
g t
erm
bo
rrow
ing
s an
alys
is (
con
tin
ued
) Term
inye
ars
Inte
rest
rate
%
Fin
alR
edem
pti
on
Dat
e
Op
enin
gam
ou
nt E
Rec
eive
d ER
epai
d E
Fore
ign
Exc
han
ge
and
inte
rest
Ad
just
men
t E
Clo
sin
gB
alan
ce E
As
at 3
1 M
arch
201
1
Fore
ign
cu
rren
cy
Sw
azila
nd L
oan
no.
4 –
51.3
.2 (a
)30
2.0
31.1
2.20
11-
--
-
Sw
azila
nd L
oan
no.
6 –
51.3
.2 (b
)30
8.0
30.0
6.20
152
041
839
-(3
79 6
66)
(26
534)
1 63
5 63
9
eur
opea
n In
vest
men
t B
ank-
Mot
raco
P
roje
ct lo
an -
51.3
.2 (c
)20
*10
.06.
2019
54 6
21 5
42-
-1
496
765
56 1
18 3
07
eur
opea
n In
vest
men
t B
ank
– 40
0 kV
In
tegr
atio
n P
roje
ct lo
an -
51.3
.2 (d
)20
5.57
15.1
0.20
2069
353
803
-(3
918
200
)(2
774
227
)62
661
376
eur
opea
n In
vest
men
t B
ank
– 40
0 kV
In
tegr
atio
n P
roje
ct lo
an (P
hase
1) –
51
.3.2
(e)
173.
016
.11.
2020
31 9
08 4
12-
(2 5
73 5
29)
(911
354
)28
423
529
157
925
596
-(6
871
395
)(2
215
350
)14
8 83
8 85
1
Loca
l cu
rren
cy
Sw
azila
nd G
over
nmen
t Lo
an n
o.7
–
51.3
.2 (f
)17
2.0
1.04
.201
11
733
948
-(
1 73
3 94
8)-
-
Sw
azila
nd G
over
nmen
t Lo
an n
o.10
–
51.3
.2 (g
)25
8.0
1.04
.201
431
7 50
0-
(63
500)
-25
4 00
0
Sw
azila
nd G
over
nmen
t Lo
an n
o.11
- 51
.3.2
(h
)25
8.0
1.04
.201
554
0 00
0-
(90
000)
-45
0 00
0
dev
elop
men
t B
ank
of S
outh
ern
afr
ica
400
kV In
tegr
atio
n P
roje
ct -
51.3
.2 (i
)20
**10
286
216
-(7
34 7
30)
-9
551
486
Pub
lic S
ervi
ce P
ensi
on F
und
– 51
.3.2
(j)
10**
*15
.09.
2021
75 0
00 0
0075
000
000
--
150
000
000
87 8
77 6
6475
000
000
(2 6
22 1
78)
-16
0 25
5 48
6
Tota
l lon
g te
rm b
orro
win
gs24
5 80
3 26
075
000
000
(9 4
93 5
73)
(2 2
15 3
50)
309
094
337
* Th
is lo
an c
onta
ins
an e
mbe
dded
der
ivat
ive
liabi
lity.
ref
er t
o no
te 5
1a.
** F
loat
ing
rate
at
6 m
onth
s Za
r- J
IBa
r- S
aFe
X p
lus
135
basi
s po
ints
.
***
Floa
ting
rate
at
prim
e m
inus
2%
per
ann
um, w
ith a
floo
r of
8%
and
a c
ap o
f 12
% p
er a
nnum
.
NO
TES T
O T
HE
CO
NSO
LId
ATE
d f
INA
NCIA
L STA
TEM
ENTS
(co
ntin
ued)
FOr
Th
e Y
ea
r e
nd
ed
31
Ma
rc
h 2
011

77
51
. B
Or
rO
wIN
gS (CO
NTI
Nu
Ed)
51.2
.1. L
on
g t
erm
bo
rrow
ing
s an
alys
is (
con
tin
ued
) Term
inye
ars
Inte
rest
rate
%
Fin
alR
edem
pti
on
Dat
e
Op
enin
gam
ou
nt E
Rec
eive
d ER
epai
d E
Fore
ign
Exc
han
ge
and
inte
rest
Ad
just
men
t E
Clo
sin
gB
alan
ce E
As
at 3
1 M
arch
201
1
Fore
ign
cu
rren
cy
Sw
azila
nd L
oan
no.
4 –
51.3
.2 (a
)30
2.0
31.1
2.20
115
043
454
-(4
026
133
)(1
017
321
)-
Sw
azila
nd L
oan
no.
6 –
51.3
.2 (b
)30
8.0
30.0
6.20
153
095
639
-(3
79 6
65)
(674
135
)2
041
839
eur
opea
n In
vest
men
t B
ank-
Mot
raco
P
roje
ct lo
an -
51.3
.2 (c
)20
*10
.06.
2019
65 9
74 0
63-
-(1
1 35
2 52
1)54
621
542
eur
opea
n In
vest
men
t B
ank
– 40
0 kV
In
tegr
atio
n P
roje
ct lo
an –
51.
3.2
(d)
205.
5715
.10.
2020
95 2
10 2
78-
(3 8
03 8
00)
(22
052
675)
69 3
53 8
03
eur
opea
n In
vest
men
t B
ank
– 40
0 kV
Inte
grat
ion
Pro
ject
loan
(Pha
se 1
) –
51.3
.2 (e
)17
3.0
16.1
1.20
2044
425
059
-(2
573
529
)(9
943
118
)31
908
412
213
748
493
-(1
0 78
3 12
7)(4
5 03
9 77
0)15
7 92
5 59
6
Loca
l cu
rren
cy
Sw
azila
nd G
over
nmen
t Lo
an n
o.7
–
51.3
.2 (f
)17
2.0
1.04
.201
12
600
872
-(8
66 9
24)
-1
733
948
Sw
azila
nd G
over
nmen
t Lo
an n
o.10
–
51.3
.2 (g
)25
8.0
1.04
.201
438
1 0
00
-(6
3 50
0)-
317
500
Sw
azila
nd G
over
nmen
t Lo
an n
o.11
–
51.3
.2 (h
)25
8.0
1.04
.201
563
0 0
00
-(9
0 0
00)
-54
0 0
00
dev
elop
men
t B
ank
of S
outh
ern
afr
ica
400
kV In
tegr
atio
n P
roje
ct –
51.
3.2
(i)
20
**11
020
945
-(7
34 7
29)
-10
286
216
Pub
lic S
ervi
ce P
ensi
on F
und
– 51
.3.2
(j)
10**
*15
.09.
2021
-75
00
0 0
00
--
75 0
00
00
0
14 6
32 8
1775
00
0 0
00
(1 7
55 1
53)
-87
877
664
Tota
l lo
ng
ter
m b
orr
owin
gs
228
381
310
75 0
00
00
0(1
2 53
8 28
0)
(45
039
770)
245
803
260
* Th
is lo
an c
onta
ins
an e
mbe
dded
der
ivat
ive
liabi
lity.
ref
er t
o no
te 5
1a.
** F
loat
ing
rate
at
6 m
onth
s Za
r- J
IBa
r- S
aFe
X p
lus
135
basi
s po
ints
.
***
Floa
ting
rate
at
prim
e m
inus
2%
per
ann
um, w
ith a
floo
r of
8%
and
a c
ap o
f 12
% p
er a
nnum
.
NO
TES T
O T
HE
CO
NSO
LId
ATE
d f
INA
NCIA
L STA
TEM
ENTS
(co
ntin
ued)
FOr
Th
e Y
ea
r e
nd
ed
31
Ma
rc
h 2
011
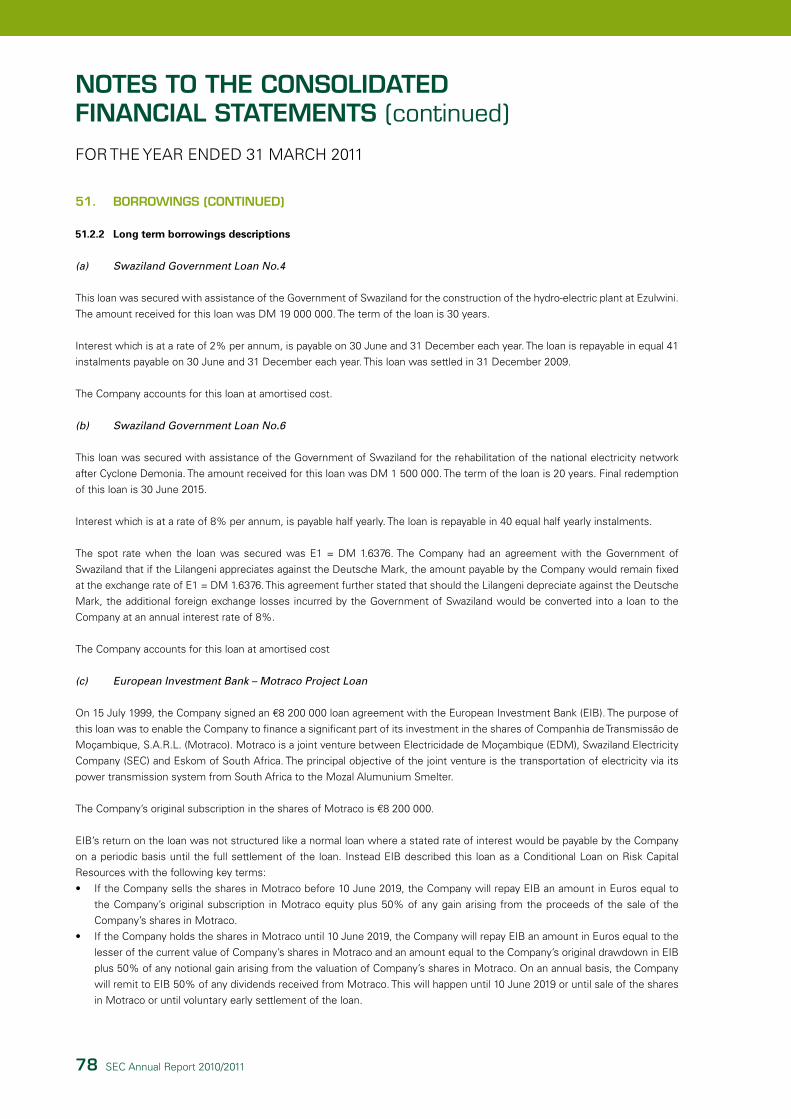
78 Sec annual report 2010/2011
NOTES TO THE CONSOLIdATEd fINANCIAL STATEMENTS (continued)
FOr The Year ended 31 March 2011
51. BOrrOwINgS (CONTINuEd)
51.2.2 Long term borrowings descriptions
(a) SwazilandGovernmentLoanNo.4
This loan was secured with assistance of the Government of Swaziland for the construction of the hydro-electric plant at ezulwini.
The amount received for this loan was dM 19 000 000. The term of the loan is 30 years.
Interest which is at a rate of 2% per annum, is payable on 30 June and 31 december each year. The loan is repayable in equal 41
instalments payable on 30 June and 31 december each year. This loan was settled in 31 december 2009.
The company accounts for this loan at amortised cost.
(b) SwazilandGovernmentLoanNo.6
This loan was secured with assistance of the Government of Swaziland for the rehabilitation of the national electricity network
after cyclone demonia. The amount received for this loan was dM 1 500 000. The term of the loan is 20 years. Final redemption
of this loan is 30 June 2015.
Interest which is at a rate of 8% per annum, is payable half yearly. The loan is repayable in 40 equal half yearly instalments.
The spot rate when the loan was secured was e1 = dM 1.6376. The company had an agreement with the Government of
Swaziland that if the Lilangeni appreciates against the deutsche Mark, the amount payable by the company would remain fixed
at the exchange rate of e1 = dM 1.6376. This agreement further stated that should the Lilangeni depreciate against the deutsche
Mark, the additional foreign exchange losses incurred by the Government of Swaziland would be converted into a loan to the
company at an annual interest rate of 8%.
The company accounts for this loan at amortised cost
(c) EuropeanInvestmentBank–MotracoProjectLoan
On 15 July 1999, the company signed an €8 200 000 loan agreement with the european Investment Bank (eIB). The purpose of
this loan was to enable the company to finance a significant part of its investment in the shares of companhia de Transmissão de
Moçambique, S.a.r.L. (Motraco). Motraco is a joint venture between electricidade de Moçambique (edM), Swaziland electricity
company (Sec) and eskom of South africa. The principal objective of the joint venture is the transportation of electricity via its
power transmission system from South africa to the Mozal alumunium Smelter.
The company’s original subscription in the shares of Motraco is €8 200 000.
eIB’s return on the loan was not structured like a normal loan where a stated rate of interest would be payable by the company
on a periodic basis until the full settlement of the loan. Instead eIB described this loan as a conditional Loan on risk capital
resources with the following key terms:
• If the company sells the shares in Motraco before 10 June 2019, the company will repay eIB an amount in euros equal to
the company’s original subscription in Motraco equity plus 50% of any gain arising from the proceeds of the sale of the
company’s shares in Motraco.
• If the company holds the shares in Motraco until 10 June 2019, the company will repay eIB an amount in euros equal to the
lesser of the current value of company’s shares in Motraco and an amount equal to the company’s original drawdown in eIB
plus 50% of any notional gain arising from the valuation of company’s shares in Motraco. On an annual basis, the company
will remit to eIB 50% of any dividends received from Motraco. This will happen until 10 June 2019 or until sale of the shares
in Motraco or until voluntary early settlement of the loan.

79
• If the company decides to voluntarily settle the loan early without disposing the shares in Motraco, the amount payable by
the company would be the higher of the outstanding balance and an amount equal to the company’s original subscription in
Motraco equity plus 50% of any notional gain arising from the valuation of company’s shares in Motraco.
• If Motraco becomes insolvent, is liquidated or wound up, no further remuneration will accrue to eIB and the company
will make no further repayments of the principal on the loan. however, the company will have to remit to eIB any final
distributions arising from the liquidation or winding of Motraco.
The company received the loan in two instalments: a €5 400 000 instalment received on 30 november 1999 and a €2 800 000
instalment received on 20 august 2002.
The company intends to hold the investment in Motraco shares until at least 10 June 2019, the maturity date of the eIB loan.
The company has adopted the following accounting treatment in terms of International accounting Standard 39 – “Financial
Instruments: recognition and Measurement” (IaS 39) regarding the eIB loan:
• To account for the original subscription of €8 200 000 which is at least repayable on 10 June 2019 as a borrowing accounted
for at amortised cost. The €1 000 000 difference between the €8 200 000 disbursements received and the €9 200 000
repayable, would be considered to constitute a nominal interest equivalent on the €8 200 000 principal. On initial recognition,
the company discounted the two loan disbursements at market related rates on the dates they were received. applying
amortised cost, the company is accruing interest on these discounted values until 10 June 2019, at which point in time the
discounted loan values plus the accumulated interest will equal €9 200 000. The company is charging the interest to the
statement of comprehensive income on an annual basis and crediting it to the loan.
• To separate the cash outflows related to the loan that are dependent on the company value of Motraco on 10 June 2019 when
the loan is settled, because they meet the definition of an embedded derivative. refer to note 50a for the values attached to
this embedded derivative and how it has been determined and accounted for.
• In the year under review the company paid european Investment Bank e4.015 million as part of the financing arrangement.
(d) EuropeanInvestmentBank–400kVIntegrationProjectLoan
This loan was secured for the purposes of funding the company’s Transmission Project. The amount received for this loan was
€10 000 000. The term of the loan is 20 years. Final redemption of this loan is on 15 October 2020.
Interest is payable on 15 april and 15 October each year. The agreement states that the interest rate should be the greater of 3%
and a rate determined by subtracting the 3.06% interest rate subsidy from the standard rate of interest applicable at the date the
loan was issued. The loan is repayable in semi-annual instalments payable on 15 april and 15 October each year.
The company has to maintain a ratio of at least 1:3 for its own funds to borrowings and a ratio of at least 1.5:1 for its annual debt
service coverage.
The Government of Swaziland guarantees the company’s performance of its obligation in relation to this loan and indemnifies the
european Investment Bank against all losses.
The company accounts for this loan at amortised cost.
(e) EuropeanInvestmentBank–400KVIntegrationProjectLoanPhase1
This loan was secured for the purposes of funding the 400KV Integration Project. The amount received for this loan was
€5 000 000. The term of the loan is 17 years commencing on 02 July 2001. Final redemption of this loan is on 16 november 2020.
Interest which is at a rate of 3% per annum, is payable on 15 november each year. The loan is repayable in equal 17 instalments
payable on 15 november each year.
NOTES TO THE CONSOLIdATEd fINANCIAL STATEMENTS (continued)
FOr The Year ended 31 March 2011

80 Sec annual report 2010/2011
The company has to maintain a ratio of at least 1:3 for its own funds to borrowings and a ratio of at least 1.5:1 for its annual debt
service coverage.
The Government of Swaziland guarantees the company’s performance of its obligation in relation to this loan and indemnifies the
european Investment Bank against all losses.
The company accounts for this loan at amortised cost.
(f) SwazilandGovernmentLoanNo.7
This loan was secured for the purposes of funding infrastructure improvements. The amount received for this loan was
e15 171 174. The term of the loan is 20 years. This loan was fully settled on 31 March 2011.
Interest which is at a rate of 2% per annum, is payable in april and november each year. The loan is repayable in equal 35 semi-
annual instalments payable in april and november each year.
The company accounts for this loan at amortised cost.
(g) SwazilandGovernmentLoanNo.10
This loan was secured for the purposes of funding infrastructure improvements. The amount received for this loan was
e1 270 000. The term of the loan is 20 years. Final redemption of this loan is on 01 april 2014.
Interest which is at a rate of 8% per annum, is payable on 31 March each year. The loan is repayable in 20 equal instalments of
e63 500 payable on 31 March each year.
The company accounts for this loan at amortised cost.
(h) SwazilandGovernmentLoanNo.11
This loan was secured for the purposes of funding infrastructure improvements. The amount received for this loan was e1 800
000. The term of the loan is 20 years. Final redemption of this loan is on 01 april 2015.
Interest which is at a rate of 8% per annum, is payable on 31 March each year. The loan is repayable in 20 equal instalments of
e90 000.
The company accounts for this loan at amortised cost.
(i) DevelopmentBankofSouthernAfrica(DBSA)Loan
This loan was secured for the purposes of funding the 400kV Integration Phase II Project. The amount received for this loan was
e97 135 000. The term of the loan is 20 years commencing from 05 March 2003 with a two years grace period.
Interest which is at a rate of 6 months Zar-JIBar-SaFeX plus 135 basis points for the risk margin, is payable on 01 april and
01 October each year. The company has an option to convert the rate from the floating rate to fixed rate of interest. The fixed rate
of interest is determined at the dBSa base rate plus 135 basis points. The dBSa base rate is market related rate.
The loan is repayable in 36 equal half yearly instalments payable on 01 april and 01 October each year.
The company accounts for this loan at amortised cost.
NOTES TO THE CONSOLIdATEd fINANCIAL STATEMENTS (continued)
FOr The Year ended 31 March 2011
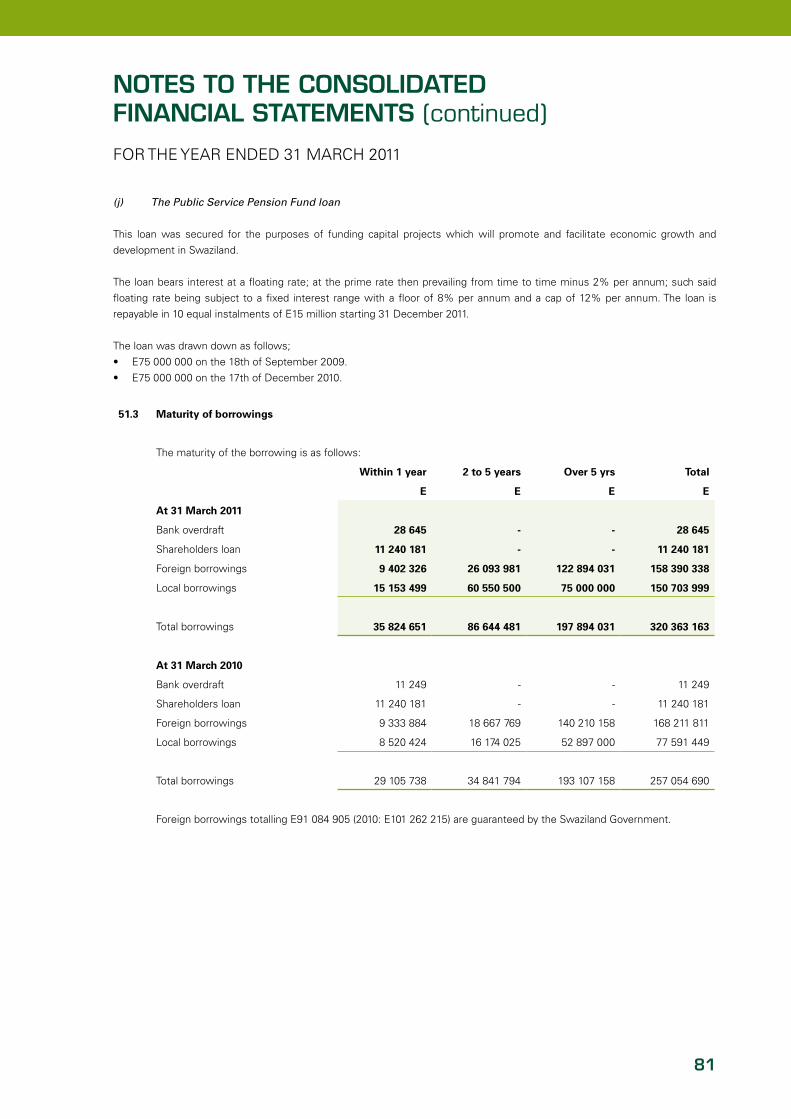
81
(j) ThePublicServicePensionFundloan
This loan was secured for the purposes of funding capital projects which will promote and facilitate economic growth and
development in Swaziland.
The loan bears interest at a floating rate; at the prime rate then prevailing from time to time minus 2% per annum; such said
floating rate being subject to a fixed interest range with a floor of 8% per annum and a cap of 12% per annum. The loan is
repayable in 10 equal instalments of e15 million starting 31 december 2011.
The loan was drawn down as follows;
• e75 000 000 on the 18th of September 2009.
• e75 000 000 on the 17th of december 2010.
51.3 Maturity of borrowings
The maturity of the borrowing is as follows:
Within 1 year 2 to 5 years Over 5 yrs Total
E E E E
At 31 March 2011
Bank overdraft 28 645 - - 28 645
Shareholders loan 11 240 181 - - 11 240 181
Foreign borrowings 9 402 326 26 093 981 122 894 031 158 390 338
Local borrowings 15 153 499 60 550 500 75 000 000 150 703 999
Total borrowings 35 824 651 86 644 481 197 894 031 320 363 163
At 31 March 2010
Bank overdraft 11 249 - - 11 249
Shareholders loan 11 240 181 - - 11 240 181
Foreign borrowings 9 333 884 18 667 769 140 210 158 168 211 811
Local borrowings 8 520 424 16 174 025 52 897 000 77 591 449
Total borrowings 29 105 738 34 841 794 193 107 158 257 054 690
Foreign borrowings totalling e91 084 905 (2010: e101 262 215) are guaranteed by the Swaziland Government.
NOTES TO THE CONSOLIdATEd fINANCIAL STATEMENTS (continued)
FOr The Year ended 31 March 2011
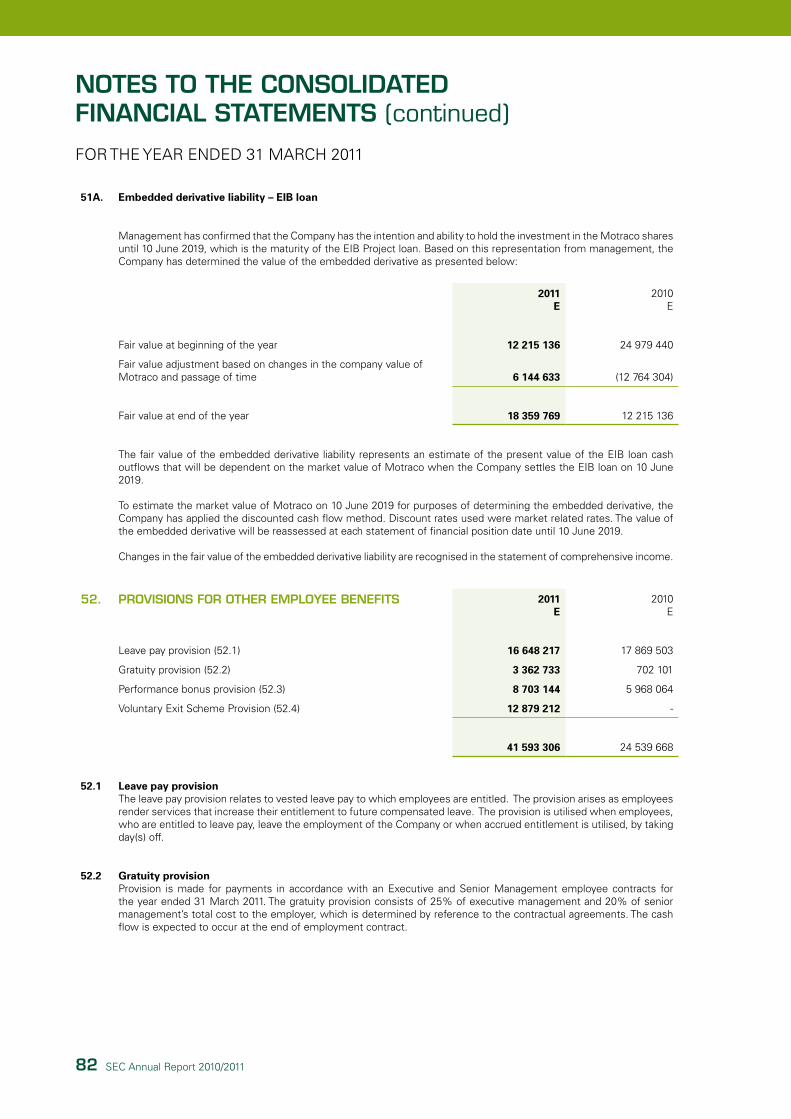
82 Sec annual report 2010/2011
51A. Embedded derivative liability – EIB loan
Management has confirmed that the company has the intention and ability to hold the investment in the Motraco shares until 10 June 2019, which is the maturity of the eIB Project loan. Based on this representation from management, the company has determined the value of the embedded derivative as presented below:
2011E
2010e
Fair value at beginning of the year 12 215 136 24 979 440
Fair value adjustment based on changes in the company value of Motraco and passage of time 6 144 633 (12 764 304)
Fair value at end of the year 18 359 769 12 215 136
The fair value of the embedded derivative liability represents an estimate of the present value of the eIB loan cash outflows that will be dependent on the market value of Motraco when the company settles the eIB loan on 10 June 2019.
To estimate the market value of Motraco on 10 June 2019 for purposes of determining the embedded derivative, the company has applied the discounted cash flow method. discount rates used were market related rates. The value of the embedded derivative will be reassessed at each statement of financial position date until 10 June 2019.
changes in the fair value of the embedded derivative liability are recognised in the statement of comprehensive income.
52. PrOVISIONS fOr OTHEr EMPLOyEE BENEfITS 2011E
2010e
Leave pay provision (52.1) 16 648 217 17 869 503
Gratuity provision (52.2) 3 362 733 702 101
Performance bonus provision (52.3) 8 703 144 5 968 064
Voluntary exit Scheme Provision (52.4) 12 879 212 -
41 593 306 24 539 668
52.1 Leave pay provisionThe leave pay provision relates to vested leave pay to which employees are entitled. The provision arises as employees render services that increase their entitlement to future compensated leave. The provision is utilised when employees, who are entitled to leave pay, leave the employment of the company or when accrued entitlement is utilised, by taking day(s) off.
52.2 Gratuity provision Provision is made for payments in accordance with an executive and Senior Management employee contracts for the year ended 31 March 2011. The gratuity provision consists of 25% of executive management and 20% of senior management’s total cost to the employer, which is determined by reference to the contractual agreements. The cash flow is expected to occur at the end of employment contract.
NOTES TO THE CONSOLIdATEd fINANCIAL STATEMENTS (continued)
FOr The Year ended 31 March 2011

83
NOTES TO THE CONSOLIdATEd fINANCIAL STATEMENTS (continued)
FOr The Year ended 31 March 2011
52.3 Performance bonus provision
The bonus provision consists of performance-based bonuses, which are determined with reference to the overall company performance with regard to a set of pre-determined key measures. Bonuses are payable annually.
52.4 Voluntary Exit Package provision
Provision is made for payments in accordance with the entity’s policy on voluntary exit scheme. The Voluntary exit Package provision consists of 4 days notice pay, severance pay, ex-gratia pay and one month basic salary, which is determined by reference to the contractual agreements. The cash flow is expected to occur within the next 12 months from year end.
53. dErIVATIVE fINANCIAL INSTruMENTS
Financial assets Financial liabilities
2011E
2010e
2011E
2010e
Cross currency interest rate swaps:-
Foreign currency swaps 26 238 488 33 948 954 45 229 176 177
Interest rate swaps – fair value hedges - - 4 503 851 4 676 067
26 238 488 33 948 954 4 549 080 4 852 244
at 31 March 2011, Borrowings included an amount of e100 636 391 (2010: e111 548 431 ) in respect of a long term loan due in foreign currency, which has been hedged using the cross currency and interest rate swap as stipulated above.
derivatives are classified as non-current asset or liability. The full fair value of the hedge derivative is classified as non-current asset and liability if the remaining maturity of hedged item is more than 12 months, as current asset or liability of maturity of hedged item to less than 12 month.
The ineffective portion of the derivative is recognized in the profit or loss. There was no ineffectiveness recognized during the year.
a)Foreigncurrencyswaps–fairvaluehedgeGains and losses on the foreign currency swaps are recognized in the statement of comprehensive income since the swaps are used as a fair value hedge.
b)Interestrateswaps–fairvalueat 31 March 2011, the fixed interest rates varied from 2% to 8% (2010: 2% to 8%), and the main floating rates are at 6 months Zar – JIBar-SaFeX minus 315 basis points. Gains and losses are recognised in the statement of comprehensive income since the swaps are used as a fair value hedge.

84 Sec annual report 2010/2011
NOTES TO THE CONSOLIdATEd fINANCIAL STATEMENTS (continued)
FOr The Year ended 31 March 2011
53. dErIVATIVE fINANCIAL INSTruMENTS (CONTINuEd)
Movements and analysis of gains or losses arising from fair value hedges is as follows:
Financial assets Financial liabilities
2011E
2010e
2011E
2010e
Fair value at the beginning of the year 33 948 954 63 083 437 4 852 244 5 171 366
Utilised or terminated fair value hedging instruments - - (1 026 341)
Fair value gains or losses on fair value hedges (7 710 466) (29 134 483) (303 164) 707 219
Fair value at the end of the year 26 238 488 33 948 954 4 549 080 4 852 244
The maximum exposure to credit risk at reporting date is the fair value of the derivative asset in the balance.

85
54. EMPLOyEE rETIrEMENT BENEfITS OBLIgATION 2011E
2010e
retirement benefit asset (3 611 531) (1 887 368)
The amount of employee retirement benefit obligation recognised in the statement of financial position is determined as follows:
Present value of plan obligations 156 263 977 152 553 307
Fair value of plan assets (146 396 046) (144 790 772)
Present value of unfunded obligations 9 867 931 7 762 535
Unrecognised actuarial loss (13 479 462) (9 649 903)
Asset in the statement of financial position (3 611 531) (1 887 368)
The company makes contributions to a defined benefit plan that provides pension benefits for permanent employees upon retirement. as at 31 March 2011 the company converted all current employees to a defined contribution plan. The last actuarial valuation was carried out at 31 March 2011.
The movements in asset recognised in the statement of financial position are as follows:
(asset)/Liability at beginning of year (1 887 368) (250 000)
contributions to the fund (8 757 949) (9 462 611)
expense recognised in the statement of comprehensive income (note 34) 7 033 786 7 825 243
asset in the statement of financial position (3 611 531) (1 887 368)
Movement in the defined benefit obligation over the year is as follows:
Beginning of year 152 553 307 131 188 859
current service cost 6 848 545 7 955 626
Interest cost 12 780 529 11 670 510
contributions by plan participants 2 950 792 3 188 211
Benefits paid (24 754 776) (17 070 005)
actuarial losses 5 885 580 15 620 106
End of year 156 263 977 152 553 307
NOTES TO THE CONSOLIdATEd fINANCIAL STATEMENTS (continued)
FOr The Year ended 31 March 2011
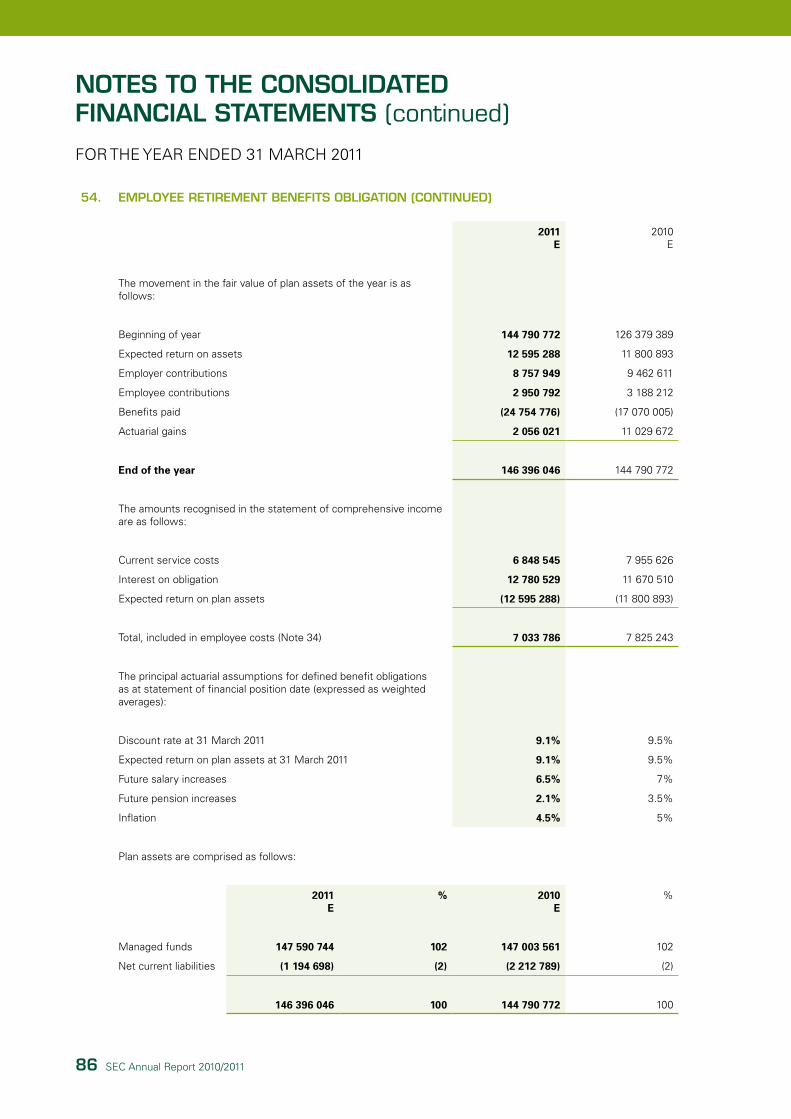
86 Sec annual report 2010/2011
NOTES TO THE CONSOLIdATEd fINANCIAL STATEMENTS (continued)
FOr The Year ended 31 March 2011
54. EMPLOyEE rETIrEMENT BENEfITS OBLIgATION (CONTINuEd)
2011E
2010e
The movement in the fair value of plan assets of the year is as follows:
Beginning of year 144 790 772 126 379 389
expected return on assets 12 595 288 11 800 893
employer contributions 8 757 949 9 462 611
employee contributions 2 950 792 3 188 212
Benefits paid (24 754 776) (17 070 005)
actuarial gains 2 056 021 11 029 672
End of the year 146 396 046 144 790 772
The amounts recognised in the statement of comprehensive income are as follows:
current service costs 6 848 545 7 955 626
Interest on obligation 12 780 529 11 670 510
expected return on plan assets (12 595 288) (11 800 893)
Total, included in employee costs (note 34) 7 033 786 7 825 243
The principal actuarial assumptions for defined benefit obligations as at statement of financial position date (expressed as weighted averages):
discount rate at 31 March 2011 9.1% 9.5%
expected return on plan assets at 31 March 2011 9.1% 9.5%
Future salary increases 6.5% 7%
Future pension increases 2.1% 3.5%
Inflation 4.5% 5%
Plan assets are comprised as follows:
2011E
% 2010E
%
Managed funds 147 590 744 102 147 003 561 102
net current liabilities (1 194 698) (2) (2 212 789) (2)
146 396 046 100 144 790 772 100

87
54. EMPLOyEE rETIrEMENT BENEfITS OBLIgATION (CONTINuEd)
The expected return on plan assets is determined by considering the expected returns available on the assets underlying the current investments. expected yields on fixed interest investments are based on gross redemption yields as at the statement of financial position date.
The actuarial position of the fund as at year end was as follows:
2011E
2010e
Present value of defined benefit obligation 156 263 977 152 553 307
Fair value of plan assets (146 396 046) (144 790 772)
Deficit 9 867 931 7 762 535
55. dEfErrEd INCOME TAx
deferred income tax assets and liabilities are offset when there is a legally enforceable right to offset current tax assets against current tax liabilities and when the deferred income taxes relate to the same fiscal authority. The offset amounts are as follows:
2011E
2010e
deferred tax assets:
- deferred tax asset to be recovered after more than 12 months (28 536 643) (27 787 048)
deferred tax liabilities:
- deferred tax liability to be recovered after more than 12 months 174 191 766 141 187 514
Deferred tax liabilities (net) 145 655 123 113 400 466
The gross movement on the deferred income tax account is as follows:
Beginning of year 113 400 466 68 264 627
Statement of comprehensive income charge (note 35) 34 990 926 43 609 807
Statement of other comprehensive income charge (note 35) (2 736 269) 1 526 032
End of year 145 655 123 113 400 466
NOTES TO THE CONSOLIdATEd fINANCIAL STATEMENTS (continued)
FOr The Year ended 31 March 2011

88 Sec annual report 2010/2011
NOTES TO THE CONSOLIdATEd fINANCIAL STATEMENTS (continued)
FOr The Year ended 31 March 2011
55. dEfErrEd TAxATION (CONTINuEd)
The movement in deferred tax assets and liabilities during the year, without taking into consideration the offsetting of balances within the same tax jurisdiction is as follows:
Deferred tax liabilities
Acceleratedtax
depreciationPre-
payments
Retirementbenefit
asset
Withholdingtax on
Motraco unremitted
earnings Total
e e e e e
at 1 april 2009 94 479 860 531 580 75 000 - 95 086 440
charged/(credited) to the statement of comprehensive income
30 971 047 4 440 612 491 211 10 198 204 46 101 074
at 31 March 2010 125 450 907 4 972 192 566 211 10 198 204 141 187 514
charged to the statement of comprehensive income 22 589 349 10 604 646 517 249 (706 992) 33 004 252
At 31 March 2011 148 040 256 15 576 838 1 083 460 9 491 212 174 191 766
Deferred tax assets
Provisionsfor other
employee benefits
Doubtful debt
allowanceTax losses
Interest on EIB loan
Deferred revenue Total
e e e e e e
at 1 april 2009 (4 515 142) (14 596 745) (5 401 025) (2 308 901) - (26 821 813)
Foreign exchange adjustment - - - 255 980 - 255 980
(credited)/charged to the statement of comprehensive income (2 846 758) (3 717 250) 5 375 748 677 500 (710 455) (1 221 215)
at 31 March 2010 (7 361 900) (18 313 995) (25 277) (1 375 421)
(710 455) (27 787 048)
(credited)/charged to the statement of comprehensive income (5 116 092) 7 407 878 25 277 (312 864) (2 753 794) (749 595)
at 31 March 2011 (12 477 992) (10 906 117) - (1 688 285) (3 464 249) (28 536 643)
deferred income tax assets are recognised for tax loss carry-forwards to the extent that the realisation of the related tax benefit through the future taxable profits is probable.
The company has recognised deferred tax on the unremitted earnings of the joint venture company (note 40) because there is a 20% withholding tax payable when these earnings are distributed by the joint venture company.

89
NOTES TO THE CONSOLIdATEd fINANCIAL STATEMENTS (continued)
FOr The Year ended 31 March 2011
56. TrAdE ANd OTHEr PAyABLES 2011E
2010e
Trade payables and accrued expenses 92 844 625 106 646 613
Project payables - 11 734 830
capital contribution deposit 34 086 971 22 889 319
126 931 596 141 270 762
57. NOTES TO THE CASH fLOw STATEMENT
57.1 Reconciliation of cash generated by operations to net income:-
Profit before income tax 254 320 240 200 188 456
Adjustment for non-cash items:
Grant amortization (note 36) (5 118 870) (5 431 367)
Share of profits of joint venture company (20 416 888) (18 329 753)
employer contribution to employee benefit obligation expense 7 033 786 7 825 243
depreciation (note 39) 60 091 039 47 073 111
Fair value gains on derivative financial instruments (note 37) 7 407 301 28 815 362
Fair value adjustment – eIB loan embedded derivative (note 51a) 6 144 633 (12 764 304)
non cash interest on eIB loan (note 37) 9 347 316 3 280 596
Unrealised foreign exchange gains – loans (5 931 932) (42 480 555)
Finance cost on local and foreign denominated loans 13 587 387 13 605 604
Interest income (note 37) (12 540 644) (17 661 434)
Profit on disposal of property, plant and equipment (note 57.3) ( 3 290 153) (232 102)
310 633 215 203 888 857
changes in working capital: (27 381 260) (40 646 841)
Increase in trade and other receivables (42 633 620) (60 766 519)
decrease/(increase) in inventories 14 527 (6 949 326)
Increase in provisions for other employee benefits 17 053 638 9 489 194
Increase in deferred revenue 8 261 085 12 659 119
(decrease)/increase in trade and other payables (10 076 890) 4 920 691
net cash outflows from operating activities 283 251 955 163 242 016

90 Sec annual report 2010/2011
NOTES TO THE CONSOLIdATEd fINANCIAL STATEMENTS (continued)
FOr The Year ended 31 March 2011
57. NOTES TO THE CASH fLOw STATEMENT (CONTINuEd)
2011E
2010e
57.2 Additions to property, plant and equipment
Total additions (note 39) 228 080 497 152 155 594
228 080 497 152 155 594
57.3 Proceeds from disposal of property, plant and equipment
In the cash flow statement, proceeds from sale of property, plant and equipment comprise:
net carrying amount (note 39) 2 458 10 247
Profit on disposal of property, plant and equipment 3 290 153 232 103
Proceeds on disposal 3 292 611 242 350

91
58
AA
NA
LySIS
Of
fIN
AN
CIA
L A
SSET
S A
Nd
LIA
BIL
ITIE
S B
y M
EASu
rEM
ENT
BA
SIS
Fina
ncia
l ass
ets
and
finan
cial
liab
ilitie
s ar
e m
easu
red
on a
n on
goin
g ba
sis
eith
er a
t fa
ir va
lue
or a
t am
ortis
ed c
ost.
The
sum
mar
y of
sig
nific
ant
acco
untin
g po
licie
s de
scrib
es h
ow t
he c
lass
es o
f fin
anci
al in
stru
men
ts a
re m
easu
red,
and
how
inco
me
and
expe
nses
, inc
ludi
ng f
air
valu
e ga
ins
and
loss
es, a
re r
ecog
nise
d. T
he
follo
win
g ta
ble
anal
yses
the
car
ryin
g am
ount
s of
the
fina
ncia
l ass
ets
and
liabi
litie
s by
cat
egor
y as
defi
ned
in Ia
S 3
9 an
d by
sta
tem
ent
of fi
nanc
ial p
ositi
on h
eadi
ng.
Loan
s an
dre
ceiv
able
s
Fin
anci
al a
sset
s an
d li
abili
ties
at
amo
rtis
ed c
ost
Der
ivat
ives
Ava
ilab
leFo
r sa
lein
vest
men
tTo
tal
ee
ee
e
As
at 3
1 M
arch
201
1
Fin
anci
al a
sset
s
Oth
er a
sset
s-
--
45 6
82 9
7945
682
979
cas
h an
d ca
sh e
quiv
alen
ts-
--
208
494
908
208
494
908
der
ivat
ive
finan
cial
inst
rum
ents
– s
wap
s-
-26
238
488
-26
238
488
Trad
e an
d ot
her
rece
ivab
les
209
739
232
--
-20
9 73
9 23
2
209
739
232
-26
238
488
254
177
887
490
155
607
Fin
anci
al li
abili
ties
Bor
row
ings
-32
0 36
3 16
3-
-32
0 36
3 16
3
em
bedd
ed d
eriv
ativ
e lia
bilit
y-
-18
359
769
-18
359
769
der
ivat
ive
finan
cial
inst
rum
ents
– s
wap
s-
-4
549
080
-4
549
080
Trad
e an
d ot
her
paya
bles
-12
6 93
1 59
7-
-12
6 93
1 59
7
Oth
er d
efer
red
inco
me
--
-45
682
979
45 6
82 9
79
-44
7 29
4 76
022
908
849
45 6
82 9
7951
5 88
6 58
8
NO
TES T
O T
HE
CO
NSO
LId
ATE
d f
INA
NCIA
L STA
TEM
ENTS
(co
ntin
ued)
FOr
Th
e Y
ea
r e
nd
ed
31
Ma
rc
h 2
011

92 Sec annual report 2010/2011
58
AA
NA
LySIS
Of
fIN
AN
CIA
L A
SSET
S A
Nd
LIA
BIL
ITIE
S B
y M
EASu
rEM
ENT
BA
SIS
(CO
NTI
Nu
Ed)
Loan
s an
dre
ceiv
able
s
Fin
anci
al a
sset
s an
d li
abili
ties
at
amo
rtis
ed c
ost
Der
ivat
ives
Ava
ilab
leFo
r sa
lein
vest
men
tTo
tal
ee
ee
e
As
at 3
1 M
arch
201
1
Fin
anci
al a
sset
s
Oth
er a
sset
s-
--
26 2
37 5
8826
237
588
cas
h an
d ca
sh e
quiv
alen
ts-
--
131
013
121
131
013
121
der
ivat
ive
finan
cial
inst
rum
ents
– s
wap
s-
-33
948
954
-33
948
954
Trad
e an
d ot
her
rece
ivab
les
167
105
612
--
-16
7 10
5 61
2
167
105
612
-33
948
954
157
250
709
358
305
275
Fin
anci
al li
abili
ties
Bor
row
ings
-25
7 05
4 69
0-
-25
7 05
4 69
0
em
bedd
ed d
eriv
ativ
e lia
bilit
y-
-12
215
136
-12
215
136
der
ivat
ive
finan
cial
inst
rum
ents
– s
wap
s-
-4
852
244
-4
852
244
Trad
e an
d ot
her
paya
bles
-14
1 27
0 76
2-
-14
1 27
0 76
2
Oth
er d
efer
red
inco
me
--
-26
237
588
26 2
37 5
88
-39
8 32
5 45
217
067
380
26 2
37 5
8844
1 63
0 42
0
NO
TES T
O T
HE
CO
NSO
LId
ATE
d f
INA
NCIA
L STA
TEM
ENTS
(co
ntin
ued)
FOr
Th
e Y
ea
r e
nd
ed
31
Ma
rc
h 2
011

93
58
BCr
EdIT
Qu
ALI
Ty O
f fI
NA
NCIA
L A
SSET
S
The
cred
it qu
alit
y of
fina
ncia
l ass
ets
that
are
nei
ther
pas
t du
e no
r im
paire
d is
ass
esse
d by
ref
eren
ce t
o in
tern
al c
redi
t ris
k ra
tings
. The
ent
ity’
s fin
anci
al a
sset
s,
grou
ped
acco
rdin
g to
inte
rnal
cre
dit
risk
ratin
gs, a
re a
s fo
llow
s:
Trad
e an
do
ther
rece
ivab
les
Oth
eras
sets
Cas
h a
nd
cas
heq
uiv
alen
ts
Der
ivat
ives
des
ign
ated
as fa
ir v
alu
eh
edg
ing
inst
rum
ents
Tota
l
ee
ee
e
As
at 3
1 M
arch
201
1
Co
un
terp
arti
es w
ith
ou
t ex
tern
al c
red
it
rati
ng
s:-
- Low
ris
k 15
2 36
7 49
145
682
979
208
494
908
26 2
38 4
8843
7 78
3 86
6
- Gen
eral
cre
dit
risk
37 0
82 7
84-
--
37 0
82 7
84
- hig
h ris
k20
288
957
--
-20
288
957
209
739
232
45 6
82 9
7920
8 49
4 90
826
238
488
490
155
607
As
at 3
1 M
arch
201
0
Co
un
terp
arti
es w
ith
ou
t ex
tern
al c
red
it
rati
ng
s:-
- Low
ris
k 83
429
233
26 2
37 5
8813
1 01
3 12
133
948
954
274
628
896
- Gen
eral
cre
dit
risk
52 5
78 4
62-
--
52 5
78 4
62
- hig
h ris
k31
097
917
--
-31
097
917
167
105
612
26 2
37 5
8813
1 01
3 12
133
948
954
358
305
275
NO
TES T
O T
HE
CO
NSO
LId
ATE
d f
INA
NCIA
L STA
TEM
ENTS
(co
ntin
ued)
FOr
Th
e Y
ea
r e
nd
ed
31
Ma
rc
h 2
011
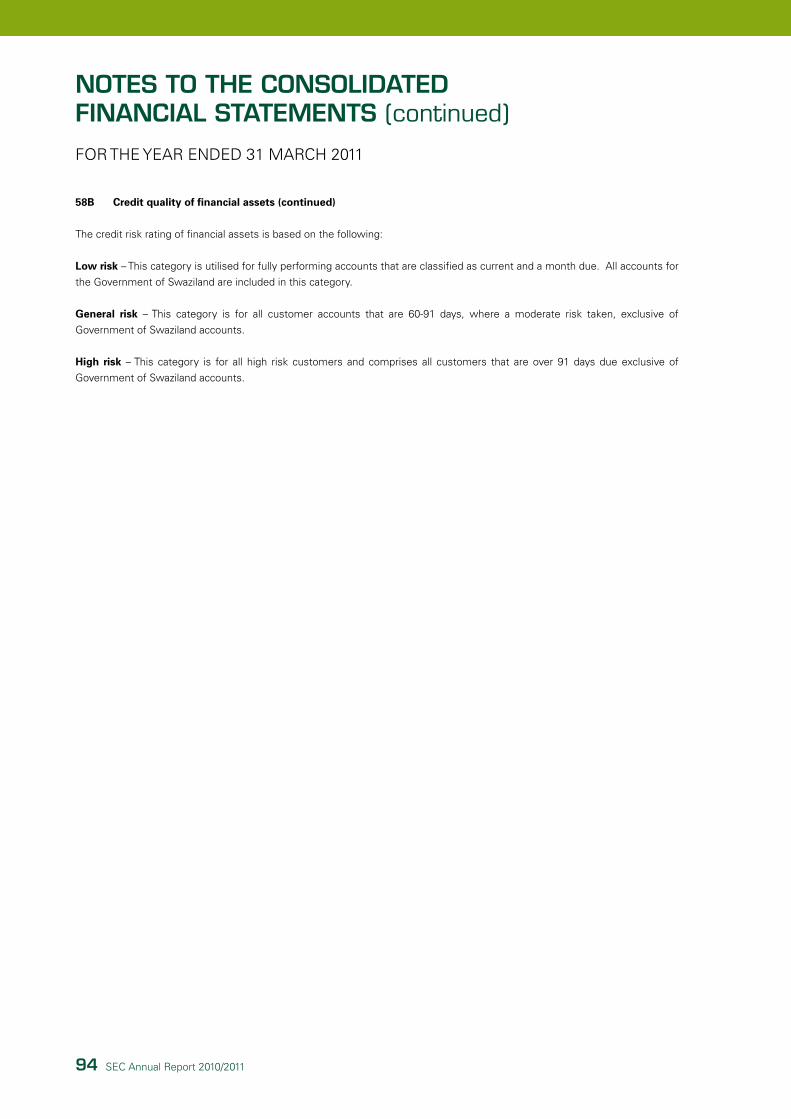
94 Sec annual report 2010/2011
58B Credit quality of financial assets (continued)
The credit risk rating of financial assets is based on the following:
Low risk – This category is utilised for fully performing accounts that are classified as current and a month due. all accounts for
the Government of Swaziland are included in this category.
General risk – This category is for all customer accounts that are 60-91 days, where a moderate risk taken, exclusive of
Government of Swaziland accounts.
High risk – This category is for all high risk customers and comprises all customers that are over 91 days due exclusive of
Government of Swaziland accounts.
NOTES TO THE CONSOLIdATEd fINANCIAL STATEMENTS (continued)
FOr The Year ended 31 March 2011

95
59. fINANCIAL INSTruMENTS – MATurITy ANALySIS
The company’s financial instruments are made up of the following financial assets and liabilities classified by maturity dates:
Less than1 year
Between 2 and 5 years Over 5 years Total
e e e e
31 March 2011
Financial assets:
Other assets 45 682 979 - - 45 682 979
Trade and other receivables 209 739 232 - - 209 739 232
cash and bank 208 494 908 - - 208 494 908
derivative financial instruments - - 26 238 488 26 238 488
463 917 119 - 26 238 488 490 155 607
Financial liabilities:
Trade and other payables 126 931 597 - - 126 931 597
Bank overdraft 28 645 - - 28 645
Shareholder’s loan 11 240 181 - - 11 240 181
Other deferred income 45 682 797 - - 45 682 797
derivative financial instrument - 4 549 080 4 549 080
Long term liabilities 24 555 825 86 644 481 197 894 031 309 094 337
embedded derivative liability - 18 359 769 18 359 769
deferred revenue 20 920 205 - - 20 920 205
229 359 250 86 644 481 220 802 880 536 806 611
31 March 2010
Financial assets:
Other assets 26 237 588 - - 26 237 588
Trade and other receivables 167 105 612 - - 167 105 612
cash and bank 131 013 121 - - 131 013 121
derivative financial instruments - - 33 948 954 33 948 954
324 356 321 - 33 948 954 358 305 275
Financial liabilities:
Trade and other payables 141 270 762 - - 141 270 762
Bank overdraft 11 249 - - 11 249
Shareholder’s loan 11 240 181 - - 11 240 181
Other deferred income 26 237 588 - - 26 237 588
derivative financial instrument - - 4 852 244 4 852 244
Long term liabilities 17 854 308 34 841 794 193 107 158 245 803 260
embedded derivative liability - - 12 215 136 12 215 136
deferred revenue 12 659 119 - - 12 659 119
209 273 207 34 841 794 210 174 538 454 289 539
NOTES TO THE CONSOLIdATEd fINANCIAL STATEMENTS (continued)
FOr The Year ended 31 March 2011
96 Sec annual report 2010/2011
NOTES TO THE CONSOLIdATEd fINANCIAL STATEMENTS (continued)
FOr The Year ended 31 March 2011
60. COMMITMENTS 2011E
2010e
60.1 Capital Commitments
capital expenditure approved at statement of financial position date but not yet incurred is as follows:
approved capital expenditure (note 60.1.1) 192 205 350 327 995 949
This expenditure will be financed from debt and internally generated funds and is expected to be incurred and due for completion within the next three years.
Details of capital commitments are as follows:-
60.1.1 Networkupgrades
The company has an approved capital expenditure budget of e192 million (2010: e40 million) to cater for routine additions to the network during the 2010/2011 financial year. e71 million of the capital expenditure have been contracted for at year end all this capital expenditure will be financed from current resources and external borrowings.
60.2 Right of use for electricity wheeling on 400kV line
For the next 8 years, the company has committed to a fixed monthly charge of US$89 755 (2009: US$89 755) for right of use of the 400kV line. These monthly charges are being funded from internal resources.
60.3 Motraco wheeling agreement
In terms of an electricity wheeling agreement between Motraco and Swaziland electricity company, the company pledged shares to the value of US$2 million to Motraco as security that the electricity wheeling service at edwaleni II will not discontinue. On the fourth anniversary date of Swaziland electricity company taking supply at edwaleni II and every year thereafter, the amount of such secured shares shall be reduced by US$ 200 000.
60.4 Power Purchase Agreement
In terms of the power purchase agreement with Ubombo Sugar Limited, the company paid e150 million for an exclusive right to purchase all excess power guaranteed by USL up to 2026 at a base price agreed to from 2011. This commitment will be funded from internally generated resources.
97
NOTES TO THE CONSOLIdATEd fINANCIAL STATEMENTS (continued)
FOr The Year ended 31 March 2011
60. COMMITMENTS (CONTINuEd)
60.4 Derivative financial instruments
The company entered into a range of derivative instruments, foreign currency swaps and interest rate swaps, arrangement with Standard corporate and Merchant Bank and Investec capital Market to hedge against foreign exchange risk on its foreign currency based commitment with the european Investment Bank and Kreditanstalt fur Wiederaufbau.
60.5 Supply of energy
Swaziland electricity company entered into long-term agreements with, eskom, a supplier for electricity purchases.
In January 2011 the company signed a Power Purchase agreement with USL until 2016. The agreement was an exclusive right to the company to purchase excess electricity from USL.
61. guArANTEES ANd CONTINgENCIES
61.1 Litigations 2011E
2010e
Legal cases pending with potential liability for claims were in process against the company at year end. The company is disputing these claims and has indicated that it intends to defend any legal action which may be instituted. On the basis of the evidence available it appears that no obligation is present and the claims are therefore disclosed as a contingent liability. 4.8 million 2.5 million

98 Sec annual report 2010/2011
NOTES TO THE CONSOLIdATEd fINANCIAL STATEMENTS (continued)
FOr The Year ended 31 March 2011
62. rELATEd PArTy TrANSACTIONS
The company is wholly owned and controlled by the Swaziland Government, which own 100% of its shares.
The related party disclosure is required in terms of IaS 24, related Parties disclosures.
The related parties of Swaziland electricity company Limited consist mainly of government departments, state-owned enterprises, subsidiaries of Swaziland electricity company Limited, as well as key management personnel and members of board of directors of Swaziland electricity company Limited or its shareholder and close family members of these related parties.
In addition, related parties comprise a joint venture company, Motraco, and post-retirement benefit plans for the benefit of employees.
The following transactions were carried out with related parties:-
2011E
2010e
62.1 Government grant funding for electrification
cumulative contributions received for rural electrification Projects (note 41.1) 18 453 425 17 710 663
62.2 Purchases of goods and services
Joint venture, Motraco, wheeling charges (note 31) 16 071 918 17 416 256
employee pension fund costs (note 54) 7 033 786 7 825 243
23 105 704 25 241 499
Goods and services are bought from related parties on an arm’s length basis at market-related prices.
62.3 Interest expenses
Shareholder, Government of Swaziland 101 110 130 730

99
NOTES TO THE CONSOLIdATEd fINANCIAL STATEMENTS (continued)
FOr The Year ended 31 March 2011
62. rELATEd PArTy TrANSACTIONS (CONTINuEd) 2011E
2010e
62.4 Year-end balances arising from transactions
(i)Receivablesfromrelatedparties
Government departments 12 055 558 8 525 602
Joint venture, Motraco
- costs incurred on behalf of Motraco 1 075 830 1 443 937
electricity sales income is normally receivable within 15 or 30 days of invoice date. In most cases, electricity customers have provided the company with a guarantee or a cash deposit which approximates three months of electricity sales. all other sales income is receivable within 30 days of invoice date.
Interest receivable on financial market instruments is in accordance with normal market practice.
(ii)Provisionfordoubtfuldebtsforrelatedparties
There is no provision for doubtful debt, nor bad debts written off during the year that relates to related parties.
(iii)Payablestorelatedparties:
Shareholder, including Government departments
- Long term loans 704 000 2 591 448
- Shareholders loan 11 240 181 11 240 181
Joint venture, Motraco
- electricity wheeling charges 1 263 642 1 270 072
employee Pension Fund (contributions) 8 757 949 9 462 612
The provision of funds to the Swaziland electricity company Limited by the Government of Swaziland is based on long term agreement that enable the company to obtain financing below the normal market interest rate (prime lending rate). The Swaziland Government offer financing with interest rate ranging between 2% and 8%, which is below the prime lending rate of 9% (2010:10%).

100 Sec annual report 2010/2011
NOTES TO THE CONSOLIdATEd fINANCIAL STATEMENTS (continued)
FOr The Year ended 31 March 2011
62. rELATEd PArTy TrANSACTIONS (CONTINuEd) 2011E
2010e
62.5 Transactions with key management personnel
Key management are those charged with planning, directing and controlling the activities of the company, directly or indirectly. Transactions with key management personnel include salaries, bonuses, gratuities and director’s fees. compensation paid to key management is shown below:
Board fees 383 075 467 834
Executive Management:
Short term employee benefits 5 926 669 4 435 991
Gratuity-net (Provision) 1 223 745 970 225
7 533 489 5 874 050
63. EVENTS AfTEr THE rEPOrTINg PErIOd
events since the reporting period:
(a) have been fully taken into account insofar as they have a bearing on the amounts attributable to assets and/or liabilities at that date;
(b) apart from changes in the ordinary course of business, have not made the present financial position substantially different from that shown by the balance sheet;
(c) have not required adjustments to the fair value measurements and disclosures included in the consolidated financial statements.

EDITED BY
DESIGNED BY BLUE APPLEwww.blueapple.co.za

SWAZILAND ELECTRICITY COMPANY
Eluvatsini House, Mhlambanyatsi Road, MbabanePO Box 258, Mbabane, Swaziland
Tel: +268 2409 4000, Fax: +268 2404 2335Website: www.sec.co.sz, Email: [email protected]
Related Documents