HOLIMAGE Annual Report 2010

Welcome message from author
This document is posted to help you gain knowledge. Please leave a comment to let me know what you think about it! Share it to your friends and learn new things together.
Transcript
Ho
lim
ag
e
annual Report 2010
F J
gay
loR
Contact uslocation: Balaclava Road, North Ryde, Sydney, australiaPostal address: macquarie University, NSW 2109, australiaBusiness hours: monday–Friday, 9am–5pm
T: +61 2 9850 7111F: +61 2 9850 7433www.mq.edu.auexternal costs incurred in the production of this annual Report totalled $2741.48
iSSN 0728–9480© macquarie University 2011
For copies of the annual Report please contact the marketing Uniton +61 2 9850 7309 or email [email protected] report is also available on the University’s website at www.mq.edu.au/university/about/reports.html
CRiCoS Providor 00002J
annual Report 1
Annual Report
For the period 1 January 2010 to 31 December 2010
The Hon Adrian Piccoli, BEc, LLB MPMinister for EducationParliament House, Sydney
Dear minister,
The Council of macquarie University has the honour to submit the annual Report of macquarie University for the year ended 31 December 2010. The report has been prepared for presentation to Parliament in accordance with the Annual Reports (Statutory Bodies) Act 1984 and the Public Finance and Audit Act 1983.
yours faithfully,
The Hon Michael EganChancellor
Professor Steven SchwartzVice-Chancellor and President

2 Macquarie University annual Report 2010
Table of contents 3
Macquarie University .................................................................................................................................................................................4macquarie’s values 4
Charter and aims 4
University governance .......................................................................................................................................................................5Report by members of Council 5
organisation chart 7
Principal office bearers 8
macquarie University Council 8
Research ...............................................................................................................................................................................................................................................................11Research funding 11
Research partnerships 11
Research publications 11
Research quality 12
Higher degree research enrolments and completions 12
Research excellence recognised 13
Learning and teaching ..............................................................................................................................................................15Relevant, future-focused and high-quality programs 15
Students 16
internationalisation 17
Community engagement and alumni......................................................18institutional advancement 18
Community engagement 19
Infrastructure and facilities................................................................................................................................20
Sustainability...............................................................................................................................................................................................................................21
Staff development and capability .................................................................................23Policy and procedure 23
Staff statistics 23
Health and safety 24
Social Inclusion ................................................................................................................................................................................................................27access and inclusion initiatives 27
indigenous engagement 30
employment equity and diversity 31
Operations ................................................................................................................................................................................................................................................37informatics 37
Freedom of information 39
government information (Public access) 47
insurance 51
internal audit and risk management 51
Privacy 52
Student complaints, appeals and discipline 52
Travel 53
Financial performance ...............................................................................................................................................................54State superannuation schemes 54
Consolidated income analysis 54
Consolidated expense analysis 55
Consolidated balance sheet 55
Risk analysis 56
Returns on University investments 56
Budgets 57
Macquarie University Financial Statements ..........................................................................................................................................................................59
Index ..............................................................................................................................................................................................................................................................................145
Table of contents
4 Macquarie University annual Report 2010
Macquarie University
established in 1964 with a founding mission to serve the needs of industry and the community, macquarie University was always envisioned to be a unique institution in the australian higher education setting.
Macquarie’s 126 hectare park-like campus belies its setting within the high-technology corridor of Sydney’s north-west. This location enables the University to establish close relationships with some of the world’s most successful companies, many of whom are located in the University’s research park, and allows a collaborative approach to research and teaching to ensure Macquarie graduates are highly sought after and command high starting salaries. It also provides Macquarie students with first-class internship opportunities with world leading companies from a range of industries.
Macquarie is on track to becoming one of Australia’s leading research universities. Vice-Chancellor Professor Steven Schwartz has articulated the goal that by 2014 – the University’s 50th anniversary – Macquarie will be among the top eight research universities in Australia and among the top 200 in the world.
Macquarie’s valuesWe are ethical. ethical behaviour is paramount. We aim to promote a collegial community and to foster a culture within the University that is responsible, respectful and reflective.
We pride ourselves on being enquiring, open to new ideas, new ways of thinking and new ways of ensuring we create a sustainable institution.
We are always creative in our response to opportunitiesand challenges.
We are inclusive. inclusiveness is about making the system fairer and providing access to everyone, no matter what their background, who has potential to benefit from higher education.
We are agile. agility is our willingness and our ability to be responsive, to listen and act, and not to be bound to traditional approaches where these no longer work.
and lastly, we are committed to excellence. This is the standard to which we aspire in everything we do. We are asked to offer our best even when something less may be acceptable to others; and to always uphold the standards relevant to our discipline or practice.
These values are what macquarie University stands for. We bring these values to life in everything we do.
Charter and aimsThe Macquarie University Act 1989 sets out the charter of the University. The Act provides that the functions of the University, within the limits of its resources, include:• the provision of facilities for education and research of
university standard• the encouragement of the dissemination,
advancement, development and application of knowledge informed by free inquiry
• the provision of courses of study or instruction across a range of fields, and the carrying out of research, to meet the needs of the community
• the participation in public discourse• the conferring of degrees, including those of bachelor,
master and doctor, and the awarding of diplomas, certificates and other awards
• the provision of teaching and learning that engage with advanced knowledge and inquiry
• the development of governance, procedural rules, admission policies, financial arrangements and quality assurance processes that are underpinned by the values and goals referred to in the functions set out above, and that are sufficient to ensure the integrity of the University’s academic programs.
University governance 5
University governance
Report by Members of CouncilThe members of the Council present their report on the consolidated entity consisting of macquarie University and the entities it controlled at the end of, or during, the year ended 31 December 2010.
MembersThe following persons were members of the Council of macquarie University during 2010:
The Hon michael egan Dr malcolm irving – Deputy ChancellorProfessor Steven Schwartz – Vice-Chancellor and PresidentProfessor Julie Fitness – Vice-President, academic Senatemr andrew Bissettms maxine BrodieProfessor anne BurnsProfessor max Coltheart, amassociate Professor Pamela Couttsms elizabeth Crouchmr Chum DarvallProfessor mitchell DeanThe Hon Patricia Forsythemr greg Jonesmr greg lindsay, aomr Warren mundineThe Hon Sandra Norimr Steve Rubicms amy Smith
Meetings of membersinformation about the numbers of meetings of the members of macquarie University’s Council held during the year ended 31 December 2010, and the number of meetings attended by each member, appears on page 11 of this report.
Principal activitiesDuring the year, the principal continuing activities of the consolidated entity consisted of:
(a) the provision of facilities for education and research of university standard
(b) the encouragement of the dissemination, advancement, development and application of knowledge formed by free enquiry
(c) the provision of courses of study or instruction across a range of fields, and the carrying out of research, to meet the needs of the community
(d) the participation in public discourse
(e) the conferring of degrees, including those of bachelor, master and doctor, and the awarding of diplomas, certificates and other awards
(f ) the provision of teaching and learning that engage with advanced knowledge and enquiry
(g) the development of governance, procedural rules, admission policies, financial arrangements and quality assurance processes that are underpinned by the values and goals referred to in the functions set out in this subsection, and that are sufficient to ensure the integrity of the University’s academic programs.
There were no significant changes in the nature of the University’s activities during the year.
Review of operationsThe activities of the Council of macquarie University during 2010 included:
• receipt of the Vice-Chancellor’s yearly report on progress against 2010 Key Performance indicators
• receipt of the Vice-Chancellor’s Report to each meeting of Council, covering major strategic items, external developments and general issues of note, including selected projects and goals related to the objectives contained in key performance indicators
• approval of increases in HeCS and full fee rates effective from 2011
• review of the Vice-Chancellor’s performance
• receipt of regular reports on progress against the initiatives detailed in the Macquarie University Campus Masterplan and projects under development in the international and Development portfolio area
• approval of key compliance reports including the Macquarie University 2009 Annual Report
• approval of the 2011 Consolidated Budget and 2011 Capital Management Plan.
Significant changes in state of affairsCouncil resolved in 2010 that the membership of the Standing Committee on appeals be expanded to include:
• the Chancellor (ex officio) (Chair)
• the Deputy Chancellor (ex officio)
• two academic staff representative members of Council (act:9(1)(d))
• one graduate representative member of Council (act: 9(1)(g))
• one professional staff representative member of Council (act:9(1)(3))
6 Macquarie University annual Report 2010
University governance continued
Matters subsequent to the end of the financial yearThere have been no subsequent events of significance announced by the University since the end of 2010.
Likely developments and expected results of operationsThere have been no developments of significance since the end of 2010.
Environmental regulationThe significant environmental regulations to which the University is subject are as follows:
• Environment Protection and Biodiversity Conservation Act 1999 (Cwlth)
• Environmental Planning and Assessment Act 1979 (NSW)
• Environmental Planning and Assessment (Affordable Housing) Act 2000 (NSW)
• Environmental Planning and Assessment (Infrastructure and Other Planning Reform) Act 2005 (NSW)
• Environmental Trust Act 1998 (NSW)
• Environmentally Hazardous Chemicals Act 1985 (NSW)
• Heritage Act 1977 (NSW)
• National Greenhouse and Energy Reporting Act 2007 (Cwlth)
• Native Vegetation Act 2003 (NSW)
• Noxious Weeds Act 1993 (NSW)
• Ozone Protection Act 1989 (NSW)
• Threatened Species Conservation Act 1995 (NSW)
• Waste Avoidance and Resource Recovery Act 2001 (NSW)
• Water Management Act 2000 (NSW)
• Water Management Amendment Act 2000 (NSW).
Insurance of officersThe University holds two insurance policies covering members of Council and officers of the University. They are:
• Professional liability insurance: covers all professional, consulting, research and teaching activities (and any activities associated therewith), undertaken by the University or its affiliates, including the provision of and/or the facilitation of all recognised student activities.
• Directors and officers Protection: covers University and affiliate persons for their legal liability arising out of their conduct as officers of the University. it includes any Chancellor, Deputy Chancellor, Vice-Chancellor, Deputy Vice-Chancellor, Registrar, Bursar, member of Council, member of Senate, member of a Regulatory Board or Committee, University Secretary and any employee who is concerned in, or takes part in, the management of the University.
This report is made in accordance with a resolution of the members of the macquarie University Council.
Michael Rueben EganChancellorMember of the Macquarie University CouncilNorth Ryde, NSW19 April 2011
University governance 7
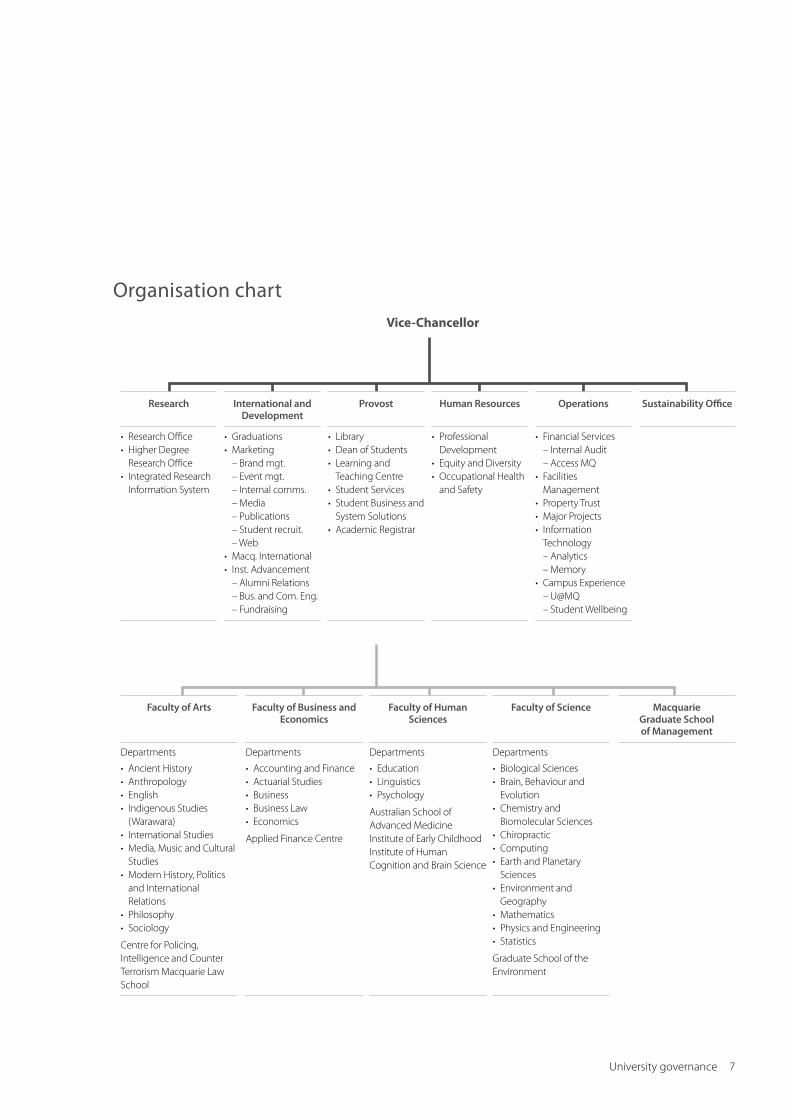
Organisation chartVice-Chancellor
Faculty of Business and Economics
Departments
• accounting and Finance• actuarial Studies• Business• Business law• economics
applied Finance Centre
Faculty of Human Sciences
Departments
• education• linguistics• Psychology
australian School of advanced medicine institute of early Childhood institute of Human Cognition and Brain Science
Faculty of Science
Departments
• Biological Sciences• Brain, Behaviour and
evolution• Chemistry and
Biomolecular Sciences• Chiropractic• Computing• earth and Planetary
Sciences• environment and
geography• mathematics• Physics and engineering• Statistics
graduate School of the environment
Macquarie Graduate School of Management
Faculty of Arts
Departments
• ancient History• anthropology• english• indigenous Studies
(Warawara) • international Studies• media, music and Cultural
Studies• modern History, Politics
and international Relations
• Philosophy• Sociology
Centre for Policing, intelligence and Counter Terrorism macquarie law School
Research
• Research office• Higher Degree
Research office• integrated Research
information System
Provost
• library• Dean of Students• learning and
Teaching Centre• Student Services• Student Business and
System Solutions• academic Registrar
International and Development
• graduations• marketing
– Brand mgt.– event mgt.– internal comms.– media– Publications– Student recruit.– Web
• macq. international• inst. advancement
– alumni Relations– Bus. and Com. eng.– Fundraising
Operations
• Financial Services– internal audit– access mQ
• Facilities management
• Property Trust• major Projects• information
Technology– analytics– memory
• Campus experience– U@mQ– Student Wellbeing
Sustainability Office Human Resources
• Professional Development
• equity and Diversity• occupational Health
and Safety
8 Macquarie University annual Report 2010
University governance continued
Principal office bearersVisitorHer excellency the governor of New South Wales
ChancellorThe Hon michael Rueben egan, Ba Syd., FaiCD
Deputy ChancellorDr malcolm geoffrey irving, am, BCom NSW, HonDlitt Macq., FaiCD, FCPa, FSia
Vice-Chancellor and PresidentProfessor Steven Schwartz, Ba C.U.N.Y., mS Syr., PhD Syr., FaSSa
Deputy Vice-Chancellor (Provost)Professor Judyth Sachs, Ba Qld., PhD Qld., ma WMich.
Deputy Vice-Chancellor (Research)Professor James Piper, BSc Otago, PhD Otago, FoSa, FaiP
Deputy Vice-Chancellor, Chief Operating OfficerDr Peter Dodd, BCom NU, mCom, Qld, mScRochester,PhDRochester
Deputy Vice-Chancellor (International and Development)ms Caroline Trotman, Ba Canberra, gDip (appFin) Securities Institute of Australia, mBa Macq.
Chief Financial Officermr John gorman, BBus Kuring-gai, mBa Rochester, FCPa, FTia
Director, Human Resourcesmr Timothy Sprague, BSc Syd., Diped Syd., mCom NSW
Executive Director, Campus Experiencems Deidre anderson, Barts, ma VU, PgCert athlete Counselling AIS PgDipSocSc Latrobe
Macquarie University Council(membership as at 31 December 2010)
macquarie University Council is the governing authority of the University, established under part 3 of theMacquarie University Act 1989. Under part 4 of the act, the Council acts for and on behalf of the University in the exercise of the University’s functions, has the control and management of the affairs and concerns of the University, and may act in all matters concerning the University in such manner as appears to the Council to be best calculated to promote the object and interests of the University.
Members of Council
The ChancellorElected pursuant to Section 10(1) of the Act
The Hon michael Rueben egan, Ba Syd., FaiCDCurrent term to 28 February 2014
The Vice-ChancellorAppointed pursuant to Section 9(1)(a)(ii) of the Act
Professor Steven Schwartz, Ba C.U.N.Y., mS Syr., PhD Syr., FaSSa
The Vice-President of the Academic SenateAppointed pursuant to Section 9(1)(a)(iii) of the Act
Professor Julie Fitness, Ba Canterbury, ma Canterbury PhD Canterbury
Appointed by the Minister for Education and Training Pursuant to Section 9(1)(b) of the Act
ms elizabeth anne Crouch, Bec Macq., gaiCDCurrent term to 22 april 2011
The Hon Patricia Forsythe, Ba Diped Newcastle (NSW) Current term to 31 December 2010
mr gregory mackenzie Jones, Ba Macq., ma Macq.Current term to 22 april 2011
The Hon Sandra Christine Nori, Bec Syd.Current term to 31 December 2010
mr Warren mundine Hon DUni Sthn Cross, Faim maiCDCurrent term to 31 December 2011
University governance 9
Appointed by CouncilPursuant to Section 9(1)(c) of the Act
Dr malcolm geoffrey irving, am, BCom NSW,HonDlittMacq., FaiCD, FCPa, FSiaCurrent term to 31 December 2010
Elected by and from the academic staffPursuant to Section 9(1)(d) of the Act
Professor anne Cecily Howell Burns, Ba Wales, gradDip TeSol Sydney Cae, ma Macq., PhD Macq.Current term to 31 December 2010
Professor mitchell Dean Ba (Hons), PhDNSWappointed by Council to replace Professor max Coltheart, member elected by the academic Staff pursuant to section 9(1)(d) of the act, for the unexpired portion of Professor Coltheart’s term. Current term from 1 January 2010 to 31 December 2010
associate Professor Pamela Coutts, BSc Diped Syd., Ba (Hons) Macq., PhD Macq. maPsSCurrent term to 31 December 2010
Elected by and from the non-academic staffPursuant to Section 9(1)(e) of the Act
ms maxine Brodie, Ba Diped Syd., Diplib NSW,mBa Macq. aaliaCurrent term to 31 December 2012
Elected by and from the students of the UniversityPursuant to Section 9(1)(f )(i) of the Act
ms amy Smith Current term to 21 may 2011
Appointed by CouncilPursuant to Section 9(1)(g) of the Act
mr gregory John lindsay, ao BaMacq., DipTchg STCCurrent term to 31 December 2010
mr Steven Rubic, Bachelor of Health administration NSW, mBa mgSm Current term to 31 December 2012
mr Chum Darvall BaMacq.F Fin and FaiCDCurrent term to 31 December 2012
mr andrew Bissett, BCom Macq., mCom Macq., mBa Macq.Current term to 30 June 2011
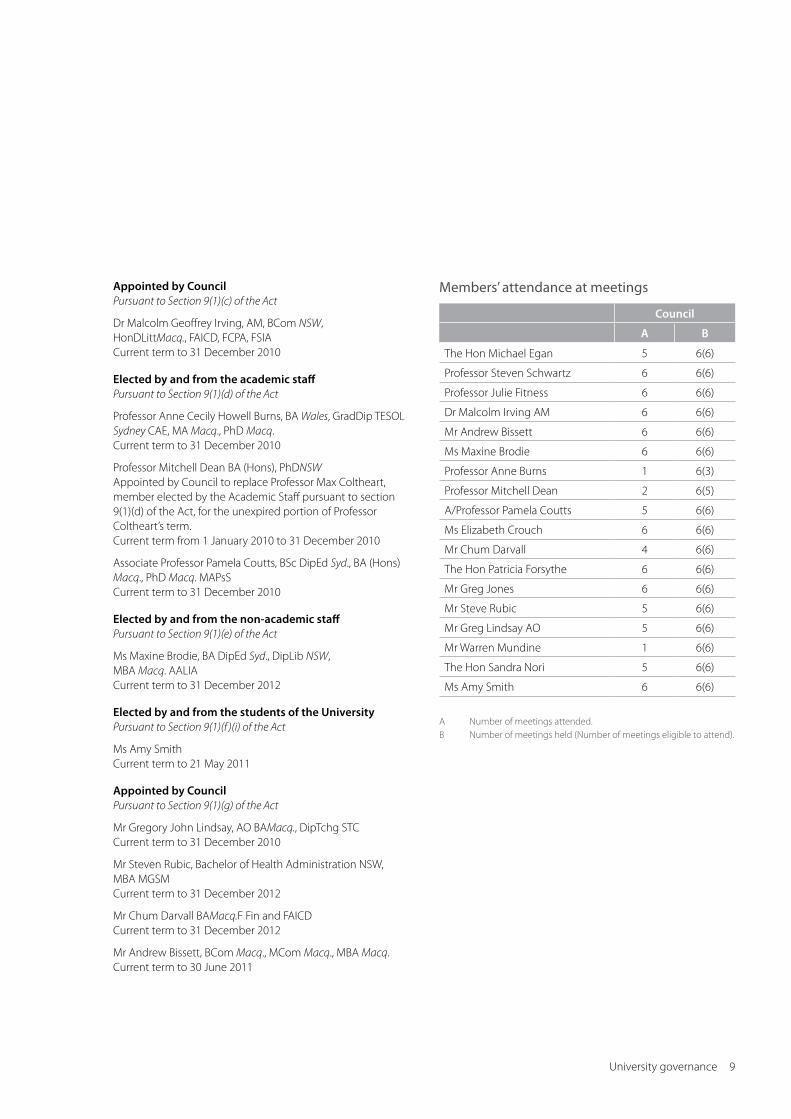
Members’ attendance at meetings
Council
A B
The Hon michael egan 5 6(6)
Professor Steven Schwartz 6 6(6)
Professor Julie Fitness 6 6(6)
Dr malcolm irving am 6 6(6)
mr andrew Bissett 6 6(6)
ms maxine Brodie 6 6(6)
Professor anne Burns 1 6(3)
Professor mitchell Dean 2 6(5)
a/Professor Pamela Coutts 5 6(6)
ms elizabeth Crouch 6 6(6)
mr Chum Darvall 4 6(6)
The Hon Patricia Forsythe 6 6(6)
mr greg Jones 6 6(6)
mr Steve Rubic 5 6(6)
mr greg lindsay ao 5 6(6)
mr Warren mundine 1 6(6)
The Hon Sandra Nori 5 6(6)
ms amy Smith 6 6(6)
a Number of meetings attended.B Number of meetings held (Number of meetings eligible to attend).
10 Macquarie University annual Report 2010
University governance continued
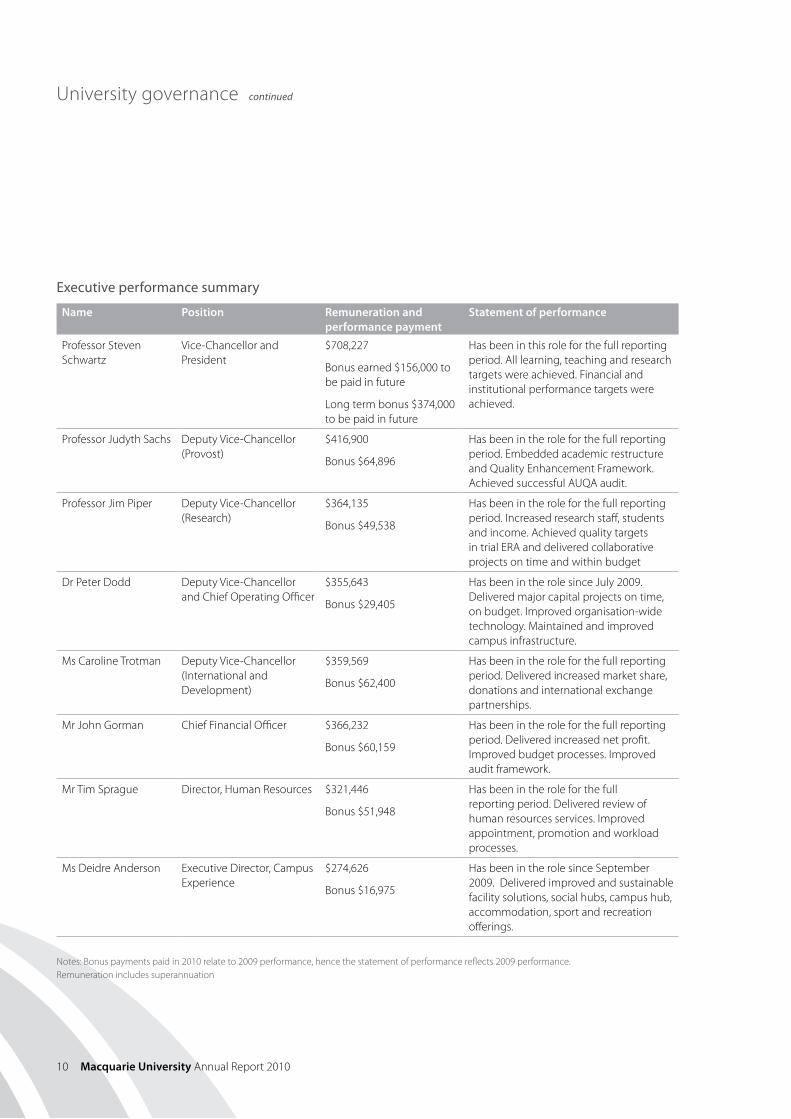
Executive performance summary
Name Position Remuneration and performance payment
Statement of performance
Professor Steven Schwartz
Vice-Chancellor and President
$708,227
Bonus earned $156,000 to be paid in future
long term bonus $374,000 to be paid in future
Has been in this role for the full reporting period. all learning, teaching and research targets were achieved. Financial and institutional performance targets were achieved.
Professor Judyth Sachs Deputy Vice-Chancellor (Provost)
$416,900
Bonus $64,896
Has been in the role for the full reporting period. embedded academic restructure and Quality enhancement Framework. achieved successful aUQa audit.
Professor Jim Piper Deputy Vice-Chancellor (Research)
$364,135
Bonus $49,538
Has been in the role for the full reporting period. increased research staff, students and income. achieved quality targets in trial eRa and delivered collaborative projects on time and within budget
Dr Peter Dodd Deputy Vice-Chancellor and Chief operating officer
$355,643
Bonus $29,405
Has been in the role since July 2009. Delivered major capital projects on time, on budget. improved organisation-wide technology. maintained and improved campus infrastructure.
ms Caroline Trotman Deputy Vice-Chancellor (international and Development)
$359,569
Bonus $62,400
Has been in the role for the full reporting period. Delivered increased market share, donations and international exchange partnerships.
mr John gorman Chief Financial officer $366,232
Bonus $60,159
Has been in the role for the full reporting period. Delivered increased net profit. improved budget processes. improved audit framework.
mr Tim Sprague Director, Human Resources $321,446
Bonus $51,948
Has been in the role for the full reporting period. Delivered review of human resources services. improved appointment, promotion and workload processes.
ms Deidre anderson executive Director, Campus experience
$274,626
Bonus $16,975
Has been in the role since September 2009. Delivered improved and sustainable facility solutions, social hubs, campus hub, accommodation, sport and recreation offerings.
Notes: Bonus payments paid in 2010 relate to 2009 performance, hence the statement of performance reflects 2009 performance. Remuneration includes superannuation
Research 11
Research
macquarie University’s ambition is to rank amongst the top 200 research intensive universities in the world by 2014. The University has a clearly defined strategy articulated in the Research Strategic Plan 2009–2011.
The strategy contains five key elements, which are:
1. to establish a pervasive research culture across all areas of the University
2. to achieve international and national prominence in research in selected Concentrations of Research Excellence (COREs)
3. to maximise research outcomes by maintaining the number of high quality higher degree research commencing candidates, and by increasing completions
4. to be a significant contributor to the nation’s economic, social, cultural and environmental wellbeing
5. to increase Macquarie’s international research collaborations, outreach and global impact
Research fundingour researchers attract significant funding through competitive research grants and negotiated research contracts. Following a period of rapid growth in external research funding, research income has shown a small dip as large grants for externally funded research centres reach the end of their funding cycle. in 2010, external research funding included $30.32 million of research grants and contracts and $25.64 million of research block grants (Commonwealth government). aRC and NHmRC funding remained stable in 2010. our strong investment in new research-focused staff through the CoRe recruitment strategy over the past four years has resulted in significant increases in grant application and success rates. medical research at macquarie is increasing following the foundation of, and recruitment of staff into, the australian School of advanced medicine and the macquarie University Hospital.
Research partnershipsHighlights in the development of partnerships include being awarded the lead in two new prestigious aRC Centres of excellence during 2010 – the Centre for Cognition and its Disorders (led by Professor Stephen Crain) and the Centre for Core to Crust Fluid Systems (led by Professor Sue o’Reilly). The University is also a major partner in two other aRC Centres of excellence – the Centre for Ultrahigh-bandwidth Devices for optical Systems (CUDoS) and engineered Quantum Systems (eQuS).
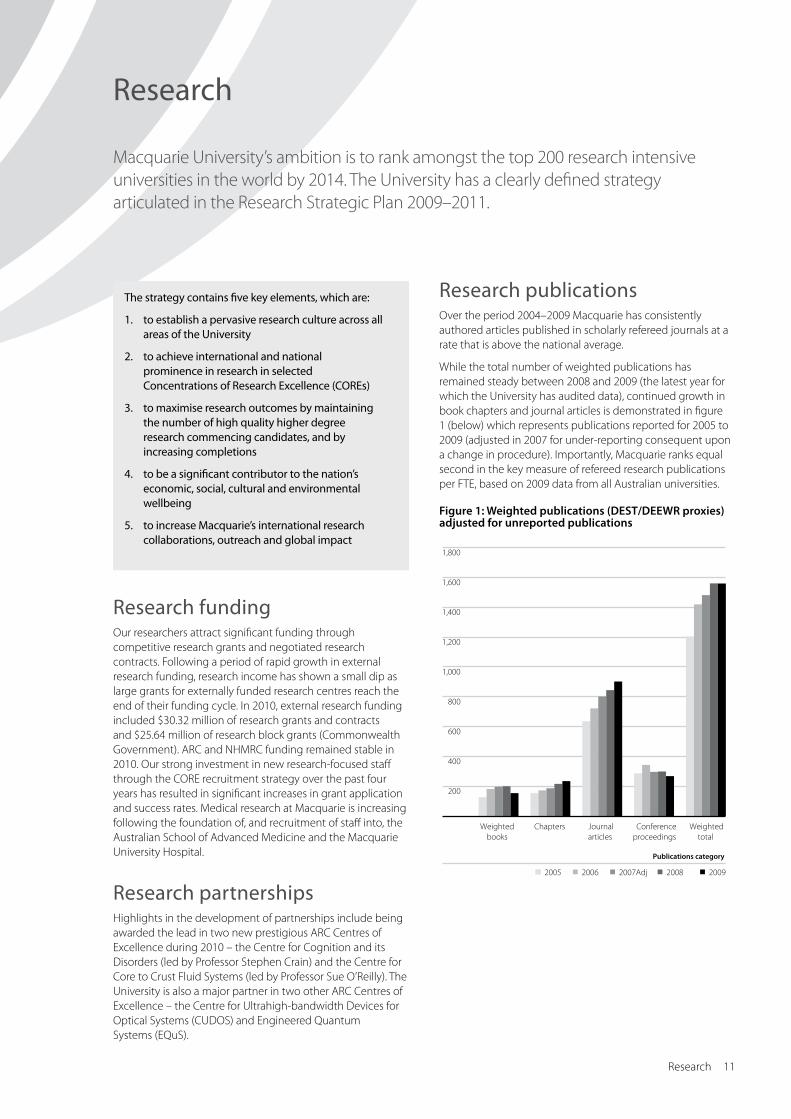
Research publicationsover the period 2004–2009 macquarie has consistently authored articles published in scholarly refereed journals at a rate that is above the national average.
While the total number of weighted publications has remained steady between 2008 and 2009 (the latest year for which the University has audited data), continued growth in book chapters and journal articles is demonstrated in figure 1 (below) which represents publications reported for 2005 to 2009 (adjusted in 2007 for under-reporting consequent upon a change in procedure). importantly, macquarie ranks equal second in the key measure of refereed research publications per FTe, based on 2009 data from all australian universities.
Figure 1: Weighted publications (DEST/DEEWR proxies) adjusted for unreported publications
Weighted books
Chapters Journal articles
Conferenceproceedings
Weighted total
Publications category
2005 2006 2007Adj 2008 2009
200
400
600
800
1,000
1,200
1,400
1,600
1,800
12 Macquarie University annual Report 2010
Research continued
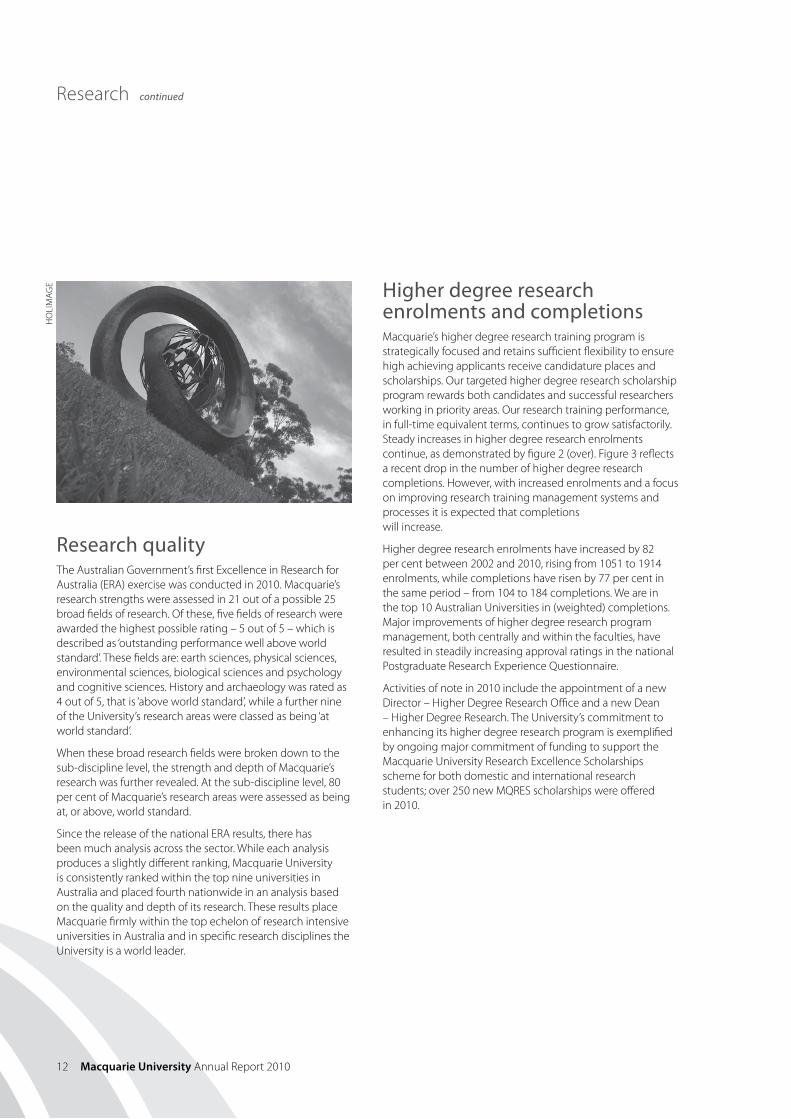
Research quality The australian government’s first excellence in Research for australia (eRa) exercise was conducted in 2010. macquarie’s research strengths were assessed in 21 out of a possible 25 broad fields of research. of these, five fields of research were awarded the highest possible rating – 5 out of 5 – which is described as ‘outstanding performance well above world standard’. These fields are: earth sciences, physical sciences, environmental sciences, biological sciences and psychology and cognitive sciences. History and archaeology was rated as 4 out of 5, that is ‘above world standard’, while a further nine of the University’s research areas were classed as being ‘at world standard’.
When these broad research fields were broken down to the sub-discipline level, the strength and depth of macquarie’s research was further revealed. at the sub-discipline level, 80 per cent of macquarie’s research areas were assessed as being at, or above, world standard.
Since the release of the national eRa results, there has been much analysis across the sector. While each analysis produces a slightly different ranking, macquarie University is consistently ranked within the top nine universities in australia and placed fourth nationwide in an analysis based on the quality and depth of its research. These results place macquarie firmly within the top echelon of research intensive universities in australia and in specific research disciplines the University is a world leader.
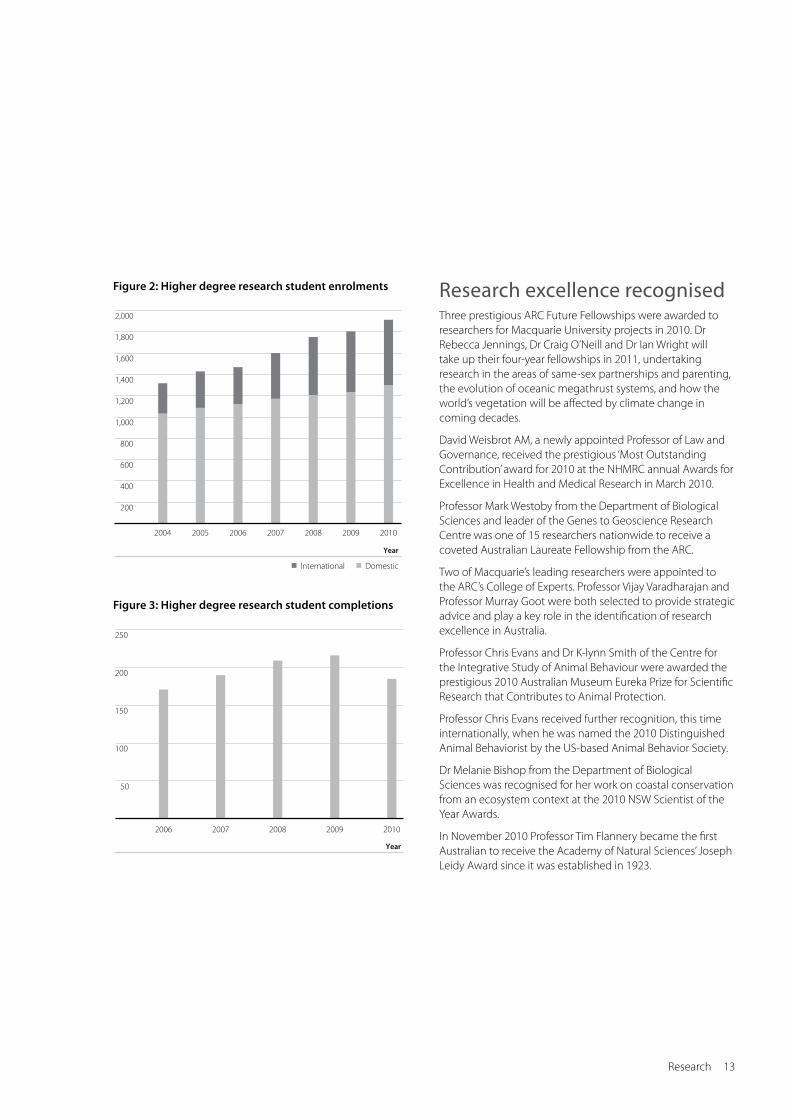
Higher degree research enrolments and completionsmacquarie’s higher degree research training program is strategically focused and retains sufficient flexibility to ensure high achieving applicants receive candidature places and scholarships. our targeted higher degree research scholarship program rewards both candidates and successful researchers working in priority areas. our research training performance, in full-time equivalent terms, continues to grow satisfactorily. Steady increases in higher degree research enrolments continue, as demonstrated by figure 2 (over). Figure 3 reflects a recent drop in the number of higher degree research completions. However, with increased enrolments and a focus on improving research training management systems and processes it is expected that completions will increase.
Higher degree research enrolments have increased by 82 per cent between 2002 and 2010, rising from 1051 to 1914 enrolments, while completions have risen by 77 per cent in the same period – from 104 to 184 completions. We are in the top 10 australian Universities in (weighted) completions. major improvements of higher degree research program management, both centrally and within the faculties, have resulted in steadily increasing approval ratings in the national Postgraduate Research experience Questionnaire.
activities of note in 2010 include the appointment of a new Director – Higher Degree Research office and a new Dean – Higher Degree Research. The University’s commitment to enhancing its higher degree research program is exemplified by ongoing major commitment of funding to support the macquarie University Research excellence Scholarships scheme for both domestic and international research students; over 250 new mQReS scholarships were offered in 2010.
Ho
lim
ag
e
Research 13
Figure 2: Higher degree research student enrolments
Figure 3: Higher degree research student completions
Research excellence recognisedThree prestigious aRC Future Fellowships were awarded to researchers for macquarie University projects in 2010. Dr Rebecca Jennings, Dr Craig o’Neill and Dr ian Wright will take up their four-year fellowships in 2011, undertaking research in the areas of same-sex partnerships and parenting, the evolution of oceanic megathrust systems, and how the world’s vegetation will be affected by climate change in coming decades.
David Weisbrot am, a newly appointed Professor of law and governance, received the prestigious ‘most outstanding Contribution’ award for 2010 at the NHmRC annual awards for excellence in Health and medical Research in march 2010.
Professor mark Westoby from the Department of Biological Sciences and leader of the genes to geoscience Research Centre was one of 15 researchers nationwide to receive a coveted australian laureate Fellowship from the aRC.
Two of macquarie’s leading researchers were appointed to the aRC’s College of experts. Professor Vijay Varadharajan and Professor murray goot were both selected to provide strategic advice and play a key role in the identification of research excellence in australia.
Professor Chris evans and Dr K-lynn Smith of the Centre for the integrative Study of animal Behaviour were awarded the prestigious 2010 australian museum eureka Prize for Scientific Research that Contributes to animal Protection.
Professor Chris evans received further recognition, this time internationally, when he was named the 2010 Distinguished animal Behaviorist by the US-based animal Behavior Society.
Dr melanie Bishop from the Department of Biological Sciences was recognised for her work on coastal conservation from an ecosystem context at the 2010 NSW Scientist of the year awards.
in November 2010 Professor Tim Flannery became the first australian to receive the academy of Natural Sciences’ Joseph leidy award since it was established in 1923.
2004 2005 2006 2007 2008 2009 2010
200
400
600
800
1,000
1,200
1,400
1,600
1,800
2,000
Year
International Domestic
Year
2006 2007 2008 2009 2010
50
100
150
200
250
14 Macquarie University annual Report 2010
Research continued
Macquarie’s Tall PoppiesDr andrew Barron and Dr anina Rich were named among the best and brightest young scientists at the prestigious 2010 young Tall Poppy Science awards for NSW.
Barron, from the Centre for integrative Study for animal Behaviour studies honey bees. His research aims to understand how the bee brain reacts to drugs, particularly cocaine.
Rich, who is based in the Centre for Cognitive Science, focuses on two aspects of attention – balancing competing internal and external demands and how attention is involved in integrating information from different senses.
Distinguished ProfessorsThe title of Distinguished Professor is awarded to eminent professors of exceptional distinction who have made an outstanding contribution to their field or discipline, and to the University.
2010 was the first year that macquarie awarded the title of macquarie University Distinguished Professor. awards were received by:
Professor Stephen Crain – for his outstanding work in the advancement in the study of human language and cognition.
Professor Naguib Kanawati – for his achievements in archaeology, art history and as a distinguished egyptologist.
Professor Samuel Lieu – for his internationally recognised research in early Christianity and the relationships between the east and West in the ancient world.
Professor Suzanne O’Reilly – for pioneering a world-leading interdisciplinary approach to mapping the inaccessible deep earth.
Professor Ron Rapee – for his outstanding contribution to research and practices in clinical psychology.
Professor Igor Shparlinski – for important contributions to the mathematical foundations of cryptography, computer security and computer science through theoretic cryptography and number theory.
Professor David Throsby – for his excellence in research, teaching and community service, as an economist with specialist interests in the economics of the arts and culture.
Professor Mark Westoby – for his research in the field of evolutionary ecology, with a concentration on vascular plants.
Macquarie’s Research Excellence AwardsThe macquarie University Research awards identify and promote excellence across the full spectrum of research activity while recognising and rewarding staff and postgraduate students for outstanding performance and excellence in research and innovation.
The award categories and the 2010 winners were:
excellence in Research – Social Sciences, Business and Humanities The cross cultural supervision project: web-based resources for candidates, supervisors and institutions Team leader: associate Professor Judi Homewood
excellence in Research – Science and engineering m*a*S*H: The macquarie/aao/Strasbourg H-alpha planetary nebula project Team leader: Professor Quentin Parker
excellence in Higher Degree Research – Social Science, Business and Humanities Upstream and downstream hydrocarbon prices: Crude oil to plastics Team leader: lurion De mello, PhD candidate
excellence in Higher Degree Research – Science and engineering Fault-tolerance in globally controlled quantum computers gerardo andres Paz Silva, PhD candidate
excellence in external Research Partnership Collaborative research partnership between Chungtia village of Nagaland and macquarie University to work on traditional medicinal plants Team leader: meza meyanungsang, PhD candidate
excellence in Research in Sustainability adaptation to impacts of climate change on human health Dr Paul J. Beggs
excellence in Commercialisation (Translation) of Research iP Continuous-wave visible laser for ophthalmology Team leader: Dr Helen Pask
early Career Researcher of the year award Dr Dayong Jin
learning and teaching 15
Learning and teaching
The introduction of the new undergraduate curriculum, with its people, planet, participation and capstone units, saw macquarie University receive its highest number of first preferences from New South Wales school leavers.
activities undertaken in 2010 include:
• adoption of an academic Plan, subsuming the Research, learning and Teaching, and Social inclusion plans into one document
• review and renewal of the postgraduate curriculum
• implementation of a new assessment Policy
• implementation of a new academic staff promotion system
• studies undertaken into learning and teaching space requirements and the student iT experience
• development of a Teaching Standards Framework
• development of a professional development website for sessional staff.
Relevant, future-focused and high-quality programsFollowing the success of the review of the undergraduate curriculum, a review into the postgraduate coursework curriculum commenced in 2010. The review unified the credit point values of units, established consistent workload and assessment regimes, unified naming practices, recommended flexible entry criteria over the use of purely academic entry requirements and agreed that professional ethics would be integrated into all programs.
Supporting students and lifelong learningin 2010 two of macquarie’s student peer mentoring groups won awards for their work in increasing student engagement:
• lawPal won the Vice-Chancellor’s Citation for outstanding Contributions to Student learning. lawPal focuses on student emotional wellbeing while also providing academic learning support.
• Telemachus ancient History mentor Program (aka Tele’s angels) won the australian learning and Teaching Council (alTC) award for Programs that enhance learning – the first australian student group to win a national award for teaching.
Develop and reward staff capabilityin 2010 the University undertook its first data collection of Teaching esteem Factors, called the Teaching index. The Teaching index rewards departments with teaching outcomes which have a significant impact on student engagement and learning. in 2010, $500,000 was distributed to departments.
in 2010 ms Penelope Watson won a NSW australian College of educators Quality Teaching award.
The following staff won australian learning and Teaching Council Citations for outstanding Contribution to Student learning:
• Dr michelle arrow for an enthusiastic, collaborative and accessible approach to teaching that inspires student engagement and enjoyment of australian history
• Dr matt Bower for supporting pre-service teachers to develop learning design capabilities based upon a scholarly and passionate approach to educational technology innovation
• Dr Kerry-ann o’Sullivan for excellence in supporting english teachers at critical points of professional transition through the innovative provision of high-quality, engaging and research-led iCT resources
• ms Sue Spinks for sustained commitment to empowering students to find their individual academic ‘voices’, and to achieving excellent outcomes for all students through relevant University committees.
The Teaching Standards Framework led by Professor Judyth Sachs was awarded an australian learning and Teaching Council Strategic Priority grant.
Diverse students and the promotion of cross-cultural understandingFor a second year macquarie students were successful in achieving two of the prestigious Prime minister’s australia asia endeavour awards:
• ms maggie lee will undertake part of her BCom – actuarial Studies and BSc – mathematics at the Chinese University of Hong Kong
• ms merriden Varrall will undertake an internship in the United Nations Development Program (UNDP) in Beijing as part of her fieldwork to study China’s foreign assistance policy for her PhD in anthropology.
16 Macquarie University annual Report 2010
learning and teaching continued
macquarie University is committed to ensuring that by 2012, a wide range of Participation and Community engagement (PaCe) opportunities are available to all students. This will become a core requirement of a majority of undergraduate degree programs by 2012. as part of the PaCe implementation 2010 initiatives included:
• identification and development of faculty-based and discipline-based participation shell units
• development of resources to support assessment and critical self-reflection in PaCe units.
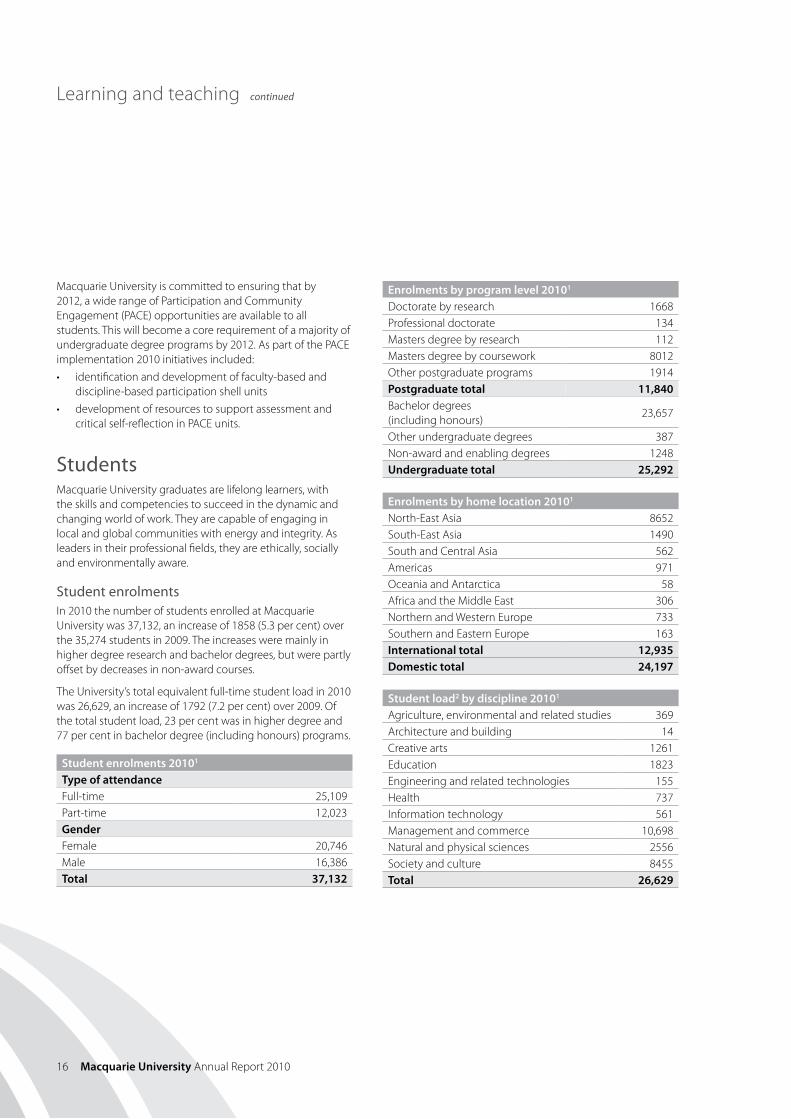
Studentsmacquarie University graduates are lifelong learners, with the skills and competencies to succeed in the dynamic and changing world of work. They are capable of engaging in local and global communities with energy and integrity. as leaders in their professional fields, they are ethically, socially and environmentally aware.
Student enrolments in 2010 the number of students enrolled at macquarie University was 37,132, an increase of 1858 (5.3 per cent) over the 35,274 students in 2009. The increases were mainly in higher degree research and bachelor degrees, but were partly offset by decreases in non-award courses.
The University’s total equivalent full-time student load in 2010 was 26,629, an increase of 1792 (7.2 per cent) over 2009. of the total student load, 23 per cent was in higher degree and 77 per cent in bachelor degree (including honours) programs.
Student enrolments 20101
Type of attendanceFull-time 25,109Part-time 12,023GenderFemale 20,746male 16,386Total 37,132
Enrolments by program level 20101
Doctorate by research 1668Professional doctorate 134masters degree by research 112masters degree by coursework 8012other postgraduate programs 1914Postgraduate total 11,840Bachelor degrees (including honours)
23,657
other undergraduate degrees 387Non-award and enabling degrees 1248Undergraduate total 25,292
Enrolments by home location 20101
North-east asia 8652South-east asia 1490South and Central asia 562americas 971oceania and antarctica 58africa and the middle east 306Northern and Western europe 733Southern and eastern europe 163International total 12,935Domestic total 24,197
Student load2 by discipline 20101
agriculture, environmental and related studies 369architecture and building 14Creative arts 1261education 1823engineering and related technologies 155Health 737information technology 561management and commerce 10,698Natural and physical sciences 2556Society and culture 8455Total 26,629
learning and teaching 17
Student awards 20103
Higher doctorate 0Honorary award 6Non-professional doctorate by research 149Professional doctorate 34masters degree by research 13masters degree by coursework 3605other postgraduate programs 1044Postgraduate total 4851Bachelor degrees (including honours) 5076other undergraduate degrees 48Undergraduate total 5124
1 Source: preliminary calendar year data as at 7 march 2011. individual figures may not add up to totals due to rounding.
2 equivalent full-time student load.3 Source: amiS data as at 7 march 2011. Note: The definition of student enrolments in this annual report is
the same as 2007–2009 but is slightly changed compared with 2002–2006. in 2002–2006 a student who enrolled in two different course levels between semesters in the year was counted as two enrolments. in this annual report a student with multiple enrolments will be counted only once in the latest enrolled course. The approach of each student being counted once is consistent with the method adopted by government agencies and other universities for comparative analysis.
Internationalisationat the end of 2010 international students accounted for 34.8 per cent of the total student population. macquarie international’s programs attracted over 12,000 international students from 104 countries, with another 1010 students enrolled in the various offshore programs in China, Hong Kong, Japan, Korea, malaysia and Singapore.
The University has maintained its competitive position in the sector in 2010. macquarie is ranked among australia’s top 10 universities (Shanghai Jiao Tong University academic Rankings of World Universities, 2010) and the mBa program is recognised as one of the finest in the world (The economist 2010 Full Time mBa rankings).
as part of macquarie’s commitment to internationalisation and innovation, macquarie international offers a range of opportunities to all macquarie students to enhance their skills and experience, including student exchange, internship placements, overseas volunteer programs and the sector leading global leadership Program.
macquarie’s international research reputation has grown in recent years and is supported by the appointment of a Director of international Research Programs in 2007. in 2010 there were 107 cotutelle/joint PhD agreements with 76 universities in 24 countries. Close to 37 per cent of all 420 commencing higher degree research students were international students.
macquarie international achieved better operational efficiency in 2010 and implemented a range of new innovative programs such as the graduate Trainee Program and the graduate Development Program, responding to student feedback provided by the international Student Barometer.
in response to the increasingly competitive environment in international education, a comprehensive range of new marketing initiatives have been added to existing platforms.
18 Macquarie University annual Report 2010
Community engagement and alumni
macquarie University values external partnerships that strengthen opportunities for enterprise and innovation, and contribute to the development of the local, national and international community.
Institutional advancementestablished in 2007, the office of institutional advancement engages the University’s alumni, business and community partners to create a strong future through the establishment of significant new revenue streams for new facilities, research, teaching, professorial chairs and scholarships.
The macquarie University Foundation plays a pivotal role in supporting vital fundraising programs. The Foundation’s Committee of Patrons, chaired by mr maurice Newman aC, comprises 10 of australia’s most prominent business and community leaders who generously donate their time and resources to support the University’s fundraising efforts.
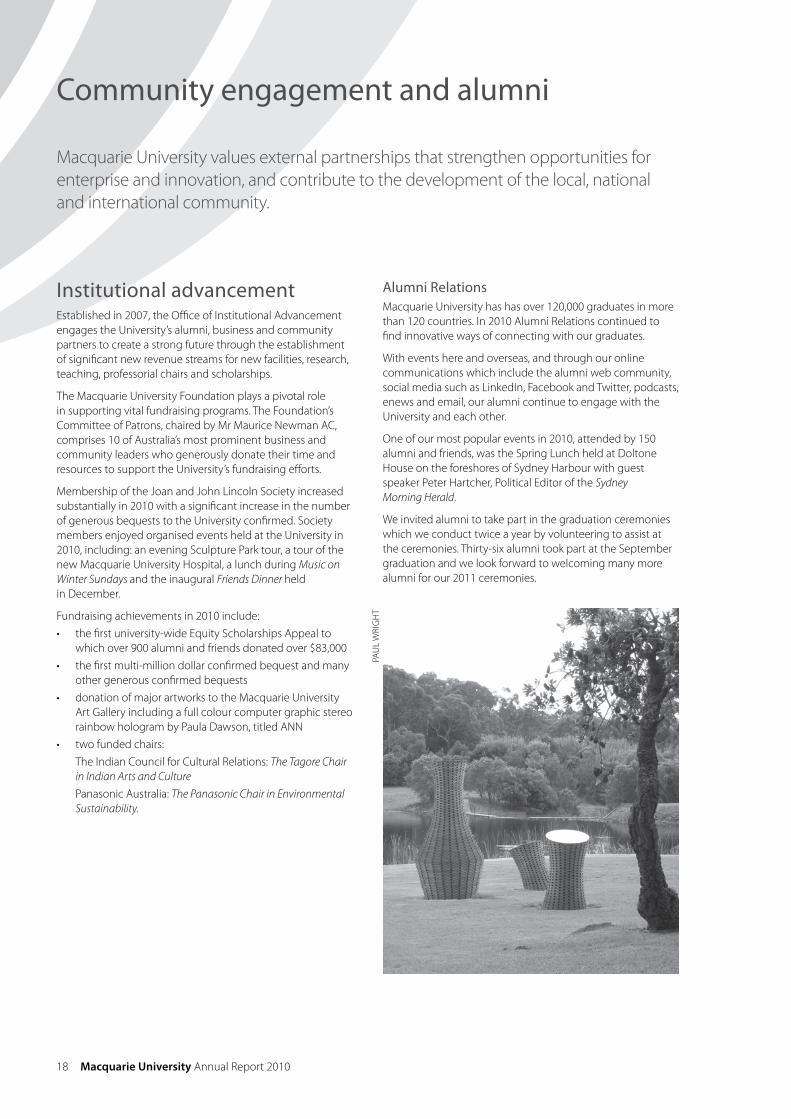
membership of the Joan and John lincoln Society increased substantially in 2010 with a significant increase in the number of generous bequests to the University confirmed. Society members enjoyed organised events held at the University in 2010, including: an evening Sculpture Park tour, a tour of the new macquarie University Hospital, a lunch during Music on Winter Sundays and the inaugural Friends Dinner heldin December.
Fundraising achievements in 2010 include:
• the first university-wide equity Scholarships appeal to which over 900 alumni and friends donated over $83,000
• the first multi-million dollar confirmed bequest and many other generous confirmed bequests
• donation of major artworks to the macquarie University art gallery including a full colour computer graphic stereo rainbow hologram by Paula Dawson, titled aNN
• two funded chairs:
The indian Council for Cultural Relations: The Tagore Chair in Indian Arts and Culture
Panasonic australia: The Panasonic Chair in Environmental Sustainability.
Alumni Relationsmacquarie University has has over 120,000 graduates in more than 120 countries. in 2010 alumni Relations continued to find innovative ways of connecting with our graduates.
With events here and overseas, and through our online communications which include the alumni web community, social media such as linkedin, Facebook and Twitter, podcasts, enews and email, our alumni continue to engage with the University and each other.
one of our most popular events in 2010, attended by 150 alumni and friends, was the Spring lunch held at Doltone House on the foreshores of Sydney Harbour with guest speaker Peter Hartcher, Political editor of the SydneyMorning Herald.
We invited alumni to take part in the graduation ceremonies which we conduct twice a year by volunteering to assist at the ceremonies. Thirty-six alumni took part at the September graduation and we look forward to welcoming many more alumni for our 2011 ceremonies.
PaU
l W
Rig
HT
Community engagement and alumni 19
Community engagementCommunity engagement is an important aspect of the University’s commitment to being a good neighbour and friend to those who may not be directly involved in the day-to-day life of macquarie. our efforts to increase community engagement resulted in an increase in attendance at our many cultural and recreational activities with more than 15,000 visitors to campus.
more than 6000 people attended our most popular events including: Music on Winter Sundays, Balmain Sinfonia and Macquarie Singers concerts, Movies@Macquarie, Cinema in the Park and our popular astronomy nights. one of the highlights of the year was the Lachlan Macquarie Lecture Series.
The six art gallery exhibitions and related events including Sculpture Park tours and guided walks attracted more than 9000 visitors, including 14 school visits.
The Science Partnership launched in 2007 with the New South Wales Department of education and Training, the Science Partnership is designed to positively influence young people’s attitudes towards studying science, technology, engineering and mathematics subjects (STem).
During 2010 the STem Project has further expanded to include enrichment activities for students from Kindergarten to year 12 in specialised activities created by University staff and teachers from the Peninsula Community of Schools both on and off campus. Robotics featured highly in these programs as an innovative approach for the delivery of STem curriculum.
The introduction of STem competitions allowing student participation from K–10 has been hugely successful with over 5000 entries across three competitions. The partnership was also featured in the Smarter Schools National Partnership Program in a school package entitled “So who goes to university” which aims at providing better links between schools and universities to lift participation, attainment and university enrolments.
Making Up Lost Time in Literacy The making Up lost Time in literacy (mUlTiliT) initiative is directed by Professor Kevin Wheldall from the macquarie University Special education Centre. mUlTiliT researches and develops more effective ways of teaching low-progress readers. Since its inception in 1995, mUlTiliT has demonstrated a strong commitment to community engagement and outreach activities. mUlTiliT has a long-standing and important relationship with The exodus Foundation. as a result, a mUlTiliT program has been delivered to nearly 1500 disadvantaged children and young people since 1996 in New South Wales (ashfield and Redfern), Queensland (gladstone) and the Northern Territory. in 2010, an additional tutorial centre was added, making seven in total. mUlTiliT and the exodus Foundation are exploring ways to collaborate further in the future.
Following the selection of mUlTiliT in the Commonwealth and State National Partnerships Program for literacy and Numeracy in New South Wales in 2009, the Western australian Department of education selected mUlTiliT for this important literacy initiative. This will ensure that even greater numbers of low-progress readers will benefit from mUlTiliT instruction.
an exciting new initiative was launched in 2010 with PaRRaSiP (Parramatta Schools industry Partnership), a federal and state government funded not-for-profit organisation linking business to schools to enhance literacy and numeracy outcomes. mTC Work Solutions (who provided funding), PaRRaSiP and mUlTiliT worked together to provide literacy support to high school students with literacy challenges. Five schools accepted the offer to take part in the pilot program. Students from year 9 to 11 took part in mUlTiliT training, then were assigned a year 7 low-progress reader to read with several times a week. early success has ensured a continuation of the program in 2011. mUlTiliT provided further schools initiatives in conjunction with another university’s Compass program. Sixteen schools in the inner west and west participated in this community initiative.
20 Macquarie University annual Report 2010
Infrastructure and facilities
macquarie University is investing in a number of infrastructure projects to ensure the campus has the facilities required to attract and retain the best students and staff, to support world-class research, and to enter into partnerships with like-minded companies to support and further the research aims of the University.
Learning and Research CentreThe learning and Research Centre will represent a new generation of library design, creating a centre full of dynamic, collaborative and open spaces for learning. Construction commenced in october 2008 with the $90.76 million project scheduled for completion in early 2011. Substantial work on the project continued in 2010, with the structure and interior near completion.
The opening date has been set for the end of march 2011, following fitout and commissioning of the building.
Macquarie University HospitalThe macquarie University Hospital, which opened in June 2010, is a $200 million project that delivers training, medical research and quality patient care in specialty areas.
Construction began in 2007, and proceeded throughout 2008 and 2009 ensuring that the hospital was on track to open its doors to patients in mid 2010. as the first private teaching hospital to be located on a university campus in australia, it combines excellence in clinical care, medical education and research. The hospital complements teaching and research already offered at macquarie.
The hospital is the first facility in australasia to utilise what is the world’s most effective radiosurgery treatment. gamma Knife radiosurgery is used to treat brain tumours and brain disorders, but it does so without being invasive. it delivers a dose of gamma radiation to the target area with surgical precision, without affecting surrounding healthy tissue.
The hospital also accommodates the University’s new medical school, the australian School of advanced medicine, which delivers postgraduate programs in specialty and sub-specialty fields, working in partnership with the Royal australasian College of Surgeons.
Australian Hearing HubThe australian Hearing Hub is being established to enhance research, education and training capacity in hearing and speech sciences through collaboration. The building will be sited within the University’s North Ryde campus, adjacent to Cochlear ltd’s new global headquarters and principal manufacturing facility, and will form the western gateway into the University via epping Road.
Projected partners include academic units from the University (audiology, speech pathology, macquarie Centre for language Sciences plus key elements of the macquarie Centre for Cognitive Sciences, microelectronics, clinical psychology and early childhood and special education); australian Hearing and National acoustic laboratories; and teams from Sydney Cochlear implant Centre, the Shepherd Centre and Royal institute for Deaf and Blind Children.
The building is designed to have approximately 24,000m2
of gross floor area over four levels plus two basements for parking. Construction is due to commence in early 2011. Demolition of three existing car parks commenced in December 2010 to make way for this new facility. The project budget is estimated at $120 million and has a targeted completion date of late 2012.
Station precinctmacquarie University is continuing the pre-development of the 90,000m2mixed use project. The Station North development is located on the corner of Waterloo and Herring Roads – one of the most valuable sites in the area. The proposed development comprises high quality mixed-use office space and hotel/serviced apartments in a number of multi-storey towers, basement car parking and retail space.
The University is currently undertaking detailed site analysis in support of a preferred concept design to enable a project development plan to be completed during the first half of 2011.
Campus Hubmacquarie is undertaking planning associated with a revitalisation of the central retail and student services function, the Campus Hub. Planning will continue through 2011, with focus on the old library, C7a.
it is intended that a revitalised hub will recreate visual linkages to the campus amenity to the west, and articulate the axis from the planned campus green in the east through to the aquatic centre and university housing in the west.
Sustainability 21
Sustainability
educational institutions have a responsibility to ensure that students and staff have the knowledge and experience to contibute to a more sustainable society. We acknowledge this responsibility and are working towards becoming an example of best practice in our operations, and through our learning and teaching.
The University’s sustainability vision is to be ecologically sound, socially just and economically viable in all its activities. This means that we aim to:
• function as a sustainable community, embodying responsible consumption of energy, water, food, products and transport
• actively support sustainability in the local community and region
• ensure our students leave the University prepared to contribute as working citizens to an environmentally healthy and equitable society
• have a reputation for being the place to learn, to work and to connect with the local and global community
• actively seek to meet the changing social, environmental and economic conditions to reduce the impact of climate change upon the environment.
Education and engagement
Formal learning and teaching2010 saw the launch of the Sustainability in learning and Teaching grants scheme to encourage academics to look at how sustainability can be embedded into the curriculum. a total of $80,000 was awarded across six projects, each of which looked at:
• developing and supporting sustainability skills in teaching and learning
• identifying, fostering and evaluating sustainability focused learning outcomes and/or graduate capabilities
• supporting sustainability focused research-enhanced learning and teaching
• promoting environmental or social sustainability.
Informal learning and teachinginformal learning outside of the classroom environment is just as important as learning that occurs as part of a degree.
The green Steps program, which looks to upskill students in the practical delivery of environmental sustainability, was run during semester two. Students enjoyed the five day training workshop and placement into work, school or government.
Sustainable procurement training was offered to staff during the second half of the year. over 50 staff took part in a three hour workshop to develop a better understanding of terms like life cycle assessment, whole of life value for money, offsetting and greenwashing. Participants received a seven step framework for sustainable purchasing.
Cycle skills workshops were also held each quarter to help staff and students develop their confidence and competency
in bike maintenance and cycle safety. each of the sessions averaged around 15 people.
EngagementStaff engagement is a major focus as we believe that staff become advocates for sustainability amongst our student population and greater community.
The Sustainability Representative Network (SRN) comprises 45 staff members from different departments who work with macquarie Sustainability to realise stated goals and objectives. These volunteers communicate and disseminate information, as well as undertake small actions, both of which have led to amazing results.
The second Department Sustainability Challenge was held during the latter half of the year. The challenge encourages departments to undertake actions in eight key theme areas such as participation, energy, waste, governance and transport.
The annual Sustainability Fair was open to staff, students and local community members. The stalls included: organic foods, fair trade products, wildlife organisations, student groups and charity focused organisations such as amnesity international and oxfam. over 200 local high schol students attended, taking part in a variety of activities such as tree planting, stream watch and a sustainability tour.
macquarie’s Director of Sustainability became President of australasian Campuses Towards Sustainability (aCTS). The Director and the Vice-Chancellor developed an initiative focused on a sector commitment for sustainability by engaging key organisations such as TeFma, ayCC, Universities australia, australian learning and Teaching Council and DeeWR. The initiative is supported by international organisations environmental association for Universities and Colleges (UK) and the american Colleges and Universities Presidents Climate Commitment (USa). The bulk of this initiative will be undertaken during 2011.
Increasing resource recovery and efficiencyactions undertaken to improve resource use included:
Energy• a 1,000,000 litre thermal energy storage tank was installed
to reduce peak demand for chilling air conditioning systems
• eighty electrical sub-meters were installed across campus to allow for better data capture on building energy use
• a number of solar panels were installed on the roof of e6B as well as four solar powered street lights installed along link Road
22 Macquarie University annual Report 2010
Sustainability continued
• further lighting retrofits, including the installation of sensor lighting in two high-use buildings.
Waste• an online furniture recycling scheme was introduced to
reuse office furniture
• continued initiatives to separate paper and cardboard, as well as other more environmentally damaging items such as ewaste, batteries and mobile phones.
Water• installation of 13 more water sub-meters to monitor and
capture data at a higher level
• bathroom refurbishments to improve efficiency in one of the high-use buildings, including replacement of existing taps and urinals
• involvement in the Sydney Water Bizfix program which included an audit on amenities followed by the installation of water savings devices in all audited areas.
Transport improvementsThe transport decisions made by our staff and students in travelling to and from the campus have enormous impact on traffic congestion and greenhouse gas emissions. Some of the transport initiatives implemented in 2010 include:
• an audit of staff and student travel patterns (it dentified that there was an 8 per cent modal shift to public transport, with 50 per cent of students and 25 per cent of staff travelling by train or bus to get to and from the campus)
• the installation of two self-contained bike hubs (each hub accomodates 28 bikes, 28 lockers and two showers)
• participating in the National Ride to Work and Walk to Work days.
Enhancing biodiversitya comprehensive study of mars Creek was conducted in order to plan rehabilitation works to improve the riparian zones and water quality.
Bushcare@mQ planted over 300 plants in 2010 encouraging frogs to return to the bushcare site along mars Creek near gymnasium Road. Native seedlings, grown from seeds collected on campus in 2009 formed a substantial number of the plantings for the year.
To support local habitat such as micro bats, rosellas, parrots, owls and possums, wooden nest boxes have been installed in several areas where mature trees are in place.
Planning and development
Governance and strategymuch of the work done in this area involves working with departments to see what processes and practices can incorporate sustainability principles. Some of the key advances made in this area include:
• the appointment of a dedicated Sustainability engagement officer whose primary role is to work with, support and engage staff across campus
• incorporating online sustainability awareness and resource efficiency modules as part of staff induction.
Infrastructure planninga comprehensive greenhouse gas reduction plan was developed to guide actions to reduce emissions in key areas such as new builds, refurbishments and behaviour change. it covers planning and development until 2030.
Notable Highlights
Awards• Winner of the NSW government green globe award for
Public Sector Sustainability
• Runner up in the NSW Keep australia Beautiful Water Conservation awards
• Highly commended in the NSW Keep australia Beautiful Waste minimisation awards.
ArboretumThe macquarie University arboretum was launched in august 2010. it is the only Sydney based arboretum located on a university campus and provides a valuable resource for learning and teaching, as well as community engagement.
Further informationRefer to the sustainability website at www.mq.edu.au/sustainability for more information on what is happening at macquarie and to download the annual Sustainability Report.
Staff development and capability 23
Staff development and capability
Throughout 2010 Human Resources focused on the development of staff capability and leadership potential.
in early 2010 the executive identified and approved a set of capabilities which form the basis of measurement of leadership potential and development. a leadership 360 Feedback process was conducted for the executive against these capabilities: it was implemented and completed for executive roles. The University also commenced a process of mapping competencies for professional staff – beginning with staff in the library and marketing. This gives Human Resources the ability to create leadership and staff development activities which more closely match the needs of staff and the University.
Policy and procedureHuman Resources embarked on a series of projects to improve processes and service under the banner HR Renewal. The HR Renewal commenced with the restructuring of Human Resources functions to bring in expertise in organisational Development, Strategic Sourcing, and Processes and Systems. This was followed by a review of recruitment and selection processes and the introduction of an automated recruitment system, Taleo. Under the renewal, the Return to Work Program was revised and a new induction program was released to orient staff during pre-employment and the first three months of employment. office automation systems to streamline processes reducing forms, blockages and turnaround times were also implemented.
another focus of the HR Renewal was to increase the skills and competencies of Human Resources. a range of cross-skilling training programs focused on customer service, process improvement, change and project management, and technical skills including workplace relations training and recruitment interview skills training.
Wage and salary movements all staff covered by the macquarie University enterprise agreement 2006–2009 received two 2 per cent salary increases in 2010. The first 2 per cent was at the end of march and the second 2 per cent was at the end of September. The model increase for senior management employed outside of the enterprise agreement was 4 per cent.
Following the approval by Fair Work australia (FWa) of the Professional Staff enterprise agreement, a one off sign-on payment of $1000 (pro rata for part-time staff ) was made to permanent and fixed term professional staff. The top salary step for professional staff in grades 1 through 7 was increased by $500. There have been no significant wage movements outside of these increases.
Industrial relations policies and practices The University continued enterprise bargaining negotiations with the CPSU and NTeU through 2010 and came to an agreement with the CPSU on a new Professional Staff agreement. The University put this agreement to staff in September and, while it was strongly supported by the CPSU, it was strongly opposed by the NTeU. The required majority of professional staff voted in favor of the agreement and FWa approved it on 24 December 2010. The NTeU has lodged an appeal against the making of this agreement, and against the University of Wollongong and the University of New South Wales, which have similar agreements.
While progress was made on the vast majority of issues, the University and the NTeU have not concluded bargaining on an academic Staff enterprise agreement. The NTeU mounted an industrial campaign which, at its peak, involved the withholding of student marks by 68 academic staff. The University applied for the action to be terminated by FWa on the basis that it damaged the welfare of students. Rather than defend the action, the NTeU entered into conciliation with the University and agreed to release all critical marks relating to student completion and progression. Negotiations with the NTeU will continue into 2011.
Staff statistics The number of non-casual (full-time and fractional full-time) staff as at 31 march 2010 was 2163, an increase of 45 (2.1 per cent) over 2009.
There were 172 female academic staff at the level of level C (Senior lecturer) or above (41 per cent of all female academic staff ), compared to 367 males (63 per cent of all male academic staff ).
of the 1158 professional staff, 435 (38 per cent) were in academic faculties and research centres of the University, 292 (25 per cent) in central administration, 144 (12 per cent) in the library and 75 (6 per cent) in the office of the academic Registrar. The balance of 212 (18 per cent) were in other offices of the University administration.
Staff full-time equivalenceThe full-time equivalence (FTe) of non-casual staff as at 31 march 2010 was 1988, an increase of 50 FTe (2.6 per cent) over 2009. The change consisted of an increase of 39 FTe for academic staff and 11 FTe for professional staff. in 2010 the FTe of casual staff was 480, including 256 academic and 223 professional.
Full-time staff members who work more than a normal workload for additional remuneration hold notional
24 Macquarie University annual Report 2010
Staff development and capability continued
appointments as casual staff in addition to their full-time position. The additional load of such staff members is converted into casual FTe based on the amount paid to them, with the total FTe per individual capped at an upper limit for a realistic representation of a person’s capacity.
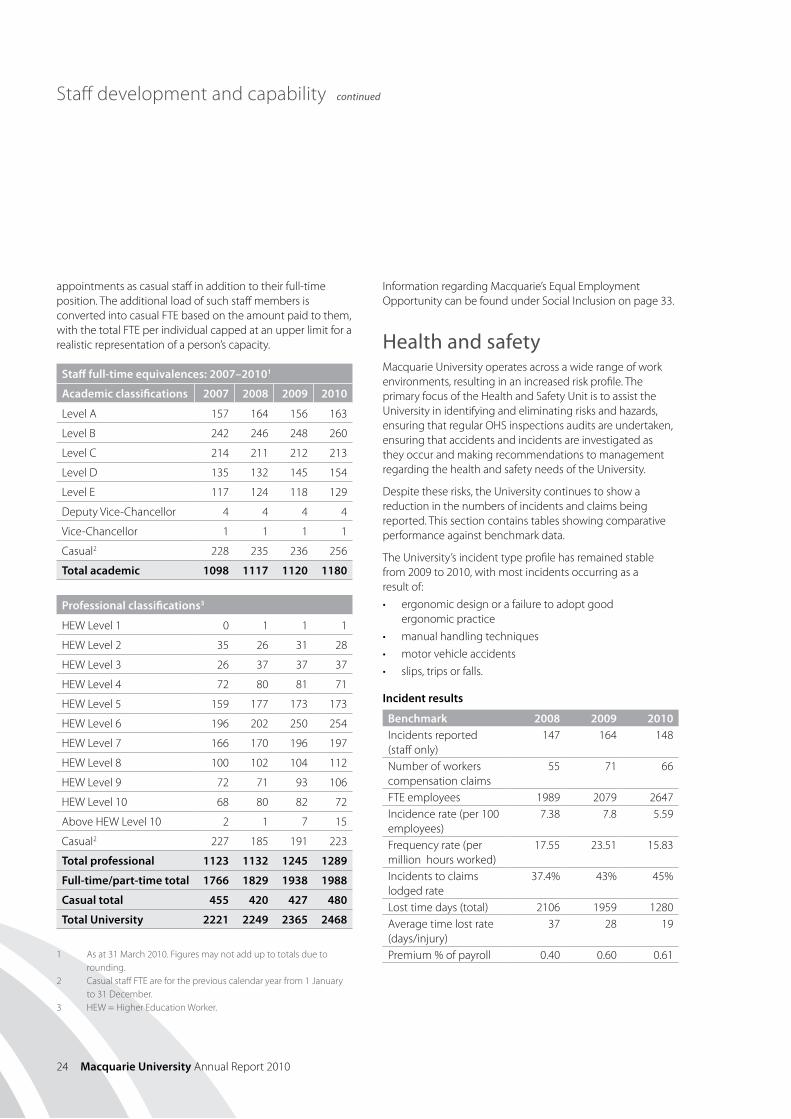
Staff full-time equivalences: 2007–20101
Academic classifications 2007 2008 2009 2010
level a 157 164 156 163
level B 242 246 248 260
level C 214 211 212 213
level D 135 132 145 154
level e 117 124 118 129
Deputy Vice-Chancellor 4 4 4 4
Vice-Chancellor 1 1 1 1
Casual2 228 235 236 256
Total academic 1098 1117 1120 1180
Professional classifications3
HeW level 1 0 1 1 1
HeW level 2 35 26 31 28
HeW level 3 26 37 37 37
HeW level 4 72 80 81 71
HeW level 5 159 177 173 173
HeW level 6 196 202 250 254
HeW level 7 166 170 196 197
HeW level 8 100 102 104 112
HeW level 9 72 71 93 106
HeW level 10 68 80 82 72
above HeW level 10 2 1 7 15
Casual2 227 185 191 223
Total professional 1123 1132 1245 1289
Full-time/part-time total 1766 1829 1938 1988
Casual total 455 420 427 480
Total University 2221 2249 2365 2468
1 as at 31 march 2010. Figures may not add up to totals due to rounding.
2 Casual staff FTe are for the previous calendar year from 1 January to 31 December.
3 HeW = Higher education Worker.
information regarding macquarie’s equal employment opportunity can be found under Social inclusion on page 33.
Health and safetymacquarie University operates across a wide range of work environments, resulting in an increased risk profile. The primary focus of the Health and Safety Unit is to assist the University in identifying and eliminating risks and hazards, ensuring that regular oHS inspections audits are undertaken, ensuring that accidents and incidents are investigated as they occur and making recommendations to management regarding the health and safety needs of the University.
Despite these risks, the University continues to show a reduction in the numbers of incidents and claims being reported. This section contains tables showing comparative performance against benchmark data.
The University’s incident type profile has remained stable from 2009 to 2010, with most incidents occurring as a result of:
• ergonomic design or a failure to adopt good ergonomic practice
• manual handling techniques
• motor vehicle accidents
• slips, trips or falls.
Incident results
Benchmark 2008 2009 2010incidents reported (staff only)
147 164 148
Number of workers compensation claims
55 71 66
FTe employees 1989 2079 2647incidence rate (per 100 employees)
7.38 7.8 5.59
Frequency rate (per million hours worked)
17.55 23.51 15.83
incidents to claims lodged rate
37.4% 43% 45%
lost time days (total) 2106 1959 1280 average time lost rate (days/injury)
37 28 19
Premium % of payroll 0.40 0.60 0.61
Staff development and capability 25
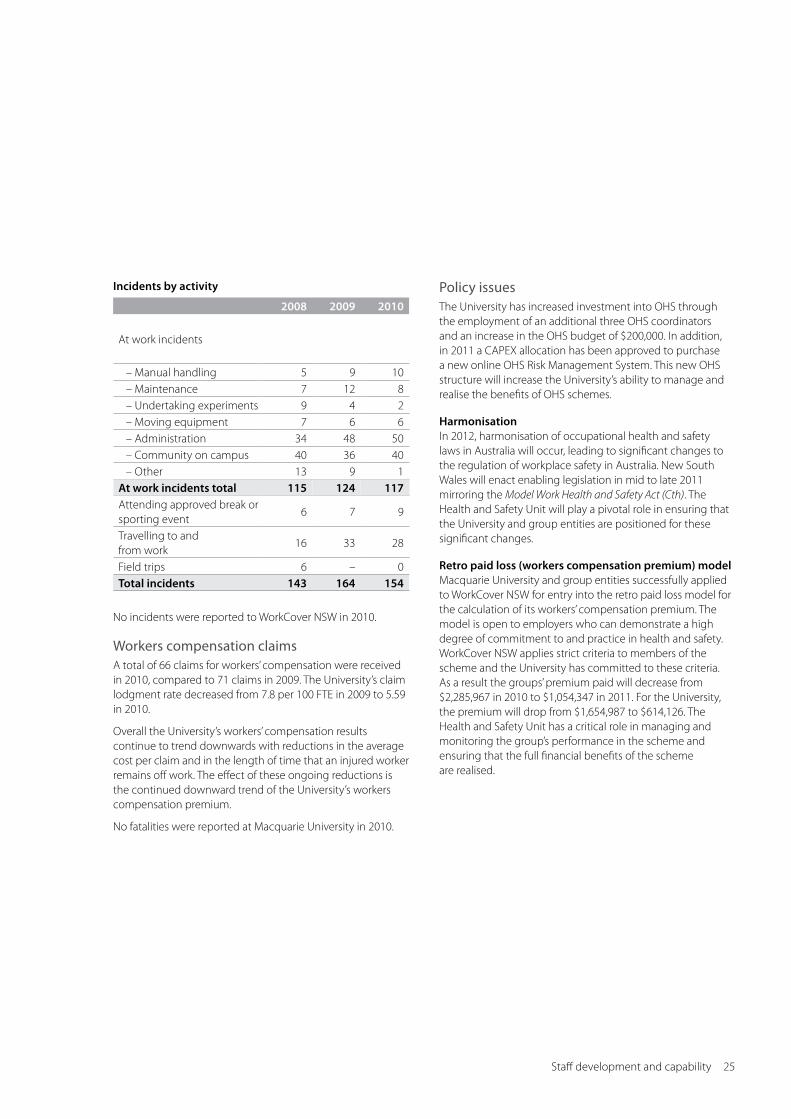
Incidents by activity
2008 2009 2010
at work incidents
– manual handling 5 9 10– maintenance 7 12 8– Undertaking experiments 9 4 2– moving equipment 7 6 6– administration 34 48 50– Community on campus 40 36 40– other 13 9 1
At work incidents total 115 124 117attending approved break or sporting event
6 7 9
Travelling to and from work
16 33 28
Field trips 6 – 0Total incidents 143 164 154
No incidents were reported to WorkCover NSW in 2010.
Workers compensation claimsa total of 66 claims for workers’ compensation were received in 2010, compared to 71 claims in 2009. The University’s claim lodgment rate decreased from 7.8 per 100 FTe in 2009 to 5.59 in 2010.
overall the University’s workers’ compensation results continue to trend downwards with reductions in the average cost per claim and in the length of time that an injured worker remains off work. The effect of these ongoing reductions is the continued downward trend of the University’s workers compensation premium.
No fatalities were reported at macquarie University in 2010.
Policy issuesThe University has increased investment into oHS through the employment of an additional three oHS coordinators and an increase in the oHS budget of $200,000. in addition, in 2011 a CaPeX allocation has been approved to purchase a new online oHS Risk management System. This new oHS structure will increase the University’s ability to manage and realise the benefits of oHS schemes.
Harmonisationin 2012, harmonisation of occupational health and safety laws in australia will occur, leading to significant changes to the regulation of workplace safety in australia. New South Wales will enact enabling legislation in mid to late 2011 mirroring the Model Work Health and Safety Act (Cth). The Health and Safety Unit will play a pivotal role in ensuring that the University and group entities are positioned for these significant changes.
Retro paid loss (workers compensation premium) modelmacquarie University and group entities successfully applied to WorkCover NSW for entry into the retro paid loss model for the calculation of its workers’ compensation premium. The model is open to employers who can demonstrate a high degree of commitment to and practice in health and safety. WorkCover NSW applies strict criteria to members of the scheme and the University has committed to these criteria. as a result the groups’ premium paid will decrease from $2,285,967 in 2010 to $1,054,347 in 2011. For the University, the premium will drop from $1,654,987 to $614,126. The Health and Safety Unit has a critical role in managing and monitoring the group’s performance in the scheme and ensuring that the full financial benefits of the scheme are realised.
26 Macquarie University annual Report 2010
Staff development and capability continued
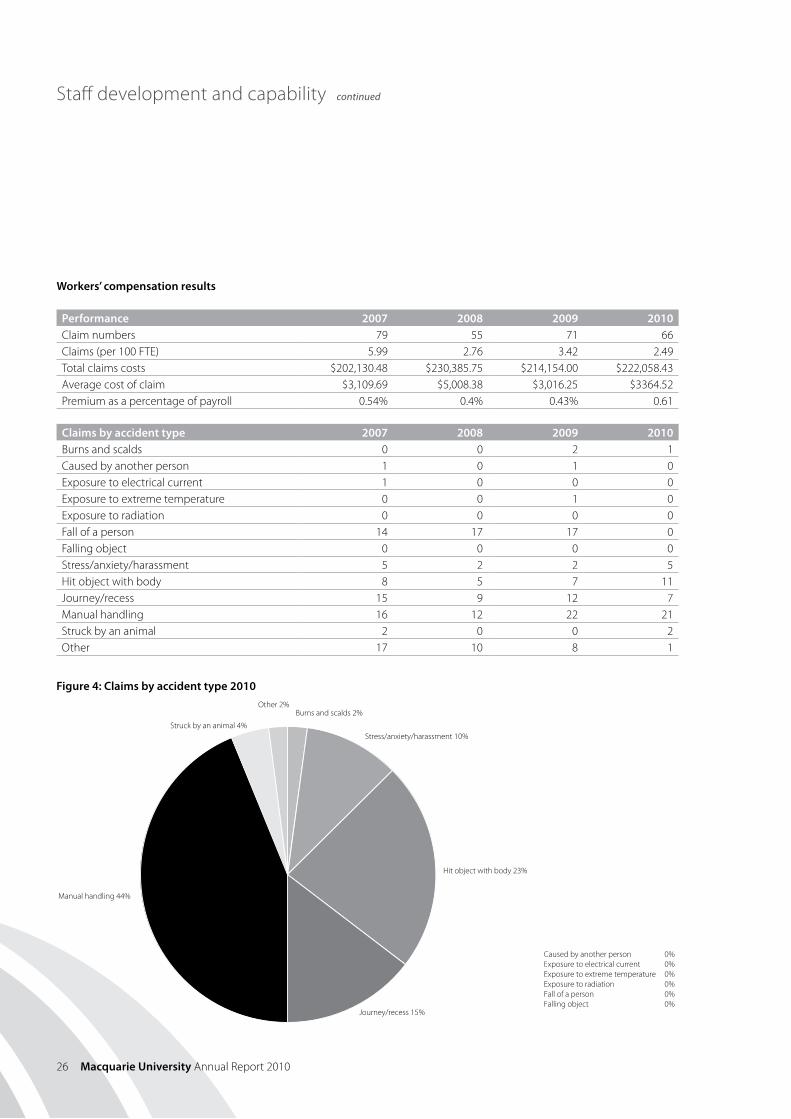
Workers’ compensation results
Performance 2007 2008 2009 2010Claim numbers 79 55 71 66Claims (per 100 FTe) 5.99 2.76 3.42 2.49Total claims costs $202,130.48 $230,385.75 $214,154.00 $222,058.43average cost of claim $3,109.69 $5,008.38 $3,016.25 $3364.52Premium as a percentage of payroll 0.54% 0.4% 0.43% 0.61
Claims by accident type 2007 2008 2009 2010Burns and scalds 0 0 2 1Caused by another person 1 0 1 0exposure to electrical current 1 0 0 0exposure to extreme temperature 0 0 1 0exposure to radiation 0 0 0 0Fall of a person 14 17 17 0Falling object 0 0 0 0Stress/anxiety/harassment 5 2 2 5Hit object with body 8 5 7 11Journey/recess 15 9 12 7manual handling 16 12 22 21Struck by an animal 2 0 0 2other 17 10 8 1
Figure 4: Claims by accident type 2010
Burns and scalds 2%
Hit object with body 23%
Journey/recess 15%
Manual handling 44%
Struck by an animal 4%
Other 2%
Stress/anxiety/harassment 10%
Caused by another person 0%Exposure to electrical current 0%Exposure to extreme temperature 0%Exposure to radiation 0%Fall of a person 0%Falling object 0%
Social inclusion 27
Social Inclusion
macquarie University is vibrant, diverse, innovative and committed to social inclusion, equality of opportunity in employment and education, and building an environment where all can flourish.
as a strategic priority, Social inclusion is interested in increasing aspiration for university study in those who may not have considered it an option due to disadvantage, and in creating a university workforce and environment where people from diverse backgrounds are represented and have the opportunity to develop and contribute meaningfully.
in 2010 the Social inclusion Plan was integrated into the macquarie University academic Plan. With the establishment of the new macquarie Student Representative association (mUSRa) six equity and diversity representative portfolios’ were created: for Women, glBTi, Disability, indigenous australian, Cultural and linguistically Diverse (CalD) and Social Justice. in this reporting year, the University significantly increased its outreach strategies for students from low socio-economic backgrounds in line with the federal agenda, a Review of indigenous education was undertaken, and an indigenous Cadetship program for undergraduate students was introduced.
Social inclusion goals1. build a more diverse student population
prioritising low SES and Indigenous students
2. build a more diverse staff population prioritising Indigenous Australians, people with disabilities, people from CALD backgrounds and women (in non-traditional roles and in senior positions)
3. ensure a safe, positive and supportive experience and environment for all students and staff to maximise achievement levels
4. develop an inclusive culture and practice in the areas of learning and teaching, research and service orientation and delivery
5. generate knowledge through basic, applied and evaluative research into socially inclusive policy and practice.
Access and inclusion initiativesin 2010, macquarie developed a suite of outreach programs targeting groups previously under-represented, especially students from low socio-economic status (low SeS) backgrounds, including: partnership with NSW DeT to develop a mentoring program for refugee secondary students; introduction of the advancement via individual Determination program for middle students; introduction of the macquarie Robotics Program to schools; and partnership
with the Country education Foundation of australia in hosting rural students from nine schools on campus.
The University was active in the Sydney Widening Participation Higher education Forum, working collaboratively with five Sydney universities on schools outreach.
in 2010, the australian History museum continued to offer reduced rate education programs to low SeS secondary schools and visited Hunter Valley and Bathurst regional schools.
Supporting alternative pathways to university
Distance education and non-awardmacquarie’s Centre for open education offers a pathway to entry via non-award courses which are open to all domestic students able to pay tuition fees and who meet the more flexible entry requirements. each application is treated on a case-by-case basis, including consideration of non-academic factors.
The Centre for open education continued to offer direct entry places to the Bachelor of arts and the Bachelor of Science.
From mid 2010 the non-award pathway changed to include an additional six bachelor degrees bringing the total to 11 degrees. interest in these pathways remained strong with students from 40 countries participating (386 students; 23.5 per cent born outside australia but holding australian citizenship or a permanent residence visa).
Open Universities Australiaopen Universities australia offers a non-award pathway to a Bachelor of arts degree after successful completion of four units. in 2010 there were approximately 10,000 unit enrolments: 0.75 per cent identified as indigneous australians, 0.75 per cent lived in remote or very remote areas, 5.4 per cent had a disability, 7 per cent spoke a language other than english at home, 5 per cent did not complete high school and 0.24 per cent were incarcerated.
a further pathway is via the Certificate in languages. This certificate does not require specific entry qualifications and articulates into a diploma and then a bachelor degree.
Special consideration entry schemesThe lighthouse Scheme is the University’s educational access Scheme for students who evidence disadvantage that seriously affected their schooling in years 11 and 12. The Jubilee Scheme applies to applicants over 21 years of age who have not previously undertaken any tertiary education. Warawara, Department of indigenous Studies facilitates the alternative entry Program for indigenous applicants seeking undergraduate enrolment at macquarie.
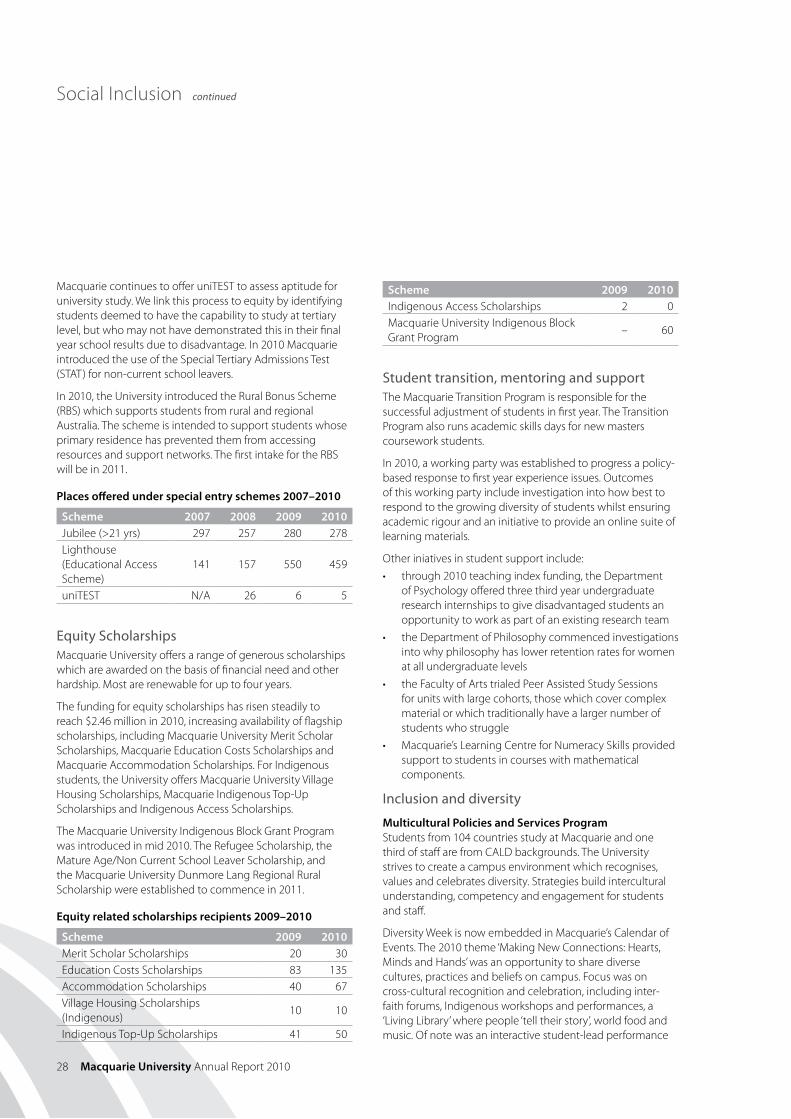
28 Macquarie University annual Report 2010
Social inclusion continued
macquarie continues to offer uniTeST to assess aptitude for university study. We link this process to equity by identifying students deemed to have the capability to study at tertiary level, but who may not have demonstrated this in their final year school results due to disadvantage. in 2010 macquarie introduced the use of the Special Tertiary admissions Test (STaT) for non-current school leavers.
in 2010, the University introduced the Rural Bonus Scheme (RBS) which supports students from rural and regional australia. The scheme is intended to support students whose primary residence has prevented them from accessing resources and support networks. The first intake for the RBS will be in 2011.
Places offered under special entry schemes 2007–2010
Scheme 2007 2008 2009 2010Jubilee (>21 yrs) 297 257 280 278lighthouse (educational access Scheme)
141 157 550 459
uniTeST N/a 26 6 5
Equity Scholarshipsmacquarie University offers a range of generous scholarships which are awarded on the basis of financial need and other hardship. most are renewable for up to four years.
The funding for equity scholarships has risen steadily to reach $2.46 million in 2010, increasing availability of flagship scholarships, including macquarie University merit Scholar Scholarships, macquarie education Costs Scholarships and macquarie accommodation Scholarships. For indigenous students, the University offers macquarie University Village Housing Scholarships, macquarie indigenous Top-Up Scholarships and indigenous access Scholarships.
The macquarie University indigenous Block grant Program was introduced in mid 2010. The Refugee Scholarship, the mature age/Non Current School leaver Scholarship, and the macquarie University Dunmore lang Regional Rural Scholarship were established to commence in 2011.
Equity related scholarships recipients 2009–2010
Scheme 2009 2010merit Scholar Scholarships 20 30education Costs Scholarships 83 135accommodation Scholarships 40 67Village Housing Scholarships (indigenous)
10 10
indigenous Top-Up Scholarships 41 50
Scheme 2009 2010indigenous access Scholarships 2 0macquarie University indigenous Block grant Program
– 60
Student transition, mentoring and supportThe macquarie Transition Program is responsible for the successful adjustment of students in first year. The Transition Program also runs academic skills days for new masters coursework students.
in 2010, a working party was established to progress a policy-based response to first year experience issues. outcomes of this working party include investigation into how best to respond to the growing diversity of students whilst ensuring academic rigour and an initiative to provide an online suite of learning materials.
other iniatives in student support include:
• through 2010 teaching index funding, the Department of Psychology offered three third year undergraduate research internships to give disadvantaged students an opportunity to work as part of an existing research team
• the Department of Philosophy commenced investigations into why philosophy has lower retention rates for women at all undergraduate levels
• the Faculty of arts trialed Peer assisted Study Sessions for units with large cohorts, those which cover complex material or which traditionally have a larger number of students who struggle
• macquarie’s learning Centre for Numeracy Skills provided support to students in courses with mathematical components.
Inclusion and diversity
Multicultural Policies and Services ProgramStudents from 104 countries study at macquarie and one third of staff are from CalD backgrounds. The University strives to create a campus environment which recognises, values and celebrates diversity. Strategies build intercultural understanding, competency and engagement for students and staff.
Diversity Week is now embedded in macquarie’s Calendar of events. The 2010 theme ‘making New Connections: Hearts, minds and Hands’ was an opportunity to share diverse cultures, practices and beliefs on campus. Focus was on cross-cultural recognition and celebration, including inter-faith forums, indigenous workshops and performances, a ‘living library’ where people ‘tell their story’, world food and music. of note was an interactive student-lead performance
Social inclusion 29
where international and migrant students shared cultural experiences with staff and students.
The University was approached by the NSW ethnic Communities Council to seek collaboration on a national Building inclusive Communities awards as a result.
The Equity and Diversity Unitin 2010 the University signed as a Foundation Partner to expand the Courageous Conversations about Race (CCaR) initiative. Cultural awareness and anti-racism workshops develop cultural sensitivity, and aim to deepen cultural competence and literacy among participants. During 2010, 130 staff participated in introductory workshops.
in 2010 the equity and Diversity Unit, in partnership with the macquarie learning and Teaching Centre purchased the Flinders University ‘Cultural Diversity and inclusive Practice Toolkit’ for tailoring and implementation at macquarie. The toolkit aims to raise awareness and offer practical assistance to the University community around inclusive practice and the promotion of mutually respectful relationships across cultures.
The macquarie ally Network provides visible support to the gay, lesbian, bisexual, transgender, intersex (glBTi) community and helps raise awareness in the broader community. in 2010 information on the ally Network was presented to iSaNa staff (international Student advisors Network NSW) and key macquarie international staff became allies.
Student wellbeingmacquarie University provides a range of on-campus health, welfare, disability and financial support services to students from diverse backgrounds. The Women’s Room and Queerspace were formalised and actively promoted. Peak student bodies appointed equity and Diversity officers.
a 24/7 care line was established in 2010 and a bilingual service centre is available to answer enquiries from students and family members in a range of languages. The University Chaplaincy serves 18 faith groups and in 2010 a Chaplaincy agreement was developed to guide operations on campus.
PACE: Participation and Community Engagementmacquarie’s PaCe program develops the capabilities of students to actively contribute to the wellbeing of people and the planet through opportunities to apply their academic learning to real world situations – locally, regionally and internationally.
During 2010 the University expanded domestic participation partnerships across the arts, aged care, community sector, disability services, health, mental health, education, housing, local and state government, indigenous organisations, child/youth services and research services.
From 2012, a majority of undergraduate programs will require students to complete a participation unit. Through these units macquarie will assist our local, regional and international partners build their capacity.
Global Leadership ProgramThe macquarie global leadership Program continued to provide a structured 30-hour program in 2010 for students to develop cross-cultural understanding through elective workshops focusing on global issues and professional skills development. The program attracted 2300 students and 200 incoming Study abroad students.
Supporting CALD studentsThe University conducted a number of communications based programs targeting CalD students in 2010.
The Department of linguistics introduced three new discipline specific units on academic communication and literacy to support CalD students. it also developed a website to provide relevant academic literacy support for higher degree research students, many of whom are from CalD backgrounds.
2010 saw the establishment of the Study Skills Support Unit which offers academic support and a range of literacy study skills to assist undergraduate and postgraduate students. The Unit offers workshops, individual consultations and a suite of online resources. in 2010, 636 students participated in workshops with 66 per cent from CalD backgrounds.
ongoing activities such as the Centre for macquarie english, the Peer assisted learning Program and the Writing Skills Program continued to provide academic literacy support to undergraduate and postgraduate coursework students, including introductory seminars, courses on writing strategies and individual consultations.
Engagement with the CALD Communityin a addition to a range of research and degree programs which focus on engagement, the University runs a number of initiatives to engage with the CalD community.
The Department of international Studies promotes ethnic diversity and cross-cultural understanding, particularly from the perspectives of non-western regions and has built strong relationships with the Chinese and Japanese Consulates,

30 Macquarie University annual Report 2010
Social inclusion continued
the Japan Foundation and the Japanese Department of education. The Department also continues to work closely with Sydney’s diasporic communities from Croatia, greece and Poland with an annual prize giving ceremony which includes community representatives.
in 2010, the Department of english continued to engage with staff and students from CalD backgrounds with regard to issues such as diaspora, race, ethnicity, globalisation, religion, law, and refugee policy.
The australian History museum offers continual assistance to students from diverse backgrounds in the form of internship placement and supports the development of teaching and learning resources across the University as evidenced by linkages with a number of departments.
Goals for 2011• develop a University-wide strategy to strengthen cross-
cultural understanding and competency of all staff and students
• launch and monitor the macquarie outreach Program including the Refugee mentoring Program
• develop successful collaborations with the NSW ethnic Communities Council
• continue and expand language Cafes on campus
• investigate intercultural competence as a graduate capability
• strengthen mechanisms which allow CalD staff and students to participate fully in academic and campus life
• continue to support career advancement, professional development opportunities and visibility of CalD staff and monitor equity in human resources processes
• ensure that equity and diversity related policy, procedures and guidelines are available online
• provide a range of cultural events and celebrations throughout the year
• continue to provide language and literacy programs for CalD students and staff
• develop and disseminate events protocols to show respect and increase participation of CalD staff and students
• monitor university and student publications to ensure balanced representation for CalD students and staff in content and images.
Indigenous engagementWarawara – Department of Indigenous StudiesWarawara offers two residential block-mode undergraduate programs for indigenous australians who may travel from communities around australia to participate: the Bachelor of Community management and, in conjunction with the institute of early Childhood, the Bachelor of Teaching (early Childhood Services).
Warawara’s academic staff conduct guest lectures in mainstream university courses and undertake research into indigenous areas. They play an integral role in the provision of advice to the University on cultural competency development and on a range of equity matters affecting indigenous students and staff.
in 2010, Warawara continued to provide support for indigenous students through the provision of academic advice, induction, referral and pastoral care.
in 2010 there were 141 indigenous students enrolled across macquarie. The majority were in the Faculty of arts (70) and Faculty of Human Sciences (51). There were 123 undergraduate, 11 postgraduate coursework and seven higher degree research students.
Engagement with Indigenous school studentsin 2010 macquarie forged new relationships with schools with strong cohorts of indigenous students, to build student aspiration and increase awareness of educational opportunities and campus life. Schools include mackellar girls High School, Trinity grammar School and Bilgola Plateau Primary School.
Projects of note included:
• the Daruganora project
• the ‘away’ Program (museum of ancient Cultures)
• indigenous Science education Program (iSeP)
• maclean High School Science immersion Program
• Chifley College: Senior Science Day and Science expo
• November Science Show Visit for Canteen Creek students.
From education to employmentTo further the educational experience and employment opportunities for indigenous australians, the University offered indigenous traineeships and introduced a cadetship scheme for undergraduate students in 2010.
Social inclusion 31
Employment equity and diversityWomenThe University has been awarded waiving status by the federal equal opportunity for Women in the Workplace agency and is not required to report to them again until 2011.
in 2010, the overall representation of women on staff was 54 per cent (FTe 1207 women from a total of 2232 staff ), exceeding the 50 per cent government benchmark (academic women 42 per cent; professional 63 per cent).
The representation of women on University decision-making bodies in 2010 was: University executive 37 per cent (3f/8 members), University Council 42 per cent (8f/19 members) and academic Senate 33 per cent (12f/36 members).
Women’s representation in the academic workforce in 2010 was 42 per cent which is on par with the 2008 sector average (latest figures available). The representation of women at level D (associate Professor) was 37 per cent and at the most senior academic level e it was 26 per cent, both of which are above the 2008 sector averages (D 29 per cent and e 21 per cent).
The 2010 group Distribution index (gDi) for academic women’s employment across all levels decreased by 2 points during the reporting period and remains below the government benchmark, where values less than 100 indicate that women are concentrated at lower salary levels.
in 2010, 92 per cent of academic women in continuing positions worked full-time which was 2 per cent lower than 2009. There were no voluntary redundancies or forced separations of academic women in 2010. The overall rate at which academic women leave the macquarie workforce (44 per cent) has slowed by 6 per cent over the reporting period to be closer to their workforce participation rate of 42 per cent. in 2010, 41 per cent of separations were due to agreed contracts expiring and 48 per cent for other reasons such as resignations and retirements.
of the 45 senior academic positions in the University’s Concentrations of Research excellence, women continue to be recruited at a rate of ~30 per cent. The percentage of women applying to participate in the overseas Study Program in 2010 was 41 per cent (n=85, 35f ).
in 2010, academic women applied for promotion at a rate 9 per cent higher than their workforce participation rate (68 applications; 35f, 33m). applications rates for women were above their workforce participation rates at each level and success rates on par or above for each level.
• for level B the application rate was 58 per cent (12 apps total, 7 fem) and success rate 50 per cent (n=10, 5 fem)
• for level C the application rate was 58 per cent (24 apps total, 14 fem) and success rate 55 per cent (n=18,10 fem)
• for level D the application rate was 40 per cent (20 apps total, 8 fem) and success rate 42 per cent (n=12, 5 fem)
• For level e the application rate was 54.5 per cent (11 apps total, 6 fem) and success rate 66 per cent (n=6, 4 fem).
Women’s representation at level D (associate Professor) in 2010 was 37.4 per cent, an increase of 3 per cent over the reporting period and the highest representation rate over the past five years. For level e (Professor) the representation of women remained steady (26.3 per cent). it is still the highest over the past five years and is 5.3 per cent above the 2008 sector average.
in 2010, the representation of women on professional staff remains steady at 61.3 per cent. Women remain clustered in mid-range employment levels. in terms of pay equity, professional women employed in full-time and fractional roles received 94 per cent and 93 per cent of the average salary, respectively. The gDi for professional women’s employment during the reporting period was 93 which has dropped one point per year since 2008.
Women on professional staff remain under-represented in full-time ongoing positions (59 per cent in 2010) against their workforce participation rate of 63 per cent and remain significantly over-represented in part-time ongoing positions. The latter however has seen a 5 per cent reduction to 88.9 per cent during the 2010 reporting year.
in terms of contract employment, women in professional roles are significantly over-represented in fractional positions of 1–3 years duration (79 per cent in 2010) against their workforce participation rate. This is the highest rate of representation over the past five years.
During the reporting year, there was a reduction in the number of contracts being offered at macquarie (reduced from 365 to 335) without any significant change to the number of women employed in contract roles. The most significant change during the year was a 22 per cent reduction in women’s representation in part time contracts of more than three years duration.
The percentage of professional women leaving the University decreased by 5.5 per cent during the reporting year to reach 56.5 per cent.
The macquarie parental leave policy allows four weeks’ paid leave at the child’s birth (for birth mother and partner) plus 22 paid weeks for the primary carer. macquarie University
32 Macquarie University annual Report 2010
Social inclusion continued
recognises same sex parents and the adoption and fostering of children.
Indigenous Australians1
indigenous education and employment are a priority for macquarie University. it is of note that the statistical data on all equity groups (except gender) is gathered through a voluntary online process and as such, numerical evidence should be viewed with caution. For this reporting year there were five academic and six professional indigenous staff respondents, however it is known that in 2010 the University employed five academic staff and 16 professional indigenous staff.
The representation of aboriginal people and Torres Strait islanders remains below the government benchmark of 2.6 per cent (academic 0.8 per cent and professional 0.5 per cent). in 2010, the University commissioned an indigenous Review in order to identify educational and employment strategies for indigenous advancement at the University, and established an indigenous education Review Committee.
according to the voluntary data, the number of indigenous academics at macquarie has marginally decreased over the reporting period to 0.75 per cent. New appointments and promotion saw the distribution of academic staff improve to now be across a, B, C, and D academic levels in 2010. The University is yet to appoint an indigenous professor. in 2010 the new position of Deputy Director, Warawara was created as a level C appointment.
in terms of indigenous employment in professional roles, the voluntary data fails to reflect actual outcomes including the employment of five level 2 indigenous trainees during 2010 and the ongoing employment of three of them following successful completion of their traineeships.
The pay disparity for indigenous academic staff employed in full-time ongoing roles reduced by 6 per cent over the reporting period (from 77 per cent in 2009 to 83 per cent in 2010). For indigenous staff on part-time contracts, pay disparity improved by 1 per cent over the reporting period to 66 per cent.
Pay disparity for indigenous australians is being addressed through educational advancement and targeted employment initiatives.
in 2010, the University continued to support indigenous staff to attend conferences (national and international) and offered a range of opportunities, in order to enhance the careers of indigenous staff.
a highlight of the year was the introduction of the first macquarie indigenous Postgraduate Research Fellowship and the promotion to level B of the first recipient. in 2010 all indigenous professional staff employed in Warawara were undertaking undergraduate study (including an honours program). indigenous cadetships were introduced for undergraduate students who express interest in a university career with cadets employed as fixed term level 2 professional staff. macquarie aims to be considered an employer of choice by indigenous australians and to this end, continues to recognise, value and support indigenous australian culture, knowledges and achievements.
People with disabilitiesThe 2010 government benchmark for the representation of people with disabilities in employment is 12 per cent and for those requiring workplace adjustments 7 per cent.
in 2010 the representation of academic staff with disabilities at macquarie was 4.4 per cent and for professional staff 4.6 per cent. The representation of staff with disabilities requiring workplace adjustment was the same for both academic and professional staff at 1.1 per cent. it should be noted here that voluntary nature of the data and issues of disclosure of disabilities in the workplace may affect the accuracy of reporting. The University is taking steps to increase the employment of people with disabilities and to create an environment where staff and students feel comfortable disclosing.
according to the voluntary data, academic staff with disabilities are primarily employed at level C (Senior lecturer) and in mid range professional staff positions at level 6. it was pleasing to note that during the reporting year, four staff with disabilities were represented in academic level C and higher, and four professional staff had their positions reclassified to more senior levels 8 and 10.
There were no voluntary redundancies or forced separations from the University for academic staff with disabilities in 2010. For professional staff there was one voluntary redundancy, two separations as a result of contracts expiring and three other separations such as resignations or retirement.
in terms of the mode of employment for academic staff with disabilities, 85 per cent of those employed in continuing positions were full-time. academic staff with disabilities were over represented in part-time continuing employment (15 per cent in 2010 against 6 per cent for people without disabilities).
1 Data pertaining to designated equity groups (indigenous australians, staff with disabilities and staff from culturally and linguistically diverse backgrounds) is gathered through voluntary esurvey responses.

Social inclusion 33
The University recognises that employment equity for people with disabilities requires targeted interventions on a number of fronts and to this end, forged a new relationship in 2010 with CRS australia to provide work placements for people with disabilities. Raising the awareness of disability issues, rights and responsibilities is a key part of professional development and linked to the development of the University’s first Disability action Plan, due for completion in 2011. During the reporting year over 130 consultations (including focus groups) were conducted with staff and students with regards to six priority areas: Policy and Planning, learning and Teaching, the Virtual environment, the Built environment, employment and Professional Development and Campus life.
People from CALD2 backgroundsin 2010 the overall representation of staff from CalD backgrounds remained well above the 19 per cent government benchmark. according to the voluntary data, representation of CalD staff in the academic workforce was 25.6 per cent and representation among professional staff was 33 per cent, which is the highest in the past five years.
in 2010 the strongest representation of CalD academic staff was at level C (Senior lecturer). CalD academic staff were recruited from outside the University most significantly at the more junior levels (level a 30 per cent; level B 40 per cent). During the reporting period CalD staff were promoted to the more senior levels of Senior lecturer (C) and associate Professor (D) and Professor (e).
There were no voluntary redundancies or forced separations from the University for CalD academic staff during 2010. CalD academic staff were represented in continuing full-time and part-time roles at similar rates as for all staff. according to the voluntary data, CalD academic staff are over represented by 10 per cent in contract employment of less than one year, and under represented in contracts of more than three years duration.
Pay equity for CalD staff during the reporting period was 102 per cent for those in full-time continuing roles and 106 per cent for those in continuing part-time positions.
Employment equity goals for 2011• implement and promote employment equity and
diversity priorities in line with the University’s planning documents including the eo Plan and eo management Plan for Women
• finalise the five year Disability action Plan and work with staff and students to develop local area operational plans and strategies which promote and support employment (including the CRS placements)
• strengthen indigenous employment through the trainee and cadetship programs, implementation of the findings from the indigenous education Review and the continued development of a diverse and culturally competent University workforce
• in consultation with faculties and offices, implement local equity and diversity action plans to inform local workforce strategic planning
• continue to work with Human Resources on succession planning, research and management leadership strategies to ensure that equity and diversity principle are embedded in strategies and operational responses
• continuously improve information and professional development on legislation, rights and responsibilities around all forms of discrimination and harassment for staff and students.
2 Culturally and linguistically Diverse

34 Macquarie University annual Report 2010
Social inclusion continued
EEO group representation (2006–2010) – benchmark comparison at 31 March 20101
Professional staff
2006 2007 2008 2009 2010Government benchmark
Women2 63% 64% 63% 61% 62.9% 50%aboriginal people and Torres Strait islanders3 2.3% 1.6% 0.9% 0.5% 0.5% 2.6%
People whose first language was not english3 26% 27% 27% 32% 32.2% 19%
People with a disability3 7.0% 7% 6% 5% 4.6% 12%People with a disability requiring work-related adjustment3 1.9% 1.3% 1.0% 0.7% 1.1% 7.0%
Academic staff
2006 2007 2008 2009 2010Government benchmark
Women2 44% 43% 43% 42% 42.1% 50%aboriginal people and Torres Strait islanders3 0.7% 0.9% 0.9% 0.9% 0.8% 2.6%
People whose first language was not english3 24% 23% 23% 26% 25.6% 19%
People with a disability3 6.0% 6% 5% 5% 4.4% 12%People with a disability requiring work-related adjustment3 1.4% 1.6% 0.8% 0.8% 1.1% 7.0%
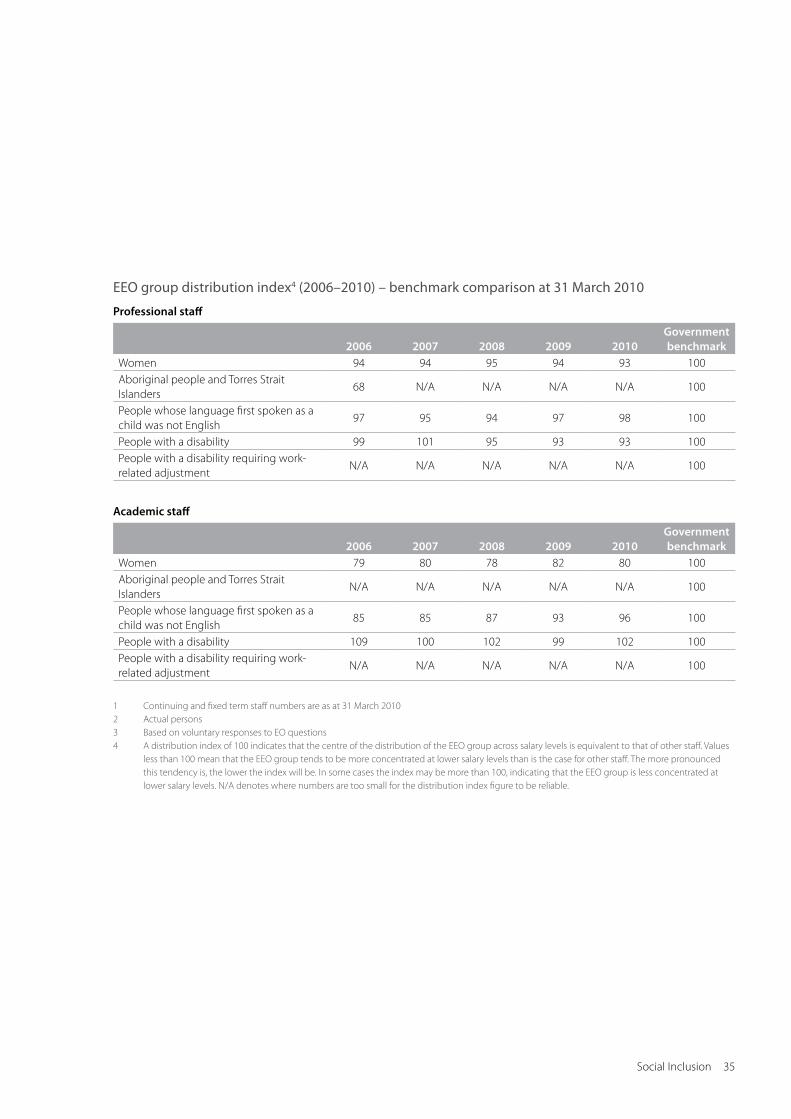
Social inclusion 35
EEO group distribution index4 (2006–2010) – benchmark comparison at 31 March 2010
Professional staff
2006 2007 2008 2009 2010Government benchmark
Women 94 94 95 94 93 100aboriginal people and Torres Strait islanders
68 N/a N/a N/a N/a 100
People whose language first spoken as a child was not english
97 95 94 97 98 100
People with a disability 99 101 95 93 93 100People with a disability requiring work-related adjustment
N/a N/a N/a N/a N/a 100
Academic staff
2006 2007 2008 2009 2010Government benchmark
Women 79 80 78 82 80 100aboriginal people and Torres Strait islanders
N/a N/a N/a N/a N/a 100
People whose language first spoken as a child was not english
85 85 87 93 96 100
People with a disability 109 100 102 99 102 100People with a disability requiring work-related adjustment
N/a N/a N/a N/a N/a 100
1 Continuing and fixed term staff numbers are as at 31 march 20102 actual persons3 Based on voluntary responses to eo questions4 a distribution index of 100 indicates that the centre of the distribution of the eeo group across salary levels is equivalent to that of other staff. Values
less than 100 mean that the eeo group tends to be more concentrated at lower salary levels than is the case for other staff. The more pronounced this tendency is, the lower the index will be. in some cases the index may be more than 100, indicating that the eeo group is less concentrated at lower salary levels. N/a denotes where numbers are too small for the distribution index figure to be reliable.
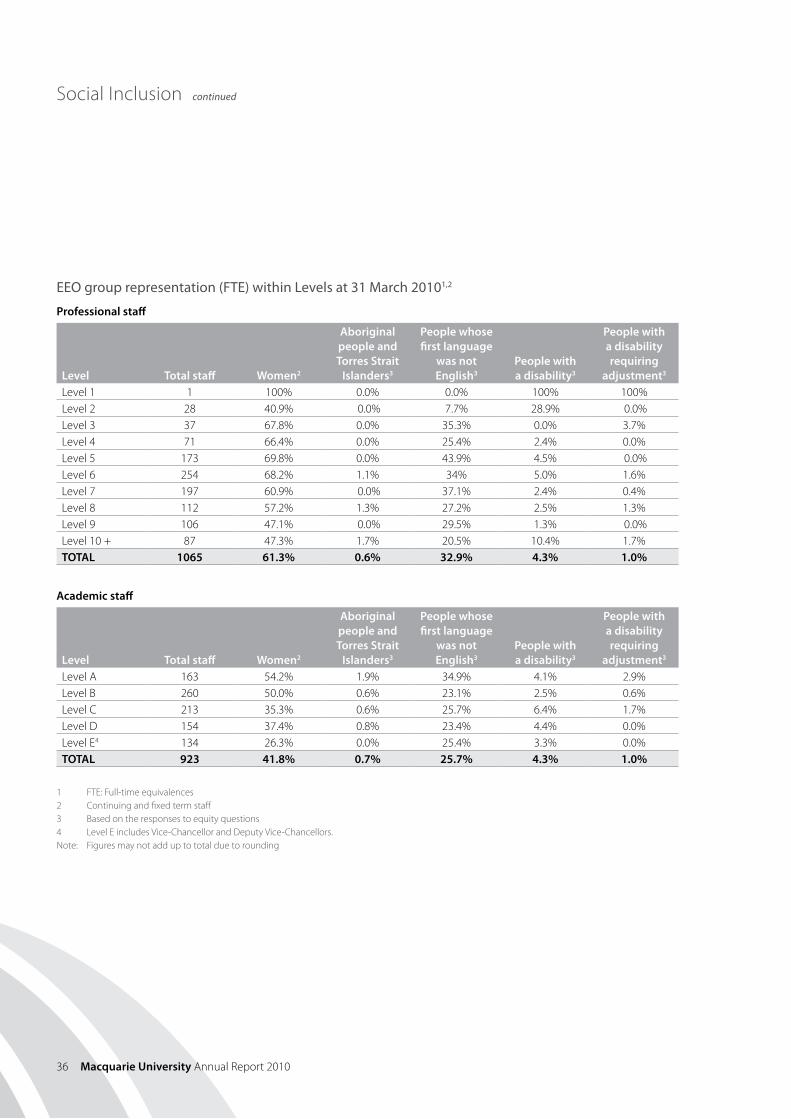
36 Macquarie University annual Report 2010
Social inclusion continued
EEO group representation (FTE) within Levels at 31 March 20101,2
Professional staff
Level Total staff Women2
Aboriginal people and Torres Strait
Islanders3
People whose first language
was not English3
People with a disability3
People with a disability requiring
adjustment3
level 1 1 100% 0.0% 0.0% 100% 100%level 2 28 40.9% 0.0% 7.7% 28.9% 0.0%level 3 37 67.8% 0.0% 35.3% 0.0% 3.7% level 4 71 66.4% 0.0% 25.4% 2.4% 0.0% level 5 173 69.8% 0.0% 43.9% 4.5% 0.0%level 6 254 68.2% 1.1% 34% 5.0% 1.6%level 7 197 60.9% 0.0% 37.1% 2.4% 0.4%level 8 112 57.2% 1.3% 27.2% 2.5% 1.3% level 9 106 47.1% 0.0% 29.5% 1.3% 0.0%level 10 + 87 47.3% 1.7% 20.5% 10.4% 1.7%TOTAL 1065 61.3% 0.6% 32.9% 4.3% 1.0%
Academic staff
Level Total staff Women2
Aboriginal people and Torres Strait
Islanders3
People whose first language
was not English3
People with a disability3
People with a disability requiring
adjustment3
level a 163 54.2% 1.9% 34.9% 4.1% 2.9%level B 260 50.0% 0.6% 23.1% 2.5% 0.6%level C 213 35.3% 0.6% 25.7% 6.4% 1.7%level D 154 37.4% 0.8% 23.4% 4.4% 0.0% level e4 134 26.3% 0.0% 25.4% 3.3% 0.0%TOTAL 923 41.8% 0.7% 25.7% 4.3% 1.0%
1 FTe: Full-time equivalences2 Continuing and fixed term staff3 Based on the responses to equity questions4 level e includes Vice-Chancellor and Deputy Vice-Chancellors.Note: Figures may not add up to total due to rounding
operations 37
Operations
Informatics2010 saw an invigorated and reorganised macquarie informatics structure replace the former information Technology Services. informatics incorporates macquarie analytics and macquarie memory, and reports to Chief information officer marc Bailey. its mission is to lift investment focus from infrastructure to innovation.
The major achievement in 2010 was improved sentiment about information technology and improved confidence in people, leadership and future potential. This was evidenced anecdotally and reputationally by year-on-year data point shifts in the official yourSay survey. The turnaround is by no means complete, but it has induced a significant shift in mindset, attitude and spirit of informatics staff.
an initially conservative approach to spending and hiring was adopted, especially during the managing Change process in the first half of the year. The revised structure is now in place; an extremely cohesive and strong management team now exists and is extending teambuilding and reform within each major group.
During the year informatics:
• delivered to opex and capex budgets, favoring project completion and operational robustness over quantity of projects as agreed with the Coo
• introduced equitable resource pricing
• reduced outstanding audit action items
• improved operational culture including reduced downtime and increased reliability
• arrested credential proliferation and made significant progress on identity management
• developed a refined TCo model for capex funding in 2011, including recognition of oncosts
• united local and central iT
• won considerable new business from historically isolated controlled entities mgSm, aSam, aFC and SiBT.
OneNet – wired, wireless and voice network technologymacquarie University completed design, deployment and delivery of oneNet, its state-of-the-art total replacement of wired, wireless and voice network infrastructure in 2010.
WiredThree years, 5062km of cabling and 20,256 individual connections later, an $8.5 million wired network replacement project was completed in June 2010 within its 2009 re-baselined cost estimate. The network delivers 10x speed increase at the destkop, 800x increase in the data centre
with a further 100x of untapped future capacity without redesign. Unplanned downtime has decreased by 75 per cent and is expected to further improve in 2011. oneNet is well positioned to take advantages of federal interconnection with the National Broadband Network, National eResearch Tools and Resources and Research Data Storage initiatives.
WirelessConsumer demand continues to drive increased coverage, density and performance in WiFi network deployment. an investment of $505,000 in 2010 enables 540 access points to deliver connectivity to 90 per cent of campus building interiors and 25 per cent of exterior spaces. Demarcation between staff and student coverage was eliminated, access simplified and security increased resulting in adoption increases week-on-week.
VoiceWe retired a 24-year old legacy PaBX and replaced 4500 telephones in favour of a state of the art communication system leveraging Voice over internet Protocol (VoiP) technology, which minimises costs and maximises flexibility. This residual $483,000 project was completed within its forecast time and expenditure envelope.
Gmailall staff email accounts were transferred to gmail, including the transition of up to a decade of historical archives. Within a single year, approximately 20,000 gigabytes of email was transplanted from over 40 legacy system islands. The University is the first amongst its australian competitors to offer a single world-class google cloud based email system. Two controlled entities chose to wait for mainstream implementation success before committing to transition in 2011.
OneID: simplified, safer, single access directoryTen critical systems were connected to oneiD, with many more planned for 2011. The benefit to staff and students is a vastly simplified security environment, fewer credentials to remember, reduced red tape to gain access and functional gains. at the same time as expanding the range of connected products, population reach was extended by issuing oneiDs to all mgSm, aSam and access macquarie personnel. oneiD is now entrenched in the vernacular, with new systems and existing organisational groups now demanding compatibility.
Help desk, field support and telephonyinformatics delivery continued to offer a popular and well regarded level of high touch customer service in its three areas of responsibility – help desk, field support and
38 Macquarie University annual Report 2010
operations continued
telephony. most significantly, deployment of a new unified call, request and issue tracking system known as oneHelp provides the ability to pool resources, transfer tickets/problems, offering accountability and self-service. all four faculties and many offices have now opted in by choice.
Core technology improvementsinvestment in the core systems that manage University student, staff and financial information was maintained. During 2010 major upgrades were carried out in student management, human resources and finance systems ensuring each is current and supported. Benefits from this work include:
• functionality to support the new curriculum
• improved capacity management for high demand periods
• compliance with government regulatory and reporting requirements.
Collaborationintensive efforts were made to improve cooperation and coordination of projects needing iT contribution within the University. Notable outcomes included:
• significantly improved relations with all faculty iT groups and controlled entity iT groups
• integration of WebCentral, the embodiment of the marketing led University Web Strategy
• reverse engineering and robustness injection to legacy web properties and introduction of wiki social media technology
• establishment of a coherent digital signage strategy and implementation known as oneVision
• establishment of a Datamart Committee to focus on cross-departmental data correlation
• delivery of oneForge; central, modern technology to secure and manage software intellectual property, improve development productivity and reduce risk.
2011 in anticipationgreater collaboration and synergy will continue to build on the goodwill and cooperation fostered in 2010. The strategy, while informatics continues its reformation, is to transition more commoditised products and services centrally, while leaving specialty services in-faculty.
investment priorities are shifting from outstanding facilities towards operational excellence, reflecting a repositioning of informatics in the value chain of teaching, learning and research within the University. a $11.6 million portfolio of 56 projects is planned for 2011, with significant investment in:
• student computer laboratory capacity expansion over the internet
• sustainability initiatives including reassessment of printing, improved personal computing procurement and intention to measure the campus iT carbon footprint
• institutional operational data and actionable insights delivered as a trusted product known as Datamart
• document, records and workflow automation at campus scale through Truth.mq.edu.au
• collaboration with the learning and Teaching Centre to integrate strategic new learning management technology
• collaboration with Student Business Systems and Services to enhance customer relationship management for students and staff alike
• an emergency broadcast notification system harnessing existing channels like digital signs, text messaging, computer displays and public announcement audio systems
• a shift in infrastructure strategy from disaster recovery to business continuity, maximising both uptime and performance.

PaU
l W
Rig
HT
operations 39
Freedom of Information During the first half of 2010 from 1 January 2010 to 30 June 2010 the University was subject to the Freedom of Information Act 1989 (the Foi act) and received seven Foi applications for access to documents.
in october 2010 macquarie memory (formerly Records and archives Services) was contacted by the Therapeutic goods administration as part of a consultation process under the Commonwealth Freedom of information act 1982. The University responded to the Therapeutic goods administration within statutory timeframes.
Under the Freedom of Information Act 1989 (the Foi act), members of the public, including staff and students of the University, had the right to obtain access to documents containing personal information or information concerning the functioning or activities of government agencies and public authorities. The University is a statutory authority and fell under the jurisdiction of the Foi act.
in complying with the Foi act the University adopted a policy of open access to information. Staff members who wished to view their personal files could arrange access by contacting the office of Human Resources. macquarie memory is responsible for vital records, student files, central administrative files and the University archives access is usually granted to bona fide researchers, although some restrictions apply.
a freedom of information application had to be made for access to material that the University considered confidential or otherwise exempt under the Foi act. The application fee for a freedom of information request was $30, and the processing charge was $30 per hour, although 20 hours’ processing was included in the application fee where the information relates to the applicant’s personal affairs.
The University Secretary was responsible for Freedom of information matters. macquarie memory supported the University’s Freedom of information operations through the coordination of all applications and associated recordkeeping requirements.
The statistical reports that follow correspond to appendix B of the New South Wales Foi manual – a joint publication of NSW Department of Premier and Cabinet and the NSW ombudsman – and detail Foi activity for both 2009 and the first half of 2010.
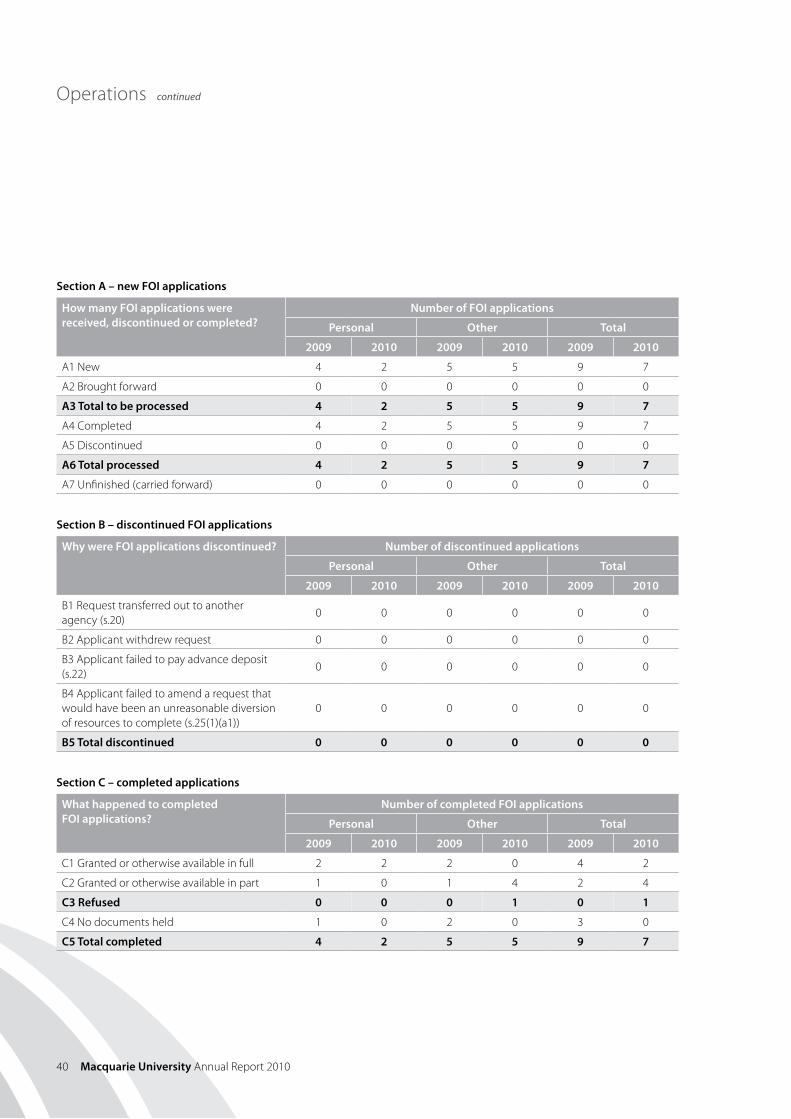
40 Macquarie University annual Report 2010
operations continued
Section A – new FOI applications
How many FOI applications were received, discontinued or completed?
Number of FOI applications
Personal Other Total
2009 2010 2009 2010 2009 2010
a1 New 4 2 5 5 9 7
a2 Brought forward 0 0 0 0 0 0
A3 Total to be processed 4 2 5 5 9 7
a4 Completed 4 2 5 5 9 7
a5 Discontinued 0 0 0 0 0 0
A6 Total processed 4 2 5 5 9 7
a7 Unfinished (carried forward) 0 0 0 0 0 0
Section B – discontinued FOI applications
Why were FOI applications discontinued? Number of discontinued applications
Personal Other Total
2009 2010 2009 2010 2009 2010
B1 Request transferred out to another agency (s.20)
0 0 0 0 0 0
B2 applicant withdrew request 0 0 0 0 0 0
B3 applicant failed to pay advance deposit (s.22)
0 0 0 0 0 0
B4 applicant failed to amend a request that would have been an unreasonable diversion of resources to complete (s.25(1)(a1))
0 0 0 0 0 0
B5 Total discontinued 0 0 0 0 0 0
Section C – completed applications
What happened to completed FOI applications?
Number of completed FOI applications
Personal Other Total
2009 2010 2009 2010 2009 2010
C1 granted or otherwise available in full 2 2 2 0 4 2
C2 granted or otherwise available in part 1 0 1 4 2 4
C3 Refused 0 0 0 1 0 1
C4 No documents held 1 0 2 0 3 0
C5 Total completed 4 2 5 5 9 7
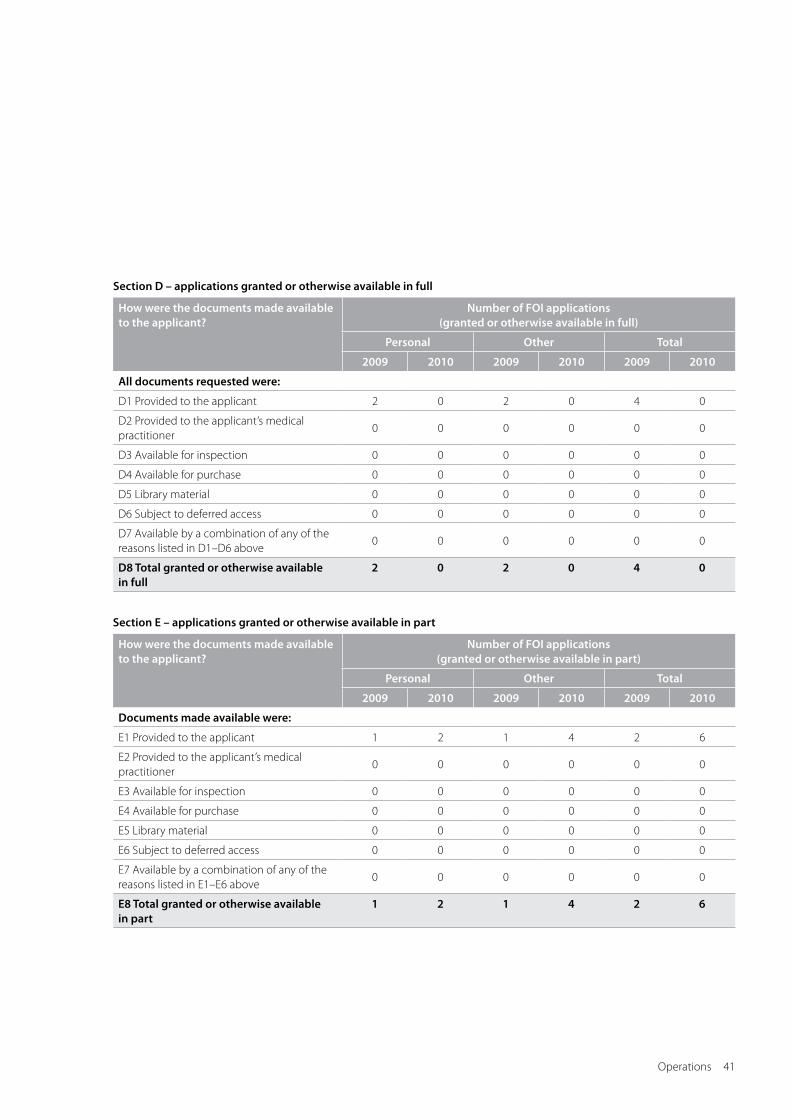
operations 41
Section D – applications granted or otherwise available in full
How were the documents made available to the applicant?
Number of FOI applications (granted or otherwise available in full)
Personal Other Total
2009 2010 2009 2010 2009 2010
All documents requested were:
D1 Provided to the applicant 2 0 2 0 4 0
D2 Provided to the applicant’s medical practitioner
0 0 0 0 0 0
D3 available for inspection 0 0 0 0 0 0
D4 available for purchase 0 0 0 0 0 0
D5 library material 0 0 0 0 0 0
D6 Subject to deferred access 0 0 0 0 0 0
D7 available by a combination of any of the reasons listed in D1–D6 above
0 0 0 0 0 0
D8 Total granted or otherwise available in full
2 0 2 0 4 0
Section E – applications granted or otherwise available in part
How were the documents made available to the applicant?
Number of FOI applications (granted or otherwise available in part)
Personal Other Total
2009 2010 2009 2010 2009 2010
Documents made available were:
e1 Provided to the applicant 1 2 1 4 2 6
e2 Provided to the applicant’s medical practitioner
0 0 0 0 0 0
e3 available for inspection 0 0 0 0 0 0
e4 available for purchase 0 0 0 0 0 0
e5 library material 0 0 0 0 0 0
e6 Subject to deferred access 0 0 0 0 0 0
e7 available by a combination of any of the reasons listed in e1–e6 above
0 0 0 0 0 0
E8 Total granted or otherwise available in part
1 2 1 4 2 6

42 Macquarie University annual Report 2010
operations continued
Section F – refused FOI applications
Why was access to the documents refused?
Number of refused FOI applications
Personal Other Total
2009 2010 2009 2010 2009 2010
F1 exempt 0 0 0 0 0 0
F2 Deemed refusal 0 0 0 0 0 0
F3 Total refused 0 0 0 0 0 0
Section G – exempt documents
Why were the documents classified as exempt? (identify one reason only)
Number of FOI applications (granted or otherwise available in part only)
Personal Other Total
2009 2010 2009 2010 2009 2010
Restricted documents:
g1 Cabinet documents (Clause 1) 0 0 0 0 0 0
g2 executive Council documents (Clause 2) 0 0 0 0 0 0
g3 Documents affecting law enforcement and public safety (Clause 4)
0 0 0 0 0 0
g4 Documents affecting counter terrorism measures (Clause 4a)
0 0 0 0 0 0
Documents requiring consultation:
g5 Documents affecting intergovernmental relations (Clause 5)
0 0 0 0 0 0
g6 Documents affecting personal affairs (Clause 6)
0 2 0 3 0 5
g7 Documents affecting business affairs (Clause 7)
0 0 0 0 0 0
g8 Documents affecting the conduct of research (Clause 8)
0 0 0 0 0 0
Documents otherwise exempt:
g9 Schedule 2 exempt agency 0 0 0 0 0 0
g10 Documents containing information confidential to olympic Committees (Clause 22)
0 0 0 0 0 0
g11 Documents relating to threatened species, aboriginal objects or aboriginal places (Clause 23)
0 0 0 0 0 0
g12 Documents relating to threatened species conservation (Clause 24)
0 0 0 0 0 0
g13 Plans of management containing information of aboriginal significance (Clause 25)
0 0 0 0 0 0
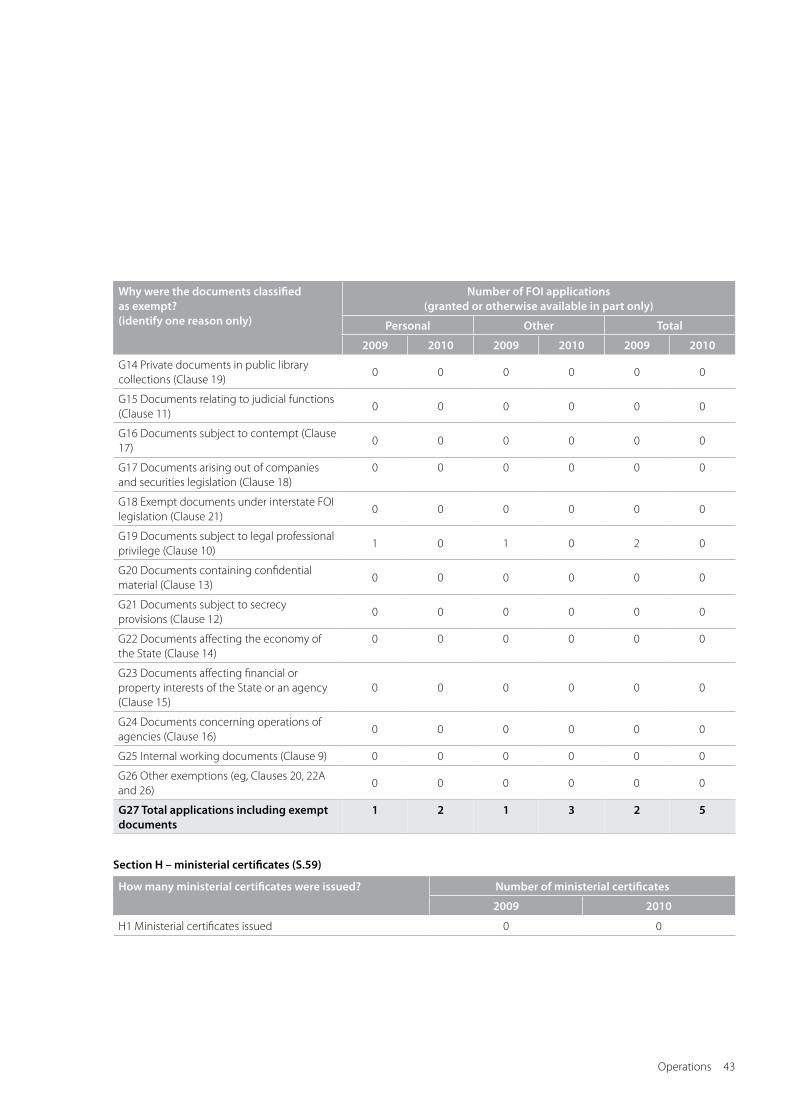
operations 43
Why were the documents classified as exempt? (identify one reason only)
Number of FOI applications (granted or otherwise available in part only)
Personal Other Total
2009 2010 2009 2010 2009 2010
g14 Private documents in public library collections (Clause 19)
0 0 0 0 0 0
g15 Documents relating to judicial functions (Clause 11)
0 0 0 0 0 0
g16 Documents subject to contempt (Clause 17)
0 0 0 0 0 0
g17 Documents arising out of companies and securities legislation (Clause 18)
0 0 0 0 0 0
g18 exempt documents under interstate Foi legislation (Clause 21)
0 0 0 0 0 0
g19 Documents subject to legal professional privilege (Clause 10)
1 0 1 0 2 0
g20 Documents containing confidential material (Clause 13)
0 0 0 0 0 0
g21 Documents subject to secrecy provisions (Clause 12)
0 0 0 0 0 0
g22 Documents affecting the economy of the State (Clause 14)
0 0 0 0 0 0
g23 Documents affecting financial or property interests of the State or an agency (Clause 15)
0 0 0 0 0 0
g24 Documents concerning operations of agencies (Clause 16)
0 0 0 0 0 0
g25 internal working documents (Clause 9) 0 0 0 0 0 0
g26 other exemptions (eg, Clauses 20, 22a and 26)
0 0 0 0 0 0
G27 Total applications including exempt documents
1 2 1 3 2 5
Section H – ministerial certificates (S.59)
How many ministerial certificates were issued? Number of ministerial certificates
2009 2010
H1 ministerial certificates issued 0 0
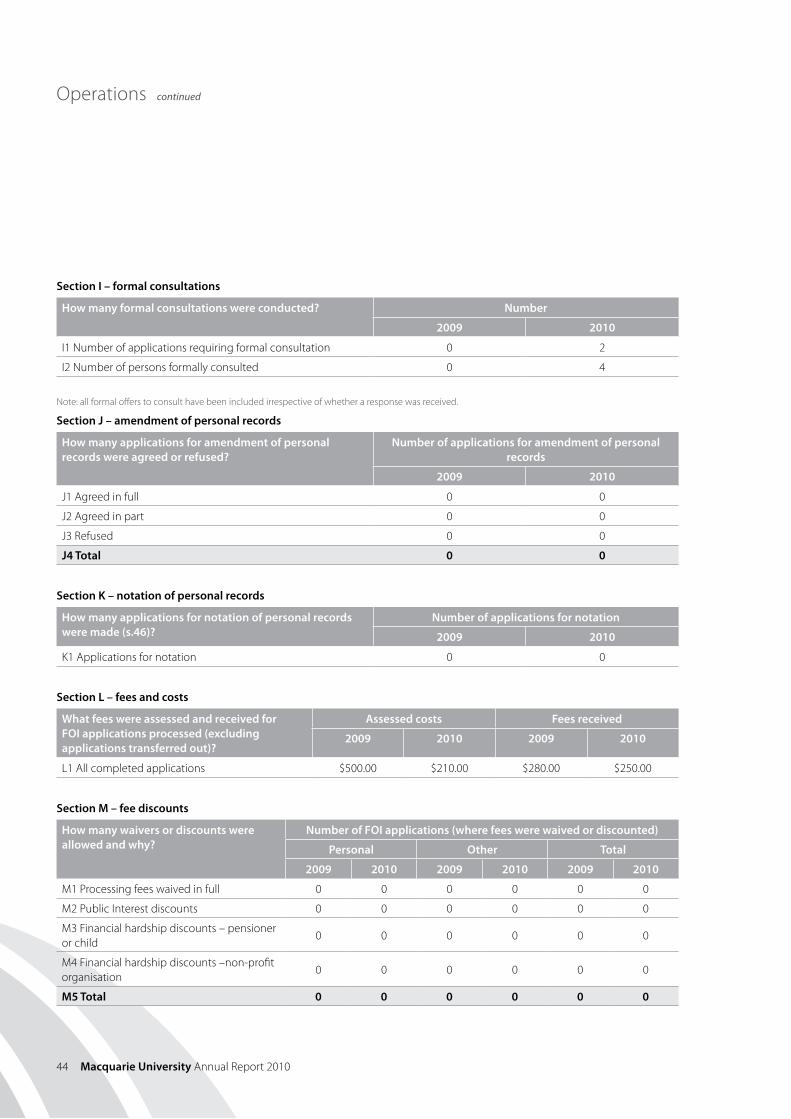
44 Macquarie University annual Report 2010
operations continued
Section I – formal consultations
How many formal consultations were conducted? Number
2009 2010
i1 Number of applications requiring formal consultation 0 2
i2 Number of persons formally consulted 0 4
Note: all formal offers to consult have been included irrespective of whether a response was received.
Section J – amendment of personal records
How many applications for amendment of personal records were agreed or refused?
Number of applications for amendment of personal records
2009 2010
J1 agreed in full 0 0
J2 agreed in part 0 0
J3 Refused 0 0
J4 Total 0 0
Section K – notation of personal records
How many applications for notation of personal records were made (s.46)?
Number of applications for notation
2009 2010
K1 applications for notation 0 0
Section L – fees and costs
What fees were assessed and received for FOI applications processed (excluding applications transferred out)?
Assessed costs Fees received
2009 2010 2009 2010
l1 all completed applications $500.00 $210.00 $280.00 $250.00
Section M – fee discounts
How many waivers or discounts were allowed and why?
Number of FOI applications (where fees were waived or discounted)
Personal Other Total
2009 2010 2009 2010 2009 2010
m1 Processing fees waived in full 0 0 0 0 0 0
m2 Public interest discounts 0 0 0 0 0 0
m3 Financial hardship discounts – pensioner or child
0 0 0 0 0 0
m4 Financial hardship discounts –non-profit organisation
0 0 0 0 0 0
M5 Total 0 0 0 0 0 0

operations 45
Section N – fee refunds
How many fee refunds were granted as a result of significant correction of personal records?
Number of refunds
2009 2010
N1 Number of fee refunds granted as a result of significant correction or personal records
0 0
Section O – days taken to complete request
How long did it take to process completed applications? (Note: calendar days)
Number of FOI applications
Personal Other Total
2009 2010 2009 2010 2009 2010
o1 0–21 days – statutory determination period
3 1 5 5 8 6
o2 22–35 days – extended statutory determination period for consultation or retrieval of archived records (S.59B)
0 1 0 0 0 1
o3 over 21 days – deemed refusal where no extended determination period applies
1 0 0 0 1 0
o4 over 35 days – deemed refusal where extended determination period applies
0 0 0 0 0 0
O5 Total 4 2 5 5 9 7
Section P – processing time: hours
How long did it take to process completed applications?
Number of completed FOI applications
Personal Other Total
2009 2010 2009 2010 2009 2010
P1 0–10 hours 0 0 0 0 0 0
P2 11–20 hours 1 0 2 0 3 0
P3 21–40 hours 1 2 1 5 2 7
P4 over 40 hours 2 0 2 0 4 0
P5 Total 4 2 5 5 9 7
Section Q – number of reviews
How many reviews were finalised? Number of completed reviews
2009 2010
Q1 internal reviews 1 0
Q2 ombudsman reviews 1 0
Q3 aDT reviews 0 0
Q4 ombudsman review of Foi act 0 0
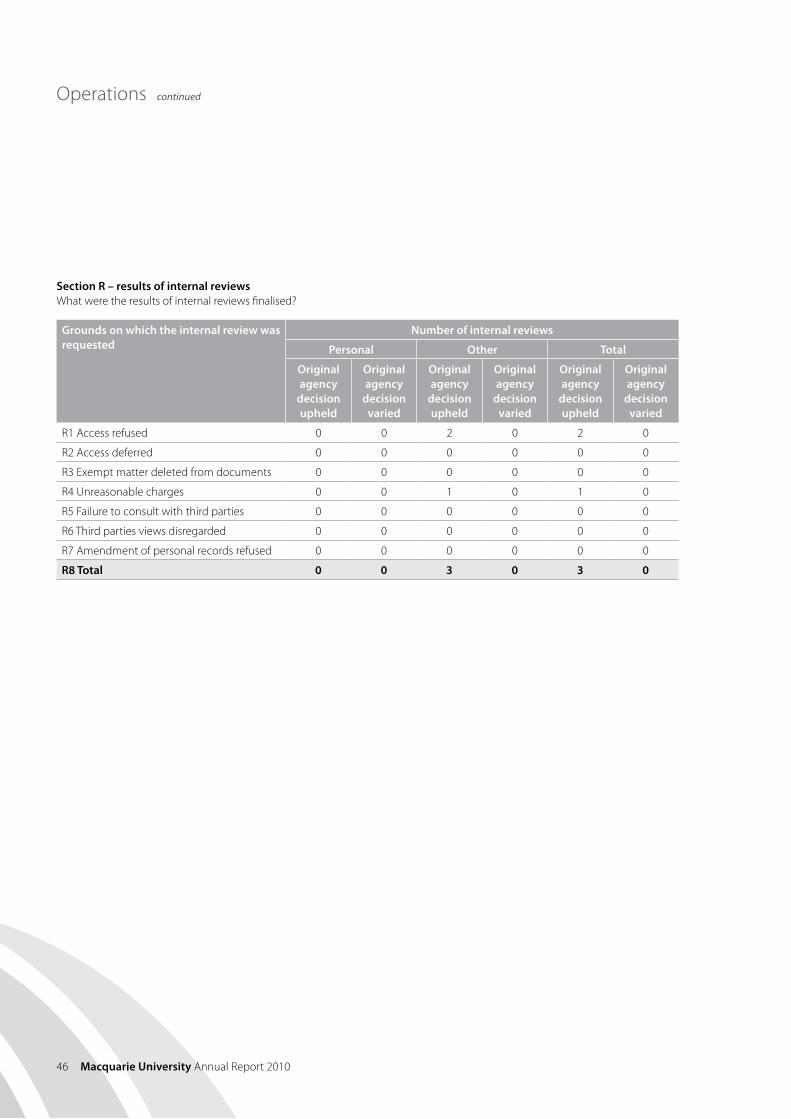
46 Macquarie University annual Report 2010
operations continued
Section R – results of internal reviewsWhat were the results of internal reviews finalised?
Grounds on which the internal review was requested
Number of internal reviews
Personal Other Total
Original agency
decision upheld
Original agency
decision varied
Original agency
decision upheld
Original agency
decision varied
Original agency
decision upheld
Original agency
decision varied
R1 access refused 0 0 2 0 2 0
R2 access deferred 0 0 0 0 0 0
R3 exempt matter deleted from documents 0 0 0 0 0 0
R4 Unreasonable charges 0 0 1 0 1 0
R5 Failure to consult with third parties 0 0 0 0 0 0
R6 Third parties views disregarded 0 0 0 0 0 0
R7 amendment of personal records refused 0 0 0 0 0 0
R8 Total 0 0 3 0 3 0
Ho
lim
ag
e
operations 47
Government Information (Public Access)From 1 July 2010 the new Government Information (Public Access) Act 2009 (giPa act) replaced the Freedom of Information Act 1989 (NSW).
access to information held by the University was available by either searching the University’s website or by contacting the University. The University would then assess and decide whether the information requested is readily available, could be disclosed as part of a proactive release of information, could be disclosed through informal release, or that a formal access application was required. The application fee for a formal giPa act application was $30.
During the period 1 July 2010 to 31 December 2010 macquarie University received seven formal access applications for information. all of these applications were determined within statutory timeframes. in one instance the applicant sought a review of the University’s decision by the information Commissioner. This review had not been determined by 31 December 2010.
assistance for any matter concerning the giPa act is available from:
The Right to information officer Building e11a Room 155 macquarie University Sydney NSW 2109 T: +61 2 9850 1561 e: [email protected]
The statistical reports that follow correspond to schedule 2 of the Government Information (Public Access) Amendment Regulation 2010.

48 Macquarie University annual Report 2010
operations continued
Table A: Number of applications by type of applicant and outcome*
Access granted
in full
Access granted in part
Access refused in full
Information not held
Information already
available
Refuse to deal with
application
Refuse to confirm/
deny whether
information is held
Application withdrawn
media 0 0 0 1 0 0 0 0members of Parliament
0 0 0 0 2 0 0 0
Private sector business
0 0 0 0 0 0 0 0
Not for profit organisations or community groups
0 0 1 0 0 0 0 0
members of the public (application by legal representative)
0 0 0 0 0 0 0 0
members of the public (other)
2 0 1 0 0 0 0 0
* more than one decision can be made in respect of a particular access application. if so, a recording must be made in relation to each such decision. This also applies to table B.
Table B: Number of applications by type of application and outcome
Access granted
in full
Access granted in part
Access refused in full
Information not held
Information already
available
Refuse to deal with
application
Refuse to confirm/
deny whether
information is held
Application withdrawn
Personal information applications*
2 0 1 0 0 0 0 0
access applications (other than personal information applications)
0 0 1 1 2 0 0 0
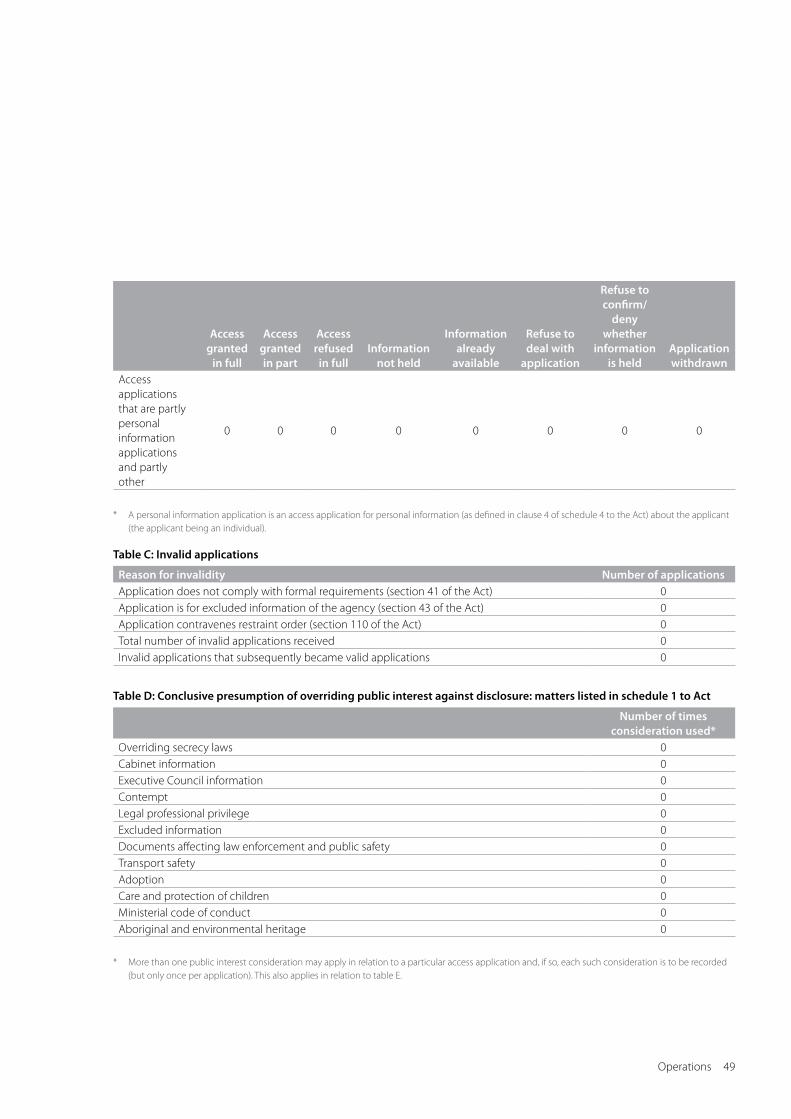
operations 49
Access granted
in full
Access granted in part
Access refused in full
Information not held
Information already
available
Refuse to deal with
application
Refuse to confirm/
deny whether
information is held
Application withdrawn
access applications that are partly personal information applications and partly other
0 0 0 0 0 0 0 0
* a personal information application is an access application for personal information (as defined in clause 4 of schedule 4 to the act) about the applicant (the applicant being an individual).
Table C: Invalid applications
Reason for invalidity Number of applicationsapplication does not comply with formal requirements (section 41 of the act) 0application is for excluded information of the agency (section 43 of the act) 0application contravenes restraint order (section 110 of the act) 0Total number of invalid applications received 0invalid applications that subsequently became valid applications 0
Table D: Conclusive presumption of overriding public interest against disclosure: matters listed in schedule 1 to Act
Number of times consideration used*
overriding secrecy laws 0Cabinet information 0executive Council information 0Contempt 0legal professional privilege 0excluded information 0Documents affecting law enforcement and public safety 0Transport safety 0adoption 0Care and protection of children 0ministerial code of conduct 0aboriginal and environmental heritage 0
* more than one public interest consideration may apply in relation to a particular access application and, if so, each such consideration is to be recorded (but only once per application). This also applies in relation to table e.

50 Macquarie University annual Report 2010
operations continued
Table E: Other public interest considerations against disclosure: matters listed in table to section 14 of Act
Number of occasions when application not successful
Responsible and effective government 0law enforcement and security 0individual rights, judicial processes and natural justice 0Business interests of agencies and other persons 1environment, culture, economy and general matters 0Secrecy provisions 0exempt documents under interstate Freedom of information legislation 0
Table F: Timeliness
Number of applicationsDecided within the statutory timeframe (20 days plus any extensions) 7Decided after 35 days (by agreement with applicant) 0Not decided within time (deemed refusal) 0Total 7
Table G: Number of applications reviewed under part 5 of the Act (by type of review and outcome)
Decision varied Decision upheld Totalinternal review 0 0 0Review by information Commissioner* 0 0 0internal review following recommendation under section 93 of act
0 0 0
Review by aDT 0 0 0Total 0 0 0
* The information Commissioner does not have the authority to vary decisions, but can make recommendations to the original decision maker. The data in this case indicates that a recommendation to vary or uphold the original decision has been made by the information Commissioner.
Table H: Applications for review under part 5 of the Act (by type of applicant)
Number of applications for review
applications by access applicants 0applications by persons to whom information the subject of access application relates (see section 54 of the act)
0
operations 51
InsuranceThe University ensures that a cost effective insurance program that sufficiently protects the University’s investment in assets and protects against liabilities arising from the conduct of its business activities is in place at all times. Following an exhaustive tendering process marsh limited was appointed as the University’s insurance brokers for a three year term in July 2010. The open market approach adopted by the University resulted in the University securing the best available terms from its existing insurer.
The additional insurance requirements in respect of the macquarie University Hospital have been examined by Willis australia ltd and were in place prior to the commencement of operations of the hospital.
The University group has been accepted by New South Wales WorkCover as a participant in the Retro Paid loss Premium model in respect of its Worker’s Compensation insurance requirements. This model is driven largely by claims costs and provides incentives for employers with strong performance in occupational health and safety, injury management and return to work. The University expects substantial savings on premium cost provided that claims costs are maintained at current levels.
Internal audit and risk managementThe internal audit and risk management functions of the University are overseen by the Council’s audit and Risk Committee and undertaken by Deloitte Touche Tohmatsu (Deloittes).
The University re-appointed Deloittes to the internal audit and risk management function in 2009, following an exhaustive tendering process conducted by the University’s audit and Risk Committee for the 2010–2012 period. The internal audit and risk management function is primarily concerned with evaluating the accuracy and effectiveness of internal controls and assessing risks which may impact on the University’s ability to achieve its objectives.
a new three year strategic internal audit and risk management plan for 2010–2012 was developed following a high-level business risk assessment of the University’s operations in conjunction with management. a consultative process to arrive at the corporate risk register was completed. The plan and corporate risk register were approved by the University’s audit and Risk Committee.
in addition to the business risk assessment, internal audits undertaken in 2010 involved assessments of internal controls and associated risks and compliance with University policies and procedures and government guidelines in the following areas:
• capital projects
• finance, payroll and administrative systems used in subsidiary entities
• gap analysis of internal audit framework TPP09-05
• international student recruitment
• travel, including corporate credit card use.
audit and assurance activities resulted in identification of areas where there was opportunity for improvement and/or enhancement of existing processes and controls. Following discussion and agreement with management, internal audit reports were submitted to key stakeholders and reported to the audit and Risk Committee. The status of significant and important risk issues outstanding are monitored by the audit and Risk Committee.
Credit card certificationDuring the 2010 financial year, credit card use was in accordance with both the University’s credit card policy and purchasing policy. These policies are based on the requirements of the New South Wales Treasury.
Credit card use within the University is largely limited to claimable work related travel expenses and accommodation (excluding international airfares) and for minor consumable expenses where the use of credit cards is a more efficient process.
officers are required to sign a declaration that their obligations and duties in relation to the use of credit cards have been explained to them before a credit card is issued. officers issued with a credit card can review their expenses on a daily basis via the University’s online expense management system. on a monthly basis officers are required to verify and certify that expenses were for official University business. at this time original tax invoices must be provided. acquittals are examined and authorised by a more senior officer who has appropriate delegation. The University follows a strict process of warning and cancellation of credit cards where they are used outside policy or not acquitted in a timely manner.
Payment of accountsThe University’s term of credit in respect of its creditors is 30 days. in 2010, 82 per cent of invoices were paid in accordance with these terms.

52 Macquarie University annual Report 2010
operations continued
Statement of attitude to fraud and corruptionThe University requires all staff at all times to act honestly, and with integrity to safeguard the public resources for which they are responsible. The University is committed to protecting all revenue, expenditure and assets from any attempt to gain illegal financial or other benefits. any fraud or corruption committed against the University is a major concern to the University. Consequently, any case will be thoroughly investigated and appropriate disciplinary action will be taken against any staff member who is guilty of corrupt conduct. This may include referral to the police.
The University has an obligation to report suspected corruption, whether or not it involves an officer of the University, to the independent Commission against Corruption. The University endeavours to make its staff, contractors, suppliers and clients are aware of its statement of attitude to fraud and corruption by placing it on the University’s website, referring to key attributes of its strategy in University publications including the annual Report, providing a summary in training sessions and regular fraud and corruption awareness activities.
Privacymacquarie University has a commitment to privacy, valuing the privacy of individuals and actively seeking to preserve the privacy rights of those who share information with the University. it is believed individuals have the right to know how information to the University is handled.
The role of Privacy officer is assigned to the University secretary and general Counsel and the role of Privacy Contact officer is assigned to the manager, Records and archives services. These officers have direct accountability for the University’s compliance with its privacy policy.
macquarie University’s Privacy management Plan was developed to comply with section 33 of the New South Wales Privacy and Personal Information Protection Act 1998 and is to be amended to include compliance measures for the Health Records and Information Privacy Act 2002.
The Privacy management Plan details:
• the policies and practices that the University has in place to comply with the Privacy and Personal information Protection act
• the dissemination of privacy policies and practices within the University procedures in relation to an internal review under Part 5 of the Privacy and Personal information Protection act
• other matters which are considered relevant to the University in relation to the act.
During 2010, no privacy complaints were received by the University. No requests for access to records under section 14 of the Privacy and Personal information Protection act were received. No amendments to personal records pursuant to the Privacy and Personal information Protection act were carried out in 2010.
Student complaints, appeals and disciplinea number of committees receive student complaints and appeals and address disciplinary matters.
Academic Appeals CommitteeThe academic appeals Committee met three times in 2010 to determine appeals by undergraduate and postgraduate coursework students against their exclusion under the relevant degree rules.
Academic Appeals Committee determinations
Appeals 2006 2007 2008 2009 2010Considered 117 216 357 304 289Successful 55 128 141 84 59
as shown in the above table, the number of appeals determined by the committee rose significantly between 2006 and 2008. This was in response to two policy changes in 2006: students are liable for exclusion due to failing a core unit twice in the Bachelor of Commerce – accounting; and students are liable for exclusion after summer session and after first-half year, as well as at the end of the academic year. additionally, students who were excluded for failure to maintain a satisfactory minimum rate of progress accounted for the increase in the number of show cause submissions received from 2008.
Grading Appeals CommitteeThe grading appeals Committee investigates appeals against grades by undergraduate and postgraduate coursework students to determine whether due process has been observed, and whether appropriate academic procedures have been carried out and grades determined in a fair and just manner in accordance with University policies and procedures. The committee met six times during 2010 (including two appeals for reconsideration). Four appeals were received from students. only two were upheld. This
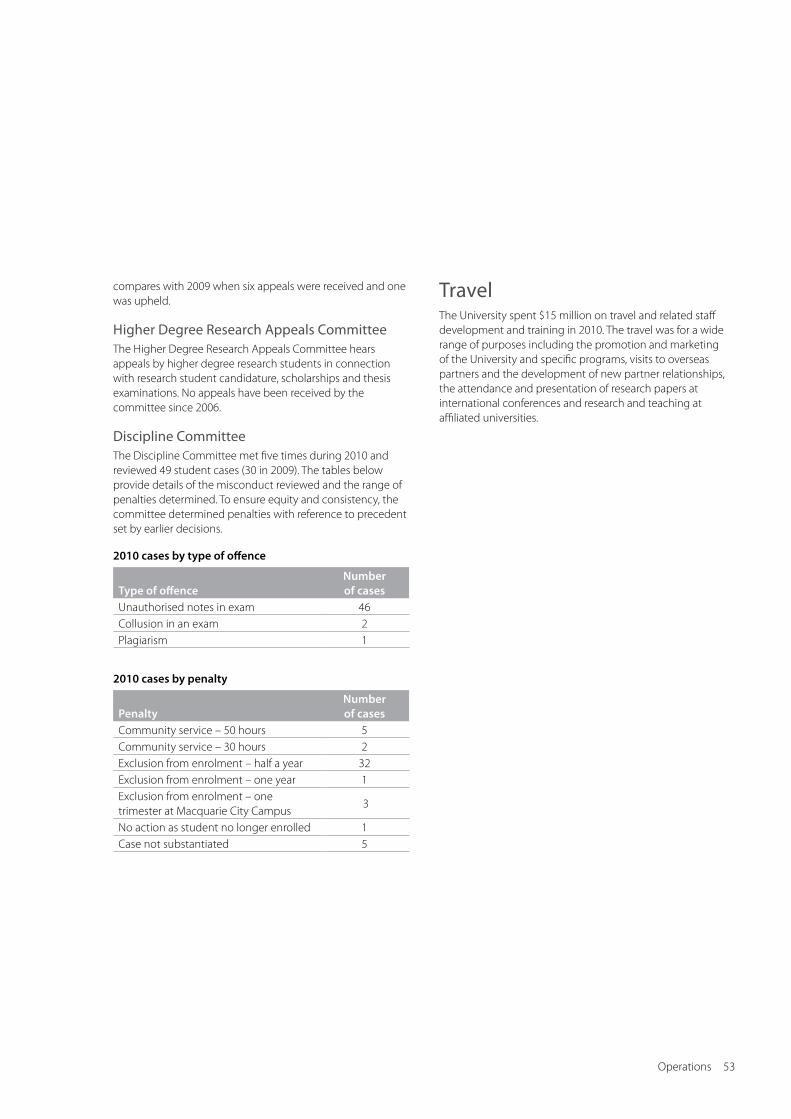
operations 53
compares with 2009 when six appeals were received and one was upheld.
Higher Degree Research Appeals CommitteeThe Higher Degree Research appeals Committee hears appeals by higher degree research students in connection with research student candidature, scholarships and thesis examinations. No appeals have been received by the committee since 2006.
Discipline CommitteeThe Discipline Committee met five times during 2010 and reviewed 49 student cases (30 in 2009). The tables below provide details of the misconduct reviewed and the range of penalties determined. To ensure equity and consistency, the committee determined penalties with reference to precedent set by earlier decisions.
2010 cases by type of offence
Type of offenceNumber of cases
Unauthorised notes in exam 46Collusion in an exam 2Plagiarism 1
2010 cases by penalty
PenaltyNumber of cases
Community service – 50 hours 5Community service – 30 hours 2exclusion from enrolment – half a year 32exclusion from enrolment – one year 1exclusion from enrolment – one trimester at macquarie City Campus
3
No action as student no longer enrolled 1Case not substantiated 5
TravelThe University spent $15 million on travel and related staff development and training in 2010. The travel was for a wide range of purposes including the promotion and marketing of the University and specific programs, visits to overseas partners and the development of new partner relationships, the attendance and presentation of research papers at international conferences and research and teaching at affiliated universities.
54 Macquarie University annual Report 2010
Financial performance
Statements in this chapter are unaudited
The operating result for the year for Macquarie University and its subsidiaries was a surplus of $76.2 million.
The surplus for the consolidated University represented 11.1 per cent of revenue. There are several factors underlying this result which are of note.
• theUniversitycommitted$333.5milliontowardsproperty, plant and equipment in 2010
• theUniversityhasreceivedamountstotalling$38.6 million from the Department of Education, Employment and Workplace Relations (DEEWR), under the Education Investment Fund (EIF) and Teaching and Learning Capital Fund for the Hearing Hub ($14 million), Australian School of Advanced Medicine fit-out ($11.6 million) and the upgrade of teaching spaces, laboratories and lecture theatres ($13 million)
• theUniversityhasplannedCapitalexpenditureof $295 million over the course of 2011–2013. Major expenditure includes: $115.4 million for the Australian Hearing Hub, $50.3 million for the refurbishment and upgrade of teaching spaces, laboratories and lecture theatres, $33.4 million for information technology and learning management systems and $30 million for planning and infrastructure.
State superannuation schemesDuring the year, macquarie University changed its accounting policy on the recognition of defined superannuation actuarial gains and losses. Superannuation actuarial gains and losses are now recognised, outside the income statement, in other comprehensive income. Previously, these gains and losses were recognised in the income statement. The comparative figures for 2009 have been restated to reflect the change in policy.
This change in policy has been adopted on the basis that actuarial gains/losses are re-measurements, based on assumptions that do not necessarily reflect the ultimate cost of providing superannuation.
This change in accounting policy increased the 2010 operating result of $75.14 million to $76.23 million (2009: reduced result from $60.29 million to $55.67 million), by excluding from the result the superannuation actuarial gain(loss) item (2010: loss of $1.09 million 2009: gain of $4.63 million) for the Consolidated entity.
The deferred superannuation expense is now the net of income and expense from actuarial assessment for the State authorities Non Contributory Superannuation Scheme (SaNCS) and Professorial Superannuation Fund (PSF).
The unfunded liability of these schemes was $258.1 million at 31 December 2010 ($230.6 million in 2009). This is matched by an asset based on future funding expected from the Commonwealth government.
Consolidated income analysisincome totaled $686.8 million, an increase of 17.8 per cent. This increase has been driven by a number of factors:
• income from australian government grants increased by $33.3 million, this includes $38.6 million from DeeWR ($15 million 2009) as outlined above
• income from HeCS-HelP (both government and student payments) increased by $9.4 million owing to increased student load in Commonwealth Supported Places
• income from Fee-HelP has increased by $2.3 million, resulting from an increase in the take-up rate, fee levels and enrolments for domestic fee-paying students
• income from fees and charges has increased by $56.9 million, primarily from an increase of fee-paying overseas student fees and other non-course fees and charges, being patient revenues from the opening of the macquarie University Hospital.
Ho
lim
ag
e
Financial performance 55
Consolidated expense analysisexpenses totaled $610.6 million, an increase of 15.7 per cent. This increase has occurred over several expense categories:
• academic and general staff salaries and related costs increased by $39.7 million (13.4 per cent) due to salary increases and the appointment of additional staff including the macquarie University Hospital operations
• depreciation and amortisation increased by $9.5 million due to the planned capital program and the macquarie University Hospital and Clinic and Cochlear building becoming operational
• repairs and maintenance increased by $2 million as a result of remedial work performed on the University’s laboratories and lecture theatres
• other expenses have increased by $20.6 million resulting partly from significant increases in scholarships, grants and prizes increase of $6.3 million, general consumables/materials increase of $8.6 million, rental, hire and other leasing fees increase of $6.9 million and tuition services increase of $7.5 million.
Consolidated balance sheetNet assets increased from 2009 to 2010 by $124.2 million with total assets increasing by $300 million and total liabilities increasing by $175.8 million. These amounts include an increase of $27.5 million in both the asset and liability for deferred superannuation.
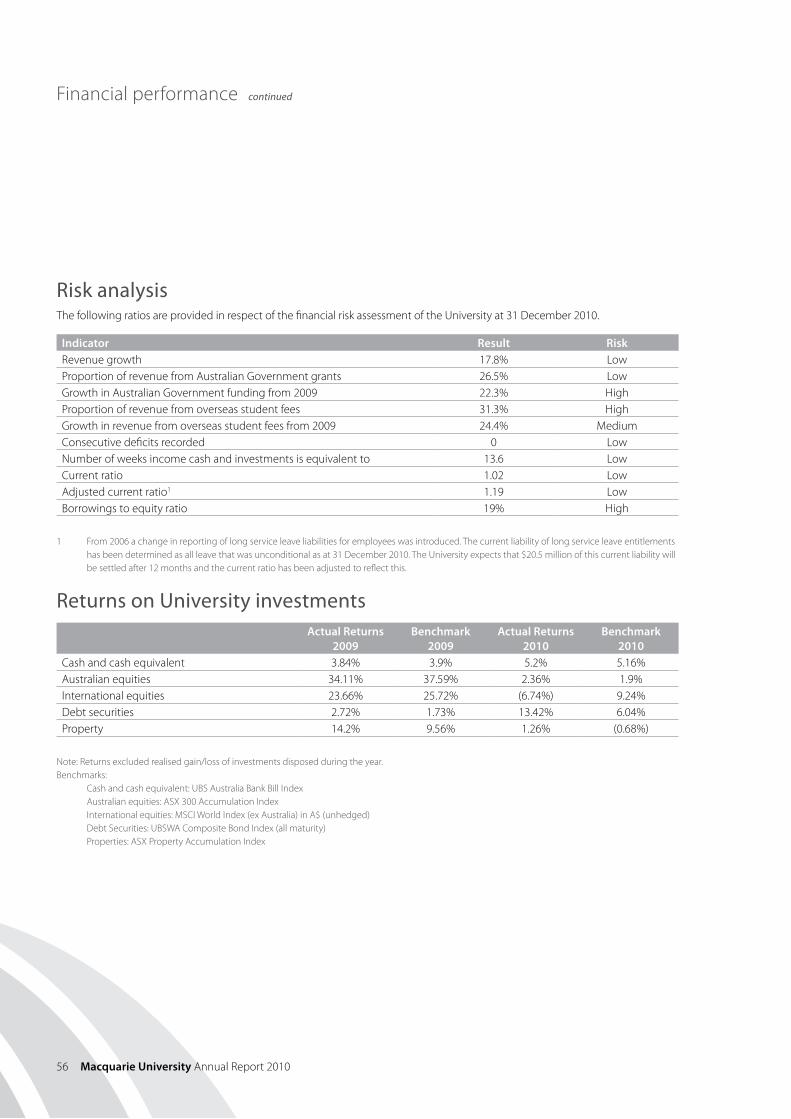
56 Macquarie University annual Report 2010
Financial performance continued
Risk analysisThe following ratios are provided in respect of the financial risk assessment of the University at 31 December 2010.
Indicator Result RiskRevenue growth 17.8% lowProportion of revenue from australian government grants 26.5% lowgrowth in australian government funding from 2009 22.3% HighProportion of revenue from overseas student fees 31.3% Highgrowth in revenue from overseas student fees from 2009 24.4% mediumConsecutive deficits recorded 0 lowNumber of weeks income cash and investments is equivalent to 13.6 lowCurrent ratio 1.02 lowadjusted current ratio1 1.19 lowBorrowings to equity ratio 19% High
1 From 2006 a change in reporting of long service leave liabilities for employees was introduced. The current liability of long service leave entitlements has been determined as all leave that was unconditional as at 31 December 2010. The University expects that $20.5 million of this current liability will be settled after 12 months and the current ratio has been adjusted to reflect this.
Returns on University investments
Actual Returns
2009Benchmark
2009Actual Returns
2010Benchmark
2010Cash and cash equivalent 3.84% 3.9% 5.2% 5.16%australian equities 34.11% 37.59% 2.36% 1.9%international equities 23.66% 25.72% (6.74%) 9.24%Debt securities 2.72% 1.73% 13.42% 6.04%Property 14.2% 9.56% 1.26% (0.68%)
Note: Returns excluded realised gain/loss of investments disposed during the year.Benchmarks: Cash and cash equivalent: UBS australia Bank Bill index australian equities: aSX 300 accumulation index international equities: mSCi World index (ex australia) in a$ (unhedged) Debt Securities: UBSWa Composite Bond index (all maturity) Properties: aSX Property accumulation index
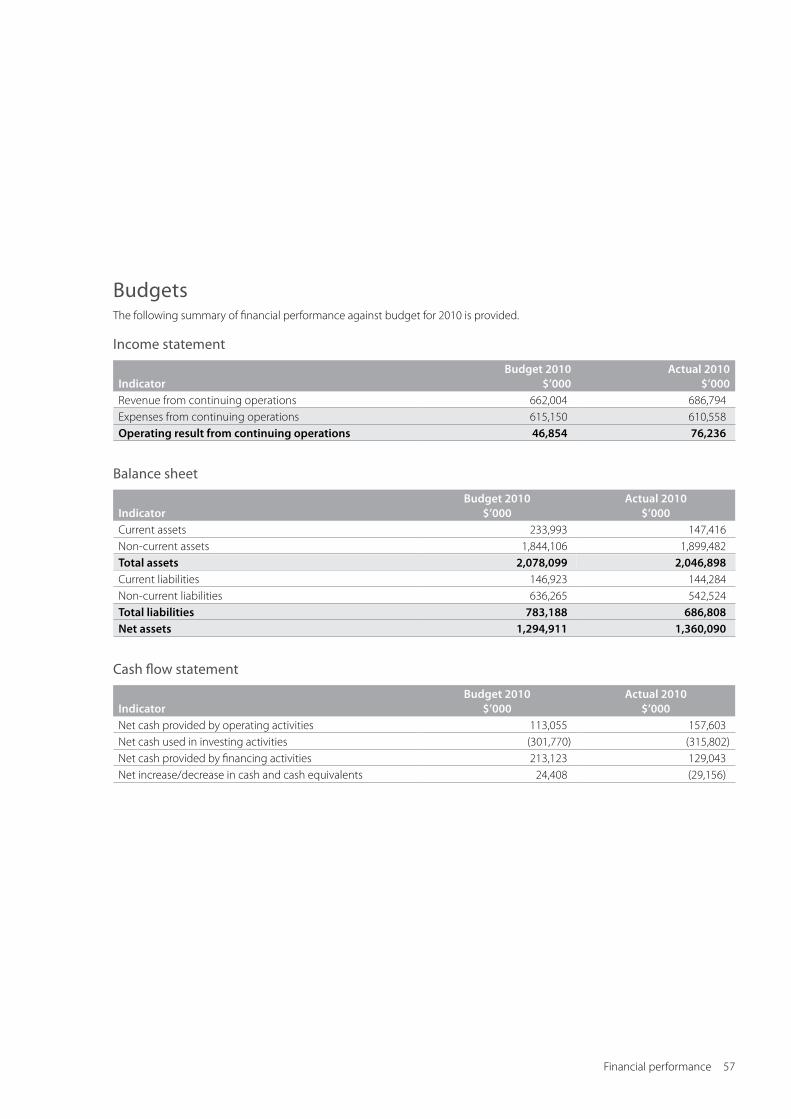
Financial performance 57
BudgetsThe following summary of financial performance against budget for 2010 is provided.
Income statement
IndicatorBudget 2010
$’000Actual 2010
$’000Revenue from continuing operations 662,004 686,794expenses from continuing operations 615,150 610,558Operating result from continuing operations 46,854 76,236
Balance sheet
IndicatorBudget 2010
$’000Actual 2010
$’000Current assets 233,993 147,416Non-current assets 1,844,106 1,899,482Total assets 2,078,099 2,046,898Current liabilities 146,923 144,284Non-current liabilities 636,265 542,524Total liabilities 783,188 686,808Net assets 1,294,911 1,360,090
Cash flow statement
IndicatorBudget 2010
$’000Actual 2010
$’000Net cash provided by operating activities 113,055 157,603Net cash used in investing activities (301,770) (315,802)Net cash provided by financing activities 213,123 129,043Net increase/decrease in cash and cash equivalents 24,408 (29,156)

58 Macquarie University annual Report 2010
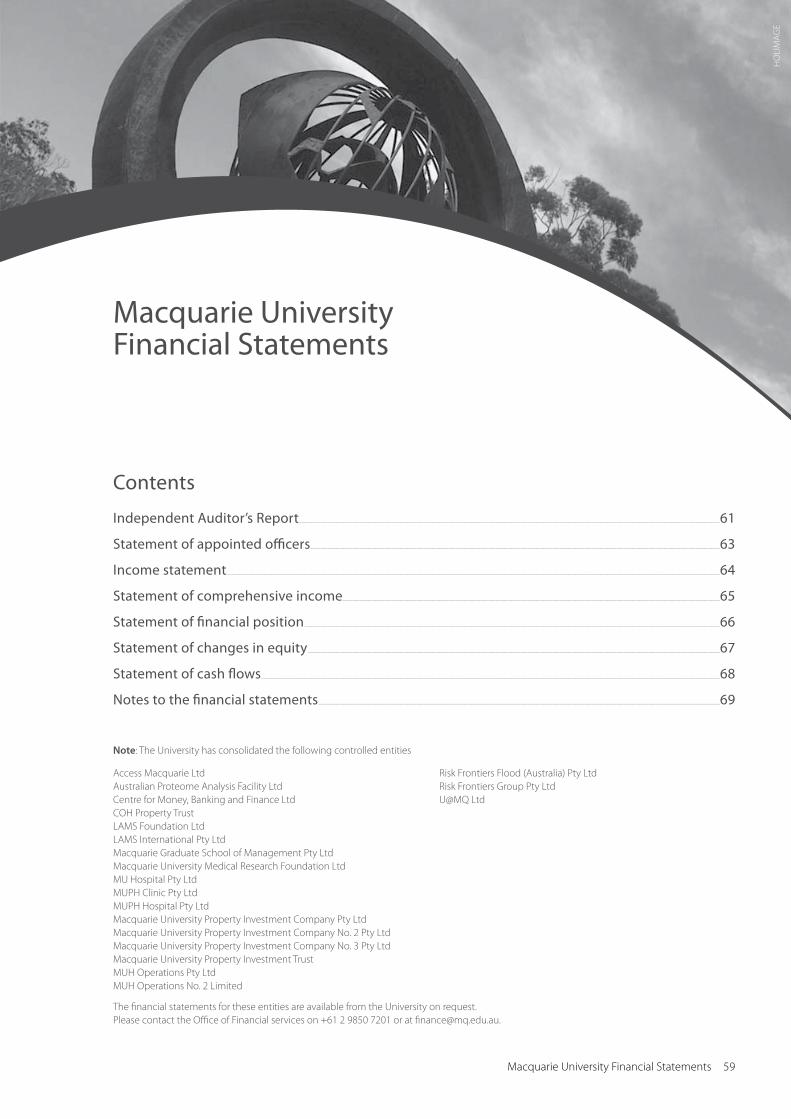
macquarie University Financial Statements 59
Ho
lim
ag
e
Macquarie UniversityFinancial Statements
access macquarie ltdaustralian Proteome analysis Facility ltdCentre for money, Banking and Finance ltd CoH Property TrustlamS Foundation ltdlamS international Pty ltdmacquarie graduate School of management Pty ltdmacquarie University medical Research Foundation ltdmU Hospital Pty ltdmUPH Clinic Pty ltdmUPH Hospital Pty ltdmacquarie University Property investment Company Pty ltdmacquarie University Property investment Company No. 2 Pty ltd macquarie University Property investment Company No. 3 Pty ltdmacquarie University Property investment TrustmUH operations Pty ltdmUH operations No. 2 limited
Risk Frontiers Flood (australia) Pty ltdRisk Frontiers group Pty ltdU@mQ ltd
The financial statements for these entities are available from the University on request. Please contact the office of Financial services on +61 2 9850 7201 or at [email protected].
Note: The University has consolidated the following controlled entities
Contents
Independent Auditor’s Report ......................................................................................................................................................................................................................................................................................................................................................................................................................................................................................................61
Statement of appointed officers .........................................................................................................................................................................................................................................................................................................................................................................................................................................................................................63
Income statement ..........................................................................................................................................................................................................................................................................................................................................................................................................................................................................................................................................................................................64
Statement of comprehensive income....................................................................................................................................................................................................................................................................................................................................................................................................................................................65
Statement of financial position ................................................................................................................................................................................................................................................................................................................................................................................................................................................................................................66
Statement of changes in equity ............................................................................................................................................................................................................................................................................................................................................................................................................................................................................................67
Statement of cash flows ..................................................................................................................................................................................................................................................................................................................................................................................................................................................................................................................................................68
Notes to the financial statements ................................................................................................................................................................................................................................................................................................................................................................................................................................................................................69

60 Macquarie University annual Report 2010

Financial Statements 61
Independent Auditor’s Report
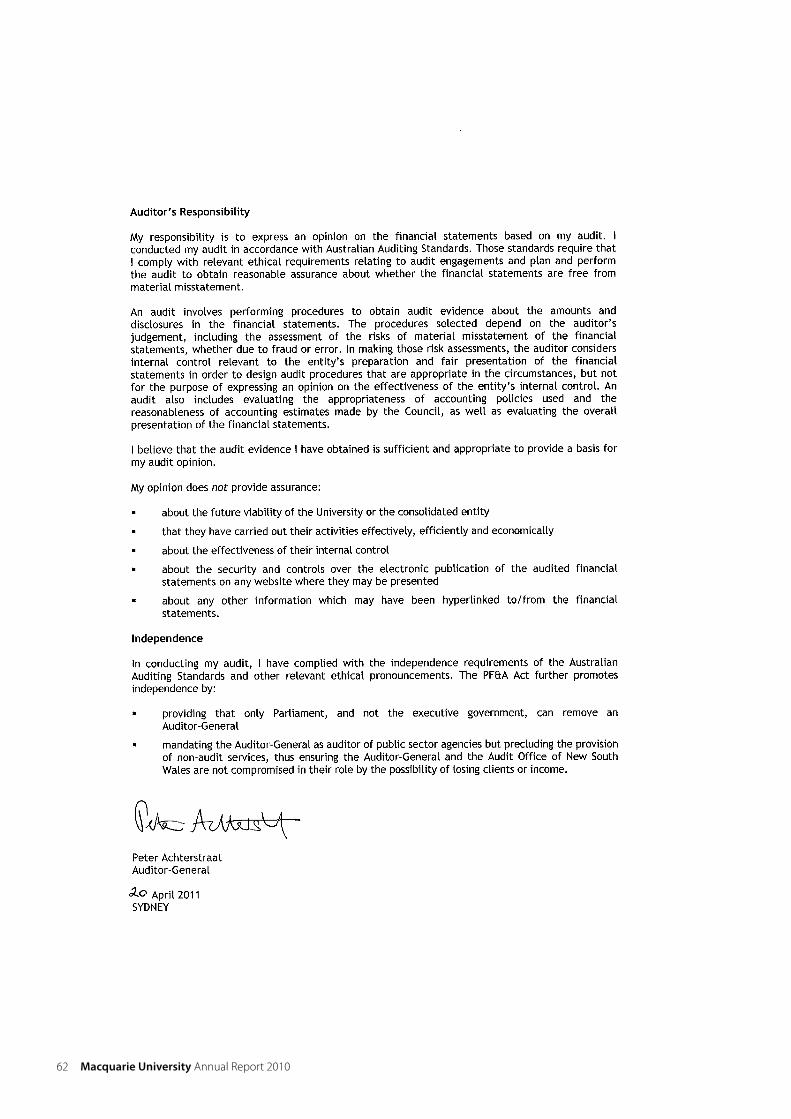
62 Macquarie University annual Report 2010
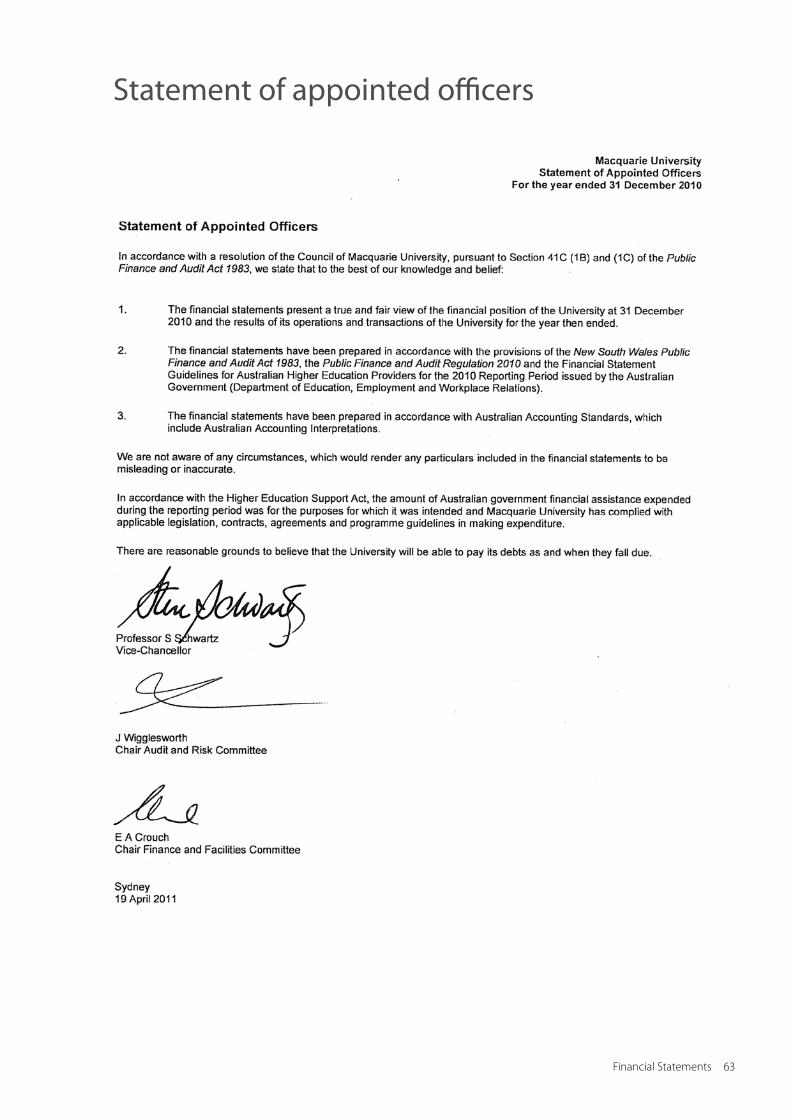
Financial Statements 63
Statement of appointed officers
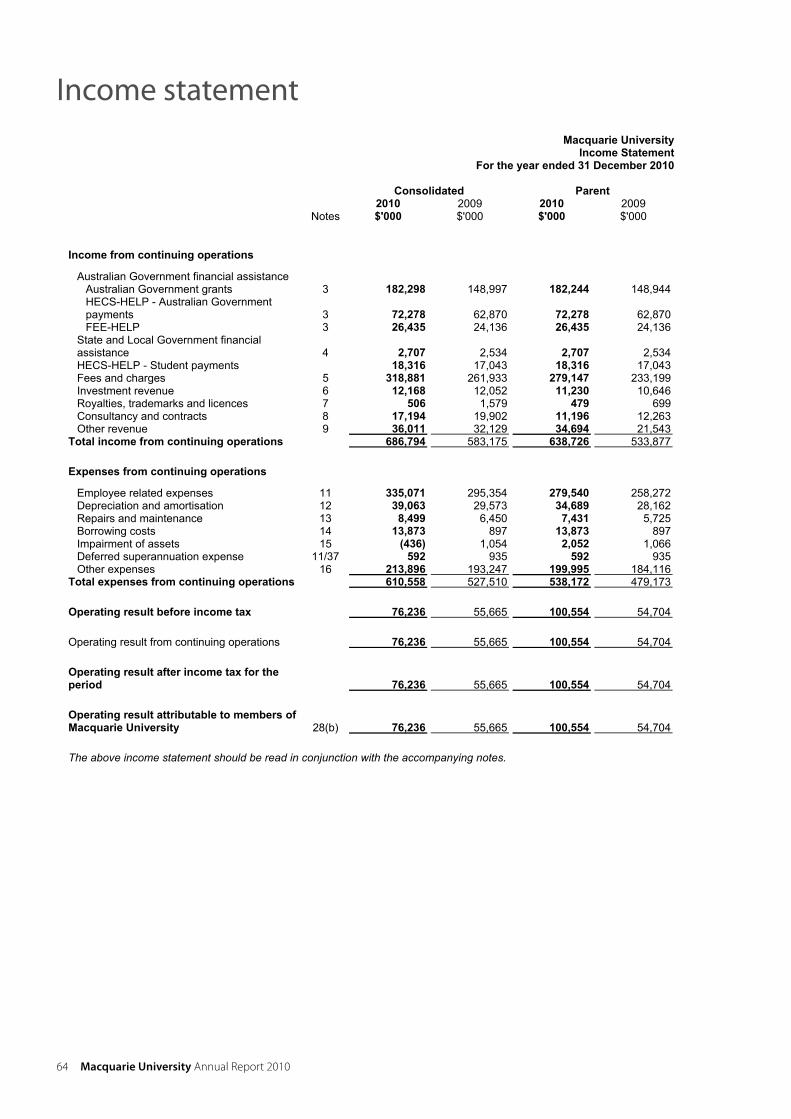
Macquarie UniversityIncome Statement
For the year ended 31 December 2010
Consolidated Parent2010 2009 2010 2009
Notes $'000 $'000 $'000 $'000
Income from continuing operations
Australian Government financial assistance Australian Government grants 3 182,298 148,997 182,244 148,944 HECS-HELP - Australian Government payments 3 72,278 62,870 72,278 62,870 FEE-HELP 3 26,435 24,136 26,435 24,136
State and Local Government financial assistance 4 2,707 2,534 2,707 2,534 HECS-HELP - Student payments 18,316 17,043 18,316 17,043 Fees and charges 5 318,881 261,933 279,147 233,199 Investment revenue 6 12,168 12,052 11,230 10,646 Royalties, trademarks and licences 7 506 1,579 479 699 Consultancy and contracts 8 17,194 19,902 11,196 12,263 Other revenue 9 36,011 32,129 34,694 21,543
Total income from continuing operations 686,794 583,175 638,726 533,877
Expenses from continuing operations
Employee related expenses 11 335,071 295,354 279,540 258,272 Depreciation and amortisation 12 39,063 29,573 34,689 28,162 Repairs and maintenance 13 8,499 6,450 7,431 5,725 Borrowing costs 14 13,873 897 13,873 897 Impairment of assets 15 (436) 1,054 2,052 1,066 Deferred superannuation expense 11/37 592 935 592 935 Other expenses 16 213,896 193,247 199,995 184,116
Total expenses from continuing operations 610,558 527,510 538,172 479,173
Operating result before income tax 76,236 55,665 100,554 54,704
Operating result from continuing operations 76,236 55,665 100,554 54,704
Operating result after income tax for the period 76,236 55,665 100,554 54,704
Operating result attributable to members of Macquarie University 28(b) 76,236 55,665 100,554 54,704
The above income statement should be read in conjunction with the accompanying notes.
64 Macquarie University annual Report 2010
Income statement
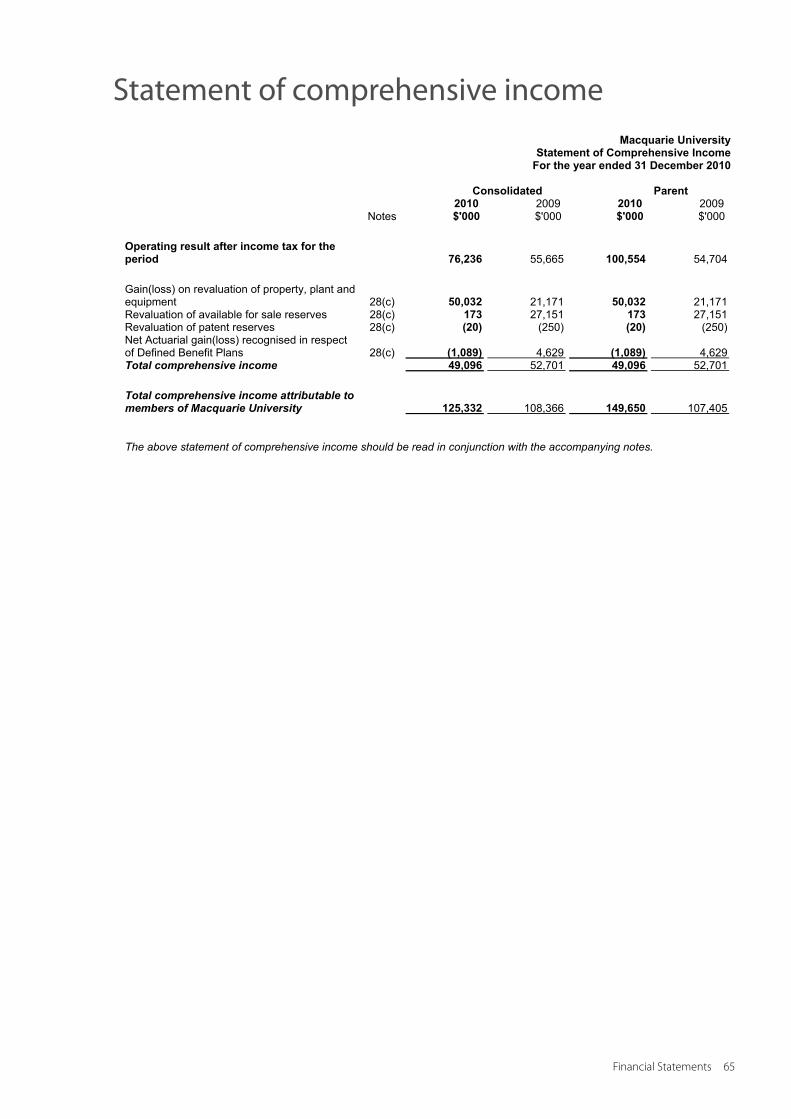
Macquarie UniversityStatement of Comprehensive Income
For the year ended 31 December 2010
Consolidated Parent2010 2009 2010 2009
Notes $'000 $'000 $'000 $'000
Operating result after income tax for the period 76,236 55,665 100,554 54,704
Gain(loss) on revaluation of property, plant and equipment 28(c) 50,032 21,171 50,032 21,171 Revaluation of available for sale reserves 28(c) 173 27,151 173 27,151 Revaluation of patent reserves 28(c) (20) (250) (20) (250) Net Actuarial gain(loss) recognised in respect of Defined Benefit Plans 28(c) (1,089) 4,629 (1,089) 4,629 Total comprehensive income 49,096 52,701 49,096 52,701
Total comprehensive income attributable to members of Macquarie University 125,332 108,366 149,650 107,405
The above statement of comprehensive income should be read in conjunction with the accompanying notes.
Financial Statements 65
Statement of comprehensive income
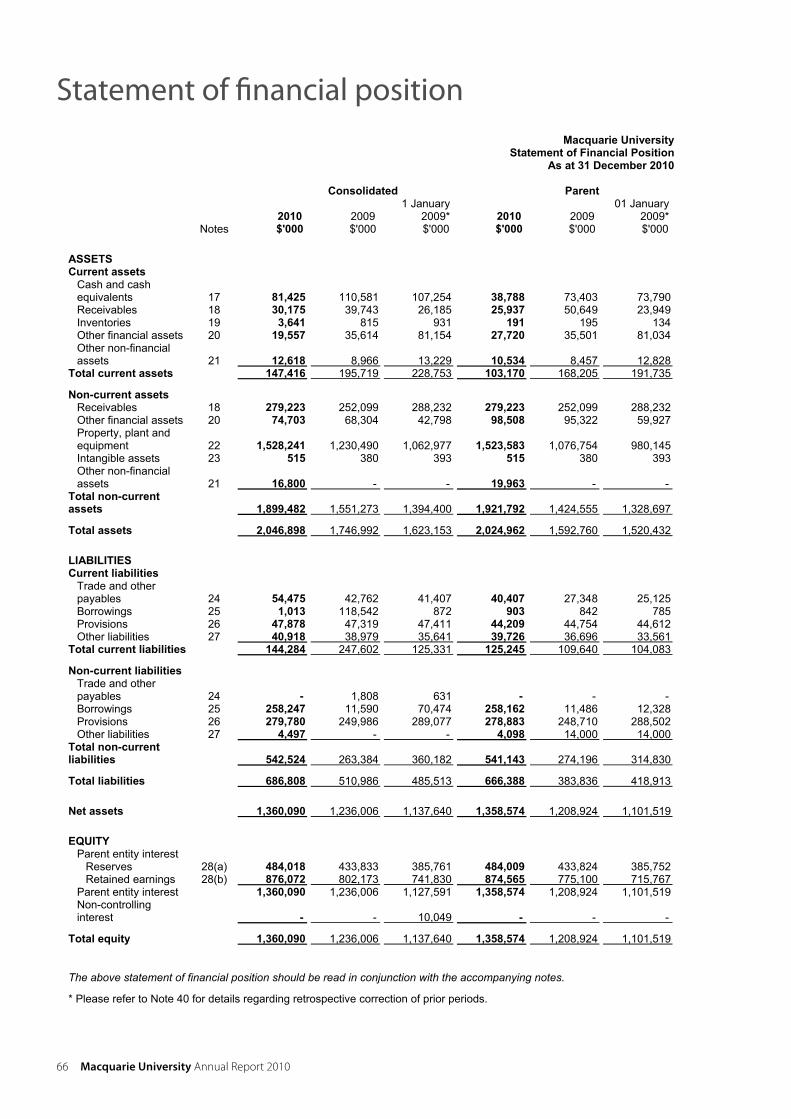
Macquarie UniversityStatement of Financial Position
As at 31 December 2010
Consolidated Parent
2010 2009 1 January
2009* 2010 2009 01 January
2009*Notes $'000 $'000 $'000 $'000 $'000 $'000
ASSETS Current assets
Cash and cash equivalents 17 81,425 110,581 107,254 38,788 73,403 73,790 Receivables 18 30,175 39,743 26,185 25,937 50,649 23,949 Inventories 19 3,641 815 931 191 195 134 Other financial assets 20 19,557 35,614 81,154 27,720 35,501 81,034 Other non-financial assets 21 12,618 8,966 13,229 10,534 8,457 12,828
Total current assets 147,416 195,719 228,753 103,170 168,205 191,735
Non-current assets Receivables 18 279,223 252,099 288,232 279,223 252,099 288,232 Other financial assets 20 74,703 68,304 42,798 98,508 95,322 59,927 Property, plant and equipment 22 1,528,241 1,230,490 1,062,977 1,523,583 1,076,754 980,145 Intangible assets 23 515 380 393 515 380 393 Other non-financial assets 21 16,800 - - 19,963 - -
Total non-current assets 1,899,482 1,551,273 1,394,400 1,921,792 1,424,555 1,328,697
Total assets 2,046,898 1,746,992 1,623,153 2,024,962 1,592,760 1,520,432
LIABILITIES Current liabilities
Trade and other payables 24 54,475 42,762 41,407 40,407 27,348 25,125 Borrowings 25 1,013 118,542 872 903 842 785 Provisions 26 47,878 47,319 47,411 44,209 44,754 44,612 Other liabilities 27 40,918 38,979 35,641 39,726 36,696 33,561
Total current liabilities 144,284 247,602 125,331 125,245 109,640 104,083
Non-current liabilities Trade and other payables 24 - 1,808 631 - - - Borrowings 25 258,247 11,590 70,474 258,162 11,486 12,328 Provisions 26 279,780 249,986 289,077 278,883 248,710 288,502 Other liabilities 27 4,497 - - 4,098 14,000 14,000
Total non-current liabilities 542,524 263,384 360,182 541,143 274,196 314,830
Total liabilities 686,808 510,986 485,513 666,388 383,836 418,913
Net assets 1,360,090 1,236,006 1,137,640 1,358,574 1,208,924 1,101,519
EQUITY Parent entity interest
Reserves 28(a) 484,018 433,833 385,761 484,009 433,824 385,752 Retained earnings 28(b) 876,072 802,173 741,830 874,565 775,100 715,767
Parent entity interest 1,360,090 1,236,006 1,127,591 1,358,574 1,208,924 1,101,519 Non-controlling interest - - 10,049 - - -
Total equity 1,360,090 1,236,006 1,137,640 1,358,574 1,208,924 1,101,519
The above statement of financial position should be read in conjunction with the accompanying notes.
* Please refer to Note 40 for details regarding retrospective correction of prior periods.
66 Macquarie University annual Report 2010
Statement of financial position
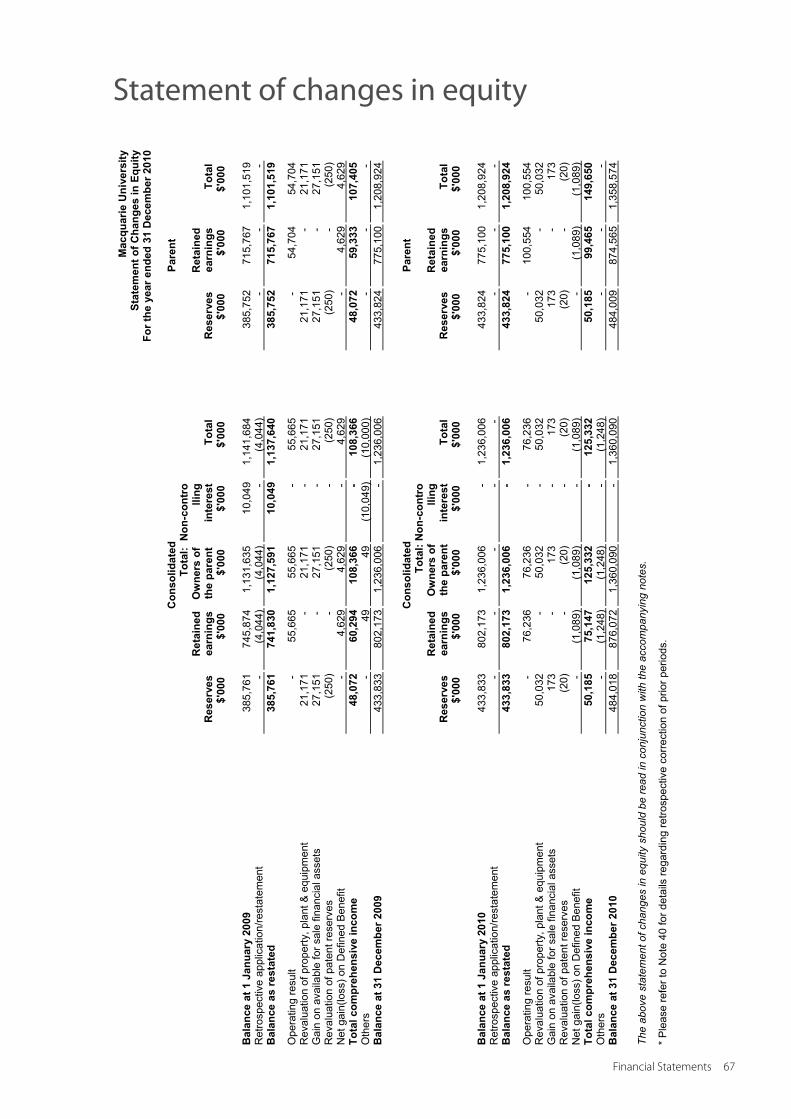
Mac
quar
ie U
nive
rsity
Stat
emen
t of C
hang
es in
Equ
ityFo
r the
yea
r end
ed 3
1 D
ecem
ber 2
010
Con
solid
ated
Pa
rent
R
eser
ves
Ret
aine
dea
rnin
gs
Tota
l: O
wne
rs o
f th
e pa
rent
Non
-con
tro
lling
in
tere
stTo
tal
R
eser
ves
Ret
aine
dea
rnin
gsTo
tal
$'00
0$'
000
$'00
0$'
000
$'00
0$'
000
$'00
0$'
000
Bal
ance
at 1
Jan
uary
200
9
385,
761
74
5,87
4
1,13
1,63
5
10,0
49
1,14
1,68
4
38
5,75
2
715,
767
1,
101,
519
R
etro
spec
tive
appl
icat
ion/
rest
atem
ent
-
(4
,044
)
(4,0
44)
-
(4
,044
)
-
-
-
Bal
ance
as
rest
ated
385,
761
741,
830
1,12
7,59
1
10,0
491,
137,
640
385,
752
715,
767
1,10
1,51
9
Ope
ratin
g re
sult
-
55
,665
55
,665
-
55
,665
-
54,7
04
54,7
04
Rev
alua
tion
of p
rope
rty, p
lant
& e
quip
men
t
21,1
71
-
21,1
71
-
21,1
71
21
,171
-
21
,171
G
ain
on a
vaila
ble
for s
ale
finan
cial
ass
ets
27
,151
-
27
,151
-
27
,151
27,1
51
-
27,1
51
Rev
alua
tion
of p
aten
t res
erve
s
(250
)
-
(250
)
-
(250
)
(2
50)
-
(2
50)
Net
gai
n(lo
ss) o
n D
efin
ed B
enef
it
-
4,62
9
4,62
9
-
4,62
9
-
4,
629
4,
629
Tota
l com
preh
ensi
ve in
com
e48
,072
60,2
9410
8,36
6
-10
8,36
648
,072
59,3
3310
7,40
5
Oth
ers
-
49
49
(1
0,04
9)
(10,
000)
-
-
- B
alan
ce a
t 31
Dec
embe
r 200
9
433,
833
80
2,17
3
1,23
6,00
6
-
1,23
6,00
6
43
3,82
4
775,
100
1,
208,
924
Con
solid
ated
Pa
rent
R
eser
ves
Ret
aine
dea
rnin
gs
Tota
l: O
wne
rs o
f th
e pa
rent
Non
-con
tro
lling
in
tere
stTo
tal
R
eser
ves
Ret
aine
dea
rnin
gsTo
tal
$'00
0$'
000
$'00
0$'
000
$'00
0$'
000
$'00
0$'
000
Bal
ance
at 1
Jan
uary
201
0
433,
833
80
2,17
3
1,23
6,00
6
-
1,23
6,00
6
43
3,82
4
775,
100
1,
208,
924
R
etro
spec
tive
appl
icat
ion/
rest
atem
ent
-
-
-
-
-
-
-
- B
alan
ce a
s re
stat
ed43
3,83
380
2,17
31,
236,
006
-
1,23
6,00
643
3,82
477
5,10
01,
208,
924
Ope
ratin
g re
sult
-
76
,236
76
,236
-
76
,236
-
100,
554
10
0,55
4
Rev
alua
tion
of p
rope
rty, p
lant
& e
quip
men
t
50,0
32
-
50,0
32
-
50,0
32
50
,032
-
50
,032
G
ain
on a
vaila
ble
for s
ale
finan
cial
ass
ets
17
3
-
173
-
17
3
17
3
-
173
R
eval
uatio
n of
pat
ent r
eser
ves
(2
0)
-
(20)
-
(2
0)
(2
0)
-
(20)
N
et g
ain(
loss
) on
Def
ined
Ben
efit
-
(1
,089
)
(1,0
89)
-
(1
,089
)
-
(1
,089
)
(1,0
89)
Tota
l com
preh
ensi
ve in
com
e50
,185
75,1
4712
5,33
2
-12
5,33
250
,185
99,4
6514
9,65
0
Oth
ers
-
(1
,248
)
(1,2
48)
-
(1
,248
)
-
-
-
Bal
ance
at 3
1 D
ecem
ber 2
010
48
4,01
8
876,
072
1,
360,
090
-
1,
360,
090
484,
009
87
4,56
5
1,35
8,57
4
The
abov
e st
atem
ent o
f cha
nges
in e
quity
sho
uld
be re
ad in
con
junc
tion
with
the
acco
mpa
nyin
g no
tes.
* P
leas
e re
fer t
o N
ote
40 fo
r det
ails
rega
rdin
g re
trosp
ectiv
e co
rrect
ion
of p
rior p
erio
ds.
Financial Statements 67
Statement of changes in equity
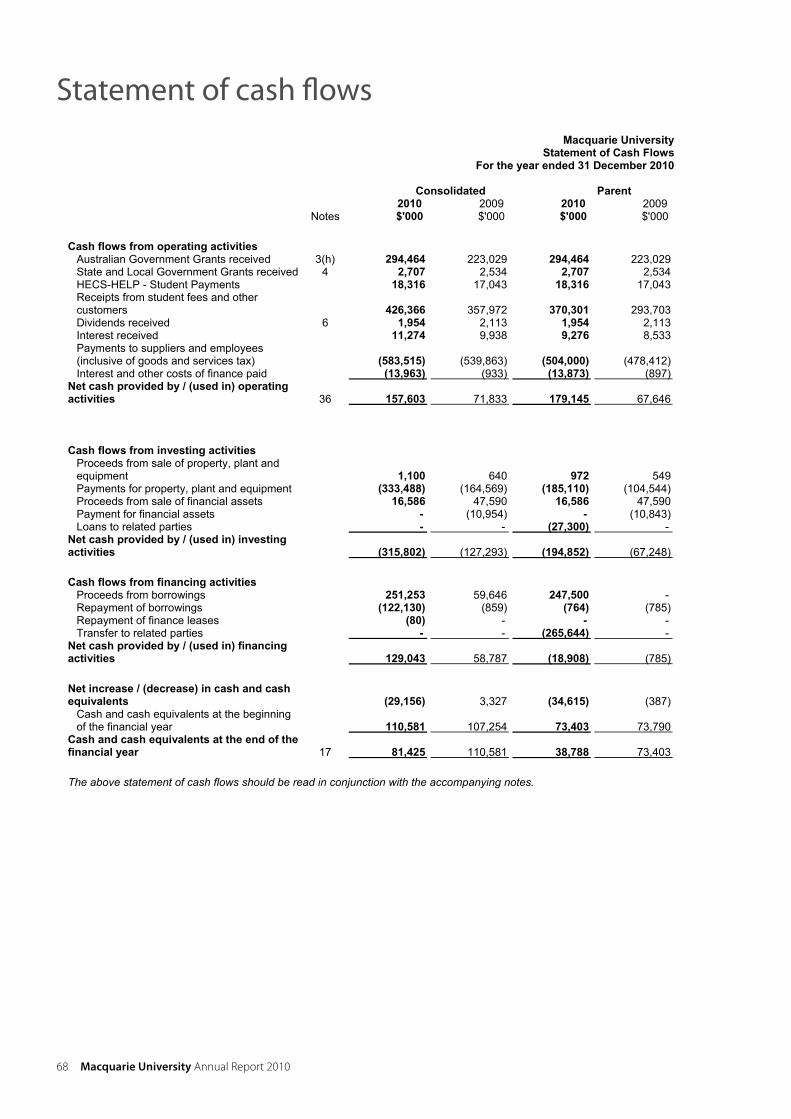
Macquarie UniversityStatement of Cash Flows
For the year ended 31 December 2010
Consolidated Parent2010 2009 2010 2009
Notes $'000 $'000 $'000 $'000
Cash flows from operating activities Australian Government Grants received 3(h) 294,464 223,029 294,464 223,029 State and Local Government Grants received 4 2,707 2,534 2,707 2,534 HECS-HELP - Student Payments 18,316 17,043 18,316 17,043 Receipts from student fees and other customers 426,366 357,972 370,301 293,703 Dividends received 6 1,954 2,113 1,954 2,113 Interest received 11,274 9,938 9,276 8,533 Payments to suppliers and employees (inclusive of goods and services tax) (583,515) (539,863) (504,000) (478,412) Interest and other costs of finance paid (13,963) (933) (13,873) (897)
Net cash provided by / (used in) operating activities 36 157,603 71,833 179,145 67,646
Cash flows from investing activities Proceeds from sale of property, plant and equipment 1,100 640 972 549 Payments for property, plant and equipment (333,488) (164,569) (185,110) (104,544) Proceeds from sale of financial assets 16,586 47,590 16,586 47,590 Payment for financial assets - (10,954) - (10,843) Loans to related parties - - (27,300) -
Net cash provided by / (used in) investing activities (315,802) (127,293) (194,852) (67,248)
Cash flows from financing activities Proceeds from borrowings 251,253 59,646 247,500 - Repayment of borrowings (122,130) (859) (764) (785) Repayment of finance leases (80) - - - Transfer to related parties - - (265,644) -
Net cash provided by / (used in) financing activities 129,043 58,787 (18,908) (785)
Net increase / (decrease) in cash and cash equivalents (29,156) 3,327 (34,615) (387)
Cash and cash equivalents at the beginning of the financial year 110,581 107,254 73,403 73,790
Cash and cash equivalents at the end of the financial year 17 81,425 110,581 38,788 73,403
The above statement of cash flows should be read in conjunction with the accompanying notes.
68 Macquarie University annual Report 2010
Statement of cash flows
Macquarie UniversityNotes to the financial statements
31 December 2010
1 Summary of significant accounting policies The principal accounting policies adopted in the preparation of the financial statements are set out below. These policies have been consistently applied to all the years presented, unless otherwise stated. The financial statements include separate financial statements for Macquarie University as a parent entity and the consolidated entity consisting of Macquarie University and its subsidiaries.
(a) Basis of preparation
The financial statements are general purpose financial statements which have been prepared on an accrual basis in accordance with Australian Accounting Standards, AASB Interpretations, the requirements of the Department of Education, Employment and Workplace Relations (DEEWR) and the Public Finance and Audit Act 1983 and the Public Finance and Audit Regulations 2010. The financial statements for the year ended 31 December 2010 have been authorised for issue by the Macquarie University Council on 19 April 2011.
Compliance with IFRSs The financial statements and notes of Macquarie University comply with Australian Accounting Standards, some of which contain requirements specific to not-for-profit entities that are inconsistent with IFRS requirements.
Historical cost convention These financial statements have been prepared under the historical cost convention, as modified by the revaluation of available-for-sale financial assets, financial assets and liabilities (including derivative instruments) at fair value through income statement, certain classes of property, plant and equipment and investment property.
Critical accounting estimates The preparation of financial statements in conformity with Australian Accounting Standards requires the use of certain critical accounting estimates. It also requires management to exercise its judgement in the process of applying the Macquarie University’s accounting policies. All significant estimates or assumptions made in the preparation of the financial statements have been explained in the accounting policy notes.
Common control transactions The predecessor method of accounting is used account for business combinations between the entities in the Group.
Assets acquired and liabilities assumed in the common control transactions are measured at the acquisition date at the carrying value for the Group's perspective.
Internal restructures arising from transfers of interests in entities that are under the control of the ultimate parent (Macquarie University) are not specifically within the scope of any accounting standard. Therefore, Macquarie University developed an accounting policy using the hierarchy for the selection of accounting policies includes in AASB 108 Accounting Policies, Changes in Accounting Estimates and Errors. Consequently, Macquarie University elected to measure such transactions, including non-cash distribution outside the scope of Australian Interpretation 17 Distributions of Non-cash Assets to Owners, at book value.
Consequently, non-cash distributions involving entities under common control are treated as contributions by owners/distributions to owners and are accounted for through equity, as a redemption of ownership interest.
Transfer of businesses, assets and liabilities involving entities under common control are done at book values through equity. Intercompany loans between entities under common control are accounted for through equity.
(b) Basis of consolidation
(i) Subsidiaries
The consolidated financial statements incorporate the assets and liabilities of all subsidiaries of Macquarie University (''parent entity'') as at 31 December 2010 and the results of all subsidiaries for the year then ended. Macquarie University and its subsidiaries together are referred to in these financial statements as the Group or the consolidated entity.
Subsidiaries are all those entities (including special purpose entities) over which the Group has the power to govern the financial and operating policies, generally accompanying a holding of more than one-half of the voting rights. The existence and effect of potential voting rights that are currently exercisable or convertible are considered when assessing whether the Group controls another entity.
Subsidiaries are fully consolidated from the date on which control is transferred to the Group. They are de-consolidated from the date that control ceases.
Financial Statements 69
Notes to the financial statements
Macquarie UniversityNotes to the financial statements
31 December 2010(continued)
1 Summary of significant accounting policies (continued) Intercompany transactions, balances and unrealised gains on transactions between Group companies are eliminated. Unrealised losses are also eliminated unless the transaction provides evidence of the impairment of the asset transferred. Accounting policies of subsidiaries have been changed where necessary to ensure consistency with the policies adopted by the Group.
A list of the subsidiaries appear in Note 34.
(ii) Joint ventures
Joint venture operations
The proportionate interests in the assets, liabilities and expenses of the joint venture operations were not considered material and have not been incorporated in the financial statements. Details of the joint venture are set out in note 35.
(c) Foreign currency translation
(i) Functional and presentation currency
Items included in the financial statements of each of the Group’s entities are measured using the currency of the primary economic environment in which the entity operates (‘the functional currency’). The consolidated financial statements are presented in Australian dollars, which is Macquarie University’s functional and presentation currency.
(ii) Transactions and balances
Foreign currency transactions during the period have been converted to Australian currency at the rate applicable at the dates of transactions, with exchange rate fluctuations being recorded in the Income Statement. The balances of foreign currency accounts at balance date are included with Cash and cash equivalents in the Statement of Financial Position, converted at the rates applicable at year end.
(d) Comparative amounts
Where the presentation or reclassification of items in the financial statements are amended, comparable amounts shall be reclassified unless reclassification is impracticable. When comparable amounts are reclassified, the University shall disclose:
(a) the nature of the reclassification;
(b) the amount of each item or class of items that is reclassified; and
(c) the reason for the reclassification.
When it is impracticable to reclassify comparative amounts, the University shall disclose:
(a) the reason for not reclassifying the amounts; and
(b) the nature of the adjustments that would have been made, if the amounts had been reclassified.
(e) Revenue recognition
Revenue is measured at the fair value of the consideration received or receivable. Amounts disclosed as revenue are net of returns, trade allowances, rebates and amounts collected on behalf of third parties.
The Group recognises revenue when the amount of revenue can be reliably measured, it is probable that future economic benefits will flow to the Group and specific criteria have been met for each of the Group’s activities as described below. The amount of revenue is not considered to be reliably measurable until all contingencies relating to the sale have been resolved. The Group bases its estimates on historical results, taking into consideration the type of customer, the type of transaction and the specifics of each arrangement.
Revenue is recognised for the major business activities as follows:
(i) Government grants
The University treats operating grants received from Australian Government entities as income in the year of receipt or when entitlement for the revenue is established.
70 Macquarie University annual Report 2010

Macquarie UniversityNotes to the financial statements
31 December 2010(continued)
1 Summary of significant accounting policies (continued) (ii) Student fees and charges
Fees and charges are recognised as income in the year of receipt, except to the extent that fees and charges relate to courses to be held in future periods. Such income is treated as income in advance. Conversely, fees and charges relating to debtors are recognised as revenue in the year to which the prescribed course relates.
(iii) Interest Revenue
Interest revenue is recognised as interest revenue accrued using the effective interest method.
(iv) Lease income
Lease income from operating leases is recognised in income on a straight-line basis over the lease term.
(v) Consultancy and research revenue
Contract revenue is recognised in accordance with the percentage of completion method. The stage of completion is measured by reference to labour hours incurred to date as a percentage of estimated total labour hours for each contract.
Other human resources revenue is recognised when the service is provided.
(f) Income Tax Exemption
Macquarie University and its controlled entities with the exception of LAMS International Pty Ltd, Risk Frontiers Flood (Australia) Pty Ltd and Macquarie University Property Investment Group has received an endorsement by the Australian Taxation Office to access the income tax exemption from 1st July 2000 under Subdivision 50-B of the Income Tax Assessment Act 1997. LAMS International Pty Ltd has no income tax liability as at 31 December 2010.
The income tax status for Macquarie Graduate School of Management Pty Ltd (MGSM) is currently being reviewed by the Australian Taxation Office. Management believes that the MGSM should be entitled to an income tax exemption. Accordingly, no provision for income tax liability or future income tax benefit has been included in the accounts.
(g) Leases
Leases in which a significant portion of the risks and rewards of ownership are retained by the lessor are classified as operating leases (note 32). Payments made under operating leases (net of any incentives received from the lessor) are charged to the income statement on a straight-line basis, over the period of the lease.
The University leases some of its land to commercial organisations. The legal ownership and the benefits and the risks of the ownership rest with the University as lessor.
At the end of the lease period, buildings constructed by the lessees on the various sites will revert to University ownership without payment of consideration to the lessee. These assets have not been recognised in the financial statements as management considered the value of the assets at the end of the long term lease period to be immaterial.
Lease income from operating leases is recognised in income on a straight-line basis over the lease term.
Where the benefits and risks of ownership rest with the lessee, the University has classified these assets as finance leases.
(h) Impairment of assets
Assets that have an indefinite useful life are not subject to amortisation and are tested annually for impairment. Assets thatare subjected to amortisation are reviewed for impairment when events or changes in circumstances indicate that the carrying amount may not be recoverable. An impairment loss is recognised for the amount by which the asset’s carrying amount exceeds its recoverable amount. The recoverable amount is the higher of an asset’s fair value less costs to sell and value in use i.e. depreciated replacement cost. Financial assets are reviewed for impairment when events or changes in circumstances indicate that the asset may not be recoverable.
Financial Statements 71
Macquarie UniversityNotes to the financial statements
31 December 2010(continued)
1 Summary of significant accounting policies (continued)
(i) Cash and cash equivalents
Cash and cash equivalents includes cash on hand, deposits held at call with financial institutions, other short-term, highly liquid investments with original maturities of three months or less that are readily convertible to known amounts of cash and which are subject to an insignificant risk of changes in value, and bank overdrafts. Bank overdrafts are shown within borrowings in current liabilities on the statement of financial position.
(j) Trade receivables
Trade receivables are initially recognised and subsequently measured at invoiced amount. There is no material difference between invoiced amount and amortised cost due to their short term nature. Collectability of trade receivables is reviewed on an ongoing basis. Debts which are known to be uncollectible are written off. A provision for impairment of receivables is established when there is objective evidence that the Group may not be able to collect all amounts due according to the original terms of receivables.
Trade receivables generally settled within 42 days are carried at amount due. A provision for impairment of receivables has been created based on a review of all outstanding amounts at 31 December 2010. Bad debts are written off in the period in which they are identified.
(k) Inventories
Printery, publications, food and beverage, service stores, medical supplies and other inventories held for resale are valued at the lower of cost and net realisable value.
(l) Investments and other financial assets
Funds are invested using guidelines established by the University Council. In 1996, the University applied for and was granted wide investment powers under part 4 of Schedule 4 of the "Public Authorities (Financial Arrangements) Act 1987". Using these powers in 1997 the University implemented a strategy to diversify its investment portfolio between current and non-current investments. Current investments are reported at market value and non current investments are reported at fair value.
For further information references should be made to the following notes:
Other financial assets at fair value through income statement (Note 20)
Available-for-sale financial assets (Note 20)
Held to maturity investments (Note 20)
Other financial assets (Note 20)
Reserves and retained earnings (Note 28)
The Group classifies its investments in the following categories: financial assets at fair value through income statement, loans and receivables, held-to-maturity investments and available-for-sale financial assets. The classification depends on the purpose for which the investments were acquired. Management determines the classification of its investments at initial recognition and re-evaluates this designation at each reporting date.
(i) Financial assets at fair value through income statement
Financial assets at fair value through income statement include financial assets held for trading. A financial asset is classified in this category if acquired principally for the purpose of selling in the short term or if so designated by management. The policy of management is to designate a financial asset if there exists the possibility it will be sold in the short term and the asset is subject to frequent changes in fair value. Derivatives are classified as held for trading unless they are designated as hedges. Assets in this category are classified as current assets if they are either held for trading orare expected to be realised within 12 months of the statement of financial position date.
72 Macquarie University annual Report 2010
Macquarie UniversityNotes to the financial statements
31 December 2010(continued)
1 Summary of significant accounting policies (continued) (ii) Loans and receivables
Loans and receivables are non-derivative financial assets with fixed or determinable payments that are not quoted in an active market. They arise when the Group provides money, goods or services directly to a debtor with no intention of selling the receivable. They are included in current assets, except for those with maturities greater than 12 months after the statement of financial position date which are classified as non-current assets. Loans and receivables are included in receivables in the statement of financial position. (note 18).
(iii) Held-to-maturity investments
Held-to-maturity investments are non-derivative financial assets with fixed or determinable payments and fixed maturities that the Group’s management has the positive intention and ability to hold to maturity.
(iv) Available-for-sale financial assets
Available-for-sale financial assets, comprising principally marketable equity securities, are non-derivatives that are either designated in this category or not classified in any of the other categories. They are included in non-current assets unless management intends to dispose of the investment within 12 months of the statement of financial position date.
Purchases and sales of financial assets are recognised on trade-date - the date on which the Group commits to purchase or sell the asset. Investments are initially recognised at fair value plus transaction costs for all financial assets that are notcarried at fair value through income statement. Financial assets carried at fair value through income statement are initially recognised at fair value and transaction costs are expensed in the income statement. Financial assets are derecognised when the rights to receive cash flows from the financial assets have expired or have been transferred and the Group has transferred substantially all the risks and rewards of ownership.
Subsequent measurement Available-for-sale financial assets and financial assets at fair value through income statement are subsequently carried at fair value. Loans and receivables and held-to-maturity investments are carried at amortised cost using the effective interest method. Realised and unrealised gains and losses arising from changes in the fair value of the ‘financial assets at fair value through income statement’ category are included in the income statement in the period in which they arise.
Unrealised gains and losses arising from changes in the fair value of non monetary securities classified as available-for-sale are recognised in equity in the available-for-sale investments revaluation reserve. When securities classified as available-for-sale are sold or impaired, the accumulated fair value adjustments are included in the statement of comprehensive income as gains and losses from investment securities.
Fair value The fair values of quoted investments are based on current bid prices. If the market for a financial asset is not active (and for unlisted securities), the Group establishes fair value by using valuation techniques. These include reference to the fair values of recent arm’s length transactions, involving the same instruments or other instruments that are substantially the same, discounted cash flow analysis, and option pricing models refined to reflect the issuer’s specific circumstances. If fairvalue could not be determined investment in unlisted securities are measured at cost.
Impairment The Group assesses at each balance date whether there is objective evidence that a financial asset or group of financial assets is impaired. In the case of equity securities classified as available-for-sale, a significant or prolonged decline in thefair value of a security below its cost is considered in determining whether the security is impaired. If any such evidence exists for available-for-sale financial assets, the cumulative loss - measured as the difference between the acquisition cost and the current fair value, less any impairment loss on that financial asset previously recognised in profit and loss - is removed from equity and recognised in the income statement. Impairment losses recognised in the income statement on equity instruments are not reversed through the income statement.
(m) Fair value estimation
The fair value of financial assets and financial liabilities must be estimated for recognition and measurement or for disclosure purposes.
The fair value of financial instruments traded in active markets (such as publicly traded derivatives, and trading and available-for-sale securities) is based on quoted market prices.
The fair value of financial instruments that are not traded in an active market (for example, shares in unlisted entities) is determined on a cost basis or net asset basis.
Financial Statements 73
Macquarie UniversityNotes to the financial statements
31 December 2010(continued)
1 Summary of significant accounting policies (continued)
(n) Property, plant and equipment
Acquisition and additions of non-current assets are capitalised if the value is more than $1,000 for subsidiaries or $5,000 for Parent entity, where individual items are less than these amounts but the project total is collectively greater than the capitalisation limit, the collective total may be capitalised. These additions are recorded at cost in the year of acquisition.
Land and buildings are measured on their fair value basis. Fair value is determined on the basis of an independent valuation prepared by external experts and is assessed in accordance with AASB 116.
The fair value of property, plant and equipment is measured on an existing use basis, where there are no feasible alternative uses in the existing natural, legal, financial and socio-political environment. However, in the limited circumstances where there are feasible alternative uses, assets are valued at their highest and best use. Fair value of property, plant and equipment is determined based on the best available market evidence, including current market selling prices for the same or similar assets. Where there is no available market evidence, the asset's fair value is measured at its market buying price, the best indicator of which is depreciated replacement cost.
The fair values are recognised in the financial statements, and are reviewed at the end of the reporting periods to ensure that the carrying values of land and buildings are not materially different from their value.
Any accumulated depreciation at the date of revaluation is eliminated against the gross carrying amount of the asset and the net amount is restated to the revalued amount of the asset. Subsequent costs are included in the asset’s carrying amount or recognised as a separate asset, as appropriate, only when it is probable that future economic benefits associated with the item will flow to the Group and the cost of the item can be measured reliably. All other repairs and maintenance are charged to the income statement during the financial period in which they are incurred.
Increases in the carrying amounts arising on revaluation of land and buildings are recognised in comprehensive income and accumulated in equity under the heading reserves. To the extent that the increase reverses a decrease previously recognised in income statement, the increase is first recognised in the income statement. Decreases that reverse previous increases of the same asset are firstly recognised in other comprehensive income before reducing the balance of revaluation reserves in equity, to the extent of the remaining reserve attributable to the asset; all other decreases are charged to the income statement.
Gains and losses on disposals are recorded on a net basis in the income statement. When revalued assets are sold, it is Group policy to transfer the amounts included in other reserves in respect of those assets to retained earnings.
Land, Building and Infrastructure was revalued with dates of inspection between 1 June 2010 to 12 July 2010 and valuation date as at 31 December 2010. The valuation was provided by Mr. Graham Scrymgeour AAPI, Registered Valuer No. 1578 of Global Valuations Services Pty Ltd.
The carrying value of other plant and equipment are measured at depreciated historic cost. There is no substantive difference between the fair value and the carrying value of these assets.
Works of art are valued at fair value and are revalued every five years. Fair value has been assessed on the basis of market value for existing use. The works of art were valued as at 31 December 2009 by Mr W Caruana for the indigenous works, and by Ms S Downer and Ms S Hewitt for the non-indigenous works, including works in the University's Sculpture Park. The valuers are approved valuers under the Australian Government Cultural Gifts Program.
The Library General Collection is recorded at fair value on the basis of depreciated replacement value.
The Library Special Collection was revalued as at 30 November 2009. The valuation was provided by Mr S Taaffe, an approved valuer under the Australian Government Cultural Gifts Program.
Artefacts contained in the Lachlan Macquarie Room located at Macquarie University were revalued on 1 December 2008. The valuation was provided by Mr Simon Hollington M.A.V.A.A, Registered Valuer No. 255 of Hollington Fine Art Valuation.
Artefacts owned by Macquarie University in the Museum of Ancient Cultures were revalued on 16 February 2008. The valuation was provided by Mr James Ede from Charles Ede Limited, an approved valuer under the Australian Government Cultural Gifts Program.
The collections of papyri held by the Museum of Ancient Cultures were revalued on 14 February 2008. The valuation was provided by Mr James Ede from Charles Ede Limited, an approved valuer under the Australian Government Cultural Gifts Program.
Coins held in the Museum of Ancient Cultures located at Macquarie University were revalued on 5 February 2008. The valuation was provided by Mr Walter Holt ANA, ANS, ASAN.
74 Macquarie University annual Report 2010
Macquarie UniversityNotes to the financial statements
31 December 2010(continued)
1 Summary of significant accounting policies (continued) Property, plant and equipment are depreciated only when they are completed and ready for use. Depreciation is calculated on a straight line basis to expense the net cost or fair value of each item of property, plant and equipment over its expected useful life. Land is not depreciated. The applicable rates are:
Asset % p.a.- Patents 5- Buildings 1.72 to 33.33- Infrastructure 4.76 to 5.00- Assets under construction NilPlant and Equipment- Computer Equipment 30.0- Other Equipment 10 to 30- Motor Vehicles 15- Library Collections: General 20- Library Collections: Special Nil- Works of Art and Museum Collections Nil- Medical Equipment 10 to 20
The assets’ residual values and useful lives are reviewed, and adjusted if appropriate, annually.
An asset's carrying amount is written down immediately to its recoverable amount if the asset's carrying amount is greater than its estimated recoverable amount.
(o) Intangible assets
(i) Research and development
Expenditure on research activities, undertaken with the prospect of obtaining new scientific or technical knowledge and understanding, is recognised in the income statement as an expense, when it is incurred.
Expenditure on development activities, being the application of research findings or other knowledge to a plan or design for the production of new or substantially improved products or services before the start of commercial production or use, is capitalised if the product or service is technically and commercially feasible and adequate resources are available to complete development. The expenditure capitalised comprises all directly attributable costs, including costs of materials, services, direct labour and an appropriate proportion of overheads. Other development expenditure is recognised in the income statement as an expense as incurred. Capitalised development expenditure is stated at cost less accumulated amortisation. Amortisation is calculated using the straight-line method to allocate the cost over the period of the expected benefit.
Patents were revalued on 1 December 2008. The valuation was provided Mr Steven Allan from Moore Stephens, Associates of the Institute of Chartered Accountants in Australia, Member of the Australian Society of Certified Practising Accountants and Fellow of the Taxation Institute of Australia.
(p) Unfunded superannuation
In accordance with the 1998 instructions issued by the Department of Education, Training and Youth Affairs (DETYA) now known as DEEWR, the effects of the unfunded superannuation liabilities of the University and its controlled entities were recorded in the Income statement and the statement of financial position for the first time in 1998. The prior years' practice had been to disclose liabilities by way of a note to the financial statements.
The unfunded liabilities recorded in the statement of financial position under Provisions have been determined by the actuary of Superannuation Administrations Corporation, trading as Pillar Administration, William Mercer.
An arrangement exists between the Australian Government and the State Government to meet the unfunded liability for the University’s beneficiaries of the State Superannuation Scheme and the State Authorities Superannuation Scheme on an emerging cost basis. This arrangement is evidenced by the State Grants (General Revenue) Amendment Act 1987, Higher Education Funding Act 1988 and subsequent amending legislation. Accordingly, the unfunded liabilities have been recognised in the income statement under Provisions with a corresponding asset recognised under Receivables. The recognition of both the asset and the liability consequently does not affect the year end net asset position of the University and its controlled entities.
Financial Statements 75
Macquarie UniversityNotes to the financial statements
31 December 2010(continued)
1 Summary of significant accounting policies (continued)
(q) Trade and other payables
Trade accounts payable are recognised when the University becomes obliged to make future payments as a result of purchases. The amounts are unsecured and are usually paid within 30 days of recognition. Trade accounts payable are measured at original cost, which is not materially different to amortised cost due to the short term nature of liabilities.
(r) Borrowings
Borrowings are initially recognised at fair value, net of transaction costs incurred. Borrowings are subsequently measured at amortised cost. Any difference between the proceeds (net of transaction costs) and the redemption amount is recognised in the income statement over the period of the interest bearing liabilities using the effective interest method.
Borrowings are classified as current liabilities unless the Group has an unconditional right to defer settlement of the liability for at least 12 months after the statement of financial position date.
(s) Borrowing costs
Borrowing costs are recognised as expenses in the period in which they are incurred (except where they are included in the costs of qualifying assets during the period of time that is required to complete and prepare the asset for its intended use orsale). Borrowing costs relates to loans, which are recorded at face value. Interest is expensed as it accrues, unless it relates to qualifying assets, in this case the borrowing cost is capitalised.
(t) Provisions
Provisions for legal claims and service warranties are recognised when: the Group has a present legal or constructive obligation as a result of past events; it is probable that an outflow of resources will be required to settle the obligation andthe amount has been reliably estimated. Provisions are not recognised for future operating losses.
Where there are a number of similar obligations, the likelihood that an outflow will be required in settlement is determined by considering the class of obligations as a whole. A provision is recognised even if the likelihood of an outflow with respect to any one item included in the same class of obligations may be small.
Provisions are measured at the present value of management’s best estimate of the expenditure required to settle the present obligation at the statement of financial position date. The discount rate used to determine the present value reflects current market assessments of the time value of money and the risks specific to the liability. The increase in the provision due to the passage of time is recognised as a finance cost.
(u) Employee benefits
Provisions have been made for employee entitlements in respect of salaries and wages, annual leave, long service leave, and superannuation where applicable. The balance of these provisions at 31 December has been categorised for statement of financial position purposes as either current liabilities or non-current liabilities. Employee benefits for untakenannual leave are accrued using the nominal method at expected pay rates including appropriate salary on costs. Employee benefits for long service leave have been recognised according to an actuarial assessment performed in accordance with AASB 119 "Employee Benefits".
All University employees, including casuals, receive superannuation benefits equal to or exceeding the Superannuation Guarantee Levy.
(i) Wages and salaries, annual leave and sick leave
Liabilities for wages and salaries, including non-monetary benefits, annual leave and accumulating sick leave expected to be settled within 12 months of the reporting date are recognised in other payables in respect of employees' services up to the reporting date and are measured at the amounts expected to be paid when the liabilities are settled. Liabilities for non-accumulating sick leave are recognised when the leave is taken and measured at the rates paid or payable. Regardless of the expected timing of settlements, provisions made in respect of employee benefits are classified as a current liability, unless there is an unconditional right to defer the settlement of the liability for at least 12 months after the reporting date, in which case it would be classified as a non-current liability.
76 Macquarie University annual Report 2010
Macquarie UniversityNotes to the financial statements
31 December 2010(continued)
1 Summary of significant accounting policies (continued) (ii) Long service leave
The liability for long service leave is recognised in the provision for employee benefits and measured as the present value of expected future payments to be made in respect of services provided by employees up to the reporting date using the projected unit credit method. Consideration is given to expected future wage and salary levels, experience of employee departures and periods of service. Expected future payments are discounted using market yields at the reporting date on national government bonds with terms to maturity and currency that match, as closely as possible, the estimated future cash outflows.
(iii) Retirement benefit obligations
All employees of the Group are entitled to benefits on retirement, disability or death from the Group's superannuation plan. The Group has a defined benefit section and a defined contribution section within its plan. The defined benefit section provides defined lump sum benefits based on years of service and final average salary. The defined contribution section receives fixed contributions from Group companies and the Group's legal or constructive obligation is limited to these contributions. The employees of the parent entity are all members of the defined contribution section of the Group's plan.
A liability or asset in respect of defined benefit superannuation plans is recognised in the statement of financial position, and is measured as the present value of the defined benefit obligation at the reporting date less the fair value of the superannuation fund’s assets at that date and any unrecognised past service cost. The present value of the defined benefit obligation is based on expected future payments which arise from membership of the fund to the reporting date, calculated annually by independent actuaries using the projected unit credit method. Consideration is given to expected future wage and salary levels, experience of employee departures and periods of service.
Expected future payments are discounted using market yields at the reporting date on national government bonds with terms to maturity and currency that match, as closely as possible, the estimated future cash outflows.
Actuarial gains and losses arising from experience adjustments and changes in actuarial assumptions are recognised in the period in which they occur outside of the income statement in the statement of comprehensive income.
Past service costs are recognised immediately in income, unless the changes to the superannuation fund are conditional on the employees remaining in service for a specified period of time (the vesting period). In this case, the past service costs are amortised on a straight-line basis over the vesting period.
Contributions to the defined contribution fund are recognised as an expense as they become payable. Prepaid contributions are recognised as an asset to the extent that a cash refund or a reduction in the future payments is available.
(iv) Termination benefits
Termination benefits are payable when employment is terminated before the normal retirement date, or when an employee accepts voluntary redundancy in exchange for these benefits. The Group recognises termination benefits when it is demonstrably committed to either terminating the employment of current employees according to a detailed formal plan without possibility of withdrawal or providing termination benefits as a result of an offer made to encourage voluntary redundancy. Benefits falling due more than 12 months after balance date are discounted to present value.
(v) Goods and Services Tax (GST)
Revenues, expenses and assets are recognised net of the amount of goods and services GST, except where the amount of GST incurred is not recoverable from the Australian Taxation Office (ATO). In these circumstances the GST is recognised as part of the cost of acquisition of the asset or as part of an item of the expense.
Receivables and payables are stated with the amount of GST included. The net amount of GST recoverable from, or payable to, ATO is included with other receivables or payables in the statement of financial position.
Cash flows are included in the statement of cash flows on a gross basis. The GST components of cash flows arising from investing or financing activities which are recoverable from, or payable to, the ATO are classified as operating cash flows.
(w) Rounding of amounts
Amounts in the financial statements have been rounded to the nearest thousand dollars.
Financial Statements 77
Macquarie UniversityNotes to the financial statements
31 December 2010(continued)
1 Summary of significant accounting policies (continued)
(x) New accounting standards and Interpretations
Certain new Accounting Standards and Interpretations have been published that are not mandatory for 31 December 2010 reporting periods.
The University has assessed the impact of these new Standards and Interpretations and considers the impact to be insignificant.
(y) Derivatives
Derivatives are initially recognised at fair value on the date a derivative contract is entered into and are subsequently remeasured to their fair value. The method of recognising the resulting gain or loss depends on whether the derivative is designated as a hedging instrument, and if so, the nature of the item being hedged. The Group designates certain derivatives as either; (1) hedges of the fair value of recognised assets or liabilities or a firm commitment (fair value hedge);or (2) hedges of highly probable forecast transactions (cash flow hedges).
(i) Fair value hedge
Changes in the fair value of derivatives that are designated and qualify as fair value hedges are recorded in the income statement, together with any changes in the fair value of the hedged asset or liability that are attributable to the hedged risk.
(ii) Cash flow hedge
The effective portion of changes in the fair value of derivatives that are designated and qualify as cash flow hedges is recognised in equity in other comprehensive income. The gain or loss relating to the ineffective portion is recognised immediately in the income statement within other income or borrowing costs.
Amounts that have been recognised in other comprehensive income are reclassified from equity to income statement as a reclassification adjustment in the periods when the hedged item affects profit or loss (for instance when the forecast sale that is hedged takes place). The gain or loss relating to the effective portion of interest rate swaps hedging variable rate borrowings is recognised in the income statement within `borrowing costs’. The gain or loss relating to the effective portion of forward foreign exchange contracts is recognised in the income statement within `Fees and charges’.
However, when the forecast cash flow that is hedged results in the recognition of a non-financial asset (for example, inventory or fixed assets) the gains and losses previously recognised in other comprehensive income are either reclassified as a reclassification adjustment to the income statement or are included in the initial measurement of the cost of the asset. The deferred amounts are ultimately recognised in the income statement as other expenses in the case of inventory, or as depreciation in the case of fixed assets.
When a hedging instrument expires or is sold or terminated, or when a hedge no longer meets the criteria for hedge accounting, any cumulative gain or loss that has been recognised in other comprehensive income from the period when the hedge was effective shall remain separately in equity until the forecast transaction occurs. When a forecast transaction is no longer expected to occur, the cumulative gain or loss that was recognised in other comprehensive income shall be reclassified to the income statement as a reclassification adjustment.
(iii) Derivatives that do not qualify for hedge accounting
Certain derivative instruments do not qualify for hedge accounting. Changes in the fair value of any derivative instrument that does not qualify for hedge accounting are recognised immediately in the income statement and are included in other income or borrowing costs.
78 Macquarie University annual Report 2010

Macquarie UniversityNotes to the financial statements
31 December 2010(continued)
2 Disaggregated information
(a) Geographical - Consolidated
Revenue Results Assets
2010 2009 2010 2009 2010 2009$'000 $'000 $'000 $'000 $'000 $'000
Australia 685,106 581,985 75,378 55,666 2,046,898 1,746,992 Asia 1,688 1,190 858 (1) - -
Total 686,794 583,175 76,236 55,665 2,046,898 1,746,992
Financial Statements 79
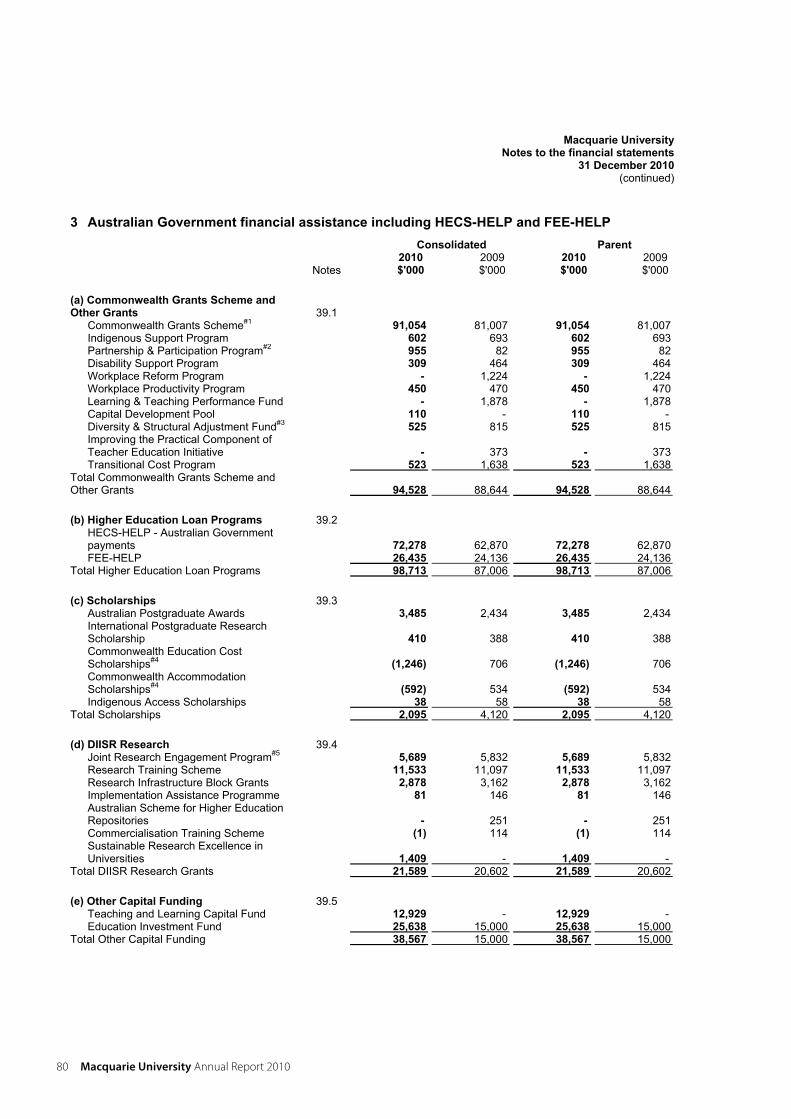
Macquarie UniversityNotes to the financial statements
31 December 2010(continued)
3 Australian Government financial assistance including HECS-HELP and FEE-HELP Consolidated Parent
2010 2009 2010 2009 Notes $'000 $'000 $'000 $'000
(a) Commonwealth Grants Scheme and Other Grants 39.1
Commonwealth Grants Scheme#1 91,054 81,007 91,054 81,007 Indigenous Support Program 602 693 602 693 Partnership & Participation Program#2 955 82 955 82 Disability Support Program 309 464 309 464 Workplace Reform Program - 1,224 - 1,224 Workplace Productivity Program 450 470 450 470 Learning & Teaching Performance Fund - 1,878 - 1,878 Capital Development Pool 110 - 110 - Diversity & Structural Adjustment Fund#3 525 815 525 815 Improving the Practical Component of Teacher Education Initiative - 373 - 373 Transitional Cost Program 523 1,638 523 1,638
Total Commonwealth Grants Scheme and Other Grants 94,528 88,644 94,528 88,644
(b) Higher Education Loan Programs 39.2 HECS-HELP - Australian Government payments 72,278 62,870 72,278 62,870 FEE-HELP 26,435 24,136 26,435 24,136
Total Higher Education Loan Programs 98,713 87,006 98,713 87,006
(c) Scholarships 39.3 Australian Postgraduate Awards 3,485 2,434 3,485 2,434 International Postgraduate Research Scholarship 410 388 410 388 Commonwealth Education Cost Scholarships#4 (1,246) 706 (1,246) 706 Commonwealth Accommodation Scholarships#4 (592) 534 (592) 534 Indigenous Access Scholarships 38 58 38 58
Total Scholarships 2,095 4,120 2,095 4,120
(d) DIISR Research 39.4 Joint Research Engagement Program#5 5,689 5,832 5,689 5,832 Research Training Scheme 11,533 11,097 11,533 11,097 Research Infrastructure Block Grants 2,878 3,162 2,878 3,162 Implementation Assistance Programme 81 146 81 146 Australian Scheme for Higher Education Repositories - 251 - 251 Commercialisation Training Scheme (1) 114 (1) 114 Sustainable Research Excellence in Universities 1,409 - 1,409 -
Total DIISR Research Grants 21,589 20,602 21,589 20,602
(e) Other Capital Funding 39.5 Teaching and Learning Capital Fund 12,929 - 12,929 - Education Investment Fund 25,638 15,000 25,638 15,000
Total Other Capital Funding 38,567 15,000 38,567 15,000
80 Macquarie University annual Report 2010

Macquarie UniversityNotes to the financial statements
31 December 2010(continued)
3 Australian Government financial assistance including HECS-HELP and FEE-HELP (continued)
Consolidated Parent2010 2009 2010 2009
Notes $'000 $'000 $'000 $'000
(f) Australian Research Council 39.6 (i) Discovery 39.6(a)Project 7,905 7,091 7,905 7,091 Fellowships 998 77 998 77 Total Discovery 8,903 7,168 8,903 7,168
(ii) Linkages 39.6(b)Infrastructure 1,470 - 1,470 - International - 15 - 15 Projects 1,980 2,157 1,980 2,157 Total Linkages 3,450 2,172 3,450 2,172
(iii) Networks and Centres 39.6(c)Research Networks - 712 - 712 Total Networks and Centres - 712 - 712
Total Australian Research Council 12,353 10,052 12,353 10,052
(g) Other Australian Government financial assistance
Commonwealth Parliament 54 53 - - Agriculture, Fisheries and Forestry 27 64 27 64 Attorney-General's 10 - 10 - Broadband, Communications and the Digital Economy - 265 - 265 Defence 62 415 62 415 Education, Employment and Workplace Relations 9,267 5,064 9,267 5,064 Environment, Water, Heritage and the Arts 9 259 9 259 Families, Housing, Community Services and Indigenous Affairs 20 115 20 115 Finance and Deregulation - 10 - 10 Foreign Affairs and Trade 532 1,381 532 1,381 Health and Ageing 1,927 2,468 1,927 2,468 Immigration and Citizenship 24 - 24 - Innovation, Industry, Science and Research 350 71 350 71 Prime Minister and Cabinet - 78 - 78 Resources, Energy and Tourism 7 - 7 - Other 877 336 877 336
Total Other Australian Government financial assistance 13,166 10,579 13,112 10,526
Total Australian Government financial assistance 281,011 236,003 280,957 235,950
#1 Includes the basic CGS grant amount, Maths and Science Transition Loading and HEFA Transition Fund.
#2 Includes Equity Support Program.
#3 Includes Collaboration & Structural Adjustment Program.
#4 Includes National Priority Scholarships.
#5 Includes Institutional Grants Scheme.
Financial Statements 81
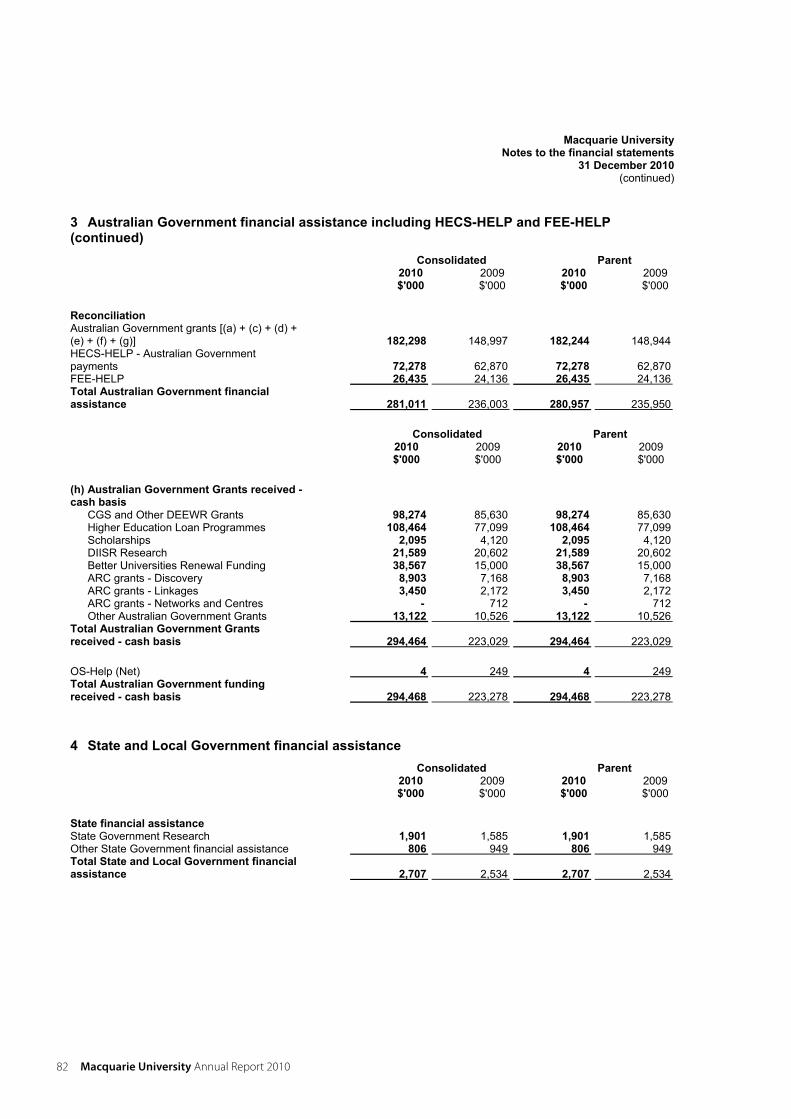
Macquarie UniversityNotes to the financial statements
31 December 2010(continued)
3 Australian Government financial assistance including HECS-HELP and FEE-HELP (continued)
Consolidated Parent2010 2009 2010 2009 $'000 $'000 $'000 $'000
ReconciliationAustralian Government grants [(a) + (c) + (d) + (e) + (f) + (g)] 182,298 148,997 182,244 148,944 HECS-HELP - Australian Government payments 72,278 62,870 72,278 62,870 FEE-HELP 26,435 24,136 26,435 24,136 Total Australian Government financial assistance 281,011 236,003 280,957 235,950
Consolidated Parent2010 2009 2010 2009 $'000 $'000 $'000 $'000
(h) Australian Government Grants received - cash basis
CGS and Other DEEWR Grants 98,274 85,630 98,274 85,630 Higher Education Loan Programmes 108,464 77,099 108,464 77,099 Scholarships 2,095 4,120 2,095 4,120 DIISR Research 21,589 20,602 21,589 20,602 Better Universities Renewal Funding 38,567 15,000 38,567 15,000 ARC grants - Discovery 8,903 7,168 8,903 7,168 ARC grants - Linkages 3,450 2,172 3,450 2,172 ARC grants - Networks and Centres - 712 - 712 Other Australian Government Grants 13,122 10,526 13,122 10,526
Total Australian Government Grants received - cash basis 294,464 223,029 294,464 223,029
OS-Help (Net) 4 249 4 249 Total Australian Government funding received - cash basis 294,468 223,278 294,468 223,278
4 State and Local Government financial assistance Consolidated Parent
2010 2009 2010 2009 $'000 $'000 $'000 $'000
State financial assistance State Government Research 1,901 1,585 1,901 1,585 Other State Government financial assistance 806 949 806 949 Total State and Local Government financial assistance 2,707 2,534 2,707 2,534
82 Macquarie University annual Report 2010
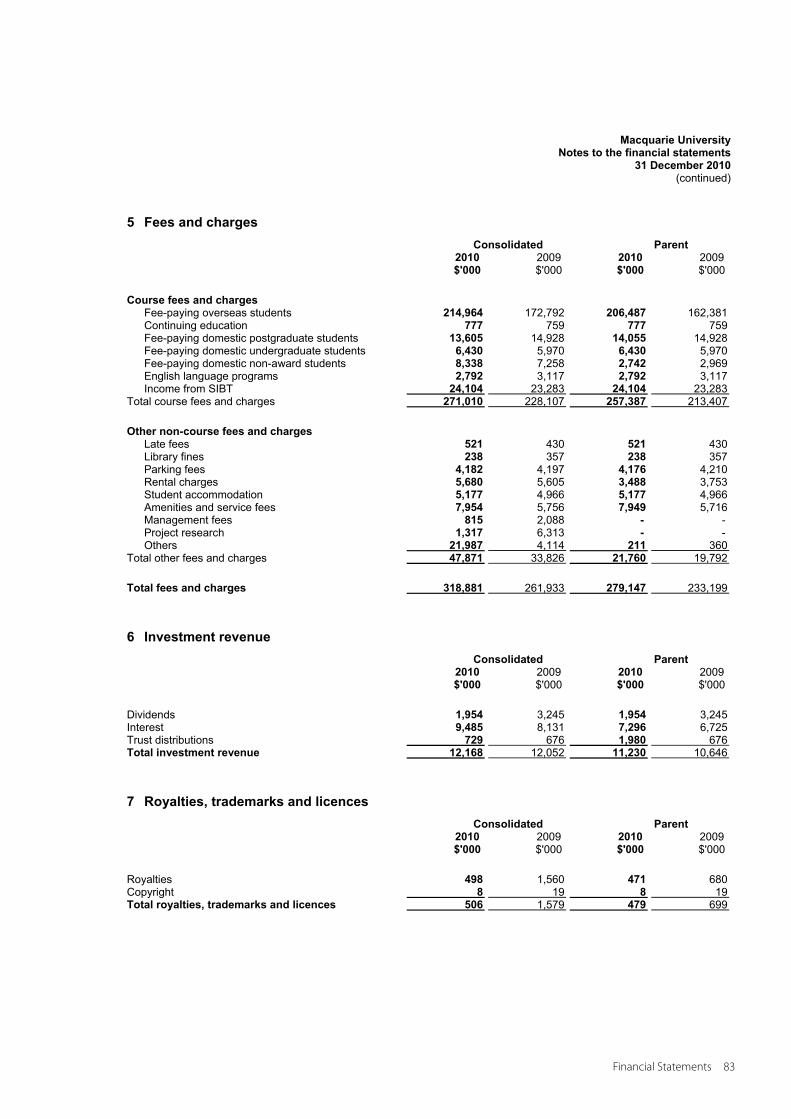
Macquarie UniversityNotes to the financial statements
31 December 2010(continued)
5 Fees and charges Consolidated Parent
2010 2009 2010 2009 $'000 $'000 $'000 $'000
Course fees and charges Fee-paying overseas students 214,964 172,792 206,487 162,381 Continuing education 777 759 777 759 Fee-paying domestic postgraduate students 13,605 14,928 14,055 14,928 Fee-paying domestic undergraduate students 6,430 5,970 6,430 5,970 Fee-paying domestic non-award students 8,338 7,258 2,742 2,969 English language programs 2,792 3,117 2,792 3,117 Income from SIBT 24,104 23,283 24,104 23,283
Total course fees and charges 271,010 228,107 257,387 213,407
Other non-course fees and charges Late fees 521 430 521 430 Library fines 238 357 238 357 Parking fees 4,182 4,197 4,176 4,210 Rental charges 5,680 5,605 3,488 3,753 Student accommodation 5,177 4,966 5,177 4,966 Amenities and service fees 7,954 5,756 7,949 5,716 Management fees 815 2,088 - - Project research 1,317 6,313 - - Others 21,987 4,114 211 360
Total other fees and charges 47,871 33,826 21,760 19,792
Total fees and charges 318,881 261,933 279,147 233,199
6 Investment revenue Consolidated Parent
2010 2009 2010 2009 $'000 $'000 $'000 $'000
Dividends 1,954 3,245 1,954 3,245 Interest 9,485 8,131 7,296 6,725 Trust distributions 729 676 1,980 676 Total investment revenue 12,168 12,052 11,230 10,646
7 Royalties, trademarks and licences Consolidated Parent
2010 2009 2010 2009 $'000 $'000 $'000 $'000
Royalties 498 1,560 471 680 Copyright 8 19 8 19 Total royalties, trademarks and licences 506 1,579 479 699
Financial Statements 83
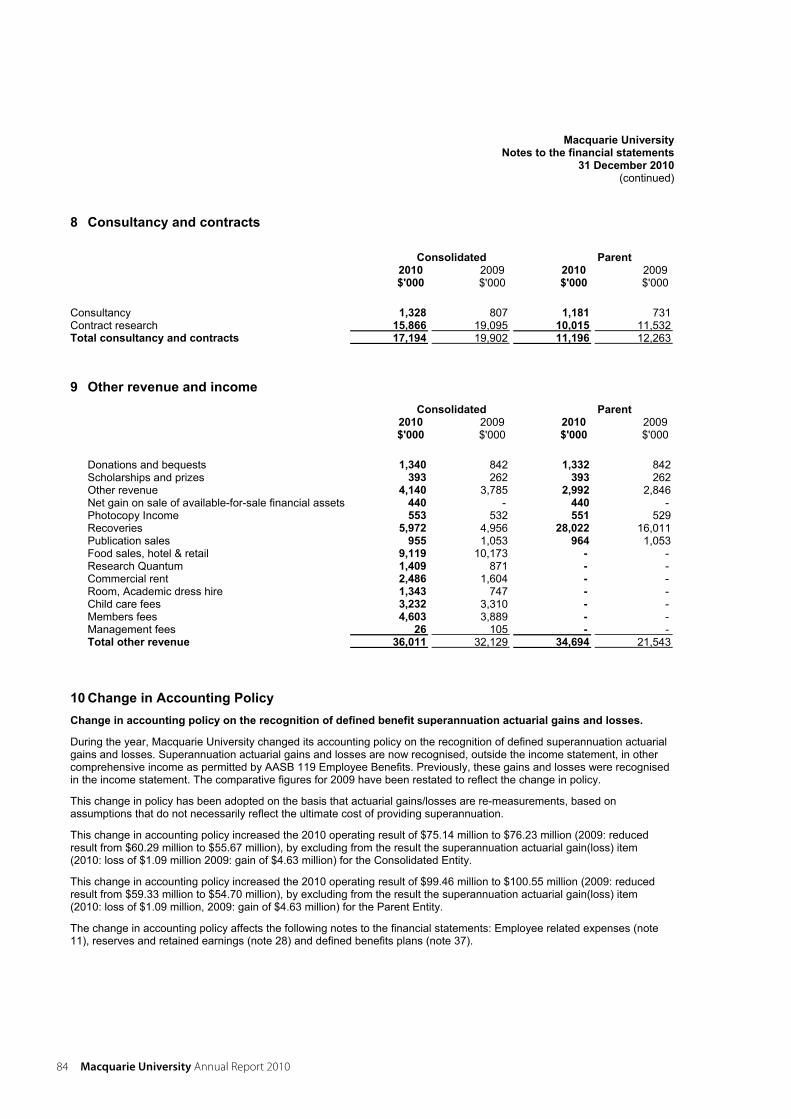
Macquarie UniversityNotes to the financial statements
31 December 2010(continued)
8 Consultancy and contracts
Consolidated Parent2010 2009 2010 2009 $'000 $'000 $'000 $'000
Consultancy 1,328 807 1,181 731 Contract research 15,866 19,095 10,015 11,532 Total consultancy and contracts 17,194 19,902 11,196 12,263
9 Other revenue and income Consolidated Parent
2010 2009 2010 2009 $'000 $'000 $'000 $'000
Donations and bequests 1,340 842 1,332 842 Scholarships and prizes 393 262 393 262 Other revenue 4,140 3,785 2,992 2,846 Net gain on sale of available-for-sale financial assets 440 - 440 - Photocopy Income 553 532 551 529 Recoveries 5,972 4,956 28,022 16,011 Publication sales 955 1,053 964 1,053 Food sales, hotel & retail 9,119 10,173 - - Research Quantum 1,409 871 - - Commercial rent 2,486 1,604 - - Room, Academic dress hire 1,343 747 - - Child care fees 3,232 3,310 - - Members fees 4,603 3,889 - - Management fees 26 105 - - Total other revenue 36,011 32,129 34,694 21,543
10 Change in Accounting Policy Change in accounting policy on the recognition of defined benefit superannuation actuarial gains and losses.
During the year, Macquarie University changed its accounting policy on the recognition of defined superannuation actuarial gains and losses. Superannuation actuarial gains and losses are now recognised, outside the income statement, in other comprehensive income as permitted by AASB 119 Employee Benefits. Previously, these gains and losses were recognised in the income statement. The comparative figures for 2009 have been restated to reflect the change in policy.
This change in policy has been adopted on the basis that actuarial gains/losses are re-measurements, based on assumptions that do not necessarily reflect the ultimate cost of providing superannuation.
This change in accounting policy increased the 2010 operating result of $75.14 million to $76.23 million (2009: reduced result from $60.29 million to $55.67 million), by excluding from the result the superannuation actuarial gain(loss) item (2010: loss of $1.09 million 2009: gain of $4.63 million) for the Consolidated Entity.
This change in accounting policy increased the 2010 operating result of $99.46 million to $100.55 million (2009: reduced result from $59.33 million to $54.70 million), by excluding from the result the superannuation actuarial gain(loss) item (2010: loss of $1.09 million, 2009: gain of $4.63 million) for the Parent Entity.
The change in accounting policy affects the following notes to the financial statements: Employee related expenses (note 11), reserves and retained earnings (note 28) and defined benefits plans (note 37).
84 Macquarie University annual Report 2010
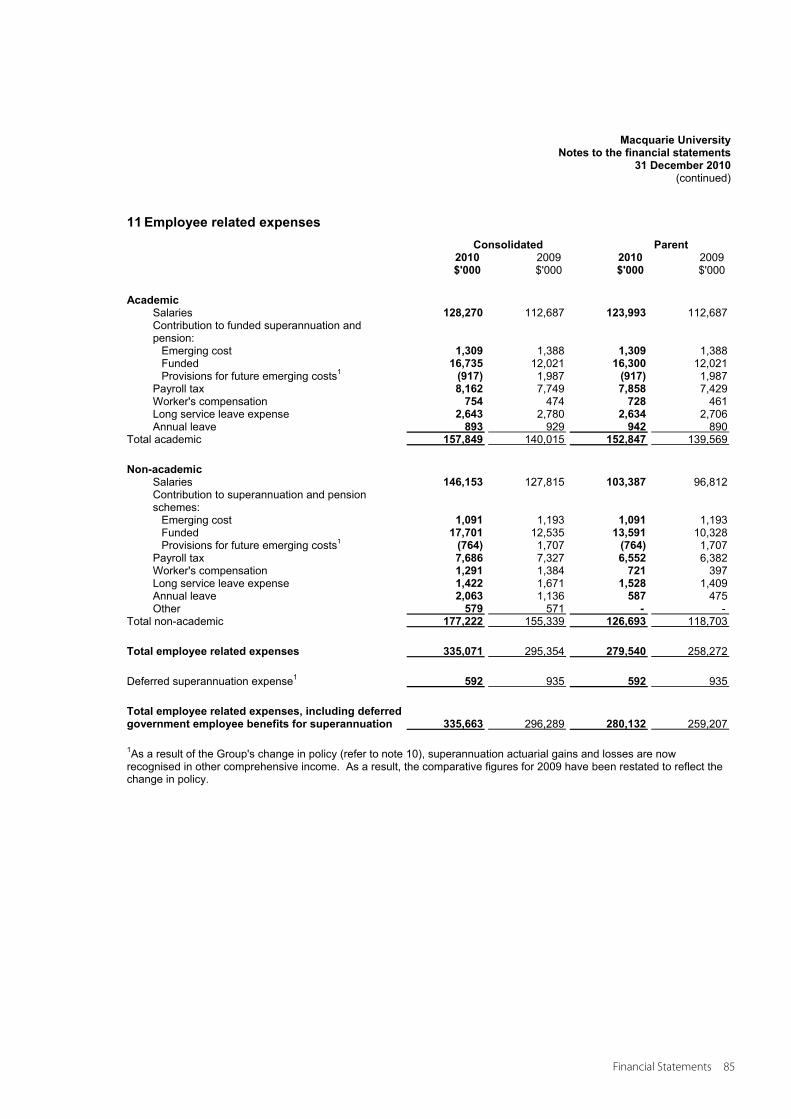
Macquarie UniversityNotes to the financial statements
31 December 2010(continued)
11 Employee related expenses Consolidated Parent
2010 2009 2010 2009 $'000 $'000 $'000 $'000
Academic Salaries 128,270 112,687 123,993 112,687 Contribution to funded superannuation and pension:
Emerging cost 1,309 1,388 1,309 1,388 Funded 16,735 12,021 16,300 12,021 Provisions for future emerging costs1 (917) 1,987 (917) 1,987
Payroll tax 8,162 7,749 7,858 7,429 Worker's compensation 754 474 728 461 Long service leave expense 2,643 2,780 2,634 2,706 Annual leave 893 929 942 890
Total academic 157,849 140,015 152,847 139,569
Non-academic Salaries 146,153 127,815 103,387 96,812 Contribution to superannuation and pension schemes:
Emerging cost 1,091 1,193 1,091 1,193 Funded 17,701 12,535 13,591 10,328 Provisions for future emerging costs1 (764) 1,707 (764) 1,707
Payroll tax 7,686 7,327 6,552 6,382 Worker's compensation 1,291 1,384 721 397 Long service leave expense 1,422 1,671 1,528 1,409 Annual leave 2,063 1,136 587 475 Other 579 571 - -
Total non-academic 177,222 155,339 126,693 118,703
Total employee related expenses 335,071 295,354 279,540 258,272
Deferred superannuation expense1 592 935 592 935
Total employee related expenses, including deferred government employee benefits for superannuation 335,663 296,289 280,132 259,207
1As a result of the Group's change in policy (refer to note 10), superannuation actuarial gains and losses are now recognised in other comprehensive income. As a result, the comparative figures for 2009 have been restated to reflect the change in policy.
Financial Statements 85
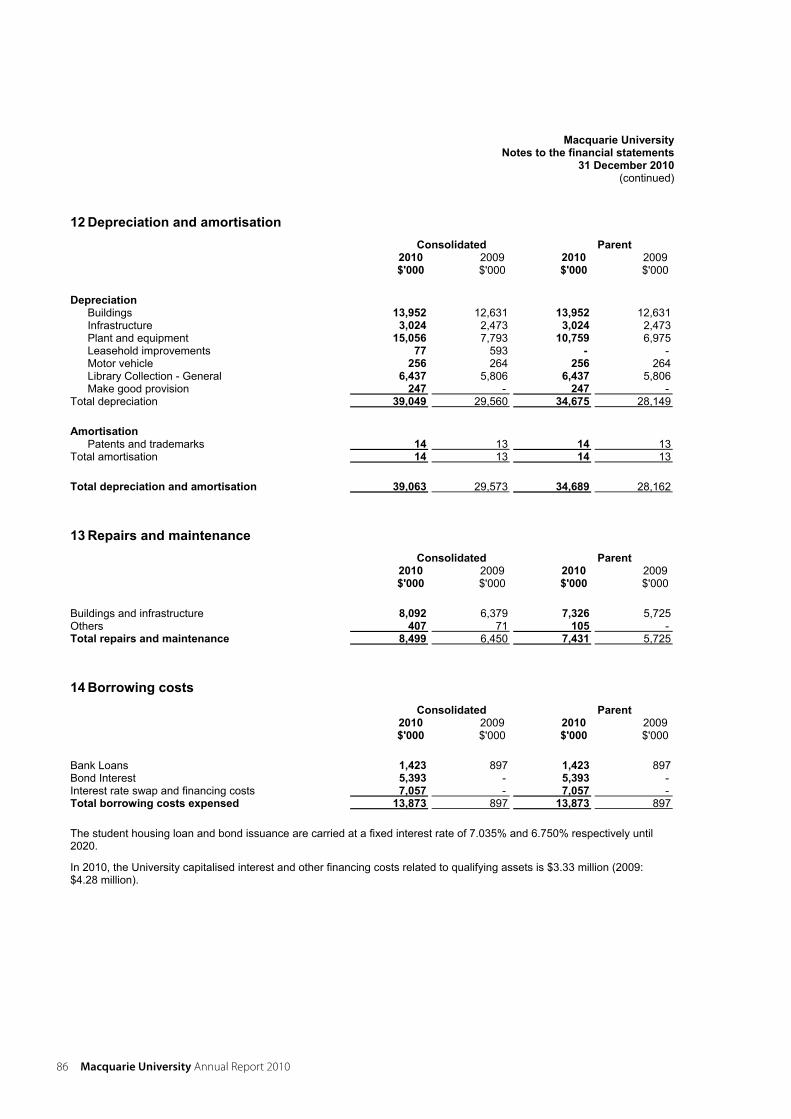
Macquarie UniversityNotes to the financial statements
31 December 2010(continued)
12 Depreciation and amortisation Consolidated Parent
2010 2009 2010 2009 $'000 $'000 $'000 $'000
Depreciation Buildings 13,952 12,631 13,952 12,631 Infrastructure 3,024 2,473 3,024 2,473 Plant and equipment 15,056 7,793 10,759 6,975 Leasehold improvements 77 593 - - Motor vehicle 256 264 256 264 Library Collection - General 6,437 5,806 6,437 5,806 Make good provision 247 - 247 -
Total depreciation 39,049 29,560 34,675 28,149
Amortisation Patents and trademarks 14 13 14 13
Total amortisation 14 13 14 13
Total depreciation and amortisation 39,063 29,573 34,689 28,162
13 Repairs and maintenance Consolidated Parent
2010 2009 2010 2009 $'000 $'000 $'000 $'000
Buildings and infrastructure 8,092 6,379 7,326 5,725 Others 407 71 105 - Total repairs and maintenance 8,499 6,450 7,431 5,725
14 Borrowing costs Consolidated Parent
2010 2009 2010 2009 $'000 $'000 $'000 $'000
Bank Loans 1,423 897 1,423 897 Bond Interest 5,393 - 5,393 - Interest rate swap and financing costs 7,057 - 7,057 - Total borrowing costs expensed 13,873 897 13,873 897
The student housing loan and bond issuance are carried at a fixed interest rate of 7.035% and 6.750% respectively until 2020.
In 2010, the University capitalised interest and other financing costs related to qualifying assets is $3.33 million (2009: $4.28 million).
86 Macquarie University annual Report 2010
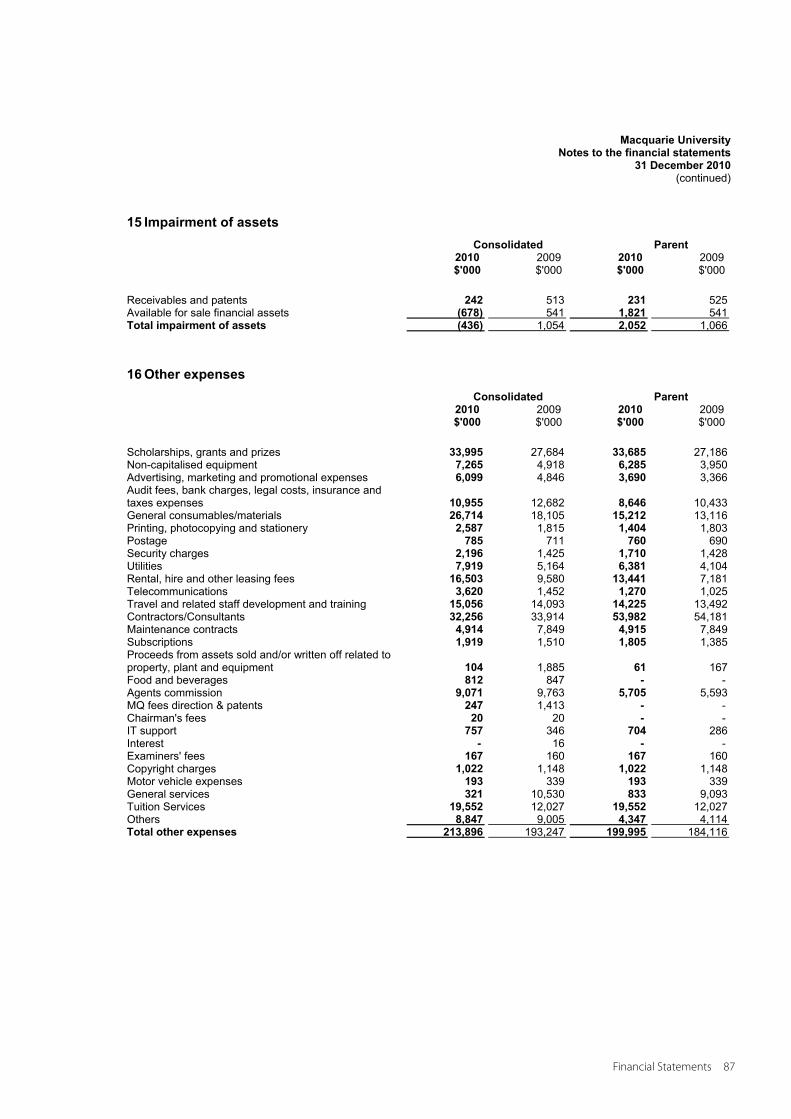
Macquarie UniversityNotes to the financial statements
31 December 2010(continued)
15 Impairment of assets Consolidated Parent
2010 2009 2010 2009 $'000 $'000 $'000 $'000
Receivables and patents 242 513 231 525 Available for sale financial assets (678) 541 1,821 541 Total impairment of assets (436) 1,054 2,052 1,066
16 Other expenses Consolidated Parent
2010 2009 2010 2009 $'000 $'000 $'000 $'000
Scholarships, grants and prizes 33,995 27,684 33,685 27,186 Non-capitalised equipment 7,265 4,918 6,285 3,950 Advertising, marketing and promotional expenses 6,099 4,846 3,690 3,366 Audit fees, bank charges, legal costs, insurance and taxes expenses 10,955 12,682 8,646 10,433 General consumables/materials 26,714 18,105 15,212 13,116 Printing, photocopying and stationery 2,587 1,815 1,404 1,803 Postage 785 711 760 690 Security charges 2,196 1,425 1,710 1,428 Utilities 7,919 5,164 6,381 4,104 Rental, hire and other leasing fees 16,503 9,580 13,441 7,181 Telecommunications 3,620 1,452 1,270 1,025 Travel and related staff development and training 15,056 14,093 14,225 13,492 Contractors/Consultants 32,256 33,914 53,982 54,181 Maintenance contracts 4,914 7,849 4,915 7,849 Subscriptions 1,919 1,510 1,805 1,385 Proceeds from assets sold and/or written off related to property, plant and equipment 104 1,885 61 167 Food and beverages 812 847 - - Agents commission 9,071 9,763 5,705 5,593 MQ fees direction & patents 247 1,413 - - Chairman's fees 20 20 - - IT support 757 346 704 286 Interest - 16 - - Examiners' fees 167 160 167 160 Copyright charges 1,022 1,148 1,022 1,148 Motor vehicle expenses 193 339 193 339 General services 321 10,530 833 9,093 Tuition Services 19,552 12,027 19,552 12,027 Others 8,847 9,005 4,347 4,114 Total other expenses 213,896 193,247 199,995 184,116
Financial Statements 87
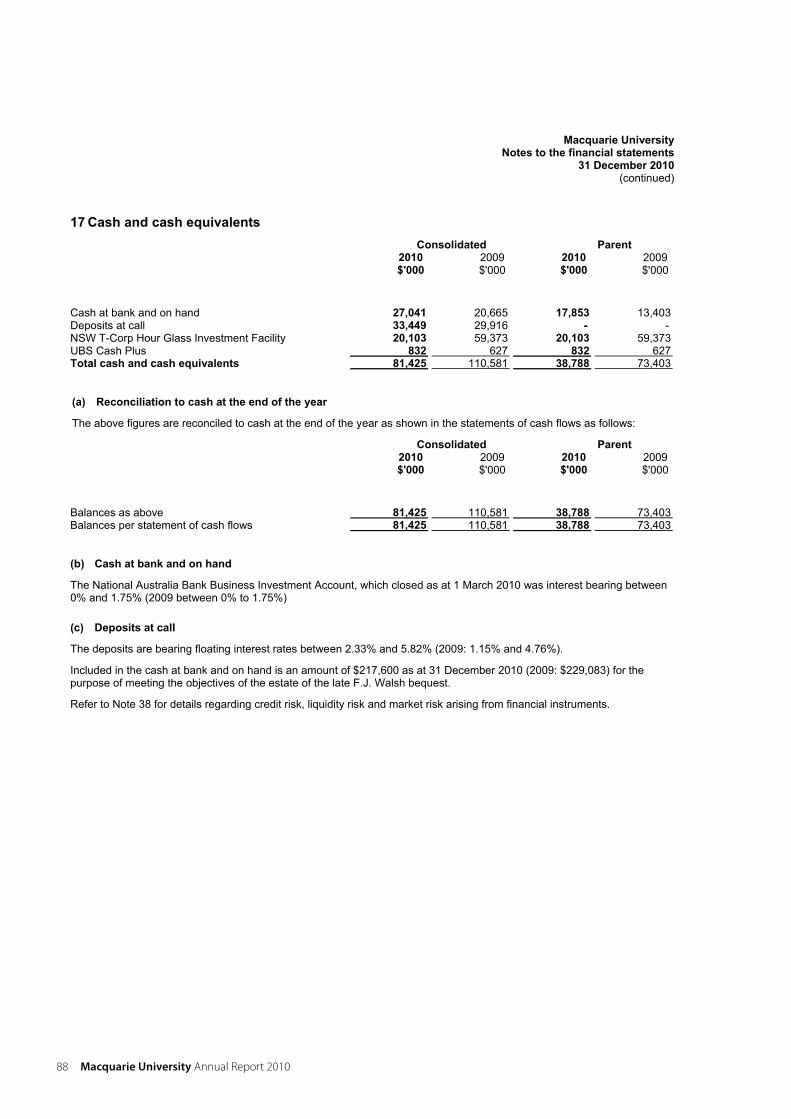
Macquarie UniversityNotes to the financial statements
31 December 2010(continued)
17 Cash and cash equivalents Consolidated Parent
2010 2009 2010 2009 $'000 $'000 $'000 $'000
Cash at bank and on hand 27,041 20,665 17,853 13,403 Deposits at call 33,449 29,916 - - NSW T-Corp Hour Glass Investment Facility 20,103 59,373 20,103 59,373 UBS Cash Plus 832 627 832 627 Total cash and cash equivalents 81,425 110,581 38,788 73,403
(a) Reconciliation to cash at the end of the year
The above figures are reconciled to cash at the end of the year as shown in the statements of cash flows as follows:
Consolidated Parent2010 2009 2010 2009 $'000 $'000 $'000 $'000
Balances as above 81,425 110,581 38,788 73,403 Balances per statement of cash flows 81,425 110,581 38,788 73,403
(b) Cash at bank and on hand
The National Australia Bank Business Investment Account, which closed as at 1 March 2010 was interest bearing between 0% and 1.75% (2009 between 0% to 1.75%)
(c) Deposits at call
The deposits are bearing floating interest rates between 2.33% and 5.82% (2009: 1.15% and 4.76%).
Included in the cash at bank and on hand is an amount of $217,600 as at 31 December 2010 (2009: $229,083) for the purpose of meeting the objectives of the estate of the late F.J. Walsh bequest.
Refer to Note 38 for details regarding credit risk, liquidity risk and market risk arising from financial instruments.
88 Macquarie University annual Report 2010
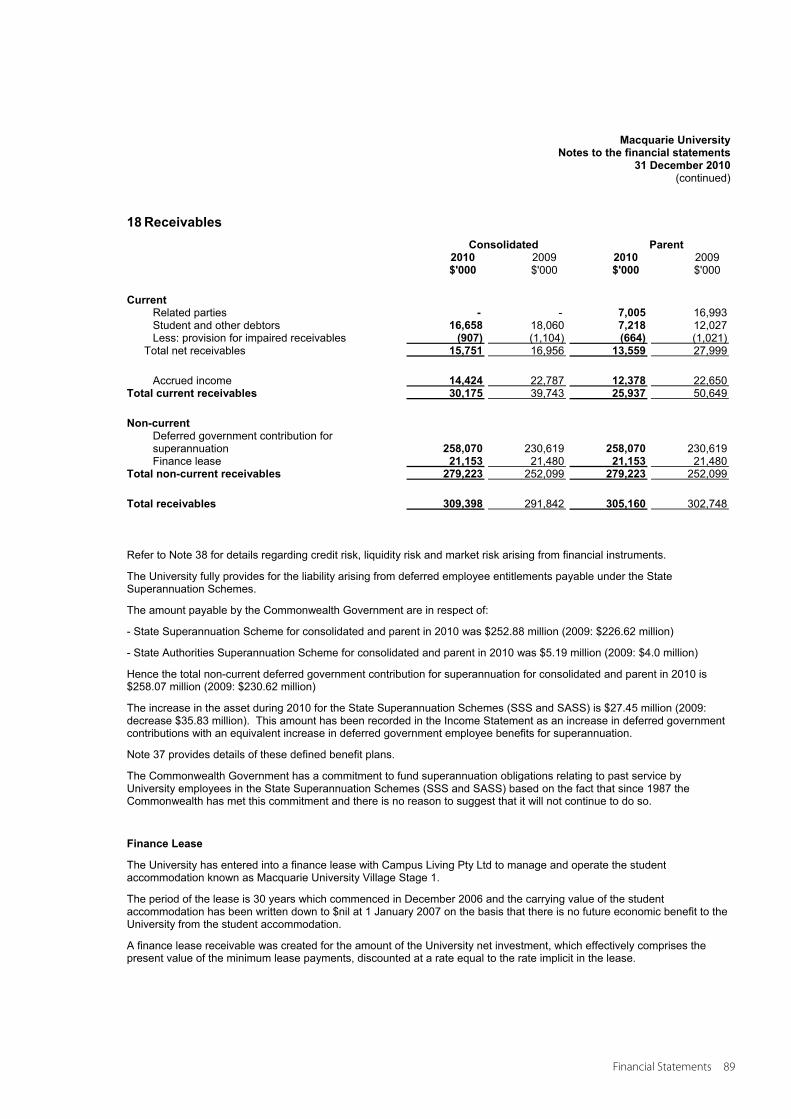
Macquarie UniversityNotes to the financial statements
31 December 2010(continued)
18 Receivables Consolidated Parent
2010 2009 2010 2009 $'000 $'000 $'000 $'000
Current Related parties - - 7,005 16,993 Student and other debtors 16,658 18,060 7,218 12,027 Less: provision for impaired receivables (907) (1,104) (664) (1,021)
Total net receivables 15,751 16,956 13,559 27,999
Accrued income 14,424 22,787 12,378 22,650 Total current receivables 30,175 39,743 25,937 50,649
Non-current Deferred government contribution for superannuation 258,070 230,619 258,070 230,619 Finance lease 21,153 21,480 21,153 21,480
Total non-current receivables 279,223 252,099 279,223 252,099
Total receivables 309,398 291,842 305,160 302,748
Refer to Note 38 for details regarding credit risk, liquidity risk and market risk arising from financial instruments.
The University fully provides for the liability arising from deferred employee entitlements payable under the State Superannuation Schemes.
The amount payable by the Commonwealth Government are in respect of:
- State Superannuation Scheme for consolidated and parent in 2010 was $252.88 million (2009: $226.62 million)
- State Authorities Superannuation Scheme for consolidated and parent in 2010 was $5.19 million (2009: $4.0 million)
Hence the total non-current deferred government contribution for superannuation for consolidated and parent in 2010 is $258.07 million (2009: $230.62 million)
The increase in the asset during 2010 for the State Superannuation Schemes (SSS and SASS) is $27.45 million (2009: decrease $35.83 million). This amount has been recorded in the Income Statement as an increase in deferred government contributions with an equivalent increase in deferred government employee benefits for superannuation.
Note 37 provides details of these defined benefit plans.
The Commonwealth Government has a commitment to fund superannuation obligations relating to past service by University employees in the State Superannuation Schemes (SSS and SASS) based on the fact that since 1987 the Commonwealth has met this commitment and there is no reason to suggest that it will not continue to do so.
Finance Lease
The University has entered into a finance lease with Campus Living Pty Ltd to manage and operate the student accommodation known as Macquarie University Village Stage 1.
The period of the lease is 30 years which commenced in December 2006 and the carrying value of the student accommodation has been written down to $nil at 1 January 2007 on the basis that there is no future economic benefit to the University from the student accommodation.
A finance lease receivable was created for the amount of the University net investment, which effectively comprises the present value of the minimum lease payments, discounted at a rate equal to the rate implicit in the lease.
Financial Statements 89
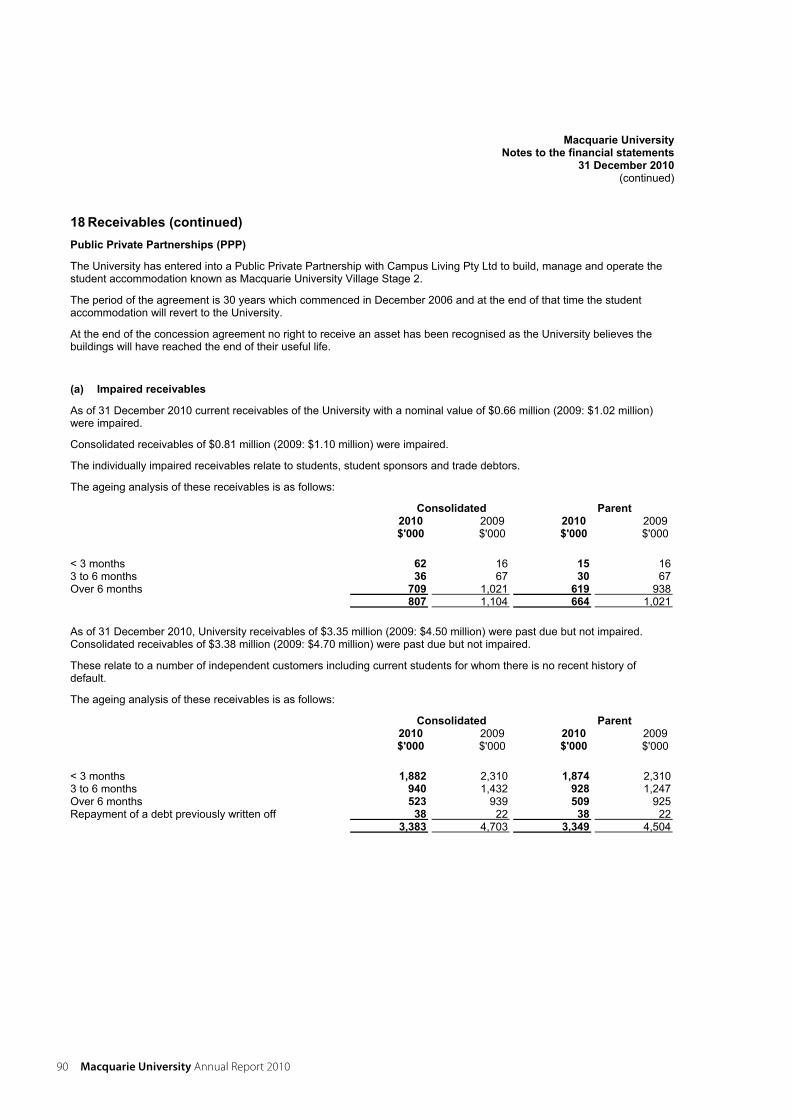
Macquarie UniversityNotes to the financial statements
31 December 2010(continued)
18 Receivables (continued) Public Private Partnerships (PPP)
The University has entered into a Public Private Partnership with Campus Living Pty Ltd to build, manage and operate the student accommodation known as Macquarie University Village Stage 2.
The period of the agreement is 30 years which commenced in December 2006 and at the end of that time the student accommodation will revert to the University.
At the end of the concession agreement no right to receive an asset has been recognised as the University believes the buildings will have reached the end of their useful life.
(a) Impaired receivables
As of 31 December 2010 current receivables of the University with a nominal value of $0.66 million (2009: $1.02 million) were impaired.
Consolidated receivables of $0.81 million (2009: $1.10 million) were impaired.
The individually impaired receivables relate to students, student sponsors and trade debtors.
The ageing analysis of these receivables is as follows:
Consolidated Parent2010 2009 2010 2009 $'000 $'000 $'000 $'000
< 3 months 62 16 15 16 3 to 6 months 36 67 30 67 Over 6 months 709 1,021 619 938
807 1,104 664 1,021
As of 31 December 2010, University receivables of $3.35 million (2009: $4.50 million) were past due but not impaired. Consolidated receivables of $3.38 million (2009: $4.70 million) were past due but not impaired.
These relate to a number of independent customers including current students for whom there is no recent history of default.
The ageing analysis of these receivables is as follows:
Consolidated Parent2010 2009 2010 2009 $'000 $'000 $'000 $'000
< 3 months 1,882 2,310 1,874 2,310 3 to 6 months 940 1,432 928 1,247 Over 6 months 523 939 509 925 Repayment of a debt previously written off 38 22 38 22
3,383 4,703 3,349 4,504
90 Macquarie University annual Report 2010

Macquarie UniversityNotes to the financial statements
31 December 2010(continued)
18 Receivables (continued) Movements in the provision for impaired receivables are as follows:
Consolidated Parent2010 2009 2010 2009 $'000 $'000 $'000 $'000
At 1 January 1,104 747 1,021 721 Provision for impairment recognised during the year 74 498 217 492 Receivables written off during the year as uncollectible (622) (212) (612) (214) Repayment of debt previously written off 102 71 38 22 At 31 December 658 1,104 664 1,021
The creation and release of the provision for impaired receivables has been included in ‘other expenses’ in the income statement. Amounts charged to the provision account are generally written off when there is no expectation of recovering additional cash.
The other amounts within receivables do not contain impaired assets and are not past due. Based on credit history, it is expected that these amounts will be received when due.
19 Inventories Consolidated Parent
2010 2009 2010 2009 $'000 $'000 $'000 $'000
CurrentPrintery
- at net realisable value 72 77 43 46 Food and beverages
- at net realisable value 68 53 - - Other Inventories
- at net realisable value 148 149 148 149 Medical supplies
- at cost 2,779 - - - Services store
- at cost 151 - - - - at net realisable value 423 536 - -
574 536 - -
Total current Inventories 3,641 815 191 195
Total Inventories 3,641 815 191 195
Financial Statements 91
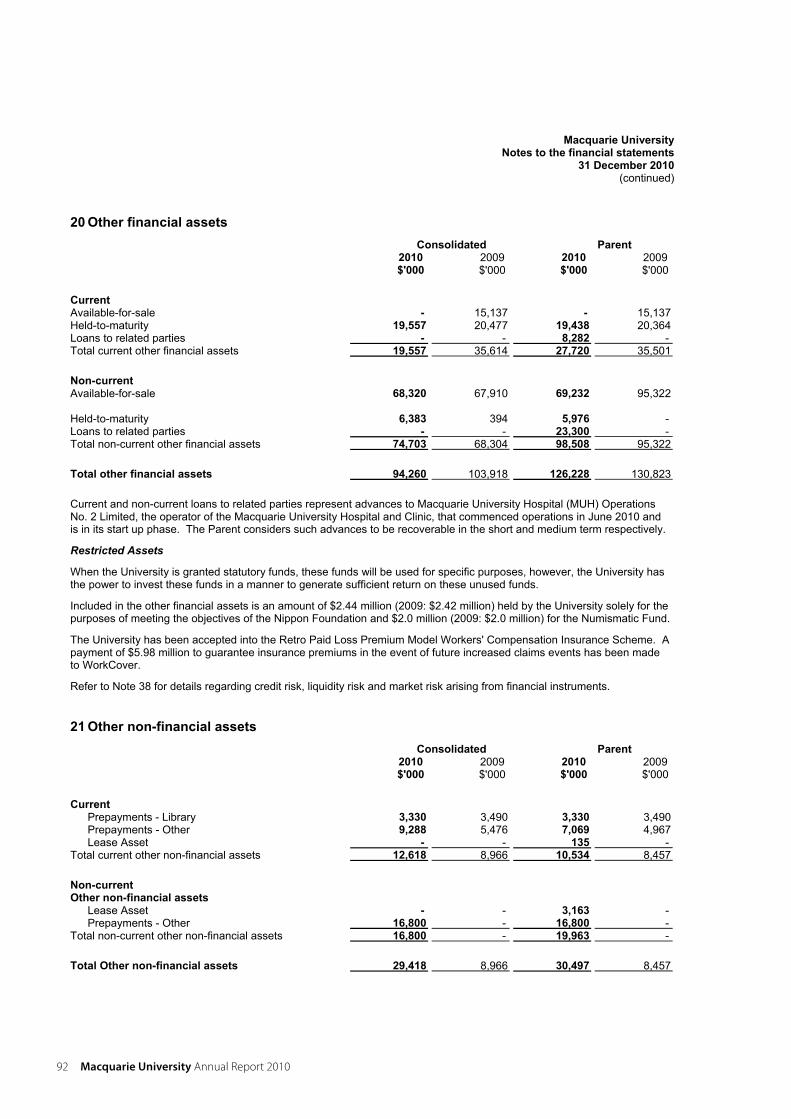
Macquarie UniversityNotes to the financial statements
31 December 2010(continued)
20 Other financial assets Consolidated Parent
2010 2009 2010 2009 $'000 $'000 $'000 $'000
Current Available-for-sale - 15,137 - 15,137 Held-to-maturity 19,557 20,477 19,438 20,364 Loans to related parties - - 8,282 - Total current other financial assets 19,557 35,614 27,720 35,501
Non-current Available-for-sale 68,320 67,910 69,232 95,322
Held-to-maturity 6,383 394 5,976 - Loans to related parties - - 23,300 - Total non-current other financial assets 74,703 68,304 98,508 95,322
Total other financial assets 94,260 103,918 126,228 130,823
Current and non-current loans to related parties represent advances to Macquarie University Hospital (MUH) Operations No. 2 Limited, the operator of the Macquarie University Hospital and Clinic, that commenced operations in June 2010 and is in its start up phase. The Parent considers such advances to be recoverable in the short and medium term respectively.
Restricted Assets
When the University is granted statutory funds, these funds will be used for specific purposes, however, the University has the power to invest these funds in a manner to generate sufficient return on these unused funds.
Included in the other financial assets is an amount of $2.44 million (2009: $2.42 million) held by the University solely for thepurposes of meeting the objectives of the Nippon Foundation and $2.0 million (2009: $2.0 million) for the Numismatic Fund.
The University has been accepted into the Retro Paid Loss Premium Model Workers' Compensation Insurance Scheme. A payment of $5.98 million to guarantee insurance premiums in the event of future increased claims events has been made to WorkCover.
Refer to Note 38 for details regarding credit risk, liquidity risk and market risk arising from financial instruments.
21 Other non-financial assets Consolidated Parent
2010 2009 2010 2009 $'000 $'000 $'000 $'000
Current Prepayments - Library 3,330 3,490 3,330 3,490 Prepayments - Other 9,288 5,476 7,069 4,967 Lease Asset - - 135 -
Total current other non-financial assets 12,618 8,966 10,534 8,457
Non-current Other non-financial assets
Lease Asset - - 3,163 - Prepayments - Other 16,800 - 16,800 -
Total non-current other non-financial assets 16,800 - 19,963 -
Total Other non-financial assets 29,418 8,966 30,497 8,457
92 Macquarie University annual Report 2010
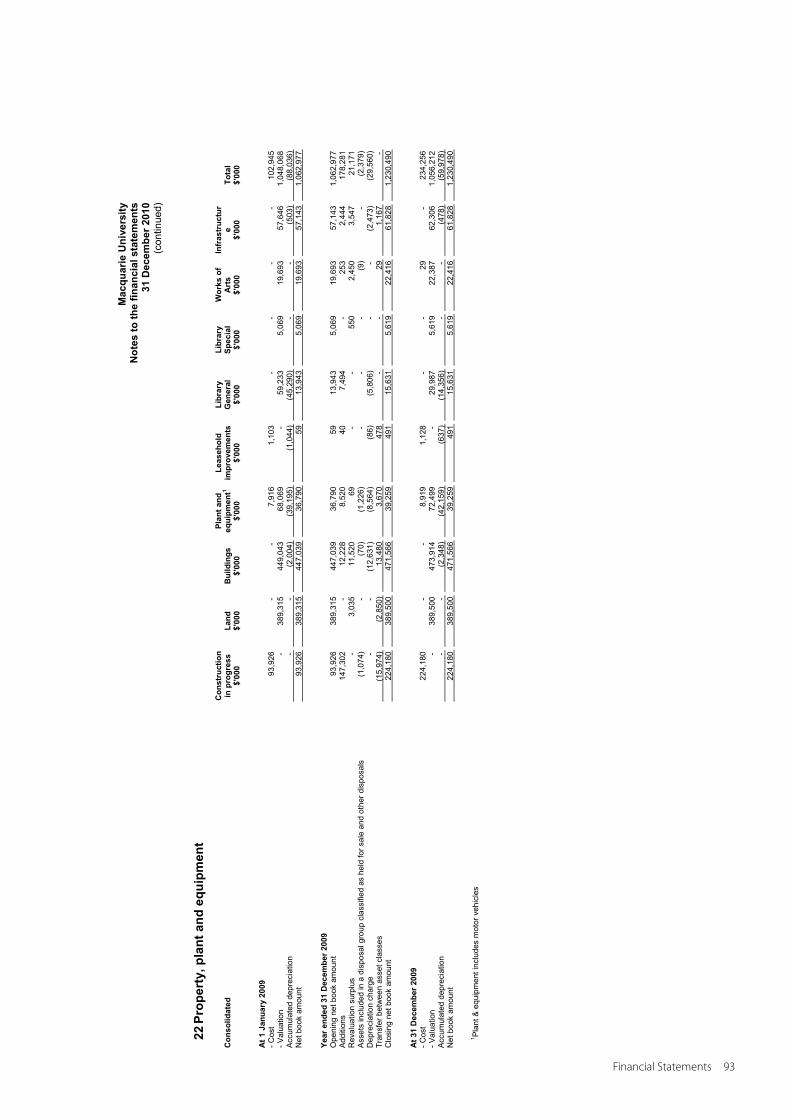
Mac
quar
ie U
nive
rsity
N
otes
to th
e fin
anci
al s
tate
men
ts
31 D
ecem
ber 2
010
(con
tinue
d)
22 P
rope
rty,
pla
nt a
nd e
quip
men
t
Con
solid
ated
C
onst
ruct
ion
in p
rogr
ess
Land
B
uild
ings
Pl
ant a
nd
equi
pmen
t1Le
aseh
old
impr
ovem
ents
Libr
ary
Gen
eral
Li
brar
y Sp
ecia
lW
orks
of
Art
s In
fras
truc
tur
e To
tal
$'00
0$'
000
$'00
0 $'
000
$'00
0$'
000
$'00
0$'
000
$'00
0 $'
000
At 1
Jan
uary
200
9
- C
ost
93
,926
-
-
7,
916
1,
103
-
-
-
-
10
2,94
5
- Val
uatio
n
-
389,
315
44
9,04
3
68,0
69
-
59,2
33
5,06
9
19,6
93
57,6
46
1,04
8,06
8
Acc
umul
ated
dep
reci
atio
n
-
-
(2,0
04)
(3
9,19
5)
(1,0
44)
(4
5,29
0)
-
-
(503
)
(88,
036)
N
et b
ook
amou
nt
93
,926
38
9,31
5
447,
039
36
,790
59
13
,943
5,
069
19
,693
57
,143
1,
062,
977
Year
end
ed 3
1 D
ecem
ber 2
009
Ope
ning
net
boo
k am
ount
93,9
26
389,
315
44
7,03
9
36,7
90
59
13,9
43
5,06
9
19,6
93
57,1
43
1,06
2,97
7
Add
ition
s
147,
302
-
12
,228
8,
520
40
7,
494
-
25
3
2,44
4
178,
281
R
eval
uatio
n su
rplu
s
-
3,03
5
11,5
20
69
-
-
550
2,
450
3,
547
21
,171
A
sset
s in
clud
ed in
a d
ispo
sal g
roup
cla
ssifi
ed a
s he
ld fo
r sal
e an
d ot
her d
ispo
sals
(1,0
74)
-
(7
0)
(1,2
26)
-
-
-
(9
)
-
(2,3
79)
Dep
reci
atio
n ch
arge
-
-
(12,
631)
(8
,564
)
(86)
(5
,806
)
-
-
(2,4
73)
(2
9,56
0)
Tran
sfer
bet
wee
n as
set c
lass
es
(1
5,97
4)
(2,8
50)
13
,480
3,
670
47
8
-
-
29
1,16
7
- C
losi
ng n
et b
ook
amou
nt
22
4,18
0
389,
500
47
1,56
6
39,2
59
491
15
,631
5,
619
22
,416
61
,828
1,
230,
490
At 3
1 D
ecem
ber 2
009
- Cos
t
224,
180
-
-
8,
919
1,
128
-
-
29
-
23
4,25
6
- Val
uatio
n
-
389,
500
47
3,91
4
72,4
99
-
29,9
87
5,61
9
22,3
87
62,3
06
1,05
6,21
2
Acc
umul
ated
dep
reci
atio
n
-
-
(2,3
48)
(4
2,15
9)
(637
)
(14,
356)
-
-
(4
78)
(5
9,97
8)
Net
boo
k am
ount
224,
180
38
9,50
0
471,
566
39
,259
49
1
15,6
31
5,61
9
22,4
16
61,8
28
1,23
0,49
0
1 Pla
nt &
equ
ipm
ent i
nclu
des
mot
or v
ehic
les
Financial Statements 93
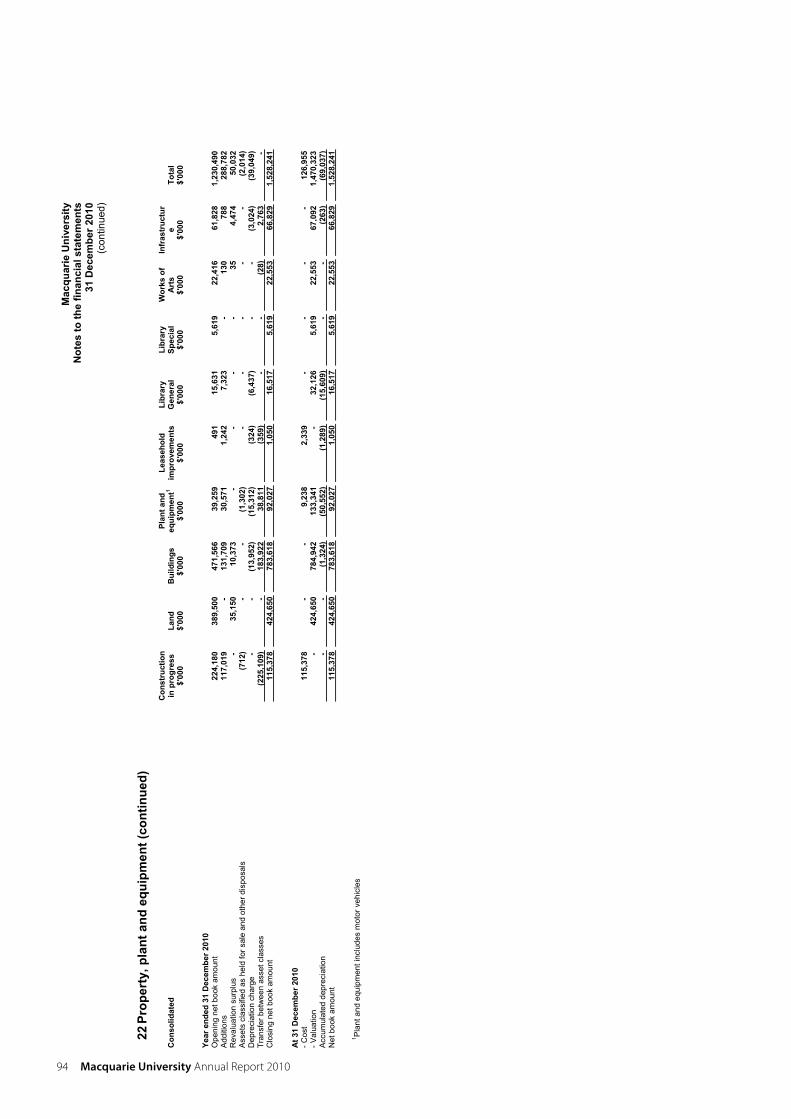
Mac
quar
ie U
nive
rsity
N
otes
to th
e fin
anci
al s
tate
men
ts
31 D
ecem
ber 2
010
(con
tinue
d)
22 P
rope
rty,
pla
nt a
nd e
quip
men
t (co
ntin
ued)
Con
solid
ated
C
onst
ruct
ion
in p
rogr
ess
Land
B
uild
ings
Pl
ant a
nd
equi
pmen
t1Le
aseh
old
impr
ovem
ents
Libr
ary
Gen
eral
Li
brar
y Sp
ecia
lW
orks
of
Art
s In
fras
truc
tur
e To
tal
$'00
0$'
000
$'00
0 $'
000
$'00
0$'
000
$'00
0$'
000
$'00
0 $'
000
Year
end
ed 3
1 D
ecem
ber 2
010
Ope
ning
net
boo
k am
ount
224,
180
38
9,50
0
471,
566
39
,259
49
1
15,6
31
5,61
9
22,4
16
61,8
28
1,23
0,49
0
Add
ition
s
117,
019
-
13
1,70
9
30,5
71
1,24
2
7,32
3
-
130
78
8
288,
782
R
eval
uatio
n su
rplu
s
-
35,1
50
10,3
73
-
-
-
-
35
4,47
4
50,0
32
Ass
ets
clas
sifie
d as
hel
d fo
r sal
e an
d ot
her d
ispo
sals
(712
)
-
-
(1,3
02)
-
-
-
-
-
(2
,014
) D
epre
ciat
ion
char
ge
-
-
(1
3,95
2)
(15,
312)
(3
24)
(6
,437
)
-
-
(3,0
24)
(3
9,04
9)
Tran
sfer
bet
wee
n as
set c
lass
es
(2
25,1
09)
-
18
3,92
2
38,8
11
(359
)
-
-
(28)
2,
763
-
Clo
sing
net
boo
k am
ount
11
5,37
842
4,65
078
3,61
8
92,0
271,
050
16,5
175,
619
22,5
5366
,829
1,
528,
241
At 3
1 D
ecem
ber 2
010
- Cos
t
115,
378
-
-
9,
238
2,
339
-
-
-
-
12
6,95
5
- Val
uatio
n
-
424,
650
78
4,94
2
133,
341
-
32
,126
5,
619
22
,553
67
,092
1,
470,
323
A
ccum
ulat
ed d
epre
ciat
ion
-
-
(1
,324
)
(50,
552)
(1
,289
)
(15,
609)
-
-
(2
63)
(6
9,03
7)
Net
boo
k am
ount
11
5,37
842
4,65
078
3,61
8
92,0
271,
050
16,5
175,
619
22,5
5366
,829
1,
528,
241
1 Pla
nt a
nd e
quip
men
t inc
lude
s m
otor
veh
icle
s
94 Macquarie University annual Report 2010
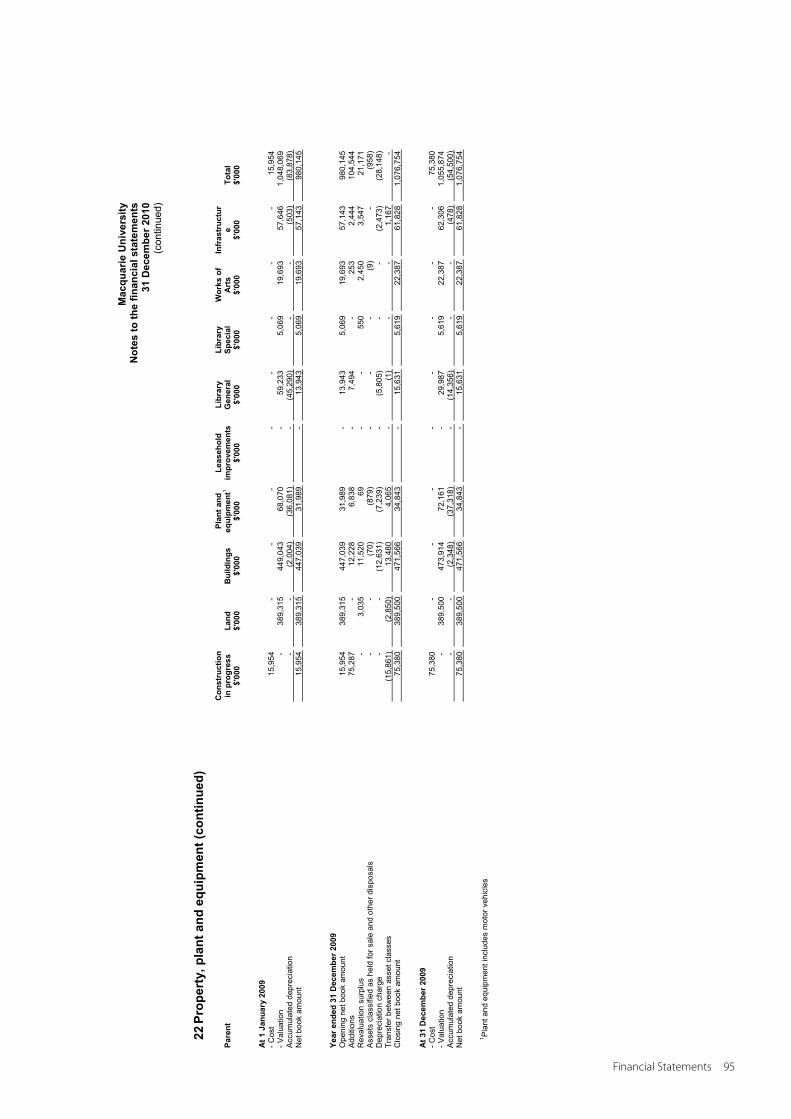
Mac
quar
ie U
nive
rsity
N
otes
to th
e fin
anci
al s
tate
men
ts
31 D
ecem
ber 2
010
(con
tinue
d)
22 P
rope
rty,
pla
nt a
nd e
quip
men
t (co
ntin
ued)
Pare
nt
Con
stru
ctio
n in
pro
gres
s La
nd
Bui
ldin
gs
Plan
t and
eq
uipm
ent1
Leas
ehol
dim
prov
emen
tsLi
brar
y G
ener
al
Libr
ary
Spec
ial
Wor
ks o
f A
rts
Infr
astr
uctu
re
Tota
l $'
000
$'00
0$'
000
$'00
0$'
000
$'00
0$'
000
$'00
0$'
000
$'00
0
At 1
Jan
uary
200
9
- C
ost
15
,954
-
-
-
-
-
-
-
-
15
,954
- V
alua
tion
-
38
9,31
5
449,
043
68
,070
-
59
,233
5,
069
19
,693
57
,646
1,
048,
069
A
ccum
ulat
ed d
epre
ciat
ion
-
-
(2
,004
)
(36,
081)
-
(4
5,29
0)
-
-
(503
)
(83,
878)
N
et b
ook
amou
nt
15
,954
38
9,31
5
447,
039
31
,989
-
13
,943
5,
069
19
,693
57
,143
98
0,14
5
Year
end
ed 3
1 D
ecem
ber 2
009
Ope
ning
net
boo
k am
ount
15,9
54
389,
315
44
7,03
9
31,9
89
-
13,9
43
5,06
9
19,6
93
57,1
43
980,
145
A
dditi
ons
75
,287
-
12
,228
6,
838
-
7,
494
-
25
3
2,44
4
104,
544
R
eval
uatio
n su
rplu
s
-
3,03
5
11,5
20
69
-
-
550
2,
450
3,
547
21
,171
A
sset
s cl
assi
fied
as h
eld
for s
ale
and
othe
r dis
posa
ls
-
-
(7
0)
(879
)
-
-
-
(9)
-
(9
58)
Dep
reci
atio
n ch
arge
-
-
(12,
631)
(7
,239
)
-
(5,8
05)
-
-
(2
,473
)
(28,
148)
Tr
ansf
er b
etw
een
asse
t cla
sses
(15,
861)
(2
,850
)
13,4
80
4,06
5
-
(1)
-
-
1,
167
-
Clo
sing
net
boo
k am
ount
75,3
80
389,
500
47
1,56
6
34,8
43
-
15,6
31
5,61
9
22,3
87
61,8
28
1,07
6,75
4
At 3
1 D
ecem
ber 2
009
- Cos
t
75,3
80
-
-
-
-
-
-
-
-
75,3
80
- Val
uatio
n
-
389,
500
47
3,91
4
72,1
61
-
29,9
87
5,61
9
22,3
87
62,3
06
1,05
5,87
4
Acc
umul
ated
dep
reci
atio
n
-
-
(2,3
48)
(3
7,31
8)
-
(14,
356)
-
-
(4
78)
(5
4,50
0)
Net
boo
k am
ount
75,3
80
389,
500
47
1,56
6
34,8
43
-
15,6
31
5,61
9
22,3
87
61,8
28
1,07
6,75
4
1 Pla
nt a
nd e
quip
men
t inc
lude
s m
otor
veh
icle
s
Financial Statements 95
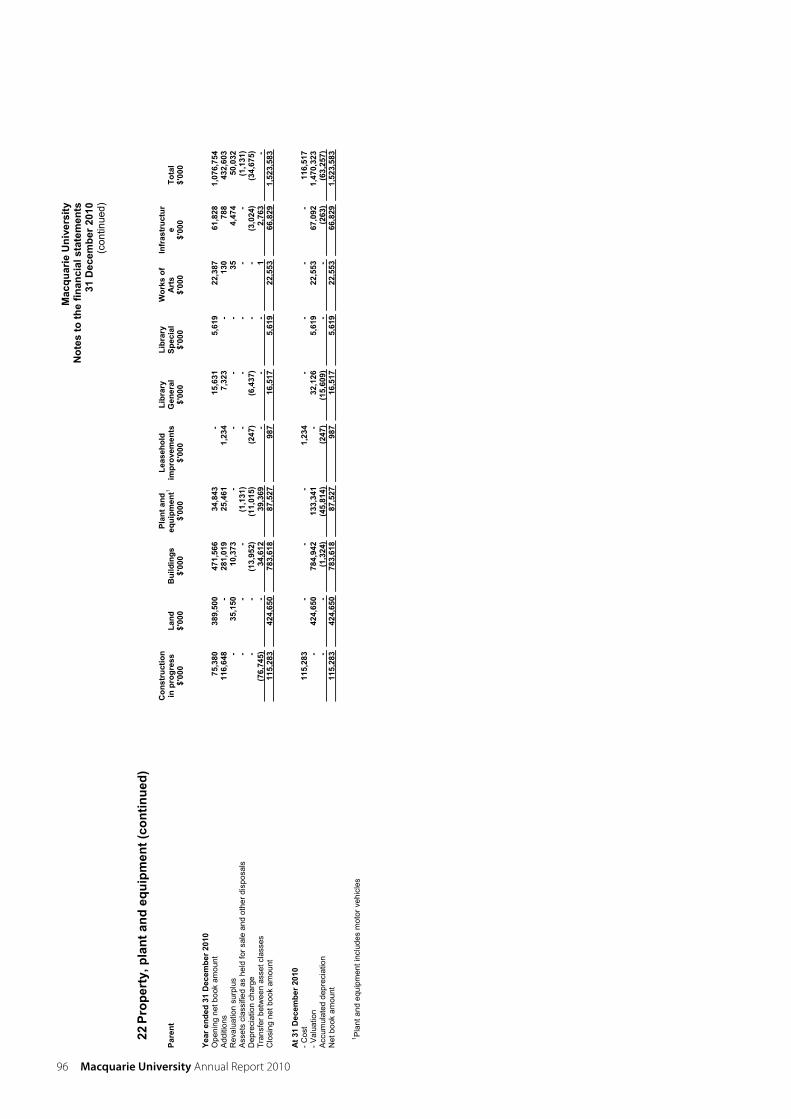
Mac
quar
ie U
nive
rsity
N
otes
to th
e fin
anci
al s
tate
men
ts
31 D
ecem
ber 2
010
(con
tinue
d)
22 P
rope
rty,
pla
nt a
nd e
quip
men
t (co
ntin
ued)
Pare
nt
Con
stru
ctio
n in
pro
gres
s La
nd
Bui
ldin
gs
Plan
t and
eq
uipm
ent1
Leas
ehol
dim
prov
emen
tsLi
brar
y G
ener
al
Libr
ary
Spec
ial
Wor
ks o
f A
rts
Infr
astr
uctu
re
Tota
l $'
000
$'00
0$'
000
$'00
0$'
000
$'00
0$'
000
$'00
0$'
000
$'00
0
Year
end
ed 3
1 D
ecem
ber 2
010
Ope
ning
net
boo
k am
ount
75,3
80
389,
500
47
1,56
6
34,8
43
-
15,6
31
5,61
9
22,3
87
61,8
28
1,07
6,75
4
Add
ition
s
116,
648
-
28
1,01
9
25,4
61
1,23
4
7,32
3
-
130
78
8
432,
603
R
eval
uatio
n su
rplu
s
-
35,1
50
10,3
73
-
-
-
-
35
4,47
4
50,0
32
Ass
ets
clas
sifie
d as
hel
d fo
r sal
e an
d ot
her d
ispo
sals
-
-
-
(1,1
31)
-
-
-
-
-
(1
,131
) D
epre
ciat
ion
char
ge
-
-
(1
3,95
2)
(11,
015)
(2
47)
(6
,437
)
-
-
(3,0
24)
(3
4,67
5)
Tran
sfer
bet
wee
n as
set c
lass
es
(7
6,74
5)
-
34,6
12
39,3
69
-
-
-
1
2,76
3
- C
losi
ng n
et b
ook
amou
nt
115,
283
424,
650
783,
618
87
,527
987
16,5
175,
619
22,5
5366
,829
1,
523,
583
At 3
1 D
ecem
ber 2
010
- Cos
t
115,
283
-
-
-
1,
234
-
-
-
-
11
6,51
7
- Val
uatio
n
-
424,
650
78
4,94
2
133,
341
-
32
,126
5,
619
22
,553
67
,092
1,
470,
323
A
ccum
ulat
ed d
epre
ciat
ion
-
-
(1
,324
)
(45,
814)
(2
47)
(1
5,60
9)
-
-
(263
)
(63,
257)
N
et b
ook
amou
nt
115,
283
424,
650
783,
618
87
,527
987
16,5
175,
619
22,5
5366
,829
1,
523,
583
1 Pla
nt a
nd e
quip
men
t inc
lude
s m
otor
veh
icle
s
96 Macquarie University annual Report 2010
Macquarie UniversityNotes to the financial statements
31 December 2010(continued)
22 Property, plant and equipment (continued)
(a) Valuations of land and buildings
The 2010 revaluations were based on independent assessment by Global Valuation Services Pty Ltd. Land, Building and Infrastructure was revalued with dates of inspection between 1 June 2010 to 12 July 2010 and valuation date as at 31 December 2010. The revaluation surplus was credited to property, plant and equipment revaluation reserve.
(b) Land and Buildings
As at 31 December 2010, the University is not aware of any land or native title claims against University owned land.
(c) Leased non-current assets
The University leased some of its land to commercial organisations. No depreciation has been applied to this land owned by the University. The legal ownership and the benefits and the risks of the ownership rest with the University as lessor.
It is the University's expectation that these buildings will have reached the end of their useful life when control reverts to theUniversity.
- Macquarie University Research Park
University land at the corner of Herring and Talavera Road was developed as a site for Macquarie University Research Park. The Park is being developed through private investment. The University enters into long-term leases with investors, who finance the buildings, which are then leased to tenants. As at 31 December 2010, five buildings are occupied by tenants.
During 2010 the Macquarie University Hospital, Clinic building and Cochlear building were completed. These three developments are recorded in Land and Building and are occupied by the University, its controlled entities and leased to tenants.
Financial Statements 97
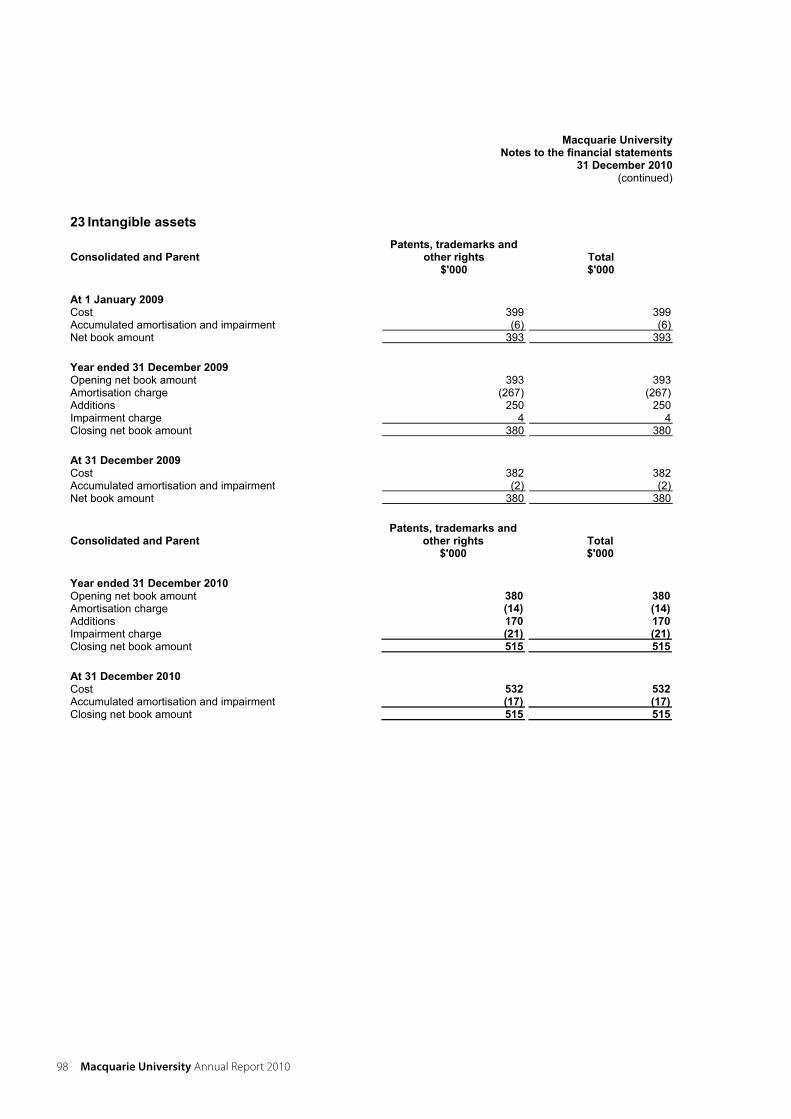
Macquarie UniversityNotes to the financial statements
31 December 2010(continued)
23 Intangible assets
Consolidated and Parent Patents, trademarks and
other rights Total $'000 $'000
At 1 January 2009 Cost 399 399 Accumulated amortisation and impairment (6) (6) Net book amount 393 393
Year ended 31 December 2009Opening net book amount 393 393 Amortisation charge (267) (267) Additions 250 250 Impairment charge 4 4 Closing net book amount 380 380
At 31 December 2009 Cost 382 382 Accumulated amortisation and impairment (2) (2) Net book amount 380 380
Consolidated and Parent Patents, trademarks and
other rights Total $'000 $'000
Year ended 31 December 2010Opening net book amount 380 380Amortisation charge (14) (14)Additions 170 170Impairment charge (21) (21)Closing net book amount 515 515
At 31 December 2010 Cost 532 532Accumulated amortisation and impairment (17) (17)Closing net book amount 515 515
98 Macquarie University annual Report 2010
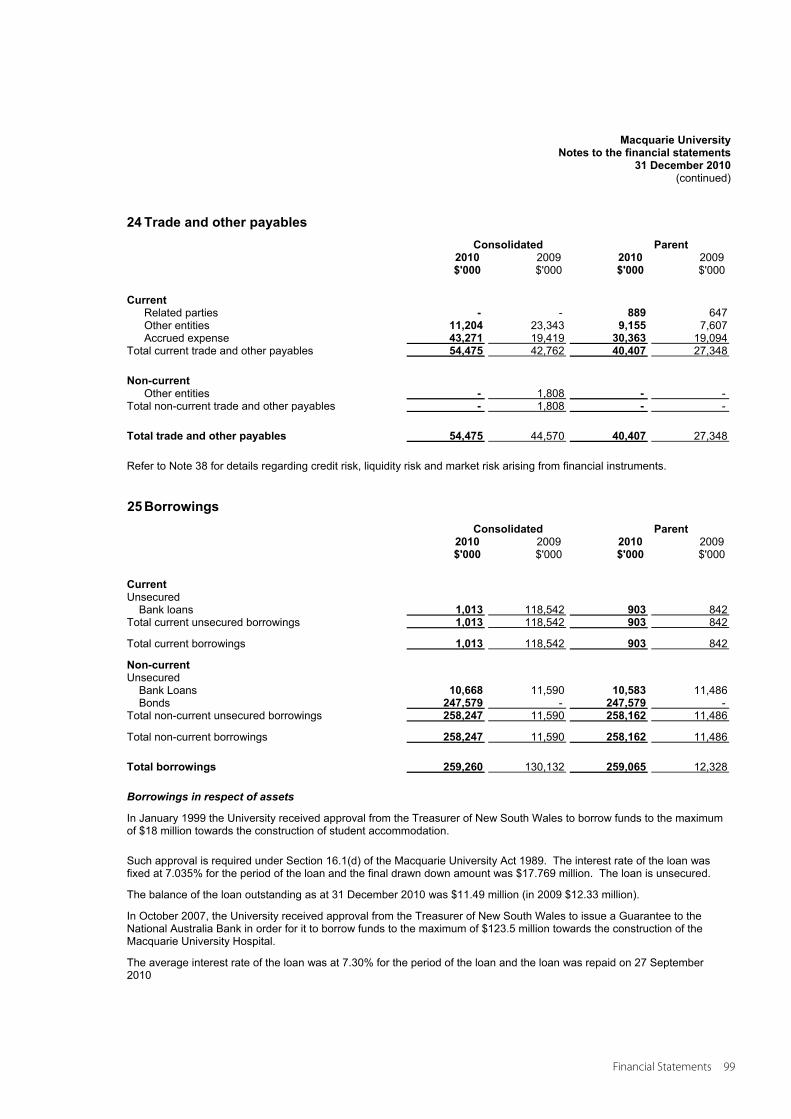
Macquarie UniversityNotes to the financial statements
31 December 2010(continued)
24 Trade and other payables Consolidated Parent
2010 2009 2010 2009 $'000 $'000 $'000 $'000
Current Related parties - - 889 647 Other entities 11,204 23,343 9,155 7,607 Accrued expense 43,271 19,419 30,363 19,094
Total current trade and other payables 54,475 42,762 40,407 27,348
Non-current Other entities - 1,808 - -
Total non-current trade and other payables - 1,808 - -
Total trade and other payables 54,475 44,570 40,407 27,348
Refer to Note 38 for details regarding credit risk, liquidity risk and market risk arising from financial instruments.
25 Borrowings Consolidated Parent
2010 2009 2010 2009 $'000 $'000 $'000 $'000
Current Unsecured
Bank loans 1,013 118,542 903 842 Total current unsecured borrowings 1,013 118,542 903 842
Total current borrowings 1,013 118,542 903 842
Non-current Unsecured
Bank Loans 10,668 11,590 10,583 11,486 Bonds 247,579 - 247,579 -
Total non-current unsecured borrowings 258,247 11,590 258,162 11,486
Total non-current borrowings 258,247 11,590 258,162 11,486
Total borrowings 259,260 130,132 259,065 12,328
Borrowings in respect of assets
In January 1999 the University received approval from the Treasurer of New South Wales to borrow funds to the maximum of $18 million towards the construction of student accommodation.
Such approval is required under Section 16.1(d) of the Macquarie University Act 1989. The interest rate of the loan was fixed at 7.035% for the period of the loan and the final drawn down amount was $17.769 million. The loan is unsecured.
The balance of the loan outstanding as at 31 December 2010 was $11.49 million (in 2009 $12.33 million).
In October 2007, the University received approval from the Treasurer of New South Wales to issue a Guarantee to the National Australia Bank in order for it to borrow funds to the maximum of $123.5 million towards the construction of the Macquarie University Hospital.
The average interest rate of the loan was at 7.30% for the period of the loan and the loan was repaid on 27 September 2010
Financial Statements 99
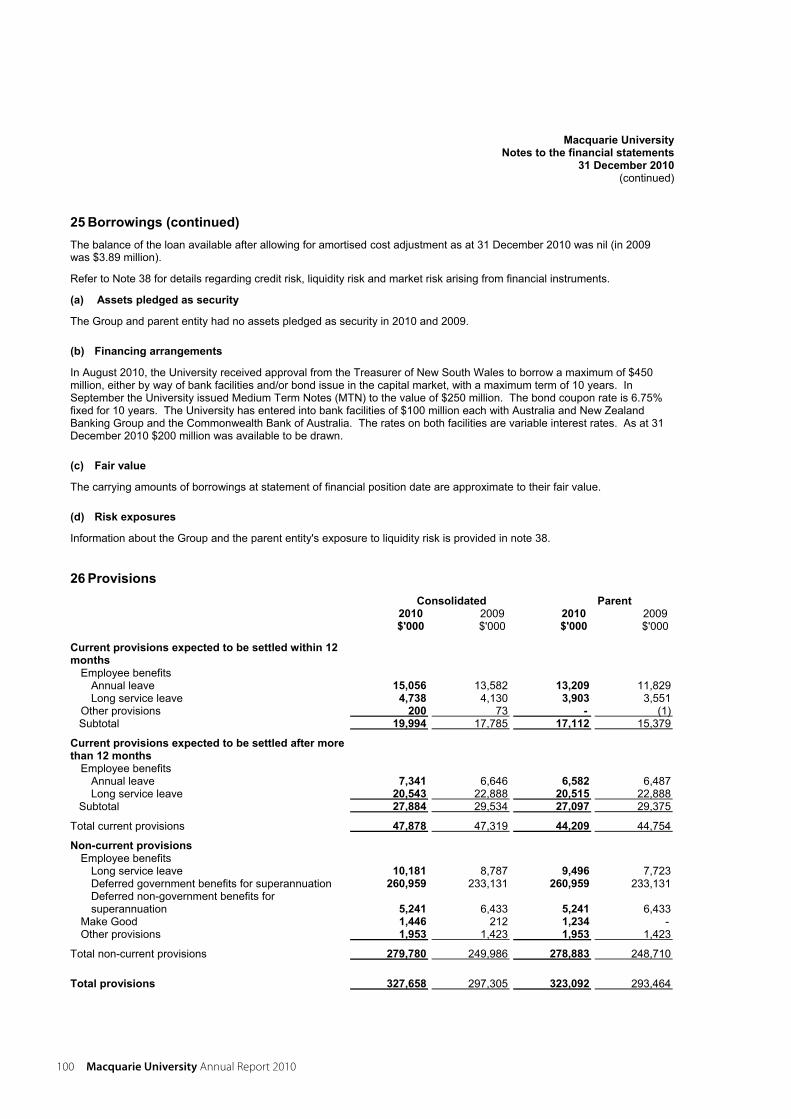
Macquarie UniversityNotes to the financial statements
31 December 2010(continued)
25 Borrowings (continued) The balance of the loan available after allowing for amortised cost adjustment as at 31 December 2010 was nil (in 2009 was $3.89 million).
Refer to Note 38 for details regarding credit risk, liquidity risk and market risk arising from financial instruments.
(a) Assets pledged as security
The Group and parent entity had no assets pledged as security in 2010 and 2009.
(b) Financing arrangements
In August 2010, the University received approval from the Treasurer of New South Wales to borrow a maximum of $450 million, either by way of bank facilities and/or bond issue in the capital market, with a maximum term of 10 years. In September the University issued Medium Term Notes (MTN) to the value of $250 million. The bond coupon rate is 6.75% fixed for 10 years. The University has entered into bank facilities of $100 million each with Australia and New Zealand Banking Group and the Commonwealth Bank of Australia. The rates on both facilities are variable interest rates. As at 31 December 2010 $200 million was available to be drawn.
(c) Fair value
The carrying amounts of borrowings at statement of financial position date are approximate to their fair value.
(d) Risk exposures
Information about the Group and the parent entity's exposure to liquidity risk is provided in note 38.
26 Provisions Consolidated Parent
2010 2009 2010 2009 $'000 $'000 $'000 $'000
Current provisions expected to be settled within 12 months
Employee benefits Annual leave 15,056 13,582 13,209 11,829 Long service leave 4,738 4,130 3,903 3,551
Other provisions 200 73 - (1) Subtotal 19,994 17,785 17,112 15,379
Current provisions expected to be settled after more than 12 months
Employee benefits Annual leave 7,341 6,646 6,582 6,487 Long service leave 20,543 22,888 20,515 22,888
Subtotal 27,884 29,534 27,097 29,375
Total current provisions 47,878 47,319 44,209 44,754
Non-current provisions Employee benefits
Long service leave 10,181 8,787 9,496 7,723 Deferred government benefits for superannuation 260,959 233,131 260,959 233,131 Deferred non-government benefits for superannuation 5,241 6,433 5,241 6,433
Make Good 1,446 212 1,234 - Other provisions 1,953 1,423 1,953 1,423
Total non-current provisions 279,780 249,986 278,883 248,710
Total provisions 327,658 297,305 323,092 293,464
100 Macquarie University annual Report 2010
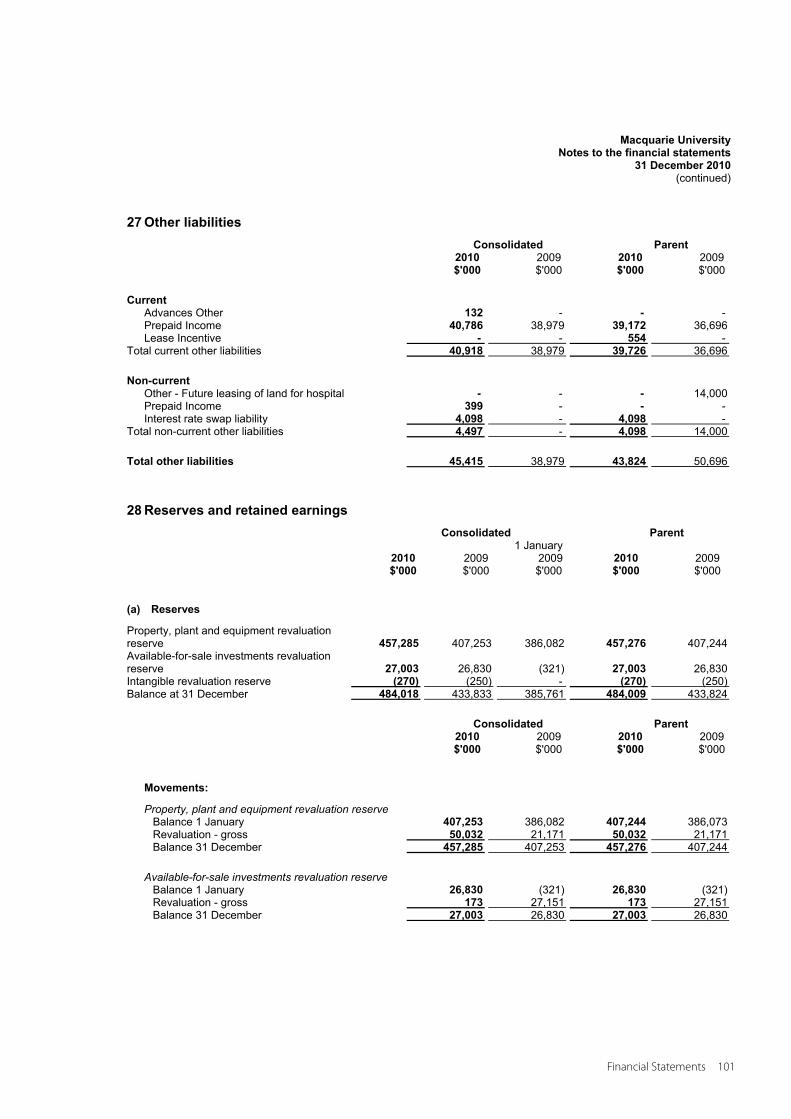
Macquarie UniversityNotes to the financial statements
31 December 2010(continued)
27 Other liabilities Consolidated Parent
2010 2009 2010 2009 $'000 $'000 $'000 $'000
Current Advances Other 132 - - - Prepaid Income 40,786 38,979 39,172 36,696 Lease Incentive - - 554 -
Total current other liabilities 40,918 38,979 39,726 36,696
Non-current Other - Future leasing of land for hospital - - - 14,000 Prepaid Income 399 - - - Interest rate swap liability 4,098 - 4,098 -
Total non-current other liabilities 4,497 - 4,098 14,000
Total other liabilities 45,415 38,979 43,824 50,696
28 Reserves and retained earnings Consolidated Parent
2010 2009 1 January
2009 2010 2009 $'000 $'000 $'000 $'000 $'000
(a) Reserves
Property, plant and equipment revaluation reserve 457,285 407,253 386,082 457,276 407,244 Available-for-sale investments revaluation reserve 27,003 26,830 (321) 27,003 26,830 Intangible revaluation reserve (270) (250) - (270) (250) Balance at 31 December 484,018 433,833 385,761 484,009 433,824
Consolidated Parent2010 2009 2010 2009 $'000 $'000 $'000 $'000
Movements:
Property, plant and equipment revaluation reserve Balance 1 January 407,253 386,082 407,244 386,073 Revaluation - gross 50,032 21,171 50,032 21,171 Balance 31 December 457,285 407,253 457,276 407,244
Available-for-sale investments revaluation reserve Balance 1 January 26,830 (321) 26,830 (321) Revaluation - gross 173 27,151 173 27,151 Balance 31 December 27,003 26,830 27,003 26,830
Financial Statements 101
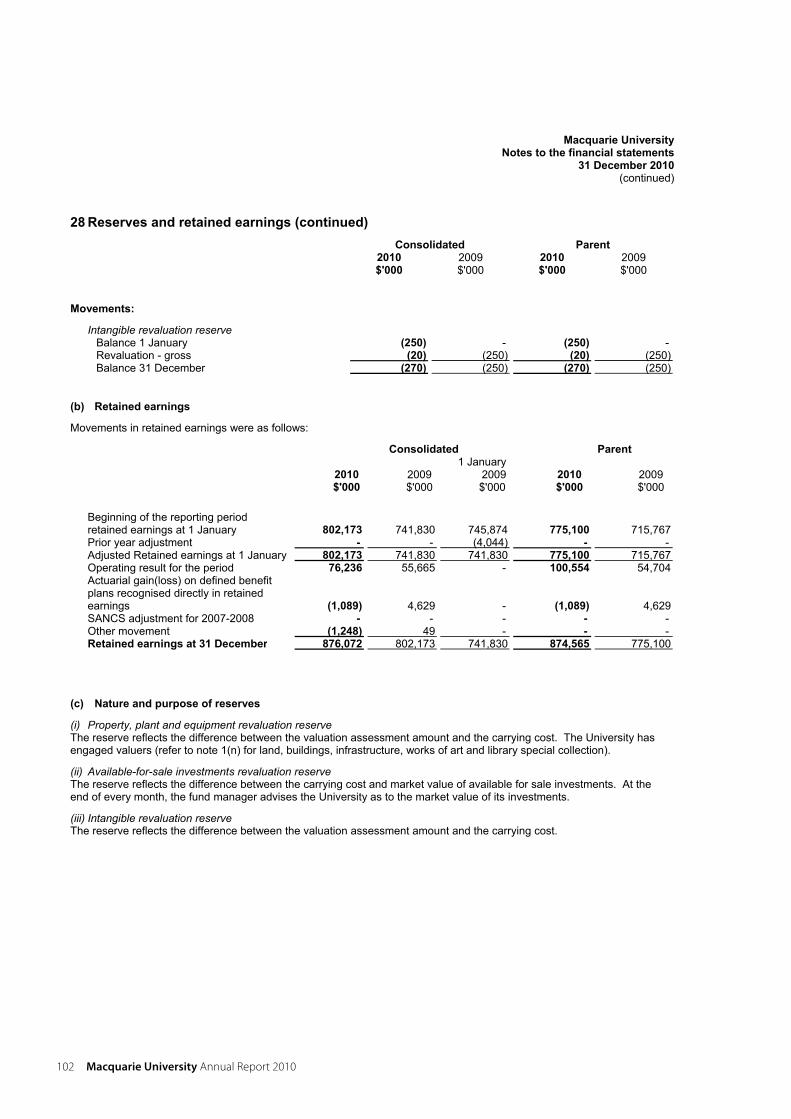
Macquarie UniversityNotes to the financial statements
31 December 2010(continued)
28 Reserves and retained earnings (continued) Consolidated Parent
2010 2009 2010 2009 $'000 $'000 $'000 $'000
Movements:
Intangible revaluation reserve Balance 1 January (250) - (250) - Revaluation - gross (20) (250) (20) (250) Balance 31 December (270) (250) (270) (250)
(b) Retained earnings
Movements in retained earnings were as follows:
Consolidated Parent
2010 2009 1 January
2009 2010 2009 $'000 $'000 $'000 $'000 $'000
Beginning of the reporting period retained earnings at 1 January 802,173 741,830 745,874 775,100 715,767 Prior year adjustment - - (4,044) - - Adjusted Retained earnings at 1 January 802,173 741,830 741,830 775,100 715,767 Operating result for the period 76,236 55,665 - 100,554 54,704 Actuarial gain(loss) on defined benefit plans recognised directly in retained earnings (1,089) 4,629 - (1,089) 4,629 SANCS adjustment for 2007-2008 - - - - - Other movement (1,248) 49 - - - Retained earnings at 31 December 876,072 802,173 741,830 874,565 775,100
(c) Nature and purpose of reserves
(i) Property, plant and equipment revaluation reserve The reserve reflects the difference between the valuation assessment amount and the carrying cost. The University has engaged valuers (refer to note 1(n) for land, buildings, infrastructure, works of art and library special collection).
(ii) Available-for-sale investments revaluation reserve The reserve reflects the difference between the carrying cost and market value of available for sale investments. At the end of every month, the fund manager advises the University as to the market value of its investments.
(iii) Intangible revaluation reserve The reserve reflects the difference between the valuation assessment amount and the carrying cost.
102 Macquarie University annual Report 2010
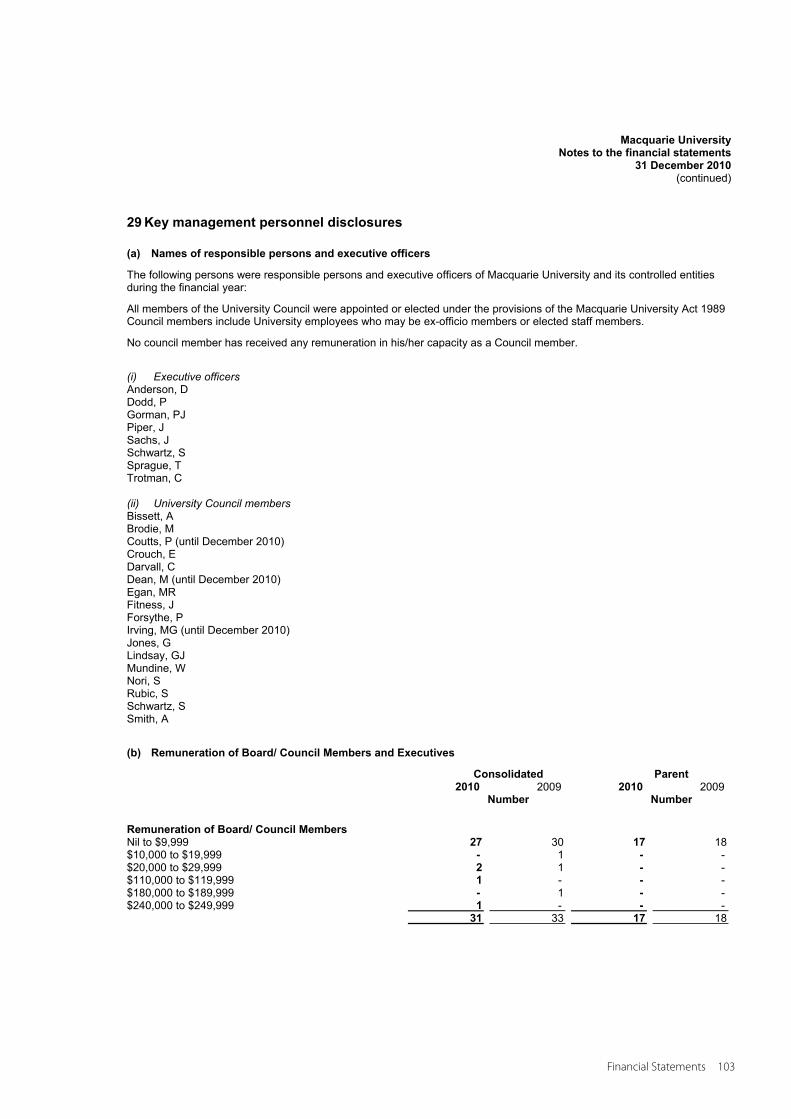
Macquarie UniversityNotes to the financial statements
31 December 2010(continued)
29 Key management personnel disclosures
(a) Names of responsible persons and executive officers
The following persons were responsible persons and executive officers of Macquarie University and its controlled entities during the financial year:
All members of the University Council were appointed or elected under the provisions of the Macquarie University Act 1989 Council members include University employees who may be ex-officio members or elected staff members.
No council member has received any remuneration in his/her capacity as a Council member.
(i) Executive officers Anderson, D Dodd, P Gorman, PJ Piper, J Sachs, J Schwartz, S Sprague, T Trotman, C
(ii) University Council members Bissett, A Brodie, M Coutts, P (until December 2010) Crouch, E Darvall, C Dean, M (until December 2010) Egan, MR Fitness, J Forsythe, P Irving, MG (until December 2010) Jones, G Lindsay, GJ Mundine, W Nori, SRubic, S Schwartz, S Smith, A
(b) Remuneration of Board/ Council Members and Executives
Consolidated Parent2010 2009 2010 2009
Number Number
Remuneration of Board/ Council Members Nil to $9,999 27 30 17 18 $10,000 to $19,999 - 1 - - $20,000 to $29,999 2 1 - - $110,000 to $119,999 1 - - - $180,000 to $189,999 - 1 - - $240,000 to $249,999 1 - - -
31 33 17 18
Financial Statements 103
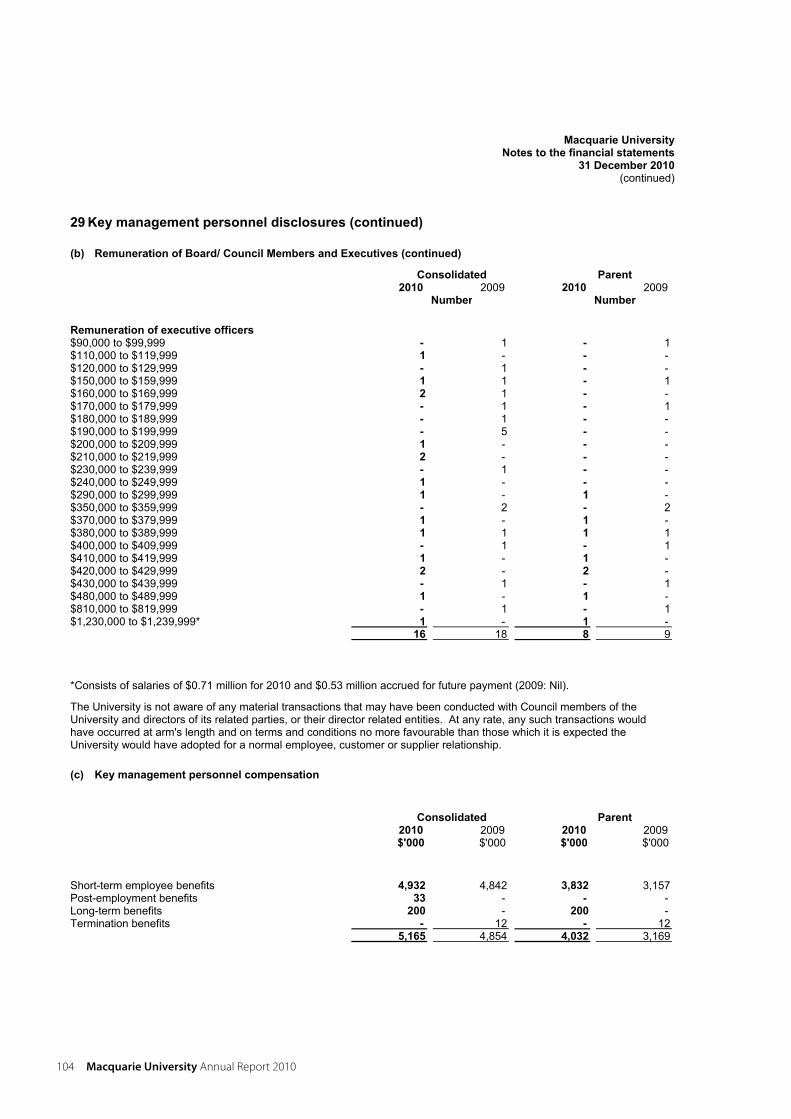
Macquarie UniversityNotes to the financial statements
31 December 2010(continued)
29 Key management personnel disclosures (continued)
(b) Remuneration of Board/ Council Members and Executives (continued)
Consolidated Parent2010 2009 2010 2009
Number Number
Remuneration of executive officers $90,000 to $99,999 - 1 - 1 $110,000 to $119,999 1 - - - $120,000 to $129,999 - 1 - - $150,000 to $159,999 1 1 - 1 $160,000 to $169,999 2 1 - - $170,000 to $179,999 - 1 - 1 $180,000 to $189,999 - 1 - - $190,000 to $199,999 - 5 - - $200,000 to $209,999 1 - - - $210,000 to $219,999 2 - - - $230,000 to $239,999 - 1 - - $240,000 to $249,999 1 - - - $290,000 to $299,999 1 - 1 - $350,000 to $359,999 - 2 - 2 $370,000 to $379,999 1 - 1 - $380,000 to $389,999 1 1 1 1 $400,000 to $409,999 - 1 - 1 $410,000 to $419,999 1 - 1 - $420,000 to $429,999 2 - 2 - $430,000 to $439,999 - 1 - 1 $480,000 to $489,999 1 - 1 - $810,000 to $819,999 - 1 - 1 $1,230,000 to $1,239,999* 1 - 1 -
16 18 8 9
*Consists of salaries of $0.71 million for 2010 and $0.53 million accrued for future payment (2009: Nil).
The University is not aware of any material transactions that may have been conducted with Council members of the University and directors of its related parties, or their director related entities. At any rate, any such transactions would have occurred at arm's length and on terms and conditions no more favourable than those which it is expected the University would have adopted for a normal employee, customer or supplier relationship.
(c) Key management personnel compensation
Consolidated Parent2010 2009 2010 2009 $'000 $'000 $'000 $'000
Short-term employee benefits 4,932 4,842 3,832 3,157 Post-employment benefits 33 - - - Long-term benefits 200 - 200 - Termination benefits - 12 - 12
5,165 4,854 4,032 3,169
104 Macquarie University annual Report 2010
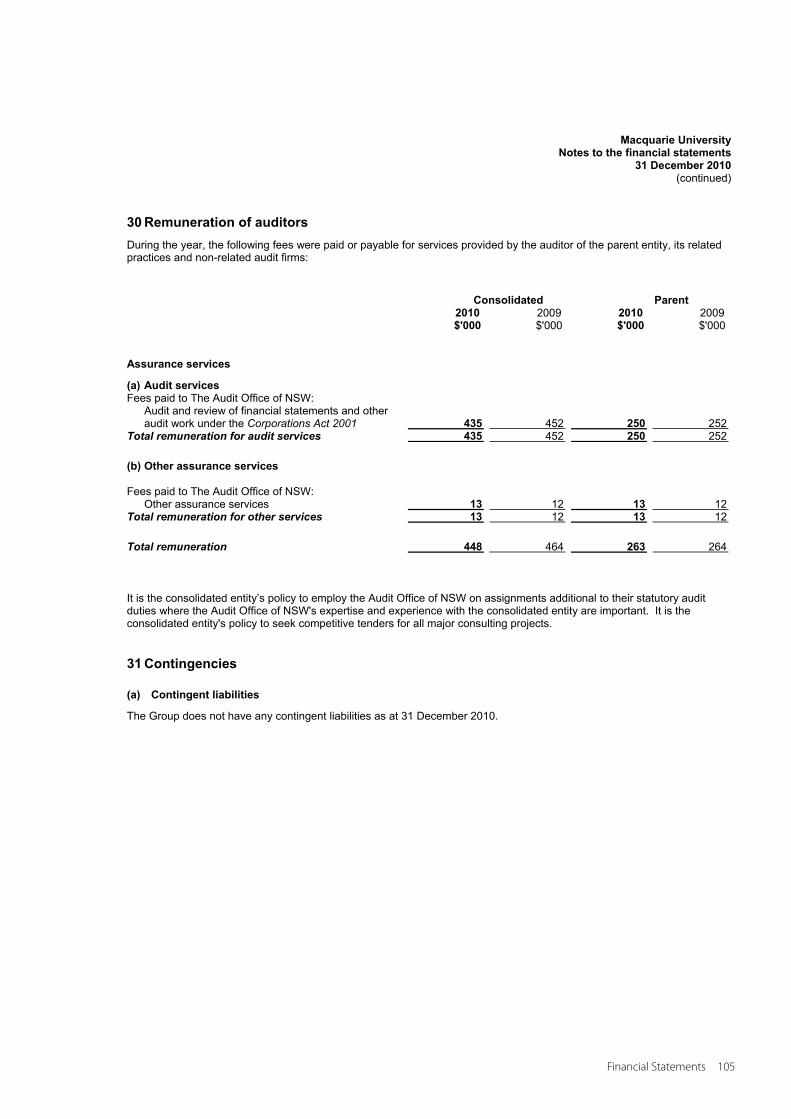
Macquarie UniversityNotes to the financial statements
31 December 2010(continued)
30 Remuneration of auditors During the year, the following fees were paid or payable for services provided by the auditor of the parent entity, its relatedpractices and non-related audit firms:
Consolidated Parent2010 2009 2010 2009 $'000 $'000 $'000 $'000
Assurance services
(a) Audit services Fees paid to The Audit Office of NSW:
Audit and review of financial statements and other audit work under the Corporations Act 2001 435 452 250 252
Total remuneration for audit services 435 452 250 252
(b) Other assurance services
Fees paid to The Audit Office of NSW: Other assurance services 13 12 13 12
Total remuneration for other services 13 12 13 12
Total remuneration 448 464 263 264
It is the consolidated entity’s policy to employ the Audit Office of NSW on assignments additional to their statutory audit duties where the Audit Office of NSW's expertise and experience with the consolidated entity are important. It is the consolidated entity's policy to seek competitive tenders for all major consulting projects.
31 Contingencies
(a) Contingent liabilities
The Group does not have any contingent liabilities as at 31 December 2010.
Financial Statements 105
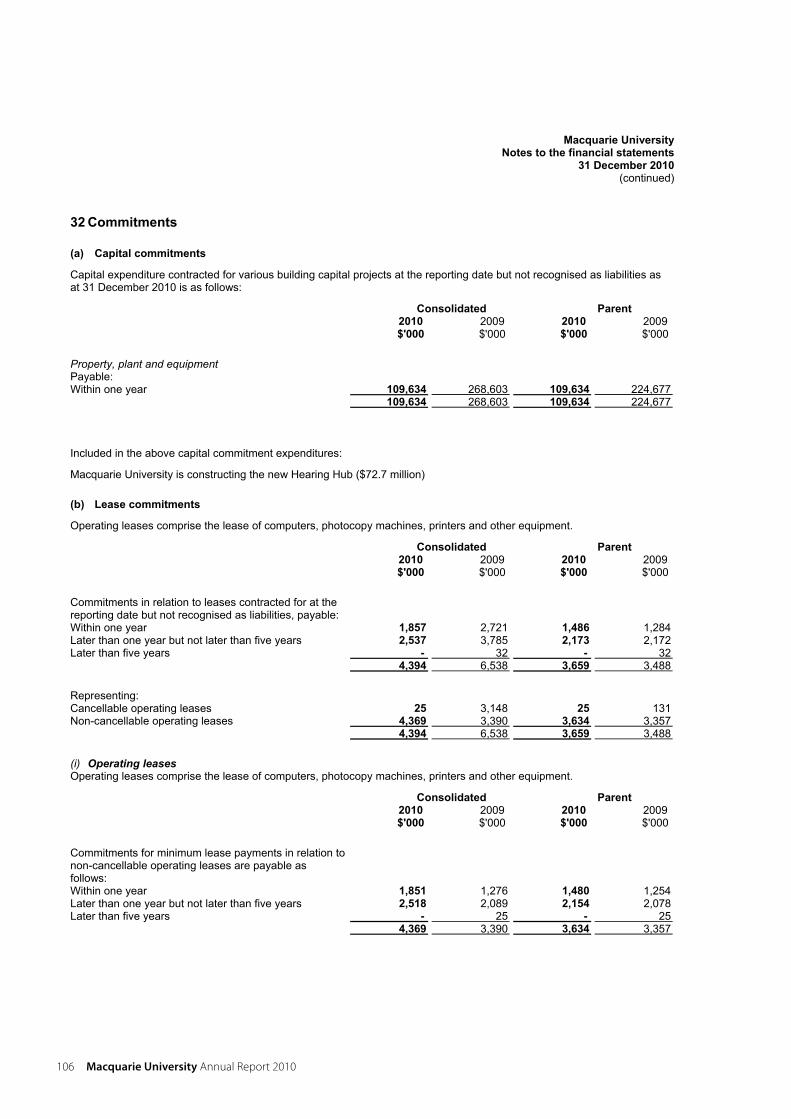
Macquarie UniversityNotes to the financial statements
31 December 2010(continued)
32 Commitments
(a) Capital commitments
Capital expenditure contracted for various building capital projects at the reporting date but not recognised as liabilities asat 31 December 2010 is as follows:
Consolidated Parent2010 2009 2010 2009 $'000 $'000 $'000 $'000
Property, plant and equipment Payable: Within one year 109,634 268,603 109,634 224,677
109,634 268,603 109,634 224,677
Included in the above capital commitment expenditures:
Macquarie University is constructing the new Hearing Hub ($72.7 million)
(b) Lease commitments
Operating leases comprise the lease of computers, photocopy machines, printers and other equipment.
Consolidated Parent2010 2009 2010 2009 $'000 $'000 $'000 $'000
Commitments in relation to leases contracted for at the reporting date but not recognised as liabilities, payable: Within one year 1,857 2,721 1,486 1,284 Later than one year but not later than five years 2,537 3,785 2,173 2,172 Later than five years - 32 - 32
4,394 6,538 3,659 3,488
Representing: Cancellable operating leases 25 3,148 25 131 Non-cancellable operating leases 4,369 3,390 3,634 3,357
4,394 6,538 3,659 3,488
(i) Operating leasesOperating leases comprise the lease of computers, photocopy machines, printers and other equipment.
Consolidated Parent2010 2009 2010 2009 $'000 $'000 $'000 $'000
Commitments for minimum lease payments in relation to non-cancellable operating leases are payable as follows: Within one year 1,851 1,276 1,480 1,254 Later than one year but not later than five years 2,518 2,089 2,154 2,078 Later than five years - 25 - 25
4,369 3,390 3,634 3,357
106 Macquarie University annual Report 2010
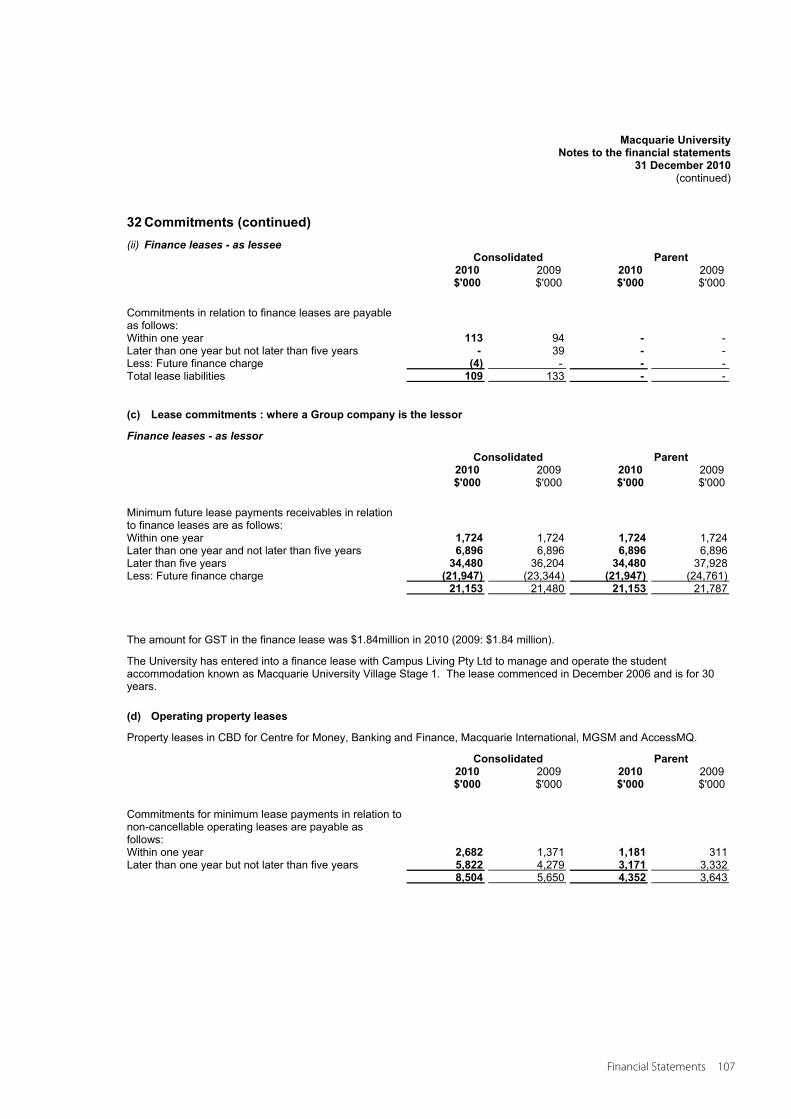
Macquarie UniversityNotes to the financial statements
31 December 2010(continued)
32 Commitments (continued) (ii) Finance leases - as lessee
Consolidated Parent2010 2009 2010 2009 $'000 $'000 $'000 $'000
Commitments in relation to finance leases are payable as follows: Within one year 113 94 - - Later than one year but not later than five years - 39 - - Less: Future finance charge (4) - - - Total lease liabilities 109 133 - -
(c) Lease commitments : where a Group company is the lessor
Finance leases - as lessor
Consolidated Parent2010 2009 2010 2009 $'000 $'000 $'000 $'000
Minimum future lease payments receivables in relation to finance leases are as follows:Within one year 1,724 1,724 1,724 1,724 Later than one year and not later than five years 6,896 6,896 6,896 6,896 Later than five years 34,480 36,204 34,480 37,928 Less: Future finance charge (21,947) (23,344) (21,947) (24,761)
21,153 21,480 21,153 21,787
The amount for GST in the finance lease was $1.84million in 2010 (2009: $1.84 million).
The University has entered into a finance lease with Campus Living Pty Ltd to manage and operate the student accommodation known as Macquarie University Village Stage 1. The lease commenced in December 2006 and is for 30 years.
(d) Operating property leases
Property leases in CBD for Centre for Money, Banking and Finance, Macquarie International, MGSM and AccessMQ.
Consolidated Parent2010 2009 2010 2009 $'000 $'000 $'000 $'000
Commitments for minimum lease payments in relation to non-cancellable operating leases are payable as follows:Within one year 2,682 1,371 1,181 311 Later than one year but not later than five years 5,822 4,279 3,171 3,332
8,504 5,650 4,352 3,643
Financial Statements 107
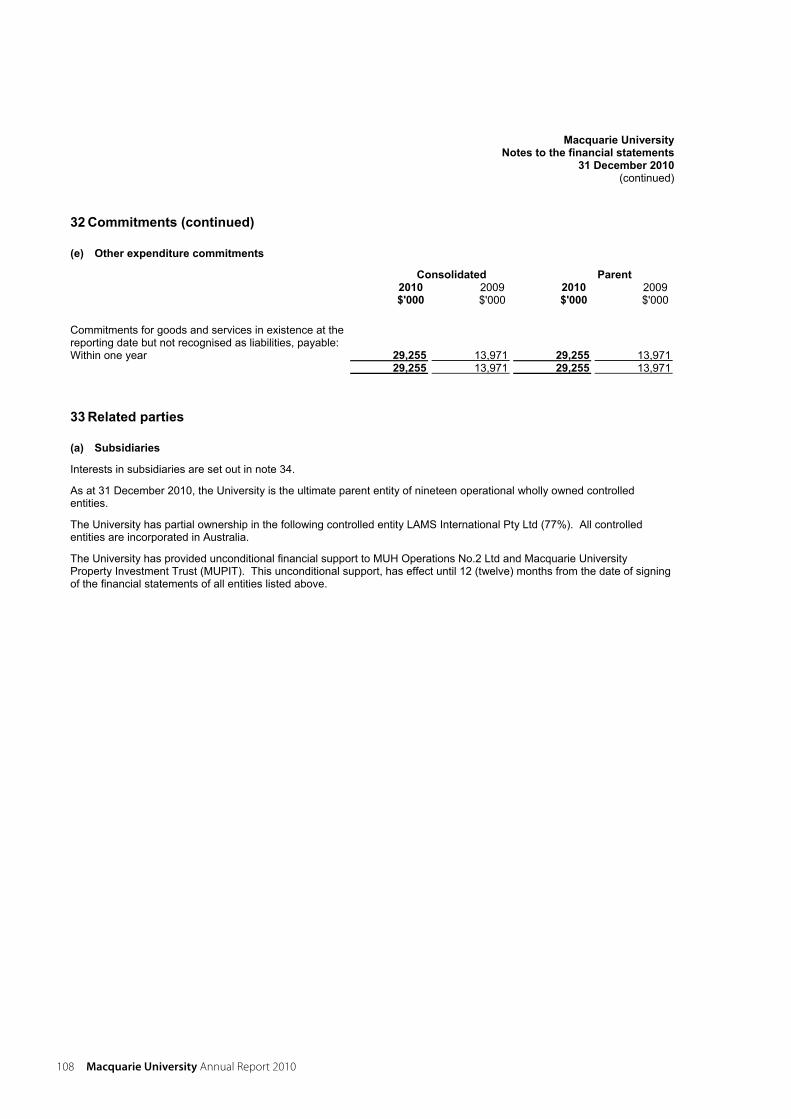
Macquarie UniversityNotes to the financial statements
31 December 2010(continued)
32 Commitments (continued)
(e) Other expenditure commitments
Consolidated Parent2010 2009 2010 2009 $'000 $'000 $'000 $'000
Commitments for goods and services in existence at the reporting date but not recognised as liabilities, payable: Within one year 29,255 13,971 29,255 13,971
29,255 13,971 29,255 13,971
33 Related parties
(a) Subsidiaries
Interests in subsidiaries are set out in note 34.
As at 31 December 2010, the University is the ultimate parent entity of nineteen operational wholly owned controlled entities.
The University has partial ownership in the following controlled entity LAMS International Pty Ltd (77%). All controlled entities are incorporated in Australia.
The University has provided unconditional financial support to MUH Operations No.2 Ltd and Macquarie University Property Investment Trust (MUPIT). This unconditional support, has effect until 12 (twelve) months from the date of signing of the financial statements of all entities listed above.
108 Macquarie University annual Report 2010
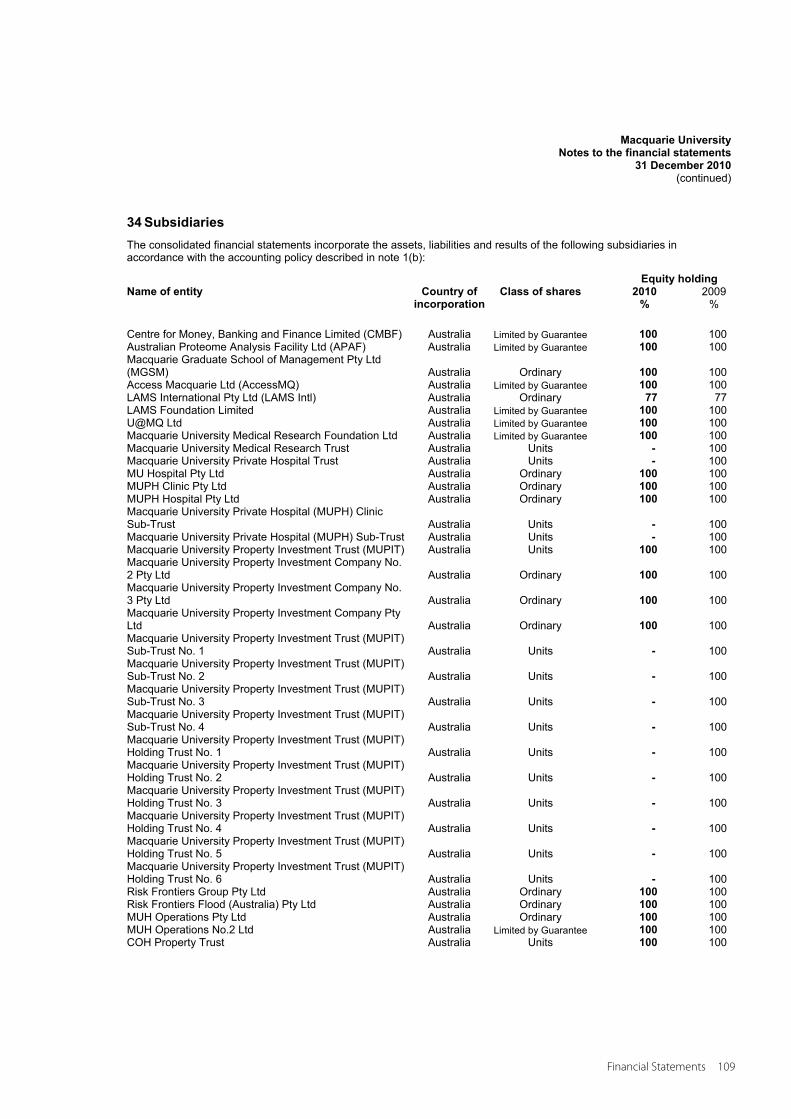
Macquarie UniversityNotes to the financial statements
31 December 2010(continued)
34 Subsidiaries The consolidated financial statements incorporate the assets, liabilities and results of the following subsidiaries in accordance with the accounting policy described in note 1(b):
Equity holdingName of entity Country of
incorporationClass of shares 2010
%2009
%
Centre for Money, Banking and Finance Limited (CMBF) Australia Limited by Guarantee 100 100 Australian Proteome Analysis Facility Ltd (APAF) Australia Limited by Guarantee 100 100 Macquarie Graduate School of Management Pty Ltd (MGSM) Australia Ordinary 100 100 Access Macquarie Ltd (AccessMQ) Australia Limited by Guarantee 100 100 LAMS International Pty Ltd (LAMS Intl) Australia Ordinary 77 77 LAMS Foundation Limited Australia Limited by Guarantee 100 100 U@MQ Ltd Australia Limited by Guarantee 100 100 Macquarie University Medical Research Foundation Ltd Australia Limited by Guarantee 100 100 Macquarie University Medical Research Trust Australia Units - 100 Macquarie University Private Hospital Trust Australia Units - 100 MU Hospital Pty Ltd Australia Ordinary 100 100 MUPH Clinic Pty Ltd Australia Ordinary 100 100 MUPH Hospital Pty Ltd Australia Ordinary 100 100 Macquarie University Private Hospital (MUPH) Clinic Sub-Trust Australia Units - 100 Macquarie University Private Hospital (MUPH) Sub-Trust Australia Units - 100 Macquarie University Property Investment Trust (MUPIT) Australia Units 100 100 Macquarie University Property Investment Company No. 2 Pty Ltd Australia Ordinary 100 100 Macquarie University Property Investment Company No. 3 Pty Ltd Australia Ordinary 100 100 Macquarie University Property Investment Company Pty Ltd Australia Ordinary 100 100 Macquarie University Property Investment Trust (MUPIT) Sub-Trust No. 1 Australia Units - 100 Macquarie University Property Investment Trust (MUPIT) Sub-Trust No. 2 Australia Units - 100 Macquarie University Property Investment Trust (MUPIT) Sub-Trust No. 3 Australia Units - 100 Macquarie University Property Investment Trust (MUPIT) Sub-Trust No. 4 Australia Units - 100 Macquarie University Property Investment Trust (MUPIT) Holding Trust No. 1 Australia Units - 100 Macquarie University Property Investment Trust (MUPIT) Holding Trust No. 2 Australia Units - 100 Macquarie University Property Investment Trust (MUPIT) Holding Trust No. 3 Australia Units - 100 Macquarie University Property Investment Trust (MUPIT) Holding Trust No. 4 Australia Units - 100 Macquarie University Property Investment Trust (MUPIT) Holding Trust No. 5 Australia Units - 100 Macquarie University Property Investment Trust (MUPIT) Holding Trust No. 6 Australia Units - 100 Risk Frontiers Group Pty Ltd Australia Ordinary 100 100 Risk Frontiers Flood (Australia) Pty Ltd Australia Ordinary 100 100 MUH Operations Pty Ltd Australia Ordinary 100 100 MUH Operations No.2 Ltd Australia Limited by Guarantee 100 100 COH Property Trust Australia Units 100 100
Financial Statements 109
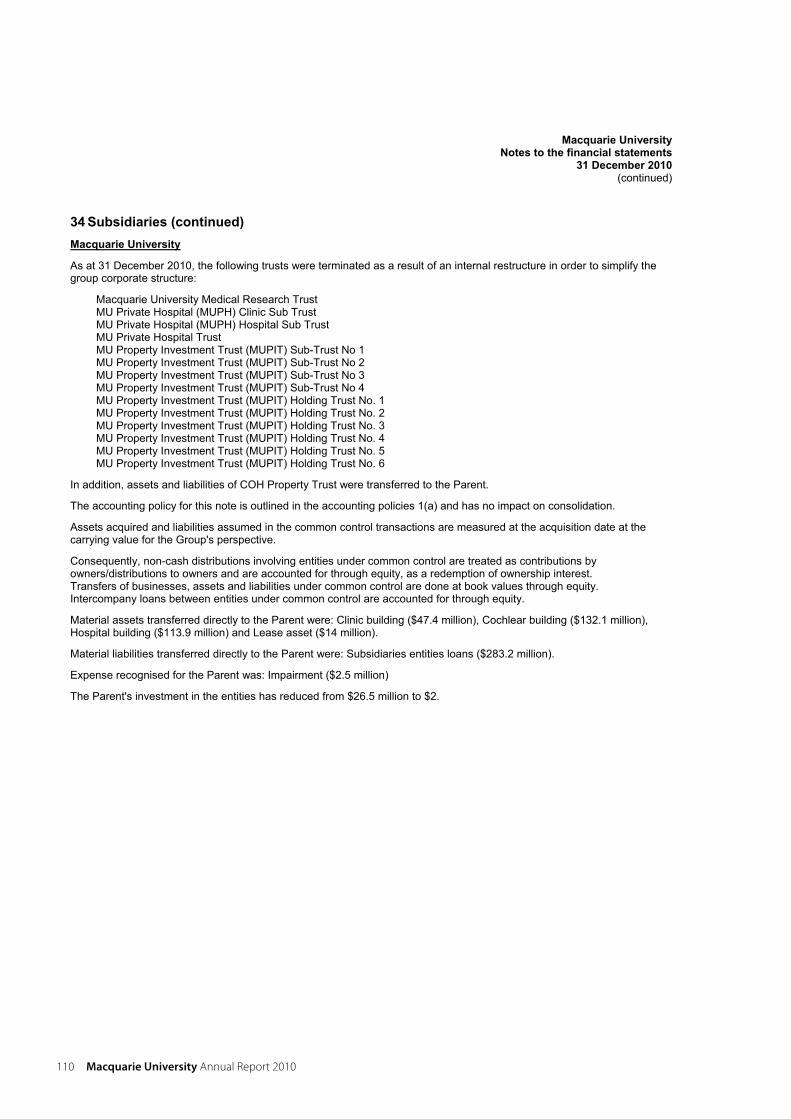
Macquarie UniversityNotes to the financial statements
31 December 2010(continued)
34 Subsidiaries (continued) Macquarie University
As at 31 December 2010, the following trusts were terminated as a result of an internal restructure in order to simplify the group corporate structure:
Macquarie University Medical Research Trust MU Private Hospital (MUPH) Clinic Sub Trust MU Private Hospital (MUPH) Hospital Sub Trust MU Private Hospital Trust MU Property Investment Trust (MUPIT) Sub-Trust No 1 MU Property Investment Trust (MUPIT) Sub-Trust No 2 MU Property Investment Trust (MUPIT) Sub-Trust No 3 MU Property Investment Trust (MUPIT) Sub-Trust No 4 MU Property Investment Trust (MUPIT) Holding Trust No. 1 MU Property Investment Trust (MUPIT) Holding Trust No. 2 MU Property Investment Trust (MUPIT) Holding Trust No. 3 MU Property Investment Trust (MUPIT) Holding Trust No. 4 MU Property Investment Trust (MUPIT) Holding Trust No. 5 MU Property Investment Trust (MUPIT) Holding Trust No. 6
In addition, assets and liabilities of COH Property Trust were transferred to the Parent.
The accounting policy for this note is outlined in the accounting policies 1(a) and has no impact on consolidation.
Assets acquired and liabilities assumed in the common control transactions are measured at the acquisition date at the carrying value for the Group's perspective.
Consequently, non-cash distributions involving entities under common control are treated as contributions by owners/distributions to owners and are accounted for through equity, as a redemption of ownership interest. Transfers of businesses, assets and liabilities under common control are done at book values through equity. Intercompany loans between entities under common control are accounted for through equity.
Material assets transferred directly to the Parent were: Clinic building ($47.4 million), Cochlear building ($132.1 million), Hospital building ($113.9 million) and Lease asset ($14 million).
Material liabilities transferred directly to the Parent were: Subsidiaries entities loans ($283.2 million).
Expense recognised for the Parent was: Impairment ($2.5 million)
The Parent's investment in the entities has reduced from $26.5 million to $2.
110 Macquarie University annual Report 2010
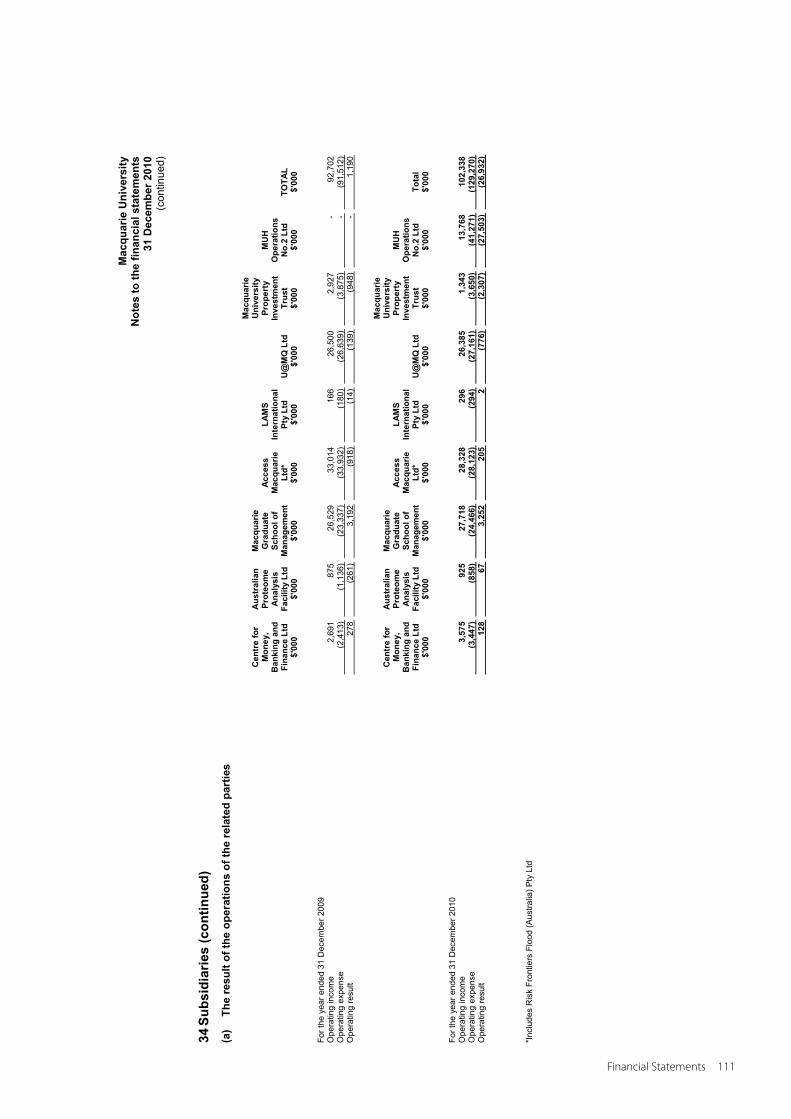
Mac
quar
ie U
nive
rsity
N
otes
to th
e fin
anci
al s
tate
men
ts
31 D
ecem
ber 2
010
(con
tinue
d)
34 S
ubsi
diar
ies
(con
tinue
d)
(a)
The
resu
lt of
the
oper
atio
ns o
f the
rela
ted
part
ies
Cen
tre
for
Mon
ey,
Ban
king
and
Fi
nanc
e Lt
d
Aus
tral
ian
Prot
eom
e A
naly
sis
Faci
lity
Ltd
Mac
quar
ie
Gra
duat
e Sc
hool
of
Man
agem
ent
Acc
ess
Mac
quar
ie
Ltd*
LAM
S In
tern
atio
nal
Pty
Ltd
U@
MQ
Ltd
Mac
quar
ie
Uni
vers
ity
Prop
erty
In
vest
men
t Tr
ust
MU
H
Ope
ratio
ns
No.
2 Lt
d TO
TAL
$'00
0$'
000
$'00
0 $'
000
$'00
0$'
000
$'00
0$'
000
$'00
0
For t
he y
ear e
nded
31
Dec
embe
r 200
9
Ope
ratin
g in
com
e
2,69
1
875
26
,529
33
,014
16
6
26,5
00
2,92
7
-
92,7
02
Ope
ratin
g ex
pens
e
(2,4
13)
(1
,136
)
(23,
337)
(3
3,93
2)
(180
)
(26,
639)
(3
,875
)
-
(91,
512)
O
pera
ting
resu
lt
278
(2
61)
3,
192
(9
18)
(1
4)
(139
)
(948
)
-
1,19
0
Cen
tre
for
Mon
ey,
Ban
king
and
Fi
nanc
e Lt
d
Aus
tral
ian
Prot
eom
e A
naly
sis
Faci
lity
Ltd
Mac
quar
ie
Gra
duat
e Sc
hool
of
Man
agem
ent
Acc
ess
Mac
quar
ie
Ltd*
LAM
S In
tern
atio
nal
Pty
Ltd
U@
MQ
Ltd
Mac
quar
ie
Uni
vers
ity
Prop
erty
In
vest
men
t Tr
ust
MU
H
Ope
ratio
ns
No.
2 Lt
d To
tal
$'00
0$'
000
$'00
0 $'
000
$'00
0$'
000
$'00
0$'
000
$'00
0
For t
he y
ear e
nded
31
Dec
embe
r 201
0
Ope
ratin
g in
com
e
3,57
5
925
27
,718
28
,328
29
6
26,3
85
1,34
3
13,7
68
102,
338
O
pera
ting
expe
nse
(3
,447
)
(858
)
(24,
466)
(2
8,12
3)
(294
)
(27,
161)
(3
,650
)
(41,
271)
(1
29,2
70)
Ope
ratin
g re
sult
128
673,
252
20
52
(776
)(2
,307
)(2
7,50
3)(2
6,93
2)
*Inc
lude
s R
isk
Fron
tiers
Flo
od (A
ustra
lia) P
ty L
td
Financial Statements 111

Mac
quar
ie U
nive
rsity
N
otes
to th
e fin
anci
al s
tate
men
ts
31 D
ecem
ber 2
010
(con
tinue
d)
34 S
ubsi
diar
ies
(con
tinue
d)
(b)
The
Stat
emen
ts o
f fin
anci
al p
ositi
on o
f the
con
trol
led
entit
ies
Cen
tre
for
Mon
ey,
Ban
king
and
Fi
nanc
e Lt
d
Aus
tral
ian
Prot
eom
e A
naly
sis
Faci
lity
Ltd
Mac
quar
ie
Gra
duat
e Sc
hool
of
Man
agem
ent
Acc
ess
Mac
quar
ie
Ltd*
LAM
S In
tern
atio
nal
Pty
Ltd
U@
MQ
Ltd
Mac
quar
ie
Uni
vers
ity
Prop
erty
In
vest
men
t Tr
ust
MU
H
Ope
ratio
ns
No.
2 Lt
d To
tal
$'00
0$'
000
$'00
0 $'
000
$'00
0$'
000
$'00
0$'
000
$'00
0
As
at 3
1 D
ecem
ber 2
009
C
urre
nt a
sset
s
1,49
4
1,06
0
15,6
32
15,5
30
230
9,
988
1,
218
-
45
,152
N
on-c
urre
nt a
sset
s
12
-
1,38
7
1,18
0
21
7,43
1
162,
374
-
17
2,40
5 To
tal a
sset
s
1,50
6
1,06
0
17,0
19
16,7
10
251
17
,419
16
3,59
2
-
217,
557
Cur
rent
liab
ilitie
s
182
88
4
4,46
2
11,2
52
99
2,43
6
121,
076
-
14
0,39
1
Non
-cur
rent
liab
ilitie
s
11
-
351
67
2
-
345
17
,020
-
18
,399
To
tal l
iabi
litie
s
193
88
4
4,81
3
11,9
24
99
2,78
1
138,
096
-
15
8,79
0
Net
ass
ets
1,
313
17
6
12,2
06
4,78
6
152
14
,638
25
,496
-
58
,767
Rep
rese
nted
by:
Res
erve
s
-
-
-
-
-
-
-
-
- R
etai
ned
prof
it/(lo
sses
)
1,31
3
176
12
,206
4,
786
15
2
14,6
38
25,4
96
-
58,7
67
Net
equ
ity
1,
313
17
6
12,2
06
4,78
6
152
14
,638
25
,496
-
58
,767
112 Macquarie University annual Report 2010
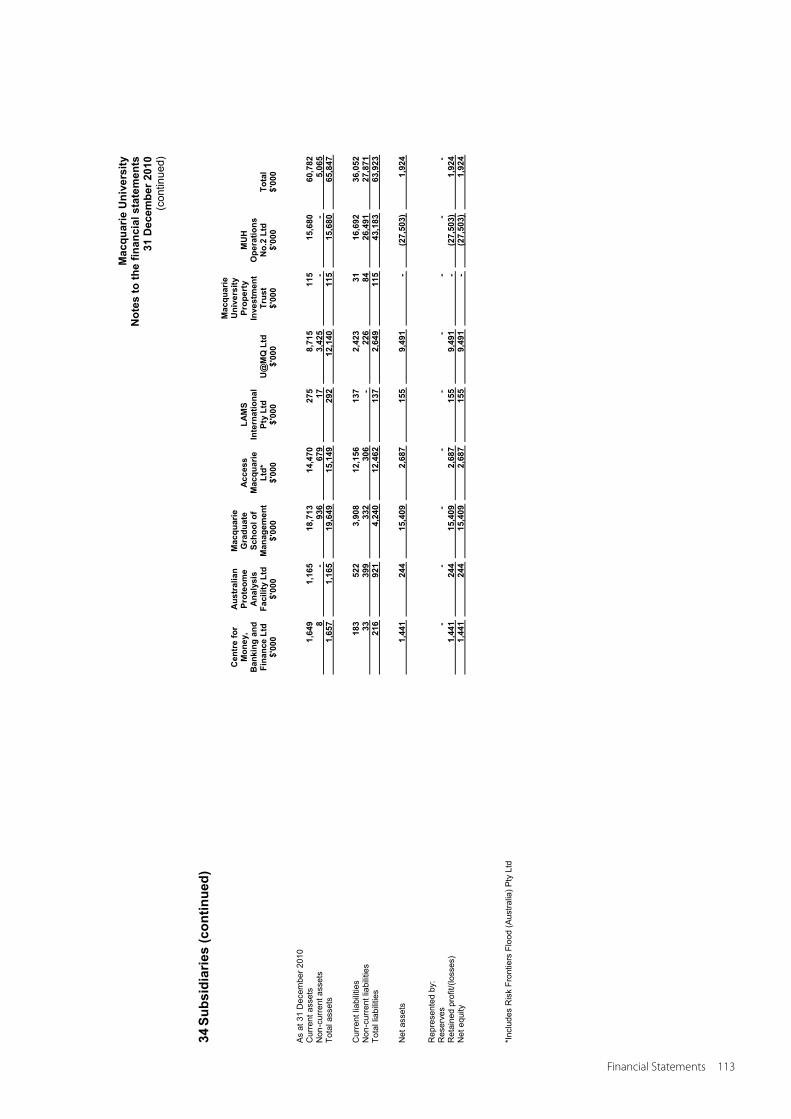
Mac
quar
ie U
nive
rsity
N
otes
to th
e fin
anci
al s
tate
men
ts
31 D
ecem
ber 2
010
(con
tinue
d)
34 S
ubsi
diar
ies
(con
tinue
d)
Cen
tre
for
Mon
ey,
Ban
king
and
Fi
nanc
e Lt
d
Aus
tral
ian
Prot
eom
e A
naly
sis
Faci
lity
Ltd
Mac
quar
ie
Gra
duat
e Sc
hool
of
Man
agem
ent
Acc
ess
Mac
quar
ie
Ltd*
LAM
S In
tern
atio
nal
Pty
Ltd
U@
MQ
Ltd
Mac
quar
ie
Uni
vers
ity
Prop
erty
In
vest
men
t Tr
ust
MU
H
Ope
ratio
ns
No.
2 Lt
d To
tal
$'00
0$'
000
$'00
0 $'
000
$'00
0$'
000
$'00
0$'
000
$'00
0
As
at 3
1 D
ecem
ber 2
010
C
urre
nt a
sset
s
1,64
9
1,16
5
18,7
13
14,4
70
275
8,
715
11
5
15,6
80
60,7
82
Non
-cur
rent
ass
ets
8
-
93
6
679
17
3,
425
-
-
5,
065
Tota
l ass
ets
1,65
71,
165
19,6
49
15,1
4929
212
,140
115
15,6
8065
,847
Cur
rent
liab
ilitie
s
183
52
2
3,90
8
12,1
56
137
2,
423
31
16
,692
36
,052
N
on-c
urre
nt li
abilit
ies
33
39
9
332
30
6
-
226
84
26
,491
27
,871
To
tal l
iabi
litie
s 21
692
14,
240
12
,462
137
2,64
911
543
,183
63,9
23
Net
ass
ets
1,44
124
415
,409
2,
687
155
9,49
1-
(27,
503)
1,92
4
Rep
rese
nted
by:
Res
erve
s
-
-
-
-
-
-
-
-
- R
etai
ned
prof
it/(lo
sses
)
1,44
1
244
15
,409
2,
687
15
5
9,49
1
-
(27,
503)
1,
924
Net
equ
ity
1,44
124
415
,409
2,
687
155
9,49
1-
(27,
503)
1,92
4
*Inc
lude
s R
isk
Fron
tiers
Flo
od (A
ustra
lia) P
ty L
td
Financial Statements 113
Macquarie UniversityNotes to the financial statements
31 December 2010(continued)
35 Joint ventures, associates and minority interests Other entities that are operational with percentage of holdings more than 20%
1. Sydney Educational Broadcasting Limited
The University has a 50% joint venture interest in the F.M. radio station, 2SER-FM. The University of Technology, Sydney (UTS) holds the remaining 50% interest in the station. The University's contribution to the operations of the company in 2010 was $0.20 million (2009: $0.20 million). The company is independently audited by the Auditor-General of New South Wales and its Financial Statements are not included in the Consolidated Financial Statements of the University.
2. Sydney Institute Marine Science Limited
Sydney Institute Marine Science Limited (SIMS) is a partnership between Macquarie University, University of New South Wales (UNSW), the University of Sydney and the University of Technology, Sydney (UTS). SIMS is a joint venture, research facility based on Sydney Harbour's North Shore at Chowder Bay. It will bring together key researchers to form cross-disciplinary teams of leading scientists working on issues that are critical for the sustainable management of our coastal and oceanic environments. The University holds a 25% interest in the company. The University did not adopt equity accounting as its shares of results of operations, assets, liabilities and equity is not considered material.
114 Macquarie University annual Report 2010
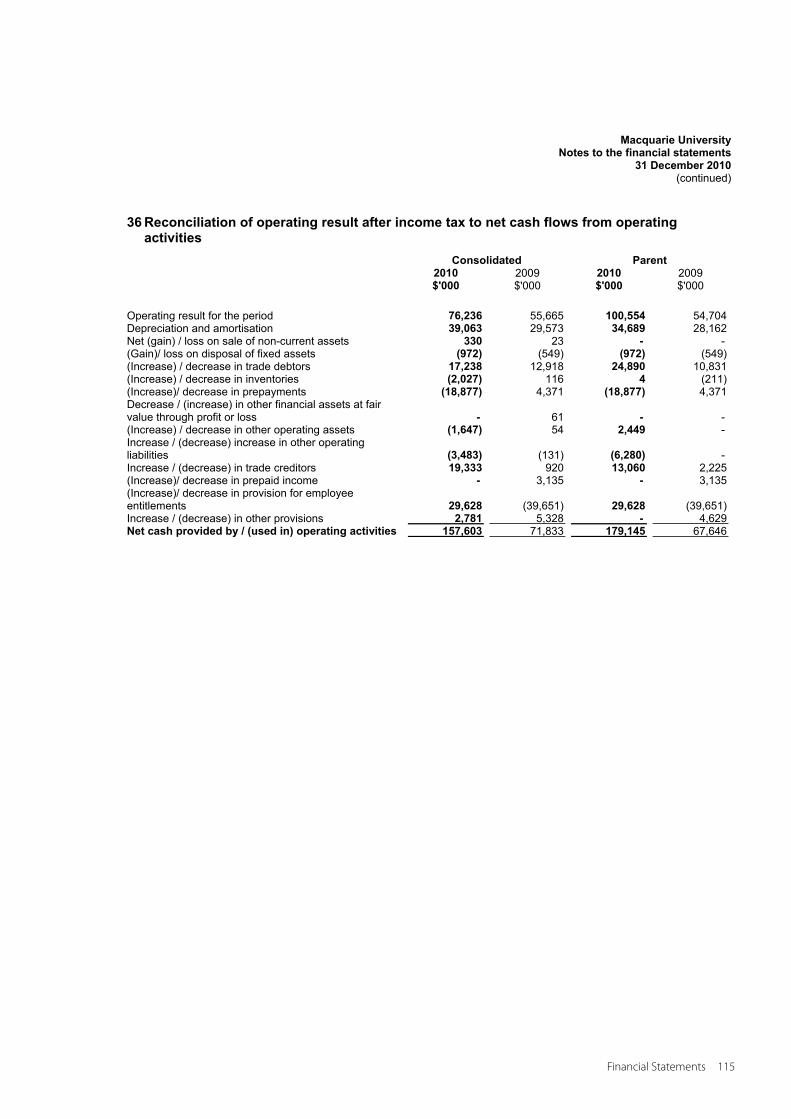
Macquarie UniversityNotes to the financial statements
31 December 2010(continued)
36 Reconciliation of operating result after income tax to net cash flows from operating activities
Consolidated Parent2010 2009 2010 2009 $'000 $'000 $'000 $'000
Operating result for the period 76,236 55,665 100,554 54,704 Depreciation and amortisation 39,063 29,573 34,689 28,162 Net (gain) / loss on sale of non-current assets 330 23 - - (Gain)/ loss on disposal of fixed assets (972) (549) (972) (549) (Increase) / decrease in trade debtors 17,238 12,918 24,890 10,831 (Increase) / decrease in inventories (2,027) 116 4 (211) (Increase)/ decrease in prepayments (18,877) 4,371 (18,877) 4,371 Decrease / (increase) in other financial assets at fair value through profit or loss - 61 - - (Increase) / decrease in other operating assets (1,647) 54 2,449 - Increase / (decrease) increase in other operating liabilities (3,483) (131) (6,280) - Increase / (decrease) in trade creditors 19,333 920 13,060 2,225 (Increase)/ decrease in prepaid income - 3,135 - 3,135 (Increase)/ decrease in provision for employee entitlements 29,628 (39,651) 29,628 (39,651) Increase / (decrease) in other provisions 2,781 5,328 - 4,629 Net cash provided by / (used in) operating activities 157,603 71,833 179,145 67,646
Financial Statements 115
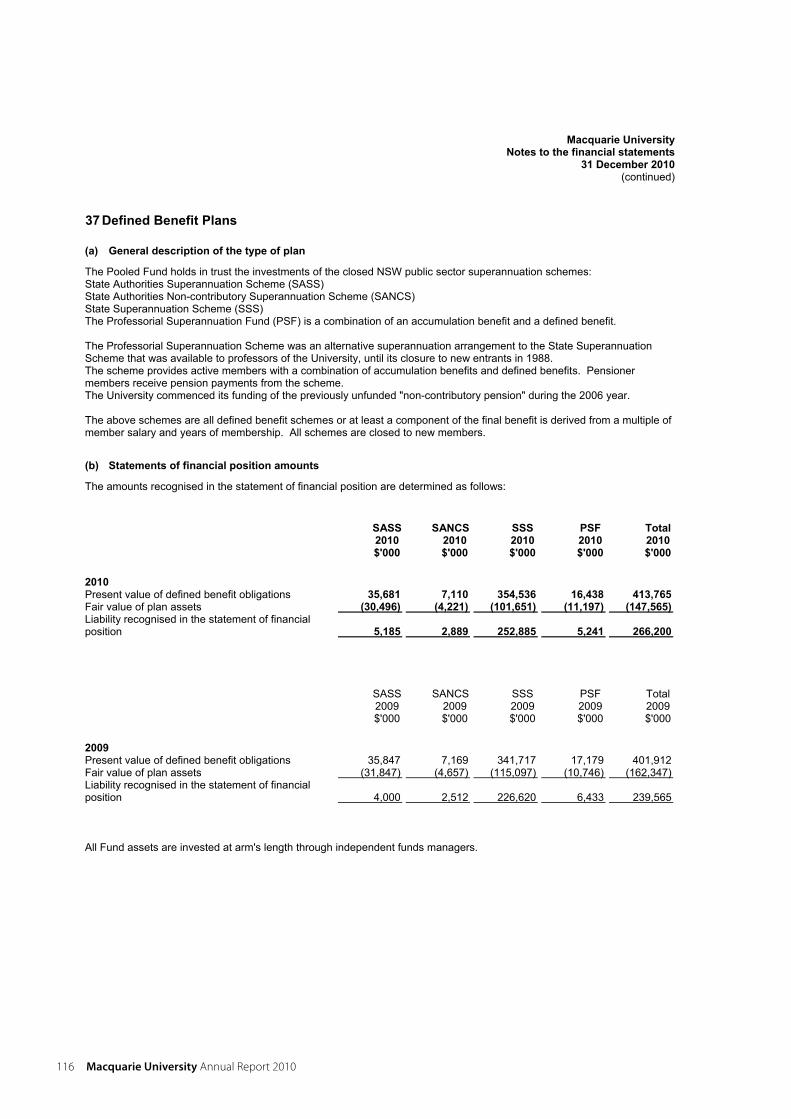
Macquarie UniversityNotes to the financial statements
31 December 2010(continued)
37 Defined Benefit Plans
(a) General description of the type of plan
The Pooled Fund holds in trust the investments of the closed NSW public sector superannuation schemes: State Authorities Superannuation Scheme (SASS) State Authorities Non-contributory Superannuation Scheme (SANCS) State Superannuation Scheme (SSS) The Professorial Superannuation Fund (PSF) is a combination of an accumulation benefit and a defined benefit.
The Professorial Superannuation Scheme was an alternative superannuation arrangement to the State Superannuation Scheme that was available to professors of the University, until its closure to new entrants in 1988. The scheme provides active members with a combination of accumulation benefits and defined benefits. Pensioner members receive pension payments from the scheme. The University commenced its funding of the previously unfunded "non-contributory pension" during the 2006 year.
The above schemes are all defined benefit schemes or at least a component of the final benefit is derived from a multiple of member salary and years of membership. All schemes are closed to new members.
(b) Statements of financial position amounts
The amounts recognised in the statement of financial position are determined as follows:
SASS SANCS SSS PSF Total2010 2010 2010 2010 2010$'000 $'000 $'000 $'000 $'000
2010 Present value of defined benefit obligations 35,681 7,110 354,536 16,438 413,765Fair value of plan assets (30,496) (4,221) (101,651) (11,197) (147,565)Liability recognised in the statement of financial position 5,185 2,889 252,885 5,241 266,200
SASS SANCS SSS PSF Total 2009 2009 2009 2009 2009
$'000 $'000 $'000 $'000 $'000
2009 Present value of defined benefit obligations 35,847 7,169 341,717 17,179 401,912 Fair value of plan assets (31,847) (4,657) (115,097) (10,746) (162,347) Liability recognised in the statement of financial position 4,000 2,512 226,620 6,433 239,565
All Fund assets are invested at arm's length through independent funds managers.
116 Macquarie University annual Report 2010
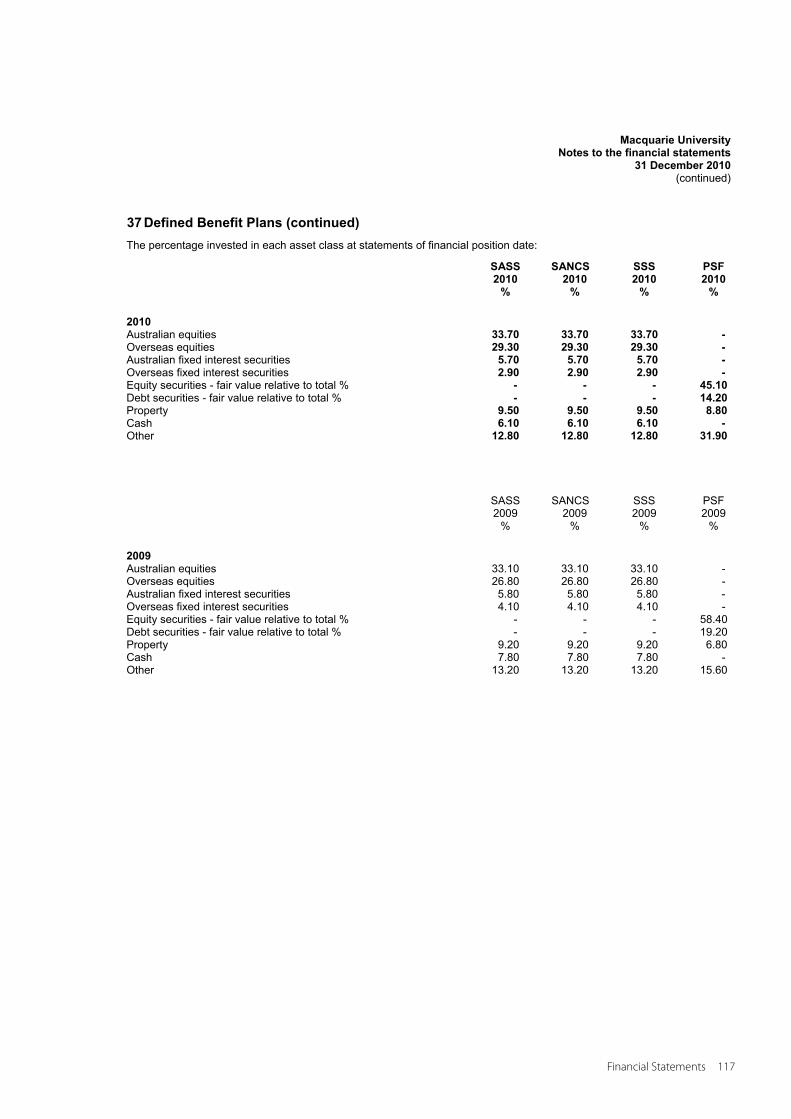
Macquarie UniversityNotes to the financial statements
31 December 2010(continued)
37 Defined Benefit Plans (continued) The percentage invested in each asset class at statements of financial position date:
SASS SANCS SSS PSF2010 2010 2010 2010
% % % %
2010 Australian equities 33.70 33.70 33.70 -Overseas equities 29.30 29.30 29.30 -Australian fixed interest securities 5.70 5.70 5.70 -Overseas fixed interest securities 2.90 2.90 2.90 -Equity securities - fair value relative to total % - - - 45.10Debt securities - fair value relative to total % - - - 14.20Property 9.50 9.50 9.50 8.80Cash 6.10 6.10 6.10 -Other 12.80 12.80 12.80 31.90
SASS SANCS SSS PSF 2009 2009 2009 2009
% % % %
2009 Australian equities 33.10 33.10 33.10 - Overseas equities 26.80 26.80 26.80 - Australian fixed interest securities 5.80 5.80 5.80 - Overseas fixed interest securities 4.10 4.10 4.10 - Equity securities - fair value relative to total % - - - 58.40 Debt securities - fair value relative to total % - - - 19.20 Property 9.20 9.20 9.20 6.80 Cash 7.80 7.80 7.80 - Other 13.20 13.20 13.20 15.60
Financial Statements 117
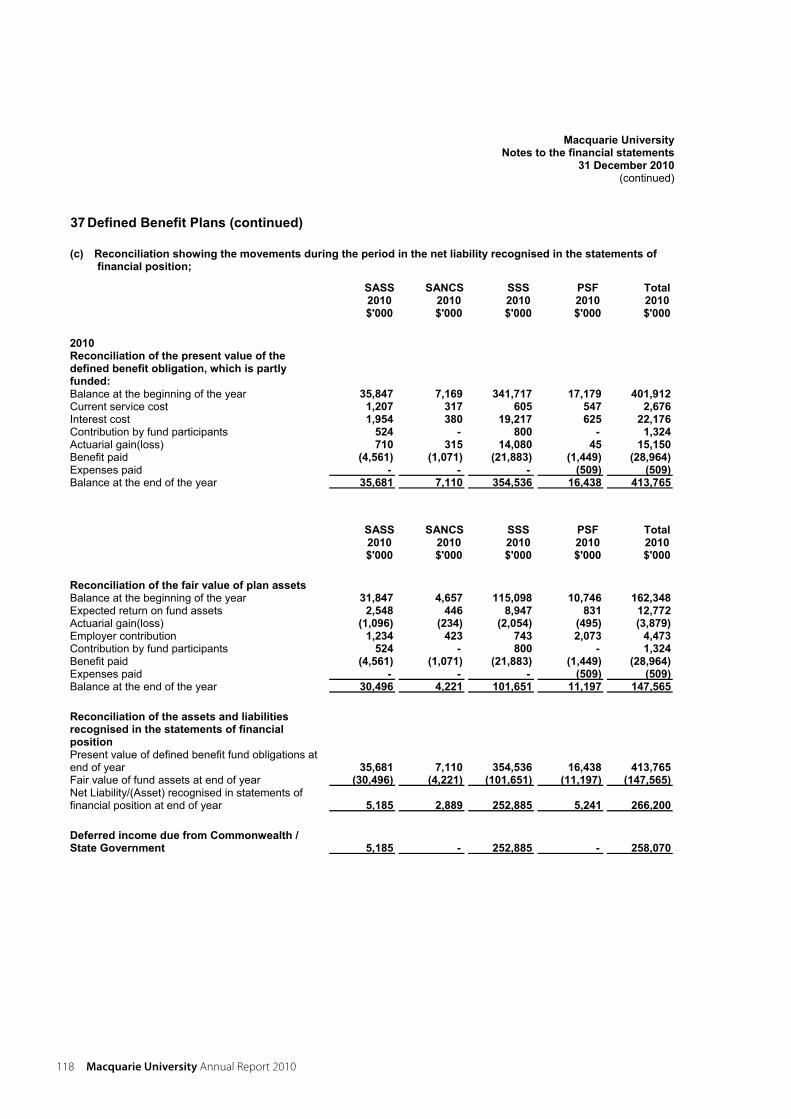
Macquarie UniversityNotes to the financial statements
31 December 2010(continued)
37 Defined Benefit Plans (continued)
(c) Reconciliation showing the movements during the period in the net liability recognised in the statements of financial position;
SASS SANCS SSS PSF Total2010 2010 2010 2010 2010$'000 $'000 $'000 $'000 $'000
2010 Reconciliation of the present value of the defined benefit obligation, which is partly funded: Balance at the beginning of the year 35,847 7,169 341,717 17,179 401,912Current service cost 1,207 317 605 547 2,676Interest cost 1,954 380 19,217 625 22,176Contribution by fund participants 524 - 800 - 1,324Actuarial gain(loss) 710 315 14,080 45 15,150Benefit paid (4,561) (1,071) (21,883) (1,449) (28,964)Expenses paid - - - (509) (509)Balance at the end of the year 35,681 7,110 354,536 16,438 413,765
SASS SANCS SSS PSF Total2010 2010 2010 2010 2010$'000 $'000 $'000 $'000 $'000
Reconciliation of the fair value of plan assets Balance at the beginning of the year 31,847 4,657 115,098 10,746 162,348Expected return on fund assets 2,548 446 8,947 831 12,772Actuarial gain(loss) (1,096) (234) (2,054) (495) (3,879)Employer contribution 1,234 423 743 2,073 4,473Contribution by fund participants 524 - 800 - 1,324Benefit paid (4,561) (1,071) (21,883) (1,449) (28,964)Expenses paid - - - (509) (509)Balance at the end of the year 30,496 4,221 101,651 11,197 147,565
Reconciliation of the assets and liabilities recognised in the statements of financial position Present value of defined benefit fund obligations at end of year 35,681 7,110 354,536 16,438 413,765 Fair value of fund assets at end of year (30,496) (4,221) (101,651) (11,197) (147,565)Net Liability/(Asset) recognised in statements of financial position at end of year 5,185 2,889 252,885 5,241 266,200
Deferred income due from Commonwealth / State Government 5,185 - 252,885 - 258,070
118 Macquarie University annual Report 2010
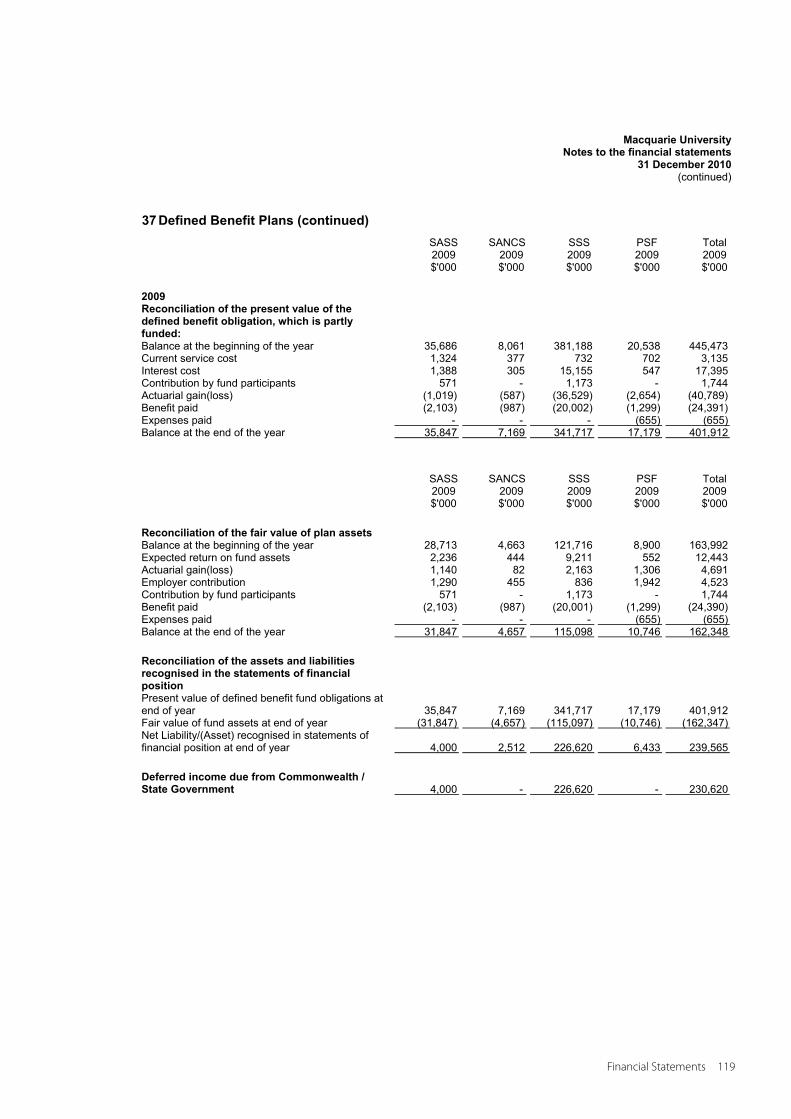
Macquarie UniversityNotes to the financial statements
31 December 2010(continued)
37 Defined Benefit Plans (continued) SASS SANCS SSS PSF Total
2009 2009 2009 2009 2009$'000 $'000 $'000 $'000 $'000
2009 Reconciliation of the present value of the defined benefit obligation, which is partly funded: Balance at the beginning of the year 35,686 8,061 381,188 20,538 445,473 Current service cost 1,324 377 732 702 3,135 Interest cost 1,388 305 15,155 547 17,395 Contribution by fund participants 571 - 1,173 - 1,744 Actuarial gain(loss) (1,019) (587) (36,529) (2,654) (40,789) Benefit paid (2,103) (987) (20,002) (1,299) (24,391) Expenses paid - - - (655) (655) Balance at the end of the year 35,847 7,169 341,717 17,179 401,912
SASS SANCS SSS PSF Total 2009 2009 2009 2009 2009
$'000 $'000 $'000 $'000 $'000
Reconciliation of the fair value of plan assets Balance at the beginning of the year 28,713 4,663 121,716 8,900 163,992 Expected return on fund assets 2,236 444 9,211 552 12,443 Actuarial gain(loss) 1,140 82 2,163 1,306 4,691 Employer contribution 1,290 455 836 1,942 4,523 Contribution by fund participants 571 - 1,173 - 1,744 Benefit paid (2,103) (987) (20,001) (1,299) (24,390) Expenses paid - - - (655) (655) Balance at the end of the year 31,847 4,657 115,098 10,746 162,348
Reconciliation of the assets and liabilities recognised in the statements of financial position Present value of defined benefit fund obligations at end of year 35,847 7,169 341,717 17,179 401,912 Fair value of fund assets at end of year (31,847) (4,657) (115,097) (10,746) (162,347) Net Liability/(Asset) recognised in statements of financial position at end of year 4,000 2,512 226,620 6,433 239,565
Deferred income due from Commonwealth / State Government 4,000 - 226,620 - 230,620
Financial Statements 119
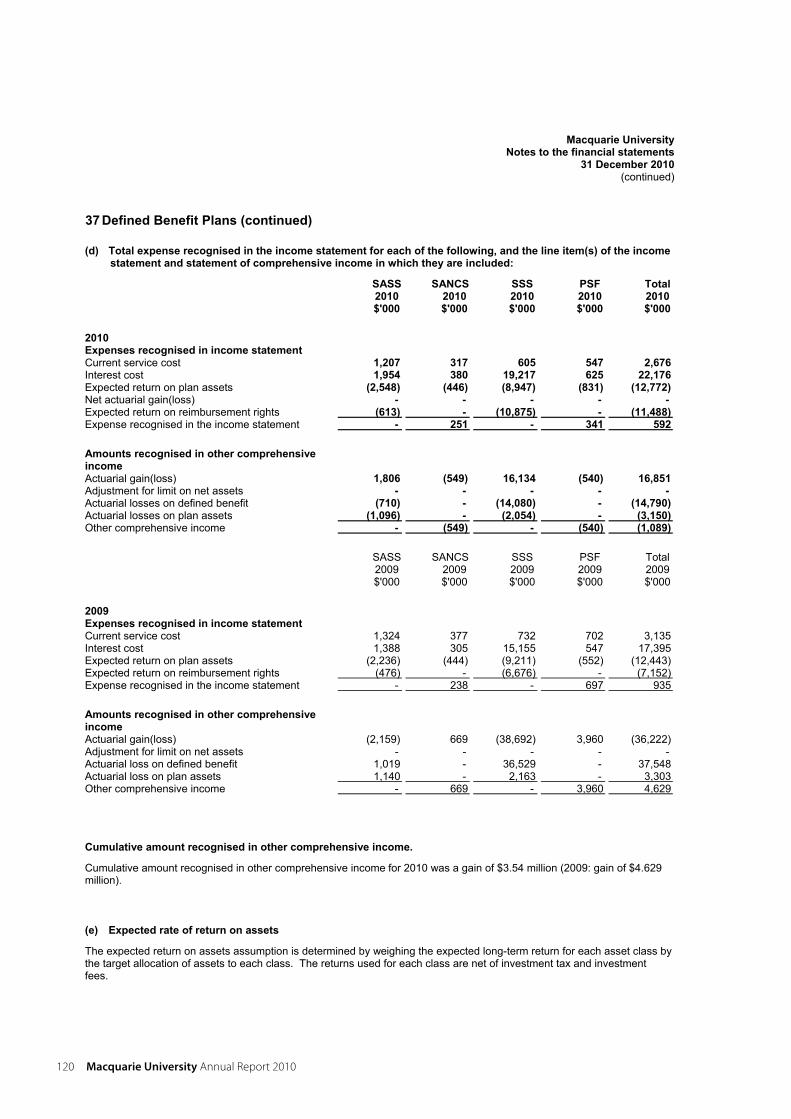
Macquarie UniversityNotes to the financial statements
31 December 2010(continued)
37 Defined Benefit Plans (continued)
(d) Total expense recognised in the income statement for each of the following, and the line item(s) of the income statement and statement of comprehensive income in which they are included:
SASS SANCS SSS PSF Total2010 2010 2010 2010 2010$'000 $'000 $'000 $'000 $'000
2010 Expenses recognised in income statement Current service cost 1,207 317 605 547 2,676Interest cost 1,954 380 19,217 625 22,176Expected return on plan assets (2,548) (446) (8,947) (831) (12,772)Net actuarial gain(loss) - - - - -Expected return on reimbursement rights (613) - (10,875) - (11,488)Expense recognised in the income statement - 251 - 341 592
Amounts recognised in other comprehensive income Actuarial gain(loss) 1,806 (549) 16,134 (540) 16,851Adjustment for limit on net assets - - - - -Actuarial losses on defined benefit (710) - (14,080) - (14,790)Actuarial losses on plan assets (1,096) - (2,054) - (3,150)Other comprehensive income - (549) - (540) (1,089)
SASS SANCS SSS PSF Total 2009 2009 2009 2009 2009
$'000 $'000 $'000 $'000 $'000
2009 Expenses recognised in income statement Current service cost 1,324 377 732 702 3,135 Interest cost 1,388 305 15,155 547 17,395 Expected return on plan assets (2,236) (444) (9,211) (552) (12,443) Expected return on reimbursement rights (476) - (6,676) - (7,152) Expense recognised in the income statement - 238 - 697 935
Amounts recognised in other comprehensive income Actuarial gain(loss) (2,159) 669 (38,692) 3,960 (36,222) Adjustment for limit on net assets - - - - - Actuarial loss on defined benefit 1,019 - 36,529 - 37,548 Actuarial loss on plan assets 1,140 - 2,163 - 3,303 Other comprehensive income - 669 - 3,960 4,629
Cumulative amount recognised in other comprehensive income.
Cumulative amount recognised in other comprehensive income for 2010 was a gain of $3.54 million (2009: gain of $4.629 million).
(e) Expected rate of return on assets
The expected return on assets assumption is determined by weighing the expected long-term return for each asset class by the target allocation of assets to each class. The returns used for each class are net of investment tax and investment fees.
120 Macquarie University annual Report 2010
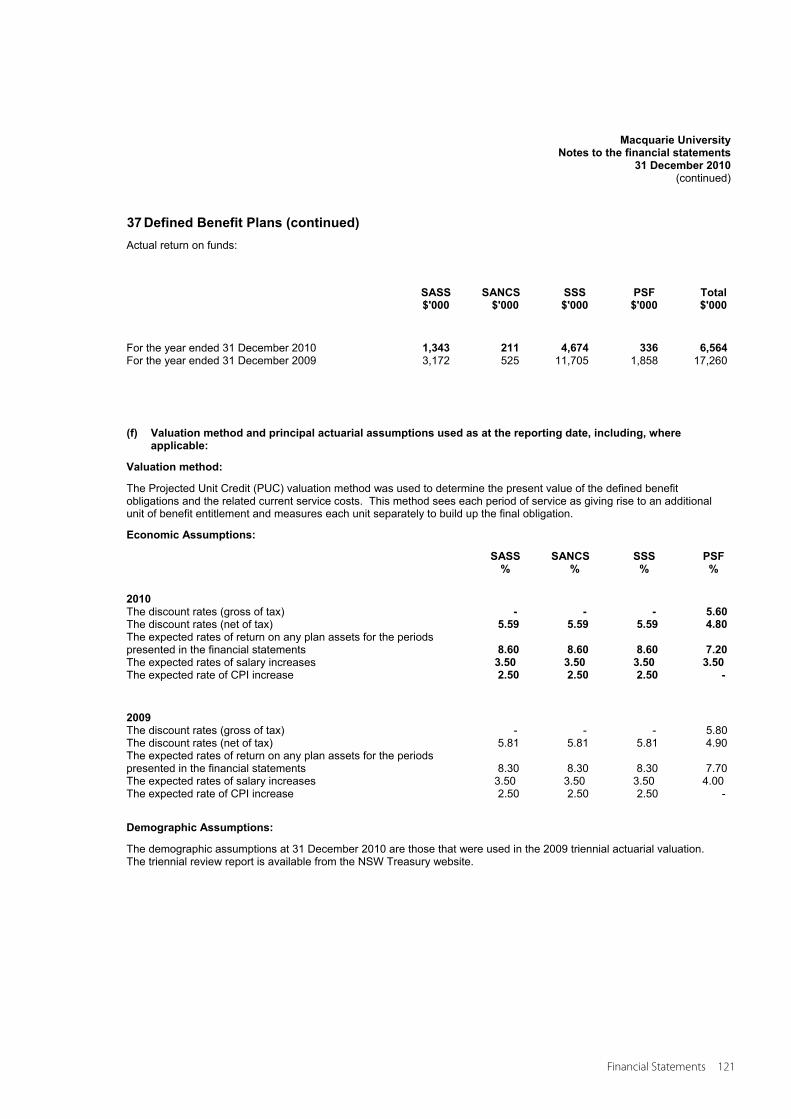
Macquarie UniversityNotes to the financial statements
31 December 2010(continued)
37 Defined Benefit Plans (continued) Actual return on funds:
SASS SANCS SSS PSF Total$'000 $'000 $'000 $'000 $'000
For the year ended 31 December 2010 1,343 211 4,674 336 6,564For the year ended 31 December 2009 3,172 525 11,705 1,858 17,260
(f) Valuation method and principal actuarial assumptions used as at the reporting date, including, where applicable:
Valuation method:
The Projected Unit Credit (PUC) valuation method was used to determine the present value of the defined benefit obligations and the related current service costs. This method sees each period of service as giving rise to an additional unit of benefit entitlement and measures each unit separately to build up the final obligation.
Economic Assumptions:
SASS SANCS SSS PSF% % % %
2010 The discount rates (gross of tax) - - - 5.60The discount rates (net of tax) 5.59 5.59 5.59 4.80The expected rates of return on any plan assets for the periods presented in the financial statements 8.60 8.60 8.60 7.20 The expected rates of salary increases 3.50 3.50 3.50 3.50The expected rate of CPI increase 2.50 2.50 2.50 -
2009 The discount rates (gross of tax) - - - 5.80 The discount rates (net of tax) 5.81 5.81 5.81 4.90 The expected rates of return on any plan assets for the periods presented in the financial statements 8.30 8.30 8.30 7.70 The expected rates of salary increases 3.50 3.50 3.50 4.00 The expected rate of CPI increase 2.50 2.50 2.50 -
Demographic Assumptions:
The demographic assumptions at 31 December 2010 are those that were used in the 2009 triennial actuarial valuation. The triennial review report is available from the NSW Treasury website.
Financial Statements 121
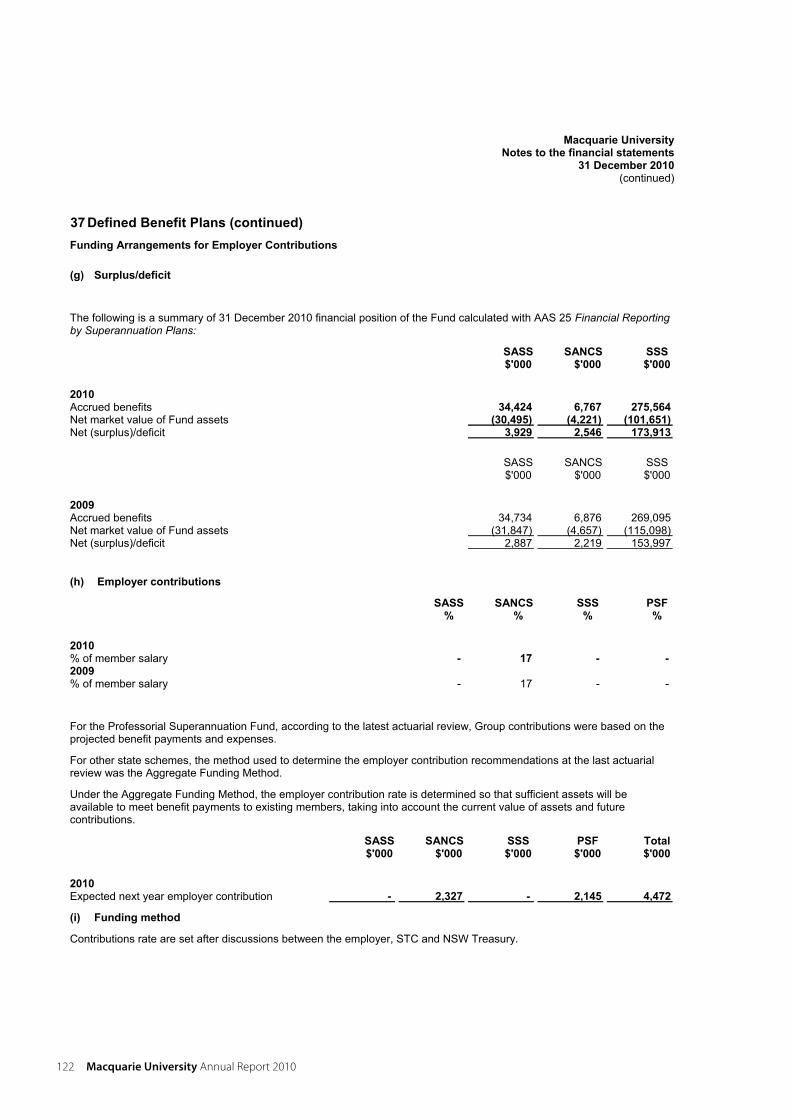
Macquarie UniversityNotes to the financial statements
31 December 2010(continued)
37 Defined Benefit Plans (continued) Funding Arrangements for Employer Contributions
(g) Surplus/deficit
The following is a summary of 31 December 2010 financial position of the Fund calculated with AAS 25 Financial Reporting by Superannuation Plans:
SASS SANCS SSS$'000 $'000 $'000
2010 Accrued benefits 34,424 6,767 275,564Net market value of Fund assets (30,495) (4,221) (101,651)Net (surplus)/deficit 3,929 2,546 173,913
SASS SANCS SSS$'000 $'000 $'000
2009 Accrued benefits 34,734 6,876 269,095 Net market value of Fund assets (31,847) (4,657) (115,098) Net (surplus)/deficit 2,887 2,219 153,997
(h) Employer contributions
SASS SANCS SSS PSF% % % %
2010 % of member salary - 17 - -2009 % of member salary - 17 - -
For the Professorial Superannuation Fund, according to the latest actuarial review, Group contributions were based on the projected benefit payments and expenses.
For other state schemes, the method used to determine the employer contribution recommendations at the last actuarial review was the Aggregate Funding Method.
Under the Aggregate Funding Method, the employer contribution rate is determined so that sufficient assets will be available to meet benefit payments to existing members, taking into account the current value of assets and future contributions.
SASS SANCS SSS PSF Total$'000 $'000 $'000 $'000 $'000
2010 Expected next year employer contribution - 2,327 - 2,145 4,472
(i) Funding method
Contributions rate are set after discussions between the employer, STC and NSW Treasury.
122 Macquarie University annual Report 2010

Macquarie UniversityNotes to the financial statements
31 December 2010(continued)
37 Defined Benefit Plans (continued)
(j) Economic assumptions
The economic assumptions for the 2009 actuarial review of the Fund are:
(%)Weighted-average assumptions
Expected rate of return on Fund assets backing current pension liabilities 8.30Expected rate of return on Fund assets backing other liabilities 7.30Expected salary increase rate 4.00Expected rate of CPI increase 2.50
(k) Nature of asset/liability
If a surplus exists in the employer's interest in the Fund, the employer may be able to take advantage of it in the form of a reduction in the required contribution rate, depending on the advice of the Fund's actuary.
Where a deficiency exists, the employer is responsible for any difference between the employer's share of Fund assets and the defined benefit obligation.
(l) Historic Summary
SASS SANCS SSS PSF Total2010 2010 2010 2010 2010$'000 $'000 $'000 $'000 $'000
2010 Defined benefit plan obligation 35,681 7,110 354,536 16,438 413,765Plan assets (30,496) (4,221) (101,651) (11,197) (147,565)Deficit 5,185 2,889 252,885 5,241 266,200
Experience adjustments arising on plan liabilities 710 315 14,080 414 15,519Experience adjustments arising on plan assets 1,096 234 2,054 495 3,879
1,806 549 16,134 909 19,398
SASS SANCS SSS PSF Total 2009 2009 2009 2009 2009
$'000 $'000 $'000 $'000 $'000
2009 Defined benefit plan obligation 35,847 7,169 341,717 17,179 401,912 Plan assets (31,847) (4,657) (115,098) (10,746) (162,348) Deficit 4,000 2,512 226,619 6,433 239,564
Experience adjustments arising on plan liabilities (1,019) (587) (36,529) (131) (38,266) Experience adjustments arising on plan assets (1,140) 81 (2,163) (1,306) (4,528) (2,159) (506) (38,692) (1,437) (42,794)
Financial Statements 123
Macquarie UniversityNotes to the financial statements
31 December 2010(continued)
37 Defined Benefit Plans (continued)
(m) UniSuper
The University also contributes to UniSuper Defined Benefit Plan ('UniSuper') (formerly Superannuation Scheme for Australian Universities) (SSAU) for academic staff appointed since 1 March 1988 and all other staff from 1 July 1991.
UniSuper is not considered to be controlled by the University and therefore the excess/shortfall of assets over accrued benefits have not been included in the University's accounts.
The UniSuper Defined Benefit Division (DBD) is a defined benefit plan under Superannuation Law but, as a result of Clause 34 of the UniSuper Trust Deed, a defined contribution plan under Accounting Standard AASB 119.
As at 30 June 2010, the assets of the DBD in aggregate were estimated to be $1,217 million in deficiency of vested benefits. The vested benefits are benefits which are not conditional upon continued membership (or any factor other than leaving the service of the participating institution) and include the value of CPI indexed pensions being provided by the DBD.
As at 30 June 2010, the assets of the DBD in aggregate were estimated to be $312 million in excess of accrued benefits. The accrued benefits have been calculated as the present value of expected future benefits payments to members and CPI indexed pensioners which arise from membership of UniSuper up to the reporting date.
The vested benefit and accrued benefit liabilities were determined by the Fund's actuary, Russell Employee Benefits, using the actuarial demographic assumptions outlined in their report dated 12 June 2009 on actuarial investigation of DBD as at 31 December 2008. The financial assumptions used were:
Vested Benefits
Accrued Benefits
% %
Gross of tax investment return 7.25 8.50 Net of tax investment return 6.75 8.00 Consumer Price Index 2.75 2.75 Inflationary salary increases long term 3.75 3.75 Assets have been included at their net market value, i.e. allowing for realisation costs.
38 Financial risk management The Group's activities expose it to a variety of financial risks: market risk (including currency risk, fair value interest raterisk, cash flow interest risk and price risk), credit risk and liquidity risk. The Group's overall risk management program focuses on the unpredictability of financial markets and seeks to minimise potential adverse effects on the financial performance of the Group. The Group uses derivative financial instruments such as foreign exchange contracts and interest rate swaps to hedge certain risk exposures. The Group uses different methods to measure different types of risk to which it is exposed. These methods include sensitivity analysis in the case of interest rate, foreign exchange and other price risks, ageing analysis for credit risk and beta analysis in respect of investment portfolios to determine market risk.
The Group's Finance and Facilities Committee reviews the University's Financial Risk at each of its bi-monthly meetings. The Group's Investment Policy and Strategy has been determined by the Finance and Facilities Committee and is also reviewed against performance by senior University management. The Group has minimal exposure to Foreign Exchange risk.
(a) Market risk
(i) Foreign exchange risk
The Group is exposed to fluctuations in foreign currencies arising from the purchase of goods and services in currencies other than the Group's functional currency. The Group used foreign currency derivative products.
(ii) Price risk The University is exposed to equity securities price risk. This arises from investments held by the University and classified on the statement of financial position as available-for-sale. The University has no direct exposure to commodity price risk.
124 Macquarie University annual Report 2010
Macquarie UniversityNotes to the financial statements
31 December 2010(continued)
38 Financial risk management (continued) (iii) Cash flow and fair value interest rate risk Although the University carries debt, the debt is at a fixed rate of interest. Interest rate risk relates to investments. All other financial assets and liabilities are non-interest bearing.
(iv) Summarised sensitivity analysis The following table summarises the sensitivity of the University's financial assets and financial liabilities to interest rate risk, foreign exchange risk and other price risk.
Consolidated Interest rate risk Foreign exchange risk Other price risk -1% +1% -10% +10% -10% +10%
31 December 2010 Carrying amount Result Equity Result Equity Result Equity Result Equity Result Equity Result Equity
$'000 $'000 $'000 $'000 $'000 $'000 $'000 $'000 $'000 $'000 $'000 $'000 $'000
Financial assets Cash and cash equivalents 81,425 (814) - 814 - - - - - - - - - Accounts receivable 288,243 - - - - - - - - - - - - Finance lease receivable 21,153 - (212) - 212 - - - - - (2,115) - 2,115 Other financial assets 25,942 - (259) - 259 - - - - - (2,594) - 2,594 Listed investments 63,234 - (632) - 632 - - - - - (6,323) - 6,323 Unquoted investments 5,086 - (51) - 51 - - - - - (509) - 509 Financial liabilities Trade payables 54,475 - - - - - - - - - - - - Borrowings 259,259 - - - - - - - - - - - - Total increase/ (decrease) (814) (1,154) 814 1,154 - - - - - (11,541) - 11,541
Consolidated Interest rate risk Foreign exchange risk Other price risk -1% +1% -10% +10% -10% +10%
31 December 2009 Carrying amount Result Equity Result Equity Result Equity Result Equity Result Equity Result Equity $'000 $'000 $'000 $'000 $'000 $'000 $'000 $'000 $'000 $'000 $'000 $'000 $'000
Financial assets Cash and cash equivalents 110,581 (1,106) - 1,106 - - - - - - - - - Accounts receivable 270,361 - - - - - - - - - - - - Finance lease receivable 21,480 - (215) - 215 - - - - - (2,148) - 2,148 Other financial assets 36,008 - (360) - 360 - - - - - (3,601) - 3,601 Listed investments 64,554 - (646) - 646 - - - - - (6,455) - 6,455 Unquoted investments 3,356 - (34) - 34 - - - - - (336) - 336 Financial liabilities Trade payables 44,570 - - - - - - - - - - - - Borrowings 130,132 - - - - - - - - - - - - Total increase/ (decrease) (1,106) (1,255) 1,106 1,255 - - - - - (12,540) - 12,540
Financial Statements 125
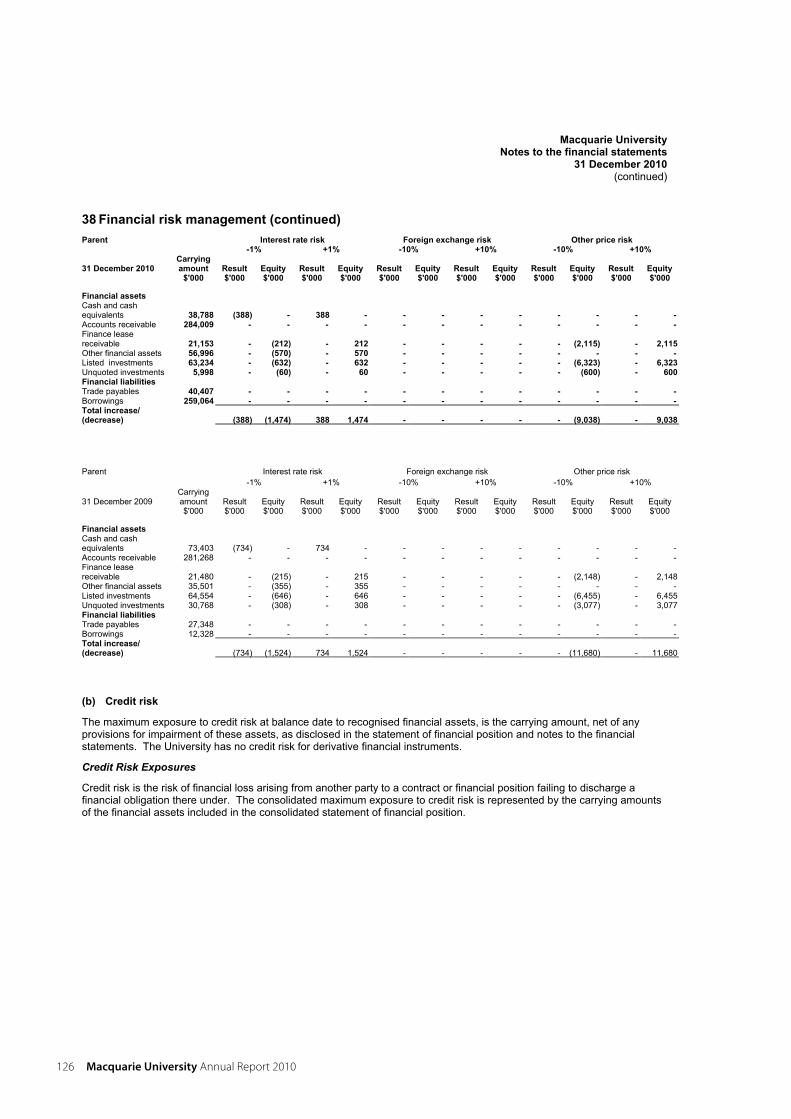
Macquarie UniversityNotes to the financial statements
31 December 2010(continued)
38 Financial risk management (continued) Parent Interest rate risk Foreign exchange risk Other price risk
-1% +1% -10% +10% -10% +10%
31 December 2010 Carrying amount Result Equity Result Equity Result Equity Result Equity Result Equity Result Equity
$'000 $'000 $'000 $'000 $'000 $'000 $'000 $'000 $'000 $'000 $'000 $'000 $'000
Financial assets Cash and cash equivalents 38,788 (388) - 388 - - - - - - - - - Accounts receivable 284,009 - - - - - - - - - - - - Finance lease receivable 21,153 - (212) - 212 - - - - - (2,115) - 2,115 Other financial assets 56,996 - (570) - 570 - - - - - - - - Listed investments 63,234 - (632) - 632 - - - - - (6,323) - 6,323 Unquoted investments 5,998 - (60) - 60 - - - - - (600) - 600 Financial liabilities Trade payables 40,407 - - - - - - - - - - - - Borrowings 259,064 - - - - - - - - - - - - Total increase/ (decrease) (388) (1,474) 388 1,474 - - - - - (9,038) - 9,038
Parent Interest rate risk Foreign exchange risk Other price risk -1% +1% -10% +10% -10% +10%
31 December 2009 Carrying amount Result Equity Result Equity Result Equity Result Equity Result Equity Result Equity $'000 $'000 $'000 $'000 $'000 $'000 $'000 $'000 $'000 $'000 $'000 $'000 $'000
Financial assets Cash and cash equivalents 73,403 (734) - 734 - - - - - - - - - Accounts receivable 281,268 - - - - - - - - - - - - Finance lease receivable 21,480 - (215) - 215 - - - - - (2,148) - 2,148 Other financial assets 35,501 - (355) - 355 - - - - - - - - Listed investments 64,554 - (646) - 646 - - - - - (6,455) - 6,455 Unquoted investments 30,768 - (308) - 308 - - - - - (3,077) - 3,077 Financial liabilities Trade payables 27,348 - - - - - - - - - - - - Borrowings 12,328 - - - - - - - - - - - - Total increase/ (decrease) (734) (1,524) 734 1,524 - - - - - (11,680) - 11,680
(b) Credit risk
The maximum exposure to credit risk at balance date to recognised financial assets, is the carrying amount, net of any provisions for impairment of these assets, as disclosed in the statement of financial position and notes to the financial statements. The University has no credit risk for derivative financial instruments.
Credit Risk Exposures
Credit risk is the risk of financial loss arising from another party to a contract or financial position failing to discharge afinancial obligation there under. The consolidated maximum exposure to credit risk is represented by the carrying amounts of the financial assets included in the consolidated statement of financial position.
126 Macquarie University annual Report 2010
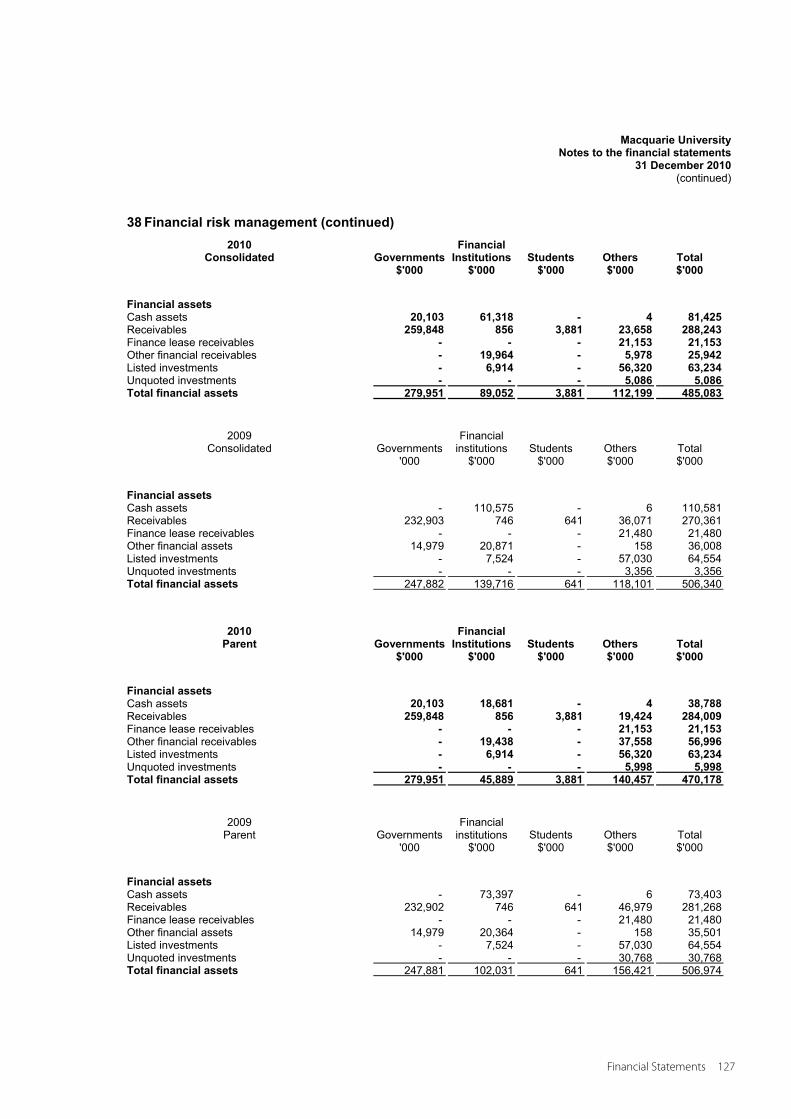
Macquarie UniversityNotes to the financial statements
31 December 2010(continued)
38 Financial risk management (continued) 2010
Consolidated GovernmentsFinancial
Institutions Students Others Total $'000 $'000 $'000 $'000 $'000
Financial assets Cash assets 20,103 61,318 - 4 81,425Receivables 259,848 856 3,881 23,658 288,243Finance lease receivables - - - 21,153 21,153Other financial receivables - 19,964 - 5,978 25,942Listed investments - 6,914 - 56,320 63,234Unquoted investments - - - 5,086 5,086Total financial assets 279,951 89,052 3,881 112,199 485,083
2009 Consolidated Governments
Financial institutions Students Others Total
'000 $'000 $'000 $'000 $'000
Financial assets Cash assets - 110,575 - 6 110,581 Receivables 232,903 746 641 36,071 270,361 Finance lease receivables - - - 21,480 21,480 Other financial assets 14,979 20,871 - 158 36,008 Listed investments - 7,524 - 57,030 64,554 Unquoted investments - - - 3,356 3,356 Total financial assets 247,882 139,716 641 118,101 506,340
2010 Parent Governments
Financial Institutions Students Others Total
$'000 $'000 $'000 $'000 $'000
Financial assets Cash assets 20,103 18,681 - 4 38,788Receivables 259,848 856 3,881 19,424 284,009Finance lease receivables - - - 21,153 21,153Other financial receivables - 19,438 - 37,558 56,996Listed investments - 6,914 - 56,320 63,234Unquoted investments - - - 5,998 5,998Total financial assets 279,951 45,889 3,881 140,457 470,178
2009 Parent Governments
Financial institutions Students Others Total
'000 $'000 $'000 $'000 $'000
Financial assets Cash assets - 73,397 - 6 73,403 Receivables 232,902 746 641 46,979 281,268 Finance lease receivables - - - 21,480 21,480 Other financial assets 14,979 20,364 - 158 35,501 Listed investments - 7,524 - 57,030 64,554 Unquoted investments - - - 30,768 30,768 Total financial assets 247,881 102,031 641 156,421 506,974
Financial Statements 127
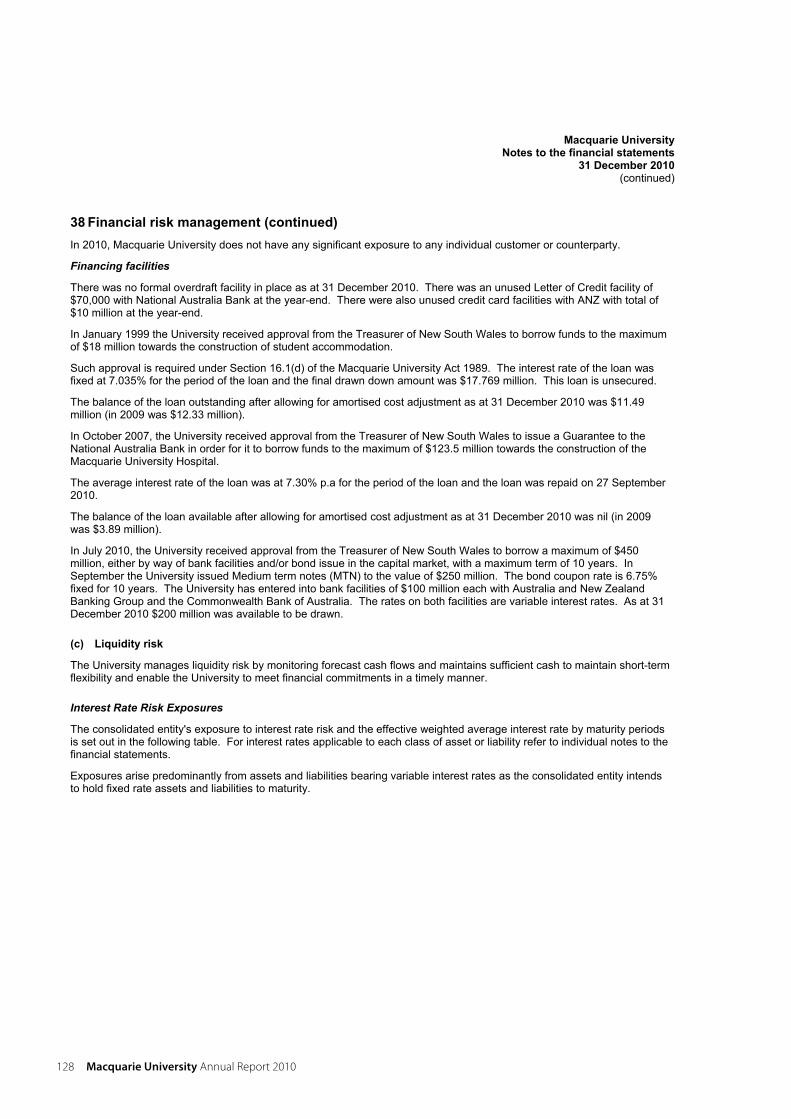
Macquarie UniversityNotes to the financial statements
31 December 2010(continued)
38 Financial risk management (continued) In 2010, Macquarie University does not have any significant exposure to any individual customer or counterparty.
Financing facilities
There was no formal overdraft facility in place as at 31 December 2010. There was an unused Letter of Credit facility of $70,000 with National Australia Bank at the year-end. There were also unused credit card facilities with ANZ with total of $10 million at the year-end.
In January 1999 the University received approval from the Treasurer of New South Wales to borrow funds to the maximum of $18 million towards the construction of student accommodation.
Such approval is required under Section 16.1(d) of the Macquarie University Act 1989. The interest rate of the loan was fixed at 7.035% for the period of the loan and the final drawn down amount was $17.769 million. This loan is unsecured.
The balance of the loan outstanding after allowing for amortised cost adjustment as at 31 December 2010 was $11.49 million (in 2009 was $12.33 million).
In October 2007, the University received approval from the Treasurer of New South Wales to issue a Guarantee to the National Australia Bank in order for it to borrow funds to the maximum of $123.5 million towards the construction of the Macquarie University Hospital.
The average interest rate of the loan was at 7.30% p.a for the period of the loan and the loan was repaid on 27 September 2010.
The balance of the loan available after allowing for amortised cost adjustment as at 31 December 2010 was nil (in 2009 was $3.89 million).
In July 2010, the University received approval from the Treasurer of New South Wales to borrow a maximum of $450 million, either by way of bank facilities and/or bond issue in the capital market, with a maximum term of 10 years. In September the University issued Medium term notes (MTN) to the value of $250 million. The bond coupon rate is 6.75% fixed for 10 years. The University has entered into bank facilities of $100 million each with Australia and New Zealand Banking Group and the Commonwealth Bank of Australia. The rates on both facilities are variable interest rates. As at 31 December 2010 $200 million was available to be drawn.
(c) Liquidity risk
The University manages liquidity risk by monitoring forecast cash flows and maintains sufficient cash to maintain short-term flexibility and enable the University to meet financial commitments in a timely manner.
Interest Rate Risk Exposures
The consolidated entity's exposure to interest rate risk and the effective weighted average interest rate by maturity periods is set out in the following table. For interest rates applicable to each class of asset or liability refer to individual notes to the financial statements.
Exposures arise predominantly from assets and liabilities bearing variable interest rates as the consolidated entity intends to hold fixed rate assets and liabilities to maturity.
128 Macquarie University annual Report 2010
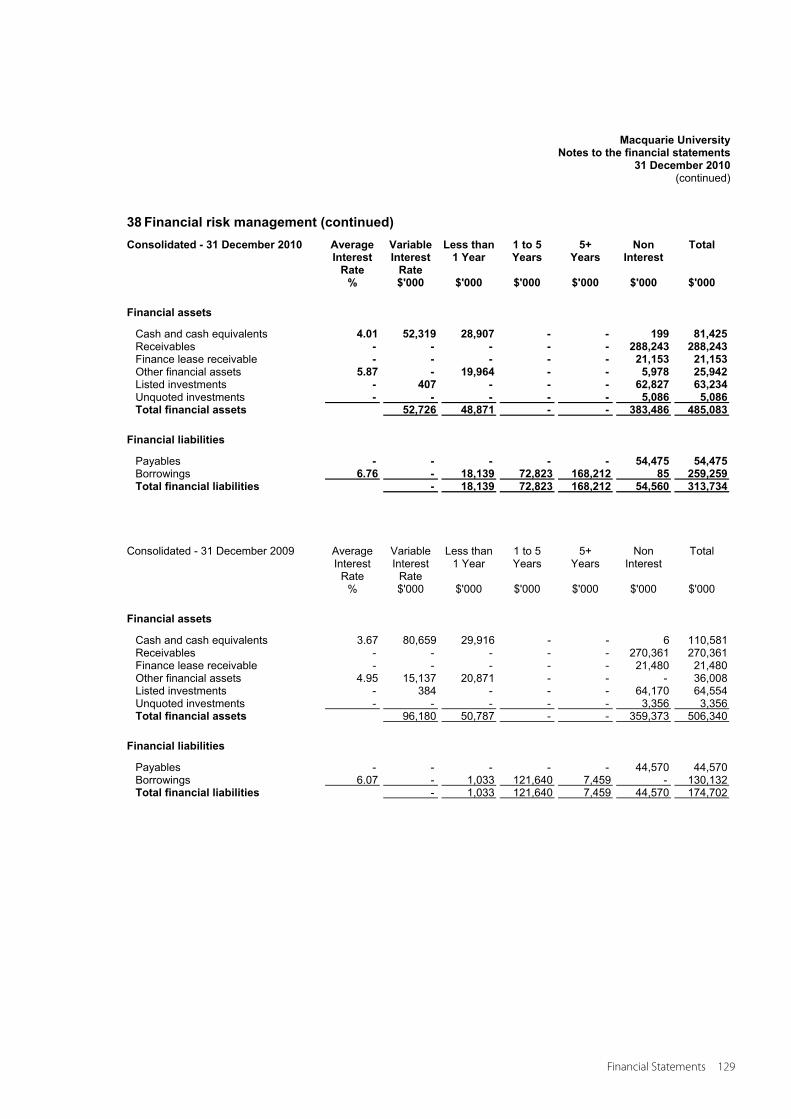
Macquarie UniversityNotes to the financial statements
31 December 2010(continued)
38 Financial risk management (continued) Consolidated - 31 December 2010 Average
InterestRate
VariableInterest
Rate
Less than 1 Year
1 to 5Years
5+ Years
NonInterest
Total
% $'000 $'000 $'000 $'000 $'000 $'000
Financial assets
Cash and cash equivalents 4.01 52,319 28,907 - - 199 81,425Receivables - - - - - 288,243 288,243Finance lease receivable - - - - - 21,153 21,153Other financial assets 5.87 - 19,964 - - 5,978 25,942Listed investments - 407 - - - 62,827 63,234Unquoted investments - - - - - 5,086 5,086Total financial assets 52,726 48,871 - - 383,486 485,083
Financial liabilities
Payables - - - - - 54,475 54,475Borrowings 6.76 - 18,139 72,823 168,212 85 259,259Total financial liabilities - 18,139 72,823 168,212 54,560 313,734
Consolidated - 31 December 2009 AverageInterest
Rate
VariableInterest
Rate
Less than 1 Year
1 to 5 Years
5+ Years
NonInterest
Total
% $'000 $'000 $'000 $'000 $'000 $'000
Financial assets
Cash and cash equivalents 3.67 80,659 29,916 - - 6 110,581 Receivables - - - - - 270,361 270,361 Finance lease receivable - - - - - 21,480 21,480 Other financial assets 4.95 15,137 20,871 - - - 36,008 Listed investments - 384 - - - 64,170 64,554 Unquoted investments - - - - - 3,356 3,356 Total financial assets 96,180 50,787 - - 359,373 506,340
Financial liabilities
Payables - - - - - 44,570 44,570 Borrowings 6.07 - 1,033 121,640 7,459 - 130,132 Total financial liabilities - 1,033 121,640 7,459 44,570 174,702
Financial Statements 129
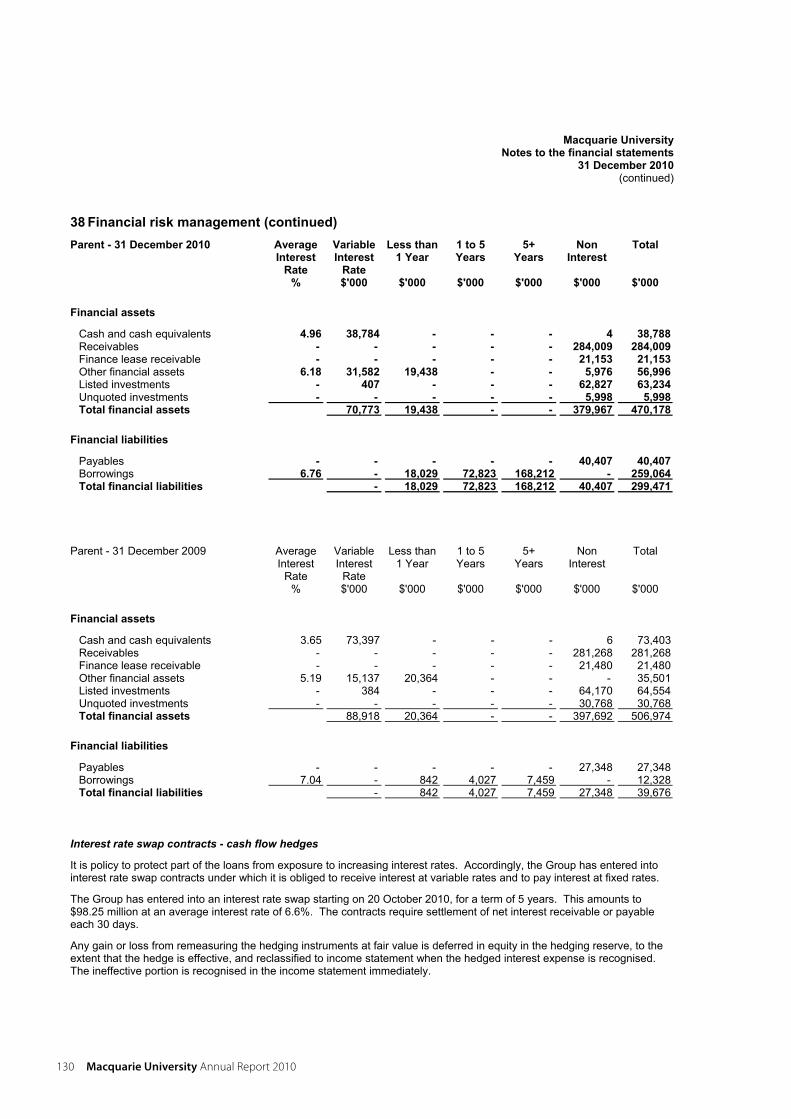
Macquarie UniversityNotes to the financial statements
31 December 2010(continued)
38 Financial risk management (continued) Parent - 31 December 2010 Average
InterestRate
VariableInterest
Rate
Less than 1 Year
1 to 5Years
5+ Years
NonInterest
Total
% $'000 $'000 $'000 $'000 $'000 $'000
Financial assets
Cash and cash equivalents 4.96 38,784 - - - 4 38,788Receivables - - - - - 284,009 284,009Finance lease receivable - - - - - 21,153 21,153Other financial assets 6.18 31,582 19,438 - - 5,976 56,996Listed investments - 407 - - - 62,827 63,234Unquoted investments - - - - - 5,998 5,998Total financial assets 70,773 19,438 - - 379,967 470,178
Financial liabilities
Payables - - - - - 40,407 40,407Borrowings 6.76 - 18,029 72,823 168,212 - 259,064Total financial liabilities - 18,029 72,823 168,212 40,407 299,471
Parent - 31 December 2009 AverageInterest
Rate
VariableInterest
Rate
Less than 1 Year
1 to 5 Years
5+ Years
NonInterest
Total
% $'000 $'000 $'000 $'000 $'000 $'000
Financial assets
Cash and cash equivalents 3.65 73,397 - - - 6 73,403 Receivables - - - - - 281,268 281,268 Finance lease receivable - - - - - 21,480 21,480 Other financial assets 5.19 15,137 20,364 - - - 35,501 Listed investments - 384 - - - 64,170 64,554 Unquoted investments - - - - - 30,768 30,768 Total financial assets 88,918 20,364 - - 397,692 506,974
Financial liabilities
Payables - - - - - 27,348 27,348 Borrowings 7.04 - 842 4,027 7,459 - 12,328 Total financial liabilities - 842 4,027 7,459 27,348 39,676
Interest rate swap contracts - cash flow hedges
It is policy to protect part of the loans from exposure to increasing interest rates. Accordingly, the Group has entered into interest rate swap contracts under which it is obliged to receive interest at variable rates and to pay interest at fixed rates.
The Group has entered into an interest rate swap starting on 20 October 2010, for a term of 5 years. This amounts to $98.25 million at an average interest rate of 6.6%. The contracts require settlement of net interest receivable or payable each 30 days.
Any gain or loss from remeasuring the hedging instruments at fair value is deferred in equity in the hedging reserve, to the extent that the hedge is effective, and reclassified to income statement when the hedged interest expense is recognised. The ineffective portion is recognised in the income statement immediately.
130 Macquarie University annual Report 2010
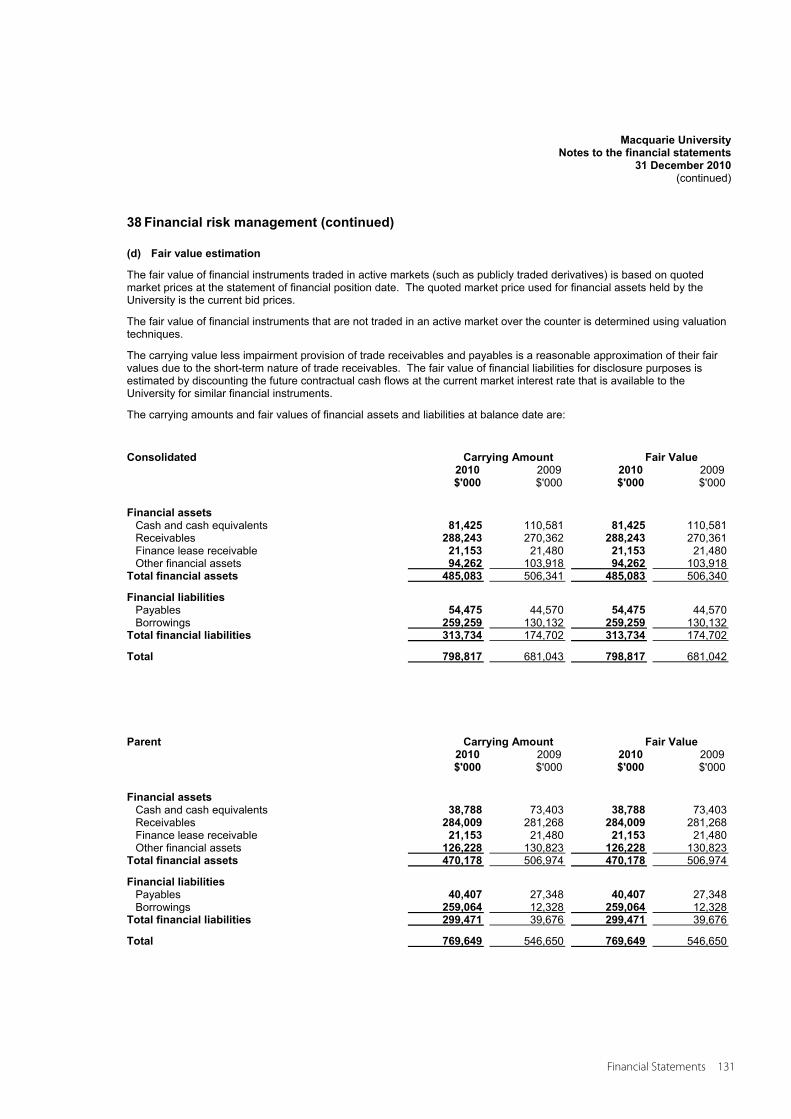
Macquarie UniversityNotes to the financial statements
31 December 2010(continued)
38 Financial risk management (continued)
(d) Fair value estimation
The fair value of financial instruments traded in active markets (such as publicly traded derivatives) is based on quoted market prices at the statement of financial position date. The quoted market price used for financial assets held by the University is the current bid prices.
The fair value of financial instruments that are not traded in an active market over the counter is determined using valuation techniques.
The carrying value less impairment provision of trade receivables and payables is a reasonable approximation of their fair values due to the short-term nature of trade receivables. The fair value of financial liabilities for disclosure purposes is estimated by discounting the future contractual cash flows at the current market interest rate that is available to the University for similar financial instruments.
The carrying amounts and fair values of financial assets and liabilities at balance date are:
Consolidated Carrying Amount Fair Value2010 2009 2010 2009 $'000 $'000 $'000 $'000
Financial assets Cash and cash equivalents 81,425 110,581 81,425 110,581 Receivables 288,243 270,362 288,243 270,361 Finance lease receivable 21,153 21,480 21,153 21,480 Other financial assets 94,262 103,918 94,262 103,918
Total financial assets 485,083 506,341 485,083 506,340
Financial liabilities Payables 54,475 44,570 54,475 44,570 Borrowings 259,259 130,132 259,259 130,132
Total financial liabilities 313,734 174,702 313,734 174,702
Total 798,817 681,043 798,817 681,042
Parent Carrying Amount Fair Value2010 2009 2010 2009 $'000 $'000 $'000 $'000
Financial assets Cash and cash equivalents 38,788 73,403 38,788 73,403 Receivables 284,009 281,268 284,009 281,268 Finance lease receivable 21,153 21,480 21,153 21,480 Other financial assets 126,228 130,823 126,228 130,823
Total financial assets 470,178 506,974 470,178 506,974
Financial liabilities Payables 40,407 27,348 40,407 27,348 Borrowings 259,064 12,328 259,064 12,328
Total financial liabilities 299,471 39,676 299,471 39,676
Total 769,649 546,650 769,649 546,650
Financial Statements 131
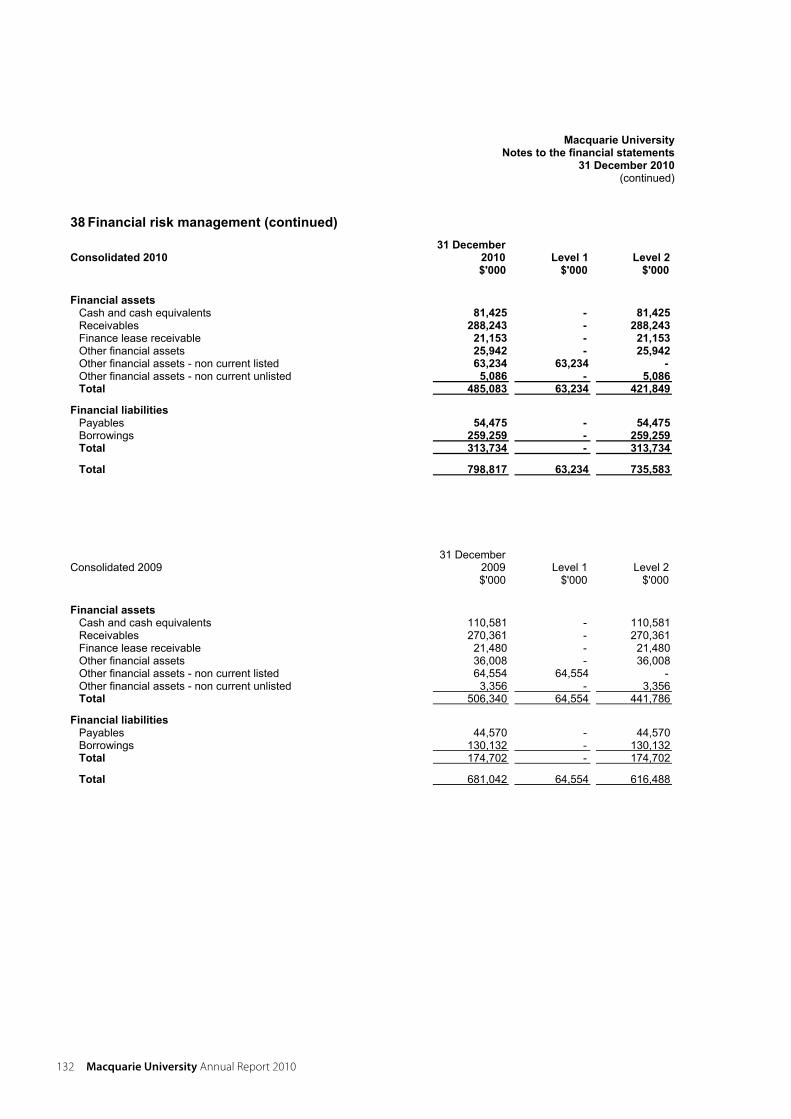
Macquarie UniversityNotes to the financial statements
31 December 2010(continued)
38 Financial risk management (continued)
Consolidated 2010 31 December
2010 Level 1 Level 2$'000 $'000 $'000
Financial assets Cash and cash equivalents 81,425 - 81,425Receivables 288,243 - 288,243Finance lease receivable 21,153 - 21,153Other financial assets 25,942 - 25,942Other financial assets - non current listed 63,234 63,234 -Other financial assets - non current unlisted 5,086 - 5,086Total 485,083 63,234 421,849
Financial liabilities Payables 54,475 - 54,475Borrowings 259,259 - 259,259Total 313,734 - 313,734
Total 798,817 63,234 735,583
Consolidated 2009 31 December
2009 Level 1 Level 2$'000 $'000 $'000
Financial assets Cash and cash equivalents 110,581 - 110,581 Receivables 270,361 - 270,361 Finance lease receivable 21,480 - 21,480 Other financial assets 36,008 - 36,008 Other financial assets - non current listed 64,554 64,554 - Other financial assets - non current unlisted 3,356 - 3,356 Total 506,340 64,554 441,786
Financial liabilities Payables 44,570 - 44,570 Borrowings 130,132 - 130,132 Total 174,702 - 174,702
Total 681,042 64,554 616,488
132 Macquarie University annual Report 2010
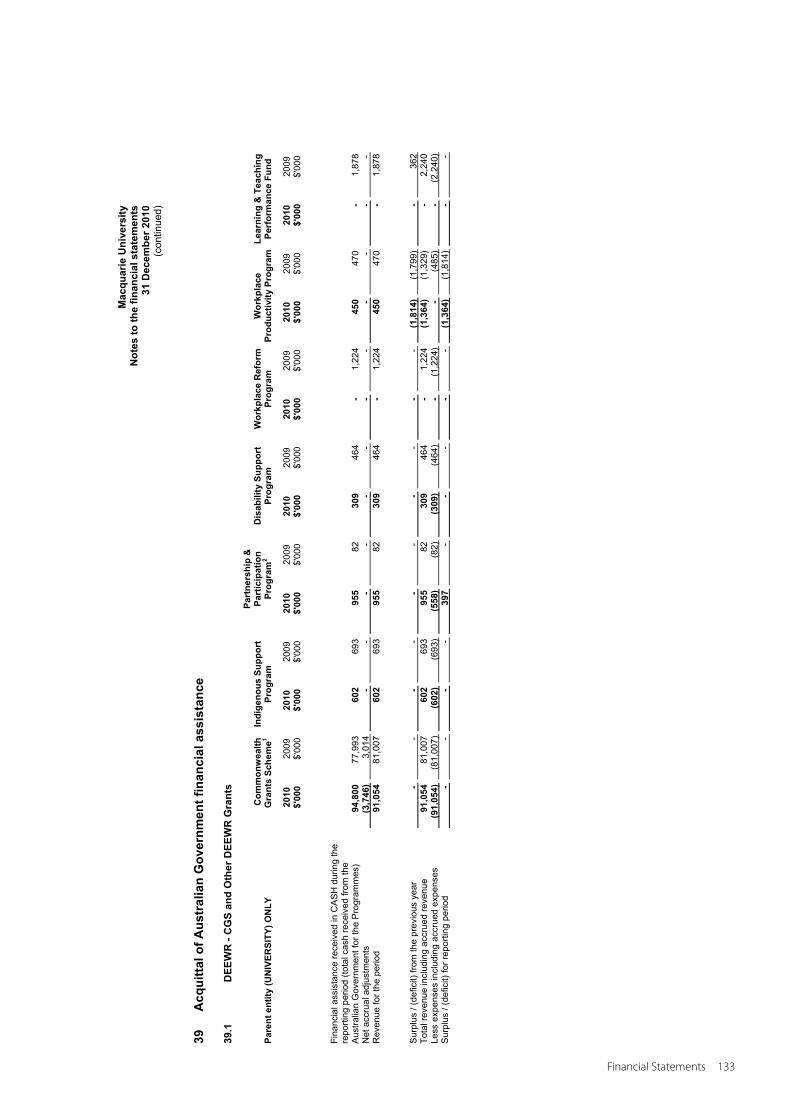
Mac
quar
ie U
nive
rsity
N
otes
to th
e fin
anci
al s
tate
men
ts
31 D
ecem
ber 2
010
(con
tinue
d)
39
Acq
uitta
l of A
ustr
alia
n G
over
nmen
t fin
anci
al a
ssis
tanc
e
39.1
D
EEW
R -
CG
S an
d O
ther
DEE
WR
Gra
nts
Pare
nt e
ntity
(UN
IVER
SITY
) ON
LY
Com
mon
wea
lth
Gra
nts
Sche
me1
Indi
geno
us S
uppo
rt
Prog
ram
Part
ners
hip
&
Part
icip
atio
n Pr
ogra
m2
Dis
abili
ty S
uppo
rt
Prog
ram
W
orkp
lace
Ref
orm
Pr
ogra
m
Wor
kpla
cePr
oduc
tivity
Pro
gram
Lear
ning
& T
each
ing
Perf
orm
ance
Fun
d
2010
20
09
2010
20
09
2010
20
09
2010
20
09
2010
20
09
2010
20
09
2010
20
09
$'00
0$'
000
$'00
0$'
000
$'00
0$'
000
$'00
0$'
000
$'00
0$'
000
$'00
0$'
000
$'00
0$'
000
Fi
nanc
ial a
ssis
tanc
e re
ceiv
ed in
CA
SH
dur
ing
the
repo
rting
per
iod
(tota
l cas
h re
ceiv
ed fr
om th
e A
ustra
lian
Gov
ernm
ent f
or th
e P
rogr
amm
es)
94
,800
77
,993
60
2
693
95
5
82
309
46
4
-
1,22
4
450
47
0
-
1,87
8
Net
acc
rual
adj
ustm
ents
(3,7
46)
3,
014
-
-
-
-
-
-
-
-
-
-
-
-
Rev
enue
for t
he p
erio
d
91,0
54
81,0
07
602
69
3
955
82
30
9
464
-
1,
224
45
0
470
-
1,
878
Sur
plus
/ (d
efic
it) fr
om th
e pr
evio
us y
ear
-
-
-
-
-
-
-
-
-
-
(1
,814
)
(1,7
99)
-
36
2 To
tal r
even
ue in
clud
ing
accr
ued
reve
nue
91
,054
81
,007
60
2
693
95
5
82
309
46
4
-
1,22
4
(1,3
64)
(1
,329
)
-
2,24
0
Less
exp
ense
s in
clud
ing
accr
ued
expe
nses
(91,
054)
(8
1,00
7)
(602
)
(693
)
(558
)
(82)
(3
09)
(4
64)
-
(1
,224
)
-
(485
)
-
(2,2
40)
Sur
plus
/ (d
efic
it) fo
r rep
ortin
g pe
riod
-
-
-
-
39
7
-
-
-
-
-
(1,3
64)
(1
,814
)
-
-
Financial Statements 133
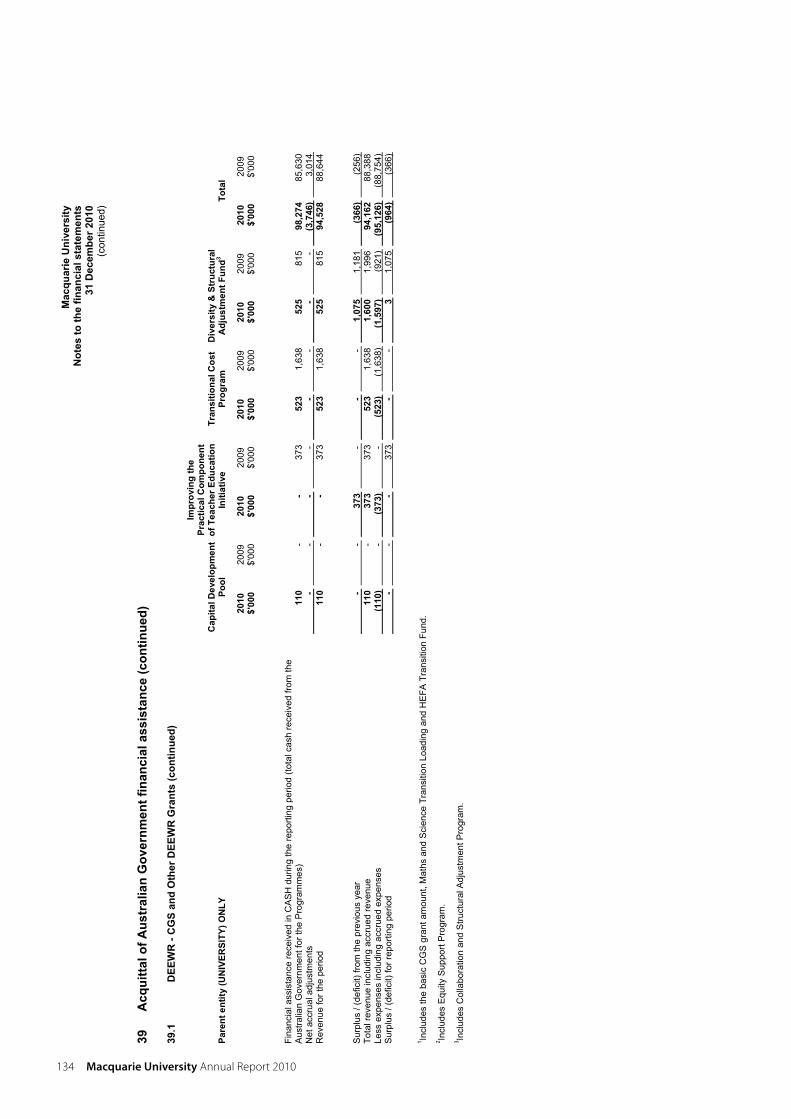
Mac
quar
ie U
nive
rsity
N
otes
to th
e fin
anci
al s
tate
men
ts
31 D
ecem
ber 2
010
(con
tinue
d)
39
Acq
uitta
l of A
ustr
alia
n G
over
nmen
t fin
anci
al a
ssis
tanc
e (c
ontin
ued)
39.1
D
EEW
R -
CG
S an
d O
ther
DEE
WR
Gra
nts
(con
tinue
d)
Pare
nt e
ntity
(UN
IVER
SITY
) ON
LY
Cap
ital D
evel
opm
ent
Pool
Impr
ovin
g th
e Pr
actic
al C
ompo
nent
of
Tea
cher
Edu
catio
n In
itiat
ive
Tran
sitio
nal C
ost
Prog
ram
D
iver
sity
& S
truc
tura
l A
djus
tmen
t Fun
d3 To
tal
2010
20
09
2010
20
09
2010
20
09
2010
20
09
2010
20
09
$'00
0$'
000
$'00
0$'
000
$'00
0$'
000
$'00
0$'
000
$'00
0$'
000
Fi
nanc
ial a
ssis
tanc
e re
ceiv
ed in
CA
SH
dur
ing
the
repo
rting
per
iod
(tota
l cas
h re
ceiv
ed fr
om th
e A
ustra
lian
Gov
ernm
ent f
or th
e P
rogr
amm
es)
11
0
-
-
373
52
3
1,63
8
525
81
5
98,2
74
85,6
30
Net
acc
rual
adj
ustm
ents
-
-
-
-
-
-
-
-
(3,7
46)
3,
014
Rev
enue
for t
he p
erio
d
110
-
-
37
3
523
1,
638
52
5
815
94
,528
88
,644
Sur
plus
/ (d
efic
it) fr
om th
e pr
evio
us y
ear
-
-
37
3
-
-
-
1,07
5
1,18
1
(366
)
(256
) To
tal r
even
ue in
clud
ing
accr
ued
reve
nue
11
0
-
373
37
3
523
1,
638
1,
600
1,
996
94
,162
88
,388
Le
ss e
xpen
ses
incl
udin
g ac
crue
d ex
pens
es
(1
10)
-
(3
73)
-
(5
23)
(1
,638
)
(1,5
97)
(9
21)
(9
5,12
6)
(88,
754)
S
urpl
us /
(def
icit)
for r
epor
ting
perio
d
-
-
-
373
-
-
3
1,
075
(9
64)
(3
66)
1 Incl
udes
the
basi
c C
GS
gra
nt a
mou
nt, M
aths
and
Sci
ence
Tra
nsiti
on L
oadi
ng a
nd H
EFA
Tra
nsiti
on F
und.
2 Incl
udes
Equ
ity S
uppo
rt P
rogr
am.
3 Incl
udes
Col
labo
ratio
n an
d S
truct
ural
Adj
ustm
ent P
rogr
am.
134 Macquarie University annual Report 2010
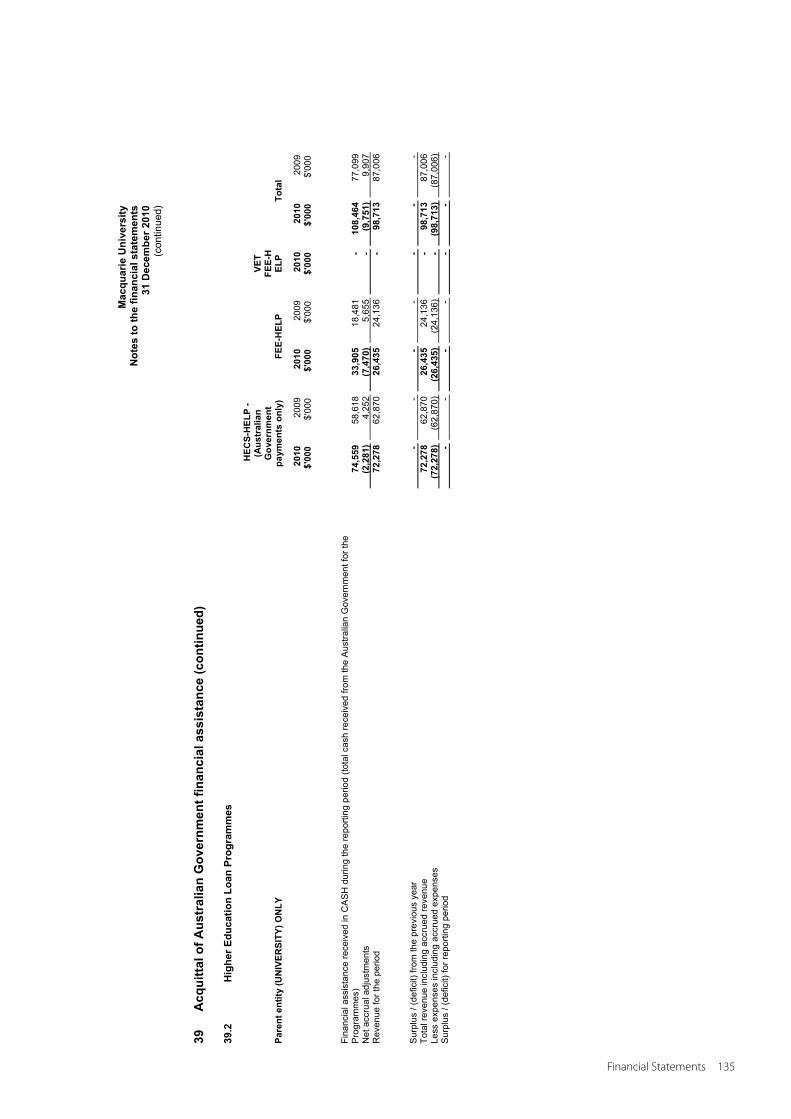
Mac
quar
ie U
nive
rsity
N
otes
to th
e fin
anci
al s
tate
men
ts
31 D
ecem
ber 2
010
(con
tinue
d)
39
Acq
uitta
l of A
ustr
alia
n G
over
nmen
t fin
anci
al a
ssis
tanc
e (c
ontin
ued)
39.2
H
ighe
r Edu
catio
n Lo
an P
rogr
amm
es
Pare
nt e
ntity
(UN
IVER
SITY
) ON
LY
HEC
S-H
ELP
- (A
ustr
alia
n G
over
nmen
t pa
ymen
ts o
nly)
FE
E-H
ELP
VET
FEE-
HEL
P To
tal
2010
2009
2010
2009
2010
2010
20
09
$'00
0$'
000
$'00
0$'
000
$'00
0$'
000
$'00
0
Fina
ncia
l ass
ista
nce
rece
ived
in C
AS
H d
urin
g th
e re
porti
ng p
erio
d (to
tal c
ash
rece
ived
from
the
Aus
tralia
n G
over
nmen
t for
the
Pro
gram
mes
)
74,5
59
58,6
18
33,9
05
18,4
81
-
108,
464
77
,099
N
et a
ccru
al a
djus
tmen
ts
(2
,281
)
4,25
2
(7,4
70)
5,
655
-
(9
,751
)
9,90
7 R
even
ue fo
r the
per
iod
72
,278
62
,870
26
,435
24
,136
-
98
,713
87
,006
Sur
plus
/ (d
efic
it) fr
om th
e pr
evio
us y
ear
-
-
-
-
-
-
-
Tota
l rev
enue
incl
udin
g ac
crue
d re
venu
e
72,2
78
62,8
70
26,4
35
24,1
36
-
98,7
13
87,0
06
Less
exp
ense
s in
clud
ing
accr
ued
expe
nses
(72,
278)
(6
2,87
0)
(26,
435)
(2
4,13
6)
-
(98,
713)
(8
7,00
6)
Sur
plus
/ (d
efic
it) fo
r rep
ortin
g pe
riod
-
-
-
-
-
-
-
Financial Statements 135
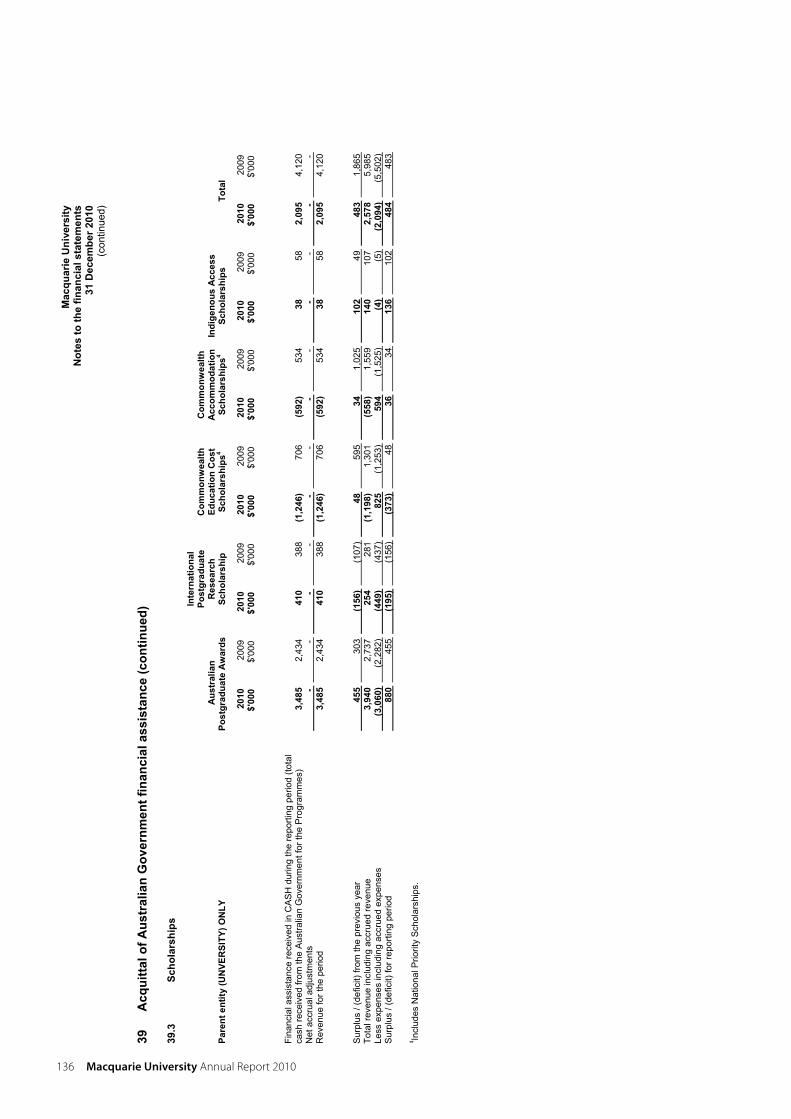
Mac
quar
ie U
nive
rsity
N
otes
to th
e fin
anci
al s
tate
men
ts
31 D
ecem
ber 2
010
(con
tinue
d)
39
Acq
uitta
l of A
ustr
alia
n G
over
nmen
t fin
anci
al a
ssis
tanc
e (c
ontin
ued)
39.3
Sc
hola
rshi
ps
Pare
nt e
ntity
(UN
VER
SITY
) ON
LY
Aus
tral
ian
Post
grad
uate
Aw
ards
Inte
rnat
iona
l Po
stgr
adua
te
Res
earc
hSc
hola
rshi
p
Com
mon
wea
lth
Educ
atio
n C
ost
Scho
lars
hips
4
Com
mon
wea
lth
Acc
omm
odat
ion
Scho
lars
hips
4In
dige
nous
Acc
ess
Scho
lars
hips
To
tal
2010
2009
2010
2009
20
1020
0920
1020
0920
1020
0920
10
2009
$'
000
$'00
0 $'
000
$'00
0 $'
000
$'00
0 $'
000
$'00
0 $'
000
$'00
0 $'
000
$'00
0
Fi
nanc
ial a
ssis
tanc
e re
ceiv
ed in
CA
SH
dur
ing
the
repo
rting
per
iod
(tota
l ca
sh re
ceiv
ed fr
om th
e A
ustra
lian
Gov
ernm
ent f
or th
e P
rogr
amm
es)
3,
485
2,
434
41
0
388
(1
,246
)
706
(5
92)
53
4
38
58
2,09
5
4,12
0
Net
acc
rual
adj
ustm
ents
-
-
-
-
-
-
-
-
-
-
-
- R
even
ue fo
r the
per
iod
3,
485
2,
434
41
0
388
(1
,246
)
706
(5
92)
53
4
38
58
2,09
5
4,12
0
Sur
plus
/ (d
efic
it) fr
om th
e pr
evio
us y
ear
45
5
303
(1
56)
(1
07)
48
59
5
34
1,02
5
102
49
48
3
1,86
5 To
tal r
even
ue in
clud
ing
accr
ued
reve
nue
3,
940
2,
737
25
4
281
(1
,198
)
1,30
1
(558
)
1,55
9
140
10
7
2,57
8
5,98
5
Less
exp
ense
s in
clud
ing
accr
ued
expe
nses
(3,0
60)
(2
,282
)
(449
)
(437
)
825
(1
,253
)
594
(1
,525
)
(4)
(5
)
(2,0
94)
(5
,502
) S
urpl
us /
(def
icit)
for r
epor
ting
perio
d
880
45
5
(195
)
(156
)
(373
)
48
36
34
136
10
2
484
48
3
4 Incl
udes
Nat
iona
l Prio
rity
Sch
olar
ship
s.
136 Macquarie University annual Report 2010
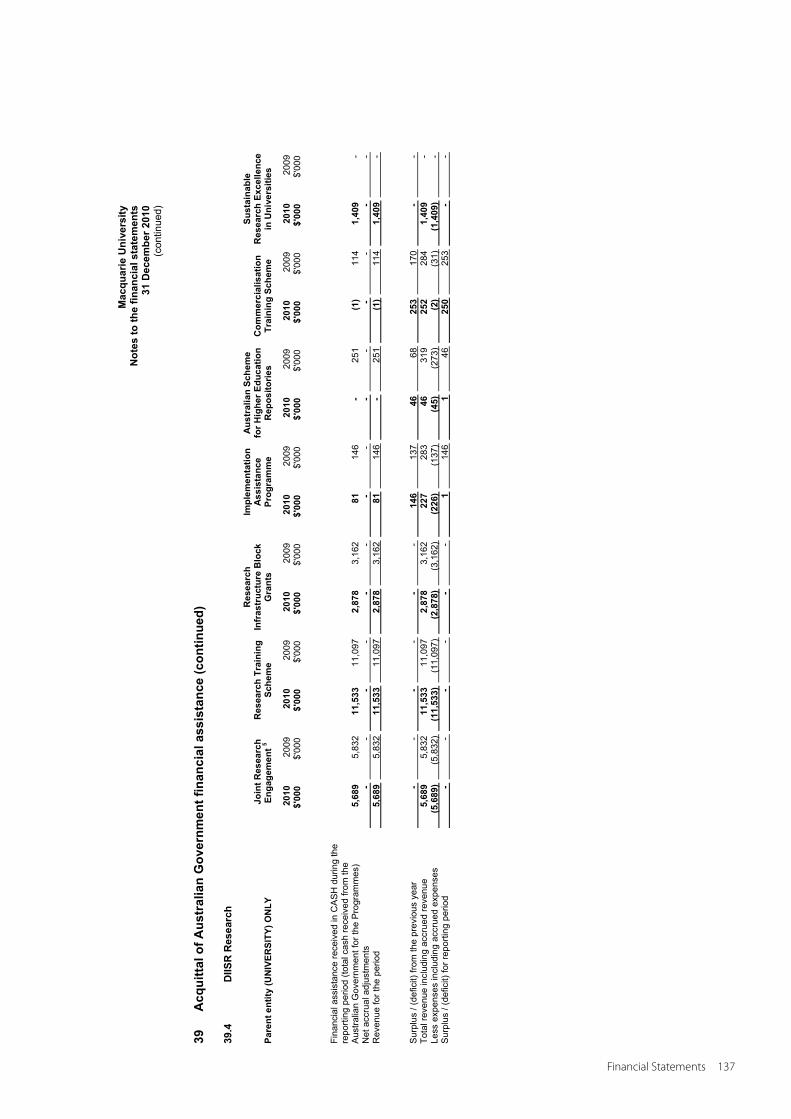
Mac
quar
ie U
nive
rsity
N
otes
to th
e fin
anci
al s
tate
men
ts
31 D
ecem
ber 2
010
(con
tinue
d)
39
Acq
uitta
l of A
ustr
alia
n G
over
nmen
t fin
anci
al a
ssis
tanc
e (c
ontin
ued)
39.4
D
IISR
Res
earc
h
Pare
nt e
ntity
(UN
IVER
SITY
) ON
LY
Joi
nt R
esea
rch
Enga
gem
ent 5
Res
earc
h Tr
aini
ng
Sche
me
Res
earc
hIn
fras
truc
ture
Blo
ck
Gra
nts
Impl
emen
tatio
n A
ssis
tanc
e Pr
ogra
mm
e
Aus
tral
ian
Sche
me
for H
ighe
r Edu
catio
n R
epos
itorie
s C
omm
erci
alis
atio
n Tr
aini
ng S
chem
e
Sust
aina
ble
Res
earc
h Ex
celle
nce
in U
nive
rsiti
es
2010
2009
2010
2009
2010
2009
20
1020
0920
1020
0920
1020
0920
10
2009
$'
000
$'00
0 $'
000
$'00
0 $'
000
$'00
0 $'
000
$'00
0 $'
000
$'00
0 $'
000
$'00
0 $'
000
$'00
0
Fi
nanc
ial a
ssis
tanc
e re
ceiv
ed in
CA
SH
dur
ing
the
repo
rting
per
iod
(tota
l cas
h re
ceiv
ed fr
om th
e A
ustra
lian
Gov
ernm
ent f
or th
e P
rogr
amm
es)
5,
689
5,
832
11
,533
11
,097
2,
878
3,
162
81
14
6
-
251
(1
)
114
1,
409
-
Net
acc
rual
adj
ustm
ents
-
-
-
-
-
-
-
-
-
-
-
-
-
- R
even
ue fo
r the
per
iod
5,
689
5,
832
11
,533
11
,097
2,
878
3,
162
81
14
6
-
251
(1
)
114
1,
409
-
Sur
plus
/ (d
efic
it) fr
om th
e pr
evio
us y
ear
-
-
-
-
-
-
14
6
137
46
68
25
3
170
-
-
Tota
l rev
enue
incl
udin
g ac
crue
d re
venu
e
5,68
9
5,83
2
11,5
33
11,0
97
2,87
8
3,16
2
227
28
3
46
319
25
2
284
1,
409
-
Less
exp
ense
s in
clud
ing
accr
ued
expe
nses
(5,6
89)
(5
,832
)
(11,
533)
(1
1,09
7)
(2,8
78)
(3
,162
)
(226
)
(137
)
(45)
(2
73)
(2
)
(31)
(1
,409
)
- S
urpl
us /
(def
icit)
for r
epor
ting
perio
d
-
-
-
-
-
-
1
146
1
46
25
0
253
-
-
Financial Statements 137
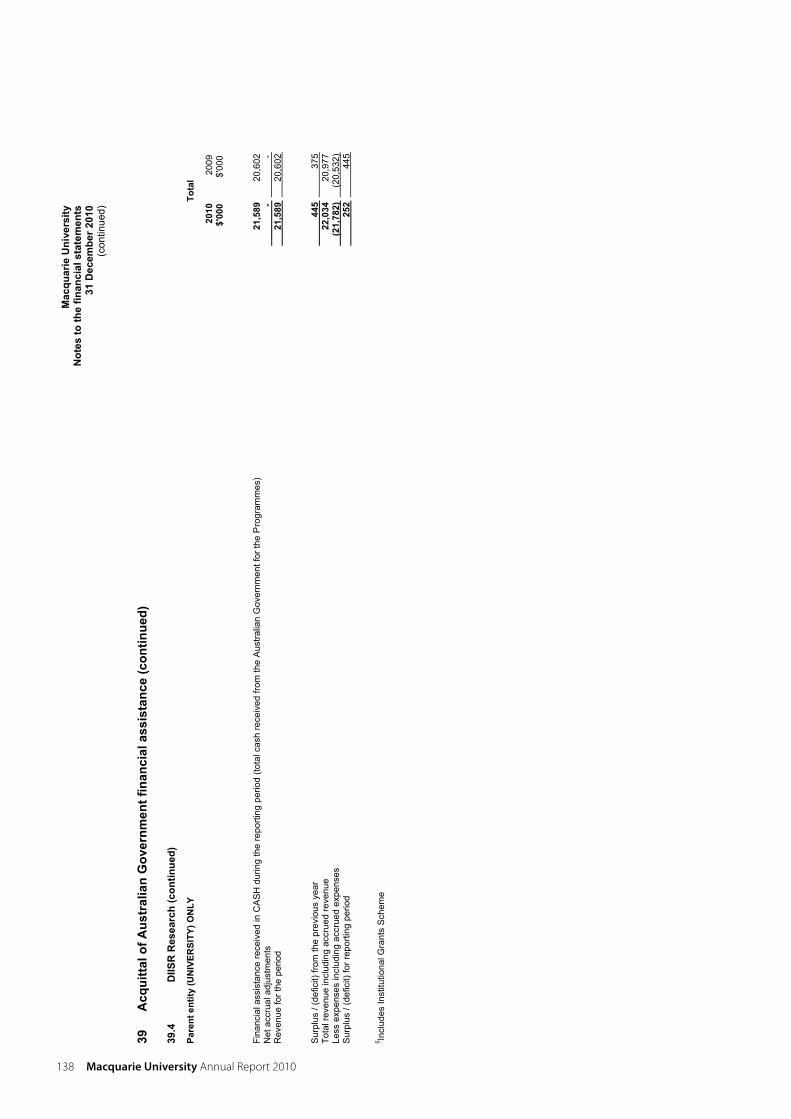
Mac
quar
ie U
nive
rsity
N
otes
to th
e fin
anci
al s
tate
men
ts
31 D
ecem
ber 2
010
(con
tinue
d)
39
Acq
uitta
l of A
ustr
alia
n G
over
nmen
t fin
anci
al a
ssis
tanc
e (c
ontin
ued)
39.4
D
IISR
Res
earc
h (c
ontin
ued)
Pare
nt e
ntity
(UN
IVER
SITY
) ON
LYTo
tal
2010
20
09
$'00
0$'
000
Fina
ncia
l ass
ista
nce
rece
ived
in C
AS
H d
urin
g th
e re
porti
ng p
erio
d (to
tal c
ash
rece
ived
from
the
Aus
tralia
n G
over
nmen
t for
the
Pro
gram
mes
)
21,5
89
20,6
02
Net
acc
rual
adj
ustm
ents
-
- R
even
ue fo
r the
per
iod
21
,589
20
,602
Sur
plus
/ (d
efic
it) fr
om th
e pr
evio
us y
ear
44
5
375
Tota
l rev
enue
incl
udin
g ac
crue
d re
venu
e
22,0
34
20,9
77
Less
exp
ense
s in
clud
ing
accr
ued
expe
nses
(21,
782)
(2
0,53
2)
Sur
plus
/ (d
efic
it) fo
r rep
ortin
g pe
riod
25
2
445
5 Incl
udes
Inst
itutio
nal G
rant
s S
chem
e
138 Macquarie University annual Report 2010
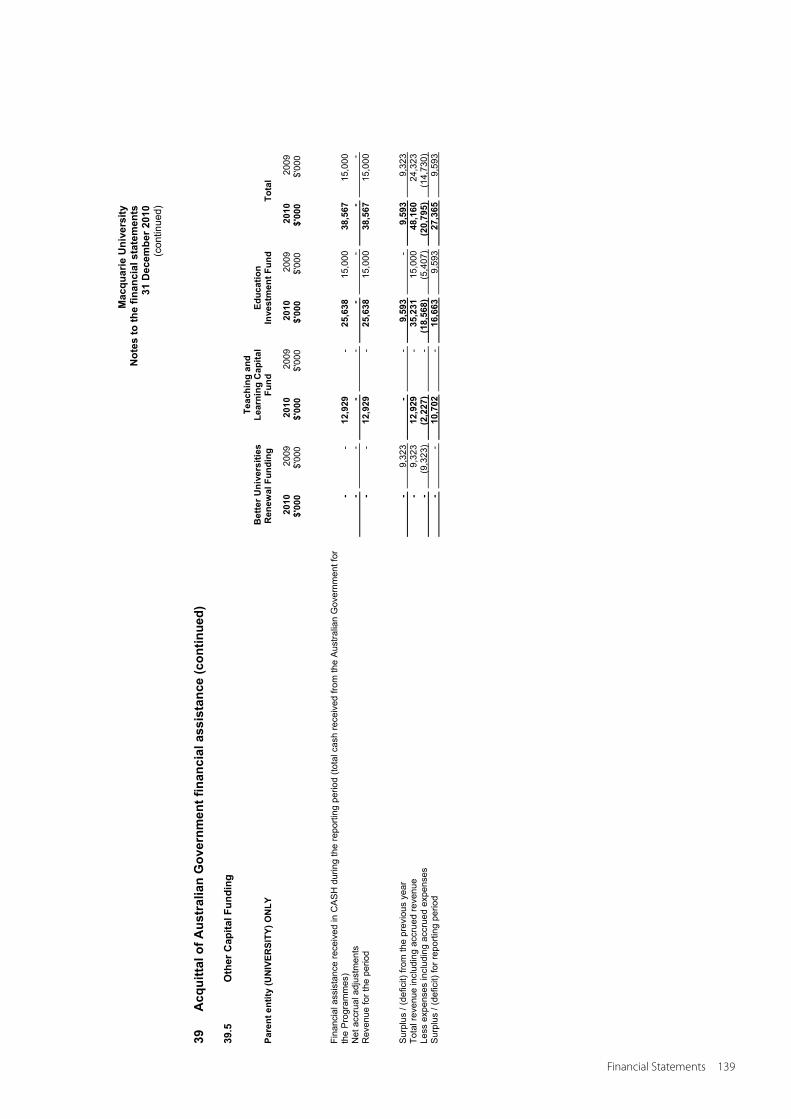
Mac
quar
ie U
nive
rsity
N
otes
to th
e fin
anci
al s
tate
men
ts
31 D
ecem
ber 2
010
(con
tinue
d)
39
Acq
uitta
l of A
ustr
alia
n G
over
nmen
t fin
anci
al a
ssis
tanc
e (c
ontin
ued)
39.5
O
ther
Cap
ital F
undi
ng
Pare
nt e
ntity
(UN
IVER
SITY
) ON
LY
Bet
ter U
nive
rsiti
es
Ren
ewal
Fun
ding
Teac
hing
and
Le
arni
ng C
apita
l Fu
ndEd
ucat
ion
Inve
stm
ent F
und
Tota
l
2010
2009
2010
2009
2010
2009
2010
20
09
$'00
0$'
000
$'00
0$'
000
$'00
0$'
000
$'00
0$'
000
Fi
nanc
ial a
ssis
tanc
e re
ceiv
ed in
CA
SH
dur
ing
the
repo
rting
per
iod
(tota
l cas
h re
ceiv
ed fr
om th
e A
ustra
lian
Gov
ernm
ent f
or
the
Pro
gram
mes
)
-
-
12,9
29
-
25,6
38
15,0
00
38,5
67
15,0
00
Net
acc
rual
adj
ustm
ents
-
-
-
-
-
-
-
- R
even
ue fo
r the
per
iod
-
-
12
,929
-
25
,638
15
,000
38
,567
15
,000
Sur
plus
/ (d
efic
it) fr
om th
e pr
evio
us y
ear
-
9,
323
-
-
9,
593
-
9,
593
9,
323
Tota
l rev
enue
incl
udin
g ac
crue
d re
venu
e
-
9,32
3
12,9
29
-
35,2
31
15,0
00
48,1
60
24,3
23
Less
exp
ense
s in
clud
ing
accr
ued
expe
nses
-
(9,3
23)
(2
,227
)
-
(18,
568)
(5
,407
)
(20,
795)
(1
4,73
0)
Sur
plus
/ (d
efic
it) fo
r rep
ortin
g pe
riod
-
-
10
,702
-
16
,663
9,
593
27
,365
9,
593
Financial Statements 139
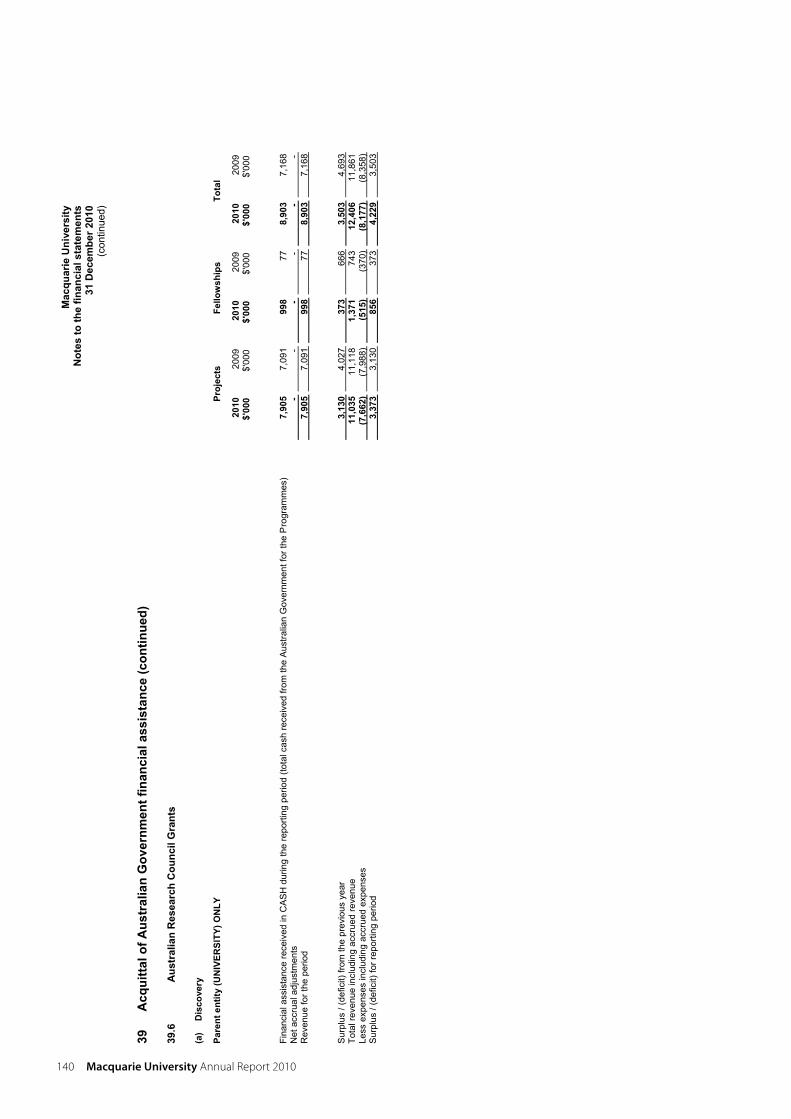
Mac
quar
ie U
nive
rsity
N
otes
to th
e fin
anci
al s
tate
men
ts
31 D
ecem
ber 2
010
(con
tinue
d)
39
Acq
uitta
l of A
ustr
alia
n G
over
nmen
t fin
anci
al a
ssis
tanc
e (c
ontin
ued)
39.6
A
ustr
alia
n R
esea
rch
Cou
ncil
Gra
nts
(a)
Dis
cove
ry
Pare
nt e
ntity
(UN
IVER
SITY
) ON
LYPr
ojec
tsFe
llow
ship
sTo
tal
2010
2009
2010
2009
2010
20
09
$'00
0$'
000
$'00
0$'
000
$'00
0$'
000
Fi
nanc
ial a
ssis
tanc
e re
ceiv
ed in
CA
SH
dur
ing
the
repo
rting
per
iod
(tota
l cas
h re
ceiv
ed fr
om th
e A
ustra
lian
Gov
ernm
ent f
or th
e P
rogr
amm
es)
7,
905
7,
091
99
8
77
8,90
3
7,16
8
Net
acc
rual
adj
ustm
ents
-
-
-
-
-
- R
even
ue fo
r the
per
iod
7,
905
7,
091
99
8
77
8,90
3
7,16
8
Sur
plus
/ (d
efic
it) fr
om th
e pr
evio
us y
ear
3,
130
4,
027
37
3
666
3,
503
4,
693
Tota
l rev
enue
incl
udin
g ac
crue
d re
venu
e
11,0
35
11,1
18
1,37
1
743
12
,406
11
,861
Le
ss e
xpen
ses
incl
udin
g ac
crue
d ex
pens
es
(7
,662
)
(7,9
88)
(5
15)
(3
70)
(8
,177
)
(8,3
58)
Sur
plus
/ (d
efic
it) fo
r rep
ortin
g pe
riod
3,
373
3,
130
85
6
373
4,
229
3,
503
140 Macquarie University annual Report 2010

Mac
quar
ie U
nive
rsity
N
otes
to th
e fin
anci
al s
tate
men
ts
31 D
ecem
ber 2
010
(con
tinue
d)
39
Acq
uitta
l of A
ustr
alia
n G
over
nmen
t fin
anci
al a
ssis
tanc
e (c
ontin
ued)
39.6
A
ustr
alia
n R
esea
rch
Cou
ncil
Gra
nts
(con
tinue
d)
(b)
Link
ages
Pare
nt e
ntity
(UN
IVER
SITY
) ON
LY
Spe
cial
Res
earc
h In
itiat
ives
In
fras
truc
ture
In
tern
atio
nal
Proj
ects
To
tal
2010
2009
20
1020
0920
1020
0920
1020
0920
10
2009
$'
000
$'00
0 $'
000
$'00
0 $'
000
$'00
0 $'
000
$'00
0 $'
000
$'00
0
Fi
nanc
ial a
ssis
tanc
e re
ceiv
ed in
CA
SH
dur
ing
the
repo
rting
per
iod
(tota
l cas
h re
ceiv
ed fr
om th
e A
ustra
lian
Gov
ernm
ent f
or th
e P
rogr
amm
es)
-
-
1,
470
-
-
15
1,
980
2,
157
3,
450
2,
172
N
et a
ccru
al a
djus
tmen
ts
-
-
-
-
-
-
-
-
-
-
Rev
enue
for t
he p
erio
d
-
-
1,47
0
-
-
15
1,98
0
2,15
7
3,45
0
2,17
2
Sur
plus
/ (d
efic
it) fr
om th
e pr
evio
us y
ear
-
34
-
-
12
19
43
3
1,10
5
445
1,
158
Tota
l rev
enue
incl
udin
g ac
crue
d re
venu
e
-
34
1,47
0
-
12
34
2,41
3
3,26
2
3,89
5
3,33
0
Less
exp
ense
s in
clud
ing
accr
ued
expe
nses
-
(34)
(7
35)
-
(5
)
(22)
(2
,295
)
(2,8
29)
(3
,035
)
(2,8
85)
Sur
plus
/ (d
efic
it) fo
r rep
ortin
g pe
riod
-
-
73
5
-
7
12
118
43
3
860
44
5
Financial Statements 141
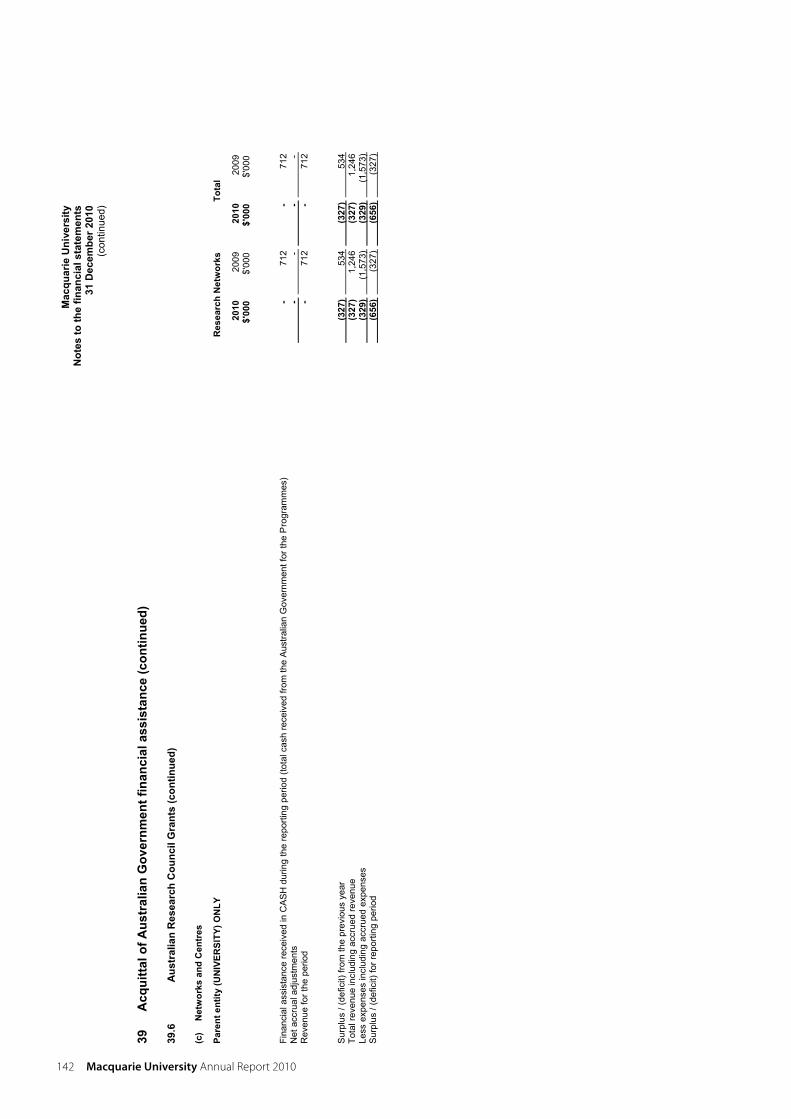
Mac
quar
ie U
nive
rsity
N
otes
to th
e fin
anci
al s
tate
men
ts
31 D
ecem
ber 2
010
(con
tinue
d)
39
Acq
uitta
l of A
ustr
alia
n G
over
nmen
t fin
anci
al a
ssis
tanc
e (c
ontin
ued)
39.6
A
ustr
alia
n R
esea
rch
Cou
ncil
Gra
nts
(con
tinue
d)
(c)
Net
wor
ks a
nd C
entr
es
Pare
nt e
ntity
(UN
IVER
SITY
) ON
LYR
esea
rch
Net
wor
ksTo
tal
2010
2009
2010
20
09
$'00
0$'
000
$'00
0$'
000
Fina
ncia
l ass
ista
nce
rece
ived
in C
AS
H d
urin
g th
e re
porti
ng p
erio
d (to
tal c
ash
rece
ived
from
the
Aus
tralia
n G
over
nmen
t for
the
Pro
gram
mes
)
-
712
-
71
2
Net
acc
rual
adj
ustm
ents
-
-
-
- R
even
ue fo
r the
per
iod
-
71
2
-
712
Sur
plus
/ (d
efic
it) fr
om th
e pr
evio
us y
ear
(3
27)
53
4
(327
)
534
Tota
l rev
enue
incl
udin
g ac
crue
d re
venu
e
(327
)
1,24
6
(327
)
1,24
6
Less
exp
ense
s in
clud
ing
accr
ued
expe
nses
(329
)
(1,5
73)
(3
29)
(1
,573
) S
urpl
us /
(def
icit)
for r
epor
ting
perio
d
(656
)
(327
)
(656
)
(327
)
142 Macquarie University annual Report 2010
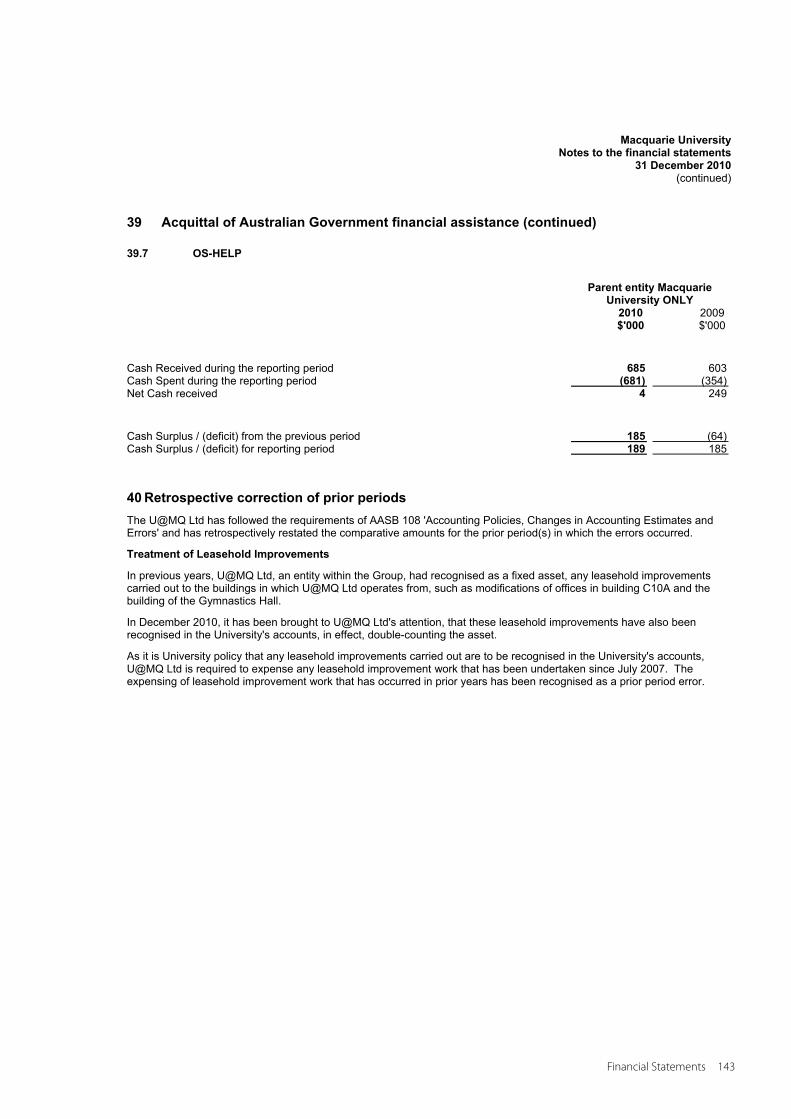
Macquarie UniversityNotes to the financial statements
31 December 2010(continued)
39 Acquittal of Australian Government financial assistance (continued)
39.7 OS-HELP
Parent entity Macquarie University ONLY
2010 2009 $'000 $'000
Cash Received during the reporting period 685 603 Cash Spent during the reporting period (681) (354) Net Cash received 4 249
Cash Surplus / (deficit) from the previous period 185 (64) Cash Surplus / (deficit) for reporting period 189 185
40 Retrospective correction of prior periods The U@MQ Ltd has followed the requirements of AASB 108 'Accounting Policies, Changes in Accounting Estimates and Errors' and has retrospectively restated the comparative amounts for the prior period(s) in which the errors occurred.
Treatment of Leasehold Improvements
In previous years, U@MQ Ltd, an entity within the Group, had recognised as a fixed asset, any leasehold improvements carried out to the buildings in which U@MQ Ltd operates from, such as modifications of offices in building C10A and the building of the Gymnastics Hall.
In December 2010, it has been brought to U@MQ Ltd's attention, that these leasehold improvements have also been recognised in the University's accounts, in effect, double-counting the asset.
As it is University policy that any leasehold improvements carried out are to be recognised in the University's accounts, U@MQ Ltd is required to expense any leasehold improvement work that has been undertaken since July 2007. The expensing of leasehold improvement work that has occurred in prior years has been recognised as a prior period error.
Financial Statements 143
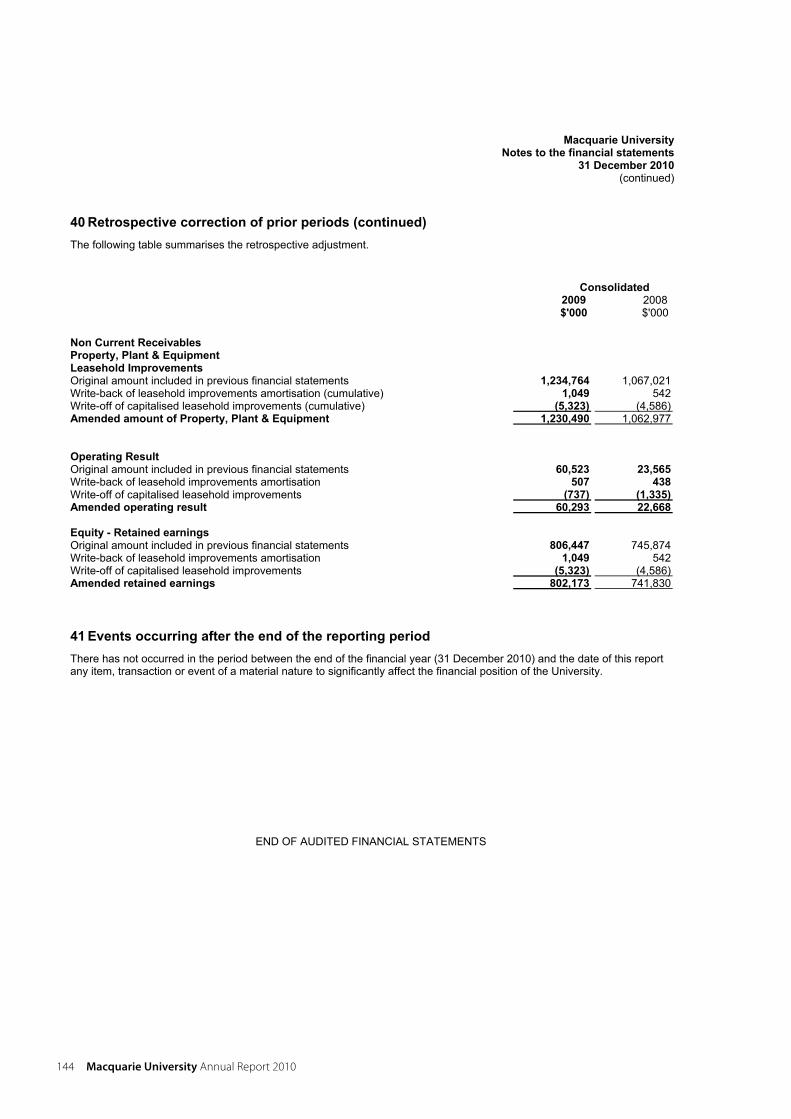
Macquarie UniversityNotes to the financial statements
31 December 2010(continued)
40 Retrospective correction of prior periods (continued) The following table summarises the retrospective adjustment.
Consolidated2009 2008 $'000 $'000
Non Current Receivables Property, Plant & Equipment Leasehold Improvements Original amount included in previous financial statements 1,234,764 1,067,021 Write-back of leasehold improvements amortisation (cumulative) 1,049 542 Write-off of capitalised leasehold improvements (cumulative) (5,323) (4,586) Amended amount of Property, Plant & Equipment 1,230,490 1,062,977
Operating ResultOriginal amount included in previous financial statements 60,523 23,565Write-back of leasehold improvements amortisation 507 438Write-off of capitalised leasehold improvements (737) (1,335)Amended operating result 60,293 22,668
Equity - Retained earningsOriginal amount included in previous financial statements 806,447 745,874 Write-back of leasehold improvements amortisation 1,049 542 Write-off of capitalised leasehold improvements (5,323) (4,586) Amended retained earnings 802,173 741,830
41 Events occurring after the end of the reporting period There has not occurred in the period between the end of the financial year (31 December 2010) and the date of this report any item, transaction or event of a material nature to significantly affect the financial position of the University.
END OF AUDITED FINANCIAL STATEMENTS
144 Macquarie University annual Report 2010
index 145
Index
Aaboriginal people and Torres Strait islanders,
see equal employment opportunity
academic appeals Committee, 52
access, inside front cover
access macquarie ltd, 59, 109
accounts, payment of, 51
act, macquarie University, see macquarie University act
aims, charter and, 4
see also principal activities
alumni, 18
appeals, academic, 52
audit, internal, 51
australian Hearing Hub, 20
australian Proteome analysis Facility ltd, 59, 109
australian School of advanced medicine, 7, 11, 20, 37, 54
awards received by academic staff, 13–15
alTC awards, 15
aRC Fellowships, 13
Distinguished Professors, 14
eureka Prize, 13
young Tall Poppy Science award, 14
awards received by students
australia asia endeavour awards, 15
Bbalance sheet, consolidated, 55
budgets, 57
CCampus Hub, 20
Centre for money, Banking and Finance ltd, 59, 109
charter, 4
see also principal activities
CmBF, see Centre for money, Banking and Finance ltd
community engagement, 18, 21, 30
complaints, student, 52
completions, higher degree research, 12
consumer response, 52
controlled entities, 109–110
financial statements, 59
costs incurred in production of Report, inside front cover
cotutelle agreements, 17
Council,
members of, 8–9
report by members of, 5–6
credit card certification, 51
cultural diversity, see Social inclusion
curriculum, Undergraduate, 15
Ddegrees awarded, 17
disability, people with a, see equal employment opportunity
Discipline Committee, 52
discipline, student, 52
Distance education, 27
Diversity Week, 29
146 Macquarie University annual Report 2010
index continued
Eeeo, see equal employment opportunity
employee relations, 23
energy, 21
enrolments, 16
higher degree research, 12–13
entities, controlled, see controlled entities
entry schemes, special consideration, 27
environmental regulation, 6
see also sustainability
equal employment opportunity, 31–33
statistics, 34–36
equity and diversity, 29–33
executive performance summary, 10
expense analysis, consolidated, 55
Ffacilities, 20
financial performance, unaudited, 54–57
financial statements
controlled entities, 59, 109–110
macquarie University, audited, 61–144
Foi, see Freedom of information
fraud and corruption, statement of attitude to, 52
Freedom of information, 39
statistics, 40–46
funding, research, see research
GgiPa, see government information (Public access)
global leadership Program, 17
governance, 5–10
government information (Public access), 47
statistics, 48–50
grading appeals Committee, 52
Hhealth, see occupational health and safety
Hearing Hub, australian, 20
Higher Degree Research appeals Committee, 53
higher degree research students, see research
Hospital, macquarie University, 11, 18, 20, 51, 54, 55
Hub, Campus, 20
human resources, 23–24
Iincome analysis, consolidated, 54
income, research see research
indigenous people, see equal employment opportunity
industrial relations, 23
informatics, 37–38
infrastructure, 20
institutional advancement, 18
insurance, 6, 51
internal audit, 51
internationalisation, 17
investment performance, 56
LlamS Foundation ltd, 59, 109
lamS international Pty ltd, 59, 109
learning and teaching, 15–17
sustainability, 21
learning and Research Centre, 20
learning Centre for Numeracy Skills, 29
letter of submission, 1
library, see learning and Research Centre
index 147
Mmacquarie@50, 4
macquarie graduate School of management Pty ltd, 59, 109
macquarie international, 17
macquarie University act, 4
establishment of Council under, 8
macquarie University Foundation, 18
macquarie University Hospital, 11, 18, 20, 51, 54, 55
macquarie University medical Research Foundation ltd, 59, 109
macquarie University medical Research Trust, 59, 109
macquarie University Private Hospital Clinic Pty ltd, 59, 109
macquarie University Private Hospital Clinic Sub-Trust, 109–110
macquarie University Private Hospital Sub-Trust, 109–110
macquarie University Hospital Pty ltd, 59, 109
macquarie University Private Hospital Trust, 109–110
macquarie University Property investment Company Pty ltd 1–3, 59, 109
macquarie University Property investment ltd Sub-Trust 1–4, 109–110
macquarie University Property investment Trust, Holding Trust 1–6, 109–110
making Up lost Time in literacy, 19
management and structure, 7–10
meetings, Council members’ attendance at, 9
mUH operations Pty ltd, 59, 109
muliticultural Policies and Services Plan, 29
mUlTiliT, see making Up lost Time in literacy
NNumeracy Skills, learning Centre for, 20
Ooccupational health and safety, 24–25
office bearers, principal, 8
oHS, see occupational health and safety
open Universities australia, 27
operations, 37–53
see also principal activities
organisation chart, 7
outcomes, research, see research
overseas travel, see travel
P participation and community engagement, 30
partnerships, research, 11
pathways to university, 27–28
payment of accounts, 51
performance summary, executive, 10
personnel, 23–24, 31–33
policies, staff, 23
principal activities, 4
principal office bearers, 8
privacy, 52
publications, research, 11
Rranking, international, 4, 17
recycling, see waste
research, 11–14
review of operations, see principal activities
Risk Frontiers group Pty ltd, 59, 109
Risk Frontiers Flood (australia) Pty ltd, 59, 109
risk analysis, 56
risk management, 51
148 Macquarie University annual Report 2010
index continued
Ssafety, see occupational health and safety
salary movements, 23
science partnership, 19
scholarships, 28
Senate, see academic Senate
social inclusion, 27–36
special consideration entry schemes, 27
staff, 23–24, 31–36
statement of attitude to fraud and corruption, 52
station precinct, 20
statistics
equal employment opportunity, 34–36
Freedom of information, 39–46
government information (Public access), 47–50
occupational health and safety, 24–25
staff, 23–24
student awards, 16
student enrolments, 17
strategy, 4
research, 11
students, 16–17
complaints, 52
degrees awarded, 17
enrolment statistics, 16
higher degree research, 12–13
international, 17
special entry schemes, 27–28
support services, 29–30
Wellbeing, 29
summary review of operations, see principal activities
superannuation, state schemes, 54
sustainability, 21–22
Tteaching, see learning and teaching
travel, 53
UU@mQ ltd, 59, 109
uniTeST, 28
University Council, see Council
University organisation chart, 9
Vvalues, University, 4
volunteering, student, 17, 30
Wwage and salary movements, 23
Warawara – Department of indigenous Studies, 28
waste, 22
water, 22
Wellbeing, Student, 29
women, see equal employment opportunity
workers’ compensation claims, 25
workplace safety, 24–25


Balaclava Road, North Ryde, Sydney, AustraliaTelephone (02) 9850 7111, Facsimile (02) 9850 7433
Macquarie University CRICOS Provider Number 00002J
www.mq.edu.au
Related Documents


