Annual Report 2010

Welcome message from author
This document is posted to help you gain knowledge. Please leave a comment to let me know what you think about it! Share it to your friends and learn new things together.
Transcript
Annual Report 2010

2
KONGSBERG AUTOMOTIVE – ANNUAL REPORT 2010
00-05 The Company 06-12 Directors' Report 13-52 Financials 53-58 HSE 59-60 Corporate Governance
00-05 The Company 06-12 Directors' Report 13-52 Financials 53-58 HSE 59-60 Corporate Governance
00-05 The Company 06-12 Directors' Report 13-52 Financials 53-58 HSE 59-60 Corporate Governance
00-05 The Company 06-12 Directors' Report 13-52 Financials 53-58 HSE 59-60 Corporate Governance
00-05 The Company 06-12 Directors' Report 13-52 Financials 53-58 HSE 59-60 Corporate Governance
QUARTERLY HIGHLIGHTSCONTENTS
For further information visitwww.kongsbergautomotive.com
The CompanyQuarterly Highlights 02Our Business 03CEO Outlook 04New organizational structure 05
Directors’ Report 06
Financials 13
Key Financial Data 52 Environmental Report 53
Corporate Governance 59
Q1 The positive market trends continued in all segments Delivering positive EBIT for the first time since Q3 08 Continue to win significant global contracts New organization structure implemented
Q2 Revenue growth was stronger than growth in the global
vehicle production volume Important business win for Chinese heavy-duty trucks New innovative seat comfort massage system sold in the
Chinese market Booked MEUR 40 in average annual sales in new orders
Q3
Revenue growth was stronger than growth in the global vehicle production volume
Closure of the PPS Hagerstown facility by consolidation in the Willis facility
Consolidation of US R&D capabilities in one Detroit based Tech Center (Novi)
Stronger order intake especially in the Interior System segment
Q4 Executing an operational roadmap for 2011, improving the
margins in the automotive segments Revenue growth continues to be stronger than the increase in
global vehicle production Continuing to win global contracts securing our market
position
3
KONGSBERG AUTOMOTIVE – ANNUAL REPORT 2010
00-05 The Company 06-12 Directors' Report 13-52 Financials 53-58 HSE 59-60 Corporate Governance
00-05 The Company 06-12 Directors' Report 13-52 Financials 53-58 HSE 59-60 Corporate Governance
00-05 The Company 06-12 Directors' Report 13-52 Financials 53-58 HSE 59-60 Corporate Governance
00-05 The Company 06-12 Directors' Report 13-52 Financials 53-58 HSE 59-60 Corporate Governance
00-05 The Company 06-12 Directors' Report 13-52 Financials 53-58 HSE 59-60 Corporate Governance
QUARTERLY HIGHLIGHTS OUR BUSINESS
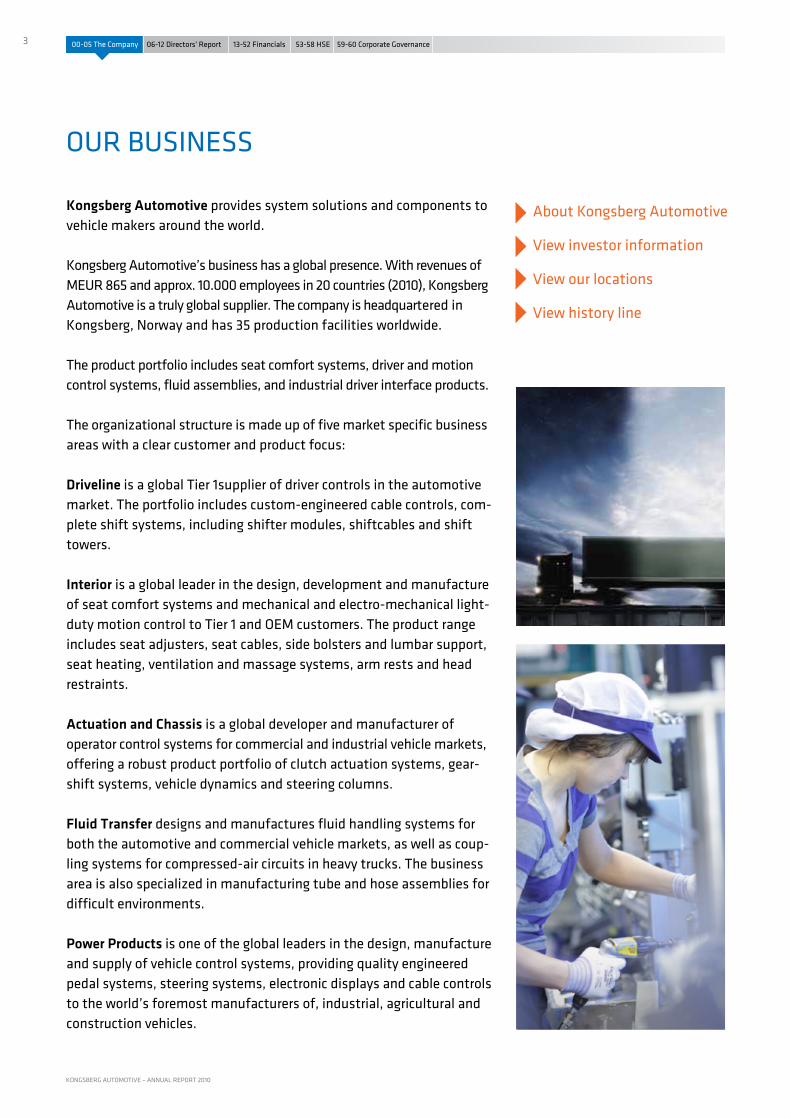
Kongsberg Automotive provides system solutions and components to vehicle makers around the world.
Kongsberg Automotive’s business has a global presence. With revenues of MEUR 865 and approx. 10.000 employees in 20 countries (2010), Kongsberg Automotive is a truly global supplier. The company is headquartered in Kongsberg, Norway and has 35 production facilities worldwide.
The product portfolio includes seat comfort systems, driver and motion control systems, fluid assemblies, and industrial driver interface products.
The organizational structure is made up of five market specific business areas with a clear customer and product focus:
Driveline is a global Tier 1supplier of driver controls in the automotive market. The portfolio includes custom-engineered cable controls, com-plete shift systems, including shifter modules, shiftcables and shift towers.
Interior is a global leader in the design, development and manufacture of seat comfort systems and mechanical and electro-mechanical light-duty motion control to Tier 1 and OEM customers. The product range includes seat adjusters, seat cables, side bolsters and lumbar support, seat heating, ventilation and massage systems, arm rests and head restraints.
Actuation and Chassis is a global developer and manufacturer of operator control systems for commercial and industrial vehicle markets, offering a robust product portfolio of clutch actuation systems, gear-shift systems, vehicle dynamics and steering columns.
Fluid Transfer designs and manufactures fluid handling systems for both the automotive and commercial vehicle markets, as well as coup-ling systems for compressed-air circuits in heavy trucks. The business area is also specialized in manufacturing tube and hose assemblies for difficult environments.
Power Products is one of the global leaders in the design, manufacture and supply of vehicle control systems, providing quality engineered pedal systems, steering systems, electronic displays and cable controls to the world’s foremost manufacturers of, industrial, agricultural and construction vehicles.
About Kongsberg Automotive
View investor information
View our locations
View history line

4
KONGSBERG AUTOMOTIVE – ANNUAL REPORT 2010
00-05 The Company 06-12 Directors' Report 13-52 Financials 53-58 HSE 59-60 Corporate Governance
00-05 The Company 06-12 Directors' Report 13-52 Financials 53-58 HSE 59-60 Corporate Governance
00-05 The Company 06-12 Directors' Report 13-52 Financials 53-58 HSE 59-60 Corporate Governance
00-05 The Company 06-12 Directors' Report 13-52 Financials 53-58 HSE 59-60 Corporate Governance
00-05 The Company 06-12 Directors' Report 13-52 Financials 53-58 HSE 59-60 Corporate Governance
Dear readerOne year ago, I took on the position as CEO of Kongsberg Automotive. It is a true privilege to lead more than 10.000 Kongsberg Automotive employees located in 20 coun-tries worldwide. Our industry has experienced difficult times over the last couple of years, and yet our people have responded with skill, creativity and hard work to all challenges.
Now we face a new day in the automotive industry. The companies still in business have restructured and are better positioned to grow. Kongsberg Automotive has come thru the crisis as a stronger company.
We are today a truly global organization. In 2010 we proved this by winning several global contracts. There are KA components in all of the top 10 selling cars in Europe, and every week we see that our technology is migrating from the mature markets into emerging markets. This is all very exciting. It shows that we are ready to capitalize on the automotive rebound. But it will not happen by itself.
We must never take our customers’ confi-dence in us for granted. Therefore, in 2011, we will continue seizing the opportunity to deliver sustainable success:
• Bycontinuingourrestructuringandcost reducing efforts to make us more efficient • Bycreatingroomforourengineerstotake on the challenge from our customers to make even more unique and innovative products. Products that reduce cost, answer to market demands and are profitable from the moment they hit the market• Byfurtherutilizingourstrongcorporate culture and talented employees and use this as the driver for better products, a more efficient organization and improved market positions
I’m confident that our combined efforts will drive shareholder value and bring us back as a profitable company in 2011.
Hans Peter HavdalCEOKongsberg Automotive Holding ASA
CEO OUTLOOK
»There are KA components in all of the top 10 selling cars in Europe«

5
KONGSBERG AUTOMOTIVE – ANNUAL REPORT 2010
00-05 The Company 06-12 Directors' Report 13-52 Financials 53-58 HSE 59-60 Corporate Governance
00-05 The Company 06-12 Directors' Report 13-52 Financials 53-58 HSE 59-60 Corporate Governance
00-05 The Company 06-12 Directors' Report 13-52 Financials 53-58 HSE 59-60 Corporate Governance
00-05 The Company 06-12 Directors' Report 13-52 Financials 53-58 HSE 59-60 Corporate Governance
00-05 The Company 06-12 Directors' Report 13-52 Financials 53-58 HSE 59-60 Corporate Governance
Safety and comfort related products for
vehicle interiors
Head restraints, lumbar support
systems and seat climate systems
Interior Driveline Actuation & Chassis Fluid Transfer Power Products
MARKET
PRODUCTS
Gear shift systems for light duty vehicles
Automatic- and manual gear shifters, shift cables and gear
selectors
Driver control systems and chassis related
products to commercial vehicles
Gear shifters, clutch servos, steering
columns and chassis stabilizers
Fluid handling systems for light duty, industrial and
commercial vehicles
Pipe/hose assemblies for turbo chargers,
brake- and fuel systems. Couplings for
air systems
Products related to outdoor power equipment and
recreational products
Displays, throttle- and brake pedals, hand
controls and light duty cables
In 2010 Kongsberg Automotive introduced a new organizational structure, establishing five business areas - Driveline, Interior, Fluid Transfer, Actuation & Chassis and Power Products - to sharpen our customer focus and accelerate profitable growth. These business areas are taliored to support specific market segments. Dedicated sales, marketing and research & development functions within each business area bring teams closer to their customers.
This business area structure allows us to rapidly address different customer and pro-duct requirements within both passenger, com-mercial and off-highway vehicle segments, and positions the company to drive strong, sustained growth and improved profitability. Each business area is headed by an Executive Vice President that has full P&L responsibility and reports directly to CEO Hans Peter Havdal. Synergies are sought through cooperation and resource sharing across the business
areas. Combined with a strong global pre-sence this will provide leverage and highly competitive scale. With almost one full year since its introduc-tion, we experience that the new structure is working well. In 2011 it will be our focus to foster the continued growth of each business area, and to ensure that each area continue to deliver high value, cost-effective projects with uncompromising safety, quality, and timeliness to our customers.
NEW ORGANIzATIONAL STRUCTURE
Interior – 25 %
Driveline – 32.5 %
Actuation & Chassis – 12.5%
Fluid Transfer – 15 %
Power Products – 15 %
All business areas have dedicated sales, marketing and research & development functions.
Revenue share per business area
6
KONGSBERG AUTOMOTIVE – ANNUAL REPORT 2010
00-05 The Company 06-12 Directors' Report 13-52 Financials 53-58 HSE 59-60 Corporate Governance
00-05 The Company 06-12 Directors' Report 13-52 Financials 53-58 HSE 59-60 Corporate Governance
00-05 The Company 06-12 Directors' Report 13-52 Financials 53-58 HSE 59-60 Corporate Governance
00-05 The Company 06-12 Directors' Report 13-52 Financials 53-58 HSE 59-60 Corporate Governance
00-05 The Company 06-12 Directors' Report 13-52 Financials 53-58 HSE 59-60 Corporate Governance
REPORT Of THE BOARD Of DIRECTORS AND CEO
2010 was the start of a market recovery in the automotive industry after two years of sharply declining pro-duction volumes. Kongsberg Automotive (KA) experienced a 39 % revenue growth and improved profitability in 2010 versus 2009. The revenue in 2010 was MEUR 864.4 versus MEUR 622.8 in 2009 with an operating profit of MEUR 10.2 compared to a net loss of MEUR 46.3 in the previous year.
Kongsberg Automotive will create wealth to all stakeholders by being our customers’ num-ber one choice.
The international automotive industry is our market. We shall maintain a leading position in our major product categories and focus on product segments with considerable growth and margin potential.
Our customers demand high-quality products and services, on-time deliveries, a global pre-sence, innovation and continuous improve-ments, in addition to competitive prices and terms.
We will meet these requirements by develo-ping advanced product technology that offers users more functionality at a lower cost. We achieve this by automating the production process and locating manufacturing opera-tions as well as purchasing where we find the best combination of competence and cost. Kongsberg Automotive will design and standardize working methods that ensure a high level of customer satisfaction and quality combined with high internal resource utilization.
New organization and new CEOFollowing the retirement of Olav Volldal, effective of April 1 2010, Hans Peter Havdal was appointed as Chief Executive Officer for Kongsberg Automotive Holding ASA.
Mr. Volldal served as CEO of Kongsberg Automotive since its foundation in 1987. He has done a remarkable job as an industry leader, developing the company from a small Scandinavian player with 2 plants in Norway to a leading automotive supplier with 35 plants around the globe. The Board of Directors wants to express its sincere gratitude for his contribution to the company.
Mr. Havdal has been with Kongsberg Automotive since 1990, the last 15 years as a member of the executive management team. He held the position as President Automotive Systems until April 1. Havdal has a deep under standing of the automotive business and is well connected and respected within all parts of the Kongsberg Automotive business.
As the new CEO took over, a new organi-zational structure was introduced. The new structure consists of 5 business areas: Driveline, Interior, Actuation & Chassis, Fluid Transfer and Power Products. The managers heading the 5 business areas are members of the new executive management team. Each business area includes sales & marketing, R&D and operations, and this structure is tailored to increase the focus on the global
customers and products. Each business area manager has a full profit and loss responsi-bility.
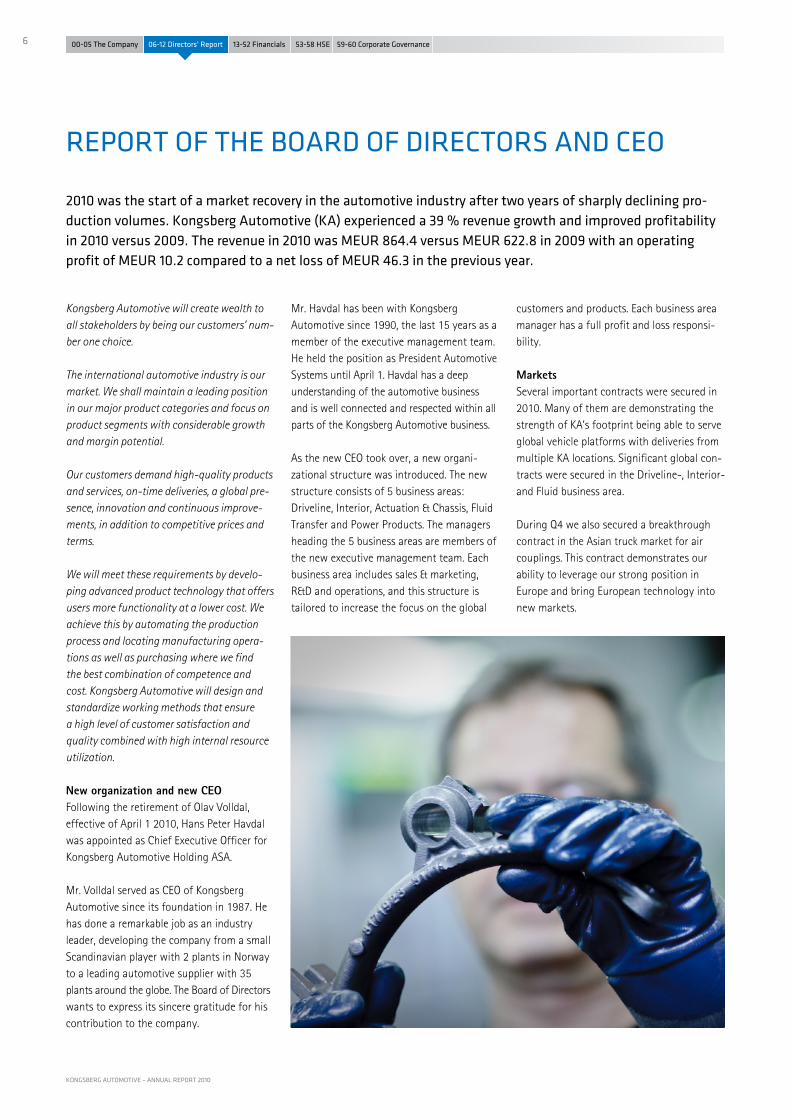
Markets Several important contracts were secured in 2010. Many of them are demonstrating the strength of KA’s footprint being able to serve global vehicle platforms with deliveries from multiple KA locations. Significant global con-tracts were secured in the Driveline-, Interior- and Fluid business area.
During Q4 we also secured a breakthrough contract in the Asian truck market for air couplings. This contract demonstrates our ability to leverage our strong position in Europe and bring European technology into new markets.

7
00-05 The Company 06-12 Directors' Report 13-52 Financials 53-58 HSE 59-60 Corporate Governance
00-05 The Company 06-12 Directors' Report 13-52 Financials 53-58 HSE 59-60 Corporate Governance
00-05 The Company 06-12 Directors' Report 13-52 Financials 53-58 HSE 59-60 Corporate Governance
00-05 The Company 06-12 Directors' Report 13-52 Financials 53-58 HSE 59-60 Corporate Governance
00-05 The Company 06-12 Directors' Report 13-52 Financials 53-58 HSE 59-60 Corporate Governance
KONGSBERG AUTOMOTIVE – ANNUAL REPORT 2010
During 2010 we were able to outgrow the general market growth. The KA YoY revenue growth was 39 % versus 23.6 % volume growth in the light vehicle market and 43.8 % growth in the commercial vehicle market. This was driven by increased market share and our strong position with the winning OEMs in the market.
The heavy duty truck sales in Europe experi-enced a very strong recovery in 2010, 2.7 M units were sold, versus the dramatically low volume of 1.9 M units in 2009. Our strong position with Volvo and Scania contributed to KA’s growth within the commercial vehicle segment.
Within the light vehicle segment, North America experienced a good recovery in 2010 going from total vehicle sales of 8.5 M units in 2009 to 11.8 M units in 2010. We also saw a strong continued momentum in China with 16.6 M units sold in 2010 versus 12.8 M units in 2009.
In Europe the recovery was more modest with sales volumes increasing from 16.7 M units to 18.9 M units in 2010.
Emerging marketsOur organization in the Asian region was further strengthened in 2010 increasing our ability to win business in this important growth market. KA had 1.106 employees in China at the end of 2010. Further expansion is planned for 2011.
We also strengthened our position in India by acquiring 100 % of the shares in our former JV, Technico Kongsberg Automotive India Ltd. Today KA has two facilities in India that will serve both the light vehicle and commercial vehicle market.
R&DOur R&D efforts are kept at 5 % of sales and the company has 450 employees within R&D.
KA is consolidating its R&D resources into fewer, but stronger units. Kongsberg in Norway, Mullsjö in Sweden and Hallbergmoos in Germany are the main hubs for Europe. In 2010 a new sales and R&D office was opened in Novi, outside Detroit Michigan. This office already has more than 100 employees ser-
ving the North American OEMs. This enables the Group to have resources near the main customers which drives technology shifts in the industry.
New products were launched in several product areas. During 2010 our focus on the trend towards electric- and hybrid vehicles has increased, and we see this continuing forward.
A dedicated engineering team is established, concentrating solely on product development within this area. We have developed product prototypes for specific customer applications. The effort in this area is a key to our strategy forward to be part of this growing vehicle segment.
OperationsOur focus on lean operations and expansion in low cost areas continued in 2010.
Also in low cost countries, it is important to have a lean overhead structure. To gain bene-fits of scale we have introduced a “Campus concept” where multiple business areas share production facilities with a common plant management team. The management team is responsible for functions like quality, IT, HR and logistics. The profit and loss for each business area is still monitored within dedi-cated value streams/production teams.
The effort to further streamline our global operations will continue in 2011.
Going concernAccording to section 3-3 of the Norwegian Accounting Act, we confirm that the consoli-dated financial statements and the financial statements of the parent company have been prepared based on the going concern assumption and that it is appropriate to use this assumption. After making enquiries, and in light of the group’s liquidity situation, the group forecast for 2011 and the medium-term plans, the directors have an expectation that the group has adequate resources to continue operations for the foreseeable future. The going concern basis for the acco-unts has therefore continued to be adopted. The board of directors wishes to emphasize that all assessments involving future condi-tions are uncertain.
Operational risk Kongsberg Automotive supplies many pro-ducts that are safety critical. Suppliers in the automotive industry face the possibility of substantial financial responsibility for war-ranty cases related to potential product or delivery failures, and Kongsberg Automotive is no exception. This responsibility represents a potential risk. Work methods and qualifying procedures implemented by the company are designed to minimize this risk.
Financial riskThe Group’s activities are exposed to diffe-rent types of financial risk. Some of the most important factors are foreign exchange rates, interest rates, raw material prices and credit risks, as well as liquidity risk. In today’s auto-motive market, the credit risk is higher than normal. Kongsberg Automotive is exposed to all major OEMs. The company keeps high focus on outstanding amounts due from these, as well as other customers, and rapidly implements actions if receivables become overdue. Sound routines have been establis-hed for following up receivables where the company has concentrated on debt collection, as well as follow up of customer creditworthiness. Losses in this area have been minimal in the past.

8
KONGSBERG AUTOMOTIVE – ANNUAL REPORT 2010
00-05 The Company 06-12 Directors' Report 13-52 Financials 53-58 HSE 59-60 Corporate Governance
00-05 The Company 06-12 Directors' Report 13-52 Financials 53-58 HSE 59-60 Corporate Governance
00-05 The Company 06-12 Directors' Report 13-52 Financials 53-58 HSE 59-60 Corporate Governance
00-05 The Company 06-12 Directors' Report 13-52 Financials 53-58 HSE 59-60 Corporate Governance
00-05 The Company 06-12 Directors' Report 13-52 Financials 53-58 HSE 59-60 Corporate Governance
Interest risk is linked to long term debt and the interest development in EUR and USD rates. For details about interest swap, see note 10 to the accounts.
As the consolidation currency for the Group is EUR, there will always be ongoing exposure associated with the reporting of consolidated profit and loss statements and balance sheets.
The responsibility for the Group’s financial risk management is centralized and risk ex-posure is constantly monitored. The Group constantly evaluates and potentially uses de-rivatives in order to minimize risks relating to currency, interests and raw-material prices. As the Company operates in many countries, it is vulnerable to currency risk. The greatest currency exposure is associated with EUR, USD and GBP, while raw material exposure is greatest in copper, zinc, aluminum and steel.
For further risk analysis, see note 17 to the accounts.
Review of accounts (All figures in parenthesis refer to 2009)GroupOperating revenues for the Group in 2010 amounted to MEUR 864.4 (622.8) an increase of close to 40 %.
For the Group in total the operating result was MEUR 10.2 (-46.3). This gave an opera-ting margin of 1.1 % (-7.4 %). The increase in
revenues from 2009 to 2010 reflects the im-proved market conditions in the automotive industry in general, and KA’s strong footprint with the OEMs that are doing well in the market. All major markets have experienced positive development across all business areas during 2010. The higher sales combi-ned with managing the fixed cost has been the main contributor behind the improved profita bility for the Group.
SegmentsThe Interior revenues were up MEUR 67.2 (43.8 %) in 2010 compared to 2009. The higher sales gave an EBITDA improvement from MEUR 12.6 in 2009 to MEUR 23.0 in 2010.
The Driveline revenues were up by MEUR 54.8 (23.3 %). The increased sales combined with improvement projects brought the business area from an EBITDA of MEUR -14.0 in 2009 close to break even in 2010, including approximately 6.0 MEUR of restructuring cost in 2010. These are cost taken in 2010 that will give improvements in 2011 and onward.
The Fluid Transfer revenues were up MEUR 45.0 (51.4 %). EBITDA for Fluid Transfer was MEUR 15.7, which is MEUR 16.1 above comparable period last year reflecting the higher sales.
The Actuation & Chassis revenues were up MEUR 46.4 (68.3 %), reflecting a strong reco-very in the commercial vehicle segments. The increased revenues give an EBITDA improve-ment of MEUR 15.7 to MEUR 18.6 in 2010.
The Power Products revenues were up MEUR 31.5 (30.5 %). EBITDA improved by MEUR 5.0 compared to 2009.
Net financial items amounted to MEUR -12.1 in 2010 (18.1). Interest expenses were reduced from MEUR 41.6 in 2009 to MEUR 22.2 in 2010 reflecting lower debt level and better terms. 2009 was highly influenced by positive currency conversion effects of MEUR 61.4.
Net result for the year is MEUR -9.2 compared with MEUR -27.5 in 2009.
CapitalThe Group’s long term interest-bearing bank debt amounted to MEUR 370.5 (381.8) as of 31st December 2010. Short term interest bearing loans were at 31.12 MEUR 30.8. The change in long term debt is mainly driven by currency conversion effects. In December 2010, the Group repaid 1.9 MEUR (14.5 MNOK) of the loan from Innovasjon Norge. No other repayments were made in 2010.
For more information, see note 16 and 17 to the accounts.
As of 31st December 2010, the Group’s book equity amounted to MEUR 174.6 (178.9). The equity ratio was 21.7 % (23.4 %).
LiquidityIn total, Kongsberg Automotive had liquidity reserves in cash and overdraft facilities of approximately 160 MEUR at the year end.
Cash flowThe Group had a positive cash flow from operations in 2010 of MEUR 43.9 compared to MEUR 22.6 in 2009. The Group invested MEUR 23.7 in tangible and intangible assets, which was an increase of MEUR 9.5 from 2009. The net change in cash and bank over-draft during 2010 was MEUR -2.5.
ImpairmentAt the year end close, the company performed impairment tests in accordance with the requirement in IAS 36. Based on the result, no need for write-downs was considered neces-sary. See note 5.2 for further details.

9
00-05 The Company 06-12 Directors' Report 13-52 Financials 53-58 HSE 59-60 Corporate Governance
00-05 The Company 06-12 Directors' Report 13-52 Financials 53-58 HSE 59-60 Corporate Governance
00-05 The Company 06-12 Directors' Report 13-52 Financials 53-58 HSE 59-60 Corporate Governance
00-05 The Company 06-12 Directors' Report 13-52 Financials 53-58 HSE 59-60 Corporate Governance
00-05 The Company 06-12 Directors' Report 13-52 Financials 53-58 HSE 59-60 Corporate Governance
KONGSBERG AUTOMOTIVE – ANNUAL REPORT 2010
Kongsberg Automotive Holding ASA – The parent companyIn 2010, the parent company earned total operating revenue of MEUR 33.2 (12.1) with a corresponding operating result of MEUR 15.6 (-3.3). The parent company had net financial items of MEUR 25.1 in 2010 (-7.6). The net result after tax for the year amounted to MEUR 31.2 (-8.0). As of 31 December 2010, the parent company’s book equity was MEUR 286.3 (242.4) of which MEUR 39 was free equity. The company’s free equity could not be distributed as dividend due to restrictions in the loan agreements.
AppropriationsThe board of directors will propose to the Annual General Assembly that no dividend be paid for 2010. The board of directors pro-poses that Kongsberg Automotive Holding ASA’s net result of MEUR 31.2 is allocated as follows:
Transferred to other equity: MEUR 31.2
Employees At the end of 2010, KA had 10 535 employ-ees, an increase of 1675 people compared to the same period in 2009. The increase reflects the recovery of the global automotive market and the revenue growth for the company.
The company has been able to reduce the number of white collar employees by 79 during 2010. The employment growth has come within the direct work force.
Overall, the main growth in employees within the company has been in Mexico (638) and USA (307). In Europe the main growth has been in Poland (273) and Sweden (150).
Kongsberg Automotive is committed to en-suring and benefiting from diversity in the group with focus on gender, ethnic minori-ties, senior employees and those with disa-bilities.
Kongsberg Automotive sets requirements for diversity in recruitment and management development programs. The company recog-nizes that a good balance between work and private life is becoming increasingly important for today’s employees, regardless of gender.
Of the total workforce 49 % is comprised of women. The Company actively works to increase the number of females at Corporate and Divisional Management positions. By po-licy, the company invites women and minori-ties to interview for all new positions.
Females and minority candidates are invited into the internal training programs at all levels within the organization. In order to se-cure a better gender balance, our succession planning will specifically focus on internal female and minority candidates for executive positions.
The Board of Kongsberg Automotive Holding ASA consists of three (43 %) women and four (57 %) men, among the shareholder elected members it is a 50 % share of each.
Kongsberg Automotive recognizes the impor-tance of attracting and retaining skilled and motivated employees, including managers, with a strong commitment to the business in line with KA’s ethical guidelines and values.
In 2010 the company resumed the leadership training for all leaders within the executive committee and the Business Areas manage-ment teams.
Kongsberg Automotive also began the fifth Interdal class in the company’s history. “Interdal” is Kongsberg’s pre-executive training program; this Interdal group has 23 promising participants from across the world, brought together for various training sessions.
10
KONGSBERG AUTOMOTIVE – ANNUAL REPORT 2010
00-05 The Company 06-12 Directors' Report 13-52 Financials 53-58 HSE 59-60 Corporate Governance
00-05 The Company 06-12 Directors' Report 13-52 Financials 53-58 HSE 59-60 Corporate Governance
00-05 The Company 06-12 Directors' Report 13-52 Financials 53-58 HSE 59-60 Corporate Governance
00-05 The Company 06-12 Directors' Report 13-52 Financials 53-58 HSE 59-60 Corporate Governance
00-05 The Company 06-12 Directors' Report 13-52 Financials 53-58 HSE 59-60 Corporate Governance
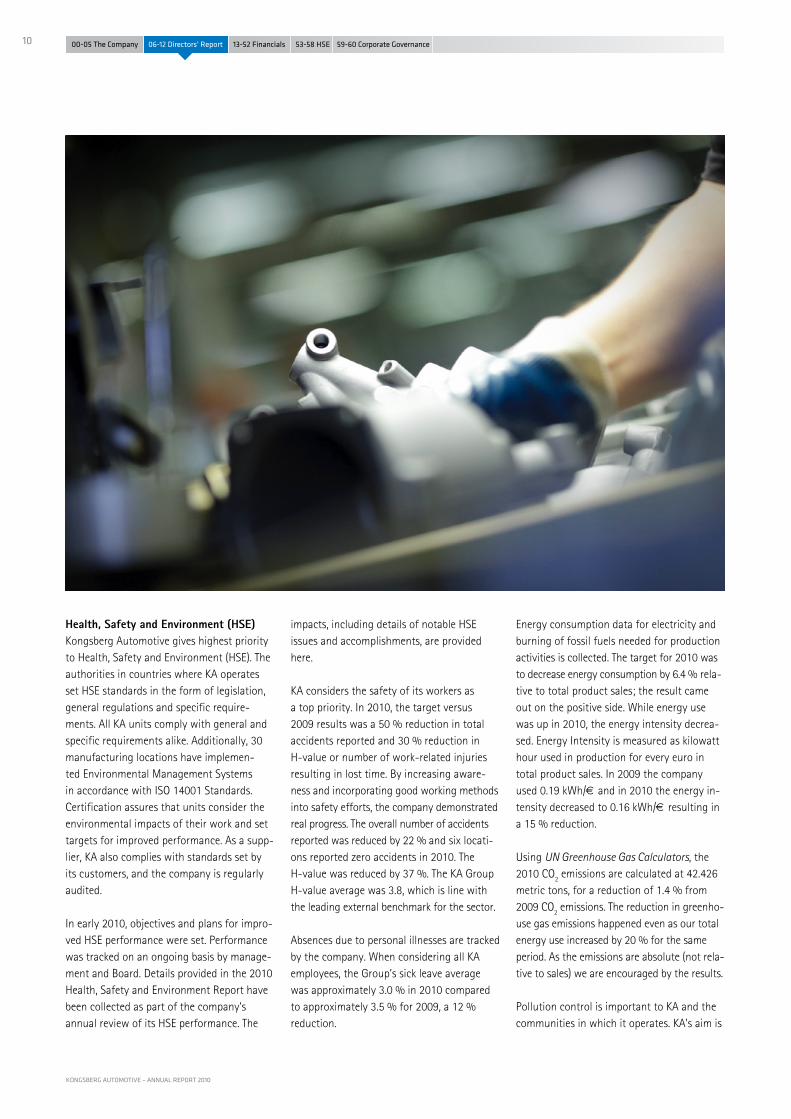
Health, Safety and Environment (HSE)Kongsberg Automotive gives highest priority to Health, Safety and Environment (HSE). The authorities in countries where KA operates set HSE standards in the form of legislation, general regulations and specific require-ments. All KA units comply with general and specific requirements alike. Additionally, 30 manufacturing locations have implemen-ted Environmental Management Systems in accordance with ISO 14001 Standards. Certification assures that units consider the environmental impacts of their work and set targets for improved performance. As a supp-lier, KA also complies with standards set by its customers, and the company is regularly audited.
In early 2010, objectives and plans for impro-ved HSE performance were set. Performance was tracked on an ongoing basis by manage-ment and Board. Details provided in the 2010 Health, Safety and Environment Report have been collected as part of the company’s annual review of its HSE performance. The
impacts, including details of notable HSE issues and accomplishments, are provided here.
KA considers the safety of its workers as a top priority. In 2010, the target versus 2009 results was a 50 % reduction in total accidents reported and 30 % reduction in H-value or number of work-related injuries resulting in lost time. By increasing aware-ness and incorporating good working methods into safety efforts, the company demonstrated real progress. The overall number of accidents reported was reduced by 22 % and six locati-ons reported zero accidents in 2010. The H-value was reduced by 37 %. The KA Group H-value average was 3.8, which is line with the leading external benchmark for the sector.
Absences due to personal illnesses are tracked by the company. When considering all KA employees, the Group’s sick leave average was approximately 3.0 % in 2010 compared to approximately 3.5 % for 2009, a 12 % reduction.
Energy consumption data for electricity and burning of fossil fuels needed for production activities is collected. The target for 2010 was to decrease energy consumption by 6.4 % rela-tive to total product sales; the result came out on the positive side. While energy use was up in 2010, the energy intensity decrea-sed. Energy Intensity is measured as kilowatt hour used in production for every euro in total product sales. In 2009 the company used 0.19 kWh/€ and in 2010 the energy in-tensity decreased to 0.16 kWh/€ resulting in a 15 % reduction.
Using UN Greenhouse Gas Calculators, the 2010 CO2 emissions are calculated at 42.426 metric tons, for a reduction of 1.4 % from 2009 CO2 emissions. The reduction in greenho-use gas emissions happened even as our total energy use increased by 20 % for the same period. As the emissions are absolute (not rela-tive to sales) we are encouraged by the results.
Pollution control is important to KA and the communities in which it operates. KA’s aim is

11
00-05 The Company 06-12 Directors' Report 13-52 Financials 53-58 HSE 59-60 Corporate Governance
00-05 The Company 06-12 Directors' Report 13-52 Financials 53-58 HSE 59-60 Corporate Governance
00-05 The Company 06-12 Directors' Report 13-52 Financials 53-58 HSE 59-60 Corporate Governance
00-05 The Company 06-12 Directors' Report 13-52 Financials 53-58 HSE 59-60 Corporate Governance
00-05 The Company 06-12 Directors' Report 13-52 Financials 53-58 HSE 59-60 Corporate Governance
KONGSBERG AUTOMOTIVE – ANNUAL REPORT 2010
to minimize the amount sent to landfills and the toxicity of waste requiring special treat-ment and disposal. All units sought oppor-tunities to reuse and recycle. Details of these efforts are provided in the full Health, Safety and Environmental Report.
KA had two small fires in 2010 with little or no damage to property. No employees were injured. All locations continue to look at potential fire risks and enact plans to control and mitigate such risks.
No spills or unauthorized releases to the environment were reported in 2010 nor were there any external complaints related to HSE reported during the year.
Corporate governanceThe corporate culture and governance policy in Kongsberg Automotive is based on trans-parency, openness, accountability and equal treatment of all stakeholders. The company homepage features an overview of Kongsberg Automotive’s governing structures, control mechanisms and information about how we comply with legal and regulatory require-ments in order to satisfy shareholders and the communities we operate in.
The board has ensured that Kongsberg Automotive’s guidelines for corporate govern-ance have been followed carefully. Three committees have been in existence: Auditing Committee, Compensation Committee and
Nomination Committee. The company’s inter-nal rules of governance accord with guide-lines in the Norwegian Code of Practice for Corporate Governance of 21 October 2010 (“The code of Practice”). In addition to the company’s General Guidelines for Corporate Governance, specific instructions have been prepared with regard to: procedures for the board of directors and CEO; remuneration for senior management, Compensation Committee, Audit Committee, the Auditor and any close associate’s non-auditing work; ethics and Kongsberg Automotive’s fundamen-tal values; and the Nomination Committee.
The board conducts a continuous assessment of the most significant risks the company faces. A self assessment of the board’s perfor mance of its work is conducted annu-ally. Kongsberg Automotive’s compliance with the requirements of each of the 15 main principles of the Code of Practice is further detailed in the section “Corporate Governance in Kongsberg Automotive” in the annual report, and this information is also available on the company’s web pages.
Composition and work of the BoardThe Board of Directors has a broad and diver-sified background. Apart from the employees’ representatives, no other Board members are employees of KA or have carried out any work for KA. The Board has carried out a self-assessment. The Board of Directors held 9 board meetings in 2010.
Future outlookThe board of directors wishes to emphasize that all assessments involving future con-ditions are uncertain. They are subject to developments which to a large degree are beyond the company’s control.
The company has given an EBITDA margin target of above 13 %, based on the revenues getting back to a 1 billion euro level. The company has throughout 2010 shown a strong top line growth and the EBITDA margin has improved from 2009 to 2010 from respectively 0.1 % to 6.6 %.
The commercial vehicle segments have so far had a quicker recovery trend than the passenger car segments. The company has initi ated more actions to speed up the improve ments in its automotive segments.
Based on the latest market assumptions the company estimates revenues in 2011 of approx. 950 MEUR. This represents a growth of approx 10 %. Based on this revenue level the group expects to deliver an EBITDA of approx MEUR 105 (11 %). There are several effects behind this improvement.
The outlook is based and dependent on the current market assumptions.
Ulla-Britt Fräjdin-Hellqvist Kjell Kristiansen Tone Bjørnov Dr. Jürgen Harnisch Tonje Sivesindtajet Thomas Falck Eivind Holvik
12
KONGSBERG AUTOMOTIVE – ANNUAL REPORT 2010
00-05 The Company 06-12 Directors' Report 13-52 Financials 53-58 HSE 59-60 Corporate Governance
00-05 The Company 06-12 Directors' Report 13-52 Financials 53-58 HSE 59-60 Corporate Governance
00-05 The Company 06-12 Directors' Report 13-52 Financials 53-58 HSE 59-60 Corporate Governance
00-05 The Company 06-12 Directors' Report 13-52 Financials 53-58 HSE 59-60 Corporate Governance
00-05 The Company 06-12 Directors' Report 13-52 Financials 53-58 HSE 59-60 Corporate Governance
Board members of Kongsberg Automotive Holding ASAKongsberg, 23. March 2011
Thomas Falck(Sign.)
Dr. Jürgen Harnisch(Sign.)
Eivind Holvik(Sign.)
Ulla-Britt Fräjdin-HellqvistChairman
(Sign.)
Tone Bjørnov(Sign.)
Kjell Kristiansen(Sign.)
Tonje Sivesindtajet(Sign.)
Hans Petter HavdalPresident and CEO
(Sign.)
13
00-05 The Company 06-12 Directors' Report 13-52 Financials 53-58 HSE 59-60 Corporate Governance
00-05 The Company 06-12 Directors' Report 13-52 Financials 53-58 HSE 59-60 Corporate Governance
00-05 The Company 06-12 Directors' Report 13-52 Financials 53-58 HSE 59-60 Corporate Governance
00-05 The Company 06-12 Directors' Report 13-52 Financials 53-58 HSE 59-60 Corporate Governance
00-05 The Company 06-12 Directors' Report 13-52 Financials 53-58 HSE 59-60 Corporate Governance
KONGSBERG AUTOMOTIVE – ANNUAL REPORT 2010
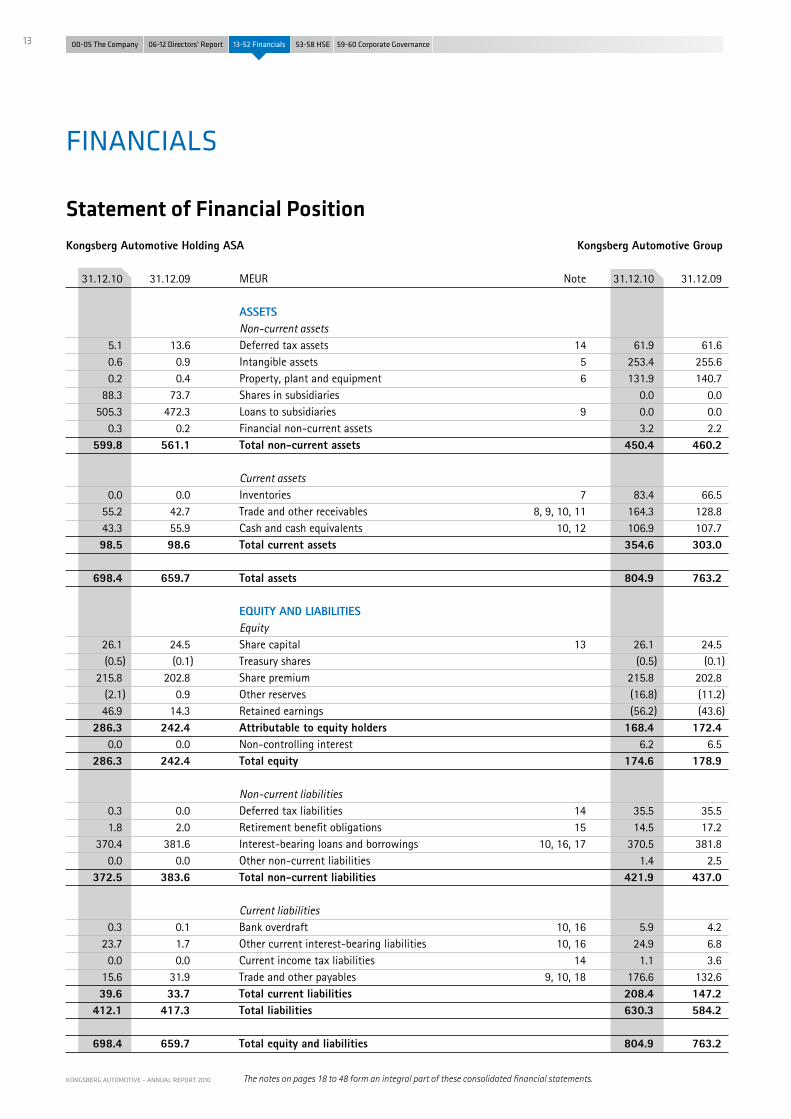
fINANCIALS
Statement of Financial Position
Kongsberg Automotive Holding ASA Kongsberg Automotive Group
31.12.10 31.12.09 MEUR Note 31.12.10 31.12.09 ASSETS Non-current assets 5.1 13.6 Deferred tax assets 14 61.9 61.6 0.6 0.9 Intangible assets 5 253.4 255.6 0.2 0.4 Property, plant and equipment 6 131.9 140.7 88.3 73.7 Shares in subsidiaries 0.0 0.0 505.3 472.3 Loans to subsidiaries 9 0.0 0.0 0.3 0.2 Financial non-current assets 3.2 2.2 599.8 561.1 Total non-current assets 450.4 460.2 Current assets 0.0 0.0 Inventories 7 83.4 66.5 55.2 42.7 Trade and other receivables 8, 9, 10, 11 164.3 128.8 43.3 55.9 Cash and cash equivalents 10, 12 106.9 107.7 98.5 98.6 Total current assets 354.6 303.0 698.4 659.7 Total assets 804.9 763.2 EQUITY AND LIABILITIES Equity 26.1 24.5 Share capital 13 26.1 24.5 (0.5) (0.1) Treasury shares (0.5) (0.1) 215.8 202.8 Share premium 215.8 202.8 (2.1) 0.9 Other reserves (16.8) (11.2) 46.9 14.3 Retained earnings (56.2) (43.6) 286.3 242.4 Attributable to equity holders 168.4 172.4 0.0 0.0 Non-controlling interest 6.2 6.5 286.3 242.4 Total equity 174.6 178.9 Non-current liabilities 0.3 0.0 Deferred tax liabilities 14 35.5 35.5 1.8 2.0 Retirement benefit obligations 15 14.5 17.2 370.4 381.6 Interest-bearing loans and borrowings 10, 16, 17 370.5 381.8 0.0 0.0 Other non-current liabilities 1.4 2.5 372.5 383.6 Total non-current liabilities 421.9 437.0 Current liabilities 0.3 0.1 Bank overdraft 10, 16 5.9 4.2 23.7 1.7 Other current interest-bearing liabilities 10, 16 24.9 6.8 0.0 0.0 Current income tax liabilities 14 1.1 3.6 15.6 31.9 Trade and other payables 9, 10, 18 176.6 132.6 39.6 33.7 Total current liabilities 208.4 147.2 412.1 417.3 Total liabilities 630.3 584.2 698.4 659.7 Total equity and liabilities 804.9 763.2
The notes on pages 18 to 48 form an integral part of these consolidated financial statements.

14
KONGSBERG AUTOMOTIVE – ANNUAL REPORT 2010
00-05 The Company 06-12 Directors' Report 13-52 Financials 53-58 HSE 59-60 Corporate Governance
00-05 The Company 06-12 Directors' Report 13-52 Financials 53-58 HSE 59-60 Corporate Governance
00-05 The Company 06-12 Directors' Report 13-52 Financials 53-58 HSE 59-60 Corporate Governance
00-05 The Company 06-12 Directors' Report 13-52 Financials 53-58 HSE 59-60 Corporate Governance
00-05 The Company 06-12 Directors' Report 13-52 Financials 53-58 HSE 59-60 Corporate Governance
Statement of Comprehensive Income Kongsberg Automotive Holding ASA Kongsberg Automotive Group
31.12.10 31.12.09 MEUR Note 31.12.10 31.12.09 33.2 12.1 Operating revenues 4 864.4 622.8 Operating expenses 0.0 0.0 Raw materials consumed (557.1) (395.1) 0.0 0.0 Change in inventories 7 16.9 18.3 (5.0) (3.3) Salaries and social expenses 21 (209.2) (168.9) (12.0) (11.5) Other operating expenses (57.9) (76.6) (0.2) (0.2) Depreciation 6 (30.1) (30.0) (0.4) (0.4) Amortization 5 (16.8) (16.8) (17.6) (15.4) Total operating expenses (854.2) (669.0) 15.6 (3.3) Operating (loss) / profit 10.2 (46.3) Financial items 50.9 46.7 Financial income 22 8.9 62.8 (25.8) (54.3) Financial expenses 22 (21.0) (44.7) 25.1 (7.6) Net financial items (12.1) 18.1
40.7 (10.9) (Loss) / profit before income tax (1.9) (28.2) (9.5) 2.8 Income tax 14 (7.3) 0.7 31.2 (8.0) (Loss) / profit for the year (9.2) (27.5) Other comprehensive income 0.0 0.0 Translation differences 11.2 (53.3) 0.0 0.0 Tax on translation differences (0.1) 13.7 0.0 0.0 Other comprehensive income 11.1 (39.6) 31.2 (8.0) Total comprehensive income for the year 1.9 (67.1) Profit attributable to 31.2 (8.0) Equity holders (parent company) (9.8) (27.1) 0.0 0.0 Non-controlling interests 0.6 (0.4) 31.2 (8.0) Total (9.2) (27.5) Total comprehensive income attributable to 31.2 (8.0) Equity holders (parent company) 1.1 (67.1) 0.0 0.0 Non-controlling interests 0.8 0.0 31.2 (8.0) Total 1.9 (67.1) Earnings per share Basic earnings per share, Euros 23 (0.02) (0.18) Diluted earnings per share, Euros 23 (0.02) (0.18)
The Board of Directors of Kongsberg Automotive Holding ASAKongsberg, 23 March 2011
Thomas Falck(Sign.)
Dr. Jürgen Harnisch(Sign.)
Eivind A. Holvik(Sign.)
Hans Petter HavdalPresident and CEO
(Sign.)
Ulla-Britt Fräjdin-HellqvistChairman
(Sign.)
Tone Bjørnov(Sign.)
Kjell A. Kristiansen(Sign.)
Tonje Sivesindtajet(Sign.)

15
00-05 The Company 06-12 Directors' Report 13-52 Financials 53-58 HSE 59-60 Corporate Governance
00-05 The Company 06-12 Directors' Report 13-52 Financials 53-58 HSE 59-60 Corporate Governance
00-05 The Company 06-12 Directors' Report 13-52 Financials 53-58 HSE 59-60 Corporate Governance
00-05 The Company 06-12 Directors' Report 13-52 Financials 53-58 HSE 59-60 Corporate Governance
00-05 The Company 06-12 Directors' Report 13-52 Financials 53-58 HSE 59-60 Corporate Governance
KONGSBERG AUTOMOTIVE – ANNUAL REPORT 2010
Statement of Changes in Equity
Kongsberg Automotive Group Non- Share Treasury Share Other Retained controlling Total MEUR capital shares premium reserves earnings Sub-total interest equity Equity 01.01.09 3.4 (0.1) 55.5 21.8 2.7 83.3 7.4 90.7Issue of new shares 19.7 131.3 151.0 151.0Value of share options charged to income statement 0.2 0.2 0.2Value of warrants issued 5.0 5.0 5.0Changes in non-controlling interests (0.9) (0.9) Total comprehensive income for the year (Loss) for the year (27.1) (27.1) (0.4) (27.5)Other comprehensive income: Translation differences 1.4 16.0 (51.9) (19.2) (53.7) 0.4 (53.3)Tax on translation differences 13.7 13.7 13.7Equity 31.12.09 / 01.01.10 24.5 (0.1) 202.8 (11.2) (43.6) 172.4 6.5 178.9Acquisition of treasury shares (0.4) (3.9) (4.3) (4.3)Value of share options charged to income statement 0.8 0.8 0.8 Changes in non-controlling interests 0.3 0.3 (1.7) (1.4)Other changes in equity (1.4) (1.4) (1.4) Total comprehensive income for the year (Loss) for the year (9.8) (9.8) 0.6 (9.2)Other comprehensive income: Translation differences 1.6 13.0 (1.4) (2.8) 10.4 0.8 11.2 Tax on translation differences (0.1) (0.1) (0.1) Equity 31.12.10 26.1 (0.5) 215.8 (16.8) (56.2) 168.4 6.2 174.6
Dividend 2010 2009Dividend per share in Euros - paid 0.0 0.0 Dividend per share in Euros - proposed 0.0 0.0 Kongsberg Automotive Holding ASA (parent company) Share Treasury Share Other Retained Total MEUR capital shares premium reserves earnings equity Equity 01.01.09 3.4 (0.1) 55.5 (3.4) 18.0 73.4 Foreign currency translation 1.4 16.0 (0.9) 4.3 20.8 Issue of new shares 19.7 131.3 151.0 Value of share options charged to income statement 0.2 0.2 Value of warrants issued 5.0 5.0 (Loss) for the year (8.0) (8.0) Equity 31.12.09 / 01.01.10 24.5 (0.1) 202.8 0.9 14.3 242.4 Foreign currency translation 1.6 13.0 0.1 1.5 16.2 Acquisition of treasury shares (0.4) (3.9) (4.3) Value of share options charged to income statement 0.8 0.8 Profit for the year 31.2 31.2 Equity 31.12.10 26.1 (0.5) 215.8 (2.1) 46.9 286.3
16
KONGSBERG AUTOMOTIVE – ANNUAL REPORT 2010
00-05 The Company 06-12 Directors' Report 13-52 Financials 53-58 HSE 59-60 Corporate Governance
00-05 The Company 06-12 Directors' Report 13-52 Financials 53-58 HSE 59-60 Corporate Governance
00-05 The Company 06-12 Directors' Report 13-52 Financials 53-58 HSE 59-60 Corporate Governance
00-05 The Company 06-12 Directors' Report 13-52 Financials 53-58 HSE 59-60 Corporate Governance
00-05 The Company 06-12 Directors' Report 13-52 Financials 53-58 HSE 59-60 Corporate Governance
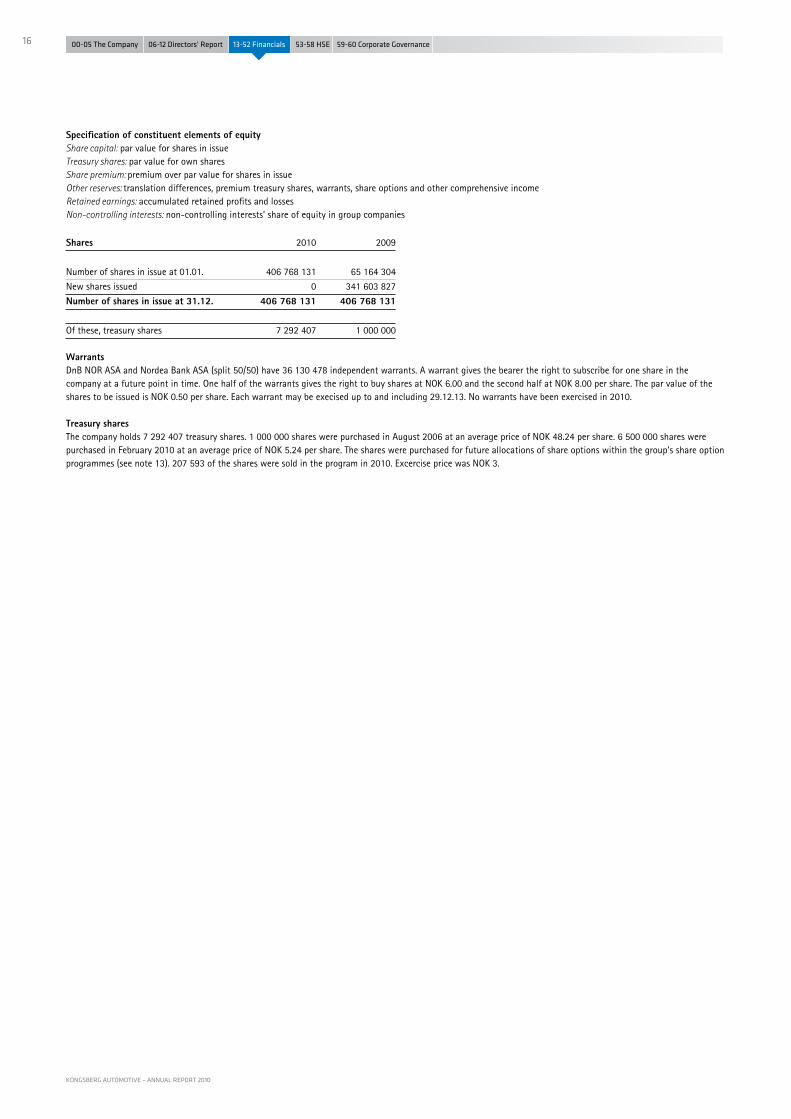
Specification of constituent elements of equityShare capital: par value for shares in issueTreasury shares: par value for own sharesShare premium: premium over par value for shares in issueOther reserves: translation differences, premium treasury shares, warrants, share options and other comprehensive income Retained earnings: accumulated retained profits and lossesNon-controlling interests: non-controlling interests’ share of equity in group companies
Shares 2010 2009
Number of shares in issue at 01.01. 406 768 131 65 164 304
New shares issued 0 341 603 827
Number of shares in issue at 31.12. 406 768 131 406 768 131
Of these, treasury shares 7 292 407 1 000 000 WarrantsDnB NOR ASA and Nordea Bank ASA (split 50/50) have 36 130 478 independent warrants. A warrant gives the bearer the right to subscribe for one share in the company at a future point in time. One half of the warrants gives the right to buy shares at NOK 6.00 and the second half at NOK 8.00 per share. The par value of the shares to be issued is NOK 0.50 per share. Each warrant may be execised up to and including 29.12.13. No warrants have been exercised in 2010.
Treasury shares The company holds 7 292 407 treasury shares. 1 000 000 shares were purchased in August 2006 at an average price of NOK 48.24 per share. 6 500 000 shares were purchased in February 2010 at an average price of NOK 5.24 per share. The shares were purchased for future allocations of share options within the group’s share option programmes (see note 13). 207 593 of the shares were sold in the program in 2010. Excercise price was NOK 3.

17
00-05 The Company 06-12 Directors' Report 13-52 Financials 53-58 HSE 59-60 Corporate Governance
00-05 The Company 06-12 Directors' Report 13-52 Financials 53-58 HSE 59-60 Corporate Governance
00-05 The Company 06-12 Directors' Report 13-52 Financials 53-58 HSE 59-60 Corporate Governance
00-05 The Company 06-12 Directors' Report 13-52 Financials 53-58 HSE 59-60 Corporate Governance
00-05 The Company 06-12 Directors' Report 13-52 Financials 53-58 HSE 59-60 Corporate Governance
KONGSBERG AUTOMOTIVE – ANNUAL REPORT 2010
Statement of Cash Flows
Kongsberg Automotive Holding ASA Kongsberg Automotive Group 31.12.10 31.12.09 MEUR 31.12.10 31.12.09 Operating activities 40.7 (10.9) (Loss) / profit before taxes (1.9) (28.2) 0.2 0.2 Depreciation 30.1 30.0 0.4 0.4 Amortization 16.8 16.8 (25.6) (28.9) Interest income (0.8) (1.4) 21.9 40.9 Interest expenses 22.2 41.6 0.0 0.0 Taxes paid (6.6) (2.2) 0.0 0.0 (Gain) / loss on sale of non-current assets 3.7 (2.0) (13.0) 1.4 Changes in working capital (9.0) 36.7 (7.7) (13.8) Currency differences over P/L (7.7) (61.4) (4.2) 0.0 Changes in value of financial derivatives (5.9) (11.0) (7.9) 7.9 Changes in other items 3.0 3.7 4.8 (2.8) Cash flow from operating activities 43.9 22.6 Investing activities (0.1) 0.0 Capital expenditures, including intangible assets (23.7) (14.2) 0.0 0.0 Proceeds from sale of fixed assets 1) 3.7 0.0 0.0 0.0 Proceeds from sale and liquidation of subsidiaries 2) 1.5 23.5 (10.1) (1.2) Investment in subsidiaries 3) (1.0) 0.0 0.7 3.0 Interest received 0.8 1.4 9.9 4.0 Dividends received 0.0 0.0 0.4 5.9 Cash flow from investing activities (18.8) 10.7
Financing activities 0.0 151.0 Proceeds from issuance of ordinary shares 0.0 151.0 (4.3) 0.0 Purchase of treasury shares 4) (4.3) 0.0 0.1 0.0 Proceeds from sale of treasury shares 0.1 0.0 0.0 16.0 Proceeds from new external loans 0.0 16.0 (1.9) (91.4) Repayment of external loans 5) (1.9) (92.2) 19.8 27.5 Proceeds from group loans 0.0 0.0 (10.6) 0.0 Issue of new group loans 0.0 0.0 (2.5) 0.0 Repayment of group loans 0.0 0.0 (21.9) (35.4) Interest paid (21.9) (36.8) 0.0 0.0 Dividends paid 0.0 0.0 (0.4) 0.0 Other financial charges (0.4) 0.0 (21.7) 67.7 Cash flow from financing activities (28.4) 38.0 3.7 4.8 Currency effects on cash 0.9 9.0 (12.8) 75.6 Net change in cash (2.5) 80.3 55.8 (19.9) Net cash at 01.01 (including bank overdraft) 103.5 23.2 43.0 55.8 Net cash at 31.12 (including bank overdraft) 101.0 103.5 0.2 0.1 Of this, restricted cash 1.5 1.0
1) Comprises the sale of buildings in Grand Mere (Canada) and Hagerstown (US)
2) Comprises the sale of KAs investment in Chongqing (China) and liquidation settlements (see note 3 and 25)
3) Comprises the acquisiton of shares in Binola (India) (see note 25)
4) Comprises the acquisition of 6.5 million treasury shares (see ”Statement of Changes in Equity”)
5) Comprises a repayment of loan to Innovasjon Norge (see note 16)

18
KONGSBERG AUTOMOTIVE – ANNUAL REPORT 2010
00-05 The Company 06-12 Directors' Report 13-52 Financials 53-58 HSE 59-60 Corporate Governance
00-05 The Company 06-12 Directors' Report 13-52 Financials 53-58 HSE 59-60 Corporate Governance
00-05 The Company 06-12 Directors' Report 13-52 Financials 53-58 HSE 59-60 Corporate Governance
00-05 The Company 06-12 Directors' Report 13-52 Financials 53-58 HSE 59-60 Corporate Governance
00-05 The Company 06-12 Directors' Report 13-52 Financials 53-58 HSE 59-60 Corporate Governance
Kongsberg Automotive Holding ASA (’the company’) and its subsidiaries (together ’the group’) develop, manufacture and sell products to the automotive industry worldwide.
The company is a limited liability company incorporated and domiciled in Norway. The address of its registered office is Dyrmyrgata 48, NO-3601 Kongsberg, Norway.
The company is listed on the Oslo Stock Exchange. The group consolidated financial statements were authorised for issue by the Board of Directors on 23 March 2011.
Note 1 – General information
2.1) Statement of complianceThe group’s consolidated financial statements have
been prepared in accordance with International
Financial Reporting Standards (IFRS) and IFRIC inter-
pretations as endorsed by EU. The parent company’s
financial statements are perpared in accordance
with simplified IFRS according to the Norwegian
accounting act § 3-9. The parent is following the
same accounting policies as of the group.
The consolidated financial statements have been
prepared on the historical cost basis except for
certain financial instruments that are measured at
revalued amounts or fair values, as explained in the
accounting policies below. Historical cost is
generally based on the fair value of the consider-
ation given in exchange for assets.
The preparation of financial statements in con-
formity with IFRS requires the use of certain critical
accounting estimates. It also requires management
to exercise its judgement in the process of apply-
ing the group’s accounting policies. Group financial
state ments are prepared on a going concern basis.
2.1.1) Changes in accounting policy and disclosures in 2010
(a) New and amended standards adoptedby the group
IAS 36 (amendment), ‘Impairment of assets’, effec-
tive 1 January 2010. The amendment clarifies that
the largest cash-generating unit (or group of units)
to which goodwill should be allocated for the pur-
poses of impairment testing is an operating segment,
as defined by paragraph 5 of IFRS 8, ‘ Operating seg-
ments’ (that is, before the aggregation of segments
with similar economic characteristics). The amend-
ment causes limited effects in the 2010 Financial
statements.
IAS 27 (revised), ’Consolidated and separate financial
statements’, The revised standard requires the effects
of all transactions with non-controlling interests
to be recorded in equity if there is no change in
control and these transactions will no longer result
in goodwill or gains and losses. The standard also
specifies the accounting treatment to be adopted
when control is lost. Any remaining interest in the
equity is remeasured to fair value and a gain or loss
is recognized in profit or loss. The revised standard
has limited effect on the 2010 Financial statements.
IFRS 3 (revised), ‘Business combinations’, and conse-
quential amendments to IAS 27, ‘Consolidated and
separate financial statements’, IAS 28, ‘Investments
in associates’, and IAS 31, ‘Interests in joint ventures’,
are effective prospectively to business combinations
for which the acquisition date is on or after the
beginning of the first annual reporting period begin-
ning on or after 1 July 2009.
The revised standard continues to apply the acquisi-
tion method to business combinations but with some
significant changes compared with IFRS 3. For example,
all payments to purchase a business are recorded at
fair value at the acquisition date, with contingent
payments classified as debt subsequently remeasured
through the statement of comprehensive income.
There is a choice on an acquisition-by-acquisition
basis to measure the non-controlling interest in the
acquiree either at fair value or at the non-controlling
interest’s proportionate share of the acquiree’s net
assets. All acquisition-related costs are expensed.
The revised standard has been used in 2010 for the
acquisition of 30 % (from 70 % to 100 % ownership)
of Technico Kongsberg Automotive India Ltd (Binola).
The impact of the revised standard, on the financial
statements of KA group, is considered insignificant. The
acquisition reflects fair value and is booked accordingly.
Acquisition related cost is charged to P&L.
(b) New and amended standards, and interpreta-tions mandatory for the first time for the financial year beginning 1 January 2010 but not currently relevant to the group (although they may affect the accounting for future transactions and events)
IFRIC 17, ‘Distribution of non-cash assets to owners’
(effective on or after 1 July 2009). The interpretation
was published in November 2008. This interpretation
provides guidance on accounting for arrangements
whereby an entity distributes non-cash assets to
shareholders either as a distribution of reserves
or as dividends. IFRS 5 has also been amended to
require that assets are classified as held for distribu-
tion only when they are available for distribution in
their present condition and the distribution is highly
probable.The interpretation is not relevant for KA
in 2010.
IFRIC 18, ‘Transfers of assets from customers’, effec-
tive for transfer of assets received on or after 1 July
2009. This interpretation clarifies the requirements
of IFRSs for agreements in which an entity receives
from a customer an item of property, plant and
equipment that the entity must then use either to
connect the customer to a network or to provide the
customer with ongoing access to a supply of goods
or services (such as a supply of electricity, gas or
water). In some cases, the entity receives cash from
a customer that must be used only to acquire or
construct the item of property, plant, and equipment
in order to connect the customer to a network or
provide the customer with ongoing access to a supply
of goods or services (or to do both). The interpreta-
tion is not relevant for KA in 2010.
IFRIC 9, ‘Reassessment of embedded derivatives
and IAS 39, Financial instruments: Recognition and
measure ment’, effective 1 July 2009. This amend-
ment to IFRIC 9 requires an entity to assess whether
an embedded derivative should be separated from a
host contract when the entity reclassifies a hybrid
financial asset out of the ‘fair value through profit or
loss’ category. This assessment is to be made based
on circumstances that existed on the later of the
date the entity first became a party to the contract
and the date of any contract amendments that
significantly change the cash flows of the contract.
If the entity is unable to make this assessment,
the hybrid instrument must remain classified as at
fair value through profit or loss in its entirety. This
amendment is not relevant for KA in 2010.
IFRIC 16, ‘Hedges of a net investment in a foreign
operation’ effective 1 July 2009. This amendment
states that, in a hedge of a net investment in a foreign
Note 2 – Summary of significant accounting policies
Notes

19
00-05 The Company 06-12 Directors' Report 13-52 Financials 53-58 HSE 59-60 Corporate Governance
00-05 The Company 06-12 Directors' Report 13-52 Financials 53-58 HSE 59-60 Corporate Governance
00-05 The Company 06-12 Directors' Report 13-52 Financials 53-58 HSE 59-60 Corporate Governance
00-05 The Company 06-12 Directors' Report 13-52 Financials 53-58 HSE 59-60 Corporate Governance
00-05 The Company 06-12 Directors' Report 13-52 Financials 53-58 HSE 59-60 Corporate Governance
KONGSBERG AUTOMOTIVE – ANNUAL REPORT 2010
operation, qualifying hedging instruments may be
held by any entity or entities within the group, in-
cluding the foreign operation itself, as long as the
designation, documentation and effectiveness re-
quirements of IAS 39 that relate to a net investment
hedge are satisfied. In particular, the group should
clearly document its hedging strategy because of
the possibility of different designations at different
levels of the group. IAS 38 (amendment), ‘Intangible
assets’, effective 1 January 2010. The amendment
clarifies guidance in measuring the fair value of an
intangible asset acquired in a business combination
and permits the grouping of intangible assets as a
single asset if each asset has similar useful economic
lives. This amendment is not relevant for KA in 2010.
IAS 1 (amendment), ‘Presentation of financial state-
ments’. The amendment clarifies that the potential
settlement of a liability by the issue of equity is not
relevant to its classification as current or non current.
By amending the definition of current liability, the
amendment permits a liability to be classified as non-
current (provided that the entity has an unconditional
right to defer settlement by transfer of cash or other
assets for at least 12 months after the accounting
period) notwithstanding the fact that the entity could
be required by the counterparty to settle in shares at
any time. This amendment is not relevant for KA in
2010.
IFRS 2 (amendments), ‘Group cash-settled share-
based payment transactions’, effective form 1 January
2010. In addition to incorporating IFRIC 8, ‘Scope of
IFRS 2’, and IFRIC 11, ‘IFRS 2 – Group and treasury
share transactions’, the amendments expand on the
guidance in IFRIC 11 to address the classification of
group arrangements that were not covered by that
interpretation. The new amendment has no effect on
the 2010 Financial statements.
IFRS 5 (amendment), ‘Non-current assets held for
sale and discontinued operations’. The amendment
clarifies that IFRS 5 specifies the disclosures required
in respect of non-current assets (or disposal groups)
classified as held for sale or discontinued operations.
It also clarifies that the general requirement of IAS
1 still apply, in particular paragraph 15 (to achieve a
fair presentation) and paragraph 125 (sources of
estimation uncertainty) of IAS 1. The amendment
has no effect on the 2010 Financial statements.
(C) New standards, amendments and interpretati-ons issued but not effective for the financial year beginning 1 January 2010 and not early adopted by the group
IFRS 9, ‘Financial instruments’, issued in November
2009. This standard is the first step in the process to
replace IAS 39, ‘Financial instruments: recognition and
measurement’. IFRS 9 introduces new requirements
for classifying and measuring financial assets and is
likely to affect the group’s accounting for its financial
assets. The standard is not applicable until 1 January
2013 but is available for early adoption. However,
the standard has not yet been endorsed by the EU. KA
consider it too early to conclude on future effects.
IAS 24 (revised), ‘Related party disclosures’, issued in
November 2009. It supersedes IAS 24, ‘Related party
disclosures’, issued in 2003. IAS 24 (revised) is manda-
tory for periods beginning on or after 1 January 2011.
Earlier application, in whole or in part, is permitted.
However, the standard has not yet been endorsed by
the EU. The effect is assumed to be limited for KA.
IFRIC 14 (amendment) ‘Prepayments of a minimum
funding requirement’. The amendments correct an
unintended consequence of IFRIC 14, ‘IAS 19 – The
limit on a defined benefit asset, minimum funding
requirements and their interaction’. Without the
amendments, entities are not permitted to recognize
as an asset some voluntary prepayments for mini-
mum funding contributions. This was not intended
when IFRIC 14 was issued, and the amendments
correct this. The amendments are effective for
annual periods beginning 1 January 2011. Earlier
application is permitted. The amendments should be
applied retro spectively to the earliest comparative
period pre sented. The group will apply these amend-
ments for the financial reporting period commencing
on 1 January 2011. The effect is assumed to be
limited for KA.
IAS 32 (amendment) ‘Classification of rights issues’,
issued in October 2009. The amendment applies
to annual periods beginning on or after 1 February
2010. Earlier application is permitted. The amend-
ment addresses the accounting for rights issues
that are denominated in a currency other than the
functional currency of the issuer. Provided certain
conditions are met, such rights issues are now
classi fied as equity regardless of the currency in
which the exercise price is denominated. Previously,
these issues had to be accounted for as derivative
liabilities. The amendment applies retrospectively in
accordance with IAS 8 ‘Accounting policies, changes
in accounting estimates and errors’. The effect is
assumed to be limited for KA.
2.2) Basis of consolidationThe consolidated financial statements comprise the
financial statements of Kongsberg Automotive
Holding ASA and its subsidiaries as of 31 December
each year. The financial statements of subsidiaries are
prepared for the same reporting periods as the parent
company, using consistent accounting principles.
Subsidiary companies are consolidated from the date
of acquisition, being the date on which the group
obtained control, and continue to be consolidated
until the date on which such control ceases. Acquisi-
tions are accounted for using the purchase method
of accounting, involving the allocation of the cost of
business combinations to the fair value of the
acquired assets and liabilities and contingent liabili-
ties assumed at the date of acquisition.
All intra-group balances, transactions, income,
expenses and profits and losses resulting from intra-
group transactions that are recognized in assets are
eliminated.
Investments in subsidiaries are recorded at cost in
the parent company’s financial statements.
2.3) Critical judgments and key sources of estimation uncertaintyThe preparation of financial statements in accor-
dance with generally accepted accounting principles
requires, in some cases, the use of estimates and
assumptions by management. The estimates are
based on past experiences and assumptions that the
management believes are fair and reasonable. The
estimates and the judgment behind them affect the
reported amounts of assets and liabilities, as well
as income and expenses in the financial statements
presented. Actual outcome can later, to some extent,
differ from the estimates and the assumptions made.
Certain accounting policies are considered to be
particularly important to the financial position of
KA, since they require management to make complex
or subjective judgments and estimates, the majority
of which relate to matters that are inherently un-
certain. These critical judgments and estimates are
in particular associated with: the impairment testing of Goodwill and other
relevant assets
the deferred tax assets (and losses carried
forward)
the actuarial calculations of pension liabilities
Impairment testingGoodwill (and other relevant assets) is tested for
impairment annually, or more frequently if events
or changes in circumstances indicate that it might
be impaired. This consists of an analysis to assess
whether the carrying amount of goodwill is fully re-
coverable. The determination of recoverable amount
involves establishing the Value in use (VIU), measu-
red as the present value of the cash flows expected
from the cash-generating unit, to which the goodwill
has been allocated. The cash-generating units in KA
are the five business areas (Driveline, Interior, Actua-
tion & Chassis, Fluid Transfer and Power Products).
The forecasts of future cash flows are based on the
group’s best estimates of future revenues and ex-
penses for the cash-generating units to which good-
will has been allocated. A number of assumptions
and estimates can have significant effects on these
calculations and include parameters such as macro-
economic assumptions, market growth, business
20
KONGSBERG AUTOMOTIVE – ANNUAL REPORT 2010
00-05 The Company 06-12 Directors' Report 13-52 Financials 53-58 HSE 59-60 Corporate Governance
00-05 The Company 06-12 Directors' Report 13-52 Financials 53-58 HSE 59-60 Corporate Governance
00-05 The Company 06-12 Directors' Report 13-52 Financials 53-58 HSE 59-60 Corporate Governance
00-05 The Company 06-12 Directors' Report 13-52 Financials 53-58 HSE 59-60 Corporate Governance
00-05 The Company 06-12 Directors' Report 13-52 Financials 53-58 HSE 59-60 Corporate Governance
volumes, margins and cost effectiveness. Changes to
any of these parameters, following changes in the
market conditions, competition, strategy or other
factors, affect the forecasted cash flows and may
result in impairment of goodwill. See Note 5 - Intan-
gible assets, under the heading ”Impairment testing”.
Deferred tax assetsDeferred income tax assets are recognized for tax
losses carried forward only to the extent that realisa-
tion of the related benefit is probable. Several subsi-
diaries have losses carried forward on which they have
recognized deferred tax assets. The probability of their
realisation is determined by applying a professional
judgment to forecast cash flows. These cash flows are
based on assumptions and estimates and, accordingly,
changes to the forecasts may result in changes to de-
ferred tax assets and tax positions. See Note 14 - Taxes.
Actuarial calculations of pension liabilities related to employeesThe Projected Benefit Pension Obligation (PBO) for
major pension plans is calculated by external actua-
ries using demographic assumptions based on the
current population. A number of actuarial and finan-
cial parameters are used as bases for these calcula-
tions. The most important financial parameter is the
discount rate. Other parameters such as assumptions
as to salary increases and inflation are determined
based on the expected long-term development. The
fixing of these parameters at the year end is dis-
closed in Note 15 - Retirement benefit obligations.
2.4) Functional currency and presentation currencyThe group presents its consolidated financial state–
ments in Euros. The group has subsidiaries with
functional currencies other than Euros. For consoli-
dation the balance sheet amounts for subsidiaries
with different functional currencies are translated
at the rates applicable at the balance sheet date and
the income statements are translated at the average
rates for each month of the period. Exchange diffe-
rences on translation are recognized in equity.
The presentation currency of the parent company is Euro,
whilst its functional currency is Norwegian Kroner. The
reason for the use of Euros is to enable all amounts in
the published financial statements of both the group and
the company to be presented in the same currency.
Transactions in foreign currencies are translated at
the exchange rate applicable on the transaction date.
Exchange gains and losses that arise as a result of
changes in the exchange rate between the transaction
date and the settlement date are recognized in the
income statement as financial income or expenses.
Main exchange rates per 31.12.2010: 1 EUR: NOK 7.81 (end of period)
1 USD: NOK 5.86 (end of period)
2.5) Segment informationOperating segments are reported in a manner con-
sistent with the internal reporting provided to the
chief operating decision-maker. The chief operating
decision-maker, who is responsible for allocating
resources and assessing performance of the opera-
ting segments, has been identified as the group’s
Executive Committee (led by CEO).
2.6) Revenue recognitionRevenue is recognized at the point at which it is
probable that future economic benefits will accrue
to the group and then only when the amount can be
reliably estimated. Sales revenues are presented net
of value added tax and discounts.
Revenues from the sale of goods are recognized at
the point at which the risks and rewards of owner-
ship are transferred. Revenue from other income
streams, such as tooling, prototype parts and engi-
neering services is recognized upon notification of
formal customer acceptance.
The parent company has only group internal reve-
nues. Most of the revenues are Management fees to
cover the groups common expenses.
2.7) Intangible assetsGoodwillGoodwill represents the excess of cost of an acqui-
sition over the fair value of the group’s share of the
net identifiable assets of the acquired subsidiary at
the date of acquisition. Goodwill on the acquisition
of subsidiaries is included within intangible assets.
Goodwill arising from the acquisition of a foreign
entity is treated as an asset in the foreign entity and
is translated at the exchange rate applicable at the
balance sheet date.
For the purpose of impairment testing, goodwill is
allocated to the relevant cash-generating unit (CGU).
The allocation is made to those units that are
expect ed to benefit from the acquisition. The group
allocates goodwill to each operating segment.
Goodwill is stated net of any impairment losses.
Impairment is tested annually (or changes in
circumstances indicate that it might be impaired);
impairment losses are regarded as permanent in
nature and are not reversed.
Other intangible assetsIntangible assets are recognized in the balance sheet
if it can be proven that there are probable future eco-
nomic benefits that can be attributed to the assets and
if the assets cost price can be reliably estimated.
Intangible assets with a finite useful life are amortized
and due consideration is given to any need for recog-
nition of impairment losses. Amortization is charged
using the straight-line method over the estimated use-
ful life of the asset. The amortization estimate and the
method are subject to annual assessment based on the
pattern of consumption of future economic benefits.
Customer relationshipsCustomer relationships acquired are amortized over
10 years. Assessments are performed when acquiring
new businesses.
PatentsPatents are amortized over their lifetimes, which
generally are between three and 21 years. 75 % of
the net book value relates to patents with a lifetime
of 11 years or more.
Research and development costsResearch costs are expensed as incurred. Intangible
assets arising from development costs on specific
projects are recognized only when the group can
demonstrate: the technical feasibility of completing the in-
tangible asset so that it will be available for use
or for sale
its intention to exercise the right to use or to
sell the asset
how the asset will generate future economic
benefits
the ability of resources to complete the project
the ability to reliably measure the expenditure
incurred
Development costs are amortized over the period of
expected future sales of the developed product from
the time that deliveries commence. When the sales
period is uncertain or is longer than five years, the
amortization period limited to five years.
SoftwareCosts associated with maintaining com puter soft-
ware are expensed as incurred. Development costs
that are directly attributable to the design and tes-
ting of identifiable and unique software products
controlled by the group are recognized as intangible
assets when the following criteria are met:
it is technically feasible to complete the soft-
ware product so that it will be available for use
management intends to complete the software
product and use or sell it
it can be demonstrated how the software
product will generate probable future economic
benefits
adequate technical, financial and other
resources to complete the development and to
use or sell the software product are available
the expenditure attributable to the software
product during its development can be reliably
measured
Directly attributable costs that are capitalized as
part of the software product include employee costs
and an appropriate proportion of relevant overheads.

21
00-05 The Company 06-12 Directors' Report 13-52 Financials 53-58 HSE 59-60 Corporate Governance
00-05 The Company 06-12 Directors' Report 13-52 Financials 53-58 HSE 59-60 Corporate Governance
00-05 The Company 06-12 Directors' Report 13-52 Financials 53-58 HSE 59-60 Corporate Governance
00-05 The Company 06-12 Directors' Report 13-52 Financials 53-58 HSE 59-60 Corporate Governance
00-05 The Company 06-12 Directors' Report 13-52 Financials 53-58 HSE 59-60 Corporate Governance
KONGSBERG AUTOMOTIVE – ANNUAL REPORT 2010
Development expenses that do not meet these crite-
ria are expensed as incurred and are not recognized
as an asset in a subsequent accounting period.
Software costs are amortized over their estimated
useful lives, which do not exceed three years.
2.8) Tangible non-current assetsTangible non-current assets are carried at cost less
accumulated depreciation and impairment losses.
The assets are depreciated over their useful
economic lives using the straight-line method.
Cost includes duties and taxes and installation and
commissioning costs relating to making the non-
current asset available for use. Subsequent costs,
such as repair and maintenance costs, are normally
expensed when incurred. Whenever increased future
economic benefits arising as a result of repair and
maintenance work can be proven, such costs are
recognized in the balance sheet as additions to
non-current assets. Each part of an item of tangible
non-current assets is depreciated separately.
Straight-line depreciation is calculated at the
follow ing rates:
Land Not depreciated
Buildings 3–4 %
Production machinery and tooling 10–25 %
Computer equipment 33 %
Whenever non-current assets are sold or scrapped,
the gross carrying amount and the accumulated
depreciation are reversed. The gain or loss on
disposal or scrapping is recognized in the income
statement.
Tangible non-current assets are tested annually for
impairment. Assets are grouped at cash generating
unit levels and are written down to their recoverable
amounts if their carrying values are greater than
their estimated recoverable amounts.
2.9) InventoriesInventories are measured using the FIFO (First In -
First Out) principle and are valued at the lower of
cost and net realisable value. Raw materials are
valued at purchase price, including freight, forward-
ing charges and import duties. Work in progress and
finished goods include variable production costs and
fixed costs allocated on normal capacity. Interest
costs are not included. Provision for slow moving
and obsolete inventory is deducted.
2.10) Trade receivablesTrade receivables are carried at original invoice amounts,
less an allowance for any uncollectable amounts.
2.11) Cash and cash equivalentsCash and cash equivalents comprise cash at banks
and in hand, together with short-term deposits having
a maturity of three months or less. Bank overdraft
appear in the balance sheet within current liabilities.
2.12) Taxes payable and deferred taxesThe tax expense for the period comprises current and
deferred tax. Tax is recognized in the income statement,
except to the extent that it relates to items recognized
in other comprehensive income or directly in equity. In
this case the tax is also recognis ed in other compre-
hensive income or directly in equity, respectively.
The current income tax charge is calculated on the
basis of the tax laws enacted or substantively
enacted at the balance sheet date in the countries in
which the company’s subsidiaries operate. Manage-
ment periodically evaluates positions taken in tax
returns and establishes provisions where appropriate
on the basis of amounts expected to be paid to the
tax authorities.
Deferred income tax is recognized, using the liability
method, on temporary differences arising between the
tax bases of assets and liabilities and their carrying
amounts in the consolidated financial statements,
using tax rates that have been enacted or substan-
tively enacted by the balance sheet date and are ex-
pected to apply when the deferred income tax asset is
realized or the deferred income tax liability settled.
Deferred income tax assets are recognized only to
the extent that it is probable that future taxable
profit will be available against which the temporary
differences can be utilized.
2.13) Retirement benefit obligationsThe parent company Kongsberg Automotive Holding
ASA and its Norwegian subsidiary Kongsberg
Automotive AS have defined benefit and defined
contribution pension plans. The plans were changed
from defined benefit to defined contribution in 2004.
The defined benefit plan was continued for em-
ployees who had already retired. The other defined
benefit plans still in operation are early retirement
agreements through the AFP scheme and an early
retirement plan for the CEO.
Defined benefit pension plans also exist in two
subsidiaries in Germany and in subsidiaries in Italy,
Netherlands and France.
The subsidiaries in Sweden, the UK and the USA have
defined contribution pension plans for employees.
Defined benefit plans: The pension assets and lia-
bilities are valued by actuaries each year using a
linear accrual formula, which regards the employees’
accrued pension rights during the period as the
pension cost for the year. Gains or losses linked to
reductions in or terminations of pension plans are
recognized in the income statement when they arise.
Actuarial gains / losses are recognized as income
or expense when the net cumulative unrecognized
actuarial gains and losses for each individual plan at
the end of the previous reporting year exceeded 10 %
of the higher of the defined benefit obligation and
the fair value of the plan assets at that date. These
gains and losses are recognized over the expected
average remaining working lives of the employees
participating in the plans. The pension commitments
are calculated on the basis of the net present value
of future cash flows.
Defined contribution plans: The companies’ contri-
butions to the plans are recognized in the income
statement for the year for which the contributions
apply.
2.14) Interest-bearing loans and borrowingsAll loans and borrowings are initially recognized
at the fair value of the consideration received, less
directly attributable transaction costs. After initial
recognition, interest-bearing loans and borrowings
are subsequently measured at amortized cost using
the effective interest method. Repayments of long-
term debt due within twelve months of the balance
sheet date are shown as current liabilities.
2.15) Financial derivative instrumentsThe group uses financial derivative instruments
such as forward currency and metal contracts to
reduce risks associated with foreign currency and
metal price fluctuations. These derivatives are not
desig nat ed hedging instruments. The derivatives are
measured at fair value. Changes in fair value are
recognized in the income statement as financial
income or expenses, depending upon whether they
represent gains or losses. They are disclosed on the
line “Changes in value of financial derivatives”
within Note 22 - Financial Items.
2.16) LeasesOperational leaseLeases in which a significant portion of the risks and
rewards of ownership are retained by the lessor are
classified as operating leases. Payments made under
operating leases (net of any incentives received from
the lessor) are charged to the income statement on
a straight-line basis over the period of the lease.
Financial leaseThe group leases certain property, plant and equip-
ment. Leases of property, plant and equipment
where the group has substantially all the risks
and rewards of ownership are classified as finance
leases. Finance leases are capitalized at the lease’s
commence ment at the lower of the fair value of the
leased property and the present value of the mini-
mum lease payments.
Each lease payment is allocated between the liability
and finance charges so as to achieve a constant rate

22
KONGSBERG AUTOMOTIVE – ANNUAL REPORT 2010
00-05 The Company 06-12 Directors' Report 13-52 Financials 53-58 HSE 59-60 Corporate Governance
00-05 The Company 06-12 Directors' Report 13-52 Financials 53-58 HSE 59-60 Corporate Governance
00-05 The Company 06-12 Directors' Report 13-52 Financials 53-58 HSE 59-60 Corporate Governance
00-05 The Company 06-12 Directors' Report 13-52 Financials 53-58 HSE 59-60 Corporate Governance
00-05 The Company 06-12 Directors' Report 13-52 Financials 53-58 HSE 59-60 Corporate Governance
on the finance balance outstanding. The correspond-
ing rental obligations, net of finance charges, are
included in other long-term payables. The interest
element of the finance cost is charged to the income
statement over the lease period so as to produce a
constant periodic rate of interest on the remaining
balance of the liability for each period. The property,
plant and equipment acquired under finance leases
is depreciated over the shorter of the useful life of
the asset and the lease term.
2.17) Share optionsThe group operates a number of equity-settled,
share-based compensation plans under which the
group receives services from employees as conside-
ration for equity instruments (options) of the group.
The fair value of the services the group has received
from employees as a return service for granted
options is recognised as an expense. The total
amount to be expensed over the contribution time is
calculated based on the fair value of the granted
options. The group carries out a re-evaluation of its
estimates of the number of options likely to be exer-
cised at each balance sheet date.
The proceeds received net of any directly attribut-
able transaction costs are credited to share capital
(nominal value) and share premium when the opti-
ons are exercised.
2.18) Treasury sharesWhenever any group company purchases the
company’s equity share capital as treasury shares
the consideration paid, including any directly attri-
butable incremental costs and net of income taxes is
deducted from equity attributable to the company’s
equity shareholders until the shares are cancelled
or re-issued. Where such shares are subsequently
reissued any consideration received, net of any
direct ly attributable transaction costs and the rela-
ted income tax effects, is included in equity attribu-
table to the company’s equity shareholders.
2.19) Dividend distributionDividend distribution to the company’s shareholders
is recognised as a liability in the group’s financial
statements in the period between dividends are
approved by the company’s shareholders and paid.
Note 3 – Subsidiaries
Country/State Companies owned
Company name of incorporation Ownership % by parent Holding companies
Kongsberg Interior Systems Pty Ltd Australia 100 %
Kongsberg Automotive Ltda Brazil 100 % x
Kongsberg Inc Canada 100 %
Kongsberg Automotive (Shanghai) Co Ltd China 100 %
Kongsberg Automotive (Wuxi) Ltd China 100 % x
Shanghai Kongsberg Automotive Dong Feng Morse Co Ltd China 51 %
Shanghai Lone Star Cable Co Ltd China 100 %
Kongsberg Automotive SARL France 100 % x
Kongsberg Driveline Systems SAS France 100 %
Kongsberg SAS France 100 % x
Raufoss Couplings France SAS France 100 %
SCI Immobilière La Clusienne France 100 %
Kongsberg 1 GmbH Germany 100 % x
Kongsberg Actuation Systems GmbH Germany 100 %
Kongsberg Automotive GmbH Germany 100 % x
Kongsberg Driveline Systems GmbH Germany 100 %
Kongsberg Actuation Systems Ltd Great Britain 100 %
Kongsberg Automotive Ltd Great Britain 100 % x
Kongsberg Holding Ltd Great Britain 100 % x
Kongsberg Interior Systems Ltd Great Britain 100 %
Kongsberg Power Products Systems Ltd Great Britain 100 %
Kongsberg Automotive Hong Kong Ltd Hong Kong 100 % x
Kongsberg Automotive Holding Kft Hungary 100 % x
Kongsberg Interior Systems Kft Hungary 100 %
Kongsberg Automotive (India) Private Ltd India 100 % x
Technico Kongsberg Automotive India Ltd India 100 % x
Kongsberg Power Products Systems Srl Italy 100 %
Kongsberg Automotive Ltd Korea 100 % x
Kongsberg Automotive S. de RL de CV Mexico 100 %
Kongsberg Driveline Systems S. de RL de CV Mexico 100 %
Kongsberg Interior Systems S. de RL de CV Mexico 100 %
Kongsberg Actuation Systems BV Netherlands 100 %
Kongsberg Automotive AS Norway 100 % x
Kongsberg Automotive Holding 2 AS Norway 100 % x x
Kongsberg Automotive Sp. z.o.o. Poland 100 % x
Kongsberg Automotive s.r.o Slovakia 100 %
Kongsberg Actuation Systems SL Spain 100 %

23
00-05 The Company 06-12 Directors' Report 13-52 Financials 53-58 HSE 59-60 Corporate Governance
00-05 The Company 06-12 Directors' Report 13-52 Financials 53-58 HSE 59-60 Corporate Governance
00-05 The Company 06-12 Directors' Report 13-52 Financials 53-58 HSE 59-60 Corporate Governance
00-05 The Company 06-12 Directors' Report 13-52 Financials 53-58 HSE 59-60 Corporate Governance
00-05 The Company 06-12 Directors' Report 13-52 Financials 53-58 HSE 59-60 Corporate Governance
KONGSBERG AUTOMOTIVE – ANNUAL REPORT 2010
The most significant changes of the groups legal structure in 2010India: Acquisition of 30 % of Technico Kongsberg Automotive India Ltd (see note 25) China: Kongsberg Auto Parts (Chongqing) Co. Ltd was sold (see note 25) Great Britain: Ctex Seat Comfort (Holding) Ltd was liquidated France: Kongsberg Power Products Systems SARL was liquidated Italy: Kongsberg Automotive Holding Srl was liquidated Spain: Kongsberg Power Products Systems SL and Kongsberg Automotive SL was liquidated
Country/State Companies owned
Company name of incorporation Ownership % by parent Holding companies
Kongsberg Automotive AB Sweden 100 % x
Kongsberg Power Products Systems AB Sweden 100 %
Capro GP, LLC USA 100 % x
Capro LP, LLC USA 100 % x
Kongsberg Driveline Systems III, Partnership USA 100 %
Kongsberg Driveline Systems I, Inc USA 100 %
Kongsberg Driveline Systems II, Corp USA 100 %
Kongsberg Actuation Systems I, Inc USA 100 %
Kongsberg Actuation Systems II, Inc USA 100 %
Kongsberg Actuation Systems III, Inc USA 100 %
Kongsberg Holding II, LLC USA 100 % x
Kongsberg Holding III, Inc USA 100 % x
Kongsberg Interior Systems I, Inc USA 100 %
Kongsberg Interior Systems II, Inc USA 100 %
Kongsberg Automotive Inc USA 100 % x
Kongsberg Power Products Systems I, Inc USA 100 %
Kongsberg Power Products Systems V, Ltd USA 100 %
Operating segmentsThe group has 5 reportable segments, which are the strategic business units: Driveline Systems, Interior Systems, Power Products Systems, Actuation & Chassis and Fluid
Transfer Systems. The Business Areas were derived out of the 3 previous divisions: Automotive Systems was split into Driveline and Interior, Commercial Vehicle Systems
was split into Actuation & Chassis and Fluid Systems, and Power Products Systems as before. The significant change from 2009 is therefore the split and presentation of
operating segments. The 2009 segment data has been reworked in the tables below to adapt the new segment structure.
The strategic business areas (segments) offer different products and services, and are managed separately because they require different technology and marketing stra-
tegies. The Group’s risks and rates of return are affected predominantly by differences in the products manufactured. The 5 segments have different risk profiles in the
short-term perspective, but over a long-term perspective the profiles are considered to be the same. The group’s Executive Committee (led by CEO) reviews the internal
management reports from all strategic business areas on a monthly basis. The following summary describes the operations of each of the group’s reportable segments:
Driveline Systems: is a global supplier of gear shift systems in the light vehicle market. The BA is a Tier 1 supplier of custom engineered cable controls and
complete gear shift systems, comprising shifter modules, knobs, boots, shift cables, and shift towers. KA is a strong leader in both control cables and manual and
automatic shifter systems worldwide.
Interior Systems: is a global leader in the design, development and manufacture seat comfort systems and mechanical-/electro-mechanical light duty motion
control systems to automotive Tier 1 and OEM customers. The BA’s product range includes seat adjusters, seat cables, side bolsters and lumbar support, seat
heating, ventilation and massage systems, arm rests and head restraints. KA is the only global supplier in the world currently offering a complete range of seat com-
fort products.
Actuation & Chassis: is a developer and manufacturer of operator control systems for heavy vehicles, offering a robust product portfolio of clutch actuation
systems, gearshift systems, stabilising rods and steering columns.
Fluid Transfer Systems: designs and manufactures fluid handling systems for both the automotive and commercial vehicle sectors, as well as coupling systems for
compressed air circuits heavy trucks. The BA is also specialised in manufacturing tube and hose assemblies for challenging environments. Power Products Systems: is a global leader in the design and manufacture of vehicle control systems, providing engineered pedal systems, steering systems,
electronic displays and cable controls to manufacturers of industrial, agricultural and construction vehicles.
Sales transactions and cost allocations between the business units are based on the arms’ length principle. The results for each segment and the capital allocation elements
comprise both items that are directly related to and recorded within the segment, as well as items that are allocated based on reasonable allocation keys.
Note 4 – Segment reporting

24
KONGSBERG AUTOMOTIVE – ANNUAL REPORT 2010
00-05 The Company 06-12 Directors' Report 13-52 Financials 53-58 HSE 59-60 Corporate Governance
00-05 The Company 06-12 Directors' Report 13-52 Financials 53-58 HSE 59-60 Corporate Governance
00-05 The Company 06-12 Directors' Report 13-52 Financials 53-58 HSE 59-60 Corporate Governance
00-05 The Company 06-12 Directors' Report 13-52 Financials 53-58 HSE 59-60 Corporate Governance
00-05 The Company 06-12 Directors' Report 13-52 Financials 53-58 HSE 59-60 Corporate Governance
Information regarding the results of each reportable segment is included below. Performance is measured on EBITDA and EBIT as included in the internal management
reports issued on monthly basis. Segment EBIT is used to measure performance as management believes that such information is the most relevant in evaluating the
results of the segments (also relative to other entities that operate within these industries).
4.1) OPERATING REPORTABLE SEGMENTS
2010 Fluid Power
Driveline Interior Actuation Transfer Products Eliminations
MEUR Systems Systems & Chassis Systems Systems & other KA Group
Operating revenues 289.5 220.5 114.3 132.6 134.9 (27.4) 864.4
EBITDA (1.2) 23.0 18.6 15.7 7.0 (6.0) 57.1 Depreciation (9.4) (6.6) (4.6) (6.4) (2.8) (0.2) (30.1)
Amortization (3.2) (2.9) (2.1) (4.1) (3.9) (0.4) (16.8)
Operating (loss) / profit (EBIT) (13.9) 13.5 11.8 5.2 0.3 (6.6) 10.2
Assets and liabilities
Goodwill 6.2 73.6 20.3 47.4 14.0 (0.1) 161.3
Other intangible assets 19.0 14.8 11.1 23.3 23.1 0.6 92.1
Property, plant and equipment 40.9 25.8 22.1 31.5 10.9 0.7 131.9
Inventories 27.3 12.2 10.3 16.3 17.7 (0.5) 83.4
Trade receivables 36.5 36.3 12.7 20.5 20.6 (0.0) 126.6
Segment assets 129.9 162.7 76.6 139.0 86.3 0.7 595.3 Unallocated assets 209.6 209.6
Total assets 129.9 162.7 76.6 139.0 86.3 210.4 804.9 Trade payables 37.9 22.7 13.2 20.0 16.1 0.3 110.3
Unallocated liabilities 520.0 520.0
Total liabilities 37.9 22.7 13.2 20.0 16.1 520.4 630.3 Capital expenditure 5.1 8.9 2.9 2.8 1.0 0.9 21.7
The column “Elimination & other” includes
Revenues: elimination of intercompany sales.
Assets and liabilities: balance sheet elements from Kongsberg Automotive Holding ASA (parent) and journal entries, which are considered insignificant amounts, and
unallocated assets and – liabilities, see paragraph 4.2 for a specification.
2009 Fluid Power
Driveline Interior Actuation Transfer Products Eliminations
MEUR Systems Systems & Chassis Systems Systems & other KA Group
Operating revenues 234.7 153.3 67.9 87.6 103.4 (24.1) 622.8
EBITDA (14.0) 12.6 2.9 (0.4) 2.0 (2.6) 0.5 Depreciation (8.9) (6.8) (4.3) (6.9) (2.7) (0.4) (30.0)
Amortization (3.6) (2.6) (1.4) (3.8) (3.2) (2.1) (16.8)
Operating (loss) / profit (EBIT) (26.5) 3.3 (2.8) (11.1) (4.0) (5.1) (46.3)
Assets and liabilities
Goodwill 6.9 69.8 18.8 44.8 13.4 0.4 154.1
Other intangible assets 21.1 18.2 11.1 25.8 25.2 0.2 101.5
Property, plant and equipment 44.5 24.0 21.7 33.7 16.1 0.8 140.7
Inventories 24.9 8.9 6.8 9.2 17.2 (0.5) 66.5
Trade receivables 31.9 28.0 10.6 16.7 16.6 (0.1) 103.7
Segment assets 129.4 148.8 68.9 130.1 88.5 0.8 566.4 Unallocated assets 196.7 196.7
Total assets 129.4 148.8 68.9 130.1 88.5 197.5 763.2 Trade payables 32.7 12.8 7.5 14.7 11.7 0.1 79.5
Unallocated liabilities 504.8 504.8
Total liabilities 32.7 12.8 7.5 14.7 11.7 504.9 584.2 Capital expenditure 3.7 4.2 2.6 1.9 0.4 0.0 12.8

25
00-05 The Company 06-12 Directors' Report 13-52 Financials 53-58 HSE 59-60 Corporate Governance
00-05 The Company 06-12 Directors' Report 13-52 Financials 53-58 HSE 59-60 Corporate Governance
00-05 The Company 06-12 Directors' Report 13-52 Financials 53-58 HSE 59-60 Corporate Governance
00-05 The Company 06-12 Directors' Report 13-52 Financials 53-58 HSE 59-60 Corporate Governance
00-05 The Company 06-12 Directors' Report 13-52 Financials 53-58 HSE 59-60 Corporate Governance
KONGSBERG AUTOMOTIVE – ANNUAL REPORT 2010
4.2) RECONCILIATION OF REPORTABLE SEGMENTS ASSETS AND LIABILITIES
Reportable segments’ assets are reconciled to total assets as follows (MEUR):
2010 2009
Segment assets of reportable segments 594.6 565.3
Eliminations & other 0.7 1.1
Unallocated assets include
Deferred tax assets 61.9 61.6
Financial non-current assets 3.2 2.2
Cash and cash equivalents 106.9 107.7
Other receivables (excluded: trade receivables) 37.6 25.2
Total assets per Statement of Financial position 804.9 763.2
Reportable segments’ liabilities are reconciled to total liabilities as follows (MEUR):
2010 2009
Trade payables of reportable segments 110.0 79.4
Eliminations & other 0.3 0.1
Unallocated liabilities include
Deferred tax liabilities 35.5 35.5
Retirement benefit obligations 14.5 17.2
Interest-bearing loans and borrowings 370.5 381.8
Other non-current liabilities 1.4 2.5
Bank overdrafts 5.9 4.2
Other current interest-bearing liabilities 24.9 6.8
Current income tax liabilities 1.1 3.6
Other payables (excluded: trade payables) 66.3 53.1
Total liabilities per Statement of Financial position 630.3 584.2
4.3) SEGMENTS - GEOGRAPHICAL LOCATION
The group’s geographical segments for sales to external customers are based on the geographical locations of the customers. The group’s geographical segments for
non-current assets are based on the geographical locations of its subsidiaries.
4.3.1) Sales to external customers by geographical location 2010 2009
MEUR Jan–Dec % Jan–Dec %
Sweden 82.2 9.5 % 52.9 8.5 %
Germany 114.1 13.2 % 88.3 14.2 %
Other EU 248.4 28.7 % 190.1 30.5 %
Total EU 444.6 51.4 % 331.3 53.2 % USA 202.3 23.4 % 148.2 23.8 %
NA other 80.7 9.3 % 48.6 7.8 %
Total NA 283.0 32.7 % 196.8 31.6 %China 65.4 7.6 % 52.1 8.4 %
Asia Other 31.7 3.7 % 20.8 3.3 %
Total Asia 97.1 11.2 % 73.0 11.7 %Other 39.7 4.6 % 21.6 3.5 %
Total operating revenues 864.4 100 % 622.8 100 %
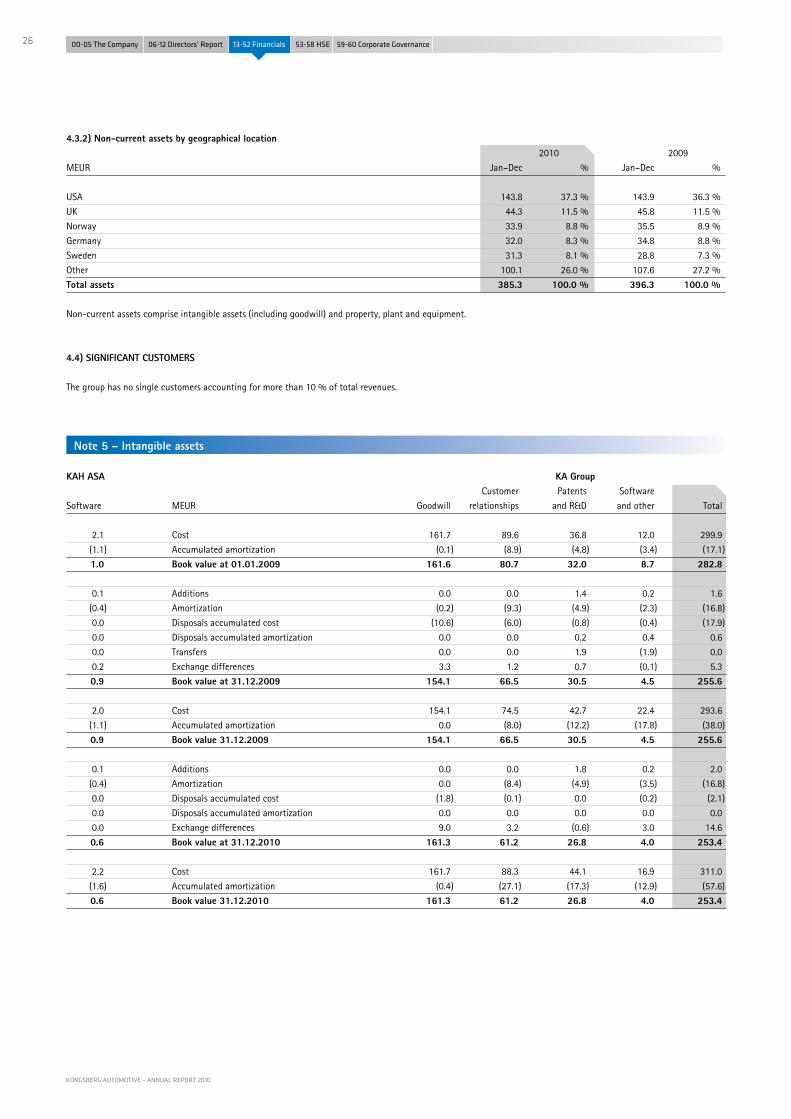
26
KONGSBERG AUTOMOTIVE – ANNUAL REPORT 2010
00-05 The Company 06-12 Directors' Report 13-52 Financials 53-58 HSE 59-60 Corporate Governance
00-05 The Company 06-12 Directors' Report 13-52 Financials 53-58 HSE 59-60 Corporate Governance
00-05 The Company 06-12 Directors' Report 13-52 Financials 53-58 HSE 59-60 Corporate Governance
00-05 The Company 06-12 Directors' Report 13-52 Financials 53-58 HSE 59-60 Corporate Governance
00-05 The Company 06-12 Directors' Report 13-52 Financials 53-58 HSE 59-60 Corporate Governance
4.3.2) Non-current assets by geographical location 2010 2009
MEUR Jan–Dec % Jan–Dec %
USA 143.8 37.3 % 143.9 36.3 %
UK 44.3 11.5 % 45.8 11.5 %
Norway 33.9 8.8 % 35.5 8.9 %
Germany 32.0 8.3 % 34.8 8.8 %
Sweden 31.3 8.1 % 28.8 7.3 %
Other 100.1 26.0 % 107.6 27.2 %
Total assets 385.3 100.0 % 396.3 100.0 %
Non-current assets comprise intangible assets (including goodwill) and property, plant and equipment.
4.4) SIGNIFICANT CUSTOMERS
The group has no single customers accounting for more than 10 % of total revenues.
KAH ASA KA Group Customer Patents Software
Software MEUR Goodwill relationships and R&D and other Total
2.1 Cost 161.7 89.6 36.8 12.0 299.9
(1.1) Accumulated amortization (0.1) (8.9) (4.8) (3.4) (17.1)
1.0 Book value at 01.01.2009 161.6 80.7 32.0 8.7 282.8
0.1 Additions 0.0 0.0 1.4 0.2 1.6
(0.4) Amortization (0.2) (9.3) (4.9) (2.3) (16.8)
0.0 Disposals accumulated cost (10.6) (6.0) (0.8) (0.4) (17.9)
0.0 Disposals accumulated amortization 0.0 0.0 0.2 0.4 0.6
0.0 Transfers 0.0 0.0 1.9 (1.9) 0.0
0.2 Exchange differences 3.3 1.2 0.7 (0.1) 5.3
0.9 Book value at 31.12.2009 154.1 66.5 30.5 4.5 255.6
2.0 Cost 154.1 74.5 42.7 22.4 293.6
(1.1) Accumulated amortization 0.0 (8.0) (12.2) (17.8) (38.0)
0.9 Book value 31.12.2009 154.1 66.5 30.5 4.5 255.6
0.1 Additions 0.0 0.0 1.8 0.2 2.0
(0.4) Amortization 0.0 (8.4) (4.9) (3.5) (16.8)
0.0 Disposals accumulated cost (1.8) (0.1) 0.0 (0.2) (2.1)
0.0 Disposals accumulated amortization 0.0 0.0 0.0 0.0 0.0
0.0 Exchange differences 9.0 3.2 (0.6) 3.0 14.6
0.6 Book value at 31.12.2010 161.3 61.2 26.8 4.0 253.4
2.2 Cost 161.7 88.3 44.1 16.9 311.0
(1.6) Accumulated amortization (0.4) (27.1) (17.3) (12.9) (57.6)
0.6 Book value 31.12.2010 161.3 61.2 26.8 4.0 253.4
Note 5 – Intangible assets

27
00-05 The Company 06-12 Directors' Report 13-52 Financials 53-58 HSE 59-60 Corporate Governance
00-05 The Company 06-12 Directors' Report 13-52 Financials 53-58 HSE 59-60 Corporate Governance
00-05 The Company 06-12 Directors' Report 13-52 Financials 53-58 HSE 59-60 Corporate Governance
00-05 The Company 06-12 Directors' Report 13-52 Financials 53-58 HSE 59-60 Corporate Governance
00-05 The Company 06-12 Directors' Report 13-52 Financials 53-58 HSE 59-60 Corporate Governance
KONGSBERG AUTOMOTIVE – ANNUAL REPORT 2010
5.1) Internally developed intangible assets
Internally developed intangible assets comprise capitalised costs related to development of new products. They are included in the column headed “Patents and R&D” above.
MEUR 2010 2009
Per 31.12 internally developed intangible assets 8.5 10.3
Additions during the year 1.7 1.0
Recognized R&D cost in the reporting period (P/L): 14.7 MEUR (not capitalized) (2009: 43.2).
5.2) Impairment testing of goodwill and other assetsThe group has performed impairment tests on the carrying values of all intangible assets (including goodwill), tangible non-current assets, and changes in net working
capital in accordance with the requirements of IAS 36. Value in use (VIU) was recognized as recoverable amount. The tests comprised NPV (net present value) analyses
of forecasted future cash flows by CGUs (cash generating units). The five Business Areas; Driveline, Interior, Actuation&Chassis, Fluid Transfer and Power Products, were
identified as the respective CGUs.
Cash flow modelThe model was based on a 5 year forecast of discounted cash flow plus a terminal value (calculated by Gordons model). The net discounted cash flows were calculated
before tax. The NPV-model included the following assumptions:
Business caseA business case was used for each CGU as the basis for the cash flow estimates which covered the period 2011 to 2015. The business cases were based on the group’s
strategic five year plan, adjusted for recent changes in internal rolling forecasts and relevant market data. Both the five year plan and the rolling forecasts were
”bottom-up-models” where all input data had been produced by respective entities in the Group.
The input data in the business cases were gathered from renowned external sources such as CSM and JD Power in addition to all relevant internal information such as
changes in orders, customer portfolio, fitment rate for products, geographical development, market shares etc. The compounded annual growth rate (CAGR) per CGU
was: Drivline 2.1 %, Interior 5.6 %, Actuation&Chassis 13.5 %, Fluid 8.2 % and PPS 1.4 % for the period 2011 to 2015. The annual growth rate in the terminal value was
estimated to 2 % for each of the CGUs.
WACC (Weighted average cost of capital)The required rate of return was calculated by use of the WACC methodology. The input data of the WACC was chosen by an individual assessment of each parameter.
Information from representative sources, peer groups etc. was used to determine the best estimate. The WACC was calculated to 11.2 % pre tax. The same WACC was
used for all CGUs, the reason being that the long-term risk profiles of the five CGUs are not considered to be significanly different. The following parametes were applied:
Risk free interest rate: A 10 year governmental bond rate has been used as the risk free rate.
Beta: 2.7. Based on an estimated unlevered beta for the automotive industry adjusted for KA’s capital structure.
Market Risk Premium: 5 % (post tax). Based on market sources.
Cost of Debt: Based on the risk free rate plus a risk component to reflect a probable rate of default (300 basis points).
Capital structure: Based on the Group’s long term target for equity ratio of 33 % (interest bearing debt 67 %).
Sensitivity analyzisThe following sensitivity analyzis were carried out to test whether changes in relevant parameters would influence the conclusion;
1. Change in cash flows: The analyzis showed that a decline in free cash flow of 40 % per CGU for each year in the business plan (including the terminal value) was
neccesary to change conclusion. The result indicated that there had to be a significant decline in the market situation to trigger impairment.
2. Change in discount rates: The analyzis showed the following headroom in discount rates per CGU to change conclution; Driveline + 6.6 %, Interior + 13.6 %,
Actuation&Chassis + 42.5 %, Fluid + 13.1 % and PPS + 15.0 %. The results indicated that the test was robust in terms of the level of discount rates.
We have not found any reasons to test combinations of relevant sensitivities.

28
KONGSBERG AUTOMOTIVE – ANNUAL REPORT 2010
00-05 The Company 06-12 Directors' Report 13-52 Financials 53-58 HSE 59-60 Corporate Governance
00-05 The Company 06-12 Directors' Report 13-52 Financials 53-58 HSE 59-60 Corporate Governance
00-05 The Company 06-12 Directors' Report 13-52 Financials 53-58 HSE 59-60 Corporate Governance
00-05 The Company 06-12 Directors' Report 13-52 Financials 53-58 HSE 59-60 Corporate Governance
00-05 The Company 06-12 Directors' Report 13-52 Financials 53-58 HSE 59-60 Corporate Governance
Test results: Value in use (VIU) versus carrying amount by CGUThe table shows the outcome of the impairment test as at 31.12.10:
Fluid Power
Driveline Interior Actuation Transfer Products
MEUR Systems Systems & Chassis Systems Systems Total
Carrying amounts
Goodwill 6.2 73.6 20.3 47.4 14.0 161.4
Other intangible assets 19.0 14.8 11.1 23.3 23.1 91.4
Property, plant and equipment 40.9 25.8 22.1 31.5 10.9 131.2
Net working capital 25.9 25.7 9.9 16.8 22.2 100.6
Total carrying amount (TCA) 92.0 139.9 63.4 119.0 70.2 484.6 Value in use (VIU) from the test model 161.6 359.6 398.0 281.9 174.4 1 375.5
VIU - TCA (headroom) 69.5 219.7 334.6 162.9 104.2 890.9
The impairment tests indicated no requirement for write downs.
KAH ASA KA GroupEquipment MEUR Land Buildings Equipment Total
0.8 Cost 7.7 50.6 329.5 387.8
(0.2) Accumulated depreciation 0.0 (23.4) (208.3) (231.7)
0.6 Book value at 01.01.2009 7.7 27.2 121.2 156.1
0.0 Additions 0.5 0.6 11.8 12.8
(0.2) Depreciation 0.0 (2.1) (27.8) (30.0)
(0.2) Disposals accumulated cost (0.5) (0.1) (21.5) (22.1)
0.1 Disposals accumulated depreciation 0.0 0.2 20.5 20.7
0.1 Exchange differences 0.0 0.8 2.4 3.2
0.4 Book value at 31.12.2009 7.7 26.6 106.5 140.7
0.8 Cost 7.7 50.2 330.3 388.2
(0.4) Accumulated depreciation 0.0 (23.6) (223.8) (247.5)
0.4 Book value 31.12.2009 7.7 26.6 106.5 140.7
0.0 Additions 0.0 0.6 21.1 21.7
(0.2) Depreciation 0.0 (2.9) (27.2) (30.1)
0.0 Disposals accumulated cost (1.5) (3.3) (16.1) (20.9)
0.0 Disposals accumulated depreciation 0.0 0.4 10.8 11.2
0.0 Exchange differences 0.2 1.5 7.5 9.2
0.2 Book value at 31.12.2010 6.4 22.9 102.6 131.9
0.8 Cost 6.4 49.6 371.3 427.3
(0.6) Accumulated depreciation 0.0 (26.7) (268.7) (295.4)
0.2 Book value 31.12.2010 6.4 22.9 102.6 131.9
Impairment testing
See note 5 for the impairment testing on tangible non-current assets. The test results indicated no requirement for write down.
Note 6 – Tangible non-current assets

29
00-05 The Company 06-12 Directors' Report 13-52 Financials 53-58 HSE 59-60 Corporate Governance
00-05 The Company 06-12 Directors' Report 13-52 Financials 53-58 HSE 59-60 Corporate Governance
00-05 The Company 06-12 Directors' Report 13-52 Financials 53-58 HSE 59-60 Corporate Governance
00-05 The Company 06-12 Directors' Report 13-52 Financials 53-58 HSE 59-60 Corporate Governance
00-05 The Company 06-12 Directors' Report 13-52 Financials 53-58 HSE 59-60 Corporate Governance
KONGSBERG AUTOMOTIVE – ANNUAL REPORT 2010
Note 7 – Inventories
Note 8 – Trade and other receivables
KAH ASA KA Group 2010 2009 MEUR 2010 2009
0.0 0.0 Raw materials 56.3 44.2
0.0 0.0 Work in progress 11.9 8.0
0.0 0.0 Finished goods 15.2 14.3
0.0 0.0 Total 83.4 66.5
Group inventories are stated net of a provision for slow moving and obsolete inventory. The amount of this provision as at 31.12.10 was MEUR 6.5 (2009: 7.2).
KAH ASA KA Group 2010 2009 MEUR 2010 2009
0.0 0.0 Trade receivables 126.6 103.7
55.0 42.4 Short-term group receivables 0.0 0.0
0.2 0.0 Other short-term receivables 27.8 16.1
0.0 0.0 Financial derivative instruments 1.1 (0.6)
0.1 0.3 Prepayments 8.7 9.6
55.2 42.7 Total 164.3 128.8
The carrying amounts of trade and other receivables are denominated in the following currencies:
KAH ASA KA Group 2010 2009 MEUR 2010 2009
0.0 0.0 EUR 35.1 28.6
0.0 0.0 USD 40.4 32.9
55.2 42.7 NOK 13.0 9.6
0.0 0.0 GBP 10.0 8.2
0.0 0.0 Other 65.7 49.6
55.2 42.7 Total 164.3 128.8
Operating and finance leases
The Group is a lessee under operating lease. The total group cost for operating leases was MEUR 4.4 in 2010 (2009: 5.7). Operating leases are mostly used for the rental
of office equipment. Maturity schedule for operational leases KA group (MEUR):
Maturity 2010 As % of total
2011 4.7 20 %
2012 4.2 18 %
2013 3.9 17 %
2014 3.7 16 %
2015 3.2 14 %
Thereafter 3.9 15 %
Total 23.6
The Group is a lessee under financial lease, but the group has only a limited number of financial lease contracts and the total amount is considered insignificant.

30
KONGSBERG AUTOMOTIVE – ANNUAL REPORT 2010
00-05 The Company 06-12 Directors' Report 13-52 Financials 53-58 HSE 59-60 Corporate Governance
00-05 The Company 06-12 Directors' Report 13-52 Financials 53-58 HSE 59-60 Corporate Governance
00-05 The Company 06-12 Directors' Report 13-52 Financials 53-58 HSE 59-60 Corporate Governance
00-05 The Company 06-12 Directors' Report 13-52 Financials 53-58 HSE 59-60 Corporate Governance
00-05 The Company 06-12 Directors' Report 13-52 Financials 53-58 HSE 59-60 Corporate Governance
Trade receivables
The Group trade receivables (external customers) have the following maturity structure at 31.12.2010:
In % of
Amounts in gross trade
Maturity MEUR receivables
Not overdue 115.7 90 %
Overdue 1-20 days 6.3 5 %
Overdue 21-40 days 3.1 2 %
Overdue 41-80 days 1.5 1 %
Overdue 81-100 days 0.4 0 %
Overdue > 100 days 2.2 2 %
Gross trade receivables 129.2
Total provision for bad debt (2.6) 2 %
Net trade receivables 126.6
The provision for bad debt has increased by MEUR 0.1 compared to YTD 2009 (MEUR 2.5). Trade receivables are subject to constant monitoring. Impaired receivables are
reflected through provision for bad debt. Monthly assessments of loss risk are performed and corresponding provisions are made on entity level. The provision for bad
debt reflects the total loss risk on groups trade receivables. The eldest trade receivables, overdue > 100 days, represents the highest risk level. Most of the impaired trade
receivables are included in that category. Actual losses on trade receivables are considered not significant. The risk for losses on other receivables than trade receivables
is assessed to be insignificant. For credit risk and currency exchange risk, see note 17.
Note 9 – Outstanding accounts between parent company and other group companies
KAH ASA Non-current assetsLoans to subsidiaries MEUR 2010 2009
Kongsberg Automotive Inc 18.4 17.4
Kongsberg Automotive Hong Kong Ltd 28.9 26.9
Kongsberg Automotive Holding 2 AS 436.8 398.2
Other group companies 21.3 29.8
Total 505.3 472.3
Current assetsShort-term group receivables MEUR 2010 2009
Kongsberg Actuation Systems SL 6.2 0.0
Kongsberg Automotive s.r.o 5.4 2.6
Kongsberg Driveline Systems SAS 4.9 7.1
Kongsberg Driveline Systems GmbH 3.2 3.2
Kongsberg Driveline Systems I, Inc 2.2 0.0
Other group companies 33.1 29.4
Total 55.0 42.4
Current liabilitiesShort-term group liabilities MEUR 2010 2009
Group companies 8.6 20.8
Total 8.6 20.8
Current assets and - liabilities have due dates within 1 year.
The companies loans to group companies have due dates exceeding 1 year.

31
00-05 The Company 06-12 Directors' Report 13-52 Financials 53-58 HSE 59-60 Corporate Governance
00-05 The Company 06-12 Directors' Report 13-52 Financials 53-58 HSE 59-60 Corporate Governance
00-05 The Company 06-12 Directors' Report 13-52 Financials 53-58 HSE 59-60 Corporate Governance
00-05 The Company 06-12 Directors' Report 13-52 Financials 53-58 HSE 59-60 Corporate Governance
00-05 The Company 06-12 Directors' Report 13-52 Financials 53-58 HSE 59-60 Corporate Governance
KONGSBERG AUTOMOTIVE – ANNUAL REPORT 2010
Note 10 – Classification of financial instruments
The following principles have been used to measure the financial instruments in the balance sheet after initial recognition (MEUR):
KA Group Financial assets
2010 at fair value
through profit
Assets and loss Total
Trade receivables 126.6 126.6
Financial derivative instruments 1.1 1.1
Cash and cash equivalents 106.9 106.9
Total 234.6 234.6
Financial
liabilities at
Financial fair value
liabilities at through profit
Liabilities amortized cost and loss Total
Interest-bearing loans and borrowings 370.5 370.5
Interest rate swap 4.3 4.3
Bank overdraft 5.9 5.9
Other current interest-bearing liabilities 24.9 24.9
Trade payables 110.3 110.3
Total 395.4 120.5 515.9
The Group has no financial assets available for sale or financial assets held for trading.
The group’s loans to subsidiaries are classified as a net investment in the relevant subsidiaries. The fair value of such loans in the parent company as at 31.12.10 was
MEUR 437 (2009: 398). The effect of currency translation has been recognised as a translation difference within the equity.
KA Group Financial assets
2009 at fair value
through profit
Assets and loss Total
Trade receivables 103.7 103.7
Cash and cash equivalents 107.7 107.7
Total 211.4 211.4
Financial
liabilities at
Financial fair value
liabilities at through profit
Liabilities amortized cost and loss Total
Interest-bearing loans and borrowings 381.8 381.8
Financial derivative instruments 0.6 0.6
Interest rate swaps 8.1 8.1
Bank overdraft 4.2 4.2
Other current interest bearing liab. 6.8 6.8
Trade payables 79.5 79.5
Total 472.3 8.7 481.0
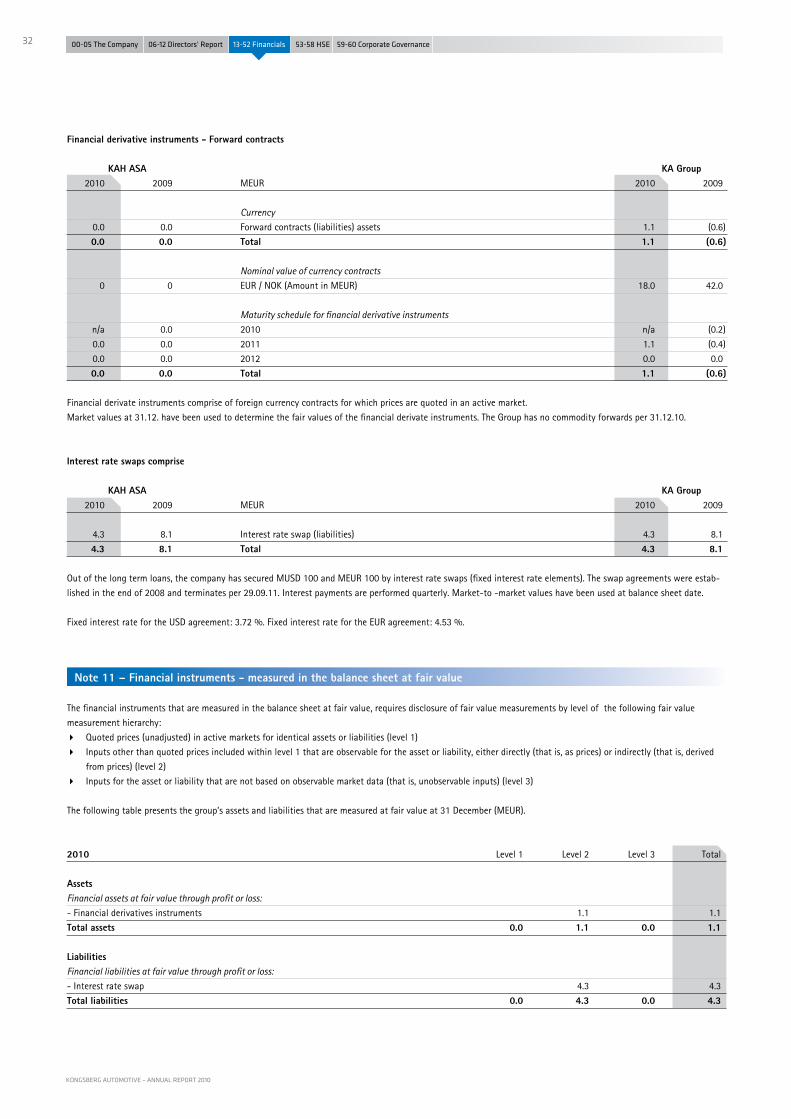
32
KONGSBERG AUTOMOTIVE – ANNUAL REPORT 2010
00-05 The Company 06-12 Directors' Report 13-52 Financials 53-58 HSE 59-60 Corporate Governance
00-05 The Company 06-12 Directors' Report 13-52 Financials 53-58 HSE 59-60 Corporate Governance
00-05 The Company 06-12 Directors' Report 13-52 Financials 53-58 HSE 59-60 Corporate Governance
00-05 The Company 06-12 Directors' Report 13-52 Financials 53-58 HSE 59-60 Corporate Governance
00-05 The Company 06-12 Directors' Report 13-52 Financials 53-58 HSE 59-60 Corporate Governance
Financial derivative instruments - Forward contracts
KAH ASA KA Group 2010 2009 MEUR 2010 2009
Currency 0.0 0.0 Forward contracts (liabilities) assets 1.1 (0.6)
0.0 0.0 Total 1.1 (0.6)
Nominal value of currency contracts
0 0 EUR / NOK (Amount in MEUR) 18.0 42.0
Maturity schedule for financial derivative instruments
n/a 0.0 2010 n/a (0.2)
0.0 0.0 2011 1.1 (0.4)
0.0 0.0 2012 0.0 0.0
0.0 0.0 Total 1.1 (0.6)
Financial derivate instruments comprise of foreign currency contracts for which prices are quoted in an active market.
Market values at 31.12. have been used to determine the fair values of the financial derivate instruments. The Group has no commodity forwards per 31.12.10.
Interest rate swaps comprise
KAH ASA KA Group 2010 2009 MEUR 2010 2009
4.3 8.1 Interest rate swap (liabilities) 4.3 8.1
4.3 8.1 Total 4.3 8.1
Out of the long term loans, the company has secured MUSD 100 and MEUR 100 by interest rate swaps (fixed interest rate elements). The swap agreements were estab-
lished in the end of 2008 and terminates per 29.09.11. Interest payments are performed quarterly. Market-to -market values have been used at balance sheet date.
Fixed interest rate for the USD agreement: 3.72 %. Fixed interest rate for the EUR agreement: 4.53 %.
Note 11 – Financial instruments - measured in the balance sheet at fair value
The financial instruments that are measured in the balance sheet at fair value, requires disclosure of fair value measurements by level of the following fair value
measurement hierarchy:
Quoted prices (unadjusted) in active markets for identical assets or liabilities (level 1)
Inputs other than quoted prices included within level 1 that are observable for the asset or liability, either directly (that is, as prices) or indirectly (that is, derived
from prices) (level 2)
Inputs for the asset or liability that are not based on observable market data (that is, unobservable inputs) (level 3)
The following table presents the group’s assets and liabilities that are measured at fair value at 31 December (MEUR).
2010 Level 1 Level 2 Level 3 Total
Assets Financial assets at fair value through profit or loss: - Financial derivatives instruments 1.1 1.1
Total assets 0.0 1.1 0.0 1.1
Liabilities
Financial liabilities at fair value through profit or loss:- Interest rate swap 4.3 4.3
Total liabilities 0.0 4.3 0.0 4.3
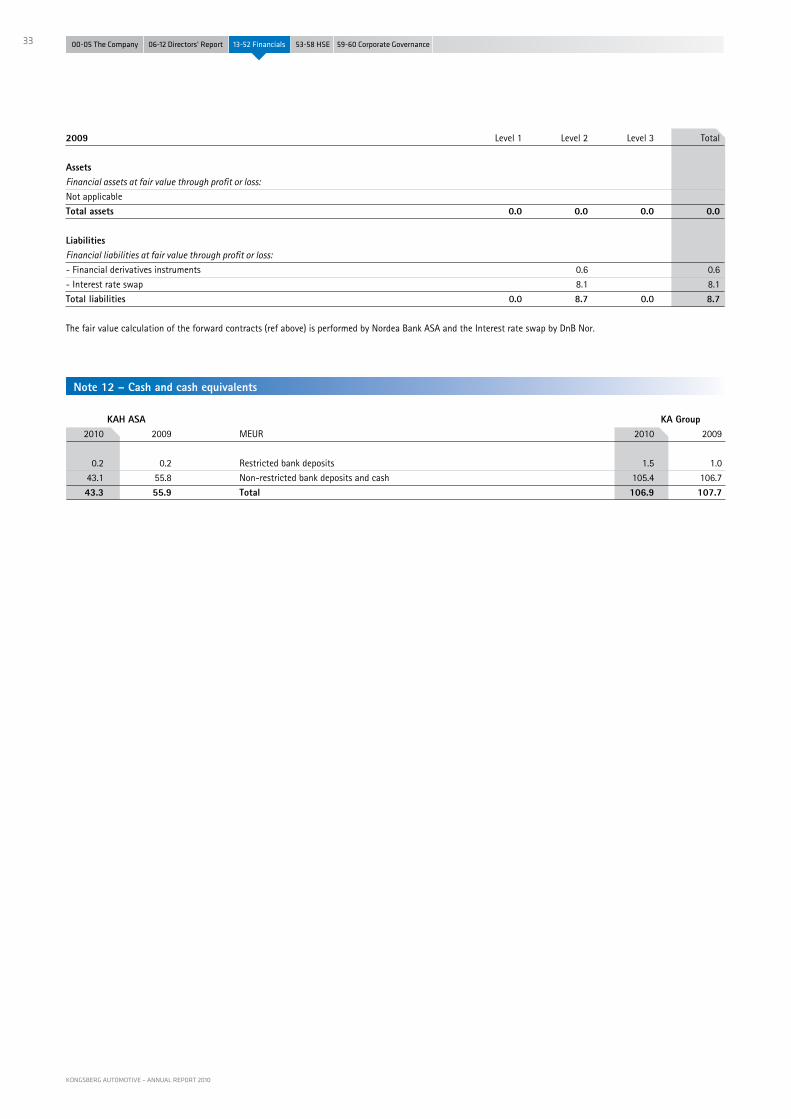
33
00-05 The Company 06-12 Directors' Report 13-52 Financials 53-58 HSE 59-60 Corporate Governance
00-05 The Company 06-12 Directors' Report 13-52 Financials 53-58 HSE 59-60 Corporate Governance
00-05 The Company 06-12 Directors' Report 13-52 Financials 53-58 HSE 59-60 Corporate Governance
00-05 The Company 06-12 Directors' Report 13-52 Financials 53-58 HSE 59-60 Corporate Governance
00-05 The Company 06-12 Directors' Report 13-52 Financials 53-58 HSE 59-60 Corporate Governance
KONGSBERG AUTOMOTIVE – ANNUAL REPORT 2010
2009 Level 1 Level 2 Level 3 Total
Assets Financial assets at fair value through profit or loss: Not applicable
Total assets 0.0 0.0 0.0 0.0 Liabilities
Financial liabilities at fair value through profit or loss:- Financial derivatives instruments 0.6 0.6
- Interest rate swap 8.1 8.1
Total liabilities 0.0 8.7 0.0 8.7
The fair value calculation of the forward contracts (ref above) is performed by Nordea Bank ASA and the Interest rate swap by DnB Nor.
Note 12 – Cash and cash equivalents
KAH ASA KA Group 2010 2009 MEUR 2010 2009
0.2 0.2 Restricted bank deposits 1.5 1.0
43.1 55.8 Non-restricted bank deposits and cash 105.4 106.7
43.3 55.9 Total 106.9 107.7

34
KONGSBERG AUTOMOTIVE – ANNUAL REPORT 2010
00-05 The Company 06-12 Directors' Report 13-52 Financials 53-58 HSE 59-60 Corporate Governance
00-05 The Company 06-12 Directors' Report 13-52 Financials 53-58 HSE 59-60 Corporate Governance
00-05 The Company 06-12 Directors' Report 13-52 Financials 53-58 HSE 59-60 Corporate Governance
00-05 The Company 06-12 Directors' Report 13-52 Financials 53-58 HSE 59-60 Corporate Governance
00-05 The Company 06-12 Directors' Report 13-52 Financials 53-58 HSE 59-60 Corporate Governance
The share capital of the company is NOK 203 384 066, comprising 406 768 131 ordinary shares with a par value of NOK 0.50. The company holds 7 292 407 shares as
treasury shares. For more information see ”Statement of Changes in Equity”.
The share is listed on the Oslo Stock Exchange. The ticker code is KOA.
The twenty largest shareholders in the company as at 31.12.10 were as follows:
Shareholder No of shares % Country
Nordea Bank Norge ASA 28 384 734 7.0 % Norway
DnB Nor Bank ASA 23 883 044 5.9 % Norway
Skagen Vekst 15 151 251 3.7 % Norway
Odin Norden 14 995 132 3.7 % Norway
Odin Norge 14 986 857 3.7 % Norway
Holberg Norge 14 220 500 3.5 % Norway
DnB Nor SMB 7 500 000 1.8 % Norway
Kongsberg Automotive Holding ASA (treasury shares) 7 292 407 1.8 % Norway
MP Pensjon PK 7 150 000 1.8 % Norway
Holberg Norden 5 758 479 1.4 % Norway
Skandinaviska Enskilda Banken 4 128 372 1.0 % Sweden
KLP Aksje Norge VFP 3 984 367 1.0 % Norway
SHB Stockholm clients account 2 867 369 0.7 % Norway
Ebitec Invest AS 2 775 000 0.7 % Sweden
Verdipapirfondet Handelsbanken 2 600 000 0.6 % Norway
KLP Aksje Norge Index VFP 2 364 589 0.6 % Norway
Delphi Norge 2 000 000 0.5 % UK
Ojada AS 2 000 000 0.5 % Norway
Toluma Norden AS 2 000 000 0.5 % Norway
WarrenWicklund Norge 1 986 975 0.5 % Norway
Total number of shares 166 029 076 Other Shareholders 240 739 055 59 %
Total number of shares in issue 406 768 131 100 % Number of shareholders 7 904
Foreign ownership 13.5 %
Share optionsShare options are granted to management and to selected employees. An option entitles participants to purchase one share per option. Options are offered and granted
during the first quarter of the year. The exercise price is the average trading price for the company’s share during the first ten calendar days immediately after publi-
cation of fourth quarter results. Offer to be granted options is presented immediately thereafter. Participants in the share option programme are required to hold a
number of the company’s share at least equivalent to 10 % of the number of options granted. Options at exercise price of NOK 37 and NOK 32 are exerciseable on
13.05.2011, and expire if not exercised on such day. One third of the options at exercise price NOK 20, NOK 3 and NOK 5 are exercisable after one, two and three years
respectively after the date of grant. Options at NOK 5 expire after five years, and options at NOK 20 and NOK 3 expire ten years after the date of grant. The company has
no legal or constructive obligation to repurchase or settle the options in cash.
The shares issued during the autumn of 2009 had a substantial dilution effect on outstanding share options. In order to maintain the value of share options as an
effective incentive for management, the Extraordinary General Assembly on 21 December 2009 resolved to adjust the number of outstanding options and to some
degree exercise prices, as follows:
Note 13 – Share capital

35
00-05 The Company 06-12 Directors' Report 13-52 Financials 53-58 HSE 59-60 Corporate Governance
00-05 The Company 06-12 Directors' Report 13-52 Financials 53-58 HSE 59-60 Corporate Governance
00-05 The Company 06-12 Directors' Report 13-52 Financials 53-58 HSE 59-60 Corporate Governance
00-05 The Company 06-12 Directors' Report 13-52 Financials 53-58 HSE 59-60 Corporate Governance
00-05 The Company 06-12 Directors' Report 13-52 Financials 53-58 HSE 59-60 Corporate Governance
KONGSBERG AUTOMOTIVE – ANNUAL REPORT 2010
Before adjustment 21.12.2009: 2006 2007 2008 2009 Total options
Exercise price (NOK) 60 52 33 3
Number of outstanding options 691 893 66 438 908 847 1 667 178
Granted 1 733 000 1 733 000
Forfeited (27 210) (15 674) (105 800) (23 000) (171 684)
Expired (221 561) (22 146) (243 707)
Options before adjustment 21.12.2009 443 122 28 618 803 047 1 710 000 2 984 787
Adjustment 21.12.2009: Total options
Adjustment factor exercise price 1.6265 1.6265 1.6265
Adjustment factor number of options 1.6265 1.6265 1.6265 2.2673
Adjusted exercise price (NOK) 37 32 20 3
Adjusted number of outstanding options* 720 730 46 547 1 306 165 3 877 097 5 950 539
* The numbers are adjusted for errors in the 2009 Annual report.
For options at exercise price NOK 60, NOK 52 and NOK 33, the quantities and exercise prices were adjusted according to the Oslo Stock Exchange’s General Rules for
Derivative Contracts. For options at exercise price NOK 3, only the quantity and not the exercise price was adjusted.
The number of options intended to be offered during the first quarter of 2010, resolved by the Ordinary General Assembly in 2009 was also adjusted, by factor 2.1681,
extending the number of options to be offered from 1.800.000 to 3.902.612, in order to maintain the intended value of options to be granted.
Number of options and their exercise dates for the programme adopted by the General Assembly in 2010 in respect of options to be granted during the first quarter of
2011.
Options vesting and
potentially exercisable in Last possible
2012 2013 2014 exercise 2018
By year 1 333 333 1 333 333 1 333 333
Cumulative 1 333 333 2 666 667 4 000 000 4 000 000
Movements in share options and their related weighted average exercise prices are as follows (NOK):
2010 2009
Average Average
exercise price Options exercise price Options
Options at 01.01 11.08 5 950 539 44.96 1 667 178
Granted 5.00 3 727 855 3.00 1 733 000
Forfeited 19.58 (217 685) 34.99 (171 684)
Expired 25.59 (383 639) 59.27 (243 707)
Exercised 3.00 (207 593)
Adjustment of 2009 error 67 682
Options before adjustment 21.12.2009 20.00 2 984 787
Options at 31.12 7.48 8 937 159 11.08 5 950 539

36
KONGSBERG AUTOMOTIVE – ANNUAL REPORT 2010
00-05 The Company 06-12 Directors' Report 13-52 Financials 53-58 HSE 59-60 Corporate Governance
00-05 The Company 06-12 Directors' Report 13-52 Financials 53-58 HSE 59-60 Corporate Governance
00-05 The Company 06-12 Directors' Report 13-52 Financials 53-58 HSE 59-60 Corporate Governance
00-05 The Company 06-12 Directors' Report 13-52 Financials 53-58 HSE 59-60 Corporate Governance
00-05 The Company 06-12 Directors' Report 13-52 Financials 53-58 HSE 59-60 Corporate Governance
Outstanding options at the end of the year have the following expiry dates and exercise prices (NOK):
2010 2009
Expiry date Exercise price Options Exercise price Options*
14.05.2010 37.00 360 365
14.05.2010 32.00 23 274
13.05.2011 37.00 345 490 37.00 360 365
13.05.2011 32.00 2 832 32.00 23 274
31.03.2015 5.00 3 727 855
31.03.2018 20.00 1 223 116 20.00 1 306 165
31.03.2019 3.00 3 637 867 3.00 3 877 097
Options at 31.12 8 937 159 5 950 539
* The numbers are adjusted for errors in the 2009 Annual report.
The weighted average fair value of options granted during the period determined using the Black-Scholes valuation model was NOK 1.97 per option (2009: 1.69).
The significant inputs to the model were the share trading price of NOK 4.83. At the date of grant, exercise prices (NOK 5.00) shown above, a weighted average volatility
of 77.73 %, an expected option life of three, four and five years and a weighted average annual risk-free interest rate of 2.89 %.
Number of options exercisable at 31.12None of the 2009 options that might have been exercisable if the market share price had been above NOK 20, carried over to 2010, where in the money at 31.12.10.
The total number of these options was 815 411.
Note 14 – Taxes
14.1) Statement of comprehensive income KAH ASA KA Group 2010 2009 MEUR 2010 2009
0.0 0.0 Current tax on profits for the year (7.4) (2.1)
0.0 0.0 Adjustments in respect of prior years 1.2 0.0
0.0 0.0 Total current tax (6.2) (2.1) (8.9) 2.8 Current year deferred tax 2.8 16.5
0.0 0.0 Impact of changes in tax rates 2.4 0.0
(0.6) 0.0 Adjustments in respect of prior years (6.3) (13.7)
(9.5) 2.8 Total deferred tax (1.1) 2.8 (9.5) 2.8 Income tax (expense) / credit (7.3) 0.7
The tax on the group’s operating profit before tax differs from the theoretical amount that would arise using the tax rate of Norway as follows (MEUR):
40.7 (10.9) (Loss) / profit before tax (1.9) (28.2)
(11.4) 3.1 Tax calculated at Norwegian tax rate 0.5 7.9
Tax effect of permanent differences:
2.8 1.2 - Dividends 0.0 0.0
(0.3) (1.5) - Other permanent differences / currency (1.0) (5.3)
0.0 0.0 Effect of different tax rates 3.5 (0.1)
0.0 0.0 Losses not recognised as deferred tax assets (5.1) (1.8)
(0.6) 0.0 Adjustments in respect of prior years (5.2) 0.0
(9.5) 2.8 Income tax (expense) / credit (7.3) 0.7
23 % 26 % Average effective tax rate -384 % 2 %

37
00-05 The Company 06-12 Directors' Report 13-52 Financials 53-58 HSE 59-60 Corporate Governance
00-05 The Company 06-12 Directors' Report 13-52 Financials 53-58 HSE 59-60 Corporate Governance
00-05 The Company 06-12 Directors' Report 13-52 Financials 53-58 HSE 59-60 Corporate Governance
00-05 The Company 06-12 Directors' Report 13-52 Financials 53-58 HSE 59-60 Corporate Governance
00-05 The Company 06-12 Directors' Report 13-52 Financials 53-58 HSE 59-60 Corporate Governance
KONGSBERG AUTOMOTIVE – ANNUAL REPORT 2010
The tax (expense) / credit relating to components of other comprehensive income is as follows (MEUR):
0.0 0.0 Translation differences before tax 11.2 (53.3)
0.0 0.0 Tax on translation differences (expense) / credit (0.1) 13.7
0.0 0.0 Translation differences after tax 11.1 (39.6)
14.2) Statement of Financial position
KAH ASA KA Group 2010 2009 MEUR 2010 2009
0.0 0.0 Current income tax liabilities 1.1 3.6
0.0 0.0 Total current tax 1.1 3.6
Deferred taxes
0.0 (3.0) Deferred tax (assets) to be recovered within 12 months (23.9) (10.6)
0.0 0.4 Deferred tax liabilities to be recovered within 12 months 3.3 4.8
(2.6) (1.4) Deferred tax (assets) to be recovered after more than 12 months (6.3) (16.5)
0.3 0.0 Deferred tax liabilities to be recovered after more than 12 months 32.3 30.7
(2.5) (9.6) Losses carried forward (31.7) (31.2)
0.0 0.0 Other tax deferred (assets) / liabilities 0.0 (3.4)
(4.8) (13.6) Net deferred tax (assets) / liabilities (26.4) (26.1) (5.1) (14.0) Of which deferred tax assets (61.9) (61.6)
0.3 0.4 Of which deferred tax liabilities 35.5 35.5
The movements in deferred income tax assets and liabilities during the year, without taking into consideration the offsetting of balances within the same tax jurisdiction,
are as follows:
KAH ASA KA GroupTax losses Other MEUR Tax losses Other
Change in deferred tax
(9.1) (4.9) Deferred tax (assets) as at 01.01 (31.2) (30.4)
7.9 1.7 Recorded through the income statement 1.6 1.4
(0.5) (0.2) Exchange rate differences (2.1) (1.2)
(1.7) (3.4) Deferred tax (assets) as at 31.12 (31.7) (30.2)
Tangible & Tangible &
intangible intangible
assets Other MEUR assets Other
Change in deferred tax
0.0 0.4 Deferred tax liabilities as at 01.01 31.2 4.3
0.0 (0.1) Recorded through the income statement (3.6) 1.7
0.0 0.0 Exchange rate differences 1.8 0.2
0.0 0.3 Deferred tax liabilities as at 31.12 29.3 6.2

38
KONGSBERG AUTOMOTIVE – ANNUAL REPORT 2010
00-05 The Company 06-12 Directors' Report 13-52 Financials 53-58 HSE 59-60 Corporate Governance
00-05 The Company 06-12 Directors' Report 13-52 Financials 53-58 HSE 59-60 Corporate Governance
00-05 The Company 06-12 Directors' Report 13-52 Financials 53-58 HSE 59-60 Corporate Governance
00-05 The Company 06-12 Directors' Report 13-52 Financials 53-58 HSE 59-60 Corporate Governance
00-05 The Company 06-12 Directors' Report 13-52 Financials 53-58 HSE 59-60 Corporate Governance
Description of terms for recognition of deferred tax Deferred income tax assets on tax losses carried forward are recognised only to the extent that realisation of the related benefit is probable. The group’s future profit
is dependent on future sales of new vehicles. The group has conducted comprehensive analyses of future cash flows and the positive net present values indicate that
future taxable profits will be available against which the tax losses will be able to be utilized, but not before 2015 at the earliest. The remaining lifetime of the group’s
tax losses is as shown below:
Lifetime Amount (MEUR)
Less than five years 5.5
5 - 10 years 4.3
10 - 15 years 0.0
15 - 20 years 30.4
Without time limit 81.2
Tax losses recognised as at 31.12 121.4
The group’s subsidiaries are located in different countries, so there will always be risks arising from local tax jurisdictions’ assessments of the respective tax positions.
Local differences could lead to different opinions about the probability of realisation and to limitations to the utilisation of losses carried forward. Local tax decisions
could therefore influence the carrying value of the group’s consolidated deferred tax asset.
The group has not recognised deferred income tax assets of MEUR 4.5 (2009: 1.8) in respect of losses amounting to MEUR 18.3 (2009: 7.2) that can be carried forward
against future taxable income.
Note 15 – Retirement benefit obligations
The parent company Kongsberg Automotive Holding ASA and its Norwegian subsidiary Kongsberg Automotive AS have defined benefit and defined contribution pension
plans. The plans were changed from defined benefit to defined contribution in 2004. The defined benefit plan was continued for employees who had already retired. The
other defined benefit plans still in operation are early retirement agreements through the AFP scheme and an early retirement plan for the CEO.
Defined benefit pension plans also exist in two subsidiaries in Germany and in subsidiaries in the Netherlands, Italy and France. The German- and Norwegian subsidiaries
represented 92 % of the groups Net benefit obligation (German: 72 %, Norwegian: 20 %) in 2010.
The subsidiaries in Sweden, the UK and the USA have defined contribution plans for employees.
15.1) Defined benefit schemes
The following actuarial assumptions have been applied when estimating future pension benefits:
KAH ASA KA Group 2010 2009 2010* 2009
3.9 % 4.4 % Discount rate 5.0 % 4.4 %
5.3 % 5.6 % Rate of return on plan assets 4.7 % 5.6 %
4.0 % 4.3 % Salary increases 2.5 % 4.3 %
3.8 % 4.0 % Increase in basic government pension amount 2.4 % 4.0 %
1.2 % 1.3 % Pension increase 0.8 % 1.3 %
* The assumptions for KA group 2010 is presented as a weighted average of the assuptions reported from respective subsidiaries. The weighted average is calculated by share of total Net pension liability multi-
plied with respective local assumtion. The 2009 assumptions are unweighted as of 2009 Annual report.

39
00-05 The Company 06-12 Directors' Report 13-52 Financials 53-58 HSE 59-60 Corporate Governance
00-05 The Company 06-12 Directors' Report 13-52 Financials 53-58 HSE 59-60 Corporate Governance
00-05 The Company 06-12 Directors' Report 13-52 Financials 53-58 HSE 59-60 Corporate Governance
00-05 The Company 06-12 Directors' Report 13-52 Financials 53-58 HSE 59-60 Corporate Governance
00-05 The Company 06-12 Directors' Report 13-52 Financials 53-58 HSE 59-60 Corporate Governance
KONGSBERG AUTOMOTIVE – ANNUAL REPORT 2010
15.2) Net periodic pension cost
KAH ASA KA Group 2010 2009 MEUR 2010 2009
0.0 0.1 Service cost 0.2 0.6
0.1 0.1 Interest on benefit obligations 0.8 1.1
0.0 0.0 Expected return on pension assets (0.1) (0.4)
0.0 0.5 Amortization of estimate differences 1.4 0.9
0.0 0.0 Administration cost 0.0 0.0
0.0 0.0 Social security taxes 0.0 0.0
(0.1) 0.0 AFP adjustment* (2.8) 0.0
0.0 0.7 Net periodic pension cost (0.6) 2.2
0.0 % 6.0 % Actual return on plan assets 5.9 % 0.4 %
* The AFP-pension arrangement in Norway has been revised. This has resulted in a decrease in pension liabilities in the Norwegian entities of total 2.8 MEUR.
15.3) Net pension liability
KAH ASA KA Group 2010 2009 MEUR 2010 2009
Pension liabilities and assets
1.6 1.8 Projected benefit obligation (PBO) 14.8 20.3
0.0 0.0 Fair value of pension assets (0.6) (3.7)
1.6 1.8 Pension liability in excess of pension asset 14.2 16.6
Unrecognized effect of changes in estimates
and differences between actual and expected
0.0 (0.1) return on pension assets (0.2) (1.6)
1.6 1.7 Net pension liability before social security taxes 14.0 15.0 0.2 0.2 Social security taxes 0.4 1.0
1.8 2.0 Net pension liability 14.4 16.0
Specification of carrying value of net pension liability (MEUR):
2010 2009
Retirement benefit obligation 14.5 17.2
Retirement benefit asset (0.1) (1.2)
Net pension liability 14.4 16.0
15.4) Changes in net pension liabilities
KAH ASA KA Group 2010 2009 MEUR 2010 2009
2.0 1.3 Net pension liability 01.01 16.0 15.4
0.0 0.7 Pension cost for the year (0.6) 2.2
(0.3) 0.0 Paid pensions (1.3) (1.6)
0.1 0.0 Translation differences 0.2 0.0
1.8 2.0 Net pension liability 31.12 14.4 16.0

40
KONGSBERG AUTOMOTIVE – ANNUAL REPORT 2010
00-05 The Company 06-12 Directors' Report 13-52 Financials 53-58 HSE 59-60 Corporate Governance
00-05 The Company 06-12 Directors' Report 13-52 Financials 53-58 HSE 59-60 Corporate Governance
00-05 The Company 06-12 Directors' Report 13-52 Financials 53-58 HSE 59-60 Corporate Governance
00-05 The Company 06-12 Directors' Report 13-52 Financials 53-58 HSE 59-60 Corporate Governance
00-05 The Company 06-12 Directors' Report 13-52 Financials 53-58 HSE 59-60 Corporate Governance
15.5) Average expected lifetimes
Average expected lifetime at the balance sheet date for a person retiring on reaching age 65:
Male employee 19 years
Female employee 21 years
Average expected lifetime 20 years after the balance sheet date for a person retiring on reaching age 65:
Male employee 23 years
Female employee 26 years
15.6) Defined contribution pension plansNorway, Sweden, the UK and the USA have defined contribution pension plans for employees. The pension plans are regulated under the tax rules of each country.
The subsidiaries in each country is required to pay the annual contributions to the plan. The expense charged to the income statement in respect of defined contribution
pension plans is disclosed in note 21 to the financial statements.
15.7) Expected pension paymentWe expect the pension payment of 2011 to be in line with the 2010 payment.
Note 16 – Interest-bearing loans and borrowings
KAH ASA KA Group 2010 2009 MEUR 2010 2009
Non-current liabilities
370.4 381.6 Bank loans 370.5 381.8
Current liabilities
0.3 0.1 Bank overdrafts 5.9 4.2
23.7 1.7 Other current interest-bearing liabilities 24.9 6.8
394.4 383.4 Total interest-bearing liabilities 401.2 392.8
Non-current liabilities
The group has outstanding financing facilities as follows (in local currencies, million):
Facility Amount Interest Rate
as of 31.12.2010 Currency Maturity Date (incl margin)
DnB Nor / Nordea Facility
Tranche in EUR 221.4 EUR 29.12.13 3.80 %
Tranche in USD 208.2 USD 29.12.13 3.26 %
Nordea Revolving Facility 250.0 NOK 29.12.13 1.20 % - 5.60 %
DNB Nor Overdraft Facility 250.0 NOK 29.12.13 0.50 % - 5.60 %
Innovasjon Norge 130.5 NOK 10.06.15 5.28 %
In December 2010, the Group repaid 1.9 MEUR (14.5 MNOK) under the Innovasjon Norge Loan. No other repayment were made in 2010.
The financing facilities bear interest at rates based on a market based reference rates plus an applicable margin. MUSD 100 and MEUR 100 have been hedged through
interest rate swaps at 3.72 % and 4.53 % respectively until Q3 2011. See also notes 10.
Please refer to the next page for the repayment schedule.
Other current interest-bearing liabilitiesThese comprise accrued interest and capital repayments on long-term loans payable within twelve months of the balance sheet date, as well certain other short-term
interest-bearing liabilities.

41
00-05 The Company 06-12 Directors' Report 13-52 Financials 53-58 HSE 59-60 Corporate Governance
00-05 The Company 06-12 Directors' Report 13-52 Financials 53-58 HSE 59-60 Corporate Governance
00-05 The Company 06-12 Directors' Report 13-52 Financials 53-58 HSE 59-60 Corporate Governance
00-05 The Company 06-12 Directors' Report 13-52 Financials 53-58 HSE 59-60 Corporate Governance
00-05 The Company 06-12 Directors' Report 13-52 Financials 53-58 HSE 59-60 Corporate Governance
KONGSBERG AUTOMOTIVE – ANNUAL REPORT 2010
Liquidity reserveThe liquidity reserve of KA group consists of: cash & cash equivalents + undrawn credit facilities. MEUR 2010 2009 Total (before use) 170.9 166.8Used (Bankoverdraft) (5.9) (4.2)
Unused liquidity reserve 165.0 162.6
Borrowings by currency were as below:
KAH ASA KA Group 2010 2009 MEUR 2010 2009
221.4 221.4 EUR 226.2 225.2
156.1 144.6 USD 156.8 147.5
17.0 17.4 NOK 17.0 18.4
0.0 0.0 Other currencies 1.2 1.7
394.4 383.4 Total interest-bearing liabilities 401.2 392.8
See Note 17 for an assessment of currency risk.
The carrying amounts and fair values of non-current borrowings are as follows:
KAH ASA KA Group 2010 2009 MEUR 2010 2009
370.4 381.6 Carrying amounts 370.5 381.8
370.4 381.6 Fair values 370.5 381.8
The carrying amount (amortised cost) is equal to the fair value of the loans. The loan terms were renegotiated in September 2009. The interest rate represents the
market’s interest rate as at the balance sheet date.
Non-current liabilities
The maturity schedule for non-current borrowings is as follows (in local currencies, million):
Year EUR USD NOK
Repayable during 2012 40.0 29.0
Repayable during 2013 161.4 208.2 29.0
Repayable during 2014 29.0
Repayable during 2015 14.5
Repayable during 2016 (and later)
Total 201.4 208.2 101.5
Current liabilities
The maturity schedule for other current interest-bearing liabilities is as follows (in local currencies, million):
The table contains accrued liabilities to be paid within 12 months (2011).
Other
As at 31.12.10 EUR USD NOK currencies
Repayable 0-3 months after year end 0.1
Repayable 3-6 months after year end 10.0 1.9
Repayable 6-9 months after year end
Repayable 9-12 months after year end 14.8 0.7 1.9 1.4
Total 24.9 0.7 3.8 1.4

42
KONGSBERG AUTOMOTIVE – ANNUAL REPORT 2010
00-05 The Company 06-12 Directors' Report 13-52 Financials 53-58 HSE 59-60 Corporate Governance
00-05 The Company 06-12 Directors' Report 13-52 Financials 53-58 HSE 59-60 Corporate Governance
00-05 The Company 06-12 Directors' Report 13-52 Financials 53-58 HSE 59-60 Corporate Governance
00-05 The Company 06-12 Directors' Report 13-52 Financials 53-58 HSE 59-60 Corporate Governance
00-05 The Company 06-12 Directors' Report 13-52 Financials 53-58 HSE 59-60 Corporate Governance
CovenantsThe group’s banking covenant requirements comprise:
Nominal equity: Minimum MEUR 50
Minimum liquidity: Minimum MEUR 50
Gearing ratio (Net Int. Bearing Debt to EBITDA) Not to be measured before end of March 2011. The required gearing ratio levels will then decrease quarterly from
7.40 initially to 3.00 per Q3 2012 and then stay on that level until termination date (29.12.13).
Capital expenditures: Maximum 4 % of consolidated turnover 2010 and 4 % thereafter. No restrictions, if below a Gearing ratio of 3.00.
Dividend restrictions: The Gearing ratio can not be higher than 3.00.
The covenants are tested quarterly. The group is in complience with the covenants as at 31.12.10. Both the liquidity and equity levels are significantly above
the covenant levels. In addition the capital expenditure (in percentage of revenue) is below the maximum permitted level.
Security for the loan agreementAll lenders are ranked pari passu with first priority security over all material shares and assets of the group.
Note 17 – Financial risk
FINANCIAL RISK MANAGEMENT
Financial risk factorsThe group’s activities expose it to a variety of
financial risks:
a) Market risk (including currency risk, interest
rate risk, and operational risks)
b) Credit risk
c) Liquidity risk.
The group’s overall risk management focuses on the
unpredictability of financial markets and seeks to
minimize potential adverse effects on the group’s
financial performance. The group exploits derivative
financial instruments for potential hedging of
certain risk exposures, however the current usage of
such instruments are limited.
(a) Market risk(i) Foreign exchange riskKongsberg Automotive operates internationally in
a number of countries and is exposed to foreign
exchange risk arising from various currency exposu-
res. The primary exposures are EUR and USD. Foreign
exchange risk arises from future commercial trans-
actions, recognized assets and liabilities and net
investments in foreign operations. As the Company
reports its financial results in EUR, changes in the
relative strength of EUR to the currencies in which
the Company conduct business can adversely affect
the Company’s financial development. Historically
changes in currency rates have had an effect on
the top line development, however it has not had a
significant impact on operating profit since the costs
usually off set the effects from the top line.
Management is monitoring the currency exposure
on a Group level. The Group treasury uses the debt
structure and profile to balance the net exposure of
the cash flow from operations. The group treasury
continually evaluates the use of hedging instruments
but has currently a low usage of such instruments.
The group has certain investments in foreign opera-tions, whose net assets are exposed to foreign
currency translation risk. Currency exposure arising
from the net assets of the group’s foreign operations
is managed primarily through borrowings denomi-
nated in the relevant foreign currencies.
SensitivityAt 31 December 2010, if the currency USD had
weakened/strengthened by 5 % against the EUR
with all other variables held constant, revenues
would have been MEUR +/- 7.5. Operating profit
would not have been significantly changed.
A change in EUR and USD of +/- 5 % versus the NOK
would have influenced the conversion of the long
term debt and hence influenced the financial items
with approximately MEUR +/- 20. These changes
would also have generated changes in currency
conversion in the equity of approximately the same
amounts, hence the equity change would have been
less significant.
(ii) Operational risksOperation and investment risks and uncertainties The Company is usually contracted as a supplier
with a long-term commitment. The commitment
is usually based on the model platforms, which for
passenger cars are typically 3 to 5 years, while on
commercial vehicles it is typically 5-7 years and
in some cases even longer. Purchase orders are
achieved on a competitive bidding basis for either a
specific time-period or indefinite time. Even if present
commit ments are cost reimbursable they can be
adversely affected by many factors and short term
variances including shortages of materials, equipment
and work force, political risk, customer default, labor
conflicts, accidents, environmental pollution, the
prices of raw materials, unforeseen problems, changes
in circumstances that may lead to cancellations and
other factors beyond the control of the Company. In
addition, some of the Company’s customer contracts
may be reduced, suspended or terminated by the
customer at any time upon the giving of notice.
Customer contracts also permit the customer to vary
the scope of work under the contract. As a result,
the Company may be required to renegotiate the
terms or scope of such contracts at any time, which
may result in the imposition of terms less favorable
than the previous terms.
CompetitionThe Company has significant competitors in each of
its business areas and across the geographical
markets in which the Company operates. The
Company believes that competition in the business
areas in which Kongsberg Automotive operates will
continue in the future.
Volatility in prices of input factorsThe Company’s financial condition is dependent on
prices of input factors, i.e. raw materials and
different semi-finished components with a varying
degree of processing, used in the production of the
various automotive parts. Some of the major raw
materials are: Steel including rod and sheet metal, cast iron
and machined steel components
Polymer components of rubber, foam, plastic
components and plastic raw materials
Copper
Zinc
Aluminium
Because of the raw material exposure, a change in the
prices of these raw materials will have an effect on
the Company. The steel, copper, zinc, aluminium and
polymer prices have reached historically high levels
over the last years, being subject to large fluctuations
in response to relatively minor changes in supply and
demand and a variety of additional factors beyond the
control of the Company, including government regu-
lation, capacity, and general economic conditions.
A substantial part of the Company’s steel and brass
(copper and zinc) based products is sold to truck

43
00-05 The Company 06-12 Directors' Report 13-52 Financials 53-58 HSE 59-60 Corporate Governance
00-05 The Company 06-12 Directors' Report 13-52 Financials 53-58 HSE 59-60 Corporate Governance
00-05 The Company 06-12 Directors' Report 13-52 Financials 53-58 HSE 59-60 Corporate Governance
00-05 The Company 06-12 Directors' Report 13-52 Financials 53-58 HSE 59-60 Corporate Governance
00-05 The Company 06-12 Directors' Report 13-52 Financials 53-58 HSE 59-60 Corporate Governance
KONGSBERG AUTOMOTIVE – ANNUAL REPORT 2010
Note 18 – Trade and other payables
manufacturers. Business practice in the truck industry
allows the Company to some extent to pass increa-
ses in steel, aluminium and brass prices over to its
customers. However, there is a time lag of three to six
months before the Company can adjust the price of
its products to reflect fluctuations in the mentioned
raw material prices, and a sudden change in market
conditions could therefore impact the Company’s
financial position, revenues, profits and cash flow.
When the market prices go down the adverse affect
will occur. For products sold to passenger car appli-
cations, the Company does not have the same oppor-
tunity to pass increases in raw materials prices.
Uninsured lossesThe Company maintains a number of separate
insurance policies to protect its core businesses
against loss and/or liability to third parties. Risks
insured include general liability, business interrup-
tion, workers’ compensation and employee liability,
professional indemnity and material damage.
(iii) Interest rate riskThe group’s interest rate risk arises from long-term
borrowings. The Group’s debt is mainly drawn up in
EUR and USD with the corresponding interest rates.
The group analyses its interest rate exposure on a run-
ning basis. Various scenarios are simulated taking into
consideration refinancing, renewal of existing positions,
alternative financing and hedging. Based on the various
scenarios, the group manages its cash flow interest rate
risk by using floating-to-fixed interest rate swaps. Such
interest rate swaps have the economic effect of con-
verting borrowings from floating rates to fixed rates.
Based on these scenarios, the group calculates the im-
pact on profit and loss of a defined interest rate shift.
SensitivityBased on the simulations performed per 31.12.2010,
the impact on pre tax profit of a +/- 0.5 % shift in
both the EUR and USD interest would be a maximum
increase or decrease of MEUR 2.1.
(b) Credit riskCredit risk is managed on group basis. Credit risk
arises mainly from trade with customers and out-
standing receivables. The level of receivables and
overdue are monitored on a weekly basis. Historically
the Group have had very limited loss on receivables.
The automotive industry consist of a limited num-
ber of vehicle manufacturers, hence the 5 biggest
customers will be in the around 35% of total sales.
The company have a very diversified customer base,
where no individual customer represents more than
10 % of the Group’s revenues. It is the company’s
opinion that concentration risks is not present,
however due to the number of vehicle manufacturer
and hence customers it could be viewed to exist a
concentration risk.
(c) Liquidity riskCash flow forecasting is performed by each ope-
rating entities of the group on a weekly basis for
the next 12 weeks. Group finance monitors these
forecasts and the 5 quarter rolling forecasts for
the group to keep track of the group’s liquidity re-
quirements and to ensure there are sufficient cash
to meet both operational needs while maintaining
sufficient headroom on its undrawn committed bor-
rowing facilities at all times so that the group does
not breach borrowing limits or covenants on any
of its borrowing facilities. Surplus cash held by the
operating entities over and above balance required
for working capital management are transferred to
the Group treasury. For unused liquidity reserve, see
note 16.
CAPITAL RISK MANAGEMENTThe group’s objectives when managing capital are to
safeguard the group’s ability to continue as a going
concern in order to provide returns for shareholders
and benefits for other stakeholders and to maintain
an optimal capital structure to reduce the cost of
capital and balance the risk profile.
The group monitors capital on the basis of the gea-
ring ratio and the level of equity. These ratios are
calculated as net debt divided by EBITDA and Equity
divided by total balance. The Group has a treasury
policy regulating the levels on these key ratios.
KAH ASA KA Group 2010 2009 MEUR 2010 2009
0.3 0.1 Trade payables 110.3 79.5
8.6 20.8 Short-term group liabilities 0.0 0.0
1.9 1.1 Accrued expenses 56.6 41.5
4.7 9.9 Other short-term liabilities 9.7 11.6
15.6 31.9 Total 176.6 132.6
Trade payables The Group trade payables (external) have the following maturity structure at 31.12.2010:
In % of gross
Maturity Amounts in MEUR treade by payables
Repayable 0-3 months after year end 102.8 93.2 %
Repayable 3-6 months after year end 6.7 6.1 %
Repayable 6-9 months after year end 0.4 0.4 %
Repayable 9-12 months after year end 0.4 0.3 %
Net trade payables 110.3
The Group total provision for restructuring cost is MEUR 3.9 per 31.12.10 (2009: 0.3).

44
KONGSBERG AUTOMOTIVE – ANNUAL REPORT 2010
00-05 The Company 06-12 Directors' Report 13-52 Financials 53-58 HSE 59-60 Corporate Governance
00-05 The Company 06-12 Directors' Report 13-52 Financials 53-58 HSE 59-60 Corporate Governance
00-05 The Company 06-12 Directors' Report 13-52 Financials 53-58 HSE 59-60 Corporate Governance
00-05 The Company 06-12 Directors' Report 13-52 Financials 53-58 HSE 59-60 Corporate Governance
00-05 The Company 06-12 Directors' Report 13-52 Financials 53-58 HSE 59-60 Corporate Governance
Note 19 – Remuneration and fees for management, board of directors and auditor
The following amounts of remuneration and fees have been expensed in the income statement (KEUR) 2010 2009
Total remuneration of the Board of Directors 170.1 162.0
Salary of the CEOs 411.0 376.9
Other remuneration of the CEOs 15.6 14.9
Pension costs of the CEOs 228.4 5.8
Management salaries other than to the CEOs 1 784.3 795.8
Other remuneration of management other than the CEOs 70.9 120.7
Pension costs of management other than the CEOs 48.6 17.4
Total 2 728.8 1 493.5
Hans Peter Havdal assumed the position of CEO from Olav Volldal on 01.04.10. The amounts presented above represent the remuneration of the two CEOs
for their respective periods of office.
Spesification of remuneration to Board of Directors (KEUR)
Name Position 2010 2009
Ulla-Britt Fräjdin-Hellqvist Chairman 40.5 26.2
Tone Bjørnov 35.4 15.8
Thomas Falck 17.4 0.0
Jürgen K. Harnisch 25.9 26.2
Kjell A. Kristiansen 7.6 4.8
Tonje Sivesindtajet 7.6 4.8
Eivind A. Holvik 10.7 4.8
Others (replaced board members) 25.0 79.7
Total - Board of Directors 170.1 162.0
Compensation Audit BOD
Name committee committee meetings Total 2010
Ulla-Britt Fräjdin-Hellqvist 2.2 2.5 35.8 40.5
Tone Bjørnov 3.1 6.3 26.0 35.4
Thomas Falck 2.5 14.9 17.4
Jürgen K. Harnisch 25.9 25.9
Kjell A. Kristiansen 7.6 7.6
Tonje Sivesindtajet 7.6 7.6
Eivind A. Holvik 3.1 7.6 10.7
Others (replaced board members) 2.2 22.8 25.0
Total - Board of Directors 10.6 11.3 148.2 170.1
Spesification of remuneration to management other than the CEO (KEUR) 2010 Name Position Salary Pension Other Hans Peter Havdal* President & CEO 70.5 3.3 3.1 Bård Klungseth Executive Vice President, COO 274.1 6.5 13.0Trond Stabekk Executive Vice President, CFO 202.2 6.5 13.0Bent Wessel-Aas Executive Vice President, Business Development 162.0 6.5 13.0Joachim Magnusson Executive Vice President, Driveline Systems 193.4 0.0 2.4Raymond Bomya Executive Vice President, Interior Systems 211.1 1.9 16.9Scott Paquette Executive Vice President, Fluid Transfer Systems 171.1 4.7 0.0Trond Fiskum Executive Vice President, Actuation & Chassis Systems 190.7 14.3 0.0James G Ryan Executive Vice President, Power Products Systems 185.3 4.9 9.1Niklas Berntsson Executive Vice President, Purchase 124.0 0.0 0.5
Total - management other than CEO 1 784.3 48.6 70.9
* The amounts above represent the remuneration of Hans Peter Havdal in his role as President of Automotive Systems for the three first months of the year.
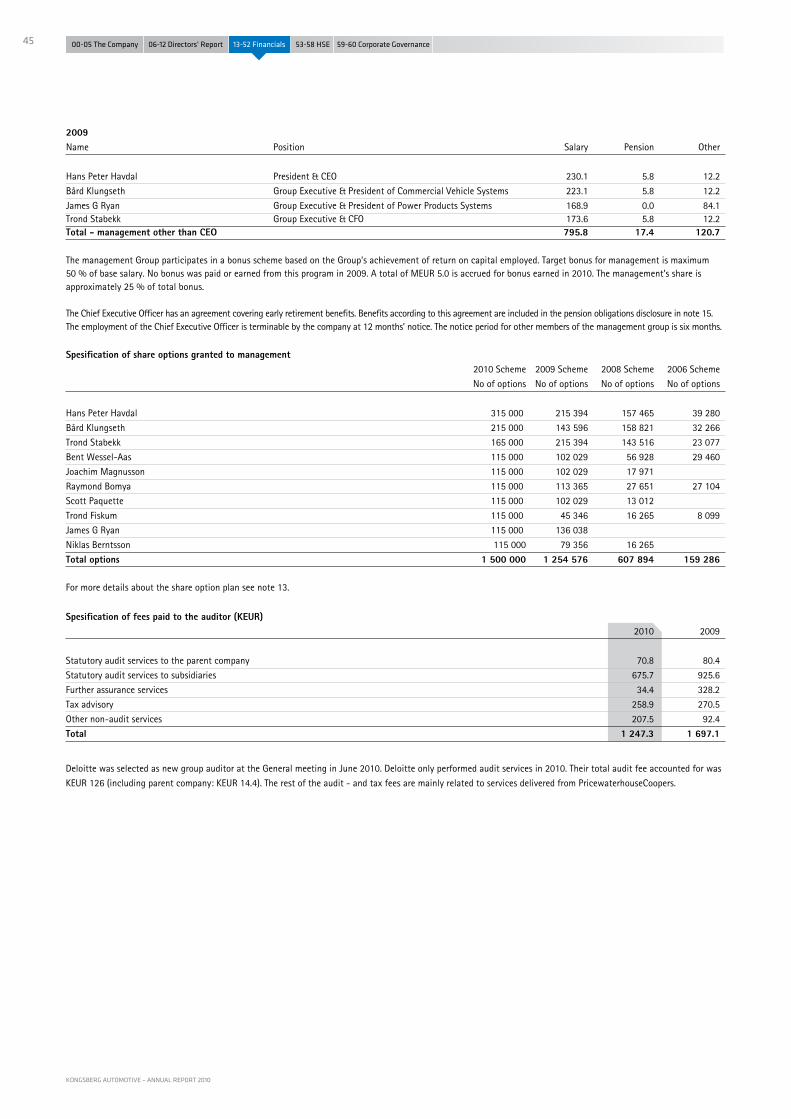
45
00-05 The Company 06-12 Directors' Report 13-52 Financials 53-58 HSE 59-60 Corporate Governance
00-05 The Company 06-12 Directors' Report 13-52 Financials 53-58 HSE 59-60 Corporate Governance
00-05 The Company 06-12 Directors' Report 13-52 Financials 53-58 HSE 59-60 Corporate Governance
00-05 The Company 06-12 Directors' Report 13-52 Financials 53-58 HSE 59-60 Corporate Governance
00-05 The Company 06-12 Directors' Report 13-52 Financials 53-58 HSE 59-60 Corporate Governance
KONGSBERG AUTOMOTIVE – ANNUAL REPORT 2010
2009 Name Position Salary Pension Other
Hans Peter Havdal President & CEO 230.1 5.8 12.2
Bård Klungseth Group Executive & President of Commercial Vehicle Systems 223.1 5.8 12.2
James G Ryan Group Executive & President of Power Products Systems 168.9 0.0 84.1 Trond Stabekk Group Executive & CFO 173.6 5.8 12.2 Total - management other than CEO 795.8 17.4 120.7 The management Group participates in a bonus scheme based on the Group’s achievement of return on capital employed. Target bonus for management is maximum 50 % of base salary. No bonus was paid or earned from this program in 2009. A total of MEUR 5.0 is accrued for bonus earned in 2010. The management’s share is approximately 25 % of total bonus.
The Chief Executive Officer has an agreement covering early retirement benefits. Benefits according to this agreement are included in the pension obligations disclosure in note 15. The employment of the Chief Executive Officer is terminable by the company at 12 months’ notice. The notice period for other members of the management group is six months.
Spesification of share options granted to management 2010 Scheme 2009 Scheme 2008 Scheme 2006 Scheme
No of options No of options No of options No of options
Hans Peter Havdal 315 000 215 394 157 465 39 280
Bård Klungseth 215 000 143 596 158 821 32 266
Trond Stabekk 165 000 215 394 143 516 23 077
Bent Wessel-Aas 115 000 102 029 56 928 29 460
Joachim Magnusson 115 000 102 029 17 971
Raymond Bomya 115 000 113 365 27 651 27 104
Scott Paquette 115 000 102 029 13 012
Trond Fiskum 115 000 45 346 16 265 8 099
James G Ryan 115 000 136 038
Niklas Berntsson 115 000 79 356 16 265
Total options 1 500 000 1 254 576 607 894 159 286 For more details about the share option plan see note 13.
Spesification of fees paid to the auditor (KEUR)
2010 2009
Statutory audit services to the parent company 70.8 80.4
Statutory audit services to subsidiaries 675.7 925.6
Further assurance services 34.4 328.2
Tax advisory 258.9 270.5
Other non-audit services 207.5 92.4
Total 1 247.3 1 697.1
Deloitte was selected as new group auditor at the General meeting in June 2010. Deloitte only performed audit services in 2010. Their total audit fee accounted for was
KEUR 126 (including parent company: KEUR 14.4). The rest of the audit - and tax fees are mainly related to services delivered from PricewaterhouseCoopers.

46
KONGSBERG AUTOMOTIVE – ANNUAL REPORT 2010
00-05 The Company 06-12 Directors' Report 13-52 Financials 53-58 HSE 59-60 Corporate Governance
00-05 The Company 06-12 Directors' Report 13-52 Financials 53-58 HSE 59-60 Corporate Governance
00-05 The Company 06-12 Directors' Report 13-52 Financials 53-58 HSE 59-60 Corporate Governance
00-05 The Company 06-12 Directors' Report 13-52 Financials 53-58 HSE 59-60 Corporate Governance
00-05 The Company 06-12 Directors' Report 13-52 Financials 53-58 HSE 59-60 Corporate Governance
KAH ASA KA Group 2010 2009 MEUR 2010 2009
2.9 1.6 Wages and salaries 154.1 130.9
0.4 0.5 Social security tax 28.3 22.2
0.0 0.7 Pension cost (defined benefit plans) 5.5 2.4
(0.2) 0.1 Pension cost (defined contribution plans) 3.4 2.8
1.8 0.4 Other payments 18.0 10.6
5.0 3.3 Total 209.2 168.9
As at 31.12.10 the group had 10.538 employees and the parent company 17 employees.
Note 21 – Salaries and social expenses
Board of Directors No of shares
Ulla-Britt Fräjdin-Hellqvist 32 800
Tone Bjørnov 0
Thomas Falck 400 000
Jürgen K. Harnisch 80 000
Kjell A. Kristiansen 20 180
Tonje Sivesindtajet 33 000
Eivind A. Holvik 0
Total number of shares 565 980
Group management No of shares
Hans Peter Havdal 297 025
Bård Klungseth 95 238
Trond Stabekk 103 080
Bent Wessel-Aas 415 004
Joachim Magnusson 23 693
Raymond Bomya 31 022
Scott Paquette 40 800
Trond Fiskum 240 673
James G Ryan 158 400
Niklas Berntsson 32 400
Total number of shares 1 437 335
Note 20 – Shares owned by management and board of directors as at 31.12.10
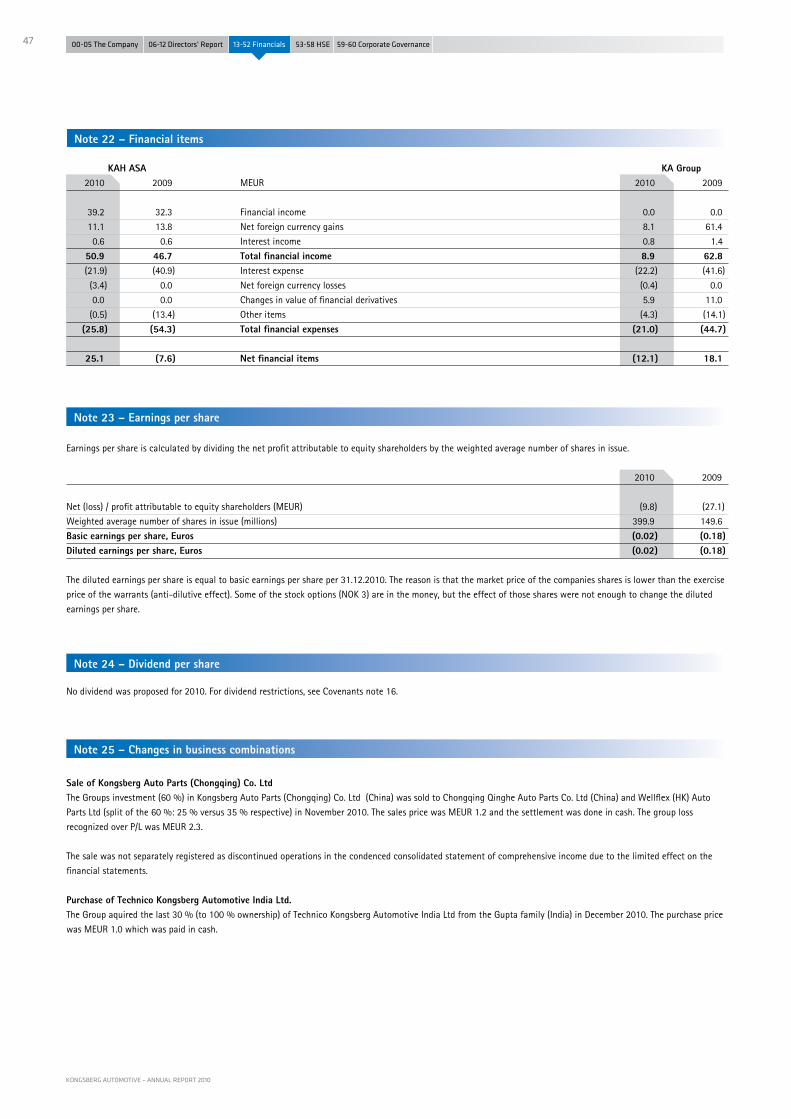
47
00-05 The Company 06-12 Directors' Report 13-52 Financials 53-58 HSE 59-60 Corporate Governance
00-05 The Company 06-12 Directors' Report 13-52 Financials 53-58 HSE 59-60 Corporate Governance
00-05 The Company 06-12 Directors' Report 13-52 Financials 53-58 HSE 59-60 Corporate Governance
00-05 The Company 06-12 Directors' Report 13-52 Financials 53-58 HSE 59-60 Corporate Governance
00-05 The Company 06-12 Directors' Report 13-52 Financials 53-58 HSE 59-60 Corporate Governance
KONGSBERG AUTOMOTIVE – ANNUAL REPORT 2010
Sale of Kongsberg Auto Parts (Chongqing) Co. Ltd The Groups investment (60 %) in Kongsberg Auto Parts (Chongqing) Co. Ltd (China) was sold to Chongqing Qinghe Auto Parts Co. Ltd (China) and Wellflex (HK) Auto
Parts Ltd (split of the 60 %: 25 % versus 35 % respective) in November 2010. The sales price was MEUR 1.2 and the settlement was done in cash. The group loss
recognized over P/L was MEUR 2.3.
The sale was not separately registered as discontinued operations in the condenced consolidated statement of comprehensive income due to the limited effect on the
financial statements.
Purchase of Technico Kongsberg Automotive India Ltd.The Group aquired the last 30 % (to 100 % ownership) of Technico Kongsberg Automotive India Ltd from the Gupta family (India) in December 2010. The purchase price
was MEUR 1.0 which was paid in cash.
Note 25 – Changes in business combinations
No dividend was proposed for 2010. For dividend restrictions, see Covenants note 16.
KAH ASA KA Group 2010 2009 MEUR 2010 2009
39.2 32.3 Financial income 0.0 0.0
11.1 13.8 Net foreign currency gains 8.1 61.4
0.6 0.6 Interest income 0.8 1.4
50.9 46.7 Total financial income 8.9 62.8 (21.9) (40.9) Interest expense (22.2) (41.6)
(3.4) 0.0 Net foreign currency losses (0.4) 0.0
0.0 0.0 Changes in value of financial derivatives 5.9 11.0
(0.5) (13.4) Other items (4.3) (14.1)
(25.8) (54.3) Total financial expenses (21.0) (44.7) 25.1 (7.6) Net financial items (12.1) 18.1
Earnings per share is calculated by dividing the net profit attributable to equity shareholders by the weighted average number of shares in issue.
2010 2009
Net (loss) / profit attributable to equity shareholders (MEUR) (9.8) (27.1)
Weighted average number of shares in issue (millions) 399.9 149.6
Basic earnings per share, Euros (0.02) (0.18)Diluted earnings per share, Euros (0.02) (0.18)
The diluted earnings per share is equal to basic earnings per share per 31.12.2010. The reason is that the market price of the companies shares is lower than the exercise
price of the warrants (anti-dilutive effect). Some of the stock options (NOK 3) are in the money, but the effect of those shares were not enough to change the diluted
earnings per share.
Note 23 – Earnings per share
Note 22 – Financial items
Note 24 – Dividend per share
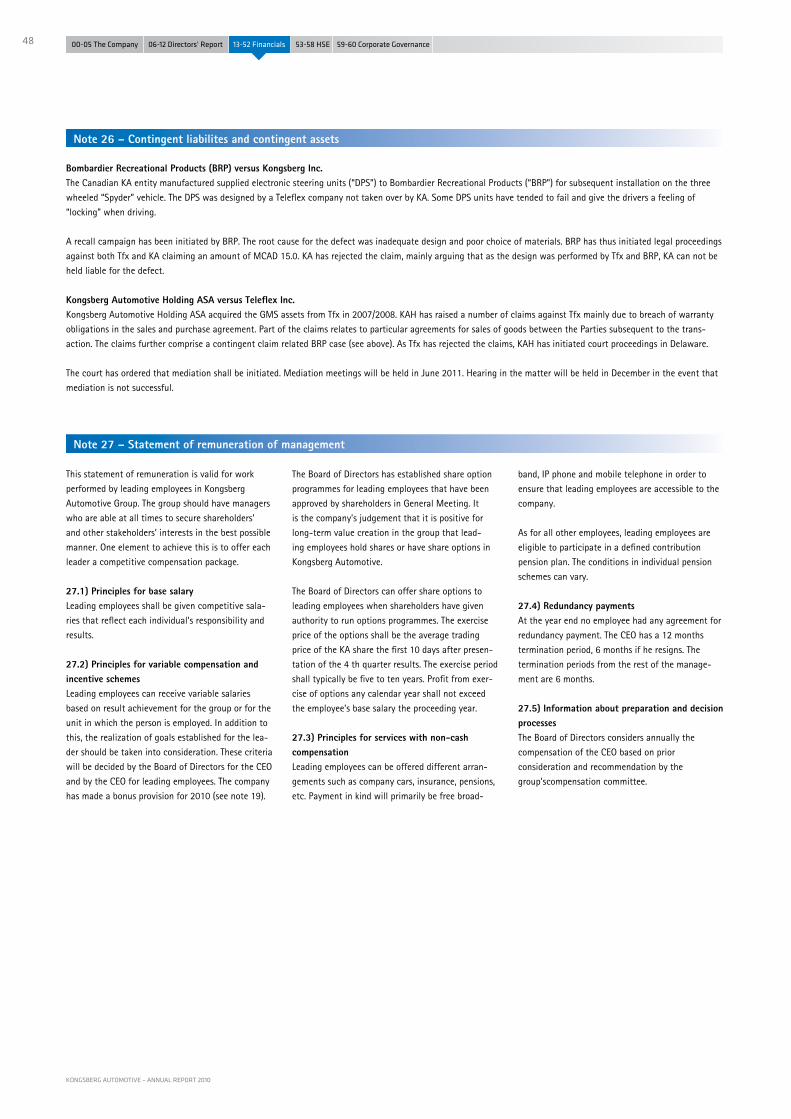
48
KONGSBERG AUTOMOTIVE – ANNUAL REPORT 2010
00-05 The Company 06-12 Directors' Report 13-52 Financials 53-58 HSE 59-60 Corporate Governance
00-05 The Company 06-12 Directors' Report 13-52 Financials 53-58 HSE 59-60 Corporate Governance
00-05 The Company 06-12 Directors' Report 13-52 Financials 53-58 HSE 59-60 Corporate Governance
00-05 The Company 06-12 Directors' Report 13-52 Financials 53-58 HSE 59-60 Corporate Governance
00-05 The Company 06-12 Directors' Report 13-52 Financials 53-58 HSE 59-60 Corporate Governance
This statement of remuneration is valid for work
performed by leading employees in Kongsberg
Automotive Group. The group should have managers
who are able at all times to secure shareholders’
and other stakeholders’ interests in the best possible
manner. One element to achieve this is to offer each
leader a competitive compensation package.
27.1) Principles for base salaryLeading employees shall be given competitive sala-
ries that reflect each individual’s responsibility and
results.
27.2) Principles for variable compensation and incentive schemesLeading employees can receive variable salaries
based on result achievement for the group or for the
unit in which the person is employed. In addition to
this, the realization of goals established for the lea-
der should be taken into consideration. These criteria
will be decided by the Board of Directors for the CEO
and by the CEO for leading employees. The company
has made a bonus provision for 2010 (see note 19).
The Board of Directors has established share option
programmes for leading employees that have been
approved by shareholders in General Meeting. It
is the company’s judgement that it is positive for
long-term value creation in the group that lead-
ing employees hold shares or have share options in
Kongsberg Automotive.
The Board of Directors can offer share options to
leading employees when shareholders have given
authority to run options programmes. The exercise
price of the options shall be the average trading
price of the KA share the first 10 days after presen-
tation of the 4 th quarter results. The exercise period
shall typically be five to ten years. Profit from exer-
cise of options any calendar year shall not exceed
the employee’s base salary the proceeding year.
27.3) Principles for services with non-cash compensationLeading employees can be offered different arran-
gements such as company cars, insurance, pensions,
etc. Payment in kind will primarily be free broad-
band, IP phone and mobile telephone in order to
ensure that leading employees are accessible to the
company.
As for all other employees, leading employees are
eligible to participate in a defined contribution
pension plan. The conditions in individual pension
schemes can vary.
27.4) Redundancy paymentsAt the year end no employee had any agreement for
redundancy payment. The CEO has a 12 months
termination period, 6 months if he resigns. The
termination periods from the rest of the manage-
ment are 6 months.
27.5) Information about preparation and decision processesThe Board of Directors considers annually the
compensation of the CEO based on prior
consider ation and recommendation by the
group’scompensation committee.
Note 27 – Statement of remuneration of management
Bombardier Recreational Products (BRP) versus Kongsberg Inc.The Canadian KA entity manufactured supplied electronic steering units (“DPS”) to Bombardier Recreational Products (“BRP”) for subsequent installation on the three
wheeled “Spyder” vehicle. The DPS was designed by a Teleflex company not taken over by KA. Some DPS units have tended to fail and give the drivers a feeling of
“locking” when driving.
A recall campaign has been initiated by BRP. The root cause for the defect was inadequate design and poor choice of materials. BRP has thus initiated legal proceedings
against both Tfx and KA claiming an amount of MCAD 15.0. KA has rejected the claim, mainly arguing that as the design was performed by Tfx and BRP, KA can not be
held liable for the defect.
Kongsberg Automotive Holding ASA versus Teleflex Inc. Kongsberg Automotive Holding ASA acquired the GMS assets from Tfx in 2007/2008. KAH has raised a number of claims against Tfx mainly due to breach of warranty
obligations in the sales and purchase agreement. Part of the claims relates to particular agreements for sales of goods between the Parties subsequent to the trans-
action. The claims further comprise a contingent claim related BRP case (see above). As Tfx has rejected the claims, KAH has initiated court proceedings in Delaware.
The court has ordered that mediation shall be initiated. Mediation meetings will be held in June 2011. Hearing in the matter will be held in December in the event that
mediation is not successful.
Note 26 – Contingent liabilites and contingent assets

49
00-05 The Company 06-12 Directors' Report 13-52 Financials 53-58 HSE 59-60 Corporate Governance
00-05 The Company 06-12 Directors' Report 13-52 Financials 53-58 HSE 59-60 Corporate Governance
00-05 The Company 06-12 Directors' Report 13-52 Financials 53-58 HSE 59-60 Corporate Governance
00-05 The Company 06-12 Directors' Report 13-52 Financials 53-58 HSE 59-60 Corporate Governance
00-05 The Company 06-12 Directors' Report 13-52 Financials 53-58 HSE 59-60 Corporate Governance
KONGSBERG AUTOMOTIVE – ANNUAL REPORT 2010
Deloitte refers to one or more of Deloitte Touche Tohmatsu Limited, a UK Limited company, and its network of member firms, each of which is a legally separate and independent entity. Please see www.deloitte.com/no/omoss for a detailed description of the legal structure of Deloitte Touche Tohmatsu and its member firms.
org.nr: 980 211 282
Deloitte AS Karenslyst allé 20 Postboks 347 Skøyen NO-0213 Oslo Norway Tel: +47 23 27 90 00 Fax: +47 23 27 90 01 www.deloitte.no
Translation from the original Norwegian version To the Annual Shareholders' Meeting of Kongsberg Automotive Holding ASA INDEPENDENT AUDITOR’S REPORT Report on the Financial Statements We have audited the accompanying financial statements of Kongsberg Automotive Holding ASA, which comprise the financial statements for the parent company and the financial statements for the group. The financial statements for the parent company comprise the statement of financial position as at 31 December 2010, the statement of comprehensive income, the statement of changes in equity and the statement of cash flows for the year then ended and a summary of significant accounting policies and other explanatory information. The financial statements for the group comprise the statement of financial position as at 31 December 2010, the statement of comprehensive income, the statement of changes in equity and the statement of cash flows for the year then ended and a summary of significant accounting policies and other explanatory information. The Board of Directors and the President and CEO’s Responsibility for the Financial Statements The Board of Directors and the President and CEO are responsible for the preparation and fair presentation of these financial statements in accordance with simplified application of international accounting standards according to the Norwegian accounting act § 3-9 for the company accounts and in accordance with International Financial Reporting Standards as adopted by EU for the group accounts, and for such internal control as the Board of Directors and the President and CEO determines is necessary to enable the preparation of financial statements that are free from material misstatement, whether due to fraud or error. Auditor’s Responsibility Our responsibility is to express an opinion on these financial statements based on our audit. We conducted our audit in accordance with laws, regulations, and auditing standards and practices generally accepted in Norway, including International Standards on Auditing. Those standards require that we comply with ethical requirements and plan and perform the audit to obtain reasonable assurance about whether the financial statements are free from material misstatement. An audit involves performing procedures to obtain audit evidence about the amounts and disclosures in the financial statements. The procedures selected depend on the auditor’s judgment, including the assessment of the risks of material misstatement of the financial statements, whether due to fraud or error. In making those risk assessments, the auditor considers internal control relevant to the entity’s preparation and fair presentation of the financial statements in order to design audit procedures that are appropriate in the circumstances, but not for the purpose of expressing an opinion on the effectiveness of the entity’s internal control. An audit also includes evaluating the appropriateness of accounting policies used and the reasonableness of accounting estimates made by management, as well as evaluating the overall presentation of the financial statements.
Report of the Auditors

50
KONGSBERG AUTOMOTIVE – ANNUAL REPORT 2010
00-05 The Company 06-12 Directors' Report 13-52 Financials 53-58 HSE 59-60 Corporate Governance
00-05 The Company 06-12 Directors' Report 13-52 Financials 53-58 HSE 59-60 Corporate Governance
00-05 The Company 06-12 Directors' Report 13-52 Financials 53-58 HSE 59-60 Corporate Governance
00-05 The Company 06-12 Directors' Report 13-52 Financials 53-58 HSE 59-60 Corporate Governance
00-05 The Company 06-12 Directors' Report 13-52 Financials 53-58 HSE 59-60 Corporate Governance
page 2
We believe that the audit evidence we have obtained is sufficient and appropriate to provide a basis for our audit opinion. Opinion on the financial statements for the parent company In our opinion, the financial statements of the parent company give a true and fair view of the financial position of Kongsberg Automotive Holding ASA as at 31 December 2010, and of its financial performance and its cash flows for the year then ended in accordance with simplified application of international accounting standards according to the Norwegian accounting act § 3-9. Opinion on the financial statements for the group In our opinion, the financial statements of the group give a true and fair view of the financial position of the group Kongsberg Automotive Holding ASA as at 31 December 2010, and of its financial performance and its cash flows for the year then ended in accordance with International Financial Reporting Standards as adopted by EU. Report on Other Legal and Regulatory Requirements Opinion on the Board of Directors’ report and the allocation of the profit Based on our audit of the financial statements as described above, it is our opinion that the information presented in the Board of Directors report concerning the financial statements and the going concern assumption, and the proposal in the financial statements for the allocation of the profit complies with the law and regulations and that the information is consistent with the financial statements. Opinion on Registration and Documentation Based on our audit of the financial statements as described above, and control procedures we have considered necessary in accordance with the International Standard on Assurance Engagements (ISAE) 3000, «Assurance Engagements Other than Audits or Reviews of Historical Financial Information», it is our opinion that the company’s management has fulfilled its duty to produce a proper and clearly set out registration and documentation of the company’s accounting information in accordance with the law and bookkeeping standards and practices generally accepted in Norway. Oslo, 23 March 2011 Deloitte AS Ingebret G. Hisdal State Authorised Public Accountant (Norway) [Translation has been made for information purposes only]

51
00-05 The Company 06-12 Directors' Report 13-52 Financials 53-58 HSE 59-60 Corporate Governance
00-05 The Company 06-12 Directors' Report 13-52 Financials 53-58 HSE 59-60 Corporate Governance
00-05 The Company 06-12 Directors' Report 13-52 Financials 53-58 HSE 59-60 Corporate Governance
00-05 The Company 06-12 Directors' Report 13-52 Financials 53-58 HSE 59-60 Corporate Governance
00-05 The Company 06-12 Directors' Report 13-52 Financials 53-58 HSE 59-60 Corporate Governance
KONGSBERG AUTOMOTIVE – ANNUAL REPORT 2010
Declaration to the Annual Report 2010
Responsibility Statement
We confirm, to the best of our knowledge, that the consolidated financial statements for the period 1 January to 31 December 2010 have been prepared in accordance with IFRS as adopted by EU, as well as additional information requirements in accordance with the Norwegian Accounting Act, and that the financial statements of the parent company for 2010 have been prepared in accordance with simplified application of international accounting standards according to the Norwegian Accounting Act § 3-9, and that the information presented in the financial statements give a true and fair view of the Company’s and the Group’s assets, liabilities, financial position and result for the period viewed in their entirety. We also confirm that the Board of Directors report gives a true and fair view of the development, performance and the financial position of the Company and the Group, and includes a description of the principle risks and uncertainties facing the Company and the Group.
Kongsberg, 23.03.2011Board of Directors in Kongsberg Automotive Holding ASA
Dr. Jürgen Harnisch(Sign.)
Kjell Kristiansen(Sign.)
Tonje Sivesindtajet(Sign.)
Ulla-Britt Fräjdin-HellqvistChairman
(Sign.)
Tone Bjørnov(Sign.)
Thomas Falck(Sign.)
Hans Petter HavdalPresident and CEO
(Sign.)
Eivind Holvik(Sign.)
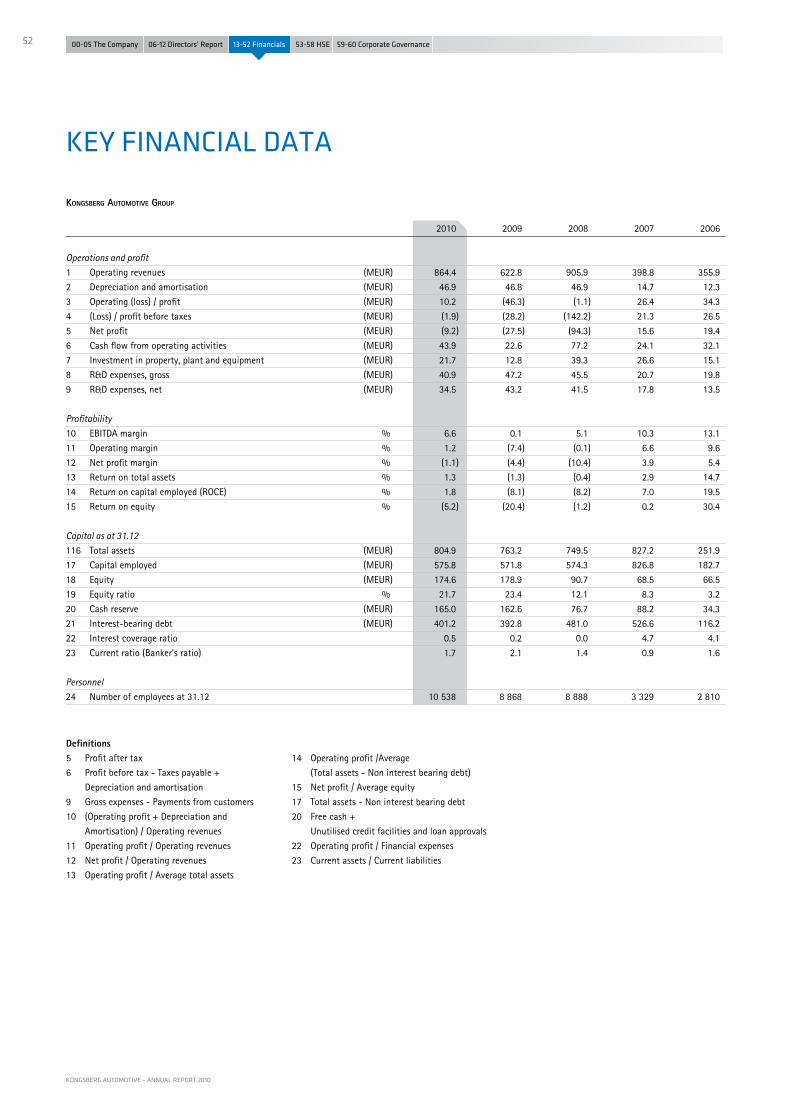
52
KONGSBERG AUTOMOTIVE – ANNUAL REPORT 2010
00-05 The Company 06-12 Directors' Report 13-52 Financials 53-58 HSE 59-60 Corporate Governance
00-05 The Company 06-12 Directors' Report 13-52 Financials 53-58 HSE 59-60 Corporate Governance
00-05 The Company 06-12 Directors' Report 13-52 Financials 53-58 HSE 59-60 Corporate Governance
00-05 The Company 06-12 Directors' Report 13-52 Financials 53-58 HSE 59-60 Corporate Governance
00-05 The Company 06-12 Directors' Report 13-52 Financials 53-58 HSE 59-60 Corporate Governance
Definitions 5 Profit after tax
6 Profit before tax - Taxes payable +
Depreciation and amortisation
9 Gross expenses - Payments from customers
10 (Operating profit + Depreciation and
Amortisation) / Operating revenues
11 Operating profit / Operating revenues
12 Net profit / Operating revenues
13 Operating profit / Average total assets
14 Operating profit /Average
(Total assets - Non interest bearing debt)
15 Net profit / Average equity
17 Total assets - Non interest bearing debt
20 Free cash +
Unutilised credit facilities and loan approvals
22 Operating profit / Financial expenses
23 Current assets / Current liabilities
KEY FINANCIAL DATA
Kongsberg Automotive group
2010 2009 2008 2007 2006
Operations and profit
1 Operating revenues (MEUR) 864.4 622.8 905.9 398.8 355.9
2 Depreciation and amortisation (MEUR) 46.9 46.8 46.9 14.7 12.3
3 Operating (loss) / profit (MEUR) 10.2 (46.3) (1.1) 26.4 34.3
4 (Loss) / profit before taxes (MEUR) (1.9) (28.2) (142.2) 21.3 26.5
5 Net profit (MEUR) (9.2) (27.5) (94.3) 15.6 19.4
6 Cash flow from operating activities (MEUR) 43.9 22.6 77.2 24.1 32.1
7 Investment in property, plant and equipment (MEUR) 21.7 12.8 39.3 26.6 15.1
8 R&D expenses, gross (MEUR) 40.9 47.2 45.5 20.7 19.8
9 R&D expenses, net (MEUR) 34.5 43.2 41.5 17.8 13.5
Profitability
10 EBITDA margin % 6.6 0.1 5.1 10.3 13.1
11 Operating margin % 1.2 (7.4) (0.1) 6.6 9.6
12 Net profit margin % (1.1) (4.4) (10.4) 3.9 5.4
13 Return on total assets % 1.3 (1.3) (0.4) 2.9 14.7
14 Return on capital employed (ROCE) % 1.8 (8.1) (8.2) 7.0 19.5
15 Return on equity % (5.2) (20.4) (1.2) 0.2 30.4
Capital as at 31.12
116 Total assets (MEUR) 804.9 763.2 749.5 827.2 251.9
17 Capital employed (MEUR) 575.8 571.8 574.3 826.8 182.7
18 Equity (MEUR) 174.6 178.9 90.7 68.5 66.5
19 Equity ratio % 21.7 23.4 12.1 8.3 3.2
20 Cash reserve (MEUR) 165.0 162.6 76.7 88.2 34.3
21 Interest-bearing debt (MEUR) 401.2 392.8 481.0 526.6 116.2
22 Interest coverage ratio 0.5 0.2 0.0 4.7 4.1
23 Current ratio (Banker’s ratio) 1.7 2.1 1.4 0.9 1.6
Personnel
24 Number of employees at 31.12 10 538 8 868 8 888 3 329 2 810

53
00-05 The Company 06-12 Directors' Report 13-52 Financials 53-58 HSE 59-60 Corporate Governance
00-05 The Company 06-12 Directors' Report 13-52 Financials 53-58 HSE 59-60 Corporate Governance
00-05 The Company 06-12 Directors' Report 13-52 Financials 53-58 HSE 59-60 Corporate Governance
00-05 The Company 06-12 Directors' Report 13-52 Financials 53-58 HSE 59-60 Corporate Governance
00-05 The Company 06-12 Directors' Report 13-52 Financials 53-58 HSE 59-60 Corporate Governance
KONGSBERG AUTOMOTIVE – ANNUAL REPORT 2010
Kongsberg Automotive, and all of its opera-ting units, subscribe to the following policies.
Health and Safety PolicyKongsberg Automotive gives the highest pri-ority to the health, safety and well-being of all employees and those who may be affected by our work activities. This is a consequence of applying our core values and will serve as the basis for goods and services we provide and the foundation on which to achieve our business objectives.
We are committed to achieving the highest-industry standards by;
Assessing the nature and scale of risk through a program of continuous impro-vement.
Setting objectives and targets to gain im-provements in overall health and safety performance.
Complying with applicable legislation and other relevant requirements.
Providing necessary information, instruc-tion and training.
Putting into place preventative, then pro-tective, measures to eliminate, reduce and control potential to cause injury, harm or loss.
Tracking health and safety performance through internal evaluation and repor-ting.
Emphasizing to all employees, suppliers, contractors, and others working on our behalf, their responsibility and accounta-bility for safe performance.
Statement for working knowledge:“Put safety first”. Identify any safety or health hazards so preventative action can be taken before an incident occurs.”
Environmental PolicyKongsberg Automotive is committed to take responsibility for the environment. We strive to improve our environmental performance as this is essential in meeting our business objectives and customer demands. We respect the concerns of the communities where we operate and value the input of interested parties, especially our employees.
We assure our commitment by: Assessing the scale of our environmental
aspects and impacts through a program of continuous improvement.
Executing specific plans of action with measurable targets.
Complying with all legal and other rele-vant requirements.
Evaluating our processes and products to optimize the use of resources and where practicable reusing, recycling and recove-ring material to minimize waste.
Providing necessary information, instruc-tion and training.
Tracking our performance through internal evaluation and reporting.
Reviewing our performance and sharing our results with interested parties.
Requiring commitment of suppliers and other partners to apply these same prin-ciples.
HEALTH, SAfETY & ENVIRONMENTAL REPORT
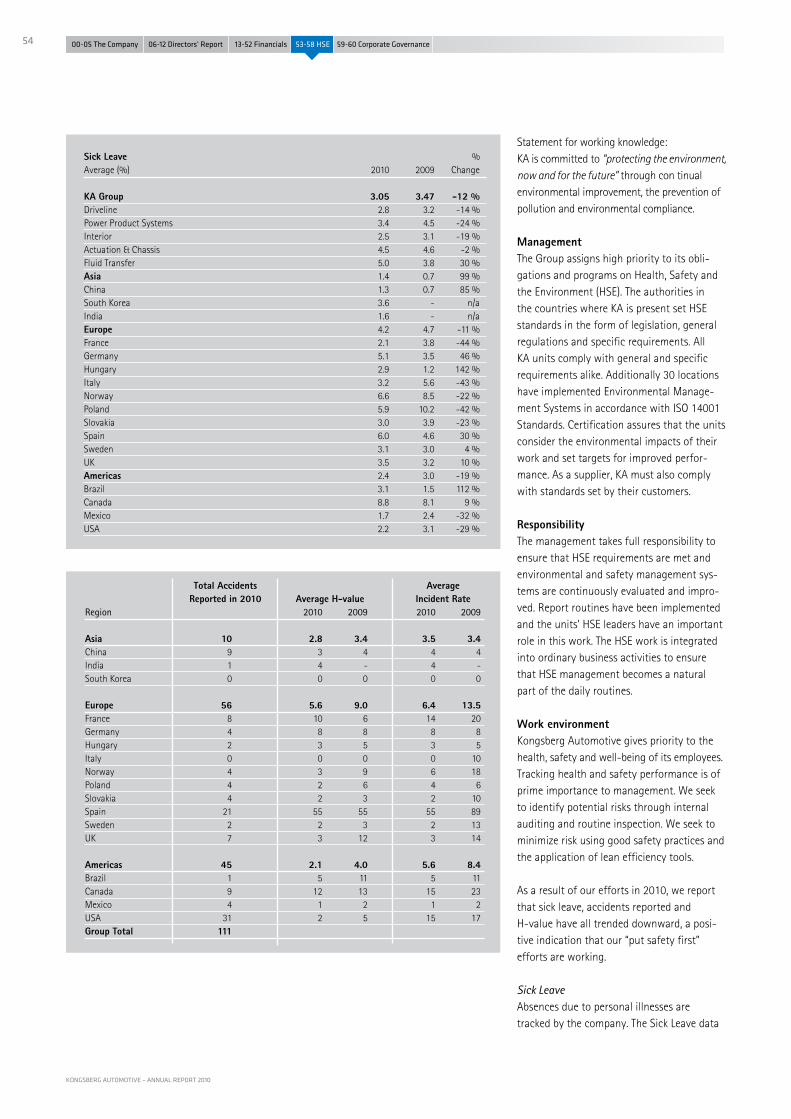
54
KONGSBERG AUTOMOTIVE – ANNUAL REPORT 2010
00-05 The Company 06-12 Directors' Report 13-52 Financials 53-58 HSE 59-60 Corporate Governance
00-05 The Company 06-12 Directors' Report 13-52 Financials 53-58 HSE 59-60 Corporate Governance
00-05 The Company 06-12 Directors' Report 13-52 Financials 53-58 HSE 59-60 Corporate Governance
00-05 The Company 06-12 Directors' Report 13-52 Financials 53-58 HSE 59-60 Corporate Governance
00-05 The Company 06-12 Directors' Report 13-52 Financials 53-58 HSE 59-60 Corporate Governance
Statement for working knowledge:KA is committed to “protecting the environment, now and for the future” through con tinual environmental improvement, the prevention of pollution and environmental compliance.
ManagementThe Group assigns high priority to its obli-gations and programs on Health, Safety and the Environment (HSE). The authorities in the countries where KA is present set HSE standards in the form of legislation, general regulations and specific requirements. All KA units comply with general and specific requirements alike. Additionally 30 locations have implemented Environmental Manage-ment Systems in accordance with ISO 14001 Standards. Certification assures that the units consider the environmental impacts of their work and set targets for improved perfor-mance. As a supplier, KA must also comply with standards set by their customers.
ResponsibilityThe management takes full responsibility to ensure that HSE requirements are met and environmental and safety management sys-tems are continuously evaluated and impro-ved. Report routines have been implemented and the units’ HSE leaders have an important role in this work. The HSE work is integrated into ordinary business activities to ensure that HSE management becomes a natural part of the daily routines.
Work environmentKongsberg Automotive gives priority to the health, safety and well-being of its employees. Tracking health and safety performance is of prime importance to management. We seek to identify potential risks through internal auditing and routine inspection. We seek to minimize risk using good safety practices and the application of lean efficiency tools.
As a result of our efforts in 2010, we report that sick leave, accidents reported and H-value have all trended downward, a posi-tive indication that our “put safety first” efforts are working.
Sick LeaveAbsences due to personal illnesses are tracked by the company. The Sick Leave data
Sick Leave % Average (%) 2010 2009 Change KA Group 3.05 3.47 -12 %Driveline 2.8 3.2 -14 %Power Product Systems 3.4 4.5 -24 %Interior 2.5 3.1 -19 %Actuation & Chassis 4.5 4.6 -2 %Fluid Transfer 5.0 3.8 30 %Asia 1.4 0.7 99 %China 1.3 0.7 85 %South Korea 3.6 - n/aIndia 1.6 - n/aEurope 4.2 4.7 -11 %France 2.1 3.8 -44 %Germany 5.1 3.5 46 %Hungary 2.9 1.2 142 %Italy 3.2 5.6 -43 %Norway 6.6 8.5 -22 %Poland 5.9 10.2 -42 %Slovakia 3.0 3.9 -23 %Spain 6.0 4.6 30 %Sweden 3.1 3.0 4 %UK 3.5 3.2 10 %Americas 2.4 3.0 -19 %Brazil 3.1 1.5 112 %Canada 8.8 8.1 9 %Mexico 1.7 2.4 -32 %USA 2.2 3.1 -29 %
Total Accidents Average Reported in 2010 Average H-value Incident RateRegion 2010 2009 2010 2009 Asia 10 2.8 3.4 3.5 3.4China 9 3 4 4 4India 1 4 - 4 -South Korea 0 0 0 0 0 Europe 56 5.6 9.0 6.4 13.5 France 8 10 6 14 20Germany 4 8 8 8 8Hungary 2 3 5 3 5Italy 0 0 0 0 10Norway 4 3 9 6 18Poland 4 2 6 4 6Slovakia 4 2 3 2 10Spain 21 55 55 55 89Sweden 2 2 3 2 13UK 7 3 12 3 14 Americas 45 2.1 4.0 5.6 8.4Brazil 1 5 11 5 11Canada 9 12 13 15 23Mexico 4 1 2 1 2USA 31 2 5 15 17Group Total 111

55
00-05 The Company 06-12 Directors' Report 13-52 Financials 53-58 HSE 59-60 Corporate Governance
00-05 The Company 06-12 Directors' Report 13-52 Financials 53-58 HSE 59-60 Corporate Governance
00-05 The Company 06-12 Directors' Report 13-52 Financials 53-58 HSE 59-60 Corporate Governance
00-05 The Company 06-12 Directors' Report 13-52 Financials 53-58 HSE 59-60 Corporate Governance
00-05 The Company 06-12 Directors' Report 13-52 Financials 53-58 HSE 59-60 Corporate Governance
KONGSBERG AUTOMOTIVE – ANNUAL REPORT 2010
are reported below as an average % of short and long term absences per total number employees for the Business Area or Country noted. When considering all KA employees, the Group’s sick leave average was 3.05% in 2010 compared to 3.47 % for 2009, a 12% reduction.
SafetyWork related injuries should not occur, and KA works systematically to reduce the num-ber of accidents and injuries affecting em-ployees. All work related injuries are reported and tracked. Reasons for injuries are analyzed and corrective actions are implemented.
In 2010, KA Group set a target of 30 % reduc-tion in H-value and 50 % reduction in Total Accidents reported. As a result of increasing awareness and adapting good procedures to safety work, the H-value was down 37 %, while Total Accidents were reduced by 22 %.
For KA Group, a total of 111 accidents were reported in 2010 versus the 143 reported accidents in 2009. In 2010, the Average per Plant decreased by 22 %. Notably, the Group’s Incident Rate decreased by 43 %. In 2010, the Group averaged 5.6 accidents for every one million man hours worked. In 2009, the Incident Rate was 9.8 accidents for every one million man hours worked. We view this as significant progress considering that as man hours increased in 2010, the acci-dents reported went down. Furthermore, the Group’s Incident Rate average is considered better than external benchmarks.
H-value relates to severity of accidents, or those causing time away from work. KA’s H-value is a measure of injuries resulting in lost time relative to one million man hours worked. In 2010, the average H-value for the Group was 3.8 resulting in a 37 % reduction in the severity of accidents over the year. When benchmarking our H-value perfor-mance, we find ourselves performing better than peers in the industry.
For 2011 the target is a further reduction of 30 % in both Total Accidents reported and H-value. By implementing robust safety awareness and training programs, we expect more improvement in the coming year.
Energy Intensity kWh/€ kWh/€ Change KA Group 0.16 0.20 -21 % Actuation & Chassis 0.24 0.33 -27 %Driveline 0.17 0.19 -6 %Fluid Transfer 0.16 0.26 -38 %Interior 0.13 0.15 -18 %Power Product Systems 0.11 0.18 - 39 % By Region Americas 0.18 0.23 -20 %Europe 0.16 0.19 -17 %Asia 0.11 0.20 -43 % By CountryNorway 0.30 0.38 -23 %Mexico 0.24 0.30 -20 %Brazil 0.21 0.08 167 %India 0.21 - n/aSweden 0.18 0.23 -24 %Germany 0.18 0.19 -2 %USA 0.17 0.21 -20 %South Korea 0.14 0.12 21 %Slovakia 0.13 0.15 -16 %UK 0.13 0.15 -17 %China 0.11 0.21 -48 %Spain 0.11 0.23 -54 %Italy 0.11 0.09 36 %Hungary 0.10 0.10 -1 %Canada 0.09 0.08 5 %France 0.08 0.09 -11 %Poland 0.04 0.06 -22 %
2010 2009 % Total Energy (absolute) (Million kWh) (Million kWh) ChangeKA Group 137 149 9 %
All Accidents Reported Average *Average % (Average per Plant) 2010 2009 Change KA Group 3.2 4.1 - 22 %Actuation & Chassis 1.3 1.2 14 %Driveline 2.6 4.9 - 46 %Power Product Systems 3.0 3.3 - 11 %Interior 3.3 4.2 - 20 %Fluid Transfer 5.8 7.0 -17 % Incident Rate Driveline 2.8 6.7 - 59 %Interior 3.6 5.5 - 35 %Power Product Systems 6.2 12.6 - 51 %Actuation & Chassis 10.3 11.4 -10 %Fluid Transfer 24.2 35.2 -31 %KA Group adjusted** 1.1 2.0 External Benchmark** 4.3 4.3 H-valueInterior 2.2 3.8 - 42 %Power Product Systems 2.3 6.7 -66 %Driveline 2.5 3.3 - 23 %Actuation & Chassis 9.0 8.1 11 %Fluid Transfer 18.0 26.0 - 31 %KA Group adjusted** 0.8 1.2External Benchmark** 1.0 1.0
* In 2010, data was collected from 35 operational manufacturing facilities. Accordingly, the 2009 data, previously reported, was adjusted here to reflect performance of the same 35 locations. **External benchmark used for 2010 and 2009 is the US BLS 2009 data for Total recordable cases (Incident Rate) and Cases with days away from work (H-value) for Manufacturing Sector. BLS uses 100 equivalent workers or 200.000 man- hours. KA uses 1 Million man hours so numbers were divided by 5 so comparisons could be made.

56
KONGSBERG AUTOMOTIVE – ANNUAL REPORT 2010
00-05 The Company 06-12 Directors' Report 13-52 Financials 53-58 HSE 59-60 Corporate Governance
00-05 The Company 06-12 Directors' Report 13-52 Financials 53-58 HSE 59-60 Corporate Governance
00-05 The Company 06-12 Directors' Report 13-52 Financials 53-58 HSE 59-60 Corporate Governance
00-05 The Company 06-12 Directors' Report 13-52 Financials 53-58 HSE 59-60 Corporate Governance
00-05 The Company 06-12 Directors' Report 13-52 Financials 53-58 HSE 59-60 Corporate Governance
The external environmentEnergy consumption and Energy IntensityEnergy consumption data collected in 2010 includes electricity use and burning of fossil fuels needed to support production activities. The target for 2010 was to decrease energy consumption by 6.4 % relative to total pro-duct sales; the result came out on the positive side. While energy use was up in absolute terms by 9 % in 2010, the energy intensity decreased. Energy Intensity is measured as kilo watt hour used in production for every euro of total product sales. In 2009 the company used 0.20 kWh/€ and in 2010 the energy intensity decreased to 0.16 kWh/€ re-sulting in a 21 % reduction. In 2011 sites will continue to work diligently to find opportuni-ties through operational controls and equip-ment upgrades to use energy more efficiently.
Energy Use and CO2 EmissionsTotal kilograms of CO2 emitted as a result of our energy use, has been calculated using The Greenhouse Gas Protocol, a Corporate Repor-ting and Accounting Standard, revised edition and UN Greenhouse Gas Calculators. For our operational inventory, Kongsberg Automotive follows the control approach and includes Greenhouse House Gas (GHG) emissions, spe-cifically CO2 from sources over which it has operational control. The inventory considers Scope 1, direct GHG emissions from sources that are company owned or controlled, and Scope 2, indirect emissions associated with purchased electricity. For 2010, we calculate 42,426 metric tons of CO2 were emitted as
2010 2009 % CO2 Emissions Intensity kWh/€ kWh/€ Change (Metric ton CO2/€ of total product sales) KA Group 0.05 0.06 -28 %Interior 0.06 0.09 -40 %Driveline 0.05 0.03 39 %Fluid Transfer 0.04 0.07 -40 %Power Product Systems 0.04 0.06 -34 %Actuation & Chassis 0.02 0.05 -69 % By Region Americas 0.08 0.10 -20 %Asia 0.04 0.08 -49 %Europe 0.02 0.04 -34 %
By CountryMexico 0.12 0.14 -11 %India 0.10 - n/aUSA 0.07 0.10 -32 %South Korea 0.06 0.09 -36 %Germany 0.05 0.04 4 %UK 0.05 0.06 -14 %China 0.04 0.08 -54 %Spain 0.04 0.07 -38 %Italy 0.04 0.03 9 %Poland 0.03 0.04 -23 %Slovakia 0.03 0.03 -16 %Hungary 0.03 0.03 -3 %Canada 0.02 0.02 5 %France 0.01 0.07 -85 %Sweden 0.01 0.01 -26 %Norway 0.009 0.006 36 %Brazil 0.005 0.007 -30 %
2010 2009 % CO2 Emissions (absolute) Total CO2 Total CO2 Change (metric tons) (metric tons) KA Group 42426 43192 -1.8%

57
00-05 The Company 06-12 Directors' Report 13-52 Financials 53-58 HSE 59-60 Corporate Governance
00-05 The Company 06-12 Directors' Report 13-52 Financials 53-58 HSE 59-60 Corporate Governance
00-05 The Company 06-12 Directors' Report 13-52 Financials 53-58 HSE 59-60 Corporate Governance
00-05 The Company 06-12 Directors' Report 13-52 Financials 53-58 HSE 59-60 Corporate Governance
00-05 The Company 06-12 Directors' Report 13-52 Financials 53-58 HSE 59-60 Corporate Governance
KONGSBERG AUTOMOTIVE – ANNUAL REPORT 2010
a result of direct and indirect (purchased electricity) energy use at 35 manufacturing sites. However, even as we increased our total sales, we report that absolute 2010 emissions were 1.8 % less than 2009 CO2 emissions.
The CO2 Emissions Intensity decreased in 2010 to 0.05 metric ton CO2/€ of total pro-duct sales. Meaningful trends will continue to emerge as we collect data over the next few years and compare total energy use and resulting CO2 emissions to total product sales.
WastePollution control is important both to KA and the societies where it operates. KA aims is to minimize the toxicity of its’ waste and the vo-lume of waste sent to landfills. All units seek opportunities to reduce, reuse and recycle. Data regarding volume of Regulated Waste (waste requiring special treatment) and waste sent to landfill was collected from all units. Information is compared to total product sales; this is known as the Waste Index. The goal was to reduce the Group’s Waste Index (kg related to € sales) by 5.7 % in 2010; we exceeded our goal and reached an 8 % reduc-tion. To reduce Regulated Waste sites looked at opportunities to eliminate and reduce the use of hazardous materials in process. To reduce waste sent to landfill, plants imple-mented programs to better segregate waste streams; opportunities to reuse and recycle segregated material where pursued when possible. Also, efficiency programs reduced volume of scrap materials produced and thus the waste sent to landfills.
Fire or near firesKA had two fires in 2010 with no damage to property. No employees were injured. Ac-cordingly all locations continue to look at potential fire risks and enact plans to control and mitigate such. Each location is expected to conduct an annual fire drill and regular checks of their fire safety equipment.
ComplaintsNo spills or unauthorized releases to environ-ment were reported in 2010 nor were any external complaints related to HSE reported during the year.
2010 2009 % Total Waste Index (kg/100€) (kg/100€) Change (KG/100€) KA Group 0.32 0.34 -8 %Power Product Systems 0.42 0.36 18 %Interior 0.41 0.31 32 %Fluid Transfer 0.31 0.61 -38 %Driveline 0.28 0.32 -13 %Actuation & Chassis 0.14 0.20 -29 % By Region Americas 0.45 0.41 10 %Europe 0.30 0.38 -21 %Asia 0.07 0.06 14 %
By CountryHungary 0.80 1.0 -17 %USA 0.77 0.70 10 %Slovakia 0.58 0.55 6 %Germany 0.33 0.33 0 %UK 0.29 0.35 -16 %Sweden 0.29 0.51 -43 %Norway 0.22 0.28 -21 %Mexico 0.20 0.20 2 %Canada 0.19 - -France 0.15 0.18 -15 %Italy 0.09 0.08 8 %Poland 0.08 0.09 -13 %Brazil 0.08 0.05 55 %Spain 0.07 0.60 -88 %China 0.07 0.06 18 %India 0.004 - n/aSouth Korea 0.001 0.004 -66 %
2010 2009 % Total Waste (absolute) (metric tons) (metric tons) Change KA Group 2145 2911 36 %
58
KONGSBERG AUTOMOTIVE – ANNUAL REPORT 2010
00-05 The Company 06-12 Directors' Report 13-52 Financials 53-58 HSE 59-60 Corporate Governance
00-05 The Company 06-12 Directors' Report 13-52 Financials 53-58 HSE 59-60 Corporate Governance
00-05 The Company 06-12 Directors' Report 13-52 Financials 53-58 HSE 59-60 Corporate Governance
00-05 The Company 06-12 Directors' Report 13-52 Financials 53-58 HSE 59-60 Corporate Governance
00-05 The Company 06-12 Directors' Report 13-52 Financials 53-58 HSE 59-60 Corporate Governance
Highlights of HSE improvement measures in 2010All units were challenged with the following performance improvement targets for 2010 relative to 2009 outcome.
Target: Reduce total number of accidents by 50 %.
We reduced total number of accidents by 22 %.
Target: Reduce H-value, or accidents re sulting in lost time, by 30 %.
We reduced H-value by 37 %. Target: Decrease energy consumption by
6.4 % (related to total product sales). We reduced Energy Index by 21 %.
Target: Decrease amount of waste sent for special treatment or to landfill by 5.7 % (related to total product sales).
We reduced Waste Index by 8 %. Notable achievements
21 out of 35 facilities reduced their total number of accidents for the year. 14 of these locations reduced total accidents reported by more than 50 % and remai-ning 7 facilities reduced accidents by more than 20 %.
The Yangsan City, Nuevo Laredo, Dassel, Ljungsarp, Selvazzano and Shanghai Xin-feng facilities all reported zero accidents in 2010. Additionally, the Yangsan City facility in Korea reported six years with no lost time accidents.
22 units reported a reduction in their H-value (accident severity).
23 units reduced their Energy Intensity in 2010. Not only did reductions save money but the resulting CO2 emissions in absolute terms were also reduced, despite the in-crease in production and related sales.
Waste minimization programs were im-plemented at most units. Efficiency pro-grams targeted reduction at the source. Facilities carefully tracked and segregated waste streams and sought opportunities to reuse and recycle. Some of the results are impressive. For example: Siofok Hungary is now recycling 100 %
of its cardboard and packaging foil. Through careful segregation and re-
cycling initiatives, Basildon UK has reduced the waste it sent to landfill by 51 %.
After installing an evaporative sys-tem, Suffield USA reduced used oil waste by more than 50 %.
Pruszkow Poland decreased heating water parameters on input side from 90°C to 60°C and achieved their Energy Index goal.
Mullsjö Sweden recycled 96 tons of plastic waste from the production process thus reducing volume to landfill.
To save energy, many facilities looked at compressed air usage, optimized and balanced their systems and repaired leaks in the distribution system. In particular, Burton UK underwent a full system audit through the Carbon Trust. They fixed leaks and optimized equipment such that 50 % less steam was used.
Other locations, like Dassel Germany, Swainsboro Georgia, Heiligenhaus Ger-many and Pruszkow Poland, upgraded shop floor lighting with energy saving lamps. Mullsjö Sweden installed more movement detectors to the fluorescent tube lights.
PPS Business Area (BA) embarked on an aggressive HSE awareness and improve-ment program. PPS developed its’ own Green Card to track and discuss on a monthly basis each plant’s performance of key HSE indicators- accidents, internal audits, energy use and waste reduction. As a result, the BA created its’ own safety mascot, risk assessment targets, and en-vironmental internal auditing plans. Sig-nificant improvements have been made.
A Fleet Safety program was also launched globally.
Group Targets & Expectations for 2011All units are challenged to contribute to the following performance objectives for 2011, relative to the 2010 outcome;
Reduce total number of accidents by 30 %. Reduce H-value (accidents resulting in
lost time) by 30 %. Decrease energy consumption by 1.5 % Decrease amount of waste sent for
special treatment or to landfill by 1.5 %
Each unit will set specific goals to their meet Divisional objectives which are derived from Group expectations noted above. Additionally facilities will set objectives and targets that consider significant environmental aspects and legal & other requirements as detailed in their Environmental Management System. Site and Divisional progress, now tracked as e-KPIs, is required to be monitored and reported to senior management on a monthly basis.

59
00-05 The Company 06-12 Directors' Report 13-52 Financials 53-58 HSE 59-60 Corporate Governance
00-05 The Company 06-12 Directors' Report 13-52 Financials 53-58 HSE 59-60 Corporate Governance
00-05 The Company 06-12 Directors' Report 13-52 Financials 53-58 HSE 59-60 Corporate Governance
00-05 The Company 06-12 Directors' Report 13-52 Financials 53-58 HSE 59-60 Corporate Governance
00-05 The Company 06-12 Directors' Report 13-52 Financials 53-58 HSE 59-60 Corporate Governance
KONGSBERG AUTOMOTIVE – ANNUAL REPORT 2010
CORPORATE GOVERNANCE IN KONGSBERG AUTOMOTIVE HOLDING ASA
1) Implementation of the Principles for Corporate GovernanceKA’s guidelines for Corporate Governance conform with the Norwegian Code of Practice For Corporate Governance of 21st October 2009.
2) Definition of KA’s BusinessThe objective is defined in the Articles of Association for the Company article 2:
“The company’s objective is to engage in engineering industry and other activities naturally related thereto, and the com-pany shall emphasize development, mar-keting and manufacturing of products to the car industry. The company shall be managed in accordance with general business practice. The company may co-operate with, establish and participate in other companies.”
Article 2 provides a clear description of the actual business of the Company at present. The Annual report contains a description of the Company’s objectives and principal strat-e gies.
3) Equity and DividendsThe Company shall have an equity capital which over a period of time is at an appro-priate level for its objective, strategy and risk profile.
According to the dividends policy of the Company, returns to shareholders should be a combination of changes in share price and dividends. Dividends should reflect the results of the Company, while recognizing opportunities for new, profitable investments. Over time, the returns to shareholders should come more from an increased share price rather than through dividend distributions. The Board of Directors of KA considers that dividends over a period should average roughly 35 percent of the Company’s net income.
The general meeting 11th June 2009 has granted a mandate to the Board of directors to purchase up to 6.516. 430 of its own
shares. The mandate expires at the earlier of the next ordinary General Meeting or 30 June 2010.
By resolution of 21 December 2009 a man-date was granted to the Board of Directors to increase the share capital by up to NOK 5.000 000 in connection with execution of the Company’s stock option program. The mandate expires 30 June 2011.
The current loan agreement with the Banks sets some restrictions on the Company’s abi-lity to pay out dividend. This is related to the gearing level of the Company. See notes in the annual report.
4) Equal treatment of Shareholders and transactions with close AssociatesKA has only one class of shares and all share-holders in KA enjoy equal rights.
Transactions in own shares are in general carried out through the stock exchanges or at prevailing stock exchange prices. Possible buy backs, will be carried out at market prices.
In the event of transactions between the Company and its shareholders, board directors or members of the executive management, or parties closely associated with such parties, independent valuation will be obtained if such transactions are not immaterial, provided that the transactions are not to be approved by the General Meeting according to law. Independ- ent valuation will also be obtained for trans-actions within the same group of companies even if such companies involved have minor- ity shareholdings.
5) Freely negotiable SharesThe shares in KA are freely negotiable and there are no restrictions on negotiability in the Company’s articles of association.
6) General MeetingsThe notice of calling the General Meeting will be published on the Company’s web pages;
www.kongsbergautomotive.com no later than 21 days prior to the meeting. The notice shall further be sent to all known shareholders not later than three weeks prior to the meeting. Support information, such as resolutions to be considered by the General Meeting and recommendations by the Nomination Committee shall be made available within the same dates. The supporting material shall be sufficiently detailed and comprehensive to allow all shareholders to form a view on all matters to be considered at the General Meeting. Documents that according to law shall be distributed to the shareholders may be made available on the Company’s web pages.
Shareholders who wish to attend the General Meeting shall notify the Company or its an-nounced representative no later than 5 days prior to the General Meeting.
Shareholders who can not attend the General Meeting may vote by proxy. Forms for the granting of proxies are enclosed with the summons to the General Meetings.
To the extent possible, members of the Board of Directors, the Nomination Committee and the Auditor will be present at the General Meeting.
The General Meetings is usually opened by the Chairman of the Board of Directors. The shareholders are encouraged to propose candi dates to chair the General Meeting.
The notice calling the General Meeting will provide information on procedures share-holders must observe at the General Meeting including:
The procedure for representation by proxy, including form for appointment of a proxy.
The notice and supporting material will be available on the Company’s web pages.
60
KONGSBERG AUTOMOTIVE – ANNUAL REPORT 2010
00-05 The Company 06-12 Directors' Report 13-52 Financials 53-58 HSE 59-60 Corporate Governance
00-05 The Company 06-12 Directors' Report 13-52 Financials 53-58 HSE 59-60 Corporate Governance
00-05 The Company 06-12 Directors' Report 13-52 Financials 53-58 HSE 59-60 Corporate Governance
00-05 The Company 06-12 Directors' Report 13-52 Financials 53-58 HSE 59-60 Corporate Governance
00-05 The Company 06-12 Directors' Report 13-52 Financials 53-58 HSE 59-60 Corporate Governance
The following information will be made avail-able at the Company’s web pages at the ear-liest opportunity:
Information on the right of the share-holders to propose matters to be consid-
ered by the General Meeting. Proposals for resolutions to be conside-
red by the General Meeting, alternatively comments on matters where no resolu-tion is proposed.
A form for appointing a proxy.
The Board of Directors and the chairman of the General Meeting shall ensure that the General Meeting is given the opportunity to vote separately for each candidate nominated for election to the Company’s corporate bodies.
7) The Nomination CommitteeThe duties of the Nomination Committee are to propose candidates to the Board of Directors and to propose remuneration to be paid to the Directors.
It follows from the Articles of Association for the Company § 5 that the Company shall have a Nomination Committee consisting of 3 members elected by the General Meeting for 3 years at a time, unless the General Meeting resolves otherwise. The members of the Nomination Committee may not have other functions in the Company. Prior to each election of directors to the Board, the Board of Directors shall notify the Nomination Committee and the latter shall find eligible candidates for directorship and deputy direc-torship to be elected by the General Meeting. The Nomination Committee’s nominations shall be enclosed with the summons for the General Meeting.
Information about the Nomination Commit-tee and the deadlines for submitting pro-posals to the Nomination Committee will be made available on the Company’s web pages.
8) Board of Directors, Composition and IndependenceThe Board of Directors shall according to the Articles of Association of the Company consist of 3 – 9 members of whom up to 5 members including the chairman and up to 2 deputy members shall be elected by the General Meeting.
All Directors to the Board elected by the Gene-ral Meeting are independent of the executive management and material business contacts of the Company.
The term of office for the Directors to the Board is 2 years.
Information about the Directors to the Board is available on the Company’s web pages.
9) The work of the Board of DirectorsThe Board of Directors has issued Rules of Procedure for the Board of Directors as well as instructions for the Chief Executive Officer of the Company with the aim of establishing clear internal allocation of responsibilities and duties. Said procedure and instructions are available on the Company’s web pages.
The Board of Directors has appointed a Com-pensation Committee and an Auditing Com-mittee. The members of said committees are independent of the executive management.
The Board of Directors evaluates its perfomance and expertise annually by a self assessment.
10) Risk Management and Internal ControlThe Board of Directors carries out an annual review of the Company’s most important areas of exposure to risk and internal control arrangements.
The main features of the Company’s internal control and risk management systems as they relate to the Company’s financial reporting are included in note 15 to the annual accounts.
11) Remuneration of the Directors of the Board The remuneration paid to each Board member is specified in note 17 to the annual accounts. The Directors hold no other assignment in the Company than the directorships to the Board and memberships to subcommittees to the Board.
12) Remuneration to the Executive ManagementThe Board of Directors has established guide-lines for the remuneration to the executive management. The guidelines are available
on the Company’s web pages and are com-municated to the annual General meeting. Information about the remuneration paid to the executive management of the Company is included herein in note 17 to the annual accounts.
13) Information and CommunicationThe Board of Directors has established guide-lines for the Company’s reporting of financial and other information based on openness and taking into account the requirement for equal treatment of all participants in the securities market. A financial calendar for the Company is available on the Company’s web pages.
All information distributed to the sharehold ers will be made available simultaneously on the Company’s web pages.
14) Take-oversThe Board of Directors has established guid-ing principles for how it will act in the event of a take over bid. These are in compliance with article 14 of the Code of Practice. The main elements of these principles are included in the Rules of Procedures for the Board of Directors and available on the Company’s web pages.
There are no defense mechanisms in the Articles of Association for the Company or any underlying documents, nor are there implemented any measures to limit the opp-ortunity to acquire shares in the Company.
15) AuditorThe Auditor participates in the meetings with the Audit Committee and in the Board mee-ting that approves the financial statements and meets with the Board without the management of the Company present at least once a year. The Company has established guidelines for the Auditor’s and associated persons’ non-auditing work. Compensation to the Auditor is disclosed in a note to the Annual Accounts hereto and is also reported and approved by the General Meeting.
For further information visitwww.kongsbergautomotive.com

Kongsberg Automotive Holding ASADyrmyrgata 48Postboks 623601 KongsbergNorwayTelephone: +47 32 77 05 00Telefax: +47 32 77 05 09E-mail: [email protected]
If you have questions related to this report, please contact Hans Jørgen Mørland, Director of Corporate Communications at Kongsberg Automotive: [email protected]
Related Documents