2010 2010 Annual Report

Welcome message from author
This document is posted to help you gain knowledge. Please leave a comment to let me know what you think about it! Share it to your friends and learn new things together.
Transcript

2 0 1 02 0 1 0A n n u a l R e p o r t

1 A Letter from the GM & CEO/Board President
2 Planning for the Future
4 Helping Our Customers Make Their Mark
6 Implementing a Solar Strategy in the Sunshine State
8 Keeping a Finger on the Pulse of the Market
10 Ensuring a Clean, Reliable Water Supply
12 The Year in Review by the Numbers
A-1 Audited Financial Statements
Table ofContents
OUC’s Commission(seated, from left)
Buddy DyerCity of Orlando MayorCommissioner
Katie PortaPresident
Maylen DominguezFirst Vice President
(standing, from left)
Craig McAllasterCommissioner
Ken KsionekGeneral Manager & CEO
Dan Kirby, AIA, AICPSecond Vice President

Making Our Mark 1
What a year this has been. From the increased home foreclosures and
unemployment to the volatile markets, the economy has become as unpredictable as the weather. OUC was able to stay the course, thanks to our solid fi nancial foundation, strong wholesale and retails sales and our ability to hold the line on expenses. This allowed us to end the year ahead of budget without raising rates.
Despite a stalling economy and slowing of customer growth, Orlando saw the opening of three exciting new large-scale projects, including the Wizarding World of Harry Potter attraction at Universal Orlando, the University of Central Florida Medical School, and the new Amway Center—home of the Orlando Magic. OUC worked closely with these large customers to meet their unique electric and water needs.
Our customers have come to expect reliability from OUC—and this year was no diff erent. Despite the coldest winter since 1945 and a humid, stormy summer, our employees kept the electricity and water fl owing—enabling us to meet peak customer demand without issue. Once again, we were ranked the most reliable electric utility in the state.
Perhaps the most signifi cant event this year was the Florida Public Service Commission’s (PSC) establishment of new peak demand and energy conservation
requirements for the large electric utilities in the state. The new rules require OUC to reduce energy consumption, increase customer education and awareness, enhance residential and commercial customer programs, and introduce new ones.
OUC chose not only to meet the PSC goals, but to try to exceed them. To accomplish this, we launched our “Reliably Green” initiative, which focuses on how OUC “Makes Our Mark” and how consumers can “Make Their Mark.” It’s our promise to weave sustainability through everything we do and to help our customers reduce energy and water consumption. From investing in hybrid bucket trucks and planning to build a solar farm to adding 25 new customer programs, everyone at OUC is focused on reducing our carbon footprint or, —as we like to refer to it—expanding our green handprint.
Fuel diversity has always been a priority, and thanks to SEC B, our 300 Megawatt (MW) natural gas combined cycle generator at the Stanton Energy Center that came online in February, OUC’s clean generation is now 59 percent of our fuel mix.
The new unit helped us meet strong wholesale and retail power sales. In January 2010, OUC began a 20-year power supply agreement with the City of Vero Beach to supply 100 MWs of generation to the City.
Since our inception in 1923, OUC has placed a high priority on planning. With an eye to the future, we set out to adjust our organizational structure to meet the needs of a changing marketplace. OUC undertook an Organization Development Program designed to place a greater focus on our external customers, encourage sustainable business practices across the organization, and facilitate the development of employees.
In tough times, being reliable is more important than ever—and throughout the year, OUC’s employees went above and beyond to live up to our name. Thanks to our strong fi nancial foundation and prudent planning, OUC was able to hold the line on rates, provide the highest level of electric reliability and water quality, and invest in clean generation.
We don’t know how long it will take for the economy to recover, but OUC is prepared for the long haul. That’s what makes us . . . The Reliable One.
A Letter from the General Manager/CEO & President
Katie PortaPresident
Ken KsionekGeneral Manager & CEO

2 2010 Annual Report
While the economy continued to falter and customer growth may have slowed,
Orlando continued to open large-scale projects. From the Wizarding World of Harry Potter to a new medical school at the University of Central Florida and a state-of-the-art home for the Orlando Magic basketball team, OUC was ready to provide reliable service to meet the unique power quality needs of each of these customers.
Living Up to Our Name
For the ninth year in a row, OUC performed well ahead of Florida’s four largest utilities in key measurements of electric reliability, including average restoration time and average number of outage minutes per year, as measured by the Florida Public Service Commission. Even with a record-breaking cold winter and a hot, stormy summer, OUC customers were the least likely to lose power, but when they did, we restored power nearly twice as fast as any other service provider.
From our year-round tree trimming program to the undergrounding of new services, we’re always seeking to prevent outages, and more than 60 percent of our distribution system is underground. That reliability is never more critical than when it comes to serving Lake Nona’s growing medical city. This year we began providing electric and chilled water services to the University of Central Florida College of Medicine’s medical education building, which
is designed to meet Leadership in Energy and Environmental Design (LEED) silver standards. Dependable service is critical to the 170,000-square-foot facility that features the latest in lab and classroom technology.
In downtown Orlando, OUCooling brought our newest chilled water facility online on time to serve the new Amway Center, home of the NBA’s Orlando Magic. With three chillers and room to grow, the facility is a key component in the arena’s pursuit of LEED certifi cation, making it the NBA’s greenest new facility. OUConvenient Lighting upgraded the outdoor lighting at Lockheed Martin’s Sand Lake facility with nearly 300 new energy effi cient LED light fi xtures.
Protecting Our Electric Grid
To protect our infrastructure and ensure the overall security and reliability of the nation’s bulk-power system, OUC has also been working with the industry and the North American Electric Reliability Corporation (NERC) to meet federal critical infrastructure protection (CIP) requirements.
Keeping Customers Informed
And to help keep our customers informed about outages that might be aff ecting them, we launched an online Outage Map (at right) that features the size and location of the outage and estimated restoration times. To provide customers with real-time information when and
where they want it, OUC is working to install the foundational systems needed to build a smarter grid that can manage, store and protect customer information and data from the meter to the payment process.
Investing in Our Employees
Our employees have always been the foundation of our success; and with more than 30 percent of our workforce able to retire within fi ve years, retaining our highly trained employees and attracting new talent has never been more critical. This past year the General Manager and CEO began an Organization Development Program aimed at developing our future leaders and ensuring that we remain poised to meet the needs of a changing marketplace.
Keeping the power on and the water fl owing means many of our employees have physically demanding jobs. So to promote a healthy workforce and combat rising health care costs, we launched a wellness campaign for employees and their families. The Know Your Numbers campaign features free wellness assessments, educational sessions, activities and more.
Planning for the FutureAt OUC, we work around the clock to provide reliable, affordable, and clean power and water to our customers. We’re committed to investing in our infrastructure and employees to ensure that we can continue to provide the most reliable service and support the growth of our community while protecting our electrical grid.

Making Our Mark 3
Photo courtesy of City of OrlandoOUC’s new downtown west chilled water facility that serves the Amway Center
OUC prepares to provide underground electric service to Nemours Children’s Hospital, which is under construction

4 2010 Annual Report
The Florida Public Service Commission’s (PSC) new peak demand and energy
conservation rules for the large electric utilities in the state require OUC to reduce customer energy consumption by 3,600,000 kilowatt hours (kWh) per year—enough to power about 1,000 homes. To meet those targets, OUC is increasing customer education and awareness, enhancing existing residential and commercial customer programs, and introducing new ones. Our goal is to incorporate more sustainable energy and water sources and practices without compromising OUC’s commitment to reliable, affordable, and high quality service.
Commercial Programs
OUC’s Conservation and Renewables department reviewed our existing conservation off erings, as well as potential new ones, to identify our least-cost but highest energy- saving alternatives. The result was the addition of fi ve new commercial programs and 10 residential ones, as well as an increase in rebate amounts for effi ciency upgrades.
This year OUC launched the Commercial & Industrial (C&I) Custom Incentive Program that offers inducements to install energy efficient retrofit projects in
commercial and industrial facilities, as well as new construction projects that exceed minimum energy efficiency standards. The incentives are paid for verified demand and energy savings based on the reduction in peak demand that the projects achieve.
We also joined Orange County in the Kilowatt Crackdown Challenge, an energy use reduction program that aims to reduce businesses’ energy consumption through effi ciency improvements, such as lighting retrofi ts and HVAC upgrades.
Focusing on the Customer Experience
With the combination of extreme hot and cold weather and an economy marked by rising foreclosure and jobless rates, we saw an increase in calls from customers seeking to learn how to lower their utility bills, set up payment arrangements and—
in some cases—fi nd emergency fi nancial assistance.
Thanks to the newly formed Customer Experience area, which aligns our Metering, Customer Connection, Accounts Receivable and Collections departments under the same umbrella, we were able to continue to provide outstanding service for
Helping Our Customers Make Their Mark Small changes can add up to big savings. That’s the message we took to customers as we strive to meet the new energy conservation requirements set forth by the Florida Public Service Commission. Through grassroots campaigns and innovative partnerships, we have been reaching out to customers and showing them how to reduce their energy and water use and ultimately their utility bills.
A new website and mobile-friendly site help customers learn how to save
Customer Service Analysts like Alex Rivera delivered outstanding service at a time when our customers needed it most

Making Our Mark 5
our customers at a time when they needed it most. Customer Experience was formed in October 2010 to unify the customer experience from the meter to the collection of money.
The new alignment paid off as we heard from numerous customers who wanted to say, “Thank you” to our employees for their great customer service. From the letters and comments we received, it was clear we are making a positive impact with our customers.
Taking Our Message to Our Customers
In response to the increased calls, we held 13 community meetings to talk directly with customers about our conservation and rebate programs to help lower their bills, as well as our bill payment options and emergency utility assistance fund, Project Care.
OUC also partnered with the City of Orlando on several weatherization
programs that target homes in some of the City’s least energy-efficient neighborhoods. Based on historical consumption data from OUC, the City developed an energy intensity map to identify the neighborhoods with the highest energy consumption per square foot.
Using the map as a guide, the Green Neighborhood Program was provided free to homeowners, thanks
to OUC and federal stimulus funds the City received in the form of an Energy Effi ciency and Conservation Block Grant. Participants received a comprehensive energy and water audit from OUC followed by a complimentary package of electric and water conservation measures valued up to $1,000.
Depending on the residence, homeowners received compact fl uorescent lighting, insulation, caulking, low-fl ow shower heads, toilet fl apper valves and more. When complete, the program will have helped more than 1,000 homeowners in the City’s six Commission districts.
Another new program—P.O.W.E.R. (Provide Opportunity, Weatherization, Effi ciency and Rehabilitation)—weatherizes and renovates the homes of Orlando residents who apply and meet specifi c income requirements.
In 2010, the Green Neighborhood Program:
Implemented more than $530,000 in conservation measures
for a total annual energy savings of more than 1.2 million kWh
in more than 814 homes in the City of Orlando.
Community Relations Coordinator Karlene Ramirez welcomes a customer to one of OUC’s community meetings

Solar photovoltaic array atop the roof of the Orlando Science Center

Making Our Mark 7
Planning a Solar Farm
Stanton Energy Center will soon add solar to its fleet of natural gas, coal, and landfill gas generation already on site. In March 2011, OUC plans to break ground on the first solar farm in Orange County. The 25-acre installation, which will be visibly located along Innovation Way, will produce about 6 MW direct current (DC), or enough power for about 600 homes.
OUC plans to purchase that power for the next 20 years. OUC partnered with Duke Energy and Regenesis Power LLC to install, operate, and maintain the system. OUC selected the location so that customers will be able to see the solar generation that will be providing renewable energy to their homes and businesses. Upon completion, the solar farm with its more than 25,000 modules will be the largest ground-mounted photovoltaic (PV) array in the area.
The solar farm not only increases OUC’s portfolio of clean generation, it also provides the opportunity to
evaluate the impact a large-scale solar array will have on our electric distribution system. Regenesis says its Florida-proof solar panels feature a patented single-axis tracking system design that can withstand Category 4 hurricane winds while increasing electricity output by up to 30 percent.
A Solar Showcase
This year, we also invested $100,000 in an educational partnership with the Orlando Science Center to build a 31.5 kilowatt PV array atop the Science Center’s observatory. Similar in size and scope to our Reliable Plaza installation, the Science Center system provides about 42,660 kilowatt hours (kWh) of electricity per year, or enough power to serve about four homes.
The PV system not only provides green power to the Science Center but also an educational experience on the science of solar energy for the thousands of children who visit the center each year.
Implementing a Solar Strategy in the Sunshine StateAfter helping Orlando earn the distinction of Solar America City two years ago, we continue to uphold our promise to invest in the clean, renewable power of the sun. To do that, OUC has developed a strategy to evaluate a mix of commercial and residential systems, solar farms, and even solar on utility poles to determine their impact on our electric system and identify business models that best benefit our customers.
For more than 87 years, OUC has provided reliable electric service to homes and businesses throughout Orlando, and now we’re taking steps to provide that same reliable service to power our customers’ electric cars. This year, we unveiled two electric-vehicle charging stations at Reliable Plaza, including Orlando’s first solar-powered unit, that power plug-in vehicles in our fleet.
And to help prepare Central Florida to support plug-ins, OUC partnered with the City of Orlando, Orange County, and others as part of a national non-profit initiative called Project Get Ready.
OUC and the City of Orlando also hosted the national kickoff of the U.S. Department of Energy ChargePoint America Grant, which will provide nearly 300 charging stations to Central Florida.
Our commitment to clean transportation extends to our own fleet. This year we added one hybrid bucket truck to our growing number of low-emission vehicles and expect to add three more. We also have brought on a tower truck with a battery-operated aerial.
Since 2006, our trucks have been running on biodiesel—a clean-burning alternative fuel blend. With the opening of Central Florida LYNX transit system’s biodiesel blending facility and fueling station, we will be able to “fuel up” our service tanks closer to home.
Growing a Greener Fleet

8 2010 Annual Report
Diverse Portfolio Pays OffWhen OUC brought the SEC B natural gas combined cycle generator online in February 2010, the 300 MW unit altered OUC’s generation makeup so that natural gas now accounts for 54 percent of OUC’s generation capacity with coal (41 percent), nuclear (4 percent) and renewables (1 percent) rounding out the mix.
So when natural gas prices fell below coal, OUC responded by ratcheting down its coal-fi red units and turning up Stanton A and B, which are fueled by clean-burning natural gas. The drop in natural gas prices paired with OUC’s overall increase in generation capability—thanks to the addition of SEC B—put OUC in a position to utilize the most effi cient and economical units at the time.
Keeping a Finger on the Pulse of the MarketAn increasingly diverse fuel mix and generation portfolio allows OUC to react quickly to changes in the market and adjust accordingly if one type of fuel becomes more economical than another. That ability to respond to the market, combined with the outstanding performance and reliability of the Stanton Energy Center, ensures that we’re able to uphold our commitment to providing the most dependable, affordable, and clean power for our customers.
Control Center operator Carl Woods (left) and plant operator Richard Zayas (right) keep a watchful eye on the Stanton Energy Center

Equivalent Forced Outage Rate (EFOR)
0%
1%
2%
3%
4%
5%
6%
7%
8%
9%
10%
Oct2009
Nov2009
Dec2009
Jan2010
Feb2010
Mar2010
Apr2010
May2010
Jun2010
Jul2010
Aug2010
Sep2010
SEC National Average
Making Our Mark 9
SEC B, which broke ground in September 2007, was to be one of the fi rst integrated gasifi cation combined cycle (IGCC) power plants in the country. But concerns over tightening regulations on coal-fi red power plants in Florida led OUC and Southern Company, OUC’s partner on the project, to cancel the coal gasifi cation portion of the project.
High Marks for Reliability
With the natural gas generators carrying more of the load, OUC was able to take Stanton’s coal-fi red Units 1 and 2 offl ine—1 in the spring and 2 during the fall —a little earlier than their regularly scheduled outages for inspection and maintenance. Considered among the most reliable in the nation since coming online in 1987 and 1996 respectively, these base load units rarely get a chance to rest. That extra time allowed for additional testing, analysis, and repairs to ensure that they continue to deliver their highest generation output.
In fact, this past year, Units 1 and 2 out-performed the national average for Equivalent Forced Outage Rate (EFOR), which measures a coal-fi red unit’s unavailability, by more than 400 percent. EFOR measures a unit’s unplanned outages, not scheduled ones. The national average runs around 8 percent of the time, but SEC Units 1 and 2 average less than 2 percent, thanks in large part to a solid preventative and predictive maintenance schedule.
The low outage numbers also mean OUC is avoiding the high costs associated with having a unit down for an unplanned event, which could mean having to purchase generation from the market at a much higher rate.
Expanding Landfi ll Gas
In addition to natural gas and coal, the SEC is also home to one of the most successful renewable energy projects in the state. Since 1997, OUC and DTE Biomass have been working together to recover methane gas from the Orange County landfi ll and pipe it to the SEC where it is co-fi red with coal. OUC and Orange County recently signed an agreement to recover up to 22 MW of additional landfi ll gas capacity from the Orange County Landfi ll’s southern expansion site. In addition to reducing greenhouse gas emissions from the landfi ll, these green energy programs are expected to displace up to 3 percent of the fossil fuel needed by SEC Units 1 and 2 over the life of the project.
In 2011, we anticipate signing a 20-year renewable energy purchase power agreement for nearly 4 MWs of energy generated from landfi ll gas in Port Charlotte.
Powering the Cities of Vero Beach & Bartow
Just days before record-breaking cold weather hit Central Florida, OUC began providing power to the City of Vero Beach on January 1, 2010. OUC’s system proved it was up to the challenge of the increased demand, and the 20-year power purchase
agreement kicked off without a hitch in service. Under the agreement, OUC delivers about 100 MWs of electricity to the beachfront community, serving as Vero Beach’s exclusive power provider and power marketer and supplying future requirements above the city’s current energy needs.
Starting January 1, 2011, OUC also began delivering wholesale power to the City of Bartow as part of a seven-year power purchase agreement. The City of Bartow selected OUC after evaluating a number of proposals from power providers. Bartow is buying the wholesale power and then distributing it to about 11,000 customers through its existing infrastructure.
Recent expansion of OUC and Orange County landfill gas project

10 2010 Annual Report
Planning for the Future
While economic and regulatory uncertainty clouds Central Florida’s water future, the economy has had a dampening eff ect on customer demand, delaying the need for water resources well beyond what was anticipated just a few years ago. Despite the decrease in consumption, OUC continues to pursue regional solutions, innovative partnerships, and alternative water sources to ensure that we will always be able to meet our customers’ water needs.
In 2010, OUC mapped out an Integrated Resource Plan (IRP) to
develop an expanded water portfolio in accordance with our Consumptive Use Permit (CUP) while continuing to use high quality, reliable groundwater from the Floridan Aquifer as the backbone of our system.
As part of the plan, OUC is seeking to maintain current groundwater allocations, while continuing conservation eff orts, expanding reclaimed water levels, and developing alternative water sources.
Keeping the Water On
Thanks to a masterful process that OUC has employed for decades, water
crews lowered four-and-a-half miles of a relatively new, 16-inch water main several feet along Narcoossee Road without an interruption in service to any customers.
To make way for the road widening project, our crews kept the line, which supplies water for much of Eagle Creek, under pressure—and our customers in service. They skillfully lowered the pipe three to six feet below the roadway and shifted it laterally in several places. Crews worked in tandem with a backhoe to dig under the line before carefully lowering it in sections.
Ensuring a Clean, Reliable Water SupplyThanks to a high quality water supply, top notch facilities, and excellent operations management, OUC has been delivering clean, reliable, affordable water to our customers for more than 87 years. And we remain committed to ensuring that we can provide that same level of service in the years to come.

Making Our Mark 11
In the spring, OUC and the Orlando Science Center delivered water conservation workshops to fifth grade classrooms throughout OUC’s service territory via Project AWESOME (Alternative Water & Energy Supply; Observation, Methods & Education). It was the second semester of the educational program that promotes both water and energy conservation through a hands-on curriculum using content approved by OUC and meeting Sunshine State Standards.
Project AWESOME, which launched in 2009, delivers two 90-minute classroom workshops—energy in the fall and water in the spring—to students in support of their Science FCAT preparation. In the 2009–2010 school year, 5,201 fifth grade students in 50 schools in Orange and Osceola County participated, and the program received high marks from both teachers and students. Based on its success, OUC has renewed Project AWESOME for the 2010–2011 school year.
Historic Restoration
Maintaining 1,700 miles of underground pipe, some of it more than 100 years old in places, is no small task. Our award-winning water department uses high tech leak detection equipment to locate any problems quickly and effi ciently.
So when a 70-year-old water main broke beneath a busy Orange Avenue intersection during morning rush hour in April, a speedy response from OUC water crews and a coordinated eff ort involving OUC electric crews and outside agencies
kept nearby customers—including Orlando Regional Medical Center (ORMC)—in service.
A geotechnical analysis of the site determined that the collapse of an historic sink hole under Orange Avenue between Gore and Columbia streets likely caused the road to sink and damage the underlying infrastructure that included OUC’s 16-inch cast iron water main.
Despite the extensive nature of the restoration, OUC was able to keep the hospital in service at all times.
Pictured below, OUC water and electric crews (left and right, respectively) kept nearby Orlando Regional Medical Center in service despite a massive road repair on Orange Avenue
Delivering Water Conservation to the Classroom

12 2010 Annual Report
The Year in Review By the Numbers
2006 2007 2008 2009 2010
32
30
28
26
24
22
Water SalesIn Billions of Gallons
Electrical Retail SalesIn Millions of Megawatt Hours
2006 2007 2008 2009 2010
6.5
6.0
5.5
5.0
4.5
4.0
Total Operating RevenuesIn Millions of Dollars
2000 2001 2002 2003 2004 2005 2006 2007 2008 2009 2010
S1,000
$800
$600
$400
$200
OUC CustomersTotal
Number of Electric & Water Customers 73,114
Electric-Only Customers 111,890
Water-Only Customers 36,376
Total 221,380
In 2010, OUC:pumped 24.9 billion gallons of water,
produced 7.4 million megawatts of power,
installed 1,839,923 feet of electric wire, and
answered 697,319 calls from customers.

2 0 1 02 0 1 0Audited Financial Statements
A-2 2010 Annual Report
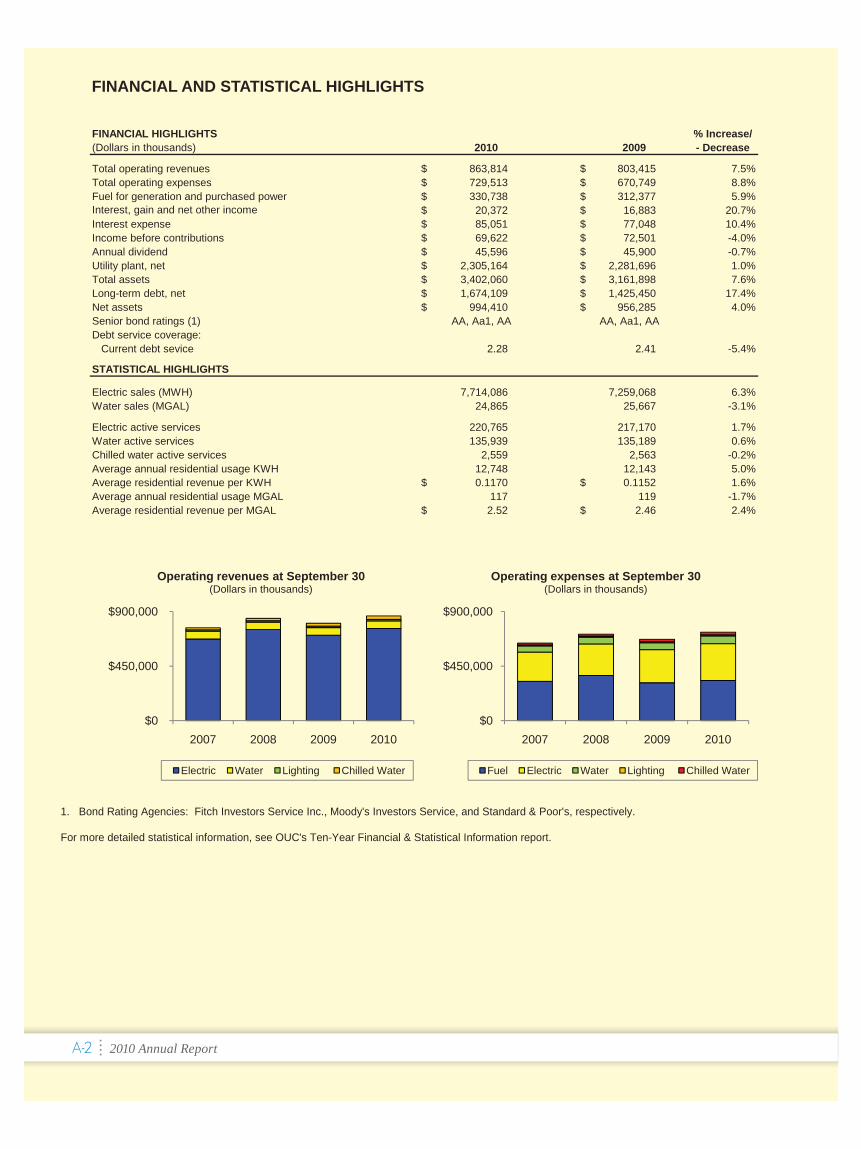
FINANCIAL AND STATISTICAL HIGHLIGHTS
FINANCIAL HIGHLIGHTS % Increase/(Dollars in thousands) 2010 2009 - Decrease
Total operating revenues 863,814$ 803,415$ 7.5%Total operating expenses 729,513$ 670,749$ 8.8%Fuel for generation and purchased power 330,738$ 312,377$ 5.9%Interest, gain and net other income 20,372$ 16,883$ 20.7%Interest expense 85,051$ 77,048$ 10.4%Income before contributions 69,622$ 72,501$ -4.0%Annual dividend 45,596$ 45,900$ -0.7%Utility plant, net 2,305,164$ 2,281,696$ 1.0%Total assets 3,402,060$ 3,161,898$ 7.6%Long-term debt, net 1,674,109$ 1,425,450$ 17.4%Net assets 994,410$ 956,285$ 4.0%Senior bond ratings (1) AA, Aa1, AA AA, Aa1, AADebt service coverage: Current debt sevice 2.28 2.41 -5.4%
STATISTICAL HIGHLIGHTS
Electric sales (MWH) 7,714,086 7,259,068 6.3%Water sales (MGAL) 24,865 25,667 -3.1%
Electric active services 220,765 217,170 1.7%Water active services 135,939 135,189 0.6%Chilled water active services 2,559 2,563 -0.2%Average annual residential usage KWH 12,748 12,143 5.0%Average residential revenue per KWH 0.1170$ 0.1152$ 1.6%Average annual residential usage MGAL 117 119 -1.7%Average residential revenue per MGAL 2.52$ 2.46$ 2.4%
1. Bond Rating Agencies: Fitch Investors Service Inc., Moody's Investors Service, and Standard & Poor's, respectively.
For more detailed statistical information, see OUC's Ten-Year Financial & Statistical Information report.
$0
$450,000
$900,000
2007 2008 2009 2010
Operating revenues at September 30(Dollars in thousands)
Electric Water Lighting Chilled Water
$0
$450,000
$900,000
2007 2008 2009 2010
Operating expenses at September 30(Dollars in thousands)
Fuel Electric Water Lighting Chilled Water

Making Our Mark A-3
–
AUDITED FINANCIAL STATEMENTS

This page intentionally left blank.
A-4 2010 Annual Report

Making Our Mark A-5
MANAGEMENT’S DISCUSSION AND ANALYSIS
This discussion should be read in conjunction with the Financial Statements and Notes to the Financial Statements.
Management’s Report
The management of Orlando Utilities Commission (OUC) has prepared — and is responsible for — the integrity of the financial statements and related information included in this report. The financial statements have been prepared in accordance with generally accepted accounting principles and follow the standards outlined by the Governmental Accounting Standards Board.
To ensure the integrity of our financial statements, OUC maintains a system of internal accounting controls. These internal accounting controls are supported by written policies and procedures and an organizational structure that appropriately assigns responsibilities to mitigate risks. These controls have been put in place to ensure OUC’s assets are properly safeguarded and the books and records reflect only those transactions that have been duly authorized. OUC’s controls are evaluated on an ongoing basis by both management and OUC’s internal auditors. In addition, Ernst & Young LLP, OUC’s independent public accountants, considers certain elements of the internal control system to determine their auditing procedures for the purpose of expressing an opinion on the financial statements.
Based on the statements above, it is management’s assertion that the financial statements do not omit disclosures necessary for a fair presentation of the information nor do they improperly include untrue statements of a material fact or statements of a misleading nature.
Kenneth P. Ksionek John E. Hearn Mindy F. WillisGeneral Manager & Vice President & DirectorChief Executive Officer Chief Financial Officer Accounting & Budgeting Services

A-6 2010 Annual Report
Overview of the Financial Statements
This discussion and analysis is intended to serve as an introduction to OUC’s financial statements. It defines the basic financial statements, summarizes OUC’s general financial condition and results of operations and should be read in conjunction with OUC’s financial statements and accompanying notes, which follow this section.
110BBackground
Orlando Utilities Commission (OUC) was created in 1923 by a Special Act of the Florida Legislature as a statutory commission of the State of Florida and is governed by a Board (the Board) consisting of five members including the Mayor of the City of Orlando. The Act confers upon OUC the rights and powers to set rates and charges for electric and water services. OUC is responsible for the generation, transmission and distribution of electric, water,lighting and chilled water services to customers primarily within Orange and Osceola Counties.
Setting of Rates
The setting of electric and water rates is the responsibility of the Board. Rate changes are implemented after public workshops are held and approved by the Board.
In January 2009, the Board approved average bill rate increases for electric and water of 13.7% and 7.8%, respectively, which became effective in March 2009. No rate changes were approved for 2010.
Financial Reporting
OUC’s financial statements are presented in conformity with generally accepted accounting principles as prescribed by the Governmental Accounting Standards Board (GASB) and in accordance with the accounting principles prescribed by the Financial Accounting Standards Board (FASB), where not in conflict with GASB. The accounting records are maintained in accordance with the accounting principles and methods prescribed by the Federal Energy Regulatory Commission (FERC) with the exception of contributions in aid of construction, which are recorded in accordance with the standards prescribed by GASB.
OUC is a regulated enterprise and applies the accounting principles permitted by FASB including Statement No. 71, “Accounting for the Effects of Certain Types of Regulation”. In accordance with these principles, the Board has taken various regulatory actions for ratemaking purposes that have resulted in the deferral of certain revenues or expenses. In 2010, regulatory actions taken by the Board resulted in the deferral of electric retail energy revenues in the amount of $8.5 million, which will be recognized through the ratemaking process in future periods. In 2009, regulatory actions taken by the Board resulted in the deferral of revenue and unanticipated gains in the amount of $12.6 million, which will be recognized through the ratemaking process in future periods.
Basic Financial Statements
The basic financial statements are prepared to provide the reader with a comprehensive overview of OUC’s financial position, results of operations and cash flows.
Statements of Net Assets: These statements are prepared using the accrual method of accounting distinguishing current and long-term assets and liabilities, as well as the nature and amount of resources and obligations at a point in time.
Statements of Revenues, Expenses and Changes in Net Assets: These statements present current and prior year revenues and expenses. In addition, included in these statements is the presentation of operating income, which is reported separately from non-operating income, contributions in aid of construction and annual dividend.
Statements of Cash Flows: These statements are presented using the direct method and outline the sources and uses of cash as resulting from operations, non-capital-related financing, capital related financing and investing activities.
MANAGEMENT’S DISCUSSION AND ANALYSIS

Making Our Mark A-7
FINANCIAL HIGHLIGHTS
(Dollars in thousands) 2010 2009 2008AssetsUtility plant, net 2,305,164$ 2,281,696$ 2,151,924$ Restricted and internally designated assets 658,089 462,519 505,172 Current assets 302,029 265,528 255,238 Other assets 136,778 152,155 139,752 Total assets 3,402,060$ 3,161,898$ 3,052,086$
Liabilities and net assetsLong-term debt, net 1,674,109$ 1,425,450$ 1,352,397$ Current liabilities 333,164 400,499 437,550 Other liabilities and deferred credits 400,377 379,664 344,033 Net assets: Invested in capital assets, net of related debt 779,897 778,475 754,793 Restricted net assets 425 44 1,468 Unrestricted net assets 214,088 177,766 161,845 Total liabilities and net assets 3,402,060$ 3,161,898$ 3,052,086$
Years ended September 30
Condensed Statement of Net Assets
2010 Compared to 2009
4BAssets
Utility plant, net: In 2010, Utility plant, net increased $23.5 million inclusive of the change in accumulated depreciation. Utility plant additions in the amount of $146.4 million were incurred in 2010 with $56.6 million incurred for generation facility projects, $38.8 million for transmission upgrades, $19.2 million for energy delivery enhancements and $8.8 million for the expansion of chilled water operations. In addition in February 2010, the new combined generation facility at the Stanton Energy Center Unit B (SECB) began commercial operations including energizing the supporting transmission switchyard upgrades.
Restricted and internally designated assets: Restricted and internally designated assets increased $195.6 million in 2010. This increase was driven by the issuance of $200.0 million of construction bonds through the Build America Bonds (BAB) grant program of the American Reinvestment and Recovery Act, increased interest sinking fund requirements in the amount of $12.4 million for the BAB and increased fuel stabilization funds in the amount of $32.1 million. These increases were offset by the use of $59.2 million of construction funds, net of the replenishment of capital reserve funds, for the construction of utility plant additions.
$0
$1,200
$2,400
2008 2009 2010
Utility plant, net at September 30(Dollars in millions)
Electric Water Chilled water Lighting Common
MANAGEMENT’S DISCUSSION AND ANALYSIS

A-8 2010 Annual Report
MANAGEMENT’S DISCUSSION AND ANALYSIS
Current assets: Current assets increased $36.5 million in 2010 as compared to 2009. Operating cash and investments increased $21.1 million as a result of the timing of accounts payable and accrued expenses and the results of current year operations. In addition, interest rate swap margin deposit requirements increased $6.6 million, Customer accounts receivables increased $2.5 million as a result of higher wholesale sales and Accrued utility revenues increased $1.6 million as a result of year-over-year consumption growth.
Other assets: Other assets decreased $15.4 million in 2010 as compared to 2009. The key component of this change is related to the implementation of the GASB Statement No. 53, “Accounting and Reporting for Derivatives”, and the change in fair value of derivatives assets. In 2010, the fair value of effective interest rate swaps decreased in the amount of $14.0 million, net of the termination of two interest rate swaps. In addition, other decreases were the result of the systematic recognition of deferred assets including the reclassification of $3.5 million from the Advance pension funding amount to Prepaid expenses and deferred charges.
Liabilities
Long-term debt, net: Long-term debt, net increased $248.7 million in 2010 primarily due to the issuance of the Series 2010A Bonds in the amount of $200.0 million in association with the BAB grant program. In January 2010, the Series 2002A Bonds were refunded in the amount of $120.0 million including the termination of an interest rate swap agreement in the amount of $10.5 million. In May 2010, the Series 2009B Bonds in the amount of $197.7 million were also refunded with termination costs for the associated interest rate swap agreement of $8.8 million. Offsetting these increases was the reclassification of the Series 2010D Bonds in the amount of $97.5 million to properly reflect the scheduled maturity of this series in 2011.
As of September 30, 2010, OUC had an underlying credit rating of “AA” from both Standard & Poor’s and Fitch Investors Service and a rating of “Aa1” from Moody’s Investors Service.
In 2010, OUC terminated two interest rate swap agreements, which reduced its exposure to counterparty credit risk and liquidity risk. In accordance with its derivative policy, OUC continues to review its counterparty credit ratings, and to date, no circumstances have arisen to require OUC to terminate a counterparty agreement. In respect to liquidity risk, volatility in the financial markets continues, and interest rate swap margin deposits at September 30, 2010 and 2009 were $35.7 million and $29.1 million, respectively.
In addition to terminating interest rate swap agreements as a component of the two bond refunding transactions, active debt portfolio management has resulted in the execution of two renegotiated interest rate swap agreements in 2010. In October 2009, the interest rate swap agreement in association with the Series 2008 Bonds was renegotiated, granting the counterparty the right to terminate the agreement for an agreed-upon period of time, in exchange for a lower fixed interest rate. In August 2010, the interest rate swap agreement in association with the Series 2010D Bonds was amended, and the rate was revised along with the index used to establish the reference rate. The effective date of this amendment is October 1, 2010.
$0
$950
$1,900
2008 2009 2010
Current and long-term debt, net at September 30(Dollars in millions)
Long-term fixed-rate Long-term variable-rate Current portion

Making Our Mark A-9
Current liabilities: Current liabilities have decreased $67.3 million in 2010 as compared to 2009. This change is primarily the result of a decrease in the current portion of long-term debt in the amount of $98.0 million offset by higher trade and interest payables and increased customer deposits. In respect to the change in the Current portion of long-term debt, in June 2010 the current portion of the Series 2009B Bonds in the amount of $197.7 million matured and was refunded with the issuance of the Series 2010C and 2010D Bonds in the amounts of $96.5 million and $97.5 million, respectively. As the Series 2010D Bonds will mature in June 2011, these bonds were included under the heading of Current portion of long-term debt. Offsetting this net decrease in the Current portion of long-term debt, Accounts payable and accrued expenses increased $17.9 million in 2010 as compared to 2009 as a result of the timing of construction payables and the accrual of pollution remediation obligations in the amount of $1.7 million. Interest payable on notes and bonds also increased $9.7 million as a result of the issuance of the Series 2010A Bonds, the refunding of the variable rate Series 2002A Bonds with the fixed rate Series 2009C Bonds and the refunding of a portion of the Series 2009B with the Series 2010C and 2010D Bonds. Lastly, customer deposits increased in the amount of $5.6 million in 2010 in response to changes in the Central Florida economy.
Other liabilities and deferred credits: Other liabilities increased $20.7 million in 2010. Continued moderating offuel prices in the energy markets resulted in a $34.2 million increase in fuel stabilization funds. In addition, modifications to the current year’s revenue requirements for delayed depreciation and conservation costs increased regulatory liabilities $8.5 million. Offsetting this increase was a $14.0 million decrease in the fair value of effective interest rate hedges, net of the two terminated interest rate swap agreements and the continued systematic recognition of the deferred gain from the Indian River power generation facility in the amount of $4.0 million to mitigate depreciation-related costs for Stanton Energy Center Unit A (SECA), the replacement power generation facility.
116B2009 Compared to 2008
117BAssets
Utility plant, net: In 2009, Utility plant, net increased $129.8 million inclusive of a change in accumulated depreciation of $82.4 million and the impact of the disposal of fully depreciated assets. Capital additions in the amount of $247.4 million were expended in 2009 with approximately 40% of this amount or $99.6 million being incurred for the construction of SECB and the supporting transmission switchyard upgrade. Additional large capital expenditures were incurred at Stanton Units 1 & 2 in the amount of $17.2 million for system upgrades and on the Taft-Lakeland transmission line for capacity enhancements in the amount of $8.3 million.
Restricted and internally designated assets: Restricted and internally designated assets decreased $42.7 million in 2009 primarily due to the use of construction funds for approved capital projects. Capital project funding from restricted assets, net of the issuance of construction bonds of $100.0 million, was $47.9 million and funding from designated assets from the capital reserve fund was $32.1 million. Offsetting these uses was an increase in fuel stabilization funds in the amount of $28.4 million as a result of declining natural gas costs, as well as the settlement of the twenty-year prepaid gas agreement in the amount of $8.0 million.
MANAGEMENT’S DISCUSSION AND ANALYSIS

A-10 2010 Annual Report
Current assets: Current assets increased $10.3 million in 2009 as compared to 2008. Fuel for generation increased $14.0 million as a result of increased coal supply at both OUC and non-OUC operated generation facilities. Margin deposits for interest rate swaps also increased $12.1 million as compared to 2008 as a result of continued volatility in the financial markets. In addition, deferred charges for the fuel hedges increased $1.2 million as a result of higher contract volumes. Offsetting these increases was a decrease in Miscellaneous receivables in the amount of $5.9 million as a result of payments received for the completion of utility relocation projects.
Other assets: Other assets increased $12.4 million in 2009 as compared to 2008. This increase was due to the change in Deferred outflows - hedging derivatives in the amount of $17.0 million in association with the retroactive implementation of GASB Statement No. 53. In addition, other long-term assets increased $4.9 million primarily due to the increase in deferred costs for the SECA long-term service agreement and the associated planned major outages not scheduled to occur until 2011. Offsetting this increase was a decrease in regulatory costs for the asset retirement obligation in the amount of $4.8 million as a result of securing additional information from the owner-operators related to the legal obligation for the decommissioning of the nuclear generation plants and the pending license extensions. In addition, other decreases were the result of the systematic recognition of deferred assets, including the reclassification of $2.5 million from the Advance pension funding amount to Prepaid expenses and deferred charges.
Liabilities
Long-term debt, net: Long-term debt, net increased $73.1 million primarily due to the issuance of new construction bonds in the amount of $100.0 million in May 2009. In addition, there was a decrease in long-term debt in the amount of $19.5 million due to the refunding of the Series 2004 Bonds, which matured in July 2009 in the amount of $218.8 million offset by the reclassification of the current portion of the Series 2009B Bonds in the amount of $199.3 million, which matured in June 2010.
At September 30, 2009 and 2008 interest rate margin deposits were $29.1 million and $17.0 million, respectively. To mitigate credit and liquidity risk, OUC renegotiated the terms of one of its interest rate swaps effective October 1, 2009 and terminated two interest rate swap agreements in 2009. The terminated interest rate swap agreements resulted in gains of $4.8 million of which $2.5 million was deferred in accordance with Board action.
Current liabilities: Current liabilities have decreased $37.1 million in 2009 as compared to 2008. A portion of this change was due to the decrease in the Current portion of long-term debt in the amount of $17.2 million. This change is a result of the reclassification of the Series 2009B Bonds, which matured in June 2010 in the amount of $199.3 million compared to the current portion of long-term debt of the Series 2004 Bonds, which matured in July 2008 in the amount of $218.8 million. In addition, fuel and purchased power and vendor payables decreased $16.7 million and $7.6 million, respectively, as a result of moderating fuel prices and lower construction spending. Offsetting these changes was an increase in the amount of $5.9 million for interest rate swap payables as a result of volatility in the financial markets.
Other liabilities and deferred credits: Other liabilities increased $35.6 million in 2009 primarily due to increased deferred inflows and fuel stabilization funds. Rising deferred charges from interest rate swap hedging activities increased other liabilities by $7.7 million and moderating fuel prices, coupled with the prepaid gas termination settlement deferred gain in the amount of $8.0 million, increased fuel stabilization funds $29.0 million. In addition, other regulatory actions including the deferral of gains recognized from the termination of an interest rate swap in the amount of $2.5 million and the deferral of revenue requirements for the development of a nuclear generation facility in the amount of $2.2 million also contributed to the increase. Offsetting these increases was the systematic recognition of the deferred gain from the Indian River power generation facility in the amount of $4.0 million to mitigate depreciation-related costs for SECA, the replacement power generation facility.
MANAGEMENT’S DISCUSSION AND ANALYSIS

Making Our Mark A-11
MANAGEMENT’S DISCUSSION AND ANALYSIS
(Dollars in thousands) 2010 2009 2008Operating revenues 863,814$ 803,415$ 844,182$Operating expenses 729,513 670,749 712,977Operating income 134,301 132,666 131,205Net non-operating expenses 64,679 60,165 51,324Income before contributions 69,622 72,501 79,881Contributions in aid of construction 14,099 11,579 18,734Annual dividend (45,596) (45,900) (45,952)Increase in net assets 38,125 38,180 52,663Net assets - beginning of year 956,285 918,105 865,442Net assets - end of year 994,410$ 956,285$ 918,105$
Condensed Statement of Revenues, Expenses and Changes in Net Assets
Years ended September 30
2B2010 Compared to 2009
Changes in Net Assets
Operating revenues: Operating revenues increased $60.4 million or 7.5% inclusive of the Board approved action to defer $8.5 million of electric retail revenues. Electric resale and retail energy were the primary drivers of this increase with variances of $31.4 million and $23.9 million, respectively. Resale energy increased as a result of OUC securing a wholesale agreement with the City of Vero Beach beginning on January 1, 2010 and retail energy increased due to weather variances from normal during both the winter and summer months. In addition, chilled water revenues increased $4.6 million in conjunction with expansions of both the I-Drive and Downtown chilled water districts.
Operating expenses: In 2010, total operating expenses were $58.8 million or 8.8% higher than in 2009. Fuel for generation and purchased power costs increased $18.4 million in 2010. This increase was driven by higher resale and retail sales, including the additional fuel costs to support the energy production from SECB.
Unit/department expenses increased $30.2 million or 15.4% in 2010 as compared to 2009. Operational costs for the commencement of SECB in the amount of $3.2 million combined with generation facility planned outage expenses and environmental compliance costs of $12.8 million, net of participant ownership allocations, increased unit/department expenses in 2010. Outage activities in 2010 were expanded to offset cost saving measures taken in 2009, including deferring certain outage activities. Accrued environmental remediation costs increased in the amount of $2.3 million in conjunction with the planned removal of paving material at OUC’s Pershing facility, the consolidation of substation operations and recognition of deferred remediation costs in association with the transfer of property to the City of Orlando.
$0
$450,000
$900,000
2008 2009 2010
Operating revenues at September 30(Dollars in thousands)
Retail electric Resale electric Water Chilled water Lighting Other

A-12 2010 Annual Report
Increased actuarial pension costs in the amount of $3.5 million also contributed to the higher unit/department expenses in 2010 as a result of the lower-than-projected investment returns. In addition, in an effort to remain flexible to the potential changes in the Central Florida market, contract labor costs increased $1.7 million while regular salaries remained unchanged from 2009. Lastly, increased utility costs in the amount of $1.7 million were incurred in direct proportion to the increase in chilled water revenues.
Depreciation and amortization expenses were $117.1 million, an increase from 2009 of $7.0 million or 6.4%. This increase is primarily due to the SECB generation facility beginning commercial operations in late February 2010. In addition, in 2010 asset impairment costs for the change in asset usage of a transmission substation in the amount of $1.8 million were recognized along with the write-down of $1.7 million of land value associated with the transfer of property in the Lake Highland area of the City of Orlando.
Payments to other governments and taxes increased $3.3 million or 6.4% in 2010 as compared to 2009 as a result of the increase in operating revenues.
Net non-operating expenses: Total net non-operating expenses increased $4.5 million or 7.5% in 2010 as compared to 2009. A portion of this change was due to higher interest expenses in the amount of $8.0 million as a result of the issuance of the BAB in January 2010 in the amount of $200.0 million and the impact of a full year of interest expense for the Series 2009A Bonds issued in May 2009 in the amount of $100.0 million. In addition, as interest income is an offset to interest expense, the decrease in interest income as a result of continued declining market interest rates also contributed to the increase in net non-operating expenses. Offsetting these increases was the receipt of the federal grant interest rate subsidy from the BAB program in the amount of $2.7 million.
Contributions in aid of construction: Contributions in aid of construction increased $2.5 million in 2010 as compared to 2009 as a result of the impacts of increased road and utility relocation projects.
$0
$400,000
$800,000
2008 2009 2010
Operating expenses at September 30(Dollars in thousands)
Fuel and purchased power Depreciation and amortization
Unit/department Payments and taxes
MANAGEMENT’S DISCUSSION AND ANALYSIS

Making Our Mark A-13
2009 Compared to 2008
Changes in Net Assets
Operating revenues: Operating revenues decreased $40.8 million or 4.8% in 2009 as compared to 2008, inclusive of the $18.8 million of stabilization revenue, which was recognized in 2008 to offset budget shortfalls. The primary driver of this change was a $58.9 million decrease in fuel revenue as a result of moderating fuel prices in 2009. In addition, resale energy revenues decreased $19.1 million as a result of the economic downturn and milder weather. Offsetting these decreases was an increase of $31.8 million in energy revenues as a result of rate increases implemented in March 2009 and a $5.2 million increase in chilled water revenues as a result of the commencement of the new chilled water district in Lake Nona.
Operating expenses: In 2009, total operating expenses were $42.2 million or 5.9% lower than in 2008 primarily due to decreased fuel and purchased power costs in the amount of $58.9 million as a result of moderating fuel prices.
Unit/department expenses increased $1.9 million or 1.0% in 2009 as compared to 2008. Although the year-over-year change was an increase, cost saving measures ranging from a hiring freeze to deferred maintenance activities garnered savings of $10.2 million. These savings were offset by higher actuarial defined benefit pension costs of $5.0 million, as a result of narrowing the pension corridor thresholds, and higher material costs inclusive of chemical costs of $4.2 million.
Depreciation and amortization expenses were $110.1 million, an increase from 2008 of $11.8 million or 12.0%. In addition to the increase in systematic depreciation and amortization as a result of additional capitalization of utility plant, impairment expenses for the change in usage of the Southeast water treatment plant and the decrease in fair market value for the old administration building in the amount of $2.5 million and $0.8 million, respectively, were recognized in 2009. Additional decommissioning expense in the amount of $2.4 million and increased depreciation expense for the new administration building in the amount of $2.0 million were also recognized in 2009.
Payments to other governments and taxes increased $4.6 million or 9.9% in 2009 as compared to 2008. This increase was driven by the rate changes implemented in 2009.
Net non-operating expenses: Total net non-operating expenses increased $8.8 million or 17.2% in 2009 as compared to 2008. A portion of this change was due to higher interest expense in the amount of $2.9 million as a result of the issuance of the Series 2009A Bonds in May 2009. Interest and other income were recorded as an offset to interest expense and in 2009, interest income decreased $6.0 million as a result of lower market interest rates, lower cash balances on hand and limited opportunities to capture investment gains.
Contributions in aid of construction: Contributions in aid of construction decreased $7.2 million in 2009 as compared to 2008 as a result of a decrease in road and utility relocation projects and slower overall growth in the Central Florida area.
MANAGEMENT’S DISCUSSION AND ANALYSIS

A-14 2010 Annual Report
(Dollars in thousands) 2010 2009
Assets Utility plant
Utility plant in service 3,441,648$ 3,105,313$Allowances for depreciation and amortization (1,306,685) (1,304,803)
2,134,963 1,800,510Land 62,868 59,501 Construction work in progress 107,333 421,685 Total utility plant, net 2,305,164 2,281,696
Restricted and internally designated assets Restricted assets 250,285 122,985 Internally designated assets 407,804 339,534 Total restricted and internally designated assets 658,089 462,519
Current assetsCash and investments 54,715 33,622 Customer accounts receivable, less allowance for doubtful accounts (2010 - $31,997, 2009 - $23,379) 84,000 81,482 Miscellaneous receivables 6,971 5,731 Accrued utility revenue 41,689 40,050 Fuel for generation 19,863 19,950 Materials and supplies inventory 37,827 36,727 Accrued interest receivable 1,685 1,834 Prepaid expenses and deferred charges 55,279 46,132 Total current assets 302,029 265,528
Other assetsAdvance pension funding 30,800 34,268 Regulatory assets 12,225 13,393 Other long-term assets 22,910 21,000 Deferred debt costs 3,523 2,905 Deferred outflow - hedging derivatives 67,320 80,589 Total other assets 136,778 152,155
Total assets 3,402,060$ 3,161,898$
See notes to the financial statements.
Years ended September 30
STATEMENTS OF NET ASSETS

Making Our Mark A-15
(Dollars in thousands) 2010 2009
LiabilitiesCurrent liabilitiesPayable from restricted assets
Current portion of long-term debt 149,602$ 247,616$Accrued interest payable on notes and bonds 37,284 27,552Customer meter deposits 39,062 33,485Total payable from restricted and designated assets 225,948 308,653
Payable from current assetsAccounts payable and accrued expenses 74,306 56,395Billings on behalf of state and local governments 14,342 13,388Compensated absences and accrued wages 9,983 11,185Accrued governmental payments 2,534 2,310Accrued swap payables 6,051 8,568Total payable from current assets 107,216 91,846Total current liabilities 333,164 400,499
Other liabilities and deferred creditsRegulatory liabilities 267,736 229,539Deferred revenue 22,226 22,986Asset retirement obligation and other liabilities 55,749 58,036Other deferred items 54,666 69,103Total other liabilities and deferred credits 400,377 379,664
Long-term debtBond and note principal 1,688,665 1,444,605Unamortized discount/premium and deferred amount on refunding (14,556) (19,155)Total long-term debt, net 1,674,109 1,425,450
Total liabilities 2,407,650$ 2,205,613$
Net assetsInvested in capital assets, net of related debt 779,897$ 778,475$Restricted 425 44Unrestricted 214,088 177,766
Total net assets 994,410$ 956,285$
See notes to the financial statements.
Years ended September 30
STATEMENTS OF NET ASSETS

A-16 2010 Annual Report
STATEMENTS OF REVENUES, EXPENSES AND CHANGES IN NET ASSETS
(Dollars in thousands) 2010 2009
Operating revenuesRetail electric revenues 567,173$ 543,270$Resale electric revenues 168,471 137,044Water revenues 62,616 62,665Chilled water revenues 28,555 23,988Lighting revenues 12,166 12,046Other revenues 24,833 24,402Total operating revenues 863,814 803,415
Operating expensesFuel for generation and purchased power 330,738 312,377Unit/department expenses 227,017 196,786Depreciation and amortization 117,105 110,068Payments to other governments and taxes 54,653 51,356Storm related expenses - 162Total operating expenses 729,513 670,749
Operating income 134,301 132,666
Non-operating income and expensesInterest income 8,569 10,649Other income, net 7,832 2,263Amortization of deferred gain on sale of assets 3,971 3,971Interest expense (85,051) (77,048)Total net non-operating expenses (64,679) (60,165)
Income before contributions 69,622 72,501
Contributions in aid of construction 14,099 11,579Annual dividend (45,596) (45,900)Increase in net assets 38,125 38,180
Net assets - beginning of year 956,285 918,105
Net assets - end of year 994,410$ 956,285$
See notes to the financial statements.
Years ended September 30
B

Making Our Mark A-17
(Dollars in thousands) 2010 2009Cash flows from operating activities
Cash received from customers 899,241$ 827,231$Cash paid for fuel and purchased power (328,583) (347,691)Cash paid for unit/department expenses excluding salaries and benefits (68,711) (75,027)Cash paid for salaries and benefits (128,988) (115,283)Cash paid to other governments and taxes (54,429) (50,993)Net cash provided by operating activities 318,529 238,237
Cash flows from non-capital-related financing activitiesDividend payment (45,596) (45,900)Net cash used in non-capital-related financing activities (45,596) (45,900)
Cash flows from capital-related financing activitiesPrincipal payments on long-term debt (366,000) (362,945)Debt interest payments (97,153) (66,104)Collateral deposits (6,600) (12,132)Debt issuances 541,050 419,875Debt issuance expenses (5,086) (3,955)Construction and acquisition of utility plant, net of contributions (141,230) (237,983)Net cash used in capital-related financing activities (75,019) (263,244)
Cash flows from investing activitiesProceeds from sales and maturities of investment securities 700,558 598,096Gain on sale of investments 3,314 2,230Purchases of investment securities (864,934) (497,435)Investments and other income received 14,602 13,921Net cash provided by/(used in) investing activities (146,460) 116,812
Net decrease in cash and cash equivalents 51,455 45,905Cash and cash equivalents - beginning of year 155,665 109,760Cash and cash equivalents - end of year 207,120$ 155,665$
Reconciliation of operating income to net cash provided by operating activitiesOperating income 134,301$ 132,666$
Adjustments to reconcile operating income to net cash provided by operating activitiesDepreciation and amortization of plant charged to operations 117,105 110,068Depreciation charged to fuel for generation and purchased power 3,986 4,051Depreciation of vehicles and equipment charged to unit/department expenses 10,296 6,126
Changes in assets and liabilitiesIncrease in receivables and accrued revenue (3,179) (1,267)Decrease/(Increase) in fuel and materials and supplies inventories 2,733 (7,407)Increase/(Decrease) in accounts payable and accrued expenses 19,602 (20,786)Decrease in deposits payable and deferred costs (11,599) (14,322)Increase in stabilization and deferred revenue 45,156 29,108
Net cash provided by operating activities 318,401$ 238,237$
Reconciliation of cash and cash equivalentsRestricted and internally designated investments 89,181$ 88,474$Cash and investments 1,261 4,362Construction and related funds 35,182 33,042Debt service and related funds 81,496 29,787
Cash and cash equivalents - end of year 207,120$ 155,665$
Supplemental disclosure of non-cash financing activitiesAssets contributed in aid of construction 1,695$ 2,953$Fair value of investments (609)$ (2,275)$Amortization of debt-related costs 717$ 3,689$
Years ended September 30
STATEMENTS OF CASH FLOWS

A-18 2010 Annual Report
Note A – The Organization
Orlando Utilities Commission (OUC) was created in 1923 by a Special Act of the Florida Legislature as a statutory commission of the State of Florida. The Act confers upon OUC the rights and powers to set rates and charges for electric and water services. OUC is responsible for the acquisition, generation, transmission and distribution of electric and water services to its customers within Orange and Osceola Counties. In addition, OUC provides chilled water and lighting services.
The Board consists of five members including the Mayor of the City of Orlando. Members serve without compensation and with the exception of the Mayor, who is an ex-officio member of OUC, may serve no more than two full consecutive four-year terms.
Note B – Summary of Significant Accounting Policies
Basis of presentation: The financial statements are presented in conformity with generally accepted accounting principles for enterprise funds as prescribed by the Governmental Accounting Standards Board (GASB) and in accordance with the accounting principles prescribed by the Financial Accounting Standards Board (FASB), where not in conflict with GASB. The accounting records are maintained in accordance with the accounting principles and methods prescribed by the Federal Energy Regulatory Commission (FERC) with the exception of contributions in aid of construction, which are recorded in accordance with the standards prescribed by GASB.
OUC has elected not to apply FASB statements and interpretations issued after November 30, 1989, as permitted by GASB Statement No. 20, “Accounting and Financial Reporting for Proprietary Funds and other Governmental Entities”.
OUC is a regulated enterprise and, as such, applies the accounting principles permitted by FASB Statement No. 71, “Accounting for the Effects of Certain Types of Regulation”. Under this guidance, certain expenses and revenues are deferred and recognized in accordance with rate actions of the Board.
Reporting entity: OUC meets the criteria of an “other stand-alone government” as defined in GASB Statement No. 14, “The Financial Reporting Entity” and No. 39, “Determining Whether Certain Organizations are Component Units”.
OUC has undivided interests in several power generation facilities which are operated through participation agreements and are described in Note D – Jointly Owned Operations. Title to the property is held in accordance with the terms defined in each agreement, and as such, each party is obligated for its contractual share of operations. There are no separate entities or organizations associated with these agreements.
Measurement focus, basis of accounting, and financial statement presentation: OUC reports operating revenues and expenses separately from net non-operating expenses and contributions in aid of construction. Operating revenues and expenses generally result from producing and delivering utility service in the forms of electric, water, chilled water and lighting. The principal operating revenues are charges to retail and wholesale customers and are recorded net of the provision for uncollectible accounts. Operating expenses include fuel and purchased power, unit/department, taxes, and depreciation on capital assets. Net non-operating expenses include financial and investment activities. Contributions in aid of construction are primarily comprised of impact fees assessed for the future expansion and development of OUC’s water system as well as developer contributions to OUC’s electric and water systems above the required obligation-to-serve levels.
NOTES TO FINANCIAL STATEMENTS

Making Our Mark A-19
NOTES TO FINANCIAL STATEMENTS
Note B – Summary of Significant Accounting Policies (continued)
Setting of rates: According to the existing laws of the State of Florida, the Board acts as the regulatory authority for the establishment of electric and water rates. Electric rates are set in accordance with the “rate structures” established by the Florida Public Service Commission (FPSC), as they have the jurisdiction to regulate the electric “rate structures” of municipal utilities in Florida. A rate structure is defined as the rate relationship between customer class and among customers within rate classes and is distinguishable from the total amount of revenue requirements a utility may receive from rates.
Periodically, OUC performs a rate adequacy study to determine the electric base and fuel revenue requirements. Based on this study, current cost-of-service studies, and regulations of the FPSC regarding electric rate structures, OUC develops the electric rate schedules. Prior to the implementation of any rate change, OUC notifies customers individually, convenes a public workshop, presents the rates to the Board for approval and files the proposed tariffs with the FPSC. Water rate requirements are studied and prepared in a similar manner excluding filing a notification with the FPSC.
In January 2009, the Board approved an overall rate increase for retail electric to become effective on March 1, 2009. This rate increase was projected to result in a 13.7% average bill increase with 10.3% and 3.4% to energy and fuel rates, respectively. In respect to water rates, the Board also approved an average bill increase of 7.8% in January 2009.
Budgets: Revenue and expense budgets are prepared on an annual basis in accordance with OUC's budget policy and bond resolutions and submitted to the Board for approval prior to the beginning of the fiscal year. OUC’s annual operating budget and capital plan are approved and adopted, respectively, in the month of August preceding the upcoming fiscal year. In January 2009, due to the economic downturn, the original budget was revised and an amended operating budget was approved. The legal adoption of OUC’s operating budget and capital plan are not required.
In accordance with OUC’s budget policy and bond resolutions, actual revenues and expenses are compared to the budget by operating unit line item and then submitted to the Board monthly.
Utility plant: Utility plant is stated at historical cost with the exception of the fair value assets recorded in accordance with FERC Order 631, “Accounting, Financial Reporting, and Rate Filing Requirements for Asset Retirement Obligations” and impaired assets recorded in accordance with GASB Statement No. 42, “Accounting and Financial Reporting for Impairment of Capital Assets and for Insurance Recoveries”. Fair value assets are recognized over the license period of the nuclear generation facility and are subject to periodic re-measuring.
Historical utility plant costs include the costs of contract work, labor, materials and allocated indirect charges for equipment, supervision and engineering. Interest expense is not a component of OUC’s historical utility plant costs.
Assets are subject to capitalization if they have a useful life of at least 2 years, a unit cost of at least $1,000 with the exception of bulk asset purchases which must have a minimum per unit cost of $500 and a total purchase amount of at least $75,000. Assets are depreciated systematically using the straight-line method over the estimated useful life considering FERC guidelines or license period of the asset. The cost of electric or water utility plant assets retired, together with removal costs less salvage, are charged to accumulated depreciation. In addition, when utility plant constituting an operating unit or system is sold or disposed of and the net proceeds are at least $500,000, the gain or loss on the sale or disposal is deferred and proceeds, if applicable, are placed in the Renewal and Replacement fund in accordance with the Board-approved Policy on Accounting Treatment of Disposal of Capital Assets.

A-20 2010 Annual Report
Note B – Summary of Significant Accounting Policies (continued)
The consolidated average annual composite depreciation rates for 2010 and 2009 inclusive of impairment expenses were 3.7% and 3.5%, respectively. Depreciation is calculated using the following estimated lives:
Electric 5 – 50 yearsWater 3 – 67 yearsChilled Water 3 – 40 yearsLighting 5 – 20 yearsCommon 2 – 40 years
In addition, nuclear fuel is included in utility plant and amortized to fuel for generation and purchased power as it is used.
Intangible assets: In accordance with the implementation of GASB Statement No. 51, “Accounting and Financial Reporting for Intangible Assets”, all intangible assets excluding those exempt from this standard including goodwill, are classified under the heading of Utility plant, net. These assets are recognized, measured and depreciated consistent with OUC’s capitalization criteria.
Cash, cash equivalents and investments: OUC’s cash and cash equivalents include all authorized instruments purchased with an original maturity date of three months or less, including all investments in money market funds.
Investments are reported at fair market value with the exception of the funds held in the Debt Service Reserve funds. The Debt Service Reserve funds are recorded at their amortized cost in accordance with OUC's ratemaking model and its intention to retain these investments until the underlying debt has reached maturity or the series has been refunded. Realized and unrealized gains and losses for all investments except those executed in conjunction with a bond refunding are included in Interest income on the Statements of Revenues, Expenses and Changes in Net Assets. Realized gains recognized as a component of Interest income in 2010 and 2009 were $3.3 million and $2.2 million, respectively, with $0.7 million and $0.9 million of these amounts recognized as unrealized gains in prior years, respectively. Premiums and discounts on bonds and other investments are amortized using the effective interest method.
Investments maintained in OUC’s Defined Benefit and Post-Employment Benefit Trust funds were reported at quoted market value as of their actuarial valuation date. See valuation information related to these trust funds in Note K -Pension Plans and Note L - Other Post-Employment Benefits.
Restricted and internally designated assets: Funds classified as restricted assets represent cash, cash equivalents and investments, which were designated by law, bond requirements or regulatory statutes. Funds classified as internally designated assets also represent cash, cash equivalents and investments for which OUC has a customer obligation or the Board has taken action to designate.
Accounts receivable: OUC bills customers monthly on a cyclical basis recognizing revenue in the period in which it was earned, net of an allowance for uncollectible accounts. The allowance for uncollectible accounts was calculated based upon OUC’s historical experience with collections and current energy market conditions. In addition in 2010, the allowance for uncollectible accounts included customer-assessed collection fees in the amount of $1.5 million. Bad debt expense was recorded as a reduction of operating revenues in the Statements of Revenues, Expenses and Changes in Net Assets in the amount of $7.6 million and $7.0 million for the years ended September 30, 2010 and 2009, respectively.
NOTES TO FINANCIAL STATEMENTS

Making Our Mark A-21
NOTES TO FINANCIAL STATEMENTS
Note B – Summary of Significant Accounting Policies (continued)
The net customer accounts receivable balance of $84.0 million and $81.5 million at September 30, 2010 and 2009, respectively, includes billings on behalf of the State and other local governments of $10.4 million and $10.0 million, respectively. As OUC acts as billing agent, these amounts are not reflected in the Statements of Revenues, Expenses and Changes in Net Assets.
All receivables are anticipated to be collected within an operating cycle and are reported as current assets at September 30.
(Dollars in thousands) 2010 2009Customer receivables 66,321$ 66,894$ State and other local government receivables 10,437 10,037 Wholesale sale receivable 7,242 4,551
Total customer receivables 84,000$ 81,482$
Accrued utility revenue: This amount represents services provided to retail customers but not billed at the end of the fiscal year for electric, water, chilled water and lighting. Accrued unbilled revenue at September 30, 2010 and 2009 was $41.7 million and $40.1 million, respectively, including unbilled electric fuel revenues in the amount of $14.7million and $12.6 million, respectively.
Fuel for generation: Fuel oil and coal are reported at current cost which is adjusted on a monthly basis in accordance with market band fuel indices. Fuel for generation at September 30, 2010 and 2009 were $19.9 million and $20.0 million, respectively.
Materials and supplies inventory: Materials and supplies are reported at current cost which is evaluated on a periodic basis in conjunction with OUC’s contractual material and supply agreements. Materials and supplies at September 30, 2010 and 2009 were $37.8 million and $36.7 million, respectively.
Prepaid expenses and deferred charges: Prepaid expenses represent costs that are anticipated to be recognized in the Statements of Revenues, Expenses and Changes in Net Assets in the near future including service agreement costs and the current portion of the advance pension funding. Deferred charges represent costs such as margin deposits and deferred fuel hedge costs. Prepaid expenses and deferred charges at September 30, 2010 and 2009 were $55.3 million and $46.1 million for which margin deposits (see Note H – Long-term Debt) were $35.7 million and $29.1 million, respectively.
Advance pension funding asset: The advance pension funding asset originated with the issuance of the pension obligation bonds. The amortization of this deferred asset is being recognized in accordance with calculations provided to OUC by its actuaries in conjunction with its annual actuarial valuation report and was $30.8 million and $34.3 million at September 30, 2010 and 2009, respectively. The outstanding balances for the pension obligation bonds, Series 2003T Bonds, were $37.3 million and $40.6 million at September 30, 2010 and 2009, respectively.
Deferred debt costs: Deferred debt costs represent costs related to bond issuances, which are amortized using the bonds outstanding method and recorded net of accumulated amortization. Deferred costs related to bond series scheduled to mature in the next 12 months are included under the heading of Prepaid expenses and deferred charges.
Derivative instruments: In conjunction with the implementation of GASB Statement No. 53, “Accounting and Financial Reporting for Derivative Instruments” all derivative instruments are included on the Statements of Net Assets as either an asset or liability measured at fair market value. This standard was implemented retroactively

A-22 2010 Annual Report
Note B – Summary of Significant Accounting Policies (continued)
and as such fair value assets and liabilities were included in 2010 and restated in 2009. Changes in the fair value of effective hedging derivative instruments during the year are deferred and recognized in the period in which the derivative is settled. The settlement of fuel and financial-related hedging derivatives are included as a part of Fuel for generation and purchased power costs and Interest expense, respectively, in the Statements of Revenues, Expenses and Changes in Net Assets. Changes in the fair value of investment derivative instruments are recognized in the Statement of Revenues, Expenses and Changes in Net Assets in the period in which they are incurred unless otherwise authorized by Board action to be deferred and recognized through the rate-making process.
Fuel-related derivative transactions for natural gas and crude oil are executed in accordance with OUC's internally established Energy Risk Management Oversight Committee (ERMOC) whose primary objective is to minimize exposure to energy price volatility for cash flow and control purposes. ERMOC has a defined organizational structure and responsibilities, which include approving all brokerage relationships, counterparty credit worthiness and overall program compliance. In addition, the Energy Risk Management Program incorporates specific volume and financial limits for natural gas derivatives which begin at 40% of the approved fuel budget of the current year (the 1st year) and graduate down in 5% increments to 20% of the forecasted annual fuel budget for the 5th year. Crude oil derivatives are hedged based on the expected volume of oil consumed, in conjunction with coal transportation costs.
Financial-related derivatives are executed to modify interest rates on outstanding debt. These agreements are prepared in accordance with OUC’s Derivative policy, presented to the Finance Committee and approved by the Board. Periodically, as defined by the underlying agreement, the net differential between the fixed and variable rate is exchanged with the counterparty and included as a component of Interest expense. Financial-related derivatives terminated in conjunction with a bond refunding are deferred and included as a component of Unamortized discount/premium and deferred amount on refunding. Financial-related derivatives, which are terminated prior to their original maturity date and are not terminated in conjunction with a bond refunding, are recognized as a component of Interest expense unless otherwise authorized by Board action.
Accounts payable and accrued expenses: Accounts payable and accrued expenses include liabilities incurred in conjunction with fuel and purchased power costs, vendor payables and accrued expenses for self insurance expenses. The following table summarizes the significant payable balances included under this heading at September 30, 2010 and 2009:
(Dollars in thousands) 2010 2009Vendor payables 36,291$ 25,465$Fuel & purchased power payables 28,116 24,850Accrued self insurance expenses 3,032 2,887Other accounts payable and accrued expenses 6,867 3,193Total 74,306$ 56,395$
Pollution remediation obligations: In accordance with GASB Statement No. 49, “Accounting and Financial Reporting for Pollution Remediation Obligations”, OUC has recognized liabilities in the amounts of $2.3 million and $0.6 million at September 30, 2010 and 2009, respectively, under the heading of Accounts payable and accrued expenses.
NOTES TO FINANCIAL STATEMENTS

Making Our Mark A-23
NOTES TO FINANCIAL STATEMENTS
Note B – Summary of Significant Accounting Policies (continued)
Compensated absences and accrued wages: OUC accrues vacation leave for all employees annually on January 1. Sick leave is earned annually on the employee’s anniversary date and is accrued based on a ratio of sick leave taken to sick leave earned. This ratio is then used to determine an employee’s payout at either theretirement rate of 50% or termination rate of 25%. No payout is available for employees with less than two years of employment. Compensatory time is accrued when earned. At September 30, 2010 and 2009, the estimated liability for compensated absences and accrued wages was $10.0 million and $11.2 million, respectively. The decrease in this liability is primarily due to the change in payroll days accrued at September 30, 2010 and 2009 of 4 days and 8days, respectively.
Deferred revenue: Deferred revenue represents advanced funds received for future services that are amortized over a period consistent with the service agreement. In October 1999, in conjunction with the sale of the Indian River Plant, OUC received prepaid transmission access fees that are being amortized over the life of the agreement. Deferred revenue related to this agreement at September 30, 2010 and 2009 was $11.6 million and $12.6 million, respectively.
Asset retirement obligation and other liabilities: Included in this amount are the asset retirement obligations (ARO) related to the legal requirement of decommissioning OUC’s interest in the St. Lucie Unit 2 and Crystal River Unit 3 nuclear generation facilities and advances received from customers for construction commitments.
The asset retirement obligation was determined based on the most recent approved Florida Public Service Commission (FPSC) report provided to OUC by the owner-operators of these plants. The amount estimated for OUC’s share of the decommissioning cost of these facilities, in 2000 dollars, was $26.7 million and $8.6 million for St. Lucie Unit 2 and Crystal River Unit 3, respectively. Adjusted to 2003 dollars, based on FPSC-approved earnings rates, these amounts were $31.4 million and $9.6 million, respectively. This liability is systematically accreted over a life consistent with each plant’s license period. Asset retirement obligations recorded at September 30, 2010 and 2009 were $38.3 million and $36.6 million and $15.0 million and $14.2 million, for St. Lucie Unit 2 and Crystal River Unit 3, respectively.
License expirations for St. Lucie and Crystal River are 2043 and 2016, respectively; however, Crystal River is currently being evaluated for a license extension for an additional 20 years.
Unamortized discount/premium and deferred amount on refunding: Unamortized discount/premium on outstanding bonds is recorded in the year of issuance. Amortization of these amounts is recorded using the bonds outstanding method based on the individual serial maturities and is presented net of accumulated amortization.
Deferred amounts on refunding represent deferred gains or losses from bond refundings and are amortized over the shorter of the refunded or refunding debt lives, using the straight-line method and are presented, net of accumulated amortization.
Unamortized discount/premium including underwriter discounts and deferred amounts on refunding related to bond series scheduled to mature within the next 12 months are included under the heading of Current-portion of long-term debt outstanding.
Contributions in aid of construction: Funds received from developers and customers, including system development fees and assets deeded to OUC for future maintenance, are recorded as Contributions in aid of construction in the period in which they have been received on the Statements of Revenues, Expenses and Changes in Net Assets

A-24 2010 Annual Report
Note B – Summary of Significant Accounting Policies (continued)
Net assets: OUC classifies its net assets into three components as follows:
Invested in capital assets, net of related debt: This component of net assets consists of capital assets, net of accumulated depreciation reduced by the outstanding debt balances, net of unamortized debt expenses excluding bond issue costs and underwriters discounts.Restricted: This component consists of net assets with external constraints placed on their use. Constraints include those by debt indentures, grants or laws and regulations of other governments and those established by law through constitutional provisions or enabling legislation. Unrestricted: This component of net assets consists of net assets that do not meet the definition of “Invested in capital assets, net of related debt” or “Restricted”.
Implementation of new accounting standards: In June 2008, GASB issued Statement No. 53, “Accounting and Financial Reporting for Derivative Instruments”, to address the recognition, measurement and disclosure of information related to hedging activities. This statement is effective for periods beginning after June 15, 2009 and as such, is being retroactively adopted in 2010. The impact to OUC’s financial position is included inNote M - Hedging Activities.
Review of new accounting standards: New standards were issued by GASB, including Statement No. 57, “OPEB Measurements by Agent Employers and Agent Multiple-Employer Plans”, and Statement No. 58, “Accounting and Financial Reporting for Chapter 9 Bankruptcies”, in December 2009. In respect to Statement No. 57, OUC maintains a single-employer other post-employment benefit plan (OPEB) and as such, this standard is not applicable. In respect to Statement No. 58, OUC does not anticipate the implementation of this standard will have an impact on its financial statements.
In 2009, GASB Statement No. 52, “Land and Other Real Estate Held as Investments by Endowments”, became effective. The scope of this standard established accounting and financial reporting for land and other real estate held as investment by endowments. OUC does not maintain any assets of this nature and as such, this standard is not applicable to OUC’s operations. In February 2009, GASB Statement No. 54, “Fund Balance Reporting and Governmental Fund Types”, was issued. This standard establishes accounting and financial reporting standards for all governments that report governmental funds. As an enterprise fund, this standard is not applicable to OUC. In March 2009, GASB Statement No. 55, “The Hierarchy of Generally Accepted Accounting Principles for State and Local Governments”, and Statement No. 56, “Codification of Accounting and Financial Reporting Guidance Contained in the AICPA Statements”, were issued. These standards incorporate existing generally accepted accounting guidance into the GASB authoritative literature. As these standards have already been incorporated, the implementation of these standards into GASB literature does not have a material impact on OUC’s financial position.
Reclassifications: Certain amounts in 2009 have been reclassified to conform to the 2010 presentation.
NOTES TO FINANCIAL STATEMENTS

Making Our Mark A-25
NOTES TO FINANCIAL STATEMENTS
Note C – Utility Plant
Activity for utility plant for the years ended September 30, 2010 and September 30, 2009 were as follows:
(Dollars in thousands)
September 2009 Additions
Transfers
Retirements/ reclassifications
September 2010
Utility plant Electric (5-50 years) 2,260,202$ 13,683$ 393,292$ (80,517)$ 2,586,660$Water (3-50 years) 485,472 1,625 8,326 (11,436) 483,987 Chilled water 96,746 - 14,029 - 110,775 Lighting 76,573 - 3,247 (16,949) 62,871 Shared/customer service (3-50 years) 186,320 2,083 18,365 (9,413) 197,355 Total utility plant 3,105,313 17,391 437,259 (118,315) 3,441,648
Accumulated depreciationElectric (1,003,312) (81,240) 1,158 76,834 (1,006,560) Water (160,927) (14,454) 739 11,406 (163,236) Chilled water (19,671) (3,654) (12) (15) (23,352) Lighting (30,960) (3,087) 18 16,914 (17,115) Shared/customer service (89,933) (14,015) (1,903) 9,429 (96,422) Total accumulated depreciation (1,304,803) (116,450) - 114,568 (1,306,685)
Total depreciable utility plant, net 1,800,510 (99,059) 437,259 (3,747) 2,134,963 Land and other non-depreciable assets 59,501 129 4,964 (1,726) 62,868 Construction work in progress 421,685 128,857 (442,223) (986) 107,333 Utility plant, net 2,281,696$ 29,927$ -$ (6,459)$ 2,305,164$
(Dollars in thousands)
September 2008 Additions Transfers
Retirements/ reclassifications
September 2009
Utility Plant
Electric 2,186,936$ 13,949$ 69,060 (9,743)$ 2,260,202$
Water 475,923 2,692 8,913 (2,056) 485,472
Chilled water 81,471 - 15,740 (465) 96,746
Lighting 73,587 18 3,090 (122) 76,573
Shared/customer service 153,247 1,464 54,336 (22,727) 186,320
Total utility plant 2,971,164 18,123 151,139 (35,113) 3,105,313
Accumulated depreciation
Electric (933,837) (67,389) 55 (2,141) (1,003,312)
Water (144,800) (18,136) 20 1,989 (160,927)
Chilled water (16,795) (3,664) - 788 (19,671)
Lighting (28,108) (2,938) - 86 (30,960)
Shared/customer service (98,854) (13,708) (75) 22,704 (89,933)
Total accumulated depreciation (1,222,394) (105,835) - 23,426 (1,304,803)
Total depreciable utility plant, net 1,748,770 (87,712) 151,139 (11,687) 1,800,510
Land and other non-depreciable assets 59,196 436 - (131) 59,501
Construction work in progress 343,958 228,866 (151,139) - 421,685
Utility plant, net 2,151,924$ 141,590$ -$ (11,818)$ 2,281,696$
Asset impairment costs, recorded as a component of depreciation and amortization were recognized in 2010 for the changes in asset usage of a transmission substation in the amount of $1.8 million and the transfer of property owned by OUC to the City of Orlando in the amount of $1.7 million.
In 2009, impairment costs were recognized for the change in asset usage of the Southeast water treatment plant in the amount of $2.5 million and the decrease in fair market value of the former administration building in the amount of $0.8 million.

A-26 2010 Annual Report
Note D – Jointly Owned Operations
OUC operated: OUC maintains fiscal, budgetary and operating control at four (4) power generation facilities for which there are undivided participant ownership interests. These undivided ownership interests are with the Florida Municipal Power Agency (FMPA) and Kissimmee Utility Authority (KUA). Each agreement is limited to the generation facilities and excludes the external facilities. OUC also maintains operational control of a wastewater treatment facility at the Stanton Units 1 & 2 sites through an agreement with Orange County.
Non-OUC operated: OUC maintains an undivided participant interest with Southern Company at their Stanton Unit A combined cycle generation facility located at OUC’s Stanton Energy Center, Florida Power & Light at their St. Lucie Unit 2 nuclear generation facility, Progress Energy at their Crystal River Unit 3 nuclear generation facility and the City of Lakeland at their McIntosh Unit 3 coal-fired generation facility. In each of these agreements, fiscal, budgetary and operational controls are not maintained by OUC with the exception of fuel-related services at Stanton Unit A, where OUC retains responsibility as fuel agent for the initial 10 years of operation. Funds secured in this role as fuel agent are restricted on the Statements of Net Assets and disclosed in Note E - Cash, Cash Equivalents and Investments.
OUC and non-OUC operated agreements and the related undivided interests are as follows:
Facility name Agreement yearTotal facility net
megawatt capacityOUC undivided
ownership interestNet OUC megawatt
capacity
Crystal River Unit 3 (CR3) 1975 890 1.60% 14
McIntosh Unit 3 (MAC3) 1978 364 40.00% 146
St. Lucie Unit 2 (SL2) 1980 850 6.09% 52
Stanton Unit 1 (SEC1) 1984 425 68.55% 291Indian River Combustion Turbines (IRP - A&B) 1988 76 48.80% 37Indian River Combustion Turbines (IRP - C&D) 1990 224 79.00% 177
Stanton Unit 2 (SEC2) 1991 425 71.59% 304
Stanton Unit A (SECA) 2001 633 28.00% 177
Plant balances and construction work in progress for SEC1, SEC2, MAC3 and the Indian River Plant CTs include the cost of common and/or external facilities. At the other plants, participants pay user charges to the operating entity for the cost of common and/or external facilities. User charges paid for SECA are remitted back to OUC at their proportionate ownership interest of Shared Facilities. Allowance for depreciation and amortization of utility plant is determined by each participant based on their depreciation methods and rates relating to their share of the plant.
The following is a summary of OUC's recorded gross and net share of each jointly owned power generation facilityat September 30:
Utility plantAccumulated depreciation Net book value Utility plant
Accumulated depreciation Net book value
SEC2 427,741$ 157,871$ 269,870$ 424,469$ 146,572$ 277,897$
SEC1 347,090 182,745 164,345 341,021 173,759 167,262
MAC3 179,515 104,823 74,692 176,573 99,698 76,875
SL2 151,578 81,091 70,487 146,384 79,118 67,266
SECA 73,943 21,453 52,490 74,318 17,775 56,543
IRP 61,668 44,800 16,868 66,264 48,193 18,071 CR3 26,925 13,585 13,340 23,599 13,105 10,494
Total 1,268,460$ 606,368$ 662,092$ 1,252,628$ 578,220$ 674,408$
September 2009September 2010
NOTES TO FINANCIAL STATEMENTS

Making Our Mark A-27
Investment type 2010 2009
U.S. Agencies:
Federal Home Loan Banks 43% 18%
Federal National Mortgage Association (Fannie Mae) 18% 13%
Federal Home Loan Mortgage Corporation (Freddie Mac) 5% 17%
SunTrust interest bearing depository account 12% 10%
September
NOTES TO FINANCIAL STATEMENTS
Note E – Cash, Cash Equivalents and Investments
OUC maintains a portion of its cash, cash equivalents and investments in interest-bearing qualified public depository accounts with institutions insured by the Federal Deposit Insurance Corporation or collateralized by a pool of U.S. Governmental securities, per the Florida Security of Public Deposits Act, Chapter 280 of the Florida Statutes, as well as other types authorized by the investment policy.
Unexpended funds from the sale of bonds, debt service funds and other special funds are included in the Restricted and internally designated section of the Statements of Net Assets. The use of these funds is designated in accordance with applicable debt indentures, Board action, or any other laws and regulations established through legislation.
In compliance with GASB Statement No. 31, “Accounting and Financial Reporting for Certain Investments and for External Investment Pools”, all equity and debt securities are recorded at their fair value with gains and losses recorded as a component of interest income in the Statements of Revenues, Expenses and Changes in Net Assets. At September 30, 2010 and 2009, the total amount of deposits and investments were $712.0 million and $495.5 million, respectively.
The investment policy, inclusive of the portfolio weighing guidelines noted below, provides management with guidelines to ensure risks associated with these assets are mitigated. The following are the key controls which OUC utilizes to mitigate investment risk:
Interest rate risk: OUC’s investment policy requires that a minimum of 10% of the operating portfolio be held in highly marketable securities with maturities not exceeding 30 days. This requirement enables OUC to mitigate fair value changes within the portfolio and reduce its exposure to this risk. In addition, the investment policy limits maturities based on investment type and credit strength and entrusts OUC’s management to execute transactions in accordance with the “prudent person” rule requiring the evaluation of current market conditions to ensure overall interest rate risks that might adversely affect the portfolio value are mitigated
Custodial credit risk: This is the risk that in the event of the failure of a depository financial institution or counterparty, OUC’s deposits may not be returned or OUC will not be able to recover the value of its deposits, investments or collateral securities that are in the possession of another party. OUC does not have a deposit policy for custodial credit risk and as such, $118.1 million and $67.0 million of investments held in money market funds and interest-bearing qualified public depository accounts were exposed to this risk as of September 30, 2010 and 2009, respectively. OUC views this type of risk as minimal due to its use of Qualified Public Depositories (QPDs) of the State of Florida or money market mutual funds rated no less than “Aaa”, “AAAm” or equivalent with a stable net asset value of $1 per share and daily liquidity.
Credit risk: To mitigate the risk that an issuer of an investment will not fulfill its obligation to the holder of the investment, OUC limits investments to those rated, at a minimum, “A-1” or equivalent for commercial paper and “A” or equivalent for medium-term corporate notes by nationally recognized rating agencies.
Concentration risk: This is the risk of loss associated with the extent of OUC’s investment in a single issuer. OUC places no limit on the amounts invested in any one issuer. The following are the investment concentrations greater than five percent for a single issuer, exclusive of U.S. Treasury notes:

A-28 2010 Annual Report
Note E – Cash, Cash Equivalents and Investments (continued)
Foreign currency risk: This is the risk of loss associated with changes in exchange rates which could adversely affect investment valuations. As OUC is not authorized to invest in foreign currency, there is no exposure to this risk.
Cash, cash equivalents and investments are managed by OUC in accordance with its investment policy. The following table summarizes the investment criteria underlying OUC’s investment policy segregated by investment type, credit guidelines and maximum portfolio weighting.
2010 2009
Certificates of depositInvestments held by or purchased from institutions certified with the Florida Security of Public Deposits Act, Chapter 280 of the Florida Statutes. 5% - -
High-grade corporate notes Minimum rating of "A+", "A1" by at least two nationally recognized rating agencies. 10% 5% 6%Taxable municipal bonds Minimum "A1" rating by a nationally recognized rating agency 10% - -
Bankers acceptances
Inventory based with an unsecured, uninsured and unguaranteed obligation rating of at least "P-1" and "A", and "A-1" and "A" by Moody’s and S&P, respectively. Bank must be ranked in the top 100 banks in terms of total assets by the American Bank’s yearly report. 10% - -
Money market funds
Limited to funds that meet a stable net asset value of $1 per share and are not rated less than "Aaa", "AAAm" or equivalent by at least one nationally recognized rating agency. 20% 5% 3%
Commercial paperMinimum rating of "A-1", "P-1" and "F1" by at least two nationally recognized rating agencies. 20% 6% -
Interest-bearing qualified public depository accounts
Investments held by or purchased from institutions certified with the Florida Security of Public Deposits Act, Chapter 280 of the Florida Statutes. 20% 12% 10%
Local government surplus funds investment pool Qualified under the laws of the State of Florida. 25% - -
Treasury notesDirect obligations that are unconditionally guaranteed by the United States Government. 100% 7% 31%
U.S. agenciesIndebtedness issued by government-sponsored enterprises (GSE), which are non-full faith and credit by the United States Government. 100% 65% 50%
Repurchase and reverse repurchase agreements
Secured transactions executed under a master repurchase agreement with collateral limited to direct governmental and agency obligations with terms of <10 years and held and maintained by a third party trust at a market value of 102% of the cash value.
50% and 20%, respectively - -
Portfolio weighting at September
Investment type Credit guidelines
Maximum portfolio
weighting
The following schedule discloses the weighted average maturity in years for each of the investment classifications at September 30:
Investment type 2010 2009
Treasury notes 4.65 1.94
U.S. agencies 1.94 3.22
Corporate notes 1.92 1.99
Commercial paper 0.30 0.00
September
NOTES TO FINANCIAL STATEMENTS
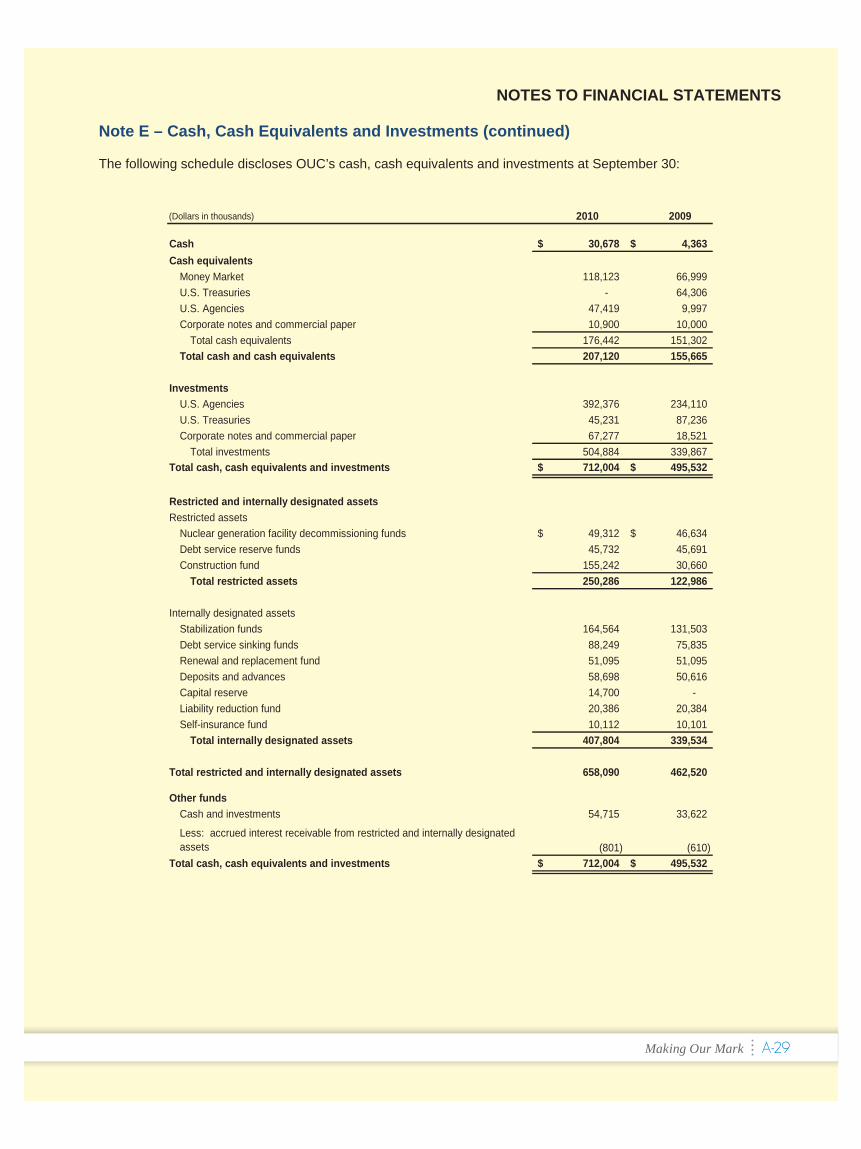
Making Our Mark A-29
(Dollars in thousands) 2010 2009
Cash 30,678$ 4,363$
Cash equivalents
Money Market 118,123 66,999
U.S. Treasuries - 64,306
U.S. Agencies 47,419 9,997
Corporate notes and commercial paper 10,900 10,000
Total cash equivalents 176,442 151,302
Total cash and cash equivalents 207,120 155,665
Investments
U.S. Agencies 392,376 234,110
U.S. Treasuries 45,231 87,236
Corporate notes and commercial paper 67,277 18,521
Total investments 504,884 339,867
Total cash, cash equivalents and investments 712,004$ 495,532$
Restricted and internally designated assets
Restricted assets
Nuclear generation facility decommissioning funds 49,312$ 46,634$
Debt service reserve funds 45,732 45,691
Construction fund 155,242 30,660
Total restricted assets 250,286 122,986
Internally designated assets
Stabilization funds 164,564 131,503
Debt service sinking funds 88,249 75,835
Renewal and replacement fund 51,095 51,095
Deposits and advances 58,698 50,616
Capital reserve 14,700 -
Liability reduction fund 20,386 20,384
Self-insurance fund 10,112 10,101
Total internally designated assets 407,804 339,534
Total restricted and internally designated assets 658,090 462,520
Other funds
Cash and investments 54,715 33,622
Less: accrued interest receivable from restricted and internally designated assets (801) (610)
Total cash, cash equivalents and investments 712,004$ 495,532$
NOTES TO FINANCIAL STATEMENTS
Note E – Cash, Cash Equivalents and Investments (continued)
The following schedule discloses OUC’s cash, cash equivalents and investments at September 30:

A-30 2010 Annual Report
Note F – Regulatory Assets and Deferrals
Based on regulatory action taken by the Board and accounting guidance provided from the FASB, OUC has recorded the following regulatory assets and liabilities that will be included in the ratemaking process and recognized as expenses and revenues, respectively, in future periods.
Regulatory assets:
Loss on defeasance: In December 2006, OUC used $109.8 million from the Liability Reduction Fund to defease portions of the Series 2001, 2001A and 2003A Bonds in anticipation of yielding a favorable rate differential between the interest earnings from the Liability Reduction funds and the defeased debt. In conjunction with this defeasance, a loss in the amount of $10.9 million was deferred and will be amortized over an eight year period, which is consistent with the originally scheduled recovery period. The deferred amounts at September 30, 2010 and 2009 were $6.2 million and $7.5 million, respectively.
Deferred interest costs: This amount represents the deferral of interest costs incurred in association with the Series 1993 and 1993B Bonds as a result of differing short-term and long-term rates at the time of bond issuance. The amounts of deferred charges at September 30, 2010 and 2009 were $4.9 million and $5.3 million, respectively. Deferred charges are currently amortized to interest expense over the remaining period of the original bond series.
Asset retirement obligation costs: This amount represents the deferral of the difference between retirement obligation expenses and income for financial and rate recovery purposes. To date retirement obligation expenses exceed the associated income earned from the associated restricted investments andas such, the asset retirement obligation regulatory assets at September 30, 2010 and 2009 were $1.1 million and $0.6 million, respectively.
The following is a summary of OUC’s regulatory assets at September 30:
(Dollars in thousands) 2010 2009
Loss on defeasance 6,232$ 7,478$
Deferred interest costs 4,897 5,305
Asset retirement obligation costs 1,096 610
Total regulatory assets 12,225$ 13,393$
Regulatory liabilities:
Deferred gain on sale of assets: On October 5, 1999, OUC sold its steam units at the Indian River Plant (IRP) and elected to defer the gain on sale of $144.0 million. In accordance with this action, $45.0 million was designated to offset generating facility demand payments. In 2004, the Board approved the systematic recognition of the remaining $99.0 million over a period consistent with the life of SECA. As a result of this action, OUC has recognized gains of $3.9 million annually during the years ended September 30, 2010 and 2009. The deferred gain on sale amount at September 30, 2010 and 2009 was $73.2 million and $77.1 million, respectively.
NOTES TO FINANCIAL STATEMENTS

Making Our Mark A-31
NOTES TO FINANCIAL STATEMENTS
Note F – Regulatory Assets and Deferrals (continued)
Deferred gain on settlement: As a result of an eminent domain action in July 2005, the Florida Department of Transportation (FDOT) took possession of OUC’s administration building parking garage. In exchange for taking possession of OUC’s garage and the underlying land, the FDOT provided OUC with an adjacent land parcel and a cash settlement of $15.0 million. In association with this action, OUC constructed a new administration facility and utilized $6.0 million of the gain on settlement for transition and relocation costs and retained the remaining amount of $2.3 million as a regulatory liability in accordance with the Board’s Capital Asset Disposal Policy. As the new administration facility was occupied in the fall of 2009, the accrual for transition and relocation costs was substantially utilized with a balance outstanding of $0.1 million at September 30, 2009. In 2010, due to the economic downturn and decline in property values, the remaining transition and relocation accrual of $0.1 million was utilized along with a portion of the gain on settlement. The deferred gain on settlement amount at September 30, 2010 and 2009 was $2.1 million and $2.3 million, respectively.
Deferred wholesale trading profits: This account represents a portion of profits generated from resale sales. No funds were approved for usage in 2010 and 2009.
Electric and water rate stabilization: The Board established these accounts for costs/revenues that are to be recovered by or used to reduce rates in periods other than when incurred/realized. In August 2010, the Board approved the deferral of $5.5 million of retail electric revenue requirements as a result of budgetary changes to both the commencement and depreciable life of SECB. In addition, $3.0 million of retail electric revenue requirements were deferred as a result of OUC receiving later than anticipated legislative guidance for the implementation of new and expanded conservation programs. No funds were approved for deferral or usage in 2009.
Fuel stabilization: This account was established in accordance with guidelines from the Public Utilities Regulatory Policies Act of 1978 and represents the difference between the fuel costs charged to customers inclusive of accrued utility revenue and fuel costs. In addition in 2009, in accordance with Board action, an $8.0 million settlement received in conjunction with the termination of OUC’s interest in the twenty-year natural gas prepaid supply agreement was included in this fund. These funds will be recognized consistent with other deferred amounts through the rate-making process.
Other Stabilization Funds: In accordance with Board action, the following funds have been deferred:
Deferred gain on swap termination: This amount was recognized in association with the early termination of an interest-rate swap agreement. As the underlying bonds are scheduled to mature in October 2011, the Board approved a portion of the gain, $2.5 million, be recognized consistent with the life of the outstanding bonds. Regulatory liabilities deferred at September 30, 2010 and 2009 were $1.3 million and $2.5 million, respectively.
Deferred nuclear revenue requirements: This amount was deferred as a result of delays associated with OUC’s participation in the construction of a new nuclear generation facility. In 2009, development costs in the amount of $2.2 million were anticipated to be incurred and as a result of project delays, these costs were not incurred. These amounts are anticipated to be recognized consistent with the recognition of nuclear generation development costs and continue to remain outstanding at September 30, 2010.
Deferred health insurance reserve: This account was established to mitigate unexpected increases in medical costs to employees. Funds deferred at September 30, 2010 and 2009 were $0.6 million.

A-32 2010 Annual Report
Note F – Regulatory Assets and Deferrals (continued)
In conjunction with the recording of certain regulatory liabilities, the Board internally designated cash and investments to fund these deferrals (see Note E – Cash, Cash Equivalents and Investments). Regulatory liability funds earned the same interest rate as OUC's operating investment portfolio and were as follows at September 30:
(Dollars in thousands) 2010 2009Fuel stabilization 127,343$ 93,149$Rate stabilization 44,424 34,992Deferred wholesale trading profits 16,618 16,616Other stabilization funds 4,060 5,321Deferred revenue regulatory liabilities 192,445 150,078Deferred gain on sale of assets 73,190 77,161Deferred gain on settlement 2,101 2,300Deferred gain regulatory liabilities 75,291 79,461Total regulatory liabilities 267,736$ 229,539$
Note G – Insurance Programs and Claims
Insurance Programs
OUC is exposed to various risks of loss related to torts, theft and destruction of assets, errors and omissions, andnatural disasters. In addition, OUC is exposed to risks of loss due to injuries and illness of its employees. These risks are managed through OUC’s self-insurance program and third-party claims administration program. Under the self-insurance program, OUC is liable for all claims up to certain maximum amounts per occurrence. Claims in excess of $250 thousand for healthcare coverage, $2.0 million for general and automobile liability and $500 thousand for worker’s compensation are covered by insurance at September 30, 2010 and 2009.
The healthcare benefits program is administered by an insurance company (administrator). The administrator is responsible for processing the claims in accordance with OUC’s benefit specifications and is reimbursed regularly for claims paid. Incurred claims include current period payments, as well as estimated incurred-but-not-received claims based on actuarial information received in conjunction with OUC’s annual State of Florida self-insurance filing.
Liabilities associated with the healthcare programs are determined based on actuarial studies and include amounts for claims that have been incurred but not reported. For worker’s compensation claims, liabilities are determined from estimates provided by the current claims adjusting firm based on amounts already paid and the age and type of claim. Liabilities associated with general and automobile liability coverage are determined based on historic information in addition to estimated costs for current pending claims. These liabilities are included in the Statements of Net Assets under the heading of Accounts payable and accrued expenses.
NOTES TO FINANCIAL STATEMENTS

Making Our Mark A-33
NOTES TO FINANCIAL STATEMENTS
Note G – Insurance Programs and Claims (continued)
Self-insurance program liability was as follows:
(Dollars in thousands)
Workers compensation
General and automobile
liabilityHealth and
medical claims Total
Balance at September 30, 2008 635$ 675$ 1,709$ 3,019$ Payments, net of recoveries and adjustments (402) (614) (14,269) (15,285)
Incurred claims 481 249 14,423 15,153
Balance at September 30, 2009 714 310 1,863 2,887 Payments, net of recoveries and adjustments (593) (140) (16,720) (17,453)
Incurred claims 479 138 16,981 17,598
Balance at September 30, 2010 600$ 308$ $ 2,124 $ 3,032
Claims
It is the opinion of OUC’s general counsel that OUC, as a statutory commission, may enjoy sovereign immunity in the same manner as a municipality, as allowed by Florida Court of Appeals rulings. Under said rulings, Florida Statutes limit of liability for claims or judgments by one person for general liability or auto liability is $100,000 or a total of $200,000 for the same incident or occurrence; greater liability can result only through an act of the Florida Legislature. Furthermore, any defense of sovereign immunity shall not be deemed to have been waived or the limits of liability increased as a result of obtaining or providing insurance in excess of statutory limitations.
OUC’s transmission and distribution system is not covered by property insurance since such coverage is generally not available.
Nuclear liability insurance: Liability for accidents at the nuclear power plants for which OUC has a minority interest are governed by the Price Anderson Act, which limits the public liability of nuclear reactor owners to the amount of insurance available from private sources and an industry retrospective payment plan. Both majority owners, Florida Power & Light and Progress Energy Corporation, maintain private liability insurance for all participants owning an undivided interest in the generation facility of $375 million and $500 million per site, respectively, and participate in a secondary financial protection system. In addition, both majority owners participate in nuclear mutual companies that provide limited insurance coverage for property damage, decontamination and premature decommissioning risks. Irrespective of the insurance coverage, should a catastrophic loss occur at either of the plants, the amounts of insurance available may not be adequate to cover property damage and other expenses incurred. The owners of a nuclear power plant could be assessed to pay a maximum payout of $117.5 million per unit per incident at any nuclear utility reactor in the United States, payable at a rate not to exceed $17.5 million per incident per year. Uninsured losses, to the extent not recovered through rates, would be borne by each of the owners at their proportionate ownership share and may have an adverse effect on their financial position. Any losses in excess of that amount are self-insured, such that OUC would be responsible for its pro-rata share of any losses in excess of insurance coverage. See Note D - Jointly Owned Operations, for OUC’s ownership interest in St. Lucie Unit 2 and Crystal River Unit 3.
On behalf of all the co-owners of St. Lucie Unit No. 2 and Crystal River Unit No. 3, FPL and Progress Energy, respectively, each carries in excess of $2 billion of property damage insurance; however, substantially all insurance proceeds must first be used to satisfy decontamination and clean-up cost before they can be used for repair or restoration of plants.

A-34 2010 Annual Report
Note H – Long-term Debt
The following schedules summarize long-term debt activity.
Series (Dollars in thousands)
Final principal payment Interest rates (%)
September 2009
Additions during year
Decreases during year
September2010
Current portion
1992 Bonds 2010 6.00% 76,775$ -$ 37,270$ 39,505$ 39,505$ 1996A Bonds 2023 3.75% 60,000 - - 60,000 - 2001 Bonds 2023 4.50 - 5.25% 75,515 - 6,725 68,790 2,635 2001A Bonds 2020 4.00 - 5.25% 16,395 - - 16,395 - 2002A Bonds 2017 Variable rate (1) 120,000 - 120,000 - - 2002C Bonds 2027 5.00 - 5.25% 25,685 - - 25,685 - 2003 Bonds 2025 3.50% 54,775 - - 54,775 - 2003A Bonds 2022 4.00 - 5.00% 110,615 - 145 110,470 - 2003B Bonds 2022 4.00 - 5.00% 93,745 - 920 92,825 955 2003T Bonds 2018 4.26 - 5.29% 40,580 - 3,290 37,290 3,420 2005A Bonds 2011 3.50 - 4.00% 40,525 - - 40,525 - 2005B Bonds 2025 4.55 - 5.00% 120,000 - - 120,000 - 2006 Bonds 2023 4.00 - 5.00% 123,515 - - 123,515 - 2007 Bonds 2016 Variable & fixed rate (2) 120,705 - - 120,705 4,565 2008 Bonds 2033 Variable rate (1) 200,000 - - 200,000 - 2009A Bonds 2039 5.25% 100,000 - - 100,000 - 2009B Bonds 2033 2.00 - 5.00% 311,775 - 197,650 114,125 - 2009C Bonds 2017 3.00 - 5.00% - 118,610 - 118,610 - 2010A Bonds 2040 5.662% - 200,000 - 200,000 - 2010C Bonds 2022 3.00 - 5.25% - 96,530 - 96,530 - 2010D Bonds 2011 2.50% 97,465 97,465 97,465
Total debt 1,690,605 512,605 366,000 1,837,210 148,545 Less current portion (246,000) (148,545) (246,000) (148,545) - Total long-term debt 1,444,605$ 364,060$ 120,000$ 1,688,665$ 148,545
Current portion of unamortized discounts 1,057 Current portion of long-term debt, net 149,602$
(1) Variable rates ranged from 0.10% to 0.55% for the year ended September 30, 2010.
(2) Variable and fixed rates ranged from 0.00% to 3.771% and 4.00% to 5.00%, respectively, for the year ended September 30, 2010.
NOTES TO FINANCIAL STATEMENTS

Making Our Mark A-35
NOTES TO FINANCIAL STATEMENTS
Note H – Long-term Debt (continued)
Series (Dollars in thousands)
Final principal payment Interest rates (%)
September2008
Additions during year
Decreases during year
September2009
Current portion
1992 Bonds 2010 6.00% 111,970$ -$ 35,195$ 76,775$ 37,270$ 1996A Bonds 2023 3.75% 60,000 - - 60,000 - 2001 Bonds 2023 4.00 - 5.25% 82,000 - 6,485 75,515 6,725 2001A Bonds 2020 4.00 - 5.25% 16,555 - 160 16,395 - 2002A Bonds 2017 Variable rate (1) 120,000 - - 120,000 - 2002B Bonds 2022 Variable rate (1) 100,000 - 100,000 - - 2002C Bonds 2027 5.00 - 5.25% 25,685 - - 25,685 - 2003 Bonds 2025 3.50% 54,775 - - 54,775 - 2003A Bonds 2022 3.00 - 5.00% 110,755 - 140 110,615 145 2003B Bonds 2022 4.00 - 5.00% 94,635 - 890 93,745 920 2003T Bonds 2018 3.92 - 5.29% 43,755 - 3,175 40,580 3,290 2004 Bonds 2009 3.00 - 5.25% 216,900 - 216,900 - - 2005A Bonds 2011 3.50 - 4.00% 40,525 - - 40,525 - 2005B Bonds 2025 4.55 - 5.00% 120,000 - - 120,000 - 2006 Bonds 2023 4.00 - 5.00% 123,515 - - 123,515 - 2007 Bonds 2016 Variable & fixed rate (2) 120,705 - - 120,705 - 2008 Bonds 2033 Variable rate (1) 200,000 - - 200,000 - 2009A Bonds 2039 5.25% - 100,000 - 100,000 - 2009B Bonds 2033 2.00 - 5.00% - 311,775 - 311,775 197,650
Total debt 1,641,775 411,775 362,945 1,690,605 246,000 Less current portion (262,945) (246,000) (262,945) (246,000) - Total long-term debt 1,378,830$ 165,775$ 100,000$ 1,444,605$ 246,000
Current portion of unamortized discounts 1,616 Current portion of long-term debt, net 247,616$
(1) Variable rates ranged from 0.12% to 6.00% for the year ended September 30, 2009.
(2) Variable and fixed rates ranged from 0.00% to 6.65% and 4.00% to 5.00%, respectively, for the year ended September 30, 2009.
Debt service requirements: As of September 30, 2010 aggregate debt service requirements of OUC’s debt (fixed and variable rate) and net receipts/payments on associated hedging derivative instruments are presented below. These amounts assume that current interest rates on variable rate bonds and the current reference rates of hedging derivative instruments will remain the same for their term. As these rates vary, interest payments on variable rate bonds and net receipts/payments on the hedging derivative instruments will vary. The hedging derivative instruments column reflects only net receipts/payments on derivative instruments that qualify for hedge accounting.
(Dollars in thousands) Principal Interest Hedging Derivative
Instrument Total
2010 (1) 51,080$ 77,576$ 9,642$ 138,298$
2011 185,915 75,455 8,425 269,795
2012 50,610 70,429 9,836 130,875
2013 52,650 68,199 9,835 130,684
2014-2018 308,395 303,336 48,009 659,740
2019-2023 479,685 219,365 46,950 746,000
2024-2028 203,590 128,910 39,165 371,665
2029-2033 205,285 99,054 10,500 314,839
2034-thereafter 300,000 69,299 - 369,299
Total 1,837,210$ 1,111,623$ 182,362$ 3,131,195$
(1) Principal payments in 2010 exclude the current portion of the Series 2010D Bonds. These amounts are included in subsequent periods based on the expected refunding periods in which they are projected to mature.

A-36 2010 Annual Report
Note H – Long-term Debt (continued)
General bond resolution: On October 9, 2001 the general bond resolution was adopted. Bonds issued after this date fall under the provisions of this resolution. On November 12, 2003, the 51% consent threshold was met toenact the provisions of this resolution including ranking all debt obligations without preference, priority or distinction. The following are some key provisions of the resolution:
Rate covenant: The net revenue requirement for annual debt service has been set at 100% of available funds plus net revenues at 125% of annual debt service.
Additional bonds test: This test is limited to OUC’s certification that it meets the rate covenant.
Flow of funds: There are no funding requirements; however, consistent with prior resolutions, OUC can determine whether to fund a debt service reserve account on an issue-by-issue basis or internally designate funds.
System definition: OUC's system definition has been modified to utility system. This definition is a more expansive definition to accommodate organizational changes and the expansion into new services.
Sale of assets: System assets may be sold if the sale will not interfere with OUC's ability to meet rate covenants. Consistent with prior lien resolutions, proceeds must first be used to pay debt service.
Issued bonds: In January 2010, OUC issued the Series 2010A Bonds in the amount of $200.0 million at a discount of $1.5 million with a fixed rate coupon, paid semi-annually, at a rate of 5.66%. Proceeds from the sale of the bonds were used to finance the 2010 and 2011 capital plans. These bonds were issued as “Build America Bonds” underthe American Recovery and Reinvestment Act of 2009 and are eligible to receive refundable tax credits from the United States Department of Treasury in an amount equal to 35% of interest payable on the bonds. These refundable tax credits represent grant income and as such, are included under the heading of Other income, net on the Statements of Revenues, Expenses and Changes in Net Assets. The bonds will mature on October 1, 2040.
In May 2009, OUC issued the Series 2009A Bonds in the amount of $100.0 million at a premium of $1.5 million and a fixed-rate coupon, paid semi-annually, at a rate of 5.25%. Proceeds from the sale of the bonds were used to finance the 2009 and 2010 capital plans. The all-in interest cost, which includes the par, premium, underwriters discount costs and cost of issuance, for the bonds was 5.21%. The bonds will mature between October 1, 2034 and October 1, 2039.
Refunded and defeased bonds: Consistent with accounting guidance, all refunded and defeased bonds are treated as extinguished debt for financial reporting purposes and have been removed from the Statement of Net Assets. The proceeds secured from refunding transactions are invested in United States Treasury obligations in irrevocable escrow deposit trust funds. Each escrow deposit trust is structured to mature at such time as to provide sufficient funds for the payment of maturing principal and interest on the refunded bonds. Interest earned or accrued on these escrow funds has been pledged and will be used for the payment of the principal and interest on each respective bond series.
In May 2010, OUC issued the Series 2010C and 2010D Bonds at a par of $96.5 million and $97.5 million and premiums of $11.9 million and $1.8 million, respectively. The proceeds from the offering were escrowed for the refunding of the Series 2009B Bonds in the amount of $197.7 million. In association with this refunding, the underlying swap agreement was terminated at a cost of $8.8 million. The swap termination payment and unamortized bond issue costs resulted in a deferred accounting loss of $8.8 million which was included as a component of Unamortized discount/premium and deferred amounts of refunding on the Statements of Net Assets. These amounts will be amortized over the life of the refunding issue.
NOTES TO FINANCIAL STATEMENTS

Making Our Mark A-37
NOTES TO FINANCIAL STATEMENTS
Note H – Long-term Debt (continued)
In January 2010, OUC issued the Series 2009C Bonds at a par of $118.6 million with a premium of $12.9 million. The proceeds were used to refund the 2002A variable rate revenue bonds in the amounts of $120.0 million, a swap termination payment of $10.5 million, and the associated issuance cost. The Series 2002A Bonds were hedged with two fixed rate swaps, which were terminated on December 17, 2009. The refunding resulted in a deferred accounting loss of $10.7 million, which was included under the heading of Unamortized discount/premium and deferred amounts of refunding on the Statements of Net Assets. These amounts will be amortized over the life of the refunding issue.
In June 2009, OUC issued the Series 2009B Bonds at a par of $311.8 million with a premium of $6.6 million. The proceeds from the offering were escrowed for the marketing of the Series 2002B Variable Rate Bonds and the retirement of the Series 2004 Bonds in the amounts of $100.0 million and $216.9 million, respectively. The refunding resulted in the recognition of a deferred accounting loss of $0.2 million, which was included under the heading of Unamortized discount/premium and deferred amounts of refunding on the Statements of Net Assets. These amounts are being amortized over the life of the refunding issue.
Sale proceeds from the issues were invested in United States Treasury obligations in an irrevocable Escrow Deposit Trust Fund. Such United States Treasury obligations provided sufficient funds to satisfy the outstanding debt principal on the refunded bonds. The refunded bonds are summarized below for the periods ended September 30, 2010 and 2009.
Debt IssuedMonth Issued
Par Amount Issued
Par Amount Refunded
PVSavings
Accounting Loss
Savings % of Refunded Bond Debt Refunded
2010C Bonds May 2010 $ 96,530 $ 98,825 $ - $ 8,823 0% 2009B Bonds
2010D Bonds May 2010 $ 97,465 $ 98,825 $ - $ - 0% 2009B Bonds
2009C Bonds Jan 2010 $ 118,610 $ 120,000 $ - $ 10,734 0% 2002A Bonds
2009B Bonds Jun 2009 $ 311,775 $ 316,900 $ - $ 232 0% 2002B/2004 Bonds
The balance outstanding at September 30, 2010 and 2009 for defeased bonds was $346.1 million.
Interest rate swaps: OUC limits its execution of interest rate swap agreements to major financial institutions with a minimum credit rating of “Aa3” or “AA-“ by any two nationally recognized credit rating agencies or have a subsidiary rated “AAA” by at least two nationally recognized credit rating agencies per the derivatives policy. The ratings of all swap counterparties met the minimum rating requirements as of the execution dates. Although some of the counterparty ratings have lowered as a result of the weakened economy, OUC does not anticipate nonperformance by a counterparty and to date, no instances of nonperformance have occurred. In the event of the termination of a swap agreement, OUC may be required to make or be subject to receive a termination payment, as shown in the swap schedule below.
In accordance with each interest rate swap agreement, margin deposit thresholds have been established. These thresholds require OUC to remit to its counterparty deposits to mitigate their exposure to counterparty credit risk. As a result of continued market volatility and the fair value liability of certain interest rate swaps in excess of their contractual thresholds, margin deposits in the amount of $35.7 million and $29.1 million were held by OUC counterparties at September 30, 2010 and 2009, respectively.

A-38 2010 Annual Report
NOTES TO FINANCIAL STATEMENTS
Note H – Long-term Debt (continued)
The following schedule summarizes OUC’s fair value position, based on quoted market rates, for its outstandingswap agreements at September 30, 2010 and 2009. Costs associated with these agreements are deferred and amortized over the life of the underlying bond agreement. The notional amounts below are the basis for which interest is calculated; however, the notional amounts are not exchanged. Derivative instrument disclosure requirements are presented in Note M - Hedging Activities.
Series(Dollars in thousands)
Notional amount OUC pays Rate paid Rate received
Termination date
2010 Fair value liability
2009 Fair value liability
Counterparty credit rating
2002A Bonds (1) 72,000$ Fixed 3.596% 67% of Libor 12/17/2009 -$ (7,530)$ Aa3 / A+ / A+2002A Bonds (1) 48,000 Fixed 3.596% 67% of Libor 12/17/2009 - (5,010) A3 / A / A+2002B Bonds (1) 60,000 Fixed 3.530% 67% of Libor 4/28/2010 - (6,136) A3 / A / A+2002B Bonds (1) 40,000 Fixed 3.530% 67% of Libor 4/28/2010 - (4,078) Aa3 / A+ / A+2007 Bonds 22,615 Fixed 3.640% CPI + 105 bps 10/1/2015 (1,368) (1,235) A1 / A / A+2007 Bonds 13,400 Fixed 3.660% CPI + 105 bps 10/1/2016 (832) (710) A1 / A / A+2008 Bonds (2) 200,000 Fixed 3.800% 99.38% of Libor 10/1/2033 (26,627) (25,342) A1 / A / A+2010D Bonds (3) 100,000 Fixed 4.442% SIFMA 10/1/2027 (25,761) (18,546) A2 / A / ATotal (54,588)$ (68,587)$
(1) A termination payment in the amount of $10.5 million and $8.8 million was remitted to the counterparties in conjunction with the bond refunding of the Series 2002A and 2002B Bonds, respectively. Swap termination payments were included as a component of the deferred loss on refunding and will be amortized over the life of the refunded bonds.
(2) On October 2009, OUC amended the terms of the swap which reduced the fixed rate from 4.559% to 3.80% in exchange for OUC granting the counter-party the right to terminate the interest rate swap at par through April 2011.
(3) In August 2010, OUC amended the terms of the swap which reduced the fixed rate from 4.442% to 3.79% and revised the floating index to 67% of 3-month LIBOR from SIFMA effective October 1, 2010.
Note I – Commitments and Contingent Liabilities
Fuel for generation and purchased power commitments: As owner-operator of Stanton Unit 1 & 2 and the Indian River combustion turbine generation facilities, OUC and its participants have entered into fuel supply and transportation contracts. As fuel agent for the SECA and the Vero Beach generation facilities owned and operated by Southern Company and the City of Vero Beach, respectively, OUC has fuel supply and transportation contract commitments for periods consistent with its fuel agent obligations. Lastly, as owner-operator of SECB, fuel supply and transportation contracts were secured to coincide with the commencement of commercial operations in February 2010.
In addition, included in the commitment schedule below are purchased power commitments OUC has secured for capacity to meet its load requirements, several of which have minimum take-or-pay energy commitments. The following schedule summarizes OUC’s yearly commitments for fuel for generation and purchased power as of September 30, 2010:
Year ended
(Dollars in thousands) Amount
2011 93,622$
2012 56,195$
2013 54,609$
2014 50,191$
2015 50,191$
2016-2020 240,318$
2021 - thereafter 189,637$

Making Our Mark A-39
NOTES TO FINANCIAL STATEMENTS
Note I – Commitments and Contingent Liabilities (continued)
Generation facility agreement: In association with SECB beginning commercial operations in February 2010, a Customer Service Agreement (CSA) was secured to cover parts, services and repairs, program management, additional warranties and automated performance monitoring for the high risk/high dollar equipment related to the combustion and steam turbine components of the unit. The CSA agreement was secured in 2010 for an estimated period of 14 years at an aggregate amount of $50.0 million.
Chilled water commitment: In June 1998, OUC entered into an agreement with Trigen-Cinergy Solutions (TCS) to construct and provide air conditioning cooling systems (chilled water) for buildings in the Orlando metropolitan area. In March 2004, the Board authorized the dissolution of this agreement and as such, acquired TCS’s 51% operational interest in the chilled water operations. In addition to the acquisition price of $24.4 million, contingent payments are due upon the securing of new customer contracts in certain chilled water operating loops. In 2010,OUC made a payment in the amount of $4.4 million to the entity which acquired TCS, Suez-Degs of Orlando.Additional contingency payments are not anticipated in 2011.
Regulation: The electric utility industry has been and will in the future be affected by a number of legislative and regulatory factors. The following summarizes the key regulations impacting OUC:
Deregulation: Although a handful of states have enacted legislation or issued orders designed to deregulate the production and sale of electricity, no legislative or regulatory action that would result in retail competition has been executed in the State of Florida. At this time, the only opportunities for unrestricted competition of new generation at the wholesale level are for plants that are below the size threshold subject to mandatory siting under the Florida Electrical Power Plant Siting Act. All other plants (including all steam and solar generating plants with 75 megawatts or more of generating capacity) must be built either by retail-serving utilities that have a demonstrated need for the plant, or by independent power producers that have contracts to sell their plants' output to such Florida retail-serving utilities.
Federal regulation: In February 2009, EPA voluntarily withdrew its appeal petition for the vacated Clean Air Interstate Rule, indicating that it intends to develop emissions standards for power plants under Section 112 of the Clean Air Act (MACT standards). In July 2009, the EPA issued a proposed information collection request as a first step in the rulemaking process for the new MACT standards. On August 2, 2010, EPA published in the Federal Register its Proposed Clean Air Transport Rule (Transport Rule or CATR). The proposed Transport Rule would limit emissions of nitrogen oxide (NOx) and sulfur dioxide (SO2) through federal implementation plans (FIPs) that regulate electric generating units (EGUs) located in 31 states and the District of Columbia. EPA’s desire to craft a Transport Rule that effectively addresses interstate transport of ozone and particulate matter (PM) complies with the D.C. Circuit’s 2008 opinion in North Carolina v. EPA and achieves an orderly transition from the Clean Air Interstate Rule (CAIR). Comment period for the proposed Transport Rule ended October 1, 2010, and the final Transport Rule is expected to be issued in June 2011. OUC continues to monitor and review the impact of these developments on the equipment procurement and installation of projects that would have ensured compliance with these regulations.
In 2009, the American Clean Energy and Security Act was proposed, including provisions establishing emissions levels and a cap-and-trade plan. At this time, the Act has not been approved, although it is becoming more apparent to management that potential legislation is not likely. The estimated cost of compliance with this legislation is subject to significant uncertainties, although it is estimated that compliance costs would be significant.
In accordance with section 215 of the Federal Power Act, FERC has the authority to enforce compliance with reliability standards for utilities registered with the North American Electric Reliability Corporation (NERC). Monitoring of these standards is performed through a delegation agreement by the Florida

A-40 2010 Annual Report
Note I – Commitments and Contingent Liabilities (continued)
Reliability Coordinating Council (FRCC) and in January 2010, OUC was subject to a review of its critical infrastructure protection standards (CIP). As a result of this review, OUC was found to be in substantial compliance with these standards.
Florida state regulation: Legislation under sections 366.80 through 366.85, and 403.519, Florida Statutes (F.S.), are known collectively as the Florida Energy Efficiency and Conservation Act (FEECA). This Act provides the FPSC with the authority to establish goals every five years to encourage electric utilities to increase the efficiency of energy consumption, limit the growth of energy consumption and minimize weather sensitive peak demands. OUC submitted its five-year Conservation Plan; final approval was submitted through a Consummating Order on September 28, 2010. The approved plan calls for OUC to achieve the same level of conservation it has achieved through its programs in the past. OUC will continue to address conservation and appropriately budget costs to implement demand-side management, conservation and customer education programs.
Open access transmission: In accordance with FERC rulemaking for mandatory non-discriminatory open transmission system access, OUC has adopted a “safe harbor” open access transmission tariff (OATT). To ensure compliance with this regulation, mandatory reliability standards were adopted by FERC. The monitoring of these standards is being performed by the Florida Regional Coordinating Council (FRCC). In January 2010, the FRCC completed a Critical Infrastructure Protection (CIP) spot check and found OUC to be in substantial compliance with the self-reporting standards.
Note J – Major Agreements
City of Orlando: OUC pays to the City of Orlando (City) a revenue-based payment and an income-based dividend payment.
The revenue based payment is recorded as an operating expense and is derived to yield a payment based on 6% of gross retail electric and water billings and 4% of chilled water billings for retail customers within the City limits. The income-based dividend payment is recorded as a reduction to the Increase in net assets line on the Statement of Revenues, Expenses and Changes in Net Assets and is derived to yield a payment of 60% of net income before contributions.
Prior to 2008, the revenue and income based payments were remitted based on actual revenue billed and income before contributions, respectively. Beginning in 2008 and ending in 2011, in conjunction with Board action, these payments were fixed based on projected revenues and income before contributions. Revenue and income based payments for the years ended September 30, 2010 and 2009 were $28.8 million and $45.6 million and $27.3 million and $45.9 million, respectively. Fixed revenue and income based payments for 2011 are $76.6 million.
City of St. Cloud: In April 1997, OUC entered into an interlocal agreement with the City of St. Cloud (STC) to provide retail electric energy services to all STC customers and to maintain and operate STC's electric transmission, distribution and generation facility rights and ownership interests. In return, OUC has guaranteed to pay STC 9.5% of gross retail electric billings to STC customers and to pay STC’s electric system net debt service. Debt service requirements outstanding at September 30, 2010 and 2009 were $7.3 million and $9.3 million, respectively, and mature in July 2014. Debt secured subsequent to the agreement date for electric system upgrades and enhancements has been secured by OUC and is included in Note H - Long-term Debt. The term of the agreement commenced May 1, 1997 and, as amended in April 2003, continues until September 30, 2032.
NOTES TO FINANCIAL STATEMENTS

Making Our Mark A-41
NOTES TO FINANCIAL STATEMENTS
Note J – Major Agreements (continued)
Billed revenue for this interlocal agreement is included under the heading of Resale electric revenue and was $73.9 million and $67.5 million, respectively, for the years ended September 30, 2010 and 2009. Revenue based payments and net debt service payments recorded under the heading of Payments to other governments for the years ended September 30, 2010 and 2009 were $7.5 million and $7.2 million, respectively.
Orange County: OUC pays a revenue-based payment to Orange County calculated at 1% of gross retail electric billings to customers within the County but outside the city limits of the City of Orlando and other municipalities. This payment is recorded under the heading of Payments to other governments and taxes on the Statements of Revenues, Expenses and Changes in Net Assets. Revenue based payments accrued at September 30, 2010 and 2009 were $1.8 million and $1.7 million, respectively.
City of Vero Beach: In April 2008, OUC and the City of Vero Beach executed a power supply agreement whereby OUC supplements Vero Beach’s electric capacity and energy requirements. In association with this agreement, effective January 1, 2010, OUC began providing Vero Beach with fuel management services and wholesale power marketing services, as well as advisory services for planning, forecasting, regulatory reporting, and power plant operations. The term of the agreement is twenty years with a ten-year extension option. Billed revenue, included under the heading of Resale electric revenue, was $20.6 million for the year ended September 30, 2010.
Note K – Pension Plans
Defined Benefit Plan
Plan description: OUC maintains a single-employer, defined benefit pension plan for all employees who regularly work 20 or more hours per week, were hired prior to January 1, 1998 and did not elect to transition their pension plan interests to the defined contribution plan. Under provisions of this closed pension plan, employees who participate receive a pension benefit equal to 2.5% of the highest three consecutive years average base earnings times years of employment. Benefits in this plan vest after five years of service and are earned for up to a maximum service period of 30 years. OUC also offers, subject to annual approval by the General Manager, a supplementary cost-of-living adjustment (COLA) for employees covered under the defined benefit pension plan. OUC is the administrator of the plan and as such, has the authority to make changes subject to Board approval.
Actuarial reports are prepared annually, with the most recent reports completed for the periods ending September 30, 2010 and 2009. To better match the budgetary and rate-making requirements, the actuarial reports received each February disclose the valuation of plan assets and actuarial liabilities as of the beginning of the current fiscal year for required contribution levels in the subsequent fiscal year. In 2010 and 2009, as a result of the market downturn, the valuations at October 1, 2009 and 2008 were used for the years ending September 30, 2010 and 2009, respectively. At the October 1, 2009 and 2008 valuation dates, the plan included 422 and 443 active participants and 809 and 796 retirees, beneficiaries and terminated vested members, respectively.
Periodically the plan issues stand-alone financial statements in accordance with generally accepted accounting principles with the most recent report being issued for the year ending September 30, 2009. This report may be obtained by writing to OUC Defined Benefit Pension Plan Trust, 100 West Anderson Street, Orlando, Florida 32801.
Funding policy: The pension plan agreement requires OUC to contribute, at a minimum, amounts actuarially determined. Required participant contribution obligations are 4% of earnings until the later of age 62 or completion of 30 years of service, with no required contributions thereafter. The benefit reduction for early retirement is 1% per year.

Note K – Pension Plans (continued)
The rate of contribution, based on annual covered payroll, required by OUC for the years ending September 30, 2010 and 2009 was 51.83% and 32.71%, respectively. This increase was due to a combination of items including the impact of incorporating previously approved cost-of-living benefits and lower recognized investment returns.
In November 2003, OUC issued taxable pension bonds in the amount of $55.3 million to advance fund the plan. Proceeds from this issuance were remitted to the defined benefit trust and have been included as a component of the net pension asset. Interest earnings on this advance funding are included as a component of the annual pension cost under the heading of “Adjustment to ARC”.
In addition, this advance funding has been included as a deferred asset under the heading of Other assets in the Statements of Net Assets. The amortization of this asset is consistent with the annual pension cost and for the years ending September 30, 2010 and 2009 was $3.5 million and $2.5 million, respectively. The net pension asset relates to this advance funding was $30.8 million and $34.3 million in 2010 and 2009, respectively.
Actuarial methods and assumptions: OUC recognizes annual pension costs in accordance with GASB Statement No. 27, “Accounting for Pensions by State and Local Government Employers”, and based on information obtained from the annual actuarial report. GASB Statement No. 27 also requires recognition of a net pension asset or obligation for the cumulative differences between the annual pension cost and employer contributions to the plan.
Annual actuarial amounts are calculated using the aggregate cost method and are based upon the following approved actuarial assumptions for the valuation periods of October 1, 2009 and 2008 for required contribution levels at September 30, 2010 and 2009, respectively.
October 1
2009 2008
Investment rate of return 8.00% 8.00%
Projected salary increases 5.00% 5.50%
Inflation component 4.00% 4.00%
In 2009, the actuarial assumption for the pension corridor was modified from a range of 80%-120% to 90%-110%. The pension corridor is used to establish boundaries around the market value of assets as compared to the actuarial value of the plan assets and, as such, captures cost differentials for current period recognition. The impact of this change in 2009 resulted in a reduction in the actuarial value of assets from $270.1 million to $254.4 million and an increase in the annual required contribution of $5.0 million to $10.0 million.
Although not funded through the defined benefit trust, an ad-hoc cost-of-living benefit may be provided annually based on approval by the General Manager and Chief Executive Officer. This non-binding benefit has historically been approximately 1.5% however, for the year ending September 30, 2010, no benefit was approved. A cost-of-living benefit of 1.0% was approved for the year ending September 30, 2011.
Liabilities associated with approved non-binding ad-hoc cost-of-living benefits prior to 2001 have been recognized by the plan and as such, are included in the actuarial report. Approved non-binding cost-of-living benefits provided for the periods of 2001 through 2010 are included in the actuarial report, but are paid outside of the plan on a pay-as-you-go basis. The impact of including the benefits for the period of 2001 through 2010 in the actuarial valuation increased the annual required contribution $2.4 million. Of this amount, $1.6 million was recognized on a pay-as-you-go basis under the heading of Unit/department expenses and $0.7 million was included as a component of Accounts payable and accrued expenses. In addition to the increase in the annual required contribution, the inclusion of approved non-binding benefits for the period of 2001 through 2010 increased the actuarial accrued liability $14.6 million as of September 30, 2010. Costs associated with the approved cost-of-living benefits approved for the year ending September 30, 2011 or future ad-hoc cost-of-living benefits have not been included in the actuarial valuation report
NOTES TO FINANCIAL STATEMENTS

Making Our Mark A-43
NOTES TO FINANCIAL STATEMENTS
Note K – Pension Plans (continued)
Annual pension costs and net pension assets: Actuarial amounts for the annual pension costs are calculated using the aggregate method, which as noted in the guidance, does not identify or separately amortize unfunded actuarial assets/obligations. The actuarial value of assets/obligations was determined using techniques that smooth the effects of short-term volatility in the market value of investments over a five-year period, as well as incorporating the recognition of the current year impacts associated with corridor changes. The following are the pension costs and the net pension assets at September 30:
(Dollars in thousands) 2010 2009
Actuarial required contribution (ARC) 15,012$ 9,970$
Interest earnings on net pension asset (3,012) (3,298)
Adjustment to ARC 6,343 6,881
Annual pension cost 18,343 13,553
Contributions applicable to pension period 15,020 10,249
Change in net pension asset (3,323) (3,304)
Beginning net pension asset 37,643 40,947
Ending net pension asset 34,320 37,643
Less current portion (3,520) (3,375)
Long-term advance pension funding asset 30,800$ 34,268$
The following table summarizes the three-year trend information for the pension plan including the impacts of the amortization of the pension bonds.
Years ended (Dollars in thousands)
Annual pension cost (APC)
Current year contributions
Percentage of APC contributed
2010 18,344$ 18,032$ 98.3%
2009 13,553$ 13,547$ 100.0%
2008 9,164$ 9,120$ 99.5%
Funded status and funding progress: For the year ending September 30, 2010, including the impacts of previously approved cost-of-living benefits, the plan was 74.9% funded. The actuarial accrued liability for benefits was $321.6 million, and the actuarial value of the plan assets was $241.0 million for an unfunded actuarial accrued liability (UAAL) of $80.6 million. The covered payroll (annual payroll of active employees hired prior to January 1, 1998 who did not elect to transition to the defined contribution plan) was $29.0 million, and the ratio of the UAAL to the covered payroll was 278.1%. The fair value of the plan assets, based on published investment market rates, at September 30, 2010 was $233.8 million.
For the year ending September 30, 2009, the plan was 81.6% funded. The actuarial accrued liability for benefits was $311.7 million, and the actuarial value of the plan assets was $254.3 million for an unfunded actuarial accrued liability (UAAL) of $57.4 million. The covered payroll (annual payroll of active employees hired prior to January 1, 1998 who did not elect to transition to the defined contribution plan) was $30.5 million, and the ratio of the UAAL to the covered payroll was 188.3%. The fair value of the plan assets, based on published investment market rates, at September 30, 2009 was $219.1 million.

A-44 2010 Annual Report
Note K – Pension Plans (continued)
In addition, following the notes to the financial statements, under the heading of Required Supplemental Information, is the schedule of funding progress presenting multi-year trend information. As anticipated, the impact of the decline in the financial markets has decreased the actuarial value of the plan assets and the funded status of the plan
Defined Contribution Plan
All employees who regularly work 20 or more hours per week and were hired on or after January 1, 1998 are required to participate in a defined contribution retirement plan established under section 401(a) of the Internal Revenue Code and administered by OUC. In addition, employees hired prior to January 1, 1998 were offered the option to convert their defined benefit pension account to this plan. At September 30, 2010 and 2009, active employees enrolled in this pension plan were 724 and 688, respectively.
Under the plan, each eligible employee, upon commencement of employment, is required to contribute 4% of their salary, with OUC matching an equivalent amount. In addition, employee voluntary contributions are permitted and matched by OUC up to an additional 2%. Employees are fully vested after one year of employment. Total contributions for the years ended September 30, 2010 and September 30, 2009 were $4.9 million ($2.3 million employer and $2.6 million employee) and $4.6 million ($2.1 million employer and $2.5 million employee), respectively.
Note L – Other Post-Employment Benefits
Health and Medical Insurance
Plan description: OUC offers medical, dental and life insurance coverage in a non-binding agreement, to all employees who retire on or after attaining age 55 with at least 10 years of service or at any age after completing 25 or more years of service. Secondary health coverage is available to those retirees who are Medicare eligible. Post-employment benefits are also offered in the area of utility discounts to employees hired prior to 1985.
Contribution requirements of the plan members and their dependents for all post-employment benefits are determined by the Board. Medical and dental benefits, inclusive of secondary health coverage for Medicare-eligible employees, are fully subsidized for employees retiring under the defined benefit pension plan and partially subsidized for their dependents. Employees and their dependents retiring under the defined contribution pension plan are provided access to the medical and dental coverage and receive an implicit subsidy however are required to pay for medical and dental coverage at approved premium rates. Utility discount benefits are provided through employee rates for those active and retired employees eligible for participation in this program.
At September 30, 2010, 1,144 plan participants (425 active employees and 689 retired employees) were eligible for fully subsidized medical and dental coverage, and 681 plan participants were eligible for implicit subsidy benefits. At September 30, 2009, 1,126 plan participants (443 active employees and 683 retired employees) were eligible for fully subsidized medical and dental coverage, and 673 plan participants were eligible for implicit subsidy benefits.
OUC is the administrator of this single employer other post-employment benefit plan and as such, has the authority to make changes thereto. Consistent with the defined benefit plan disclosed in Note K – Pension Plans, the plan will issue stand-alone financial statements on a periodic basis.
Funding policy: In accordance with GASB Statement No. 45, “Accounting and Financial Reporting by Employers for Post-Employment Benefits other than Pensions” (OPEB), funding for post-employment benefits is established from actuarial valuations and is approved annually by the Board.
NOTES TO FINANCIAL STATEMENTS

Making Our Mark A-45
NOTES TO FINANCIAL STATEMENTS
Note L – Other Post-Employment Benefits (continued)
In 2008, an OPEB Trust (Trust), similar to the Defined Benefit Pension Trust, was established to retain funds for the future payment of other post-employment benefit costs. The Trust agreement was set up such that OUC will contribute to the trust and periodically withdraw amounts to reimburse operations for costs incurred on a pay-as-you-go basis. In the future, it is anticipated the Trust will reach a sufficient funding level to directly disburse annual benefit payments and as such, reimbursements to operations will no longer be necessary.
The annual required contributions provided to OUC as part of the actuarial valuation report prepared on October 1, 2009 for the year ended September 30, 2010 and the actuarial valuation report prepared on October 1, 2008 for the year ended September 30, 2009 were $14.1 million and $13.7 million, respectively. The portion of the annual OPEB costs which were funded on a pay-as-you-go basis in 2010 and 2009 were $7.9 million and $7.3 million, respectively. The remaining portions of the annual OPEB cost, $6.3 million and $7.3 million, were paid to the Trust in 2010 and 2009, respectively.
The employer rates of contribution, based on annual covered payroll for the years ended September 30, 2010 and 2009 were 20.8% and 20.5%, respectively.
Actuarial methods and assumptions: Projection of benefits for financial reporting purposes is based on the substantive plan (the plan as understood by the employer and the plan members) and includes the types of benefits provided at the time of each valuation and the historical pattern of sharing of actuarial methods and assumptions used, including techniques that are designed to reduce the effects of short-term volatility in actuarial liabilities and the actuarial value of assets, consistent with the long-term perspective of the calculations. Actuarial valuations involve estimates of the value of reported amounts and assumptions about the probability of events into the future; as such, these actuarial amounts are subject to continual valuation.
The annual actuarial valuations were prepared using the frozen entry age normal cost method with an increasing normal cost pattern consistent with the salary increase assumption. The actuarial assumptions used for these valuations were as follows:
2009 2008
Investment rate of return 8.00% 8.00%
General price inflation rate 3.00% 3.00%
Annual health care cost trend rate 9.00% 9.00%
October 1
The unfunded actuarial accrued liability is being amortized as a level percentage of projected payrolls over a twentyyear period beginning in October 2006.
Annual OPEB cost and net OPEB obligation: OUC’s annual OPEB cost (expense) is calculated based on the annual required contribution (ARC) actuarially determined in accordance with the parameters of GASB Statement No. 45. In 2010 and 2009, OUC’s ARC and OPEB expense were $14.1 million and $13.7 million, respectively. The ARC represents a level of funding that, if paid on an ongoing basis, is projected to cover normal costs each year and a portion of the unfunded actuarial liabilities over a period of twenty years, a period consistent with the estimated employment tenure of those employees receiving fully subsidized benefits. The net OPEB receivable at September 30, 2010 and 2009 was $1.3 million for each of these periods.

A-46 2010 Annual Report
Note L – Other Post-Employment Benefits (continued)
The following table shows the components of OUC’s OPEB cost, current year contributions and changes in the net OPEB obligation at September 30:
(Dollars in thousands) 2010 2009
Actuarial required contribution (ARC) 14,149$ 13,683$
Interest earnings on net OPEB asset (107) -
Adjustment to ARC 105 -
Annual OPEB Cost 14,147 13,683
Pay-as-you-go contributions (7,875) (7,259)
Change in OPEB obligation 6,272 6,424
Amount paid to OPEB Trust 6,267 7,250
Change in net OPEB asset (5) 826
Beginning net OPEB asset 1,336 510
Ending net OPEB asset 1,331$ 1,336$
The following table summarizes the three-year trend information for the OPEB plan, including the annual OPEB cost. In addition, the schedule includes the amount and percentage of current year funds contributed.
Annual Percentage of
Years ended OPEB cost Current year Contribution AOPEBC(Dollars in thousands) (AOPEBC) contributions receivables contributed
2010 14,147$ 14,142$ 1,331$ 100%
2009 13,683$ 14,509$ 1,336$ 106%
2008 13,876$ 14,386$ 510$ 104%
Funded status and funding progress: At September 30, 2010, the most recent actuarial valuation date, the plan was 14.6% funded. The actuarial accrued liability for benefits was $169.6 million, and the actuarial value of the plan assets was $24.7 million for an unfunded actuarial accrued liability (UAAL) of $144.9 million. Covered payroll (including 425 employees receiving fully subsidized benefits and 681 employees receiving implicit subsidy benefits) was $67.9 million, and the ratio of the UAAL to the covered payroll was 213.5%.
At September 30, 2009, the plan was 10.0% funded. The actuarial liability for benefits was $160.7 million, and the actuarial value of the plan assets was $16.0 million for an unfunded actuarial liability (UAAL) of $144.7 million. Covered payroll (including 443 employees receiving fully subsidized benefits and 673 employees receiving implicit subsidy benefits) was $66.7 million, and the ratio of the UAAL to the covered payroll was 217.1%.
The fair value of the plan assets, based on published investment rates, for September 30, 2010 and 2009 was $33.2 million and $24.7 million, respectively.
In addition, following the notes to the financial statements, under the heading of Required Supplemental Information, is the schedule of funding progress presenting multi-year trend information.
NOTES TO FINANCIAL STATEMENTS

Making Our Mark A-47
NOTES TO FINANCIAL STATEMENTS
Note M – Hedging Activities
OUC manages the impacts of interest rate and fuel market fluctuations on its earnings, cash flows and market values of assets and liabilities through its hedging programs.
Interest rate risk is managed through the execution of interest rate swap agreements. Interest rate hedges are executed in accordance with OUC’s Derivative Policy, presented to the Finance Committee and approved by the Board. Interest rate swap agreements are typically executed in conjunction with a bond transaction and as such, have inception and termination dates, which align with the debt series the interest rate swap is intended to hedge. Early termination can be executed in accordance with the underlying agreement terms.
OUC’s derivative policy requires counterparty creditworthiness to achieve at least the minimum double A rating category from at least two of the three nationally recognized rating agencies maintaining a rating for qualified swap providers. In addition, for all counterparties OUC may require a two way credit support agreement that requires parental guarantees, letters of credit or collateral. In respect to the fair value of interest rate swap agreements, the value of these agreements take into consideration the prevailing interest rate environment and the specific terms and conditions of each contract. Fair value amounts were estimated using the zero-coupon discounting method,including utilizing option pricing models, which consider probabilities, volatilities, time, underlying prices and other variables.
Oversight responsibility for OUC’s fuel hedge program is performed by the Energy Risk Management Oversight Committee (ERMOC). ERMOC’s responsibilities include establishing specific volume and financial limits, as well as overall program compliance and counterparty creditworthiness. Counterparty creditworthiness is evaluated considering the market segment, financial ratios, agency and market-implied ratings and other factors. The fair value amounts for the over-the-counter energy hedges (natural gas and crude oil) were determined by the monthly market prices over the lifetime of each outstanding contract using the latest end-of-trading-month forward prices published by Platts or West Texas Intermediate, respectively.
As a result of engaging in hedging activities, OUC is subject to the following key risks:
Credit risk: This is the risk that results when counterparties are unable or unwilling to fulfill their present and future obligations. OUC addresses this risk through creditworthiness criteria included in its Derivative Policy and responsibilities of the ERMOC. Interest rate counterparties must have a minimum credit rating of “AA-“ issued by Standard and Poor’s or Fitch’s rating services or “Aa3” issued by Moody’s Investor Services. Fuel related counterparties must have a minimum credit rating of “BBB” issued by Standard and Poor’s or Fitch’s rating services or “Baa2” issued by Moody’s Investor Services.
Interest rate risk: This is the risk that changes in interest rates will adversely affect the fair values of OUC’s financial instruments or cash flows. OUC is exposed to this risk through its pay-fixed, variable interest rate swaps and as such, has been actively addressing this issue through the renegotiation of outstanding interest swap agreements. There is no exposure to this risk for fuel related hedges.
Basis risk: This is the risk that arises when variable rates or prices of derivative instruments and a hedged item are based on different reference rates. OUC is exposed to this risk on its pay-fixed interest rate swaps, as the variable rate received by OUC differs from the rate paid on the hedged item. As noted above, OUC has been actively working with its counterparties to renegotiate interest rate swap agreements where the basis risk has increased.
Termination risk: This is the risk that a derivative instrument’s unplanned end will affect OUC’s asset and liability strategy or potentially require termination payments. This risk is mitigated through OUC’s creditworthiness criteria, and to date no instances of this nature have occurred.

A-48 2010 Annual Report
Note M – Hedging Activities (continued)
Rollover risk: This is the risk that a derivative instrument associated with a hedged item does not extend to the maturity of the hedged item. OUC is exposed to rollover risk on interest rate swap agreements that mature or terminate prior to the maturity of the hedged debt. When these interest rate swap agreements terminate or the counterparty exercises its termination option, OUC will be re-exposed to the risks being hedged by the interest rate swap. OUC’s exposure to this risk is limited to the 2008 interest rate swap as a result of renegotiating the rate in exchange for providing the counterparty with the option to terminate by April 2011. As no cash settlement is required if the counterparty elects to terminate the interest rate swap, the rollover risk has been minimized. There is only limited exposure to this risk for fuel hedges based on the volume and nature of the derivatives.
Market access risk: This is the risk that OUC will not be able to enter credit markets for both interest rate swap agreements and fuel hedges, or that credit markets will become more costly. OUC maintains a strong credit rating, “AA” from Standard & Poor’s and Fitch Investors Service and “Aa1” from Moody’s Investors Service, and to date has not encountered any market barriers or credit market challenges for either market.
In accordance with the implementation of GASB Statement No. 53, outstanding hedges are evaluated and classified as either hedging derivative instruments (effective) or investment derivative instruments (ineffective), with the change in fair market value recognized as deferred inflows/outflows or investment income/expense, respectively. OUC’s interest rate swap agreements have been deemed effective and as such, the fair value of these long-term derivatives has been included under the heading of Other assets and Other liabilities and deferred credits on the Statements of Net Assets on September 30, 2010 and 2009.
The following table summarizes the fair value and net settlement amounts of interest rate derivative contracts outstanding on October 1, 2009, the effective date of implementation and September 30, 2010.
Series(Dollars in thousands)
September 2009
Change in fair value
Termination payments
September 2010
Net settlement charges
Notional amount September 2010
Interest rate swap agreements
2002A Bonds (1) (12,540)$ 23,019$ (10,479)$ -$ 870$ -$
2007 Bonds (1) (1,945) (255) - (2,200) 458 36,015$
2009B Bonds (1) (2) (10,214) 19,037 (8,823) - 1,939 -$
Forward interest rate contracts
2008 Bonds (1) (25,342) (1,285) - (26,627) 6,911 200,000$
2010D Bonds (1) (3) (18,546) (7,215) - (25,761) 4,183 100,000$
Total (68,587)$ 33,301$ (19,302)$ (54,588)$ 14,361$
(1) Additional interest rate swap information is included in Note H - Long-term Debt.
(2) The Series 2009B Bonds refunded the Series 2002B Bonds and as such the underlying interest rate swap agreement now acts as a fixed rate hedge for the Series 2009B Bonds.
(3) The Series 2010D Bonds refunded the Series 2009B Bonds and as such the underlying interest rate swap agreement now acts as a fixed rate hedge for the Series 2009B Bonds.
NOTES TO FINANCIAL STATEMENTS

Making Our Mark A-49
NOTES TO FINANCIAL STATEMENTS
Note M – Hedging Activities (continued)
Series(Dollars in thousands)
September 2008
Change in fair value
Termination receipts
September 2009
Net settlement charges/ (receipts)
Notional amount September 2009
Interest rate swap agreements
2002A Bonds (1) (7,011)$ (5,529)$ -$ (12,540) 3,516$ 120,000$
2002B Bonds (1) (2) (4,941) (5,273) - (10,214) 2,860 100,000$
2003 Bonds (1) (3) 747 (747) - - - -$
2004 Bonds (1) (4) 1,406 (2,690) 1,284 - (1,065) -$
2005A Bonds (1) (5) 2,888 (6,388) 3,500 - (1,101) -$
2007 Bonds (1) (598) (1,347) - (1,945) (305) 36,015$
Forward interest rate contracts
2008 Bonds (1) (21,506) (3,836) - (25,342) 6,853 200,000$
2009B Bonds (1) (6) (7,157) (11,389) - (18,546) 1,965 100,000$
Total (36,172)$ (37,199)$ 4,784$ (68,587)$ 12,724$
(1) Additional interest rate swap information is included in Note H - Long-term Debt.
(3) The interest swap agreement for the Series 2003 Bonds matured on October 1, 2008 in accordance with the terms of the agreement.
(4) The interest rate swaps for the Series 2004 Bonds were terminated on October 24, 2008 prior to the refunding on July 1, 2009.
(5) The interest rate swap for the Series 2005A Bonds was terminated in December 2008 and the gain on termination was deferred in accordance with Board action.
(2) The Series 2009B Bonds refunded the Series 2002B Bonds and as such the underlying interest rate swap agreement now acts as a fixed rate hedge for the Series 2009B Bonds.
With respect to fuel related derivatives, these derivatives are net settled in the period in which the option expires and are recognized as fuel expenses on the Statements of Revenues, Expenses and Changes in Net Assets. Settlement gains and losses for the years ended September 30, 2010 and 2009 for fuel related derivatives were $13.7 million and $4.1 million, respectively. The following outstanding fuel derivatives at September 30 have been deemed to be effective and as such, are recorded on the Statement of Net Assets as either a deferred charge or a deferred credit until such time as the contract matures.
(Dollars in thousands)
Fair value2009
Change in fair value
Fair value2010
Notional amount
2010 Volume Term
Natural gas 2,144$ 5,292$ 7,436$ 2,430 MMBTU Oct. 2010 - Sept. 2011
Crude oil 1,408 (822) 586 37 BBL Oct. 2010 - Sept. 2011
Total current deferred costs 3,552 4,470 8,022 2,467
Natural gas 12,002 730 12,732 4,100 MMBTU Oct. 2011 - June 2014
Crude oil 18 300 318 92 BBL Oct. 2011 - June 2012
Total long-term deferred costs 12,020 1,030 13,050 4,192
Total deferred costs 15,572 5,500 21,072 6,659
Natural gas 314 (314) - - Oct. 2010 - Sept. 2011
Crude oil - 31 31 10 BBL Oct.2010 - Sept. 2011
Total current deferred credits 314 (283) 31 10
Natural gas 201 (201) - - Oct. 2011 - June 2014
Crude oil - 17 17 8 BBL Oct. 2011 - June 2012
Total long-term deferred credits 201 (184) 17 8
Total deferred credits 515 (467) 48 18
Total net fuel hedge contracts 15,057$ 5,967$ 21,024$ 6,641

A-50 2010 Annual Report
(Dollars in thousands)
Fair value2008
Change in fair value
Fair value2009
Notional amount2009 Volume Term
Natural gas 4,375$ (2,231)$ 2,144$ 1,230 MMBTU Oct. 2009 - Sept. 2010
Crude oil 1,107 301 1,408 138 BBL Oct. 2009 - Sept. 2010
Total current deferred costs 5,482 (1,930) 3,552 1,368
Natural gas 1,766 10,236 12,002 7,010 MMBTU Oct. 2010 - June 2014
Crude oil - 18 18 - BBL Oct. 2010 - Oct. 2012
Total long-term deferred costs 1,766 10,254 12,020 7,010
Total deferred costs 7,248 8,324 15,572 8,378
Natural gas 114 200 314 1,040 MMBTU Oct. 2009 - Sept. 2010
Crude oil - - - - Oct. 2009 - Sept. 2010
Total current deferred credits 114 200 314 1,040
Natural gas 826 (625) 201 480 MMBTU Oct. 2010 - June 2014
Crude oil - - - - Oct. 2010 - Oct. 2012
Total long-term deferred credits 826 (625) 201 480
Total deferred credits 940 (425) 515 1,520
Total fuel hedge contracts 6,308$ 8,749$ 15,057$ 6,858
NOTES TO FINANCIAL STATEMENTS
Note M – Hedging Activities (continued)

Making Our Mark A-51
REQUIRED SUPPLEMENTAL INFORMATION
Required Supplemental Information
Defined benefit plan
The following funding schedule presents multi-year trend information on the funded status of the Defined Benefit Pension plan as of October 1, 2009. As a result of the economic downturn and associated market valuation changes, the funded ratio has decreased from 94.1% in 2007 to 74.9%. To mitigate the impact of these changes in future years, OUC has modified its pension corridor and valuation date plan assumption to increase its annual contributions.
Actuarial Actuarial UAAL as a % Actuarial value of accrued liability Unfunded Funded Covered of covered Annual valuation assets (AAL) - entry age AAL (UAAL) ratio payroll payroll required Percentage
date (a) (b) (b - a) (a / b) ( c ) ((b - a) / c) contribution contributed
10/1/2009 241,002$ 321,552$ 80,550$ 74.9% 28,964$ 278.1% 15,012$ 100%10/1/2008 254,353$ 311,731$ 57,378$ 81.6% 30,479$ 188.3% 9,970$ 100%10/1/2007 268,893$ 285,786$ 16,893$ 94.1% 30,981$ 54.5% 5,665$ 100%10/1/2006 254,462$ 275,759$ 21,297$ 92.3% 31,686$ 67.2% 5,872$ 100%10/1/2005 243,973$ 266,618$ 22,645$ 91.5% 32,393$ 69.9% 5,840$ 101%10/1/2004 219,853$ 244,485$ 24,632$ 89.9% 32,845$ 75.0% 3,984$ 101%
Schedule of funding progress and contributions(Dollars in thousands)
Other Post-Employment Benefit Plan
The following funding schedule presents multi-year trend information on the funded status of the Other post-employment benefit plan as of October 1, 2009. This schedule has been prepared using the entry age actuarial method used to prepare OUC’s actuarial valuation.
Actuarial Actuarial UAAL as a % Actuarial value of accrued liability Unfunded Funded Covered of covered valuation assets (AAL) - entry age AAL (UAAL) ratio payroll payroll
date (a) (b) (b - a) (a / b) ( c ) ((b - a) / c)
10/01/09 $ 24,667 $ 169,568 144,901$ 14.6% 67,873$ 213.5%10/01/08 $ 15,994 $ 160,727 144,733$ 10.0% 66,679$ 217.1%10/01/07 9,034$ 157,456$ 148,422$ 5.7% 62,524$ 237.4%
Schedule of funding progress(Dollars in thousands)

A-52 2010 Annual Report

Making Our Mark A-53

Reliable Plaza100 West Anderson St.
Orlando, FL 32801Phone: 407.423.9100 • Fax: 407.236.9616
www.ouc.com
Related Documents


![1. Cover Page ANNUAL PROJECT REPORT [2010] PROJECT NAME: Public Sector Reform &Institutional Capacity Development Project REPORTING PERIOD: Jan-Dec 2010.](https://static.cupdf.com/doc/110x72/5514bfc1550346b0338b4813/1-cover-page-annual-project-report-2010-project-name-public-sector-reform-institutional-capacity-development-project-reporting-period-jan-dec-2010.jpg)