Annual Report 2009 © GettyImages/Paul Debois

Welcome message from author
This document is posted to help you gain knowledge. Please leave a comment to let me know what you think about it! Share it to your friends and learn new things together.
Transcript

Annual Report 2009
© G
etty
Images
/Pau
l D
ebois

2

Vital Forsikring ASA
Vital Forsikring Group
Table of Contents Annual Report 2009
Directors’ Report, page 4
Annual accounts, page 6
Income statement, page 12
Balance sheet, page 14
Statement of changes in equity, page 16
Cash fl ow statement, page 16
Return on capital, page 17
Accounting principles, page 18
Signifi cant accounting estimates and discretionary judgements, page 24
Combination of balance sheet items, page 25
Profi t and loss accounts and analyses distributed by segment, page 26
Transfers, page 28
New business premiums, page 28
Net income from investments, page 29
Specifi cation of insurance-related operating costs, page 31
Number of employees / man-labour years, page 31
Pension liabilities and costs, page 31
Tax expenses, page 35
Classifi cation of assets and liabilities, page 36
Financial instruments at fair value, page 38
Investment properties, page 39
Shares in subsidiaries and associated companies, page 41
Hold-to-maturity Investments held to maturity, page 44
Shares, units and primary capital certifi cates at fair value through the profi t and loss account, page 45
Bonds and certifi cates at fair value, page 60
Loans and receivables, page 61
Outstanding derivative contracts, nominal amounts and market values, page 61
Other fi nancial assets, page 62
Life assurance assets with investment choice, page 62
Cash and cash equivalents, page 63
Intangible assets and other assets, page 63
Insurance liabilities, page 64
Changes in insurance liabilities, page 65
Subordinated loan capital / perpetual subordinated loans, page 66
Risks, page 66
Insurance risk, page 67
Capital adequacy and solvency margin capital, page 71
Interest rate sensitivity, page 72
Quantifi cation of fi nancial derivatives, page 73
Currency positions, page 74
Liquidity risk, page 74
Credit risk, page 74
Remuneration, etc., page 76
Related parties, page 80
Other liabilities and obligations, page 80
Security registered, page 80
Reports, page 81
Auditors’ Report for 2009, page 82
Control Committee’s Statement, page 83
Board of Representatives’ Statement to the Annual General Meeting, page 84
Excerpt from minutes of meeting of the Board of Directors – consideration of the annual accounts, page 84
Defi nitions, page 85
Notes to the accounts
Income statement
Balance Sheet – Assets
Balance Sheet – Liabilities
Information on risk
Other information
Note 1
Note 2
Note 3
Note 4
Note 5
Note 6
Note 7
Note 8
Note 9
Note 10
Note 11
Note 12
Note 13
Note 14
Note 15
Note 16
Note 17
Note 18
Note 19
Note 20
Note 21
Note 22
Note 23
Note 24
Note 25
Note 26
Note 27
Note 28
Note 29
Note 30
Note 31
Note 32
Note 33
Note 34
Note 35
Note 36
Note 37
Note 38
Note 39
3
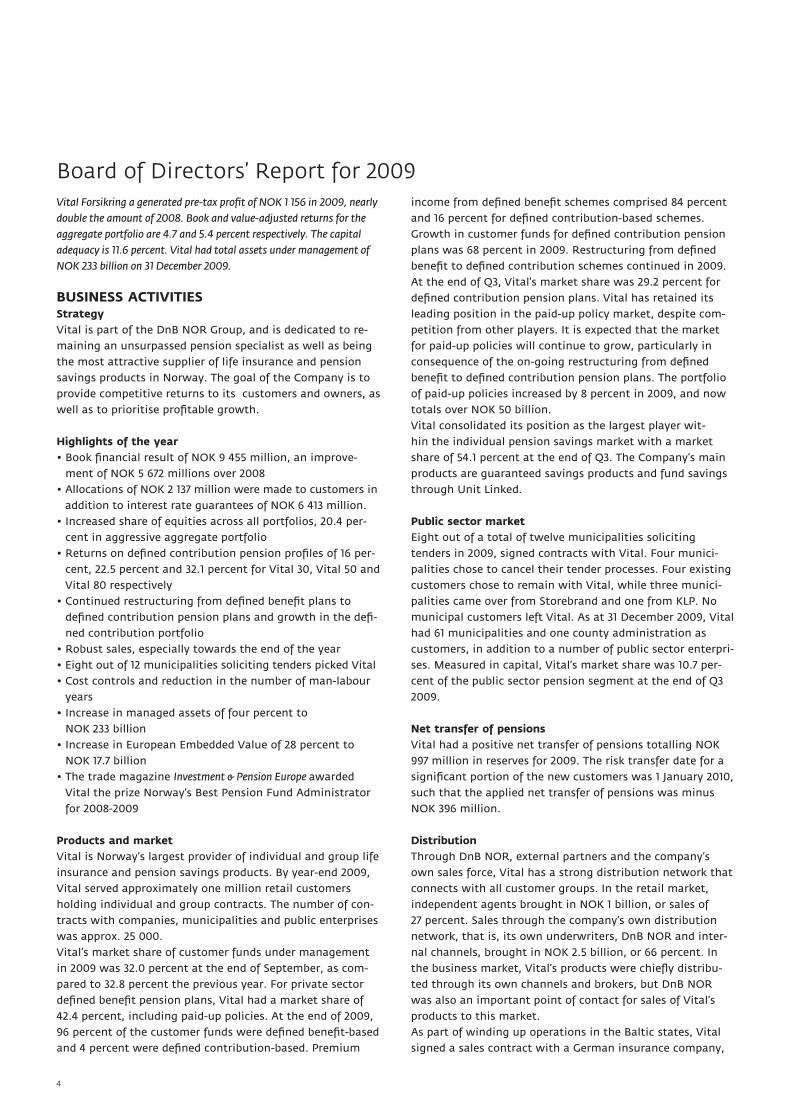
Board of Directors’ Report for 2009Vital Forsikring a generated pre-tax profit of NOK 1 156 in 2009, nearly
double the amount of 2008. Book and value-adjusted returns for the
aggregate portfolio are 4.7 and 5.4 percent respectively. The capital
adequacy is 11.6 percent. Vital had total assets under management of
NOK 233 billion on 31 December 2009.
BUSINESS ACTIVITIESStrategyVital is part of the DnB NOR Group, and is dedicated to re-
maining an unsurpassed pension specialist as well as being
the most attractive supplier of life insurance and pension
savings products in Norway. The goal of the Company is to
provide competitive returns to its customers and owners, as
well as to prioritise profitable growth.
Highlights of the year • Book financial result of NOK 9 455 million, an improve-
ment of NOK 5 672 millions over 2008
• Allocations of NOK 2 137 million were made to customers in
addition to interest rate guarantees of NOK 6 413 million.
• Increased share of equities across all portfolios, 20.4 per-
cent in aggressive aggregate portfolio
• Returns on defined contribution pension profiles of 16 per-
cent, 22.5 percent and 32.1 percent for Vital 30, Vital 50 and
Vital 80 respectively
• Continued restructuring from defined benefit plans to
defined contribution pension plans and growth in the defi-
ned contribution portfolio
• Robust sales, especially towards the end of the year
• Eight out of 12 municipalities soliciting tenders picked Vital
• Cost controls and reduction in the number of man-labour
years
• Increase in managed assets of four percent to
NOK 233 billion
• Increase in European Embedded Value of 28 percent to
NOK 17.7 billion
• The trade magazine Investment & Pension Europe awarded
Vital the prize Norway’s Best Pension Fund Administrator
for 2008-2009
Products and marketVital is Norway’s largest provider of individual and group life
insurance and pension savings products. By year-end 2009,
Vital served approximately one million retail customers
holding individual and group contracts. The number of con-
tracts with companies, municipalities and public enterprises
was approx. 25 000.
Vital’s market share of customer funds under management
in 2009 was 32.0 percent at the end of September, as com-
pared to 32.8 percent the previous year. For private sector
defined benefit pension plans, Vital had a market share of
42.4 percent, including paid-up policies. At the end of 2009,
96 percent of the customer funds were defined benefit-based
and 4 percent were defined contribution-based. Premium
income from defined benefit schemes comprised 84 percent
and 16 percent for defined contribution-based schemes.
Growth in customer funds for defined contribution pension
plans was 68 percent in 2009. Restructuring from defined
benefit to defined contribution schemes continued in 2009.
At the end of Q3, Vital’s market share was 29.2 percent for
defined contribution pension plans. Vital has retained its
leading position in the paid-up policy market, despite com-
petition from other players. It is expected that the market
for paid-up policies will continue to grow, particularly in
consequence of the on-going restructuring from defined
benefit to defined contribution pension plans. The portfolio
of paid-up policies increased by 8 percent in 2009, and now
totals over NOK 50 billion.
Vital consolidated its position as the largest player wit-
hin the individual pension savings market with a market
share of 54.1 percent at the end of Q3. The Company’s main
products are guaranteed savings products and fund savings
through Unit Linked.
Public sector marketEight out of a total of twelve municipalities soliciting
tenders in 2009, signed contracts with Vital. Four munici-
palities chose to cancel their tender processes. Four existing
customers chose to remain with Vital, while three munici-
palities came over from Storebrand and one from KLP. No
municipal customers left Vital. As at 31 December 2009, Vital
had 61 municipalities and one county administration as
customers, in addition to a number of public sector enterpri-
ses. Measured in capital, Vital’s market share was 10.7 per-
cent of the public sector pension segment at the end of Q3
2009.
Net transfer of pensionsVital had a positive net transfer of pensions totalling NOK
997 million in reserves for 2009. The risk transfer date for a
significant portion of the new customers was 1 January 2010,
such that the applied net transfer of pensions was minus
NOK 396 million.
DistributionThrough DnB NOR, external partners and the company’s
own sales force, Vital has a strong distribution network that
connects with all customer groups. In the retail market,
independent agents brought in NOK 1 billion, or sales of
27 percent. Sales through the company’s own distribution
network, that is, its own underwriters, DnB NOR and inter-
nal channels, brought in NOK 2.5 billion, or 66 percent. In
the business market, Vital’s products were chiefly distribu-
ted through its own channels and brokers, but DnB NOR
was also an important point of contact for sales of Vital’s
products to this market.
As part of winding up operations in the Baltic states, Vital
signed a sales contract with a German insurance company,
4
Ergo, in December 2009. The portfolio will be transferred
over the course of the first half of 2010, once final approval
has been obtained from the Norwegian and local authori-
ties. Vital’s employees in the two countries will be offered
continued employment with Ergo.
Financial management in 2009The year yielded a financial result of NOK 9 455 million,
which must be characterised as extremely good taking into
consideration the uncertainty at the beginning of 2009.
Active management contributed over NOK 1 billion to the
result for the year. In 2009, Norwegian equity management
at DnB NOR Kapitalforvaltning completed its twelfth year in
a row of positive returns for Vital.
At the beginning of 2009, all sub-portfolios in the aggre-
gate portfolio had equal equity positions. Over the year,
the various sub-portfolios in the aggregate portfolio, were
re-differentiated at the same time as the equity share grew
throughout the year to 13.5 percent. The equity positions in
the aggressive portfolio comprise 20.4 percent.
The real estate market has seen a challenging year, with
major changes and uncertainty about general economic
conditions. However, towards the end of the year observers
noted a stabilisation in rents and moderate increases in
value in parts of the market. Moreover, a successful issue
was carried out for Vital Eiendomsfond KS 3, which brought
in NOK 574 million.
Vitals defined contribution schemes has three standard
investment profiles representing varying levels of risk and
associated fixed distributions across different asset classes.
The trends in the financial markets, and in Vital’s invest-
ment profiles, were quite positive in 2009. Compared to
both 2008 and normal years, returns on Vital’s investment
profiles were good. Vital’s investment profiles are structured
for the long-term and are composed robustly. Periodic con-
tributions contribute to soften the impact of strong move-
ments in the financial markets.
Returns for 2009 were 16 percent, 22.5 percent and 32.1 per-
cent for Vital 30, Vital 50 and Vital 80 respectively
Risk exposureGood risk management at Vital is a strategic tool for increa-
sing value creation. The Company is managed across the
following risk categories:
• Financial risk associated with asset management (market
and credit risks).
• Insurance risk related to changes in future payments be-
cause of changes in the life expectancy and disability status
of policyholders.
• Operational risk, which is the risk of losses due to weak-
nesses or defects in processes and systems, errors caused by
employees and external events.
• Business risk, which is the risk of losses due to changes in
external conditions, such as the market situation or govern-
ment regulation. The risk also includes reputation risk.
An annual interest rate guarantee covers a substantial por-
tion of the commitments made to customers. The average
interest rate guarantee is approx. 3.4 percent. Financial
risk is primarily connected with the Company’s ability to
generate annual investment returns that are, at least, equal
to the guaranteed interest. The insurance risk is monitored
using stress tests, in order to compute potential losses in
extreme situations. Monitoring operational and business
risks also constitute an integrated part of Vital’s total risk
management.
Total buffer capital must be sufficient to cover the total risk.
Calculations for other categories of risk must therefore also
be taken into consideration when establishing a framework
for asset management risks.
The risk situation at Vital is considered in the context of the
Group’s overall risk profile periodically by the Group’s Asset
and Liability Committee. It is the task of Vital’s Managing
Director and Board of Directors to co-ordinate appropriately
risk management and strategy at Vital with the Group’s risk
profile.
The framework for financial risk is established annually by
the Board of Directors. The framework for financial risk is
established in nominal amounts. In order to address con-
siderations for minimum diversification, frameworks have
been put in place for each asset class. In addition, a fram-
ework has been established for concentration risk relating to
individual issuers. A separate framework has been prepared
for derivatives. The Department for Risk Analysis and Con-
trol monitors and follows up on frameworks and guidelines.
A stress test has been defined at Vital in order to compute
the total risk tolerance. Potential losses from the test are
measured against the buffer capital in addition to the requi-
rements of the law. This method is also utilised as a basis
for the measurement of risk and the establishment of a
framework for asset management risk. In addition, the asset
management strategy dictates that profit creation must be
stabilised.
Different tools will be used to assess the company’s total
risk on an on-going basis. The risk management at Vital also
utilises the DnB NOR Group’s model for total risk.
5
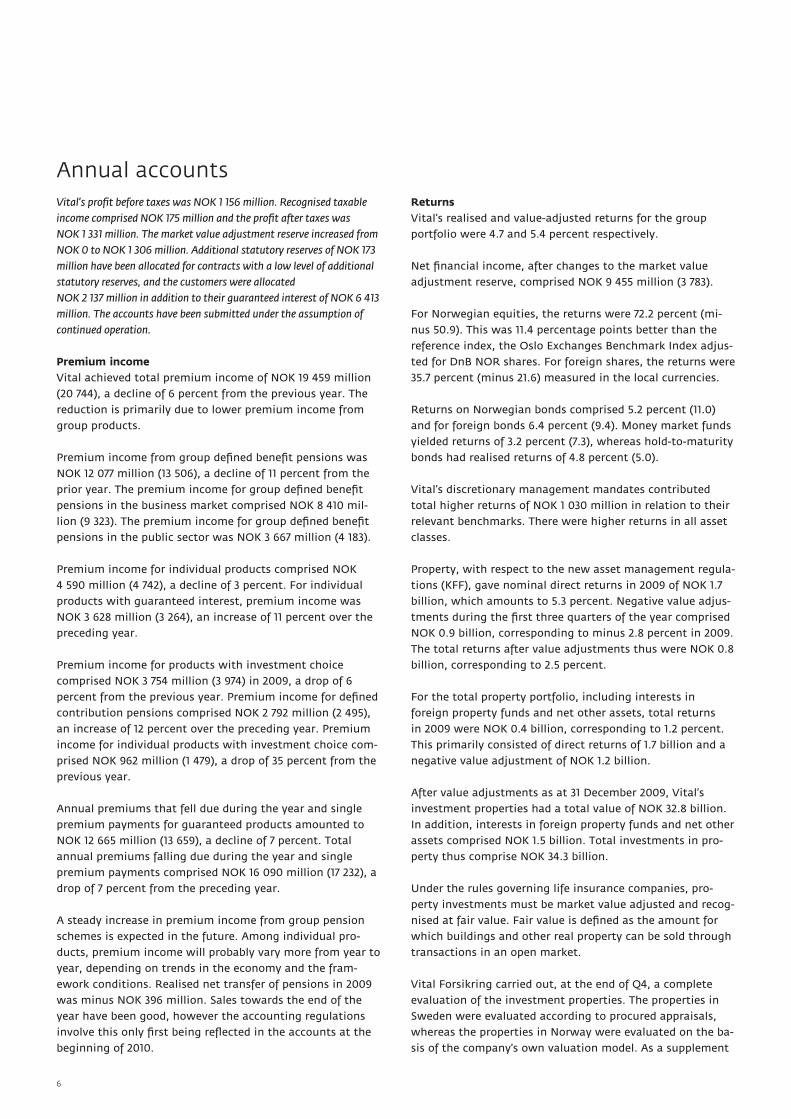
Annual accountsVital’s profit before taxes was NOK 1 156 million. Recognised taxable
income comprised NOK 175 million and the profit after taxes was
NOK 1 331 million. The market value adjustment reserve increased from
NOK 0 to NOK 1 306 million. Additional statutory reserves of NOK 173
million have been allocated for contracts with a low level of additional
statutory reserves, and the customers were allocated
NOK 2 137 million in addition to their guaranteed interest of NOK 6 413
million. The accounts have been submitted under the assumption of
continued operation.
Premium incomeVital achieved total premium income of NOK 19 459 million
(20 744), a decline of 6 percent from the previous year. The
reduction is primarily due to lower premium income from
group products.
Premium income from group defined benefit pensions was
NOK 12 077 million (13 506), a decline of 11 percent from the
prior year. The premium income for group defined benefit
pensions in the business market comprised NOK 8 410 mil-
lion (9 323). The premium income for group defined benefit
pensions in the public sector was NOK 3 667 million (4 183).
Premium income for individual products comprised NOK
4 590 million (4 742), a decline of 3 percent. For individual
products with guaranteed interest, premium income was
NOK 3 628 million (3 264), an increase of 11 percent over the
preceding year.
Premium income for products with investment choice
comprised NOK 3 754 million (3 974) in 2009, a drop of 6
percent from the previous year. Premium income for defined
contribution pensions comprised NOK 2 792 million (2 495),
an increase of 12 percent over the preceding year. Premium
income for individual products with investment choice com-
prised NOK 962 million (1 479), a drop of 35 percent from the
previous year.
Annual premiums that fell due during the year and single
premium payments for guaranteed products amounted to
NOK 12 665 million (13 659), a decline of 7 percent. Total
annual premiums falling due during the year and single
premium payments comprised NOK 16 090 million (17 232), a
drop of 7 percent from the preceding year.
A steady increase in premium income from group pension
schemes is expected in the future. Among individual pro-
ducts, premium income will probably vary more from year to
year, depending on trends in the economy and the fram-
ework conditions. Realised net transfer of pensions in 2009
was minus NOK 396 million. Sales towards the end of the
year have been good, however the accounting regulations
involve this only first being reflected in the accounts at the
beginning of 2010.
ReturnsVital’s realised and value-adjusted returns for the group
portfolio were 4.7 and 5.4 percent respectively.
Net financial income, after changes to the market value
adjustment reserve, comprised NOK 9 455 million (3 783).
For Norwegian equities, the returns were 72.2 percent (mi-
nus 50.9). This was 11.4 percentage points better than the
reference index, the Oslo Exchanges Benchmark Index adjus-
ted for DnB NOR shares. For foreign shares, the returns were
35.7 percent (minus 21.6) measured in the local currencies.
Returns on Norwegian bonds comprised 5.2 percent (11.0)
and for foreign bonds 6.4 percent (9.4). Money market funds
yielded returns of 3.2 percent (7.3), whereas hold-to-maturity
bonds had realised returns of 4.8 percent (5.0).
Vital’s discretionary management mandates contributed
total higher returns of NOK 1 030 million in relation to their
relevant benchmarks. There were higher returns in all asset
classes.
Property, with respect to the new asset management regula-
tions (KFF), gave nominal direct returns in 2009 of NOK 1.7
billion, which amounts to 5.3 percent. Negative value adjus-
tments during the first three quarters of the year comprised
NOK 0.9 billion, corresponding to minus 2.8 percent in 2009.
The total returns after value adjustments thus were NOK 0.8
billion, corresponding to 2.5 percent.
For the total property portfolio, including interests in
foreign property funds and net other assets, total returns
in 2009 were NOK 0.4 billion, corresponding to 1.2 percent.
This primarily consisted of direct returns of 1.7 billion and a
negative value adjustment of NOK 1.2 billion.
After value adjustments as at 31 December 2009, Vital’s
investment properties had a total value of NOK 32.8 billion.
In addition, interests in foreign property funds and net other
assets comprised NOK 1.5 billion. Total investments in pro-
perty thus comprise NOK 34.3 billion.
Under the rules governing life insurance companies, pro-
perty investments must be market value adjusted and recog-
nised at fair value. Fair value is defined as the amount for
which buildings and other real property can be sold through
transactions in an open market.
Vital Forsikring carried out, at the end of Q4, a complete
evaluation of the investment properties. The properties in
Sweden were evaluated according to procured appraisals,
whereas the properties in Norway were evaluated on the ba-
sis of the company’s own valuation model. As a supplement
6

to the values in the internal model, external appraisals are
procured throughout the year from two independent apprai-
sers for roughly 80 percent of the property portfolio.
Defined contribution pensions with investment profiles of
30/50/80 respectively gave returns of 16.0/22.5/32.1 percent.
Returns from share capital were 5.1 percent. Vital’s company
portfolio is conservatively organised and consists chiefly of
money market investments.
Compensation and repurchasesTotal compensation paid out was NOK 16 322 million
(23 130). Of the total repurchases of individual products, pro-
ducts with interest guarantees comprised NOK 1 915 million
(8 113) and products with investment choice NOK 1 226 mil-
lion (2 233). Payments to policyholders (excluding repurcha-
ses) were NOK 9 248 million (9 404).
Operating costsOperating costs, including costs for financial management,
comprised NOK 1 841 million (1 943). The decline is due chie-
fly to a reduction in activity-based costs and lower commis-
sions. Measured in percent of average customer funds, the
operating costs for guaranteed products were 0.71 percent
(0.72).
Profit/loss for the yearThe interest result was NOK 3 043 million (minus 2 623), the
risk result NOK 92 million (136) and the administration result
minus NOK 108 million (minus 143). Profit elements in defi-
ned benefit pensions for businesses as well as public sector
enterprises and municipalities increased from NOK 437 to 477
million, an increase corresponding to 9.2 percent.
Profit and loss analysis Vital Forsikring:
Amounts in NOK millions 31.12.09 31.12.08Interest result 3 043 (2 623)
Administration result (108) (143)
Risk result 92 136
Risk profit and guaranteed interest 477 437
Other (36) (68)
Profit for distribution 3 466 (2 261)
To / from additional statutory reserves (173) 2 993
Customer allocation (2 138) (89)
Profit before taxes 1 156 644
Taxes (175) 426
Profit/loss for the year 1 331 218
TaxesProfits on equities and dividends encompassed by the
exemption method, including returns from property compa-
nies, are tax-free income for Vital. At the same time, alloca-
tions of these returns to customer funds are tax deductible.
Years with good returns under the exemption method thus
give Vital tax income. In accordance with IFRS, deferred
taxes connected with properties in our own companies are
not recognised. Increased tax-related depreciation in conse-
quence of changed depreciation rules in 2009 are increasing
deferred taxes in the property companies. Tax income for
2009 was NOK 175 million in consequence of returns from
the share market and increased tax-related depreciation in
2009.
Balance sheetTotal assets as at 31 December 2009 were NOK 232 971 mil-
lion (224 129), an increase of 3.9 percent. Total assets, exclu-
ding customer funds invested in products with investment
choice, are distributed with 26.8 percent (43.9) in bonds
and commercial paper at fair value, 16.5 percent (3.8) in
equities, 34.6 percent (28.8) in hold-to-maturity bonds, 16.7
percent (16.7) in property and 5.4 percent (6.8) in other. The
distribution of the total assets takes financial derivatives
into account. Customer funds associated with products with
investment choice are distributed with 50.2 percent (35.9)
in equities, 38.7 percent (42.0) in combination, bond and
money market funds, 11.1 percent (21.4) in bank deposits and
0.0 percent (0.7) in other.
SolvencySolvency capital, which protects the customers premium
reserves, may consist of a market value adjustment reserve,
valuation reserve in hold-to-maturity bonds, additional
statutory reserves, security reserves, subordinated loans and
equity capital, including the risk equalisation fund and ad-
ministration reserve. The different elements in the solvency
capital have different preconditions and time horizons for
use, and may in certain instances be utilised to fulfil the
guaranteed returns to the customers. The composition of
the solvency capital thus is important in the assessment of
the company’s risk situation. The solvency capital of Vital
Forsikring as at 31 December 2009 was NOK 20 372 million
(16 972). Vital has a sufficient ability to take investment risks
and meet fluctuations in the financial markets.
The solvency capital has been strengthened through the
year, in consequence of the result being available as equity
capital, the additional statutory reserves have increased and
the market value adjustment reserve has been built up.
7

The composition of the solvency capital and its trend during
the course of 2009 was as follows:
Amounts in NOK millions 31.12.09 31.12.08Market value adjustment reserve 1 307 0
Valuation reserve in, hold-to-maturity 865 200
Additional statutory reserves 5 550 5 360
Equity capital 10 018 8 740
Subordinated loans/
Perpetual subordinated loans 2 489 2 575
Security reserves 143 97
Total solvency capital 20 372 16 972
The buffer capital, i.e. equity capital in addition to legally
mandated minimum requirements as well as additional
statutory reserves and the market value adjustment reserve,
were NOK 10 012 million (8 166) as at 31 December 2009.
Market risk in the joint portfolio will primarily be dependent
upon the composition of assets. Vital’s goal is to achieve
competitive returns over time and be in a position to assu-
me necessary risks. The company’s buffer capital is deemed
to be sufficient to carry out such a strategy, also in periods
with fluctuations in the financial markets. The Board of Di-
rectors has established a level of risk that through manage-
ment models, operative rules and monitoring are continually
being followed up on. The Board of Directors will establish
a framework for the company’s market risk. As an element
of the management routines, follow-ups are conducted to
check compliance with the framework and requirements of
governmental authorities for capital adequacy and solvency.
Work is being done on an on-going basis on further develop
tools and systems for managing and monitoring market risk.
Capital adequacy and solvency margin capitalCapital adequacy is a term referring to the company’s pri-
mary capital as a portion of the risk-weighted balance sheet.
Vital’s eligible primary capital was as at 31 December 2009
a total of NOK 11 269 million (10 398). The capital adequacy
was 11.6 percent (12.3). Solvency margin capital consists of
primary capital with the addition of 50 percent of additional
statutory reserves and 50 percent of the risk equalisation
fund. Vital’s solvency margin capital as at 31 December 2009
was NOK 14 247 million (13 202) and the solvency margin
requirement 8 317 million (8 147).
Embedded ValueThe European Embedded Value (EEV) of Vital as at 31 Decem-
ber 2009 has been calculated.
The EEV is a valuation of a company based upon the present
value of future cash flows to the shareholders from the
portfolio as at the date of the balance sheet, in addition
to realised equity capital. A deduction is made for costs of
binding equity capital in the company.
The calculations show an EEV for Vital as at 31 December
2009 of NOK 17 768 million, which is an increase in Embed-
ded Value of NOK 3 972 million. The increase in Embedded
Value is due to the reduced value of customer guaranteed
interest and higher income from products without profit
sharing.
For more detailed information concerning Vital’s EEV cal-
culations, see the report «European Embedded Value 2009,
Supplementary Information – 11. February 2010», which is
available at Vital’s Web site.
EmployeesIt is important for Vital to attract and retain talented
employees. Including subsidiaries, Vital has 884 employees
(1 062) as at 31 December 2009. The number of fulltime equi-
valent employees comprised 856.6 (1 026.4). The conditions
for employees of Vital are co-ordinated with arrangements
in the DnB NOR Group in general. The reduction in staff is
to a large extent due to Vital’s on-going cost reduction and
rationalisation programme, in addition to co-ordination of
all the company’s IT resources within DnB NOR.
Working environmentThe trend in sick leave has been negative in 2009. Employee
sick leave absences were 6.01 percent (5.16). No serious
injuries or accidents were recorded in 2008. Vital is working
with systematic measures that can reduce employee sick
leave absences.
Vital places a special focus on individual employees who
have been on sick leave for long periods of time. By follo-
wing up on these cases directly, more employees come back
to jobs with accommodating working conditions. Vital has a
light level of activity in health, safety and environment work
(HSE). HSE is reported in parallel with the other internal
controls. Through Vital Opptur, a number of measures have
been initiated to increase the physical activity of the em-
ployees. Vital is an Inclusive Working Life Organisation and
is certified as an Environmental Lighthouse Organisation.
In 2009, the legally mandated working environment trai-
ning was carried out for all line supervisors with personnel
responsibilities. The management has regular meetings with
union representatives for the employees organised under the
Finance Sector Union of Norway.
Gender equalityThere are nearly identical numbers of female and male em-
ployees at Vital Forsikring. However, of the 94 (111) part-time
employees, women comprise 83 (91) percent. Of managers
with personnel responsibilities a total of 99 (123) are men
and 53 (50) women. The conditions contribute to the av-
erage wage for women employees being lower than for men.
In 2009, two new women have become members of Vital’s
senior management group.
Vital is seeking to increase the number of women in leading
positions, including through the increased participation of
8
women in programmes for personal development, manage-
ment development and trainee programmes. There is still
some distance to go before Vital has the desired balance
in the distribution of genders at the management level.
Through the DnB NOR Group, Vital will work actively with
tangible measures and analyses connected to how women
can be recruited to a greater extent for management posi-
tions.
Changes in Vital’s organisationIn 2009, the organisation has made the necessary adap-
tations to meet the challenges we will have to face in the
future, and salary schedule placements in accordance with a
new organisational chart have been completed. The com-
pany is now nearer to the goal of a more homogenous and
competitive Vital, where parallel chains of value and dupli-
cated functions have been removed.
Beginning on 1 October 2009, a total of 110 of Vital’s IT
employees were transferred to the DnB NOR Group’s joint IT
department – DnB NOR IT. The primary objective is a homo-
genous and more professional IT function, which gives the
group clear competitive advantages and increases the value
and utility of the IT investments.
Corporate responsibilityVital conducts responsible corporate activities by contribu-
ting to financial security and flexibility during retirement, in
the event of disability or when someone passes away. Vital
also works to have a high environmental standard and good
energy solutions in its own offices and in the set of build-
ings that the company leases out to other tenants. We also
pose requirements for responsible corporate activities of our
suppliers and co-operating partners. Through co-operation
with athletics and culture, Vital contributes to general
societal endeavours. Vital also contributes to humanitarian
measures for youth in difficulties, including co-operation
with municipal authorities. Vital also contributes to strengt-
hening traffic safety through co-operation with the police
on the increased use of reflective clothing among schoolchil-
dren.
The company’s business activities do not pollute the external
environment. Vital works to reduce the travel activity of its
employees, including through extensive use of telephone
and video meetings.
Vital’s work within the corporate responsibility area is
synchronised with the DnB NOR Group’s efforts within this
area, with an emphasis on our relationships with customers
and suppliers, how we meet the climate challenges, our con-
tribution to the society around us and how we work with
diversity and openness.
Ethical portfolio managementVital follows ethical guidelines in its management of its
customer pension funds. Recognised international principles
lie at the basis of the investments. The guidelines establish
minimum standards and are in line with DnB NOR’s policy
for corporate responsibility and international principles and
conventions that the group has endorsed.
When making investments, Vital follows the principles laid
down in the UN’s Global Compact and the OECD’s Guidelines
for Multinational Companies. In addition, Vital has adopted
specific criteria that exclude investments in companies that
produce tobacco and pornography, and companies that are
involved in the production or distribution of components for
weapons of mass destruction, including land mines and clus-
ter weapons. These principles are now also followed by DnB
NOR Kapitalforvaltning, such that the ethical guidelines for
all portfolio management are the same within the entire
DnB NOR Group.
At the end of 2009 there were 54 companies that were
excluded from the investment portfolio based upon crite-
ria from the Group’s rules associated with ethical portfolio
management.
Customer satisfactionVital’s customer satisfaction has also exhibited a satisfactory
in 2009. Some individual areas, particularly within sales and
settlement, have shown significant progress during the year.
Board of Directors and managementVital’s Board of Directors is chaired by DnB NOR’s Group
Managing Director Rune Bjerke.
Rune Selmar and Kari Olrud Moen were elected as new
members in 2009. The Board also consists of Deputy Chair-
man Bjørn Erik Næss and members Cathrine Klouman,
Lars Rosén, Siri Pettersen Strandenes and Tove Pettersen.
Employee-elected members are Vibeke Holsen, Oddmunn
Olsen and Jørn O. Kvilhaug.
In 2009, Board members Tom Grøndahl and Bjørg Ven wit-
hdrew from Vital’s Board, both due to impartiality reasons
in consequence of them assuming new duties during the
course of 2009 outside the Group. In addition, employee
elected member Kristin Birkeland withdrew from the Board
in 2009. Oddmunn Olsen took over as the new employee
elected member.
The company is headed by Managing Director Tom Rathke.
The senior management is also comprised of Deputy Ma-
naging Director Anders Skjævestad, Director of Direct Sales
Frode J. Hansen, Director of Finance Truls Tollefsen, Director
of Operations and Customer Service Geir Sæbdal, Director of
Distribution Britt-Iren Spjeld and Director of Products Hanne
Langseth.
9
Future prospectsThe work of adapting Vital’s products to the future pen-
sion reform will have a high priority in 2010. Governmental
authorities have convened committees that will report on
precisely what changes the new old-age pension from the
National Insurance will mean for public and private occu-
pational pension schemes. The committees have concluded
that it is not possible to carry out all the changes to the
occupational pension schemes before 1 January 2011. It is
being proposed that implementation of Pension Reform be
carried out in several phases, where with effect beginning
on 1 January 2011, a flexible point in time for withdrawals
from old-age pensions will first and foremost be taken into
account. In addition, changes are being assessed in defined
contribution pensions, including increasing the contribution
rates. An increase in the contribution rates will contribute
to making the defined contribution product more competi-
tive with defined benefit pensions, something that over time
will involve an increased transition from defined benefit
pensions to defined contribution pensions. Despite the fact
that changes that must be carried out for the occupational
pension products as at 1 January 2011 are limited, a short im-
plementation period will be demanding for the life insurance
segment.
Vital continues to experience growth in the public sector,
winning the tender competitions in eight out of a total of
12 municipalities. The potential for continued growth in
this area is substantial. It is however the perception of Vital
that the procurement rules for occupational pensions in the
public sector ought to be changed so that there is real com-
petition for all municipal pension arrangements. This is not
the case today, with rules that favour the largest players.
Vital has intensified its work with preparations for Solvency
II, a new body of solvency regulations for insurance com-
panies that, among other things, will replace the present
solvency margin requirement.
Elements of the preparations include assessing the conse-
quences for capital needs as well as organisation, system
requirements, etc. The requirements that follow from Sol-
vency II involve needs for significant adjustments to the IT
systems and infrastructure of the insurance companies. Even
though the final implementation provisions and national
adaptations are not yet known, the framework directive gi-
ves a basis for evaluating the central requirements that the
companies must fulfil before the end of 2012.
Dividends and allocationsThe Board proposes that the year’s profit of NOK 1 331 million
be allocated as follows:
To the fund for unrealised profits 62
To the risk equalisation fund 158
To administration reserve for annual risk policies 28
To other equity capital 1 083
Total 1 331
Oslo, 5 February 2010
Rune Bjerke Bjørn Erik Næss Chairman Vice-chairman
Kari Olrud Moen Jørn O. Kvilhaug Tove E. Pettersen
Lars Rosén Siri Pettersen Strandenes Cathrine Klouman
Rune Selmar Vibeke Holsen Oddmunn Olsen Tom Rathke
Managing Director
10

© G
etty
Images
/Im
age
Sou
rce
11

31.12.08 31.12.09 Note Amounts in NOK millions Note 31.12.09 31.12.08
TECHNICAL ACCOUNT
17 578 16 798 Premiums due, gross 16 798 17 578
(346) (707) - Reinsurance premiums paid (707) (346)
Transfer of customer premium reserves from other insurance
3 512 3 368 5 companies/pension schemes 5 3 368 3 512
20 744 19 459 4 Premium income for own account 4 19 459 20 744
Income from investments in subsidiaries,
3 (1) associated companies and joint ventures (470) (1 504)
4 252 7 171 Interest income and dividends, etc. on financial assets 7 828 7 873
1 604 1 657 Net operating income from property 9 12
(4 642) (1 173) Changes in value of investments 292 (2 675)
(1 315) 2 571 Realised profits and losses on investments 2 565 (3 803)
(97) 10 225 4,7 Net income from investments in the aggregate portfolio 4,7 10 225 (97)
Income from investments in subsidiaries,
0 0 associated companies and joint ventures 0 (120)
107 79 Interest income and dividends, etc. on financial assets 79 168
47 0 Net operating income from property 0 0
(4 701) 3 941 Changes in value of investments 3 941 (4 595)
66 1 Realised profits and losses on investments 1 66
(4 481) 4 021 4 Net income from investments in investment choice portfolio 4 4 021 (4 481)
81 11 Other insurance-related income 11 81
(19 213) (12 185) Claims paid (12 185) (19 213)
(19 414) (12 687) Gross (12 687) (19 414)
201 502 - Reinsurance share of claims paid 502 201
(537) (204) Change in reserves for claims (204) (537)
(537) (204) Gross (204) (537)
0 0 - Changes in reinsurance portion of claims reserves 0 0
Transfer of customer premium reserves, additional statutory reserves and market
(3 380) (3 933) 5 value adjustment reserve to other insurance companies/pension schemes 5 (3 933) (3 380)
(23 130) (16 322) 4 Claims for own account 4 (16 322) (23 130)
(832) (5 937) Changes in premium reserve (5 937) (832)
(755) (5 821) To (from) premium reserve, gross (5 821) (755)
(77) (116) - Change in reinsurance portion of premium reserve (116) (77)
3 023 (164) Change in additional statutory reserves (164) (3 023)
3 342 (1 306) Changes in market value adjustment reserve (1 306) (3 342)
(234) (140) Changes in premium fund, deposit reserve and pensioners’ surplus fund (140) (234)
(72) (41) Changes in technical reserves for property and casualty insurance business (41) (72)
(72) (41) To (from) technical reserves for property and casualty insurance business (41) (72)
Transfer of additional statutory reserves and market value adjustment reserve
403 168 5 from other insurance companies/pension schemes 5 168 403
Changes in insurance liabilities through income statement – 5 631 (7 420) 4 Contractually established obligations 4 (7 420) 5 631
19 (32) Change in premium reserve (32) 19
0 (5 221) Changes in premium fund, deposit reserve and pensioners’ surplus fund (5 221) 0
3 630 0 Changes in other reserves 0 3 630
Transfer of additional statutory reserves from other
0 0 insurance companies/pension schemes 0 0
Changes in insurance liabilities through income
3 650 (5 253) 4 statement – special investment choice 4 (5 253) 3 650
VITAL FORSIKRING GROUP VITAL FORSIKRING ASA
Income statement 2009
12

VITAL FORSIKRING GROUP VITAL FORSIKRING ASA
Income statement 2009
31.12.08 31.12.09 Note Amounts in NOK millions Note 31.12.09 31.12.08
(84) (1 697) Profit on investment returns (1 697) (84)
0 (177) Risk result assigned insurance contracts (177) 0
(4) (263) Other assignment of profit (263) (4)
(89) (2 137) 4 Funds assigned insurance contracts – contractually established obligations 4 (2 137) (89)
(1 940) (1 836) 8,10,24 Insurance-related operating costs 8,10,24 (1 836) (1 940)
(239) (142) Other insurance-related costs (142) (239)
131 605 4 Result from technical account 4 605 131
NON-TECHNICAL ACCOUNT
Income from investments in subsidiaries,
23 0 associated companies and joint ventures 2 23
749 525 Interest income and dividends, etc. on financial assets 525 749
0 0 Net operating income from property 0 0
63 44 Changes in value of investments 44 63
(11) 87 Realised profits and losses on investments 87 (11)
(111) 0 Interest expenses 0 (111)
713 656 7 Net income from investments in company portfolio 7 658 713
0 71 Other income 14 0
(199) (176) Management costs and other costs associated with company portfolio (121) (199)
514 551 Result from non-technical account 551 514
644 1 156 Profit before taxes 1 156 644
(426) 175 11 Tax cost 11 175 (426)
218 1 331 Result before other profit components 1 331 218
0 0 Other profit components 0 0
218 1 331 TOTAL RESULT 1 331 218
13
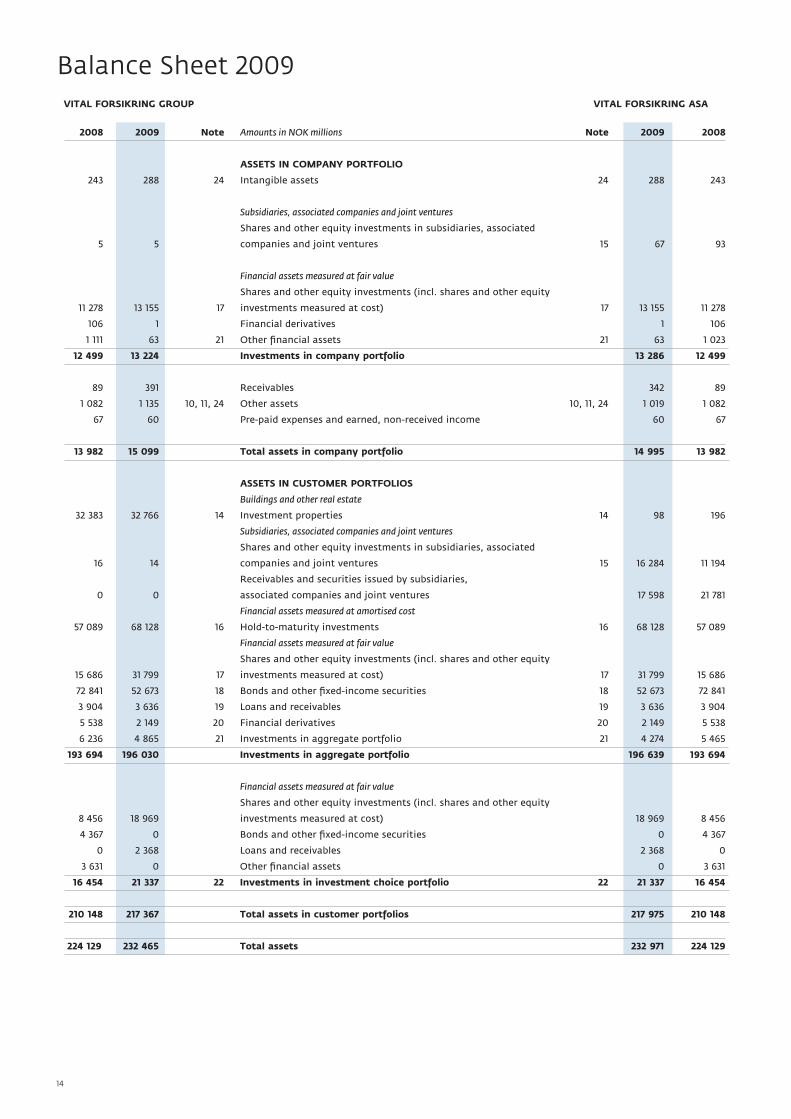
2008 2009 Note Amounts in NOK millions Note 2009 2008
ASSETS IN COMPANY PORTFOLIO
243 288 24 Intangible assets 24 288 243
Subsidiaries, associated companies and joint ventures
Shares and other equity investments in subsidiaries, associated
5 5 companies and joint ventures 15 67 93
Financial assets measured at fair value
Shares and other equity investments (incl. shares and other equity
11 278 13 155 17 investments measured at cost) 17 13 155 11 278
106 1 Financial derivatives 1 106
1 111 63 21 Other financial assets 21 63 1 023
12 499 13 224 Investments in company portfolio 13 286 12 499
89 391 Receivables 342 89
1 082 1 135 10, 11, 24 Other assets 10, 11, 24 1 019 1 082
67 60 Pre-paid expenses and earned, non-received income 60 67
13 982 15 099 Total assets in company portfolio 14 995 13 982
ASSETS IN CUSTOMER PORTFOLIOS
Buildings and other real estate
32 383 32 766 14 Investment properties 14 98 196
Subsidiaries, associated companies and joint ventures
Shares and other equity investments in subsidiaries, associated
16 14 companies and joint ventures 15 16 284 11 194
Receivables and securities issued by subsidiaries,
0 0 associated companies and joint ventures 17 598 21 781
Financial assets measured at amortised cost
57 089 68 128 16 Hold-to-maturity investments 16 68 128 57 089
Financial assets measured at fair value
Shares and other equity investments (incl. shares and other equity
15 686 31 799 17 investments measured at cost) 17 31 799 15 686
72 841 52 673 18 Bonds and other fixed-income securities 18 52 673 72 841
3 904 3 636 19 Loans and receivables 19 3 636 3 904
5 538 2 149 20 Financial derivatives 20 2 149 5 538
6 236 4 865 21 Investments in aggregate portfolio 21 4 274 5 465
193 694 196 030 Investments in aggregate portfolio 196 639 193 694
Financial assets measured at fair value
Shares and other equity investments (incl. shares and other equity
8 456 18 969 investments measured at cost) 18 969 8 456
4 367 0 Bonds and other fixed-income securities 0 4 367
0 2 368 Loans and receivables 2 368 0
3 631 0 Other financial assets 0 3 631
16 454 21 337 22 Investments in investment choice portfolio 22 21 337 16 454
210 148 217 367 Total assets in customer portfolios 217 975 210 148
224 129 232 465 Total assets 232 971 224 129
VITAL FORSIKRING GROUP VITAL FORSIKRING ASA
Balance Sheet 2009
14
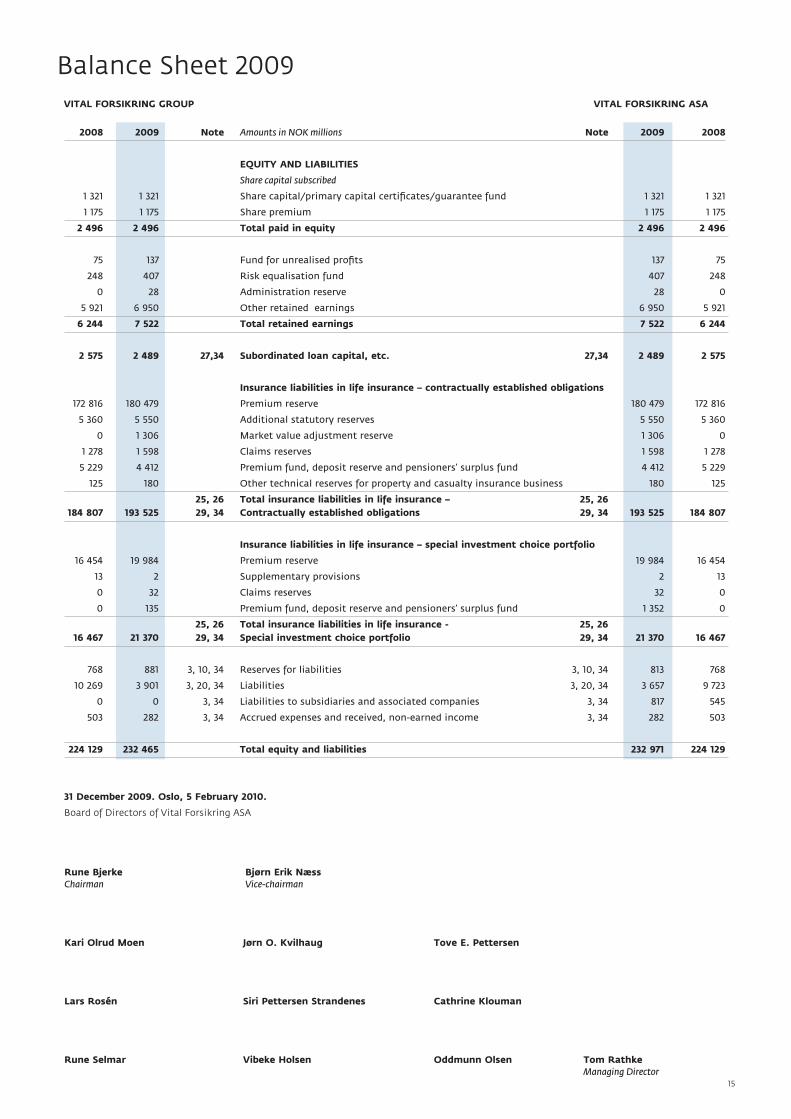
2008 2009 Note Amounts in NOK millions Note 2009 2008
EQUITY AND LIABILITIES
Share capital subscribed
1 321 1 321 Share capital/primary capital certificates/guarantee fund 1 321 1 321
1 175 1 175 Share premium 1 175 1 175
2 496 2 496 Total paid in equity 2 496 2 496
75 137 Fund for unrealised profits 137 75
248 407 Risk equalisation fund 407 248
0 28 Administration reserve 28 0
5 921 6 950 Other retained earnings 6 950 5 921
6 244 7 522 Total retained earnings 7 522 6 244
2 575 2 489 27,34 Subordinated loan capital, etc. 27,34 2 489 2 575
Insurance liabilities in life insurance – contractually established obligations
172 816 180 479 Premium reserve 180 479 172 816
5 360 5 550 Additional statutory reserves 5 550 5 360
0 1 306 Market value adjustment reserve 1 306 0
1 278 1 598 Claims reserves 1 598 1 278
5 229 4 412 Premium fund, deposit reserve and pensioners’ surplus fund 4 412 5 229
125 180 Other technical reserves for property and casualty insurance business 180 125
25, 26 Total insurance liabilities in life insurance – 25, 26 184 807 193 525 29, 34 Contractually established obligations 29, 34 193 525 184 807
Insurance liabilities in life insurance – special investment choice portfolio
16 454 19 984 Premium reserve 19 984 16 454
13 2 Supplementary provisions 2 13
0 32 Claims reserves 32 0
0 135 Premium fund, deposit reserve and pensioners’ surplus fund 1 352 0
25, 26 Total insurance liabilities in life insurance - 25, 26 16 467 21 370 29, 34 Special investment choice portfolio 29, 34 21 370 16 467
768 881 3, 10, 34 Reserves for liabilities 3, 10, 34 813 768
10 269 3 901 3, 20, 34 Liabilities 3, 20, 34 3 657 9 723
0 0 3, 34 Liabilities to subsidiaries and associated companies 3, 34 817 545
503 282 3, 34 Accrued expenses and received, non-earned income 3, 34 282 503
224 129 232 465 Total equity and liabilities 232 971 224 129
VITAL FORSIKRING GROUP VITAL FORSIKRING ASA
Balance Sheet 2009
31 December 2009. Oslo, 5 February 2010.
Board of Directors of Vital Forsikring ASA
Rune Bjerke Bjørn Erik Næss Chairman Vice-chairman
Kari Olrud Moen Jørn O. Kvilhaug Tove E. Pettersen
Lars Rosén Siri Pettersen Strandenes Cathrine Klouman
Rune Selmar Vibeke Holsen Oddmunn Olsen Tom Rathke Managing Director
15

Administration Fund for Risk reserve Other unrealised equalisation property accrued Total Amounts in NOK millions Share capital Share premium profits fund and casualty earnings equity
Balance Sheet as at 31 December 2007 1 321 1 175 5 867 8 363
Transferred from security reserve to
risk equalisation fund as at 1 January 2008 160 160
Demerger, property subsidiaries capital reduction (116) (150) (865) (1 132)
Demerger, property subsidiaries
contributions in kind 116 150 865 1 132
Profit/loss for the year 75 88 54 218
Balance sheet as at 31 December 2008 1 321 1 175 75 248 5 921 8 740
Profit/loss for the year 62 158 28 1 083 1 331
Group contribution (54) (54)
Balance sheet as at 31 December 2009 1 321 1 175 137 407 28 6 950 10 018
Share capital subscribed consists of share capital and share premium, a total of NOK 2 496 million. Retained earnings comprise the fund for
unrealised profits, risk equalisation fund, administration reserves property and casualty insurance and other accrued earnings. In total NOK 7 522
million.
The number of shares is 52 827 288, with a par value of NOK 25 per share. The company is 100 percent owned by DnB NOR ASA.
Amounts in NOK millions 31.12.09 31.12.08
Cash flow from operational activities
Net receipts from premiums/premium fund 15 452 14 482
Net receipts/payments from transfers (345) (629)
Net receipts from investments 10 764 (663)
Payment from life insurance with investment choice (10) 4 893
Other insurance-related receipts 21 44
Compensation payments (11 815) (18 959)
Payment for operation (2 333) (1 795)
Taxes paid (4) 0
A=Cash flow from operational activities 11 731 (2 627)
Net investment in shares and other equity investments (15 180) 22 506
Net investment in bonds 5 056 (17 061)
Net investment in loans (307) (3 028)
Net investment in investment contracts (1 059) (867)
Net investment in properties (1 268) (1 448)
Net investment in other financial assets 398 (675)
Net investment in tangible fixed assets (9) (17)
Net investment in intangible assets (127) (129)
B=Net cash flow from investments made (12 497) (720)
Cash flow from financing activities
Repayment of subordinated loans 124 (35)
Paid dividends/group contributions (54) (1 221)
Changes from other financing activities 42 (632)
C=Cash flow from financing activities 112 (1 887)
Net liquidity change (A+B+C) (654) (5 234)
Liquidity holding as at 01.01 4 547 9 781
Liquidity holding as at 31.12 3 893 4 547
SHARE CAPITAL SUBSCRIBED ACCRUED EARNINGS
Changes in equity
Cash flow analysis
16
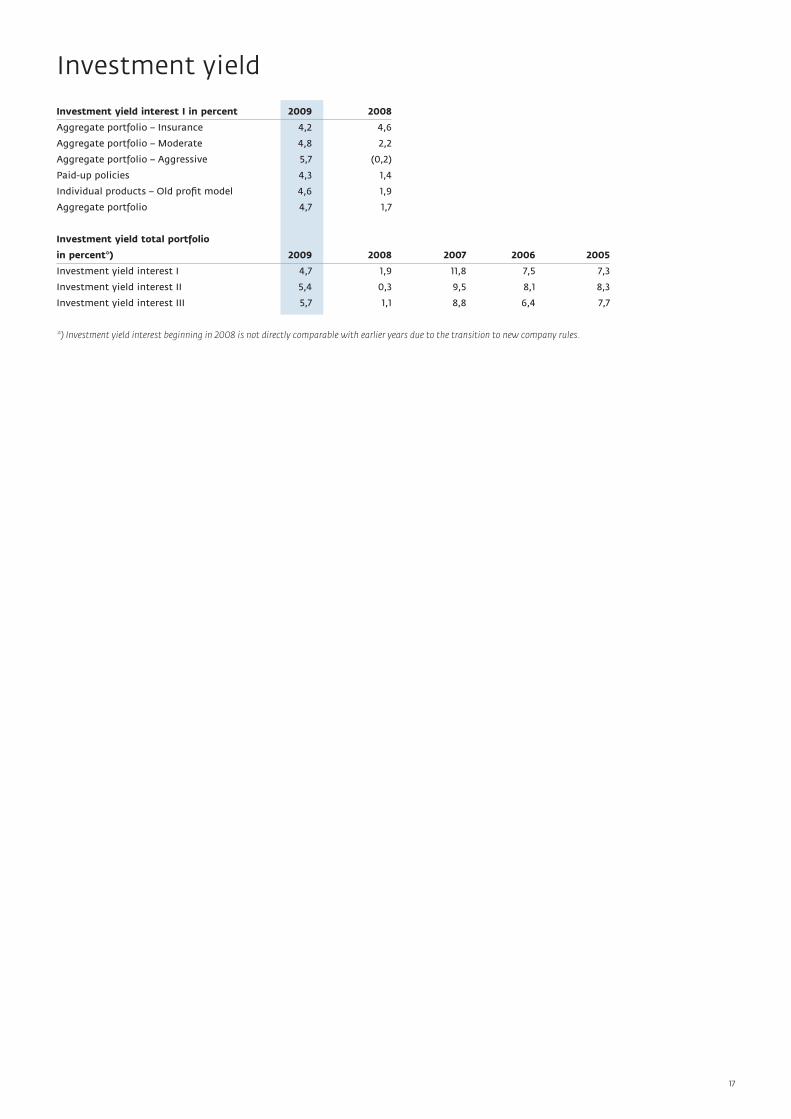
Investment yield interest I in percent 2009 2008
Aggregate portfolio – Insurance 4,2 4,6
Aggregate portfolio – Moderate 4,8 2,2
Aggregate portfolio – Aggressive 5,7 (0,2)
Paid-up policies 4,3 1,4
Individual products – Old profit model 4,6 1,9
Aggregate portfolio 4,7 1,7
Investment yield total portfolio
in percent*) 2009 2008 2007 2006 2005
Investment yield interest I 4,7 1,9 11,8 7,5 7,3
Investment yield interest II 5,4 0,3 9,5 8,1 8,3
Investment yield interest III 5,7 1,1 8,8 6,4 7,7
*) Investment yield interest beginning in 2008 is not directly comparable with earlier years due to the transition to new company rules.
Investment yield
17

1. BASIS FOR PREPARATION OF ACCOUNTSThe accounts for Vital Forsikring ASA are submitted in accor-
dance with the Regulations for Annual Accounts etc. related
to Insurance Companies, the Norwegian Accounting Act of
1998, Generally Accepted Accounting Principles in Norway
(Annual Accounts Regulations), as well as other regulations
promulgated by the Financial Supervisory Authority of Nor-
way.
The annual accounts must be approved by the Annual Gene-
ral Meeting of Vital Forsikring ASA before their submission
may be deemed to be final.
2. CHANGES IN ACCOUNTING PRINCIPLESThe Financial Supervisory Authority of Norway has made it
clear in 2009 that section 3-8, second subsection, of the Ac-
counting Act does not apply for life insurance companies. On
this basis, for the 2009 accounting year, both consolidated
accounts and unconsolidated accounts have been prepared
for the company. The change principally affects the presen-
tation of investment properties. In the company’s unconsoli-
dated accounts the aggregate portfolio’s investments in real
estate subsidiaries are presented as shares and other equity
investments in subsidiaries and receivables from subsidiaries.
Beginning 1 January 2009, the company has used amended
IFRS 7 Financial instruments – information. The changes to
the standard affect the information in the notes concerning
financial instruments in the accounts. Financial instruments
that are measured at fair value must be grouped in three
levels as per the specific type of information that is used in
the valuation: exchange-listed prices, observable market data
from active markets and information other than observable
market data. If a financial instrument is measured with the
use of a valuation method not based on observable market
data, expanded information requirements become applicable,
see note 13. In line with the transition rules, corresponding
information for comparable periods is not given. Expanded
information must also be provided concerning the liquidity
risk pursuant to amendments to IFRS 7, see note 34.
IAS 40 – Investment property has been amended with effect
beginning 1.1.2009. The change involves a property under
construction or development for future use as an investment
property having to be classified as an investment property
and being measured at fair value. Furthermore, IAS 40 has
been amended with effect beginning 1.1.2009 such that
projects associated with existing properties that are being
further developed must be measured at fair value. Refer to
note 14.
3. ESTIMATESThe preparation of the annual accounts involves the manage-
ment making evaluations and estimates, as well as assump-
tions being made that affect the assets and liabilities, income
and expenses. A more detailed account is given in note 2 of
significant estimates and assumptions.
4. CONSOLIDATIONIn the consolidated accounts for Vital Forsikring ASA (“Vital”)
real estate subsidiaries owned are included in the aggregate
portfolio, as well as subsidiaries that are included in the
company portfolio. Refer to note 15. The accounting princi-
ples are applied consistently in the consolidation of owner-
ship interests in subsidiaries, joint ventures and associated
companies and are based upon the same reporting periods as
for the parent company.
Investments in subsidiaries are fully consolidated. Invest-
ments in joint ventures are consolidated proportionately.
Investments in associated companies are consolidated in ac-
cordance with the equity method. No subsidiaries have signi-
ficant minority interests, neither individually nor in total. For
subsidiaries, joint ventures and associated companies held
in the aggregate portfolio, results before taxes are reported
collectively under financial income, whereas the tax costs are
reported as a part of the Group’s tax costs.
In the preparation of the consolidated accounts, group-inter-
nal transactions, balances and unrealised profits and losses
on transactions between units in the group are eliminated.
For subsidiaries that are owned in the company portfolio, but
which in full or in part sell services that are expenses in the
technical accounts, the profit/loss for the year before taxes
appears on one line under other income outside technical ac-
counts. This primarily concerns Vital Eiendom AS.
Subsidiaries are defined as companies that Vital controls
through direct or indirect ownership interests or other relati-
onships and where the ownership proportion is more than 50
percent of the capital with voting rights. Normally, it is pre-
sumed that Vital has control when the ownership interests in
another company are greater than 50 percent, however Vital
also assesses whether the Group in fact has control. For com-
panies where the ownership proportion is under 50 percent,
Vital makes an assessment of whether other circumstances
exist that deem that they in fact do have control.
Joint ventures represent investments in companies where
Vital controls a company along with others. This type of
collaboration is based upon an agreement that governs the
central working relationship.
Associated companies are companies where the Group exer-
cises significant influence, but not control and normally en-
compasses companies with ownership proportions between
20 percent and 50 percent. Investments in associated compa-
nies are consolidated in accordance with the equity method.
Taxes are included in the same manner as for subsidiaries.
5. SUBSIDIARIESSubsidiaries, joint ventures and associated companies are
recognised in accordance with the equity method. The ac-
counts of subsidiaries are converted in accordance with the
principles under which the unconsolidated accounts of insu-
rance companies are prepared. Income from investments in
subsidiaries in the company portfolio is included after taxes.
Note 1 – Accounting principles
18

Note 1 – Accounting principles continued
Income from investments in subsidiaries in the customer
portfolios is included before taxes. This is because the custo-
mer must be credited with the returns before taxes. Trans-
actions with consolidated accounts are done in accordance
with customary business conditions and principles, such that
income, costs, losses and profits are distributed between the
companies in the group in the most correct manner possible.
6. CONVERSION OF TRANSACTIONS IN FOREIGN CURRENCIES
The Group’s presentation currency and functional currency is
the Norwegian krone (NOK).
Income and expense in foreign currencies are converted to
Norwegian kroner by using the exchange rate at the point
in time of the transaction. The exception is for income and
expenses associated with the company’s properties abroad,
which are converted to Norwegian kroner based upon the
average exchange rate for each quarter.
Financial assets, investment properties and subordinated
loans in foreign currencies are converted to Norwegian kro-
ner in accordance with the exchange rate as at the date of
the balance sheet. Changes in valuations due to changes in
exchange rates between the date of the transaction and the
date of the balance sheet are realised on the income state-
ment.
Hold-to-maturity bonds are recognised on the balance sheet
at amortised cost in the local currency, being converted to
Norwegian kroner using the exchange rate on the date of the
balance sheet.
7. ENTRY OF INCOME AND ExPENSES Premium income and claims paidInsurance premiums and claims are recognised in the income
statement in the amounts that were due during the year.
Net premium income encompasses the premiums due during
the year, transferred premium reserves and reinsurance
premiums paid. Accruals of earned premiums are handled by
reserves for the premium reserve in the insurance fund.
Transfer of premium reserves from account transfersThe accounting transactions for the transfer of insurance
contracts take place at the point in time the insurance risk
is transferred. With a transfer of risk as at 31 December, the
accounting for such is performed in the following year. The
amounts transferred include the contract’s share of additio-
nal statutory reserves, the market value adjustment reserve
and the profit/loss for the year.
Transfers of premium reserves are accounted for as premium
income for received reserves, and for disbursed reserves
as claims for own account. Received additional statutory
reserves are recognised under the item change in insurance
reserves.
Recognised changes in insurance obligationsGuaranteed returns provided to insurance customers who
have products with guaranteed interest are included under
the item recognised changes in insurance obligations – con-
tractually established obligations. Other returns for these
customers are recognised under the item funds assigned
insurance contracts – contractually established obligations.
Changes in the market value adjustment reserve in the group
portfolio are included under recognised changes in insurance
obligations for contractually established obligations.
8. ENTRY OF ASSETS AND LIABILITIES ON BALANCE SHEETAssets and liabilities are recognised on the balance sheet as
at the point in time of the actual transfer of risk.
Assets are recognised on the balance sheet at the point in
time that the actual risk concerning the assets is transferred.
Liabilities are no longer included once they have been fulfil-
led, lapsed or expired.
9. FINANCIAL INSTRUMENTS Classification of financial instrumentsWhen financial assets are initially recognised, they are clas-
sified according to the purpose of the investment.
The company’s financial assets are classified as:
• Financial assets identified at fair value with changes in
value realised on the income statement.
• Hold-to-maturity investments, recognised on the balance
sheet at amortised cost
Vital has no assets classified as trading or available for sale
under IAS 39.
Guidelines for classificationFinancial assets at fair value with changes in
value realised on the income statement
These are assets and liabilities that when recognised for the
first time are identified with the category fair value with
changes in value realised on the income statement. With the
exception of bonds that are classified in the hold-to-maturity
category, most of Vital’s financial assets fall into this cate-
gory. Financial derivatives are also included in the category
fair value with changes in value realised on the income state-
ment since Vital does not have derivatives that are classified
as hedging under IAS 39.
Hold-to-maturity investments are recognised on
the balance sheet at amortised cost
Financial assets with a fixed maturity, which the company
has a positive intention of holding until maturity, and which
when recognised initially are not identified as fair value
with changes in value realised on the income statement, are
included in this classification. Parts of the bond portfolio in
the aggregate portfolio are classified as hold-to-maturity and
are assessed at amortised cost using the effective interest
method.
19

Valuation of financial instrumentsInitial recognition of financial instruments
Financial instruments are recognised on the balance sheet at
fair value on the transaction date. For financial instruments
at fair value on the income statement, fair value on the date
of acquisition will be the transaction price. Financial instru-
ments assessed at amortised cost will be included at the
transaction price.
Subsequent value measurement at fair value
Fair value is the amount that an asset can be swapped for, or
a liability can be settled for, in a transaction between inde-
pendent parties. In the calculation, the presumption of con-
tinued operation is taken as fundamental, and reserves for
credit risks in the instrument are included in the valuation.
Shares and units listed on exchanges or other regulated mar-
ketplaces are valued at the official closing price on the last
trading day up through and including the date of the balance
sheet. Other shares and units are valued at their computed
fair value based on the available information on the date of
the balance sheet.
Bonds and other fixed-income securities with a fixed return
listed on an exchange or other regulated marketplace are
valued at the official closing price on the last trading day up
through and including the date of the balance sheet.
Instruments traded in the active market
The majority of the company’s financial derivatives such
as forward exchange contract transactions, contracts that
secure a future interest rate, interest rate options, foreign ex-
change options, interest rate swaps and interest rate futures,
are traded in an active market. In addition, some portion of
the investments in shares, commercial paper and bonds are
traded in active markets.
A market is active if it is possible to procure externally ob-
servable prices, rates or volatilities and such prices represent
actual and frequent market transactions. With respect to
instruments traded in an active market, quoted prices are
used, obtained from a stock exchange, a broker or a price-
setting agency. If no prices are quoted for the instrument, it
is decomposed and valued on the basis of quoted prices on
the individual components.
Instruments not traded in an active market
Financial instruments not traded in an active market are
valued according to different valuation techniques and are
divided into two categories:
Valuation based on observable market data:
• recently observed transactions in the relevant instrument
between informed, willing and independent parties
• instruments traded in an active market which are substan-
tially similar to the instrument that is valued
• other valuation techniques where key parameters are based
on observable market data
Valuation based on other factors than observable market
data:
• estimated cash flows
• valuation of assets and liabilities in companies
• models where at least one parameter of central significance
to the valuation is not based on observable market data
• possible industry standards
When using valuation techniques, values are adjusted for
credit and liquidity risk. Valuations are based on pricing of
risk for similar instruments. Cf. also note 13, which concerns
pricing categories.
Subsequent measurement at amortised cost
Financial instruments not recorded at fair value are recorded
at amortised cost, and income is calculated based on the
instrument’s effective interest rate. The effective interest rate
is set by discounting contractual cash flows based on the
expected life of the financial instrument.
On each balance sheet date, the company evaluates whether
there are objective indications that the financial assets that
are recognised at amortised cost have been subjected to a
decline in their value.
A financial asset or a group of financial assets is written
down if there are objective, non-transitory indications of a
decline in value.
Objective indications for declines in value encompass signifi-
cant financial problems among debtors, breaches of payment
or other significant contractual violations, instances where it
is deemed probable that a debtor will initiate debt settlement
proceedings or other tangible conditions that have arisen.
Write-downs of other financial assets are recognised on the
income statement where they belong according to their
nature.
Presentation in the balance sheet and income statementNet income from investments
As per the transition to new company rules, net income from
investments will be presented by portfolio in the accounts.
Note 7 specifies the result elements from the different asset
classes for investments in the company and aggregate port-
folios.
Bonds and other fixed-income securities
This category includes commercial paper and bonds that the
company has classified as fair value with changes in valua-
tion on the income statement on initial recognition. Items
recognised on the balance sheet include accrued interest.
Shares and units
This category includes shares and unit trusts to be accounted
for at fair value on the income statement. Beginning in 2008,
bond funds are also included in this category. These were
previously recognised under the category bonds and other
fixed income securities.
Note 1 – Accounting principles (continued)
20

Financial derivatives
Financial derivatives are presented as assets if the value is
positive and as liabilities if there is a negative value. Netting
is undertaken if the company has a legally binding netting
agreement with its counterparty and intends to make a net
redemption or sell the asset and meet the obligation at the
same time.
Loans and receivables
This category includes loans that the company has classified
as fair value with changes in valuation on the income state-
ment on initial recognition. Items recognised on the balance
sheet include accrued interest.
Investments that are held to maturity
This category includes bonds that the company has classified
as hold-to-maturity at amortised cost. Items recognised on
the balance sheet include accrued interest.
Assets in life insurance with investment choiceAssets in life insurance with investment choice consist of
shares, bonds, commercial paper and financial contracts,
units of unit trusts, bond funds, combined share and bond
funds and bank funds. The instruments are valued together
at market value. Unrealised profits/losses are realised on an
on-going basis by the customers.
10. INVESTMENT PROPERTIESProperties that are owned in order to achieve returns in
customer portfolios by earning rental income and obtaining
valuation increases are classified as investment properties.
Investment properties must be included and measured in ac-
cordance with IAS 40.
Investments in buildings and other real estate are divided
up into directly owned properties and indirectly owned
properties organised into separate legal entities (limited
companies, general partnerships and limited partnerships).
In the company’s unconsolidated accounts, investments in
consolidated property companies are presented as shares and
units of subsidiaries, etc. For debt financing of the property
companies investment properties, loans are presented as
Receivables from subsidiaries, etc. in the company’s unconso-
lidated accounts.
Rental income and operating costs are presented as net
operating income from property. The year’s realised change
in market value and realised profits and losses on sales of
properties are recognised on the income statement, respecti-
vely, as changes in value of investments and realised profits
and losses on investments. Changes in market value in con-
sequence of changes in exchange rates for properties located
abroad are presented as changes in value of investments.
In the company’s unconsolidated accounts, proportionate
shares of the results from consolidated property companies
are presented as income from investments in subsidiaries,
associated companies and joint ventures. The equivalent ap-
plies for changes in market value recognised on the income
statement and realised profits/losses from such investments.
Interest income associated with internal loans to property
subsidiaries are presented as interest income and dividends,
etc. from financial assets.
The company uses forward contracts to hedge exchange rates
for properties abroad. The forward contracts are assessed at
fair value with changes in valuation on the income statement
and are presented as financial derivatives.
11. INTANGIBLE ASSETS IT systems and softwarePurchased software is capitalised at acquisition cost, inclu-
ding expenses associated with making the software ready for
use. Directly identifiable expenses for self-developed software
are capitalised as intangible assets. This presumes that the
systems are controlled by the company, the probable econo-
mic benefits exceed the development costs and the anticipa-
ted lifespan in over 3 years.
Direct expenses include employees directly involved with
the software development, material costs and a portion of
directly attributable overhead. Expenses associated with
maintenance of software and IT systems are expensed on an
on-going basis on the income statement.
Capitalised IT systems and software are depreciated linearly
over their presumed economic lifespan. At each reporting
date, management assesses whether there are indicators of
an impairment in intangible assets. If such indications exist,
a recoverable amount is computed. The capitalised value of
the asset is written down immediately if the value on the ba-
lance sheet is higher than the estimated recoverable amount.
12. FIxED ASSETSFixed assets for internal use are classified as other assets on
the balance sheet. Fixed assets are valued at their acquisition
costs with linear depreciation deducted based on their presu-
med economic lifespan.
13. INSURANCE PRINCIPLES Classification of contractsIFRS 4 concerns the accounting treatment of insurance
contracts. IFRS 4 defines contracts where the insurance risk
comprises a significant part of the product’s total risk as
being insurance contracts. Products offered by Vital include
group pension insurance, group association insurance, indi-
vidual endowment insurance, individual annuity and pension
insurance, products with a investment choice and group life
insurance. The insurance reserves in the accounts are in ac-
cordance with Norwegian legislation in the area, as well as
with IFRS 4.
Insurance reserves.Technical insurance reserves at Vital include the premium
reserve, additional statutory reserves, market value adjust-
ment reserve, the claims reserve, the risk equalisation fund
and other technical reserves. In addition, the premium fund,
deposit fund and the pensioners’ surplus fund are included in
insurance provisions.
Note 1 – Accounting principles (continued)
21

The premium reserve is a reserve to secure future insurance
liabilities to policyholders and insured persons. The premium
reserve represents the technical cash value, i.e. the net pre-
sent value, of the company’s total insurance liabilities inclu-
ding costs, less the cash value of future agreed premiums.
Additional statutory reserves are a conditional allocation to
policyholders where changes during the year are recogni-
sed in the income statement. Finanstilsynet (the Financial
Supervisory Authority of Norway) has issued regulations on
maximum additional allocations per contract. According to
these regulations, maximum additional allocations per con-
tract cannot exceed 12 percent of the premium reserve for
the contract. Actual allocations for the individual years are
determined in connection with year-end adjustments.
The value adjustment reserve corresponds to the total total
unrealised gains on current financial assets included in the
aggregate portfolio. If the portfolio of current financial assets
shows a net unrealised loss, the value adjustment reserve is
set to 0.
Unrealised profits and losses associated with changes in
exchange rates on derivatives used to hedge exchange rates
for properties, loans and hold-to-maturity bonds in foreign
currencies are not included in the market value adjustment
reserve.
The claims reserve shall cover the company’s anticipated
compensation payments for insurance claims that have not
been settled or advanced against the company at the end of
the accounting year. The claims reserve represents only the
funds that would have been disbursed during the accounting
year if the processing of the insurance claims had been com-
pleted.
The risk equalisation fund can be used to cover negative risk
results. The annual allocation is reviewed in connection with
year-end adjustments. The risk equalisation fund is classified
as equity in the balance sheet.
The premium fund contains premiums prepaid by policyhol-
ders within individual and group pension insurance. A share
of annual profits is allocated to the pensioners’ surplus fund
and used to strengthen the premium reserve for pensioners
in connection with adjustments in pension payments.
Classification of insurance obligations – special investment choice portfolioThe insurance reserves for coverage of obligations associated
with the value of special investment choice portfolios must
at all times correspond to the value of the investment portfo-
lio that is assigned to the contract. The allocated portion of a
positive risk result is included.
Supplemental reserves for special investment choice portfo-
lios are reserves for coverage of guaranteed returns for these
contracts that have such. The reserves must correspond to
the anticipated disbursements from the company to the
customer when retirement age is reached.
Assessment of liabilities to policyholdersLiabilities should be in reasonable proportion to the associa-
ted risk. This is ensured through continual follow-ups and
monitoring of existing contracts. Furthermore, all premium
rates prepared by the company must be reported to Finans-
tilsynet, which has overall responsibility for controlling that
adequate premiums are applied. On-going evaluations are
made of the computational basis that is used.
With respect to group pension insurance, the basis for
computing premium reserves was changed on 1 January 2008
to include new assumptions for life expectancy and marital
status. With respect to existing individual pension insurance
contracts, the calculation base used for large parts of the
portfolio dates further back.
The basis for calculating disability risk is more recent, taking
account of the increase in disability observed in society
at large. The company took new premium rates for group
disability pensions into use in 2005. New premium rates were
introduced for municipal schemes as of 1 January 2004.
The base rate is used to calculate the present value of future
premiums, payments and insurance reserves. The maximum
base rate at any point in time is stipulated by Finanstilsy-
net, based on the yield on long-term government bonds. The
maximum base rate for new contracts signed after 1 January
2006 is 2.75 percent. For contracts signed prior to 1 January
2006, the base rate is generally between 3 and 4 per cent.
Adequacy testThe Group carries out, in accordance with IFRS 4, and annual
adequacy test to assess whether its premium reserves are
adequate to cover its liabilities to policyholders. The test is
described in more detail in Note 29, insurance risk.
14. SUBORDINATED LOAN CAPITALSubordinated loan capital is valued as amortised cost on the
balance sheet. Subordinated loan capital in foreign currencies
is converted to Norwegian kroner according to the exchange
rate on the date of the balance sheet. Both realised and un-
realised currency gains/losses for subordinated loan capital
are realised as financial income/costs. Interest expenses for
the subordinated loans are recognised as other costs in the
non-technical accounts.
15. TAxESThe year’s realised tax costs consist of payable taxes and
the change for the year in deferred taxes. Deferred taxes are
computed in the basis of differences between reported tax-
related and accounting-related results that will be settled in
the future. The assessment is based upon the tax positions at
the date of the balance sheet.
In accordance with IAS 12, deferred taxes are not associated
with properties in real estate companies since Vital Forsik-
ring ASA is expected to be able to control the reserves for
these temporary differences, and since the assets are not
used in Vital’s business.
Note 1 – Accounting principles (continued)
22

Temporary differences that increase and decrease taxes and
that are expected to be reversed during the same period are
offset and netted. Net deferred tax benefits are recognised on
the balance sheet to the degree that it is probable that there
will be taxable income that the temporary difference can be
applied against.
Unrealised profits/losses on investments that are encompas-
sed by the market value adjustment reserve (current financial
assets) are assessed in relation to the exemption method.
Unrealised profits/losses in the exemption method are
treated as a permanent difference. Unrealised profits/gains
associated with investments in investment choice portfolios
are in their entirety treated as a temporary difference on an
equal footing with temporary differences associated with the
customer commitments for the same portfolio.
16. PENSIONS Defines benefit schemeIn a defined benefit scheme, the employer is committed to
providing future specified pension benefits.
The basis for calculating pension expenses is a linear distribu-
tion of pension entitlements measured against estimated ac-
cumulated commitments at the time of retirement. Expenses
are calculated on the basis of pension entitlements earned
during the year with the deduction of the return on funds
assigned to pensions.
Pension commitments which are administered through life
insurance companies are matched against funds within the
scheme. When total pension funds exceed estimated pension
commitments on the balance sheet date, the net value is
classified as an asset in the balance sheet if it has been ren-
dered probable that the overfunding can be utilised to cover
future commitments.
When pension commitments exceed pension funds, the net
commitments are classified under liabilities in the balance
sheet. Each scheme is considered separately.
Pension commitments which are not administered through
life insurance companies, are recorded as liabilities in the
balance sheet.
Pension commitments represent the present value of esti-
mated future pension payments that in the accounts are
classified as accumulated on the balance sheet date. The cal-
culation of pension commitments is based on actuarial and
economic assumptions about life expectancy, rise in salaries
and early retirement. The discount rate used is determined by
reference to market yields at the balance sheet date on long
term (10-year) government bonds, plus an addition that takes
into account the relevant duration of the pension liabilities.
Deviations in estimates are recorded in the income state-
ment over the average remaining service period when the
difference exceeds the greater of 10 per cent of pension funds
and 10 per cent of pension commitments.
The financial effects of changes in pension schemes are
recorded as income or charged to expense on the date of the
change, unless the rights under the new pension scheme
are conditional on the employee remaining in service for a
specified period.
Pension expenses are based on assumptions determined at
the start of the period. Pension expenses are classified as
personnel expenses in the income statement. Employer’s
contributions are included in pension expenses and pension
commitments.
The company’s pension schemes are administrated through
its own company. No eliminations are made with respect
to the company’s pension commitments and pension funds
or for pension expenses and premium income in the income
statement.
17. EQUITY CAPITALThe risk equalisation fund and fund for unrealised profits
were introduced into the insurance accounts with the transi-
tion to the new Insurance Act. Allocations of reserves for the
funds are made in connection with year-end adjustments.
Risk equalisation fundThe purpose of the risk equalisation fund is to absorb fluctua-
tions in the risk result over time, by this result, within more
precisely defined limits, being able to be balanced against
the risk equalisation fund. The reserve is not deemed to be
associated with the insurance company’s insurance risk for
existing or future customers and must be classified as ac-
crued earnings in the company’s balance sheet.
Administration reserveThe administration reserve is intended to cover expenses
of claims settlements after any possible liquidation of the
company. The reserve is not deemed to be associated with
the insurance company’s insurance risk for existing or future
customers and must be classified as retained earning on the
company’s balance sheet.
Fund for unrealised profitsThe fund for unrealised profits corresponds to the sum of
unrealised profits on financial assets that are included in
the company portfolio and are a parallel to the market value
adjustment reserve in the aggregate portfolio.
18. CASH FLOW STATEMENTSThe cash flow statements show net cash flows grouped ac-
cording to source and use. Cash is defined as cash, deposits
with central banks and deposits with credit institutions with
no agreed period of notice.
Note 1 – Accounting principles (continued)
23

When preparing the consolidated accounts, management
makes estimates and discretionary judgements and prepa-
res assumptions that influence the effect of the accounting
principles applied. In turn, this will affect the recorded values
of assets and liabilities, income and expenses.
Estimates and discretionary judgements are subject to con-
tinual evaluation and are based on historical experience and
other factors, including expectations of future events that
are believed to be probable on the balance sheet date. At the
end of the 2008 accounting year, there was great uncertainty
associated with developments in 2009. This uncertainty has
been significantly reduced at the end of 2009.
Future prospectsThe economic growth from the second half-year of 2009 will
probably continue into 2010 without any significant setbacks.
Global GNP growth is expected to be between 4 and 4.5 per-
cent. Strong commodities markets are expected to lead to the
stock markets in Norway and emerging economies having
relatively better trends than broader international markets.
In such a scenario, with moderate growth and a large capa-
city gap, even moderate growth in the earnings of companies
will yield in part strong growth in the profit performance of
companies.
In order for the Western economies, particularly the US, to
achieve moderate growth in 2010, it is assumed that the
contribution from the consumer must increase in relation to
what has been the case since the turnaround in 2009. This
requires first and foremost the further stabilisation of the
American labour market. Furthermore, increased consump-
tion probably also requires that the banking system functions
more normally that the case has been in 2009.
It is widely assumed that it is highly improbable that central
banks such as the Fed and ECB will be raising interest rates
in 2010. Norway lies in front of the rest of the Western world
in this trend, and Norges Bank will probably be gradually
raising its interest rates here.
In the property markets, there have been significant drops
in values during the past two years, at first driven by yield
losses and later be drops in the expected trend in rent levels.
It is a challenge to establish prices in the market because
the quantity of transactions has fallen dramatically, with the
consequence that there are extremely few relevant transac-
tions that can document price levels. This has particularly
been the situation in the Norwegian market in 2009. This is
due to a lack of access to credit, but also to the significant
differences that exist with respect to price expectations bet-
ween buyers and sellers.
It is our perception that the yield increase has stopped in
most markets and flattened out at a somewhat higher level.
We have expectations that the yields will begin to be pulled
downwards, due in part to an unusually large yield gap and
the risk that the cash flows will diminish with lower rents.
Together with an improvement in access to credit, this gives
support for a moderately positive trend in the property mar-
ket.
Valuation of properties within Vital ForsikringThe property portfolio of Vital Forsikring is recorded at fair
value. The property portfolio in Norway is valued using the
company’s own model based on the net present value of
anticipated cash flows. In addition, internal valuations are
benchmarked against independent external appraisals. There
was an increasing level of activity in the property market
in the second half of 2009, though there were still a limited
number of relevant references in the market. Central para-
meters in the valuation model have been harmonised with
external market information during Q4.
Changes in assumptions regarding the required rate of return
and future rental levels subsequent to the contract period co-
uld result in a significant change in the value of the property
portfolio. The assumptions used in calculating the fair value
of the property portfolio can be found in note 15 Investment
property.
Fair value of financial derivatives and other financial instrumentsThe fair value of financial instruments that are not traded in
an active market is determined by using different valuation
techniques. The company considers and chooses techniques
and assumptions that as far as possible are based on market
conditions on the balance sheet date. When valuing financial
instruments for which observable market data are not avai-
lable, the company will make assumptions regarding what it
expects the market to use as a basis for valuing correspon-
ding financial instruments. The valuations require extensive
use of judgement when calculating liquidity risk, credit risk
and volatility. Changes in these factors could affect the estab-
lished fair value of the company’s financial instruments.
When determining the fair value of Private Equity, PE, funds,
the industry’s recognised guidelines for PE valuations are
used. The industry standard has been prepared by the Eu-
ropean Private Equity & Venture Capital Association, EVCA.
The method is considered to represent the best basis for
the best estimate of fair values for investments in not very
liquid equity instruments. On the balance sheet date, the
company did not have access to valuations of PE funds as at
31 December 2009. Valuations in the consolidated accounts
are thus based on valuations received for previous periods,
adjusted for a time lag in the reporting from the funds. The
time lags are assessed based on a weighted index consisting
of one parameter for the stock market, represented by MSCI
World as a reference index, and one parameter for operation,
represented by anticipated long-term returns on PE invest-
ments. If developments in the weighted quarterly index are
within a determined reliability interval, the portfolio value is
adjusted by the parameter for operation. If developments in
the weighted quarterly index fall outside the reliability inter-
val, a full valuation must be made relative to the weighted
index. The method has been tested on historical data and is
considered to have good prediction ability. See note 17 Sha-
res, interests and primary capital certificates at fair value in
the profit and loss account.
Note 2 – Important accounting estimates and discretionary judgements
24

VITAL FORSIKRING ASA
AMALGAMATION OF BALANCE SHEET ITEMS 2009 2008
Reserves for liabilities
Pension commitments, etc. 169 157
Tax liabilities
Liabilities for period tax 644 28
Liabilities for deferred taxes 0 584
Total reserves for liabilities as at 31 December 813 768
Liabilities
Liabilities in connection with direct insurance 263 126
Liabilities in connection with reinsurance 29 15
Liabilities to credit institutions 284 635
Financial derivatives 1 909 7 950
Other liabilities 1 172 997
Other liabilities to DS, TS 817 545
Total liabilities as at 31 December 4 473 10 269
Accrued expenses and received, non-earned income
Other accrued expenses and received, non-earned income 282 503
Total accrued expenses and received, non-earned income as at 31 December 282 503
VITAL FORSIKRING GROUP
Amalgamation of balance sheet items 2009 2008
Reserves for liabilities
Pension commitments, etc. 227 157
Tax liabilities
Liabilities for period tax 654 28
Liabilities for deferred taxes 0 584
Other reserves for liabilities 0 0
Total reserves for liabilities as at 31 December 881 768
Liabilities
Liabilities in connection with direct insurance 263 126
Liabilities in connection with reinsurance 29 15
Liabilities to credit institutions 284 635
Financial derivatives 1 909 7 950
Other liabilities 1 416 1 542
Total liabilities as at 31 December 3 901 10 269
Accrued expenses and received, non-earned income
Other accrued expenses and received, non-earned income 282 503
Total accrued expenses and received, non-earned income as at 31 December 282 503
Note 3 – Amalgamation of balance sheet items
25

Note 4 – Profit and loss accounts and analyses distributed by segment
Group Group Group Prod with pension pension assoc. Individ Individ Group Prop. & inv.Amounts in NOK millions privat off. pension pension capital life casualty choice 2009 2008
INCOME STATEMENT:
Premium income 7 991 3 667 45 1 415 2 190 320 276 3 555 19 459 20 744
Net income from investments in
aggregate portfolio 5 770 1 586 224 2 002 611 32 0 0 10 225 (97)
Net income from investments
in investment portfolio 0 0 0 0 0 0 0 4 021 4 021 (4 481)
Other insurance-related income 2 0 0 1 1 0 0 7 11 81
Claims (5 815) (1 186) (385) (4 853) (1 670) (270) (166) (1 978) (16 322) (23 130)
– of which repurchases (147) 0 (4) (849) (1 066) 0 0 (1 227) (3 294) (10 269)
Realised liabilities (5 470) (3 174) 171 1 929 (737) (4) (135) 0 (7 420) 5 631
Realised investment portfolio 0 0 0 0 0 0 0 (5 253) (5 253) 3 650
Funds assigned insurance contracts –
contractually established obligations (1 198) (594) (19) (129) (144) (55) 0 0 (2 137) (89)
Insurance-related operating costs (601) (150) (26) (293) (177) (61) (40) (489) (1 836) (1 940)
Other insurance-related costs (87) (42) 0 (9) (3) 0 0 0 (142) (239)
Profit/loss for the year from technical accounts as at 31 December 593 108 10 64 71 (39) (64) (138) 605 131
Included in addition in non-technical accounts: Net income from investments in company portfolio(annual risk policies) 4 23 27
Other result elements (products with investment choice) (5) (5)
PROFIT AND LOSS ANALYSIS:
Profit for distribution 1 791 702 29 192 215 16 (64) (138) 2 743 219
– Result provided to customers (1 198) (594) (19) (129) (144) (55) - - (2 137) (89)
Risk result 131 12 1 (89) 26 (31) (26) 2 26 (28)
Investment returns 48 0 10 143 37 0 0 17 255 (115)
Administration result 37 10 (1) 5 0 (8) (8) (157) (121) (148)
Risk profit 152 41 0 0 0 0 0 0 193 143
Remuneration for guaranteed interest 225 45 0 5 8 0 0 0 284 278
Other result elements 0 0 0 0 0 0 (31) 0 (31) 0
Profit/loss for the year from technical accounts as at 31 December 593 108 10 64 71 (39) (64) (138) 605 13
The investment returns are adjusted for allocations ofreserves to / use of additional statutory reserves 88 8 0 34 43 0 0 0 173 (2 993)
GROUP INDUSTRIES Modified Contr. Def. contrib. Profit model profit model w/o right pens. w/ as per new rules Section 9-12 of to portion of invest. Amounts in NOK millions Section 9-9 of Insur. Act Insur. Act profits choice 2009 2008
Premium income 11 065 594 419 2 792 14 869 16 004
Net income from investments in aggregate portfolio 4 866 2 494 0 0 7 360 (162)
Net income from investments in investment choice portfolio 0 0 0 1 229 1 229 (592)
Other insurance-related income 1 1 0 0 2 29
Claims (4 411) (2 593) (259) (338) (7 602) (7 204)
– of which repurchases (36) (111) 0 (2) (149) (48)
Realised liabilities (8 652) 13 (157) 0 (8 795) (5 272)
Realised investment portfolio 0 0 0 (3 593) (3 593) (1 321)
Funds assigned insurance contracts –
contractually established obligations (1 593) (201) 0 0 (1 795) (103)
Insurance-related operating costs (522) (230) (68) (264) (1 084) (990)
Other insurance-related costs (119) (10) 0 0 (128) (221)
Other result elements 0 0 0 0 0 0
Profit/loss for the year from technical
accounts as at 31 December 635 68 (65) (174) 464 167
Included in addition in non-technical accounts:
Net income from investments in company portfolio(annual risk policies) 27 27
Other result elements (products with investment choice) (5) (5)
26

Note 4 – Profit and loss accounts and analyses distributed by segment (continued)
GROUP INDUSTRIES CTD. Profit model Modified profit Contr. w/o Def. contrib. as per new rules model Section right to portion pens. w/ Amounts in NOK millions Section 9-9 of Insur. Act 9-12 of Insur. Act of profits invest.choice 2009 2008
PROFIT AND LOSS ANALYSIS:
Profit for distribution 2 228 269 (65) (174) 2 258 270
– Result provided to customers (1 593) (201) 0 0 (1 795) (103)
Risk result 143 3 (16) 0 130 3
Investment returns (2) 50 0 16 64 (160)
Administration result 30 15 (19) (190) (163) (96)
Risk profit 193 0 0 0 193 147
Remuneration for guaranteed interest 270 0 0 0 270 272
Other result elements 0 0 (31) 0 (31) 0
Profit/loss for the year from
technical accounts as at 31 December 635 68 (65) (174) 464 167
The investment returns is adjusted for allocations of reserves to /
use of additional statutory reserves 50 46 0 0 96 (2 111)
INDIVIDUAL INDUSTRIES Profit model Profit model as per old rules Contr. w/o Products as per new rules Section 8-1 of right to portion with Amounts in NOK millions Section 9-9 of Insur. Act Insur. Act of profits invest.choice 2009 2008
Premium income 2 366 1 415 46 762 4 590 4 739
Net income from investments in aggregate portfolio 174 2 676 16 0 2 865 66
Net income from investments in investment choice portfolio 0 0 0 2 792 2 792 (3 890)
Other insurance-related income 0 2 0 7 9 53
Claims (480) (6 542) (58) (1 640) (8 720) (15 926)
– of which repurchases (255) (1 628) (36) (1 226) (3 144) (10 221)
Realised liabilities (1 927) 3 297 5 0 1 375 10 903
Realised investment portfolio 0 0 0 (1 660) (1 660) 4 971
Funds assigned insurance contracts –
contractually established obligations (81) (262) 0 0 (343) 15
Insurance-related operating costs (86) (434) (7) (225) (752) (950)
Other insurance-related costs (1) (12) 0 0 (14) (18)
Other result elements 0 0 0 0 0 0
Profit/loss for the year from technical
accounts as at 31 December (34) 139 1 36 142 (37)
PROFIT AND LOSS ANALYSIS:
Profit for distribution 46 401 1 36 484 (51)
– Result provided to customers (81) (262) 0 0 (343) 14
Risk result (45) (59) (2) 2 (105) (31)
Investment returns 0 188 1 1 191 44
Administration result (2) 10 2 33 42 (52)
Risk profit 0 0 0 0 0 (4)
Remuneration for guaranteed interest 14 0 0 0 14 6
Other result elements 0 0 0 0 0 0
Profit/loss for the year from technical
accounts as at 31 December (34) 139 1 36 142 (37)
The investment returns are adjusted for allocations of reserves
to / use of additional statutory reserves 55 22 0 0 77 (882)
27
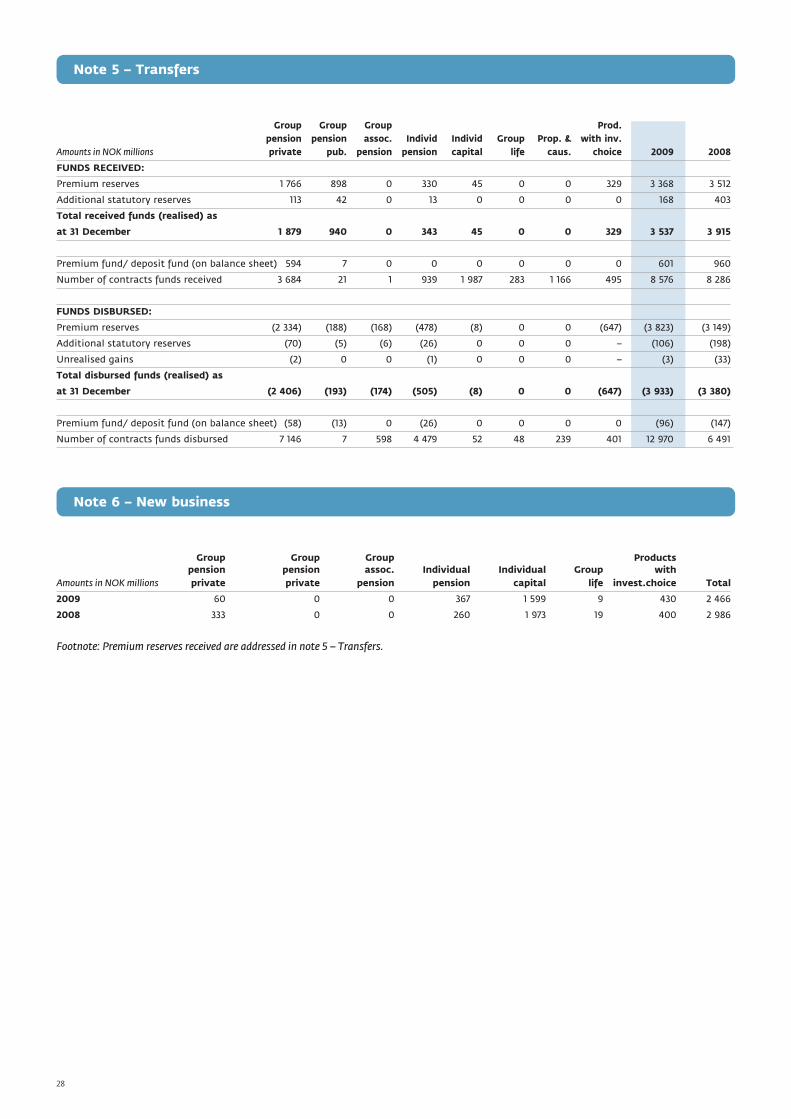
Note 5 – Transfers
Group Group Group Prod. pension pension assoc. Individ Individ Group Prop. & with inv.Amounts in NOK millions private pub. pension pension capital life caus. choice 2009 2008
FUNDS RECEIVED:
Premium reserves 1 766 898 0 330 45 0 0 329 3 368 3 512
Additional statutory reserves 113 42 0 13 0 0 0 0 168 403
Total received funds (realised) as
at 31 December 1 879 940 0 343 45 0 0 329 3 537 3 915
Premium fund/ deposit fund (on balance sheet) 594 7 0 0 0 0 0 0 601 960
Number of contracts funds received 3 684 21 1 939 1 987 283 1 166 495 8 576 8 286
FUNDS DISBURSED:
Premium reserves (2 334) (188) (168) (478) (8) 0 0 (647) (3 823) (3 149)
Additional statutory reserves (70) (5) (6) (26) 0 0 0 – (106) (198)
Unrealised gains (2) 0 0 (1) 0 0 0 – (3) (33)
Total disbursed funds (realised) as
at 31 December (2 406) (193) (174) (505) (8) 0 0 (647) (3 933) (3 380)
Premium fund/ deposit fund (on balance sheet) (58) (13) 0 (26) 0 0 0 0 (96) (147)
Number of contracts funds disbursed 7 146 7 598 4 479 52 48 239 401 12 970 6 491
Note 6 – New business
Group Group Group Products pension pension assoc. Individual Individual Group withAmounts in NOK millions private private pension pension capital life invest.choice Total
2009 60 0 0 367 1 599 9 430 2 466
2008 333 0 0 260 1 973 19 400 2 986
Footnote: Premium reserves received are addressed in note 5 – Transfers.
28

VITAL FORSIKRING ASA
Amounts in NOK millions Company portfolio Aggregate portfolio 2009 2008
Income from investments in subsidiaries, associated
companies and joint ventures 2 (470) (468) (1 482)
Net operating income from property 0 9 9 12
Interest on loans at fair value 0 103 103 55
Interest real estate companies 0 654 654 1 190
Interest bank 17 0 17 219
Interest on commercial paper and bonds at fair value 0 2 713 2 713 2 618
Interest bonds amortised cost 0 3 323 3 323 2 813
Interest derivatives (7) 411 405 (107)
Interest shares and units 380 387 767 878
Dividends 10 256 266 757
Other 123 (19) 104 199
Total interest and dividends 525 7 828 8 353 8 623
Change in value property 0 (2) (2) 0
Change in value shares and units 236 2 467 2 703 (6 469)
Change in value bonds 0 (3 237) (3 237) 4 620
Change in value bonds amortised cost 0 (1 000) (1 000) 1 139
Change in value derivatives (187) 2 640 2 454 (2 428)
Change in value loans 0 (572) (572) 528
Changes in value other (5) (3) (8) (1)
Total changes in value including changes in exchange rates 44 292 337 (2 612)
Realised property 0 5 5 (4)
Realised shares and units 17 (98) (80) (4 579)
Realised bonds 0 395 395 (4)
Realised derivatives (5) 1 140 1 135 3 191
Currency gains shares (1) 28 27 (388)
Currency gains bonds 0 180 180 711
Currency gains derivatives 0 1 152 1 152 (2 920)
Currency gains loans 0 (20) (20) 7
Currency gains misc. (9) (217) (226) 173
Other financial income and expenses 86 0 86 1
Total realised profits 87 2 565 2 653 (3 814)
Interest expenses 0 (111)
Total net income from investments 658 10 225 10 883 617
Net income from investments in investment choice portfolio 4 021 (4 481)
Total net income from investments 14 904 (3 865)
Note 7 – Net income from investments
29
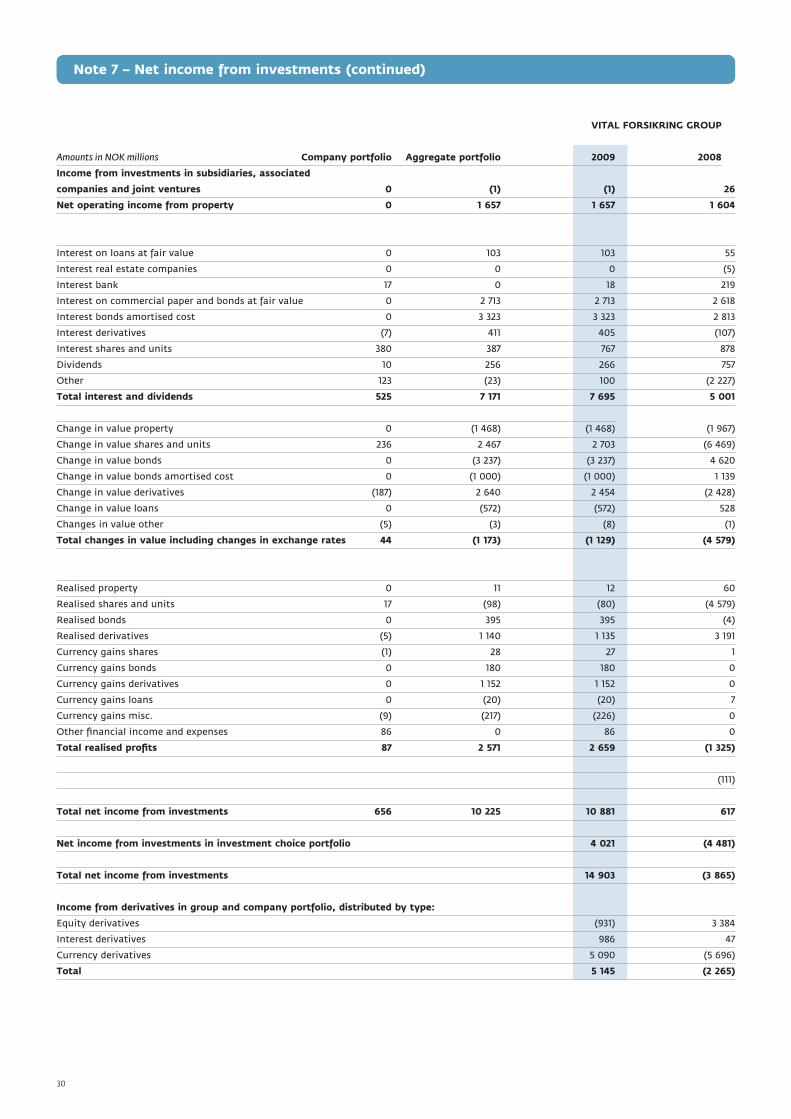
VITAL FORSIKRING GROUP
Amounts in NOK millions Company portfolio Aggregate portfolio 2009 2008
Income from investments in subsidiaries, associated
companies and joint ventures 0 (1) (1) 26
Net operating income from property 0 1 657 1 657 1 604
Interest on loans at fair value 0 103 103 55
Interest real estate companies 0 0 0 (5)
Interest bank 17 0 18 219
Interest on commercial paper and bonds at fair value 0 2 713 2 713 2 618
Interest bonds amortised cost 0 3 323 3 323 2 813
Interest derivatives (7) 411 405 (107)
Interest shares and units 380 387 767 878
Dividends 10 256 266 757
Other 123 (23) 100 (2 227)
Total interest and dividends 525 7 171 7 695 5 001
Change in value property 0 (1 468) (1 468) (1 967)
Change in value shares and units 236 2 467 2 703 (6 469)
Change in value bonds 0 (3 237) (3 237) 4 620
Change in value bonds amortised cost 0 (1 000) (1 000) 1 139
Change in value derivatives (187) 2 640 2 454 (2 428)
Change in value loans 0 (572) (572) 528
Changes in value other (5) (3) (8) (1)
Total changes in value including changes in exchange rates 44 (1 173) (1 129) (4 579)
Realised property 0 11 12 60
Realised shares and units 17 (98) (80) (4 579)
Realised bonds 0 395 395 (4)
Realised derivatives (5) 1 140 1 135 3 191
Currency gains shares (1) 28 27 1
Currency gains bonds 0 180 180 0
Currency gains derivatives 0 1 152 1 152 0
Currency gains loans 0 (20) (20) 7
Currency gains misc. (9) (217) (226) 0
Other financial income and expenses 86 0 86 0
Total realised profits 87 2 571 2 659 (1 325)
(111)
Total net income from investments 656 10 225 10 881 617
Net income from investments in investment choice portfolio 4 021 (4 481)
Total net income from investments 14 903 (3 865)
Income from derivatives in group and company portfolio, distributed by type:
Equity derivatives (931) 3 384
Interest derivatives 986 47
Currency derivatives 5 090 (5 696)
Total 5 145 (2 265)
Note 7 – Net income from investments (continued)
30
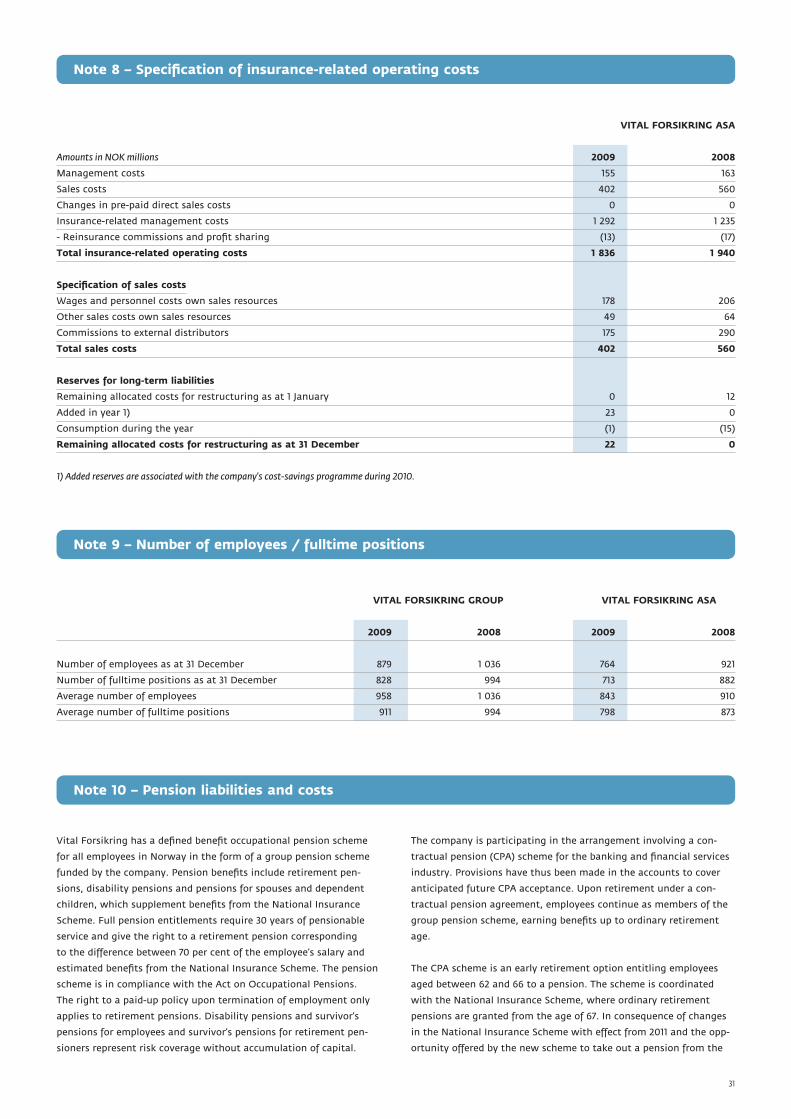
VITAL FORSIKRING ASA
Amounts in NOK millions 2009 2008
Management costs 155 163
Sales costs 402 560
Changes in pre-paid direct sales costs 0 0
Insurance-related management costs 1 292 1 235
- Reinsurance commissions and profit sharing (13) (17)
Total insurance-related operating costs 1 836 1 940
Specification of sales costs
Wages and personnel costs own sales resources 178 206
Other sales costs own sales resources 49 64
Commissions to external distributors 175 290
Total sales costs 402 560
Reserves for long-term liabilities
Remaining allocated costs for restructuring as at 1 January 0 12
Added in year 1) 23 0
Consumption during the year (1) (15)
Remaining allocated costs for restructuring as at 31 December 22 0
1) Added reserves are associated with the company’s cost-savings programme during 2010.
Note 8 – Specification of insurance-related operating costs
VITAL FORSIKRING GROUP VITAL FORSIKRING ASA
2009 2008 2009 2008
Number of employees as at 31 December 879 1 036 764 921
Number of fulltime positions as at 31 December 828 994 713 882
Average number of employees 958 1 036 843 910
Average number of fulltime positions 911 994 798 873
Note 9 – Number of employees / fulltime positions
Note 10 – Pension liabilities and costs
Vital Forsikring has a defined benefit occupational pension scheme
for all employees in Norway in the form of a group pension scheme
funded by the company. Pension benefits include retirement pen-
sions, disability pensions and pensions for spouses and dependent
children, which supplement benefits from the National Insurance
Scheme. Full pension entitlements require 30 years of pensionable
service and give the right to a retirement pension corresponding
to the difference between 70 per cent of the employee’s salary and
estimated benefits from the National Insurance Scheme. The pension
scheme is in compliance with the Act on Occupational Pensions.
The right to a paid-up policy upon termination of employment only
applies to retirement pensions. Disability pensions and survivor’s
pensions for employees and survivor’s pensions for retirement pen-
sioners represent risk coverage without accumulation of capital.
The company is participating in the arrangement involving a con-
tractual pension (CPA) scheme for the banking and financial services
industry. Provisions have thus been made in the accounts to cover
anticipated future CPA acceptance. Upon retirement under a con-
tractual pension agreement, employees continue as members of the
group pension scheme, earning benefits up to ordinary retirement
age.
The CPA scheme is an early retirement option entitling employees
aged between 62 and 66 to a pension. The scheme is coordinated
with the National Insurance Scheme, where ordinary retirement
pensions are granted from the age of 67. In consequence of changes
in the National Insurance Scheme with effect from 2011 and the opp-
ortunity offered by the new scheme to take out a pension from the
31

age of 62, a new act on contractual pensions has been adopted. The
new CPA scheme will give a lifelong supplement to the retirement
pension. The annual pension will be higher the later the pension is
taken out. The new CPA scheme is regarded as a new defined benefit,
multiple company scheme.
The former scheme will be wound up over a period of several years.
Commitments will no longer apply in relation to employees who are
not entitled to the former CPA scheme, i.e. employees born after
1948.
The Group also has commitments relating to salaries exceeding 12G
(12 times the National Insurance basic amount) and early retirement
agreements. Commitments relating to salaries exceeding 12G and
early retirement agreements are funded through the Group’s opera-
tions. Under other forms of early retirement than CPA, employees
resign from the company pension plans but are, upon reaching the
ordinary retirement age, compensated for the reduction in benefits
earned.
Employer’s contributions are included in pension expenses and com-
mitments. In pension schemes where pension funds exceed pension
commitments, no allocation has been made for employer’s contribu-
tions.
The company has the management right to undertake changes to the
company pension scheme.
ECONOMIC ASSUMPTIONS ExPENSES COMMITMENTS
2009 2008 31.12.09 31.12.08
Discount rate 1) 3.80 % 4.70 % 4.40 % 3.80 %
Anticipated return 2) 5.80 % 5.80 % 5.60 % 5.80 %
Anticipated rise in salaries 4.00 % 4.50 % 4.25 % 4.00 %
Anticipated increase in basic amount 3.75 % 4.25 % 4.00 % 3.75 %
Anticipated rise in pensions 2.0/3.75% 2.25 % 2.25 % 2.00 %
Anticipated CPA acceptance 35 % 35 % 35 % 35 %
Demographic assumptions about mortality 3) K2005 K2005 K2005 K2005
1. The discount rate used is determined by reference to market yields at the balance sheet date on long term (10-year) government bonds, plus an addition that takes into
account the relevant duration of the pension liabilities.
2. The anticipated return on pension funds was calculated by assessing the expected return on the assets encompassed by the current investment policy. The anticipated
gain on fixed-rate investments is based on gross gains upon redemption on the balance sheet date. The anticipated return on equity and property investments reflects
anticipated long-term real returns in the respective markets.
3. K2005 is a calculation base for statistical mortality assumptions. It includes two projected calculations of mortality based on empirical data from the period 1996 to
2001. One of the calculation bases is projected up until 2005, while the other is projected up until 2020. Mortality rates are expected to be lower in 2020 than in 2005.
When calculating pension costs and pension commitments, a combination of both calculation bases has been used.
PENSION ExPENSES VITAL FORSIKRING ASA
2009 2008
Amounts in NOK millions Funded Unfunded Total Funded Unfunded Total
Net present value of pension entitlements 1) 51 17 67 52 12 64
Interest expenses on pension commitments 49 9 58 60 8 68
Anticipated return on pension funds (72) 0 (72) (71) (1) (72)
Changes in pension schemes 0 0 0 0 0 0
Amortisation of changes in estimates not recorded in the accounts 11 8 19 9 1 10
Administrative expenses 8 0 8 2 0 2
Effect of changes to Norwegian accounting standards for pensions 0 0 0 0 0 0
Net pension expenses 47 33 80 51 20 71
1)) Incl. employer’s contributions.
NET PENSION COMMITMENTS 31 December 2009 31 December 2008
Amounts in NOK millions Funded Unfunded Total Funded Unfunded Total
Accrued pension commitments 1 132 181 1 313 1 131 179 1 310
Estimated effect of future salary adjustments 160 50 210 198 57 255
Total pension commitments 1 292 231 1 523 1 329 235 1 565
Value of pension funds 1 222 0 1 222 1 283 0 1 283
Net pension commitments 70 231 301 46 235 282
Changes in the estimates not recorded in the accounts (226) (94) (320) (249) (112) (360)
Employer’s contributions 10 33 42 7 33 40
Recorded pension commitments/(funds) (145) 169 24 (196) 157 (39)
Over-funding of pension schemes consisting of funds comprised NOK 145 million as at 31 December 2009, and under-funding of such schemes
comprised NOK 169 million.
Note 10 – Pension liabilities and costs (continued)
32
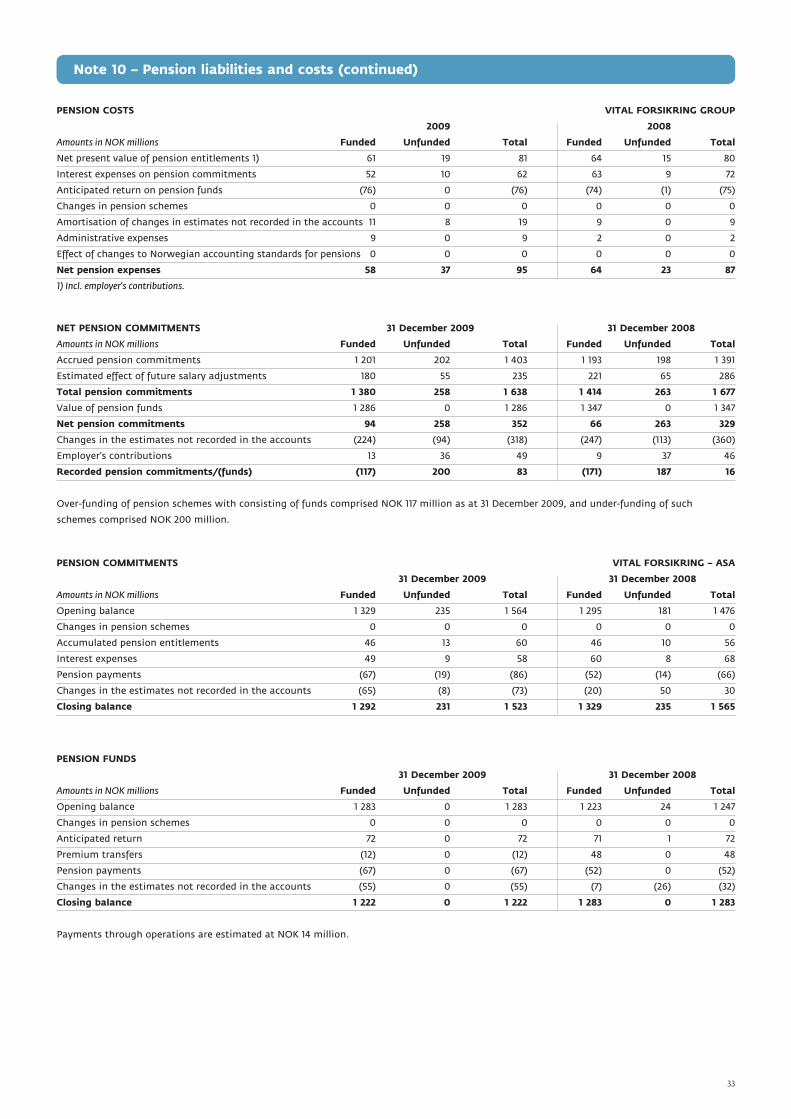
PENSION COSTS VITAL FORSIKRING GROUP
2009 2008
Amounts in NOK millions Funded Unfunded Total Funded Unfunded Total
Net present value of pension entitlements 1) 61 19 81 64 15 80
Interest expenses on pension commitments 52 10 62 63 9 72
Anticipated return on pension funds (76) 0 (76) (74) (1) (75)
Changes in pension schemes 0 0 0 0 0 0
Amortisation of changes in estimates not recorded in the accounts 11 8 19 9 0 9
Administrative expenses 9 0 9 2 0 2
Effect of changes to Norwegian accounting standards for pensions 0 0 0 0 0 0
Net pension expenses 58 37 95 64 23 87
1) Incl. employer’s contributions.
NET PENSION COMMITMENTS 31 December 2009 31 December 2008
Amounts in NOK millions Funded Unfunded Total Funded Unfunded Total
Accrued pension commitments 1 201 202 1 403 1 193 198 1 391
Estimated effect of future salary adjustments 180 55 235 221 65 286
Total pension commitments 1 380 258 1 638 1 414 263 1 677
Value of pension funds 1 286 0 1 286 1 347 0 1 347
Net pension commitments 94 258 352 66 263 329
Changes in the estimates not recorded in the accounts (224) (94) (318) (247) (113) (360)
Employer’s contributions 13 36 49 9 37 46
Recorded pension commitments/(funds) (117) 200 83 (171) 187 16
Over-funding of pension schemes with consisting of funds comprised NOK 117 million as at 31 December 2009, and under-funding of such
schemes comprised NOK 200 million.
PENSION COMMITMENTS VITAL FORSIKRING – ASA
31 December 2009 31 December 2008
Amounts in NOK millions Funded Unfunded Total Funded Unfunded Total
Opening balance 1 329 235 1 564 1 295 181 1 476
Changes in pension schemes 0 0 0 0 0 0
Accumulated pension entitlements 46 13 60 46 10 56
Interest expenses 49 9 58 60 8 68
Pension payments (67) (19) (86) (52) (14) (66)
Changes in the estimates not recorded in the accounts (65) (8) (73) (20) 50 30
Closing balance 1 292 231 1 523 1 329 235 1 565
PENSION FUNDS
31 December 2009 31 December 2008
Amounts in NOK millions Funded Unfunded Total Funded Unfunded Total
Opening balance 1 283 0 1 283 1 223 24 1 247
Changes in pension schemes 0 0 0 0 0 0
Anticipated return 72 0 72 71 1 72
Premium transfers (12) 0 (12) 48 0 48
Pension payments (67) 0 (67) (52) 0 (52)
Changes in the estimates not recorded in the accounts (55) 0 (55) (7) (26) (32)
Closing balance 1 222 0 1 222 1 283 0 1 283
Payments through operations are estimated at NOK 14 million.
Note 10 – Pension liabilities and costs (continued)
33
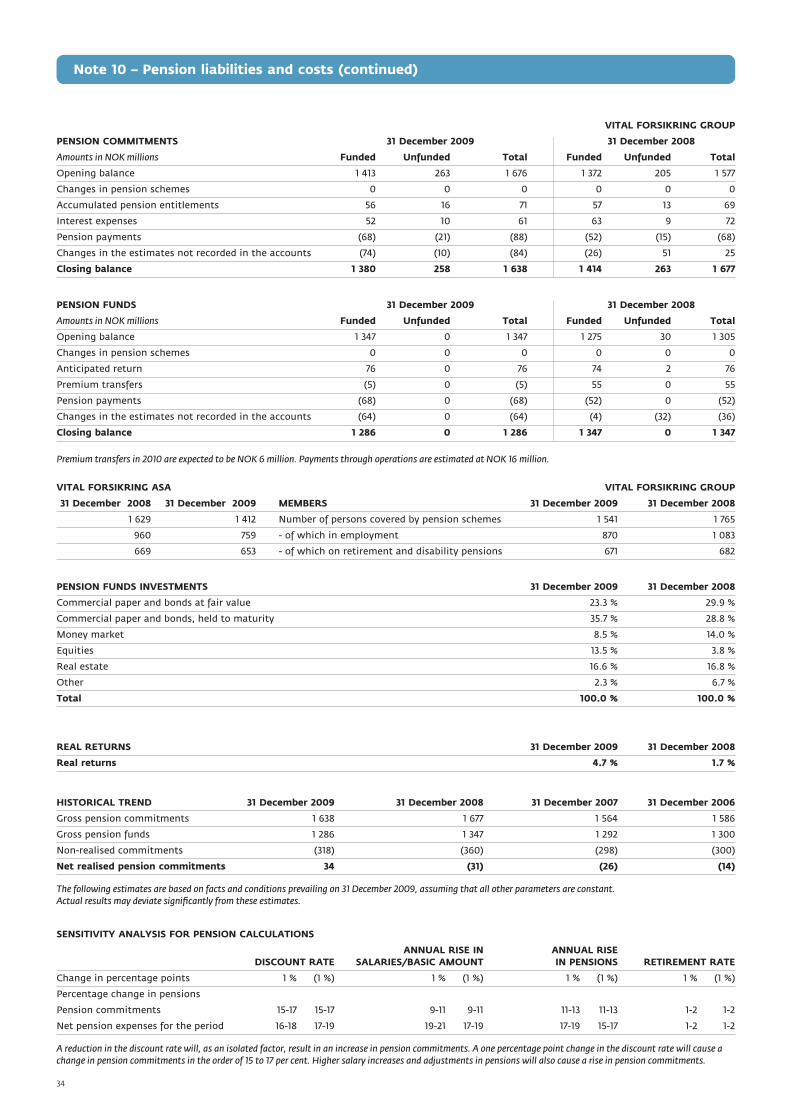
VITAL FORSIKRING GROUP
PENSION COMMITMENTS 31 December 2009 31 December 2008
Amounts in NOK millions Funded Unfunded Total Funded Unfunded Total
Opening balance 1 413 263 1 676 1 372 205 1 577
Changes in pension schemes 0 0 0 0 0 0
Accumulated pension entitlements 56 16 71 57 13 69
Interest expenses 52 10 61 63 9 72
Pension payments (68) (21) (88) (52) (15) (68)
Changes in the estimates not recorded in the accounts (74) (10) (84) (26) 51 25
Closing balance 1 380 258 1 638 1 414 263 1 677
PENSION FUNDS 31 December 2009 31 December 2008
Amounts in NOK millions Funded Unfunded Total Funded Unfunded Total
Opening balance 1 347 0 1 347 1 275 30 1 305
Changes in pension schemes 0 0 0 0 0 0
Anticipated return 76 0 76 74 2 76
Premium transfers (5) 0 (5) 55 0 55
Pension payments (68) 0 (68) (52) 0 (52)
Changes in the estimates not recorded in the accounts (64) 0 (64) (4) (32) (36)
Closing balance 1 286 0 1 286 1 347 0 1 347
Premium transfers in 2010 are expected to be NOK 6 million. Payments through operations are estimated at NOK 16 million.
VITAL FORSIKRING ASA VITAL FORSIKRING GROUP
31 December 2008 31 December 2009 MEMBERS 31 December 2009 31 December 2008
1 629 1 412 Number of persons covered by pension schemes 1 541 1 765
960 759 - of which in employment 870 1 083
669 653 - of which on retirement and disability pensions 671 682
PENSION FUNDS INVESTMENTS 31 December 2009 31 December 2008
Commercial paper and bonds at fair value 23.3 % 29.9 %
Commercial paper and bonds, held to maturity 35.7 % 28.8 %
Money market 8.5 % 14.0 %
Equities 13.5 % 3.8 %
Real estate 16.6 % 16.8 %
Other 2.3 % 6.7 %
Total 100.0 % 100.0 %
REAL RETURNS 31 December 2009 31 December 2008
Real returns 4.7 % 1.7 %
HISTORICAL TREND 31 December 2009 31 December 2008 31 December 2007 31 December 2006
Gross pension commitments 1 638 1 677 1 564 1 586
Gross pension funds 1 286 1 347 1 292 1 300
Non-realised commitments (318) (360) (298) (300)
Net realised pension commitments 34 (31) (26) (14)
The following estimates are based on facts and conditions prevailing on 31 December 2009, assuming that all other parameters are constant. Actual results may deviate significantly from these estimates.
SENSITIVITY ANALYSIS FOR PENSION CALCULATIONS
ANNUAL RISE IN ANNUAL RISE DISCOUNT RATE SALARIES/BASIC AMOUNT IN PENSIONS RETIREMENT RATE
Change in percentage points 1 % (1 %) 1 % (1 %) 1 % (1 %) 1 % (1 %)
Percentage change in pensions
Pension commitments 15-17 15-17 9-11 9-11 11-13 11-13 1-2 1-2
Net pension expenses for the period 16-18 17-19 19-21 17-19 17-19 15-17 1-2 1-2
A reduction in the discount rate will, as an isolated factor, result in an increase in pension commitments. A one percentage point change in the discount rate will cause a change in pension commitments in the order of 15 to 17 per cent. Higher salary increases and adjustments in pensions will also cause a rise in pension commitments.
Note 10 – Pension liabilities and costs (continued)
34

Note 11 – Tax cost
VITAL FORSIKRING ASA VITAL FORSIKRING GROUP
Amounts in NOK millions 2009 2008 2009 2008
CALCULATION OF TAxABLE INCOME
Calculation of taxable income
Profit before taxes 1 156 644 1 156 644
Permanent differences (711) 844 (711) 844
Received group contribution 0 0 0 0
Changes in temporary differences 2 096 (237) 2 132 (237)
Loss carryforwards, used 0 (767) 0 (767)
Compensation carryforwards, used (243) (387) (243) (387)
Taxable income 2 298 98 2 335 98
Tax due (28%) 644 28 654 28
COMPUTATION OF DEFERRED TAxES
Tax-increasing temporary differences
Real estate 54 96 54 96
Securities 794 1 214 794 1 214
Long-term receivables and loans in currency (120) 634 (120) 634
Profit and loss account 357 396 357 396
Funds exceeding commitments insured pension scheme 145 196 145 196
Total tax-increasing temporary differences 1 230 2 537 1 230 2 537
Tax-reducing temporary differences
Pension commitments 169 157 229 157
Fixed assets 79 83 81 83
Other 993 214 996 214
Total tax-reducing temporary differences 1 241 453 1 305 453
Loss carryforwards 109 0 109 0
Compensation carryforwards 0 0 0 0
Total loss and compensation carryforwards 109 0 109 0
Basis for deferred taxes/tax benefits 120 (2 084) 184 (2 084)
Deferred taxes (28%) per 31 December 34 (584) 52 (584)
TAx ExPENSES FOR THE YEAR
Tax due (644) (28) (654) (28)
Change in deferred tax 533 114 551 114
Change in deferred taxes associated with
changes in the estimates in previous years 78 (53) 78 (53)
”Net change in deferred tax in connection with demerger
of investment property beginning on 1 January 2008” 0 (198) 0 (198)
Share of tax group contribution 10 (159) 10 (159)
Change deferred tax subsidiary assessed as per the equity method 0 (102) 0 (102)
Reversing allocation deferred tax in subsidiary 198 0 190 0
The year’s realised tax costs (-) -income (+) 175 (426) 175 (426)
DETERMINATION OF EFFECTIVE TAx RATE
Profit before taxes 1 156 644 1 156 644
Estimated income tax at nominal tax rate (28 per cent) (324) (180) (324) (180)
Tax effect of:
Realised/Unrealised profits and losses shares/units 170 101 170 101
Change in value indirectly owned property (248) (581) (248) (581)
Change unrealised deferred taxes property companies 305 0 313 0
Reversing allocation deferred tax in subsidiary 198 0 190 0
Insufficient tax costs allocated previous years 78 31 78 31
Other permanent differences (5) 203 (5) 203
Tax income (+) -cost (-) 175 (426) 175 (426)
Effective tax rate (15 %) 66 % (15 %) 66 %
35
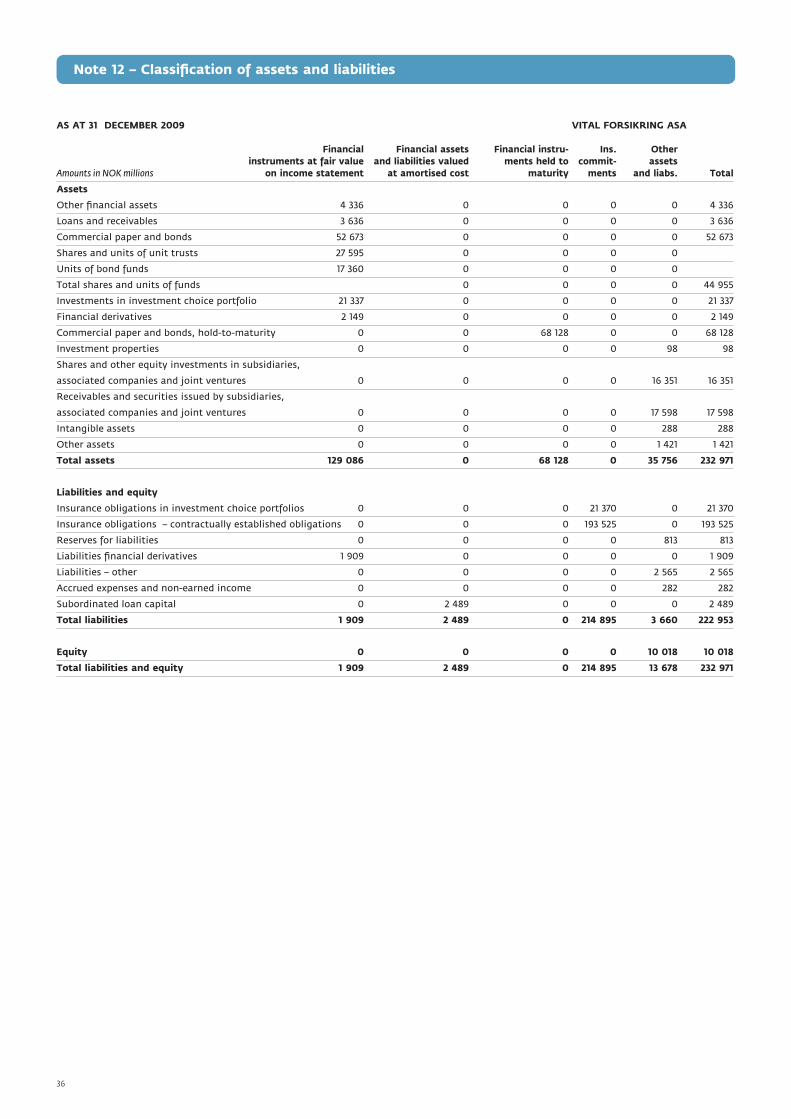
AS AT 31 DECEMBER 2009 VITAL FORSIKRING ASA
Financial Financial assets Financial instru- Ins. Other instruments at fair value and liabilities valued ments held to commit- assetsAmounts in NOK millions on income statement at amortised cost maturity ments and liabs. Total
Assets
Other financial assets 4 336 0 0 0 0 4 336
Loans and receivables 3 636 0 0 0 0 3 636
Commercial paper and bonds 52 673 0 0 0 0 52 673
Shares and units of unit trusts 27 595 0 0 0 0
Units of bond funds 17 360 0 0 0 0
Total shares and units of funds 0 0 0 0 44 955
Investments in investment choice portfolio 21 337 0 0 0 0 21 337
Financial derivatives 2 149 0 0 0 0 2 149
Commercial paper and bonds, hold-to-maturity 0 0 68 128 0 0 68 128
Investment properties 0 0 0 0 98 98
Shares and other equity investments in subsidiaries,
associated companies and joint ventures 0 0 0 0 16 351 16 351
Receivables and securities issued by subsidiaries,
associated companies and joint ventures 0 0 0 0 17 598 17 598
Intangible assets 0 0 0 0 288 288
Other assets 0 0 0 0 1 421 1 421
Total assets 129 086 0 68 128 0 35 756 232 971
Liabilities and equity
Insurance obligations in investment choice portfolios 0 0 0 21 370 0 21 370
Insurance obligations – contractually established obligations 0 0 0 193 525 0 193 525
Reserves for liabilities 0 0 0 0 813 813
Liabilities financial derivatives 1 909 0 0 0 0 1 909
Liabilities – other 0 0 0 0 2 565 2 565
Accrued expenses and non-earned income 0 0 0 0 282 282
Subordinated loan capital 0 2 489 0 0 0 2 489
Total liabilities 1 909 2 489 0 214 895 3 660 222 953
Equity 0 0 0 0 10 018 10 018
Total liabilities and equity 1 909 2 489 0 214 895 13 678 232 971
Note 12 – Classification of assets and liabilities
36
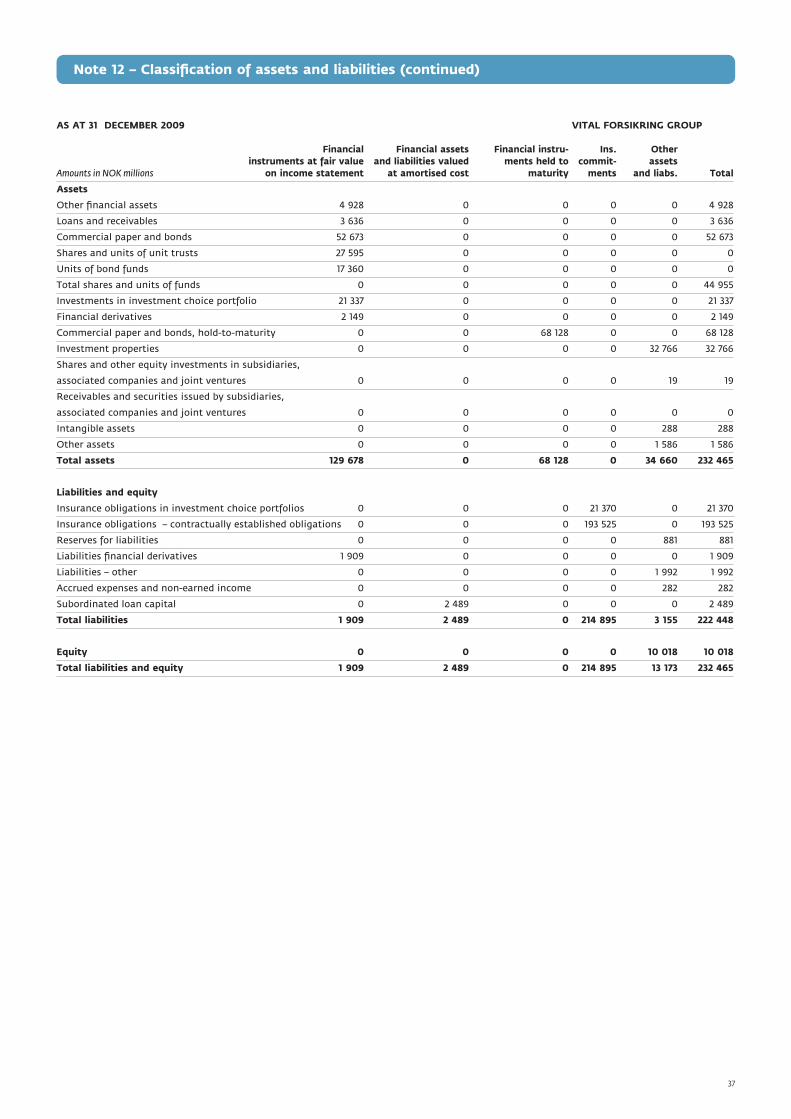
AS AT 31 DECEMBER 2009 VITAL FORSIKRING GROUP Financial Financial assets Financial instru- Ins. Other instruments at fair value and liabilities valued ments held to commit- assetsAmounts in NOK millions on income statement at amortised cost maturity ments and liabs. Total
Assets
Other financial assets 4 928 0 0 0 0 4 928
Loans and receivables 3 636 0 0 0 0 3 636
Commercial paper and bonds 52 673 0 0 0 0 52 673
Shares and units of unit trusts 27 595 0 0 0 0 0
Units of bond funds 17 360 0 0 0 0 0
Total shares and units of funds 0 0 0 0 0 44 955
Investments in investment choice portfolio 21 337 0 0 0 0 21 337
Financial derivatives 2 149 0 0 0 0 2 149
Commercial paper and bonds, hold-to-maturity 0 0 68 128 0 0 68 128
Investment properties 0 0 0 0 32 766 32 766
Shares and other equity investments in subsidiaries,
associated companies and joint ventures 0 0 0 0 19 19
Receivables and securities issued by subsidiaries,
associated companies and joint ventures 0 0 0 0 0 0
Intangible assets 0 0 0 0 288 288
Other assets 0 0 0 0 1 586 1 586
Total assets 129 678 0 68 128 0 34 660 232 465
Liabilities and equity
Insurance obligations in investment choice portfolios 0 0 0 21 370 0 21 370
Insurance obligations – contractually established obligations 0 0 0 193 525 0 193 525
Reserves for liabilities 0 0 0 0 881 881
Liabilities financial derivatives 1 909 0 0 0 0 1 909
Liabilities – other 0 0 0 0 1 992 1 992
Accrued expenses and non-earned income 0 0 0 0 282 282
Subordinated loan capital 0 2 489 0 0 0 2 489
Total liabilities 1 909 2 489 0 214 895 3 155 222 448
Equity 0 0 0 0 10 018 10 018
Total liabilities and equity 1 909 2 489 0 214 895 13 173 232 465
Note 12 – Classification of assets and liabilities (continued)
37
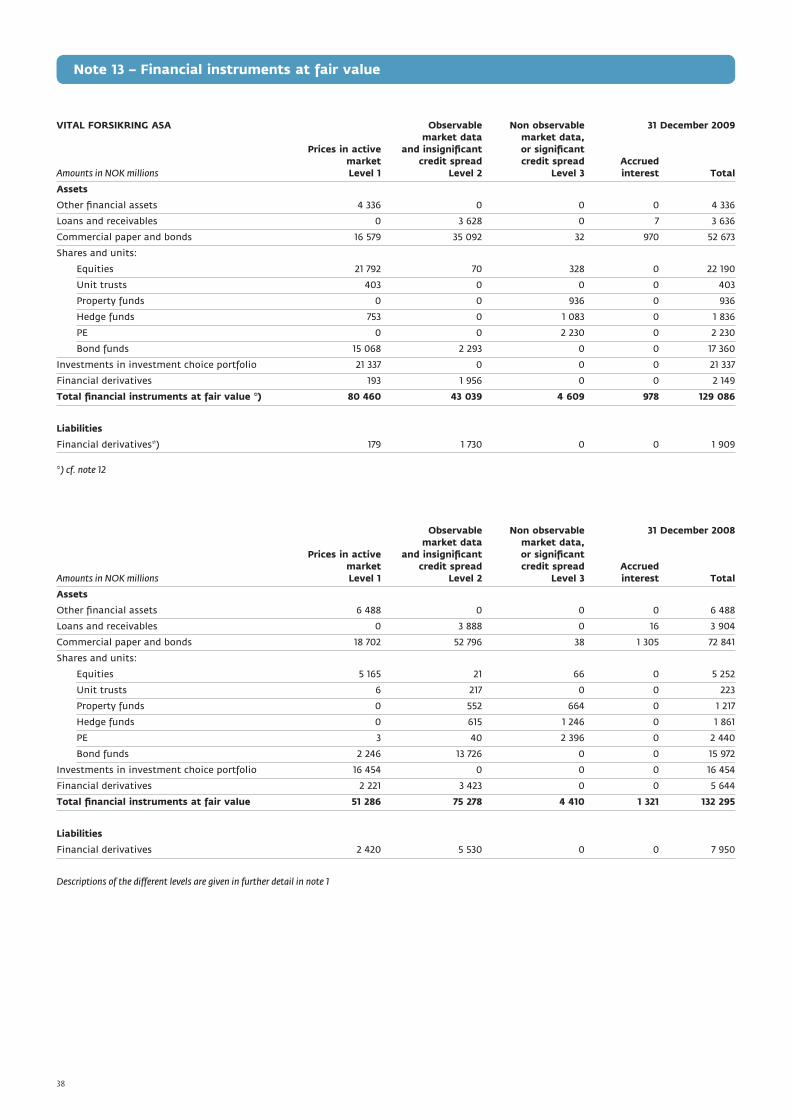
VITAL FORSIKRING ASA Observable Non observable 31 December 2009 market data market data, Prices in active and insignificant or significant market credit spread credit spread Accrued
Amounts in NOK millions Level 1 Level 2 Level 3 interest Total
Assets
Other financial assets 4 336 0 0 0 4 336
Loans and receivables 0 3 628 0 7 3 636
Commercial paper and bonds 16 579 35 092 32 970 52 673
Shares and units:
Equities 21 792 70 328 0 22 190
Unit trusts 403 0 0 0 403
Property funds 0 0 936 0 936
Hedge funds 753 0 1 083 0 1 836
PE 0 0 2 230 0 2 230
Bond funds 15 068 2 293 0 0 17 360
Investments in investment choice portfolio 21 337 0 0 0 21 337
Financial derivatives 193 1 956 0 0 2 149
Total financial instruments at fair value *) 80 460 43 039 4 609 978 129 086
Liabilities
Financial derivatives*) 179 1 730 0 0 1 909
*) cf. note 12
Observable Non observable 31 December 2008 market data market data, Prices in active and insignificant or significant market credit spread credit spread Accrued
Amounts in NOK millions Level 1 Level 2 Level 3 interest Total
Assets
Other financial assets 6 488 0 0 0 6 488
Loans and receivables 0 3 888 0 16 3 904
Commercial paper and bonds 18 702 52 796 38 1 305 72 841
Shares and units:
Equities 5 165 21 66 0 5 252
Unit trusts 6 217 0 0 223
Property funds 0 552 664 0 1 217
Hedge funds 0 615 1 246 0 1 861
PE 3 40 2 396 0 2 440
Bond funds 2 246 13 726 0 0 15 972
Investments in investment choice portfolio 16 454 0 0 0 16 454
Financial derivatives 2 221 3 423 0 0 5 644
Total financial instruments at fair value 51 286 75 278 4 410 1 321 132 295
Liabilities
Financial derivatives 2 420 5 530 0 0 7 950
Descriptions of the different levels are given in further detail in note 1
Note 13 – Financial instruments at fair value
38

Note 13 – Financial instruments at fair value (continued)
Note 14 – Investment properties
The properties of Vital are a part of the funds in the aggregate
portfolio and are owned with the intention to achieve long-term
returns for policyholders. Vital’s property portfolio is recorded at fair
value on the balance sheet date. Vital values the properties based
on internal models and external valuations. In the internal models,
the present value of expected cash flows is estimated. Contractual
cash flows are discounted with a normalised nominal required rate
of return, whereas future non-contractual cash flows are discounted
with a required rate of return which includes an extra risk premium.
The model stipulates a required rate of return of 6.25 per cent during
the contract period and, subsequent to this, 9.25 per cent for office
properties. The anticipated inflation rate and the implicit assumption
regarding real interest rates are kept unchanged during the two peri-
ods. The difference in the required rates of return thus solely reflects
an increase in the risk premium. The increase in the risk premium of
3 percentage points is intended to compensate for the shift from a
reliable and known cash flow to a cash flow which does not have the
same degree of predictability. In principle, the same rate of return
is used for hotels and shopping centres, but following an individual
assessment, the required rate of return was revised downwards by up
to 0.75 percentage points for certain properties and upwards by up to
1.5 percentage points for others.
For calculation of the normalised required rate of return, the compa-
ny takes a point of departure in a risk-free rate of interest, normally
a government bond yield with a duration of three to five years. Then
a relevant risk premium related to the asset class or the project to be
valued is subsequently added.
Future market rents are considered individually for each property
based on a wide range of information, including external market
statistics, external analyses and market assessments, internal market
interpretations and information and knowledge of local market con-
ditions and the properties’ technical condition.
After an overall assessment of the market and risk situation, the
required rates of return used in the internal valuation in the fourth
quarter of 2009 were reduced by 0.25 percentage points to 6.25 per
cent for contractual cash flows and 9.25 per cent for future cash flows.
During 2009, market rents for parts of the office portfolio were
revised downwards. Both market rents and other parameters in the
valuation model are considered to be quite consistent with market
developments.
Vital Forsikring carried out, at the end of Q4, a complete evaluation
of the investment properties. The properties in Sweden were eva-
luated according to procured appraisals, whereas the properties in
Norway were evaluated on the basis of the company’s own valuation
model. As a supplement to the values in the internal model, ap-
praisals were obtained from two independent, external appraisers for
a representative selection of properties corresponding to approxi-
mately 23 per cent of the property portfolio in Norway. The purpose
of the external appraisals is to benchmark the internal valuations
against independent references. Vital’s calculations and recorded
values are within an acceptable reliability interval of plus/minus 5
per cent in relation to average external appraisals. Relevant market
transactions are important benchmarks for both internal valuations
and external appraisals. There was a generally low level of activity in
the transaction market in 2009, and there was thus a limited number
of relevant benchmarks.
FLOW ANALYSIS LEVEL 3 FINANCIAL ASSETS FINANCIAL Loans and Financial LIABILITIES receivables at Commercial assets, credit Loans to paper Shares customer Financial Financial Amounts in NOK millions institutions customers and bonds and units bears risk derivatives derivatives
Balance sheet as at 31 December 2008 0 0 38 4 372 0 0 0
Net realised gains 0 0 0 48 0 0 0
Net unrealised gains 1) 0 0 (6) (782) 0 0 0
Total realised and unrealised gains 0 0 (6) (734) 0 0 0
Acquired/purchased nominal value 0 0 0 850 0 0 0
Traded fair value 0 0 0 (436) 0 0 0
Due fair value 0 0 0 0 0 0 0
Transferred from level 1 or 2 nominal value 0 0 0 1 066 0 0 0
Transferred to level 1 or 2 fair value 0 0 0 (542) 0 0 0
Other 0 0 0 0 0 0 0
Balance sheet as at 31 December 2009 0 0 32 4 576 0 0 0
1) The standard requires that how much of the realised gains are related to volumes that are on the balance sheet at the end of the period be shown. A differentiation is
thus made between realised and unrealised gains.
2) Remarks on transfers in/out of level 3:
Transfers to level 3 are due to it as at 31 December 2009 not being possible to value the security based upon observable and updated market data.
Transfers from level 3 are due to it being possible as at 31 December 2009 to value the security with a point of departure based upon observable market data, or that the
valuation may now occur based upon listed prices in an active market.
3) Changes in exchange rates, etc.
Specific information for Vital Forsikring Group is not prepared.
2)
2)
3)
39

The property market has experienced a negative trend over the past
18-24 months, characterised by higher vacancy levels, falling rental
prices and values and sluggish activity in both the rental and the
transaction markets. During 2009, total contractual rent for the
wholly owned portfolio in Norway declined by NOK 6 million to NOK
1,591 million. During the same period, estimated market rents for the
same portfolio were reduced by NOK 47.5 million to NOK 1,720 mil-
lion. Rental prices appear to have stabilised towards the end of 2009.
Economic vacancy in the portfolio increased from 2.7 per cent to 4.4
per cent during the year.
The valuations resulted in total write-downs of NOK 887 million to
the property portfolio in 2009. Of this, write-downs on development
projects represented NOK 218 million. The projects have been asses-
sed as set out in the provisions in IAS 40. Costs relating to projects
in Vital Forsikring’s portfolio will normally be guaranteed through
turnkey contracts, while income will generally be ensured through
contracts concluded before the projects are started.
Valuations are particularly sensitive to changes in required rates of
return and assumptions regarding future income flows. Other things
equal, a 0.25 percentage point change in the required rate of return
will change the value of the property portfolio by approx. 3.5 percent.
Other things equal, a 5 percent change in future market rents will
change the value of the property portfolio by 3.7 per cent.
Tenants in Vital Forsikring’s properties are subject to a semi-annual
credit evaluation. In Q4 of 2009, 1 per cent of the tenants were
categorised as noncreditworthy and unable to provide collateral. The
overall outcome of the credit evaluations in the fourth quarter of
2009 was on the overall approximately the same as for the previous
year.
Annual rental Gross leased Avg. rental time in
Building type Town/Location Fair value level per sqm area m2 No. of yrs.
Office building East 11 240 1 466 566 353 5.4
Office building Rest of Norway 3 179 1 388 163 994 3.9
Shopping centre Oslo/Bergen/Trondheim/other 7 485 2 085 223 160 4.0
Hotels Oslo/Bergen/Trondheim/other 3 631 1 529 155 986 10.5
Abroad London/Stockholm/Gothenburg/Malmö 7 053 2 316 201 598 3.6
Other East/West 178 2 181 3 375 0
Total directly owned properties, ANS,
KS and AS as at 31 December 2009 32 766 1 710 1 314 466 5.0
Of which values of projects 1 395
Total directly owned properties, ANS,
KS and AS as at 31 December 2008 32 383 1 698 1 255 684 4.3
Change in 2009 383 12 58 782 0.7
FORM OF OWNERSHIP OF INVESTMENT PROPERTY *) 31 December 2009 31 December 2008
Directly owned properties 98 196
Properties in subsidiaries, AS 26 533 26 302
Properties in subsidiaries, ANS/KS 6 135 5 879
Total 32 766 32 383
*) Properties presented as investment properties regardless of form of ownership.
DIRECT RETURNS 31.12.09 31.12.08
Rental income 2 051 2 001
Operating costs (394) (389)
Net rent 1 657 1 612
INVESTMENTS/SALES OF REAL ESTATE LAST 5 YEARS 2009 2008 2007 2006 2005
– Invested 3 050 2 488 1 002 1 500 2 198
– Sold (selling price) 1 198 933 529 1 071 532
Note 14 – Investment properties (continued)
40
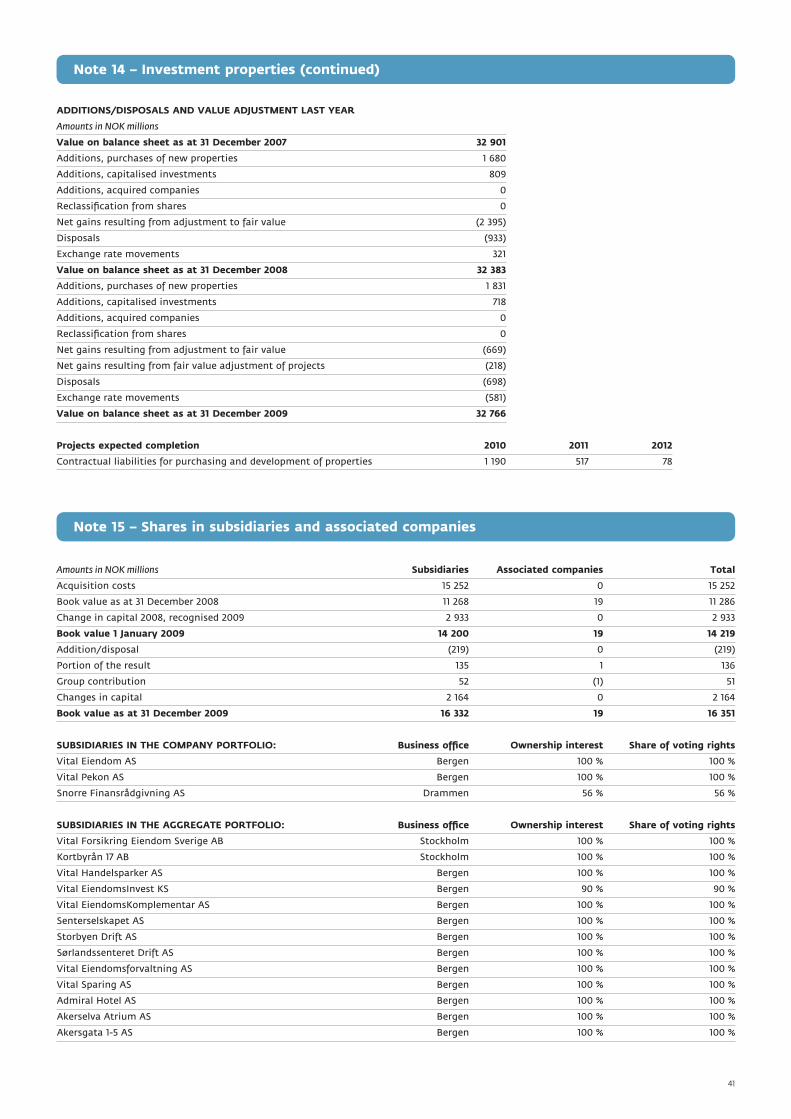
ADDITIONS/DISPOSALS AND VALUE ADJUSTMENT LAST YEAR
Amounts in NOK millions
Value on balance sheet as at 31 December 2007 32 901
Additions, purchases of new properties 1 680
Additions, capitalised investments 809
Additions, acquired companies 0
Reclassification from shares 0
Net gains resulting from adjustment to fair value (2 395)
Disposals (933)
Exchange rate movements 321
Value on balance sheet as at 31 December 2008 32 383
Additions, purchases of new properties 1 831
Additions, capitalised investments 718
Additions, acquired companies 0
Reclassification from shares 0
Net gains resulting from adjustment to fair value (669)
Net gains resulting from fair value adjustment of projects (218)
Disposals (698)
Exchange rate movements (581)
Value on balance sheet as at 31 December 2009 32 766
Projects expected completion 2010 2011 2012
Contractual liabilities for purchasing and development of properties 1 190 517 78
Amounts in NOK millions Subsidiaries Associated companies Total
Acquisition costs 15 252 0 15 252
Book value as at 31 December 2008 11 268 19 11 286
Change in capital 2008, recognised 2009 2 933 0 2 933
Book value 1 January 2009 14 200 19 14 219
Addition/disposal (219) 0 (219)
Portion of the result 135 1 136
Group contribution 52 (1) 51
Changes in capital 2 164 0 2 164
Book value as at 31 December 2009 16 332 19 16 351
SUBSIDIARIES IN THE COMPANY PORTFOLIO: Business office Ownership interest Share of voting rights
Vital Eiendom AS Bergen 100 % 100 %
Vital Pekon AS Bergen 100 % 100 %
Snorre Finansrådgivning AS Drammen 56 % 56 %
SUBSIDIARIES IN THE AGGREGATE PORTFOLIO: Business office Ownership interest Share of voting rights
Vital Forsikring Eiendom Sverige AB Stockholm 100 % 100 %
Kortbyrån 17 AB Stockholm 100 % 100 %
Vital Handelsparker AS Bergen 100 % 100 %
Vital EiendomsInvest KS Bergen 90 % 90 %
Vital EiendomsKomplementar AS Bergen 100 % 100 %
Senterselskapet AS Bergen 100 % 100 %
Storbyen Drift AS Bergen 100 % 100 %
Sørlandssenteret Drift AS Bergen 100 % 100 %
Vital Eiendomsforvaltning AS Bergen 100 % 100 %
Vital Sparing AS Bergen 100 % 100 %
Admiral Hotel AS Bergen 100 % 100 %
Akerselva Atrium AS Bergen 100 % 100 %
Akersgata 1-5 AS Bergen 100 % 100 %
Note 15 – Shares in subsidiaries and associated companies
Note 14 – Investment properties (continued)
41

SUBSIDIARIES IN THE AGGREGATE PORTFOLIO: Business office Ownership interest Share of voting rights
Bakerikvartalet AS Bergen 100 % 100 %
Beddingen 16 AS Bergen 100 % 100 %
Brugata 19 AS Bergen 100 % 100 %
Bryggen Eiendom Tromsø AS Bergen 100 % 100 %
Brynsveien 11/13 Eiendom AS Bergen 100 % 100 %
Brynsveien 12 Eiendom AS Bergen 100 % 100 %
Brynsveien 3 Eiendom AS Bergen 100 % 100 %
Drammensveien 165/167 AS Bergen 100 % 100 %
Drammensveien 169/171 AS Bergen 100 % 100 %
Drammensveien 173/175/177 Eiendom AS Bergen 100 % 100 %
Essendropsgate 3 AS Bergen 100 % 100 %
Folke Bernadottesvei 40 AS Bergen 100 % 100 %
Fornebuveien 7 AS Bergen 100 % 100 %
Fornebuveien Bygg AS Bergen 100 % 100 %
Galleriet Kjøpesenter AS Bergen 100 % 100 %
Granfos Næringspark AS Bergen 100 % 100 %
Grønvold Gård AS Bergen 100 % 100 %
Haslevangen 15 AS Bergen 100 % 100 %
Hoffsveien 21/23 AS Bergen 100 % 100 %
Hotellgården AS Bergen 100 % 100 %
Hygea AS Bergen 100 % 100 %
Kirkegaten 24-26 AS Bergen 100 % 100 %
Klæbuveien 194 AS Bergen 100 % 100 %
Lysaker Brygge AS Bergen 100 % 100 %
Strandveien 13-15 AS Bergen 100 % 100 %
Lysaker Brygge Næring AS Bergen 100 % 100 %
Lørenveien 55 AS Bergen 100 % 100 %
Lørenveien 57 AS Bergen 100 % 100 %
Lørenveien 59-65 AS Bergen 100 % 100 %
Markeveien 1 B AS Bergen 100 % 100 %
Medie-Hjørnet AS Bergen 100 % 100 %
Nordnorsk Hotell AS Bergen 100 % 100 %
Oslo City Kjøpesenter AS Bergen 100 % 100 %
Roald Amundsensgate 6 Eiendom AS Bergen 100 % 100 %
Rosenkrantzgaten 12 AS Bergen 100 % 100 %
Rosenkrantzgaten 3 AS Bergen 100 % 100 %
Royal Christiania Hotel AS Bergen 100 % 100 %
Sandbrogaten 5/7 AS Bergen 100 % 100 %
Sandsligården 2 AS Bergen 100 % 100 %
Sandsligården AS Bergen 100 % 100 %
Sandvika Torg AS Bergen 100 % 100 %
Sannergaten 2 AS Bergen 100 % 100 %
Sjøgaten Eiendomsutvikling AS Bergen 100 % 100 %
Sjøsiden Kjøpesenter AS Bergen 100 % 100 %
Skjærgården Hotell & Badepark AS Bergen 100 % 100 %
Starvhusgaten 2 A AS Bergen 100 % 100 %
Starvhusgaten 2 B AS Bergen 100 % 100 %
Storbyen Kjøpesenter AS Bergen 100 % 100 %
Stortinggaten 22 AS Bergen 100 % 100 %
Stortorvet 7 AS Bergen 100 % 100 %
Strandgaten 17 AS Bergen 100 % 100 %
Strandkanten Garasjeanlegg AS Bergen 100 % 100 %
Strandveien 10 AS Bergen 100 % 100 %
Strandveien 50 AS Bergen 100 % 100 %
Strømsveien 344 AS Bergen 100 % 100 %
Tollboden Eiendom Drammen AS Bergen 100 % 100 %
Tollbugaten 32 AS Bergen 100 % 100 %
Torggården AS Bergen 100 % 100 %
Note 15 – Shares in subsidiaries and associated companies (continued)
42
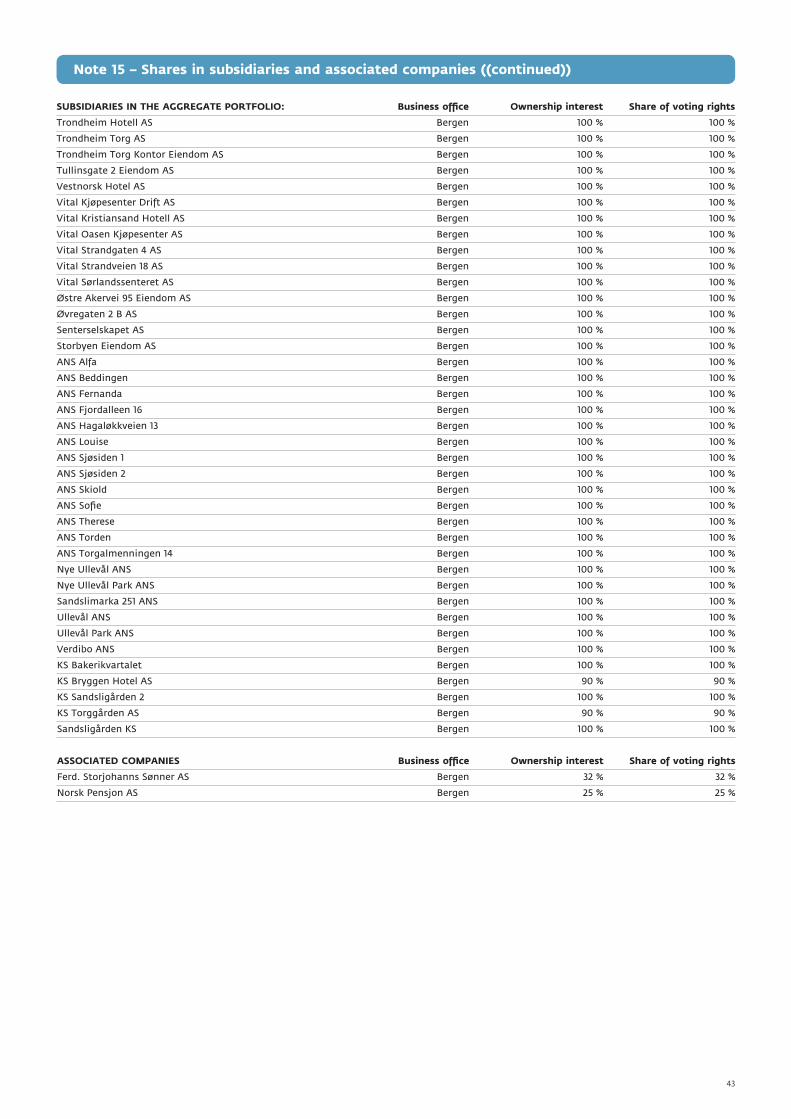
SUBSIDIARIES IN THE AGGREGATE PORTFOLIO: Business office Ownership interest Share of voting rights
Trondheim Hotell AS Bergen 100 % 100 %
Trondheim Torg AS Bergen 100 % 100 %
Trondheim Torg Kontor Eiendom AS Bergen 100 % 100 %
Tullinsgate 2 Eiendom AS Bergen 100 % 100 %
Vestnorsk Hotel AS Bergen 100 % 100 %
Vital Kjøpesenter Drift AS Bergen 100 % 100 %
Vital Kristiansand Hotell AS Bergen 100 % 100 %
Vital Oasen Kjøpesenter AS Bergen 100 % 100 %
Vital Strandgaten 4 AS Bergen 100 % 100 %
Vital Strandveien 18 AS Bergen 100 % 100 %
Vital Sørlandssenteret AS Bergen 100 % 100 %
Østre Akervei 95 Eiendom AS Bergen 100 % 100 %
Øvregaten 2 B AS Bergen 100 % 100 %
Senterselskapet AS Bergen 100 % 100 %
Storbyen Eiendom AS Bergen 100 % 100 %
ANS Alfa Bergen 100 % 100 %
ANS Beddingen Bergen 100 % 100 %
ANS Fernanda Bergen 100 % 100 %
ANS Fjordalleen 16 Bergen 100 % 100 %
ANS Hagaløkkveien 13 Bergen 100 % 100 %
ANS Louise Bergen 100 % 100 %
ANS Sjøsiden 1 Bergen 100 % 100 %
ANS Sjøsiden 2 Bergen 100 % 100 %
ANS Skiold Bergen 100 % 100 %
ANS Sofie Bergen 100 % 100 %
ANS Therese Bergen 100 % 100 %
ANS Torden Bergen 100 % 100 %
ANS Torgalmenningen 14 Bergen 100 % 100 %
Nye Ullevål ANS Bergen 100 % 100 %
Nye Ullevål Park ANS Bergen 100 % 100 %
Sandslimarka 251 ANS Bergen 100 % 100 %
Ullevål ANS Bergen 100 % 100 %
Ullevål Park ANS Bergen 100 % 100 %
Verdibo ANS Bergen 100 % 100 %
KS Bakerikvartalet Bergen 100 % 100 %
KS Bryggen Hotel AS Bergen 90 % 90 %
KS Sandsligården 2 Bergen 100 % 100 %
KS Torggården AS Bergen 90 % 90 %
Sandsligården KS Bergen 100 % 100 %
ASSOCIATED COMPANIES Business office Ownership interest Share of voting rights
Ferd. Storjohanns Sønner AS Bergen 32 % 32 %
Norsk Pensjon AS Bergen 25 % 25 %
Note 15 – Shares in subsidiaries and associated companies ((continued))
43

Commercial paper and bonds, hold-to-maturity Book value Fair value Book value Fair value
Amounts in NOK millions 31.12.09 31.12.09 31.12.08 31.12.08
State/state guaranteed 15 960 15 958 19 729 20 288
State-owned enterprise 644 1 059 645 614
Municipalities/county municipalities 8 974 9 028 4 968 5 081
Financial institutions 19 372 19 452 21 816 21 746
Bonds with preferential rights 12 961 13 350 2 965 3 078
Other issuers 8 451 8 379 5 639 5 123
Total commercial paper and bonds, hold-to-maturity 66 361 67 227 55 761 55 930
Accrued interest 1 767 1 767 1 328 1 328
Commercial paper and bonds, hold-to-maturity 68 128 68 994 57 089 57 257
Of which listed securities 51 %
CHANGES IN HOLDINGS THROUGH THE ACCOUNTING YEAR
Amounts in NOK millions
Balance sheet as at 1 January 2008 58 139
Addition 6 899
Disposal 10 416
Accrued premium/discount for the year (amortisation) (41)
Change of currency value 1 179
Balance sheet as at 31 December 2008 55 761
Addition 17 737
Disposal 6 137
Accrued premium/discount for the year (amortisation) (66)
Change of currency value (934)
Balance sheet as at 31 December 2009 66 361
SPECIFIED BY CURRENCY
Amounts in NOK millions Book value Fair value Book value Fair value
31.12.09 31.12.09 31.12.08 31.12.08
NOK 61 126 61 728 49 565 49 609
EUR 4 831 5 071 5 706 5 815
USD 404 428 490 506
Total 66 361 67 227 55 761 55 930
Accrued interest 1 767 1 767 1 328 1 328
Commercial paper and bonds, hold-to-maturity 68 128 68 994 57 089 57 257
GROUPED BY MATURITY DATE:
Amounts in NOK millions
up to 1 month 1 to 3 months 3 months to 1 year 1 to 5 years over 5 years Total
NOK 0 302 4 020 18 160 38 644 61 126
EUR 0 0 479 3 064 1 288 4 831
USD 0 0 0 404 0 404
Total 0 302 4 499 21 628 39 932 66 361
31.12.09 31.12.08
Duration 5.08 4.90
Average effective interest in percent* 5.03 4.97
*) For the individual interest-bearing instrument, the effective interest is computed based upon the book value of the paper. The weighting for the average effective interest
rate for the entire holding is done using each individual paper’s portion of the total interest rate sensitivity as weights.
Note 16 – Investments that are held to maturity
Commercial paper and bonds are held to maturity by Vital Forsikring and comprised NOK 68 128 million as at 31 December 2009. Vital’s portfolio
of securities consists of bonds issued by highly creditworthy borrowers. At end-December 2009, bonds with government guarantees represented
approximately 24 per cent of the portfolio. The remaining bonds are generally issued by municipalities/county municipalities and finance com-
panies with sound creditworthiness. All investments in bonds issued by finance companies represent senior debt, which has the highest ranking
in the capital structure and first priority if the issuer goes bankrupt. Only in exceptional cases does Vital invest in bonds issued by traditional
manufacturing companies. The composition of the portfolio is presented below.
44
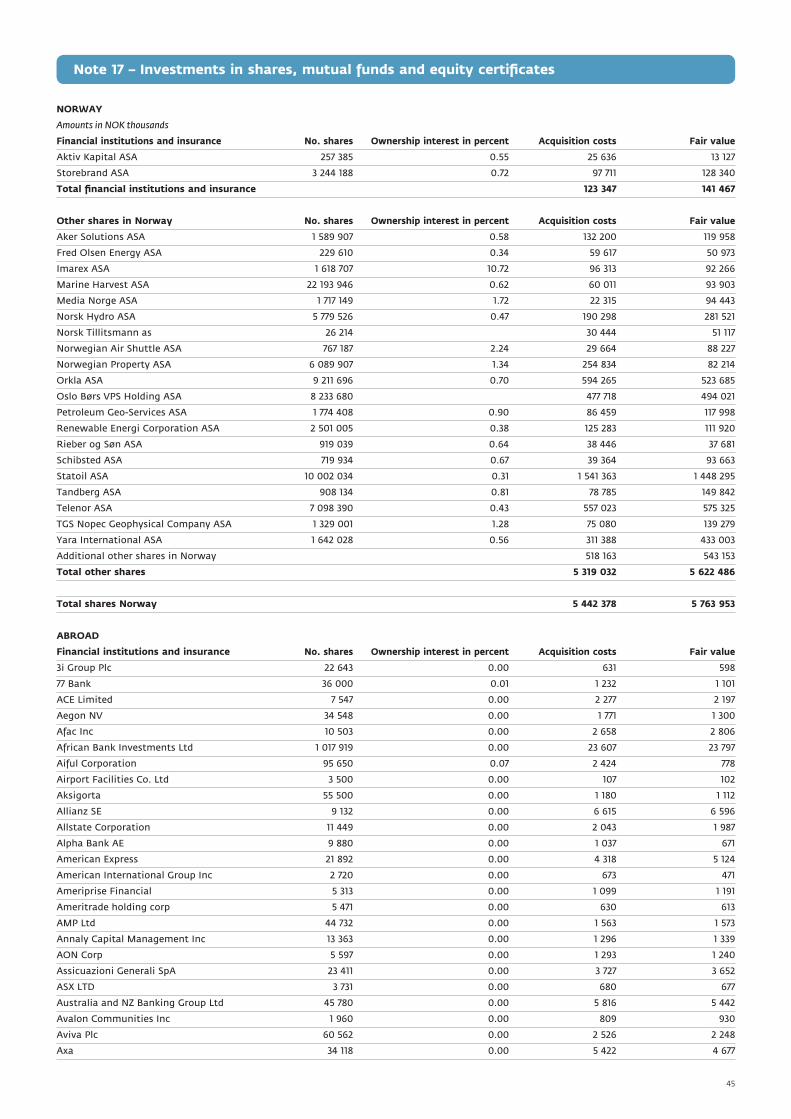
NORWAY
Amounts in NOK thousands
Financial institutions and insurance No. shares Ownership interest in percent Acquisition costs Fair value
Aktiv Kapital ASA 257 385 0.55 25 636 13 127
Storebrand ASA 3 244 188 0.72 97 711 128 340
Total financial institutions and insurance 123 347 141 467
Other shares in Norway No. shares Ownership interest in percent Acquisition costs Fair value
Aker Solutions ASA 1 589 907 0.58 132 200 119 958
Fred Olsen Energy ASA 229 610 0.34 59 617 50 973
Imarex ASA 1 618 707 10.72 96 313 92 266
Marine Harvest ASA 22 193 946 0.62 60 011 93 903
Media Norge ASA 1 717 149 1.72 22 315 94 443
Norsk Hydro ASA 5 779 526 0.47 190 298 281 521
Norsk Tillitsmann as 26 214 30 444 51 117
Norwegian Air Shuttle ASA 767 187 2.24 29 664 88 227
Norwegian Property ASA 6 089 907 1.34 254 834 82 214
Orkla ASA 9 211 696 0.70 594 265 523 685
Oslo Børs VPS Holding ASA 8 233 680 477 718 494 021
Petroleum Geo-Services ASA 1 774 408 0.90 86 459 117 998
Renewable Energi Corporation ASA 2 501 005 0.38 125 283 111 920
Rieber og Søn ASA 919 039 0.64 38 446 37 681
Schibsted ASA 719 934 0.67 39 364 93 663
Statoil ASA 10 002 034 0.31 1 541 363 1 448 295
Tandberg ASA 908 134 0.81 78 785 149 842
Telenor ASA 7 098 390 0.43 557 023 575 325
TGS Nopec Geophysical Company ASA 1 329 001 1.28 75 080 139 279
Yara International ASA 1 642 028 0.56 311 388 433 003
Additional other shares in Norway 518 163 543 153
Total other shares 5 319 032 5 622 486
Total shares Norway 5 442 378 5 763 953
ABROAD
Financial institutions and insurance No. shares Ownership interest in percent Acquisition costs Fair value
3i Group Plc 22 643 0.00 631 598
77 Bank 36 000 0.01 1 232 1 101
ACE Limited 7 547 0.00 2 277 2 197
Aegon NV 34 548 0.00 1 771 1 300
Afac Inc 10 503 0.00 2 658 2 806
African Bank Investments Ltd 1 017 919 0.00 23 607 23 797
Aiful Corporation 95 650 0.07 2 424 778
Airport Facilities Co. Ltd 3 500 0.00 107 102
Aksigorta 55 500 0.00 1 180 1 112
Allianz SE 9 132 0.00 6 615 6 596
Allstate Corporation 11 449 0.00 2 043 1 987
Alpha Bank AE 9 880 0.00 1 037 671
American Express 21 892 0.00 4 318 5 124
American International Group Inc 2 720 0.00 673 471
Ameriprise Financial 5 313 0.00 1 099 1 191
Ameritrade holding corp 5 471 0.00 630 613
AMP Ltd 44 732 0.00 1 563 1 573
Annaly Capital Management Inc 13 363 0.00 1 296 1 339
AON Corp 5 597 0.00 1 293 1 240
Assicuazioni Generali SpA 23 411 0.00 3 727 3 652
ASX LTD 3 731 0.00 680 677
Australia and NZ Banking Group Ltd 45 780 0.00 5 816 5 442
Avalon Communities Inc 1 960 0.00 809 930
Aviva Plc 60 562 0.00 2 526 2 248
Axa 34 118 0.00 5 422 4 677
Note 17 – Investments in shares, mutual funds and equity certificates
45
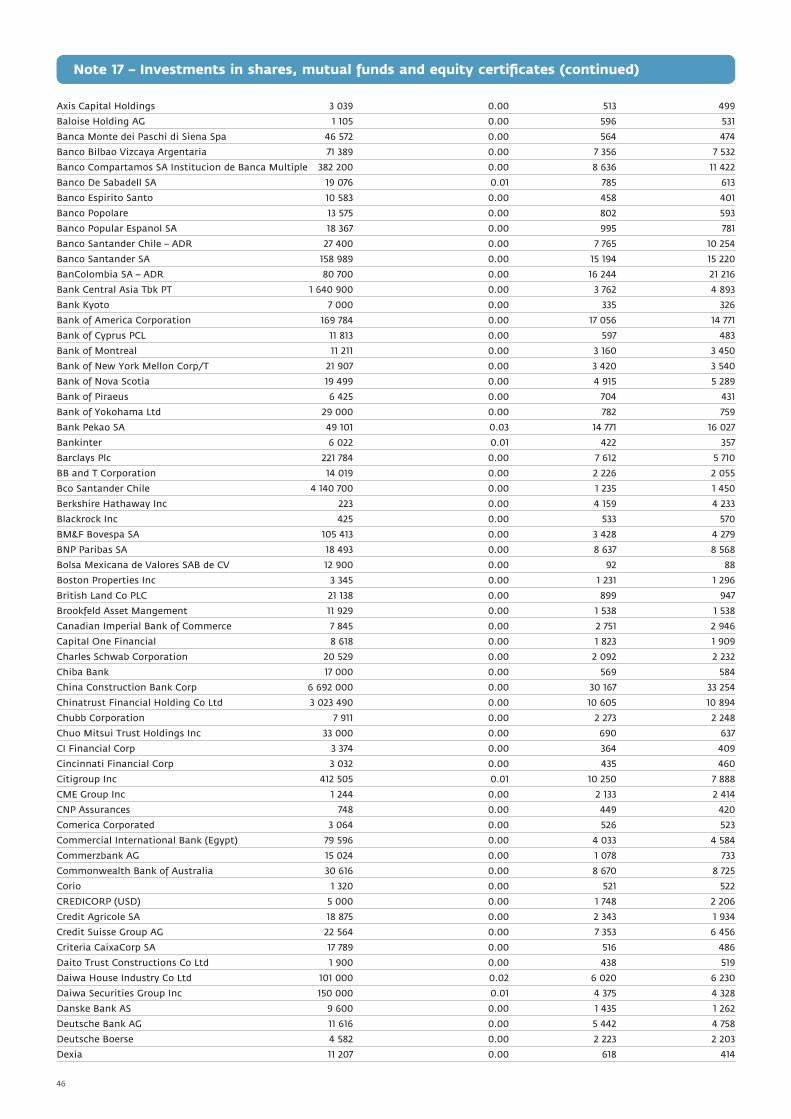
Axis Capital Holdings 3 039 0.00 513 499
Baloise Holding AG 1 105 0.00 596 531
Banca Monte dei Paschi di Siena Spa 46 572 0.00 564 474
Banco Bilbao Vizcaya Argentaria 71 389 0.00 7 356 7 532
Banco Compartamos SA Institucion de Banca Multiple 382 200 0.00 8 636 11 422
Banco De Sabadell SA 19 076 0.01 785 613
Banco Espirito Santo 10 583 0.00 458 401
Banco Popolare 13 575 0.00 802 593
Banco Popular Espanol SA 18 367 0.00 995 781
Banco Santander Chile – ADR 27 400 0.00 7 765 10 254
Banco Santander SA 158 989 0.00 15 194 15 220
BanColombia SA – ADR 80 700 0.00 16 244 21 216
Bank Central Asia Tbk PT 1 640 900 0.00 3 762 4 893
Bank Kyoto 7 000 0.00 335 326
Bank of America Corporation 169 784 0.00 17 056 14 771
Bank of Cyprus PCL 11 813 0.00 597 483
Bank of Montreal 11 211 0.00 3 160 3 450
Bank of New York Mellon Corp/T 21 907 0.00 3 420 3 540
Bank of Nova Scotia 19 499 0.00 4 915 5 289
Bank of Piraeus 6 425 0.00 704 431
Bank of Yokohama Ltd 29 000 0.00 782 759
Bank Pekao SA 49 101 0.03 14 771 16 027
Bankinter 6 022 0.01 422 357
Barclays Plc 221 784 0.00 7 612 5 710
BB and T Corporation 14 019 0.00 2 226 2 055
Bco Santander Chile 4 140 700 0.00 1 235 1 450
Berkshire Hathaway Inc 223 0.00 4 159 4 233
Blackrock Inc 425 0.00 533 570
BM&F Bovespa SA 105 413 0.00 3 428 4 279
BNP Paribas SA 18 493 0.00 8 637 8 568
Bolsa Mexicana de Valores SAB de CV 12 900 0.00 92 88
Boston Properties Inc 3 345 0.00 1 231 1 296
British Land Co PLC 21 138 0.00 899 947
Brookfeld Asset Mangement 11 929 0.00 1 538 1 538
Canadian Imperial Bank of Commerce 7 845 0.00 2 751 2 946
Capital One Financial 8 618 0.00 1 823 1 909
Charles Schwab Corporation 20 529 0.00 2 092 2 232
Chiba Bank 17 000 0.00 569 584
China Construction Bank Corp 6 692 000 0.00 30 167 33 254
Chinatrust Financial Holding Co Ltd 3 023 490 0.00 10 605 10 894
Chubb Corporation 7 911 0.00 2 273 2 248
Chuo Mitsui Trust Holdings Inc 33 000 0.00 690 637
CI Financial Corp 3 374 0.00 364 409
Cincinnati Financial Corp 3 032 0.00 435 460
Citigroup Inc 412 505 0.01 10 250 7 888
CME Group Inc 1 244 0.00 2 133 2 414
CNP Assurances 748 0.00 449 420
Comerica Corporated 3 064 0.00 526 523
Commercial International Bank (Egypt) 79 596 0.00 4 033 4 584
Commerzbank AG 15 024 0.00 1 078 733
Commonwealth Bank of Australia 30 616 0.00 8 670 8 725
Corio 1 320 0.00 521 522
CREDICORP (USD) 5 000 0.00 1 748 2 206
Credit Agricole SA 18 875 0.00 2 343 1 934
Credit Suisse Group AG 22 564 0.00 7 353 6 456
Criteria CaixaCorp SA 17 789 0.00 516 486
Daito Trust Constructions Co Ltd 1 900 0.00 438 519
Daiwa House Industry Co Ltd 101 000 0.02 6 020 6 230
Daiwa Securities Group Inc 150 000 0.01 4 375 4 328
Danske Bank AS 9 600 0.00 1 435 1 262
Deutsche Bank AG 11 616 0.00 5 442 4 758
Deutsche Boerse 4 582 0.00 2 223 2 203
Dexia 11 207 0.00 618 414
Note 17 – Investments in shares, mutual funds and equity certificates (continued)
46
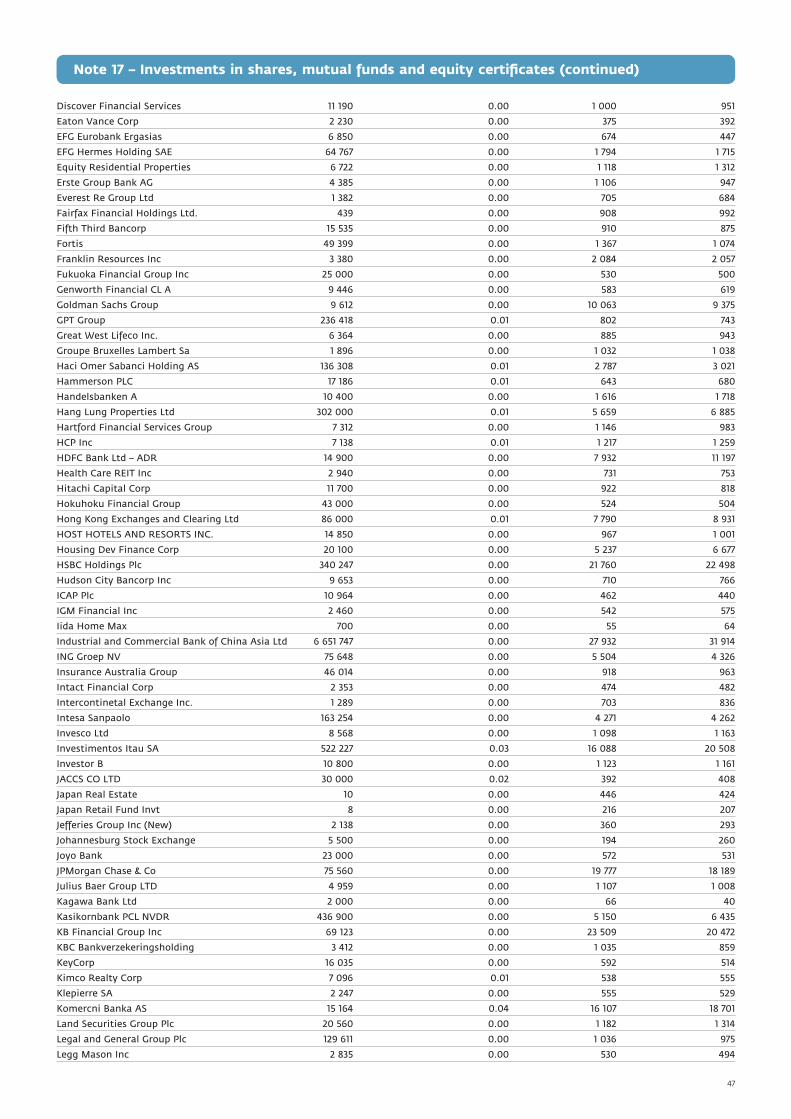
Discover Financial Services 11 190 0.00 1 000 951
Eaton Vance Corp 2 230 0.00 375 392
EFG Eurobank Ergasias 6 850 0.00 674 447
EFG Hermes Holding SAE 64 767 0.00 1 794 1 715
Equity Residential Properties 6 722 0.00 1 118 1 312
Erste Group Bank AG 4 385 0.00 1 106 947
Everest Re Group Ltd 1 382 0.00 705 684
Fairfax Financial Holdings Ltd. 439 0.00 908 992
Fifth Third Bancorp 15 535 0.00 910 875
Fortis 49 399 0.00 1 367 1 074
Franklin Resources Inc 3 380 0.00 2 084 2 057
Fukuoka Financial Group Inc 25 000 0.00 530 500
Genworth Financial CL A 9 446 0.00 583 619
Goldman Sachs Group 9 612 0.00 10 063 9 375
GPT Group 236 418 0.01 802 743
Great West Lifeco Inc. 6 364 0.00 885 943
Groupe Bruxelles Lambert Sa 1 896 0.00 1 032 1 038
Haci Omer Sabanci Holding AS 136 308 0.01 2 787 3 021
Hammerson PLC 17 186 0.01 643 680
Handelsbanken A 10 400 0.00 1 616 1 718
Hang Lung Properties Ltd 302 000 0.01 5 659 6 885
Hartford Financial Services Group 7 312 0.00 1 146 983
HCP Inc 7 138 0.01 1 217 1 259
HDFC Bank Ltd – ADR 14 900 0.00 7 932 11 197
Health Care REIT Inc 2 940 0.00 731 753
Hitachi Capital Corp 11 700 0.00 922 818
Hokuhoku Financial Group 43 000 0.00 524 504
Hong Kong Exchanges and Clearing Ltd 86 000 0.01 7 790 8 931
HOST HOTELS AND RESORTS INC. 14 850 0.00 967 1 001
Housing Dev Finance Corp 20 100 0.00 5 237 6 677
HSBC Holdings Plc 340 247 0.00 21 760 22 498
Hudson City Bancorp Inc 9 653 0.00 710 766
ICAP Plc 10 964 0.00 462 440
IGM Financial Inc 2 460 0.00 542 575
Iida Home Max 700 0.00 55 64
Industrial and Commercial Bank of China Asia Ltd 6 651 747 0.00 27 932 31 914
ING Groep NV 75 648 0.00 5 504 4 326
Insurance Australia Group 46 014 0.00 918 963
Intact Financial Corp 2 353 0.00 474 482
Intercontinetal Exchange Inc. 1 289 0.00 703 836
Intesa Sanpaolo 163 254 0.00 4 271 4 262
Invesco Ltd 8 568 0.00 1 098 1 163
Investimentos Itau SA 522 227 0.03 16 088 20 508
Investor B 10 800 0.00 1 123 1 161
JACCS CO LTD 30 000 0.02 392 408
Japan Real Estate 10 0.00 446 424
Japan Retail Fund Invt 8 0.00 216 207
Jefferies Group Inc (New) 2 138 0.00 360 293
Johannesburg Stock Exchange 5 500 0.00 194 260
Joyo Bank 23 000 0.00 572 531
JPMorgan Chase & Co 75 560 0.00 19 777 18 189
Julius Baer Group LTD 4 959 0.00 1 107 1 008
Kagawa Bank Ltd 2 000 0.00 66 40
Kasikornbank PCL NVDR 436 900 0.00 5 150 6 435
KB Financial Group Inc 69 123 0.00 23 509 20 472
KBC Bankverzekeringsholding 3 412 0.00 1 035 859
KeyCorp 16 035 0.00 592 514
Kimco Realty Corp 7 096 0.01 538 555
Klepierre SA 2 247 0.00 555 529
Komercni Banka AS 15 164 0.04 16 107 18 701
Land Securities Group Plc 20 560 0.00 1 182 1 314
Legal and General Group Plc 129 611 0.00 1 036 975
Legg Mason Inc 2 835 0.00 530 494
Note 17 – Investments in shares, mutual funds and equity certificates (continued)
47
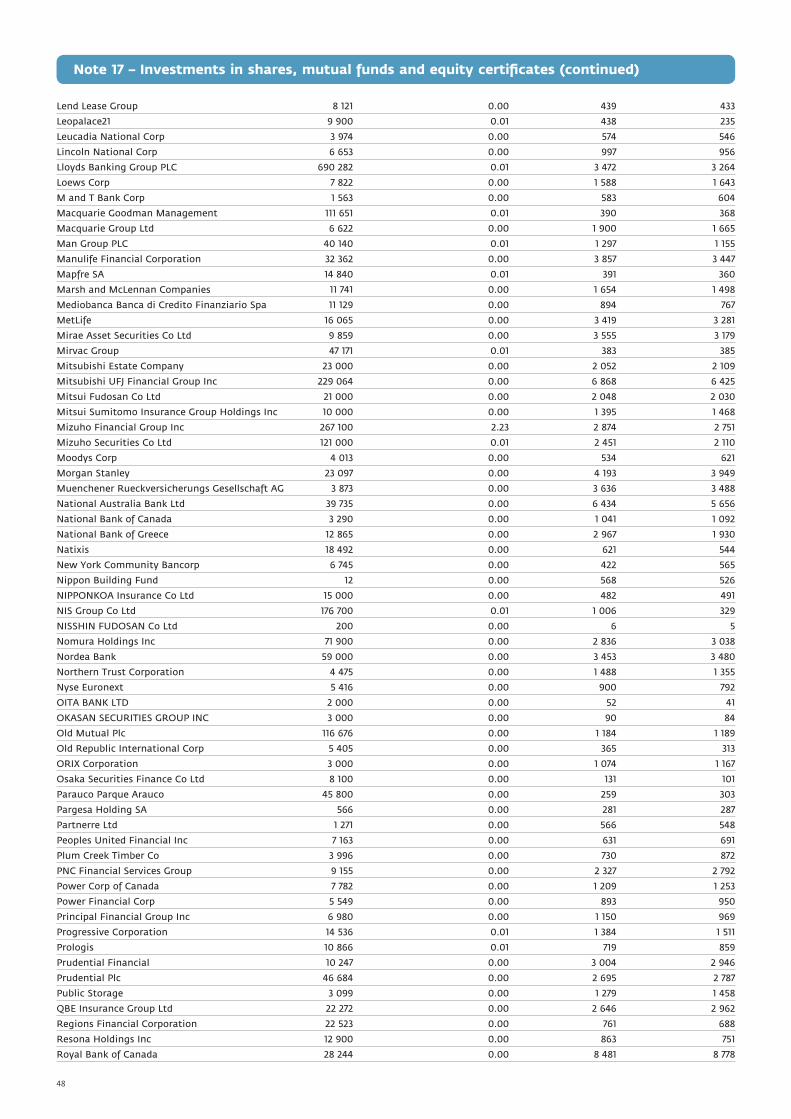
Lend Lease Group 8 121 0.00 439 433
Leopalace21 9 900 0.01 438 235
Leucadia National Corp 3 974 0.00 574 546
Lincoln National Corp 6 653 0.00 997 956
Lloyds Banking Group PLC 690 282 0.01 3 472 3 264
Loews Corp 7 822 0.00 1 588 1 643
M and T Bank Corp 1 563 0.00 583 604
Macquarie Goodman Management 111 651 0.01 390 368
Macquarie Group Ltd 6 622 0.00 1 900 1 665
Man Group PLC 40 140 0.01 1 297 1 155
Manulife Financial Corporation 32 362 0.00 3 857 3 447
Mapfre SA 14 840 0.01 391 360
Marsh and McLennan Companies 11 741 0.00 1 654 1 498
Mediobanca Banca di Credito Finanziario Spa 11 129 0.00 894 767
MetLife 16 065 0.00 3 419 3 281
Mirae Asset Securities Co Ltd 9 859 0.00 3 555 3 179
Mirvac Group 47 171 0.01 383 385
Mitsubishi Estate Company 23 000 0.00 2 052 2 109
Mitsubishi UFJ Financial Group Inc 229 064 0.00 6 868 6 425
Mitsui Fudosan Co Ltd 21 000 0.00 2 048 2 030
Mitsui Sumitomo Insurance Group Holdings Inc 10 000 0.00 1 395 1 468
Mizuho Financial Group Inc 267 100 2.23 2 874 2 751
Mizuho Securities Co Ltd 121 000 0.01 2 451 2 110
Moodys Corp 4 013 0.00 534 621
Morgan Stanley 23 097 0.00 4 193 3 949
Muenchener Rueckversicherungs Gesellschaft AG 3 873 0.00 3 636 3 488
National Australia Bank Ltd 39 735 0.00 6 434 5 656
National Bank of Canada 3 290 0.00 1 041 1 092
National Bank of Greece 12 865 0.00 2 967 1 930
Natixis 18 492 0.00 621 544
New York Community Bancorp 6 745 0.00 422 565
Nippon Building Fund 12 0.00 568 526
NIPPONKOA Insurance Co Ltd 15 000 0.00 482 491
NIS Group Co Ltd 176 700 0.01 1 006 329
NISSHIN FUDOSAN Co Ltd 200 0.00 6 5
Nomura Holdings Inc 71 900 0.00 2 836 3 038
Nordea Bank 59 000 0.00 3 453 3 480
Northern Trust Corporation 4 475 0.00 1 488 1 355
Nyse Euronext 5 416 0.00 900 792
OITA BANK LTD 2 000 0.00 52 41
OKASAN SECURITIES GROUP INC 3 000 0.00 90 84
Old Mutual Plc 116 676 0.00 1 184 1 189
Old Republic International Corp 5 405 0.00 365 313
ORIX Corporation 3 000 0.00 1 074 1 167
Osaka Securities Finance Co Ltd 8 100 0.00 131 101
Parauco Parque Arauco 45 800 0.00 259 303
Pargesa Holding SA 566 0.00 281 287
Partnerre Ltd 1 271 0.00 566 548
Peoples United Financial Inc 7 163 0.00 631 691
Plum Creek Timber Co 3 996 0.00 730 872
PNC Financial Services Group 9 155 0.00 2 327 2 792
Power Corp of Canada 7 782 0.00 1 209 1 253
Power Financial Corp 5 549 0.00 893 950
Principal Financial Group Inc 6 980 0.00 1 150 969
Progressive Corporation 14 536 0.01 1 384 1 511
Prologis 10 866 0.01 719 859
Prudential Financial 10 247 0.00 3 004 2 946
Prudential Plc 46 684 0.00 2 695 2 787
Public Storage 3 099 0.00 1 279 1 458
QBE Insurance Group Ltd 22 272 0.00 2 646 2 962
Regions Financial Corporation 22 523 0.00 761 688
Resona Holdings Inc 12 900 0.00 863 751
Royal Bank of Canada 28 244 0.00 8 481 8 778
Note 17 – Investments in shares, mutual funds and equity certificates (continued)
48

Royal Bank of Scotland Group Plc 358 420 0.01 1 558 976
RSA Insurance Group PLC 73 702 0.00 904 829
Sampo 9 300 0.00 1 332 1 312
Sapporo Hokuyo Holding 59 000 0.01 1 239 1 234
SCOR SE 3 664 0.00 563 531
SEB A 32 200 0.00 1 184 1 155
Segro Plc 18 141 0.00 618 583
Shinsei Bank Ltd 664 000 0.05 5 651 4 162
Simon Property Group Inc 5 717 0.00 2 224 2 635
SLM Corporation 9 364 0.00 497 610
Sm Prime Holdings Inc 3 201 962 0.00 3 178 3 921
Societe Generale de France 12 035 0.00 4 811 4 883
Softbank Investment Corp 481 0.01 528 494
Sompo Japan Insurance Inc 20 000 0.00 721 736
Standard Bank Group Ltd 66 345 0.00 4 346 5 309
Standard Chartered 39 626 0.00 5 626 5 822
Standard Life Assurance Company 48 932 0.00 1 035 988
State Street Corporation 10 127 0.00 3 077 2 547
Stockland Trust Management Ltd 63 044 0.00 1 309 1 294
Sumitomo Mitsui Financial Group Inc 30 700 0.00 6 556 5 039
Sumitomo Realty & Development 9 000 0.00 965 971
Sumitomo Trust and Banking Co Ltd 43 000 0.00 1 308 1 209
Sun Life Financial Services of Canada Inc 12 576 0.00 2 157 2 096
Suncorp Metway Ltd 27 931 0.00 1 303 1 261
SunTrust Banks 9 560 0.00 1 181 1 121
Swedbank A 10 700 0.00 563 615
Swiss Life Holding N ORD 601 0.00 450 443
Swiss Reinsurance 7 636 0.00 1 996 2 130
T Rowe Price Group Inc 5 322 0.00 1 423 1 637
T & D Holdings Inc 5 350 0.00 791 630
TFS Financial Corp 1 908 0.00 127 134
The Shizuoka Bank 16 000 0.00 869 799
The Travelers Cos 11 138 0.00 3 001 3 208
Tokio Marine Holdings Inc 16 700 0.97 2 515 2 622
Toronto-Dominion Bank 16 889 0.00 5 972 6 139
Tosei Corp 56 0.00 129 66
UBS AG 69 238 0.01 7 232 6 210
Unibail-Rodamco 1 633 0.00 2 030 2 080
UniCredito Italiano SpA 286 249 0.00 6 579 5 558
Unione Di Banche Italiane SCPA 12 192 0.00 1 104 1 015
Unum Group 7 443 0.00 929 839
US Bancorp 37 351 0.00 4 977 4 857
Ventas Inc 3 842 0.00 870 971
Vornado Realty Trust 3 907 0.00 1 371 1 579
Wells Fargo and Company 92 967 0.01 16 093 14 495
Westfeld Group 47 116 0.00 3 194 3 070
Westpac Banking Corporation Ltd 60 302 0.00 8 335 7 926
Willis Group Holdings PLC 3 760 0.00 571 573
XL Capital Ltd 7 686 0.01 785 814
Yapi ve Kredi Bankasi AS 98 820 0.00 1 122 1 249
Zurich Financial Services Group 2 953 0.00 4 115 3 738
Total financial institutions and insurance 784 795 794 199
Other shares abroad No. shares Ownership interest in percent Acquisition costs Fair value
3M Company 141 194 0.02 66 301 67 430
ABB Ltd 419 186 0.02 46 528 46 709
Abbott Laboratories 245 011 0.02 76 265 76 416
Abertis Infraestructuras SA 46 510 0.01 5 985 6 060
Accenture Plc 105 726 0.02 25 535 25 346
Accor SA 22 329 0.01 6 555 7 079
Acergy SA 1 987 776 1.02 133 462 182 180
Acs Actividades Cons Y Serv 20 741 0.01 6 298 5 984
Adecco SA 28 272 0.02 8 249 9 013
Note 17 – Investments in shares, mutual funds and equity certificates (continued)
49

Adidas AG 27 322 0.01 8 920 8 553
Adobe Systems Inc 61 751 0.01 13 423 13 120
Adva AG Optical Networking 348 079 0.75 6 448 7 299
Advance Auto Parts 49 135 0.05 11 322 11 490
AES Corp 152 099 0.02 12 424 11 695
Aes Tiete S/A 109 600 0.00 5 693 7 264
Aetna Inc 98 235 0.03 18 709 17 989
AGCO Corp 87 574 0.00 16 054 16 361
Agilent Technologies Incagilus 39 102 0.01 6 045 7 018
AGL Energy Ltd 81 724 0.00 5 886 5 970
Agnico-Eagle Mines Ltd 21 152 0.00 7 670 6 634
Agrium 26 128 0.02 9 042 9 419
Air Products & Chemicals Inc 33 691 0.01 15 222 15 776
Akzo Nobel NV 32 970 0.01 12 626 12 679
Alcatel – Lucent 535 854 0.04 11 129 10 579
Alcoa Inc 129 784 0.01 10 293 12 086
Alfa Laval 168 300 0.04 12 137 13 480
Allergan Inc 35 800 0.00 11 943 13 031
Alstom 43 257 0.03 18 738 17 589
Altera Corp 45 193 0.01 5 376 5 908
Amazon.Com Inc 53 222 0.01 39 520 41 359
Amcor Ltd 259 223 0.03 7 779 8 390
America Movil – ADR 42 700 0.00 11 266 11 589
American Electric Power Co Inc 52 567 0.01 9 820 10 565
American Tower Corp A 44 255 0.01 10 815 11 047
Amerisourcebergen Corp 87 403 0.04 12 053 13 163
Amgen Inc 190 938 0.02 65 545 62 397
Amphenol Corp 25 708 0.03 6 466 6 858
Anadarko Petroleum Corporation 105 522 0.04 38 069 38 050
Analog Devices Inc 33 810 0.01 5 631 6 168
Anglo American Plc 239 095 0.02 58 924 60 467
Anheuser-Busch InBev NV 105 128 0.02 31 314 31 712
AP Møller Maersk AS 311 0.01 12 814 12 679
Apache Corporation 66 744 0.02 39 111 39 779
Apple Inc 141 792 0.02 160 326 172 716
Applied Material Inc 160 735 0.01 12 804 12 944
ArcelorMittal SA 196 378 0.00 49 202 52 377
Archer Daniels Midland 112 239 0.02 18 960 20 301
ASML Holding NV 48 281 0.01 9 387 9 604
Astellas Pharma Inc 28 600 0.00 6 462 6 140
AstraZeneca Plc 210 577 0.01 56 356 57 174
Asustek Computer Inc 1 708 553 0.00 17 007 19 070
AT&T Inc 888 687 0.03 136 079 143 899
Atlantia Spa 42 553 0.01 5 827 6 437
Atlas Copco A 155 600 0.02 12 839 13 256
Automatic Data Processing 59 473 0.01 13 797 14 711
AutoZone 8 037 0.01 6 704 7 339
Avon Products Inc 50 454 0.01 9 689 9 181
Baker Hughes Inc 34 955 0.01 8 048 8 174
BASF SE 167 952 0.02 61 581 60 498
Baxter International Inc 127 338 0.02 41 470 43 165
Bayer AG 127 764 0.02 58 655 59 258
Becton Dickinson and Company 29 415 0.01 11 914 13 400
Bed Bath & Beyond Inc 30 698 0.01 6 549 6 850
Beijing Enterprises Holdings Ltd 215 000 0.00 6 543 9 010
Best Buy Company 53 594 0.02 12 224 12 217
Bezeq Israeli Telecommunication Corp Ltd 1 821 298 0.07 21 299 26 603
BG Group Plc 644 270 0.02 65 556 67 434
Bharti Televentures 485 846 0.00 24 574 19 888
BHP Billiton Ltd 602 748 0.02 118 588 135 030
BHP Billiton Plc 426 295 0.02 76 182 79 336
Biogen Idec Inc 35 015 0.01 10 275 10 822
BMC Software 27 551 0.01 5 984 6 382
Note 17 – Investments in shares, mutual funds and equity certificates (continued)
50
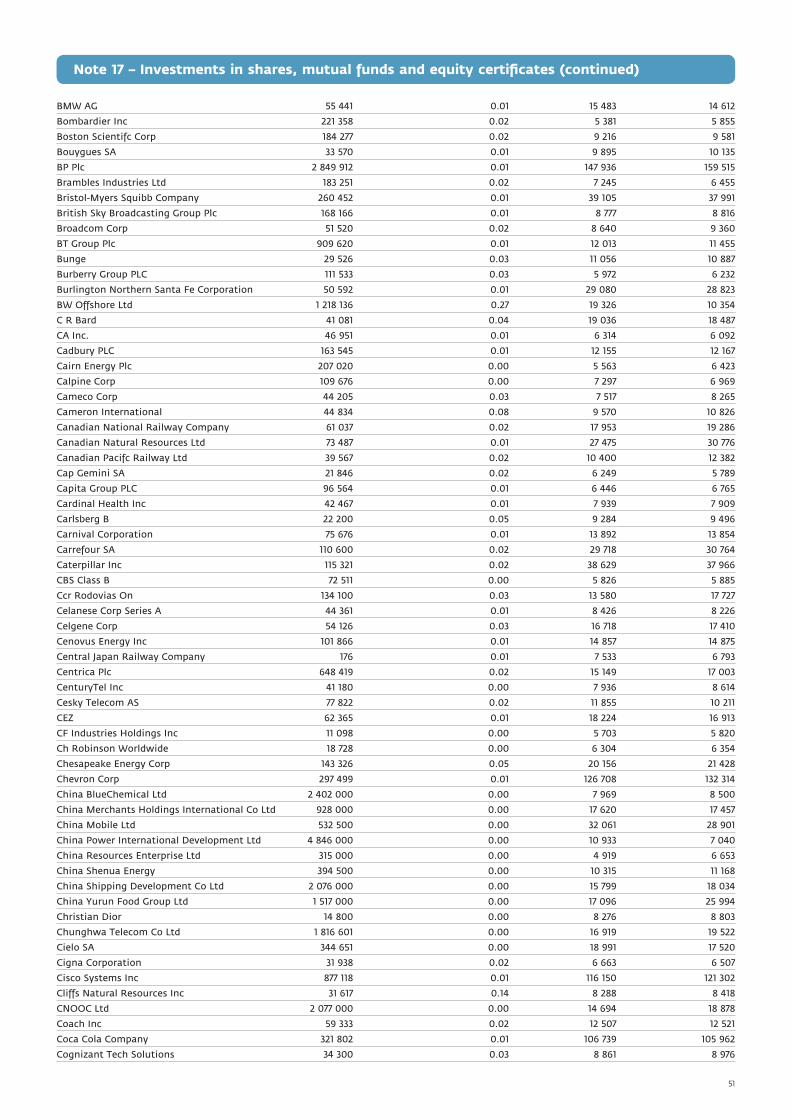
BMW AG 55 441 0.01 15 483 14 612
Bombardier Inc 221 358 0.02 5 381 5 855
Boston Scientifc Corp 184 277 0.02 9 216 9 581
Bouygues SA 33 570 0.01 9 895 10 135
BP Plc 2 849 912 0.01 147 936 159 515
Brambles Industries Ltd 183 251 0.02 7 245 6 455
Bristol-Myers Squibb Company 260 452 0.01 39 105 37 991
British Sky Broadcasting Group Plc 168 166 0.01 8 777 8 816
Broadcom Corp 51 520 0.02 8 640 9 360
BT Group Plc 909 620 0.01 12 013 11 455
Bunge 29 526 0.03 11 056 10 887
Burberry Group PLC 111 533 0.03 5 972 6 232
Burlington Northern Santa Fe Corporation 50 592 0.01 29 080 28 823
BW Offshore Ltd 1 218 136 0.27 19 326 10 354
C R Bard 41 081 0.04 19 036 18 487
CA Inc. 46 951 0.01 6 314 6 092
Cadbury PLC 163 545 0.01 12 155 12 167
Cairn Energy Plc 207 020 0.00 5 563 6 423
Calpine Corp 109 676 0.00 7 297 6 969
Cameco Corp 44 205 0.03 7 517 8 265
Cameron International 44 834 0.08 9 570 10 826
Canadian National Railway Company 61 037 0.02 17 953 19 286
Canadian Natural Resources Ltd 73 487 0.01 27 475 30 776
Canadian Pacifc Railway Ltd 39 567 0.02 10 400 12 382
Cap Gemini SA 21 846 0.02 6 249 5 789
Capita Group PLC 96 564 0.01 6 446 6 765
Cardinal Health Inc 42 467 0.01 7 939 7 909
Carlsberg B 22 200 0.05 9 284 9 496
Carnival Corporation 75 676 0.01 13 892 13 854
Carrefour SA 110 600 0.02 29 718 30 764
Caterpillar Inc 115 321 0.02 38 629 37 966
CBS Class B 72 511 0.00 5 826 5 885
Ccr Rodovias On 134 100 0.03 13 580 17 727
Celanese Corp Series A 44 361 0.01 8 426 8 226
Celgene Corp 54 126 0.03 16 718 17 410
Cenovus Energy Inc 101 866 0.01 14 857 14 875
Central Japan Railway Company 176 0.01 7 533 6 793
Centrica Plc 648 419 0.02 15 149 17 003
CenturyTel Inc 41 180 0.00 7 936 8 614
Cesky Telecom AS 77 822 0.02 11 855 10 211
CEZ 62 365 0.01 18 224 16 913
CF Industries Holdings Inc 11 098 0.00 5 703 5 820
Ch Robinson Worldwide 18 728 0.00 6 304 6 354
Chesapeake Energy Corp 143 326 0.05 20 156 21 428
Chevron Corp 297 499 0.01 126 708 132 314
China BlueChemical Ltd 2 402 000 0.00 7 969 8 500
China Merchants Holdings International Co Ltd 928 000 0.00 17 620 17 457
China Mobile Ltd 532 500 0.00 32 061 28 901
China Power International Development Ltd 4 846 000 0.00 10 933 7 040
China Resources Enterprise Ltd 315 000 0.00 4 919 6 653
China Shenua Energy 394 500 0.00 10 315 11 168
China Shipping Development Co Ltd 2 076 000 0.00 15 799 18 034
China Yurun Food Group Ltd 1 517 000 0.00 17 096 25 994
Christian Dior 14 800 0.00 8 276 8 803
Chunghwa Telecom Co Ltd 1 816 601 0.00 16 919 19 522
Cielo SA 344 651 0.00 18 991 17 520
Cigna Corporation 31 938 0.02 6 663 6 507
Cisco Systems Inc 877 118 0.01 116 150 121 302
Cliffs Natural Resources Inc 31 617 0.14 8 288 8 418
CNOOC Ltd 2 077 000 0.00 14 694 18 878
Coach Inc 59 333 0.02 12 507 12 521
Coca Cola Company 321 802 0.01 106 739 105 962
Cognizant Tech Solutions 34 300 0.03 8 861 8 976
Note 17 – Investments in shares, mutual funds and equity certificates (continued)
51

Colgate Palmolive Company 84 438 0.02 40 255 40 071
Comcast Corp 465 836 0.03 43 279 45 371
Comcast Corporation Cl A Special Common Stock 103 648 0.01 9 199 9 586
Compagnie de Saint Gobain 63 224 0.02 19 887 19 949
Compagnie Financiere Richemont SA 102 971 0.02 19 690 19 984
Compass Group Plc 426 844 0.02 18 050 17 727
Conagra Foods Inc 52 062 0.01 6 336 6 932
ConocoPhillips 268 446 0.04 75 834 79 197
Consolidated Edison 49 010 0.02 11 943 12 862
Cooper Industries PLC 25 742 0.03 6 304 6 341
Corning Incorporated 204 313 0.01 21 999 22 791
Costco Wholesale Corporation 105 438 0.02 33 479 36 040
Covidien Plc 61 842 0.00 15 963 17 109
CPFL Energia SA 116 200 0.02 11 975 13 597
Crescent Point Energy Corp 36 841 0.00 7 545 8 017
CRH Plc 119 115 0.02 18 687 18 768
Crown Castle Int’L Corp 38 473 0.02 8 548 8 677
CSL Limited 80 376 0.04 13 376 13 567
CSX Corp 72 947 0.03 19 358 20 434
Cummins 30 690 0.00 8 523 8 131
CVS Caremark Corp 394 330 0.05 80 187 73 373
Daimler AG 129 172 0.01 37 936 39 859
Danaher Corporation 43 459 0.01 18 942 18 879
Danone 80 274 0.03 27 002 28 496
Darden Restaurants Inc 36 679 0.02 7 059 7 431
Deere & Co 67 814 0.03 21 728 21 190
Dell Inc 202 454 0.01 18 033 16 795
Deutsche Lufthansa AG 92 350 0.02 8 567 8 994
Deutsche Post AG 107 149 0.01 12 121 11 976
Deutsche Telecom AG 427 356 0.01 36 309 36 448
Devon Energy Corporation 80 045 0.02 31 528 33 987
Diageo Plc 411 289 0.01 38 504 41 591
Diagnosticos America On 30 800 0.01 1 006 5 817
Diamond Offshore Drilling 10 460 0.01 5 755 5 947
DIRECTV 153 038 0.01 29 382 29 484
Discovery Communications Inc 59 927 0.00 11 030 10 618
Dominion Resources Inc 88 310 0.03 18 132 19 855
Dover Corporation 28 655 0.01 6 148 6 888
Dow Chemical 186 684 0.02 28 836 29 797
DTE Energy Company 23 273 0.01 5 804 5 860
Duke Energy Corporation 178 077 0.02 16 813 17 704
E.ON AG 288 730 0.01 68 192 69 949
East Japan Railway Company 28 100 0.01 11 399 10 235
Eaton Corporation 25 132 0.02 9 341 9 237
eBay Inc 155 241 0.01 20 708 21 111
Ecolab Inc 51 378 0.02 13 226 13 231
Edison International 55 352 0.02 10 969 11 121
Edwards Lifesciences Corp 13 768 0.00 6 372 6 908
Egyptian Company for Mobile Services 28 873 0.00 6 195 7 313
EI Du Pont de Nemours & Co 163 004 0.02 32 269 31 705
El Paso Corporation 106 130 0.02 5 996 6 027
Eldorado Gold Corp 99 340 0.00 7 591 8 167
Electricite de France 30 066 0.00 9 558 10 357
Electronic Arts Inc 95 141 0.03 10 784 9 756
Eli Lilly & Co 144 045 0.01 28 535 29 715
EMC Corporation 282 112 0.01 27 066 28 471
Emerson Electric 184 873 0.04 41 889 45 496
Enbridge Inc 40 277 0.01 10 697 10 793
Encana Corp 101 866 0.01 16 842 19 147
Enel SpA 1 297 782 0.01 46 464 43 536
Enersis SA – ADR 192 600 0.00 20 309 25 434
Eni SpA 409 673 0.01 59 121 60 440
Ensco International PLC 31 945 0.02 8 122 7 371
Note 17 – Investments in shares, mutual funds and equity certificates (continued)
52
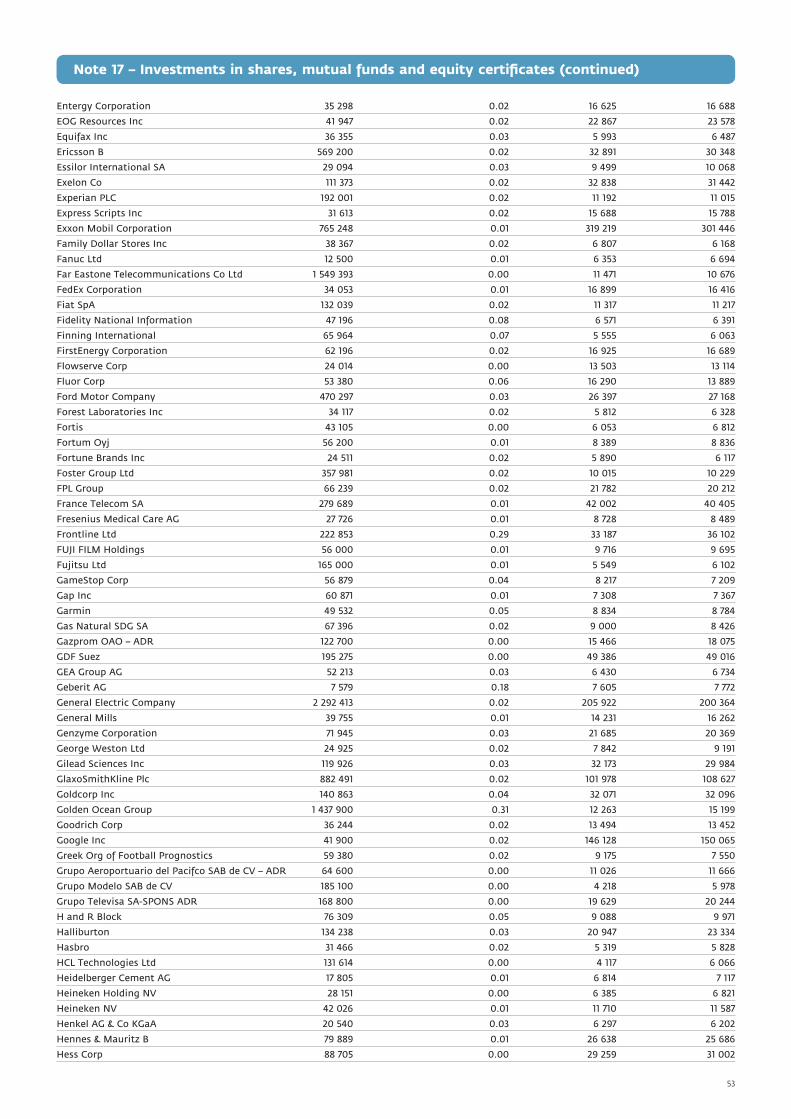
Entergy Corporation 35 298 0.02 16 625 16 688
EOG Resources Inc 41 947 0.02 22 867 23 578
Equifax Inc 36 355 0.03 5 993 6 487
Ericsson B 569 200 0.02 32 891 30 348
Essilor International SA 29 094 0.03 9 499 10 068
Exelon Co 111 373 0.02 32 838 31 442
Experian PLC 192 001 0.02 11 192 11 015
Express Scripts Inc 31 613 0.02 15 688 15 788
Exxon Mobil Corporation 765 248 0.01 319 219 301 446
Family Dollar Stores Inc 38 367 0.02 6 807 6 168
Fanuc Ltd 12 500 0.01 6 353 6 694
Far Eastone Telecommunications Co Ltd 1 549 393 0.00 11 471 10 676
FedEx Corporation 34 053 0.01 16 899 16 416
Fiat SpA 132 039 0.02 11 317 11 217
Fidelity National Information 47 196 0.08 6 571 6 391
Finning International 65 964 0.07 5 555 6 063
FirstEnergy Corporation 62 196 0.02 16 925 16 689
Flowserve Corp 24 014 0.00 13 503 13 114
Fluor Corp 53 380 0.06 16 290 13 889
Ford Motor Company 470 297 0.03 26 397 27 168
Forest Laboratories Inc 34 117 0.02 5 812 6 328
Fortis 43 105 0.00 6 053 6 812
Fortum Oyj 56 200 0.01 8 389 8 836
Fortune Brands Inc 24 511 0.02 5 890 6 117
Foster Group Ltd 357 981 0.02 10 015 10 229
FPL Group 66 239 0.02 21 782 20 212
France Telecom SA 279 689 0.01 42 002 40 405
Fresenius Medical Care AG 27 726 0.01 8 728 8 489
Frontline Ltd 222 853 0.29 33 187 36 102
FUJI FILM Holdings 56 000 0.01 9 716 9 695
Fujitsu Ltd 165 000 0.01 5 549 6 102
GameStop Corp 56 879 0.04 8 217 7 209
Gap Inc 60 871 0.01 7 308 7 367
Garmin 49 532 0.05 8 834 8 784
Gas Natural SDG SA 67 396 0.02 9 000 8 426
Gazprom OAO – ADR 122 700 0.00 15 466 18 075
GDF Suez 195 275 0.00 49 386 49 016
GEA Group AG 52 213 0.03 6 430 6 734
Geberit AG 7 579 0.18 7 605 7 772
General Electric Company 2 292 413 0.02 205 922 200 364
General Mills 39 755 0.01 14 231 16 262
Genzyme Corporation 71 945 0.03 21 685 20 369
George Weston Ltd 24 925 0.02 7 842 9 191
Gilead Sciences Inc 119 926 0.03 32 173 29 984
GlaxoSmithKline Plc 882 491 0.02 101 978 108 627
Goldcorp Inc 140 863 0.04 32 071 32 096
Golden Ocean Group 1 437 900 0.31 12 263 15 199
Goodrich Corp 36 244 0.02 13 494 13 452
Google Inc 41 900 0.02 146 128 150 065
Greek Org of Football Prognostics 59 380 0.02 9 175 7 550
Grupo Aeroportuario del Pacifco SAB de CV – ADR 64 600 0.00 11 026 11 666
Grupo Modelo SAB de CV 185 100 0.00 4 218 5 978
Grupo Televisa SA-SPONS ADR 168 800 0.00 19 629 20 244
H and R Block 76 309 0.05 9 088 9 971
Halliburton 134 238 0.03 20 947 23 334
Hasbro 31 466 0.02 5 319 5 828
HCL Technologies Ltd 131 614 0.00 4 117 6 066
Heidelberger Cement AG 17 805 0.01 6 814 7 117
Heineken Holding NV 28 151 0.00 6 385 6 821
Heineken NV 42 026 0.01 11 710 11 587
Henkel AG & Co KGaA 20 540 0.03 6 297 6 202
Hennes & Mauritz B 79 889 0.01 26 638 25 686
Hess Corp 88 705 0.00 29 259 31 002
Note 17 – Investments in shares, mutual funds and equity certificates (continued)
53

Hewlett Packard Company 405 791 0.01 121 474 120 748
Hitachi High Technologies 106 898 0.00 11 314 12 199
Hitachi Ltd 363 000 0.01 10 479 6 397
HJ Heinz Company 38 153 0.01 8 832 9 424
Holcim Ltd 34 911 0.02 15 359 15 705
Home Depot Inc 282 412 0.01 45 565 47 197
Honda Motor Company Ltd 59 200 0.01 10 702 11 425
Hyundai Motor Co Ltd 73 620 0.00 16 194 15 704
Iberdrola SA 599 267 0.07 32 314 33 129
Illinois Tool Works 81 331 0.03 21 237 22 547
Impala Platinum Holdings Ltd 39 600 0.06 4 696 6 306
Imperial Oil Ltd 42 685 0.01 9 576 9 564
IMS Health Inc 48 136 0.02 5 808 5 856
Inditex 26 349 0.00 9 610 9 476
Infosys Technologies Ltd 67 600 0.00 15 906 21 828
Ingersoll-Rand Plc 51 146 0.03 10 680 10 560
Ingram Micro Inc 138 093 0.08 13 812 13 920
Intel Corporation 837 792 0.01 96 324 98 731
International Business Machines Corporation 189 523 0.01 135 817 143 314
International Paper Company 55 494 0.01 8 536 8 585
International Power PLC 451 121 0.03 11 648 13 008
Intuit Inc 34 392 0.02 5 993 6 101
Intuitive Surgical Inc 4 616 0.00 6 439 8 088
Itochu Corp 151 000 0.01 5 890 6 390
ITT Industries Inc 41 541 0.05 12 397 11 936
J M Smucker Company 17 851 0.04 5 751 6 368
JB Hunt Transport Services 33 003 0.02 6 023 6 152
Jiangsu Express Co Ltd 2 192 000 0.00 10 546 11 301
Johnson & Johnson 423 216 0.01 151 783 157 472
Johnson Controls 102 065 0.05 15 154 16 061
Johnson Matthey PLC 49 768 0.02 6 990 7 108
Joy Global 20 873 0.00 6 304 6 221
JSC Kazmunaigas Exploration and Production – GDR 78 458 0.02 8 580 11 286
Juniper Networks 61 074 0.01 9 165 9 410
K+S AG 34 819 0.02 11 008 11 541
Kellogg Co 32 419 0.01 9 197 9 963
Kimberly-Clark Corporation 69 997 0.01 25 124 25 762
Kimberly-Clark de Mexico SAB de CV 342 400 0.00 8 523 8 872
Kingfsher Plc 551 385 0.02 11 310 11 779
Kinross Gold 110 949 0.03 13 103 11 842
Kohls Corporation 35 630 0.01 11 340 11 100
Konica Minolta Holdings Inc 191 500 0.04 10 942 11 313
Koninklijke Ahold NV 143 782 0.01 10 245 11 035
Koninklijke DSM NV 21 072 0.02 6 031 6 018
Koninklijke KPN NV 309 470 0.01 29 098 30 369
Koninklijke Philips Electronics NV 152 995 0.01 25 833 26 224
Kraft Foods Inc 279 220 0.05 44 889 43 841
Kroger Company 152 400 0.02 19 351 18 074
L air Liquide SA 45 979 0.04 29 721 31 642
Lafarge SA 28 399 0.02 13 903 13 607
Liberty Global Inc 66 900 0.03 8 380 8 468
Life Technologies Corp. 19 611 0.04 5 418 5 917
Linde AG 21 578 0.01 15 339 15 052
Linear Technology Corporation 34 357 0.01 5 447 6 061
Lite-On Technology Corp 2 842 642 0.00 23 633 24 669
Lojas Americanas Pn 146 640 0.00 4 783 7 547
Loreal SA 39 601 0.01 24 683 25 601
Lowe’s Cos Inc 264 479 0.03 33 992 35 736
Lubrizol Corp 14 914 0.01 5 973 6 285
Lukoil OIO – ADR 73 300 0.00 25 770 24 263
LVMH Moet Hennessy Louis Vuitton SA 36 343 0.01 23 094 23 610
Magnit OAO 18 700 0.00 3 231 7 751
Man AG 22 712 0.02 11 378 10 248
Note 17 – Investments in shares, mutual funds and equity certificates (continued)
54

Manpower Inc 22 873 0.03 7 230 7 212
Marathon Oil Corporation 114 215 0.03 21 317 20 599
Marks and Spencer Group Plc 341 103 0.02 12 747 12 792
Marubeni Corp 246 000 0.02 7 771 7 800
Marvell Technology Group 60 522 0.02 6 990 7 255
Masco Corporation 74 916 0.02 6 172 5 977
MasterCard Inc 15 106 0.00 22 153 22 338
Mattel 58 551 0.01 6 396 6 758
Maxis Berhad 1 334 600 0.00 11 272 12 091
McDonald’s Corporation 186 168 0.01 63 333 67 151
McGraw Hill Companies 61 883 0.02 12 336 11 979
McKesson Corporation 33 604 0.01 11 384 12 133
MeadWestvaco Corp 50 745 0.02 8 155 8 393
Medco Health Solutions Inc 78 763 0.03 26 296 29 079
Mediatek Inc 347 777 0.00 25 780 35 049
Medtronic Inc 169 644 0.01 42 667 43 100
Merck & Company 509 713 0.02 111 762 107 592
Merck Kgaa 18 819 0.04 10 303 10 163
METRO A 42 947 0.00 8 273 9 282
Metro AG 16 627 0.01 5 399 5 867
Michelin (CGDE) 30 723 0.02 14 010 13 644
Microsoft Corporation 1 266 290 0.01 222 244 223 038
Millicom Intl. Cellular SDR 19 600 0.03 8 223 8 452
Mitsui & Co Ltd 75 200 0.00 6 044 6 118
Mobile Telesystems OJSC – ADR 44 600 0.04 12 333 12 596
Monsanto Company 108 644 0.04 51 993 51 307
Mosaic Co 20 393 0.00 6 441 7 037
Motorola 307 846 0.01 14 362 13 800
Murphy Oil Corp 19 749 0.00 6 909 6 183
National Grid Plc 357 835 0.01 20 481 22 666
National Oilwell Varco 59 525 0.01 14 379 15 161
Natura Cosmeticos On 86 500 0.02 7 283 10 408
Nestle SA 555 668 0.14 155 590 155 880
NetApp Inc 36 674 0.01 7 042 7 286
Newcrest Mining Ltd 89 319 0.03 14 528 16 395
Newfeld Exploration Co 44 448 0.04 10 811 12 384
Newmont Mining Corporation 108 114 0.03 30 440 29 548
News Corp 362 460 0.02 28 187 28 665
Nexen Inc 51 063 0.02 6 662 7 096
NHN Corp. 7 536 0.00 5 721 7 178
Nike Inc 56 256 0.03 19 303 21 471
Nippon Telegraph & Telephone Corporation 31 848 0.00 8 430 7 213
NiSource Inc 123 604 0.05 11 234 10 982
Nissan Motor Company 233 500 0.01 8 740 11 736
Noble Corp 28 557 0.02 6 228 6 714
Noble Energy 19 651 0.02 7 436 8 085
Nokia Oyj 636 000 0.02 51 332 47 020
Norfolk Southern Corporation 42 197 0.01 11 964 12 778
Northeast Utilities 44 581 0.00 6 090 6 642
Novartis AG 302 147 0.01 96 147 95 398
Novo Nordisk AS 84 700 0.03 31 741 31 322
NTT DoCoMo Inc 864 0.00 7 920 6 948
NuCor Corp 67 455 0.04 17 522 18 178
Nvidia Corp 62 351 0.04 6 118 6 728
Occidental Petroleum Corporation 127 506 0.03 55 575 59 921
Omnicom Group Inc 39 758 0.02 8 603 8 992
Oracle Corporation 583 017 0.01 76 160 82 650
Orascom Telecom Holding SAE – GDR 102 815 0.00 23 618 13 655
Orica Limited 77 907 0.03 9 171 10 544
Origin Energy Ltd 142 278 0.02 11 207 12 433
Owens-Illinois 39 468 0.03 7 247 7 494
Paccar Inc 55 280 0.03 11 992 11 583
Pactiv Corp 65 145 0.04 8 889 9 085
Note 17 – Investments in shares, mutual funds and equity certificates (continued)
55
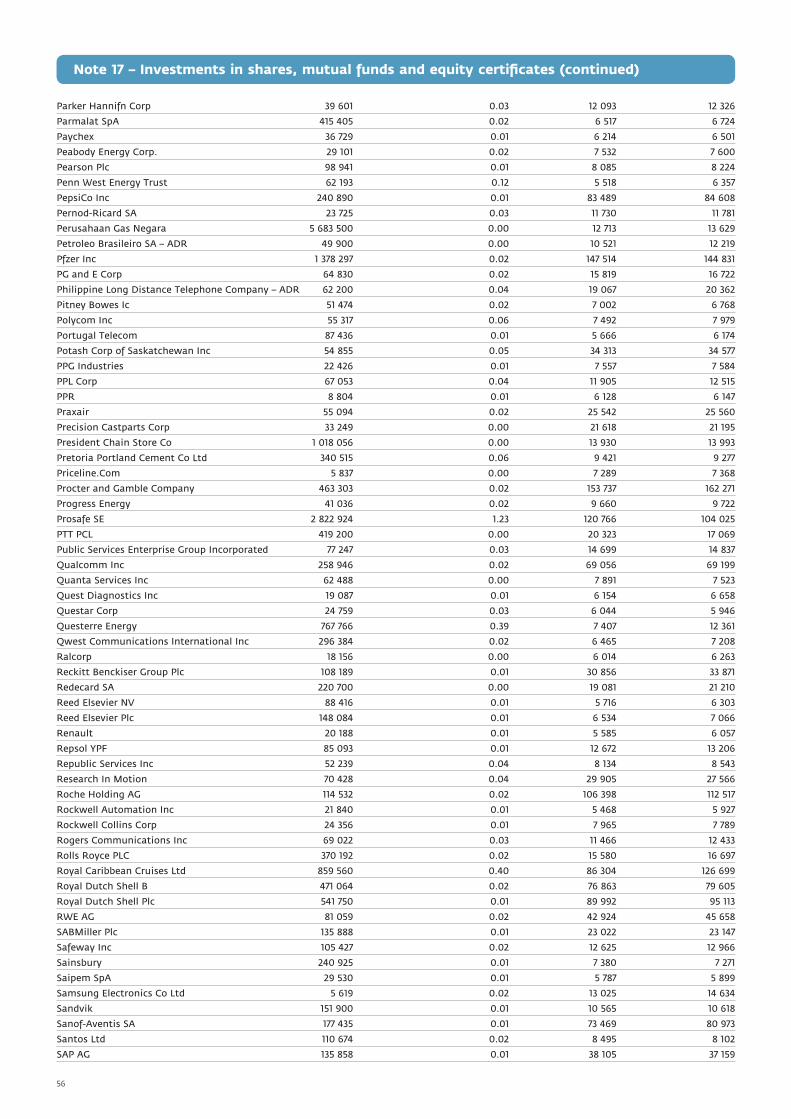
Parker Hannifn Corp 39 601 0.03 12 093 12 326
Parmalat SpA 415 405 0.02 6 517 6 724
Paychex 36 729 0.01 6 214 6 501
Peabody Energy Corp. 29 101 0.02 7 532 7 600
Pearson Plc 98 941 0.01 8 085 8 224
Penn West Energy Trust 62 193 0.12 5 518 6 357
PepsiCo Inc 240 890 0.01 83 489 84 608
Pernod-Ricard SA 23 725 0.03 11 730 11 781
Perusahaan Gas Negara 5 683 500 0.00 12 713 13 629
Petroleo Brasileiro SA – ADR 49 900 0.00 10 521 12 219
Pfzer Inc 1 378 297 0.02 147 514 144 831
PG and E Corp 64 830 0.02 15 819 16 722
Philippine Long Distance Telephone Company – ADR 62 200 0.04 19 067 20 362
Pitney Bowes Ic 51 474 0.02 7 002 6 768
Polycom Inc 55 317 0.06 7 492 7 979
Portugal Telecom 87 436 0.01 5 666 6 174
Potash Corp of Saskatchewan Inc 54 855 0.05 34 313 34 577
PPG Industries 22 426 0.01 7 557 7 584
PPL Corp 67 053 0.04 11 905 12 515
PPR 8 804 0.01 6 128 6 147
Praxair 55 094 0.02 25 542 25 560
Precision Castparts Corp 33 249 0.00 21 618 21 195
President Chain Store Co 1 018 056 0.00 13 930 13 993
Pretoria Portland Cement Co Ltd 340 515 0.06 9 421 9 277
Priceline.Com 5 837 0.00 7 289 7 368
Procter and Gamble Company 463 303 0.02 153 737 162 271
Progress Energy 41 036 0.02 9 660 9 722
Prosafe SE 2 822 924 1.23 120 766 104 025
PTT PCL 419 200 0.00 20 323 17 069
Public Services Enterprise Group Incorporated 77 247 0.03 14 699 14 837
Qualcomm Inc 258 946 0.02 69 056 69 199
Quanta Services Inc 62 488 0.00 7 891 7 523
Quest Diagnostics Inc 19 087 0.01 6 154 6 658
Questar Corp 24 759 0.03 6 044 5 946
Questerre Energy 767 766 0.39 7 407 12 361
Qwest Communications International Inc 296 384 0.02 6 465 7 208
Ralcorp 18 156 0.00 6 014 6 263
Reckitt Benckiser Group Plc 108 189 0.01 30 856 33 871
Redecard SA 220 700 0.00 19 081 21 210
Reed Elsevier NV 88 416 0.01 5 716 6 303
Reed Elsevier Plc 148 084 0.01 6 534 7 066
Renault 20 188 0.01 5 585 6 057
Repsol YPF 85 093 0.01 12 672 13 206
Republic Services Inc 52 239 0.04 8 134 8 543
Research In Motion 70 428 0.04 29 905 27 566
Roche Holding AG 114 532 0.02 106 398 112 517
Rockwell Automation Inc 21 840 0.01 5 468 5 927
Rockwell Collins Corp 24 356 0.01 7 965 7 789
Rogers Communications Inc 69 022 0.03 11 466 12 433
Rolls Royce PLC 370 192 0.02 15 580 16 697
Royal Caribbean Cruises Ltd 859 560 0.40 86 304 126 699
Royal Dutch Shell B 471 064 0.02 76 863 79 605
Royal Dutch Shell Plc 541 750 0.01 89 992 95 113
RWE AG 81 059 0.02 42 924 45 658
SABMiller Plc 135 888 0.01 23 022 23 147
Safeway Inc 105 427 0.02 12 625 12 966
Sainsbury 240 925 0.01 7 380 7 271
Saipem SpA 29 530 0.01 5 787 5 899
Samsung Electronics Co Ltd 5 619 0.02 13 025 14 634
Sandvik 151 900 0.01 10 565 10 618
Sanof-Aventis SA 177 435 0.01 73 469 80 973
Santos Ltd 110 674 0.02 8 495 8 102
SAP AG 135 858 0.01 38 105 37 159
Note 17 – Investments in shares, mutual funds and equity certificates (continued)
56
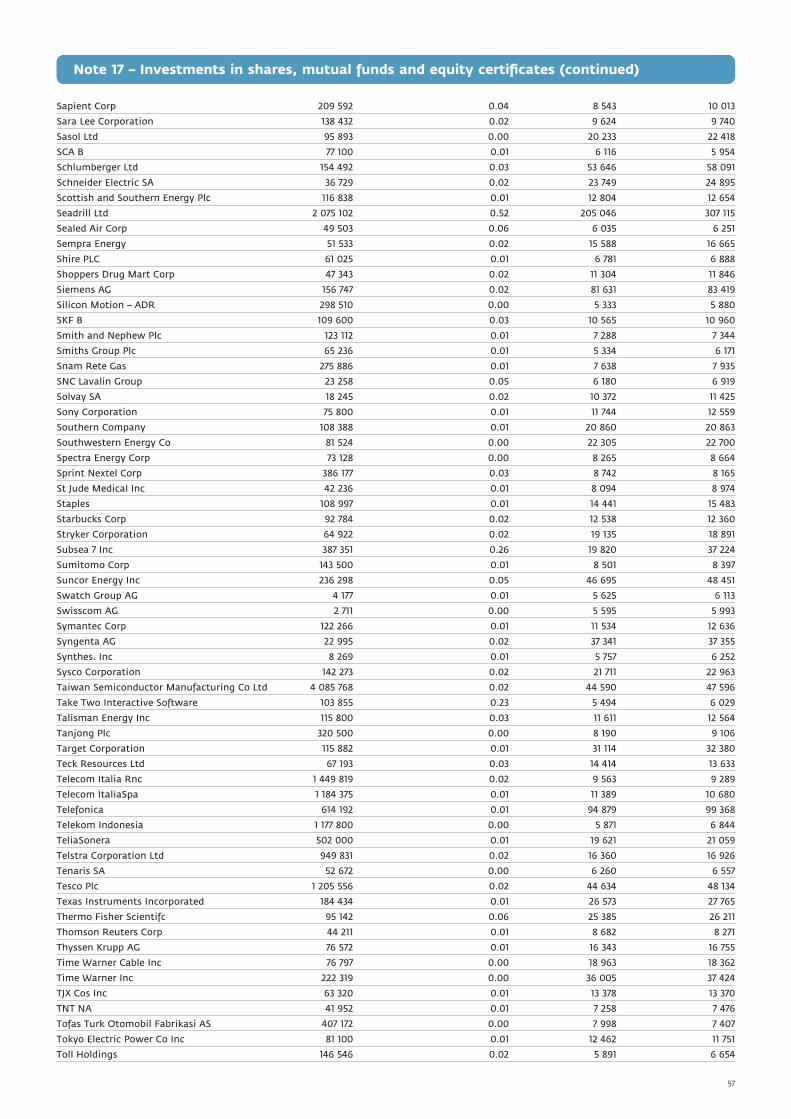
Sapient Corp 209 592 0.04 8 543 10 013
Sara Lee Corporation 138 432 0.02 9 624 9 740
Sasol Ltd 95 893 0.00 20 233 22 418
SCA B 77 100 0.01 6 116 5 954
Schlumberger Ltd 154 492 0.03 53 646 58 091
Schneider Electric SA 36 729 0.02 23 749 24 895
Scottish and Southern Energy Plc 116 838 0.01 12 804 12 654
Seadrill Ltd 2 075 102 0.52 205 046 307 115
Sealed Air Corp 49 503 0.06 6 035 6 251
Sempra Energy 51 533 0.02 15 588 16 665
Shire PLC 61 025 0.01 6 781 6 888
Shoppers Drug Mart Corp 47 343 0.02 11 304 11 846
Siemens AG 156 747 0.02 81 631 83 419
Silicon Motion – ADR 298 510 0.00 5 333 5 880
SKF B 109 600 0.03 10 565 10 960
Smith and Nephew Plc 123 112 0.01 7 288 7 344
Smiths Group Plc 65 236 0.01 5 334 6 171
Snam Rete Gas 275 886 0.01 7 638 7 935
SNC Lavalin Group 23 258 0.05 6 180 6 919
Solvay SA 18 245 0.02 10 372 11 425
Sony Corporation 75 800 0.01 11 744 12 559
Southern Company 108 388 0.01 20 860 20 863
Southwestern Energy Co 81 524 0.00 22 305 22 700
Spectra Energy Corp 73 128 0.00 8 265 8 664
Sprint Nextel Corp 386 177 0.03 8 742 8 165
St Jude Medical Inc 42 236 0.01 8 094 8 974
Staples 108 997 0.01 14 441 15 483
Starbucks Corp 92 784 0.02 12 538 12 360
Stryker Corporation 64 922 0.02 19 135 18 891
Subsea 7 Inc 387 351 0.26 19 820 37 224
Sumitomo Corp 143 500 0.01 8 501 8 397
Suncor Energy Inc 236 298 0.05 46 695 48 451
Swatch Group AG 4 177 0.01 5 625 6 113
Swisscom AG 2 711 0.00 5 595 5 993
Symantec Corp 122 266 0.01 11 534 12 636
Syngenta AG 22 995 0.02 37 341 37 355
Synthes. Inc 8 269 0.01 5 757 6 252
Sysco Corporation 142 273 0.02 21 711 22 963
Taiwan Semiconductor Manufacturing Co Ltd 4 085 768 0.02 44 590 47 596
Take Two Interactive Software 103 855 0.23 5 494 6 029
Talisman Energy Inc 115 800 0.03 11 611 12 564
Tanjong Plc 320 500 0.00 8 190 9 106
Target Corporation 115 882 0.01 31 114 32 380
Teck Resources Ltd 67 193 0.03 14 414 13 633
Telecom Italia Rnc 1 449 819 0.02 9 563 9 289
Telecom ItaliaSpa 1 184 375 0.01 11 389 10 680
Telefonica 614 192 0.01 94 879 99 368
Telekom Indonesia 1 177 800 0.00 5 871 6 844
TeliaSonera 502 000 0.01 19 621 21 059
Telstra Corporation Ltd 949 831 0.02 16 360 16 926
Tenaris SA 52 672 0.00 6 260 6 557
Tesco Plc 1 205 556 0.02 44 634 48 134
Texas Instruments Incorporated 184 434 0.01 26 573 27 765
Thermo Fisher Scientifc 95 142 0.06 25 385 26 211
Thomson Reuters Corp 44 211 0.01 8 682 8 271
Thyssen Krupp AG 76 572 0.01 16 343 16 755
Time Warner Cable Inc 76 797 0.00 18 963 18 362
Time Warner Inc 222 319 0.00 36 005 37 424
TJX Cos Inc 63 320 0.01 13 378 13 370
TNT NA 41 952 0.01 7 258 7 476
Tofas Turk Otomobil Fabrikasi AS 407 172 0.00 7 998 7 407
Tokyo Electric Power Co Inc 81 100 0.01 12 462 11 751
Toll Holdings 146 546 0.02 5 891 6 654
Note 17 – Investments in shares, mutual funds and equity certificates (continued)
57

Toshiba Corporation 241 000 0.01 6 626 7 642
Total SA 329 774 0.01 113 576 123 010
Toyota Motor Corporation 88 400 0.00 20 678 21 284
TransCanada Corp 90 259 0.02 17 821 17 999
Transocean Ltd 42 012 0.01 19 904 20 095
Transurban Group 220 084 0.03 5 146 6 335
Tullow Oil PLC 165 784 0.00 18 674 20 182
Tupras 164 744 0.07 14 844 18 888
Turkcell Iletisim Hizmet AS 995 121 0.05 36 775 40 652
Tyco Electronics Ltd 143 988 0.00 19 255 20 420
Tyco International Ltd 136 094 0.01 26 604 28 051
Unilever NV 278 488 0.05 52 016 52 511
Unilever Plc 173 104 0.01 28 622 32 200
Union Pacifc Corporation 97 467 0.04 35 519 35 979
United Parcel Service Inc 110 050 0.02 36 551 36 472
United States Steel Corp 39 971 0.03 11 708 12 727
UnitedHealth Group Incorporated 236 340 0.02 43 306 41 614
Vale SA-SP Pref – ADR 176 900 0.00 20 247 25 364
Valero Energy Corp 185 402 0.07 19 469 17 940
Vallourec SA 12 192 0.00 12 544 12 838
Veolia Environnement 47 984 0.01 9 754 9 197
Verizon Communications Inc 430 762 0.02 77 327 82 442
Vertex Pharmaceuticals 27 127 0.00 5 916 6 715
Vestas Wind System 40 400 0.02 17 204 14 265
VF Corp 14 374 0.01 5 920 6 082
Viacom CL B 70 221 0.00 12 156 12 060
Vimpelcom – ADR 84 863 0.04 9 375 9 113
Vinci SA 83 405 0.05 26 421 27 285
Visa Inc 72 800 0.00 37 702 36 781
Vivendi SA 201 696 0.02 34 111 34 763
Vizrt Ltd 363 492 0.68 6 091 9 087
Vodafone Group Plc 8 293 418 0.01 106 361 111 176
Volkswagen AG PFD 14 419 0.01 8 107 7 856
Volvo B 164 100 0.01 8 391 8 159
Walgreen 253 320 0.02 52 211 53 735
Walt Disney Company 272 024 0.01 50 722 50 679
Waste Management 64 557 0.01 11 722 12 609
Weatherford International Ltd 79 323 0.06 9 442 8 207
Wellpoint Inc 64 724 0.01 22 054 21 794
Wesfarmers Ltd 182 170 0.05 24 756 29 595
Western Digital Corp 58 574 0.03 14 377 14 939
Western Union Co 108 176 0.00 11 774 11 780
Weyerhauser Company 27 696 0.01 6 922 6 902
Williams Companies 63 218 0.01 7 661 7 698
Wisconsin Energy Corp 24 970 0.02 6 617 7 188
WM Morrison Supermarkets PLC 434 514 0.00 11 396 11 244
Woodside Petroleum Ltd 60 424 0.01 14 602 14 817
Woolworths Ltd 222 162 0.02 31 758 32 318
WPP PLC 159 735 0.01 9 069 9 082
WW Grainger Inc 22 542 0.03 12 006 12 609
Xcel Energy Inc 66 767 0.02 7 885 8 185
Xilinx 42 321 0.01 5 594 6 127
Xstrata plc 357 469 0.04 35 153 37 382
XTO Energy Inc 78 803 0.02 21 574 21 182
Yahoo! Inc 388 598 0.03 35 494 37 669
Yamana Gold 96 102 0.00 6 404 6 355
Yamatake Corp 53 900 0.00 7 069 6 890
Yum Brands 58 089 0.02 11 931 11 735
Zimmer Holdings 27 559 0.01 9 329 9 410
Additional other shares abroad 1 565 330 1 562 452
Total other shares abroad 15 073 544 15 631 865
Total shares abroad 15 858 340 16 426 064
Total shares 21 300 718 22 190 018
Note 17 – Investments in shares, mutual funds and equity certificates (continued)
58
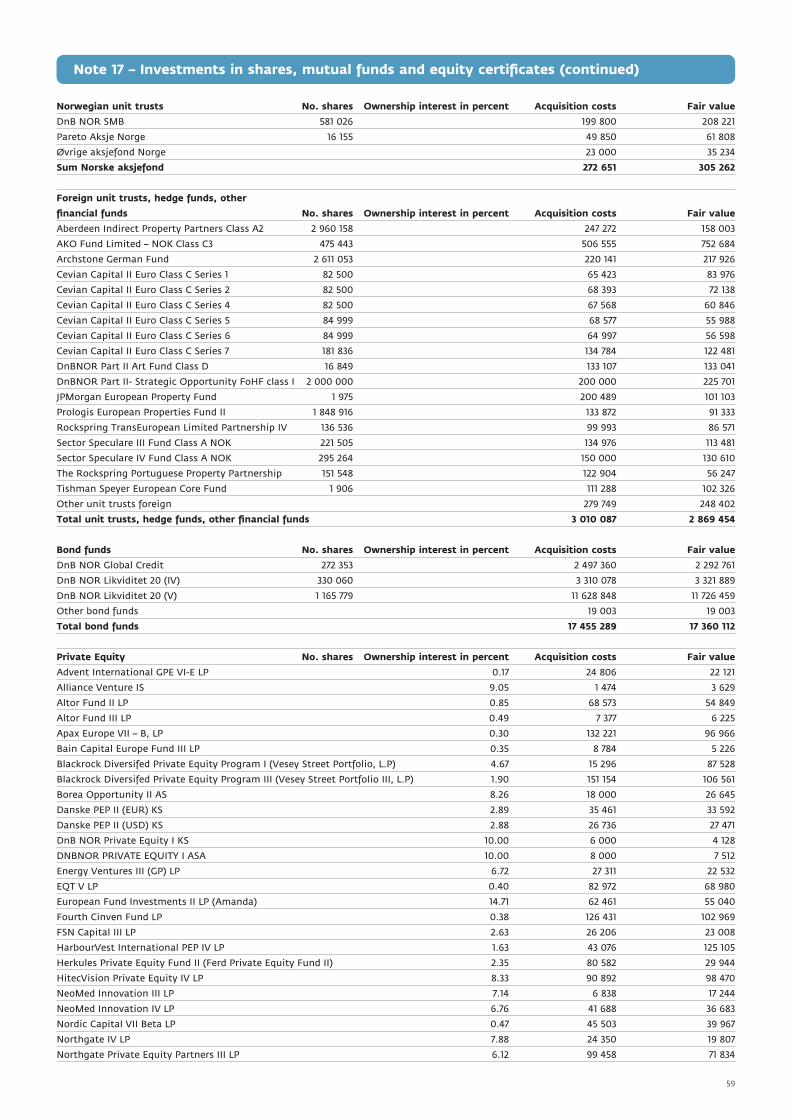
Norwegian unit trusts No. shares Ownership interest in percent Acquisition costs Fair value
DnB NOR SMB 581 026 199 800 208 221
Pareto Aksje Norge 16 155 49 850 61 808
Øvrige aksjefond Norge 23 000 35 234
Sum Norske aksjefond 272 651 305 262
Foreign unit trusts, hedge funds, other
financial funds No. shares Ownership interest in percent Acquisition costs Fair value
Aberdeen Indirect Property Partners Class A2 2 960 158 247 272 158 003
AKO Fund Limited – NOK Class C3 475 443 506 555 752 684
Archstone German Fund 2 611 053 220 141 217 926
Cevian Capital II Euro Class C Series 1 82 500 65 423 83 976
Cevian Capital II Euro Class C Series 2 82 500 68 393 72 138
Cevian Capital II Euro Class C Series 4 82 500 67 568 60 846
Cevian Capital II Euro Class C Series 5 84 999 68 577 55 988
Cevian Capital II Euro Class C Series 6 84 999 64 997 56 598
Cevian Capital II Euro Class C Series 7 181 836 134 784 122 481
DnBNOR Part II Art Fund Class D 16 849 133 107 133 041
DnBNOR Part II- Strategic Opportunity FoHF class I 2 000 000 200 000 225 701
JPMorgan European Property Fund 1 975 200 489 101 103
Prologis European Properties Fund II 1 848 916 133 872 91 333
Rockspring TransEuropean Limited Partnership IV 136 536 99 993 86 571
Sector Speculare III Fund Class A NOK 221 505 134 976 113 481
Sector Speculare IV Fund Class A NOK 295 264 150 000 130 610
The Rockspring Portuguese Property Partnership 151 548 122 904 56 247
Tishman Speyer European Core Fund 1 906 111 288 102 326
Other unit trusts foreign 279 749 248 402
Total unit trusts, hedge funds, other financial funds 3 010 087 2 869 454
Bond funds No. shares Ownership interest in percent Acquisition costs Fair value
DnB NOR Global Credit 272 353 2 497 360 2 292 761
DnB NOR Likviditet 20 (IV) 330 060 3 310 078 3 321 889
DnB NOR Likviditet 20 (V) 1 165 779 11 628 848 11 726 459
Other bond funds 19 003 19 003
Total bond funds 17 455 289 17 360 112
Private Equity No. shares Ownership interest in percent Acquisition costs Fair value
Advent International GPE VI-E LP 0.17 24 806 22 121
Alliance Venture IS 9.05 1 474 3 629
Altor Fund II LP 0.85 68 573 54 849
Altor Fund III LP 0.49 7 377 6 225
Apax Europe VII – B, LP 0.30 132 221 96 966
Bain Capital Europe Fund III LP 0.35 8 784 5 226
Blackrock Diversifed Private Equity Program I (Vesey Street Portfolio, L.P) 4.67 15 296 87 528
Blackrock Diversifed Private Equity Program III (Vesey Street Portfolio III, L.P) 1.90 151 154 106 561
Borea Opportunity II AS 8.26 18 000 26 645
Danske PEP II (EUR) KS 2.89 35 461 33 592
Danske PEP II (USD) KS 2.88 26 736 27 471
DnB NOR Private Equity I KS 10.00 6 000 4 128
DNBNOR PRIVATE EQUITY I ASA 10.00 8 000 7 512
Energy Ventures III (GP) LP 6.72 27 311 22 532
EQT V LP 0.40 82 972 68 980
European Fund Investments II LP (Amanda) 14.71 62 461 55 040
Fourth Cinven Fund LP 0.38 126 431 102 969
FSN Capital III LP 2.63 26 206 23 008
HarbourVest International PEP IV LP 1.63 43 076 125 105
Herkules Private Equity Fund II (Ferd Private Equity Fund II) 2.35 80 582 29 944
HitecVision Private Equity IV LP 8.33 90 892 98 470
NeoMed Innovation III LP 7.14 6 838 17 244
NeoMed Innovation IV LP 6.76 41 688 36 683
Nordic Capital VII Beta LP 0.47 45 503 39 967
Northgate IV LP 7.88 24 350 19 807
Northgate Private Equity Partners III LP 6.12 99 458 71 834
Note 17 – Investments in shares, mutual funds and equity certificates (continued)
59
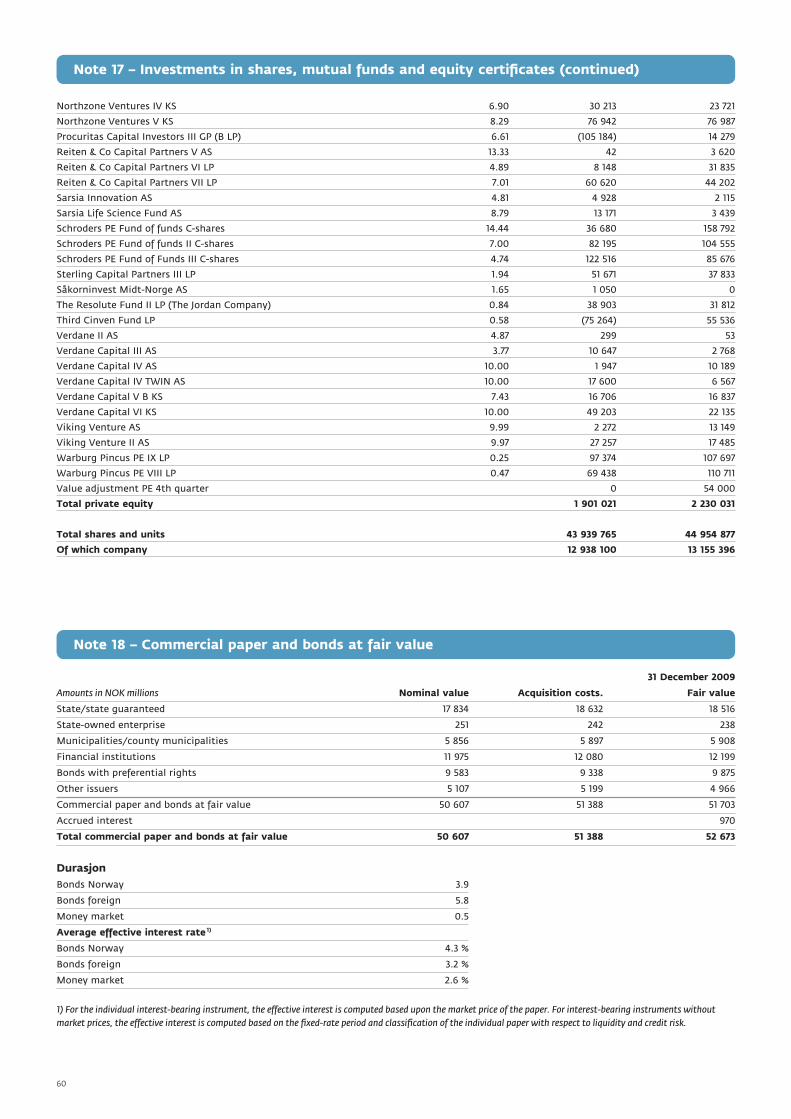
Note 18 – Commercial paper and bonds at fair value
Note 17 – Investments in shares, mutual funds and equity certificates (continued)
Northzone Ventures IV KS 6.90 30 213 23 721
Northzone Ventures V KS 8.29 76 942 76 987
Procuritas Capital Investors III GP (B LP) 6.61 (105 184) 14 279
Reiten & Co Capital Partners V AS 13.33 42 3 620
Reiten & Co Capital Partners VI LP 4.89 8 148 31 835
Reiten & Co Capital Partners VII LP 7.01 60 620 44 202
Sarsia Innovation AS 4.81 4 928 2 115
Sarsia Life Science Fund AS 8.79 13 171 3 439
Schroders PE Fund of funds C-shares 14.44 36 680 158 792
Schroders PE Fund of funds II C-shares 7.00 82 195 104 555
Schroders PE Fund of Funds III C-shares 4.74 122 516 85 676
Sterling Capital Partners III LP 1.94 51 671 37 833
Såkorninvest Midt-Norge AS 1.65 1 050 0
The Resolute Fund II LP (The Jordan Company) 0.84 38 903 31 812
Third Cinven Fund LP 0.58 (75 264) 55 536
Verdane II AS 4.87 299 53
Verdane Capital III AS 3.77 10 647 2 768
Verdane Capital IV AS 10.00 1 947 10 189
Verdane Capital IV TWIN AS 10.00 17 600 6 567
Verdane Capital V B KS 7.43 16 706 16 837
Verdane Capital VI KS 10.00 49 203 22 135
Viking Venture AS 9.99 2 272 13 149
Viking Venture II AS 9.97 27 257 17 485
Warburg Pincus PE IX LP 0.25 97 374 107 697
Warburg Pincus PE VIII LP 0.47 69 438 110 711
Value adjustment PE 4th quarter 0 54 000
Total private equity 1 901 021 2 230 031
Total shares and units 43 939 765 44 954 877
Of which company 12 938 100 13 155 396
31 December 2009
Amounts in NOK millions Nominal value Acquisition costs. Fair value
State/state guaranteed 17 834 18 632 18 516
State-owned enterprise 251 242 238
Municipalities/county municipalities 5 856 5 897 5 908
Financial institutions 11 975 12 080 12 199
Bonds with preferential rights 9 583 9 338 9 875
Other issuers 5 107 5 199 4 966
Commercial paper and bonds at fair value 50 607 51 388 51 703
Accrued interest 970
Total commercial paper and bonds at fair value 50 607 51 388 52 673
Durasjon Bonds Norway 3.9
Bonds foreign 5.8
Money market 0.5
Average effective interest rate
Bonds Norway 4.3 %
Bonds foreign 3.2 %
Money market 2.6 %
1) For the individual interest-bearing instrument, the effective interest is computed based upon the market price of the paper. For interest-bearing instruments without
market prices, the effective interest is computed based on the fixed-rate period and classification of the individual paper with respect to liquidity and credit risk.
1)
60
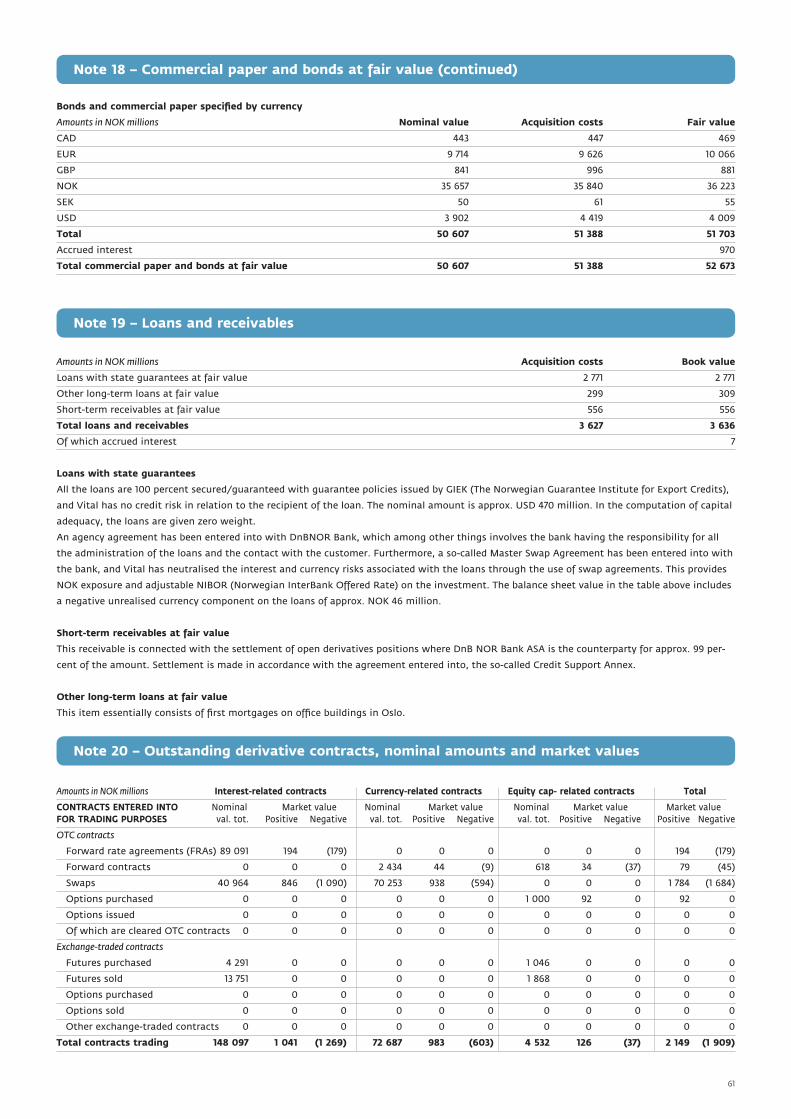
Bonds and commercial paper specified by currency
Amounts in NOK millions Nominal value Acquisition costs Fair value
CAD 443 447 469
EUR 9 714 9 626 10 066
GBP 841 996 881
NOK 35 657 35 840 36 223
SEK 50 61 55
USD 3 902 4 419 4 009
Total 50 607 51 388 51 703
Accrued interest 970
Total commercial paper and bonds at fair value 50 607 51 388 52 673
Note 19 – Loans and receivables
Amounts in NOK millions Acquisition costs Book value
Loans with state guarantees at fair value 2 771 2 771
Other long-term loans at fair value 299 309
Short-term receivables at fair value 556 556
Total loans and receivables 3 627 3 636
Of which accrued interest 7
Loans with state guarantees
All the loans are 100 percent secured/guaranteed with guarantee policies issued by GIEK (The Norwegian Guarantee Institute for Export Credits),
and Vital has no credit risk in relation to the recipient of the loan. The nominal amount is approx. USD 470 million. In the computation of capital
adequacy, the loans are given zero weight.
An agency agreement has been entered into with DnBNOR Bank, which among other things involves the bank having the responsibility for all
the administration of the loans and the contact with the customer. Furthermore, a so-called Master Swap Agreement has been entered into with
the bank, and Vital has neutralised the interest and currency risks associated with the loans through the use of swap agreements. This provides
NOK exposure and adjustable NIBOR (Norwegian InterBank Offered Rate) on the investment. The balance sheet value in the table above includes
a negative unrealised currency component on the loans of approx. NOK 46 million.
Short-term receivables at fair value
This receivable is connected with the settlement of open derivatives positions where DnB NOR Bank ASA is the counterparty for approx. 99 per-
cent of the amount. Settlement is made in accordance with the agreement entered into, the so-called Credit Support Annex.
Other long-term loans at fair value
This item essentially consists of first mortgages on office buildings in Oslo.
Note 20 – Outstanding derivative contracts, nominal amounts and market values
Amounts in NOK millions Interest-related contracts Currency-related contracts Equity cap- related contracts Total
CONTRACTS ENTERED INTO Nominal Market value Nominal Market value Nominal Market value Market value FOR TRADING PURPOSES val. tot. Positive Negative val. tot. Positive Negative val. tot. Positive Negative Positive Negative
OTC contracts
Forward rate agreements (FRAs) 89 091 194 (179) 0 0 0 0 0 0 194 (179)
Forward contracts 0 0 0 2 434 44 (9) 618 34 (37) 79 (45)
Swaps 40 964 846 (1 090) 70 253 938 (594) 0 0 0 1 784 (1 684)
Options purchased 0 0 0 0 0 0 1 000 92 0 92 0
Options issued 0 0 0 0 0 0 0 0 0 0 0
Of which are cleared OTC contracts 0 0 0 0 0 0 0 0 0 0 0
Exchange-traded contracts
Futures purchased 4 291 0 0 0 0 0 1 046 0 0 0 0
Futures sold 13 751 0 0 0 0 0 1 868 0 0 0 0
Options purchased 0 0 0 0 0 0 0 0 0 0 0
Options sold 0 0 0 0 0 0 0 0 0 0 0
Other exchange-traded contracts 0 0 0 0 0 0 0 0 0 0 0
Total contracts trading 148 097 1 041 (1 269) 72 687 983 (603) 4 532 126 (37) 2 149 (1 909)
Note 18 – Commercial paper and bonds at fair value (continued)
61

Note 21 – Other financial assets
Note 22 – Assets in life insurance with investment choice
VITAL FORSIKRING ASA Investment choice Amounts in NOK millions Company portfolio Aggregate portfolio portfolio 2009 2008
Settlement accounts financial 0 318 0 318 1 748
Cash and cash equivalents 54 3 036 0 3 090 3 706
Other 9 920 0 929 4 666
Total as at 31 December 63 4 274 0 4 336 10 120
VITAL FORSIKRING GROUP Investment choice Amounts in NOK millions Company portfolio Aggregate portfolio portfolio 2009 2008
Settlement accounts financial 0 318 0 318 1 748
Cash and cash equivalents 54 3 409 0 3 463 3 706
Other 9 1 138 0 1 147 4 414
Total as at 31 December 63 4 865 0 4 928 9 868
Currency of Returns Savings Price in Price in listed in percent balance inInvestment management Fund name currency NOK fund price last year NOK millions
Alfred Berg Kapitalforvaltning Alfred Berg Gambak (4) 9 952.75 9 952.75 NOK 71.8 114
Carlsson Investment Management Carlson Asian Small Cap (5) 4.57 38.10 EUR 76.6 97
Carlsson Investment Management Carlson SEK Short Bond 25.86 20.95 SEK (7.4) 101
DnBNOR Kapitalforvaltning DnB NOR Bankkonto (1) 1.71 1.71 NOK 2.2 2 275
DnBNOR Kapitalforvaltning DnB NOR Europa (I) (3) 306.78 306.78 NOK 12.8 86
DnBNOR Kapitalforvaltning DnB NOR Miljøinvest (5) 403.10 403.10 NOK 42.8 158
DnBNOR Kapitalforvaltning DnB NOR Navigator (6) 3 973.58 3 973.58 NOK 64.7 117
DnBNOR Kapitalforvaltning DnB NOR Norden(I) (4) 1 275.39 1 275.39 NOK 43.5 93
DnBNOR Kapitalforvaltning DnB NOR Norge Selektiv (I) (4 427.10 427.10 NOK 69.3 175
DnBNOR Kapitalforvaltning DnB NOR Norge(I) (4) 933.86 933.86 NOK 70.5 142
DnBNOR Kapitalforvaltning DnB NOR Obligasjon 20 (I) (1) 1 218.66 1 218.66 NOK 6.2 174
DnBNOR Kapitalforvaltning DnB NOR Pengemarked (1) 1 035.72 1 035.72 NOK 4.9 443
DnBNOR Kapitalforvaltning DnB NOR SMB (5) 357.98 357.98 NOK 95.2 199
East Capital Asset Management East Capital Russland (6) 1 187.77 962.09 SEK 102.6 224
East Capital Asset Management East Capital Østeuropa (5 36.67 29.70 SEK 69.7 157
Erik Penzer Fonder Erik Penser Hedgefund 136.09 110.22 SEK (8.2) 84
FIM FIM Brazil (6) 27.27 227.16 EUR 100.6 161
Holberg Fondsforvaltning Holberg Norden (4) 185.16 185.16 NOK 52 145
Holberg Fondsforvaltning Holberg Norge (4) 314.46 314.46 NOK 72.2 214
JP Morgan Asset Management JPM China Fund A (5) 46.79 271.85 USD 36.2 239
JP Morgan Asset Management JPM India Fund (6) 68.25 396.53 USD 45.5 108
DnBNOR Kapitalforvaltning MasterFund Balanse (3) 138.45 138.45 NOK 24.1 890
DnBNOR Kapitalforvaltning MasterFund Offensiv (5) 114.90 114.90 NOK 25.8 275
DnBNOR Kapitalforvaltning MasterFund Trygg (2) 153.02 153.02 NOK 15.2 903
DnBNOR Kapitalforvaltning Postbanken Balanse (3 138.45 138.45 NOK 0.2 99
DnBNOR Kapitalforvaltning Postbanken Offensiv (5) 114.90 114.90 NOK 0.6 79
DnBNOR Kapitalforvaltning Postbanken Trygg (2) 153.02 153.02 NOK 0.2 133
Skagen AS Skagen Global 869.29 704.04 SEK 6.6 136
Skagen AS Skagen Global (3) 698.91 698.91 NOK 6.6 919
Skagen AS Skagen Kon-Tiki 585.04 473.83 SEK 37.3 96
Skagen AS Skagen Kon-Tiki (6) 470.37 470.37 NOK 37.3 928
Skagen AS Skagen Vekst (4) 1 269.63 1 269.63 NOK 24.5 485
Storebrand Kapitalforvaltning Storebrand Verdi (4) 336.47 336.47 NOK 60.8 178
Total other funds 2 237
VIP Equity Fund 3 625
VIP Bond Fund 3 465
VIP Money Market Fund 1 076
VIP Combination Fund 309
Total 21 337
62

Note 23 – Cash and cash equivalents
Amounts in NOK millions 2009 2008
Cash and cash equivalents in financial assets (note 22) 3 090 3 706
Cash and bank under other assets (note 25) 803 841
Total cash and cash equivalents 3 893 4 547
Of which inter-companyAmounts in NOK millions 2009 accounts comprise
Withholding tax 242 242
Cash in bank and holdings 1 207 695
Other settlement accounts 2 444 0
Total cash and cash equivalents 3 893 937
VITAL FORSIKRING ASA VITAL FORSIKRING GROUP
Amounts in NOK millions 2009 2008 2009 2008
Goodwill 0 0 0 0
Other intangible assets 288 243 288 243
Sum Intangible assets per 31 December 288 243 288 243
Amounts in NOK millions 2009 2008 2009 2008
Fixed assets 36 45 43 45
Holdings, bank 803 841 895 841
Tax assets 34 – 52 –
Other assets 146 196 146 196
Total other assets as at 31 December 1 019 1 082 1 135 1 082
Development Other intangible
VITAL FORSIKRING GROUP of IT-systems assets IT systems Fixed assets Total
Per 31 December 2008
Original acquisition cost 796 0 164 960
Total depreciation and write-downs 2) 553 0 119 672
Book value as at 31 December 2008 243 0 45 289
Year ending 31 December 2009
Book value 243 0 45 289
Addition 1) 126 1 19 145
Write-downs 2 0 0 2
Depreciation 3) 79 0 21 101
Book value as at 31 December 2009 288 1 43 331
As at 31 December 2009
Original acquisition cost 921 1 183 1 105
Total depreciation and write-downs 633 0 140 774
Book value as at 31 December 2009 288 1 43 331
Note 24 – Intangible assets and other assets
63
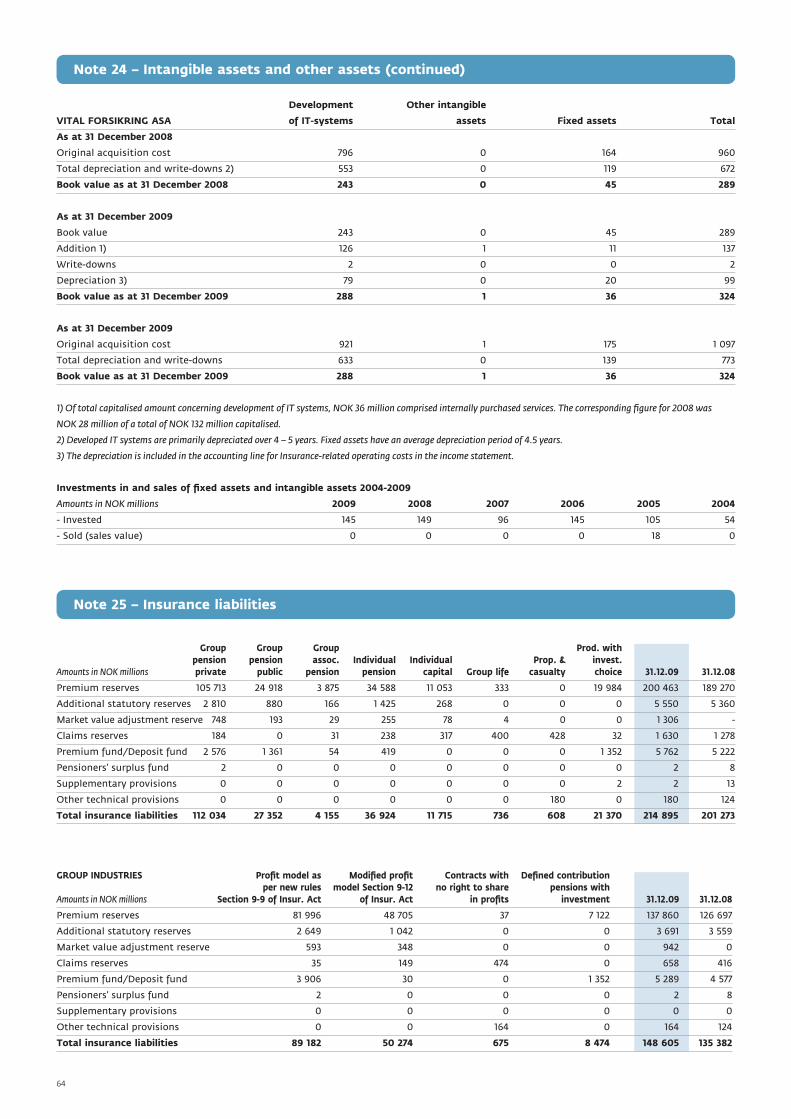
Development Other intangible
VITAL FORSIKRING ASA of IT-systems assets Fixed assets Total
As at 31 December 2008
Original acquisition cost 796 0 164 960
Total depreciation and write-downs 2) 553 0 119 672
Book value as at 31 December 2008 243 0 45 289
As at 31 December 2009
Book value 243 0 45 289
Addition 1) 126 1 11 137
Write-downs 2 0 0 2
Depreciation 3) 79 0 20 99
Book value as at 31 December 2009 288 1 36 324
As at 31 December 2009
Original acquisition cost 921 1 175 1 097
Total depreciation and write-downs 633 0 139 773
Book value as at 31 December 2009 288 1 36 324
1) Of total capitalised amount concerning development of IT systems, NOK 36 million comprised internally purchased services. The corresponding figure for 2008 was
NOK 28 million of a total of NOK 132 million capitalised.
2) Developed IT systems are primarily depreciated over 4 – 5 years. Fixed assets have an average depreciation period of 4.5 years.
3) The depreciation is included in the accounting line for Insurance-related operating costs in the income statement.
Investments in and sales of fixed assets and intangible assets 2004-2009
Amounts in NOK millions 2009 2008 2007 2006 2005 2004
- Invested 145 149 96 145 105 54
- Sold (sales value) 0 0 0 0 18 0
Note 25 – Insurance liabilities
Group Group Group Prod. with pension pension assoc. Individual Individual Prop. & invest. Amounts in NOK millions private public pension pension capital Group life casualty choice 31.12.09 31.12.08
Premium reserves 105 713 24 918 3 875 34 588 11 053 333 0 19 984 200 463 189 270
Additional statutory reserves 2 810 880 166 1 425 268 0 0 0 5 550 5 360
Market value adjustment reserve 748 193 29 255 78 4 0 0 1 306 -
Claims reserves 184 0 31 238 317 400 428 32 1 630 1 278
Premium fund/Deposit fund 2 576 1 361 54 419 0 0 0 1 352 5 762 5 222
Pensioners’ surplus fund 2 0 0 0 0 0 0 0 2 8
Supplementary provisions 0 0 0 0 0 0 0 2 2 13
Other technical provisions 0 0 0 0 0 0 180 0 180 124
Total insurance liabilities 112 034 27 352 4 155 36 924 11 715 736 608 21 370 214 895 201 273
GROUP INDUSTRIES Profit model as Modified profit Contracts with Defined contribution per new rules model Section 9-12 no right to share pensions withAmounts in NOK millions Section 9-9 of Insur. Act of Insur. Act in profits investment 31.12.09 31.12.08
Premium reserves 81 996 48 705 37 7 122 137 860 126 697
Additional statutory reserves 2 649 1 042 0 0 3 691 3 559
Market value adjustment reserve 593 348 0 0 942 0
Claims reserves 35 149 474 0 658 416
Premium fund/Deposit fund 3 906 30 0 1 352 5 289 4 577
Pensioners’ surplus fund 2 0 0 0 2 8
Supplementary provisions 0 0 0 0 0 0
Other technical provisions 0 0 164 0 164 124
Total insurance liabilities 89 182 50 274 675 8 474 148 605 135 382
Note 24 – Intangible assets and other assets (continued)
64
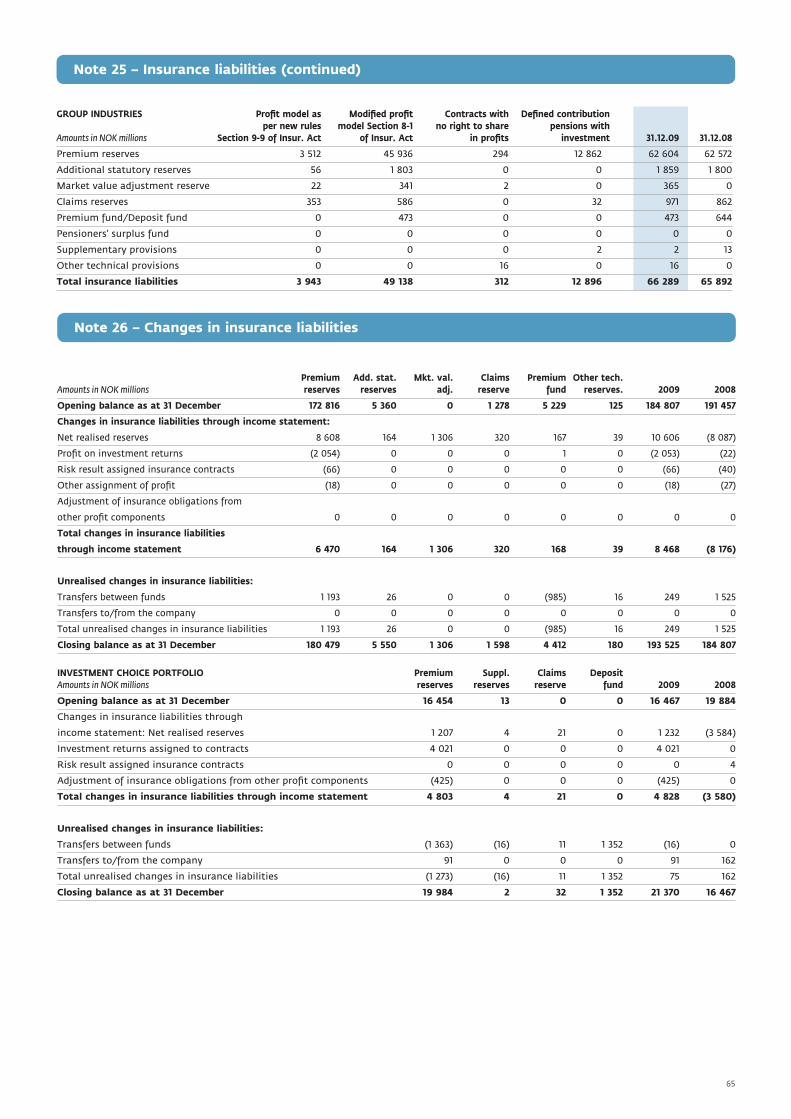
GROUP INDUSTRIES Profit model as Modified profit Contracts with Defined contribution per new rules model Section 8-1 no right to share pensions withAmounts in NOK millions Section 9-9 of Insur. Act of Insur. Act in profits investment 31.12.09 31.12.08
Premium reserves 3 512 45 936 294 12 862 62 604 62 572
Additional statutory reserves 56 1 803 0 0 1 859 1 800
Market value adjustment reserve 22 341 2 0 365 0
Claims reserves 353 586 0 32 971 862
Premium fund/Deposit fund 0 473 0 0 473 644
Pensioners’ surplus fund 0 0 0 0 0 0
Supplementary provisions 0 0 0 2 2 13
Other technical provisions 0 0 16 0 16 0
Total insurance liabilities 3 943 49 138 312 12 896 66 289 65 892
Note 26 – Changes in insurance liabilities
Premium Add. stat. Mkt. val. Claims Premium Other tech. Amounts in NOK millions reserves reserves adj. reserve fund reserves. 2009 2008
Opening balance as at 31 December 172 816 5 360 0 1 278 5 229 125 184 807 191 457
Changes in insurance liabilities through income statement:
Net realised reserves 8 608 164 1 306 320 167 39 10 606 (8 087)
Profit on investment returns (2 054) 0 0 0 1 0 (2 053) (22)
Risk result assigned insurance contracts (66) 0 0 0 0 0 (66) (40)
Other assignment of profit (18) 0 0 0 0 0 (18) (27)
Adjustment of insurance obligations from
other profit components 0 0 0 0 0 0 0 0
Total changes in insurance liabilities
through income statement 6 470 164 1 306 320 168 39 8 468 (8 176)
Unrealised changes in insurance liabilities:
Transfers between funds 1 193 26 0 0 (985) 16 249 1 525
Transfers to/from the company 0 0 0 0 0 0 0 0
Total unrealised changes in insurance liabilities 1 193 26 0 0 (985) 16 249 1 525
Closing balance as at 31 December 180 479 5 550 1 306 1 598 4 412 180 193 525 184 807
INVESTMENT CHOICE PORTFOLIO Premium Suppl. Claims Deposit Amounts in NOK millions reserves reserves reserve fund 2009 2008
Opening balance as at 31 December 16 454 13 0 0 16 467 19 884
Changes in insurance liabilities through
income statement: Net realised reserves 1 207 4 21 0 1 232 (3 584)
Investment returns assigned to contracts 4 021 0 0 0 4 021 0
Risk result assigned insurance contracts 0 0 0 0 0 4
Adjustment of insurance obligations from other profit components (425) 0 0 0 (425) 0
Total changes in insurance liabilities through income statement 4 803 4 21 0 4 828 (3 580)
Unrealised changes in insurance liabilities:
Transfers between funds (1 363) (16) 11 1 352 (16) 0
Transfers to/from the company 91 0 0 0 91 162
Total unrealised changes in insurance liabilities (1 273) (16) 11 1 352 75 162
Closing balance as at 31 December 19 984 2 32 1 352 21 370 16 467
Note 25 – Insurance liabilities (continued)
65
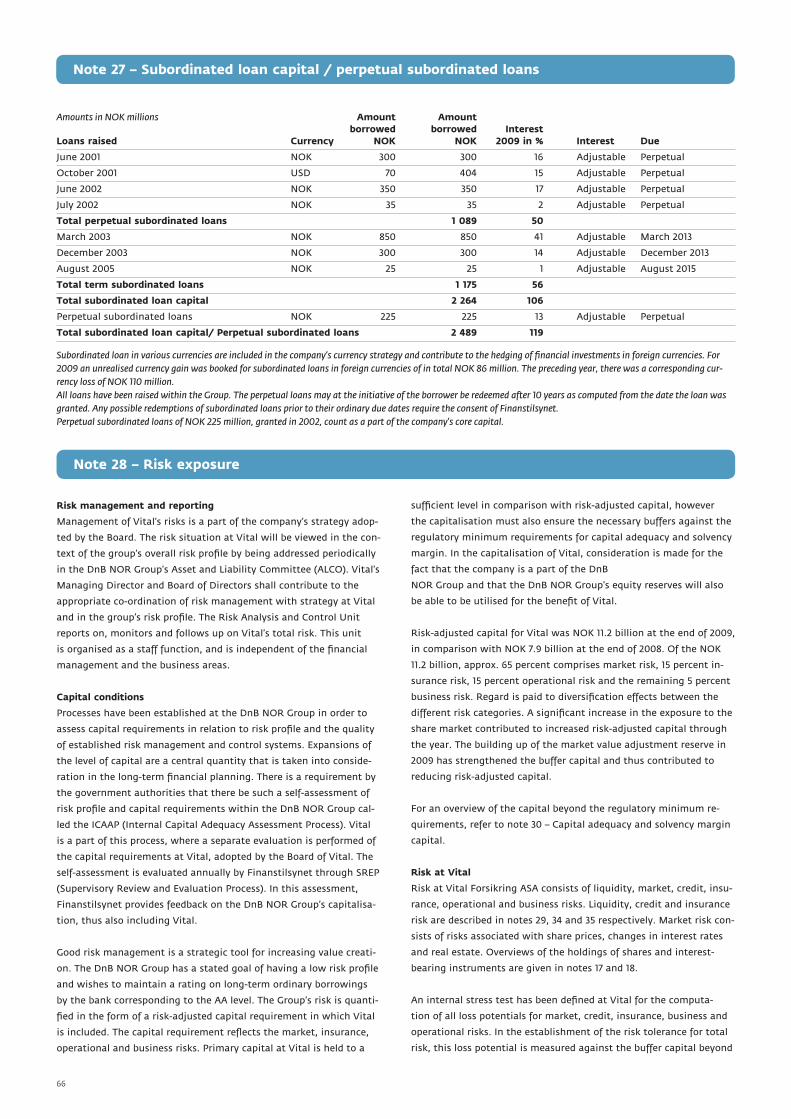
Amounts in NOK millions Amount Amount borrowed borrowed InterestLoans raised Currency NOK NOK 2009 in % Interest Due
June 2001 NOK 300 300 16 Adjustable Perpetual
October 2001 USD 70 404 15 Adjustable Perpetual
June 2002 NOK 350 350 17 Adjustable Perpetual
July 2002 NOK 35 35 2 Adjustable Perpetual
Total perpetual subordinated loans 1 089 50
March 2003 NOK 850 850 41 Adjustable March 2013
December 2003 NOK 300 300 14 Adjustable December 2013
August 2005 NOK 25 25 1 Adjustable August 2015
Total term subordinated loans 1 175 56
Total subordinated loan capital 2 264 106
Perpetual subordinated loans NOK 225 225 13 Adjustable Perpetual
Total subordinated loan capital/ Perpetual subordinated loans 2 489 119
Subordinated loan in various currencies are included in the company’s currency strategy and contribute to the hedging of financial investments in foreign currencies. For
2009 an unrealised currency gain was booked for subordinated loans in foreign currencies of in total NOK 86 million. The preceding year, there was a corresponding cur-
rency loss of NOK 110 million.
All loans have been raised within the Group. The perpetual loans may at the initiative of the borrower be redeemed after 10 years as computed from the date the loan was
granted. Any possible redemptions of subordinated loans prior to their ordinary due dates require the consent of Finanstilsynet.
Perpetual subordinated loans of NOK 225 million, granted in 2002, count as a part of the company’s core capital.
Risk management and reporting
Management of Vital’s risks is a part of the company’s strategy adop-
ted by the Board. The risk situation at Vital will be viewed in the con-
text of the group’s overall risk profile by being addressed periodically
in the DnB NOR Group’s Asset and Liability Committee (ALCO). Vital’s
Managing Director and Board of Directors shall contribute to the
appropriate co-ordination of risk management with strategy at Vital
and in the group’s risk profile. The Risk Analysis and Control Unit
reports on, monitors and follows up on Vital’s total risk. This unit
is organised as a staff function, and is independent of the financial
management and the business areas.
Capital conditions
Processes have been established at the DnB NOR Group in order to
assess capital requirements in relation to risk profile and the quality
of established risk management and control systems. Expansions of
the level of capital are a central quantity that is taken into conside-
ration in the long-term financial planning. There is a requirement by
the government authorities that there be such a self-assessment of
risk profile and capital requirements within the DnB NOR Group cal-
led the ICAAP (Internal Capital Adequacy Assessment Process). Vital
is a part of this process, where a separate evaluation is performed of
the capital requirements at Vital, adopted by the Board of Vital. The
self-assessment is evaluated annually by Finanstilsynet through SREP
(Supervisory Review and Evaluation Process). In this assessment,
Finanstilsynet provides feedback on the DnB NOR Group’s capitalisa-
tion, thus also including Vital.
Good risk management is a strategic tool for increasing value creati-
on. The DnB NOR Group has a stated goal of having a low risk profile
and wishes to maintain a rating on long-term ordinary borrowings
by the bank corresponding to the AA level. The Group’s risk is quanti-
fied in the form of a risk-adjusted capital requirement in which Vital
is included. The capital requirement reflects the market, insurance,
operational and business risks. Primary capital at Vital is held to a
sufficient level in comparison with risk-adjusted capital, however
the capitalisation must also ensure the necessary buffers against the
regulatory minimum requirements for capital adequacy and solvency
margin. In the capitalisation of Vital, consideration is made for the
fact that the company is a part of the DnB
NOR Group and that the DnB NOR Group’s equity reserves will also
be able to be utilised for the benefit of Vital.
Risk-adjusted capital for Vital was NOK 11.2 billion at the end of 2009,
in comparison with NOK 7.9 billion at the end of 2008. Of the NOK
11.2 billion, approx. 65 percent comprises market risk, 15 percent in-
surance risk, 15 percent operational risk and the remaining 5 percent
business risk. Regard is paid to diversification effects between the
different risk categories. A significant increase in the exposure to the
share market contributed to increased risk-adjusted capital through
the year. The building up of the market value adjustment reserve in
2009 has strengthened the buffer capital and thus contributed to
reducing risk-adjusted capital.
For an overview of the capital beyond the regulatory minimum re-
quirements, refer to note 30 – Capital adequacy and solvency margin
capital.
Risk at Vital
Risk at Vital Forsikring ASA consists of liquidity, market, credit, insu-
rance, operational and business risks. Liquidity, credit and insurance
risk are described in notes 29, 34 and 35 respectively. Market risk con-
sists of risks associated with share prices, changes in interest rates
and real estate. Overviews of the holdings of shares and interest-
bearing instruments are given in notes 17 and 18.
An internal stress test has been defined at Vital for the computa-
tion of all loss potentials for market, credit, insurance, business and
operational risks. In the establishment of the risk tolerance for total
risk, this loss potential is measured against the buffer capital beyond
Note 27 – Subordinated loan capital / perpetual subordinated loans
Note 28 – Risk exposure
66

the regulatory requirements. This method is also used as a basis for
the measurement and establishment of the framework for market
and credit risk in asset management. In computing the loss potential
for market and credit risks, a stress test is incorporated for shares,
interest rates, currencies, real estate, spread risks and counterparty
risks respectively.
Financial derivatives are utilised in order to be able to effectuate a
market view / allocations through quick and cost-efficient asset and
market exposures. Furthermore, use of derivatives provides the possi-
bility of performing active risk management of market risk. Deriva-
tives are also used in order to differentiate subportfolios and hedge
currency exposures. Both linear and non-linear derivatives on interest
rates and shares may be utilised in asset management. On overview
of the derivative positions are given in note 32.
Sensitivity analysis
In order to address considerations for minimum diversification, fram-
eworks have been established for each asset class. The frameworks
also limit the concentration risk against a single issuer. A separate
framework has been prepared for use of derivatives in asset manage-
ment. All frameworks for asset management are established annually
by the Board.
The table below shows the change in value and effects on results at
year-end of a price change of 20 percent for shares, an interest rate
change of 1.5 percentage points and a valuation change of 12 percent
for real estate. The sensitivities have been computed individually.
The effect of the change in value on the result is also shown in the
table. The effect on the result depends on the level of additional sta-
tutory reserves and the market value adjustment reserve.
Market risk Change in value Effect on result
Shares 20 % 5 235 668
Shares (20 %) (5 123) (368)
Interest rates 1.5 % (2 794) (175)
Interest rates (1.5 %) 2 794 391
Real estate 12 % 4 172 606
Real estate (12 %) (4 172) (243)
Three stress scenarios are presented below that show a simulated price drop in shares, an interest rate increase and a drop in value of real
estate. Diversifications are not taken into account. In comparison with the prior year, the loss potential has increased and reflects increased risk-
taking throughout the year. Credit risk consists primarily of counterparty risks in derivative contracts and spread risk associated with interest
instruments. At the end of the year this comprised 4 percent of total risk at Vital measured as per Finanstilsynet’s Stress Test 2.
Total loss
Shares Interest rates Real estate 31.12.09 31.12.08
Scenario 1 (20 %) 0.3 % (5 %) 7 466 3 960
Scenario 2 (20 %) 0.5 % (12 %) 10 305 6 993
Scenario 3 (20 %) 1.5 % (12 %) 12 157 9 693
Management of market risk is performed through on-going adjustments of the portfolio for the company’s capital beyond the minimum requi-
rements for capital established by Finanstilsynet. Analyses show that this will improve the risk-adjusted returns over time. The probability of an
extremely negative outcome is reduced, while at the same time the possibilities for participating in an upturn in the share markets are good.
Note 29 – Insurance risk
ANALYSIS OF INSURANCE OBLIGATIONS Investment choice Traditional product Amounts in NOK millions obligations obligations
Balance Sheet as at 31 December 2007 19 868 191 626
Deposits 3 573 13 659
Returns (4 544) (34)
Addition of reserves 1 170 3 203
Disposal of reserves (717) (3 524)
Insurance payments (2 771) (16 442)
Other changes (111) (3 680)
Balance sheet as at 31 December 2008 16 467 184 807
Deposits 3 055 11 411
Returns 4 021 10 225
Addition of reserves 796 3 239
Disposal of reserves (846) (3 754)
Insurance payments (1 799) (10 386)
Other changes (324) (2 018)
Balance sheet as at 31 December 2009 21 370 193 525
Note 28 – Risk exposure (continued)
67
Description of the insurance products
The company offers traditional life and pension insurance, unit-
linked insurance and non-life insurance. A calculation rate is used to
determine provisions and premiums for the traditional products. The
highest calculation rate is set by Finanstilsynet. This interest rate is
often called the base rate, and is 2.75 per cent for new contracts. The
base rate is the annual guaranteed rate of return on policyholders’
funds. In most unit-linked insurance products, policyholders bear the
financial risk. Non-life insurance policies are products generating
payments related to policyholders’ life and health. These products are
not subject to profit sharing and are repriced annually.
Group contracts
Under group defined benefit pensions, pension payments are disbur-
sed from an agreed age and until the death of the policyholder. It can
also be agreed that the pension payments cease at a certain age. A
defined benefit pension may include a retirement pension, disability
pension, dependent’s pension and children’s pension. Group defined-
benefit pensions follow the regulations for the insurance industry
effective from 1 January 2008. This means that policyholders pay in
advance an annual premium for interest rate risk, insurance risk and
administration. The company is entitled to change the premium an-
nually. Interest in excess of the guaranteed rate of return is awarded
to policyholders in its entirety. If the interest is between 0 and the
guaranteed rate of return, the company can use additional allocati-
ons to meet the guaranteed rate of return, otherwise the company
must cover the deficit. A positive risk result may either be used to
increase the risk equalisation fund or be distributed to the policyhol-
ders. No more than 50 per cent of annual profits may be allocated to
the risk equalisation fund. The company must cover any remaining
losses after the risk equalisation fund has been used. The administra-
tion result is allocated in its entirety to the company.
When a member terminates a pension agreement or a pension agre-
ement ends, he or she is entitled to a paid-up policy. Rights earned
on the termination date are continued in paid-up policies. Paid-up
policies have a separate profit model where a minimum of 80 percent
of profits are distributed to policyholders. Profits for distribution
consist of the interest result and the risk result. The administration
result is allocated in its entirety to the company.
Group association insurance is pension insurance taken out by as-
sociations for their members. Association insurance can comprise
retirement pensions, disability pensions, dependent pensions and
children pensions.
Individual contracts
Individual annuity and pension insurance policies are savings sche-
mes whereby the company disburses monthly amounts up until the
death of the policyholder, or until the policyholder reaches an agreed
age. This usually comprises a retirement pension, disability pension,
dependent’s pension and children’s pension.
Individual endowment insurance policies are contracts whereby the
company disburses an agreed amount upon the death of the poli-
cyholder or when the policyholder attains an agreed age. Individual
endowment insurance may also include disability cover, which is a
one-off benefit for permanent disability.
For individual contracts sold prior to 1 January 2008, the past profit-
sharing scheme applies. This then implies that the interest result, the
risk result and the administration result are included in the profits to
be distributed between policyholders and the company. No less than
65 per cent of annual profits must be distributed to policyholders.
The new regulations apply to contracts sold as of 1 January 2008.
Contracts where policyholders bear the risk
Defined-contribution pensions are group pension schemes where the
employees bear the financial risk. However, full or partial hedging of
the paid amount can be bought upon retirement age.
Individual unit-linked insurance polices are endowment insurance
policies or annuity insurance polices where policyholders bear the
financial risk.
Other sectors
Group life insurance policies are death-risk insurance policies taken
out by employers or associations for their employees or members
and, where applicable, also for their spouses and children. The
amount recoverable under the policy is disbursed upon the death of
the policyholder. Group life insurance may also comprise disability
cover, which is a one-off benefit for permanent disability.
Employer’s liability insurance is a one-year risk product which com-
panies link to their pension agreements. This may be corporate group
life insurance or accident insurance. Occupational injury insurance is
mandatory for all enterprises.
Insurance risk
Within life insurance, insurance risk is mainly related to the likeli-
hood of death and disability.
Insurance risk at Vital is divided, in varying degrees, between poli-
cyholders and the company. With respect to the non-life insurance
products employers’ liability insurance and certain pure risk pro-
ducts, the company is exposed to insurance risk. For group pension
agreements and new individual pension and endowment insurance
products, the company’s risk represents its obligation to cover a pos-
sible negative risk result. The company is credited up to 50 per cent
of any positive risk result in the form of allocations to the risk equa-
lisation fund. With respect to individual insurance policies sold prior
to 1 January 2008, the risk result is included in profits for allocation
to policyholders and the company, where the company is entitled to
receive up to 35 percent of annual profits.
Risk for Vital related to changes in mortality rates is twofold. With
respect to mortality risk coverage (mainly dependants’ and children’s
pensions) lower mortality rates will give an improved risk result and
a more limited need for provisions. For pensions that are currently
payable, lower mortality rates will result in extended disbursement
periods and thus require greater provisions. Pursuant to sections
9-11 and 9-25 of the Norwegian Insurance Act, it will be possible to
cover the required increase in reserves relating to insurance risk by
profits from future surpluses on investment results. Due to higher
life expectancy, Vital needs to strengthen recorded premium reserves
within individual pension insurance and group association insurance.
The need for increased reserves is computed to be around NOK two
billion, and an application has been submitted to Finanstilsynet for
an escalation period of 10 years starting in 2009, cf. section 9-25 of
the Insurance Act. Vital made allocations of NOK 177 million in 2009
in accordance with the application submitted to Finanstilsynet.
Disability risk is more exposed to short-term changes. Allocations
covering incurred, unsettled insurance claims are under continu-
ous review. No further needs for strengthening existing provisions
relating to disability pensions or other disability products have been
identified.
With respect to existing contracts, insurance risk is subject to con-
tinual review by analysing and monitoring risk results within each
Note 29 – Insurance risk (continued)
68

industry. In addition, the company applies reinsurance as an instru-
ment to reduce insurance risk. The company’s current reinsurance
contracts cover catastrophes and significant individual risks within
group and individual insurance. The reinsurance agreements imply
that Vital is responsible for risk up to a certain level while the reinsu-
rer covers excess risk up to a maximum defined limit.
In order to reduce insurance risk exposure, it is mandatory that
policyholders undergo a health check before entering into a contract
for individual risk products. Individual health checks are also required
under small-scale group schemes. In connection with the sale of disa-
bility pensions, policyholders are divided into risk categories based
on a tangible risk assessment in each individual case.
Vital Forsikring’s operations are concentrated in Norway. In this mar-
ket, the portfolio is well diversified and without any concentrations
of risk in specific geographical areas or industries.
The risk result arises when empirical data for mortality, disability
and exit risk deviate from the assumptions underlying the calculation
base for premiums and provisions. When the risk result genera-
tes a surplus, the surplus can be allocated to the risk equalisation
fund. The risk equalisation fund cannot exceed 150 percent of the
company’s total risk premiums for the accounting year. If there is
a deficit on the risk result, the risk equalisation fund can be used.
The risk equalisation fund does not apply to risk insurance with a
maximum term of one year, paid-up policies or individual contracts
subject to the former profit sharing model.
GROUP LIFE INSURANCE INDIVIDUAL DEFINED-BENEFIT PENSIONS PENSION SAVINGS RISK RESULT Group association Annuity and Endowment Other Amounts in NOK millions Private Public sector insurance pension insurance insurance sectors Total
Risk result in 2009 1) 262 25 22 (96) 78 (22) 269
Risk result in 2008 17 160 21 (73) 47 (36) 136
Sensitivities – effect on risk result
5 percent reduction in mortality rate (16) (10) (1) (10) 2 12 (23)
10 percent increase in disability rate (113) (33) (1) (14) (9) (48) (218)
1) Of which: Mortality risk 8 40 44 8 71 52 223
Of which pure endowment risk (208) 28 (35) (121) 0 0 (336)
Of which disability rate 462 (43) 13 17 7 (74) 382
The table shows the effect on the risk result for 2009 of given changes in empirical mortality or disability data.
In 2009, additional allocations of NOK 177 million were made within group association, annuity and pension insurance to reflect changes in as-
sumptions about life expectancy.
Permanent changes in the calculation assumptions will require changes in premiums and provisions. With respect to group life insurance and
individual policies sold after 1 January 2008, it will be possible to finance higher premium reserve requirements by the risk result for the year,
or by current or future investment results in accordance with sections 9-11 and 9-25 of the Insurance Act. For individual contracts sold prior to
1 January 2008, rising premium reserve requirements can be financed by profits for allocation or future profits for allocation in accordance with
section 9-25 of the Insurance Act.
Calculation assumptions
Amounts in NOK millions Change Effect on gross premium reserve
Mortality (5 %) 1 740
Disability 10 % 2 037
The table shows the effect of changes in key calculation assumptions on gross premium reserves (NOK millions).
Mortality and disability
The table shows the net annual risk premium for a sum assured of NOK 100 000. For dependant’s pensions, the premium shown is for an annual
disability pension of NOK 10 000 paid from the death of the primary policyholder until the spouse reaches the age of 77. For disability pensions,
the premium shown is for an annual disability pension of NOK 10 000 paid until 67 years of age.
MEN WOMENAmounts in NOK millions 30 yrs 45 yrs 60 yrs 30 yrs 45 yrs 60 yrs
Individual life insurance 136 340 1 447 68 170 724
Individual disability lump sum 223 695 0 333 1 177 0
Individual disability pension 394 1 000 3 229 630 1 900 4 858
Dependant’s pensions in group schemes 20 164 698 17 79 224
Disability pensions in group schemes 254 556 1 114 388 975 1 672
Premiums for individual disability pensions are based on the company’s own experience and were last changed in 2006. Premiums for
dependant’s pensions and disability pensions in group schemes are based upon the company’s own experiences and were last changed in 2008.
Note 29 – Insurance risk (continued)
69

Guaranteed rate of return
The table shows long-term developments in the average guaranteed rate of return for each sector. The guaranteed rate of return is shown as a
percentage of the premium reserve, premium fund and additional allocations, and is measured as at 31 December. The guaranteed rate of return
is gradually reduced each year as the rate for premiums paid within group pensions is guaranteed at 3 percent.
Percent 2009 2008 2007 2006
Group pension insurance, private sector 3.5% 3.6% 3.7% 3.7%
Group pension insurance, public sector 3.1% 3.1% 3.2% 3.2%
Individual pension insurance 3.5% 3.4% 3.4% 3.4%
Individual endowment insurance 3.1% 3.3% 3.4% 3.4%
Group association insurance 4.1% 4.1% 4.1% 4.1%
Total 3.4% 3.5% 3.6% 3.6%
Description of liability adequacy test
In accordance with IFRS 4, the company has assessed whether its premium reserves are adequate to cover its liabilities. If the test shows that the
premium reserves are too low to bear the future liabilities of the company, the difference should be recognised on the test date. Adequacy tests
are implemented each quarter based on the various profit-sharing models.
All tariff rates used by the company are based on past experience within product segments or business sectors. Thus, products may have different
technical rates of interest, mortality and disability assumptions, and may incur different costs. The adequacy test assesses the margins in the
tariff rates.
Long-term interest rate levels indicate the company’s margin relative to the calculation rate used for premium reserves. Norwegian swap rates
are used to estimate the risk-free interest rate in the test.
As at 31 December 2009, the average duration of the liabilities was approximately 16 years, while the average calculation rate was 3.4 percent.
Sensitivity analyses show that the premium reserve is adequate to tolerate long-term swap rates of approximately 4 percent when future increa-
ses in life expectancy are taken into account. The swap rate with a 15-year duration was 4.92 percent as at 31 December 2009. The adequacy test
thus indicated no need for further provisions covering liabilities to policyholders.
Solvency capital
The solvency capital consists of the securities adjustment reserve, additional statutory reserves, the security reserve, equity, subordinated loan
capital and perpetual subordinated loan capital securities and unrealised gains on bonds classified as fixed assets. All these elements, with the
exception of parts of the security reserve can be used to meet the guaranteed rate of return on policyholders’ funds.
Amounts in NOK millions 31.12.09 31.12.2008
Market value adjustment reserve 1 306 0
Additional statutory reserves 5 550 5 360
Security fund 143 97
Equity 10 018 8 740
Subordinated loan capital and perpetual
subordinated loan capital securities 2 489 2 575
Unrealised gains on bonds classified as fixed assets 865 200
Total solvency capital 20 372 16 972
Guaranteed return on policyholders’ funds 6 413 6 376
Note 29 – Insurance risk (continued)
70
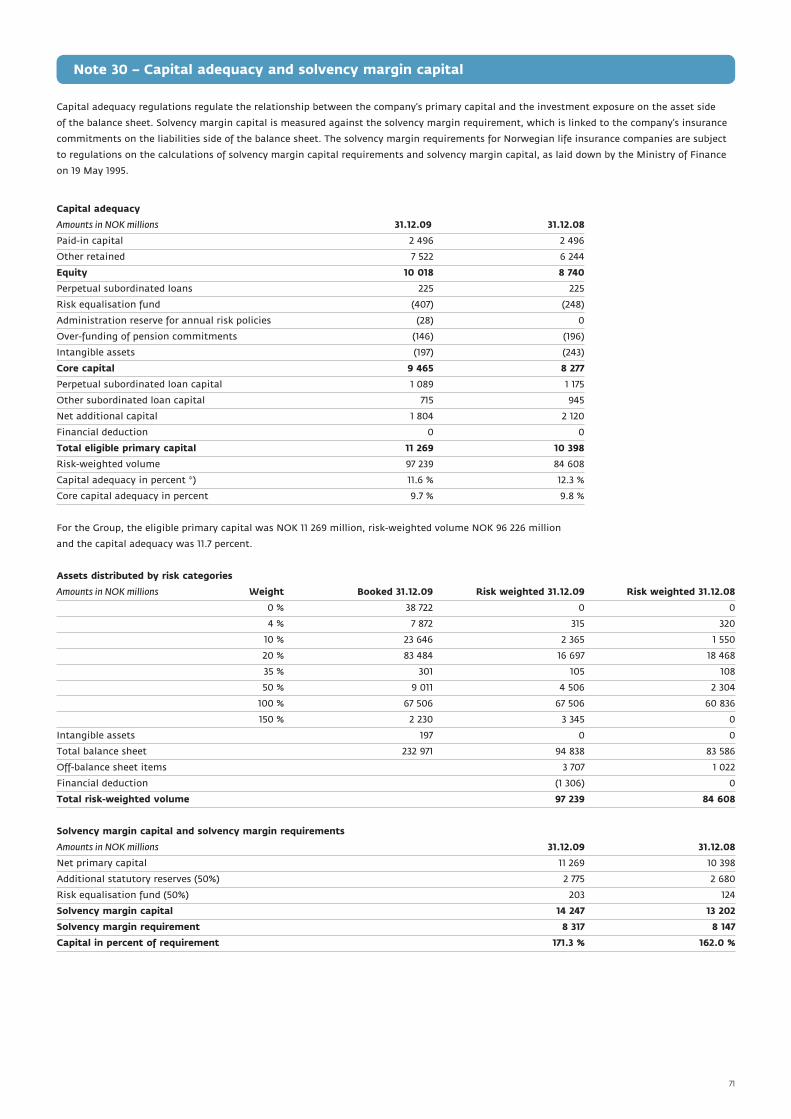
Note 30 – Capital adequacy and solvency margin capital
Capital adequacy regulations regulate the relationship between the company’s primary capital and the investment exposure on the asset side
of the balance sheet. Solvency margin capital is measured against the solvency margin requirement, which is linked to the company’s insurance
commitments on the liabilities side of the balance sheet. The solvency margin requirements for Norwegian life insurance companies are subject
to regulations on the calculations of solvency margin capital requirements and solvency margin capital, as laid down by the Ministry of Finance
on 19 May 1995.
Capital adequacy
Amounts in NOK millions 31.12.09 31.12.08
Paid-in capital 2 496 2 496
Other retained 7 522 6 244
Equity 10 018 8 740
Perpetual subordinated loans 225 225
Risk equalisation fund (407) (248)
Administration reserve for annual risk policies (28) 0
Over-funding of pension commitments (146) (196)
Intangible assets (197) (243)
Core capital 9 465 8 277
Perpetual subordinated loan capital 1 089 1 175
Other subordinated loan capital 715 945
Net additional capital 1 804 2 120
Financial deduction 0 0
Total eligible primary capital 11 269 10 398
Risk-weighted volume 97 239 84 608
Capital adequacy in percent *) 11.6 % 12.3 %
Core capital adequacy in percent 9.7 % 9.8 %
For the Group, the eligible primary capital was NOK 11 269 million, risk-weighted volume NOK 96 226 million
and the capital adequacy was 11.7 percent.
Assets distributed by risk categories
Amounts in NOK millions Weight Booked 31.12.09 Risk weighted 31.12.09 Risk weighted 31.12.08
0 % 38 722 0 0
4 % 7 872 315 320
10 % 23 646 2 365 1 550
20 % 83 484 16 697 18 468
35 % 301 105 108
50 % 9 011 4 506 2 304
100 % 67 506 67 506 60 836
150 % 2 230 3 345 0
Intangible assets 197 0 0
Total balance sheet 232 971 94 838 83 586
Off-balance sheet items 3 707 1 022
Financial deduction (1 306) 0
Total risk-weighted volume 97 239 84 608
Solvency margin capital and solvency margin requirements
Amounts in NOK millions 31.12.09 31.12.08
Net primary capital 11 269 10 398
Additional statutory reserves (50%) 2 775 2 680
Risk equalisation fund (50%) 203 124
Solvency margin capital 14 247 13 202
Solvency margin requirement 8 317 8 147
Capital in percent of requirement 171.3 % 162.0 %
71

Note 31 – Interest rate sensitivity
INTEREST RATE SENSITIVITY BY TIME PERIOD AS AT 31 DECEMBER 2009
Amounts in NOK millions Up to 1 month From 1 month From 3 months From 1 year up to 3 months up to 1 year up to 5 Over 5 years Total
NOK 13 57 55 531 740 1 287
USD 3 86 140 57 198 198
EUR 5 96 4 80 229 205
GBP 1 35 0 4 70 38
Other currencies 2 5 15 5 22 5
INTEREST RATE SENSITIVITY BY TIME PERIOD AS AT 31 DECEMBER 2008
Amounts in NOK millions Up to 1 month From 1 month From 3 months From 1 year up to 3 months up to 1 year up to 5 Over 5 years Total
NOK 6 67 69 564 1 437 2 009
USD 2 31 7 70 165 257
EUR 2 55 2 89 263 406
GBP 0 0 0 6 63 70
Other currency 0 0 1 21 22 44
The above table shows the interest rate sensitivity associated with Vital’s financial assets excluding commercial paper and bonds being held to
maturity.
Duration (Primary mandates) 31.12.09 31.12.08
Bonds Norway – average time remaining to maturity (years) 2) 3.9 4.3
Bonds foreign – average time remaining to maturity (years) 2) 5.8 6.1
Money market – average time remaining to maturity (years) 2) 0.5 0.4
International credit – average time remaining to maturity (years) 2) 5.3 5.2
Average effective interest rate bonds Norway (percent) 1) 4.3 4.1
Average effective interest rate bonds foreign (percent) 1) 3.2 4.1
Average effective interest rate money market (percent) 1) 2.6 3.6
Average effective interest rate international credit (percent) 1) 4.4 8.3
1) For the individual interest-bearing instrument, the effective interest is computed based upon the market value of the paper. The weighting for
the average effective interest rate for the entire holding is done using each individual paper’s portion of the total market value as weights.
2) The duration calculation contains all interest-bearing instruments including derivatives.
72

Note 32 – Quantification of financial derivatives
INTEREST FUTURES
Amounts in NOK millions Underlying value Currency Underlying value Interest rate risk Expiry average 2009
GBP (445) 35 March 10 (384)
EUR (2 607) 92 March 10 (2 220)
USD (6 409) 55 March 10 (4 041)
Total (9 461) 182 (6 646)
INTEREST RATE SWAPS
Amounts in NOK millions Nominal amount Currency Nominal amount currency Nominal amount Interest rate risk Average 2009
EUR 90 5 719 29 6 007
NOK 35 245 35 245 (419) 38 568
USD 0 0 0 86
Total 40 964 (390) 44 661
FRAS
Amounts in NOK millions Nominal amount Currency Nominal amount Interest rate risk Average 2009
NOK 81 000 70 356 233
SEK 8 091 0 7 870
Total 89 091 70 364 103
ASSET SWAPS
Amounts in NOK millions Nominal amount Currency Nominal amount currency Nominal amount Interest rate risk Average 2009
USD (480) (2 734) 3 (3 026)
NOK 2 734 2 734 (3) 3 026
Total 0 0 0
SHARE INDEx FUTURES / SHARE INDEx FORWARDS
Amounts in NOK millions Cash equivalent valueCurrency Cash equivalent value Expiry Average 2009
AUD 0 (14)
CHF 0 (20)
EUR 0 (70)
GBP 0 (51)
JPY 0 (62)
NOK (170) February 10 (1 761)
USD (822) March 10 (596)
Total (992) (2 574)
SHARE INDEx OPTIONS
Amounts in NOK millions Cash equivalent value Currency Cash equivalent value Market value Average 2009
NOK 559 92 47
Total 559 92 47
Fx CONTRACTS, CURRENCY ExPOSURE DISTRIBUTED BY TIME TO MATURITY
Amounts in NOK millions
Currency Under 1 yr 1-3 yrs over 3 yrs Total per currency
AUD (87) 0 0 (87)
CAD (193) 0 0 (193)
CHF (102) 0 0 (102)
DKK (70) 0 0 (70)
EUR (1 874) 0 (4) (1 878)
GBP (257) 0 0 (257)
JPY (7 782) 0 0 (7 782)
SEK (6 706) (1 574) 0 (8 280)
SGD 3 0 0 3
USD (2 332) 0 0 (2 332)
Total (19 401) (1 574) (4) (20 979)
73
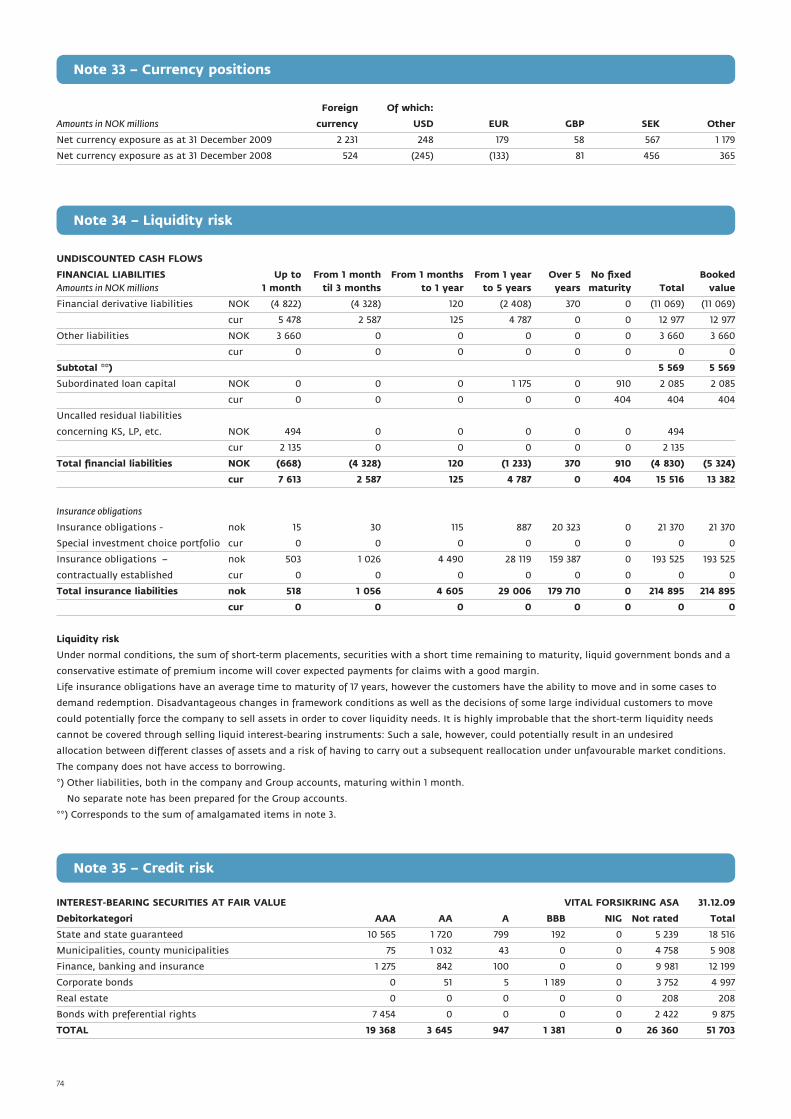
Foreign Of which:
Amounts in NOK millions currency USD EUR GBP SEK Other
Net currency exposure as at 31 December 2009 2 231 248 179 58 567 1 179
Net currency exposure as at 31 December 2008 524 (245) (133) 81 456 365
UNDISCOUNTED CASH FLOWS
FINANCIAL LIABILITIES Up to From 1 month From 1 months From 1 year Over 5 No fixed BookedAmounts in NOK millions 1 month til 3 months to 1 year to 5 years years maturity Total value
Financial derivative liabilities NOK (4 822) (4 328) 120 (2 408) 370 0 (11 069) (11 069)
cur 5 478 2 587 125 4 787 0 0 12 977 12 977
Other liabilities NOK 3 660 0 0 0 0 0 3 660 3 660
cur 0 0 0 0 0 0 0 0
Subtotal **) 5 569 5 569
Subordinated loan capital NOK 0 0 0 1 175 0 910 2 085 2 085
cur 0 0 0 0 0 404 404 404
Uncalled residual liabilities
concerning KS, LP, etc. NOK 494 0 0 0 0 0 494
cur 2 135 0 0 0 0 0 2 135
Total financial liabilities NOK (668) (4 328) 120 (1 233) 370 910 (4 830) (5 324)
cur 7 613 2 587 125 4 787 0 404 15 516 13 382
Insurance obligations
Insurance obligations - nok 15 30 115 887 20 323 0 21 370 21 370
Special investment choice portfolio cur 0 0 0 0 0 0 0 0
Insurance obligations – nok 503 1 026 4 490 28 119 159 387 0 193 525 193 525
contractually established cur 0 0 0 0 0 0 0 0
Total insurance liabilities nok 518 1 056 4 605 29 006 179 710 0 214 895 214 895
cur 0 0 0 0 0 0 0 0
Liquidity risk
Under normal conditions, the sum of short-term placements, securities with a short time remaining to maturity, liquid government bonds and a
conservative estimate of premium income will cover expected payments for claims with a good margin.
Life insurance obligations have an average time to maturity of 17 years, however the customers have the ability to move and in some cases to
demand redemption. Disadvantageous changes in framework conditions as well as the decisions of some large individual customers to move
could potentially force the company to sell assets in order to cover liquidity needs. It is highly improbable that the short-term liquidity needs
cannot be covered through selling liquid interest-bearing instruments: Such a sale, however, could potentially result in an undesired
allocation between different classes of assets and a risk of having to carry out a subsequent reallocation under unfavourable market conditions.
The company does not have access to borrowing.
*) Other liabilities, both in the company and Group accounts, maturing within 1 month.
No separate note has been prepared for the Group accounts.
**) Corresponds to the sum of amalgamated items in note 3.
INTEREST-BEARING SECURITIES AT FAIR VALUE VITAL FORSIKRING ASA 31.12.09
Debitorkategori AAA AA A BBB NIG Not rated Total
State and state guaranteed 10 565 1 720 799 192 0 5 239 18 516
Municipalities, county municipalities 75 1 032 43 0 0 4 758 5 908
Finance, banking and insurance 1 275 842 100 0 0 9 981 12 199
Corporate bonds 0 51 5 1 189 0 3 752 4 997
Real estate 0 0 0 0 0 208 208
Bonds with preferential rights 7 454 0 0 0 0 2 422 9 875
TOTAL 19 368 3 645 947 1 381 0 26 360 51 703
Note 33 – Currency positions
Note 35 – Credit risk
Note 34 – Liquidity risk
74
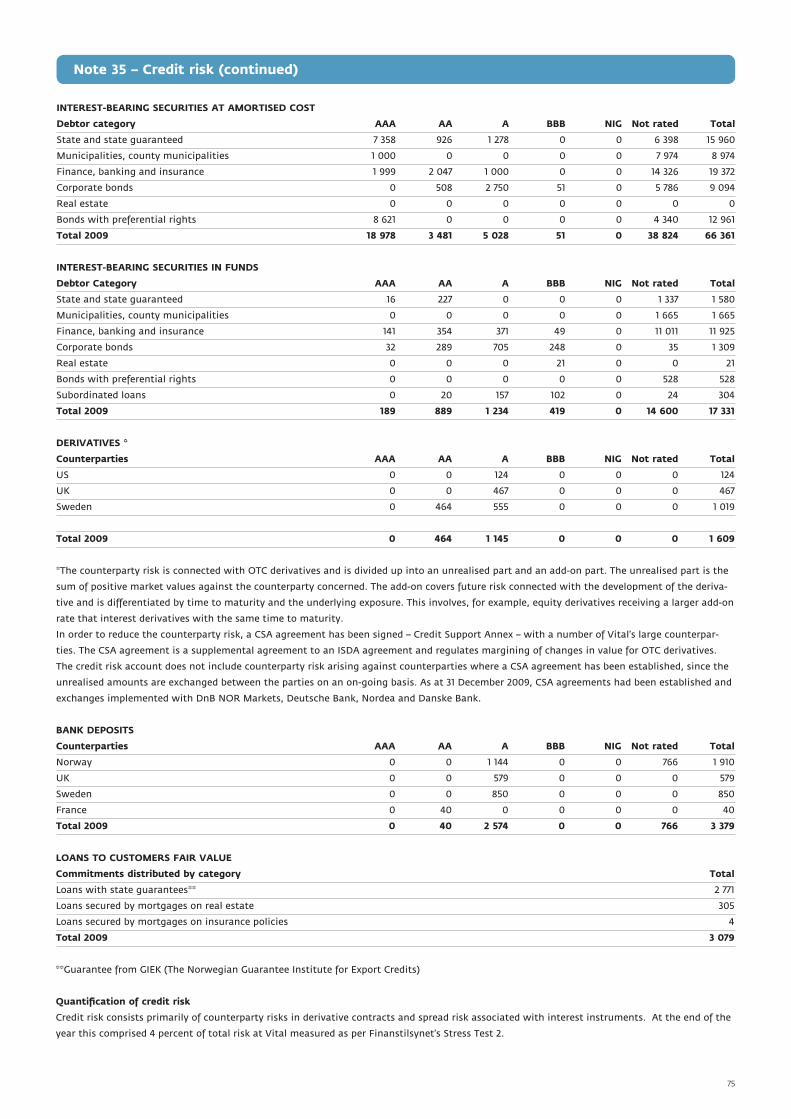
INTEREST-BEARING SECURITIES AT AMORTISED COST
Debtor category AAA AA A BBB NIG Not rated Total
State and state guaranteed 7 358 926 1 278 0 0 6 398 15 960
Municipalities, county municipalities 1 000 0 0 0 0 7 974 8 974
Finance, banking and insurance 1 999 2 047 1 000 0 0 14 326 19 372
Corporate bonds 0 508 2 750 51 0 5 786 9 094
Real estate 0 0 0 0 0 0 0
Bonds with preferential rights 8 621 0 0 0 0 4 340 12 961
Total 2009 18 978 3 481 5 028 51 0 38 824 66 361
INTEREST-BEARING SECURITIES IN FUNDS
Debtor Category AAA AA A BBB NIG Not rated Total
State and state guaranteed 16 227 0 0 0 1 337 1 580
Municipalities, county municipalities 0 0 0 0 0 1 665 1 665
Finance, banking and insurance 141 354 371 49 0 11 011 11 925
Corporate bonds 32 289 705 248 0 35 1 309
Real estate 0 0 0 21 0 0 21
Bonds with preferential rights 0 0 0 0 0 528 528
Subordinated loans 0 20 157 102 0 24 304
Total 2009 189 889 1 234 419 0 14 600 17 331
DERIVATIVES *
Counterparties AAA AA A BBB NIG Not rated Total
US 0 0 124 0 0 0 124
UK 0 0 467 0 0 0 467
Sweden 0 464 555 0 0 0 1 019
Total 2009 0 464 1 145 0 0 0 1 609
*The counterparty risk is connected with OTC derivatives and is divided up into an unrealised part and an add-on part. The unrealised part is the
sum of positive market values against the counterparty concerned. The add-on covers future risk connected with the development of the deriva-
tive and is differentiated by time to maturity and the underlying exposure. This involves, for example, equity derivatives receiving a larger add-on
rate that interest derivatives with the same time to maturity.
In order to reduce the counterparty risk, a CSA agreement has been signed – Credit Support Annex – with a number of Vital’s large counterpar-
ties. The CSA agreement is a supplemental agreement to an ISDA agreement and regulates margining of changes in value for OTC derivatives.
The credit risk account does not include counterparty risk arising against counterparties where a CSA agreement has been established, since the
unrealised amounts are exchanged between the parties on an on-going basis. As at 31 December 2009, CSA agreements had been established and
exchanges implemented with DnB NOR Markets, Deutsche Bank, Nordea and Danske Bank.
BANK DEPOSITS
Counterparties AAA AA A BBB NIG Not rated Total
Norway 0 0 1 144 0 0 766 1 910
UK 0 0 579 0 0 0 579
Sweden 0 0 850 0 0 0 850
France 0 40 0 0 0 0 40
Total 2009 0 40 2 574 0 0 766 3 379
LOANS TO CUSTOMERS FAIR VALUE
Commitments distributed by category Total
Loans with state guarantees** 2 771
Loans secured by mortgages on real estate 305
Loans secured by mortgages on insurance policies 4
Total 2009 3 079
**Guarantee from GIEK (The Norwegian Guarantee Institute for Export Credits)
Quantification of credit risk
Credit risk consists primarily of counterparty risks in derivative contracts and spread risk associated with interest instruments. At the end of the
year this comprised 4 percent of total risk at Vital measured as per Finanstilsynet’s Stress Test 2.
Note 35 – Credit risk (continued)
75

Note 36 – Remuneration, etc.
Pursuant to section 6-16a of the Norwegian Public Limited
Companies Act, the Board of Directors will present the following
remuneration guidelines to the Annual General Meeting:
”The Board of Directors’ statement on the stipulation of salaries
and other remunerations to senior executives
DnB NOR’s guidelines for determining remunerations to the group
chief executive and other members of the group management team
should, at all times, support prevailing strategy and values, while
contributing to the attainment of the Group’s targets. The remune-
rations should inspire conduct to build the desired corporate culture
with respect to performance and profit orientation. In connection
with this statement, the Board of Directors has passed no resolution
entailing changes to the principles for the stipulation of remunera-
tions compared with statements presented previously.
Decision-making process
The Board of Directors in DnB NOR ASA has established a compen-
sation committee consisting of three members: the chairman of the
Board, the vice-chairman and one board member.
The Compensation Committee prepares matters for the Board of
Directors and has the following main responsibilities:
• Annually evaluate and present its recommendations regarding the
total remuneration awarded to the group chief executive
• Annually prepare a recommendation for the group chief executive’s
score card
• Based on suggestions from the group chief executive, decide the re-
muneration and other key benefits awarded to the group executive
vice president, Group Audit
• Act in an advisory capacity to the group chief executive regarding
remunerations and other key benefits for members of the group
management team and, when applicable, for others who report to
the group chief executive
• Consider other matters as decided by the Board of Directors and/or
the Compensation Committee
• Evaluate other personnel-related issues which can be assumed to
entail great risk to the Group’s reputation
A. Guidelines for the coming accounting year
Remuneration to the group chief executive:
The total remuneration to the group chief executive consists of basic
salary (main element), benefits in kind, variable salary, and pension
and insurance schemes. The total remuneration is determined based
on a total evaluation, and the variable part of the salary is primarily
based on the following elements: financial performance, customer
satisfaction, employee satisfaction and the DnB NOR Group’s repu-
tation.
The basic salary is subject to an annual evaluation and is determined
based on general salary levels in the labour market and especially in
the financial industry.
Variable salary to the group chief executive is determined based on
specific performance measurements of defined target areas stipula-
ted in the group chief executive’s score card and an overall discretio-
nary assessment. Variable salary cannot exceed 50 per cent of fixed
salary. The group chief executive is not awarded performance-based
payments other than the stated bonus.
In addition to variable salary, the group chief executive can be gran-
ted benefits in kind such as company car, newspapers/periodicals and
telephone schemes. Benefits in kind should be relevant to the group
chief executive’s function or in line with market practice, and should
not be significant relative to the group chief executive’s basic salary.
The Group will respect the agreement entered into with the group
chief executive, whereby his retirement age is 60 years with a pen-
sion representing 70 per cent of fixed salary. If employment is termi-
nated prior to the age of 60, the pension will be paid from the age
of 60 with the deduction of 1/14 of the pension amount for each full
year remaining to his 60th birthday. According to the agreement, the
group chief executive is entitled to a termination payment for two
years if employment is terminated prior to the age of 60. If, during
this period, the group chief executive receives income from other
employment, the termination payment will be reduced by an amount
corresponding to the salary received from this employment. Benefits
in kind will be maintained for a period of three months.
Remuneration to other senior executives:
The group chief executive determines the remunerations to senior
executives in agreement with the Chairman of the Board of Direc-
tors. The Board of Directors will honour existing binding agreements.
The total remuneration to senior executives consists of basic salary
(main element), benefits in kind, variable salary, and pension and
insurance schemes. The total remuneration is determined based on
the need to offer competitive terms in the various business areas.
The remunerations should promote the Group’s competitiveness in
the relevant labour market, as well as the Group’s profitability, inclu-
ding the desired trend in income and costs. The total remuneration
must neither pose a threat to DnB NOR’s reputation nor be market-
leading, but should ensure that DnB NOR attracts and retains senior
executives with the desired skills and experience.
The basic salary is subject to an annual evaluation and is determined
based on general salary levels in the labour market and especially in
the financial industry.
Benefits in kind may be offered to senior executives to the extent the
benefits have a relevant connection to the employee’s function in the
Group or are in line with market practice. The benefits should not be
significant relative to the employee’s basic salary.
Variable salary is determined based on specific performance mea-
surements of defined target areas stipulated in the executive’s
scorecard and an overall discretionary judgement. The scheme should
be performance-based without exposing the Group to unwanted
risk, nor should the scheme pose a threat to DnB NOR’s reputation.
Variable salary (bonus) cannot exceed 50 per cent of fixed salary. The
Board of Directors can make exceptions for certain positions if this
is necessary to ensure competitive terms. Though the total remu-
neration in the latter case should be competitive, it should not be
market-leading.
Pension schemes and any agreements on termination payments etc.
should be considered relative to other remuneration and should en-
sure competitive terms. The various components in pension schemes
and severance pay, either alone or together, must not be such that
they could pose a threat to DnB NOR’s reputation.
76

Note 36 – Remuneration, etc. (continued)
As a main rule, senior executives are entitled to a pension at the
age of 65, though this can be deviated from. In accordance with the
Group’s pension scheme for all employees, defined-benefit pension
entitlements should not exceed 70 per cent of fixed salary and should
constitute maximum 12 times the National Insurance basic amount.
However, the DnB NOR Group will honour existing agreements.
As a main rule, no termination payment agreements will be signed.
However, the Group will honour existing agreements.
When entering into new agreements, the guidelines generally apply
and comprise all senior executives.
See table of remunerations for senior executives below.
B. Binding guidelines for shares, subscription rights, options etc.
for the coming accounting year
An amount corresponding to 20 per cent of the gross earned variable
salary of the group chief executive and senior executives is invested
in shares in DnB NOR ASA. The shares have a minimum holding
period of two years. Guidelines have been established.
No additional shares, subscription rights, options or other forms of
remuneration only linked to shares or only to developments in the
share price of the company or other companies within the Group,
will be awarded to the group chief executive or senior executives.
The group chief executive and senior executives are, however, given
the opportunity to participate in a share subscription scheme on the
same terms as other employees in the DnB NOR Group.
C. Statement on the senior executive salary policy in the previous
account year
A new group executive vice president joined the Group on 1 April
2009, whose employment agreement stipulates ordinary pension
terms and a retirement age of 65 years. In addition, a group executi-
ve vice president was appointed on 1 July 2009 from another position
in the Group, whose existing pension agreement has been retained.
Group chief executive Rune Bjerke chose to renounce nominal wage
increases and bonus payments in 2009 (based on the Group’s finan-
cial performance in 2008).
As in previous years, the performance-based pay agreement for 2009
for the head of DnB NOR Markets deviates from the model used
for the other group executive vice presidents. The agreement has a
higher maximum limit, and the performance-based pay earned in
2009, excluding tax, will in its entirety be invested in shares in DnB
NOR ASA. The shares have a minimum holding period of three years.
In all other respects, the guidelines determined for 2009 have been
followed.
D. Statement on the effects for the company and the sharehol-
ders of remuneration agreements awarding shares, subscrip-
tion rights, options etc.
An amount corresponding to 20 per cent of the gross earned variable
salary of the group chief executive and senior executives is invested
in shares in DnB NOR ASA. The Board of Directors believes that the
awarding of shares to senior executives, in view of the total number
of shares in the company, will have no negative consequences for the
company or the shareholders.”
Paid Bonus Total Bonus Present remuneration Paid earned in Benefits remun earned in Loans Accrued value of Fixed annual in salaries in 2008, paid in kind in eration 2009, paid as at pension pension Amounts in NOK thousands 31.12.09 1) 2009 2) 2009 3) in 2009 i 2009 in 2009 in 2010 31.12.09 4) expenses 5) agreem. 5)
BOARD OF DIRECTORS OF
VITAL FORSIKRING ASA
Rune Bjerke, Chairman 4 437 0 4 639 0 305 4 945 676 106 3 272 8 846
Bjørn Erik Næss, Vice-chairman 3 186 0 3 187 956 195 4 339 1 045 2 644 2 704 4 646
Cathrine Klouman 2 098 0 2 133 629 161 2 923 797 3 639 952 5 657
Lars Rosén - 195 - - 0 195 - 0 - -
Siri Pettersen Strandenes - 540 - - 1 541 - 0 - -
Tove E. Pettersen - 195 - - 1 196 - 1 916 - -
Rune Selmar, from 17.06.09 - 105 - - 0 105 - 0 - -
Kari Oldrud Moen, from 17.06.09 1 383 0 1 498 277 146 1 921 598 0 381 1 327
Vibeke Holsen, employee-elected 446 195 1 208 0 25 1 428 10 3 413 228 2 926
Jørn Kvilhaug, employee-elected 908 455 1 051 0 17 1 523 10 745 128 4 700
Oddmunn Johan Olsen, employee-elected from 17.06.09 561 104 726 10 19 859 10 1 225 72 1 695
Tom Grøndahl, until 17.06.09 - 0 3 003 0 93 3 096 - 1 587 0
Bjørg Ven, until 09.03.09 - 35 - - 1 36 - - - -
Kristin Birkeland, employee-elected until 17.06.09 363 90 351 0 14 455 10 31 19 137
Total Board 13 382 1 915 17 796 1 872 977 22 560 3 156 13 719 8 342 29 934
77
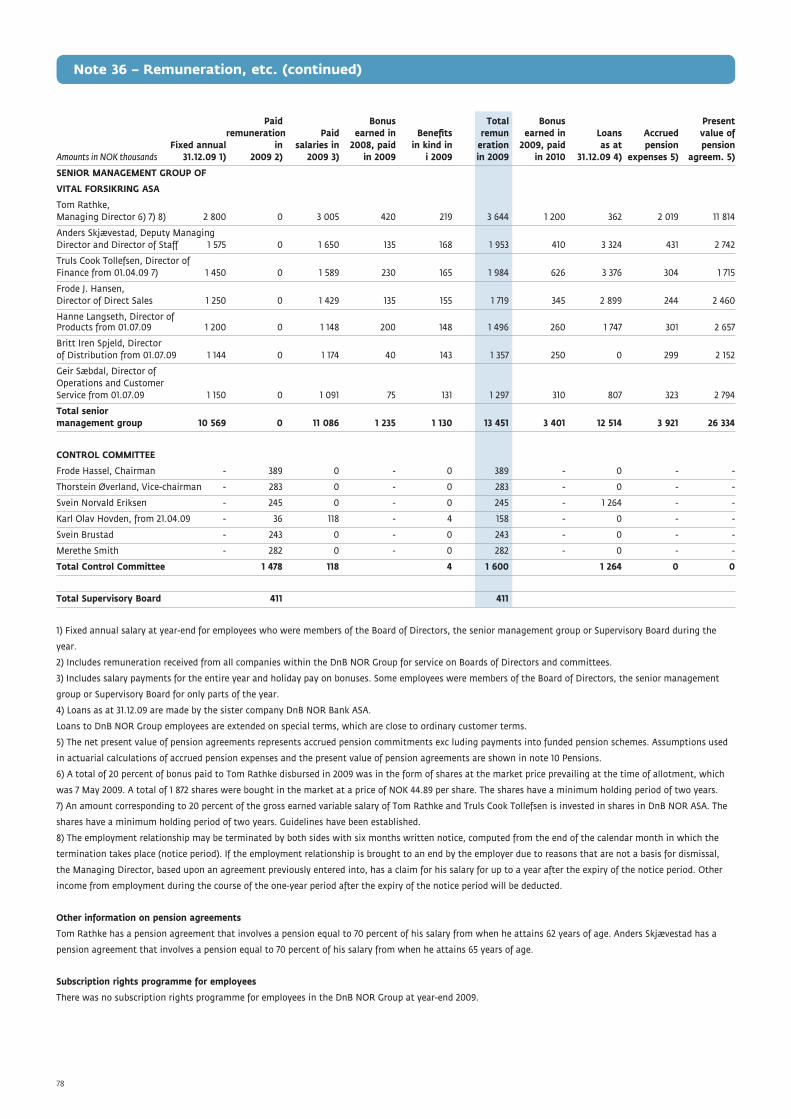
Paid Bonus Total Bonus Present remuneration Paid earned in Benefits remun earned in Loans Accrued value of Fixed annual in salaries in 2008, paid in kind in eration 2009, paid as at pension pension Amounts in NOK thousands 31.12.09 1) 2009 2) 2009 3) in 2009 i 2009 in 2009 in 2010 31.12.09 4) expenses 5) agreem. 5)
SENIOR MANAGEMENT GROUP OF
VITAL FORSIKRING ASA
Tom Rathke, Managing Director 6) 7) 8) 2 800 0 3 005 420 219 3 644 1 200 362 2 019 11 814
Anders Skjævestad, Deputy Managing Director and Director of Staff 1 575 0 1 650 135 168 1 953 410 3 324 431 2 742
Truls Cook Tollefsen, Director of Finance from 01.04.09 7) 1 450 0 1 589 230 165 1 984 626 3 376 304 1 715
Frode J. Hansen, Director of Direct Sales 1 250 0 1 429 135 155 1 719 345 2 899 244 2 460
Hanne Langseth, Director of Products from 01.07.09 1 200 0 1 148 200 148 1 496 260 1 747 301 2 657
Britt Iren Spjeld, Director of Distribution from 01.07.09 1 144 0 1 174 40 143 1 357 250 0 299 2 152
Geir Sæbdal, Director of Operations and Customer Service from 01.07.09 1 150 0 1 091 75 131 1 297 310 807 323 2 794
Total senior management group 10 569 0 11 086 1 235 1 130 13 451 3 401 12 514 3 921 26 334
CONTROL COMMITTEE
Frode Hassel, Chairman - 389 0 - 0 389 - 0 - -
Thorstein Øverland, Vice-chairman - 283 0 - 0 283 - 0 - -
Svein Norvald Eriksen - 245 0 - 0 245 - 1 264 - -
Karl Olav Hovden, from 21.04.09 - 36 118 - 4 158 - 0 - -
Svein Brustad - 243 0 - 0 243 - 0 - -
Merethe Smith - 282 0 - 0 282 - 0 - -
Total Control Committee 1 478 118 4 1 600 1 264 0 0
Total Supervisory Board 411 411
1) Fixed annual salary at year-end for employees who were members of the Board of Directors, the senior management group or Supervisory Board during the
year.
2) Includes remuneration received from all companies within the DnB NOR Group for service on Boards of Directors and committees.
3) Includes salary payments for the entire year and holiday pay on bonuses. Some employees were members of the Board of Directors, the senior management
group or Supervisory Board for only parts of the year.
4) Loans as at 31.12.09 are made by the sister company DnB NOR Bank ASA.
Loans to DnB NOR Group employees are extended on special terms, which are close to ordinary customer terms.
5) The net present value of pension agreements represents accrued pension commitments exc luding payments into funded pension schemes. Assumptions used
in actuarial calculations of accrued pension expenses and the present value of pension agreements are shown in note 10 Pensions.
6) A total of 20 percent of bonus paid to Tom Rathke disbursed in 2009 was in the form of shares at the market price prevailing at the time of allotment, which
was 7 May 2009. A total of 1 872 shares were bought in the market at a price of NOK 44.89 per share. The shares have a minimum holding period of two years.
7) An amount corresponding to 20 percent of the gross earned variable salary of Tom Rathke and Truls Cook Tollefsen is invested in shares in DnB NOR ASA. The
shares have a minimum holding period of two years. Guidelines have been established.
8) The employment relationship may be terminated by both sides with six months written notice, computed from the end of the calendar month in which the
termination takes place (notice period). If the employment relationship is brought to an end by the employer due to reasons that are not a basis for dismissal,
the Managing Director, based upon an agreement previously entered into, has a claim for his salary for up to a year after the expiry of the notice period. Other
income from employment during the course of the one-year period after the expiry of the notice period will be deducted.
Other information on pension agreements
Tom Rathke has a pension agreement that involves a pension equal to 70 percent of his salary from when he attains 62 years of age. Anders Skjævestad has a
pension agreement that involves a pension equal to 70 percent of his salary from when he attains 65 years of age.
Subscription rights programme for employees
There was no subscription rights programme for employees in the DnB NOR Group at year-end 2009.
Note 36 – Remuneration, etc. (continued)
78
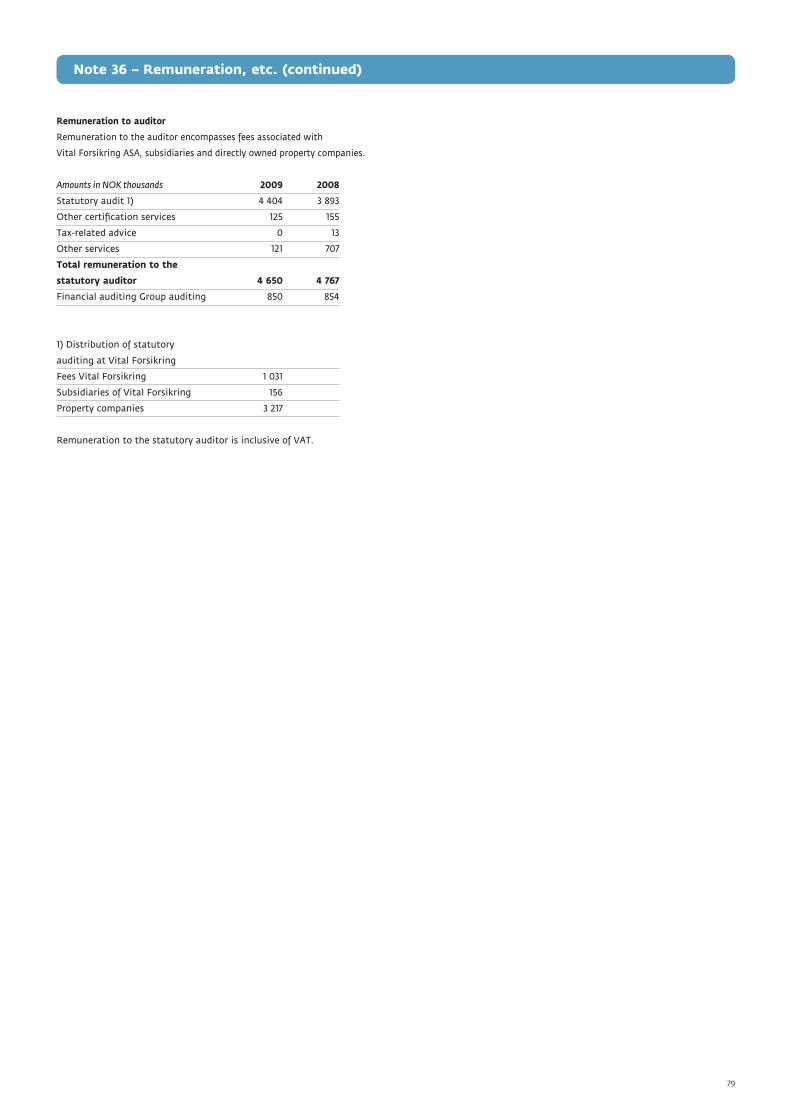
Remuneration to auditor
Remuneration to the auditor encompasses fees associated with
Vital Forsikring ASA, subsidiaries and directly owned property companies.
Amounts in NOK thousands 2009 2008
Statutory audit 1) 4 404 3 893
Other certification services 125 155
Tax-related advice 0 13
Other services 121 707
Total remuneration to the
statutory auditor 4 650 4 767
Financial auditing Group auditing 850 854
1) Distribution of statutory
auditing at Vital Forsikring
Fees Vital Forsikring 1 031
Subsidiaries of Vital Forsikring 156
Property companies 3 217
Remuneration to the statutory auditor is inclusive of VAT.
Note 36 – Remuneration, etc. (continued)
79
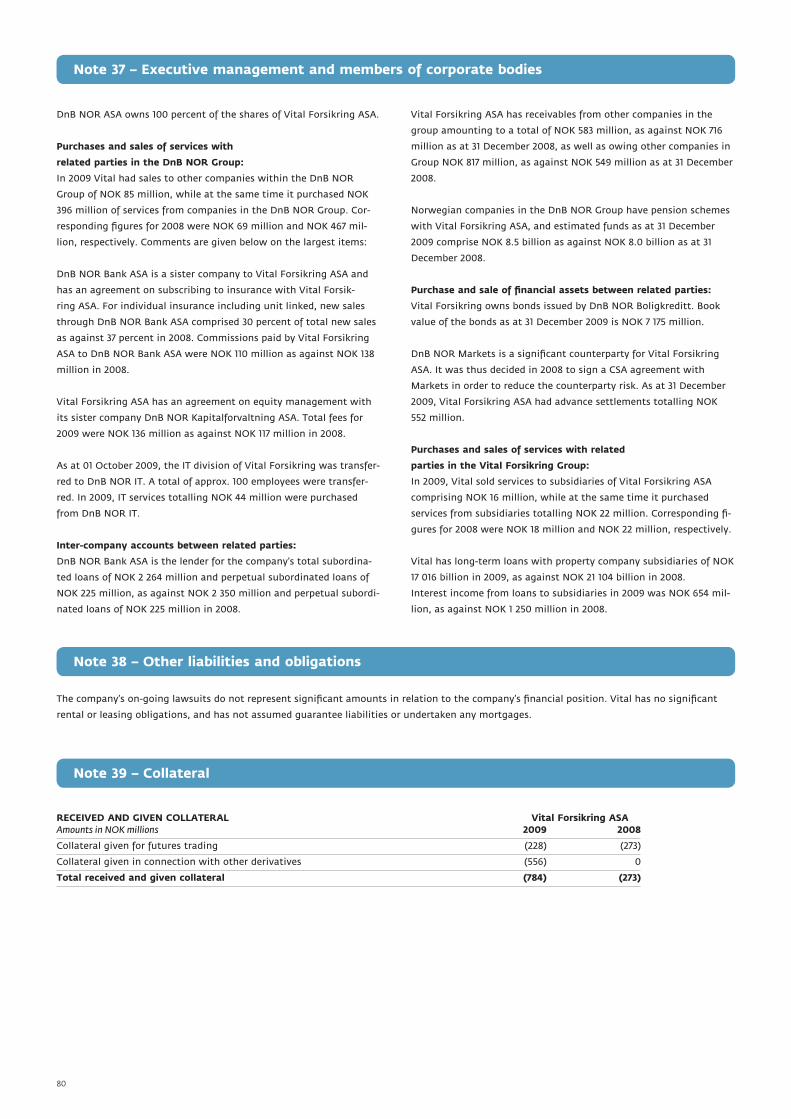
Note 37 – Executive management and members of corporate bodies
Note 38 – Other liabilities and obligations
Note 39 – Collateral
DnB NOR ASA owns 100 percent of the shares of Vital Forsikring ASA.
Purchases and sales of services with
related parties in the DnB NOR Group:
In 2009 Vital had sales to other companies within the DnB NOR
Group of NOK 85 million, while at the same time it purchased NOK
396 million of services from companies in the DnB NOR Group. Cor-
responding figures for 2008 were NOK 69 million and NOK 467 mil-
lion, respectively. Comments are given below on the largest items:
DnB NOR Bank ASA is a sister company to Vital Forsikring ASA and
has an agreement on subscribing to insurance with Vital Forsik-
ring ASA. For individual insurance including unit linked, new sales
through DnB NOR Bank ASA comprised 30 percent of total new sales
as against 37 percent in 2008. Commissions paid by Vital Forsikring
ASA to DnB NOR Bank ASA were NOK 110 million as against NOK 138
million in 2008.
Vital Forsikring ASA has an agreement on equity management with
its sister company DnB NOR Kapitalforvaltning ASA. Total fees for
2009 were NOK 136 million as against NOK 117 million in 2008.
As at 01 October 2009, the IT division of Vital Forsikring was transfer-
red to DnB NOR IT. A total of approx. 100 employees were transfer-
red. In 2009, IT services totalling NOK 44 million were purchased
from DnB NOR IT.
Inter-company accounts between related parties:
DnB NOR Bank ASA is the lender for the company’s total subordina-
ted loans of NOK 2 264 million and perpetual subordinated loans of
NOK 225 million, as against NOK 2 350 million and perpetual subordi-
nated loans of NOK 225 million in 2008.
Vital Forsikring ASA has receivables from other companies in the
group amounting to a total of NOK 583 million, as against NOK 716
million as at 31 December 2008, as well as owing other companies in
Group NOK 817 million, as against NOK 549 million as at 31 December
2008.
Norwegian companies in the DnB NOR Group have pension schemes
with Vital Forsikring ASA, and estimated funds as at 31 December
2009 comprise NOK 8.5 billion as against NOK 8.0 billion as at 31
December 2008.
Purchase and sale of financial assets between related parties:
Vital Forsikring owns bonds issued by DnB NOR Boligkreditt. Book
value of the bonds as at 31 December 2009 is NOK 7 175 million.
DnB NOR Markets is a significant counterparty for Vital Forsikring
ASA. It was thus decided in 2008 to sign a CSA agreement with
Markets in order to reduce the counterparty risk. As at 31 December
2009, Vital Forsikring ASA had advance settlements totalling NOK
552 million.
Purchases and sales of services with related
parties in the Vital Forsikring Group:
In 2009, Vital sold services to subsidiaries of Vital Forsikring ASA
comprising NOK 16 million, while at the same time it purchased
services from subsidiaries totalling NOK 22 million. Corresponding fi-
gures for 2008 were NOK 18 million and NOK 22 million, respectively.
Vital has long-term loans with property company subsidiaries of NOK
17 016 billion in 2009, as against NOK 21 104 billion in 2008.
Interest income from loans to subsidiaries in 2009 was NOK 654 mil-
lion, as against NOK 1 250 million in 2008.
The company’s on-going lawsuits do not represent significant amounts in relation to the company’s financial position. Vital has no significant
rental or leasing obligations, and has not assumed guarantee liabilities or undertaken any mortgages.
RECEIVED AND GIVEN COLLATERAL Vital Forsikring ASAAmounts in NOK millions 2009 2008
Collateral given for futures trading (228) (273)
Collateral given in connection with other derivatives (556) 0
Total received and given collateral (784) (273)
80
Reports
Statement of Chief Actuary
The Chief Actuary shall see to it that the company’s business is conducted at all times in a defensible manner as regards
technical insurance matters. With respect to this, the technical insurance situation for Vital Forsikring ASA has been evaluated
as at 31 December 2009.
With reference to the accounts submitted for 2009, it is confirmed that the technical insurance reserves have been undertaken
in accordance with the applicable computational basis and in accordance with the applicable statutes and associated regula-
tions. The expected higher life expectancy is causing the mortality assumptions in the bases for the reserves to come under
pressure. Margins in other computational bases are causing the total reserves as at 31 December 2009 to be assessed as being
sufficient regardless.
The distribution of results between the customers and the company has in the perception of the below-signed been carried out
with respect to the applicable code of regulations.
Bergen, 5 February 2010
Egil Heilund, Chief Actuary
81

82
Control Committee’s ReportTo the Supervisory Board and Annual General Meeting of Vital Forsikring ASA The Control Committee has carried out supervision of Vital Forsikring ASA in accordance with law and instructions laid down
by the Supervisory Board.
In connection with the closing of the accounts for the 2009 financial year, the Control Committee has examined the Directors’
Report, the annual accounts, the Statement of Chief Actuary and the Auditor’s Report for Vital Forsikring ASA and the Group.
The Committee finds that the Board of Directors’ assessment of the financial position of the company is adequate and recom-
mends the approval of the Directors’ Report and annual accounts for the 2009 financial year.
Oslo, 17 March 2010
Frode Hassel
(Chairman)
Karl Olav Hovede Svein N. Eriksen
Svein Brustad
(Substitute)
Merethe Smith
(Substitute)
Thorstein Øverland
83

Board of Representatives’ statement to the Annual General Meeting
Excerpt from Board meeting minutes – processing of the annual accountsItem 3/2010The Board of Directors approved the submitted annual accounts with notes,
proposal for disposition of the year’s results and the Directors’ report issued by the Board.
5 February 2010
The Board of Representatives recommends that the profit and loss account and balance sheet,
and the annual report for 2009, as proposed by the Board of directore, be adopted by the
Annual General meeting as the accounts of Vital Forsikring ASA for 2009.
Oslo, 25 March 2010
Amund Skarholt
84
Refer also to the accounting principles.
RESULTS AND INVESTMENT YIELDSAdministration result:
The results of the period’s operating costs deviating the
assumptions in the premium tariff.
Interest result:
Investment returns, less the base rate.
Risk result:
The result of the period’s mortality and disability deviating
from the assumptions in the premium tariff.
Investment yield I:
Booked returns.
Investment yield II:
Booked returns + unrealised changes in value that are alloca-
ted to the market value adjustment reserve.
Investment yield III:
Booked returns + unrealised changes in value that are al-
located to the market value adjustment reserve + changes in
value in the hold-to-maturity portfolio.
Average interest:
The average interest expresses the average realised return
obtained on policyholder funds during the course of the
year. Due to the manner in which the average interest is
calculated, it will not be comparable with the interest rates
of other financial institutions. The manner of calculation
is established by Kredittilsynet and can be described as the
ration between:
1. Gross financial income with the deduction of interest
expenses, dividends on share capital, allocated reserves
to equity, tax expenses and allocated reserves to the
security fund.
2. The average funds of policyholders.
Base rate:
The company offers traditional life and pension insurance,
unit-linked insurance and non-life insurance. A calculation
rate is used to determine provisions and premiums for the
traditional products.
The highest calculation rate is established by Kredittilsynet.
This interest is often called the base rate. For new contracts,
the maximum base rate is 2.75 percent. The base rate is the
annual guaranteed rate of return on policyholders’ funds. In
most unit-linked insurance products, policyholders bear the
financial risk. Non-life insurance policies are products ge-
nerating payments related to policyholders’ life and health.
These products are not subject to profit sharing and are
repriced annually.
INSURANCE PRODUCTS Group contractsDefined group benefit pensions:
Under group defined benefit pensions, pension payments
are disbursed from an agreed age and until the death of the
policyholder. It can also be agreed that the pension pay-
ments cease at a certain age. A defined benefit pension may
include a retirement pension, disability pension, dependent’s
pension and children’s pension. Group defined-benefit
pensions follow the regulations for the insurance industry
effective from 1 January 2008. This means that policyholders
pay in advance an annual premium for interest rate risk,
insurance risk and administration. The company is entit-
led to change the premium annually. Interest in excess of
the guaranteed rate of return is awarded to policyholders
in its entirety. If the interest is between 0 percent and the
guaranteed rate of return, the company can use additional
allocations to meet the guaranteed rate of return, otherwise
the company must cover the deficit.
A positive risk result may either be used to increase the risk
equalisation fund or be distributed to the policyholders. No
more than 50 percent of annual profits may be allocated
to the risk equalisation fund. The company must cover any
remaining losses after the risk equalisation fund has been
used. The administration result is allocated in its entirety to
the company.
Paid-up policies:
When a member terminates a pension agreement or a
pension agreement ends, he or she is entitled to a paid-up
policy. Rights earned on the termination date are continued
in paid-up policies. Paid-up policies have a separate profit
model where a minimum of 80 percent of profits are distri-
buted to policyholders. Profits for distribution consist of the
interest result and the risk result. The administration result
is allocated in its entirety to the company.
Group association insurance:
Group association insurance is pension insurance taken out
by associations for their members. Association insurance
can comprise retirement pensions, disability pensions,
dependent’s pensions and children’s pensions.
INDIVIDUAL CONTRACTSIndividual annuity and pension insurance:
Individual annuity and pension insurance policies are
savings schemes whereby the company disburses monthly
amounts up until the death of the policyholder, or until the
Definitions
85
policyholder reaches an agreed age. This usually comprises a
retirement pension, disability pension, dependent’s pension
and children’s pension.
Individual endowment insurance:
Individual endowment insurance policies are contracts
whereby the company disburses an agreed amount upon
the death of the policyholder or when the policyholder at-
tains an agreed age. Individual endowment insurance may
also include disability cover, which is a one-off benefit for
permanent disability. For individual contracts sold prior to
1 January 2008, the past profit-sharing scheme applies This
then implies that the interest result, the risk result and
the administration result are included in the profits to be
distributed between policyholders and the company. No
less than 65 percent of annual profits must be distributed to
policyholders. The new regulations apply to contracts sold as
of 1 January 2008.
CONTRACTS WHERE THE CUSTOMER BEARS THE RISKDefined-contribution pensions:
Defined-contribution pensions are group pension schemes
where the employees bear the financial risk. However, full
or partial hedging of the paid amount can be bought upon
retirement age.
Individual unit-linked insurance:
Individual unit-linked insurance polices are endowment
insurance policies or annuity insurance polices where policy-
holders bear the financial risk.
OTHER SECTORSGroup life insurance:
Group life insurance policies are death-risk insurance
policies taken out by employers or associations for their
employees or members and, where applicable, also for their
spouses and children. The amount recoverable under the
policy is disbursed upon the death of the policyholder. Group
life insurance may also comprise disability cover, which is a
one-off benefit for permanent disability.
Employer’s liability insurance:
Employer’s liability insurance is a one-year risk product
which companies link to their pension agreements. This may
be corporate group life insurance or accident insurance. Oc-
cupational injury insurance is mandatory for all enterprises.
PREMIUMS AND CLAIMSSingle premium payment:The total amount that is to be paid for the insurance is paid
once and for all.
Claim:
The amount the company is to pay in relation to the insu-
rance contract when an insured incident occurs.
Reinsurance:
Transfer of a part of the risk to another insurance company.
Repurchase:
When the policyholder terminates the insurance relationship
and the repurchase value is paid out.
Transferred reserves:
Transferred premium reserves and additional statutory reser-
ves to/from other
insurance companies/pension schemes.
FINANCIAL DERIVATIVESShare index futures:
Share index futures are agreements to buy or sell an index at
a specific price at a specific point of time in the future. The
contracts are standardised and exchange-listed. Daily settle-
ments of gains/losses are performed based upon changes in
the closing price.
Share index options:
Share index options involve one-sided rights to buy or sell
shares at a predetermined price. The options are associated
with share indexes.
Forward Rate Agreement (FRA):
An FRA contract is a contract that establishes an interest
rate for a future interest period. When purchasing them,
borrowing rates are established, and when selling them,
lending rates. The principal, the amount subject to inte-
rest, is only a reference amount in the contract, and is not
exchanged.
Interest rate futures:
Interest rate futures can most simply be describes as stan-
dardised and exchange-listed future interest rate agre-
ements. Gains and losses on differences between the con-
tract interest rate and market rates are settled daily through
a clearing centre.
Interest rate swaps:
An agreement between two parties to exchange interest
conditions on a security for an amount agreed upon in ad-
vance during a specified future period.
Swaption:
A swaption involves a one-sided right to buy or sell interest
rate swaps at a price agreed upon in advance.
86

Currency forward contracts:
Contract to sell/buy an agreed currency amount at an
established exchange rate for delivery at a future point in
time. Forward exchange contract transactions normally have
a short time to maturity, i.e. three months to one year. The
contracts are primarily used to hedge shares, bonds and
other holdings in foreign currencies.
CAPITAL ADEQUACY AND SOLVENCY MARGIN CAPITALCapital adequacy rules:
Regulations concerning requirements for primary capital at
financial institutions. The rules specify the computation and
level of primary capital measured against the risk-weighted
balance sheet. The result is termed capital adequacy.
Primary capital:
Primary capital consists of core capital and additional capi-
tal.
Core capital:
The core capital for an insurance company primarily consists
of paid-in equity capital and accrued earnings.
Additional capital:
Consists primarily of subordinated loan capital.
Subordinated loan capital:
Loans that the company takes out and which under specific
conditions are included in the total primary capital. Special
permission from the authorities is required in order to take
out subordinated loans, and they have special rules for their
terms and repayment. Subordinated loan capital is unsecu-
red and stands behind the company’s other liabilities.
Capital adequacy:
Eligible primary capital in percent of the risk-weighted ba-
lance sheet.
Solvency margin capital:
Capital that may be included in covering the solvency
margin requirement. The capital consists of primary capital,
50 percent of additional statutory reserves and the security
fund beyond 55 percent of its minimum value. The solvency
margin capital must exceed the solvency margin require-
ment.
Solvency margin requirement:
A term for the risk associated with the insurance-related
obligations. The solvency margin requirement is computed
in accordance with more detailed rules with a point of de-
parture based in the individual groups of insurance con-
tracts, and is summed for the company as a whole.
87

Business address:
Vital Forsikring ASA
Postal address: P.b. 7500,
N-5020 Bergen
Location address:
Folke Bernadottesv. 40
N-5147 Fyllingsdalen
Norwegian Organisation Number:
914782007
– a member of the DnB NOR Group
Vital Forsikring, Trondheim
Postal address: N-7469 Trondheim
Location address: Beddingen 16
N-7014 Trondheim
Vital Forsikring, Oslo
Postal address: P.b. 250, N-1326 Lysaker
Location address: Vollsveien 17A
N-1326 Lysaker
Related Documents