2009 Annual Report

Annual Report 2009
Mar 08, 2016
MIS Annual Report 2009
Welcome message from author
This document is posted to help you gain knowledge. Please leave a comment to let me know what you think about it! Share it to your friends and learn new things together.
Transcript
2009Annual Report
www.miscoltd.com
Ma
ri
ti
me
In
du
st
ri
al
Se
rv
ic
es
Co
.Lt
d.I
nc
|An
nu
al
Re
po
rt
20
09

Page
Message from the Managing Director
Board of Directors’ Report
Board of Directors
Auditor’s Report
Corporate Governance Disclosures
Financial Calendar
Company Addresses
4
7
13
14
60
67
68
Table of Contents

3

Dear Fellow Shareholders, Valued Clients, Employees,
2009 marked MIS’ 30th year of operations in the Middle East. As we celebrated this significant achievement, our eyes remained focused on the long term strategic goals of taking MIS to a $1 billion company with a net income of $100 million by 2013.
Financial Growth
We are therefore pleased to report that in 2009, MIS made major strides towards achieving our goals. MIS delivered record figures both in terms of revenues for the year of $478 million and net income of $29 million. The latter was a reflection of productivity and profitability gains not just in our New Build value stream but also across our traditional business. We are pleased that MIS was able to deliver such results despite 2009 being a challenging year not just for the industry at large but also for MIS which faced the suspension of work on two of its rigs, Hulls 106 and 108, in September after it terminated its contracts with Mosvold Middle East Jackup (MEJU). This resulted in our fourth quarter revenue being 27% lower than that of the same period last year and also dented our net income, but not enough to prevent us from recording a record level of profit and improving the group’s net worth by 24% on 2008.We’re particularly pleased with the fact that in these circumstances we were able to significantly improve MIS’ cash flow in 2009 and reduce its debt by some $43.6 million.
Organisational Development
In addition to the sound financial performance of MIS, 2009 saw other successes across the organisation. We delivered two offshore jack-up drilling rigs, the first ever to be built in the Middle East, a testament to MIS’ determination to establish itself as a viable global player amongst new build yards. We lived up to our promise of focusing on and developing our traditional business areas where we built a year-endbacklog of $60 million and also managed to establish new customer relationships within those value streams. We completed the first year of our Balanced Scorecard programme, introduced in late 2008 as part of our new management system to provide focus and clarity, and to align and engage our employees. We completed a ‘Change for Growth’ initiative designed to address specific behaviours that would help guide the organisation further towards its strategic growth targets. To further strengthen MIS’ ability to offer comprehensive solutions to our clients in the energy sector, MIS launched a new business unit, Energy Projects International (EPI), to build on its expertise in the EPC and EPCM markets with a particular focus on the growth markets of Abu Dhabi and Saudi Arabia. We expect this value stream to be a major contributor to our long-term strategic goals.
Message from the Managing Director
“On the path to growth”
4

Lastly, building on MIS’ tradition of investing in the continuous development of its people, MIS forged a strategic alliance with one of the UAE’s leading universities, the American University of Sharjah, to establish a customised executive development programme for selected leadership candidates.
These accomplishments, coupled with the introduction of other significant change initiatives to a company that is as successful and as well established as MIS, are things that I am particularly proud to have been part of. They would not have been possible without the trust and commitment of our shareholders and our valued clients, the dedication of our experienced employees and the guidance of MIS’ Board.
Outlook
MIS is aware of the challenges that are intrinsic to this industry, but has a cautiously optimistic view of 2010 and beyond, our strategy is still focused on developing backlog outside New Build, while broaden-ing our scope within New Build to target projects within the renewable energy sector and the like. The market is offering opportunities in all the business areas in which MIS operates and we are confident that our rich experience will help us to penetrate the Abu Dhabi and Saudi Arabia markets more effectively. While the concentration in these markets is on building an EPC and EPCM capability through our newest business unit, EPI, we believe that there are opportunities there for all of our businesses.
MIS emerged from a difficult year profitable and with a strong balance sheet, achieving record figures in terms of revenue and net income. With this, and with our market position supported by six value streams, today MIS’ unique positioning of offering comprehensive solutions to its clients in the energy industry remains as strong as ever.
Kevin J. HudsonManaging Director
5
6

7
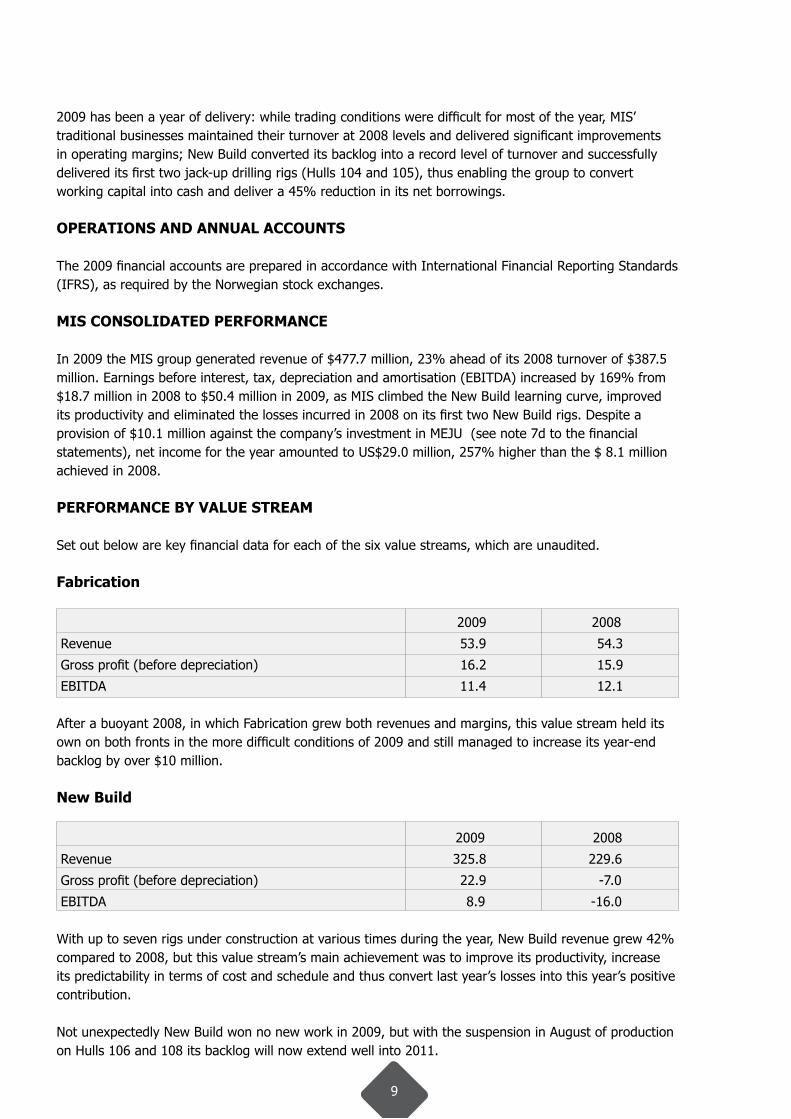
All figures are in Millions of US $ unless otherwise indicated.
SUMMARY CONSOLIDATED FINANCIAL HIGHLIGHTS
FY 2009 FY 2008 FY 2007
REVENUES 477.7 387.5 308.0
Revenue growth y/y 23% 26% 74%
GROSS PROFIT (before depreciation) 76.4 39.6 51.5
EBITDA 50.4 18.7 27.6
EBITDA margin 10.6% 4.8% 9.1%
EBIT 40.7 11.2 22.4
EBIT margin 8.5% 2.9% 7.4%
NET INCOME 29.0 8.1 22.0
Net income growth y/y 257% -63% 14%
OPERATING CASH FLOW 30.1 -9.1 -85.4
CAPITAL EXPENDITURES -10.1 -8.9 -15.4
ENDING BACKLOG 31 DECEMBER 371 716 260
MIS was established in Dubai in 1979 and in 2009 completed 30 years of profitable trading. Through facilities in the UAE, Saudi Arabia and throughout the Middle East it provides engineering, procurement, fabrication, construction, safety, operating and maintenance services to customers in the oil, gas, energy,petrochemical, power generation, marine and heavy industries. Its operations are organised within the following six value streams:
1. Fabrication (pressure vessels, process modules and general fabrication)2. New Build (jack-up drilling rigs and other marine construction) 3. Refurb (refurbishment and maintenance of drilling rigs and production equipment)4. EPC (engineering, procurement and construction services)5. Sunbelt (safety services and products including H2S protection)6. Tech Services (operational and maintenance services and personnel)
Energy Projects International (EPI) a new business unit, was launched in 2009 to focus on further building MIS’ EPC and EPCM capabilities.
8
Board of Directors’ Report
2009 has been a year of delivery: while trading conditions were difficult for most of the year, MIS’ traditional businesses maintained their turnover at 2008 levels and delivered significant improvements in operating margins; New Build converted its backlog into a record level of turnover and successfully delivered its first two jack-up drilling rigs (Hulls 104 and 105), thus enabling the group to convertworking capital into cash and deliver a 45% reduction in its net borrowings.
OPERATIONS AND ANNUAL ACCOUNTS
The 2009 financial accounts are prepared in accordance with International Financial Reporting Standards (IFRS), as required by the Norwegian stock exchanges.
MIS CONSOLIDATED PERFORMANCE
In 2009 the MIS group generated revenue of $477.7 million, 23% ahead of its 2008 turnover of $387.5 million. Earnings before interest, tax, depreciation and amortisation (EBITDA) increased by 169% from $18.7 million in 2008 to $50.4 million in 2009, as MIS climbed the New Build learning curve, improved its productivity and eliminated the losses incurred in 2008 on its first two New Build rigs. Despite a provision of $10.1 million against the company’s investment in MEJU (see note 7d to the financial statements), net income for the year amounted to US$29.0 million, 257% higher than the $ 8.1 million achieved in 2008.
PERFORMANCE BY VALUE STREAM
Set out below are key financial data for each of the six value streams, which are unaudited.
Fabrication
2009 2008
Revenue 53.9 54.3
Gross profit (before depreciation) 16.2 15.9
EBITDA 11.4 12.1
After a buoyant 2008, in which Fabrication grew both revenues and margins, this value stream held its own on both fronts in the more difficult conditions of 2009 and still managed to increase its year-end backlog by over $10 million.
New Build
2009 2008
Revenue 325.8 229.6
Gross profit (before depreciation) 22.9 -7.0
EBITDA 8.9 -16.0
With up to seven rigs under construction at various times during the year, New Build revenue grew 42% compared to 2008, but this value stream’s main achievement was to improve its productivity, increase its predictability in terms of cost and schedule and thus convert last year’s losses into this year’s positive contribution.
Not unexpectedly New Build won no new work in 2009, but with the suspension in August of production on Hulls 106 and 108 its backlog will now extend well into 2011.
9

Refurb
2009 2008
Revenue 29.4 25.1
Gross profit (before depreciation) 8.1 5.8
EBITDA 6.6 4.9
Refurb made further progress in both turnover and margins during 2009. Gross margin improved from 23% to 28% and EBITDA was up 35%. Backlog was virtually exhausted by the end of the year, but major prospects were being pursued prior to the year end, resulting in a $55 million award from Abu Dhabi’s National Drilling Company in early 2010.
EPC
2009 2008
Revenue 32.0 44.6
Gross profit (before depreciation) 12.4 10.6
EBITDA 10.0 6.9
EPC found volume harder to come by in 2009, particularly in the first half, and so turnover fell by 28%. EBITDA, however, increased by 45%, as 2009’s results benefited from the absence of the Qatar-based HFO contract, which contributed a loss of $8.5 million in 2008. Backlog more than doubled during the year, with work-winning improving steadily as the year progressed.
Sunbelt
2009 2008
Revenue 22.7 23.0
Gross profit (before depreciation) 10.8 10.1
EBITDA 8.4 7.6
While growth slowed in 2009, Sunbelt improved its margins on a maintained turnover, increasing its EBITDA by 10%. The strategy of geographical and product diversification continues unchanged.
Tech Services
2009 2008
Revenue 13.9 10.9
Gross profit (before depreciation) 6.0 4.2
EBITDA 5.1 3.2
The strengths of Tech Services’ business are reliability, quality of service and long-standing relationships with key clients in the local oil and gas sector. All those relationships were successfully maintained in 2009 and the largest single contract was extended for a further three years. While positively engaging with its client’s increasing focus on cost and value for money, Tech Services once again improved its margins, increasing EBITDA by 58% on turnover up 28%.
10
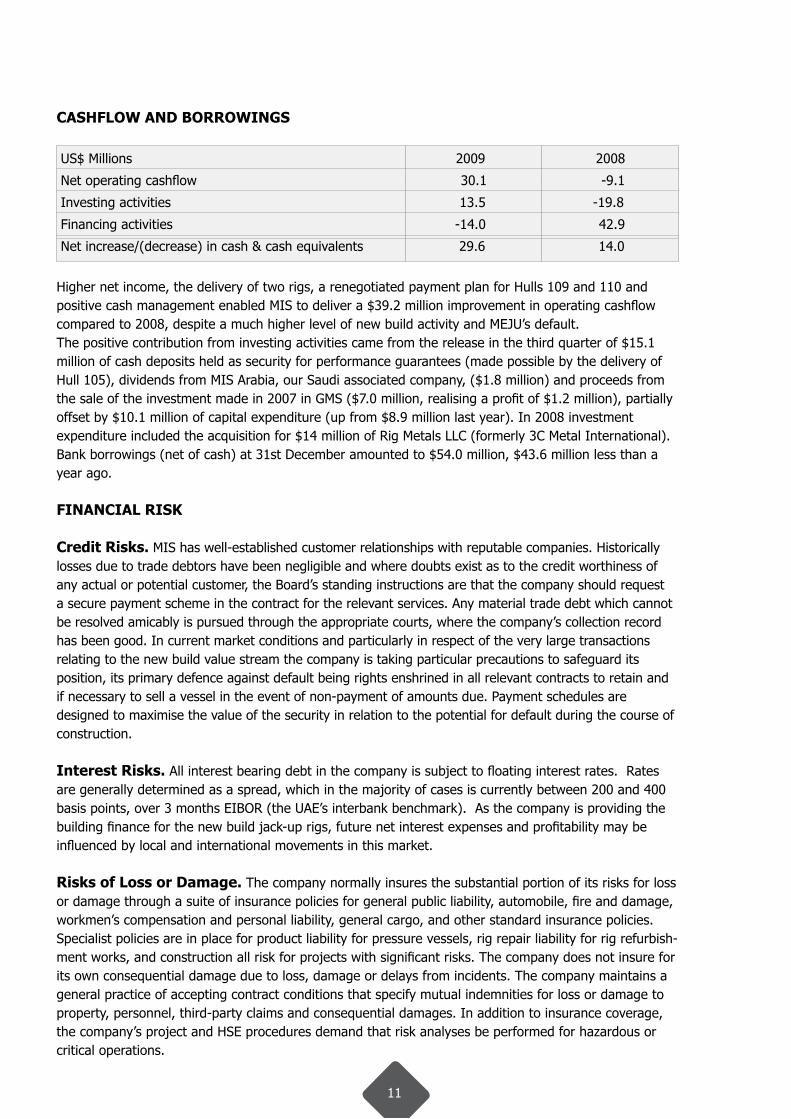
CASHFLOW AND BORROWINGS
US$ Millions 2009 2008
Net operating cashflow 30.1 -9.1
Investing activities 13.5 -19.8
Financing activities -14.0 42.9
Net increase/(decrease) in cash & cash equivalents 29.6 14.0
Higher net income, the delivery of two rigs, a renegotiated payment plan for Hulls 109 and 110 and positive cash management enabled MIS to deliver a $39.2 million improvement in operating cashflow compared to 2008, despite a much higher level of new build activity and MEJU’s default. The positive contribution from investing activities came from the release in the third quarter of $15.1 million of cash deposits held as security for performance guarantees (made possible by the delivery of Hull 105), dividends from MIS Arabia, our Saudi associated company, ($1.8 million) and proceeds from the sale of the investment made in 2007 in GMS ($7.0 million, realising a profit of $1.2 million), partially offset by $10.1 million of capital expenditure (up from $8.9 million last year). In 2008 investment expenditure included the acquisition for $14 million of Rig Metals LLC (formerly 3C Metal International). Bank borrowings (net of cash) at 31st December amounted to $54.0 million, $43.6 million less than a year ago.
FINANCIAL RISK
Credit Risks. MIS has well-established customer relationships with reputable companies. Historically losses due to trade debtors have been negligible and where doubts exist as to the credit worthiness of any actual or potential customer, the Board’s standing instructions are that the company should request a secure payment scheme in the contract for the relevant services. Any material trade debt which cannot be resolved amicably is pursued through the appropriate courts, where the company’s collection record has been good. In current market conditions and particularly in respect of the very large transactions relating to the new build value stream the company is taking particular precautions to safeguard its position, its primary defence against default being rights enshrined in all relevant contracts to retain and if necessary to sell a vessel in the event of non-payment of amounts due. Payment schedules are designed to maximise the value of the security in relation to the potential for default during the course of construction.
Interest Risks. All interest bearing debt in the company is subject to floating interest rates. Rates are generally determined as a spread, which in the majority of cases is currently between 200 and 400 basis points, over 3 months EIBOR (the UAE’s interbank benchmark). As the company is providing the building finance for the new build jack-up rigs, future net interest expenses and profitability may be influenced by local and international movements in this market.
Risks of Loss or Damage. The company normally insures the substantial portion of its risks for loss or damage through a suite of insurance policies for general public liability, automobile, fire and damage, workmen’s compensation and personal liability, general cargo, and other standard insurance policies. Specialist policies are in place for product liability for pressure vessels, rig repair liability for rig refurbish-ment works, and construction all risk for projects with significant risks. The company does not insure for its own consequential damage due to loss, damage or delays from incidents. The company maintains a general practice of accepting contract conditions that specify mutual indemnities for loss or damage to property, personnel, third-party claims and consequential damages. In addition to insurance coverage, the company’s project and HSE procedures demand that risk analyses be performed for hazardous or critical operations.
11
Currency Risks. The company is exposed to currency exchange risks only on sales and expenditures in currencies other than the UAE Dirham and US Dollar, as the Dirham has a longstanding fixed rate relationship of AED3.67:US$1. This risk is considered to be minor since the majority of contracts and expenditures are in Dirhams or Dollars. If the Dirham / US Dollar peg were to be abandoned that would create a risk to the company, but MIS does not consider that risk to be significant in the near term. The company’s policy is to minimise any exchange risks and all essential foreign currency exposures are therefore secured immediately through forward contracts or through the use of foreign currency accounts established with local banks.
FUTURE PROSPECTS
MIS has a cautiously optimistic view of 2010. Work winning outside New Build has shown a rising trend and opportunities in all value streams appear to have become more plentiful, in response to a greater level of confidence in the energy markets. In February we delivered our third rig, the KS Endeavor (Hull 107) and our existing New Build backlog will keep us productively employed throughout 2010, allowing some breathing space for the maturing of new vessel prospects in both the oil and gas and renewable energy sectors. We are continuing to work on the development of opportunities to penetrate the Abu Dhabi and Saudi Arabia markets more effectively. While our concentration is on building an EPC and EPCM capability, we believe that there are opportunities there for all of our value streams. Having emerged from a difficult year profitably and with a stronger balance sheet, MIS remains, more than ever, uniquelypositioned in its ability to offer comprehensive solutions to its clients in the energy sector.
SHAREHOLDER RELATIONS
At December 31, 2009, the company had just under 500 shareholders and its issued share capital was made up of 46,273,750 shares at a par value of US$ 2.00 per share.
YEAR-END PROFIT AND DISPOSAL
The year-end profit for MIS in 2009 was US$ 28,994,567. The Board of Directors recommended and the shareholders approved at the Annual General Meeting that no cash dividend should be paid in respect of 2009 and that consequently US$ 28,994,567 should be transferred to retained earnings.
12

The MIS Board of Directors and term expiry dates after the Annual General Meeting held in Dubai, United Arab Emirates, on April 22, 2010 are as follows:
The MIS Board of Directors is confident that MIS will continue to grow and prosper in its current market. Through its joint efforts, the Board will endeavour to guide MIS along the path of good corporate governance and successful operations.
Charles L. DavisDirector
expires AGM 2012
Jerry M. SmithDirector &
Special advisor to the Boardexpires AGM 2012
Kevin J. HudsonManaging Directorexpires AGM 2011
Abdul Salam El ZeidyDirector
expires AGM 2012
John O’LearyDirector
expires AGM 2012
Richard DallasDirector
expires AGM 2011
Dr. Karim El SolhChairman of the Board
expires AGM 2011
Ammar Al KhudairyDirector
expires AGM 2011
Timothy NoonanAlternate Directorexpires AGM 2011
Fadi ArbidAlternate Directorexpires AGM 2011
Dr. Karim El SolhChairman of the Board
Kevin J. HudsonManaging Director
13
Board of Directors

MARITIME INDUSTRIAL SERVICES CO. LTD. INC.
CONSOLIDATED FINANCIAL STATEMENTS AND INDEPENDENT AUDITOR’S REPORTFOR THE YEAR ENDED DECEMBER 31, 2008
Table of Contents Page
Independent Auditor’s Report
Consolidated Balance Sheet
Consolidated Income Statement
Consolidated Statement of Changes in Equity
Consolidated Cash Flow Statement
Notes to the Consolidated Financial Statements
15
16
17
18
19
20-58
Board of Directors
14
Auditor’s Report

Independent Auditor’s Report
The ShareholdersMaritime Industrial Services Co. Ltd. Inc.Jebel Ali Free ZoneDubai, United Arab Emirates
Report on the Financial Statements
We have audited the accompanying consolidated financial statements of Maritime Industrial Services Co. Ltd. Inc. (the “Company”) and Subsidiaries, (the “Group”), which comprise the consolidated statement of financial position as of December 31, 2009, and the consolidated statement of comprehensive income, consolidated statement of changes in equity and consolidated statement of cash flows for the year then ended, and a summary of significant accounting policies and other explanatory notes.
Management’s Responsibility for the Financial Statements
Management is responsible for the preparation and fair presentation of these financial statements in accordance with International Financial Reporting Standards. This responsibility includes: designing, implementing and maintaining internal control relevant to the preparation and fair presentation of consolidated financial statements that are free from material misstatement, whether due to fraud or error; selecting and applying appropriate accounting policies; and making accounting estimates that are reasonable in the circumstances.
Auditor’s Responsibility
Our responsibility is to express an opinion on these consolidated financial statements based on our audit. We conducted our audit in accordance with International Standards on Auditing. Those standards require that we comply with ethical requirements and plan and perform the audit to obtain reasonable assurance whether the consolidated financial statements are free from material misstatement. An audit involves performing procedures to obtain audit evidence about the amounts and disclosures in the consolidated financial statements. The procedures selected depend on the auditor’s judgment, including the assessment of the risks of material misstatement of the consolidated financial statements, whether due to fraud or error. In making those risk assessments, the auditor considers internal control relevant to the entity’s preparation and fair presentation of the consolidated financial statements in order to design audit procedures that are appropriate in the circumstances, but not for the purpose of expressing an opinion on the effectiveness of the entity’s internal control. An audit also includes evaluating the appropriateness of accounting policies used and the reasonableness of accounting estimates made by management, as well as evaluating the overall presentation of the consolidated financial statements.
We believe that the audit evidence we have obtained is sufficient and appropriate to provide a basis for our audit opinion.
Opinion
In our opinion, the consolidated financial statements present fairly, in all material respects, the consolidated financial position of the Group as of December 31, 2009, and its financial performance and its cash flows for the year then ended in accordance with International Financial Reporting Standards.
Emphasis of Matters
Without qualifying our opinion, we draw attention to the following matters addressed in Notes 7 and 8 to the consolidated financial statements:
Note 7(d) describes a claim made against the Group by a customer for an alleged breach of technical specifications on two New Build rigs under construction. The same customer has defaulted on payment of instalments due during 2009 against already achieved and independently certified milestones. The Group has referred the claim to arbitration in which the arbitrators, on November 17, 2009, have issued a partial final award permitting the sale of the two rigs in question to third parties with the sale proceeds held for common account and placed in escrow pending further order of the arbitrators. Based on indicative offers received to date, management is confident that the sale proceeds will ultimately enable full recovery of amounts currently due under the terms of the contract.
Note 8(b) describes a contractual dispute with a client in Qatar currently subject to litigation proceedings, the ultimate outcome of which is uncertain.
No provisions have been taken in relation to the above uncertainties.
DubaiMarch 10, 2010
15
Maritime Industrial Services Co. Ltd. Inc.
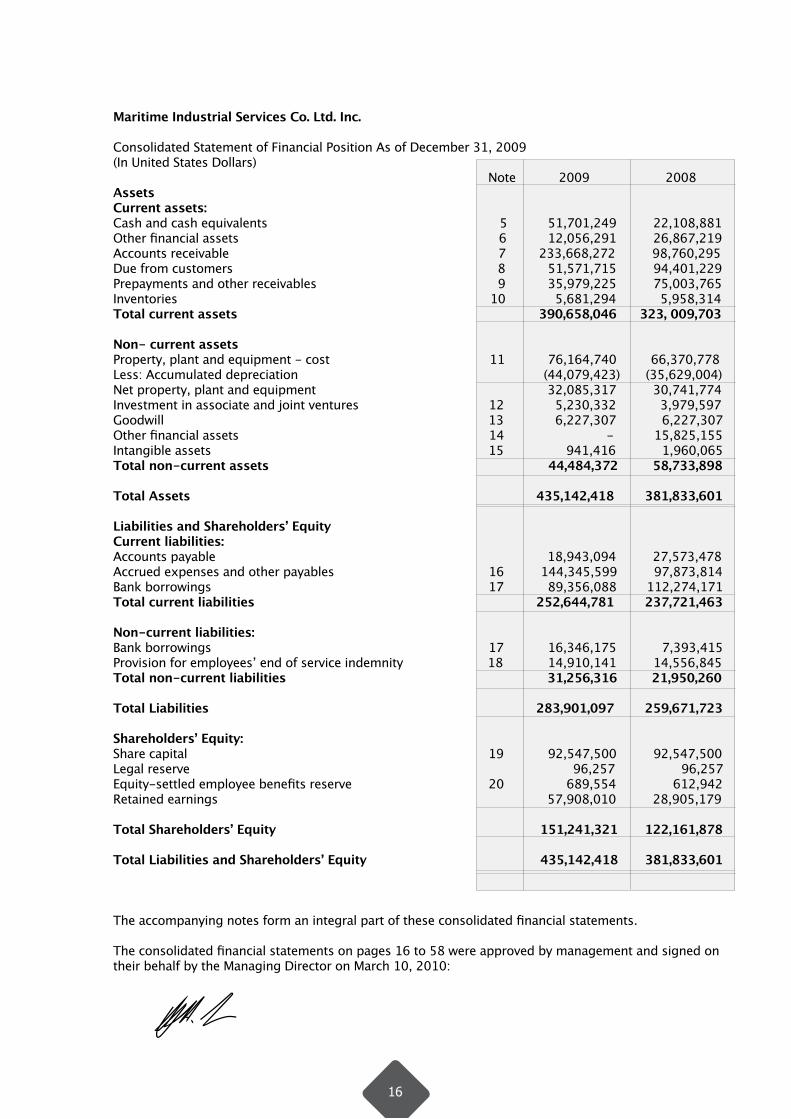
Consolidated Statement of Financial Position As of December 31, 2009 (In United States Dollars) Note 2009 2008 Assets Current assets:Cash and cash equivalents 5 51,701,249 22,108,881Other financial assets 6 12,056,291 26,867,219 Accounts receivable 7 233,668,272 98,760,295 Due from customers 8 51,571,715 94,401,229 Prepayments and other receivables 9 35,979,225 75,003,765 Inventories 10 5,681,294 5,958,314Total current assets 390,658,046 323, 009,703
Non- current assets Property, plant and equipment - cost 11 76,164,740 66,370,778Less: Accumulated depreciation (44,079,423) (35,629,004)Net property, plant and equipment 32,085,317 30,741,774Investment in associate and joint ventures 12 5,230,332 3,979,597 Goodwill 13 6,227,307 6,227,307Other financial assets 14 - 15,825,155 Intangible assets 15 941,416 1,960,065 Total non-current assets 44,484,372 58,733,898 Total Assets 435,142,418 381,833,601
Liabilities and Shareholders’ Equity Current liabilities: Accounts payable 18,943,094 27,573,478Accrued expenses and other payables 16 144,345,599 97,873,814 Bank borrowings 17 89,356,088 112,274,171 Total current liabilities 252,644,781 237,721,463 Non-current liabilities:Bank borrowings 17 16,346,175 7,393,415 Provision for employees’ end of service indemnity 18 14,910,141 14,556,845 Total non-current liabilities 31,256,316 21,950,260 Total Liabilities 283,901,097 259,671,723 Shareholders’ Equity:Share capital 19 92,547,500 92,547,500 Legal reserve 96,257 96,257 Equity-settled employee benefits reserve 20 689,554 612,942Retained earnings 57,908,010 28,905,179 Total Shareholders’ Equity 151,241,321 122,161,878 Total Liabilities and Shareholders’ Equity 435,142,418 381,833,601
The accompanying notes form an integral part of these consolidated financial statements.
The consolidated financial statements on pages 16 to 58 were approved by management and signed on their behalf by the Managing Director on March 10, 2010:
16

Maritime Industrial Services Co. Ltd. Inc.
Consolidated Statement of Comprehensive Income For the year endedDecember 31, 2009 (In United States Dollars)
Note 2009 2008
Revenue 477,675,861 387,470,884 Cost of sales (409,099,839) (354,269,057) Gross profit 68,576,022 33,201,827General, selling and administrative expenses 21 (27,919,644) (21,955,184) Other income 22 950,864 962,315Finance charges (5,895,556) (5,319,780) Profit from associates and joint ventures - net 12 3,056,412 2,406,608Allowance for investment 7(d) & 14 (10,087,011) -Gain on disposal of other financial assets 14 1,163,805 - Income before income tax 29,844,892 9,295,786 Income tax expense 23 (850,325) (1,183,685) Net income for the year 28,994,567 8,112,101Other comprehensive income - - Comprehensive income for the year 28,994,567 8,112,101
Basic earnings per share 0.63 0.18
Diluted earnings per share 0.61 0.17
Weighted average number of shares used in the calculation of basic earnings per share 46,273,750 46,193,066
Employee stock options 1,393,750 1,417,500 Weighted average number of shares used in the calculation of diluted earnings per share 47,667,500 47,610,566
The accompanying notes form an integral part of these consolidated financial statements.
17

Mar
itim
e In
dust
rial
Ser
vice
s Co
. Ltd
. Inc
.
Cons
olid
ated
Sta
tem
ent o
f Cha
nges
in E
quity
For
the
year
end
ed D
ecem
ber 3
1, 2
009
(In U
nite
d St
ates
Dol
lars
)
E
quity
-set
tled
em
ploy
ee
S
hare
Leg
al
bene
fits
R
etai
ned
cap
ital
res
erve
r
eser
ve
ear
ning
s
T
otal
Bala
nce
at D
ecem
ber
31, 2
007
9
2,00
0,00
0
96,2
57
239
,742
2
4,20
1,29
1 11
6,53
7,29
0D
ivid
ends
pai
d (N
ote
24)
-
-
-
(3,
608,
183)
(3,6
08,1
83)
Net
pro
fit fo
r th
e ye
ar 2
008
-
-
-
8,
112,
101
8
,112
,101
To
tal c
ompr
ehen
sive
inco
me
for
the
year
-
-
-
8,11
2,10
1
8,1
12,1
01
Fore
ign
curr
ency
tran
slat
ion
-
-
-
199,
970
199
,970
Reco
gniti
on o
f em
ploy
ee s
tock
opt
ions
-
-
3
73,2
00
-
3
73,2
00Is
sue
of s
hare
cap
ital (
Not
e 19
)
547
,500
-
-
-
547
,500
Bala
nce
at D
ecem
ber
31, 2
008
9
2,54
7,50
0
96,2
57
612
,942
2
8,90
5,17
9 12
2,16
1,87
8N
et p
rofit
for
the
year
200
9
-
-
-
2
8,99
4,56
7 2
8,99
4,56
7To
tal c
ompr
ehen
sive
inco
me
for
the
year
-
-
-
2
8,99
4,56
7 2
8,99
4,56
7Fo
reig
n cu
rren
cy tr
ansl
atio
n
-
-
-
8,2
64
8
,264
Reco
gniti
on o
f em
ploy
ee s
tock
opt
ions
-
-
76,6
12
-
76,6
12Ba
lanc
e at
Dec
embe
r 31
, 200
9
92,
547,
500
96,
257
689,
554
57,9
08,0
10
151,
241,
321
The
acco
mpa
nyin
g no
tes
form
an
inte
gral
par
t of t
hese
con
solid
ated
fina
ncia
l sta
tem
ents
.
18
Maritime Industrial Services Co. Ltd. Inc.
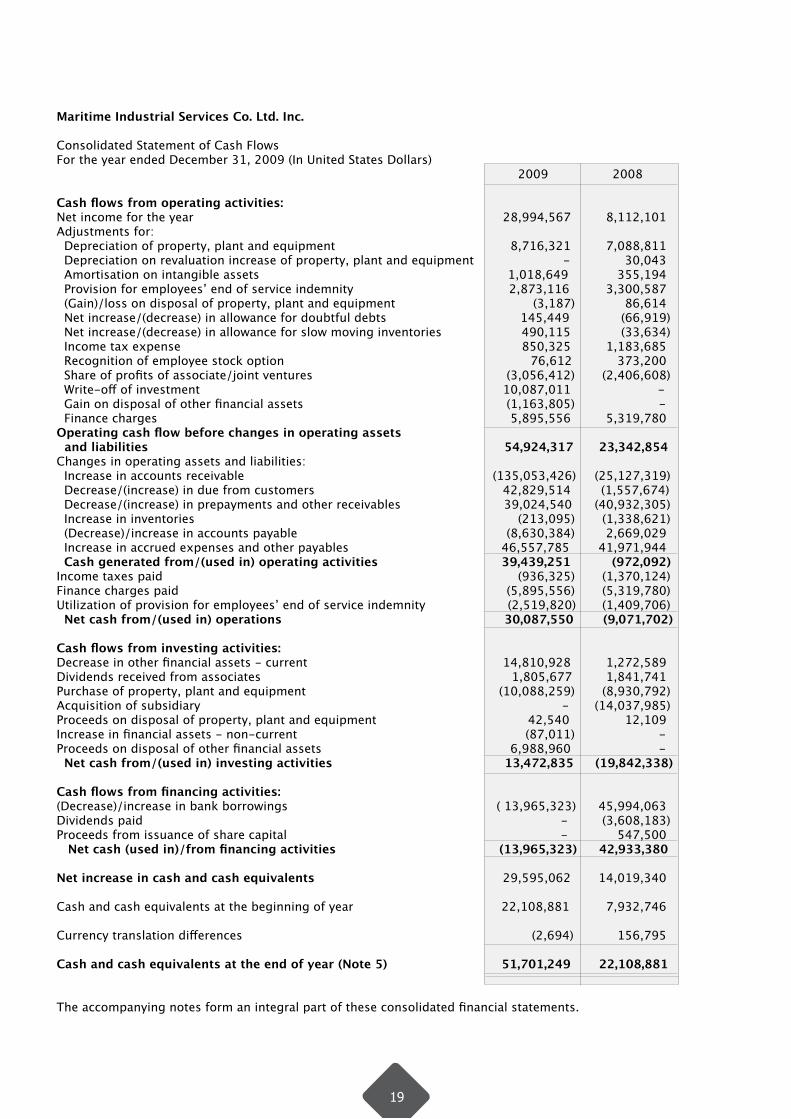
Consolidated Statement of Cash FlowsFor the year ended December 31, 2009 (In United States Dollars) 2009 2008
Cash flows from operating activities: Net income for the year 28,994,567 8,112,101 Adjustments for: Depreciation of property, plant and equipment 8,716,321 7,088,811 Depreciation on revaluation increase of property, plant and equipment - 30,043 Amortisation on intangible assets 1,018,649 355,194 Provision for employees’ end of service indemnity 2,873,116 3,300,587 (Gain)/loss on disposal of property, plant and equipment (3,187) 86,614 Net increase/(decrease) in allowance for doubtful debts 145,449 (66,919) Net increase/(decrease) in allowance for slow moving inventories 490,115 (33,634) Income tax expense 850,325 1,183,685 Recognition of employee stock option 76,612 373,200 Share of profits of associate/joint ventures (3,056,412) (2,406,608) Write-off of investment 10,087,011 - Gain on disposal of other financial assets (1,163,805) - Finance charges 5,895,556 5,319,780Operating cash flow before changes in operating assets and liabilities 54,924,317 23,342,854 Changes in operating assets and liabilities: Increase in accounts receivable (135,053,426) (25,127,319) Decrease/(increase) in due from customers 42,829,514 (1,557,674) Decrease/(increase) in prepayments and other receivables 39,024,540 (40,932,305) Increase in inventories (213,095) (1,338,621) (Decrease)/increase in accounts payable (8,630,384) 2,669,029 Increase in accrued expenses and other payables 46,557,785 41,971,944 Cash generated from/(used in) operating activities 39,439,251 (972,092) Income taxes paid (936,325) (1,370,124) Finance charges paid (5,895,556) (5,319,780)Utilization of provision for employees’ end of service indemnity (2,519,820) (1,409,706) Net cash from/(used in) operations 30,087,550 (9,071,702)
Cash flows from investing activities:Decrease in other financial assets - current 14,810,928 1,272,589 Dividends received from associates 1,805,677 1,841,741 Purchase of property, plant and equipment (10,088,259) (8,930,792) Acquisition of subsidiary - (14,037,985)Proceeds on disposal of property, plant and equipment 42,540 12,109Increase in financial assets - non-current (87,011) -Proceeds on disposal of other financial assets 6,988,960 - Net cash from/(used in) investing activities 13,472,835 (19,842,338)
Cash flows from financing activities: (Decrease)/increase in bank borrowings ( 13,965,323) 45,994,063 Dividends paid - (3,608,183) Proceeds from issuance of share capital - 547,500 Net cash (used in)/from financing activities (13,965,323) 42,933,380
Net increase in cash and cash equivalents 29,595,062 14,019,340
Cash and cash equivalents at the beginning of year 22,108,881 7,932,746
Currency translation differences (2,694) 156,795
Cash and cash equivalents at the end of year (Note 5) 51,701,249 22,108,881
The accompanying notes form an integral part of these consolidated financial statements.
19

Maritime Industrial Services Co. Ltd. Inc.
Notes to the Consolidated Financial StatementsFor the year ended December 31, 2009
1. Legal status and business activities
Maritime Industrial Services Co. Ltd. Inc. (the “Company”) is incorporated in Panama and has its Corporate Office at Jebel Ali Free Zone, Dubai, United Arab Emirates and branches in each of Dubai and Sharjah, U.A.E., Kazakhstan, Kuwait and Qatar. These financial statements are those of the Company, consolidated with the following subsidiaries (collectively the “Group”):
Proportion of legal Place of ownership Name of entity operation interest Principal activity % 1. Maritime Industrial Services Sultanate 49* Engineering and project Co. Ltd. of Oman management, safety and training products and services, fabrication onshore and offshore construction and other operating and maintenance services.
2. MIS International Ltd. Inc. Middle East 100 Fabrication, rig overhaul and repair business.
3. Maurlis International Ltd. Inc. Republic of 100 Investing in a joint venture Panama set up to build and operate a rig.
4. Marine Investment Co. Ltd. Inc. Republic of 100 Investing in a Group Panama engaged in fabrication, engineering and repair business.
5. Global Acquisition and Republic of 100 Investing in a Group Management Co. Ltd. Inc. Panama engaged in the operation of oil rigs.
6. Rig Metals LLC (Formerly United Arab 49* Manufacturing, repair of 3C Metal International LLC) Emirates rigs and oil and natural gas well drilling.
* By virtue of agreements between the shareholders, the Group has a 100% beneficial ownership in these companies.
Furthermore, the consolidated financial statements include an associate and joint ventures as set out in Note 12 to the financial statements.
20
Maritime Industrial Services Co. Ltd. Inc.
Notes to the Consolidated Financial Statements - continuedFor the year ended December 31, 2009
1. Legal status and business activities (continued)
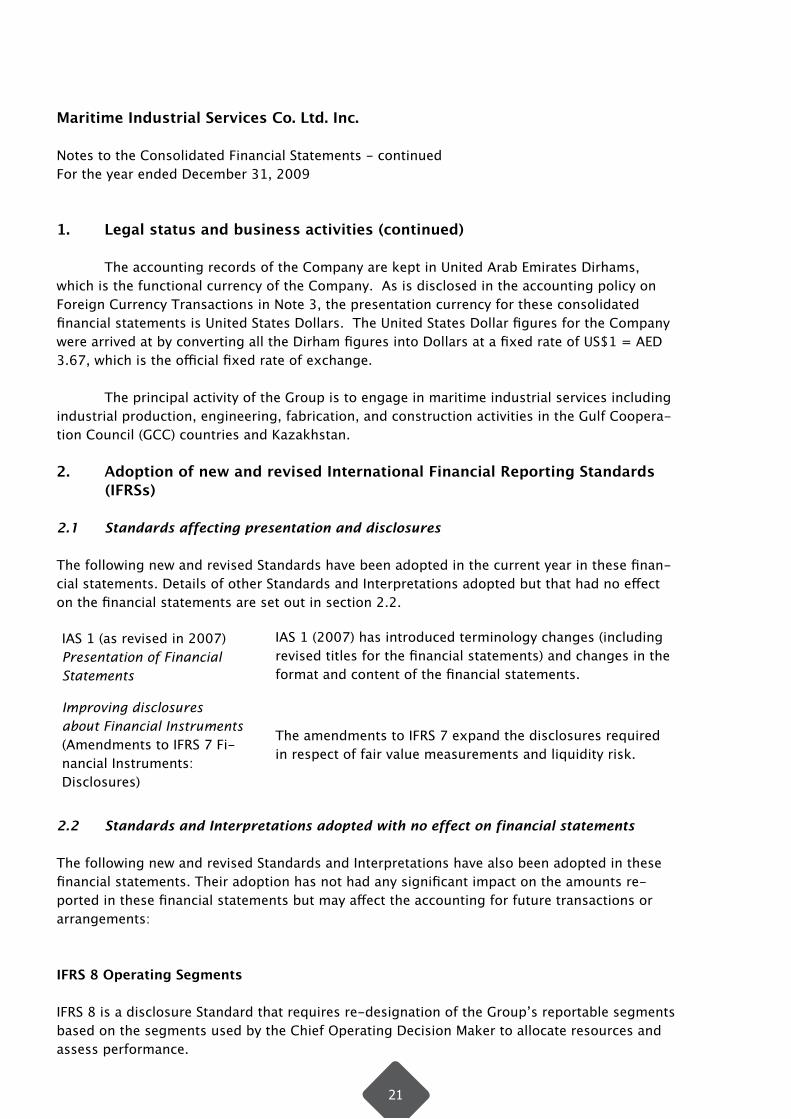
The accounting records of the Company are kept in United Arab Emirates Dirhams, which is the functional currency of the Company. As is disclosed in the accounting policy on Foreign Currency Transactions in Note 3, the presentation currency for these consolidated financial statements is United States Dollars. The United States Dollar figures for the Company were arrived at by converting all the Dirham figures into Dollars at a fixed rate of US$1 = AED 3.67, which is the official fixed rate of exchange.
The principal activity of the Group is to engage in maritime industrial services including industrial production, engineering, fabrication, and construction activities in the Gulf Coopera-tion Council (GCC) countries and Kazakhstan.
2. Adoption of new and revised International Financial Reporting Standards (IFRSs)
2.1 Standards affecting presentation and disclosures
The following new and revised Standards have been adopted in the current year in these finan-cial statements. Details of other Standards and Interpretations adopted but that had no effect on the financial statements are set out in section 2.2.
2.2 Standards and Interpretations adopted with no effect on financial statements
The following new and revised Standards and Interpretations have also been adopted in these financial statements. Their adoption has not had any significant impact on the amounts re-ported in these financial statements but may affect the accounting for future transactions or arrangements:
IFRS 8 Operating Segments
IFRS 8 is a disclosure Standard that requires re-designation of the Group’s reportable segments based on the segments used by the Chief Operating Decision Maker to allocate resources and assess performance.
IAS 1 (2007) has introduced terminology changes (including revised titles for the financial statements) and changes in the format and content of the financial statements.
The amendments to IFRS 7 expand the disclosures required in respect of fair value measurements and liquidity risk.
IAS 1 (as revised in 2007) Presentation of Financial Statements
Improving disclosures about Financial Instruments (Amendments to IFRS 7 Fi-nancial Instruments: Disclosures)
21
Maritime Industrial Services Co. Ltd. Inc.
Notes to the Consolidated Financial Statements - continuedFor the year ended December 31, 2009
2. Adoption of new and revised International Financial Reporting Standards (IFRSs) (continued)
2.2 Standards and Interpretations adopted with no effect on financial statements (continued)
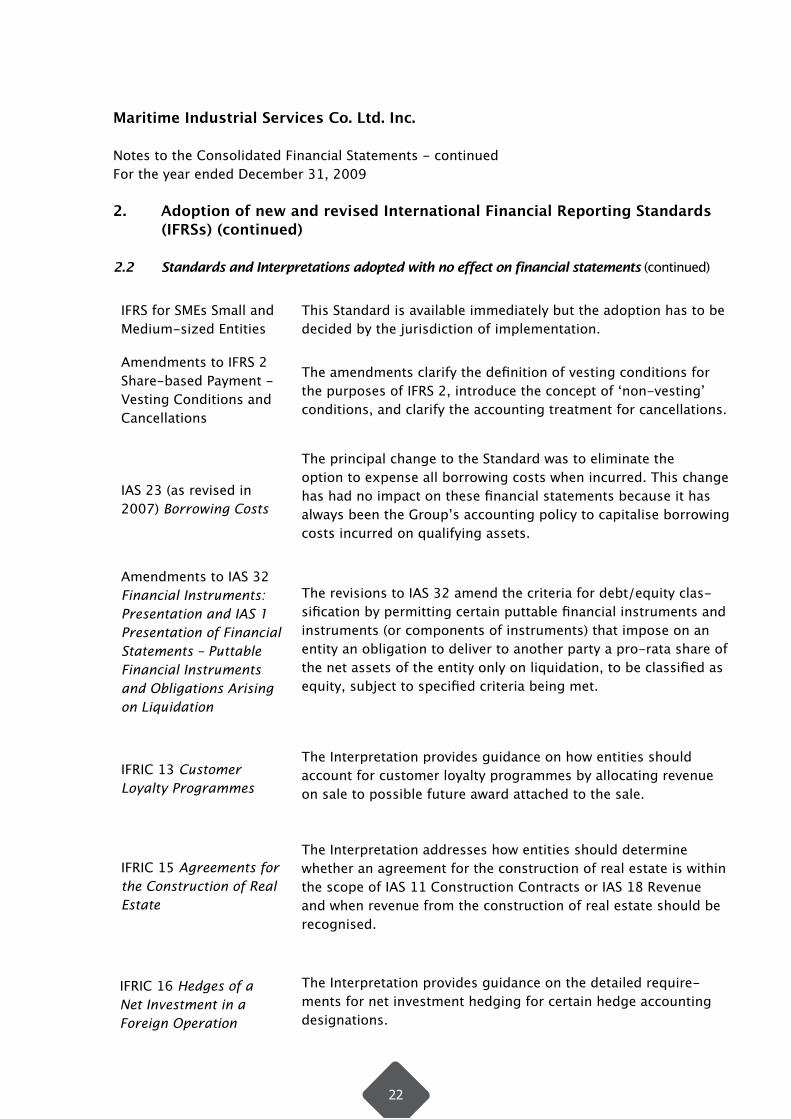
IFRS for SMEs Small and Medium-sized Entities
Amendments to IFRS 2 Share-based Payment - Vesting Conditions and Cancellations
IAS 23 (as revised in 2007) Borrowing Costs
Amendments to IAS 32 Financial Instruments: Presentation and IAS 1 Presentation of Financial Statements – Puttable Financial Instruments and Obligations Arising on Liquidation
IFRIC 13 Customer Loyalty Programmes
IFRIC 15 Agreements for the Construction of Real Estate
IFRIC 16 Hedges of a Net Investment in a Foreign Operation
This Standard is available immediately but the adoption has to be decided by the jurisdiction of implementation.
The amendments clarify the definition of vesting conditions for the purposes of IFRS 2, introduce the concept of ‘non-vesting’ conditions, and clarify the accounting treatment for cancellations.
The principal change to the Standard was to eliminate the option to expense all borrowing costs when incurred. This change has had no impact on these financial statements because it has always been the Group’s accounting policy to capitalise borrowing costs incurred on qualifying assets.
The revisions to IAS 32 amend the criteria for debt/equity clas-sification by permitting certain puttable financial instruments and instruments (or components of instruments) that impose on an entity an obligation to deliver to another party a pro-rata share of the net assets of the entity only on liquidation, to be classified as equity, subject to specified criteria being met.
The Interpretation provides guidance on how entities should account for customer loyalty programmes by allocating revenue on sale to possible future award attached to the sale.
The Interpretation addresses how entities should determine whether an agreement for the construction of real estate is within the scope of IAS 11 Construction Contracts or IAS 18 Revenue and when revenue from the construction of real estate should be recognised.
The Interpretation provides guidance on the detailed require-ments for net investment hedging for certain hedge accounting designations.
22
Maritime Industrial Services Co. Ltd. Inc.
Notes to the Consolidated Financial Statements - continuedFor the year ended December 31, 2009
2. Adoption of new and revised International Financial Reporting Standards (IFRSs) (continued)
2.2 Standards and Interpretations adopted with no effect on financial statements (continued)
Improvements to IFRSs (2008) Amendments to IFRS 5, IAS 1, IAS 16, IAS 19, IAS 20, IAS 23, IAS 27, IAS 28, IAS 29, IAS 31, IAS 36, IAS 38, IAS 39, IAS 40 and IAS 41 resulting from the May and October 2008 Annual Improvements to IFRSs majority of which are effective for annual periods beginning on or after January 1, 2009.
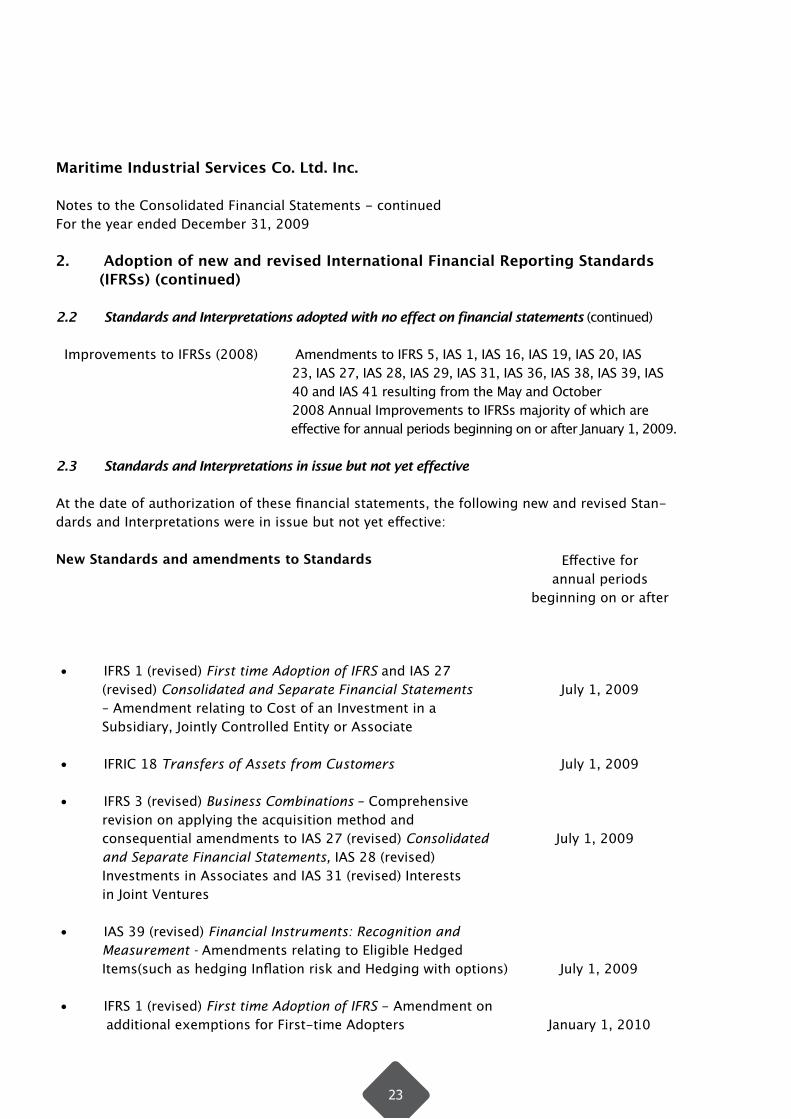
2.3 Standards and Interpretations in issue but not yet effective
At the date of authorization of these financial statements, the following new and revised Stan-dards and Interpretations were in issue but not yet effective:
New Standards and amendments to Standards
• IFRS 1 (revised) First time Adoption of IFRS and IAS 27 (revised) Consolidated and Separate Financial Statements July 1, 2009 – Amendment relating to Cost of an Investment in a Subsidiary, Jointly Controlled Entity or Associate
• IFRIC 18 Transfers of Assets from Customers July 1, 2009
• IFRS 3 (revised) Business Combinations – Comprehensive revision on applying the acquisition method and consequential amendments to IAS 27 (revised) Consolidated July 1, 2009 and Separate Financial Statements, IAS 28 (revised) Investments in Associates and IAS 31 (revised) Interests in Joint Ventures
• IAS 39 (revised) Financial Instruments: Recognition and Measurement - Amendments relating to Eligible Hedged Items(such as hedging Inflation risk and Hedging with options) July 1, 2009
• IFRS 1 (revised) First time Adoption of IFRS - Amendment on additional exemptions for First-time Adopters January 1, 2010
Effective forannual periods
beginning on or after
23
Maritime Industrial Services Co. Ltd. Inc.
Notes to the Consolidated Financial Statements - continuedFor the year ended December 31, 2009
2. Adoption of new and revised International Financial Reporting Standards (IFRSs) (continued)
2.3 Standards and Interpretations in issue but not yet effective (continued)
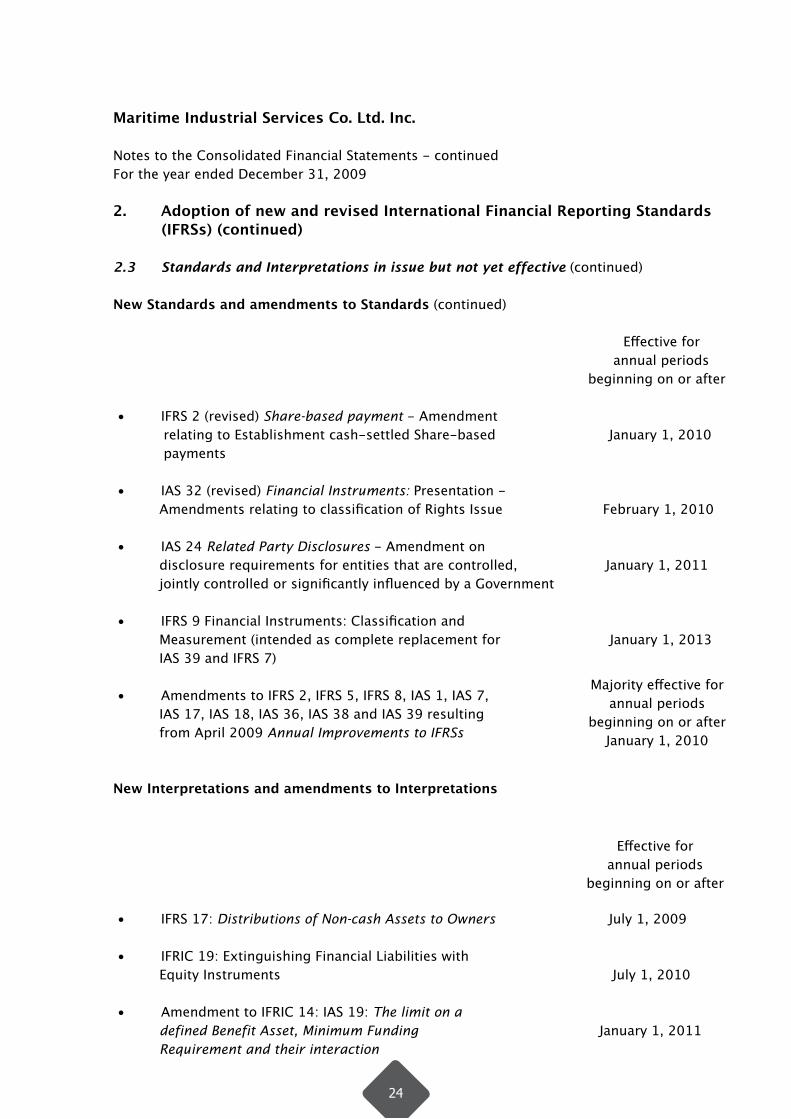
New Standards and amendments to Standards (continued)
Effective for annual periods beginning on or after
• IFRS 2 (revised) Share-based payment - Amendment relating to Establishment cash-settled Share-based January 1, 2010 payments • IAS 32 (revised) Financial Instruments: Presentation - Amendments relating to classification of Rights Issue February 1, 2010
• IAS 24 Related Party Disclosures - Amendment on disclosure requirements for entities that are controlled, January 1, 2011 jointly controlled or significantly influenced by a Government
• IFRS 9 Financial Instruments: Classification and Measurement (intended as complete replacement for January 1, 2013 IAS 39 and IFRS 7)
• Amendments to IFRS 2, IFRS 5, IFRS 8, IAS 1, IAS 7, IAS 17, IAS 18, IAS 36, IAS 38 and IAS 39 resulting from April 2009 Annual Improvements to IFRSs
New Interpretations and amendments to Interpretations
• IFRS 17: Distributions of Non-cash Assets to Owners July 1, 2009
• IFRIC 19: Extinguishing Financial Liabilities with Equity Instruments July 1, 2010
• Amendment to IFRIC 14: IAS 19: The limit on a defined Benefit Asset, Minimum Funding January 1, 2011 Requirement and their interaction
Majority effective for annual periods
beginning on or after January 1, 2010
Effective forannual periods
beginning on or after
24
Maritime Industrial Services Co. Ltd. Inc.
Notes to the Consolidated Financial Statements - continuedFor the year ended December 31, 2009
2. Adoption of new and revised International Financial Reporting Standards (IFRSs)(continued)
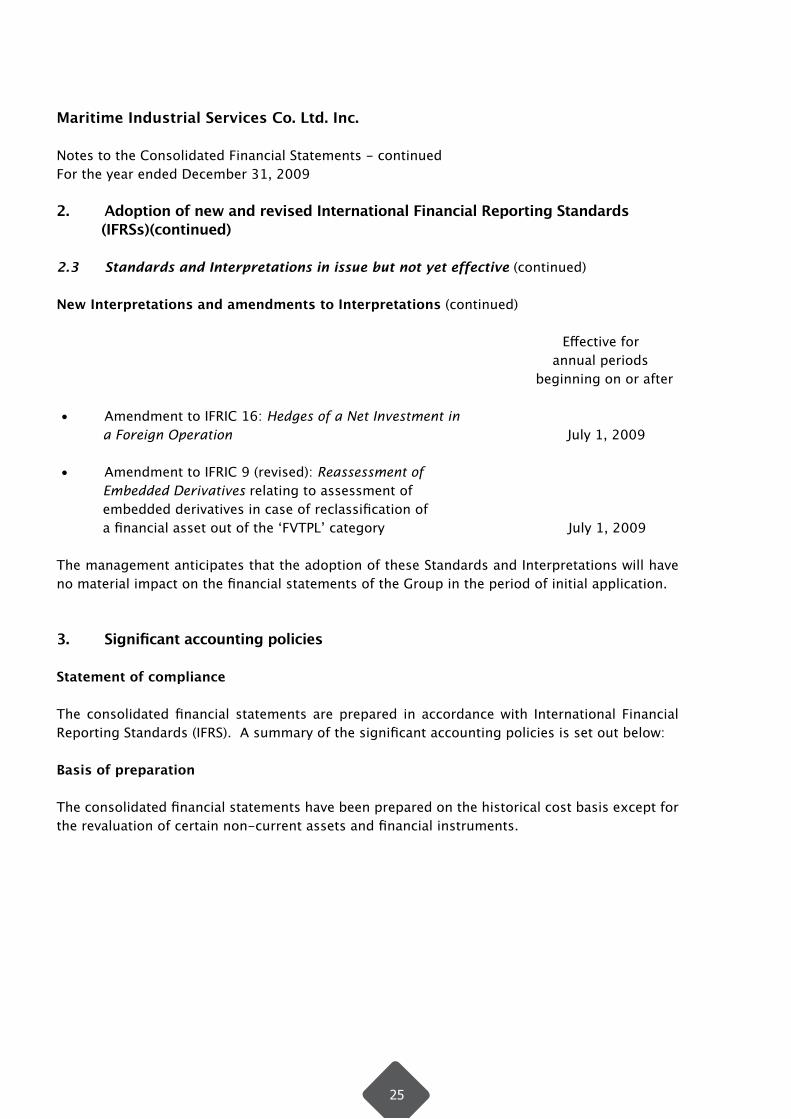
2.3 Standards and Interpretations in issue but not yet effective (continued)
New Interpretations and amendments to Interpretations (continued)
Effective for annual periods beginning on or after
• Amendment to IFRIC 16: Hedges of a Net Investment in a Foreign Operation July 1, 2009
• Amendment to IFRIC 9 (revised): Reassessment of Embedded Derivatives relating to assessment of embedded derivatives in case of reclassification of a financial asset out of the ‘FVTPL’ category July 1, 2009
The management anticipates that the adoption of these Standards and Interpretations will have no material impact on the financial statements of the Group in the period of initial application.
3. Significant accounting policies
Statement of compliance
The consolidated financial statements are prepared in accordance with International Financial Reporting Standards (IFRS). A summary of the significant accounting policies is set out below:
Basis of preparation
The consolidated financial statements have been prepared on the historical cost basis except for the revaluation of certain non-current assets and financial instruments.
25
Maritime Industrial Services Co. Ltd. Inc.
Notes to the Consolidated Financial Statements - continuedFor the year ended December 31, 2009
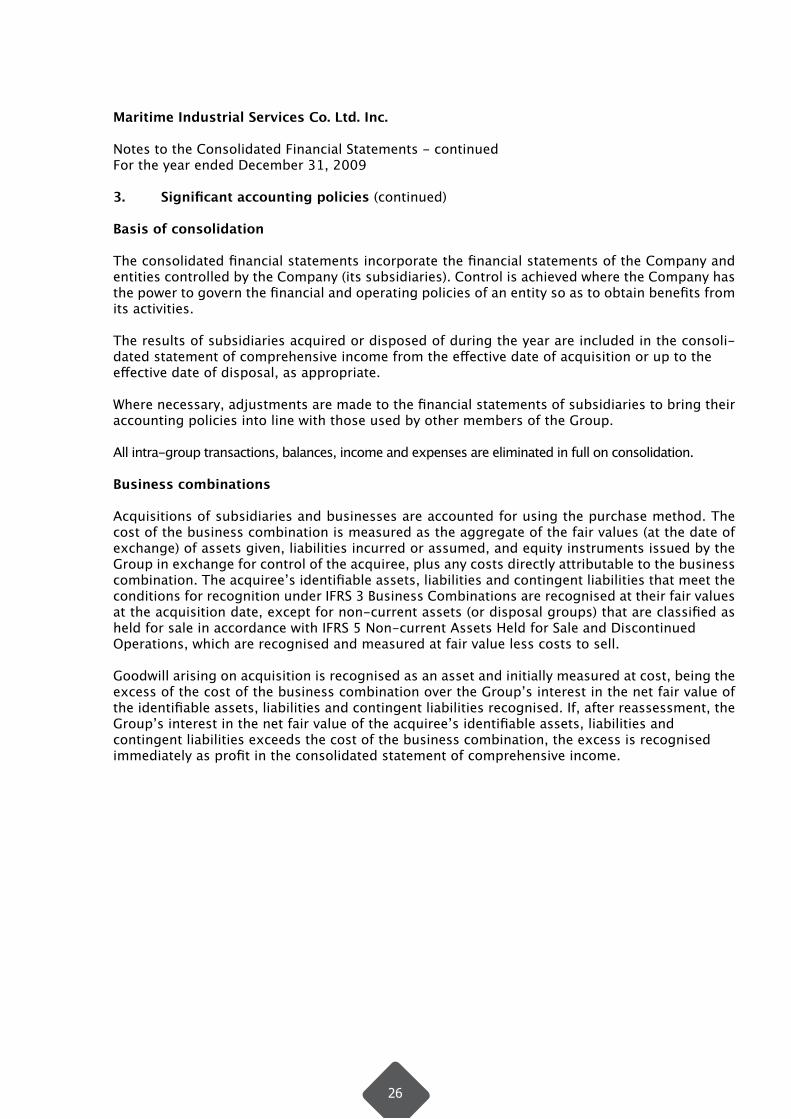
3. Significant accounting policies (continued)
Basis of consolidation
The consolidated financial statements incorporate the financial statements of the Company and entities controlled by the Company (its subsidiaries). Control is achieved where the Company has the power to govern the financial and operating policies of an entity so as to obtain benefits from its activities.
The results of subsidiaries acquired or disposed of during the year are included in the consoli-dated statement of comprehensive income from the effective date of acquisition or up to the effective date of disposal, as appropriate.
Where necessary, adjustments are made to the financial statements of subsidiaries to bring their accounting policies into line with those used by other members of the Group.
All intra-group transactions, balances, income and expenses are eliminated in full on consolidation.
Business combinations
Acquisitions of subsidiaries and businesses are accounted for using the purchase method. The cost of the business combination is measured as the aggregate of the fair values (at the date of exchange) of assets given, liabilities incurred or assumed, and equity instruments issued by the Group in exchange for control of the acquiree, plus any costs directly attributable to the business combination. The acquiree’s identifiable assets, liabilities and contingent liabilities that meet the conditions for recognition under IFRS 3 Business Combinations are recognised at their fair values at the acquisition date, except for non-current assets (or disposal groups) that are classified as held for sale in accordance with IFRS 5 Non-current Assets Held for Sale and DiscontinuedOperations, which are recognised and measured at fair value less costs to sell.
Goodwill arising on acquisition is recognised as an asset and initially measured at cost, being the excess of the cost of the business combination over the Group’s interest in the net fair value of the identifiable assets, liabilities and contingent liabilities recognised. If, after reassessment, the Group’s interest in the net fair value of the acquiree’s identifiable assets, liabilities and contingent liabilities exceeds the cost of the business combination, the excess is recognised immediately as profit in the consolidated statement of comprehensive income.
26

Maritime Industrial Services Co. Ltd. Inc.
Notes to the Consolidated Financial Statements - continuedFor the year ended December 31, 2009
3. Significant accounting policies (continued)
Investments in associates
An associate is an enterprise over which the Group is in a position to exercise significant influence, through participation in the financial and operating policy decisions of the investee.
The investments are initially recorded at cost and adjusted thereafter for the post acquisition change in the Group’s share of the net assets. The carrying amount of such investments isreduced to recognise any impairment in the value of individual investments.
To the extent practical, where a group enterprise transacts with an associate of the Group, unrealised profits and losses are eliminated to the extent of the Group’s interest in the relevant associate, except where unrealised losses provide evidence of an impairment of the asset transferred.
Interests in joint ventures
A joint venture is a contractual arrangement whereby the Group and other parties undertake an economic activity that is subject to joint control, that is when the strategic financial and operating policy decisions relating to the activities require the unanimous consent of the parties sharing control.
Joint venture arrangements that involve the establishment of a separate entity in which each venturer has an interest are referred to as jointly controlled entities. The Group reports itsinterests in jointly controlled entities using the equity method.
Where the Group transacts with its jointly controlled entities, unrealised profits and losses are eliminated to the extent of the Group’s interest in the joint venture.
Goodwill
Goodwill arising on the acquisition of a subsidiary or a jointly controlled entity represents the excess of the cost of acquisition over the Group’s interest in the net fair value of the identifiable assets, liabilities and contingent liabilities of the subsidiary or jointly controlled entity recognised at the date of acquisition. Goodwill is initially recognised as an asset at cost and is subsequently measured at cost less any accumulated impairment losses.
For the purpose of impairment testing, goodwill is allocated to each of the Group’s cash-generating units expected to benefit from the synergies of the combination. Cash-generating units to which goodwill has been allocated are tested for impairment annually, or more frequently when there is an indication that the unit may be impaired. If the recoverable amount of thecash-generating unit is less than the carrying amount of the unit, the impairment loss is allocated first to reduce the carrying amount of any goodwill allocated to the unit and then to the other assets of the unit pro-rata on the basis of the carrying amount of each asset in the unit. An impairment loss recognised for goodwill is not reversed in a subsequent period.
On disposal of a subsidiary or a jointly controlled entity, the attributable amount of goodwill is included in the determination of the profit or loss on disposal.
27
Maritime Industrial Services Co. Ltd. Inc.
Notes to the Consolidated Financial Statements - continuedFor the year ended December 31, 2009
3. Significant accounting policies (continued)
Due from/to customers
Due from/to customers at the statement of financial position date comprises the cost of work done to date on construction projects in progress, plus any profit attributable recognized in accordance with the Group’s policy for revenue recognition, less progress billings made to date.
Inventories
Inventories are valued at the lower of cost and net realizable value. Cost is allocated on First-In First-out (FIFO) basis and comprises direct materials and, where applicable, direct labour costs and those overheads that have been incurred in bringing the inventories to their present location and condition. Net realizable value represents the estimated selling price less all estimated costs to completion and costs to be incurred in marketing, selling and distribution.
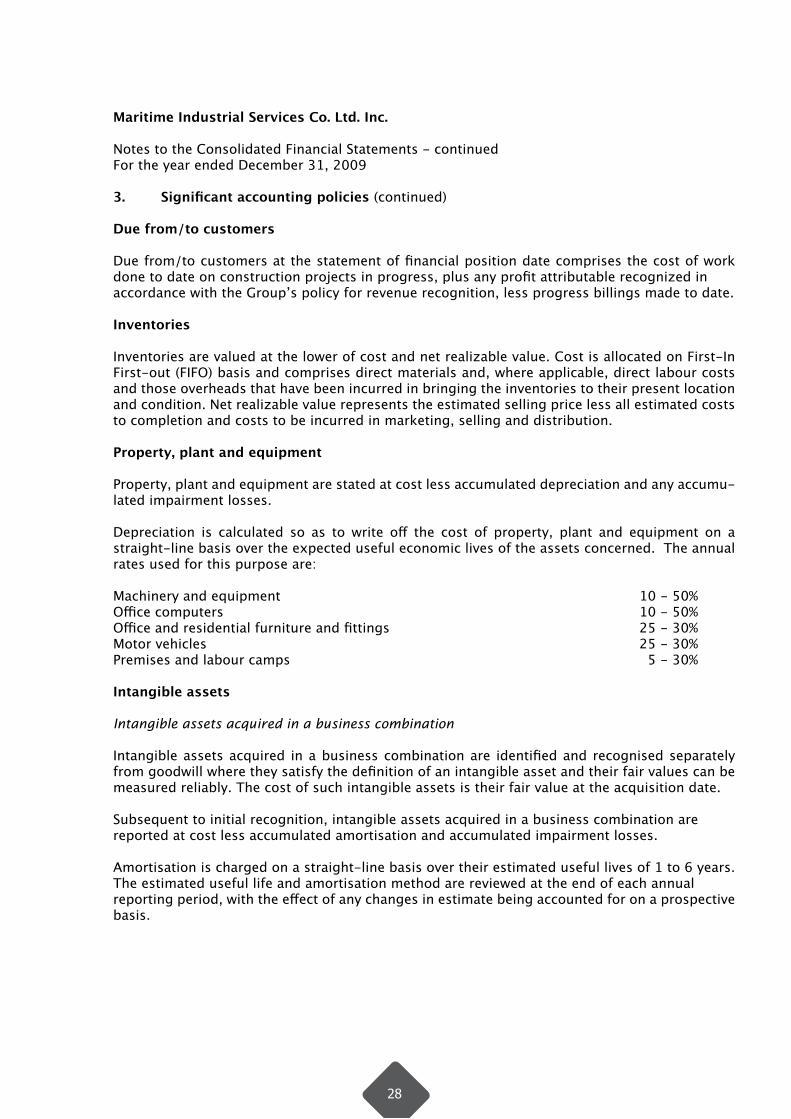
Property, plant and equipment
Property, plant and equipment are stated at cost less accumulated depreciation and any accumu-lated impairment losses.
Depreciation is calculated so as to write off the cost of property, plant and equipment on a straight-line basis over the expected useful economic lives of the assets concerned. The annual rates used for this purpose are:
Machinery and equipment Office computers Office and residential furniture and fittings Motor vehicles Premises and labour camps
Intangible assets
Intangible assets acquired in a business combination
Intangible assets acquired in a business combination are identified and recognised separately from goodwill where they satisfy the definition of an intangible asset and their fair values can be measured reliably. The cost of such intangible assets is their fair value at the acquisition date.
Subsequent to initial recognition, intangible assets acquired in a business combination are reported at cost less accumulated amortisation and accumulated impairment losses. Amortisation is charged on a straight-line basis over their estimated useful lives of 1 to 6 years. The estimated useful life and amortisation method are reviewed at the end of each annual reporting period, with the effect of any changes in estimate being accounted for on a prospective basis.
10 - 50%10 - 50%25 - 30%25 - 30%
5 - 30%
28

Maritime Industrial Services Co. Ltd. Inc.
Notes to the Consolidated Financial Statements - continuedFor the year ended December 31, 2009
3. Significant accounting policies (continued)
Impairment of tangible and intangible assets
At each statement of financial position date, the Group reviews the carrying amounts of itstangible and intangible assets to determine whether there is any indication that those assets have suffered an impairment loss. If any such indication exists, the recoverable amount of the asset is estimated in order to determine the extent of the impairment loss (if any). Where it is not pos-sible to estimate the recoverable amount of an individual asset, the Group estimates the recov-erable amount of the cash-generating unit to which the asset belongs. Where a reasonable and consistent basis of allocation can be identified, corporate assets are also allocated to individual cash-generating units, or otherwise they are allocated to the smallest group of cash-generating units for which a reasonable and consistent allocation basis can be identified.
Intangible assets with indefinite useful lives and intangible assets not yet available for use are tested for impairment annually, and whenever there is an indication that the asset may be impaired.
Recoverable amount is the higher of fair value less costs to sell and value in use. In assessing value in use, the estimated future cash flows are discounted to their present value using a pre-tax discount rate that reflects current market assessments of the time value of money and the risks specific to the asset for which the estimates of future cash flows have not been adjusted.
If the recoverable amount of an asset (or cash-generating unit) is estimated to be less than its carrying amount, the carrying amount of the asset (or cash-generating unit) is reduced to its recoverable amount. An impairment loss is recognised immediately in the consolidated statement of comprehensive income, unless the relevant asset is carried at a revalued amount, in which case the impairment loss is treated as a revaluation decrease.
Where an impairment loss subsequently reverses, the carrying amount of the asset(or cash-generating unit) is increased to the revised estimate of its recoverable amount, but so that the increased carrying amount does not exceed the carrying amount that would have been determined had no impairment loss been recognised for the asset (or cash-generating unit) in prior years. A reversal of an impairment loss is recognised immediately in the consolidated statement of comprehensive income, unless the relevant asset is carried at a revalued amount, in which case the reversal of the impairment loss is treated as a revaluation increase.
Provision for employees’ end of service indemnity
Provision for employees’ end of service indemnity is made in accordance with the Labour Laws applicable in the countries in which the Group operates, and is computed based on the current employee remuneration at the statement of financial position date and cumulative number of years of service at that date.
29
Maritime Industrial Services Co. Ltd. Inc.
Notes to the Consolidated Financial Statements - continuedFor the year ended December 31, 2009
3. Significant accounting policies (continued)
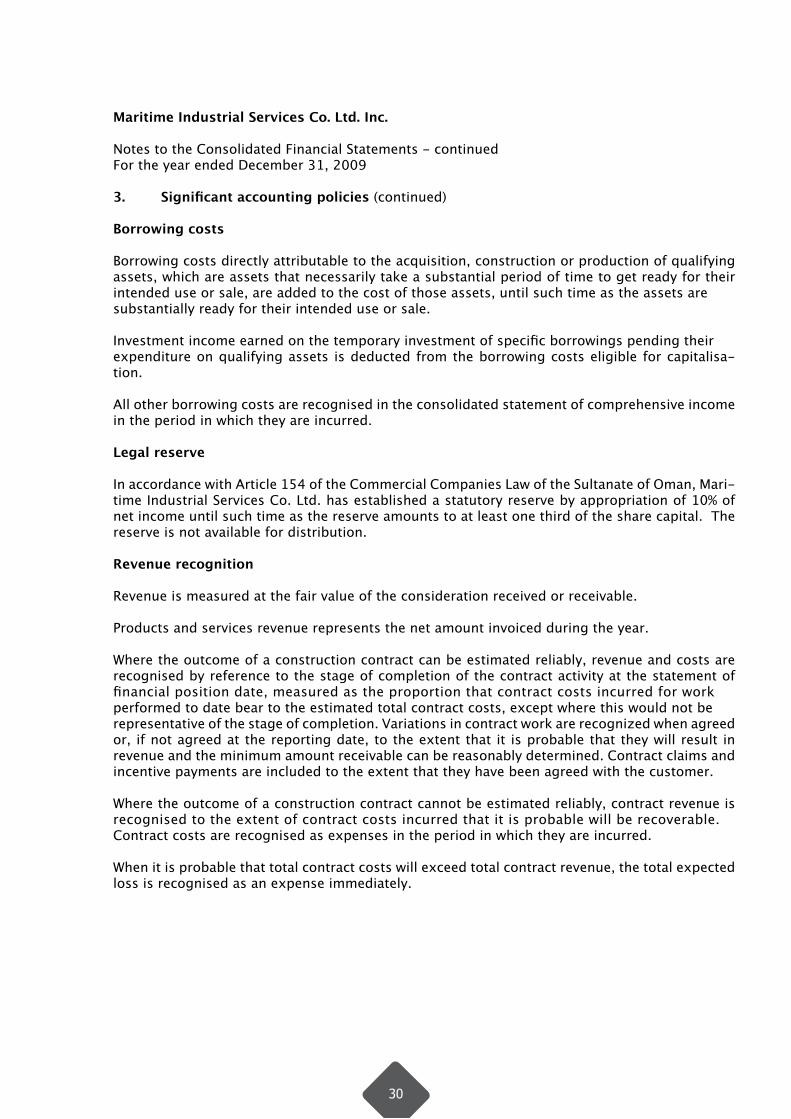
Borrowing costs
Borrowing costs directly attributable to the acquisition, construction or production of qualifying assets, which are assets that necessarily take a substantial period of time to get ready for their intended use or sale, are added to the cost of those assets, until such time as the assets are substantially ready for their intended use or sale.
Investment income earned on the temporary investment of specific borrowings pending their expenditure on qualifying assets is deducted from the borrowing costs eligible for capitalisa-tion.
All other borrowing costs are recognised in the consolidated statement of comprehensive income in the period in which they are incurred.
Legal reserve
In accordance with Article 154 of the Commercial Companies Law of the Sultanate of Oman, Mari-time Industrial Services Co. Ltd. has established a statutory reserve by appropriation of 10% of net income until such time as the reserve amounts to at least one third of the share capital. The reserve is not available for distribution.
Revenue recognition
Revenue is measured at the fair value of the consideration received or receivable.
Products and services revenue represents the net amount invoiced during the year.
Where the outcome of a construction contract can be estimated reliably, revenue and costs are recognised by reference to the stage of completion of the contract activity at the statement of financial position date, measured as the proportion that contract costs incurred for work performed to date bear to the estimated total contract costs, except where this would not be representative of the stage of completion. Variations in contract work are recognized when agreed or, if not agreed at the reporting date, to the extent that it is probable that they will result in revenue and the minimum amount receivable can be reasonably determined. Contract claims and incentive payments are included to the extent that they have been agreed with the customer.
Where the outcome of a construction contract cannot be estimated reliably, contract revenue is recognised to the extent of contract costs incurred that it is probable will be recoverable. Contract costs are recognised as expenses in the period in which they are incurred.
When it is probable that total contract costs will exceed total contract revenue, the total expected loss is recognised as an expense immediately.
30
Maritime Industrial Services Co. Ltd. Inc.
Notes to the Consolidated Financial Statements - continuedFor the year ended December 31, 2009
3. Significant accounting policies (continued)
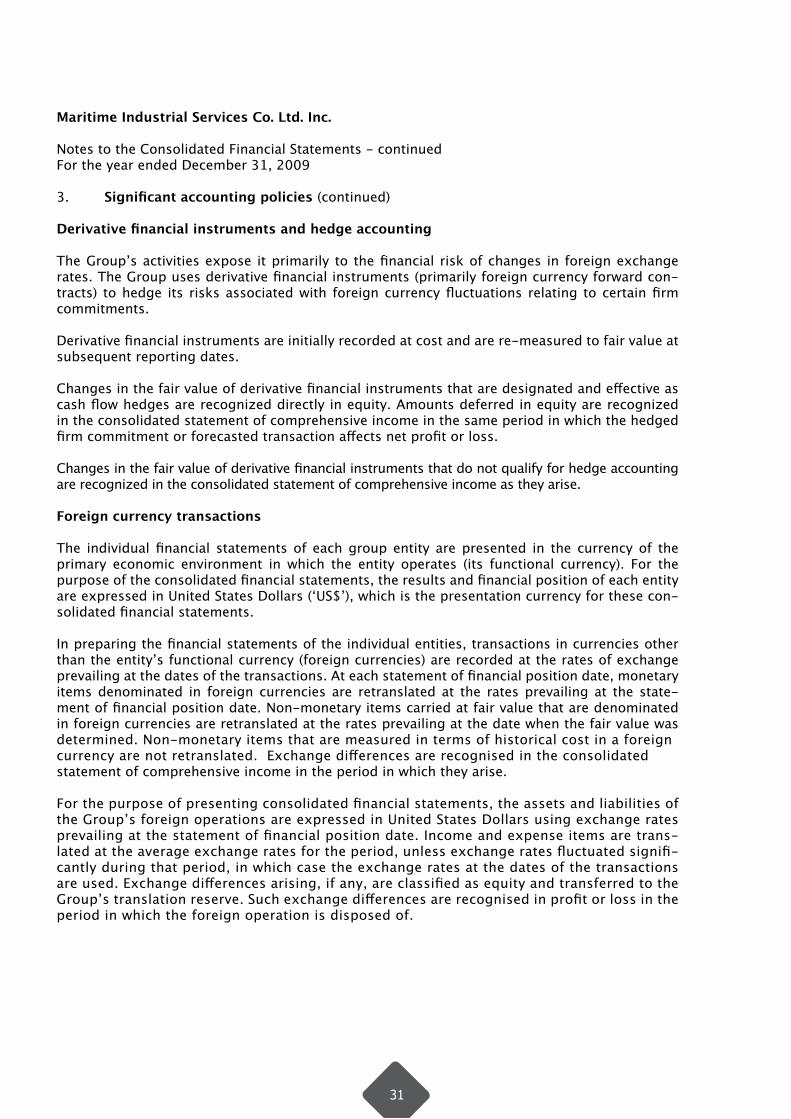
Derivative financial instruments and hedge accounting
The Group’s activities expose it primarily to the financial risk of changes in foreign exchange rates. The Group uses derivative financial instruments (primarily foreign currency forward con-tracts) to hedge its risks associated with foreign currency fluctuations relating to certain firm commitments.
Derivative financial instruments are initially recorded at cost and are re-measured to fair value at subsequent reporting dates.
Changes in the fair value of derivative financial instruments that are designated and effective as cash flow hedges are recognized directly in equity. Amounts deferred in equity are recognized in the consolidated statement of comprehensive income in the same period in which the hedged firm commitment or forecasted transaction affects net profit or loss.
Changes in the fair value of derivative financial instruments that do not qualify for hedge accounting are recognized in the consolidated statement of comprehensive income as they arise.
Foreign currency transactions
The individual financial statements of each group entity are presented in the currency of the primary economic environment in which the entity operates (its functional currency). For the purpose of the consolidated financial statements, the results and financial position of each entity are expressed in United States Dollars (‘US$’), which is the presentation currency for these con-solidated financial statements.
In preparing the financial statements of the individual entities, transactions in currencies other than the entity’s functional currency (foreign currencies) are recorded at the rates of exchange prevailing at the dates of the transactions. At each statement of financial position date, monetary items denominated in foreign currencies are retranslated at the rates prevailing at the state-ment of financial position date. Non-monetary items carried at fair value that are denominated in foreign currencies are retranslated at the rates prevailing at the date when the fair value was determined. Non-monetary items that are measured in terms of historical cost in a foreign currency are not retranslated. Exchange differences are recognised in the consolidated statement of comprehensive income in the period in which they arise.
For the purpose of presenting consolidated financial statements, the assets and liabilities of the Group’s foreign operations are expressed in United States Dollars using exchange rates prevailing at the statement of financial position date. Income and expense items are trans-lated at the average exchange rates for the period, unless exchange rates fluctuated signifi-cantly during that period, in which case the exchange rates at the dates of the transactions are used. Exchange differences arising, if any, are classified as equity and transferred to the Group’s translation reserve. Such exchange differences are recognised in profit or loss in the period in which the foreign operation is disposed of.
31

Maritime Industrial Services Co. Ltd. Inc.
Notes to the Consolidated Financial Statements - continuedFor the year ended December 31, 2009
3. Significant accounting policies (continued)
Taxation
Tax expense is based on results for the period in each tax jurisdiction in which the Group’s branches or entities are registered as adjusted for items which are non-assessable or disallowed. It is calculated using tax rates for each jurisdiction that have been enacted or substantially enact-ed by the statement of financial position date. Deferred tax is accounted for using the statement of financial position liability method in respect of temporary differences arising from differences between the carrying amount of assets and liabilities in the consolidated financial statements and the corresponding tax basis used in the computation of taxable profit.
Financial instruments
Financial assets and financial liabilities are recognized on the Group’s statement of financial po-sition when the Group becomes a party to the contractual provisions of the instrument. Cash and cash equivalents
Cash and cash equivalents comprise cash on hand and demand deposits, and other short-term highly liquid investments that are readily convertible to a known amount of cash and are subject to an insignificant risk of changes in value.
Loans and receivables
Accounts receivable, loans, and other receivables that have fixed or determinable payments that are not quoted in an active market are classified as loans and receivables. Loans and receivables are measured at amortized cost using the effective interest method, less any impairment. Interest income is recognized by applying the effective interest rate, except for short-term receivables when the recognition of interest would be immaterial.
Classification as debt or equity
Debt and equity instruments are classified as either financial liabilities or as equity in accordance with the substance of the contractual arrangement.
Equity instruments
An equity instrument is any contract that evidences a residual interest in the assets of an entity after deducting all of its liabilities. Equity instruments issued by the Group are recorded at the proceeds received, net of direct issue costs.
Other financial liabilities
Other financial liabilities, including borrowings, are initially measured at fair value, net of trans-action costs.
Other financial liabilities are subsequently measured at amortized cost using the effective inter-est method, with interest expense recognized on an effective yield basis.
32
Maritime Industrial Services Co. Ltd. Inc.
Notes to the Consolidated Financial Statements - continuedFor the year ended December 31, 2009
3. Significant accounting policies (continued)
Financial instruments (continued)
Other financial liabilities (continued)
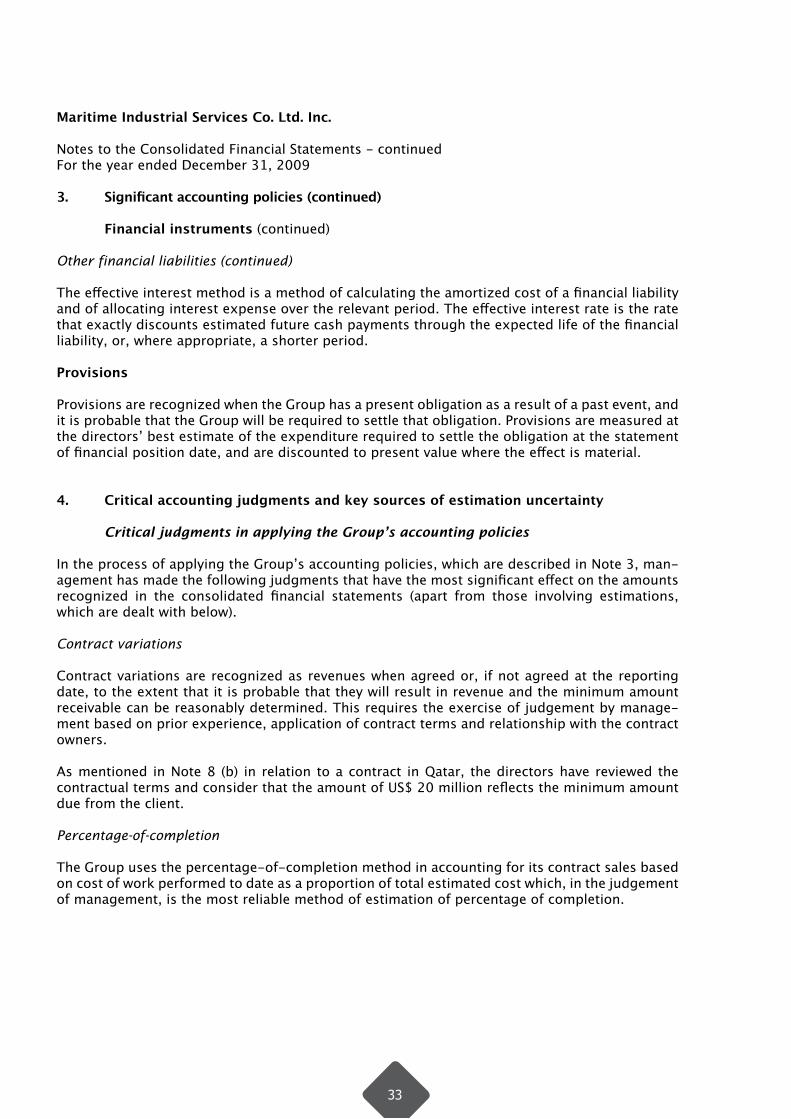
The effective interest method is a method of calculating the amortized cost of a financial liability and of allocating interest expense over the relevant period. The effective interest rate is the rate that exactly discounts estimated future cash payments through the expected life of the financial liability, or, where appropriate, a shorter period.
Provisions
Provisions are recognized when the Group has a present obligation as a result of a past event, and it is probable that the Group will be required to settle that obligation. Provisions are measured at the directors’ best estimate of the expenditure required to settle the obligation at the statement of financial position date, and are discounted to present value where the effect is material.
4. Critical accounting judgments and key sources of estimation uncertainty
Critical judgments in applying the Group’s accounting policies
In the process of applying the Group’s accounting policies, which are described in Note 3, man-agement has made the following judgments that have the most significant effect on the amounts recognized in the consolidated financial statements (apart from those involving estimations, which are dealt with below).
Contract variations
Contract variations are recognized as revenues when agreed or, if not agreed at the reporting date, to the extent that it is probable that they will result in revenue and the minimum amount receivable can be reasonably determined. This requires the exercise of judgement by manage-ment based on prior experience, application of contract terms and relationship with the contract owners.
As mentioned in Note 8 (b) in relation to a contract in Qatar, the directors have reviewed the contractual terms and consider that the amount of US$ 20 million reflects the minimum amount due from the client.
Percentage-of-completion
The Group uses the percentage-of-completion method in accounting for its contract sales based on cost of work performed to date as a proportion of total estimated cost which, in the judgement of management, is the most reliable method of estimation of percentage of completion.
33

Maritime Industrial Services Co. Ltd. Inc.
Notes to the Consolidated Financial Statements - continuedFor the year ended December 31, 2009
4. Critical accounting judgments and key sources of estimation uncertainty (continued)
Key sources of estimation uncertainty
The key assumptions concerning the future, and other key sources of estimation uncertainty at the statement of financial position date, that have a significant risk of causing a material adjustment to the carrying amounts of assets and liabilities within the next financial year, are discussed below.
Inventories
Inventories are stated at the lower of cost or net realizable value. Adjustments to reduce the cost of inventory to its net realizable value, if required, are made at the item level for estimatedexcess, obsolescence or impaired balances. Factors influencing these adjustments include changes in demand, technological changes, physical deterioration and quality issues. Based on the above factors, management has applied certain percentages against the cost of this inventory to calculate the allowance for slow moving and obsolete inventory. Revisions to the allowance for slow moving inventory would be required if the outcome of these indicative factors differs from the estimates.
Property, plant and equipment The cost of property, plant and equipment is depreciated over the estimated useful life of the asset. The estimated useful life is based on expected usage of the asset and expected physical wear and tear, which depends on operational factors. The management estimates the residual value of assets on a periodic basis and has considered a residual value no greater than 10% of the cost of the assets.
Allowance for irrecoverable debts
Allowance for irrecoverable debts is determined using a combination of factors to ensure that the accounts receivable are not overstated due to uncollectability. The allowance for irrecoverable debts for all customers is based on a variety of factors, including the overall quality and aging of receivables, continuing credit evaluation of the customers’ financial conditions and collateral requirements from customers in certain circumstances. Also, specific allowances for individual accounts are recorded when the Group becomes aware of the customer’s inability to meet its financial obligations.
Taxation
Management believes that it has adequately provided for tax liabilities in the accompanyingfinancial statements. However, the risk remains that relevant authorities could take differing positions with regard to interpretive issues and the effect could be significant. There are anumber of matters where the interpretation of the tax law and tax positions adopted by the Group may not be accepted by the tax authorities. Consequently, additional taxes may be assessed including penalties and interest which will impact the tax charge and provision in the period in which such assessment is finalised, which could be significant.
34
Maritime Industrial Services Co. Ltd. Inc.
Notes to the Consolidated Financial Statements - continuedFor the year ended December 31, 2009
4. Critical accounting judgments and key sources of estimation uncertainty (continued)
Key sources of estimation uncertainty (continued)
Contract revenues/costs
Contract revenues recognized are based on the percentage completion method which requires management to estimate the total contract costs at each measurement date. Included in the total contract costs are estimates for maintenance and warranty which could be incurred after completion of each project. Revisions to the value of revenue recognized and amounts due from customers for unbilled contract work would be required if actual costs differ from the original estimates.
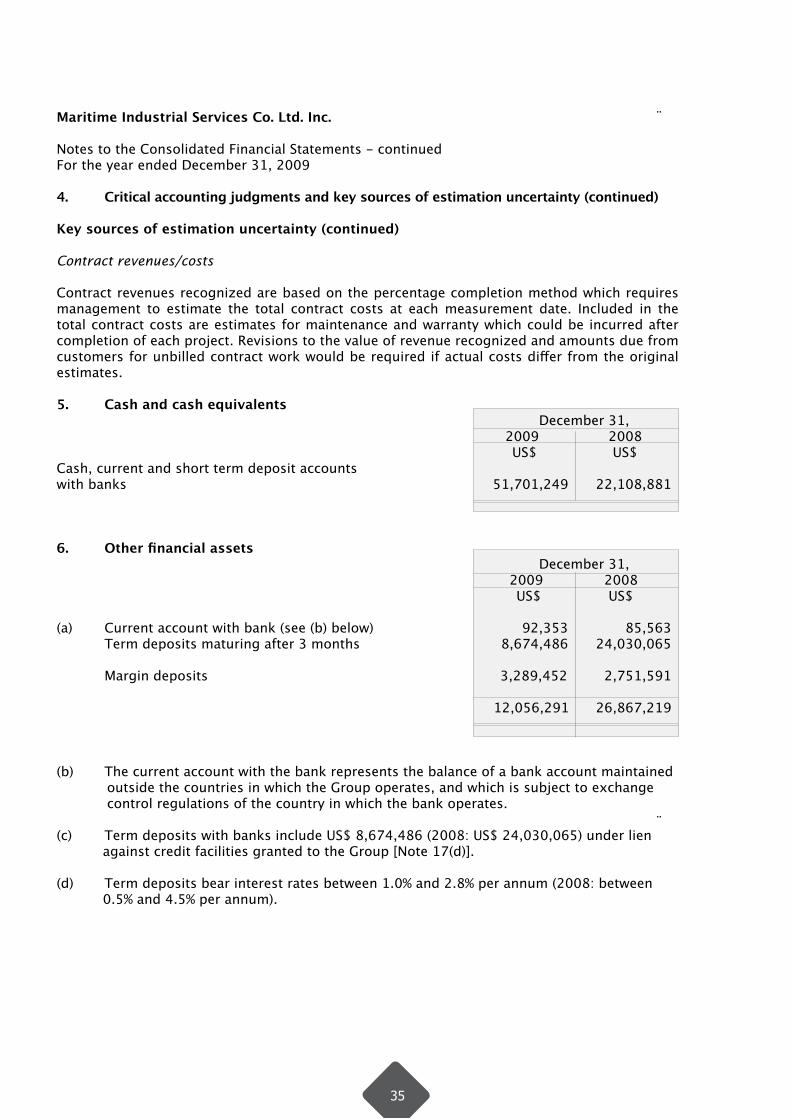
5. Cash and cash equivalents December 31, 2009 2008 US$ US$Cash, current and short term deposit accounts with banks 51,701,249 22,108,881
6. Other financial assets December 31, 2009 2008 US$ US$
(a) Current account with bank (see (b) below) 92,353 85,563 Term deposits maturing after 3 months 8,674,486 24,030,065 Margin deposits 3,289,452 2,751,591
12,056,291 26,867,219
(b) The current account with the bank represents the balance of a bank account maintained outside the countries in which the Group operates, and which is subject to exchange control regulations of the country in which the bank operates.
(c) Term deposits with banks include US$ 8,674,486 (2008: US$ 24,030,065) under lien against credit facilities granted to the Group [Note 17(d)].
(d) Term deposits bear interest rates between 1.0% and 2.8% per annum (2008: between 0.5% and 4.5% per annum).
35
Maritime Industrial Services Co. Ltd. Inc. Notes to the Consolidated Financial Statements - continuedFor the year ended December 31, 2009
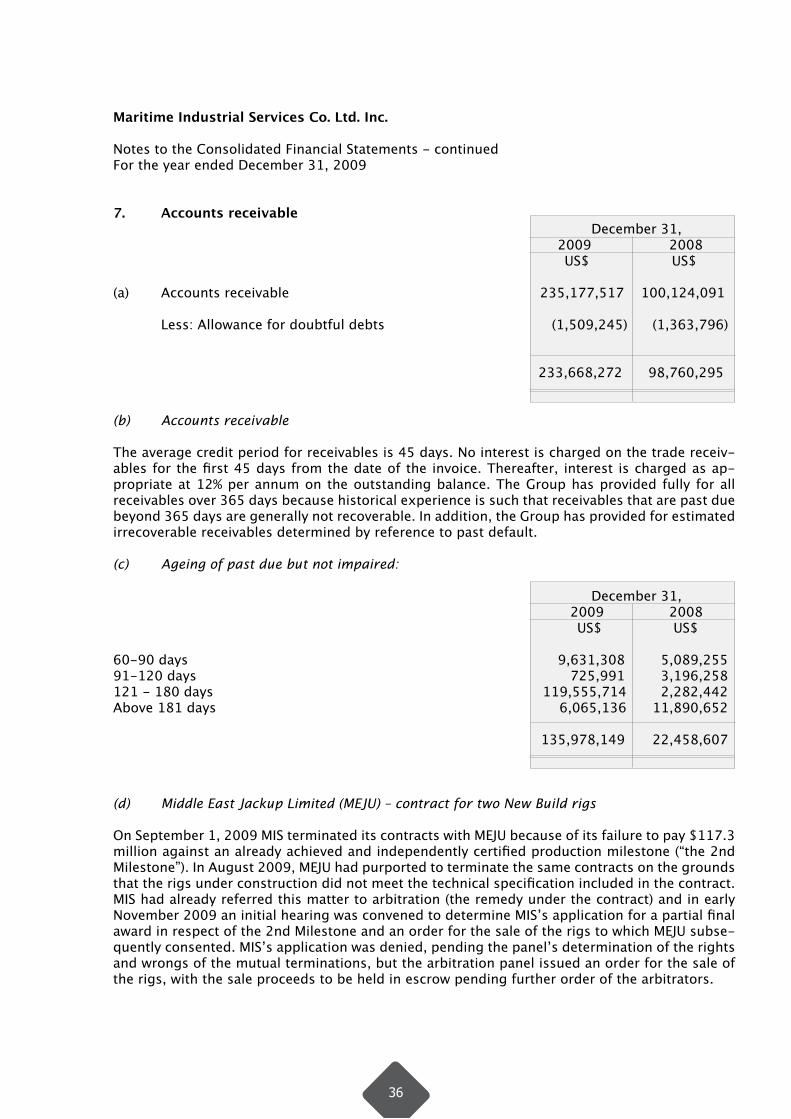
7. Accounts receivable December 31, 2009 2008 US$ US$
(a) Accounts receivable 235,177,517 100,124,091 Less: Allowance for doubtful debts (1,509,245) (1,363,796)
233,668,272 98,760,295 (b) Accounts receivable
The average credit period for receivables is 45 days. No interest is charged on the trade receiv-ables for the first 45 days from the date of the invoice. Thereafter, interest is charged as ap-propriate at 12% per annum on the outstanding balance. The Group has provided fully for all receivables over 365 days because historical experience is such that receivables that are past due beyond 365 days are generally not recoverable. In addition, the Group has provided for estimated irrecoverable receivables determined by reference to past default.
(c) Ageing of past due but not impaired:
December 31, 2009 2008 US$ US$
60-90 days 9,631,308 5,089,25591-120 days 725,991 3,196,258121 - 180 days 119,555,714 2,282,442Above 181 days 6,065,136 11,890,652 135,978,149 22,458,607
(d) Middle East Jackup Limited (MEJU) – contract for two New Build rigs
On September 1, 2009 MIS terminated its contracts with MEJU because of its failure to pay $117.3 million against an already achieved and independently certified production milestone (“the 2nd Milestone”). In August 2009, MEJU had purported to terminate the same contracts on the grounds that the rigs under construction did not meet the technical specification included in the contract. MIS had already referred this matter to arbitration (the remedy under the contract) and in early November 2009 an initial hearing was convened to determine MIS’s application for a partial final award in respect of the 2nd Milestone and an order for the sale of the rigs to which MEJU subse-quently consented. MIS’s application was denied, pending the panel’s determination of the rights and wrongs of the mutual terminations, but the arbitration panel issued an order for the sale of the rigs, with the sale proceeds to be held in escrow pending further order of the arbitrators.
36

Maritime Industrial Services Co. Ltd. Inc. Notes to the Consolidated Financial Statements - continuedFor the year ended December 31, 2009
7. Accounts receivable (continued)
(d) Middle East Jackup Limited (MEJU) – contract for two New Build rigs (continued)
• Balances related to the above mentioned customer in the statement of financial position at December 31, 2009 totalled US$ 127.9 million comprising accounts receivable of $117.3 million and due from customers (Note 8) of US$ 10.6 million. Based on the indicative offers received management expects to fully recover these amounts from the proceeds of sale.
• MIS had contracts for the construction of Hulls 106 and 108 with respectively Mosvold Middle East Jackup I Limited and Mosvold Middle East Jackup II Limited, collectively referred to here as MEJU, in which MIS also has an indirect shareholding of 10%. This investment, valued at $10.1 million, has been fully provided.
(e) Movement in the allowance for doubtful debts:
December 31, 2009 2008 US$ US$
Balance at beginning of the year 1,363,796 1,430,715 Allowance for doubtful debts 626,123 402,131 Amounts written off as uncollectible (42,740) (17,642) Amounts recovered during the year (322,191) (451,408) Impairment losses reversed (115,743) - Balance at end of the year 1,509,245 1,363,796
In determining the recoverability of a accounts receivable, the Group considers any change in the credit quality of the accounts receivable from the date credit was initially granted up to the reporting date. The concentration of credit risk is limited due to the customer base being large and unrelated. Accordingly, the directors believe that there is no further credit provision required in excess of the allowance for doubtful debts.
(f) Ageing of impaired accounts receivable:
December 31, 2009 2008 US$ US$Impaired trade receivables 60-90 days - - 90-120 days - -121-365 days - -Above 365 days 1,509,245 1,363,796 Total 1,509,245 1,363,796
37

Maritime Industrial Services Co. Ltd. Inc.
Notes to the Consolidated Financial Statements - continuedFor the year ended December 31, 2009
8. Due from customers
(a) Due from customers represents costs incurred and attributable profit recognized in excess of progress billings on jobs in progress.
December 31, 2009 2008 US$ US$Costs incurred plus recognized profits less recognized losses to date 612,942,774 575,143,681 Less: Progress billings (610,403,892) (506,431,385)
2,538,882 68,712,296 Disclosed as:Due from customers 51,571,715 94,401,229 Due to customers (Note 16) (49,032,833) (25,688,933)
2,538,882 68,712,296
(b) Qatar project
Included in the amount due from customers is an amount of US$ 20 million relating to variation orders on a construction project in Qatar, resulting from client imposed delays. The client made a formal settlement offer of US$ 20 million in October 2008 which MIS rejected. MIS is claim-ing approximately US$ 75 million and, although it continues to seek settlement on an amicable basis, it has now filed a formal lawsuit in Qatar and a hearing is set for March 23, 2010. MIS is confident that recovery will exceed the carrying value of US$ 20 million, but no revenue has been recognized in respect of the amounts claimed in excess of that amount.
38

Maritime Industrial Services Co. Ltd. Inc.
Notes to the Consolidated Financial Statements - continuedFor the year ended December 31, 2009
9. Prepayments and other receivables
December 31, 2009 2008 US$ US$
(a) Advances paid to suppliers [Note 9(b)] 22,606,763 59,085,865 Due from employees 1,207,952 1,467,401 Prepaid expenses 2,215,248 2,645,083 Deposits 999,416 1,239,713 Interest receivable 74,342 55,248 Other receivables 8,875,504 10,510,455
35,979,225 75,003,765 (b) Advances paid to suppliers in 2009 and 2008 are net of a provision of US$ 6.5 million in respect of advances made to a civil contractor engaged in a major Group construction contract which the directors consider may not be recoverable from the civil contractor.
10. Inventories
December 31, 2009 2008 US$ US$
Materials 3,844,408 3,223,577Spare parts 2,046,118 1,911,954Consumables 895,760 1,704,659Finished goods 890,397 623,398 7,676,683 7,463,588 Less: Allowance for slow moving inventories (1,995,389) (1,505,274) 5,681,294 5,958,314
39
Mar
itim
e In
dust
rial
Ser
vice
s Co
. Ltd
. Inc
.
Not
es to
the
Cons
olid
ated
Fin
anci
al S
tate
men
ts -
con
tinue
dFo
r th
e ye
ar e
nded
Dec
embe
r 31
, 200
9
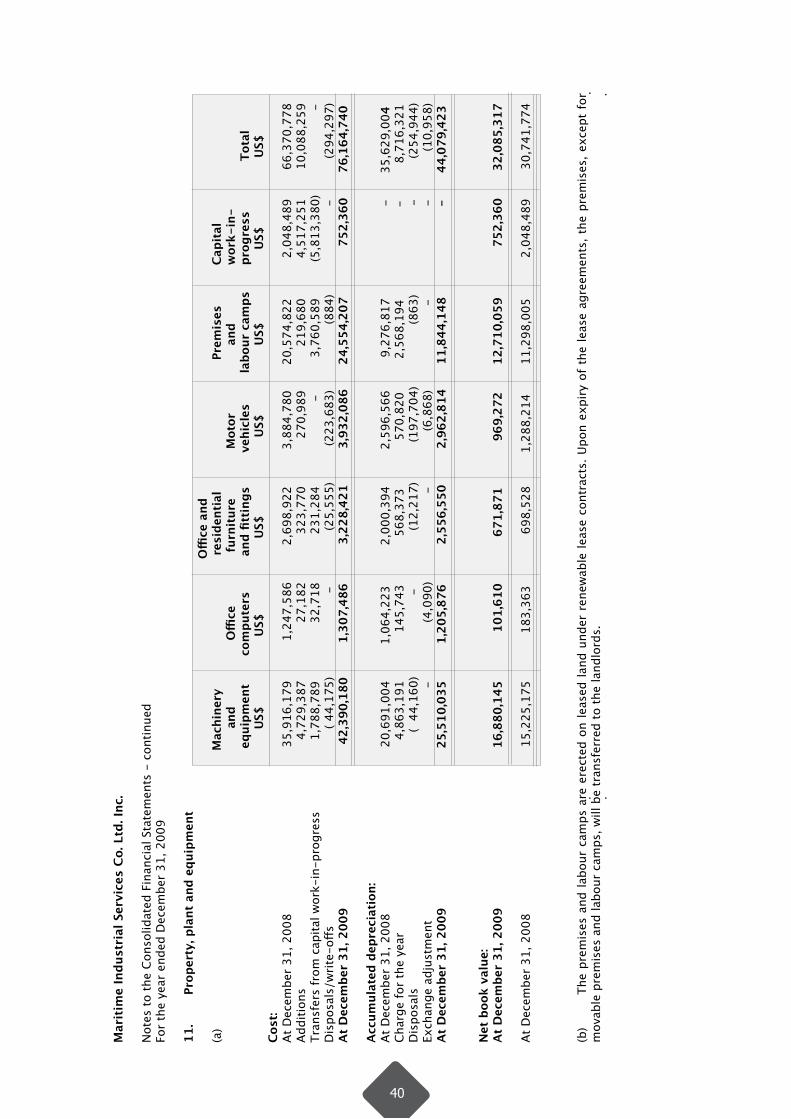
11.
Prop
erty
, pla
nt a
nd e
quip
men
t
Offi
ce a
nd
(a
)
M
achi
nery
resi
dent
ial
P
rem
ises
Capi
tal
and
O
ffice
furn
itur
e
M
otor
a
nd
w
ork-
in-
eq
uipm
ent
c
ompu
ters
a
nd fi
ttin
gs
v
ehic
les
labo
ur c
amps
prog
ress
Tot
al
US$
U
S$
U
S$
US$
U
S$
US$
U
S$Co
st:
At D
ecem
ber
31, 2
008
3
5,91
6,17
9
1,2
47,5
86
2
,698
,922
3,8
84,7
80
20,
574,
822
2
,048
,489
66,3
70,7
78Ad
ditio
ns
4,7
29,3
87
2
7,18
2
3
23,7
70
270
,989
2
19,6
80
4
,517
,251
10,0
88,2
59
Tran
sfer
s fr
om c
apita
l wor
k-in
-pro
gres
s
1,7
88,7
89
32,
718
2
31,2
84
-
3,7
60,5
89
(5
,813
,380
)
-
Dis
posa
ls/w
rite-
offs
(
44,1
75)
-
(25,
555)
(2
23,6
83)
(884
)
-
(2
94,2
97)
At
Dec
embe
r 31
, 200
9
42,
390,
180
1
,307
,486
3,2
28,4
21
3
,932
,086
2
4,55
4,20
7
75
2,36
0
76,
164,
740
Acc
umul
ated
dep
reci
atio
n:At
Dec
embe
r 31
, 200
8
20,
691,
004
1
,064
,223
2,0
00,3
94
2
,596
,566
9,2
76,8
17
-
35,
629,
004
Char
ge fo
r th
e ye
ar
4,8
63,1
91
1
45,7
43
5
68,3
73
5
70,8
20
2,56
8,19
4
-
8,
716,
321
Dis
posa
ls
(
44,
160)
-
(1
2,21
7)
(19
7,70
4)
(8
63)
-
(2
54,9
44)
Exch
ange
adj
ustm
ent
-
(4
,090
)
-
(6
,868
)
-
-
(1
0,95
8)A
t D
ecem
ber
31, 2
009
25
,510
,035
1,2
05,8
76
2,5
56,5
50
2,9
62,8
14
11,
844,
148
- 4
4,07
9,42
3
Net
boo
k va
lue:
At
Dec
embe
r 31
, 200
9
16,8
80,1
45
101
,610
6
71,8
71
96
9,27
2
12
,710
,059
752
,360
32,
085,
317
At D
ecem
ber
31, 2
008
1
5,22
5,17
5
1
83,3
63
698
,528
1,2
88,2
14
11,
298,
005
2
,048
,489
30,7
41,7
74
(b)
The
prem
ises
and
labo
ur c
amps
are
ere
cted
on
leas
ed la
nd u
nder
ren
ewab
le le
ase
cont
ract
s. U
pon
expi
ry o
f th
e le
ase
agre
emen
ts, t
he p
rem
ises
, exc
ept
for
mov
able
pre
mis
es a
nd la
bour
cam
ps, w
ill b
e tr
ansf
erre
d to
the
land
lord
s.
40

Maritime Industrial Services Co. Ltd. Inc.
Notes to the Consolidated Financial Statements - continuedFor the year ended December 31, 2009
12. Investment in associate and joint ventures
(a) Details of the Group’s associate at the statement of financial position date were as follows:
Proportion of Place of incorporation ownership Principal Name of associate and operation interest activities MIS Arabia Co. Ltd. Jubail, Kingdom of Saudi Arabia 30% * *Production, manufacturing and erection of heat exchangers, pressure vessels, tanks, structural steel, piping and other related activities.
(b) Summarized financial information in respect of the Group’s associate is set out below:
December 31, 2009 2008 US$ US$
Total assets 30,418,652 24,187,096 Total liabilities (10,726,471) (9,520,281) Net assets 19,692,181 14,666,815 Group’s share of associate’s net assets - (A) 5,263,038 3,996,989
December 31, 2009 2008 US$ US$
Revenue 39,905,840 37,376,098
Profit for the year 13,864,514 10,362,416
Group’s share of associate’s profit for the year - (B) 3,071,727 2,422,865
41
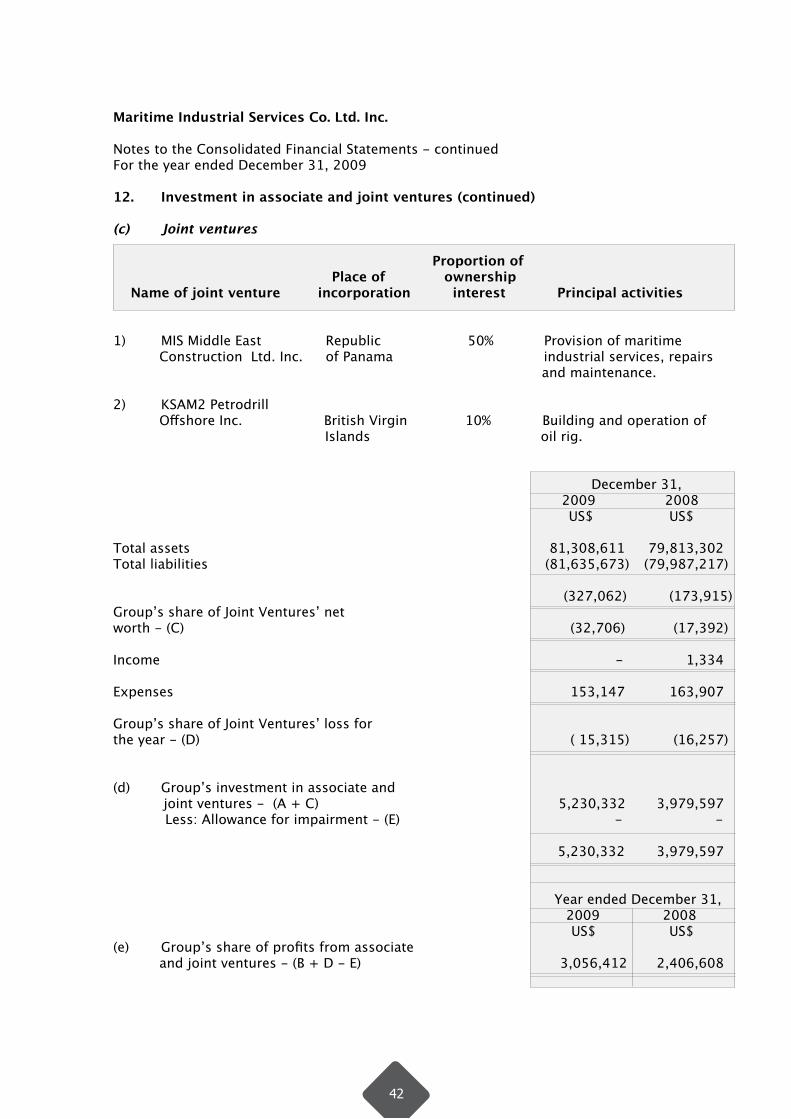
Maritime Industrial Services Co. Ltd. Inc.
Notes to the Consolidated Financial Statements - continuedFor the year ended December 31, 2009
12. Investment in associate and joint ventures (continued)
(c) Joint ventures
Proportion of Place of ownership Name of joint venture incorporation interest Principal activities
1) MIS Middle East Republic 50% Provision of maritime Construction Ltd. Inc. of Panama industrial services, repairs and maintenance.
2) KSAM2 Petrodrill Offshore Inc. British Virgin 10% Building and operation of Islands oil rig.
December 31, 2009 2008 US$ US$
Total assets 81,308,611 79,813,302 Total liabilities (81,635,673) (79,987,217) (327,062) (173,915) Group’s share of Joint Ventures’ net worth - (C) (32,706) (17,392) Income - 1,334 Expenses 153,147 163,907 Group’s share of Joint Ventures’ loss for the year - (D) ( 15,315) (16,257) (d) Group’s investment in associate and joint ventures - (A + C) 5,230,332 3,979,597 Less: Allowance for impairment - (E) - - 5,230,332 3,979,597
Year ended December 31, 2009 2008 US$ US$(e) Group’s share of profits from associate and joint ventures - (B + D - E) 3,056,412 2,406,608
42
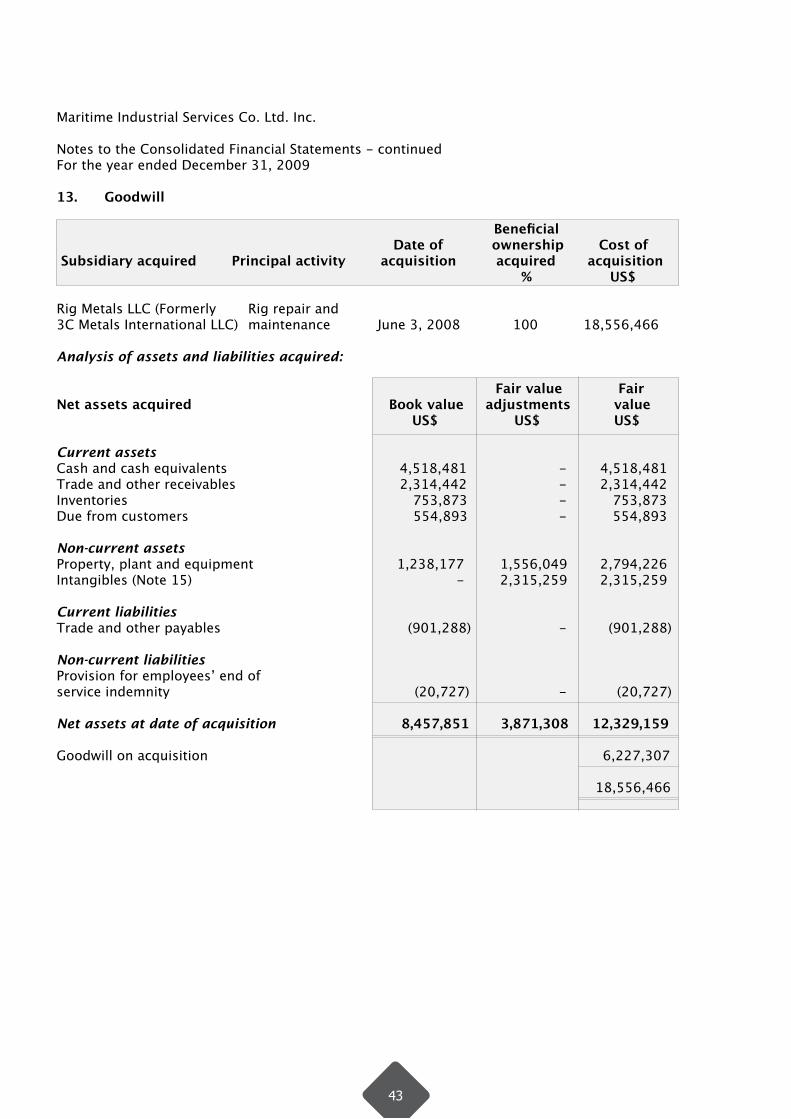
Maritime Industrial Services Co. Ltd. Inc.
Notes to the Consolidated Financial Statements - continuedFor the year ended December 31, 2009
13. Goodwill
Beneficial Date of ownership Cost of Subsidiary acquired Principal activity acquisition acquired acquisition % US$
Rig Metals LLC (Formerly Rig repair and 3C Metals International LLC) maintenance June 3, 2008 100 18,556,466
Analysis of assets and liabilities acquired:
Fair value Fair Net assets acquired Book value adjustments value US$ US$ US$
Current assetsCash and cash equivalents 4,518,481 - 4,518,481Trade and other receivables 2,314,442 - 2,314,442Inventories 753,873 - 753,873Due from customers 554,893 - 554,893
Non-current assetsProperty, plant and equipment 1,238,177 1,556,049 2,794,226Intangibles (Note 15) - 2,315,259 2,315,259 Current liabilitiesTrade and other payables (901,288) - (901,288)
Non-current liabilities Provision for employees’ end of service indemnity (20,727) - (20,727)
Net assets at date of acquisition 8,457,851 3,871,308 12,329,159
Goodwill on acquisition 6,227,307
18,556,466
43
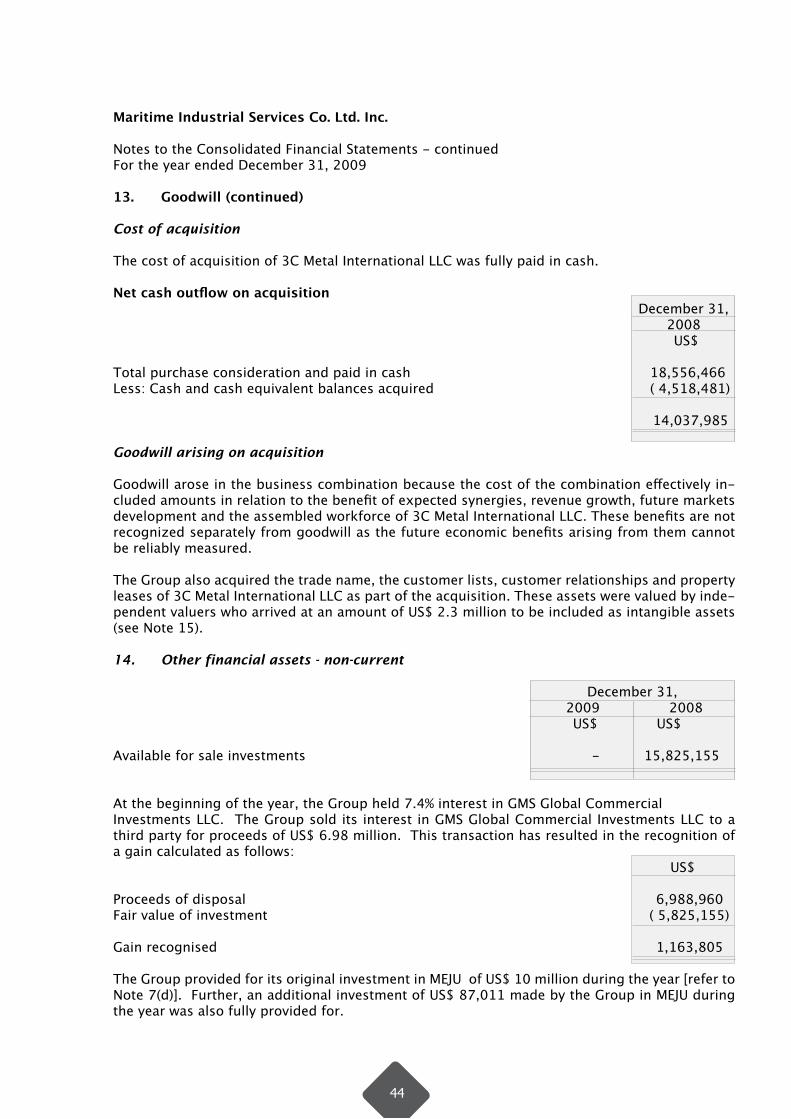
Maritime Industrial Services Co. Ltd. Inc.
Notes to the Consolidated Financial Statements - continuedFor the year ended December 31, 2009
13. Goodwill (continued)
Cost of acquisition
The cost of acquisition of 3C Metal International LLC was fully paid in cash.
Net cash outflow on acquisition December 31, 2008 US$
Total purchase consideration and paid in cash 18,556,466Less: Cash and cash equivalent balances acquired ( 4,518,481)
14,037,985
Goodwill arising on acquisition
Goodwill arose in the business combination because the cost of the combination effectively in-cluded amounts in relation to the benefit of expected synergies, revenue growth, future markets development and the assembled workforce of 3C Metal International LLC. These benefits are not recognized separately from goodwill as the future economic benefits arising from them cannot be reliably measured.
The Group also acquired the trade name, the customer lists, customer relationships and property leases of 3C Metal International LLC as part of the acquisition. These assets were valued by inde-pendent valuers who arrived at an amount of US$ 2.3 million to be included as intangible assets (see Note 15).
14. Other financial assets - non-current
December 31, 2009 2008 US$ US$ Available for sale investments - 15,825,155
At the beginning of the year, the Group held 7.4% interest in GMS Global Commercial Investments LLC. The Group sold its interest in GMS Global Commercial Investments LLC to a third party for proceeds of US$ 6.98 million. This transaction has resulted in the recognition of a gain calculated as follows: US$
Proceeds of disposal 6,988,960Fair value of investment ( 5,825,155)
Gain recognised 1,163,805
The Group provided for its original investment in MEJU of US$ 10 million during the year [refer to Note 7(d)]. Further, an additional investment of US$ 87,011 made by the Group in MEJU during the year was also fully provided for.
44
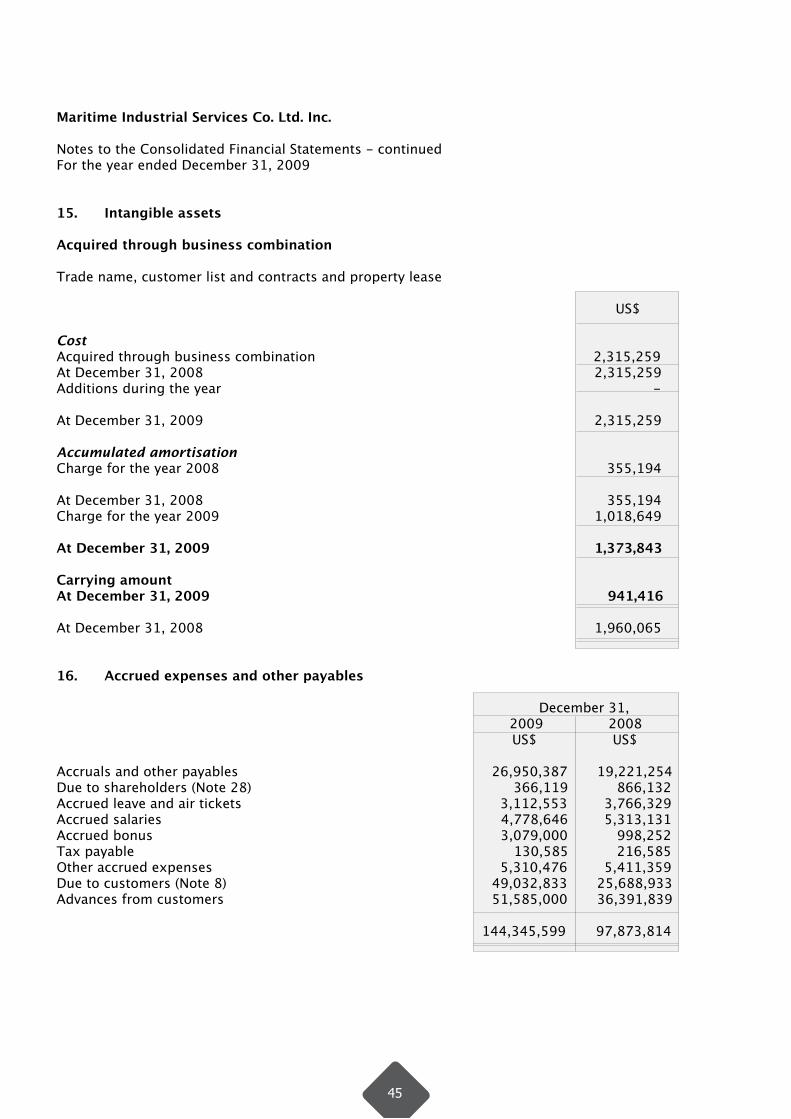
Maritime Industrial Services Co. Ltd. Inc.
Notes to the Consolidated Financial Statements - continuedFor the year ended December 31, 2009
15. Intangible assets
Acquired through business combination Trade name, customer list and contracts and property lease US$ Cost Acquired through business combination 2,315,259At December 31, 2008 2,315,259Additions during the year -
At December 31, 2009 2,315,259 Accumulated amortisation Charge for the year 2008 355,194
At December 31, 2008 355,194 Charge for the year 2009 1,018,649
At December 31, 2009 1,373,843 Carrying amountAt December 31, 2009 941,416 At December 31, 2008 1,960,065 16. Accrued expenses and other payables
December 31, 2009 2008 US$ US$
Accruals and other payables 26,950,387 19,221,254Due to shareholders (Note 28) 366,119 866,132Accrued leave and air tickets 3,112,553 3,766,329Accrued salaries 4,778,646 5,313,131Accrued bonus 3,079,000 998,252Tax payable 130,585 216,585Other accrued expenses 5,310,476 5,411,359Due to customers (Note 8) 49,032,833 25,688,933Advances from customers 51,585,000 36,391,839 144,345,599 97,873,814
45

Maritime Industrial Services Co. Ltd. Inc.
Notes to the Consolidated Financial Statements - continuedFor the year ended December 31, 2009
17. Bank borrowings
December 31, 2009 2008
US$ US$
(a) Bank overdrafts 27,600,584 36,517,522 Bank term loan 78,101,679 75,169,355 Trust receipts - 7,980,709 105,702,263 119,667,586 (b) The bank borrowings are repayable as follows:
On demand or within one year 89,356,088 112,274,171 In the second year 15,821,018 2,755,504 In the third to fifth years inclusive 525,157 4,312,756 After five years - 325,155 105,702,263 119,667,586 Less: Amount due for settlement within 12 months (shown under current liabilities) (89,356,088) (112,274,171)
Amount due for settlement after 12 months (shown under non-current liabilities) 16,346,175 7,393,415
(c) As of December 31, 2009, the Group has banking facilities in the amount of approxi-mately US$ 397 million with commercial banks in the U.A.E. The banks’ facilities include bank overdrafts, letters of guarantees, letters of credit and short-term loans.
(d) Bank facilities are secured by lien over term deposits in the amount of US$ 8,674,486 (2008: US$ 24,030,065), the Group’s counter indemnities for guarantees issued on their behalf, the Group’s corporate guarantee, letter of undertaking, letter of credit payment guarantee, cash margin held against letters of guarantee, assignment of insurance policies over property, plant and equipment and over inventories, leasehold rights for land and certain contract receivables.
46

Maritime Industrial Services Co. Ltd. Inc.
Notes to the Consolidated Financial Statements - continuedFor the year ended December 31, 2009
17. Bank borrowings (continued)
(e) The bank term loans as of December 31, 2009 are repayable as follows:
Number of Loan balance equal instalments Interest rate
US$ 1.5 million Six half-yearly 3 months EIBOR* + 2.5% per annumUS$ 1.6 million Five quarterly 3 months EIBOR + 3.00% per annum US$ 45 million One - 3 month term loan 3 months LIBOR + 2.00% per annumUS$ 18.8 million Four half-yearly 3 months LIBOR + 2.00% per annumUS$ 11.2 million Four half-yearly 3 months EIBOR + 3.65% per annum
*EIBOR: Emirates Inter-bank Offered Rate
18. Provision for employees’ end of service indemnity
December 31, 2009 2008 US$ US$
Balance as at beginning of year 14,556,845 12,623,724 Foreign currency translation difference - 42,240 Additional provision during the year 2,873,116 3,300,587 Utilization of provision during the year (2,519,820) (1,409,706) Balance at end of year 14,910,141 14,556,845
19. Share capital
a) Share capital No. of Share shares capital US$
Total shares in issue at December 31, 2007 46,000,000 92,000,000
No. of shares issued in 2008 [19(b)] 273,750 547,500
Total shares in issue at December 31, 2008 46,273,750 92,547,500
No. of shares issued in 2009 - -
Total shares in issue at December 31, 2009 46,273,750 92,547,500
b) During 2008, the Company issued 273,750 optional shares to employees under theEmployee Share Option Plan.
47

Maritime Industrial Services Co. Ltd. Inc.
Notes to the Consolidated Financial Statements - continuedFor the year ended December 31, 2009
20. Equity settled employee benefits reserve
In October 2006, the Group set up an ownership-based compensation scheme for executives and senior employees of the Group. In accordance with the provisions of the plan, as approved by shareholders, key personnel identified and recommended by the Board of Directors may be granted options to purchase ordinary shares.
Each employee share option converts into one ordinary share of the Company on exercise. No amounts are paid or payable by the recipient on receipt of the option. The options carry neither rights to dividends nor voting rights. Options may be exercised at any time from the date of vest-ing to the date of their expiry.
The total number of options to be issued is 5% of the total issued shares. 50% of the options will be allotted as approved by the Board of Directors. The vesting of the options shall be 25% on award, 25% after one year of further employment, 25% after two years and 25% after three years. The options granted expire within eighteen months of their issue. The remaining number of op-tions will be issued if and when decided by the Board.
The strike price of the 281,250 options granted in October, 2006, is equal to the share issue price of the private placement in October 2006, which was NOK22. Subsequent options granted carry the strike price reflecting market price at the time of issuance. These strike prices range from NOK 3.45 to NOK 42.00. The market price of the shares at December 31, 2009 was NOK 6.75, equivalent to US$ 1.162 per share.
21. General, selling and administrative expenses
Year ended December 31, 2009 2008 US$ US$
Salaries, wages and benefits 16,203,229 13,669,345 Bonus 3,079,000 743,195Rent 216,029 179,164Communication expenses 1,099,934 1,235,644Entertainment and business promotion 1,759,139 1,391,935Write-off amount due from customers - 1,696,484Licence, registration and sponsorship fees 487,903 468,753Audit and legal expenses 1,970,098 669,563Printing and stationery 274,540 346,848Amortisation of intangible assets 1,018,648 355,194Others 1,811,124 1,199,059
27,919,644 21,955,184
48
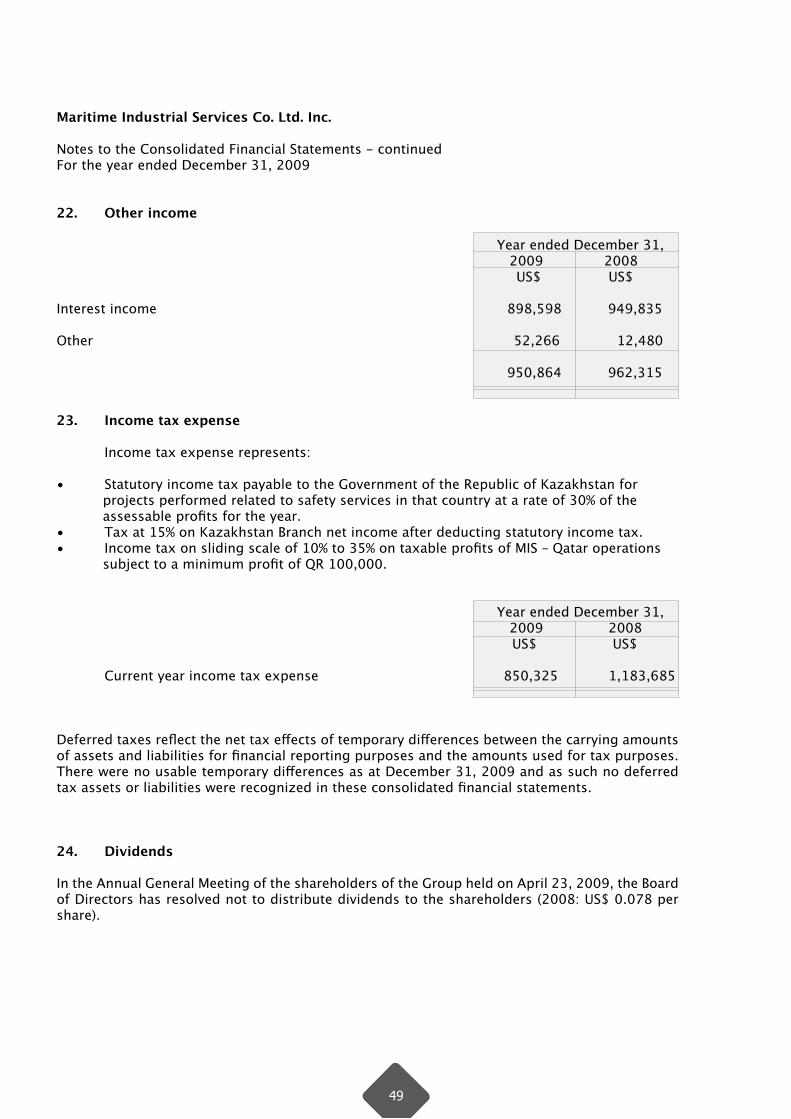
Maritime Industrial Services Co. Ltd. Inc.
Notes to the Consolidated Financial Statements - continuedFor the year ended December 31, 2009
22. Other income
Year ended December 31, 2009 2008 US$ US$
Interest income 898,598 949,835 Other 52,266 12,480 950,864 962,315
23. Income tax expense
Income tax expense represents:
• Statutory income tax payable to the Government of the Republic of Kazakhstan for projects performed related to safety services in that country at a rate of 30% of the assessable profits for the year.• Tax at 15% on Kazakhstan Branch net income after deducting statutory income tax.• Income tax on sliding scale of 10% to 35% on taxable profits of MIS – Qatar operations subject to a minimum profit of QR 100,000.
Year ended December 31, 2009 2008 US$ US$ Current year income tax expense 850,325 1,183,685
Deferred taxes reflect the net tax effects of temporary differences between the carrying amounts of assets and liabilities for financial reporting purposes and the amounts used for tax purposes. There were no usable temporary differences as at December 31, 2009 and as such no deferred tax assets or liabilities were recognized in these consolidated financial statements.
24. Dividends
In the Annual General Meeting of the shareholders of the Group held on April 23, 2009, the Board of Directors has resolved not to distribute dividends to the shareholders (2008: US$ 0.078 per share).
49
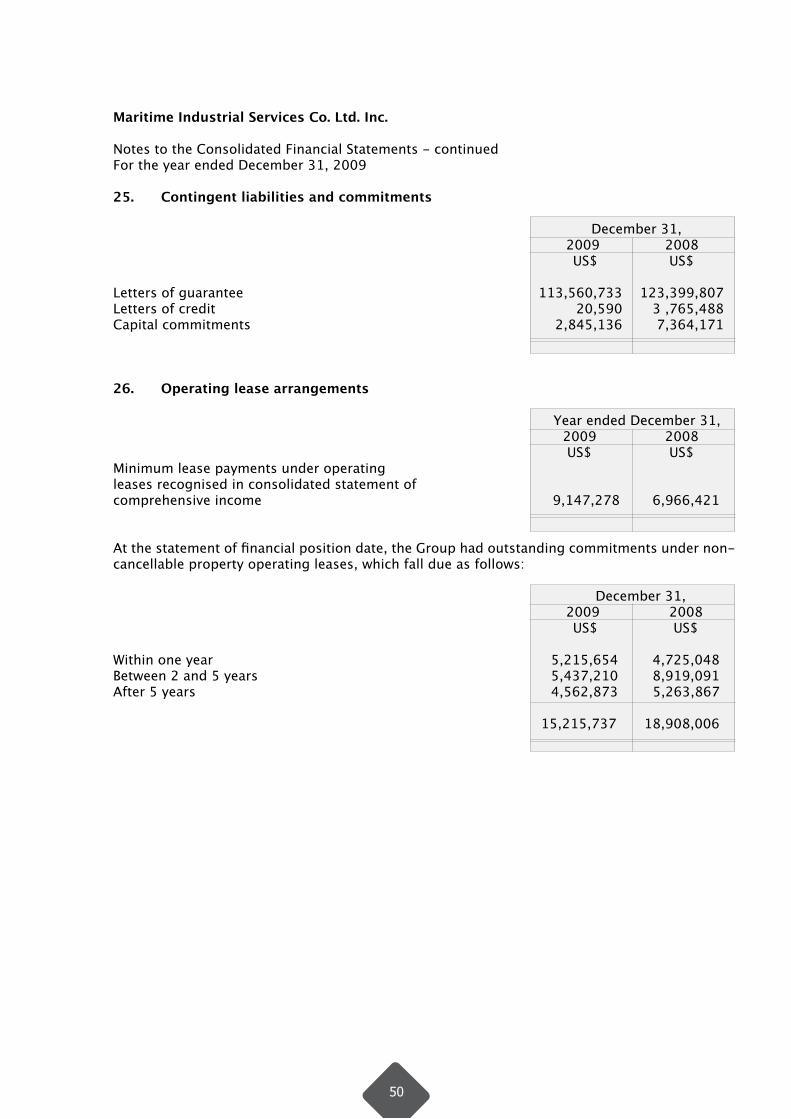
Maritime Industrial Services Co. Ltd. Inc.
Notes to the Consolidated Financial Statements - continuedFor the year ended December 31, 2009
25. Contingent liabilities and commitments
December 31, 2009 2008 US$ US$
Letters of guarantee 113,560,733 123,399,807 Letters of credit 20,590 3 ,765,488 Capital commitments 2,845,136 7,364,171
26. Operating lease arrangements
Year ended December 31, 2009 2008 US$ US$Minimum lease payments under operating leases recognised in consolidated statement ofcomprehensive income 9,147,278 6,966,421
At the statement of financial position date, the Group had outstanding commitments under non-cancellable property operating leases, which fall due as follows:
December 31, 2009 2008 US$ US$
Within one year 5,215,654 4,725,048 Between 2 and 5 years 5,437,210 8,919,091 After 5 years 4,562,873 5,263,867 15,215,737 18,908,006
50
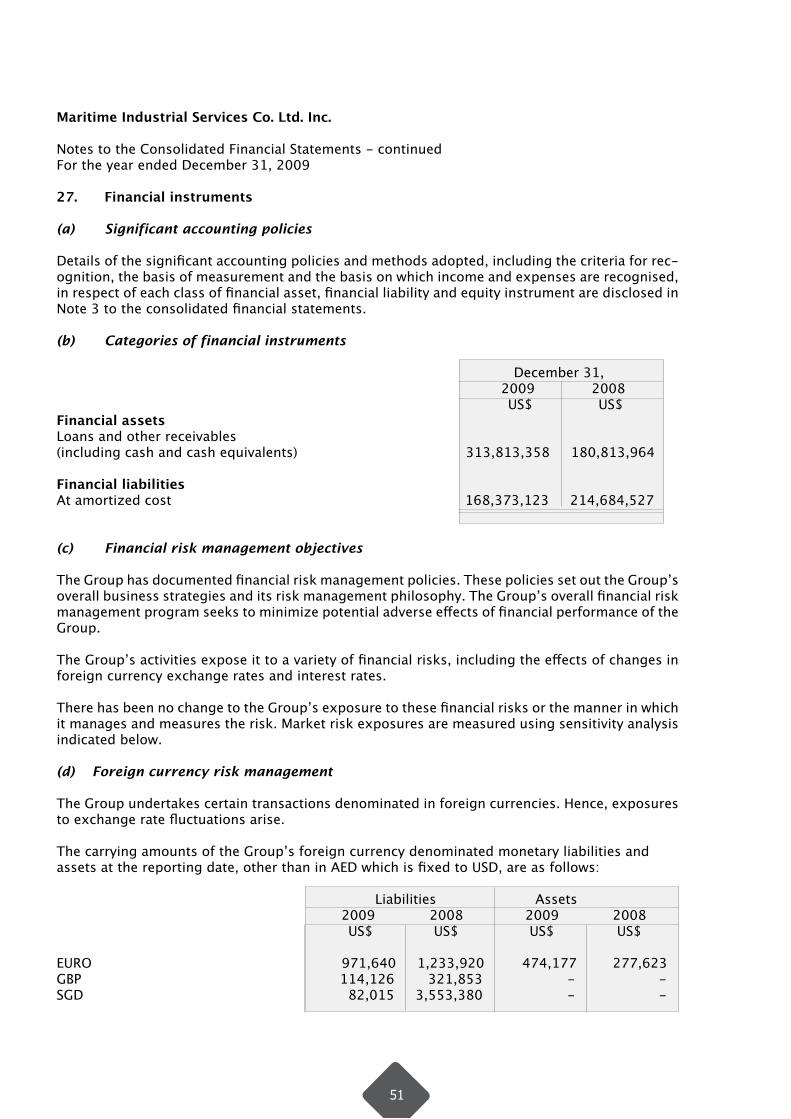
Maritime Industrial Services Co. Ltd. Inc.
Notes to the Consolidated Financial Statements - continuedFor the year ended December 31, 2009
27. Financial instruments
(a) Significant accounting policies
Details of the significant accounting policies and methods adopted, including the criteria for rec-ognition, the basis of measurement and the basis on which income and expenses are recognised, in respect of each class of financial asset, financial liability and equity instrument are disclosed in Note 3 to the consolidated financial statements.
(b) Categories of financial instruments
December 31, 2009 2008 US$ US$Financial assets Loans and other receivables (including cash and cash equivalents) 313,813,358 180,813,964 Financial liabilities At amortized cost 168,373,123 214,684,527
(c) Financial risk management objectives
The Group has documented financial risk management policies. These policies set out the Group’s overall business strategies and its risk management philosophy. The Group’s overall financial risk management program seeks to minimize potential adverse effects of financial performance of the Group. The Group’s activities expose it to a variety of financial risks, including the effects of changes in foreign currency exchange rates and interest rates.
There has been no change to the Group’s exposure to these financial risks or the manner in which it manages and measures the risk. Market risk exposures are measured using sensitivity analysis indicated below.
(d) Foreign currency risk management
The Group undertakes certain transactions denominated in foreign currencies. Hence, exposures to exchange rate fluctuations arise.
The carrying amounts of the Group’s foreign currency denominated monetary liabilities and assets at the reporting date, other than in AED which is fixed to USD, are as follows:
Liabilities Assets 2009 2008 2009 2008 US$ US$ US$ US$ EURO 971,640 1,233,920 474,177 277,623 GBP 114,126 321,853 - -SGD 82,015 3,553,380 - -
51

Maritime Industrial Services Co. Ltd. Inc.
Notes to the Consolidated Financial Statements - continuedFor the year ended December 31, 2009
27. Financial instruments (continued) (e) Foreign currency sensitivity analysis
The following table details the Group’s sensitivity to a 10% increase and decrease in the US$ against the relevant foreign currencies. 10% is the sensitivity rate used when reporting foreign currency risk internally to key management personnel and represents management’s assessment of the reasonably possible change in foreign exchange rates. The sensitivity analysis includes only outstanding foreign currency denominated monetary items and adjusts their translation at the period end for a 10% change in foreign currency rates. A positive number below indicates an increase in profit and other equity where the US$ strengthens 10% against the relevant currency. For a 10% weakening of the US$ against the relevant currency, there would be an equal and opposite impact on the profit and other equity, and the balances below would be negative.
Profit or loss 2009 2008 US$ US$
EURO 49,746 95,630GBP 11,413 32,185SGD 8,202 355,338
This is mainly attributable to the exposure to outstanding payables and accounts receivable at the year end.
(f) Interest rate risk management
The Group’s exposure to interest rate risk relates to its deposits with banks and bank overdrafts/loans. Bank deposits bear interest rates between 1.0% and 2.8% per annum (2008: 0.5% and 4.5% per annum). Bank overdrafts/loans are at floating rates linked to LIBOR/EIBOR at levels which are generally obtainable in the U.A.E.
The Group’s exposure to interest rates on financial assets and financial liabilities are detailed in the liquidity risk management section of this note.
52
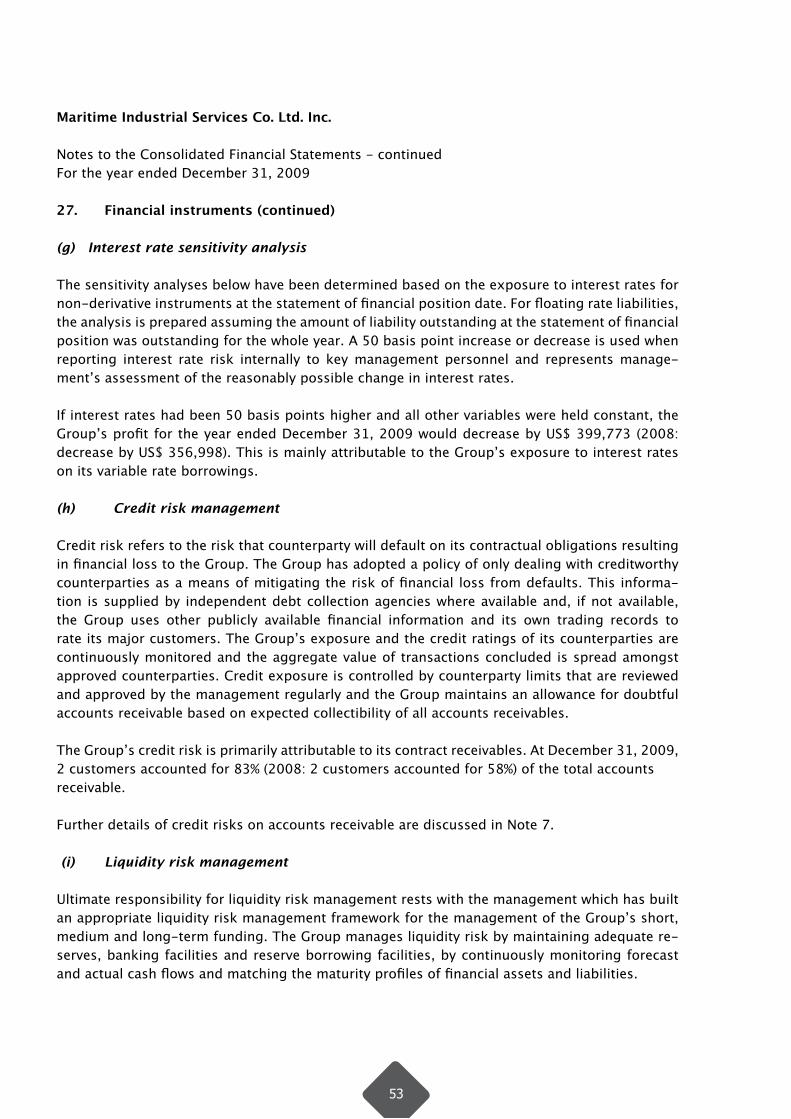
Maritime Industrial Services Co. Ltd. Inc.
Notes to the Consolidated Financial Statements - continuedFor the year ended December 31, 2009
27. Financial instruments (continued)
(g) Interest rate sensitivity analysis
The sensitivity analyses below have been determined based on the exposure to interest rates for non-derivative instruments at the statement of financial position date. For floating rate liabilities, the analysis is prepared assuming the amount of liability outstanding at the statement of financial position was outstanding for the whole year. A 50 basis point increase or decrease is used when reporting interest rate risk internally to key management personnel and represents manage-ment’s assessment of the reasonably possible change in interest rates.
If interest rates had been 50 basis points higher and all other variables were held constant, the Group’s profit for the year ended December 31, 2009 would decrease by US$ 399,773 (2008: decrease by US$ 356,998). This is mainly attributable to the Group’s exposure to interest rates on its variable rate borrowings.
(h) Credit risk management
Credit risk refers to the risk that counterparty will default on its contractual obligations resulting in financial loss to the Group. The Group has adopted a policy of only dealing with creditworthy counterparties as a means of mitigating the risk of financial loss from defaults. This informa-tion is supplied by independent debt collection agencies where available and, if not available, the Group uses other publicly available financial information and its own trading records to rate its major customers. The Group’s exposure and the credit ratings of its counterparties are continuously monitored and the aggregate value of transactions concluded is spread amongst approved counterparties. Credit exposure is controlled by counterparty limits that are reviewed and approved by the management regularly and the Group maintains an allowance for doubtful accounts receivable based on expected collectibility of all accounts receivables.
The Group’s credit risk is primarily attributable to its contract receivables. At December 31, 2009, 2 customers accounted for 83% (2008: 2 customers accounted for 58%) of the total accounts receivable.
Further details of credit risks on accounts receivable are discussed in Note 7.
(i) Liquidity risk management
Ultimate responsibility for liquidity risk management rests with the management which has built an appropriate liquidity risk management framework for the management of the Group’s short, medium and long-term funding. The Group manages liquidity risk by maintaining adequate re-serves, banking facilities and reserve borrowing facilities, by continuously monitoring forecast and actual cash flows and matching the maturity profiles of financial assets and liabilities.
53
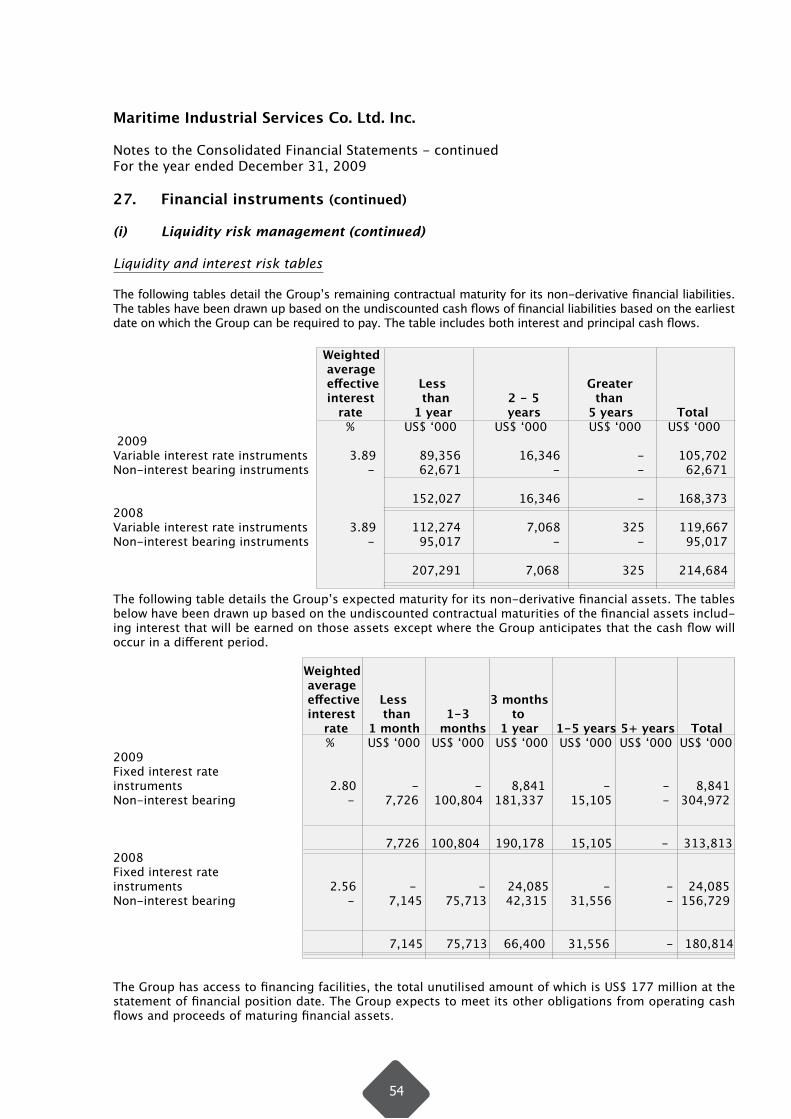
Maritime Industrial Services Co. Ltd. Inc.
Notes to the Consolidated Financial Statements - continuedFor the year ended December 31, 2009
27. Financial instruments (continued)
(i) Liquidity risk management (continued)
Liquidity and interest risk tables
The following tables detail the Group’s remaining contractual maturity for its non-derivative financial liabilities. The tables have been drawn up based on the undiscounted cash flows of financial liabilities based on the earliest date on which the Group can be required to pay. The table includes both interest and principal cash flows.
Weighted average effective Less Greater interest than 2 - 5 than rate 1 year years 5 years Total % US$ ‘000 US$ ‘000 US$ ‘000 US$ ‘000 2009Variable interest rate instruments 3.89 89,356 16,346 - 105,702Non-interest bearing instruments - 62,671 - - 62,671
152,027 16,346 - 168,3732008Variable interest rate instruments 3.89 112,274 7,068 325 119,667Non-interest bearing instruments - 95,017 - - 95,017
207,291 7,068 325 214,684
The following table details the Group’s expected maturity for its non-derivative financial assets. The tables below have been drawn up based on the undiscounted contractual maturities of the financial assets includ-ing interest that will be earned on those assets except where the Group anticipates that the cash flow will occur in a different period. Weighted average effective Less 3 months interest than 1-3 to rate 1 month months 1 year 1-5 years 5+ years Total % US$ ‘000 US$ ‘000 US$ ‘000 US$ ‘000 US$ ‘000 US$ ‘0002009Fixed interest rateinstruments 2.80 - - 8,841 - - 8,841Non-interest bearing - 7,726 100,804 181,337 15,105 - 304,972
7,726 100,804 190,178 15,105 - 313,8132008Fixed interest rateinstruments 2.56 - - 24,085 - - 24,085Non-interest bearing - 7,145 75,713 42,315 31,556 - 156,729
7,145 75,713 66,400 31,556 - 180,814
The Group has access to financing facilities, the total unutilised amount of which is US$ 177 million at the statement of financial position date. The Group expects to meet its other obligations from operating cash flows and proceeds of maturing financial assets.
54
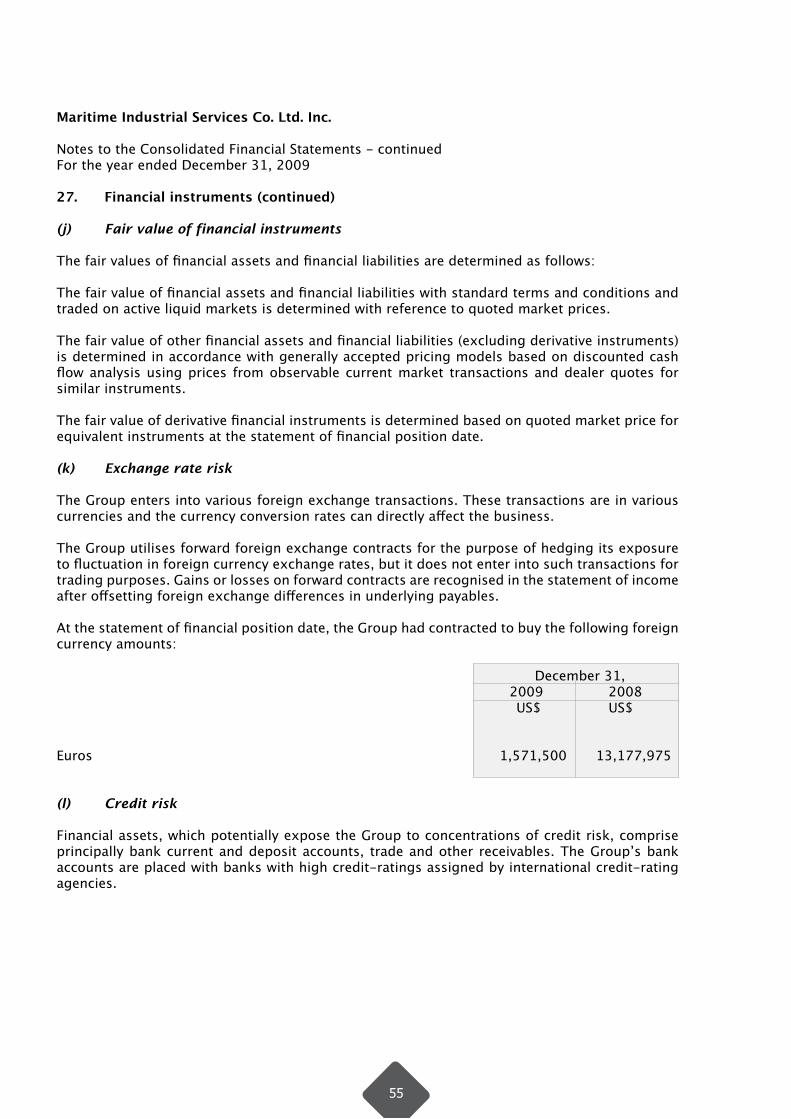
Maritime Industrial Services Co. Ltd. Inc.
Notes to the Consolidated Financial Statements - continuedFor the year ended December 31, 2009
27. Financial instruments (continued)
(j) Fair value of financial instruments
The fair values of financial assets and financial liabilities are determined as follows:
The fair value of financial assets and financial liabilities with standard terms and conditions and traded on active liquid markets is determined with reference to quoted market prices.
The fair value of other financial assets and financial liabilities (excluding derivative instruments) is determined in accordance with generally accepted pricing models based on discounted cash flow analysis using prices from observable current market transactions and dealer quotes for similar instruments.
The fair value of derivative financial instruments is determined based on quoted market price for equivalent instruments at the statement of financial position date.
(k) Exchange rate risk
The Group enters into various foreign exchange transactions. These transactions are in various currencies and the currency conversion rates can directly affect the business.
The Group utilises forward foreign exchange contracts for the purpose of hedging its exposure to fluctuation in foreign currency exchange rates, but it does not enter into such transactions for trading purposes. Gains or losses on forward contracts are recognised in the statement of income after offsetting foreign exchange differences in underlying payables.
At the statement of financial position date, the Group had contracted to buy the following foreign currency amounts:
December 31, 2009 2008 US$ US$
Euros 1,571,500 13,177,975
(l) Credit risk
Financial assets, which potentially expose the Group to concentrations of credit risk, comprise principally bank current and deposit accounts, trade and other receivables. The Group’s bank accounts are placed with banks with high credit-ratings assigned by international credit-rating agencies.
55
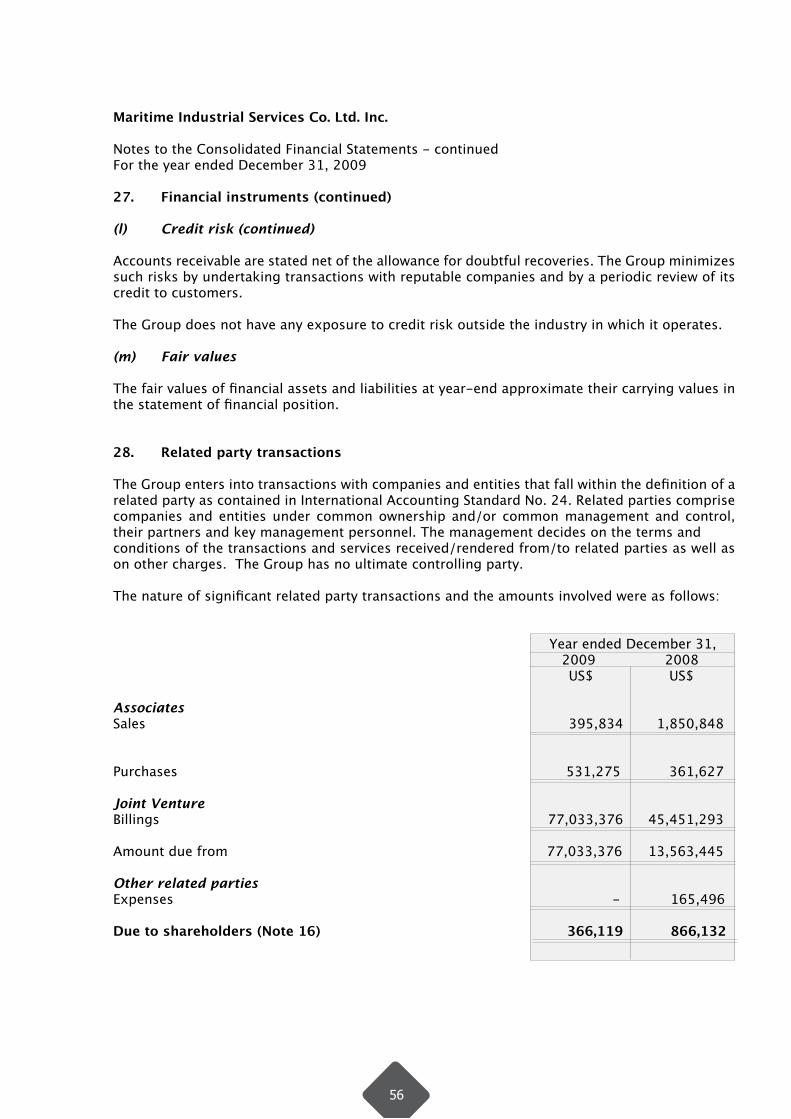
Maritime Industrial Services Co. Ltd. Inc. Notes to the Consolidated Financial Statements - continuedFor the year ended December 31, 2009
27. Financial instruments (continued)
(l) Credit risk (continued)
Accounts receivable are stated net of the allowance for doubtful recoveries. The Group minimizes such risks by undertaking transactions with reputable companies and by a periodic review of its credit to customers.
The Group does not have any exposure to credit risk outside the industry in which it operates.
(m) Fair values
The fair values of financial assets and liabilities at year-end approximate their carrying values in the statement of financial position.
28. Related party transactions
The Group enters into transactions with companies and entities that fall within the definition of a related party as contained in International Accounting Standard No. 24. Related parties comprise companies and entities under common ownership and/or common management and control, their partners and key management personnel. The management decides on the terms and conditions of the transactions and services received/rendered from/to related parties as well as on other charges. The Group has no ultimate controlling party.
The nature of significant related party transactions and the amounts involved were as follows:
Year ended December 31, 2009 2008 US$ US$
Associates Sales 395,834 1,850,848
Purchases 531,275 361,627 Joint Venture Billings 77,033,376 45,451,293 Amount due from 77,033,376 13,563,445 Other related parties Expenses - 165,496 Due to shareholders (Note 16) 366,119 866,132
56
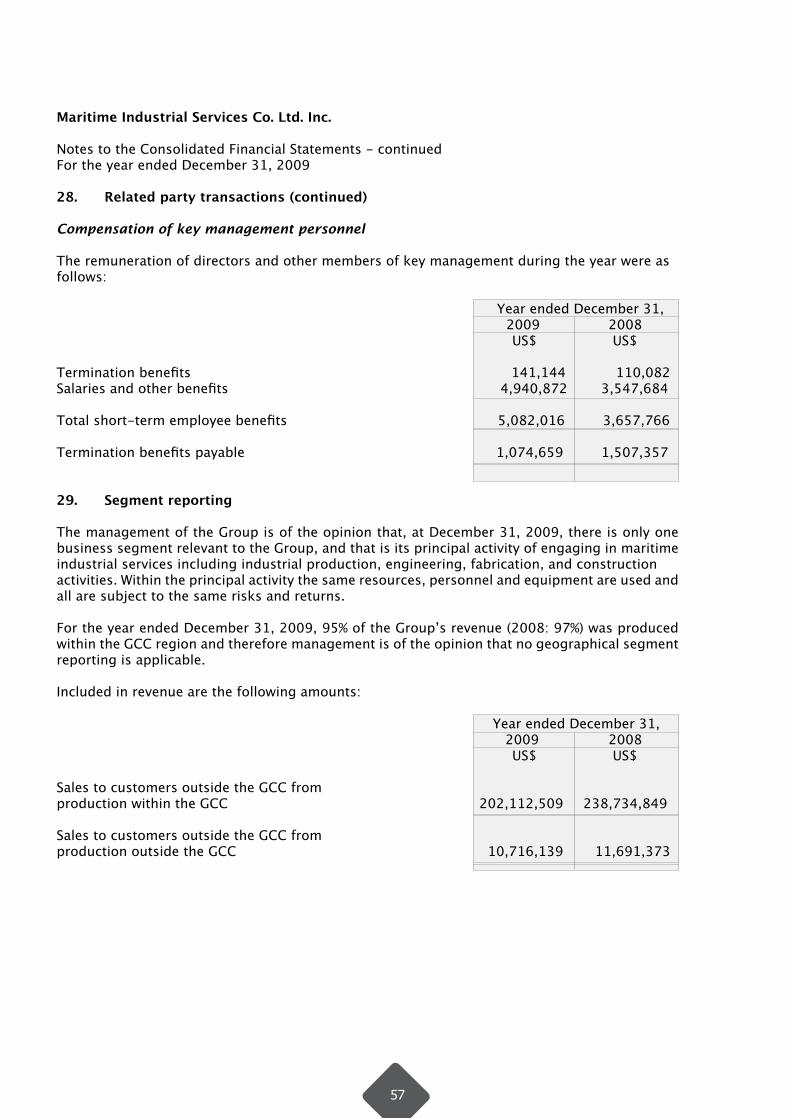
Maritime Industrial Services Co. Ltd. Inc.
Notes to the Consolidated Financial Statements - continuedFor the year ended December 31, 2009
28. Related party transactions (continued)
Compensation of key management personnel
The remuneration of directors and other members of key management during the year were as follows:
Year ended December 31, 2009 2008 US$ US$ Termination benefits 141,144 110,082 Salaries and other benefits 4,940,872 3,547,684 Total short-term employee benefits 5,082,016 3,657,766 Termination benefits payable 1,074,659 1,507,357 29. Segment reporting
The management of the Group is of the opinion that, at December 31, 2009, there is only one business segment relevant to the Group, and that is its principal activity of engaging in maritime industrial services including industrial production, engineering, fabrication, and construction activities. Within the principal activity the same resources, personnel and equipment are used and all are subject to the same risks and returns.
For the year ended December 31, 2009, 95% of the Group’s revenue (2008: 97%) was produced within the GCC region and therefore management is of the opinion that no geographical segment reporting is applicable.
Included in revenue are the following amounts: Year ended December 31, 2009 2008 US$ US$
Sales to customers outside the GCC from production within the GCC 202,112,509 238,734,849
Sales to customers outside the GCC from production outside the GCC 10,716,139 11,691,373
57
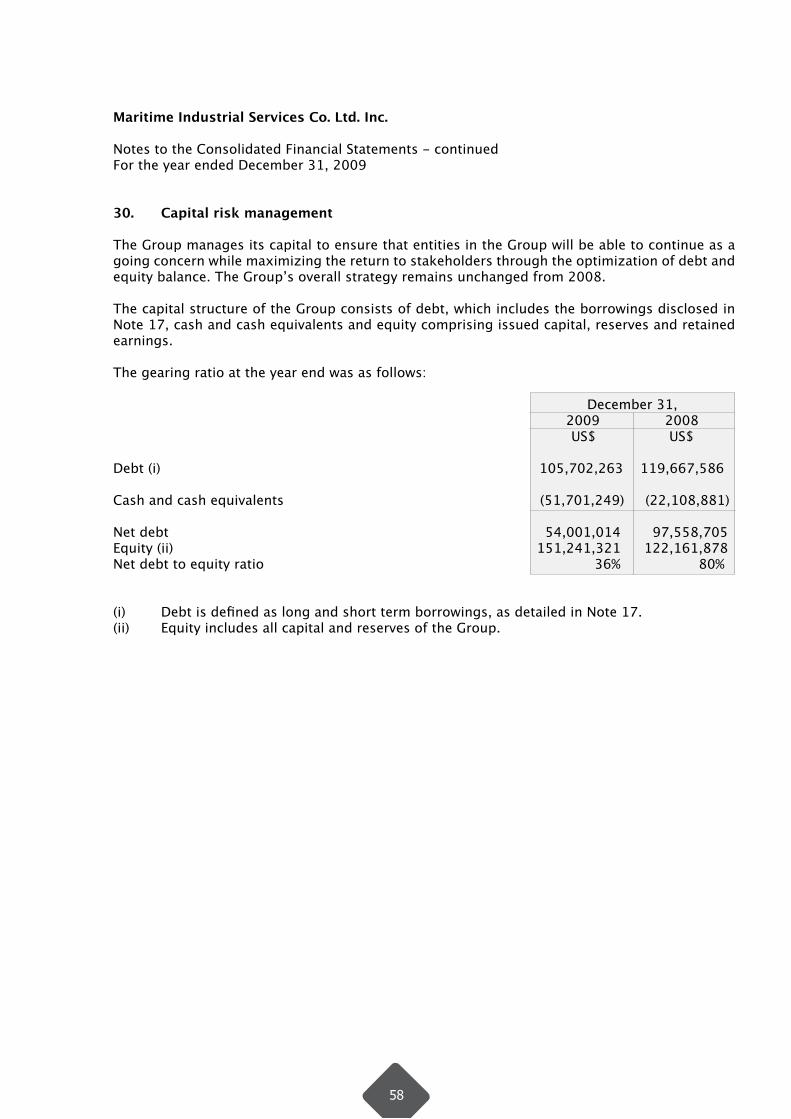
Maritime Industrial Services Co. Ltd. Inc.
Notes to the Consolidated Financial Statements - continued For the year ended December 31, 2009
30. Capital risk management
The Group manages its capital to ensure that entities in the Group will be able to continue as a going concern while maximizing the return to stakeholders through the optimization of debt and equity balance. The Group’s overall strategy remains unchanged from 2008.
The capital structure of the Group consists of debt, which includes the borrowings disclosed in Note 17, cash and cash equivalents and equity comprising issued capital, reserves and retained earnings.
The gearing ratio at the year end was as follows:
December 31, 2009 2008 US$ US$
Debt (i) 105,702,263 119,667,586
Cash and cash equivalents (51,701,249) (22,108,881) Net debt 54,001,014 97,558,705Equity (ii) 151,241,321 122,161,878 Net debt to equity ratio 36% 80%
(i) Debt is defined as long and short term borrowings, as detailed in Note 17.(ii) Equity includes all capital and reserves of the Group.
58

59
Corporate Governance at MIS is based on our corporate values and ethical guidelines which focus on efficient management, equal treatment of all shareholder interests, and a controlled and profitable development of the company.
Norwegian Code of Practice for Corporate Governance (“the Code”)
MIS, a company registered in Panama but listed on the Oslo Stock Exchange (Oslo Børs), complies with the Code, but as it is not a Norwegian company many elements of Norwegian Company law are notapplicable. Any material deviations from the Code are explained in this report.
The Business
In article 3 of its Articles of Association MIS states its objective as, “to engage in maritime industrial services and industrial production, engineering, fabrication and construction activities including but not limited to ship building and repairs, safety services and training, maintenance, oil field supplies, steel industry structures and all other facilities related thereto and to have ownership interests in other enterprises engaged in such service and activities worldwide”.
The articles, together with a statement of the company’s vision and strategy, can be found on the group’s website at www.miscoltd.com
Dividend Policy
MIS will generally determine its dividend policy in order to provide an appropriate cash return to its shareholders, taking into account the level of retained profits and net equity in relation to the needs of its business, market conditions and the availability of cash and other sources of finance necessary for MIS to conduct its business in a responsible manner. Current market conditions are such that the company has recommended no dividend payment from its 2009 profit, in order to conserve cash and strengthen its balance sheet.
Equity Shares
MIS has one class of shares, all of which have equal rights. All MIS shares are freely negotiable and the Articles of Association place no restrictions on transferability or on voting rights.
The right of the Board of Directors (“the board”) to acquire the company’s own shares is conditional of such purchases being made in the market. The repurchase of own shares for subsequent cancellation will be carried out through the Oslo Børs.
Currently, there are no mandates to increase share capital or mandates to waive existing shareholders’ rights to subscribe for these shares.
60
Corporate Governance Disclosures
Transactions with Close Associates
MIS has rules to ensure that directors and senior officers report to the board if they have a significant interest, directly or indirectly, in any agreement concluded by the company. No material transactions took place in 2009 between the company and its shareholders, directors, senior officers or the close associates of any of these.
Annual General Meeting
The Annual General Meeting (AGM) secures the participation of shareholders in the company’s highest decision-making body. The company’s Articles of Association are adopted by the general meeting. All shareholders are entitled to submit matters for inclusion on the agenda of a general meeting, as well as to attend, speak at and vote at the meeting.
MIS calls the meeting and sends resolutions and meeting information (including any recommendations for nominations) prior to the AGM to all shareholders as well as posting it on the company’s website. The Company’s Articles require the AGM to be held no later than 30 June every year. In 2010 it was held on 22 April and the next AGM is scheduled for 21 April 2011. Written notice of the meeting will be sent to all shareholders no later than two weeks before the actual meeting date through the Norwegian VPS.
The board seeks to facilitate the attendance of as many shareholders as possible and therefore sets the deadline for notification of attendance as close as possible to the meeting date. Shareholders wishing to attend the general meeting must notify the company of this intention before the deadline stipulated in the notice. Shareholders who are unable to attend are encouraged to use their right to appoint a proxy for voting on all agenda matters.
The board determines the agenda, with the main items as specified in Article 16 of the Articles of As-sociation. The minutes are published as a stock exchange announcement and posted on the company’s website.
Corporate Assembly
Being a non-Norwegian company and owing to its relative size, MIS has chosen not to adopt a corporate assembly, a practice derived from Norwegian Company Law. The function of the corporate assembly is carried out by the AGM.
Composition and Independence of the board
The board comprises eight directors, who are elected by the shareholders for a term of two years. Staggering of the appointment dates helps to ensure continuity on the board by providing newly elected directors with a thorough briefing about the company’s history, business, status and challenges. The board gives weight to avoiding conflicts of interest between directors, senior officers, their close associates and external players with whom the company collaborates. The board also seeks to ensure that directors and senior officers collectively possess both broad-based and in depth expertise relevant to the business pursued and to the different market segments served nationally and internationally.
All but one of the directors are independent from the executive management of the company. At the AGM in 2009 the shareholders approved the appointment of the Chief Executive Officer (CEO), Mr Kevin Hudson, to the position of Managing Director, in recognition of his technical expertise and industry experience. Although this is not in accordance with the Code, the board believes that the large majority of non-executive board members is sufficient to prevent any conflict of interest.
The composition of the board is set out on page 13. At the 2010 AGM the following changes occurred:
Four directors were re-elected – Charles L. Davis, Jerry M. Smith, Abdul Salam El Zeidy and John O’Leary
One alternate director was re-elected – Fadi Arbid
61
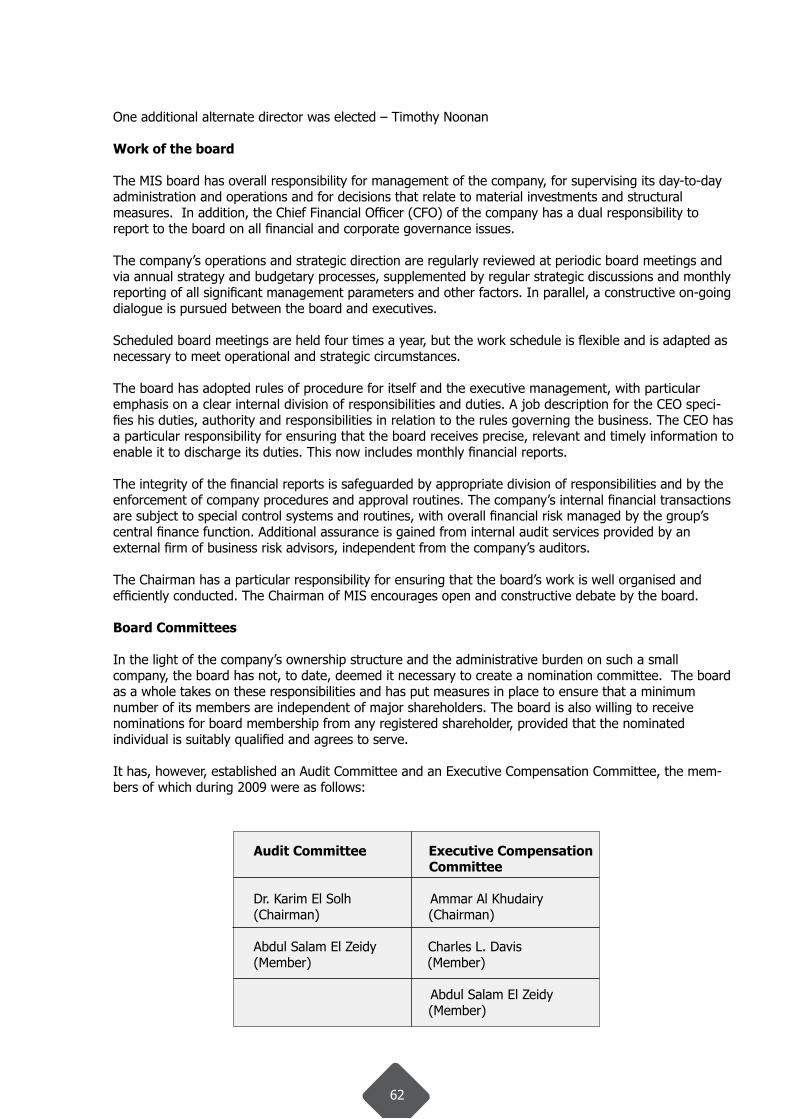
One additional alternate director was elected – Timothy Noonan
Work of the board
The MIS board has overall responsibility for management of the company, for supervising its day-to-day administration and operations and for decisions that relate to material investments and structural measures. In addition, the Chief Financial Officer (CFO) of the company has a dual responsibility to report to the board on all financial and corporate governance issues.
The company’s operations and strategic direction are regularly reviewed at periodic board meetings and via annual strategy and budgetary processes, supplemented by regular strategic discussions and monthly reporting of all significant management parameters and other factors. In parallel, a constructive on-going dialogue is pursued between the board and executives.
Scheduled board meetings are held four times a year, but the work schedule is flexible and is adapted as necessary to meet operational and strategic circumstances. The board has adopted rules of procedure for itself and the executive management, with particular emphasis on a clear internal division of responsibilities and duties. A job description for the CEO speci-fies his duties, authority and responsibilities in relation to the rules governing the business. The CEO has a particular responsibility for ensuring that the board receives precise, relevant and timely information to enable it to discharge its duties. This now includes monthly financial reports.
The integrity of the financial reports is safeguarded by appropriate division of responsibilities and by the enforcement of company procedures and approval routines. The company’s internal financial transactions are subject to special control systems and routines, with overall financial risk managed by the group’s central finance function. Additional assurance is gained from internal audit services provided by an external firm of business risk advisors, independent from the company’s auditors.
The Chairman has a particular responsibility for ensuring that the board’s work is well organised and efficiently conducted. The Chairman of MIS encourages open and constructive debate by the board.
Board Committees
In the light of the company’s ownership structure and the administrative burden on such a small company, the board has not, to date, deemed it necessary to create a nomination committee. The board as a whole takes on these responsibilities and has put measures in place to ensure that a minimum number of its members are independent of major shareholders. The board is also willing to receive nominations for board membership from any registered shareholder, provided that the nominated individual is suitably qualified and agrees to serve.
It has, however, established an Audit Committee and an Executive Compensation Committee, the mem-bers of which during 2009 were as follows:
Audit Committee Executive Compensation Committee
Dr. Karim El Solh Ammar Al Khudairy(Chairman) (Chairman)
Abdul Salam El Zeidy Charles L. Davis(Member) (Member)
Abdul Salam El Zeidy (Member)
62
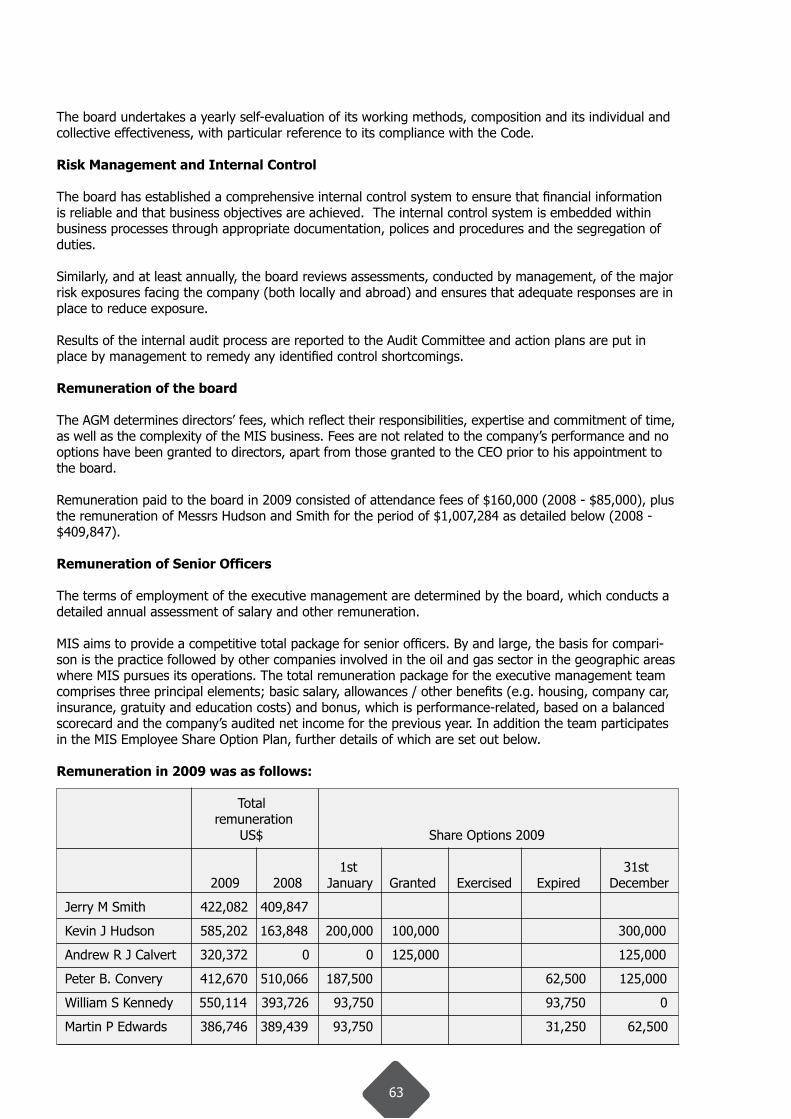
The board undertakes a yearly self-evaluation of its working methods, composition and its individual and collective effectiveness, with particular reference to its compliance with the Code.
Risk Management and Internal Control
The board has established a comprehensive internal control system to ensure that financial information is reliable and that business objectives are achieved. The internal control system is embedded within business processes through appropriate documentation, polices and procedures and the segregation of duties.
Similarly, and at least annually, the board reviews assessments, conducted by management, of the major risk exposures facing the company (both locally and abroad) and ensures that adequate responses are in place to reduce exposure.
Results of the internal audit process are reported to the Audit Committee and action plans are put in place by management to remedy any identified control shortcomings. Remuneration of the board
The AGM determines directors’ fees, which reflect their responsibilities, expertise and commitment of time, as well as the complexity of the MIS business. Fees are not related to the company’s performance and no options have been granted to directors, apart from those granted to the CEO prior to his appointment to the board.
Remuneration paid to the board in 2009 consisted of attendance fees of $160,000 (2008 - $85,000), plus the remuneration of Messrs Hudson and Smith for the period of $1,007,284 as detailed below (2008 - $409,847).
Remuneration of Senior Officers
The terms of employment of the executive management are determined by the board, which conducts a detailed annual assessment of salary and other remuneration.
MIS aims to provide a competitive total package for senior officers. By and large, the basis for compari-son is the practice followed by other companies involved in the oil and gas sector in the geographic areas where MIS pursues its operations. The total remuneration package for the executive management team comprises three principal elements; basic salary, allowances / other benefits (e.g. housing, company car, insurance, gratuity and education costs) and bonus, which is performance-related, based on a balanced scorecard and the company’s audited net income for the previous year. In addition the team participates in the MIS Employee Share Option Plan, further details of which are set out below.
Remuneration in 2009 was as follows:
Total remuneration US$ Share Options 2009
1st 31st 2009 2008 January Granted Exercised Expired December
Jerry M Smith 422,082 409,847
Kevin J Hudson 585,202 163,848 200,000 100,000 300,000
Andrew R J Calvert 320,372 0 0 125,000 125,000
Peter B. Convery 412,670 510,066 187,500 62,500 125,000
William S Kennedy 550,114 393,726 93,750 93,750 0
Martin P Edwards 386,746 389,439 93,750 31,250 62,500
63
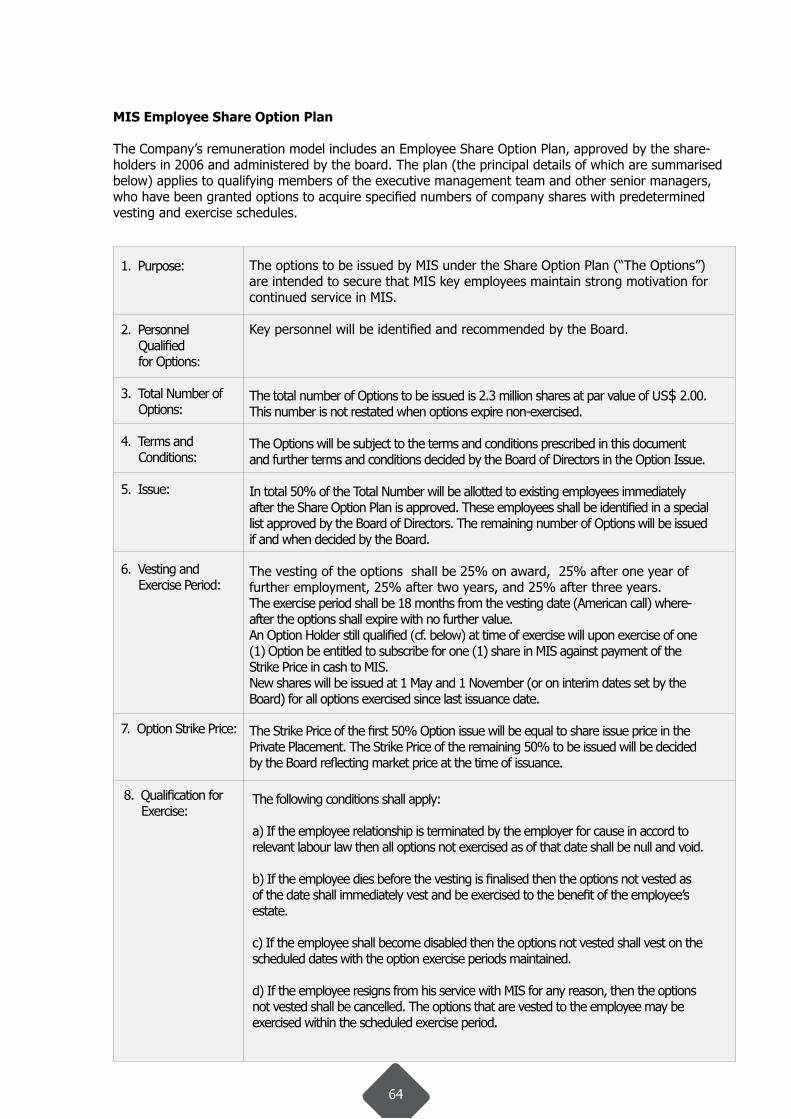
The options to be issued by MIS under the Share Option Plan (“The Options”) are intended to secure that MIS key employees maintain strong motivation for continued service in MIS.
Key personnel will be identified and recommended by the Board.
The total number of Options to be issued is 2.3 million shares at par value of US$ 2.00. This number is not restated when options expire non-exercised.
The Options will be subject to the terms and conditions prescribed in this document and further terms and conditions decided by the Board of Directors in the Option Issue.
In total 50% of the Total Number will be allotted to existing employees immediately after the Share Option Plan is approved. These employees shall be identified in a special list approved by the Board of Directors. The remaining number of Options will be issued if and when decided by the Board.
The vesting of the options shall be 25% on award, 25% after one year of further employment, 25% after two years, and 25% after three years. The exercise period shall be 18 months from the vesting date (American call) where-after the options shall expire with no further value. An Option Holder still qualified (cf. below) at time of exercise will upon exercise of one (1) Option be entitled to subscribe for one (1) share in MIS against payment of the Strike Price in cash to MIS.New shares will be issued at 1 May and 1 November (or on interim dates set by the Board) for all options exercised since last issuance date.
The Strike Price of the first 50% Option issue will be equal to share issue price in the Private Placement. The Strike Price of the remaining 50% to be issued will be decided by the Board reflecting market price at the time of issuance.
1. Purpose:
2. Personnel Qualified for Options: 3. Total Number of Options:
4. Terms and Conditions:
5. Issue:
6. Vesting and Exercise Period:
7. Option Strike Price:
The following conditions shall apply:
a) If the employee relationship is terminated by the employer for cause in accord to relevant labour law then all options not exercised as of that date shall be null and void.
b) If the employee dies before the vesting is finalised then the options not vested as of the date shall immediately vest and be exercised to the benefit of the employee’s estate.
c) If the employee shall become disabled then the options not vested shall vest on the scheduled dates with the option exercise periods maintained.
d) If the employee resigns from his service with MIS for any reason, then the options not vested shall be cancelled. The options that are vested to the employee may be exercised within the scheduled exercise period.
8. Qualification for Exercise:
MIS Employee Share Option Plan
The Company’s remuneration model includes an Employee Share Option Plan, approved by the share-holders in 2006 and administered by the board. The plan (the principal details of which are summarised below) applies to qualifying members of the executive management team and other senior managers, who have been granted options to acquire specified numbers of company shares with predetermined vesting and exercise schedules.
64
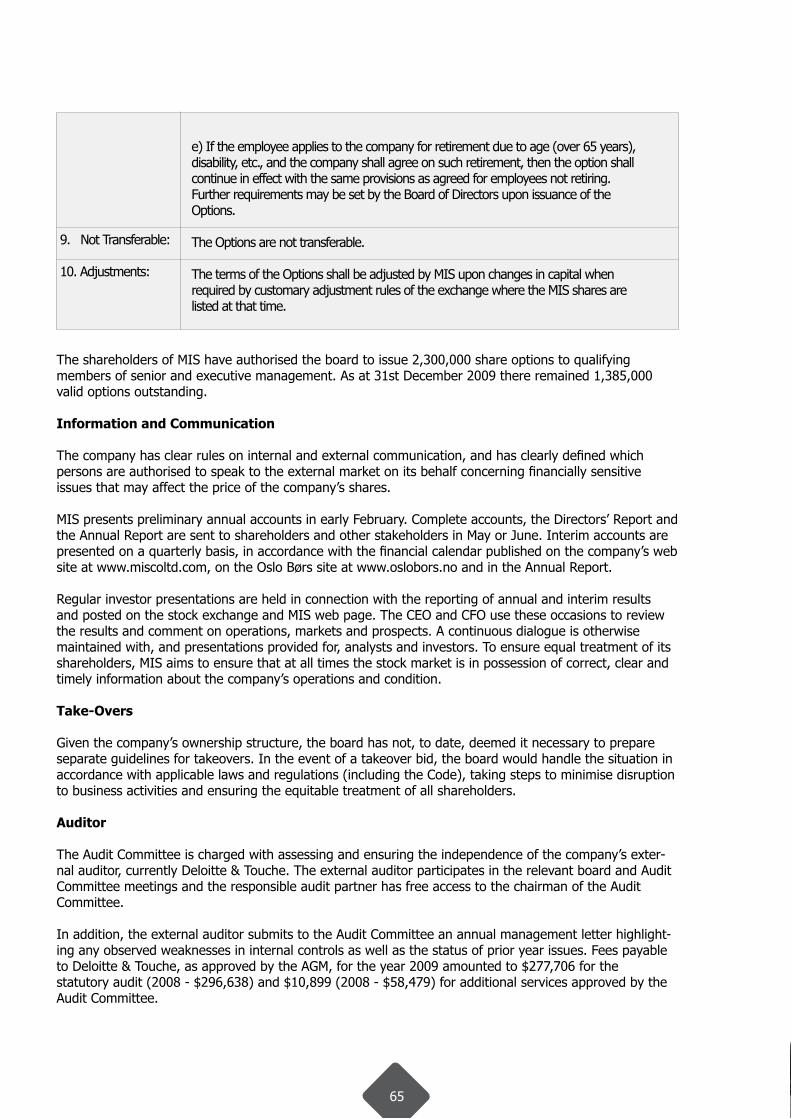
The shareholders of MIS have authorised the board to issue 2,300,000 share options to qualifying members of senior and executive management. As at 31st December 2009 there remained 1,385,000 valid options outstanding.
Information and Communication
The company has clear rules on internal and external communication, and has clearly defined which persons are authorised to speak to the external market on its behalf concerning financially sensitiveissues that may affect the price of the company’s shares.
MIS presents preliminary annual accounts in early February. Complete accounts, the Directors’ Report and the Annual Report are sent to shareholders and other stakeholders in May or June. Interim accounts are presented on a quarterly basis, in accordance with the financial calendar published on the company’s web site at www.miscoltd.com, on the Oslo Børs site at www.oslobors.no and in the Annual Report.
Regular investor presentations are held in connection with the reporting of annual and interim results and posted on the stock exchange and MIS web page. The CEO and CFO use these occasions to review the results and comment on operations, markets and prospects. A continuous dialogue is otherwise maintained with, and presentations provided for, analysts and investors. To ensure equal treatment of its shareholders, MIS aims to ensure that at all times the stock market is in possession of correct, clear and timely information about the company’s operations and condition.
Take-Overs
Given the company’s ownership structure, the board has not, to date, deemed it necessary to prepare separate guidelines for takeovers. In the event of a takeover bid, the board would handle the situation in accordance with applicable laws and regulations (including the Code), taking steps to minimise disruption to business activities and ensuring the equitable treatment of all shareholders.
Auditor
The Audit Committee is charged with assessing and ensuring the independence of the company’s exter-nal auditor, currently Deloitte & Touche. The external auditor participates in the relevant board and Audit Committee meetings and the responsible audit partner has free access to the chairman of the Audit Committee.
In addition, the external auditor submits to the Audit Committee an annual management letter highlight-ing any observed weaknesses in internal controls as well as the status of prior year issues. Fees payable to Deloitte & Touche, as approved by the AGM, for the year 2009 amounted to $277,706 for the statutory audit (2008 - $296,638) and $10,899 (2008 - $58,479) for additional services approved by the Audit Committee.
e) If the employee applies to the company for retirement due to age (over 65 years), disability, etc., and the company shall agree on such retirement, then the option shall continue in effect with the same provisions as agreed for employees not retiring.Further requirements may be set by the Board of Directors upon issuance of the Options.
The Options are not transferable.
The terms of the Options shall be adjusted by MIS upon changes in capital when required by customary adjustment rules of the exchange where the MIS shares are listed at that time.
9. Not Transferable:
10. Adjustments:
65

66
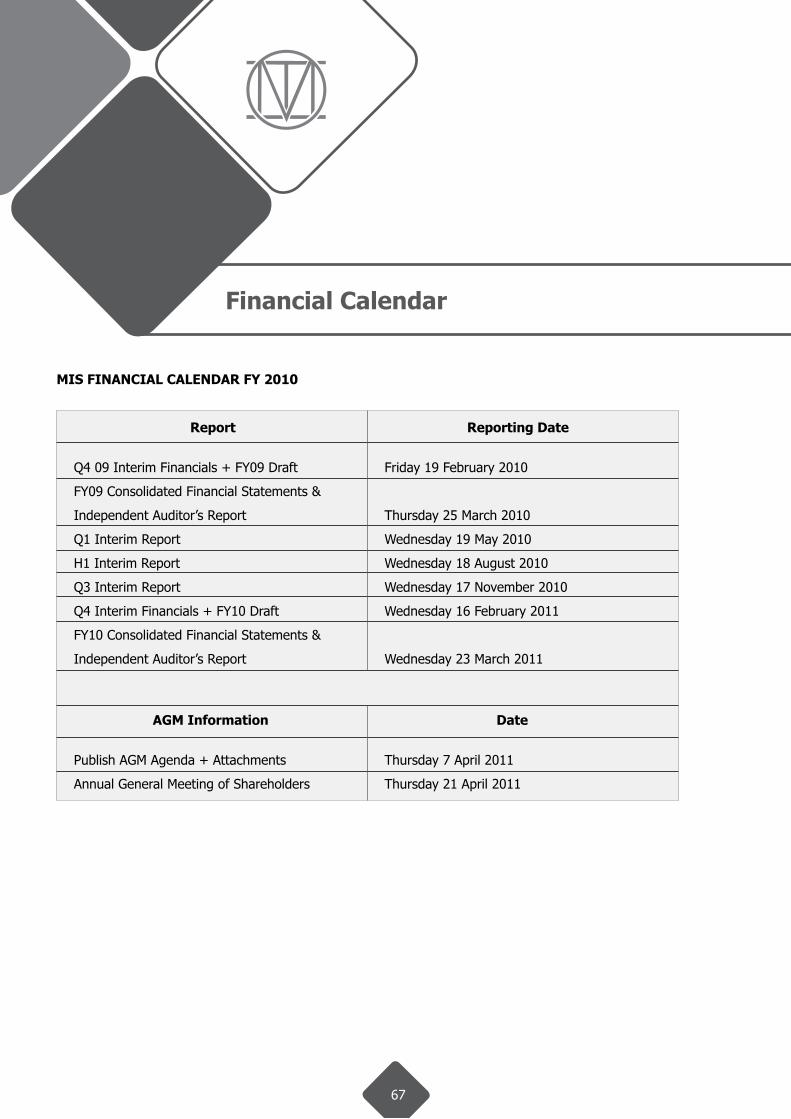
MIS FINANCIAL CALENDAR FY 2010
Reporting Date
Friday 19 February 2010
Thursday 25 March 2010
Wednesday 19 May 2010
Wednesday 18 August 2010
Wednesday 17 November 2010
Wednesday 16 February 2011
Wednesday 23 March 2011
Date
Thursday 7 April 2011
Thursday 21 April 2011
Report
Q4 09 Interim Financials + FY09 Draft
FY09 Consolidated Financial Statements &
Independent Auditor’s Report
Q1 Interim Report
H1 Interim Report
Q3 Interim Report
Q4 Interim Financials + FY10 Draft
FY10 Consolidated Financial Statements &
Independent Auditor’s Report
AGM Information
Publish AGM Agenda + Attachments
Annual General Meeting of Shareholders
67
Financial Calendar

68
Company Addresses
CORPORATE HEADQUARTERS
Maritime Industrial Services Co. Ltd. Inc. (MIS)Media 1 Al Jaber Tower, 24th Floor, Office no. 3PO Box 11791, Dubai, United Arab EmiratesTel: +9714 446 2857 Fax: +9714 449 4043www.miscoltd.com
FABRICATION YARDS & BASE FACILITIES
MIS Sharjah Operations Sharjah Port (Mina Khalid)P.O. Box 4596, Sharjah, United Arab EmiratesTel: +9716 528 5345, Fax: +9716 528 5820
MIS Sunbelt H2S, Safety Services DivisionOilfields Supply Center Compound, Jebel Ali Free Port ZoneP.O. Box 11791, Dubai, United Arab EmiratesTel: +9714 883 6182, Fax: +9714 883 6478www.sunbeltsafety.com
MIS Arabia OperationsJubail Industrial CityP.O. Box 11187, Jubail, Kingdom of Saudi ArabiaTel: +9663 341 6376, Fax: +9663 341 2784
MIS Kuwait OperationsInheritance ofHamad Ahmad Abdul Lateef Al-Hamad Co.General Trading & ContractingTel: +965 232 62161, +965 232 62164, Fax: +965 232 62160
MIS Qatar Operations5th Floor Suite 17 Bank Saderat Iran BuildingDoha, QatarTel: +974 437 3931, Fax: +974 436 1232
Rig Metals LLCP.O. Box 115404, Dubai Investment Park, Dubai, United Arab EmiratesTel: +9714 885 1442, Fax: +9714 885 1443www.rigmetals.com
Energy Projects International (EPI)Oilfields Supply Center Compound, Jebel Ali Free ZoneP.O. Box 11791, Dubai, United Arab EmiratesTel: +9714 883 7040, Fax: +9714 883 6484
2009Annual Report
www.miscoltd.com
Ma
ri
ti
me
In
du
st
ri
al
Se
rv
ic
es
Co
.Lt
d.I
nc
|An
nu
al
Re
po
rt
20
09
Related Documents