ANNUAL REPORT 2009 ‑ 2010 Oracle Financial Services Software Limited

Welcome message from author
This document is posted to help you gain knowledge. Please leave a comment to let me know what you think about it! Share it to your friends and learn new things together.
Transcript

ANNUAL REPORT2009 ‑ 2010Oracle Financial Services Software Limited
Annual Report 2009_2010_Colour.indd 1 7/23/2010 9:03:59 PM

Annual Report 2009_2010_Colour.indd 2 7/23/2010 9:03:59 PM

Oracle provides the world’s
most complete, open, and
integrated business software
and hardware systems,
including a comprehensive
footprint of business
applications built on open
standards. Today, 20 of the
world’s top 20 banks rely on
Oracle to deliver higher levels
of business productivity. Oracle
FLEXCUBE, Oracle Reveleus,
Oracle Mantas and Oracle
Financial Services Consulting
are key components of this
portfolio.
Annual Report 2009_2010_Colour.indd 3 7/23/2010 9:04:05 PM

“Oracle Financial Services Software is providing us with a flexible, best-in-class solution that fits well with our current and future business requirements. Oracle Reveleus is a proven solution and we are impressed by how it has consistently delivered value to tier-1 banks across the world. We expect that we will be able to significantly improve our operational efficiency using Oracle Reveleus.”
Deepak Katyal, Vice President, Information Technology, TAIB Bank.
“Being a large bank in Azerbaijan, our interest is in the welfare of the general public and our esteemed shareholders. In order to serve them in the best possible way, a high-end solution is the answer and for this reason we are using Oracle FLEXCUBE to serve our customers and also obtain a competitive edge. About 700,000 of our customers have already benefited from improved customer service and we are confident this association will continue to be an enduring and beneficial one.“
Emil Mustafayev, First Deputy Chairman, International Bank of Azerbaijan.
* All quotes are from the press releases issued during the 2009 – 2010 fiscal
Annual Report 2009_2010_Colour.indd 4 7/23/2010 9:04:07 PM

3
From the Chairman’s desk
Oracle Financial Services Software has completed another remarkable year. In 2009‑2010, despite the financial services industry being adversely affected by a global economic crisis we delivered a 36% increase in the operating income.
Our mission of enabling financial institutions to reach their full potential continues to inspire us. We continued to invest in enhancing our portfolio and improving our value proposition to our customers. We gained new customers and momentum with a number of new releases of Oracle Financial Services Analytical Applications that address enterprise risk, fraud and financial crime and enterprise performance management. In the same year, we launched Oracle FLEXCUBE Release 11 to help our customers set new standards of efficiency for both their domestic and global operations.
Our products and services continue to win industry accolades and recognition. In May 2010, leading independent analyst firm, Forrester Research, Inc., recognized Oracle as a “Global Power Seller” for banking platform deals in its Global Banking Platform Deals 2009 report. Our customers have also won numerous awards for their innovation and leadership. Jibun Bank, Japan, won The Asian Banker IT Implementation Awards for “Best Core Banking Project.” It was also given an Honorable Mention for “Most Innovative Entry,” for the project’s innovation in enabling a complete bank on a mobile phone. UBank, a division of National Australia Bank, has won the CANSTAR CANNEX Innovation Excellence Award for its USaver online savings account that showed innovation through its rate reassurance and online application process. USaver was also judged as the Best Online Savings Account 2010 in Money magazine’s ‘Best of the Best’ awards.
After the events of 2008 and 2009, financial institutions are preparing for the “new normal” that has emerged. Regulators now expect banks to conduct regular stress tests for capital and liquidity. During the fiscal year we introduced offerings that address these requirements and have won deals in top tier banks.
We value the contribution of our employees to the Company’s success. Their tireless efforts, limitless passion, and commitment to our mission have placed us firmly on the path of excellence.
We look forward to another exciting year ahead at Oracle Financial Services Software.
Regards,
William T Comfort, Jr. Chairman Oracle Financial Services Software Limited
Annual Report 2009_2010_Colour.indd 3 7/23/2010 9:04:07 PM

Oracle Financial Services Software – Annual Report 2009-10
Contents
Financials at a Glance 6
Corporate Information 8
Directors’ Report 11
Corporate Governance Report 18
Financials
Indian GAAP
– Unconsolidated 33
– Consolidated 83
Annual General Meeting (AGM) Notice 123
Attendance Slip & Proxy Form 135
Annual Report 2009_2010_Colour.indd 4 7/24/2010 1:32:30 PM

5
• Oracle Financial Services Software announces Oracle FLEXCUBE Enterprise Limits and Collateral Management
April 14, 2009
• JibunBankwinsprestigiousawardforbestcorebankingimplementation May 12, 2009
• Bank of London and The Middle East plc goes live on Oracle FLEXCUBE Private Banking May 13, 2009
• Leading independent analyst firm names Oracle a ‘Global Power Seller’ in 2008 Banking Platform Deals June 4, 2009
• Oracle Financial Services Software leads OpRisk & Compliance Annual Compliance Software Rankings June 25, 2009
• National Bank of Cambodia selects Oracle FLEXCUBE as banking platform June 30, 2009
• Cambodia's PRASAC Microfinance Institution selects Oracle FLEXCUBE Universal Banking June 30, 2009
• International Bank of Azerbaijan goes live on Oracle FLEXCUBE Universal Banking July 14, 2009
• Oracle Financial Services Software reports Q1 net income of Rs. 186 Crore July 30, 2009
• Leading analyst firm positions Oracle FLEXCUBE in ‘Leaders Quadrant’ in International Retail Core Banking Report
August 5, 2009
• Oracle Financial Services Software announces new release of Oracle Mantas Fraud September 1, 2009
• TAIB Bank uses Oracle Reveleus to accelerate time to Basel II compliance September 10, 2009
• Oracle announces new Financial Services Analytical Applications for Enterprise Performance Management
September 11, 2009
• Oracle Financial Services Software announces new release of Oracle FLEXCUBE Universal Banking September 14, 2009
• Oracle Announces Oracle Financial Services Revenue Management and Billing for Banking September 14, 2009
• Oracle awarded SWIFTReady Labels September 14, 2009
• Leading analyst firm positions Oracle Financial Services Software in ‘Leaders Quadrant’ in its 2009 Operational Risk Management Software Report
September 29, 2009
• Caribbean Development Bank goes live on Oracle FLEXCUBE Universal Banking to improve operational efficiency
October 1, 2009
• Oracle Announces new financial services solution for enterprise‑wide stress testing October 13, 2009
• Oracle Financial Services Software reports Q2 net income of Rs. 205 Crore October 30, 2009
• Oracle Financial Services Software announces Oracle FLEXCUBE Universal Banking Release 11.0 January 7, 2010
• Oracle Financial Services Software reports Q3 net income of Rs. 227 Crore January 29, 2010
• Oracle Financial Services announces the latest release of Oracle FLEXCUBE Investor Servicing February 25, 2010
Announcements 2009 – 2010
Annual Report 2009_2010_Colour.indd 5 7/23/2010 9:04:07 PM
Oracle Financial Services Software – Annual Report 2009-10
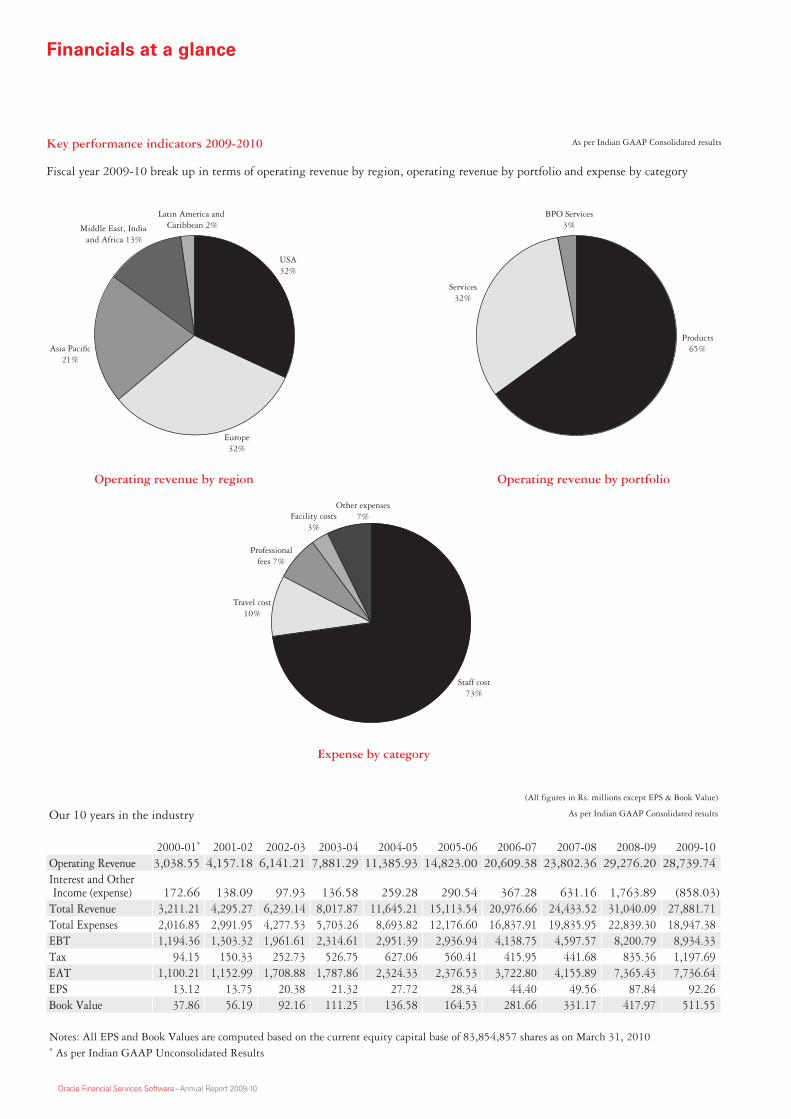
(All figures in Rs. millions except EPS & Book Value)
Our 10 years in the industry As per Indian GAAP Consolidated results
2000-01* 2001-02 2002-03 2003-04 2004-05 2005-06 2006-07 2007-08 2008-09 2009-10 Operating Revenue 3,038.55 4,157.18 6,141.21 7,881.29 11,385.93 14,823.00 20,609.38 23,802.36 29,276.20 28,739.74 Interest and Other Income (expense) 172.66 138.09 97.93 136.58 259.28 290.54 367.28 631.16 1,763.89 (858.03)
Total Revenue 3,211.21 4,295.27 6,239.14 8,017.87 11,645.21 15,113.54 20,976.66 24,433.52 31,040.09 27,881.71 Total Expenses 2,016.85 2,991.95 4,277.53 5,703.26 8,693.82 12,176.60 16,837.91 19,835.95 22,839.30 18,947.38 EBT 1,194.36 1,303.32 1,961.61 2,314.61 2,951.39 2,936.94 4,138.75 4,597.57 8,200.79 8,934.33 Tax 94.15 150.33 252.73 526.75 627.06 560.41 415.95 441.68 835.36 1,197.69 EAT 1,100.21 1,152.99 1,708.88 1,787.86 2,324.33 2,376.53 3,722.80 4,155.89 7,365.43 7,736.64 EPS 13.12 13.75 20.38 21.32 27.72 28.34 44.40 49.56 87.84 92.26 Book Value 37.86 56.19 92.16 111.25 136.58 164.53 281.66 331.17 417.97 511.55
Notes: All EPS and Book Values are computed based on the current equity capital base of 83,854,857 shares as on March 31, 2010* As per Indian GAAP Unconsolidated Results
Key performance indicators 2009‑2010
Fiscal year 2009-10 break up in terms of operating revenue by region, operating revenue by portfolio and expense by category
Financials at a glance
As per Indian GAAP Consolidated results
Operating revenue by portfolio
USA32%
Asia Paci�c21%
Middle East, India and Africa 13%
Latin America and Caribbean 2%
Europe32%
Expense by category
Staff cost73%
Professionalfees 7%
Facility costs3%
Other expenses7%
Travel cost10%
Products65%
Services32%
BPO Services3%
Operating revenue by region
Annual Report 2009_2010_Colour.indd 6 7/24/2010 10:58:20 AM

7
Key metrics 2000 – 2010
Country presenceCustomers serviced
Net incomeOperating revenue
Earnings Per ShareEconomic Value Added
Earnings per share is computed on the equity capital base of 83,854,857 shares as on March 31, 2010
Number of employees including subsidiariesBook value
Book Value is computed on the equity capital base of 83,854,857 shares as on March 31, 2010
0.00
5,000.00
10,000.00
15,000.00
20,000.00
25,000.00
30,000.00
09-1008-0907-0806-0705-0604-0503-0402-0301-0200-01*
in R
s. m
illi
on
3,038.554,157.18
6,141.217,881.29
11,385.93
14,823.00
20,609.38
23,802.36
29,276.2028,739.74
0.00
1,000.00
2,000.00
3,000.00
4,000.00
5,000.00
6,000.00
7,000.00
8,000.00
09-1008-0907-0806-0705-0604-0503-0402-0301-0200-01*
1,100.21 1,152.99
1,708.88 1,787.86
2,324.33
3,722.80
2,376.53
7,736.647,365.43
4,155.89
in R
s. m
illi
on
0
500
1,000
1,500
2,000
2,500
3,000
09-1008-09 07-08 06-07 05-06 04-05 03-04 02-03 01-02 00-01*
548.39669.33 720.91
1,294.001,149.83
in R
s. m
illi
on
472.33
903.50 911.58
2,859.79
2,335.05
0.00
10.00
20.00
30.00
40.00
50.00
60.00
70.00
80.00
90.00
100.00
09-1008-0907-0806-0705-0604-0503-0402-0301-0200-01*
13.12 13.75
20.38 21.32
27.72
44.40
28.34
92.2687.84
49.56
in R
s.
0.00
100.00
200.00
300.00
400.00
500.00
600.00
09-1008-0907-0806-0705-0604-0503-0402-0301-0200-01*
37.8656.19
92.16111.25
136.58
281.66
164.53
511.55
417.97
331.17
in R
s.
0
2,000
4,000
6,000
8,000
10,000
12,000
09-1008-0907-0806-0705-0604-0503-0402-0301-0200-01*
1,5902,032 2,327
2,974
4,747
9,068
6,858
11,006
Num
ber
of E
mpl
oyee
s
11,386
10,451
0
30
60
90
120
150
09-1008-09 07-08 06-07 05-06 04-05 03-04 02-03 01-02 00-01*
137
74
8493
108112
128123
137133
Cou
ntry
Bas
e
0
200
400
600
800
1,000
09-1008-09 07-08 06-07 05-06 04-05 03-04 02-03 01-02 00-01*
281
345404
480
544
753
642
882922
814
Num
ber
of C
usto
mer
s
Annual Report 2009_2010_Colour.indd 7 7/24/2010 10:58:21 AM

Oracle Financial Services Software – Annual Report 2009-10
Corporate informationOracle Financial Services Software
G NarasimhanGanesh RamakrishnanGeorge ThomasGirish ChhatparH S TejiJambu NatarajanJunichi KoharaK Kochappan DavisK LaxminarayanK Surya Karthick R PrasadKiran NarsuK Sanjay IyerLaura BalachandranLoganathan DamodaranM RavikumarMadhukar Harbanslal KapoorMahesh RaoRajesh MakhijaManoj Narayan KulkarniMeenakshy IyerMini S MuralidharMohan BhatiaMustafa MoonimNaveen GroverNikos G Goutsoulas O’Laughlin Patrick TP PrasannavadananP Suresh KumarPeter Martin HillPradeep GodboleR RamamurthiRajendra PotdarRanjan RoyRavi MahadevanRavi PanditRavikumar VSalmon Seth PSanjay BajajSanjay V DeshpandeSanjeet Prakash RaoShahab AlamSivaramakrishnan GSridhar RamachandranSunder Annamraju
Surendra ShuklaTejus ShethTeresa O’LearyThomas MathewUttam Gadkary V SrinivasanV SrivatsanVarun RajpalVenkata SubramanianVijay AlexanderVinayak Hampihallikar
Company SecretaryHoshi D Bhagwagar
Chief Financial OfficerMakarand Padalkar
Chief Accounting OfficerAvadhut (Vinay) Ketkar
SolicitorsRamesh P Makhija & Co.
AuditorsS. R. Batliboi & Associates
BankersBank of IndiaCanara BankCentral Bank of LibyaCitibank N.A.HDFC Bank Ltd.Kotak Mahindra Bank Ltd.Syndicate BankState Bank of Mauritius Ltd.Yes Bank Ltd.
Registrars & Transfer AgentsLink Intime India Private LimitedC/13 Pannalal Silk Mills CompoundL.B.S. Road, Bhandup (West)Mumbai 400078
Board of Directors
Derek H WilliamsDorian DaleyFrank Brienzi Joseph John (Whole-time Director)N R Kothandaraman (N R K Raman) (Managing Director and CEO)Tarjani VakilWilliam Corey WestWilliam T Comfort, Jr. (Chairman)Y M Kale
Senior Management
Executive Vice PresidentsV ShankarKishore Kapoor
Senior Vice PresidentsAtul GuptaVikram GuptaManmath KulkarniS HariharanS SundararajanSajal MukherjeeVijay SharmaVivek GovilkarR NarasimhanKapil Gupta
Vice Presidents A SrinivasanAbhik RayAjay BhatiaAnand PitreAshit ShahBharat B MehtaBhaskar Jayaraman Bimal GuptaBuddhadeb Das GuptaChandrasekaran BalsubramanianDinakar Kuntadi KiniDinesh ShettyDon Ganguly
Annual Report 2009_2010_Colour.indd 8 7/24/2010 10:58:21 AM

9
Registered Office
Oracle Financial Services Software LimitedOracle ParkOff Western Express HighwayGoregaon (East) Mumbai 400063 Maharashtra, India
Offices
399, Subhash RoadVile Parle (East)Mumbai 400057 Maharashtra, India
Nirlon CompoundOff Western Express HighwayGoregaon (East)Mumbai 400063 Maharashtra, India
SDF 1, Unit 10 & 11SEEPZAndheri (East)Mumbai 400096 Maharashtra, India
1st floor, ‘C’ BuildingShah Industrial EstateSaki‑Vihar Road, Andheri (East)Mumbai 400072 Maharashtra, India
Lohia Jain IT ParkPaud Road, KothrudPune 411029 Maharashtra, India
Oracle Park AmbrosiaPune 411021 Maharashtra, India
Pride Silicon Plaza2nd FloorSenapati Bapat RoadPune 411053 Maharashtra, India
9A, Ambrosia Bavdhan Khurd Taluka MulshiPune 411021 Maharashtra, India
Embassy Business ParkC.V. Raman NagarBangalore 560093 Karnataka, India
#333, Millenium Tower BrookefieldsKundalahalli RoadMahadevapuraBangalore 560037 Karnataka, India
#150, Diamond DistrictB Tower, Lower Ground FloorKodihalli, Airport RoadBangalore 560008 Karnataka, India
SJR I ParkGround & First floor, Tower 2EPIP Zone, Whitefield Road, WhitefieldBangalore 560066 Karnataka, India
RMZ NXTCampus 1, Block B, 3rd FloorEPIP Zone, WhitefieldBangalore 560066 Karnataka, India
Global AxisPlot # 152/1, EPIP ZoneWhitefieldBangalore 560066 Karnataka, India
99, Venkatnarayana RoadT NagarChennai 600017 Tamil Nadu, India
Green I Tech, # 5 Muthiah Mudali StreetOff Cathedral RoadChennai 600086 Tamil Nadu, India
18 Krasnopresnenskaya nab., Block C, 9th floorMoscow 123317, Russia
Building No. 03128, 1st floor 205, 207, 2nd floorDubai Internet City, P.O. Box: 500053Dubai, UAE
Subsidiary Offices – India
Oracle (OFSS) ASP Private Limited(Formerly known as Flexcel International Private Limited)Plot No. 24 – 25, Street No. 9Behind Hotel Tunga ParadiseMIDC, Andheri (East)Mumbai 400093 Maharashtra, India
Oracle (OFSS) Processing Services Limited(Formerly known as i‑flex Processing Services Limited)399, Subhash RoadVile Parle (East)Mumbai 400057 Maharashtra, India
SDF‑1, Unit 12SEEPZ ‑ SEZAndheri (East)Mumbai 400096 Maharashtra, India
Block A, NR Enclave, 4th FloorPlot No. 1, EPIP Industrial AreaVillage limits of HoodiKrishnarajapuram HobliWhitefieldBangalore 560066 Karnataka, India
Subsidiary Offices – Asia Pacific
Oracle Financial Services Software (Shanghai) Limited11th Floor, China Life TowerNo. 16 Chao Wai DajieBeijing 100020, China
Oracle Financial Services Software Pte. Ltd.27, International Business Park#02‑01 iQUEST@IBP BuildingSingapore 609924
Offices
Room 806, Central PlazaNo. 227 HuangPi Road NorthShanghai 200003, China
1st Floor, Incubator Building 2‑ANo. 2 Beijing Zhongguancun Software ParkHaidian District Dong Bei WangBeijing, China
Annual Report 2009_2010_Colour.indd 9 7/23/2010 9:04:08 PM

Oracle Financial Services Software – Annual Report 2009‑10
Oracle Aoyama Center 3F2‑5‑8 Kita AoyamaMinato‑kuTokyo 107‑0061 Japan
3/F Samhwa Building Samsung‑dongKangnam‑GuSeoul, South Korea
35F, No.66, Sec. 1,Chung Hsiao W. Rd.,Taipei 10018, Taiwan, R.O.C
39/F The Lee Gardens33 Hysan AvenueCauseway Bay, Hong Kong
19/F Pacific Star BuildingSen. Gil Puyat corner Makati AvenueMakati City, Philippines
Suite 38.01‑04 Level 38 Menara Citibank165 Jalan AmpangKuala Lumpur 50450 Malaysia
Level 10, Margaret StreetSydney, NSW 2000 Australia
Level 4, 4 Julius AvenueNorth RydeSydney, NSW 2113 Australia
Oracle Financial Services Consulting Pte. Ltd. (subsidiary of Oracle Financial Services Software Pte. Ltd.)27, International Business Park#04‑05 iQUEST@IBP BuildingSingapore 609924
Subsidiary Office ‑ Europe
Oracle Financial Services Software B.V.Claude Debussylaan 3214th floor/Vinoly Building1082 MD AmsterdamThe Netherlands
Offices
Mainzer Landstrasse 49a60329 Frankfurt am Main, Germany
121, Meridian PlaceOff Marsh Wall, South QuayLondon E14 9FE, UK
Level 2540 Bank Street, Canary WharfLondon E14 5NR, UK
Molyneux HouseBride StreetDublin 8 Ireland
Eastpoint Business ParkFairviewDublin 3Ireland
Suite 22Portes de la Defense15, boulevard Charles de Gaulle92700 Colombes France
Subsidiary Office ‑ Greece
Oracle Financial Services Software SA6‑8 Kifisias Avenue151 25 MarousiAthens, Greece
Subsidiary Offices – North America
Oracle Financial Services Software America, Inc.,Oracle Financial Services Software, Inc. & Mantas Inc.399 Thornall Street, 6th FloorEdison, NJ 08837 USA
Offices
8000 Norman Center DriveBloomington, MN 55437
1900 Oracle Way, 3rd FloorReston, VA 20190 USA
1250 Hancock StreetQuincy, Massachusetts 02169
6505 Blue Lagoon Drive, Suite #400Miami, FL 33126 USA
Mantas Inc.13650 Dulles Technology Drive, Suite 100Herndon, VA 20171 USA
Oracle Financial Services Software, Inc.145 King Street West Suite 500 Toronto, Ontario M5H 1J8, Canada
Subsidiary Office – Mauritius
ISP Internet (Mauritius) Company LimitedC/o Multiconsult LimitedRogers House, 5 President John Kennedy StreetPort Louis, Mauritius
Offices
i‑flex Processing Services Inc.17682, Mitchell North, Suite 201IrvineCA 92614 USA
Oracle (OFSS) BPO Services Limited(Formerly known as Equinox Global Services Limited)A‑16/9, Poorvi MargVasant ViharNew Delhi‑110 057
DLF Infinity Tower A, 3rd FloorDLF Cyber City, Phase IIGurgaon 122002 Haryana, India
Annual Report 2009_2010_Colour.indd 10 7/23/2010 9:04:08 PM

11
Dear Members,
The Directors are delighted to present their report on the business and operations of your Company along with the Annual Report and audited financial statements for the financial year 2009–2010.
Financial highlights
As per Indian GAAP Unconsolidated financial statements:
(All amounts in millions of Indian Rupees)
Year ended March 31, 2010
Year ended March 31, 2009
Revenue 22,434.70 22,126.23Income from operations before depreciation & amortization 8,530.50 6,537.37Depreciation & amortization (374.10) (428.41)Interest/other income (expenses) (682.72) 1,682.86Exceptional item – (468.90)Income before taxes 7,473.68 7,322.92Provision for tax (865.19) (365.80)Net income 6,608.49 6,957.12Balance brought forward 15,075.43 8,118.31Profit available for appropriation 21,683.92 15,075.43Appropriations – –Balance carried forward 21,683.92 15,075.43
As per Indian GAAP Consolidated financial statements:
(All amounts in millions of Indian Rupees)
Year ended March 31, 2010
Year ended March 31, 2009
Revenue 28,739.74 29,276.19Income from operations before depreciation & amortization 10,281.02 7,754.79Depreciation & amortization (488.65) (557.94)Impairment loss – (291.05)Interest/other income (expenses) (856.17) 1,789.41Exceptional item – (468.90)Income before taxes 8,936.20 8,226.31Provision for tax (1,197.69) (835.36)Net income for the year before minority interest, share of profit (loss) of associate 7,738.51 7,390.95Minority interest (1.87) (12.93)Share of profit (loss) of associate – (12.59)Net income 7,736.64 7,365.43
Performance
On an unconsolidated basis, your Company’s revenue grew to Rs. 22,434 million during the financial year 2009–2010 from Rs. 22,126 million last year. This represents a growth of 1.39%. The Company’s net income dropped by 5.02% over the previous financial year and decreased to Rs. 6,608 million.
Revenue, on the basis of consolidated financials, stood at Rs. 28,740 million this year, a drop of 2% from Rs. 29,276 million as compared to the previous financial year. The net income increased to Rs. 7,737 million this year, an increase of 5%.
A detailed analysis of the financials is given in the Management Discussion and Analysis report that forms part of this Annual Report.
Dividend
Your Company has plans to capitalize on the opportunities emerging from the current market conditions and needs to invest in business growth. Keeping this in view, the Board has decided not to declare a dividend for the financial year 2009‑2010. The funds will be used to further invest in new product development, infrastructure expansion and other growth opportunities to enhance the solution offerings, market reach and delivery capabilities and sustain the leadership position of your Company.
Directors’ report Financial year 2009‑10
Annual Report 2009_2010_Colour.indd 11 7/23/2010 9:04:08 PM

Oracle Financial Services Software – Annual Report 2009‑10
Transfer to reserves
The Company does not propose to transfer any amount to the General Reserve out of the amount available for appropriation. An amount of Rs. 21,683.92 million is proposed to be retained in the Profit & Loss Account.
Share capital
During the year, the Company allotted 85,471 equity shares of face value of Rs. 5/‑ each to its employees/directors, who exercised their options under the Employee Stock Option Plan. As a result, as on March 31, 2010, the paid up equity share capital of the Company increased to Rs. 419,274,285/‑ divided into 83,854,857 equity shares of face value of Rs. 5/‑ each.
Oracle’s holding in the Company
As of March 31, 2010, Oracle Global (Mauritius) Limited held 67,481,698 equity shares (80.47% of the equity capital) of the Company.
Directors
Mr. Y M Kale and Mr. William T Comfort, Jr., Directors of the Company, retire by rotation at the ensuing Annual General Meeting and being eligible, offer themselves for re‑appointment.
Ms. Tarjani Vakil is liable to retire by rotation at the ensuing Annual General Meeting and has not offered herself for re‑appointment.
Mr. Rajesh Hukku has taken a broader role at Oracle Corporation as Chief Strategy Officer, Financial Services. Mr. R Ravisankar has been promoted to Chief Operating Officer, Oracle Financial Services Global Business Unit. Both of them have resigned from the Board of Directors of the Company with effect from April 29, 2010. Mr. Charles Phillips resigned from the Board of Directors of the Company with effect from July 22, 2010. The Board places on record its appreciation for the contributions made by Mr. Rajesh Hukku, Mr. R Ravisankar and Mr. Charles Phillips as members of the Board.
Pursuant to Section 260 of the Companies Act, 1956, Mr. Frank Brienzi, General Manager, Oracle FSGBU and Mr. Joseph John, Executive Vice President, Banking Products Division of the Company were appointed as Additional Directors of the Company on April 29, 2010. Mr. William Corey West, Senior Vice President, Corporate Controller and Chief Accounting Officer, Oracle Corporation was appointed as an Additional Director of the Company on July 22, 2010. They hold office up to the date of the ensuing Annual General Meeting. The Company has received Notices in writing from Members, pursuant to Section 257 of the Companies Act, 1956, proposing the candidature of Mr. Frank Brienzi, Mr. Joseph John and Mr. William Corey West for the office of a Director.
Pursuant to the provisions of Sections 198, 269, 309 and 310 of the Companies Act, 1956, Mr. Joseph John was appointed as Whole‑time Director of the Company for a period of three years i.e. from April 29, 2010 to April 28, 2013. Mr. Joseph John shall be liable to retire by rotation.
As stipulated under Clause 49 of the Listing Agreement entered into with the stock exchanges, brief resumes of the Directors proposed to be appointed/re‑appointed, nature of their expertise in specific functional areas and the names of companies in which they hold directorships and membership/chairmanship of Board Committees, are provided in the Report on Corporate Governance forming part of the Annual Report.
The Board recommends to the members the resolutions for re‑appointment of Mr. Y M Kale and Mr. William T Comfort, Jr. as Directors of the Company. The Board also recommends the appointment of Mr. Frank Brienzi, Mr. Joseph John and Mr. William Corey West as Directors. It further recommends the appointment and remuneration payable to Mr. Joseph John as Whole‑time Director of the Company and revision in remuneration payable to Mr. N R K Raman, Managing Director of the Company.
Infrastructure
During the year, your Company made the following changes to its infrastructure:
Bangalore
We rationalized our facilities in Bangalore and surrendered one floor (2nd Floor) of our RMZ office on August 3, 2009.
Your Company has obtained SEZ approval for the Global Axis office, on March 29, 2010. This office covers an area of about 1 million sq. ft. and is coming up at Bangalore.
Pune
Renovation work is in progress at Ambrosia owned premises. It has an area of 360,000 sq. ft. and a portion of this office is expected to be ready for occupation by the end of July 2010.
Chennai
We have taken new office premises on lease at Chennai – Green Valley Shelters (GVS), w.e.f. February 1, 2010 for a 3 year lease period.
Annual Report 2009_2010_Colour.indd 12 7/23/2010 9:04:09 PM

13
We have de‑leased our NGM premises w.e.f. May 31, 2010 and all our staff from Nungambakkam have moved to the GVS office premises.
Corporate developments
To reflect the close strategic and operational alignment within the Company, the names of the following subsidiary companies were changed during the year from:
• ‘EquinoxGlobalServicesLimited’to“Oracle(OFSS)BPOServicesLimited”w.e.f.March9,2010
• ‘i‑flexProcessingServicesLimited’to“Oracle(OFSS)ProcessingServicesLimited”w.e.f.March19,2010
• ‘FlexcelInternationalPrivateLimited’to“Oracle(OFSS)ASPPrivateLimited”w.e.f.March22,2010
Global alliances
YourCompanyattachesgreatimportancetobuildingandexpandingitspartnernetworkwithorganizations,whichcanpromote,sell, implement and support its offerings around the world. The partner network currently comprises more than 35 resellers and 45 implementation partners.
LeadingSystemIntegration(SI)PartnersplayanactiveroleindeliveringsolutionstocustomersofyourCompany.TheSIPartnersdeliverprojectsintheCIS,LatinAmerica,MiddleEast,JapanandIndia.
The highlight of our engagement with partners this year has been the acceleration of our efforts to enable our partners to sell, implementandsupportourproductsuite–includingOracleFLEXCUBE,OracleReveleus,OracleMantasandOracleDaybreak.Wehavealsobegunthemigrationofyourcompany’spartnernetworktotheOraclePartnerNetwork(OPN).Thismigrationwillspeedtheenablementofpartners,leverageexistingOraclerelationshipstopromotegrowth,andbenefitbothsidesofthepartnerrelationship.
Subsidiaries
YourCompanyhassubsidiariesinIndia,theUSA,Singapore,theNetherlands,Canada,Mauritius,Greece,ChinaandChiletohandleoperations, strengthen marketing and sales efforts, ensure deeper sales penetration and provide post‑sales support in these regions.
Pursuant to Section212of theCompaniesAct, 1956 (“theAct”), theCompany is required to attach to itsAnnualReport, theBalanceSheet,ProfitandLossAccount,Director’sReportandtheReportoftheAuditors(collectivelyreferredtoas‘theaccountsandreports’),ofitssubsidiariesfortheyearendedMarch31,2010.SincetheCompanypresentsauditedconsolidatedfinancialstatementsunderIndianGAAPinitsAnnualReport,theCompanyhadappliedtotheCentralGovernmentforanexemptionfromattachingtheaccountsandreportsofitssubsidiariestotheAnnualReport.TheapprovaloftheCentralGovernmentinthisregardhasbeenreceivedvideletterno.47/272/2010‑CL‑IIIdatedApril20,2010exemptingtheCompanyfromattachingtheaccountsandreportsofsubsidiarycompaniesundertheprovisionsofSection212oftheAct.Assuch,theaccountsandreportsofthesubsidiarycompaniesarenotattachedtotheAnnualReportoftheCompany.
The Company will make available the accounts and related information of the subsidiary companies upon request by any member/investor of theCompany or its subsidiaries. Further, the accounts and related information of the subsidiary companieswill be kept open for inspection by any member, at the registered office of the Company and at the registered office of the subsidiaries during office hours of the Company/subsidiaries and the same will also be available on the website of the Company www.oracle.com/financialservices.
Fixed deposits
Duringthefinancialyear2009‑2010,theCompanyhasnotacceptedanyfixeddepositswithinthemeaningofSection58AoftheCompaniesAct,1956andassuch,noamountofprincipalorinterestwasoutstandingasofthedateoftheBalanceSheet.
Corporate governance
TheCompanyhastakenappropriatestepsandmeasurestocomplywithalltheapplicablemandatoryprovisionsofClause49ofthelistingagreemententeredwithstockexchangesandSection292AoftheCompaniesAct,1956.
YourCompanyhasconstituted fivecommitteesconsistingofBoardmembersandotherseniorofficialsof theCompany,namely,anAuditCommittee,CompensationCommittee,ESOPAllotmentCommittee,TransferCommitteeandShareholders’GrievancesCommittee.AseparatereportonCorporateGovernance,alongwithacertificateofStatutoryAuditorsoftheCompany,isannexedherewith.
A certificate from theManagingDirector andChief FinancialOfficer of the Company confirming internal controls and checkspertainingtofinancialstatementsfortheyearendedMarch31,2010wasplacedbeforetheBoardofDirectorsandtheBoardhasnoted the same.
Annual Report 2009_2010_Colour.indd 13 7/24/2010 10:58:41 AM

Oracle Financial Services Software – Annual Report 2009-10
AlistofthecommitteesoftheBoardandnamesoftheirmembersasonMarch31,2010isgivenbelow.
ThescopeofeachofthesecommitteesandotherrelatedinformationaredetailedintheenclosedCorporateGovernanceReport.
Audit committee
Mr.YMKale(Chairman)Mr.WilliamTComfort,Jr.Ms. Tarjani Vakil
Compensation committee
Mr.WilliamTComfort,Jr.(Chairman) Mr. Y M Kale Mr.CharlesPhillips
Transfer committee
Ms.TarjaniVakil(Chairperson) Mr.MakarandPadalkar
ESOP allotment committee
Ms.TarjaniVakil(Chairperson) Mr.MakarandPadalkar
Shareholders’ grievances committee
Ms.TarjaniVakil(Chairperson) Mr.MakarandPadalkar
Allotment of ESOP shares
ThemembersoftheCompanyhadapprovedtheEmployeesStockOptionScheme(ESOP)oftheCompanyinitsAnnualGeneralMeetingof2001.Accordingtothesaidscheme,theCompanyhasgrantedsharestoeligibleemployees/directorsfromtimetotime.The details are given below:
Financialyear TotalnumberofOptionsgranted
2001 – 02 4,548,9202002 – 03 80,0002003 – 04 36,0002004 – 05 60,0002005–06 10,0002006–07 373,0002007–08 Nil2008–09 Nil2009–10 NilTotal 5,107,920Pricingformula Atthemarketprice
as on the date of grant
Optionsvestedattheendofthefinancialyear2009–2010 141,382Optionsexercisedduring2009–2010 85,471Totalnumberofsharesarisingasaresultofexerciseofoptionsduring2009–2010 85,471
Optionslapsed2002 – 03 129,5202003 – 04 112,5002004 – 05 82,2002005–06 87,6002006–07 46,6002007–08 35,9002008–09 60,4552009–10 21,000Total 575,775Variation of terms of options NoneMoneyrealizedbyexerciseofoptionsduringthefinancialyear2009–2010 Rs.70,015,083Total number of options in force 242,382
Employee‑wisedetailsofoptionsgrantedduringthefinancialyearendedMarch31,2010to:
NumberofOptions
i. Director Nilii. Anyotheremployee,whoreceivesgrantinanyoneyearofoptionamountingto5%ormoreofoptiongranted
during that year Niliii. Identifiedemployeeswhoweregrantedoption,duringanyoneyear,equaltoorexceeding1%oftheissued
capital(excludingoutstandingwarrantsandconversions)oftheCompanyatthetimeofgrant Niliv. DilutedEarningsPerShare(EPS)pursuanttotheissueofsharesonexerciseofoptioncalculatedinaccordance
withaccountingstandard20‘EarningsPerShare’issuedbytheInstituteofCharteredAccountantsofIndia Rs.78.72
Annual Report 2009_2010_Colour.indd 14 7/24/2010 10:58:41 AM

15
HadcompensationcostfortheCompany’sESOPbeendeterminedbasedonfairvalueatthegrantdates,Company’snetincomeandearnings per share would have been reduced to proforma amounts indicated below:
March 31, 2010
Net income as reported 6,608,488Less:Compensationexpensedeterminedusingfairvalueofoptions (5,659)Proformanetincome 6,602,829Basicincomepershare:Asreported 78.87Proforma 78.80Dilutedincomepershare:Asreported 78.72Proforma 78.65
All stock options under the 2002Employee StockOptionPlanwere granted at a prevalentmarket price on the date of grant.Accordingly,wehavecalculatedthecompensationcostarisingonaccountofstockoptionsgrantedusingtheintrinsicvaluemethod.Hence,thedisclosureintermsofClause12.1(n)oftheSecuritiesandExchangeBoardofIndia(EmployeesStockOptionSchemeandEmployeeStockPurchaseScheme)Guidelines,1999,isnotapplicable.
AsummaryoftheactivityintheCompany’sESOPisasfollows:
Year ended March 31, 2010
Shares arising from options
Weighted average exerciseprice(Rs.)
Outstandingatbeginningofyear 348,853 1,075Exercised (85,471) 819Forfeited (21,000) 1,232Outstandingatendoftheyear 242,382 1,152
Human resources
Employeesareourkeyassetsandwecontinuouslyinvestinthemtoretainourcompetitiveedge.Wehavecreatedahealthyandproductiveenvironment, togetherwitha strongperformancemanagement systemtoencourageexcellence.OurHRpracticesareamongthebestintheindustry.Ourtraininginitiativeoffersthebestandlatestintechnology,domainexpertiseandleadership.
This was a year of consolidation of our resources. Your Company continued to focus on productivity instead of investing in additional manpower.Ourtotalmanpowershowedalittledipfromthetotalstaffstrengthfrom11,386bytheendofMarch2009to10,451by end of March 2010.
Corporate Social Responsibility
Aninitiativetosupportchildren,originallyrolledoutas“i‑flexforchildren”,isinitseighthsuccessfulyear.OurCorporateSocialResponsibilitiesaremanagedbyacommitteeofseniorcompanyofficialsandvolunteersfromdivisionsandlocationsinIndia.Ourpolicy is to support activities which do not have any religious or political affiliation. Your Company encourages employees to actively participateinanddrivesuchprograms.WealsosupportinitiativesbyouremployeesandtheirfamilymembersinruralIndia.Theinitiative is funded each year to support activities proposed to the committee by employees.
Awiderangeofactivitiesweresupportedduringfiscalyear2009‑2010,includingconstructionofadditionalfacilitiesatschoolsandhospitals,scholarshipsforchildrenwithspecialneedsandprocuringbusestospecialneedschools.Forthepast4yearsyourCompanyhas supported an annual athletic event for children.
Directors’ responsibility statement
AsrequiredunderSection217(2AA)oftheCompaniesAct,1956,theDirectorsherebyconfirmthat:
i. Inpreparationof theannualaccounts, theapplicableaccountingstandardshavebeen followedalongwithproperexplanationrelating to material departures;
ii. TheDirectorshaveselectedsuchaccountingpoliciesandappliedthemconsistentlyandmadejudgmentsandestimatesthatarereasonable and prudent so as to give a true and fair view of the state of affairs of the Company at the end of the financial year and of the profit of the Company for that period;
iii.TheDirectorshavetakenproperandsufficientcareforthemaintenanceofadequateaccountingrecordsinaccordancewiththeprovisionsofthisActforsafeguardingtheassetsoftheCompanyandforpreventinganddetectingfraudandotherirregularities;
iv. TheDirectorshavepreparedtheannualaccountsona‘goingconcern’basis.
Annual Report 2009_2010_Colour.indd 15 7/24/2010 10:58:41 AM

Oracle Financial Services Software – Annual Report 2009‑10
Auditors
M/s S. R. Batliboi & Associates, Chartered Accountants, the present Statutory Auditors of the Company, hold office till the ensuing Annual General Meeting and have confirmed their eligibility and willingness to accept office, if re‑appointed.
Auditors’ Report
With regard to the Auditors’ comment in the CARO report concerning delays in payment of a few tax payment, e.g., Service Tax, Income Tax, Value Added Tax, Payroll Tax, the Company would like to state the following:
i. The Company has sought help of tax experts in the interpretation of laws and regulations relating to corporate taxes and VAT in foreign countries. The Company has accrued the liabilities in the books taking a conservative approach, however the payments shall be made to the authorities in due course based on the final advice your Company receives.
ii. Based on the opinion of tax experts and learned counsel, the Company has accrued for service tax liability on import of taxable services. The amount shall be paid in due course.
iii. The Company continually assesses payroll tax implications in various jurisdictions outside India on salaries and travel related reimbursements paid to its employees posted therein and accordingly makes accruals in the books. As per the local laws of most host countries, the tax is payable by the employee, however in a few countries tax payment is a responsibility of the employer, which amounts to Rs. 2.82 Crore. The Company and the employees ensure tax compliance in such countries as advised by the tax consultants.
Conservation of energy, technology absorption and foreign exchange earnings and outgo
The particulars as prescribed under Sub‑Section (1)(e) of Section 217 of the Companies Act, 1956 read with Companies (Disclosure of Particulars in the Report of Board of Directors) Rules, 1988, the relevant data pertaining to conservation of energy, technology absorption on foreign exchange earnings and outgo are furnished hereunder:
i. Conservation of energy and technology absorption:
We believe in providing cutting edge technology to our users, to enhance their productivity and performance. Oracle Financial Services Software endeavors to fulfill its responsibility towards a green environment. We are an environmentally responsible company and some of our key technology initiatives to protect the environment are presented below:
Virtualization: It is commonly observed that a large number of servers frequently run with underutilization of processing capability. Virtualization, leads to abstraction of resources. It helps in increasing operational efficiency by consolidating several physical servers onto one logical machine. Running multiple machines on one server increases capacity utilization, reduces power usage and related maintenance expenditure. With extensive adoption of Virtualization technology, the Company has made substantial savings in power consumption of up to 50%.
Printer Control: As a part of the “Go Green” campaign at Oracle, the Company has adopted practices such as monitoring of printer usage and the automation of various activities to optimize paper usage. We have already reduced printing consumption by almost 40%.
Our Company has also implemented green technologies such as intelligent lighting in datacenter, water and paper recycling, investment on power saving equipments etc. to ensure eco‑friendly operations at various levels. The significance of conserving our environment is also conveyed periodically to employees through mailers and posters to elicit their active participation in this cause and to raise their awareness levels.
ii. Foreign exchange earnings and outgo:
(All amounts in millions of Indian Rupees)
Foreign Exchange Earnings* 21,653.79Foreign Exchange Outgo 6,014.87(Including capital goods & other expenditure)
* Excluding reimbursement of traveling expenses and interest income.
Prospects
With the change in the economic environment over the last 24 months, banks have reviewed their IT investments to realign them to address new business priorities. We see continued demand for core banking applications as banks expand by buying the assets of other banks, establish presence in new countries and standardize applications across regions. Banks have also sought centralization of banking services such as account opening and origination of credit. They want to do so to improve their service levels and productivity and gain greater control over processes that are coming under increasing regulatory scrutiny.
Banks have worked hard to regain public trust. This declined after the recent downturn and in turn reduced transactions and floating capital making the financial system less efficient. Banks want the right technology to help them enhance security, improve risk and liquidity management, stress testing as well as process measurement and improvement.
Annual Report 2009_2010_Colour.indd 16 7/23/2010 9:04:09 PM

17
Banks are evolving into intelligent investors who make informed decisions based on the business benefits that accrue from technology investments. Some of the more aggressive banks have experimented and successfully delivered new business services in their markets by leveraging technology. Such banks have completely differentiated themselves from competition and delivered a better banking experience to their customers. The next generations of these services are being actively considered by many existing Oracle customers as applications and technologies that are offered pre‑integrated rather than implemented at the bank’s location.
Your company has continued to invest in Oracle FLEXCUBE to address these emerging needs and help our customers achieve excellence through the effective use of information technology. Oracle FLEXCUBE 11.0 was announced in January 2010 to address important and evolving requirements of banks around the globe.
Evolving regulations around Liquidity Risk, Stress Testing and Credit Risk continue to contribute to increasing traction at Tier 1 banks for our products. Over the past 12 months financial institutions have exhibited renewed interest in finance, risk and performance applications and in aligning these three areas to deliver better and more meaningful results. Risk Adjusted Performance Measurement (RAPM) that makes such alignment possible has received greater attention from regulators and from the boards of many banks.
Capital reform is another area of focus for regulators. A key element of effective capital reform is better and more comprehensive adaptation of capital requirements to risks. The rules surrounding the Internal Capital Adequacy Assessment Process (ICAAP), Pillar 2 of Basel II, mandate financial institutions to develop internal procedures and systems to ensure that they possess adequate capital resources in the long term taking in to consideration all material risks.
Many countries have also revised fraud and financial crime regulations to protect their consumers. The increasing sophistication of fraudulent activity continues to force financial institutions to be on guard when it comes to fighting financial crime. In addition, regulators in Asia, Africa and Latin America have also published guidelines asking financial institutions to comply with Anti Money Laundering regulations over the next 24‑36 months.
After an intense review of the financial events of 2008‑2009, regulators have asked banks to align their internal processes to safeguard customer interest and avoid past failures in investment transactions. Capital markets around the world are witnessing increased activity post recession and a greater probability of fraud. Changes in the investment‑banking environment have contributed to the increased adoption of broker compliance and trading compliance solutions. Financial institutions will also have to comply with energy trading compliance mandates from regulators as these markets have proved to be very volatile in the past.
We have created a complete and fully integrated portfolio of analytical applications covering enterprise risk, regulatory compliance, performance management and customer insight. It is built on a shared analytical infrastructure consisting of a unified financial services data model, shared analytical computations and the industry leading Oracle Business Intelligence platform.
IT services in leading markets are consolidating and are becoming more price sensitive. However, the use of these services has expanded as the pressure has spread to Tier 2 and Tier 3 banks to remain cost effective. Financial institutions continue to look at ways to maximize efficiency and rationalize their IT infrastructure usage. Customers are leveraging our service offerings to gain unmatched competitive advantage for their businesses.
Employee particulars
Information as per Section 217(2A) of the Companies Act, 1956 (“the Act”), read with the Companies (Particulars of Employees) Rules, 1975, forms part of this Report. As per the provisions of Section 219(1)(b)(iv) of the Act, the Directors’ Report and the Accounts are being sent to the members excluding the statement giving particulars of employees under Section 217(2A) of the Act.
Any member interested in obtaining a copy of the statement, may write to the Company Secretary at the Registered Office of the Company.
Acknowledgements
Your Directors take this opportunity to thank the Company’s customers, members, vendors and bankers for their continued support during the year. Your Directors also wish to thank the Government of India and its various agencies, Department of Electronics, the Software Technology Parks – Bangalore, Mumbai, Chennai and Pune, SEEPZ Special Economic Zone, the Customs and Excise Department, Ministry of Commerce, Ministry of Finance, Ministry of External Affairs, Ministry of Corporate Affairs, Department of Telecommunication, the Reserve Bank of India, the State Governments of Maharashtra, Karnataka, Haryana and Tamil Nadu and other local Government Bodies, for their support and look forward to their continued support in the future.
Your Directors also place on record their appreciation for the excellent contribution made by employees of the Company through their commitment, competence, co‑operation and diligence with a view to achieving consistent growth for the Company.
For and on behalf of the Board,
William T Comfort, Jr. Chairman
July 22, 2010
Annual Report 2009_2010_Colour.indd 17 7/23/2010 9:04:09 PM

Oracle Financial Services Software – Annual Report 2009‑10
The detailed report on Corporate Governance of Oracle Financial Services Software Limited for the financial year ended 2009 – 2010 as per Clause 49 of the Listing Agreement entered with Stock Exchanges is set out below.
1. Company’s philosophy on code of governance
The Company believes in adopting and adhering to globally recognized corporate governance practices and continuously benchmarking itself against such practices. The Company understands and respects its fiduciary role and responsibility to its members and strives to meet their expectations.
2. Board of Directors
2.1 Composition and category
The composition of the Board of Directors of the Company (“the Board”) as on March 31, 2010, was as given below.
Name Designation Category Directorshipsin other
Companies
Chairpersonshipof Committees4
of Boards of other
Companies
Membershipof Committees4
of Boards of other
Companies
Mr. William T Comfort, Jr. Chairman Non‑Executive, Independent Director 5 Nil Nil
Ms. Dorian Daley1 Director Non‑Executive, Non‑Independent Director 22 Nil Nil
Mr. Rajesh Hukku2 Director Non‑Executive, Non‑Independent Director Nil Nil Nil
Mr. Y M Kale Director Non‑Executive, Independent Director 6 Nil Nil
Mr. Charles Phillips3 Director Non‑Executive, Non‑Independent Director 2 Nil 1
Mr. N R Kothandaraman (N R K Raman)
Managing Director Executive, Non‑Independent Director 4 Nil Nil
Mr. R Ravisankar2 Vice Chairman Executive, Non‑Independent Director 6 Nil Nil
Ms. Tarjani Vakil Director Non‑Executive, Independent Director 8 3 3
Mr. Derek H Williams Director Non‑Executive, Non‑Independent Director 1 1 Nil
1 Ms. Dorian Daley was appointed as a Director in the Annual General Meeting of August 25, 2009. All her other directorships are in Foreign Companies.
2 Mr. Rajesh Hukku and Mr. R. Ravisankar ceased to be Directors with effect from April 29, 2010.3 Mr. Charles Phillips ceased to be Director with effect from July 22, 2010.4 Only the Audit Committee and Shareholders’ Grievances Committee are considered.
Mr. Frank Brienzi and Mr. Joseph John were appointed as Additional Directors with effect from April 29, 2010. Mr. Joseph John was appointed as a Whole‑time Director with effect from April 29, 2010. Mr. William Corey West was appointed as an Additional Director with effect from July 22, 2010.
2.2 Attendance of each Director at the Board Meetings and the last Annual General Meeting
The Company holds regular Board Meetings. The detailed agenda along with the explanatory notes are circulated in advance. The Directors can suggest the inclusion of any item in the agenda at the Board Meeting. The independent Directors actively participate in the Board Meetings and contribute to the decision making process by expressing their opinions, views and suggestions.
During the Financial Year 2009 – 2010, five Board Meetings were held on the following dates:
May 15, 2009, July 30, 2009, August 25, 2009, October 30, 2009, January 29, 2010.
Corporate governance report
Annual Report 2009_2010_Colour.indd 18 7/23/2010 9:04:09 PM

19
The attendance of the Directors at the Board Meetings and the Annual General Meeting held during the financial year 2009 – 2010 are as given below:
Name of the Director Number of Board Meetings attended
Number of Board Meetings attended Last AGM Attended
In person On phone/video conference
Mr. William T Comfort, Jr. 5 4 1 YesMs. Dorian Daley1 3 1 2 YesMr. Rajesh Hukku 5 3 2 YesMr. Y M Kale 5 5 – YesMr. Charles Phillips 4 1 3 Yes Mr. N R K Raman 5 5 – YesMr. R Ravisankar 5 3 2 YesMs. Tarjani Vakil 5 5 – YesMr. Derek H Williams 5 2 3 Yes
1 Ms. Dorian Daley was appointed as a Director on August 25, 2009.
2.3 Details of other directorships
Details of the directorships of the Company’s Directors in other companies as on March 31, 2010 are given below:
Name of the Director Other directorships
Mr. William T Comfort, Jr. Citigroup Venture CapitalCourt Square Capital Partners LimitedDeutsche Annington (DAIG)Nabors IndustriesCX Partners
Ms. Dorian Daley BEA Crossgain InternationalBEA InternationalBEA Systems Ireland Holding LimitedEontec LimitedJ.D. Edwards Europe LimitedNetsure Telecom LimitedOCAPAC Distributor PartnerOCAPAC Holding CompanyOCAPAC Research CompanyOCAPAC Research PartnerOracle America Inc.Oracle Credit CorporationOracle Global (Mauritius) LimitedOracle Global Holdings, Inc.Oracle International CorporationOracle International Holding CompanyOracle International Technology CorporationOracle Systems CorporationOracle Technology CompanySiebel Systems Ireland Holding LimitedSiebel Systems, Inc.Sun Microsystems Technology Ltd.
Mr. Rajesh Hukku –
Mr. Y M Kale Ashok Leyland LimitedGulf Oil Marine Limited Hinduja Foundries LimitedHinduja General Insurance Company LimitedHinduja Life Insurance Company LimitedIndusInd Bank Limited
Mr. Charles Phillips Oracle CorporationViacom Inc.
Mr. N R K Raman ISP Internet Mauritius CompanyOracle Financial Services Software America Inc.Oracle Financial Services Software Inc.Oracle Financial Services Software SA
Annual Report 2009_2010_Colour.indd 19 7/23/2010 9:04:09 PM

Oracle Financial Services Software – Annual Report 2009‑10
Name of the Director Other directorships
Mr. R Ravisankar Castek inc.Castek RBG Inc.Castek Software Factory LimitedMantas Inc.Oracle Financial Services Software America Inc.Oracle Financial Services Software Inc.
Ms. Tarjani Vakil Aditya Birla Nuvo LimitedAditya Birla Trustee Company Private LimitedAlkyl Amines Chemicals LimitedAsian Paints LimitedBirla Sun Life Insurance Company Limited DSP BlackRock Trustee Company Private LimitedIdea Cellular LimitedMahindra Intertrade Limited
Mr. Derek H Williams Nihon Oracle Kabushiki Kaisha
2.4 Details of memberships of Board Committees
None of the Directors of the Company hold memberships of more than ten committees nor is any Director a Chairperson of more than five Committees of the Boards of the companies where he/she holds directorship. For this purpose, “Committees” include Audit Committee and Shareholders’ Grievances Committee of a company.
The details of the memberships of the Company’s Directors in the above mentioned committees of all the Companies of which they are members as on March 31, 2010 are given below:
Name of the Director Audit Committee
Shareholders’ Grievances Committee
Chairperson Member Chairperson MemberMr. William T Comfort, Jr. – 1 – –Ms. Dorian Daley1 – – – –Mr. Rajesh Hukku – – – –Mr. Y M Kale 1 – – –Mr. Charles Phillips – 1 – –Mr. N R K Raman – – – –Mr. R Ravisankar – – – –Ms. Tarjani Vakil 3 4 1 –Mr. Derek H Williams 1 – – –
1 Ms. Dorian Daley was appointed as a Director on August 25, 2009.
2.5 Brief resume of Directors who will be retiring by rotation at the ensuing Annual General Meeting of the Company and, being eligible, offer themselves for re‑appointment
Mr. Y M Kale
Mr. Y M Kale, born on November 4, 1947, was President of the Institute of Chartered Accountants of India (1995 – 1996) and is also a fellow member of the Institute of Chartered Accountants of England and Wales. He has contributed to various governmental and regulatory bodies such as the Securities and Exchange Board of India, the Committee of Offer Documents, the Committee of Takeovers and the Committee on Accounting for Corporates. He has participated as a member of the group for the Introduction of Concurrent Audit of Banks, which was organized by the Reserve Bank of India. He was also a member of the National Drugs and Pharmaceutical Development Council of the Government of India. He was also on the Board of the International Accounting Standards Committee from 1995 to 1998 as India’s representative.
Mr. Kale does not hold any equity shares of the Company as on date.
Mr. William T Comfort, Jr.
Mr. William T Comfort, Jr., born on August 3, 1937, is the Chairman of Citigroup Venture Capital. He received his B.A. and LL.B. and was honored with the Doctorate of Humane Letters (D.H.L) at the University of Oklahoma. He received an LL.M. at the New York University Law School. He is a trustee of the New York University Law Center Foundation, the John A. Hartford Foundation, Inc., and was an adjunct professor at the Columbia Business School. He is currently Chairman of Citigroup Venture Capital and Chairman of the Investment Committee of Court Square Capital Partners. He is also a member of the Board of Directors of Deutsche Annington (DAIG ‑ Germany), and Nabors Industries (Bermuda). Mr. Comfort has been associated with the Company as a board member since 2002 and was appointed as Chairman of its Board of Directors on March 24, 2009.
Mr. Comfort does not hold any equity shares of the Company as on date.
Annual Report 2009_2010_Colour.indd 20 7/23/2010 9:04:10 PM

21
2.6 Brief resume of Directors proposed to be appointed at the ensuing Annual General Meeting of the Company
Mr. Frank Brienzi
Mr. Frank Brienzi, born on February 25, 1962, is Senior Vice President and General Manager of Oracle’s Financial Services Global Business Unit. He brings more than 25 years of financial services experience and expertise to his role at Oracle.
Mr. Brienzi began his career with EDS in 1984, as part of the financial services strategic business unit responsible for large‑scale banking and insurance development, sales and account management. For the past 15 years, he was a managing partner at Accenture, helping to grow their global financial services business and leading Accenture’s Application Outsourcing practice in North America, Asia Pacific, Europe, Africa and Latin America.
Mr. Brienzi has written several articles for major magazines including Forbes and InformationWeek. He currently serves on the board of Aidmatrix and is Vice‑Chairman for NPower, Texas. He is an active member in United Way programs and Stonebriar Community Church.
Mr. Brienzi holds double majors in mathematics and management information systems from the University of Northern Colorado.
Mr. Brienzi does not hold any equity shares of the Company as on date.
Mr. Joseph John
Mr. Joseph John, born on December 15, 1957, is a member of the board of directors and head of the banking products division of Oracle Financial Services Software Limited. He is responsible for the development, implementation and support for the Oracle FLEXCUBE suite of products.
Mr. John joined Oracle Financial Services Software Limited (then a part of Citicorp Overseas Software Limited) in 1988, where he undertook wide‑ranging Business Process Reengineering and Software Project Management assignments for customers in North America and Europe. Since 1992, he has been spearheading the product development strategy of the Company. He was product development head for its product MicroBanker, and thereafter headed the Banking Products Division, which is responsible for product development, consulting, and support of its flagship product Oracle FLEXCUBE, which is deployed in over 125 countries.
Prior to his tenure at Oracle, he was part of the software division at International Data Management.
Mr. John holds a bachelors degree in Engineering.
Mr. John holds 36,650 equity shares of the Company as on date.
Mr. William Corey West
Mr. William Corey West, born on May 4, 1962, is Senior Vice President, Corporate Controller and Chief Accounting Officer of Oracle Corporation. He brings more than 25 years of finance, accounting and executive management experience and expertise to his role at Oracle.
Mr. West began his career with Arthur Andersen in 1984, as part of the accounting and audit practice. He served clients in a variety of industries for 14 years and left Arthur Andersen in 1998 as a partner. After leaving Arthur Andersen he worked in finance, accounting and executive management positions at RPC, Adecco, Cadence Design Systems, The Gap and Intuit. Mr. West joined Oracle Corporation on April 2, 2007.
Mr. West graduated from the University of Washington in December 1984 with a bachelor’s degree in business, accounting and finance concentration.
Mr. William Corey West does not hold any equity shares of the Company as on date.
3. Audit committee
3.1 Primary objectives and powers of the Audit Committee
The primary objective of the Audit Committee is to monitor and provide effective supervision of the management’s financial reporting process and to ensure accurate, timely and proper disclosures and transparency, integrity and quality of financial reporting.
The powers of the Audit Committee include the following:
1. To investigate any activity within its terms of reference.
2. To seek information from any employee.
3. To obtain outside legal or other professional advice.
4. To secure attendance of outsiders with relevant expertise, if it considers necessary.
Annual Report 2009_2010_Colour.indd 21 7/24/2010 10:58:48 AM

Oracle Financial Services Software – Annual Report 2009-10
3.2 Broad terms of reference
The terms of reference of the Audit Committee are as follows:
1. Oversight of the Company’s financial reporting process and the disclosure of its financial information to ensure that the financial statement is correct, sufficient and credible.
2. Recommending to the Board, the appointment, re‑appointment and, if required, the replacement or removal of the statutory auditor and the fixation of audit fees.
3. Approval of payment to statutory auditors for any other services rendered by the statutory auditors.
4. Reviewing, with the management, the annual financial statements before submission to the Board for approval, with particular reference to:
a. Matters required to be included in the Director’s Responsibility Statement to be included in the Board’s report in terms of Section 217 (2AA) of the Companies Act, 1956
b. Changes, if any, in accounting policies and practices and reasons for the same
c. Major accounting entries involving estimates based on the exercise of judgment by management
d. Significant adjustments made in the financial statements arising out of audit findings
e. Compliance with listing and other legal requirements relating to financial statements
f. Disclosure of any related party transactions
g. Qualifications in the draft audit report
5. Reviewing, with management, the quarterly financial statements before submission to the Board for approval.
6. Reviewing, with management, the performance of statutory and internal auditors and the adequacy of the internal control systems.
7. Reviewing the adequacy of the internal audit function including the structure of the internal audit department, staffing and seniority of the official heading the department, reporting structure coverage and frequency of internal audit.
8. Discussion with internal auditors regarding any significant findings and any follow‑up required.
9. Reviewing the findings of any internal investigations by the internal auditors into matters where there is suspected fraud or irregularity or a failure of internal control systems of a material nature and reporting the matter to the Board.
10. Discussion with statutory auditors, before the audit commences, about the nature and scope of the audit as well as post‑audit discussion to determine any area of concern.
11. To determine the reasons for any substantial defaults in the payment to depositors, debenture holders, shareholders (in case of non payment of declared dividends) and creditors.
12. To review the functioning of the Whistle Blower function.
13. Carrying out any other function as is mentioned in the terms of reference of the Audit Committee.
3.3 Composition of the committee
The composition of Audit Committee as on March 31, 2010 was as follows:
Mr. Y M Kale Chairman, Non‑Executive, Independent Director Mr. William T Comfort, Jr. Member, Non‑Executive, Independent DirectorMs. Tarjani Vakil Member, Non‑Executive, Independent Director
3.4 Meetings and attendance
During the Financial Year 2009 – 2010, six meetings of the Committee were held on April 22, 2009, May 15, 2009, July 28, 2009, August 25, 2009, October 29, 2009, and January 28, 2010.
The member’s attendance at the Committee Meetings was as given below:
Name Number of meetings attended
In person On phoneMr. Y M Kale 6 –Mr. William T Comfort, Jr. 4 2Ms. Tarjani Vakil 6 –
The auditors of the Company were invited for the meetings.
Annual Report 2009_2010_Colour.indd 22 7/24/2010 1:45:51 PM

23
3.5 Audit committee’s recommendations
The Committee reviewed the financial results of the Company prepared in accordance with Indian GAAP (including consolidated results) as at and for the quarters ended June 30, 2009, September 30, 2009 and December 31, 2009 as also for the year ended March 31, 2010 and recommended the same to the Board for adoption.
The Committee recommended to the Board the re‑appointment of M/s. S. R. Batliboi & Associates, Chartered Accountants, as Statutory Auditors of the Company for the financial year 2010 – 2011.
The Committee also recommended the re‑appointment of M/s. Axis Risk Consulting Pvt. Ltd. as the internal auditors of the Company to conduct the internal audit for the financial year 2010 – 2011.
The Committee reviewed Internal Auditors’ reports and related reports on actions taken, risk management policies, compliance with the clause 49 of the Listing Agreement, etc. from time to time.
4. Compensation committee
4.1 Brief description of terms of reference
The scope of Compensation Committee is to determine the compensation of the Directors and any profit linked bonus policies of the Company. The Compensation Committee also approves, allocates and administers the Employee Stock Option Plan 2002, reviews performance appraisal criteria and sets norms for ESOP allocation.
4.2 The Composition of the Committee
The Composition of Compensation Committee as on March 31, 2010 was as follows:
Mr. William T Comfort, Jr. Chairman, Non‑Executive, Independent DirectorMr. Y M Kale Member, Non‑Executive, Independent DirectorMr. Charles Phillips Member, Non‑Executive, Non‑Independent Director
4.3 Meeting and attendance
During the year, one meeting of the Committee was held on August 25, 2009 and all the members of the Committee were present for the meeting.
4.4 Compensation policy
The Compensation Committee determines and recommends to the Board the compensation payable to the Directors. The limit for the commission to be paid to the Board members and the remuneration payable to the Managing Director of the Company are approved by the members of the Company. The annual compensation of the non‑executive directors is approved by the Compensation Committee, within the parameters set by the members at the members’ meetings.
The criteria for payment of commission to the non‑executive directors include a base commission plus incremental commission depending on the number and type of committees where they are Members or Chairpersons.
The Committee also has the mandate to review and recommend compensation payable to the Senior Executives of the Company. It also sets norms for ESOP allocation.
4.5 Details of remuneration paid to the Directors during the financial year 2009‑2010 are as follows:
Name of Director ESOPs granted under ESOP
Plan during the year
Commission paid
(Rs. ‘000)
Salary(Rs. ‘000)
Contribution to PF (Rs. ‘000)
Total Amount paid
(Rs. ‘000)
Mr. William T Comfort Jr. – – – – –Ms. Dorian Daley1 – – – – –Mr. Rajesh Hukku – – – – –Mr. Y M Kale – 1,200 – – 1,200Mr. Charles Phillips – – – – –Mr. N R K Raman – – 21,422 477 21,899Mr. R Ravisankar – – – – –Ms. Tarjani Vakil – 900 – – 900Mr. Derek H Williams – – – – –Total – 2,100 21,422 477 23,999
1 Ms. Dorian Daley was appointed as a Director on August 25, 2009.
The Company accrues for gratuity benefit, compensated absences and bonus for all employees as a whole. It is not possible to ascertain the provision for individual director and hence the same has not been disclosed above. The Company discloses such benefits on cash basis.
Annual Report 2009_2010_Colour.indd 23 7/23/2010 9:04:10 PM

Oracle Financial Services Software – Annual Report 2009‑10
During the financial year 2009‑2010, Mr. N R K Raman, the Managing Director of the Company was paid remuneration within the limits envisaged in the Companies Act, 1956. Non‑executive, Independent Directors of the Company were paid remuneration by way of commission as approved by the Board of Directors/shareholders of the Company subject however to the condition that the commission shall not exceed 1% of the net profits of the Company for all the Non‑executive Directors in aggregate in one financial year.
There were no sitting fees and/or perquisites paid to the Directors during the financial year 2009‑2010 except as stated above.
The terms of Employee Stock Options granted to the Directors are given below:
Name of Director Scheme Options outstanding
as at March 31, 2010
Options exercised
during the year
Grant price (Rs.)
Expiry Date Equity shares held as at
March 31, 2010
Mr. William T Comfort Jr. N.A. – – N.A. N.A. –Ms. Dorian Daley1 N.A. – – N.A. N.A. –Mr. Rajesh Hukku ESOP 2002 – – 265.00 N.A. 676,524Mr. Y M Kale ESOP 2002 – – 418.92 N.A. –Mr. Charles Phillips N.A. – – N.A. N.A. –Mr. N R K Raman ESOP 2002 – – 265.00 N.A. 80,000Mr. R Ravisankar ESOP 2002 – – 265.00 N.A. 274,272Ms. Tarjani Vakil ESOP 2002 – 2,000 559.60 N.A. 9,400Mr. Derek H Williams N.A. – – N.A. N.A. –
1 Ms. Dorian Daley was appointed as a Director on August 25, 2009.
The above options were issued at Fair Market Value on the respective dates of grant. The options vest over a period of 5 years from the date of grant and are subject to continued employment/directorship with the Company.
5. Shareholders’ grievances committee
5.1 Composition of the Committee
The composition of Shareholders’ Grievances Committee as on March 31, 2010 was as follows:
Ms. Tarjani Vakil Chairperson, Non‑Executive, Independent DirectorMr. Makarand Padalkar Chief Financial Officer
5.2 Scope of shareholders’ grievances committee’s activities
The scope of the Shareholders’ Grievances Committee is to review and address the grievances of the members in respect of share transfers, transmission, dematerialization and rematerialization of shares and other share related activities.
During the year, three meetings of the Committee were held on May 13, 2009, October 29, 2009 and January 20, 2010.
The member’s attendance at the Committee Meetings was as given below:
Name Number of meetings attended
In personMs. Tarjani Vakil 3Mr. Makarand Padalkar 3
6. Company Secretary and Compliance Officer
Company Secretary and Compliance Officer Mr. Hoshi D BhagwagarAddress Oracle Financial Services Software Limited
399, Subhash RoadVile Parle (East)Mumbai 400057
Tel + 91‑22‑6718 5000Fax + 91‑22‑2831 5593e‑mail [email protected]
Annual Report 2009_2010_Colour.indd 24 7/23/2010 9:04:10 PM

25
7. Details of shareholders’ complaints received, resolved during the financial year 2009 – 2010
Sr. No. Nature of Complaints Opening Balance Received Cleared Pending
1 Non receipt of warrant – 2 2 –2 Non receipt of certificate – – – –3 Non receipt of demat credit/
rejections – 2 2 –
4 SEBI/Stock Exchange/Ministry of Corporate Affairs – – – –
5 Legal – – – –6 Others – 4 4 – Total – 8 8 –
Number of pending share transfers as on March 31, 2010 – Nil
8. Transfer Committee
The composition of the Transfer Committee as on March 31, 2010 was as follows:
Ms. Tarjani Vakil Chairperson, Non‑Executive, Independent DirectorMr. Makarand Padalkar Chief Financial Officer
During the year, six meetings of the Committee were held on May 13, 2009, July 30, 2009, October 29, 2009, December 3, 2009, January 20, 2010 and February 19, 2010.
The member’s attendance at the Committee Meetings was as given below:
Name Number of meetings attended
In personMs. Tarjani Vakil 6Mr. Makarand Padalkar 6
9. ESOP Allotment Committee
The composition of the ESOP Allotment Committee as on March 31, 2010 was as follows:
Ms. Tarjani Vakil Chairperson, Non‑Executive, Independent DirectorMr. Makarand Padalkar Chief Financial Officer
During the year, three meetings of the Committee were held on December 3, 2009, January 20, 2010 and February 26, 2010.
The member’s attendance at the Committee Meetings was as given below:
Name Number of meetings attended
In personMs. Tarjani Vakil 3Mr. Makarand Padalkar 3
10. General body meetings
10.1 Location, date and time where last three Annual General Meetings were held:
Financial Year Venue Date Time
2008 – 2009 The Leela Kempinski,Sahar, Andheri (East), Mumbai 400059 August 25, 2009 3.00 p.m.
2007 – 2008 The Leela Kempinski,Sahar, Andheri (East), Mumbai 400059 August 22, 2008 3.00 p.m.
2006 – 2007 InterContinental The Grand MumbaiSahar Airport Road, Andheri (East), Mumbai 400059 August 24, 2007 3.00 p.m.
Annual Report 2009_2010_Colour.indd 25 7/23/2010 9:04:10 PM

Oracle Financial Services Software – Annual Report 2009‑10
10.2 The details of Special Resolutions passed in AGMs during the last three years are given below:
Financial Year
Day, Date & Time Venue Gist of Special Resolution Passed
2008 – 09 Tuesday,August 25, 2009At 3.00 p.m.
The Leela Kempinski, Sahar, Andheri (East), Mumbai 400059
No special resolution was passed.
2007 – 08 Friday, August 22, 2008At 3.00 p.m.
The Leela Kempinski, Sahar, Andheri (East), Mumbai 400059
No special resolution was passed.
2006 – 07 Friday,August 24, 2007At 3.00 p.m.
InterContinental The Grand Mumbai, Sahar Airport Road, Andheri (East), Mumbai 400059
1. Payment of commission to the Directors of the Company (excluding the Managing Director and Whole‑time Directors), not exceeding in the aggregate one percent per annum of the net profits of the Company which shall be calculated in accordance with the provisions of Sections 198, 349 and 350 of the Companies Act, 1956.
2. Amendment to the ‘2002 Employees Stock Option Plan’ of the Company providing that the eligible employees should bear or reimburse to the Company fringe benefit tax including related surcharge, cess, duty or any other levy, to the extent to which the Company is liable to pay the fringe benefit tax in relation to the value of fringe benefits provided to the eligible employee.
10.3 The details of Special Resolution passed in the EGM in the last three years are given below:
Financial Year Day, Date & Time Venue Gist of Special Resolution Passed
2008 – 09 Monday,August 11, 2008At 3.00 p.m.
InterContinental The Grand Mumbai, Sahar Airport Road, Andheri (East), Mumbai 400059
1. The Name of the Company be Changed from ‘i‑flex solutions Limited’ to ‘Oracle Financial Services Software Limited’ and that the Name ‘i‑flex solutions Limited’ wherever it appears in the Memorandum and Articles of Association of the Company and other records be substituted by the new Name ‘Oracle Financial Services Software Limited’.
There were no EGMs held in the Financial Year 2006 – 07 and 2007 – 08.
10.4 There were no matters requiring approval of the members through Postal Ballot in previous year.
10.5 No special resolution is proposed to be conducted through postal ballot.
10.6 Procedure for the Postal ballot Process:
After receiving the approval of the Board of Directors, notice of the Postal Ballot, text of the Resolution and Explanatory statement, Postal Ballot Form and self‑addressed postage pre‑paid envelopes are sent to the members to enable them to consider and vote for or against the proposal within a period of 30 days from the date of dispatch. The calendar of events containing the activity chart is filled with the Registrar of Companies within 7 days of the passing of the Resolution by the Board of Directors of the Company. After the last date for receipt of the ballots, the Scrutinizer after due verification, submits the results to the Chairman of the Board of Directors of the Company. Thereafter, the Chairman declares the result of the Postal ballot. The same is published in the Newspapers and displayed on the website and the Notice Board at the registered office of the Company.
11. Disclosures
a. All the relevant information in respect of materially significant related party transactions, i.e., transactions of the Company of material nature with its promoters, directors or management or their relatives, subsidiaries of the Company, etc. has been disclosed in the respective financial statements presented in the Annual Report. The Company did not undertake any transaction with any related party having potential conflict with the interest of the Company at large.
b. The Company has complied with statutory compliances and no penalty or stricture is imposed on the Company by the Stock Exchanges or Securities and Exchange Board of India (SEBI) or any other statutory authority on any matter related to the capital markets during the last three years.
c. With regard to the Initial Public Offer (“IPO”) made by the Company in 2002, the office of the Registrar of Companies, Maharashtra at Mumbai (‘the ROC’) had vide its letters dated July 8, 2009 and July 13, 2009 sought information with regard to the utilization of IPO proceeds. The ROC also issued a show cause notice dated July 7, 2009 to the Company and its Directors and Officer alleging that the Company had utilized the IPO amount for giving loans to the subsidiary companies which was ultra virus against the object of the Prospectus and therefore violated the provisions of Section 62 of the Companies Act, 1956. The
Annual Report 2009_2010_Colour.indd 26 7/23/2010 9:04:11 PM

27
Company provided the required information to the ROC vide its letter dated August 17, 2009. The Company also responded to the show cause notice vide letter dated August 17, 2009, stating that it had not used the IPO funds for purposes other than those stated in the Prospectus and had thus not violated the provisions of Section 62 of the Act. The Company has not received any further communication in this regard since then.
d. The Company has a Whistle Blower Policy which provides an avenue for employees to raise concerns about any violations of the Code of Conduct, incorrect or misrepresentation of any financial statements and reports, unethical behavior, etc. The policy provides adequate safeguards to employees reporting such violations to the Company. No employee has been denied access to the Audit Committee.
e. The Company is fully compliant with the applicable mandatory requirements of Clause 49 of the listing agreement with the Stock Exchanges. The Clause further states that the non‑mandatory requirements may be implemented at the discretion of the Company. Thus, of the non‑mandatory requirements, the Company has complied with the requirement of Compensation Committee and also has a Whistle Blower Policy in place.
f. During the year, the Ministry of Corporate Affairs, Government of India, issued the Corporate Governance Voluntary Guidelines 2009 (“the Guidelines”). The objective of these Guidelines is to encourage companies to voluntarily adopt best practices in corporate governance. The Guidelines focuses on matters relating to functions of the Board, Audit Committee, Auditors role and Secretarial Compliance. The corporate governance framework of the Company already encompasses a significant portion of the recommendations contained in the Guidelines.
12. Means of communication
During the Financial Year 2009‑2010:
– The quarterly, half yearly and annual results of the Company were published in the widely circulated English and Marathi newspapers, such as The Economic Times and The Sakal.
– Company’s quarterly financial results and press releases are posted on the Company’s website www.oracle.com/financialservices
– Detailed Management Discussion and Analysis Reports covering Indian GAAP un‑consolidated and consolidated financials have been included in this Annual Report.
– The Company has also posted information relating to its financial results and Distribution of shareholding on a quarterly basis on Electronic Data Information Filing and Retrieval System (EDIFAR) http://sebiedifar.nic.in. However, following a circular no. CIR/CFD/DCR/3/2010 dated April 16, 2010 issued by the SEBI, this practice has been discontinued with effect from April 1, 2010.
– Since January 2008, pursuant to new provisions contained in the listing agreement executed by the Company with BSE and NSE, the Company has uploaded the information relating to its financial results, shareholding pattern and report on corporate governance on website – http://corpfiling.co.in.
– The details of directors are also updated on Directors Database, a Corporate Governance initiative of the Bombay Stock Exchange Limited.
13. General shareholder information
Annual General Meeting Day and Date Wednesday, August 25, 2010Time 3.00 p.m.Venue The Leela Kempinski, Sahar,
Andheri (East), Mumbai 400059
Financial Year April 1, 2009 to March 31, 2010
Date of Book Closure Saturday, August 21, 2010 to Wednesday, August 25, 2010 (both days inclusive)
Listing on Stock Exchanges at Bombay Stock Exchange Limited (BSE); andNational Stock Exchange of India Limited (NSE)
Stock CodeBombay Stock Exchange Limited (BSE) 532466National Stock Exchange of India Limited (NSE) OFSS
Listing
The annual listing fees for the year 2010 – 2011 have been paid to BSE and NSE.
The Company has paid Custodial fees for the year 2010 – 2011 to National Securities Depository Limited and Central Depository Services (India) Limited on the basis of number of beneficial accounts maintained by them as on March 31, 2010.
Annual Report 2009_2010_Colour.indd 27 7/23/2010 9:04:11 PM

Oracle Financial Services Software – Annual Report 2009‑10
14. Market price data
Monthly high, low and volume of the shares of the Company traded on stock exchange from April 1, 2009 to March 31, 2010 are given below:
Month and Year High (Rs.) Low (Rs.) Volume of Shares
High (Rs.) Low (Rs.) Volume of Shares
BSE NSE April 2009 950.00 742.00 1,082,562 950.00 731.00 2,415,676 May 2009 1,220.00 812.00 706,474 1,199.00 835.00 1,811,331 June 2009 1,365.00 1,153.15 402,314 1,375.00 1,152.25 1,452,380 July 2009 1,580.00 1,100.05 349,747 1,558.00 1,102.00 1,022,394 August 2009 1,826.00 1,460.00 489,061 1,823.60 1,460.00 1,566,029 September 2009 1,875.00 1,715.00 369,550 1,875.00 1,717.00 1,483,607 October 2009 2,250.00 1,772.00 947,471 2,250.00 1,772.30 3,294,783 November 2009 2,300.00 1,911.00 601,665 2,300.00 1,912.00 2,237,234 December 2009 2,364.70 2,043.00 550,259 2,357.30 2,042.05 2,497,438 January 2010 2,524.95 2,045.00 788,929 2,550.00 2,048.80 3,047,070 February 2010 2,301.00 2,099.00 382,303 2,299.00 2,075.00 1,798,517 March 2010 2,363.00 2,221.55 345,460 2,364.00 2,205.05 1,415,589
Relative movement chart
The chart below shows the comparison of your Company’s share price movement on NSE vis‑à‑vis the movement of the S&P CNX NIFTY for the year 2009 – 2010.
500
1,000
1,500
2,000
2,500
3,000
0
1,000
2,000
3,000
4,000
5,000
6,000
7,000
March 2010February 2010December 2009October 2009August 2009June 2009April 2009
OFSS PriceS&P CNX NIFTY
OFS
S P
rice
S&
P C
NX
NIF
TY
Annual Report 2009_2010_Colour.indd 28 7/23/2010 9:04:11 PM

29
The chart below gives the relative movement of the closing prices of the Company’s share and S&P CNX NIFTY relative to the closing prices since listing of our shares on NSE.
0
100
200
300
400
500
600
700
800
900
1,000
1,100
1,200
June 2010June 2009June 2008June 2007June 2006June 2005June 2004June 2003June 2002
OFSS S&P CNX NIFTY
15. Registrars and Transfer Agents
Link Market Services Limited, an Australia‑based global registry and financial services company, has acquired 51% stake as a strategic investment in Link Intime India Private Limited, the Registrars and Transfer Agents of the Company (“the Registrars”). Consequently, the name of the Registrars has been changed from ‘Intime Spectrum Registry Limited’ to ‘Link Intime India Private Limited’. The management and executive team as well as location and address of the Registrars remain unchanged.
Name Link Intime India Private LimitedAddress C‑13, Pannalal Silk Mills Compound, L. B. S. Marg, Bhandup (West), Mumbai 400078Tel +91‑22‑2594 6970Fax +91‑22‑2594 6969e‑mail [email protected] 203, Davar House, 197/199 D. N. Road, Fort, Mumbai 400001Tel +91‑22‑2269 4127
16. Physical share certificate transfer system
The Registrars and Transfer Agents (“the Registrar”), on receipt of transfer deed with respective share certificate(s), scrutinizes the same and verifies signature(s) of transferor(s) on the transfer deed with specimen signature(s) registered with the Company. A list of such transfers is prepared and checked thoroughly and a transfer register is prepared. The transfer register is placed before the Transfer Committee Meeting for approval, which meets at regular intervals.
During the last financial year Nil equity shares were transferred in physical mode.
Secretarial Audit
A qualified practicing Chartered Accountant has carried out secretarial audit every quarter to reconcile the total admitted capital with National Securities Depository Limited (NSDL) and Central Depository Services (India) Limited (CDSL) and the total issued and listed capital. The audit confirms that the total issued/paid up capital is in agreement with the aggregate total number of shares in physical form and the total number of dematerialized shares held with NSDL and CDSL.
Annual Report 2009_2010_Colour.indd 29 7/24/2010 10:59:04 AM

Oracle Financial Services Software – Annual Report 2009-10
17. Distribution of Shareholding as on March 31, 2010
Shares of nominal value of (Rs.) Number of Shareholders
% Share amount (Rs.) % to Equity
UPTO 2,500 18,793 91.23 3,995,100 0.952,501 – 5,000 424 2.06 1,637,235 0.395,001 – 10,000 400 1.94 2,996,770 0.7110,001 – 20,000 341 1.66 5,134,450 1.2220,001 – 30,000 149 0.72 3,727,135 0.8930,001 – 40,000 100 0.49 3,501,520 0.8440,001 – 50,000 55 0.27 2,537,890 0.6150,001 – 100,000 176 0.85 12,222,800 2.92100,001 & ABOVE 160 0.78 383,521,385 91.47Total 20,598 100.00 419,274,285 100.00
18. Shareholding per Category as on March 31, 2010
Category of shareholders Number of shares %
Promoters: Oracle Global (Mauritius) Limited 67,481,698 80.47Mutual Funds/UTI 3,488,154 4.16Financial Institutions/Banks 27,044 0.03Insurance Companies 10,335 0.01Foreign Institutional Investors 1,300,437 1.55Bodies Corporate 641,085 0.76Individuals‑ i. Holding nominal share capital upto Rs. 1 lakh 5,317,196 6.34ii. Holding nominal share capital in excess of Rs. 1 lakh 2,397,565 2.86Clearing Member 29,831 0.04Market Maker 2,057 0.00Foreign Nationals 22,000 0.03NRI (Repatriate) 349,428 0.42NRI (Non‑Repatriate) 1,506,859 1.80Overseas Corporate Bodies 800 0.00Directors 1,040,196 1.24Trust 219,826 0.27HUF 20,346 0.02Total 83,854,857 100.00
During the financial year 2009‑2010:
1. The Company issued and allotted 85,471 equity shares to its employees/directors who exercised their ESOPs during the year.
2. The Company has not issued any ADR/GDR.
3. The promoters have not pledged any of the shares held in the Company.
19. Dematerialization of shares and liquidity
The shares of the Company are under compulsory demat mode. Under the Depository System, the International Securities Identification Number (ISIN) allotted to the Company’s shares is INE881D01027.
As on March 31, 2010, 98.51% of the shares of the Company were in electronic form.
20. Address for correspondence
Registered Office
Oracle Financial Services Software LimitedOracle ParkOff Western Express HighwayGoregaon (East)Mumbai 400063MaharashtraIndiaTel +91‑22‑6718 3000 Fax +91‑22‑6718 3001e‑mail: investors‑vp‑[email protected]
The details of other office addresses in India have been mentioned in the Corporate information section of the annual report.
Annual Report 2009_2010_Colour.indd 30 7/24/2010 10:59:04 AM

31
Annexure to Directors’ report
To The Board of Directors Oracle Financial Services Software Limited Mumbai
This is to certify that:
(a) We have reviewed financial statements and the cash flow statement of Oracle Financial Services Software Limited (“the Company”) for the financial year ended March 31, 2010 and that to the best of our knowledge and belief:
(i) These statements do not contain any materially untrue statement/figures or omit any material fact or contain statements/figures that might be misleading;
(ii) These statements together present a true and fair view of the Company’s affairs and are in compliance with existing accounting standards, applicable laws and regulations.
(b) There are, to the best of our knowledge and belief, no transactions entered into by the Company during the financial year ended March 31, 2010 which are fraudulent, illegal or violative of the Company’s code of conduct.
(c) We accept responsibility for establishing and maintaining internal controls for financial reporting and that we have evaluated the effectiveness of the internal control systems of the Company pertaining to financial reporting and we have disclosed to the auditors and the Audit Committee, deficiencies in the design or operation of such internal controls, if any, of which we are aware and the steps we have taken or propose to take to rectify these deficiencies.
(d) We have indicated to the auditors and the Audit Committee:
(i) Significant changes in internal control over financial reporting during the financial year ended March 31, 2010, if any;
(ii) Significant changes in accounting policies during the financial year ended March 31, 2010, if any; and that the same have been disclosed in the notes to the financial statements; and
(iii) instances of significant fraud of which we have become aware and the involvement therein, if any, of the management or an employee having a significant role in the Company’s internal control system over financial reporting.
(e) We further declare that all Board members and Senior Management Personnel have affirmed compliance with Codes of Conduct for the financial year ended March 31, 2010.
For Oracle Financial Services Software Limited
N R K Raman Makarand Padalkar Managing Director and CEO Chief Financial Officer
May 7, 2010
Annual Report 2009_2010_Colour.indd 31 7/23/2010 9:04:12 PM

ToThe Members of Oracle Financial Services Software Limited
We have examined the compliance of conditions of corporate governance by Oracle Financial Services Software Limited (the ‘Company’), for the year ended on March 31, 2010, as stipulated in clause 49 of the Listing Agreement of the said Company with stock exchange.
The compliance of conditions of corporate governance is the responsibility of the management. Our examination was limited to procedures and implementation thereof, adopted by the Company for ensuring the compliance of the conditions of the Corporate Governance. It is neither an audit nor an expression of opinion on the financial statements of the Company.
In our opinion and to the best of our information and according to the explanations given to us, we certify that the Company has complied with the conditions of Corporate Governance as stipulated in the above mentioned Listing Agreement.
We further state that such compliance is neither an assurance as to the future viability of the Company nor the efficiency or effectiveness with which the management has conducted the affairs of the Company.
For S. R. Batliboi & Associates Firm registration number:101049W Chartered Accountants
per Amit Majmudar Partner Membership No.: 36656
Mumbai, India July 22, 2010
Auditors’ certificate
Annual Report 2009_2010_Colour.indd 32 7/23/2010 9:04:12 PM

Financials
Financial statements for the year ended March 31, 2010 prepared in accordance with Indian Generally Accepted Accounting Principles (Indian GAAP) (Unconsolidated).
Annual Report 2009_2010_Colour.indd 33 7/23/2010 9:04:22 PM

“Jibun Bank and Oracle Financial Services Software demonstrated a remarkable degree of collaboration to implement the core banking project where both teams had to truly think out of the box to produce an innovative, highly customized solution that was nonetheless rolled out fairly rapidly. With the implementation of this technology, Jibun Bank managed to acquire 500,000 accounts in just eight months.”
Ms. Elena Torrijos, Managing Editor and Project leader, The Asian Banker. Jibun Bank and Oracle Financial Services Software bagged The Asian Banker IT Implementation Awards for “Best Core Banking Project.”
“We see technology as a key enabler in the modernization of our financial system and are taking steps to deploy a core banking system that provides a platform for effectively and efficiently managing growth. In Oracle FLEXCUBE, we have found a solution with the comprehensive functionality we require as a central bank. The overall solution offered an integrated technology set that we expect will enable a straightforward implementation and a platform that we can build on for future initiatives. We are also pleased to be able to use local partners, Interflex and Neeka, in combination with our strategic relationship with Oracle Financial Services Software.”
Mr. Thai Saphear, Head of the Governor’s Office, National Bank of Cambodia
* All quotes are from the press releases issued during the 2009 – 2010 fiscal
Annual Report 2009_2010_Colour.indd 34 7/23/2010 9:04:23 PM

35
The following discussion is based on our audited standalone financial statements, which have been prepared in conformity with accounting principles generally accepted in India and complying in all material respects with the notified Accounting Standards by Companies (Accounting Standards) Rules, 2006 and the relevant provisions of the Companies Act, 1956.
You should read the following discussion of our financial condition and results of operations together with the detailed standalone Indian GAAP financial statements and the notes to those statements. Our fiscal year ends on March 31 of each year.
Information technology in the financial services industry
Financial institutions today face a significantly altered competitive landscape. New business models have emerged together with other opportunities and threats including deregulation. Competitors from within and outside the industry have effectively differentiated themselves and the preferences and power of buyers have changed.
The focus of financial institutions is on the transformation of their business models. They seek to identify revenue enhancing opportunities at the same time as they attempt cost‑optimization by strengthening their ability to offer targeted services and improved service levels to their customers. To stay competitive, financial institutions need to offer a variety of integrated and global products in different markets. They also need to ensure that their activities are in sync with market dynamics and changing regulatory mandates. With the emergence of new customer segments banks have chosen “next generation” models and offer new and innovative products and services.
The recent turmoil in global financial markets has important lessons for the risk management of financial institutions. A key lesson is that even if financial institutions are well capitalized their viability could be threatened by a liquidity crunch. The management of liquidity risk is seen as vital for the sound management of financial institutions and the stability of the financial system. Over the last two years central banks and regulatory bodies have actively reviewed the framework for financial regulation and supervision, including that regulating the provision of liquidity.
The increasing operational complexity of financial institutions has been accompanied by innovation in the measurement and monitoring of their risk exposure. One such innovation is Stress Testing. It can be defined as the examination of the impact of exceptional though plausible events on a firm or financial system’s well being. Financial institutions are using stress and scenario testing to identify, analyze and manage the risks inherent in their businesses and it is becoming an important part of their planning and risk management process.
Financial institutions have to cope with a stringent regulatory environment as also with the increasing sophistication of fraudulent activity. Fraudsters have mastered the use of techniques to circumvent processes designed to detect and address fraud. Financial institutions are therefore turning towards technology to tackle fraud and meet dynamic compliance mandates.
Banks also require services that address their need for renewal in areas such as consumer regulation, security and process consistency.
Overview
Oracle Financial Services Software Limited, majority owned by Oracle, is a world leader in providing IT solutions to the financial services industry. With its experience of delivering value‑based IT solutions to global financial institutions, Oracle Financial Services Software understands the specific challenges that financial institutions face such as the need for building customer intimacy and competitive advantage through cost‑effective solutions while, simultaneously, adhering to the stringent demands of a dynamic regulatory environment.
Our mission is to enable financial institutions to excel through the effective use of information technology. We offer financial services institutions the world’s most comprehensive and contemporary banking applications and technology footprint that addresses their complex IT and business requirements.
We are organized by region and business segment. We have two major business segments ‑ the products business (comprising product licensing, customization, implementation and, support) and consulting services (comprising IT application and technology services).
These segments are described in detail below:
Products
Unmatched banking solutions footprint
Together with Oracle, Oracle Financial Services Software offers the world’s most comprehensive and contemporary banking applications and technology footprint. This footprint spans the distribution, manufacturing, risk and finance and corporate administration functions of a financial institution. Each solution in the financial services application footprint is best‑of‑breed, open and integrated.
Management’s discussion and analysis of financial condition and results of operations
Annual Report 2009_2010_Colour.indd 35 7/23/2010 9:04:23 PM

Oracle Financial Services Software – Annual Report 2009‑10
Oracle FLEXCUBE
Oracle FLEXCUBE is a complete banking product suite for consumer, corporate, investment, mobile and internet banking, consumer lending, asset management and investor servicing, including payments. Oracle FLEXCUBE enables banks to standardize operations across multiple countries, transform their local operations as well as address niche business models like direct banking, Islamic banking and mobile banking. Financial institutions use Oracle FLEXCUBE to respond faster to market dynamics, define and track processes and ensure compliance. The suite is also equipped with SWIFT 2007 enhancements and supports SEPA payment processing.
Oracle FLEXCUBE can help financial institutions address the fast growing market for cross‑border remittances and initiate, process, and disburse remittances.
Oracle FLEXCUBE release 11.0 brings together Oracle’s vast experience in supporting banks across the globe. Banks can take advantage of the solution’s entire range of functionality. They can also earn a higher return on investment through multi‑product origination, support for broker‑aided distribution, end‑to‑end lending and mortgage lifecycle management. Supported by an exhaustive set of Web services, SOA‑enabled Oracle FLEXCUBE enables accelerated deployment and easy integration with a bank’s existing application landscape. Release 11 offers complete lifecycle support for consumer, commercial, syndicated, Islamic banking and mortgage processing ‑‑ including origination, servicing, and collections.
Oracle FLEXCUBE Enterprise Limits and Collateral Management offers a single source for managing exposure across a business portfolio. It enables centralized collateral management, limits definition, tracking and exposure measurement for effective exposure management and resource utilization.
Oracle FLEXCUBE Private Banking is a comprehensive solution for private banking. It gives wealth managers a unified view and analyses of their customers’ wealth across asset classes. It provides the added benefit of performance tracking and improved customer relationship management. The application is a comprehensive, customer‑centric solution. It offers a wealth management portal, a customer interaction tool, and portfolio management capabilities – all of which can be integrated with the existing core banking solutions used by a bank.
Oracle FLEXCUBE Investor Servicing is a process enabled transfer agency and investor servicing solution. It helps financial institutions manage the complete fund lifecycle and reduce operational costs through process automation across fund structures, intermediary hierarchies, and investors. The ISO 20022 and 15022 compliant Oracle FLEXCUBE Investor Servicing ensures enhanced STP processing through support for a wide variety of SWIFT NET 4.0 messages. With a comprehensive business rules engine for products – hedge funds, mutual funds and unit‑linked insurance products, funds, and fee structures, Oracle FLEXCUBE Investor Servicing allows fund management companies to configure and launch new products rapidly.
Oracle Analytics for Financial Services is a complete and fully integrated portfolio of analytical solutions. Financial institutions need an integrated approach that enables them to address present and future requirements, including regulatory requirements, which encompass enterprise risk, performance management, regulatory compliance and customer insight.
Oracle Analytics for Financial Services fulfills this need. It combines a diverse set of compliance and risk solutions and is built upon a shared analytical infrastructure that consists of a unified financial services data model, shared analytical computations and the industry‑leading Oracle Business Intelligence platform. Unlike other hard‑coded solutions, it provides both prebuilt rules and the capability to create and modify rules. This flexibility allows financial institutions to easily create custom rules for their own analytical requirements and to cost‑effectively address ever‑changing compliance regulations. Any rule can be viewed and audited for its underlying definition to enable supervisory oversight.
Support services
Oracle Financial Services Support offers support services for Oracle FLEXCUBE, Oracle Reveleus and Oracle Mantas. These services help our customers accelerate adoption, reduce the time, effort, and cost of operating applications thereby allowing them to achieve a higher return on their investments. These services also enable our customers to manage their applications more effectively and take advantage of the latest technological enhancements.
Oracle Financial Services Consulting
Oracle Financial Services Consulting offers Consulting Services, Application Services and Technology Services to financial institutions.
Consulting Services
We offer an end‑to‑end consulting partnership. It provides comprehensive business and technology solutions that enable financial services enterprises to improve process efficiency, optimize costs, meet risk and compliance requirements, define IT architecture and manage the transformation process. We offer consulting services in the areas of business transformation, risk and compliance, program management, IT architecture, IT governance and process improvement.
PrimeSourcing Application Services
We provide comprehensive customized IT solutions for banking, securities and insurance that encompasses the complete lifecycle of an IT application asset‑‑from conceptualization to creation and maintenance. These high‑quality IT solutions reflect the division’s
Annual Report 2009_2010_Colour.indd 36 7/23/2010 9:04:23 PM

37
domain expertise in financial services. This includes the knowledge gleaned while developing solutions for specialized practice lines like payments, business intelligence, CRM, Oracle Technology and Applications and testing.
Customers can take advantage of the division’s in‑depth expertise across a range of technologies such as Java, Microsoft, Mainframe and Open Source. Its IT processes are certified as CMMI V1.1 Level 5 and it has well‑established CoBIT‑compliant global infrastructure and development centers. This includes a comprehensive pool of proprietary methodologies, tools and best practices.
PrimeSourcing Technology Services
We offer expertise in conceptualization, design, evaluation, implementation and management of IT infrastructure for financial institutions under two service lines of Technology Management Services and Remote Infrastructure Management. These services are based on best practices such as ITIL (IT Infrastructure Library) and COBIT (Control Objectives for Information and related Technology) governance models (globally accepted standards for IT management and control) and are certified under ISO 27001 (Information Security Management System) and ISO 20000 (IT Services Management).
Corporate development
Oracle Global (Mauritius) Limited (‘‘Oracle’’) ownership interest in the Company is 80.47 % as on March 31, 2010.
On November 26, 2009, we formed a wholly owned subsidiary company in Chile by name Oracle Financial Services Software Chile Limitada.
On February 23, 2010, we formed a wholly owned subsidiary company in China by name Oracle Financial Services Software (Shanghai) Limited.
Business metrics
Our total revenues in fiscal 2010 were Rs. 22,434.7 million, representing an increase of 1% from Rs. 22,126.2 million in fiscal 2009. The net income in fiscal 2010 was Rs. 6,608.5 million, against Rs. 6,957.1 million in fiscal 2009. Our net income margin in fiscal 2010 is at 29% as against 31% in fiscal 2009. We define net income margins for a particular period as the ratio of net income to total revenues during the period. We had 9,083 employees as on March 31, 2010 as against 9,755 at the end of the previous year.
Products business
(All amounts in millions of Indian Rupees)
Year ended March 31, 2010
Year ended March 31, 2009
Product revenues 15,178.5 14,391.6 Cost of product revenues (6,159.7) (6,236.4)Sales and marketing expenses (359.1) (876.1)General and administrative expenses (839.0) (851.9)Depreciation and amortization (159.1) (194.9)Income from operations 7,661.6 6,232.3Operating margin* 50% 43%
* Operating margin is defined as income from operations from the products business (excluding corporate expenses) as a percentage of total products revenue.
Products revenues
Our products revenues represented 68% of the total revenues for fiscal year ended 2010 and 65% for year ended 2009. Our products revenues were Rs. 15,178.5 million during the fiscal year ended March 31, 2010; an increase of 5% from Rs. 14,391.6 million during the fiscal year ended March 31, 2009.
Our products revenues comprise license fees, professional fees for implementation & enhancement services and annual maintenance contract (Post Contract Support ‑ PCS) fees for our products.
License fee
Our products are offered as perpetual use licenses which are priced based on number of accounts, or application users or subscribers, or assets under management or processor based or a combination of these depending on the solutions deployed.
Implementation fee
Along with licensing for our products, customers can also optionally avail services related to the implementation of products at customer sites, integration with other customer systems and enhancement of products to address their specific requirements. The customer is typically charged a service fee either on a fixed‑price basis or a time and materials basis.
Annual Report 2009_2010_Colour.indd 37 7/23/2010 9:04:23 PM

Oracle Financial Services Software – Annual Report 2009‑10
Annual maintenance contract fees
Customers typically sign an Annual Maintenance Contract with us under which we provide technical support, maintenance, problem resolution and upgrades for licensed products. These support agreements typically cover a period of 12 months and generates another revenue stream for us.
The revenue generated from license fees and implementation and enhancement services rendered by us depends on factors such as the number of new customers added, milestones achieved, implementation time, etc. Therefore, such revenues typically vary from year to year. The annual maintenance contracts generate steady revenues and would grow to the extent that new customers enter into the support phase of their lifecycle with us.
The percentages of our revenues from these streams are as follows:
Year ended March 31, 2010
Year ended March 31, 2009
License fees 18% 23%Implementation and customization fees 59% 57%PCS arrangements 23% 20%Total 100% 100%
Cost of products revenues and operating expenses
The cost of product revenue consists of costs attributable to the implementation, enhancement, maintenance and continued development, including research and development effort, of our core product offerings ‑ the Oracle FLEXCUBE suite of products, Oracle Reveleus and other products. These costs primarily consist of compensation expenses for all the software professionals working in the products business, project‑related travel expenses, professional fees paid to software services vendors and the cost of application software for internal use.
Research and development costs are expensed as incurred. Software product development costs are expensed as incurred until technological feasibility is established. Software product development cost incurred subsequent to the achievement of technological feasibility is not material and is expensed as incurred.
Our operating expenses include selling and marketing expenses and general and administrative expenses. These consist of commissions payable to our partners, product advertising and marketing expenses. These also includes allocated overhead expenses associated with support and monitoring functions such as human resources, facilities and infrastructure expenses, quality assurance and financial control as well as depreciation and amortization.
Services business
(All amounts in millions of Indian Rupees)
Year ended March 31, 2010
Year ended March 31, 2009
Services revenues 7,256.2 7,734.6 Cost of services revenues (5,174.0) (5,691.2) Sales and marketing expenses (61.8) (164.2) General and administrative expenses (558.6) (680.4) Depreciation and amortization (175.5) (177.6) Income from operations 1,286.3 1,021.3 Operating margin* 18% 13%
* Operating margin is defined as income from operations from the Services Business (excluding corporate expenses) as a percentage of total services revenue.
Services revenues
Our services revenue represented 32% and 35% of our total revenues for the fiscal year ended March 31, 2010 and 2009 respectively. Our services revenues were Rs. 7,256.2 million in the fiscal year ended March 31, 2010, representing a decrease of 6% from Rs. 7,734.6 million in the fiscal year ended March 31, 2009.
The contracts relating to our services business are either time or material contracts or fixed price contracts. The percentage of total services revenues from time and material contracts was 64% in fiscal 2010 and 72% in fiscal 2009, with the remainder of our services revenues attributable to fixed price contracts.
We render services through offshore centers located in India, onsite teams operating at our customers’ premises and our development centers located in other parts of the world. Offshore services revenues consists of revenues from work conducted at our development centers in India and for Indian customers at their locations. Onsite revenues consist of work conducted at customer premises outside India and our development centers outside India. The composition of our onsite and offshore revenues is determined by the project lifecycle. Typically, the work involving the design of new systems or relating to a system roll‑out would be conducted onsite, while the core software development, maintenance and support activity may be conducted offshore. We received 62% and 59% of our services revenues from onsite work and 38% and 41% from offshore work during the fiscal years 2010 and 2009 respectively.
Annual Report 2009_2010_Colour.indd 38 7/23/2010 9:04:23 PM

39
Cost of services revenues and operating expenses
The cost of revenues for services consists primarily of compensation expenses for our software professionals, cost of application software for internal use, travel expenses and professional fees paid to software services vendors. We recognize these costs as incurred. Our operating expenses include selling, general and administrative expenses and allocated overhead expenses associated with support and monitoring functions such as human resources, corporate marketing, information management systems, quality assurance and financial control and depreciation.
Geographic breakup of revenues
Our overall revenues continue to be well diversified. The following table represents the percentage breakup of our revenues for products and services business by region:
Year ended March 31, 2010 Year ended March 31, 2009Products Revenues
Services Revenues
Total Revenues
Products Revenues
Services Revenues
Total Revenues
United States of America 14% 52% 27% 10% 49% 24%Europe 40% 18% 33% 45% 19% 36%Asia Pacific 22% 24% 22% 16% 25% 20%Middle East, India and Africa 21% 5% 16% 25% 7% 18%Latin America and Caribbean 3% 1% 2% 3% 0% 2%Total 100% 100% 100% 100% 100% 100%
Customer concentration
Our operations and business depend on our relationships with a number of large customers. Our revenues from our top ten customers for fiscal 2010 were 30% and 29% for fiscal year 2009, as a percentage of our total revenues. The top‑ten customers in our services business contributed 43% of the total services revenues and the top ten customers in the products business contributed 34% of the total products revenues during fiscal 2010.
The accompanying table provides the percentage of total revenues that we derived from our largest customer, top five customers and top ten customers during fiscal years 2010 and 2009. In the table, various affiliates of Citigroup are classified as separate customers and the last row sets forth the percentage of total revenues we earned from the various affiliates of Citigroup with respect to our products and services business individually and with respect to our business taken as a whole.
Products Revenues Services Revenues Total Revenues2010 2009 2010 2009 2010 2009
Largest customer 5% 6% 7% 10% 4% 5%Largest 5 customers 25% 18% 28% 29% 22% 18%Largest 10 customers 34% 27% 43% 45% 30% 29%Citigroup and its affiliates 12% 10% 36% 34% 20% 18%
Trade receivables
Trade receivables as of fiscal March 31, 2010 and 2009 were Rs. 8,772.35 million and Rs. 11,710.4 million respectively. Our days sales outstanding (which is the ratio of sundry debtors to total sales in a particular year multiplied by 365) for fiscal 2010 and 2009 were approximately 143 and 193 respectively. The Company periodically reviews its account receivables outstanding as well as the aging, quality of the account receivable, customer relationship and history of the client. The following table presents the age profile of our sundry debtors:
Year ended March 31, 2010
Year ended March 31, 2009
Period in days0 – 180 87% 76%More than 180 13% 24%Total 100% 100%
Foreign currency and treasury operations
A substantial portion of our revenues is generated in foreign currency while a majority of our expenses are incurred in Indian Rupees with the remaining expenses are incurred in US Dollars (USD) and European currencies.
Our philosophy for treasury operations is conservative and we invest funds predominantly in time deposits with well‑known and highly rated Indian and foreign banks. The Company has ensured adequate internal controls over asset management including cash management operations, credit management and debt collection.
The Company also maintains funds in USD accounts or INR deposits based on the comparative exchange rates, interest rates and currency requirements. The Company books forward cover from time to time in line with its treasury management philosophy.
Annual Report 2009_2010_Colour.indd 39 7/23/2010 9:04:24 PM

Oracle Financial Services Software – Annual Report 2009‑10
Income taxes
Currently, we partially benefit from the tax holidays the Government of India provides to software products and IT services exporters from specially designated software technology parks in India. As a result of these incentives, our operations have been subject to relatively lower tax liabilities in India. These tax incentives currently include a 10‑year tax holiday from Indian corporate income‑taxes for the operations of seven of our Indian facilities. As a result a substantial portion of our pre‑tax income has not been subject to tax in recent years.
The Finance Act, 2000, restricts the ten‑year tax holiday available from the fiscal year in which the undertaking begins to manufacture or produce, or until fiscal 2011 (as extended in Finance Act, 2009), whichever is earlier. For seven of our facilities, these benefits expire in stages through 2011. Income taxes also include foreign taxes representing income taxes payable overseas by us in various countries.
Employee Stock Purchase Scheme (‘ESPS’)
The Company has adopted an ESPS administered through a Trust (“the Trust”) to provide equity based incentives to key employees of the Company. The Trust purchases shares of the Company from the market using the proceeds of loans obtained from the Company. Such shares are offered by the Trust to employees at an exercise price, which approximates the fair value on the date of the grant. The employees can purchase the shares in a phased manner over a period of five years based on continued employment, until which time, the Trust holds the shares for the benefit of the employee. The employee will be entitled to receive dividends, bonus, etc., that may be declared by the Company from time to time for the entire portion of shares held by the Trust on behalf of the employees.
On acceptance of the offer, the selected employee shall undertake to pay within ten years from the date of acceptance of the offer the cost of the shares incurred by the Trust including repayment of the loan relatable thereto. The repayment of the loan by the Trust to the Company would be dependent on employee repaying the amount to the Trust. In case the employee resigns from employment, the rights relating to shares, which are eligible for exercise, may be purchased by payment of the exercise price whereas, the balance shares shall be forfeited in favor of the Trust. The Trustees have the right of recourse against the employee for any amounts that may remain unpaid on the shares accepted by the employee. The shares that an employee is eligible to exercise during the initial five‑year period merely go to determine the amount and scheduling of the loan to be repaid on exercise by the employee. The Trust shall repay the loan obtained from the Company on receipt of payments from employees against shares exercised or otherwise.
The Securities and Exchange Board of India (‘SEBI’) has issued the Employee Stock Option Scheme and Stock Purchase Guidelines, 1999 (‘SEBI guidelines’), which are applicable to stock purchase schemes for employees of all listed Companies. In accordance with these guidelines, the excess of market price of the underlying equity shares on the date of grant of the stock options over the exercise price of the options is to be recognized in the books of account and amortized over the vesting period. However, no compensation cost has been recorded as the scheme terms are fixed and the exercise price equals the market price of the underlying stock on the grant date.
A summary of the activity in the Company’s ESPS is as follows:
Year ended March 31, 2010
Year ended March 31, 2009
Number of shares Number of sharesOpening balance of unallocated shares 165,145 158,963Shares forfeited during the year 5 6,182Closing balance of unallocated shares 165,150 165,145
Opening balance of allocated shares 134,834 221,101Shares exercised during the year (80,281) (80,085)Shares forfeited during the year (5) (6,182)Closing balance of allocated shares 54,548 134,834
Shares eligible for exercise 54,548 74,534Shares not eligible for exercise – 60,300Total allocated shares 54,548 134,834
Employee Stock Option Plan (‘ESOP’)
Pursuant to the ESOP scheme approved by the shareholders of the Company held on August 14, 2001, the Board of Directors, on March 4, 2002 approved the Employees Stock Option Scheme (‘the Scheme’) for issue of 4,753,600 options to the employees and directors of the Company and its subsidiaries. According to the Scheme, the Company has granted 4,548,920 options prior to the IPO and 559,000 options at various dates after IPO (including the grants of options which were granted earlier but forfeited subsequently). As per the scheme, each of 20% of the total options granted will vest to the eligible employees and directors on completion of 12, 24, 36, 48 and 60 months and is subject to continued employment of the employee or director with the Company or its subsidiaries. The options have an exercise period of 10 years. The employee pays the exercise price upon exercise of option.
Annual Report 2009_2010_Colour.indd 40 7/23/2010 9:04:24 PM

41
A summary of the activity in the Company’s ESOP is as follows:
Year ended March 31, 2010 Year ended March 31, 2009Shares arising from options
Weighted average exercise price (Rs.)
Shares arising from options
Weighted average exercise price (Rs.)
Outstanding at beginning of year 348,853 1,075 431,253 1,025Exercised (85,471) 819 (21,945) 491Forfeited (21,000) 1,232 (60,455) 930Outstanding at end of the year 242,382 1,152 348,853 1,075
The weighted average share price for the year over which stock options were exercised was Rs. 2,250.
The details of options unvested and options vested and exercisable as on March 31, 2010 are as follows:
Range of exercise prices (Rs.)
Shares Weighted average exercise price (Rs.)
Weighted average remaining
contractual life (Years)
Options unvested 419 – 560 – – –1,291 – 1,291 101,000 1,291 6.1
Options vested and exercisable 265 – 265 32,800 265 1.9 419 – 560 32 514 3.3
1,291 – 1,291 108,550 1,291 6.1242,382 1,152 5.5
The details of options unvested and options vested and exercisable as on March 31, 2009 were as follows:
Range of exercise prices (Rs.)
Shares Weighted average exercise price (Rs.)
Weighted average remaining
contractual life (Years)
Options unvested 419 – 560 2,000 560 5.41,291 – 1,291 165,300 1,291 7.1
Options vested and exercisable 265 – 265 40,400 265 2.9419 – 560 39,003 462 3.9
1,291 – 1,291 102,150 1,291 7.1348,853 1,075 6.3
Analysis of our financial results
Comparison of fiscal 2010 with fiscal 2009
Revenues
Our total revenues in the fiscal year ended March 31, 2010, were Rs. 22,434.7 million, an increase of 1% over our total revenues of Rs. 22,126.2 million in the fiscal year ended March 31, 2009. The increase in revenues was primarily attributable to an increase in the revenues from our products business.
Products revenues
Our products revenues in the fiscal year ended March 31, 2010, stood at Rs. 15,178.5 million, an increase of 5% over our products revenues of Rs. 14,391.6 million in the fiscal year ended March 31, 2009 on the strength of large customer wins in USA and Europe. The revenues from license fees comprised 18% of revenues, implementation fees comprised 59%, and Annual Maintenance Contracts comprised 23% of revenues for the fiscal 2010.
Services revenues
Our services revenues represented 32% and 35% of our total revenues in the fiscal year ended March 31, 2010 and 2009. Our services revenues were Rs. 7,256.2 million in the fiscal year ended March 31, 2010; decrease of 6% from Rs. 7,734.6 million in the fiscal year ended March 31, 2009.
Revenues from time and material contracts comprised 64% of the revenues and fixed price contracts comprised 36% for the fiscal 2010.
Annual Report 2009_2010_Colour.indd 41 7/23/2010 9:04:24 PM

Oracle Financial Services Software – Annual Report 2009‑10
Interest and other income (expenses)
Our interest and other income (expenses) in the fiscal year ended March 31, 2010, was Rs. (682.7) million, as against Rs. 1,682.9 million in the fiscal year ended March 31, 2009. The overall decrease of Rs. 2,365.6 million in interest and other income (expenses) is attributable to lower interest income of Rs. 43.5 million and foreign exchange loss of Rs. 2,317.9 million during the year mainly due to sharp appreciation of Rupee against the US Dollar, GBP and Euro as compared to fiscal 2009.
Cost of revenues and operating expenses
Cost of revenues
Our cost of revenues in the fiscal year ended March 31, 2010, was Rs. 11,333.6 million, a decrease of 5% over our cost of revenues of Rs. 11,927.6 million in the fiscal year ended March 31, 2009. Our cost of revenues as a percentage of total revenues was 51% in the fiscal year ended March 31, 2010 as compared to 54% in the fiscal year ended March 31, 2009.
We have invested significantly both in our products and services businesses to meet emerging market requirements, and create a strong foundation for future growth. In the financial year 2009‑2010, we continued to invest in enhancing our products. We announced the launch of Oracle FLEXCUBE 11.0 that helps financial institutions respond faster to market dynamics, define and track processes and ensure compliance. Our investments in the Oracle Analytics platform resulted in the launch of several new offerings. These included new OFSA Enterprise Performance Management applications as well as new Reveleus products for Capital Management and Stress Testing.
Our cost of products revenues in the fiscal year ended March 31, 2010, was Rs. 6,159.7 million, a decrease of 1% over our cost of products revenues of Rs. 6,236.4 million in the fiscal year ended March 31, 2009. Our cost of products revenues as a percentage of products revenues was 41% in the fiscal year ended March 31, 2010, compared to 43% in the fiscal year ended March 31, 2009.
Our cost of services revenues in the fiscal year ended March 31, 2010 was Rs. 5,174.0 million, a decrease of 9% over our cost of services revenues of Rs. 5,691.2 million in the fiscal year ended March 31, 2009. The cost of services revenues as a percentage of services revenues was 71% in the fiscal year ended March 31, 2010 compared to 74% in the fiscal year ended March 31, 2009.
Sales and marketing expenses
Our sales and marketing expenses in the fiscal year ended March 31, 2010, were Rs. 421.0 million, a decrease of 60% over our sales and marketing expenses of Rs. 1,040.2 million in the fiscal year ended March 31, 2009. Our sales and marketing expenses as a percentage of total revenues was 2% for the fiscal year ended March 31, 2010 and 5% in the fiscal year ended March 31, 2009.
Our sales and marketing expenses for our Products business in the fiscal year ended March 31, 2010, were Rs. 359.1 million, a decrease of 59% over our sales and marketing expenses for our products business of Rs. 876.1 million in the fiscal year ended March 31, 2009. Sales and marketing expenses for our products business as a percentage of products revenues was 2% for the fiscal year ended March 31, 2010 and 6% in the fiscal year ended March 31, 2009.
Our sales and marketing expenses for our services business in the fiscal year ended March 31, 2010 were Rs. 61.8 million, a decrease of 62% over our sales and marketing expenses for our services business of Rs. 164.2 million in the fiscal year ended March 31, 2009. Sales and marketing expenses for our services business as a percentage of services revenues was 1% for the fiscal year ended March 31, 2010 and 2% in the fiscal year ended March 31, 2009.
General and administrative expenses
Our general and administrative expenses in the fiscal year ended March 31, 2010 were Rs. 2,149.6 million, a decrease of 18% over our general and administrative expenses of Rs. 2,621.0 million in the fiscal year ended March 31, 2009. Our general and administrative expenses as a percentage of total revenues were at 10% in the fiscal year ended March 31, 2010 compared to 12% in the fiscal year ended March 31, 2009.
General and administrative expenses for our products business in the fiscal year ended March 31, 2010, were Rs. 839.0 million, a decrease of 2% over general and administrative expenses for our products business of Rs. 851.9 million in the fiscal year ended March 31, 2009. Our general and administrative expenses for our products business as percentage of products revenues has remained at 6% in both the fiscal years ended March 31, 2010 and March 31, 2009.
General and administrative expenses for our services business in the fiscal year ended March 31, 2010, were Rs. 558.6 million, a decrease of 18% over our general and administrative expenses for our services business of Rs. 680.4 million in the fiscal year ended March 31, 2009. Our general and administrative expenses for our services business as a percentage of services revenues for the fiscal years ended March 31, 2010, and March 31, 2009 is 8% and 9% respectively.
Income taxes
Our provision for income tax in the fiscal year ended March 31, 2010, was Rs. 865.2 million (including income tax expense of Rs. 544.5 million for previous years) an increase of 137% over the provision for income tax of Rs. 365.8 million in the fiscal year ended March 31, 2009. Our effective tax rate was 12% for the fiscal year ended March 31, 2010 as against 5% for the fiscal years ended March 31, 2009. The increase in the effective tax rate is primarily due to creation of tax provision for certain contingencies related to certain jurisdictions.
Annual Report 2009_2010_Colour.indd 42 7/23/2010 9:04:24 PM

43
Exceptional items
The Company has settled a dispute with a party for Rs. 468.9 million for full release of all alleged claims and has disclosed the same as an exceptional item in the financial results for the year ended March 31, 2009.
Income from operations and net income
As a result of the foregoing factors, income from operations increased by 34% to Rs. 8,156.4 million in fiscal 2010 from Rs. 6,109.0 million in fiscal 2009 and net income decreased by 5% to Rs. 6,608.5 million in fiscal 2010 from Rs. 6,957.1 million in fiscal 2009. Our net income margin is 29% in fiscal 2010 as against 31% in fiscal 2009. We define net income margins for a particular period as the ratio of net income to total revenues during such period.
Liquidity and capital resources
Our capital requirements relate primarily to financing the growth of our business. We have historically financed the majority of our working capital, capital expenditure and other requirements through our operating cash flow. During fiscal 2010 and 2009 we generated cash from operations Rs. 6,927.0 million and Rs. 4,322.4 million respectively.
Oracle Financial Services Software is a zero debt company. We expect that our primary financing requirements in the future will be capital expenditure and working capital requirements in connection with the expansion of our business. We believe that the cash generated from operations will be sufficient to satisfy our currently foreseeable capital expenditure and working capital requirements.
Human capital
We recruit graduates from leading engineering and management institutions. We also hire functional experts from the banking industry. We had a net reduction of 672 employees during the fiscal year taking our employee strength to 9,083 employees as on March 31, 2010. The blend of functional knowledge and technical expertise, coupled with Oracle Financial Services Software training and experience make our employees unique.
We enjoy cordial relationships with our employees and endeavor to give them an excellent, professionally rewarding and enriching work environment. We operate an effective performance management system with a focus on employee development. This measures key result areas, competencies and training needs, ensuring all‑round employee development.
Risks and concerns
Quantitative and Qualitative Disclosures about Market Risk
Our primary market risk exposures are due to the following:
– Foreign exchange rate fluctuations,
– Fluctuations in interest rates; and
– Fluctuations in the value of our investments.
As of March 31, 2010, we had Cash and Bank Balances of Rs. 17,592.3 million, out of which Rs. 14,025.6 million was in interest‑bearing bank deposits. Consequently, we face an exposure on account of fluctuation in interest rates. These funds were invested in bank deposits of longer maturity (more than 90 days) to earn a higher rate of interest income.
A substantial portion of our revenues is generated in foreign currencies, while a majority of our expenses are incurred in Indian Rupees and the balance in US Dollars and European currencies. Our functional currency for Indian operations is the Indian Rupee. We expect the majority of our revenues will continue to be generated in foreign currencies for the foreseeable future and a significant portion of our expenses, including personnel costs and capital and operating expenditure, to continue to be incurred in Indian Rupees.
In addition, we face normal business risks such as global competition and country risks pertaining to countries that we operate in.
SWOT analysis
Strengths:
– Deep domain expertise
– Unmatched solutions portfolio with depth of offering in the retail, corporate and investment banking, funds, cash management, trade, treasury, payments, lending, private wealth management, asset management and business analytics areas
– Superior quality and cost‑efficient, end‑to‑end service capability, from business consulting, to application development and deployment, IT management
– Solutions built on best‑in‑class technology and architecture
– Continued momentum in new customer additions
Annual Report 2009_2010_Colour.indd 43 7/23/2010 9:04:24 PM

Oracle Financial Services Software – Annual Report 2009‑10
– Extensive global client base
– High quality manpower resources
– Strong R&D capability
– Acknowledged leadership in core banking, application services and governance, risk and compliance, Anti‑Money laundering, operational risk and process outsourcing domains
Weaknesses:
– Exposure to various economies
– Lack of local resources in new markets/opportunities
Opportunities:
– Increasing momentum in the acquisition of core banking systems by large and global financial institutions
– Entry into hitherto untapped markets
– Evolving needs due to regulatory pressures and economic outlook
– Expanding solutions portfolio and entry into new market segments Consumer finance, business analytics, Basel II, Anti‑Money Laundering, Private Wealth Management, Islamic banking, among others
– The need for banks to improve performance and efficiency through effective use of information technology solutions
Threats:
– Unfavorable conditions in global markets
– Customers negotiating harder as the financial position in many markets have changed
– Restrictions by governments on the movement of people to protect local employment
Outlook
The worldwide market for financial services is undergoing rapid transformation. Emerging markets are becoming increasingly significant sources of growth for firms in mature economies. New asset classes such as private equity and hedge funds have seen
Annual Report 2009_2010_Colour.indd 44 7/23/2010 9:04:24 PM

45
dramatic shifts in customer engagement and have altered the focus of capital markets. The payments space, a major source of revenue and profit for financial institutions, is being restructured, thus altering the fundamental dynamics of the banking industry.
Over the last 24 months there have been significant changes in the economic environment. Your company views the current economic scenario as an opportunity to help financial institutions meet their emerging business needs. To sustain their growth and profitability, global financial institutions will need to excel in areas such as off‑shoring, taxation and financial reporting, internal controls and service and process innovation.
Financial institutions are also reviewing their existing IT investments to ensure that they are attuned to changing customer preferences and aligned to new business priorities. Core banking, risk management and compliance, investor service and internet banking are among the areas that continue to show significant potential. Financial institutions are innovating using available technologies to offer services to their customers on a ‘self service’ basis.
We see demand for core banking applications continuing as banks expand by buying the assets of other banks, establish presence in new countries or standardize applications across regions. Banks are exploring how they can centralize banking services such as account opening and origination of credit to improve their service levels, increase productivity and gain greater control over processes that are subject to regulatory scrutiny.
Global regulators have re‑emphasized the importance of stress testing in the measurement of liquidity and credit risk and in evaluating how banks would fare under different scenarios. As a result of these factors we have gained increasing traction at Tier 1 banks for our products. Over the last 12 months banks have also exhibited renewed interest in aligning finance, risk and performance applications. Risk Adjusted Performance Measurements (RAPM), that can manage such alignment, has received interest from many regulators and has also attracted attention from the boards of many banks.
Oracle has been ranked number one in the banking space by an independent vendor and is committed to maintaining its leadership position in financial services. Oracle will continue to invest in expanding its banking footprint through its own internal R&D and also seek “best‑in‑class” acquisition targets.
With a process‑driven approach based on a Service‑Oriented Architecture, your company has the distinct advantage of offering banks the combined benefits of interoperability, extensibility and standardization. Together with Oracle we provide a complete banking footprint, spanning all major distribution, manufacturing and corporate administration functions.
Internal control systems and their adequacy
The Company has in place adequate systems of internal control and documented procedures covering all financial and operating functions. These systems have been designed to provide reasonable assurance with regard to maintaining proper accounting controls, monitoring economy and efficiency of operations, protecting assets from unauthorized use or losses and ensuring reliability of financial and operational information. The Company continuously strives to align all its processes and controls with global best practices.
Annual Report 2009_2010_Colour.indd 45 7/23/2010 9:04:24 PM

Oracle Financial Services Software – Annual Report 2009‑10
Reconciliation Statement of profit as per Indian GAAP unconsolidated and Indian GAAP consolidated
(All amounts in thousands of Indian Rupees)
Year ended March 31, 2010
Year ended March 31, 2009
Net income as per Indian GAAP unconsolidated profit and loss account 6,608,488 6,957,116
Add:Revenue of subsidiaries, netOracle Financial Services Software B.V. 7,851,792 8,234,392 Oracle Financial Services Software Pte. Ltd.‑ consolidated 5,536,927 5,209,744 Oracle Financial Services Software America, Inc.‑ consolidated 7,637,467 8,143,691 ISP Internet Mauritius Company ‑ consolidated 533,061 519,968 Oracle (OFSS) Processing Services Limited 3,052 3,010 Oracle (OFSS) ASP Private Limited 82,403 177,070 Oracle Financial Services Software (Shanghai) Limited 228,440 –
21,873,142 22,287,875
Other income from subsidiaries, net (240,245) 180,129 21,632,897 22,468,004
Oracle Financial Services Software B.V. (7,186,992) (7,688,590)Oracle Financial Services Software Pte. Ltd.‑ consolidated (5,304,107) (5,053,565)Oracle Financial Services Software America, Inc.‑ consolidated (7,470,221) (8,744,861)ISP Internet Mauritius Company ‑ consolidated (359,917) (387,808)Oracle (OFSS) Processing Services Limited 90,508 (6,317)Oracle (OFSS) ASP Private Limited (81,424) (165,956)Oracle Financial Services Software (Shanghai) Limited (192,594) –
1,128,150 420,907
Provision for diminution in value of investment – –
Profit after consolidating subsidiaries 7,736,638 7,378,023
Profit/(Loss) on equity investment – (12,595)
Net income as per Indian GAAP consolidated profit and loss account 7,736,638 7,365,428
Annual Report 2009_2010_Colour.indd 46 7/23/2010 9:04:24 PM

47
Auditors’ report
To The Members of Oracle Financial Services Software Limited
1. We have audited the attached balance sheet of Oracle Financial Services Software Limited (the ‘Company’) as at March 31, 2010 and also the profit and loss account and the cash flow statement for the year ended on that date annexed thereto. These financial statements are the responsibility of the Company’s management. Our responsibility is to express an opinion on these financial statements based on our audit.
2. We conducted our audit in accordance with auditing standards generally accepted in India. Those Standards require that we plan and perform the audit to obtain reasonable assurance about whether the financial statements are free of material misstatement. An audit includes examining, on a test basis, evidence supporting the amounts and disclosures in the financial statements. An audit also includes assessing the accounting principles used and significant estimates made by management, as well as evaluating the overall financial statement presentation. We believe that our audit provides a reasonable basis for our opinion.
3. As required by the Companies (Auditors’ Report) Order, 2003 (as amended) (‘the Order’) issued by the Central Government of India in terms of sub‑section (4A) of Section 227 of the Companies Act, 1956 (‘the Act’), we enclose in the Annexure a statement on the matters specified in paragraphs 4 and 5 of the said Order.
4. Further to our comments in the Annexure referred to above, we report that:
i. We have obtained all the information and explanations, which to the best of our knowledge and belief were necessary for the purposes of our audit;
ii. In our opinion, proper books of account as required by law have been kept by the Company so far as appears from our examination of those books;
iii. The balance sheet, profit and loss account and cash flow statement dealt with by this report are in agreement with the books of account;
iv. In our opinion, the balance sheet, profit and loss account and cash flow statement dealt with by this report comply with the accounting standards referred to in sub‑section (3C) of Section 211 of the Act.
v. On the basis of the written representations received from the directors, as on March 31, 2010, and taken on record by the Board of Directors, we report that none of the directors is disqualified as on March 31, 2010 from being appointed as a director in terms of clause (g) of sub‑section (1) of Section 274 of the Act.
vi. In our opinion and to the best of our information and according to the explanations given to us, the said accounts give the information required by the Act, in the manner so required and give a true and fair view in conformity with the accounting principles generally accepted in India;
(a) in the case of the balance sheet, of the state of affairs of the Company as at March 31, 2010;
(b) in the case of the profit and loss account, of the profit for the year ended on that date; and
(c) in the case of cash flow statement, of the cash flows for the year ended on that date.
For S. R. Batliboi & Associates Firm registration number:101049W Chartered Accountants
per Amit Majmudar Partner Membership No.: 36656
Mumbai, India May 7, 2010
Annual Report 2009_2010_Colour.indd 47 7/23/2010 9:04:24 PM

Oracle Financial Services Software – Annual Report 2009‑10
Annexure referred to in paragraph 3 of our report of even date Re: Oracle Financial Services Software Limited
(i) (a) The Company has maintained proper records showing full particulars, including quantitative details and situation of fixed assets.
(b) Fixed assets have been physically verified by the management during the year and as informed, no material discrepancies were identified on such verification.
(c) There was no substantial disposal of fixed assets during the year.
(ii) Due to the nature of its business, paragraph 4 (ii) of the Order, relating to physical verification of inventory is not applicable to the Company.
(iii) (a) As informed, the Company has not granted any loans, secured or unsecured to companies, firms or other parties covered in the register maintained under section 301 of the Act. Accordingly, paragraph 4 (iii) (a) to 4 (iii) (d) of the Order is not applicable.
(b) As informed, the Company has not taken any loans, secured or unsecured from companies, firms or other parties covered in the register maintained under section 301 of the Act. Accordingly, paragraph 4 (iii) (e) to 4 (iii) (g) of the Order is not applicable.
(iv) In our opinion and according to the information and explanations given to us, there is an adequate internal control system commensurate with the size of the Company and the nature of its business, for the purchase of fixed assets, sale of software licenses and for the sale of services. During the course of our audit, no major weakness has been noticed in the internal control system in respect of these areas. Due to the nature of its business the Company does not purchase any inventory.
(v) According to the information and explanations provided by the management, we are of the opinion that there are no contracts and arrangements that need to be entered into the register maintained under Section 301 of the Act. Accordingly, paragraph 4 (v) of the Order is not applicable.
(vi) The Company has not accepted any deposits from the public.
(vii) In our opinion, the Company has an internal audit system commensurate with the size and nature of its business.
(viii) To the best of our knowledge and as explained, the Central Government has not prescribed maintenance of cost records under clause (d) of sub‑section (1) of Section 209 of the Act for the products of the Company.
(ix) (a) The Company is generally regular in depositing with appropriate authorities undisputed statutory dues including provident fund, investor education and protection fund, employees’ state insurance, income‑tax, sales‑tax, wealth‑tax, service tax, customs duty, excise duty, cess and other material statutory dues applicable to it though there have been considerable delays in few cases of service tax, foreign taxes, income tax and value added tax. As explained to us, the Company did not have any dues of excise duty. Further, since the Central Government has till date not prescribed the amount of cess payable under section 441 A of the Act, we are not in a position to comment upon the regularity or otherwise of the company in depositing the same.
(b) According to the information and explanations given to us, undisputed dues in respect of provident fund, investor education and protection fund, employees’ state insurance, income‑tax, wealth‑tax, service tax, sales‑tax, customs duty, cess and other statutory dues which were outstanding, at the year end for a period of more than six months from the date they became payable are as follows:
Name of the statute
Nature of the dues
Amount (Rs.) Period to which the amount relates Due Date Date of Payment
Service Tax Act, 1994 Service tax 20,197,607 April 2006 to September 2009 Various dates Not yet paid
Foreign Tax Income Tax 121,077,496 January 2004 to August 2009 Various dates Not yet paid
Value added Tax (VAT) 22,930,090 April 2007 to March 2009 Various dates Not yet paid
Withholding Tax 28,203,155 September 2007 to September 2009 Various dates Not yet paid
Income Tax Act, 1961 Income Tax 30,898,494 April 2007 to March 2008 19th August, 2009 Not yet paid
Annual Report 2009_2010_Colour.indd 48 7/23/2010 9:04:25 PM

49
(c) According to the records of the Company, the dues outstanding of income‑tax, sales‑tax, wealth‑tax, service tax, custom duty and cess on account of any dispute, are as follows:
(x) The Company has no accumulated losses at the end of the financial year and it has not incurred cash losses in the current and immediately preceding financial year.
(xi) The Company did not have any dues to any financial institution, bank or debenture holder during the year.
(xii) According to the information and explanations given to us and based on the documents and records produced to us, the Company has not granted loans and advances on the basis of security by way of pledge of shares, debentures and other securities.
(xiii) In our opinion, the Company is not a chit fund or a nidhi/mutual benefit fund/society. Therefore, the provisions of paragraph 4 (xiii) of the Order are not applicable to the Company.
(xiv) In our opinion, the Company is not dealing in or trading in shares, securities, debentures and other investments. Accordingly, the provisions of paragraph 4 (xiv) of the Order are not applicable to the Company.
(xv) According to the information and explanations given to us, the Company has not given any guarantee for loans taken by others from bank or financial institutions.
(xvi) The Company did not have any term loans outstanding during the year.
(xvii) According to the information and explanations given to us and on an overall examination of the balance sheet of the Company, we report that no funds raised on short‑term basis have been used for long‑term investment.
(xviii) The Company has not made any preferential allotment of shares to parties or companies covered in the register maintained under Section 301 of the Act.
(xix) The Company did not have any outstanding debentures during the year.
(xx) The Company has not raised any money by public issue during the year.
(xxi) Based upon the audit procedures performed for the purpose of reporting the true and fair view of the financial statements and as per the information and explanations given by management, we report that no fraud on or by the Company has been noticed or reported during the course of our audit.
For S. R. Batliboi & Associates Firm registration number:101049W Chartered Accountants
per Amit Majmudar Partner Membership No.: 36656
Mumbai, India May 7, 2010
Name of the statute Nature of the dues
Amount (Rs.) Period to which the amount relates
Forum where dispute is pending
The Karnataka Value Added Tax Act, 2003 VAT 19,768,839 April 2004 to March 2007
Joint Commissioner of commercial taxes (Appeal)
The Central Sales Tax Act, 1956 CST 8,626,179 April 2002 to March 2007
Joint Commissioner of commercial taxes (Appeal)
The Karnataka Sales Tax Act, 1957 VAT 145,113 April 2002 to March 2004
Joint Commissioner of commercial taxes (Appeal)
Annual Report 2009_2010_Colour.indd 49 7/23/2010 9:04:25 PM

Oracle Financial Services Software – Annual Report 2009‑10
(All amounts in thousands of Indian Rupees)
Schedules 2010 2009Sources of fundsShareholders’ funds
Share capital 1 419,274 418,847 Share application money pending allotment 8,068 106 Reserves and surplus 2 41,353,344 34,675,269
41,780,686 35,094,222
Application of fundsFixed assets 3
Gross block 4,879,784 5,007,785 Less: Accumulated depreciation and amortization 2,814,052 2,641,693 Net book value 2,065,732 2,366,092 Capital work‑in‑progress and advances 1,304,106 1,013,261
3,369,838 3,379,353 Investments 4 7,247,296 7,201,374
Deferred tax assets 5 384,071 305,103
Current assets, loans and advances 6Sundry debtors 8,772,357 11,710,383 Cash and bank balances 17,592,367 10,842,275 Other current assets 2,038,002 1,481,697 Loans and advances 8,484,297 7,254,297
36,887,023 31,288,652 Less: Current liabilities and provisions 7
Current liabilities 5,322,888 6,421,296 Provisions 784,654 658,964
6,107,542 7,080,260
Net current assets 30,779,481 24,208,392
41,780,686 35,094,222
Notes to accounts 15
The schedules referred to above and notes to accounts form an integral part of the balance sheet.
Balance sheet as at March 31
As per our report of even date For and on behalf of the Board of Directors
For S. R. Batliboi & AssociatesFirm Registration No. 101049WChartered Accountants
N R K RamanManaging Director& Chief Executive Officer
Y M Kale Director
per Amit MajmudarPartnerMembership No.: 36656
Hoshi D Bhagwagar Company Secretary & Compliance Officer
Tarjani Vakil Director
Mumbai, IndiaMay 7, 2010
Mumbai, IndiaMay 7, 2010
Annual Report 2009_2010_Colour.indd 50 7/23/2010 9:04:25 PM

51
As per our report of even date For and on behalf of the Board of Directors
For S. R. Batliboi & AssociatesFirm Registration No. 101049WChartered Accountants
N R K RamanManaging Director& Chief Executive Officer
Y M Kale Director
per Amit MajmudarPartnerMembership No.: 36656
Hoshi D Bhagwagar Company Secretary & Compliance Officer
Tarjani Vakil Director
Mumbai, IndiaMay 7, 2010
Mumbai, IndiaMay 7, 2010
(All amounts in thousands of Indian Rupees, except per share data)
Schedules 2010 2009
Revenue 8 22,434,696 22,126,231
Cost of revenue 9 (11,333,615) (11,927,641)Gross profit 11,101,081 10,198,590
Operating expensesSelling and marketing expenses [Refer note 12 of Schedule 15] 10 (420,968) (1,040,245)General and administrative expenses 11 (2,149,614) (2,620,979)Depreciation and amortization 3 (374,102) (428,405)
Operating profit 8,156,397 6,108,961 Non‑operating income (expenses)
Interest income 12 680,051 723,511 Foreign exchange (loss) gain, net (1,363,733) 954,175 Other income, net 13 967 5,178
Profit before exceptional item and provision for taxes 7,473,682 7,791,825 Exceptional item [Refer note 13 of Schedule 15] – (468,900)Profit before provision for taxes 7,473,682 7,322,925
Provision for taxesCurrent tax [Refer note 14 of Schedule 15] (968,658) (372,803)Deferred tax 78,968 83,389 Fringe benefit tax 24,496 (76,395)
Net profit for the year 6,608,488 6,957,116
Profit and loss account, beginning of the year 15,075,430 8,118,314 Surplus carried to Balance Sheet 21,683,918 15,075,430
Earnings per share of Rs. 5/‑ each (in Rs.) 14Basic 78.87 83.06 Diluted 78.72 83.03
Notes to accounts 15
The schedules referred to above and notes to accounts form an integral part of the profit and loss account.
Profit and loss account for the year ended March 31
Annual Report 2009_2010_Colour.indd 51 7/23/2010 9:04:25 PM

Oracle Financial Services Software – Annual Report 2009‑10
(All amounts in thousands of Indian Rupees, except share data)
As at March 31, 2010
As at March 31, 2009
Schedule 1: Share capital
Authorized:100,000,000 (March 31, 2009 – 100,000,000) equity shares of Rs. 5/‑ each 500,000 500,000
Issued, subscribed and fully paid up:83,854,857 (March 31, 2009 – 83,769,386) equity shares of Rs. 5/‑ each 419,274 418,847
a. Of the above, 67,481,698 (March 31, 2009 – 67,481,698) equity shares of Rs. 5/‑ each are held by Oracle Global (Mauritius) Limited, holding company.
b. Of the above, 62,121,800 (March 31, 2009 – 62,121,800) equity shares of Rs. 5/‑ each had been issued as fully paid up bonus shares by capitalizing the securities premium account.
c. Refer note 6(b) of Schedule 15 for options granted for unissued equity shares.
Schedule 2: Reserves and surplus
Securities premiumBalance, beginning of the year 9,454,648 9,443,984 Received during the year on exercise of stock options 69,587 10,664 Balance, end of the year 9,524,235 9,454,648
General reserve 10,145,191 10,145,191
Profit and loss account 21,683,918 15,075,430
41,353,344 34,675,269
Schedules annexed to and forming part of the accounts
Annual Report 2009_2010_Colour.indd 52 7/23/2010 9:04:26 PM

53
Sch
edu
le 3
: Fi
xed
ass
ets
Par
ticu
lars
Gro
ss b
lock
D
epre
ciat
ion
and
amor
tiza
tion
N
et b
ook
valu
e A
s at
A
pril
1, 2
009
Add
itio
ns
Sal
e/de
leti
ons
As
at
Mar
ch 3
1, 2
010
As
at
Apr
il 1
, 200
9Fo
r th
e ye
arSa
le/d
elet
ions
As
at
Mar
ch 3
1, 2
010
As
at
Mar
ch 3
1, 2
010
As
at
Mar
ch 3
1, 2
009
Tan
gibl
e as
sets
:Fr
eeho
ld la
nd 5
38,3
12
– –
538
,312
–
– –
– 5
38,3
12
538
,312
Im
prov
emen
t to
le
aseh
old
prem
ises
167
,000
–
2,5
48
164
,452
1
62,6
49
2,5
38
2,2
07
162
,980
1
,472
4
,351
B
uild
ings
[R
efer
not
e be
low
] 1
,131
,141
2
,573
–
1,1
33,7
14
120
,711
5
6,65
1 –
177
,362
9
56,3
52
1,0
10,4
30
Com
pute
r eq
uipm
ents
1,4
12,8
11
39,
918
163
,904
1
,288
,825
1
,249
,545
1
19,2
53
163
,810
1
,204
,988
8
3,83
7 1
63,2
66
Ele
ctri
cal a
nd o
ffic
e eq
uipm
ents
764
,058
1
5,79
2 1
7,11
7 7
62,7
33
404
,615
8
9,23
5 1
2,02
1 4
81,8
29
280
,904
3
59,4
43
Furn
itur
e an
d fi
xtur
es 5
42,8
99
1,6
76
16,
706
527
,869
3
10,1
63
66,
258
10,
885
365
,536
1
62,3
33
232
,736
V
ehic
les
unde
r fi
nanc
e le
ase
39,
415
25,
719
13,
404
51,
730
20,
045
10,
549
12,
820
17,
774
33,
956
19,
370
Inta
ngib
le a
sset
s:G
oodw
ill o
n ac
quis
itio
n 1
97,4
73
– –
197
,473
1
97,4
73
– –
197
,473
–
–C
usto
mer
con
trac
ts
22,
290
– –
22,
290
22,
290
– –
22,
290
– –
Pro
duct
IP
R
138
,619
–
– 1
38,6
19
118
,359
1
8,86
5 –
137
,224
1
,395
2
0,26
0 P
eopl
eSof
t E
RP
53,
767
– –
53,
767
35,
843
10,
753
– 4
6,59
6 7
,171
1
7,92
4
Tot
al 5
,007
,785
8
5,67
8 2
13,6
79
4,8
79,7
84
2,6
41,6
93
374
,102
2
01,7
43
2,8
14,0
52
2,0
65,7
32
2,3
66,0
92
As
at M
arch
31,
200
9 4
,030
,206
9
93,6
46
16,
067
5,0
07,7
85
2,2
26,0
83
428
,405
1
2,79
5 2
,641
,693
C
apit
al w
ork‑
in‑p
rogr
ess
and
adva
nces
1,3
04,1
06
1,0
13,2
61
3,3
69,8
38
3,3
79,3
53
Not
e: I
nclu
des
10 (M
arch
31,
200
9 –
10)
sha
res
of R
s. 5
0/‑
each
in T
aksh
ila
Bui
ldin
g N
o. 9
, Co‑
op H
ousi
ng S
ocie
ty L
imit
ed, M
umba
i.
Annual Report 2009_2010_Colour.indd 53 7/23/2010 9:04:26 PM

Oracle Financial Services Software – Annual Report 2009‑10
As atMarch 31, 2010
As atMarch 31, 2009
Schedule 4: Investments
a. Long term investments (at cost)
i. Trade (unquoted)EBZ Online Private Limited 242,240 (March 31, 2009 – 242,240) equity shares of Rs. 10/‑ each, fully paid up 45,000 45,000 Less: Provision for diminution in value of investment (45,000) (45,000)
– –
Login SA 33,000 (March 31, 2009 – 33,000) equity shares of EUR 2/‑ each, fully paid up 6,593 6,593
ii. In wholly owned subsidiaries (unquoted)Oracle (OFSS) ASP Private Limited (formerly known as Flexcel International Private Limited)
5,170,000 (March 31, 2009 – 5,170,000) equity shares of Rs. 10/‑ each, fully paid up 46,104 46,104 Less: Provision for diminution in value of investment (20,680) (20,680)
25,424 25,424
Oracle Financial Services Software B.V.140,000 (March 31, 2009 – 140,000) equity shares of EUR 100/‑ each, fully paid up 776,308 776,308
Oracle Financial Services Software Pte. Ltd.250,000 (March 31, 2009 – 250,000) equity shares of SGD 1/‑ each, fully paid up 6,626 6,626
Oracle Financial Services Software America, Inc.[Refer note 11(a) of schedule 15]1 (March 31, 2009 – 1) equity share of USD 0.01/‑ each, fully paid up 3,452,256 3,452,256 100 (March 31, 2009 – 100) Series A Convertible Participating Preference Shares of USD 0.01/‑ each, fully paid up 2,839,487 2,839,487
Oracle Financial Services Software (Shanghai) Limited 45,505 –March 31, 2010 – 100% subscription to the registered capital (March 31, 2009 – Nil)
ISP Internet Mauritius Company[Refer note 11(b) of schedule 15]30,000 (March 31, 2009 – 30,000) equity shares of USD 1/‑ each, fully paid up 192,115 192,115 Less: Provision for diminution in value of investment (120,000) (120,000)
72,115 72,115
Oracle (OFSS) Processing Services Limited (formerly known as i‑flex Processing Services Limited)
1,300,000 (March 31, 2009 – 1,300,000) equity shares of Rs. 10/‑ each, fully paid up 13,000 13,000
b. Current investment (cost or fair value whichever is lower)
Non trade (quoted)9% Dhanalakshmi Bank Bonds Series VI10 (March 31, 2009 – 10) bonds of Rs. 1,000,000 each, fully paid up 9,982 9,565
7,247,296 7,201,374
Aggregate amount of quoted investments 9,982 9,565 Aggregate market value of quoted investments 9,982 9,565 Aggregate amount of unquoted investments 7,237,314 7,191,809
Schedule 5: Deferred tax asset
Difference between book and tax depreciation 174,216 221,437 Provision for compensated absence 102,100 –Provision for gratuity 78,317 44,257 Provision for doubtful debts 26,663 39,409 Others 2,775 –
384,071 305,103
Annual Report 2009_2010_Colour.indd 54 7/23/2010 9:04:26 PM

55
As atMarch 31, 2010
As atMarch 31, 2009
Schedule 6: Current assets, loans and advances
a. Sundry debtors (unsecured) Debts outstanding for a period exceeding six months:
Considered good 1,131,935 2,779,883 Considered doubtful 631,105 699,193
1,763,040 3,479,076 Other debts‑considered good 7,640,422 8,930,500
9,403,462 12,409,576 Less: Provision for doubtful debts (631,105) (699,193)
8,772,357 11,710,383
Amount due from subsidiaries [Refer Note 9 of schedule 15] 6,836,323 9,076,388
b. Cash and bank balancesCash in hand 469 477 Cheques on hand 494 545 Balances with scheduled banks:
Current accounts in foreign currency 3,404,787 1,213,886 Other current accounts 117,372 100,839 Deposit accounts 14,025,624 9,479,661 Margin money deposit 6,067 6,067 Unclaimed dividend accounts 982 1,335
Balances with non‑scheduled banks: Current accounts in foreign currency 36,175 39,021 Deposit account in foreign currency 397 444
17,592,367 10,842,275
Balances with non‑scheduled banks:Citibank, Dubai current account 1,448 2,204 Citibank, Dubai deposit account 397 444 Citibank, Moscow current accounts 3,066 4,795 Central Bank, Libya current account 31,661 32,022
Maximum balance held during the year:Citibank, Dubai current account 28,337 17,251 Citibank, Dubai deposit account 438 444 Citibank, Moscow current accounts 8,657 16,994 Central Bank, Libya current account 31,866 33,366
c. Other current assetsInterest accrued on:
Bank deposits 99,421 64,101 Loan to subsidiaries 111,049 115,554
Unbilled revenue 1,820,552 1,284,813 Net investment in lease 6,980 17,229
2,038,002 1,481,697
d. Loans and advances (unsecured, considered good)Loan to subsidiaries [Refer Note 9 of schedule 15] 993,742 1,057,383 Amount recoverable from subsidiaries [Refer Note 9 of schedule 15] 135,679 110,656 Advances recoverable in cash or in kind or for value to be received:
Deposits for premises and others 3,230,937 3,098,248 Prepaid expenses 186,258 244,349 Other advances 457,344 394,210
Advance tax, net of provision for taxes 1,580,675 1,486,702 MAT credit entitlement 1,899,662 862,749
8,484,297 7,254,297
Annual Report 2009_2010_Colour.indd 55 7/23/2010 9:04:27 PM

Oracle Financial Services Software – Annual Report 2009‑10
As atMarch 31, 2010
As atMarch 31, 2009
Schedule 7: Current liabilities and provisions
a. Current liabilitiesAmount due to subsidiaries 1,809,890 2,141,445 Accrued expenses 1,705,342 1,702,606 Deferred revenues 1,396,310 2,080,813 Sundry creditors 20,749 109,216 Advances from customers 2,199 15,819 Investor Education and Protection Fund to be credited by unclaimed dividends* 982 1,335 Forward contract payable, net – 61,347 Other current liabilities 387,416 308,715
5,322,888 6,421,296
Amounts due to Micro, Medium and Small Enterprises 1,630 – (The identification of Micro, Medium and Small Enterprises are based on Management’s knowledge of their status)
* There is no amount due and outstanding as at balance sheet date to be credited to the Investor Education and Protection Fund.
b. ProvisionsProvision for gratuity 255,412 230,204 Provision for compensated absence 364,272 326,925 Provision for fringe benefit tax, net of advance tax – 12,730 Provision for taxation, net of advance tax 164,970 89,105
784,654 658,964
Year ended March 31, 2010
Year ended March 31, 2009
Schedule 8: Revenue
Product licenses and related activities 15,178,505 14,391,599 IT solutions and consulting services 7,256,191 7,734,632
22,434,696 22,126,231
Schedule 9: Cost of revenue
Employee costs 9,211,173 9,412,323 Travel related expenses (net of recoveries) 1,347,313 1,383,506 Professional fees 582,031 638,513 Application software 193,098 493,299
11,333,615 11,927,641
Schedule 10: Selling and marketing expenses
Employee costs 381,333 299,491 Professional fees [Refer note 12 of schedule 15] (59,151) 205,495 Travelling expenses 74,955 117,506 Advertising expenses 672 6,932 Provision for doubtful debts, net of reversals (15,672) 348,913 Bad debts 6,849 4,480 Repairs and maintenance 2,536 4,399 Other expenses 29,446 53,029
420,968 1,040,245
Schedule 11: General and administrative expenses
Employee costs 893,103 863,237 Rent 391,963 520,963 Professional fees 178,522 427,707 Power 185,737 213,992 Communication expenses 136,087 139,227 Repairs and maintenance 122,317 110,508 Travelling expenses 60,574 48,838 Other expenses 181,311 296,507
2,149,614 2,620,979
Annual Report 2009_2010_Colour.indd 56 7/23/2010 9:04:27 PM

57
Year ended March 31, 2010
Year ended March 31, 2009
Schedule 12: Interest income
Interest on:Bank deposits 640,186 671,565
(Includes tax deducted at source of Rs. 81,524 (March 31, 2009 – Rs. 151,973))Bonds 900 1,363
(Includes tax deducted at source of Rs. Nil (March 31, 2009 – Rs. Nil))Income tax refund 26,601 29,555 Loan to subsidiaries 9,174 16,314 Leased assets 3,088 4,596 Loans to employees 102 118
680,051 723,511
Schedule 13: Other (expenses) income
Loss on sale of fixed assets, net (10,468) (185)Miscellaneous income 11,435 5,363
967 5,178
Schedule 14: Reconciliation of basic and diluted equity shares used in computing earnings per share
Number of shares
Weighted average shares outstanding for basic earnings per share 83,793,213 83,763,033 Add: Effect of dilutive stock options 158,986 29,743 Weighted average shares outstanding for diluted earnings per share 83,952,199 83,792,776
Schedule 15: Notes to accounts
1. Background and nature of operations
Oracle Financial Services Software Limited (“the Company”) was incorporated in India with limited liability on September 27, 1989. Oracle Financial Services Software Limited is a subsidiary of Oracle Global (Mauritius) Limited holding 80.47% ownership interest in the Company as at March 31, 2010.
The Company is principally engaged in the business of providing information technology solutions to the financial services industry worldwide. Oracle Financial Services Software Limited has a suite of banking products, which caters to the needs of corporate, retail, investment banking, treasury operations and data warehousing.
2. Summary of significant accounting policies
a. Basis of presentation
The financial statements are prepared under the historical cost convention, on the accrual basis of accounting, in conformity with accounting principles generally accepted in India and complying in all material respects the notified Accounting Standards by Companies (Accounting Standards) Rules, 2006 (as amended) and the relevant provisions of the Companies Act, 1956 (the ‘Act’). The accounting policies applied by the Company are consistent with those used in the previous years. The financial statements are presented in the general format specified in Schedule VI to the Act.
The significant accounting policies adopted by the Company, in respect of the financial statements are set out as below:
b. Use of estimates
The preparation of financial statements in conformity with generally accepted accounting principles requires management to make estimates and assumptions that affect the reported amounts of assets and liabilities and disclosure of contingent liabilities at the date of the financial statements and the results of operations during the reporting year end. Although these estimates are based upon management’s best knowledge of current events and actions, actual results could differ from these estimates.
c. Fixed assets, depreciation and amortization
Fixed assets including assets under finance lease arrangements are stated at cost less accumulated depreciation. The Company capitalizes all direct costs relating to the acquisition and installation of fixed assets. Advances paid towards the acquisition of fixed assets outstanding at each balance sheet date and the cost of fixed assets not ready to use before such date are disclosed under ‘Capital work‑in‑progress and advances’. Customer contracts and product IPRs acquired as part of business acquisitions are capitalized based on a fair value. The Company records the difference between considerations paid to acquire these contracts and the fair value of assets and liabilities acquired as goodwill.
Annual Report 2009_2010_Colour.indd 57 7/23/2010 9:04:27 PM

Oracle Financial Services Software – Annual Report 2009‑10
The Company purchases certain specific‑use application software, which is in ready to use condition, for internal use. It is estimated that such software has a relatively short useful life, usually less than one year. The Company, therefore, charges to income the cost of acquiring such software.
Depreciation and amortization are computed using straight‑line method, at the rates specified in Schedule XIV to the Act or based on the estimated useful life of assets, whichever is higher. The estimated useful life considered for depreciation of fixed assets is as follows:
Asset description Asset life (in years)
Tangible assetsImprovement of leasehold premises Lesser of 7 years or lease termBuildings 20Computer equipments 3Electrical and office equipments 2 – 7Furniture and fixtures 2 – 7Vehicles under finance Lease Lesser of 3 to 5 years or lease termIntangible assetsGoodwill on acquisition 3 to 5Customer contract 5Product IPR 5PeopleSoft ERP 5
The carrying amounts of assets are reviewed at each balance sheet date if there is any indication of impairment based on internal/external factors. An impairment loss is recognized wherever the carrying amount of an asset exceeds its recoverable amount. The recoverable amount is the greater of the assets net selling price and value in use. In assessing value in use, the estimated future cash flows are discounted to their present value at the weighted average cost of capital. After impairment, depreciation is provided on the revised carrying amount of the asset over its remaining useful life.
d. Investments
Investments that are readily realizable and intended to be held for not more than a year are classified as current investments. All other investments are classified as long‑term investments. Trade investments refer to the investments made with the aim of enhancing the Company’s business interests in providing information technology solutions to the financial services industry worldwide. Long term investments are stated at cost less provision for diminution on account of other than temporary decline in the value of the investment.
Current investments are stated at lower of cost and fair value determined on an individual investment basis.
e. Foreign currency transactions
Foreign currency transactions during the year are recorded at the exchange rates prevailing on the date of the transaction. Foreign currency denominated monetary items are translated into Rupees at the closing rates of exchange prevailing at the date of the balance sheet. Non‑monetary items, which are carried in terms of historical cost denominated in a foreign currency, are reported using the exchange rate at the date of the transaction. Exchange differences arising on the settlement of monetary items or on reporting company’s monetary items at rates different from those at which they were initially recorded or reported in previous financial statements are recognized as income or expenses in the year in which they arise.
In respect of forward exchange contracts entered into by the Company to hedge the foreign currency risk, the premium or discount arising at the inception of forward exchange contracts is amortized as income or expense over the life of the contract. Exchange differences on such contracts are recognized in the statement of profit and loss in the year in which the exchange rates change. Any profit or loss arising on cancellation or renewal of forward exchange contract is recognized as income or expense for the year.
f. Revenue recognition
Revenue is recognized as follows:
Product licenses and related revenue
– License fees are recognized, on delivery and subsequent milestone schedule as per the terms of the contract with the end user.
– Implementation services are recognized as services are provided, when arrangements are on a time and material basis. Revenue for fixed price contracts is recognized using the proportionate completion method till contracts reach 90% completion. Balance revenue is recognized at the time of receipt of customer acceptance.
– Customization services are recognized as services are provided, when arrangements are on a time and material basis. Revenue for fixed price contracts is recognized using the proportionate completion method and restricted to the acceptance received from the customer for the milestone achieved.
Proportionate completion is measured based upon the efforts incurred to date in relation to the total estimated efforts to complete the contract. The Company monitors estimates of total contract revenue and cost on a routine basis throughout the delivery period. The cumulative impact of any change in estimates of the contract revenue or costs is reflected in the period in which the changes become known. In the event that a loss is anticipated on a particular contract, provision is made for the estimated loss.
Annual Report 2009_2010_Colour.indd 58 7/23/2010 9:04:27 PM

59
– Product maintenance revenue is recognized, over the period of the maintenance contract.
IT solutions and consulting services
Revenue from IT solutions and consulting services are recognized as services are provided, when arrangements are on a time and material basis.
Revenue from fixed price contracts is recognized using the proportionate completion method till contract reach 90% completion. Balance revenue is recognized at the time of receipt of customer acceptance. Proportionate completion is measured based upon the efforts incurred to date in relation to the total estimated efforts to complete the contract. The Company monitors estimates of total contract revenue and cost on a routine basis throughout the delivery period. The cumulative impact of any change in estimates of the contract revenue or costs is reflected in the period in which the changes become known. In the event that a loss is anticipated on a particular contract, provision is made for the estimated loss.
Cost and revenue in excess of billings is classified as unbilled revenue while billing in excess of revenue is classified as deferred revenue.
Reimbursable expenses for projects are invoiced separately to customers and although reflected as sundry debtors to the extent outstanding as at year end, are not included as revenue or expense.
Interest income
Interest income is recognized on a time proportion basis taking into account the amount outstanding and the rate applicable.
g. Research and development expenses for software products
Research and development costs are expensed as incurred. Software product development costs are expensed as incurred until technological feasibility is established. Software product development costs incurred subsequent to the achievement of technological feasibility are not material and are expensed as incurred.
h. Employee benefits
The Company’s employee benefits primarily cover provident fund, superannuation, gratuity and compensated absences.
Provident fund and superannuation fund are defined contribution schemes and the Company has no further obligation beyond the contributions made to the fund. Contributions are charged to profit and loss account in the year in which they accrue.
Gratuity liability is a defined benefit obligation and is recorded based on actuarial valuation on projected unit credit method made at the end of the year. The gratuity liability and net periodic gratuity cost is actuarially determined after considering discount rates, expected long term return on plan assets and increase in compensation levels. All actuarial gain/loss are immediately recorded to the profit and loss account and are not deferred. The Company makes contributions to a fund administered and managed by the Life Insurance Corporation of India (LIC) to fund the gratuity liability. Under this scheme, the obligation to pay gratuity remains with the Company, although LIC administers the scheme.
Short term compensated absences are provided for based on estimates. Long term compensated absences are provided for based on actuarial valuation. The actuarial valuation is done as per projected unit credit method.
i. Leases
a. Where the Company is the lessee
Lease of assets under which substantially all the risks and benefits incidental to ownership are transferred to the Company are classified as finance leases. These assets are capitalized at the lower of the fair value and present value of the minimum lease payments at the inception of the lease term and disclosed as leased assets. Lease payments are apportioned between the finance charges and reduction of the lease liability based on the implicit rate of return. Finance charges are charged directly against income. Lease management fees, legal charges and other initial direct costs are capitalized.
Leases of assets under which all the risks and rewards of ownership are effectively retained by the lessor are classified as operating leases. Lease payments under operating leases are recognized as an expense on a straight‑line basis over the lease term.
b. Where the Company is the lessor
Assets given under a finance lease are recognized as a receivable at an amount equal to the net investment in the lease. Lease rentals are apportioned between principal and interest on the IRR method. The principal amount received reduces the net investment in the lease and interest is recognized as revenue.
j. Income‑tax
Tax expense comprises of current, deferred and fringe benefit tax. Current income tax and fringe benefit tax is measured at the amount expected to be paid to the tax authorities in accordance with the Indian Income Tax Act, 1961 (‘Indian Income Tax Act’). Deferred income taxes are recognized for the future tax consequences attributable to timing differences between the financial statement determination of income and their recognition for tax purposes. Deferred tax is measured based on the tax rates and the tax laws enacted or substantively enacted at the balance sheet date. Deferred tax assets are recognized and carried forward only to the extent that there is a reasonable certainty that sufficient future taxable income will be available against which such deferred tax assets can be
Annual Report 2009_2010_Colour.indd 59 7/24/2010 10:59:18 AM

Oracle Financial Services Software – Annual Report 2009-10
realized. Unrecognized deferred tax assets of earlier years are re‑assessed and recognized to the extent that it has become reasonably certain that future taxable income will be available against which deferred tax assets can be realized. Deferred tax asset is recognized only on those timing differences, which reverses in post tax free period, as Company enjoys exemption under Section 10A of Indian Income Tax Act.
Minimum Alternative tax (‘MAT’) credit is recognized as an asset only when and to the extent there is convincing evidence that the Company will pay normal income tax during the specified period. In the year in which the MAT credit becomes eligible to be recognized as an asset in accordance with the recommendations contained in guidance note issued by the Institute of Chartered Accountants of India (‘ICAI’), the said asset is created by way of a credit to the profit and loss account and shown as MAT Credit Entitlement. The Company reviews the same at each balance sheet date and writes down the carrying amount of MAT Credit Entitlement to the extent there is no longer convincing evidence to the effect that Company will pay normal Income Tax during the specified period.
k. Earnings per share
The earnings considered in ascertaining the Company’s earnings per share comprise the net profit after tax. The number of shares used in computing basic earnings per share is the weighted average number of shares outstanding during the year. The number of shares used in computing diluted earnings per share comprises the weighted average number of shares considered for deriving basic earnings per share, and also the weighted average number of shares, if any which would have been issued on the conversion of all dilutive potential equity shares. The weighted average number of shares and potentially dilutive equity shares are adjusted for the bonus shares and sub‑division of shares.
l. Share‑based compensation/payments
Measurement and disclosure of the employee share‑based payment plans is done in accordance with the Securities and Exchange Board of India (‘SEBI’) (Employee Stock Option Scheme and Employee Stock Purchase Scheme) Guidelines, 1999 and the Guidance Note on Accounting for Employee Share‑based Payments, issued by the ICAI. The Company uses the intrinsic value method of accounting for its employee share based compensation plan and other share based arrangements. Under this method compensation expense is recorded over the vesting period of the option on a straight line basis, if the fair market value of the underlying stock exceeds the exercise price at the measurement date, which typically is the grant date.
m. Provision and contingencies
A provision is recognized when an enterprise has a present obligation as a result of past event and it is probable that an outflow of resources will be required to settle the obligation, in respect of which a reliable estimate can be made. Provisions are not discounted to its present value and are determined based on management estimate required to settle the obligation at the balance sheet date. These are reviewed at each balance sheet date and adjusted to reflect the current management estimates.
n. Cash and cash equivalents
Cash and cash equivalents in the balance sheet comprise cash at bank and in hand and short‑term investments with an original maturity of three months or less.
3. Commitments and contingent liabilities
a. Capital commitments
Contracts remaining to be executed on capital account and not provided for (net of advances) aggregates to Rs. 1,957,451 (includes capital commitment through issuance of letter of intents of Rs. 979,350 (March 31, 2009 – Rs. 260,505) as at March 31, 2010 (March 31, 2009 – Rs. 1,419,990).
b. Contingent liabilities
Disputed liability in respect of Income‑tax demands as at March 31, 2010 Rs. Nil (March 31, 2009 – Rs. 285,638).
Annual Report 2009_2010_Colour.indd 60 7/24/2010 10:59:18 AM

61
4. Leases
a. Where Company is lessee
Finance lease
The Company takes vehicles under finance lease of upto five years. None of the lease agreements have an escalation clause. Future minimum lease payments under finance lease as at March 31, 2010 and 2009 are as follows:
As at March 31, 2010
Principal Interest TotalNot later than one year 10,013 3,621 13,634Later than one year but not later than five years 25,952 4,648 30,600Total minimum payments 35,965 8,269 44,234
As at March 31, 2009
Principal Interest TotalNot later than one year 7,245 1,716 8,961Later than one year but not later than five years 13,407 2,096 15,503Total minimum payments 20,652 3,812 24,464
Operating lease
The Company has taken certain office premises and residential premises for employees under operating lease, which expire at various dates through year 2025. Some of the lease agreements have a price escalation clause. Gross rental expenses for the year ended March 31, 2010 aggregated to Rs. 399,300 (March 31, 2009 – Rs. 524,021). The minimum rental payments to be made in future in respect of these leases are as follows:
March 31, 2010 March 31, 2009
Not later than one year 475,195 445,876Later than one year but not later than five years 855,253 741,176Later than five years 2,150,147 1,395,955
3,480,595 2,583,007
b. Where Company is lessor
The Company has given IT equipments under finance lease for a period of five years. Present value of minimum lease payments receivable under this finance lease as at March 31, 2010 and 2009 are as follows:
As at March 31, 2010
Principal Interest TotalNot later than one year 6,980 1,199 8,179Later than one year but not later than five years – – –Total minimum payments 6,980 1,199 8,179
As at March 31, 2009
Principal Interest TotalNot later than one year 5,875 4,764 10,639Later than one year but not later than five years 4,539 2,051 6,590Total minimum payments 10,414 6,815 17,229
Annual Report 2009_2010_Colour.indd 61 7/23/2010 9:04:28 PM

Oracle Financial Services Software – Annual Report 2009‑10
5. Derivatives
The Company enters into forward foreign exchange contracts and option contracts where the counter party is a bank. The Company purchases forward foreign exchange contracts and option contracts to mitigate the risks of change in foreign exchange rate on receivables and payables denominated in certain foreign currencies. The Company considers the risk of non‑performance by the counter party as non‑material. During the year ended March 31, 2010, the Company has not entered in to any forward contract or option contracts. As at March 31, 2010 and 2009 the Company has following outstanding derivative instruments:
(Amounts in thousands, foreign currency)
March 31, 2010 March 31, 2009
ParticularsForward contracts – SellIn $ (US) – 9,000
As of the balance sheet date, the Company’s net foreign currency exposure that is not hedged is Rs. 21,552,027 (March 31, 2009 – Rs. 19,094,976).
6. Share‑based compensation/payments
a. Employee Stock Purchase Scheme (‘ESPS’)
The Company has adopted the ESPS administered through a Trust (“the Trust”) to provide equity based incentives to key employees of the Company. The Trust purchases shares of the Company from market using the proceeds of loans obtained from the Company. Such shares are offered by the Trust to employees at an exercise price, which approximates the fair value on the date of the grant. The employees can purchase the shares in a phased manner over a period of five years based on continued employment, until which, the Trust holds the shares for the benefit of the employee. The employee will be entitled to receive dividends, bonus, etc., that may be declared by the Company from time to time for the entire portion of shares held by the Trust on behalf of the employees.
On the acceptance of the offer, the selected employee shall undertake to pay within ten years from the date of acceptance of the offer the cost of the shares incurred by the Trust including repayment of the loan relatable thereto. The repayment of the loan by the Trust to the Company would be dependent on employee repaying the amount to the Trust. In case the employee resigns from employment, the rights relating to shares, which are eligible for exercise, may be purchased by payment of the exercise price whereas, the balance shares shall be forfeited in favor of the Trust. The Trustees have the right of recourse against the employee for any amounts that may remain unpaid on the shares accepted by the employee. The shares that an employee is eligible to exercise during the initial five‑year period merely go to determine the amount and scheduling of the loan to be repaid on exercise by the employee. The Trust shall repay the loan obtained from the Company on receipt of payments from employees against shares exercised or otherwise.
The Securities and Exchange Board of India (‘SEBI’) has issued the Employee Stock Option Scheme and Stock Purchase Guidelines, 1999 (‘SEBI guidelines’), which are applicable to stock purchase schemes for employees of all listed Companies. In accordance with these guidelines, the excess of market price of the underlying equity shares on the date of grant of the stock options over the exercise price of the options is to be recognized in the books of account and amortized over the vesting period. However, no compensation cost has been recorded as the scheme terms are fixed and the exercise price equals the market price of the underlying stock on the grant date.
A summary of the activity in the Company’s ESPS is as follows:
Year ended March 31, 2010
Year ended March 31, 2009
Number of shares Number of sharesOpening balance of unallocated shares 165,145 158,963Shares forfeited during the year 5 6,182Closing balance of unallocated shares 165,150 165,145
Opening balance of allocated shares 134,834 221,101Shares exercised during the year (80,281) (80,085)Shares forfeited during the year (5) (6,182)Closing balance of allocated shares 54,548 134,834
Shares eligible for exercise 54,548 74,534Shares not eligible for exercise – 60,300Total allocated shares 54,548 134,834
Annual Report 2009_2010_Colour.indd 62 7/23/2010 9:04:28 PM

63
b. Employee Stock Option Plan (‘ESOP’)
Pursuant to ESOP scheme approved by the shareholders of the Company held on August 14, 2001, the Board of Directors, on March 4, 2002 approved the Employees Stock Option Scheme (‘the Scheme’) for issue of 4,753,600 options to the employees and directors of the Company and its subsidiaries. According to the Scheme, the Company has granted 4,548,920 options prior to the IPO and 559,000 options at various dates after IPO. As per the scheme, each of 20% of the total options granted will vest to the eligible employees and directors on completion of 12, 24, 36, 48 and 60 months and is subject to continued employment of the employee or director with the company or its subsidiaries. Options have exercise period of 10 years. The employee pays the exercise price upon exercise of option.
A summary of the activity in the Company’s ESOP is as follows:
Year ended March 31, 2010 Year ended March 31, 2009Shares arising from options
Weighted average exercise price (Rs.)
Shares arising from options
Weighted average exercise price (Rs.)
Outstanding at beginning of year 348,853 1,075 431,253 1,025Exercised (85,471) 819 (21,945) 491Forfeited (21,000) 1,232 (60,455) 930Outstanding at end of the year 242,382 1,152 348,853 1,075
The weighted average share price for the year over which stock options were exercised was Rs. 2,250.
The details of options unvested and options vested and exercisable as on March 31, 2010 are as follows:
Range of exercise prices (Rs.)
Shares Weighted average exercise price (Rs.)
Weighted average remaining
contractual life (Years)
Options unvested 419 – 560 – – –1,291 – 1,291 101,000 1,291 6.1
Options vested and exercisable 265 – 265 32,800 265 1.9 419 – 560 32 514 3.3
1,291 – 1,291 108,550 1,291 6.1242,382 1,152 5.5
The details of options unvested and options vested and exercisable as on March 31, 2009 were as follows:
Range of exercise prices (Rs.)
Shares Weighted average exercise price (Rs.)
Weighted average remaining
contractual life (Years)
Options unvested 419 – 560 2,000 560 5.41,291 – 1,291 165,300 1,291 7.1
Options vested and exercisable 265 – 265 40,400 265 2.9419 – 560 39,003 462 3.9
1,291 – 1,291 102,150 1,291 7.1348,853 1,075 6.3
Had compensation cost been determined in a manner consistent with the fair value approach, the Company’s net profit and earnings per share as reported would have changed to the amounts indicated below:
Year ended March 31, 2010
Year ended March 31, 2009
Net profit as reported 6,608,488 6,957,116Add: Compensation expense included in reported profit – –Less: Compensation expense determined using fair value of options (5,659) (11,135)
Proforma net profit 6,602,829 6,945,981Basic earnings per share
As reported 78.87 83.06Proforma 78.80 82.92
Diluted earnings per shareAs reported 78.72 83.03Proforma 78.65 82.89
Annual Report 2009_2010_Colour.indd 63 7/23/2010 9:04:28 PM

Oracle Financial Services Software – Annual Report 2009‑10
7. Employee benefit obligation
Defined contribution plans
During year ended March 31, 2010 and 2009, the Company contributed following amounts to defined contributions plans:
Year ended March 31, 2010
Year ended March 31, 2009
ParticularsProvident fund 172,165 180,152Superannuation fund 55,094 56,118 227,259 236,270
Defined benefit plan – gratuity
The amounts recognized in the profit and loss account for the year ended March 31, 2010 and 2009 are as follows:
Year ended March 31, 2010
Year ended March 31, 2009
ParticularsCurrent service cost 46,321 37,626Interest cost 18,178 15,224Expected return on plan assets (2,515) (99)Recognized net actuarial (gain) loss (21,955) 20,671Total included in ‘employee benefit expense’ 40,029 73,422Actual return on plan assets 331 356
The amounts recognized in the balance sheet are as follows:
Year ended March 31, 2010
Year ended March 31, 2009
ParticularsPresent value of funded obligations 257,770 231,672Fair value of plan assets (2,358) (1,468)Net liability 255,412 230,204
Changes in present value of defined benefit obligation representing reconciliation of opening and closing balances thereof are as follows:
Year ended March 31, 2010
Year ended March 31, 2009
ParticularsDefined benefit obligation at beginning of the year 231,672 173,999Current service cost 46,321 37,627Interest cost 18,178 15,224Benefits paid (14,262) (16,106)Actuarial (gain) loss (24,139) 20,928Defined benefit obligation at end of the year 257,770 231,672
Changes in the fair value of plan assets representing reconciliation of opening and closing balances thereof are as follows:
Year ended March 31, 2010
Year ended March 31, 2009
ParticularsFair value of plan assets at beginning of the year 1,468 228Expected return on plan assets 2,515 99Actuarial (gain) loss (2,184) 257Contribution by employer 14,821 16,990Benefits paid (14,262) (16,106)Fair value of plan assets at end of the year 2,358 1,468
Plan assets are administered by LIC and 100% of the plan assets are invested in lower risk assets, primarily in debt securities.
Annual Report 2009_2010_Colour.indd 64 7/23/2010 9:04:28 PM

65
The assumptions used in accounting for the gratuity plan are set out as below:
March 31, 2010 March 31, 2009
Discount rate 7.60% 6.99%Expected return on plan assets 7.50% 7.50%
Withdrawal rates Age (Years) Rates Age (Years) Rates21 – 30 21% 21 – 30 20%31 – 34 19% 31 – 34 20%35 – 44 13% 35 – 44 15%45 – 59 9% 45 – 59 8%
The estimates of future salary increase, considered in actuarial valuation, take account of inflation, seniority, promotions and other relevant factors such as supply and demand in the employment market.
The Company evaluates these assumptions annually based on its long‑term plans of growth and industry standards. The discount rates are based on current market yields on government bonds consistent with the currency and estimated term of the post employment benefits obligations. Plan assets are administered by the LIC and invested in lower risk assets, primarily debt securities. The Company’s contribution to the fund for the year ending March 31, 2011 is expected to be Rs. 25,000.
The expected benefit payments from the fund as of March 31, 2010 are below:
Year ending March 31 Amount
2011 40,6462012 48,2212013 57,4082014 59,2902015 60,3092016 – 2020 253,774
Present value of the defined benefit obligation, fair value of the plan assets, deficit and experience adjustments in the plan assets and liabilities for the current year and previous three years are as follows:
Year ended March 31, 2010
Year ended March 31, 2009
Year ended March 31, 2008
Year ended March 31, 2007
ParticularsPresent value of funded obligations (257,770) (231,672) (173,999) (131,397)Fair value of plan assets 2,358 1,468 228 4,697Deficit (255,412) (230,204) (173,771) (126,700)Experience adjustments
On plan liabilities (13,345) (719) 20,047 6,632On plan assets (2,184) 257 (469) 9
The Company has adopted AS 15 (Revised) from April 1, 2006 and thereby has not given disclosures of the above for the year ended March 31, 2006.
8. Segment information
Business segments are defined as a distinguishable component of an enterprise that is engaged in providing a group of related products or services and that is subject to differing risks and returns and about which separate financial information is available. This information is reviewed and evaluated regularly by the management in deciding how to allocate resources and in assessing the performance.
The Company is organized by business segment and geographically. For management purposes the Company is primarily organized on a worldwide basis into two business segments:
a. Product licenses and related activities (‘Products’) and
b. IT solutions and consulting services (‘Services’).
The business segments are the basis on which the Company reports its primary operational information to management. Product licenses and related activities segment deals with various banking software products. The related activities include enhancements, implementation and maintenance activities.
Annual Report 2009_2010_Colour.indd 65 7/23/2010 9:04:29 PM

Oracle Financial Services Software – Annual Report 2009‑10
Oracle Financial Services Consulting offers services spanning the entire lifecycle of applications used by financial services institutions. The division’s portfolio includes Consulting, Application, Support and Technology Services that help institutions improve efficiency, optimize cost, meet risk and compliance mandates and implement IT solutions finely attuned to their business needs.
Year ended March 31, 2010
Particulars Products Services Corporate Total Revenue 15,178,505 7,256,191 – 22,434,696 Cost of revenue (6,159,690) (5,173,925) – (11,333,615)Gross profit 9,018,815 2,082,266 – 11,101,081 Selling and marketing expenses [Refer note 12 of schedule 15] (359,124) (61,844) – (420,968)
General and administrative expenses (838,986) (558,591) (752,037) (2,149,614)Depreciation and amortization (159,053) (175,534) (39,515) (374,102)Operating profit 7,661,652 1,286,297 (791,552) 8,156,397 Interest income 680,051 Foreign exchange (loss), net (1,363,733)Other income, net 967 Profit before provision for taxes 7,473,682 Provision for taxes (865,194)Net profit 6,608,488
Other informationCapital expenditure by segment 53,074 20,227 12,377 85,678 Other non cash expenses (12,516) (3,156) – (15,672)Segment assets 7,400,540 5,966,207 34,521,481 47,888,228 Segment liabilities 3,537,286 1,966,612 603,644 6,107,542 Shareholders' funds – – 41,780,686 41,780,686
Year ended March 31, 2009
Particulars Products Services Corporate Total Revenue 14,391,599 7,734,632 – 22,126,231 Cost of revenue (6,236,441) (5,691,200) – (11,927,641)Gross profit 8,155,158 2,043,432 – 10,198,590 Selling and marketing expenses (876,050) (164,195) – (1,040,245)General and administrative expenses (851,908) (680,361) (1,088,710) (2,620,979)Depreciation and amortization (194,881) (177,585) (55,939) (428,405)Operating profit 6,232,319 1,021,291 (1,144,649) 6,108,961 Interest income 723,511 Foreign exchange gain, net 954,175 Other income, net 5,178 Profit before exceptional item and provision for taxes 7,791,825
Exceptional item (Refer note 13 of schedule 15) (468,900)
Profit before provision for taxes 7,322,925 Provision for taxes (365,809)Net profit 6,957,116
Other informationCapital expenditure by segment 66,844 608,308 318,494 993,646 Other non cash expenses 288,419 60,494 – 348,913 Segment assets 8,745,212 7,105,693 26,323,577 42,174,482 Segment liabilities 4,588,915 1,914,164 577,181 7,080,260Shareholders' funds – – 35,094,222 35,094,222
Annual Report 2009_2010_Colour.indd 66 7/23/2010 9:04:29 PM

67
Segment revenue and expense:
Revenue is generated through licensing of software products as well as by providing software solutions to the customers including consulting services. The expenses which are not directly attributable to a business segment are classified as unallocated corporate expenses and shown under corporate in the segment disclosure above.
Segment assets and liabilities:
Segment assets include all operating assets used by a segment and consist principally of debtors, net of allowances, unbilled revenue, deposits for premises and fixed assets. Segment liabilities primarily includes deferred revenues, finance lease obligation, advance from customer, accrued employee cost and other current liabilities. While most of such assets and liabilities can be directly attributed to individual segments, the carrying amount of certain assets and liabilities used jointly by two or more segments is allocated to the segment on a reasonable basis. Assets and liabilities that cannot be allocated between the segments are shown as part of corporate assets and liabilities.
Geographical segments
The following table shows the distribution of the Company’s sales by geographical market:
Year ended March 31, 2010 Year ended March 31, 2009
Regions Amount % Amount %United States of America 5,937,716 27% 5,262,766 24%Europe 7,431,197 33% 7,884,872 36%Asia Pacific 5,022,548 22% 4,444,099 20%Middle East, India and Africa 3,571,101 16% 4,127,499 18%Latin America and Caribbean 472,134 2% 406,995 2%
22,434,696 100% 22,126,231 100%
The following table shows the Company’s assets by geographical market:
Year ended March 31, 2010 Year ended March 31, 2009
Regions Amount % Amount %United States of America 10,706,194 22% 11,239,232 27%Europe 3,149,850 7% 4,466,519 10%Asia Pacific 4,038,337 8% 3,388,629 8%Middle East, India and Africa 29,925,492 62% 22,713,435 54%Latin America and Caribbean 68,355 1% 366,667 1%
47,888,228 100% 42,174,482 100%
Annual Report 2009_2010_Colour.indd 67 7/23/2010 9:04:29 PM

Oracle Financial Services Software – Annual Report 2009‑10
9. Names of related parties and description of relationship:
Relationship Names of related parties
Ultimate Holding Company Oracle Corporation
Holding Company Oracle Global (Mauritius) Limited
Fellow Subsidiaries Oracle USA, Inc.Oracle Egypt LimitedOracle Netherlands B.V.Oracle Systems LimitedOracle India Private Limited Oracle Corporation (Pty) LimitedOracle Corporation Australia Pty Ltd.Oracle Corporation South Africa (PTY) Ltd.Oracle Corporation (Thailand) Co. LtdOracle Research & Development Centre (shenzhen) Co., Ltd
Direct Subsidiaries Oracle Financial Services Software B.V.Oracle Financial Services Software Pte. Ltd.Oracle Financial Services Software Chile Limitada (from November 26, 2009)Oracle Financial Services Software (Shanghai) Limited (from February 23, 2010)Oracle Financial Services Software America, Inc.ISP Internet Mauritius CompanyOracle (OFSS) Processing Services LimitedOracle (OFSS) ASP Private Limited
Subsidiaries of Subsidiaries Subsidiary of Oracle Financial Services Software B.V.Oracle Financial Services Software SA
Subsidiary of Oracle Financial Services Software Pte. Ltd.Oracle Financial Services Consulting Pte. Ltd
Subsidiaries of Oracle Financial Services Software America, Inc.Oracle Financial Services Software Inc.i‑flex solutions Inc. (Canada)Subsidiaries of i‑flex solutions Inc. (Canada)
Castek Software Factory Ltd.Castek RBG Inc.Castek Inc.Mantas Inc.
Subsidiaries of Mantas Inc.Mantas Singapore Pte. Ltd.Mantas India Private Limited.Mantas LimitedSotas Inc.
Subsidiaries of ISP Internet Mauritius Companyi‑flex Processing Services Inc.Oracle (OFSS) BPO Services Limited (formerly known as Equinox Global Services Limited.)
Associates Login SA
Key Managerial Personnel ('KMP') R Ravisankar – Vice Chairman (Whole‑time Director)N R Kothandaraman (N R K Raman) – Managing Director and Chief Executive OfficerMakarand Padalkar – Chief Financial OfficerAvadhut (Vinay) Ketkar – Chief Accounting OfficerJoseph John – Executive Vice President, Universal Banking ProductsV Shankar – Executive Vice President and Global Head, PrimeSourcing & Insurance Solutions
Atul Gupta – Sr. Vice President, Process and Quality Management GroupVijay Sharma – Sr. Vice President, Oracle Financial Services Consulting Pte. LtdS Hariharan – Sr. Vice President, Infrastructure Services GroupVivek Govilkar – Sr. Vice President, Human Resources and TrainingV Srinivasan – Vice President, Corporate Development and Chief of StaffVikram Gupta – Vice President Private Wealth Management
Annual Report 2009_2010_Colour.indd 68 7/23/2010 9:04:29 PM

69
Transactions and balances outstanding with these parties are described below:
Transactions Amount receivable (payable)Year ended
March 31, 2010Year ended
March 31, 2009As at
March 31, 2010As at
March 31, 2009
RevenueFellow Subsidiaries
Oracle USA, Inc. 447,898 88,116 402,107 78,690 Oracle Corporation Australia Pty Ltd 3,459 – – 7,479 Oracle Corporation (Pty) Limited – 6,676 – –Oracle India Private Limited 1,430 – 1,577 63 Oracle Egypt Limited 20,258 – 9,428 –Oracle Corporation (Thailand) Co., Ltd – – 163 –
SubsidiariesOracle Financial Services Software B.V. 5,304,900 5,656,209 1,111,942 2,125,494 Oracle Financial Services Software, Inc. 4,852,638 4,785,091 2,917,804 4,040,840Oracle Financial Services Software Pte. Ltd. 4,324,903 3,900,002 2,558,002 2,466,268 Oracle Financial Services Consulting Pte. Ltd. – – 8,944 15,692 Oracle Financial Services Software (Shanghai) Limited 182,752 – – –i‑flex Processing Services Inc. – – 19,971 22,545 Oracle (OFSS) BPO Services Limited – – 1,428 1,428 Mantas Inc. – – 4,996 –i‑flex solutions Inc. (Canada) – (7,669) 19,972 22,546 Oracle Financial Services Software SA 888,802 942,819 191,664 350,462 Oracle (OFSS) ASP Private Limited 13,910 39,420 1,600 31,113
Unbilled revenueFellow Subsidiaries
Oracle USA, Inc – – 13,805 12,629 Oracle Egypt Limited – – 440 –
SubsidiariesOracle Financial Services Software B.V. – – 427,074 342,823 Oracle Financial Services Software Inc. – – 496,140 260,963 Oracle Financial Services Software Pte. Ltd. – – 332,143 285,764 Oracle Financial Services Software (Shanghai) Limited – – 182,752 –Oracle Financial Services Software SA – – 11,725 65,482 Oracle (OFSS) ASP Private Limited – – – 9,336
Deferred revenue Fellow Subsidiaries
Oracle USA, Inc – – (334) (87)Oracle Corporation (Pty) Limited – – – (3,459)
Subsidiaries Oracle Financial Services Software B.V. – – (380,664) (493,867)Oracle Financial Services Software, Inc. – – (161,025) (280,310)Oracle Financial Services Software Pte. Ltd. – – (233,572) (351,134)Oracle Financial Services Software SA – – (106,592) (111,140)Oracle (OFSS) ASP Private Limited – – (1,556) (4,703)
Advance received from CustomersFellow Subsidiaries
Oracle Corporation (Pty) Limited – 25,353 – (38,077)Oracle Egypt Limited 2,638 – (2,638) –Oracle USA, Inc. 343,188 – (343,188) –
Provision for doubtful debtsFellow Subsidiaries
Oracle India Private Limited (13) (13) – (13)Oracle USA, Inc. 2,019 – (2,019) –
Subsidiaries Oracle Financial Services Software B.V. (32,320) 76,023 (70,636) (102,956)Oracle Financial Services Software, Inc. (15,084) 108,365 (166,503) (181,587)Oracle Financial Services Software Pte. Ltd. 15,253 47,748 (95,900) (80,647)i‑flex solutions Inc. (Canada) (2,574) 22,546 (19,972) (22,546)Oracle Financial Services Software SA 295 – (295) –Mantas Inc. 25 – (25) –
Annual Report 2009_2010_Colour.indd 69 7/24/2010 1:45:57 PM

Oracle Financial Services Software – Annual Report 2009‑10
Transactions Amount receivable (payable)Year ended
March 31, 2010Year ended
March 31, 2009As at
March 31, 2010As at
March 31, 2009
Professional feesFellow Subsidiaries
Oracle India Private Limited – 8,042 – –Oracle Research & Development Center (shezhen) Co., Ltd 59,764 – (53,788) –
SubsidiariesMantas Inc. – – – –Oracle Financial Services Software Inc. 18,146 – – –Oracle (OFSS) ASP Private Limited 86,125 72,499 (20,323) (34,927)
AssociateLogin SA – 11,379 – –
Lease rentKey managerial personnel 1,429 1,722 – –
Application softwareFellow Subsidiaries
Oracle India Private Limited 102,531 157,469 (15,108) –Oracle Systems Limited 2,348 – – –
SubsidiariesOracle Financial Services Software Inc. 18,146 18,650 – (18,216)
Reimbursement of expenses Subsidiaries
Oracle Financial Services Software B.V. 1,199,291 1,262,608 (192,753) (249,001)Oracle Financial Services Software Inc. 1,934,624 2,773,057 (1,107,834) (1,410,685)Oracle Financial Services Software Pte. Ltd. 1,359,622 1,543,807 (488,980) (428,616)Oracle (OFSS) Processing Services Limited 181 (47,646) 50,547 50,366 Oracle (OFSS) ASP Private Limited (25,505) (24,012) 85,132 60,290
RemunerationKey managerial personnel [Refer note 1 below] 89,252 110,723 – –
Rent paidFellow subsidiaries
Oracle Netherlands B.V 3,414 – – –Oracle Corporation South Africa (PTY) Ltd. 372 – 372 –
Key managerial personnel 96 84 – –
Rental depositKey managerial personnel – – 100 100
Advance rent Key managerial personnel – 70 – 42
Annual Report 2009_2010_Colour.indd 70 7/23/2010 9:04:30 PM

71
Maximum balance outstanding during the year were as follows:
March 2010 March 2009
Oracle Financial Services Software America, Inc. 501,670 509,030 ISP Internet Mauritius Company 47,653 48,353 Oracle (OFSS) BPO Services Limited 500,000 500,000
Transactions Amount receivable (payable)Year ended
March 31, 2010Year ended
March 31, 2009As at
March 31, 2010As at
March 31, 2009
Loan outstandingSubsidiaries
Oracle Financial Services Software America, Inc. [Refer note 2 below] (58,120) 110,230 450,910 509,030
ISP Internet Mauritius Company. [Refer note 2 below] (5,521) 10,471 42,832 48,353
Oracle (OFSS) BPO Services Limited. [Refer note 3 below] – – 500,000 500,000
Interest on loan givenSubsidiaries
Oracle Financial Services Software America, Inc. 7,583 14,745 103,062 108,237 ISP Internet Mauritius Company 1,591 1,569 7,987 7,316
Provision for diminution in investmentSubsidiaries
ISP Internet Mauritius Company – – (120,000) (120,000)Oracle (OFSS) ASP Private Limited – – (20,680) (20,680)
Investments during the yearSubsidiaries
Oracle Financial Services Software (Shanghai) Limited 45,505 – – –
Notes:1. Remuneration includes salary, bonus and perquisites. The bonus is included on payment basis. As the liabilities for gratuity and compensated
absence are provided on an actuarial basis for the Company as a whole, the amounts pertaining to individual KMP are not included above.2. Loan given to subsidiaries represents loan to Oracle Financial Services Software America, Inc. amounting to Rs. 450,910 (interest LIBOR + 50
basis points) as at March 31, 2010 (March 31, 2009 – 509,030) and ISP Internet Mauritius Company amounting to Rs. 42,832 (interest LIBOR + 50 basis points) as at March 31, 2010 (March 31, 2009 – 48,353). No additional loans have been given during the year. The amount shown above is towards the revaluation impact of the outstanding loans.
3. Loan given to Oracle (OFSS) BPO Services Limited had a conversion option into their equity shares which can be exercised by the Company till May 31, 2010. In case of such a conversion, interest on the loan at the rate of 8% p.a. would not be payable by Oracle (OFSS) BPO Services Limited and hence no interest has been accrued on the loan. The conversion option can be further extended on mutually agreed terms.
Annual Report 2009_2010_Colour.indd 71 7/23/2010 9:04:30 PM

Oracle Financial Services Software – Annual Report 2009‑10
Year ended March 31, 2010
Year ended March 31, 2009
10. Supplementary information
a. Aggregate expensesFollowing are the aggregate amounts incurred on certain specific expenses that are required to be disclosed under Schedule VI to the Act:
Salaries and bonus 10,000,741 9,987,101 Staff welfare expenses 217,320 277,618 Contribution to provident and other funds 267,548 310,332 Travel related expenses (net of recoveries) 1,482,842 1,549,850 Professional fees [Refer note 12 of schedule 15] 701,402 1,271,715 Application software 186,054 552,860 Communication expenses 142,567 149,557 Rent 407,798 534,783 Advertising expenses 3,485 9,949 Power 189,348 217,985 Insurance 20,640 20,204 Repairs and maintenance:
Buildings and leasehold premises 28,941 37,211 Computer equipments 49,606 37,065 Others 46,306 40,631
Rates and taxes 114,841 25,848 Finance charge on leased assets 2,326 2,948 Provision for doubtful debts, net (15,672) 348,913 Bad debts 6,849 4,480 Other expenses 51,255 209,815
13,904,197 15,588,865
b. Managerial remuneration (on accrual basis)Salary and incentives 21,422 9,666 Contribution to provident and other funds 477 445 Commission to non whole‑time directors 2,100 2,415
23,999 12,526
Remuneration includes salary, bonus and perquisites. The bonus is included on payment basis. As the liabilities for gratuity and compensated absence are provided on an actuarial basis for the Company as a whole, the amounts pertaining to the directors are not included above.
Computation of net profit for calculating commission payable to non‑whole‑time directors in accordance with Section 349 of the Act:
Net profit after tax 6,608,488 6,957,116 Add:Managerial remuneration 21,899 10,111 Commission to non‑whole‑time Directors 2,100 2,415 Depreciation and amortization as per books of accounts 374,102 428,405 Donation 5,361 10,815 Provision for doubtful debts (15,672) 348,913 Provision for income taxes 865,194 365,809
7,861,472 8,123,584 Less:Profit on sale of fixed assets, net – –Depreciation and amortization as per Section 350 of the Act [Refer note below] 374,102 428,405 Net profit on which commission is payable 7,487,370 7,695,179
Commission payable to non‑whole‑time Director:Maximum allowed as per Companies Act, 1956 (1 percent) 74,874 76,952 Maximum approved by the shareholders (1 percent) 74,874 76,952 Commission approved by the Board of Directors 2,100 2,415
Note: The Company depreciates fixed assets based on estimated useful lives of the assets. The rates of depreciation used by the Company are higher than the minimum rates prescribed by Schedule XIV of the Act.
c. Payments to auditorsAs Auditor:
Statutory audits (including quarterly audits) 5,515 5,515 Tax audit 662 662 Special reports – 1,765 Certifications 579 441 Out‑of‑pocket expenses 507 811
7,263 9,194 In other manner:
Special reports 1,324 –
Annual Report 2009_2010_Colour.indd 72 7/23/2010 9:04:31 PM

73
Year ended March 31, 2010
Year ended March 31, 2009
d. Earnings in foreign currency (on accrual basis)Product licenses and related revenue 14,434,978 13,575,678 IT solutions and consulting services 7,187,175 7,658,483 Interest income 31,637 16,314
21,653,790 21,250,475
e. Expenditure in foreign currency (on accrual basis)Salaries and bonus 4,194,554 4,627,356 Travelling, net of recovery 1,053,991 1,196,716 Professional fees 481,769 989,617 Exceptional item [Refer note 13 of schedule 15] – 468,900 Application software 45,069 97,042 Foreign taxes 104,169 108,705 Others 47,116 38,957
5,926,668 7,527,293
f. Value of imports on CIF basis ‑ capital goods 88,205 61,974
11. Investments in wholly owned subsidiaries
a. As at March 31, 2010, the Company has total investment of Rs. 6,291,743 in Oracle Financial Services Software America, Inc. (‘OAI’). Further, the Company has loan outstanding of Rs. 450,910 to OAI. OAI is the holding company for US operations and has acquired Companies in earlier years. On a consolidated basis, OAI along with subsidiaries (‘OAI Group’) has accumulated losses of Rs. 1,434,248 as at March 31, 2010. The OAI Group has posted a profit of Rs. 222,562 for the year ended March 31, 2010. Based on the assessment of the estimated future cash flows from the US operations and the results of the current year, the management of the Company believes that no provision is required towards diminution in the value of investment in OAI as at March 31, 2010.
b. As at March 31, 2010, the Company has total investment of Rs. 192,115 in ISP Internet Mauritius Company (‘ISP’) which is the holding company of i‑flex Processing Services Inc, US and Oracle (OFSS) BPO Services Limited, India, entities operating in business of Business Process Outsourcing (BPO). The Company has further granted a loan of Rs. 42,832 to ISP and Rs. 500,000 to Oracle (OFSS) BPO Services Limited. On a consolidated basis, ISP and its subsidiaries (‘ISP Group’) have accumulated losses amounting to Rs. 30,230 as at March 31, 2010. However ISP Group has posted a profit of Rs. 134,077 for the year ended March 31, 2010. Accordingly, the Company believes that Rs. 120,000 recorded as diminution in value of investment in previous year is appropriate and no further diminution in value is considered necessary as at the balance sheet date.
12. Selling and marketing expenses of product segment for the current year include reversal of referral fee provisions amounting to Rs. 184,476 based on a settlement agreement entered with a distributor.
13. The Company has settled a dispute with a party for Rs. 468,900 for full release of all alleged claims and has disclosed the same as an exceptional item in the financial results for the year ended March 31, 2009.
14. Provision for taxesa. Break up of current tax is as follows:
Current Tax 2,005,571 872,947 Less: MAT credit entitlement (1,036,913) (500,144)Net Current Tax liability 968,658 372,803
b. During the year ended March 31, 2010, the Company has recorded income tax expenses of Rs. 544,542 (March 31, 2009 – Rs. 69,640) related to previous years.
15. Prior year amounts have been reclassified, where necessary to conform with current year’s presentation.
As per our report of even date For and on behalf of the Board of Directors
For S. R. Batliboi & AssociatesFirm Registration No. 101049WChartered Accountants
N R K RamanManaging Director& Chief Executive Officer
Y M Kale Director
per Amit MajmudarPartnerMembership No.: 36656
Hoshi D Bhagwagar Company Secretary & Compliance Officer
Tarjani Vakil Director
Mumbai, IndiaMay 7, 2010
Mumbai, IndiaMay 7, 2010
Annual Report 2009_2010_Colour.indd 73 7/23/2010 9:04:31 PM

Oracle Financial Services Software – Annual Report 2009-10
(All amounts in thousands of Indian Rupees)
2010 2009
Cash flows from operating activitiesProfit before provision for taxes 7,473,682 7,322,925
Adjustments to reconcile profit before provision for taxes to cash (used in) provided by operating activities:
Depreciation and amortization 374,102 428,405 Loss on sale of fixed assets, net 10,468 185 Marked to market of current investment (417) (479)Interest income (680,051) (723,511)Effect of exchange rate changes in cash and cash equivalent 336,480 (93,371)Unrealized exchange loss (gain) 765,452 (304,081)Finance charge on leased assets 2,326 2,948 Deferred rent (34,029) 22,770 Provision for doubtful debts, net (15,672) 348,913 Bad debts 6,849 4,480 Operating Profit before Working Capital changes 8,239,190 7,009,184
Changes in assets and liabilitiesDecrease (increase) in sundry debtors and unbilled revenue 1,680,825 (3,092,239)(Increase) in loans and advances (53,419) (62,856)(Decrease) increase in current liabilities and provisions (839,903) 1,880,043 Cash from operating activities 9,026,693 5,734,132 Payment of domestic and foreign taxes (2,099,647) (1,411,692)Net cash provided by operating activities 6,927,046 4,322,440
Cash flows from investing activitiesAdditions to fixed assets including capital work‑in‑progress (357,851) (686,366)Net investment in lease 13,336 9,420 Investment in subsidiary company (45,505) –Deposit for office premises (132,689) (10,991)Proceeds from sale of fixed assets 884 569 Bank fixed deposits having maturity of more than three months matured 22,465,711 10,817,366
Bank fixed deposits having maturity of more than three months booked (26,920,639) (14,670,052)
Proceeds from maturity of investments – 33,254 Interest received 646,149 682,121 Net cash (used) in investing activities (4,330,604) (3,824,679)
Cash flows from financing activitiesIssue of shares against Employee Stock Option scheme 69,098 10,509 Advance against equity shares to be issued under ESOP scheme 8,068 106 Payment of lease obligations (12,147) (12,038)Net cash provided by (used) in financing activities 65,829 (1,423)
Net increase in cash and cash equivalents 2,662,271 496,338 Cash and cash equivalents at beginning of the period 1,557,167 967,458 Effect of exchange rate changes (336,480) 93,371 Cash and cash equivalents at end of the year (Note 1) 3,882,958 1,557,167
Statement of cash flow for the year ended March 31
Annual Report 2009_2010_Colour.indd 74 7/24/2010 11:06:39 AM

75
(All amounts in thousands of Indian Rupees)
2010 2009
Note 1: Component of cash and cash equivalentCash and bank balances [Refer schedule 6 (b)]* 17,592,367 10,842,275 Less:Bank deposits having maturity of more than three months (13,703,342) (9,279,041)Margin money deposit (6,067) (6,067)Cash and cash equivalents at the end of the year 3,882,958 1,557,167
* Includes amount kept in unclaimed dividend accounts of Rs. 982 (March 31, 2009 – Rs. 1,335) not available for use by the Company.
Statement of cash flow (continued)for the year ended March 31
As per our report of even date For and on behalf of the Board of Directors
For S. R. Batliboi & AssociatesFirm Registration No. 101049WChartered Accountants
N R K RamanManaging Director& Chief Executive Officer
Y M Kale Director
per Amit MajmudarPartnerMembership No.: 36656
Hoshi D Bhagwagar Company Secretary & Compliance Officer
Tarjani Vakil Director
Mumbai, IndiaMay 7, 2010
Mumbai, IndiaMay 7, 2010
Annual Report 2009_2010_Colour.indd 75 7/23/2010 9:04:31 PM

Oracle Financial Services Software – Annual Report 2009-10
Balance sheet abstract and company’s general business profile
I. Registration detailsCIN L 7 2 2 0 0 M H 1 9 8 9 P L C 0 5 3 6 6 6
Registration number 5 3 6 6 6 State Code 1 1
Balance Sheet date 3 1 0 3 2 0 1 0Date Month Year
II. Capital raised during the year (amount in Rs. thousands)Public issue Rights issue
N I L N I LBonus issue Private placement
N I L N I L
Issue of Shares under Employee Stock Option Plan Scheme4 2 7
III. Position of mobilization and deployment of funds (amount in Rs. thousands)Total liabilities Total assets
4 1 7 8 0 6 8 6 4 1 7 8 0 6 8 6Sources of funds
Paid up capitalShare application money
pending allotment4 1 9 2 7 4 8 0 6 8
Reserves and surplus4 1 3 5 3 3 4 4
Secured loans Unsecured loansN I L N I L
Application of funds Net fixed assets Investments3 3 6 9 8 3 8 7 2 4 7 2 9 6
Net current assets Deferred tax assets3 0 7 7 9 4 8 1 3 8 4 0 7 1
Miscellaneous expenditure Accumulated losses
N I L N I L
IV. Performance of company (amount in Rs. thousands)Revenue Other Income
2 2 4 3 4 6 9 6 ‑ 6 8 2 7 1 5Total income Total expenditure
2 1 7 5 1 9 8 1 1 4 2 7 8 2 9 9+/– Profit/loss before tax +/– Profit/loss after tax
+ 7 4 7 3 6 8 2 + 6 6 0 8 4 8 8
(Please tick appropriate box + for profit, – for loss)Earning per share in
Rs. Basic Dividend rate %7 8 . 8 7 N I L
Earning per share in Rs. Diluted
7 8 . 7 2
V. Generic names of three principal products/services of company(as per monetary terms)Item Code number(ITC code) N . A .
Product description
S O F T W A R E D E V E L O P M E N T S E R V I C E SS O F T W A R E P R O J E C T A S S I G N M E N T SS O F T W A R E P R O D U C T M A N A G E M E N T
Annual Report 2009_2010_Colour.indd 76 7/24/2010 10:59:37 AM

77
Sta
tem
ent
pu
rsu
ant
to S
ecti
on
212
of
the
Co
mp
anie
s A
ct, 1
956
rela
tin
g t
o S
ub
sid
iary
Co
mp
anie
s
(All
am
ount
s in
tho
usan
ds o
f Ind
ian
Rup
ees)
O
racl
e Fi
nanc
ial S
ervi
ces
Soft
war
e B
.V.
Ora
cle
Fina
ncia
l Ser
vice
s SA
Ora
cle
Fina
ncia
l Ser
vice
s So
ftw
are
Pte
. Ltd
.O
racl
e Fi
nanc
ial S
ervi
ces
Con
sult
ing
Pte
. Ltd
.O
racl
e Fi
nanc
ial S
ervi
ces
Soft
war
e A
mer
ica,
Inc
.T
he F
inan
cial
Yea
r of
the
Sub
sidi
ary
Com
pany
en
ded
on M
arch
31,
201
0 M
arch
31,
201
0 M
arch
31,
201
0 M
arch
31,
201
0 M
arch
31,
201
0
Hol
ding
Com
pany
Ora
cle
Fina
ncia
l Ser
vice
s So
ftw
are
Lim
ited
Ora
cle
Fina
ncia
l Ser
vice
s So
ftw
are
B.V
.O
racl
e Fi
nanc
ial S
ervi
ces
Soft
war
e Li
mit
edO
racl
e Fi
nanc
ial S
ervi
ces
Soft
war
e P
te. L
td.
Ora
cle
Fina
ncia
l Ser
vice
s So
ftw
are
Lim
ited
Hol
ding
Com
pany
's in
tere
st10
0%10
0%10
0%10
0%10
0%Sh
ares
hel
d by
the
Hol
ding
Com
pany
in t
he
Subs
idia
ry14
0,00
0 eq
uity
sha
res
of
100
€ (E
uro)
eac
h, fu
lly
paid
up
60,0
00 s
hare
s of
1 €
(Eur
o)
each
, ful
ly p
aid
up25
0,00
0 sh
ares
of
Sing
apor
e $
1 ea
ch fu
lly
paid
up
16,1
85,1
70 s
hare
s of
Si
ngap
ore
$ 1
each
full
y pa
id u
p
1 E
quit
y sh
are
of U
S$ 0
.01
each
full
y pa
id u
p
Net
agg
rega
te o
f Pro
fit/
(los
ses)
of t
he s
ubsi
diar
y so
far
as it
con
cern
s th
e M
embe
rs o
f the
Hol
ding
Com
pany
and
is n
ot d
ealt
wit
h in
the
acc
ount
s of
the
Hol
ding
Com
pany
.
a.
for
the
fina
ncia
l yea
r en
ded
on M
arch
31,
201
0 3
87,4
92
58,
754
276
,209
(6
,532
) 6
4,91
8
b.
for
the
prev
ious
fina
ncia
l yea
rs o
f the
sub
sidi
ary
sinc
e it
bec
ame
a su
bsid
iary
1,3
45,9
03
158
,766
1
,155
,473
(1
55,4
06)
(297
,022
)
Net
agg
rega
te o
f Pro
fit/
(los
ses)
of t
he s
ubsi
diar
y so
far
as it
con
cern
s th
e M
embe
rs o
f the
Hol
ding
Com
pany
and
is d
ealt
wit
h or
pro
vide
d fo
r in
the
acc
ount
s of
the
Hol
ding
Com
pany
a.
for
the
fina
ncia
l yea
r en
ded
on M
arch
31,
201
0–
––
––
b.
for
the
prev
ious
fina
ncia
l yea
rs o
f the
sub
sidi
ary
sinc
e it
bec
ame
a su
bsid
iary
––
––
–
Annual Report 2009_2010_Colour.indd 77 7/23/2010 9:04:32 PM
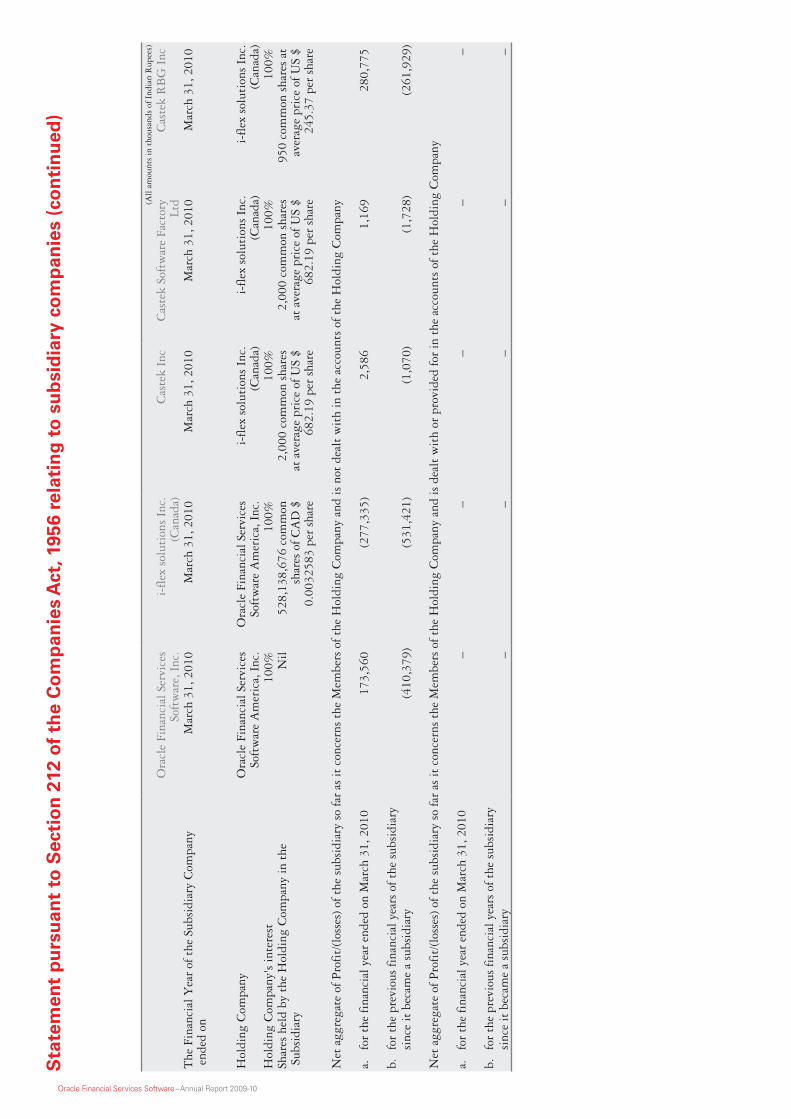
Oracle Financial Services Software – Annual Report 2009‑10
Sta
tem
ent
pu
rsu
ant
to S
ecti
on
212
of
the
Co
mp
anie
s A
ct, 1
956
rela
tin
g t
o s
ub
sid
iary
co
mp
anie
s (c
on
tin
ued
)
(All
am
ount
s in
tho
usan
ds o
f Ind
ian
Rup
ees)
O
racl
e Fi
nanc
ial S
ervi
ces
Soft
war
e, I
nc.
i‑fl
ex s
olut
ions
Inc
. (C
anad
a)C
aste
k In
cC
aste
k So
ftw
are
Fact
ory
Ltd
Cas
tek
RB
G I
nc
The
Fin
anci
al Y
ear
of t
he S
ubsi
diar
y C
ompa
ny
ende
d on
Mar
ch 3
1, 2
010
Mar
ch 3
1, 2
010
Mar
ch 3
1, 2
010
Mar
ch 3
1, 2
010
Mar
ch 3
1, 2
010
Hol
ding
Com
pany
Ora
cle
Fina
ncia
l Ser
vice
s So
ftw
are
Am
eric
a, I
nc.
Ora
cle
Fina
ncia
l Ser
vice
s So
ftw
are
Am
eric
a, I
nc.
i‑fl
ex s
olut
ions
Inc
. (C
anad
a)i‑
flex
sol
utio
ns I
nc.
(Can
ada)
i‑fl
ex s
olut
ions
Inc
. (C
anad
a)H
oldi
ng C
ompa
ny's
inte
rest
100%
100%
100%
100%
100%
Shar
es h
eld
by t
he H
oldi
ng C
ompa
ny in
the
Su
bsid
iary
Nil
528,
138,
676
com
mon
sh
ares
of C
AD
$
0.00
3258
3 pe
r sh
are
2,00
0 co
mm
on s
hare
s at
ave
rage
pri
ce o
f US
$ 68
2.19
per
sha
re
2,00
0 co
mm
on s
hare
s at
ave
rage
pri
ce o
f US
$ 68
2.19
per
sha
re
950
com
mon
sha
res
at
aver
age
pric
e of
US
$ 24
5.37
per
sha
re
Net
agg
rega
te o
f Pro
fit/
(los
ses)
of t
he s
ubsi
diar
y so
far
as it
con
cern
s th
e M
embe
rs o
f the
Hol
ding
Com
pany
and
is n
ot d
ealt
wit
h in
the
acc
ount
s of
the
Hol
ding
Com
pany
a.
for
the
fina
ncia
l yea
r en
ded
on M
arch
31,
201
0 1
73,5
60
(277
,335
) 2
,586
1
,169
2
80,7
75
b.
for
the
prev
ious
fina
ncia
l yea
rs o
f the
sub
sidi
ary
sinc
e it
bec
ame
a su
bsid
iary
(410
,379
) (5
31,4
21)
(1,0
70)
(1,7
28)
(261
,929
)
Net
agg
rega
te o
f Pro
fit/
(los
ses)
of t
he s
ubsi
diar
y so
far
as it
con
cern
s th
e M
embe
rs o
f the
Hol
ding
Com
pany
and
is d
ealt
wit
h or
pro
vide
d fo
r in
the
acc
ount
s of
the
Hol
ding
Com
pany
a.
for
the
fina
ncia
l yea
r en
ded
on M
arch
31,
201
0–
––
––
b.
for
the
prev
ious
fina
ncia
l yea
rs o
f the
sub
sidi
ary
sinc
e it
bec
ame
a su
bsid
iary
––
––
–
Annual Report 2009_2010_Colour.indd 78 7/23/2010 9:04:32 PM

79
Sta
tem
ent
pu
rsu
ant
to S
ecti
on
212
of
the
Co
mp
anie
s A
ct, 1
956
rela
tin
g t
o s
ub
sid
iary
co
mp
anie
s (c
on
tin
ued
)
(All
am
ount
s in
tho
usan
ds o
f Ind
ian
Rup
ees)
M
anta
s In
c.M
anta
s Lt
dSo
tas
Inc
Man
tas
Sing
apor
e P
te. L
td.
Man
tas
(Ind
ia) P
vt. L
tdT
he F
inan
cial
Yea
r of
the
Sub
sidi
ary
Com
pany
en
ded
on M
arch
31,
201
0 M
arch
31,
201
0 M
arch
31,
201
0 M
arch
31,
201
0 M
arch
31,
201
0
Hol
ding
Com
pany
Ora
cle
Fina
ncia
l Ser
vice
s So
ftw
are
Am
eric
a, I
nc.
Man
tas
Inc.
Man
tas
Inc.
Man
tas
Inc.
Man
tas
Inc.
Hol
ding
Com
pany
's in
tere
st10
0%10
0%10
0%10
0%10
0%Sh
ares
hel
d by
the
Hol
ding
Com
pany
in t
he
Subs
idia
ry1
shar
e of
US
$ 0.
01 p
ar
valu
e co
mm
on s
tock
at
US
$ 1.
00
Nil
Nil
Nil
Nil
Net
agg
rega
te o
f Pro
fit/
(los
ses)
of t
he s
ubsi
diar
y so
far
as it
con
cern
s th
e M
embe
rs o
f the
Hol
ding
Com
pany
and
is n
ot d
ealt
wit
h in
the
acc
ount
s of
the
Hol
ding
Com
pany
a.
for
the
fina
ncia
l yea
r en
ded
on M
arch
31,
201
0 (2
1,92
7) (4
2) 8
7 3
2 (1
,260
)
b.
for
the
prev
ious
fina
ncia
l yea
rs o
f the
sub
sidi
ary
sinc
e it
bec
ame
a su
bsid
iary
(18,
893)
(1,2
21)
(501
) (6
10)
6,0
40
Net
agg
rega
te o
f Pro
fit/
(los
ses)
of t
he s
ubsi
diar
y so
far
as it
con
cern
s th
e M
embe
rs o
f the
Hol
ding
Com
pany
and
is d
ealt
wit
h or
pro
vide
d fo
r in
the
acc
ount
s of
the
Hol
ding
Com
pany
a.
for
the
fina
ncia
l yea
r en
ded
on M
arch
31,
201
0–
––
––
b.
for
the
prev
ious
fina
ncia
l yea
rs o
f the
sub
sidi
ary
sinc
e it
bec
ame
a su
bsid
iary
––
––
–
Annual Report 2009_2010_Colour.indd 79 7/23/2010 9:04:33 PM

Oracle Financial Services Software – Annual Report 2009‑10
Sta
tem
ent
pu
rsu
ant
to S
ecti
on
212
of
the
Co
mp
anie
s A
ct, 1
956
rela
tin
g t
o s
ub
sid
iary
co
mp
anie
s (c
on
tin
ued
)
(All
am
ount
s in
tho
usan
ds o
f Ind
ian
Rup
ees)
IS
P I
nter
net
Mau
riti
us
Com
pany
i‑fl
ex P
roce
ssin
g Se
rvic
es
Inc
Ora
cle
(OFS
S) B
PO
Ser
vice
s Lt
d.1
Ora
cle
(OFS
S) P
roce
ssin
g Se
rvic
es L
td.2
Ora
cle
(OFS
S) A
SP P
riva
te
Ltd.
3
The
Fin
anci
al Y
ear
of t
he S
ubsi
diar
y C
ompa
ny
ende
d on
Mar
ch 3
1, 2
010
Mar
ch 3
1, 2
010
Mar
ch 3
1, 2
010
Mar
ch 3
1, 2
010
Mar
ch 3
1, 2
010
Hol
ding
Com
pany
Ora
cle
Fina
ncia
l Ser
vice
s So
ftw
are
Lim
ited
ISP
Int
erne
t M
auri
tius
C
ompa
ny
ISP
Int
erne
t M
auri
tius
C
ompa
ny
Ora
cle
Fina
ncia
l Ser
vice
s So
ftw
are
Lim
ited
Ora
cle
Fina
ncia
l Ser
vice
s So
ftw
are
Lim
ited
Hol
ding
Com
pany
's in
tere
st10
0%10
0%10
0%10
0%10
0%Sh
ares
hel
d by
the
Hol
ding
Com
pany
in t
he
Subs
idia
ry25
200
Seri
es A
ord
inar
y sh
ares
of N
o P
ar v
alue
48
00 S
erie
s B
ord
inar
y sh
ares
of N
o P
ar v
alue
20,0
00 c
omm
on s
tock
of
US
$ 0.
01 e
ach
5,81
9,36
0 eq
uity
sha
res
of
Rs.
10
each
full
y pa
id u
p1,
300,
000
Equ
ity
shar
es o
f R
s. 1
0/‑
each
full
y pa
id u
p51
,70,
000
Equ
ity
Shar
es o
f R
s. 1
0/‑
each
, ful
ly p
aid
up
Net
agg
rega
te o
f Pro
fit/
(los
ses)
of t
he s
ubsi
diar
y so
far
as it
con
cern
s th
e M
embe
rs o
f the
Hol
ding
Com
pany
and
is n
ot d
ealt
wit
h in
the
acc
ount
s of
the
Hol
ding
Com
pany
a.
fo
r th
e fi
nanc
ial y
ear
ende
d on
Mar
ch 3
1, 2
010
(1,9
12)
31,
862
102
,962
8
3,68
4 (6
,182
)
b.
for
the
prev
ious
fina
ncia
l yea
rs o
f the
sub
sidi
ary
sinc
e it
bec
ame
a su
bsid
iary
(31,
557)
(366
,643
) (7
4,94
9) 1
5,41
6 2
2,11
7
Net
agg
rega
te o
f Pro
fit/
(los
ses)
of t
he s
ubsi
diar
y so
far
as it
con
cern
s th
e M
embe
rs o
f the
Hol
ding
Com
pany
and
is d
ealt
wit
h or
pro
vide
d fo
r in
the
acc
ount
s of
the
Hol
ding
Com
pany
a.
for
the
fina
ncia
l yea
r en
ded
on M
arch
31,
201
0–
––
––
b.
for
the
prev
ious
fina
ncia
l yea
rs o
f the
sub
sidi
ary
sinc
e it
bec
ame
a su
bsid
iary
––
––
–
Not
es:
1 Fo
rmer
ly k
now
n as
Equ
inox
Glo
bal S
ervi
ces
Ltd.
2 Fo
rmer
ly k
now
n as
i‑fl
ex P
roce
ssin
g Se
rvic
es L
td.
3 Fo
rmer
ly k
now
n as
Fle
xcel
Int
erna
tion
al P
riva
te L
td.
4 E
xcha
nge
Rat
es t
aken
into
con
side
rati
on fo
r co
nver
sion
are
as
of M
arch
31,
201
0
Annual Report 2009_2010_Colour.indd 80 7/23/2010 9:04:33 PM

81
Sta
tem
ent
pu
rsu
ant
to e
xem
pti
on
rec
eive
d u
nd
er S
ecti
on
212
(8)
of
the
Co
mp
anie
s A
ct, 1
956
re
lati
ng
to
su
bsi
dia
ry c
om
pan
ies
(All
am
ount
s in
tho
usan
ds o
f Ind
ian
Rup
ees)
Nam
e of
the
sub
sidi
ary
com
pany
Rep
orti
ng
Cur
renc
yE
xcha
nge
Rat
e5Sh
are
Cap
ital
Res
erve
sT
otal
Ass
ets
Tot
al
Liab
ilit
ies
Inve
stm
ent
othe
r th
an
Inve
stm
ent in
Subs
idia
ry
Tur
nove
rP
rofi
t/(L
oss)
be
fore
T
axat
ion
Pro
visi
on
for
Tax
atio
n
Pro
fit
afte
r T
axat
ion
Pro
pose
d D
ivid
end
Cou
ntry
of
Inco
rpor
atio
n
Ora
cle
Fina
ncia
l Ser
vice
s So
ftw
are
B.V
.E
UR
O60
.45
776
,308
1,73
3,39
6 1
0,41
6,04
6 7
,906
,342
–
6,7
52,2
27
483
,185
(9
5,69
2) 3
87,4
92
–T
he
Net
herl
ands
Ora
cle
Fina
ncia
l Ser
vice
s SA
EU
RO
60.4
5 7
23,6
42
226
,958
2
,169
,839
1
,219
,239
–
1,1
72,8
90
124
,031
(6
5,27
7) 5
8,75
4 –
Gre
ece
Ora
cle
Fina
ncia
l Ser
vice
s So
ftw
are
Pte
. Ltd
.U
SD45
.09
6,6
26
1,
431,
682
9,2
80,3
35
7,8
42,0
27
– 5
,537
,161
4
13,9
95
(137
,786
) 2
76,2
09
–Si
ngap
ore
Ora
cle
Fina
ncia
l Ser
vice
s C
onsu
ltin
g P
te. L
td.
SGD
32.1
8 4
6,36
6 (1
61,9
37)
52,
310
167
,881
–
11,
635
(6,5
32)
– (6
,532
)–
Sing
apor
e
Ora
cle
Fina
ncia
l Ser
vice
s So
ftw
are
Am
eric
a, I
nc.
USD
45.0
9
5,81
0,56
6 3
07,6
66
6,9
43,8
64
825,
632
––
67,
920
(3,0
02)
64,
918
–U
SA
Ora
cle
Fina
ncia
l Ser
vice
s So
ftw
are,
Inc
.U
SD45
.09
– 3
08,4
00
9,4
27,6
34 9
,119
,234
– 7
,875
,860
1
78,9
20
(5,3
60)
173
,560
–
USA
i‑fl
ex s
olut
ions
Inc
. (C
anad
a)C
AD
44.2
7 2
96,5
44
(615
,542
)10
6,85
242
5,85
0–
140
(2
77,3
35)
– (2
77,3
35)
–C
anad
a
Cas
tek
Inc
USD
45.0
9 5
4,38
8 (1
0,31
0) 6
3,79
3 1
9,71
5 –
– 2
,586
–
2,5
86
–U
SA
Cas
tek
Soft
war
e Fa
ctor
y Lt
dU
SD45
.09
54,
388
(63,
061)
4,4
64
13,
138
––
1,1
69
– 1
,169
–
USA
Cas
tek
RB
G I
ncU
SD45
.09
38
(232
,027
)–
231
,989
–
– 2
80,7
75
– 2
80,7
75
–U
SA
Man
tas
Inc.
USD
45.0
95,
650,
170
(784
,342
)4,
866,
268
440
–
– (2
1,90
3) (2
4) (2
1,92
7)–
USA
Man
tas
Ltd
GB
P67
.95
–(1
06)
5,9
41
7,0
47
––
(42)
– (4
2)–
UK
Sota
s In
cU
SD45
.09
– (4
44)
– 4
44
––
87
– 8
7 –
USA
Man
tas
Sing
apor
e P
te. L
td.
USD
45.0
9–
(586
) 5
7 6
43
––
32
– 3
2 –
Sing
apor
e
Man
tas
(Ind
ia) P
vt. L
tdIN
R1.
00–
4,7
80
4,9
13
133
–
– (1
,260
)–
(1,2
60)
–In
dia
ISP
Int
erne
t M
auri
tius
C
ompa
nyU
SD45
.09
139
,982
(2
8,71
5) 1
66,3
63
55,
096
––
(1,9
12)
– (1
,912
)–
Rep
ubli
c of
M
auri
tius
Annual Report 2009_2010_Colour.indd 81 7/23/2010 9:04:33 PM

Oracle Financial Services Software – Annual Report 2009‑10
Sta
tem
ent
pu
rsu
ant
to e
xem
pti
on
rec
eive
d u
nd
er S
ecti
on
212
(8)
of
the
Co
mp
anie
s A
ct, 1
956
re
lati
ng
to
su
bsi
dia
ry c
om
pan
ies
(co
nti
nu
ed)
(All
am
ount
s in
tho
usan
ds o
f Ind
ian
Rup
ees)
Nam
e of
the
sub
sidi
ary
com
pany
Rep
orti
ng
Cur
renc
yE
xcha
nge
Rat
e5Sh
are
Cap
ital
Res
erve
sT
otal
Ass
ets
Tot
al
Liab
ilit
ies
Inve
stm
ent
othe
r th
an
Inve
stm
ent in
Subs
idia
ry
Tur
nove
rP
rofi
t/(L
oss)
be
fore
T
axat
ion
Pro
visi
on
for
Tax
atio
n
Pro
fit
afte
r T
axat
ion
Pro
pose
d D
ivid
end
Cou
ntry
of
Inco
rpor
atio
n
i‑fl
ex P
roce
ssin
g Se
rvic
es I
ncU
SD45
.09
(360
,032
) 2
03,1
73
563
,205
–
533
,076
3
5,29
3 (3
,431
) 3
1,86
2 –
USA
Ora
cle
(OFS
S) B
PO
Ser
vice
s Lt
d.1
INR
1.00
58,
194
28,
014
652
,418
5
66,2
11
– 4
36,5
95
106
,162
(3
,200
) 1
02,9
62
–In
dia
Ora
cle
(OFS
S) P
roce
ssin
g Se
rvic
es L
td.2
INR
1.00
13,
000
99,
100
206
,735
9
4,63
5 –
220
,083
8
4,52
4 (8
40)
83,
684
–In
dia
Ora
cle
(OFS
S) A
SP P
riva
te
Ltd.
3IN
R1.
00 5
1,70
0 1
6,71
0 1
84,4
10
116
,000
–
192
,997
(1
,325
) (4
,857
) (6
,182
)–
Indi
a
Not
es:
1 Fo
rmer
ly k
now
n as
Equ
inox
Glo
bal S
ervi
ces
Ltd.
2 Fo
rmer
ly k
now
n as
i‑fl
ex P
roce
ssin
g Se
rvic
es L
td.
3 Fo
rmer
ly k
now
n as
Fle
xcel
Int
erna
tion
al P
riva
te L
td.
4 A
ccou
ntin
g po
licy
ado
pted
for
fore
ign
curr
ency
tra
nsac
tion
s ar
e si
mil
ar t
o th
ose
adop
ted
in c
onso
lida
ted
fina
ncia
ls.
5 E
xcha
nge
rate
as
of M
arch
31,
201
0
For
and
on b
ehal
f of t
he B
oard
of D
irec
tors
N R
K R
aman
Man
agin
g D
irec
tor
& C
hief
Exe
cuti
ve O
ffic
er
Y M
Kal
e D
irec
tor
Hos
hi D
Bh
agw
agar
C
ompa
ny S
ecre
tary
&
Com
plia
nce
Off
icer
Tar
jan
i Vak
il
Dir
ecto
r
Mu
mb
ai, I
nd
iaM
ay 7
, 201
0
Sinc
e th
e C
ompa
ny p
rese
nts
audi
ted
cons
olid
ated
fina
ncia
l sta
tem
ents
und
er I
ndia
n G
AA
P in
its
Ann
ual R
epor
t, t
he C
ompa
ny h
ad a
ppli
ed t
o th
e C
entr
al G
over
nmen
t fo
r an
exe
mpt
ion
from
att
achi
ng t
he a
ccou
nts
and
repo
rts
of it
s su
bsid
iari
es in
the
Ann
ual R
epor
t. T
he a
ppro
val o
f the
Cen
tral
Gov
ernm
ent
in t
his
rega
rd h
as b
een
rece
ived
vid
e le
tter
no.
47/
272/
2010
‑CL‑
III
date
d A
pril
20,
201
0 ex
empt
ing
the
Com
pany
from
att
achi
ng t
he a
ccou
nts
and
repo
rts
of s
ubsi
diar
y co
mpa
nies
und
er t
he p
rovi
sion
s of
Sec
tion
212
of t
he C
ompa
nies
Act
, 195
6. A
s su
ch, t
he a
ccou
nts
and
repo
rts
of t
he s
ubsi
diar
y co
mpa
nies
are
not
att
ache
d to
the
Ann
ual R
epor
t of
the
Com
pany
.
The
Com
pany
wil
l mak
e av
aila
ble
the
acco
unts
and
rep
orts
of t
he s
ubsi
diar
y co
mpa
nies
upo
n re
ques
t by
any
mem
ber/
inve
stor
of t
he C
ompa
ny o
r it
s su
bsid
iary
com
pani
es. T
he a
ccou
nts
and
repo
rts
of t
he s
ubsi
diar
y co
mpa
nies
w
ill b
e ke
pt o
pen
for
insp
ecti
on b
y an
y m
embe
r at
the
reg
iste
red/
corp
orat
e of
fice
of t
he C
ompa
ny a
nd t
he r
egis
tere
d of
fice
of t
he s
ubsi
diar
ies
duri
ng o
ffic
e ho
urs
of t
he C
ompa
ny/s
ubsi
diar
ies.
The
Com
pany
wil
l als
o m
ake
the
sam
e av
aila
ble
at it
s w
ebsi
te w
ww
.ora
cle.
com
/fin
anci
alse
rvic
es.
Annual Report 2009_2010_Colour.indd 82 7/23/2010 9:04:33 PM

Financials
Financial statements for the year ended March 31, 2010 prepared in accordance with Indian Generally Accepted Accounting Principles (Indian GAAP) (Consolidated).
Annual Report 2009_2010_Colour.indd 83 7/23/2010 9:04:39 PM

“Oracle Financial Services Software is providing us with a best-in-class product footprint that will significantly improve our operational efficiency. With Oracle FLEXCUBE and Reveleus’ capability, we will be able to differentiate ourselves from our competitors by offering a superior customer experience. We also have the benefit of a comprehensive, ongoing, product investments from Oracle, something our previous legacy system providers were unable to offer,”
Mr. Omar Essa, AGM, Head of Core Banking and Technology, Union Bank, Jordan.
“Oracle is the stand-out vendor across numerous categories this year. It has benefited from the rebranding of its several units – namely Oracle, Mantas and Reveleus – into a single entity, as well as building on its outstanding reputation as a premier player in the risk and compliance sector. Such a solid performance in so many areas demonstrates Oracle’s truly enterprise reach.”
OpRisk & Compliance magazine. Oracle Financial Services Software led the OpRisk & Compliance Annual Compliance Software Rankings in 2009.
* All quotes are from the press releases issued during the 2009 – 2010 fiscal
Annual Report 2009_2010_Colour.indd 84 7/23/2010 9:04:41 PM

85
The following discussion is based on our audited consolidated financial statements, which have been prepared in conformity with accounting principles generally accepted in India and complying in all material respects with the notified Accounting Standards by Companies (Accounting Standards) Rules, 2006 and the relevant provisions of the Companies Act, 1956.
The financial statements are consolidated for Oracle Financial Services Software (“the Group”) that includes Oracle Financial Services Software Limited (“the Company”), its subsidiaries and associate company (together referred to as “the Group” as described in Note 1 of Schedule 15 to the financial statements) as at March 31, 2010. Investment in Login SA, an associate company has been accounted for using the equity method, considering that the group has significant influence in the operations of Login SA.
You should read the following discussion of our financial condition and results of operations together with the detailed consolidated Indian GAAP financial statements and the notes to those statements. Our fiscal year ends on March 31 of each year.
Information technology in the financial services industry
Financial institutions today face a significantly altered competitive landscape. New business models have emerged together with other opportunities and threats including deregulation. Competitors from within and outside the industry have effectively differentiated themselves and the preferences and power of buyers have changed.
The focus of financial institutions is on the transformation of their business models. They seek to identify revenue enhancing opportunities at the same time as they attempt cost‑optimization by strengthening their ability to offer targeted services and improved service levels to their customers. To stay competitive, financial institutions need to offer a variety of integrated and global products in different markets. They also need to ensure that their activities are in sync with market dynamics and changing regulatory mandates. With the emergence of new customer segments banks have chosen “next generation” models and offer new and innovative products and services.
The recent turmoil in global financial markets has important lessons for risk management of financial institutions. A key lesson is that even if financial institutions are well capitalized their viability could be threatened by a liquidity crunch. The management of liquidity risk is seen as vital for the sound management of financial institutions and the stability of the financial system. Over the last two years central banks and regulatory bodies have actively reviewed the framework for financial regulation and supervision, including that regulating the provision of liquidity.
The increasing operational complexity of financial institutions has been accompanied by innovation in the measurement and monitoring of their risk exposure. One such innovation is Stress Testing. It can be defined as the examination of the impact of exceptional though plausible events on a firm or financial system’s well being. Financial institutions are using stress and scenario testing to identify, analyze and manage the risks inherent in their businesses and it is becoming an important part of their planning and risk management process.
Financial institutions have to cope with a stringent regulatory environment as also with the increasing sophistication of fraudulent activity. Fraudsters have mastered the use of techniques to circumvent processes designed to detect and address fraud. Financial institutions are therefore turning towards technology to tackle fraud and meet dynamic compliance mandates.
Banks also require services that address their need for renewal in areas such as consumer regulation, security and process consistency.
Overview
Oracle Financial Services Software Limited, majority owned by Oracle, is a world leader in providing IT solutions to the financial services industry. With its experience of delivering value‑based IT solutions to global financial institutions, Oracle Financial Services Software understands the specific challenges that financial institutions face: the need for building customer intimacy and competitive advantage through cost‑effective solutions while, simultaneously, adhering to the stringent demands of a dynamic regulatory environment.
Our mission is to enable financial institutions to excel through the effective use of information technology. We offer financial institutions the world’s most comprehensive and contemporary banking applications and a technology footprint that addresses their complex IT and business requirements.
We are organized by region and business segment. We have two major business segments ‑ the products business (comprising product licensing, customization, implementation, support and ASP services) and consulting services (comprising IT application and technology services and BPO services).
Management’s discussion and analysis of financial condition and results of operations
Annual Report 2009_2010_Colour.indd 85 7/23/2010 9:04:41 PM

Oracle Financial Services Software – Annual Report 2009‑10
Products
Unmatched banking solutions footprint
Together with Oracle, Oracle Financial Services Software offers the world’s most comprehensive and contemporary banking applications and technology footprint. This footprint spans the distribution, manufacturing, risk and finance and corporate administration functions of a financial institution. Each solution in the financial services application footprint is best‑of‑breed, open and integrated.
Oracle FLEXCUBE
Oracle FLEXCUBE is a complete banking product suite for consumer, corporate, investment, mobile and internet banking, consumer lending, asset management and investor servicing, including payments. Oracle FLEXCUBE enables banks to standardize operations across multiple countries, transform their local operations as well as address niche business models like direct banking, Islamic banking and mobile banking. Financial institutions use Oracle FLEXCUBE to respond faster to market dynamics, define and track processes and ensure compliance. The suite is also equipped with SWIFT 2007 enhancements and supports SEPA payment processing.
Oracle FLEXCUBE can help financial institutions address the fast growing market for cross‑border remittances and initiate, process, and disburse remittances.
Oracle FLEXCUBE release 11.0 brings together Oracle’s vast experience in supporting banks across the globe. Banks can take advantage of the solution’s entire range of functionality. They can also earn a higher return on investment through multi‑product origination, support for broker‑aided distribution, end‑to‑end lending and mortgage lifecycle management. Supported by an exhaustive set of Web services, SOA‑enabled Oracle FLEXCUBE enables accelerated deployment and easy integration with a bank’s existing application landscape. Release 11 offers complete lifecycle support for consumer, commercial, syndicated, Islamic banking and mortgage processing ‑‑ including origination, servicing, and collections.
Oracle FLEXCUBE Enterprise Limits and Collateral Management offers a single source for managing exposure across a business portfolio. It enables centralized collateral management, limits definition, tracking and exposure measurement for effective exposure management and resource utilization.
Oracle FLEXCUBE Private Banking is a comprehensive solution for private banking. It gives wealth managers a unified view and analyses of their customers’ wealth across asset classes. It provides the added benefit of performance tracking and improved customer relationship management. The application is a comprehensive, customer‑centric solution. It offers a wealth management portal, a customer interaction tool, and portfolio management capabilities – all of which can be integrated with the existing core banking solutions used by a bank.
Oracle FLEXCUBE Investor Servicing is a process enabled transfer agency and investor servicing solution. It helps financial institutions manage the complete fund lifecycle and reduce operational costs through process automation across fund structures, intermediary hierarchies, and investors. The ISO 20022 and 15022 compliant Oracle FLEXCUBE Investor Servicing ensures enhanced STP processing through support for a wide variety of SWIFT NET 4.0 messages. With a comprehensive business rules engine for products – hedge funds, mutual funds and unit‑linked insurance products, funds, and fee structures, Oracle FLEXCUBE Investor Servicing allows fund management companies to configure and launch new products rapidly.
Oracle Analytics for Financial Services is a complete and fully integrated portfolio of analytical solutions. Financial institutions need an integrated approach that enables them to address present and future requirements, including regulatory requirements that encompass enterprise risk, performance management, regulatory compliance and customer insight.
Oracle Analytics for Financial Services fulfills this need. It combines a diverse set of compliance and risk solutions and is built upon a shared analytical infrastructure that consists of a unified financial services data model, shared analytical computations and the industry‑leading Oracle Business Intelligence platform. Unlike other hard‑coded solutions, it provides both prebuilt rules and the capability to create and modify rules. This flexibility allows financial institutions to easily create custom rules for their own analytical requirements and to cost‑effectively address ever‑changing compliance regulations. Any rule can be viewed and audited for its underlying definition to enable supervisory oversight.
ASP services
Oracle Financial Services offers Oracle FLEXCUBE on‑demand using a hosted model. An on‑demand model helps banks reduce their immediate costs for accessing world‑class core banking applications backed by high‑end technology support. This approach provides banks tremendous flexibility as it helps them deploy applications quicker, have complete support for their operations and avoid the obsolescence of their application and technology platforms.
Support services
Oracle Financial Services Support offers support services for Oracle FLEXCUBE, Oracle Reveleus and Oracle Mantas. These services help our customers accelerate adoption, reduce the time, effort, and cost of operating applications thereby allowing them to achieve a higher return on their investments. These services also enable our customers to manage their applications more effectively and take advantage of the latest technological enhancements.
Oracle Financial Services Consulting
Oracle Financial Services Consulting offers Consulting Services, Application Services, Technology Services, and BPO services to financial institutions.
Annual Report 2009_2010_Colour.indd 86 7/23/2010 9:04:41 PM

87
Consulting Services
We offer an end‑to‑end consulting partnership. It provides comprehensive business and technology solutions that enable financial services enterprises to improve process efficiency, optimize costs, meet risk and compliance requirements, define IT architecture and manage the transformation process. We offer consulting services in the areas of business transformation, risk and compliance, program management, IT architecture, IT governance and process improvement.
PrimeSourcing Application Services
We provide comprehensive customized IT solutions for banking, securities and insurance that encompasses the complete lifecycle of an IT application asset‑‑from conceptualization to creation and maintenance. These high‑quality IT solutions reflect the division’s domain expertise in financial services. This includes the knowledge gleaned while developing solutions for specialized practice lines like payments, business intelligence, CRM, Oracle Technology and Applications and testing.
Customers can take advantage of the division’s in‑depth expertise across a range of technologies such as Java, Microsoft, Mainframe and Open Source. Its IT processes are certified as CMMI V1.1 Level 5 and it has well‑established CoBIT‑compliant global infrastructure and development centers. This includes a comprehensive pool of proprietary methodologies, tools and best practices.
PrimeSourcing Technology Services
We offer expertise in conceptualization, design, evaluation, implementation and management of IT infrastructure for financial institutions under two service lines of Technology Management Services and Remote Infrastructure Management. These services are based on best practices such as ITIL (IT Infrastructure Library) and COBIT (Control Objectives for Information and related Technology) governance models (globally accepted standards for IT management and control) and are certified under ISO 27001 (Information Security Management System) and ISO 20000 (IT Services Management).
Business Process Outsourcing Services
Our BPO offering excels in providing cost effective and high quality BPO services ranging from complex back‑office work to contact centre services for the banking, capital markets, insurance and asset management domains. This comprehensive ecosystem of BPO services also draws upon software applications such as Oracle FLEXCUBE and is backed by a mature process and consulting framework.
The International Association of Outsourcing Professionals (IAOP) selected our BPO offering to be in the Leadership Category for the ‘2010 The Global Outsourcing 100.’ The Outsourcing Centre short listed it to be amongst 2010 Finalists for its Outsourcing Excellence Awards. The BPO offerings are ISO 9001 certified for quality management and ISO 27001 certified for information security management.
Corporate development
Oracle Global (Mauritius) Limited (“Oracle”) ownership interest in the Company is 80.47% as at March 31, 2010.
On May 26, 2009, Oracle Financial Services Software S.A. became a wholly owned subsidiary of Oracle Financial Services Software B. V. with the acquisition from other shareholders of the remaining 10% shares of Oracle Financial Services Software S.A.
On November 26, 2009, we formed a wholly owned subsidiary company in Chile by name Oracle Financial Services Software Chile Limitada.
On February 23, 2010, we formed a wholly owned subsidiary company in China by name Oracle Financial Services Software (Shanghai) Limited.
To reflect the close strategic and operational alignment within the group, names of the following subsidiary companies were changed during the year from:
– ‘Equinox Global Services Limited’ to “Oracle (OFSS) BPO Services Limited” w.e.f. March 9, 2010
– ‘i‑flex Processing Services Limited’ to “Oracle (OFSS) Processing Services Limited” w.e.f. March 19, 2010
– ‘Flexcel International Private Limited’ to “Oracle (OFSS) ASP Private Limited” w.e.f. March 22, 2010
Business metrics
Our total revenues in fiscal 2010 were Rs. 28,739.7 million, representing a decrease of 2% from Rs. 29,276.2 million in fiscal 2009. The net income in fiscal 2010 was Rs. 7,736.6 million, as against Rs. 7,365.4 million in fiscal 2009. Our net income margins are 27% and 25% for the fiscal years 2010 and 2009 respectively. We define net income margins for a particular period as the ratio of net income to total revenues during the period. We had 10,451 employees as on March 31, 2010 against 11,386 at the end of the previous year.
Annual Report 2009_2010_Colour.indd 87 7/23/2010 9:04:41 PM

Oracle Financial Services Software – Annual Report 2009‑10
Products business
(All amounts in millions of Indian Rupees)
Year ended March 31, 2010
Year ended March 31, 2009
Product revenues 18,704.7 18,131.1 Cost of product revenues (7,008.6) (7,445.2)Sales and marketing expenses (1,928.0) (2,640.0)General and administrative expenses (1,192.5) (1,243.5)Depreciation and amortization (219.9) (254.6)Income from operations 8,355.7 6,547.8Operating margin* 45% 36%
* Operating margin is defined as income from operations from the products business (excluding corporate expenses) as a percentage of total products revenue.
Products revenues
Our product revenues were Rs. 18,704.7 million during the fiscal year ended March 31, 2010, an increase of 3% from Rs. 18,131.1 million during the fiscal year ended March 31, 2009. Products revenue represented 65% and 62% of total revenues for fiscal years ended 2010 and 2009, respectively.
Our product revenues comprise license fees, professional fees for implementation and enhancement services and annual maintenance contract (post contract support – ‘PCS’) fees for products.
License fee
Our products are offered as perpetual use licenses which are priced based on number of accounts, or application users or subscribers, or assets under management or processor based or a combination of these depending on the solutions deployed.
Implementation fee
Along with licenses for our products, our customers can also optionally avail services related to the implementation of products at their sites, integration with other systems or enhancements to address their specific requirements. The customer is typically charged a service fee on either a fixed price basis or a time and material basis.
Annual maintenance contract fees
Customers typically sign an Annual Maintenance Contract with us under which we provide technical support, maintenance, problem resolution and upgrades for licensed products. These support agreements typically cover a period of 12 months and generate another revenue stream for us.
The revenue generated from license fees, implementation and enhancement services rendered by us depends on factors such as the number of new customers added, milestones achieved, implementation time, etc. Therefore, such revenues typically vary from year to year. The annual maintenance contracts generate steady revenues and would grow to the extent that new customers enter into the support phase of their lifecycle with us.
The percentages of our revenue from these streams are as follows:
Year ended March 31, 2010
Year ended March 31, 2009
License fees 18% 22%Implementation and customization fees 59% 58%PCS arrangements 23% 20%Total 100% 100%
Cost of products revenues and operating expenses
The cost of product revenue consists of costs attributable to the implementation, enhancement, maintenance and continued development, including research and development effort, of our core product offerings ‑ the Oracle FLEXCUBE suite of products, Oracle Reveleus and other products. These costs primarily consist of compensation expenses for all software professionals working in the products business, project‑related travel expenses, professional fees paid to software services vendors and the cost of application software for internal use.
Research and development costs are expensed as incurred. Software product development costs are expensed as incurred until technological feasibility is established. Software product development cost incurred subsequent to the achievement of technological feasibility is not material and is expensed as incurred.
Our operating expenses include selling and marketing expenses and general and administrative expenses. These consist of commissions payable to our partners, product advertising and marketing expenses. These also includes allocated overhead expenses associated with
Annual Report 2009_2010_Colour.indd 88 7/23/2010 9:04:41 PM

89
support and monitoring functions such as human resources, facilities and infrastructure expenses, quality assurance and financial control as well as depreciation and amortization.
Services business
(All amounts in millions of Indian Rupees)
Year ended March 31, 2010
Year ended March 31, 2009
Services revenues 9,400.41 10,625.43Cost of services revenues (5,828.4) (6,750.5)Sales and marketing expenses (333.8) (661.2)General and administrative expenses (620.3) (846.0)Depreciation and amortization (186.0) (205.1)Inter‑segment expense (211.2) (199.3)Income from operations 2,220.7 1,963.3Operating margin* 24% 18%
* Operating margin is defined as income from operations from the services business (excluding corporate expenses) as a percentage of total services revenue.
Services revenue
Our services revenue represented 32% and 36% of our total revenues for the fiscal year ended March 31, 2010 and 2009 respectively. Our services revenue were Rs. 9,400.4 million in the fiscal year ended March 31, 2010, a decrease of 12% from Rs. 10,625.4 million in the fiscal year ended March 31, 2009.
The contracts relating to our services business are either time or material contracts or fixed price contracts. The percentage of total services revenues from time and material contracts was 66% in fiscal 2010 and 77% in fiscal 2009, with the remainder of our services revenues attributable to fixed price contracts.
We render services through offshore centers located in India, onsite teams operating at our customers’ premises and our development centers located in other parts of the world. Offshore services revenues consists of revenue from work conducted at our development centers in India and for Indian customers at their locations. Onsite revenues consist of work conducted at customer premises outside India and our development centers outside India. The composition of our onsite and offshore revenue is determined by the project lifecycle. Typically, the work involving the design of new systems or relating to a system rollout would be conducted onsite, while the core software development, maintenance and support activity may be conducted offshore. We received 50% and 63% of our services revenue from on‑site work and 50% and 37% from off‑shore work during the fiscal years 2010 and 2009 respectively.
Cost of services revenues and operating expenses
The cost of revenues for services consists primarily of compensation expenses for our software professionals, cost of application software for internal use, travel expenses and professional fees paid to software services vendors. We recognize these costs as incurred. Our operating expenses include selling, general and administrative expenses and allocated overhead expenses associated with support and monitoring functions such as human resources, corporate marketing, information management systems, quality assurance and financial control and depreciation.
Business Process Outsourcing (BPO) Services Business
(All amounts in millions of Indian Rupees)
Year ended March 31, 2010
Year ended March 31, 2009
Services revenues 845.8 719.1Cost of services revenues (249.8) (296.0)Sales and marketing expenses (91.8) (125.2)General and administrative expenses (164.1) (124.9)Depreciation and amortization (24.1) (18.8)Income from operation 316.0 154.2Operating margin* 37% 21%
* Operating margin is defined as income from operations from the Business Process Outsourcing (BPO) Business (excluding corporate expenses) as a percentage of total services revenue.
Business Process Outsourcing (BPO) Services Revenue
Our BPO services revenues represented 3% and 2% of our total revenues for the fiscal year ended March 31, 2010 and 2009. Our BPO services revenues were Rs. 845.8 million in the fiscal year ended March 31, 2010, an increase of 18% from Rs. 719.1 million in the fiscal year ended March 31, 2009.
Annual Report 2009_2010_Colour.indd 89 7/23/2010 9:04:42 PM

Oracle Financial Services Software – Annual Report 2009‑10
Cost of Business Process Outsourcing (BPO) Revenues and Operating Expenses
The cost of revenues for BPO Services consists primarily of compensation expenses for our professionals, travel expenses and professional fees paid to vendors. We recognize these costs as incurred. Our operating expenses include selling, general and administrative expenses and allocated overhead expenses.
Geographic breakup of revenues
Our overall revenues continue to be well diversified. The following table represents the percentage breakup of our revenues for our Products and Services Business by region:
Year ended March 31, 2010 Year ended March 31, 2009Products Revenues
Services Revenues
Total Revenues
Products Revenues
Services Revenues
Total Revenues
United States of America 18% 57% 32% 14% 54% 29%Europe 40% 16% 32% 45% 17% 34%Asia Pacific 21% 23% 21% 18% 23% 20%Middle East, India and Africa 18% 4% 13% 20% 6% 15%Latin America and Caribbean 3% 0% 2% 3% 0% 2%Total 100% 100% 100% 100% 100% 100%
Customer concentration
Our operations and business depend on our relationships with a number of large customers. Our revenues from our top ten customers for fiscal 2009 and 2010 were 26% of our total revenue. The top ten customers in our services business contributed 41% of the total services revenues, and the top ten customers in our products business, contributed 29% and 28% of the total products revenues during fiscal 2010 and fiscal 2009 respectively.
The accompanying table provides the percentage of total revenues that we derived from our largest customer, top five customers and top ten customers during fiscal years 2010 and 2009. In the table, various affiliates of Citigroup are classified as separate customers, and the last row sets forth the percentage of total revenues we earned from the various affiliates of Citigroup with respect to our products and services business individually and with respect to our business taken as a whole.
Products Revenues Services Revenues Total Revenues2010 2009 2010 2009 2010 2009
Top customer 5% 6% 6% 8% 4% 5%Top 5 customers 20% 18% 27% 26% 16% 18%Top 10 customers 29% 28% 41% 41% 26% 26%Citigroup and its affiliates 11% 9% 37% 36% 20% 20%
Trade receivables
Trade receivables as of fiscal March 31, 2010 and 2009 were Rs. 6,782.4 and Rs. 8,402.3 million respectively. Our days sales outstanding (which is the ratio of sundry debtors to total sales in a particular year multiplied by 365) for fiscal 2010 and 2009 were approximately 86 and 105 respectively. The Group periodically reviews its trade receivables outstanding as well as the aging, quality of the trade receivables, customer relationship and the history of the client. The following table presents the age profile of our sundry debtors:
Year ended March 31, 2010
Year ended March 31, 2009
Period in days0 – 180 93% 88%More than 180 7% 12%Total 100% 100%
Foreign currency and treasury operations
A substantial portion of our revenues is generated in foreign currency while the majority of our expenses are incurred in Indian Rupees with the remaining expenses are incurred in US Dollars (USD) and European currencies.
Our philosophy for treasury operations is conservative and we invest funds predominately in time deposits with well‑known and highly rated Indian and foreign banks. The Group has ensured adequate internal controls over asset management including cash management operations, credit management and debt collection.
The Group also maintains funds in USD bank accounts or in INR deposits based on the comparative exchange rates, interest rates and currency requirements.
Annual Report 2009_2010_Colour.indd 90 7/23/2010 9:04:42 PM

91
Income taxes
Currently, we partially benefit from tax holidays extended by the Government of India to software products and IT services exporters from specially designated software technology parks in India. As a result of these incentives, our operations have been subject to relatively lower tax liabilities in India. These tax incentives currently include a 10‑year tax holiday from Indian corporate income taxes for the operation of seven of our Indian facilities. As a result, a substantial portion of our pre‑tax income has not been subject to tax in recent years.
The Finance Act, 2000, restricts the ten‑year tax holiday available from the fiscal year in which the undertaking begins to manufacture or produce, or until fiscal 2011 (as extended in Finance Act, 2009), whichever is earlier. For seven of our facilities, these benefits expire in stages through 2011. Income taxes also include foreign taxes representing income taxes payable overseas by us in various countries.
Employee Stock Purchase Scheme (‘ESPS’)
The Company has adopted an ESPS administered through a Trust (“the Trust”) to provide equity based incentives to key employees of the Company. The Trust purchases shares of the Company from the market using the proceeds of loans obtained from the Company. Such shares are offered by the Trust to employees at an exercise price, which approximates the fair value on the date of the grant. The employees can purchase the shares in a phased manner over a period of five years based on continued employment until which time the Trust holds the shares for the benefit of the employee. The employee will be entitled to receive dividends, bonus, etc., that may be declared by the Company from time to time for the entire portion of shares held by the Trust on behalf of the employees.
On the acceptance of the offer, the selected employee shall undertake to pay within ten years from the date of acceptance of the offer the cost of the shares incurred by the Trust including repayment of the loan relatable thereto. The repayment of the loan by the Trust to the Company would be dependent on employee repaying the amount to the Trust. In case the employee resigns from employment, the rights relating to shares, which are eligible for exercise, may be purchased by payment of the exercise price whereas, the balance shares shall be forfeited in favor of the Trust. The Trustees have the right of recourse against the employee for any amounts that may remain unpaid on the shares accepted by the employee. The shares that an employee is eligible to exercise during the initial five‑year period merely go to determine the amount and scheduling of the loan to be repaid on exercise by the employee. The Trust shall repay the loan obtained from the Company on receipt of payments from employees against shares exercised or otherwise.
The Securities and Exchange Board of India (‘SEBI’) has issued the Employee Stock Option Scheme and Stock Purchase Guidelines, 1999 (‘SEBI guidelines’), which are applicable to stock purchase schemes for employees of all listed Companies. In accordance with these guidelines, the excess of market price of the underlying equity shares on the date of grant of the stock options over the exercise price of the options is to be recognized in the books of account and amortized over the vesting period. However, no compensation cost has been recorded as the scheme terms are fixed and the exercise price equals the market price of the underlying stock on the grant date.
A summary of the activity in the Company’s ESPS is as follows:
Year ended March 31, 2010
Year ended March 31, 2009
Number of shares Number of sharesOpening balance of unallocated shares 165,145 158,963Shares forfeited during the year 5 6,182Closing balance of unallocated shares 165,150 165,145
Opening balance of allocated shares 134,834 221,101Shares exercised during the year (80,281) (80,085)Shares forfeited during the year (5) (6,182)Closing balance of allocated shares 54,548 134,834
Shares eligible for exercise 54,548 74,534Shares not eligible for exercise – 60,300Total allocated shares 54,548 134,834
Employee Stock Option Plan (‘ESOP’)
Pursuant to the ESOP scheme approved by the shareholders of the Company held on August 14, 2001, the Board of Directors, on March 4, 2002 approved the Employees Stock Option Scheme (‘the Scheme’) for issue of 4,753,600 options to the employees and directors of the Company and its subsidiaries. According to the Scheme, the Company has granted 4,548,920 options prior to the IPO and 559,000 options at various dates after IPO (including the grants of options which were granted earlier but forfeited subsequently). As per the scheme, each of 20% of the total options granted will vest to the eligible employees and directors on completion of 12, 24, 36, 48 and 60 months and is subject to continued employment of the employee or director with the Company or its subsidiaries. The options have an exercise period of 10 years. The employee pays the exercise price upon exercise of option.
Annual Report 2009_2010_Colour.indd 91 7/23/2010 9:04:42 PM

Oracle Financial Services Software – Annual Report 2009-10
A summary of the activity in the Company’s ESOP is as follows:
Year ended March 31, 2010 Year ended March 31, 2009Shares arising from options
Weighted average exercise price (Rs.)
Shares arising from options
Weighted average exercise price (Rs.)
Outstanding at beginning of year 348,853 1,075 431,253 1,025Exercised (85,471) 819 (21,945) 491Forfeited (21,000) 1,232 (60,455) 930Outstanding at end of the year 242,382 1,152 348,853 1,075
The weighted average share price for the year over which stock options was exercised was Rs. 2,250.
The details of options unvested and options vested and exercisable as on March 31, 2010 are as follows:
Range of exercise prices (Rs.)
Shares Weighted average exercise price (Rs.)
Weighted average remaining
contractual life (Years)
Options unvested 419 – 560 – – –1,291 – 1,291 101,000 1,291 6.1
Options vested and exercisable 265 – 265 32,800 265 1.9419 – 560 32 514 3.3
1,291 – 1,291 108,550 1,291 6.1242,382 1,152 5.5
The details of options unvested and options vested and exercisable as on March 31, 2009 were as follows:
Range of exercise prices (Rs.)
Shares Weighted average exercise price (Rs.)
Weighted average remaining
contractual life (Years)
Options unvested 419 – 560 2,000 560 5.41,291 – 1,291 165,300 1,291 7.1
Options vested and exercisable 265 – 265 40,400 265 2.9419 – 560 39,003 462 3.9
1,291 – 1,291 102,150 1,291 7.1348,853 1,075 6.3
Analysis of our financial results
Comparison of fiscal 2010 with fiscal 2009
Revenues
Our total revenues in the fiscal year ended March 31, 2010 were Rs. 28,739.7 million, a decrease of 2% over our total revenues of Rs. 29,276.2 million in the fiscal year ended March 31, 2009. The increase in revenues was attributable to a 3% increase in the revenues from our products business and 12% decrease in the revenues from our services business.
Products revenues
Our products revenues in the fiscal year ended March 31, 2010 were Rs. 18,704.7 million, an increase of 3% over our products revenues of Rs. 18,131.1 million in the fiscal year ended March 31, 2009 on the strength of large customer wins in Europe and ASPAC. The revenues from license fees comprised 18% of revenues, implementation fees comprised 59% and Annual Maintenance Contracts comprised 23% of revenues for the fiscal 2010.
Services revenues
Our services revenues represented 32% and 36% of our total revenues for the fiscal year ended March 31, 2010 and 2009. Our services revenues were Rs. 9,400.4 million in the fiscal year ended March 31, 2010, a decrease of 12% from Rs. 10,625.4 million in the fiscal year ended March 31, 2009.
Revenues from time and material contracts comprised 66% of the revenues and fixed price contracts comprised 34% for the fiscal 2010.
Annual Report 2009_2010_Colour.indd 92 7/24/2010 1:46:04 PM

93
Business Process Outsourcing (BPO) Revenue
Our revenues from BPO services in the fiscal year ended March 31, 2010 were Rs. 845.8 million, an increase of 18% over our revenues from BPO services of Rs. 719.10 million in the fiscal year ended March 31, 2009.
Interest and other income (expense)
Our interest and other income in the fiscal year ended March 31, 2010 was an expense of Rs. 856.2 million, as compared to income of Rs. 1,789.4 million in the fiscal year ended March 31, 2009. The decrease in interest income amounted to Rs. 70.94 million resulting from sharp decrease in Interest rate over fiscal 2009. Additionally in fiscal 2010 there was foreign exchange loss amounting to Rs. 1,568.7 million as compared to a gain of Rs. 1,044.1 million in fiscal 2009, mainly due to sharp appreciation of rupee against the US Dollar and Euro in the current year.
Cost of revenues and operating expenses
Cost of revenues
Our cost of revenues in the fiscal year ended March 31, 2010 was Rs. 13,086.9 million, a decrease of 10% over our cost of revenues of Rs. 14,491.6 million in the fiscal year ended March 31, 2009. Cost of revenue as a percentage of total revenue was 46% in the fiscal year ended March 31, 2010, compared to 49% in the fiscal year ended March 31, 2009.
We have invested significantly both in our products and services businesses to meet emerging market requirements, and create a strong foundation for future growth. In the financial year 2009‑2010, we continued to invest in enhancing our products. We announced the launch of Oracle FLEXCUBE 11.0 that helps financial institutions respond faster to market dynamics, define and track processes and ensure compliance. Our investments in the Oracle Analytics platform resulted in the launch of several new offerings. These included new OFSA Enterprise Performance Management applications as well as new Reveleus products for Capital Management and Stress Testing.
Our cost of products revenues in the fiscal year ended March 31, 2010 was Rs. 7,008.6 million, a decrease of 6% over our cost of products revenues of Rs. 7,445.2 million in the fiscal year ended March 31, 2009. Our cost of products revenues as a percentage of products revenues was 37% in the fiscal year ended March 31, 2010, compared to 41% in the fiscal year ended March 31, 2009.
Our cost of services revenues in the fiscal year ended March 31, 2010 was Rs. 5,828.4 million, a decrease of 14% over our cost of services revenues of Rs. 6,750.4 million in the fiscal year ended March 31, 2009. The cost of services revenues as a percentage of services revenues was 62% in the fiscal year ended March 31, 2010, compared to 64% in the fiscal year ended March 31, 2009.
Our cost of BPO revenues in the fiscal year ended March 31, 2010 was Rs. 249.8 million, a decrease of 16% over our cost of BPO revenues of Rs. 296 million in the fiscal year ended March 31, 2009. The cost of BPO revenues as a percentage of BPO revenues was 30% in the fiscal year ended March 31, 2010 compared to 41% in the fiscal year ended March 31, 2009.
Sales and marketing expenses
Our sales and marketing expenses in the fiscal year ended March 31, 2010 were Rs. 2,353.7 million, a decrease of 31% over our sales and marketing expenses of Rs. 3,426.3 million in the fiscal year ended March 31, 2009. Our sales and marketing expenses as a percentage of total revenues stood at 8% for the fiscal year ended March 31, 2010 compared to 12% for the fiscal year ended March 31, 2009.
Our sales and marketing expenses for our products business in the fiscal year ended March 31, 2010 were Rs. 1,928 million, a decrease of 27% over our sales and marketing expenses for our products business of Rs. 2,639.9 million in the fiscal year ended March 31, 2009. Sales and marketing expenses for our products business as a percentage of products revenues was 10% in the fiscal year ended March 31, 2010, compared to 15% in the fiscal year ended March 31, 2009.
Our sales and marketing expenses for our services business in the fiscal year ended March 31, 2010 were Rs. 333.8 million, a decrease of 50% over our sales and marketing expenses for our services business of Rs. 661.1 million in the fiscal year ended March 31, 2009. Sales and marketing expenses for our services business as a percentage of services revenues was 4% in the fiscal year ended March 31, 2010, compared to 6% in the fiscal year ended March 31, 2009.
Our sales and marketing expenses for our BPO business in the fiscal year ended March 31, 2010 were Rs. 91.8 million, a decrease of 27% over our sales and marketing expenses for our BPO business of Rs. 125.2 million in the fiscal year ended March 31, 2009. Sales and marketing expenses for our BPO business as a percentage of BPO revenues was 11% in the fiscal year ended March 31, 2010 compared to 17% in the fiscal year ended March 31, 2009.
General and administrative expenses
Our general and administrative expenses in the fiscal year ended March 31, 2010 stood at Rs. 3,018.2 million, a decrease of 16% over our general and administrative expenses of Rs. 3,603.4 million in the fiscal year ended March 31, 2009. Our general and administrative expenses as a percentage of total revenues was 11% in the fiscal year ended March 31, 2010, compared to 12% in the fiscal year ended March 31, 2009.
Annual Report 2009_2010_Colour.indd 93 7/23/2010 9:04:42 PM

Oracle Financial Services Software – Annual Report 2009‑10
General and administrative expenses for our products business in the fiscal year ended March 31, 2010 were Rs. 1,192.5 million, a decrease of 4% over our general and administrative expenses for our products business of Rs. 1,243.5 million in the fiscal year ended March 31, 2009. Our general and administrative expenses for our products business as a percentage of products revenues was 6% for the fiscal year ended March 31, 2010 compared to 7% for the fiscal year ended March 31, 2009.
General and administrative expenses for our services business in the fiscal year ended March 31, 2010 were Rs. 620.3 million, an decrease of 27% over our general and administrative expenses for our services business of Rs. 845.9 million in the fiscal year ended March 31, 2009. Our general and administrative expenses for our services business as a percentage of services revenues was 7% for the fiscal year ended March 31, 2010 compared to 8% for the fiscal years ended March 31, 2009.
General and administrative expenses for our BPO business in the fiscal year ended March 31, 2010 were Rs. 164 million, an increase of 31% over our general and administrative expenses for our BPO business of Rs. 124.9 million in the fiscal year ended March 31, 2009. Our general and administrative expenses for our BPO business as a percentage of BPO revenues was 19% for the fiscal year ended March 31, 2010 compared to 17% for the fiscal years ended March 31, 2009.
Income taxes
Our provision for income taxes in the fiscal year ended March 31, 2010 was Rs. 1,197.7 million (including income tax expense of Rs. 544.5 Million for previous years), an increase of 43% over our provision for income taxes of Rs. 835.3 million in the fiscal year ended March 31, 2009. Our effective tax rate was 13.4% in the fiscal year ended March 31, 2010 compared to 10.2% in the fiscal year ended March 31, 2009.
Exceptional items
The Company has settled a dispute with a party for Rs. 468.9 million for full release of all alleged claims and has disclosed the same as an exceptional item in the financial results for the financial year ended March 31, 2009.
Impairment of Goodwill
During the financial year ended March 31, 2009, the Group has recorded impairment loss amounting to Rs. 291 million in respect of goodwill created for i‑flex Solutions Inc. Canada (formerly known as Castek Software Inc.).
Income from operations and net income
As a result of the foregoing factors, income from operations increased by 36% to Rs. 9,792.3 million in fiscal 2010 from Rs. 7,196.8 million in fiscal 2009, and net income increased by 5% to Rs. 7,736.6 million in fiscal 2010 from Rs. 7,365.4 million in fiscal 2009. Our net margins increased to 27% in fiscal 2010 from 25% in fiscal 2009. We define net income margins for a particular period as the ratio of net income to total revenues during such period.
Liquidity and capital resources
Our capital requirement relate primarily to financing the growth of our business. We have historically financed the majority of our working capital, capital expenditure and other requirements through our operating cash flow. During fiscal 2010 and 2009, we generated cash from operations of Rs. 7,138.4 million and Rs. 6,213.5 million respectively.
Oracle Financial Services Software Ltd. is a zero debt company. We expect that our primary financing requirements in the future will be capital expenditure and working capital requirements in connection with the expansion of our business. We believe that the cash generated from operations will be sufficient to satisfy our currently foreseeable capital expenditure and working capital requirements.
Human capital
We recruit graduates from leading engineering and management institutions. We also hire functional experts from the banking industry. We had a net reduction of 935 employees during the fiscal year taking our employee strength to 10,451 employees as on March 31, 2010. The blend of functional knowledge and technical expertise, coupled with in‑house training and on real‑life, experiences in working with financial institutions make our employees unique.
We enjoy cordial relationships with our employees and endeavor to give them an excellent, professionally rewarding and enriching work environment. We operate an effective performance management system with a focus on employee development. This measures key result areas, competencies and training requirements ensuring all‑round employee development.
Risks and concerns
Quantitative and Qualitative Disclosures about Market Risk
Our primary market risk exposures are due to the following:
– Foreign exchange rate fluctuations,
– Fluctuations in interest rates; and
– Fluctuations in the value of our investments.
Annual Report 2009_2010_Colour.indd 94 7/23/2010 9:04:42 PM

95
As of March 31, 2010, we had Cash and Bank Balances of Rs. 22,045.8 million out of which Rs. 16,932.9 million was in interest–bearing bank deposits. Consequently, we face an exposure on account of fluctuation in interest rates. These funds were invested in bank deposits of longer maturity (more than 90 days) to earn a higher rate of interest income.
A substantial portion of our revenues is generated in foreign currencies while a majority of our expenses are incurred in Indian Rupees and the balance in US Dollars and European currencies. Our functional currency for Indian operations and consolidated financials is the Indian Rupee. We expect that the majority of our revenues will continue to be generated in foreign currencies for the foreseeable future and a significant portion of our expenses, including personnel costs and capital and operating expenditure, to continue to be incurred in Indian Rupees.
In addition, we face normal business risks such as global competition and country risks pertaining to countries that we operate in.
Integration of mergers and acquisitions
On May 26, 2009, Oracle Financial Services Software S.A. became a wholly owned subsidiary of Oracle Financial Services Software B.V. with the acquisition of the balance 10% shares from minority shareholders for total consideration of Rs. 66,341. The Group has recorded goodwill of Rs. 45,276 after adjusting minority liability till the date of acquisition.
SWOT analysis
Strengths:
– Deep domain expertise
– Unmatched solutions portfolio with depth of offering in the retail, corporate and investment banking, funds, cash management, trade, treasury, payments, lending, private wealth management, asset management and business analytics areas
– Superior quality and cost‑efficient, end‑to‑end service capability, from business consulting, to application development and deployment, IT management, to Business Process Outsourcing
– Solutions built on best‑in‑class technology and architecture
– Continued momentum in new customer additions
– Extensive global client base
– High quality manpower resources
– Strong R&D capability
– Acknowledged leadership in core banking, application services and governance, risk and compliance, Anti‑Money laundering, operational risk and process outsourcing domains
Weaknesses:
– Exposure to various economies
– Lack of local resources in new markets/opportunities
Opportunities:
– Increasing momentum in the acquisition of core banking systems by large and global financial institutions
– Entry into hitherto untapped markets
– Evolving needs due to regulatory pressures and economic outlook
– Expanding solutions portfolio and entry into new market segments Consumer finance, business analytics, Basel II, Anti‑Money Laundering, Private Wealth Management, Islamic banking, among others
– The need for banks to improve performance and efficiency through effective use of information technology solutions
Threats:
– Unfavorable conditions in global markets
– Customers negotiating harder as the financial position in many markets have changed
– Restrictions by governments on the movement of people to protect local employment
Annual Report 2009_2010_Colour.indd 95 7/23/2010 9:04:42 PM

Oracle Financial Services Software – Annual Report 2009‑10
Outlook
The worldwide market for financial services is undergoing rapid transformation. Emerging markets are becoming increasingly significant sources of growth for firms in mature economies. New asset classes such as private equity and hedge funds have seen dramatic shifts in customer engagement and have altered the focus of capital markets. The payments space, a major source of revenue and profit for financial institutions, is being restructured, thus altering the fundamental dynamics of the banking industry.
Over the last 24 months there have been significant changes in the economic environment. Your company views the current economic scenario as an opportunity to help financial institutions meet their emerging business needs. To sustain their growth and profitability, global financial institutions will need to excel in areas such as off‑shoring, taxation and financial reporting, internal controls and service and process innovation.
Financial institutions are also reviewing their existing IT investments to ensure that they are attuned to changing customer preferences and aligned to new business priorities. Core banking, risk management and compliance, investor service and internet banking are among the areas that continue to show significant potential. Financial institutions are innovating using available technologies to offer services to their customers on a ‘self service’ basis.
We see demand for core banking applications continuing as banks expand by buying the assets of other banks, establish presence in new countries or standardize applications across regions. Banks are exploring how they can centralize banking services such as account opening and origination of credit to improve their service levels, increase productivity and gain greater control over processes that are subject to regulatory scrutiny.
Global regulators have re‑emphasized the importance of stress testing in the measurement of liquidity and credit risk and in evaluating how banks would fare under different scenarios. As a result of these factors we have gained increasing traction at Tier 1 banks for our products. Over the last 12 months banks have also exhibited renewed interest in aligning finance, risk and performance applications. Risk Adjusted Performance Measurements (RAPM), that can manage such alignment, has received interest from many regulators and has also attracted attention from the boards of many banks.
Oracle has been ranked number one in the banking space by an independent vendor and is committed to maintaining its leadership position in financial services. Oracle will continue to invest in expanding its banking footprint through its own internal R&D and also seek “best‑in‑class” acquisition targets.
With a process‑driven approach based on a Service‑Oriented Architecture, your company has the distinct advantage of offering banks the combined benefits of interoperability, extensibility and standardization. Together with Oracle we provide a complete banking footprint, spanning all major distribution, manufacturing and corporate administration functions.
Internal control systems and their adequacy
Oracle Financial Services Software group has in place adequate systems for internal control and documented procedures covering all financial and operating functions. These systems are designed to provide reasonable assurance with regard to maintaining proper accounting controls, monitoring economy and efficiency of operations, protecting assets from unauthorized use or losses, and ensuring reliability of financial and operational information. The group continuously strives to align all its processes and controls with global best practices.
Annual Report 2009_2010_Colour.indd 96 7/23/2010 9:04:42 PM

97
Auditors’ report
To The Board of Directors of Oracle Financial Services Software Limited
1. We have audited the attached consolidated balance sheet of Oracle Financial Services Software Limited, its subsidiaries and associate company (together referred to as the ‘Group’ as described in Note 1 of Schedule 15 to the consolidated financial statements) as at March 31, 2010 and also the consolidated profit and loss account and the consolidated cash flow statement for the year ended on that date annexed thereto. These financial statements are the responsibility of the Group’s management. Our responsibility is to express an opinion on these financial statements based on our audit.
2. We conducted our audit in accordance with auditing standards generally accepted in India. Those Standards require that we plan and perform the audit to obtain reasonable assurance about whether the financial statements are free of material misstatements. An audit includes, examining on a test basis, evidence supporting the amounts and disclosures in the financial statements. An audit also includes assessing the accounting principles used and significant estimates made by management, as well as evaluating the overall financial statements presentation. We believe that our audit provides a reasonable basis for our opinion.
3. We report that the consolidated financial statements have been prepared by the Group’s management in accordance with the requirements of Accounting Standard (‘AS’) 21, Consolidated Financial Statements and AS 23, Accounting for Investments in Associates in Consolidated Financial Statements notified pursuant to the Companies (Accounting Standards) Rules, 2006 (as amended).
4. In our opinion and to the best of our information and according to the explanations given to us, the consolidated financial statements give a true and fair view in conformity with the accounting principles generally accepted in India:
(a) in the case of the consolidated balance sheet, of the state of affairs of the Group as at March 31, 2010;
(b) in the case of the consolidated profit and loss account, of the profit of the Group for the year then ended; and
(c) in the case of the consolidated cash flow statement, of the cash flows of the Group for the year then ended.
For S. R. Batliboi & Associates Firm registration number:101049W Chartered Accountants
per Amit Majmudar Partner Membership No.: 36656
Mumbai, India May 7, 2010
Annual Report 2009_2010_Colour.indd 97 7/23/2010 9:04:42 PM

Oracle Financial Services Software – Annual Report 2009‑10
(All amounts in thousands of Indian Rupees)
Schedules 2010 2009
Sources of fundsShareholders' funds
Share capital 1 419,274 418,847 Share application money pending allotment 8,068 106 Reserves and surplus 2 42,476,622 34,629,799
Minority interest – 19,198 Deferred tax liability 3 32,911 20,707
42,936,875 35,088,657
Application of fundsFixed assets 4
Gross block 12,000,159 12,052,804 Less: Accumulated depreciation and amortization/impairment 3,636,871 3,360,379 Net book value 8,363,288 8,692,425 Capital work‑in‑progress and advances 1,304,106 1,013,260
9,667,394 9,705,685 Investments 5 9,982 9,565
Deferred tax assets 3 399,726 325,944
Current assets, loans and advances 6Sundry debtors 6,782,391 8,402,313 Cash and bank balances 22,045,843 15,489,517 Other current assets 2,327,793 1,746,868 Loans and advances 7,724,538 6,442,319
38,880,565 32,081,017 Less: Current liabilities and provisions 7
Current liabilities 4,990,369 6,094,991 Provisions 1,030,423 938,563
6,020,792 7,033,554
Net current assets 32,859,773 25,047,463
42,936,875 35,088,657
Notes to accounts 15
The schedules referred to above and notes to accounts form an integral part of the consolidated balance sheet.
Consolidated balance sheet as at March 31
As per our report of even date For and on behalf of the Board of Directors
For S. R. Batliboi & Associates Firm Registration No. 101049WChartered Accountants
N R K RamanManaging Director& Chief Executive Officer
Y M Kale Director
per Amit MajmudarPartnerMembership No.: 36656
Hoshi D Bhagwagar Company Secretary & Compliance Officer
Tarjani Vakil Director
Mumbai, IndiaMay 7, 2010
Mumbai, IndiaMay 7, 2010
Annual Report 2009_2010_Colour.indd 98 7/23/2010 9:04:42 PM
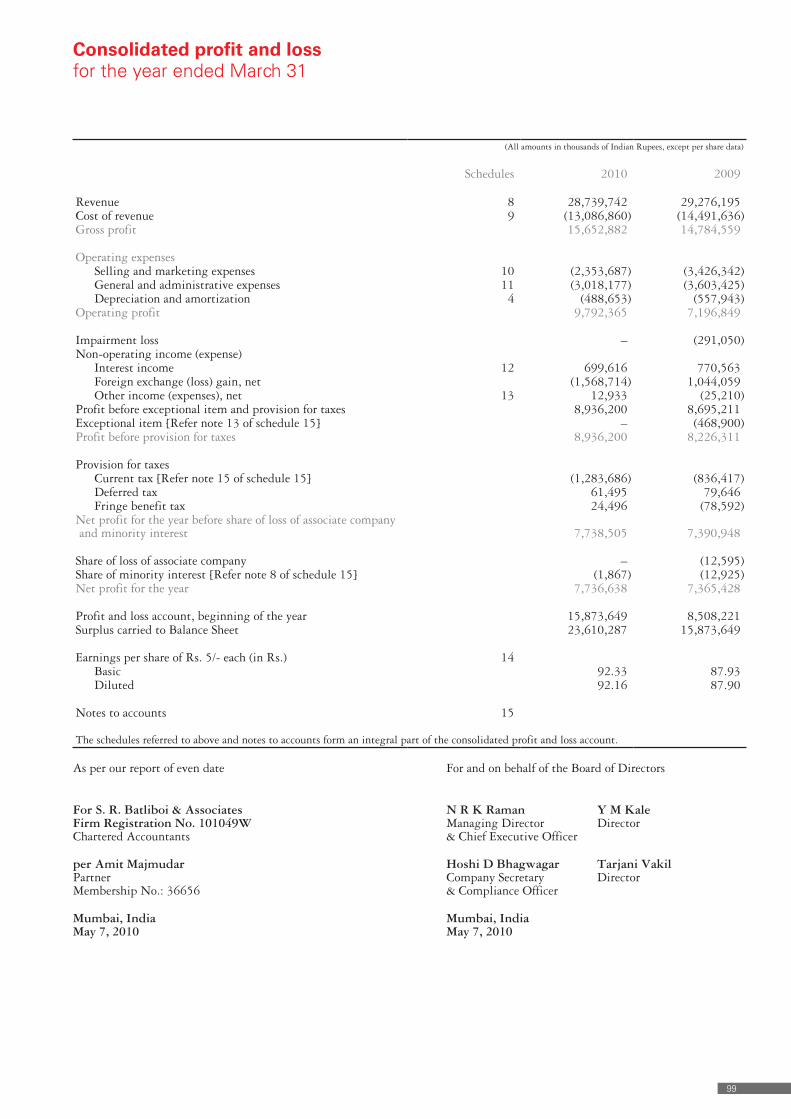
99
As per our report of even date For and on behalf of the Board of Directors
For S. R. Batliboi & Associates Firm Registration No. 101049WChartered Accountants
N R K RamanManaging Director& Chief Executive Officer
Y M Kale Director
per Amit MajmudarPartnerMembership No.: 36656
Hoshi D Bhagwagar Company Secretary & Compliance Officer
Tarjani Vakil Director
Mumbai, IndiaMay 7, 2010
Mumbai, IndiaMay 7, 2010
(All amounts in thousands of Indian Rupees, except per share data)
Schedules 2010 2009
Revenue 8 28,739,742 29,276,195 Cost of revenue 9 (13,086,860) (14,491,636)Gross profit 15,652,882 14,784,559
Operating expensesSelling and marketing expenses 10 (2,353,687) (3,426,342)General and administrative expenses 11 (3,018,177) (3,603,425)Depreciation and amortization 4 (488,653) (557,943)
Operating profit 9,792,365 7,196,849
Impairment loss – (291,050)Non‑operating income (expense)
Interest income 12 699,616 770,563 Foreign exchange (loss) gain, net (1,568,714) 1,044,059 Other income (expenses), net 13 12,933 (25,210)
Profit before exceptional item and provision for taxes 8,936,200 8,695,211 Exceptional item [Refer note 13 of schedule 15] – (468,900)Profit before provision for taxes 8,936,200 8,226,311
Provision for taxesCurrent tax [Refer note 15 of schedule 15] (1,283,686) (836,417)Deferred tax 61,495 79,646 Fringe benefit tax 24,496 (78,592)
Net profit for the year before share of loss of associate company and minority interest 7,738,505 7,390,948
Share of loss of associate company – (12,595)Share of minority interest [Refer note 8 of schedule 15] (1,867) (12,925)Net profit for the year 7,736,638 7,365,428
Profit and loss account, beginning of the year 15,873,649 8,508,221 Surplus carried to Balance Sheet 23,610,287 15,873,649
Earnings per share of Rs. 5/‑ each (in Rs.) 14Basic 92.33 87.93 Diluted 92.16 87.90
Notes to accounts 15
The schedules referred to above and notes to accounts form an integral part of the consolidated profit and loss account.
Consolidated profit and loss for the year ended March 31
Annual Report 2009_2010_Colour.indd 99 7/23/2010 9:04:43 PM

Oracle Financial Services Software – Annual Report 2009‑10
(All amounts in thousands of Indian Rupees, except share data)
As at March 31, 2010
As at March 31, 2009
Schedule 1: Share capital
Authorized:100,000,000 (March 31, 2009 – 100,000,000) equity shares of Rs. 5/‑ each 500,000 500,000
Issued, subscribed and fully paid up:83,854,857 (March 31, 2009 – 83,769,386) equity shares of Rs. 5/‑ each 419,274 418,847
a. Of the above, 67,481,698 (March 31, 2009 – 67,481,698) equity shares of Rs. 5/‑ each are held by Oracle Global (Mauritius) Limited, holding company.
b. Of the above, 62,121,800 (March 31, 2009 – 62,121,800) equity shares of Rs. 5/‑ each had been issued as fully paid up bonus shares by capitalizing the securities premium account.
c. Refer Note 6(b) of Schedule 15 for the options granted for unissued equity shares.
Schedule 2: Reserves and surplus
Securities premiumBalance, beginning of the year 9,454,959 9,444,295 Received during the year on exercise of stock options 69,587 10,664 Balance, end of the year 9,524,546 9,454,959
General reserve 10,145,191 10,145,191
Foreign currency translation reserveBalance, beginning of year (844,907) (747,043)Addition during the year on net investment in Non integral operations 40,598 (97,864)Balance, end of the year (804,309) (844,907)
Gain on dilution of equity investment in joint venture 907 907
Profit and loss account 23,610,287 15,873,649 42,476,622 34,629,799
Schedule 3: Deferred tax asset (liability)
Deferred tax asset Difference between book and tax depreciation 179,180 226,398 Provision for compensated absence 102,100 –Provision for gratuity 78,317 44,257 Provision for doubtful debts 26,663 39,409 Others 13,466 15,879
399,726 325,944 Deferred tax liabilityDifference between book and tax depreciation (2,978) (2,943)Deferred revenue (29,933) (17,764)
(32,911) (20,707) 366,815 305,237
Schedules annexed to and forming part of the accounts
Annual Report 2009_2010_Colour.indd 100 7/23/2010 9:04:43 PM

101
Sch
edu
le 4
: Fi
xed
ass
ets
Par
ticu
lars
Gro
ss b
lock
D
epre
ciat
ion,
am
orti
zati
on a
nd im
pair
men
t lo
sses
Net
boo
k va
lue
As a
t A
pril
01, 2
009
Add
itio
ns
Sale
/ de
leti
ons
Tra
nsla
tion
ga
in (l
oss)
As a
t M
arch
31,
201
0 A
s at
Apr
il 01
, 200
9 F
or t
he
year
Im
pair
men
t lo
ss
Sale
/ de
leti
ons
Tra
nsla
tion
ga
in (l
oss)
As a
t M
arch
31,
201
0A
s at
Mar
ch 3
1, 2
010
As a
t M
arch
31,
200
9T
angi
ble
asse
ts:
Free
hold
Lan
d 5
38,3
12
––
– 5
38,3
12
––
––
––
538
,312
5
38,3
12
Impr
ovem
ent
to
leas
ehol
d pr
emis
es 3
48,2
54
12,
601
2,8
88
– 3
57,9
67
236
,585
2
2,92
9 –
2,5
46
– 2
56,9
68
100
,999
1
11,6
69
Bui
ldin
gs (N
ote
1) 1
,131
,141
2
,573
–
– 1
,133
,714
1
20,7
11
56,
651
––
– 1
77,3
62
956
,352
1
,010
,430
C
ompu
ter
equi
pmen
tsO
wne
d 1
,730
,023
6
5,76
1 1
68,0
82
(1,2
16)
1,6
26,4
86
1,4
86,4
89
190,
522
– 1
67,9
53
(1,1
34)
1,5
07,9
24
118
,562
2
43,5
34
Und
er fi
nanc
e le
ase
7,2
32
––
– 7
,232
7
,232
–
––
– 7
,232
–
–E
lect
rica
l and
off
ice
equi
pmen
ts 8
08,8
83
16,
597
18,
620
(257
) 8
06,6
03
421
,017
9
5,54
2 –
12,
610
(224
) 5
03,7
25
302
,878
3
87,8
66
Furn
itur
e an
d fi
xtur
esO
wne
d 6
50,8
83
4,9
15
21,
620
– 6
34,1
78
349
,173
8
2,84
2 –
14,
874
– 4
17,1
41
217
,037
3
01,7
10
Und
er fi
nanc
e le
ase
2,9
82
––
– 2
,982
2
,982
–
––
– 2
,982
–
–V
ehic
les
unde
r fi
nanc
e le
ase
39,
415
25,
719
13,
404
– 5
1,73
0 2
0,04
5 1
0,54
9 –
12,
820
– 1
7,77
4 3
3,95
6 1
9,37
0
Inta
ngib
le a
sset
s:G
oodw
ill o
n co
nsol
idat
ion
[Not
e 2
belo
w]
6,3
83,5
30
45,
276
––
6,4
28,8
06
342
,180
–
––
– 3
42,1
80
6,0
86,6
26
6,0
41,3
50
Goo
dwil
l on
acqu
isit
ion
197
,473
–
––
197
,473
1
97,4
73
––
––
197
,473
–
–C
usto
mer
con
trac
ts 2
2,29
0 –
––
22,
290
22,
290
––
––
22,
290
––
Pro
duct
IP
R 1
38,6
19
––
– 1
38,6
19
118
,359
1
8,86
5 –
––
137
,224
1
,395
2
0,26
0 P
eopl
eSof
t E
RP
53,
767
––
– 5
3,76
7 3
5,84
3 1
0,75
3 –
––
46,
596
7,1
71
17,
924
Tot
al 1
2,05
2,80
4 1
73,4
42
224
,614
(1
,473
) 1
2,00
0,15
9 3
,360
,379
48
8,65
3 –
210
,803
(1
,358
) 3
,636
,871
8
,363
,288
8
,692
,425
As
at
Mar
ch 3
1, 2
009
11,
088,
250
1,0
72,9
28
113
,033
4
,659
1
2,05
2,80
4 2
,575
,047
55
7,94
3 2
91,0
50
67,
993
4,3
32
3,3
60,3
79
Cap
ital
wor
k‑in
‑pro
gres
s an
d ad
vanc
es 1
,304
,106
1
,013
,260
9
,667
,394
9
,705
,685
Not
e:1.
In
clud
es 1
0 (M
arch
31,
200
9 ‑ 1
0) s
hare
s of
Rs.
50/
‑ ea
ch in
Tak
shil
a B
uild
ing
No.
9, C
o‑op
Hou
sing
Soc
iety
Ltd
., M
umba
i.2.
A
ccum
ulat
ed d
epre
ciat
ion,
am
orti
zati
on a
nd i
mpa
irm
ent
loss
es a
s at
Apr
il 1
, 20
09 c
onsi
sts
of i
mpa
irm
ent
of g
oodw
ill
of S
uper
Solu
tion
s C
orpo
rati
on [
mer
ged
wit
h O
racl
e Fi
nanc
ial
Serv
ices
Sof
twar
e, I
nc.
effe
ctiv
e Ja
nuar
y 2,
200
8] a
mou
ntin
g to
Rs.
51,
130
and
impa
irm
ent
of g
oodw
ill o
f i‑f
lex
solu
tion
s In
c. (C
anad
a) a
mou
ntin
g to
Rs.
291
,050
.
Annual Report 2009_2010_Colour.indd 101 7/23/2010 9:04:43 PM

Oracle Financial Services Software – Annual Report 2009‑10
As at March 31, 2010
As at March 31, 2009
Schedule 5: Investments
a. Long term investments (at cost)
i. Trade (unquoted)EBZ Online Private Limited242,240 (March 31, 2009 – 242,240) equity shares of Rs. 10/‑ each, fully paid up 45,000 45,000 Less: Provision for diminution in value of investment (45,000) (45,000)
– –Login SA33,000 (March 31, 2009 – 33,000) equity shares of EUR 2/‑ each, fully paid up – 12,595 Less: Share of loss of associate company – (12,595)
b. Current Investment (cost or fair value, whichever is lower)
9% Dhanalakshmi Bank Bond Series VI10 (March 31, 2009 – 10) Bonds of Rs. 1,000,000 each, fully paid up 9,982 9,565
9,982 9,565
Aggregate amount of quoted investment 9,982 9,565 Aggregate market value of quoted investment 9,982 9,565 Aggregate amount of unquoted investment – –
Schedule 6: Current assets, loans and advances
a. Sundry debtors (unsecured)Debts outstanding for a period exceeding six months:
Considered good 453,145 988,033 Considered doubtful 758,878 1,028,730
1,212,023 2,016,763 Other debts‑considered good 6,329,246 7,414,280
7,541,269 9,431,043 Less: Provision for doubtful debts (758,878) (1,028,730)
6,782,391 8,402,313
b. Cash and bank balancesCash in hand 1,787 1,947 Cheques on hand 494 545 Balances with scheduled banks:
Current accounts in foreign currency 3,404,787 1,213,886 Other current accounts 128,243 140,764 Deposit accounts 14,263,523 9,623,593 Margin money deposit 6,570 10,793 Unclaimed dividend accounts 982 1,335
Balances with non‑scheduled banks: Current accounts in foreign currency 1,570,067 1,960,759 Deposit account in foreign currency 2,669,390 2,535,895
22,045,843 15,489,517
c. Other current assetsInterest accrued on Bank deposits 102,235 67,868 Unbilled revenue 2,218,578 1,661,771 Net investment in lease 6,980 17,229
2,327,793 1,746,868
d. Loans and advances (unsecured, considered good)Advances recoverable in cash or in kind or for value to be received:
Deposits for premises and others 3,305,759 3,179,260 Prepaid expenses 253,863 301,749 Other advances 499,348 425,705
Advance tax, net of provision for taxes 1,727,792 1,663,551 MAT credit entitlement 1,937,776 872,054
7,724,538 6,442,319
Annual Report 2009_2010_Colour.indd 102 7/23/2010 9:04:43 PM

103
As at March 31, 2010
As at March 31, 2009
Schedule 7: Current liabilities and provisions
a. Current liabilitiesAccrued expenses 2,212,247 2,389,336 Deferred revenues 1,884,263 2,628,814 Sundry creditors 107,743 240,948 Advances from customers 45,201 29,029 Investor Education and Protection Fund to be credited by unclaimed dividends* 982 1,335 Forward contract payable, net – 61,347 Other current liabilities 739,933 744,182
4,990,369 6,094,991
* There is no amount due and outstanding as at balance sheet date to be credited to the Investor Education and Protection Fund.
b. ProvisionsProvision for gratuity 271,453 238,269 Provision for compensated absence 438,830 442,352 Provision for fringe benefit tax, net of advance tax – 12,782 Provision for taxation, net of advance tax 320,140 245,160
1,030,423 938,563
Year ended March 31, 2010
Year ended March 31, 2009
Schedule 8: Revenue
Product licenses and related activities 18,704,705 18,131,084 IT solutions and consulting services 9,189,218 10,426,034 Business Processing Services 845,819 719,077
28,739,742 29,276,195
Schedule 9: Cost of revenue
Employee costs 10,398,175 10,814,255 Travel related expenses (net of recoveries) 1,409,839 1,474,660 Professional fees 1,064,101 1,702,483 Application software 214,745 500,238
13,086,860 14,491,636
Schedule 10: Selling and marketing expenses
Employee costs 1,787,821 1,771,780 Professional fees [Refer note 12 of schedule 15] (3,323) 334,908 Travelling expenses 261,289 347,364 Advertising expenses 58,250 43,719 Rent 99,618 103,635 Communication expenses 50,521 101,173 Provision for doubtful debts, net of reversals (198,603) 574,151 Bad Debts 214,858 4,480 Repairs and maintenance 8,585 20,048 Other expenses 74,671 125,084
2,353,687 3,426,342
Schedule 11: General and administrative expenses
Employee costs 1,175,581 1,235,755 Professional fees 256,346 520,225 Rent 609,887 739,193 Communication expenses 256,338 274,094 Power 228,877 241,784 Repairs and maintenance 155,588 151,332 Travelling expenses 76,874 65,084 Other expenses 258,686 375,958
3,018,177 3,603,425
Annual Report 2009_2010_Colour.indd 103 7/23/2010 9:04:44 PM

Oracle Financial Services Software – Annual Report 2009‑10
Year ended March 31, 2010
Year ended March 31, 2009
Schedule 12: Interest income
Interest on:Bank deposits 667,345 726,958 (Includes tax deducted at source of Rs. 83,535 (March 31, 2009 – Rs. 152,586))Bonds 900 1,363 (Includes tax deducted at source of Rs. Nil (March 31, 2009 – Rs. Nil)
Income tax refund 28,156 37,525 Lease assets 3,088 4,596 Loans to employees 127 121
699,616 770,563
Schedule 13: Other income (expense), net
Loss on sale/write off of fixed assets, net (12,190) (41,697)Miscellaneous income 25,123 16,487
12,933 (25,210)
Schedule 14: Reconciliation of basic and diluted shares used in computing earnings per share
Number of shares
Weighted average shares outstanding for basic earnings per share 83,793,213 83,763,033 Add: Effect of dilutive stock options 158,986 29,743 Weighted average shares outstanding for diluted earnings per share 83,952,199 83,792,776
Annual Report 2009_2010_Colour.indd 104 7/23/2010 9:04:44 PM

105
Schedule 15: Notes to accounts
1. Background and nature of operations
Oracle Financial Services Software Limited (“the Company”) was incorporated in India with limited liability on September 27, 1989. Oracle Financial Services Software Limited is a subsidiary of Oracle Global (Mauritius) Limited (“Oracle”) with Oracle holding 80.47% ownership interest in the Company as at March 31, 2010.
The Company along with its subsidiaries and associate is principally engaged in the business of providing information technology solutions and knowledge processing services to the financial services industry worldwide. Oracle Financial Services Software Limited has a suite of banking products, which caters to the needs of corporate, retail, investment banking, treasury operations and data warehousing.
The Company has following subsidiaries and associate (hereinafter collectively referred as the “Group”):
Companies Country of Incorporation Ownership Interest Relationship
Direct holdingOracle Financial Services Software B.V. The Netherlands 100% SubsidiaryOracle Financial Services Software Pte. Ltd. Singapore 100% SubsidiaryOracle Financial Services Software America, Inc. United States of America 100% SubsidiaryISP Internet Mauritius Company Republic of Mauritius 100% SubsidiaryOracle (OFSS) Processing Services Limited (formerly known as i‑flex Processing Services Limited) India 100% Subsidiary
Oracle (OFSS) ASP Private Limited (formerly known as Flexcel International Private Limited) India 100% Subsidiary
Oracle Financial Services Software Chile Limitada (incorporated on November 26, 2009) Chile 100% Subsidiary
Oracle Financial Services Software (Shanghai) Limited (incorporated on February 23, 2010) Republic of China 100% Subsidiary
Login SA France 33% AssociateSubsidiaries of Oracle Financial Services Software America, Inc.
Oracle Financial Services Software, Inc. United States of America 100% Subsidiaryi‑flex solutions Inc. (Canada) Canada 100% SubsidiaryMantas Inc. United States of America 100% SubsidiarySubsidiaries of Mantas Inc.Mantas Limited United Kingdom 100% SubsidiarySotas Inc. United States of America 100% SubsidiaryMantas Singapore Pte. Ltd. Singapore 100% SubsidiaryMantas India Private Limited India 100% SubsidiarySubsidiaries of i‑flex solutions Inc. (Canada)Castek Inc. United States of America 100% SubsidiaryCastek Software Factory Ltd. United States of America 100% SubsidiaryCastek RBG Inc. United States of America 100% SubsidiarySubsidiary of Oracle Financial Services Software B.V.Oracle Financial Services Software SA [Refer Note 8] Greece 100% SubsidiarySubsidiary of Oracle Financial Services Software Pte. ltd.Oracle Financial Services Consulting Pte. Ltd. Singapore 100% SubsidiarySubsidiaries of ISP Internet Mauritius Companyi‑flex Processing Services Inc. United States of America 100% SubsidiaryOracle (OFSS) BPO Services Limited (formerly known as Equinox Global Services Limited) India 100% Subsidiary
2. Summary of significant accounting policies
a. Basis of presentation and consolidation
The consolidated financial statements includes the accounts of Oracle Financial Services Software Limited, its subsidiaries and associate company and are prepared in accordance with accounting principles generally accepted in India under the historical cost convention on the accrual basis of accounting and complying in all material respects with the notified Accounting Standards by Companies (Accounting Standards) Rules, 2006 (as amended) and the relevant provisions of the Companies Act, 1956 (the ‘Act’). The consolidated financial statements have been prepared using uniform accounting policies for like transactions and other events in similar circumstances. The accounting policies have been consistently applied by the group and are consistent with those used in the previous year. The financial statements are presented in the general format specified in Schedule VI to the Act. However, as these financial statements are not statutory financial statements, full compliance with the Act are not required and hence these financial statements do not reflect all the disclosure requirements of the Act.
The consolidated financial statements are prepared in accordance with the principles and procedures required for the preparation and presentation of consolidated financial statements as laid down under Accounting Standard (‘AS’) 21, ‘Consolidated Financials Statements’ and AS 23, ‘Accounting for Investments in Associates in Consolidated Financial Statements’, notified by Companies (Accounting Standards) Rules, 2006 (as amended). The financial statements of the Company and its subsidiaries are consolidated on a line to line basis by adding together like items of assets, liabilities, income and expenses, after eliminating intra‑group balances and intra‑group transactions resulting in unrealized profits or unrealized cash losses. Any excess of the cost to the parent company of its
Annual Report 2009_2010_Colour.indd 105 7/24/2010 10:59:44 AM

Oracle Financial Services Software – Annual Report 2009‑10
investment in a subsidiary over the parent company’s portion of equity of subsidiary at the date, at which investment in the subsidiary is made, is described as goodwill and recognized separately as an asset in the consolidated financial statements. Investment in associate company is accounted under equity method in consolidated financial statements.
The significant accounting policies adopted by the Group, in respect of the consolidated financial statements are set in following paragraphs.
b. Use of estimates
The preparation of financial statements in conformity with generally accepted accounting principles requires management to make estimates and assumptions that affect the reported amounts of assets and liabilities and disclosure of contingent liabilities at the date of the financial statements and the results of operations during the reporting year end. Although these estimates are based upon management’s best knowledge of current events and actions, actual results could differ from these estimates.
c. Fixed assets, depreciation and amortization
Fixed assets including assets under finance lease arrangements are stated at cost less accumulated depreciation. The Group capitalizes all direct costs relating to the acquisition and installation of fixed assets. Advances paid towards the acquisition of fixed assets outstanding at each balance sheet date and the cost of fixed assets not ready to use before such date are disclosed under ‘Capital work‑in‑progress and advances’. Customer contracts and product Intellectual property rights (IPRs) are capitalized based on a fair value. The Group records the difference between considerations paid to acquire these contracts and the fair value of assets and liabilities acquired as goodwill.
The Group purchases certain specific use application software, which is in ready to use condition, for internal use. It is estimated that such software has a relatively short useful life, usually less than one year. The Group, therefore, charges to income the cost of acquiring such software.
Depreciation and amortization are computed using straight‑line method, at the rates specified in Schedule XIV to the Act or based on the estimated useful life of assets, whichever is higher. The estimated useful life considered for depreciation of fixed assets are as follows:
Asset description Asset life (in years)
Tangible assetsImprovement of leasehold premises Lesser of 7 years or lease termBuildings 20Computer equipments 3Electrical and office equipments 2 – 7Furniture and fixtures 2 – 7Vehicles under finance lease Lesser of 3 to 5 years or lease term
Intangible assetsGoodwill on acquisition 3 to 5Customer contract 5Product IPR 5PeopleSoft ERP 5
Goodwill arising on consolidation is evaluated for impairment annually.
The carrying amounts of assets are reviewed at each balance sheet date if there is any indication of impairment based on internal/external factors. An impairment loss is recognized wherever the carrying amount of an asset exceeds its recoverable amount. The recoverable amount is the greater of the assets net selling price and value in use. In assessing value in use, the estimated future cash flows are discounted to their present value at the weighted average cost of capital. After impairment, depreciation is provided on a revised carrying amount of assets over its remaining useful life.
d. Investments
Investments that are readily realizable and intended to be held for not more than a year are classified as current investments. All other investments are classified as long‑term investments. Trade investments refer to the investments made with the aim of enhancing the Group’s business interests in providing information technology solutions to the financial services industry worldwide. Long term investments are stated at cost less provision for diminution on account of other than temporary decline in the value of the investment.
Current investments are stated at lower of cost and fair value determined on an individual investment basis.
e. Foreign currency transactions
Foreign currency transactions during the year are recorded at the exchange rates prevailing on the date of the transaction. Foreign currency denominated monetary items are translated into reporting currency at the closing rates of exchange prevailing at the date of the balance sheet. Non‑monetary items, which are carried in terms of historical cost denominated in a foreign currency, are reported using the exchange rate at the date of the transaction. Exchange differences arising on the settlement of monetary items or on reporting company’s monetary items at rates different from those at which they were initially recorded or reported in previous
Annual Report 2009_2010_Colour.indd 106 7/23/2010 9:04:44 PM

107
financial statement, are recognized as income or as expenses in the year in which they arise except those arising from investments in non‑integral operations.
In respect of forward exchange contracts entered into by the Group to hedge the foreign currency risk, the premium or discount arising at the inception of forward exchange contracts is amortized as income or expense over the life of the contract. Exchange differences on such contracts are recognized in the statement of profit and loss in the year in which the exchange rates change. Any profit or loss arising on cancellation or renewal of forward exchange contract is recognized as income or as expense for the year.
Foreign operations of the Group are classified under integral and non integral foreign operations. The financial statements of integral foreign operations are translated as if the transactions of foreign operations have been those of the Company itself. In translating the financial statements of non‑integral foreign operations for incorporation in financial statements, the assets and liabilities, both monetary and non‑monetary, of the non‑integral foreign operations are translated at closing rate, income and expense items of the non‑integral foreign operations are translated at the average exchange rate; all the resulting exchange differences are accumulated in foreign currency translation reserve until the disposal of the net investment. On the disposal of a non‑integral foreign operation, the cumulative amount of the exchange differences which have deferred and which relate to that operation are recognized as income or a expenses in the same period in which the gain or loss on disposal is recognized. When there is a change in the classification of a foreign operation, the translation procedures applicable to the revised classification are applied from the date of the change in the classification.
f. Revenue recognition
Revenue is recognized as follows:
Product licenses and related revenue:
– License fees are recognized, on delivery and subsequent milestone schedule as per the terms of the contract with the end user.
– Implementation services are recognized as services are provided, when arrangements are on a time and material basis. Revenue for fixed price contracts is recognized using the proportionate completion method till contracts reach 90% completion. Balance revenue is recognized at the time of receipt of customer acceptance.
– Customization services are recognized as services are provided, when arrangements are on a time and material basis. Revenue for fixed price contracts is recognized using the proportionate completion method and restricted to the acceptance received from the customer for the milestone achieved.
– Proportionate completion is measured based upon the efforts incurred to date in relation to the total estimated efforts to complete the contract. The Company monitors estimates of total contract revenue and cost on a routine basis throughout the delivery period. The cumulative impact of any change in estimates of the contract revenue or costs is reflected in the period in which the changes become known. In the event that a loss is anticipated on a particular contract, provision is made for the estimated loss.
– Product maintenance revenue is recognized, over the period of the maintenance contract.
IT solutions and consulting services:
Revenue from IT solutions and consulting services are recognized as services are provided, when arrangements are on a time and material basis.
Revenue from fixed price contracts is recognized using the proportionate completion method till contracts reach 90% completion. Balance revenue is recognized at the time of receipt of customer acceptance. Proportionate completion is measured based upon the efforts incurred to date in relation to the total estimated efforts to complete the contract. The Group monitors estimates of total contract revenue and cost on a routine basis throughout the delivery period. The cumulative impact of any change in estimates of the contract revenue or costs is reflected in the period in which the changes become known. In the event that a loss is anticipated on a particular contract, provision is made for the estimated loss.
Business processing services (‘BPO’):
Revenue from BPO services are recognized as services are provided, as per the arrangement with customers.
Cost and revenue in excess of billing is classified as unbilled revenue while billing in excess of revenue is classified as deferred revenue.
Reimbursable expenses for projects are invoiced separately to customers and although reflected as sundry debtors to the extent outstanding as at year end, are not included as revenue or expense.
Interest income
Interest income is recognized on a time proportion basis taking into account the amount outstanding and the rate applicable.
g. Research and development expenses for software products
Research and development costs are expensed as incurred. Software product development costs are expensed as incurred until technological feasibility is established. Software product development costs incurred subsequent to the achievement of technological feasibility are not material and are expensed as incurred.
Annual Report 2009_2010_Colour.indd 107 7/23/2010 9:04:44 PM

Oracle Financial Services Software – Annual Report 2009‑10
h. Employee benefits
The Group’s employee benefits primarily cover provident fund, superannuation, gratuity and compensated absences.
Provident fund and superannuation fund are defined contribution schemes and the Group has no further obligation beyond the contributions made to the fund. Contributions are charged to profit and loss account in the year in which they accrue.
Gratuity liability is defined benefit obligation and recorded based on actuarial valuation done on projected unit credit method made at the end of the year. The gratuity liability and net periodic gratuity cost is actuarially determined after considering discount rates, expected long term return on plan assets and increases in compensation levels. All actuarial gains/losses are immediately recorded to the profit and loss account and are not deferred. The Company makes contributions to a fund administered and managed by the Life Insurance Corporation of India (LIC) to fund the gratuity liability. Under this scheme, the obligation to pay gratuity remains with the Company, although LIC administers the scheme.
Short term compensated absences are provided for based on estimates. Long term compensated absences are provided for based on actuarial valuation. The actuarial valuation is done as per projected unit credit method.
i. Leases
Where the Company is the lessee
Lease of assets under which substantially all the risks and benefits incidental to ownership are transferred to the Company are classified as finance leases. These assets are capitalized at the lower of the fair value and present value of the minimum lease payments at the inception of the lease term and disclosed as leased assets. Lease payments are apportioned between the finance charges and reduction of the lease liability based on the implicit rate of return. Finance charges are charged directly against income. Lease management fees, legal charges and other initial direct costs are capitalized.
Leases of assets under which all the risks and rewards of ownership are effectively retained by the lessor are classified as operating leases. Lease payments under operating leases are recognized as an expense on a straight‑line basis over the lease term.
Where the Company is the lessor
Assets given under a finance lease are recognized as a receivable at an amount equal to the net investment in the lease. Lease rentals are apportioned between principal and interest on the IRR method. The principal amount received reduces the net investment in the lease and interest is recognized as revenue.
j. Income‑tax
Tax expense comprises of current, deferred and fringe benefit tax. Current income tax and fringe benefit tax for the Company is measured at the amount expected to be paid to the tax authorities in accordance with the Indian Income Tax Act, 1961.Tax expense relating to overseas operations is determined in accordance with tax laws applicable in countries where such operations are domiciled. Advance taxes and provisions for current income taxes are presented in the balance sheet after off‑setting advance taxes paid and income tax provisions arising in the same tax jurisdiction and enterprise.
Deferred income taxes are recognized for the future tax consequences attributable to timing differences between the financial statement determination of income and their recognition for tax purposes. The effect on deferred tax assets and liabilities of a change in tax rates is recognized in profit and loss account using the tax rates and tax laws that have been enacted or substantively enacted by the balance sheet date. Deferred tax assets and deferred tax liabilities across various countries of operation are not set off against each other as the company does not have a legal right to do so. Deferred tax assets are recognized and carried forward only to the extent that there is a reasonable certainty that sufficient future taxable income will be available against which such deferred tax assets can be realized. In situations where there are carry forward losses, deferred tax asset is recognized only if there is virtual certainty supported by convincing evidence that future taxable income will be available against which deferred tax asset can be realized. Unrecognized deferred tax assets of earlier years are re‑assessed and recognized to the extent that it has become reasonably certain or virtually certain that future taxable income will be available against which deferred tax assets can be realized. In case of Indian operations, deferred tax asset is recognized only on those timing differences, which reverses in post tax free period, as the Company enjoys exemption under section 10A of the Indian Income Tax Act, 1961.
Minimum Alternative Tax (MAT) credit is recognized as an asset only when and to the extent there is convincing evidence that the Group will pay normal income tax during the specified period. In the year in which the MAT credit becomes eligible to be recognized as an asset in accordance with the recommendations contained in guidance Note issued by the Institute of Chartered Accountants of India (‘ICAI’), the said asset is created by way of a credit to the profit and loss account and shown as MAT Credit Entitlement. The Group reviews the same at each balance sheet date and writes down the carrying amount of MAT Credit Entitlement to the extent there is no longer convincing evidence to the effect that Group will pay normal Income Tax during the specified period.
Annual Report 2009_2010_Colour.indd 108 7/23/2010 9:04:44 PM

109
k. Earnings per share
The earnings considered in ascertaining the Group’s earnings per share comprise the net profit after tax. The number of shares used in computing basic earnings per share is the weighted average number of shares outstanding during the year. The number of shares used in computing diluted earnings per share comprises the weighted average number of shares considered for deriving basic earnings per share, and also the weighted average number of shares, if any which would have been issued on the conversion of all dilutive potential equity shares. The weighted average number of shares and potentially dilutive equity shares are adjusted for the bonus shares and sub‑division of shares.
l. Share‑based compensation/payments
Measurement and disclosure of the employee share‑based payment plans is done in accordance with the Securities and Exchange Board of India (SEBI) (Employee Stock Option Scheme and Employee Stock Purchase Scheme) Guidelines, 1999 and the Guidance Note on Accounting for Employee Share‑based Payments, issued by the ICAI. The Group uses the intrinsic value method of accounting for its employee share based compensation plan and other share based arrangements. Under this method compensation expense is recorded over the vesting period of the option on straight line basis, if the fair value of the underlying stock exceeds the exercise price at the measurement date, which typically is the grant date.
m. Provision and contingencies
A provision is recognized when an enterprise has a present obligation as a result of past event and it is probable that an outflow of resources will be required to settle the obligation, in respect of which a reliable estimate can be made. Provisions are not discounted to its present value and are determined based on management estimate required to settle the obligation at the balance sheet date. These are reviewed at each balance sheet date and adjusted to reflect the current management estimates.
n. Cash and cash equivalents
Cash and cash equivalents in the balance sheet comprise cash at bank and in hand and short terms investments with an original maturity of three months or less.
3. Commitments and contingent liabilities
a. Capital commitments
Contracts remaining to be executed on capital account and not provided for (net of advances) aggregates to Rs. 1,957,451 (includes capital commitment through issuance of letter of intents of Rs. 979,350 (March 31, 2009 – Rs. 260,505) as at March 31, 2010 (March 31, 2009 – Rs. 1,419,990).
b. Contingent Liabilities
Disputed liability in respect of Income‑tax demands as at March 31, 2010 Rs. Nil (March 31, 2009 – Rs. 285,638).
4. Leases
a. Where Company is lessee
Finance lease
The Group takes vehicles, furniture and fixture and computer equipments under finance lease of upto five years. None of the lease agreements have an escalation clause. Future minimum lease payments under finance lease as at March 31, 2010 and 2009 are as follows:
As at March 31, 2010
Principal Interest TotalNot later than one year 10,013 3,621 13,634Later than one year but not later than five years 25,952 4,648 30,600Total minimum payments 35,965 8,269 44,234
As at March 31, 2009
Not later than one year 7,245 1,716 8,961Later than one year but not later than five years 13,407 2,096 15,503Total minimum payments 20,652 3,812 24,464
Annual Report 2009_2010_Colour.indd 109 7/23/2010 9:04:44 PM

Oracle Financial Services Software – Annual Report 2009‑10
Operating lease
The Group has taken certain office premises and residential premises for employees under operating lease, which expire at various dates through year 2025. Some of these lease agreements have a price escalation clause. Gross rental expenses for the year ended March 31, 2010 aggregated to Rs. 691,450 (March 31, 2009 – Rs. 827,699). The minimum rental payments to be made in future in respect of these leases are as follows:
March 31, 2010 March 31, 2009
Not later than one year 719,881 745,999Later than one year but not later than five years 1,442,977 1,389,824Later than five years 2,531,391 1,800,373
4,694,249 3,936,196
b. Where Company is lessor
The Company has given IT equipments under finance lease for a period of five years. Present value of minimum lease payments receivable under this finance lease as at March 31, 2010 and 2009 are as follows:
As at March 31, 2010
Principal Interest TotalNot later than one year 6,980 1,199 8,179Later than one year but not later than five years – – –Total minimum payments 6,980 1,199 8,179
As at March 31, 2009
Not later than one year 5,875 4,764 10,639Later than one year but not later than five years 4,539 2,051 6,590Total minimum payments 10,414 6,815 17,229
5. Derivatives
The Group enters into forward foreign exchange contracts and option contracts where the counter party is a bank. The Group purchases forward foreign exchange contracts and option contracts to mitigate the risks of change in foreign exchange rate on receivable and payables denominated in certain foreign currencies. The Group considers the risk of non‑performance by the counter party as immaterial. During the year ended March 31, 2010 Oracle Financial Services Software Limited has not entered in to any forward contract or option contracts. As at March 31, 2010 and 2009 the Group has following outstanding derivative instruments:
(Amounts in thousands, foreign currency)
March 31, 2010 March 31, 2009
ParticularsForward contracts – Sellin USD – 9,000
As of balance sheet date, the Group’s net foreign currency exposure that is not hedged is Rs. 21,871,139 (March 31, 2009 – Rs. 17,863,649).
6. Share‑based compensation/payments
a. Employee Stock Purchase Scheme (‘ESPS’)
The Company has adopted the ESPS administered through a Trust (“the Trust”) to provide equity based incentives to key employees of the Company. The Trust purchases shares of the Company from market using the proceeds of loans obtained from the Company. Such shares are offered by the Trust to employees at an exercise price, which approximates the fair value on the date of the grant. The employees can purchase the shares in a phased manner over a period of five years based on continued employment, until which, the Trust holds the shares for the benefit of the employee. The employee will be entitled to receive dividends, bonus, etc., that may be declared by the Company from time to time for the entire portion of shares held by the Trust on behalf of the employees.
On the acceptance of the offer, the selected employee shall undertake to pay within ten years from the date of acceptance of the offer the cost of the shares incurred by the Trust including repayment of the loan relatable thereto. The repayment of the loan by the Trust to the Company would be dependent on employee repaying the amount to the Trust. In case the employee resigns from employment, the rights relating to shares, which are eligible for exercise, may be purchased by payment of the exercise price whereas, the balance
Annual Report 2009_2010_Colour.indd 110 7/23/2010 9:04:44 PM

111
shares shall be forfeited in favor of the Trust. The Trustees have the right of recourse against the employee for any amounts that may remain unpaid on the shares accepted by the employee. The shares that an employee is eligible to exercise during the initial five‑year period merely go to determine the amount and scheduling of the loan to be repaid on exercise by the employee. The Trust shall repay the loan obtained from the Company on receipt of payments from employees against shares exercised or otherwise.
The Securities and Exchange Board of India (‘SEBI’) has issued the Employee Stock Option Scheme and Stock Purchase Guidelines, 1999 (‘SEBI guidelines’), which are applicable to stock purchase schemes for employees of all listed Companies. In accordance with these guidelines, the excess of market price of the underlying equity shares on the date of grant of the stock options over the exercise price of the options is to be recognized in the books of account and amortized over the vesting period. However, no compensation cost has been recorded as the scheme terms are fixed and the exercise price equals the market price of the underlying stock on the grant date.
A summary of the activity in the Company’s ESPS is as follows:
Year ended March 31, 2010
Year ended March 31, 2009
Number of shares Number of sharesOpening balance of unallocated shares 165,145 158,963Shares forfeited during the year 5 6,182Closing balance of unallocated shares 165,150 165,145
Opening balance of allocated shares 134,834 221,101Shares exercised during the year (80,281) (80,085)Shares forfeited during the year (5) (6,182)Closing balance of allocated shares 54,548 134,834
Shares eligible for exercise 54,548 74,534Shares not eligible for exercise – 60,300Total allocated shares 54,548 134,834
b. Employee Stock Option Plan (‘ESOP’)
Pursuant to ESOP scheme approved by the shareholders of the Company held on August 14, 2001, the Board of Directors, on March 4, 2002 approved the Employees Stock Option Scheme (‘the Scheme’) for issue of 4,753,600 options to the employees and directors of the Company and its subsidiaries. According to the Scheme, the Company has granted 4,548,920 options prior to the IPO and 559,000 options at various dates after IPO. As per the scheme, each of 20% of the total options granted will vest to the eligible employees and directors on completion of 12, 24, 36, 48 and 60 months and is subject to continued employment of the employee or director with the Company or its subsidiaries. Options have exercise period of 10 years. The employee pays the exercise price upon exercise of option.
A summary of the activity in the Company’s ESOP is as follows:
Year ended March 31, 2010 Year ended March 31, 2009Shares arising from options
Weighted average exercise price (Rs.)
Shares arising from options
Weighted average exercise price (Rs.)
Outstanding at beginning of year 348,853 1,075 431,253 1,025Exercised (85,471) 819 (21,945) 491Forfeited (21,000) 1,232 (60,455) 930Outstanding at end of the year 242,382 1,152 348,853 1,075
The weighted average share price for the year over which stock options was exercised was Rs. 2,250.
The details of options unvested and options vested and exercisable as on March 31, 2010 are as follows:
Range of exercise prices (Rs.)
Shares Weighted average exercise price (Rs.)
Weighted average remaining
contractual life (Years)
Options unvested 419 – 560 – – –1,291 – 1,291 101,000 1,291 6.1
Options vested and exercisable 265 – 265 32,800 265 1.9419 – 560 32 514 3.3
1,291 – 1,291 108,550 1,291 6.1242,382 1,152 5.5
Annual Report 2009_2010_Colour.indd 111 7/23/2010 9:04:44 PM

Oracle Financial Services Software – Annual Report 2009‑10
The details of options unvested and options vested and exercisable as on March 31, 2009 were as follows:
Range of exercise prices (Rs.)
Shares Weighted average exercise price (Rs.)
Weighted average remaining
contractual life (Years)
Options unvested 419 – 560 2,000 560 5.41,291 – 1,291 165,300 1,291 7.1
Options vested and exercisable 265 – 265 40,400 265 2.9419 – 560 39,003 462 3.9
1,291 – 1,291 102,150 1,291 7.1348,853 1,075 6.3
Had compensation cost been determined in a manner consistent with the fair value approach, the Group’s net profit and earnings per share as reported would have changed to the amounts indicated below:
Year ended March 31, 2010
Year ended March 31, 2009
Net profit as reported 7,736,638 7,365,428Add: Compensation expense included in reported profit – –Less: Compensation expense determined using fair value of options (5,659) (11,135)
Proforma net profit 7,730,979 7,354,293Basic earnings per share
As reported 92.33 87.93Proforma 92.26 87.80
Diluted earnings per shareAs reported 92.16 87.90Proforma 92.09 87.77
7. Employee Benefits Obligation
Defined contribution plans
During the year ended March 31, 2010 and 2009, the Group contributed following amounts to defined contributions plans:
Year ended March 31, 2010
Year ended March 31, 2009
ParticularsProvident fund 181,090 184,570Superannuation fund 55,094 56,118 236,184 240,688
Defined benefit plan‑gratuity
The amounts recognized in the profit and loss account are as follows:
Year ended March 31, 2010
Year ended March 31, 2009
ParticularsCurrent service cost 51,050 38,457Interest cost 18,601 15,464Expected return on plan assets (2,515) (99)Recognized net actuarial loss (19,034) 25,055Net employee benefit expense 48,102 78,877Actual return on plan assets 331 356
The amounts recognized in the balance sheet are as follows:
March 31, 2010 March 31, 2009
ParticularsPresent value of funded obligations 257,770 231,672Present value of unfunded obligations 16,041 8,065Total defined benefit obligations 273,811 239,737Fair value of plan assets (2,358) (1,468)Net liability 271,453 238,269
Annual Report 2009_2010_Colour.indd 112 7/23/2010 9:04:45 PM

113
Changes in present value of defined benefit obligation representing reconciliation of opening and closing balances thereof are as follows:
Year ended March 31, 2010
Year ended March 31, 2009
ParticularsDefined benefit obligation at beginning of the year 239,737 176,734Current service cost 51,050 38,457Interest cost 18,601 15,464Benefits paid (14,359) (16,231)Actuarial (gain) loss (21,218) 25,313Defined benefit obligation at end of the year 273,811 239,737
Changes in the fair value of plan assets representing reconciliation of opening and closing balances thereof are as follows:
Year ended March 31, 2010
Year ended March 31, 2009
ParticularsFair value of plan assets at beginning of the year 1,468 228Expected return on plan assets 2,515 99Actuarial (loss) gain (2,184) 257Contributions by employer 14,918 17,115Benefits paid (14,359) (16,231)Fair value of plan assets at end of the year 2,358 1,468
Plan assets are administered by LIC and 100% of the plan assets are invested in lower risk assets, primarily in debt securities.
The assumptions used in accounting for the gratuity plan are set out as below:
March 31, 2010 March 31, 2009
Discount rate 4.3% – 7.9% 5.15% – 6.99%Expected returns on plan assets 7.50% 7.50%
The estimates of future salary increase, considered in actuarial valuation, take account of inflation, seniority, promotions and other relevant factors such as supply and demand in the employment market.
The Group evaluates these assumptions annually based on its long‑term plans of growth and industry standards. The discount rates are based on current market yields on government bonds consistent with the currency and estimated term of the post employment benefits obligations. Plan assets are administered by the LIC and invested in lower risk assets, primarily debt securities. The Group’s contribution for the year ending March 31, 2011 is expected to be Rs. 31,333.
The expected benefit payments as of March 31, 2010 are below:
Year ending March 31 Amount
2011 46,979 2012 53,139 2013 60,779 2014 61,725 2015 62,082 2016 – 2020 256,708
Present value of the defined benefit obligation, fair value of the plan assets, deficit and experience adjustments in the plan assets and liabilities for current and previous three years are as follows:
Year ended March 31, 2010
Year ended March 31, 2009
Year ended March 31, 2008
Year ended March 31, 2007
ParticularsPresent value of funded obligations (257,770) (231,672) (173,999) (131,397)Present value of unfunded obligations (16,041) (8,065) (2,735) (2,787)Fair value of plan assets 2,358 1,468 228 4,697Deficit (271,453) (238,269) (176,506) (129,487)Experience adjustments on plan liabilities (10,677) 3,204 18,051 6,702Experience adjustments on plan assets (2,184) 257 (469) 9
The Group has adopted AS 15 (Revised) from April 1, 2006 and thereby has not given disclosures of the above for the year ended March 31, 2006.
Annual Report 2009_2010_Colour.indd 113 7/23/2010 9:04:45 PM

Oracle Financial Services Software – Annual Report 2009‑10
8. Acquisition of 10% of shares of Oracle Financial Services Software S.A.
On May 26, 2009, Oracle Financial Services Software S.A. became a wholly owned subsidiary of Oracle Financial Services Software B.V. with the acquisition of the balance 10% shares from minority shareholders for total consideration of Rs. 66,341. The Group has recorded goodwill of Rs. 45,276 after adjusting minority liability till the date of acquisition.
9. Segment information
Business segments are defined as a distinguishable component of an enterprise that is engaged in providing a group of related products or services and that is subject to differing risks and returns and about which separate financial information is available. This information is reviewed and evaluated regularly by the management in deciding how to allocate resources and in assessing the performance.
The Group is organized by business segment and geographically. For management purposes the Group is primarily organized on a worldwide basis into three business segments:
a. Product licenses and related activities (‘Products’)
b. IT solutions and consulting services (‘Services’) and
c. Business Processing Services (‘BPO ‑ Services’)
The business segments are the basis on which the Group reports its primary operational information to management. Product licenses and related activities segment deals with various banking software products. The related activities include enhancements, implementation and maintenance activities.
Oracle Financial Services Consulting offers services spanning the entire lifecycle of applications used by financial service institutions. The division’s portfolio includes Consulting, Application, Support and Technology Services that help institutions improve efficiency, optimize costs, meet risk and compliance mandates and implement IT solutions finely attuned to their business needs.
BPO ‑ Services comprises of business process outsourcing services to the Lending, Collections, Customer Service, Capital Markets industry.
Year ended March 31, 2010
Particulars Products Services BPO‑Services Corporate Eliminations Total RevenueExternal revenue 18,704,705 9,400,418 634,619 – – 28,739,742 Inter‑segment revenue – – 211,200 – (211,200) –Total revenue 18,704,705 9,400,418 845,819 – (211,200) 28,739,742 Cost of revenue (7,008,634) (5,828,397) (249,829) – – (13,086,860)Gross profit 11,696,071 3,572,021 595,990 – (211,200) 15,652,882 Selling and marketing expenses [Refer note 12 of schedule 15] (1,928,047) (333,843) (91,797) – – (2,353,687)
General and administrative expenses (1,192,475) (620,289) (164,054) (1,041,359) – (3,018,177)Depreciation and amortization (219,891) (185,991) (24,139) (58,632) – (488,653)Inter segment expense – (211,200) – – 211,200 –Operating profit 8,355,658 2,220,698 316,000 (1,099,991) – 9,792,365 Interest income 699,616 Foreign exchange (loss), net (1,568,714)Other income, net 12,933 Profit before provision for taxes 8,936,200 Provision for taxes (1,197,695)Net profit for the year before share minority interest 7,738,505
Share of loss of associate company –Share of minority interest [Refer note 8 of Schedule 15] (1,867)
Net profit 7,736,638
Other informationCapital expenditure by segment 56,085 20,799 7,840 43,442 – 128,166 Other non cash expenses (9,347) (191,463) 2,207 – – (198,603)Segment assets 12,703,472 3,822,359 252,541 32,179,295 – 48,957,667 Segment liabilities 3,077,591 1,180,330 111,769 1,684,013 – 6,053,703 Shareholders' funds – – – 42,903,964 – 42,903,964
Annual Report 2009_2010_Colour.indd 114 7/23/2010 9:04:45 PM

115
Year ended March 31, 2009
Particulars Products Services BPO‑ Services
Corporate Eliminations Total
RevenueExternal revenue 18,131,084 10,625,431 519,680 – – 29,276,195 Inter‑segment revenue – – 199,397 – (199,397) –Total revenue 18,131,084 10,625,431 719,077 – (199,397) 29,276,195 Cost of revenue (7,445,151) (6,750,449) (296,036) – – (14,491,636)Gross profit 10,685,933 3,874,982 423,041 – (199,397) 14,784,559 Selling and marketing expenses (2,639,957) (661,198) (125,187) – – (3,426,342)General and administrative expenses (1,243,528) (845,990) (124,887) (1,389,020) – (3,603,425)Depreciation and amortization (254,601) (205,076) (18,760) (79,506) – (557,943)Inter segment expense – (199,397) – – 199,397 –Operating profit 6,547,847 1,963,321 154,207 (1,468,526) – 7,196,849 Impairment loss [Refer note 14 of schedule 15] (291,050)
Interest income 770,563 Foreign exchange gain, net 1,044,059 Other income, net (25,210)Exceptional item [Refer note 13 of schedule 15] (468,900)
Profit before provision for taxes 8,226,311 Provision for taxes (835,363)Net profit for the year before share of associate company and minority interest 7,390,948
Share of loss of associate company (12,595)Share of minority interest (12,925)Net profit 7,365,428
Other informationCapital expenditure by segment 69,706 608,308 – 394,914 – 1,072,928 Other non cash expenses 307,848 250,680 15,623 – – 574,151 Segment assets 12,225,484 5,464,490 262,599 24,169,638 – 42,122,211 Segment liabilities 4,088,486 939,364 134,344 1,911,265 – 7,073,459 Shareholders' funds – – – 35,048,752 – 35,048,752
Annual Report 2009_2010_Colour.indd 115 7/23/2010 9:04:45 PM

Oracle Financial Services Software – Annual Report 2009‑10
Segment revenue and expense
Revenue is generated through licensing of software products as well as by providing software solutions to the customers including consulting services and business process outsourcing services. The expenses which are not directly attributable to a business segment are classified as unallocated corporate expenses and shown under corporate in the segment disclosure above.
Segment assets and liabilities
Segment assets include all operating assets used by a segment and consist principally of debtors, net of allowances, unbilled revenue, deposits for premises and fixed assets. Segment liabilities primarily includes deferred revenues, finance lease obligation, advance from customer, Accrued employee cost and other current liabilities. While most such assets and liabilities can be directly attributed to individual segments, the carrying amount of certain assets and liabilities used jointly by two or more segments is allocated to segments on a reasonable basis. Assets and liabilities that cannot be allocated between the segments are shown as part of corporate assets and liabilities.
Geographical segments
The following table shows the distribution of the Group’s consolidated sales by geographical market:
Year ended March 31, 2010 Year ended March 31, 2009
Regions Amount % Amount %United States of America 9,054,624 32% 8,522,375 29%Europe 9,061,042 32% 10,002,873 34%Asia Pacific 6,349,813 21% 5,820,040 20%Middle East, India and Africa 3,646,644 13% 4,320,720 15%Latin America and Caribbean 627,619 2% 610,187 2%
28,739,742 100% 29,276,195 100%
The following table shows the Group’s consolidated assets by geographical market:
March 31, 2010 March 31, 2009
Regions Amount % Amount %United States of America 8,211,621 17% 8,150,527 19%Europe 5,416,942 11% 6,401,239 15%Asia Pacific 5,460,098 11% 4,879,641 12%Middle East, India and Africa 29,672,558 60% 22,479,879 53%Latin America and Caribbean 196,448 1% 210,925 1%
48,957,667 100% 42,122,211 100%
Annual Report 2009_2010_Colour.indd 116 7/23/2010 9:04:45 PM

117
10. Related party transactions
Names of Related Parties and description of relationship:
Relationship Names of related parties
Ultimate Holding Company Oracle Corporation
Holding Company Oracle Global (Mauritius) Limited
Fellow Subsidiaries Oracle USA, Inc.Oracle India Private Limited Oracle Corporation Australia Pty LtdOracle Consulting Services USAOracle Corporation Singapore Pte Ltd.Oracle Corporation IrelandOracle (China) Software Systems Company LimitedOracle Hungary Kft.Oracle Portugal – Sistemas de Informacao Lda.Oracle Software Systems Israel LtdPT Oracle IndonesiaOracle Iberica, S.R.L.Oracle Nederland B.V.Oracle East Central Europe LimitedOracle Hellas, S.A.Oracle Information Systems (Japan) K.K. Oracle (Philippines) CorporationOracle Systems Hong Kong limitedOracle Korea, Ltd.Oracle do Brasil Sistemas LimitadaOracle Corporation South Africa (PTY) Ltd.Oracle Caribbean, Inc.Oracle Corporation (Pty) LimitedOracle Corporation (Thailand) Co., LtdOracle Corporation Malaysia Sdn. Bhd.Oracle Egypt LimitedOracle Research & Development Center (shenzhen) Co., LtdOracle Systems LimitedOracle Taiwan LLC
Key Managerial Personnel ('KMP') R Ravisankar – Vice Chairman (Whole‑time Director)N R Kothandaraman (N R K Raman) – Managing Director and Chief Executive Officer
Makarand Padalkar – Chief Financial OfficerAvadhut (Vinay) Ketkar – Chief Accounting OfficerKishore Kapoor – CEO – Oracle Financial Services Software Pte. Ltd.Sajal Mukherjee – CEO – Oracle Financial Services Software, Inc.Mahesh Rao – CEO – Oracle (OFSS) Processing Services Limited (formerly known as i‑flex Processing Services Limited)
S. Ramakrishnan – CEO – ReveleusJoseph John – Executive Vice President, Universal Banking ProductsV Shankar – Executive Vice President and Global Head, PrimeSourcing & Insurance Solutions
Atul Gupta – Sr. Vice President, Process and Quality Management GroupVijay Sharma – Sr. Vice President, Oracle Financial Services Consulting Pte. LtdS Hariharan – Sr. Vice President, Infrastructure Services GroupVivek Govilkar – Sr. Vice President, Human Resources and TrainingV Srinivasan – Vice President, Corporate Development and Chief of StaffVikram Gupta – Vice President Private Wealth Management
Annual Report 2009_2010_Colour.indd 117 7/23/2010 9:04:45 PM

Oracle Financial Services Software – Annual Report 2009‑10
Transactions and balances outstanding with these parties are described below:
Transactions Amount receivable (payable)Year ended
March 31, 2010Year ended
March 31, 2009Year ended
March 31, 2010Year ended
March 31, 2009
RevenueFellow subsidiariesOracle USA, Inc. 588,065 387,720 541,368 100,115 Oracle Corporation Australia Pty Ltd 1,180,414 322,140 684,971 278,837 Oracle Portugal ‑ Sistemas de Informacao Lda. 15,121 43,650 1,931 2,218 Oracle Software Systems Israel Ltd 2,096 23,650 – 15,286 Oracle Corporation Singapore Pte Ltd. 570 10,733 – 13,675 Oracle Corporation (Pty) Limited – 6,676 – 7,479 Oracle Consulting Services USA – 4,743 32 4,731 Oracle Corporation Ireland – – – 6,377 PT Oracle Indonesia – – 83 94 Oracle India Private Limited 1,430 – 1,577 63 Oracle Hungary Kft. – 795 – –Oracle do Brasil Sistemas Limitada – – 1,804 –Oracle Systems Hong Kong limited 4,685 – – –Oracle Corporation Malaysia Sdn. Bhd. 23,196 – – –Oracle Corporation (Thailand) Co., Ltd 2,966 – 3,179 –Oracle Egypt Limited 21,325 – 15,534 –Oracle Nederland B.V. 69,542 – 73,940 –
Unbilled revenueFellow subsidiariesOracle Corporation Australia Pty Ltd – – 159,368 25,928 Oracle USA, Inc. – – 13,805 21,878 Oracle Portugal ‑ Sistemas de Informacao Lda. – – – 20,180 Oracle Nederland B.V. – – 671 –Oracle Egypt Limited – – 440 –Oracle Systems Hong Kong limited – – 4,685 –Oracle Corporation Malaysia Sdn. Bhd. – – 23,196 –Oracle Software Systems Israel Ltd – – – 9,751
Provision for doubtful debtsFellow subsidiariesOracle USA, Inc. 3,759 9,497 12,172 9,497 Oracle Corporation Ireland (1,976) 2,118 – 2,118 Oracle Portugal ‑ Sistemas de Informacao Lda. 1,062 429 1,449 429 Oracle Corporation Australia Pty Ltd (496) 422 – 422 PT Oracle Indonesia 46 19 62 19 Oracle India Private Limited (13) 13 – 13 Oracle Consulting Services USA 6 – 6 –
Application softwareFellow subsidiariesOracle India Private Limited 102,531 157,469 (15,108) –Oracle USA, Inc. 381 1,224 – –Oracle Systems Limited 2,348 – – –Oracle Iberica, S.R.L. – 2,735 – –Oracle Nederland B.V. – 2,082 – 2,082 Oracle Caribbean, Inc. 4,897 – – –Oracle Software Systems Israel Ltd 2,303 – – –
Professional feesFellow subsidiariesOracle Nederland B.V. – 17,771 – –Oracle India Private Limited – 8,042 – –Oracle Research & Development Center (shenzhen) Co., Ltd 59,764 – (53,788) –
Oracle East Central Europe Limited – 5,960 – –
Annual Report 2009_2010_Colour.indd 118 7/23/2010 9:04:46 PM

119
Transactions Amount receivable (payable)Year ended
March 31, 2010Year ended
March 31, 2009Year ended
March 31, 2010Year ended
March 31, 2009
Other expensesFellow subsidiariesOracle USA, Inc. 495 19,852 495 4,036 Oracle India Private Limited 1,061 – – –Oracle Corporation Singapore Pte Ltd. 1,977 – – –Oracle Hellas, S.A. 1,034 2,161 – –
Deferred RevenueFellow subsidiariesOracle USA, Inc. – – (10,726) (7,706)Oracle do Brasil Sistemas Limitada – – (1,821) –Oracle Corporation Australia Pty Ltd – – (57,353) (3,622)Oracle Corporation (Pty) Limited – – – (3,459)Oracle Portugal ‑ Sistemas de Informacao Lda. – – (138) (6,735)Oracle Corporation Singapore Pte Ltd. – – – (1,842)Oracle Egypt Limited – – (5,801) –Oracle Nederland B.V. – – (1,091) –
Security DepositOracle India Private Limited – 892 892 892
RentFellow subsidiariesOracle Information Systems (Japan) K.K. 20,125 7,490 – –Oracle India Private Limited 6,242 1,642 – –Oracle Korea, Ltd. 287 607 – –Oracle (China) Software Systems Company Limited 863 595 – –Oracle Corporation Australia Pty Ltd – 480 – –Oracle (Philippines) Corporation 176 168 – –Oracle Corporation Malaysia Sdn. Bhd. – 139 – –Oracle USA, Inc. 1,145 – 225 –Oracle Systems Hong Kong limited 735 113 – –Oracle Nederland B.V. 3,414 – – –Oracle Corporation South Africa (PTY) Ltd. 372 – – –Oracle Taiwan LLC 614 – – –
Advance received from CustomersFellow subsidiariesOracle Corporation Australia Pty Ltd 12,840 – (12,840) –Oracle Corporation (Pty) Limited – 25,353 – (38,077)Oracle Egypt Limited 2,638 – (2,638) –Oracle USA, Inc. 343,188 – (343,188) –
Key Managerial personnelRemuneration [Refer note 1 below] 155,209 194,507 – –Lease rent 1,429 1,722 – –Rent 96 84 – –Rental deposit – – 100 100 Advance rent – 70 – 42
Note 1: Remuneration includes salary, bonus and perquisites. The bonus is included on payment basis. As the liabilities for gratuity and compensated absence are provided on an actuarial basis for the Company as a whole, the amounts pertaining to individual KMP are not included above.
Annual Report 2009_2010_Colour.indd 119 7/23/2010 9:04:46 PM

Oracle Financial Services Software – Annual Report 2009‑10
11. Aggregate expenses
Year ended March 31, 2010
Year ended March 31, 2009
Salaries and bonus 12,707,914 13,084,468 Staff welfare expenses 323,495 373,332 Contribution to provident and other funds 330,168 363,990 Travel related expenses (net of recoveries) 1,748,002 1,887,108 Professional fees [Refer note 12 of schedule 15] 1,317,124 2,557,616 Application software 210,260 563,500 Communication expenses 306,859 375,267 Rent 709,505 842,828 Advertising expenses 61,063 45,086 Power 240,542 253,889 Insurance 20,956 22,134 Repairs and maintenance:
Buildings and leasehold premises 35,631 47,275 Computer equipments 74,723 72,855 Others 53,819 51,250
Rates and taxes 133,126 41,200 Finance charge on leased assets 2,492 4,188 Provision for doubtful debts, net (198,603) 574,151 Bad debts 214,858 4,480 Other expenses 166,790 356,786
18,458,724 21,521,403
12. Selling and marketing expenses of product segment for the current year include reversal of referral fee provisions amounting to Rs. 184,476 based on a settlement agreement entered with a distributor.
13. The Company has settled a dispute with a party for Rs. 468,900 for full release of all alleged claims and has disclosed the same as an exceptional item in the financial results for the year ended March 31, 2009.
14. The Group has recognized an impairment loss of Rs. 291,050 on goodwill arising out of acquisition of i‑flex solutions Inc. (Canada) during the year ended March 31, 2009.
15. Provision for taxesa. Breakup of current tax is as follows:
Year ended March 31, 2010
Year ended March 31, 2009
Current tax 2,349,408 1,345,866 Less: MAT credit entitlement (1,065,722) (509,449)Net Current tax 1,283,686 836,417
b. During the year ended March 31, 2010, the Group has recorded income tax expense of Rs. 544,542 (March 31, 2009 – Rs. 146,322) related to previous years.
16. Prior year amounts have been reclassified, where necessary to conform with current year’s presentation. As per our report of even date For and on behalf of the Board of Directors
For S. R. Batliboi & Associates Firm Registration No. 101049WChartered Accountants
N R K RamanManaging Director& Chief Executive Officer
Y M Kale Director
per Amit MajmudarPartnerMembership No.: 36656
Hoshi D Bhagwagar Company Secretary & Compliance Officer
Tarjani Vakil Director
Mumbai, IndiaMay 7, 2010
Mumbai, IndiaMay 7, 2010
Annual Report 2009_2010_Colour.indd 120 7/23/2010 9:04:46 PM

121
(All amounts in thousands of Indian Rupees)
2010 2009
Cash flows from operating activitiesProfit before provision for taxes 8,936,200 8,226,311
Adjustments to reconcile profit before provision for taxes to cash used in operating activities:
Depreciation and amortization 488,653 557,943 Impairment loss – 291,050 Loss on sale/write off of fixed assets, net 12,190 41,697 Provision for doubtful debts, net (198,603) 574,151 Bad debts 214,858 4,480 Interest income (699,616) (770,563)Effect of exchange rate changes in cash and cash equivalent 639,970 (274,536)Unrealized exchange (gain) loss 596,972 (404,581)Deferred rent (20,756) 28,415 Marked to market of current investment (417) (479)Finance charge on leased assets 2,492 4,188 Operating Profit before Working Capital changes 9,971,943 8,278,076 Changes in assets and liabilities, net of effect of acquisitionDecrease (increase) in sundry debtors and unbilled revenue 268,643 (370,354)Decrease (increase) in loans and advances (44,026) 16,850 (Increase) decrease in current liabilities and provisions (634,601) 110,867 Cash from operating activities 9,561,958 8,035,439 Payment of domestic and foreign taxes (2,423,520) (1,821,921)Net cash provided by operating activities 7,138,438 6,213,518
Cash flows from investing activitiesAdditions to fixed assets including capital work in progress (400,341) (762,360)Net investment in lease 13,336 9,420 Deposits for office premises (134,312) 6,688 Acquisition of company, net of cash acquired (66,341) –Proceeds from sale of fixed assets 1,037 825 Bank fixed deposits having maturity of more than three months matured 24,973,721 11,032,846 Bank fixed deposits having maturity of more than three months booked (29,675,453) (15,874,971)Proceeds from maturity of investments – 33,254 Proceeds from maturity of margin money 4,280 –Interest received 662,040 770,555 Net cash used in investing activities (4,622,033) (4,783,743)
Cash flows from financing activitiesIssue of shares against ESOP scheme 69,908 10,509 Advance against equity shares to be issued under ESOP Scheme 8,068 106 Payment of lease obligations (12,313) (20,041)Net cash provided by (used in) financing activities 65,663 (9,426)
Net increase (decrease) in cash and cash equivalents 2,582,069 1,420,349 Cash and cash equivalents at beginning of the year 4,912,371 3,217,486 Effect of exchange rate changes in cash and cash equivalent (639,970) 274,536 Cash and cash equivalents at end of the year (Note 1) 6,854,470 4,912,371
Consolidated statement of cash flow for the year ended March 31
Annual Report 2009_2010_Colour.indd 121 7/24/2010 10:59:54 AM

Oracle Financial Services Software – Annual Report 2009‑10
(All amounts in thousands of Indian Rupees)
2010 2009
Note 1: Component of cash and cash equivalentCash and bank balances [Refer Schedule 6(b)]* 22,045,843 15,489,517
Less:Bank deposits having maturity of more than three months (15,184,803) (10,566,353)Margin money deposit (6,570) (10,793)Cash and cash equivalents at end of the year 6,854,470 4,912,371
* Includes amount kept in unclaimed dividend accounts of Rs. 982 (March 31, 2009 – Rs. 1,335) not available for the use by company.
Consolidated statement of cash flow (continued)for the year ended March 31
As per our report of even date For and on behalf of the Board of Directors
For S. R. Batliboi & Associates Firm Registration No. 101049WChartered Accountants
N R K RamanManaging Director& Chief Executive Officer
Y M Kale Director
per Amit MajmudarPartnerMembership No.: 36656
Hoshi D Bhagwagar Company Secretary & Compliance Officer
Tarjani Vakil Director
Mumbai, IndiaMay 7, 2010
Mumbai, IndiaMay 7, 2010
Annual Report 2009_2010_Colour.indd 122 7/23/2010 9:04:46 PM

Annual General Meeting (AGM) Notice
Annual Report 2009_2010_Colour.indd 123 7/23/2010 9:04:54 PM

“With Oracle FLEXCUBE Lending and Leasing, we are now able to streamline our lending services by integrating our entire Loan Origination and Loan Servicing operations onto the single Oracle platform. We are now looking forward to being the first organization in Africa to benefit from the functionality of this solution,”
Maged Tammam, Chief Information Officer, Credit Agricole, Egypt.
“By implementing Oracle FLEXCUBE, we hope to enable technology-driven transformation at our bank as a first step to strengthening the banking system in the country. After our due diligence, we came to the conclusion that Oracle FLEXCUBE can help us create the necessary transformation in a quick and efficient manner and prepare us for the opportunities and challenges of the future. The solution will also help us in several key areas such as payments, currency management, and cost effective operations,”
Rashid Al Fandi, Executive Director, Banking Operations, Central Bank of UAE.
* All quotes are from the press releases issued during the 2009 – 2010 fiscal
Annual Report 2009_2010_Colour.indd 124 7/23/2010 9:05:00 PM

125
NOTICE is hereby given that the Twenty First Annual General Meeting of Oracle Financial Services Software Limited will be held at The Leela Kempinski, Sahar, Andheri (East), Mumbai 400059 on Wednesday, August 25, 2010 at 3.00 p.m. to transact the following business:
Ordinary Business:
1. To receive, consider and adopt the Audited Balance Sheet as on March 31, 2010, the Profit and Loss Account for the year ended on that date and the Reports of the Board of Directors and the Auditors thereon.
2. To appoint a Director in place of Mr. Y M Kale, who retires by rotation and, being eligible, offers himself for re‑appointment.
3. To appoint a Director in place of Mr. William T Comfort, Jr., who retires by rotation and, being eligible, offers himself for re‑appointment.
4. To appoint Auditors of the Company and to fix their remuneration.
Special Business:
5. To consider and, if thought fit, to pass, with or without modification(s), as an Ordinary Resolution the following:
“RESOLVED THAT pursuant to the provisions of Section 228 and other applicable provisions, if any, of the Companies Act, 1956, the Board of Directors of the Company be and is hereby authorized to appoint Branch Auditors to conduct the audit of branch office(s) of the Company whether existing or which may be opened hereafter, in India or abroad, in consultation with the Company’s Statutory Auditors, any person(s) qualified to act as Branch Auditors within the meaning of Section 228 of the Companies Act, 1956, and to fix their remuneration.”
6. To consider and, if thought fit, to pass, with or without modification(s), as an Ordinary Resolution the following:
“RESOLVED THAT Mr. Frank Brienzi, who was appointed as an Additional Director of the Company and who holds office until the date of the Annual General Meeting pursuant to Section 260 of the Companies Act, 1956, and Article 109 of the Articles of Association of the Company and in respect of whom the Company has received a notice from a member under Section 257 of the Companies Act, 1956, proposing his candidature, be and is hereby appointed as a Director of the Company, liable to retire by rotation.”
7. To consider and, if thought fit, to pass, with or without modification(s), as an Ordinary Resolution the following:
“RESOLVED THAT Mr. Joseph John, who was appointed as an Additional Director of the Company and who holds office until the date of the Annual General Meeting pursuant to Section 260 of the Companies Act, 1956, and Article 109 of the Articles of the Association of the Company and in respect of whom the Company has received a notice from a member under Section 257 of the Companies Act, 1956, proposing his candidature, be and is hereby appointed as a Director of the Company, liable to retire by rotation.”
8. To consider and, if thought fit, to pass, with or without modification(s), as an Ordinary Resolution the following:
“RESOLVED THAT Mr. William Corey West, who was appointed as an Additional Director of the Company and who holds office until the date of the Annual General Meeting pursuant to Section 260 of the Companies Act, 1956, and Article 109 of the Articles of Association of the Company and in respect of whom the Company has received a notice from a member under Section 257 of the Companies Act, 1956, proposing his candidature, be and is hereby appointed as a Director of the Company, liable to retire by rotation.”
9. To consider and, if thought fit, to pass, with or without modification(s), as an Ordinary Resolution the following:
“RESOLVED THAT pursuant to the provisions of Sections 198, 269, 309, 310 and other applicable provisions of the Companies Act, 1956, if any, read with Schedule XIII of the said Act and subject to such other approvals as may be necessary in this regard, the consent of the Company be and is hereby accorded to the appointment and terms of remuneration of Mr. Joseph John as the
Notice to members
Annual Report 2009_2010_Colour.indd 125 7/23/2010 9:05:00 PM

Oracle Financial Services Software – Annual Report 2009‑10
Whole‑time Director of the Company for a period of three years with effect from April 29, 2010 to April 28, 2013 as set out below.
Remuneration:
1. Gross Salary: In the scale of Rs. 50 lakh p.a. to Rs. 100 lakh p.a., inclusive of perquisites and allowances as mentioned below:
Perquisites and allowances:
a. Housing: Furnished/unfurnished residential accommodation or house rent allowance up to 10% of the salary in lieu thereof. The expenditure incurred by the Company on gas, electricity, water and furnishings, if any, shall be valued as per Income Tax Rules, 1962.
b. Medical reimbursement/allowance: Reimbursement of actual expenses for self and family and/or allowance as per the rules of the Company.
c. Leave travel concession/allowance: For self and family once in a year, as per the rules of the Company.
d. Provision for driver/driver’s salary allowance: As per the rules of the Company.
e. Company car and telephone: Use of Company’s car and telephone at the residence for official purposes, as per the rules of the Company.
f. Personal accident insurance: As per the rules of the Company.
2. Performance linked Bonus: Payable annually or at other intervals, as may be decided by the Board or the Compensation Committee of the Board.
3. Other benefits:
a. Earned/privilege leave: As per the rules of the Company.
b. Company’s contribution to provident fund and superannuation fund: As per the rules of the Company.
c. Gratuity: As per the rules of the Company.
d. Encashment of leave: As per the rules of the Company.
RESOLVED FURTHER THAT notwithstanding anything stated herein above, wherein in any financial year, closing on and after March 31, 2011, the Company incurs a loss or its profits are inadequate, the Company shall pay to Mr. Joseph John the remuneration as mentioned above as the minimum remuneration.
RESOLVED FURTHER THAT the Board or the Compensation Committee of the Board be and is hereby authorised to decide the remuneration (salary, perquisites and bonus) payable to Mr. Joseph John, within the terms approved by the Members as above, subject to such other approvals as may be required.
RESOLVED FURTHER THAT the terms and conditions and the remuneration as mentioned above that forms part of the Agreement dated May 7, 2010 entered into between Mr. Joseph John and the Company, together with the draft Supplemental Agreement to be entered into between Mr. Joseph John and the Company, that is submitted to this meeting and for identification signed by the Chairman of the Company, is approved and that the Board of Directors of the Company be and is hereby authorised to alter and vary the terms and conditions of the said appointment and/or Agreement(s) in such manner as may be agreed to between the Board of Directors and Mr. Joseph John.”
Annual Report 2009_2010_Colour.indd 126 7/23/2010 9:05:00 PM

127
10. To consider and, if thought fit, to pass, with or without modification(s), the following Resolution as an Ordinary Resolution:
“RESOLVED THAT in partial modification of the Resolution passed by the Members at their Eighteenth Annual General Meeting (“AGM”) held on August 24, 2007, vide Item No.10 of the Notice convening that Meeting, relating to the appointment and payment of remuneration to Mr. N R Kothandaraman (N R K Raman) as the Managing Director, effective July 16, 2010, be revised to Gross Salary in the scale of Rs. 60 lakh p.a. to Rs. 120 lakh p.a., subject to such other approvals as may be required, other terms and conditions of the appointment and remuneration remaining the same.
RESOLVED FURTHER THAT the Board or the Compensation Committee of the Board be and is hereby authorised to decide the remuneration (salary, perquisites and bonus) payable to Mr. N R K Raman, within the terms approved by the Members at their AGM held on August 24, 2007, revised and modified as above, subject to such other approvals as may be required.
RESOLVED FURTHER THAT the terms and conditions and the remuneration as mentioned above that forms part of the Agreement dated December 20, 2007, entered into between Mr. N R K Raman and the Company, together with the draft Supplemental Agreement to be entered into between Mr. N R K Raman and the Company, that is submitted to this meeting and for identification signed by the Chairman of the Company, is approved and that the Board of Directors of the Company be and is hereby authorised to alter and vary the terms and conditions of the said appointment and/or Agreement(s) in such manner as may be agreed to between the Board of Directors and Mr. N R K Raman.”
11. To consider and, if thought fit, to pass, with or without modification(s), as an Ordinary Resolution the following:
“RESOLVED THAT Ms. Tarjani Vakil, a Director, who retires by rotation at this Annual General Meeting and who has expressed her desire not to be re‑appointed as a Director, be retired and not be re‑appointed.
RESOLVED FURTHER THAT the resulting vacancy on the Board be not filled up at this meeting or any adjourned meeting thereof.”
By Order of the Board
Hoshi D BhagwagarCompany Secretary and Compliance Officer
Registered Office:Oracle ParkOff Western Express HighwayGoregaon (East)Mumbai 400063
July 22, 2010
Annual Report 2009_2010_Colour.indd 127 7/24/2010 11:00:20 AM

Oracle Financial Services Software – Annual Report 2009-10
Notes:
a) The information as required pursuant to Clause 49 of the listing agreement along with an Explanatory Statement as required under Section 173 (2) of the Companies Act, 1956 in respect of item nos. 5 to 11 mentioned in the above Notice are annexed hereto.
b) The Register of Members and the Share Transfer Books of the Company will remain closed from Saturday, August 21, 2010 to Wednesday, August 25, 2010, both days inclusive, for the purpose of Annual General Meeting.
c) A MEMBER ENTITLED TO ATTEND AND VOTE IS ENTITLED TO APPOINT A PROXY OR PROXIES TO ATTEND AND VOTE INSTEAD OF HIMSELF ON A POLL ONLY AND THAT A PROXY NEED NOT BE A MEMBER.
d) The instrument appointing proxy should be deposited at the Registered Office of the Company not less than 48 hours before the commencement of the meeting.
e) The members/proxies are requested to bring duly completed Attendance Slips sent herewith for attending the meeting.
f) The documents referred to in the Notice and the Explanatory Statement annexed hereto are available for inspection by the members of the Company at the Registered Office of the Company between 2.00 p.m. to 4.00 p.m. on any working day of the Company.
g) Members may please note that the Registrars and Transfer Agents have set up a separate cell to address various investor queries. Accordingly, the queries can be directed on 022‑2594 6970 or can be e‑mailed to [email protected].
h) Members who hold shares in physical form are requested to notify promptly any change in their addresses to the Company’s Registrars and Transfer Agents, Link Intime India Private Limited having its office at C‑13, Pannalal Silk Mills Compound, L.B.S Marg, Bhandup (West), Mumbai 400078. The members who hold shares in demat mode are requested to notify promptly any change in their addresses to their respective Depository Participants.
i) The members seeking any information with regard to accounts are requested to write to the Company at its registered office at an early date to enable the Management to keep the information ready.
j) Pursuant to Sections 205A, 205C and other applicable provisions, if any, of the Companies Act, 1956, any money transferred to the unpaid dividend account which remains unpaid or unclaimed for a period of 7 years from the date they become due for payment, is required to be transferred to the ‘Investor Education and Protection Fund’ set up by the Central Government. Accordingly, the amount of unclaimed dividend for the financial year ended March 31, 2003 will be transferred to the ‘Investor Education and Protection Fund’ in due course. Once the amount is so transferred, no claim shall lie against the aforesaid fund or the Company in respect of such dividend amount thereafter. The members are requested to send to the Company their claims, if any, for the dividend for financial year 2002 – 2003 onwards immediately.
k) Members may kindly note that due to security reasons, there could be certain restrictions and limitations in terms of movement of people, hand baggage and vehicles at the venue of the meeting. The people and accompanied items would be subject to inspection. We solicit your co‑operation.
l) Members may please note that the Company has made arrangements of to and fro bus service for the members to reach the venue of the Annual General Meeting. The details are given below:
Bus pick up:
From Andheri (East) Railway Station to Venue(land mark – Classic Veg. Restaurant, Old Nagardas Road, Andheri (East), Mumbai) 2.00 p.m.
From Ghatkopar (East) Railway Station to Venue(land mark – near BMC office) 2.00 p.m.
Bus drop:
From Venue to Andheri (East) Railway StationOn conclusion of the meetingFrom Venue to Ghatkopar (East) Railway Station
Annual Report 2009_2010_Colour.indd 128 7/24/2010 11:00:20 AM

129
ADDITIONAL INFORMATION PURSUANT TO CLAUSE 49 OF THE LISTING AGREEMENT WITH REGARD TO DIRECTORS SEEKING APPOINTMENT/RE‑APPOINTMENT AT THE TWENTY FIRST ANNUAL GENERAL MEETING:
1. Mr. Y M Kale
Mr. Y M Kale, born on November 4, 1947, was President of the Institute of Chartered Accountants of India (1995 – 1996) and is also a fellow member of the Institute of Chartered Accountants of England and Wales. He has contributed to various governmental and regulatory bodies such as the Securities and Exchange Board of India, the Committee of Offer Documents, the Committee of Takeovers and the Committee on Accounting for Corporates. He has participated as a member of the group for the Introduction of Concurrent Audit of Banks, which was organized by the Reserve Bank of India. He was also a member of the National Drugs and Pharmaceutical Development Council of the Government of India. He was also on the Board of the International Accounting Standards Committee from 1995 to 1998 as India’s representative.
Mr. Kale does not hold any equity shares of the Company as on date.
Mr. Kale holds directorships and committee memberships* in the following Companies:
List of other Directorships held Membership in Committees of other companies
Chairmanship in Committees of other companies
Ashok Leyland Limited – –Gulf Oil Marine Limited – –Hinduja Foundries Limited – –IndusInd Bank Limited – –
* Only the Audit and Shareholders’ Grievances Committees are considered.
2. Mr. William T Comfort, Jr.
Mr. William T Comfort, Jr., born on August 3, 1937, is the Chairman of Citigroup Venture Capital. He received his B.A. and LL.B. and was honored with the Doctorate of Humane Letters (D.H.L) at the University of Oklahoma. He received an LL.M. at the New York University Law School. He is a trustee of the New York University Law Center Foundation, the John A. Hartford Foundation, Inc., and was an adjunct professor at the Columbia Business School. He is currently Chairman of Citigroup Venture Capital and Chairman of the Investment Committee of Court Square Capital Partners. He is also a member of the Board of Directors of Deutsche Annington (DAIG - Germany), and Nabors Industries (Bermuda). Mr. Comfort has been associated with the Company as a board member since 2002 and was appointed as Chairman of its Board of Directors on March 24, 2009.
Mr. Comfort does not hold any equity shares of the Company as on date.
Mr. William T Comfort, Jr. holds directorships and committee memberships* in the following companies:
List of other Directorships held Membership in Committees of other companies
Chairmanship in Committees of other
companies
Citigroup Venture Capital – –Court Square Capital Partners Limited – –Deutsche Annington (DAIG) – –Nabors Industries – –CX Partners – –
* Only the Audit and Shareholders’ Grievances Committees are considered.
3. Mr. Frank Brienzi
Mr. Frank Brienzi, born on February 25, 1962, is Senior Vice President and General Manager of Oracle’s Financial Services Global Business Unit. He brings more than 25 years of financial services experience and expertise to his role at Oracle.
Mr. Brienzi began his career with EDS in 1984, as part of the financial services strategic business unit responsible for large-scale banking and insurance development, sales and account management. For the past 15 years, he was a managing partner at Accenture, helping to grow their global financial services business and leading Accenture’s Application Outsourcing practice in North America, Asia Pacific, Europe, Africa and Latin America.
Mr. Brienzi has written several articles for major magazines including Forbes and InformationWeek. He currently serves on the board of Aidmatrix and is Vice-Chairman for NPower, Texas. He is an active member in United Way programs and Stonebriar Community Church.
Mr. Brienzi holds double majors in mathematics and management information systems from the University of Northern Colorado.
Mr. Brienzi does not hold any equity shares of the Company as on date.
Annual Report 2009_2010_Colour.indd 129 7/24/2010 1:32:44 PM

Oracle Financial Services Software – Annual Report 2009-10
Mr. Brienzi holds directorships and committee memberships* in the following Companies:
List of other Directorships held Membership in Committees of other companies
Chairmanship in Committees of
other companies
NPower, Texas – –Aidmatrix – –
* Only the Audit and Shareholders’ Grievances Committees are considered.
4. Mr. Joseph John
Mr. Joseph John, born on December 15, 1957, is a member of the board of directors and head of the banking products division of Oracle Financial Services Software Limited. He is responsible for the development, implementation and support for the Oracle FLEXCUBE suite of products.
Mr. John joined Oracle Financial Services Software Limited (then a part of Citicorp Overseas Software Limited) in 1988, where he undertook wide-ranging Business Process Reengineering and Software Project Management assignments for customers in North America and Europe. Since 1992, he has been spearheading the product development strategy of the Company. He was product development head for its product MicroBanker, and thereafter headed the Banking Products Division, which is responsible for product development, consulting, and support of its flagship product Oracle FLEXCUBE, which is deployed in over 125 countries.
Prior to his tenure at Oracle, he was part of the software division at International Data Management.
Mr. John holds a bachelors degree in Engineering.
Mr. Joseph John holds 36,650 equity shares of the Company as on date.
Mr. Joseph John does not hold any other directorships and committee memberships.
5. Mr. William Corey West
Mr. William Corey West, born on May 4, 1962, is Senior Vice President, Corporate Controller and Chief Accounting Officer of Oracle Corporation. He brings more than 25 years of finance, accounting and executive management experience and expertise to his role at Oracle.
Mr. West began his career with Arthur Andersen in 1984, as part of the accounting and audit practice. He served clients in a variety of industries for 14 years and left Arthur Andersen in 1998 as a partner. After leaving Arthur Andersen he worked in finance, accounting and executive management positions at RPC, Adecco, Cadence Design Systems, The Gap and Intuit. Mr. West joined Oracle Corporation on April 2, 2007.
Mr. West graduated from the University of Washington in December 1984 with a bachelor’s degree in business, accounting and finance concentration.
Mr. William Corey West does not hold any equity shares of the Company as on date.
Mr. William Corey West holds directorships and committee memberships* in the following Companies:
List of other Directorships held Membership in Committees of other companies
Chairmanship in Committees of
other companies
BEA Crossgain International – –BEA International – –BEA Systems Ireland Holding Limited – –Eontec Limited – –J.D. Edwards Europe Limited – –Netsure Telecom Limited – –OCAPAC Distributor Partner – –OCAPAC Holding Company – –OCAPAC Research Company – –OCAPAC Research Partner – –Oracle Australia Holdings Pty. Ltd. – –Oracle Consolidation Australia Pty. Ltd. – –Oracle Corporation Malyasia Holdings Sdn Bhd. – –Oracle Global (Mauritius) Limited – –Oracle Hong Kong Holdings Ltd. – –Oracle Singapore Holdings Pte Ltd. – –Oracle Technology Company – –Siebel Systems Ireland Holding Ltd. – –Sun Microsystems Technology Limited – –
* Only the Audit and Shareholders’ Grievances Committees are considered.
Annual Report 2009_2010_Colour.indd 130 7/24/2010 1:32:44 PM

131
Explanatory Statement as required by Section 173 (2) of the Companies Act, 1956.
The following Explanatory Statement sets out all the material facts relating to the special business mentioned in the accompanying Notice dated July 22, 2010.
Item no. 5:
The Company has branch offices in India and abroad and may also open new branches in future. It may be necessary to appoint branch auditors for conducting the audit of the books of accounts of the Company at such branches.
The Board of Directors of the Company (“the Board”) seeks approval of the members for authorising the Board to appoint Branch Auditors and to fix their remuneration in consultation with the Statutory Auditors of the Company.
No Director is in any way concerned or interested in the resolution at item no. 5 of the Notice to the members.
Your Directors recommend the resolution at item no. 5 of the Notice.
Item no. 6:
Mr. Frank Brienzi was appointed as an Additional Director of the Company at the Board Meeting held on April 29, 2010. Pursuant to and in accordance with the provisions of the Section 260 of the Companies Act, 1956, and Article 109 of the Articles of Association of the Company, he holds office up to the date of this Annual General Meeting and is eligible for appointment as a director of the Company.
The Company has received a notice from a member, along with the requisite deposit under Section 257 of the Companies Act, 1956, proposing his candidature for appointment as Director of the Company. The details regarding the above proposed appointee as the Director and his detailed resume are given in this Notice.
Mr. Frank Brienzi’s immense knowledge and experience will add great value to the Company.
Except Mr. Frank Brienzi, none of the Directors of the Company is concerned or interested in the resolution at item no. 6 of the Notice to the members.
Your Directors recommend the resolution at item no. 6 of the Notice.
Item no. 7:
Mr. Joseph John was appointed as an Additional Director of the Company at the Board Meeting held on April 29, 2010. Pursuant to and in accordance with the provisions of the Section 260 of the Companies Act, 1956, and Article 109 of the Articles of Association of the Company, he holds office up to the date of this Annual General Meeting and is eligible for appointment as a director of the Company.
The Company has received a notice from a member, along with the requisite deposit under Section 257 of the Companies Act, 1956, proposing his candidature for appointment as Director of the Company. The details regarding the above proposed appointee as the Director and his detailed resume are given in this Notice.
Mr. Joseph John’s immense knowledge and experience will add great value to the Company.
Except Mr. Joseph John none of the Directors of the Company is concerned or interested in the resolution at item no. 7 of the Notice to the members.
Your Directors recommend the resolution at item no. 7 of the Notice.
Item no. 8:
Mr. William Corey West was appointed as an Additional Director of the Company at the Board Meeting held on July 22, 2010. Pursuant to and in accordance with the provisions of the Section 260 of the Companies Act, 1956, and Article 109 of the Articles of Association of the Company, he holds office up to the date of this Annual General Meeting and is eligible for appointment as a director of the Company.
The Company has received a notice from a member, along with the requisite deposit under Section 257 of the Companies Act, 1956, proposing his candidature for appointment as Director of the Company. The details regarding the above proposed appointee as the Director and his detailed resume are given in this Notice.
Mr. William Corey West’s immense knowledge and experience will add great value to the Company.
Annexure to notice
Annual Report 2009_2010_Colour.indd 131 7/24/2010 11:00:21 AM

Oracle Financial Services Software – Annual Report 2009-10
Except Mr. William Corey West none of the Directors of the Company is concerned or interested in the resolution at item no. 8 of the Notice to the members.
Your Directors recommend the resolution at item no. 8 of the Notice.
Item no. 9:
The Board of Directors of the Company at its meeting held on May 7, 2010, appointed Mr. Joseph John as a Whole‑time Director of the Company with effect from April 29, 2010, for a period of three years, on the following terms and conditions.
Remuneration:
1. Gross Salary: Rs. 8,683,880 p.a., inclusive of perquisites and allowances as mentioned below:
Perquisites and allowances:
a. Housing: Furnished/unfurnished residential accommodation or house rent allowance up to 10% of the salary in lieu thereof. The expenditure incurred by the Company on gas, electricity, water and furnishings, if any, shall be valued as per Income Tax Rules, 1962.
b. Medical reimbursement/allowance: Reimbursement of actual expenses for self and family and/or allowance as per the rules of the Company.
c. Leave travel concession/allowance: For self and family once in a year, as per the rules of the Company.
d. Provision for driver/driver’s salary allowance: As per the rules of the Company.
e. Company car and telephone: Use of Company’s car and telephone at the residence for official purposes, as per the rules of the Company.
f. Personal accident insurance: As per the rules of the Company.
2. Performance linked Bonus: Payable annually or at other intervals, as may be decided by the Board or the Compensation Committee of the Board.
3. Other benefits:
a. Earned/privilege leave: As per the rules of the Company.
b. Company’s contribution to provident fund and superannuation fund: As per the rules of the Company.
c. Gratuity: As per the rules of the Company.
d. Encashment of leave: As per the rules of the Company.
Further, if in any financial year closing on and after March 31, 2011, the Company incurs a loss or its profits are inadequate, the Company shall pay to Mr. Joseph John the remuneration as mentioned above as the minimum remuneration.
An abstract of the terms and conditions of appointment and remuneration payable to Mr. Joseph John was sent to the members in May 2010 as required under Section 302 of the Act.
The Board of Directors of the Company has on July 22, 2010 approved the revision in the Gross Salary payable to Mr. Joseph John from Rs. 8,683,880 p.a. to a Gross Salary in the scale of Rs. 50 lakh p.a. to Rs. 100 lakh p.a., with effect from April 29, 2010 subject to the approval of the members of the Company and such other approvals as may be required. All other terms and conditions of his appointment being the same. The remuneration payable to Mr. Joseph John as set out in the resolution no. 9 of the Notice is within the limits prescribed under Schedule XIII and other applicable provisions of the Companies Act, 1956.
The Agreement dated May 7, 2010, entered into between Mr. Joseph John and the Company together with the draft Supplemental Agreement to be entered into between Mr. Joseph John and the Company is available for inspection by the Members of the Company at its Registered Office between 2.00 p.m. to 4.00 p.m. on any working day of the Company.
This may be treated as an abstract under Section 302 of the Companies Act, 1956 with regard to variation in terms of appointment and remuneration.
Except Mr. Joseph John no other Directors of the Company is concerned or interested in the resolution at item no. 9 of the Notice to the members.
Your Directors recommend the resolution at item no. 9 of the Notice.
Annual Report 2009_2010_Colour.indd 132 7/24/2010 11:00:21 AM

133
Item no. 10:
The Members at their Annual General Meeting held on August 24, 2007, had approved the appointment and terms of remuneration of Mr. N R Kothandaraman (N R K Raman) as the Managing Director of the Company for a period of five years with effect from May 1, 2007 to April 30, 2012 on the following terms and conditions.
1. Gross Salary: In the scale of Rs. 55 lakh p.a. to Rs. 62 lakh p.a. inclusive of perquisites as mentioned below.
2. Performance linked Bonus: Payable quarterly or at other intervals, as may be decided by the Compensation Committee and the Board.
3. Perquisites and allowances:
a. Housing: Furnished/unfurnished residential accommodation or house rent allowance up to 10% of the salary in lieu thereof. The expenditure incurred by the Company on gas, electricity, water and furnishings, if any, shall be valued as per Income Tax Rules, 1962.
b. Medical reimbursement/allowance: Reimbursement of actual expenses for self and family and/or allowance will be paid as decided by the Board from time to time.
c. Leave travel concession/allowance: For self and family once in a year, as decided by the Compensation Committee and the Board from time to time.
d. Club fees: Fees payable subject to a maximum of two clubs.
e. Provision for driver/driver’s salary allowance: As per the rules of the Company.
f. Personal accident insurance: As per the rules of the Company.
4. Other benefits:
a. Earned/privilege leave: As per the rules of the Company.
b. Company’s contribution to provident fund and superannuation fund: As per the rules of the Company.
c. Gratuity: As per the rules of the Company.
d. Encashment of leave: As per the rules of the Company.
e. Company car and telephone: Use of the Company’s car and telephone at the residence for official purposes, as per the rules of the company.
Further, if in any financial year closing on and after March 31, 2008, the Company incurs a loss or its profits are inadequate, the Company shall pay to Mr. N R K Raman the remuneration as mentioned above as the minimum remuneration.
The Board of Directors of the Company has on July 22, 2010, approved the revision in the Gross Salary payable to Mr. N R K Raman from the scale of Rs. 55 lakh p.a. to Rs. 62 lakh p.a. to a Gross Salary of Rs. 60 lakh p.a. to Rs. 120 lakh p.a. with effect from July 16, 2010 subject to the approval of the members of the Company and such other approvals as may be required. All other terms and conditions of his appointment being the same. The remuneration payable to Mr. N R K Raman as set out in the resolution no. 10 of the Notice is within the limits prescribed under Schedule XIII and other applicable provisions of the Companies Act, 1956.
The Agreement dated December 20, 2007, entered into between Mr. N R K Raman and the Company together with the draft Supplemental Agreement to be entered into between Mr. N R K Raman and the Company is available for inspection by the Members of the Company at its Registered Office between 2.00 p.m. to 4.00 p.m. on any working day of the Company.
This may be treated as an abstract under Section 302 of the Companies Act, 1956 with regard to variation in terms of appointment and remuneration.
Except Mr. N R K Raman no other Directors of the Company is concerned or interested in the resolution at item no. 10 of the Notice to the members.
Your Directors recommend the resolution at item no. 10 of the Notice.
Annual Report 2009_2010_Colour.indd 133 7/24/2010 11:00:21 AM

Oracle Financial Services Software – Annual Report 2009‑10
Item no. 11:
In accordance with the provisions of Section 256 of the Companies Act, 1956 and the Articles of Association of the Company, Ms. Tarjani Vakil retires by rotation at this Annual General Meeting and is eligible for re‑appointment. She has expressed her desire not to be re‑appointed. The Company does not propose to fill the vacancy at this meeting or at adjourned meeting thereof. Hence, as required under Section 256 of the Companies Act, 1956, a resolution is proposed accordingly.
Except Ms. Tarjani Vakil no other Directors of the Company is concerned or interested in the above resolution at item no. 11 of the Notice to the members.
Your directors recommend the resolution at item no. 11 of the Notice.
By Order of the Board
Hoshi D Bhagwagar Company Secretary and Compliance Officer
Registered Office:Oracle ParkOff Western Express HighwayGoregaon (East)Mumbai 400063
July 22, 2010
Annual Report 2009_2010_Colour.indd 134 7/23/2010 9:05:01 PM

135
I/We .......................................................................................................................... of .......................................................... in the
district of ..................................................................................................................... being a member/members of the above
named Company, hereby appoint .............................................................................................................................................
of ....................................................................................... in district of ..........................................................................................
or failing him/her ..................................................................................................... of ............................................................. in the
district of .............................................................. as my/our proxy to attend and vote for me/us and on my/our behalf at
the Twenty First Annual General Meeting of the Company to be held on Wednesday, August 25, 2010 at 3.00 p.m. at The Leela
Kempinski, Sahar, Andheri (East), Mumbai 400059, and at any adjournment thereof.
Signed this ................................................. day of ................................................. 2010.
Ledger Folio No. ........................................ DP ID ......................................... Client ID .................................................................
No. of Shares held ............................................................
Note: 1. The proxy need not be a member.
2. The proxy form duly signed across Re. 1/‑ revenue stamp should reach the Registered Office of the Company not less than 48 hours before the time fixed for the meeting.
PROXY FORM
Oracle Financial Services Software LimitedRegistered Office: Oracle Park, Off Western Express Highway,
Goregaon (East), Mumbai 400063
AttendAnce sliP
I hereby record my presence at the Twenty First Annual General Meeting of the Company held on Wednesday, August 25, 2010 at
3.00 p.m. at The Leela Kempinski, Sahar, Andheri (East), Mumbai 400059.
Full name of the Shareholder .........................................................................................................................................................
(in block letters)
Ledger Folio No. ............................................... DP ID ................................................ Client ID ...................................................
Number of Shares held ......................................................................................................................................................................
Signature of Shareholder or Proxy attending ................................................................................................................................
Full name of Proxy ..........................................................................................................................................................................
(in block letters)
Please provide full name of the 1st Joint Holder.
Mr./Mrs./Ms. ....................................................................................................................................................................................
Note: Please fill in the attendance slip and hand it over at the ENTRANCE OF THE HALL
Oracle Financial Services Software LimitedRegistered Office: Oracle Park, Off Western Express Highway,
Goregaon (East), Mumbai 400063
Please affix Re. 1/‑ revenue
stamp and sign across
Annual Report 2009_2010_Colour.indd 135 7/24/2010 1:32:49 PM

Annual Report 2009_2010_Colour.indd 136 7/23/2010 9:05:01 PM

Annual Report 2009_2010_Colour.indd 137 7/23/2010 9:05:09 PM

Copyright © 2010, Oracle Financial Services Software Limited and/or its affiliates. All rights reserved.
Oracle is a registered trademark of Oracle Corporation and/or its affiliates. Other names may be trademarks of their respective owners.
Oracle Financial Services Software LimitedREGISTERED OFFICE
Oracle ParkOff Western Express HighwayGoregaon (East) Mumbai, 400063, MaharashtraIndia
INVESTOR ENqUIRIES
Phone
+ 91.22.6718.3000
Fax + 91.22.6718.3001
oracle.com/financialservices
Annual Report 2009_2010_Colour.indd 138 7/23/2010 9:05:09 PM
Related Documents