Annual Report 2008

Welcome message from author
This document is posted to help you gain knowledge. Please leave a comment to let me know what you think about it! Share it to your friends and learn new things together.
Transcript
Annual Report 2008
Key f igu res
(amounts x € 1 million, unless stated otherwise)
* Refer to glossary for definitions and abbreviations
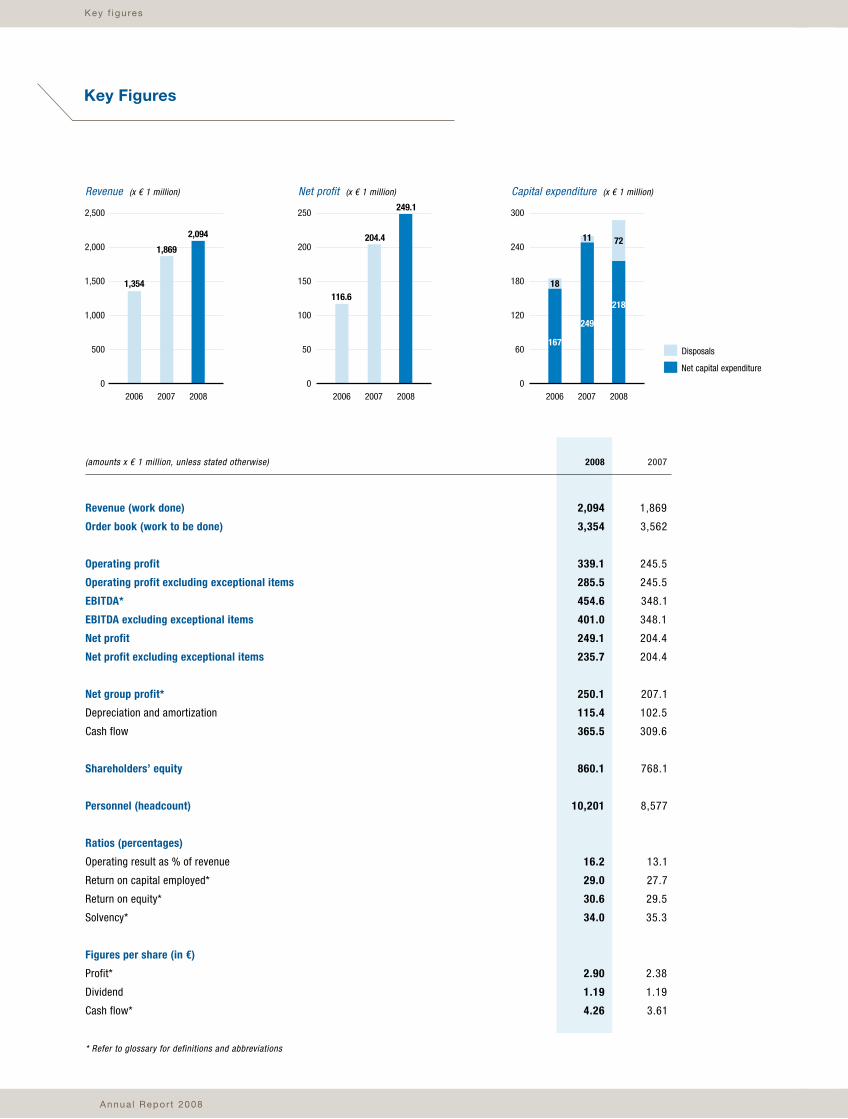
Revenue (work done)
Order book (work to be done)
Operating profit
Operating profit excluding exceptional items
EBITDA*
EBITDA excluding exceptional items
Net profit
Net profit excluding exceptional items
Net group profit*
Depreciation and amortization
Cash flow
Shareholders’ equity
Personnel (headcount)
Ratios (percentages)
Operating result as % of revenue
Return on capital employed*
Return on equity*
Solvency*
Figures per share (in €)
Profit*
Dividend
Cash flow*
Annua l Rev iew 2008
Revenue (x € 1 million)
2006 2007 2008
2,500
2,000
1,500
1,000
500
0
2,094
1,354
1,869
2006 2007 2008
250
200
150
100
50
0
249.1
116.6
204.4
Net profit (x € 1 million) Capital expenditure (x € 1 million)
2006 2007 2008
300
240
180
120
60
0
167
18
11
249
218
72
Key Figures
Net capital expenditure
Disposals
2008 2007
2,094 1,869
3,354 3,562
339.1 245.5
285.5 245.5
454.6 348.1
401.0 348.1
249.1 204.4
235.7 204.4
250.1 207.1
115.4 102.5
365.5 309.6
860.1 768.1
10,201 8,577
16.2 13.1
29.0 27.7
30.6 29.5
34.0 35.3
2.90 2.38
1.19 1.19
4.26 3.61
Roya l Boska l i s Westmins te r nv
Key f igu res
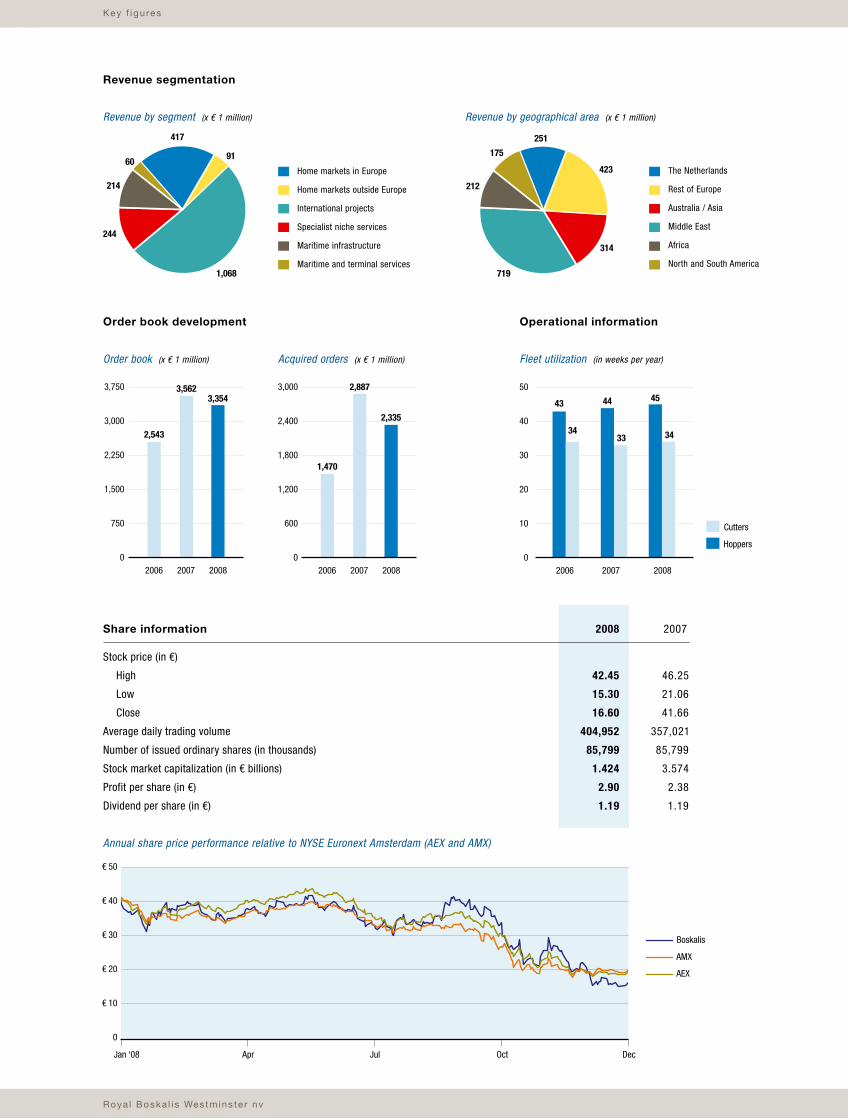
2008 2007
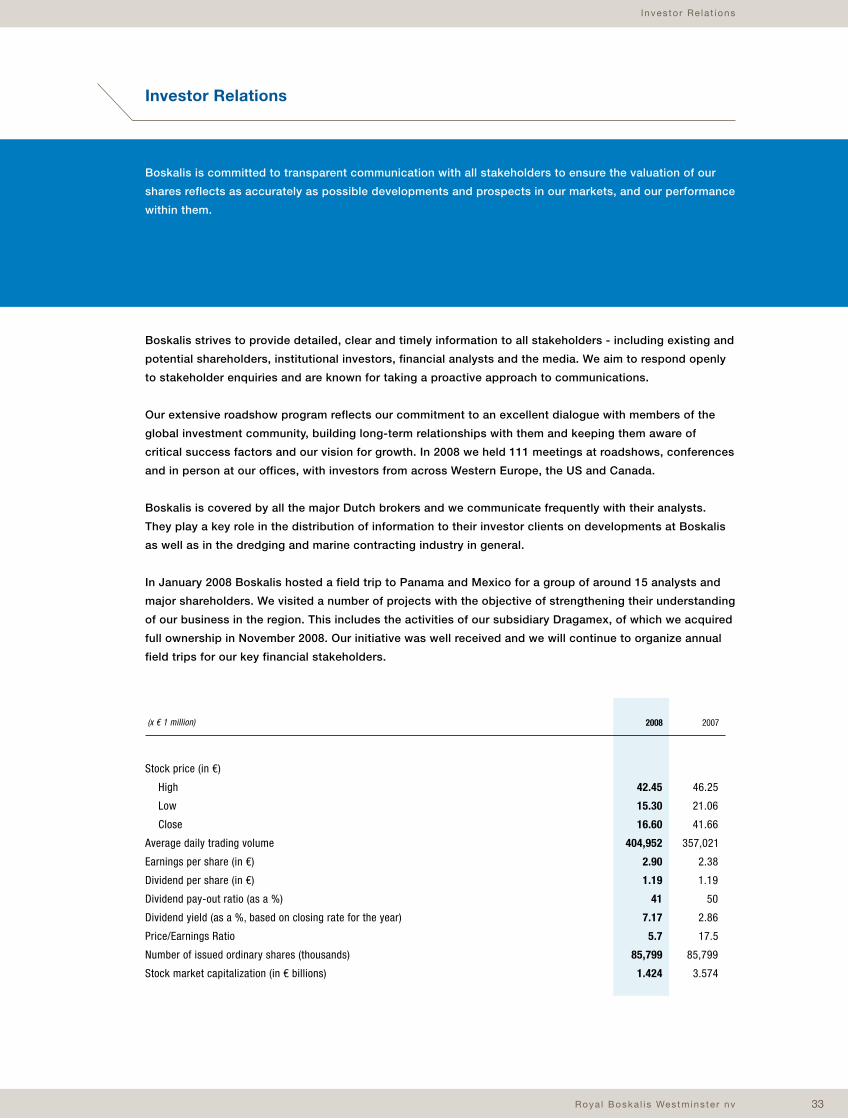
42.45 46.25
15.30 21.06
16.60 41.66
404,952 357,021
85,799 85,799
1.424 3.574
2.90 2.38
1.19 1.19
Stock price (in €)
High
Low
Close
Average daily trading volume
Number of issued ordinary shares (in thousands)
Stock market capitalization (in € billions)
Profit per share (in €)
Dividend per share (in €)
Share information
Operational informationOrder book development
Revenue by geographical area (x € 1 million)
bewerkt voor JV2008
251
423
314
719
212
175
The Netherlands
Rest of Europe
Australia / Asia
Middle East
Africa
North and South America
Revenue by segment (x € 1 million)
bewerkt voor JV2008
417
91
1,068
244
214
60Home markets in Europe
Home markets outside Europe
International projects
Specialist niche services
Maritime infrastructure
Maritime and terminal services
Revenue segmentation
2007 2008
3,3543,562
2006
3,750
3,000
2,250
1,500
750
0
2,543
Order book (x € 1 million) Acquired orders (x € 1 million)
€ 50
€ 40
€ 30
€ 20
€ 10
0
Annual share price performance relative to NYSE Euronext Amsterdam (AEX and AMX)
AMX
AEX
Hoppers
Cutters
Boskalis
Fleet utilization (in weeks per year)
2006 2007 2008
50
40
30
20
10
0
33
44
34
45
34
43
Jan ‘08 Apr Jul Oct Dec
2006 2007 2008
3,000
2,400
1,800
1,200
600
0
1,470
2,887
2,335
ColofonColophon
Compiled and coordinated by Royal Boskalis Westminster N.V.
Corporate Communications Department
Group Reporting Department
Design and realization
The Concept Store, Eindhoven
Photography
Van der Kloet, Picture Report, Chris Henderson, Mario Vivado, Oscar Seijkens
and others
Lithography and print
PlantijnCasparie Capelle a/d IJssel
Key f igu res
(amounts x € 1 million, unless stated otherwise)
* Refer to glossary for definitions and abbreviations
Revenue (work done)
Order book (work to be done)
Operating profit
Operating profit excluding exceptional items
EBITDA*
EBITDA excluding exceptional items
Net profit
Net profit excluding exceptional items
Net group profit*
Depreciation and amortization
Cash flow
Shareholders’ equity
Personnel (headcount)
Ratios (percentages)
Operating result as % of revenue
Return on capital employed*
Return on equity*
Solvency*
Figures per share (in €)
Profit*
Dividend
Cash flow*
Annua l Rev iew 2008
Revenue (x € 1 million)
2006 2007 2008
2,500
2,000
1,500
1,000
500
0
2,094
1,354
1,869
2006 2007 2008
250
200
150
100
50
0
249.1
116.6
204.4
Net profit (x € 1 million) Capital expenditure (x € 1 million)
2006 2007 2008
300
240
180
120
60
0
167
18
11
249
218
72
Key Figures
Net capital expenditure
Disposals
2008 2007
2,094 1,869
3,354 3,562
339.1 245.5
285.5 245.5
454.6 348.1
401.0 348.1
249.1 204.4
235.7 204.4
250.1 207.1
115.4 102.5
365.5 309.6
860.1 768.1
10,201 8,577
16.2 13.1
29.0 27.7
30.6 29.5
34.0 35.3
2.90 2.38
1.19 1.19
4.26 3.61
Roya l Boska l i s Westmins te r nv
Key f igu res
2008 2007
42.45 46.25
15.30 21.06
16.60 41.66
404,952 357,021
85,799 85,799
1.424 3.574
2.90 2.38
1.19 1.19
Stock price (in €)
High
Low
Close
Average daily trading volume
Number of issued ordinary shares (in thousands)
Stock market capitalization (in € billions)
Profit per share (in €)
Dividend per share (in €)
Share information
Operational informationOrder book development
Revenue by geographical area (x € 1 million)
bewerkt voor JV2008
251
423
314
719
212
175
The Netherlands
Rest of Europe
Australia / Asia
Middle East
Africa
North and South America
Revenue by segment (x € 1 million)
bewerkt voor JV2008
417
91
1,068
244
214
60Home markets in Europe
Home markets outside Europe
International projects
Specialist niche services
Maritime infrastructure
Maritime and terminal services
Revenue segmentation
2007 2008
3,3543,562
2006
3,750
3,000
2,250
1,500
750
0
2,543
Order book (x € 1 million) Acquired orders (x € 1 million)
€ 50
€ 40
€ 30
€ 20
€ 10
0
Annual share price performance relative to NYSE Euronext Amsterdam (AEX and AMX)
AMX
AEX
Hoppers
Cutters
Boskalis
Fleet utilization (in weeks per year)
2006 2007 2008
50
40
30
20
10
0
33
44
34
45
34
43
Jan ‘08 Apr Jul Oct Dec
2006 2007 2008
3,000
2,400
1,800
1,200
600
0
1,470
2,887
2,335
ColofonColophon
Compiled and coordinated by Royal Boskalis Westminster N.V.
Corporate Communications Department
Group Reporting Department
Design and realization
The Concept Store, Eindhoven
Photography
Van der Kloet, Picture Report, Chris Henderson, Mario Vivado, Oscar Seijkens
and others
Lithography and print
PlantijnCasparie Capelle a/d IJssel
Annua l Repor t 2008
Key f igu res
(amounts x € 1 million, unless stated otherwise)
* Refer to glossary for definitions and abbreviations
Revenue (work done)
Order book (work to be done)
Operating profit
Operating profit excluding exceptional items
EBITDA*
EBITDA excluding exceptional items
Net profit
Net profit excluding exceptional items
Net group profit*
Depreciation and amortization
Cash flow
Shareholders’ equity
Personnel (headcount)
Ratios (percentages)
Operating result as % of revenue
Return on capital employed*
Return on equity*
Solvency*
Figures per share (in €)
Profit*
Dividend
Cash flow*
Annua l Rev iew 2008
Revenue (x € 1 million)
2006 2007 2008
2,500
2,000
1,500
1,000
500
0
2,094
1,354
1,869
2006 2007 2008
250
200
150
100
50
0
249.1
116.6
204.4
Net profit (x € 1 million) Capital expenditure (x € 1 million)
2006 2007 2008
300
240
180
120
60
0
167
18
11
249
218
72
Key Figures
Net capital expenditure
Disposals
2008 2007
2,094 1,869
3,354 3,562
339.1 245.5
285.5 245.5
454.6 348.1
401.0 348.1
249.1 204.4
235.7 204.4
250.1 207.1
115.4 102.5
365.5 309.6
860.1 768.1
10,201 8,577
16.2 13.1
29.0 27.7
30.6 29.5
34.0 35.3
2.90 2.38
1.19 1.19
4.26 3.61
Roya l Boska l i s Westmins te r nv
Key f igu res
2008 2007
42.45 46.25
15.30 21.06
16.60 41.66
404,952 357,021
85,799 85,799
1.424 3.574
2.90 2.38
1.19 1.19
Stock price (in €)
High
Low
Close
Average daily trading volume
Number of issued ordinary shares (in thousands)
Stock market capitalization (in € billions)
Profit per share (in €)
Dividend per share (in €)
Share information
Operational informationOrder book development
Revenue by geographical area (x € 1 million)
bewerkt voor JV2008
251
423
314
719
212
175
The Netherlands
Rest of Europe
Australia / Asia
Middle East
Africa
North and South America
Revenue by segment (x € 1 million)
bewerkt voor JV2008
417
91
1,068
244
214
60Home markets in Europe
Home markets outside Europe
International projects
Specialist niche services
Maritime infrastructure
Maritime and terminal services
Revenue segmentation
2007 2008
3,3543,562
2006
3,750
3,000
2,250
1,500
750
0
2,543
Order book (x € 1 million) Acquired orders (x € 1 million)
€ 50
€ 40
€ 30
€ 20
€ 10
0
Annual share price performance relative to NYSE Euronext Amsterdam (AEX and AMX)
AMX
AEX
Hoppers
Cutters
Boskalis
Fleet utilization (in weeks per year)
2006 2007 2008
50
40
30
20
10
0
33
44
34
45
34
43
Jan ‘08 Apr Jul Oct Dec
2006 2007 2008
3,000
2,400
1,800
1,200
600
0
1,470
2,887
2,335
ColofonColophon
Compiled and coordinated by Royal Boskalis Westminster N.V.
Corporate Communications Department
Group Reporting Department
Design and realization
The Concept Store, Eindhoven
Photography
Van der Kloet, Picture Report, Chris Henderson, Mario Vivado, Oscar Seijkens
and others
Lithography and print
PlantijnCasparie Capelle a/d IJssel
Key f igu res
(amounts x € 1 million, unless stated otherwise)
* Refer to glossary for definitions and abbreviations
Revenue (work done)
Order book (work to be done)
Operating profit
Operating profit excluding exceptional items
EBITDA*
EBITDA excluding exceptional items
Net profit
Net profit excluding exceptional items
Net group profit*
Depreciation and amortization
Cash flow
Shareholders’ equity
Personnel (headcount)
Ratios (percentages)
Operating result as % of revenue
Return on capital employed*
Return on equity*
Solvency*
Figures per share (in €)
Profit*
Dividend
Cash flow*
Annua l Rev iew 2008
Revenue (x € 1 million)
2006 2007 2008
2,500
2,000
1,500
1,000
500
0
2,094
1,354
1,869
2006 2007 2008
250
200
150
100
50
0
249.1
116.6
204.4
Net profit (x € 1 million) Capital expenditure (x € 1 million)
2006 2007 2008
300
240
180
120
60
0
167
18
11
249
218
72
Key Figures
Net capital expenditure
Disposals
2008 2007
2,094 1,869
3,354 3,562
339.1 245.5
285.5 245.5
454.6 348.1
401.0 348.1
249.1 204.4
235.7 204.4
250.1 207.1
115.4 102.5
365.5 309.6
860.1 768.1
10,201 8,577
16.2 13.1
29.0 27.7
30.6 29.5
34.0 35.3
2.90 2.38
1.19 1.19
4.26 3.61
Roya l Boska l i s Westmins te r nv
Key f igu res
2008 2007
42.45 46.25
15.30 21.06
16.60 41.66
404,952 357,021
85,799 85,799
1.424 3.574
2.90 2.38
1.19 1.19
Stock price (in €)
High
Low
Close
Average daily trading volume
Number of issued ordinary shares (in thousands)
Stock market capitalization (in € billions)
Profit per share (in €)
Dividend per share (in €)
Share information
Operational informationOrder book development
Revenue by geographical area (x € 1 million)
bewerkt voor JV2008
251
423
314
719
212
175
The Netherlands
Rest of Europe
Australia / Asia
Middle East
Africa
North and South America
Revenue by segment (x € 1 million)
bewerkt voor JV2008
417
91
1,068
244
214
60Home markets in Europe
Home markets outside Europe
International projects
Specialist niche services
Maritime infrastructure
Maritime and terminal services
Revenue segmentation
2007 2008
3,3543,562
2006
3,750
3,000
2,250
1,500
750
0
2,543
Order book (x € 1 million) Acquired orders (x € 1 million)
€ 50
€ 40
€ 30
€ 20
€ 10
0
Annual share price performance relative to NYSE Euronext Amsterdam (AEX and AMX)
AMX
AEX
Hoppers
Cutters
Boskalis
Fleet utilization (in weeks per year)
2006 2007 2008
50
40
30
20
10
0
33
44
34
45
34
43
Jan ‘08 Apr Jul Oct Dec
2006 2007 2008
3,000
2,400
1,800
1,200
600
0
1,470
2,887
2,335
ColofonColophon
Compiled and coordinated by Royal Boskalis Westminster N.V.
Corporate Communications Department
Group Reporting Department
Design and realization
The Concept Store, Eindhoven
Photography
Van der Kloet, Picture Report, Chris Henderson, Mario Vivado, Oscar Seijkens
and others
Lithography and print
PlantijnCasparie Capelle a/d IJssel

Roya l Boska l i s Westmins te r nv 11Roya l Boska l i s Westmins te r nv
Annual Report 2008
This Annual Report contains foward-looking statements. These statements are based on current expectations,
estimates and projections of Boskalis’ management and information currently available to the company.
These forecasts are not certain and contain elements of risk that are difficult to predict and therefore Boskalis does
not guarantee that its expectations will be realized. Boskalis has no obligation to update the statements contained
in this Annual Report.
Unless stated otherwise, all amounts in this Annual Report are in euros (€). Some of the projects referred to in this
review were carried out in joint venture or in a subcontractor role.
This is a translation of the prevailing official Annual Report in the Dutch language.
An Annual Review, a shortened version of the Annual Report, has been printed and is available on request in
English and Dutch. All reports can be read or downloaded from Boskalis’ public website at www.boskalis.com
Annua l Repor t 20082 2
Roya l Boska l i s Westmins te r nv 3
Tab le o f conten ts
Chairman’s statement 4
Company profile 8
Key developments 9
Strategy: Focus, Reinforce & Expand 10
Product Segment: Dredging & Earthmoving 18
Product Segment: Maritime Infrastructure 21
Product Segment: Maritime & Terminal Services 24
Market Segment: Oil & Gas 28
Corporate social responsibility 32
Investor Relations 33
Market Segment: Ports 38
Members of the Supervisory Board 42
Report of the Supervisory Board 43
Members of the Board of Management 48
Report of the Board of Management 49
Market Segment: Land Reclamation & Coastal Protection 66
Corporate Governance 70
Financial statements 2008 77
Ten-year overview of Boskalis 137
Legal structure 138
Organization 140
The world of Boskalis 142
Offices 143
Glossary 149
Equipment 155
Table of contents
Annua l Repor t 20084
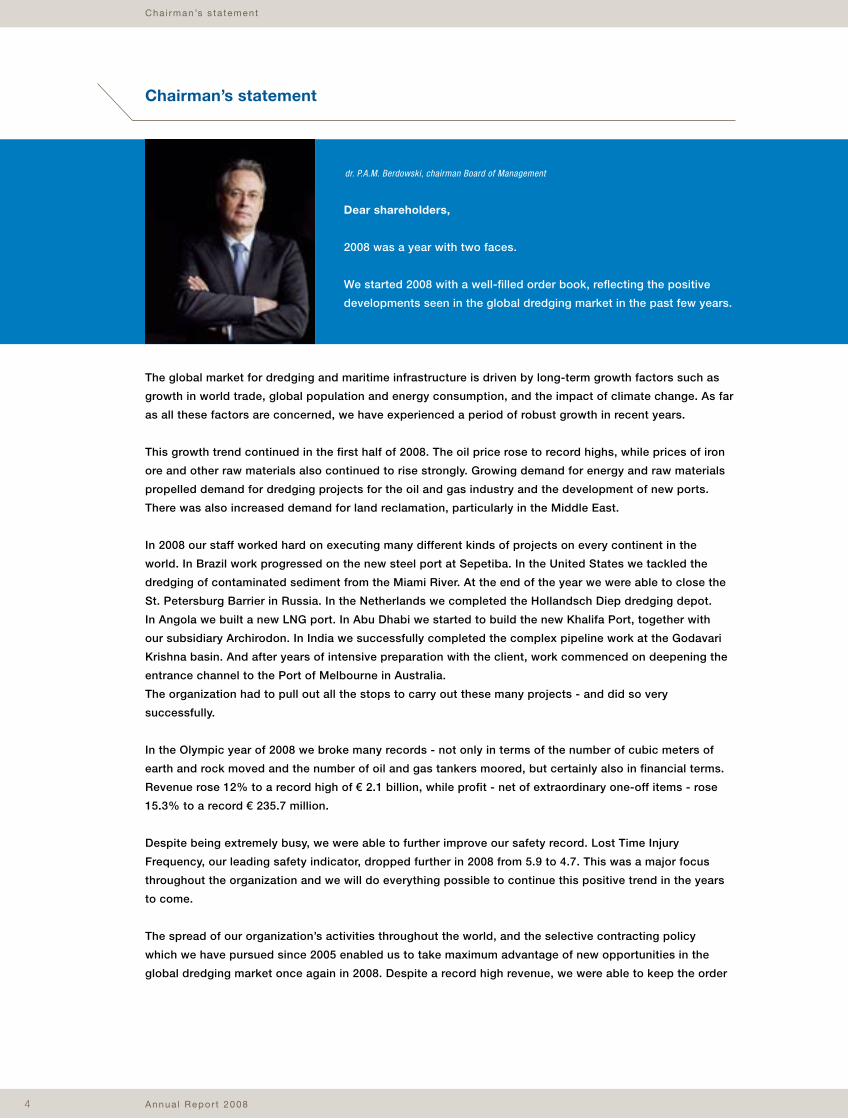
Cha i rman’s s ta tement
Dear shareholders,
2008 was a year with two faces.
We started 2008 with a well-filled order book, reflecting the positive
developments seen in the global dredging market in the past few years.
dr. P.A.M. Berdowski, chairman Board of Management
The global market for dredging and maritime infrastructure is driven by long-term growth factors such as
growth in world trade, global population and energy consumption, and the impact of climate change. As far
as all these factors are concerned, we have experienced a period of robust growth in recent years.
This growth trend continued in the first half of 2008. The oil price rose to record highs, while prices of iron
ore and other raw materials also continued to rise strongly. Growing demand for energy and raw materials
propelled demand for dredging projects for the oil and gas industry and the development of new ports.
There was also increased demand for land reclamation, particularly in the Middle East.
In 2008 our staff worked hard on executing many different kinds of projects on every continent in the
world. In Brazil work progressed on the new steel port at Sepetiba. In the United States we tackled the
dredging of contaminated sediment from the Miami River. At the end of the year we were able to close the
St. Petersburg Barrier in Russia. In the Netherlands we completed the Hollandsch Diep dredging depot.
In Angola we built a new LNG port. In Abu Dhabi we started to build the new Khalifa Port, together with
our subsidiary Archirodon. In India we successfully completed the complex pipeline work at the Godavari
Krishna basin. And after years of intensive preparation with the client, work commenced on deepening the
entrance channel to the Port of Melbourne in Australia.
The organization had to pull out all the stops to carry out these many projects - and did so very
successfully.
In the Olympic year of 2008 we broke many records - not only in terms of the number of cubic meters of
earth and rock moved and the number of oil and gas tankers moored, but certainly also in financial terms.
Revenue rose 12% to a record high of € 2.1 billion, while profit - net of extraordinary one-off items - rose
15.3% to a record € 235.7 million.
Despite being extremely busy, we were able to further improve our safety record. Lost Time Injury
Frequency, our leading safety indicator, dropped further in 2008 from 5.9 to 4.7. This was a major focus
throughout the organization and we will do everything possible to continue this positive trend in the years
to come.
The spread of our organization’s activities throughout the world, and the selective contracting policy
which we have pursued since 2005 enabled us to take maximum advantage of new opportunities in the
global dredging market once again in 2008. Despite a record high revenue, we were able to keep the order
Chairman’s statement
Roya l Boska l i s Westmins te r nv 5
Cha i rman’s s ta tement
book well-filled at € 3.4 billion. Notable new orders included Maasvlakte 2 in the Netherlands, extension
of the port of Felixstowe in the United Kingdom, the development of the port of Pipavav in India and the
development of the coal export port of Newcastle in Australia.
In 2008 we acquired a remaining 50% stake in our Mexican subsidiary Dragamex. Mexico is one of our
home markets with a permanent presence of around 500 employees and a local dredging fleet. We expect
the Mexican market to grow strongly in the coming years, helped by the ambitious investment plans of the
Mexican government.
We invested around € 290 million to strengthen and renew our fleet in 2008. The 5,600 m3 trailing suction
hopper dredger Shoreway was christened on April 17 and sister ship Crestway followed on May 16. In
November we started extending the trailing suction hopper dredger Queen of the Netherlands in Singapore,
with completion scheduled for March 2009. In 2008 construction also started on both a 12,000 m3 trailing
suction hopper dredger at IHC and a fallpipe vessel for offshore operations at the Yantai Raffles shipyard in
China. Finally, our subsidiary Lamnalco invested around € 27 million in vessels for terminal services for oil
and gas companies.
In 2008 we also worked hard to create a new three-year business plan for Boskalis after first conducting
a global market review of all relevant trends and developments in our markets. As part of the process,
we visited around 100 clients and end-users of our products.
The review provided some interesting insights. It showed that the long-term prospects for our industry
are excellent. The market segments that are most important for Boskalis - and on which we will further
increase our focus - are:
• Oil & Gas;
• Ports;
• Land Reclamation & Coastal Protection.
Furthermore, it showed the role our clients feel we should be playing is rapidly shifting and growing.
We see an increasing need for:
• early contractor involvement (feasibility and engineering);
• support in financing;
• assistance in project realization (management and technical);
• responsibility as main contractor;
• a wider and more comprehensive product range.
To respond to these changing market circumstances we will strengthen our organization in the coming
years, both by making adjustments to it where necessary and by making targeted acquisitions.
It is in view of this strategic long-term perspective that we are interested in parts of Smit Internationale N.V.
The acquisition of Smit would allow us to position Lamnalco as the global leader in the market for terminal
services. At the same time we could strengthen our rapidly growing and soundly profitable offshore
business and provide it with the wider range of products our clients would like to see.
Annua l Repor t 20086
Cha i rman’s s ta tement
On 15 September 2008 we announced that we were interested in various parts of Smit. We have since built
up a stake of more than 25% in Smit and we have held discussions with the company’s Management Board
and potential partners to see if we can reach a deal.
Our efforts have not as yet resulted in the acquisition of the operations we have our eye on, but we will
explore further options to try to make it happen.
In the final quarter of 2008 the global economic stage - and with it the landscape in the dredging industry -
changed drastically.
Even though long-term structural growth factors like world trade and energy consumption remain positive
for the dredging industry, a great deal has changed for the short term. The price of oil has dropped sharply,
demand for raw materials has plummeted and world trade is stagnating. Naturally this is affecting demand
for our products and services. After years of robust growth we are bracing ourselves for a period of
stagnation - an economic downturn in the structural growth we are witnessing in the industry.
As in other sectors it is currently difficult to predict how long this downturn will last. It may be a year, it may
be longer. Nobody knows.
On a positive note, amidst all these developments our order book is well-filled, resulting in solid fleet
utilization levels for 2009 and even part of 2010. This sets us apart from many other sectors which are
affected much more directly by changes in consumer confidence and spending behavior. In addition, it
gives us time to streamline the organization as we deem appropriate for these changed market conditions.
Due in part to the aforementioned developments, 2009 will be a very different year than 2008. We will
have to fight even harder for every project in the market and we will have to keep an even tighter grip
on expenses.
It is, however, important to note that the state of our company going forward is tremendously strong:
• we have a well-filled order book;
• our financial position is extremely sound;
• we have a diversified and competitive fleet;
• and, last but not least, we employ the best and most highly motivated people in the industry.
It is for these reasons that we look to the future with confidence and will be preparing to celebrate our
centenary in robust health next year.
In light of the current economic conditions, Boskalis has a preference for distributing dividends entirely or
partly in shares for the next few years. It will therefore be proposed to the Annual General Meeting on
May 14, 2009 that a dividend of € 1.19 per share will be paid in ordinary shares, unless the shareholder opts
for a cash dividend.
Roya l Boska l i s Westmins te r nv 7
As we were putting the finishing touches to this report news reached us that the chairman of the
Supervisory Board, Mr R.M.F. van Loon, was stepping down for health reasons. Since his appointment in
2005 Mr Van Loon has shown a great interest in Boskalis and has been closely involved with the business.
In no time at all, our great company became his company, and he always spoke of it with the most sincere
admiration and pride. In his capacity as chairman Mr Van Loon played a major role in renewing and
strengthening the Supervisory Board. We would like to take this opportunity to express our thanks to
Mr Van Loon for his inspiration and effort.
On behalf of the Board of Management
dr. P.A.M. Berdowski
Cha i rman’s s ta tement
Annua l Repor t 20088
Company pro f i l e
Royal Boskalis Westminster N.V. is a leading global services provider operating in the dredging, maritime
infrastructure and maritime services sectors. We provide creative and innovative all-round solutions to
infrastructural challenges in the maritime, coastal and delta regions of the world. Our operations are
broadly spread across all continents and three market segments, giving the company a stable foundation,
the flexibility to capture a wide range of projects and excellent prospects for balanced growth.
Boskalis’ market segments comprise the oil and gas sector, ports and projects related to land reclamation
and coastal protection. Our main clients in these three market segments include national, regional and
local governments, port operators, international project developers, oil companies, mining companies and
other contractors.
Our main product segment is Dredging & Earthmoving, which includes port development, pipeline
intervention activities, land reclamation, and coastal and riverbank protection.
Our second product segment is Maritime Infrastructure, which Boskalis is involved in through its strategic
partnership with Archirodon, a leading contractor in this sector.
The third product segment is Maritime & Terminal Services, through our strategic partnership with
Lamnalco, one of the world’s leading suppliers of maritime terminal services to the oil and gas industry.
Boskalis’ worldwide spread reaches across all geographic and industrial sectors and demand for the
company’s services is driven by a clear set of global trends: growth in global trade, growing energy
consumption, growth in world population and climate change.
Boskalis is unique in combining strong ‘home market’ positions in various countries with a diverse, global
network of regional market positions, making us both a local and a global competitor. The company has
strong positions in markets across Europe, Australia, Asia, Africa, North and South America and the
Middle East.
Our balance of home market strength with international reach and capacity makes Boskalis one of the
world’s leading dredging and marine contractors, with one of the largest and most technically advanced
fleets. We can provide leading-edge expertise and equipment that is typically not available locally, while
offering the economies of scale and world-class expertise needed to tackle the largest infrastructure
projects and meeting the most stringent safety, health and environmental standards.
Boskalis continually invests in its versatile fleet, which currently consists of over 300 vessels. Including
its share in partnerships, Boskalis has around 10,000 employees and operates in over 50 countries across
five continents. Our experienced professionals are constantly on the lookout for attractive new business
opportunities around the world.
Royal Boskalis Westminster N.V. has been listed on the Amsterdam stock exchange - now NYSE Euronext
Amsterdam - since 1972.
Company Profile
Roya l Boska l i s Westmins te r nv 9
Key deve lopments
Record revenue and net profit
Revenue rose by 12% to € 2,094 million (2007: € 1,869 million).
Net profit rose to € 249.1 million (2007: € 204.4 million). Net profit excluding exceptional items rose
by 15.3% to € 235.7.
Earnings per share € 2.90 (2007: € 2.38).
Strong order book remains well spread
Our contracting policy was once again successful in acquiring projects on all continents and in all the
market segments we serve.
The order book was worth a total of € 3,354 million.
Fleet expansion on track
In April 2008 the Crestway, a 5,600 m³ trailing suction hopper dredger, was launched. We took delivery
of the Crestway at the end of 2008. Her sister ship, Shoreway, was launched in May 2008 and is due for
delivery in the first quarter of 2009. Also construction started on a larger trailing suction hopper dredger
with a capacity of 12,000 m³ and on the rock placement system for our third fallpipe vessel. In addition,
in November we began the process of lengthening our largest hopper the Queen of the Netherlands to
expand her capacity by 50% to 35,500 m³. The Queen of the Netherlands returned to service as a mega
hopper in March 2009.
Extensive market survey validates our Focus, Reinforce & Expand strategy
A detailed global survey of our most important customers and industry experts confirmed that a
growing number of customers in the three market segments in which we operate require an integrated,
multidisciplinary approach. Instead of maintaining a traditional product-oriented approach, Boskalis is
shifting towards a market and value-focused strategy. In doing so, Boskalis will focus on markets with
relatively high growth and earnings potential, and will broaden its portfolio toward higher value-adding
activities.
Acquired stake of over 25% in Smit Internationale N.V.
The interest that Boskalis has expressed in parts of Smit Internationale N.V. ensues from this value-driven
growth strategy. On 15 September 2008 we announced that we were interested in various parts of Smit.
We have since built up a stake of more than 25% in Smit and we have held discussions with the company’s
Management Board and potential partners. To date, these efforts have not resulted in the takeover of the
targeted activities. However, we will explore further possibilities to accomplish this.
Dividend
The dividend policy features a pay-out ratio of 40% to 50%. In the light of the current economic conditions,
Boskalis has a preference for distributing dividends entirely or partly in shares for the next few years. It will
therefore be proposed to the Annual General Meeting on May 14, 2009 that a dividend of € 1.19 per share
will be paid in ordinary shares, unless the shareholder opts for a cash dividend.
Promotion to the AEX index in 2009
The average trading volume of Boskalis shares rose 13% in 2008 to 404,952 shares a day. The value
of shares traded rose by 19% to € 3.30 billion. Also on the back of these higher volumes Boskalis was
promoted to the leading AEX index with effect from March 2009.
Key developments
Annua l Repor t 200810
Strategy: Focus, Reinforce & Expand
Business drivers
St ra tegy : Focus , Re in fo rce & Expand
Introduction
Boskalis’ strategy is aimed at being prepared for some of the most exciting opportunities and challenges
the company has faced as a leader in a global and dynamic market. Boskalis will build its future success
on its current strengths and leadership position in specific market segments.
Boskalis’ Focus, Reinforce & Expand strategy is based on:
• profitable growth in attractive market segments;
• expanding and reinforcing the core business.
Global trends will continue to drive the structural long-term growth of the markets Boskalis operates
in. These trends include: the development of global trade, rising energy consumption and transport of
Liquified Natural Gas (LNG), expanding population pressures and the challenges presented by climate
change.
The three market segments Boskalis operates in - Oil & Gas, Ports, and Land Reclamation & Coastal
Protection - capitalize on these key global trends.
As these global developments will continue to drive the long-term outlook for major new coastal
and marine infrastructure projects, Boskalis is uniquely positioned to continue delivering value to
its shareholders.
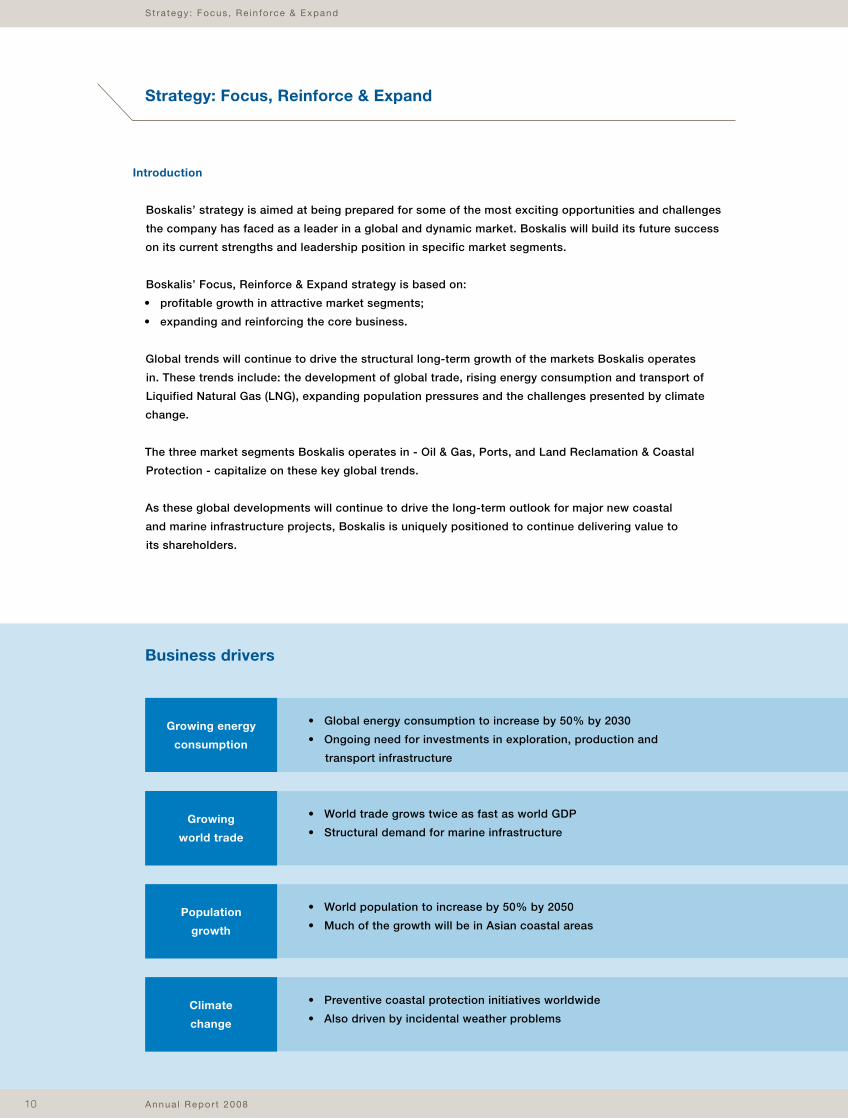
Growing energy
consumption
Growing
world trade
Population
growth
Climate
change
• Global energy consumption to increase by 50% by 2030
• Ongoing need for investments in exploration, production and
transport infrastructure
• World trade grows twice as fast as world GDP
• Structural demand for marine infrastructure
• World population to increase by 50% by 2050
• Much of the growth will be in Asian coastal areas
• Preventive coastal protection initiatives worldwide
• Also driven by incidental weather problems
Roya l Boska l i s Westmins te r nv 11
St ra tegy : Focus , Re in fo rce & Expand
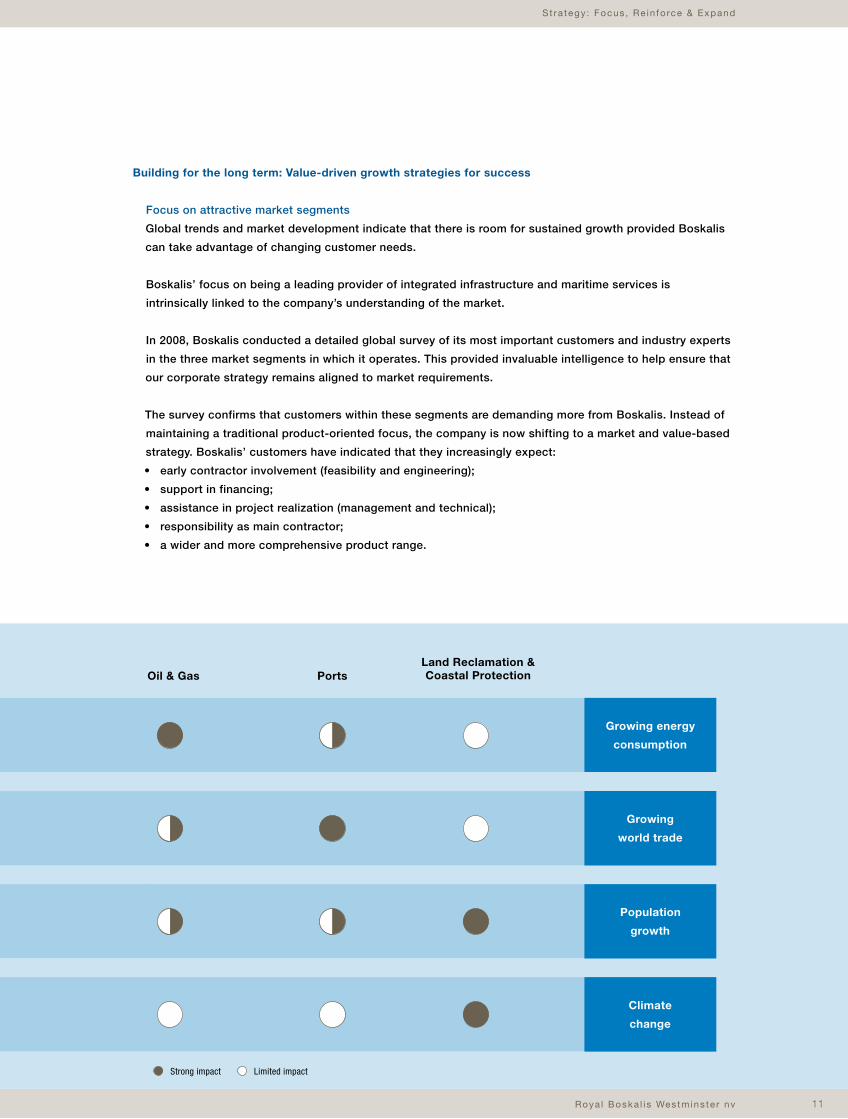
Growing energy
consumption
Growing
world trade
Population
growth
Climate
change
Building for the long term: Value-driven growth strategies for success
Focus on attractive market segments
Global trends and market development indicate that there is room for sustained growth provided Boskalis
can take advantage of changing customer needs.
Boskalis’ focus on being a leading provider of integrated infrastructure and maritime services is
intrinsically linked to the company’s understanding of the market.
In 2008, Boskalis conducted a detailed global survey of its most important customers and industry experts
in the three market segments in which it operates. This provided invaluable intelligence to help ensure that
our corporate strategy remains aligned to market requirements.
The survey confirms that customers within these segments are demanding more from Boskalis. Instead of
maintaining a traditional product-oriented focus, the company is now shifting to a market and value-based
strategy. Boskalis’ customers have indicated that they increasingly expect:
• early contractor involvement (feasibility and engineering);
• support in financing;
• assistance in project realization (management and technical);
• responsibility as main contractor;
• a wider and more comprehensive product range.
Strong impact Limited impact
Oil & Gas PortsLand Reclamation & Coastal Protection
Annua l Repor t 200812
St ra tegy : Focus , Re in fo rce & Expand
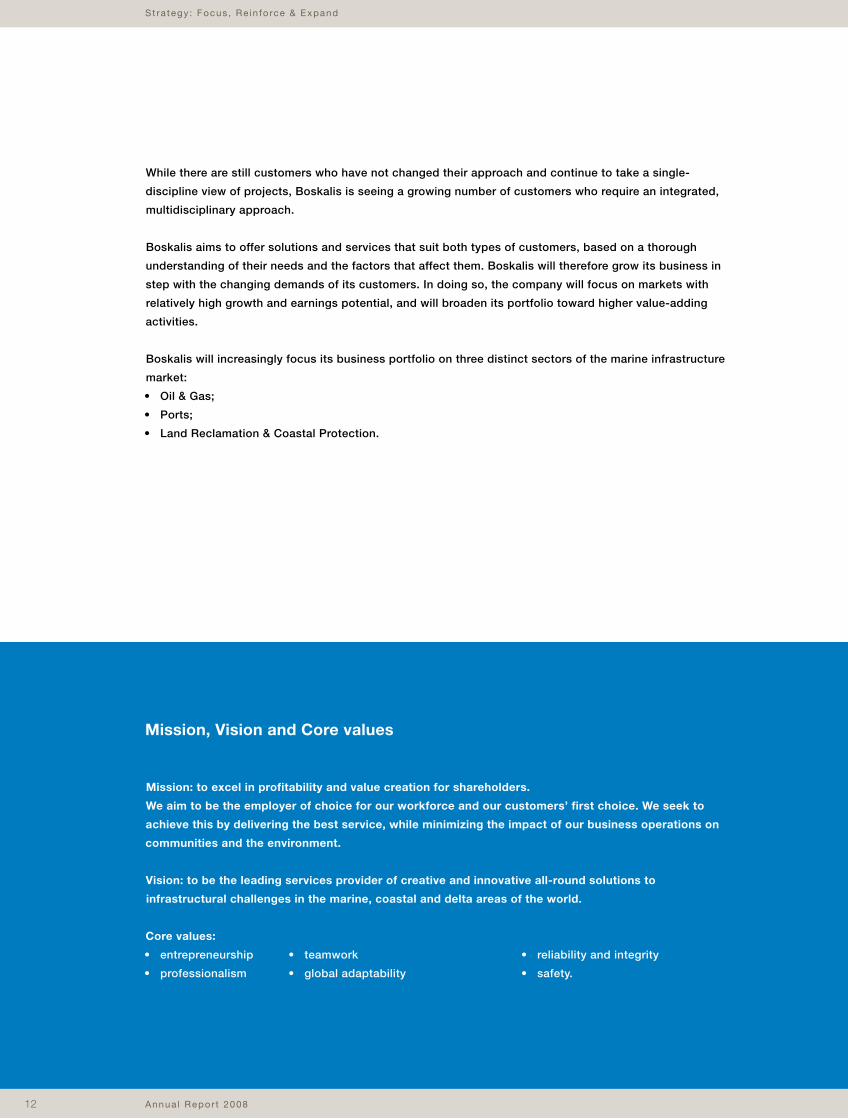
Mission: to excel in profitability and value creation for shareholders.
We aim to be the employer of choice for our workforce and our customers’ first choice. We seek to
achieve this by delivering the best service, while minimizing the impact of our business operations on
communities and the environment.
Vision: to be the leading services provider of creative and innovative all-round solutions to
infrastructural challenges in the marine, coastal and delta areas of the world.
Core values:
• entrepreneurship
• professionalism
• teamwork
• global adaptability
• reliability and integrity
• safety.
While there are still customers who have not changed their approach and continue to take a single-
discipline view of projects, Boskalis is seeing a growing number of customers who require an integrated,
multidisciplinary approach.
Boskalis aims to offer solutions and services that suit both types of customers, based on a thorough
understanding of their needs and the factors that affect them. Boskalis will therefore grow its business in
step with the changing demands of its customers. In doing so, the company will focus on markets with
relatively high growth and earnings potential, and will broaden its portfolio toward higher value-adding
activities.
Boskalis will increasingly focus its business portfolio on three distinct sectors of the marine infrastructure
market:
• Oil & Gas;
• Ports;
• Land Reclamation & Coastal Protection.
Mission, Vision and Core values
Roya l Boska l i s Westmins te r nv 13
St ra tegy : Focus , Re in fo rce & Expand
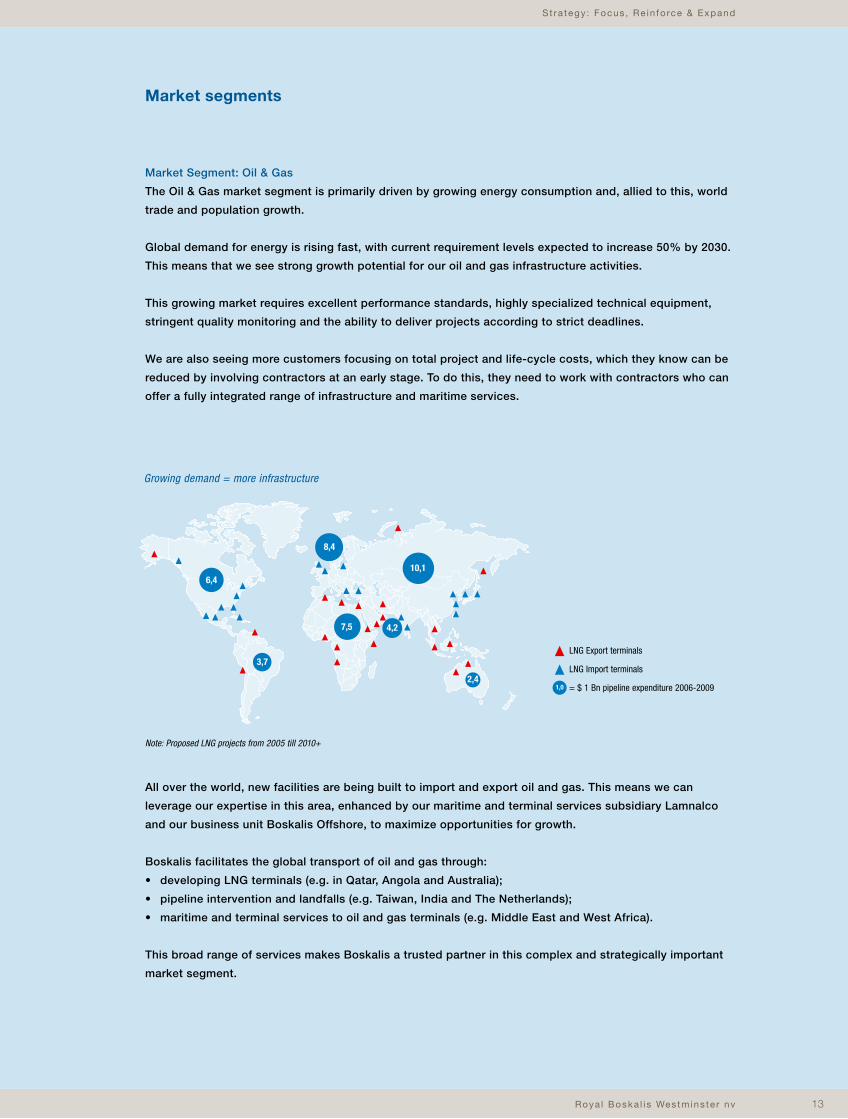
Market Segment: Oil & Gas
The Oil & Gas market segment is primarily driven by growing energy consumption and, allied to this, world
trade and population growth.
Global demand for energy is rising fast, with current requirement levels expected to increase 50% by 2030.
This means that we see strong growth potential for our oil and gas infrastructure activities.
This growing market requires excellent performance standards, highly specialized technical equipment,
stringent quality monitoring and the ability to deliver projects according to strict deadlines.
We are also seeing more customers focusing on total project and life-cycle costs, which they know can be
reduced by involving contractors at an early stage. To do this, they need to work with contractors who can
offer a fully integrated range of infrastructure and maritime services.
All over the world, new facilities are being built to import and export oil and gas. This means we can
leverage our expertise in this area, enhanced by our maritime and terminal services subsidiary Lamnalco
and our business unit Boskalis Offshore, to maximize opportunities for growth.
Boskalis facilitates the global transport of oil and gas through:
• developing LNG terminals (e.g. in Qatar, Angola and Australia);
• pipeline intervention and landfalls (e.g. Taiwan, India and The Netherlands);
• maritime and terminal services to oil and gas terminals (e.g. Middle East and West Africa).
This broad range of services makes Boskalis a trusted partner in this complex and strategically important
market segment.
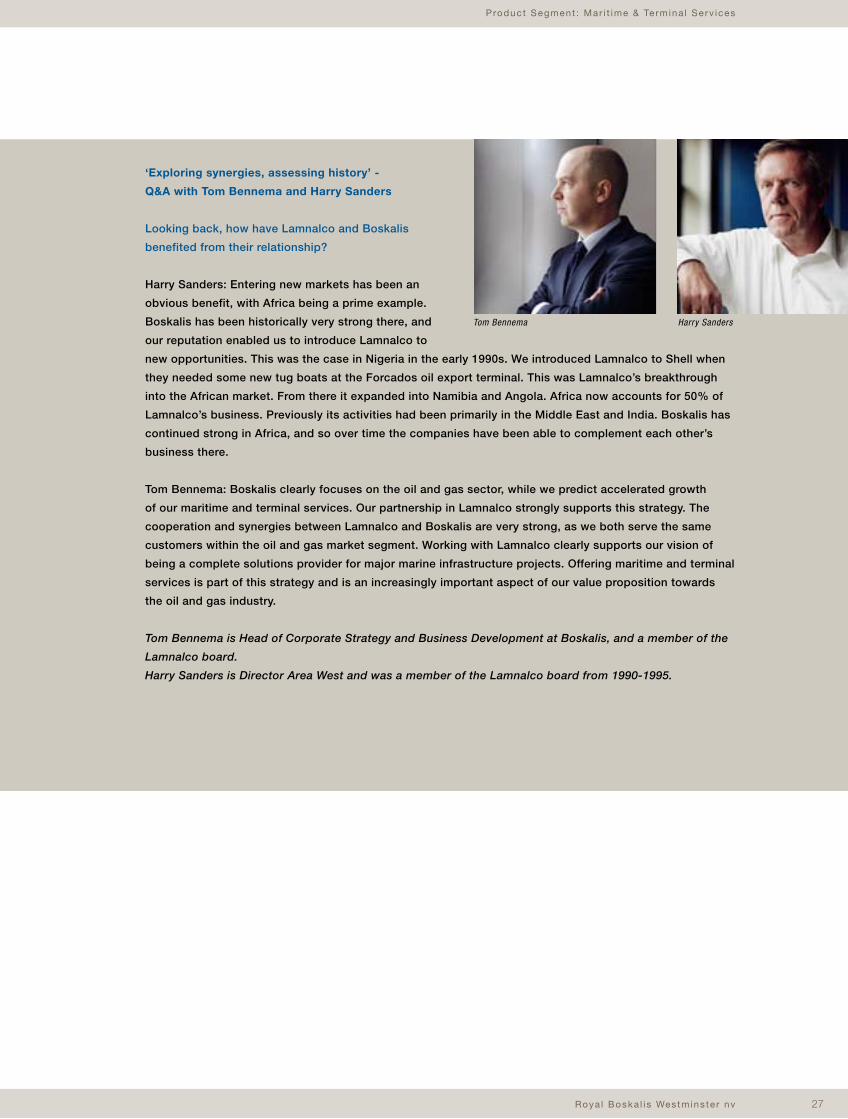
Growing demand = more infrastructure
Note: Proposed LNG projects from 2005 till 2010+
LNG Export terminals
LNG Import terminals
= $ 1 Bn pipeline expenditure 2006-2009
6,4
7,5
10,1
4,2
3,7
2,4
8,4
Market segments
Annua l Repor t 200814
St ra tegy : Focus , Re in fo rce & Expand
Market Segment: Ports
The need for and growth of ports is driven by the trade flows resulting from the growing demand for energy
and population growth.
Although the short-term outlook for world trade weakened in 2008/9, the underlying long-term
fundamentals for continued growth in global port capacity remain positive.
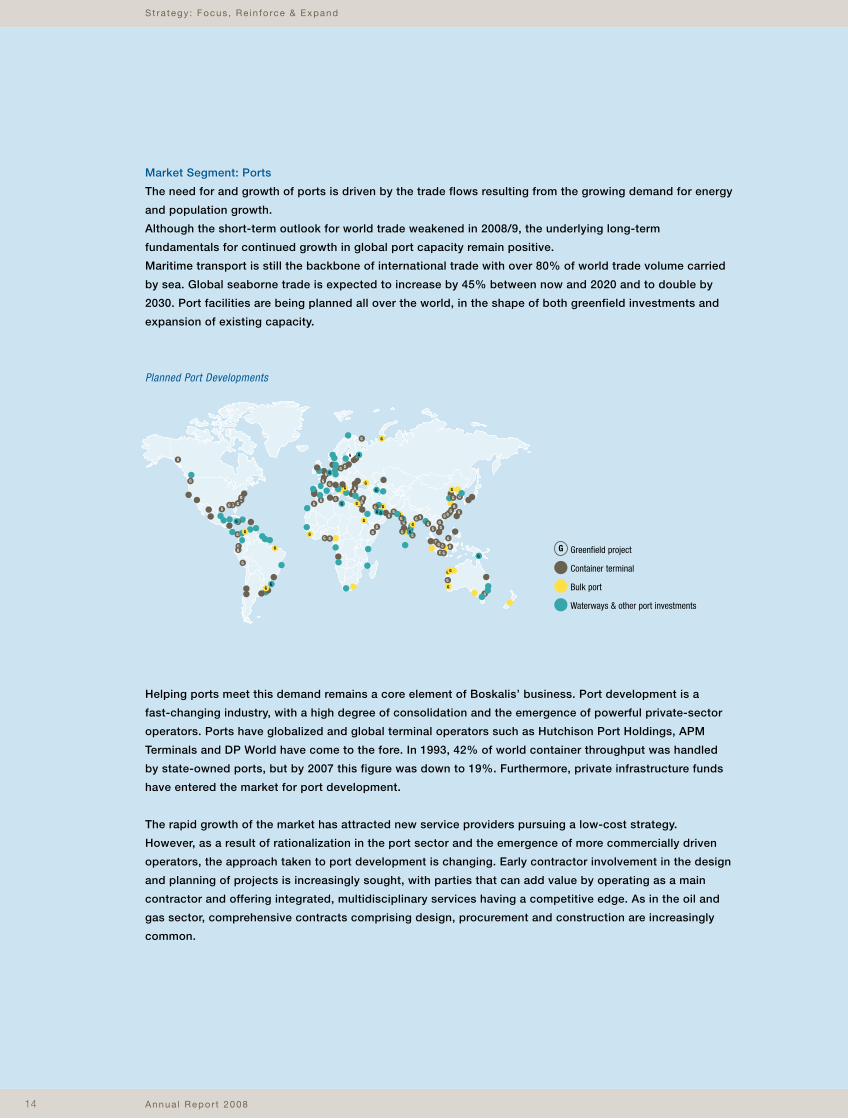
Maritime transport is still the backbone of international trade with over 80% of world trade volume carried
by sea. Global seaborne trade is expected to increase by 45% between now and 2020 and to double by
2030. Port facilities are being planned all over the world, in the shape of both greenfield investments and
expansion of existing capacity.
Helping ports meet this demand remains a core element of Boskalis’ business. Port development is a
fast-changing industry, with a high degree of consolidation and the emergence of powerful private-sector
operators. Ports have globalized and global terminal operators such as Hutchison Port Holdings, APM
Terminals and DP World have come to the fore. In 1993, 42% of world container throughput was handled
by state-owned ports, but by 2007 this figure was down to 19%. Furthermore, private infrastructure funds
have entered the market for port development.
The rapid growth of the market has attracted new service providers pursuing a low-cost strategy.
However, as a result of rationalization in the port sector and the emergence of more commercially driven
operators, the approach taken to port development is changing. Early contractor involvement in the design
and planning of projects is increasingly sought, with parties that can add value by operating as a main
contractor and offering integrated, multidisciplinary services having a competitive edge. As in the oil and
gas sector, comprehensive contracts comprising design, procurement and construction are increasingly
common.
G
G
G
G
G
G
G
G
G
G
G GG
G
G
G
G
G
G
G
G
G
G
G
G
G
G
GGG
G
GG
G
G
G
G
G
G
GG
G
G G
G
G
G
G
G
G
G
G
G
G
G
G
G
G
GG GG
G
G
G
G
GG
G
G
G
G
G
G
GGG
GG G
G
GG
G
G
G
G
Planned Port Developments
Greenfield project
Container terminal
Bulk port
Waterways & other port investments
Roya l Boska l i s Westmins te r nv 15
St ra tegy : Focus , Re in fo rce & Expand
Boskalis has responded successfully to this changing demand, in projects such as Maasvlakte 2 in
The Netherlands and Khalifa Port in Abu Dhabi (U.A.E.). Examples of the many services that Boskalis is
able to offer its customers in port development projects include: dredging, land reclamation, construction
of breakwaters, quay walls, jetties and bridges. The expertise and know-how of our in-house engineering
unit Hydronamic and our partner Archirodon are crucial in this type of project.
Market Segment: Land Reclamation & Coastal Protection
A fundamental long-term trend in the world today is the rapid population and economic growth occurring
in coastal urban areas - particularly in Asia.
The United Nations predict that 93% of the world’s total population growth will occur in the urban areas of
less developed regions, most notably in China, India and Africa. Much of this growth will be in coastal areas.
But rapid growth is also occurring in coastal areas of more developed regions, such as the Gulf States,
Japan, Hong Kong and Singapore.
All of these areas need to expand and develop their infrastructure, for industrial, recreational and
residential purposes. In many cases, especially in areas that have reached their natural capacity, new
land is needed.
One way to increase capacity is to reclaim land from the sea. Where land is scarce, such as in Hong Kong
and Singapore, airports, container ports and chemical terminals have been built on reclaimed land. Even in
greenfield projects where overcrowding is not a factor, reclaimed land is often an attractive alternative.
As coastal areas become more developed and economically important, the need to protect them from the
effects of climate change intensifies. The growing incidence of extreme weather conditions around the
world is placing an increasing emphasis on protecting coastal areas from rising sea levels and natural
disasters such as hurricanes and tsunamis. These factors require investment in sophisticated and large-
scale sea defenses - another area in which Boskalis has extensive expertise.
Annua l Repor t 200816
St ra tegy : Focus , Re in fo rce & Expand
Reinforcing and expanding our core business
Boskalis will focus on markets with higher growth and earnings potential, broadening its portfolio toward
higher value-adding activities via organic growth, performance improvement and selective contracting.
Boskalis is well positioned to take advantage of changing customer demands. The company’s strategic
opportunities lie in developing a complete service offering. This requires a strategy aimed at reinforcing
its core business and expanding associated disciplines.
Key elements in Boskalis’ strategy are:
• Reinforcing the core:
- build on the company’s leadership position;
- improve the competitive position of its core activities.
• Expanding the core:
- expand engineering and marine civil engineering activities;
- accelerate growth of maritime and terminal services.
Acquisitions and alliances provide additional opportunities for taking Boskalis to the next level.
Boskalis has the capacity for investments and acquisitions thanks to its stable, sound financial policy,
robust financing structure and strong operational cash flow.
Building for the short term
While being guided by this roadmap of long-term fundamentals, Boskalis also needs to be proactive and
flexible to deal with short-term market factors.
The capital expenditure program the company has embarked upon is designed to ensure it has the right
capacity to meet specific market demand. In the current challenging market conditions Boskalis believes
that it is of crucial importance to have the right vessels in the right place at the right time.
It is also essential that Boskalis continues to optimize its combination of global strength with local
expertise through its home markets.
Conclusion
Looking ahead, Boskalis is confident that its strategy will enable it to expand its business, increase its
ability to take on a wide variety of projects and maintain its long-term profitability.
Roya l Boska l i s Westmins te r nv 17
St ra teg ie : Waardegedreven g roe i : Focus & Expans ie
Annua l Repor t 200818
Product Segment : Dredg ing & Ear thmov ing
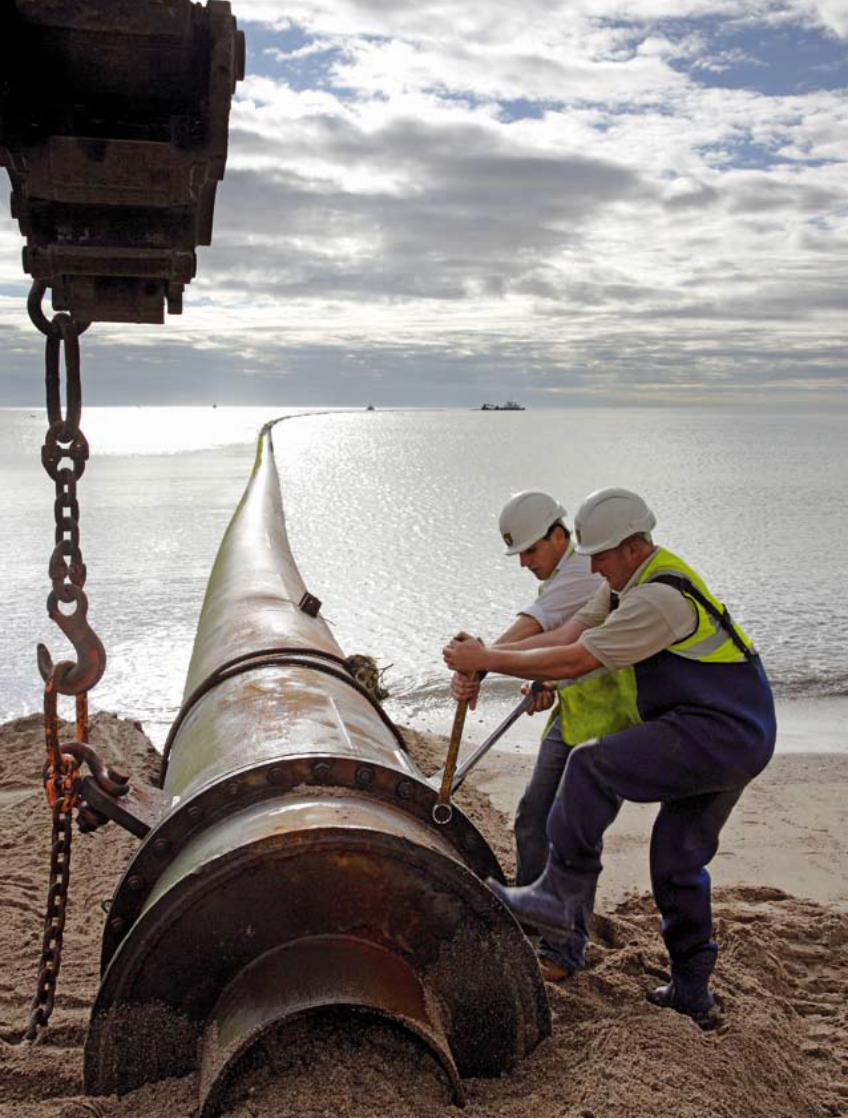
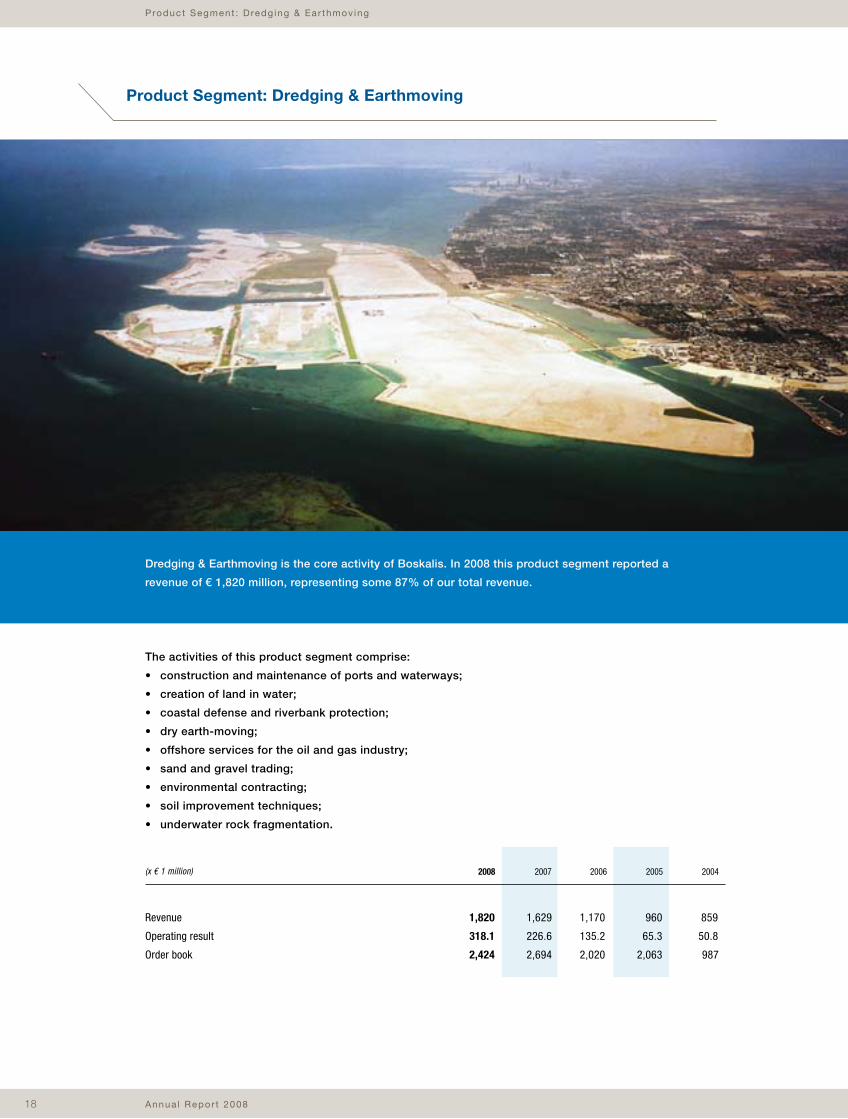
Dredging & Earthmoving is the core activity of Boskalis. In 2008 this product segment reported a
revenue of € 1,820 million, representing some 87% of our total revenue.
Product Segment: Dredging & Earthmoving
The activities of this product segment comprise:
• construction and maintenance of ports and waterways;
• creation of land in water;
• coastal defense and riverbank protection;
• dry earth-moving;
• offshore services for the oil and gas industry;
• sand and gravel trading;
• environmental contracting;
• soil improvement techniques;
• underwater rock fragmentation.
1,820 1,629 1,170 960 859
318.1 226.6 135.2 65.3 50.8
2,424 2,694 2,020 2,063 987
20072008 2006 2005 2004
Revenue
Operating result
Order book
(x € 1 million)
Roya l Boska l i s Westmins te r nv 19
Our dredging and earthmoving activities are closely linked to all three of our market segments: Oil & Gas,
Ports, and Land Reclamation & Coastal Protection.
A world leader
The international dredging and earthmoving market distinguishes between the ‘open markets’, where
international companies compete for contracts, and ‘closed’ markets, where dredging work is primarily
performed by local private or state-owned companies and regulatory or political barriers often restrict
access for international contractors.
Boskalis is a leading global player in the open markets, which generate an annual revenue of approximately
€ 7-9 billion. These markets are served by four European dredging companies, who together account for
70-80% of revenue. Boskalis is one of these, with an estimated share of the open markets of around 20%.
The remaining 20-30% of ‘free revenue’ is achieved by a wide range of smaller regional and local players.
The extensive deregulation of global trade over the past decade has resulted in more dredging contracts
being put to tender in the open market. Large professional dredging and maritime contractors such as
Boskalis are benefiting thanks to their ability to offer economies of scale and a high degree of efficiency.
Segmentation
The dredging and earthmoving services are subdivided into:
Home markets, which are characterized by a permanent presence and frequently have their own equipment
locally. We hold home-market positions in Europe (the Netherlands, United Kingdom, Germany, Nordic
countries) and outside Europe (Mexico, Nigeria).
International projects, whereby we set up an organization around a specific project which is subsequently
dismantled upon completion. Projects are equipped and manned from our central fleet and staff pools.
In certain countries we have managed to secure a steady stream of international projects and therefore
hold a well-established position. These countries, including for example Bahrain and Australia, share certain
home market characteristics.
Specialist niche services, which are supplied by companies including:
Boskalis Offshore B.V. (www.boskalis.com)
Specialized in offshore earthmoving for the oil and gas industry. Activities include deep-water dredging,
trenching, rock and sand placement, and other intervention work.
Boskalis Dolman B.V. (www.boskalisdolman.nl)
Specialized in processing and handling mineral waste and soil and waterbed remediation.
Product Segment : Dredg ing & Ear thmov ing
Annua l Repor t 200820
Product Segment : Dredg ing & Ear thmov ing
Cofra B.V. (www.cofra.nl)
Specialized in the use of geosynthetics for civil engineering and soil improvement.
Rock Fall Ltd (www.rock-fall.co.uk)
Specialized in underwater rock fragmentation, including drilling, blasting and explosives engineering.
Barriers to entry
The Dredging & Earthmoving product segment has high entry barriers, with any company aiming
to compete with the world’s largest operators needing to match them in scale, flexibility of fleet,
professionalism of staff, innovative drive, cost leadership and financial strength.
What sets us apart
Being one of the largest players is not enough on its own. We strive to distinguish ourselves in key areas.
We have a clear edge in several of these:
Home Market strength. Some 24% of our revenue is achieved in our home markets, where our fixed
presence, local employees and locally based equipment ensure a steady flow of contracts and, in certain
cases, provide us with a unique competitive position.
Balanced and diverse portfolio. Our structure allows us to balance our global reach and leadership with
local strength and continuity. Our contracting policy is geared to achieving a good geographical spread of
services, and our broad range of services meets a wide range of client needs.
Market focus. We conduct detailed market research to understand shifts in the demands of our customers
and we adjust our services accordingly. By listening to their changing needs, we become involved in
projects at an earlier stage and are considered a trusted and experienced partner.
Industry-leading expertise. We aim for the highest levels of professionalism and managerial and technical
expertise and invest in achieving them. We attract the best people and train them to the highest levels
in order to retain our leadership in this product segment. We are also renowned for our highly innovative
approach to and expert knowledge of environmentally-friendly dredging solutions, and our commitment to
meeting the highest standards of safety, health, environment and quality assurance is second to none.
These factors have helped us build a unique competitive position as an international maritime and dredging
contractor, with the right knowledge and ability to tackle the most complex projects.
Roya l Boska l i s Westmins te r nv 21
Product Segment : Mar i t ime In f ras t ruc tu re
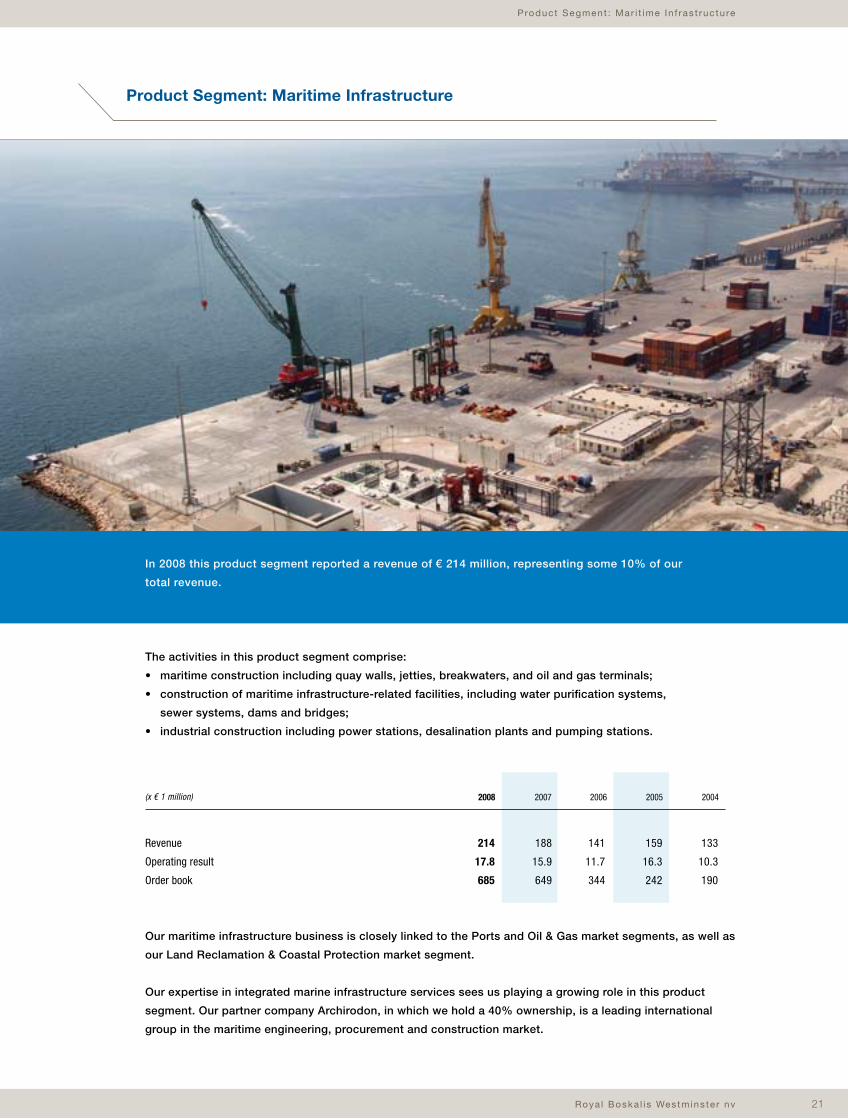
In 2008 this product segment reported a revenue of € 214 million, representing some 10% of our
total revenue.
Product Segment: Maritime Infrastructure
The activities in this product segment comprise:
• maritime construction including quay walls, jetties, breakwaters, and oil and gas terminals;
• construction of maritime infrastructure-related facilities, including water purification systems,
sewer systems, dams and bridges;
• industrial construction including power stations, desalination plants and pumping stations.
Our maritime infrastructure business is closely linked to the Ports and Oil & Gas market segments, as well as
our Land Reclamation & Coastal Protection market segment.
Our expertise in integrated marine infrastructure services sees us playing a growing role in this product
segment. Our partner company Archirodon, in which we hold a 40% ownership, is a leading international
group in the maritime engineering, procurement and construction market.
214 188 141 159 133
17.8 15.9 11.7 16.3 10.3
685 649 344 242 190
20072008 2006 2005 2004
Revenue
Operating result
Order book
(x € 1 million)
Annua l Repor t 200822
Product Segment : Mar i t ime In f ras t ruc tu re
Archirodon’s strength
Established almost fifty years ago, Archirodon has extensive expertise in the area of engineering and
construction, and an excellent track record on complex, multidisciplinary projects. Alongside its
operations in the maritime and offshore segments, Archirodon is an all-round player in the markets for
civil infrastructure and industrial facilities.
The company focuses mainly on the Middle East and North Africa. The population of the countries in the
Gulf Cooperation Council has doubled in the last 20 years and this development calls for a very wide
range of infrastructure projects, particularly those aimed at expediting trade through the region’s maritime
gateways. Growth in this market is being fuelled by the region’s continued strength in the world energy
markets, but also by widespread efforts in the Gulf region to reduce dependence on oil and gas revenues.
Areas of expertise
Archirodon has a selective contracting policy. The company focuses specifically on its own areas of
expertise and on clients with whom it has longstanding relationships. Like Boskalis, Archirodon has
renowned in-house engineering capabilities which help the company create innovative solutions for
customer needs and meet their requirements in full.
Archirodon is involved in many landmark projects throughout the Middle East and North Africa. In the
maritime infrastructure sector, the company has been responsible for the construction of various ports,
container terminals, berths, oil and gas terminals, piers and jetties.
The company currently employs more than 10,000 people and has a network of offices and branches in the
Middle East and other regions. High productivity and quality work are achieved by combining these human
resources with large, carefully maintained modern equipment, including dredgers, floating cranes, barges,
tugs, jack-up platforms, pipe-laying machines, geotechnical equipment and land-based machinery.
Three central facility yards in Jeddah (Saudi Arabia), Ajman (U.A.E.) and Cyprus provide production facilities
as well as carrying out maintenance and repairs on the heavy equipment.
Synergies
The strong and established position of Archirodon in the Middle East and ongoing infrastructure investments
in the region mean that the outlook for the company is healthy. Even though Archirodon and Boskalis
operate independently in the market, there are many examples of successful cooperation between the two
on complex infrastructure projects, where their combined, complementary maritime strengths gave them a
competitive edge.
Roya l Boska l i s Westmins te r nv 23
Product Segment : Mar i t ime In f ras t ruc tu re
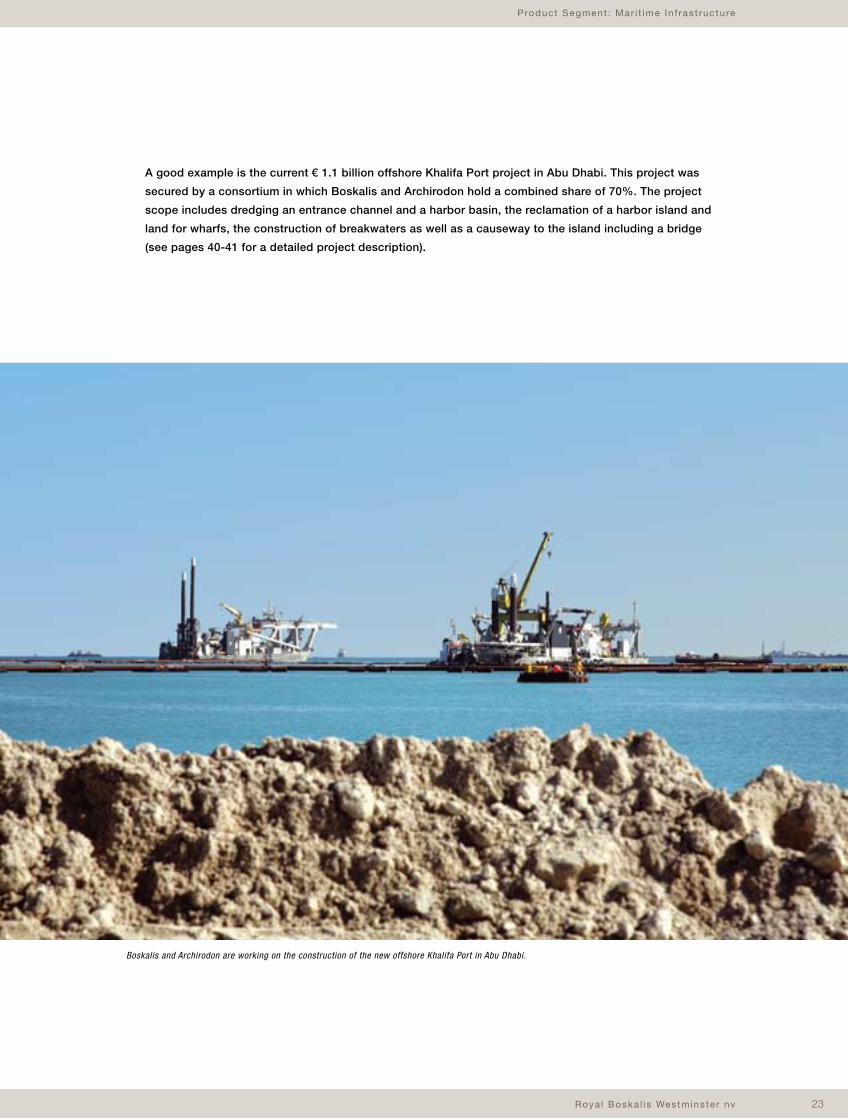
A good example is the current € 1.1 billion offshore Khalifa Port project in Abu Dhabi. This project was
secured by a consortium in which Boskalis and Archirodon hold a combined share of 70%. The project
scope includes dredging an entrance channel and a harbor basin, the reclamation of a harbor island and
land for wharfs, the construction of breakwaters as well as a causeway to the island including a bridge
(see pages 40-41 for a detailed project description).
Boskalis and Archirodon are working on the construction of the new offshore Khalifa Port in Abu Dhabi.
Annua l Repor t 200824
Product Segment : Mar i t ime & Termina l Serv ices
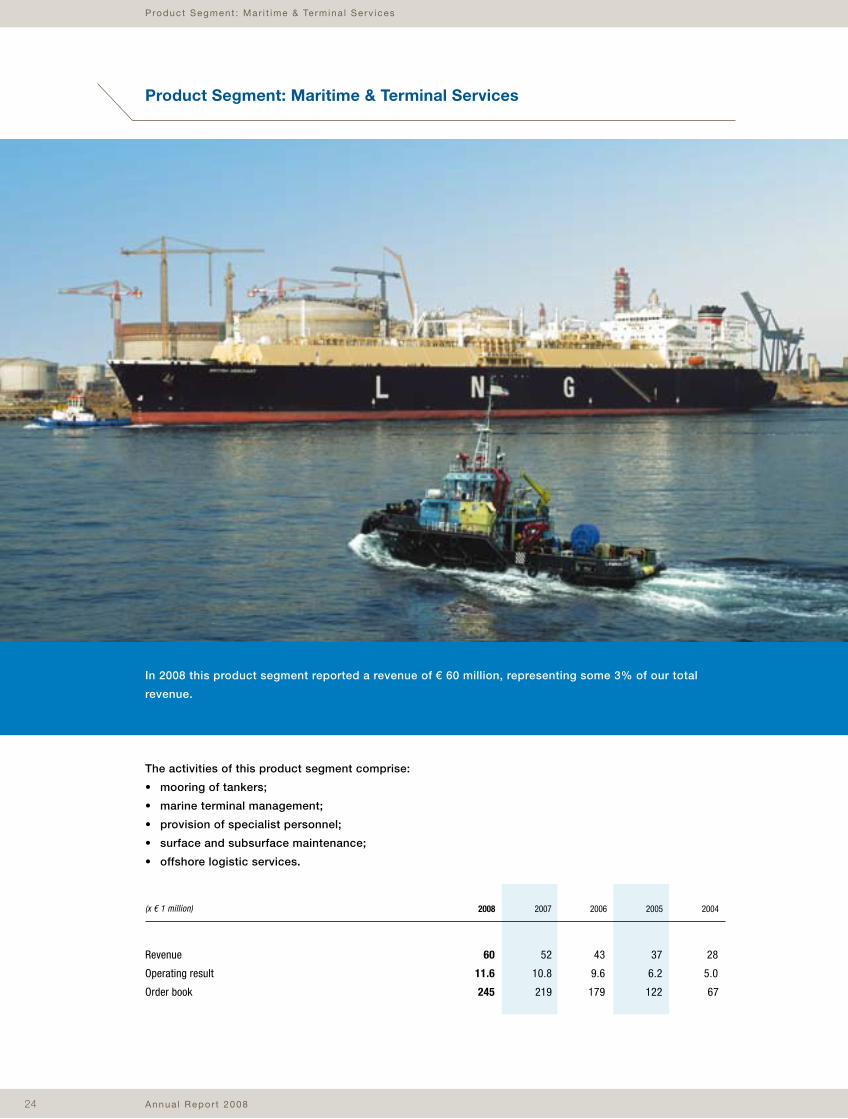
In 2008 this product segment reported a revenue of € 60 million, representing some 3% of our total
revenue.
Product Segment: Maritime & Terminal Services
The activities of this product segment comprise:
• mooring of tankers;
• marine terminal management;
• provision of specialist personnel;
• surface and subsurface maintenance;
• offshore logistic services.
60 52 43 37 28
11.6 10.8 9.6 6.2 5.0
245 219 179 122 67
20072008 2006 2005 2004
Revenue
Operating result
Order book
(x € 1 million)
Roya l Boska l i s Westmins te r nv 25
The maritime and terminal services market is closely linked to our Oil & Gas market segment. This segment
is characterized by strong growth, primarily driven by the rise in global demand for energy, and LNG in
particular.
LNG-exporting countries such as Russia, Iran, Qatar, Saudi Arabia and Angola are developing and
expanding their ports and planning new onshore and offshore export terminals. Importing countries in Asia,
Europe and the Americas also have plans for new facilities.
Thanks to our expertise in integrated marine infrastructure services Boskalis is playing a growing role
in this segment. Our partner company Lamnalco, in which we hold a 50% share, is a leader in the fast-
growing market for maritime services to oil and gas terminals. Together we are well positioned to benefit
throughout the value chain from this growing demand.
Lamnalco’s strength
Established in 1963, Lamnalco provides specialized equipment and support to oil and gas terminals and
ports around the world.
With its head office in Sharjah (U.A.E.) and branch offices in 13 countries, Lamnalco operates on an
international scale, holding particularly strong positions in the Middle East and West Africa. Since its
establishment, a key aspect of Lamnalco’s strategy has been to develop long-term partnerships (between
5 and 20 years) with its clients and with the communities in which it operates. Another important part of
Lamnalco’s corporate philosophy is to collaborate with a range of local companies.
Areas of expertise
The services provided by Lamnalco include:
• berthing / unberthing of LNG, Liquified Petroleum Gas (LPG), crude and product tankers calling at
jetties and Floating (Production) Storage and Offloading (FPSO/FSO) systems;
• marine terminal management services and traffic scheduling;
• provision of specialist personnel: pilots, mooring masters, dive maintenance teams and site
superintendents;
• surface and subsurface maintenance operations at jetties and Catenary Anchor Leg Mooring
(CALM buoys;
• provision of logistics and supply bases to support offshore operations on remote terminal locations.
This growing market requires excellent performance standards, highly specialized technical equipment and
stringent quality monitoring - all of which Lamnalco successfully provides through the development and
application of its comprehensive Operations Management System (OMS). The OMS is subject to external
verification by the Classification Society and incorporates the highest international standards for quality
(ISO 9000), safety (IMO International Safety Management Code), environmental protection (ISO 14000) and
offshore operations (IMCA).
Product Segment : Mar i t ime & Termina l Serv ices
Annua l Repor t 200826
Product Segment : Mar i t ime & Termina l Serv ices
To meet its customers’ specific requirements, Lamnalco continually invests in designing innovative vessels
that are used for long-term service contracts. This ability to offer bespoke services further strengthens
Lamnalco’s reputation and unique market position.
To ensure the safe and efficient transport of customers’ cargoes, Lamnalco provides highly skilled marine
pilots, tug crews and maintenance teams. Lamnalco is also committed to the ongoing training of its staff.
By focusing on the development of its employees, Lamnalco ensures the highest standards of operations
are maintained. The recent installation of a full mission-training simulator at the Sharjah headquarters is the
latest development in this respect.
These experienced personnel are equipped with the most modern fleet of marine equipment in the
industry, consisting of 75 vessels with an average age of only four years. In 2008, Lamnalco’s new build
program consisted of 13 vessels, including five M-Class offshore support vessels and four terminal tugs.
Two of Lamnalco’s M-Class vessels are on a long-term contract (starting 2008) providing FPSO support
to Total in Angola. The four tugs will be deployed in the Yemen LNG terminal that starts operations in
early 2009.
The fleet handles over 10,000 movements a year, in locations ranging from the Dalia Floating Production
facility 135 km off the coast of Angola, to the historic Red Sea Port of Aqaba. The majority of the fleet are
sophisticated and highly maneuverable terminal support vessels ranging in size from 25 tonnes bollard pull
to 95 tonnes bollard pull. An in-house technical team of engineers and project managers develops new
vessel designs and manages the ongoing fleet development program, ensuring Lamnalco remains at the
forefront of its market.
Synergies
The growth in energy markets promises to generate a lot of work for both Lamnalco and Boskalis in the
years ahead. Our partnership with Lamnalco enables us to offer a wide-range of maritime and terminal
services to our customers in the oil and gas sector. Our ability to offer a complete solution to the
infrastructure challenges faced by our clients in the oil and gas industry is a unique value proposition.
The two companies benefit from shared expertise in the oil and gas sector and an ability to leverage
synergies between their operations. Although they operate in different phases of the energy sector supply
chain, Boskalis and Lamnalco can share intelligence and business networks and so open up early leads for
opportunities in new locations and regions.
Roya l Boska l i s Westmins te r nv 27
Product Segment : Mar i t ime & Termina l Serv ices
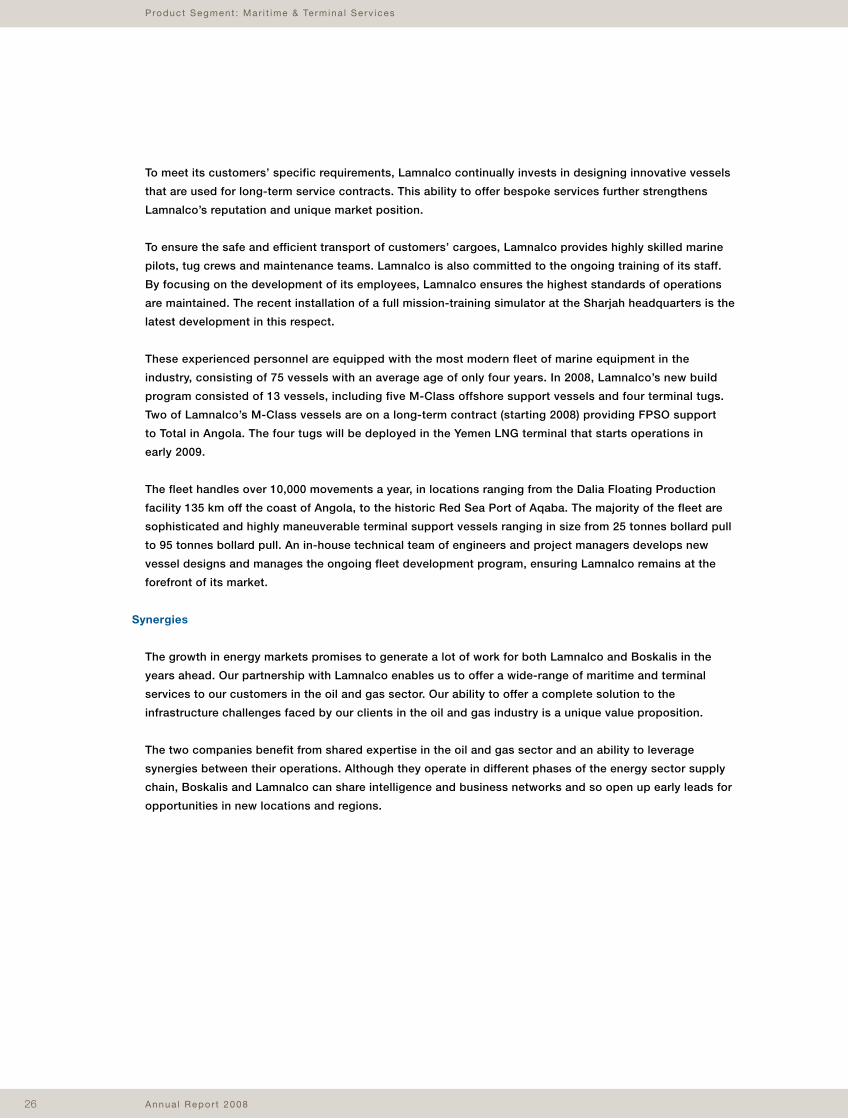
‘Exploring synergies, assessing history’ -
Q&A with Tom Bennema and Harry Sanders
Looking back, how have Lamnalco and Boskalis
benefited from their relationship?
Harry Sanders: Entering new markets has been an
obvious benefit, with Africa being a prime example.
Boskalis has been historically very strong there, and
our reputation enabled us to introduce Lamnalco to
new opportunities. This was the case in Nigeria in the early 1990s. We introduced Lamnalco to Shell when
they needed some new tug boats at the Forcados oil export terminal. This was Lamnalco’s breakthrough
into the African market. From there it expanded into Namibia and Angola. Africa now accounts for 50% of
Lamnalco’s business. Previously its activities had been primarily in the Middle East and India. Boskalis has
continued strong in Africa, and so over time the companies have been able to complement each other’s
business there.
Tom Bennema: Boskalis clearly focuses on the oil and gas sector, while we predict accelerated growth
of our maritime and terminal services. Our partnership in Lamnalco strongly supports this strategy. The
cooperation and synergies between Lamnalco and Boskalis are very strong, as we both serve the same
customers within the oil and gas market segment. Working with Lamnalco clearly supports our vision of
being a complete solutions provider for major marine infrastructure projects. Offering maritime and terminal
services is part of this strategy and is an increasingly important aspect of our value proposition towards
the oil and gas industry.
Tom Bennema is Head of Corporate Strategy and Business Development at Boskalis, and a member of the
Lamnalco board.
Harry Sanders is Director Area West and was a member of the Lamnalco board from 1990-1995.
Tom Bennema Harry Sanders
28
Market Segment: Oil & Gas
Annua l Repor t 2008
Marke t Segment : O i l & Gas
We will increasingly focus our business portfolio on three distinct segments of the marine infrastructure
market. The Oil & Gas market segment is primarily driven by growing global energy consumption and,
allied to this, growing world trade and global population growth.
Global demand for energy is rising fast, with current requirement levels expected to increase 50%
by 2030. This means that we see strong growth potential in the medium to long term in the Oil & Gas
market segment.
In all, 40% of our corporate revenue is generated by projects related to the energy sector and we
expect the importance of this segment to increase. Our expertise in this area, enhanced by our offshore
dredging know-how, the maritime and terminal services of our partner company Lamnalco, and our marine
infrastructure partner company Archirodon, is helping us maximize opportunities for growth.
We facilitate the transport of oil and gas in a number of ways:
• Our dredging expertise is helping to reclaim land for the construction of LNG plants on the shoreline,
and also to create the access channels and quays needed to accommodate ever larger LNG carriers.
Our projects in Qatar (Ras Laffan) and Angola (Soyo) are recent examples of our involvement in
LNG terminal development.
• Offshore ‘earthmoving’, i.e. deep-water dredging, trenching, rock and sand placement, and other
pipeline, platform and wellhead interventions (e.g. Taiwan, India, The Netherlands).
• Maritime and terminal services to oil and gas terminals to cater for the increased demand for
landside LNG export terminals such as the LNG export terminal for Total in Yemen, and increased
FPSO activities.
Growing demand = more infrastructure
LNG Export terminals
LNG Import terminals
= $ 1 Bn pipeline expenditure 2006-2009
6,4
7,5
10,1
4,2
3,7
2,4
8,4
Note: Proposed LNG projects from 2005 till 2010+
29Roya l Boska l i s Westmins te r nv
Marke t Segment : O i l & Gas
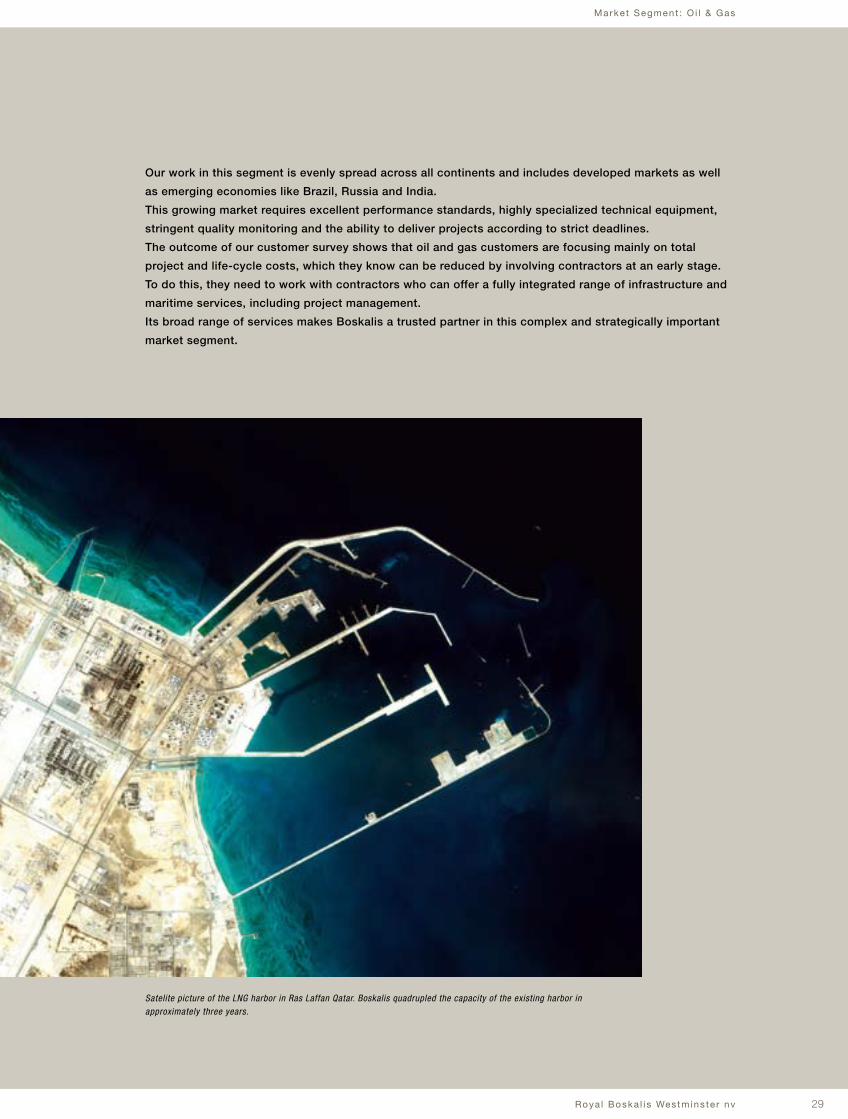
Our work in this segment is evenly spread across all continents and includes developed markets as well
as emerging economies like Brazil, Russia and India.
This growing market requires excellent performance standards, highly specialized technical equipment,
stringent quality monitoring and the ability to deliver projects according to strict deadlines.
The outcome of our customer survey shows that oil and gas customers are focusing mainly on total
project and life-cycle costs, which they know can be reduced by involving contractors at an early stage.
To do this, they need to work with contractors who can offer a fully integrated range of infrastructure and
maritime services, including project management.
Its broad range of services makes Boskalis a trusted partner in this complex and strategically important
market segment.
Satelite picture of the LNG harbor in Ras Laffan Qatar. Boskalis quadrupled the capacity of the existing harbor in approximately three years.
30 Annua l Repor t 2008
Marke t Segment : O i l & Gas
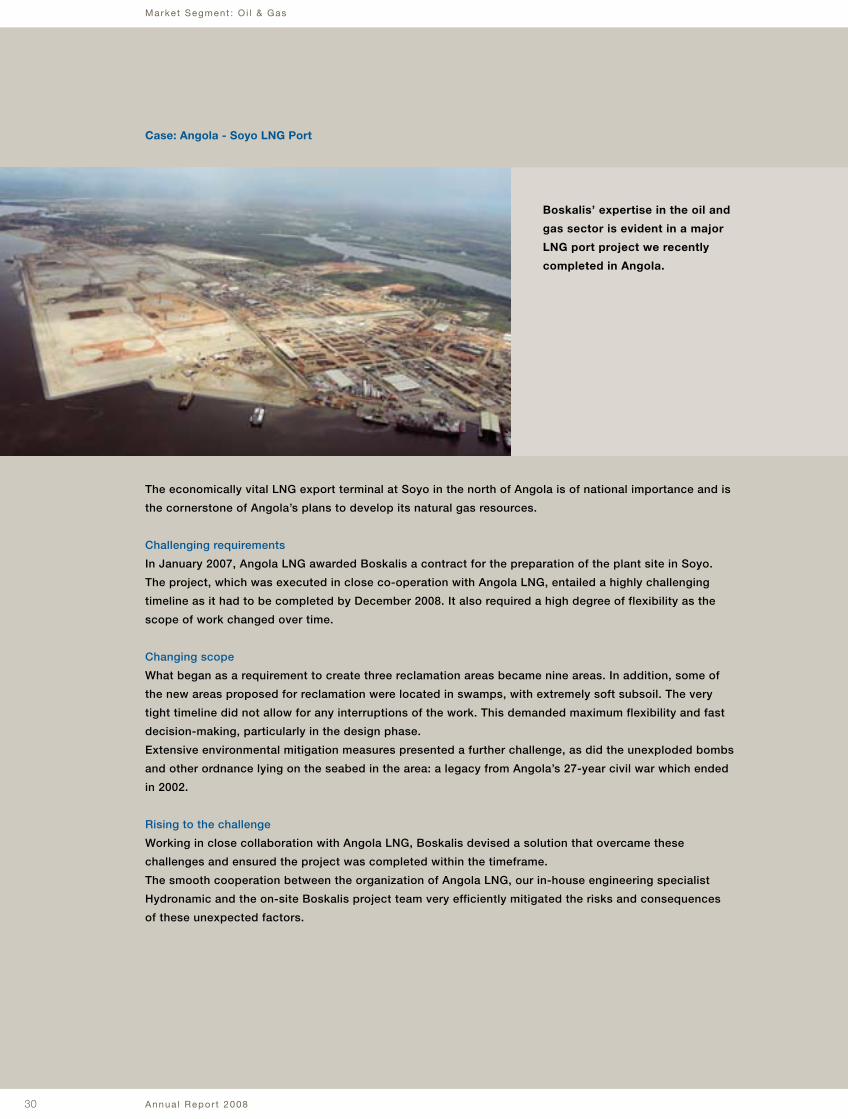
The economically vital LNG export terminal at Soyo in the north of Angola is of national importance and is
the cornerstone of Angola’s plans to develop its natural gas resources.
Challenging requirements
In January 2007, Angola LNG awarded Boskalis a contract for the preparation of the plant site in Soyo.
The project, which was executed in close co-operation with Angola LNG, entailed a highly challenging
timeline as it had to be completed by December 2008. It also required a high degree of flexibility as the
scope of work changed over time.
Changing scope
What began as a requirement to create three reclamation areas became nine areas. In addition, some of
the new areas proposed for reclamation were located in swamps, with extremely soft subsoil. The very
tight timeline did not allow for any interruptions of the work. This demanded maximum flexibility and fast
decision-making, particularly in the design phase.
Extensive environmental mitigation measures presented a further challenge, as did the unexploded bombs
and other ordnance lying on the seabed in the area: a legacy from Angola’s 27-year civil war which ended
in 2002.
Rising to the challenge
Working in close collaboration with Angola LNG, Boskalis devised a solution that overcame these
challenges and ensured the project was completed within the timeframe.
The smooth cooperation between the organization of Angola LNG, our in-house engineering specialist
Hydronamic and the on-site Boskalis project team very efficiently mitigated the risks and consequences
of these unexpected factors.
Case: Angola - Soyo LNG Port
Boskalis’ expertise in the oil and
gas sector is evident in a major
LNG port project we recently
completed in Angola.
31Roya l Boska l i s Westmins te r nv
Marke t Segment : O i l & Gas
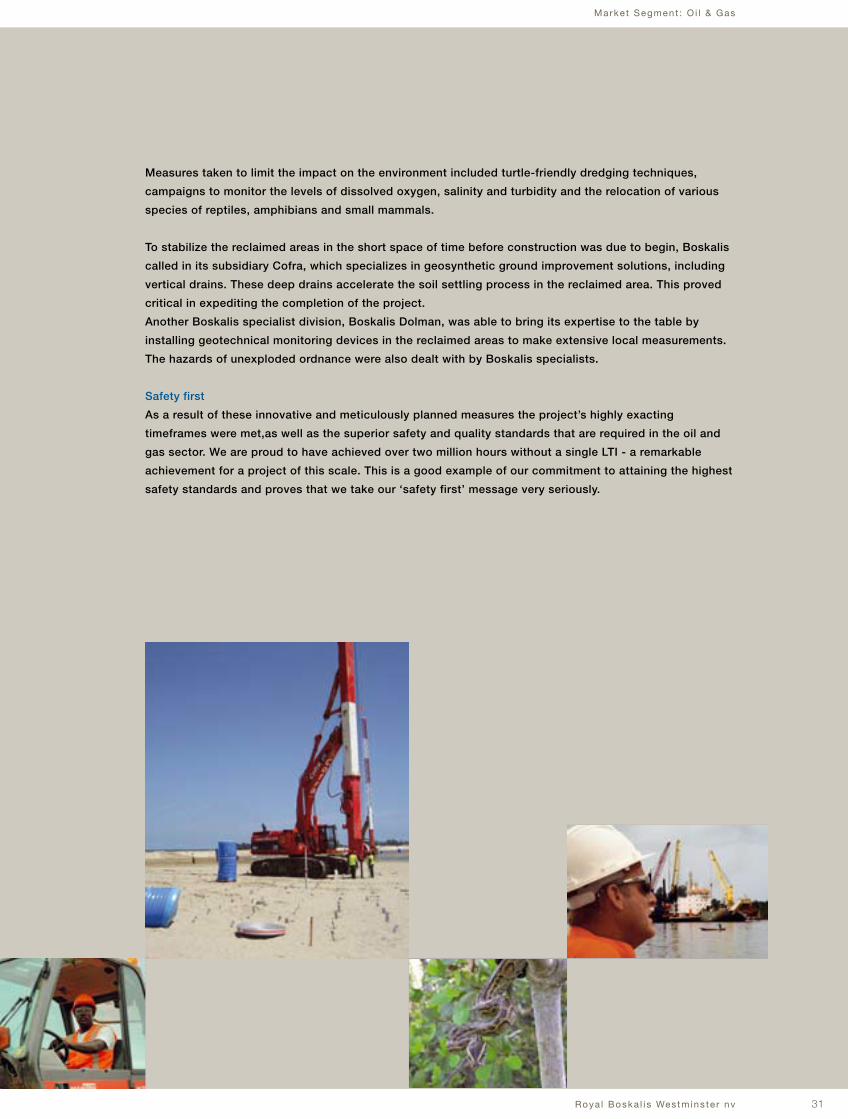
Measures taken to limit the impact on the environment included turtle-friendly dredging techniques,
campaigns to monitor the levels of dissolved oxygen, salinity and turbidity and the relocation of various
species of reptiles, amphibians and small mammals.
To stabilize the reclaimed areas in the short space of time before construction was due to begin, Boskalis
called in its subsidiary Cofra, which specializes in geosynthetic ground improvement solutions, including
vertical drains. These deep drains accelerate the soil settling process in the reclaimed area. This proved
critical in expediting the completion of the project.
Another Boskalis specialist division, Boskalis Dolman, was able to bring its expertise to the table by
installing geotechnical monitoring devices in the reclaimed areas to make extensive local measurements.
The hazards of unexploded ordnance were also dealt with by Boskalis specialists.
Safety first
As a result of these innovative and meticulously planned measures the project’s highly exacting
timeframes were met,as well as the superior safety and quality standards that are required in the oil and
gas sector. We are proud to have achieved over two million hours without a single LTI - a remarkable
achievement for a project of this scale. This is a good example of our commitment to attaining the highest
safety standards and proves that we take our ‘safety first’ message very seriously.
Annua l Repor t 200832
What corporate social responsibilty means for Boskalis
With a leading position in the global dredging and marine contracting market, and with operations in more
than 50 countries, Boskalis is intrinsically linked to society and the environment. Through the very nature of
our operations, working with communities and the natural world is ‘in our genes’. This means we take our
commitment to socially responsible business seriously.
For us, sustainability is an economic, social and environmental issue. Marine infrastructure helps countries
stimulate trade, boost economic growth and create jobs. By helping to create this infrastructure, we play a
direct role in the resulting sustainable social benefits.
We constantly strive to improve our working methods and expertise in sustainability. Our customers,
our markets and the law demand this, but we also do so to stay ahead of the industry and enhance our
competitive position.
Areas of Commitment
Our commitment to corporate social responsibility can be seen in everything we do: local labor
employment, our projects, use of technology, training, and research.
As part of our commitment to sustainable practices, we make every effort to prevent or limit noise
pollution, the contamination of soil, water and air and the generation of waste products and dangerous
materials. The responsible disposal of waste and contaminated products and the efficient use of water are
also among our key commitments.
Our activities are compliant with local legislation as well as Dutch standards for international operations.
We also follow the guidelines of the United Nations, World Health Organization (WHO) and the Dutch
government when it comes to doing business with certain countries.
We care about the social consequences of our services but do not involve ourselves with national politics
or offer opinions on cultural or political matters. We act as a responsible member of society, or a good
guest.
Employees are the lifeblood of Boskalis. We make every effort to ensure working conditions are healthy,
safe and environmentally friendly.
Our Statement of General Business Principles can be downloaded from our website (under corporate
governance). This outlines our sustainable activities and the principles we apply to all operations and
relationships.
Also available on the website are details of the many sustainable projects Boskalis is involved in around the
world, including award-winning operations. To find out more, please go to www.boskalis.com/sustainability.
Corporate social responsibility
Corpora te soc ia l respons ib i l i t y
Roya l Boska l i s Westmins te r nv 33
Boskalis is committed to transparent communication with all stakeholders to ensure the valuation of our
shares reflects as accurately as possible developments and prospects in our markets, and our performance
within them.
Boskalis strives to provide detailed, clear and timely information to all stakeholders - including existing and
potential shareholders, institutional investors, financial analysts and the media. We aim to respond openly
to stakeholder enquiries and are known for taking a proactive approach to communications.
Our extensive roadshow program reflects our commitment to an excellent dialogue with members of the
global investment community, building long-term relationships with them and keeping them aware of
critical success factors and our vision for growth. In 2008 we held 111 meetings at roadshows, conferences
and in person at our offices, with investors from across Western Europe, the US and Canada.
Boskalis is covered by all the major Dutch brokers and we communicate frequently with their analysts.
They play a key role in the distribution of information to their investor clients on developments at Boskalis
as well as in the dredging and marine contracting industry in general.
In January 2008 Boskalis hosted a field trip to Panama and Mexico for a group of around 15 analysts and
major shareholders. We visited a number of projects with the objective of strengthening their understanding
of our business in the region. This includes the activities of our subsidiary Dragamex, of which we acquired
full ownership in November 2008. Our initiative was well received and we will continue to organize annual
field trips for our key financial stakeholders.
Investor Relations
I nves to r Re la t ions
33
42.45 46.25
15.30 21.06
16.60 41.66
404,952 357,021
2.90 2.38
1.19 1.19
41 50
7.17 2.86
5.7 17.5
85,799 85,799
1.424 3.574
20072008
Stock price (in €)
High
Low
Close
Average daily trading volume
Earnings per share (in €)
Dividend per share (in €)
Dividend pay-out ratio (as a %)
Dividend yield (as a %, based on closing rate for the year)
Price/Earnings Ratio
Number of issued ordinary shares (thousands)
Stock market capitalization (in € billions)
(x € 1 million)
Annua l Repor t 200834
I nves to r Re la t ions
Website
For the latest and archived press releases, corporate presentations, current share price and other company
information such as our projects, fleet and job vacancies, please visit www.boskalis.com.
Award for Boskalis Annual Report 2007:
Boskalis was awarded the “Prix de Mazars 2008” for the best annual report in the category non-AEX
listed companies in The Netherlands. The award was based on feedback from investors, analysts and
other readers of the annual report. Boskalis was especially praised for the informative nature of the
report.
Share Information
Boskalis’ authorized share capital of € 240 million is divided into 200,000,000 shares of which 150,000,000
ordinary shares and 50,000,000 cumulative protective preference shares.
The issued capital as at December 31, 2008 consists of 85.8 million ordinary shares with a total value of
€ 68.6 million. During the 2008 and 2007 financial years there were no changes in the issued capital.
AEX Listing from March 2009
In 2008, Royal Boskalis Westminster N.V. shares were listed on the AMX index of NYSE Euronext
Amsterdam where they were traded continuously under the symbol BOKA. NYSE Euronext Amsterdam
announced on January 29, 2009 that Royal Boskalis Westminster N.V. shares were to be admitted to the
AEX prime index with effect from March 2, 2009.
The share is also a component of the Euronext Next 150 Index and the Dow Jones STOXX 600 Index.
Boskalis share options were introduced on the Amsterdam option exchange (Liffe) on September 27, 2007.
From that date professional traders and private investors have been able to trade in Boskalis options.
Tickers: Bloomberg: BOKA:NA, Reuters: BOSN.AS
Trading Volumes
In 2008, 102 million Boskalis shares were traded on NYSE Euronext Amsterdam (2007: 91 million). The
average daily trading volume in 2008 was 404,952 shares, an increase of 13% compared to 2007. The
traded value increased from € 2.76 billion to € 3.30 billion (+19%) reflecting a higher trading volume and a
higher average share price.
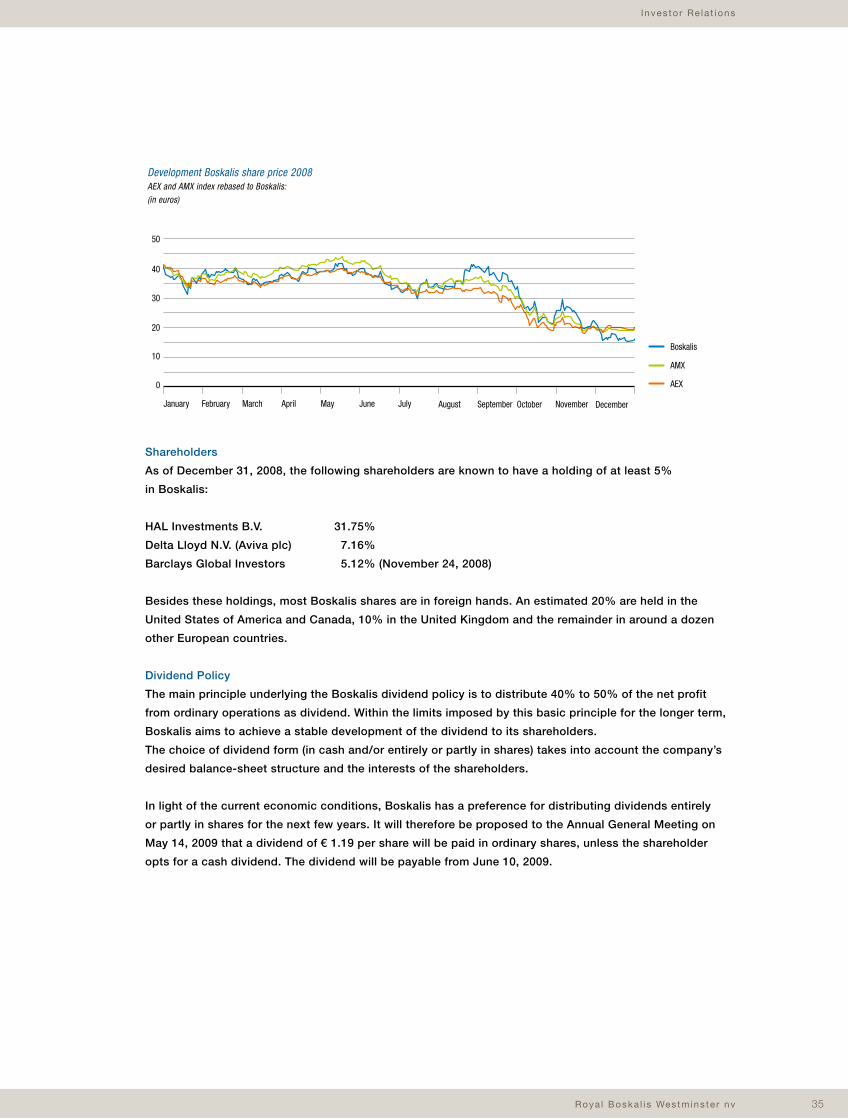
Roya l Boska l i s Westmins te r nv 35
I nves to r Re la t ions
Shareholders
As of December 31, 2008, the following shareholders are known to have a holding of at least 5%
in Boskalis:
HAL Investments B.V. 31.75%
Delta Lloyd N.V. (Aviva plc) 7.16%
Barclays Global Investors 5.12% (November 24, 2008)
Besides these holdings, most Boskalis shares are in foreign hands. An estimated 20% are held in the
United States of America and Canada, 10% in the United Kingdom and the remainder in around a dozen
other European countries.
Dividend Policy
The main principle underlying the Boskalis dividend policy is to distribute 40% to 50% of the net profit
from ordinary operations as dividend. Within the limits imposed by this basic principle for the longer term,
Boskalis aims to achieve a stable development of the dividend to its shareholders.
The choice of dividend form (in cash and/or entirely or partly in shares) takes into account the company’s
desired balance-sheet structure and the interests of the shareholders.
In light of the current economic conditions, Boskalis has a preference for distributing dividends entirely
or partly in shares for the next few years. It will therefore be proposed to the Annual General Meeting on
May 14, 2009 that a dividend of € 1.19 per share will be paid in ordinary shares, unless the shareholder
opts for a cash dividend. The dividend will be payable from June 10, 2009.
Boskalis
AMX
AEX
DecemberNovemberOctoberSeptemberAugustJulyJuneMayAprilMarchFebruaryJanuary
0
20
30
40
Development Boskalis share price 2008 AEX and AMX index rebased to Boskalis:(in euros)
10
50
Annua l Repor t 200836
I nves to r Re la t ions
Financial calendar 2009
March 18 Publication of 2008 year results
mid-April Publication of 2008 Annual Report
May 14 Trading update on first quarter of 2009
May 14 Annual General Meeting
May 18 Ex-dividend date
May 20 Dividend record date (after market close)
June 2 Final date for stating dividend preference
June 5 Determination and publication of conversion rate for stock dividend based on the
average share price on June 3, 4 and 5 (after market close)
June 10 Date of dividend payment and delivery of shares
August 20 Publication of 2009 half-year results
Information
Martijn L.D. Schuttevâer, Director Investor Relations & Corporate Communications
Telephone +31 78 69 69 822
Telefax +31 78 69 69 020
E-mail [email protected]
Website www.boskalis.com
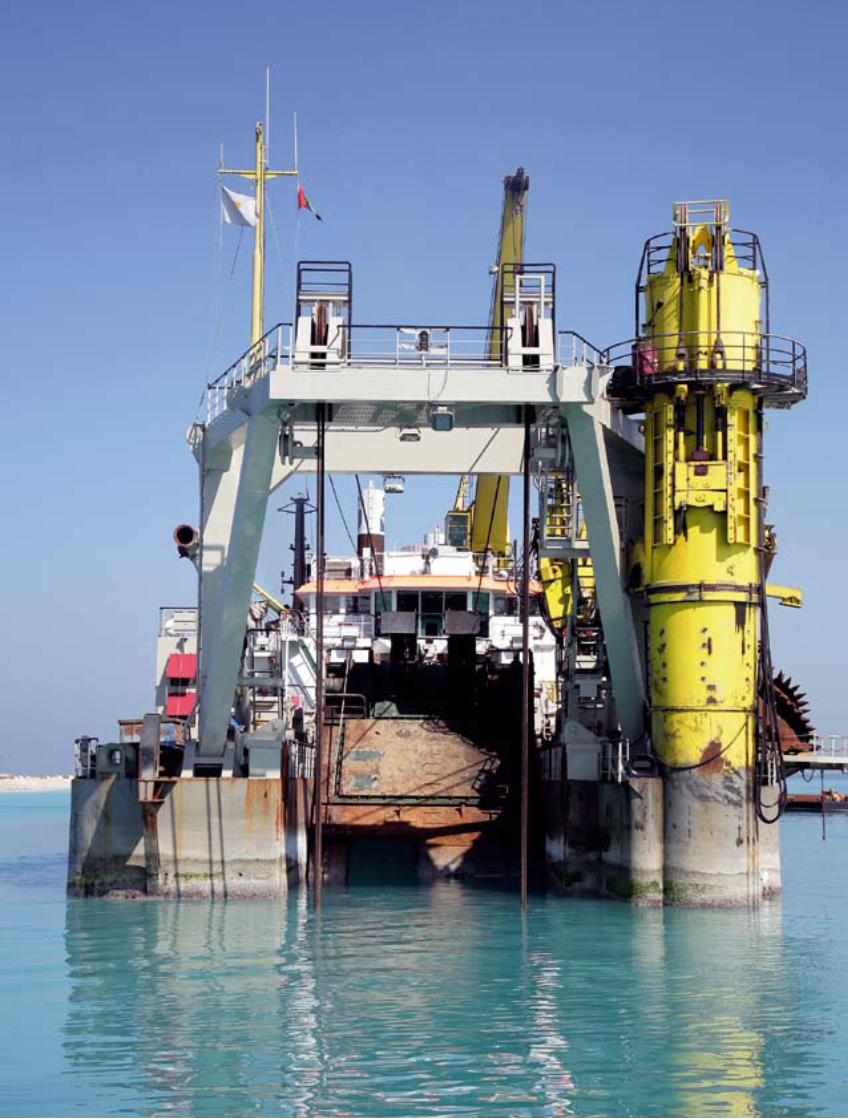
Roya l Boska l i s Westmins te r nv 37
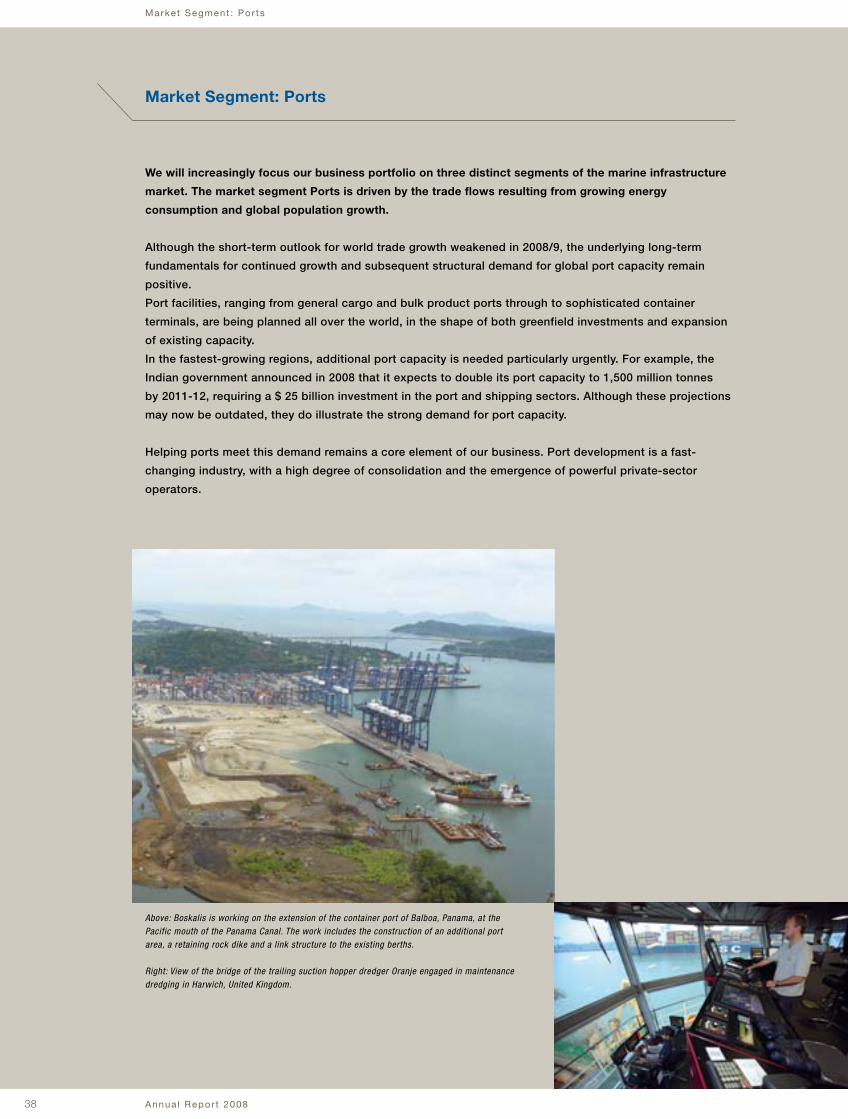
38
Market Segment: Ports
Market Segment : Por ts
Annua l Repor t 2008
We will increasingly focus our business portfolio on three distinct segments of the marine infrastructure
market. The market segment Ports is driven by the trade flows resulting from growing energy
consumption and global population growth.
Although the short-term outlook for world trade growth weakened in 2008/9, the underlying long-term
fundamentals for continued growth and subsequent structural demand for global port capacity remain
positive.
Port facilities, ranging from general cargo and bulk product ports through to sophisticated container
terminals, are being planned all over the world, in the shape of both greenfield investments and expansion
of existing capacity.
In the fastest-growing regions, additional port capacity is needed particularly urgently. For example, the
Indian government announced in 2008 that it expects to double its port capacity to 1,500 million tonnes
by 2011-12, requiring a $ 25 billion investment in the port and shipping sectors. Although these projections
may now be outdated, they do illustrate the strong demand for port capacity.
Helping ports meet this demand remains a core element of our business. Port development is a fast-
changing industry, with a high degree of consolidation and the emergence of powerful private-sector
operators.
Above: Boskalis is working on the extension of the container port of Balboa, Panama, at the Pacific mouth of the Panama Canal. The work includes the construction of an additional port area, a retaining rock dike and a link structure to the existing berths.
Right: View of the bridge of the trailing suction hopper dredger Oranje engaged in maintenance dredging in Harwich, United Kingdom.
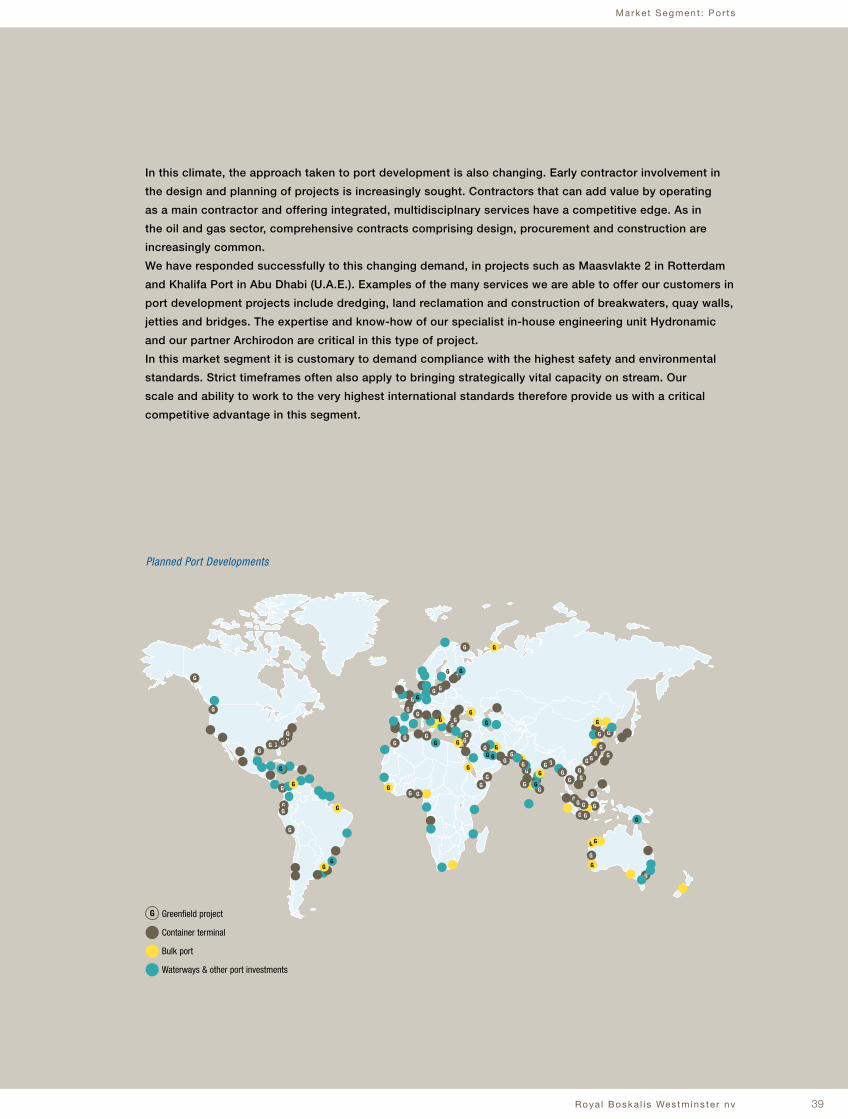
Market Segment : Por ts
39Roya l Boska l i s Westmins te r nv
In this climate, the approach taken to port development is also changing. Early contractor involvement in
the design and planning of projects is increasingly sought. Contractors that can add value by operating
as a main contractor and offering integrated, multidisciplnary services have a competitive edge. As in
the oil and gas sector, comprehensive contracts comprising design, procurement and construction are
increasingly common.
We have responded successfully to this changing demand, in projects such as Maasvlakte 2 in Rotterdam
and Khalifa Port in Abu Dhabi (U.A.E.). Examples of the many services we are able to offer our customers in
port development projects include dredging, land reclamation and construction of breakwaters, quay walls,
jetties and bridges. The expertise and know-how of our specialist in-house engineering unit Hydronamic
and our partner Archirodon are critical in this type of project.
In this market segment it is customary to demand compliance with the highest safety and environmental
standards. Strict timeframes often also apply to bringing strategically vital capacity on stream. Our
scale and ability to work to the very highest international standards therefore provide us with a critical
competitive advantage in this segment.
G
G
G
G
G
G
G
G
G
G
G GG
G
G
G
G
G
G
G
G
G
G
G
G
G
G
GGG
G
GG
G
G
G
G
G
G
GG
G
G G
G
G
G
G
G
G
G
G
G
G
G
G
G
G
GG GG
G
G
G
G
GG
G
G
G
G
G
G
GGG
GG G
G
GG
G
G
G
G
Planned Port Developments
Greenfield project
Container terminal
Bulk port
Waterways & other port investments
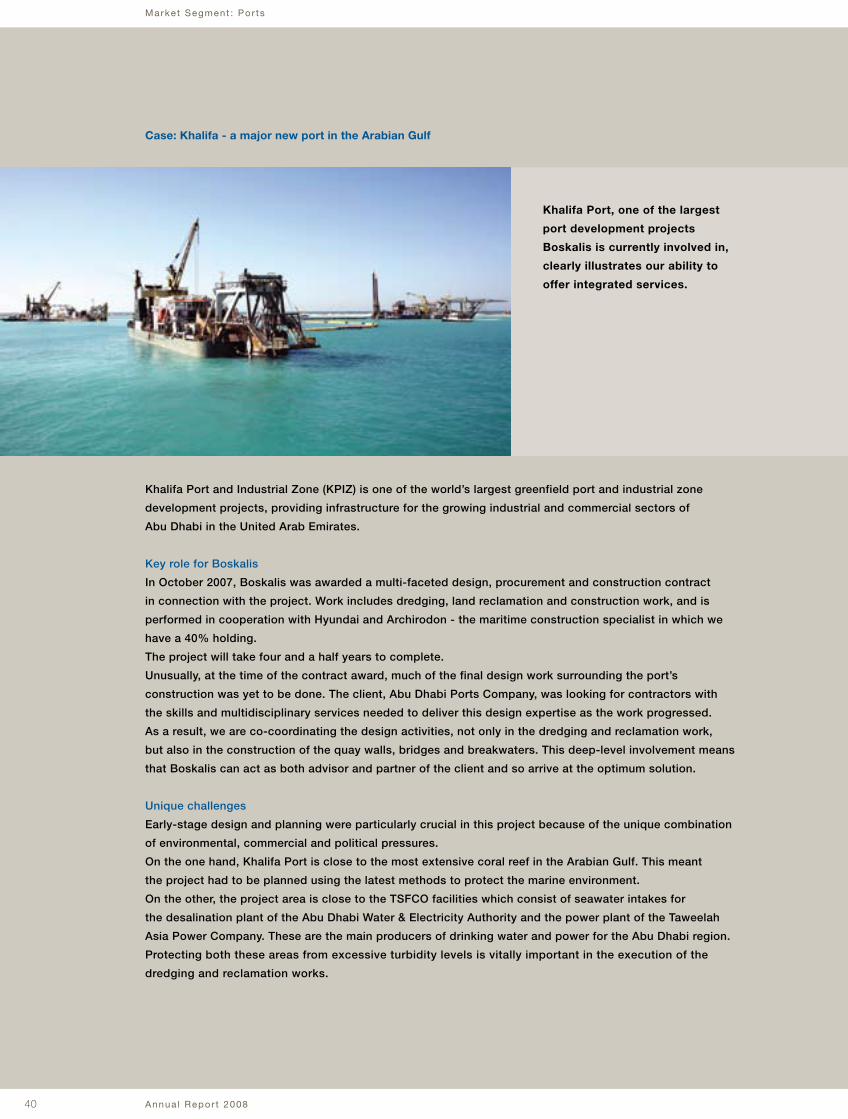
40 Annua l Repor t 2008
Marke t Segment : Por ts
Khalifa Port and Industrial Zone (KPIZ) is one of the world’s largest greenfield port and industrial zone
development projects, providing infrastructure for the growing industrial and commercial sectors of
Abu Dhabi in the United Arab Emirates.
Key role for Boskalis
In October 2007, Boskalis was awarded a multi-faceted design, procurement and construction contract
in connection with the project. Work includes dredging, land reclamation and construction work, and is
performed in cooperation with Hyundai and Archirodon - the maritime construction specialist in which we
have a 40% holding.
The project will take four and a half years to complete.
Unusually, at the time of the contract award, much of the final design work surrounding the port’s
construction was yet to be done. The client, Abu Dhabi Ports Company, was looking for contractors with
the skills and multidisciplinary services needed to deliver this design expertise as the work progressed.
As a result, we are co-coordinating the design activities, not only in the dredging and reclamation work,
but also in the construction of the quay walls, bridges and breakwaters. This deep-level involvement means
that Boskalis can act as both advisor and partner of the client and so arrive at the optimum solution.
Unique challenges
Early-stage design and planning were particularly crucial in this project because of the unique combination
of environmental, commercial and political pressures.
On the one hand, Khalifa Port is close to the most extensive coral reef in the Arabian Gulf. This meant
the project had to be planned using the latest methods to protect the marine environment.
On the other, the project area is close to the TSFCO facilities which consist of seawater intakes for
the desalination plant of the Abu Dhabi Water & Electricity Authority and the power plant of the Taweelah
Asia Power Company. These are the main producers of drinking water and power for the Abu Dhabi region.
Protecting both these areas from excessive turbidity levels is vitally important in the execution of the
dredging and reclamation works.
Case: Khalifa - a major new port in the Arabian Gulf
Khalifa Port, one of the largest
port development projects
Boskalis is currently involved in,
clearly illustrates our ability to
offer integrated services.
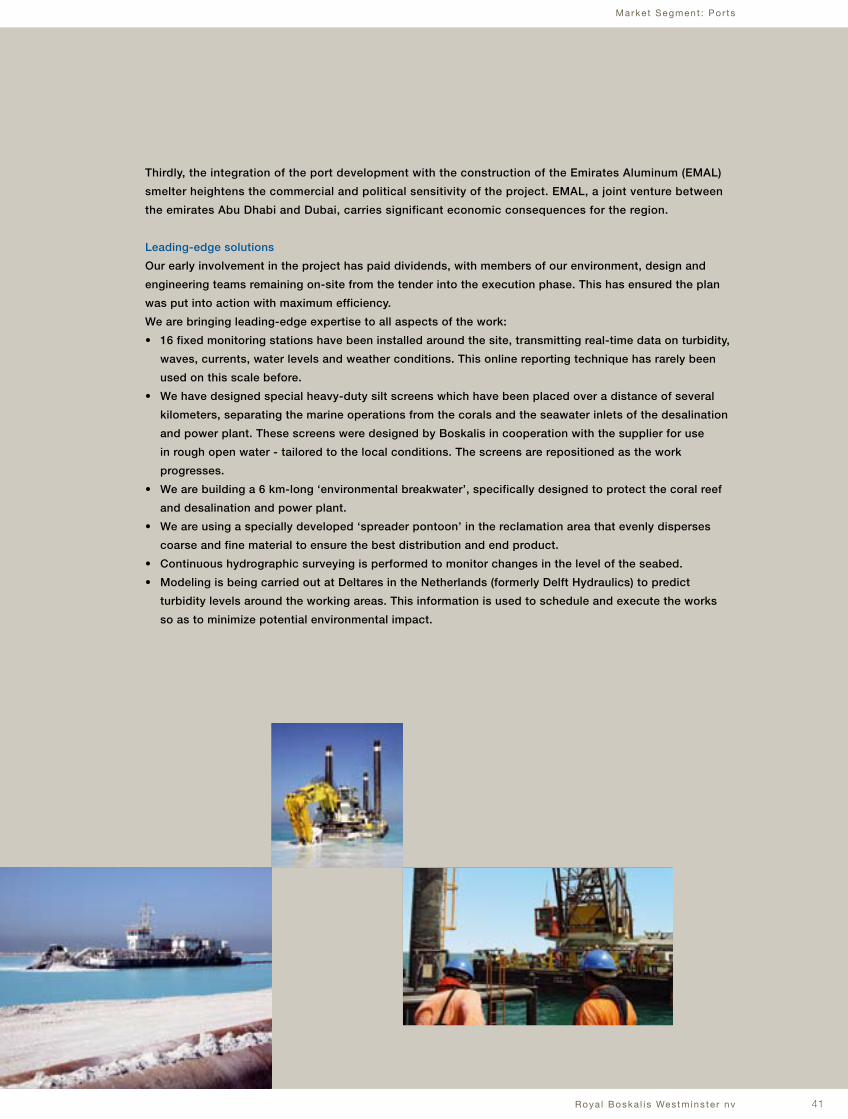
41Roya l Boska l i s Westmins te r nv
Marke t Segment : Por ts
Thirdly, the integration of the port development with the construction of the Emirates Aluminum (EMAL)
smelter heightens the commercial and political sensitivity of the project. EMAL, a joint venture between
the emirates Abu Dhabi and Dubai, carries significant economic consequences for the region.
Leading-edge solutions
Our early involvement in the project has paid dividends, with members of our environment, design and
engineering teams remaining on-site from the tender into the execution phase. This has ensured the plan
was put into action with maximum efficiency.
We are bringing leading-edge expertise to all aspects of the work:
• 16 fixed monitoring stations have been installed around the site, transmitting real-time data on turbidity,
waves, currents, water levels and weather conditions. This online reporting technique has rarely been
used on this scale before.
• We have designed special heavy-duty silt screens which have been placed over a distance of several
kilometers, separating the marine operations from the corals and the seawater inlets of the desalination
and power plant. These screens were designed by Boskalis in cooperation with the supplier for use
in rough open water - tailored to the local conditions. The screens are repositioned as the work
progresses.
• We are building a 6 km-long ‘environmental breakwater’, specifically designed to protect the coral reef
and desalination and power plant.
• We are using a specially developed ‘spreader pontoon’ in the reclamation area that evenly disperses
coarse and fine material to ensure the best distribution and end product.
• Continuous hydrographic surveying is performed to monitor changes in the level of the seabed.
• Modeling is being carried out at Deltares in the Netherlands (formerly Delft Hydraulics) to predict
turbidity levels around the working areas. This information is used to schedule and execute the works
so as to minimize potential environmental impact.
Annua l Repor t 200842
Members o f the Superv iso ry Board
Mr R.M.F. van Loon (1942), chairman until March 17, 2009
• date of first appointment: February 1, 2005
• former vice-president Shell Chemicals Ltd.
• chairman of the Supervisory Board of Synbra Holding B.V.
• member of the Supervisory Board of Royal Vopak N.V. until March 17, 2009
Mr H. Heemskerk (1943), acting chairman as from March 17, 2009
• date of first appointment: July 1, 2006; current term ends 2009
• chairman of the Executive Board of Rabobank Nederland
• member of the Supervisory Board of VADO Beheer B.V., Bank Sarasin & Cie AG and Econcern B.V.
• member of the Board of Stichting Vereniging voor de Effectenhandel
Mr M. Niggebrugge (1950)
• date of first appointment: August 30, 2006; current term ends 2009
• member of the Executive Board of N.V. Nederlandse Spoorwegen
• member of the Executive Board and general administrative board of Vereniging VNO-NCW
• member of the Supervisory Board of Diakonessenziekenhuis Utrecht
Mr M. van der Vorm (1958)
• date of first appointment: May 18, 1993; current term ends 2011
• chairman of the Executive Board of HAL Holding N.V.
• member of the Supervisory Board of Anthony Veder Group N.V. and Royal Vopak N.V.
Mr C. van Woudenberg (1948)
• date of first appointment: May 9, 2007; current term ends 2011
• former member of the Executive Committee and Air France - KLM
• member of the Supervisory Board of Royal DSM N.V., Royal Grolsch N.V., Mercurius Groep B.V.,
Transavia Airlines B.V. and Netherlands Chamber of Commerce
All members of the Supervisory Board have Dutch nationality. They do not hold shares or associated option
rights in Royal Boskalis Westminster N.V.
Secretary
Mrs F.E. Buijs (1969)
The above information is valid as of March 17, 2009.
Members of the Supervisory Board
Roya l Boska l i s Westmins te r nv 43
Financial statements 2008
In accordance with Article 27 of the Articles of Association of Royal Boskalis Westminster N.V., the
Supervisory Board presents the annual report 2008 to the Annual General Meeting of Shareholders. The
annual report, including the financial statements and the management statement, was drawn up by the
Board of Management. The financial statements are accompanied by the report of the company’s external
auditor KPMG Accountants N.V.
We recommend to the Annual General Meeting of Shareholders:
• The adoption of the financial statements, including the proposed profit appropriation;
• The discharge of the members of the Board of Management in respect of their management activities
during the year 2008;
• The discharge of the members of the Supervisory Board for their supervision of management during the
year 2008; and
• The distribution of a dividend of € 1.19 per share to be paid in ordinary shares, unless the shareholder
opts for a cash dividend.
Composition of the Board of Management
The Board of Management consists of three members. There were no changes in the composition of the
Board of Management during the year under review.
Composition of the Supervisory Board
The Supervisory Board consists of five members. On March 17, 2009 Mr R.M.F. van Loon stepped down as
chairman of the Supervisory Board for health reasons. He was succeeded by Mr H. Heemskerk as acting
chairman with effect from that date. In the course of 2009 the Board will discuss how to fill the vacancy
arising from Mr Van Loon’s departure. In accordance with the retirement rota for the Supervisory Board,
two members of the Supervisory Board will come up for reappointment in 2009. These reappointments
will be made in compliance with the procedures laid down in the Articles of Association, the corporate
governance code and the Supervisory Board regulations.
Activities of the Supervisory Board
The Supervisory Board held six meetings with the Board of Management. Permanent items on the agenda
were the development of the results, as well as the balance sheet and industry and market developments.
During the meetings the Board of Management also provided an update on the progress of potential and
existing larger projects.
Items under scrutiny of the Supervisory Board included the corporate budget, liquidity, acquisition and
investment proposals, the organizational structure and the staffing policy. Special attention was paid to
the company’s policy on health, safety and environment. The meetings also focused on corporate strategy,
while the main inherent risks involved in managing the company were also a regular topic of conversation.
Further information about this can be found on pages 71 to 76 of this report. The structure and operation
of the internal risk management and control systems were assessed regularly and discussed with the
Supervisory Board. The external auditor was present at the meetings where the annual and semi-annual
results were discussed.
Repor t o f the Superv iso ry Board
Report of the Supervisory Board
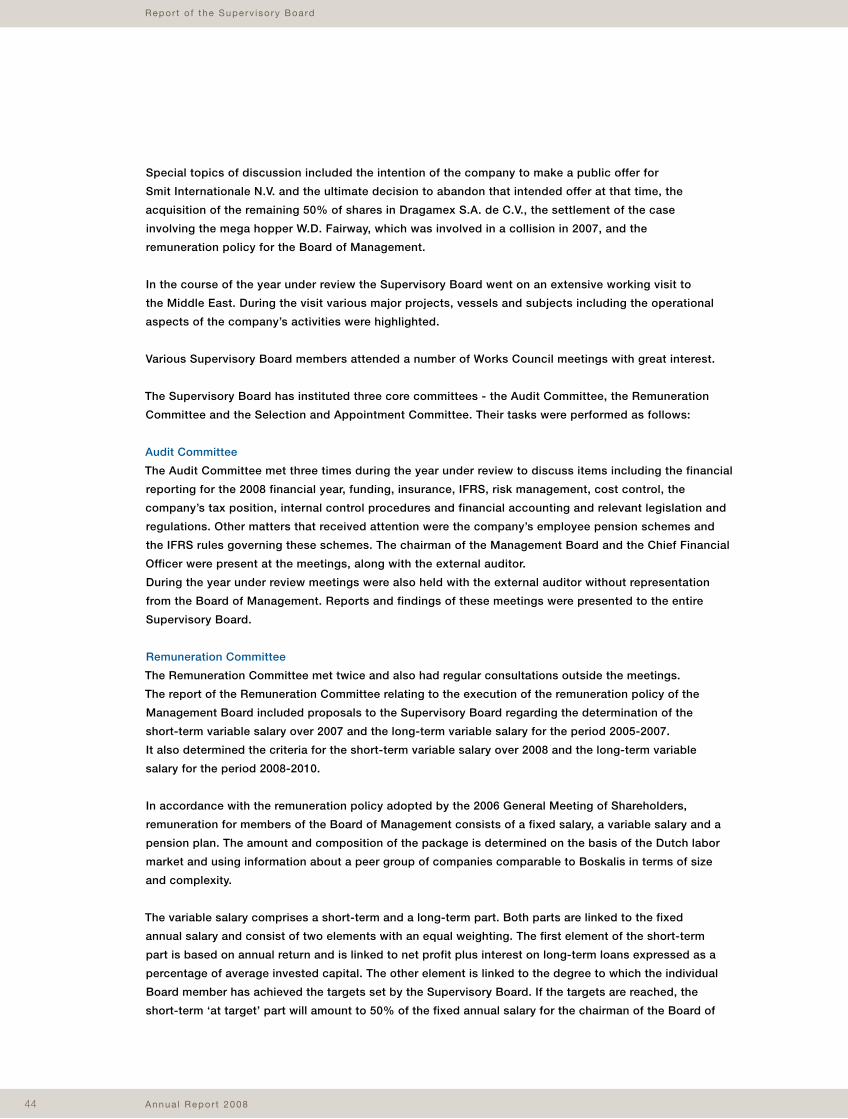
Annua l Repor t 200844
Repor t o f the Superv iso ry Board
Special topics of discussion included the intention of the company to make a public offer for
Smit Internationale N.V. and the ultimate decision to abandon that intended offer at that time, the
acquisition of the remaining 50% of shares in Dragamex S.A. de C.V., the settlement of the case
involving the mega hopper W.D. Fairway, which was involved in a collision in 2007, and the
remuneration policy for the Board of Management.
In the course of the year under review the Supervisory Board went on an extensive working visit to
the Middle East. During the visit various major projects, vessels and subjects including the operational
aspects of the company’s activities were highlighted.
Various Supervisory Board members attended a number of Works Council meetings with great interest.
The Supervisory Board has instituted three core committees - the Audit Committee, the Remuneration
Committee and the Selection and Appointment Committee. Their tasks were performed as follows:
Audit Committee
The Audit Committee met three times during the year under review to discuss items including the financial
reporting for the 2008 financial year, funding, insurance, IFRS, risk management, cost control, the
company’s tax position, internal control procedures and financial accounting and relevant legislation and
regulations. Other matters that received attention were the company’s employee pension schemes and
the IFRS rules governing these schemes. The chairman of the Management Board and the Chief Financial
Officer were present at the meetings, along with the external auditor.
During the year under review meetings were also held with the external auditor without representation
from the Board of Management. Reports and findings of these meetings were presented to the entire
Supervisory Board.
Remuneration Committee
The Remuneration Committee met twice and also had regular consultations outside the meetings.
The report of the Remuneration Committee relating to the execution of the remuneration policy of the
Management Board included proposals to the Supervisory Board regarding the determination of the
short-term variable salary over 2007 and the long-term variable salary for the period 2005-2007.
It also determined the criteria for the short-term variable salary over 2008 and the long-term variable
salary for the period 2008-2010.
In accordance with the remuneration policy adopted by the 2006 General Meeting of Shareholders,
remuneration for members of the Board of Management consists of a fixed salary, a variable salary and a
pension plan. The amount and composition of the package is determined on the basis of the Dutch labor
market and using information about a peer group of companies comparable to Boskalis in terms of size
and complexity.
The variable salary comprises a short-term and a long-term part. Both parts are linked to the fixed
annual salary and consist of two elements with an equal weighting. The first element of the short-term
part is based on annual return and is linked to net profit plus interest on long-term loans expressed as a
percentage of average invested capital. The other element is linked to the degree to which the individual
Board member has achieved the targets set by the Supervisory Board. If the targets are reached, the
short-term ‘at target’ part will amount to 50% of the fixed annual salary for the chairman of the Board of
Roya l Boska l i s Westmins te r nv 45
Repor t o f the Superv iso ry Board
Management and 45% for the other members of the Board. These percentages can grow to as much as
75% and 67.5%, respectively, in the event of excellent performance.
With respect to the long-term part, one element is aimed at creating added value (EVA), while the other
element focuses on the realization of corporate policy. The Supervisory Board formulates a number of
long-term targets which form the basis for a qualitative assessment. For this long-term part the ‘at target’
percentages are 50% for the chairman and 45% for the members of the Board of Management. These
percentages can reach a maximum of 75% and 67.5%, respectively, in the event of excellent performance.
Each year the long-term part is expressed as a conditional number of notional shares. After three years the
definite number of shares is determined and a cash amount is paid out based on the share price at that
time. That means that the variable income of members of the Management Board depends in part on the
Boskalis share price and is therefore linked to the value of the company.
The members of the Board of Management participate in the pension scheme of the foundation Stichting
Pensioenfonds Boskalis Westminster Nederland. Since January 1, 2004 the pension accrual has been
based on the average wage system; the retirement age is 65.
The policy for employee benefits is aimed at providing a package that is in line with the market.
No loans, advances or guarantees will be extended to directors, and the explicit approval of the chairman
of the Supervisory Board is required before any positions outside the company can be accepted.
An overview of the individual remuneration of the members of the Board of Management can be found
on pages 127-128 of the annual report. The variable payment awarded in 2008 relates to the 2007
financial year for the short term and to the period 2005-2007 for the long term. These pages also provide
information on the variable payment that will be awarded in 2009 in relation to both 2008 and the period
2006-2008.
In connection with the three-yearly review of the remuneration package for the Board of Management,
the Supervisory Board also studied a benchmark for measuring remuneration levels against the market.
Independent remuneration experts reporting directly to the Supervisory Board assisted with this process.
The Supervisory Board will continue its evaluation of the remuneration policy during the 2009 financial year,
thereby also taking into consideration the recommendations of the revised Dutch Corporate Governance
Code of December 2008.
Selection and Appointment Committee
During the year under review the Selection and Appointment Committee met to discuss the composition
of the Board of Management. The committee also assessed the size and composition of the Supervisory
Board, taking into account the description of the board’s profile.
The Dutch Corporate Governance Code
Since the introduction of the Dutch Corporate Governance Code (the ‘Code’) in 2004, the principles
of good corporate governance and best practice provisions set out in the Code have been discussed
regularly at Supervisory Board meetings. Information on the company’s general corporate governance
policy can be found in the special publication on the subject from the Board of Management and the
Supervisory Board, as published on the website of the company. The Supervisory Board believes that this
policy was implemented correctly in the year under review. The main points of this policy can be found on
pages 70-76 of this report.
Annua l Repor t 200846
Repor t o f the Superv iso ry Board
In the opinion of the Supervisory Board, the provisions of the Code regarding the independence of
the members of the Supervisory Board have been complied with. The Supervisory Board considers
Mr M. van der Vorm to be non-independent in the sense of the Code.
In 2009 the Supervisory Board will consider the revised Dutch Corporate Governance Code and its
application within the company.
Outside the presence of the board members the Supervisory Board discussed the performance of the
Board of Management and its individual members. The performance of the Supervisory Board and its
individual members was also discussed.
As we were putting the finishing touches to this report news reached us that the chairman of the
Supervisory Board, Mr R.M.F. van Loon, was stepping down for health reasons. Since his appointment in
2005 Mr Van Loon has shown a great interest in Boskalis and has been closely involved with the business.
In no time at all, our great company became his company, and he always spoke of it with the most sincere
admiration and pride. In his capacity as chairman Mr Van Loon played a major role in renewing and
strengthening the Supervisory Board. We would like to take this opportunity to express our thanks to
Mr Van Loon for his inspiration and effort.
The Supervisory Board extends its compliments to the company’s employees and the Board of Management
for the results achieved in 2008 and expresses its particular appreciation for the dedication and
commitment shown by all.
Papendrecht/Sliedrecht, March 17, 2009
The Supervisory Board
R.M.F. van Loon, chairman until March 17, 2009
H. Heemskerk, acting chairman as from March 17, 2009
M. Niggebrugge
M. van der Vorm
C. van Woudenberg
Members of the Audit Committee
M. Niggebrugge, chairman
R.M.F. van Loon, until March 17, 2009
Members of the Remuneration Committee
C. van Woudenberg, chairman
R.M.F. van Loon, until March 17, 2009
Members of the Selection and Appointment Committee
R.M.F. van Loon, chairman until March 17, 2009
H. Heemskerk
M. van der Vorm
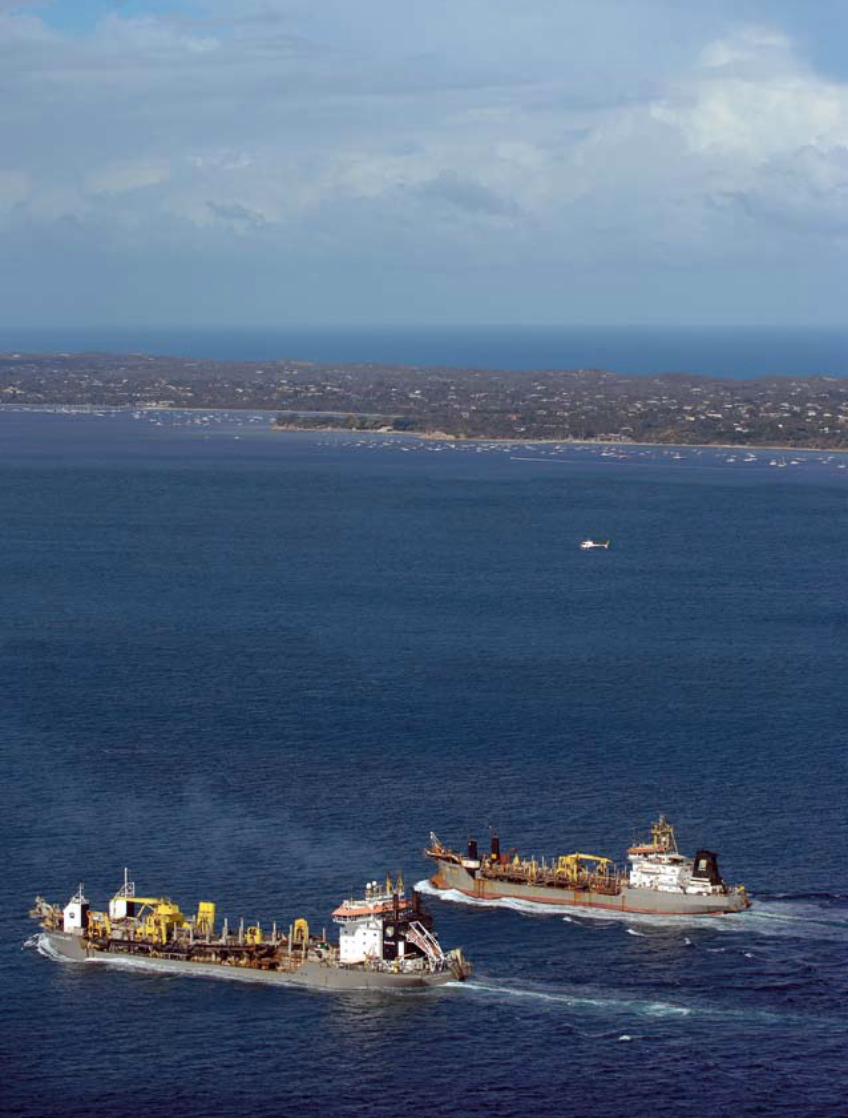
Roya l Boska l i s Westmins te r nv 47
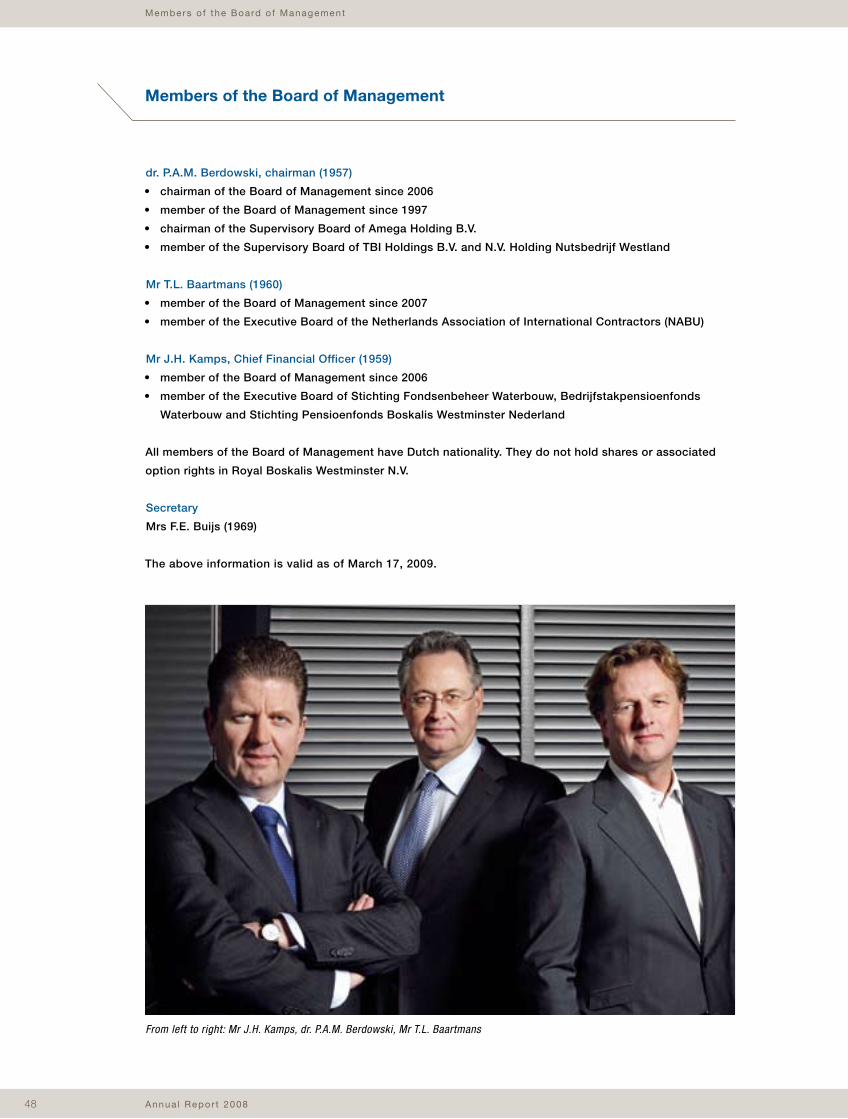
Annua l Repor t 200848
Members o f the Board o f Management
dr. P.A.M. Berdowski, chairman (1957)
• chairman of the Board of Management since 2006
• member of the Board of Management since 1997
• chairman of the Supervisory Board of Amega Holding B.V.
• member of the Supervisory Board of TBI Holdings B.V. and N.V. Holding Nutsbedrijf Westland
Mr T.L. Baartmans (1960)
• member of the Board of Management since 2007
• member of the Executive Board of the Netherlands Association of International Contractors (NABU)
Mr J.H. Kamps, Chief Financial Officer (1959)
• member of the Board of Management since 2006
• member of the Executive Board of Stichting Fondsenbeheer Waterbouw, Bedrijfstakpensioenfonds
Waterbouw and Stichting Pensioenfonds Boskalis Westminster Nederland
All members of the Board of Management have Dutch nationality. They do not hold shares or associated
option rights in Royal Boskalis Westminster N.V.
Secretary
Mrs F.E. Buijs (1969)
The above information is valid as of March 17, 2009.
Members of the Board of Management
From left to right: Mr J.H. Kamps, dr. P.A.M. Berdowski, Mr T.L. Baartmans
Roya l Boska l i s Westmins te r nv 49
Report of the Board of Management
Repor t o f the Board o f Management
Royal Boskalis Westminster N.V. achieved a net profit of € 249.1 million in 2008. Net profit excluding
exceptional items rose 15.3% to € 235.7 million in 2008. Revenue was € 2.1 billion, up 12% from 2007,
and was widely spread, both geographically and across all market segments.
In 2008 Boskalis won new orders worth € 2.3 billion. In addition, the order book was cleared of projects that
are no longer expected to be executed or are expected to suffer significant delay. Despite this adjustment,
high revenue levels in 2008 and the economic stagnation, the order book remained at the high level of
€ 3.4 billion.
It is with pleasure that the Board of Management hereby presents you its report on the past year.
Market developments
The global dredging and maritime infrastructure market is driven by factors such as growth in world trade,
the global population, energy consumption and the effects of climate change. All these factors have
undergone a period of unbridled growth in the past few years.
This growth trend continued in the first half of 2008. The price of oil rose to an unprecedented level and
the prices of iron ore and other natural resources also continued to rise strongly. Growing demand for
energy and natural resources propelled the need for dredging projects for the oil and gas industry and the
development of new ports.
These positive market conditions changed radically in the final quarter of 2008. Even though long-term
structural growth factors for dredging and maritime infrastructure remain strong, a great deal has changed
for the short term. The price of oil has dropped sharply, demand for natural resources has plummeted and
global trade is stagnating. All these factors are affecting demand for our products and services.
Financial performance
Highlights for 2008
• Net profit rises to € 249.1 million;
• Net profit excluding exceptional items up 15.3% at € 235.7 million;
• Record revenue € 2.1 billion: +12%;
• Order book steady at high level: € 3.4 billion;
• Earnings per share € 2.90; dividend per share € 1.19.
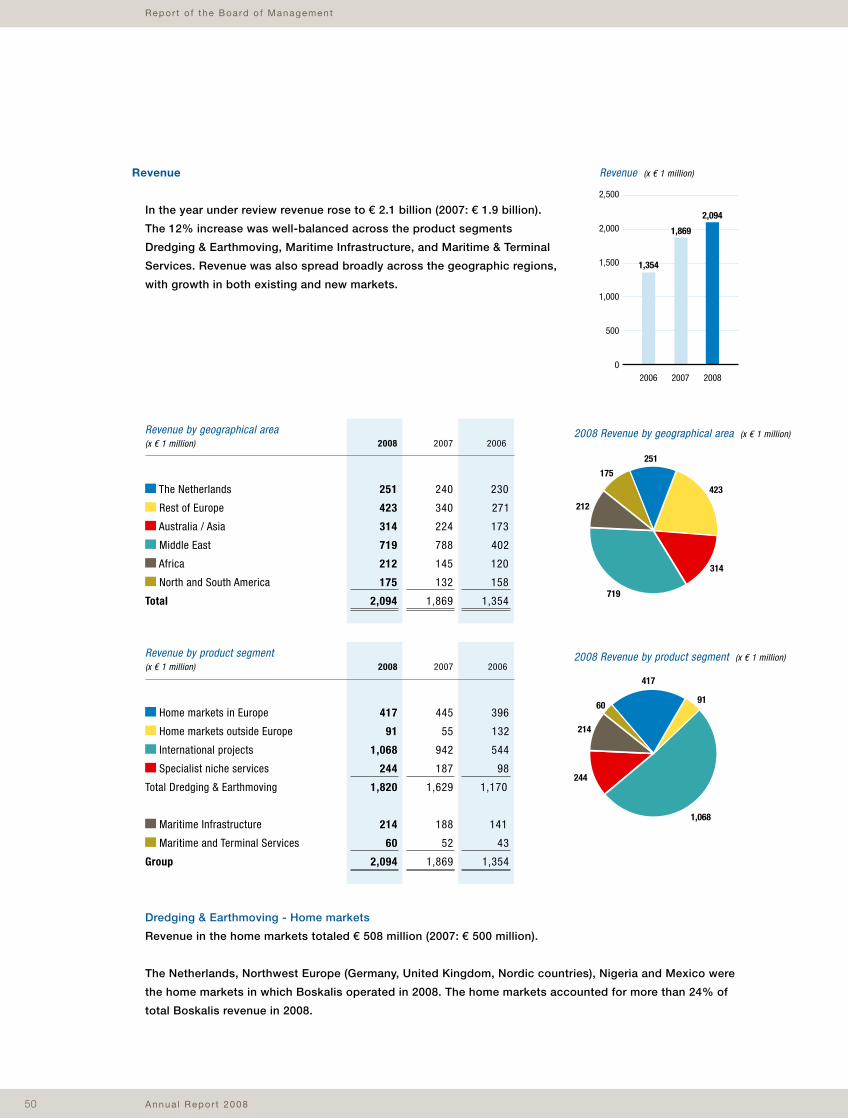
Annua l Repor t 200850
Repor t o f the Board o f Management
Revenue
In the year under review revenue rose to € 2.1 billion (2007: € 1.9 billion).
The 12% increase was well-balanced across the product segments
Dredging & Earthmoving, Maritime Infrastructure, and Maritime & Terminal
Services. Revenue was also spread broadly across the geographic regions,
with growth in both existing and new markets.
Revenue (x € 1 million)
2006 2007 2008
2,500
2,000
1,500
1,000
500
0
2,094
1,354
1,869
Revenue by geographical area (x € 1 million) 2008 2007 2006
251 240 230
423 340 271
314 224 173
719 788 402
212 145 120
175 132 158
2,094 1,869 1,354
The Netherlands
Rest of Europe
Australia / Asia
Middle East
Africa
North and South America
Total
Revenue by product segment (x € 1 million) 2008 2007 2006
417 445 396
91 55 132
1,068 942 544
244 187 98
1,820 1,629 1,170
214 188 141
60 52 43
2,094 1,869 1,354
Home markets in Europe
Home markets outside Europe
International projects
Specialist niche services
Total Dredging & Earthmoving
Maritime Infrastructure
Maritime and Terminal Services
Group
Dredging & Earthmoving - Home markets
Revenue in the home markets totaled € 508 million (2007: € 500 million).
The Netherlands, Northwest Europe (Germany, United Kingdom, Nordic countries), Nigeria and Mexico were
the home markets in which Boskalis operated in 2008. The home markets accounted for more than 24% of
total Boskalis revenue in 2008.
bewerkt voor JV2008
251
423
314
719
212
175
2008 Revenue by geographical area (x € 1 million)
bewerkt voor JV2008
417
91
1,068
244
214
60
2008 Revenue by product segment (x € 1 million)
Roya l Boska l i s Westmins te r nv 51
Repor t o f the Board o f Management
Revenue in the European home markets amounted to € 417 million (2007: € 445 million). The various
European home markets achieved comparable revenue development.
Revenue in the non-European home markets rose 65% to € 91 million (2007: € 55 million), with strong
growth achieved in both the Nigerian and Mexican home markets. In November 2008 Boskalis announced
that it had acquired the remaining shares in its Mexican subsidiary Dragamex. All revenue generated in
Mexico has been consolidated from mid-November.
Dredging & Earthmoving - International project market
Revenue from dredging on the international project market rose 13% to € 1,068 million (2007: € 942 million).
This increase was broadly spread across projects in various regions including Australia, the Middle East,
West Africa and South America.
Dredging & Earthmoving - Specialist niche services
Revenue from the specialist services increased by 30% to € 244 million (2007: € 187 million). The offshore
earthmoving activities for the oil and gas industry performed well in this segment, with notable energy
projects in the Middle East, Russia and India, as well as rock placement activities for oil and gas pipelines
elsewhere.
Maritime Infrastructure
Revenue from Maritime Infrastructure - predominantly generated on industrial and infrastructural projects
in the Middle East through Boskalis’ 40% interest in Archirodon - rose to € 214 million (2007: € 188 million).
Maritime & Terminal Services
Revenue from the energy-driven activities of our 50%-owned subsidiary Lamnalco rose 15%, driven in
part by demand for LNG terminal services. Boskalis’ share in this revenue amounted to € 60 million
(2007: € 52 million).
Order book
The order intake in 2008 (€ 2.3 billion) concerned a large number of projects spread across the world and
the various market segments. Projects that are no longer expected to be executed or are expected to suffer
significant delay, including all projects in Dubai, have been removed from the order book. This resulted in
the removal of around € 450 million worth of revenue, putting the order book at € 3,354 million (end-2007:
€ 3,562 million).
The size of the order book rose particularly in the home markets (+81%) and in the oil and gas-related
activities of Lamnalco (+12%).
Notable new orders included the Maasvlakte 2 in the Netherlands, extension of the port of Felixstowe in the
United Kingdom, the development of the port of Pipavav in India and the development of the coal export
port of Newcastle in Australia.
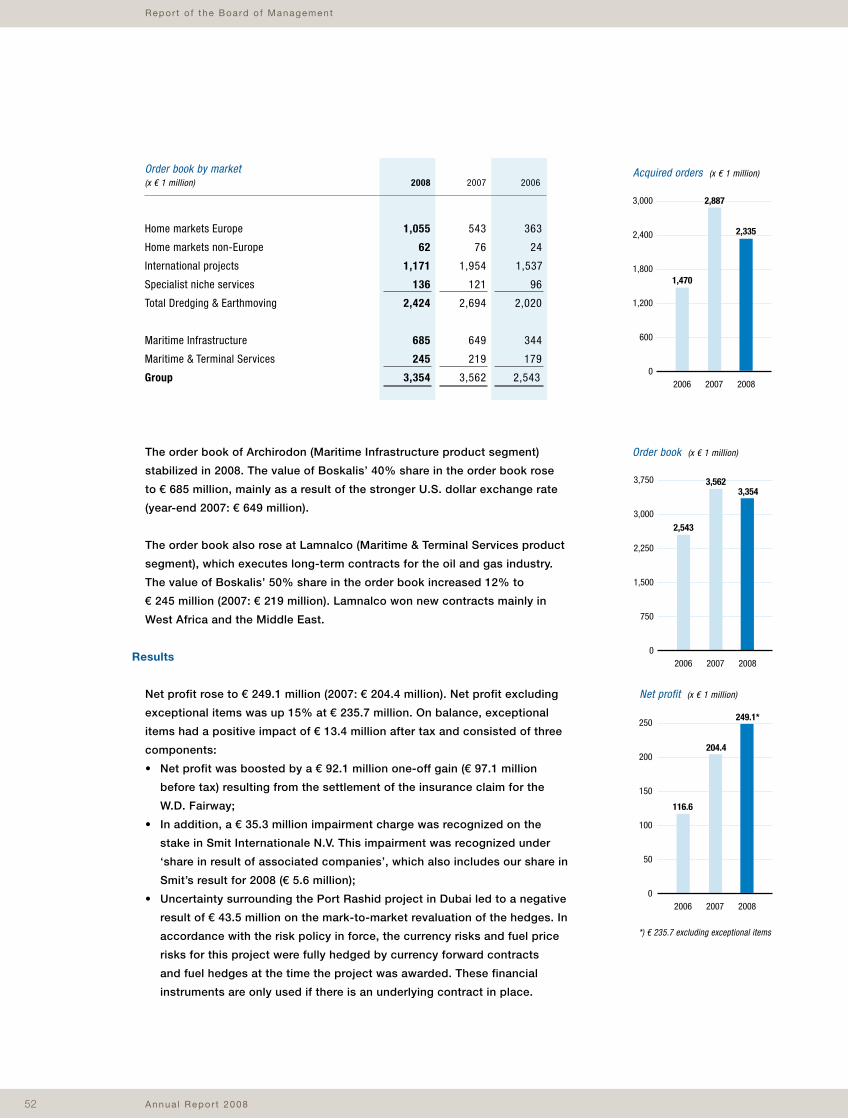
Annua l Repor t 200852
Repor t o f the Board o f Management
2006 2007 2008
250
200
150
100
50
0
249.1*
116.6
204.4
Net profit (x € 1 million)
*) € 235.7 excluding exceptional items
2007 2008
3,3543,562
2006
3,750
3,000
2,250
1,500
750
0
2,543
Order book (x € 1 million)
2006 2007 2008
3,000
2,400
1,800
1,200
600
0
1,470
2,887
Acquired orders (x € 1 million)
2,335
Order book by market (x € 1 million)
Home markets Europe
Home markets non-Europe
International projects
Specialist niche services
Total Dredging & Earthmoving
Maritime Infrastructure
Maritime & Terminal Services
Group
The order book of Archirodon (Maritime Infrastructure product segment)
stabilized in 2008. The value of Boskalis’ 40% share in the order book rose
to € 685 million, mainly as a result of the stronger U.S. dollar exchange rate
(year-end 2007: € 649 million).
The order book also rose at Lamnalco (Maritime & Terminal Services product
segment), which executes long-term contracts for the oil and gas industry.
The value of Boskalis’ 50% share in the order book increased 12% to
€ 245 million (2007: € 219 million). Lamnalco won new contracts mainly in
West Africa and the Middle East.
Results
Net profit rose to € 249.1 million (2007: € 204.4 million). Net profit excluding
exceptional items was up 15% at € 235.7 million. On balance, exceptional
items had a positive impact of € 13.4 million after tax and consisted of three
components:
• Net profit was boosted by a € 92.1 million one-off gain (€ 97.1 million
before tax) resulting from the settlement of the insurance claim for the
W.D. Fairway;
• In addition, a € 35.3 million impairment charge was recognized on the
stake in Smit Internationale N.V. This impairment was recognized under
‘share in result of associated companies’, which also includes our share in
Smit’s result for 2008 (€ 5.6 million);
• Uncertainty surrounding the Port Rashid project in Dubai led to a negative
result of € 43.5 million on the mark-to-market revaluation of the hedges. In
accordance with the risk policy in force, the currency risks and fuel price
risks for this project were fully hedged by currency forward contracts
and fuel hedges at the time the project was awarded. These financial
instruments are only used if there is an underlying contract in place.
2008 2007 2006
1,055 543 363
62 76 24
1,171 1,954 1,537
136 121 96
2,424 2,694 2,020
685 649 344
245 219 179
3,354 3,562 2,543
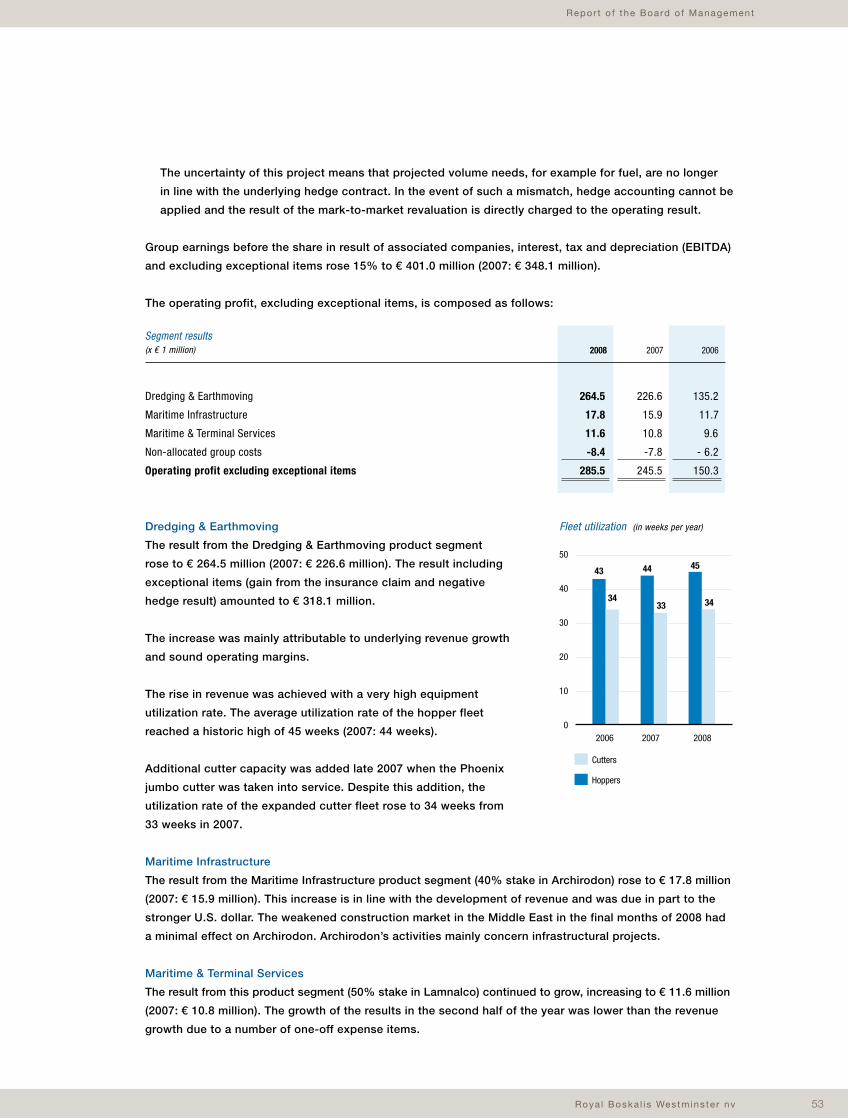
Roya l Boska l i s Westmins te r nv 53
Repor t o f the Board o f Management
The uncertainty of this project means that projected volume needs, for example for fuel, are no longer
in line with the underlying hedge contract. In the event of such a mismatch, hedge accounting cannot be
applied and the result of the mark-to-market revaluation is directly charged to the operating result.
Group earnings before the share in result of associated companies, interest, tax and depreciation (EBITDA)
and excluding exceptional items rose 15% to € 401.0 million (2007: € 348.1 million).
The operating profit, excluding exceptional items, is composed as follows:
264.5 226.6 135.2
17.8 15.9 11.7
11.6 10.8 9.6
-8.4 -7.8 - 6.2
285.5 245.5 150.3
2007 20062008
Dredging & Earthmoving
Maritime Infrastructure
Maritime & Terminal Services
Non-allocated group costs
Operating profit excluding exceptional items
Segment results (x € 1 million)
Dredging & Earthmoving
The result from the Dredging & Earthmoving product segment
rose to € 264.5 million (2007: € 226.6 million). The result including
exceptional items (gain from the insurance claim and negative
hedge result) amounted to € 318.1 million.
The increase was mainly attributable to underlying revenue growth
and sound operating margins.
The rise in revenue was achieved with a very high equipment
utilization rate. The average utilization rate of the hopper fleet
reached a historic high of 45 weeks (2007: 44 weeks).
Additional cutter capacity was added late 2007 when the Phoenix
jumbo cutter was taken into service. Despite this addition, the
utilization rate of the expanded cutter fleet rose to 34 weeks from
33 weeks in 2007.
Maritime Infrastructure
The result from the Maritime Infrastructure product segment (40% stake in Archirodon) rose to € 17.8 million
(2007: € 15.9 million). This increase is in line with the development of revenue and was due in part to the
stronger U.S. dollar. The weakened construction market in the Middle East in the final months of 2008 had
a minimal effect on Archirodon. Archirodon’s activities mainly concern infrastructural projects.
Maritime & Terminal Services
The result from this product segment (50% stake in Lamnalco) continued to grow, increasing to € 11.6 million
(2007: € 10.8 million). The growth of the results in the second half of the year was lower than the revenue
growth due to a number of one-off expense items.
Hoppers
Cutters
Fleet utilization (in weeks per year)
2006 2007 2008
50
40
30
20
10
0
33
44
34
45
34
43
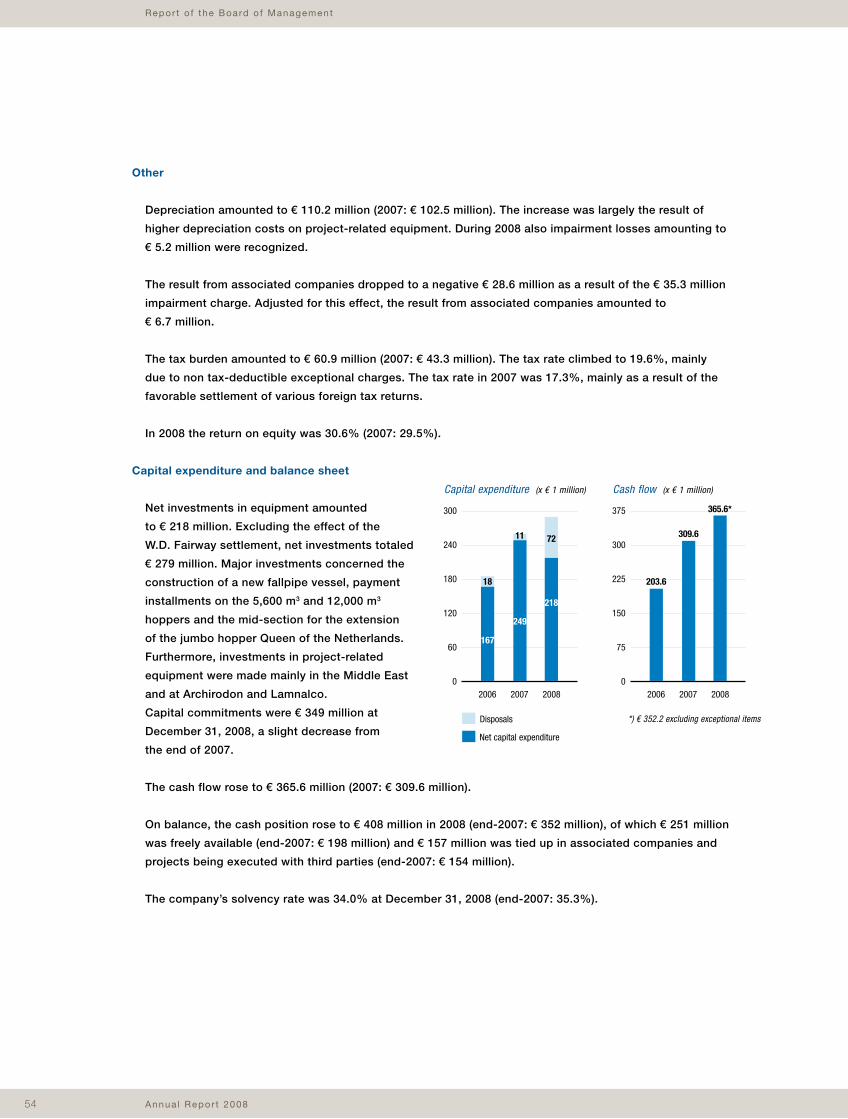
Annua l Repor t 200854
Repor t o f the Board o f Management
Other
Depreciation amounted to € 110.2 million (2007: € 102.5 million). The increase was largely the result of
higher depreciation costs on project-related equipment. During 2008 also impairment losses amounting to
€ 5.2 million were recognized.
The result from associated companies dropped to a negative € 28.6 million as a result of the € 35.3 million
impairment charge. Adjusted for this effect, the result from associated companies amounted to
€ 6.7 million.
The tax burden amounted to € 60.9 million (2007: € 43.3 million). The tax rate climbed to 19.6%, mainly
due to non tax-deductible exceptional charges. The tax rate in 2007 was 17.3%, mainly as a result of the
favorable settlement of various foreign tax returns.
In 2008 the return on equity was 30.6% (2007: 29.5%).
Capital expenditure and balance sheet
Net investments in equipment amounted
to € 218 million. Excluding the effect of the
W.D. Fairway settlement, net investments totaled
€ 279 million. Major investments concerned the
construction of a new fallpipe vessel, payment
installments on the 5,600 m3 and 12,000 m3
hoppers and the mid-section for the extension
of the jumbo hopper Queen of the Netherlands.
Furthermore, investments in project-related
equipment were made mainly in the Middle East
and at Archirodon and Lamnalco.
Capital commitments were € 349 million at
December 31, 2008, a slight decrease from
the end of 2007.
The cash flow rose to € 365.6 million (2007: € 309.6 million).
On balance, the cash position rose to € 408 million in 2008 (end-2007: € 352 million), of which € 251 million
was freely available (end-2007: € 198 million) and € 157 million was tied up in associated companies and
projects being executed with third parties (end-2007: € 154 million).
The company’s solvency rate was 34.0% at December 31, 2008 (end-2007: 35.3%).
Cash flow (x € 1 million)
2006 2007 2008
375
300
225
150
75
0
203.6
309.6
365.6*
*) € 352.2 excluding exceptional items
Capital expenditure (x € 1 million)
2006 2007 2008
300
240
180
120
60
0
167
18
11
249
218
72
Net capital expenditure
Disposals
Roya l Boska l i s Westmins te r nv 55
Repor t o f the Board o f Management
Strategy update
Boskalis’ strategy is aimed at preparing the company for the opportunities and challenges it faces as a
leader in the dynamic global market for dredging and maritime infrastructure.
The outlook for our market segments is driven by structural long-term growth factors: the development
of global trade; rising energy consumption and transport of LNG; pressures from expanding populations
and the challenges presented by climate change. Despite a slowdown in short-term growth, the long-term
prospects remain positive.
In the coming years, Boskalis will increasingly focus its business portfolio on three market segments:
Oil & Gas, Ports and Land Reclamation & Coastal Protection.
A growing number of customers in these market segments require an integrated, multidisciplinary approach
to their projects. Instead of maintaining a traditional product-oriented approach, Boskalis is shifting
towards a market and value-focused strategy. In doing so Boskalis is focusing on markets with relatively
high growth and earnings potential, and the portfolio is expanding towards activities with more added
value.
In order to develop a more comprehensive services proposition, it is essential to strengthen and expand
the core activities. Core expansion will be achieved through organic growth as well as acquisitions and
alliances.
Smit Internationale N.V.
The interest that Boskalis has expressed in parts of Smit Internationale N.V. ensues from this value-driven
growth strategy. Boskalis is mainly interested in the Smit businesses that support the realization of this
strategy.
By acquiring Smit, we could make Lamnalco the global market leader in terminal services. Furthermore, we
could extend and strengthen our rapidly growing and attractive offshore business in line with the needs of
our clients.
Against this background, Boskalis expressed an interest in parts of Smit on September 15, 2008. In the
subsequent months, we consulted with Smit’s Board of Management and potential partners.
To date, these efforts have not resulted in the takeover of the targeted activities. However, we will explore
further possibilities to accomplish this.
Proposed profit appropriation
To the retained earnings will be added € 146.9 million. The proposal to the Annual General Meeting will be
to appropriate the remainder, € 102.2 million, for a dividend payment of € 1.19 per share.
The dividend will be made payable in ordinary shares to the debit of the share premium free of tax or to the
debit of the retained earnings, unless a shareholder expressly request payment in cash.
Annua l Repor t 200856
Repor t o f the Board o f Management
Policy and Operational Matters
Personnel & Organization
Boskalis strives to be the employer of choice within the dredging and marine contracting sector. In 2008 we
focused our recruitment activities on attracting, training and retaining the industry’s best and most skilled
people into our organization as we expand the scope of our operations.
Our workforce is growing and becoming more international and we therefore endeavor to offer first-rate
education, training and career development opportunities.
Labor Market Strategy and Recruitment
To address the scarcity of qualified personnel we developed several internal and external training and
development programs. We also looked to geographical regions outside of the tight European labor
markets for suitable candidates. For example, in 2008 we forged ties with the Admiral Makarov State
Maritime Academy in St. Petersburg, Russia, from which we have begun to recruit cadets.
Staff Development and Training
The increasing complexity of the projects we undertake demands the highest levels of professionalism.
We are responding to this with training that emphasizes both professional and personal development. Our
training programs are aimed at both young graduates who are new to our business and at developing the
people who already work for us.
Trainee programs
In 2008 we launched two trainee programs. Both run for 14 months. The first program, launched in
February, is for international graduates. The second, which started in September, is more for the local
Dutch graduate market. The programs cover the theoretical aspects of project management, project
finance, personal effectiveness and leadership. The programs also include on-the-job training, with the
trainees working on three different projects for three-month periods at a time. We carefully select around
40 graduates a year. Fifteen trainees are participating in the international program.
Furthermore, we established a trainee program for surveyors, oriented towards international graduates with
a background in hydrography. We have seen good results from this program.
Sandfill master and cutter dredger skippers programs
We also developed our own in-house programs to train sandfill masters and cutter dredger skippers,
two crucial vocations for which no external training exists. The theoretical part of the program was
developed by the Shipping and Transport College (STC) of Rotterdam, while Boskalis provided work
experience on projects under the supervision of senior staff. We trained 14 sandfill masters in 2008 and
10 cutter dredger skippers.
56
Roya l Boska l i s Westmins te r nv 57
Repor t o f the Board o f Management
International Dredging Academy
In 2008 we again ran three successful modules at the International Dredging Academy (IDA), a joint venture
with the STC. The advanced dredging training is aimed at people with a maritime background but with no
prior experience working on dredging vessels. Most of them are from countries outside the Netherlands,
including the Baltic States, Russia and the Philippines.
Boskalis Maritime Development Program
This year we launched the first edition of our new Boskalis Maritime Development Program (BMDP)
designed for captains and chief engineers working onboard ships in our fleet. The two-year course
aims to enhance technical skills as well as improve leadership, team building and personal effectiveness.
A positive spin-off from the program is the informal maritime community of practice created by the
22 participants which they can use to share knowledge and best practice.
Boskalis Operational Development Program
In November we concluded the first Boskalis Operational Development Program (BODP), which began at
the end of 2006. The Advanced Track of the program aimed to develop younger project managers with
the potential to manage more complex projects in the future while the Master Track focused on preparing
senior project managers for roles as project directors. The aim is to teach participants to function as
‘new-style project managers’ with more vision, insight and knowledge of how to run complex projects.
This training will ensure we always have the right in-house skills to maintain our strategic focus on being
a leading provider of integrated infrastructure and maritime services. The program has also given rise to
a community of practice that project managers can use to share knowledge and experience and provide
support and peer coaching.
In 2009 we will run three new BODP programs - two advanced programs in the Netherlands and one for
the European home markets. Future editions of the program will be expanded beyond enhancing leadership
skills to include more practical aspects such as contract management and finance.
Best Technical Traineeship in 2008
In recognition of our dedication to training and staff development, Boskalis was awarded the accolade
for Best Technical Traineeship in The Netherlands in 2008, beating nine other well-known companies.
Workforce Size
In 2008, the average size of the Boskalis workforce was 9,389; the figure at year-end 2008 was
10,201 (8,577 at year-end 2007). The increase is mainly due to some large projects and the fact that
Mexico has been consolidated wholly from mid-November.
Annua l Repor t 200858
Repor t o f the Board o f Management
Safety, Health, Environment & Quality: SHE-Q
Safety, Health, Environment & Quality (SHE-Q) has always been our top priority. As the scope of our
operations widens and our projects become bigger and more complex, the importance of SHE-Q will only
increase. We constantly strive to improve the SHE-Q systems we use and to optimize the way we manage
our operational safety and quality issues, while at the same time minimizing the possible environmental
impact of our activities.
We have set specific objectives at every level of our organization, from corporate down to individual
projects, which allow us to continuously measure and improve our SHE-Q performance.
We are committed to achieving the highest safety standards and communicate an active safety message to
everyone who works for and with us. This includes themed information campaigns, monthly management
meetings and quarterly safety reviews by senior corporate management. SHE-Q leadership by our line
management is a key issue and this is exemplified by senior managers and project managers personally
conducting safety audits of projects.
Certification
We are committed to maintaining the highest standards in SHE-Q. We are certified with the international
environmental quality standard ISO 14001, the occupational health and safety standard OHSAS 18001 and
the internationally recognized standard for business management, ISO 9001. We have held the latter since
the 1990s. These certifications guarantee our commitment to excellence.
During 2008 we carried out a targeted program of safety, health, environment and quality audits, involving
40 extensive internal and external audits of projects and local offices worldwide. In addition, we carried out
approximately 50 International Safety Management (ISM) certification audits on our ships.
Further Developments in 2008
As the scope of our operations widens and our projects become bigger and more complex, so the risks
change, and SHE-Q requirements become stricter. In response, in 2008 we began a review of our SHE-Q
management system. This will be completed in 2009 and based on the outcome we will realign the entire
system to ensure we meet the high standards we strive for.
Bigger and more complicated projects also mean there is an increasing demand for specialist SHE-Q
knowledge. In order to be able to meet this demand we have expanded our pool of internal specialists who
advise on project-related SHE-Q issues.
During 2008, Boskalis reflagged most of its vessels from Dutch to Cypriot colors. This involved an
extensive internal and external safety audit of every vessel. It goes without saying that the high standards
we set for SHE-Q systems onboard our ships will not be affected by the reflagging.
Roya l Boska l i s Westmins te r nv 59
Repor t o f the Board o f Management
Finally, we formed a project team comprising various line managers and staff department representatives
to list ways to further improve our performance on safety. We have made huge strides in this area over
the past years but believe we can achieve an even higher standard. The project team will present a safety
performance improvement program in 2009.
To ensure we continuously improve our SHE-Q performance we set new targets at corporate, business unit
and project level. Progress is monitored by means of structural periodical reporting to senior management.
Enhanced Communication and Training
To further increase safety awareness across the organization we put extensive effort into communications
about safety, using various media and tools. Our aim is to ensure our entire staff is safety conscious.
During 2008 we continued our ‘MANSafe’ safety awareness training program and the training was given
on approximately 50 projects worldwide. In all, 1,200 employees have been trained so far. This meant that
by the end of the year we achieved our target to train 80% of the relevant staff positions. We are now
developing a new program that is focused on safety behavior and communicating about safety on
a project.
To ensure our high safety standards and procedures are adhered to, and also to further improve awareness
and performance, senior managers conducted over 100 safety inspections during 2008.
Recognition through awards
Individual safety performance is an integral part of our remuneration policy. As in previous years the
Management Board presented the Annual Safety Award to the employee with the best idea for safety
improvement.
In 2008, as in the previous year, our operating company in the United Kingdom, Westminster Dredging
Company, received two prestigious awards: the Gold Occupational Health and Safety Award from the
Royal Society for the Prevention of Accidents and the British Safety Council Award from the British Safety
Council. These accolades are an acknowledgement of our successful efforts in the area of safety, health
and the environment.
Lost-Time Injury Frequency figure
Boskalis continues to gradually decrease its accident rate, calculated as the number of lost-time injuries
per one million working hours. In 2008, our LTIF figure was reduced to 4.7, compared with 5.9 in 2007,
7.7 in 2006 and 14.3 in 2000. This represents a reduction in the accident rate of over 60% in eight years.
Annua l Repor t 200860
Repor t o f the Board o f Management
Equipment
Continued high demand for our services in 2008 meant that care in both planning and logistics was
required to ensure the right equipment was available and in a good technical condition wherever and
whenever it was needed. Our priority is to ensure our large and diverse fleet is in good working order and
maintained in a cost-effective way. To this end we introduced a value-driven maintenance management
tool, which was successfully piloted on five ships and will now be rolled out to the entire fleet.
The project to reflag about 60 vessels in our fleet under the Cypriot flag started in March 2008 and is
scheduled to conclude in March 2009. This reduces our tax burden and makes for more efficient fleet
management.
In 2008 we also launched a project to measure the types and volume of emissions from our ships as part
of our research into ways to contain operational exhaust and waste.
Fleet Expansion
In 2008 we took delivery of the Crestway, a 5,600 m³ trailing suction hopper dredger used primarily for
port maintenance and beach replenishment. She is performing well and her sister ship, the Shoreway, is
due to enter service in the first quarter of 2009. In 2008, construction started on a larger trailing suction
hopper dredger with a capacity of 12,000 m³, which will be launched in 2009. We also ordered a third
fallpipe vessel due to come into service in 2011. Construction work on the rock placement system for
this fallpipe vessel began in mid-December. This new 21,500 ton vessel will strengthen our position in the
energy markets as it will be able to work at much greater depths (up to 2,000 meter) than existing vessels
in this sector.
In addition, in November 2008 we began the process of lengthening our largest hopper the Queen of the
Netherlands to expand her capacity by 50% to 35,500 m³. The ship was cut in half in Singapore and a
50-meter mid-section added. The extension was done without any disruption to projects and the Queen
of the Netherlands returned to service as a mega hopper in March 2009. The extension has strengthened
Boskalis’ competitive position in a part of the market which is characterized by large volumes, long sailing
distances and deep dredging depths.
Fleet Management
‘Value Driven Maintenance’, a new cost-efficient way of managing and coordinating the maintenance of our
fleet was successfully piloted on five ships during 2008. With the aid of Value Driven Maintenance we can
predict when essential maintenance needs to be carried out. Knowing this in advance means we can make
sure we have the right people and the right parts on board at the right time.
Value Driven Maintenance is implemented via the Maximo IT system. This system also allows crews
aboard the vessels to coordinate their purchasing requirements and shows at a glance where spare parts
are available. Parts are stored at our logistic headquarters at Papendrecht in the Netherlands, our new
logistics center for the Middle East in Mussafah, Abu Dhabi, or at our storage centre on Batam, Indonesia.
Supplying spare parts from various locations across the world enables us to keep our transport costs down
and makes it cheaper and easier for ships to access them. This further enhances efficiency.
Roya l Boska l i s Westmins te r nv 61
Repor t o f the Board o f Management
With this system we can guarantee to have the right equipment on hand at the right place and in good
working order to support our projects worldwide. The Maximo system will now be upgraded and Value
Driven Maintenance rolled out across the fleet as we further professionalize and optimize our fleet
management processes.
Globalized Sourcing
In a further step to improve our efficiency in 2008 we sourced even more materials and spare parts from
outside Europe, for example from China, India, Turkey, the Middle East and South Korea. This has meant
lower prices and faster delivery times without quality being compromised.
Furthermore, we hired more international maintenance and project staff in 2008, which proved more
cost-effective than transferring Dutch staff to other regions.
Research & Development
Technical innovation lies at the heart of what we do. Our clients look to us to find cutting edge solutions
to meet their specific requirements. Our technological expertise also enables us to further improve our
efficiency and develop cost-effective work methods. Our state-of-the-art know-how and technical abilities
keep us at the forefront of our industry and give us an edge over our competitors.
Ripper Draghead
In 2008 we successfully applied our innovative ripper draghead on our trailing suction hopper dredger, the
Queen of the Netherlands, for the Port of Melbourne project in Australia. Phase 1 of the project involved
deepening the entrance at Port Phillip Bay to improve access for larger container vessels with a draft of up
to 14 meters.
The deepening of the entrance involved dredging through varying strengths of layered limestone. In addition,
the dredging had to be done in strong and complex currents with waves of up to three meters and in the
midst of heavy shipping traffic. The dredging area is also located near a marine nature reserve so we had
to minimize the environmental impact of the dredging on the surrounding sealife. These conditions meant
a conventional stationary cutter dredger was unsuitable and led to us developing an innovative solution for
dredging hard rock in very turbulent waters: the ripper draghead.
Dredging began in April 2008 and by mid-September the Queen of the Netherlands had dredged a total of
461,000 m³ rock. On December 19, 2008, the dredging work at the entrance was officially approved and
concluded. The CEO of the Port of Melbourne described the work to date as “an achievement on a major
scale. To carry out this work at the Entrance on schedule and within budget is a significant achievement
when you consider that prior to this project it was not known technically whether the dredging could
actually be done.”
61
Annua l Repor t 200862
Optimizing loading
In 2008 we also embarked upon a project aimed at optimizing the way we load barges alongside cutter
dredgers and hopper dredgers. The objective of the study is to minimize the loss of material that
occurs naturally during the loading process. Reducing the overflow will improve efficiency and minimize
environmental impact. In 2008 we applied the findings of the study to barges loaded alongside cutter
dredgers on a project in Khalifa Port in Abu Dhabi. We are now looking at concepts to increase the
flexibility and productivity of loading barges alongside hopper dredgers.
Fill Areas
Furthermore, in 2008 we extended our study into ‘fill areas’ - designated areas for containing dredged
material for land reclamation. Fill areas require sufficient strength and bearing capacity to support
construction. In some locations, a proportion of the material produced is too fine for this and has to be
discharged. Using the research concepts, we constructed a fill area where the fine material was used and
the quality of the reclaimed land was vastly improved by the way this fine material was deposited. For this
purpose we developed a special spray pontoon to minimize the erosion of previously applied layers. This
technique was based on laboratory tests carried out in The Netherlands and calculations of the flow of
material. Being able to use all material in the fill area by no longer having to discard the fine material has
improved our efficiency.
‘Building with Nature’ research program
In 2008, Boskalis continued its efforts within ‘Building with Nature’, a five-year innovation program for the
development of new design concepts for the layout and sustainable exploitation of river, coastal and delta
areas. This is a joint program with Dutch companies, the Dutch government, universities and knowledge
institutions. 2008 saw the foundation of EcoShape, which is responsible for realizing the Building with
Nature program, and the start of this foundation’s first research projects. These include PhD studies at
various universities and knowledge institutions. In 2009, there will be a stronger focus on applied research
within the innovation program. Boskalis is contributing to both the program governance and the execution
of case studies, for example of the Dutch coast and Singapore. The program’s objective is to develop
accepted practices, based on sound knowledge and expertise, which will allow ecological considerations
to be included in the design and realization of coastal and river projects. Participation in this program
creates the opportunity for Boskalis to take a leading position in the application of these practices and to
anticipate market demand for sustainable development.
Information & Communication Technology (ICT)
We continue to build on advances in ICT systems and processes to boost efficiency and knowledge
sharing across our global operations. Advances in ICT are providing us with the tools necessary to tackle
larger and more complex projects.
During 2008 significant progress was made in the development of our innovative ‘Enterprise Portals’.
These are tailor-made for specific stakeholders and allow information to be organized and shared
anywhere in the world, at any time, using any device. This is particularly valuable for complex projects
that involve teams working in different locations, as it makes for more efficient cooperation.
Repor t o f the Board o f Management
Roya l Boska l i s Westmins te r nv 63
During the course of the year we laid the groundwork for implementing the prototype portals. We
implemented the technology on which to build them and devised a roadmap for their development
and delivery. The ICT department worked closely with senior management on issues of security and
authorization in connection with the formalization of a new safety policy.
In 2008 we refined and finalized the prototype portals developed in 2007 for Project Management
and Estimating & Tendering. In addition, we built two new prototype portals. The Human Resources
Management portal allows users to find the right people with the right knowledge required for specific
projects. The Communities of Practice portal is particularly valuable for sharing knowledge across the
business, which is a key focus of our 2006-2010 Information Plan.
The concept of Communities of Practice was introduced at the end of 2008 in our rock works operations,
one of the areas Boskalis aims to expand as it broadens its base.
With these and other activities ICT will be integrated even further with the rest of the business.
Standardizing and centralizing information, systems and processes increases efficiency and productivity
and allows for better knowledge sharing across the company.
Outlook
After years of boisterous growth we are set for a period of stagnation. Boskalis is entering this period with
a well-filled and broadly spread order book, resulting in sound fleet utilization levels for 2009 and even
part of 2010. This gives Boskalis the time and flexibility to proactively streamline the organization for these
changed market conditions. Measures under consideration in this context include the decommissioning of
older ships and tightening the overall cost structure.
Boskalis’ financial position is extremely sound, meaning that the company will be able to finance planned
investments - amounting to around € 200-250 million per year – mostly from its own cash resources in the
coming years.
As in previous years, we are unable to provide a specific forecast for the coming year due to the project-
based nature of our work. We do, however, anticipate that 2009 earnings will be lower than the record
levels achieved in 2008.
Repor t o f the Board o f Management
Annua l Repor t 200864
Repor t o f the Board o f Management
In conclusion
2008 has been the best year in our history, with record revenue and profit. We were able to reap the fruits
of the strategy we pursued in previous years. The Board of Management thanks the employees for their
dedication and enthusiasm in the past year.
Papendrecht / Sliedrecht, March 17, 2009
Board of Management
dr. P.A.M. Berdowski
T.L. Baartmans
J.H. Kamps
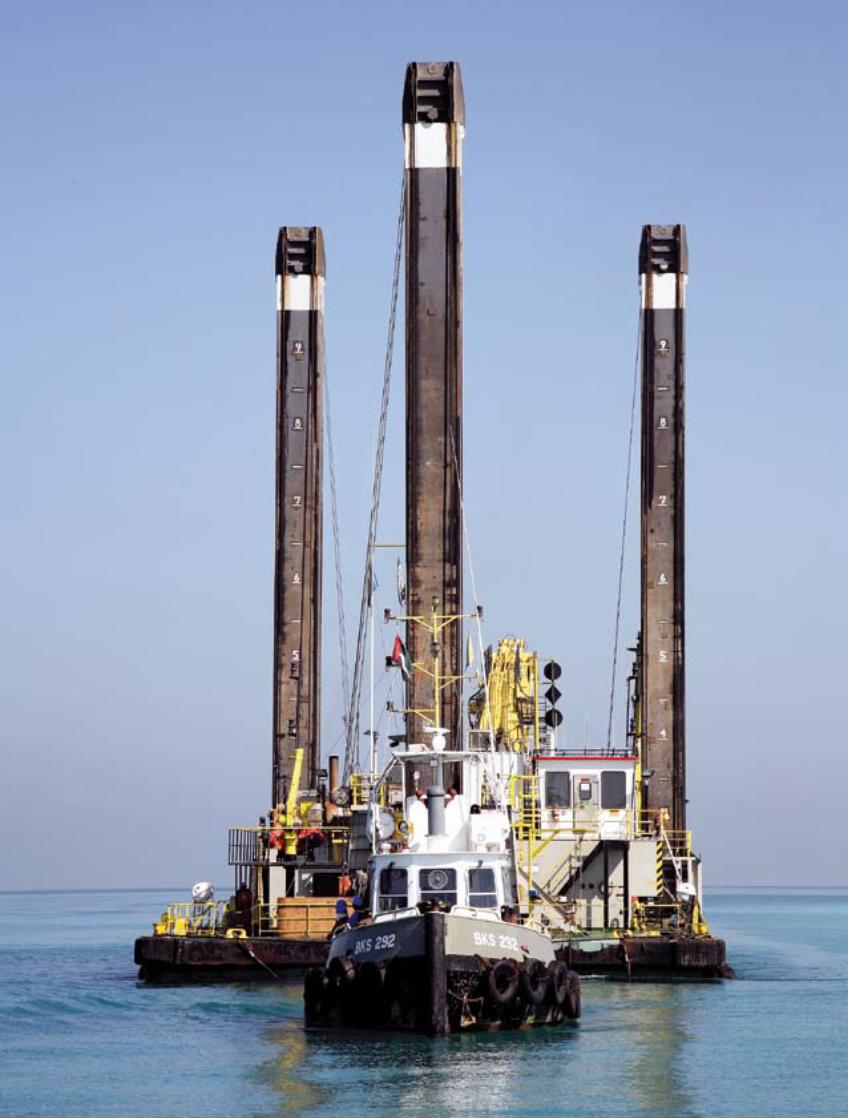
65
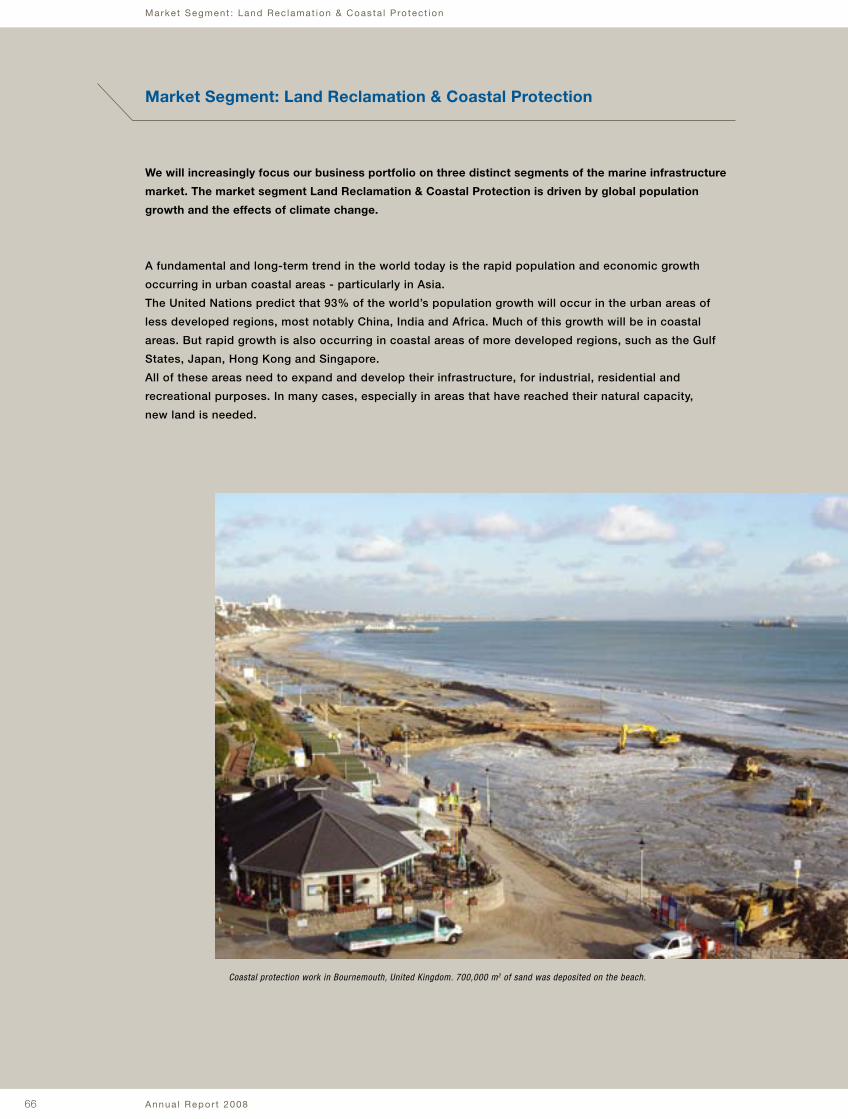
66
Market Segment: Land Reclamation & Coastal Protection
Annua l Repor t 2008
We will increasingly focus our business portfolio on three distinct segments of the marine infrastructure
market. The market segment Land Reclamation & Coastal Protection is driven by global population
growth and the effects of climate change.
A fundamental and long-term trend in the world today is the rapid population and economic growth
occurring in urban coastal areas - particularly in Asia.
The United Nations predict that 93% of the world’s population growth will occur in the urban areas of
less developed regions, most notably China, India and Africa. Much of this growth will be in coastal
areas. But rapid growth is also occurring in coastal areas of more developed regions, such as the Gulf
States, Japan, Hong Kong and Singapore.
All of these areas need to expand and develop their infrastructure, for industrial, residential and
recreational purposes. In many cases, especially in areas that have reached their natural capacity,
new land is needed.
Market Segment : Land Rec lamat ion & Coasta l P ro tec t ion
Coastal protection work in Bournemouth, United Kingdom. 700,000 m2 of sand was deposited on the beach.
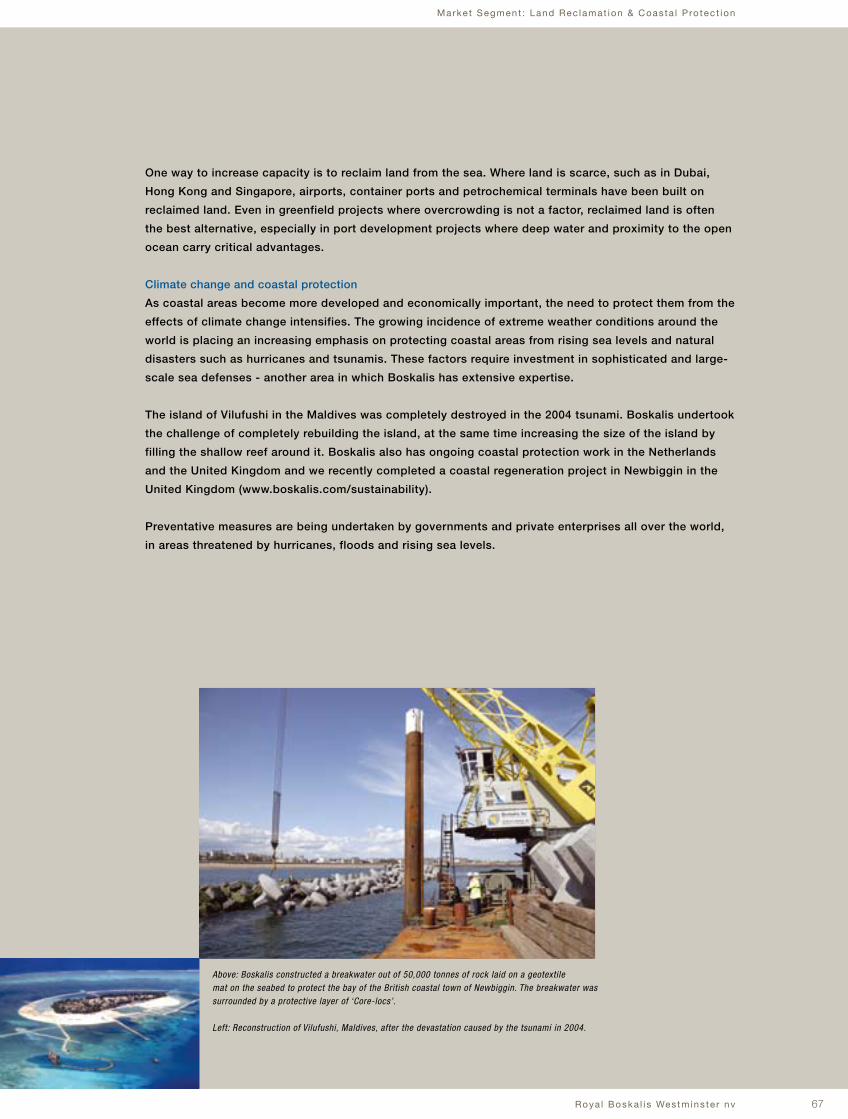
67Roya l Boska l i s Westmins te r nv
One way to increase capacity is to reclaim land from the sea. Where land is scarce, such as in Dubai,
Hong Kong and Singapore, airports, container ports and petrochemical terminals have been built on
reclaimed land. Even in greenfield projects where overcrowding is not a factor, reclaimed land is often
the best alternative, especially in port development projects where deep water and proximity to the open
ocean carry critical advantages.
Climate change and coastal protection
As coastal areas become more developed and economically important, the need to protect them from the
effects of climate change intensifies. The growing incidence of extreme weather conditions around the
world is placing an increasing emphasis on protecting coastal areas from rising sea levels and natural
disasters such as hurricanes and tsunamis. These factors require investment in sophisticated and large-
scale sea defenses - another area in which Boskalis has extensive expertise.
The island of Vilufushi in the Maldives was completely destroyed in the 2004 tsunami. Boskalis undertook
the challenge of completely rebuilding the island, at the same time increasing the size of the island by
filling the shallow reef around it. Boskalis also has ongoing coastal protection work in the Netherlands
and the United Kingdom and we recently completed a coastal regeneration project in Newbiggin in the
United Kingdom (www.boskalis.com/sustainability).
Preventative measures are being undertaken by governments and private enterprises all over the world,
in areas threatened by hurricanes, floods and rising sea levels.
Market Segment : Land Rec lamat ion & Coasta l P ro tec t ion
Above: Boskalis constructed a breakwater out of 50,000 tonnes of rock laid on a geotextile mat on the seabed to protect the bay of the British coastal town of Newbiggin. The breakwater was surrounded by a protective layer of ‘Core-locs’.
Left: Reconstruction of Vilufushi, Maldives, after the devastation caused by the tsunami in 2004.
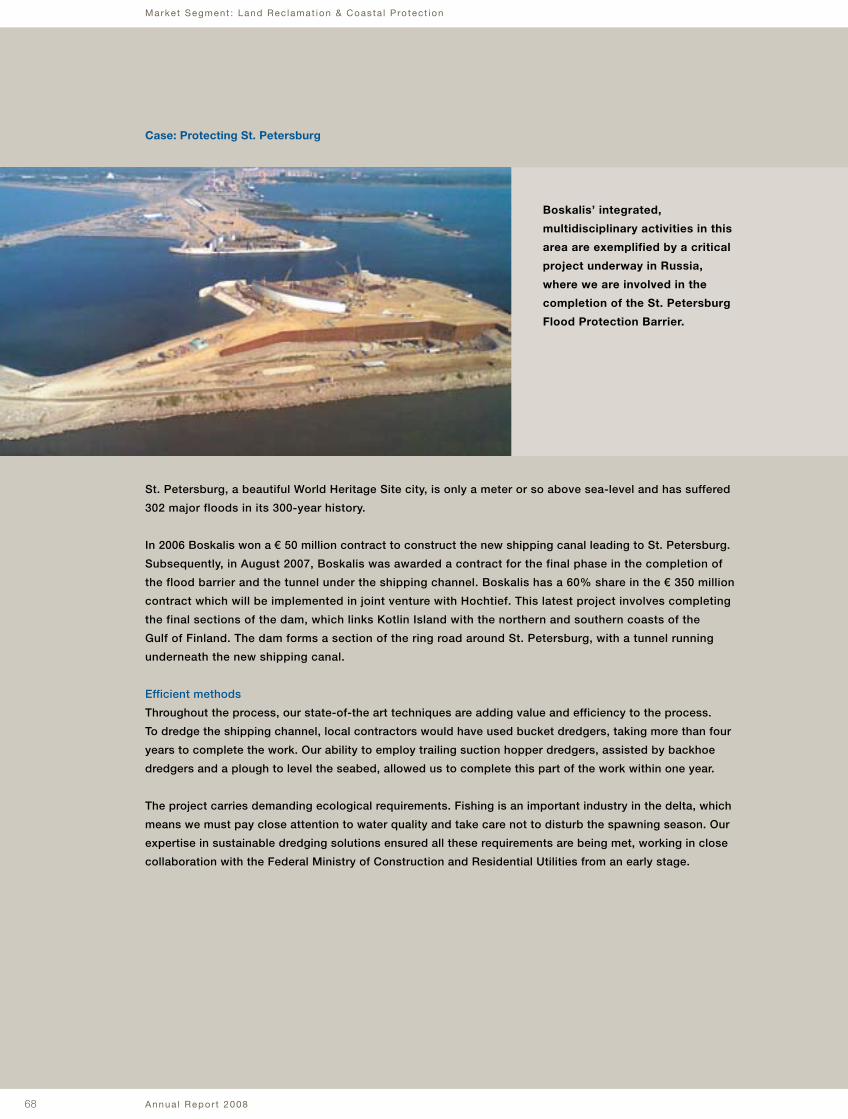
68 Annua l Repor t 2008
Marke t Segment : Land Rec lamat ion & Coasta l P ro tec t ion
St. Petersburg, a beautiful World Heritage Site city, is only a meter or so above sea-level and has suffered
302 major floods in its 300-year history.
In 2006 Boskalis won a € 50 million contract to construct the new shipping canal leading to St. Petersburg.
Subsequently, in August 2007, Boskalis was awarded a contract for the final phase in the completion of
the flood barrier and the tunnel under the shipping channel. Boskalis has a 60% share in the € 350 million
contract which will be implemented in joint venture with Hochtief. This latest project involves completing
the final sections of the dam, which links Kotlin Island with the northern and southern coasts of the
Gulf of Finland. The dam forms a section of the ring road around St. Petersburg, with a tunnel running
underneath the new shipping canal.
Efficient methods
Throughout the process, our state-of-the art techniques are adding value and efficiency to the process.
To dredge the shipping channel, local contractors would have used bucket dredgers, taking more than four
years to complete the work. Our ability to employ trailing suction hopper dredgers, assisted by backhoe
dredgers and a plough to level the seabed, allowed us to complete this part of the work within one year.
The project carries demanding ecological requirements. Fishing is an important industry in the delta, which
means we must pay close attention to water quality and take care not to disturb the spawning season. Our
expertise in sustainable dredging solutions ensured all these requirements are being met, working in close
collaboration with the Federal Ministry of Construction and Residential Utilities from an early stage.
Boskalis’ integrated,
multidisciplinary activities in this
area are exemplified by a critical
project underway in Russia,
where we are involved in the
completion of the St. Petersburg
Flood Protection Barrier.
Case: Protecting St. Petersburg
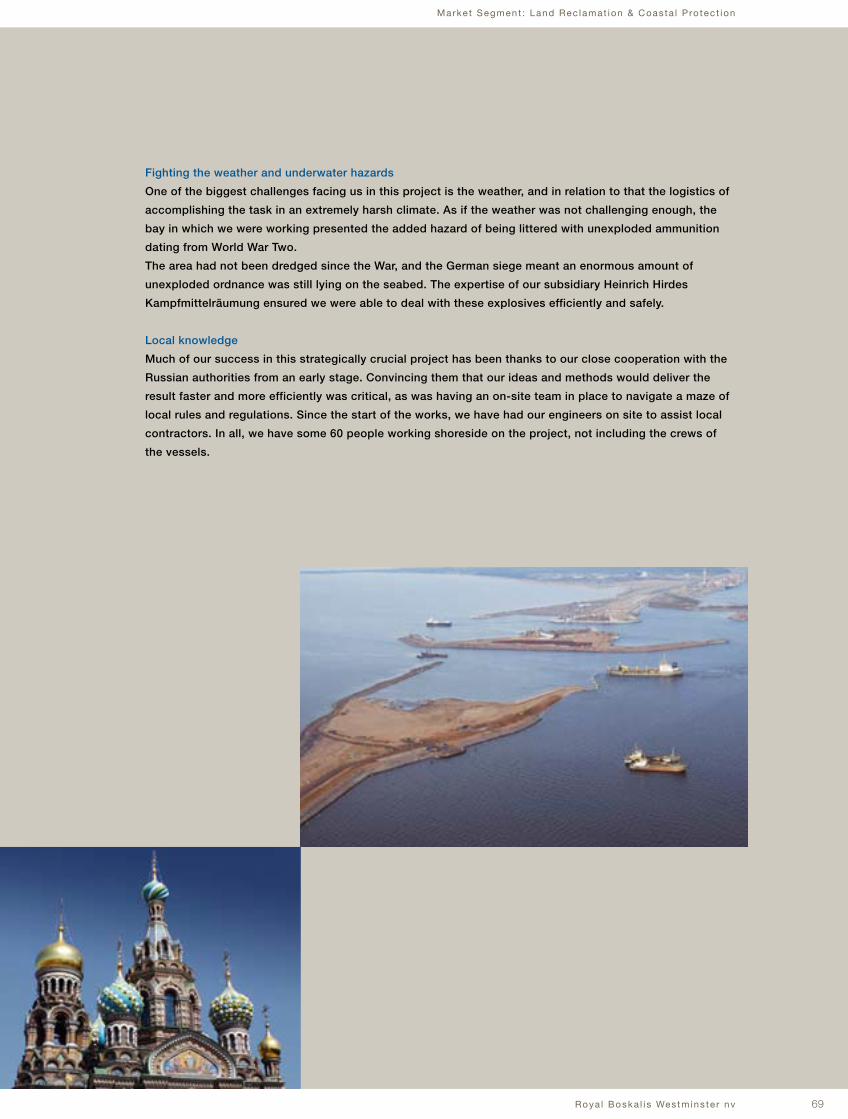
69Roya l Boska l i s Westmins te r nv
Marke t Segment : Land Rec lamat ion & Coasta l P ro tec t ion
Fighting the weather and underwater hazards
One of the biggest challenges facing us in this project is the weather, and in relation to that the logistics of
accomplishing the task in an extremely harsh climate. As if the weather was not challenging enough, the
bay in which we were working presented the added hazard of being littered with unexploded ammunition
dating from World War Two.
The area had not been dredged since the War, and the German siege meant an enormous amount of
unexploded ordnance was still lying on the seabed. The expertise of our subsidiary Heinrich Hirdes
Kampfmittelräumung ensured we were able to deal with these explosives efficiently and safely.
Local knowledge
Much of our success in this strategically crucial project has been thanks to our close cooperation with the
Russian authorities from an early stage. Convincing them that our ideas and methods would deliver the
result faster and more efficiently was critical, as was having an on-site team in place to navigate a maze of
local rules and regulations. Since the start of the works, we have had our engineers on site to assist local
contractors. In all, we have some 60 people working shoreside on the project, not including the crews of
the vessels.
Annua l Repor t 200870
Corpora te Gover nance
Application at Boskalis
Boskalis operates a two-tier board system consisting of a Board of Management which is responsible
for managing the company and a Supervisory Board that is committed to maintaining the corporate
governance standards. At the heart of all governance at Boskalis lies the long-term partnership between
the company and its various stakeholders.
Our stakeholders are those groups and individuals that directly or indirectly influence our ability to reach
our business objectives or are influenced by these objectives, and include employees, shareholders and
other financiers, suppliers, customers, government bodies, and the communities in which we operate.
The Boskalis governance model is based on a close and constructive collaboration between the
Supervisory Board and its committees, the Board of Management and our stakeholders. The Board of
Management and the Supervisory Board are responsible for guarding the interests of our stakeholders
while seeking to create shareholder value in the long term.
Two-Tier System
The Board of Management is responsible for the day-to-day management of the business and for setting
out and realizing the company’s long-term strategy. It is responsible for establishing the company’s
objectives, implementing its business policies and for its resulting performance.
The Board of Management is accountable to the Supervisory Board and the General Meeting of Shareholders.
In performing its tasks, it is guided by the interests of the company and its business and takes into account
any relevant interests of parties involved with the company.
The Supervisory Board is responsible for supervising management performance and advising the Board
of Management. Its work is supported by three core committees; the Audit Committee, the Remuneration
Committee and the Selection and Appointment Committee. For a summary report of the committees’
activities in 2008 please refer to pages 44-46 of this report.
At least one General Meeting of Shareholders takes place every year. Its tasks include the adoption of
financial statements and the appointment and dismissal of Supervisory Board members. All material
changes in Boskalis’ corporate governance structure are submitted to the General Meeting
of Shareholders for approval.
At the same time, the interests of employees are protected through the Works Council, which provides
ongoing employee representation in the context of the Works Councils Act. It is the task of the Works
Council to ensure that management objectives are aligned with those of employees.
Corporate Governance
7070
Roya l Boska l i s Westmins te r nv 71
Corpora te Gover nance
Compliance
Boskalis shares are listed and traded on NYSE Euronext Amsterdam. Under Dutch law, Boskalis is
considered a ‘two-tier board company’ and as such is subject to the rules and relevant legislation
applicable to businesses of this size.
The Dutch Corporate Governance Code (the ‘Code’), which came into force on 1 January 2004, applies
to Dutch companies listed on the stock exchange and comprises a code of conduct for governance best
practice. This Code includes both specific principles and best practice provisions, as well as guidelines
for the adequate supervision of these.
Boskalis subscribes to the notion that a sound and transparent system of checks and balances is
important to maintaining confidence in companies operating on the capital market. Boskalis believes
clarity and openness in accountability and supervision are the cornerstones of good management and
entrepreneurship.
In keeping with this view and as required by the Code, Boskalis has produced a detailed Apply or Explain
Report that sets out how the principles and best practice provisions are applied at Boskalis. This report
is available on the Boskalis website and copies can also be requested from the company’s secretary.
In 2008 Boskalis applied all the principles contained in the Code as well as 91 of the 92 best practice
provisions. The single deviation from the Code concerns best practice provision III.2.1, which Boskalis
applied in the interests of the company and its stakeholders. A comprehensive explanation of Boskalis’
position in this matter can be found in the Apply or Explain Report.
Boskalis is currently examining its corporate governance structure for compatibility with the revised
Code, which was published in December 2008. Boskalis will implement changes where necessary.
In line with the recommendation of the corporate governance monitoring committee, Boskalis intends to
present its corporate governance policy for discussion at the General Meeting of Shareholders in 2010.
Risk Management
Market and competition risks
The Boskalis markets are heterogeneous and often develop differently. In most cases, the (ultimate)
clients are national, regional, and local governments, or associated institutions, and major international
oil and gas companies. Our markets are generally driven by long-term economic factors, such as
increases in the global population, the expansion of the global economy, and the growth of international
trade and transport volumes, particularly over water. The long-term prospects for these factors are
favorable.
In the shorter term, factors outside our control may have a negative impact on our markets, despite
the long-term growth trends. These factors include the current crisis within the financial sector and
subsequent knock-on implications for the global economy, and major negative developments affecting
exploration and exploitation activities in the markets for energy and other raw materials. Boskalis aims to
Annua l Repor t 200872
Corpora te Gover nance
respond as well as possible to both positive and negative developments in individual market segments
through a global spread of activities, an extensive, versatile, and internationally based fleet, and strong
positions in the home markets. Moreover, the dredging industry is largely focused on the maintenance
and development of infrastructure. This means that longer-term developments will generally be more
important than short-term economic fluctuations. Boskalis includes contracts in the order book only
once agreement has been reached with the client. Although cancellations or substantial reductions
in the size of contracts once agreement has been reached have historically been relatively rare, such
cancellations or substantial reductions of work in portfolio cannot be ruled out. In the wake of such
a cancellation or substantial reduction, losses may arise from the unwinding or settlement of the
financial derivatives taken out to cover the related currency risks and/or fuel cost risks but for which the
underlying transaction or cash flows will no longer be realized.
Boskalis deals with large, internationally operating competitors, and with more regional or local
competitors with activities restricted to one or several submarkets.
In most cases, projects are brought to the market using public or private tender procedures. Traditionally
and in the vast majority of contracts competition is price-based. However, clients - primarily in the oil
and gas industry and private port operators - are increasingly taking other factors, also qualitative ones,
into consideration when awarding a contract.
The dredging industry is a capital-intensive industry with high entry and exit barriers, particularly for
companies operating in the international arena. Prices are influenced considerably by the relation
between the demand for dredging services and the available capacity or utilization of the equipment.
Broad international spread of market positions, and equipment and cost leadership are therefore key
success factors upon which Boskalis places a great deal of emphasis, in terms of investment strategy
and as a critical focal point in operational management.
The solid financial position also provides a strong basis for absorption of risk.
Operational risks
On the markets where Boskalis operates, ‘fixed price/lump sum’ is still the most common type of
contract. In this type of contract, the contractor must include nearly all the operating and (procurement)
cost risks in the price. Possibilities to claim payment from the client for any unexpected costs that
occur during the course of a project are generally not or rarely available. Furthermore, many contracts
include ‘milestones’ and linked penalties in case of failure to comply with them. When calculating the
cost price and drawing up tenders, considerable emphasis is placed on the identification, analysis and
quantification of operating, cost and delay risks of this kind.
Operating risks mainly involve soil and settlement conditions, variable weather or workability conditions,
technical suitability of the equipment, wear and tear due to the processing of dredged materials, and
damage to equipment and third-party property.
Boskalis focuses on controlling those risks, first of all by adopting a structured approach in the tender
phase to identify risks and their possible consequences. Tenders are assigned to particular risk
categories on the basis of size and risk profile. There are procedures for each risk category stating how
the tenders should be processed, and the management level for the authorization and setting of the
tender price and conditions. During preparations for the tender, and depending on the risk classification,
Roya l Boska l i s Westmins te r nv 73
Corpora te Gover nance
we use resources such as soil investigations, easily accessible databases containing historical data,
and adequate risk analysis techniques. The results of the risk analysis are then used as a factor in
the determination of the cost price and/or selling price, and in the drafting of tender and/or contract
conditions. When a contract is awarded, the updating of the risk analysis is part of the thorough project
preparation process, resulting in concrete actions where necessary. In addition, there is a strong focus
on staff training, schooling, and refresher courses, a certified quality and safety program, and optimal
maintenance policies to keep equipment in good condition. Some risks are also insured if possible.
Risks related to price developments on the procurement side, such as increased wages, costs of
materials, sub-contracting costs and fuel, which are borne by Boskalis, are also taken into account in
cost-price calculations. Wherever possible, especially on projects that extend over a long period of time,
contracts include cost indexation clauses, mainly for labor and fuel.
In general, fuel cost risks are mitigated in a number of ways. When possible, fuel cost variation clauses
are included in the contract while in some cases, contracts require fuel to be delivered by the client. Also,
if substantial, fuel risks are commonly covered through the use of financial instruments, such as forward
contracts or futures.
The key to the professionalism and skills of Boskalis lies in its ability to manage operating risks
effectively and responsibly.
Financial risks
Boskalis is exposed to both operating and financial risks associated with project execution. The main
financial risks include disruption by political developments and violence, and the risk of non-payment by
clients. Boskalis has a strict risk acceptance and hedging policy for political and payment risks. Unless
first-class, creditworthy clients are involved, these risks are in principle covered by credit insurance,
bank guarantees and advance payments. Revenue and profits are only accounted for when realization is
sufficiently certain.
A large proportion of projects are not contracted in euros. Generally, positions in non-euro currencies are
fully hedged as soon as they occur, usually with forward contracts.
The US dollar exchange rate in relation to the euro is particularly relevant. A large proportion of the
projects are contracted in US dollars or in currencies that are linked, to a greater or lesser extent, to the
US dollar.
As for competitiveness, a significant part of the cost structure of most of the major international
competitors of Boskalis is also based on the euro. This means that currency fluctuations have no major
effect on our competitive position. In a number of market segments, there is competition from parties
whose cost structures are not based on the euro. The impact of currency fluctuations is greater in those
market segments. However, on balance, exchange-rate fluctuations have only a limited impact on the
competitive position of the company.
The most important non-fully owned affiliated companies of Boskalis (Archirodon and Lamnalco) are
entirely or largely US dollar-based. However, the cost structures of these companies are also US dollar-
based, either in full or to a major extent. These holdings are viewed from a long-term perspective.
Exchange-rate risks related to the investments in these holdings are not hedged. It is assumed
that currency fluctuations, interest and inflation will offset each other in the long term. The income
statements of these affiliates are translated at average exchange rates. Translation differences are
charged or credited directly to shareholders’ equity.
Annua l Repor t 200874
Corpora te Gover nance
Financial derivatives (such as forward contracts, options, interest rate swaps and futures) for hedging
currency risks, fuel cost risks and/or other risks are only used if there is a physical underlying
transaction. However, there is a risk that, in the wake of a cancellation or substantial reduction in the
size of contracts, losses may arise from the unwinding or settlement of the financial derivatives taken
out but for which the underlying transaction or cash flows will no longer be realized.
As is usual in the contracting industry, Boskalis also has large amounts outstanding in the form of bank
guarantees or surety bonds (guarantees from insurance companies), usually in favor of customers.
Boskalis’ policy is to maintain a solid financial position since adequate credit, and particularly bank
guarantee facilities, are essential to an uninterrupted conduct of business. The company has adequate
credit and bank guarantee facilities at its disposal.
Internal risk management and control systems
The internal risk management and control systems are based on the principles of effective management
control and tailored to the day-to-day working environment in which Boskalis operates worldwide.
Given the hands-on nature of the company and its short lines of communication, three factors are
important in the assessment and evaluation of the internal risk management and control practices and
systems at Boskalis:
1. With regard to daily operations, an extensive framework of quality assurance rules, procedures and
systems, that include clear guidelines for responsibilities, authorization and risk control, forms the
backbone of operational risk management and control. In addition to audits by external agencies,
Boskalis also performs regular internal audits under the auspices of the SHE-Q department. Reports
about these audits are a regular item on the agenda during meetings of the Board of Management
with the business unit managers.
2. The daily management of the Boskalis organization involves clear responsibilities and short, clear
lines of command that are defined unambiguously. Both competition and project implementation
require speed, knowledge, and decisiveness. Daily management is hands-on.
3. The progress and development of the operating results and the company’s financial position, as well
as operational and financial risks, are monitored by means of structured periodical reporting, analysis
of the financial results, and performance reviews at senior management level.
Risks with regard to financial reporting
Structure of financial reporting
Financial reporting at Boskalis is structured within a tight framework of budgeting, reporting and
forecasting. Reports may be for external or internal use.
External reporting consists of an annual report, including financial statements audited by the external
auditor, as well as a half-yearly report containing abridged financial information, both consolidated and
segmented. The external reports are drawn up in accordance with EU-IFRS on the basis of the internal
financial reporting.
Internal financial reporting - ‘management reporting’ - consists of extensive consolidated quarterly
reports dealing with actual developments compared to quarterly (cumulative) budgets.
Roya l Boska l i s Westmins te r nv 75
Corpora te Gover nance
Quarterly forecasts are also drawn up of the annual results, cash flows and balance sheet positions at
the end of the financial year. The quarterly budgets are part of the annual group budget, which is set in
December every year by the Supervisory Board and the Board of Management.
The internal financial reporting has a layered structure - in accordance with the internal allocation of
management responsibilities - with consolidation taking place level by level, starting with the projects,
moving on to the business units and ending with group consolidated reports.
Project managers are responsible for budgets, income statements and balance sheets for their projects,
which are drawn up in accordance with guidelines and instructions. In turn, business unit managers are
responsible for the financial reports for their business units.
The Board of Management discusses the quarterly reports in formal quarterly meetings with the relevant
business unit managers. These meetings are minuted. The consolidated group reports are discussed
with the Supervisory Board every quarter.
The structure and quality of the financial accounting and control systems of Boskalis and its group
companies are safeguarded by unambiguous and regular internal and external audits. Relevant aspects
of the financial accounting and control systems are set out in manuals, guidelines, and procedures.
Internal audits to monitor and improve quality and discipline are conducted on the basis of random and
ad hoc investigations (‘financial audits’) that also contain elements of instruction and training. Moreover,
the quality of the financial control systems is evaluated regularly in the context of the activities of the
external auditors.
The Board of Management considers that these arrangements for financial reporting, with a clear formal
structure and regular management evaluations and discharges, safeguard the quality of the figures in the
financial reports.
Statement about risks relating to financial reporting
In spite of the risk management and control systems that Boskalis has put in place, there can be no
absolute certainty that mistakes, losses, fraud or unlawful activities will be prevented.
However, given the structure and operation of the financial reporting and review systems at Boskalis,
the Board of Management states that:
• the risk management and control systems provide reasonable assurance that the financial reporting
does not contain any material inaccuracies;
• it knows of no indications that the risk management and control systems did not work properly during
the year under review;
• it knows of no indications that the risk management and control systems will not work properly during
the year in progress.
The topic of internal risk management and control has been discussed with the Supervisory Board.
No major changes were introduced in the risk management and internal control systems during the
course of the year under review.
75
76 Annua l Repor t 2008
Statement of Directors’ responsibilities
The Board of Management of Royal Boskalis Westminster N.V. states that, to the best of its knowledge:
1. The financial statements, which have been prepared in accordance with the applicable standards for
preparing financial statements and as shown on pages 77 to 136 of this Annual Report, provide a true
and fair view of the assets, liabilities and financial position as at December 31, 2008 as well as the
result for the 2008 financial year of Royal Boskalis Westminster N.V. and the undertakings included in
the consolidation as a whole; and
2. The report of the Board of Management, as shown on pages 49 to 76, provides a true and fair view
of the position as at December 31, 2008, the business conducted during 2008 by Royal Boskalis
Westminster N.V. and by its subsidiaries whose details are included in the financial statements; and
3. The report of the Board of Management, as shown on pages 49 to 76, provides information on the
principal risks and uncertainties faced by Royal Boskalis Westminster N.V.
Papendrecht / Sliedrecht, March 17, 2009
Board of Management
dr. P.A.M. Berdowski
T.L. Baartmans
J.H. Kamps
Corpora te Gover nance
77Roya l Boska l i s Westmins te r nv
This is a translation of the prevaling official financial statements 2008 (“Jaarrekening over 2008”)
in the Dutch language.
Financial statements 2008
F inanc ia l s ta tements 2008
Annua l Repor t 200878
F inanc ia l s ta tements 2008
Consolidated income statement 80Consolidated statement of recognized income and expense 81Consolidated balance sheet before profit appropriation 82Consolidated statement of cash flows 83Explanatory notes to the consolidated financial statements 841. General 842. Compliance with International Financial Reporting Standards 842.1 Compliance statement 842.2 New standards and interpretations not yet applicable 843. Principles of financial reporting 853.1 Format and valuation 853.2 Consolidation 863.3 Foreign currencies 863.4 Derivatives and hedging 873.5 Impairment 873.6 Intangible assets 873.7 Service Concession Arrangements 883.8 Property, plant and equipment 883.9 Associated companies 883.10 Other financial fixed assets 893.11 Inventories 893.12 Due from and due to customers for work in progress 893.13 Trade and other receivables 893.14 Cash and cash equivalents 893.15 Interest-bearing borrowings 893.16 Employee benefits 903.17 Share-based remuneration plans 903.18 Provisions 903.19 Deferred income tax assets and liabilities 913.20 Trade and other payables 913.21 Revenue 913.22 Other income 913.23 Operational costs 913.24 Personnel expenses 913.25 Depreciation and amortization expenses 913.26 Finance income and expenses 913.27 Share in result of associated companies 923.28 Taxation 923.29 Dividends 923.30 Consolidated statement of cash flows 923.31 Principles for information by segment 924. Business combination 935. Information by segment 945.1 Business segments 945.2 Geographic segments 956. Other income 957. Operational costs 968. Personnel expenses 969. Finance income and expenses 9610. Taxation 9711. Income tax receivable and payable 9812. Deferred income tax assets and liabilities 9813. Intangible assets 10013.1 Goodwill 10013.2 Concession 101
Table of contents
Roya l Boska l i s Westmins te r nv 79
F inanc ia l s ta tements 2008
14. Property, plant and equipment 10215. Associated companies 10316. Other financial fixed assets 10417. Inventories 10418. Due from and due to customers for work in progress 10519. Trade and other receivables 10520. Cash and cash equivalents 10521. Group equity 10621.1 Issued capital 10721.2 Share premium 10721.3 Legal reserve 10721.4 Hedging reserve 10821.5 Revaluation reserve 10821.6 Currency translation reserve 10821.7 Actuarial reserve 10821.8 Retained earnings 10821.9 Profit for the year 10821.10 Earnings per share 10822. Interest-bearing borrowings 10923. Employee benefits 10923.1 Defined benefit pension schemes 11024. Provisions 11225. Trade and other payables 11326. Financial instruments 11326.1 Financial risk management 11326.2 On-balance financial instruments and fair value 11826.3 Capital management 12026.4 Other financial instruments 12127. Commitments and contingent liabilities 12128. Auditor remuneration 12229. Subsequent events 12230. Related parties 12230.1 Identity of related parties 12230.2 Related party transactions 126
Company income statement 129Company balance sheet before profit appropriation 130Statement of changes in shareholders’ equity 131Explanatory notes to the company financial statements 1321. General 1322. Principles of financial reporting 1323. Investment in group company 1324. Issued capital 1325. Share premium 1336. Other reserves 1337. Profit for the year 1338. Remuneration of members of the Board of Management and Supervisory Board 133
9. Commitments and contingent liabilities 133
Other information 134 Auditor’s report 135
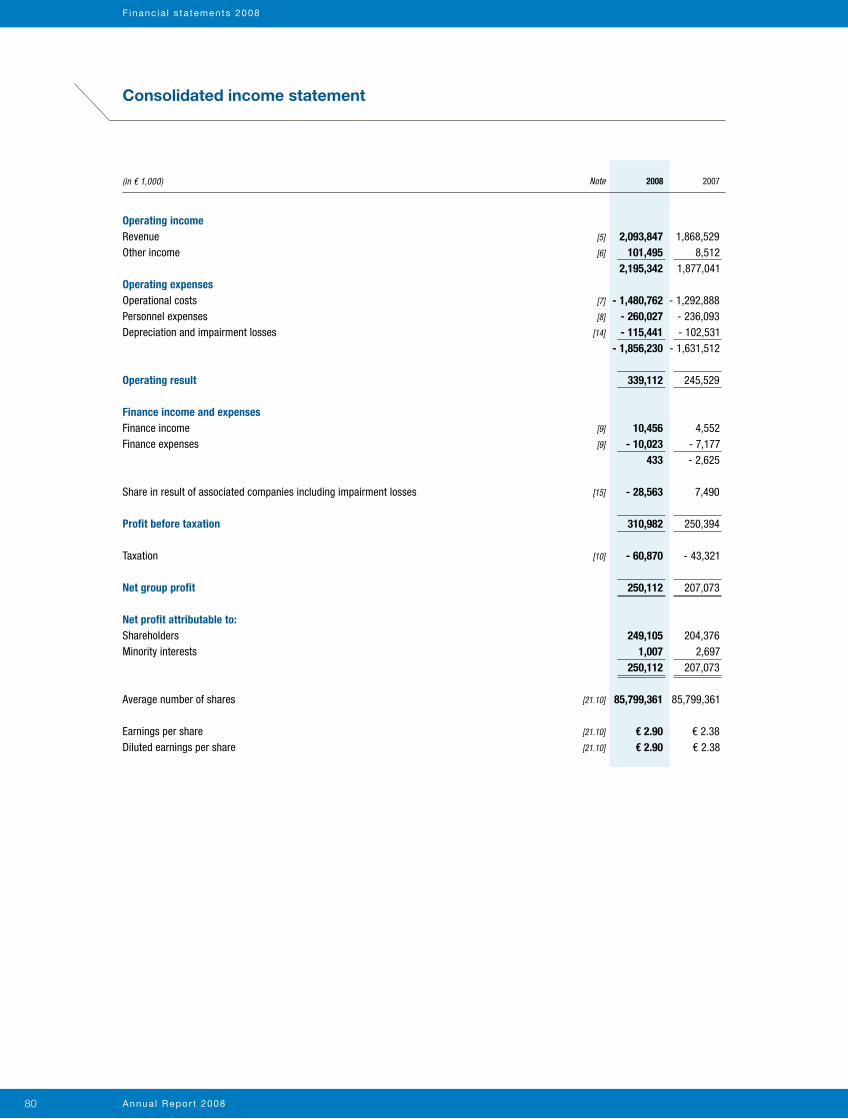
Annua l Repor t 200880
F inanc ia l s ta tements 2008
Note
Operating income Revenue [5]
Other income [6]
Operating expenses Operational costs [7]
Personnel expenses [8]
Depreciation and impairment losses [14]
Operating result
Finance income and expenses Finance income [9]
Finance expenses [9]
Share in result of associated companies including impairment losses [15]
Profit before taxation Taxation [10]
Net group profit Net profit attributable to: Shareholders Minority interests Average number of shares [21.10]
Earnings per share [21.10]
Diluted earnings per share [21.10]
2,093,847 1,868,529 101,495 8,512 2,195,342 1,877,041 - 1,480,762 - 1,292,888 - 260,027 - 236,093 - 115,441 - 102,531 - 1,856,230 - 1,631,512 339,112 245,529 10,456 4,552 - 10,023 - 7,177 433 - 2,625 - 28,563 7,490 310,982 250,394 - 60,870 - 43,321 250,112 207,073 249,105 204,376 1,007 2,697 250,112 207,073 85,799,361 85,799,361 € 2.90 € 2.38 € 2.90 € 2.38
2008 2007(in € 1,000)
Consolidated income statement
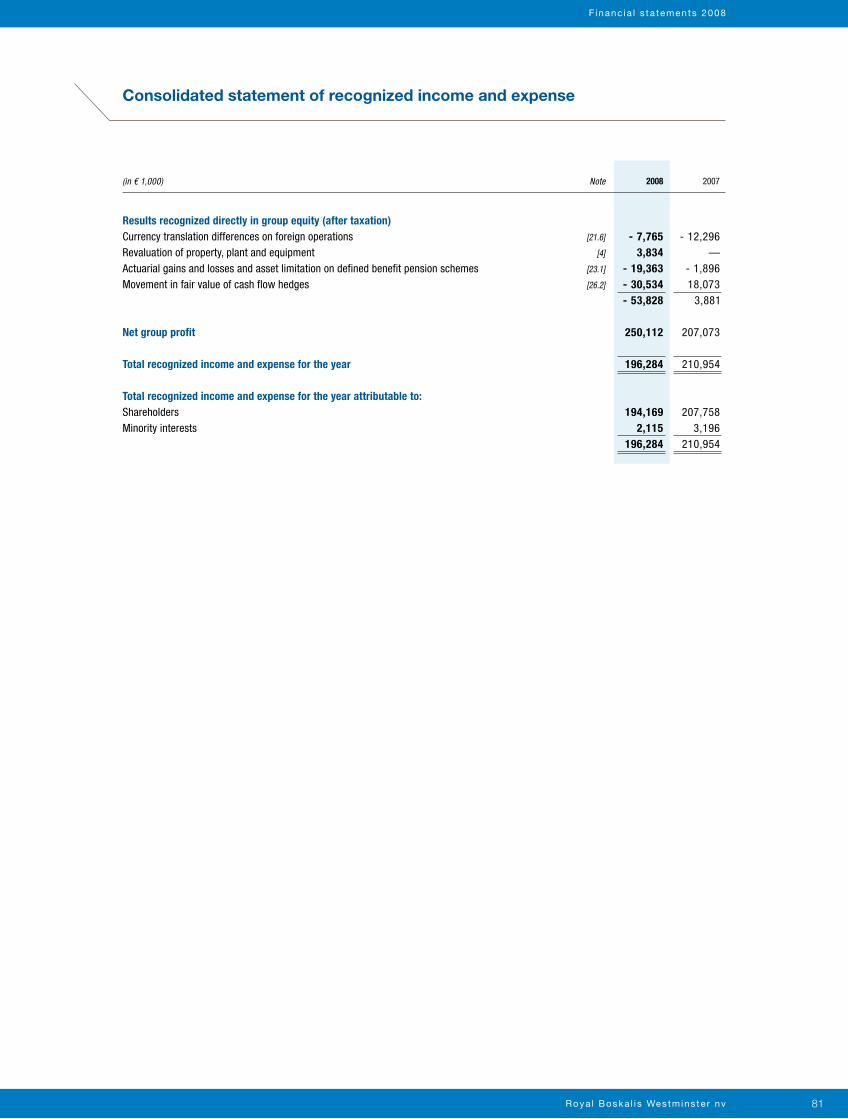
Roya l Boska l i s Westmins te r nv 81
F inanc ia l s ta tements 2008
(in € 1,000) Note
Results recognized directly in group equity (after taxation) Currency translation differences on foreign operations [21.6]
Revaluation of property, plant and equipment [4]
Actuarial gains and losses and asset limitation on defined benefit pension schemes [23.1]
Movement in fair value of cash flow hedges [26.2]
Net group profit Total recognized income and expense for the year
Total recognized income and expense for the year attributable to: Shareholders Minority interests
- 7,765 - 12,296 3,834 — - 19,363 - 1,896 - 30,534 18,073 - 53,828 3,881 250,112 207,073 196,284 210,954 194,169 207,758 2,115 3,196 196,284 210,954
2008 2007
Consolidated statement of recognized income and expense
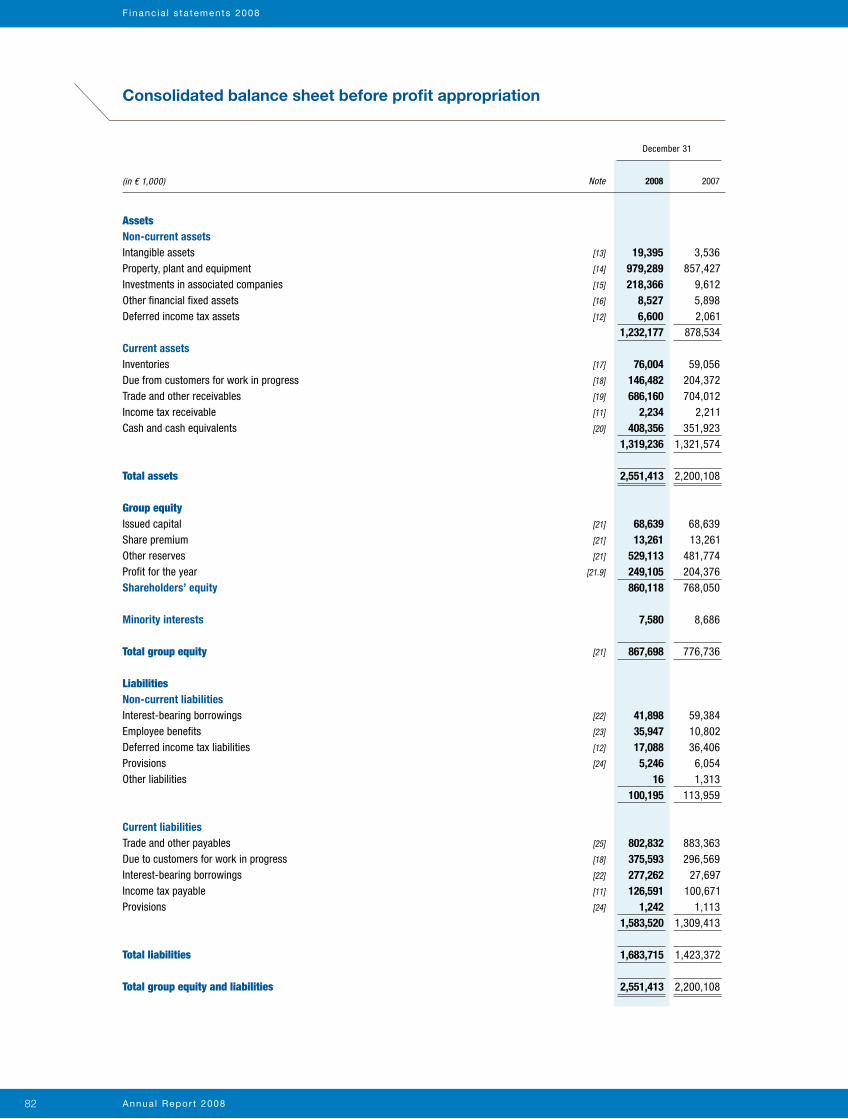
Annua l Repor t 200882
F inanc ia l s ta tements 2008
Note
Assets Non-current assets Intangible assets [13]
Property, plant and equipment [14]
Investments in associated companies [15]
Other financial fixed assets [16]
Deferred income tax assets [12]
Current assets Inventories [17]
Due from customers for work in progress [18]
Trade and other receivables [19]
Income tax receivable [11]
Cash and cash equivalents [20]
Total assets Group equity Issued capital [21]
Share premium [21]
Other reserves [21]
Profit for the year [21.9]
Shareholders’ equity Minority interests Total group equity [21]
Liabilities Non-current liabilities Interest-bearing borrowings [22]
Employee benefits [23]
Deferred income tax liabilities [12]
Provisions [24]
Other liabilities
Current liabilities Trade and other payables [25]
Due to customers for work in progress [18]
Interest-bearing borrowings [22]
Income tax payable [11]
Provisions [24]
Total liabilities
Total group equity and liabilities
19,395 3,536 979,289 857,427 218,366 9,612 8,527 5,898 6,600 2,061 1,232,177 878,534 76,004 59,056 146,482 204,372 686,160 704,012 2,234 2,211 408,356 351,923 1,319,236 1,321,574 2,551,413 2,200,108
68,639 68,639 13,261 13,261 529,113 481,774 249,105 204,376 860,118 768,050 7,580 8,686 867,698 776,736 41,898 59,384 35,947 10,802 17,088 36,406 5,246 6,054 16 1,313 100,195 113,959 802,832 883,363 375,593 296,569 277,262 27,697 126,591 100,671 1,242 1,113 1,583,520 1,309,413 1,683,715 1,423,372 2,551,413 2,200,108
2008 2007(in € 1,000)
December 31
Consolidated balance sheet before profit appropriation
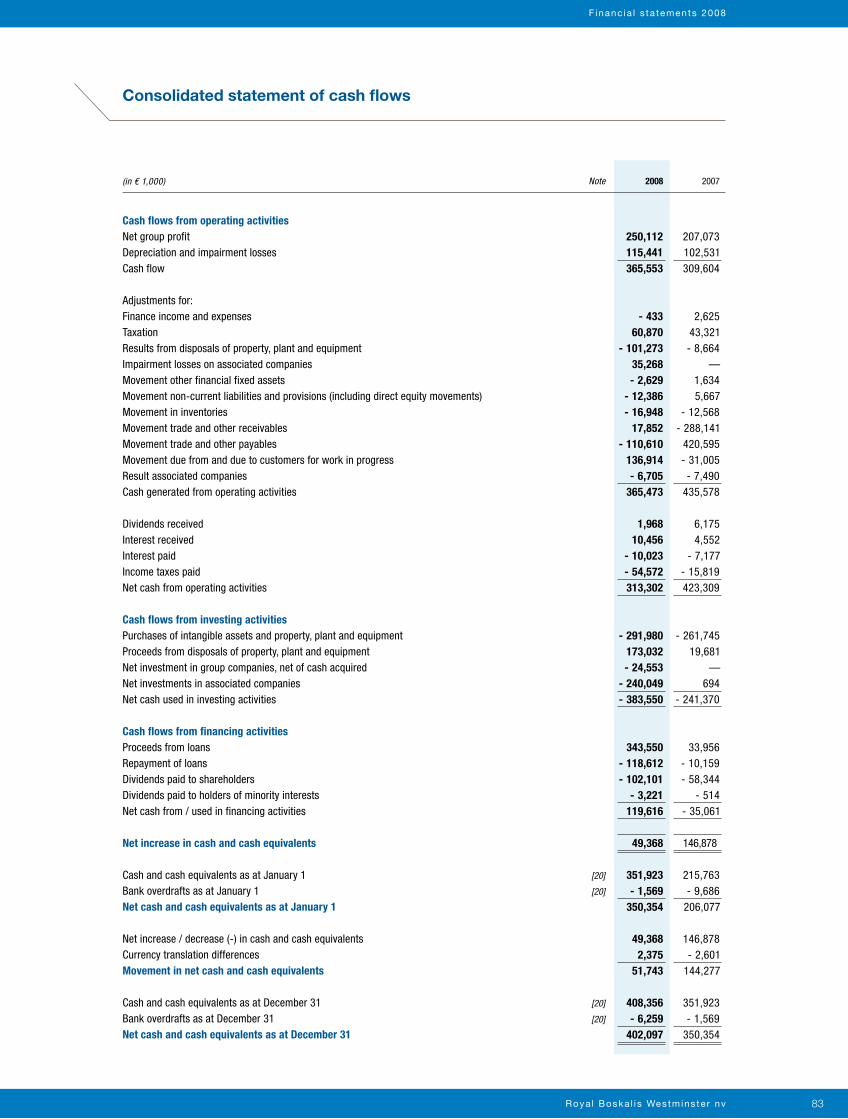
Roya l Boska l i s Westmins te r nv 83
F inanc ia l s ta tements 2008
Note
Cash flows from operating activities Net group profit Depreciation and impairment losses Cash flow Adjustments for: Finance income and expenses Taxation Results from disposals of property, plant and equipment Impairment losses on associated companies Movement other financial fixed assets Movement non-current liabilities and provisions (including direct equity movements) Movement in inventories Movement trade and other receivables Movement trade and other payables Movement due from and due to customers for work in progress Result associated companies Cash generated from operating activities
Dividends received Interest received Interest paid Income taxes paid Net cash from operating activities Cash flows from investing activities Purchases of intangible assets and property, plant and equipment Proceeds from disposals of property, plant and equipment Net investment in group companies, net of cash acquired Net investments in associated companies Net cash used in investing activities
Cash flows from financing activities Proceeds from loans Repayment of loans Dividends paid to shareholders Dividends paid to holders of minority interests Net cash from / used in financing activities
Net increase in cash and cash equivalents Cash and cash equivalents as at January 1 [20]
Bank overdrafts as at January 1 [20]
Net cash and cash equivalents as at January 1
Net increase / decrease (-) in cash and cash equivalents Currency translation differences Movement in net cash and cash equivalents
Cash and cash equivalents as at December 31 [20]
Bank overdrafts as at December 31 [20]
Net cash and cash equivalents as at December 31
250,112 207,073 115,441 102,531 365,553 309,604 - 433 2,625 60,870 43,321 - 101,273 - 8,664 35,268 — - 2,629 1,634 - 12,386 5,667 - 16,948 - 12,568 17,852 - 288,141 - 110,610 420,595 136,914 - 31,005 - 6,705 - 7,490 365,473 435,578 1,968 6,175 10,456 4,552 - 10,023 - 7,177 - 54,572 - 15,819 313,302 423,309 - 291,980 - 261,745 173,032 19,681 - 24,553 — - 240,049 694 - 383,550 - 241,370 343,550 33,956 - 118,612 - 10,159 - 102,101 - 58,344 - 3,221 - 514 119,616 - 35,061 49,368 146,878
351,923 215,763 - 1,569 - 9,686 350,354 206,077 49,368 146,878 2,375 - 2,601 51,743 144,277 408,356 351,923 - 6,259 - 1,569 402,097 350,354
2008 2007(in € 1,000)
Consolidated statement of cash flows
Annua l Repor t 200884
F inanc ia l s ta tements 2008
Explanatory notes to the consolidated financial statements
1. General
Royal Boskalis Westminster N.V. is an international group with a leading position in the world market for dredging and related maritime services. The group’s head office is located in Papendrecht, the Netherlands. Royal Boskalis Westminster N.V. is a public limited corporation that is listed on the NYSE Euronext Amsterdam stock exchange. During the reporting period the group (the company and its consolidated group companies) did not change significantly as a result of acquisitions or disposals.The financial statements were prepared by the Board of Management, were discussed in the meeting of the Supervisory Board and the Board of Management on March 17, 2009 and released for publication after having been signed. The financial statements 2008 will be submitted for approval to the Annual General Meeting of Shareholders of May 14, 2009.
On May 21, 2007 Royal Boskalis Westminster N.V. effected a share split of its ordinary shares on a three-for-one basis (three new shares for one old share). This split does not apply to the cumulative protective preference shares, but these now carry three voting rights per share from the same date. Unless otherwise noted, all relevant per share data in the financial statements are adjusted for comparative purposes in accordance with the share split in 2007.
2. Compliance with International Financial Reporting Standards
2.1 Compliance statementThe consolidated financial statements and the accompanying explanatory notes have been prepared in accordance with the International Financial Reporting Standards (IFRS), as adopted by the European Union, and with Part 9 of Book 2 of the Netherlands Civil Code.
2.2 New standards and interpretations not yet applicableThe following new standards, amendments to standards and interpretations are not yet effective for the financial year ended December 31, 2008 and have not been applied in preparing these consolidated financial statements:• IFRS 8 Operating Segments introduces the management approach to segment reporting. IFRS 8, which
becomes mandatory for the group’s 2009 consolidated financial statements, will require a change in the presentation and disclosure of segment information based on the internal reports regularly reviewed by the Group’s Chief Operating Decision Maker in order to assess each segment’s performance and to allocate resources to them. Currently the group uses the same presentation of segment information to measure the internal performance measurement as is used for external reporting. Therefore this new standard is not expected to have a material impact on the group’s 2009 consolidated financial statements.
• Revised IAS 23 Borrowing Costs removes the option to recognize borrowing costs directly as an expense or to capitalize these costs. This revision requires that an entity capitalize borrowing costs directly attributable to the acquisition, construction or production of a qualifying asset as part of the cost of that asset. Revised IAS 23 will become mandatory for the group’s 2009 consolidated financial statements and will constitute a change in accounting policy for the group. In accordance with the transitional provisions, the group will apply revised IAS 23 to qualifying assets for which capitalization of borrowing costs commences on or after the effective date. Therefore the revision will have no impact on prior periods in the group’s 2009 consolidated financial statements.
• IFRIC 13 Customer Loyalty Programmes addresses the accounting of customer loyalty programmes operated or otherwise participated in by entities that operate, or otherwise participate in, customer loyalty programmes for their customers. IFRIC 13 becomes mandatory for the group’s 2009 consolidated financial statements and will have no impact on the consolidated financial statements because the group does not have such programmes.
Roya l Boska l i s Westmins te r nv 85
F inanc ia l s ta tements 2008
• Amendments to IAS 32 Financial Instruments: Presentation and IAS 1 Presentation of Financial Statements – Puttable Financial Instruments and Obligations Arising on Liquidation requires puttable instruments, and instruments that impose on the entity an obligation to deliver to another party a pro rata share of the net assets of the entity only on liquidation, to be classified as equity if certain conditions are met. The amendments, which become mandatory for the group’s 2009 consolidated financial statements and which require retrospective application, are not expected to have any impact on the consolidated financial statements.
• Revised IFRS 3 Business Combinations (2008) incorporates the following changes that are likely to be relevant to the group’s operations:
- the definition of a business has been broadened, which is likely to result in more acquisitions being treated as business combinations;
- contingent consideration will be measured at fair value, with subsequent changes therein recognized in the income statement;
- transaction costs, other than share and debt issue costs, will be recognized as expenses for the period in which they were incurred;
- any pre-existing interest in the acquiree will be measured at fair value with the gain or loss recognized in the income statement;
- any non-controlling (minority) interest will be measured at either fair value, or at its proportionate share of the identifiable assets and liabilities of the acquiree, to be determined on a transaction-by-transaction basis.
Revised IFRS 3, which becomes mandatory for the group’s 2009 consolidated financial statements with regard to business combinations taking effect on or after July 1, 2009, will be applied prospectively and therefore will have no impact on prior periods in the group’s 2009 consolidated financial statements.
• Amended IAS 27 Consolidated and Separate Financial Statements (2008) requires accounting for changes in ownership interests by the group in a subsidiary, while control is retained, to be recognized as an equity transaction. When the group loses control of a subsidiary, any interest retained in the former subsidiary will be measured at fair value with the gain or loss on the disposal recognized in the income statement. The amendments to IAS 27 which become mandatory for the group’s 2010 consolidated financial statements, are not expected to have a significant impact on the consolidated financial statements.
• The amendment to IFRS 2 Share-based Payment – Vesting Conditions and Cancellations clarifies the definition of vesting conditions, introduces the concept of non-vesting conditions, requires non-vesting conditions to be reflected in grant-date fair value and provides the accounting treatment for non-vesting conditions and cancellations. The amendments to IFRS 2 will become mandatory for the group’s 2009 consolidated financial statements, with retrospective application. These changes will have no significant effect on the group’s consolidated financial statements.
3. Principles of financial reporting
3.1 Format and valuationThe consolidated financial statements are drawn up in euros, the group’s functional currency. The consolidated financial statements are based upon historical cost to the extent that IFRS does not prescribe another accounting method for specific items. Preparing financial statements in accordance with IFRS means that estimates and assumptions made by the management partly determine the recognized amounts under assets, liabilities, revenues and costs. The estimates and assumptions are mainly related to the measurement of property, plant and equipment (useful life and impairment), goodwill, results on completion of work in progress, pension liabilities, taxation and financial instruments. The estimates made and the related assumptions are based on management’s experience and understanding and the development of external factors that can be considered reasonable under the given circumstances. Estimates and assumptions are subject to alterations as a result of changes to facts and understanding and may have
Annua l Repor t 200886
F inanc ia l s ta tements 2008
different outcomes per reporting period. Any differences are recognized in the balance sheet or income statement, depending on the nature of the item. The actual results may deviate from results reported previously on the basis of estimates and assumptions. Unless stated otherwise, all amounts in the tables in these financial statements are stated in thousands of euros.
3.2 Consolidation
3.2.1 Group companiesGroup companies are included in the consolidation for 100% on the basis of existing control, taking into account any minority interests. The financial statements of group companies are included in the consolidated financial statements from the date that control commences until the date that control ceases. The accounting policies of group companies have been changed when necessary to align them with the policies adopted by the group.
3.2.2 Joint venturesJoint ventures – both strategic alliances and contractual project-driven construction consortiums – are included in the consolidation on a proportional basis in accordance with the share in joint control. Amounts receivable from and payable to project-driven construction consortiums are eliminated in the consolidation. Elimination differences as a result of imbalances between partners in current account relation with project-driven construction consortiums, for example timing differences in supply, are recognized in the consolidated balance sheet under Other receivables or Other creditors.
3.2.3 Associated companiesShareholdings that are not eligible for consolidation based on control, but where there is significant influence on the financial and operating policy, are recognized under associated companies. Significant influence is presumed to exist when the group holds more than 20 percent of the voting power of another entity. The consolidated financial statements include the group’s share in the result of associated companies, after adjustments to align the accounting policies with those of the group, from the date that significant influence commences until the date that significant influence ceases.
3.2.4 Elimination of transactions upon consolidationIntragroup receivables and payables, as well as intragroup transactions and unrealized results within the group and with associated companies and joint ventures, are eliminated in preparing the consolidated financial statements to the extent of the group’s share in the entity.
3.3 Foreign currenciesThe assets and liabilities of foreign group companies and joint ventures that are denominated in functional currencies other than the euro have been translated at the exchange rates as at the end of the reporting period. The income statement items of the foreign group companies and joint ventures concerned have been translated at average exchange rates, which approximate the applicable exchange rates at transaction settlement date. Resulting currency translation differences are added or charged directly to the currency translation reserve in group equity. Exchange rate differences as a result of operational transactions are included in the income statement of the reporting period.
Roya l Boska l i s Westmins te r nv 87
F inanc ia l s ta tements 2008
3.4 Derivatives and hedgingIt is the policy of Royal Boskalis Westminster N.V. to use cash flow hedges to cover all operational currency risks that mainly relate to future cash flows from projects that are highly probable and that are denominated in currencies other than the relevant functional currency. Fuel price risks and interest rate risks in future cash flows are hedged from time to time using specific derivatives. Hedge accounting is used for the majority of cash flow hedges. This means that movements in the market value of cash flow hedges not yet settled – including results realized on the “rolling forward” of existing hedges as a result of differences between the duration of the hedges concerned and the underlying cash flows – will be directly added or charged to the hedging reserve in group equity, taking taxation into account. If a cash flow hedge added or charged to the group equity either expires, is closed or is settled, or the hedge relation with the underlying cash flows can no longer be considered effective, the accumulated result will continue to be recognized in group equity as long as the underlying cash flow is still expected to take place. When the underlying cash flow actually takes place, the accumulated result is included directly in the income statement. Movements in the market value of cash flow hedges to which no hedge accounting is applied (ineffective cash flow hedges and the ineffective portion of effective cash flow hedges) are included in the income statement for the reporting period. Results from settled effective cash flow hedges and the movements in the market value of ineffective cash flow hedges are recognized in the related items within the operating result. The purchase or sale of financial instruments is generally recorded at transaction rate. Derivatives are stated at fair value.
3.5 ImpairmentAn assessment is made each reporting period to determine whether there is any indication of impairment of the assets of the group. This does not apply to assets resulting from inventory, due from customers for work in progress, deferred income tax assets, financial instruments within the application of IAS 39 and assets arising from employee benefits. If there is any indication of impairment, an estimate is made of the realizable value of the asset concerned. The difference between the results of this assessment and the relevant book value is charged as an impairment loss to the income statement and deducted from the book value. The present value is calculated at a pre-tax discount rate that reflects the current expectation of the market rate of interest, while also taking into account with regard to floating and other construction equipment specific asset-related risks that are not included in the estimated future cash flows. With the exception of goodwill, impairment losses previously charged to the income statement can be reversed if the estimate of the fair value gives cause to do so.Indications of impairment of floating and other construction equipment are based on long-term expectations for the utilization of equipment or groups of interchangeable equipment. If there is any indication of impairment, the realizable value of the asset concerned is determined on the basis of the net realizable value or the present value of the estimated future cash flows for the remaining useful life of the equipment from the utilization of the relevant equipment or of the group of interchangeable equipment.
3.6 Intangible assetsGoodwill arises upon acquiring group companies, joint ventures and associated companies and is calculated as the difference between the acquisition price and the fair value of the assets and liabilities acquired, according to the accounting principles of Royal Boskalis Westminster N.V. Goodwill and other intangible assets are capitalized net of accumulated amortization and accumulated impairment losses. Goodwill and intangible assets with an infinite useful life are not systematically amortized, but are tested for impairment every year or in case of an indication for impairment (see note 3.5). Negative goodwill that may arise upon acquisition is added directly to the income statement. Straight-line amortization is applied to other intangible assets with a limited useful life. In case of investments accounted for using the equity method the book value of the goodwill is contained in the book value of the investment.
Annua l Repor t 200888
F inanc ia l s ta tements 2008
3.7 Service Concession Arrangements Service concession arrangements within the scope of IFRIC 12 are accounted for according to the provisions of this IFRIC interpretation. Under the provisions of IFRIC 12, which has been adopted pro-actively by the group:• A financial asset is recognized to the extent that the operator has an unconditional contractual right to
receive cash or another financial asset from the grantor for construction or upgrade services.• An intangible asset is recognized to the extent that the operator has the right to charge users of the
public service.• When the operator is paid for its services partly by a financial asset and partly by a licence to charge
users, the two components of the consideration are recognized separately. The consideration received or receivable for both components is recognized initially at the fair value of the consideration received or receivable.
Under both the financial asset and the intangible asset models, the operator accounts for revenue and cost relating to construction (or upgrade) services in accordance with IAS 11 ‘Construction Contracts’.
Financial assets relating to the concession are accounted for in accordance with IAS 39 as loans or receivables and are presented at amortized cost using the effective interest rate method with the annual interest recognized in the income statement.
3.8 Property, plant and equipmentProperty, plant and equipment are recognized at cost price less accumulated depreciation and accumulated impairment losses. The cost price is calculated from the purchase price and/or the internally generated direct expenses. Depreciation of components in the initial cost price is based on the remaining useful life, taking into account any residual value. Modifications and investments to increase capacity are also capitalized at cost price and depreciated on a straight-line basis over the remaining useful life of the asset. Buildings are depreciated over periods varying from ten to fifty years. The depreciation periods for most floating and other construction equipment vary from fifteen to eighteen years. Furnitures and fittings and other fixed operating assets have depreciation periods between three and ten years.The wear and tear of dredging equipment is highly dependent on project-specific combinations of soil conditions, material to be processed, maritime circumstances, and the intensity of the deployment of the equipment (factors that are difficult to predict). Due to these erratic and time-independent patterns, the maintenance and repair expenses for upkeep of the assets are predominantly charged to the income statement. In exceptional cases the maintenance and repair expenses are eligible for capitalization and straight-line depreciation.
3.9 Associated companiesAssociated companies, in which the group has a significant influence on the financial and operating policy, are initially recognized at cost and subsequently accounted for using the equity method, adjusted for differences with the accounting principles of the group, less any accumulated impairment. When the group’s share of losses exceeds the book value of the associated company, the book value is reduced to zero and recognition of further losses is discontinued except to the extent that the group has incurred legal or constructive obligations or made payments on behalf of the associated company.
Roya l Boska l i s Westmins te r nv 89
F inanc ia l s ta tements 2008
3.10 Other financial fixed assetsThe other financial fixed assets are mainly held on a long-term basis and/or until maturity and are carried at amortized cost. Accumulated impairment losses are deducted from the book value.
3.11 InventoriesInventories, which mainly consist of fuel, auxiliary materials and spare parts, are stated at the lower of cost and net realizable value. Net realizable value is the estimated selling price in the ordinary course of business, less the estimated costs of selling.
3.12 Due from and due to customers for work in progressWork in progress is valued at the cost price of the work done, plus a part of the expected results upon completion of the project in proportion to the progress made and less progress billings, advances and provisions. Provisions are recognized for expected losses on work in progress as soon as they are foreseen, and deducted from the cost price; if necessary, any profits already recognized are reversed. The cost price includes direct project costs, consisting of direct payroll costs, materials, costs of subcontracted work, other direct costs and rental charges, and maintenance costs for the equipment used. The progress of a project is determined on the basis of the cost of the work done in relation to the expected cost price of the project as a whole. Profits are not recognized unless a reliable estimate can be made of the result on completion of the project. The balance of the value of work in progress, progress billings and advance payments is determined per project. For projects where the progress billings and advance payments exceed the value of work in progress, the balance is recognized under current liabilities instead of under current assets. The respective balance sheet items are “due from customers for work in progress” and “due to customers for work in progress”.
3.13 Trade and other receivablesTrade and other receivables are stated initially at fair value and subsequently at amortized cost less accumulated impairment losses, such as doubtful debts. Amortized cost is determined using the effective interest rate.
3.14 Cash and cash equivalentsCash and cash equivalents consist of cash and bank balances and deposits with terms of no more than three months. The explanatory notes disclose the extent to which cash and cash equivalents are not freely available as a result of transfer restrictions, joint control or other legal restrictions.
3.15 Interest-bearing borrowingsInterest-bearing borrowings are liabilities to financial institutions. At initial recognition, interest-bearing borrowings are stated at fair value less transaction costs. Subsequently, interest-bearing borrowings are stated at amortized cost.
Annua l Repor t 200890
F inanc ia l s ta tements 2008
3.16 Employee benefitsDefined contribution pension schemesA defined contribution pension scheme is a post-employment benefit scheme under which an entity pays fixed contributions into a separate entity and will have no legal or constructive obligation to pay further amounts if the pension fund has insufficient funds to pay employee benefits in connection with services rendered by the employee in the current of prior periods. Obligations for contributions to defined contribution pension schemes are recognized as an employee benefit expense as part of the personnel expenses in the income statement when they are due. Prepaid contributions are recognized as an asset to the extent that a cash refund or a reduction in future payment is available.
Defined benefit pension schemesA defined benefit pension scheme is every post-employment benefit scheme other than a defined contribution scheme. For each separate defined benefit pension scheme, the net asset or liability is determined as the balance of the discounted value of the future payments to employees and former employees, less the fair value of plan assets. The calculations are done by qualified actuaries using the projected unit credit method. The discount rate equals the yield on high quality corporate bonds as at the balance sheet date, with the period to maturity of the bonds approximating the duration of the liability. If this calculation results in a receivable for the group, this amount will only be recognized if there is a reasonable expectation that it is realizable under the applicable agreements. Actuarial gains and losses are added or charged directly to the actuarial reserve in group equity, including any movements in limitations on the net plan assets. Past service costs are charged to the income statement on a straight-line basis over the average period until the benefits become vested, insofar as the benefits are not granted unconditionally.
Other long-term employee benefitsThe other long-term employee benefits consist mainly of jubilee benefits. The calculation of these liabilities is based upon the actuarial assumptions for the predominant defined benefit scheme.
3.17 Share-based remuneration plansMembers of the Board of Management are granted a conditional number of notional shares which are distributed in cash. This conditional awarding of notional shares is linked to meeting the long-term (three years) performance criteria as explained in the paragraph ‘Remuneration Committee’ in the report of the Supervisory Board over 2008. The fair value of the conditional number of notional shares is determined on the date they are awarded and adjusted at each reporting date based on the value development of the conditional number of notional shares. If applicable, the impact of this determination and possible adjustment over a three-year period is recognized in the income statement. The fair value of the conditional number of notional shares is recognized as an expense.
3.18 ProvisionsProvisions are determined on the basis of estimates of future outflows of economic benefits relating to operational activities for legal or constructive obligations of an uncertain size or with an uncertain settlement date that arise from past events. Provisions, if applicable, relate to reorganization, warranties, legal proceedings and submitted claims. Provisions for reorganization costs are recognized when a detailed and formal plan is announced at balance sheet date to all those concerned or when the execution of the plan has commenced. Provisions for warranties are recognized for warranty claims relating to completed projects with agreed warranty periods applying to some of the consolidated/proportionally consolidated entities. The book value of these provisions is based on common practice in the industry and the company’s history of warranty claims over the past ten years for relevant projects. Provisions are discounted insofar as the difference between the discounted value and nominal value is material.
Roya l Boska l i s Westmins te r nv 91
F inanc ia l s ta tements 2008
3.19 Deferred income tax assets and liabilitiesDeferred income tax assets and liabilities mainly consist of temporary differences between the book value and tax base of assets and liabilities at the relevant applicable tax rates. Deferred tax assets and deferred tax liabilities are netted insofar as they relate to the same fiscal entity.
3.20 Trade and other payablesTrade and other payables are recognized initially at fair value and subsequently at cost/amortized cost. Insofar as the difference between the discounted and nominal value is not material, trade and other payables are stated at cost.
3.21 RevenueRevenue mainly consists of the cost price of the work done during the reporting period, plus a part of the expected results upon completion of the project in proportion to the progress made during the reporting period, and including and/or deducting the provisions recognized and/or used and released during the reporting period for expected losses. The applied “percentage-of-completion” method is, by its nature, based on an estimation process. Revenue also includes services rendered to third parties during the reporting period. Revenue does not include any direct taxes. When it is uncertain whether the economic benefits of work done or services rendered will flow to the group, the relevant revenue is not recognized.
3.22 Other incomeOther income mainly consists of book profits from disposals of and insurance results on property, plant and equipment and currency translation differences on transactions in foreign currency.
3.23 Operational costsOperational costs consist of the cost price of the work done during the reporting period, excluding personnel expenses and depreciation. Operational costs also include equipment utilization costs, general overhead costs, external costs for research and development, late results from projects and other results/late results. The limited costs for research and development are by their nature directly charged to the income statement.
3.24 Personnel expensesPersonnel expenses consist of wages and salaries for own personnel and the related social security charges and pension costs, including paid and accrued contributions for defined pension contribution plans and the movement in the assets and liabilities from defined benefit plans, excluding actuarial gains and losses and the limitation on net pension plan assets added or charged directly to group equity.
3.25 Depreciation and amortization expensesDepreciation and amortization expenses comprise the depreciation on property, plant and equipment and the amortization of other capitalized costs and intangible assets.
3.26 Finance income and expensesFinance income comprises interest received and receivable from third parties, and gains on financial instruments used to hedge interest risks that are included in the income statement. Interest income is recognized as it accrues in the income statement, using the effective interest method.Finance expenses comprises interest paid and payable to third parties, which are allocated to reporting periods based on the effective interest method, and losses on financial instruments used to hedge interest risks that are included in the income statement.
Annua l Repor t 200892
F inanc ia l s ta tements 2008
3.27 Share in result of associated companiesShare in result of associated companies comprises the share in the results after taxation of the participating interests not included in the consolidation.
3.28 TaxationTaxation is calculated on the basis of the result before taxation for the reporting period, taking into account the applicable tax provisions and tax rates, and also includes adjustments on taxation from previous reporting periods and movements in deferred taxes recognized in the reporting period. Taxation is included in the income statement unless it relates to items directly recognized in equity, in which case taxation is included in equity. Temporary differences are accounted for in deferred tax assets and/or deferred tax liabilities. Deferred tax assets are only recognized to the extent that it is probable that taxable profit will be available for realization in the foreseeable future. Deferred tax assets are reviewed at each reporting date and are reduced to the extent that it is no longer probable that the related tax benefit will be realized. Additional income taxes that arise from the distribution of dividends are recognized at the same time that the liability to pay the related dividend is recognized.
3.29 DividendsDividends are recognized as a liability in the period in which they are declared.
3.30 Consolidated statement of cash flowsThe consolidated statement of cash flows is drawn up using the indirect method. Cash is defined as cash and cash equivalents including bank overdrafts as presented in the explanatory notes to the cash and cash equivalents and the interest-bearing borrowings. Cash flows are presented separately in the statement of cash flows as cash flows from operating activities, investing activities and financing activities. Interest on long-term financing is recognized in the cash flow from operating activities. Dividends paid to shareholders and holders of minority interests are recognized in the cash flow from financing activities.
3.31 Principles for information by segmentIn addition to dredging and earthmoving activities, which are managed as a single activity, the group also carries out activities through strategic alliances. On the basis of joint control with the alliance partners, these activities are managed directly by the Board of Management and are therefore classified as separate segments of the company. This approach is also based on the specific management structures and reporting within these segments of the company. The following classification into business segments is therefore used as the primary segmentation format:• Dredging and earthmoving;• Maritime infrastructure (particularly Archirodon);• Maritime and terminal services (particularly Lamnalco).The geographic structure is used as a secondary segmentation format. The internal management structures and reporting of each of the aforementioned business segments are also organized in this way. The project-based nature of the activities results in the assets of the business segments being deployed worldwide during the reporting period, and segmentation by region of assets and investments in non-current assets would therefore be arbitrary and would not provide any relevant information.
Roya l Boska l i s Westmins te r nv 93
F inanc ia l s ta tements 2008
4. Business combination
On November 17, 2008 the group raised its 50% shareholding in Mexican companies Dragamex SA de CV and Codramex SA de CV to 100%. A cash purchase price of € 27.9 million was paid in connection with the acquisition.
In the period from mid-November to end-December 2008 the business combination contributed € 6.7 million to consolidated operational income and € 0.2 million to net group profit. Management estimates that if the acquisition had taken place on January 1, 2008, consolidated operational income for the reporting period would have totaled € 2,317.7 million and net group profit € 251.6 million. The fair-value adjustments used by management to determine these amounts at the acquisition date were the same as would have applied if the acquisition had taken place on January 1, 2008.
The assets and liabilities involved in the acquisition had a book value of € 18,008 on balance at the acquisition date and were recognized at € 27,116 after adjustment for fair value. The fair-value adjustment primarily concerns the revaluation of property, plant and equipment. The fair-value adjustment of € 3.834 after tax on the shareholding already held was credited to the revaluation reserve.
The book values prior to the acquisition were determined immediately before the actual acquisition based on the applicable IFRS standards. The value of the assets and liabilities acquired in the transaction as recognized at the acquisition date is equal to the estimated fair value (see note 3.1 for the notes on the determination of fair value).
As a result of the acquisition full control was also obtained over the cash and cash equivalents of the Mexican companies, meaning that the acquisition resulted in a net outflow of cash and cash equivalents of € 24,533.
Based on the cash purchase price paid and the recognized value of the assets and liabilities obtained as a result of the acquisition, goodwill attributable to the business combination has been calculated as € 13,595. This goodwill pertains mainly to the expertise and technical qualities of the employees and the securing of full control of the Mexican activities (compared to 50% previously).
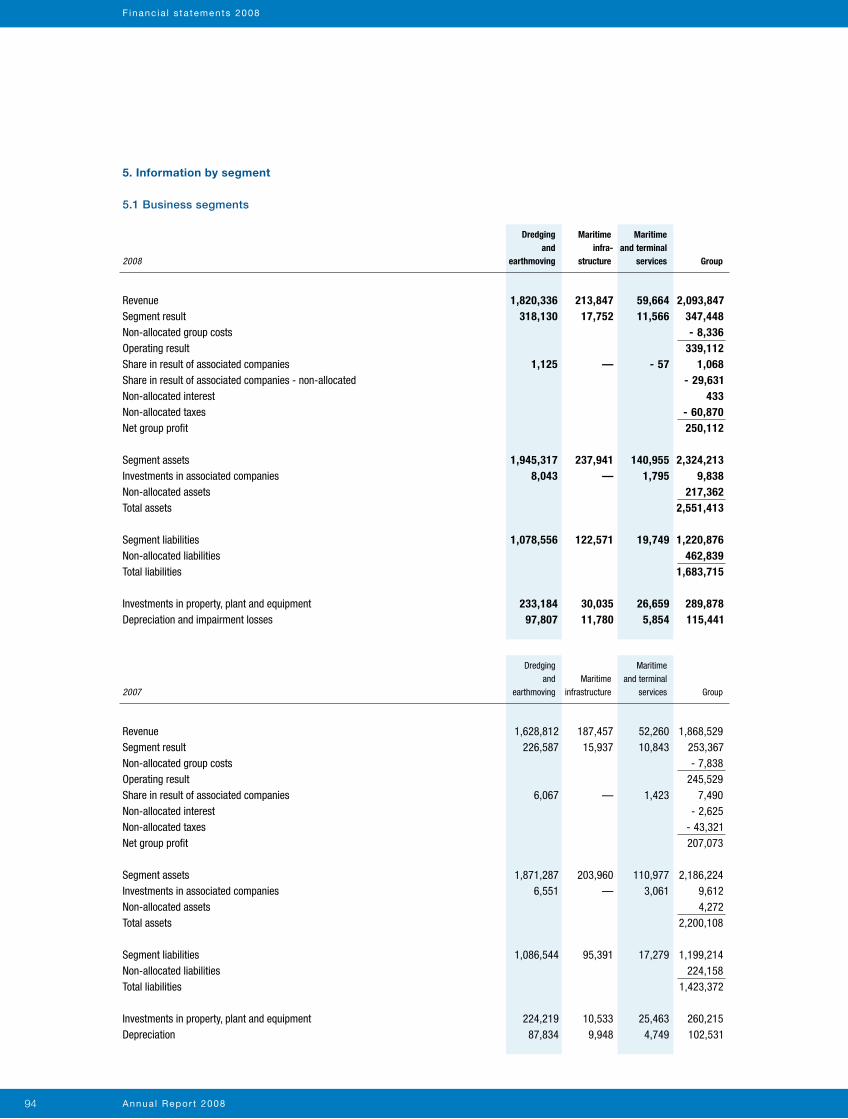
Annua l Repor t 200894
5. Information by segment
5.1 Business segments
1,820,336 213,847 59,664 2,093,847 318,130 17,752 11,566 347,448 - 8,336 339,112 1,125 — - 57 1,068 - 29,631 433 - 60,870 250,112 1,945,317 237,941 140,955 2,324,213 8,043 — 1,795 9,838 217,362 2,551,413 1,078,556 122,571 19,749 1,220,876 462,839 1,683,715 233,184 30,035 26,659 289,878 97,807 11,780 5,854 115,441
1,628,812 187,457 52,260 1,868,529 226,587 15,937 10,843 253,367 - 7,838 245,529 6,067 — 1,423 7,490 - 2,625 - 43,321 207,073 1,871,287 203,960 110,977 2,186,224 6,551 — 3,061 9,612 4,272 2,200,108 1,086,544 95,391 17,279 1,199,214 224,158 1,423,372 224,219 10,533 25,463 260,215 87,834 9,948 4,749 102,531
2008
2007
Dredging and
earth moving
Dredging and
earthmoving
Maritime infra-
structure
Maritime infrastructure
Maritime and terminal
services
Maritime and terminal
services
Group
Group
RevenueSegment resultNon-allocated group costsOperating resultShare in result of associated companiesShare in result of associated companies - non-allocatedNon-allocated interestNon-allocated taxesNet group profit
Segment assetsInvestments in associated companiesNon-allocated assetsTotal assets
Segment liabilitiesNon-allocated liabilitiesTotal liabilities
Investments in property, plant and equipmentDepreciation and impairment losses
RevenueSegment resultNon-allocated group costsOperating resultShare in result of associated companiesNon-allocated interestNon-allocated taxesNet group profit
Segment assetsInvestments in associated companiesNon-allocated assetsTotal assets
Segment liabilitiesNon-allocated liabilitiesTotal liabilities
Investments in property, plant and equipmentDepreciation
F inanc ia l s ta tements 2008
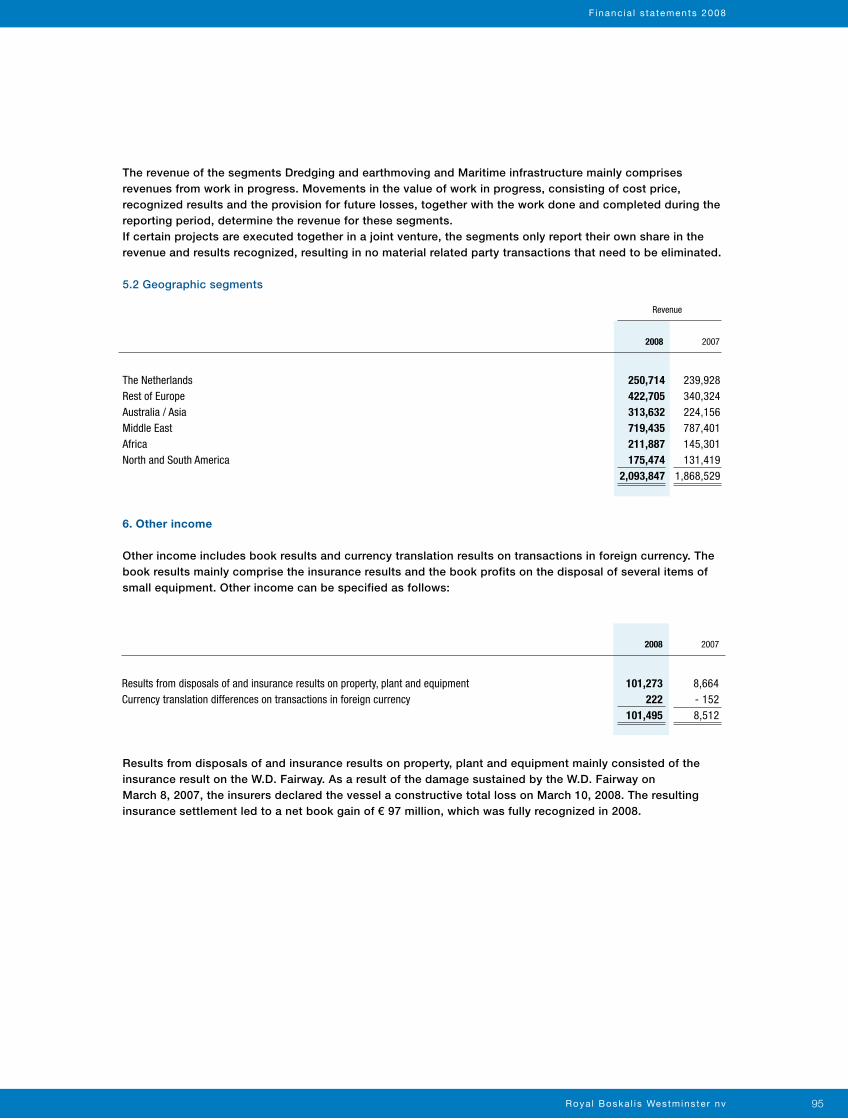
Roya l Boska l i s Westmins te r nv 95
The revenue of the segments Dredging and earthmoving and Maritime infrastructure mainly comprises revenues from work in progress. Movements in the value of work in progress, consisting of cost price, recognized results and the provision for future losses, together with the work done and completed during the reporting period, determine the revenue for these segments. If certain projects are executed together in a joint venture, the segments only report their own share in the revenue and results recognized, resulting in no material related party transactions that need to be eliminated.
5.2 Geographic segments
6. Other income
Other income includes book results and currency translation results on transactions in foreign currency. The book results mainly comprise the insurance results and the book profits on the disposal of several items of small equipment. Other income can be specified as follows:
Results from disposals of and insurance results on property, plant and equipment mainly consisted of the insurance result on the W.D. Fairway. As a result of the damage sustained by the W.D. Fairway on March 8, 2007, the insurers declared the vessel a constructive total loss on March 10, 2008. The resulting insurance settlement led to a net book gain of € 97 million, which was fully recognized in 2008.
250,714 239,928 422,705 340,324 313,632 224,156 719,435 787,401 211,887 145,301 175,474 131,419 2,093,847 1,868,529
2008 2007
The Netherlands Rest of EuropeAustralia / AsiaMiddle EastAfricaNorth and South America
Revenue
101,273 8,664 222 - 152 101,495 8,512
2008 2007
Results from disposals of and insurance results on property, plant and equipmentCurrency translation differences on transactions in foreign currency
F inanc ia l s ta tements 2008
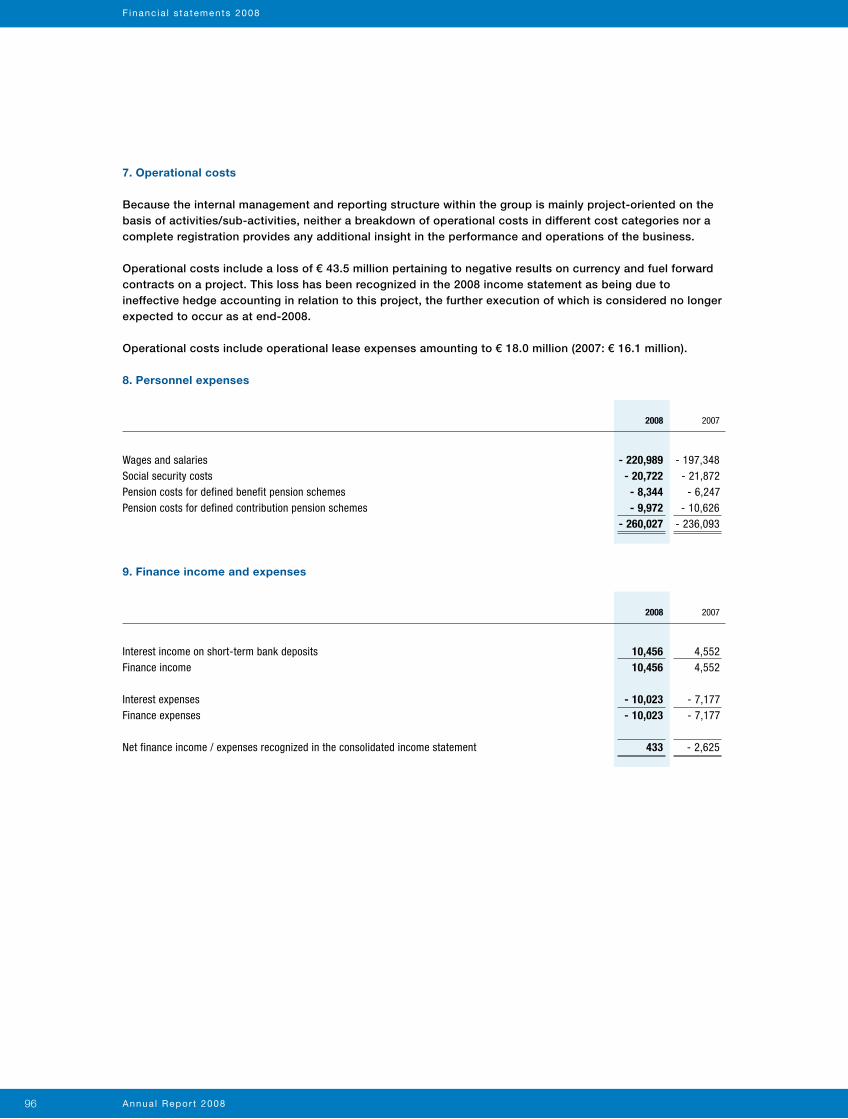
Annua l Repor t 200896
F inanc ia l s ta tements 2008
7. Operational costs
Because the internal management and reporting structure within the group is mainly project-oriented on the basis of activities/sub-activities, neither a breakdown of operational costs in different cost categories nor a complete registration provides any additional insight in the performance and operations of the business.
Operational costs include a loss of € 43.5 million pertaining to negative results on currency and fuel forward contracts on a project. This loss has been recognized in the 2008 income statement as being due to ineffective hedge accounting in relation to this project, the further execution of which is considered no longer expected to occur as at end-2008.
Operational costs include operational lease expenses amounting to € 18.0 million (2007: € 16.1 million).
8. Personnel expenses
9. Finance income and expenses
Wages and salariesSocial security costsPension costs for defined benefit pension schemesPension costs for defined contribution pension schemes
- 220,989 - 197,348 - 20,722 - 21,872 - 8,344 - 6,247 - 9,972 - 10,626 - 260,027 - 236,093
2008 2007
Interest income on short-term bank depositsFinance income
Interest expensesFinance expenses
Net finance income / expenses recognized in the consolidated income statement
10,456 4,552 10,456 4,552 - 10,023 - 7,177 - 10,023 - 7,177 433 - 2,625
2008 2007
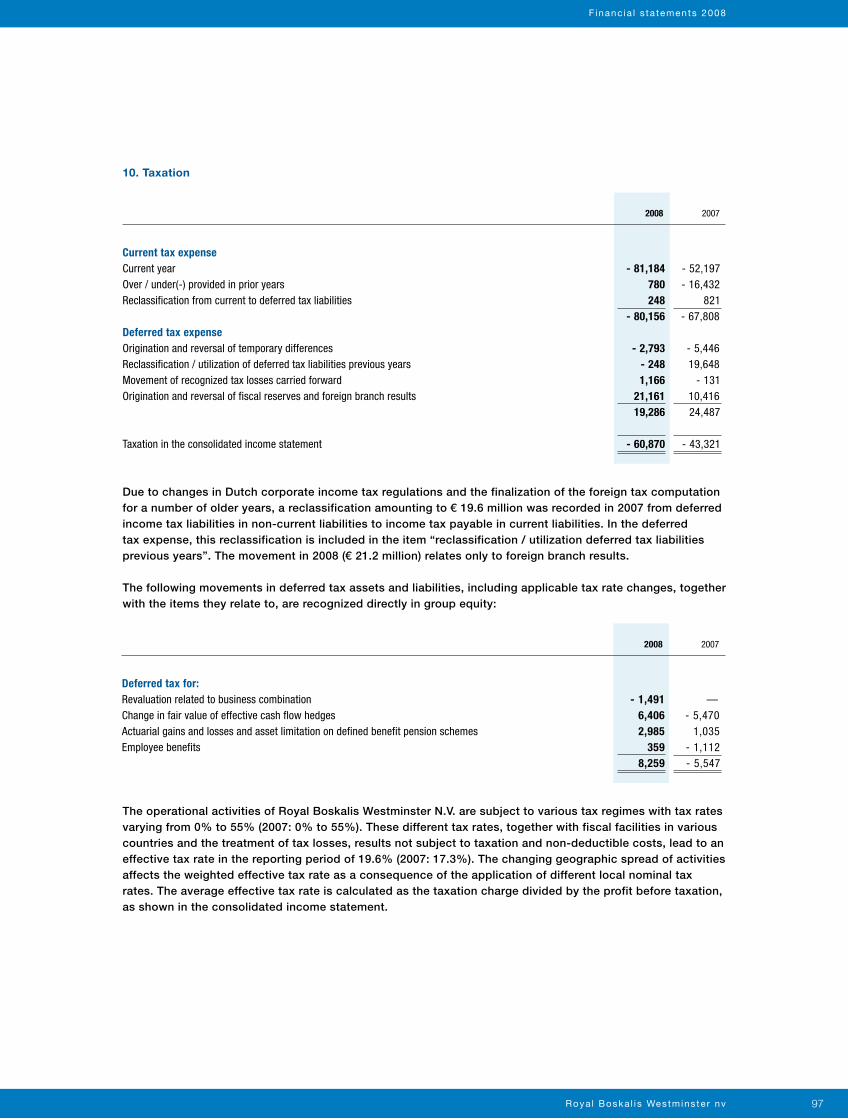
Roya l Boska l i s Westmins te r nv 97
F inanc ia l s ta tements 2008
The operational activities of Royal Boskalis Westminster N.V. are subject to various tax regimes with tax rates varying from 0% to 55% (2007: 0% to 55%). These different tax rates, together with fiscal facilities in various countries and the treatment of tax losses, results not subject to taxation and non-deductible costs, lead to an effective tax rate in the reporting period of 19.6% (2007: 17.3%). The changing geographic spread of activities affects the weighted effective tax rate as a consequence of the application of different local nominal tax rates. The average effective tax rate is calculated as the taxation charge divided by the profit before taxation, as shown in the consolidated income statement.
Due to changes in Dutch corporate income tax regulations and the finalization of the foreign tax computation for a number of older years, a reclassification amounting to € 19.6 million was recorded in 2007 from deferred income tax liabilities in non-current liabilities to income tax payable in current liabilities. In the deferred tax expense, this reclassification is included in the item “reclassification / utilization deferred tax liabilities previous years”. The movement in 2008 (€ 21.2 million) relates only to foreign branch results.
The following movements in deferred tax assets and liabilities, including applicable tax rate changes, together with the items they relate to, are recognized directly in group equity:
10. Taxation
Current tax expense Current year Over / under(-) provided in prior years Reclassification from current to deferred tax liabilities
Deferred tax expense Origination and reversal of temporary differences Reclassification / utilization of deferred tax liabilities previous years Movement of recognized tax losses carried forward Origination and reversal of fiscal reserves and foreign branch results Taxation in the consolidated income statement
- 81,184 - 52,197 780 - 16,432 248 821 - 80,156 - 67,808 - 2,793 - 5,446 - 248 19,648 1,166 - 131 21,161 10,416 19,286 24,487 - 60,870 - 43,321
2008 2007
- 1,491 — 6,406 - 5,470 2,985 1,035 359 - 1,112 8,259 - 5,547
2008 2007
Deferred tax for:Revaluation related to business combinationChange in fair value of effective cash flow hedgesActuarial gains and losses and asset limitation on defined benefit pension schemesEmployee benefits
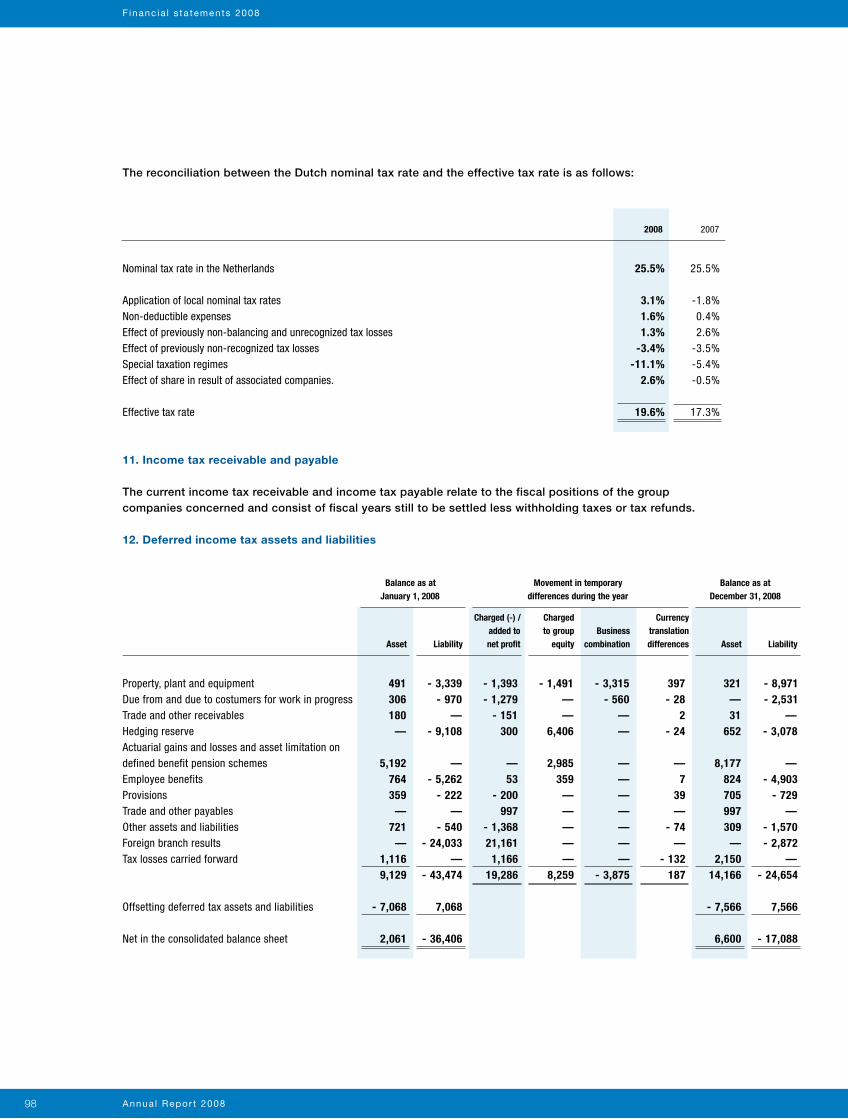
Annua l Repor t 200898
F inanc ia l s ta tements 2008
The reconciliation between the Dutch nominal tax rate and the effective tax rate is as follows:
11. Income tax receivable and payable
The current income tax receivable and income tax payable relate to the fiscal positions of the group companies concerned and consist of fiscal years still to be settled less withholding taxes or tax refunds.
12. Deferred income tax assets and liabilities
25.5% 25.5% 3.1% -1.8% 1.6% 0.4% 1.3% 2.6% -3.4% -3.5% -11.1% -5.4% 2.6% -0.5% 19.6% 17.3%
2008 2007
Nominal tax rate in the Netherlands
Application of local nominal tax ratesNon-deductible expensesEffect of previously non-balancing and unrecognized tax lossesEffect of previously non-recognized tax lossesSpecial taxation regimesEffect of share in result of associated companies.
Effective tax rate
491 - 3,339 - 1,393 - 1,491 - 3,315 397 321 - 8,971 306 - 970 - 1,279 — - 560 - 28 — - 2,531 180 — - 151 — — 2 31 — — - 9,108 300 6,406 — - 24 652 - 3,078 5,192 — — 2,985 — — 8,177 — 764 - 5,262 53 359 — 7 824 - 4,903 359 - 222 - 200 — — 39 705 - 729 — — 997 — — — 997 — 721 - 540 - 1,368 — — - 74 309 - 1,570 — - 24,033 21,161 — — — — - 2,872 1,116 — 1,166 — — - 132 2,150 — 9,129 - 43,474 19,286 8,259 - 3,875 187 14,166 - 24,654 - 7,068 7,068 - 7,566 7,566 2,061 - 36,406 6,600 - 17,088
Asset Liability
Charged (-) / added to net profit
Charged to group
equityBusiness
combination
Currency translation differences Asset Liability
Property, plant and equipmentDue from and due to costumers for work in progressTrade and other receivablesHedging reserveActuarial gains and losses and asset limitation on defined benefit pension schemesEmployee benefitsProvisionsTrade and other payablesOther assets and liabilitiesForeign branch resultsTax losses carried forward
Offsetting deferred tax assets and liabilities
Net in the consolidated balance sheet
Balance as at January 1, 2008
Balance as at December 31, 2008
Movement in temporary differences during the year
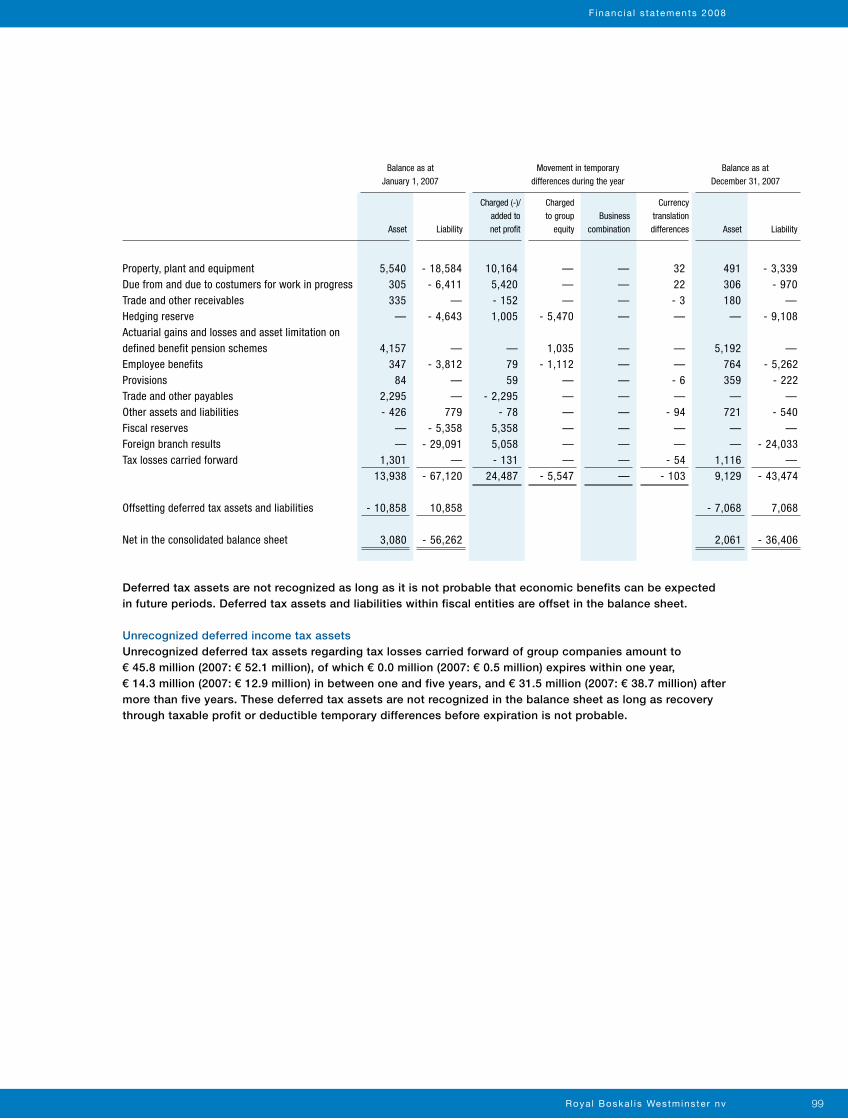
Roya l Boska l i s Westmins te r nv 99
F inanc ia l s ta tements 2008
Deferred tax assets are not recognized as long as it is not probable that economic benefits can be expected in future periods. Deferred tax assets and liabilities within fiscal entities are offset in the balance sheet.
Unrecognized deferred income tax assetsUnrecognized deferred tax assets regarding tax losses carried forward of group companies amount to € 45.8 million (2007: € 52.1 million), of which € 0.0 million (2007: € 0.5 million) expires within one year, € 14.3 million (2007: € 12.9 million) in between one and five years, and € 31.5 million (2007: € 38.7 million) after more than five years. These deferred tax assets are not recognized in the balance sheet as long as recovery through taxable profit or deductible temporary differences before expiration is not probable.
5,540 - 18,584 10,164 — — 32 491 - 3,339 305 - 6,411 5,420 — — 22 306 - 970 335 — - 152 — — - 3 180 — — - 4,643 1,005 - 5,470 — — — - 9,108 4,157 — — 1,035 — — 5,192 — 347 - 3,812 79 - 1,112 — — 764 - 5,262 84 — 59 — — - 6 359 - 222 2,295 — - 2,295 — — — — — - 426 779 - 78 — — - 94 721 - 540 — - 5,358 5,358 — — — — — — - 29,091 5,058 — — — — - 24,033 1,301 — - 131 — — - 54 1,116 — 13,938 - 67,120 24,487 - 5,547 — - 103 9,129 - 43,474
- 10,858 10,858 - 7,068 7,068 3,080 - 56,262 2,061 - 36,406
Asset Liability
Charged (-)/ added to net profit
Charged to group
equityBusiness
combination
Currency translation differences Asset Liability
Property, plant and equipmentDue from and due to costumers for work in progressTrade and other receivablesHedging reserveActuarial gains and losses and asset limitation on defined benefit pension schemesEmployee benefitsProvisionsTrade and other payablesOther assets and liabilitiesFiscal reservesForeign branch resultsTax losses carried forward
Offsetting deferred tax assets and liabilities
Net in the consolidated balance sheet
Balance as at January 1, 2007
Balance as at December 31, 2007
Movement in temporary differences during the year
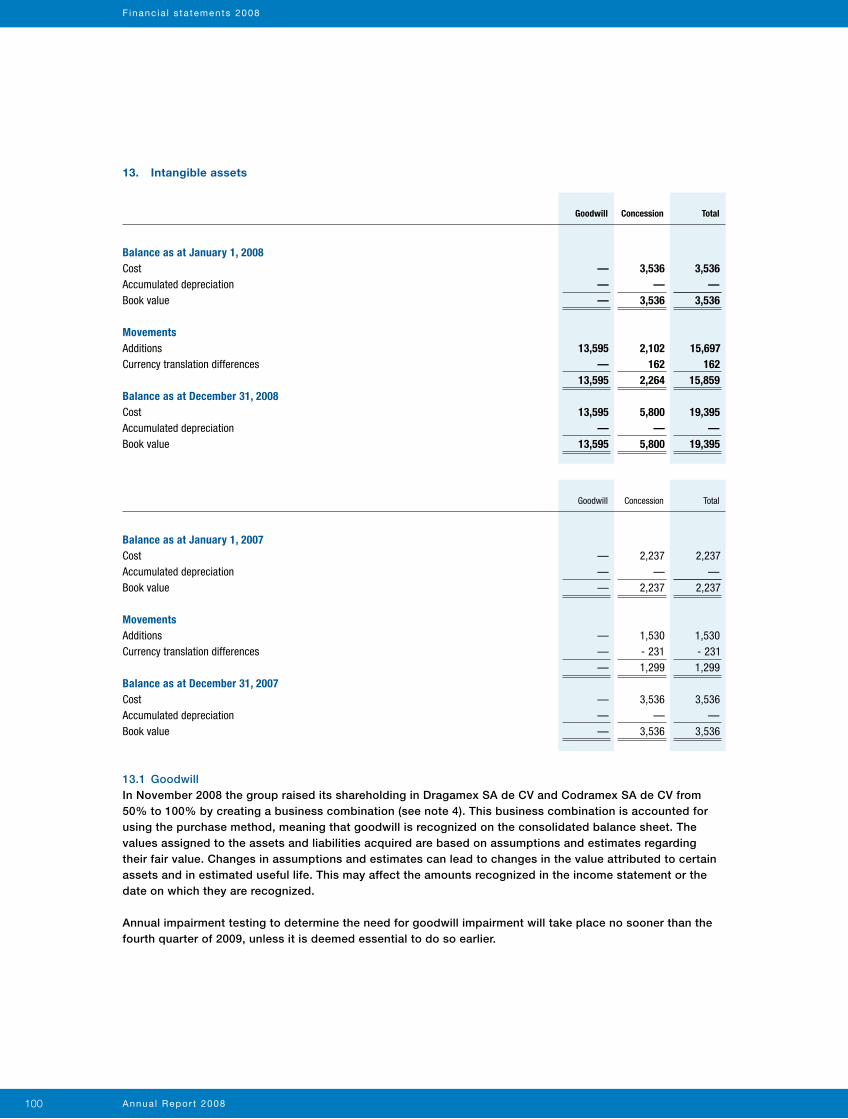
Annua l Repor t 2008100
F inanc ia l s ta tements 2008
13. Intangible assets
13.1 GoodwillIn November 2008 the group raised its shareholding in Dragamex SA de CV and Codramex SA de CV from 50% to 100% by creating a business combination (see note 4). This business combination is accounted for using the purchase method, meaning that goodwill is recognized on the consolidated balance sheet. The values assigned to the assets and liabilities acquired are based on assumptions and estimates regarding their fair value. Changes in assumptions and estimates can lead to changes in the value attributed to certain assets and in estimated useful life. This may affect the amounts recognized in the income statement or the date on which they are recognized.
Annual impairment testing to determine the need for goodwill impairment will take place no sooner than the fourth quarter of 2009, unless it is deemed essential to do so earlier.
— 3,536 3,536 — — — — 3,536 3,536 13,595 2,102 15,697 — 162 162 13,595 2,264 15,859 13,595 5,800 19,395 — — — 13,595 5,800 19,395
Balance as at January 1, 2008CostAccumulated depreciationBook value
MovementsAdditionsCurrency translation differences
Balance as at December 31, 2008CostAccumulated depreciationBook value
Goodwill Concession Total
— 2,237 2,237 — — — — 2,237 2,237 — 1,530 1,530 — - 231 - 231 — 1,299 1,299 — 3,536 3,536 — — — — 3,536 3,536
Balance as at January 1, 2007CostAccumulated depreciationBook value
MovementsAdditionsCurrency translation differences
Balance as at December 31, 2007CostAccumulated depreciationBook value
Goodwill Concession Total
Roya l Boska l i s Westmins te r nv 101
F inanc ia l s ta tements 2008
13.2 ConcessionIn late 2006 Thermaiki Odos SA, a jointly controlled entity, in which Archirodon Group N.V. participates for 50%, was awarded the Build-Finance-Operate-Transfer (BFOT) contract for the Thessaloniki Submerged Tunnel (TST).
The duration of the concession period is 30 years of which the construction period is 48 months. Total project capital expenditure is estimated to be € 406 million (100% figures). Thermaiki Odos SA has entered into an Operation and Maintenance Agreement with Thermaikes Diadromes SA, in which Archirodon Group N.V. has a 50% shareholding, and which undertakes the operation and maintenance of the project from completion of construction to the end of the concession period, as a sub-contractor.
In connection with the accounting for the concession, Royal Boskalis Westminster N.V. has adopted IFRIC 12 ’Service Concession Arrangements’ from January 1, 2007. In accordance with the concession contractual arrangement, Thermaiki Odos SA will be paid for the construction services partly by a state contribution and partly by the license to charge users during the concession period. Accordingly, and based on the provisions of IFRIC 12, the group accounts for the first part of the consideration (state contribution) through the recognition of a financial asset, while the second part of the consideration is accounted for as an intangible asset. On the basis of the above the group has recognized an intangible asset the cumulative balance of which was € 5.8 million as at December 31, 2008 (2007: € 3.5 million), while a financial asset of € 1.0 million (2007: € 0.8 million) has been recognized in respect of the concession, which is included in Other receivables and prepayments (note 19) as of the above date.
The amortization of the intangible and financial asset will commence upon the completion of the construction and will last till the end of the concession arrangement agreement.
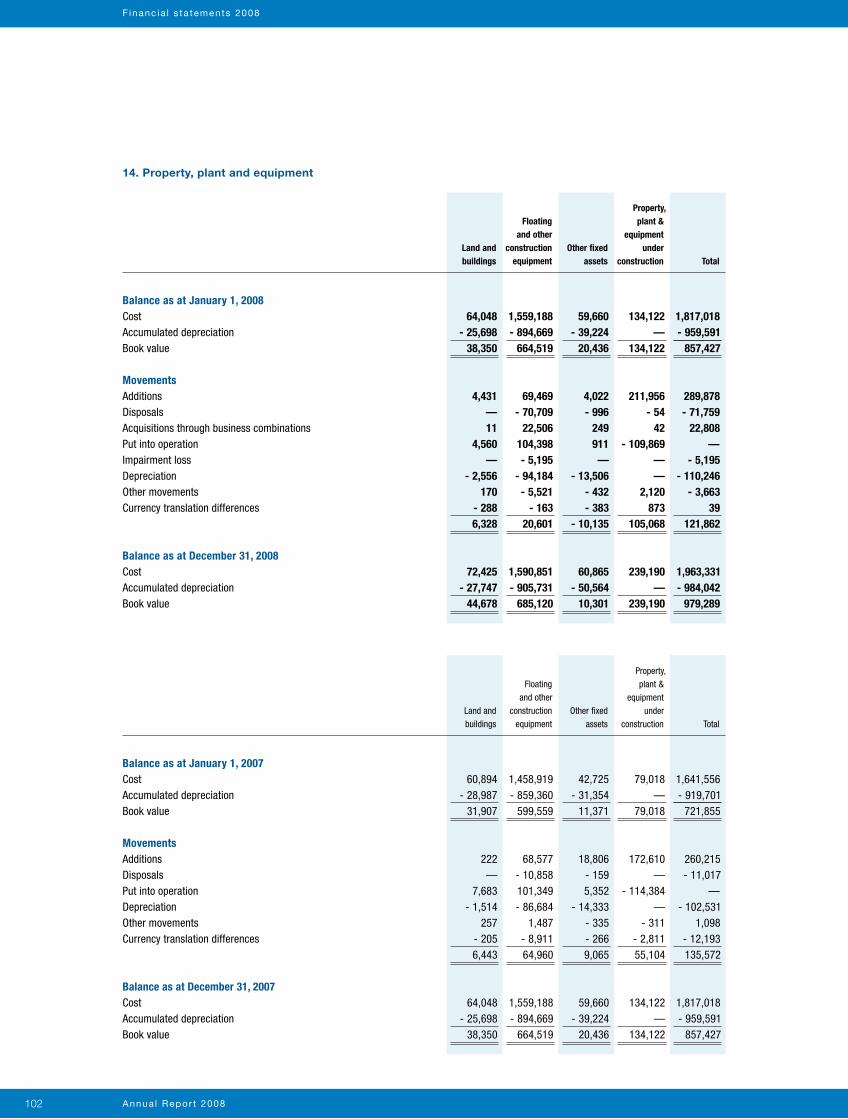
Annua l Repor t 2008102
F inanc ia l s ta tements 2008
64,048 1,559,188 59,660 134,122 1,817,018 - 25,698 - 894,669 - 39,224 — - 959,591 38,350 664,519 20,436 134,122 857,427
4,431 69,469 4,022 211,956 289,878 — - 70,709 - 996 - 54 - 71,759 11 22,506 249 42 22,808 4,560 104,398 911 - 109,869 — — - 5,195 — — - 5,195 - 2,556 - 94,184 - 13,506 — - 110,246 170 - 5,521 - 432 2,120 - 3,663 - 288 - 163 - 383 873 39 6,328 20,601 - 10,135 105,068 121,862
72,425 1,590,851 60,865 239,190 1,963,331 - 27,747 - 905,731 - 50,564 — - 984,042 44,678 685,120 10,301 239,190 979,289
60,894 1,458,919 42,725 79,018 1,641,556 - 28,987 - 859,360 - 31,354 — - 919,701 31,907 599,559 11,371 79,018 721,855 222 68,577 18,806 172,610 260,215 — - 10,858 - 159 — - 11,017 7,683 101,349 5,352 - 114,384 — - 1,514 - 86,684 - 14,333 — - 102,531 257 1,487 - 335 - 311 1,098 - 205 - 8,911 - 266 - 2,811 - 12,193 6,443 64,960 9,065 55,104 135,572 64,048 1,559,188 59,660 134,122 1,817,018 - 25,698 - 894,669 - 39,224 — - 959,591 38,350 664,519 20,436 134,122 857,427
Floating and other
construction equipment
Floating and other
construction equipment
Land and buildings
Land and buildings
Other fixed assets
Other fixed assets
Property, plant &
equip ment under
construction
Property, plant &
equip ment under
construction
Total
Total
Balance as at January 1, 2008CostAccumulated depreciationBook value
MovementsAdditionsDisposalsAcquisitions through business combinationsPut into operationImpairment lossDepreciationOther movementsCurrency translation differences
Balance as at December 31, 2008CostAccumulated depreciationBook value
Balance as at January 1, 2007CostAccumulated depreciationBook value
MovementsAdditionsDisposalsPut into operationDepreciationOther movementsCurrency translation differences
Balance as at December 31, 2007CostAccumulated depreciationBook value
14. Property, plant and equipment
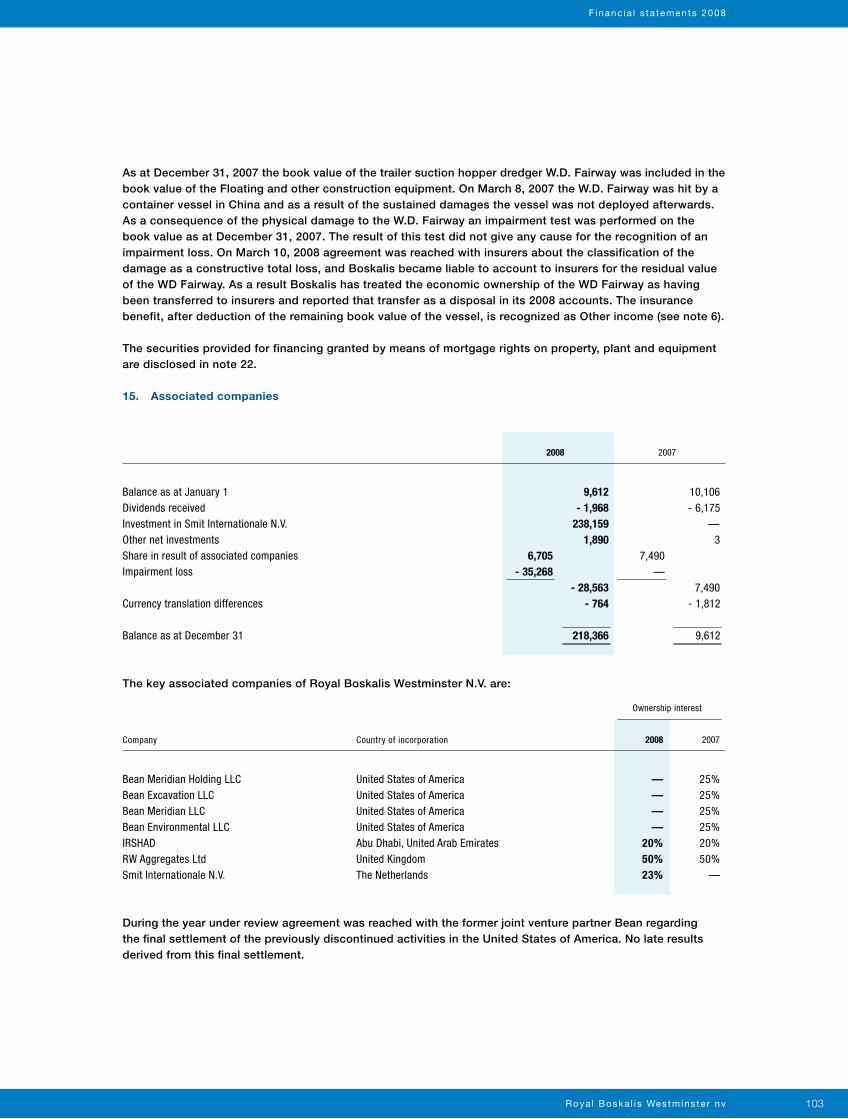
Roya l Boska l i s Westmins te r nv 103
F inanc ia l s ta tements 2008
As at December 31, 2007 the book value of the trailer suction hopper dredger W.D. Fairway was included in the book value of the Floating and other construction equipment. On March 8, 2007 the W.D. Fairway was hit by a container vessel in China and as a result of the sustained damages the vessel was not deployed afterwards. As a consequence of the physical damage to the W.D. Fairway an impairment test was performed on the book value as at December 31, 2007. The result of this test did not give any cause for the recognition of an impairment loss. On March 10, 2008 agreement was reached with insurers about the classification of the damage as a constructive total loss, and Boskalis became liable to account to insurers for the residual value of the WD Fairway. As a result Boskalis has treated the economic ownership of the WD Fairway as having been transferred to insurers and reported that transfer as a disposal in its 2008 accounts. The insurance benefit, after deduction of the remaining book value of the vessel, is recognized as Other income (see note 6).
The securities provided for financing granted by means of mortgage rights on property, plant and equipment are disclosed in note 22.
15. Associated companies
The key associated companies of Royal Boskalis Westminster N.V. are:
During the year under review agreement was reached with the former joint venture partner Bean regarding the final settlement of the previously discontinued activities in the United States of America. No late results derived from this final settlement.
Company Country of incorporation
Balance as at January 1Dividends receivedInvestment in Smit Internationale N.V.Other net investmentsShare in result of associated companiesImpairment loss
Currency translation differences
Balance as at December 31
Bean Meridian Holding LLC United States of AmericaBean Excavation LLC United States of AmericaBean Meridian LLC United States of AmericaBean Environmental LLC United States of AmericaIRSHAD Abu Dhabi, United Arab EmiratesRW Aggregates Ltd United KingdomSmit Internationale N.V. The Netherlands
— 25% — 25% — 25% — 25% 20% 20% 50% 50% 23% —
2008
2008
2007
2007
Ownership interest
9,612 10,106 - 1,968 - 6,175 238,159 — 1,890 3 6,705 7,490 - 35,268 — - 28,563 7,490 - 764 - 1,812 218,366 9,612
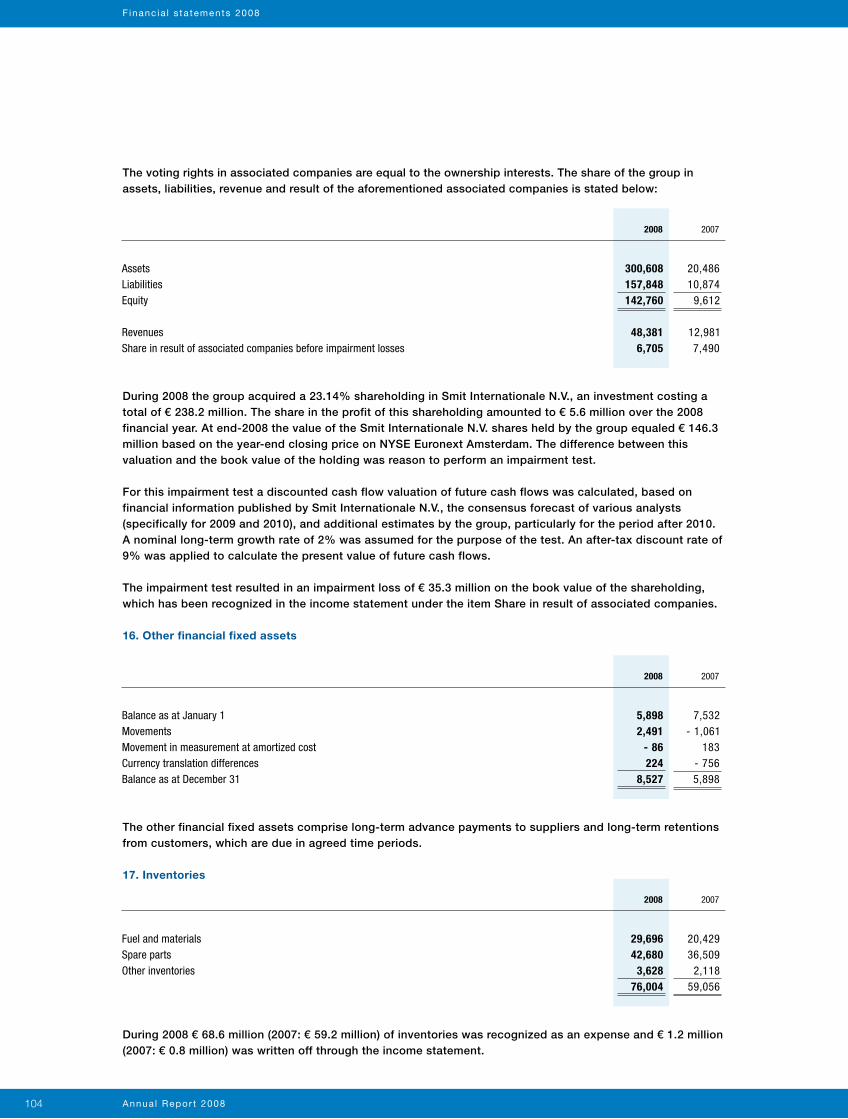
Annua l Repor t 2008104
F inanc ia l s ta tements 2008
29,696 20,429 42,680 36,509 3,628 2,118 76,004 59,056
2008 2007
Fuel and materialsSpare partsOther inventories
5,898 7,532 2,491 - 1,061 - 86 183 224 - 756 8,527 5,898
2008 2007
Balance as at January 1MovementsMovement in measurement at amortized costCurrency translation differencesBalance as at December 31
The voting rights in associated companies are equal to the ownership interests. The share of the group in assets, liabilities, revenue and result of the aforementioned associated companies is stated below:
During 2008 the group acquired a 23.14% shareholding in Smit Internationale N.V., an investment costing a total of € 238.2 million. The share in the profit of this shareholding amounted to € 5.6 million over the 2008 financial year. At end-2008 the value of the Smit Internationale N.V. shares held by the group equaled € 146.3 million based on the year-end closing price on NYSE Euronext Amsterdam. The difference between this valuation and the book value of the holding was reason to perform an impairment test.
For this impairment test a discounted cash flow valuation of future cash flows was calculated, based on financial information published by Smit Internationale N.V., the consensus forecast of various analysts (specifically for 2009 and 2010), and additional estimates by the group, particularly for the period after 2010. A nominal long-term growth rate of 2% was assumed for the purpose of the test. An after-tax discount rate of 9% was applied to calculate the present value of future cash flows.
The impairment test resulted in an impairment loss of € 35.3 million on the book value of the shareholding, which has been recognized in the income statement under the item Share in result of associated companies.
16. Other financial fixed assets
The other financial fixed assets comprise long-term advance payments to suppliers and long-term retentions from customers, which are due in agreed time periods.
17. Inventories
During 2008 € 68.6 million (2007: € 59.2 million) of inventories was recognized as an expense and € 1.2 million (2007: € 0.8 million) was written off through the income statement.
300,608 20,486 157,848 10,874 142,760 9,612 48,381 12,981 6,705 7,490
2008 2007
AssetsLiabilitiesEquity
RevenuesShare in result of associated companies before impairment losses
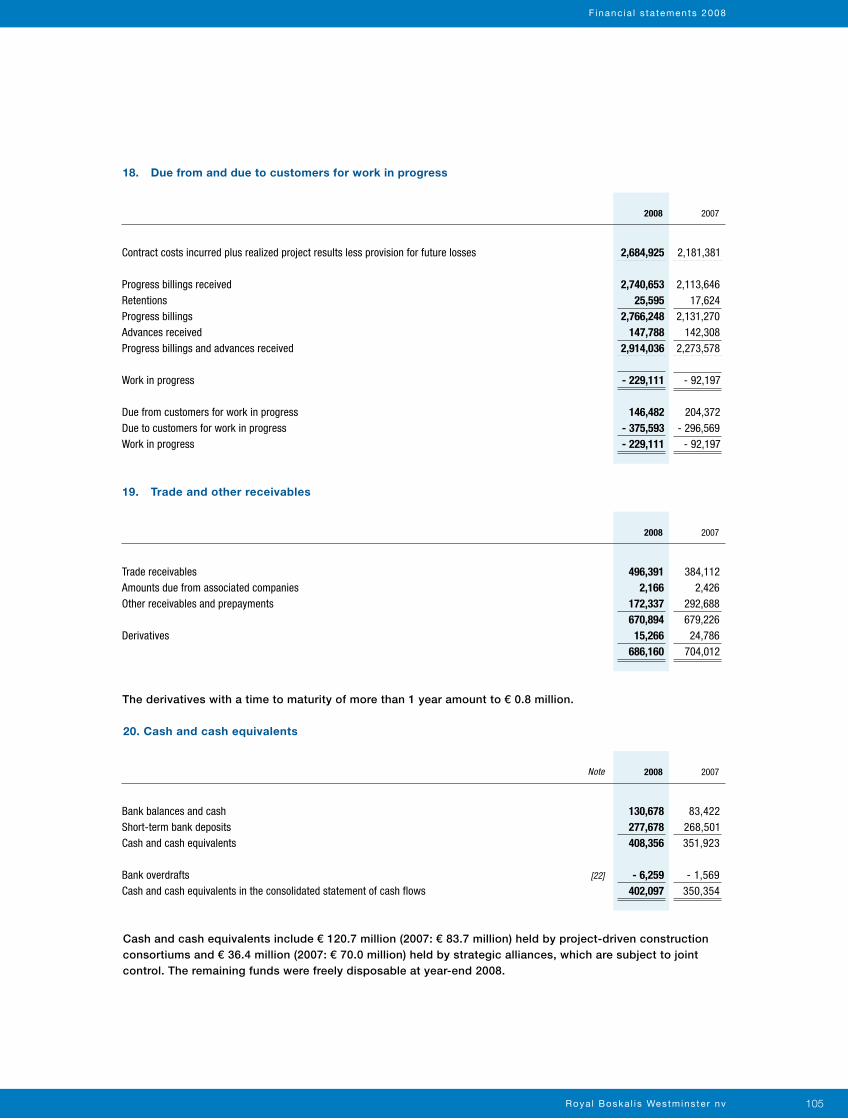
Roya l Boska l i s Westmins te r nv 105
F inanc ia l s ta tements 2008
18. Due from and due to customers for work in progress
19. Trade and other receivables
The derivatives with a time to maturity of more than 1 year amount to € 0.8 million.
20. Cash and cash equivalents
Cash and cash equivalents include € 120.7 million (2007: € 83.7 million) held by project-driven construction consortiums and € 36.4 million (2007: € 70.0 million) held by strategic alliances, which are subject to joint control. The remaining funds were freely disposable at year-end 2008.
2,684,925 2,181,381 2,740,653 2,113,646 25,595 17,624 2,766,248 2,131,270 147,788 142,308 2,914,036 2,273,578 - 229,111 - 92,197 146,482 204,372 - 375,593 - 296,569 - 229,111 - 92,197
496,391 384,112 2,166 2,426 172,337 292,688 670,894 679,226 15,266 24,786 686,160 704,012
130,678 83,422 277,678 268,501 408,356 351,923 - 6,259 - 1,569 402,097 350,354
2008
2008
2008
2007
2007
2007
Contract costs incurred plus realized project results less provision for future losses
Progress billings receivedRetentionsProgress billingsAdvances receivedProgress billings and advances received
Work in progress
Due from customers for work in progressDue to customers for work in progressWork in progress
Trade receivablesAmounts due from associated companiesOther receivables and prepayments
Derivatives
Bank balances and cashShort-term bank depositsCash and cash equivalents
Bank overdrafts [22]
Cash and cash equivalents in the consolidated statement of cash flows
Note
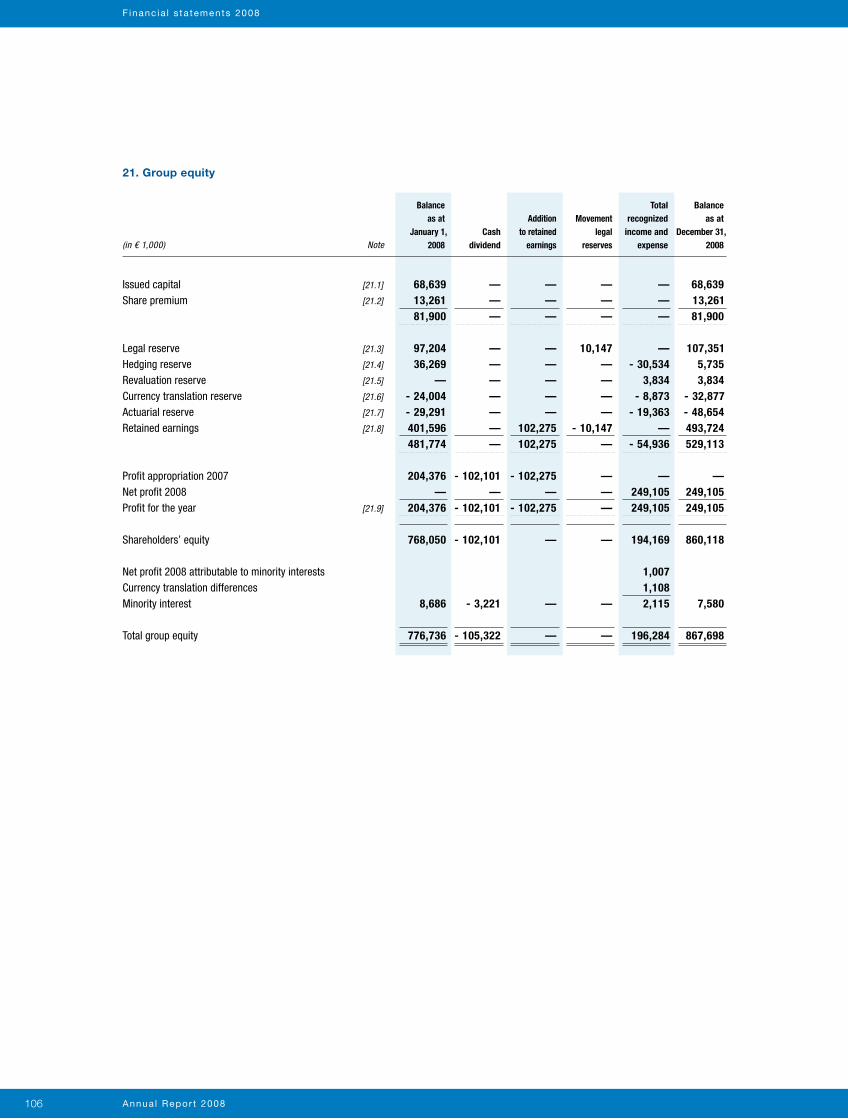
Annua l Repor t 2008106
F inanc ia l s ta tements 2008
21. Group equity
68,639 — — — — 68,639 13,261 — — — — 13,261 81,900 — — — — 81,900 97,204 — — 10,147 — 107,351 36,269 — — — - 30,534 5,735 — — — — 3,834 3,834 - 24,004 — — — - 8,873 - 32,877 - 29,291 — — — - 19,363 - 48,654 401,596 — 102,275 - 10,147 — 493,724 481,774 — 102,275 — - 54,936 529,113 204,376 - 102,101 - 102,275 — — — — — — — 249,105 249,105 204,376 - 102,101 - 102,275 — 249,105 249,105 768,050 - 102,101 — — 194,169 860,118
1,007 1,108 8,686 - 3,221 — — 2,115 7,580 776,736 - 105,322 — — 196,284 867,698
Balance as at
January 1, 2008
Cash dividend
Addition to retained
earnings
Movement legal
reserves
Total recognized
income and expense
Balance as at
December 31, 2008
Issued capital [21.1]
Share premium [21.2]
Legal reserve [21.3]
Hedging reserve [21.4]
Revaluation reserve [21.5]
Currency translation reserve [21.6]
Actuarial reserve [21.7]
Retained earnings [21.8]
Profit appropriation 2007Net profit 2008 Profit for the year [21.9] Shareholders’ equity Net profit 2008 attributable to minority interests Currency translation differences Minority interest Total group equity
Note(in € 1,000)
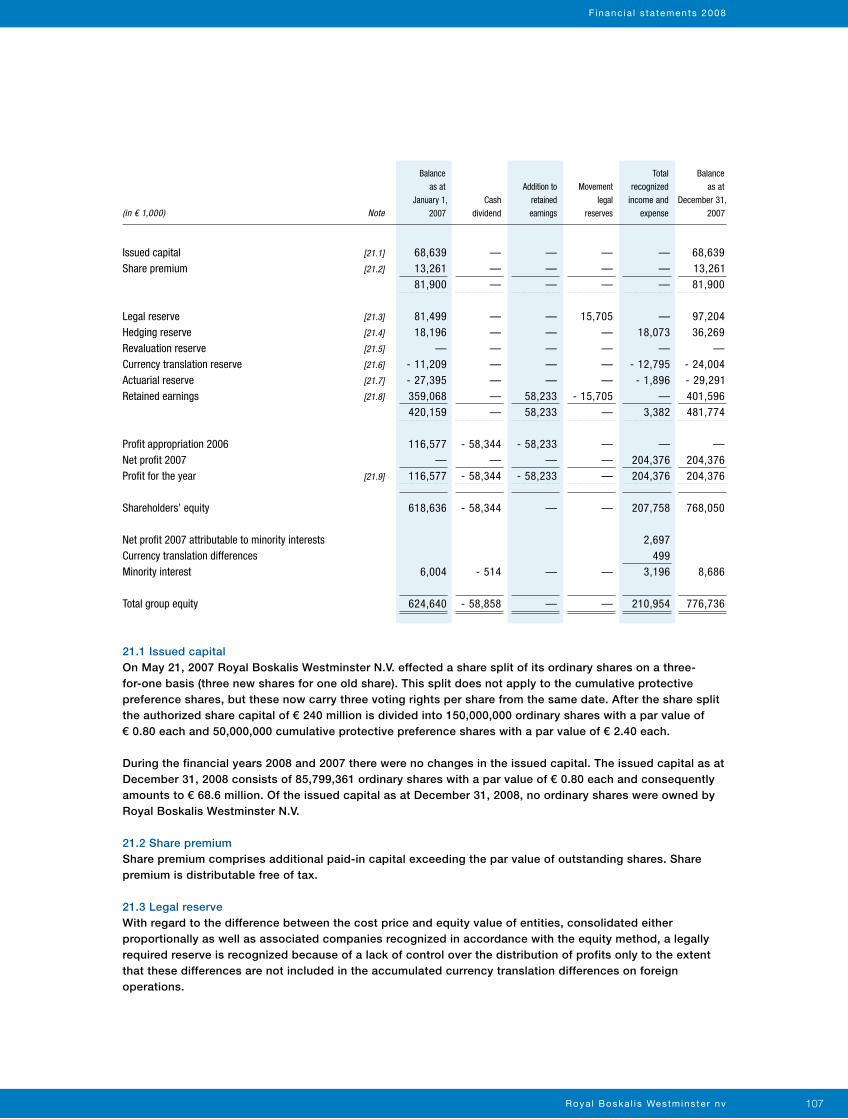
Roya l Boska l i s Westmins te r nv 107
F inanc ia l s ta tements 2008
68,639 — — — — 68,639 13,261 — — — — 13,261 81,900 — — — — 81,900 81,499 — — 15,705 — 97,204 18,196 — — — 18,073 36,269 — — — — — — - 11,209 — — — - 12,795 - 24,004 - 27,395 — — — - 1,896 - 29,291 359,068 — 58,233 - 15,705 — 401,596 420,159 — 58,233 — 3,382 481,774 116,577 - 58,344 - 58,233 — — — — — — — 204,376 204,376 116,577 - 58,344 - 58,233 — 204,376 204,376 618,636 - 58,344 — — 207,758 768,050 2,697 499 6,004 - 514 — — 3,196 8,686 624,640 - 58,858 — — 210,954 776,736
Balance as at
January 1, 2007
Cash dividend
Addition to retained earnings
Movement legal
reserves
Total recognized
income and expense
Balance as at
December 31, 2007
Issued capital [21.1]
Share premium [21.2]
Legal reserve [21.3]
Hedging reserve [21.4]
Revaluation reserve [21.5]
Currency translation reserve [21.6]
Actuarial reserve [21.7]
Retained earnings [21.8]
Profit appropriation 2006 Net profit 2007 Profit for the year [21.9]
Shareholders’ equity Net profit 2007 attributable to minority interests Currency translation differences Minority interest Total group equity
Note(in € 1,000)
21.1 Issued capitalOn May 21, 2007 Royal Boskalis Westminster N.V. effected a share split of its ordinary shares on a three-for-one basis (three new shares for one old share). This split does not apply to the cumulative protective preference shares, but these now carry three voting rights per share from the same date. After the share split the authorized share capital of € 240 million is divided into 150,000,000 ordinary shares with a par value of € 0.80 each and 50,000,000 cumulative protective preference shares with a par value of € 2.40 each.
During the financial years 2008 and 2007 there were no changes in the issued capital. The issued capital as at December 31, 2008 consists of 85,799,361 ordinary shares with a par value of € 0.80 each and consequently amounts to € 68.6 million. Of the issued capital as at December 31, 2008, no ordinary shares were owned by Royal Boskalis Westminster N.V.
21.2 Share premiumShare premium comprises additional paid-in capital exceeding the par value of outstanding shares. Share premium is distributable free of tax.
21.3 Legal reserveWith regard to the difference between the cost price and equity value of entities, consolidated either proportionally as well as associated companies recognized in accordance with the equity method, a legally required reserve is recognized because of a lack of control over the distribution of profits only to the extent that these differences are not included in the accumulated currency translation differences on foreign operations.
Annua l Repor t 2008108
F inanc ia l s ta tements 2008
21.4 Hedging reserveThe hedging reserve comprises the fair value of effective cash flow hedges, not yet realized at balance sheet date, net of taxation, including results realized on the “rolling forward” of existing hedges as a result of differences between the duration of the hedges concerned and the underlying cash flows. Details about the movements in the hedging reserve are disclosed in note 26.2.
21.5 Revaluation reserveThis reserve relates to the revaluation of property, plant and equipment prior to the business combination during 2008 through which the shareholdings in Dragamex SA de CV and Codramex SA de CV were raised from 50% to 100% (see note 4).
21.6 Currency translation reserveThe translation reserve comprises all accumulated currency translation differences arising from the translation of investments in foreign operations, which are denominated in reporting currencies other than those used by the group, including the related intragroup financing. These currency translation differences are accumulated as from the IFRS transition date (January 1, 2004) and are taken into the income statement at disposal or termination of these foreign operations.
21.7 Actuarial reserveThe actuarial reserve relates to the limitation on net plan assets of defined benefit pension schemes and the actuarial gains and losses, which originated from the difference between the realized and the expected movement in defined benefit obligations and the return on plan assets.
21.8 Retained earningsRetained earnings consist of additions and distributions based on profit appropriations, effects of changes in accounting principles and losses and movements in the legal reserve. The balance is at the disposal of the shareholders.
21.9 Profit for the yearProfit for the year represents the as yet unappropriated current year profit. A proposal for profit appropriation is included in note 29 relating to subsequent events.
21.10 Earnings per shareEarnings per share over 2008 amount to € 2.90 (2007: € 2.38). Because there are no dilution effects, the diluted earnings per share also amount to € 2.90 (2007: € 2.38). The calculation of earnings per share is based on the profit attributable to shareholders of € 249.1 million (2007: € 204.4 million). The weighted average number of ordinary shares did not change during the financial years 2008 and 2007 and amounts to 85,799,361.
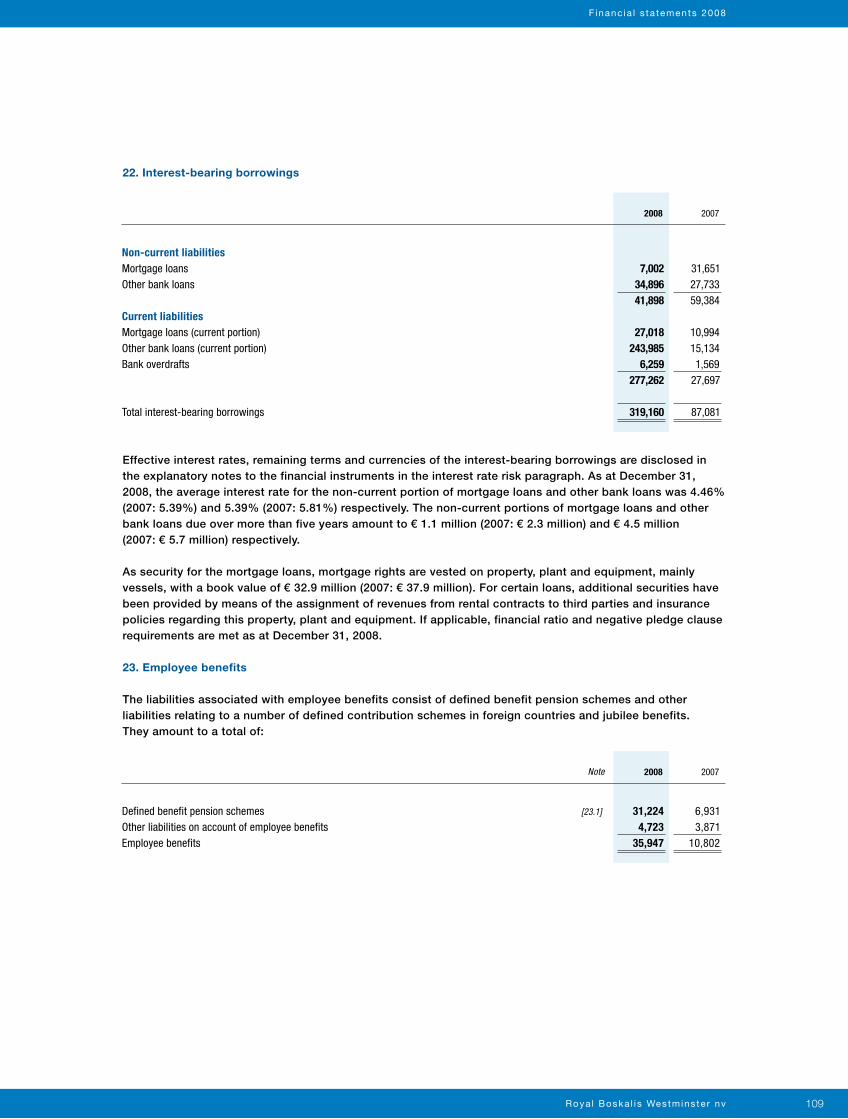
Roya l Boska l i s Westmins te r nv 109
22. Interest-bearing borrowings
Effective interest rates, remaining terms and currencies of the interest-bearing borrowings are disclosed in the explanatory notes to the financial instruments in the interest rate risk paragraph. As at December 31, 2008, the average interest rate for the non-current portion of mortgage loans and other bank loans was 4.46% (2007: 5.39%) and 5.39% (2007: 5.81%) respectively. The non-current portions of mortgage loans and other bank loans due over more than five years amount to € 1.1 million (2007: € 2.3 million) and € 4.5 million (2007: € 5.7 million) respectively.
As security for the mortgage loans, mortgage rights are vested on property, plant and equipment, mainly vessels, with a book value of € 32.9 million (2007: € 37.9 million). For certain loans, additional securities have been provided by means of the assignment of revenues from rental contracts to third parties and insurance policies regarding this property, plant and equipment. If applicable, financial ratio and negative pledge clause requirements are met as at December 31, 2008.
23. Employee benefits
The liabilities associated with employee benefits consist of defined benefit pension schemes and other liabilities relating to a number of defined contribution schemes in foreign countries and jubilee benefits. They amount to a total of:
7,002 31,651 34,896 27,733 41,898 59,384 27,018 10,994 243,985 15,134 6,259 1,569 277,262 27,697 319,160 87,081
2008 2007
Non-current liabilitiesMortgage loansOther bank loans
Current liabilitiesMortgage loans (current portion)Other bank loans (current portion)Bank overdrafts
Total interest-bearing borrowings
31,224 6,931 4,723 3,871 35,947 10,802
2008 2007
Defined benefit pension schemes [23.1]
Other liabilities on account of employee benefits Employee benefits
Note
F inanc ia l s ta tements 2008
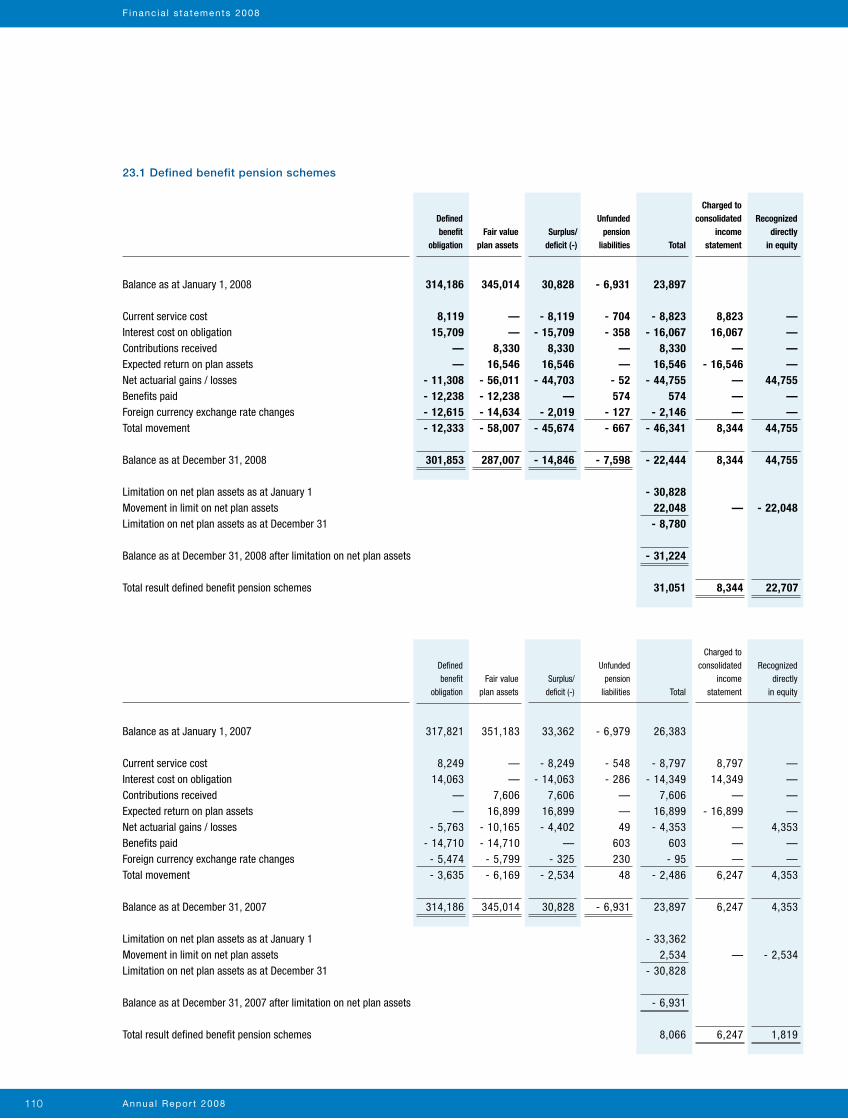
Annua l Repor t 2008110
F inanc ia l s ta tements 2008
23.1 Defined benefit pension schemes
314,186 345,014 30,828 - 6,931 23,897 8,119 — - 8,119 - 704 - 8,823 8,823 — 15,709 — - 15,709 - 358 - 16,067 16,067 — — 8,330 8,330 — 8,330 — — — 16,546 16,546 — 16,546 - 16,546 — - 11,308 - 56,011 - 44,703 - 52 - 44,755 — 44,755 - 12,238 - 12,238 — 574 574 — — - 12,615 - 14,634 - 2,019 - 127 - 2,146 — — - 12,333 - 58,007 - 45,674 - 667 - 46,341 8,344 44,755 301,853 287,007 - 14,846 - 7,598 - 22,444 8,344 44,755 - 30,828 22,048 — - 22,048 - 8,780 - 31,224 31,051 8,344 22,707
317,821 351,183 33,362 - 6,979 26,383 8,249 — - 8,249 - 548 - 8,797 8,797 — 14,063 — - 14,063 - 286 - 14,349 14,349 — — 7,606 7,606 — 7,606 — — — 16,899 16,899 — 16,899 - 16,899 — - 5,763 - 10,165 - 4,402 49 - 4,353 — 4,353 - 14,710 - 14,710 — 603 603 — — - 5,474 - 5,799 - 325 230 - 95 — — - 3,635 - 6,169 - 2,534 48 - 2,486 6,247 4,353 314,186 345,014 30,828 - 6,931 23,897 6,247 4,353 - 33,362 2,534 — - 2,534 - 30,828 - 6,931 8,066 6,247 1,819
Defined benefit
obligation
Defined benefit
obligation
Fair value plan assets
Fair value plan assets
Surplus/ deficit (-)
Surplus/ deficit (-)
Unfunded pension
liabilities
Unfunded pension
liabilities
Total
Total
Charged to consolidated
income statement
Charged to consolidated
income statement
Recognized directly
in equity
Recognized directly
in equity
Balance as at January 1, 2008
Current service costInterest cost on obligationContributions receivedExpected return on plan assetsNet actuarial gains / lossesBenefits paidForeign currency exchange rate changesTotal movement
Balance as at December 31, 2008
Limitation on net plan assets as at January 1Movement in limit on net plan assetsLimitation on net plan assets as at December 31
Balance as at December 31, 2008 after limitation on net plan assets
Total result defined benefit pension schemes
Balance as at January 1, 2007
Current service costInterest cost on obligationContributions receivedExpected return on plan assetsNet actuarial gains / lossesBenefits paidForeign currency exchange rate changesTotal movement
Balance as at December 31, 2007
Limitation on net plan assets as at January 1Movement in limit on net plan assetsLimitation on net plan assets as at December 31
Balance as at December 31, 2007 after limitation on net plan assets
Total result defined benefit pension schemes
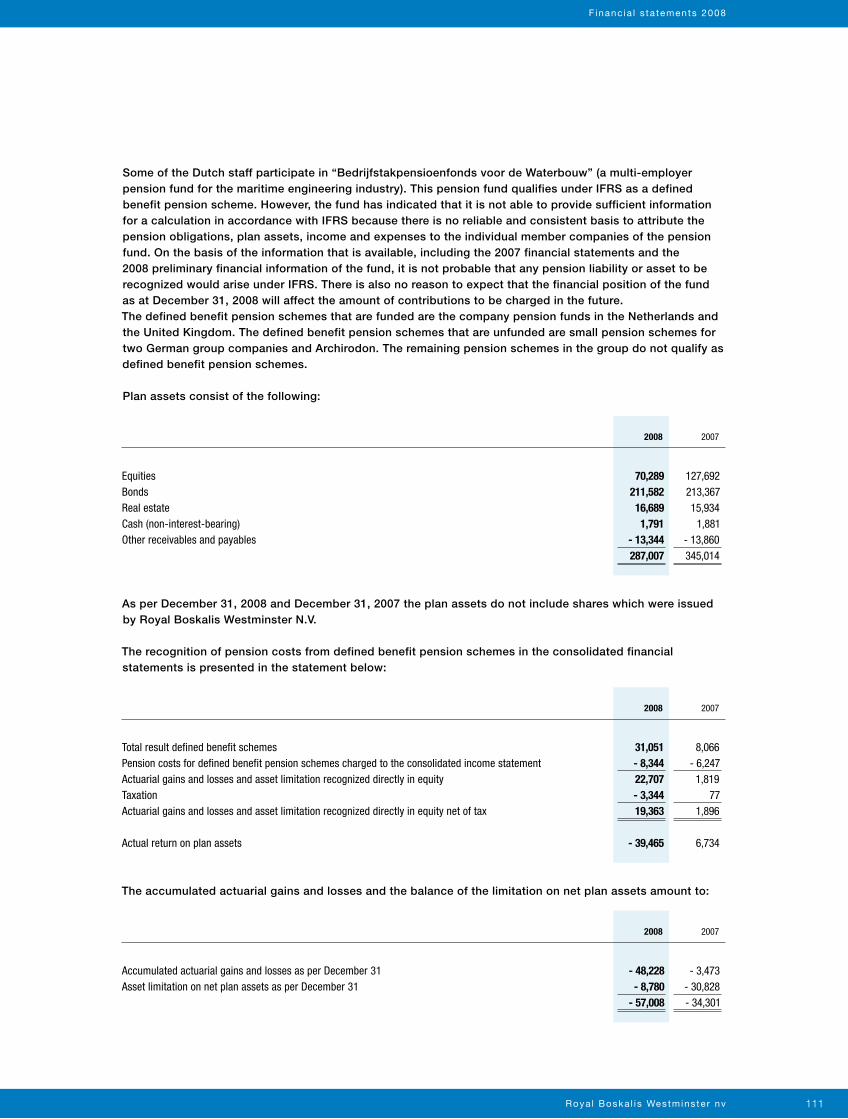
Roya l Boska l i s Westmins te r nv 111
F inanc ia l s ta tements 2008
Some of the Dutch staff participate in “Bedrijfstakpensioenfonds voor de Waterbouw” (a multi-employer pension fund for the maritime engineering industry). This pension fund qualifies under IFRS as a defined benefit pension scheme. However, the fund has indicated that it is not able to provide sufficient information for a calculation in accordance with IFRS because there is no reliable and consistent basis to attribute the pension obligations, plan assets, income and expenses to the individual member companies of the pension fund. On the basis of the information that is available, including the 2007 financial statements and the 2008 preliminary financial information of the fund, it is not probable that any pension liability or asset to be recognized would arise under IFRS. There is also no reason to expect that the financial position of the fund as at December 31, 2008 will affect the amount of contributions to be charged in the future. The defined benefit pension schemes that are funded are the company pension funds in the Netherlands and the United Kingdom. The defined benefit pension schemes that are unfunded are small pension schemes for two German group companies and Archirodon. The remaining pension schemes in the group do not qualify as defined benefit pension schemes.
Plan assets consist of the following:
As per December 31, 2008 and December 31, 2007 the plan assets do not include shares which were issued by Royal Boskalis Westminster N.V.
The recognition of pension costs from defined benefit pension schemes in the consolidated financial statements is presented in the statement below:
The accumulated actuarial gains and losses and the balance of the limitation on net plan assets amount to:
70,289 127,692 211,582 213,367 16,689 15,934 1,791 1,881 - 13,344 - 13,860 287,007 345,014
2008 2007
EquitiesBondsReal estateCash (non-interest-bearing)Other receivables and payables
31,051 8,066 - 8,344 - 6,247 22,707 1,819 - 3,344 77 19,363 1,896 - 39,465 6,734
2008 2007
Total result defined benefit schemesPension costs for defined benefit pension schemes charged to the consolidated income statementActuarial gains and losses and asset limitation recognized directly in equityTaxationActuarial gains and losses and asset limitation recognized directly in equity net of tax
Actual return on plan assets
- 48,228 - 3,473 - 8,780 - 30,828 - 57,008 - 34,301
2008 2007
Accumulated actuarial gains and losses as per December 31 Asset limitation on net plan assets as per December 31
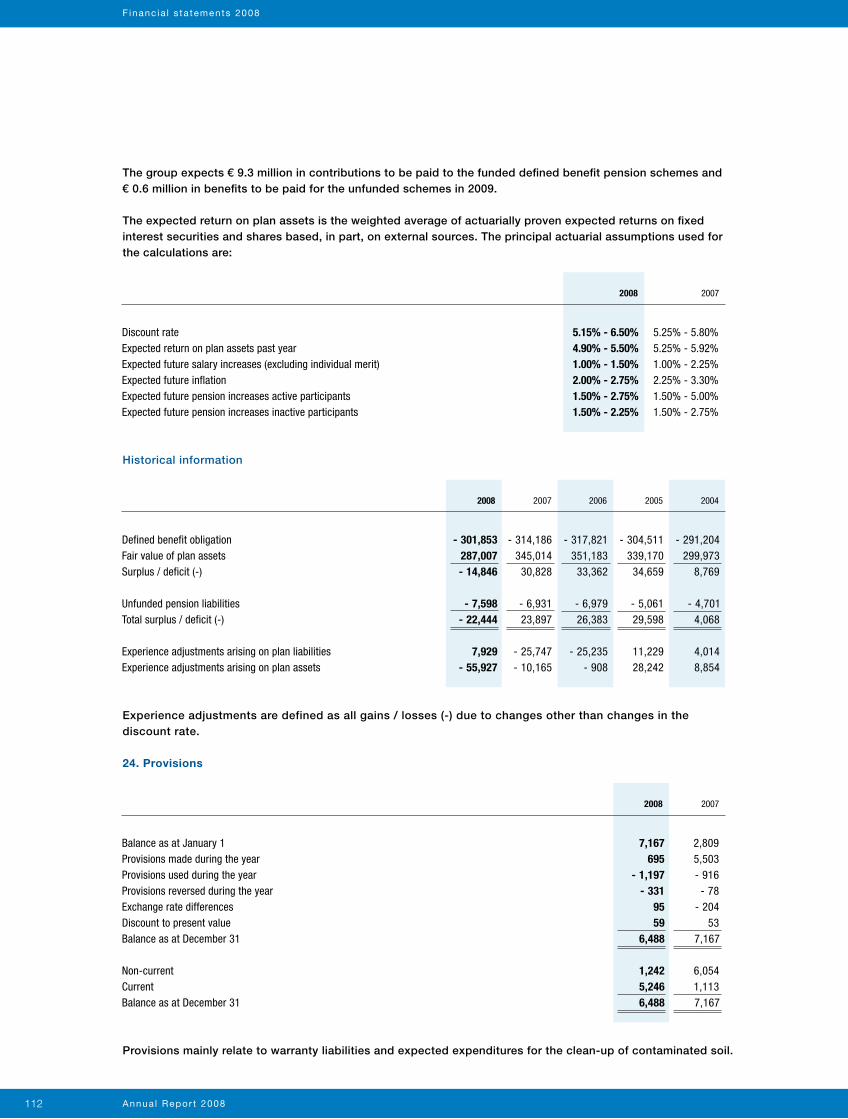
Annua l Repor t 2008112
The group expects € 9.3 million in contributions to be paid to the funded defined benefit pension schemes and € 0.6 million in benefits to be paid for the unfunded schemes in 2009.
The expected return on plan assets is the weighted average of actuarially proven expected returns on fixed interest securities and shares based, in part, on external sources. The principal actuarial assumptions used for the calculations are:
F inanc ia l s ta tements 2008
Historical information
- 301,853 - 314,186 - 317,821 - 304,511 - 291,204 287,007 345,014 351,183 339,170 299,973 - 14,846 30,828 33,362 34,659 8,769 - 7,598 - 6,931 - 6,979 - 5,061 - 4,701 - 22,444 23,897 26,383 29,598 4,068 7,929 - 25,747 - 25,235 11,229 4,014 - 55,927 - 10,165 - 908 28,242 8,854
200620072008 2005 2004
Defined benefit obligationFair value of plan assetsSurplus / deficit (-)
Unfunded pension liabilitiesTotal surplus / deficit (-)
Experience adjustments arising on plan liabilitiesExperience adjustments arising on plan assets
Experience adjustments are defined as all gains / losses (-) due to changes other than changes in the discount rate.
Provisions mainly relate to warranty liabilities and expected expenditures for the clean-up of contaminated soil.
24. Provisions
7,167 2,809 695 5,503 - 1,197 - 916 - 331 - 78 95 - 204 59 53 6,488 7,167 1,242 6,054 5,246 1,113 6,488 7,167
2008 2007
Balance as at January 1Provisions made during the yearProvisions used during the yearProvisions reversed during the yearExchange rate differencesDiscount to present valueBalance as at December 31
Non-currentCurrentBalance as at December 31
5.15% - 6.50% 5.25% - 5.80% 4.90% - 5.50% 5.25% - 5.92% 1.00% - 1.50% 1.00% - 2.25% 2.00% - 2.75% 2.25% - 3.30% 1.50% - 2.75% 1.50% - 5.00% 1.50% - 2.25% 1.50% - 2.75%
2008 2007
Discount rateExpected return on plan assets past yearExpected future salary increases (excluding individual merit)Expected future inflationExpected future pension increases active participantsExpected future pension increases inactive participants
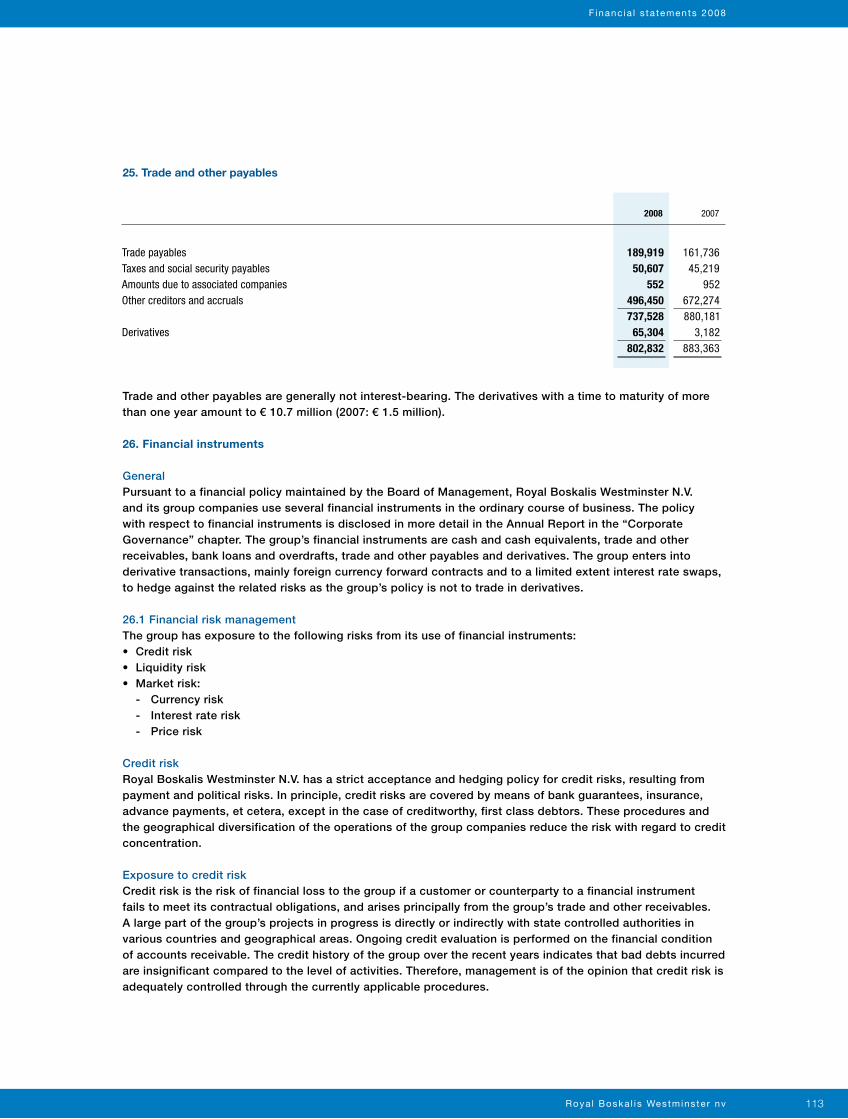
Roya l Boska l i s Westmins te r nv 113
25. Trade and other payables
Trade and other payables are generally not interest-bearing. The derivatives with a time to maturity of more than one year amount to € 10.7 million (2007: € 1.5 million).
26. Financial instruments
GeneralPursuant to a financial policy maintained by the Board of Management, Royal Boskalis Westminster N.V. and its group companies use several financial instruments in the ordinary course of business. The policy with respect to financial instruments is disclosed in more detail in the Annual Report in the “Corporate Governance” chapter. The group’s financial instruments are cash and cash equivalents, trade and other receivables, bank loans and overdrafts, trade and other payables and derivatives. The group enters into derivative transactions, mainly foreign currency forward contracts and to a limited extent interest rate swaps, to hedge against the related risks as the group’s policy is not to trade in derivatives.
26.1 Financial risk managementThe group has exposure to the following risks from its use of financial instruments:• Credit risk• Liquidity risk• Market risk: - Currency risk - Interest rate risk - Price risk
Credit riskRoyal Boskalis Westminster N.V. has a strict acceptance and hedging policy for credit risks, resulting from payment and political risks. In principle, credit risks are covered by means of bank guarantees, insurance, advance payments, et cetera, except in the case of creditworthy, first class debtors. These procedures and the geographical diversification of the operations of the group companies reduce the risk with regard to credit concentration.
Exposure to credit riskCredit risk is the risk of financial loss to the group if a customer or counterparty to a financial instrument fails to meet its contractual obligations, and arises principally from the group’s trade and other receivables. A large part of the group’s projects in progress is directly or indirectly with state controlled authorities in various countries and geographical areas. Ongoing credit evaluation is performed on the financial condition of accounts receivable. The credit history of the group over the recent years indicates that bad debts incurred are insignificant compared to the level of activities. Therefore, management is of the opinion that credit risk is adequately controlled through the currently applicable procedures.
F inanc ia l s ta tements 2008
189,919 161,736 50,607 45,219 552 952 496,450 672,274 737,528 880,181 65,304 3,182 802,832 883,363
2008 2007
Trade payablesTaxes and social security payablesAmounts due to associated companiesOther creditors and accruals
Derivatives
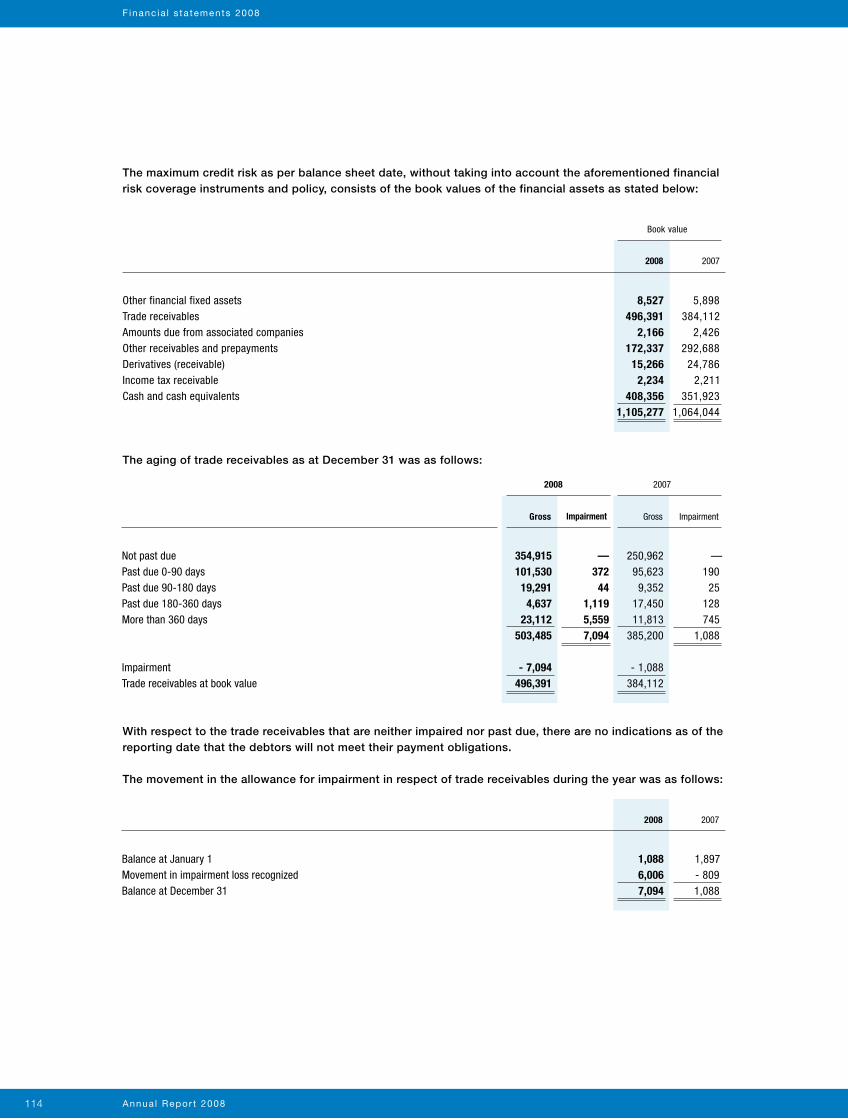
Annua l Repor t 2008114
The aging of trade receivables as at December 31 was as follows:
With respect to the trade receivables that are neither impaired nor past due, there are no indications as of the reporting date that the debtors will not meet their payment obligations.
The movement in the allowance for impairment in respect of trade receivables during the year was as follows:
354,915 — 250,962 — 101,530 372 95,623 190 19,291 44 9,352 25 4,637 1,119 17,450 128 23,112 5,559 11,813 745 503,485 7,094 385,200 1,088 - 7,094 - 1,088 496,391 384,112
Gross Impairment Gross Impairment
Not past duePast due 0-90 daysPast due 90-180 daysPast due 180-360 daysMore than 360 days
ImpairmentTrade receivables at book value
The maximum credit risk as per balance sheet date, without taking into account the aforementioned financial risk coverage instruments and policy, consists of the book values of the financial assets as stated below:
2008 2007
Other financial fixed assetsTrade receivablesAmounts due from associated companiesOther receivables and prepaymentsDerivatives (receivable)Income tax receivableCash and cash equivalents
8,527 5,898 496,391 384,112 2,166 2,426 172,337 292,688 15,266 24,786 2,234 2,211 408,356 351,923 1,105,277 1,064,044
2008 2007
Book value
1,088 1,897 6,006 - 809 7,094 1,088
2008 2007
Balance at January 1Movement in impairment loss recognizedBalance at December 31
F inanc ia l s ta tements 2008
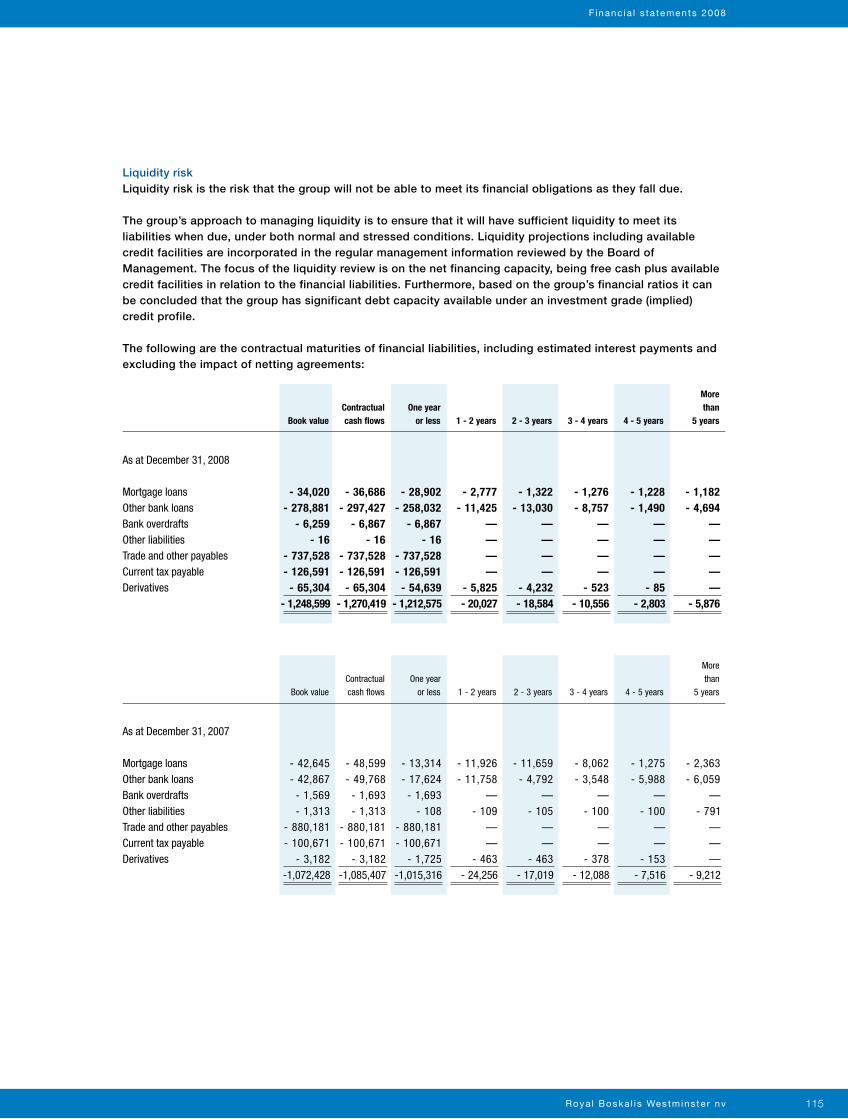
Roya l Boska l i s Westmins te r nv 115
Liquidity riskLiquidity risk is the risk that the group will not be able to meet its financial obligations as they fall due.
The group’s approach to managing liquidity is to ensure that it will have sufficient liquidity to meet its liabilities when due, under both normal and stressed conditions. Liquidity projections including available credit facilities are incorporated in the regular management information reviewed by the Board of Management. The focus of the liquidity review is on the net financing capacity, being free cash plus available credit facilities in relation to the financial liabilities. Furthermore, based on the group’s financial ratios it can be concluded that the group has significant debt capacity available under an investment grade (implied) credit profile.
The following are the contractual maturities of financial liabilities, including estimated interest payments and excluding the impact of netting agreements:
F inanc ia l s ta tements 2008
3 - 4 years
3 - 4 years
2 - 3 years
2 - 3 years
1 - 2 years
1 - 2 years
One year or less
One year or less
Contractual cash flows
Contractual cash flows
Book value
Book value
4 - 5 years
4 - 5 years
More than
5 years
More than
5 years
As at December 31, 2008
Mortgage loansOther bank loansBank overdraftsOther liabilitiesTrade and other payablesCurrent tax payableDerivatives
As at December 31, 2007
Mortgage loansOther bank loansBank overdraftsOther liabilitiesTrade and other payablesCurrent tax payableDerivatives
- 34,020 - 36,686 - 28,902 - 2,777 - 1,322 - 1,276 - 1,228 - 1,182 - 278,881 - 297,427 - 258,032 - 11,425 - 13,030 - 8,757 - 1,490 - 4,694 - 6,259 - 6,867 - 6,867 — — — — — - 16 - 16 - 16 — — — — — - 737,528 - 737,528 - 737,528 — — — — — - 126,591 - 126,591 - 126,591 — — — — — - 65,304 - 65,304 - 54,639 - 5,825 - 4,232 - 523 - 85 — - 1,248,599 - 1,270,419 - 1,212,575 - 20,027 - 18,584 - 10,556 - 2,803 - 5,876
- 42,645 - 48,599 - 13,314 - 11,926 - 11,659 - 8,062 - 1,275 - 2,363 - 42,867 - 49,768 - 17,624 - 11,758 - 4,792 - 3,548 - 5,988 - 6,059 - 1,569 - 1,693 - 1,693 — — — — — - 1,313 - 1,313 - 108 - 109 - 105 - 100 - 100 - 791 - 880,181 - 880,181 - 880,181 — — — — — - 100,671 - 100,671 - 100,671 — — — — — - 3,182 - 3,182 - 1,725 - 463 - 463 - 378 - 153 — -1,072,428 -1,085,407 -1,015,316 - 24,256 - 17,019 - 12,088 - 7,516 - 9,212
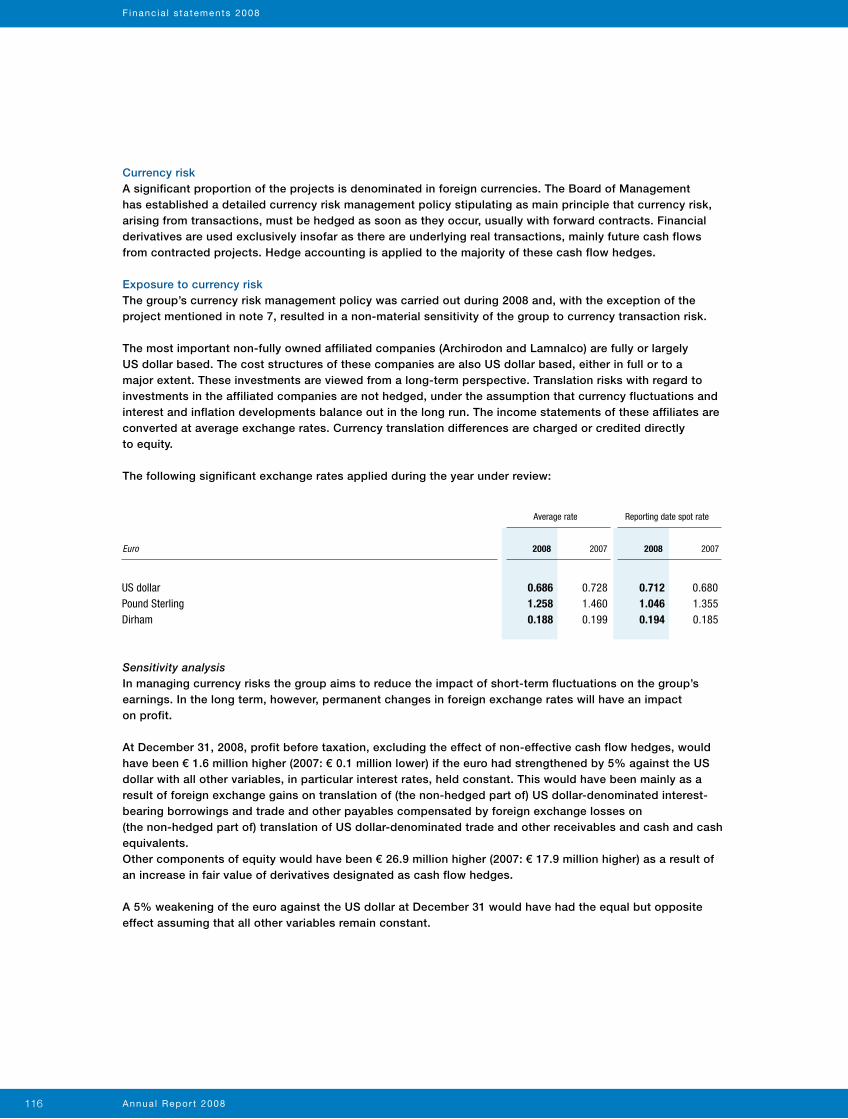
Annua l Repor t 2008116
Currency riskA significant proportion of the projects is denominated in foreign currencies. The Board of Management has established a detailed currency risk management policy stipulating as main principle that currency risk, arising from transactions, must be hedged as soon as they occur, usually with forward contracts. Financial derivatives are used exclusively insofar as there are underlying real transactions, mainly future cash flows from contracted projects. Hedge accounting is applied to the majority of these cash flow hedges.
Exposure to currency riskThe group’s currency risk management policy was carried out during 2008 and, with the exception of the project mentioned in note 7, resulted in a non-material sensitivity of the group to currency transaction risk.
The most important non-fully owned affiliated companies (Archirodon and Lamnalco) are fully or largely US dollar based. The cost structures of these companies are also US dollar based, either in full or to a major extent. These investments are viewed from a long-term perspective. Translation risks with regard to investments in the affiliated companies are not hedged, under the assumption that currency fluctuations and interest and inflation developments balance out in the long run. The income statements of these affiliates are converted at average exchange rates. Currency translation differences are charged or credited directly to equity.
The following significant exchange rates applied during the year under review:
Sensitivity analysisIn managing currency risks the group aims to reduce the impact of short-term fluctuations on the group’s earnings. In the long term, however, permanent changes in foreign exchange rates will have an impact on profit.
At December 31, 2008, profit before taxation, excluding the effect of non-effective cash flow hedges, would have been € 1.6 million higher (2007: € 0.1 million lower) if the euro had strengthened by 5% against the US dollar with all other variables, in particular interest rates, held constant. This would have been mainly as a result of foreign exchange gains on translation of (the non-hedged part of) US dollar-denominated interest-bearing borrowings and trade and other payables compensated by foreign exchange losses on (the non-hedged part of) translation of US dollar-denominated trade and other receivables and cash and cash equivalents.Other components of equity would have been € 26.9 million higher (2007: € 17.9 million higher) as a result of an increase in fair value of derivatives designated as cash flow hedges.
A 5% weakening of the euro against the US dollar at December 31 would have had the equal but opposite effect assuming that all other variables remain constant.
0.686 0.728 0.712 0.680 1.258 1.460 1.046 1.355 0.188 0.199 0.194 0.185
2008 2007 2008 2007
US dollarPound SterlingDirham
Euro
Average rate Reporting date spot rate
F inanc ia l s ta tements 2008
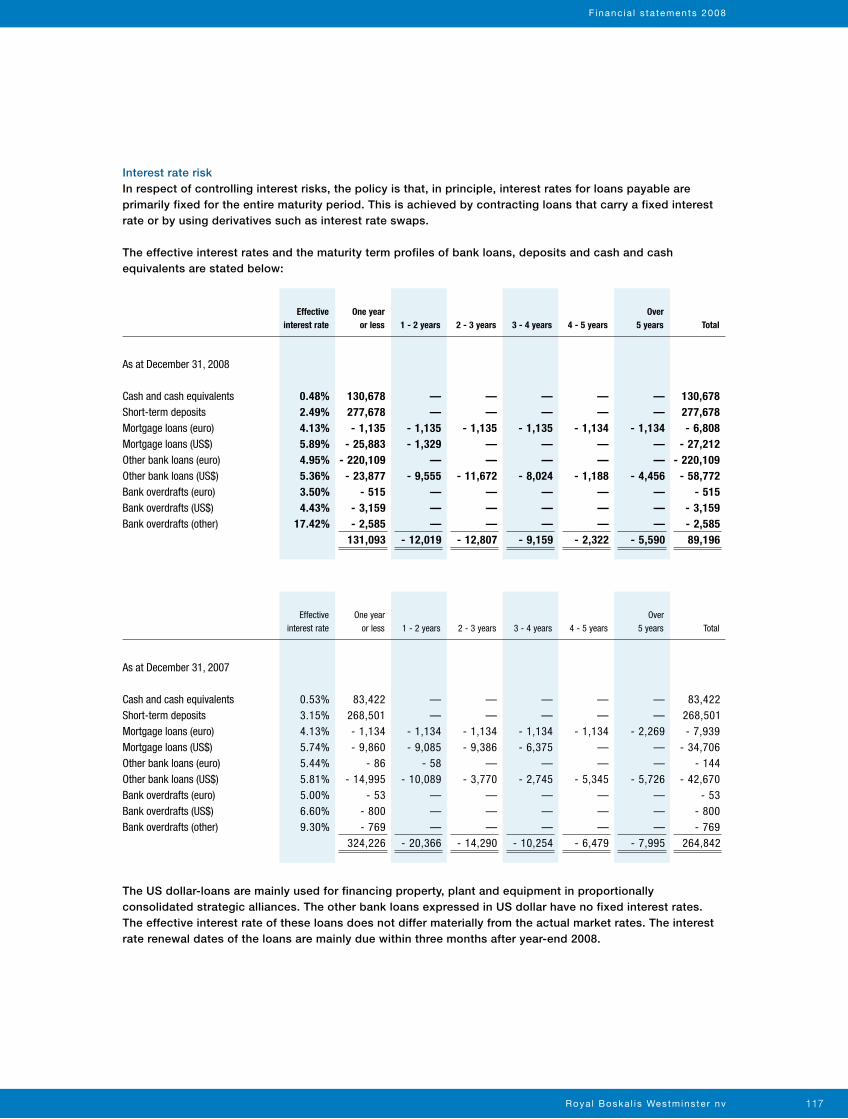
Roya l Boska l i s Westmins te r nv 117
Interest rate riskIn respect of controlling interest risks, the policy is that, in principle, interest rates for loans payable are primarily fixed for the entire maturity period. This is achieved by contracting loans that carry a fixed interest rate or by using derivatives such as interest rate swaps.
The effective interest rates and the maturity term profiles of bank loans, deposits and cash and cash equivalents are stated below:
The US dollar-loans are mainly used for financing property, plant and equipment in proportionally consolidated strategic alliances. The other bank loans expressed in US dollar have no fixed interest rates. The effective interest rate of these loans does not differ materially from the actual market rates. The interest rate renewal dates of the loans are mainly due within three months after year-end 2008.
F inanc ia l s ta tements 2008
4 - 5 years3 - 4 years2 - 3 years1 - 2 yearsOne year
or lessEffective
interest rateOver
5 years Total
As at December 31, 2008
Cash and cash equivalentsShort-term depositsMortgage loans (euro)Mortgage loans (US$)Other bank loans (euro)Other bank loans (US$)Bank overdrafts (euro)Bank overdrafts (US$)Bank overdrafts (other)
0.48% 130,678 — — — — — 130,678 2.49% 277,678 — — — — — 277,678 4.13% - 1,135 - 1,135 - 1,135 - 1,135 - 1,134 - 1,134 - 6,808 5.89% - 25,883 - 1,329 — — — — - 27,212 4.95% - 220,109 — — — — — - 220,109 5.36% - 23,877 - 9,555 - 11,672 - 8,024 - 1,188 - 4,456 - 58,772 3.50% - 515 — — — — — - 515 4.43% - 3,159 — — — — — - 3,159 17.42% - 2,585 — — — — — - 2,585 131,093 - 12,019 - 12,807 - 9,159 - 2,322 - 5,590 89,196
4 - 5 years3 - 4 years2 - 3 years1 - 2 yearsOne year
or lessEffective
interest rateOver
5 years Total
As at December 31, 2007
Cash and cash equivalentsShort-term depositsMortgage loans (euro)Mortgage loans (US$)Other bank loans (euro)Other bank loans (US$)Bank overdrafts (euro)Bank overdrafts (US$)Bank overdrafts (other)
0.53% 83,422 — — — — — 83,422 3.15% 268,501 — — — — — 268,501 4.13% - 1,134 - 1,134 - 1,134 - 1,134 - 1,134 - 2,269 - 7,939 5.74% - 9,860 - 9,085 - 9,386 - 6,375 — — - 34,706 5.44% - 86 - 58 — — — — - 144 5.81% - 14,995 - 10,089 - 3,770 - 2,745 - 5,345 - 5,726 - 42,670 5.00% - 53 — — — — — - 53 6.60% - 800 — — — — — - 800 9.30% - 769 — — — — — - 769 324,226 - 20,366 - 14,290 - 10,254 - 6,479 - 7,995 264,842
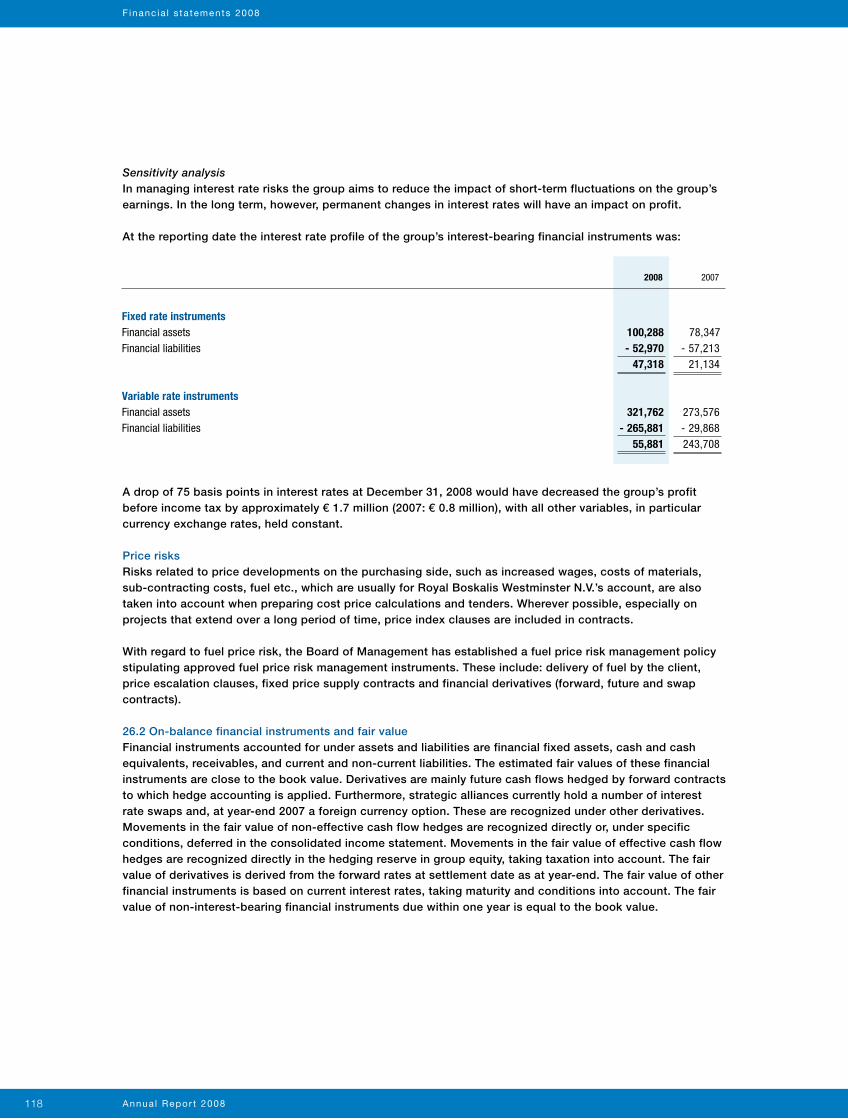
Annua l Repor t 2008118
Sensitivity analysisIn managing interest rate risks the group aims to reduce the impact of short-term fluctuations on the group’s earnings. In the long term, however, permanent changes in interest rates will have an impact on profit.
At the reporting date the interest rate profile of the group’s interest-bearing financial instruments was:
A drop of 75 basis points in interest rates at December 31, 2008 would have decreased the group’s profit before income tax by approximately € 1.7 million (2007: € 0.8 million), with all other variables, in particular currency exchange rates, held constant.
Price risksRisks related to price developments on the purchasing side, such as increased wages, costs of materials, sub-contracting costs, fuel etc., which are usually for Royal Boskalis Westminster N.V.’s account, are also taken into account when preparing cost price calculations and tenders. Wherever possible, especially on projects that extend over a long period of time, price index clauses are included in contracts.
With regard to fuel price risk, the Board of Management has established a fuel price risk management policy stipulating approved fuel price risk management instruments. These include: delivery of fuel by the client, price escalation clauses, fixed price supply contracts and financial derivatives (forward, future and swap contracts).
26.2 On-balance financial instruments and fair valueFinancial instruments accounted for under assets and liabilities are financial fixed assets, cash and cash equivalents, receivables, and current and non-current liabilities. The estimated fair values of these financial instruments are close to the book value. Derivatives are mainly future cash flows hedged by forward contracts to which hedge accounting is applied. Furthermore, strategic alliances currently hold a number of interest rate swaps and, at year-end 2007 a foreign currency option. These are recognized under other derivatives.Movements in the fair value of non-effective cash flow hedges are recognized directly or, under specific conditions, deferred in the consolidated income statement. Movements in the fair value of effective cash flow hedges are recognized directly in the hedging reserve in group equity, taking taxation into account. The fair value of derivatives is derived from the forward rates at settlement date as at year-end. The fair value of other financial instruments is based on current interest rates, taking maturity and conditions into account. The fair value of non-interest-bearing financial instruments due within one year is equal to the book value.
100,288 78,347 - 52,970 - 57,213 47,318 21,134 321,762 273,576 - 265,881 - 29,868 55,881 243,708
2008 2007
Fixed rate instrumentsFinancial assetsFinancial liabilities
Variable rate instrumentsFinancial assetsFinancial liabilities
F inanc ia l s ta tements 2008
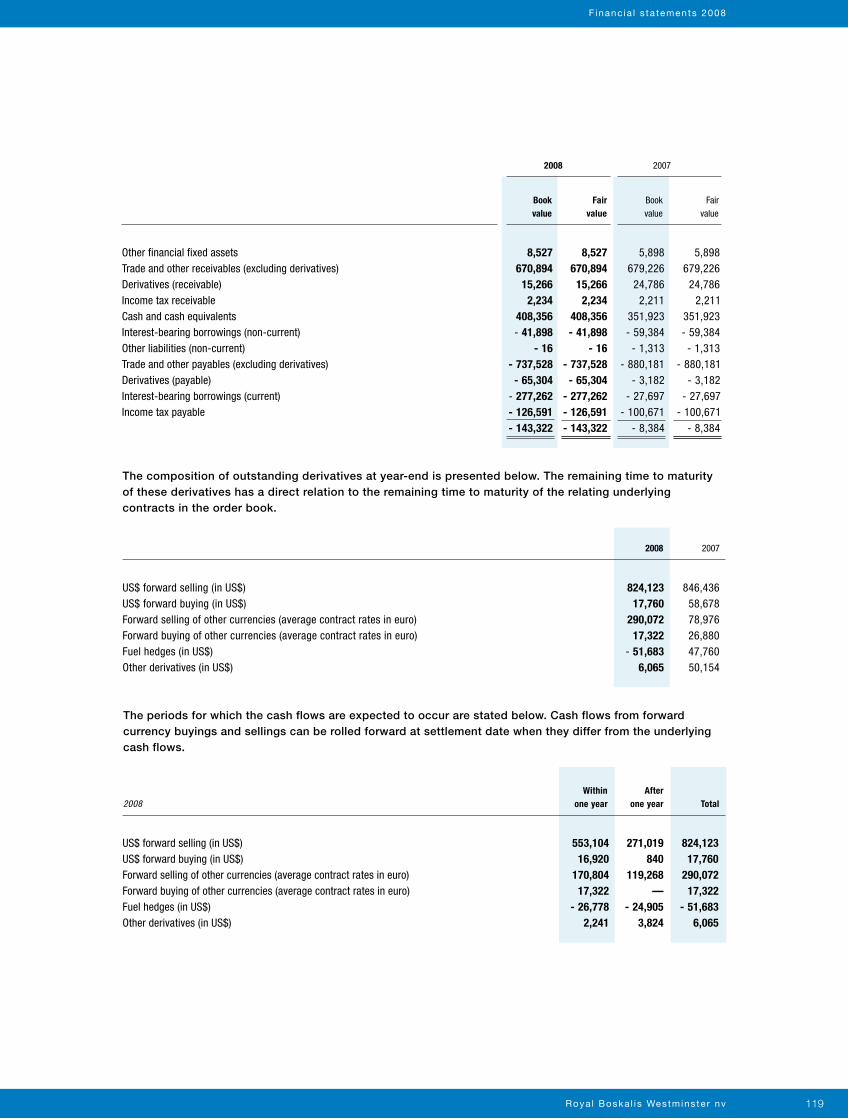
Roya l Boska l i s Westmins te r nv 119
F inanc ia l s ta tements 2008
The composition of outstanding derivatives at year-end is presented below. The remaining time to maturity of these derivatives has a direct relation to the remaining time to maturity of the relating underlying contracts in the order book.
8,527 8,527 5,898 5,898 670,894 670,894 679,226 679,226 15,266 15,266 24,786 24,786 2,234 2,234 2,211 2,211 408,356 408,356 351,923 351,923 - 41,898 - 41,898 - 59,384 - 59,384 - 16 - 16 - 1,313 - 1,313 - 737,528 - 737,528 - 880,181 - 880,181 - 65,304 - 65,304 - 3,182 - 3,182 - 277,262 - 277,262 - 27,697 - 27,697 - 126,591 - 126,591 - 100,671 - 100,671 - 143,322 - 143,322 - 8,384 - 8,384
Book value
Fair value
Bookvalue
2008 2007
Fair value
Other financial fixed assets Trade and other receivables (excluding derivatives) Derivatives (receivable) Income tax receivable Cash and cash equivalents Interest-bearing borrowings (non-current) Other liabilities (non-current) Trade and other payables (excluding derivatives) Derivatives (payable) Interest-bearing borrowings (current) Income tax payable
US$ forward selling (in US$)US$ forward buying (in US$)Forward selling of other currencies (average contract rates in euro)Forward buying of other currencies (average contract rates in euro)Fuel hedges (in US$)Other derivatives (in US$)
824,123 846,436 17,760 58,678 290,072 78,976 17,322 26,880 - 51,683 47,760 6,065 50,154
2008 2007
The periods for which the cash flows are expected to occur are stated below. Cash flows from forward currency buyings and sellings can be rolled forward at settlement date when they differ from the underlying cash flows.
553,104 271,019 824,123 16,920 840 17,760 170,804 119,268 290,072 17,322 — 17,322 - 26,778 - 24,905 - 51,683 2,241 3,824 6,065
After one year
Within one year Total
US$ forward selling (in US$)US$ forward buying (in US$)Forward selling of other currencies (average contract rates in euro)Forward buying of other currencies (average contract rates in euro)Fuel hedges (in US$)Other derivatives (in US$)
2008
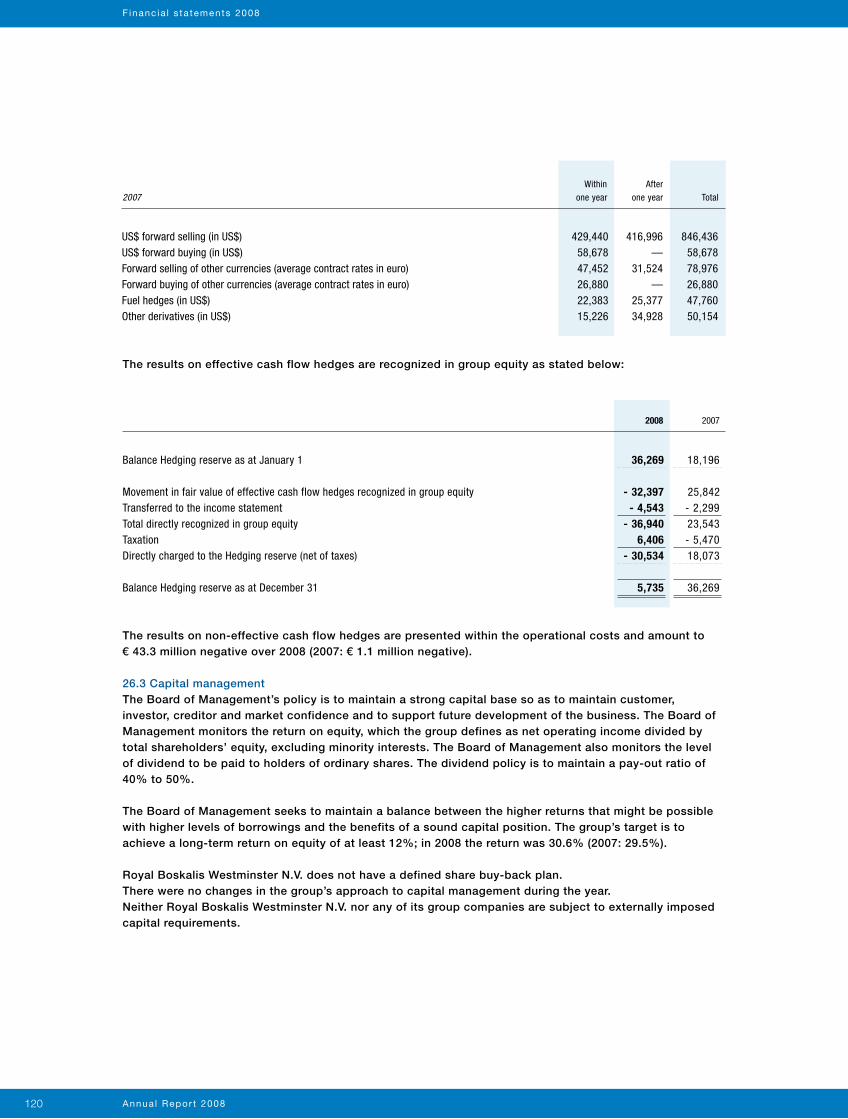
Annua l Repor t 2008120
The results on effective cash flow hedges are recognized in group equity as stated below:
The results on non-effective cash flow hedges are presented within the operational costs and amount to € 43.3 million negative over 2008 (2007: € 1.1 million negative).
26.3 Capital managementThe Board of Management’s policy is to maintain a strong capital base so as to maintain customer, investor, creditor and market confidence and to support future development of the business. The Board of Management monitors the return on equity, which the group defines as net operating income divided by total shareholders’ equity, excluding minority interests. The Board of Management also monitors the level of dividend to be paid to holders of ordinary shares. The dividend policy is to maintain a pay-out ratio of 40% to 50%.
The Board of Management seeks to maintain a balance between the higher returns that might be possible with higher levels of borrowings and the benefits of a sound capital position. The group’s target is to achieve a long-term return on equity of at least 12%; in 2008 the return was 30.6% (2007: 29.5%).
Royal Boskalis Westminster N.V. does not have a defined share buy-back plan.There were no changes in the group’s approach to capital management during the year.Neither Royal Boskalis Westminster N.V. nor any of its group companies are subject to externally imposed capital requirements.
429,440 416,996 846,436 58,678 — 58,678 47,452 31,524 78,976 26,880 — 26,880 22,383 25,377 47,760 15,226 34,928 50,154
After one year
Within one year Total
US$ forward selling (in US$)US$ forward buying (in US$)Forward selling of other currencies (average contract rates in euro)Forward buying of other currencies (average contract rates in euro)Fuel hedges (in US$)Other derivatives (in US$)
2007
Balance Hedging reserve as at January 1
Movement in fair value of effective cash flow hedges recognized in group equityTransferred to the income statementTotal directly recognized in group equityTaxationDirectly charged to the Hedging reserve (net of taxes)
Balance Hedging reserve as at December 31
2008
36,269 18,196 - 32,397 25,842 - 4,543 - 2,299 - 36,940 23,543 6,406 - 5,470 - 30,534 18,073 5,735 36,269
2007
F inanc ia l s ta tements 2008
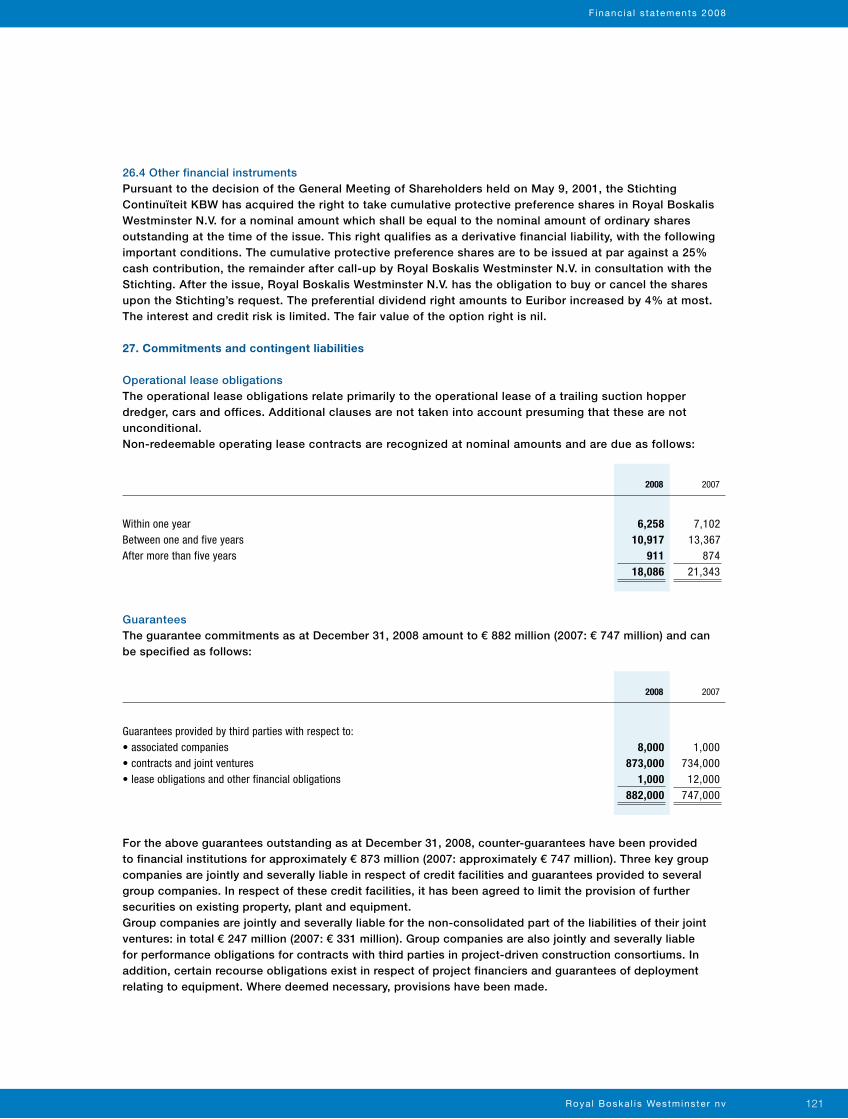
Roya l Boska l i s Westmins te r nv 121
26.4 Other financial instrumentsPursuant to the decision of the General Meeting of Shareholders held on May 9, 2001, the Stichting Continuïteit KBW has acquired the right to take cumulative protective preference shares in Royal Boskalis Westminster N.V. for a nominal amount which shall be equal to the nominal amount of ordinary shares outstanding at the time of the issue. This right qualifies as a derivative financial liability, with the following important conditions. The cumulative protective preference shares are to be issued at par against a 25% cash contribution, the remainder after call-up by Royal Boskalis Westminster N.V. in consultation with the Stichting. After the issue, Royal Boskalis Westminster N.V. has the obligation to buy or cancel the shares upon the Stichting’s request. The preferential dividend right amounts to Euribor increased by 4% at most. The interest and credit risk is limited. The fair value of the option right is nil.
27. Commitments and contingent liabilities
Operational lease obligationsThe operational lease obligations relate primarily to the operational lease of a trailing suction hopper dredger, cars and offices. Additional clauses are not taken into account presuming that these are not unconditional.Non-redeemable operating lease contracts are recognized at nominal amounts and are due as follows:
F inanc ia l s ta tements 2008
GuaranteesThe guarantee commitments as at December 31, 2008 amount to € 882 million (2007: € 747 million) and can be specified as follows:
For the above guarantees outstanding as at December 31, 2008, counter-guarantees have been provided to financial institutions for approximately € 873 million (2007: approximately € 747 million). Three key group companies are jointly and severally liable in respect of credit facilities and guarantees provided to several group companies. In respect of these credit facilities, it has been agreed to limit the provision of further securities on existing property, plant and equipment.Group companies are jointly and severally liable for the non-consolidated part of the liabilities of their joint ventures: in total € 247 million (2007: € 331 million). Group companies are also jointly and severally liable for performance obligations for contracts with third parties in project-driven construction consortiums. In addition, certain recourse obligations exist in respect of project financiers and guarantees of deployment relating to equipment. Where deemed necessary, provisions have been made.
Within one yearBetween one and five yearsAfter more than five years
Guarantees provided by third parties with respect to:• associated companies• contracts and joint ventures• lease obligations and other financial obligations
6,258 7,102 10,917 13,367 911 874 18,086 21,343
8,000 1,000 873,000 734,000 1,000 12,000 882,000 747,000
2008
2008
2007
2007
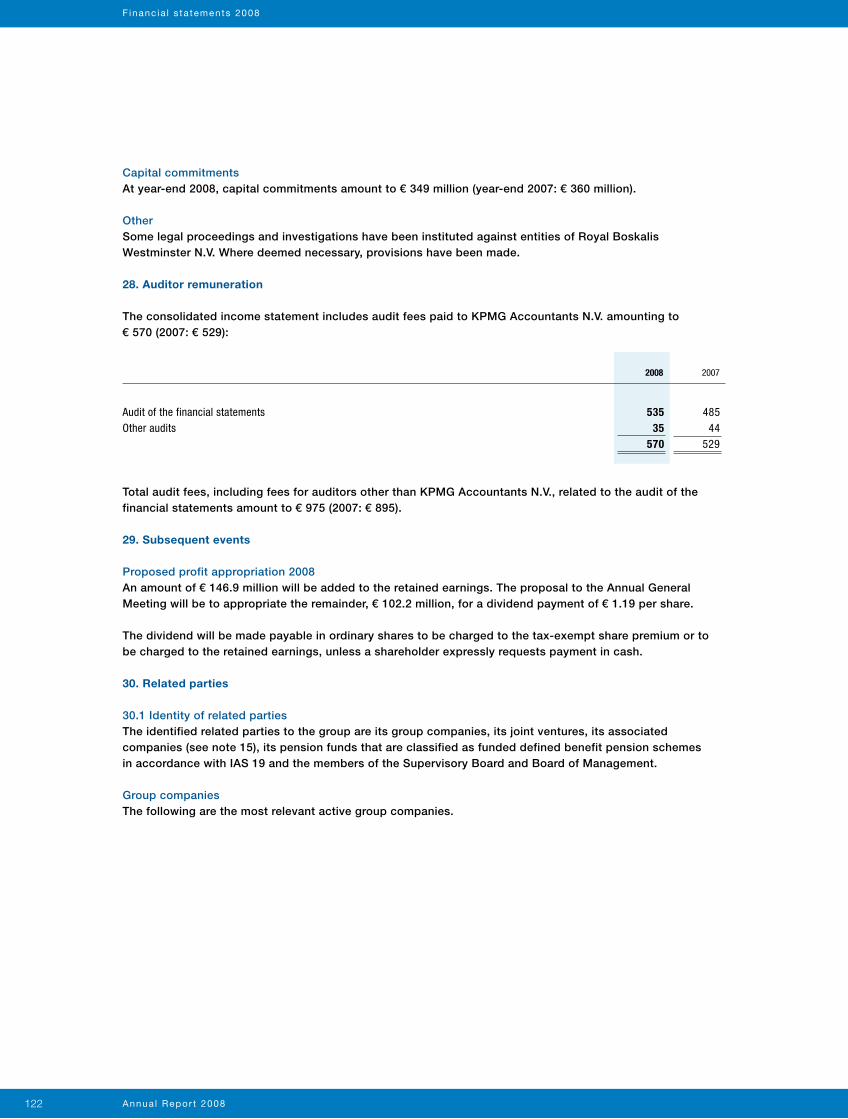
Annua l Repor t 2008122
Capital commitmentsAt year-end 2008, capital commitments amount to € 349 million (year-end 2007: € 360 million).
OtherSome legal proceedings and investigations have been instituted against entities of Royal Boskalis Westminster N.V. Where deemed necessary, provisions have been made.
28. Auditor remuneration
The consolidated income statement includes audit fees paid to KPMG Accountants N.V. amounting to € 570 (2007: € 529):
Total audit fees, including fees for auditors other than KPMG Accountants N.V., related to the audit of the financial statements amount to € 975 (2007: € 895).
29. Subsequent events
Proposed profit appropriation 2008An amount of € 146.9 million will be added to the retained earnings. The proposal to the Annual General Meeting will be to appropriate the remainder, € 102.2 million, for a dividend payment of € 1.19 per share.
The dividend will be made payable in ordinary shares to be charged to the tax-exempt share premium or to be charged to the retained earnings, unless a shareholder expressly requests payment in cash.
30. Related parties
30.1 Identity of related partiesThe identified related parties to the group are its group companies, its joint ventures, its associated companies (see note 15), its pension funds that are classified as funded defined benefit pension schemes in accordance with IAS 19 and the members of the Supervisory Board and Board of Management. Group companiesThe following are the most relevant active group companies.
F inanc ia l s ta tements 2008
Audit of the financial statementsOther audits
535 485 35 44 570 529
2008 2007
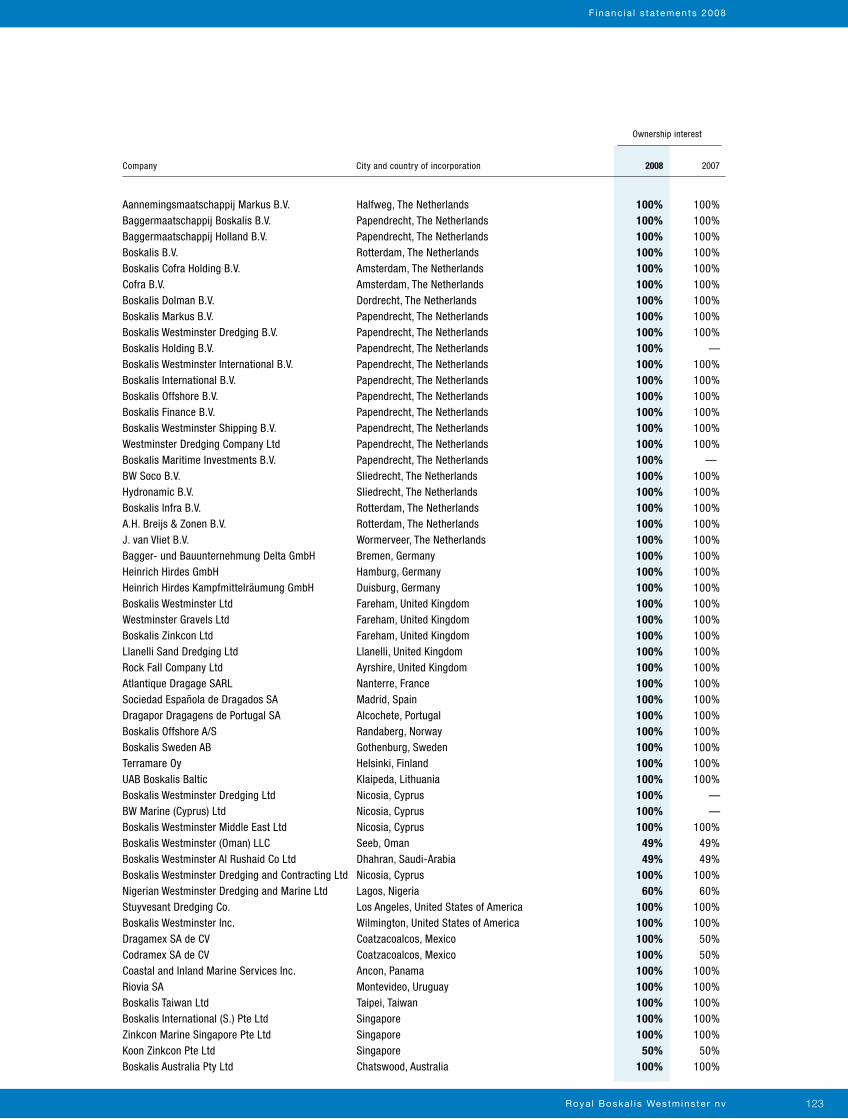
Roya l Boska l i s Westmins te r nv 123
Company City and country of incorporation
Aannemingsmaatschappij Markus B.V. Halfweg, The NetherlandsBaggermaatschappij Boskalis B.V. Papendrecht, The NetherlandsBaggermaatschappij Holland B.V. Papendrecht, The NetherlandsBoskalis B.V. Rotterdam, The NetherlandsBoskalis Cofra Holding B.V. Amsterdam, The NetherlandsCofra B.V. Amsterdam, The NetherlandsBoskalis Dolman B.V. Dordrecht, The NetherlandsBoskalis Markus B.V. Papendrecht, The NetherlandsBoskalis Westminster Dredging B.V. Papendrecht, The NetherlandsBoskalis Holding B.V. Papendrecht, The NetherlandsBoskalis Westminster International B.V. Papendrecht, The NetherlandsBoskalis International B.V. Papendrecht, The NetherlandsBoskalis Offshore B.V. Papendrecht, The NetherlandsBoskalis Finance B.V. Papendrecht, The NetherlandsBoskalis Westminster Shipping B.V. Papendrecht, The NetherlandsWestminster Dredging Company Ltd Papendrecht, The NetherlandsBoskalis Maritime Investments B.V. Papendrecht, The NetherlandsBW Soco B.V. Sliedrecht, The NetherlandsHydronamic B.V. Sliedrecht, The NetherlandsBoskalis Infra B.V. Rotterdam, The NetherlandsA.H. Breijs & Zonen B.V. Rotterdam, The NetherlandsJ. van Vliet B.V. Wormerveer, The NetherlandsBagger- und Bauunternehmung Delta GmbH Bremen, GermanyHeinrich Hirdes GmbH Hamburg, GermanyHeinrich Hirdes Kampfmittelräumung GmbH Duisburg, GermanyBoskalis Westminster Ltd Fareham, United KingdomWestminster Gravels Ltd Fareham, United KingdomBoskalis Zinkcon Ltd Fareham, United KingdomLlanelli Sand Dredging Ltd Llanelli, United KingdomRock Fall Company Ltd Ayrshire, United KingdomAtlantique Dragage SARL Nanterre, FranceSociedad Española de Dragados SA Madrid, SpainDragapor Dragagens de Portugal SA Alcochete, PortugalBoskalis Offshore A/S Randaberg, NorwayBoskalis Sweden AB Gothenburg, SwedenTerramare Oy Helsinki, FinlandUAB Boskalis Baltic Klaipeda, LithuaniaBoskalis Westminster Dredging Ltd Nicosia, CyprusBW Marine (Cyprus) Ltd Nicosia, CyprusBoskalis Westminster Middle East Ltd Nicosia, CyprusBoskalis Westminster (Oman) LLC Seeb, OmanBoskalis Westminster Al Rushaid Co Ltd Dhahran, Saudi-ArabiaBoskalis Westminster Dredging and Contracting Ltd Nicosia, CyprusNigerian Westminster Dredging and Marine Ltd Lagos, NigeriaStuyvesant Dredging Co. Los Angeles, United States of AmericaBoskalis Westminster Inc. Wilmington, United States of AmericaDragamex SA de CV Coatzacoalcos, MexicoCodramex SA de CV Coatzacoalcos, MexicoCoastal and Inland Marine Services Inc. Ancon, PanamaRiovia SA Montevideo, UruguayBoskalis Taiwan Ltd Taipei, TaiwanBoskalis International (S.) Pte Ltd SingaporeZinkcon Marine Singapore Pte Ltd SingaporeKoon Zinkcon Pte Ltd SingaporeBoskalis Australia Pty Ltd Chatswood, Australia
100% 100% 100% 100% 100% 100% 100% 100% 100% 100% 100% 100% 100% 100% 100% 100% 100% 100% 100% — 100% 100% 100% 100% 100% 100% 100% 100% 100% 100% 100% 100% 100% — 100% 100% 100% 100% 100% 100% 100% 100% 100% 100% 100% 100% 100% 100% 100% 100% 100% 100% 100% 100% 100% 100% 100% 100% 100% 100% 100% 100% 100% 100% 100% 100% 100% 100% 100% 100% 100% 100% 100% 100% 100% — 100% — 100% 100% 49% 49% 49% 49% 100% 100% 60% 60% 100% 100% 100% 100% 100% 50% 100% 50% 100% 100% 100% 100% 100% 100% 100% 100% 100% 100% 50% 50% 100% 100%
2008 2007
Ownership interest
F inanc ia l s ta tements 2008
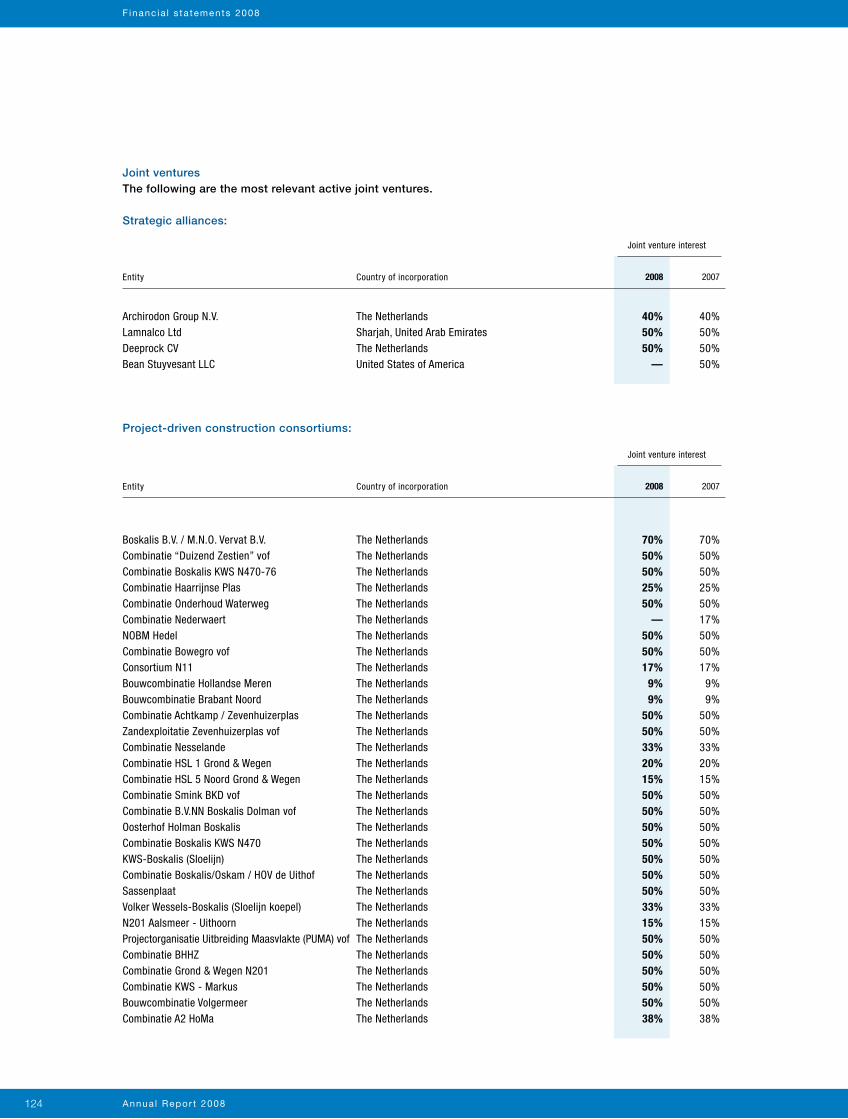
Annua l Repor t 2008124
F inanc ia l s ta tements 2008
Joint venturesThe following are the most relevant active joint ventures.
Strategic alliances:
Project-driven construction consortiums:
Entity Country of incorporation
Entity Country of incorporation
Archirodon Group N.V. The NetherlandsLamnalco Ltd Sharjah, United Arab EmiratesDeeprock CV The NetherlandsBean Stuyvesant LLC United States of America
Boskalis B.V. / M.N.O. Vervat B.V. The NetherlandsCombinatie “Duizend Zestien” vof The NetherlandsCombinatie Boskalis KWS N470-76 The NetherlandsCombinatie Haarrijnse Plas The NetherlandsCombinatie Onderhoud Waterweg The NetherlandsCombinatie Nederwaert The NetherlandsNOBM Hedel The NetherlandsCombinatie Bowegro vof The NetherlandsConsortium N11 The NetherlandsBouwcombinatie Hollandse Meren The NetherlandsBouwcombinatie Brabant Noord The NetherlandsCombinatie Achtkamp / Zevenhuizerplas The NetherlandsZandexploitatie Zevenhuizerplas vof The NetherlandsCombinatie Nesselande The NetherlandsCombinatie HSL 1 Grond & Wegen The NetherlandsCombinatie HSL 5 Noord Grond & Wegen The NetherlandsCombinatie Smink BKD vof The NetherlandsCombinatie B.V.NN Boskalis Dolman vof The NetherlandsOosterhof Holman Boskalis The NetherlandsCombinatie Boskalis KWS N470 The NetherlandsKWS-Boskalis (Sloelijn) The NetherlandsCombinatie Boskalis/Oskam / HOV de Uithof The NetherlandsSassenplaat The NetherlandsVolker Wessels-Boskalis (Sloelijn koepel) The NetherlandsN201 Aalsmeer - Uithoorn The NetherlandsProjectorganisatie Uitbreiding Maasvlakte (PUMA) vof The NetherlandsCombinatie BHHZ The NetherlandsCombinatie Grond & Wegen N201 The NetherlandsCombinatie KWS - Markus The NetherlandsBouwcombinatie Volgermeer The NetherlandsCombinatie A2 HoMa The Netherlands
40% 40% 50% 50% 50% 50% — 50%
70% 70% 50% 50% 50% 50% 25% 25% 50% 50% — 17% 50% 50% 50% 50% 17% 17% 9% 9% 9% 9% 50% 50% 50% 50% 33% 33% 20% 20% 15% 15% 50% 50% 50% 50% 50% 50% 50% 50% 50% 50% 50% 50% 50% 50% 33% 33% 15% 15% 50% 50% 50% 50% 50% 50% 50% 50% 50% 50% 38% 38%
2008
2008
2007
2007
Joint venture interest
Joint venture interest
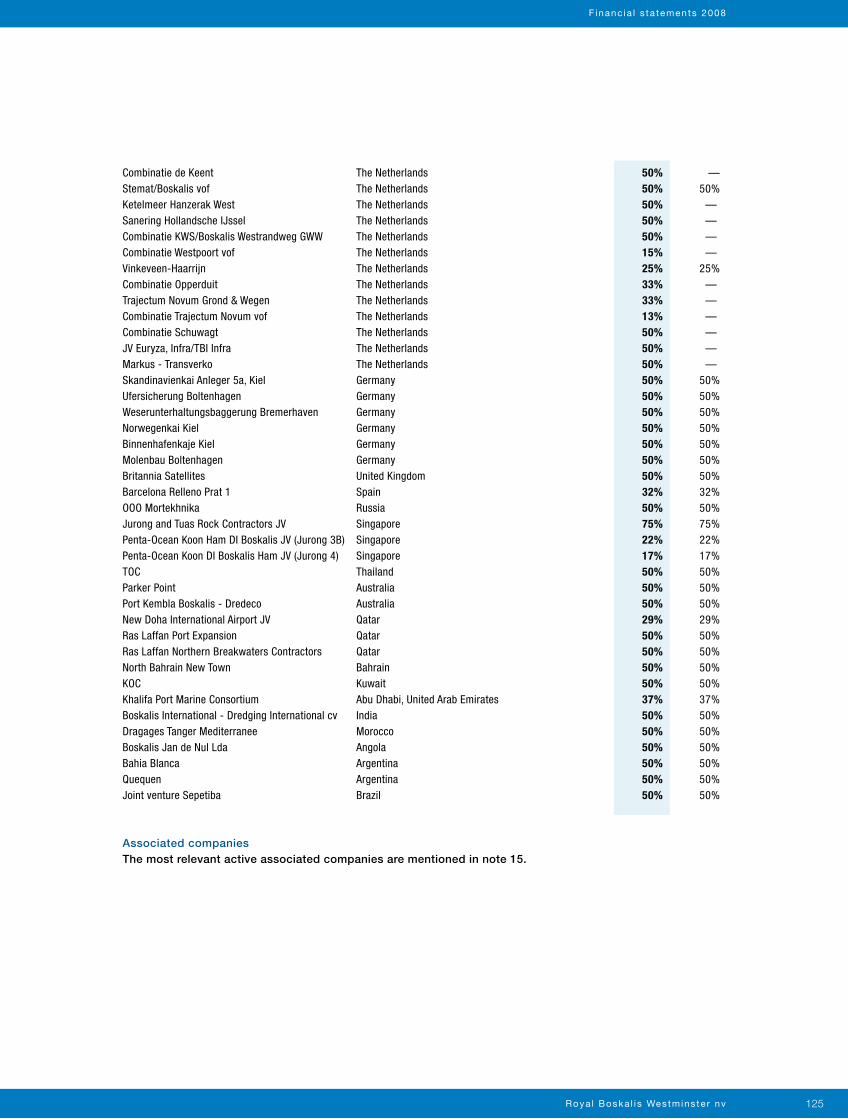
Roya l Boska l i s Westmins te r nv 125
Combinatie de Keent The NetherlandsStemat/Boskalis vof The NetherlandsKetelmeer Hanzerak West The NetherlandsSanering Hollandsche IJssel The NetherlandsCombinatie KWS/Boskalis Westrandweg GWW The NetherlandsCombinatie Westpoort vof The NetherlandsVinkeveen-Haarrijn The NetherlandsCombinatie Opperduit The NetherlandsTrajectum Novum Grond & Wegen The NetherlandsCombinatie Trajectum Novum vof The NetherlandsCombinatie Schuwagt The NetherlandsJV Euryza, Infra/TBI Infra The NetherlandsMarkus - Transverko The NetherlandsSkandinavienkai Anleger 5a, Kiel GermanyUfersicherung Boltenhagen GermanyWeserunterhaltungsbaggerung Bremerhaven GermanyNorwegenkai Kiel GermanyBinnenhafenkaje Kiel GermanyMolenbau Boltenhagen GermanyBritannia Satellites United KingdomBarcelona Relleno Prat 1 SpainOOO Mortekhnika RussiaJurong and Tuas Rock Contractors JV SingaporePenta-Ocean Koon Ham DI Boskalis JV (Jurong 3B) SingaporePenta-Ocean Koon DI Boskalis Ham JV (Jurong 4) SingaporeTOC ThailandParker Point AustraliaPort Kembla Boskalis - Dredeco AustraliaNew Doha International Airport JV QatarRas Laffan Port Expansion QatarRas Laffan Northern Breakwaters Contractors QatarNorth Bahrain New Town BahrainKOC KuwaitKhalifa Port Marine Consortium Abu Dhabi, United Arab EmiratesBoskalis International - Dredging International cv IndiaDragages Tanger Mediterranee MoroccoBoskalis Jan de Nul Lda AngolaBahia Blanca ArgentinaQuequen ArgentinaJoint venture Sepetiba Brazil
50% — 50% 50% 50% — 50% — 50% — 15% — 25% 25% 33% — 33% — 13% — 50% — 50% — 50% — 50% 50% 50% 50% 50% 50% 50% 50% 50% 50% 50% 50% 50% 50% 32% 32% 50% 50% 75% 75% 22% 22% 17% 17% 50% 50% 50% 50% 50% 50% 29% 29% 50% 50% 50% 50% 50% 50% 50% 50% 37% 37% 50% 50% 50% 50% 50% 50% 50% 50% 50% 50% 50% 50%
Associated companiesThe most relevant active associated companies are mentioned in note 15.
F inanc ia l s ta tements 2008
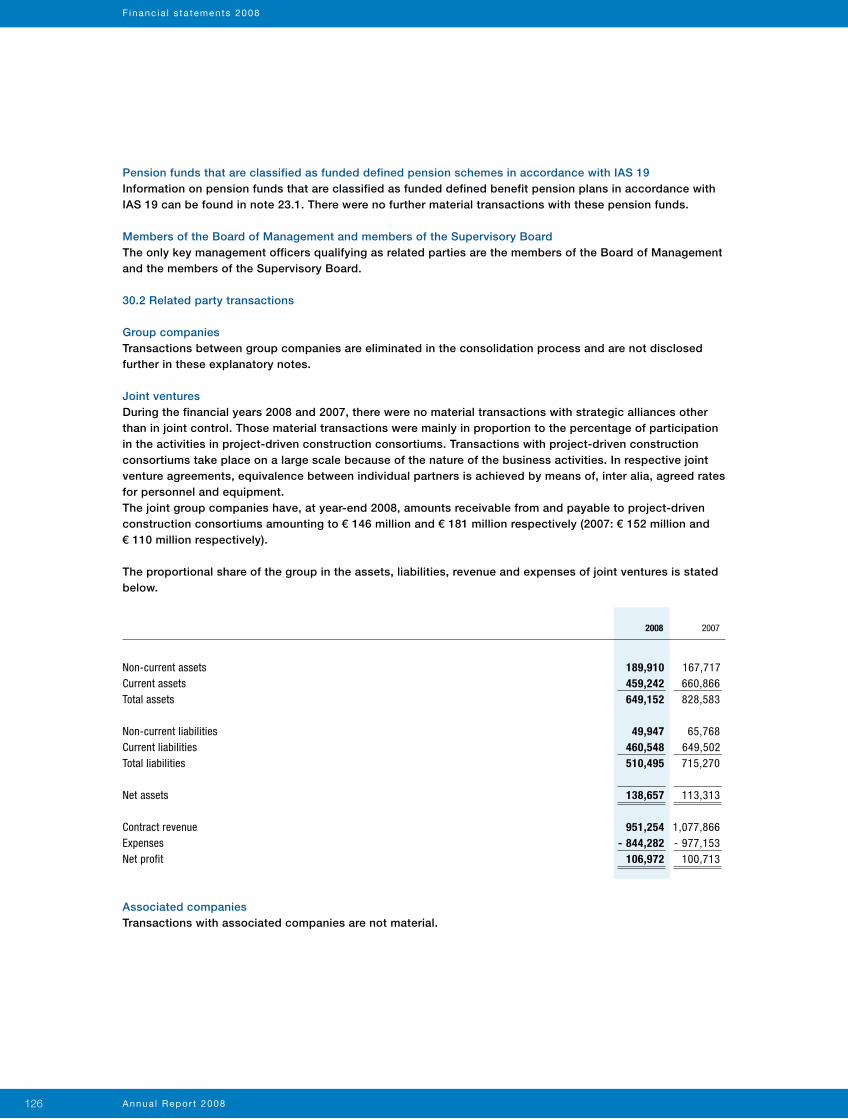
Annua l Repor t 2008126
F inanc ia l s ta tements 2008
Pension funds that are classified as funded defined pension schemes in accordance with IAS 19Information on pension funds that are classified as funded defined benefit pension plans in accordance with IAS 19 can be found in note 23.1. There were no further material transactions with these pension funds.
Members of the Board of Management and members of the Supervisory BoardThe only key management officers qualifying as related parties are the members of the Board of Management and the members of the Supervisory Board.
30.2 Related party transactions
Group companiesTransactions between group companies are eliminated in the consolidation process and are not disclosed further in these explanatory notes.
Joint venturesDuring the financial years 2008 and 2007, there were no material transactions with strategic alliances other than in joint control. Those material transactions were mainly in proportion to the percentage of participation in the activities in project-driven construction consortiums. Transactions with project-driven construction consortiums take place on a large scale because of the nature of the business activities. In respective joint venture agreements, equivalence between individual partners is achieved by means of, inter alia, agreed rates for personnel and equipment.The joint group companies have, at year-end 2008, amounts receivable from and payable to project-driven construction consortiums amounting to € 146 million and € 181 million respectively (2007: € 152 million and € 110 million respectively).
The proportional share of the group in the assets, liabilities, revenue and expenses of joint ventures is stated below.
Associated companiesTransactions with associated companies are not material.
Non-current assetsCurrent assetsTotal assets
Non-current liabilitiesCurrent liabilitiesTotal liabilities
Net assets
Contract revenueExpensesNet profit
189,910 167,717 459,242 660,866 649,152 828,583 49,947 65,768 460,548 649,502 510,495 715,270 138,657 113,313 951,254 1,077,866 - 844,282 - 977,153 106,972 100,713
2008 2007
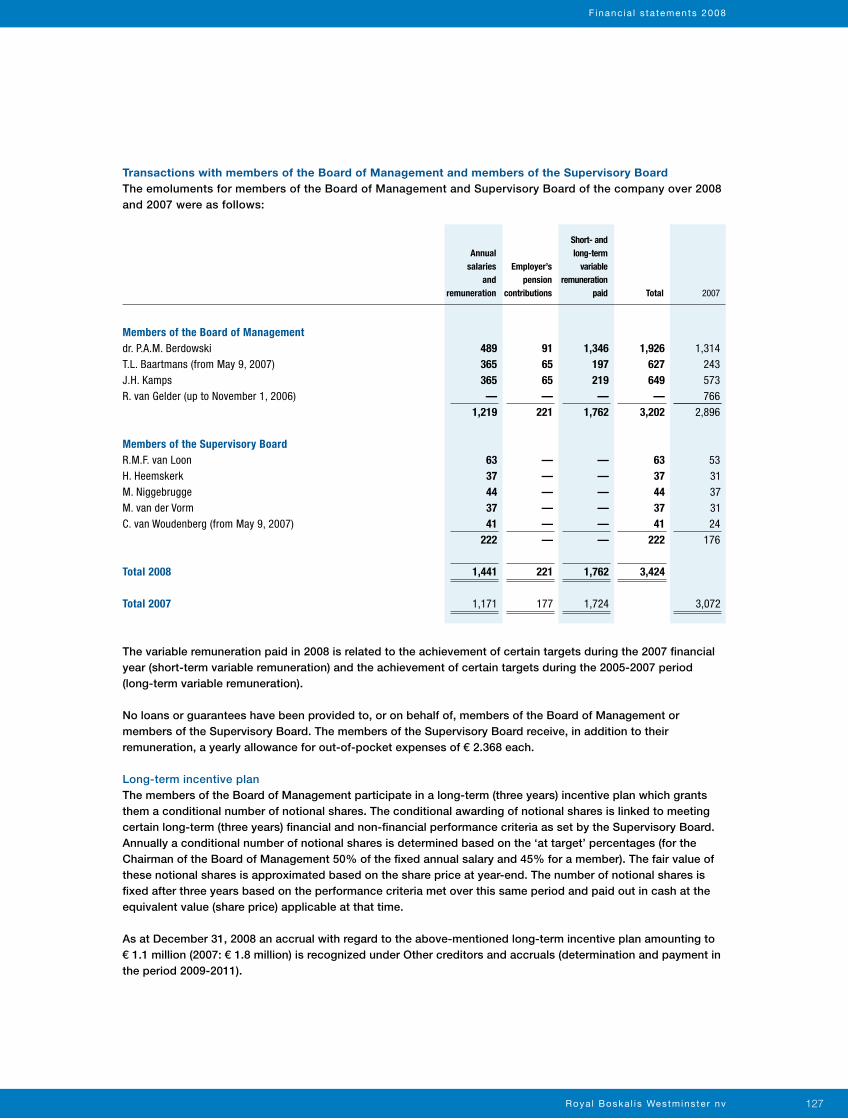
Roya l Boska l i s Westmins te r nv 127
489 91 1,346 1,926 1,314 365 65 197 627 243 365 65 219 649 573 — — — — 766 1,219 221 1,762 3,202 2,896 63 — — 63 53 37 — — 37 31 44 — — 44 37 37 — — 37 31 41 — — 41 24 222 — — 222 176 1,441 221 1,762 3,424 1,171 177 1,724 3,072
Employer’spension
contributions
Annual salaries
and remuneration
Short- and long-term
variable remuneration
paid Total 2007
Members of the Board of Managementdr. P.A.M. BerdowskiT.L. Baartmans (from May 9, 2007)J.H. KampsR. van Gelder (up to November 1, 2006)
Members of the Supervisory BoardR.M.F. van LoonH. HeemskerkM. NiggebruggeM. van der VormC. van Woudenberg (from May 9, 2007)
Total 2008
Total 2007
Transactions with members of the Board of Management and members of the Supervisory BoardThe emoluments for members of the Board of Management and Supervisory Board of the company over 2008 and 2007 were as follows:
The variable remuneration paid in 2008 is related to the achievement of certain targets during the 2007 financial year (short-term variable remuneration) and the achievement of certain targets during the 2005-2007 period (long-term variable remuneration).
No loans or guarantees have been provided to, or on behalf of, members of the Board of Management or members of the Supervisory Board. The members of the Supervisory Board receive, in addition to their remuneration, a yearly allowance for out-of-pocket expenses of € 2.368 each.
Long-term incentive planThe members of the Board of Management participate in a long-term (three years) incentive plan which grants them a conditional number of notional shares. The conditional awarding of notional shares is linked to meeting certain long-term (three years) financial and non-financial performance criteria as set by the Supervisory Board. Annually a conditional number of notional shares is determined based on the ‘at target’ percentages (for the Chairman of the Board of Management 50% of the fixed annual salary and 45% for a member). The fair value of these notional shares is approximated based on the share price at year-end. The number of notional shares is fixed after three years based on the performance criteria met over this same period and paid out in cash at the equivalent value (share price) applicable at that time.
As at December 31, 2008 an accrual with regard to the above-mentioned long-term incentive plan amounting to € 1.1 million (2007: € 1.8 million) is recognized under Other creditors and accruals (determination and payment in the period 2009-2011).
F inanc ia l s ta tements 2008
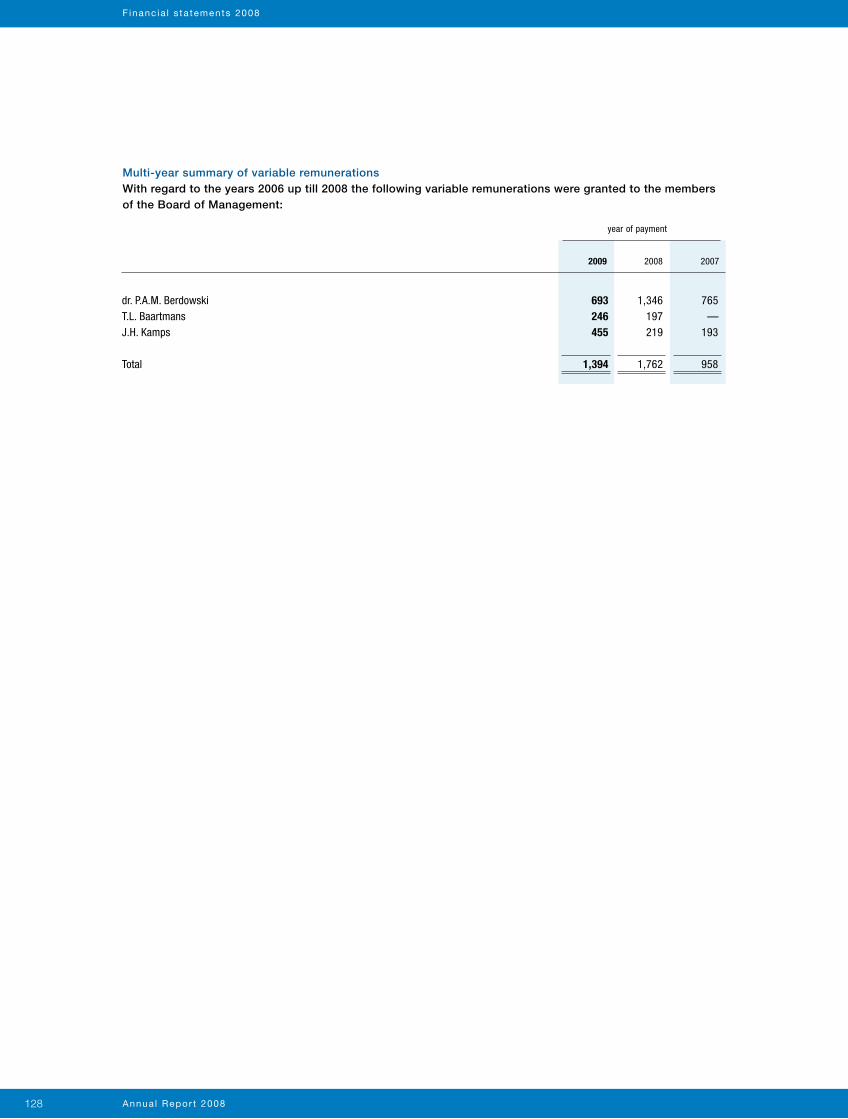
Annua l Repor t 2008128
F inanc ia l s ta tements 2008
Multi-year summary of variable remunerationsWith regard to the years 2006 up till 2008 the following variable remunerations were granted to the members of the Board of Management:
693 1,346 765 246 197 — 455 219 193 1,394 1,762 958
20082009 2007
dr. P.A.M. BerdowskiT.L. BaartmansJ.H. Kamps
Total
year of payment
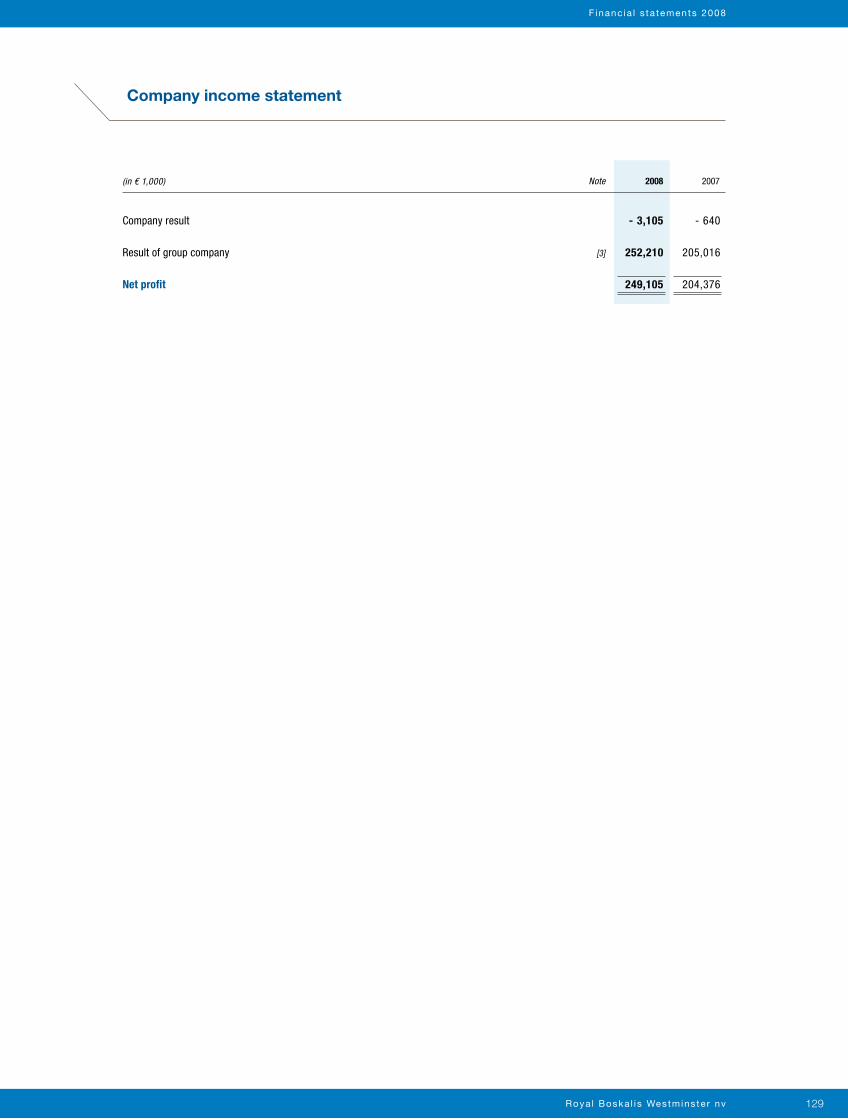
Roya l Boska l i s Westmins te r nv 129
Note
Company result
Result of group company [3]
Net profit
- 3,105 - 640 252,210 205,016 249,105 204,376
2008 2007(in € 1,000)
Company income statement
F inanc ia l s ta tements 2008
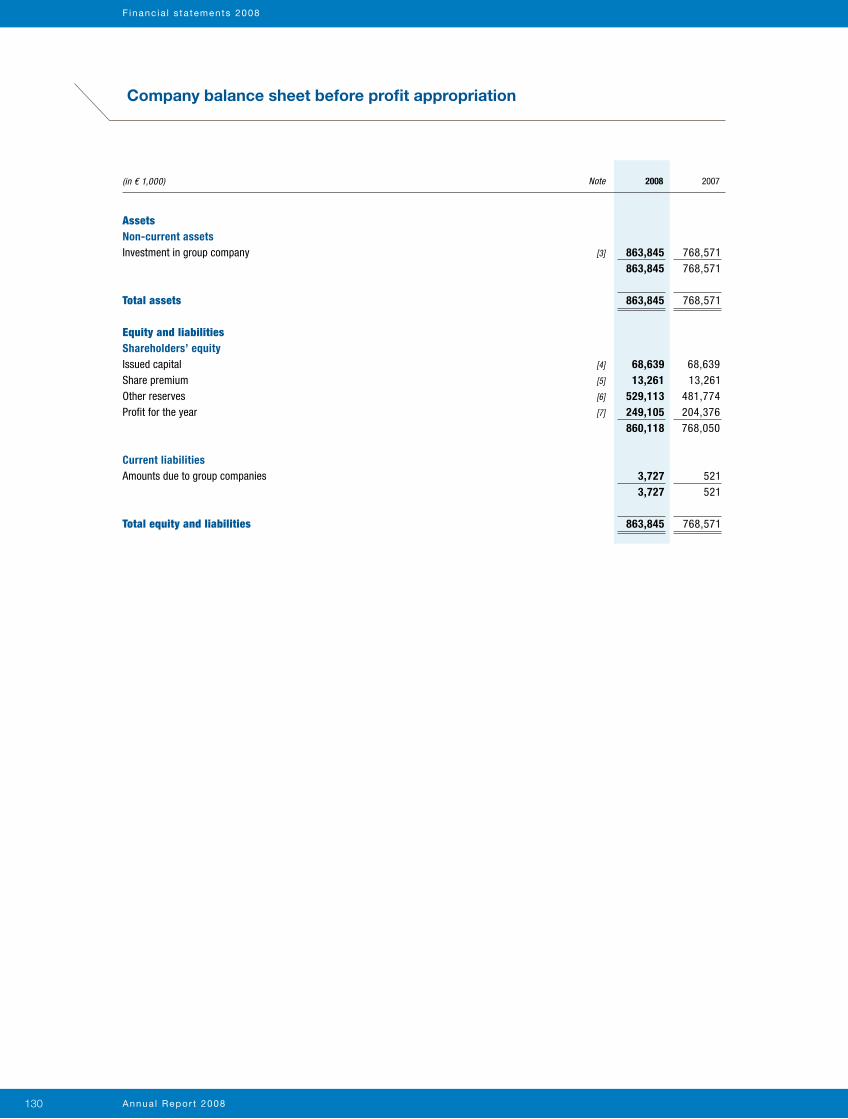
Annua l Repor t 2008130
Note
AssetsNon-current assetsInvestment in group company [3]
Total assets
Equity and liabilitiesShareholders’ equityIssued capital [4]
Share premium [5]
Other reserves [6]
Profit for the year [7]
Current liabilitiesAmounts due to group companies
Total equity and liabilities
863,845 768,571 863,845 768,571 863,845 768,571 68,639 68,639 13,261 13,261 529,113 481,774 249,105 204,376 860,118 768,050 3,727 521 3,727 521 863,845 768,571
2008 2007(in € 1,000)
Company balance sheet before profit appropriation
F inanc ia l s ta tements 2008
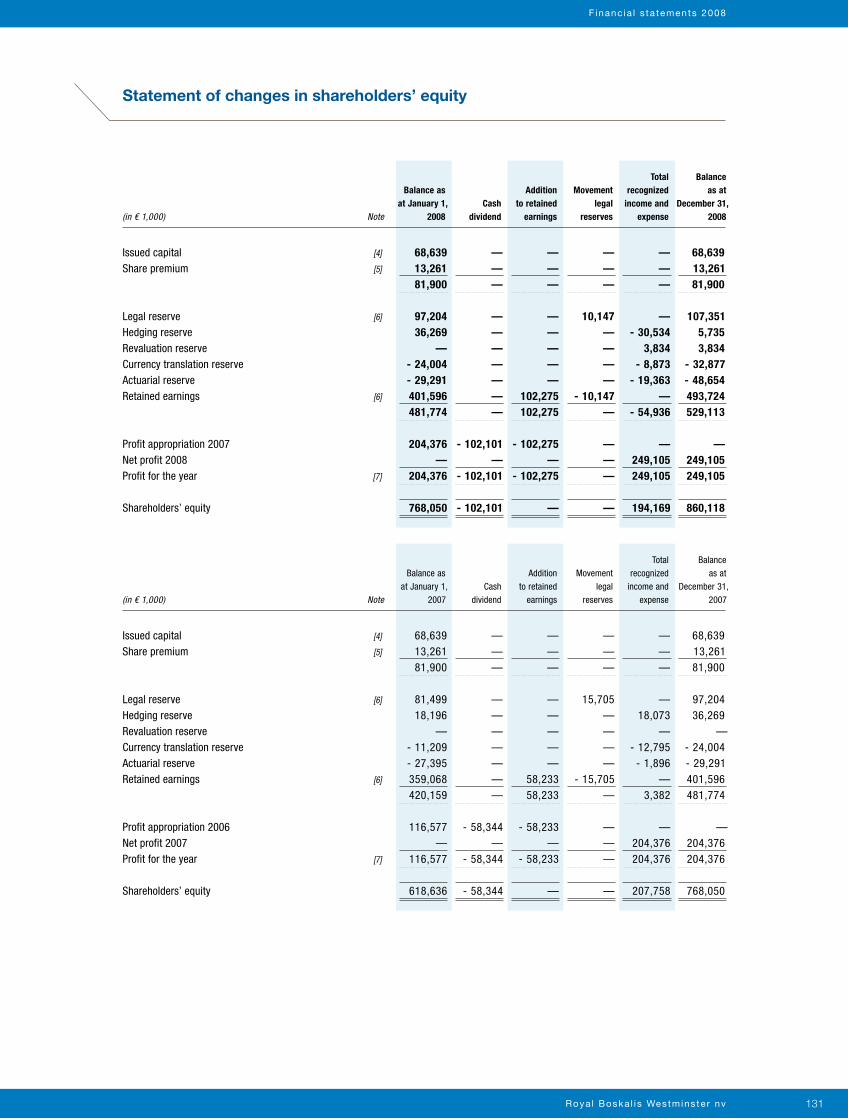
Roya l Boska l i s Westmins te r nv 131
Statement of changes in shareholders’ equity
F inanc ia l s ta tements 2008
68,639 — — — — 68,639 13,261 — — — — 13,261 81,900 — — — — 81,900 97,204 — — 10,147 — 107,351 36,269 — — — - 30,534 5,735 — — — — 3,834 3,834 - 24,004 — — — - 8,873 - 32,877 - 29,291 — — — - 19,363 - 48,654 401,596 — 102,275 - 10,147 — 493,724 481,774 — 102,275 — - 54,936 529,113 204,376 - 102,101 - 102,275 — — — — — — — 249,105 249,105 204,376 - 102,101 - 102,275 — 249,105 249,105 768,050 - 102,101 — — 194,169 860,118
(in € 1,000) Note
Balance as at January 1,
2008Cash
dividend
Addition to retained
earnings
Movement legal
reserves
Total recognized
income and expense
Balance as at
December 31, 2008
Issued capital [4]
Share premium [5]
Legal reserve [6]
Hedging reserve Revaluation reserve Currency translation reserve Actuarial reserve Retained earnings [6]
Profit appropriation 2007 Net profit 2008 Profit for the year [7] Shareholders’ equity
68,639 — — — — 68,639 13,261 — — — — 13,261 81,900 — — — — 81,900 81,499 — — 15,705 — 97,204 18,196 — — — 18,073 36,269 — — — — — — - 11,209 — — — - 12,795 - 24,004 - 27,395 — — — - 1,896 - 29,291 359,068 — 58,233 - 15,705 — 401,596 420,159 — 58,233 — 3,382 481,774 116,577 - 58,344 - 58,233 — — — — — — — 204,376 204,376 116,577 - 58,344 - 58,233 — 204,376 204,376 618,636 - 58,344 — — 207,758 768,050
(in € 1,000) Note
Balance as at January 1,
2007Cash
dividend
Addition to retained
earnings
Movement legal
reserves
Total recognized
income and expense
Balance as at
December 31, 2007
Issued capital [4]
Share premium [5]
Legal reserve [6]
Hedging reserve Revaluation reserve Currency translation reserve Actuarial reserve Retained earnings [6]
Profit appropriation 2006 Net profit 2007 Profit for the year [7]
Shareholders’ equity
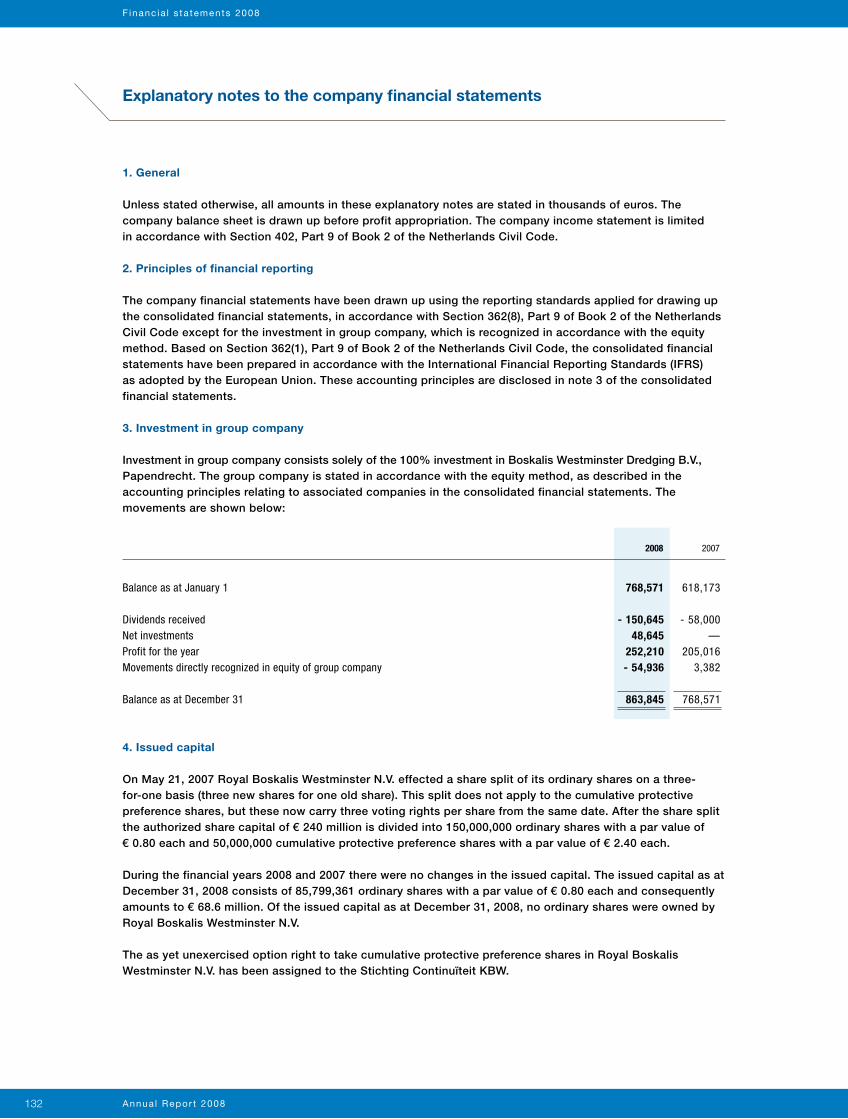
Annua l Repor t 2008132
Explanatory notes to the company financial statements
1. General
Unless stated otherwise, all amounts in these explanatory notes are stated in thousands of euros. The company balance sheet is drawn up before profit appropriation. The company income statement is limited in accordance with Section 402, Part 9 of Book 2 of the Netherlands Civil Code.
2. Principles of financial reporting
The company financial statements have been drawn up using the reporting standards applied for drawing up the consolidated financial statements, in accordance with Section 362(8), Part 9 of Book 2 of the Netherlands Civil Code except for the investment in group company, which is recognized in accordance with the equity method. Based on Section 362(1), Part 9 of Book 2 of the Netherlands Civil Code, the consolidated financial statements have been prepared in accordance with the International Financial Reporting Standards (IFRS) as adopted by the European Union. These accounting principles are disclosed in note 3 of the consolidated financial statements.
3. Investment in group company
Investment in group company consists solely of the 100% investment in Boskalis Westminster Dredging B.V., Papendrecht. The group company is stated in accordance with the equity method, as described in the accounting principles relating to associated companies in the consolidated financial statements. The movements are shown below:
4. Issued capital
On May 21, 2007 Royal Boskalis Westminster N.V. effected a share split of its ordinary shares on a three-for-one basis (three new shares for one old share). This split does not apply to the cumulative protective preference shares, but these now carry three voting rights per share from the same date. After the share split the authorized share capital of € 240 million is divided into 150,000,000 ordinary shares with a par value of € 0.80 each and 50,000,000 cumulative protective preference shares with a par value of € 2.40 each.
During the financial years 2008 and 2007 there were no changes in the issued capital. The issued capital as at December 31, 2008 consists of 85,799,361 ordinary shares with a par value of € 0.80 each and consequently amounts to € 68.6 million. Of the issued capital as at December 31, 2008, no ordinary shares were owned by Royal Boskalis Westminster N.V.
The as yet unexercised option right to take cumulative protective preference shares in Royal Boskalis Westminster N.V. has been assigned to the Stichting Continuïteit KBW.
Balance as at January 1
Dividends receivedNet investmentsProfit for the yearMovements directly recognized in equity of group company
Balance as at December 31
768,571 618,173 - 150,645 - 58,000 48,645 — 252,210 205,016 - 54,936 3,382
863,845 768,571
2008 2007
F inanc ia l s ta tements 2008
Roya l Boska l i s Westmins te r nv 133
5. Share premium
Share premium comprises additional paid-in capital exceeding the par value of outstanding shares. Share premium is distributable free of tax.
6. Other reserves
The legal reserve for non-distributed profits of group and/or associated companies amounted to € 107.4 million at the end of 2008 (2007: € 97.2 million). The other reserves recognized in the company balance sheet are disclosed in the notes to the consolidated financial statements (note 21.3-21.8).
7. Profit for the year
An amount of € 146.9 million will be added to the retained earnings. The proposal to the Annual General Meeting will be to appropriate the remainder, € 102.2 million, for a dividend payment of € 1.19 per ordinary share.
The dividend will be made payable in ordinary shares to be charged to the tax-exempt share premium or to be charged to the retained earnings, unless a shareholder expressly requests payment in cash.
8. Remuneration of members of the Board of Management and Supervisory Board
The remuneration of members of the Board of Management and Supervisory Board is disclosed in the consolidated financial statements under related party transactions (note 30.2).
9. Commitments and contingent liabilities
Royal Boskalis Westminster N.V. heads a fiscal entity which includes almost all the Dutch 100% group companies. The company is therefore liable for the tax obligations of the fiscal entity as a whole. The company has issued guarantees on behalf of project-driven construction consortiums, and group companies’ own contracts. These amounted to € 1.0 million as at December 31, 2008 (2007: € 6 million). In addition, certain recourse obligations exist in respect of project financiers. Where deemed necessary, provisions have been made. Some legal proceedings and investigations have been instituted against entities of Royal Boskalis Westminster N.V. Where deemed necessary, provisions have been made.
Papendrecht / Sliedrecht, March 17, 2009
Supervisory BoardR.M.F. van Loon, chairman until March 17, 2009H. Heemskerk, acting chairman as from March 17, 2009M. NiggebruggeM. van der VormC. van Woudenberg
Board of Managementdr. P.A.M. Berdowski, ChairmanT.L. BaartmansJ.H. Kamps
F inanc ia l s ta tements 2008
Annua l Repor t 2008134
Other information
Provisions in the Articles of Association relating to profit appropriation
Article 28.1. From the profits realized in any financial year, first of all, distributions will be made on cumulative protective
preference shares if possible, in the amount of the percentage specified below of the amount that has to be paid up on these shares as from the beginning of the financial year to which the distribution is related. The percentage referred to above equals the average Euribor interest rate determined for loans with a term of one year – weighted in respect of the number of days to which this interest rate applied – during the financial year to which the distribution is related, increased by four percentage points at most; this increase will be determined every five years by the Board of Management subject to the approval of the Supervisory Board. If in the financial year in respect of which the above-mentioned distribution takes place, the amount that has to be paid up on cumulative protective preference shares has been reduced or, pursuant to a resolution for further payment, has been increased, the distribution shall be reduced or, if possible, be increased by an amount equal to the above-mentioned percentage of the amount of the reduction or the increase, as the case may be, calculated from the moment of the reduction or from the moment further payment became compulsory. If in the course of any financial year cumulative protective preference shares have been issued, the dividend on those cumulative protective preference shares shall be reduced for that year in proportion to the day of issue, taking into account a part of a month as a full month.
2. If and in so far as the profit is not enough to realize the distribution referred to in paragraph 1, the deficit shall be distributed from the reserves, subject to statutory provisions.
3. If in any financial year the profit referred to in paragraph 1 is not enough to realize the distributions referred to above in this article, and furthermore no distribution or only a partial distribution from the reserves as referred to in paragraph 2 is realized, so that the deficit is not or not completely distributed, the provisions of this article and the provisions of the following paragraphs shall only apply in the following financial years after the deficit has been made up for. After application of paragraphs 1, 2 and 3, no further distribution shall take place on the cumulative protective preference shares.
4. Out of the remaining profit, an amount shall be reserved annually to the extent as shall be determined by the Board of Management under approval of the Supervisory Board. The remaining part of the profits after reservation, as referred to in the immediately preceding sentence, is at the free disposal of the General Meeting of Shareholders and in case of distribution, the holders of ordinary shares will be entitled thereto in proportion to their holding of ordinary shares.
Article 29.1. Dividends shall be made available for payment within thirty days of their declaration, or any sooner as the
Board of Management may determine.2. Unclaimed dividends will revert to the company after five years.3. If the Board of Management so decides, subject to the approval of the Supervisory Board, an interim
dividend shall be distributed, subject to the preference of the cumulative protective preference shares and the provisions of Article 2:105 of the Dutch Civil Code.
4. The General Meeting of Shareholders may decide, on the proposal of the Board of Management, that dividends will be distributed fully or partially in the form of shares in the company or depositary certificates thereof.
5. The company may only realize distributions to the shareholder to the extent that its equity capital exceeds the amount of the subscribed capital, increased by the reserves that have to be maintained by law or by the articles of association.
6. A deficit may only be offset against reserves that have to be maintained by law to the extent that this is permitted by the law.
Proposed profit appropriationAn amount of € 146.9 million will be added to the retained earnings. The proposal to the Annual General Meeting will be to appropriate the remainder, € 102.2 million, for a dividend payment of € 1.19 per ordinary share.
The dividend will be made payable in ordinary shares to be charged to the tax-exempt share premium or to be charged to the retained earnings, unless a shareholder expressly requests payment in cash.
F inanc ia l s ta tements 2008
Roya l Boska l i s Westmins te r nv 135
Auditor’s report
To: Annual General Meeting of Shareholders of Royal Boskalis Westminster N.V.
Report on the financial statementsWe have audited the financial statements 2008 of Royal Boskalis Westminster N.V., Sliedrecht, as set out on pages 77 to 133. The financial statements consist of the consolidated financial statements and the company financial statements. The consolidated financial statements comprise the consolidated balance sheet as at December 31, 2008, the consolidated income statement, the consolidated statement of recognized income and expense and the consolidated statement of cash flows for the year then ended, and a summary of significant accounting policies and other explanatory notes. The company financial statements comprise the company balance sheet as at December 31, 2008, the company income statement for the year then ended and the notes.
Management’s responsibilityManagement is responsible for the preparation and fair presentation of the financial statements in accordance with International Financial Reporting Standards as adopted by the European Union and with Part 9 of Book 2 of the Netherlands Civil Code, and for the preparation of the management board report in accordance with Part 9 of Book 2 of the Netherlands Civil Code. This responsibility includes: designing, implementing and maintaining internal control relevant to the preparation and fair presentation of the financial statements that are free from material misstatement, whether due to fraud or error; selecting and applying appropriate accounting policies; and making accounting estimates that are reasonable in the circumstances.
Auditor’s responsibilityOur responsibility is to express an opinion on the financial statements based on our audit. We conducted our audit in accordance with Dutch law. This law requires that we comply with ethical requirements and plan and perform the audit to obtain reasonable assurance whether the financial statements are free from material misstatement.An audit involves performing procedures to obtain audit evidence about the amounts and disclosures in the financial statements. The procedures selected depend on the auditor’s judgment, including the assessment of the risks of material misstatement of the financial statements, whether due to fraud or error. In making those risk assessments, the auditor considers internal control relevant to the entity’s preparation and fair presentation of the financial statements in order to design audit procedures that are appropriate in the circumstances, but not for the purpose of expressing an opinion on the effectiveness of the entity’s internal control. An audit also includes evaluating the appropriateness of accounting policies used and the reasonableness of accounting estimates made by management of the entity, as well as evaluating the overall presentation of the financial statements.
We believe that the audit evidence we have obtained is sufficient and appropriate to provide a basis for our audit opinion.
Opinion with respect to the consolidated financial statementsIn our opinion, the consolidated financial statements give a true and fair view of the financial position of Royal Boskalis Westminster N.V. as at December 31, 2008, and of its result, its total recognized income and expense and its cash flow for the year then ended in accordance with International Financial Reporting Standards as adopted by the European Union and with Part 9 of Book 2 of the Netherlands Civil Code.
Opinion with respect to the company financial statementsIn our opinion, the company financial statements give a true and fair view of the financial position of Royal Boskalis Westminster N.V. as at December 31, 2008, and of its result for the year then ended in accordance with Part 9 of Book 2 of the Netherlands Civil Code.
F inanc ia l s ta tements 2008
Annua l Repor t 2008136
Report on other legal and regulatory requirementsPursuant to the legal requirement under 2:393 sub 5 part f of the Netherlands Civil Code, we report, to the extent of our competence, that the management board report as set out on pages 49 to 76 is consistent with the financial statements as required by 2:391 sub 4 of the Netherlands Civil Code.
Rotterdam, March 17, 2009
KPMG Accountants N.V.
D.J. Randeraad RA
F inanc ia l s ta tements 2008
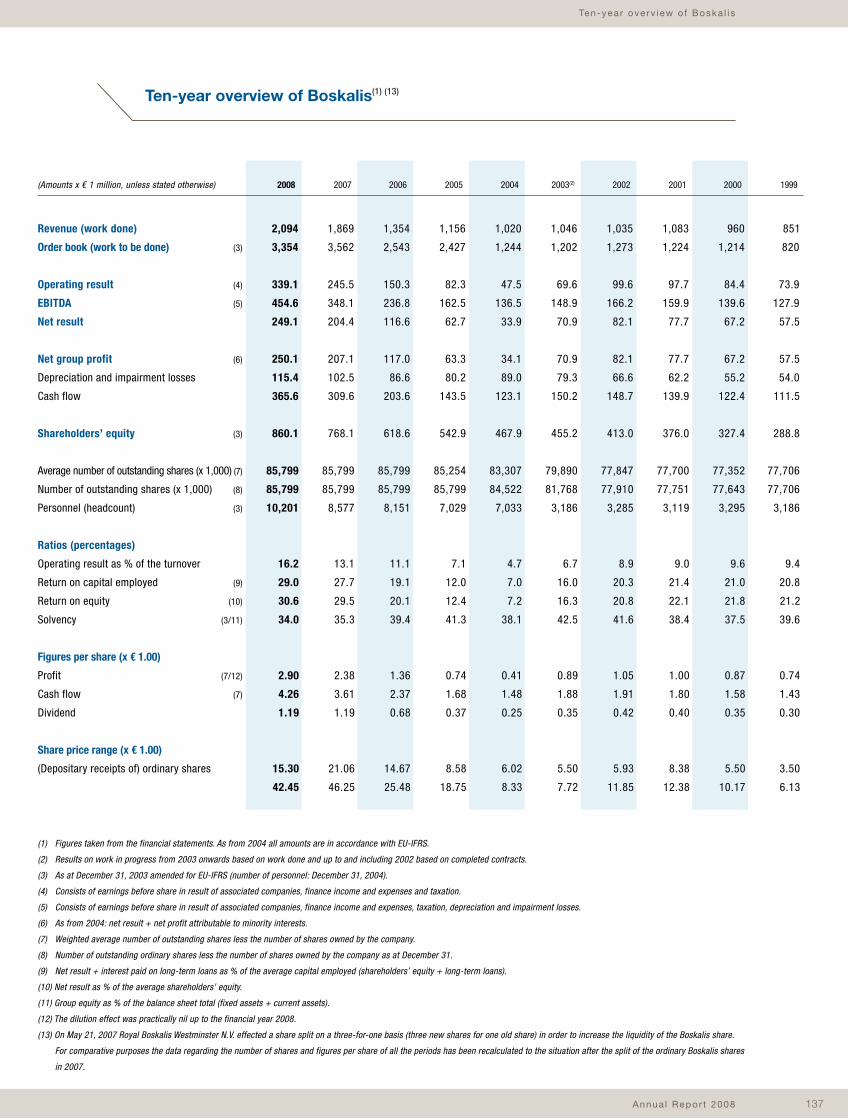
Annua l Repor t 2008 137
Ten-year overv iew o f Boska l i s
2,094 1,869 1,354 1,156 1,020 1,046 1,035 1,083 960 851
3,354 3,562 2,543 2,427 1,244 1,202 1,273 1,224 1,214 820
339.1 245.5 150.3 82.3 47.5 69.6 99.6 97.7 84.4 73.9
454.6 348.1 236.8 162.5 136.5 148.9 166.2 159.9 139.6 127.9
249.1 204.4 116.6 62.7 33.9 70.9 82.1 77.7 67.2 57.5
250.1 207.1 117.0 63.3 34.1 70.9 82.1 77.7 67.2 57.5
115.4 102.5 86.6 80.2 89.0 79.3 66.6 62.2 55.2 54.0
365.6 309.6 203.6 143.5 123.1 150.2 148.7 139.9 122.4 111.5
860.1 768.1 618.6 542.9 467.9 455.2 413.0 376.0 327.4 288.8
85,799 85,799 85,799 85,254 83,307 79,890 77,847 77,700 77,352 77,706
85,799 85,799 85,799 85,799 84,522 81,768 77,910 77,751 77,643 77,706
10,201 8,577 8,151 7,029 7,033 3,186 3,285 3,119 3,295 3,186
16.2 13.1 11.1 7.1 4.7 6.7 8.9 9.0 9.6 9.4
29.0 27.7 19.1 12.0 7.0 16.0 20.3 21.4 21.0 20.8
30.6 29.5 20.1 12.4 7.2 16.3 20.8 22.1 21.8 21.2
34.0 35.3 39.4 41.3 38.1 42.5 41.6 38.4 37.5 39.6
2.90 2.38 1.36 0.74 0.41 0.89 1.05 1.00 0.87 0.74
4.26 3.61 2.37 1.68 1.48 1.88 1.91 1.80 1.58 1.43
1.19 1.19 0.68 0.37 0.25 0.35 0.42 0.40 0.35 0.30
15.30 21.06 14.67 8.58 6.02 5.50 5.93 8.38 5.50 3.50
42.45 46.25 25.48 18.75 8.33 7.72 11.85 12.38 10.17 6.13
(Amounts x € 1 million, unless stated otherwise) 2008 2007 2006 2005 2004 2003(2) 2002 2001 2000 1999
Revenue (work done)
Order book (work to be done) (3)
Operating result (4)
EBITDA (5)
Net result
Net group profit (6)
Depreciation and impairment losses
Cash flow
Shareholders’ equity (3)
Average number of outstanding shares (x 1,000) (7)
Number of outstanding shares (x 1,000) (8)
Personnel (headcount) (3)
Ratios (percentages)
Operating result as % of the turnover
Return on capital employed (9)
Return on equity (10)
Solvency (3/11)
Figures per share (x € 1.00)
Profit (7/12)
Cash flow (7)
Dividend
Share price range (x € 1.00)
(Depositary receipts of) ordinary shares
(1) Figures taken from the financial statements. As from 2004 all amounts are in accordance with EU-IFRS.
(2) Results on work in progress from 2003 onwards based on work done and up to and including 2002 based on completed contracts.
(3) As at December 31, 2003 amended for EU-IFRS (number of personnel: December 31, 2004).
(4) Consists of earnings before share in result of associated companies, finance income and expenses and taxation.
(5) Consists of earnings before share in result of associated companies, finance income and expenses, taxation, depreciation and impairment losses.
(6) As from 2004: net result + net profit attributable to minority interests.
(7) Weighted average number of outstanding shares less the number of shares owned by the company.
(8) Number of outstanding ordinary shares less the number of shares owned by the company as at December 31.
(9) Net result + interest paid on long-term loans as % of the average capital employed (shareholders’ equity + long-term loans).
(10) Net result as % of the average shareholders’ equity.
(11) Group equity as % of the balance sheet total (fixed assets + current assets).
(12) The dilution effect was practically nil up to the financial year 2008.
(13) On May 21, 2007 Royal Boskalis Westminster N.V. effected a share split on a three-for-one basis (three new shares for one old share) in order to increase the liquidity of the Boskalis share.
For comparative purposes the data regarding the number of shares and figures per share of all the periods has been recalculated to the situation after the split of the ordinary Boskalis shares
in 2007.
Ten-year overview of Boskalis(1) (13)
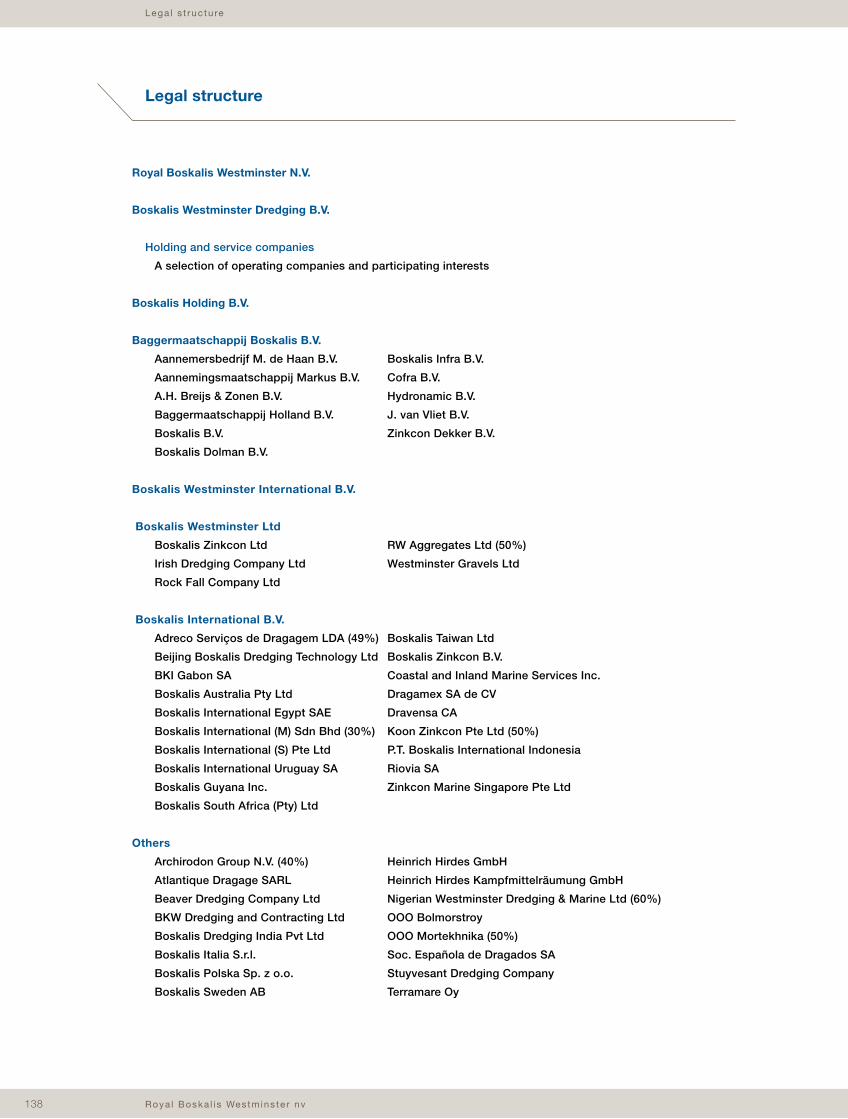
Roya l Boska l i s Westmins te r nv 138
Lega l s t ruc tu re
Royal Boskalis Westminster N.V.
Boskalis Westminster Dredging B.V.
Holding and service companies
A selection of operating companies and participating interests
Boskalis Holding B.V.
Baggermaatschappij Boskalis B.V.
Aannemersbedrijf M. de Haan B.V. Boskalis Infra B.V.
Aannemingsmaatschappij Markus B.V. Cofra B.V.
A.H. Breijs & Zonen B.V. Hydronamic B.V.
Baggermaatschappij Holland B.V. J. van Vliet B.V.
Boskalis B.V. Zinkcon Dekker B.V.
Boskalis Dolman B.V.
Boskalis Westminster International B.V.
Boskalis Westminster Ltd
Boskalis Zinkcon Ltd RW Aggregates Ltd (50%)
Irish Dredging Company Ltd Westminster Gravels Ltd
Rock Fall Company Ltd
Boskalis International B.V.
Adreco Serviços de Dragagem LDA (49%) Boskalis Taiwan Ltd
Beijing Boskalis Dredging Technology Ltd Boskalis Zinkcon B.V.
BKI Gabon SA Coastal and Inland Marine Services Inc.
Boskalis Australia Pty Ltd Dragamex SA de CV
Boskalis International Egypt SAE Dravensa CA
Boskalis International (M) Sdn Bhd (30%) Koon Zinkcon Pte Ltd (50%)
Boskalis International (S) Pte Ltd P.T. Boskalis International Indonesia
Boskalis International Uruguay SA Riovia SA
Boskalis Guyana Inc. Zinkcon Marine Singapore Pte Ltd
Boskalis South Africa (Pty) Ltd
Others
Archirodon Group N.V. (40%) Heinrich Hirdes GmbH
Atlantique Dragage SARL Heinrich Hirdes Kampfmittelräumung GmbH
Beaver Dredging Company Ltd Nigerian Westminster Dredging & Marine Ltd (60%)
BKW Dredging and Contracting Ltd OOO Bolmorstroy
Boskalis Dredging India Pvt Ltd OOO Mortekhnika (50%)
Boskalis Italia S.r.l. Soc. Española de Dragados SA
Boskalis Polska Sp. z o.o. Stuyvesant Dredging Company
Boskalis Sweden AB Terramare Oy
Legal structure
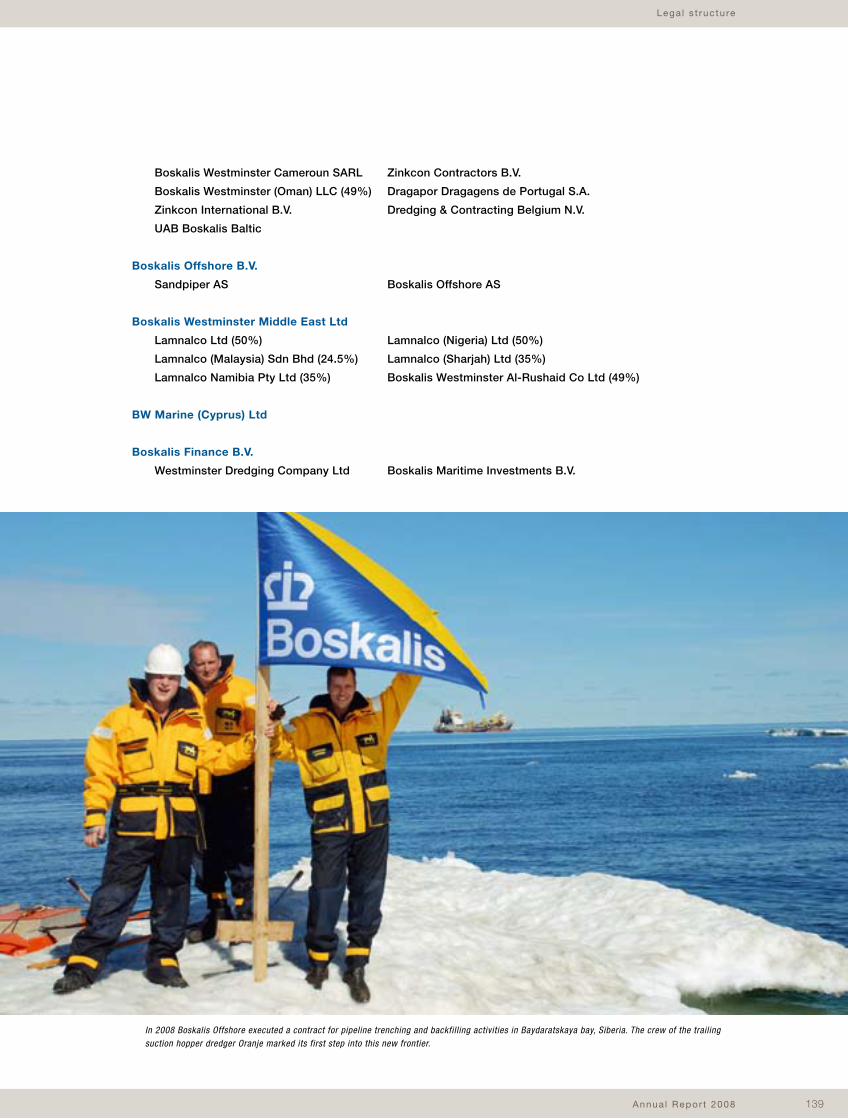
Annua l Repor t 2008 139
Boskalis Westminster Cameroun SARL Zinkcon Contractors B.V.
Boskalis Westminster (Oman) LLC (49%) Dragapor Dragagens de Portugal S.A.
Zinkcon International B.V. Dredging & Contracting Belgium N.V.
UAB Boskalis Baltic
Boskalis Offshore B.V.
Sandpiper AS Boskalis Offshore AS
Boskalis Westminster Middle East Ltd
Lamnalco Ltd (50%) Lamnalco (Nigeria) Ltd (50%)
Lamnalco (Malaysia) Sdn Bhd (24.5%) Lamnalco (Sharjah) Ltd (35%)
Lamnalco Namibia Pty Ltd (35%) Boskalis Westminster Al-Rushaid Co Ltd (49%)
BW Marine (Cyprus) Ltd
Boskalis Finance B.V.
Westminster Dredging Company Ltd Boskalis Maritime Investments B.V.
Lega l s t ruc tu re
In 2008 Boskalis Offshore executed a contract for pipeline trenching and backfilling activities in Baydaratskaya bay, Siberia. The crew of the trailing suction hopper dredger Oranje marked its first step into this new frontier.
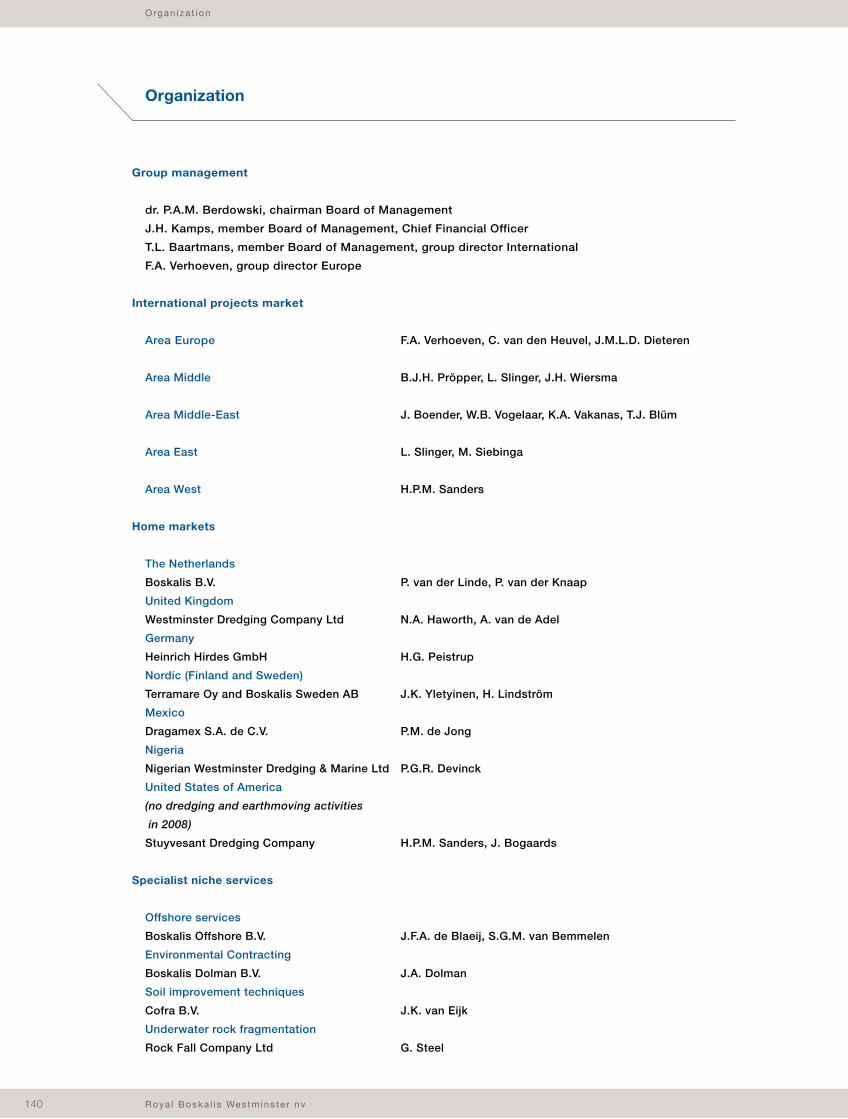
Roya l Boska l i s Westmins te r nv 140
Organ iza t ion
Group management
dr. P.A.M. Berdowski, chairman Board of Management
J.H. Kamps, member Board of Management, Chief Financial Officer
T.L. Baartmans, member Board of Management, group director International
F.A. Verhoeven, group director Europe
International projects market
Area Europe F.A. Verhoeven, C. van den Heuvel, J.M.L.D. Dieteren
Area Middle B.J.H. Pröpper, L. Slinger, J.H. Wiersma
Area Middle-East J. Boender, W.B. Vogelaar, K.A. Vakanas, T.J. Blüm
Area East L. Slinger, M. Siebinga
Area West H.P.M. Sanders
Home markets
The Netherlands
Boskalis B.V. P. van der Linde, P. van der Knaap
United Kingdom
Westminster Dredging Company Ltd N.A. Haworth, A. van de Adel
Germany
Heinrich Hirdes GmbH H.G. Peistrup
Nordic (Finland and Sweden)
Terramare Oy and Boskalis Sweden AB J.K. Yletyinen, H. Lindström
Mexico
Dragamex S.A. de C.V. P.M. de Jong
Nigeria
Nigerian Westminster Dredging & Marine Ltd P.G.R. Devinck
United States of America
(no dredging and earthmoving activities
in 2008)
Stuyvesant Dredging Company H.P.M. Sanders, J. Bogaards
Specialist niche services
Offshore services
Boskalis Offshore B.V. J.F.A. de Blaeij, S.G.M. van Bemmelen
Environmental Contracting
Boskalis Dolman B.V. J.A. Dolman
Soil improvement techniques
Cofra B.V. J.K. van Eijk
Underwater rock fragmentation
Rock Fall Company Ltd G. Steel
Organization
Annua l Repor t 2008 141
Corporate staff
Investor Relations & Corporate Communications M.L.D. Schuttevâer
Fiscal Affairs R.J. Selij
Treasury & Insurance F.A.J. Rousseau
Legal Affairs F.E. Buijs
Information & Communications Technology M.J. Krijger
Safety, Health, Environment & Quality (SHE-Q) W. Haaijer
Business Development T.R. Bennema
Operational staff
Personnel & Organization J. den Hartog
Research & Development A.C. Steenbrink
Dredging Department H. Postma
Central Technical Department E.C. Holman
Rock Department J. de Reus, S.G. van Keulen
Works Council
T.A. Scheurwater, chairman
C.C. Brijder
J.J. van den Broeck
V.P. Commandeur
F.M.C. van Gerven
A.D. Groeneveld
J. Korf
A.M.C. Kruithof
S. van der Land
G. Prins
C.G.A. Tonnaer
M. Treffers, vice-chairman
D.A. van Uitert
M.F. van Wijk
M. Wischmeijer
P.E. den Otter-Bakker, secretary
Organ iza t ion
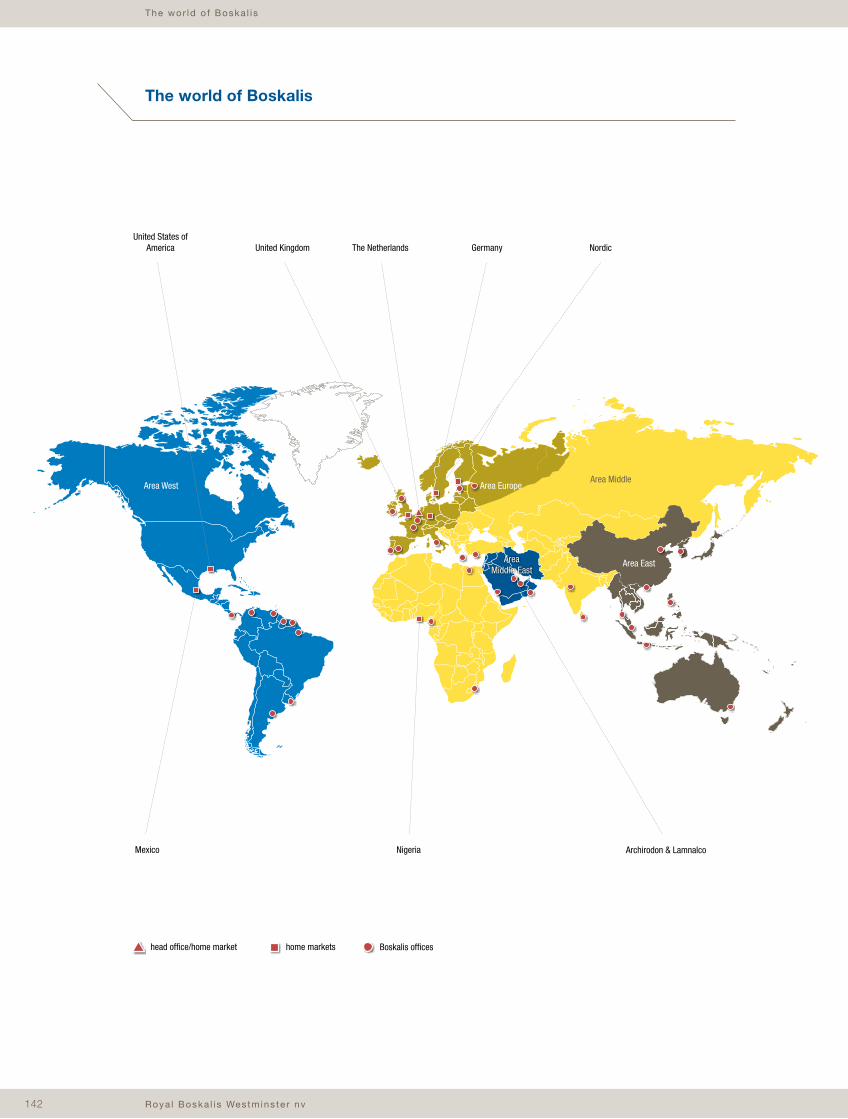
Roya l Boska l i s Westmins te r nv 142
The wor ld o f Boska l i s
Nordic
Archirodon & Lamnalco
Area Middle
Area Middle-East
Area East
Area Europe
Mexico
United States of America United Kingdom The Netherlands Germany
Nigeria
Area West
home markets Boskalis officeshead office/home market
The world of Boskalis
Annua l Repor t 2008 143
Off ices
Offices
Head office
Royal Boskalis
Westminster N.V.
Rosmolenweg 20
P.O. Box 43
3350 AA Papendrecht
The Netherlands
Telephone +31786969000
Fax +31786969555
www.boskalis.com
The Netherlands
Baggermaatschappij
Boskalis B.V.
Boskalis International B.V.
Rosmolenweg 20
P.O. Box 43
3350 AA Papendrecht
The Netherlands
Telephone +31786969011
Fax +31786969
www.boskalis.nl
Boskalis B.V.
Zinkcon Dekker B.V.
’s-Gravenweg 399-405
P.O. Box 4234
3006 AE Rotterdam
The Netherlands
Telephone +31102888777
Fax +31102888766
www.boskalisbv.nl
Boskalis Offshore B.V.
Rosmolenweg 20
P.O. Box 43
3350 AA Papendrecht
The Netherlands
Telephone +31786969011
Fax +31786969571
Boskalis Dolman B.V.
P.O. Box 76
3350 AB Papendrecht
The Netherlands
Telephone +31786969897
Fax +31786969901
www.boskalisdolman.nl
Boskalis Infra B.V.
Nijverheidstraat 68
2901 AR Capelle a/d IJssel
P.O. Box 4290
3006 AG Rotterdam
The Netherlands
Telephone +31104582022
Fax +31104583775
www.boskalisbv.nl
Aannemersbedrijf
M. de Haan B.V.
Alde Wei 2
9222 NG Drachtstercompagnie
The Netherlands
Telephone +31512341770
Fax +31512340603
www.boskalisbv.nl
A.H. Breijs & Zonen B.V.
Nijverheidstraat 68
2901 AR Capelle a/d IJssel
P.O. Box 4290
3006 AG Rotterdam
The Netherlands
Telephone +31104582022
Fax +31104583775
www.boskalisbv.nl
Cofra B.V.
Kwadrantweg 9
P.O. Box 20694
1001 NR Amsterdam
The Netherlands
Telephone +31206934596
Fax +31206941457
www.cofra.com
Hydronamic B.V.
Rosmolenweg 20
P.O. Box 209
3350 AE Papendrecht
The Netherlands
Telephone +31786969099
Fax +31786969869
www.hydronamic.nl
Aannemingsmaatschappij
Markus B.V.
Kwadrantweg 7
P.O. Box 20564
1001 NN Amsterdam
The Netherlands
Telephone +31205874000
Fax +31205874001
www.markusbv.nl
Zandhandel J. van Vliet B.V.
Toetsenbordweg 3
P.O. Box 37188
1030 AD Amsterdam
The Netherlands
Telephone + 31204936370
Fax + 31204936379
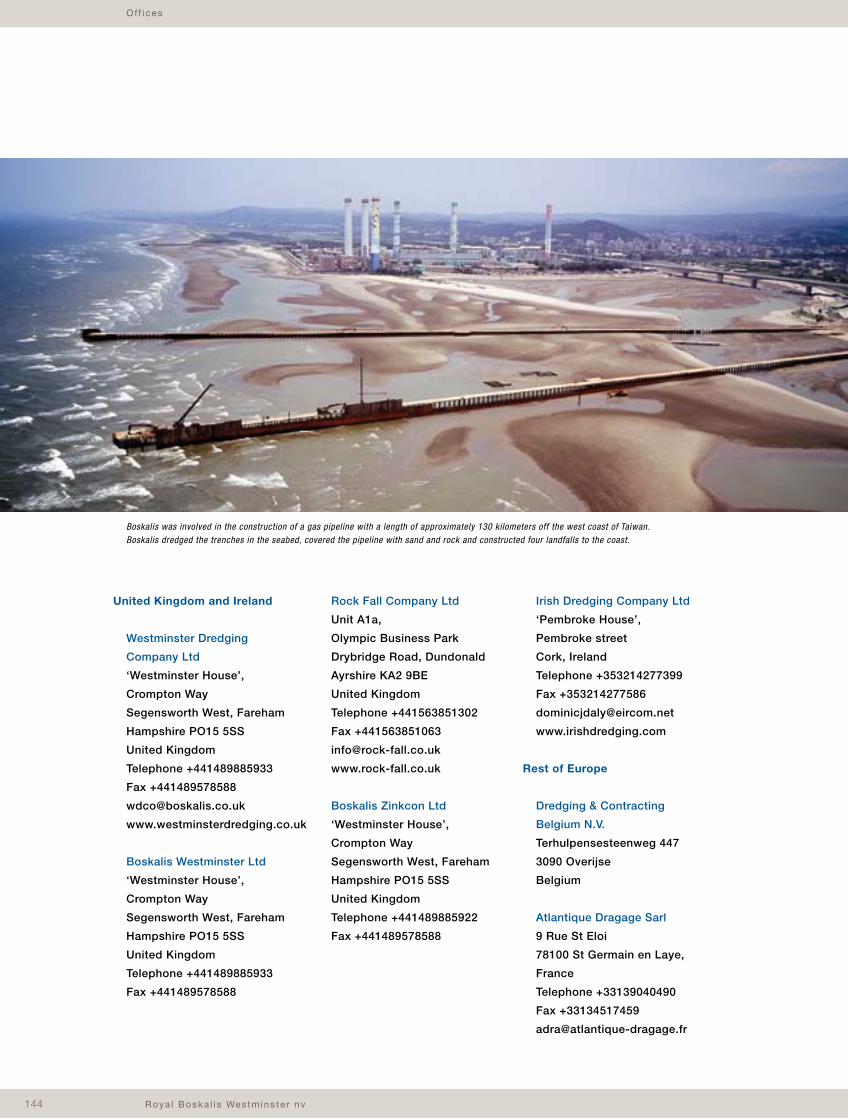
Roya l Boska l i s Westmins te r nv 144
Off ices
United Kingdom and Ireland
Westminster Dredging
Company Ltd
‘Westminster House’,
Crompton Way
Segensworth West, Fareham
Hampshire PO15 5SS
United Kingdom
Telephone +441489885933
Fax +441489578588
www.westminsterdredging.co.uk
Boskalis Westminster Ltd
‘Westminster House’,
Crompton Way
Segensworth West, Fareham
Hampshire PO15 5SS
United Kingdom
Telephone +441489885933
Fax +441489578588
Rock Fall Company Ltd
Unit A1a,
Olympic Business Park
Drybridge Road, Dundonald
Ayrshire KA2 9BE
United Kingdom
Telephone +441563851302
Fax +441563851063
www.rock-fall.co.uk
Boskalis Zinkcon Ltd
‘Westminster House’,
Crompton Way
Segensworth West, Fareham
Hampshire PO15 5SS
United Kingdom
Telephone +441489885922
Fax +441489578588
Irish Dredging Company Ltd
‘Pembroke House’,
Pembroke street
Cork, Ireland
Telephone +353214277399
Fax +353214277586
www.irishdredging.com
Rest of Europe
Dredging & Contracting
Belgium N.V.
Terhulpensesteenweg 447
3090 Overijse
Belgium
Atlantique Dragage Sarl
9 Rue St Eloi
78100 St Germain en Laye,
France
Telephone +33139040490
Fax +33134517459
Boskalis was involved in the construction of a gas pipeline with a length of approximately 130 kilometers off the west coast of Taiwan. Boskalis dredged the trenches in the seabed, covered the pipeline with sand and rock and constructed four landfalls to the coast.
Annua l Repor t 2008 145
Off ices
Sociedad Española de
Dragados, S.A.
Plaza Castilla, 3 - 7º A
28046 Madrid, Spain
Telephone +34913237703
Fax +34913237128
Dragapor Dragagens de
Portugal S.A.
Av. D. Manuel I
2890 - 014 Alcochete,
Portugal
Telephone +351212348240
Fax +351212348269
Enka-Boskalis Su Yapilari
Inçaati Ticaret A.S.
Enka Binasi
Bestekar Sevki bey Sokak 32
Balmumcu 80780 Istanbul,
Turkey
Telephone +902122742574/75
Fax +902122728869/
2122742567
Delta GmbH
Zinkcon Dekker Wasserbau
GmbH
11, zum Panrepel
28307 Bremen, Germany
Telephone +49421438350
Fax +494214383519
Heinrich Hirdes GmbH
Bauhofstrasse 8b
21079 Hamburg, Germany
Telephone +4940766094-0
Fax +4940766094-55
www.heinrichhirdes.de
Terramare Oy
Laurinmäenkuja 3a
P.O. Box 14
FIN-00441 Helsinki, Finland
Telephone +358(0)9613621
Fax +358(0)961362700
www.terramare.fi
Boskalis Sweden AB
Vassgatan 3D
SE-41502 Gothenburg,
Sweden
Telephone +4631507330
Fax +4631515039
www.boskalis.se
Boskalis Italia SrL Unipersonale
Via Leone XIII, 95
00165 - Rome, Italy
Telephone +3906398701
Fax +390639870263
Terramare Eesti Osauhing
Estonia pst 1
10143 Tallinn
Estonia
Telephone +372 6306540
Fax +372 6306541
www.terramare.ee
OOO Mortehnika
Bolshoy pr. 18A, V.O.
199034 Saint Petersburg
Russia
Telephone +78124498512
Archirodon N.V.
3, Aghiou Andreou Street,
153 43 Aghia Paraskevi
Athens, Greece
Telephone +32106073301
Fax +32106073452
Middle East
Boskalis Westminster
Middle East Ltd
19th Floor Al Mansoor Tower
(Abu Dhabi National Bank
Bldg.)
Al Salam Street,
P.O. Box 4831, Abu Dhabi,
U.A.E.
Telephone +97126447306
Fax +97126443158
Boskalis Westminster
Middle East Ltd
Falcon Tower Building
7th Floor, Flat 716
P.O. Box 10630
Manama, Bahrain
Telephone +97317535757
Fax +97317535775
Boskalis International B.V.
(Egypt Branch)
Ground floor of 1,
Al Shaheed Gamal
El Fasakhani Street
5th Avenue Al Sabaa
Emarate
Almaza - Heliopolis 11361,
Cairo, Egypt
Telephone +2024175688
Fax +2024174262
Boskalis Westminster
(Oman) LLC
P.O. Box 89,
postal code 111
CPO Seeb
Oman
Telephone +96824491244
Fax +96824491478
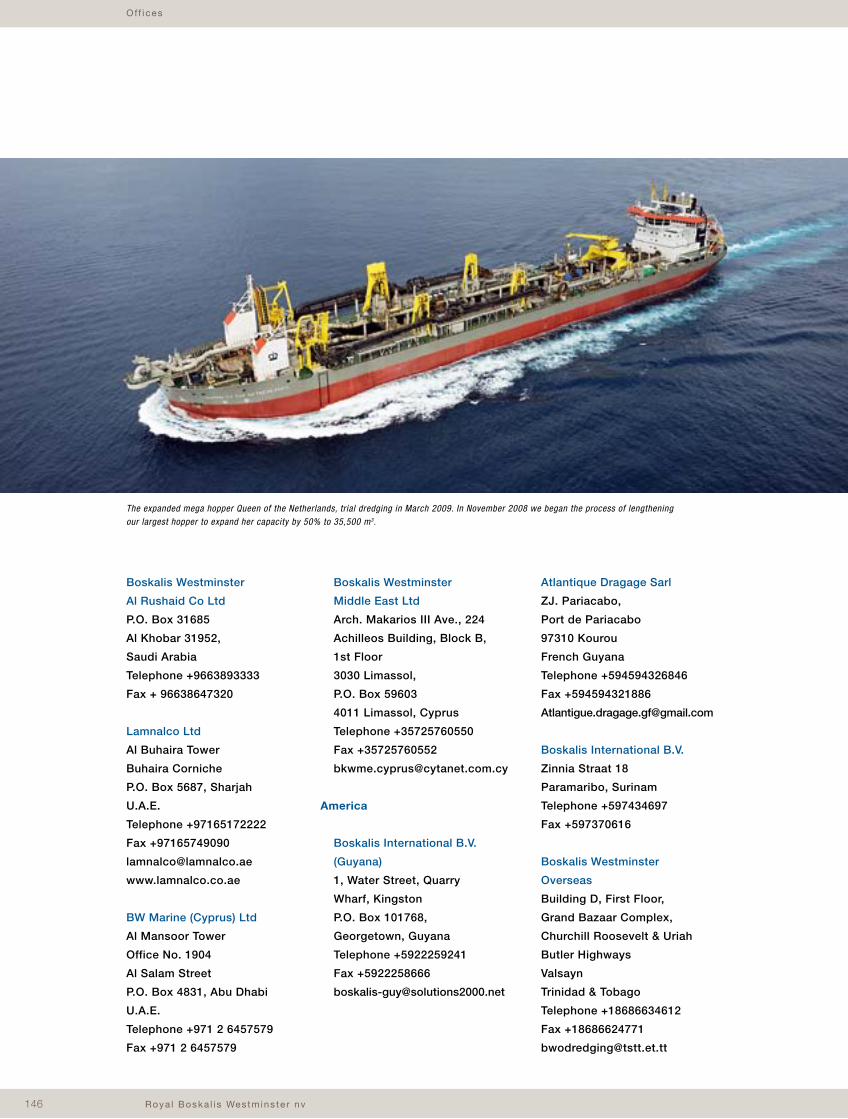
Roya l Boska l i s Westmins te r nv 146
Off ices
Boskalis Westminster
Al Rushaid Co Ltd
P.O. Box 31685
Al Khobar 31952,
Saudi Arabia
Telephone +9663893333
Fax + 96638647320
Lamnalco Ltd
Al Buhaira Tower
Buhaira Corniche
P.O. Box 5687, Sharjah
U.A.E.
Telephone +97165172222
Fax +97165749090
www.lamnalco.co.ae
BW Marine (Cyprus) Ltd
Al Mansoor Tower
Office No. 1904
Al Salam Street
P.O. Box 4831, Abu Dhabi
U.A.E.
Telephone +971 2 6457579
Fax +971 2 6457579
Boskalis Westminster
Middle East Ltd
Arch. Makarios III Ave., 224
Achilleos Building, Block B,
1st Floor
3030 Limassol,
P.O. Box 59603
4011 Limassol, Cyprus
Telephone +35725760550
Fax +35725760552
America
Boskalis International B.V.
(Guyana)
1, Water Street, Quarry
Wharf, Kingston
P.O. Box 101768,
Georgetown, Guyana
Telephone +5922259241
Fax +5922258666
Atlantique Dragage Sarl
ZJ. Pariacabo,
Port de Pariacabo
97310 Kourou
French Guyana
Telephone +594594326846
Fax +594594321886
Boskalis International B.V.
Zinnia Straat 18
Paramaribo, Surinam
Telephone +597434697
Fax +597370616
Boskalis Westminster
Overseas
Building D, First Floor,
Grand Bazaar Complex,
Churchill Roosevelt & Uriah
Butler Highways
Valsayn
Trinidad & Tobago
Telephone +18686634612
Fax +18686624771
The expanded mega hopper Queen of the Netherlands, trial dredging in March 2009. In November 2008 we began the process of lengthening our largest hopper to expand her capacity by 50% to 35,500 m3.
Annua l Repor t 2008 147
Off ices
Coastal and Inland Marine
Services, Inc.
P.H. Centro Comercial
Ciudad Siglo XXI
Avendida Ricardo J. Alfaro y
Cl. Juan Pablo II
Bethania, Panama
Telephone +5072600051/88
Fax +5072361776
Dravensa C.A.
Edificio ONIX, Piso 6,
Oficina 61, Calle Sojo -
El Rosal, Caracas, Venezuela
Telephone +582129517967
Fax +582129512773
Boskalis International B.V.
Sucursal Argentina
Edif. Porteña Plaza I, Olga
Cossettini 77
Piso 3, oficina 13
Pto. Madero, Dique 3
Buenos Aires
Argentina
Telephone +541143125963
Fax +541143125972
Boskalis International
Uruguay S.A.
Luis Alberto de Herrera 1248
World Trade Center
Torre A - Officina 703
11300 Montevideo, Uruguay
Telephone +59826285085
+59826226402
Fax +59826281563
Stuyvesant Dredging
Company
3525 North Causeway
Boulevard, Suite 612
Metairie, Louisiana 70002,
U.S.A.
Telephone +15048310880
Fax +15048370407
Dragamex S.A. de C.V.
Km 7.5 Carretera
Coatzacoalcos-Minatitlán
C.P. 96496 Coatzacoalcos
Veracruz, Mexico
Telephone +529212118200
Fax +529212118208
www.dragamex.com
Africa
Boskalis South Africa
9 Clive Street
Robindale, Randburg 2194
South Africa
Telephone +27118886218
Fax +27118886218
Boscampo Douala
S/c Cameroon Shipping Lines
S.A.
Centre des Affaires Maritimes
Bâtiment Simar IGH
2ème étage
BP 4054 Douala
Cameroon
Telephone +23733430917
Fax +23733431796
BKI Gabon (SA)
Z.I. Owendo
Route du Barracuda
Boite Postale 336, Libreville,
Gabon
Telephone +241702186
Fax +241702185
Nigerian Westminster
Dredging and Marine Ltd
‘Westminster House’
No 2 Udi Street,
Osborne Estate Ikoyi
P.O. Box 1518,
Lagos, Nigeria
Telephone +23417413309
Lamnalco (Nigeria) Ltd
Plot 264 Phase IV,
P.M.B. 159
Port Harcourt
Telephone
+23484235367/572776
Fax +23484234017
Australia and Asia
Boskalis Australia Pty Ltd
Suite 802, Level 8
Tower A, Zenith Centre,
821 Pacific Highway
Chatswood, NSW 2067
P.O. Box 341
Chatswood, NSW 2057
Australia
Telephone +61294060400
Fax +61294060424
Roya l Boska l i s Westmins te r nv 148
Off ices
Boskalis Dredging India Pvt Ltd
23 Sangeeta, Tagore Road
Santacruz (West)
Mumbai 400 054, India
Telephone +912226056699
Fax +912226640579
Boskalis International B.V.
ACE Distriparks Office Building
805/2 Negombo Road
Marbole, Wattala
P.O. Box 47
Sri Lanka
Telephone +94112945464
Fax +94112945466
Boskalis International (S) Pte Ltd
Koon Building
17B Pandan Road
#03-00/#04-00
Singapore 609269
Teban Garden Post Office,
P.O. Box 629
Singapore 916001
Telephone +6567335622
Fax +6567327530
Zinkcon Marine Singapore Pte Ltd
Koon Building
17B Pandan Road #03-00/#04-00
Singapore 609269
Jurong Post Office
P.O. Box 446
Singapore 916415
Telephone +6567333471
Fax +6567342510
Boskalis Westminster
International B.V.
Korea Branch
Suite 711, Hanaro Building
194-4, Insa-dong, Jongro-Ku,
Seoul, South Korea
Telephone +8227338973
Fax +8227338974
Boskalis International B.V.
Room 1702, Tower 1
China Hong Kong City
33 Canton Road, Tsim Sha
Tsui, Kowloon
Hong Kong SAR
Telephone +85223762330
Fax +85223763489
Boskalis International (M)
Sdn Bhd
B-19-6, Megan Avenue II
12 Jalan Yap Kwan Seng
50450 Kuala Lumpur
Malaysia
Telephone +603-2166 8092
Fax +603-2166 8093
P.T. Boskalis International
Indonesia
Plaza Centris, Floor 12A
Jl. H.R. Rasuna Said Kav. B-5
Kuningan, Jakarta 12910
Indonesia
Telephone +62215269020
Fax +62215269022
Boskalis International B.V.
Suite 23A, 3rd Floor
Legaspi Tower 300
2600 Roxas Blvd. Cor. Vito
Cruz, Manila, Philippines
Telephone +6325241627
Fax +6325217062
Boskalis International B.V.
Representative Office Beijing
Room 910
Shougang International
Building
Xizhimen North Street
Haidan District, Beijing 100088
People’s Republic of China
Telephone
+861082292361, 62, 63
Fax +861082292360
Annua l Repor t 2008 149
Glossary
Acquired orders
The contract value of acquired assignments.
Backhoe
A large hydraulic excavating machine positioned on the end of a pontoon. The pontoon is held firmly
in place using spuds. Backhoes can dredge in a range of soil types with extreme precision.
Barge unloading dredger
A ship for discharging and pumping dredged material from barges lying alongside.
Booster station
Pumping station for the transportation of sediment through pipelines over longer distances.
Btu
British thermal unit. This term is used to describe the energy content of fuels.
Bucket dredger
The standard, anchored dredger with a revolving chain and buckets that dig into the bed and are
discharged. This type of equipment is now mainly used for environmental dredging and other jobs
requiring extreme precision, such as dredging tunnel trenches.
CAGR
Compound Annual Growth Rate. Specific term for the geometric mean growth rate on an annualized basis.
CALM
Cantenary Anchor Leg Mooring. A floating structure that performs the dual function of keeping a tanker
moored on a single point and transferring fluids (generally oil, gas or by-products) while allowing the ship
to weathervane.
Competence management program
Program targeting the systematic development of the workforce in accordance with their talents and
competences.
Completed contracts
Contract value of completed work.
Cost leadership
Achieving lowest cost price.
Cutter/cutter dredger
See cutter suction dredger.
Glossary
Roya l Boska l i s Westmins te r nv 150
Glossary
Cutter suction dredger
A vessel that dredges while being held into place using spuds and anchors. This technique combines
powerful cutting with suction dredging. Cutter suction dredgers are mainly used where the bed is hard
and compact. The dredged material is loaded into hoppers but is generally pumped to land through a
pressure pipeline.
Dynamic positioning system
System for keeping a vessel in place in which the propellers and rudders are controlled by an automatic system.
EBITDA
Earnings before share in result of associated companies, finance income and expenses, taxation,
depreciation and amortization.
Environmental disc cutter
The environmental disc cutter is a cutter suction dredger with an enclosed cutter head, an adjustable
vizor and controllable suction flow. A process control system controls the various parameters so that
high-density mixture concentrations can be achieved without turbidity and with high levels of precision.
This type of cutter suction dredger is pre-eminently suited for environmental projects.
EU-IFRS
International Financial Reporting Standards: rules for financial reporting drafted and promulgated by the
IASB (International Accounting Standards Board). They are compulsory in the European Union from 2005
onwards for all listed companies.
Fallpipe vessel
Vessel that moves over the area to be covered, while dumping the stone on board through a fallpipe.
The end of the pipe is located just a few meters above the level of the surface to be covered. The fallpipe
is controlled using a precise positioning system. The fallpipe vessel Seahorse can also be equipped with
an A-frame on the aftship and a grab controlled by an ROV (Remotely Operated Vehicle). This makes it
possible to dredge down to depths of 1,000 meters.
FPSO/FSO
Floating Production Storage and Offloading system/Floating Storage and Offloading system.
Floating production, storage and transshipment systems that often operate a long way offshore.
The systems separate the incoming liquids into oil, gas and water and temporarily store the crude oil.
Tankers are used to transport the oil.
GDP
The gross domestic product (GDP) is the total value of all final goods and services produced in a particular
economy in a given year.
Annua l Repor t 2008 151
Grab crane
A stationary pontoon with a crane that uses a crane shovel or grab. Dredged material is deposited in
barges that operate independently. Grabs can manage both sludge and hard objects and this makes
them suitable for, among other things, clearing up waters that are difficult to access, for gravel winning
and maintenance dredging on uneven beds.
Greenfield project
Project to create new infrastructure.
Home market
Boskalis distinguishes itself from its competitors by the use of a home market strategy. The home market
organizations have local marketing profiles, as well as their own fleets and infrastructures. They can rely
on the support of the financial and technical resources of the global Boskalis organization.
Home markets provide a stable flow of assignments and opportunities to generate additional margins
through associated activities.
Hopper/hopper dredger
See trailing suction hopper dredger.
IMCA
Quality standard for offshore operations of the International Marine Contractors Association.
International projects market
Market that focuses primarily on larger capital expenditure projects for new buildings and/or extensions.
In addition, there are projects that regularly involve cooperation with third parties. This makes it possible
to provide clients with optimal services and to share risks.
ISM code
International Safety Management Code for the Safe Operation of Ships and for Pollution Prevention:
an international standard for compliance with safety regulations and the prevention of pollution on
sea-going vessels. The ISM-code requires ship managers to implement and maintain a safety
management system for both office and individual vessels.
This code is applicable to seagoing, self-propelled vessels larger than 500 Gross Tonnage and involved
in international trade.
ISO standards
Standards of the International Organization for Standardization; the global federation of national
normalization organizations that issues standard requirements for, among other things, quality
management systems (ISO-9001) and environmental management systems (ISO-14001).
ISPS code
International Ship & Port Facility Security Code of the International Maritime Organization regulating
precautions relating to security threats to shipping (e.g. terrorist attacks and piracy). This code
is applicable to seagoing, self-propelled vessels larger than 500 Gross Tonnage and involved in
international trade.
Glossary
Roya l Boska l i s Westmins te r nv 152
Jack up platform
Platforms that can be jacked up above the sea using legs which can be lowered like jacks. These platforms
are typically used in water depths up to 150 m. This type of rig is almost always used in connection with oil
and/or natural gas drilling.
LNG
Liquified Natural Gas.
LPG
Liquified Petroleum Gas.
LTI
Lost Time Injury. Expresses the number of workplace accidents serious enough to result in absence
from work.
LTIF
Lost Time Injury Frequency. Expresses the number of workplace accidents serious enough to result in
absence from work, per million hours worked.
Net group profit
Net result + net profit attributable to minority interests.
OHSAS-18001
Occupational Health & Safety Management System Specification. Standard for a safety management
system drawn up by, among others, the classification society Bureau Veritas.
Order book
The turnover accounted for by parts of orders as yet uncompleted.
Return on capital employed
Net result + interest paid on long-term loans as % of the average capital employed (shareholders’ equity +
long-term loans).
Return on equity
Net result as % of the average shareholders’ equity.
SHE-Q (Safety, Health, Environment & Quality)
Former QA/HSE (Quality Assurance, Health, Safety and Environment).
Solvency
Group equity as % of the balance sheet total (fixed assets + current assets).
Stone-placing vessel
A stone-placing vessel is a ship with a deck on which stone can be loaded. Using a dynamic positioning
system and slides, the stones are pushed over the edge of the ship into the right position in the water.
Glossary
Annua l Repor t 2008 153
Suction dredger
Stationary, hydraulic vessel that sucks up the sediment/water mixture through a suction pipe.
Suction dredgers are generally used for sand winning.
TEU
Twenty feet Equivalent Unit. Unit used to indicate the capacity of a container or transport flows.
Trailing suction hopper dredger
A self-propelled unit that loads its well or hopper using centrifugal pumps and pipes that trail over the
bed as the ship sails. Trailing suction hopper dredgers can operate independently of other equipment
and can transport material over long distances. The dredged material is dumped through flaps or bottom
doors, by rainbowing, or pumped onto land using a pipeline.
Turnover work done
Volumes produced in a given period. The work may not yet be completed.
Work in progress
Projects that have not been completed on the balance sheet date but that have been finished in part.
Glossary
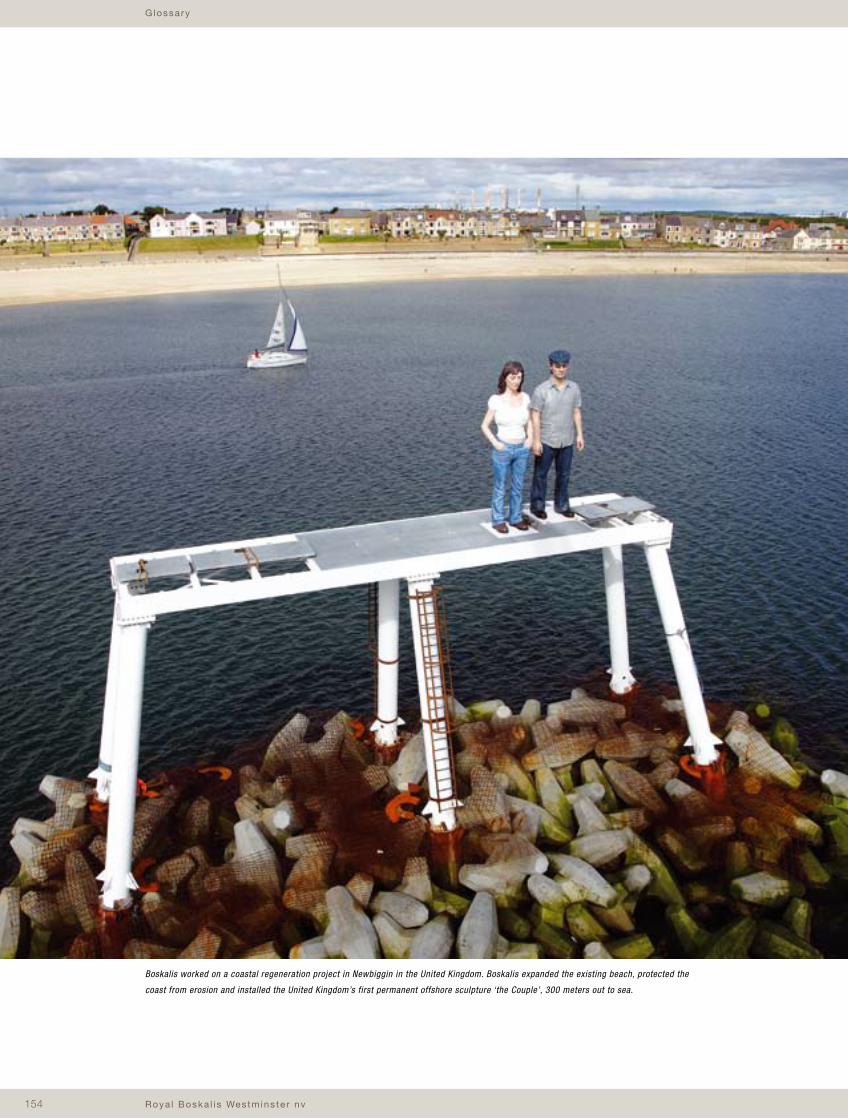
Roya l Boska l i s Westmins te r nv 154
Boskalis worked on a coastal regeneration project in Newbiggin in the United Kingdom. Boskalis expanded the existing beach, protected the
coast from erosion and installed the United Kingdom’s first permanent offshore sculpture ‘the Couple’, 300 meters out to sea.
Glossary
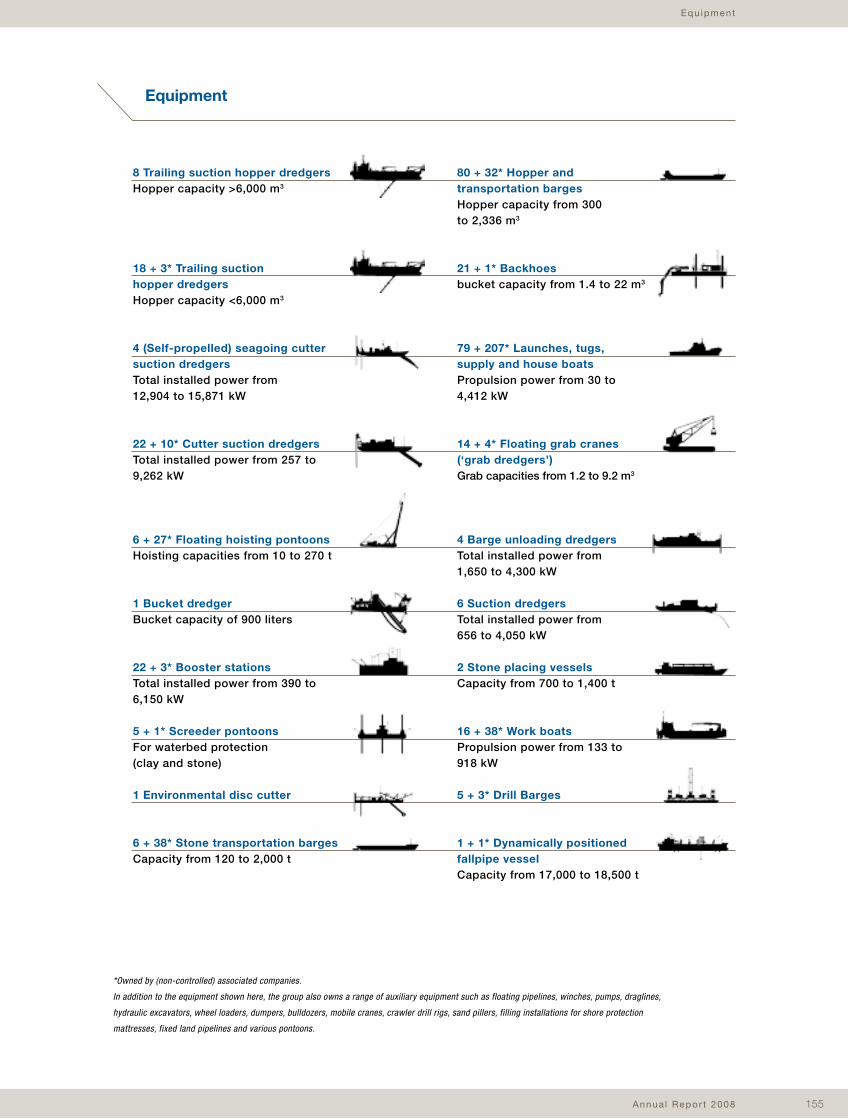
Annua l Repor t 2008 155
Equ ipment
8 Trailing suction hopper dredgers Hopper capacity >6,000 m3
18 + 3* Trailing suction hopper dredgers Hopper capacity <6,000 m3
4 (Self-propelled) seagoing cutter suction dredgers Total installed power from 12,904 to 15,871 kW
22 + 10* Cutter suction dredgers Total installed power from 257 to 9,262 kW
6 + 27* Floating hoisting pontoons Hoisting capacities from 10 to 270 t
1 Bucket dredger Bucket capacity of 900 liters
22 + 3* Booster stations Total installed power from 390 to 6,150 kW
5 + 1* Screeder pontoons For waterbed protection (clay and stone)
1 Environmental disc cutter
6 + 38* Stone transportation barges Capacity from 120 to 2,000 t
*Owned by (non-controlled) associated companies.
In addition to the equipment shown here, the group also owns a range of auxiliary equipment such as floating pipelines, winches, pumps, draglines,
hydraulic excavators, wheel loaders, dumpers, bulldozers, mobile cranes, crawler drill rigs, sand pillers, filling installations for shore protection
mattresses, fixed land pipelines and various pontoons.
80 + 32* Hopper and transportation barges Hopper capacity from 300 to 2,336 m3
21 + 1* Backhoes bucket capacity from 1.4 to 22 m3
79 + 207* Launches, tugs, supply and house boats Propulsion power from 30 to 4,412 kW
14 + 4* Floating grab cranes (‘grab dredgers’) Grab capacities from 1.2 to 9.2 m3
4 Barge unloading dredgers Total installed power from 1,650 to 4,300 kW
6 Suction dredgers Total installed power from 656 to 4,050 kW
2 Stone placing vessels Capacity from 700 to 1,400 t
16 + 38* Work boats Propulsion power from 133 to 918 kW
5 + 3* Drill Barges
1 + 1* Dynamically positioned fallpipe vessel Capacity from 17,000 to 18,500 t
Equipment
Compiled and coordinated by Royal Boskalis Westminster N.V.
Corporate Communications Department
Group Reporting Department
Design and realization
The Concept Store, Eindhoven
Photography
Van der Kloet, Picture Report, Chris Henderson, Mario Vivado, Oscar Seijkens
and others
Lithography and print
PlantijnCasparie Capelle a/d IJssel
Colophon
Royal Boskalis Westminster nv
Rosmolenweg 20 3356 LK Papendrecht The Netherlands
P.O. Box 43 3350 AA PapendrechtThe Netherlands Telephone +31 78 69 69 000 Telefax +31 78 69 69 555
E-mail [email protected] Internet www.boskalis.com
Related Documents