NXP Semiconductors Annual Report 2008

Welcome message from author
This document is posted to help you gain knowledge. Please leave a comment to let me know what you think about it! Share it to your friends and learn new things together.
Transcript
NXP Semiconductors Annual Report 2008
[-1]
Forward-looking statements This document includes forward-looking statements which include statements regarding our business strategy, financial condition, results of operations, and market data, as well as any other statements which are not historical facts. By their nature, forward-looking statements are subject to numerous factors, risks and uncertainties that could cause actual outcomes and results to be materially different from those projected. These factors, risks and uncertainties include the following: market demand and semiconductor industry conditions, our ability to successfully introduce new technologies and products, the demand for the goods into which our products are incorporated, our ability to generate sufficient cash or raise sufficient capital to meet both our debt service and research and development and capital investment requirements, our ability to accurately estimate demand and match our production capacity accordingly or obtain supplies from third-party producers, our access to production from third-party outsourcing partners, and any events that might affect their business or our relationship with them, our ability to secure adequate and timely supply of equipment and materials from suppliers, our ability to avoid operational problems and product defects and, if such issues were to arise, to rectify them quickly, our ability to form strategic partnerships and joint ventures and successfully cooperate with our alliance partners, our ability to win competitive bid selection processes to develop products for use in our customersÊ equipment and products, our ability to successfully establish a brand identity, our ability to successfully hire and retain key management and senior product architects; and, our ability to maintain good relationships with our suppliers. Except for any ongoing obligation to disclose material information as required by the United States federal securities laws, we do not have any intention or obligation to update forward-looking statements after we distribute this document. In addition, this document contains information concerning the semiconductor industry, our market segments and business units generally, which is forward-looking in nature and is based on a variety of assumptions regarding the ways in which the semiconductor industry, our market segments and product areas will develop. We have based these assumptions on information currently available to us. If any one or more of these assumptions turn out to be incorrect, actual market results may differ from those predicted. While we do not know what impact any such differences may have on our business, if there are such differences, our future results of operations and financial condition, and the market price of the notes, could be materially adversely affected.
Fair value information In presenting the NXP Semiconductors GroupÊs financial position, fair values are used for the measurement of various items in accordance with the applicable accounting standards. These fair values are based on market prices, where available, and are obtained from sources that we consider to be reliable. Users are cautioned that these values are subject to change over time and are only valid as of the balance sheet date. When a readily determinable market value does not exist, we estimate fair values using valuation models which we believe are appropriate for their purpose. These require management to make significant assumptions with respect to future developments which are inherently uncertain and may therefore deviate from actual developments. In certain cases independent valuations are obtained to support managementÊs determination of fair values. Reporting currency As from January 1, 2008, NXP has changed its reporting currency from Euro to US dollar in order to be more aligned with the Semiconductor market. Prior periods of the Financial Statements have been revised to reflect this change. US GAAP basis of presentation The financial information included in this document is based on US GAAP, unless otherwise indicated. Use of non-US GAAP information In presenting and discussing the NXP Semiconductors GroupÊs financial position, operating results and cash flows, management uses certain non-US GAAP financial measures. These non-US GAAP financial measures should not be viewed in isolation or as alternatives to the equivalent US GAAP measure(s) and should be used in conjunction with the most directly comparable US GAAP measure(s). A discussion of non-US GAAP measures included in this document and a reconciliation of such measures to the most directly comparable US GAAP measure(s) are contained in this document in the chapter „Reconciliation of non-US GAAP information‰.
[-2]
3 Financial highlights 5 Information on the NXP Semiconductors
Group
5 Structure 5 Business Overview 6 Strategy 7 Redesign Program 8 Business activities 8 Business units 16 Significant acquisitions and divestments 17 Alliances and investments 19 Management discussion and analysis
19 Basis of presentation
20 Effect of purchase accounting
22 Use of certain non-US GAAP financial measures
24 Management Summary
27 Performance of the Group 2008 compared to 2007
37 Performance by segment 2008 compared to 2007
44 Performance of the Group 2007 compared to 2006
50 Performance by segment 2007 compared to 2006
57 Employment
59 Liquidity and capital resources
65 Guarantees and contractual obligations
67 Risk management
89 Critical accounting policies
95 Reconciliation of non-US GAAP information
99 Subsequent events
100 NXPÊs leadership
105 Report of the Supervisory Board
112 Group financial statements 112 Combined and Consolidated statements of operations
113 Consolidated balance sheets
115 Combined and Consolidated statements of cash flows
117 Combined and Consolidated statements of changes in businessÊ and shareholderÊs equity
118 Notes to the combined and consolidated financial statements
204 AuditorsÊ Reports
206 Investor information
Contents
[-3]
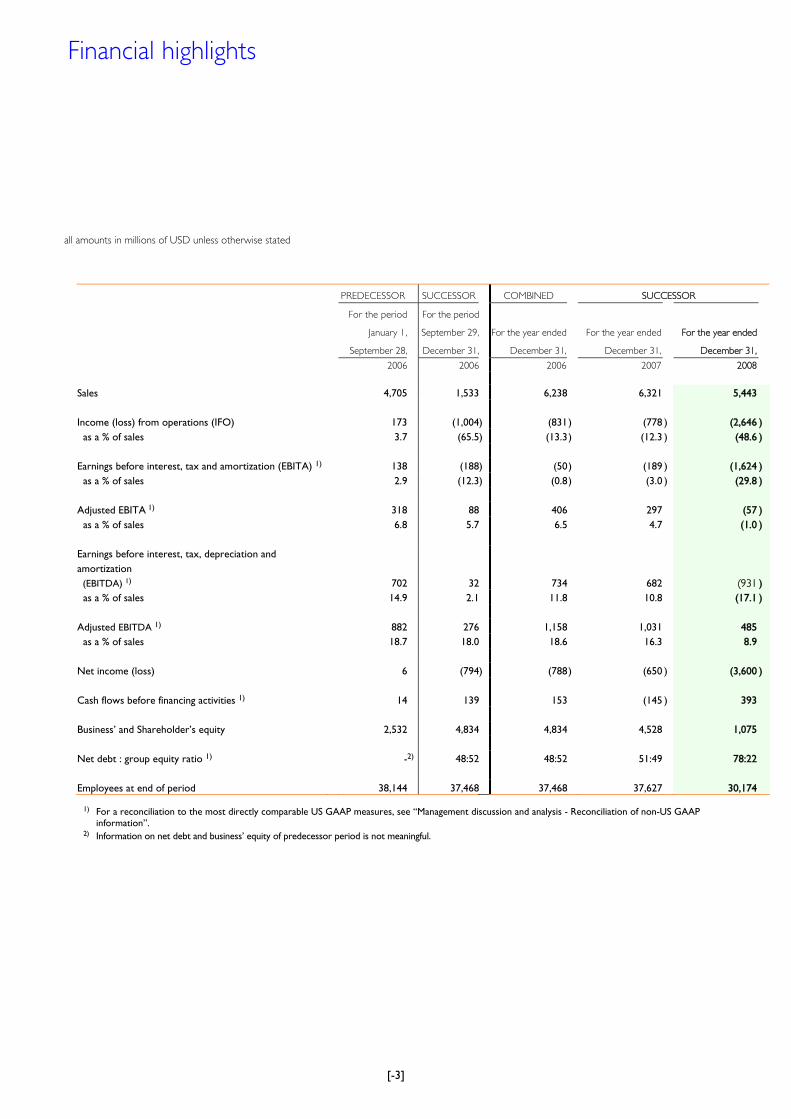
all amounts in millions of USD unless otherwise stated
PREDECESSOR SUCCESSOR COMBINED SUCCESSOR
For the period
January 1,
September 28,
For the period
September 29,
December 31,
For the year ended
December 31,
For the year ended
December 31,
For the year ended
December 31,
2006 2006 2006 2007 2008
Sales 4,705 1,533 6,238 6,321 5,443 Income (loss) from operations (IFO) 173 (1,004) (831 ) (778 ) (2,646 ) as a % of sales 3.7 (65.5) (13.3 ) (12.3 ) (48.6 ) Earnings before interest, tax and amortization (EBITA) 1) 138 (188) (50 ) (189 ) (1,624 ) as a % of sales 2.9 (12.3) (0.8 ) (3.0 ) (29.8 ) Adjusted EBITA 1) 318 88 406 297 (57 ) as a % of sales 6.8 5.7 6.5 4.7 (1.0 ) Earnings before interest, tax, depreciation and amortization (EBITDA) 1)
702 32 734 682 (931
)
as a % of sales 14.9 2.1 11.8 10.8 (17.1 ) Adjusted EBITDA 1) 882 276 1,158 1,031 485 as a % of sales 18.7 18.0 18.6 16.3 8.9 Net income (loss) 6 (794) (788 ) (650 ) (3,600 ) Cash flows before financing activities 1) 14 139 153 (145 ) 393 BusinessÊ and ShareholderÊs equity 2,532 4,834 4,834 4,528 1,075 Net debt : group equity ratio 1) -2) 48:52 48:52 51:49 78:22 Employees at end of period 38,144 37,468 37,468 37,627 30,174
1) For a reconciliation to the most directly comparable US GAAP measures, see „Management discussion and analysis - Reconciliation of non-US GAAP information‰. 2) Information on net debt and businessÊ equity of predecessor period is not meaningful.
Financial highlights
[-4]
[-5]
Structure NXP B.V. (the ÂCompanyÊ or ÂNXPÊ) is the parent company of the NXP Group (the ÂNXP GroupÊ or the ÂGroupÊ). The NXP Group in its current form was established on September 29, 2006, when Koninklijke Philips Electronics N.V. (ÂPhilipsÊ) sold 80.1% of its semiconductors businesses to a consortium of private equity investors in a multi-step transaction. In order to carry out this transaction, Philips transferred 100% of these businesses to NXP on September 28, 2006. All of our issued and outstanding shares were then acquired on September 29, 2006 by KASLION Acquisition B.V., which was formed as an acquisition vehicle by the private equity consortium and Philips. Effective January 1, 2008, the Company implemented a revised corporate governance structure. In order to simplify our organization and increase efficiency, the Board of Management and Management Team („MT‰) have been combined into one management layer. The MT now functions as the primary executive management layer within our organization and is where the leaders of our Business Units, core processes and support functions act together to lead the Company. Under our new structure, members of our Board of Management continue to hold – in addition to their MT duties - responsibility as Board members with fiduciary duties under Dutch company law. Under the chairmanship of the CEO, the Board of Management is entrusted with the general management of the Company, including setting its strategy and policies. The Board of Management, whose members are appointed and dismissed by the General Meeting of Shareholders upon proposal by the Supervisory Board, and which is embedded in NXPÊs MT, is accountable to our Supervisory Board and to our general meeting of shareholders. The MT, in turn is responsible for the deployment of the CompanyÊs strategy and policies and the achievement of its objectives and results, ensuring business matters and practices are shared across our business. Major decisions of the Board of Management require the approval of the Supervisory Board, including decisions relating to the CompanyÊs operational and financial objectives and the strategies it uses to achieve those objectives. This Annual Report contains the consolidated financial statements of NXP B.V. based on US GAAP. Business overview The NXP Group is one of the worldÊs largest semiconductor companies. With total sales of USD 5.4 billion in 2008, it ranks among the worldÊs top semiconductor providers and among the top three suppliers of application-specific semiconductors. With over 50 years of operating history, we are also one of the longest established companies in our industry. Our business targets the home electronics, personal entertainment, and automotive and identification application markets. Within these markets, we provide a diversified range of application-specific semiconductors, including system solutions, and semiconductor components. We also have a strong multi-market products business, which provides our customers with general purpose semiconductor components, including transistors and diodes, general purpose logic and power discretes as well as an array of application specific standard products.
Information on the NXP Group
[-6]
Strategy Our vision is to be a leading semiconductor supplier in a world where consumers connect to information, entertainment and services through electronic devices containing our system solutions. We aspire to be industry leaders in the markets for our, Home, Automotive & Identification and MultiMarket Semiconductors business units, and to grow revenue, profitability and cash flow. In order to meet these goals, we have adopted the strategies described below:
• Build on our market leadership positions. We believe that our market leadership positions,
extensive patent portfolio and strong research and development organization provide us with a strong foundation from which to gain additional market share in our targeted markets. We intend to build on this foundation by continuing to invest in our product portfolio, with a focus on innovations in more profitable and faster growing segments. We look to exploit our application knowledge and strengths in home, automotive, [mobile communications] and identification. We aim to extend our competitive advantage by offering differentiated semiconductor components and solutions that meet the requirements of our customers and that leverage our strong technology and design competencies in RF, analog-mixed signal, interface and interface protection, non-volatile memory, security, audio/video processing and acoustics.
• Deepen the relationships with our key customers. We intend to increase our share of the demand of our customers for semiconductors, with a particular focus on our top 40 OEM and EMS customers, and our top four distribution partners. To realize this objective, we deploy our sales and marketing resources to target and support these top customers effectively. We have created dedicated account teams that work across regions in order to better accommodate our customersÊ increasing geographical diversity. We seek to deepen our customer relationships by continuing to expand the application engineering support we provide close to our customers and by increasing the amount of product development work that we conduct jointly with our leading customers.
• Improve operational excellence. We continue on our comprehensive multi-year performance improvement program intended to drive revenue growth and increase profitability. As part of this program, we continue to reduce costs in manufacturing, selling, general and administrative activities, increase our effectiveness in research and development, and improve our organizational efficiency, manufacturing and supply chain performance, time-to-market of new products, product quality and customer service.
• Pursue our asset-light manufacturing strategy. We continue to implement our asset-light manufacturing strategy. Over the next years, we will be restructuring our legacy front-end manufacturing base in Europe and the U.S., and upgrade most remaining facilities to 8‰ wafer production. By concentrating our in-house production in fewer sites and outsourcing demand beyond that, we will be able to ensure that the remaining facilities can operate at high utilization levels. For all advanced CMOS manufacturing, we will leverage a number of foundry partners. We expect to maintain a major part of our assembly and test processes in house, as we believe that our internal facilities are highly competitive in terms of quality and cost. We believe that our asset-light strategy helps limit capital investment and thus reduces the fixed component of our cost structure and increases our return on invested capital. It also improves our operational flexibility throughout the industry cycle, while ensuring our continued access to world-class manufacturing capacity and leading-edge process technology.
[-7]
Redesign Program
On September 12, 2008, we announced a redesign program (the ÂÂRedesign ProgramÊÊ) intended
to right-size our cost base to match our revenue profile following the disposition of our wireless
business.
The Redesign Program was intended to be completed by the end of 2010 and targeted a
reduction in annual operating costs of USD 550 million, benchmarked against our 2008 forecast
cost base, adjusted for the disposition of our wireless business. This reduction was to be
delivered mainly through a significant restructuring of our manufacturing base, the refocusing and
resizing of central research and development (ÂÂR&DÊÊ), and reductions in support functions, and
was expected to affect approximately 4,500 employees globally.
As initially envisaged, planned savings in the manufacturing base of USD 300 million on a run-rate
basis were intended to be realized by the end of 2010, with R&D and support functions costs
expected to be reduced by approximately USD 250 million in 2009. The related cash expense of
the restructuring was estimated at USD 800 million, of which USD 600 million would be spent in
2009, and the remainder in 2010.
Since the announcement of the Redesign Program, we have made significant progress in detailing
the Redesign Program and deploying the required measures within NXP, including taking a
restructuring charge of USD 500 million in the third quarter of 2008 and completing the required
consultations with unions and employee representatives in each jurisdiction except France.
In light of deteriorating financial and market conditions, beginning in the third quarter of 2008
and then accelerating in the fourth quarter, we have now taken steps to accelerate and expand
the Redesign Program. Savings are now expected to be realized more quickly than previously
anticipated. We also expect that savings will be significantly higher than we originally estimated.
We also expect that the costs of the program will be lower than initially expected and estimate
the total costs of the program at USD 700 million rather than USD 800 million. As a result of this
lower estimate and its impact on our actions notwithstanding the expansion of the program, in
the fourth quarter of 2008, we reversed a portion of the associated restructuring charge,
reducing it from USD 500 million to USD 443 million in the fourth quarter.
Although we have made significant progress in implementing our Redesign Program, there can be
no assurance that we will be able to realize the intended gains in full or on our intended
timetable and at the expected cost. The expected U.S. dollar amount of savings may also be
affected by currency fluctuations, as a portion of our cost base is denominated in currencies
other than the U.S. dollar.
Information on the NXP Group
[-8]
Business activities
During 2008, our business was organized into four business units. As a result of transactions we
undertook during the year, we have reorganized into three business units.
Until July 2008, our Mobile & Personal business unit provided application-specific
semiconductors, selected components and complete system solutions applied in mobile and
portable devices.
On July 28, 2008, the key wireless operations of our Mobile & Personal business unit were sold
to STMicroelectronics for an amount in cash and a holding in the newly established joint venture
of 20%. In February 2009, STMicroelectronics exercised its option to buy NXPÊs 20% ownership
in the joint venture.
As a consequence of these transactions, the Mobile & Personal sector has been regrouped
effective as of January 1, 2009, with the remaining part of the business unit moved into the
MultiMarket Semiconductors business unit and Corporate and Other segment.
The products sold by our remaining three business units encompass two categories. The first
category consists of highly differentiated application-specific semiconductors and system solutions.
Our Home and Automotive & Identification business units primarily sell products in this category.
The profitability of these products depends to a significant degree on our ability to innovate and
develop new technologies and customer solutions.
The second of our product categories consists of standard products, which are devices that can be
incorporated in many different types of electronic equipment and which are typically sold to a wide
variety of customers, both directly and through distributors. Our MultiMarket Semiconductors
business unit carries a large range of standard products and application specific standard products,
the profitability of which is driven by manufacturing cost, supply chain efficiency and continuous
improvement of manufacturing processes.
Across our business units, we leverage both our knowledge of the consumer and our technical
expertise in the areas of audio, video, radio frequency communications, power management and
security technologies to create and deliver semiconductor solutions for the connected consumer.
Business Units
Home
Our Home business unit provides system solutions for Analog TV (ATV), Digital TV (DTV), Set-
top boxes (STB) and PC-TV application markets, as well as related semiconductor components
for a broad range of consumer products.
On September 1, 2008, NXP completed the combination of its can tuner modules operation with
those of Thomson, operating in a new venture named NuTune, which is included in the Home
business unit. NXP has a 55% ownership and Thomson the remaining 45%.
[-9]
The ATV semiconductor market served by NuTune is expected to decline further, and we
expect to maintain our leading market position.
In 2008, NXP acquired the Broadband Media Processing (BMP) business of Conexant Systems,
Inc. With these transactions, NXPÊs existing set-top box and digital TV operations were
combined with ConexantÊs BMP business. The combined operations have created a top three
player in digital video systems with the scale to establish a strong leadership position.
The DTV semiconductor market in particular is expected to grow significantly as a result of further
product integration and expanding digital TV market. Our total system solutions for the DTV
application market positions us well to benefit from this growth. Part of the growth in the digital
markets is driven by government mandates requiring the inclusion of a digital tuner in every new
television, e.g. the 2005 FCC tuner mandate in the United States.
Our industry is largely focused on the consumer products market. Typically we experience
seasonally higher sales in the second half of the year, in line with the higher demand for
consumer products experienced by our customers during that time.
Our key customers in Home include LG Electronics, Sony, Sharp, Philips and Dell.
Automotive & Identification
The Automotive & Identification business unit provides system solutions and semiconductor
components for the automotive and identification application markets.
Our automotive business focuses on the markets for Car Entertainment and Safety & Comfort.
These markets have grown consistently and at a higher rate over the recent years than the
overall semiconductor market, despite relatively slow growth in the sales of automobiles. This is
due to the increasing prevalence of semiconductor devices within vehicles, which in turn has
been the result of the further integration of consumer electronics in cars, an increasing focus on
consumer safety and comfort and the replacement of mechanical devices with semiconductors.
The emergence of more integrated, „smart‰ safety and security systems, which utilize combinations
of sensors, in-vehicle networks, micro controllers, power management components and RF
competence, favor a broad automotive portfolio such as the product lines we currently maintain.
We believe that significant barriers to enter in the automobile market, such as long product
lifecycles and zero-defect requirements of automotive manufacturers, give us a competitive
advantage. Governmental regulations like car safety obligations (such as tire pressure monitoring in
the US) and new governmental road tolling developments have positive effects on our business as
this requires increasingly advanced products.
In the above applications and segments we are working closely with the leading automotive first
tier suppliers and selected OEMs to further strengthen our leading positions in applications for
car radio, car access & immobilizers and in-vehicle networking.
Information on the NXP Group
[-10]
Our identification business plays an important role in creating the markets for Radio Frequency
Identification (RFID), e Government and Near-Field Communication (NFC) technologies. The
primary factors driving growth are new governmental requirements for secure identity
documents, the increasing prevalence of cashless transactions and more sophisticated supply
chain management models.
In 2008 we introduced our Extended Access Control products for the eGovernment market,
leading the market to higher standards in secure identity documents.
Our MIFARE automatic fare collection products are used in a growing number of cities around
the world. In September 2007, we formed the Moversa joint venture together with Sony to
combine the Felica and Mifare standards in one chip, allowing electronic access to payment and
other functionality across the world.
We focus on sophisticated and high-margin areas of the identification market, allowing
differentiation in contactless performance, security and packaging. In smart cards, we have elected
not to participate in the largely commoditized segments of the SIM and banking card market, but
have emphasized instead the high-security, higher value-added segments.
Our key customers in Automotive & Identification include Bosch, Bundesdruckerei, Continental
(including former Siemens VDO), Gemalto, G&D, Oberthur Card Systems, Smartrac, Sony and
Visteon.
MultiMarket Semiconductors
Our MultiMarket Semiconductors business unit supplies a broad range of standard products and
a wide range of application-specific standard products. The standard product offering includes
small signal diodes, medium power rectifiers and protection devices, BISS and RET transistors,
complex discretes and ESD protection devices, Bipolar power transistors, diodes, triacs and
MOSFETs and General Purpose logic devices.
Differentiation in the market for standard products is achieved through portfolio, product
performance, availability, customer service and costs.
MultiMarket Semiconductors also has a wide range of application-specific standard products
including 8 and 32 bit microcontrollers, ARM and 8051 based, radio frequency devices for power,
satellite tuners and Cable television, analog-to-digital and digital-to-analog data converters for mid
and high end applications, power management devices for lighting and power control and
interface products, clocks, watches and graphic devices.
The business unit has its own manufacturing and assembly & test sites. Integrated circuit
components marketed and sold by MultiMarket Semiconductors are produced within the
Manufacturing Operations business.
MultiMarket Semiconductors includes Jilin NXP Semiconductor Ltd. (JNS), a joint venture based in
China which we operate jointly with Jilin Sino-Microelectronics Co. Ltd. We currently hold a 60%
ownership interest in JNS. JNS was founded in 2003 and manufactures bipolar discrete power
products.
[-11]
Our revenue and operating results are affected by seasonality, with sales historically strongest in
the last quarter of the year.
A large part of sales of standard products flow through distribution channels, accounting for about
58% of the total MultiMarket sales. The main distributors are Arrow, Avnet, Future, SAC and WPI.
Original Equipment Manufacturers account for 35% of sales, the main customers are Bosch,
Continental, Nokia, Philips and Siemens.
Mobile & Personal
In August 2008, NXP and STMicroelectronics established a joint venture in order to combine
their key wireless operations. The majority of the activities of our Mobile & Personal business
unit were transferred to this joint venture. On December 31, 2008 NXP held a 20% share in this
joint venture.
Effective February 2, 2009, STM exercised its option to buy our remaining stake for an agreed
purchase price of USD 92 million.
The Mobile & Personal business unit provided application-specific semiconductors, selected
components and complete system solutions applied in mobile and portable devices, such as cellular
handsets and portable media players.
The remaining activities have been regrouped into the MultiMarket Semiconductors business unit
and Corporate and Other segment as of January 1, 2009. NXP is a leader in Sound Solutions for
mobile phones such as speakers & receivers and headsets, and is now also entering the MEMS
microphone field. With the trend towards notebooks and netbooks in the computing segment, our
very compact solutions providing excellent sound quality are attracting more and more interest in
that industry. NXPÊs RF Power technology provides leading products for mobile base stations,
microwave and broadcasting, and the broad product offering of our Audio Amplifiers business line
addresses mobile and consumer applications.
In February 2009 DSPG repurchased the 16% outstanding common stock of DSP Group Inc. at that
time held by NXP, which were obtained in 2007 following the divestment of our Cordless & VoIP
Terminal operations.
Manufacturing Operations
The Manufacturing Operations segment serves as the central source for our integrated circuit
manufacturing, test and packaging for the business units. The integration of our IC manufacturing
operations across our business units permits NXP to reduce the volatility in production demand
that would result from independent operations. Manufacturing Operations is divided into two
processes: front-end (wafer) manufacturing and back-end (assembly and test).
Information on the NXP Group
[-12]
Manufacturing and Materials The manufacturing of integrated circuits within NXP is highly comparable to the approaches in all
other leading semiconductor companies. The production equipment, the starting material (silicon
substrates), the chemicals, the photo masks and other components, are all sourced from a limited
set of commercial suppliers, and the manufacturing process we use is very similar to that used by
our competition. The details of the process flow in combination with the product design that is
embedded in the photo-masks differentiates our products from those of our competitors.
Front-end manufacturing is a highly complex process, with as many as 300 physical and chemical
process steps, with a typical production time of up to 60 days. Therefore the majority of wafer
production is built on forecast, in contrast to back-end manufacturing which is typically customer
order driven.
Back-end manufacturing comprises wafer test (electrical test of all ICs prior to assembly),
assembly (packaging the silicon dies into a package that can be soldered onto a printed circuit
board) and final testing of the individual packaged products. The throughput time of back-end
manufacturing is typically two weeks. Back-end manufacturing materials and equipment are
sourced from a limited set of suppliers that also serve our peers in the industry.
As a result of the rapid migration of front-end manufacturing to advanced technology nodes (with
minimum feature sizes as small as 45 nanometers), the capital required to create an advanced
waferfab is now in the billions of dollars. Therefore NXP has decided to rely exclusively on third
parties („foundries‰) for its advanced technology needs (i.e. for 120 nm and below). Most of the
products in this category are implemented in baseline „CMOS‰ technologies.
NXP is in the process of shrinking its wafer manufacturing base in the Western world, as a
growing part of our portfolio is migrating to externally sourced advanced CMOS technologies,
and some of the older waferfabs can no longer be cost competitive.
[-13]
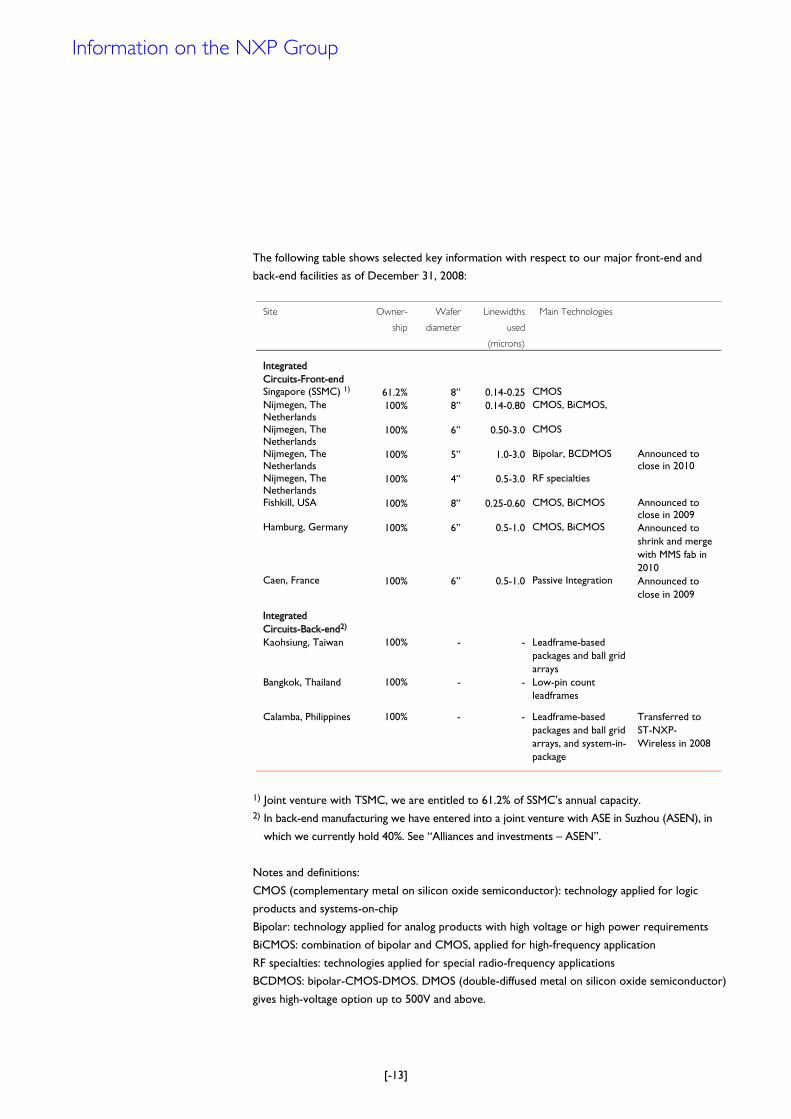
The following table shows selected key information with respect to our major front-end and
back-end facilities as of December 31, 2008:
Site Owner-
ship
Wafer
diameter
Linewidths
used
(microns)
Main Technologies
Integrated Circuits-Front-end
Singapore (SSMC) 1) 61.2% 8‰ 0.14-0.25 CMOS Nijmegen, The Netherlands
100% 8‰ 0.14-0.80 CMOS, BiCMOS,
Nijmegen, The Netherlands
100% 6‰ 0.50-3.0 CMOS
Nijmegen, The Netherlands
100% 5‰ 1.0-3.0 Bipolar, BCDMOS Announced to close in 2010
Nijmegen, The Netherlands
100% 4‰ 0.5-3.0 RF specialties
Fishkill, USA 100% 8‰ 0.25-0.60 CMOS, BiCMOS Announced to close in 2009
Hamburg, Germany 100% 6‰ 0.5-1.0 CMOS, BiCMOS Announced to shrink and merge with MMS fab in 2010
Caen, France 100% 6‰ 0.5-1.0 Passive Integration Announced to close in 2009
Integrated Circuits-Back-end2)
Kaohsiung, Taiwan 100% - - Leadframe-based packages and ball grid arrays
Bangkok, Thailand 100% - - Low-pin count leadframes
Calamba, Philippines 100% - - Leadframe-based
packages and ball grid arrays, and system-in-package
Transferred to ST-NXP-Wireless in 2008
1) Joint venture with TSMC, we are entitled to 61.2% of SSMC's annual capacity. 2) In back-end manufacturing we have entered into a joint venture with ASE in Suzhou (ASEN), in
which we currently hold 40%. See „Alliances and investments – ASEN‰.
Notes and definitions:
CMOS (complementary metal on silicon oxide semiconductor): technology applied for logic
products and systems-on-chip
Bipolar: technology applied for analog products with high voltage or high power requirements
BiCMOS: combination of bipolar and CMOS, applied for high-frequency application
RF specialties: technologies applied for special radio-frequency applications
BCDMOS: bipolar-CMOS-DMOS. DMOS (double-diffused metal on silicon oxide semiconductor)
gives high-voltage option up to 500V and above.
Information on the NXP Group
[-14]
Other Business Activities
Certain business activities are reported outside of our primary business units, and are accounted
for in the „Corporate and Other‰ reporting segment. These include:
IP Licensing We license and cross-license our intellectual property to semiconductor companies and other
technology firms. Apart from the revenues these licensing activities generate, we also view active
intellectual property licensing as an important means to promote our businesses and technologies.
Our cross-licensing activities are typically conducted with other large semiconductor companies,
who have resources and research and development activities similar to ours.
Software Solutions Our Software Solutions business develops audio and video multimedia solutions that enable mobile
device manufacturers to produce differentiated hand-held products that enhance the end-user
experience. Its software has been incorporated into over 500 million mobile devices produced by
the worldÊs leading mobile device manufacturers. It has its own sales force, product development
and marketing departments within NXP.
Software Solutions is particularly focused on partnerships with the top OEM handset manufacturers,
as well as on specific integrated circuit-based products. The major part of the revenue is generated
via royalties or license deals, the remaining part stems from integration and maintenance services.
There is some seasonality in the mobile markets with one-third of the revenue generated in the
fourth quarter.
Global Sales and Marketing
We market and sell our products worldwide to a variety of OEMs, original design manufacturers,
contract manufacturers and distributors. We focus on generating demand for our products by
adding value to our customers and leveraging our long-standing customer relationships and
providing high quality customer support.
Our sales and marketing teams in each sales region (Europe, the Americas, Greater China and Asia
Pacific) are responsible for managing the global key accounts, headquartered in that particular
region, as well as for managing regional sales to other accounts.
Marketing, channel management, alliance and partnership management, and support operations are
globally managed from our headquarters in Eindhoven, the Netherlands. Our sales and marketing
strategy focuses on adding value to our customers, building lasting relationships with them and
becoming their preferred supplier.
Research & Development
Our research and development activities are critical to our success. We conduct product-specific
development and differentiating system and process technology research. Our product-specific
research and development is aligned with our remaining three business units, and constitutes the
majority of our research and development expenditures. System and process technology research is
conducted centrally to efficiently leverage IP and know-how across our businesses. Focus areas
[-15]
include the development of improved manufacturing options and enabling technology to be utilized
and shared by our business units. Process-related research is conducted with TSMC in our joint
Research Center in Leuven, Belgium.
Environmental Regulation
In each jurisdiction in which we operate, we are subject to many environmental, health and safety
laws and regulations, which govern, among other things, emissions of pollutants into the air,
wastewater discharges, the use and handling of hazardous substances, waste disposal, the
investigation and remediation of soil and ground water contamination and the health and safety of
our employees. We are also required to obtain environmental permits from governmental
authorities for certain of our operations.
As with other companies engaged in similar activities or that own or operate real property, we
face inherent risks of environmental liability at our current and historical manufacturing facilities.
Certain environmental laws impose liability on current or previous owners or operators of real
property for the cost of removal or remediation of hazardous substances. Certain of these laws
also assess liability on persons who arrange for hazardous substances to be sent to disposal or
treatment facilities when such facilities are found to be contaminated. Soil and groundwater
contamination has been identified at some of our current and former properties resulting from
historical, ongoing or third-party activities. [As a result, we are currently in the process of
investigating and remediating contamination at some of our current and former facilities.
Information on the NXP Group
[-16]
Significant acquisitions and divestments
2008
On September 1, 2008, NXP completed the combination of its can tuner modules operation with
those of Thomson, operating in a new venture named NuTune, which is included in our Home
business unit. NXP has a 55% ownership and Thomson the remaining 45%.
On August 11, 2008, NXP completed its acquisition of the Broadband Media Processing (BMP)
business of Conexant Systems, Inc. which provides industry-leading solutions for satellite, cable
and IPTV applications. These activities are included in our Home business unit.
On August 2, 2008, NXP and STMicroelectronics (STM) combined their wireless operations to
form a new joint-venture company named ST-NXP Wireless, in which NXP contributed
businesses and assets forming a substantial portion of its Mobile & Personal business unit (the
Sound Solutions, Mobile Infrastructure and amplifiers business were not contributed and remain
within NXP). NXP received a 20% ownership interest in the joint venture and cash consideration
of USD 1.55 billion in connection with the divestment. Effective February 2, 2009, STM exercised
its option to buy our remaining stake in the joint venture for an agreed purchase price of USD 92
million.
In January 2008, NXP completed the acquisition of GloNav Inc. , a U.S. based fabless
Semiconductor company, developing single-chip solutions for global positioning systems (GPS)
and other satellite navigation systems. The activities of this new acquisition were included in the
Mobile & Personal business and subsequently transferred to the newly established ST-NXP
Wireless joint-venture.
2007
In March 2007, we completed the acquisition of the Cellular Communications business of Silicon
Laboratories Inc., a leader in Radio Frequency technology for mobile phones. As from the
acquisition date it is consolidated within Mobile & Personal.
In September 2007, we completed the divestment of the Cordless & VoIP Terminal operations
from our Mobile & Personal business unit to DSPG. We received a 13% interest in DSPG as
consideration for the divestment. In March 2009, DSPG repurchased our shares in DSPG for
cash consideration of approximately USD 20 million.
2006
In November 2006, the CompanyÊs option to purchase additional outstanding stock of the
Singapore-based Systems on Silicon Manufacturing Company (SSMC) was fully exercised. An
incremental 10.7% SSMC shares were acquired from the Economic Development Board (EDB),
increasing the CompanyÊs equity interest to 61.2%.
In 2006 there were no material divestments.
[-17]
Alliances and investments
Apart from Jilin NXP Semiconductor Ltd. (JNS) and Systems on Silicon Manufacturing Co. Pte. Ltd.
(SSMC), which are consolidated and described in previous sections, we participate in the following
alliances:
Advanced Semiconductor Manufacturing Company We established the Advanced Semiconductor Manufacturing Company (ASMC) in Shanghai in 1995
together with a number of Chinese joint venture partners. ASMC currently operates three wafer
fabs, producing five-, six- and eight-inch wafers of primarily analog integrated circuits with line
widths in the 0.35 to 3 micron range using CMOS and bipolar process technologies. We currently
own approximately 27% of the outstanding shares of ASMC, which are listed on the Hong Kong
Stock Exchange.
ASEN Together with Advanced Semiconductor Engineering Inc. (ASE) we established an assembly and test joint venture (ASEN) in September 2007. ASEN is jointly owned by ASE (60%) and NXP (40%). ASEN is positioned to serve the global semiconductor assembly and test market and has initially focused on mobile communications; it is expected to expand into other segments in the future. DSPG Following the divestment of our Cordless & VoIP Terminal operations in September 2007, we obtained approximately 13% DSPGÊs outstanding common stock and had an NXP nominee appointed to DSPGÊs board of directors. As of December 31, 2008, we held an approximate 16% interest in DSPG. DSPG is a fabless semiconductor company, offering advanced chip-set solutions for a variety of applications. Shares of DSPG are listed on the NASDAQ in the United States. In March 2009, DSPG repurchased all of the DSPG shares that we held. Moversa Moversa, established as a joint venture with Sony Corporation in November 2007, drives global adoption of contactless smart card applications in mobile phones using Near Field Communication (NFC). It incorporates both MIFARE and FeliCa™ operating systems and applications, two of the most widely installed contactless smart card technologies in the world. Both parties hold a 50% interest in the joint venture, which is headquartered in Vienna, Austria. T3G In January 2003, Datang Mobile, Philips Semiconductors and Samsung Electronics formed a joint venture, T3G Technology Co. Ltd., to design and license system solutions for mobile devices. In January 2005, Motorola joined as a partner. NXP, as PhilipsÊ successor, currently has a 42.7% interest in T3G. The cooperation combines NXP's cutting edge semiconductor design and process
Information on the NXP Group
[-18]
capability, Datang's TD-SCDMA expertise and Samsung's and Motorola's leadership in mobile handset creation. TD-SCDMA is a China based 3G standard, strongly supported by the Chinese government. We expect this support will ensure the successful adoption of TD-SCDMA as one of the 3G standards in China, the world's largest market for mobile phones. As part of the transfer of assets and liabilities of the wireless operations into the joint-venture ST-NXP Wireless, NXPÊs ownership in T3G was also transferred to the new joint-venture. Software partnerships In addition to manufacturing and process technology research, we leverage strategic partnerships to develop software for our products. As our market focus has turned increasingly towards system solutions, software is playing a critical role in determining our competitiveness. By partnering with independent software developers, we gain the benefit of industry-leading expertise and quality levels with respect to the software which operates on our products. In return, our partners, who currently include approximately 100 software companies, gain a platform with which to align their software.
[-19]
Basis of presentation The discussion and analysis of the financial results and condition of NXP Semiconductors Group (NXP) is based on the audited US GAAP financial statements of the Company for the period from January 1, 2006 through September 28, 2006 (Predecessor), the period from September 29, 2006 through December 31, 2006 and the years ended December 31, 2007 and 2008 (Successor). This discussion should be read in conjunction with those audited financial statements, which have been included in this Annual Report. On September 29, 2006, Koninklijke Philips Electronics N.V. („Philips‰) sold 80.1% of its Semiconductors business to a consortium of private equity investors (the „Consortium‰) in a multi-step transaction. In order to carry out this transaction, Philips transferred 100% of these businesses to NXP on September 28, 2006 (the „Separation‰). All of our issued and outstanding shares were then acquired on September 29, 2006 by KASLION Acquisition B.V. („KASLION‰), which was established as an acquisition vehicle by the Consortium and Philips. We refer to our acquisition by KASLION as the „Acquisition‰. As a result of the Separation and Acquisition, the accompanying combined and consolidated balance sheets and statements of operations, cash flows and businessÊ and shareholderÊs equity are presented on two different bases: Predecessor and Successor, which relate to periods preceding the Acquisition and periods from and after the Acquisition, respectively. The basis of accounting for the Predecessor is different than that for the Successor, since the consolidated financial statements of the Successor are affected by the purchase accounting applied to the Acquisition, which requires that all assets and liabilities be recorded at fair value. Furthermore, the combined financial statements for the Predecessor have been derived from the consolidated financial statements and accounting records of Philips, principally the historical results of operations and basis of assets and liabilities of PhilipsÊ Semiconductors businesses. The results for those periods include an allocation of the costs of certain corporate functions or expenses, historically provided or incurred by Philips, which allocations are made on a specifically identifiable basis, or other basis considered reasonable. The consolidated financial statements of the Successor represent actual costs incurred after the Acquisition as a stand-alone company. The costs allocated to the Predecessor are not always comparable to the actual costs incurred by the Successor. Notwithstanding the difference in the basis of accounting between the Successor and Predecessor described above, we have prepared our discussion of the results of operations for the year ended December 31, 2006 based on the arithmetical combination of these results for each of the periods January 1, 2006 through September 28, 2006 (Predecessor) and September 29, 2006 through December 31, 2006 (Successor), since we believe this provides the most meaningful comparison with the subsequent yearsÊ results. Because our accounting basis changed upon the Acquisition, however, the presentation of the combined results of our Predecessor and Successor periods during 2006 does not comply with US GAAP and has not been audited. Where relevant, we have described the impact on our results of the purchase accounting used in connection with the Acquisition and subsequent acquisitions and divestments (see „Effect of Purchase Accounting‰, below) and have also provided 2006, 2007 and 2008 adjusted financial results whereby the impact of these accounting effects („Purchase Price Adjustments‰, or „PPA‰) has been eliminated. We have also described the impact of cost allocations to the Predecessor and the actual stand-alone costs of the Successor, where relevant to the analysis.
Management discussion and analysis The following discussion is based on the US GAAP combined and consolidated financial statements and should be read in conjunction with these statements and the other financial information contained herein.
[-20]
Effect of purchase accounting KASLION Our Acquisition by KASLION has been accounted for using the purchase method. Accordingly, the USD 10,622 million purchase price has been „pushed down‰ to NXP and allocated to the fair value of assets acquired and liabilities assumed. The net assets acquired and liabilities assumed of NXP, as of the Acquisition date, amounted to USD 3,302 million, resulting in an excess of the purchase price over the net assets acquired of USD 7,320 million. The excess of the purchase price over the net assets acquired was allocated as follows: Identified technology-related intangible assets: • Existing technology with an aggregate estimated fair value of USD 2,057 million and useful
lives varying between 3 and 12 years; • In-process research & development with an aggregate estimated fair value of USD 660
million, which was written off in full in the period immediately following the Acquisition and charged to R&D expenses;
• Core technology with an aggregate estimated fair value of USD 1,013 million and with useful lives varying between 8 and 12 years.
Identified customer-related intangible assets: • Customer relationships with an aggregate estimated fair value of USD 758 million and with
useful lives varying between 14 and 16 years; • Order backlog with an aggregate estimated fair value of USD 60 million, which management
believes to be firm and was realized over one year, ending September 2007. Trademarks: Trademarks with an aggregate estimated fair value of USD 109 million, with useful lives of 5 years. Property, plant and equipment and inventories: • Property, plant and equipment of USD 549 million comprised of: Land (USD 70 million),
Buildings (USD 261 million) and Machinery and Equipment (USD 218 million); • Inventories of USD 166 million.
Other, partly offsetting the above allocations, comprised of: • Deferred tax liabilities in respect of purchase price adjustments (USD 1,023 million); • Pension liabilities (USD 133 million); • Investments equity-accounted investees (USD 13 million). The USD 3,117 million excess of the purchase price over the estimated fair value of the net assets acquired was allocated to goodwill. In accordance with SFAS 142 („Goodwill and other Intangible Assets‰), goodwill is not amortized but will be tested for impairment at least annually. In 2008 this has lead to an impairment of USD 714 million in the segment Home and Corporate and Other.
[-21]
The cumulative effect of this Purchase Accounting on our financial results is referred to as the ÂPPA effectÊ. Other acquisitions In addition, Purchase Accounting is also applied to other acquisitions such as Silicon Laboratories Inc. in 2007 and the acquisitions of GloNav Inc., the BMP business of Conexant Systems Inc. and our NuTune joint venture with Thomson in 2008. ÂPPA effectÊ includes the net effect of the purchase accounting applied to these transactions. The above mentioned adjustments in fair values had an impact on 2008 income from operations of USD 713 million (2007: USD 791 million, September 29, 2006 through December 31, 2006: USD 1,018 million) due to increased amortization and depreciation charges. This was partly offset in 2008 net income by the tax effect on the purchase price adjustments amounting to USD 349 million (2007: USD 247 million, September 29, 2006 through December 31, 2006: USD 293 million).
Management discussion and analysis
[-22]
Use of certain non-US GAAP financial measures
The following non-US GAAP financial measures are presented in the discussion because they are
used by management in evaluating the performance of the Company and its reporting segments or
because management believes the measure provides investors with useful information about the
CompanyÊs financial results.
Comparable Sales Growth This reflects the relative changes in sales between periods adjusted for the effects of foreign
currency exchange rate changes, material acquisitions and divestments and reclassified product lines
(consolidation changes). Management believes that an understanding of sales performance is
enhanced after these effects are excluded. Where presented, Ânominal growthÊ represents the
relative changes in sales between periods, including these effects. Sales are translated from foreign
currencies into the CompanyÊs reporting currency, the US dollar, at the exchange rate on
transaction dates during the respective years.
Earnings Before Interest, Tax and Amortization (EBITA) EBITA represents net income excluding income taxes, financial income and expenses and
amortization of intangible assets (including impairments). EBITA is used by management to
evaluate the group performance of the Company, since it believes that using EBITA facilitates the
comparison between periods of the underlying performance of our business.
Earnings Before Interest, Tax, Depreciation and Amortization (EBITDA) EBITDA represents net income excluding income taxes, financial income and expenses and
amortization and depreciation (including impairments). EBITDA is used by management to evaluate
the group performance of the Company, since it believes that using EBITDA facilitates the
comparison between periods of the underlying performance of our business.
Adjusted EBITA Adjusted EBITA refers to EBITA adjusted for incidental items such as restructuring, litigation, IT
system reorganization costs, exit of product lines, other non operations-related items and the
remaining effects of purchase price accounting (PPA). Management uses Adjusted EBITA to
evaluate the group performance of the Company and to make comparisons over different fiscal
periods, since it eliminates the effect of certain items management deems less relevant to the
continuing operations of the Company.
Adjusted EBITDA Adjusted EBITDA refers to EBITDA adjusted for incidental items such as restructuring, litigation, IT
system reorganization costs, exit of product lines, other non operations-related items and the
remaining effects of purchase price accounting (PPA). Management uses Adjusted EBITDA to
evaluate the group performance of the Company and to make comparisons over different fiscal
periods, since it eliminates the effect of certain items management deems less relevant to the
continuing operations of the Company.
[-23]
Adjusted IFO Adjusted IFO refers to IFO adjusted for incidental items such as restructuring, litigation, IT
system reorganization costs, exit of product lines, other non operations-related items,
impairments and the effects of purchase price accounting (PPA). Adjusted IFO is used by
management to evaluate the performance of the CompanyÊs operating businesses.
Cash flows before financing activities Cash flows before financing activities, which are defined as the sum of net cash from operating
activities and net cash from investing activities, are presented separately to facilitate investorsÊ
understanding of the CompanyÊs funding requirements.
Net debt : group equity ratio The total net debt position as a percentage of the sum of total group equity (shareholderÊs equity
and minority interests) and net debt is presented as a measure, since management considers this
a measure of the CompanyÊs solvency.
For a reconciliation of non-US GAAP financial measures to the nearest US GAAP financial measure,
refer to „Reconciliation of non-US GAAP information‰.
Management discussion and analysis
[-24]
Management Summary Economic and financial crisis We have been impacted significantly in the fourth quarter of 2008 by the unprecedented economic downturn in our industry. The financial crisis and semiconductor market conditions caused a rapid deterioration of demand towards the end of the third quarter, especially in the automotive and consumer sectors. In the fourth quarter this deterioration broadened over all sectors leading to a sequential nominal sales decline of 25.3%. The lowered sales and decreased visibility severely impacted the utilization of our factories, which declined to 56% in the fourth quarter compared to 68% in the third quarter of 2008. Also, our book to bill ratio declined to 0.71 compared to 1.00 in the third quarter of 2008, as a consequence of which our visibility on future potential sales levels declined. Margins were strongly affected by the lowered sales and related lower utilization of our factories, resulting in an EBIT loss of USD 258 million in the last quarter of 2008.
2008 results For the year ended December 31, 2008, our total sales compared to 2007 declined 13.9% to USD
5,443 million. As a result of this and a substantial impairment of goodwill and restructuring charges,
we recorded a net loss in 2008 of USD 3,600 million. Our operating cash flows also reversed from an
inflow of USD 533 million in 2007 to an outflow of USD 622 million in 2008. The challenging and
unusual conditions referred to above also make visibility very limited going forward. Please see
ÂÂOutlookÊÊ for further information.
Redesign Company On September 12, 2008, we announced a redesign program (the ÂRedesign ProgramÊ) intended to right-
size our cost base to match our revenue profile following the disposition of our wireless business.
The Redesign Program was intended to be completed by the end of 2010 and targeted a reduction in
annual operating costs of USD 550 million, benchmarked against our 2008 forecast cost base,
adjusted for the disposition of our wireless business. This reduction was to be delivered mainly
through a significant restructuring of our manufacturing base, the refocusing and resizing of central
research and development (ÂÂR&DÊÊ), and reductions in support functions, and was expected to affect
approximately 4,500 employees globally.
As initially envisaged, planned savings in the manufacturing base of USD 300 million on a run-rate
basis were intended to be realized by the end of 2010, with R&D and support functions costs
expected to be reduced by approximately USD 250 million in 2009. The related cash expense of the
restructuring was estimated at USD 800 million, of which USD 600 million would be spent in 2009,
and the remainder in 2010.
Since the announcement of the Redesign Program, we have made significant progress in detailing the
Redesign Program and deploying the required measures within NXP, including taking a restructuring
charge of USD 500 million in the third quarter of 2008 and completing the required consultations
with unions and employee representatives in each jurisdiction except France.
In light of deteriorating financial and market conditions, beginning in the third quarter and then
accelerating in the fourth quarter, we have now taken steps to accelerate and expand the Redesign
[-25]
Program. Savings are now expected to be realized more quickly than previously anticipated. We also
expect that savings will be significantly higher than we originally estimated. We also expect that the
costs of the program will be lower than initially expected and estimate the total costs of the program
at USD 700 million rather than USD 800 million. As a result of this lower estimate and its impact on
our actions notwithstanding the expansion of the program, in the fourth quarter, we reversed a
portion of the associated restructuring charge, reducing it from USD 500 million to USD 443 million
in the fourth quarter.
Although we have made significant progress in implementing our Redesign Program, there can be no assurance that we will be able to realize the intended gains in full or on our intended timetable and at the expected cost. The expected U.S. dollar amount of savings may also be affected by currency fluctuations, as a portion of our cost base is denominated in currencies other than the U.S. dollar. Impairments and write down of tax assets Conditions began to weaken from the third quarter of 2008, particularly in our Home business, which
saw declines most strongly in the cathode ray tube (ÂÂCRTÊÊ) TV market and in the retail set top box
(ÂÂSTBÊÊ) business. Taking into account these developments, the current market environment, the
divestiture of the wireless business and the implementation of the Redesign Program, the application
of the impairment test resulted in the write-down of goodwill and intangibles of USD 714 million. We
have not recognized a deferred tax asset associated with these impairment charges based on our
estimate of future profitability, which has a substantial impact on our effective tax rate.
Highlights The following highlights what we believe to be the most significant events in 2008 that impacted our
business, in addition to the significant economic downturn in 2008.
Joint venture with STMicroelectronics On July 28, 2008, we announced the closing of the joint venture we formed with STMicroelectronics
(ÂÂSTMÊÊ), which brought together the key wireless operations of both companies into ST-NXP
Wireless. We received a 20% interest in the joint venture and USD 1.55 billion cash proceeds for the
contribution of our wireless business. As part of the joint venture agreement, STM received an
option to buy our remaining 20% interest. As a result of the transaction, we deconsolidated the
associated assets and liabilities and recorded the remaining 20% interest as an investment in equity
accounted investees at its fair value at that date. The transaction resulted in a loss of USD 413
million, which was recorded during the third quarter of 2008. In the fourth quarter we wrote our
20% share down to its fair market value and as a consequence recorded an additional loss of USD
249 million, which is recorded in results relating to equity-accounted investees. On August 20, 2008,
STM announced it had entered into an agreement to merge ST-NXP Wireless and Ericsson Mobile
Platforms into a new joint venture. As a result, on February 2, 2009, STM exercised its option and
agreed to pay USD 92 million for our 20% interest.
Acquisition of Conexant On August 11, 2008, we successfully completed the acquisition of Conexant Systems Inc.Ês Broadband
Media Processing (ÂÂBMPÊÊ) business, which is comprised of products for satellite, cable and internet
protocol television (ÂÂIPTVÊÊ) applications. The BMP business has become part of our Home segment
and contributed USD 63 million to our total sales during 2008.
Management discussion and analysis
[-26]
NuTune Effective September 1, 2008, we completed the formation of a joint venture for can tuner module operations with Thomson, called NuTune. Both NXP and Thomson contributed their can tuner activities into the joint venture in exchange for NXP obtaining a 55% interest and Thomson receiving the remaining 45%. NuTune is included in the Home segment as of September 1, 2008. The incremental impact on total sales resulting from the formation of this joint venture was USD 31 million during 2008. Comparability of Results Beginning January 1, 2008, we changed our reporting currency from euro to U.S. dollar in order to be
more aligned with the semiconductor market and for comparison reasons with our peers. The
functional currency of the various entities in our group consolidation has not changed.
For consolidation purposes, the financial statements of those entities, including the parent company
NXP B.V. (ÂÂNXPÊÊ), with a functional currency other than the U.S. dollar are translated into U.S.
dollars. Assets and liabilities are translated using the exchange rates on the respective balance sheet
dates. Items in the statement of operations and cash flow statement are translated at average rates of
exchange in the periods involved. The resulting translation adjustments are recorded as a separate
component of other comprehensive income (loss) in the statements of changes in businessÊ and
shareholderÊs equity. Cumulative translation adjustments are recognized as income or expense upon
partial or complete disposal or substantially complete liquidation of a foreign entity.
Transactions are recorded based on the applicable currency exchange rate on the date of the
transaction. Any associated monetary assets or liabilities outstanding are retranslated at the end of
each reporting period based on the currency exchange rate at period end. The difference between
the currency exchange rate at the time the asset or liability was originally recorded and the currency
exchange rate at period end is recognized as an expense during the period. During 2008, we
recorded net foreign currency losses of USD 87 million.
Further, as portions of our revenues and expenses are denominated in currencies other than U.S.
dollars, our results for each period are impacted by changes in exchange rates when translated into
U.S. dollars. As a result, movements in the U.S. dollar relative to the euro or to other currencies can
have a significant impact on our statements of operations, particularly to the extent that the sales and
costs incurred in individual foreign currencies do not offset them.
As a result of these effects, results may not be fully comparable across different periods.
[-27]
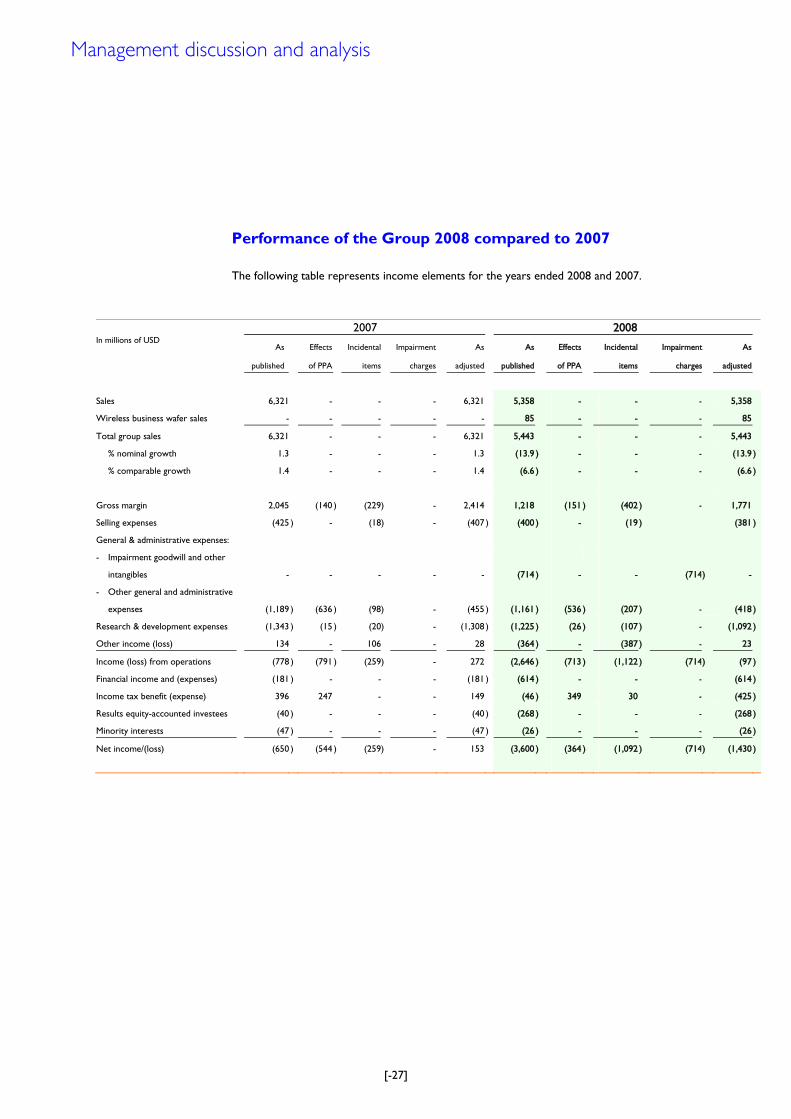
Performance of the Group 2008 compared to 2007
The following table represents income elements for the years ended 2008 and 2007.
2007 2008 In millions of USD
As
published
Effects
of PPA
Incidental
items
Impairment
charges
As
adjusted
As
published
Effects
of PPA
Incidental
items
Impairment
charges
As
adjusted
Sales 6,321 - - - 6,321 5,358 - - - 5,358
Wireless business wafer sales - - - - - 85 - - - 85
Total group sales 6,321 - - - 6,321 5,443 - - - 5,443
% nominal growth 1.3 - - - 1.3 (13.9 ) - - - (13.9 )
% comparable growth 1.4 - - - 1.4 (6.6 ) - - - (6.6 )
Gross margin 2,045 (140 ) (229) - 2,414 1,218 (151 ) (402 ) - 1,771
Selling expenses (425 ) - (18) - (407 ) (400 ) - (19 ) (381 )
General & administrative expenses:
- Impairment goodwill and other
intangibles
-
-
-
-
-
(714
)
-
-
(714
) -
- Other general and administrative
expenses
(1,189
) (636
) (98
) -
(455
) (1,161
)
(536
)
(207
) -
(418
)
Research & development expenses (1,343 ) (15 ) (20) - (1,308 ) (1,225 ) (26 ) (107 ) - (1,092 )
Other income (loss) 134 - 106 - 28 (364 ) - (387 ) - 23
Income (loss) from operations (778 ) (791 ) (259) - 272 (2,646 ) (713 ) (1,122 ) (714) (97 )
Financial income and (expenses) (181 ) - - - (181 ) (614 ) - - - (614 )
Income tax benefit (expense) 396 247 - - 149 (46 ) 349 30 - (425 )
Results equity-accounted investees (40 ) - - - (40 ) (268 ) - - - (268 )
Minority interests (47 ) - - - (47 ) (26 ) - - - (26 )
Net income/(loss) (650 ) (544 ) (259) - 153 (3,600 ) (364 ) (1,092 ) (714) (1,430 )
Management discussion and analysis
[-28]
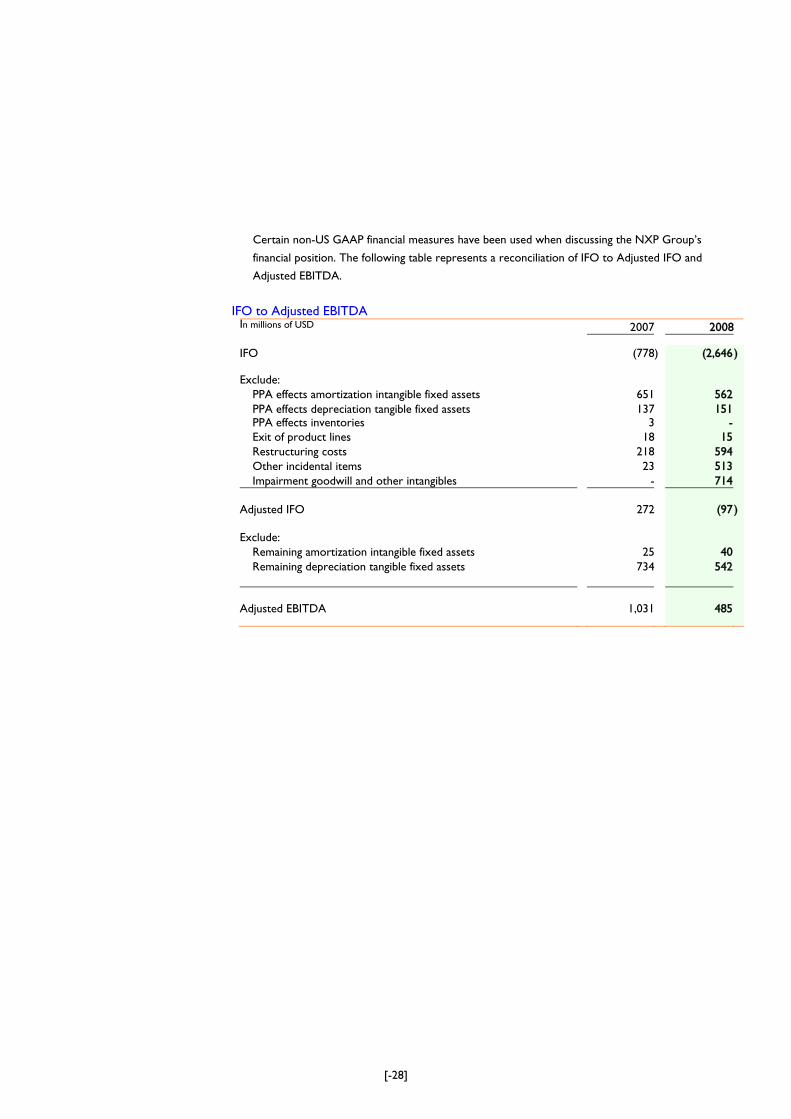
Certain non-US GAAP financial measures have been used when discussing the NXP GroupÊs
financial position. The following table represents a reconciliation of IFO to Adjusted IFO and
Adjusted EBITDA.
IFO to Adjusted EBITDA In millions of USD 2007 2008 IFO (778) (2,646) Exclude: PPA effects amortization intangible fixed assets 651 562 PPA effects depreciation tangible fixed assets 137 151 PPA effects inventories 3 - Exit of product lines 18 15 Restructuring costs 218 594 Other incidental items 23 513 Impairment goodwill and other intangibles - 714 Adjusted IFO 272 (97) Exclude: Remaining amortization intangible fixed assets 25 40 Remaining depreciation tangible fixed assets 734 542 Adjusted EBITDA 1,031 485
[-29]
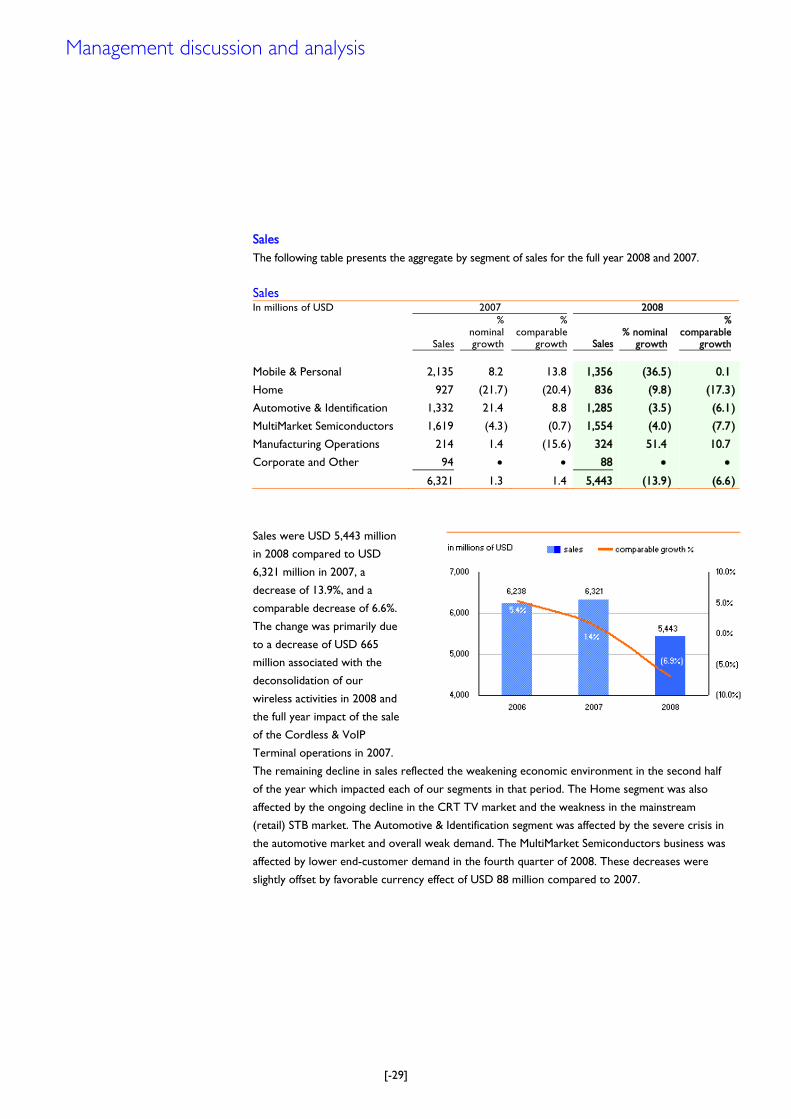
Sales The following table presents the aggregate by segment of sales for the full year 2008 and 2007.
Sales In millions of USD 2007 2008
Sales
% nominal growth
% comparable
growth Sales % nominal
growth
%comparable
growth
Mobile & Personal 2,135 8.2 13.8 1,356 (36.5) 0.1
Home 927 (21.7) (20.4 ) 836 (9.8) (17.3)
Automotive & Identification 1,332 21.4 8.8 1,285 (3.5) (6.1)
MultiMarket Semiconductors 1,619 (4.3) (0.7 ) 1,554 (4.0) (7.7)
Manufacturing Operations 214 1.4 (15.6 ) 324 51.4 10.7
Corporate and Other 94 • • 88 • •
6,321 1.3 1.4 5,443 (13.9) (6.6)
Sales were USD 5,443 million
in 2008 compared to USD
6,321 million in 2007, a
decrease of 13.9%, and a
comparable decrease of 6.6%.
The change was primarily due
to a decrease of USD 665
million associated with the
deconsolidation of our
wireless activities in 2008 and
the full year impact of the sale
of the Cordless & VoIP
Terminal operations in 2007.
The remaining decline in sales reflected the weakening economic environment in the second half
of the year which impacted each of our segments in that period. The Home segment was also
affected by the ongoing decline in the CRT TV market and the weakness in the mainstream
(retail) STB market. The Automotive & Identification segment was affected by the severe crisis in
the automotive market and overall weak demand. The MultiMarket Semiconductors business was
affected by lower end-customer demand in the fourth quarter of 2008. These decreases were
slightly offset by favorable currency effect of USD 88 million compared to 2007.
Management discussion and analysis
[-30]
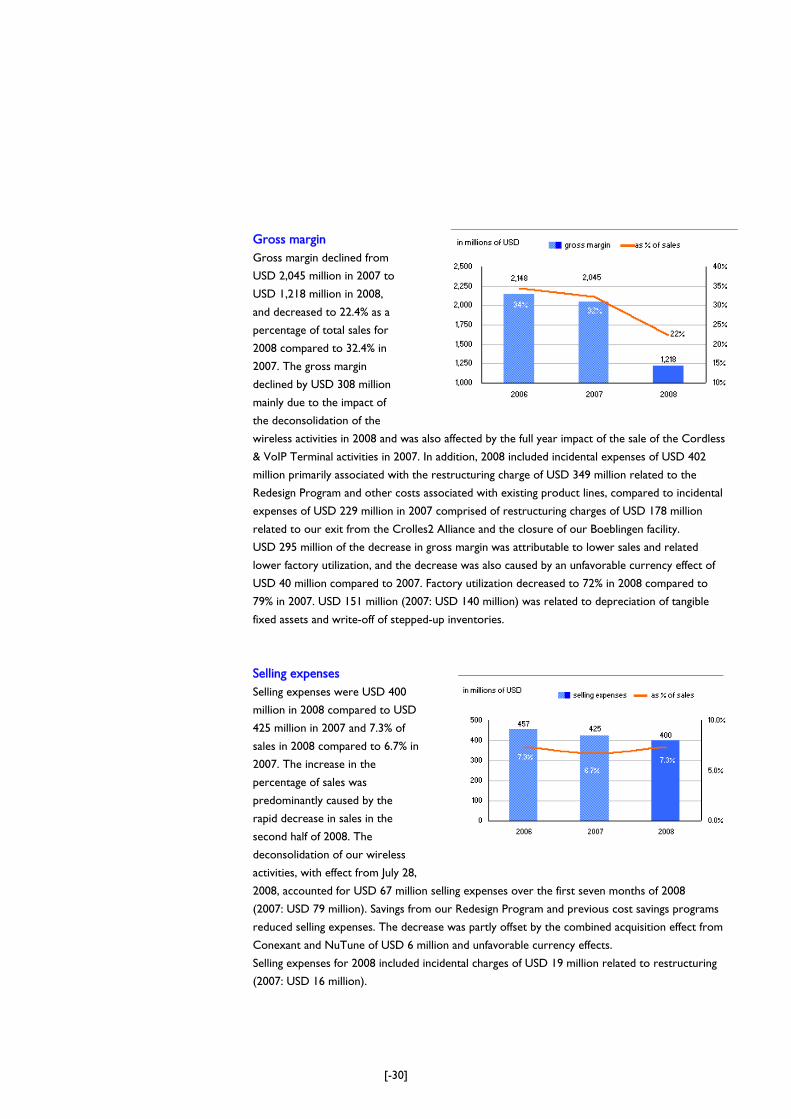
Gross margin Gross margin declined from
USD 2,045 million in 2007 to
USD 1,218 million in 2008,
and decreased to 22.4% as a
percentage of total sales for
2008 compared to 32.4% in
2007. The gross margin
declined by USD 308 million
mainly due to the impact of
the deconsolidation of the
wireless activities in 2008 and was also affected by the full year impact of the sale of the Cordless
& VoIP Terminal activities in 2007. In addition, 2008 included incidental expenses of USD 402
million primarily associated with the restructuring charge of USD 349 million related to the
Redesign Program and other costs associated with existing product lines, compared to incidental
expenses of USD 229 million in 2007 comprised of restructuring charges of USD 178 million
related to our exit from the Crolles2 Alliance and the closure of our Boeblingen facility.
USD 295 million of the decrease in gross margin was attributable to lower sales and related
lower factory utilization, and the decrease was also caused by an unfavorable currency effect of
USD 40 million compared to 2007. Factory utilization decreased to 72% in 2008 compared to
79% in 2007. USD 151 million (2007: USD 140 million) was related to depreciation of tangible
fixed assets and write-off of stepped-up inventories.
Selling expenses Selling expenses were USD 400
million in 2008 compared to USD
425 million in 2007 and 7.3% of
sales in 2008 compared to 6.7% in
2007. The increase in the
percentage of sales was
predominantly caused by the
rapid decrease in sales in the
second half of 2008. The
deconsolidation of our wireless
activities, with effect from July 28,
2008, accounted for USD 67 million selling expenses over the first seven months of 2008
(2007: USD 79 million). Savings from our Redesign Program and previous cost savings programs
reduced selling expenses. The decrease was partly offset by the combined acquisition effect from
Conexant and NuTune of USD 6 million and unfavorable currency effects.
Selling expenses for 2008 included incidental charges of USD 19 million related to restructuring
(2007: USD 16 million).
[-31]
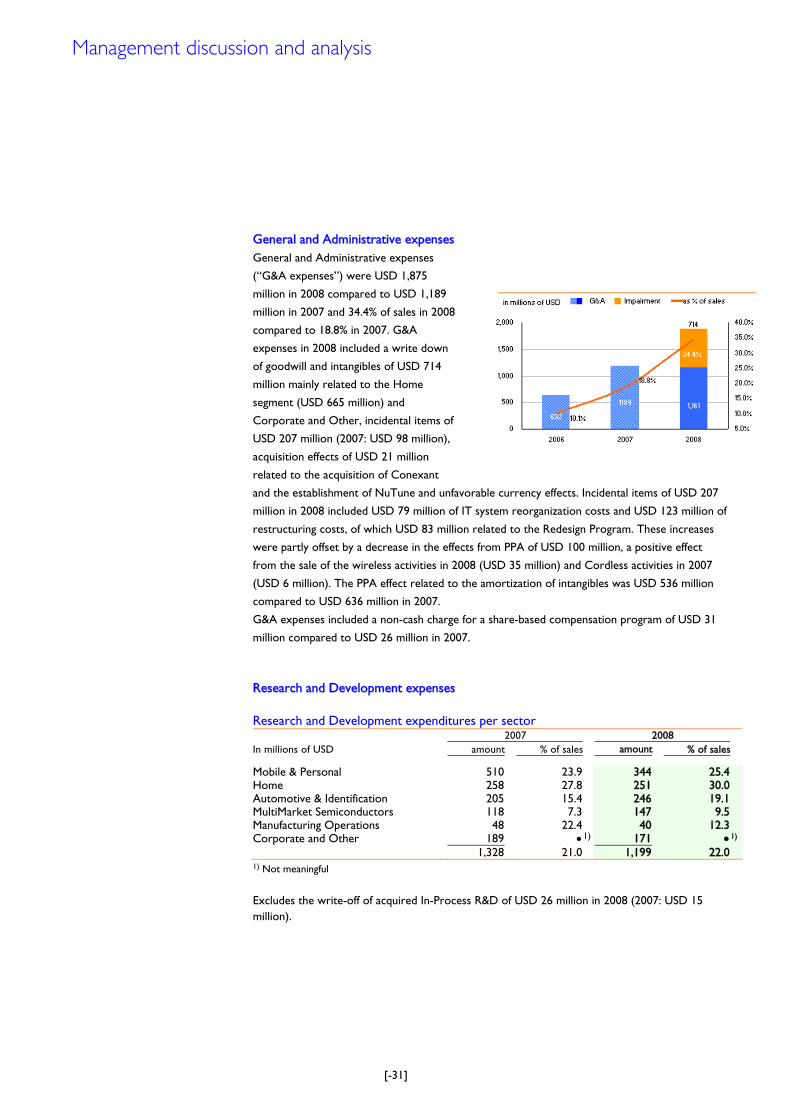
General and Administrative expenses General and Administrative expenses
(ÂÂG&A expensesÊÊ) were USD 1,875
million in 2008 compared to USD 1,189
million in 2007 and 34.4% of sales in 2008
compared to 18.8% in 2007. G&A
expenses in 2008 included a write down
of goodwill and intangibles of USD 714
million mainly related to the Home
segment (USD 665 million) and
Corporate and Other, incidental items of
USD 207 million (2007: USD 98 million),
acquisition effects of USD 21 million
related to the acquisition of Conexant
and the establishment of NuTune and unfavorable currency effects. Incidental items of USD 207
million in 2008 included USD 79 million of IT system reorganization costs and USD 123 million of
restructuring costs, of which USD 83 million related to the Redesign Program. These increases
were partly offset by a decrease in the effects from PPA of USD 100 million, a positive effect
from the sale of the wireless activities in 2008 (USD 35 million) and Cordless activities in 2007
(USD 6 million). The PPA effect related to the amortization of intangibles was USD 536 million
compared to USD 636 million in 2007.
G&A expenses included a non-cash charge for a share-based compensation program of USD 31
million compared to USD 26 million in 2007.
Research and Development expenses Research and Development expenditures per sector 2007 2008 In millions of USD amount % of sales amount % of sales Mobile & Personal 510 23.9 344 25.4 Home 258 27.8 251 30.0 Automotive & Identification 205 15.4 246 19.1 MultiMarket Semiconductors 118 7.3 147 9.5 Manufacturing Operations 48 22.4 40 12.3 Corporate and Other 189 • 1) 171 •1)
1,328 21.0 1,199 22.0 1) Not meaningful
Excludes the write-off of acquired In-Process R&D of USD 26 million in 2008 (2007: USD 15 million).
Management discussion and analysis
[-32]
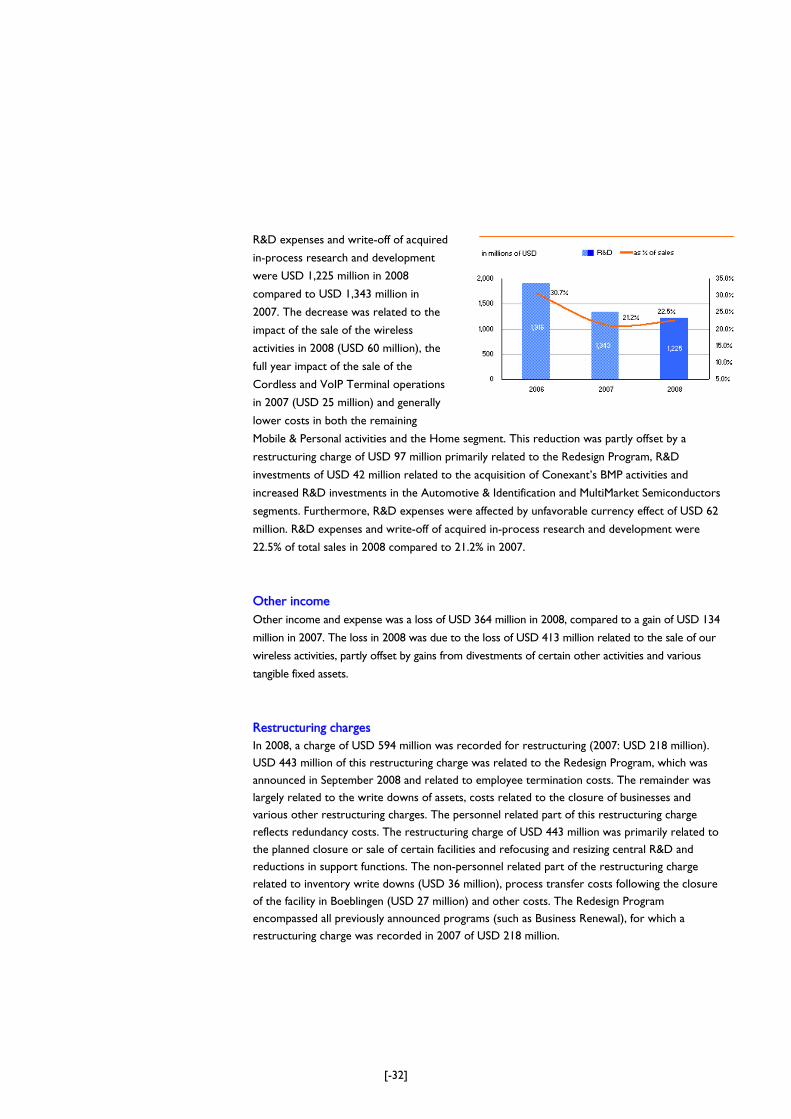
R&D expenses and write-off of acquired
in-process research and development
were USD 1,225 million in 2008
compared to USD 1,343 million in
2007. The decrease was related to the
impact of the sale of the wireless
activities in 2008 (USD 60 million), the
full year impact of the sale of the
Cordless and VoIP Terminal operations
in 2007 (USD 25 million) and generally
lower costs in both the remaining
Mobile & Personal activities and the Home segment. This reduction was partly offset by a
restructuring charge of USD 97 million primarily related to the Redesign Program, R&D
investments of USD 42 million related to the acquisition of ConexantÊs BMP activities and
increased R&D investments in the Automotive & Identification and MultiMarket Semiconductors
segments. Furthermore, R&D expenses were affected by unfavorable currency effect of USD 62
million. R&D expenses and write-off of acquired in-process research and development were
22.5% of total sales in 2008 compared to 21.2% in 2007.
Other income Other income and expense was a loss of USD 364 million in 2008, compared to a gain of USD 134
million in 2007. The loss in 2008 was due to the loss of USD 413 million related to the sale of our
wireless activities, partly offset by gains from divestments of certain other activities and various
tangible fixed assets.
Restructuring charges In 2008, a charge of USD 594 million was recorded for restructuring (2007: USD 218 million). USD 443 million of this restructuring charge was related to the Redesign Program, which was announced in September 2008 and related to employee termination costs. The remainder was largely related to the write downs of assets, costs related to the closure of businesses and various other restructuring charges. The personnel related part of this restructuring charge reflects redundancy costs. The restructuring charge of USD 443 million was primarily related to the planned closure or sale of certain facilities and refocusing and resizing central R&D and reductions in support functions. The non-personnel related part of the restructuring charge related to inventory write downs (USD 36 million), process transfer costs following the closure of the facility in Boeblingen (USD 27 million) and other costs. The Redesign Program encompassed all previously announced programs (such as Business Renewal), for which a restructuring charge was recorded in 2007 of USD 218 million.
[-33]
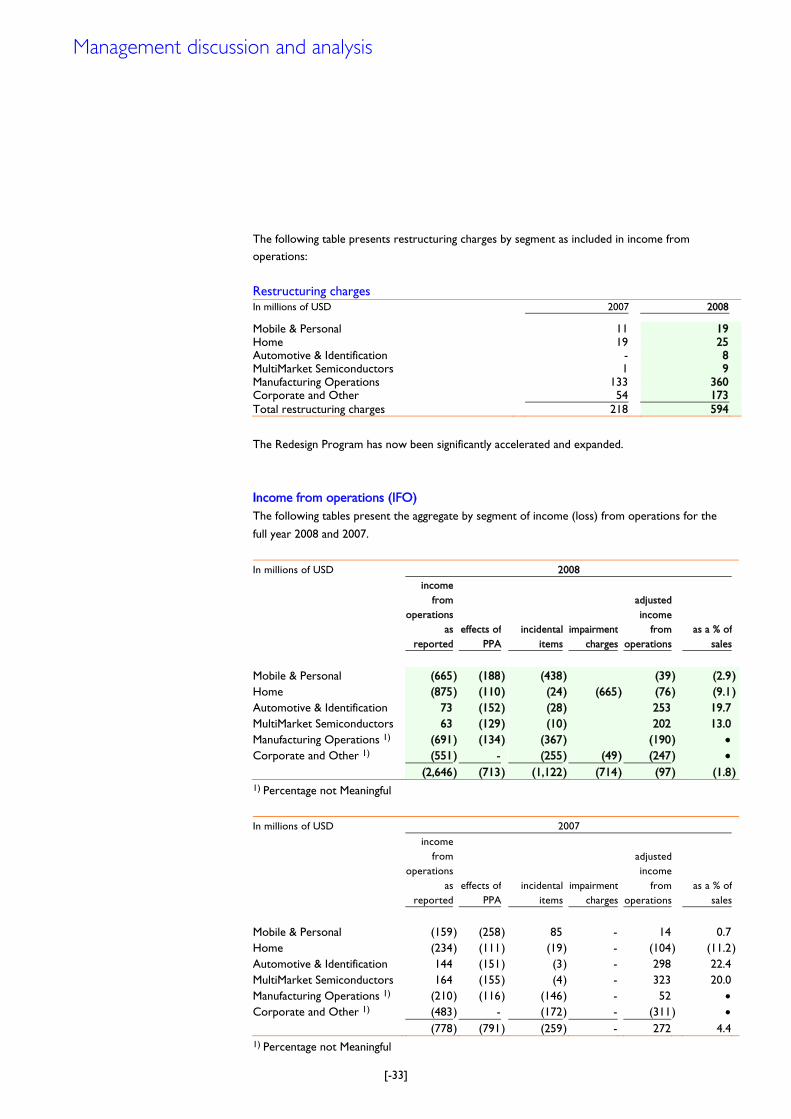
The following table presents restructuring charges by segment as included in income from operations:
Restructuring charges In millions of USD 2007 2008 Mobile & Personal 11 19Home 19 25Automotive & Identification - 8MultiMarket Semiconductors 1 9Manufacturing Operations 133 360Corporate and Other 54 173Total restructuring charges 218 594
The Redesign Program has now been significantly accelerated and expanded.
Income from operations (IFO) The following tables present the aggregate by segment of income (loss) from operations for the
full year 2008 and 2007.
In millions of USD 2008
incomefrom
operationsas
reportedeffects of
PPA
incidental items
impairment charges
adjustedincome
from operations
as a % of sales
Mobile & Personal (665) (188) (438 ) (39) (2.9)Home (875) (110) (24 ) (665 ) (76) (9.1)Automotive & Identification 73 (152) (28 ) 253 19.7 MultiMarket Semiconductors 63 (129) (10 ) 202 13.0 Manufacturing Operations 1) (691) (134) (367 ) (190) • Corporate and Other 1) (551) - (255 ) (49 ) (247) • (2,646) (713) (1,122 ) (714 ) (97) (1.8)1) Percentage not Meaningful
In millions of USD 2007
incomefrom
operationsas
reportedeffects of
PPA
incidental items
impairment charges
adjusted income
from operations
as a % of sales
Mobile & Personal (159) (258) 85 - 14 0.7 Home (234) (111) (19 ) - (104) (11.2)Automotive & Identification 144 (151) (3 ) - 298 22.4 MultiMarket Semiconductors 164 (155) (4 ) - 323 20.0 Manufacturing Operations 1) (210) (116) (146 ) - 52 • Corporate and Other 1) (483) - (172 ) - (311) • (778) (791) (259 ) - 272 4.4 1) Percentage not Meaningful
Management discussion and analysis
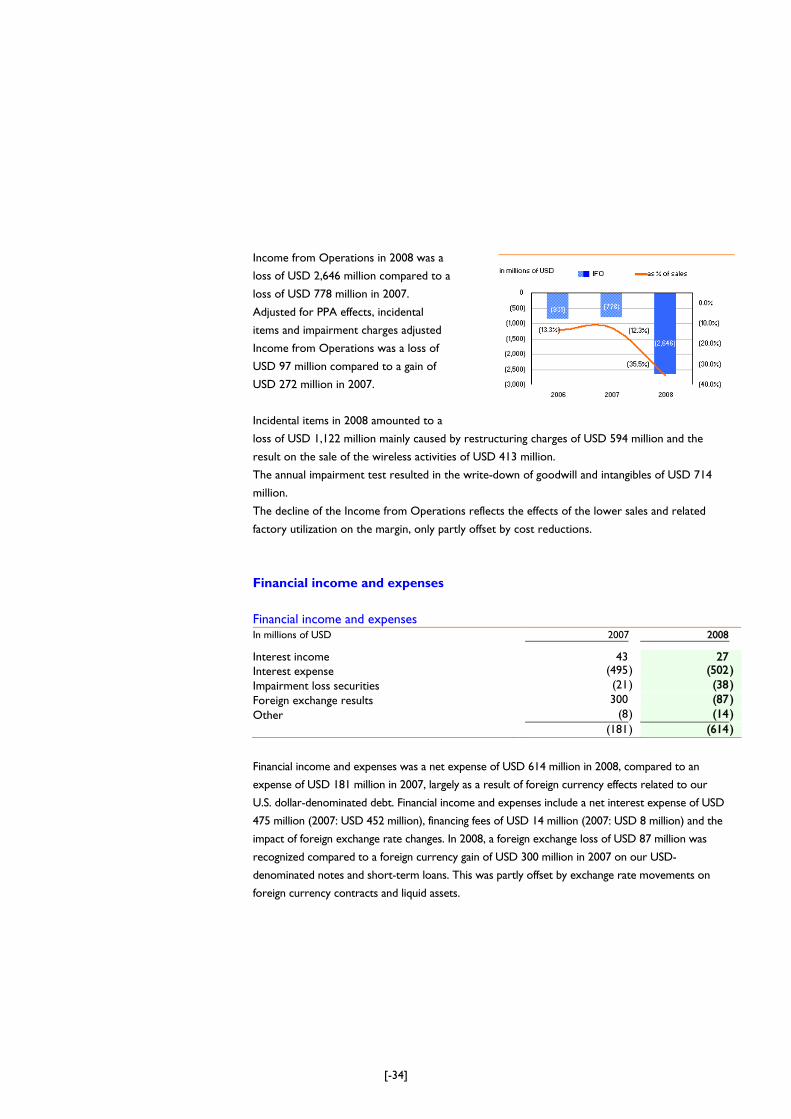
[-34]
Income from Operations in 2008 was a
loss of USD 2,646 million compared to a
loss of USD 778 million in 2007.
Adjusted for PPA effects, incidental
items and impairment charges adjusted
Income from Operations was a loss of
USD 97 million compared to a gain of
USD 272 million in 2007.
Incidental items in 2008 amounted to a
loss of USD 1,122 million mainly caused by restructuring charges of USD 594 million and the
result on the sale of the wireless activities of USD 413 million.
The annual impairment test resulted in the write-down of goodwill and intangibles of USD 714
million.
The decline of the Income from Operations reflects the effects of the lower sales and related
factory utilization on the margin, only partly offset by cost reductions.
Financial income and expenses Financial income and expenses In millions of USD 2007 2008 Interest income 43 27 Interest expense (495 ) (502 ) Impairment loss securities (21 ) (38 ) Foreign exchange results 300 (87 ) Other (8 ) (14 ) (181 ) (614 )
Financial income and expenses was a net expense of USD 614 million in 2008, compared to an
expense of USD 181 million in 2007, largely as a result of foreign currency effects related to our
U.S. dollar-denominated debt. Financial income and expenses include a net interest expense of USD
475 million (2007: USD 452 million), financing fees of USD 14 million (2007: USD 8 million) and the
impact of foreign exchange rate changes. In 2008, a foreign exchange loss of USD 87 million was
recognized compared to a foreign currency gain of USD 300 million in 2007 on our USD-
denominated notes and short-term loans. This was partly offset by exchange rate movements on
foreign currency contracts and liquid assets.
[-35]
Income tax benefit (expenses) The income tax expense for 2008 was USD 46 million, compared to a tax benefit in 2007 of USD
396 million. In 2008, the PPA effects included in income tax expense amounted to a benefit of
USD 349 million, compared to a benefit in 2007 of USD 247 million The CompanyÊs effective
income tax rate changed from a tax benefit of 41.3% in 2007 to a tax expense rate of 1.4% in
2008. The change in the effective tax rate was primarily attributable to an increase in the
valuation allowance of USD 496 million and a decrease in non-taxable income.
Results relating to equity-accounted investees Results relating to the equity-accounted investees in 2008 resulted in a loss of USD 268 million
compared to a loss of USD 40 million in 2007. The loss in 2008 was largely related to the
revaluation of the fair market value of our 20% share in the ST-NXP Wireless joint venture.
The 2007 loss included an impairment charge for our participation in Advanced Semiconductor
Manufacturing Company (ÂÂASMCÊÊ) and T3G.
Minority interests Minority interests in 2008 were a loss of USD 26 million and were related to the share of minority
shareholders in the income of consolidated companies, predominantly Systems on Silicon
Manufacturing Company Pte. Ltd. (ÂÂSSMCÊÊ) and NuTune, compared to a loss of USD 47 million in
2007.
Net income Net loss increased from USD 650 million in 2007 to a loss of USD 3,600 million in 2008 as result
of the items discussed above.
Management discussion and analysis
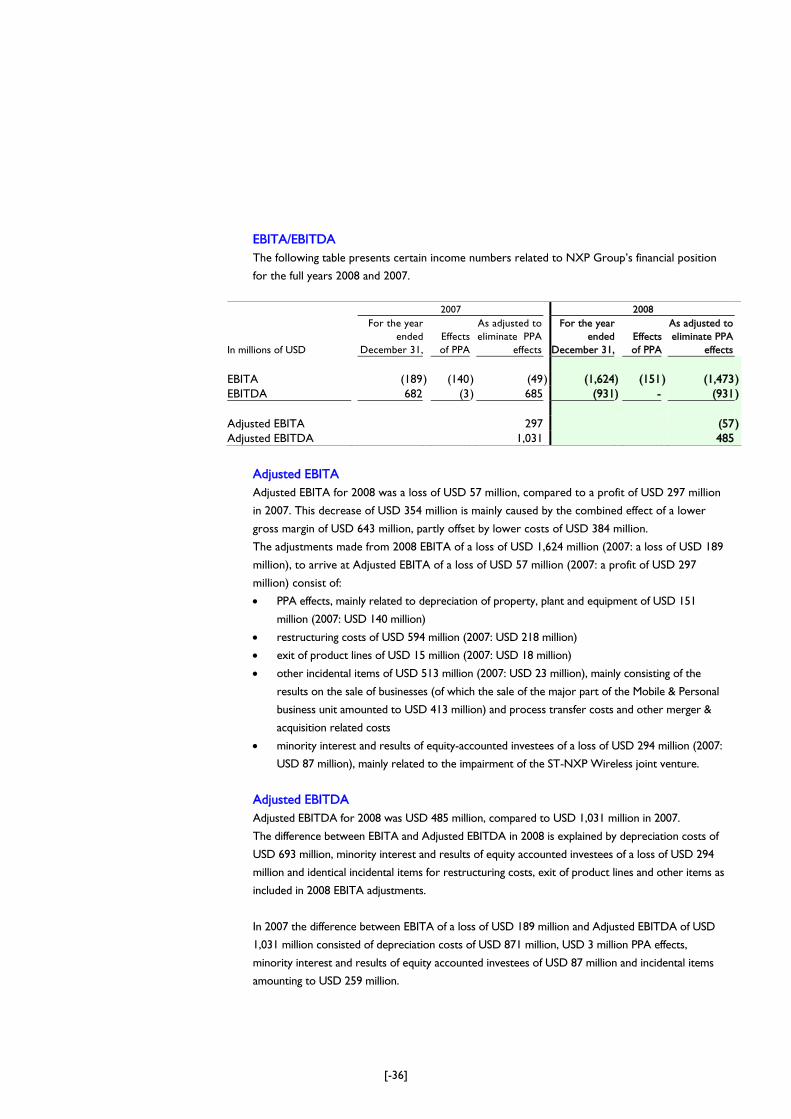
[-36]
EBITA/EBITDA The following table presents certain income numbers related to NXP GroupÊs financial position
for the full years 2008 and 2007.
2007 2008
In millions of USD
For the yearended
December 31,
Effects of PPA
As adjusted to eliminate PPA
effects
For the year ended
December 31, Effects of PPA
As adjusted to eliminate PPA
effects EBITA (189) (140) (49) (1,624) (151) (1,473)EBITDA 682 (3) 685 (931) - (931) Adjusted EBITA 297 (57)Adjusted EBITDA 1,031 485
Adjusted EBITA Adjusted EBITA for 2008 was a loss of USD 57 million, compared to a profit of USD 297 million
in 2007. This decrease of USD 354 million is mainly caused by the combined effect of a lower
gross margin of USD 643 million, partly offset by lower costs of USD 384 million.
The adjustments made from 2008 EBITA of a loss of USD 1,624 million (2007: a loss of USD 189
million), to arrive at Adjusted EBITA of a loss of USD 57 million (2007: a profit of USD 297
million) consist of:
• PPA effects, mainly related to depreciation of property, plant and equipment of USD 151
million (2007: USD 140 million)
• restructuring costs of USD 594 million (2007: USD 218 million)
• exit of product lines of USD 15 million (2007: USD 18 million)
• other incidental items of USD 513 million (2007: USD 23 million), mainly consisting of the
results on the sale of businesses (of which the sale of the major part of the Mobile & Personal
business unit amounted to USD 413 million) and process transfer costs and other merger &
acquisition related costs
• minority interest and results of equity-accounted investees of a loss of USD 294 million (2007:
USD 87 million), mainly related to the impairment of the ST-NXP Wireless joint venture.
Adjusted EBITDA Adjusted EBITDA for 2008 was USD 485 million, compared to USD 1,031 million in 2007.
The difference between EBITA and Adjusted EBITDA in 2008 is explained by depreciation costs of
USD 693 million, minority interest and results of equity accounted investees of a loss of USD 294
million and identical incidental items for restructuring costs, exit of product lines and other items as
included in 2008 EBITA adjustments.
In 2007 the difference between EBITA of a loss of USD 189 million and Adjusted EBITDA of USD
1,031 million consisted of depreciation costs of USD 871 million, USD 3 million PPA effects,
minority interest and results of equity accounted investees of USD 87 million and incidental items
amounting to USD 259 million.
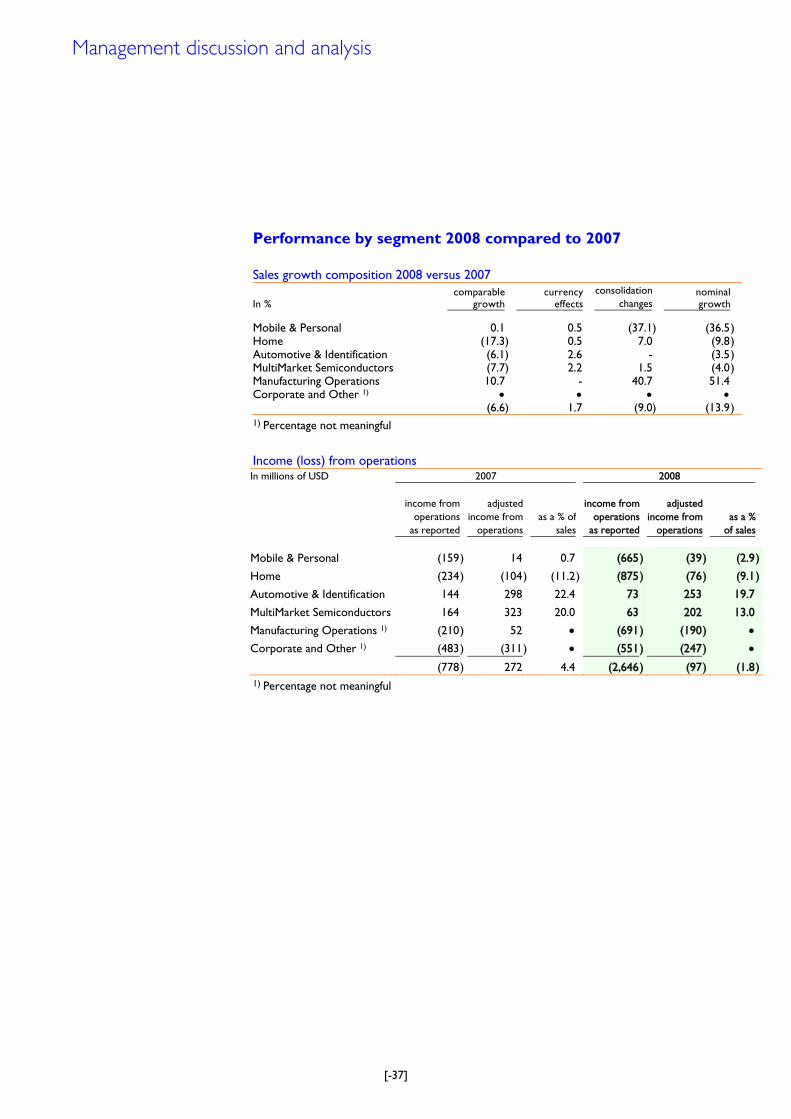
[-37]
Performance by segment 2008 compared to 2007
Sales growth composition 2008 versus 2007
In % comparable
growth currency
effects consolidation
changes nominal growth
Mobile & Personal 0.1 0.5 (37.1) (36.5) Home (17.3) 0.5 7.0 (9.8) Automotive & Identification (6.1) 2.6 - (3.5) MultiMarket Semiconductors (7.7) 2.2 1.5 (4.0) Manufacturing Operations 10.7 - 40.7 51.4 Corporate and Other 1) • • • • (6.6) 1.7 (9.0) (13.9) 1) Percentage not meaningful
Income (loss) from operations In millions of USD 2007 2008
income from operations
as reported
adjusted income from
operations as a % of
sales
income from
operations as reported
adjustedincome from
operations as a %
of sales
Mobile & Personal (159) 14 0.7 (665 ) (39) (2.9)
Home (234) (104) (11.2 ) (875 ) (76) (9.1)
Automotive & Identification 144 298 22.4 73 253 19.7
MultiMarket Semiconductors 164 323 20.0 63 202 13.0
Manufacturing Operations 1) (210) 52 • (691 ) (190) •
Corporate and Other 1) (483) (311) • (551 ) (247) •
(778) 272 4.4 (2,646 ) (97) (1.8)1) Percentage not meaningful
Management discussion and analysis
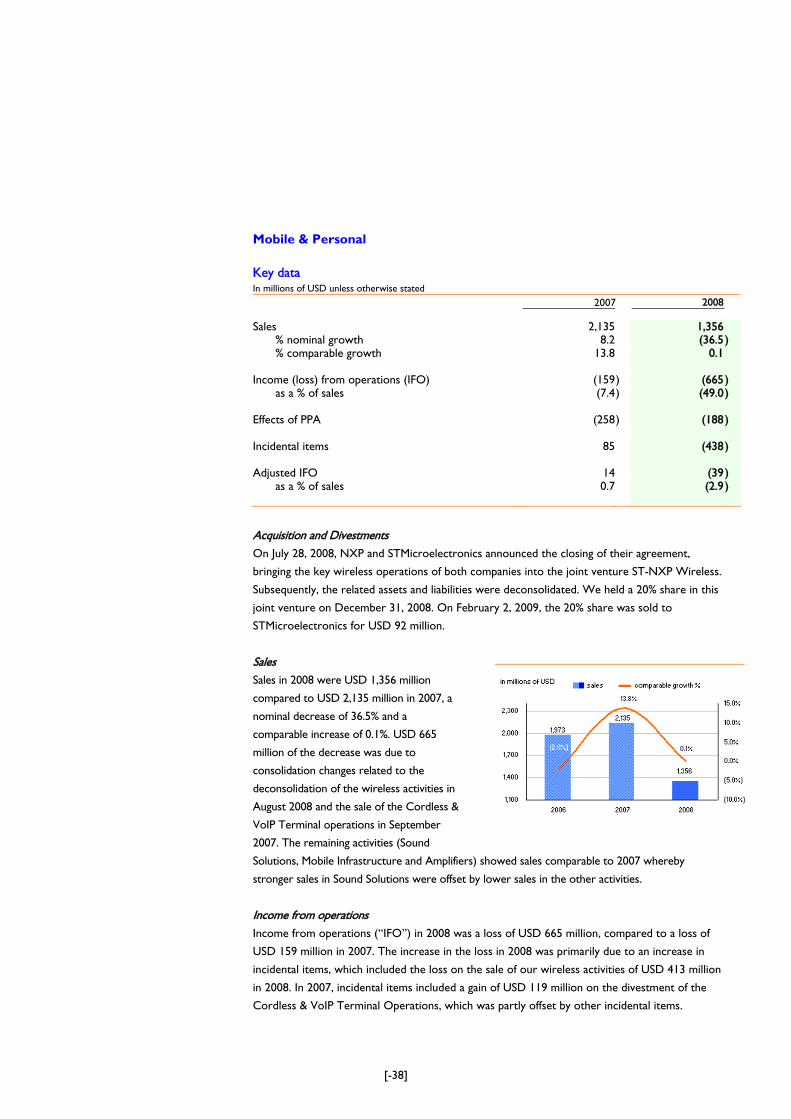
[-38]
Mobile & Personal Key data In millions of USD unless otherwise stated 2007 2008
Sales 2,135 1,356 % nominal growth 8.2 (36.5 ) % comparable growth 13.8 0.1 Income (loss) from operations (IFO) (159 ) (665) as a % of sales (7.4 ) (49.0 ) Effects of PPA (258 ) (188) Incidental items 85 (438) Adjusted IFO 14 (39) as a % of sales 0.7 (2.9 )
Acquisition and Divestments On July 28, 2008, NXP and STMicroelectronics announced the closing of their agreement,
bringing the key wireless operations of both companies into the joint venture ST-NXP Wireless.
Subsequently, the related assets and liabilities were deconsolidated. We held a 20% share in this
joint venture on December 31, 2008. On February 2, 2009, the 20% share was sold to
STMicroelectronics for USD 92 million.
Sales Sales in 2008 were USD 1,356 million
compared to USD 2,135 million in 2007, a
nominal decrease of 36.5% and a
comparable increase of 0.1%. USD 665
million of the decrease was due to
consolidation changes related to the
deconsolidation of the wireless activities in
August 2008 and the sale of the Cordless &
VoIP Terminal operations in September
2007. The remaining activities (Sound
Solutions, Mobile Infrastructure and Amplifiers) showed sales comparable to 2007 whereby
stronger sales in Sound Solutions were offset by lower sales in the other activities.
Income from operations Income from operations (ÂÂIFOÊÊ) in 2008 was a loss of USD 665 million, compared to a loss of
USD 159 million in 2007. The increase in the loss in 2008 was primarily due to an increase in
incidental items, which included the loss on the sale of our wireless activities of USD 413 million
in 2008. In 2007, incidental items included a gain of USD 119 million on the divestment of the
Cordless & VoIP Terminal Operations, which was partly offset by other incidental items.
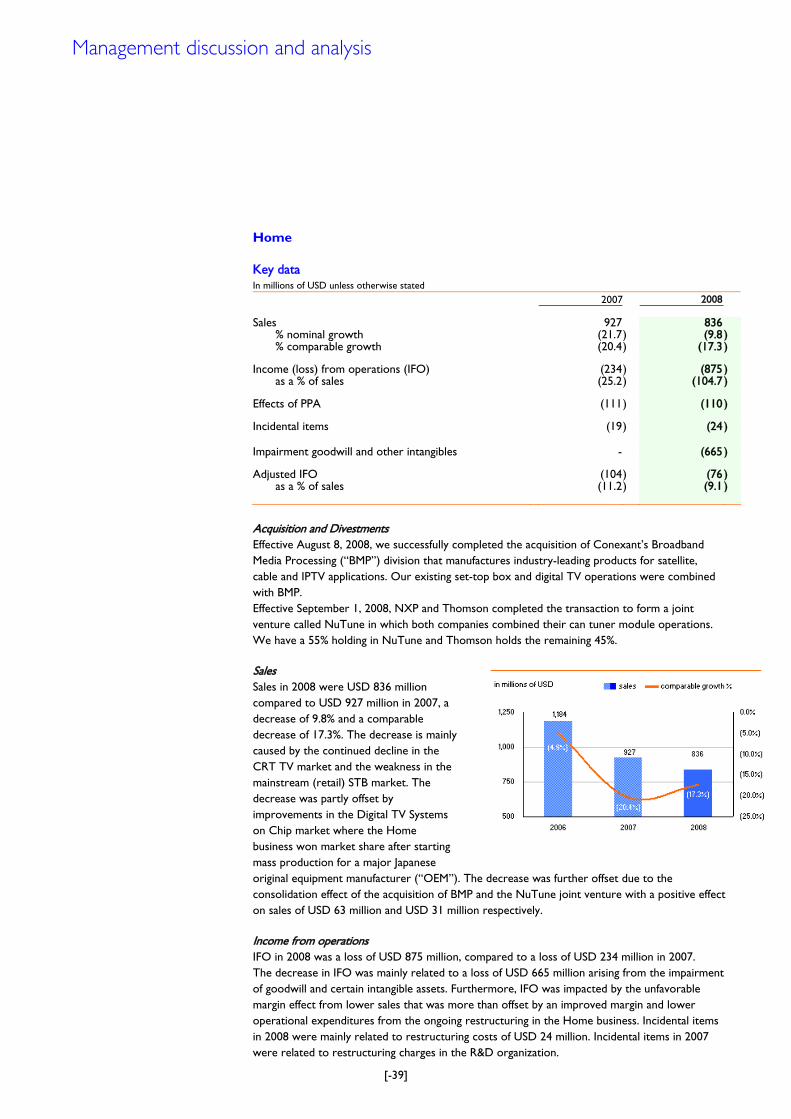
[-39]
Home Key data In millions of USD unless otherwise stated 2007 2008 Sales 927 836 % nominal growth (21.7 ) (9.8 ) % comparable growth (20.4 ) (17.3 ) Income (loss) from operations (IFO) (234 ) (875 ) as a % of sales (25.2 ) (104.7 ) Effects of PPA (111 ) (110 ) Incidental items (19 ) (24 ) Impairment goodwill and other intangibles - (665 ) Adjusted IFO (104 ) (76 ) as a % of sales (11.2 ) (9.1 )
Acquisition and Divestments Effective August 8, 2008, we successfully completed the acquisition of ConexantÊs Broadband Media Processing (ÂÂBMPÊÊ) division that manufactures industry-leading products for satellite, cable and IPTV applications. Our existing set-top box and digital TV operations were combined with BMP. Effective September 1, 2008, NXP and Thomson completed the transaction to form a joint venture called NuTune in which both companies combined their can tuner module operations. We have a 55% holding in NuTune and Thomson holds the remaining 45%.
Sales Sales in 2008 were USD 836 million compared to USD 927 million in 2007, a decrease of 9.8% and a comparable decrease of 17.3%. The decrease is mainly caused by the continued decline in the CRT TV market and the weakness in the mainstream (retail) STB market. The decrease was partly offset by improvements in the Digital TV Systems on Chip market where the Home business won market share after starting mass production for a major Japanese original equipment manufacturer (ÂÂOEMÊÊ). The decrease was further offset due to the consolidation effect of the acquisition of BMP and the NuTune joint venture with a positive effect on sales of USD 63 million and USD 31 million respectively. Income from operations IFO in 2008 was a loss of USD 875 million, compared to a loss of USD 234 million in 2007. The decrease in IFO was mainly related to a loss of USD 665 million arising from the impairment of goodwill and certain intangible assets. Furthermore, IFO was impacted by the unfavorable margin effect from lower sales that was more than offset by an improved margin and lower operational expenditures from the ongoing restructuring in the Home business. Incidental items in 2008 were mainly related to restructuring costs of USD 24 million. Incidental items in 2007 were related to restructuring charges in the R&D organization.
Management discussion and analysis
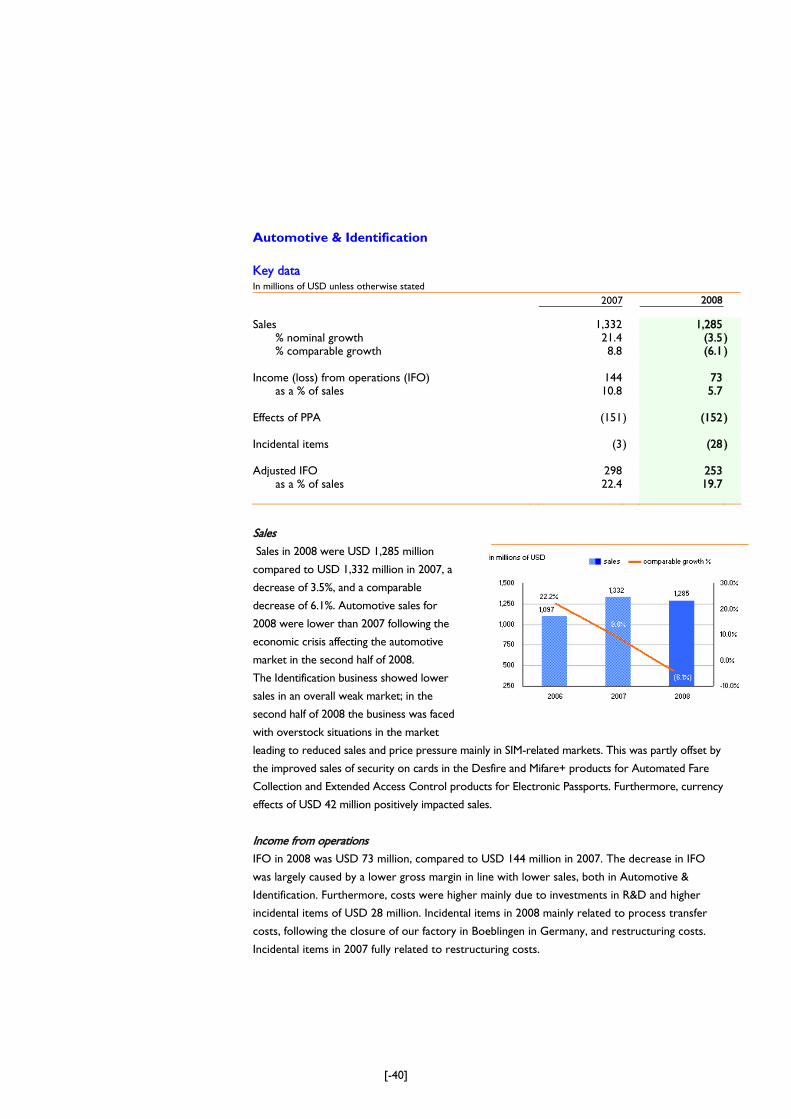
[-40]
Automotive & Identification Key data In millions of USD unless otherwise stated 2007 2008 Sales 1,332 1,285 % nominal growth 21.4 (3.5 ) % comparable growth 8.8 (6.1 ) Income (loss) from operations (IFO) 144 73 as a % of sales 10.8 5.7 Effects of PPA (151 ) (152 ) Incidental items (3 ) (28 ) Adjusted IFO 298 253 as a % of sales 22.4 19.7
Sales Sales in 2008 were USD 1,285 million
compared to USD 1,332 million in 2007, a
decrease of 3.5%, and a comparable
decrease of 6.1%. Automotive sales for
2008 were lower than 2007 following the
economic crisis affecting the automotive
market in the second half of 2008.
The Identification business showed lower
sales in an overall weak market; in the
second half of 2008 the business was faced
with overstock situations in the market
leading to reduced sales and price pressure mainly in SIM-related markets. This was partly offset by
the improved sales of security on cards in the Desfire and Mifare+ products for Automated Fare
Collection and Extended Access Control products for Electronic Passports. Furthermore, currency
effects of USD 42 million positively impacted sales.
Income from operations IFO in 2008 was USD 73 million, compared to USD 144 million in 2007. The decrease in IFO
was largely caused by a lower gross margin in line with lower sales, both in Automotive &
Identification. Furthermore, costs were higher mainly due to investments in R&D and higher
incidental items of USD 28 million. Incidental items in 2008 mainly related to process transfer
costs, following the closure of our factory in Boeblingen in Germany, and restructuring costs.
Incidental items in 2007 fully related to restructuring costs.
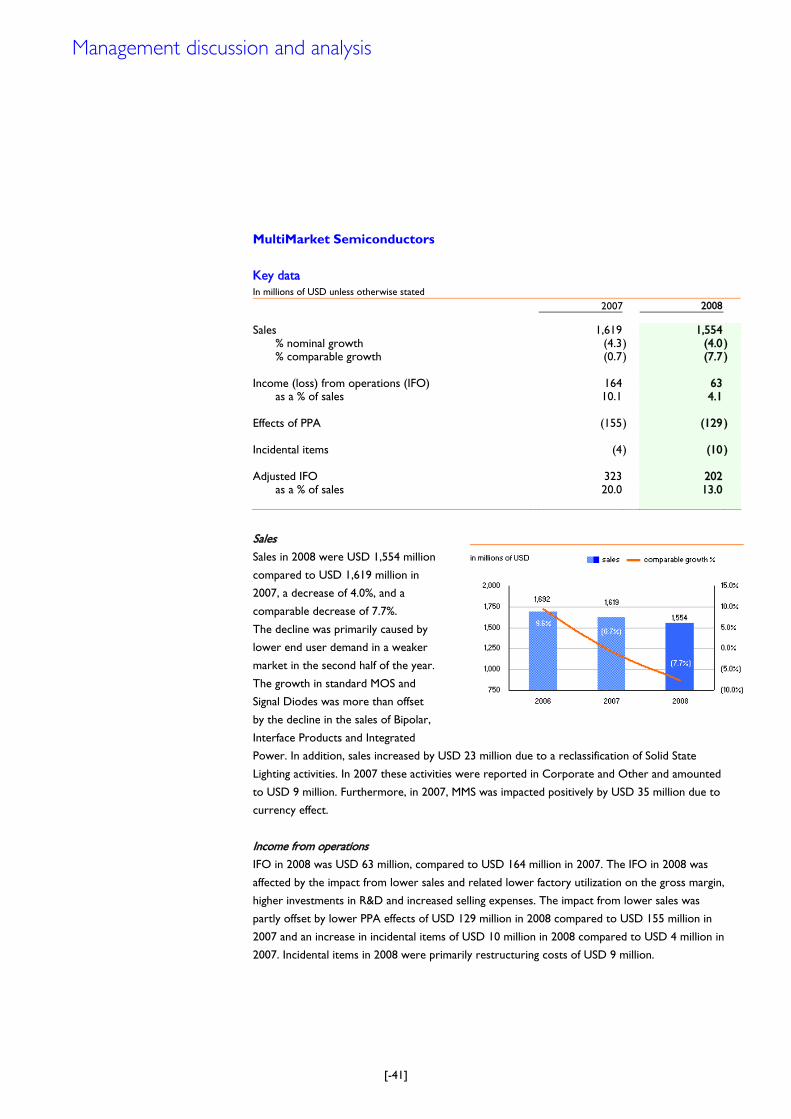
[-41]
MultiMarket Semiconductors
Key data In millions of USD unless otherwise stated 2007 2008 Sales 1,619 1,554 % nominal growth (4.3 ) (4.0 ) % comparable growth (0.7 ) (7.7 ) Income (loss) from operations (IFO) 164 63 as a % of sales 10.1 4.1 Effects of PPA (155 ) (129 ) Incidental items (4 ) (10 ) Adjusted IFO 323 202 as a % of sales 20.0 13.0
Sales Sales in 2008 were USD 1,554 million
compared to USD 1,619 million in
2007, a decrease of 4.0%, and a
comparable decrease of 7.7%.
The decline was primarily caused by
lower end user demand in a weaker
market in the second half of the year.
The growth in standard MOS and
Signal Diodes was more than offset
by the decline in the sales of Bipolar,
Interface Products and Integrated
Power. In addition, sales increased by USD 23 million due to a reclassification of Solid State
Lighting activities. In 2007 these activities were reported in Corporate and Other and amounted
to USD 9 million. Furthermore, in 2007, MMS was impacted positively by USD 35 million due to
currency effect.
Income from operations IFO in 2008 was USD 63 million, compared to USD 164 million in 2007. The IFO in 2008 was
affected by the impact from lower sales and related lower factory utilization on the gross margin,
higher investments in R&D and increased selling expenses. The impact from lower sales was
partly offset by lower PPA effects of USD 129 million in 2008 compared to USD 155 million in
2007 and an increase in incidental items of USD 10 million in 2008 compared to USD 4 million in
2007. Incidental items in 2008 were primarily restructuring costs of USD 9 million.
Management discussion and analysis
[-42]
Manufacturing Operations Key data In millions of USD unless otherwise stated 2007 2008 Sales 214 324 % nominal growth 1.4 51.4 % comparable growth (15.6 ) 10.7 Income (loss) from operations (IFO) (210 ) (691 ) as a % of sales 1) • • Effects of PPA (116 ) (134 ) Incidental items (146 ) (367 ) Adjusted IFO 52 (190 ) as a % of sales • • 1) IFO and adjusted IFO as a percentage of sales is not meaningful for Manufacturing Operations .
Sales Sales to third parties in 2008 were USD 324 million compared to USD 214 million in 2007, a
nominal increase of 51.4%, and a comparable increase of 10.7%. The increase of nominal sales
was mainly caused by wafer sales to ST-NXP Wireless, which became a third party in 2008, and
sales to the DSP Group, which became a third party in 2007, in connection with the sale of our
Cordless & VoIP Terminal operations in the third quarter of 2007.
Income from operations IFO in 2008 was a loss of USD 691 million, compared to a loss of USD 210 million in 2007.
The decline was caused by a lower gross margin, which was mainly due to incidental items, lower
factory utilization, the weaker U.S. dollar compared to 2007 and price erosion. The increase in
incidental items in 2008 mainly related to the announced Redesign Program, ongoing
restructuring in 2008 and the downscaling of production facilities in the second half of the year.
Overall factory utilization declined to 72% in 2008 compared to 79% in 2007. In the fourth
quarter of 2008 the utilization was 56%.
[-43]
Corporate and Other Key data In millions of USD unless otherwise stated 2007 2008 Sales 94 88 % nominal growth • • % comparable growth • • Income (loss) from operations (IFO) (483 ) (551 ) as a % of sales 1) • • Effects of PPA - - Incidental items (172 ) (255 ) Impairment goodwill and other intangibles - (49 ) Adjusted IFO (311 ) (247 ) as a % of sales • • 1) IFO and Adjusted IFO as a percentage of sales is not meaningful for Corporate and Other.
Corporate and Other business includes IP management, corporate research and development and
corporate infrastructure.
Sales Sales in 2008 were USD 88 million compared to USD 94 million in 2007 and related to IP licensing
and NXP Software. Consolidation changes amounted to USD 9 million and related to Solid State
Lightning activities. With effect from 2008, these activities are reported in the MultiMarket
Semiconductors segment.
Income from operations IFO in 2008 was a loss of USD 551 million, compared to a loss of USD 483 million in 2007.
The decrease compared to 2007 was caused by incidental items, currency results relating to
hedging and fair value accounting, the impairment of goodwill of USD 49 million, partly offset by
lower corporate IT costs. Incidental items in 2008 amounted to USD 255 million and consisted of
restructuring charges of USD 173 million and Merger & Acquisition related costs of USD 54
million. Incidental items in 2007included, amongst others, IT disentanglement costs and
restructuring charges for the exit from the Crolles2 Alliance and restructuring of the Global
Sales Force.
Management discussion and analysis
[-44]
Performance of the Group 2007 compared to 2006
Management Summary
• Full year sales at USD 6,321 million, compared to USD 6,238 million in 2006
• Full year Adjusted EBITDA at USD 1,031 million, compared to USD 1,158 million in 2006
• Full year Adjusted EBITA at USD 297 million, compared to USD 406 million in 2006
• Cost savings from Business Renewal Program in 2007 exceed USD 135 million on a run rate
basis
The following table presents income from operations for the years ended December 31, 2007 together
with the combined period of January 1, 2006 through December 31, 2006:
2006 Combined 2007 Successor
In millions of USD
For the yearended
December 31, Effects of PPA
As adjusted to eliminate PPA
effects
For the year ended
December 31, Effects of PPA
As adjusted to eliminate PPA
effects Total sales 6,238 - 6,238 6,321 - 6,321% nominal growth 5.4 - 5.4 1.3 - 1.3% comparable growth 5.4 - 5.4 1.4 - 1.4 Gross margin 2,148 (200) 2,348 2,045 (140) 2,185Selling expenses (457) - (457 ) (425) - (425 )General & administrative expenses (632
) (154
) (478 ) (1,189
) (636) (553
)
Research & development expenses (1,916
) (664
) (1,252 ) (1,343
) (15) (1,328
)
Other income 26 - 26 134 - 134Income (loss) from operations (831
) (1,018
) 187 (778
) (791) 13
Financial income and (expenses) (121
) -
(121 ) (181
) - (181
)
Income tax benefit (expense) 231
293
(62 ) 396
247 149
Results equity-accounted investees 1
-
1 (40 ) - (40
)
Minority interests (68) - (68 ) (47) - (47 ) Net income/(loss) (788) (725) (63 ) (650) (544) (106 )
[-45]
Sales
Sales growth composition 2007 versus 2006
In % comparable
growth currency
effects consolidation
changes nominal growth
Mobile & Personal 13.8 1.6 (7.2) 8.2 Home (20.4) (0.5 ) (0.8) (21.7) Automotive & Identification 8.8 5.4 7.2 21.4 MultiMarket Semiconductors (0.7) 2.1 (5.7) (4.3) Manufacturing Operations (15.6) 0.2 16.8 1.4 Corporate and Other - - - - 1.4 2.2 (2.3) 1.3
Sales were USD 6,321 million in 2007 compared to USD 6,238 million for 2006, an increase of
1.3% (an increase of 1.4% on a comparable basis). Sales were positively affected by stronger sales
in Automotive & Identification and the development of the EUR/USD exchange rate and partly
offset by lower sales in the Home segment.
Gross margin Gross margin declined from USD 2,148 million in 2006 to USD 2,045 million in 2007 and from
34.4% in 2006 to 32.4% in 2007 as a percentage of sales. The 2007 gross margin was impacted by
an increase in incidental items from USD 80 million in 2006 to USD 229 million in 2007, which
was partially offset by a decrease in the effects of PPA of USD 60 million. The decrease in PPA
effects was related to the depreciation of tangible fixed assets and write-off of inventories from
USD 200 million in 2006 to USD 140 million in 2007.
The remaining change in gross margin was a result of price erosion and unfavorable product mix,
which was offset by higher utilization and better performance of our manufacturing facilities.
Selling expenses Selling expenses were USD 425 million in 2007, compared to USD 457 million in 2006. As a
percentage of sales, selling expenses for 2007 were 6.7% compared to 7.3% in 2006. The decrease
in selling expenses in 2007 was mainly caused by the consolidation of sales offices, which also
resulted in a more transparent cost structure. The 2007 selling expenses included restructuring
charges of USD 16 million (2006: USD 14 million).
General and administrative expenses G&A expenses were USD 1,189 million in 2007, compared to USD 632 million in 2006, an increase
of USD 557 million. The increase was primarily due to the full year impact of the PPA effects
resulting from the amortization of intangible assets, which increased to USD 636 million in 2007
compared to USD 154 million in 2006. The remaining increase was mainly related to incidental
items of USD 98 million including, amongst others, IT system reorganization costs from Philips
(USD 75 million) and USD 26 million for equity-based compensation.
In 2006, restructuring charges of USD 32 million were incurred. The Business Renewal Program,
which was a predecessor to our Redesign Program, partly offset higher additional G&A expenses in
2007. PPA effects in 2007 amounted to USD 636 million and were related to the amortization of
intangible assets (2006: USD 154 million).
Management discussion and analysis
[-46]
Research and Development expenses
Research and Development expenditures per sector 2006 Combined 2007 Successor In millions of USD amount % of sales amount % of sales Mobile & Personal 466 23.6 510 23.9 Home 246 20.8 258 27.8 Automotive & Identification 160 14.6 205 15.4 MultiMarket Semiconductors 116 6.9 118 7.3 Manufacturing Operations 95 45.0 48 22.4 Corporate and Other 169 - 189 - 1,252 20.1 1,328 21.0 Excludes the write-off of acquired in-process R&D of USD 15 million in 2007 (2006: USD 664 million).
R&D expenses and write-off of acquired in-process research and development were USD 1,343
million in 2007, down from USD 1,916 million in 2006. The 2006 expenses included a charge of
USD 664 million relating to the write-off of acquired in-process R&D. Without taking into account
the charge in 2006, R&D expenses and write-off of acquired in-process research and development
increased by USD 91 million in 2007. This increase was a result of increased incidental costs of
USD 20 million, due to restructuring charges of USD 12 million related to the rightsizing of the
Home R&D organization, compared to incidental costs of USD 29 million in 2006. The divestment
of some of our product lines (including DVD-R, Power Amplifiers/Front End Modules, Large Display
Driver and our Cordless & VoIP Terminal operations) freed up R&D resources in 2007, which we
refocused on key battle areas in Mobile & Personal (especially 3G cellular systems) and Automotive
& Identification.
Other income Other income and expense was USD 134 million for 2007, mainly related to the gain of
USD 119 million from the sale of Cordless & VoIP Terminal operations. The remainder of other
income and expense was attributable to gains from disposal of various tangible fixed assets. For
2006, other income and expense was USD 26 million, reflecting the sale of property, release of
litigation provisions and a settlement of a legal dispute with a supplier.
[-47]
Restructuring charges The following table presents restructuring charges by segment as included in income from
operations:
Restructuring charges In millions of USD 2006 Combined 2007 Successor Restructuring: Mobile & Personal - 11Home 9 19Automotive & Identification - -MultiMarket Semiconductors (1 ) 1Manufacturing Operations 5 133Corporate and Other 13 54Total restructuring charges 26 218
Income (loss) from operations (IFO) Loss from operations was USD 778 million in 2007, compared to a loss of USD 831 million in
2006. Excluding the PPA effect of USD 791 million, 2007 income from operations was a profit of
USD 13 million compared to USD 187 million in 2006 (excluding the PPA effect of USD 1,018
million).
Financial income and expense
Financial income and expenses In millions of USD 2006 Combined 2007 Successor Interest income 19 43 Interest expense (144 ) (495) Impairment loss securities - (21) Foreign exchange results 62 300 Other (58 ) (8 ) (121 ) (181)
Financial income and expenses was a net expense of USD 181 million for 2007 compared to a net expense of USD 121 million in 2006. This change was primarily attributable to the full year impact of interest expense associated with the borrowings used to fund the acquisition by KASLION in 2006, which increased interest expenses by USD 327 million, partly offset by foreign exchange rate gains of USD 300 million. Financial income and expenses in 2007 also included an impairment loss of USD 21 million reflecting a decline in the DSP Group Inc. (ÂÂDSPGÊÊ) share price and hence of the value of our stake in DSPG.
Income tax benefit (expenses) The income tax benefit in 2007 was USD 396 million, compared to USD 231 million in 2006. In 2007, the PPA effects included in income tax amounted to a benefit of USD 247 million compared to a benefit of USD 293 million in 2006. Prior to the acquisition by KASLION, our tax rate reflected internal allocations from Philips and therefore our 2006 tax results are not comparable.
Management discussion and analysis
[-48]
Results relating to equity-accounted investees Results relating to the equity-accounted investees in 2007 showed a loss of USD 40 million compared to a gain of USD 1 million in 2006 and relate to our participations in ASMC and T3G. The loss recorded for ASMC included an impairment charge of USD 29 million, reflecting the lower share price value of ASMC at the end of December 2007.
Minority interests Minority interests in 2007 were a loss of USD 47 million and were related to our joint ventures
SSMC (USD 46 million) and Jilin NXP Semiconductor Ltd. (ÂÂJilinÊÊ) (USD 1 million). The minority
interest in 2006 was a loss of USD 65 million in SSMC and USD 3 million in Jilin. In November 2006
we increased our shareholding in SSMC from 50.5% to 61.2%.
Net income Net loss decreased from USD 788 million in 2006 to a loss of USD 650 million in 2007 as result
of the items discussed above.
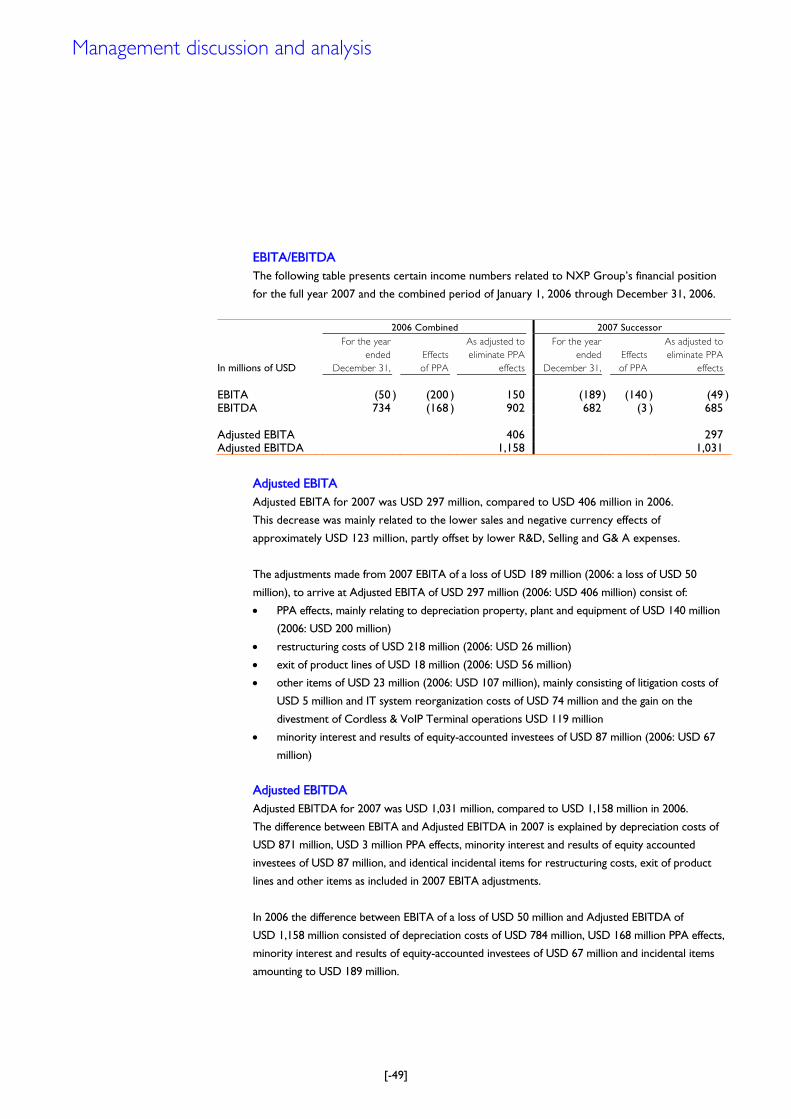
[-49]
EBITA/EBITDA The following table presents certain income numbers related to NXP GroupÊs financial position
for the full year 2007 and the combined period of January 1, 2006 through December 31, 2006.
2006 Combined 2007 Successor
In millions of USD
For the year
ended
December 31,
Effects
of PPA
As adjusted to
eliminate PPA
effects
For the year
ended
December 31,
Effects
of PPA
As adjusted to
eliminate PPA
effects
EBITA (50 ) (200 ) 150 (189 ) (140 ) (49 )EBITDA 734 (168 ) 902 682 (3 ) 685 Adjusted EBITA 406 297Adjusted EBITDA 1,158 1,031
Adjusted EBITA Adjusted EBITA for 2007 was USD 297 million, compared to USD 406 million in 2006.
This decrease was mainly related to the lower sales and negative currency effects of
approximately USD 123 million, partly offset by lower R&D, Selling and G& A expenses.
The adjustments made from 2007 EBITA of a loss of USD 189 million (2006: a loss of USD 50
million), to arrive at Adjusted EBITA of USD 297 million (2006: USD 406 million) consist of:
• PPA effects, mainly relating to depreciation property, plant and equipment of USD 140 million
(2006: USD 200 million)
• restructuring costs of USD 218 million (2006: USD 26 million)
• exit of product lines of USD 18 million (2006: USD 56 million)
• other items of USD 23 million (2006: USD 107 million), mainly consisting of litigation costs of
USD 5 million and IT system reorganization costs of USD 74 million and the gain on the
divestment of Cordless & VoIP Terminal operations USD 119 million
• minority interest and results of equity-accounted investees of USD 87 million (2006: USD 67
million)
Adjusted EBITDA Adjusted EBITDA for 2007 was USD 1,031 million, compared to USD 1,158 million in 2006.
The difference between EBITA and Adjusted EBITDA in 2007 is explained by depreciation costs of
USD 871 million, USD 3 million PPA effects, minority interest and results of equity accounted
investees of USD 87 million, and identical incidental items for restructuring costs, exit of product
lines and other items as included in 2007 EBITA adjustments.
In 2006 the difference between EBITA of a loss of USD 50 million and Adjusted EBITDA of
USD 1,158 million consisted of depreciation costs of USD 784 million, USD 168 million PPA effects,
minority interest and results of equity-accounted investees of USD 67 million and incidental items
amounting to USD 189 million.
Management discussion and analysis
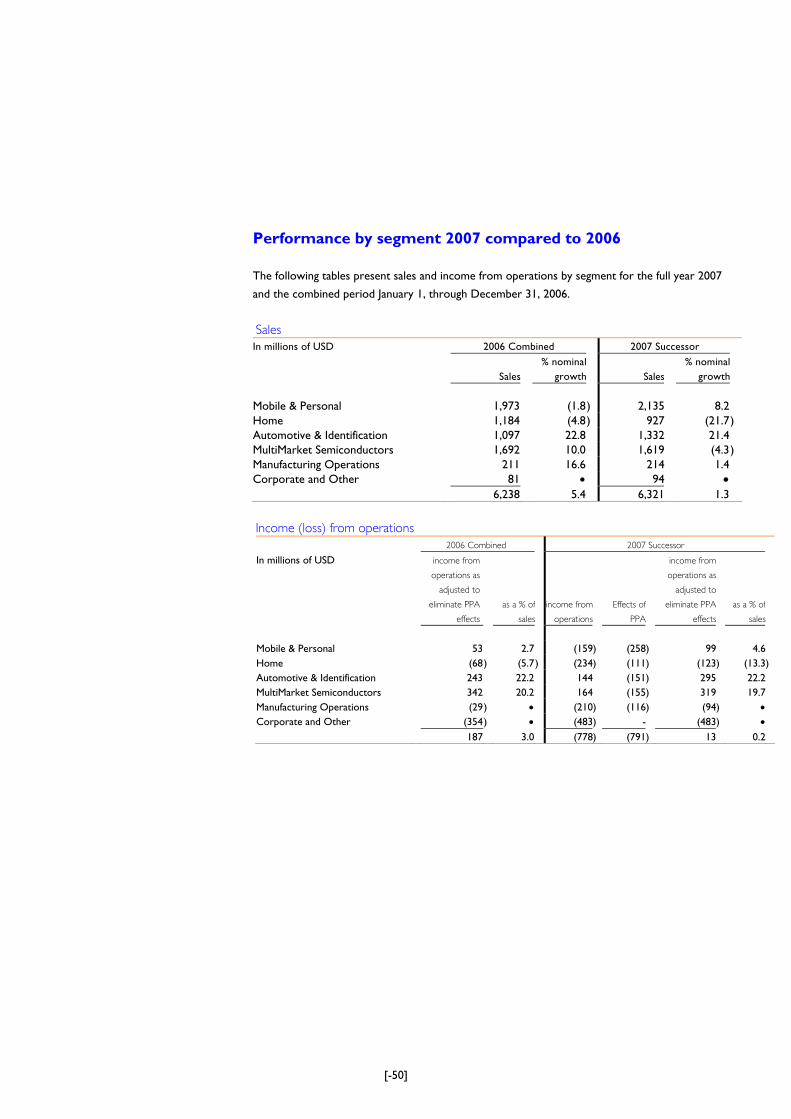
[-50]
Performance by segment 2007 compared to 2006
The following tables present sales and income from operations by segment for the full year 2007
and the combined period January 1, through December 31, 2006.
Sales
In millions of USD 2006 Combined 2007 Successor
Sales% nominal
growth Sales% nominal
growth Mobile & Personal 1,973 (1.8 ) 2,135 8.2 Home 1,184 (4.8 ) 927 (21.7) Automotive & Identification 1,097 22.8 1,332 21.4 MultiMarket Semiconductors 1,692 10.0 1,619 (4.3) Manufacturing Operations 211 16.6 214 1.4 Corporate and Other 81 • 94 • 6,238 5.4 6,321 1.3
Income (loss) from operations
2006 Combined 2007 Successor
In millions of USD income from
operations as
adjusted to
eliminate PPA
effects
as a % of
sales
income from
operations
Effects of
PPA
income from
operations as
adjusted to
eliminate PPA
effects
as a % of
sales
Mobile & Personal 53 2.7 (159) (258) 99 4.6 Home (68) (5.7) (234) (111) (123) (13.3) Automotive & Identification 243 22.2 144 (151) 295 22.2 MultiMarket Semiconductors 342 20.2 164 (155) 319 19.7 Manufacturing Operations (29) • (210) (116) (94) • Corporate and Other (354) • (483) - (483) • 187 3.0 (778) (791) 13 0.2
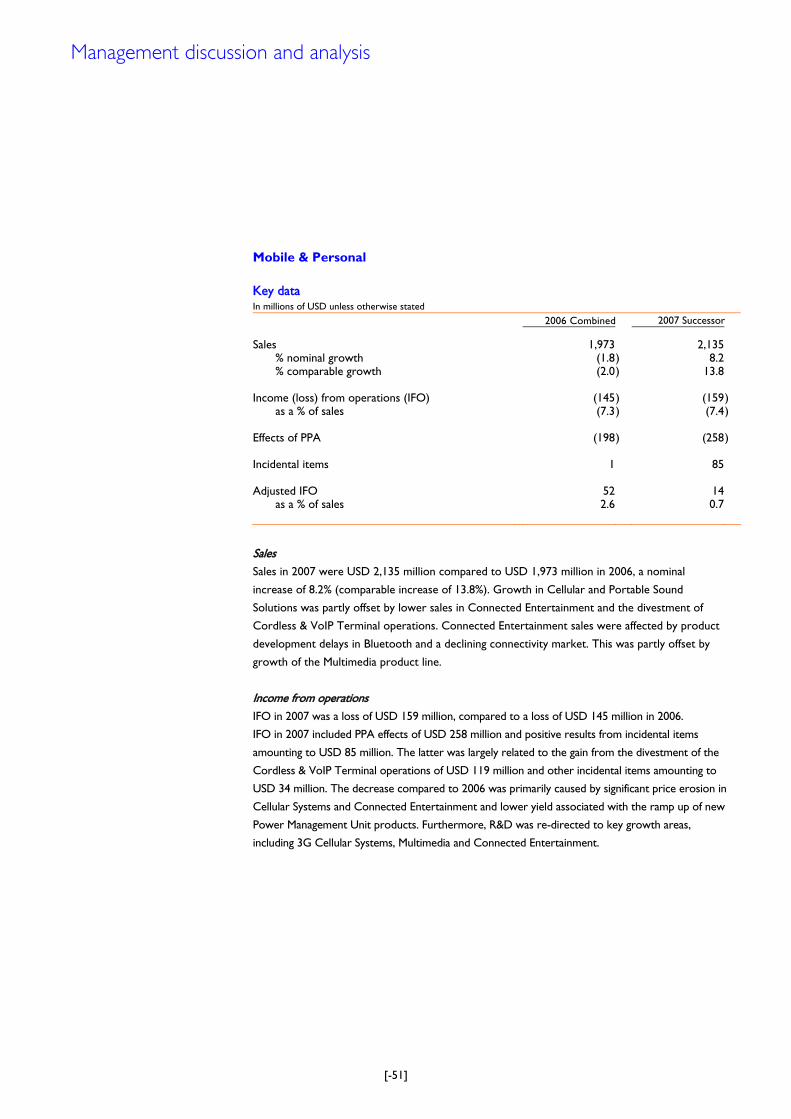
[-51]
Mobile & Personal Key data In millions of USD unless otherwise stated
2006 Combined 2007 Successor
Sales 1,973 2,135 % nominal growth (1.8 ) 8.2 % comparable growth (2.0 ) 13.8 Income (loss) from operations (IFO) (145 ) (159) as a % of sales (7.3 ) (7.4) Effects of PPA (198 ) (258) Incidental items 1 85 Adjusted IFO 52 14 as a % of sales 2.6 0.7
Sales Sales in 2007 were USD 2,135 million compared to USD 1,973 million in 2006, a nominal
increase of 8.2% (comparable increase of 13.8%). Growth in Cellular and Portable Sound
Solutions was partly offset by lower sales in Connected Entertainment and the divestment of
Cordless & VoIP Terminal operations. Connected Entertainment sales were affected by product
development delays in Bluetooth and a declining connectivity market. This was partly offset by
growth of the Multimedia product line.
Income from operations IFO in 2007 was a loss of USD 159 million, compared to a loss of USD 145 million in 2006.
IFO in 2007 included PPA effects of USD 258 million and positive results from incidental items
amounting to USD 85 million. The latter was largely related to the gain from the divestment of the
Cordless & VoIP Terminal operations of USD 119 million and other incidental items amounting to
USD 34 million. The decrease compared to 2006 was primarily caused by significant price erosion in
Cellular Systems and Connected Entertainment and lower yield associated with the ramp up of new
Power Management Unit products. Furthermore, R&D was re-directed to key growth areas,
including 3G Cellular Systems, Multimedia and Connected Entertainment.
Management discussion and analysis
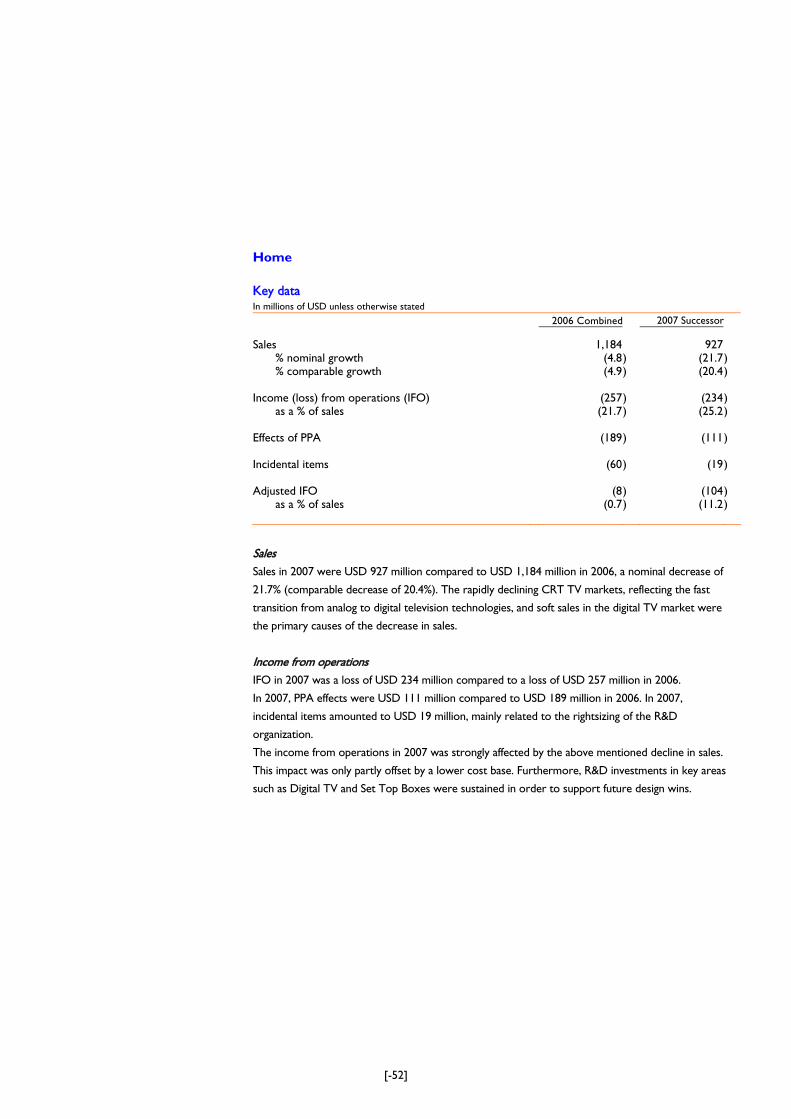
[-52]
Home Key data In millions of USD unless otherwise stated
2006 Combined 2007 Successor Sales 1,184 927 % nominal growth (4.8 ) (21.7) % comparable growth (4.9 ) (20.4) Income (loss) from operations (IFO) (257 ) (234) as a % of sales (21.7 ) (25.2) Effects of PPA (189 ) (111) Incidental items (60 ) (19) Adjusted IFO (8 ) (104) as a % of sales (0.7 ) (11.2)
Sales Sales in 2007 were USD 927 million compared to USD 1,184 million in 2006, a nominal decrease of
21.7% (comparable decrease of 20.4%). The rapidly declining CRT TV markets, reflecting the fast
transition from analog to digital television technologies, and soft sales in the digital TV market were
the primary causes of the decrease in sales.
Income from operations IFO in 2007 was a loss of USD 234 million compared to a loss of USD 257 million in 2006.
In 2007, PPA effects were USD 111 million compared to USD 189 million in 2006. In 2007,
incidental items amounted to USD 19 million, mainly related to the rightsizing of the R&D
organization.
The income from operations in 2007 was strongly affected by the above mentioned decline in sales.
This impact was only partly offset by a lower cost base. Furthermore, R&D investments in key areas
such as Digital TV and Set Top Boxes were sustained in order to support future design wins.
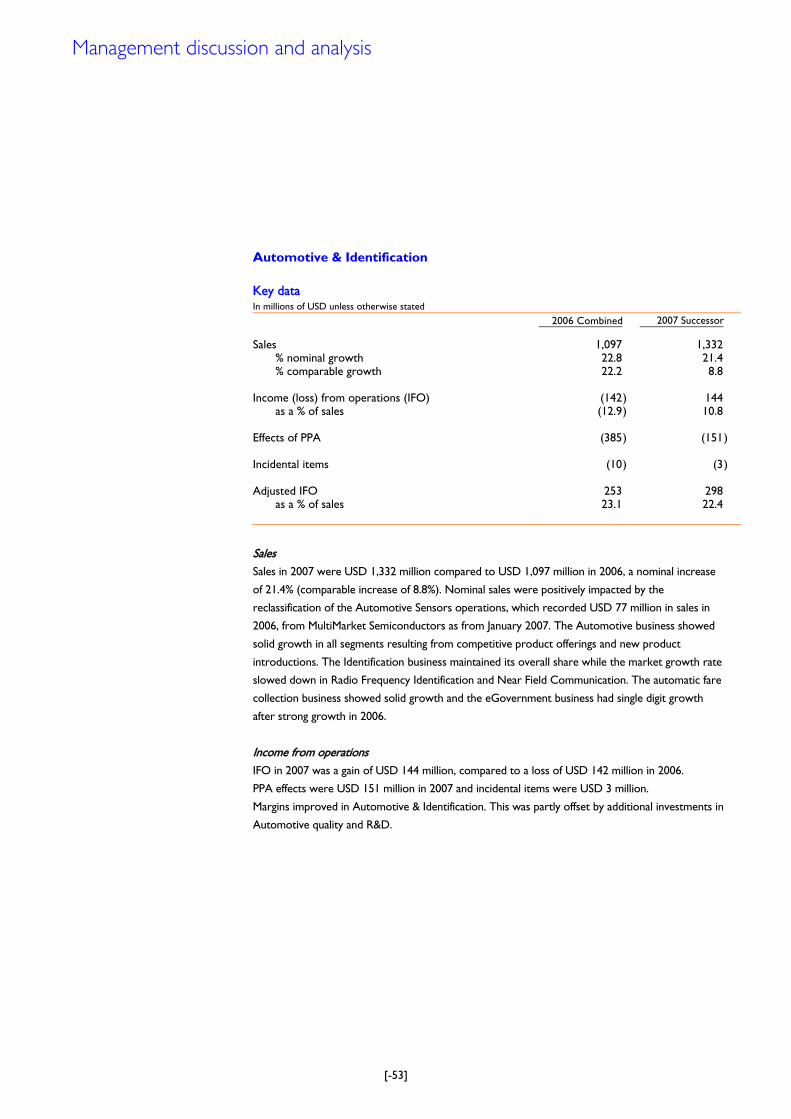
[-53]
Automotive & Identification Key data In millions of USD unless otherwise stated
2006 Combined 2007 Successor Sales 1,097 1,332 % nominal growth 22.8 21.4 % comparable growth 22.2 8.8 Income (loss) from operations (IFO) (142 ) 144 as a % of sales (12.9 ) 10.8 Effects of PPA (385 ) (151) Incidental items (10 ) (3) Adjusted IFO 253 298 as a % of sales 23.1 22.4
Sales Sales in 2007 were USD 1,332 million compared to USD 1,097 million in 2006, a nominal increase
of 21.4% (comparable increase of 8.8%). Nominal sales were positively impacted by the
reclassification of the Automotive Sensors operations, which recorded USD 77 million in sales in
2006, from MultiMarket Semiconductors as from January 2007. The Automotive business showed
solid growth in all segments resulting from competitive product offerings and new product
introductions. The Identification business maintained its overall share while the market growth rate
slowed down in Radio Frequency Identification and Near Field Communication. The automatic fare
collection business showed solid growth and the eGovernment business had single digit growth
after strong growth in 2006.
Income from operations IFO in 2007 was a gain of USD 144 million, compared to a loss of USD 142 million in 2006.
PPA effects were USD 151 million in 2007 and incidental items were USD 3 million.
Margins improved in Automotive & Identification. This was partly offset by additional investments in
Automotive quality and R&D.
Management discussion and analysis
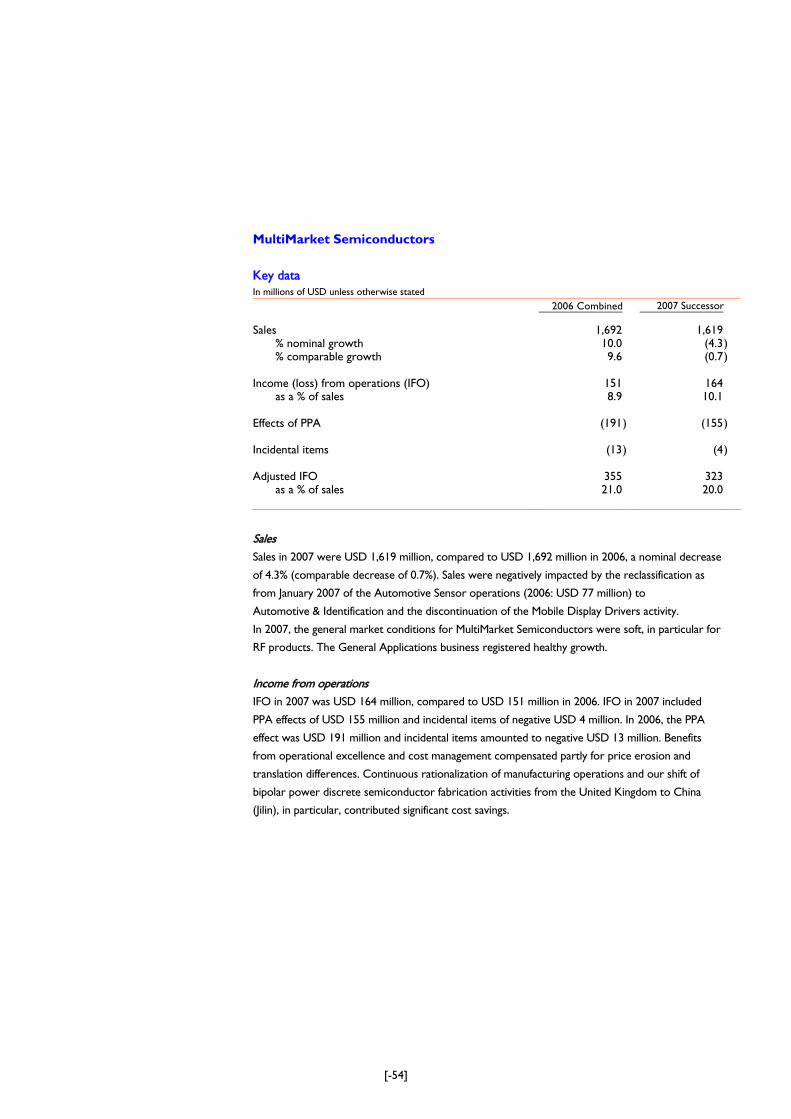
[-54]
MultiMarket Semiconductors
Key data In millions of USD unless otherwise stated 2006 Combined 2007 Successor Sales 1,692 1,619 % nominal growth 10.0 (4.3) % comparable growth 9.6 (0.7) Income (loss) from operations (IFO) 151 164 as a % of sales 8.9 10.1 Effects of PPA (191 ) (155) Incidental items (13 ) (4) Adjusted IFO 355 323 as a % of sales 21.0 20.0
Sales Sales in 2007 were USD 1,619 million, compared to USD 1,692 million in 2006, a nominal decrease
of 4.3% (comparable decrease of 0.7%). Sales were negatively impacted by the reclassification as
from January 2007 of the Automotive Sensor operations (2006: USD 77 million) to
Automotive & Identification and the discontinuation of the Mobile Display Drivers activity.
In 2007, the general market conditions for MultiMarket Semiconductors were soft, in particular for
RF products. The General Applications business registered healthy growth.
Income from operations IFO in 2007 was USD 164 million, compared to USD 151 million in 2006. IFO in 2007 included
PPA effects of USD 155 million and incidental items of negative USD 4 million. In 2006, the PPA
effect was USD 191 million and incidental items amounted to negative USD 13 million. Benefits
from operational excellence and cost management compensated partly for price erosion and
translation differences. Continuous rationalization of manufacturing operations and our shift of
bipolar power discrete semiconductor fabrication activities from the United Kingdom to China
(Jilin), in particular, contributed significant cost savings.
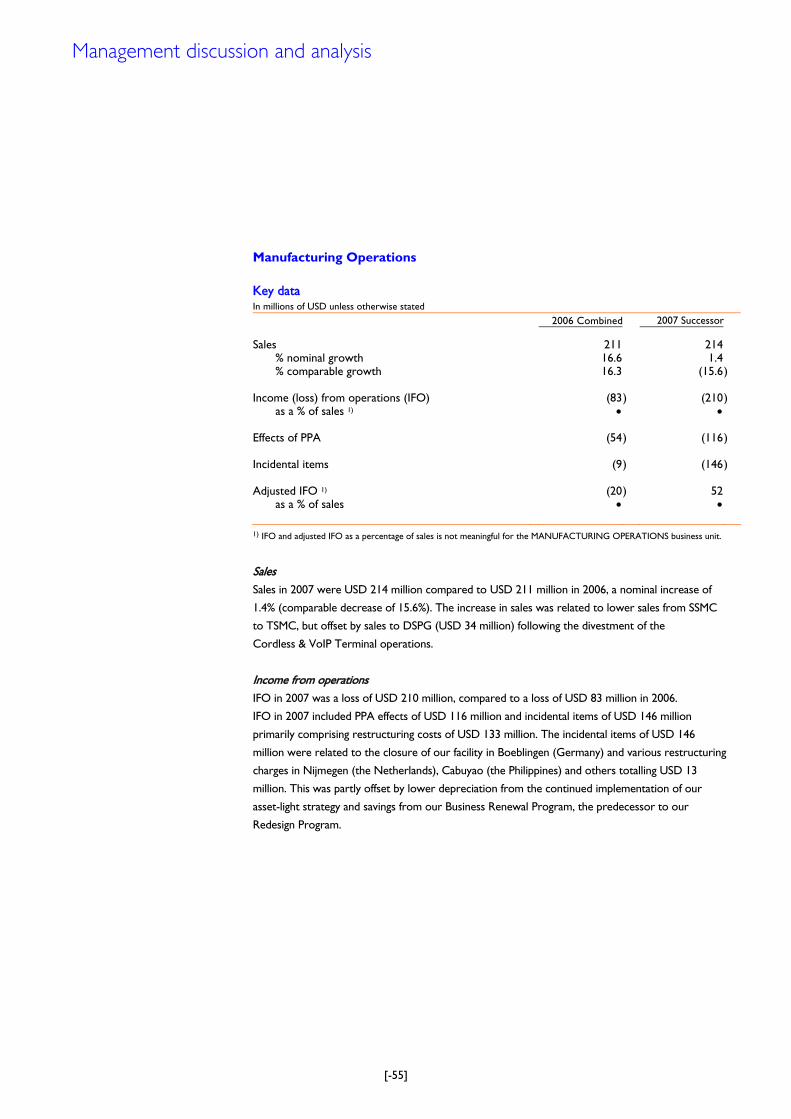
[-55]
Manufacturing Operations Key data In millions of USD unless otherwise stated
2006 Combined 2007 Successor Sales 211 214 % nominal growth 16.6 1.4 % comparable growth 16.3 (15.6) Income (loss) from operations (IFO) (83 ) (210) as a % of sales 1) • • Effects of PPA (54 ) (116) Incidental items (9 ) (146) Adjusted IFO 1) (20 ) 52 as a % of sales • • 1) IFO and adjusted IFO as a percentage of sales is not meaningful for the MANUFACTURING OPERATIONS business unit.
Sales Sales in 2007 were USD 214 million compared to USD 211 million in 2006, a nominal increase of
1.4% (comparable decrease of 15.6%). The increase in sales was related to lower sales from SSMC
to TSMC, but offset by sales to DSPG (USD 34 million) following the divestment of the
Cordless & VoIP Terminal operations.
Income from operations IFO in 2007 was a loss of USD 210 million, compared to a loss of USD 83 million in 2006.
IFO in 2007 included PPA effects of USD 116 million and incidental items of USD 146 million
primarily comprising restructuring costs of USD 133 million. The incidental items of USD 146
million were related to the closure of our facility in Boeblingen (Germany) and various restructuring
charges in Nijmegen (the Netherlands), Cabuyao (the Philippines) and others totalling USD 13
million. This was partly offset by lower depreciation from the continued implementation of our
asset-light strategy and savings from our Business Renewal Program, the predecessor to our
Redesign Program.
Management discussion and analysis
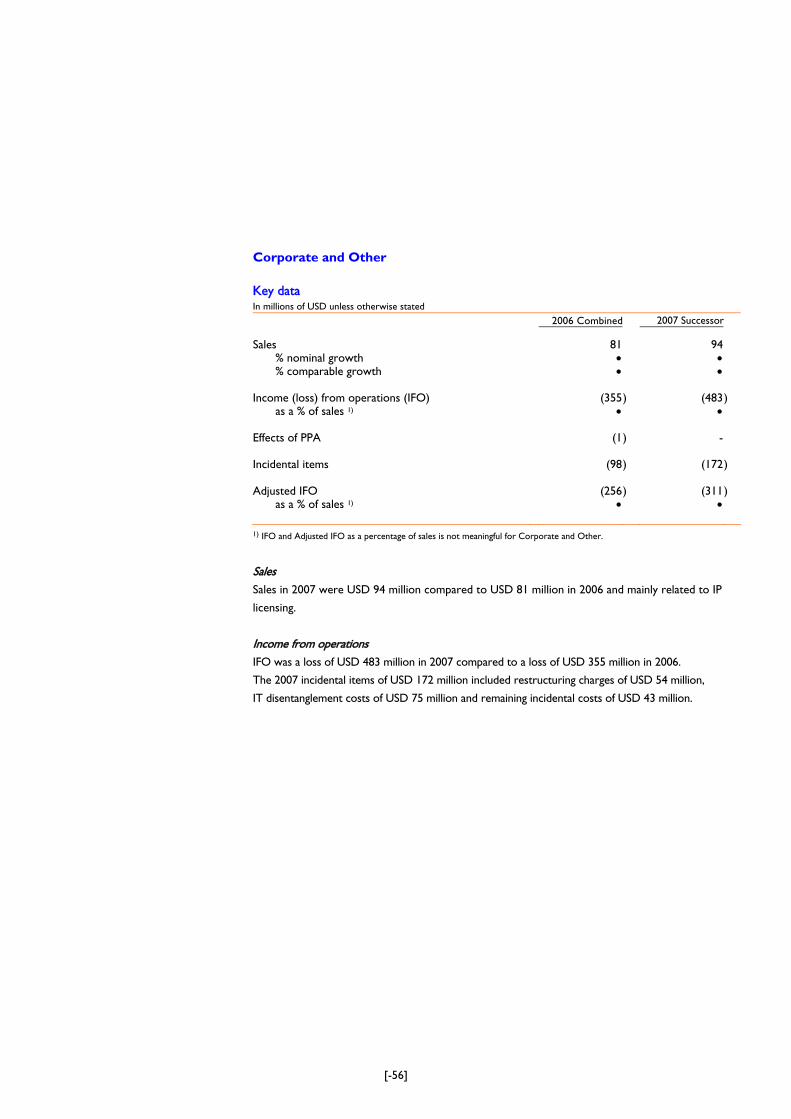
[-56]
Corporate and Other Key data In millions of USD unless otherwise stated
2006 Combined 2007 Successor Sales 81 94 % nominal growth • • % comparable growth • • Income (loss) from operations (IFO) (355 ) (483) as a % of sales 1) • • Effects of PPA (1 ) - Incidental items (98 ) (172) Adjusted IFO (256 ) (311) as a % of sales 1) • • 1) IFO and Adjusted IFO as a percentage of sales is not meaningful for Corporate and Other.
Sales Sales in 2007 were USD 94 million compared to USD 81 million in 2006 and mainly related to IP
licensing.
Income from operations IFO was a loss of USD 483 million in 2007 compared to a loss of USD 355 million in 2006.
The 2007 incidental items of USD 172 million included restructuring charges of USD 54 million,
IT disentanglement costs of USD 75 million and remaining incidental costs of USD 43 million.
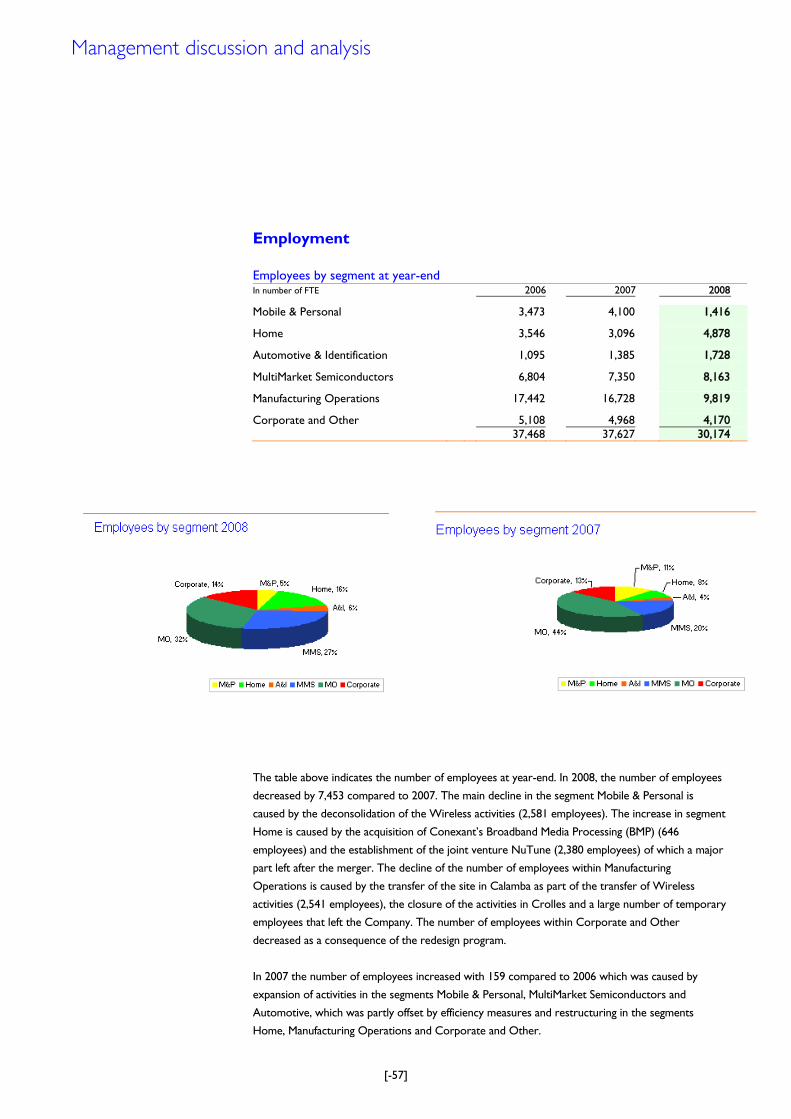
[-57]
Employment
Employees by segment at year-end In number of FTE 2006 2007 2008 Mobile & Personal 3,473 4,100 1,416 Home 3,546 3,096 4,878 Automotive & Identification 1,095 1,385 1,728 MultiMarket Semiconductors 6,804 7,350 8,163 Manufacturing Operations 17,442 16,728 9,819 Corporate and Other 5,108 4,968 4,170 37,468 37,627 30,174
The table above indicates the number of employees at year-end. In 2008, the number of employees
decreased by 7,453 compared to 2007. The main decline in the segment Mobile & Personal is
caused by the deconsolidation of the Wireless activities (2,581 employees). The increase in segment
Home is caused by the acquisition of ConexantÊs Broadband Media Processing (BMP) (646
employees) and the establishment of the joint venture NuTune (2,380 employees) of which a major
part left after the merger. The decline of the number of employees within Manufacturing
Operations is caused by the transfer of the site in Calamba as part of the transfer of Wireless
activities (2,541 employees), the closure of the activities in Crolles and a large number of temporary
employees that left the Company. The number of employees within Corporate and Other
decreased as a consequence of the redesign program.
In 2007 the number of employees increased with 159 compared to 2006 which was caused by
expansion of activities in the segments Mobile & Personal, MultiMarket Semiconductors and
Automotive, which was partly offset by efficiency measures and restructuring in the segments
Home, Manufacturing Operations and Corporate and Other.
Management discussion and analysis
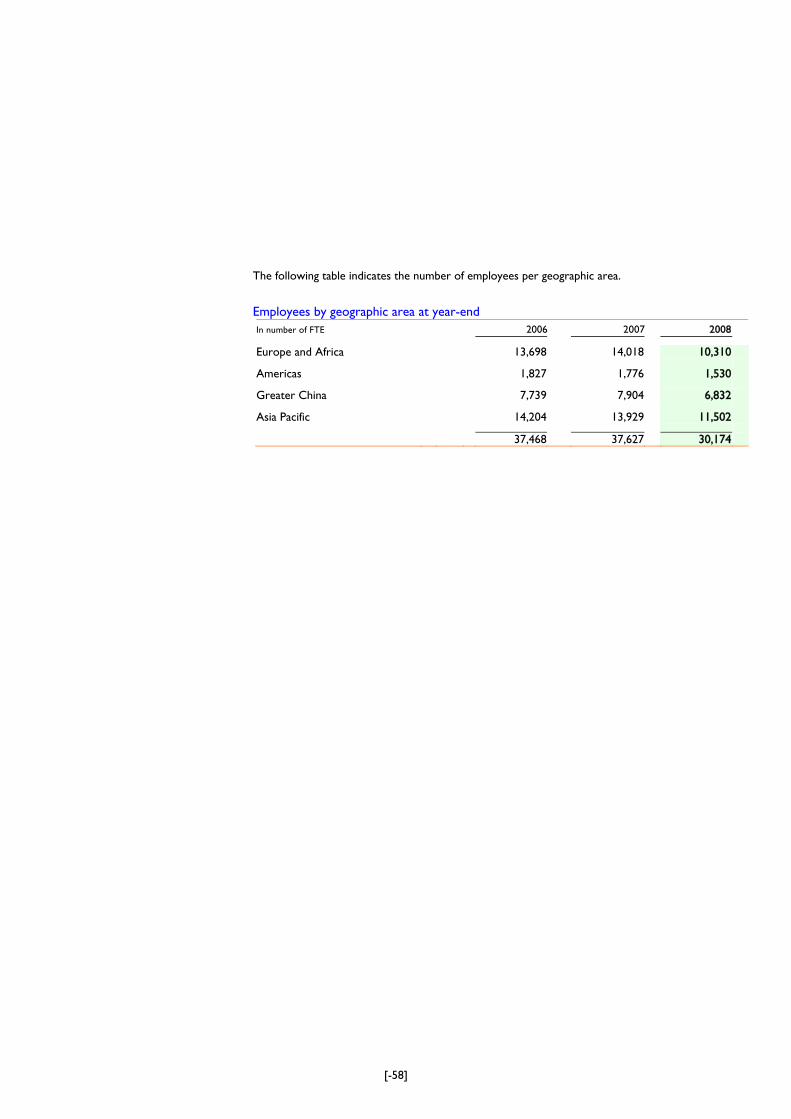
[-58]
The following table indicates the number of employees per geographic area.
Employees by geographic area at year-end In number of FTE 2006 2007 2008 Europe and Africa 13,698 14,018 10,310 Americas 1,827 1,776 1,530 Greater China 7,739 7,904 6,832 Asia Pacific 14,204 13,929 11,502 37,468 37,627 30,174
[-59]
Liquidity and capital resources
Historically, our liquidity was primarily derived from cash generated by our operations, which
generated cash flows of USD 960 million in 2006 and USD 533 million in 2007. In 2008, however,
we were required to fund cash outflows from operations of USD 622 million. Typically, we
expect to generate more sales, and therefore more cash, in the second half of the year to
compensate for a weaker first half. However, in 2008, our second half revenues were affected by
the economic downturn, leading to cash flows that were approximately neutral in the second half
of 2008 and negative for the whole year. In 2008, we also generated significant cash from the sale
of our wireless operations.
We continually assess our cash on hand, available financing and cash requirements as part of our
overall risk management strategy. In November 2008, we borrowed USD 400 million under our
senior secured revolving credit facility, which increased our available cash on hand. Our cash flow
requirements are dependent on various factors, including anticipated working capital needs,
scheduled interest repayments, planned capital expenditures and the cost of restructuring
programs. Our working capital requirements are directly impacted by the underlying
performance of our business and as a result, are subject to significant fluctuation in the current
economy. In addition, expected cash requirements associated with the Redesign Program are
based on our current estimates of costs and may change as we finalize and implement the
program.
At December 31, 2008, we had cash on hand of USD 1,796 million and availability under our
senior secured revolving credit facility. After an additional drawdown of USD 200 million on
February 13, 2009, we have borrowed USD 600 million under the facility. At February 13, 2009,
we had remaining capacity under that facility of approximately EUR 39 million, after taking into
account outstanding bank guarantees under the facility. At December 31, 2008, USD 190 million
of our cash on hand was held at our joint venture subsidiary, SSMC, and our ability to receive
this cash is dependent upon agreement with our joint venture partner to make distributions. A
portion of any distribution must also be paid to our joint venture partner. In 2008, SSMC
distributed USD 200 million of cash of which USD 78 million was distributed to our joint venture
partner.
We have developed forecasts and projections of cash flows and liquidity needs for the upcoming
year taking into account the current market conditions, reasonably possible changes in trading
performance based on such conditions, and our ability to modify our cost structure as a result of
changing economic conditions and sales levels. We have also considered in the forecasts our
available cash on hand and our available borrowings under our revolving credit facility, the impact
of the initiated debt-for-debt exchange and our ability to access additional indebtedness.
Based on these analyses, we believe that our cash on hand will provide sufficient liquidity to fund
our current obligations, expected working capital requirements, the cost of the Redesign
Program and our planned capital expenditures for a period that includes at least the next 12
months.
Management discussion and analysis
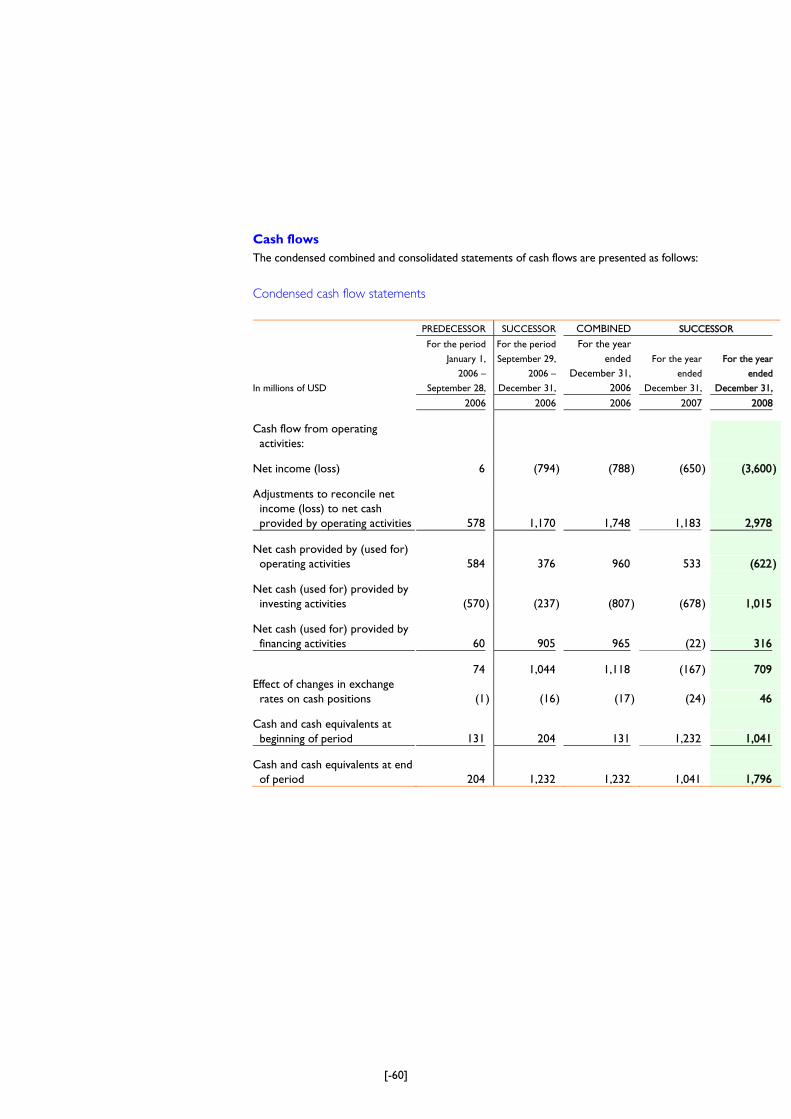
[-60]
Cash flows The condensed combined and consolidated statements of cash flows are presented as follows:
Condensed cash flow statements
PREDECESSOR SUCCESSOR COMBINED SUCCESSOR
In millions of USD
For the period
January 1,
2006 –
September 28,
For the period
September 29,
2006 –
December 31,
For the year ended
December 31, 2006
For the year
ended
December 31,
For the year
ended
December 31,
2006 2006 2006 2007 2008 Cash flow from operating activities:
Net income (loss) 6 (794) (788 ) (650) (3,600) Adjustments to reconcile net income (loss) to net cash provided by operating activities 578 1,170 1,748 1,183 2,978 Net cash provided by (used for) operating activities 584 376 960 533 (622) Net cash (used for) provided by investing activities (570) (237) (807 ) (678) 1,015 Net cash (used for) provided by financing activities 60 905 965 (22) 316 74 1,044 1,118 (167) 709 Effect of changes in exchange rates on cash positions (1) (16) (17 ) (24) 46 Cash and cash equivalents at beginning of period 131 204 131 1,232 1,041 Cash and cash equivalents at end of period 204 1,232 1,232 1,041 1,796
[-61]
Cash flow from operating activities We used USD 622 million of cash to fund our operations in 2008 compared to cash flows
generated by operations of USD 533 million in 2007. The operating cash flows were directly
impacted by our net loss in 2008 of USD 3,600 million (2007: a loss of USD 650 million). The
2008 net loss included non-cash items, which consist primarily of depreciation and amortization,
write-off of acquired in-process R&D of USD 1,296 million (2007: USD 1,547 million),
impairment charges of USD 714 million and losses (including an impairment charge of USD 249
million) relating to equity accounted investees and minority interests of USD 294 million (2007:
USD 87 million). Furthermore, it included net losses on the sale of assets of USD 369 million
(2007: a gain of USD 114 million), which proceeds are included in cash flow from investing
activities. The 2008 net loss also included an incidental charge for restructuring of USD 594
million (2007: USD 218 million) and other items of losses of USD 120 million (2007: profits of
USD 251 million). This decrease in cash flow was associated with operations and resulted from
lower cash receipts from customers of approximately USD 800 million, mainly due to the lower
sales level, and higher net payments for interest and taxes (2008: USD 567 million; 2007: USD
481 million). This was partly offset by lower cash payments to suppliers. The net cash provided
by operating activities for 2007 was USD 533 million compared to USD 960 million for 2006. The
decrease was primarily caused by higher net cash payments for interest and taxes (2007: USD
481 million; 2006: USD 92 million).
Cash flow from investing activities The Company generated cash flow from investing activities of USD 1,015 million in 2008,
compared to a cash outflow of USD 678 million in 2007. The cash generated in 2008 was
primarily due to the net proceeds from the transfer of the wireless activities of USD 1,433
million, cash paid for the acquisition of BMP of USD 111 million and net capital expenditures of
USD 224 million. In 2007, the net cash used for investing activities was USD 678 million. This
related to net capital expenditures of USD 406 million, acquisition of the Cellular
Communications business of Silicon Laboratories Inc. (USD 288 million) and the final settlement
with Philips (USD 114 million) relating to our acquisition by KASLION in 2006. This was partly
offset by proceeds of USD 169 million from the divestment of Cordless & VoIP Terminal
operations. In 2006, the net cash used for investing activities was USD 807 million. Net capital
expenditures of USD 684 million and the purchase of an additional stake of 10.7% in SSMC for
USD 120 million were the main cash payments.
Cash flow from financing activities Our financing activities generated cash flows in 2008 of USD 316 million, compared to a use of
cash related to financing activities of USD 22 million in 2007. The net cash provided by financing
activities in 2008 mainly consists of USD 400 million from the drawing of the senior secured
revolving credit facility. Furthermore, in 2008, SSMC (in which we have a 61.2% ownership share)
repaid USD 200 million of paid-in capital to its shareholders. As a consequence, the USD 78
million that was paid to TSMC (our joint venture partner in SSMC) reduced the consolidated
cash position and was reflected in the cash flow from financing activities. The net cash used for
financing activities in 2007 fully related to a reduction in short term debt.
Management discussion and analysis
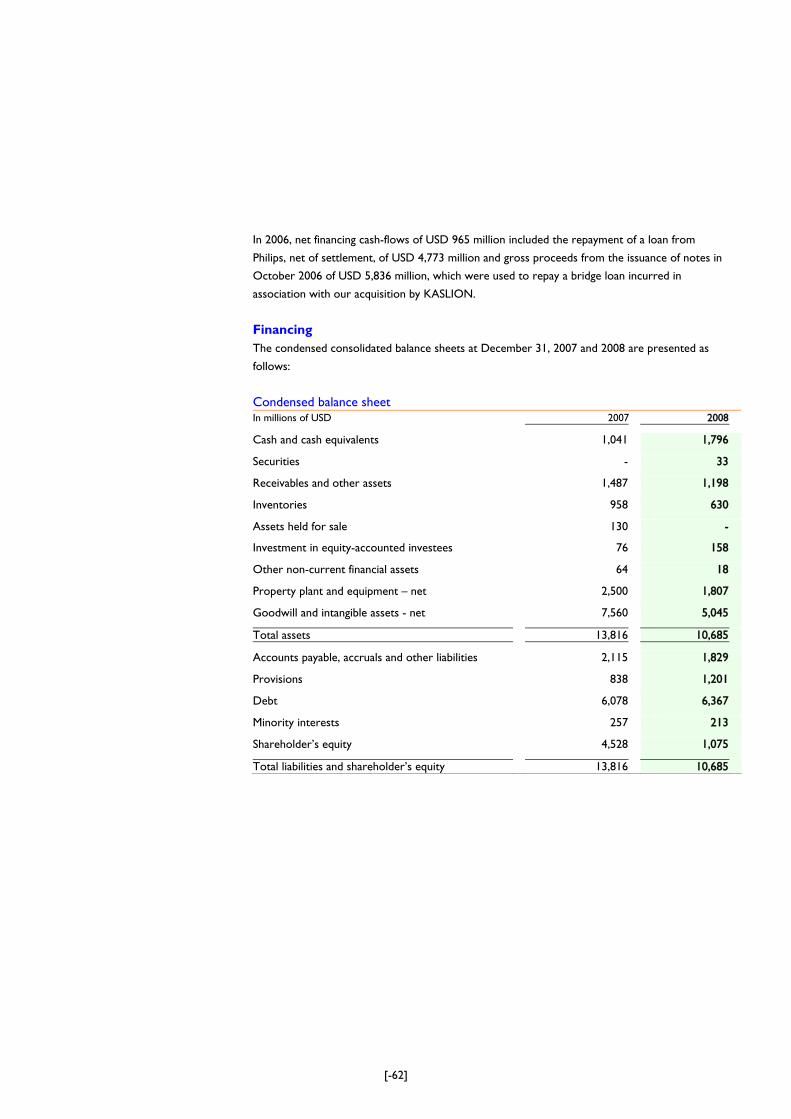
[-62]
In 2006, net financing cash-flows of USD 965 million included the repayment of a loan from
Philips, net of settlement, of USD 4,773 million and gross proceeds from the issuance of notes in
October 2006 of USD 5,836 million, which were used to repay a bridge loan incurred in
association with our acquisition by KASLION.
Financing The condensed consolidated balance sheets at December 31, 2007 and 2008 are presented as
follows:
Condensed balance sheet In millions of USD 2007 2008 Cash and cash equivalents 1,041 1,796 Securities - 33 Receivables and other assets 1,487 1,198 Inventories 958 630 Assets held for sale 130 - Investment in equity-accounted investees 76 158 Other non-current financial assets 64 18 Property plant and equipment – net 2,500 1,807 Goodwill and intangible assets - net 7,560 5,045 Total assets 13,816 10,685 Accounts payable, accruals and other liabilities 2,115 1,829 Provisions 838 1,201 Debt 6,078 6,367 Minority interests 257 213 ShareholderÊs equity 4,528 1,075 Total liabilities and shareholderÊs equity 13,816 10,685
[-63]
Cash and cash equivalents The CompanyÊs cash position at year end amounted to USD 1,796 million, compared to USD
1,041 million at the end of 2007.
The increase of the cash position is mainly caused by the proceeds from the transfer of the
Wireless activities of USD 1,433 million and the drawing of the revolving credit facility of USD
400 million, partly offset by negative Net Income of USD 1,071 (adjusted for non cash items) and
the acquisition of ConexantÊs Broadband Media Processing (BMP) of USD 111 million.
Related to the divestment of the Wireless activities we recognized gross proceeds of USD 1,550
million. Below table shows the calculation of the net proceeds and the use of these proceeds:
Gross cash proceeds 1,550 Transaction-related expenses and accruals incl. taxes * (514) Cash divested (33) Net available cash 1,003 Use of proceeds 2008: Relevant Capex 40 Conexant STB acquisition 111 Repayment revolving credit facility 450 Use of proceeds during 2008 601 Excess proceeds 402
* Any provisions, accruals and expenses related to the divestment of the Wireless business can be
deducted from the gross proceeds.
Debt position In October 2006, we issued an aggregate USD equivalent principal amount of USD 5,746 million
in fixed- and floating rate notes (which are still outstanding), in the following series:
EUR 1,000 million floating rate senior secured notes due 2013 (EURIBOR plus 2.75%)
USD 1,535 million floating rate senior secured notes due 2013 (LIBOR plus 2.75%)
USD 1,026 million 77⁄8% senior secured notes due 2014
EUR 525 million 85⁄8% senior notes due 2015
USD 1,250 million 91⁄2% senior notes due 2015
These notes require quarterly interest payments, in the case of the floating rate notes, or semi-
annual interest payments in the case of the remaining notes. The notes do not require
amortization and all principal is due on the notesÊ respective maturity dates. As of December 31,
2008, the principal amount of the notes was equal to USD 5,955 million. In addition, we have
drawn amounts under our EUR 500 million senior secured revolving credit facility. As of
December 31, 2008, after taking into account outstanding bank guarantees under the facility of
USD 5 million, we had drawn USD 405 million. Subsequently, on February 13, 2009 we drew a
further USD 200 million under the facility. As of February 13, 2009, and at the exchange rates
prevailing on that date, we had approximately EUR 39 million of remaining availability, after taking
into account outstanding bank guarantees under the facility. The facility may be repaid and
redrawn from time to time, and matures in September 2012.
Management discussion and analysis
[-64]
Net debt As of December 31, 2008 the Company had a net debt position (total debt minus cash equivalents)
of USD 4,571 million compared to USD 5,037 million at the end of 2007. Our net debt to group
equity ratio was 78 : 22 as of December 31, 2008 (December 31, 2007: 51 : 49).
ShareholderÊs equity Change in equity in 2008 relate to the net loss for that period of USD 3,600 million, currency
translation differences of USD 145 million, share-based compensation of USD 27 million and
other comprehensive income that decreased equity with USD 25 million.
As of December 31, 2008 shareholderÊs equity was USD 1,075 million compared to USD 4,528
million as of December 31, 2007.
Changes in equity in 2007 consisted of net loss for that period of USD 650 million, currency
translation differences of USD 276 million, share-based compensation of USD 28 million and
other comprehensive income that increased equity with USD 40 million.
Completion of Exchange Offers 2009 On April 2, 2009, the Company completed its private offers to exchange a portion of its
outstanding senior notes. Further reference is made to page 99, „Subsequent events‰.
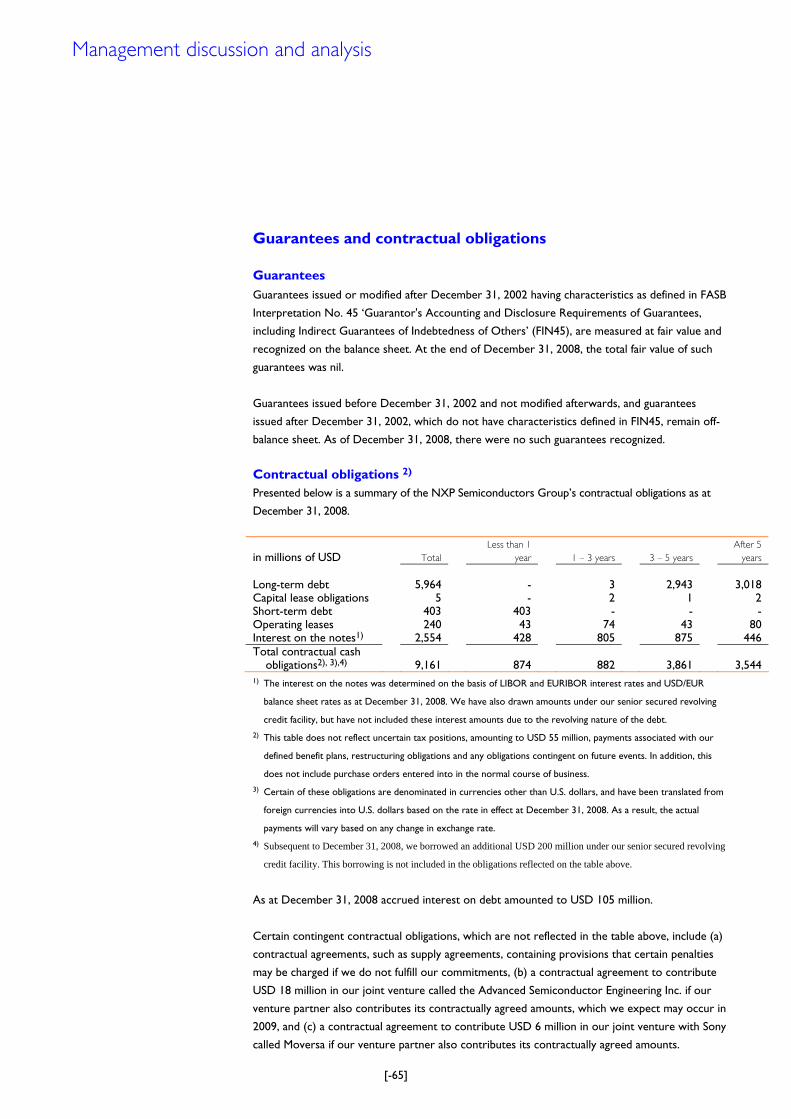
[-65]
Guarantees and contractual obligations
Guarantees Guarantees issued or modified after December 31, 2002 having characteristics as defined in FASB
Interpretation No. 45 ÂGuarantor's Accounting and Disclosure Requirements of Guarantees,
including Indirect Guarantees of Indebtedness of OthersÊ (FIN45), are measured at fair value and
recognized on the balance sheet. At the end of December 31, 2008, the total fair value of such
guarantees was nil.
Guarantees issued before December 31, 2002 and not modified afterwards, and guarantees
issued after December 31, 2002, which do not have characteristics defined in FIN45, remain off-
balance sheet. As of December 31, 2008, there were no such guarantees recognized.
Contractual obligations 2) Presented below is a summary of the NXP Semiconductors GroupÊs contractual obligations as at
December 31, 2008.
in millions of USD
Total
Less than 1
year
1 – 3 years
3 – 5 years
After 5
years
Long-term debt 5,964 - 3 2,943 3,018 Capital lease obligations 5 - 2 1 2 Short-term debt 403 403 - - - Operating leases 240 43 74 43 80 Interest on the notes1) 2,554 428 805 875 446 Total contractual cash obligations2), 3),4)
9,161
874
882
3,861
3,544
1) The interest on the notes was determined on the basis of LIBOR and EURIBOR interest rates and USD/EUR
balance sheet rates as at December 31, 2008. We have also drawn amounts under our senior secured revolving
credit facility, but have not included these interest amounts due to the revolving nature of the debt.
2) This table does not reflect uncertain tax positions, amounting to USD 55 million, payments associated with our
defined benefit plans, restructuring obligations and any obligations contingent on future events. In addition, this
does not include purchase orders entered into in the normal course of business.
3) Certain of these obligations are denominated in currencies other than U.S. dollars, and have been translated from
foreign currencies into U.S. dollars based on the rate in effect at December 31, 2008. As a result, the actual
payments will vary based on any change in exchange rate.
4) Subsequent to December 31, 2008, we borrowed an additional USD 200 million under our senior secured revolving
credit facility. This borrowing is not included in the obligations reflected on the table above.
As at December 31, 2008 accrued interest on debt amounted to USD 105 million.
Certain contingent contractual obligations, which are not reflected in the table above, include (a)
contractual agreements, such as supply agreements, containing provisions that certain penalties
may be charged if we do not fulfill our commitments, (b) a contractual agreement to contribute
USD 18 million in our joint venture called the Advanced Semiconductor Engineering Inc. if our
venture partner also contributes its contractually agreed amounts, which we expect may occur in
2009, and (c) a contractual agreement to contribute USD 6 million in our joint venture with Sony
called Moversa if our venture partner also contributes its contractually agreed amounts.
Management discussion and analysis
[-66]
We sponsor pension plans in many countries in accordance with legal requirements, customs and
the local situation in the countries involved. These are defined-benefit pension plans, defined
contribution pension plans and multi-employer plans.
Contributions to funded pension plans are made as necessary, to provide sufficient assets to
meet future benefits payable to plan participants. These contributions are determined by various
factors, including funded status, legal and tax considerations and local customs. We currently
estimate our contributions to pension plans will be USD 117 million in 2009, consisting of USD 5
million in employer contributions to defined-benefit pension plans, USD 105 million in employer
contributions to defined-contribution pension plans and multi-employer plans, and USD 7 million
expected cash outflows in relation to a funding deficit associated with pension plans.
The expected cash outflows in 2009 and subsequent years are uncertain and may change
substantially as a consequence of statutory funding requirements as well as changes in actual
versus currently assumed discount rates, estimations of compensation increases and returns on
pension plan assets.
For further details about cash obligations related to pension and other postretirement plans, see
notes 25 and 26 of the group financial statements.
[-67]
Risk management
The following sections present an overview of NXPÊs approach to risk management
and business control and a description of the nature and the extent of its exposure to
risks. These risks are further described in the section „risk factors‰ of this Annual
Report. The risk overview provided is not exhaustive. Some risks not yet known to
NXP or currently believed not to be material could later turn out to have a material
impact on NXPÊs business, financial condition or results of operations.
The risk factors should be considered in connection with the information provided
under „forward-looking statements‰, elsewhere in this Annual Report.
NXPÊs approach to risk management and business control
Risk management forms an integral part of business management. NXPÊs risk and control policy is
designed to provide reasonable assurance that objectives are met by integrating management
control over daily operations, by ensuring compliance with legal requirements and by safeguarding
the integrity of the financial reporting and related disclosures. NXP management is responsible for
identifying critical business risks and for implementing fit-for-purpose risk responses. Internal
controls are managed and controlled by a regular assessment of the installed business controls and,
if required, corrective actions.
Corporate governance
NXP believes that adequate corporate governance is a critical factor in achieving business success.
Adequate corporate governance is based on, amongst other factors, solid internal controls and high
ethical standards throughout every aspect of our business. Risk management is well-embedded in
NXPÊs corporate governance model (e.g., annual strategy determination, quarterly business review
meetings and periodical assessment of controls).
The quality of NXPÊs systems of business controls and the findings of internal and external audits
are reported to and discussed by the Audit Committee of the Supervisory Board. Internal auditors
monitor the quality of the business controls through risk-based operational audits, inspections of
financial reporting controls and compliance audits. The NXP audit committee meets on a regular
basis to address weaknesses as reported by the auditors or from self-assessments and to take
corrective action where necessary. This audit committee is also involved in determining the desired
company-wide internal audit coverage as approved by the Supervisory Board Audit Committee.
NXP Business Control Framework
The NXP Business Control Framework („BCF‰,) sets the standard for risk management and
business controls at NXP. The objectives of the BCF are to maintain integrated management
control of the CompanyÊs operations, to ensure integrity of the financial reporting and business
processes, as well as to comply with applicable laws and regulations.
Management discussion and analysis
[-68]
With respect to financial reporting, a structured company-wide assessment and monitoring process
is in place to enable the Chief Executive Officer and Chief Financial Officer to review the
effectiveness of financial risk management and business controls. Each quarter, entities issue a formal
certification statement to confirm the adequacy of the design and effectiveness of disclosure
controls and internal controls over financial reporting. As part of the annual report process,
managementÊs accountability for business controls is enforced through the formal issuance of a
Statement on Business Controls and a Letter of Representation.
US Sarbanes-Oxley Act
In connection with the registration of its exchange notes, NXP became a SEC registrant during
2007. Following this SEC registration, NXP is subject to certain provisions of the US Sarbanes-
Oxley Act. A separate Annual Report on Form 20-F, certified by both the CEO and the CFO, will
be filed with the US Securities and Exchange Commission, including management certification
relating to its internal controls over financial reporting. Both the CEO and CFO have assessed the
design and operating effectiveness of controls within the scope of section 404 of the US Sarbanes-
Oxley Act. This evaluation included controls at Group level and transactional controls at significant
locations. The scope also included relevant IT controls. Any deficiencies noted in design and
operating effectiveness not completely remediated were formally evaluated at year-end. Based on
that assessment, it was concluded that, as of December 31, 2008, the CompanyÊs internal control
over US GAAP financial reporting is considered effective.
NXP Business Code of Conduct
The NXP Business Code of Conduct (ÂBCCÊ) explicitly lays out the rules of behavior that NXP as an
organization and its employees commit to. The BCC outlines NXPÊs general commitment to be a
responsible social partner and the way in which it interacts with its stakeholders: customers,
shareholders, employees, suppliers and the market. The BCC expresses NXPÊs commitment to an
economically, socially and ethically sustainable way of working. It covers NXPÊs policy on a diverse
array of subjects, including corporate gifts, child labor, ILO conventions, working hours, sexual
harassment, free-market competition, bribery and the integrity of financial reporting.
Risks related to our business
We have experienced a severe downturn in revenues and a significant loss of cash from our operating activities in 2008, and our revenues are currently expected to decline further. Our 2008 financial statements show a severe downturn in revenues and a significant loss of cash
from our operating activities. Although it is not possible to predict our future performance,
especially in light of the unusual conditions prevailing in the semiconductor industry, our current
expectation is that our revenues for 2009 will decline compared to our 2008 revenues, and this
decline could be significant. If these negative developments continue or worsen, our liquidity will
be further impaired, along with our ability to fund our working capital, service our outstanding
indebtedness and meet our liabilities.
[-69]
We have been negatively affected by the financial crisis in the global capital and credit markets and the resulting global recession.
The global capital and credit markets have been experiencing extreme volatility and disruption.
The financial crisis and the fact that financial institutions have consolidated or gone out of
business have resulted in a tightening in the credit markets, a low level of liquidity in many
financial markets, and extreme volatility in fixed income, credit, currency and equity markets,
strongly reducing the availability of financing in general. This has had a severe negative impact on
businesses around the world and depressed the global economy. In addition, these conditions
have and could further lead to reduced consumer spending in the foreseeable future.
There are a number of severe follow-on effects from the financial crisis in the global capital and
credit markets on the semiconductor industry and on our business, which have already had a
material adverse effect on our results of operations and liquidity. The impact of this crisis on our
major customers and key suppliers cannot be predicted and is likely to be severe. In the current
depressed economic environment, there has been a decline in consumer purchases of items for
which we supply components, and such decline will likely continue as the current recessionary
period continues and disposable income declines. In addition, a disruption in the ability of our
major customers to access liquidity could cause serious disruptions or an overall deterioration of
their business, which could lead to a significant reduction in their future orders of our products
and the inability or failure on their part to meet their payment obligations to us. Similarly, the
impact of this crisis on our pension liabilities and costs cannot be predicted and may be severe.
All of the foregoing could affect our ability to maintain sufficient liquidity to fund our working
capital, service our outstanding indebtedness and meet our liabilities, including any principal due
on our debt. If our resources do not satisfy our liquidity requirements, we may have to seek
additional financing, but may not be able to successfully obtain any necessary additional financing
on favorable terms, or at all, especially in light of the crisis in the credit markets. In addition, the
financial crisis may cause banks who are parties to our senior revolving credit facility to refuse or
be unable to fund future drawings. Without sufficient liquidity, we could be forced to curtail our
operations. Moreover, any failure of derivative counterparties and other financial institutions may
negatively impact our treasury operations.
The current volatility in the financial markets and overall economic uncertainty increases the risk
that the actual amounts realized in the future on our financial instruments could differ significantly
from the fair values currently assigned to them. Other income and expense could also vary
materially from expectations depending on gains or losses realized on the sale or exchange of
financial instruments, impairment charges related to debt securities as well as equity and other
investments, interest rates, cash balances and changes in fair value of derivative instruments.
A significant write down of goodwill and other intangible assets would have a material adverse effect on our reported results of operations and net worth.
Our total assets include USD 5.0 billion of goodwill and other intangible assets as of December
31, 2008. We review our goodwill and other intangible assets balance for impairment upon any
indication of a potential impairment, and in the case of goodwill, at a minimum of once a year. As
a result of these reviews, in 2008 we recorded an impairment of USD 714 million.
Management discussion and analysis
[-70]
The assessment of impairment is based on a number of assumptions, including the use of a
weighted-average cost of capital to calculate the present value of the expected future cash flows
of our cash generating units. Future changes in the cost of capital, expected cash flows, or other
factors may cause these assets to be impaired, resulting in a non-cash charge against results of
operations to write down these assets for the amount of the impairment. If a significant write
down is required, the charge would have a material adverse effect on our reported results of
operations and net worth.
The financial performance of the semiconductor market is highly cyclical and currently experiencing a downturn which may continue in the future.
The semiconductor industry as a whole is currently in a sharp downturn, particularly in view of
deteriorating general economic conditions. We believe that these conditions have already
negatively impacted our business, leading to a severe downturn in revenues for 2008 and a
significant loss of cash from our operating activities in 2008. These conditions may worsen and
we are unable to predict the severity or length of any downturn, or what impact these conditions
will have on our securities. As a result, our financial data included in this report may not be
indicative of the full severity of the downturn in the future.
Historically, the relationship between supply and demand in the semiconductor industry has
caused a high degree of cyclicality in the semiconductor market. Semiconductor supply is driven
by manufacturing capacity, which in the past has demonstrated alternating periods of substantial
capacity additions and periods in which no or limited capacity was added. As a general matter,
semiconductor companies are more likely to add capacity in periods when current or expected
future demand is strong and margins are, or are expected to be, high. Investments in new
capacity can result in overcapacity, which can lead to a reduction in prices and margins. In
response, companies typically limit further capacity additions, eventually causing the market to be
relatively undersupplied. In addition, demand for semiconductors varies, which can exacerbate
the effect of supply fluctuations. As a result of this cyclicality, the semiconductor industry has in
the past experienced significant downturns, often in connection with, or in anticipation of,
maturing life cycles of semiconductor companiesÊ products and declines in general economic
conditions. These downturns have been characterized by diminishing demand for end-user
products, high inventory levels, underutilization of manufacturing capacity and accelerated
erosion of average selling prices. For example, in 2001 through 2003 the semiconductor industry
experienced a period of significant overcapacity, and we suffered operating losses as a result over
an extended period. As a result of the overall cyclicality in the market, the semiconductor
industry will likely continue to experience downturns of varying degrees and durations in the
future. We may not be able to adequately protect ourselves against the impact of these
downturns, which could have a material adverse effect on our business, financial condition and
results of operations.
[-71]
In difficult market conditions, our high fixed costs combined with low revenues negatively impact our results.
The semiconductor industry is characterized by high fixed costs and, notwithstanding our
significant utilization of third-party manufacturing capacity, most of our production requirements
are met by our own manufacturing facilities. In less favorable industry environments, we are
generally faced with a decline in the utilization rates of our manufacturing facilities due to
decreases in product demand. During such periods, our fabrication plants operate at a lower
loading level, while the fixed costs associated with the full capacity continue to be incurred
resulting into lower gross margins. In addition, we have made certain commitments related to
Silicon Manufacturing Company Pte. Ltd. (ÂÂSSMCÊÊ), whereby we are obligated to make cash
payments to SSMC should we fail to take up an agreed-upon percentage of the total available
capacity at SSMCÊs fabrication facilities if overall SSMC utilization levels drop below a fixed
proportion of the total available capacity. We have only had to make such payment once, for
2002, in the amount of EUR 15 million. In the event that our demand for production from SSMC
falls in the future, we may be required to make similar payments, which could be significant if
were to fail to take up our agreed-upon quota.
Currently we are experiencing a difficult market environment and our utilization levels during the
year 2008 decreased from 88% in the first quarter of 2008, to 78% in the second quarter, 68% in
the third quarter and 56% in the fourth quarter. Lower utilization has had a negative impact on
our results. Any attempts to improve utilization by rationalizing some of these facilities will be
costly and require the cooperation of our customers, which may not always be forthcoming.
Although our current Redesign Program is focused amongst other things on reducing our
manufacturing footprint, we cannot guarantee that difficult market conditions in the future will
not adversely affect our utilization rates and consequently our future gross margins. This in turn
could further materially adversely affect our business, financial condition and results of
operations.
Our historical results may not be representative of our future results.
In the two years since our separation from Philips, we have engaged in numerous acquisitions,
joint ventures and other strategic transactions. We have concluded our transformation into a
standalone company separate from Philips. We have also disposed of our wireless business,
which was a substantial portion of our business, and rationalized several product lines. We have
now embarked upon a major redesign and restructuring program. Because of the number and
significance of these events, you should not rely upon our historical financial data to be predictive
of our future performance. In addition, we have suffered a severe decline in revenues in 2008 and
expect a further decline in the first quarter of 2009 on a sequential basis, which decline may
continue. Therefore, no undue reliance should be placed on this information as a prediction of
our future performance.
Management discussion and analysis
[-72]
The demand for our products depends to a significant degree on the demand for the end products of our customers into which they are incorporated. The vast majority of our revenues are derived from sales to manufacturers in the automotive,
consumer electronics and communications industries. Demand in these markets fluctuates
significantly, driven by consumer spending, consumer preferences, the development of new
technologies and prevailing economic conditions. We have experienced lower demand as a result
of the current global downturn. In addition, the specific products in which our semiconductors
are incorporated may not be successful, or may experience price erosion or other competitive
factors that affect the price manufacturers are willing to pay us. Such customers have in the past,
and may, in the future, vary order levels significantly from period to period, request
postponements to schedule delivery dates, modify their orders or reduce lead times. This is
particularly common during periods of low demand, such as now. This can make managing our
business difficult, as it limits the foreseeability of future sales. It can also affect the accuracy of our
financial forecasts. Furthermore, developing industry trends, including customersÊ use of
outsourcing and new and revised supply chain models, may affect our revenues, costs and
working capital requirements. Additionally, a significant portion of our products is made to order.
If customers do not purchase products made specifically for them, we may not be able to resell
such products to other customers or require the customers who have ordered these products
to pay a cancellation fee. The foregoing risks could have a material adverse effect on our
business, financial condition and results of operations.
The semiconductor industry is highly competitive. If we fail to introduce new technologies and products in a timely manner, it could adversely impact our business. The semiconductor industry is highly competitive and characterized by constant and rapid
technological change, short product lifecycles, significant price erosion and evolving standards.
Accordingly, the success of our business depends to a significant extent on our ability to develop
new technologies and products that are ultimately successful in the market. The costs related to
the research and development necessary to develop new technologies and products are
significant and any reduction of our research and development budget could harm our
competitiveness. Our ability to meet evolving industry requirements and to introduce new
products to the market in a timely manner and at prices that are acceptable to our customers
are significant factors in determining our competitiveness and success. Commitments to develop
new products must be made well in advance of any resulting sales, and technologies and
standards may change during development, potentially rendering our products outdated or
uncompetitive before their introduction. If we are unable to successfully develop new products,
our revenues may decline substantially. Moreover, some of our competitors are well-established
entities, are larger than we are and have greater resources than we do. If these competitors
increase the resources they devote to developing and marketing their products, we may not be
able to compete effectively. Any consolidation among our competitors could enhance their
product offerings and financial resources, further strengthening their competitive position. In
addition, some of our competitors operate in narrow business areas relative to us, allowing them
to concentrate their research and development efforts directly on products and services for
those areas, which may give them a competitive advantage. As a result of these competitive
pressures, we may face declining sales volumes or lower prevailing prices for our products, and
[-73]
we may not be able to reduce our total costs in line with this declining revenue. If any of these
risks materializes, our business, financial condition and results of operations could be materially
adversely affected.
The semiconductor industry is characterized by aggressive pricing and rapidly declining average selling prices, especially after a product has been on the market for a significant period of time. One of the results of the rapid innovation that is exhibited by the semiconductor industry is that
pricing pressure, especially on products containing older technology, can be intense. Product life
cycles are relatively short, and as a result, products tend to be replaced by more technologically
advanced substitutes on a regular basis. In turn, demand for older technology falls, causing the
price at which such products can be sold to drop, in some cases precipitously. In order to
continue profitably supplying these products, we must reduce our production costs in line with
the lower revenues we can expect to receive per unit. Usually, this must be accomplished
through improvements in process technology and production efficiencies. If we cannot advance
our process technologies or improve our efficiencies to a degree sufficient to maintain required
margins, we will no longer be able to make a profit from the sale of these products. Moreover,
we may not be able to cease production of such products, either due to contractual obligations
or for customer relationship reasons, and as a result may be required to bear a loss on such
products. We cannot guarantee that competition in our core product markets will not lead to
price erosion, lower revenue growth rates and lower margins in the future. Should reductions in
our manufacturing costs fail to keep pace with reductions in market prices for the products we
sell, our business, results of operation and financial condition could be materially adversely
affected.
In many of the market segments in which we compete, we depend on winning highly competitive selection processes, and failure to be selected could materially adversely affect our business in that market segment. One of our business strategies is to participate in, and win, competitive bid selection processes
to develop products for use in our customersÊ equipment and products. These selection
processes can be lengthy and require us to incur significant design and development
expenditures, with no guarantee of winning a contract or generating revenue. Failure to win new
design projects and delays in developing new products with anticipated technological advances or
in commencing volume shipments of these products may have an adverse effect on our business.
This risk is particularly pronounced in markets where there are only a few potential customers
and in the automotive market, where, due to the longer design cycles involved, failure to win a
design-in could prevent access to a customer for several years. In particular, our Home business
unit is heavily dependent on winning contracts with major TV and set-top box manufacturers in
2009. Our failure to win a sufficient number of these bids could result in reduced revenues and
hurt our competitive position in future selection processes because we may not be perceived as
being a technology or industry leader, each of which could materially adversely affect our
business, financial condition and results of operations.
Management discussion and analysis
[-74]
Our Redesign Program may not be successful and our estimated savings are difficult to predict. We recently announced our Redesign Program targeted to reduce our annual cost base through
major reductions of the manufacturing base, rightsizing of central R&D, and reduction of support
functions. We have now accelerated and expanded the program. However, our actual savings
may be lower than we may currently anticipate, and they may or may not be realized on our
anticipated time line. The cost of implementing the Redesign Program may also differ from our
estimates and negative effects from the Redesign Program, such as customer dissatisfaction, may
have a larger impact on our revenues than expected.
Implementing a fundamental redesign may also be more difficult in our business than in other
businesses due to the complexity of our products, the way our products are manufactured and
the requirements of our customers. For instance, if we close or move a production line, we may
need to negotiate with customers to ensure our replacement product line will produce
satisfactory replacement components. The Redesign Program may also affect the NXP brand if
there are any issues from the redesign that impact our customers negatively. Furthermore, the
Redesign Program may create employee retention issues, including the inadvertent loss of highly
qualified employees, and may result in workerÊs council issues in some jurisdictions or other
labor issues.
We have and may continue to make acquisitions and engage in other transactions to complement or expand our existing businesses. However, we may not be successful in acquiring suitable targets at acceptable prices and integrating them into our operations, and any acquisitions we make may lead to a diversion of management resources. Our future success may depend on acquiring businesses and technologies, making investments or
forming joint ventures that complement, enhance or expand our current portfolio or otherwise
offer us growth opportunities. If we are unable to identify suitable targets, our growth prospects
may suffer, and we may not be able to realize sufficient scale advantages to compete effectively in
all markets. In addition, in pursuing acquisitions, we may face competition from other companies
in the semiconductor industry. Our ability to acquire targets may also be limited by applicable
antitrust laws and other regulations in the United States, the European Union and other
jurisdictions in which we do business. To the extent that we are successful in making acquisitions,
we may have to expend substantial amounts of cash, incur debt, assume loss-making divisions and
incur other types of expenses. We may also face challenges in successfully integrating acquired
companies into our existing organization. Each of these risks could have a material adverse effect
on our business, financial condition and results of operations.
We may from time to time desire to exit certain product lines or businesses, or to restructure our operations, but may not be successful in doing so. From time to time we may decide to divest certain product lines and businesses or restructure
our operations, including through the contribution of assets to joint ventures. We have in recent
years exited several of our product lines and businesses and we have closed several of our
manufacturing and research facilities. We may continue these practices in the future. However,
our ability to successfully extricate ourselves from product lines and businesses, or to close or
[-75]
consolidate operations, depends on a number of factors, many of which are outside of our
control. For example, if we are seeking a buyer for a particular business line, none may be
available, or we may not be successful in negotiating adequate terms with prospective buyers. In
addition, we may face internal obstacles to our efforts. In particular, several of our operations
and facilities are subject to collective bargaining agreements or involve the presence of work
councils that may prevent or complicate our efforts to sell or restructure our businesses. In
some cases, particularly with respect to our European operations, there may be laws or other
legal impediments affecting our ability to carry out such sales or restructuring. If we are unable to
exit a product line or business in a timely manner, or to restructure our operations in a manner
we deem to be advantageous, our business, financial condition and results of operations could be
materially adversely affected.
The semiconductor industry is capital intensive and if we are unable to invest the necessary capital to operate and grow our business, we may not remain competitive. To remain competitive, we must constantly improve our facilities and process technologies and
carry out extensive research and development, each of which requires investment of significant
amounts of capital. This risk is magnified by the relatively high level of debt we currently have
since we are required to use a portion of our cash flow to service that debt. If we are unable to
generate sufficient cash or raise sufficient capital to meet both our debt service and capital
investment requirements, or if we are unable to raise required capital on favorable terms when
needed, our business, financial condition and results of operations could be materially adversely
affected.
Our working capital needs are difficult to predict. Our working capital needs are difficult to predict and may fluctuate. The comparatively long
period between the time at which we commence development of a product and the time at
which it may be delivered to a customer leads to high inventory and work-in-progress levels. The
volatility of our customersÊ own businesses and the time required to manufacture products also
makes it difficult to manage inventory levels and requires us to stockpile products across many
different specifications.
Some of our suppliers may also find it harder to obtain receivables insurance on satisfactory
terms and we expect that some suppliers may therefore request more favorable terms from us.
This situation could be made worse by our credit ratings downgrade. At the same time, some of
our customers may be seeking to improve their liquidity by obtaining more favorable terms from
us on our accounts receivable.
Deterioration in our working capital position could require us to draw additional amounts on
our senior secured revolving credit facility (as to which we only retained approximately EUR 39
million of capacity as of February 13, 2009, taking into account USD 5 million of outstanding bank
guarantees) or otherwise obtain and utilize more cash. We may not be able to obtain this cash
on favorable terms or at all.
Management discussion and analysis
[-76]
Our business has and could suffer from manufacturing problems. We manufacture our products using processes that are highly complex, require advanced and
costly equipment and must continuously be modified to improve yields and performance.
Difficulties in the production process can reduce yields or interrupt production, and as a result of
such problems we may on occasion not be able to deliver products on time or in a cost-effective,
competitive manner. As the complexity of both our products and our fabrication processes has
become more advanced, manufacturing tolerances have been reduced and requirements for
precision have become more demanding. As is common in the semiconductor industry, we have
in the past experienced manufacturing difficulties that have given rise to delays in delivery and
quality control problems. There can be no assurance that any such occurrence in the future
would not materially harm our results of operations.
Furthermore, we may suffer disruptions in our manufacturing operations, either due to
production difficulties such as those described above or as a result of external factors beyond
our control. As with other semiconductor companies, we use highly combustible materials such
as silane and hydrogen in our manufacturing processes and are therefore subject to the risk of
explosions and fires, which can cause significant disruptions to our operations. These can occur
even in the absence of any fault on our part. We have experienced two significant fires at our
facilities. In March 2000, our facility in Albuquerque, New Mexico suffered a fire caused by a
power outage that shut down our fabrication line for 200 millimeter silicon wafers for over a
month. In December 2003, a fire occurred in our fabrication plant in Caen, France, resulting in a
complete loss of our production line there. If operations at a manufacturing facility are
interrupted, we may not be able to shift production to other facilities on a timely basis or at all.
The loss of our Caen facility resulted in us permanently ceasing production of several legacy
products for which we did not have alternate fabrication capability and the Albuquerque fire
caused extensive delays in shipping certain products. Even if a transfer is possible, transitioning
production of a particular type of semiconductor from one of our facilities to another can take
between six to twelve months to accomplish, and in the interim period we would likely suffer
significant or total supply disruption and incur substantial costs.
We may in the future experience manufacturing difficulties or permanent or temporary loss of
manufacturing capacity due to the foregoing or other risks. Such an event could materially
adversely affect our business, financial condition and results of operations.
Our business may be adversely affected by costs relating to product defects, and we could be faced with product liability and warranty claims. We make highly complex electronic components and, accordingly, there is a risk that defects may
occur in any of our products. Such defects can give rise to significant costs, including expenses
relating to recalling products, replacing defective items, writing down defective inventory and loss
of potential sales. In addition, the occurrence of such defects may give rise to product liability and
warranty claims, including liability for damages caused by such defects. If we release defective
products into the market, our reputation could suffer and we could lose sales opportunities and
become liable to pay damages. Moreover, since the cost of replacing defective semiconductor
devices is often much higher than the value of the devices themselves, we may at times face
[-77]
damage claims from customers in excess of the amounts they pay us for our products, including
consequential damages.
We also face exposure to potential liability resulting from the fact that our customers typically
integrate the semiconductors we sell into numerous consumer products, which are then in turn
sold into the marketplace. We are exposed to product liability claims if our semiconductors or
the consumer products based on them malfunction and result in personal injury or death. We
may be named in product liability claims even if there is no evidence that our products caused
the damage in question, and such claims could result in significant costs and expenses relating to
attorneysÊ fees and damages. In addition, our customers may recall their products if they prove to
be defective or make compensatory payments in accordance with industry or business practice
or in order to maintain good customer relationships. If such a recall or payment is caused by a
defect in one of our products, our customers may seek to recover all or a portion of their losses
from us. If any of these risks materialize, our reputation would be harmed and our business,
financial condition and results of operations could be materially adversely affected.
We rely on strategic partnerships, joint ventures and alliances for manufacturing and research and development. However, we typically do not control these partnerships and joint ventures, and actions taken by any of our partners or the termination of these partnerships or joint ventures could materially adversely affect our business, financial condition and results of operations. As part of our strategy, we have entered into a number of long-term strategic partnerships with
other leading industry participants. For example, we have entered into a joint venture with
TSMC, called Systems on SSMC, and we operate jointly with Jilin Sino-Microelectronics Co. Ltd.
the joint venture Jilin NXP Semiconductor Ltd. (ÂÂJNSÊÊ). We established the Advanced
Semiconductor Manufacturing Company together with a number of Chinese partners, and
together with Advanced Semiconductor Engineering Inc. we established an assembly and test
joint venture. Furthermore, we established Moversa with Sony Corporation and recently formed
NuTune with Thomson.
We also engage in alliances with respect to other aspects of our business, such as product
development. For example, we partner with industry participants to develop new standards in
the areas of near field communication technology and are a founding member of the FlexRay
consortium to develop advanced communication systems for automotive applications. The failure
of any of these consortia, or their obsolescence due to the success of any competing industry
groups, would damage our ability to sell into the relevant markets and to influence industry
standards, an important part of our strategy.
If any of our strategic partners in industry groups or in any of the other alliances we engage with
were to encounter financial difficulties or change their business strategies, they may no longer be
able or willing to participate in these groups or alliances, in which case our business, financial
condition and results of operations could be materially adversely affected.
Management discussion and analysis
[-78]
Failure of our outside foundry suppliers to perform could adversely affect our ability to exploit growth opportunities. We currently use outside suppliers or foundries for a portion of our manufacturing capacity, and
expect that our reliance on outsourcing will increase. Outsourcing our production presents a
number of risks. If our outside suppliers are unable to satisfy our demand, or experience
manufacturing difficulties, delays or reduced yields, our results of operations and ability to satisfy
customer demand could suffer. In addition, purchasing rather than manufacturing these products
may adversely affect our gross profit margin if the purchase costs of these products are higher
than our own manufacturing costs would have been. Our internal manufacturing costs include
depreciation and other fixed costs, while costs for products outsourced are based on market
conditions. Prices for foundry products also vary depending on capacity utilization rates at our
suppliers, quantities demanded, product technology and geometry. Furthermore, these
outsourcing costs can vary materially from quarter-to-quarter and, in cases of industry shortages,
they can increase significantly, negatively impacting our gross margin.
We rely on the timely supply of equipment and materials and could suffer if suppliers fail to meet their delivery obligations or raise prices. Certain equipment and materials needed in our manufacturing operations are only available from a limited number of suppliers. Our manufacturing operations depend on deliveries of equipment and materials in a timely
manner and, in some cases, on a just-in-time basis. From time to time, suppliers may extend lead
times, limit the amounts supplied to us or increase prices due to capacity constraints or other
factors. Supply disruptions may also occur due to shortages in critical materials, such as silicon
wafers or specialized chemicals. Because the equipment that we purchase is complex, it is
frequently difficult or impossible for us to substitute one piece of equipment for another or
replace one type of material with another. Moreover, we rely on a single source of supply for
certain equipment and materials, and a failure by such single-source suppliers to deliver our
requirements could result in disruptions to our manufacturing operations and, in some
circumstances, result in a shut-down of our operations at affected facilities. Our business,
financial condition and results of operations could be hurt if we are unable to obtain adequate
supplies of quality equipment or materials in a timely manner or if there are significant increases
in the costs of equipment or materials.
Loss of our key management and other personnel, or an inability to attract such management and other personnel, could impact our business. We depend on our key management to run our business and on our senior architects to develop
new products and technologies. The loss of any of these key personnel could materially adversely
affect our business. Competition for qualified employees among companies that rely heavily on
engineering and technology expertise is intense, and the loss of qualified employees or an inability
to attract, retain and motivate the additional highly skilled employees required for the operation
and expansion of our business could hinder our ability to successfully conduct research activities
or develop marketable products.
[-79]
Disruptions in our relationships with any one of our key customers could adversely affect our results of operations. A substantial portion of our sales is derived from our top customers. At December 31, 2008, our
largest customer was Nokia, which accounted for 9% of our revenues for the calendar year
ended December 31, 2008, compared to 9% in 2007 and 8% in 2006. For the calendar year
ended December 31, 2008, our top ten customers accounted for approximately 49% of our
revenues, compared to approximately 50% of our 2007 revenues and 47% of our 2006 revenues.
We cannot guarantee that we will be able to generate similar levels of sales from our largest
customers in the future. Should one or more of these customers substantially reduce their
purchases from us, our results of operations could be materially adversely affected.
Our business could suffer as a result of changing circumstances in different parts of the world. We operate globally, with manufacturing, assembly and testing facilities on several continents.
We also market our products in many different countries. Our business is therefore subject to
risks inherent in international business, including:
• negative economic developments in economies around the world and the instability of
governments, including the threat of war, terrorist attacks, epidemic or civil unrest;
• adverse changes in laws, policies and governmental policies, especially those affecting trade
and investment;
• pandemics, such as the avian flu, which may adversely affect our workforce as well as our
local suppliers and customers;
• import or export licensing requirements imposed by governments;
• foreign currency exchange and transfer restrictions;
• differing labor standards;
• differing levels of protection of intellectual property;
• the threat that our operations or property could be subject to nationalization and
expropriation; and
• varying practices of the regulatory, tax, judicial and administrative bodies in the jurisdictions
where we operate.
If any of these risks were to materialize or worsen, our business, financial condition and results
of operations could be materially adversely affected.
As our business is global, our operations are exposed to economic and political developments, and laws and regulations in countries across the world that could adversely impact our operating results. The business environment is influenced by economic and political uncertainties that continue to
affect the global economy and the international capital markets. As a company with global
operations, economic and political developments in various parts of the world could have an
adverse effect on our operating results. Besides this, we are subject to environmental, health and
safety laws and regulations in each jurisdiction in which we operate. We are also required to
obtain environmental permits and other authorizations or licenses from governmental authorities
Management discussion and analysis
[-80]
for certain of our operations. No assurance can be given that we have been or will be at all times
in complete compliance with such laws, regulations, permits and other authorizations or licenses.
If we violate or fail to comply with these laws, regulations, permits and other authorizations or
licenses, we could be fined or otherwise sanctioned by regulators.
Fluctuations in foreign exchange rates may have an adverse effect on our financial results. A substantial proportion of our expenses are incurred in euros, while most of our revenues are
denominated in U.S. dollars. Accordingly, our results of operations may be affected by changes in
exchange rates, particularly between the euro and the U.S. dollar. In addition, despite the fact
that a majority of our revenues are denominated in U.S. dollars and a substantial portion of our
debt is denominated in U.S. dollars, we have euro-denominated assets and liabilities and the
impact of currency translation adjustments to such assets and liabilities may be material. We have
recently converted a substantial part of our U.S. dollar denominated cash into euro as a hedge
for our short to medium term anticipated euro cash requirements, including those associated
with the Redesign Program, and the relative value of this cash could decline in U.S. dollar terms.
We are exposed to a variety of financial risks, including currency risk, interest rate risk, liquidity risk, commodity price risk, credit risk and other insurable risks, which may impact our results. We are a global company and, as a direct consequence, movements in the financial markets may
impact our financial results. We are exposed to a variety of financial risks, including currency
fluctuations, interest rate risk, liquidity risk, commodity price risk and credit risk and other
insurable risks. We enter into diverse financial transactions with several counterparties to
mitigate our currency risk. Derivative instruments are only used for hedging purposes. The rating
of our debt by major rating agencies or banks may improve or further deteriorate. As a result,
our borrowing capacity and financing costs may be impacted. We are also a purchaser of certain
base metals, precious metals and energy used in the manufacturing process of our products.
Currently, we do not use financial derivative instruments to manage exposure to fluctuations in
commodity prices. Credit risk represents the loss that would be recognized at the reporting date
if counterparties failed to perform upon their agreed payment obligations. Credit risk is present
within our trade receivables. Such exposure is reduced through ongoing credit evaluations of the
financial conditions of our customers and by adjusting payment terms and credit limits when
appropriate, but we may suffer significant losses on receivables in a worsening credit
environment. We invest available cash and cash equivalents with various financial institutions and
are in that respect exposed to credit risk with these counterparties. We actively manage
concentration risk on a daily basis adhering to a treasury management policy. Cash is invested
and financial transactions are concluded where possible with financial institutions with a strong
credit rating.
[-81]
We rely to a significant extent on proprietary intellectual property. We may not be able to protect this intellectual property against improper use by our competitors or others. We depend significantly on patents and other intellectual property rights to protect our products
and proprietary design and fabrication processes against misappropriation by others. We may in
the future have difficulty obtaining patents and other intellectual property rights and the patents
we receive may be insufficient to provide us with meaningful protection or commercial
advantage. We may not be able to obtain patent protection or secure other intellectual property
rights in all the countries in which we operate, and under the laws of such countries, patents and
other intellectual property rights may be unavailable or limited in scope. Furthermore, our trade
secrets may be vulnerable to disclosure or misappropriation by employees, contractors and
other persons. In particular, intellectual property rights are difficult to enforce in the PeopleÊs
Republic of China and certain other developing nations, since the laws governing such rights are
relatively undeveloped in these countries compared to other jurisdictions where we operate,
such as the United States and The Netherlands. Consequently, operating in the PeopleÊs Republic
of China or other developing nations may subject us to an increased risk that unauthorized
parties may attempt to copy or otherwise use our intellectual property or the intellectual
property of our suppliers or other parties with whom we engage. There is no assurance that we
will be able to protect our intellectual property rights or have adequate legal recourse in the
event that we are required to seek legal or judicial enforcement of our intellectual property
rights under the laws of such countries. Any inability on our part to protect adequately our
intellectual property may have a material adverse effect on our business, financial condition and
results of operations.
The intellectual property that was transferred or licensed to us from Philips may not be sufficient to protect our position in the industry. In connection with our separation from Philips, Philips transferred approximately 5,300 patent
families to us subject to certain limitations, including (1) any prior commitments to and
undertakings with third parties entered into prior to the separation and (2) certain licenses
retained by Philips. These licenses back to Philips give Philips the right to sublicense to third
parties in certain circumstances that may divert revenue opportunities from us. Approximately
800 of these patent families were transferred on to ST-NXP and its successor.
Philips granted us a non-exclusive license (A) to all patents Philips holds but has not assigned to
us, to the extent that they are entitled to the benefit of a filing date prior to the separation and
for which Philips is free to grant licenses without the consent of or accounting to any third party
and (B) to certain know-how that is available to us, where such patents and know-how relate: (1)
to our current products and technologies as well as successor products and technologies, (2) to
technology that was developed for us prior to the separation, and (3) to technology developed
pursuant to contract research co-funded by us. Philips has also granted us a non-exclusive
royalty-free and irrevocable license (A) under certain patents for use in giant magneto-resistive
devices outside the field of healthcare and bio applications, and (B) under certain patents relevant
to polymer electronics resulting from contract research work co-funded by us in the field of
RFID tags. Such licenses are subject to certain prior commitments and prior undertakings.
However, Philips retained ownership of certain intellectual property related to our business as
Management discussion and analysis
[-82]
well as certain rights with respect to intellectual property transferred to us in connection with
the separation. There can be no guarantee that the patents transferred to us will be sufficient to
assert offensively against our competitors or to use as leverage to negotiate future cross-licenses
to give us freedom to operate and innovate in the industry. The strength and value of our
intellectual property may be diluted if Philips licenses or otherwise transfers such intellectual
property or such rights to third parties, especially if those third parties compete with us.
We have from time to time received, and may in the future receive, communications alleging
possible infringement of patents and other intellectual property rights of others. Furthermore,
we may become involved in costly litigation brought against us regarding patents, copyrights,
trademarks, trade secrets or other intellectual property rights. If any such claims are asserted
against us, we may seek to obtain a license under the third partyÊs intellectual property rights.
We cannot assure you that we will be able to obtain any or all of the necessary licenses on
satisfactory terms, if at all. In the event that we cannot obtain a license, these parties may file
lawsuits against us seeking damages (and potentially treble damages in the United States) or an
injunction against the sale of our products that incorporate allegedly infringed intellectual
property or against the operation of our business as presently conducted. Such lawsuits could
result in an increase in the costs of selling certain of our products, our having to partially or
completely redesign our products or stop the sale of some of our products and cause damage to
our reputation. Any litigation could require significant financial and management resources
regardless of the merits or outcome, and we cannot assure you that we would prevail in any
litigation or that our intellectual property rights can be successfully asserted in the future or will
not be invalidated, circumvented or challenged. The award of damages, including material royalty
payments, or the entry of an injunction against the manufacture and sale of some or all of our
products, could affect our ability to compete or have a material adverse effect on our business,
financial condition and results of operations.
Environmental laws and regulations expose us to liability and compliance with these laws and regulations, and any such liability may negatively affect our business and financial condition. We are subject to many environmental, health and safety laws and regulations in each jurisdiction
in which we operate, which govern, among other things, emissions of pollutants into the air,
wastewater discharges, the use and handling of hazardous substances, waste disposal, the
investigation and remediation of soil and ground water contamination and the health and safety of
our employees. We are also required to obtain environmental permits from governmental
authorities for certain of our operations. We cannot assure you that we have been or will be at
all times in complete compliance with such laws, regulations and permits. If we violate or fail to
comply with these laws, regulations or permits, we could be fined or otherwise sanctioned by
regulators.
Such laws and regulations include a recently implemented European Union directive, known as
the Restriction on Hazardous Substances, or RoHS, which bans the use of lead and certain other
hazardous substances in electronic equipment. China has enacted similar legislation, commonly
referred to as China RoHS. China RoHS includes labeling and information disclosure
requirements that became effective on March 1, 2007. These laws and regulations also include
significant new regulation on these of perfluorinated compounds, or PFCs, and sulfur
[-83]
hexafluoride, or SF6. The regulation of these two types of gases, which are critical in the
semiconductor manufacturing process, currently exempts the semiconductor industry, but this
exemption may not continue in the future. The European Union has also implemented
restrictions on perfluorooctane sulfonate, or PFOS, which currently exempt semiconductor
manufacturing processes, although it is not certain whether any such exemption will be retained
in the future. In addition, a new European Union regulation regarding chemicals and their safe
use, part of which will be effective starting June 1, 2009, deals with the registration, evaluation,
authorization and restriction of chemicals (REACH), some of which we use in our manufacturing
processes. Other governments may propose and pass similar bans through legislation, regulation,
directives or adoption or amendment of international treaties. A 2005 European Union directive
established a framework that will ultimately impose labeling and energy efficiency requirements
on energy-using products. The European Union has not yet issued product-specific requirements.
The European Union directive on environmental liability with regard to the prevention and
remediation of environmental damage had to be implemented by the European Union member
states by April 2008. Following implementation of this directive in the member states, we could
face increased environmental liability, which may result in higher insurance costs, remediation
expenses and potential damage claims. The European Union directives, REACH, and any PFC, SF6
or PFOS bans that affect the semiconductor manufacturing process, have and may continue to
complicate our research and development activities and have and may continue to require us to
change certain of our manufacturing processes, to utilize more costly materials or to incur
substantial additional expenses.
As with other companies engaged in similar activities or that own or operate real property, we
face inherent risks of environmental liability at our current and historical manufacturing facilities.
Certain environmental laws impose strict, and in certain circumstances, joint and several liability
on current or previous owners or operators of real property for the cost of investigation,
removal or remediation of hazardous substances as well as liability for related damages to natural
resources. Certain of these laws also assess liability on persons who arrange for hazardous
substances to be sent to disposal or treatment facilities when such facilities are found to be
contaminated. Soil and groundwater contamination has been identified at some of our current
and former properties resulting from historical, ongoing or third-party activities. We are in the
process of investigating and remediating contamination at some of these sites. While we do not
expect that any contamination currently known to us will materially adversely affect our business
or financial condition, we cannot assure you that this is the case or that we will not discover new
facts or conditions or that environmental laws (including the European Union directive on
environmental liability referenced above) or the enforcement of such laws will not change such
that our liabilities would be increased significantly. In addition, we could also be held liable for
consequences arising out of human exposure to hazardous substances or other environmental
damage. In summary, we cannot assure you that our costs of complying with current and future
environmental and health and safety laws, or our liabilities arising from past or future releases of,
or exposures to, regulated materials will not materially adversely affect our business, results of
operations and/or financial conditions.
Management discussion and analysis
[-84]
We receive subsidies and grants in certain countries, and a reduction in the amount of governmental funding available to us or demands for repayment could increase our costs and impact our results of operations. As is the case with other large semiconductor companies, we receive subsidies and grants from
governments in some countries. These programs are subject to periodic review by the relevant
governments, and if any of these programs are curtailed or discontinued, our business, financial
condition and results of operations could be materially adversely affected. As the availability of
government funding is outside our control, we cannot guarantee that we will continue to benefit
from government support or that sufficient alternative funding will be available if we lose such
support. Moreover, should we terminate any activities or operations, including strategic alliances
or joint ventures, we may face adverse actions from the local governmental agencies providing
such subsidies to us. In particular, such government agencies could seek to recover such
subsidies from us and they could cancel or reduce other subsidies we receive from them. This
could have a materially adverse impact on our results of operations.
The impact of the financial crisis on our pension liabilities and costs cannot be predicted and may be severe. The Company estimates that it has a funding deficit associated with pension obligations of USD
190 million as of December 31, 2008. The impact of the financial crisis on our pension assets,
liabilities and costs cannot be predicted and may be severe. Our costs to meet these pension
liabilities going forward may be significant and could have a material adverse impact on our
financial condition.
If we fail to extend or renegotiate our collective bargaining agreements and social plans with our labor unions as they expire from time to time, if regular or statutory consultation processes with employee representatives such as works councils fail or are delayed, or if our unionized employees were to engage in a strike or other work stoppage, our business and operating results could be materially harmed. We are a party to collective bargaining agreements and social plans with our labor unions, which
represent a material number of our employees. Currently, some of these agreements are being
extended, renewed or renegotiated. We also are required to consult with our employee
representatives such as works councils on items such as restructurings and acquisitions and
divestitures. Although we believe that our relations with our employees, employee
representatives and unions are satisfactory, no assurance can be given that we will be able to
successfully extend or renegotiate these agreements as they expire from time to time or to
conclude the consultation processes in a timely and favorable way. The impact of future
negotiations, including changes in wages and benefit levels, and consultation processes with
employee representatives, could have a material impact on our financial results. Also, if we fail to
extend or renegotiate our labor agreements and social plans, if significant disputes with our
unions arise, or if our unionized workers engage in a strike or other work stoppage, we could
incur higher ongoing labor costs or experience a significant disruption of operations, which could
have a material adverse effect on our business.
[-85]
The interests of our principal shareholders may be inconsistent with your interests. Our principal shareholders may have conflicting interests with one another that may impede their
ability to collectively make important decisions regarding our business. The interests of our
shareholders could also conflict with your interests, particularly if we encounter financial
difficulties or are unable to pay our debts when due. In addition, our principal shareholders and
their respective affiliates could have an interest in pursuing acquisitions, divestitures, financings or
other transactions that, in their judgment, would enhance their equity investments, and their
respective affiliates may own, acquire and hold interests in businesses that compete directly or
indirectly with us or may own businesses with interests that conflict with ours.
We are exposed to a number of different tax uncertainties, which could have a significant impact on local tax results. We are exposed to foreign taxation, and potentially to penalties, including interest payments. We
have issued transfer pricing directives in the area of goods, services and financing, which are in
accordance with the Guidelines of the Organization of Economic Co-operation and
Development. As transfer pricing has a cross border effect, the focus of local tax authorities on
implemented transfer pricing procedures in a country may have an impact on results in another
country. In order to mitigate the transfer pricing uncertainties within our deployment, measures
have been taken and a monitoring system has been put in place. On a regular basis audits are
executed to test the correct implementation of the transfer pricing directives. Uncertainties can
result from disputes with local tax authorities about transfer pricing of internal deliveries of
goods and services or relate to financing, acquisitions and divestments, the use of tax credits and
permanent establishments, and losses carried forward. These uncertainties may have a significant
impact on local tax results.
We have various tax assets partly resulting from the acquisition of our business from Philips or
from other acquisitions. Tax assets can also result from the generation of tax losses in certain
legal entities. Tax authorities may challenge these tax assets. In addition, the value of the tax
assets resulting from tax losses carried forward depends on having sufficient taxable profits in the
future.
Legal proceedings covering a range of matters are pending in various jurisdictions. Due to the uncertainty inherent in litigations, it is difficult to predict the final outcome. An adverse outcome might impact our results. The Issuers and certain of their businesses are involved as plaintiffs or defendants in legal
proceedings in various matters. Although the ultimate disposition of asserted claims and
proceedings cannot be predicted with certainty, our financial position and results of operations
could be affected by an adverse outcome.
Management discussion and analysis
[-86]
Risks related to our capital structure
We may not be able to generate sufficient cash to service all of our indebtedness and be forced to take other actions to satisfy our obligations under our indebtedness, which may not be successful. Our ability to make scheduled payments or to refinance our debt obligations depends on our
financial and operating performance, which is subject to prevailing economic and competitive
conditions (including the current downturn in the global economy in general and in our industry
in particular). In 2008, we had operating cash outflows of USD 622 million and we had an
operating loss of USD 2,646 million. In the future, we may not be able to maintain a level of cash
flows from operating activities sufficient to permit us to pay the principal, premium, if any, and
interest on our indebtedness, particularly in light of the severe downturn in our sales and in the
semiconductor industry generally.
Our business may not generate sufficient cash flow from operations, or future borrowings under
our senior secured revolving credit facility or from other sources may not be available to us in an
amount sufficient, to enable us to repay our indebtedness, including the senior secured revolving
credit facility or the outstanding notes, or to fund our other liquidity needs, including our
Redesign Program and working capital and capital expenditure requirements, and we may be
forced to reduce or delay capital expenditures, sell assets or operations, seek additional capital
or restructure or refinance our indebtedness. A substantial portion of our indebtedness
currently bears interest at floating rates, and therefore if interest rates increase, our debt service
requirements will increase. We may therefore need to refinance or restructure all or a portion
of our indebtedness, including the senior secured revolving credit facility or the outstanding
notes, on or before maturity. This may not be possible unless our performance improves and
there is a recovery in the credit markets.
If we cannot service our indebtedness, we may have to take actions such as selling assets, seeking
additional equity investments or reducing or delaying capital expenditures, strategic acquisitions,
investments and alliances, any of which could have a material adverse effect on our operations, or
seeking to restructure our debt through compromises, exchanges or insolvency processes.
If we cannot make scheduled payments on our debt, we will be in default and, as a result:
• our debt holders could declare all outstanding principal and interest to be due and payable;
• the lenders under our senior secured revolving credit facility could terminate their
commitments to lend us money and foreclose against the assets securing their borrowings;
and
• we could be forced into bankruptcy or liquidation.
[-87]
If we default on our obligations to pay our indebtedness or if we otherwise fail to comply with the various covenants in the instruments governing our indebtedness, we may not be able to make interest payments on our indebtedness. Any default under the agreements governing our indebtedness, including a default under the
senior secured revolving credit facility and the indentures governing our securities and the
remedies sought by the holders of such obligations, could make us unable to pay principal,
premium, if any, and interest under our securities and substantially decrease the market value of
our securities. If we are unable to generate sufficient cash flow and are otherwise unable to
obtain funds necessary to meet required payments of principal, premium (if any) and interest on
our indebtedness, or if we otherwise fail to comply with the various covenants in the instruments
governing our indebtedness we could be in default under the terms of the agreements governing
such indebtedness, including our senior secured revolving credit facility and our indentures
governing our securities. In the event of a default, the lenders under our senior secured revolving
credit facility or the investors in our securities could elect to declare all the funds borrowed
there under to be due and payable, together with accrued and unpaid interest, the lenders under
our senior secured revolving credit facility could elect to terminate their commitments there
under and cease making further loans and institute foreclosure proceedings against our assets,
and we could be forced into bankruptcy or liquidation.
Our substantial amount of debt could adversely affect our financial health. We are highly leveraged. For a description of our outstanding indebtedness as of December 31,
2008, see ÂÂDebt positionÊÊ in „Management Discussion and Analysis‰. Our substantial
indebtedness could materially adversely affect us by making it more difficult for us to satisfy our
payment and obligations under our senior secured revolving credit facility and under our
securities; limiting our ability to borrow money for working capital, restructurings, capital
expenditures, research and development, investments, acquisitions or other purposes, if needed,
and increasing the cost of any of these borrowings; requiring us to dedicate a substantial portion
of our cash flow from operations to service our debt, which reduces the funds available for
operations and future business opportunities; limiting our flexibility in responding to changing
business and economic conditions, including increased competition and demand for new services;
placing us at a disadvantage when compared to our competitors that have less debt; and making
us more vulnerable than our competitors who have less debt to a downturn in our business,
industry or the economy in general. Despite our substantial indebtedness, we may still incur
significantly more debt, which could further exacerbate the risks described above.
We have reviewed and may continue to review alternatives to further improve our capital structure. Considering our high leverage, we have reviewed and may continue to review alternatives to
improve our capital structure. We may in the future take additional steps to reduce our leverage
and our interest charges, such as exchange offers or tender offers and private market purchases.
If our existing debt cannot be successfully refinanced or restructured, it may in some
circumstances be required or advisable for us to seek insolvency protection under Dutch, U.S. or
other laws.
Management discussion and analysis
[-88]
Restrictive covenants in our senior secured revolving credit facility and the indentures governing the outstanding notes may restrict our ability to pursue our business strategies. Our senior secured revolving credit facility and the indentures governing the outstanding notes will limit our ability, among other things, to: • incur additional indebtedness or issue preferred stock; • pay dividends or make distributions in respect of our capital stock or make certain other
restricted payments or investments; • repurchase or redeem capital stock; • sell assets, including capital stock of restricted subsidiaries; • agree to limitations on the ability of our restricted subsidiaries to make distributions; • enter into transactions with our affiliates; • incur liens; • guarantee indebtedness; • designate unrestricted subsidiaries; and • engage in consolidations, mergers or sales of substantially all of our assets. The restrictions contained in the indentures and the senior secured revolving credit facility could: • limit our ability to plan for or react to market conditions or meet capital needs or
otherwise restrict our activities or business plans; and • adversely affect our ability to finance our operations, make strategic acquisitions,
investments or alliances, engage in research and development activities, restructure our organization, finance other capital needs or engage in other business activities that would be in our interest.
Our failure to comply with the covenants contained in the credit agreement governing our senior secured revolving credit facility or the indentures governing the outstanding notes or our other debt agreements, including as a result of events beyond our control, could result in an event of default which could materially and adversely affect our operating results and our financial condition. Our senior secured revolving credit facility and the indentures governing the outstanding notes require us to comply with various covenants. If there were an event of default under any of our debt instruments that was not cured or waived, the holders of the defaulted debt could terminate commitments to lend and cause all amounts outstanding with respect to the debt to be due and payable immediately, which in turn could result in cross defaults under our other debt instruments. Our assets and cash flow may not be sufficient to fully repay borrowings under all of our outstanding debt instruments if some or all of these instruments are accelerated upon an event of default. If, when required, we are unable to repay, refinance or restructure our indebtedness under, or amend the covenants contained in, our senior secured revolving credit facility, or if a default otherwise occurs, the lenders under our senior secured revolving credit facility could elect to terminate their commitments there under, cease making further loans and issuing or renewing letters of credit, declare all outstanding borrowings and other amounts, together with accrued interest and other fees, to be immediately due and payable, institute enforcement proceedings against those assets that secure the extensions of credit under our senior secured revolving credit facility and thereby prevent us from making payments on our debt. Any such actions could force us into bankruptcy or liquidation, and we might not be able to repay our obligations under our debt in such an event.
Management discussion and analysis
[-89]
Critical accounting policies
The preparation of financial statements and related disclosures in accordance with US GAAP
requires our management to make judgments, assumptions and estimates that affect the amounts
reported in our combined (predecessor) financial statements, our consolidated (successor)
financial statements and the accompanying notes. The critical accounting policies described in this
section are related to both the predecessor financial statements as well as the successor financial
statements unless stated otherwise. Our management bases its estimates and judgments on
historical experience, current economic and industry conditions and on various other factors
that are believed to be reasonable under the circumstances. Actual results may differ from these
estimates under different assumptions or conditions. If actual results differ significantly from
managementÊs estimates, there could be a material adverse effect on our results of operations,
financial condition and liquidity.
The combined financial statements of our predecessor period ending September 28, 2006 have
been derived from the consolidated financial statements of Philips and principally represent the
semiconductors segment. Prior to September 2006, we operated as a segment of Philips and a
number of services were provided to us by Philips. These include certain corporate functions
such as management oversight and brand campaigns, basic research and intellectual property
services. In addition, we participated in Philips pension plans, overall treasury management and
tax planning strategies. The costs of all such services were estimated and we have recorded these
amounts in our combined financial statements. These estimates are subject to significant
judgment and have had a material impact on our combined financial statements. In addition, the
combined financial statements of our predecessor period do not reflect the impact of our
acquisition by KASLION. Summarized below are those of our accounting policies where
management believes the nature of the estimates or assumptions involved is material due to the
levels of subjectivity and judgment necessary to account for highly uncertain matters or the
susceptibility of such matters to change.
Inventories
Inventories are stated at the lower of cost or market. The cost of inventories comprises all costs
of purchase, costs of conversion and other costs incurred in bringing the inventories to their
present location and condition. The costs of conversion of inventories include direct labor and
fixed and variable production overheads, taking into account the stage of completion. The cost of
inventories is determined using the first-in, first-out (FIFO) method. In determining the value of
our inventories, estimates are made of material, labor and overhead consumed. In addition, our
estimated yield has a significant impact on the valuation. We estimate yield based on historical
experience.
An allowance is made for the estimated losses due to obsolescence. This allowance is determined
for groups of products based on purchases in the recent past and/or expected future demand.
Management discussion and analysis
[-90]
Impairment of Long-Lived Assets Goodwill
We review goodwill for impairment on an annual basis in September of each year, or more
frequently if there are events or circumstances that indicate the carrying amount may not be
recoverable. To assess for impairment we determine the fair value of each reporting unit that has
goodwill. If the carrying value of the net assets in the reporting unit exceeds the fair value, we
perform an additional assessment to determine the implied fair value of the goodwill. If the
carrying value of the goodwill exceeds this implied fair value, we record impairment for the
difference between the carrying value and the implied fair value.
The determination of the fair value of the reporting unit requires us to make significant
judgments and estimates including projections of future cash flows from the business. These
estimates and required assumptions include estimated revenues and revenue growth rate,
operating margins used to calculate projected future cash flows, future economic and market
conditions, determination of market comparables and the estimated weighted average cost of
capital (ÂÂWACCÊÊ). We base our estimates on assumptions we believe to be reasonable but that
are unpredictable and inherently uncertain. Actual future results may differ from those estimates.
In addition, we make judgments and assumptions in allocating assets and liabilities to each of our
reporting units.
In 2008, as a result of our goodwill impairment analysis, we were required to recognize a USD
381 million impairment related to our Home reporting unit and USD 49 million related to our
corporate and other reporting unit. This impairment resulted in significantly reduced estimated
fair values that were directly attributable to the significant economic downturn in 2008. The key
assumptions used to determine the fair value of our reporting units included (a) cash flows based
on financial projections for periods ranging from 2008 through 2011 and which were
extrapolated until 2020, (b) terminal values based on terminal growth rates not exceeding 3%, (c)
discount rates, based on WACC, ranging from 12.5% to 15.0% (WACC was business unit specific
and was based on the WACC of peer companies in the relevant industries). A change in WACC
of approximately 0.5% would have resulted in an impairment loss in both our MultiMarket
Semiconductors and Manufacturing Operations reporting units and a decrease of more than 1%
in the terminal growth rate would have resulted in an impairment in the MultiMarket
Semiconductors reporting unit. Based on our assessment of the impact of changes on the key
assumptions subsequent to the third quarter, we considered that no additional impairment was
required. We cannot predict certain future events that might adversely affect the reported value
of goodwill, which totaled USD 2.7 billion at December 31, 2008.
Long-Lived Assets other than Goodwill
We review long-lived assets for impairment when events or circumstances indicate that carrying
amounts may not be recoverable. A potential impairment exists when management has
determined that cash flows to be generated by those assets are less than their carrying value.
Management must make significant judgments and apply a number of assumptions in estimating
the future cash flows. The estimated cash flows are determined based on, among other things,
[-91]
the CompanyÊs strategic plans, long-range forecasts, estimated growth rates and assumed profit
margins.
If the initial assessment indicates a potential impairment, the fair value of the assets is determined.
Management generally estimates fair value based on discounted cash flows. The discount rates
applied to the estimated cash flows are generally based on the business unit specific Weighted
Average Costs of Capital (WACC), which ranged between 12.5% and 15.0% in 2008 and which
were based on the WACCs of peer companies in the relevant industries. An impairment loss is
recognized for the difference between the carrying value and the estimated fair value. An
indication of impairment exists, similar to goodwill, based on the unfavorable developments in the
economic climate. We performed an impairment assessment of our tangible fixed assets and
other intangible assets in 2008. The projected cash flows were modified significantly from prior
periods due to the changing economic environment, which resulted in lower projected cash flows
(and fair values). As a result of this assessment, we recorded an impairment of USD 284 million
to our intangible assets. The assumptions applied were consistent with our impairment
assessment for goodwill.
At December 31, 2008, we have USD 2.4 billion of other intangible assets and USD 1.8 billion of
long-lived tangible assets. Any changes in future periods related to the estimated cash flows from
these assets could result in an additional impairment in future periods.
Restructuring
The provision for restructuring relates to the estimated costs of initiated reorganizations that
have been approved by our Board of Management and that involve the realignment of certain
parts of the industrial and commercial organization. When such reorganizations require
discontinuance and/or closure of lines of activities, the anticipated costs of closure or
discontinuance are included in restructuring provisions.
Management uses estimates to determine the amount of restructuring provision. Our estimates
are based on our anticipated personnel reductions and average associated costs. These estimates
are subject to judgment and may need to be revised in future periods based on additional
information and actual costs.
Revenue Recognition
The CompanyÊs revenues are primarily derived from made-to-order sales to OEMs and similar
customers. A smaller portion of the CompanyÊs revenues is derived from sales to distributors.
The Company applies the guidance in SEC Staff Accounting Bulletin Topic 13 ÂÂRevenue
RecognitionÊÊ and recognizes revenue when persuasive evidence of an arrangement exists,
delivery has occurred or the service has been provided, the sales price is fixed or determinable,
and collection is reasonably assured, based on the terms and conditions of the sales contract. For
ÂÂmade to orderÊÊ sales, these criteria are generally met at the time the product is shipped and
delivered to the customer and title and risk have passed to the customer. Examples of delivery
conditions typically meeting these criteria are ÂÂFree on Board point of deliveryÊÊ and ÂÂCosts,
Management discussion and analysis
[-92]
Insurance Paid point of deliveryÊÊ. Generally, the point of delivery is the customerÊs warehouse.
Acceptance of the product by the customer is generally not contractually required, since, with
ÂÂmade-to-orderÊÊ customers, design approval commences manufacturing and subsequently
delivery follows without further acceptance protocols. Payment terms used are those that are
customary in the particular geographic market.
When management has established that all aforementioned conditions for revenue
recognitionhave been met and no further post-shipment obligations exist revenue is recognized.
For sales to distributors, the same recognition principles apply and similar terms and conditions
as for sales to other customers are applied. However, for some distributors, contractual
arrangements are in place that allow these distributors to return a product if certain conditions
are met. These conditions generally relate to the time period during which return is allowed and
reflect customary conditions in the particular geographic market. Other return conditions relate
to circumstances arising at the end of a product cycle, when certain distributors are permitted to
return products purchased during a pre-defined period after the Company has announced a
productÊs pending discontinuance. Long notice periods associated with these announcements
generally prevent significant amounts of product from being returned, however. Repurchase
agreements with OEMs or distributors are generally not entered into by the Company. For sales
where return rights exist, the Company applies the guidance given in SFAS 48 ÂÂRecognition
When Right of Return ExistsÊÊ. Based on historical data, management has determined that only a
very small percentage of the sales to this type of distributors is actually returned. In accordance
with the requirements of SFAS 48, a pro rata portion of the sales to these distributors is not
recognized but deferred until the return period has lapsed or the other return conditions no
longer apply. Revenues are recorded net of sales taxes, customer discounts, rebates and similar
charges. Shipping and handling costs billed to customers are recognized as revenues. Expenses
incurred for shipping and handling costs of internal movements of goods are recorded as cost of
sales. Shipping and handling costs related to sales to third parties are reported as selling
expenses.
Royalty income, which is generally earned based upon a percentage of sales or a fixed amount
per product sold, is recognized on an accrual basis. Government grants, other than those relating
to purchases of assets, are recognized as income as qualified expenditures are made.
A provision for product warranty is made at the time of revenue recognition and reflects the
estimated costs of replacement and free-of-charge services that will be incurred by the Company
with respect to the sold products. In cases where the warranty period is extended and the
customer has the option to purchase such an extension, which is subsequently billed separately
to the customer, revenue recognition occurs on a straight-line basis over the contract period.
Income Taxes
The CompanyÊs income taxes as presented in the predecessor combined financial statements
were calculated on a separate tax return basis, although the Company was included in the
consolidated tax return of Philips. Philips manages its tax position for the benefit of its entire
[-93]
portfolio of businesses, and its tax strategies are not necessary reflective of the tax strategies that
the Company would have followed or will follow as a stand-alone Company.
Income taxes in the successor consolidated financial statements are accounted for using the asset
and liability method. We operate in numerous countries where our income tax returns are
subject to audits and adjustments. Because we operate globally, the nature of the audit items are
often very complex. We employ internal and external tax professionals to minimize audit
adjustment amounts where possible. We have applied the provisions of FIN 48 with regard to
uncertain tax positions and have recognized a liability for tax positions taken but possibly not
entirely realizable, based on estimated amounts that have a cumulative realizability of more than
50%.
We have significant deferred tax assets primarily related to net operating losses (ÂÂNOLsÊÊ) in the
Netherlands, France, Germany, the USA and other countries. The realization of these assets is
not assured and is dependent on the generation of sufficient taxable income in the future. We
have exercised judgment in determining whether it is more likely or not that we will realize the
benefit of these net operating losses, based upon estimates of future taxable income in the
various jurisdictions in which these NOLs exist and any feasible tax planning strategies. Where
there is an expectation that on the balance of probabilities there will not be sufficient taxable
profits to utilize these NOLs a valuation allowance has been made against these deferred tax
assets.
During 2008, based on our assessment of future profitability and our ability to realize our
deferred tax assets, we recorded an additional valuation allowance of USD 496 million against
deferred tax assets.
At December 31, 2008, we had USD 539 million of deferred tax assets recognized on our
balance sheet based on our determination that it was more likely than not that these assets
would be realized. This determination was based on the estimated profitability of operations in
each jurisdiction. If the actual results differ from these estimates, or to the extent that these
estimates are adjusted in the future, any changes to the valuation allowance could materially
impact the CompanyÊs financial position and results.
Benefit Accounting
The Company accounts for the cost of pension plans and postretirement benefits other than
pensions in accordance with SFAS No. 87 ÂÂEmployerÊs Accounting for PensionsÊÊ, and SFAS No.
106 ÂÂPostretirement Benefits other than PensionÊÊ, respectively. The CompanyÊs employees
participate in pension and other postretirement benefit plans in many countries.
The costs of pension and other postretirement benefits and related assets and liabilities with
respect to the Company employees participating in defined-benefit plans have been allocated to
the Company based upon actuarial computations. We record the unfunded status associated with
these plans in accordance with the requirements of SFAS No. 158 and record the actuarially
determined pension costs each period. Pension costs in respect of defined-benefit pension plans
primarily represent the increase in the actuarial present value of the obligation for pension
Management discussion and analysis
[-94]
benefits based on employee service during the year and the interest on this obligation in respect
of employee service in previous years, net of the expected return on plan assets.
In calculating obligation and expense, we are required to select certain actuarial assumptions.
These assumptions include discount rate, expected long-term rate of return on plan assets and
rates of increase in compensation costs. Our assumptions are determined based on current
market conditions, historical information and consultation with and input from our actuaries.
Changes in the key assumptions can have a significant impact on the projected benefit obligations,
funding requirements and periodic pension cost incurred. For a discussion of the current funded
status and a sensitivity analysis with respect to pension plan assumptions, please refer to note 25
of the financial statements.
Share-based compensation
Share-based compensation plans were put in place by our parent company KASLION. Under
these plans management and certain other executives acquire the right to receive depository
receipts of KASLION shares upon exercise and payment of the exercise price, after these rights
have vested and only if a change in control event that triggers exercise has taken place. Also,
equity rights were granted to certain non-executive employees containing the right to acquire
KASLION shares for no consideration after the rights have vested and a change in control event
that triggers exercise has taken place. No share-based compensation arrangements were in place
in the period from September 29, 2006 through December 31, 2006.
The plans are accounted for in accordance with the provisions of SFAS 123(R). The Company
uses a binomial option-pricing model to determine the estimated fair value of the equity
instruments.
Since neither KASLIONÊs stock options nor its shares are traded on any stock exchange, and
exercise is dependent upon a sale or change of control of the Company, employees can receive
no value nor derive any benefit from holding these options or rights without the fulfillment of the
conditions for exercise. The Company has concluded that the fair value of the share-based
payments can best be estimated by the use of a binomial option-pricing model because such
model takes into account the various conditions and subjective assumptions that determine the
estimated value. The assumptions used are:
- Expected life of the options and equity rights is calculated as the difference between the grant dates and an exercise triggering event occurring not before the end of 2011;
- Risk-free interest rate is 4.1% for 2007 awards and 3.8% for 2008 awards; - Expected asset volatility is approximately 27%;
- Dividend pay-out ratio of nil; and
- Lack of marketability discount is 35% for 2007 awards and 26% for 2008 awards.
Because the options and rights are not traded, an option-based approach (the Finnerty model)
was used to calculate an appropriate discount for lack of marketability. The expected life of the
options and rights is an estimate based on the time period private equity investors typically take
to liquidate a portfolio investment. The volatility assumption has been based on the average
volatility of comparable companies over an equivalent period from valuation to exit date.
Changes in the assumptions can materially affect the fair value estimate.
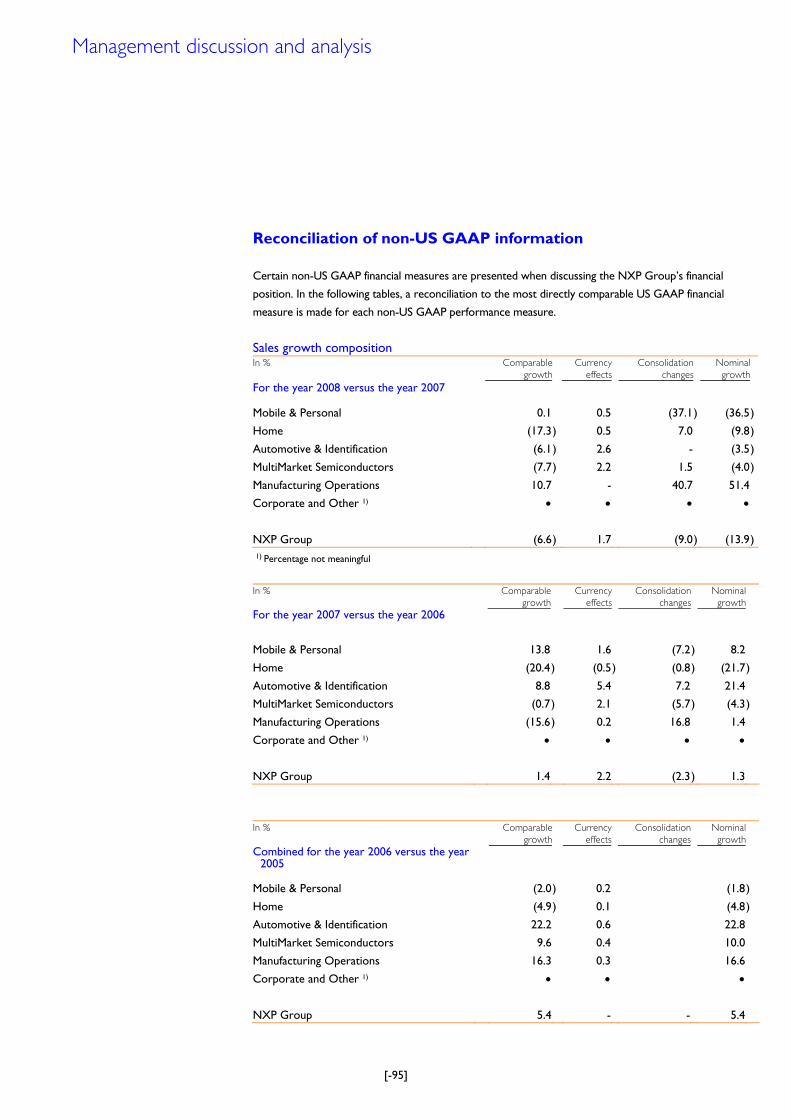
[-95]
Reconciliation of non-US GAAP information
Certain non-US GAAP financial measures are presented when discussing the NXP GroupÊs financial
position. In the following tables, a reconciliation to the most directly comparable US GAAP financial
measure is made for each non-US GAAP performance measure.
Sales growth composition In % Comparable
growth
Currency
effects
Consolidation
changes
Nominal
growth
For the year 2008 versus the year 2007 Mobile & Personal 0.1 0.5 (37.1) (36.5)
Home (17.3) 0.5 7.0 (9.8)
Automotive & Identification (6.1) 2.6 - (3.5)
MultiMarket Semiconductors (7.7) 2.2 1.5 (4.0)
Manufacturing Operations 10.7 - 40.7 51.4
Corporate and Other 1) • • • •
NXP Group (6.6) 1.7 (9.0) (13.9)1) Percentage not meaningful In % Comparable
growth
Currency
effects
Consolidation
changes
Nominal
growth
For the year 2007 versus the year 2006
Mobile & Personal 13.8 1.6 (7.2) 8.2
Home (20.4) (0.5 ) (0.8) (21.7)
Automotive & Identification 8.8 5.4 7.2 21.4
MultiMarket Semiconductors (0.7) 2.1 (5.7) (4.3)
Manufacturing Operations (15.6) 0.2 16.8 1.4
Corporate and Other 1) • • • •
NXP Group 1.4 2.2 (2.3) 1.3
In % Comparable
growth
Currency
effects
Consolidation
changes
Nominal
growth
Combined for the year 2006 versus the year 2005
Mobile & Personal (2.0) 0.2 (1.8)
Home (4.9) 0.1 (4.8)
Automotive & Identification 22.2 0.6 22.8
MultiMarket Semiconductors 9.6 0.4 10.0
Manufacturing Operations 16.3 0.3 16.6
Corporate and Other 1) • • •
NXP Group 5.4 - - 5.4
Management discussion and analysis
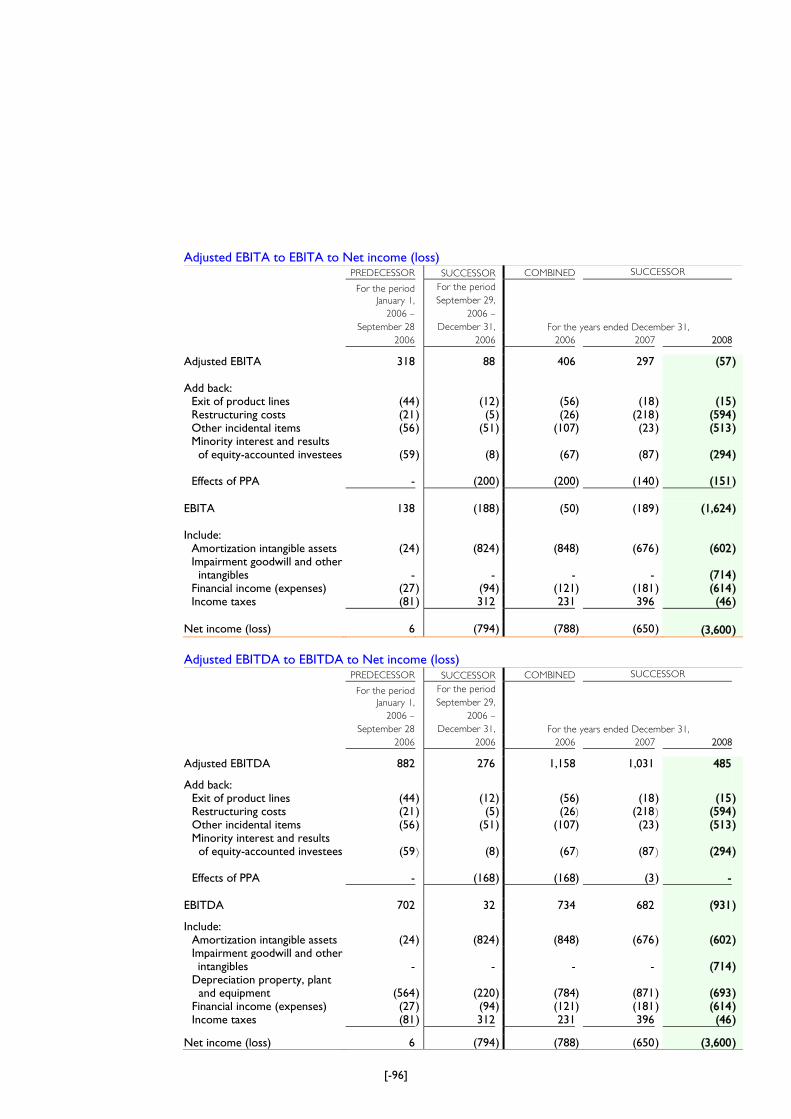
[-96]
Adjusted EBITA to EBITA to Net income (loss) PREDECESSOR SUCCESSOR COMBINED SUCCESSOR
For the period
January 1,
2006 –
September 28
For the period
September 29,
2006 –
December 31, For the years ended December 31,
2006 2006 2006 2007 2008 Adjusted EBITA 318 88 406 297 (57)
Add back: Exit of product lines (44) (12) (56) (18) (15) Restructuring costs (21) (5) (26) (218) (594) Other incidental items (56) (51) (107) (23) (513) Minority interest and results of equity-accounted investees (59
) (8
) (67
) (87
) (294
)
Effects of PPA - (200) (200) (140) (151)
EBITA 138 (188) (50) (189) (1,624) Include: Amortization intangible assets (24) (824) (848) (676) (602) Impairment goodwill and other intangibles -
-
-
-
(714 )
Financial income (expenses) (27) (94) (121) (181) (614) Income taxes (81) 312 231 396 (46)
Net income (loss) 6 (794) (788) (650) (3,600)
Adjusted EBITDA to EBITDA to Net income (loss) PREDECESSOR SUCCESSOR COMBINED SUCCESSOR
For the period
January 1,
2006 –
September 28
For the period
September 29,
2006 –
December 31, For the years ended December 31,
2006 2006 2006 2007 2008 Adjusted EBITDA 882 276 1,158 1,031 485 Add back: Exit of product lines (44) (12) (56) (18) (15) Restructuring costs (21) (5) (26) (218) (594) Other incidental items (56) (51) (107) (23) (513) Minority interest and results of equity-accounted investees (59
) (8 ) (67
) (87
) (294 )
Effects of PPA - (168) (168) (3) -
EBITDA 702 32 734 682 (931) Include: Amortization intangible assets (24) (824) (848) (676) (602) Impairment goodwill and other intangibles -
-
-
-
(714 )
Depreciation property, plant and equipment (564
) (220
) (784
) (871
) (693
)
Financial income (expenses) (27) (94) (121) (181) (614) Income taxes (81) 312 231 396 (46) Net income (loss) 6 (794) (788) (650) (3,600)
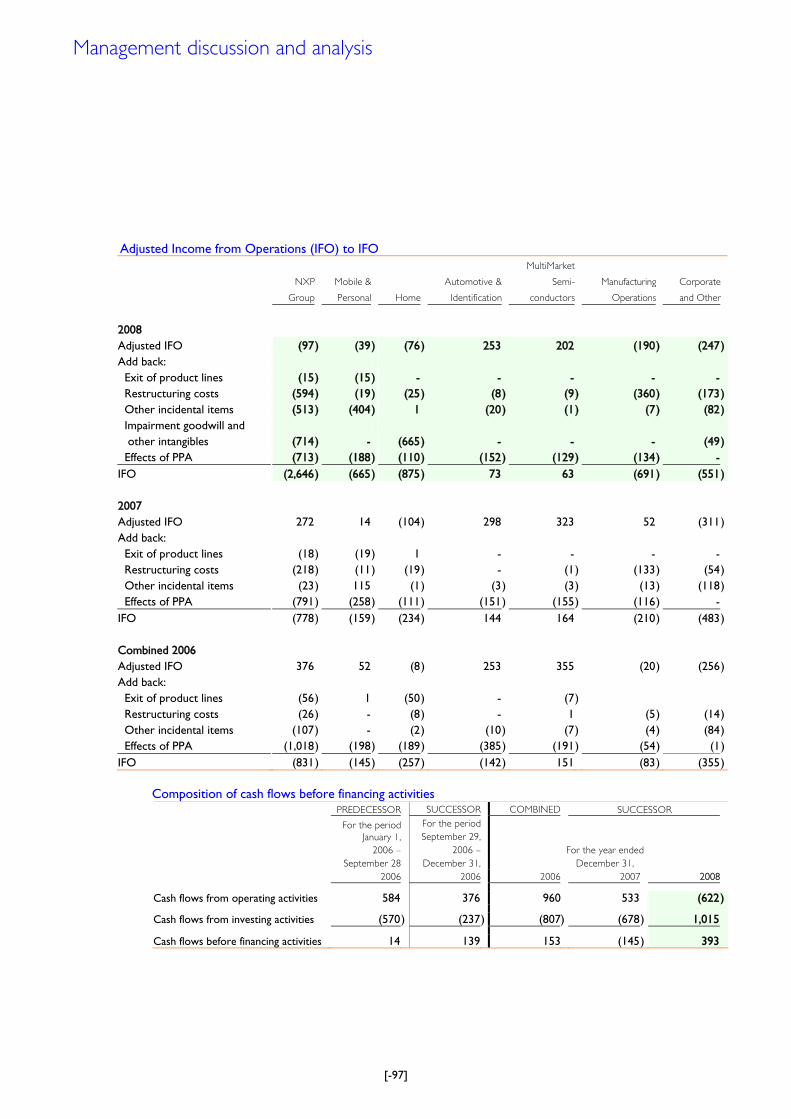
[-97]
Adjusted Income from Operations (IFO) to IFO
NXP
Group
Mobile &
Personal
Home
Automotive &
Identification
MultiMarket
Semi-
conductors
Manufacturing
Operations
Corporate
and Other
2008 Adjusted IFO (97 ) (39) (76) 253 202 (190) (247) Add back: Exit of product lines (15 ) (15) - - - - - Restructuring costs (594 ) (19) (25) (8) (9 ) (360) (173) Other incidental items (513 ) (404) 1 (20) (1 ) (7) (82) Impairment goodwill and other intangibles
(714
) -
(665
) -
-
-
(49 )
Effects of PPA (713 ) (188) (110) (152) (129 ) (134) - IFO (2,646 ) (665) (875) 73 63 (691) (551) 2007 Adjusted IFO 272 14 (104) 298 323 52 (311) Add back: Exit of product lines (18 ) (19) 1 - - - - Restructuring costs (218 ) (11) (19) - (1 ) (133) (54) Other incidental items (23 ) 115 (1) (3) (3 ) (13) (118) Effects of PPA (791 ) (258) (111) (151) (155 ) (116) - IFO (778 ) (159) (234) 144 164 (210) (483) Combined 2006 Adjusted IFO 376 52 (8) 253 355 (20) (256) Add back: Exit of product lines (56 ) 1 (50) - (7 ) Restructuring costs (26 ) - (8) - 1 (5) (14) Other incidental items (107 ) - (2) (10) (7 ) (4) (84) Effects of PPA (1,018 ) (198) (189) (385) (191 ) (54) (1) IFO (831 ) (145) (257) (142) 151 (83) (355)
Composition of cash flows before financing activities PREDECESSOR SUCCESSOR COMBINED SUCCESSOR
For the period
January 1,
2006 –
September 28
For the period
September 29,
2006 –
December 31,
For the year ended
December 31,
2006 2006 2006 2007 2008
Cash flows from operating activities 584 376 960 533 (622) Cash flows from investing activities (570) (237) (807) (678 ) 1,015 Cash flows before financing activities 14 139 153 (145 ) 393
Management discussion and analysis
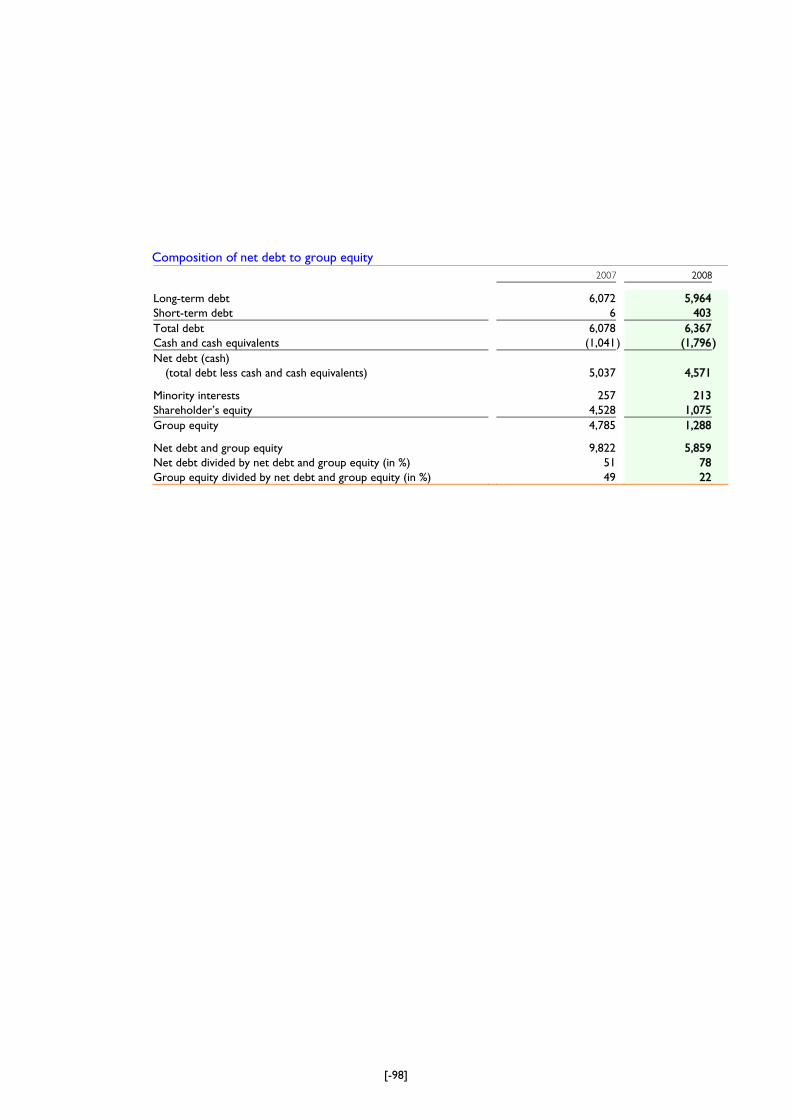
[-98]
Composition of net debt to group equity 2007 2008 Long-term debt 6,072 5,964 Short-term debt 6 403 Total debt 6,078 6,367 Cash and cash equivalents (1,041 ) (1,796) Net debt (cash) (total debt less cash and cash equivalents) 5,037 4,571 Minority interests 257 213 ShareholderÊs equity 4,528 1,075 Group equity 4,785 1,288 Net debt and group equity 9,822 5,859 Net debt divided by net debt and group equity (in %) 51 78 Group equity divided by net debt and group equity (in %) 49 22
[-99]
Subsequent events
On April 2, 2009, we announced the closing of two separate private offers to exchange existing
unsecured and secured notes for new U.S. dollar and euro-denominated super priority notes
upon the terms and subject to the conditions set forth in the confidential offering memorandum
relating to the exchange offers. The purpose of the exchange offers, commenced on March 3,
2009, is to reduce our overall indebtedness and related interest expense. As a result, overall
indebtedness will be reduced by approximately USD 465 million, with a corresponding increase
in net income, taking into account tax effects, if any. Furthermore, the related annual interest
expense will be reduced by approximately USD 30 million.
On March 13, 2009, Singapore based Systems on Silicon Manufacturing Company Pte. Ltd.
(„SSMC‰) (in which we have a 61.2% ownership share) paid USD 73 million cash dividend for
2008 to its shareholders. As a consequence, the USD 29 million that was paid to TSMC (our
joint-venture partner in SSMC) reduced the consolidated cash position which will be reflected in
the first quarter 2009 cash flow from operating activities.
On March 13, 2009, we announced the completion of the sale and repurchase of our stake in
DSPG (approximately 4.2 million shares or 16% outstanding common stock of DSPG) currently
held by us and obtained in 2007 following the divestment of our Cordless & VoIP Terminal
operations. The agreed repurchase price amounted to approximately USD 20 million. Effective
the same date, we have surrendered our seat on the board of directors of DSPG in accordance
with the Stock Repurchase Agreement.
On February 13, 2009, we drew an additional USD 200 million under our senior secured
revolving credit facility, bringing the total amount drawn under this facility to USD 600 million,
without taking into account USD 5 million of outstanding bank guarantees under the facility. As
of that date, we had approximately EUR 39 million of remaining availability under the facility, after
taking into account outstanding bank guarantees under the facility.
On February 2, 2009, STMicroelectronics purchased our 20% stake in ST-NXP. The agreed
purchase price, based on the sales and EBITDA performance of the ST-NXP business in the last
twelve months, was USD 92 million.
Eindhoven, April 7, 2009
Board of Management
Management discussion and analysis
[-100]
Board of Management Under the chairmanship of the CEO, the Board of Management is entrusted with the general management of the Company, including the deployment of its strategy and policies, and the achievement of its objectives and results. The Board of Management, whose members are appointed and dismissed by the General Meeting of Shareholders upon proposal by the Supervisory Board, and who is embedded in NXPÊs Management Team (ÂMTÊ), is accountable to our Supervisory Board and to the General Meeting of Shareholders. Members of the Board of Management hold office until they are removed or replaced by the General Meeting of Shareholders. Major decisions of the Board of Management require the approval of the Supervisory Board, including decisions relating to the CompanyÊs operational and financial objectives and the strategies it uses to achieve those objectives. Set forth below is a list of the members of the Board of Management as of January 1, 2009, along with their year of birth and nationality: Richard L. Clemmer, 1951, American 1)
Mr. Clemmer became Chairman of the Board of Management, President and Chief Executive Officer on January 1, 2009. Previously, since December 2007, Mr. Clemmer was a member of our Supervisory Board and Senior Advisor of KKR. Prior to joining NXP, he drove the turnaround and re-emergence of Agere Systems, the Lucent spin-out and a leader in semiconductors for storage, wireless data, and public and enterprise networks. He also served as Chairman of u-Nav Microelectronics, a leading GPS technology provider, and held a five-year tenure at Quantum Corporation where he was Executive Vice President and Chief Financial Officer. Prior to Quantum, Mr. Clemmer worked for Texas Instruments as Senior Vice President and Chief Financial Officer. Mr. Clemmer also serves on the boards of NCR Corporation and i2 Technologies, Inc. Karl-Henrik Sundström, 1960, Swedish 2) Mr. Sundström is a member of the Board of Management, Executive Vice President and Chief Financial Officer since May 13, 2008. In a successful 22 year career at Ericsson, Mr. Sundström gained general management experience leading the company's Global Services Operations and its Australian and New Zealand business before his appointment as Chief Financial Officer of Ericsson AB in 2003 until the end of 2007. 1) Prior to January 1, 2009, this function was fulfilled by Mr. Frans van Houten who resigned as of December 31,
2008. Mr. van Houten was Chairman of the Board of Management, President and Chief Executive Officer since
November 2004.
2) Until May 13, 2008, Mr Peter van Bommel was the Chief Financial Officer of the Company. As per this date he
resigned as member of the Board of Management. Mr. Hein van der Zeeuw and Mr. Theo Claasen resigned as
members of the Board of Management and left the Company on July 7 and August 1, 2008, respectively
NXP’s leadership
[-101]
Management Team Subject to the overall authority of our Board of Management, the Management Team is the primary executive management layer within NXP where the business units, the core processes and the support functions act as one team together to lead our company. The Management Team, consisting of the members of the Board of Management, as well as eight senior executives of the Company, has overall operational responsibility for the management of the Company and carries out the day-to-day operations of the business, including the development of business plans, budgets and operational forecasts. Members of the Management Team, other than members of the Board of Management, are appointed and dismissed by the Board of Management and hold office until they are removed or replaced by the Board of Management.
Set forth below is a list as of January 1, 2009 of the members of the Management Team, other than the members of the Board of Management along with their year of birth and nationality: Marc de Jong, 1961, Dutch 1)
Mr. de Jong is Executive Vice-President and General Manager of the Automotive & Identification business unit, a position he has held since November 2005. He has previously served in various positions at Philips since 1986.
Christos Lagomichos, 1955, Greek Mr. Lagomichos is Senior Vice-President and General Manager of the Home business unit, a position he has held since September 2007. Before joining NXP, he worked for STMicroelectronics where he held various senior management roles.
Rene Penning De Vries, 1954, Dutch Mr. Penning De Vries is Senior Vice-President and Chief Technology Officer. He was employed by Philips from 1984 to September 29, 2006 in various managerial positions. Mike Noonen, 1963, American Mr. Noonen was appointed Senior Vice-President, Global Sales on November 10, 2008 2). He previously served in a global Sales position at National Semiconductors which he joined in 2001. Before that he worked for various high-tech companies including NCR Microelectronics and Cisco Systems.
Peter Kleij, 1960, Dutch Mr. Kleij is Senior Vice-President, Human Resource Management, a position he has held since September 2002. Prior to joining Philips in 1996, he worked for various large companies, including AT&T.
NXP’s leadership
[-102]
Guido Dierick, 1959 , Dutch Mr. Dierick is Senior Vice-President, General Counsel, responsible for Legal and IP, a position he has held since 2000. He previously was employed by Philips from 1982 and worked in various legal positions.
Alexander Everke, 1963, German Mr. Everke was appointed Executive Vice-President and General Manager MultiMarket Semiconductors on January 1, 2008.3). He previously served in various senior management positions within NXP. Mr. Everke joined NXP in 2006 from Infineon Technologies, where he served most recently as general manager of the Chip Card & Security ICs business unit. Before Infineon, Mr. Everke worked for several years in Siemens.
Chris Belden, 1960 , American Mr. Belden was appointed Senior Vice-President, General Manager of Operations on July 7, 2008.4) He joined NXP as Senior Vice-President Global Manufacturing on March 1, 2008. Previously Mr. Belden worked for Applied Materials, where he was responsible for Global Operations. Before that, he spent the majority of his career at Motorola Semiconductor and Freescale Semiconductor, last responsible for Freescale's Global Manufacturing Operations.
1) Marc de Jong left NXP effective April 1, 2009. Following this change, responsibility for the Automotive and
Identification Business Unit has been taken over on an interim basis by Rick Clemmer and Alexander Everke in
addition to their existing duties. 2,3) Until September 1, 2008 Pascal Langlois was Senior Vice-President, Global Sales. From September and November
20, 2008, this function was managed by Alexander Everke on an interim basis in addition to his function as General
Manager of MultiMarket Semiconductors. 4) Until July 7, 2008, Hein van der Zeeuw was General Manager of Operations.
[-103]
Supervisory Board
The Supervisory Board has comprehensive oversight responsibilities and supervises and advises the
Board of Management in performing its management tasks and setting the direction of NXPÊs
business. It approves major management decisions, including the overall business strategy, and
supervises the structure and management of the CompanyÊs internal control systems and the
financial reporting process. It also determines the remuneration of the individual members of the
Board of Management within the established remuneration policy.
While retaining overall responsibility, the Supervisory Board assigns certain of its tasks to three
permanent committees: the Operating Committee, the Nominating and Compensation
Committee and the Audit Committee. The Supervisory Board consists of eight members,
appointed and dismissed by the General Meeting of Shareholders. Six of whom are nominated by
KASLION Holding B.V., one of whom (Mr. Eric Coutinho) is nominated by Philips, and one of
whom (Sir Peter Bonfield) is an independent Chairman, who is appointed and dismissed jointly by
KASLION Holding B.V. and Koninklijke Philips Electronics N.V. The members of the Supervisory
Board hold office until they are removed or replaced by the General Meeting of Shareholders.
Members of the permanent committees are appointed and dismissed by the Supervisory Board.
Set forth below is a list of the members of the Supervisory Board and their committee membership
as of January 1, 2009 along with their year of birth and nationality:
Sir Peter Bonfield, 1944, British Sir Peter has been the chairman of the Supervisory Board since September 29, 2006. Sir Peter
served as CEO and Chairman of the Executive Committee for BT plc from 1996 to 2002 and prior
to that was Chairman and CEO of ICL plc (now Fujitsu Services). Sir Peter also worked in the
semiconductor industry during his tenure as a divisional director at Texas Instruments, for whom he
held a variety of senior management positions around the world. Sir Peter currently holds non-
executive directorships at LM Ericsson, TSMC, Mentor Graphics and Sony.
Johannes P. Huth, 1960, German 1) 2) Mr. Huth has been a vice-chairman of the Supervisory Board since September 29, 2006 and is a
Managing Director of KKR Europe. He has been with KKR for seven years. Currently, he is on
the board of directors of ATU, Demag, Duales System Deutschland (DSD), MTU Aero Engines,
NXP, Selenia, SBS Broadcasting, Wincor Nixdorf and Zumtobel. Mr. Huth started his
professional career with Salomon Brothers in New York and London. Following that, he worked
with Investcorp in London.
Adam H. Clammer, 1970, American Mr. Clammer was elected to the Supervisory Board effective January 1, 2009, representing
KKR*).
He has been with KKR for thirteen years and during that time has been actively involved with
several companies. Currently, he is on the board of directors of Aricent and Avago Technologies.
Prior to joining KKR, Mr. Clammer was with Morgan Stanley & Co.
NXP’s leadership
[-104]
Eric Coutinho, 1951, Dutch Mr. Coutinho has been a member of the Supervisory Board since September 29, 2006 and Chief
Legal Officer of Royal Philips Electronics and a member of its Group Management Committee. He
has been with Philips since 1979 during which time he has worked in various positions. He is also
Deputy Chairman of The Netherlands Philips Pension Funds.
Egon Durban, 1973, German 1) Mr. Durban has been a member of the Supervisory Board since September 29, 2006 and is a
Managing Director of Silver Lake Partners. He joined Silver Lake in January 1999. Prior to joining
Silver Lake, Mr. Durban worked in various positions at Morgan Stanley. He serves on the board of
Intelsat and the operating committee of SunGard.
Ian Loring, 1966, American Mr. Loring has been a member of the Supervisory Board since September 29, 2006 and is a
Managing Director of Bain Capital Partners. Prior to joining Bain Capital in 1996, Mr. Loring
worked at Berkshire Partners and previously he worked at Drexel Burnham Lambert. He serves as
a director of Cumulus Media Partners, Eschelon Telecom and Warner Music Group.
Michel Plantevin, 1956, French 1) 2) Mr. Plantevin has been a member of the Supervisory Board since September 29, 2006 and is a
Managing Director of Bain Capital Partners. Prior to joining Bain Capital in 2003, Mr. Plantevin
worked at Goldman Sachs in London, and prior to that he was a partner with Bain & Company in
London and Paris. He also serves as a director of FCI.
Richard Wilson, 1965, British 1) 3) Mr. Wilson has been a member of the Supervisory Board since October 22, 2008 **) and is a
Partner of Apax Partners. Prior to joining Apax n 1995, he served as a consultant with Scientific
Generics and also worked for Marconi Space Systems. He has sat on a number of boards of Apax
portfolio companies and is a Council Member of the British Venture Capital and Private Equity
Association.
1) Member of the Supervisory Board Operating Committee
2) Member of the Supervisory Board Nominating and Compensation Committee
3) Member of the Supervisory Board Audit Committee
*) Mr. Clammer replaced Mr. Richard L. Clemmer who resigned effective December 31, 2008 to become President
and CEO of the Company .
**) Mr. Wilson replaced Mr. Christian Reitberger who resigned effective October 22, 2008.
[-105]
General
The supervision of the general affairs and business of NXP B.V. (the ÂCompanyÊ) is entrusted to the
Supervisory Board, which, in the two-tier corporate structure under Dutch law, is a separate body,
fully independent of the Board of Management. This independence is reflected in the requirement
that members of the Supervisory Board be neither members of the Board of Management, nor
employees of the Company. The Supervisory Board supervises and advises the Board of
Management in performing its management tasks and setting the direction of the CompanyÊs
business. Similar to the Board of Management, it is guided by the interests of the Company and its
business, taking into account the relevant interests of the stakeholders involved in the Company.
The Supervisory Board discusses and approves the CompanyÊs corporate strategy, it approves
major management decisions, including the overall business strategy, and supervises the structure
and management of internal control systems and the financial reporting process. The Supervisory
Board also determines the remuneration of the individual members of the Board of Management.
While retaining overall responsibility, the Supervisory Board assigns certain of its tasks to three
permanent committees: the Operating Committee, the Nominating and Compensation Committee
and the Audit Committee.
The Supervisory Board was installed on September 29, 2006, immediately following the
acquisition of a majority interest in the Company by the Consortium. The members of the
Supervisory Board are listed on pages 103 and 104 of this Annual Report.
The Supervisory Board met ten times in the course of 2008. The members of the Board of
Management and, if requested, some members of the Management Team, were present at these
meetings. The Supervisory Board was informed and consulted by the Board of Management on the
direction of the CompanyÊs business and passed several resolutions. In addition to this meeting, the
Chairman and other members of the Supervisory Board had regular contact with the CEO and
other members of the Board of Management.
Operating Committee
The Operating Committee is responsible for maintaining regular contact with the Board of
Management on the implementation of the CompanyÊs budget and group strategy. It conducts
regular business reviews, supervises the CompanyÊs general affairs, and advises the Board of
Management and Management Team. The Committee met twelve times in the course of 2008 and
reported its findings to the plenary Supervisory Board. The members of the Operating Committee
are Messrs. Huth (Chairman), Durban, Plantevin and Wilson.
Nominating and Compensation Committee
The Nominating and Compensation Committee determines selection criteria and appointment
procedures for members of the Board of Management, periodically assesses the scope and
composition of the Board of Management and evaluates the performance of its individual members.
Report of the Supervisory Board
[-106]
It is further responsible for recommending to the Supervisory Board the compensation package for
each member of the Board of Management. It reviews employment contracts entered into with
members of the Board of Management, makes recommendations to the Supervisory Board with
respect to major employment-related policies and overseas compliance with the CompanyÊs
employment and compensation-related disclosure obligations under applicable laws. The members
of the Nominating and Compensation Committee are Messrs. Huth and Plantevin.
Compensation
Indemnification Unless prohibited by law in a particular circumstance, our Articles of Association require that the Company reimburses the members of the Board of Management and Supervisory Board for damages and various costs and expenses related to claims brought against them in connection with the exercise of their duties. However, no reimbursement is available if a memberÊs act or failure to act is intentional (opzettelijk), intentionally reckless (bewust roekeloos) or seriously culpable (ernstig verwijtbaar). The Company has purchased directors and officersÊ liability insurance for the members of the Supervisory Board and Board of Management, substantially in line with that purchased by similarly situated companies. Compensation Supervisory Board. The remuneration of the members of the Supervisory Board is determined by the General Meeting of Shareholders. Other than Sir Peter Bonfield, the members of the Supervisory Board do not receive any cash compensation for their service. The remuneration is not dependent on the CompanyÊs results. As of December 31, 2008 no personal loans, guarantees or similar arrangements have been granted to the Supervisory Board Members. Board of Management and Management Team. The remuneration of the members of the Board of Management is determined by the Supervisory Board upon a recommendation of its Nominating and Compensation Committee, and the remuneration of the other members of the Management Team is determined by the CEO. Salaries and Variable Incentives The remuneration structure is designed to promote the interests in the medium and long term. The level and structure of remuneration depends on the CompanyÊs results and other developments relevant to the Company. In addition to the base salary, each year a variable cash incentive can be earned, based on the achievement of specific and challenging targets. The related targets, which are based on EBITDA, operational cash flow and net sales criteria, are determined annually by the Supervisory Board for the members of the Board of Management, and by the CEO in consultation with the Supervisory Board for members of the Management Team.
[-107]
Retirement Plans A pension plan is in force for all members of the Board of Management and other members of the Management Team. The plan is based on a combination of defined-benefits (career average) and defined-contribution. The target retirement age under the plan is 62.5. The plan does not require employee contributions. Management Equity Plan-Management Co-Investment Program Stichting Management Co-Investment NXP (the ÊFoundationÊ), a foundation established to implement our management co-investment program, holds shares of KASLION Acquisition B.V. (ÂKASLIONÊ) for the benefit of designated participants in the program. Pursuant to this program, selected members of our management have purchased depositary receipts issued by the Foundation, each representing economic interests in an ordinary share of KASLION. These interests include any dividends and other proceeds or liquidation entitlements, but do not include any voting rights, which are retained by the Foundation in its capacity as shareholder. Participants in our management co-investment program are selected by the Supervisory Board, with respect to participants who are on the Board of Management, and by the CEO, with respect to other participants. KASLION granted stock options to the members of the Board of Management, other members of the Management Team and certain other executives of NXP on October 1, 2007 and April 1, 2008. Under this stock option plan the participants acquire the right to receive depositary receipts representing economic interests over KASLION shares upon exercise and payment of the exercise price after the stock options have vested and the change in control event that triggers exercise has taken place. The purpose of this share-based compensation plan is to align the interests of management with those of the shareholders by providing additional incentives to improve the CompanyÊs performance on a long-term basis by offering the participants to share in the benefits for the shareholders of a sale or change in control of the Company.
Report of the Supervisory Board
[-108]
Audit Committee
The Audit Committee assists the Supervisory Board in supervising and monitoring, and advising the
Board of Management on, financial reporting, risk management, compliance with relevant legislation
and regulations and the CompanyÊs Business Code of Conduct. It overseas the preparation of the
CompanyÊs financial statements, its financial reporting process, system of internal business controls
and risk management, internal and external audit process and the internal and external auditorÊs
qualifications, independence and performance. The Audit Committee also reviews the CompanyÊs
annual and interim financial statements and other public disclosures, prior to publication. The
current members of the Audit Committee are Messrs. Wilson (Chairman) and Loring. The
Supervisory Board considers the knowledge and experience available on the Audit Committee as
well as the availability of advice from internal and external experts and advisors to be sufficient for
the fulfillment by the Audit Committee of its tasks and responsibilities. As such, the Supervisory
Board has chosen not to appoint any member of the Audit Committee as an „audit committee
financial expert‰, as such term is defined under the rules of the SEC. The Audit Committee met five
times in 2008 and reported its findings to the plenary Supervisory Board.
Auditor information In accordance with the procedures laid down in the NXP Policy on Auditor Independence and as
mandatory required by Dutch law, the external auditor of the Company is appointed by the
General Meeting of Shareholders on the proposal of the Supervisory Board, after the latter has
been advised by the Audit Committee and the Board of Management. Under this Auditor Policy,
once every three years the Supervisory Board and the Audit Committee conduct a thorough
assessment of the functioning of the external auditor. The main conclusions of this assessment shall
be communicated to the General Meeting of Shareholders for the purposes of assessing the
nomination for the appointment of the external auditor. The current auditor of the Company,
Deloitte Accountants B.V., was appointed in 2006. The current lead audit partner has been in
charge since 2007; in accordance with the rotation schedule determined in accordance with the
Auditor Policy, he will be replaced by another partner of the auditing firm ultimately in 2011, subject
to the re-appointment of Deloitte Accountants B.V. in 2009. The Audit Committee reports on their
dealings with the external auditor to the Supervisory Board on an annual basis, particularly with
regard to the auditorÊs independence. The Supervisory Board shall take this into account when
deciding upon its nomination for the appointment of an external auditor.
The external auditor attends, in principle, all meetings of the Audit Committee. The findings of the
external auditor, the audit approach and the risk analysis are also discussed at these meetings. The
external auditor attends the meeting of the Supervisory Board at which the report of the external
auditor with respect to the audit of the annual accounts is discussed, and at which the annual
accounts are approved. In its audit report on the annual accounts to the Board of Management and
the Supervisory Board, the external auditor refers to the financial reporting risks and issues that
were identified during the audit, internal control matters, and any other matters, as appropriate,
requiring communication under the auditing standards generally accepted in the Netherlands and
the United States.
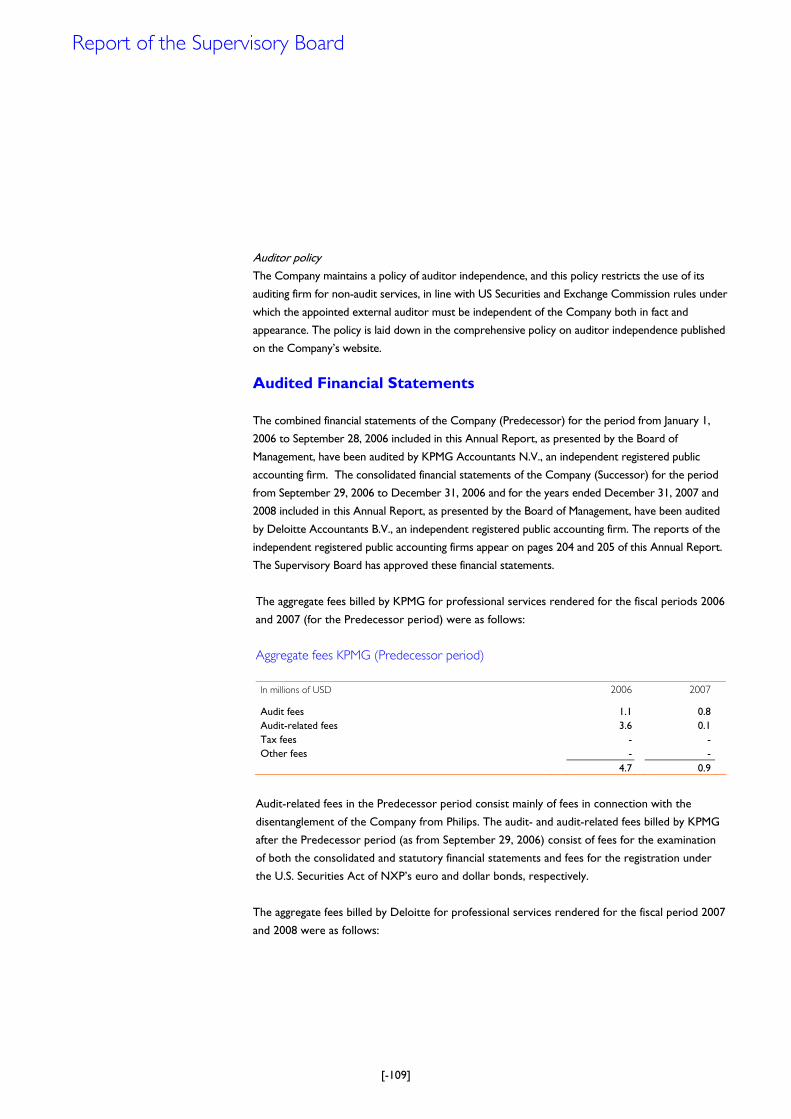
[-109]
Auditor policy The Company maintains a policy of auditor independence, and this policy restricts the use of its
auditing firm for non-audit services, in line with US Securities and Exchange Commission rules under
which the appointed external auditor must be independent of the Company both in fact and
appearance. The policy is laid down in the comprehensive policy on auditor independence published
on the CompanyÊs website.
Audited Financial Statements
The combined financial statements of the Company (Predecessor) for the period from January 1,
2006 to September 28, 2006 included in this Annual Report, as presented by the Board of
Management, have been audited by KPMG Accountants N.V., an independent registered public
accounting firm. The consolidated financial statements of the Company (Successor) for the period
from September 29, 2006 to December 31, 2006 and for the years ended December 31, 2007 and
2008 included in this Annual Report, as presented by the Board of Management, have been audited
by Deloitte Accountants B.V., an independent registered public accounting firm. The reports of the
independent registered public accounting firms appear on pages 204 and 205 of this Annual Report.
The Supervisory Board has approved these financial statements.
The aggregate fees billed by KPMG for professional services rendered for the fiscal periods 2006
and 2007 (for the Predecessor period) were as follows:
Aggregate fees KPMG (Predecessor period) In millions of USD 2006 2007
Audit fees 1.1 0.8 Audit-related fees 3.6 0.1 Tax fees - - Other fees - - 4.7 0.9
Audit-related fees in the Predecessor period consist mainly of fees in connection with the
disentanglement of the Company from Philips. The audit- and audit-related fees billed by KPMG
after the Predecessor period (as from September 29, 2006) consist of fees for the examination
of both the consolidated and statutory financial statements and fees for the registration under
the U.S. Securities Act of NXPÊs euro and dollar bonds, respectively.
The aggregate fees billed by Deloitte for professional services rendered for the fiscal period 2007
and 2008 were as follows:
Report of the Supervisory Board
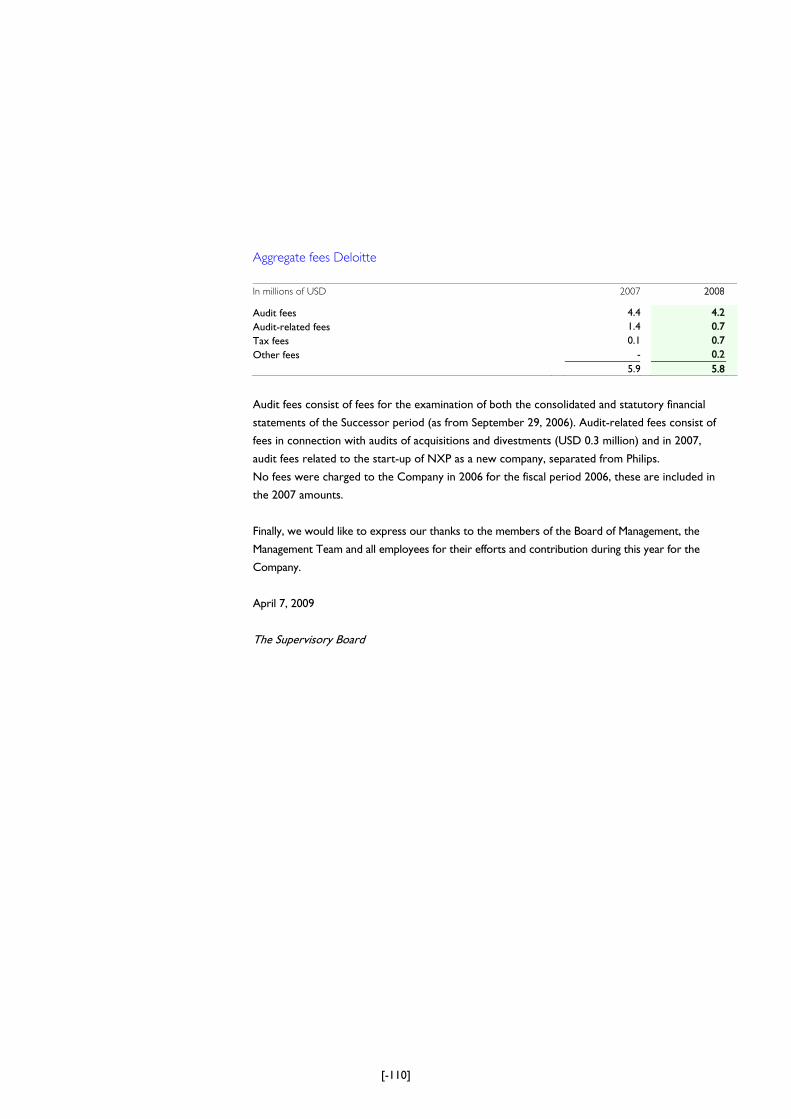
[-110]
Aggregate fees Deloitte
In millions of USD 2007 2008 Audit fees 4.4 4.2 Audit-related fees 1.4 0.7 Tax fees 0.1 0.7 Other fees - 0.2 5.9 5.8
Audit fees consist of fees for the examination of both the consolidated and statutory financial
statements of the Successor period (as from September 29, 2006). Audit-related fees consist of
fees in connection with audits of acquisitions and divestments (USD 0.3 million) and in 2007,
audit fees related to the start-up of NXP as a new company, separated from Philips.
No fees were charged to the Company in 2006 for the fiscal period 2006, these are included in
the 2007 amounts.
Finally, we would like to express our thanks to the members of the Board of Management, the
Management Team and all employees for their efforts and contribution during this year for the
Company.
April 7, 2009
The Supervisory Board

[-111]
Intentionally left blank
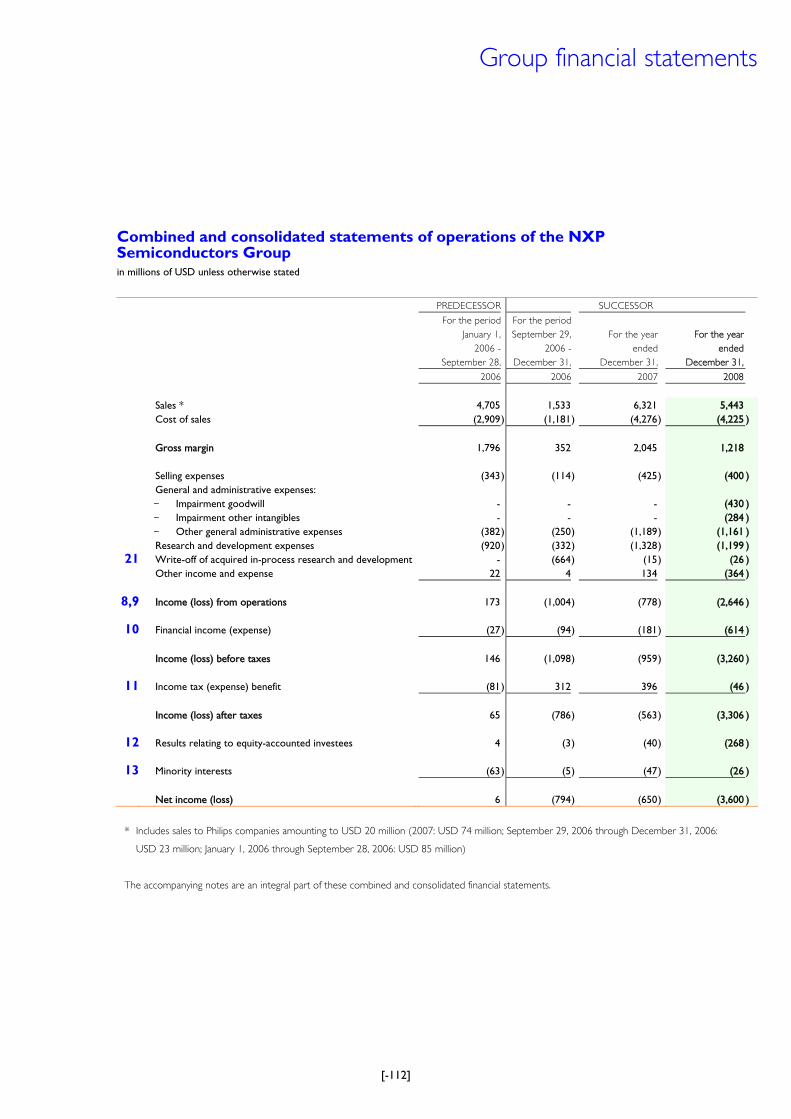
[-112]
Combined and consolidated statements of operations of the NXP Semiconductors Group in millions of USD unless otherwise stated
PREDECESSOR SUCCESSOR
For the period For the period
January 1,
2006 -
September 29,
2006 -
For the year
ended
For the year
ended
September 28, December 31, December 31, December 31,
2006 2006 2007 2008
Sales * 4,705 1,533 6,321 5,443 Cost of sales (2,909) (1,181 ) (4,276) (4,225 ) Gross margin 1,796 352 2,045 1,218 Selling expenses (343) (114 ) (425) (400 ) General and administrative expenses: − Impairment goodwill - - - (430 ) − Impairment other intangibles - - - (284 ) − Other general administrative expenses (382) (250 ) (1,189) (1,161 ) Research and development expenses (920) (332 ) (1,328) (1,199 )
21 Write-off of acquired in-process research and development - (664 ) (15) (26 ) Other income and expense 22 4 134 (364 )
8,9 Income (loss) from operations 173 (1,004 ) (778) (2,646 )
10 Financial income (expense) (27) (94 ) (181) (614 ) Income (loss) before taxes 146 (1,098 ) (959) (3,260 )
11 Income tax (expense) benefit (81) 312 396 (46 ) Income (loss) after taxes 65 (786 ) (563) (3,306 )
12 Results relating to equity-accounted investees 4 (3 ) (40) (268 )
13 Minority interests (63) (5 ) (47) (26 ) Net income (loss) 6 (794 ) (650) (3,600 )
* Includes sales to Philips companies amounting to USD 20 million (2007: USD 74 million; September 29, 2006 through December 31, 2006:
USD 23 million; January 1, 2006 through September 28, 2006: USD 85 million)
The accompanying notes are an integral part of these combined and consolidated financial statements.
Group financial statements
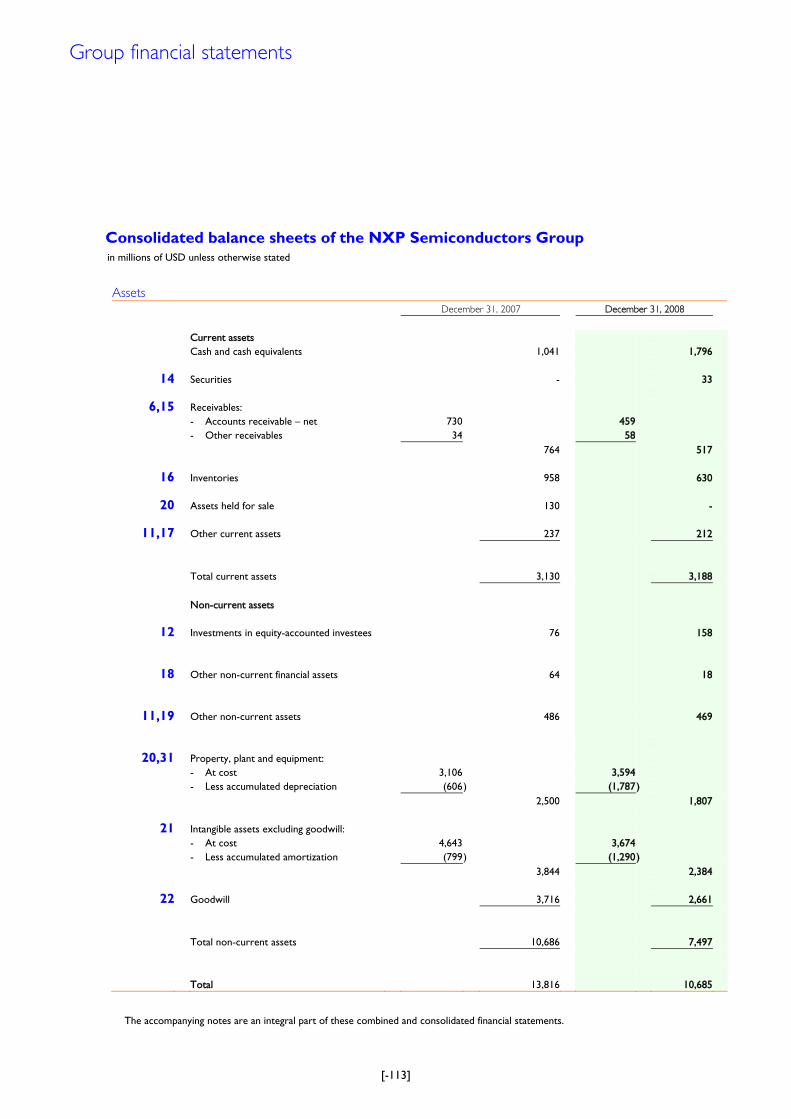
[-113]
Consolidated balance sheets of the NXP Semiconductors Group in millions of USD unless otherwise stated
Assets December 31, 2007 December 31, 2008
Current assets Cash and cash equivalents 1,041 1,796
14 Securities - 33
6,15 Receivables: - Accounts receivable – net 730 459 - Other receivables 34 58 764 517
16 Inventories 958 630
20 Assets held for sale 130 -
11,17 Other current assets 237 212 Total current assets 3,130 3,188 Non-current assets
12 Investments in equity-accounted investees 76 158
18 Other non-current financial assets 64 18
11,19 Other non-current assets 486 469
20,31 Property, plant and equipment: - At cost 3,106 3,594 - Less accumulated depreciation (606) (1,787 ) 2,500 1,807
21 Intangible assets excluding goodwill: - At cost 4,643 3,674 - Less accumulated amortization (799) (1,290 ) 3,844 2,384
22 Goodwill 3,716 2,661 Total non-current assets 10,686 7,497 Total 13,816 10,685
The accompanying notes are an integral part of these combined and consolidated financial statements.
Group financial statements
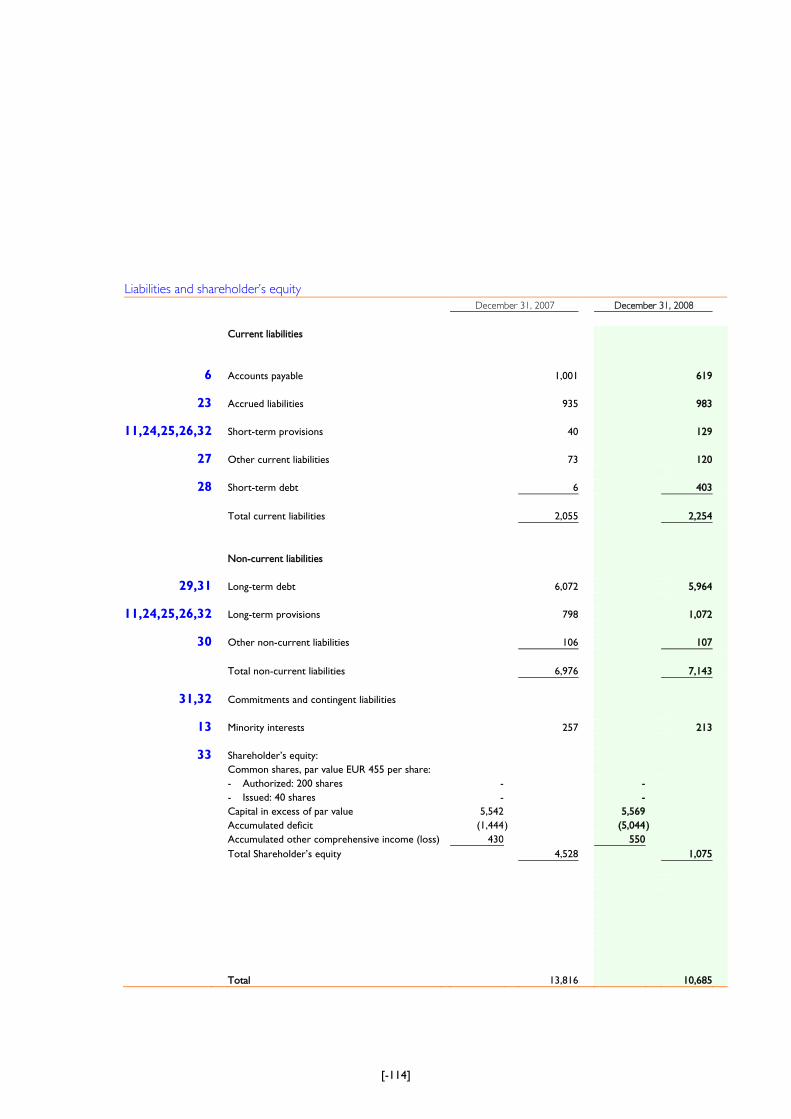
[-114]
Liabilities and shareholder’s equity
December 31, 2007 December 31, 2008
Current liabilities
6 Accounts payable 1,001 619
23 Accrued liabilities 935 983
11,24,25,26,32 Short-term provisions 40 129
27 Other current liabilities 73 120
28 Short-term debt 6 403 Total current liabilities 2,055 2,254 Non-current liabilities
29,31 Long-term debt 6,072 5,964
11,24,25,26,32 Long-term provisions 798 1,072
30 Other non-current liabilities 106 107 Total non-current liabilities 6,976 7,143
31,32 Commitments and contingent liabilities
13 Minority interests 257 213
33 ShareholderÊs equity: Common shares, par value EUR 455 per share: - Authorized: 200 shares - - - Issued: 40 shares - - Capital in excess of par value 5,542 5,569 Accumulated deficit (1,444) (5,044 ) Accumulated other comprehensive income (loss) 430 550 Total ShareholderÊs equity 4,528 1,075 Total 13,816 10,685
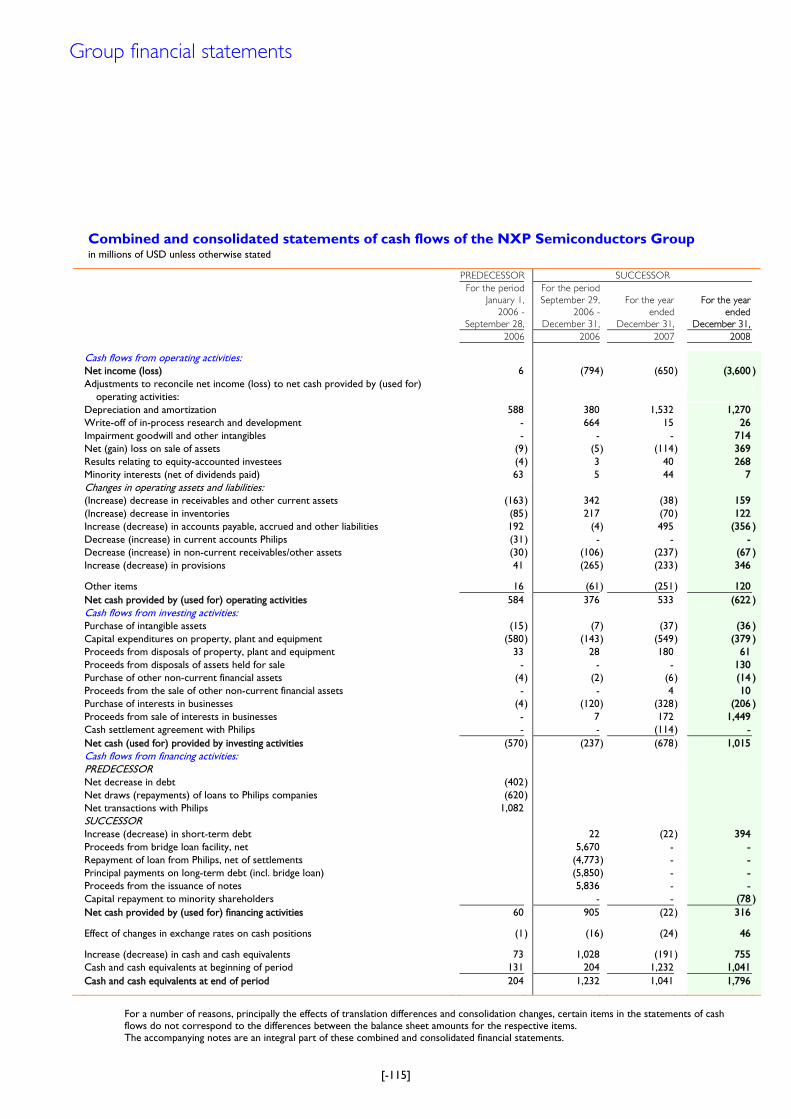
[-115]
Combined and consolidated statements of cash flows of the NXP Semiconductors Group in millions of USD unless otherwise stated
PREDECESSOR SUCCESSOR
For the period For the period
January 1, September 29, For the year For the year
2006 - 2006 - ended ended
September 28, December 31, December 31, December 31,
2006 2006 2007 2008 Cash flows from operating activities: Net income (loss) 6 (794 ) (650) (3,600 )Adjustments to reconcile net income (loss) to net cash provided by (used for) operating activities:
Depreciation and amortization 588 380 1,532 1,270 Write-off of in-process research and development - 664 15 26 Impairment goodwill and other intangibles - - - 714 Net (gain) loss on sale of assets (9) (5 ) (114) 369 Results relating to equity-accounted investees (4) 3 40 268 Minority interests (net of dividends paid) 63 5 44 7 Changes in operating assets and liabilities: (Increase) decrease in receivables and other current assets (163) 342 (38) 159 (Increase) decrease in inventories (85) 217 (70) 122 Increase (decrease) in accounts payable, accrued and other liabilities 192 (4 ) 495 (356 )Decrease (increase) in current accounts Philips (31) - - - Decrease (increase) in non-current receivables/other assets (30) (106 ) (237) (67 )Increase (decrease) in provisions 41 (265 ) (233) 346 Other items 16 (61 ) (251) 120 Net cash provided by (used for) operating activities 584 376 533 (622 )Cash flows from investing activities: Purchase of intangible assets (15) (7 ) (37) (36 )Capital expenditures on property, plant and equipment (580) (143 ) (549) (379 )Proceeds from disposals of property, plant and equipment 33 28 180 61 Proceeds from disposals of assets held for sale - - - 130 Purchase of other non-current financial assets (4) (2 ) (6) (14 )Proceeds from the sale of other non-current financial assets - - 4 10 Purchase of interests in businesses (4) (120 ) (328) (206 )Proceeds from sale of interests in businesses - 7 172 1,449 Cash settlement agreement with Philips - - (114) - Net cash (used for) provided by investing activities (570) (237 ) (678) 1,015 Cash flows from financing activities: PREDECESSOR Net decrease in debt (402) Net draws (repayments) of loans to Philips companies (620) Net transactions with Philips 1,082 SUCCESSOR Increase (decrease) in short-term debt 22 (22) 394 Proceeds from bridge loan facility, net 5,670 - - Repayment of loan from Philips, net of settlements (4,773 ) - - Principal payments on long-term debt (incl. bridge loan) (5,850 ) - - Proceeds from the issuance of notes 5,836 - - Capital repayment to minority shareholders - - (78 )Net cash provided by (used for) financing activities 60 905 (22) 316 Effect of changes in exchange rates on cash positions (1) (16 ) (24) 46 Increase (decrease) in cash and cash equivalents 73 1,028 (191) 755 Cash and cash equivalents at beginning of period 131 204 1,232 1,041 Cash and cash equivalents at end of period 204 1,232 1,041 1,796
For a number of reasons, principally the effects of translation differences and consolidation changes, certain items in the statements of cash flows do not correspond to the differences between the balance sheet amounts for the respective items. The accompanying notes are an integral part of these combined and consolidated financial statements.
Group financial statements
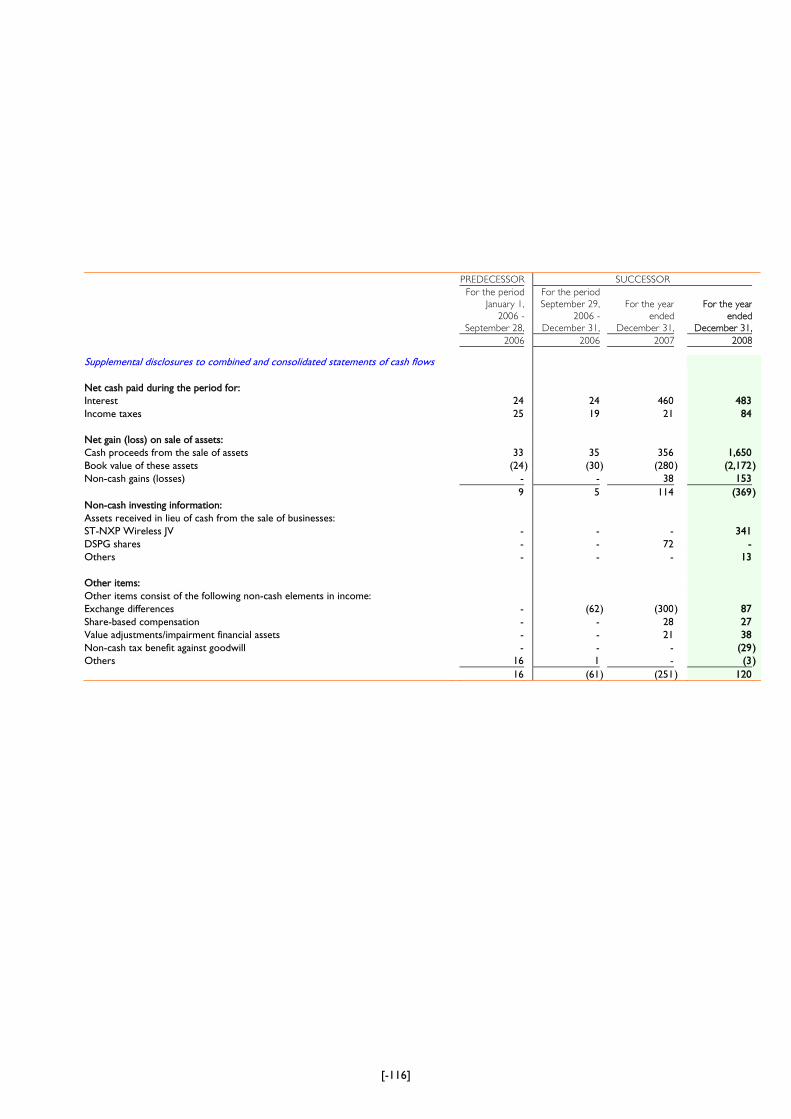
[-116]
PREDECESSOR SUCCESSOR
For the period For the period
January 1, September 29, For the year For the year
2006 - 2006 - ended ended
September 28, December 31, December 31, December 31,
2006 2006 2007 2008 Supplemental disclosures to combined and consolidated statements of cash flows Net cash paid during the period for: Interest 24 24 460 483 Income taxes 25 19 21 84 Net gain (loss) on sale of assets: Cash proceeds from the sale of assets 33 35 356 1,650 Book value of these assets (24) (30 ) (280) (2,172)Non-cash gains (losses) - - 38 153 9 5 114 (369)Non-cash investing information: Assets received in lieu of cash from the sale of businesses: ST-NXP Wireless JV - - - 341 DSPG shares - - 72 - Others - - - 13 Other items: Other items consist of the following non-cash elements in income: Exchange differences - (62 ) (300) 87 Share-based compensation - - 28 27 Value adjustments/impairment financial assets - - 21 38 Non-cash tax benefit against goodwill - - - (29)Others 16 1 - (3) 16 (61 ) (251) 120
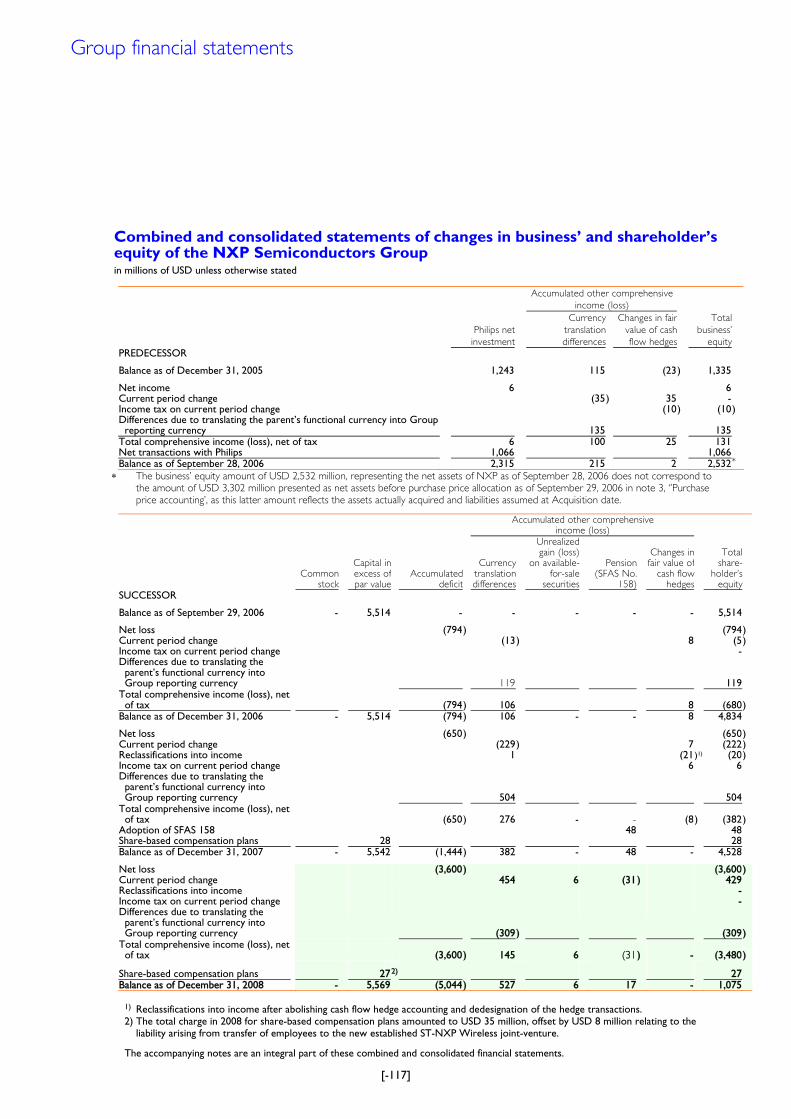
[-117]
Combined and consolidated statements of changes in businessÊ and shareholderÊs equity of the NXP Semiconductors Group in millions of USD unless otherwise stated
Accumulated other comprehensive
income (loss)
Philips net
investment
Currency
translation
differences
Changes in fair
value of cash
flow hedges
Total
business’
equity
PREDECESSOR
Balance as of December 31, 2005 1,243 115 (23) 1,335 Net income 6 6 Current period change (35 ) 35 - Income tax on current period change (10) (10) Differences due to translating the parentÊs functional currency into Group reporting currency
135
135
Total comprehensive income (loss), net of tax 6 100 25 131 Net transactions with Philips 1,066 1,066 Balance as of September 28, 2006 2,315 215 2 2,532*
∗ The business’ equity amount of USD 2,532 million, representing the net assets of NXP as of September 28, 2006 does not correspond to the amount of USD 3,302 million presented as net assets before purchase price allocation as of September 29, 2006 in note 3, ‘’Purchase price accounting’, as this latter amount reflects the assets actually acquired and liabilities assumed at Acquisition date.
Accumulated other comprehensive income (loss)
Common stock
Capital in excess ofpar value
Accumulated deficit
Currency translation differences
Unrealized gain (loss)
on available-for-sale
securities
Pension (SFAS No.
158)
Changes in fair value of
cash flow hedges
Total share-
holder’s equity
SUCCESSOR Balance as of September 29, 2006 - 5,514 - - - - - 5,514 Net loss (794) (794) Current period change (13) 8 (5) Income tax on current period change - Differences due to translating the parentÊs functional currency into Group reporting currency
119
119
Total comprehensive income (loss), net of tax
(794
) 106
8
(680
)
Balance as of December 31, 2006 - 5,514 (794) 106 - - 8 4,834 Net loss (650) (650) Current period change (229) 7 (222) Reclassifications into income 1 (21)1) (20) Income tax on current period change 6 6 Differences due to translating the parentÊs functional currency into Group reporting currency
504
504
Total comprehensive income (loss), net of tax
(650
) 276
-
-
(8 ) (382
)
Adoption of SFAS 158 48 48 Share-based compensation plans 28 28 Balance as of December 31, 2007 - 5,542 (1,444) 382 - 48 - 4,528 Net loss (3,600) (3,600) Current period change 454 6 (31 ) 429 Reclassifications into income - Income tax on current period change - Differences due to translating the parentÊs functional currency into Group reporting currency
(309
)
(309
)
Total comprehensive income (loss), net of tax
(3,600
) 145
6
(31
) -
(3,480
)
Share-based compensation plans 272) 27 Balance as of December 31, 2008 - 5,569 (5,044) 527 6 17 - 1,075
1) Reclassifications into income after abolishing cash flow hedge accounting and dedesignation of the hedge transactions. 2) The total charge in 2008 for share-based compensation plans amounted to USD 35 million, offset by USD 8 million relating to the liability arising from transfer of employees to the new established ST-NXP Wireless joint-venture. The accompanying notes are an integral part of these combined and consolidated financial statements.
Group financial statements
[-118]
1 Background, Reporting currency and Description of Business Background NXP B.V. (the ÂCompanyÊ or ÂNXPÊ) and its subsidiaries (collectively the ÂNXP GroupÊ or the ÂGroupÊ) was formed on September 29, 2006, when Koninklijke Philips Electronics N.V. (ÂPhilipsÊ) sold 80.1% of its semiconductors businesses to a consortium of private equity investors in a multi-step transaction. In order to carry out this transaction, Philips transferred 100% of these businesses to NXP on September 28, 2006. This transaction is referred to as the ÂSeparationÊ. All of NXPÊs issued and outstanding shares were then acquired on September 29, 2006 by KASLION Acquisition B.V., which was formed as an acquisition vehicle by the Private Equity Consortium and Philips. In order to fund the Acquisition of NXP by KASLION, the Private Equity Consortium and Philips contributed cash to KASLION in exchange for 80.1% and 19.9%, respectively, of the total equity of KASLION.
As a result of the Separation and Acquisition, the balance sheets, statements of operations, cash
flows and business' and shareholderÊs equity and related notes to the financial statements are
presented on a Predecessor and Successor basis: The Predecessor periods reflect the combined
financial results of NXP prior to the Acquisition. The Successor period reflects the consolidated
financial results after the Acquisition. The Company also refers to the operations of NXP for both
the Predecessor and Successor periods as NXP Semiconductors Group. Reporting currency
As from January 1, 2008, the Company has changed its reporting currency from Euro to US
dollar in order to be more aligned with the semiconductor market and for comparison reasons
with its peers.
The functional currency of the Company and the various entities in NXPÊs group consolidation
has not changed.
The financial statements have been restated for all prior periods to reflect the change reporting
currency on a consistent basis. In the process of restating the historical financial statements from
euro to U.S. dollars, the Company has applied the process described in the accounting policies.
Description of Business The Group is a semiconductor business headquartered in the Netherlands, which currently
targets mainly the automotive, home electronics and identification application markets. The
Group is organized into three primary business units: Automotive & Identification, Home and
MultiMarket Semiconductors. The Group has manufacturing facilities throughout the world. The
GroupÊs customers, who are also located throughout the world, include automotive, customer
electronics, identification and communications infrastructure suppliers, as well as other
technology providers, electronics distributors and governments.
During 2008, the GroupÊs business has been significantly impacted by the worldwide financial
crisis and the severe downturn in the semiconductor market. These events have caused a rapid
deterioration of demand towards the end of the third quarter. This downturn has impacted, and
Notes to the combined and consolidated financial statements of the NXP Semiconductors Group All amounts in millions of USD unless otherwise stated
[-119]
will likely continue to impact, the GroupÊs future development, performance and financial
position and the GroupÊs financial results, its cash flows, liquidity requirements and access to
additional borrowing facilities.
The financial statements for the year ended December 31, 2008 show that the Group generated
a loss from operations of USD 2,646 million with cash outflows from operations of USD 622
million. The 2008 loss from operations includes an amount of USD 1,709 million related to (i)
restructuring charges of USD 594 million, (ii) impairments of goodwill and intangibles for USD
714 million and (iii) a negative transaction result related to the sale of the wireless activities and a
positive deal result on the establishment of the NuTune joint venture in total amounting to
negative USD 401 million. The effects of the downturn have lead to lower demand in all
segments and an impairment of goodwill in the segment Home and Corporate and Other. At an
early stage NXP has initiated a Redesign Program to cope with this weakening economic
environment. At December 31, 2008, the Group had positive working capital (current assets less
current liabilities, excluding short-term debt) of USD 1,337 million and total outstanding
borrowings of USD 6,367 million. Prior to 2008, the Group had generated positive operating
cash inflows from operations for each of the last two years to December 31, 2007 and 2006 of
USD 533 million and USD 960 million, respectively.
The Group has developed forecasts and projections of cash flows and liquidity needs for the
upcoming year taking into account the current market conditions, reasonably possible changes in
trading performance based on such conditions, and its ability to modify its cost structure as a
result of changing economic conditions and sales levels that the Group has already started with
the implementation of the Redesign Program. It has also considered in the forecasts its cash
balances amounting to USD 1,796 million as per December 31, 2008, its available borrowings
under its revolving credit facility, and its ability to access additional indebtedness. Due to the
number of assumptions necessary to develop these forecasts, the actual cash flows may differ
significantly from the forecast.
The Group is satisfied that based on these forecasts and ability to modify its cash flows when
necessary that it will have adequate cash flow and that it is appropriate to prepare these financial
statements on the going concern basis.
2 Basis of Presentation
The combined and consolidated financial statements have been prepared in accordance with
accounting principles generally accepted in the United States of America („US GAAP‰). The
preparation of financial statements in conformity with US GAAP requires management to make
certain estimates and assumptions that affect the reported amounts of assets and liabilities and
disclosure of contingent assets and liabilities at the date of the financial statements and the reported
amounts of revenues and expenses during the reporting period. Actual results could differ from
those estimates.
Predecessor periods The combined financial statements of the Company for the Predecessor periods represent the
financial statements of NXP B.V. together with the combined financial statements of the
Group financial statements
[-120]
semiconductor businesses of Philips and have been derived from the consolidated financial
statements and accounting records of Philips, principally using the historical results of operations,
the historical basis of assets and liabilities of the semiconductor businesses. Additionally, the
combined financial statements include an allocation of the costs of certain corporate functions
(management oversight, corporate services, basic research costs, brand campaign expenses,
employee benefits and incentives including pensions) historically provided by Philips but not
recorded by its semiconductors businesses. Additionally, the combined financial statements include
allocated cash, debt and related interest income and expense, which have not been historically
reported by PhilipsÊ semiconductors businesses. Furthermore, the combined financial statements
present income taxes calculated on a basis as if the Company had filed a separate income tax return.
These allocations were made on a specifically identifiable basis or using relative percentages, as
compared to PhilipsÊ other businesses, of the CompanyÊs net sales, payroll, fixed assets, inventory,
net assets, excluding debt, headcount or other reasonable methods. Management believes the
assumptions underlying the combined financial statements to be a reasonable reflection of the
utilization of services provided by Philips. However, the costs the Company would have incurred or
will incur as a separate stand-alone company may be higher or lower than the cost allocations
reflected in these combined financial statements for the Predecessor periods. In determining these
estimates, management has retained the historical cost allocated by Philips where no more reliable
estimate of the costs are available (for example, pension cost).
Additionally, during the Predecessor periods Philips used a worldwide centralized cash management
and finance function, with the activity between Philips and the Company reflected in PhilipsÊ net
investment. Accordingly, the accompanying combined financial statements may not necessarily
reflect the CompanyÊs results of operations, financial position and cash flows in the future or what
its results of operations, financial position and cash flows would have been if the Company had been
a stand-alone company during the Predecessor periods.
Since a direct ownership relationship did not exist among the various worldwide entities comprising
the Company prior to the legal separation from Philips, PhilipsÊ net investments in the Company is
shown as BusinessÊ equity in lieu of ShareholderÊs equity in the combined financial statements for
the predecessor periods. Transactions between NXP B.V. and Philips and its affiliates have been
identified in the combined financial statements as transactions between related parties.
Successor periods The consolidated financial statements include the accounts of NXP B.V. and subsidiaries during the
Successor periods.
As a result of the purchase accounting applied to the Acquisition, the assets and liabilities reported
in the consolidated balance sheet have changed substantially for the Successor periods as discussed
in more detail in note 3. The allocation of the purchase price paid by KASLION to Philips that is
reflected in our financial statements has been based on estimated fair values.
[-121]
3 Purchase price accounting
KASLION On September 29, 2006, the Company was acquired by KASLION for a purchase price of USD
10,457 million composed of a payment of USD 5,624 million to Philips and assumed debt of USD
4,833 million. In accordance with the provisions of SFAS No 141 „Business Combinations‰ (SFAS
141), KASLION has been identified as the acquiring company and purchase accounting has been
applied to the transaction. The purchase price paid by KASLION together with the acquisition
costs of USD 58 million and a net amount of USD 107 million for certain transferred receivables
and liabilities that should have been retained by Philips, result in a total purchase price
consideration of USD 10,622 million, which has been pushed down to NXP B.V. and allocated to
the fair value of assets acquired and liabilities assumed.
After the Acquisition, the Company obtained a bridge loan facility of USD 5,670 million, net of
issuance cost of USD 129 million, which was used to repay the payable to Philips, including
certain cash balance settlements, amounting to USD 4,773 million. Subsequently the bridge loan
facility was repaid with the proceeds from the issuance of USD 5,836 million of euro and USD
denominated notes as described in more detail in note 29. On June 19, 2007, the Company
concluded an exchange offer for these notes in which investors could exchange their existing
notes for identical notes registered under the U.S. Securities Act. This exchange offer did not
affect NXPÊs capitalization or debt outstanding.
The Company has allocated the total purchase price, calculated as described above to the assets
acquired and liabilities assumed based on estimated fair values. Management is responsible for
determining these fair values, which reflects among other things, its consideration of valuation
and appraisal reports. During 2007, within the time frames permitted by applicable accounting
standards, revisions to the preliminary allocations of the purchase price were made which
affected the fair value initially assigned to the assets and liabilities. These adjustments mainly
related to deferred income tax balance, since NXP was able to clarify the tax treatment of
certain intangible assets with tax authorities resulting in the recognition of additional deferred tax
liabilities, resulting in an offsetting increase in goodwill. Furthermore, in 2007, NXP agreed on a
final settlement with Philips resulting in an additional payment of USD 110 million (including USD
3 million of interest), establishing the total purchase price to USD 10,622 million.
The table as set forth below reflects the purchase price allocation among assets acquired and
liabilities assumed, whereby the original EUR amounts have been translated into USD against the
closing rate of the USD vs. EUR as of September 29, 2006:
Group financial statements
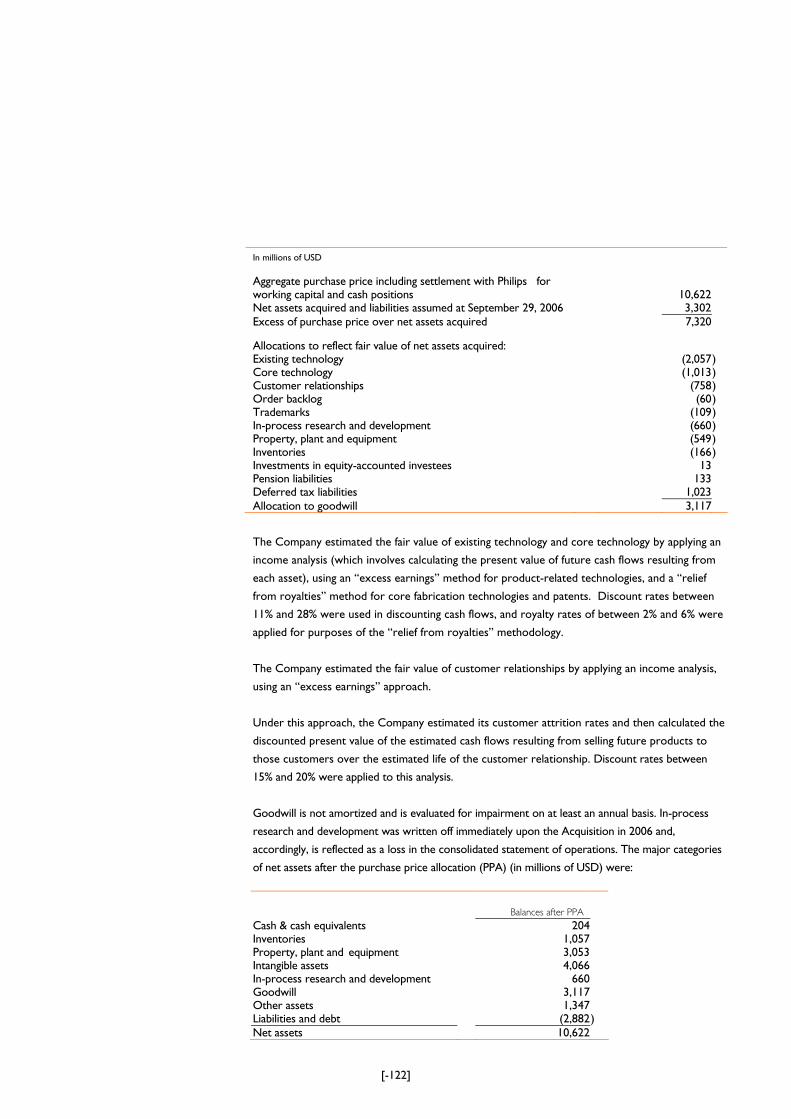
[-122]
In millions of USD Aggregate purchase price including settlement with Philips for working capital and cash positions
10,622
Net assets acquired and liabilities assumed at September 29, 2006 3,302 Excess of purchase price over net assets acquired 7,320 Allocations to reflect fair value of net assets acquired: Existing technology (2,057) Core technology (1,013) Customer relationships (758) Order backlog (60) Trademarks (109) In-process research and development (660) Property, plant and equipment (549) Inventories (166) Investments in equity-accounted investees 13 Pension liabilities 133 Deferred tax liabilities 1,023 Allocation to goodwill 3,117
The Company estimated the fair value of existing technology and core technology by applying an
income analysis (which involves calculating the present value of future cash flows resulting from
each asset), using an „excess earnings‰ method for product-related technologies, and a „relief
from royalties‰ method for core fabrication technologies and patents. Discount rates between
11% and 28% were used in discounting cash flows, and royalty rates of between 2% and 6% were
applied for purposes of the „relief from royalties‰ methodology.
The Company estimated the fair value of customer relationships by applying an income analysis,
using an „excess earnings‰ approach.
Under this approach, the Company estimated its customer attrition rates and then calculated the
discounted present value of the estimated cash flows resulting from selling future products to
those customers over the estimated life of the customer relationship. Discount rates between
15% and 20% were applied to this analysis.
Goodwill is not amortized and is evaluated for impairment on at least an annual basis. In-process
research and development was written off immediately upon the Acquisition in 2006 and,
accordingly, is reflected as a loss in the consolidated statement of operations. The major categories
of net assets after the purchase price allocation (PPA) (in millions of USD) were:
Balances after PPA
Cash & cash equivalents 204 Inventories 1,057 Property, plant and equipment 3,053 Intangible assets 4,066 In-process research and development 660 Goodwill 3,117 Other assets 1,347 Liabilities and debt (2,882 ) Net assets 10,622
[-123]
Other acquisitions In addition, Purchase Accounting is also applied to other acquisitions such as the acquisition of
the Cellular Communication Business of Silicon Laboratories Inc., the establishment of an
assembly and test joint venture (ASEN) with Advanced Semiconductor Engineering Incorporated
(ASE) in 2007 and GloNav Inc., and the BMP business of Conexant Systems Inc. in 2008.
For further information refer to note 7 „Acquisitions and divestments‰.
4 Accounting policies and new accounting standards
Accounting policies The combined and consolidated financial statements are prepared in accordance with generally
accepted accounting principles in the United States (US GAAP). Historical cost is used as the
measurement basis unless otherwise indicated. The accounting policies as described in this section
are used for both the combined financial statements for the Predecessor periods as well as the
consolidated financial statements for the Successor periods, unless otherwise indicated.
Principles for combined and consolidated financial statements The combined financial statements for the Predecessor periods include the accounts of NXP B.V.
during the Predecessor periods as a wholly owned subsidiary of Philips, and the assets and liabilities
of the semiconductor businesses of Philips. Furthermore, the combined financial statements include
all entities in which the Company holds a direct or indirect controlling interest through voting rights
or qualifying variable interests. The consolidated financial statements for the Successor periods
include the accounts of NXP B.V., during the Successor period a wholly-owned subsidiary of
KASLION, its subsidiaries and all entities in which the Company holds a direct or indirect
controlling interest through voting rights or qualifying variable interests.
All intercompany balances and transactions have been eliminated in the combined and consolidated
financial statements. Net income (loss) is reduced by the portion of the earnings of subsidiaries
applicable to minority interest. The minority interests are disclosed separately in the combined and
consolidated statements of operations and in the consolidated balance sheets.
The Company applies Financial Accounting Standards Board (FASB) Interpretation No. 46(R)
ÂConsolidation of Variable Interest Entities.Ê In accordance with Interpretation of Accounting
Research Bulletin (ARB) No. 51 ÂConsolidated Financial StatementsÊ, the Company includes in its
combined and consolidated financial statements entities in which variable interests are held to an
extent that would require the Company to absorb a majority of the entityÊs expected losses,
receive a majority of the entityÊs expected residual returns, or both.
Investments in equity-accounted investees Investments in companies in which the Company does not have the ability to directly or indirectly
control the financial and operating decisions, but does possess the ability to exert significant
influence, are accounted for using the equity method. Generally, in the absence of demonstrable
proof of significant influence, it is presumed to exist if at least 20% of the voting stock is owned. The
CompanyÊs share of the net income of these companies is included in results relating to equity-
accounted investees in the combined and consolidated statements of operations.
Group financial statements
[-124]
The Company recognizes an impairment loss when an other-than-temporary decline in the value of
an investment occurs.
When its share of losses exceeds the carrying amount of an investment accounted for by the equity
method, the carrying amount of that investment is reduced to zero and recognition of further losses
is discontinued unless the Company has guaranteed obligations of the investee or is otherwise
committed to provide further financial support for the investee.
Accounting for capital transactions of a subsidiary or an equity-accounted investee The Company recognizes in income dilution gains or losses arising from the sale or issuance of
stock by a subsidiary that is included in the combined and consolidated financial statements or an
unconsolidated entity which is accounted for using the equity method of accounting in the
combined and consolidated statement of income, unless the Company or the subsidiary either has
reacquired or plans to reacquire such shares. In such instances, the result of the transaction will be
recorded directly in equity.
The dilution gains or losses are presented in the combined and consolidated statement of
operations under other income and expense if they relate to subsidiaries that are included in the
combined and consolidated financial statements. Dilution gains and losses related to equity-
accounted investees are presented under results relating to equity-accounted investees.
Accounting for Alliance Since 2002 the Company has been a participant in a jointly funded alliance (the ÂAllianceÊ) with two
other semiconductors manufacturers in Crolles, France. The activities of the Alliance are the joint
development of advanced process and assembly/packaging technology and the joint operation of a
fabrication plant for the manufacturing of 300-millimeter wafers. The Alliance has its own
governance structure to decide on all material decisions relating to the Alliance. Each of the three
participants is equally represented in the governance structure. Upon its commencement each party
contributed assets to the Alliance. The initial term of the Alliance expired December 31, 2007, and
because the Company withdrew from the Crolles2 Alliance, effective December 31, 2007, the
automatic extension until December 31, 2010 has been cancelled.
At the termination of the Alliance, the Company would retain title to the capital assets that it
contributed to the Alliance unless another participant of the Alliance exercises its option to
purchase those assets. Capital assets contributed by the Company include primarily machinery.
Under the Alliance arrangement, each participant is responsible for funding specific allocations of
operations, research and development expenses, as well as related capital expenditures and output
from the facility. Funding requirements are divided among the Company (31%) and the two other
participants (31% and 38%), and are accounted for to ensure all expenses and capital expenditures
are recorded in relation to the funding percentage.
The CompanyÊs interest in the Alliance has been accounted for in these combined and
consolidated financial statements as a contract or cost sharing arrangement.
Accordingly, the CompanyÊs share in the results of operation of the Alliance are recorded in the
cost and expense captions in the accompanying combined and consolidated statement of
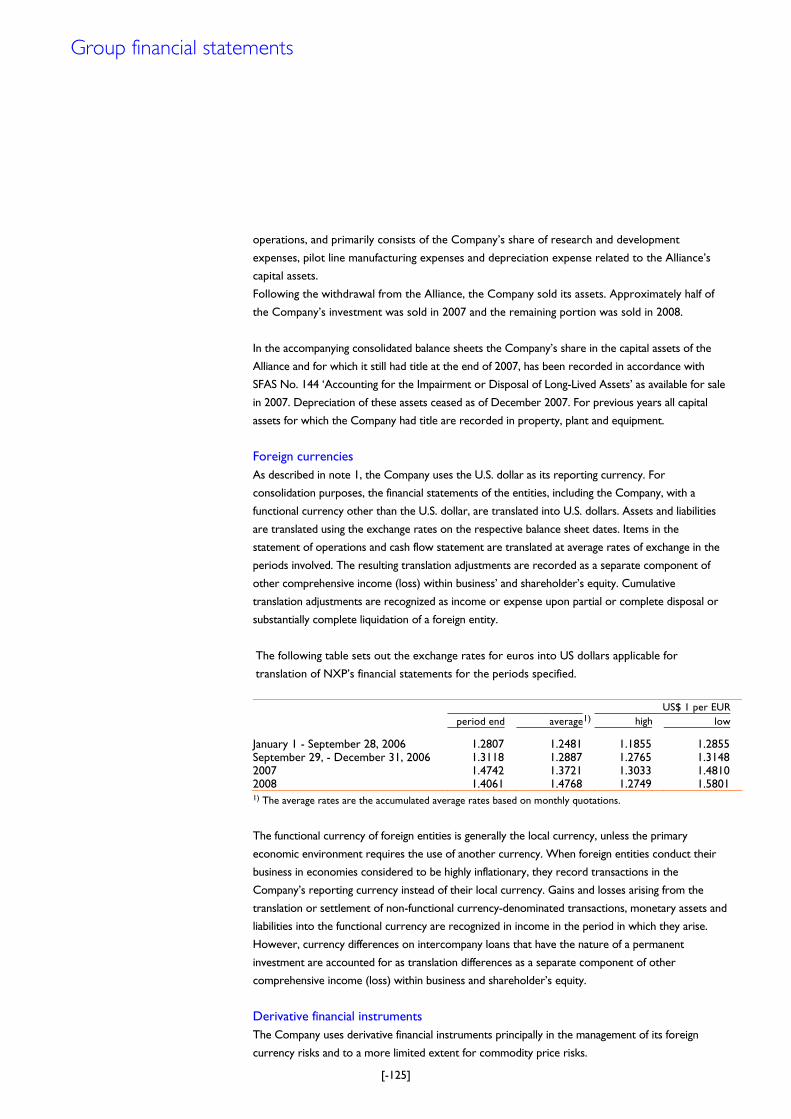
[-125]
operations, and primarily consists of the CompanyÊs share of research and development
expenses, pilot line manufacturing expenses and depreciation expense related to the AllianceÊs
capital assets.
Following the withdrawal from the Alliance, the Company sold its assets. Approximately half of
the CompanyÊs investment was sold in 2007 and the remaining portion was sold in 2008.
In the accompanying consolidated balance sheets the CompanyÊs share in the capital assets of the
Alliance and for which it still had title at the end of 2007, has been recorded in accordance with
SFAS No. 144 ÂAccounting for the Impairment or Disposal of Long-Lived AssetsÊ as available for sale
in 2007. Depreciation of these assets ceased as of December 2007. For previous years all capital
assets for which the Company had title are recorded in property, plant and equipment.
Foreign currencies As described in note 1, the Company uses the U.S. dollar as its reporting currency. For
consolidation purposes, the financial statements of the entities, including the Company, with a
functional currency other than the U.S. dollar, are translated into U.S. dollars. Assets and liabilities
are translated using the exchange rates on the respective balance sheet dates. Items in the
statement of operations and cash flow statement are translated at average rates of exchange in the
periods involved. The resulting translation adjustments are recorded as a separate component of
other comprehensive income (loss) within businessÊ and shareholderÊs equity. Cumulative
translation adjustments are recognized as income or expense upon partial or complete disposal or
substantially complete liquidation of a foreign entity.
The following table sets out the exchange rates for euros into US dollars applicable for
translation of NXPÊs financial statements for the periods specified.
US$ 1 per EUR period end average1) high low January 1 - September 28, 2006 1.2807 1.2481 1.1855 1.2855 September 29, - December 31, 2006 1.3118 1.2887 1.2765 1.3148 2007 1.4742 1.3721 1.3033 1.4810 2008 1.4061 1.4768 1.2749 1.5801 1) The average rates are the accumulated average rates based on monthly quotations.
The functional currency of foreign entities is generally the local currency, unless the primary
economic environment requires the use of another currency. When foreign entities conduct their
business in economies considered to be highly inflationary, they record transactions in the
CompanyÊs reporting currency instead of their local currency. Gains and losses arising from the
translation or settlement of non-functional currency-denominated transactions, monetary assets and
liabilities into the functional currency are recognized in income in the period in which they arise.
However, currency differences on intercompany loans that have the nature of a permanent
investment are accounted for as translation differences as a separate component of other
comprehensive income (loss) within business and shareholderÊs equity.
Derivative financial instruments The Company uses derivative financial instruments principally in the management of its foreign
currency risks and to a more limited extent for commodity price risks.
Group financial statements
[-126]
In compliance with SFAS No. 133, ÂAccounting for Derivative Instruments and Hedging ActivitiesÊ,
SFAS No. 138, ÂAccounting for Certain Derivative Instruments and Certain Hedging ActivitiesÊ, and
SFAS No. 149 ÂAmendment of Statement 133 on Derivative Instruments and Hedging ActivitiesÊ, the
Company measures all derivative financial instruments based on fair values derived from market
prices of the instruments or from option pricing models, as appropriate, and in accordance with the
provisions of SFAS No. 157 „Fair Value Measurements‰, which establishes a framework for
measuring fair value and sets out a fair value hierarchy to be used to classify the source of
information used in fair value measurements. Changes in the fair values are recognized in the
statement of operations immediately unless cash flow hedge accounting is applied.
Changes in the fair value of a derivative that is highly effective and designated and qualifies as a cash
flow hedge are recorded in accumulated other comprehensive income (loss), until earnings are
affected by the variability in cash flows of the designated hedged item.
The Company formally assesses, both at the hedgeÊs inception and on an ongoing basis, whether the
derivatives that are used in hedging transactions and for which cash flow hedge accounting is
applied, are highly effective in offsetting changes in cash flows of hedged items. When it is
established that a derivative is not highly effective as a hedge or that it has ceased to be a highly
effective hedge, the Company discontinues hedge accounting prospectively. When hedge accounting
is discontinued because it is probable that a forecasted transaction will not occur within a period of
two months from the originally forecasted transaction date, the Company continues to carry the
derivative on the consolidated balance sheets at its fair value, and gains and losses that were
accumulated in other comprehensive income are recognized immediately in earnings. In all other
situations in which hedge accounting is discontinued, the Company continues to carry the derivative
at its fair value on the consolidated balance sheets, and recognizes any changes in its fair value in
earnings. From December 2007 going forward, the application of cash flow hedge accounting for
foreign currency risks is limited to transactions that represent a substantial currency risk that could
materially affect the financial position of the Company. Consequently, the application of cash flow
hedge accounting seldom occurs.
Cash and cash equivalents Cash and cash equivalents include all cash balances and short-term highly liquid investments with a
maturity of three months or less at acquisition that are readily convertible into known amounts of
cash. It also includes restricted cash balances that cannot be freely repatriated. Cash and cash
equivalents are stated at face value.
Receivables Receivables are carried at face value, net of allowances for doubtful accounts and uncollectible
amounts. As soon as trade accounts receivable can no longer be collected in the normal way and
are expected to result in a loss, they are designated as doubtful trade accounts receivable and
valued at the expected collectible amounts. They are written off when they are deemed to be
uncollectible because of bankruptcy or other forms of receivership of the debtors.
The allowance for doubtful trade accounts receivable takes into account objective evidence about
credit-risk concentration, collective debt risk based on average historical losses, and specific
circumstances such as serious adverse economic conditions in a specific country or region.
[-127]
Inventories Inventories are stated at the lower of cost or market, less advance payments on work in progress.
The cost of inventories comprises all costs of purchase, costs of conversion and other costs
incurred in bringing the inventories to their present location and condition. The costs of conversion
of inventories include direct labor and fixed and variable production overheads, taking into account
the stage of completion. The cost of inventories is determined using the first-in, first-out (FIFO)
method. An allowance is made for the estimated losses due to obsolescence. This allowance is
determined for groups of products based on purchases in the recent past and/or expected future
demand. Individual items of inventory that have been identified as obsolete are typically disposed of
within a period of three months either by sale or by scrapping. In accordance with SFAS No. 151,
ÂInventory costs (SFAS 151), an amendment of ARB No. 43, Chapter 4Ê abnormal amounts of idle
facility expense and waste are not capitalized in inventory. The allocation of fixed production
overheads to the inventory cost is based on the normal capacity of the production facilities.
Other non-current financial assets Other non-current financial assets include available-for-sale securities, loans and cost-method
investments.
Loans receivable are stated at amortized cost, less the related allowance for impaired loans
receivable.
The Company classifies its investment in equity securities that have readily determinable fair
values based on quoted market prices as available-for-sale. Available-for-sale securities are
recorded at fair value with changes in the fair value going through other comprehensive income
in shareholderÊs equity. Unrealized holding gains and losses, net of the related tax effect, on
available-for-sale securities are excluded from earnings and are reported as a separate
component of other comprehensive income until realized. Fair value is determined in accordance
with the provisions of SFAS No. 157 „Fair Value Measurements‰, which establishes a framework
for measuring fair value and sets out a fair value hierarchy to be used to classify the source of
information used in fair value measurements. Available-for-sale securities that are contractually
restricted from sale for a period longer than 1 year are accounted for by the cost method
without changes in fair value being reflected in their measurement unless they are impaired in
which case the impairment loss is charged to earnings. Similarly, restricted equity securities
obtained as payment from the acquirer upon disposal of product lines are accounted for under
the cost method. In accordance with EITF 01-2 ÂInterpretations of APB Opinion No. 29Ê, NXP
recognizes in nonmonetary transactions the fair value of the assets surrendered at transaction
date initially as its interest in the acquirer, which is the new cost basis going forward.
Impairments of financial assets A financial asset is considered to be impaired if objective evidence indicates that one or more
events have had a negative effect on the estimated future cash flows of that asset. The Company
assesses its long-term investments accounted for as available-for-sale on a quarterly basis to
determine whether declines in market value below cost are other-than-temporary, in which case
the cost basis for the individual security is reduced and a loss realized in the period in which it
occurs. When the decline is determined to be temporary, the unrealized loses are included in other
comprehensive income.
Group financial statements
[-128]
If objective evidence indicates that cost-method investments need to be tested for impairment,
calculations are based on information derived from business plans and other information available
for estimating their fair value.
Property, plant and equipment Property, plant and equipment are stated at cost, less accumulated depreciation. Assets constructed
by the Company include direct costs, overheads and interest charges incurred during the
construction period. Government investment grants are deducted from the cost of the related
asset. Depreciation is calculated using the straight-line method over the expected economic life of
the asset. Depreciation of special tooling is generally also based on the straight-line method. Gains
and losses on the sale of property, plant and equipment are included in other income and expense.
Costs related to repair and maintenance activities are expensed in the period in which they are
incurred unless leading to an extension of the original lifetime or capacity. Plant and equipment
under capital leases are initially recorded at the present value of minimum lease payments. These
assets and leasehold improvements are amortized using the straight-line method over the shorter of
the lease term or the estimated useful life of the asset.
The Company applies SFAS No. 143 ÂAccounting for Asset Retirement ObligationsÊ (SFAS 143) and
FASB Interpretation No. 47 ÂAccounting for Conditional Asset Retirement ObligationsÊ. Under the
provisions of these pronouncements the Company recognizes the fair value of an asset retirement
obligation in the period in which it is incurred, while an equal amount is capitalized as part of the
carrying amount of the long-lived asset and subsequently depreciated over the useful life of the
asset.
Goodwill The Company accounts for goodwill in accordance with the provisions of SFAS 141 and SFAS No.
142 ÂGoodwill and Other Intangible AssetsÊ, (SFAS 142). Accordingly, goodwill is not amortized but
tested for impairment annually in the third quarter or whenever impairment indicators require so.
During the predecessor period the annual goodwill impairment test was executed in the second
quarter.
An impairment loss is recognized to the extent that the carrying amount of goodwill exceeds the
assetÊs implied fair value. This determination is made at the business unit level, which is for the
Company the reporting unit level in accordance with Statement No. 142, and consists of two steps.
First, the Company determines the carrying value of each reporting unit by assigning the assets and
liabilities, including the goodwill and intangible assets, to those reporting units. Furthermore, the
Company determines the fair value of each reporting unit and compares it to the carrying amount
of the reporting unit. If the carrying amount of a reporting unit exceeds the fair value of the
reporting unit, the Company performs the second step of the impairment test. In the second step,
the Company compares the implied fair value of the reporting unitÊs goodwill with the carrying
amount of the reporting unitÊs goodwill. The implied fair value of goodwill is determined by
allocating the fair value of the reporting unit to all of the assets (recognized and unrecognized) and
liabilities of the reporting unit in a manner similar to a purchase price allocation upon a business
combination in accordance with SFAS 141. The residual fair value after this allocation is the implied
fair value of the reporting unitÊs goodwill. The Company generally determines the fair value of the
reporting units based on discounted projected cash flows.
[-129]
Intangible assets Intangible assets (other than goodwill) arising from acquisitions are amortized using the straight-line
method over their estimated economic lives. Remaining useful lives are evaluated every year to
determine whether events and circumstances warrant a revision to the remaining period of
amortization. There are currently no intangible assets with indefinite lives. In-process research and
development with no alternative use is written off immediately upon acquisition. Patents,
trademarks and other intangible assets acquired from third parties are capitalized at cost and
amortized over their remaining useful lives.
Certain costs relating to the development and purchase of software for internal use are
capitalized and subsequently amortized over the estimated useful life of the software in
conformity with Statement of Position (SOP) 98-1, ÂAccounting for the Costs of Computer
Software Developed or Obtained for Internal UseÊ.
Impairment or disposal of intangible assets other than goodwill and tangible fixed assets The Company accounts for intangible and tangible fixed assets in accordance with the provisions of
SFAS No. 144, ÂAccounting for the Impairment or Disposal of Long-Lived AssetsÊ. This Statement
requires that long-lived assets be reviewed for impairment whenever events or changes in
circumstances indicate that the carrying amount of an asset may not be recoverable. Recoverability
of assets to be held and used is measured by a comparison of the carrying amount of an asset with
future undiscounted net cash flows expected to be generated by the asset. If the carrying amount of
an asset exceeds its estimated future undiscounted cash flows, an impairment charge is recognized
in the amount by which the carrying amount of the asset exceeds the fair value of the asset. The
Company determines the fair value based on discounted projected cash flows. The review for
impairment is carried out at the level where discrete cash flows occur that are largely independent
of other cash flows. For the Manufacturing Operations segment, the review of impairment of long-
lived assets is carried out on a Company-wide basis, as Manufacturing Operations is the shared
manufacturing base for the other business units with, for this purpose, no discrete cash flows that
are largely independent of other cash flows. Assets held for sale are reported at the lower of the
carrying amount or fair value, less cost to sell.
Non-current assets held for sale and disposal groups Non-current assets and disposal groups are classified as held for sale if their carrying amount will
be recovered through a sale transaction rather than through continuing use. For this to be the
case the asset (or disposal group) must be available for immediate sale in its present condition
and the sale must be highly probable. For the sale to be highly probable, (i) the appropriate level
of management must be committed to a plan to sell the asset, (ii) an active program to locate a
buyer and complete the plan must be initiated, (iii) the asset must be actively marketed for sale at
a price that is reasonable in relation to its current fair value, (iv) the sale should generally be
expected to qualify for recognition as a completed sale within one year from the date of
classification and (v) actions required to complete the plan indicate that it is unlikely that
significant changes to the plan will be made or that the plan will be withdrawn.
Group financial statements
[-130]
Non-current assets (or disposal groups) classified as held for sale are measured at the lower of
the assetÊs carrying amount and the fair value less costs to sell. Depreciation or amortization of
an asset ceases when it is classified as held for sale, or included within a disposal group that is
classified as held for sale.
Discontinued operations A discontinued operation is a component of the Company that either has been disposed of, or
that is classified as held for sale, and: (i) represents a separate major line of business or
geographical area of operations that can be clearly distinguished from the rest of the Company in
terms of operations and cash flows or (ii) is part of a single coordinated plan to dispose of a
separate major line of business or geographical area of operations. Generally, a major line of
business is a segment or business unit. Discontinued operations are carried at the lower of
carrying amount and fair value less cost to sell. Results from discontinued operations until the
date of disposal are presented separately as a single amount in the consolidated statements of
operations together with any gain or loss from disposal. Results from operations qualifying as
discontinued operations as of the balance sheet date for the latest period presented, that have
previously been presented as results from continuing operations, are re-presented as results
from discontinued operations for all periods presented. The financial information of discontinued
operations is excluded from the respective captions in the consolidated financial statements and
related notes for all years presented.
Research and development Costs of research and development are expensed in the period in which they are incurred, in
conformity with SFAS No. 2, ÂAccounting for Research and Development CostsÊ.
Advertising Advertising costs are expensed when incurred.
Provisions and accruals The Company recognizes provisions for liabilities and probable losses that have been incurred as of
the consolidated balance sheet dates and for which the amount is uncertain but can be reasonably
estimated.
Provisions of a long-term nature are stated at present value when the amount and timing of related
cash payments are fixed or reliably determinable unless discounting is prohibited under US GAAP.
Short-term provisions are stated at face value.
The Company applies the provisions of SOP 96-1, ÂEnvironmental liabilitiesÊ and SFAS No. 5,
ÂAccounting for ContingenciesÊ and accrues for losses associated with environmental obligations
when such losses are probable and reasonably estimable. Additionally, in accordance with SOP 96-1,
the Company accrues for certain costs such as compensation and benefits for employees directly
involved in the remediation activities. Measurement of liabilities is based on current legal
requirements and existing technology. Liabilities and expected insurance recoveries, if any, are
recorded separately. The carrying amount of liabilities is regularly reviewed and adjusted for new
facts or changes in law or technology.
[-131]
Restructuring The Company applies SFAS No. 146, ÂAccounting for Costs Associated with Exit or Disposal
ActivitiesÊ (SFAS 146).
The provision for restructuring relates to the estimated costs of initiated reorganizations that
have been approved by the Board of Management, and which involve the realignment of certain
parts of the industrial and commercial organization. When such reorganizations require
discontinuance and/or closure of lines of activities, the anticipated costs of closure or
discontinuance are included in restructuring provisions.
SFAS 146 requires that a liability be recognized for those costs only when the liability is incurred, i.e.
when it meets the definition of a liability. SFAS 146 also establishes fair value as the objective for
initial measurement of the liability.
Liabilities related to one-time employee termination benefits are recognized ratably over the future
service period when those employees are required to render services to the Company, if that
period exceeds 60 days or a longer legal notification period.
However, generally employee termination benefits are covered by a contract or an ongoing benefit
arrangement and continue to be accounted for under SFAS No. 112, ÂEmployerÊs Accounting for
Postemployment BenefitsÊ. In conformity with SFAS 112 these benefits are recognized when it is
probable that the employees will be entitled to the benefits and the amounts can be reasonably
estimated.
Guarantees The Company complies with FASB Interpretation No. 45, ÂGuarantorÊs Accounting and Disclosure
Requirements for Guarantees, including Indirect Guarantees of Indebtedness of OthersÊ (FIN 45). In
accordance with this Interpretation, the Company recognizes, at the inception of a guarantee that is
within the scope of the recognition criteria of the Interpretation, a liability for the fair value of the
obligation undertaken in issuing the guarantee.
Debt and other liabilities Debt and other liabilities, other than provisions, are stated at amortized cost. However, loans that
are hedged under a fair value hedge are remeasured for the changes in the fair value that are
attributable to the risk that is being hedged. Debt issue cost is not expensed immediately but are
reported as deferred charges and subsequently amortized over the term of the debt using the
effective interest rate method.
Currently, the Company does not have any financial instruments that are affected by SFAS No. 150
ÂAccounting for Certain Financial Instruments with Characteristics of both Liabilities and EquityÊ.
FASB Staff position No. EITF 00-19-2 ÂAccounting for Registration Payment ArrangementsÊ requires
companies that agree to register securities to recognize a liability separate from the related
securities if a payment to investors for failing to fulfill the agreement is probable and its amount can
be reasonably estimated. The Company had agreed to register an exchange offer for its outstanding
notes within 450 days from October 12, 2006 or otherwise incur higher interest expense on the
Group financial statements
[-132]
notes. Since the Company registered an exchange offer for the notes in April 2007, it is not deemed
probable that higher interest expense will be incurred as a result of failing to meet the registration
obligation.
Revenue recognition The CompanyÊs revenues are primarily derived from made-to-order sales to Original Equipment
Manufacturers („OEMÊs‰) and similar customers. The CompanyÊs revenues are also derived from
sales to distributors.
The Company applies the guidance in SEC Staff Accounting Bulletin (SAB) Topic 13 ÊRevenue
RecognitionÊ and recognizes revenue when persuasive evidence of an arrangement exists, delivery
has occurred or the service has been provided, the sales price is fixed or determinable, and
collection is reasonably assured, based on the terms and conditions of the sales contract. For
made-to-order sales, these criteria are generally met at the time the product is shipped and
delivered to the customer and title and risk have passed to the customer. Examples of delivery
conditions typically meeting these criteria are ÂFree on Board point of deliveryÊ and ÂCosts,
Insurance Paid point of deliveryÊ. Generally, the point of delivery is the customerÊs warehouse.
Acceptance of the product by the customer is generally not contractually required, since, with
made-to-order customers, design approval occurs before manufacturing and subsequently
delivery follows without further acceptance protocols. Payment terms used are those that are
customary in the particular geographic market. When management has established that all
aforementioned conditions for revenue recognition have been met and no further post-shipment
obligations exist revenue is recognized.
For sales to distributors, the same recognition principles apply and similar terms and conditions as
for sales to other customers are applied. However, for some distributors contractual arrangements
are in place, which allow these distributors to return products if certain conditions are met. These
conditions generally relate to the time period during which return is allowed and reflect customary
conditions in the particular geographic market. Other return conditions relate to circumstances
arising at the end of a product cycle, when certain distributors are permitted to return products
purchased during a pre-defined period after the Company has announced a productÊs pending
discontinuance. Long notice periods associated with these announcements generally prevent
significant amounts of product from being returned, however. Repurchase agreements with OEMÊs
or distributors are not entered into by the Company.
For sales where return rights exist, the Company applies the guidance given in SFAS 48 ÊRecognition
When Right of Return ExistsÊ. Based on historical data, management has determined that only a
very small percentage of the sales to this type of distributors is actually returned. In accordance
with the requirements of SFAS 48, a pro rata portion of the sales to these distributors is not
recognized but deferred until the return period has lapsed or the other return conditions no longer
apply.
Revenues are recorded net of sales taxes, customer discounts, rebates and similar charges. Shipping
and handling costs billed to customers are recognized as revenues. Expenses incurred for shipping
and handling costs of internal movements of goods are recorded as cost of sales. Shipping and
handling costs related to sales to third parties are reported as selling expenses.
[-133]
A provision for product warranty is made at the time of revenue recognition and reflects the
estimated costs of replacement and free-of-charge services that will be incurred by the Company
with respect to the sold products. In cases where the warranty period is extended and the
customer has the option to purchase such an extension, which is subsequently billed separately to
the customer, revenue recognition occurs on a straight-line basis over the contract period.
Royalty income, which is generally earned based upon a percentage of sales or a fixed amount
per product sold, is recognized on an accrual basis. Royalty income, other license income or
other income related to R&D arrangements and that is received in the form of non-refundable
upfront payments is recognized as income pro rata over the term of the contract unless a
separate earnings process has been completed or when it concerns software. In the latter case
revenue is recognized in accordance with Statement of Position (SOP) 97-2 „Software Revenue
recognition‰ when the 4 criteria of SAB Topic 13 are met. Government grants, other than those
relating to purchases of assets, are recognized as income as qualified expenditures are made.
Income taxes Income taxes in the consolidated financial statements are accounted for using the asset and liability
method. Income tax is recognized in the statement of operations except to the extent that it relates
to an item recognized directly within shareholderÊs equity, including other comprehensive income
(loss), in which case the related tax effect is also recognized there.
Current-year deferred taxes related to prior-year equity items, which arise from changes in tax
rates or tax laws are included in income. Current tax is the expected tax payable on the taxable
income for the year, using tax rates enacted at the consolidated balance sheet dates, and any
adjustment to tax payable in respect of previous years. Income tax payable includes amounts
payable to tax authorities. Deferred tax assets and liabilities are recognized for the expected tax
consequences of temporary differences between the tax basis of assets and liabilities and their
reported amounts. Measurement of deferred tax assets and liabilities is based upon the enacted tax
rates expected to apply to taxable income in the years in which those temporary differences are
expected to be recovered or settled. Deferred tax assets, including assets arising from loss
carryforwards, are recognized if it is more likely than not that the asset will be realized. Deferred
tax assets and liabilities are not discounted. Deferred tax liabilities for withholding taxes are
recognized for subsidiaries in situations where the income is to be paid out as dividends in the
foreseeable future, and for undistributed earnings of minority shareholdings.
In July 2006 the FASB issued FASB Interpretation No. 48 ÂAccounting for Uncertainty in Income
TaxesÊ, (FIN 48). The Company adopted FIN 48 in 2007. The Interpretation clarifies the accounting
for uncertainty in income taxes recognized in an enterpriseÊs financial statements in accordance with
SFAS No. 109 ÊAccounting for Income TaxesÊ. FIN 48 prescribes a Âmore-likely-than-notÊ
recognition threshold that must be met before a tax benefit can be recognized. FIN 48 also
prescribes a measurement methodology for those positions meeting the recognition threshold and
provides guidance on de-recognition, classification, interest and penalties, and disclosures. Penalties
are recorded as income tax charges, whereas interest is reported as financial charges in the
statement of operations.
Group financial statements
[-134]
Changes in tax rates are reflected in the period that includes the enactment date.
Predecessor The CompanyÊs income taxes as presented in the combined financial statements are calculated on a
separate tax return basis, although the Company was included in the consolidated tax return of
Philips. Philips manages its tax position for the benefit of its entire portfolio of businesses, and its tax
strategies are not necessarily reflective of the tax strategies that the Company would have followed
as a stand-alone Company.
Benefit accounting The Company accounts for the cost of pension plans and postretirement benefits other than
pensions in accordance with SFAS No. 87, ÂEmployersÊ Accounting for PensionsÊ, and SFAS No. 106,
ÂPostretirement Benefits other than PensionsÊ, respectively and in accordance with SFAS No. 158,
ÂEmployersÊ Accounting for Defined Benefit Pension and Other Postretirement Benefit PlansÊ.
The Company employees participate in pension and other postretirement benefit plans in many
countries. The costs of pension and other postretirement benefits and related assets and liabilities
with respect to the Company employees participating in defined-benefit plans have been allocated
to the Company based upon actuarial computations.
Obligations for contributions to defined-contribution pension plans are recognized as an expense in
the statement of operations as incurred.
Statement No. 158 requires that the Company recognizes on its balance sheet the over-funded
or under-funded status of its defined benefit and post retirement plans – measured as the
difference between plan assets at fair value and the defined-benefit obligation – as an asset or
liability. The offset of recognizing the funded status is recorded in accumulated other
comprehensive income (within shareholderÊs equity).
Statement 158 requires that the Company recognizes as a component of accumulated other
comprehensive income, net of taxes, the gains or losses and prior service costs and credits that
arise during the year but are not recognized as a component of net periodic benefit cost
pursuant to SFAS 87 and SFAS 106. Amounts recognized in accumulated other comprehensive
income, including the gains or losses and the prior services costs or credits are adjusted as they
are subsequently recognized as components of net periodic benefit costs pursuant to the
recognition provisions of Statements No. 87 and No. 106. Since the Company has not issued
equity securities that trade in a public market, it was not required to adopt the aforementioned
provisions of SFAS 158 until the fiscal year ending December 31, 2007. Accordingly, the
Company adopted these SFAS 158 provisions on December 31, 2007.
SFAS 158 also requires measurement of defined-benefit plan assets and obligations as of the date
of the employerÊs fiscal year-end balance sheet for years ending after December 15, 2008. For all
of the CompanyÊs defined pension benefit plans, the measurement date on which it determines
the funded status already complies with this requirement in 2008 and prior years.
Predecessor The Company has accounted for its participation in Philips sponsored pension plans in which the
Company and other Philips businesses participate as multi-employer plans.
[-135]
For pension and other postretirement benefit plans in which only Company employees participate
(the Company dedicated plans), the related costs have been included in the combined and
consolidated statements of operations.
The costs of pension and other postretirement benefits with respect to Company employees
participating in the Philips plans have been allocated to the Company based upon actuarial
computations, except for certain less significant plans, in which case a proportional allocation based
upon compensation or headcount has been used.
Share-based compensation Predecessor In 2003, the Company adopted the fair value recognition provisions of SFAS No. 123, ÂAccounting
for Stock-Based CompensationÊ (SFAS 123), as amended by SFAS No. 148, ÂAccounting for Stock-
Based Compensation – Transition and DisclosureÊ, prospectively for all employee awards granted,
modified or settled after January 1, 2003. Effective January 1, 2006, the Company adopted SFAS No.
123 (Revised 2004) (SFAS 123(R)), using the modified prospective method for the transition. Since
the Company already adopted the fair value recognition provision of SFAS 123, the effects of the
adoption of the revised standard on the Company was not material. Under the provisions of SFAS
123(R), the Company recognizes the estimated fair value of equity instruments granted to
employees as compensation expense over the vesting period on a straight-line basis taking into
account estimated forfeitures. The Company used the Black-Scholes option-pricing model to
determine the estimated fair value of the equity instruments. These employee awards were
previously granted by Philips to its employees and have been allocated to the Company for the
purpose of the predecessor combined financial statements.
For awards granted to employees prior to 2003, the Company continued to account for share-
based compensation using the intrinsic value method in accordance with Accounting Principles
Board (APB) Opinion No. 25, 'Accounting for Stock Issued to Employees'. These employee awards
were previously granted by Philips to its employees and have been subsequently allocated to the
Company.
Successor Immediately before the date of acquisition of our Company by KASLION, Philips announced all
outstanding unvested stock options and restricted share rights related to employees of the
semiconductor businesses of Philips would become fully vested and exercisable on October 16,
2006, which was recorded as part of the purchase price allocation. For the successor period,
share-based payment plans were put in place by our parent company KASLION Acquisition B.V.
for NXP employees. No share-based compensation arrangements were in place in the period
from September 29, 2006 through December 31, 2006. The plans are accounted for in
accordance with the provisions of SFAS 123(R). The Company uses a binomial option-pricing
model to determine the estimated fair value of the equity instruments.
FASB Staff Position (FSP) SFAS 123(R)-4 ÂClassification of Options and Similar Instruments Issued as
Employee Compensation That Allow for Cash Settlement upon the Occurrence of a Contingent
EventÊ amends paragraph 32 of SFAS 123 (R). The FSP requires share options and restricted shares
that have contingent cash settlement features that are outside the control of the employee,
Group financial statements
[-136]
such as a change in control or the death or disability of an employee, to be accounted for as
liabilities rather than equity if the contingent event is probable of occurring. The share-based
compensation plans that the CompanyÊs employees participate in contain contingent cash
settlement features upon an exit or change in control in combination with a termination of
employment. The Company has concluded that the likelihood of these events occurring is remote
and therefore not probable. Also, upon death or disablement the Company may offer cash
settlement, but the employee or his dependents must consent. Therefore, the Company has
concluded that this FSP is not applicable to the Company with respect to these cash settlement
features. However, in the case that for certain employees the vested share-based payment rights
have been declared to become cash settled such instruments will be recorded as liabilities as from
the date of such event.
Cash flow statements Cash flow statements have been prepared using the indirect method in accordance with the
requirements of SFAS No. 95, ÂStatement of Cash flowsÊ, as amended by SFAS No. 104, ÂStatement
of Cash Flows - Net Reporting of Certain Cash Receipts and Cash Payments and Classification of
Cash Flows from Hedging TransactionsÊ. Cash flows in foreign currencies have been translated into
USD using the weighted average rates of exchange for the periods involved.
Cash flows from derivative instruments that are accounted for as fair value hedges or cash flow
hedges are classified in the same category as the cash flows from the hedged items. Cash flows from
derivative instruments for which hedge accounting has been discontinued are classified consistent
with the nature of the instrument as from the date of discontinuance.
Concentration of risk The CompanyÊs sales are for a large part dependent on a limited number of customers, none of
which individually exceeds 10% of total sales. Furthermore, the Company is using outside suppliers
of foundries for a portion of its manufacturing capacity. For certain equipment and materials the
Company relies on a single source of supply.
New accounting standards The FASB issued several pronouncements, of which the following are to various degrees of
relevance to the Company and which are not yet effective, either partially or in full, or became
effective in 2008.
In September 2006, the FASB issued FASB Statement No. 157 „Fair value measurements‰, which
sets out a framework for measuring fair values. It applies only to fair-value measurements that
are already required or permitted by other accounting pronouncements. The Statement has
become effective prospectively for the Company from 2008 going forward, except for non-
financial assets and non-financial liabilities, other than that are recognized or disclosed at fair
value on a recurring basis, for which the effective date will start on January 1, 2009 for the
Company in accordance with the deferral provisions of FASB Staff Position FAS 157-2 „Effective
Date of FASB Statement No. 157‰. Effectively, the Statement was only applicable for NXP in
measuring the fair value of derivative instruments and available-for-sale equity securities in 2008.
The limited situations in which the Statement requires retrospective application are not expected
to be applicable to the Company. In 2009 when Statement 157 becomes fully effective, it will be
[-137]
applicable also for fair value determination of non financial assets and liabilities, the most
important of which will be the annual goodwill impairment test and the impairment test of other
long-lived assets. The method the Company currently uses for these impairment tests does not
significantly deviate from the guidance prescribed by Statement 157.
In October 2008, the FASB issued Staff Position FSP FAS 157-3 „Determining the Fair Value of a
Financial Asset When the Market for That Asset Is Not Active‰. The FSP amends Statement 157 by incorporating an example to illustrate key considerations in determining the fair value of a
financial asset in an inactive market. The FSP is effective upon issuance and should be applied to
prior periods for which financial statements have not been issued.
The Company does not hold financial assets that currently trade in inactive markets. Therefore
the effect of this FSP on the CompanyÊs financial statements is likely to be nil.
In February 2007, the FASB issued FASB Statement No.159 ÂThe Fair Value Option for Financial
Assets and Financial LiabilitiesÊ. The Statement permits an entity to measure certain financial
assets and financial liabilities at fair value and requires the entity that elected this fair value option
to report unrealized gains and losses in earnings at each subsequent reporting date. SFAS 159
establishes presentation and disclosure requirements and amends in this respect SFAS No.115
ÂAccounting for Certain Investments in Debt and Equity SecuritiesÊ with respect to available-for-
sale and trading securities. SFAS 159 became effective for the Company as from 2008. However,
the Company has elected not to account for any financial asset or financial liability under
Statement 159. Nevertheless, the amended disclosure and presentation requirements of
Statement 115 are applicable to the Company; however, without significant impact.
In December 2007 the FASB issued FASB Statement No. 141(R) ÂBusiness Combinations (revised
2007)Ê, effective from 2009. The changes compared with the original Statement 141 that are
significant for the Company are:
- Non-controlling interests acquired after the effective date of the Statement must be measured
at their fair values at the acquisition date including a related portion of the goodwill, whereas
previously these interests were recognized at predecessor carrying values;
- Acquisition-related costs may not be added to the fair values of the acquired assets and
liabilities assumed but must be recognized separately, generally as an expense in the period in
which they are incurred. Previously these transaction costs were added to the purchase price
and included in goodwill. At December 31, 2008 the Company had not incurred significant
amounts for acquisition related costs that subsequently in 2009 must be charged to the
statement of operations;
- Post closing restructuring costs for entities acquired after the effective date of the Statement
may not be recognized in the purchase accounting for the business combination and thus may
not be recognized as a liability, rather the cost must be charged to the statement of
operations in accordance with the prevailing guidance of other pronouncements;
- Contingent consideration such as earn-out arrangements for entities acquired after the
effective date of the Statement must initially be recognized at their acquisition date fair value.
Subsequent changes in the fair value are recognized in earnings. Previously, contingent
consideration was added to the purchase price when it became reliably measurable;
- The Statement requires recognition of the acquisition date fair value of research and
development assets acquired in a business combination. Subsequently, these assets will be
Group financial statements
[-138]
depreciated or amortized over their estimated useful lives. Previously such In-Process R&D
was expensed in full immediately upon acquisition.
- Statement 141(R) changes the definition of a business, which affects the identification of
reporting units to which goodwill must be allocated, both for previously completed business
combinations as well as for future acquisitions. The Company is in the process of identifying
any consequences for current goodwill allocation to reporting units. However, significant
effects are not expected.
Statement 141(R) becomes effective as of January 1, 2009 for the Company. It may not be applied
retrospectively. It will significantly affect the accounting for business combinations that are
concluded from 2009 going forward. It will not affect the assets and liabilities that were
recognized in business combinations that closed before 2009.
Simultaneously with Statement 141(R) the FASB issued Statement No. 160 „Non-controlling
Interests in Consolidated Financial Statements; and amendment of ARB No. 51‰. This Statement
amends ARB 51 to establish accounting and reporting standards for the non-controlling interests
in a subsidiary and for the deconsolidation of a subsidiary. Statement 160 requires that a non-
controlling interest, sometimes called a minority interest, be reported as equity in the
consolidated financial statements, whereas previously this was reported in the mezzanine. It also
requires that consolidated net income be reported at amounts that included the amounts
attributable to both the parent and the non-controlling interest. As a result the income
attributable to non-controlling interests may no longer be deducted as an expense in arriving at
consolidated net income. Net income (loss) attributable to the parent and the non-controlling
interests must be disclosed on the face of the statement of operations.
Statement 160 also requires that changes in the ownership of a subsidiary, not resulting in
deconsolidation, shall be accounted for as equity transactions. Consequently, no dilution gains or
losses can result from such transactions. Upon deconsolidation of a subsidiary any remaining non-
controlling interest of the parent shall be remeasured at fair value and that fair value shall be
taken into account in determining the gain or loss of the transaction.
Statement 160 becomes effective as of January 1, 2009 for the Company. It may not be applied
retrospectively except for the presentation and disclosure requirements, which shall be applied
to all periods presented. The Statement will significantly affect the CompanyÊs presentation of net
income or loss in the statement of operations and the equity in the balance sheet. It will
significantly affect the accounting for transactions that change ownership in subsidiaries that are
concluded from 2009 going forward. It will not affect the measurement of non-controlling
interests existing before 2009 and that remain unchanged thereafter.
SFAS No. 161 „Disclosures about Derivative Instruments and Hedging Activities‰ was issued in
March 2008.
The Statement becomes effective for NXP on January 1, 2009. Comparable disclosures for prior
years need only be given as from 2010 onwards but not for years before 2009.
The Statement requires quantitative and qualitative disclosures in a tabular format about fair
values, objectives, type and nature of the hedging instruments in relation to the risk exposure and
the line items in the balance sheet where derivative instruments are reported, For the gains and
losses reported in the statement of operations or in other comprehensive income (OCI) a
separate disclosure must be made for fair value hedges and for cash flow hedges. Also, the
[-139]
movements from OCI to the statement of operations must be disclosed. All this per type of
contract and indicating in which line item of the statement of operations it is being reported.
The impact of the Statement for the Company is limited to additional disclosures.
On May 9, 2008, the FASB issued Statement 162 „The Hierarchy of Generally Accepted
Accounting Principles‰, which reorganizes the GAAP hierarchy. The purpose of the new standard
is to improve financial reporting by providing a consistent framework for determining what
accounting principles should be used when preparing U.S. GAAP financial statements. This
Statement will have no immediate effect on NXPÊs financial statements.
On April 25, 2008, the FASB issued FSP FAS 142-3 „Determination of the Useful Life of Intangible
Assets‰, which amends the list of factors an entity should consider in developing renewal or
extension assumptions used in determining the useful life of recognized intangible assets under
Statement 142. The Company has concluded that this FSP is not expected to result in future
changes to economic lives of acquired intangible assets because such assets have no extension or
renewal possibilities.
On December 30, 2008, the FASB issued FSP FAS 132 (R)-1. „EmployersÊ Disclosures about
Postretirement Benefit Plan assets‰. The FSP amends statement No. 132 (R) to require additional
disclosures about assets held in an employerÊs defined benefit pension or other postretirement
plans. The Company is still investigating the impact of this pronouncement but expects it to be
limited to additional disclosures.
5 Information by Segment and Main Countries
The following sectors are distinguished as reportable segments in compliance with SFAS 131.
The Company is structured in four market-oriented business units: Mobile & Personal, MultiMarket
Semiconductors, Home and Automotive & Identification.
• Until July 2008, Mobile & Personal delivered full systems solutions for cellular phones and personal entertainment devices. On July 28, 2008 the key wireless operations of NXP were contributed to a new joint venture ST-NXP Wireless, and as such all assets and liabilities involved in this transaction have been deconsolidated from this sector. The operations until July 28, 2008 remain consolidated in the consolidated accounts.
The Mobile & Personal sector will be regrouped as from 2009. The remaining part of the
business unit, after the contribution of activities into the joint venture ST-NXP Wireless,
will be moved into the sectors MultiMarket Semiconductors and Corporate and Other in
2009.
• Home is a leading supplier of systems and components for the TV, PC TV and direct memory access segments of the consumer semiconductors market.
• Automotive & Identification has leading positions in car audio/radio, in-vehicle networking (IVN), car access and immobilization, tire pressure monitoring and magnetic sensors; Identification has leading positions in the radio frequency identification (RFID), near field communication (NFC) and eGovernment applications markets.
Group financial statements
[-140]
• MultiMarket Semiconductors provides a broad range of standard products (e.g. Bipolar, Power Discretes, Transistors & Diodes and Logic) and application specific standard products (e.g. Integrated Discretes, Interface Products and Microcontrollers).
The Company operates a shared manufacturing base, which is grouped in Manufacturing
Operations (formerly named IC Manufacturing Operations), with the exception of manufacturing
assets dedicated to MultiMarket Semiconductors products, which are reported as part of that
segment.
Corporate and Other includes certain research and development activities, IP licensing, Emerging
Products and special items not directly allocated to Business Units and/or Manufacturing
Operations.
NXP Software (formerly Philips Software) included in Corporate and Other, specializes in
innovative multimedia, security and connectivity solutions for manufacturers of mobile and
portable equipment.
Certain assets of the Company have been used jointly or managed at Corporate level.
Arithmetical allocation of these assets to the various businesses is not deemed to be meaningful
and as such total assets by segment has been omitted. Instead, inventories per segments are
included.
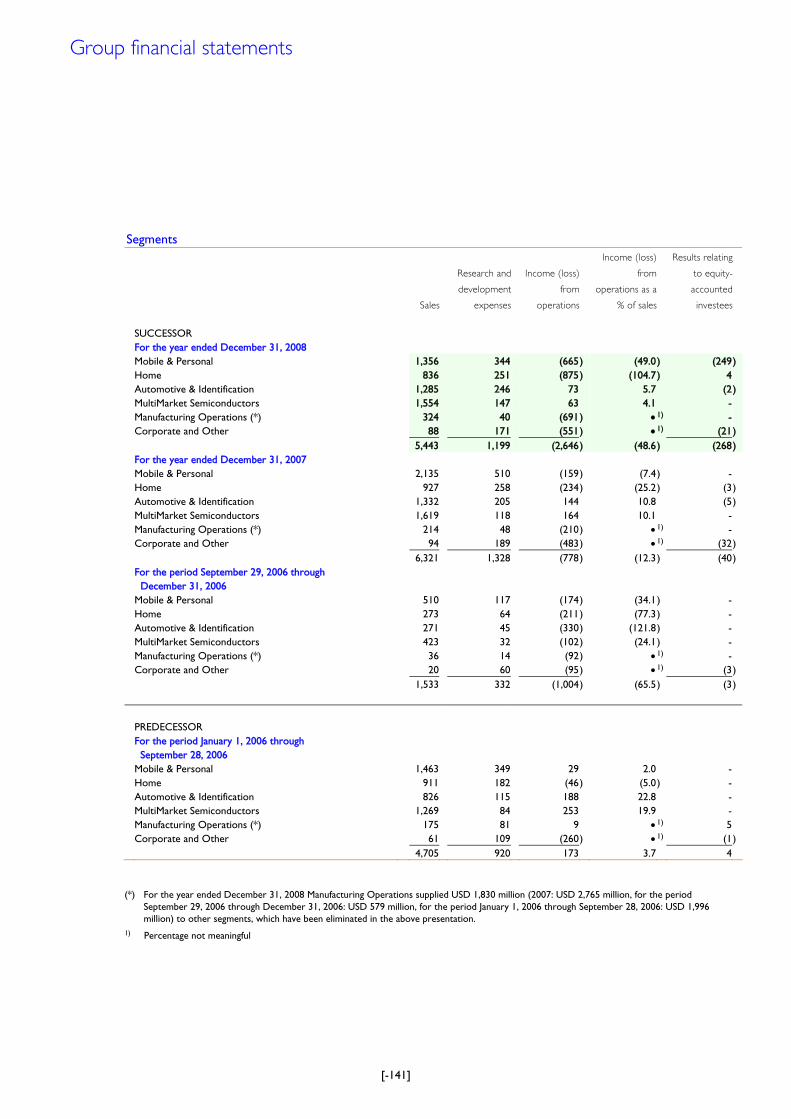
[-141]
Segments
Sales
Research and
development
expenses
Income (loss)
from
operations
Income (loss)
from
operations as a
% of sales
Results relating
to equity-
accounted
investees
SUCCESSOR
For the year ended December 31, 2008
Mobile & Personal 1,356 344 (665 ) (49.0) (249) Home 836 251 (875 ) (104.7) 4 Automotive & Identification 1,285 246 73 5.7 (2) MultiMarket Semiconductors 1,554 147 63 4.1 - Manufacturing Operations (*) 324 40 (691 ) •1) - Corporate and Other 88 171 (551 ) •1) (21) 5,443 1,199 (2,646 ) (48.6) (268) For the year ended December 31, 2007
Mobile & Personal 2,135 510 (159 ) (7.4) - Home 927 258 (234 ) (25.2) (3) Automotive & Identification 1,332 205 144 10.8 (5) MultiMarket Semiconductors 1,619 118 164 10.1 - Manufacturing Operations (*) 214 48 (210 ) •1) - Corporate and Other 94 189 (483 ) •1) (32) 6,321 1,328 (778 ) (12.3) (40) For the period September 29, 2006 through
December 31, 2006
Mobile & Personal 510 117 (174 ) (34.1) - Home 273 64 (211 ) (77.3) - Automotive & Identification 271 45 (330 ) (121.8) - MultiMarket Semiconductors 423 32 (102 ) (24.1) - Manufacturing Operations (*) 36 14 (92 ) •1) - Corporate and Other 20 60 (95 ) •1) (3) 1,533 332 (1,004 ) (65.5) (3) PREDECESSOR For the period January 1, 2006 through
September 28, 2006
Mobile & Personal 1,463 349 29 2.0 - Home 911 182 (46 ) (5.0) - Automotive & Identification 826 115 188 22.8 - MultiMarket Semiconductors 1,269 84 253 19.9 - Manufacturing Operations (*) 175 81 9 •1) 5 Corporate and Other 61 109 (260 ) •1) (1) 4,705 920 173 3.7 4
(*) For the year ended December 31, 2008 Manufacturing Operations supplied USD 1,830 million (2007: USD 2,765 million, for the period September 29, 2006 through December 31, 2006: USD 579 million, for the period January 1, 2006 through September 28, 2006: USD 1,996 million) to other segments, which have been eliminated in the above presentation.
1) Percentage not meaningful
Group financial statements
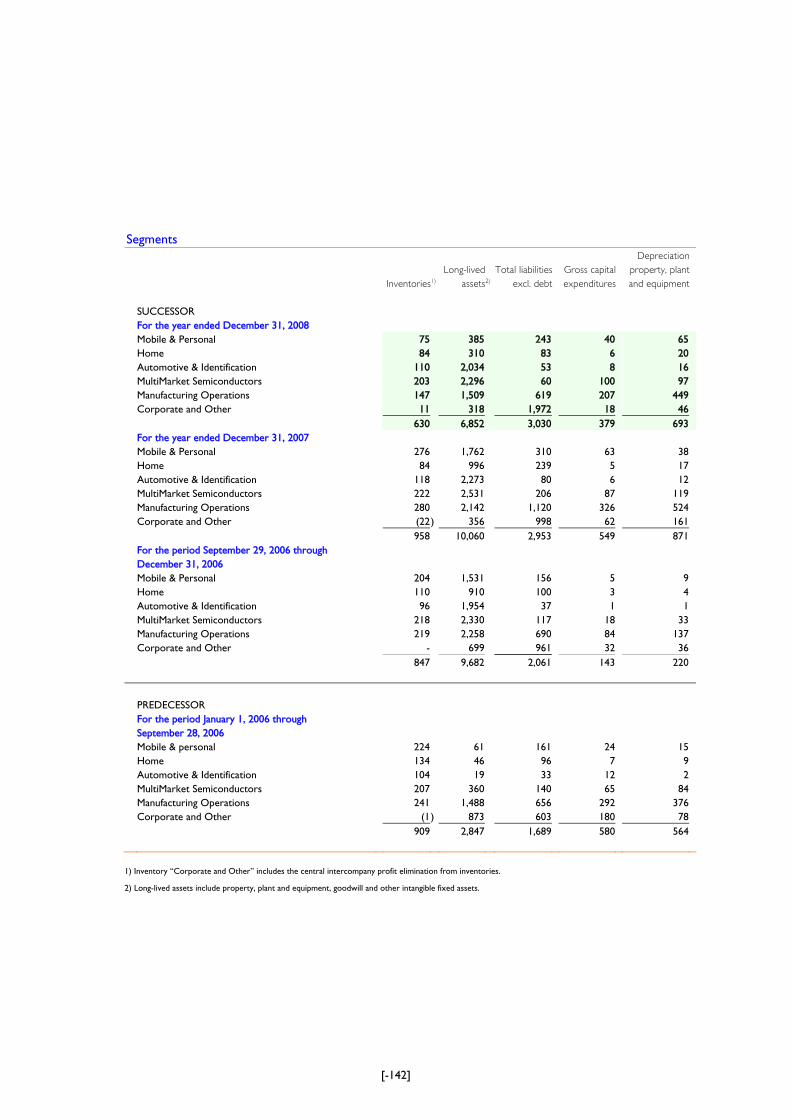
[-142]
Segments
Inventories
1)
Long-lived
assets
2)
Total liabilities
excl. debt
Gross capital
expenditures
Depreciation
property, plant
and equipment
SUCCESSOR
For the year ended December 31, 2008
Mobile & Personal 75 385 243 40 65 Home 84 310 83 6 20 Automotive & Identification 110 2,034 53 8 16 MultiMarket Semiconductors 203 2,296 60 100 97 Manufacturing Operations 147 1,509 619 207 449 Corporate and Other 11 318 1,972 18 46 630 6,852 3,030 379 693 For the year ended December 31, 2007
Mobile & Personal 276 1,762 310 63 38 Home 84 996 239 5 17 Automotive & Identification 118 2,273 80 6 12 MultiMarket Semiconductors 222 2,531 206 87 119 Manufacturing Operations 280 2,142 1,120 326 524 Corporate and Other (22) 356 998 62 161 958 10,060 2,953 549 871 For the period September 29, 2006 through
December 31, 2006
Mobile & Personal 204 1,531 156 5 9 Home 110 910 100 3 4 Automotive & Identification 96 1,954 37 1 1 MultiMarket Semiconductors 218 2,330 117 18 33 Manufacturing Operations 219 2,258 690 84 137 Corporate and Other - 699 961 32 36 847 9,682 2,061 143 220 PREDECESSOR For the period January 1, 2006 through
September 28, 2006
Mobile & personal 224 61 161 24 15 Home 134 46 96 7 9 Automotive & Identification 104 19 33 12 2 MultiMarket Semiconductors 207 360 140 65 84 Manufacturing Operations 241 1,488 656 292 376 Corporate and Other (1) 873 603 180 78 909 2,847 1,689 580 564
1) Inventory „Corporate and Other‰ includes the central intercompany profit elimination from inventories.
2) Long-lived assets include property, plant and equipment, goodwill and other intangible fixed assets.
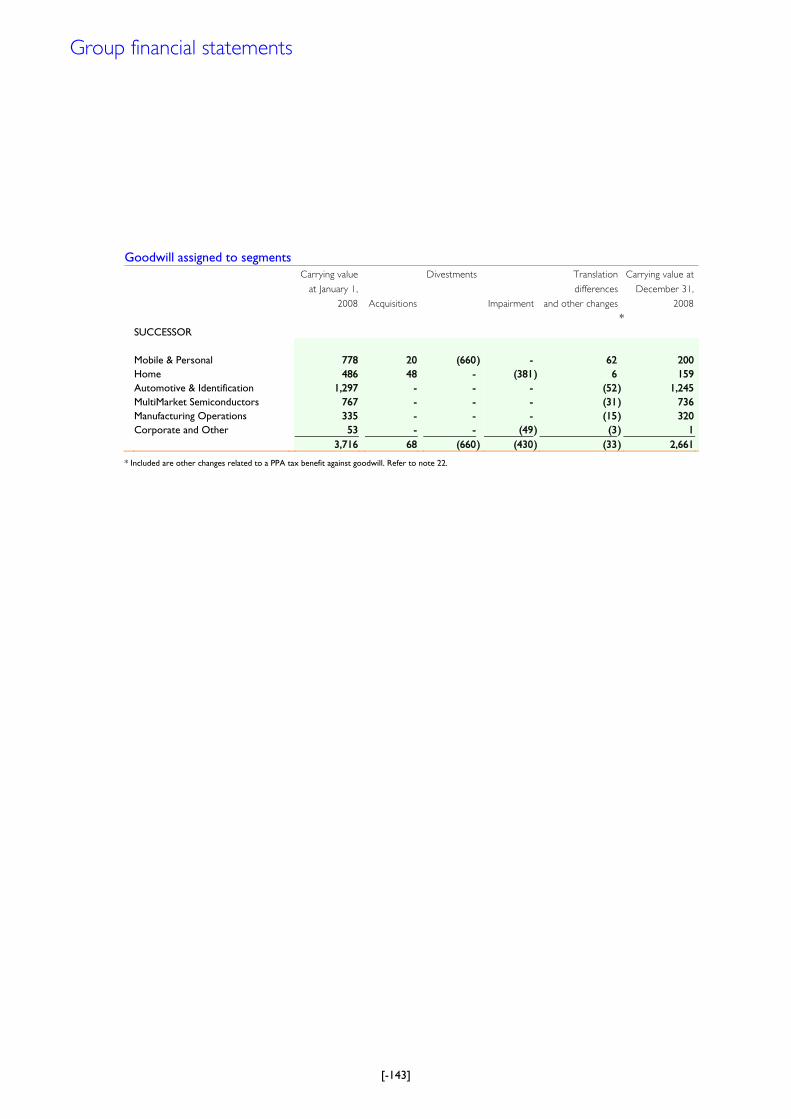
[-143]
Goodwill assigned to segments Carrying value
at January 1,
2008
Acquisitions
Divestments
Impairment
Translation
differences
and other changes
*
Carrying value at
December 31,
2008
SUCCESSOR
Mobile & Personal 778 20 (660) - 62 200 Home 486 48 - (381) 6 159 Automotive & Identification 1,297 - - - (52 ) 1,245 MultiMarket Semiconductors 767 - - - (31 ) 736 Manufacturing Operations 335 - - - (15 ) 320 Corporate and Other 53 - - (49) (3 ) 1 3,716 68 (660) (430) (33 ) 2,661
* Included are other changes related to a PPA tax benefit against goodwill. Refer to note 22.
Group financial statements
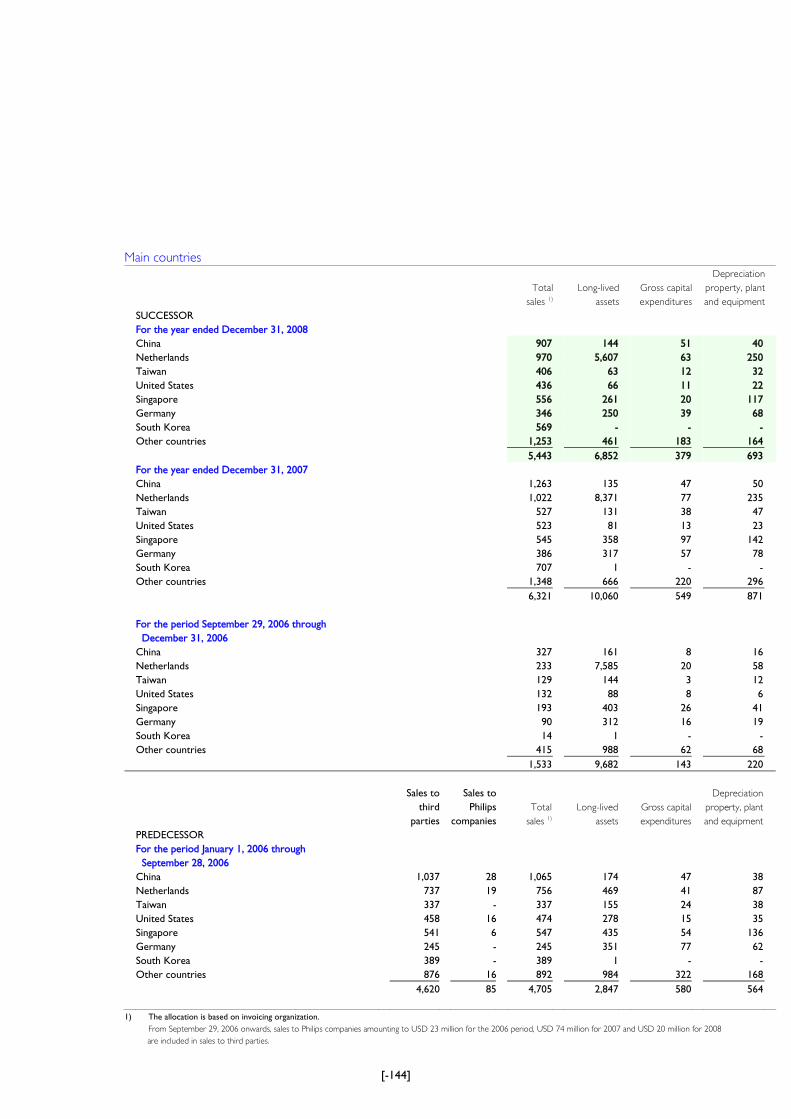
[-144]
Main countries
Total
sales 1)
Long-lived
assets
Gross capital
expenditures
Depreciation
property, plant
and equipment
SUCCESSOR
For the year ended December 31, 2008
China 907 144 51 40 Netherlands 970 5,607 63 250 Taiwan 406 63 12 32 United States 436 66 11 22 Singapore 556 261 20 117 Germany 346 250 39 68 South Korea 569 - - - Other countries 1,253 461 183 164 5,443 6,852 379 693 For the year ended December 31, 2007
China 1,263 135 47 50 Netherlands 1,022 8,371 77 235 Taiwan 527 131 38 47 United States 523 81 13 23 Singapore 545 358 97 142 Germany 386 317 57 78 South Korea 707 1 - - Other countries 1,348 666 220 296 6,321 10,060 549 871 For the period September 29, 2006 through
December 31, 2006
China 327 161 8 16 Netherlands 233 7,585 20 58 Taiwan 129 144 3 12 United States 132 88 8 6 Singapore 193 403 26 41 Germany 90 312 16 19 South Korea 14 1 - - Other countries 415 988 62 68 1,533 9,682 143 220 Sales to
third parties
Sales to Philips
companies
Total
sales 1)
Long-lived
assets
Gross capital
expenditures
Depreciation
property, plant
and equipment
PREDECESSOR For the period January 1, 2006 through
September 28, 2006
China 1,037 28 1,065 174 47 38 Netherlands 737 19 756 469 41 87 Taiwan 337 - 337 155 24 38 United States 458 16 474 278 15 35 Singapore 541 6 547 435 54 136 Germany 245 - 245 351 77 62 South Korea 389 - 389 1 - - Other countries 876 16 892 984 322 168 4,620 85 4,705 2,847 580 564 1) The allocation is based on invoicing organization.
From September 29, 2006 onwards, sales to Philips companies amounting to USD 23 million for the 2006 period, USD 74 million for 2007 and USD 20 million for 2008
are included in sales to third parties.
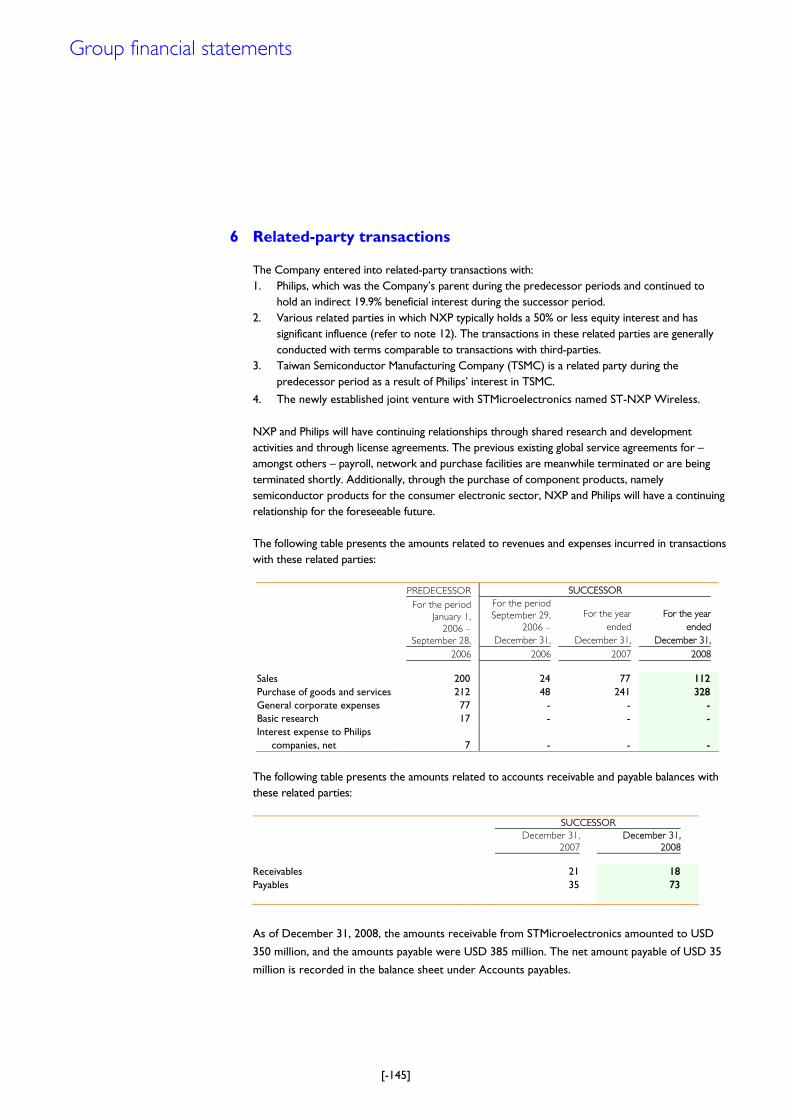
[-145]
6 Related-party transactions The Company entered into related-party transactions with: 1. Philips, which was the CompanyÊs parent during the predecessor periods and continued to
hold an indirect 19.9% beneficial interest during the successor period. 2. Various related parties in which NXP typically holds a 50% or less equity interest and has
significant influence (refer to note 12). The transactions in these related parties are generally conducted with terms comparable to transactions with third-parties.
3. Taiwan Semiconductor Manufacturing Company (TSMC) is a related party during the predecessor period as a result of PhilipsÊ interest in TSMC.
4. The newly established joint venture with STMicroelectronics named ST-NXP Wireless. NXP and Philips will have continuing relationships through shared research and development activities and through license agreements. The previous existing global service agreements for – amongst others – payroll, network and purchase facilities are meanwhile terminated or are being terminated shortly. Additionally, through the purchase of component products, namely semiconductor products for the consumer electronic sector, NXP and Philips will have a continuing relationship for the foreseeable future. The following table presents the amounts related to revenues and expenses incurred in transactions with these related parties:
PREDECESSOR SUCCESSOR
For the period
January 1,
2006 –
September 28,
For the period
September 29,
2006 –
December 31,
For the year
ended
December 31,
For the year
ended
December 31,
2006 2006 2007 2008
Sales 200 24 77 112 Purchase of goods and services 212 48 241 328 General corporate expenses 77 - - - Basic research 17 - - -
Interest expense to Philips companies, net
7 -
-
-
The following table presents the amounts related to accounts receivable and payable balances with these related parties:
SUCCESSOR
December 31,
2007
December 31,
2008
Receivables 21 18 Payables 35 73
As of December 31, 2008, the amounts receivable from STMicroelectronics amounted to USD
350 million, and the amounts payable were USD 385 million. The net amount payable of USD 35
million is recorded in the balance sheet under Accounts payables.
Group financial statements
[-146]
Predecessor Costs of services and corporate functions During the predecessor periods the Company participated in a variety of corporate-wide programs
administered by Philips in areas such as cash management, insurance, employee benefits, information
technology, intellectual property, and customs.
Furthermore, the Company utilized various Philips shared services organizations for services such
as:
• Human Resource services such as payroll processing, benefits administration, recruitment and training
• Accounting services • Information technology such as the cost of hardware, network and standard software
applications • Purchasing of non-product related items • Real Estate services
The costs of these services have been charged or allocated to the Company based on service level
agreements and other contracts that include agreements on charges against actual costs. Please
refer to notes 25, 26 and 34 for a discussion of the costs of pension benefits, other postretirement
benefits and share-based compensation.
Successor In December 2006 and during 2007, selected members of our management purchased
approximately 10.6 million depository receipts issued by the Stichting Management Co-
Investment NXP, each of these receipts representing an economic interest in a common share of
KASLION. These depository receipts have been purchased at a price estimated to be fair market
value and in the aggregate represent a beneficial interest in KASLION of 0.25%.
General corporate expenses and Basic Research The financial statements for the predecessor periods also include expense allocations for certain
corporate functions, historically provided by Philips but not charged to the semiconductors
segment, such as management oversight, accounting, treasury, tax, legal, brand management and
human resources, as well as an allocation of the costs of basic research performed by Philips. A
proportional cost allocation method based upon sales has been used to estimate the amounts of
these allocations.
The Company considers the allocation of the costs of the aforementioned services and functions to
be reasonable. However, these amounts may not be indicative of the costs that would have been
necessary for the Company to operate as a stand-alone entity.
Interest expense The amount of net interest expense charged by Philips included in the combined statements of
operations for January 1, 2006 through September 28, 2006 amounted to USD 7 million.
[-147]
Loans with Philips companies As a result of the Separation, the Company had repaid all outstanding balances owed to Philips
companies as of September 28, 2006.
Cash management and financing During the predecessor periods, the Company participated in PhilipsÊ worldwide cash management
system under which the Company maintained bank accounts in specific banks as directed by Philips.
Such accounts were generally zero balanced, where possible, to the Philips global pool, allowing cash
to be managed and centralized by Philips.
The transfer of funds in and between the countries is accounted for via intercompany accounts. The
balance of these intercompany accounts has been presented in the caption PhilipsÊ net investment in
the Company, which is presented as a part of businessÊ equity. Interest income and expense are
generally not recorded on these domestic intercompany balances. Where pooling of cash balances
was not possible, longer term cash surpluses were generally placed on deposit with Philips until
dividends were distributed to Philips. Philips also maintained an in-house banking arrangement that
provided facilities for Philips entities to obtain funds for local short term funding requirements.
Longer term and structural financing was provided to Philips legal entities either through specific
intercompany loans with Philips or through third party financing. Philips did not allocate interest to
specific segments or businesses. The combined statements of operations include intercompany
interest income and expense that has been recorded by legal entities that include only the
CompanyÊs businesses. Interest income and expense of shared legal entities of the Company and
other Philips divisions have not been included in the combined statements of operations.
Cash and cash equivalents, external debt, intercompany loans, and related interest income and
expense have been included in the CompanyÊs financial statements for the predecessor periods
to the extent such amounts were actually held or incurred by the legal entities that are part of
the Company.
7 Acquisitions and divestments
2008
During 2008, the Company entered into a number of acquisitions. All business combinations have
been accounted for using the purchase method of accounting. The more important business
combinations in 2008 were the acquisitions of GloNav, ConexantÊs Broadband Media Processing
business, and NuTune. All acquisitions, both individually and in the aggregate, were deemed
immaterial in respect of the SFAS 141 disclosure requirements.
In January, 2008, NXP acquired GloNav Inc., a US-based fabless semiconductor company, adding
GPS (Global Positioning Systems) to the connected entertainment portfolio. The assets acquired
amounted to USD 2 million, the liabilities assumed amounted to USD 4 million. The purchase
price was USD 87 million and was allocated to other intangible assets (USD 69 million) and
goodwill (USD 20 million, net of deferred taxes).
Group financial statements
[-148]
As a result of the contribution of the wireless operations into the new joint venture ST-NXP
Wireless, GloNav was part of this transaction and as such also included in this transfer of net
assets on August 2, 2008.
On August 11, 2008, NXP completed its acquisition of the Broadband Media Processing (BMP)
business of Conexant Systems, Inc. which provides industry-leading solutions for satellite, cable
and IPTV applications. The assets acquired amounted to USD 22 million, the liabilities assumed
amounted to USD 1 million. The purchase price (net of cash acquired) was USD 111 million and
was allocated to Other intangible assets (USD 58 million) and Goodwill (USD 32 million) . The
revenue in the year of acquisition since the date of acquisition was USD 63 million.
NXP also has an additional consideration of up to USD 35 million based on the achievement of
certain revenue milestones over the period from closing through 2009.
On September 1, 2008, NXP and Thomson combined their can tuner module operations in a
joint venture, named NuTune. NXP has a 55% ownership and Thomson the remaining 45%.
The net assets acquired amounted to USD 20 million and resulted in a goodwill allocation of
USD 16 million.
The revenue in the year of acquisition since the date of acquisition was USD 31 million.
The most significant divestment in 2008 was the major part of the CompanyÊs Mobile & Personal
business unit.
On August 2, 2008, NXP and STMicroelectronics (STM) combined their wireless operations to
form a new joint-venture company - ST-NXP Wireless -, in which NXP contributed business and
assets forming a substantial portion of its Mobile & Personal business unit (excluding Sound
Solutions, Mobile Infrastructure and amplifiers). STM owns a majority stake (80%) and NXP has a
20% ownership while receiving USD 1.55 billion from STM. The 20% investment in the combined
wireless operations is accounted for by the equity method because the Company has significant
influence. As a result of retaining this 20% investment and the ongoing significant cash flows, the
divestment is not reported as a discontinued operation. The net assets divested amounted to
USD 1,976 million, resulting in a loss on their transaction of USD 413 million, which has been
reported under Other business income.
In February 2009, STM exercised its option to buy the 20% ownership for an amount of USD 92
million.
2007
On March 23, 2007, NXP completed its acquisition of the Cellular Communication business of
Silicon Laboratories Inc., a leader in Radio Frequency (RF) technology for mobile phones. NXP
acquired the Cellular Communication business for USD 288 million in cash, and has been
consolidated within the segment Mobile & Personal as from the acquisition date. Contingent
upon the achievement of certain milestones in the next three years, an additional USD 65 million
may be paid up for the acquisition. Related to this earn-out, an amount of USD 4 million has been
included in the purchase price accounting. The purchase price for the acquisition was allocated to
Property, plant and equipment (USD 9 million), Other intangible assets (USD 104 million), Assets
and liabilities (USD 22 million) and Goodwill (USD 153 million).
[-149]
On September 5, 2007, NXP completed the divestment of its Cordless and VoIP Terminal
operations to DSP Group for an initial payment of USD 200 million in cash and 4,186,603 newly
issued shares of DSP GroupÊs common stock. As a result of the transaction, NXP now owns
approximately 16% of DSP GroupÊs outstanding common stock. The net assets divested
amounted to USD 90 million. Furthermore, liabilities for future payments and various expenses
were taken into consideration resulting in a gain on this transaction of USD 119 million, which
has been reported under Other business income.
2006
Successor In November 2006, the CompanyÊs option to purchase additional outstanding stock of the
Singapore-based wafer fabrication firm Systems on Silicon Manufacturing Company (SSMC) was
fully exercised. An incremental 10.7% SSMC shares were acquired from the Economic
Development Board (EDB), increasing the CompanyÊs equity interest to 61.2%, at cost of USD
118 million paid in cash. The total purchase price was allocated to property, plant and equipment
(USD 8 million), goodwill (USD 35 million), other intangibles (USD 19 million) and, as a
consequence, a reduction in minority interests (USD 59 million). Other intangibles fully consist of
core technology.
In 2006 there were no material divestments.
8 Income from operations
For information related to sales and income from operations on a geographical and business basis,
see note 5.
Sales composition PREDECESSOR SUCCESSOR
For the period
January 1,
2006 –
September 28,
For the period
September 29,
2006 –
December 31,
For the year
ended
December 31,
For the year
ended
December 31,
2006 2006 2007 2008 Goods 4,684 1,526 6,291 5,420 Licenses 21 7 30 23 4,705 1,533 6,321 5,443
Group financial statements
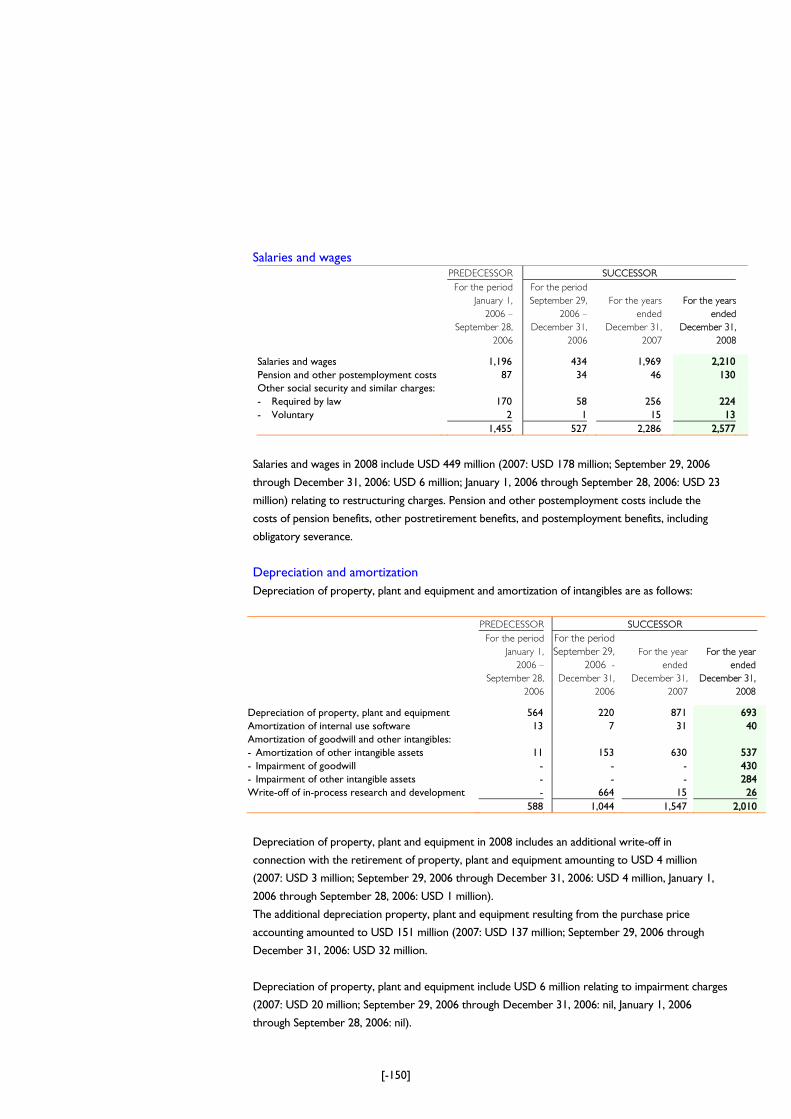
[-150]
Salaries and wages PREDECESSOR SUCCESSOR
For the period
January 1,
2006 –
September 28,
For the period
September 29,
2006 –
December 31,
For the years
ended
December 31,
For the years
ended
December 31,
2006 2006 2007 2008 Salaries and wages 1,196 434 1,969 2,210 Pension and other postemployment costs 87 34 46 130 Other social security and similar charges: - Required by law 170 58 256 224 - Voluntary 2 1 15 13 1,455 527 2,286 2,577
Salaries and wages in 2008 include USD 449 million (2007: USD 178 million; September 29, 2006
through December 31, 2006: USD 6 million; January 1, 2006 through September 28, 2006: USD 23
million) relating to restructuring charges. Pension and other postemployment costs include the
costs of pension benefits, other postretirement benefits, and postemployment benefits, including
obligatory severance.
Depreciation and amortization Depreciation of property, plant and equipment and amortization of intangibles are as follows:
PREDECESSOR SUCCESSOR
For the period
January 1,
2006 –
September 28,
For the period
September 29,
2006 -
December 31,
For the year
ended
December 31,
For the year
ended
December 31,
2006 2006 2007 2008 Depreciation of property, plant and equipment 564 220 871 693 Amortization of internal use software 13 7 31 40 Amortization of goodwill and other intangibles: - Amortization of other intangible assets 11 153 630 537 - Impairment of goodwill - - - 430 - Impairment of other intangible assets - - - 284 Write-off of in-process research and development - 664 15 26 588 1,044 1,547 2,010
Depreciation of property, plant and equipment in 2008 includes an additional write-off in
connection with the retirement of property, plant and equipment amounting to USD 4 million
(2007: USD 3 million; September 29, 2006 through December 31, 2006: USD 4 million, January 1,
2006 through September 28, 2006: USD 1 million).
The additional depreciation property, plant and equipment resulting from the purchase price
accounting amounted to USD 151 million (2007: USD 137 million; September 29, 2006 through
December 31, 2006: USD 32 million.
Depreciation of property, plant and equipment include USD 6 million relating to impairment charges
(2007: USD 20 million; September 29, 2006 through December 31, 2006: nil, January 1, 2006
through September 28, 2006: nil).
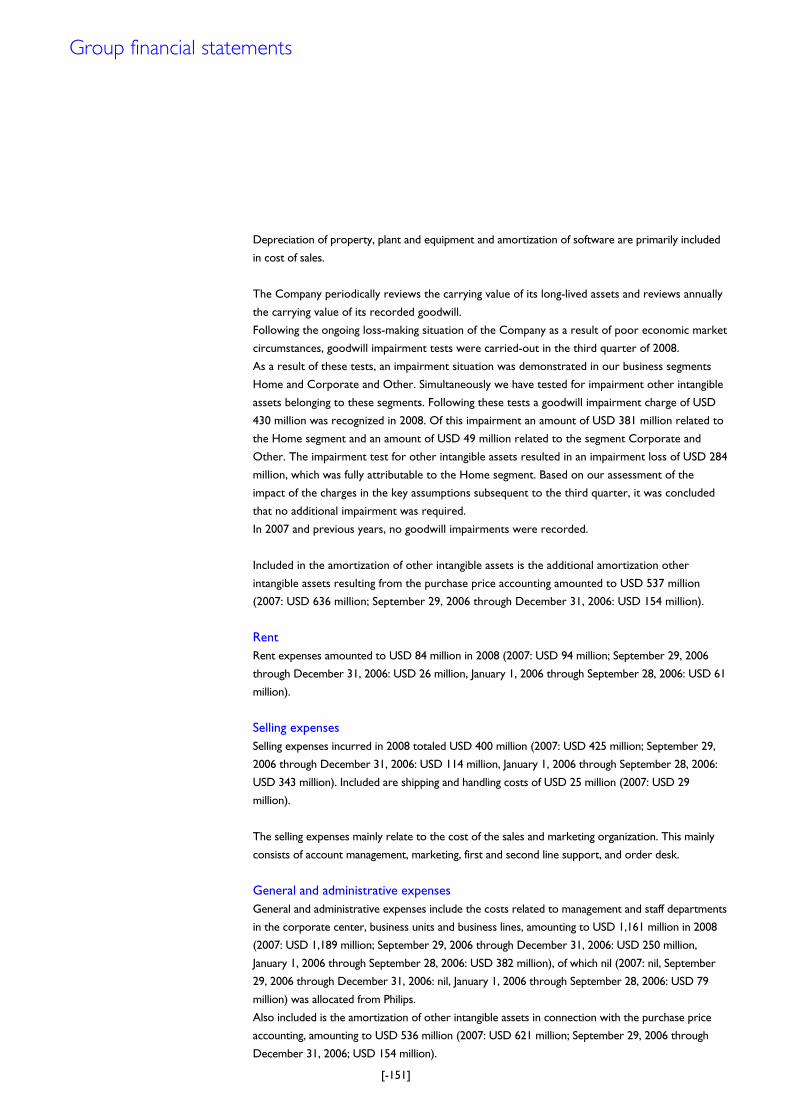
[-151]
Depreciation of property, plant and equipment and amortization of software are primarily included
in cost of sales.
The Company periodically reviews the carrying value of its long-lived assets and reviews annually
the carrying value of its recorded goodwill.
Following the ongoing loss-making situation of the Company as a result of poor economic market
circumstances, goodwill impairment tests were carried-out in the third quarter of 2008.
As a result of these tests, an impairment situation was demonstrated in our business segments
Home and Corporate and Other. Simultaneously we have tested for impairment other intangible
assets belonging to these segments. Following these tests a goodwill impairment charge of USD
430 million was recognized in 2008. Of this impairment an amount of USD 381 million related to
the Home segment and an amount of USD 49 million related to the segment Corporate and
Other. The impairment test for other intangible assets resulted in an impairment loss of USD 284
million, which was fully attributable to the Home segment. Based on our assessment of the
impact of the charges in the key assumptions subsequent to the third quarter, it was concluded
that no additional impairment was required.
In 2007 and previous years, no goodwill impairments were recorded.
Included in the amortization of other intangible assets is the additional amortization other
intangible assets resulting from the purchase price accounting amounted to USD 537 million
(2007: USD 636 million; September 29, 2006 through December 31, 2006: USD 154 million).
Rent Rent expenses amounted to USD 84 million in 2008 (2007: USD 94 million; September 29, 2006
through December 31, 2006: USD 26 million, January 1, 2006 through September 28, 2006: USD 61
million).
Selling expenses Selling expenses incurred in 2008 totaled USD 400 million (2007: USD 425 million; September 29,
2006 through December 31, 2006: USD 114 million, January 1, 2006 through September 28, 2006:
USD 343 million). Included are shipping and handling costs of USD 25 million (2007: USD 29
million).
The selling expenses mainly relate to the cost of the sales and marketing organization. This mainly
consists of account management, marketing, first and second line support, and order desk.
General and administrative expenses General and administrative expenses include the costs related to management and staff departments
in the corporate center, business units and business lines, amounting to USD 1,161 million in 2008
(2007: USD 1,189 million; September 29, 2006 through December 31, 2006: USD 250 million,
January 1, 2006 through September 28, 2006: USD 382 million), of which nil (2007: nil, September
29, 2006 through December 31, 2006: nil, January 1, 2006 through September 28, 2006: USD 79
million) was allocated from Philips.
Also included is the amortization of other intangible assets in connection with the purchase price
accounting, amounting to USD 536 million (2007: USD 621 million; September 29, 2006 through
December 31, 2006; USD 154 million).
Group financial statements
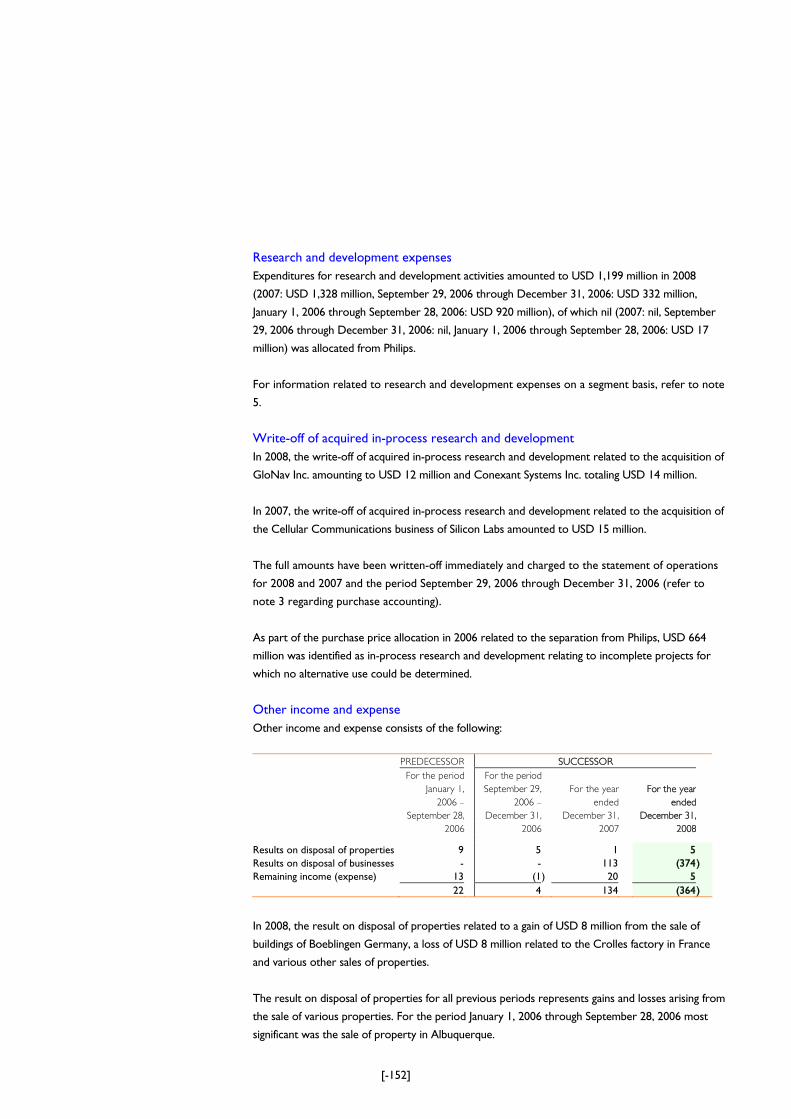
[-152]
Research and development expenses Expenditures for research and development activities amounted to USD 1,199 million in 2008
(2007: USD 1,328 million, September 29, 2006 through December 31, 2006: USD 332 million,
January 1, 2006 through September 28, 2006: USD 920 million), of which nil (2007: nil, September
29, 2006 through December 31, 2006: nil, January 1, 2006 through September 28, 2006: USD 17
million) was allocated from Philips.
For information related to research and development expenses on a segment basis, refer to note
5.
Write-off of acquired in-process research and development In 2008, the write-off of acquired in-process research and development related to the acquisition of
GloNav Inc. amounting to USD 12 million and Conexant Systems Inc. totaling USD 14 million.
In 2007, the write-off of acquired in-process research and development related to the acquisition of
the Cellular Communications business of Silicon Labs amounted to USD 15 million.
The full amounts have been written-off immediately and charged to the statement of operations
for 2008 and 2007 and the period September 29, 2006 through December 31, 2006 (refer to
note 3 regarding purchase accounting).
As part of the purchase price allocation in 2006 related to the separation from Philips, USD 664
million was identified as in-process research and development relating to incomplete projects for
which no alternative use could be determined.
Other income and expense Other income and expense consists of the following:
PREDECESSOR SUCCESSOR
For the period
January 1,
2006 –
September 28,
For the period
September 29,
2006 –
December 31,
For the year
ended
December 31,
For the year
ended
December 31,
2006 2006 2007 2008 Results on disposal of properties 9 5 1 5 Results on disposal of businesses - - 113 (374) Remaining income (expense) 13 (1) 20 5 22 4 134 (364)
In 2008, the result on disposal of properties related to a gain of USD 8 million from the sale of
buildings of Boeblingen Germany, a loss of USD 8 million related to the Crolles factory in France
and various other sales of properties.
The result on disposal of properties for all previous periods represents gains and losses arising from
the sale of various properties. For the period January 1, 2006 through September 28, 2006 most
significant was the sale of property in Albuquerque.
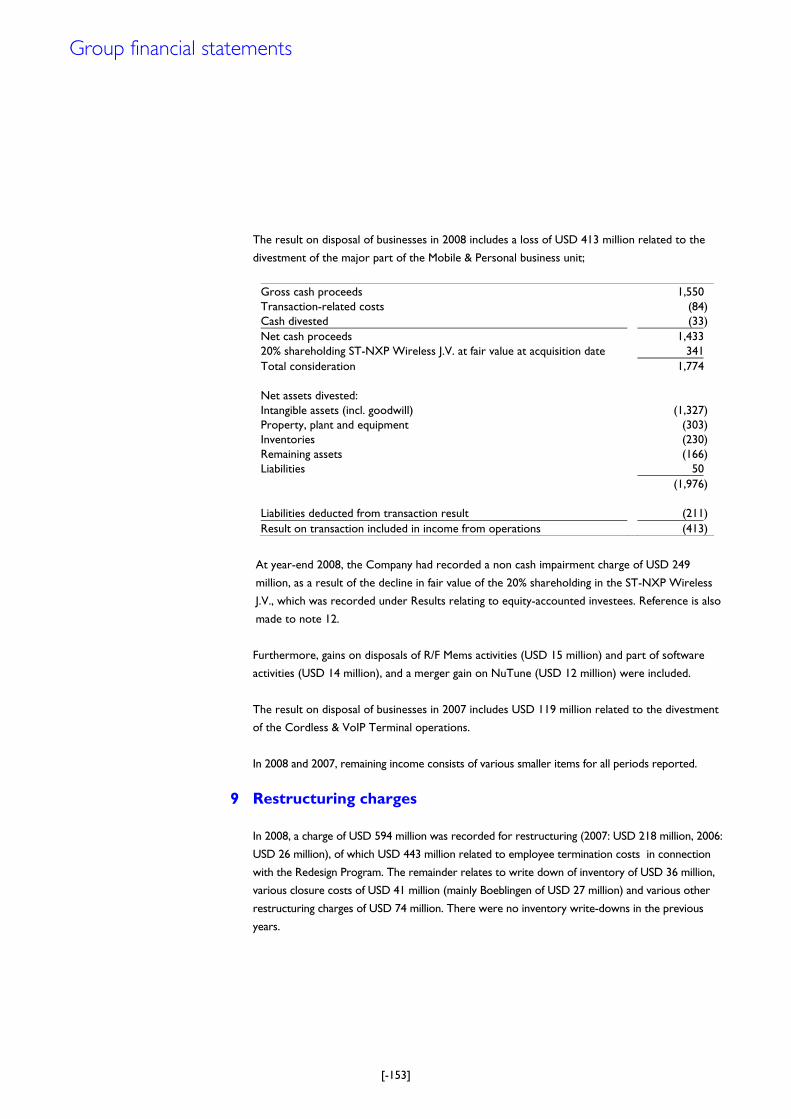
[-153]
The result on disposal of businesses in 2008 includes a loss of USD 413 million related to the
divestment of the major part of the Mobile & Personal business unit;
Gross cash proceeds 1,550 Transaction-related costs (84)Cash divested (33)Net cash proceeds 1,433 20% shareholding ST-NXP Wireless J.V. at fair value at acquisition date 341 Total consideration 1,774 Net assets divested: Intangible assets (incl. goodwill) (1,327)Property, plant and equipment (303)Inventories (230)Remaining assets (166)Liabilities 50 (1,976) Liabilities deducted from transaction result (211)Result on transaction included in income from operations (413)
At year-end 2008, the Company had recorded a non cash impairment charge of USD 249
million, as a result of the decline in fair value of the 20% shareholding in the ST-NXP Wireless
J.V., which was recorded under Results relating to equity-accounted investees. Reference is also
made to note 12.
Furthermore, gains on disposals of R/F Mems activities (USD 15 million) and part of software
activities (USD 14 million), and a merger gain on NuTune (USD 12 million) were included.
The result on disposal of businesses in 2007 includes USD 119 million related to the divestment
of the Cordless & VoIP Terminal operations.
In 2008 and 2007, remaining income consists of various smaller items for all periods reported.
9 Restructuring charges
In 2008, a charge of USD 594 million was recorded for restructuring (2007: USD 218 million, 2006:
USD 26 million), of which USD 443 million related to employee termination costs in connection
with the Redesign Program. The remainder relates to write down of inventory of USD 36 million,
various closure costs of USD 41 million (mainly Boeblingen of USD 27 million) and various other
restructuring charges of USD 74 million. There were no inventory write-downs in the previous
years.
Group financial statements
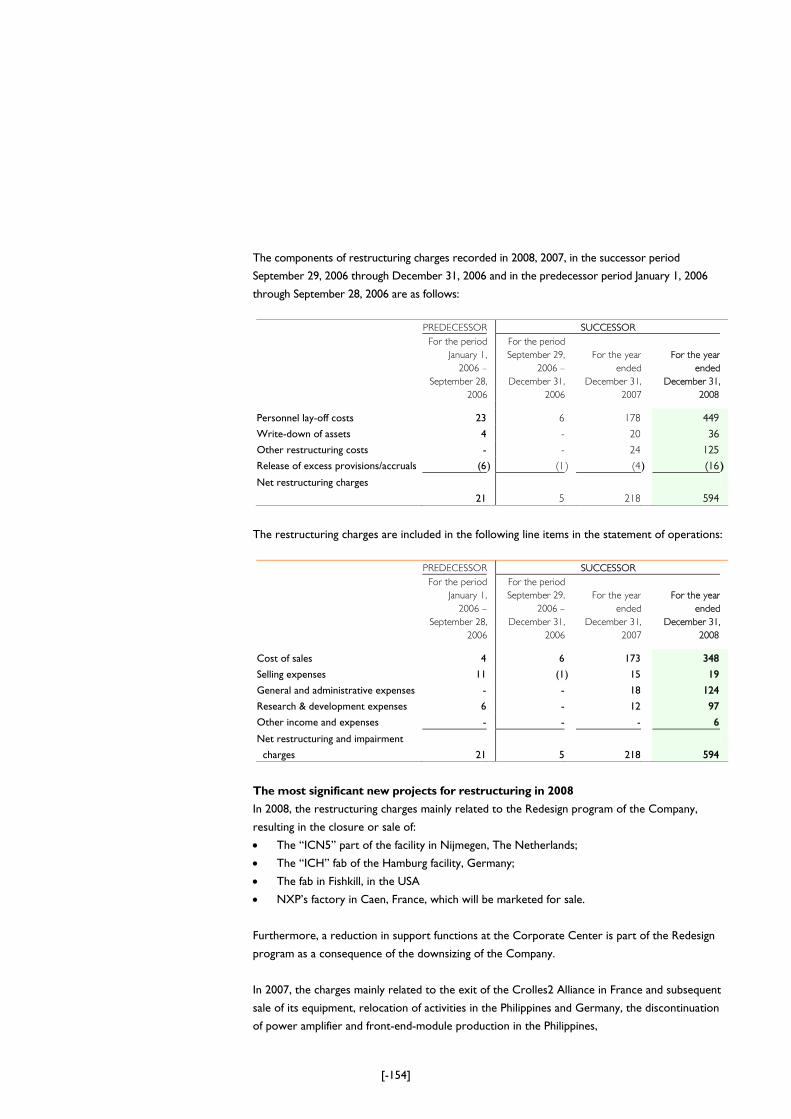
[-154]
The components of restructuring charges recorded in 2008, 2007, in the successor period
September 29, 2006 through December 31, 2006 and in the predecessor period January 1, 2006
through September 28, 2006 are as follows:
PREDECESSOR SUCCESSOR
For the period
January 1,
2006 –
September 28,
For the period
September 29,
2006 –
December 31,
For the year
ended
December 31,
For the year
ended
December 31,
2006 2006 2007 2008 Personnel lay-off costs 23 6 178 449
Write-down of assets 4 - 20 36
Other restructuring costs - - 24 125
Release of excess provisions/accruals (6) (1 ) (4 ) (16 )
Net restructuring charges
21
5
218
594
The restructuring charges are included in the following line items in the statement of operations:
PREDECESSOR SUCCESSOR
For the period
January 1,
2006 –
September 28,
For the period
September 29,
2006 –
December 31,
For the year
ended
December 31,
For the year
ended
December 31,
2006 2006 2007 2008 Cost of sales 4 6 173 348
Selling expenses 11 (1 ) 15 19
General and administrative expenses - - 18 124
Research & development expenses 6 - 12 97
Other income and expenses - - - 6
Net restructuring and impairment
charges 21
5
218
594
The most significant new projects for restructuring in 2008
In 2008, the restructuring charges mainly related to the Redesign program of the Company,
resulting in the closure or sale of:
• The „ICN5‰ part of the facility in Nijmegen, The Netherlands;
• The „ICH‰ fab of the Hamburg facility, Germany;
• The fab in Fishkill, in the USA
• NXPÊs factory in Caen, France, which will be marketed for sale.
Furthermore, a reduction in support functions at the Corporate Center is part of the Redesign
program as a consequence of the downsizing of the Company.
In 2007, the charges mainly related to the exit of the Crolles2 Alliance in France and subsequent
sale of its equipment, relocation of activities in the Philippines and Germany, the discontinuation
of power amplifier and front-end-module production in the Philippines,
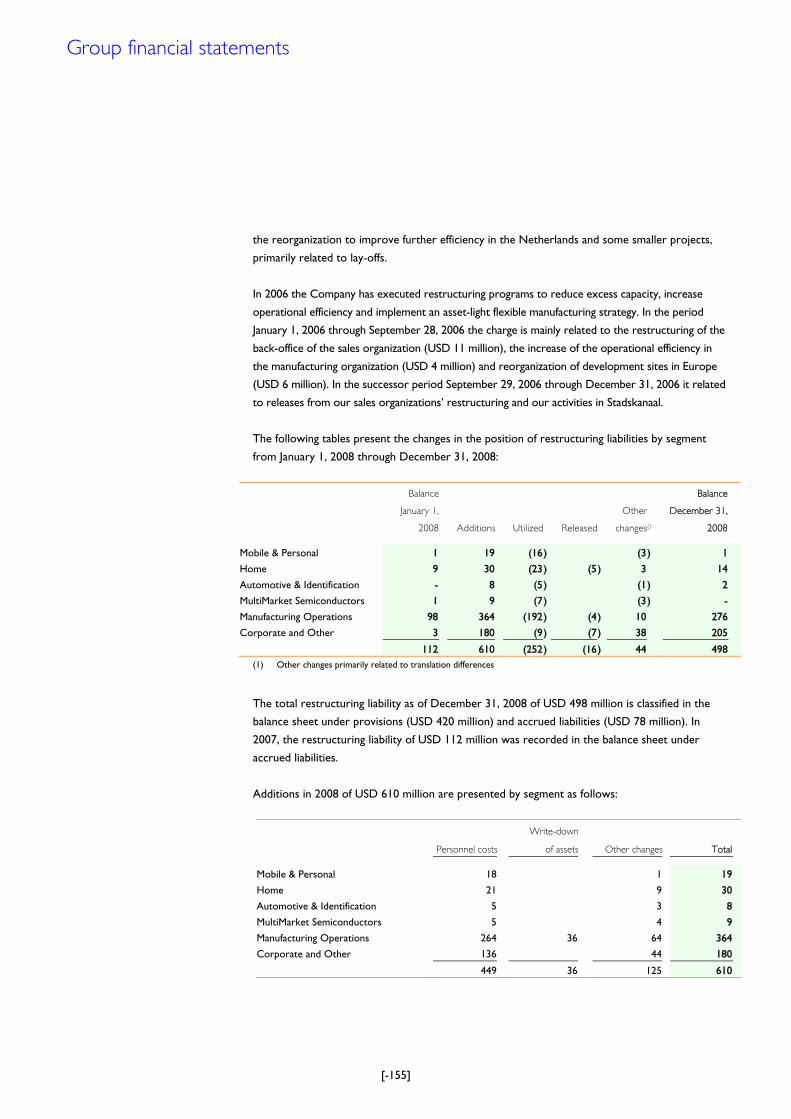
[-155]
the reorganization to improve further efficiency in the Netherlands and some smaller projects,
primarily related to lay-offs.
In 2006 the Company has executed restructuring programs to reduce excess capacity, increase
operational efficiency and implement an asset-light flexible manufacturing strategy. In the period
January 1, 2006 through September 28, 2006 the charge is mainly related to the restructuring of the
back-office of the sales organization (USD 11 million), the increase of the operational efficiency in
the manufacturing organization (USD 4 million) and reorganization of development sites in Europe
(USD 6 million). In the successor period September 29, 2006 through December 31, 2006 it related
to releases from our sales organizationsÊ restructuring and our activities in Stadskanaal.
The following tables present the changes in the position of restructuring liabilities by segment
from January 1, 2008 through December 31, 2008:
Balance
January 1,
2008
Additions
Utilized
Released
Other
changes
()
Balance
December 31,
2008
Mobile & Personal 1 19 (16) (3 ) 1
Home 9 30 (23) (5 ) 3 14
Automotive & Identification - 8 (5) (1 ) 2
MultiMarket Semiconductors 1 9 (7) (3 ) -
Manufacturing Operations 98 364 (192) (4 ) 10 276
Corporate and Other 3 180 (9) (7 ) 38 205
112 610 (252) (16 ) 44 498 (1) Other changes primarily related to translation differences
The total restructuring liability as of December 31, 2008 of USD 498 million is classified in the
balance sheet under provisions (USD 420 million) and accrued liabilities (USD 78 million). In
2007, the restructuring liability of USD 112 million was recorded in the balance sheet under
accrued liabilities.
Additions in 2008 of USD 610 million are presented by segment as follows:
Personnel costs
Write-down
of assets
Other changes
Total
Mobile & Personal 18 1 19
Home 21 9 30
Automotive & Identification 5 3 8
MultiMarket Semiconductors 5 4 9
Manufacturing Operations 264 36 64 364
Corporate and Other 136 44 180
449 36 125 610
Group financial statements
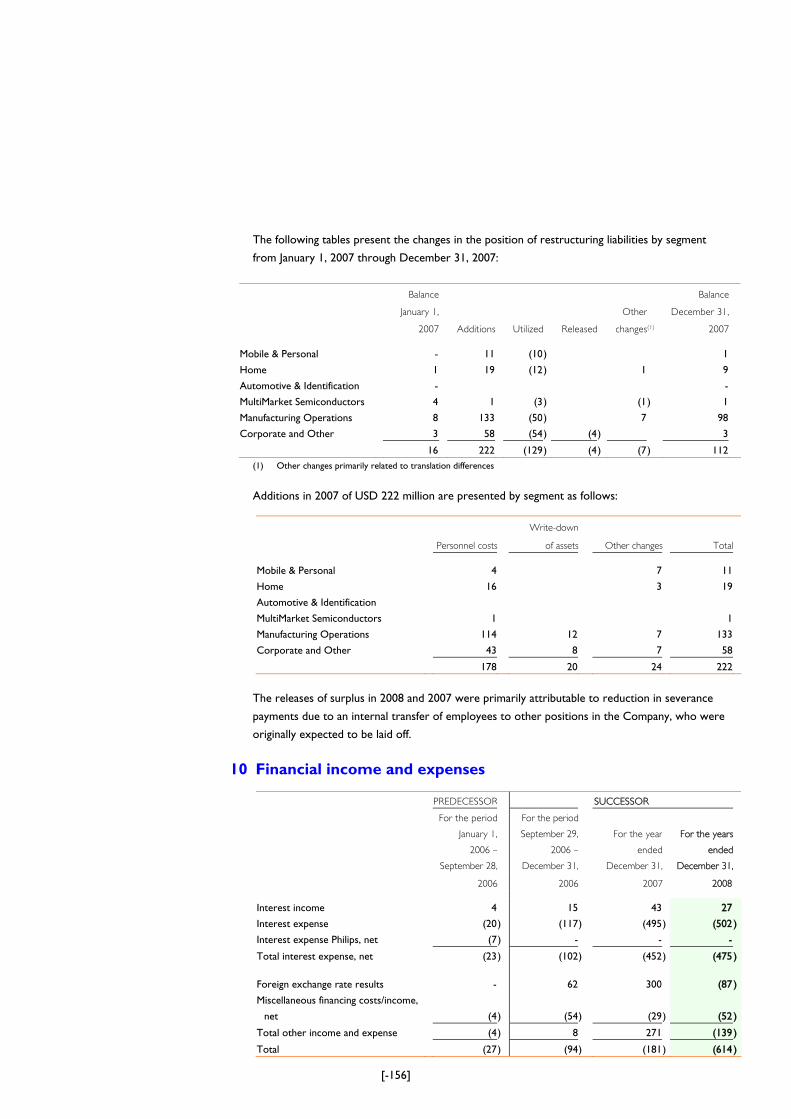
[-156]
The following tables present the changes in the position of restructuring liabilities by segment
from January 1, 2007 through December 31, 2007:
Balance
January 1,
2007
Additions
Utilized
Released
Other
changes
(1)
Balance
December 31,
2007
Mobile & Personal - 11 (10) 1 Home 1 19 (12) 1 9 Automotive & Identification - - MultiMarket Semiconductors 4 1 (3) (1 ) 1 Manufacturing Operations 8 133 (50) 7 98 Corporate and Other 3 58 (54) (4 ) 3 16 222 (129) (4 ) (7 ) 112
(1) Other changes primarily related to translation differences
Additions in 2007 of USD 222 million are presented by segment as follows:
Personnel costs
Write-down
of assets
Other changes
Total
Mobile & Personal 4 7 11
Home 16 3 19
Automotive & Identification
MultiMarket Semiconductors 1 1
Manufacturing Operations 114 12 7 133
Corporate and Other 43 8 7 58
178 20 24 222 The releases of surplus in 2008 and 2007 were primarily attributable to reduction in severance
payments due to an internal transfer of employees to other positions in the Company, who were
originally expected to be laid off.
10 Financial income and expenses
PREDECESSOR SUCCESSOR
For the period
January 1,
2006 –
September 28,
For the period
September 29,
2006 –
December 31,
For the year
ended
December 31,
For the years
ended
December 31,
2006 2006 2007 2008 Interest income 4 15 43 27
Interest expense (20) (117 ) (495) (502 )
Interest expense Philips, net (7) - - -
Total interest expense, net (23) (102 ) (452) (475 ) Foreign exchange rate results - 62 300 (87 )
Miscellaneous financing costs/income,
net
(4
)
(54
) (29
) (52
)
Total other income and expense (4) 8 271 (139 )
Total (27) (94 ) (181) (614 )
[-157]
Successor
In 2008, interest expense, net, of USD 475 million (2007: USD 452 million) was mainly related to
the interest expense on the EUR and USD notes.
Interest expense for the period September 29, 2006 through December 31, 2006, net of USD
102 million, was mainly related to the interest expense that was recorded in connection with the
bridge financing facility (USD 18 million) and the issuance of notes (USD 95 million).
In 2008, foreign exchange results amounted to a loss of USD 87 million (2007: a gain of USD 300
million) and are composed of exchange rate fluctuations:
• related to the USD notes, a loss of USD 230 million (2007: a gain of USD 419 million);
• related to intercompany financing a loss of USD 46 million (2007: a loss of USD 29 million).
• related to the CompanyÊs foreign currency cash and cash equivalents of a gain of USD 163
million (2007: a loss of USD 64 million);
• related to foreign currency contracts a gain of USD 25 million (2007: a loss of USD 20
million);
• related to remaining items a gain of USD 1 million (2007: a loss of USD 6 million)
Foreign exchange results for the period September 29, 2006 through December 31, 2006, a
profit of USD 62 million mainly include losses related to a bridge financing (USD 36 million) and
foreign exchange gains related to the USD denominated notes (USD 143 million). Furthermore,
an exchange loss of USD 31 million was related to cash and cash equivalents.
In 2008, miscellaneous financing costs included an impairment charge of USD 25 million (2007:
USD 21 million) related to the DSPG shares, that were received in connection with the
divestment of the Cordless & VoIP Terminals operations in 2007. Furthermore, an impairment
loss of USD 13 million was recorded in 2008 on the fair value of a put option that was received
in connection with a partly divestment of software activities.
Also included in 2008 is the amortization of capitalized fees (relating to the issuance of the
EUR/USD notes in 2006) amounting to USD 14 million (2007: USD 8 million).
Miscellaneous financing costs for the period September 29, 2006 through December 31, 2006
include fees related to the bridge financing (USD 50 million).
Predecessor
Net interest expense, for the period January 1, 2006 through September 28, 2006 decreased to
USD 23 million, mainly due to lower financing by Philips.
11 Income taxes
Accounting for Income Taxes In accounting for income taxes the liability method has been used. Deferred tax assets and liabilities
are recorded for temporary differences between the tax basis of assets and liabilities and their
reported amounts in the consolidated financial statements, using the statutory tax rates in effect for
the year in which the differences are expected to reverse. The effect on deferred tax assets and
Group financial statements
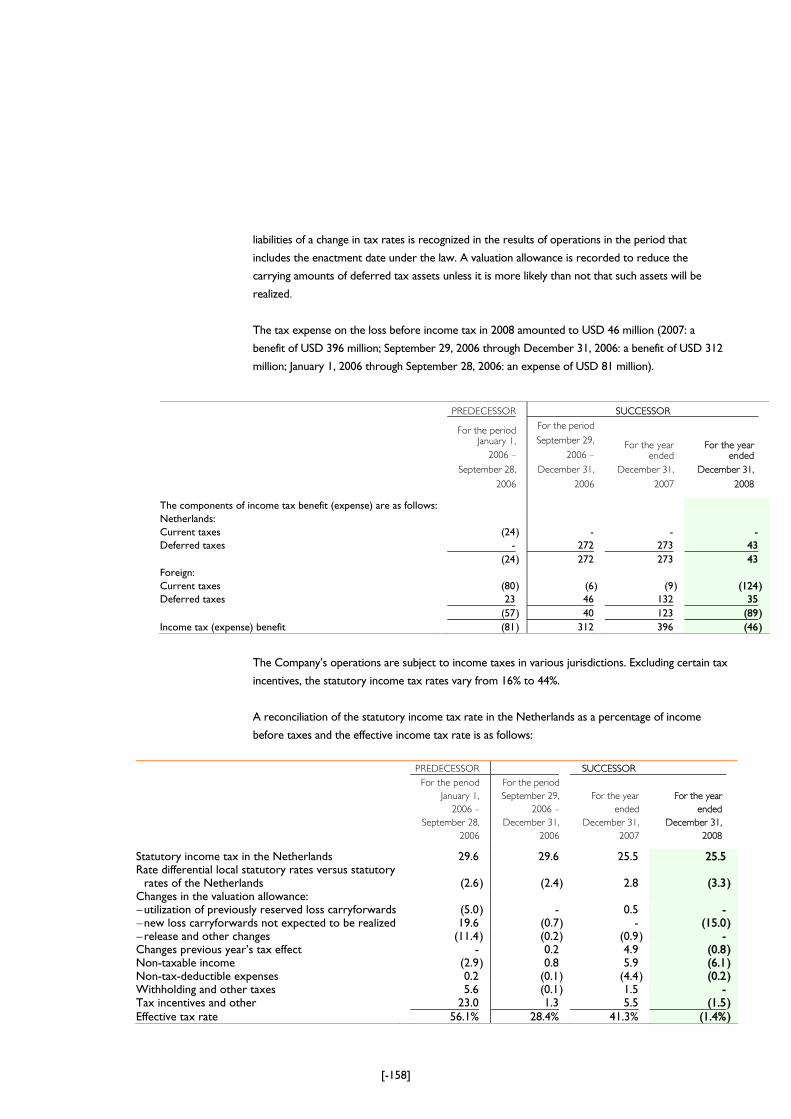
[-158]
liabilities of a change in tax rates is recognized in the results of operations in the period that
includes the enactment date under the law. A valuation allowance is recorded to reduce the
carrying amounts of deferred tax assets unless it is more likely than not that such assets will be
realized.
The tax expense on the loss before income tax in 2008 amounted to USD 46 million (2007: a
benefit of USD 396 million; September 29, 2006 through December 31, 2006: a benefit of USD 312
million; January 1, 2006 through September 28, 2006: an expense of USD 81 million).
PREDECESSOR SUCCESSOR
For the periodJanuary 1,
2006 –
September 28,
For the period
September 29,
2006 –
December 31,
For the year ended
December 31,
For the year ended
December 31,
2006 2006 2007 2008 The components of income tax benefit (expense) are as follows: Netherlands: Current taxes (24) - - - Deferred taxes - 272 273 43 (24) 272 273 43 Foreign: Current taxes (80) (6 ) (9) (124) Deferred taxes 23 46 132 35 (57) 40 123 (89) Income tax (expense) benefit (81) 312 396 (46)
The CompanyÊs operations are subject to income taxes in various jurisdictions. Excluding certain tax
incentives, the statutory income tax rates vary from 16% to 44%.
A reconciliation of the statutory income tax rate in the Netherlands as a percentage of income
before taxes and the effective income tax rate is as follows:
PREDECESSOR SUCCESSOR
For the period
January 1,
2006 –
September 28,
For the period
September 29,
2006 –
December 31,
For the year
ended
December 31,
For the year
ended
December 31,
2006 2006 2007 2008 Statutory income tax in the Netherlands 29.6 29.6 25.5 25.5 Rate differential local statutory rates versus statutory rates of the Netherlands
(2.6
) (2.4
)
2.8
(3.3
)
Changes in the valuation allowance: – utilization of previously reserved loss carryforwards (5.0) - 0.5 - – new loss carryforwards not expected to be realized 19.6 (0.7) - (15.0) – release and other changes (11.4) (0.2) (0.9 ) - Changes previous yearÊs tax effect - 0.2 4.9 (0.8) Non-taxable income (2.9) 0.8 5.9 (6.1) Non-tax-deductible expenses 0.2 (0.1) (4.4 ) (0.2) Withholding and other taxes 5.6 (0.1) 1.5 - Tax incentives and other 23.0 1.3 5.5 (1.5) Effective tax rate 56.1% 28.4% 41.3% (1.4%)
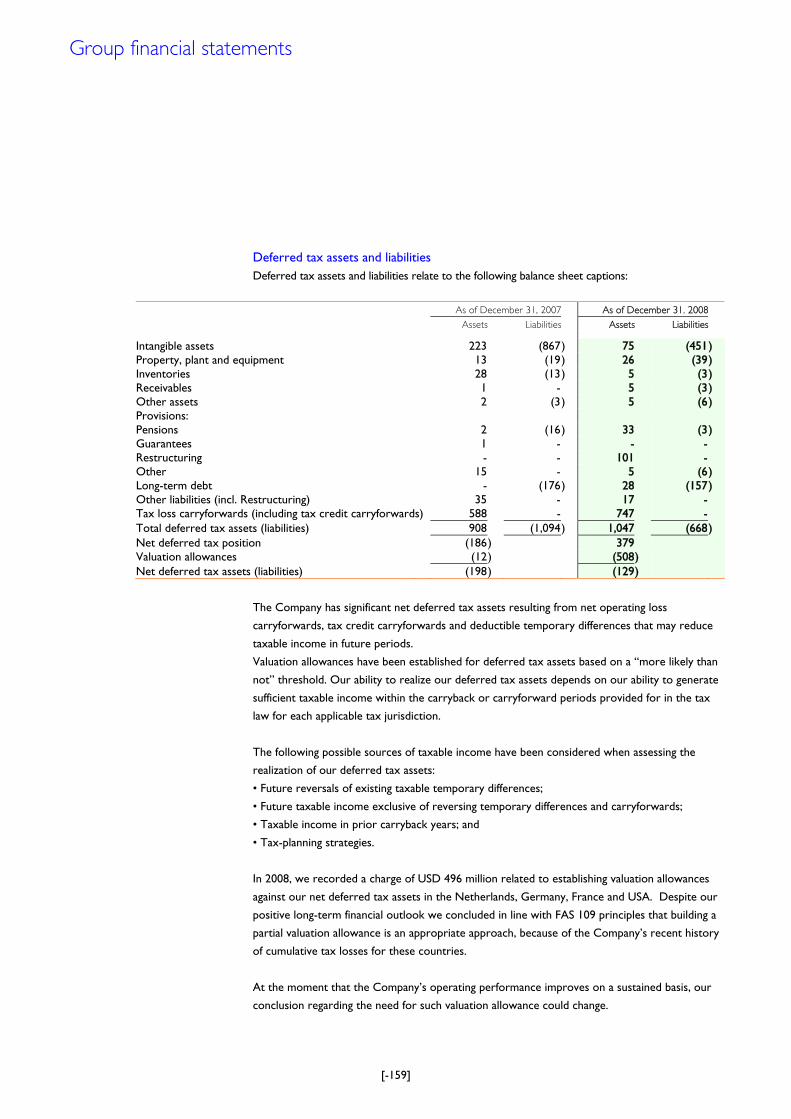
[-159]
Deferred tax assets and liabilities Deferred tax assets and liabilities relate to the following balance sheet captions:
As of December 31, 2007 As of December 31, 2008
Assets Liabilities Assets Liabilities Intangible assets 223 (867 ) 75 (451) Property, plant and equipment 13 (19 ) 26 (39) Inventories 28 (13 ) 5 (3) Receivables 1 - 5 (3) Other assets 2 (3 ) 5 (6) Provisions: Pensions 2 (16 ) 33 (3) Guarantees 1 - - - Restructuring - - 101 - Other 15 - 5 (6) Long-term debt - (176 ) 28 (157) Other liabilities (incl. Restructuring) 35 - 17 - Tax loss carryforwards (including tax credit carryforwards) 588 - 747 - Total deferred tax assets (liabilities) 908 (1,094 ) 1,047 (668) Net deferred tax position (186) 379 Valuation allowances (12) (508 ) Net deferred tax assets (liabilities) (198) (129 )
The Company has significant net deferred tax assets resulting from net operating loss
carryforwards, tax credit carryforwards and deductible temporary differences that may reduce
taxable income in future periods.
Valuation allowances have been established for deferred tax assets based on a „more likely than
not‰ threshold. Our ability to realize our deferred tax assets depends on our ability to generate
sufficient taxable income within the carryback or carryforward periods provided for in the tax
law for each applicable tax jurisdiction.
The following possible sources of taxable income have been considered when assessing the
realization of our deferred tax assets:
• Future reversals of existing taxable temporary differences;
• Future taxable income exclusive of reversing temporary differences and carryforwards;
• Taxable income in prior carryback years; and
• Tax-planning strategies.
In 2008, we recorded a charge of USD 496 million related to establishing valuation allowances
against our net deferred tax assets in the Netherlands, Germany, France and USA. Despite our
positive long-term financial outlook we concluded in line with FAS 109 principles that building a
partial valuation allowance is an appropriate approach, because of the CompanyÊs recent history
of cumulative tax losses for these countries.
At the moment that the CompanyÊs operating performance improves on a sustained basis, our
conclusion regarding the need for such valuation allowance could change.
Group financial statements
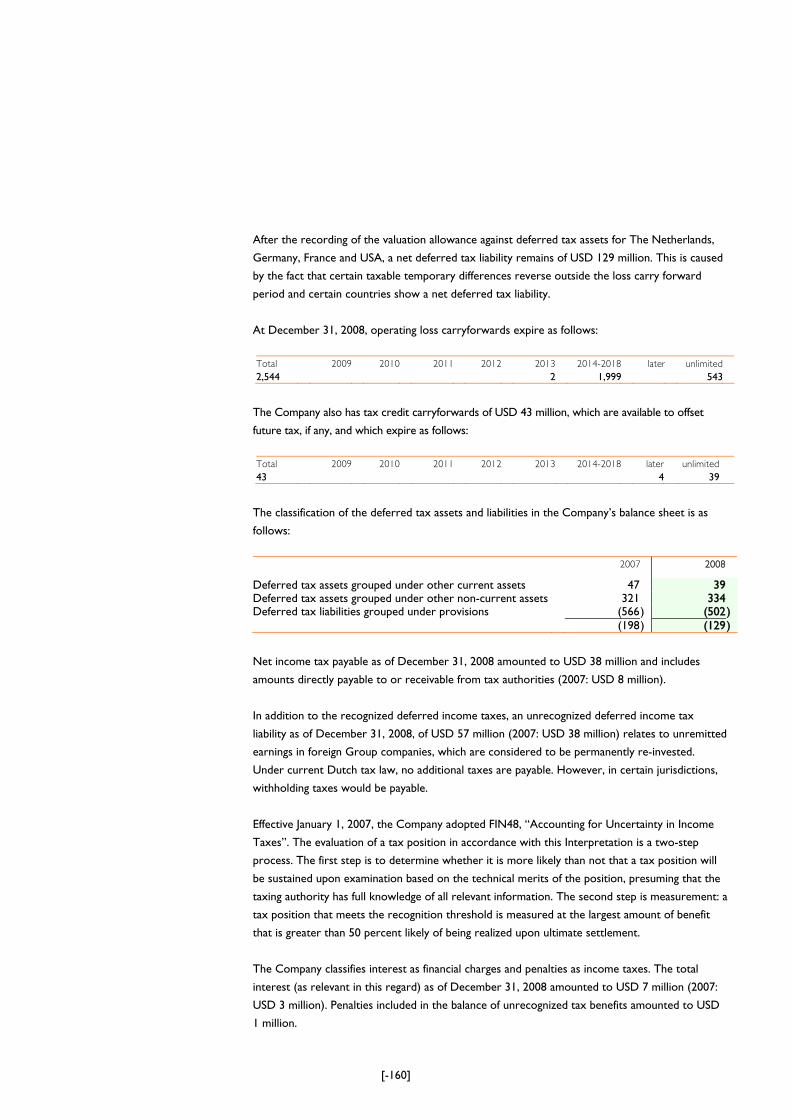
[-160]
After the recording of the valuation allowance against deferred tax assets for The Netherlands,
Germany, France and USA, a net deferred tax liability remains of USD 129 million. This is caused
by the fact that certain taxable temporary differences reverse outside the loss carry forward
period and certain countries show a net deferred tax liability.
At December 31, 2008, operating loss carryforwards expire as follows:
Total 2009 2010 2011 2012 2013 2014-2018 later unlimited
2,544 2 1,999 543
The Company also has tax credit carryforwards of USD 43 million, which are available to offset
future tax, if any, and which expire as follows:
Total 2009 2010 2011 2012 2013 2014-2018 later unlimited
43 4 39
The classification of the deferred tax assets and liabilities in the CompanyÊs balance sheet is as
follows:
2007 2008
Deferred tax assets grouped under other current assets 47 39 Deferred tax assets grouped under other non-current assets 321 334 Deferred tax liabilities grouped under provisions (566 ) (502) (198 ) (129)
Net income tax payable as of December 31, 2008 amounted to USD 38 million and includes
amounts directly payable to or receivable from tax authorities (2007: USD 8 million).
In addition to the recognized deferred income taxes, an unrecognized deferred income tax
liability as of December 31, 2008, of USD 57 million (2007: USD 38 million) relates to unremitted
earnings in foreign Group companies, which are considered to be permanently re-invested.
Under current Dutch tax law, no additional taxes are payable. However, in certain jurisdictions,
withholding taxes would be payable.
Effective January 1, 2007, the Company adopted FIN48, „Accounting for Uncertainty in Income
Taxes‰. The evaluation of a tax position in accordance with this Interpretation is a two-step
process. The first step is to determine whether it is more likely than not that a tax position will
be sustained upon examination based on the technical merits of the position, presuming that the
taxing authority has full knowledge of all relevant information. The second step is measurement: a
tax position that meets the recognition threshold is measured at the largest amount of benefit
that is greater than 50 percent likely of being realized upon ultimate settlement.
The Company classifies interest as financial charges and penalties as income taxes. The total
interest (as relevant in this regard) as of December 31, 2008 amounted to USD 7 million (2007:
USD 3 million). Penalties included in the balance of unrecognized tax benefits amounted to USD
1 million.
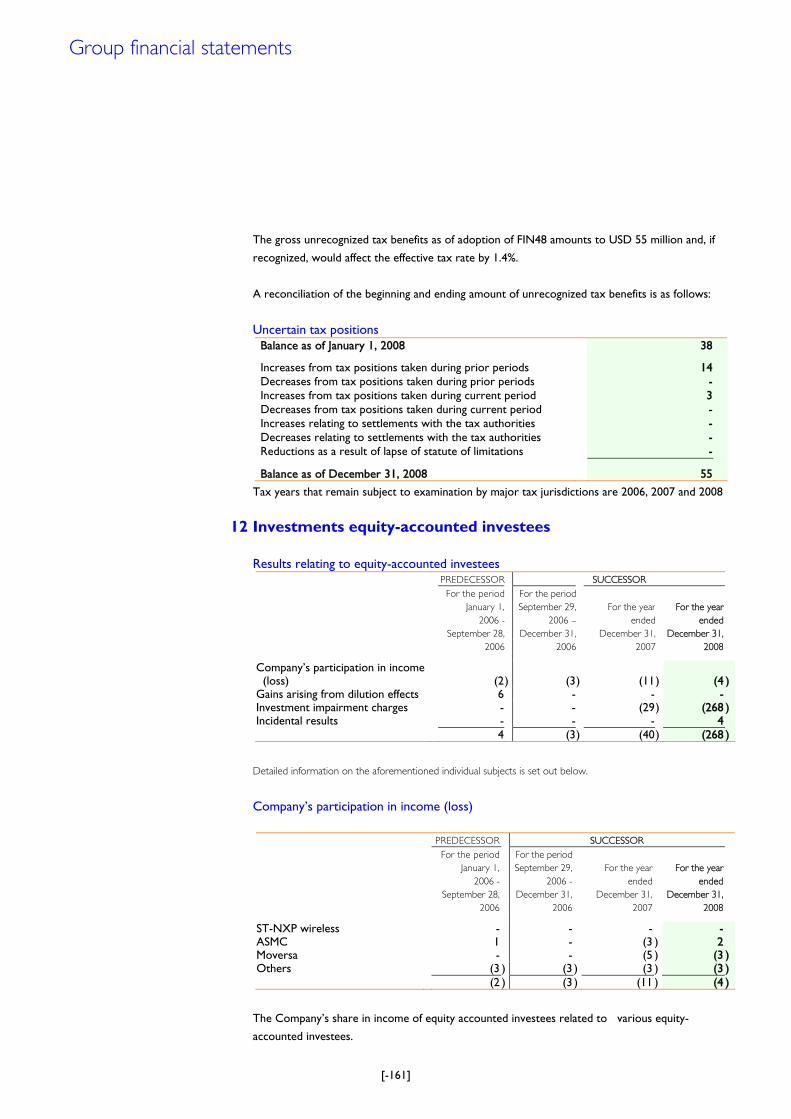
[-161]
The gross unrecognized tax benefits as of adoption of FIN48 amounts to USD 55 million and, if
recognized, would affect the effective tax rate by 1.4%.
A reconciliation of the beginning and ending amount of unrecognized tax benefits is as follows:
Uncertain tax positions Balance as of January 1, 2008 38 Increases from tax positions taken during prior periods 14 Decreases from tax positions taken during prior periods - Increases from tax positions taken during current period 3 Decreases from tax positions taken during current period - Increases relating to settlements with the tax authorities - Decreases relating to settlements with the tax authorities - Reductions as a result of lapse of statute of limitations - Balance as of December 31, 2008 55
Tax years that remain subject to examination by major tax jurisdictions are 2006, 2007 and 2008
12 Investments equity-accounted investees
Results relating to equity-accounted investees PREDECESSOR SUCCESSOR
For the period
January 1,
2006 -
September 28,
For the period
September 29,
2006 –
December 31,
For the year
ended
December 31,
For the year
ended
December 31,
2006 2006 2007 2008 CompanyÊs participation in income
(loss)
(2 )
(3
) (11
) (4
)
Gains arising from dilution effects 6 - - - Investment impairment charges - - (29) (268 ) Incidental results - - - 4 4 (3 ) (40) (268 )
Detailed information on the aforementioned individual subjects is set out below.
CompanyÊs participation in income (loss)
PREDECESSOR SUCCESSOR
For the period
January 1,
2006 -
September 28,
For the period
September 29,
2006 -
December 31,
For the year
ended
December 31,
For the year
ended
December 31,
2006 2006 2007 2008 ST-NXP wireless - - - - ASMC 1 - (3 ) 2 Moversa - - (5 ) (3 ) Others (3 ) (3 ) (3 ) (3 ) (2 ) (3 ) (11 ) (4 )
The CompanyÊs share in income of equity accounted investees related to various equity-
accounted investees.
Group financial statements
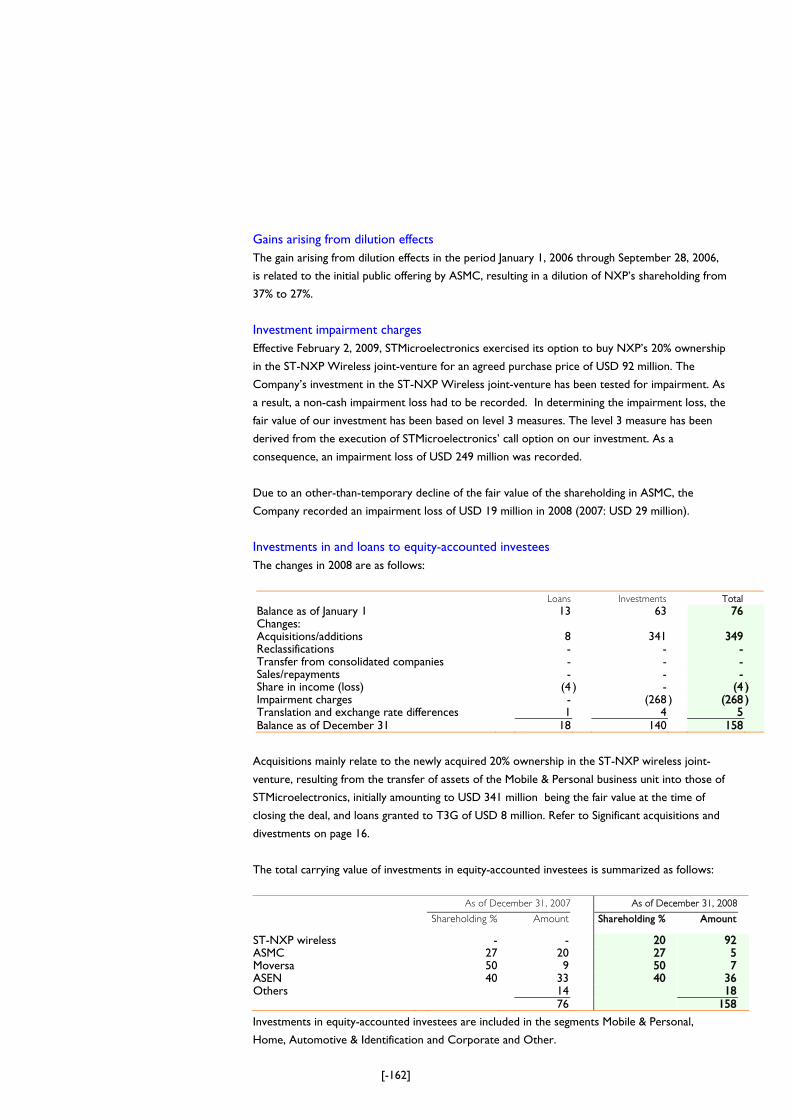
[-162]
Gains arising from dilution effects The gain arising from dilution effects in the period January 1, 2006 through September 28, 2006,
is related to the initial public offering by ASMC, resulting in a dilution of NXPÊs shareholding from
37% to 27%.
Investment impairment charges Effective February 2, 2009, STMicroelectronics exercised its option to buy NXPÊs 20% ownership
in the ST-NXP Wireless joint-venture for an agreed purchase price of USD 92 million. The
CompanyÊs investment in the ST-NXP Wireless joint-venture has been tested for impairment. As
a result, a non-cash impairment loss had to be recorded. In determining the impairment loss, the
fair value of our investment has been based on level 3 measures. The level 3 measure has been
derived from the execution of STMicroelectronicsÊ call option on our investment. As a
consequence, an impairment loss of USD 249 million was recorded.
Due to an other-than-temporary decline of the fair value of the shareholding in ASMC, the
Company recorded an impairment loss of USD 19 million in 2008 (2007: USD 29 million).
Investments in and loans to equity-accounted investees The changes in 2008 are as follows:
Loans Investments Total
Balance as of January 1 13 63 76 Changes: Acquisitions/additions 8 341 349 Reclassifications - - - Transfer from consolidated companies - - - Sales/repayments - - - Share in income (loss) (4 ) - (4 ) Impairment charges - (268 ) (268 ) Translation and exchange rate differences 1 4 5 Balance as of December 31 18 140 158
Acquisitions mainly relate to the newly acquired 20% ownership in the ST-NXP wireless joint-
venture, resulting from the transfer of assets of the Mobile & Personal business unit into those of
STMicroelectronics, initially amounting to USD 341 million being the fair value at the time of
closing the deal, and loans granted to T3G of USD 8 million. Refer to Significant acquisitions and
divestments on page 16.
The total carrying value of investments in equity-accounted investees is summarized as follows:
As of December 31, 2007 As of December 31, 2008
Shareholding % Amount Shareholding % Amount ST-NXP wireless - - 20 92 ASMC 27 20 27 5 Moversa 50 9 50 7 ASEN 40 33 40 36 Others 14 18 76 158
Investments in equity-accounted investees are included in the segments Mobile & Personal,
Home, Automotive & Identification and Corporate and Other.
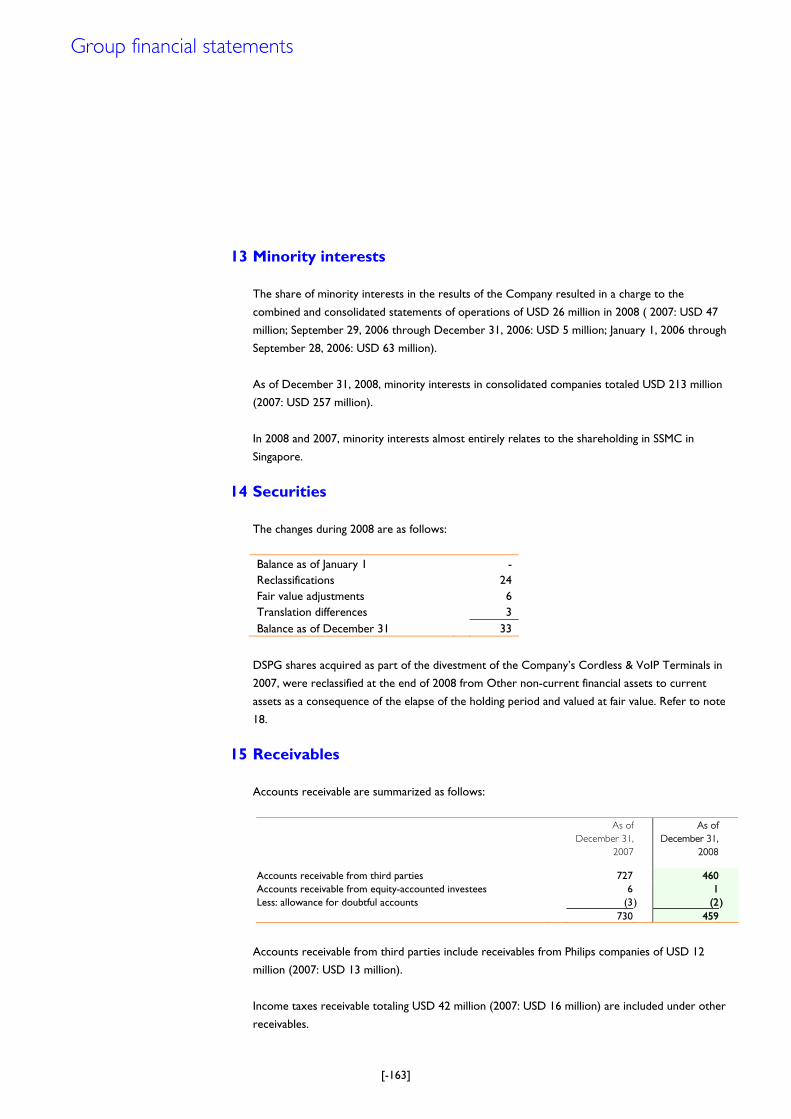
[-163]
13 Minority interests
The share of minority interests in the results of the Company resulted in a charge to the
combined and consolidated statements of operations of USD 26 million in 2008 ( 2007: USD 47
million; September 29, 2006 through December 31, 2006: USD 5 million; January 1, 2006 through
September 28, 2006: USD 63 million).
As of December 31, 2008, minority interests in consolidated companies totaled USD 213 million
(2007: USD 257 million).
In 2008 and 2007, minority interests almost entirely relates to the shareholding in SSMC in
Singapore.
14 Securities
The changes during 2008 are as follows:
Balance as of January 1 - Reclassifications 24 Fair value adjustments 6 Translation differences 3 Balance as of December 31 33
DSPG shares acquired as part of the divestment of the CompanyÊs Cordless & VoIP Terminals in
2007, were reclassified at the end of 2008 from Other non-current financial assets to current
assets as a consequence of the elapse of the holding period and valued at fair value. Refer to note
18.
15 Receivables
Accounts receivable are summarized as follows:
As of
December 31,
2007
As of
December 31,
2008
Accounts receivable from third parties 727 460 Accounts receivable from equity-accounted investees 6 1 Less: allowance for doubtful accounts (3 ) (2) 730 459
Accounts receivable from third parties include receivables from Philips companies of USD 12
million (2007: USD 13 million).
Income taxes receivable totaling USD 42 million (2007: USD 16 million) are included under other
receivables.
Group financial statements
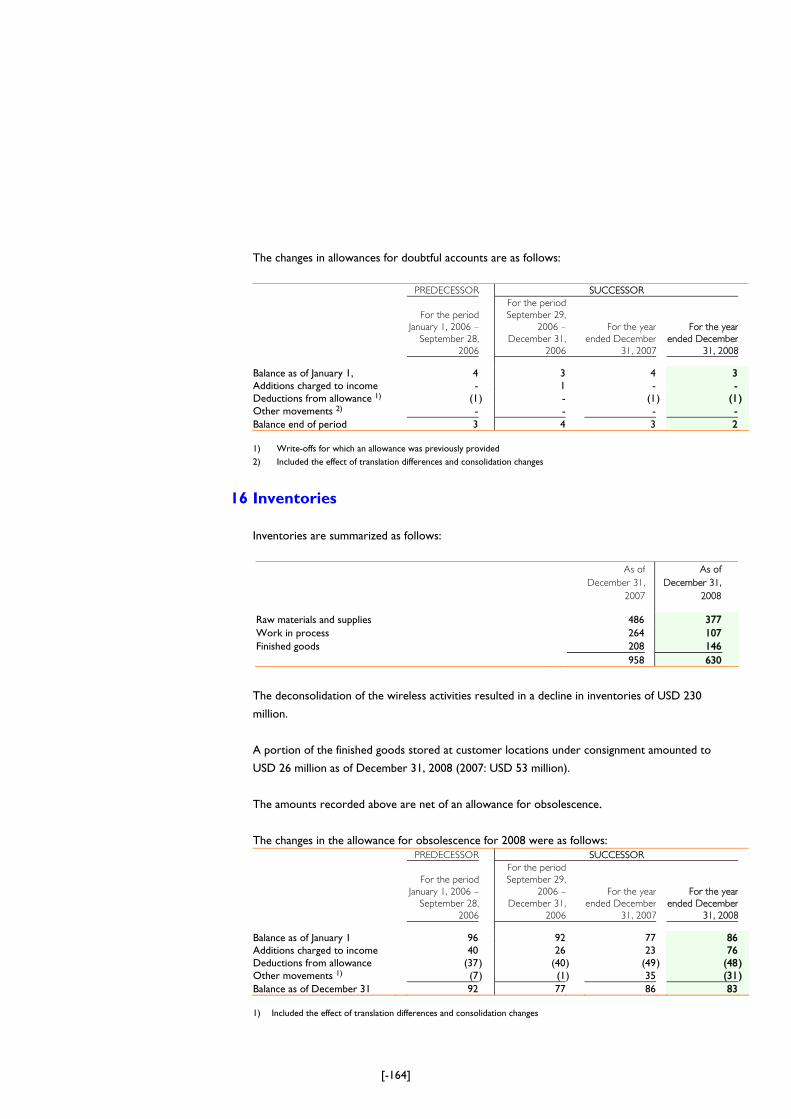
[-164]
The changes in allowances for doubtful accounts are as follows:
PREDECESSOR SUCCESSOR
For the period
January 1, 2006 –
September 28,
2006
For the period
September 29,
2006 –
December 31,
2006
For the year
ended December
31, 2007
For the year
ended December
31, 2008 Balance as of January 1, 4 3 4 3 Additions charged to income - 1 - - Deductions from allowance 1) (1) - (1) (1) Other movements 2) - - - - Balance end of period 3 4 3 2
1) Write-offs for which an allowance was previously provided 2) Included the effect of translation differences and consolidation changes
16 Inventories
Inventories are summarized as follows:
As of
December 31,
2007
As of
December 31,
2008
Raw materials and supplies 486 377 Work in process 264 107 Finished goods 208 146 958 630
The deconsolidation of the wireless activities resulted in a decline in inventories of USD 230
million.
A portion of the finished goods stored at customer locations under consignment amounted to
USD 26 million as of December 31, 2008 (2007: USD 53 million).
The amounts recorded above are net of an allowance for obsolescence.
The changes in the allowance for obsolescence for 2008 were as follows: PREDECESSOR SUCCESSOR
For the period
January 1, 2006 –
September 28,
2006
For the period
September 29,
2006 –
December 31,
2006
For the year
ended December
31, 2007
For the year
ended December
31, 2008 Balance as of January 1 96 92 77 86 Additions charged to income 40 26 23 76 Deductions from allowance (37) (40 ) (49) (48) Other movements 1) (7) (1 ) 35 (31) Balance as of December 31 92 77 86 83
1) Included the effect of translation differences and consolidation changes
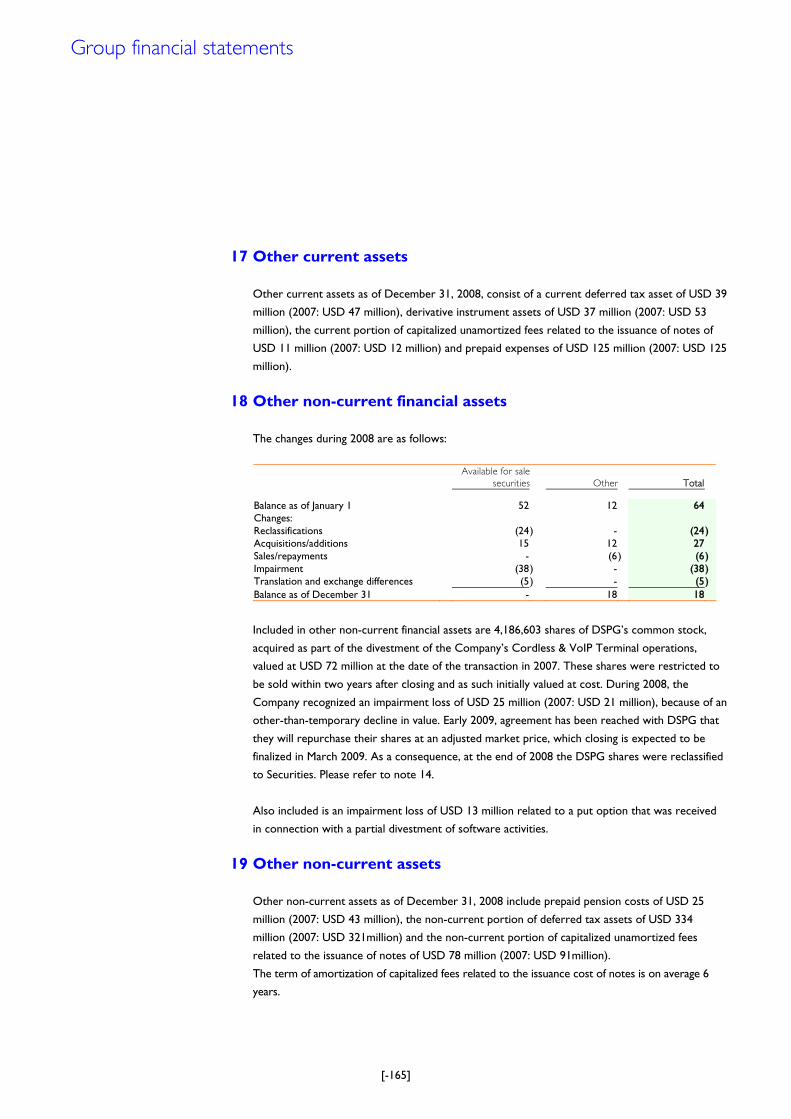
[-165]
17 Other current assets
Other current assets as of December 31, 2008, consist of a current deferred tax asset of USD 39
million (2007: USD 47 million), derivative instrument assets of USD 37 million (2007: USD 53
million), the current portion of capitalized unamortized fees related to the issuance of notes of
USD 11 million (2007: USD 12 million) and prepaid expenses of USD 125 million (2007: USD 125
million).
18 Other non-current financial assets
The changes during 2008 are as follows:
Available for sale
securities Other Total Balance as of January 1 52 12 64 Changes: Reclassifications (24) - (24) Acquisitions/additions 15 12 27 Sales/repayments - (6 ) (6) Impairment (38) - (38) Translation and exchange differences (5) - (5) Balance as of December 31 - 18 18
Included in other non-current financial assets are 4,186,603 shares of DSPGÊs common stock,
acquired as part of the divestment of the CompanyÊs Cordless & VoIP Terminal operations,
valued at USD 72 million at the date of the transaction in 2007. These shares were restricted to
be sold within two years after closing and as such initially valued at cost. During 2008, the
Company recognized an impairment loss of USD 25 million (2007: USD 21 million), because of an
other-than-temporary decline in value. Early 2009, agreement has been reached with DSPG that
they will repurchase their shares at an adjusted market price, which closing is expected to be
finalized in March 2009. As a consequence, at the end of 2008 the DSPG shares were reclassified
to Securities. Please refer to note 14.
Also included is an impairment loss of USD 13 million related to a put option that was received
in connection with a partial divestment of software activities.
19 Other non-current assets
Other non-current assets as of December 31, 2008 include prepaid pension costs of USD 25
million (2007: USD 43 million), the non-current portion of deferred tax assets of USD 334
million (2007: USD 321million) and the non-current portion of capitalized unamortized fees
related to the issuance of notes of USD 78 million (2007: USD 91million).
The term of amortization of capitalized fees related to the issuance cost of notes is on average 6
years.
Group financial statements
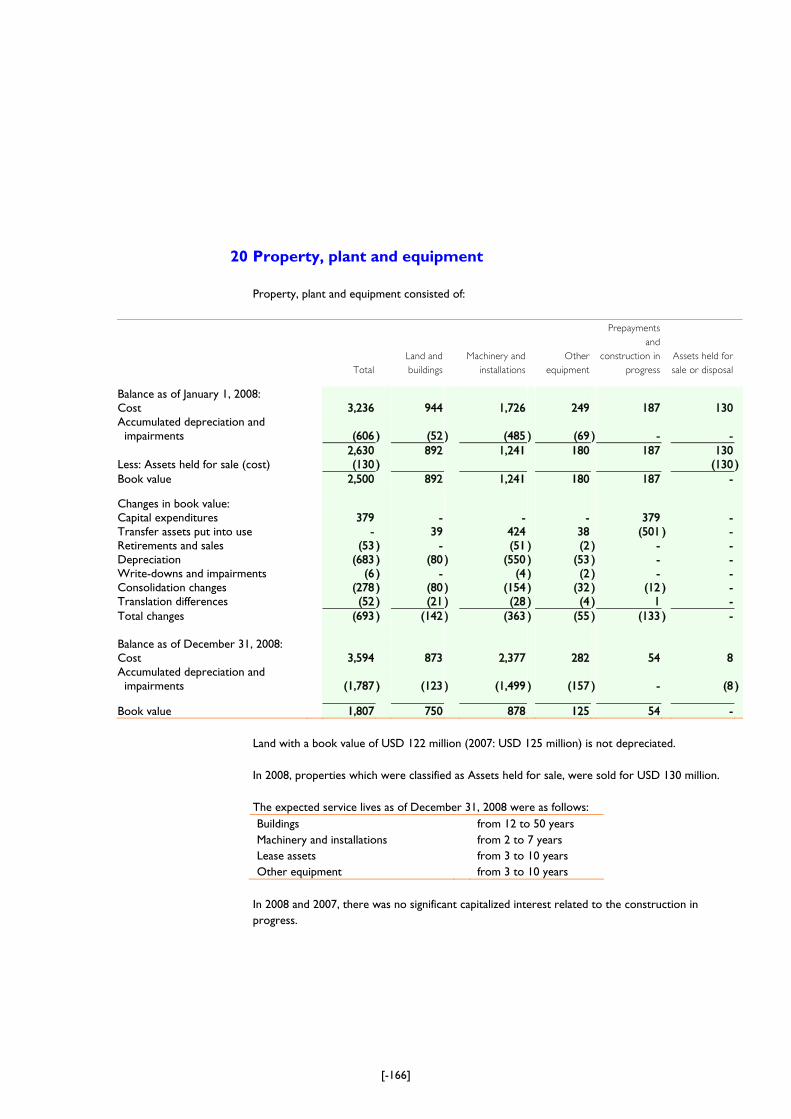
[-166]
20 Property, plant and equipment
Property, plant and equipment consisted of:
Total
Land and
buildings
Machinery and
installations
Other
equipment
Prepayments
and
construction in
progress
Assets held for
sale or disposal Balance as of January 1, 2008: Cost 3,236 944 1,726 249 187 130 Accumulated depreciation and impairments
(606
) (52
) (485
)
(69
) -
-
2,630 892 1,241 180 187 130 Less: Assets held for sale (cost) (130 ) (130 )Book value 2,500 892 1,241 180 187 - Changes in book value: Capital expenditures 379 - - - 379 - Transfer assets put into use - 39 424 38 (501 ) - Retirements and sales (53 ) - (51 ) (2 ) - - Depreciation (683 ) (80 ) (550 ) (53 ) - - Write-downs and impairments (6 ) - (4 ) (2 ) - - Consolidation changes (278 ) (80 ) (154 ) (32 ) (12 ) - Translation differences (52 ) (21 ) (28 ) (4 ) 1 - Total changes (693 ) (142 ) (363 ) (55 ) (133 ) - Balance as of December 31, 2008: Cost 3,594 873 2,377 282 54 8 Accumulated depreciation and impairments
(1,787
) (123
) (1,499
)
(157
) -
(8
)
Book value 1,807 750 878 125 54 -
Land with a book value of USD 122 million (2007: USD 125 million) is not depreciated. In 2008, properties which were classified as Assets held for sale, were sold for USD 130 million. The expected service lives as of December 31, 2008 were as follows: Buildings from 12 to 50 years Machinery and installations from 2 to 7 years Lease assets from 3 to 10 years Other equipment from 3 to 10 years
In 2008 and 2007, there was no significant capitalized interest related to the construction in progress.
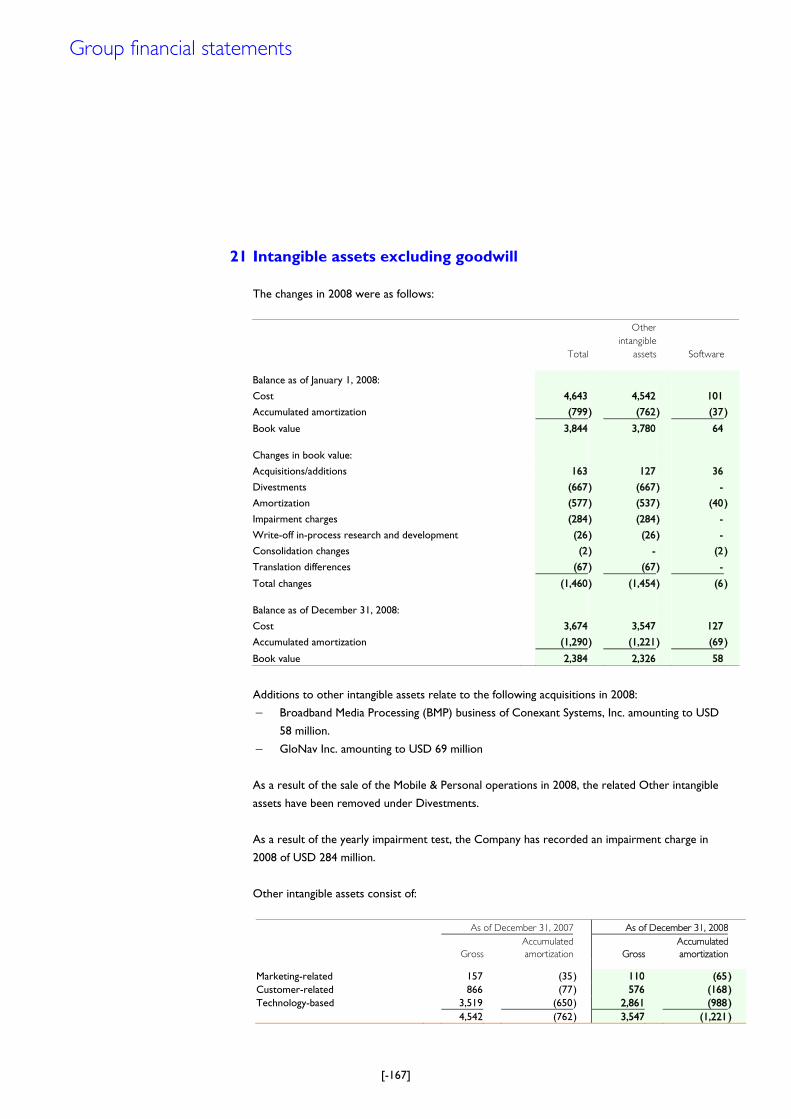
[-167]
21 Intangible assets excluding goodwill
The changes in 2008 were as follows:
Total
Other
intangible
assets Software
Balance as of January 1, 2008:
Cost 4,643 4,542 101
Accumulated amortization (799 ) (762) (37 )
Book value 3,844 3,780 64 Changes in book value:
Acquisitions/additions 163 127 36
Divestments (667 ) (667) -
Amortization (577 ) (537) (40 )
Impairment charges (284 ) (284) -
Write-off in-process research and development (26 ) (26) -
Consolidation changes (2 ) - (2 )
Translation differences (67 ) (67) -
Total changes (1,460 ) (1,454) (6 ) Balance as of December 31, 2008:
Cost 3,674 3,547 127
Accumulated amortization (1,290 ) (1,221) (69 )
Book value 2,384 2,326 58
Additions to other intangible assets relate to the following acquisitions in 2008:
− Broadband Media Processing (BMP) business of Conexant Systems, Inc. amounting to USD
58 million.
− GloNav Inc. amounting to USD 69 million
As a result of the sale of the Mobile & Personal operations in 2008, the related Other intangible
assets have been removed under Divestments.
As a result of the yearly impairment test, the Company has recorded an impairment charge in
2008 of USD 284 million.
Other intangible assets consist of:
As of December 31, 2007 As of December 31, 2008
Gross
Accumulated
amortization
Gross
Accumulated
amortization
Marketing-related 157 (35 ) 110 (65 ) Customer-related 866 (77 ) 576 (168 ) Technology-based 3,519 (650 ) 2,861 (988 ) 4,542 (762 ) 3,547 (1,221 )
Group financial statements
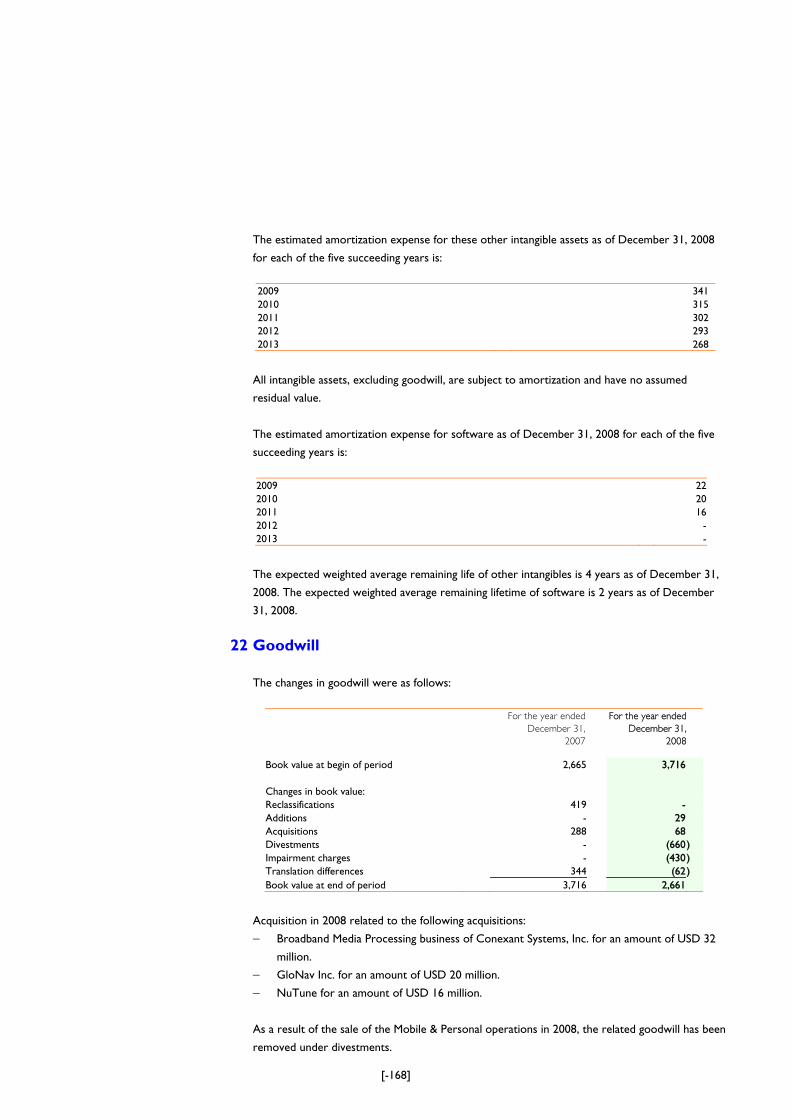
[-168]
The estimated amortization expense for these other intangible assets as of December 31, 2008
for each of the five succeeding years is:
2009 341 2010 315 2011 302 2012 293 2013 268
All intangible assets, excluding goodwill, are subject to amortization and have no assumed
residual value.
The estimated amortization expense for software as of December 31, 2008 for each of the five
succeeding years is:
2009 222010 202011 162012 -2013 -
The expected weighted average remaining life of other intangibles is 4 years as of December 31,
2008. The expected weighted average remaining lifetime of software is 2 years as of December
31, 2008.
22 Goodwill
The changes in goodwill were as follows:
For the year ended
December 31,
2007
For the year ended
December 31,
2008 Book value at begin of period 2,665 3,716 Changes in book value: Reclassifications 419 - Additions - 29 Acquisitions 288 68 Divestments - (660) Impairment charges - (430) Translation differences 344 (62) Book value at end of period 3,716 2,661
Acquisition in 2008 related to the following acquisitions:
− Broadband Media Processing business of Conexant Systems, Inc. for an amount of USD 32
million.
− GloNav Inc. for an amount of USD 20 million.
− NuTune for an amount of USD 16 million.
As a result of the sale of the Mobile & Personal operations in 2008, the related goodwill has been
removed under divestments.
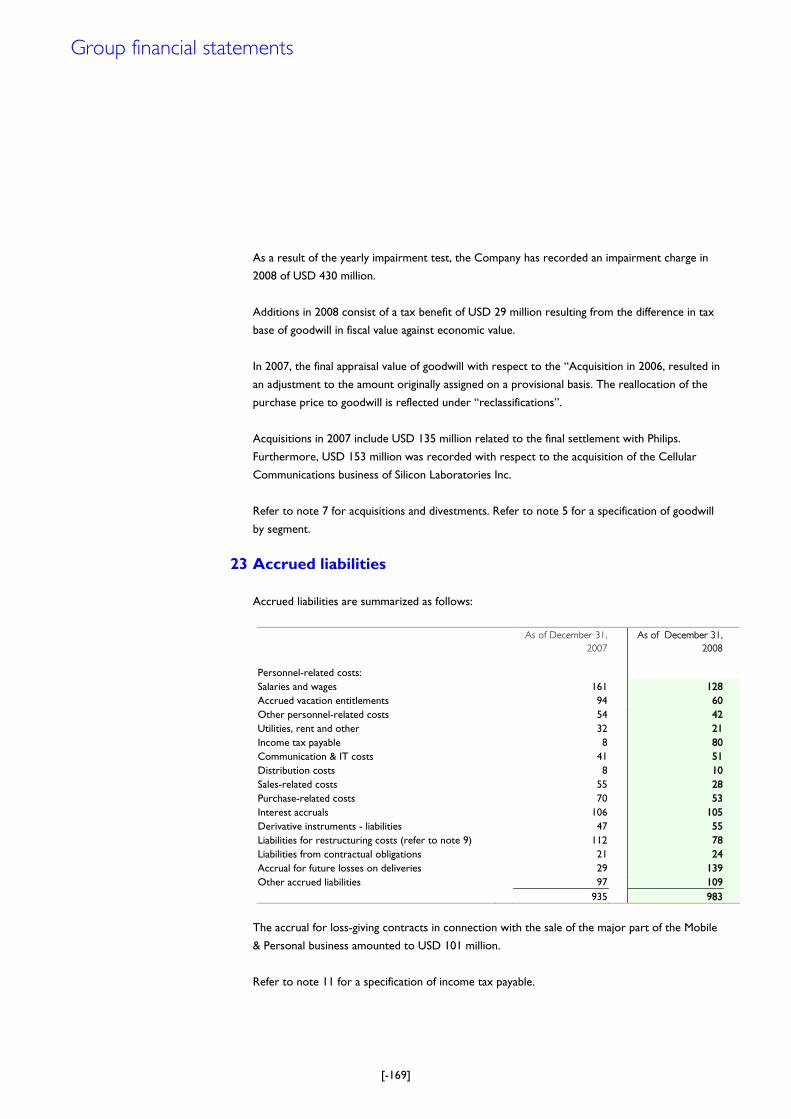
[-169]
As a result of the yearly impairment test, the Company has recorded an impairment charge in
2008 of USD 430 million.
Additions in 2008 consist of a tax benefit of USD 29 million resulting from the difference in tax
base of goodwill in fiscal value against economic value.
In 2007, the final appraisal value of goodwill with respect to the „Acquisition in 2006, resulted in
an adjustment to the amount originally assigned on a provisional basis. The reallocation of the
purchase price to goodwill is reflected under „reclassifications‰.
Acquisitions in 2007 include USD 135 million related to the final settlement with Philips.
Furthermore, USD 153 million was recorded with respect to the acquisition of the Cellular
Communications business of Silicon Laboratories Inc.
Refer to note 7 for acquisitions and divestments. Refer to note 5 for a specification of goodwill
by segment.
23 Accrued liabilities
Accrued liabilities are summarized as follows:
As of December 31,
2007
As of December 31,
2008
Personnel-related costs: Salaries and wages 161 128 Accrued vacation entitlements 94 60 Other personnel-related costs 54 42 Utilities, rent and other 32 21 Income tax payable 8 80 Communication & IT costs 41 51 Distribution costs 8 10 Sales-related costs 55 28 Purchase-related costs 70 53 Interest accruals 106 105 Derivative instruments - liabilities 47 55 Liabilities for restructuring costs (refer to note 9) 112 78 Liabilities from contractual obligations 21 24 Accrual for future losses on deliveries 29 139 Other accrued liabilities 97 109 935 983
The accrual for loss-giving contracts in connection with the sale of the major part of the Mobile
& Personal business amounted to USD 101 million.
Refer to note 11 for a specification of income tax payable.
Group financial statements
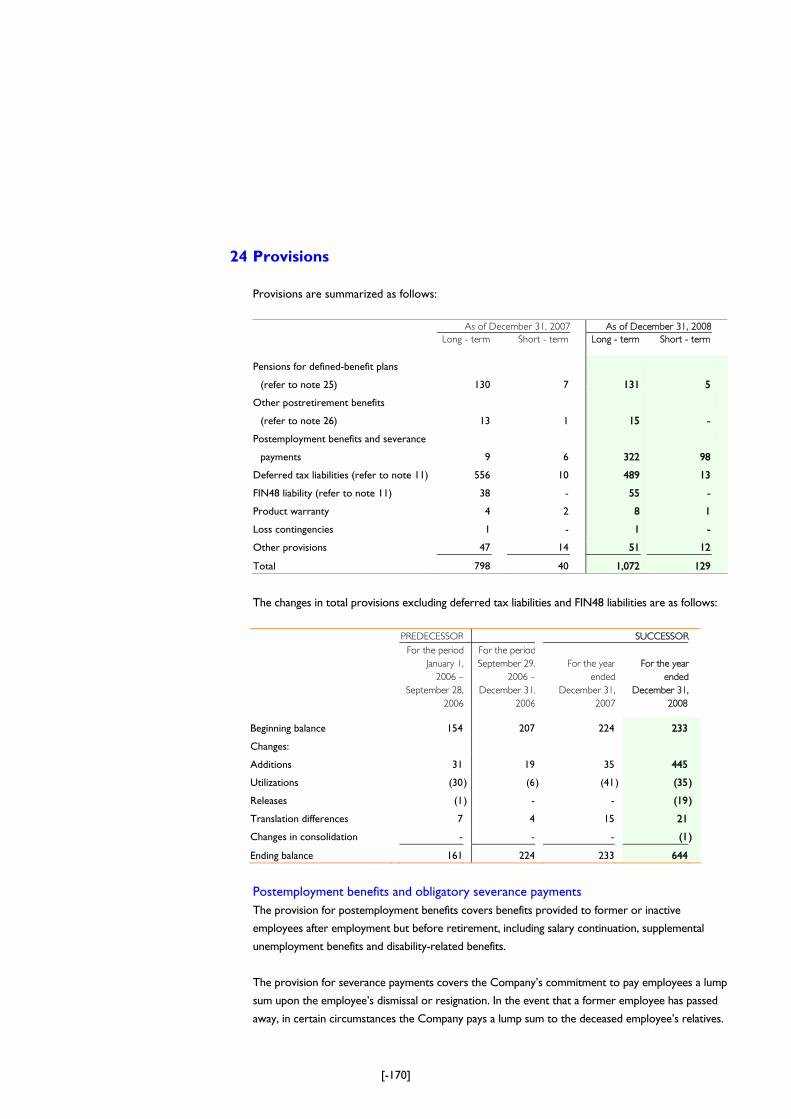
[-170]
24 Provisions
Provisions are summarized as follows:
As of December 31, 2007 As of December 31, 2008
Long - term Short - term Long - term Short - term
Pensions for defined-benefit plans
(refer to note 25)
130
7
131
5
Other postretirement benefits
(refer to note 26)
13
1
15
-
Postemployment benefits and severance
payments
9
6
322
98
Deferred tax liabilities (refer to note 11) 556 10 489 13
FIN48 liability (refer to note 11) 38 - 55 -
Product warranty 4 2 8 1
Loss contingencies 1 - 1 -
Other provisions 47 14 51 12
Total 798 40 1,072 129
The changes in total provisions excluding deferred tax liabilities and FIN48 liabilities are as follows:
PREDECESSOR SUCCESSOR
For the period
January 1,
2006 –
September 28,
For the period
September 29,
2006 –
December 31,
For the year
ended
December 31,
For the year
ended
December 31,
2006 2006 2007 2008
Beginning balance 154 207 224 233
Changes:
Additions 31 19 35 445
Utilizations (30) (6) (41 ) (35)
Releases (1) - - (19)
Translation differences 7 4 15 21
Changes in consolidation - - - (1)
Ending balance 161 224 233 644
Postemployment benefits and obligatory severance payments The provision for postemployment benefits covers benefits provided to former or inactive
employees after employment but before retirement, including salary continuation, supplemental
unemployment benefits and disability-related benefits.
The provision for severance payments covers the CompanyÊs commitment to pay employees a lump
sum upon the employeeÊs dismissal or resignation. In the event that a former employee has passed
away, in certain circumstances the Company pays a lump sum to the deceased employeeÊs relatives.
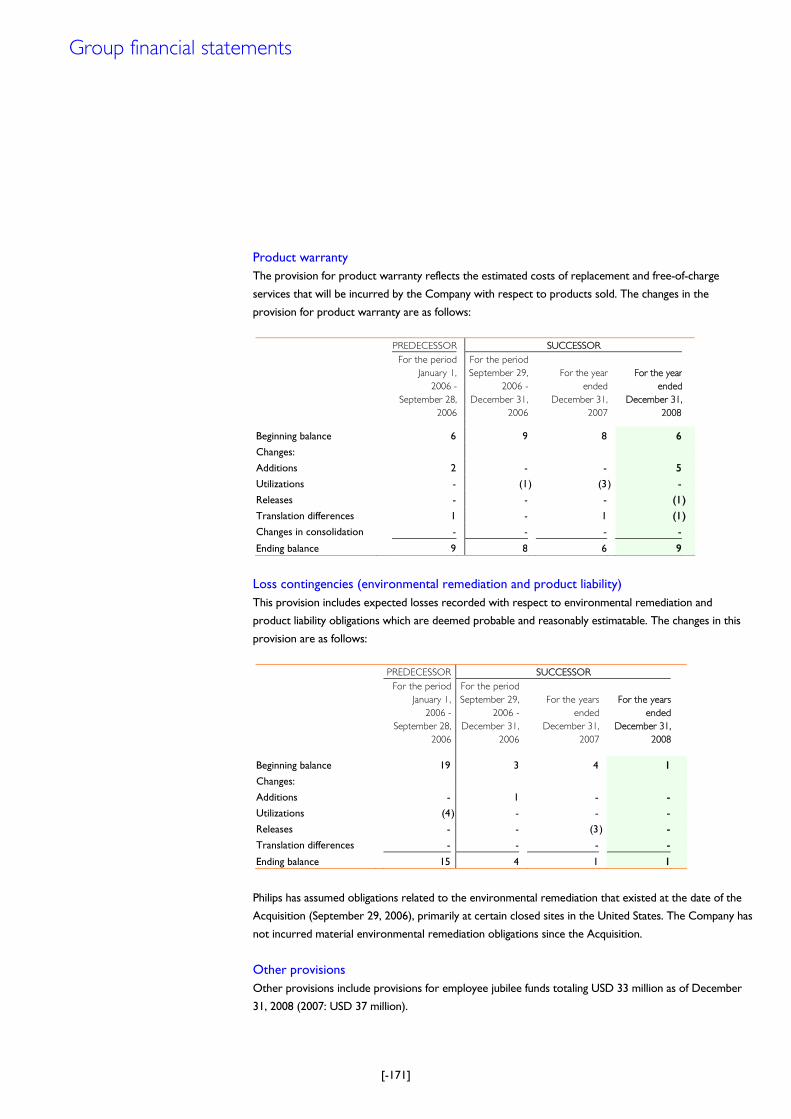
[-171]
Product warranty The provision for product warranty reflects the estimated costs of replacement and free-of-charge
services that will be incurred by the Company with respect to products sold. The changes in the
provision for product warranty are as follows:
PREDECESSOR SUCCESSOR
For the period
January 1,
2006 -
September 28,
For the period
September 29,
2006 -
December 31,
For the year
ended
December 31,
For the year
ended
December 31,
2006 2006 2007 2008 Beginning balance 6 9 8 6
Changes:
Additions 2 - - 5
Utilizations - (1) (3 ) -
Releases - - - (1)
Translation differences 1 - 1 (1)
Changes in consolidation - - - -
Ending balance 9 8 6 9
Loss contingencies (environmental remediation and product liability) This provision includes expected losses recorded with respect to environmental remediation and
product liability obligations which are deemed probable and reasonably estimatable. The changes in this
provision are as follows:
PREDECESSOR SUCCESSOR
For the period
January 1,
2006 -
September 28,
For the period
September 29,
2006 -
December 31,
For the years
ended
December 31,
For the years
ended
December 31,
2006 2006 2007 2008 Beginning balance 19 3 4 1
Changes:
Additions - 1 - -
Utilizations (4) - - -
Releases - - (3 ) -
Translation differences - - - -
Ending balance 15 4 1 1
Philips has assumed obligations related to the environmental remediation that existed at the date of the
Acquisition (September 29, 2006), primarily at certain closed sites in the United States. The Company has
not incurred material environmental remediation obligations since the Acquisition.
Other provisions Other provisions include provisions for employee jubilee funds totaling USD 33 million as of December
31, 2008 (2007: USD 37 million).
Group financial statements
[-172]
25 Pensions
Our employees participate in employee pension plans in accordance with the legal requirements, customs
and the local situation in the respective countries. These are defined-benefit pension plans, defined-
contribution plans and multi-employer plans.
The benefits provided by defined-benefit plans are based on employeesÊ years of service and
compensation levels. Contributions are made by the Company, as necessary, to provide assets sufficient
to meet the benefits payable to defined-benefit pension plan participants.
These contributions are determined based upon various factors, including funded status, legal and tax
considerations as well as local customs. The Company funds certain defined-benefit pension plans as
claims are incurred. The pension plans have been established either by Philips or changed by NXP after
disentanglement from Philips. During the predecessor period the costs of pension benefits with respect
to the CompanyÊs employees participating in these plans have been allocated to the Company based upon
actuarial computations, except for certain less significant plans, in which case a proportional allocation
based upon compensation or headcount has been used.
For pension plans in which only the CompanyÊs employees participate (the CompanyÊs dedicated plans),
the related costs of 2006 have been included in the combined and consolidated statements of operations.
The amount included in the statements of operations for the year 2008 was USD 127 million of which
USD 111 million (2007: USD 52 million; September 29, 2006 through December 31, 2006: USD 10
million; January 1, 2006 through September 28, 2006: USD 12 million) represents defined-contribution
plans and similar plans.
The total cost of defined-benefit plans amounted to USD 16 million in 2008 (2007: USD 3 million;
September 29, 2006 through December 31, 2006: USD 23 million; January 1, 2006 through September
28, 2006: USD 14 million).
The defined-benefit pension cost for 2008 of USD 16 million consists of USD 24 million net periodic cost.
The remainder, a positive result of USD 8 million, follows from special events. These are curtailments and
settlements resulting from ST-NXP Wireless, leading to a positive result of USD 11 million and charges
because of acquisitions (Conexant and NuTune) leading to a negative result of USD 3 million.
The Company currently expects contributions to pension plans which are estimated to amount to
USD 117 million in 2009, consisting of USD 5 million employer contributions to defined-benefit
pension plans, USD 105 million employer contributions to defined-contribution pension plans and
multi-employer plans, and USD 7 million expected cash outflows in relation to unfunded pension plans.
The expected cash outflows in 2009 and subsequent years are uncertain and may change substantially
as a consequence of statutory funding requirements as well as changes in actual versus currently
assumed discount rates, estimations of compensation increases and returns on pension plan assets.
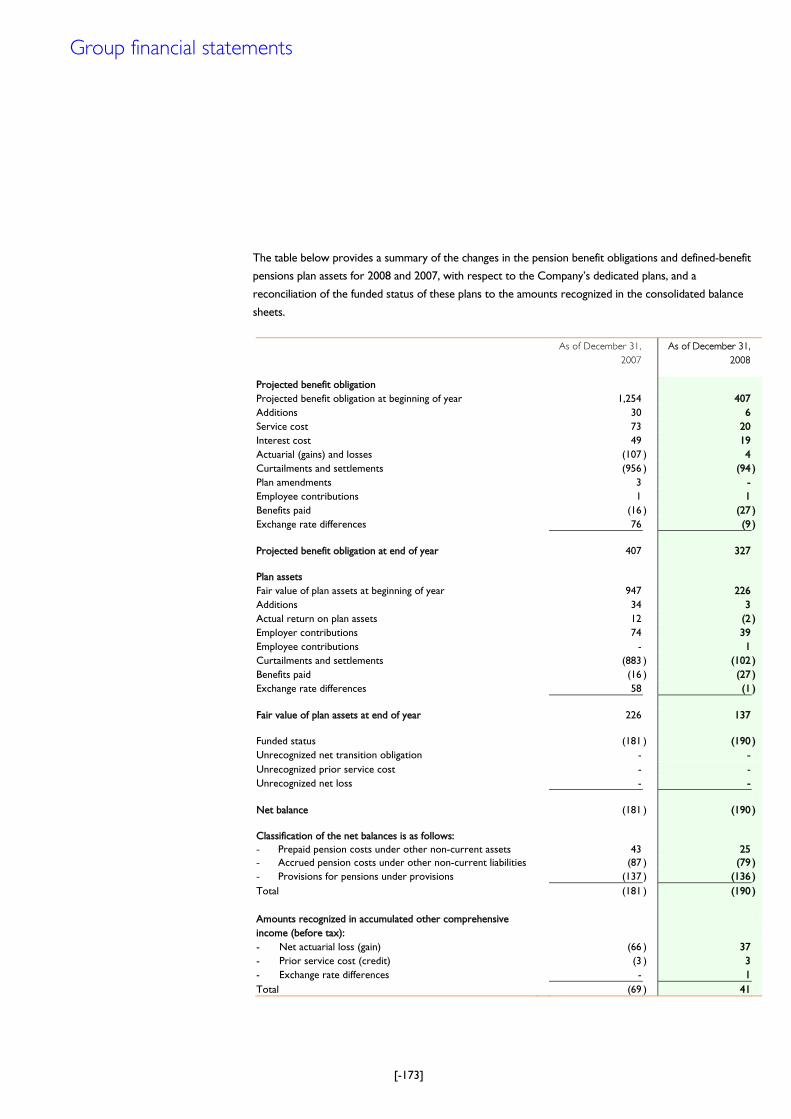
[-173]
The table below provides a summary of the changes in the pension benefit obligations and defined-benefit
pensions plan assets for 2008 and 2007, with respect to the CompanyÊs dedicated plans, and a
reconciliation of the funded status of these plans to the amounts recognized in the consolidated balance
sheets.
As of December 31,
2007
As of December 31,
2008 Projected benefit obligation Projected benefit obligation at beginning of year 1,254 407 Additions 30 6 Service cost 73 20 Interest cost 49 19 Actuarial (gains) and losses (107 ) 4 Curtailments and settlements (956 ) (94 ) Plan amendments 3 - Employee contributions 1 1 Benefits paid (16 ) (27 ) Exchange rate differences 76 (9 ) Projected benefit obligation at end of year 407 327 Plan assets Fair value of plan assets at beginning of year 947 226 Additions 34 3 Actual return on plan assets 12 (2 ) Employer contributions 74 39 Employee contributions - 1 Curtailments and settlements (883 ) (102 ) Benefits paid (16 ) (27 ) Exchange rate differences 58 (1 ) Fair value of plan assets at end of year 226 137 Funded status (181 ) (190 ) Unrecognized net transition obligation - - Unrecognized prior service cost - - Unrecognized net loss - - Net balance (181 ) (190 ) Classification of the net balances is as follows: - Prepaid pension costs under other non-current assets 43 25 - Accrued pension costs under other non-current liabilities (87 ) (79 ) - Provisions for pensions under provisions (137 ) (136 ) Total (181 ) (190 ) Amounts recognized in accumulated other comprehensive
income (before tax):
- Net actuarial loss (gain) (66 ) 37 - Prior service cost (credit) (3 ) 3 - Exchange rate differences - 1 Total (69 ) 41
Group financial statements
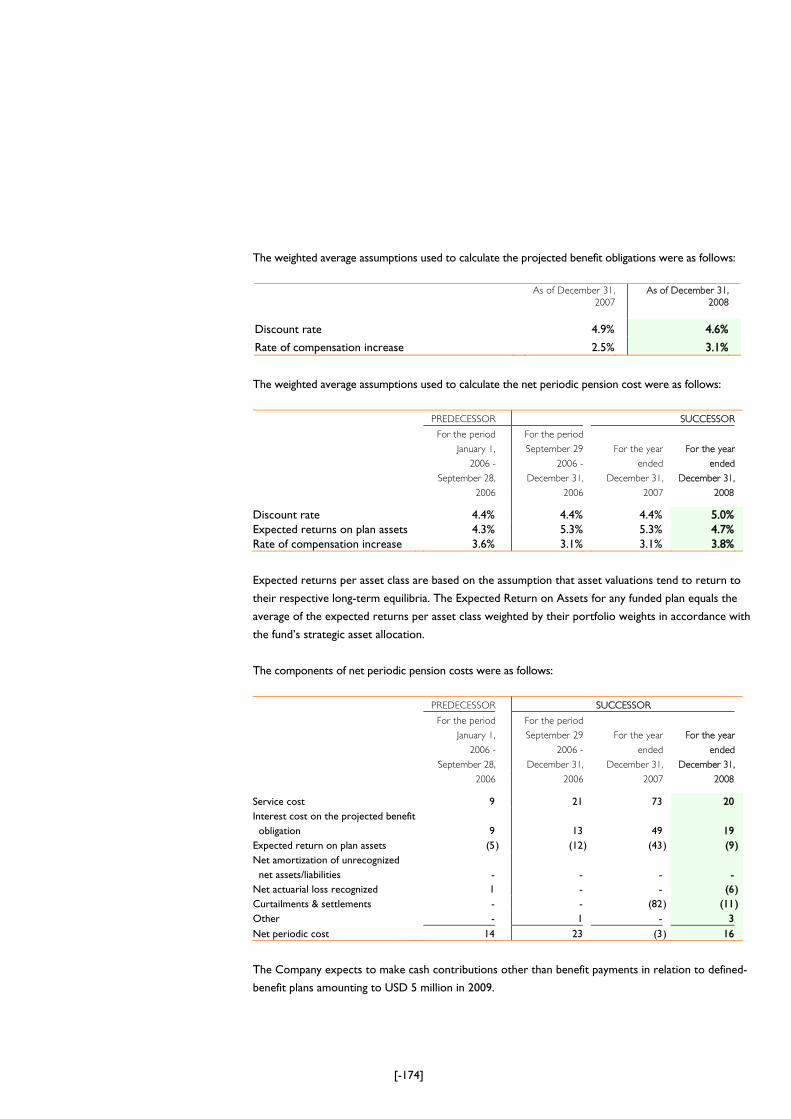
[-174]
The weighted average assumptions used to calculate the projected benefit obligations were as follows:
As of December 31,
2007
As of December 31,
2008
Discount rate 4.9% 4.6%
Rate of compensation increase 2.5% 3.1%
The weighted average assumptions used to calculate the net periodic pension cost were as follows:
PREDECESSOR SUCCESSOR
For the period
January 1,
2006 -
September 28,
For the period
September 29
2006 -
December 31,
For the year
ended
December 31,
For the year
ended
December 31,
2006 2006 2007 2008 Discount rate 4.4% 4.4% 4.4% 5.0% Expected returns on plan assets 4.3% 5.3% 5.3% 4.7% Rate of compensation increase 3.6% 3.1% 3.1% 3.8%
Expected returns per asset class are based on the assumption that asset valuations tend to return to
their respective long-term equilibria. The Expected Return on Assets for any funded plan equals the
average of the expected returns per asset class weighted by their portfolio weights in accordance with
the fundÊs strategic asset allocation.
The components of net periodic pension costs were as follows:
PREDECESSOR SUCCESSOR
For the period
January 1,
2006 -
September 28,
For the period
September 29
2006 -
December 31,
For the year
ended
December 31,
For the year
ended
December 31,
2006 2006 2007 2008 Service cost 9 21 73 20 Interest cost on the projected benefit obligation
9
13
49
19
Expected return on plan assets (5) (12 ) (43) (9)Net amortization of unrecognized net assets/liabilities
-
-
-
-
Net actuarial loss recognized 1 - - (6)Curtailments & settlements - - (82) (11)Other - 1 - 3 Net periodic cost 14 23 (3) 16
The Company expects to make cash contributions other than benefit payments in relation to defined-
benefit plans amounting to USD 5 million in 2009.
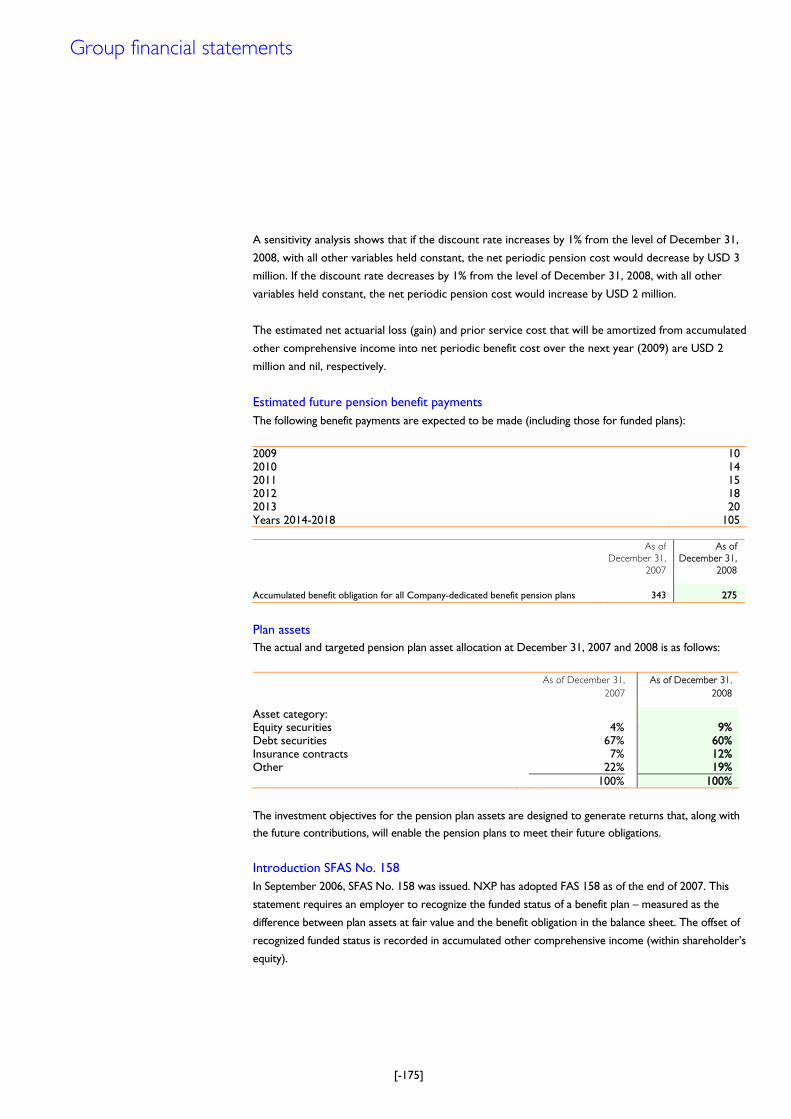
[-175]
A sensitivity analysis shows that if the discount rate increases by 1% from the level of December 31,
2008, with all other variables held constant, the net periodic pension cost would decrease by USD 3
million. If the discount rate decreases by 1% from the level of December 31, 2008, with all other
variables held constant, the net periodic pension cost would increase by USD 2 million.
The estimated net actuarial loss (gain) and prior service cost that will be amortized from accumulated
other comprehensive income into net periodic benefit cost over the next year (2009) are USD 2
million and nil, respectively.
Estimated future pension benefit payments The following benefit payments are expected to be made (including those for funded plans):
2009 102010 142011 152012 182013 20Years 2014-2018 105
As of
December 31,
2007
As of
December 31,
2008
Accumulated benefit obligation for all Company-dedicated benefit pension plans 343 275
Plan assets The actual and targeted pension plan asset allocation at December 31, 2007 and 2008 is as follows:
As of December 31,
2007
As of December 31,
2008 Asset category: Equity securities 4% 9%Debt securities 67% 60%Insurance contracts 7% 12%Other 22% 19% 100% 100% The investment objectives for the pension plan assets are designed to generate returns that, along with the future contributions, will enable the pension plans to meet their future obligations.
Introduction SFAS No. 158 In September 2006, SFAS No. 158 was issued. NXP has adopted FAS 158 as of the end of 2007. This
statement requires an employer to recognize the funded status of a benefit plan – measured as the
difference between plan assets at fair value and the benefit obligation in the balance sheet. The offset of
recognized funded status is recorded in accumulated other comprehensive income (within shareholderÊs
equity).
Group financial statements
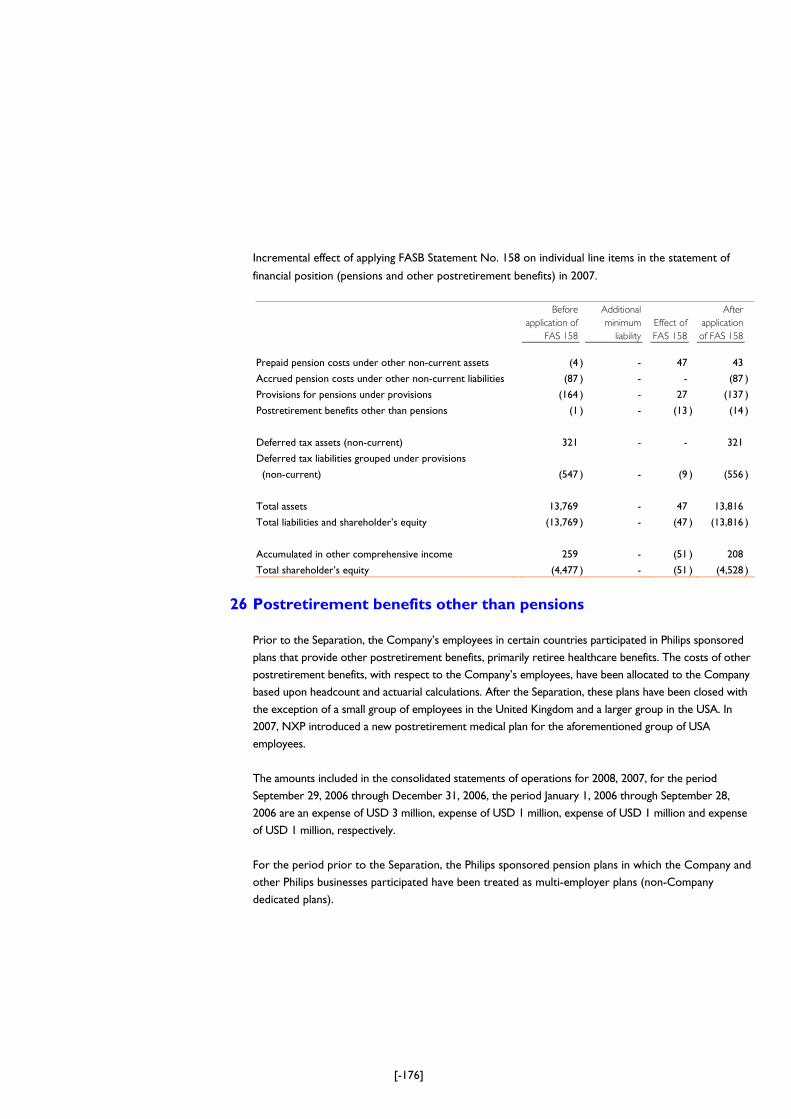
[-176]
Incremental effect of applying FASB Statement No. 158 on individual line items in the statement of
financial position (pensions and other postretirement benefits) in 2007.
Before
application of
FAS 158
Additional
minimum
liability
Effect of
FAS 158
After
application
of FAS 158
Prepaid pension costs under other non-current assets (4 ) - 47 43
Accrued pension costs under other non-current liabilities (87 ) - - (87 )
Provisions for pensions under provisions (164 ) - 27 (137 )
Postretirement benefits other than pensions (1 ) - (13 ) (14 )
Deferred tax assets (non-current) 321 - - 321
Deferred tax liabilities grouped under provisions
(non-current)
(547
)
-
(9
) (556
)
Total assets 13,769 - 47 13,816
Total liabilities and shareholderÊs equity (13,769 ) - (47 ) (13,816 )
Accumulated in other comprehensive income 259 - (51 ) 208
Total shareholderÊs equity (4,477 ) - (51 ) (4,528 )
26 Postretirement benefits other than pensions Prior to the Separation, the CompanyÊs employees in certain countries participated in Philips sponsored plans that provide other postretirement benefits, primarily retiree healthcare benefits. The costs of other postretirement benefits, with respect to the CompanyÊs employees, have been allocated to the Company based upon headcount and actuarial calculations. After the Separation, these plans have been closed with the exception of a small group of employees in the United Kingdom and a larger group in the USA. In 2007, NXP introduced a new postretirement medical plan for the aforementioned group of USA employees. The amounts included in the consolidated statements of operations for 2008, 2007, for the period September 29, 2006 through December 31, 2006, the period January 1, 2006 through September 28, 2006 are an expense of USD 3 million, expense of USD 1 million, expense of USD 1 million and expense of USD 1 million, respectively. For the period prior to the Separation, the Philips sponsored pension plans in which the Company and other Philips businesses participated have been treated as multi-employer plans (non-Company dedicated plans).
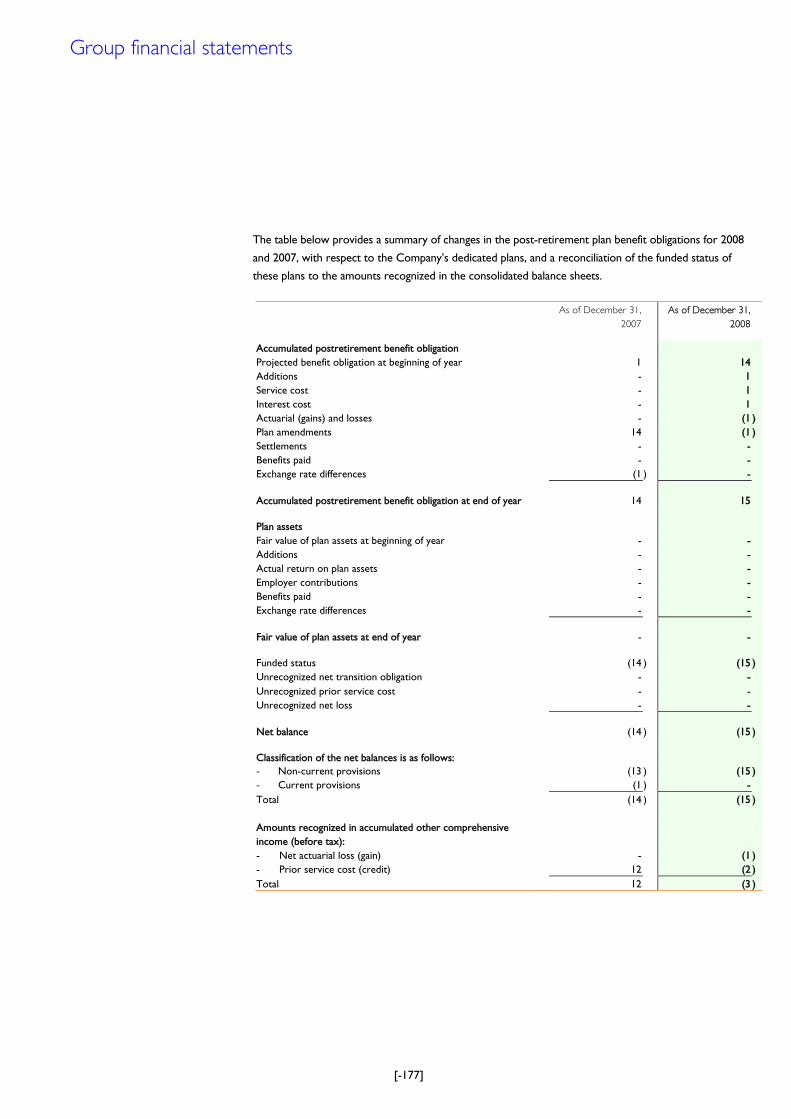
[-177]
The table below provides a summary of changes in the post-retirement plan benefit obligations for 2008
and 2007, with respect to the CompanyÊs dedicated plans, and a reconciliation of the funded status of
these plans to the amounts recognized in the consolidated balance sheets.
As of December 31,
2007
As of December 31,
2008 Accumulated postretirement benefit obligation Projected benefit obligation at beginning of year 1 14 Additions - 1 Service cost - 1 Interest cost - 1 Actuarial (gains) and losses - (1 ) Plan amendments 14 (1 ) Settlements - - Benefits paid - - Exchange rate differences (1 ) - Accumulated postretirement benefit obligation at end of year 14 15 Plan assets Fair value of plan assets at beginning of year - - Additions - - Actual return on plan assets - - Employer contributions - - Benefits paid - - Exchange rate differences - - Fair value of plan assets at end of year - - Funded status (14 ) (15 ) Unrecognized net transition obligation - - Unrecognized prior service cost - - Unrecognized net loss - - Net balance (14 ) (15 ) Classification of the net balances is as follows: - Non-current provisions (13 ) (15 ) - Current provisions (1 ) - Total (14 ) (15 ) Amounts recognized in accumulated other comprehensive
income (before tax):
- Net actuarial loss (gain) - (1 ) - Prior service cost (credit) 12 (2 ) Total 12 (3 )
Group financial statements
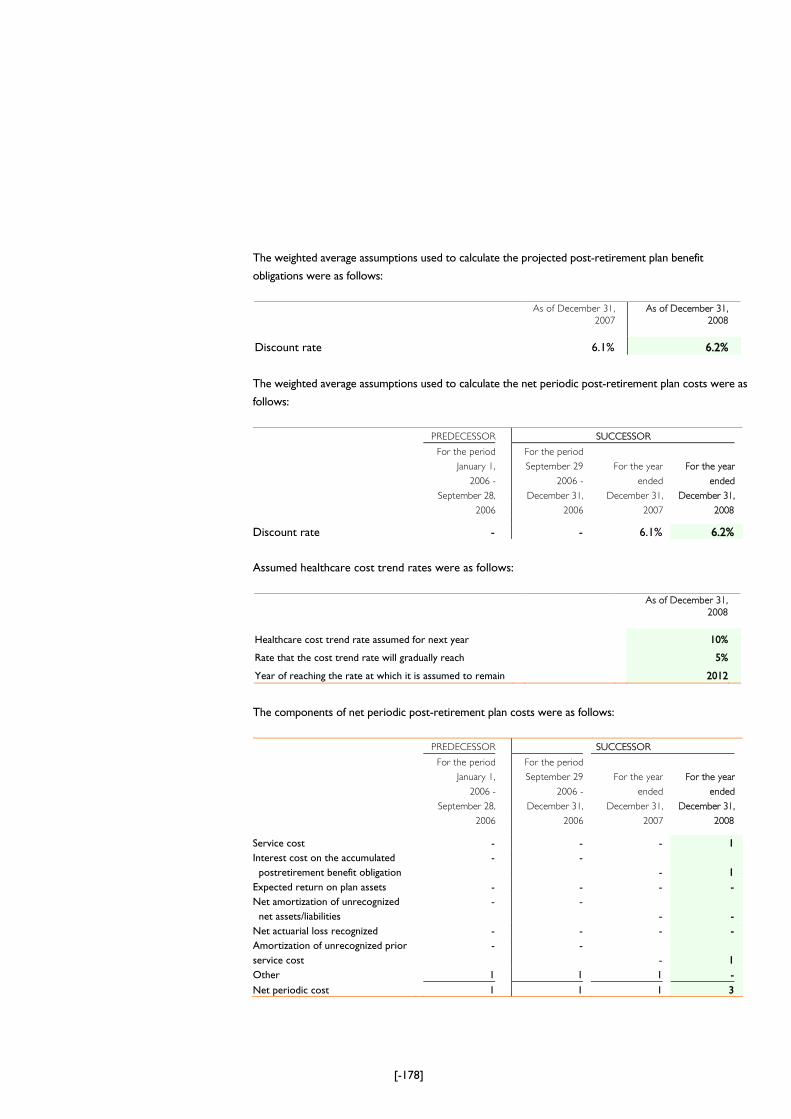
[-178]
The weighted average assumptions used to calculate the projected post-retirement plan benefit
obligations were as follows:
As of December 31,
2007
As of December 31,
2008
Discount rate 6.1% 6.2%
The weighted average assumptions used to calculate the net periodic post-retirement plan costs were as
follows:
PREDECESSOR SUCCESSOR
For the period
January 1,
2006 -
September 28,
For the period
September 29
2006 -
December 31,
For the year
ended
December 31,
For the year
ended
December 31,
2006 2006 2007 2008 Discount rate - - 6.1% 6.2%
Assumed healthcare cost trend rates were as follows:
As of December 31,
2008
Healthcare cost trend rate assumed for next year 10%
Rate that the cost trend rate will gradually reach 5%
Year of reaching the rate at which it is assumed to remain 2012
The components of net periodic post-retirement plan costs were as follows:
PREDECESSOR SUCCESSOR
For the period
January 1,
2006 -
September 28,
For the period
September 29
2006 -
December 31,
For the year
ended
December 31,
For the year
ended
December 31,
2006 2006 2007 2008 Service cost - - - 1 Interest cost on the accumulated postretirement benefit obligation
- - -
1
Expected return on plan assets - - - - Net amortization of unrecognized net assets/liabilities
- - -
-
Net actuarial loss recognized - - - - Amortization of unrecognized prior service cost
- - -
1
Other 1 1 1 - Net periodic cost 1 1 1 3
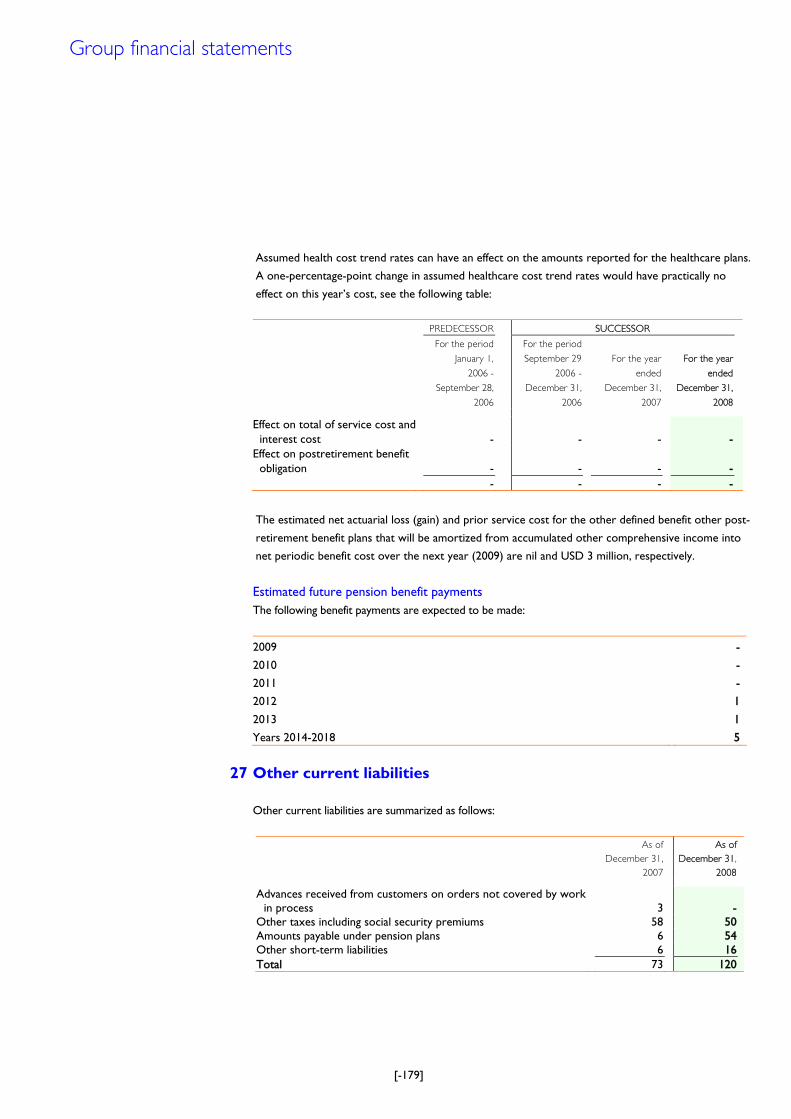
[-179]
Assumed health cost trend rates can have an effect on the amounts reported for the healthcare plans.
A one-percentage-point change in assumed healthcare cost trend rates would have practically no
effect on this yearÊs cost, see the following table:
PREDECESSOR SUCCESSOR
For the period
January 1,
2006 -
September 28,
For the period
September 29
2006 -
December 31,
For the year
ended
December 31,
For the year
ended
December 31,
2006 2006 2007 2008 Effect on total of service cost and interest cost
-
-
-
-
Effect on postretirement benefit obligation
-
-
-
-
- - - -
The estimated net actuarial loss (gain) and prior service cost for the other defined benefit other post-
retirement benefit plans that will be amortized from accumulated other comprehensive income into
net periodic benefit cost over the next year (2009) are nil and USD 3 million, respectively.
Estimated future pension benefit payments The following benefit payments are expected to be made:
2009 -
2010 -
2011 -
2012 1
2013 1
Years 2014-2018 5
27 Other current liabilities
Other current liabilities are summarized as follows:
As of
December 31,
2007
As of
December 31,
2008
Advances received from customers on orders not covered by work in process
3
-
Other taxes including social security premiums 58 50 Amounts payable under pension plans 6 54 Other short-term liabilities 6 16 Total 73 120
Group financial statements
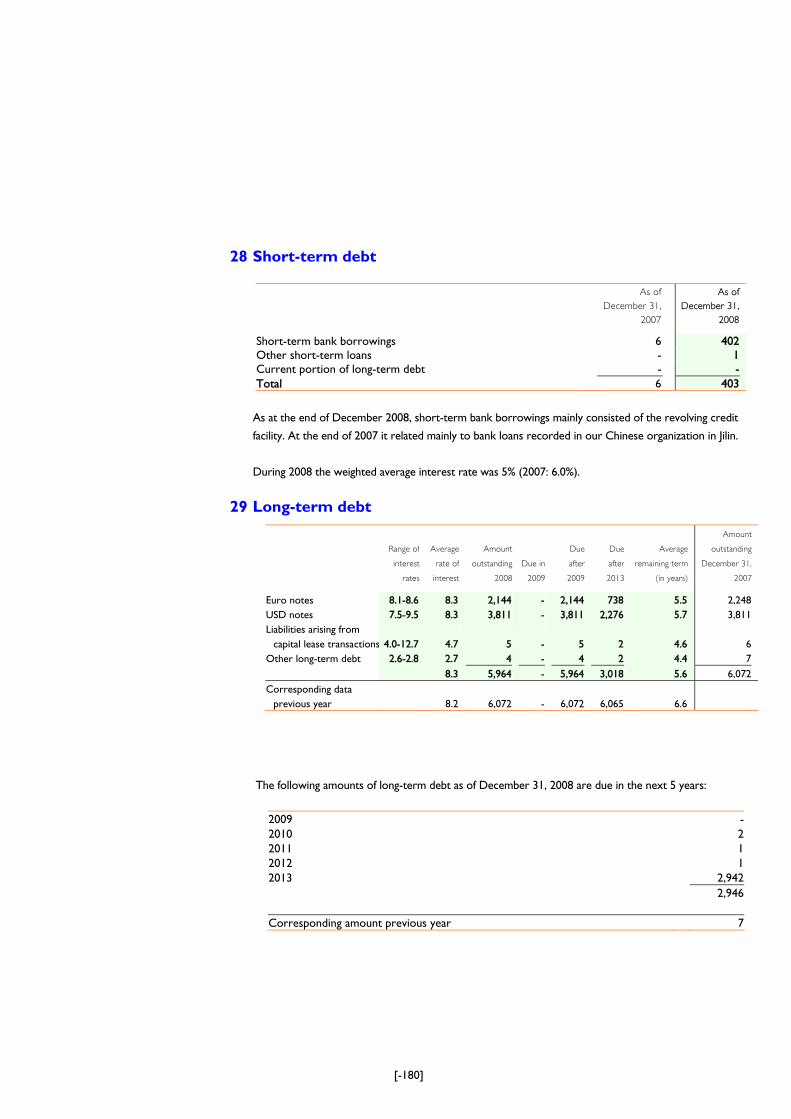
[-180]
28 Short-term debt
As of
December 31,
2007
As of
December 31,
2008 Short-term bank borrowings 6 402 Other short-term loans - 1 Current portion of long-term debt - - Total 6 403
As at the end of December 2008, short-term bank borrowings mainly consisted of the revolving credit
facility. At the end of 2007 it related mainly to bank loans recorded in our Chinese organization in Jilin.
During 2008 the weighted average interest rate was 5% (2007: 6.0%).
29 Long-term debt
The following amounts of long-term debt as of December 31, 2008 are due in the next 5 years:
2009 - 2010 2 2011 1 2012 1 2013 2,942 2,946 Corresponding amount previous year 7
Range of
interest
rates
Average
rate of
interest
Amount
outstanding
2008
Due in
2009
Due
after
2009
Due
after
2013
Average
remaining term
(in years)
Amount
outstanding
December 31,
2007
Euro notes 8.1-8.6 8.3 2,144 - 2,144 738 5.5 2,248 USD notes 7.5-9.5 8.3 3,811 - 3,811 2,276 5.7 3,811 Liabilities arising from
capital lease transactions 4.0-12.7
4.7
5
-
5
2
4.6
6
Other long-term debt 2.6-2.8 2.7 4 - 4 2 4.4 7 8.3 5,964 - 5,964 3,018 5.6 6,072 Corresponding data
previous year
8.2
6,072
-
6,072
6,065
6.6
[-181]
At the end of December 2008, long-term debt mainly consisted of the notes issued in 2006 in relation
with the Acquisition (Euro notes: USD 2,144 million; USD notes: USD 3,811 million, unchanged from
2007).
Related to the Acquisition, NXP issued on October 12, 2006 several series of notes with maturities
ranging from 7 to 9 years and a mix of floating and fixed rates. Several series are denominated in US
dollar and several series are euro denominated. The euro and US dollar notes represent 36% and 64%
respectively of the total principal amount of the notes outstanding. The series with tenors of 7 and 8
years are secured as described below; the two series with a tenor of 9 years are unsecured. On June
19, 2007, the Company concluded an exchange offer for these notes in which investors could
exchange their existing notes for identical notes registered under the U.S. Securities Act. This
exchange offer did not affect NXPÊs capitalization or debt outstanding.
Euro notes
The Euro notes consist of the following two series:
− a EUR 1,000 million aggregate principal amount of floating rate senior secured notes due 2013 with an interest rate of three-month EURIBOR plus 2.75%, except that the interest rate for the period beginning on the date these notes were offered, October 12, 2006 through January 14, 2007 the interest rate was 6.214%; and
− a EUR 525 million aggregate principal amount of 8.625% senior notes due 2015.
No redemptions on any of these series have been made; both series are fully outstanding at their original
principal euro amount at year-end 2008.
USD notes
The USD notes consist of the following three series:
− a USD 1,535 million aggregate principal amount of floating rate senior secured notes due 2013 with an interest rate of three-month LIBOR plus 2.75%, except that the interest rate for the period beginning on the date these notes were offered, October 12, 2006 through January 14, 2007 the interest rate was 8.118%; and
− a USD 1,026 million aggregate principal amount of 7.875% senior secured notes due 2014; and − a USD 1,250 million aggregate principal amount of 9.5% senior notes due 2015.
No redemptions on any of these series have been made; all three series are fully outstanding at their
original principal US dollar amount at year-end 2008.
Certain terms and Covenants of the Euro and USD notes
The Company is not required to make mandatory redemption payments or sinking fund payments with
respect to the notes.
Group financial statements
[-182]
The indentures governing the notes contain covenants that, among other things, limit the CompanyÊs
ability and that of restricted subsidiaries to incur additional indebtedness, create liens, pay dividends,
redeem capital stock or make certain other restricted payments or investments; enter into agreements
that restrict dividends from restricted subsidiaries; sell assets, including capital stock of restricted
subsidiaries; engage in transactions with affiliates; and effect a consolidation or merger.
Certain portions of long-term and short-term debt as of December 31, 2008 in the amount of USD 4,373
million (2007: USD 4,035 million) have been secured by collateral on substantially all of the CompanyÊs
assets and of certain of its subsidiaries.
The notes are fully and unconditionally guaranteed jointly and severally, on a senior basis by certain of the
CompanyÊs current and future material wholly-owned subsidiaries („Guarantors‰).
Pursuant to various security documents related to the above mentioned secured notes and the USD 703
million (denominated EUR 500 million) committed revolving credit facility, the Company and each
Guarantor has granted first priority liens and security interests in, amongst others, the following, subject
to the grant of further permitted collateral liens:
(a) all present and future shares of capital stock of (or other ownership or profit interests in) each of its present and future direct subsidiaries, other than SMST Unterstützungskasse GmbH, and material joint venture entities;
(b) all present and future intercompany debt of the Company and each Guarantor; (c) all of the present and future property and assets, real and personal, of the Company, and each
Guarantor, including, but not limited to, machinery and equipment, inventory and other goods, accounts receivable, owned real estate, leaseholds, fixtures, general intangibles, license rights, patents, trademarks, trade names, copyrights, chattel paper, insurance proceeds, contract rights, hedge agreements, documents, instruments, indemnification rights, tax refunds, but excluding cash and bank accounts; and
(d) all proceeds and products of the property and assets described above.
Notwithstanding the foregoing, certain assets may not be pledged (or the liens not perfected) in
accordance with agreed security principles, including:
• if the cost of providing security is not proportionate to the benefit accruing to the holders; • if providing such security requires consent of a third party and such consent cannot be obtained
after the use of commercially reasonable efforts; and • if providing such security would be prohibited by applicable law, general statutory limitations,
financial assistance, corporate benefit, fraudulent preference, „thin capitalization‰ rules or similar matters or providing security would be outside the applicable pledgorÊs capacity or conflict with fiduciary duties of directors or cause material risk of personal or criminal liability after using commercially reasonable efforts to overcome such obstacles;
[-183]
• if providing such security would have a material adverse effect (as reasonably determined in good faith by such subsidiary) on the ability of such subsidiary to conduct its operations and business in the ordinary course as otherwise permitted by the indenture; and
• if providing such security or perfecting liens thereon would require giving notice (i) in the case of receivables security, to customers or (ii) in the case of bank accounts, to the banks with whom the accounts are maintained. Such notice will only be provided after the secured notes are accelerated.
Subject to agreed security principles, if material property is acquired by the Company or a Guarantor
that is not automatically subject to a perfected security interest under the security documents, then the
Company or relevant Guarantor will within 60 days provide security over this property and deliver
certain certificates and opinions in respect thereof as specified in the indenture governing the notes.
Credit facilities
At December 31, 2008, the Company had a senior secured revolving credit facility of USD 703 million
(denominated: EUR 500 million) (2007: USD 737 million) entered into as from September 29, 2006, in
order to finance the working capital requirements and general corporate purposes of which USD 298
million (2007: USD 733 million) was unused. This committed revolving credit facility has a tenor of 5
years and expires in 2012.
Although the revolving credit facility expires in 2012, the Company has the flexibility of drawing and
repaying under this facility and therefore the amount drawn is classified under short-term debt.
All of the Guarantors of the secured notes described above are also guarantor of our obligations under
this committed revolving credit facility and similar security (on a first priority basis) as granted under the
secured notes has been granted for the benefit of the lenders under this facility.
30 Other non-current liabilities
Other non-current liabilities are summarized as follows:
As of December 31,
2007
As of December 31,
2008 Accrued pension costs 87 79 Asset retirement obligations 10 12 Other 9 16 106 107
31 Contractual obligations For an explanation of long-term debt and other long-term liabilities, see note 29. Capital leases Property, plant and equipment includes USD 5 million as of December 31, 2008 (2007: USD 6 million) for capital leases and other beneficial rights of use, such as building rights and hire purchase agreements. The financial obligations arising from these contractual agreements are reflected in long-term debt.
Group financial statements
[-184]
Operating leases Long-term operating lease commitments totaled USD 240 million as of December 31, 2008 (2007: USD 162 million). The long-term operating leases are mainly related to the rental of buildings. These leases expire at various dates during the next 30 years. The future payments that fall due in connection with these obligations are as follows:
2009 43 2010 40 2011 34 2012 26 2013 17 Later 80 Total 240
32 Contingent liabilities
Guarantees In the normal course of business, the Company issues certain guarantees. Guarantees issued or modified
after December 31, 2002, having characteristics defined in FIN 45, are measured at fair value and
recognized on the balance sheet. At the end of 2008 there were no material guarantees recognized by
the Company.
Guarantees issued before December 31, 2002 and not modified afterwards, and certain guarantees issued
after December 31, 2002, which do not have characteristics as defined in FIN 45, remain off-balance
sheet. At the end of 2008 there were no such guarantees recognized.
Capital contributions NXP has a contractual agreement to contribute USD 18 million in its ASEN venture if our venture
partner also contributes its contractually agreed amounts; the contribution is expected to take place in
the first half of 2009.
Other commitments The Company has made certain commitments to SSMC, whereby the Company is obligated to make cash
payments to SSMC should it fail to purchase an agreed-upon percentage of the total available capacity at
SSMCÊs fabrication facilities if overall SSMC utilization levels drop below a fixed proportion of the total
available capacity. In the periods presented in these financial statements no such payments were made.
Furthermore, other commitments exist with respect to long-term obligations for a joint development
contract with Catena Holding BV of USD 15 million and with respect to long-term software license
contracts of USD 143 million, among others with Synopsis and Cadence.
Environmental remediation The Company accrues for losses associated with environmental obligations when such losses are
probable and reasonably estimable. Refer to note 24 to the combined and consolidated financial
statements for a specification of provisions for environmental remediation.
[-185]
Litigation The Company and certain of its businesses are involved as plaintiffs or defendants in litigation relating to
such matters as commercial transactions, intellectual property rights and product liability. Although the
ultimate disposition of asserted claims and proceedings cannot be predicted with certainty, it is the
opinion of the CompanyÊs management that the outcome of any such claims, either individually or on a
combined basis, will not have a material adverse effect on the CompanyÊs combined or consolidated
financial position, but may be material to the consolidated statement of operations of the Company for a
particular period.
On January 7, 2009, the European Commission issued a release in which it confirms it will start
investigations in the smart card chip sector. The European Commission has reason to believe that the
companies concerned may have violated European Union competition rules prohibiting certain practices
such as price fixing, customer allocation and the exchange of commercially sensitive information. As one
of the companies active in the smart card chip sector, NXP is subject to a number of these ongoing
investigations and is assisting the regulatory authorities in these investigations. The investigations are in
their initial stages and it is currently impossible to reliably estimate the outcome of the investigations.
33 ShareholderÊs equity
The Company has issued and paid up 40 ordinary shares at a par value of EUR 455 each or a nominal
share capital of EUR 18,200 (in the balance sheet rounded to zero).
The CompanyÊs parent, KASLION Acquisition B.V., has granted stock options and equity rights to
receive KASLION shares or depository receipts in future (refer to note 34).
34 Share-based compensation
Successor The CompanyÊs parent, KASLION Acquisition BV, granted stock options to the members of the Board of
Management and certain other executives of NXP starting in 2007. Under the stock option plans the
participants acquire the right to receive a depositary receipt over KASLION shares upon exercise and
payment of the exercise price after the stock options have vested and the change in control event that
triggers exercise has taken place. Also, equity rights were granted by KASLION to certain non-executive
employees of the Company also starting in 2007. These rights offer the participants the right to acquire
KASLION shares or depository receipts for no consideration after the rights have vested and a change in
control event that triggers exercise has taken place. The purpose of these share-based compensation
plans is to align the interests of management with those of the shareholders by providing additional
incentives to improve the CompanyÊs performance on a long-term basis by offering the participants to
share in the benefits for the shareholders of a sale or change in control of the Company.
In accordance with SFAS No. 123(R), the fair value of share-based payments is required to be based upon
an option valuation model. Since neither KASLIONÊs stock options nor its shares are traded on any
exchange and exercise is dependent upon a sale or change of control of the Company, employees can
receive no value nor derive any benefit from holding these options or rights without the fulfillment of the
conditions for exercise. The Company has concluded that the fair value of the share-based payments can
best be estimated by the use of a binomial option-pricing model because such models take into account
Group financial statements
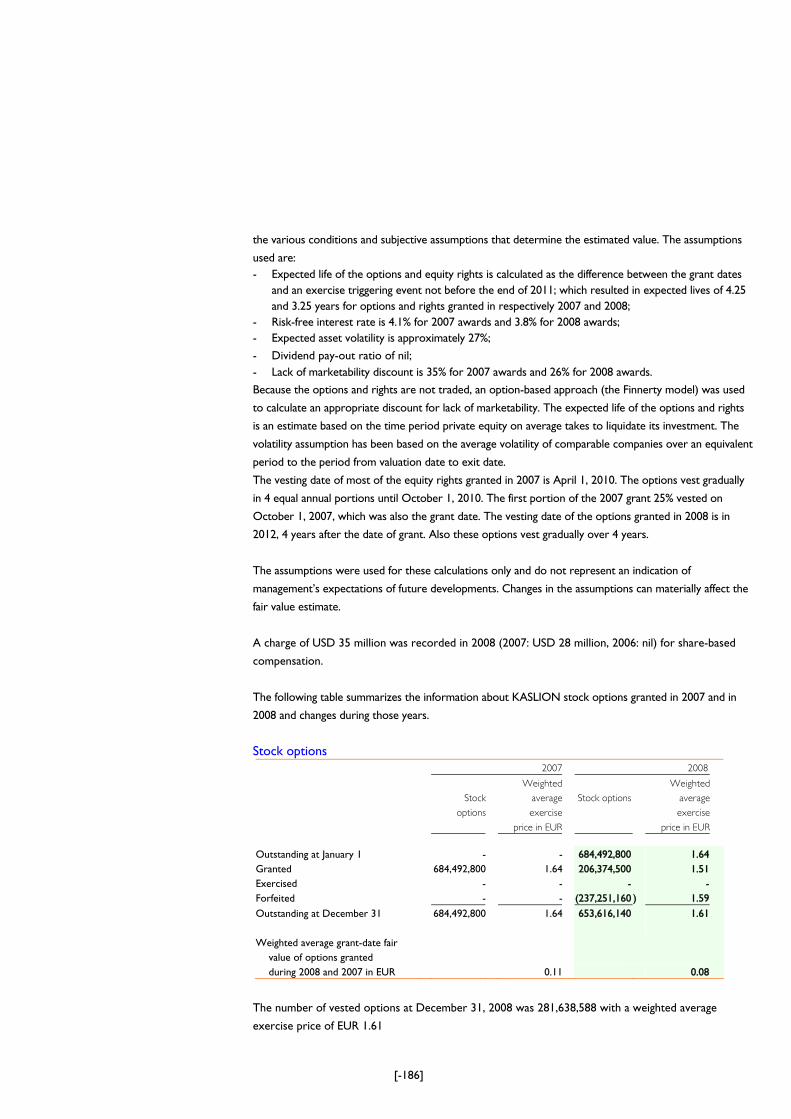
[-186]
the various conditions and subjective assumptions that determine the estimated value. The assumptions
used are: - Expected life of the options and equity rights is calculated as the difference between the grant dates
and an exercise triggering event not before the end of 2011; which resulted in expected lives of 4.25 and 3.25 years for options and rights granted in respectively 2007 and 2008;
- Risk-free interest rate is 4.1% for 2007 awards and 3.8% for 2008 awards; - Expected asset volatility is approximately 27%;
- Dividend pay-out ratio of nil; - Lack of marketability discount is 35% for 2007 awards and 26% for 2008 awards.
Because the options and rights are not traded, an option-based approach (the Finnerty model) was used
to calculate an appropriate discount for lack of marketability. The expected life of the options and rights
is an estimate based on the time period private equity on average takes to liquidate its investment. The
volatility assumption has been based on the average volatility of comparable companies over an equivalent
period to the period from valuation date to exit date.
The vesting date of most of the equity rights granted in 2007 is April 1, 2010. The options vest gradually
in 4 equal annual portions until October 1, 2010. The first portion of the 2007 grant 25% vested on
October 1, 2007, which was also the grant date. The vesting date of the options granted in 2008 is in
2012, 4 years after the date of grant. Also these options vest gradually over 4 years.
The assumptions were used for these calculations only and do not represent an indication of
managementÊs expectations of future developments. Changes in the assumptions can materially affect the
fair value estimate.
A charge of USD 35 million was recorded in 2008 (2007: USD 28 million, 2006: nil) for share-based
compensation.
The following table summarizes the information about KASLION stock options granted in 2007 and in
2008 and changes during those years.
Stock options 2007 2008
Stock
options
Weighted
average
exercise
price in EUR
Stock options
Weighted
average
exercise
price in EUR
Outstanding at January 1 - - 684,492,800 1.64Granted 684,492,800 1.64 206,374,500 1.51Exercised - - - -Forfeited - - (237,251,160 ) 1.59Outstanding at December 31 684,492,800 1.64 653,616,140 1.61 Weighted average grant-date fair value of options granted during 2008 and 2007 in EUR 0.11
0.08
The number of vested options at December 31, 2008 was 281,638,588 with a weighted average
exercise price of EUR 1.61
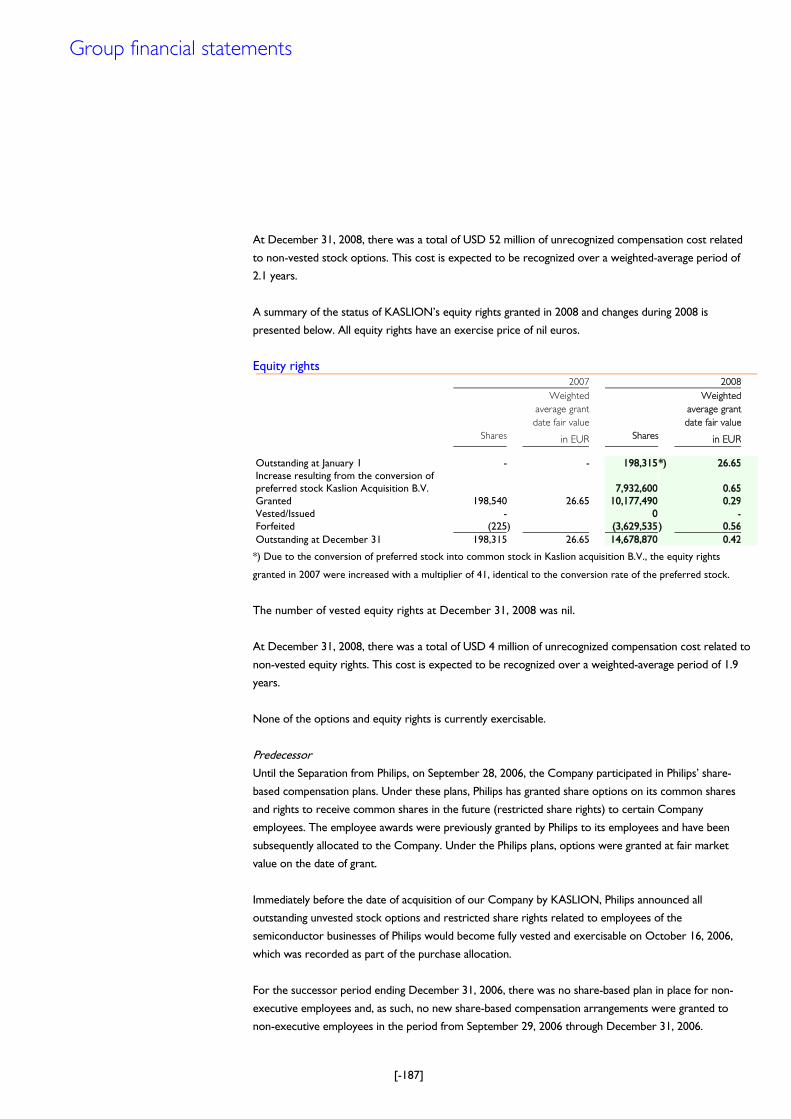
[-187]
At December 31, 2008, there was a total of USD 52 million of unrecognized compensation cost related
to non-vested stock options. This cost is expected to be recognized over a weighted-average period of
2.1 years.
A summary of the status of KASLIONÊs equity rights granted in 2008 and changes during 2008 is
presented below. All equity rights have an exercise price of nil euros.
Equity rights 2007 2008
Shares
Weighted
average grant
date fair value
in EUR Shares
Weighted
average grant
date fair value
in EUR
Outstanding at January 1 - - 198,315*) 26.65 Increase resulting from the conversion of preferred stock Kaslion Acquisition B.V.
7,932,600
0.65
Granted 198,540 26.65 10,177,490 0.29 Vested/Issued - 0 - Forfeited (225) (3,629,535) 0.56 Outstanding at December 31 198,315 26.65 14,678,870 0.42
*) Due to the conversion of preferred stock into common stock in Kaslion acquisition B.V., the equity rights
granted in 2007 were increased with a multiplier of 41, identical to the conversion rate of the preferred stock.
The number of vested equity rights at December 31, 2008 was nil.
At December 31, 2008, there was a total of USD 4 million of unrecognized compensation cost related to
non-vested equity rights. This cost is expected to be recognized over a weighted-average period of 1.9
years.
None of the options and equity rights is currently exercisable.
Predecessor Until the Separation from Philips, on September 28, 2006, the Company participated in PhilipsÊ share-
based compensation plans. Under these plans, Philips has granted share options on its common shares
and rights to receive common shares in the future (restricted share rights) to certain Company
employees. The employee awards were previously granted by Philips to its employees and have been
subsequently allocated to the Company. Under the Philips plans, options were granted at fair market
value on the date of grant.
Immediately before the date of acquisition of our Company by KASLION, Philips announced all
outstanding unvested stock options and restricted share rights related to employees of the
semiconductor businesses of Philips would become fully vested and exercisable on October 16, 2006,
which was recorded as part of the purchase allocation.
For the successor period ending December 31, 2006, there was no share-based plan in place for non-
executive employees and, as such, no new share-based compensation arrangements were granted to
non-executive employees in the period from September 29, 2006 through December 31, 2006.
Group financial statements
[-188]
From 2003 to September 28, 2006, Philips issued restricted share rights to certain CompanyÊs
employees that vest in equal annual installments over a three-year period. Restricted shares are Philips
shares that the grantee will receive in three successive years, provided the grantee is still with Philips
on the respective delivery dates. If the grantee still holds the shares after three years from the delivery
date, Philips will grant 20% additional (premium) shares, provided the grantee is still with Philips.
From 2002, Philips granted fixed share options to certain CompanyÊs employees that expire upon the
earlier of 10 years after the grant, or 5 years after the termination of the granteeÊs employment with
Philips. Generally, the options vest after 3 years; however, a limited number of options granted to certain
employees of acquired businesses contain accelerated vesting. In prior years, fixed and variable
(performance) options were issued with terms of ten years, vesting one to three years after grant. In
contrast to 2001 and certain prior years, when variable (performance) share options were issued, the
share-based compensation grants from 2002 consider the performance of Philips versus a peer group of
multinationals.
USD-denominated share options and restricted share rights are granted to employees in the United
States only.
In The Netherlands, and through September 28, 2006, Philips issued personnel debentures to the
CompanyÊs employees with a 5-year right of conversion into common shares of Philips. The
conversion price is equal to the current share price at the date of issuance. The fair value of the
conversion option of EUR 6.41 in 2006 (predecessor period) was recorded as compensation expense.
Effective January 1, 2006, the Company adopted SFAS 123(R) using the modified prospective method
for the transition. Since the Company had previously adopted the fair value provisions of SFAS 123
prospectively for all employee awards granted, modified or settled after January 1, 2003, the adoption
of SFAS 123(R) did not have a material impact on the CompanyÊs financial position or results of
operations.
An expense of USD 19 million was recorded in the period January 1, 2006 through September 28,
2006 for share-based compensation.
Prior to 2003, the Company accounted for share-based compensation using the intrinsic value method,
and the recognition and measurement provisions of APB Opinion No. 25, 'Accounting for Stock Issued to
Employees', and related interpretations.
Since awards issued under Philips plans prior to 2003 vested over three years, there was no impact for 2006. In accordance with SFAS 123(R), the fair value of share options granted is required to be based upon a statistical option valuation model. Since the Philips share options are not traded on any exchange, employees can neither receive any value nor derive any benefit from holding these share options without an increase in the market price of PhilipsÊ shares.
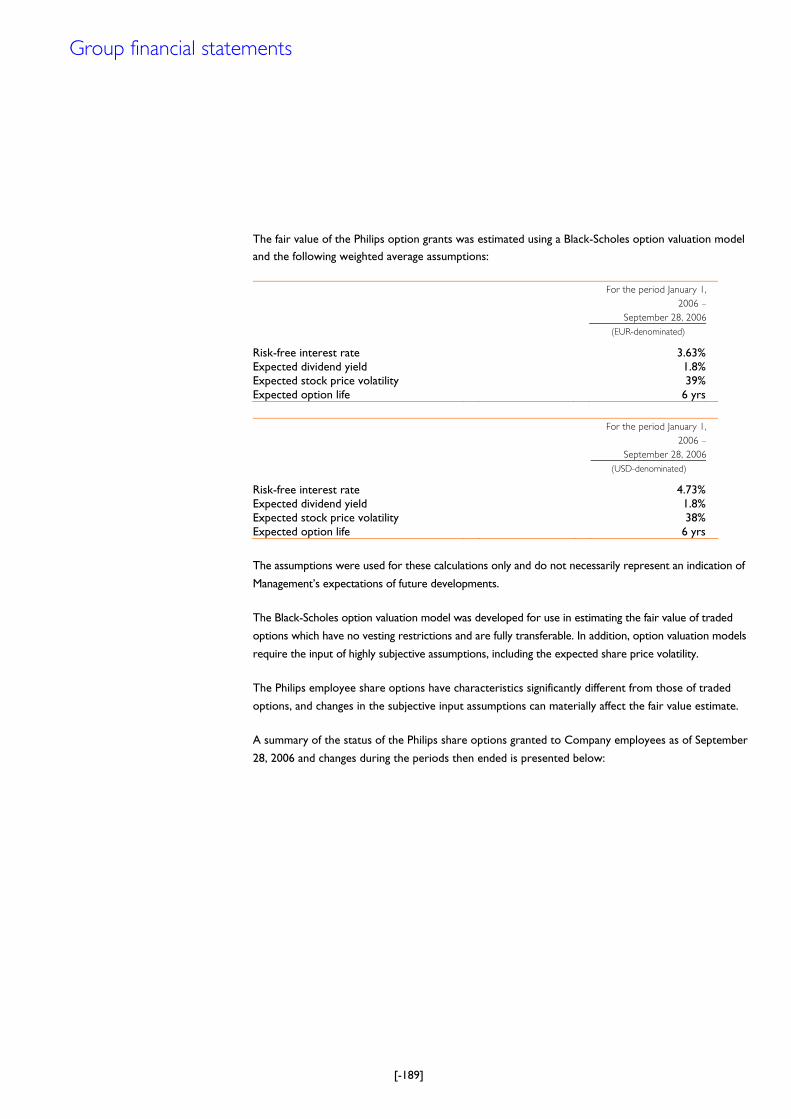
[-189]
The fair value of the Philips option grants was estimated using a Black-Scholes option valuation model and the following weighted average assumptions:
For the period January 1,
2006 –
September 28, 2006
(EUR-denominated) Risk-free interest rate 3.63%Expected dividend yield 1.8%Expected stock price volatility 39%Expected option life 6 yrs
For the period January 1,
2006 –
September 28, 2006
(USD-denominated)
Risk-free interest rate 4.73%Expected dividend yield 1.8%Expected stock price volatility 38%Expected option life 6 yrs
The assumptions were used for these calculations only and do not necessarily represent an indication of
ManagementÊs expectations of future developments.
The Black-Scholes option valuation model was developed for use in estimating the fair value of traded
options which have no vesting restrictions and are fully transferable. In addition, option valuation models
require the input of highly subjective assumptions, including the expected share price volatility.
The Philips employee share options have characteristics significantly different from those of traded
options, and changes in the subjective input assumptions can materially affect the fair value estimate.
A summary of the status of the Philips share options granted to Company employees as of September
28, 2006 and changes during the periods then ended is presented below:
Group financial statements
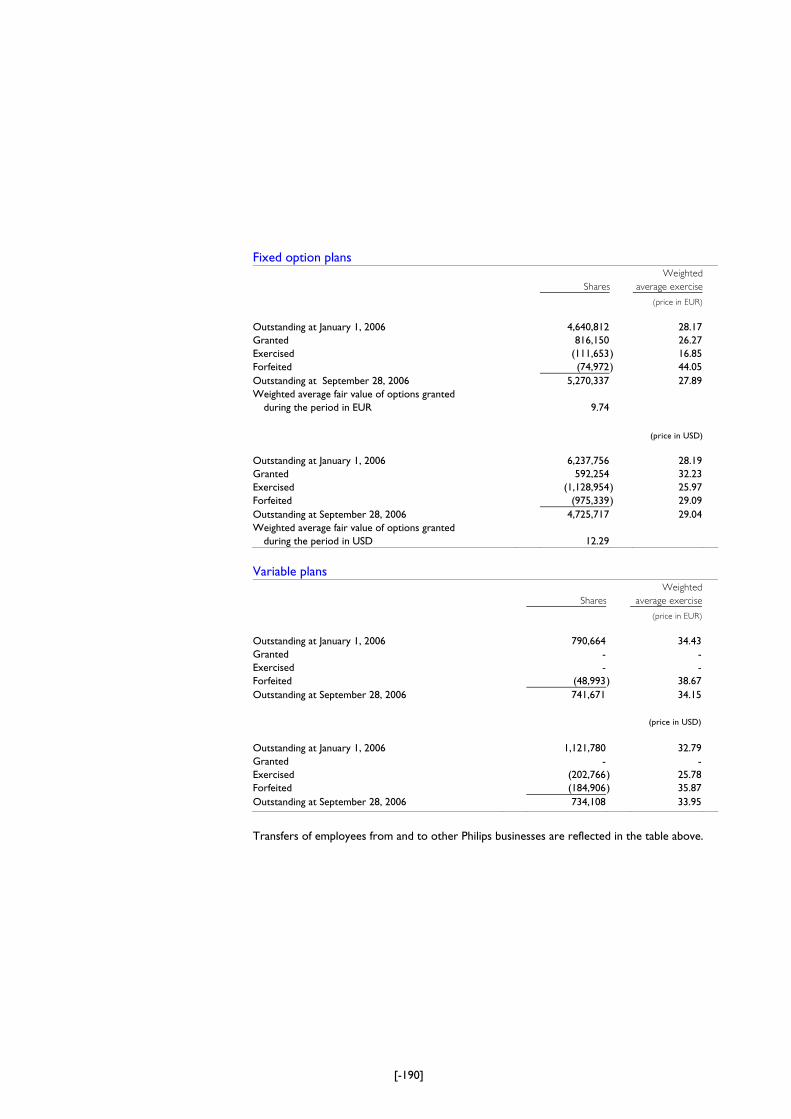
[-190]
Fixed option plans
Shares
Weighted
average exercise
(price in EUR)
Outstanding at January 1, 2006 4,640,812 28.17
Granted 816,150 26.27
Exercised (111,653 ) 16.85
Forfeited (74,972 ) 44.05
Outstanding at September 28, 2006 5,270,337 27.89
Weighted average fair value of options granted during the period in EUR
9.74
(price in USD)
Outstanding at January 1, 2006 6,237,756 28.19
Granted 592,254 32.23
Exercised (1,128,954 ) 25.97
Forfeited (975,339 ) 29.09
Outstanding at September 28, 2006 4,725,717 29.04
Weighted average fair value of options granted during the period in USD
12.29
Variable plans
Shares
Weighted
average exercise
(price in EUR)
Outstanding at January 1, 2006 790,664 34.43 Granted - - Exercised - - Forfeited (48,993 ) 38.67 Outstanding at September 28, 2006 741,671 34.15
(price in USD)
Outstanding at January 1, 2006 1,121,780 32.79 Granted - - Exercised (202,766 ) 25.78 Forfeited (184,906 ) 35.87 Outstanding at September 28, 2006 734,108 33.95
Transfers of employees from and to other Philips businesses are reflected in the table above.
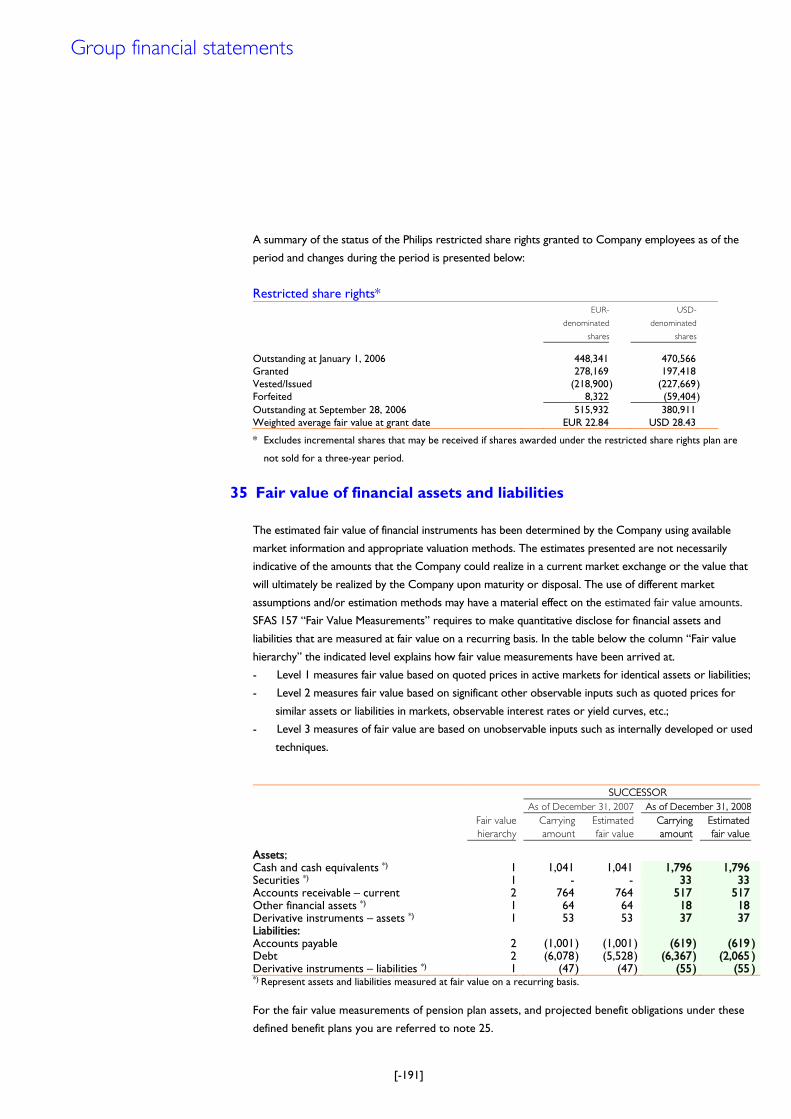
[-191]
A summary of the status of the Philips restricted share rights granted to Company employees as of the
period and changes during the period is presented below:
Restricted share rights*
EUR-
denominated
shares
USD-
denominated
shares
Outstanding at January 1, 2006 448,341 470,566 Granted 278,169 197,418 Vested/Issued (218,900 ) (227,669) Forfeited 8,322 (59,404) Outstanding at September 28, 2006 515,932 380,911 Weighted average fair value at grant date EUR 22.84 USD 28.43
* Excludes incremental shares that may be received if shares awarded under the restricted share rights plan are
not sold for a three-year period.
35 Fair value of financial assets and liabilities
The estimated fair value of financial instruments has been determined by the Company using available
market information and appropriate valuation methods. The estimates presented are not necessarily
indicative of the amounts that the Company could realize in a current market exchange or the value that
will ultimately be realized by the Company upon maturity or disposal. The use of different market
assumptions and/or estimation methods may have a material effect on the estimated fair value amounts.
SFAS 157 „Fair Value Measurements‰ requires to make quantitative disclose for financial assets and
liabilities that are measured at fair value on a recurring basis. In the table below the column „Fair value
hierarchy‰ the indicated level explains how fair value measurements have been arrived at.
- Level 1 measures fair value based on quoted prices in active markets for identical assets or liabilities;
- Level 2 measures fair value based on significant other observable inputs such as quoted prices for
similar assets or liabilities in markets, observable interest rates or yield curves, etc.;
- Level 3 measures of fair value are based on unobservable inputs such as internally developed or used
techniques.
SUCCESSOR
As of December 31, 2007 As of December 31, 2008
Fair value
hierarchy
Carrying
amount
Estimated
fair value
Carrying
amount
Estimated
fair value Assets; Cash and cash equivalents *) 1 1,041 1,041 1,796 1,796 Securities *) 1 - - 33 33 Accounts receivable – current 2 764 764 517 517 Other financial assets *) 1 64 64 18 18 Derivative instruments – assets *) 1 53 53 37 37 Liabilities: Accounts payable 2 (1,001 ) (1,001 ) (619) (619 )Debt 2 (6,078 ) (5,528 ) (6,367) (2,065 )Derivative instruments – liabilities *) 1 (47 ) (47 ) (55) (55 )*) Represent assets and liabilities measured at fair value on a recurring basis. For the fair value measurements of pension plan assets, and projected benefit obligations under these
defined benefit plans you are referred to note 25.
Group financial statements
[-192]
The following methods and assumptions were used to estimate the fair value of financial instruments: Cash and cash equivalents, accounts receivable and payable The carrying amounts approximate fair value because of the short maturity of these instruments. Other financial assets and derivative instruments For other financial assets, fair value is based upon the quoted market prices. Debt The fair value is estimated on the basis of the quoted market prices for certain issues, or on the basis of discounted cash flow analyses based upon the incremental borrowing rates for similar types of borrowing arrangements with comparable terms and maturities. Accrued interest is included under accounts payable and not within the carrying amount or estimated fair value of debt.
36 Other financial instruments, derivatives and currency risk
The Company does not purchase or hold financial derivative instruments for trading purposes. Assets
and liabilities related to derivative instruments are disclosed in note 17 and note 23. Currency
fluctuations may impact the CompanyÊs financial results. The Company has a structural currency
mismatch between costs and revenues, as a proportion of its production, administration and research
and development costs is denominated in US dollars or US dollar-related, while a higher proportion of
its revenues is denominated in US dollars or US dollar-related.
The CompanyÊs transactions are denominated in a variety of currencies. The Company uses financial
instruments to reduce its exposure to the effects of currency fluctuations. The Company generally
hedges foreign currency exposures in relation to transaction exposures, such as receivables/payables
resulting from such transactions and part of anticipated sales and purchases. The Company generally uses
forwards to hedge these exposures.
Changes in the fair value of foreign currency accounts receivable/payable as well as changes in the fair
value of the hedges of accounts receivable/payable are reported in the statement of operations under
cost of sales. The hedges related to anticipated transactions are recorded as cash flow hedges. The
results from such hedges were deferred in equity until 2007. From December 2007 going forward, the
application of cash flow hedge accounting for foreign currency risks is limited to transactions that
represent a substantial currency risk that could materially affect the financial position of the Company.
Consequently, the application of cash flow hedge accounting seldom occurs. Changes in the fair value of
these forward currency transactions that are not designated to anticipated transactions are immediately
reported in the statement of operations under cost of sales.
For the predecessor period, hedges entered into by the Company were generally concluded by Philips.
Derivative instruments relate to
• hedged balance sheet items,
• hedged anticipated currency exposures with a duration of up to 12 months.
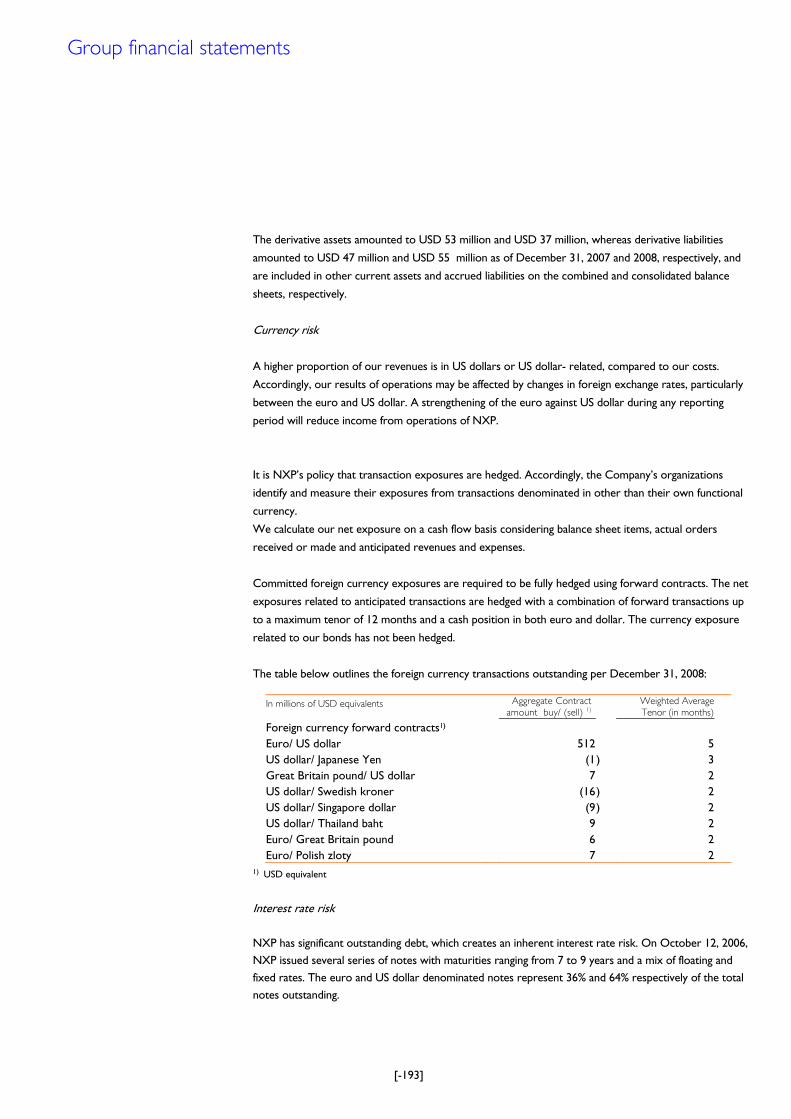
[-193]
The derivative assets amounted to USD 53 million and USD 37 million, whereas derivative liabilities
amounted to USD 47 million and USD 55 million as of December 31, 2007 and 2008, respectively, and
are included in other current assets and accrued liabilities on the combined and consolidated balance
sheets, respectively.
Currency risk A higher proportion of our revenues is in US dollars or US dollar- related, compared to our costs.
Accordingly, our results of operations may be affected by changes in foreign exchange rates, particularly
between the euro and US dollar. A strengthening of the euro against US dollar during any reporting
period will reduce income from operations of NXP.
It is NXPÊs policy that transaction exposures are hedged. Accordingly, the CompanyÊs organizations
identify and measure their exposures from transactions denominated in other than their own functional
currency.
We calculate our net exposure on a cash flow basis considering balance sheet items, actual orders
received or made and anticipated revenues and expenses.
Committed foreign currency exposures are required to be fully hedged using forward contracts. The net
exposures related to anticipated transactions are hedged with a combination of forward transactions up
to a maximum tenor of 12 months and a cash position in both euro and dollar. The currency exposure
related to our bonds has not been hedged.
The table below outlines the foreign currency transactions outstanding per December 31, 2008:
In millions of USD equivalents Aggregate Contract
amount buy/ (sell) 1) Weighted Average
Tenor (in months)
Foreign currency forward contracts1) Euro/ US dollar 512 5 US dollar/ Japanese Yen (1 ) 3 Great Britain pound/ US dollar 7 2 US dollar/ Swedish kroner (16 ) 2 US dollar/ Singapore dollar (9 ) 2 US dollar/ Thailand baht 9 2 Euro/ Great Britain pound 6 2 Euro/ Polish zloty 7 2
1) USD equivalent
Interest rate risk NXP has significant outstanding debt, which creates an inherent interest rate risk. On October 12, 2006, NXP issued several series of notes with maturities ranging from 7 to 9 years and a mix of floating and fixed rates. The euro and US dollar denominated notes represent 36% and 64% respectively of the total notes outstanding.
Group financial statements
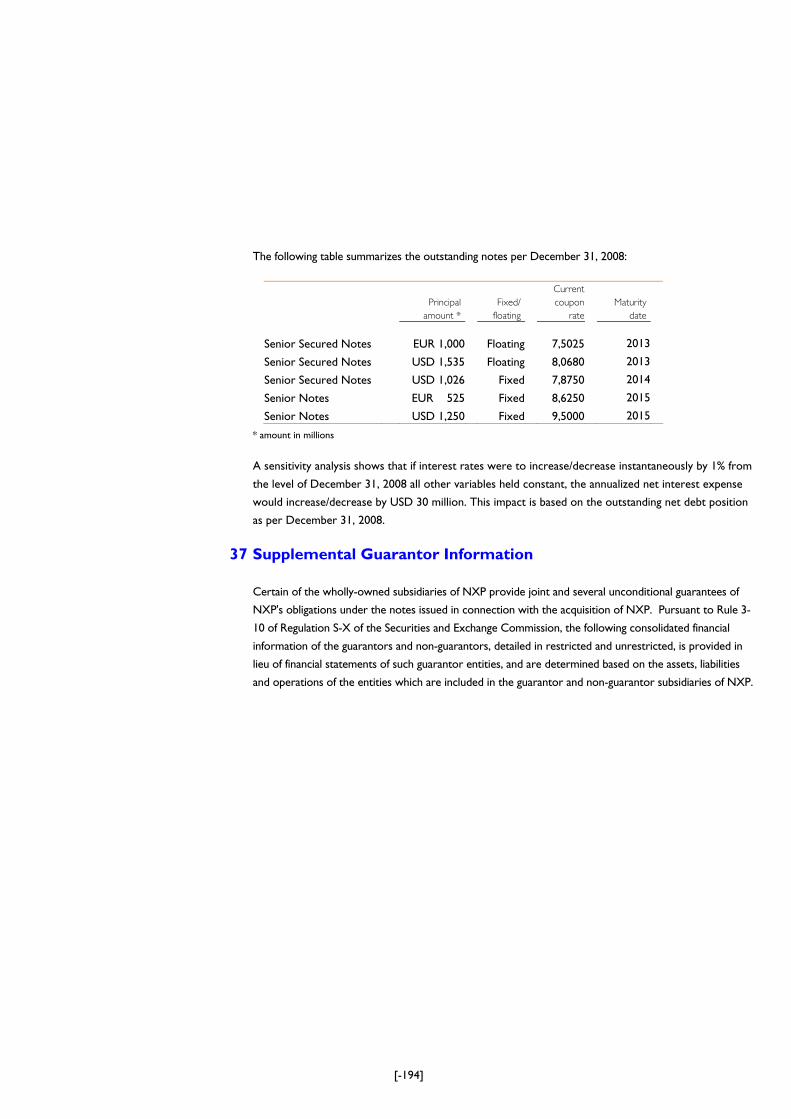
[-194]
The following table summarizes the outstanding notes per December 31, 2008:
Principal
amount *
Fixed/
floating
Current
coupon
rate
Maturity
date
Senior Secured Notes EUR 1,000 Floating 7,5025 2013
Senior Secured Notes USD 1,535 Floating 8,0680 2013
Senior Secured Notes USD 1,026 Fixed 7,8750 2014
Senior Notes EUR 525 Fixed 8,6250 2015
Senior Notes USD 1,250 Fixed 9,5000 2015
* amount in millions A sensitivity analysis shows that if interest rates were to increase/decrease instantaneously by 1% from
the level of December 31, 2008 all other variables held constant, the annualized net interest expense
would increase/decrease by USD 30 million. This impact is based on the outstanding net debt position
as per December 31, 2008.
37 Supplemental Guarantor Information
Certain of the wholly-owned subsidiaries of NXP provide joint and several unconditional guarantees of
NXP's obligations under the notes issued in connection with the acquisition of NXP. Pursuant to Rule 3-
10 of Regulation S-X of the Securities and Exchange Commission, the following consolidated financial
information of the guarantors and non-guarantors, detailed in restricted and unrestricted, is provided in
lieu of financial statements of such guarantor entities, and are determined based on the assets, liabilities
and operations of the entities which are included in the guarantor and non-guarantor subsidiaries of NXP.
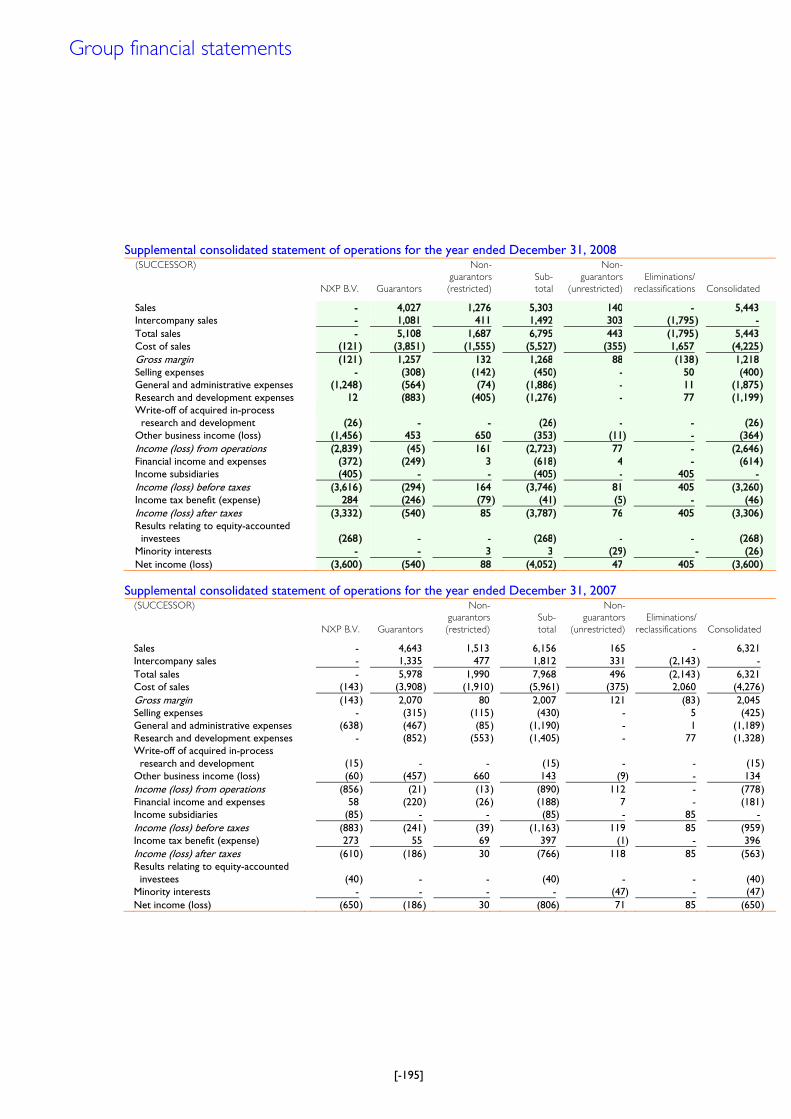
[-195]
Supplemental consolidated statement of operations for the year ended December 31, 2008
(SUCCESSOR)
NXP B.V.
Guarantors
Non-
guarantors
(restricted)
Sub-
total
Non-
guarantors
(unrestricted)
Eliminations/
reclassifications Consolidated Sales - 4,027 1,276 5,303 140 - 5,443 Intercompany sales - 1,081 411 1,492 303 (1,795) - Total sales - 5,108 1,687 6,795 443 (1,795) 5,443 Cost of sales (121) (3,851) (1,555) (5,527) (355) 1,657 (4,225) Gross margin (121) 1,257 132 1,268 88 (138) 1,218 Selling expenses - (308) (142) (450) - 50 (400) General and administrative expenses (1,248) (564) (74) (1,886) - 11 (1,875) Research and development expenses 12 (883) (405) (1,276) - 77 (1,199)
Write-off of acquired in-process research and development (26) - -
(26
) - - (26)
Other business income (loss) (1,456) 453 650 (353) (11) - (364) Income (loss) from operations (2,839) (45) 161 (2,723) 77 - (2,646) Financial income and expenses (372) (249) 3 (618) 4 - (614) Income subsidiaries (405) - - (405) - 405 - Income (loss) before taxes (3,616) (294) 164 (3,746) 81 405 (3,260) Income tax benefit (expense) 284 (246) (79) (41) (5) - (46) Income (loss) after taxes (3,332) (540) 85 (3,787) 76 405 (3,306) Results relating to equity-accounted
investees
(268 ) -
-
(268 ) -
-
(268 )
Minority interests - - 3 3 (29) - (26) Net income (loss) (3,600) (540) 88 (4,052) 47 405 (3,600) Supplemental consolidated statement of operations for the year ended December 31, 2007
(SUCCESSOR)
NXP B.V.
Guarantors
Non-
guarantors
(restricted)
Sub-
total
Non-
guarantors
(unrestricted)
Eliminations/
reclassifications Consolidated Sales - 4,643 1,513 6,156 165 - 6,321 Intercompany sales - 1,335 477 1,812 331 (2,143) - Total sales - 5,978 1,990 7,968 496 (2,143) 6,321 Cost of sales (143) (3,908) (1,910) (5,961) (375) 2,060 (4,276) Gross margin (143) 2,070 80 2,007 121 (83) 2,045 Selling expenses - (315) (115) (430) - 5 (425) General and administrative expenses (638) (467) (85) (1,190) - 1 (1,189) Research and development expenses - (852) (553) (1,405) - 77 (1,328)
Write-off of acquired in-process research and development (15) - -
(15
) - - (15)
Other business income (loss) (60) (457) 660 143 (9) - 134 Income (loss) from operations (856) (21) (13) (890) 112 - (778) Financial income and expenses 58 (220) (26) (188) 7 - (181) Income subsidiaries (85) - - (85) - 85 - Income (loss) before taxes (883) (241) (39) (1,163) 119 85 (959) Income tax benefit (expense) 273 55 69 397 (1) - 396 Income (loss) after taxes (610) (186) 30 (766) 118 85 (563) Results relating to equity-accounted
investees
(40 ) -
-
(40 ) -
-
(40 )
Minority interests - - - - (47) - (47) Net income (loss) (650) (186) 30 (806) 71 85 (650)
Group financial statements
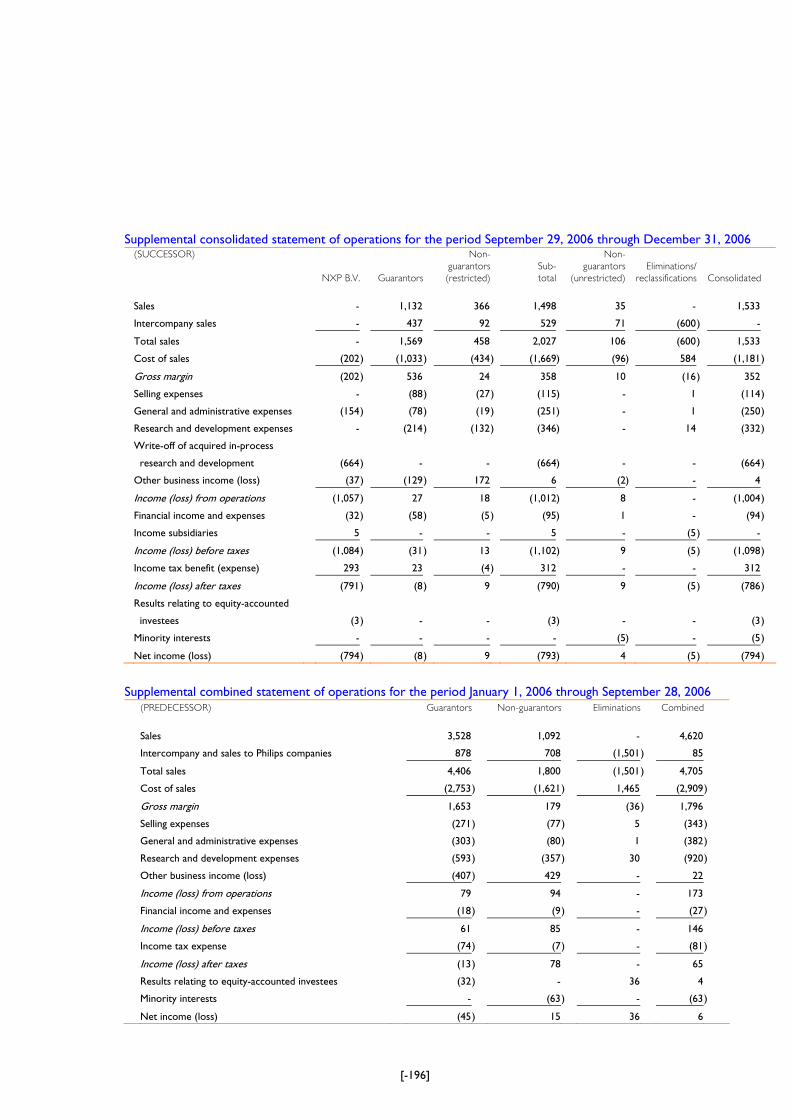
[-196]
Supplemental consolidated statement of operations for the period September 29, 2006 through December 31, 2006 (SUCCESSOR)
NXP B.V.
Guarantors
Non-
guarantors
(restricted)
Sub-
total
Non-
guarantors
(unrestricted)
Eliminations/
reclassifications Consolidated
Sales - 1,132 366 1,498 35 - 1,533
Intercompany sales - 437 92 529 71 (600) -
Total sales - 1,569 458 2,027 106 (600) 1,533
Cost of sales (202) (1,033) (434) (1,669) (96) 584 (1,181)
Gross margin (202) 536 24 358 10 (16) 352
Selling expenses - (88) (27) (115) - 1 (114)
General and administrative expenses (154) (78) (19) (251) - 1 (250)
Research and development expenses - (214) (132) (346) - 14 (332)
Write-off of acquired in-process
research and development (664) - -
(664
) - - (664)
Other business income (loss) (37) (129) 172 6 (2) - 4
Income (loss) from operations (1,057) 27 18 (1,012) 8 - (1,004)
Financial income and expenses (32) (58) (5) (95) 1 - (94)
Income subsidiaries 5 - - 5 - (5) -
Income (loss) before taxes (1,084) (31) 13 (1,102) 9 (5) (1,098)
Income tax benefit (expense) 293 23 (4) 312 - - 312
Income (loss) after taxes (791) (8) 9 (790) 9 (5) (786)
Results relating to equity-accounted
investees
(3
) -
-
(3
) -
-
(3
)
Minority interests - - - - (5) - (5)
Net income (loss) (794) (8) 9 (793) 4 (5) (794)
Supplemental combined statement of operations for the period January 1, 2006 through September 28, 2006 (PREDECESSOR) Guarantors Non-guarantors Eliminations Combined
Sales 3,528 1,092 - 4,620
Intercompany and sales to Philips companies 878 708 (1,501 ) 85
Total sales 4,406 1,800 (1,501 ) 4,705
Cost of sales (2,753) (1,621 ) 1,465 (2,909)
Gross margin 1,653 179 (36 ) 1,796
Selling expenses (271) (77 ) 5 (343)
General and administrative expenses (303) (80 ) 1 (382)
Research and development expenses (593) (357 ) 30 (920)
Other business income (loss) (407) 429 - 22
Income (loss) from operations 79 94 - 173
Financial income and expenses (18) (9 ) - (27)
Income (loss) before taxes 61 85 - 146
Income tax expense (74) (7 ) - (81)
Income (loss) after taxes (13) 78 - 65
Results relating to equity-accounted investees (32) - 36 4
Minority interests - (63 ) - (63)
Net income (loss) (45) 15 36 6
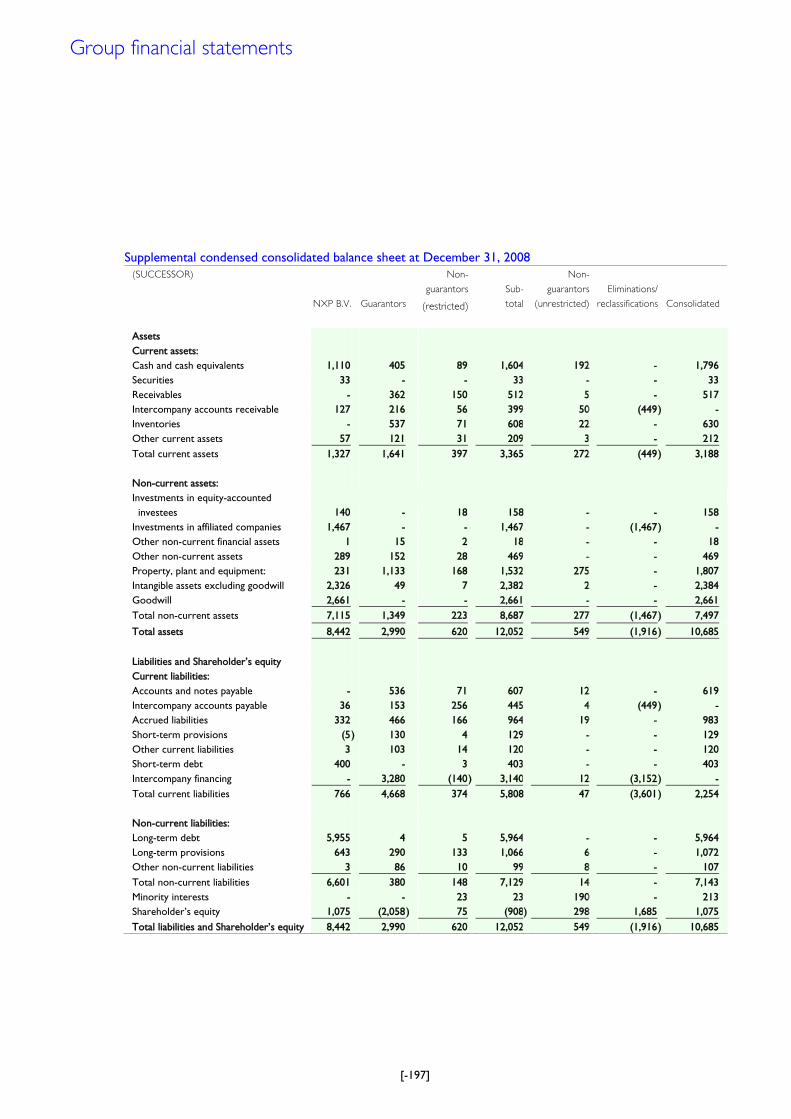
[-197]
Supplemental condensed consolidated balance sheet at December 31, 2008 (SUCCESSOR)
NXP B.V.
Guarantors
Non-
guarantors
(restricted)
Sub-
total
Non-
guarantors
(unrestricted)
Eliminations/
reclassifications Consolidated
Assets Current assets: Cash and cash equivalents 1,110 405 89 1,604 192 - 1,796 Securities 33 - - 33 - - 33 Receivables - 362 150 512 5 - 517 Intercompany accounts receivable 127 216 56 399 50 (449) - Inventories - 537 71 608 22 - 630 Other current assets 57 121 31 209 3 - 212 Total current assets 1,327 1,641 397 3,365 272 (449) 3,188 Non-current assets:
Investments in equity-accounted investees 140 - 18 158 - - 158
Investments in affiliated companies 1,467 - - 1,467 - (1,467) - Other non-current financial assets 1 15 2 18 - - 18 Other non-current assets 289 152 28 469 - - 469 Property, plant and equipment: 231 1,133 168 1,532 275 - 1,807 Intangible assets excluding goodwill 2,326 49 7 2,382 2 - 2,384 Goodwill 2,661 - - 2,661 - - 2,661 Total non-current assets 7,115 1,349 223 8,687 277 (1,467) 7,497
Total assets 8,442 2,990 620 12,052 549 (1,916) 10,685 Liabilities and ShareholderÊs equity Current liabilities: Accounts and notes payable - 536 71 607 12 - 619 Intercompany accounts payable 36 153 256 445 4 (449) - Accrued liabilities 332 466 166 964 19 - 983 Short-term provisions (5) 130 4 129 - - 129 Other current liabilities 3 103 14 120 - - 120 Short-term debt 400 - 3 403 - - 403 Intercompany financing - 3,280 (140) 3,140 12 (3,152) - Total current liabilities 766 4,668 374 5,808 47 (3,601) 2,254 Non-current liabilities: Long-term debt 5,955 4 5 5,964 - - 5,964 Long-term provisions 643 290 133 1,066 6 - 1,072 Other non-current liabilities 3 86 10 99 8 - 107 Total non-current liabilities 6,601 380 148 7,129 14 - 7,143 Minority interests - - 23 23 190 - 213 ShareholderÊs equity 1,075 (2,058) 75 (908) 298 1,685 1,075 Total liabilities and ShareholderÊs equity 8,442 2,990 620 12,052 549 (1,916) 10,685
Group financial statements
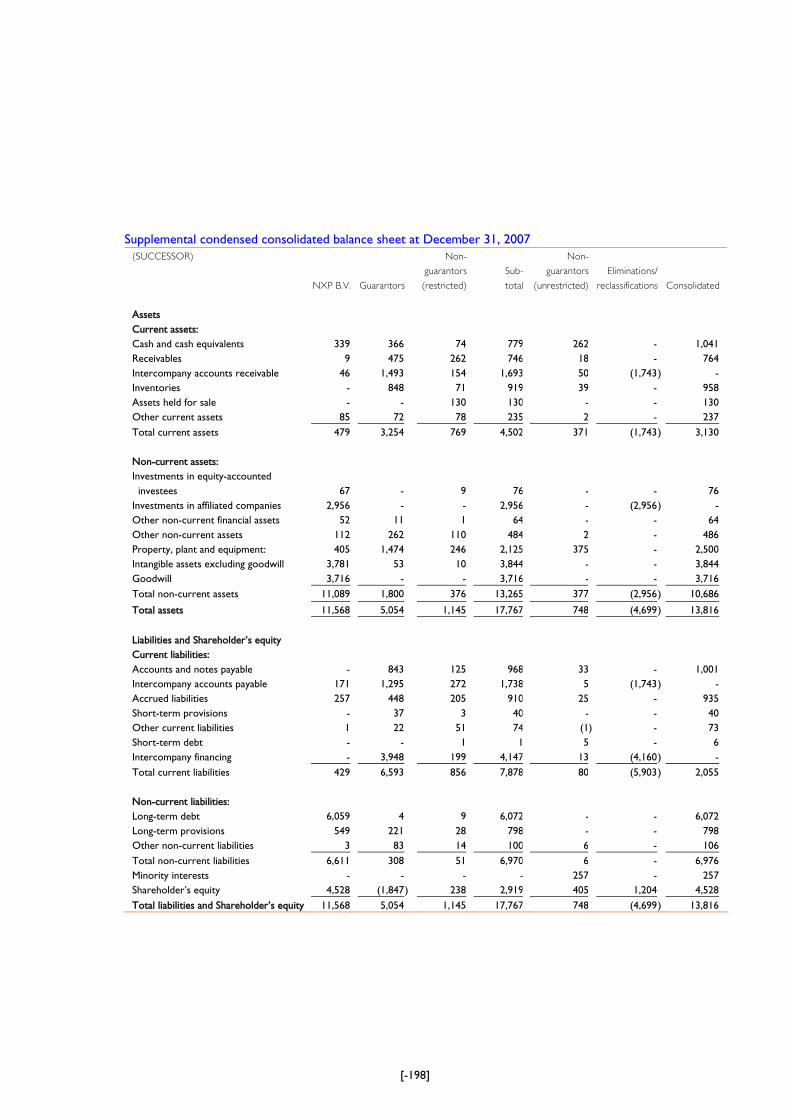
[-198]
Supplemental condensed consolidated balance sheet at December 31, 2007 (SUCCESSOR)
NXP B.V.
Guarantors
Non-
guarantors
(restricted)
Sub-
total
Non-
guarantors
(unrestricted)
Eliminations/
reclassifications Consolidated
Assets Current assets: Cash and cash equivalents 339 366 74 779 262 - 1,041 Receivables 9 475 262 746 18 - 764 Intercompany accounts receivable 46 1,493 154 1,693 50 (1,743) - Inventories - 848 71 919 39 - 958 Assets held for sale - - 130 130 - - 130 Other current assets 85 72 78 235 2 - 237 Total current assets 479 3,254 769 4,502 371 (1,743) 3,130 Non-current assets: Investments in equity-accounted
investees
67
-
9
76
-
-
76
Investments in affiliated companies 2,956 - - 2,956 - (2,956) - Other non-current financial assets 52 11 1 64 - - 64 Other non-current assets 112 262 110 484 2 - 486 Property, plant and equipment: 405 1,474 246 2,125 375 - 2,500 Intangible assets excluding goodwill 3,781 53 10 3,844 - - 3,844 Goodwill 3,716 - - 3,716 - - 3,716 Total non-current assets 11,089 1,800 376 13,265 377 (2,956) 10,686
Total assets 11,568 5,054 1,145 17,767 748 (4,699) 13,816 Liabilities and ShareholderÊs equity Current liabilities: Accounts and notes payable - 843 125 968 33 - 1,001 Intercompany accounts payable 171 1,295 272 1,738 5 (1,743) - Accrued liabilities 257 448 205 910 25 - 935 Short-term provisions - 37 3 40 - - 40 Other current liabilities 1 22 51 74 (1) - 73 Short-term debt - - 1 1 5 - 6 Intercompany financing - 3,948 199 4,147 13 (4,160) - Total current liabilities 429 6,593 856 7,878 80 (5,903) 2,055 Non-current liabilities: Long-term debt 6,059 4 9 6,072 - - 6,072 Long-term provisions 549 221 28 798 - - 798 Other non-current liabilities 3 83 14 100 6 - 106 Total non-current liabilities 6,611 308 51 6,970 6 - 6,976 Minority interests - - - - 257 - 257 ShareholderÊs equity 4,528 (1,847) 238 2,919 405 1,204 4,528 Total liabilities and ShareholderÊs equity 11,568 5,054 1,145 17,767 748 (4,699) 13,816
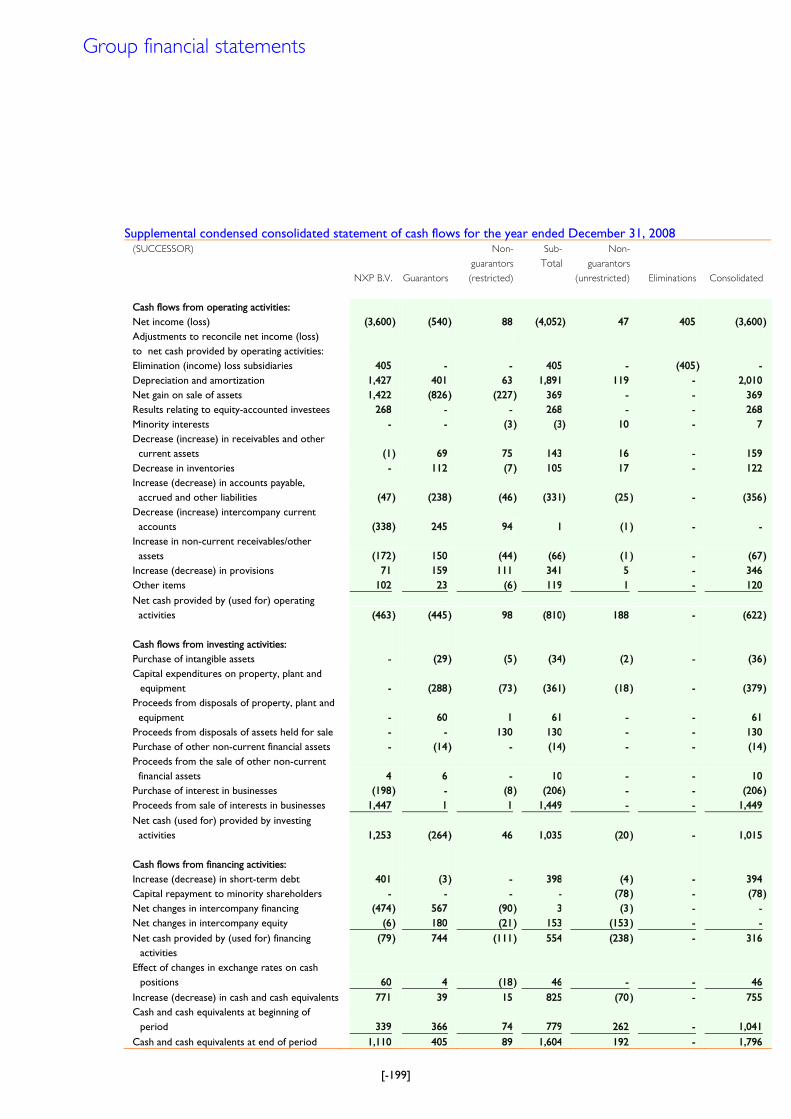
[-199]
Supplemental condensed consolidated statement of cash flows for the year ended December 31, 2008 (SUCCESSOR)
NXP B.V.
Guarantors
Non-
guarantors
(restricted)
Sub-
Total
Non-
guarantors
(unrestricted) Eliminations Consolidated
Cash flows from operating activities: Net income (loss) (3,600) (540) 88 (4,052) 47 405 (3,600) Adjustments to reconcile net income (loss)
to net cash provided by operating activities:
Elimination (income) loss subsidiaries 405 - - 405 - (405) - Depreciation and amortization 1,427 401 63 1,891 119 - 2,010 Net gain on sale of assets 1,422 (826) (227) 369 - - 369 Results relating to equity-accounted investees 268 - - 268 - - 268 Minority interests - - (3) (3) 10 - 7 Decrease (increase) in receivables and other
current assets
(1) 69 75 143 16 - 159 Decrease in inventories - 112 (7) 105 17 - 122
Increase (decrease) in accounts payable, accrued and other liabilities (47) (238) (46) (331) (25 ) - (356)
Decrease (increase) intercompany current accounts
(338) 245 94 1 (1 ) - -
Increase in non-current receivables/other assets
(172) 150 (44) (66) (1 ) - (67)
Increase (decrease) in provisions 71 159 111 341 5 - 346 Other items 102 23 (6) 119 1 - 120 Net cash provided by (used for) operating
activities
(463) (445) 98 (810) 188 - (622) Cash flows from investing activities: Purchase of intangible assets - (29) (5) (34) (2 ) - (36) Capital expenditures on property, plant and
equipment
- (288) (73) (361) (18 ) - (379) Proceeds from disposals of property, plant and
equipment
- 60 1 61 - - 61 Proceeds from disposals of assets held for sale - - 130 130 - - 130 Purchase of other non-current financial assets - (14) - (14) - - (14) Proceeds from the sale of other non-current
financial assets
4 6 - 10 - - 10 Purchase of interest in businesses (198) - (8) (206) - - (206) Proceeds from sale of interests in businesses 1,447 1 1 1,449 - - 1,449 Net cash (used for) provided by investing
activities
1,253 (264) 46 1,035 (20 ) - 1,015 Cash flows from financing activities: Increase (decrease) in short-term debt 401 (3) - 398 (4 ) - 394 Capital repayment to minority shareholders - - - - (78 ) - (78) Net changes in intercompany financing (474) 567 (90) 3 (3 ) - - Net changes in intercompany equity (6) 180 (21) 153 (153 ) - - Net cash provided by (used for) financing
activities (79) 744 (111) 554 (238 ) - 316
Effect of changes in exchange rates on cash positions
60 4 (18) 46 - - 46
Increase (decrease) in cash and cash equivalents 771 39 15 825 (70 ) - 755 Cash and cash equivalents at beginning of
period
339 366 74 779 262 - 1,041 Cash and cash equivalents at end of period 1,110 405 89 1,604 192 - 1,796
Group financial statements
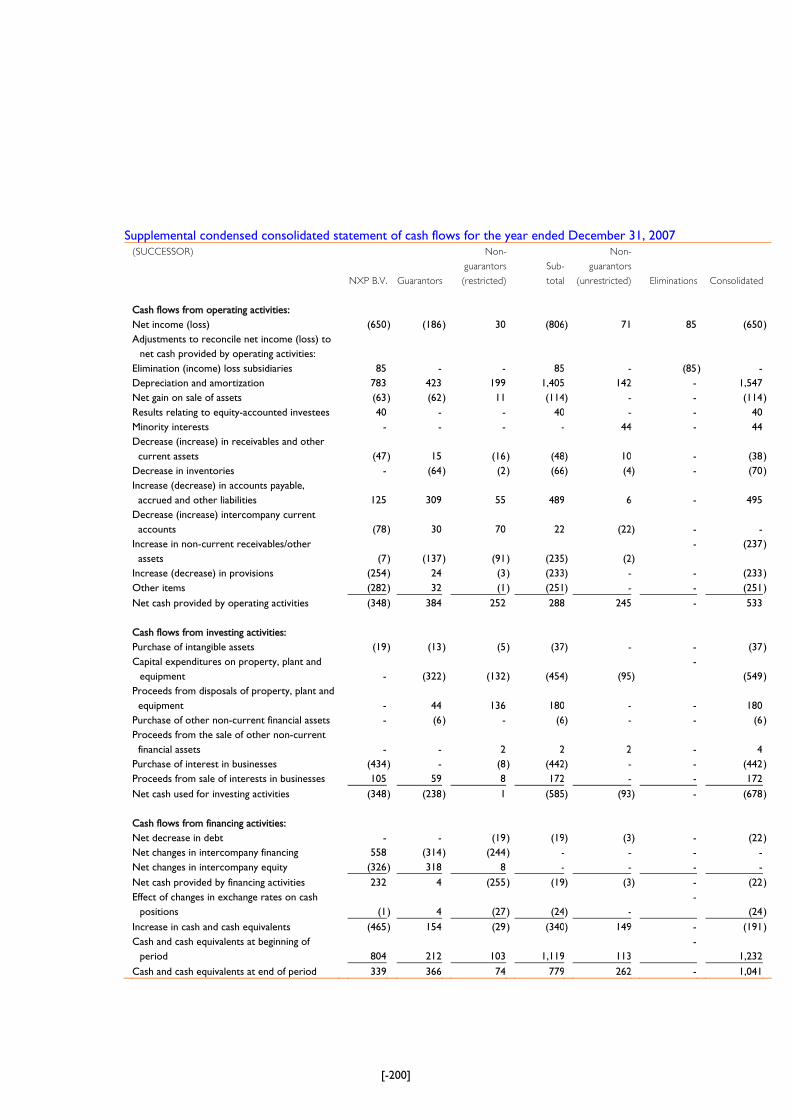
[-200]
Supplemental condensed consolidated statement of cash flows for the year ended December 31, 2007 (SUCCESSOR)
NXP B.V.
Guarantors
Non-
guarantors
(restricted)
Sub-
total
Non-
guarantors
(unrestricted) Eliminations Consolidated
Cash flows from operating activities: Net income (loss) (650) (186) 30 (806) 71 85 (650) Adjustments to reconcile net income (loss) to
net cash provided by operating activities:
Elimination (income) loss subsidiaries 85 - - 85 - (85) - Depreciation and amortization 783 423 199 1,405 142 - 1,547 Net gain on sale of assets (63) (62) 11 (114) - - (114) Results relating to equity-accounted investees 40 - - 40 - - 40 Minority interests - - - - 44 - 44 Decrease (increase) in receivables and other
current assets
(47 ) 15
(16
) (48
)
10
-
(38 )
Decrease in inventories - (64) (2) (66) (4 ) - (70)
Increase (decrease) in accounts payable, accrued and other liabilities 125 309 55 489
6 - 495
Decrease (increase) intercompany current accounts
(78
) 30
70
22
(22
) -
-
Increase in non-current receivables/other assets
(7
) (137
) (91
) (235
)
(2
)
- (237)
Increase (decrease) in provisions (254) 24 (3) (233) - - (233) Other items (282) 32 (1) (251) - - (251) Net cash provided by operating activities (348) 384 252 288 245 - 533 Cash flows from investing activities: Purchase of intangible assets (19) (13) (5) (37) - - (37) Capital expenditures on property, plant and
equipment
-
(322 ) (132
) (454
)
(95
)
- (549
)
Proceeds from disposals of property, plant and equipment
-
44
136
180
-
-
180
Purchase of other non-current financial assets - (6) - (6) - - (6) Proceeds from the sale of other non-current
financial assets
-
-
2
2
2
-
4
Purchase of interest in businesses (434) - (8) (442) - - (442) Proceeds from sale of interests in businesses 105 59 8 172 - - 172 Net cash used for investing activities (348) (238) 1 (585) (93 ) - (678) Cash flows from financing activities: Net decrease in debt - - (19) (19) (3 ) - (22) Net changes in intercompany financing 558 (314) (244) - - - - Net changes in intercompany equity (326) 318 8 - - - - Net cash provided by financing activities 232 4 (255) (19) (3 ) - (22) Effect of changes in exchange rates on cash
positions
(1 ) 4
(27
) (24
)
- -
(24 )
Increase in cash and cash equivalents (465) 154 (29) (340) 149 - (191) Cash and cash equivalents at beginning of
period
804
212
103
1,119
113 -
1,232
Cash and cash equivalents at end of period 339 366 74 779 262 - 1,041
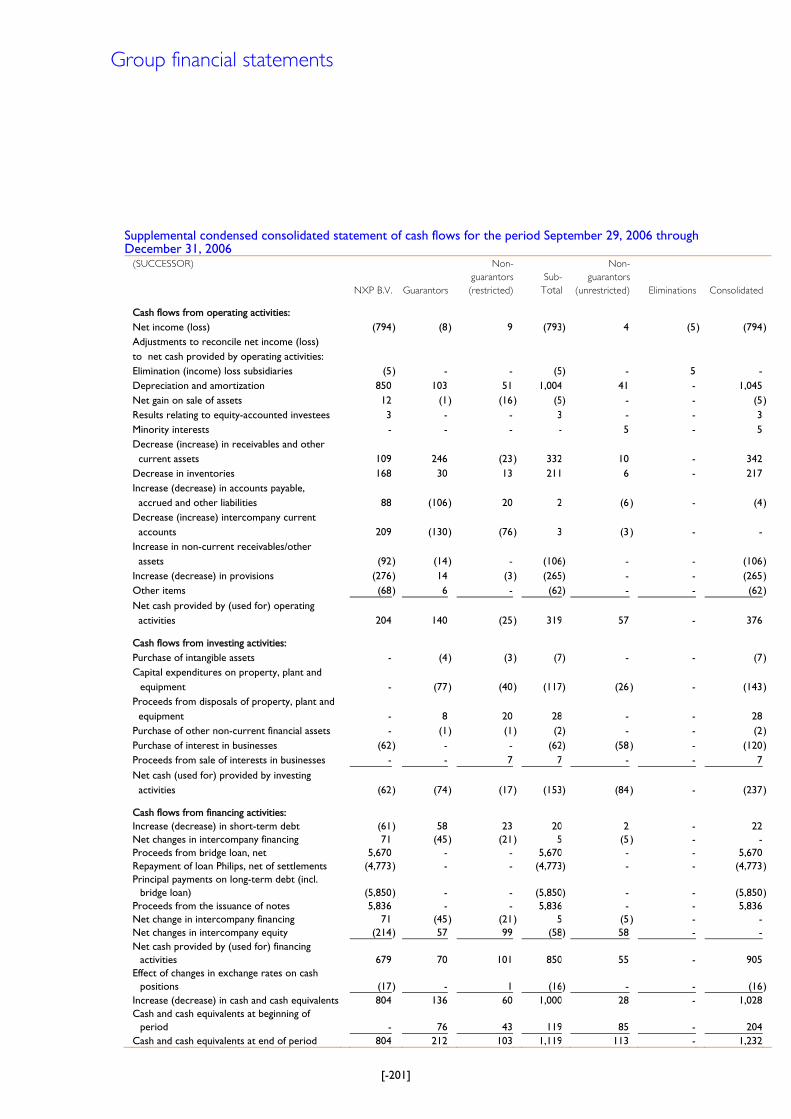
[-201]
Supplemental condensed consolidated statement of cash flows for the period September 29, 2006 through December 31, 2006
(SUCCESSOR)
NXP B.V.
Guarantors
Non-
guarantors
(restricted)
Sub-
Total
Non-
guarantors
(unrestricted) Eliminations Consolidated
Cash flows from operating activities: Net income (loss) (794) (8) 9 (793) 4 (5) (794) Adjustments to reconcile net income (loss)
to net cash provided by operating activities:
Elimination (income) loss subsidiaries (5) - - (5) - 5 - Depreciation and amortization 850 103 51 1,004 41 - 1,045 Net gain on sale of assets 12 (1) (16) (5) - - (5) Results relating to equity-accounted investees 3 - - 3 - - 3 Minority interests - - - - 5 - 5 Decrease (increase) in receivables and other
current assets
109 246 (23) 332 10 - 342 Decrease in inventories 168 30 13 211 6 - 217
Increase (decrease) in accounts payable, accrued and other liabilities 88 (106) 20 2 (6 ) - (4)
Decrease (increase) intercompany current accounts
209 (130) (76) 3 (3 ) - -
Increase in non-current receivables/other assets
(92) (14) - (106) - - (106)
Increase (decrease) in provisions (276) 14 (3) (265) - - (265) Other items (68) 6 - (62) - - (62) Net cash provided by (used for) operating
activities
204 140 (25) 319 57 - 376 Cash flows from investing activities: Purchase of intangible assets - (4) (3) (7) - - (7) Capital expenditures on property, plant and
equipment
- (77) (40) (117) (26 ) - (143) Proceeds from disposals of property, plant and
equipment
- 8 20 28 - - 28 Purchase of other non-current financial assets - (1) (1) (2) - - (2) Purchase of interest in businesses (62) - - (62) (58 ) - (120) Proceeds from sale of interests in businesses - - 7 7 - - 7 Net cash (used for) provided by investing
activities
(62) (74) (17) (153) (84 ) - (237) Cash flows from financing activities: Increase (decrease) in short-term debt (61) 58 23 20 2 - 22 Net changes in intercompany financing 71 (45) (21) 5 (5 ) - - Proceeds from bridge loan, net 5,670 - - 5,670 - - 5,670 Repayment of loan Philips, net of settlements (4,773) - - (4,773) - - (4,773) Principal payments on long-term debt (incl.
bridge loan)
(5,850 ) -
-
(5,850 )
-
-
(5,850 )
Proceeds from the issuance of notes 5,836 - - 5,836 - - 5,836 Net change in intercompany financing 71 (45) (21) 5 (5 ) - - Net changes in intercompany equity (214) 57 99 (58) 58 - - Net cash provided by (used for) financing
activities
679
70
101
850
55
-
905
Effect of changes in exchange rates on cash positions
(17) - 1 (16) - - (16)
Increase (decrease) in cash and cash equivalents 804 136 60 1,000 28 - 1,028 Cash and cash equivalents at beginning of
period
- 76 43 119 85 - 204 Cash and cash equivalents at end of period 804 212 103 1,119 113 - 1,232
Group financial statements
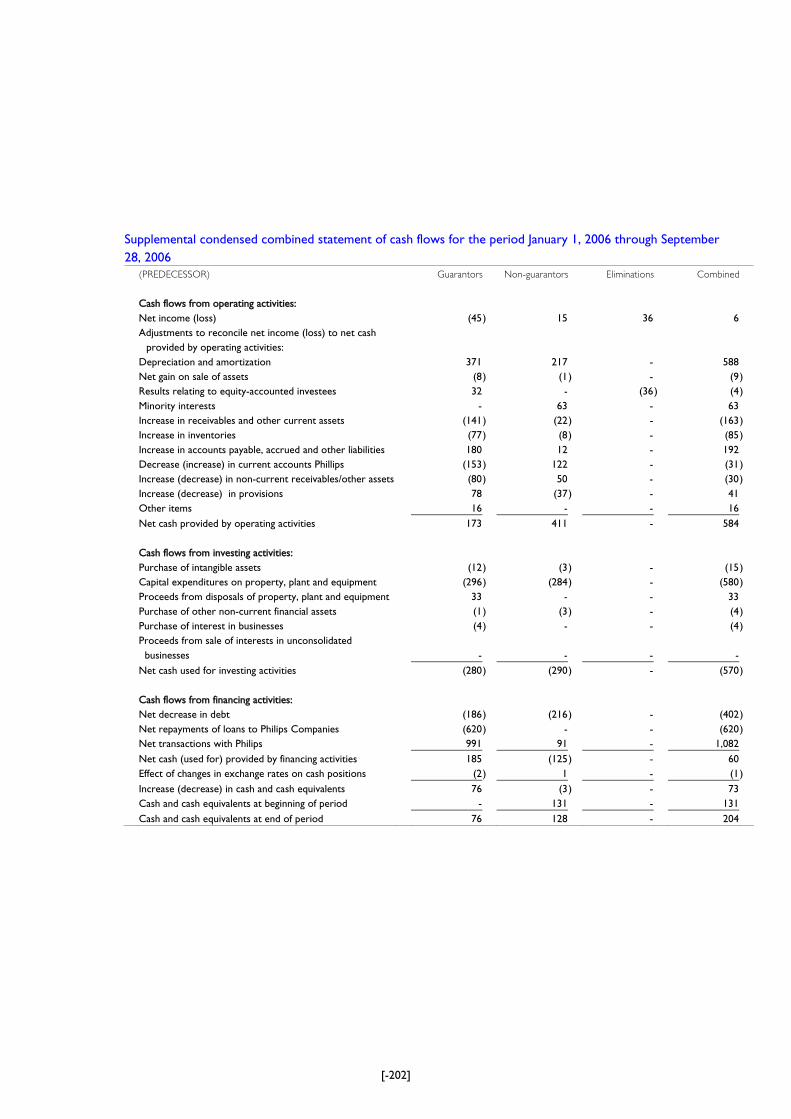
[-202]
Supplemental condensed combined statement of cash flows for the period January 1, 2006 through September 28, 2006
(PREDECESSOR) Guarantors Non-guarantors Eliminations Combined
Cash flows from operating activities: Net income (loss) (45) 15 36 6 Adjustments to reconcile net income (loss) to net cash
provided by operating activities:
Depreciation and amortization 371 217 - 588 Net gain on sale of assets (8) (1 ) - (9) Results relating to equity-accounted investees 32 - (36 ) (4) Minority interests - 63 - 63 Increase in receivables and other current assets (141) (22 ) - (163) Increase in inventories (77) (8 ) - (85) Increase in accounts payable, accrued and other liabilities 180 12 - 192 Decrease (increase) in current accounts Phillips (153) 122 - (31) Increase (decrease) in non-current receivables/other assets (80) 50 - (30) Increase (decrease) in provisions 78 (37 ) - 41 Other items 16 - - 16 Net cash provided by operating activities 173 411 - 584 Cash flows from investing activities: Purchase of intangible assets (12) (3 ) - (15) Capital expenditures on property, plant and equipment (296) (284 ) - (580) Proceeds from disposals of property, plant and equipment 33 - - 33 Purchase of other non-current financial assets (1) (3 ) - (4) Purchase of interest in businesses (4) - - (4) Proceeds from sale of interests in unconsolidated
businesses
-
-
-
-
Net cash used for investing activities (280) (290 ) - (570) Cash flows from financing activities: Net decrease in debt (186) (216 ) - (402) Net repayments of loans to Philips Companies (620) - - (620) Net transactions with Philips 991 91 - 1,082 Net cash (used for) provided by financing activities 185 (125 ) - 60 Effect of changes in exchange rates on cash positions (2) 1 - (1) Increase (decrease) in cash and cash equivalents 76 (3 ) - 73 Cash and cash equivalents at beginning of period - 131 - 131 Cash and cash equivalents at end of period 76 128 - 204
[-203]
38 Subsequent events
On April 2, 2009, we announced the closing of two separate private offers to exchange existing
unsecured and secured notes for new U.S. dollar and euro-denominated super priority notes
upon the terms and subject to the conditions set forth in the confidential offering memorandum
relating to the exchange offers. The purpose of the exchange offers, commenced on March 3,
2009, is to reduce our overall indebtedness and related interest expense. As a result, overall
indebtedness will be reduced by approximately USD 465 million, with a corresponding increase
in net income, taking into account tax effects, if any. Furthermore, the related annual interest
expense will be reduced by approximately USD 30 million.
On March 13, 2009, Singapore based Systems on Silicon Manufacturing Company Pte. Ltd.
(„SSMC‰) (in which we have a 61.2% ownership share) paid USD 73 million cash dividend for
2008 to its shareholders. As a consequence, the USD 29 million that was paid to TSMC (our
joint-venture partner in SSMC) reduced the consolidated cash position which will be reflected in
the first quarter 2009 cash flow from operating activities.
On March 13, 2009, we announced the completion of the sale and repurchase of our stake in
DSPG (approximately 4.2 million shares or 16% outstanding common stock of DSPG) currently
held by us and obtained in 2007 following the divestment of our Cordless & VoIP Terminal
operations. The agreed repurchase price amounted to approximately USD 20 million. Effective
the same date, we have surrendered our seat on the board of directors of DSPG in accordance
with the Stock Repurchase Agreement.
On February 13, 2009, we drew an additional USD 200 million under our senior secured
revolving credit facility, bringing the total amount drawn under this facility to USD 600 million,
without taking into account USD 5 million of outstanding bank guarantees under the facility. As of
that date, we had approximately EUR 39 million of remaining availability under the facility, after
taking into account outstanding bank guarantees under the facility.
On February 2, 2009, STMicroelectronics purchased our 20% stake in ST-NXP. The agreed
purchase price, based on the sales and EBITDA performance of the ST-NXP business in the last
twelve months, was USD 92 million.
Group financial statements
[-204]
Auditors' Reports
Report of Independent Registered Public Accounting Firm To the Board of Management of NXP B.V.
We have audited the accompanying combined statements of operations, changes in businessÊ
equity and cash flows of NXP B.V. (formerly known as Philips Semiconductors International B.V.)
and the semiconductor businesses of Philips (Predecessor) for the period January 1, 2006 to
September 28, 2006 (Predecessor period) appearing on pages 112 to 203. These combined
financial statements are the responsibility of the CompanyÊs management. Our responsibility is to
express an opinion on these combined financial statements based on our audit.
We conducted our audit in accordance with the standards of the Public Company Accounting
Oversight Board (United States). Those standards require that we plan and perform the audit to
obtain reasonable assurance about whether the financial statements are free of material
misstatement. An audit includes examining, on a test basis, evidence supporting the amounts and
disclosures in the financial statements. An audit also includes assessing the accounting principles
used and significant estimates made by management, as well as evaluating the overall financial
statement presentation. We believe that our audit provides a reasonable basis for our opinion.
In our opinion, the combined financial statements referred to above present fairly, in all material
respects, the combined results of operations and cash flows of NXP B.V. (formerly known as
Philips Semiconductors International B.V.) and the semiconductor businesses of Philips
(Predecessor) for the period January 1, 2006 to September 28, 2006 (Predecessor period) in
conformity with U.S. generally accepted accounting principles.
As disclosed under Reporting Currency in Note 1 to the combined and consolidated financial
statements on page 118, effective from January 1, 2008, NXP B.V. changed its reporting currency
from Euro to U.S. dollars. This change has been applied on a retrospective basis. Accordingly, the
accompanying combined financials statements for the period January 1, 2006 to September 28,
2006 (Predecessor period) differ from those previously reported.
KPMG ACCOUNTANTS N.V.
Amstelveen, The Netherlands
March 22, 2007 except for Note 1 under Reporting Currency on page 118
to which the date is March 3, 2009.
[-205]
Report of Independent Registered Public Accounting Firm To the Board of Management and Shareholders of NXP B.V.
We have audited the accompanying consolidated balance sheets of NXP B.V. and subsidiaries
(the "Company") as of December 31, 2008 and 2007, and the related consolidated statements of
operations, shareholders' equity, and cash flows for the two years then ended and the period
from September 29, 2006 to December 31, 2006 (Successor period) as set out on page 112 until
page 203. These consolidated financial statements are the responsibility of the Company's
management. Our responsibility is to express an opinion on these consolidated financial
statements based on our audits.
We conducted our audits in accordance with the standards of the Public Company Accounting
Oversight Board (United States). Those standards require that we plan and perform the audit to
obtain reasonable assurance about whether the financial statements are free of material
misstatement. The Company is not required to have, nor were we engaged to perform, an audit
of its internal control over financial reporting. Our audits included consideration of internal
control over financial reporting as a basis for designing audit procedures that are appropriate in
the circumstances, but not for the purpose of expressing an opinion on the effectiveness of the
Company's internal control over financial reporting. Accordingly, we express no such opinion.
An audit also includes examining, on a test basis, evidence supporting the amounts and
disclosures in the financial statements, assessing the accounting principles used and significant
estimates made by management, as well as evaluating the overall financial statement
presentation. We believe that our audits provide a reasonable basis for our opinion.
In our opinion, such consolidated financial statements present fairly, in all material respects, the
financial position of NXP B.V. and subsidiaries as of December 31, 2008 and 2007, and the results
of their operations and their cash flows for the two years then ended and the period from
September 29, 2006 to December 31, 2006 in conformity with accounting principles generally
accepted in the United States of America.
Deloitte Accountants B.V.
M.J. van der Vegte
Amsterdam, The Netherlands
March 3, 2009
(April 7, 2009 as to Note 38)
Group financial statements
[-206]
Corporate seat and head office We were incorporated in The Netherlands as a Dutch private company with limited liability (besloten vennootschap) on December 21, 1990 as a wholly-owned subsidiary of Koninklijke Philips Electronics N.V. On
September 29, 2006 we changed our name from Philips Semiconductors International B.V. to NXP B.V. Our
corporate seat is in Eindhoven, The Netherlands, and the statutory list of all subsidiaries and affiliated companies,
prepared in accordance with the relevant legal requirements (Netherlands Civil Code, Book 2, Sections 379 and
414), forms part of the notes to the consolidated financial statements and is deposited at the office of the
Commercial Register in Eindhoven, Netherlands (file no. 17070622).
Our registered office is:
NXP Semiconductors
High Tech Campus 60,
PO Box 80073, 5600 KA Eindhoven
The Netherlands
Switchboard telephone: +31-40-27 29999 Investor Information Activities NXP is in contact with its investors via broker conferences, roadshows, conference calls and meetings. The purpose hereof is to inform the market on the results, strategy and decisions made. Financial calendar First quarterly report 2009 April 29, 2009 *) Second quarterly report 2009 July 23, 2009 *) Third quarterly report 2009 October 27, 2009 *) Fourth quarterly report 2009/Annual Report 2009 February 23, 2010 *) *) These dates are subject to final confirmation
Credit ratings (as per December 31, 2008) *) Agency Standard & PoorÊs MoodyÊs Corporate rating CCC Caa1 Senior Secured notes CCC Caa1 Senior unsecured notes CCC- Caa3 Secured revolving credit facility B *) The Standard & PoorÊs and MoodyÊs ratings have a negative outlook.
Website Detailed information for investors is available on our Investor Relations website http://www.nxp.com/investor/. Next to financial reports and presentations, the site provides a financial calendar, recent company news, a subscription possibility and contact information. Contacts Jan Maarten Ingen Housz SVP & Group Treasurer/Investor Relations Telephone: +31-40- 27 28685 E-mail: [email protected] Mariëlle Oprinsen Office Manager – Investor Relations Telephone: +31-40-27 28079 E-mail: [email protected]
Investor Information

Date of release: April 2009
Printed in the Netherlands
© 2009 NXP B.V.
Related Documents