Welcome message from author
This document is posted to help you gain knowledge. Please leave a comment to let me know what you think about it! Share it to your friends and learn new things together.
Transcript

Seneca Foods Corporation
Annual Report 2005

Seneca Foods Corporation conducts its business almostentirely in food processing, which currently contributes about99% of the Company’s sales. Canned vegetables represent89% of the food processing volume. Frozen vegetablesrepresent 9% of food processing volume. Fruit productsaccount for the remaining 2% of food processing sales.
Approximately 10% of the Company’s food products arepacked under its own brands including Seneca®, Libby’s®,
Years ended March 31, 2005 2004 Increase (Decrease)
Net sales $864,274,000 $890,850,000 (3.0%)Net earnings 7,907,000 12,941,000 (38.9)Stockholders’ equity 195,809,000 190,249,000 2.9Diluted earnings per share $ 0.70 $ 1.17 (40.2%)Total Stockholders’ equity per
equivalent common share 17.49 17.00 2.9
Financial Highlights
Aunt Nellie’s Farm Kitchen®, Stokely’s®, Read®, Festal®,and Diamond A®. About 46% of the processed foods arepacked under private labels and 18% are sold to institutionalfood distributors. The remaining 26% are sold under anAlliance Agreement with General Mills Operations, Inc.
Marion, New YorkJune 10, 2005
Description of Business
1

Fiscal year 2005 was a challenging one as the benefits of the prior year’sacquisition of Chiquita Processed Foods were offset by a rapid increasein input costs and a difficult growing season. As a result, Seneca Foodsearned $7,907,000 or $.70 per share in fiscal year 2005 versus $12,941,000or $1.17 per share in fiscal year 2004. This was on sales of $864,274,000versus $890,850,000. As is often the case, the numbers do not tell theentire story, and we remain upbeat about the Company’s future.
During the first six months of fiscal year 2005, the Company was profitable,reaping the benefits of one of the largest acquisitions in our 55-yearhistory. However, as we approached the new pack season, the cost ofkey commodity inputs such as steel, natural gas, and fuel was risingquickly. As a result, our can, transportation, plant energy, and otherlogistical costs were significantly higher than the prior year. As many ofour customer contracts are semi-annual or annual in nature, we were notin a position to fully pass along these higher costs. This conditioncontinues into the new fiscal year until the expiry of these commitments.
Last summer and fall, we also experienced a difficult growing season. Inour primary agricultural areas of Minnesota, Wisconsin, and New York,we had one of the coldest Augusts on record and, in fact, it was the firsttime in 100 years that the month of August had lower average temperaturesthan September. These unusual weather patterns slowed our harvestconsiderably as our crops did not mature on a timely basis due to the coolweather. Many crops were still in the ground when the first frost hit inlate September. This impacted us in a dramatic fashion as our costsincreased by over $20 million in just a two-week period in early Octoberdue to the reduced recoveries and product left in the field. Our Companywas hurt more than some of our competitors because our production ismore heavily weighted in the state of Minnesota where the impact of thefreeze was most severe.
Furthermore, a reduction in canned and frozen case volume requirementsfrom our Alliance partner, General Mills, resulted in excess capacitywithin our existing plant configuration. Working closely with GeneralMills to determine the long-term implications of their reduced needs, wedecided to close a facility in Walla Walla, Washington in order to realignthe capacity with the demands. Fortunately, we were able to negotiatefuture reimbursement for the plant closing from General Mills on a mutuallysatisfactory basis.
During fiscal year 2005, we completed several initiatives that involvedplant consolidations. We closed a green bean plant in upstate New Yorkand a cream style corn plant in northeastern Wisconsin. Both of theseopportunities were borne out of the acquisition as we were able to realizesubstantial savings by moving the volumes into our other plants withminimal capital investment. Also, we restructured the newly acquiredPayette, Idaho plant to remove canned meat and to focus exclusively onbeans. This decision turned the operation from a loss to a profit in a shortperiod of time. These closings and restructurings resulted in a charge toearnings of $7,678,000. These projects were mostly non-cash chargesthat will lower our future cost of operations.
To Our Shareholders
Finally, like all public companies, we have been financially impacted bythe passage of the Sarbanes-Oxley Act of 2002. The implementationcosts were at least $2,500,000 in fiscal year 2005 as our Companyaggressively worked to comply with the intent of the law. As this was thefirst year for Seneca to comply with Section 404 of the Act on internalcontrols, there have been many start-up expenses that should not berepeated. This was a very challenging project for our Company as wehave grown through acquisitions in recent years.
As we look forward to the upcoming year, we will be taking a breather oncapital investments in our vegetable processing plants. For the past twoyears, Seneca has been busy working on integrating the Chiquita ProcessedFoods acquisition with all of the attendant investments in modernizingthe newly acquired plants, the harvesting equipment, and warehousing.This effort is essentially complete, so with a single-minded focus towardoperational excellence this year, we expect to reap the rewards of our hardwork and investment. As we focus on canned and frozen vegetables, weintend to divest some smaller non-core areas including our glace fruit andcanned meat business. We are in discussions with parties to divest thesesmall product lines with total sales of less than $5 million.
Our biggest challenge remains the increases associated with steel andenergy. Higher steel prices alone are going to impact our upcoming packby over $15 million. We are addressing this challenge with added investmentin our can-manufacturing plants to reduce the metal content in our canswith the newest technology available. Also, we are expanding the capacitiesof the can-making operations to meet the additional requirements fromthe Chiquita Processed Foods acquisition.
In our Snack Chip business, we have been seeing encouraging trends asthe low-carbohydrate diet fad appears to have ended. We have developedsome interesting new uses for our apple chips, including a salad toppingfor a nationally recognized restaurant chain, as well as an ingredient fortrail-mix type products. Our potato chip business has also rebounded asour contract packing customers have increased bookings for the comingyear.
In conclusion, Seneca stands today as the largest canned vegetable companyin the world, with state-of-the-art plants and warehouses, an experiencedworkforce, and a complete dedication to success. While this past yearwas a challenging one in terms of profits, we remain confident that thesteps that Seneca has taken over the past decade to become the leader inour industry will reward our shareholders.
Chairman President & Chief Executive Officer
2

Summary of Operations and Financial Condition(In thousands of dollars, except per share data)
Years ended March 31, 2005 2004 2003 2002 2001
Net sales $864,274 $890,850 $644,379 $651,075 $674,300
Operating earnings [before interest and other(income) expense, net] $ 24,868 $ 36,476 $ 33,035 $ 20,406 $ 20,795
Net earnings 7,907 12,941 9,050 1,140 813
Basic earnings per common share .71 1.18 .89 .11 .08Diluted earnings per common share .70 1.17 .88 .11 .08
Working capital $205,430 $187,764 $172,382 $163,606 $163,367Inventories 294,470 270,283 141,649 181,835 229,170Net property, plant, and equipment 163,290 181,907 132,969 155,189 167,450Total assets 524,495 533,903 379,540 403,576 444,233Long-term debt and capital lease
obligations 154,125 160,987 133,337 156,100 171,346Stockholders’ equity 195,809 190,249 159,364 151,123 149,759
Additions to property, plant, and equipment $ 14,415 $ 23,109 $ 6,832 $ 13,423 $ 15,395Interest expense, net 16,592 16,135 13,757 17,441 18,662
Net earnings/average equity 4.1% 7.4% 5.8% 0.8% 0.5%Earnings before taxes/sales 1.4% 2.3% 2.3% 0.3% 0.2%Net earnings/sales 0.9% 1.5% 1.4% 0.2% 0.1%Long-term debt/equity 79% 85% 84% 103% 114%Current ratio 2.3:1 2.2:1 3.4:1 3.0:1 2.5:1
Stockholders’ equity per common share $ 20.77 $ 19.97 $ 17.64 $ 16.46 $ 16.26Class A National Market System closing price range 20.00-16.75 21.97-16.20 18.75-10.75 14.75-11.50 15.25-11.00Class B National Market System closing price range 19.45-16.99 22.88-16.85 18.38-12.75 14.78-12.00 14.88-10.75Common cash dividends declared per share - - - - -Price earnings ratio 23.8 16.0 13.6 84.3 110.2
Five Year Selected Financial Data
3

OVERVIEW
Our Business
Seneca Foods is the world’s leading producer and distributor ofcanned vegetables. Canned vegetables are sold nationwide in allchannels serving retail markets, certain export markets, the foodservice industry, and other food processors. Canned vegetablesrepresent 89% of the Company’s sales. The Company maintains anumber one share in the private label, food service, and exportcanned vegetable markets; and a number three position in thebranded canned vegetable market. Our Company also suppliescanned and frozen vegetable products to General Mills Operations,Inc. (“GMOI”) under an Alliance Agreement. In addition, ourCompany is the supplier of frozen vegetable products, principallyto the food service industry; and fruit and snack chip products,principally serving retail markets and other food processors.
Currently, our business strategies are designed to maintain ourmarket share and enhance our sales and margins and include: (1)position the Company as the low-cost, high-quality producer ofcanned vegetables through the elimination of costs from our supplychain and investment in state-of-the-art production and logisticaltechnology; (2) effective integration of the recent ChiquitaProcessed Foods acquisition (“the Acquisition”); (3) drive growthin earnings through the use of cash flow to de-leverage the balancesheet; and (4) focus on our growth segments to capitalize on theirhigher expected returns.
The Acquisition
On May 27, 2003, the Company completed its acquisition of 100%of the membership interest in Chiquita Processed Foods, L.L.C.(“CPF”) from Chiquita Brands International, Inc. The rationale forthe acquisition was twofold: (1) strengthen the Company’s marketposition in the canned vegetable segment; and (2) improve theCompany’s cost structure through the realization of cost savingsby eliminating duplicative functions and combining the purchasingpower of the two companies. The purchase price totaled $126.1million plus the assumption of certain liabilities. This acquisitionwas financed with cash, proceeds from a new $200.0 millionrevolving credit facility, and $16.1 million of the Company’sParticipating Convertible Preferred Stock. The Preferred Stock isconvertible into the Company’s Class A Common Stock on a one-for-one basis subject to antidilution adjustments. The PreferredStock was valued at $16.60 per share based on the market value ofthe Class A Common Stock at the time the acquisition wasannounced.
Purchase Price Allocation
The purchase price to acquire CPF was allocated based on the fairvalue of the assets and liabilities acquired. The Company obtainedan independent valuation of its property, plant, and equipment,and internally determined the fair value of its other assets and
liabilities. The purchase price of $130.3 million has been calculatedas follows (in millions):
Cash $ 110.0Issuance of convertible preferred stock 16.1Closing costs 4.2Purchase price $ 130.3
The total purchase price of the transaction has been allocatedas follows:
Current assets $ 137.8Property, plant, and equipment 87.8Other assets 6.5Current liabilities (69.6)Long-term debt (27.9)Other non-current liabilities (4.3)Total $ 130.3
Restructuring
After a comprehensive review of our production capacitiesfollowing the CPF acquisition, the Company completed a plantrestructuring program in 2005 resulting in a restructuring chargeof $7.7 million. The restructuring charge consisted of a non-cashimpairment charge of $7.0 million and a cash severance charge of$0.7 million which are included in plant restructuring in theConsolidated Statement of Net Earnings. This restructuringprogram principally involved the closure of three processingfacilities including a green bean plant in upstate New York andcorn plants in Wisconsin and Washington. In addition, theCompany restructured the newly acquired Payette, Idaho facilitythrough the removal of canned meat production to focusexclusively on dry beans. The rationalization of the Company’sproductive capacity will: (1) improve the Company’s overall coststructure and competitive position; (2) address the excess capacitysituation arising from the recent acquisition of CPF; and (3) mitigatethe effect of inflationary pressures on the Company’s raw materialinputs such as steel and fuel. The closure of the Washington corn processing facility coincidedwith an amendment to the Alliance Agreement with GMOI. Underthe above amendment, the Blue Earth, Minnesota facility wasremoved from the Alliance Agreement due to a reduction in GMOIvolume requirements and will be operated by the Company as anon-Alliance facility. Additionally, GMOI agreed to reimburse theCompany in the future for remaining lease and depreciation costsat the Blue Earth facility which, on a net present value basis,approximates the closure costs associated with the Washingtonfacility.
Management’s Discussion and Analysis ofFinancial Condition and Results of Operations
4

Divestitures
The Company sold three former Chiquita Processed Foods plantsand related assets to Lakeside Foods, Inc. on June 17, 2003. TheCompany sold one additional plant of Chiquita Processed Foodsand related assets to Lakeside Foods, Inc. on August 6, 2003. Theaforementioned divestitures to Lakeside Foods generated $46.0million in cash proceeds, which was used to pay down debt. TheCompany sold additional plant locations and related assets thatwere previously closed by Chiquita Processed Foods anddesignated as assets held for sale during 2005 and 2004, generating$1.6 million and $2.5 million, respectively, in additional proceedsused for debt repayment.
Liquidity and Capital Resources
The Company’s primary cash requirements are to make paymentson our debt, finance seasonal working capital needs, and to makecapital expenditures. Internally generated funds and amounts underour revolving credit facility are our primary sources of liquidity.
Revolving Credit Facility
On May 27, 2003, in connection with the Acquisition, the Companyentered into a $200.0 million five-year floating rate securedrevolving credit facility (the “Revolver”) with several lenders, underwhich $118.2 million was initially borrowed. As of March 31, 2005,the outstanding balance on the Revolver was $60.7 million. Inorder to maintain availability of funds under the facility, we pay acommitment fee on the unused portion of the Revolver. TheRevolver is used to fund our seasonal working capital needs, whichare affected by the growing cycles of the vegetables we process.The vast majority of vegetable inventories are produced duringthe harvesting and packing months of May through October anddepleted through the remaining six months. Accordingly, our needto draw on the Revolver may fluctuate significantly throughoutthe year. As a result of the additional liquidity generated by theaforementioned divestitures, the Company provided notice to itsbank lenders during the first quarter in 2005 of its intention toreduce the revolving credit facility from $200.0 million to $150.0million. Correspondingly, the Company took a non-cash charge of$0.5 million reflecting the write-down of the pro-rata amount ofdeferred financing costs, which is included in Other Income (net)in the Consolidated Statements of Net Earnings. During the fourthquarter of 2005, the Company provided notice to its bank lendersof its intention to further reduce the revolving credit facility from$150.0 million to $125.0 million and took a non-cash charge of $0.2million reflecting the write-down of the corresponding pro-rataamount of deferred financing costs, which is included in OtherIncome (net) in the Consolidated Statements of Net Earnings.Subsequent to 2005 year-end, the Company and its lendersextended the term of the Revolver for an additional year with afinal maturity date of May 27, 2009.
We believe that cash flows from operations and availability underour Revolver will provide adequate funds for our working capitalneeds, planned capital expenditures, and debt service obligationsfor at least the next 12 months.
Long-Term Debt
On June 24, 2004, the Company issued a mortgage to GE Capitalfor $8.0 million with an interest rate of 6.35% and a term of 15 years.The proceeds were used to finance new warehouse constructionin Janesville and Cambria, Wisconsin. The Company did not issueany other significant long-term debt in 2005. During 2004, theCompany refinanced $42.5 million of debt outstanding under therevolving credit facility with new term debt from John HancockLife Insurance Company. At issuance, the John Hancock notetotaled $75.0 million and included the refinance of $32.5 million inexisting John Hancock debt. The John Hancock note has a fixedinterest rate of 8.03%, a fifteen-year amortization and a ten-yearterm.
The Company has two major long-term debt instruments: (1) a$70.9 million secured note payable to John Hancock Life InsuranceCompany, with an interest rate of 8.03%, which is due through2014; and (2) a $46.6 million secured nonrecourse note payable toGMOI, with an interest rate of 8%, which is due through 2010.
At March 31, 2005, scheduled maturities of long-term debt in eachof the five succeeding fiscal years are as follows (in thousands):
2006 14,8962007 9,1012008 8,9562009 9,1512010 38,110
Restrictive Covenants
Our credit facilities contain covenants that restrict our ability, andthe ability of our subsidiaries, to incur additional indebtedness;pay dividends on and redeem our capital stock; make otherrestricted payments, including investments; sell our assets; incurliens; transfer all, or substantially all, of our assets and enter intoconsolidations or mergers. Our credit facilities also require us tomeet certain financial tests including minimum fixed chargecoverage, minimum interest coverage, and maximum total debtratios. These financial requirements and ratios generally becomemore restrictive over time, subject to allowances for seasonalfluctuations. We are in compliance with all such financialcovenants, and were in compliance therewith as of March 31, 2005.The most restrictive financial covenant in the credit agreements isthe minimum fixed charge coverage ratio.
Management’s Discussion and Analysis ofFinancial Condition and Results of Operations
5

Capital Expenditures
Capital expenditures in 2005 totaled $14.4 million and include $7.4million of construction costs for three warehouse expansionprojects in Geneva, New York; Janesville, Wisconsin; and Cambria,Wisconsin, together with equipment replacement and cost-savingprojects. Capital expenditures in 2004 totaled $23.1 million andinclude $7.2 million of construction in progress on warehouseexpansion projects in Janesville and Cambria, plus equipmentreplacement and other improvements, and economic return andcost-saving projects. The total cost of the Geneva, Janesville, andCambria warehouse projects over the two years was $14.8 million.
Inventories
In 2005, inventories increased by $24.2 million, primarily reflectingthe effect of unit cost increases for key commodity inputs, includingsteel and energy. In 2004, inventories increased by $125.5 million,primarily reflecting the effect of seasonal production from the eightplants acquired in the CPF acquisition. Inventories consist primarilyof finished canned vegetable products and raw materials andsupplies, including cans and ends.
Critical Accounting Policies
During the year ended 2005, the Company sold for cash, on a billand hold basis, $176.5 million of Green Giant finished goodsinventory to GMOI. At the time of the sale of the Green Giantvegetables to GMOI, title of the specified inventory transferred toGMOI. In addition, the aforementioned finished goods inventorywas complete, ready for shipment, and segregated from theCompany’s other finished goods inventory. Further, the Companyhad performed all of its obligations with respect to the sale of thespecified Green Giant finished goods inventory.
Trade promotions are an important component of the sales andmarketing of the Company’s branded products, and are critical tothe support of the business. Trade promotion costs, which arerecorded as a reduction of net sales, include amounts paid toencourage retailers to offer temporary price reductions for the saleof our products to consumers, amounts paid to obtain favorabledisplay positions in retailers’ stores, and amounts paid to retailersfor shelf space in retail stores. Accruals for trade promotions arerecorded primarily at the time of sale of product to the retailerbased on expected levels of performance. Settlement of theseliabilities typically occurs in subsequent periods primarily throughan authorized process for deductions taken by a retailer fromamounts otherwise due to us. As a result, the ultimate cost of atrade promotion program is dependent on the relative success ofthe events and the actions and level of deductions taken by retailersfor amounts they consider due to them. Final determination of thepermissible deductions may take extended periods of time.
The Company assesses its long-lived assets for impairmentwhenever there is an indicator of impairment. Property, plant, and
equipment are depreciated over their assigned lives. The assignedlives and the projected cash flows used to test impairment aresubjective. If actual lives are shorter than anticipated, or if futurecash flows are less than anticipated, a future impairment charge ora loss on disposal of the assets could be incurred. Impairmentlosses are recognized when the carrying value of an asset exceedsits fair value.
Obligations and Commitments
As of March 31, 2005, the Company is obligated to make cashpayments in connection with our capital leases, debt, and operatingleases. The effect of these obligations and commitments on ourliquidity and cash flows in future periods are listed below. All ofthese arrangements require cash payments over varying periodsof time. Certain of these arrangements are cancelable on shortnotice and others require termination or severance payments aspart of any early termination.
Contractual ObligationsMarch 31, 2005
20112006 2007-8 2009-10 and beyond
Long-term debt $ 14,896 $ 18,057 $ 47,261 $ 83,001Interest 14,019 25,513 19,850 33,752Notes payable — — 60,733 —Operating lease obligations 18,415 27,922 18,888 15,049Pension — 2,009 2,331 7,371Purchase commitments 122,466 — — —Capital lease obligations 775 1,527 1,105 3,175Total $170,571 $ 75,028 $150,168 $142,348
We have no material off-balance sheet debt or other unrecordedobligations other than the items noted in the above table.
Standby Letters of Credit
We have standby letters of credit for certain insurance-relatedrequirements and capital leases. The majority of our standby lettersof credit are automatically renewed annually, unless the issuergives cancellation notice in advance. On March 31, 2005, we had$6.2 million in outstanding standby letters of credit.
Cash Flows
In 2005, our cash and cash equivalents increased by $0.6 million,which is primarily due to the net impact of $18.0 million providedby operating activities, $8.2 million used in investing activities,and $9.2 million used by financing activities.
Operating Activities
Cash provided by operating activities increased to $18.0 million in
Management’s Discussion and Analysis ofFinancial Condition and Results of Operations
6

2005 from $1.6 million in 2004. The increase is primarily a functionof the negative cash flow impact in 2004 associated with theinventory increase related to the CPF acquisition, partially offsetby lower operating earnings in 2005. The cash requirements of thebusiness fluctuate significantly throughout the year to coincidewith the seasonal growing cycles of vegetables. The vast majorityof the inventories are produced during the packing months, fromMay through October, and then depleted during the remaining sixmonths. Cash flow from operating activities is one of our mainsources of liquidity.
Cash provided by operating activities decreased from $68.8 millionin 2003 to $1.6 million in 2004. The decrease reflects higher inventorybalances associated with the seasonal production from the eightplants acquired in the CPF acquisition, which were primarily fundedthrough the issuance of debt.
Investing Activities
Cash used in investing activities was $8.2 million in 2005, principallyreflecting capital expenditures partially offset by $6.2 million inproceeds from the sale of assets including $4.6 million from thesale of Class B Common Stock of Moog Inc. Capital expendituresaggregated $14.4 million in 2005 versus $23.1 million in 2004. Capitalexpenditures were unusually high in 2004, reflecting a significantnumber of equipment upgrades and other improvements inconnection with the CPF acquisition. Capital expenditures in 2005and 2004 included $7.4 million and $7.2 million, respectively, forwarehouse expansion projects. This included the completion ofthe Janesville and Cambria, Wisconsin projects started in 2004and a Geneva, New York warehouse expansion.
Cash used in investing activities was $85.9 million for 2004, primarilyreflecting the cash requirements of the CPF acquisition partiallyoffset by proceeds from the sale of assets primarily involving thedivestiture of four plants to Lakeside Foods. Capital expendituresaggregated $23.1 million in 2004 versus $6.8 million in 2003. Theincrease is primarily attributable to equipment replacement andother improvements at the former CPF locations, together with$7.2 million of construction in progress on two warehouseexpansion projects in Janesville and Cambria, Wisconsin.
Cash used in investing activities was $6.2 million in 2003, principallyreflecting capital expenditures.
Financing Activities
Cash used in financing activities was $9.2 million in 2005, principallyconsisting of the repayment of $21.9 million in long-term debtpartially offset by the $9.1 million in proceeds from long-term debt.
Cash provided by financing activities was $23.9 million in 2004.During 2004, we borrowed cash to fund the CPF acquisition. Cashused in financing activities was $22.6 million in 2003, principallyreflecting debt repayment.
Management’s Discussion and Analysis ofFinancial Condition and Results of Operations
RESULTS OF OPERATIONS
Fiscal 2005 versus Fiscal 2004
Classes of similarproducts/services: 2005 2004 2003
(In thousands)Net Sales:GMOI $ 22 5 ,52 7 $ 24 7 ,99 2 $ 25 2 ,05 9Canned vegetables 5 8 1 ,4 8 6 5 8 6 ,5 9 4 3 2 8 ,9 0 7Frozen vegetables 2 8 ,3 0 4 2 9 ,4 1 0 3 0 ,4 2 2Fruit and chip products 1 6 ,6 7 4 1 5 ,3 4 7 2 0 ,7 8 4Other 1 2 ,2 8 3 1 1 ,5 0 7 1 2 ,2 0 7
$ 86 4 ,27 4 $ 89 0 ,85 0 $ 64 4 ,37 9
Net sales for fiscal 2005 decreased $26.6 million, or 3%, from $890.9million to $864.3 million. The decrease primarily reflects a plannedreduction of $22.5 million in GMOI production, which wasexacerbated by the poor sweet corn growing conditions in thesummer of 2004. In addition, we experienced a planned reductionof $15.0 million in canned vegetable co-pack volume reflecting astrategic decision by the Company to exit certain unprofitable co-pack business. Although 2004 included only 10 months of CPFacquisition-related sales activity, the sales retention rate from theacquisition was higher in 2004, reflecting volume associated withplants that were ultimately divested to Lakeside Foods.
Cost of product sold as a percentage of sales increased from 92.2%in 2004 to 92.6% in 2005. The increase in the percentage of the costof product sold reflects higher production costs in fiscal 2005associated with unfavorable manufacturing variances, principallythe result of commodity inflation in key inputs such as steel, naturalgas, and fuel. In addition, last summer and fall, we experienced adifficult growing season due to lower average temperatures inAugust, which impacted crop yields and plant recovery rates, andfurther resulted in certain contracted raw produce being unable tobe harvested. The cost of implementing the Sarbanes-Oxley Act of2002, which totaled $2.5 million in 2005, was also a significantfactor in the cost increase. Furthermore, the cost of a productrecall, initiated in the second quarter of 2005, amounted to $1.4million. Finally, we were unable to fully pass along those highercosts to our customers since many of our customer contracts aresemi-annual and annual in nature.
Selling, general, and administrative expense remained at 3.7% ofsales, as the negative impact of the sales reduction was offset byeffective expense control.
Interest expense increased from $16.1 million in 2004 to $16.6 millionin 2005, primarily reflecting a full year of acquisition-related debt in2005.
Plant restructuring costs were $7.7 million in 2005, primarilyinvolving the closure of three processing facilities which aredetailed in the Restructuring Program section above. As a result
7

of the CPF acquisition, the Company was able to complete someplant consolidations, which will result in substantial savings bymoving the volumes into other plants with minimal capitalinvestment.
Other income of $3.8 million in 2005 reflects the gain on the sale ofMoog Inc. stock of $3.9 million and the sale of certain fixed assetsof $0.6 million. This was partially offset by a non-cash charge of$0.7 million, reflecting the write-down of deferred financing costsassociated with the reduction of the Revolver from $200 million to$125 million. Other income of $0.2 million in 2004 reflects the gainon the sale of certain fixed assets.
As a result of the above factors, pre-tax earnings decreased from$20.5 million in 2004 to $12.0 million in 2005. The effective tax ratewas 34.3% in 2005 and 37.0% in 2004. The 2005 effective tax ratereduction is a result of the reversal of certain tax reserves, whichwere no longer required.
Fiscal 2004 versus Fiscal 2003
Net sales for fiscal 2004 increased $246.5 million, or 38%, from$644.4 million to $890.9 million. The increase reflects ten months ofoperating activity related to the CPF acquisition, which resulted ina 35% increase in vegetable unit volume.
Cost of product sold as a percentage of sales increased from 91.6%in 2003 to 92.2% in 2004. The increase in the percentage of the costof product sold reflects higher production costs in fiscal 2004associated with unfavorable manufacturing variances, principallythe result of drought conditions in the Midwest growing areasand extreme heat in the Northwest growing areas, followed by anearly killing frost which included the late-season growing areas ofIllinois. The drought and hot weather conditions impacted cropyields and plant recovery rates;and further resulted in the bunchingof crop maturities whereby certain contracted raw produce wasunable to be harvested. Although we were able to increase sellingprices over the second half of the fiscal year, the effect of theseincreases was more than offset by the higher manufacturing costs.
Selling, general, and administrative expense increased as apercentage of sales from 3.3% to 3.7%, due in large part to the factthat GMOI sales do not involve selling expense, and GMOI salesdecreased as a percentage of total sales from 39.1% in 2003 to27.8% in 2004. In addition, outside warehousing expense increasedin connection with the CPF acquisition.
Interest expense increased from $13.8 million to $16.1 million,reflecting the new debt supporting the CPF acquisition.
Other income of $0.2 million in 2004 reflects the gain on the sale ofcertain fixed assets. Other expense of $4.7 million in 2003 reflects anon-cash impairment charge attributable to idle fixed assets.
Management’s Discussion and Analysis ofFinancial Condition and Results of Operations
As a result of the above factors, pre-tax earnings increased from$14.6 million in 2003 to $20.5 million in 2004. The effective tax ratewas 37.0% in 2004 and 37.8% in 2003.
Recently Issued Accounting Standards
Recently issued accounting standards have been considered bythe Company and are not expected to have a material effect on theCompany’s financial position or results of operations.
8

Interest Rate Risk
As a result of its regular borrowing activities, the Company’soperating results are exposed to fluctuations in interest rates, whichit manages primarily through its regular financing activities. TheCompany uses bank lines of credit with variable interest rates tofinance seasonal working capital requirements. The Companymaintains $5.2 million in cash equivalents as of March 31, 2005.Long-term debt represents secured and unsecured notes anddebentures, certain notes payable to insurance companies usedto finance long-term investments such as business acquisitions,and capital lease obligations. Long-term debt bears interest atfixed and variable rates. With $80.5 million in average variable ratedebt, a 1% change in interest rates would have an $805 thousandeffect on interest expense. The following table provides informationabout the Company’s financial instruments that are sensitive tochanges in interest rates. The table presents principal cash flowsand sinking fund requirements and related weighted-averageinterest rates by expected maturity date. Weighted-average interestrates on variable-rate debt are based on rates as of March 31, 2005.
QUANTITATIVE AND QUALITATIVEDISCLOSURES ABOUT MARKET RISK
Commodity Risk
The materials that the Company uses, such as vegetables, steel,and packaging materials are commodities that may experience pricevolatility caused by external factors including market fluctuations,availability, currency fluctuations, and changes in governmentalregulations and agricultural programs. These events can result inreduced supplies of these materials, higher supply costs, orinterruptions in our production schedules. If prices of these rawmaterials increase and the Company is not able to effectively passsuch price increases along to its customers, operating income willdecrease. In light of the recent volatility in steel pricing, a 5%change in steel unit costs would equate to a $3.1 million costimpact.
Interest Rate Sensitivity of Long-Term Debt, Short-Term Debt, and Short-Term InvestmentsMarch 31, 2005
(In thousands)
EXPECTED MATURITY DATE
Total/ EstimatedWeighted Fair
2006 2007 2008 2009 2010 Thereafter Average Value
Fixed-rate L/T debt:Principal cash flows $ 15,221 $ 9,446 $ 9,326 $ 9,541 $ 38,525 $ 63,246 $145,305 $140,516Average interest rate 7.36% 6.88% 7.10% 7.10% 7.85% 7.71% 7.55% —
Variable-rate L/T debt:Principal cash flows $ 450 $ 454 $ 358 $ 150 $ 150 $ 22,929 $ 24,491 $ 24,491Average interest rate 2.09% 2.08% 2.25% 3.37% 3.25% 3.25% 3.17% —
Average variable-rate S/T debt:Principal cash flows $ 55,996 $ 55,996Average interest rate 3.70% —
Short-term investments:Average balance $ 284 $ 284Average interest rate 1.95% —
Management’s Discussion and Analysis ofFinancial Condition and Results of Operations
9

Seneca Foods Corporation and Subsidiaries(In thousands of dollars, except share amounts)
Years ended March 31, 2005 2004 2003
Net sales $864,274 $890,850 $644,379
Costs and expenses:Cost of product sold 800,002 821,604 590,079Selling, general, and administrative expense 31,726 32,770 21,265Plant restructuring 7,678 — —
Total costs and expenses 839,406 854,374 611,344Operating income 24,868 36,476 33,035Other (income) expense, net (3,757) (207) 4,719Interest expense, net of interest income of
$102, $395, and $834, respectively 16,592 16,135 13,757
Earnings before income taxes 12,033 20,548 14,559Income taxes 4,126 7,607 5,509
Net earnings $ 7,907 $ 12,941 $ 9,050
Basic earnings per common share $ .71 $ 1.18 $ .89
Diluted earnings per common share $ .70 $ 1.17 $ .88
See notes to consolidated financial statements.
Consolidated Statements of Net Earnings
10

Seneca Foods Corporation and Subsidiaries(In thousands)
March 31, 2005 2004
AssetsCurrent Assets:
Cash and cash equivalents $ 5,179 $ 4,570Marketable securities — 4,465Accounts receivable, less allowance for doubtful accounts
of $625 and $945, respectively 43,664 46,180Inventories:
Finished products 209,874 202,573In process 17,168 15,365Raw materials and supplies 67,428 52,345
Deferred income taxes 5,669 6,615Assets held for sale 1,451 2,931Refundable income taxes 1,199 451Prepaid expenses 7,192 12,098
Total Current Assets 358,824 347,593Other assets 2,381 4,403Property, Plant, and Equipment:
Land 9,981 9,222Building 122,644 112,061Equipment 296,512 313,494
429,137 434,777Less accumulated depreciation and amortization 265,847 252,870
Net Property, Plant, and Equipment 163,290 181,907Total Assets $524,495 $533,903
Liabilities and Stockholders’ EquityCurrent Liabilities:
Notes payable $ 60,733 $ 58,395Accounts payable 38,719 37,362Accrued expenses 38,271 42,553Current portion of long-term debt and capital lease obligations 15,671 21,519 Total Current Liabilities 153,394 159,829
Long-term debt 148,318 154,428Capital lease obligations 5,807 6,559Other liabilities 10,042 7,790Deferred income taxes 11,125 15,048
Total Liabilities 328,686 343,654Commitments and other contingencies (Note 14)Stockholders’ Equity:
Preferred stock 56,335 56,338Common stock 2,859 2,859
Total Capital Stock 59,194 59,197Additional paid-in capital 15,992 15,989Accumulated other comprehensive income — 2,324Retained earnings 120,623 112,739
Total Stockholders’ Equity 195,809 190,249Total Liabilities and Stockholders’ Equity $524,495 $533,903
See notes to consolidated financial statements.
Consolidated Balance Sheets
11

Seneca Foods Corporation and Subsidiaries(In thousands)
Years ended March 31, 2005 2004 2003
Cash flows from operating activities:Net earnings $ 7,907 $ 12,941 $ 9,050
Adjustments to reconcile net earnings tonet cash provided by operations:
Depreciation and amortization 29,178 29,393 22,597Deferred income taxes (1,552) 1,107 3,520Gain on the sale of assets (4,469) (207) —Impairment provision and other expenses 5,673 — 4,719Changes in operating assets and liabilities:
Accounts receivable 2,516 9,991 236Inventories (24,187) (41,122) 40,186Prepaid expenses 4,906 (10,782) (892)Accounts payable, accrued expenses, and other liabilities (1,218) (1,686) (11,588)Income taxes (748) 1,987 942
Net cash provided by operations 18,006 1,622 68,770
Cash flows from investing activities:Additions to property, plant, and equipment (14,415) (23,109) (6,832)Proceeds from the sale of assets 6,233 48,808 677Acquisition — (114,172) —Cash received from acquisition — 2,560 —
Net cash used in investing activities (8,182) (85,913) (6,155)
Cash flows from financing activities:Borrowings on notes payable 285,425 396,568 —Payments on notes payable (283,087) (363,548) —Payments of long-term debt and capital lease obligations (21,856) (51,903) (22,834)Proceeds from issuance of long-term debt 9,146 42,562 235Other assets 1,180 221 18Preferred dividends paid (23) (23) (23)
Net cash (used in) provided by financing activities (9,215) 23,877 (22,604)
Net increase (decrease) in cash and cash equivalents 609 (60,414) 40,011Cash and cash equivalents, beginning of year 4,570 64,984 24,973Cash and cash equivalents, end of year $ 5,179 $ 4,570 $ 64,984
Supplemental disclosures of cash flow information:Cash paid during the year for:
Interest $ 16,973 $ 15,023 $ 15,122Income taxes 6,425 5,768 2,025
Supplemental information of non-cash investing and financing activities:
$16.1 million of Preferred Stock was issued in partial consideration for the CPF acquisition in 2004. The Company assumed $9.1 millionof long-term debt related to the CPF acquisition.
See notes to consolidated financial statements.
Consolidated Statements of Cash Flows
12

Preferred Stock
6% 10%
Cumulative Par Cumulative Par Accumulated
Value $.25 Value $.025 Participating Participating Class A Class B Additional Other
Callable at Par Convertible Convertible Par Convertible Par Common Stock Common Stock Paid-In Comprehensive Retained Comprehensive
Voting Voting Value $.025 Value $.025 Par Value $.25 Par Value $.25 Capital Income Earnings Income
Shares authorized 200,000 1,400,000 967,742 4,166,667 20,000,000 10,000,000
Shares issued and outstanding:
March 31, 2003 200,000 807,240 — 3,485,506 3,908,470 2,764,005
March 31, 2004 200,000 807,240 967,742 3,443,596 3,950,380 2,764,005
March 31, 2005 200,000 807,240 967,742 3,443,359 3,951,717 2,762,905
Balance March 31, 2002 $50 $20 $— $42,605 $956 $1,871 $13,619 $1,208 $90,794
Net earnings — — — — — — — — 9,050 $ 9,050
Cash dividends paid
on preferred stock — — — — — — — — (23) —
Preferred stock conversion — — — (1,019) 22 — 997 — — —
Minimum pension liability — — — — — — — (778) — (778)
Net unrealized gain on
investments — — — — — — — (8) — (8)
Balance March 31, 2003 50 20 — 41,586 978 1,871 14,616 422 99,821 $ 8,264
Net earnings — — — — — — — — 12,941 $12,941
Cash dividends paid
on preferred stock — — — — — — — — (23) —
Preferred stock conversion — — — (500) 10 — 490 — — —
Preferred stock issued — — 15,000 — — — 1,065 — — —
Minimum pension liability
(net of tax $477) — — — — — — — 778 — 778
Preferred stock adjustment — 182 — — — — (182) — — —
Net unrealized gain on
investments (net of tax $658) — — — — — — — 1,124 — 1,124
Balance March 31, 2004 50 202 15,000 41,086 988 1,871 15,989 2,324 112,739 $14,843
Net earnings — — — — — — — — 7,907 $ 7,907
Cash dividends paid
on preferred stock — — — — — — — — (23) —
Preferred stock conversion — — — (3) — — 3 — — —
Net unrealized gain on
investments (net of tax $16) — — — — — — — 32 — 32
Net reclassification of accumulated
other comprehensive income
(net of tax $1,160) — — — — — — — (2,356) — (2,356)
Balance March 31, 2005 $50 $202 $15,000 $41,083 $988 $ 1,871 $15,992 $ — $120,623 $ 5,583
Seneca Foods Corporation and Subsidiaries(In thousands, except share amounts)
See notes to consolidated financial statements.
Consolidated Statements of Stockholders Equity
13

Seneca Foods Corporation and Subsidiaries
1. Summary of Significant Accounting Policies
Nature of Operations - The Company conducts its business almostentirely in food processing, operating 27 plants and warehousesin seven states. The Company markets branded and private labelprocessed foods to retailers and institutional food distributors.
Principles of Consolidation - The consolidated financialstatements include the accounts for the parent Company and allof its wholly-owned subsidiaries after elimination of intercompanytransactions, profits, and balances.
Revenue Recognition - Sales and related cost of product sold arerecognized when legal title passes to the purchaser, which isprimarily upon shipment of products. When customers, under theterms of specific orders, request that the Company invoice goodsand hold the goods for future shipment, the Company recognizesrevenue when legal title to the finished goods inventory passes tothe purchaser. Generally, the Company receives cash from thepurchaser when legal title passes.
Concentration of Credit Risk - Financial instruments thatpotentially subject the Company to credit risk consist of tradereceivables and interest-bearing investments. Wholesale and retailfood distributors comprise a significant portion of the tradereceivables; collateral is generally not required. The risk associatedwith the concentration is limited due to the large number ofwholesalers and retailers and their geographic dispersion. TheCompany places substantially all of its interest-bearinginvestments with financial institutions and monitors creditexposure. Cash and short-term investments in certain accountsexceed the federal insured limit, however, the Company has notexperienced any losses in such accounts.
Cash and Cash Equivalents - The Company considers all highlyliquid instruments purchased with an original maturity of threemonths or less as short-term investments.
Inventories - Inventories are stated at lower of cost; determinedunder the first-in, first-out (FIFO) method; or market.
Income Taxes - The provision for income taxes includes federal,foreign, and state income taxes currently payable and thosedeferred because of temporary differences between the financialstatement and tax bases of assets and liabilities.
Shipping and Handling Costs - The Company includes all shippingand handling costs billed to customers in net sales and thecorresponding costs in cost of product sold.
Doubtful Accounts - A provision for doubtful accounts is recordedbased upon an assessment of credit risk within the accountsreceivable portfolio, experience of delinquencies (accounts over
Years ended March 31, 2005 2004 2003(In thousands, except share amounts)
Basic
Net earnings $ 7,907 $12,941 $ 9,050Deduct preferred stock dividends
paid 2 3 2 3 2 3
Undistributed earnings 7,884 12,918 9,027Earnings allocated to participating preferred 3,126 5,035 3,164
Earnings allocated to common shareholders $ 4,758 $ 7,883 $ 5,863
Weighted average common shares oustanding 6,714 6,691 6,597
Basic earnings per common share $ .71 $ 1.18 $ .89
Diluted
Earnings allocated to common shareholders $ 4,758 $ 7,883 $ 5,863Add dividends on convertible
preferred stock 2 0 2 0 2 0
Earnings applicable to commonstock on a diluted basis $ 4,778 $ 7,903 $ 5,883
Weighted average common sharesoutstanding-basic 6,714 6,691 6,597
Additional shares to be issued underfull conversion of preferred stock 6 7 6 7 6 7
Total shares for diluted 6,781 6,758 6,664
Diluted earnings per share $ .70 $ 1.17 $ .88
15 days past due) and charge-offs (accounts removed fromaccounts receivable for expectation of non-payment), and currentmarket conditions. Management believes these provisions areadequate based upon the relevant information presently available.However, it is possible that the Company’s provisions may changein the future.
Earnings per Common Share
The Company has two classes of convertible preferred stock, whichare deemed to be participating securities that are entitled toparticipate in any dividend on Class A common stock as if thepreferred stock had been converted into common stock immediatelyprior to the record date for such dividend. Basic earnings pershare for common stock must be calculated using the “two-class”method by dividing the earnings allocated to common stockholdersby the weighted average of common shares outstanding duringthe period.
Diluted earnings per share is calculated by dividing earningsallocated to common stockholders by the sum of the weightedaverage common shares outstanding plus the dilutive effect ofconvertible preferred stock using the “if-converted” method, whichtreats the contingently-issuable shares of convertible preferredstock as common stock.
Notes to Consolidated Financial Statements
14

Notes to Consolidated Financial Statements
15
Depreciation - Property, plant, and equipment are stated at cost or,in the case of capital leases, the present value of future leasepayments. For financial reporting, the Company provides fordepreciation and capital lease amortization on the straight-linemethod at rates based upon the estimated useful lives of the variousassets. Depreciation and capital lease amortization was $28,503,000,$28,676,000, and $22,597,000 in 2005, 2004, and 2003, respectively.The estimated useful lives are as follows: buildings - 30 years;machinery and equipment - 10-15 years; vehicles - 3-7 years; andland improvements - 10-20 years. Impairment losses are recognizedwhen the carrying value of an asset exceeds its fair value. TheCompany assesses its long-lived assets for impairment wheneverthere is an indicator of impairment. There were $4,960,000 ofimpairment losses in 2005 that were included in Plant Restructuring(see Plant Restructuring, note 15). There were no impairment lossesin 2004. Impairment losses of $4,719,000 were recognized in 2003and were included in Other (Income) Expense, net (see Other Incomeand Expense, note 11).
Use of Estimates in the Preparation of Financial Statements - Thepreparation of financial statements in conformity with U.S. generallyaccepted accounting principles requires management to makeestimates and assumptions that affect the reported amount of assetsand liabilities and the disclosure of contingent assets and liabilitiesat the date of the financial statements, as well as the relatedrevenues and expenses during the reporting period. Actualamounts could differ from those estimated.
Recently Issued Accounting Standards - Recently issuedaccounting standards have been considered by the Company andare not expected to have a material effect on the Company’sfinancial position or results of operations.
Reclassifications - Certain previously reported amounts have beenreclassified to conform to the current period classification.
2. Common Stock of Moog Inc.
During 2005, the Company sold its investment in the CommonStock of Moog Inc. The sale provided proceeds of $4,578,000 anda realized gain of $3,862,000. The Company’s investment in theClass B Common Stock of Moog Inc., totaling $4,465,000 as of
March 31, 2004, was included in marketable securities. The grossunrealized holding gains were $3,749,000 and $1,967,000 in 2004and 2003, respectively.
3. Lines of Credit
The Company obtains required short-term funds through bankborrowings. On May 27, 2003, in connection with the acquisitionof CPF, the Company entered into a $200 million five-year floatingrate secured revolving credit facility with various banks. During2005, the Company provided its bank lenders with notice to reducethe revolving credit facility from $200 million to $125 million.Subsequent to 2005 year-end, the Company and its lendersextended the term of the Revolver for an additional year with afinal maturity date of May 27, 2009. As of March 31, 2005, the
outstanding balance on the Revolver was $60,733,000, with aweighted average interest rate of 4.56%, and is included in notespayable on the Consolidated Balance Sheet. The $125 millionRevolver is secured by accounts receivable and inventory with acarrying value of $338,134,000. There were $58,395,000 in bankborrowings under the Revolver at March 31, 2004. The Companyhad $6,187,000 and $7,120,000 of outstanding standby letters ofcredit as of March 31, 2005 and 2004, respectively, that reduceborrowing availability under the Revolver.

4. Long-Term Debt2005 2004
(In thousands)Secured note payable to insurance company, 8.03%, due through 2014 $ 70,862 $ 73,675Secured nonrecourse subordinated promissory note, 8.00%, due through 2010 46,583 50,208Secured Industrial Revenue Development Bonds 3.53% and 3.24%, due through 2029 22,630 22,630Secured promissory note, 6.35% due through 2020 7,782 —Secured Industrial Revenue Development Bond, 5.69%, due through 2010 3,173 3,763Unsecured Industrial Revenue Development Bond, 7.75%, due through 2006 3,000 3,000Unsecured Industrial Revenue Development Bond, 8.50%, due through 2006 2,500 2,500Secured notes payable to utility company, 3.00%, due through 2009 2,295 1,956Secured note payable to insurance company, 10.78%, due through 2005 — 12,000Other 4 ,389 5,468
163,214 175,200Less current portion 14,896 20,772
$148,318 $ 154,428
Our credit facilities contain covenants that restrict our ability andthe ability of our subsidiaries to incur additional indebtedness;pay dividends on and redeem our capital stock; make otherrestricted payments, including investments; sell our assets; incurliens; transfer all or substantially all of our assets; and enter intoconsolidations or mergers. Our credit facilities also require us tomeet certain financial tests, including minimum fixed charge
coverage, minimum interest coverage, and maximum total debtratios. These financial requirements and ratios generally becomemore restrictive over time, subject to allowances for seasonalfluctuations. We are in compliance with all such financialcovenants, and were in compliance therewith as of March 31, 2005.The most restrictive financial covenant in the credit agreements isthe minimum fixed charge coverage ratio.
As of March 31, 2005, the most restrictive credit agreement limitationon the Company’s payment of dividends and other distributions,such as purchases of shares, to holders of Class A or Class BCommon Stock is an annual total limitation of $500,000 reduced byaggregate annual dividend payments totaling $23,000, which theCompany presently pays on two outstanding classes of preferredstock.
The Company has five Industrial Revenue Bonds (“IRB’s”) totaling$23,680,000, which are secured by direct pay letters of credit. Theinterest rates in the table above reflect the direct pay letters ofcredit costs and amortization of other related costs for those IRB’s.Other than the five IRB’s above, the carrying value of assetspledged for secured debt, including the $125 million Revolver is$432,656,000.
Debt repayment requirements for the next five fiscal years are:
(In thousands)2006 $ 14,8962007 9,1012008 8,9562009 9,1512010 38,110
The following is a schedule, by year, of minimum payments dueunder leases as of March 31, 2005:
5. LeasesThe Company leases a portion of its equipment and buildings.Capitalized leases consist primarily of limited obligation specialrevenue bonds, which bear interest rates from 1.42% to 4.75%.Other leases include non-cancelable operating leases expiring atvarious dates through 2025. Generally, operating leases providefor early purchase options one year prior to expiration.
Leased assets under capital leases consist of the following:
Rental expense in 2005, 2004, and 2003 was $23,059,000,$20,538,000, and $13,077,000, respectively.
Operating Capital(In thousands)
Years ending March 31:2006 $18,415 $ 1,0252007 15,160 1,0252008 12,762 9292009 10,066 7192010 8,822 7212011-2025 15,049 3,585
Total minimum payment required $80,274 $ 8,004
Less interest 1,422Present value of minimum lease payments 6,582
Amount due within one year 775Long-term capital lease obligations $ 5,807
Notes to Consolidated Financial Statements
2005 2004(In thousands)
Land $ 6 7 $ 6 7Buildings 1,033 1,033Equipment 11,476 11,313
12,576 12,413Less accumulated amortization 10,651 9,372
1,925 3,041Assets held for sale - 340
$ 1,925 $ 3,381
16

Net current deferred tax assets of $5,669,000 and $6,615,000 as ofMarch 31, 2005 and 2004, respectively, are recognized in theConsolidated Balance Sheets. Also recognized are net non-currentdeferred tax liabilities of $11,125,000 and $15,048,000 as of March31, 2005 and 2004, respectively.
6. Income TaxesThe Company files a consolidated income tax return. The provisionfor income taxes is as follows:
A reconciliation of the expected U.S. statutory rate to the effectiverate follows:
2005 2004 2003(In thousands)
Current:Federal $ 4,489 $4,938 $ 1,529State 1 ,189 1,562 4 6 0
5,678 6,500 1,989
Deferred:Federal (1 ,448) 1 ,009 3,150State (104) 9 8 3 7 0
(1,552) 1 ,107 3,520Total income taxes $ 4,126 $7,607 $ 5,509
The following is a summary of the significant components of theCompany’s deferred tax assets and liabilities as of March 31, 2005and 2004:
2005 2004(In thousands)
Deferred tax liabilities:Basis and depreciation difference $ 1 4 ,1 7 8 $ 1 5 ,6 0 8Other comprehensive income - 1 ,4 2 5O th er 1 4 2 3 0 9
1 4 ,3 2 0 1 7 ,3 4 2
Deferred tax assets:Inventory valuation 7 0 4 1 ,5 3 4Net operating loss carryforwards - 2 5Employee benefits 2 ,6 6 7 2 ,6 9 7Pension 3 ,0 2 8 2 ,1 4 2Insurance 1 ,9 6 3 2 ,0 2 5Deferred gain on sale/leaseback 4 0 5 4 8 6Severance 9 7 - 8 ,8 6 4 8 ,9 0 9
Net deferred tax liability $ 5 ,456 $ 8 ,4 3 3
2005 2004 2003Computed (expected tax rate) 35.0% 35.0% 35.0%State income taxes (net of
federal tax benefit) 5.9 5.2 3.7Reversal of tax reserves (4.2) - -Other permanent differences not deductible 1.7 1.1 0.4Tax-exempt income - (0.7) (1.5)Other (4.1) (3.6) 0.2
Effective tax rate 34.3% 37.0% 37.8%
Notes to Consolidated Financial Statements
17
7. Stockholders’ Equity
Preferred Stock – The Company has issued a class of preferredstock (“Participating Preferred Stock”) which is convertible, andparticipating. There are 3,443,359 shares outstanding as of March31, 2005. These shares are convertible immediately on a one-for-one basis into shares of Class A Common Stock subject toantidilution adjustments. There were no dividends on this classof stock. These shares have a liquidation value of $12 per share.This preferred stock has the right to receive dividends ordistributions at a rate per share equal to the amount of any dividendor distribution declared or made to Class A Common Stock. Inaddition, this preferred stock has certain distribution rights uponliquidation.
As part of the financing of the CPF acquisition, the Companyissued 967,742 shares of Participating Convertible Preferred Stock.The Preferred Stock is convertible into the Company’s Class ACommon Stock on a one-for-one basis subject to antidilutionadjustments. The Preferred Stock was valued at $16.60 per sharebased on the market value of the Class A Common Stock at thetime the acquisition was announced. This class of stock has a par
value of $.025 per share and a stated value of $15.50 per share.
The outstanding 10% cumulative, convertible, voting preferredstock consists of 407,240 Series A shares, convertible at the rate ofone common share of Class A and Class B for every 20 preferredshares, and 400,000 Series B shares, which carry a one commonshare of Class A and Class B for thirty conversion rate. The SeriesA and B shares have a $.25 stated value and a $.025 par value.There are 2,633,333 shares authorized of Class A $.025 par valuestock, which are unissued and undesignated. In addition, thereare 30,000 shares of no par stock, which are also unissued andundesignated. The Company paid dividends totaling $20,181, or$.025 per share, to the holders of this 10% preferred stock for theyears ended March 31, 2005 and 2004. The Company has 200,000shares of 6%, cumulative, voting, $.25 stated value, preferred stockwhich is callable at par value of $.25 per share. The Company paiddividends totaling $3,000 or $.015 per share to the holders of this6% preferred cumulative, $.25 par value, voting stock.

Common Stock – The Class A Common Stock and the Class BCommon Stock have substantially identical rights with respect toany dividends or distributions of cash or property declared onshares of common stock, and rank equally as to the right to receiveproceeds on liquidation or dissolution of the Company afterpayment of the Company’s indebtedness and liquidation right tothe holders of preferred shares. However, holders of Class BCommon Stock retain a full vote per share, whereas the holders ofClass A Common Stock have voting rights of 1/20th of one voteper share on all matters as to which shareholders of the Companyare entitled to vote.
Unissued shares of common stock reserved for conversionprivileges were 33,695 of Class A and Class B as of March 31, 2005and 2004. Additionally, there were 3,443,359 and 3,443,596 sharesof Class A reserved for conversion of the Participating PreferredStock as of March 31, 2005 and 2004, respectively.
Comprehensive Income – Net unrealized gains and losses are netof their related provision for income taxes.
Notes to Consolidated Financial Statements
8. Retirement PlansThe Company has a noncontributory defined benefit pension plancovering all employees who meet certain age-entry requirementsand work a stated minimum number of hours per year. Annualcontributions are made to the Plan sufficient to satisfy legal fundingrequirements.
The following tables provide a reconciliation of the changes in thePlan’s benefit obligation and fair value of plan assets over thetwo-year period ended March 31, 2005 and a statement of thefunded status as of March 31, 2005 and 2004:
The Plan holds the Company’s common stock with a fair marketvalue of $4,418,000.
The following table provides the components of net periodicbenefit cost for the Plan for fiscal years 2005, 2004, and 2003:
2005 2004(In thousands)
Change in Benefit Obligation
Benefit obligation at beginning of year $ 66,991 $ 41,369Service cost 3,050 2,546Interest cost 3,987 3,519Actuarial gain 3,877 1,227Acquisition - 20,821Benefit payments and expenses (3,222) (2,491)Benefit obligation at end of year $ 74,683 $ 66,991
Change in Plan Assets
Fair value of plan assets at beginning of year $ 59,687 $ 28,781Actual return on plan assets 3,686 13,603Employer contributions 2,821 241Benefit payments and expenses (3,222) (2,491)Acquisition - 19,553Fair value of plan assets at end of year $ 62,972 $ 59,687
2005 2004(In thousands)
Funded Status
Funded status at end of year $ (11,711) $ (7,304)Unrecognized transition asset (1,885) (2,161)Unrecognized loss 6,336 963Accrued benefit cost $ (7,260) $ (8,502)
2005 2004 2003(In thousands)
Service cost $ 3,050 $ 2,545 $ 2,571Interest cost 3,986 3,519 2,334Expected return on plan assets (5,182) (3,850) (3,005)Amortization of transition asset (276) (276) (276)Amortization of net gain - 649 -Amortization of prior service cost - - 3 1Net periodic benefit cost $ 1,578 $ 2,587 $ 1,655
18

The Company has Employees’ Savings Plans [401(k)] covering allemployees who meet certain age-entry requirements and work astated minimum number of hours per year. Participants may makecontributions up to the legal limit. The Company’s matchingcontributions are discretionary. Costs charged to operations forthe Company’s matching contributions amounted to $1,519,000,$1,708,000, and $605,000, in 2005, 2004, and 2003, respectively.
Expected Return on Plan AssetsThe expected rate of return on Plan assets is 8.75%. Seneca FoodsCorporation expects 8.75% to fall within the 40-to-50 percentilerange of returns on investment portfolios with asset diversificationsimilar to that of the pension plan’s target asset allocation.
Investment Policy and StrategySeneca Foods Corporation maintains an investment policy designed
Plan Assets
The Plan’s accumulated benefit obligation was $66,941,000 at March31, 2005, and $60,929,000 at March 31, 2004.
The prior service costs are amortized on a straight-line basis overthe average remaining service period of active participants. Gainsand losses in excess of 10% of the greater of the benefit obligationand the market-related value of assets are amortized over theaverage remaining service period of active participants.
The assumptions used to measure the Company’s benefitobligation are shown in the following table:
2005 2004
Discount rate 5.75% 6.00%Expected return on plan assets 8.75% 8.75%Rate of compensation increase 3.50% 3.50%
to achieve a long-term rate of return, including investment incomethrough dividends and equity appreciation, sufficient to meet theactuarial requirements of the pension plans. Seneca FoodsCorporation seeks to accomplish its return objectives by prudentlyinvesting in a diversified portfolio of public company equities withbroad industry representation seeking to provide long-term growthconsistent with the performance of relevant market indices, as wellas maintain an adequate level of liquidity for pension distributionsas they fall due. The strategy of being fully invested in equitieshas historically provided greater rates of return over extendedperiods of time.
Cash Flows
Expected contributions for fiscal year ending March 31, 2006: Expected employer contributions $ - Expected employee contributions -
Estimated future benefit payments reflecting expectedfuture service for the fiscal years ending March 31:
2006 $ 2,8392007 3,0352008 3,2622009 3,5652010 3,7422011-2015 23,106
9. Fair Value of Financial Instruments
The carrying amount of the estimated fair values of the Company’sfinancial instruments are summarized as follows:
The estimated fair values were determined as follows:
Long-term debt and capital lease obligations - The quotedmarket prices for similar debt or current rates offered to thecompany for debt with the same maturities.
Notes payable - The carrying amount approximates fair valuedue to the short-term maturity of the notes.
Class B Common Stock of Moog Inc. - Based on quotedmarket prices.
Target Percentage of Plan Allocation Assets at March 31,
2006 2005 2004Plan Assets:
Equity Securities 9 9 % 9 9 % 9 9 %Debt Securities - - -Real Estate - - -
Cash 1 1 1 Total 10 0% 10 0% 10 0%
2005 2004Carrying Estimated Carrying EstimatedAmount Fair Value Amount Fair Value
(In thousands)Long-term debt, including current portion $163,214 $159,211 $175,200 $175,850Notes payable 60,733 60,733 58,395 58,395Capital leases, including current portion 6,582 5,796 7,306 6,589Class B Common Stock of Moog Inc. - - 4,465 4,465
Notes to Consolidated Financial Statements
19

10. Acquisition
On May 27, 2003, the Company completed its acquisition of 100%of the membership interest in Chiquita Processed Foods, L.L.C.(“CPF”) from Chiquita Brands International, Inc. The primaryreason for the acquisition was to acquire additional productioncapacity in the Canned Vegetable business. The purchase pricetotaled $126.1 million plus the assumption of certain liabilities.This acquisition was financed with cash, proceeds from a new$200.0 million revolving credit facility, and $16.1 million of theCompany’s Participating Convertible Preferred Stock. ThePreferred Stock is convertible into the Company’s Class A CommonStock on a one-for-one basis. The Preferred Stock was valued at$16.60 per share based on the market value of the Class A CommonStock at the time the acquisition was announced.
During the quarter ended September 27, 2003, the Companyrefinanced $42.5 million of debt outstanding under the revolvingcredit facility with new term debt from an insurance company. Thenew term debt from the insurance company of $42.5 million, whencombined with the refinancing of existing insurance company debtof $32.5 million, has an interest rate of 8.03%, a fifteen-yearamortization and a ten-year term.
As part of this acquisition, the Company assumed seasonal notespayable from the CPF revolving credit facility of $25.4 million,which was paid off at the time of acquisition with proceeds fromthe new $200.0 million revolving credit facility. The Company alsoassumed $35.9 million of CPF long-term debt and capital leaseobligations, of which $26.8 million was paid off at the time ofacquisition with proceeds from the new $200.0 million revolvingcredit facility. The remaining long-term debt principally involvestwo Industrial Revenue Development Bonds totaling $5.5 millionand consisting of a $3 million Pickett, Wisconsin issue due onJune 1, 2005 with an interest rate of 7.75% and a $2.5 million WallaWalla, Washington issue due on September 1, 2005 with an interestrate of 8.5%. The balance of the debt acquired, totaling $3.6 million,has interest rates ranging from 1.9% to 9% and is due through2011.
The Company’s consolidated statement of net earnings for theyear ended March 31, 2004 includes ten months of the CPF acquiredoperations. A pro forma income statement as if the operationswere acquired at the beginning of the periods presented follows:
The Company sold three former CPF plants and related assets toLakeside Foods, Inc. on June 17, 2003. The Company sold oneadditional former CPF plant and related assets to Lakeside Foods,Inc. on August 6, 2003. The aforementioned sales to LakesideFoods, Inc. generated $46 million in cash proceeds, which wasused to pay down debt. The Company sold additional plantlocations that were designated as assets held for sale during 2005and 2004.
The total purchase price of the transaction has been allocated asfollows:
2004 2003
(unaudited)
Net Sales $945,332 $945,217
Cost of Product Sold 872,534 874,797
Selling, General and Administrative 37,075 27,144
Interest Expense (net) 16,985 18,209
Other Expense (net) 1,675 2,409
Total Costs and Expenses 928,269 922,559
Earnings Before Income Taxes 17,063 22,658
Income Taxes 6,248 7,644
Net Earnings $ 10,815 $ 15,014
Basic Earnings Per Share $ 0.96 $ 1.35
Diluted Earnings Per Share $ 0.96 $ 1.35
Current assets $ 137.8Property, plant, and equipment 87.8Other assets 6.5Current liabilities (69.6)Long-term debt (27.9)Other non-current liabilities (4.3)Total $ 130.3
Notes to Consolidated Financial Statements
20
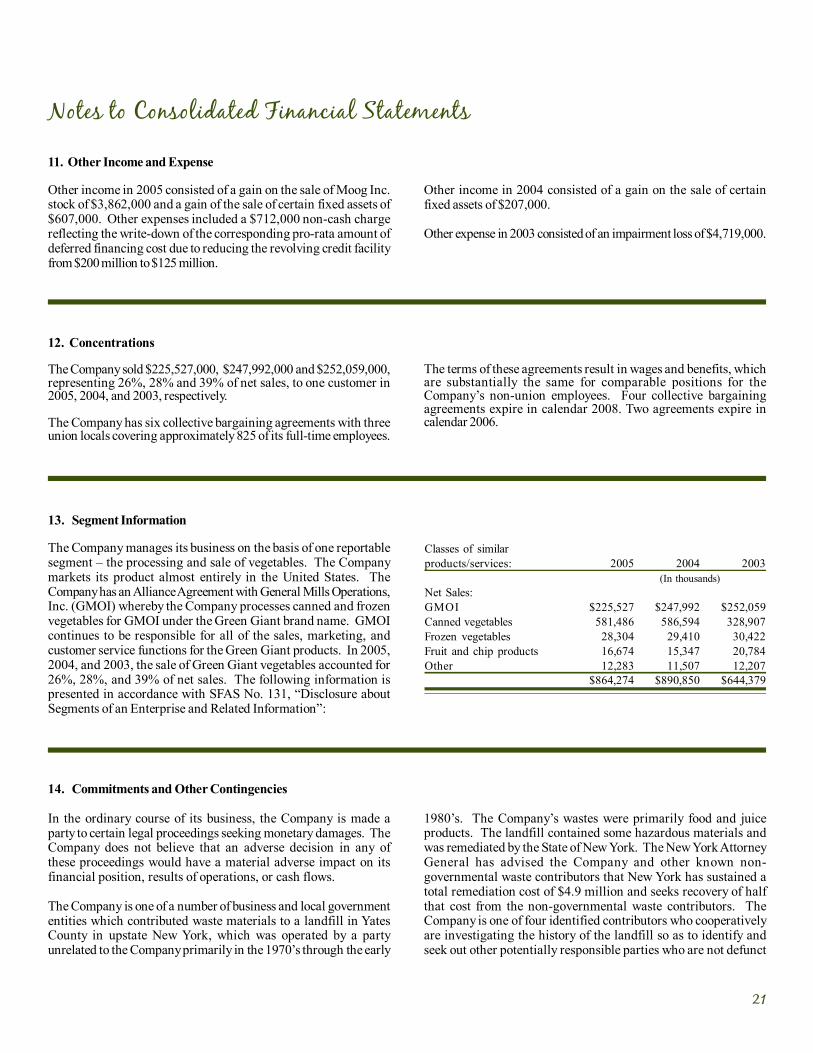
11. Other Income and Expense
Other income in 2005 consisted of a gain on the sale of Moog Inc.stock of $3,862,000 and a gain of the sale of certain fixed assets of$607,000. Other expenses included a $712,000 non-cash chargereflecting the write-down of the corresponding pro-rata amount ofdeferred financing cost due to reducing the revolving credit facilityfrom $200 million to $125 million.
Notes to Consolidated Financial Statements
Other income in 2004 consisted of a gain on the sale of certainfixed assets of $207,000.
Other expense in 2003 consisted of an impairment loss of $4,719,000.
14. Commitments and Other Contingencies
In the ordinary course of its business, the Company is made aparty to certain legal proceedings seeking monetary damages. TheCompany does not believe that an adverse decision in any ofthese proceedings would have a material adverse impact on itsfinancial position, results of operations, or cash flows.
The Company is one of a number of business and local governmententities which contributed waste materials to a landfill in YatesCounty in upstate New York, which was operated by a partyunrelated to the Company primarily in the 1970’s through the early
1980’s. The Company’s wastes were primarily food and juiceproducts. The landfill contained some hazardous materials andwas remediated by the State of New York. The New York AttorneyGeneral has advised the Company and other known non-governmental waste contributors that New York has sustained atotal remediation cost of $4.9 million and seeks recovery of halfthat cost from the non-governmental waste contributors. TheCompany is one of four identified contributors who cooperativelyare investigating the history of the landfill so as to identify andseek out other potentially responsible parties who are not defunct
13. Segment Information
The Company manages its business on the basis of one reportablesegment – the processing and sale of vegetables. The Companymarkets its product almost entirely in the United States. TheCompany has an Alliance Agreement with General Mills Operations,Inc. (GMOI) whereby the Company processes canned and frozenvegetables for GMOI under the Green Giant brand name. GMOIcontinues to be responsible for all of the sales, marketing, andcustomer service functions for the Green Giant products. In 2005,2004, and 2003, the sale of Green Giant vegetables accounted for26%, 28%, and 39% of net sales. The following information ispresented in accordance with SFAS No. 131, “Disclosure aboutSegments of an Enterprise and Related Information”:
Classes of similarproducts/services: 2005 2004 2003
(In thousands)Net Sales:GMOI $225,527 $247,992 $252,059Canned vegetables 581,486 586,594 328,907Frozen vegetables 28,304 29,410 30,422Fruit and chip products 16,674 15,347 20,784Other 12,283 11,507 12,207
$864,274 $890,850 $644,379
12. Concentrations
The Company sold $225,527,000, $247,992,000 and $252,059,000,representing 26%, 28% and 39% of net sales, to one customer in2005, 2004, and 2003, respectively.
The Company has six collective bargaining agreements with threeunion locals covering approximately 825 of its full-time employees.
The terms of these agreements result in wages and benefits, whichare substantially the same for comparable positions for theCompany’s non-union employees. Four collective bargainingagreements expire in calendar 2008. Two agreements expire incalendar 2006.
21

Notes t o Consol idated Financia l Sta tements
and are financially able to contribute to the non-governmentalparties’ reimbursement liability. Until that search is completed, theCompany’s liability cannot be definitively estimated. The Companydoes not believe that any ultimate settlement in excess of theamount accrued will have a material impact on its financial positionor results of operations.
During 2004, various claims totaling approximately $3,211,000 wereasserted by the Fleming Companies against the Company and asubsidiary acquired in 2003 in the Bankruptcy proceedings in theU.S. Bankruptcy Court for the District of Delaware for (i) receipt ofallegedly preferential payments under the U.S. Bankruptcy Code($1,292,000), (ii) receipt of alleged overpayments ($1,139,000) and(iii) amounts allegedly owing under various vendor promotionalprograms ($780,000). During 2005, the Company settled theseclaims for $399,000.
15. Plant Restructuring
After a comprehensive review of our production capacitiesfollowing the CPF acquisition in 2004, the Company completed aplant restructuring program in 2005 resulting in a restructuringcharge of $7,678,000. The restructuring charge consisted of anon-cash impairment charge of $6,952,000 and a cash severancecharge of $726,000, which are included in Plant Restructuring inthe Consolidated Statements of Net Earnings. The Company usedtwo methods to determine fair value: (1) no value was assigned tomachinery and equipment that cannot be redeployed within theCompany and where there is no ready market for the asset; and (2)quoted prices or prices for similar assets for real estate.
This restructuring program principally involved the closure of threeprocessing facilities, including a green bean plant in upstate NewYork and corn plants in Wisconsin and Washington. In addition,the Company restructured the newly acquired Payette, Idahofacility through the removal of canned meat production to focusexclusively on dry beans. The rationalization of the Company’sproductive capacity will: (1) improve the Company’s overall coststructure and competitive position; (2) address the excess capacitysituation arising from the acquisition of CPF; and (3) mitigate theeffect of inflationary pressures on the Company’s raw materialinputs such as steel and fuel.
The closure of the Washington corn processing facility coincidedwith an amendment to the Alliance Agreement with GMOI. Underthe above amendment, the Blue Earth, Minnesota facility wasremoved from the Alliance Agreement due to a reduction in GMOIvolume requirements and will be operated by the Company as anon-Alliance facility. Additionally, GMOI agreed to reimburse the
Company in the future for remaining lease and depreciation costsat the Blue Earth facility which, on a net present value basis,approximate the closure costs associated with the Washingtonfacility.
The following table summarizes the restructuring and related assetimpairment charges recorded and the accruals established during2005:
Long-LivedAsset Other
Severance Charges Costs Total (In thousands)
Total expected restructuring charge $ 726 $ 4,960 $ 1,992 $ 7,678
Balance March 31, 2004 — — — —Second-quarter charge to expense 619 — — 619Third-quarter charge to expense 9 4 3,798 1,912 5,804Fourth-quarter charge to expense 1 3 1,162 8 0 1,255Loss on disposal of assets — (3,361) — (3,361)Cash payments (470) — — (470)Balance March 31, 2005 $ 256 $ 1,599 $ 1,992 $ 3,847
In addition, $771,000 was charged to Cost of Product Sold in thesecond quarter of 2005 related to exiting a line of contract packingbusiness.
On June 15, 2004, an accident occurred at the Company’s aircrafthangar located at the Yates County Airport in Penn Yan, New York.A collision occurred between an automobile owned by an employeeof an aircraft service company doing contract work at theCompany’s hangar and two jet aircraft standing in the hangar. Theincident caused minor damage to the hangar and one of the airplanesand substantial damage to the wing of the second airplane. Acorporate customer of the Company’s Flight Division sharesownership with the Company of the less-damaged aircraft and hassole ownership of the more-damaged aircraft. The Company doesnot believe that any ultimate settlement will have a material impacton its financial position or results of operations.
22

Report of Independent Registered Public Accounting Firm
To the Board of Directors and Stockholders ofSeneca Foods CorporationMarion, New York
We have audited the accompanying consolidated balance sheets of Seneca Foods Corporation and Subsidiaries as of March 31, 2005 and 2004, and therelated consolidated statements of net earnings, stockholders’ equity, and cash flows for years then ended. These financial statements are the responsibilityof the Company’s management. Our responsibility is to express an opinion on these financial statements based on our audits.
We conducted our audits in accordance with the standards of the Public Company Accounting Oversight Board (United States). Those standards requirethat we plan and perform the audit to obtain reasonable assurance about whether the financial statements are free of material misstatement. An auditincludes examining, on a test basis, evidence supporting the amounts and disclosures in the financial statements. An audit also includes assessing theaccounting principles used and significant estimates made by management, as well as evaluating the overall financial statement presentation. We believethat our audits provide a reasonable basis for our opinion.
In our opinion, the consolidated financial statements referred to above present fairly, in all material respects, the consolidated financial position of SenecaFoods Corporation and Subsidiaries as of March 31, 2005 and 2004, and the consolidated results of their operations and their cash flows for the yearsthen ended in conformity with U.S. generally accepted accounting principles.
We have also audited, in accordance with the standards of the Public Company Accounting Oversight Board (United States), the effectiveness of SenecaFoods Corporation and its Subsidiaries’ internal control over financial reporting as of March 31, 2005, based on the criteria established in InternalControl—Integrated Framework issued by the Committee of Sponsoring Organizations of the Treadway Commission and our report dated June 10, 2005expressed an unqualified opinion on management’s assessment and an adverse opinion on the effectiveness of internal control over financial reporting.
Buffalo, New YorkJune 10, 2005
To the Board of Directors and Stockholdersof Seneca Foods CorporationMarion, New York
We have audited the accompanying consolidated statements of net earnings, stockholders’ equity, and of cash flows of Seneca FoodsCorporation and subsidiaries (the “Company”) for the year ended March 31, 2003. These financial statements are the responsibility of theCompany’s management. Our responsibility is to express an opinion on these consolidated financial statements based on our audit.
We conducted our audit in accordance with the standards of the Public Company Accounting Oversight Board (United States). Thosestandards require that we plan and perform the audit to obtain reasonable assurance about whether the financial statements are free ofmaterial misstatement. An audit includes examining, on a test basis, evidence supporting the amounts and disclosures in the financialstatements. An audit also includes assessing the accounting principles used and significant estimates made by management, as well asevaluating the overall financial statement presentation. We believe that our audit provides a reasonable basis for our opinion.
In our opinion, such consolidated financial statements present fairly, in all material respects, the results of operations and cash flows ofSeneca Foods Corporation and subsidiaries for the year ended March 31, 2003, in conformity with accounting principles generallyaccepted in the United States of America.
DELOITTE & TOUCHERochester, New YorkMay 21, 2003
23
Deloitte& Touche

Shareholder Information and Quarterly Results
The Company’s common stock is traded on The NASDAQNational Stock Market. The 3.9 million of Class A outstandingshares and 2.8 million Class B outstanding shares are owned by288 and 279 shareholders of record, respectively. The high andlow prices of the Company’s common stock during each quarter ofthe past two years are shown below:
As of March 31, 2005, the most restrictive credit agreement limitationon the Company’s payment of dividends and other distributions,such as purchases of shares, to holders of Class A or Class BCommon Stock is an annual total limitation of $500,000, reducedby aggregate annual dividend payments totaling $23,000, whichthe Company presently pays on two outstanding classes ofpreferred stock. Payment of dividends to common stockholders ismade at the discretion of the Company’s Board of Directors anddepends, among other factors, on earnings; capital requirements;and the operating and financial condition of the Company. TheCompany has not declared or paid a common dividend in manyyears.
Class A: 2005 2004Quarter High Low High Low
First $20.00 $17.92 $18.50 $16.20Second 18.81 18.25 19.30 17.30Third 19.00 18.00 21.50 19.00Fourth 18.75 16.75 21.97 18.00
Class B: 2005 2004Quarter High Low High Low
First $19.45 $18.25 $18.72 $16.85Second 18.95 17.65 19.55 17.52Third 19.10 18.25 22.88 19.05Fourth 18.75 16.99 22.25 18.25
The following is a summary of the unaudited interim results ofoperations by quarter:
Earnings for the fourth quarter have historically reflectedadjustments of previously estimated raw material costs andproduction levels. Due to the dependence on fruit and vegetableyields of the Company’s food processing segment, interim costingmust be estimated. Significant adjustments recorded in the fourthquarter include a net impairment charge of $1.3 million and areduction of the income tax provision of $571,000. During thefourth quarter, certain reclassifications were made between netsales; cost of sales; and selling, general and administrative expense,which changed previously reported quarterly amounts. There wasno effect on previously reported net earnings.
First Second Third Fourth(In thousands, except per share data)
Year ended March 31, 2005:Net sales $164,678 $220,375 $307,966 $171,255Gross margin 15,147 16,546 16,580 15,999Net earnings 4,502 2,445 (1 ,513) 2,473Basic earnings
per common share .40 .22 (.14) .23Diluted earnings
per common share .40 .22 (.14) .23
Year ended March 31, 2004:Net sales $151,672 $248,610 $326,326 $164,242Gross margin 15,567 18,812 16,410 18,457Net earnings 3,672 3,910 1,887 3,472Basic earnings
per common share .35 .35 .17 .31Diluted earnings
per common share .35 .35 .17 .31
Shareholder Information and Quarterly Results
24
Notice of Annual Meeting
The 2005 Annual Meeting of Shareholders will be held on Friday,August 5, 2005, beginning at 1:00 P.M. at the offices of SenecaFoods Corporation at 3736 South Main Street, Marion, New York.A formal notice of the meeting, together with a proxy statementand proxy form, will be mailed to shareholders of record as of June10, 2005.
Additional Information
A copy of the Company’s Annual Report on Form 10-K for thefiscal year ended March 31, 2005, as filed with the Securities andExchange Commission, will be provided by the Company to anyshareholder who so requests in writing.
Requests should be sent to Philip G. Paras, Seneca FoodsCorporation, 3736 South Main Street, Marion, New York 14505, orcontact us via our web site at http://www.senecafoods.com, oremail us at [email protected].
Forward-Looking Statements
Except for the historical information contained herein, the mattersdiscussed in this annual report are forward-looking statements asdefined in the Private Securities Litigation Reform Act (PSLRA) of1995. The Company wishes to take advantage of the “safe harbor”provisions of the PSLRA by cautioning that numerous importantfactors, which involve risks and uncertainties, including but notlimited to economic, competitive, governmental, and technologicalfactors affecting the Company’s operations, markets, products,services and prices, and other factors discussed in the Company’sfilings with the Securities and Exchange Commission, in the future,could affect the Company’s actual results and could cause itsactual consolidated results to differ materially from those expressedin any forward-looking statement made by, or on behalf of, theCompany.

Directors
Arthur H. BaerPresidentHudson Valley Publishing, Inc.
Andrew M. BoasGeneral PartnerCarl Marks Management Company, L.P.
Robert T. BradyPresident and Chief Executive OfficerMoog Inc.
Douglas F. BrushChairman and Business Development OfficerSentry Group
G. Brymer HumphreysPresidentHumphreys Farm Inc.
Kraig H. KayserPresident and Chief Executive Officer
Thomas PaulsonChief Financial OfficerInnovex, Inc.
Susan W. StuartMarketing Consultant
Arthur S. WolcottChairman
Officers
Corporate
Arthur S. WolcottChairman
Kraig H. KayserPresident and Chief Executive Officer
Philip G. ParasChief Financial Officer
Carl A. CichettiChief Information Officer
Cynthia L. FohrdVice President, Human Resources
Jeffrey L. Van RiperController and Secretary
Sarah S. MortensenAssistant Secretary
Processed Food Group
Vegetable OperationsPaul L. PalmbyPresident
Technical Services & DevelopmentMatt J. HenschlerVice President
FinanceCraig W. KnappVice President
TransportationGene W. SchaettenVice President
Customer ServiceRichard L. WaldorfVice President
Sales and Marketing Groups -
Dean E. ErstadSenior Vice President
Branded SalesJames E. BlairVice President
Private Label Retail George E. Hopkins, III
Vice President
Global Sourcing Vincent J. Lammers Vice President
Food ServiceVictoria A. NinnemanVice President
MarketingBruce S. WolcottVice President
Corporate Offices
3736 South Main StreetMarion, New York 14505Telephone (315) 926-8100
Independent Registered PublicAccounting Firm
Ernst & Young LLPBuffalo, New York
General Counsel
Jaeckle Fleischmann & Mugel, LLPBuffalo, New York
Transfer Agent and Registrar
Seneca Foods CorporationSuite 1010, 1605 Main StreetSarasota, Florida 34236Telephone (941) 366-9707
Manufacturing Plants and Warehouses
Food Group
Buhl, IdahoNew Plymouth, IdahoPayette, IdahoPrinceville, IllinoisArlington, MinnesotaBlue Earth, MinnesotaBricelyn, MinnesotaGlencoe, MinnesotaLeSueur, MinnesotaMontgomery, MinnesotaRochester, MinnesotaGeneva, New YorkLeicester, New YorkMarion, New YorkSalem, OregonDayton, WashingtonYakima, WashingtonBaraboo, WisconsinCambria, WisconsinClyman, WisconsinColeman, WisconsinCumberland, WisconsinGillett, WisconsinJanesville, WisconsinMayville, WisconsinOakfield, WisconsinRipon, Wisconsin
Non-Food Group
Penn Yan, New York
Seneca Foods Corporation
25

Reserved for Notes
Related Documents