ANNUAL REPORT 2001 Year Ended March 31, 2001 BUSINESS CONCENTRATION AND GROWTH

Welcome message from author
This document is posted to help you gain knowledge. Please leave a comment to let me know what you think about it! Share it to your friends and learn new things together.
Transcript
UB
E IN
DU
ST
RIE
S, LT
D.
AN
NU
AL R
EP
OR
T 2001
ANNUAL REPORT 2001Year Ended March 31, 2001
BUSINESS CONCENTRATION AND GROWTH
Tokyo Head Office
Seavans North Bldg., 1-2-1, Shibaura,
Minato-ku, Tokyo 105-8449, Japan
Phone: +81 (3) 5419-6110 Fax: +81 (3) 5419-6230
Ube Head Office
1978-96, Kogushi, Ube, Yamaguchi 755-8633, Japan
Phone: +81 (836) 31-1111 Fax: +81 (836) 21-2252
URL: http://www.ube-ind.co.jp
Printed in Japan 01-10 3000 TP
Founded in 1897, Ube Industries, Ltd., is preparing for operations in a third consecutive century. The four seg-
ments that comprise the UBE Group—Chemicals & Plastics, Construction Materials, Machinery & Metal
Products, and Energy & Environment—are pursuing independent business strategies but have the common
goal of strengthening consolidated Group management. Ube Industries is using superior technologies
acquired through extensive R&D to create high-quality, value-added products that are capable of securing
strong positions in domestic and overseas markets.
Profile
Contents
Fiscal 2000 Business Highlights ...................................................... 1A Message from the President ........................................................ 2New 21•UBE (New Three-Year Management
Plan Fiscal 2001–2003) ................................................................. 4Business Highlights:
—Chemicals & Plastics ............................................................... 6—Construction Materials........................................................... 11—Machinery & Metal Products.................................................. 14—Energy & Environment ........................................................... 17—Responsible Care .................................................................. 19—Corporate Research & Development...................................... 20
Consolidated Five-Year Summary ................................................. 22
Financial Review............................................................................ 23Consolidated Balance Sheets ........................................................26Consolidated Statements of Income.............................................. 28Consolidated Statements of Stockholders’ Equity ......................... 29Consolidated Statements of Cash Flows ....................................... 30Notes to Consolidated Financial Statements ................................. 31Report of Independent Certified Public Accountants
on the Consolidated Financial Statements................................... 41Board of Directors......................................................................... 42Organization Chart ........................................................................ 43Major Consolidated Subsidiaries and Affiliates............................... 44Investor Information....................................................................... 45
Thousands ofU.S. dollars
Millions of yen (Note 1)
2001 2000 2001
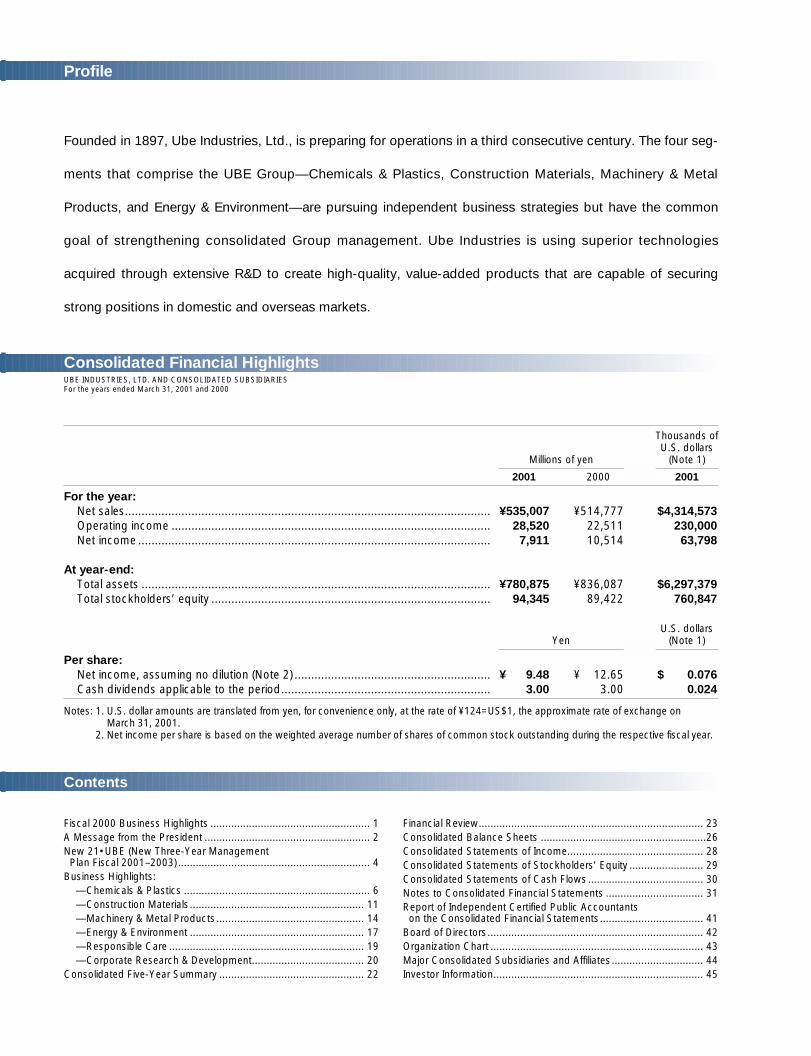
For the year:Net sales.............................................................................................................. ¥535,007 ¥514,777 $4,314,573Operating income ................................................................................................ 28,520 22,511 230,000Net income .......................................................................................................... 7,911 10,514 63,798
At year-end:Total assets ......................................................................................................... ¥780,875 ¥836,087 $6,297,379Total stockholders’ equity .................................................................................... 94,345 89,422 760,847
U.S. dollarsYen (Note 1)
Per share:Net income, assuming no dilution (Note 2) ........................................................... ¥0009.48 ¥0012.65 $0,000.076Cash dividends applicable to the period............................................................... 3.00 3.00 0.024
Notes: 1. U.S. dollar amounts are translated from yen, for convenience only, at the rate of ¥124=US$1, the approximate rate of exchange onMarch 31, 2001.
Notes: 2. Net income per share is based on the weighted average number of shares of common stock outstanding during the respective fiscal year.
Consolidated Financial HighlightsUBE INDUSTRIES, LTD. AND CONSOLIDATED SUBSIDIARIESFor the years ended March 31, 2001 and 2000
Date of Establishment: 1897
Common Stock: Authorized: 3,300 million sharesIssued: 845,828,704 shares
(¥43,564 million)
Transfer Agent and Register:The Toyo Trust and Banking Co., Ltd.
Investor Information(As of March 31, 2001)
Overseas Offices (Sales & Representative)Ube America Inc.55 East 59th Street, New York, NY 10022, U.S.A.Phone: +1 212-813-8300Fax: +1 212-826-0454
Ube Corporation Europe, S.A.Poligon El Serrallo, Grao de Castellon 12080, SpainPhone: +34 964-738065Fax: +34 964-738074
Ube Europe GmbHImmermannstr. 65B,40210 Düsseldorf, GermanyPhone: +49 211-178830Fax: +49 211-3613297
Ube Singapore Pte., Ltd.#20-05 Gateway West, 150 Beach Road, Singapore 189720Phone: +65 291-9363Fax: +65 293-9039
Ube (Hong Kong) Ltd.Rooms 1405-12, Sun Hung Kai Centre, 30 Harbour Road, Hong Kong, S.A.R., ChinaPhone: +852 2877-1628Fax: +852 2877-1262
Ube (Shanghai) Ltd.Rooms 2315-16, Bank of China Tower,200 Yincheng Road, Pudong New Area, Shanghai, China 200120Phone: +86 21-5037-2288Fax: +86 21-5037-2266
Domestic OfficesTokyo Head OfficeSeavans North Bldg., 1-2-1, Shibaura, Minato-ku, Tokyo 105-8449Phone: +81 (3) 5419-6110Fax: +81 (3) 5419-6230
Ube Head Office1978-96, Kogushi, Ube, Yamaguchi 755-8633Phone: +81 (836) 31-1111Fax: +81 (836) 21-2252
Network
JuneMayApr.Mar.Feb.Jan.2001
Dec.Nov.Oct.Sept.Aug.JulyJuneMayApr.2000
0
100
200
300
400
500
Financial institutions: 50.8%
Individuals and others: 28.5%
Domestic corporations: 8.7%
Foreign investors: 12.0%
Stock Price Range on the Tokyo Stock Exchange (¥)
Number of Stockholders: 74,973
Independent Certified Public Accountants: Century Ota Showa & Co.
Breakdown of Stockholders
45
1
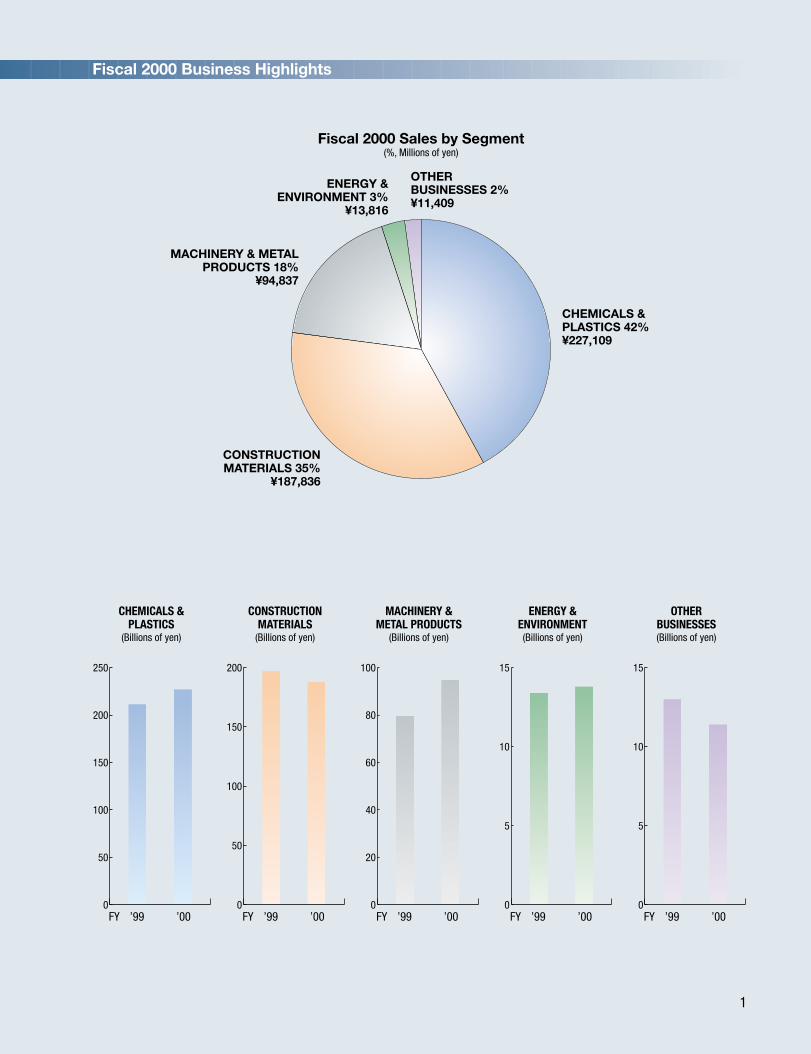
CHEMICALS &PLASTICS 42%¥227,109
OTHERBUSINESSES 2%¥11,409
CONSTRUCTIONMATERIALS 35%
¥187,836
MACHINERY & METALPRODUCTS 18%
¥94,837
ENERGY &ENVIRONMENT 3%
¥13,816
Fiscal 2000 Sales by Segment(%, Millions of yen)
Fiscal 2000 Business Highlights
0
50
100
150
200
250
’99FY FY FY FY FY’000
50
100
150
200
’99 ’000
20
40
60
80
100
’99 ’000
5
10
15
’99 ’000
5
10
15
’99 ’00
CHEMICALS &PLASTICS
(Billions of yen)
CONSTRUCTIONMATERIALS
(Billions of yen)
MACHINERY &METAL PRODUCTS
(Billions of yen)
ENERGY &ENVIRONMENT(Billions of yen)
OTHERBUSINESSES(Billions of yen)
A Message from the President
2
I have great pleasure in saying a few words to all
our stockholders on behalf of all our staff and the
Board of Directors.
Management Overview
In the first half of fiscal 2000, ended March 31,
2001, the Japanese economy seemed to be recov-
ering from recession, with an increase in exports to
Asia as well as in IT-related capital investment. In
the second half, however, the economy slipped
back following the slowdown in the U.S. economy,
lower growth rates in Asia, and a deflationary trend
in Japan. In industrial sectors, there was a number
of business reorganizations, such as mergers and
tie-ups outside traditional frameworks, in an effort
to improve competitiveness amid more intense
global competition.
Against this backdrop, in the second year of its
“21•UBE” consolidated three-year management
plan, which started in fiscal 1999, the UBE Group
focused its managerial resources on core business-
es, reorganizing its operational structure through a
policy of “selectivity and consolidation,” establish-
ing a system of management suited to the increas-
ingly information-oriented society of today, and
radically changing the corporate culture by intro-
ducing a performance-based wage system. As a
result of our efforts, we were able to increase con-
solidated net sales ¥20.2 billion compared with the
previous period, to ¥535.0 billion. Our performance
was affected by the huge increases in raw material
prices following a rise in crude oil prices. However,
cost-reduction measures and higher revenues from
our Specialty Products Division resulted in a ¥6.0 bil-
lion increase in operating income, to ¥28.5 billion,
and an ¥8.5 billion increase in ordinary income, to
¥17.8 bil l ion. However, after deducting the
Company’s ¥25.5 billion in special losses, including
the provision for an allowance for doubtful reserves,
and adding ¥21.3 billion in special profits, including
profits from the sale of assets, net income for the
year totaled ¥7.9 billion, down ¥2.6 billion from the
previous year.
On a brighter note, we achieved our management
improvement goals a year ahead of schedule. These
included curtail ing interest-bearing debt and
measures to deal with poorly performing affiliated
companies.
During the current term, the UBE Group an-
nounced its “New 21•UBE” three-year management
plan, which started in fiscal 2001, to deal with its
remaining tasks as well as develop and implement
new strategies for the future.
Outline of the “New 21•UBE” Plan
In the “New 21•UBE” plan, we have modified our
key words from “selectivity and consolidation” to
“business concentration and growth” in order to
help us work on the following tasks:
Task 1: Implementing management reforms to
perfect the “consolidated management of
segments that prioritizes stockholder value”
• Reforming our Board of Directors and introducing
an Executive Officer System
• Strengthening the functions of Ube Industries,
Ltd., as the parent company and integrating
Group services
• Establishing a personnel reward system based on
contribution to results as well as a system for
training and nurturing younger staff members
3
• Recreating our principal information system,
aggressively promoting e-commerce, and promot-
ing knowledge management, leading to a system
of management suited to the information-oriented
society of today
Task 2: Aiming for exponential growth by
focusing our managerial resources on our core
business areas—fine chemicals, pharmaceuti-
cals, specialty products, and aluminum wheels
We plan a total of ¥160 billion in capital investments
over the next three years, principally in these core
areas. Focusing our resources in this way will help
our efforts to grow exponentially in these areas. We
will also develop and nurture new businesses.
Task 3: Continually improving our financial
structure
The financial basis of the UBE Group has improved
recently through the implementation of various poli-
cies, but we cannot deny that it is still very fragile.
We will continue to firmly implement reforms for the
improvement of our financial structure by cutting
interest-bearing debt levels as well as raising funds
for investing in rapid growth through asset sales
and concentration in “areas that achieve.”
Task 4: Implementing an environment-oriented
management system
We are promoting environmental preservation activ-
ities, including measures to respond to a recycling-
oriented society and the reduction of greenhouse
gas emissions.
The UBE Group will reflect the values of its staff in
implementing its “New 21•UBE” plan. Our Group
catch copy, “Wings of technology and spirit of innova-
tion: that’s our DNA driving our global success.” com-
municates our Group vision and direction to the world.
Since its first days as a coal-mining company in
Ube City over a hundred years ago, Ube Industries
has grown by keeping up with the industrial struc-
ture of the times and constantly reinventing itself. In
all this time, however, the one thing that has not
changed is our basic philosophy of upholding
“Technology” and “Innovation,” the key words in
our Group vision.
The UBE Group will work together in pressing
ahead with the “New 21•UBE” plan. We hope to
receive the continued support and cooperation of all
our stockholders in the coming year.
Kazumasa Tsunemi
President and Representative Director
4
New 21•UBE (New Three-Year Management Plan Fiscal 2001–2003)
Group VisionThe UBE Group has drafted a Group vision in order toreflect the values of its staff and communicate its futuredirection to the world. We will work as a team toachieve the goals set out in our “New 21•UBE” plan.
•Group Catch CopyWings of technology and spirit of innovation: that’s our DNA driving our global success.
•Group StatementBy embracing the frontier spirit and optimizing theinfinite technologies, the UBE Group coexists withthe world to continue creating values for the newgeneration. We focus on our “competitive-edge busi-nesses” aiming for continued success in the future.
The Future Shape of the CompanyHaving integrated and rationalized its cement business,the Company is now contemplating becoming a holdingcompany centering on the Chemicals & Plastics andEnergy & Environment segments by around fiscal 2003.
Management PoliciesThe success of the 21•UBE plan has started us off wellin our efforts to dispose of our negative legacies. Wenow have the following policies to help us achieve out-standing growth and regenerate ourselves into a globalblue chip company.
Key words: Business concentration and growthPolicies:1) Implementing management reforms to perfect the
“consolidated management of segments that priori-tizes stockholder value”
2) Aiming for exponential growth by focusing our man-agerial resources on our core business areas
3) Continually improving our financial structure
Management Reforms
Segment-Wise Policies and Management Strategies
1) Reforming the Board of Directors and introducingan Executive Officer System
We will separate management and operational functionsthrough the introduction of an Executive Officer System. Thiswill increase the strength, speed, and efficiency of our busi-ness operations.
We will also reduce the number of directors from the cur-rent 25 to 10 (of which 6 will also be Executive Officers). Thiswill boost the strategic decision-making and corporate gov-ernance capabilities of our Board of Directors.
2) Strengthening the functions of the parent companyWe will restructure and strengthen Ube Industries, Ltd., theGroup’s parent company. We will also integrate the Group’soperations and subsequently set up service centers in theUbe (planned for October 2001) and Tokyo regions.
3) Reforming our human resource management systemWe will adopt a new wage system based on job grade andperformance instead of the traditional system of paymentrelated to individual ability. We have also started a new pro-gram for selecting and nurturing leaders from among ouryounger staff members. UBE Business School will be estab-lished as a training institution for future business leaders.
4) Responding to the IT revolutionWe will complete the reconstruction of our enterprise applicationsystems through the introduction of the R/3 System developed
by SAP Japan Co., Ltd., by the end of 2002 as a trigger for theinnovation of our business processes. We will also press aheadwith e-commerce and knowledge-based management.
5) Environmental managementWe will further advance our environmental preservation activitiesand safety-related measures, such as reducing emissions ofgreenhouse gases.
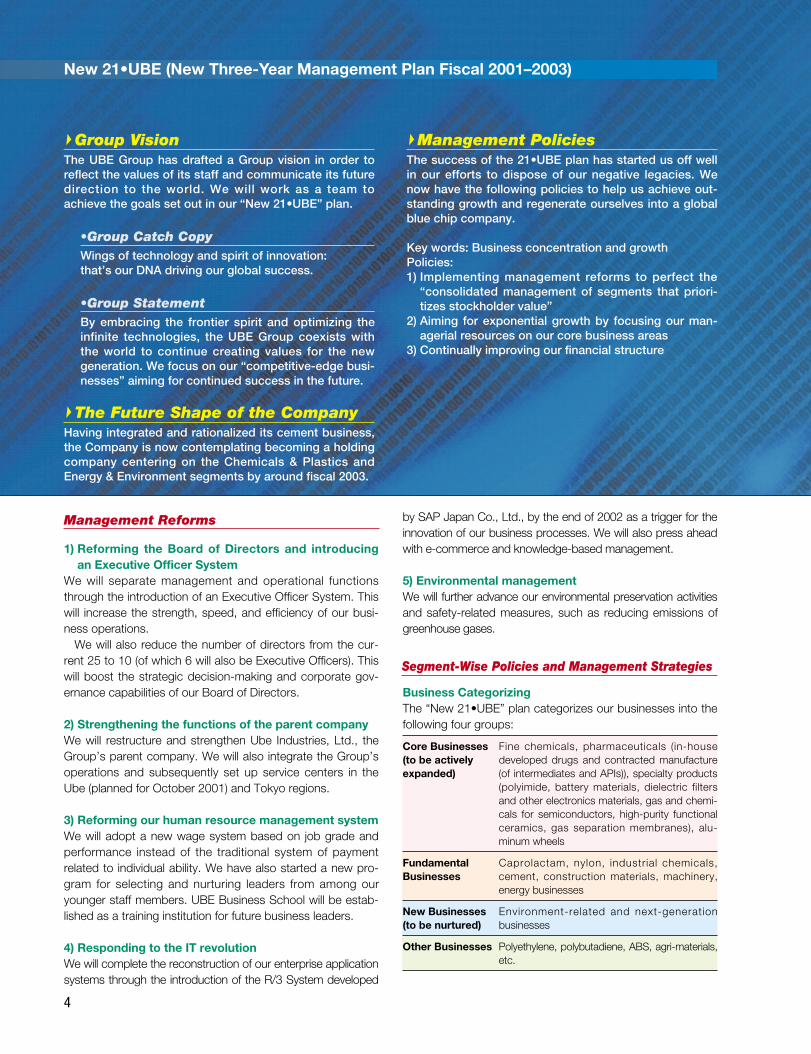
Business CategorizingThe “New 21•UBE” plan categorizes our businesses into thefollowing four groups:
Core Businesses Fine chemicals, pharmaceuticals (in-house (to be actively developed drugs and contracted manufacture expanded) (of intermediates and APIs)), specialty products
(polyimide, battery materials, dielectric filtersand other electronics materials, gas and chemi-cals for semiconductors, high-purity functionalceramics, gas separation membranes), alu-minum wheels
Fundamental Caprolactam, nylon, industrial chemicals, Businesses cement, construction materials, machinery,
energy businesses
New Businesses Environment-related and next-generation (to be nurtured) businesses
Other Businesses Polyethylene, polybutadiene, ABS, agri-materials,etc.
5
With the improvement of our financial structure and the opti-mization of assets as our priority tasks, we have set our-selves the following targets:
Fiscal 2000 Fiscal 2003Debt-to-equity ratio 5.1 times 3.5 timesBusiness income* as a proportion of total assets 3.7% 5.9%
Total created cash flow ¥34 billion ¥60 billion**** Business income = operating income + interest earned & dividends
+ equity in earnings or losses of non-consolidated subsidiaries** Cumulative value of cash flow between fiscal 2001 and fiscal 2003
Major income and balance sheet items:(Billions of yen)
Fiscal 2000 Fiscal 2003Sales ¥535.0 ¥630Operating income 28.5 45Net income 7.9 20Interest-bearing debt 483.8 455Stockholders’ equity 94.3 130
Cash Flow PlanBuilding on our current “21•UBE” plan, we will implement acash flow oriented management system and improve ourfinancial structure.
We will use the proceeds from asset sales and operatingincome before depreciation to cut interest-bearing debt lev-els, fund our financing activities, and invest sufficiently in cap-ital equipment to more than cover the depreciation resultingfrom our “business concentration and growth” activities.
Cash flow plan for the period from fiscal 2001 to fiscal 2003:(Billions of yen)
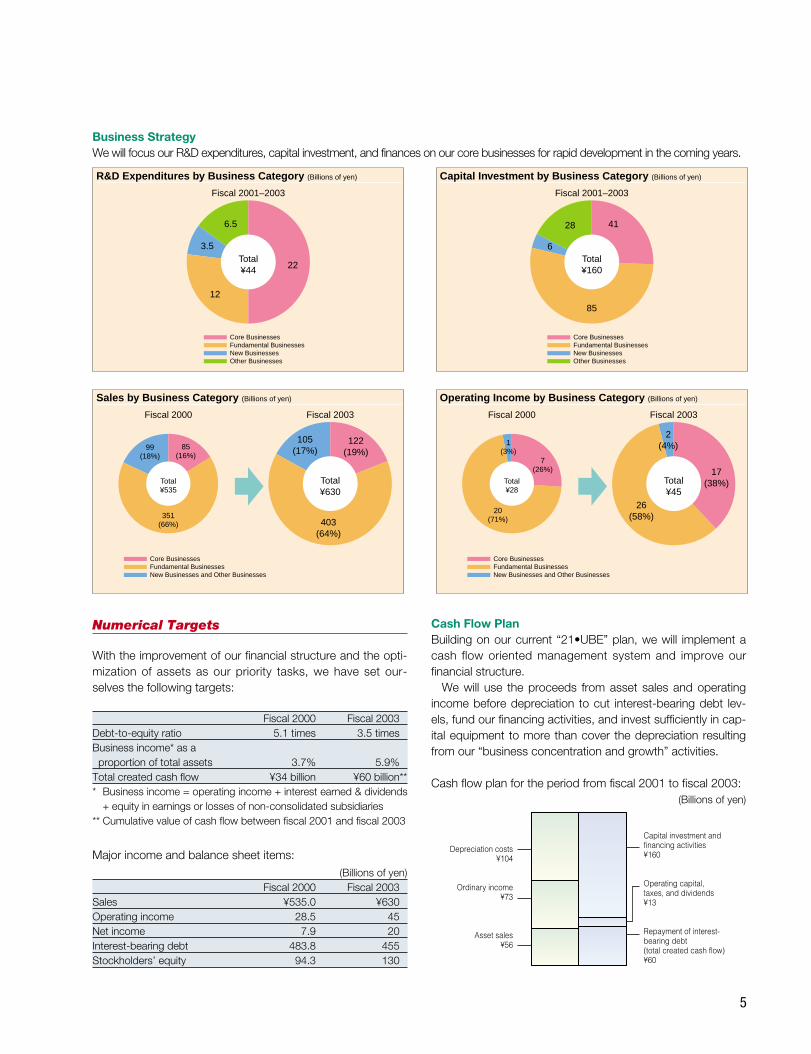
Sales by Business Category (Billions of yen)
Total¥535
85(16%)
351(66%)
99(18%)
Total¥630
Fiscal 2000 Fiscal 2003
122(19%)
403(64%)
105(17%)
Core BusinessesFundamental BusinessesNew Businesses and Other Businesses
Operating Income by Business Category (Billions of yen)
Total¥28
7(26%)
20(71%)
1(3%)
Total¥45
Fiscal 2000 Fiscal 2003
17(38%)
26(58%)
2(4%)
Core BusinessesFundamental BusinessesNew Businesses and Other Businesses
Capital Investment by Business Category (Billions of yen)
Total¥160
41
85
28
6
Fiscal 2001–2003
Core BusinessesFundamental BusinessesNew Businesses Other Businesses
R&D Expenditures by Business Category (Billions of yen)
Total¥44 22
12
6.5
3.5
Fiscal 2001–2003
Core BusinessesFundamental BusinessesNew Businesses Other Businesses
Depreciation costs¥104
Ordinary income¥73
Asset sales¥56
Capital investment and financing activities¥160
Operating capital, taxes, and dividends¥13
Repayment of interest-bearing debt(total created cash flow)¥60
Business StrategyWe will focus our R&D expenditures, capital investment, and finances on our core businesses for rapid development in the coming years.
Numerical Targets
B u s i n e s s H i g h l i g h t s
6
BUSINESS HIGHLIGHTS
BACKGROUND TO FISCAL 2000 BUSINESS RESULTS
AND CURRENT-TERM OUTLOOK
Polyolefins and Synthetic Rubber
Sales of polyolefins, synthetic rubber, and acrylonitrile
butadiene styrene (ABS) resin were largely steady despite
the effect of rises in the prices of raw materials, such as
ethylene and butadiene.
Caprolactam, Engineering Plastics,
and Industrial Chemicals
Caprolactam shipments declined, greatly affected by rises
in the prices of such raw materials as benzene and naph-
tha as well as the worsening supply and demand balance
in Asia. Sales of nylon resin improved in line with rises in
demand for automobiles and IT-related equipment, while
sales of industrial chemicals steadily improved.
Fine Chemicals and Pharmaceutical Products
In fine chemicals, shipments of 1,6-Hexanediol, DDA, and
dimethyl carbonate (DMC) improved steadily. In pharma-
ceutical bulk compounds and intermediates, the
Company has launched an antiallergenic agent developed
jointly with Tanabe Seiyaku Co., Ltd., and is currently
involved in the production of bulk compounds. Productos
Quimicos del Mediterraneo, S.A. (PQM), boosted its pro-
duction capacity for 1,6-Hexanediol, a raw material used
in the manufacture of polyurethane. The facility started
operations in August 1999 and continued its good perfor-
mance in 2000. Jade Fine Chemicals (Wúxi) Co., Ltd., a
joint venture with French company Rhodia, commenced
Chemicals & Plastics
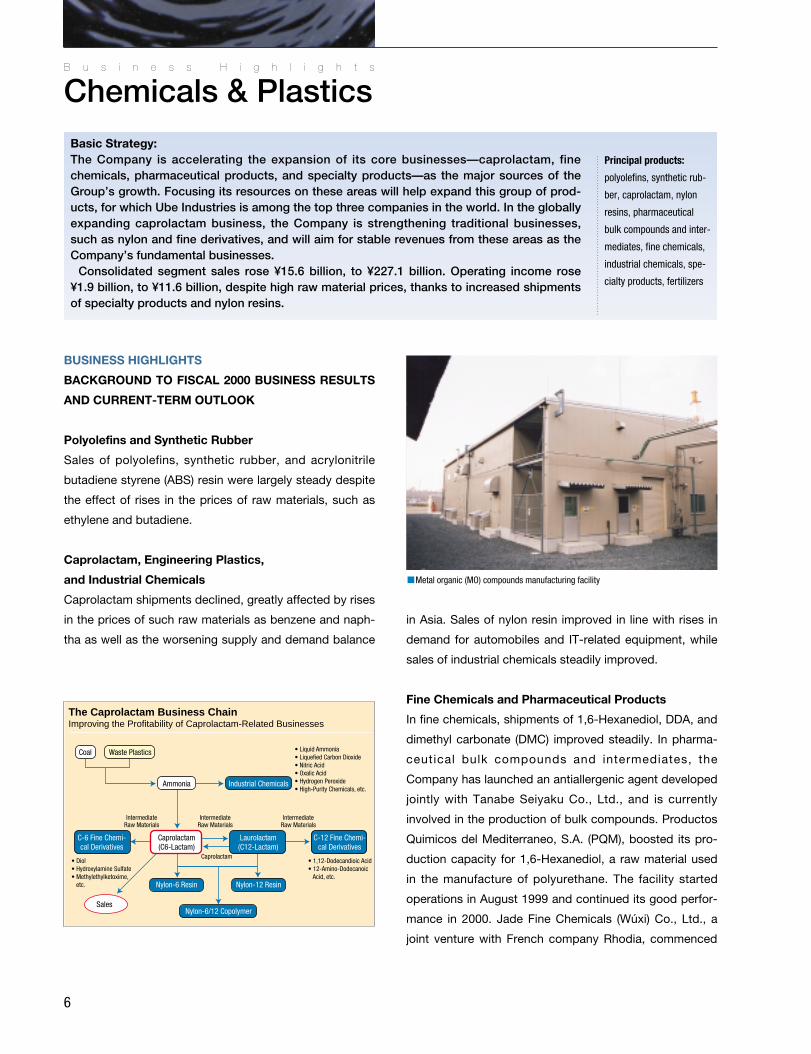
The Caprolactam Business ChainImproving the Profitability of Caprolactam-Related Businesses
Caprolactam(C6-Lactam)
Sales
C-12 Fine Chemi-cal Derivatives
Laurolactam(C12-Lactam)
C-6 Fine Chemi-cal Derivatives
Ammonia
Coal Waste Plastics
Nylon-6 Resin Nylon-12 Resin
Industrial Chemicals
Nylon-6/12 Copolymer
IntermediateRaw Materials
IntermediateRaw Materials
Caprolactam
IntermediateRaw Materials
• Liquid Ammonia• Liquefied Carbon Dioxide• Nitric Acid• Oxalic Acid• Hydrogen Peroxide• High-Purity Chemicals, etc.
• 1,12-Dodecandioic Acid• 12-Amino-Dodecanoic Acid, etc.
• Diol• Hydroxylamine Sulfate• Methylethylketoxime, etc.
Basic Strategy:The Company is accelerating the expansion of its core businesses—caprolactam, finechemicals, pharmaceutical products, and specialty products—as the major sources of theGroup’s growth. Focusing its resources on these areas will help expand this group of prod-ucts, for which Ube Industries is among the top three companies in the world. In the globallyexpanding caprolactam business, the Company is strengthening traditional businesses,such as nylon and fine derivatives, and will aim for stable revenues from these areas as theCompany’s fundamental businesses.
Consolidated segment sales rose ¥15.6 billion, to ¥227.1 billion. Operating income rose¥1.9 billion, to ¥11.6 billion, despite high raw material prices, thanks to increased shipmentsof specialty products and nylon resins.
Principal products:
polyolefins, synthetic rub-
ber, caprolactam, nylon
resins, pharmaceutical
bulk compounds and inter-
mediates, fine chemicals,
industrial chemicals, spe-
cialty products, fertilizers
Metal organic (MO) compounds manufacturing facility
7
operations in March 2000 and is currently manufacturing
guaiacol, a raw material for fragrances and pharmaceuti-
cal intermediates.
Specialty Products
In specialty products, sales of polyimide films, which are
used in materials for electronic information equipment,
electrolytes for lithium-ion batteries, high-purity chemical
pharmaceuticals used in semiconductors, and organic
metal compounds, continued to expand.
Dielectric ceramics performed steadily in the first half of
the year, but the worldwide drop in demand for mobile
phones caused shipments to fall in the second half.
BUSINESS STRATEGY AND MARKET OUTLOOK
Polyolefins and Synthetic Rubber
This business encompasses such core products as poly-
ethylene, polypropylene, polybutadiene (synthetic rubber),
amorphous polyalphaolefines (APAO), and ABS plastic.
The Company produces two types of polyethylene: low-
density polyethylene (LDPE) and linear low-density poly-
ethylene (LLDPE). Super polyethylene “Umerit”—an
LLDPE manufactured using a unique metallocene cataly-
sis process—is highly commended in the market as a
functional material. The Company’s manufacturing capac-
ity utilization for Umerit is presently running at only 60%,
but demand is increasing steadily. The Company aims to
strengthen the foundations of this business by increasing
the proportion of functional materials in its product lineup
by expanding sales of LDPEs for cable and other special
applications. The Company will also bolster the polyethyl-
ene operation’s downstream product lineup, principally
through Ube Film, Ltd.
APAO plastic production is presently running at only
60% capacity, and the Company plans to raise produc-
tion levels to full capacity as soon as possible. This is in
response to the current strong demand for hot-melt adhe-
sives as well as in preparation for anticipated demand for
automobile floor mats and enclosure tarpaulins for con-
struction sites.
Plans have been announced to combine our polypropy-
lene manufacturing business with those of Sumitomo
Chemical Co., Ltd., and Mitsui Chemicals, Inc. As part of
this process, the Company has decided to transfer all its
shares of Grand Polymer Co., Ltd., to Mitsui Chemicals,
the other partner in the joint venture.
The Company will continue to manufacture polybutadi-
ene rubber for general-use products at Thai Synthetic
Rubbers Co., Ltd., and domestically for specialty forms to
better respond to customer needs.
Ube Cycon, Ltd., a company manufacturing ABS plastic,
introduced the “Six Sigma” program in October 1999. The
company is working on enhancing efficiency and cus-
tomer service through improvements in quality control
and speedier customer response, and the benefits of
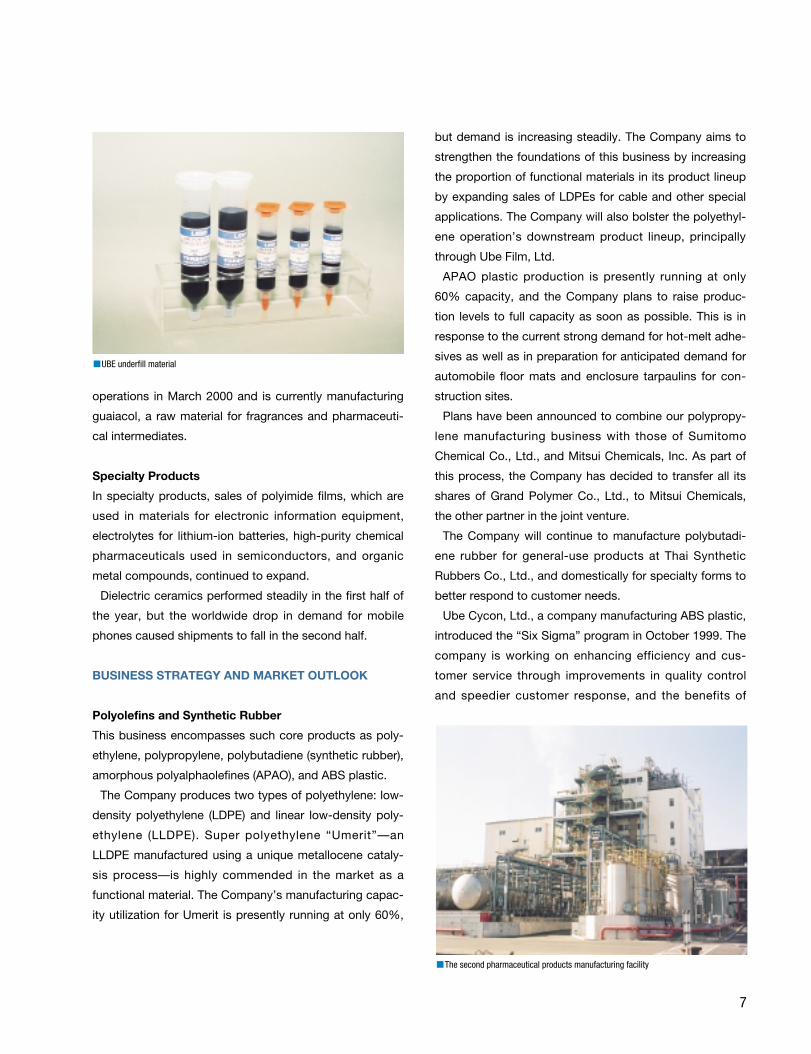
UBE underfill material
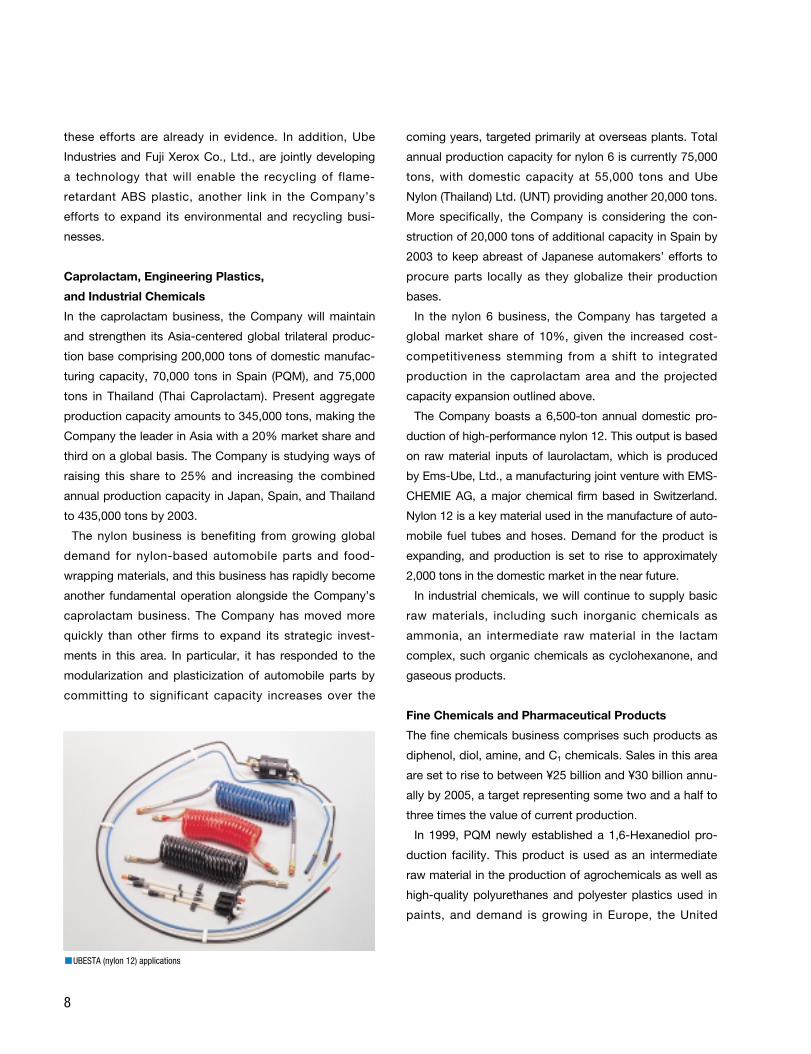
The second pharmaceutical products manufacturing facility
8
these efforts are already in evidence. In addition, Ube
Industries and Fuji Xerox Co., Ltd., are jointly developing
a technology that will enable the recycling of flame-
retardant ABS plastic, another link in the Company’s
efforts to expand its environmental and recycling busi-
nesses.
Caprolactam, Engineering Plastics,
and Industrial Chemicals
In the caprolactam business, the Company will maintain
and strengthen its Asia-centered global trilateral produc-
tion base comprising 200,000 tons of domestic manufac-
turing capacity, 70,000 tons in Spain (PQM), and 75,000
tons in Thailand (Thai Caprolactam). Present aggregate
production capacity amounts to 345,000 tons, making the
Company the leader in Asia with a 20% market share and
third on a global basis. The Company is studying ways of
raising this share to 25% and increasing the combined
annual production capacity in Japan, Spain, and Thailand
to 435,000 tons by 2003.
The nylon business is benefiting from growing global
demand for nylon-based automobile parts and food-
wrapping materials, and this business has rapidly become
another fundamental operation alongside the Company’s
caprolactam business. The Company has moved more
quickly than other firms to expand its strategic invest-
ments in this area. In particular, it has responded to the
modularization and plasticization of automobile parts by
committing to significant capacity increases over the
coming years, targeted primarily at overseas plants. Total
annual production capacity for nylon 6 is currently 75,000
tons, with domestic capacity at 55,000 tons and Ube
Nylon (Thailand) Ltd. (UNT) providing another 20,000 tons.
More specifically, the Company is considering the con-
struction of 20,000 tons of additional capacity in Spain by
2003 to keep abreast of Japanese automakers’ efforts to
procure parts locally as they globalize their production
bases.
In the nylon 6 business, the Company has targeted a
global market share of 10%, given the increased cost-
competitiveness stemming from a shift to integrated
production in the caprolactam area and the projected
capacity expansion outlined above.
The Company boasts a 6,500-ton annual domestic pro-
duction of high-performance nylon 12. This output is based
on raw material inputs of laurolactam, which is produced
by Ems-Ube, Ltd., a manufacturing joint venture with EMS-
CHEMIE AG, a major chemical firm based in Switzerland.
Nylon 12 is a key material used in the manufacture of auto-
mobile fuel tubes and hoses. Demand for the product is
expanding, and production is set to rise to approximately
2,000 tons in the domestic market in the near future.
In industrial chemicals, we will continue to supply basic
raw materials, including such inorganic chemicals as
ammonia, an intermediate raw material in the lactam
complex, such organic chemicals as cyclohexanone, and
gaseous products.
Fine Chemicals and Pharmaceutical Products
The fine chemicals business comprises such products as
diphenol, diol, amine, and C1 chemicals. Sales in this area
are set to rise to between ¥25 billion and ¥30 billion annu-
ally by 2005, a target representing some two and a half to
three times the value of current production.
In 1999, PQM newly established a 1,6-Hexanediol pro-
duction facility. This product is used as an intermediate
raw material in the production of agrochemicals as well as
high-quality polyurethanes and polyester plastics used in
paints, and demand is growing in Europe, the United
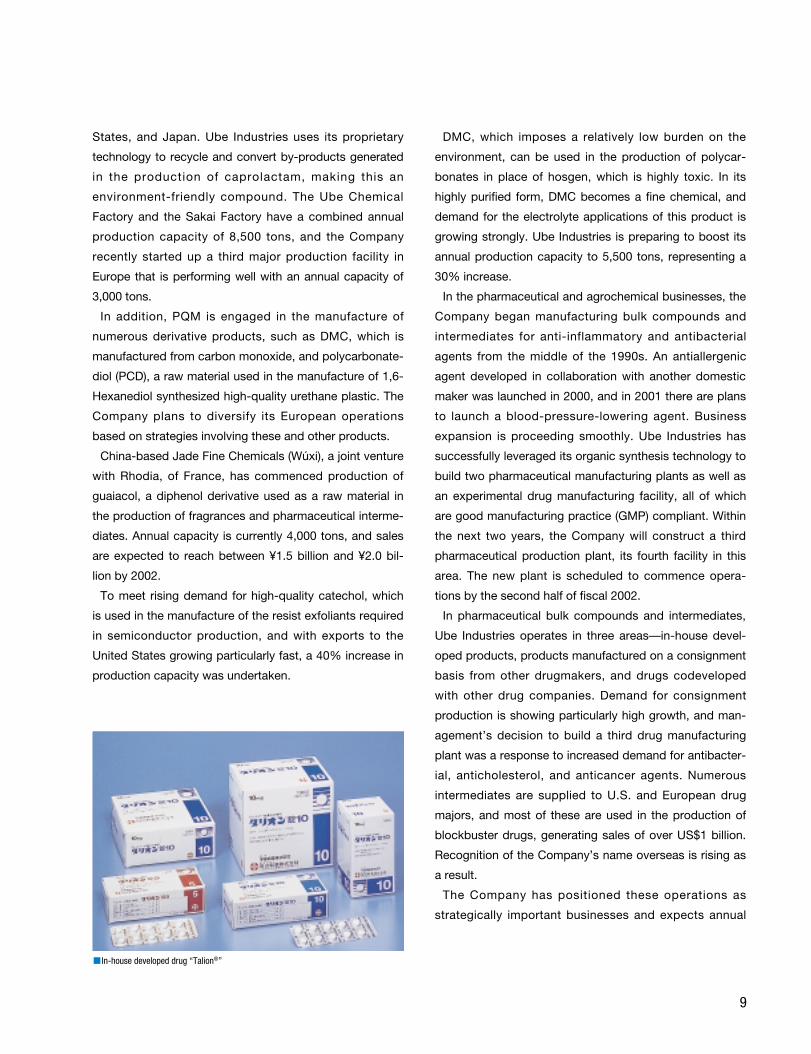
UBESTA (nylon 12) applications
9
States, and Japan. Ube Industries uses its proprietary
technology to recycle and convert by-products generated
in the production of caprolactam, making this an
environment-friendly compound. The Ube Chemical
Factory and the Sakai Factory have a combined annual
production capacity of 8,500 tons, and the Company
recently started up a third major production facility in
Europe that is performing well with an annual capacity of
3,000 tons.
In addition, PQM is engaged in the manufacture of
numerous derivative products, such as DMC, which is
manufactured from carbon monoxide, and polycarbonate-
diol (PCD), a raw material used in the manufacture of 1,6-
Hexanediol synthesized high-quality urethane plastic. The
Company plans to diversify its European operations
based on strategies involving these and other products.
China-based Jade Fine Chemicals (Wúxi), a joint venture
with Rhodia, of France, has commenced production of
guaiacol, a diphenol derivative used as a raw material in
the production of fragrances and pharmaceutical interme-
diates. Annual capacity is currently 4,000 tons, and sales
are expected to reach between ¥1.5 billion and ¥2.0 bil-
lion by 2002.
To meet rising demand for high-quality catechol, which
is used in the manufacture of the resist exfoliants required
in semiconductor production, and with exports to the
United States growing particularly fast, a 40% increase in
production capacity was undertaken.
DMC, which imposes a relatively low burden on the
environment, can be used in the production of polycar-
bonates in place of hosgen, which is highly toxic. In its
highly purified form, DMC becomes a fine chemical, and
demand for the electrolyte applications of this product is
growing strongly. Ube Industries is preparing to boost its
annual production capacity to 5,500 tons, representing a
30% increase.
In the pharmaceutical and agrochemical businesses, the
Company began manufacturing bulk compounds and
intermediates for anti-inflammatory and antibacterial
agents from the middle of the 1990s. An antiallergenic
agent developed in collaboration with another domestic
maker was launched in 2000, and in 2001 there are plans
to launch a blood-pressure-lowering agent. Business
expansion is proceeding smoothly. Ube Industries has
successfully leveraged its organic synthesis technology to
build two pharmaceutical manufacturing plants as well as
an experimental drug manufacturing facility, all of which
are good manufacturing practice (GMP) compliant. Within
the next two years, the Company will construct a third
pharmaceutical production plant, its fourth facility in this
area. The new plant is scheduled to commence opera-
tions by the second half of fiscal 2002.
In pharmaceutical bulk compounds and intermediates,
Ube Industries operates in three areas—in-house devel-
oped products, products manufactured on a consignment
basis from other drugmakers, and drugs codeveloped
with other drug companies. Demand for consignment
production is showing particularly high growth, and man-
agement’s decision to build a third drug manufacturing
plant was a response to increased demand for antibacter-
ial, anticholesterol, and anticancer agents. Numerous
intermediates are supplied to U.S. and European drug
majors, and most of these are used in the production of
blockbuster drugs, generating sales of over US$1 billion.
Recognition of the Company’s name overseas is rising as
a result.
The Company has positioned these operations as
strategically important businesses and expects annual
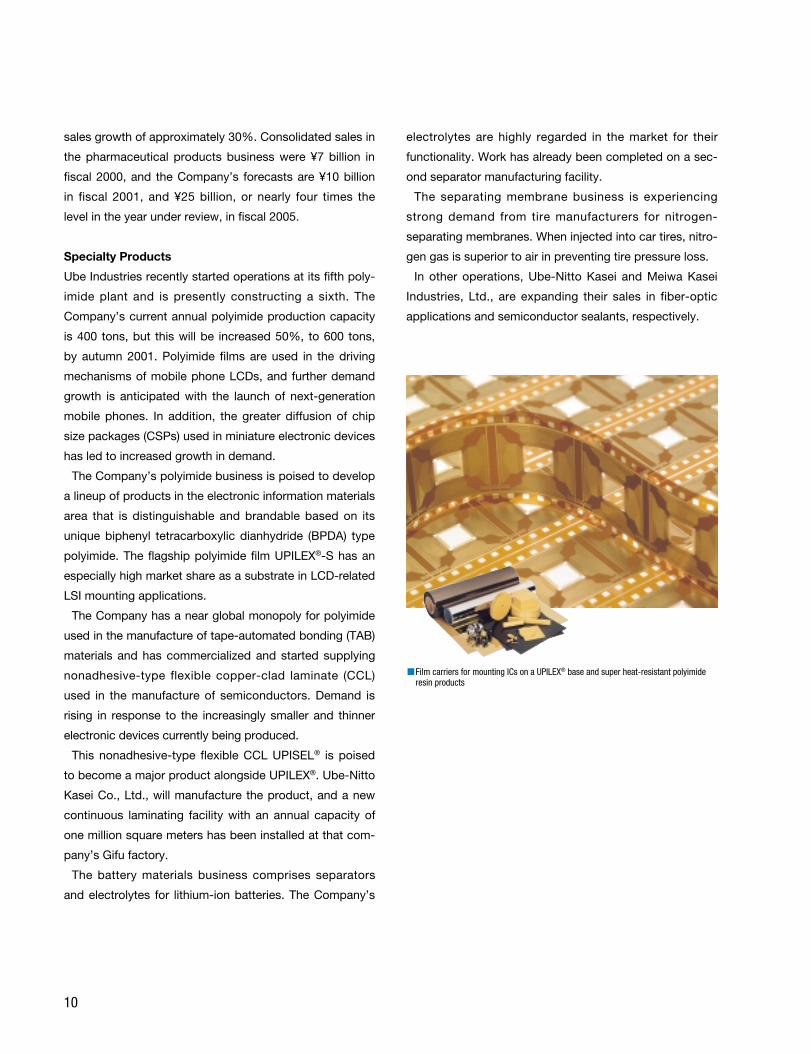
In-house developed drug “Talion®”
10
sales growth of approximately 30%. Consolidated sales in
the pharmaceutical products business were ¥7 billion in
fiscal 2000, and the Company’s forecasts are ¥10 billion
in fiscal 2001, and ¥25 billion, or nearly four times the
level in the year under review, in fiscal 2005.
Specialty Products
Ube Industries recently started operations at its fifth poly-
imide plant and is presently constructing a sixth. The
Company’s current annual polyimide production capacity
is 400 tons, but this will be increased 50%, to 600 tons,
by autumn 2001. Polyimide films are used in the driving
mechanisms of mobile phone LCDs, and further demand
growth is anticipated with the launch of next-generation
mobile phones. In addition, the greater diffusion of chip
size packages (CSPs) used in miniature electronic devices
has led to increased growth in demand.
The Company’s polyimide business is poised to develop
a lineup of products in the electronic information materials
area that is distinguishable and brandable based on its
unique biphenyl tetracarboxylic dianhydride (BPDA) type
polyimide. The flagship polyimide film UPILEX®-S has an
especially high market share as a substrate in LCD-related
LSI mounting applications.
The Company has a near global monopoly for polyimide
used in the manufacture of tape-automated bonding (TAB)
materials and has commercialized and started supplying
nonadhesive-type flexible copper-clad laminate (CCL)
used in the manufacture of semiconductors. Demand is
rising in response to the increasingly smaller and thinner
electronic devices currently being produced.
This nonadhesive-type flexible CCL UPISEL® is poised
to become a major product alongside UPILEX®. Ube-Nitto
Kasei Co., Ltd., will manufacture the product, and a new
continuous laminating facility with an annual capacity of
one million square meters has been installed at that com-
pany’s Gifu factory.
The battery materials business comprises separators
and electrolytes for lithium-ion batteries. The Company’s
electrolytes are highly regarded in the market for their
functionality. Work has already been completed on a sec-
ond separator manufacturing facility.
The separating membrane business is experiencing
strong demand from tire manufacturers for nitrogen-
separating membranes. When injected into car tires, nitro-
gen gas is superior to air in preventing tire pressure loss.
In other operations, Ube-Nitto Kasei and Meiwa Kasei
Industries, Ltd., are expanding their sales in fiber-optic
applications and semiconductor sealants, respectively.
Film carriers for mounting ICs on a UPILEX® base and super heat-resistant polyimideresin products
11
B u s i n e s s H i g h l i g h t s
Construction Materials
BUSINESS HIGHLIGHTS
BACKGROUND TO FISCAL 2000 BUSINESS RESULTS
AND CURRENT-TERM OUTLOOK
Cement
Major cost reductions were realized from rationalization
measures, such as the expanded utilization of industrial
waste products as raw materials or fuel in the cement
manufacturing process. Ube-Mitsubishi Cement
Corporation, the marketing arm for the Company’s
cement output, is working not just at improving sales but
also at various distribution and cost-rationalization mea-
sures as well as strengthening cooperation with
Sumitomo-Osaka Cement Co., Ltd., for specialty cement
consignment production.
Ready-Mixed Concrete
Integrating the Company’s affiliated suppliers of ready-
mixed concrete, involving disposing of some subsidiaries
and revitalizing the remaining ones, have helped Ube
Industries thoroughly revise its profit structure and
improve performance. As a result of these rationalization
measures, the Company’s cement subsidiaries were
reduced from 41 to 18 at the end of the term under
review.
Building Materials
Performance improved as a result of rationalization efforts
as well as steady demand for steel and housing products.
Construction Materials Segment Organization Chart
Planning & Control Dept.
Cement & BuildingMaterials Div.
Cement Production Center
Preparation & Working Group of Cement BusinessIntegration with Mitsubishi
Materials Corporation
Construction MaterialsSegment
Basic Strategy:Ube Industries has a marketing and R&D integration agreement with Mitsubishi MaterialsCorporation in its cement business. The Company plans to extend this collaboration tocover production activities by 2002. We will also actively promote resource recycling andcost reductions by reusing industrial waste as raw materials and fuel.
By reorganizing its operating structure and developing new businesses, the Company willexpand profits in this segment.
Consolidated segment sales were down ¥9.2 billion, to ¥187.8 billion, owing to the transfer of themarketing operations for metallic magnesium to Ube & Bussan Magnesium Inc. in December 1999.Operating income rose ¥0.9 billion, to ¥9.6 billion, thanks to effective cost reduction measures.
Principal products:
cement, clinker, ready-
mixed concrete, limestone,
building materials
The eastern wing of the UBE Cement Factory, which has recently been modernized
12
BUSINESS STRATEGY AND MARKET OUTLOOK
Cement
Production capacity exceeds demand in the domestic
cement industry, and the sector as a whole is facing a
comprehensive restructuring. The Company’s industrial
strategies for reviving cement operations include a reduc-
tion in supply capacity, increased competitiveness
through cost reductions, and a normalization of the
depressed pricing structure.
The joint venture with Mitsubishi Materials has been an
effective tool for rationalization as it has led to reduced
selling and distribution costs as well as lower labor
expenses at Ube-Mitsubishi Cement. Efforts to reduce
distribution costs are aimed primarily at cutting trans-
portation costs. This is done by managing shipping
schedules more efficiently and avoiding shipping
complications as well as by cutting service station
handling fees and unit transportation costs through recip-
rocal shipments.
Meanwhile, Ube-Mitsubishi Cement Research Institute
Corporation was established in October 1999 to raise the
efficiency and expand the scope of R&D efforts, while
eliminating overlap in this crucial area. This new organiza-
tional structure allows both companies to utilize their
manpower more efficiently and simultaneously acceler-
ates R&D.
The partners in the joint venture are seeking to com-
pletely integrate their cement production operations by
sharing their production technology, know-how, and cost
data. This should result in greater efficiencies and cost
reductions. They are also working to achieve an optimal
framework for the production of a soil stabilizer and for
the mutual consignment of specialty cement production.
The joint venture is moving aggressively forward with
efforts to incorporate industrial waste products into its pro-
duction processes using the technologies made available
by the two parent firms. Ube Industries operates plants in
coastal locations and is using coal ash—generated primari-
ly by electric power companies as a by-product in electric
power generation—as a raw material. Mitsubishi Materials
has plants located inland, and their proximity to urban
areas has led the company to excel in sludge and waste
plastic recycling technology. Both companies plan to use
their strengths in these areas to mutual advantage in the
future. The Company is also considering the integration of
its production activities, in addition to marketing and R&D,
with Mitsubishi Materials in 2002.
Ube Industries’ Cement Production Rationalization Plan
Ube Industries is currently reviewing its production sys-
tem and promoting cost-cutting measures, electing to
keep the Number 1 kiln at its Kanda Cement Factory idle
since fiscal 1998. The five kilns at the Ube, Isa, and Kanda
cement factories represent an annual production capacity
of 11 million tons, but the idling of the Kanda Number 1
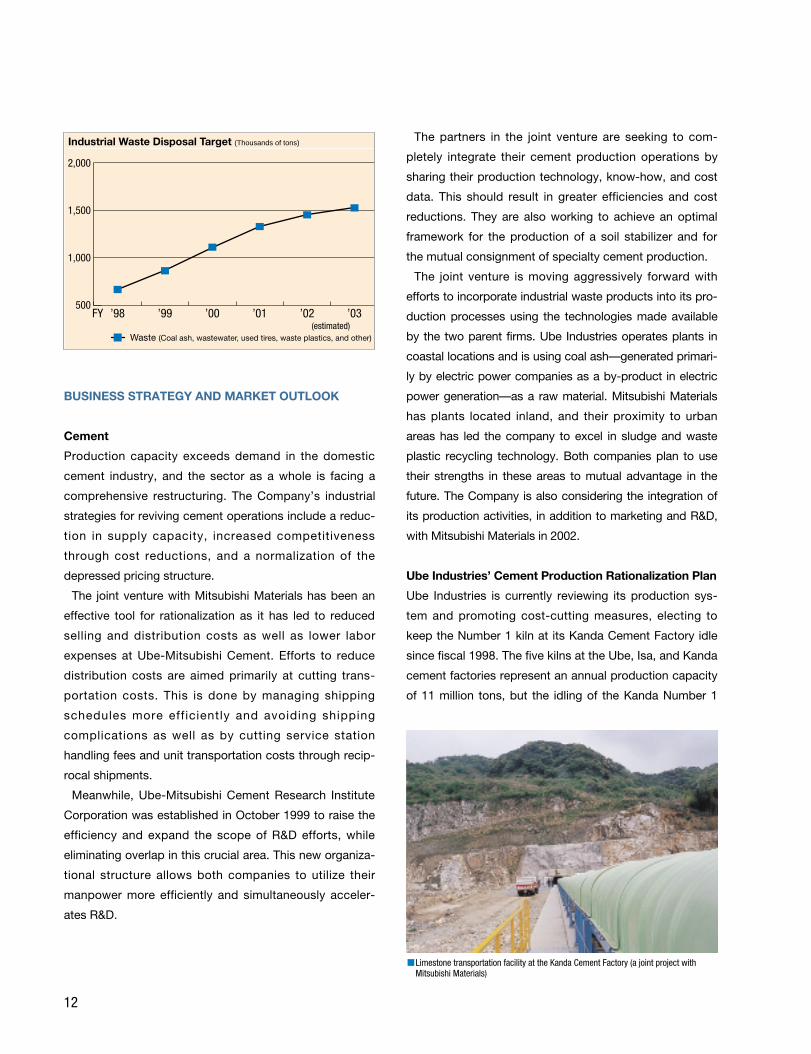
Industrial Waste Disposal Target (Thousands of tons)
500
1,000
1,500
2,000
’98FY ’99 ’00 ’01 ’02 ’03(estimated)
Waste (Coal ash, wastewater, used tires, waste plastics, and other)
Limestone transportation facility at the Kanda Cement Factory (a joint project withMitsubishi Materials)
13
kiln has reduced cement production capacity two million
tons annually, or approximately 20% of total capacity.
The Company’s cost-cutting efforts include reductions
in the labor force—the number of manufacturing person-
nel is to be reduced 20% between fiscal 1998 and fiscal
2001. A sewage sludge treatment facility was put into
operation in fiscal 2000 as part of efforts to use more
waste products as raw materials. A joint venture company
has also been set up with Tokuyama Corp. to promote
the use of ash from urban waste in cement production
that will start operations in April 2002. The project has
been given central importance as part of the zero-
emissions project in Yamaguchi Prefecture and will
receive backing from both the prefectural and national
governments. A new waste tire and waste plastic pro-
cessing facility was installed at the Ube Factory in March
2000 to help reuse more fuel-generating waste products.
Concerning l ime, a cooperative venture that l inks
Mitsubishi Materials’ Higashi-dani mine with the Kanda
Factory began operations in March 2001. This will enable
the Company to supply between 1 million and 1.5 million
tons of limestone annually from the Higashi-dani mine.
These various facilities will help the Company improve
profits approximately ¥4 billion in the cement manufactur-
ing business by the end of fiscal 2001.
Building Materials
The previous production system for small-lot diversified
products will be revamped, and the Company will devote
more resources to the following areas: lime-related
operations; building materials operations, especially self-
leveling materials and plaster materials; and waterproof
materials operations, while making efforts to improve
profits by promoting the reorganization of the operational
structure and developing new businesses.
The Company has launched a new interior wall con-
struction product called yasashii kabe (sensitive wall),
which allows for superior interior amenities and function-
ality and is effective in preventing the so-called sick house
syndrome. Strong demand is anticipated for this material
as an interior wall and ceiling material for homes, condo-
miniums, hospitals, nursing homes, and museum storage
areas. Fiscal 2001 sales are targeted at 12,000 square
meters.
An airtight tape product, RA Tape/GR505, has been
developed for low energy consumption homes. This prod-
uct helps to promote highly airtight internal spaces and
minimizes condensation inside the physical wall, thus
contributing to a better living environment, lower energy
consumption, and an extended usable life of the homes in
which it is incorporated.
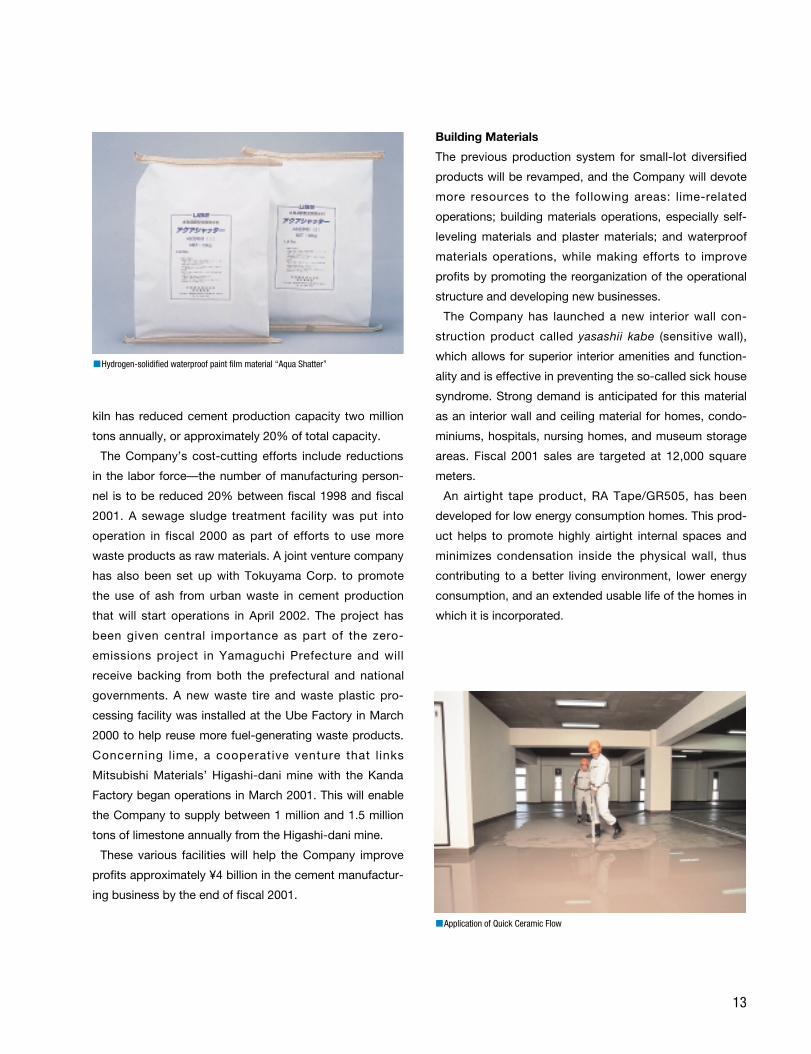
Hydrogen-solidified waterproof paint film material “Aqua Shatter”
Application of Quick Ceramic Flow
B u s i n e s s H i g h l i g h t s
Machinery & Metal Products
14
BUSINESS HIGHLIGHTS
BACKGROUND TO FISCAL 2000 BUSINESS RESULTS
AND CURRENT-TERM OUTLOOK
Ube Machinery Corporation, Ltd., formerly part of the
Machinery & Metal Products Division, was launched as a
new subsidiary in April 2000.
Heavy Machinery
This business was affected by the decline in capital
investment in the automotive industry, but all-electric
injection-molding machines performed well in the domes-
tic market, and orders increased. Exports of extrusion
presses to the United States and China rose.
Industrial Machinery, Bridges, and Steel Structures
Overall performance improved thanks to strong sales in
conveyor systems and other system machinery.
Light Metal Products
This business performed well with strong shipments of
aluminum wheels, manufactured using the Company’s
proprietary squeeze-casting technology, to both the
domestic and North American markets.
BUSINESS STRATEGY AND MARKET OUTLOOK
Ube Machinery aims to be an “Inspiring company, offering
consistent value to customers and stockholders, and
forming a global network through collaboration with staff
as well as the community.” The company’s operations are
customer-focused, and it is involved not just in marketing
but also development, design, manufacturing, and after-
sales services.
The new Technical Development Center, for instance, is
not only involved in the development and joint develop-
ment of products adapted to customer needs but has
also been “opened” to clients. Rather than supplying
machines as independent products, the company offers a
complete package of services, including process tech-
nologies and system and software services. This has
been made possible by synergy-creating alliances
between eleven of the Group’s companies as well as
the expansion of manufacturing, marketing, and after-
sales services globally through its overseas bases. This
helps the company provide comprehensive customer
services.
As part of its globalization efforts, the company set up a
wholly owned subsidiary, Ube Machinery (Shanghai), Ltd.,
to provide production, marketing, and after-sales services
in China. The company’s marketing goal is to establish
Basic Strategy:To build on its activities in the United States, the Company will strengthen its profitability byestablishing production, marketing, and after-sales services in China. We will also marketdifferentiated equipment developed using proprietary technology, strengthen and expandour service and software businesses, and enter new areas, such as the downstream partsbusiness. Ube Industries will develop and strengthen aluminum wheels as one of its coreproducts, with the aim of becoming one of the top-three global suppliers.
Consolidated sales in this segment rose ¥15.0 billion, to ¥94.8 billion, with strong sales ofall-electric injection-molding machines, extrusion presses, and bridges as well as continuedsteady shipments of aluminum wheels. Operating income rose ¥1.6 billion, to ¥3.0 billion,thanks to rationalization measures.
Principal products:
die-casting machines,
injection-molding
machines, crushing and
pulverizing machines, bulk
handling systems, bridges,
aluminum wheels
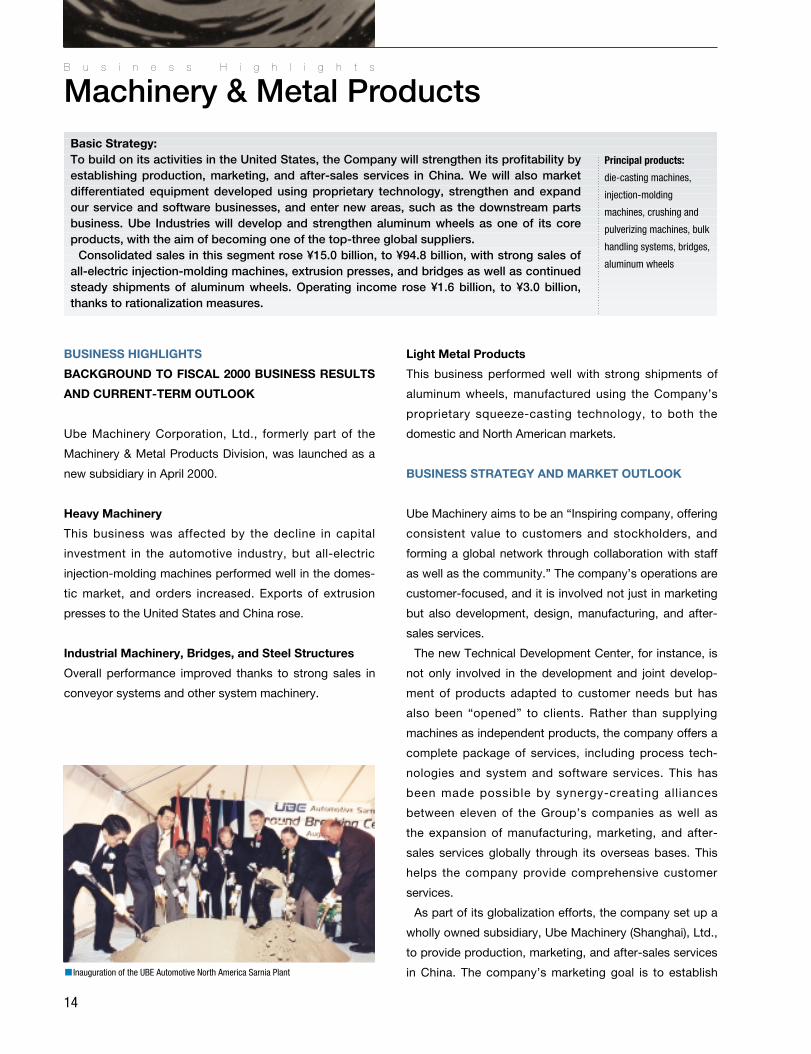
Inauguration of the UBE Automotive North America Sarnia Plant
15
itself in the three main markets in the world: the United
States, Europe, and Asia, including Japan and China.
Heavy Machinery
The Company is striving to make its injection-molding
business a leading global supplier of products to both
automakers and their parts suppliers. In die-casting
machines, which cast l ight metal products, the
Company’s products are already considered world-class.
The Company has successfully developed an all-electric
plastic injection-molding machine with a clamping force
of 1,400 tons, the largest of its kind in the world. This
machine was displayed at a plastics fair held in Chicago
in June 2000 and attracted a great deal of attention. The
Company sells all-electric injection-molding machines
with clamping forces of 650 tons, 850 tons, 1,000 tons,
and 1,400 tons, and sales have been particularly strong in
Japan and other Asian markets.
The Company has also launched a new Dieprest
Molding Process that dramatically reduces deformation
during molding by integrating the outermost layer, such
as a fabric or foam sheet. Orders for this new technology,
and consequently sales for the segment, have increased
dramatically.
An in-mold coating process for thermoplastic molds,
where surface coating can be carried out simultaneously
with injection molding, has been developed in cooperation
with Dai Nippon Toryo Co., Ltd. Being able to coat and
mold simultaneously reduces coating costs dramatically.
This technology is also very environment-friendly as the
coating agents used do not include organic solvents.
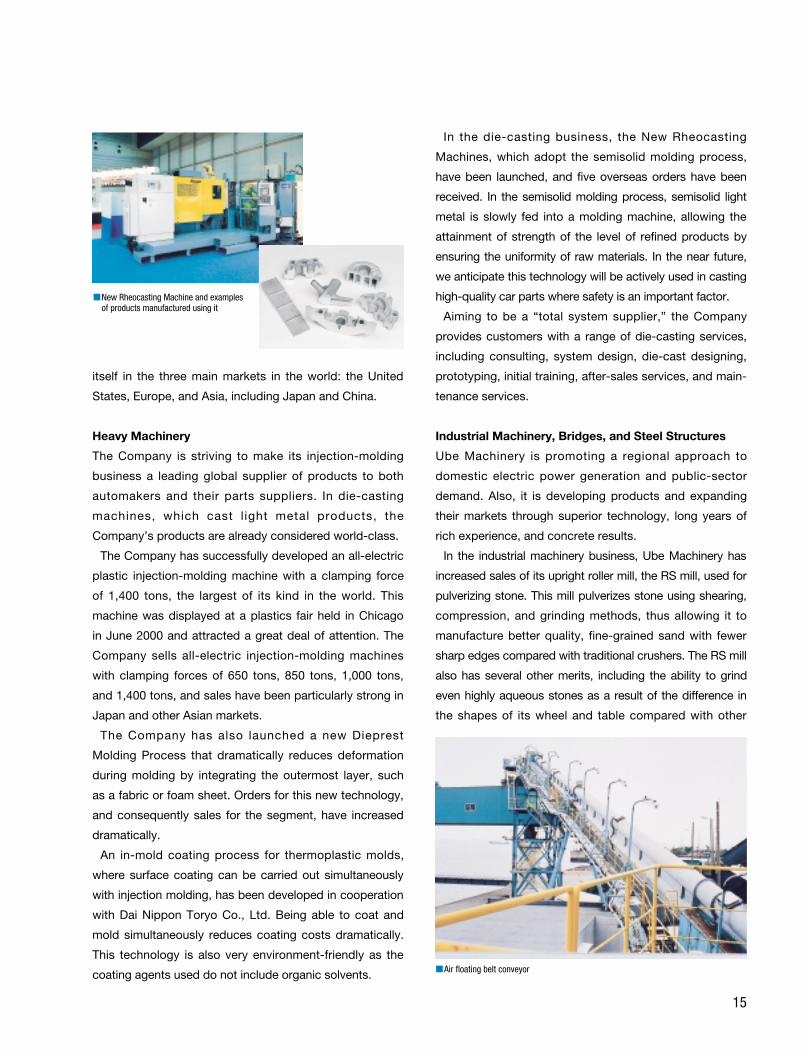
In the die-casting business, the New Rheocasting
Machines, which adopt the semisolid molding process,
have been launched, and five overseas orders have been
received. In the semisolid molding process, semisolid light
metal is slowly fed into a molding machine, allowing the
attainment of strength of the level of refined products by
ensuring the uniformity of raw materials. In the near future,
we anticipate this technology will be actively used in casting
high-quality car parts where safety is an important factor.
Aiming to be a “total system supplier,” the Company
provides customers with a range of die-casting services,
including consulting, system design, die-cast designing,
prototyping, initial training, after-sales services, and main-
tenance services.
Industrial Machinery, Bridges, and Steel Structures
Ube Machinery is promoting a regional approach to
domestic electric power generation and public-sector
demand. Also, it is developing products and expanding
their markets through superior technology, long years of
rich experience, and concrete results.
In the industrial machinery business, Ube Machinery has
increased sales of its upright roller mill, the RS mill, used for
pulverizing stone. This mill pulverizes stone using shearing,
compression, and grinding methods, thus allowing it to
manufacture better quality, fine-grained sand with fewer
sharp edges compared with traditional crushers. The RS mill
also has several other merits, including the ability to grind
even highly aqueous stones as a result of the difference in
the shapes of its wheel and table compared with other
New Rheocasting Machine and examplesof products manufactured using it
Air floating belt conveyor
16
upright roller mills, the relatively low formation of dehydra-
tion cakes, and lower power consumption because of the
more efficient grinding force.
In the conveyor system business, the air-supported con-
veyor system is the Company’s major product. Sales are
strong with steady supplies of conveyors with a world-
leading loading capacity of 5,000 tons per hour to domestic
power generation plants. This equipment has traditionally
depended on a roller system to support the conveyor belt,
but the Company has replaced the roller system with an
air-support system that has superior noise-reduction and
dust-dampening effects. The environment-friendly features
of this equipment are a great incentive for purchasers, and
numerous orders for the product have been placed.
In other areas, on account of ESI/Eurosilo B.V. in the
Netherlands as the principal, the Company now promotes
in Japan the Eurosilo System, which efficiently stores such
bulk products as FGD-gypsum or coal and has a superior
mechanism for filling and reclaiming the stored product.
In the bridge business, the Company has secured munici-
pal government orders of top national importance for its low-
cost steel and concrete mixed bridges. These bridges are
constructed by the launching erection method and utilize the
Company’s expertise in design and construction. They have
received high praise from various government agencies as
well as regional and municipal governments. Praise from
within the industry itself has also been forthcoming, and the
department will move aggressively to secure orders from
among the upcoming slate of large-scale projects.
Light Metal Products
This business devotes substantial resources to distin-
guishing the Company’s high-grade aluminum wheels.
The Company’s brand of aluminum wheels, which are
manufactured using its proprietary squeeze-casting
process, boast high tenacity, lightness, large-diameter
capability as well as superior design and luminosity.
Ube Industries separated the aluminum wheels business
from Ube Machinery and integrated it instead with the
Company’s wholly owned subsidiary, Ube Automotive,
Ltd., on July 1, 2001. To respond to customer demands
for suppliers who can also be global strategic partners,
the Company’s customer response window has also been
integrated into these operations. It has also integrated the
operations of its three factories in Japan, the United
States, and Canada and improved their productivity as
well as capital efficiency. The Company aims to establish
the foundations of this business as one of its core busi-
nesses and further improve profits.
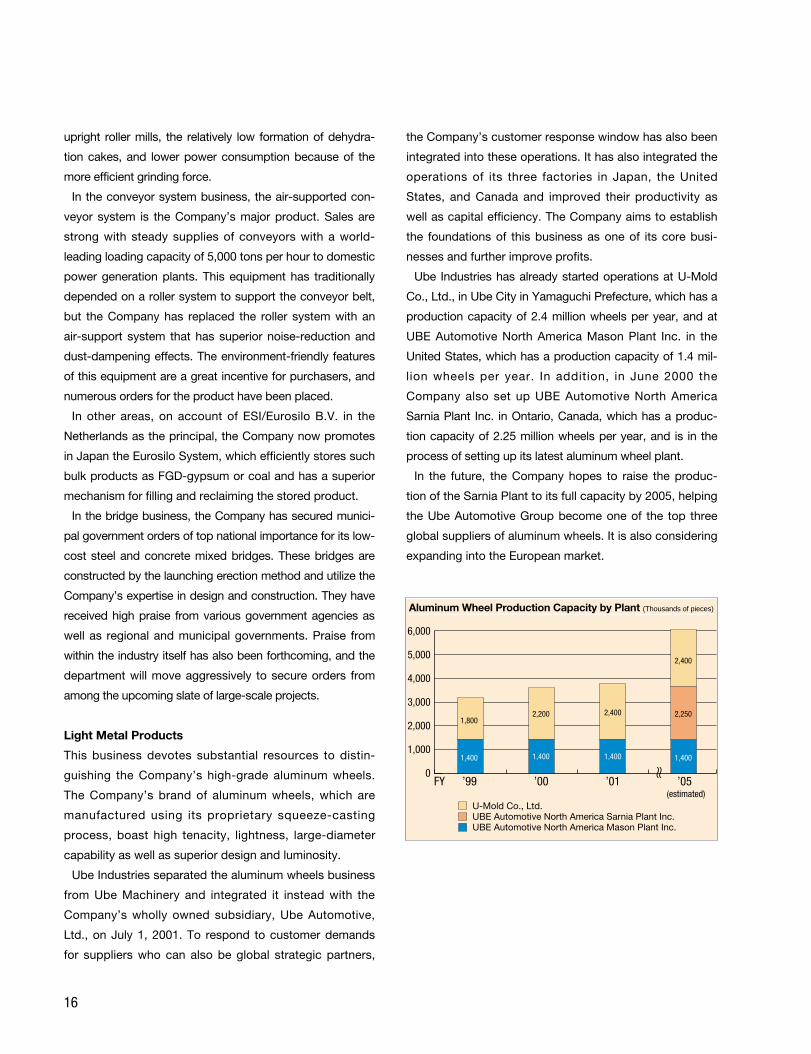
Ube Industries has already started operations at U-Mold
Co., Ltd., in Ube City in Yamaguchi Prefecture, which has a
production capacity of 2.4 million wheels per year, and at
UBE Automotive North America Mason Plant Inc. in the
United States, which has a production capacity of 1.4 mil-
lion wheels per year. In addition, in June 2000 the
Company also set up UBE Automotive North America
Sarnia Plant Inc. in Ontario, Canada, which has a produc-
tion capacity of 2.25 million wheels per year, and is in the
process of setting up its latest aluminum wheel plant.
In the future, the Company hopes to raise the produc-
tion of the Sarnia Plant to its full capacity by 2005, helping
the Ube Automotive Group become one of the top three
global suppliers of aluminum wheels. It is also considering
expanding into the European market.
Aluminum Wheel Production Capacity by Plant (Thousands of pieces)
0
1,000
2,000
3,000
4,000
5,000
6,000
’99FY ’00 ’01 ’05(estimated)
U-Mold Co., Ltd.UBE Automotive North America Sarnia Plant Inc.UBE Automotive North America Mason Plant Inc.
1,800
1,400
2,200
1,400
2,400
1,400
2,400
2,250
1,400�
17
B u s i n e s s H i g h l i g h t s
Energy & Environment
BUSINESS HIGHLIGHTS
BACKGROUND TO FISCAL 2000 BUSINESS RESULTS
AND CURRENT-TERM OUTLOOK
Environmental Business
Sales declined due to a scaling-down of the engineering
business, but earnings rose slightly compared with the
previous year, thanks to reductions in fixed costs.
Coal Business
Earnings rose from the previous fiscal year due to an
increase in the volume of coal marketed, an expansion of
our coal storage business, and an increase in dividends
received from overseas coal companies.
Electric Power Business
Earnings were largely unchanged from the previous fiscal
year.
BUSINESS STRATEGY AND MARKET OUTLOOK
Environmental Business
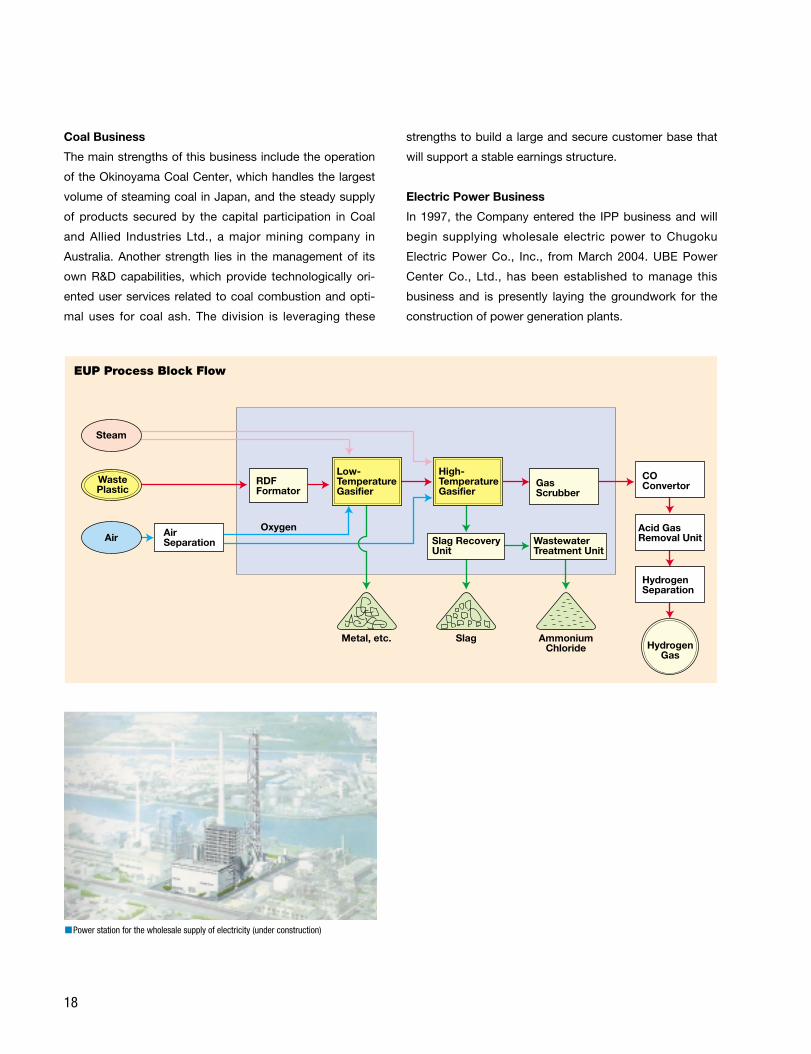
In June 2000, the Group entered the business of recycling
chemical materials from waste plastic packaging and
other organic waste through the establishment of EUP in
partnership with Ebara Corp. In October 2000, Ebara and
Ube Industries successfully completed trials of their pres-
surized two-stage gasification process for turning organic
waste into reusable raw materials, the technological linch-
pin of the business, and in January 2001 began business
operations. In the future, EUP plans to increase the
volume of waste plastic packaging recycled. With the
enactment of legislation promoting the recycling of plastic
from used home appliances and shredder dust from
scrapped cars, EUP is keeping a close eye on trends in
the recycling market and aims to expand recycling activi-
ties using new technologies.
Basic Strategy:Ube Industries considers its energy business, which is based on coal and electricity, a keypart of the Group’s operations. Our decision to begin supplying wholesale electric power inthe independent power producer (IPP) market from 2004 will help us further by providing areliable supply of power and a solid source of revenues.
In its environmental business, the Group will expand its plastic recycling activities throughEbara-UBE Process (EUP), a joint venture formed with Ebara Corp., and will create otherenvironmental businesses by taking advantage of synergies within the Group.
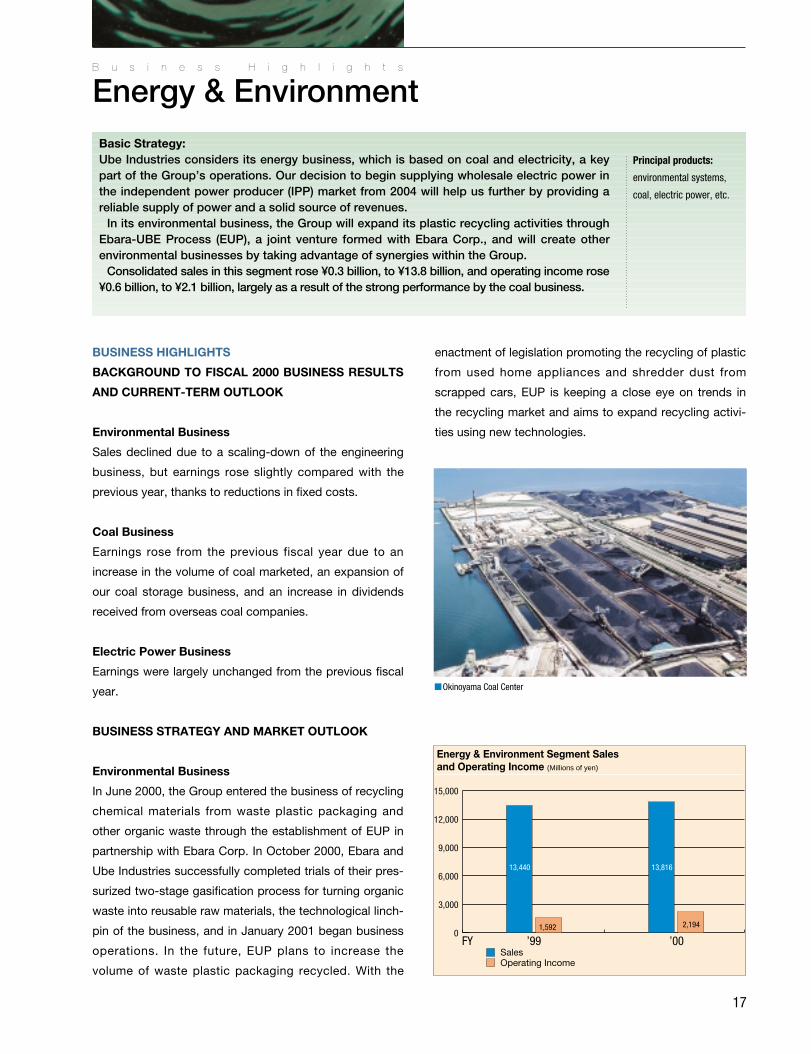
Consolidated sales in this segment rose ¥0.3 billion, to ¥13.8 billion, and operating income rose¥0.6 billion, to ¥2.1 billion, largely as a result of the strong performance by the coal business.
Principal products:
environmental systems,
coal, electric power, etc.
Energy & Environment Segment Sales and Operating Income (Millions of yen)
0
3,000
6,000
9,000
12,000
15,000
’99FY ’00
Operating IncomeSales
13,81613,440
1,592 2,194
Okinoyama Coal Center
Coal Business
The main strengths of this business include the operation
of the Okinoyama Coal Center, which handles the largest
volume of steaming coal in Japan, and the steady supply
of products secured by the capital participation in Coal
and Allied Industries Ltd., a major mining company in
Australia. Another strength lies in the management of its
own R&D capabilities, which provide technologically ori-
ented user services related to coal combustion and opti-
mal uses for coal ash. The division is leveraging these
strengths to build a large and secure customer base that
will support a stable earnings structure.
Electric Power Business
In 1997, the Company entered the IPP business and will
begin supplying wholesale electric power to Chugoku
Electric Power Co., Inc., from March 2004. UBE Power
Center Co., Ltd., has been established to manage this
business and is presently laying the groundwork for the
construction of power generation plants.
18
Oxygen
Metal, etc. Slag AmmoniumChloride
Steam
WastePlastic
Air AirSeparation
RDFFormator
Low-TemperatureGasifier
High-TemperatureGasifier
GasScrubber
COConvertor
Acid GasRemoval Unit
HydrogenSeparation
HydrogenGas
Slag RecoveryUnit
WastewaterTreatment Unit
EUP Process Block Flow
Power station for the wholesale supply of electricity (under construction)
19
B u s i n e s s H i g h l i g h t s
Responsible Care (For a Better Environment, Safety, and Health)
For the UBE Group of companies, working toward a safe
and clean environment is a basic management issue. The
Group believes that to grow and prosper as an enterprise
it is essential to proactively work toward the safety and
health of its employees, operate its facilities always with
safety in mind, and act responsibly toward the local com-
munity in terms of preserving the environment and con-
tributing to a safe living habitat. We are continuously
concerned with the safety and health of the people who
use our products as well as environmental problems, as
typified by the energy shortage issue.
In the coming years, the Company will fulfill its social
responsibilities through a wide range of Responsible Care
activities.
In the “New 21•UBE” three-year management plan,
which began in fiscal 2001, environmental measures are a
major management policy issue and are addressed as a
corporate goal under the slogan “Realize a management
structure that puts the environment first.” Priority areas
are:
•Implementing global environmental protection activities
•Reducing industrial waste and seeking to create a pro-
duction cycle that reuses all resources
•Ensuring the safety of chemical substances
During the current fiscal year, we intend to communicate
our environmental policies to the general public in a spe-
cial report, which will follow up the report released in 2000
that detailed progress in fiscal 1999.
Support Structures
The UBE Group has established the Group-Environment
and Safety Committee, which is composed of senior man-
agement, and all the Group companies have set up
Segment-Environment and Safety Committees, which
encompass each segment. These committees stipulate the
basic guidelines for safety and health, disaster prevention,
environmental preservation, and product safety as well as
develop and implement specific plans and targets on the
basis of the above guidelines.
ISO 14001
As part of efforts to steadily enhance environmental pro-
tection, the Group is setting up an environmental man-
agement system (EMS) based on ISO 14001. As of
August 2001, the Company had acquired certification for
all its facilities and is currently acquiring certification for
Group member companies.
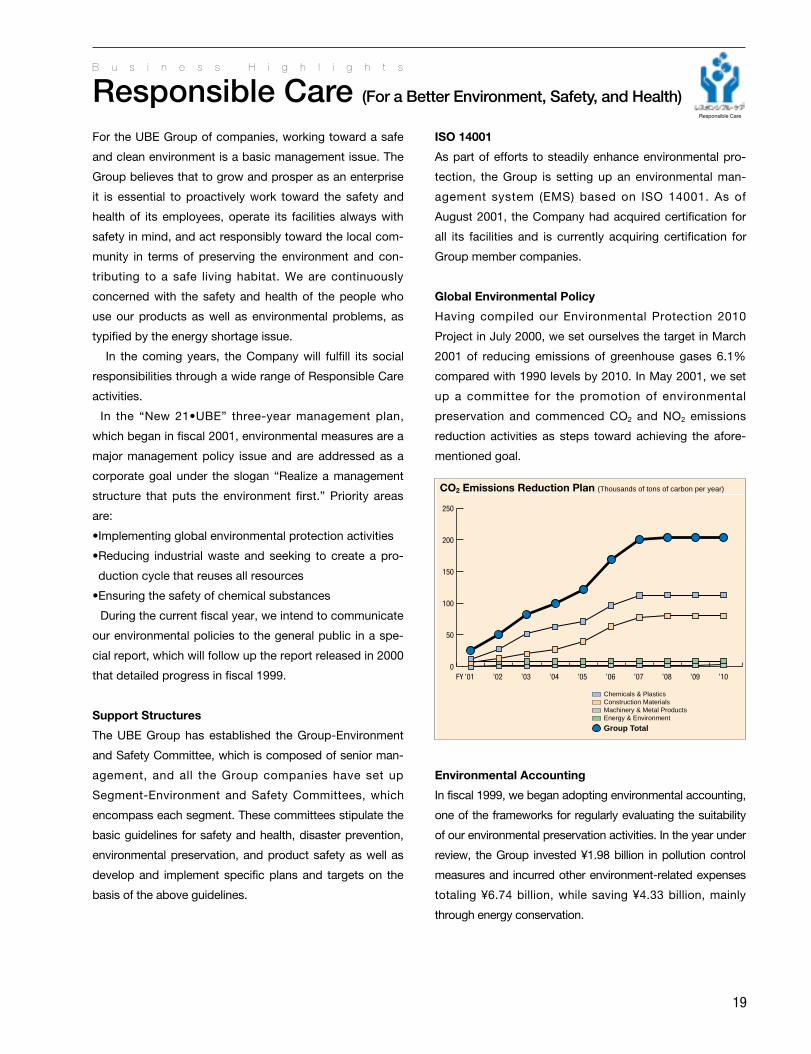
Global Environmental Policy
Having compiled our Environmental Protection 2010
Project in July 2000, we set ourselves the target in March
2001 of reducing emissions of greenhouse gases 6.1%
compared with 1990 levels by 2010. In May 2001, we set
up a committee for the promotion of environmental
preservation and commenced CO2 and NO2 emissions
reduction activities as steps toward achieving the afore-
mentioned goal.
Environmental Accounting
In fiscal 1999, we began adopting environmental accounting,
one of the frameworks for regularly evaluating the suitability
of our environmental preservation activities. In the year under
review, the Group invested ¥1.98 billion in pollution control
measures and incurred other environment-related expenses
totaling ¥6.74 billion, while saving ¥4.33 billion, mainly
through energy conservation.
Responsible Care
CO2 Emissions Reduction Plan (Thousands of tons of carbon per year)
0
50
100
150
200
250
’01FY ’02 ’03 ’04 ’05 ’06 ’07 ’08 ’09 ’10
Chemicals & PlasticsConstruction MaterialsMachinery & Metal ProductsEnergy & Environment
Group Total
20
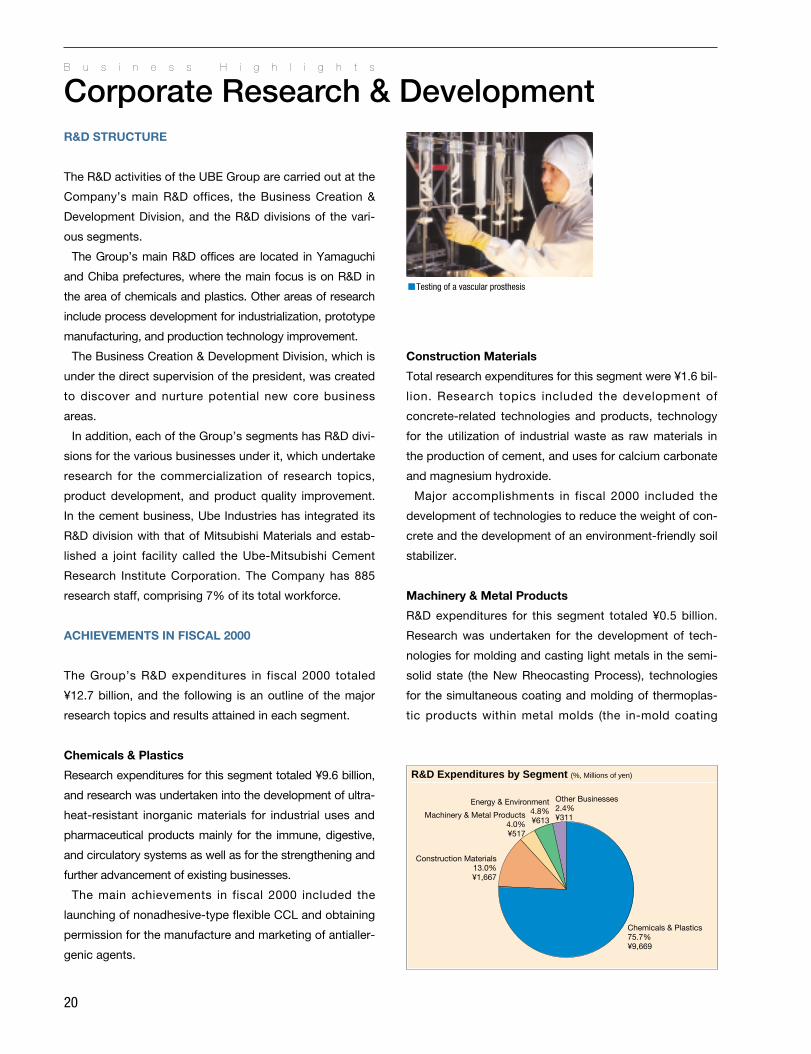
R&D Expenditures by Segment (%, Millions of yen)
Chemicals & Plastics75.7%¥9,669
Construction Materials13.0%¥1,667
Machinery & Metal Products4.0%¥517
Energy & Environment4.8%¥613
Other Businesses2.4%¥311
B u s i n e s s H i g h l i g h t s
Corporate Research & DevelopmentR&D STRUCTURE
The R&D activities of the UBE Group are carried out at the
Company’s main R&D offices, the Business Creation &
Development Division, and the R&D divisions of the vari-
ous segments.
The Group’s main R&D offices are located in Yamaguchi
and Chiba prefectures, where the main focus is on R&D in
the area of chemicals and plastics. Other areas of research
include process development for industrialization, prototype
manufacturing, and production technology improvement.
The Business Creation & Development Division, which is
under the direct supervision of the president, was created
to discover and nurture potential new core business
areas.
In addition, each of the Group’s segments has R&D divi-
sions for the various businesses under it, which undertake
research for the commercialization of research topics,
product development, and product quality improvement.
In the cement business, Ube Industries has integrated its
R&D division with that of Mitsubishi Materials and estab-
lished a joint facility called the Ube-Mitsubishi Cement
Research Institute Corporation. The Company has 885
research staff, comprising 7% of its total workforce.
ACHIEVEMENTS IN FISCAL 2000
The Group’s R&D expenditures in fiscal 2000 totaled
¥12.7 billion, and the following is an outline of the major
research topics and results attained in each segment.
Chemicals & Plastics
Research expenditures for this segment totaled ¥9.6 billion,
and research was undertaken into the development of ultra-
heat-resistant inorganic materials for industrial uses and
pharmaceutical products mainly for the immune, digestive,
and circulatory systems as well as for the strengthening and
further advancement of existing businesses.
The main achievements in fiscal 2000 included the
launching of nonadhesive-type flexible CCL and obtaining
permission for the manufacture and marketing of antialler-
genic agents.
Construction Materials
Total research expenditures for this segment were ¥1.6 bil-
lion. Research topics included the development of
concrete-related technologies and products, technology
for the utilization of industrial waste as raw materials in
the production of cement, and uses for calcium carbonate
and magnesium hydroxide.
Major accomplishments in fiscal 2000 included the
development of technologies to reduce the weight of con-
crete and the development of an environment-friendly soil
stabilizer.
Machinery & Metal Products
R&D expenditures for this segment totaled ¥0.5 billion.
Research was undertaken for the development of tech-
nologies for molding and casting light metals in the semi-
solid state (the New Rheocasting Process), technologies
for the simultaneous coating and molding of thermoplas-
tic products within metal molds (the in-mold coating
Testing of a vascular prosthesis
21
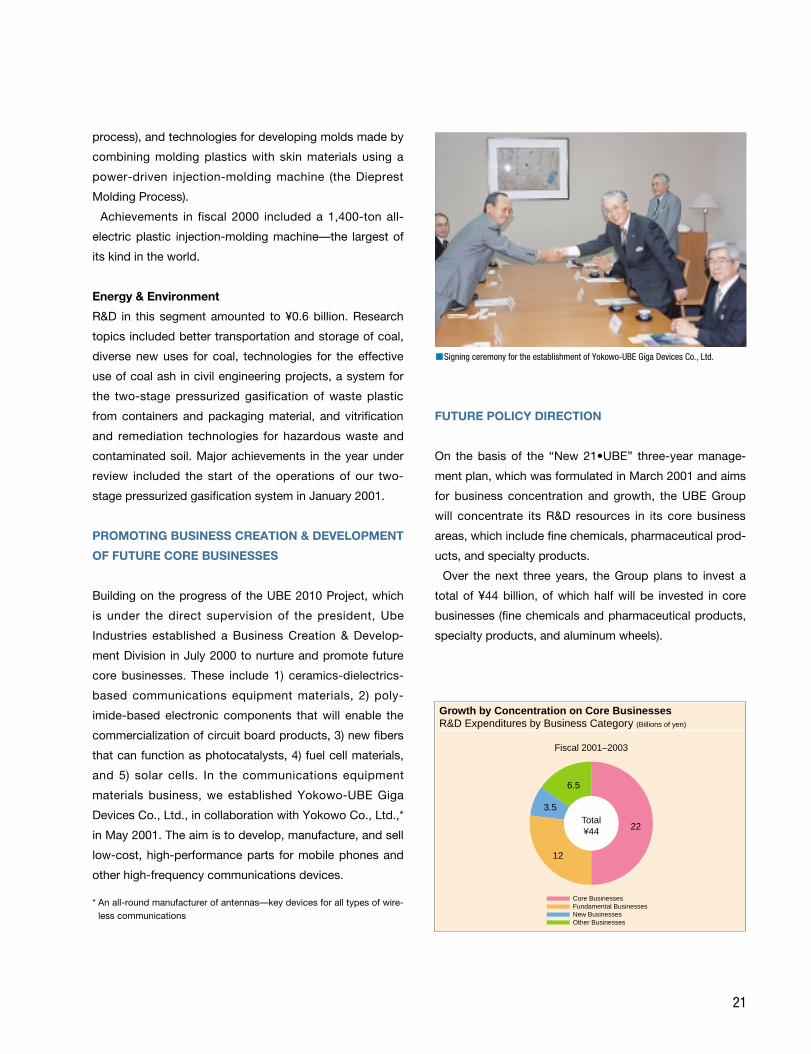
Growth by Concentration on Core BusinessesR&D Expenditures by Business Category (Billions of yen)
Total¥44 22
12
6.5
3.5
Fiscal 2001–2003
Core BusinessesFundamental BusinessesNew Businesses Other Businesses
process), and technologies for developing molds made by
combining molding plastics with skin materials using a
power-driven injection-molding machine (the Dieprest
Molding Process).
Achievements in fiscal 2000 included a 1,400-ton all-
electric plastic injection-molding machine—the largest of
its kind in the world.
Energy & Environment
R&D in this segment amounted to ¥0.6 billion. Research
topics included better transportation and storage of coal,
diverse new uses for coal, technologies for the effective
use of coal ash in civil engineering projects, a system for
the two-stage pressurized gasification of waste plastic
from containers and packaging material, and vitrification
and remediation technologies for hazardous waste and
contaminated soil. Major achievements in the year under
review included the start of the operations of our two-
stage pressurized gasification system in January 2001.
PROMOTING BUSINESS CREATION & DEVELOPMENT
OF FUTURE CORE BUSINESSES
Building on the progress of the UBE 2010 Project, which
is under the direct supervision of the president, Ube
Industries established a Business Creation & Develop-
ment Division in July 2000 to nurture and promote future
core businesses. These include 1) ceramics-dielectrics-
based communications equipment materials, 2) poly-
imide-based electronic components that will enable the
commercialization of circuit board products, 3) new fibers
that can function as photocatalysts, 4) fuel cell materials,
and 5) solar cells. In the communications equipment
materials business, we established Yokowo-UBE Giga
Devices Co., Ltd., in collaboration with Yokowo Co., Ltd.,*
in May 2001. The aim is to develop, manufacture, and sell
low-cost, high-performance parts for mobile phones and
other high-frequency communications devices.
* An all-round manufacturer of antennas—key devices for all types of wire-less communications
FUTURE POLICY DIRECTION
On the basis of the “New 21•UBE” three-year manage-
ment plan, which was formulated in March 2001 and aims
for business concentration and growth, the UBE Group
will concentrate its R&D resources in its core business
areas, which include fine chemicals, pharmaceutical prod-
ucts, and specialty products.
Over the next three years, the Group plans to invest a
total of ¥44 billion, of which half will be invested in core
businesses (fine chemicals and pharmaceutical products,
specialty products, and aluminum wheels).
Signing ceremony for the establishment of Yokowo-UBE Giga Devices Co., Ltd.
22
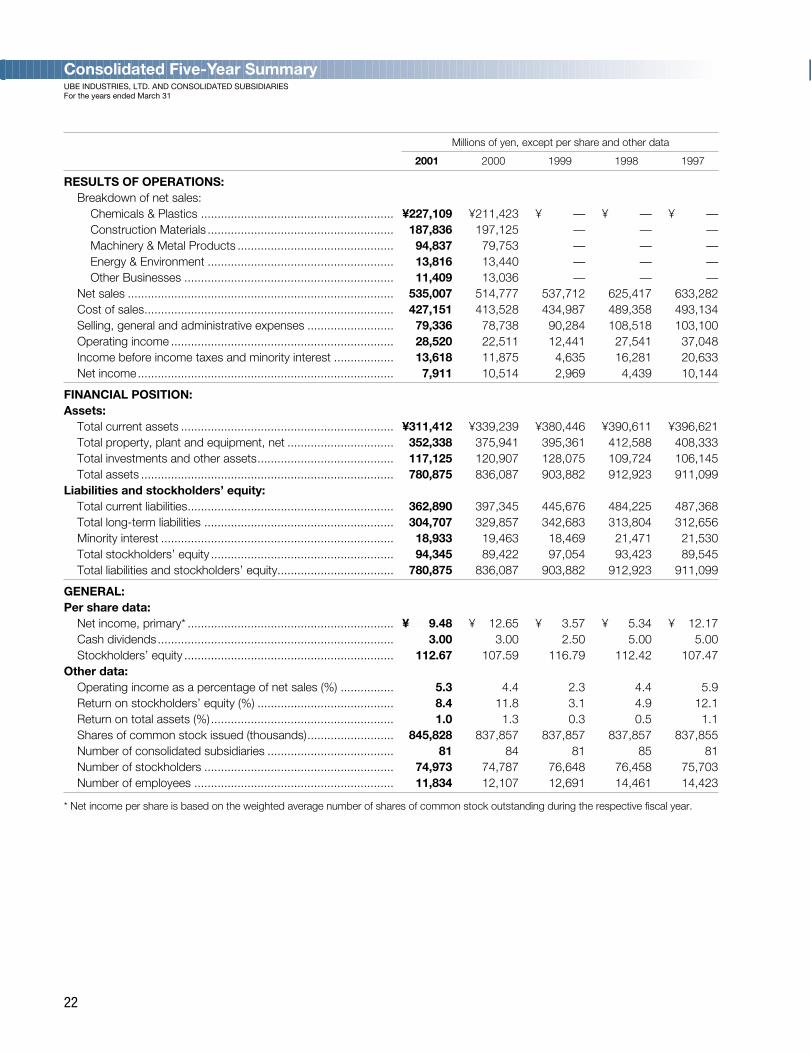
Consolidated Five-Year SummaryUBE INDUSTRIES, LTD. AND CONSOLIDATED SUBSIDIARIESFor the years ended March 31
Millions of yen, except per share and other data
2001 2000 1999 1998 1997
RESULTS OF OPERATIONS:Breakdown of net sales:
Chemicals & Plastics .......................................................... ¥227,109 ¥211,423 ¥0000,— ¥0000,— ¥0000,—Construction Materials ........................................................ 187,836 197,125 — — —Machinery & Metal Products ............................................... 94,837 79,753 — — —Energy & Environment ........................................................ 13,816 13,440 — — —Other Businesses ............................................................... 11,409 13,036 — — —
Net sales ................................................................................ 535,007 514,777 537,712 625,417 633,282Cost of sales........................................................................... 427,151 413,528 434,987 489,358 493,134Selling, general and administrative expenses .......................... 79,336 78,738 90,284 108,518 103,100Operating income ................................................................... 28,520 22,511 12,441 27,541 37,048Income before income taxes and minority interest .................. 13,618 11,875 4,635 16,281 20,633Net income............................................................................. 7,911 10,514 2,969 4,439 10,144
FINANCIAL POSITION:Assets:
Total current assets ................................................................ ¥311,412 ¥339,239 ¥380,446 ¥390,611 ¥396,621Total property, plant and equipment, net ................................ 352,338 375,941 395,361 412,588 408,333Total investments and other assets......................................... 117,125 120,907 128,075 109,724 106,145Total assets ............................................................................ 780,875 836,087 903,882 912,923 911,099
Liabilities and stockholders’ equity:Total current liabilities.............................................................. 362,890 397,345 445,676 484,225 487,368Total long-term liabilities ......................................................... 304,707 329,857 342,683 313,804 312,656Minority interest ...................................................................... 18,933 19,463 18,469 21,471 21,530Total stockholders’ equity ....................................................... 94,345 89,422 97,054 93,423 89,545Total liabilities and stockholders’ equity................................... 780,875 836,087 903,882 912,923 911,099
GENERAL:Per share data:
Net income, primary* .............................................................. ¥0009.48 ¥0012.65 ¥0003.57 ¥0005.34 ¥0012.17Cash dividends....................................................................... 3.00 3.00 2.50 5.00 5.00Stockholders’ equity ............................................................... 112.67 107.59 116.79 112.42 107.47
Other data:Operating income as a percentage of net sales (%) ................ 5.3 4.4 2.3 4.4 5.9Return on stockholders’ equity (%) ......................................... 8.4 11.8 3.1 4.9 12.1Return on total assets (%)....................................................... 1.0 1.3 0.3 0.5 1.1Shares of common stock issued (thousands).......................... 845,828 837,857 837,857 837,857 837,855Number of consolidated subsidiaries ...................................... 81 84 81 85 81Number of stockholders ......................................................... 74,973 74,787 76,648 76,458 75,703Number of employees ............................................................ 11,834 12,107 12,691 14,461 14,423
* Net income per share is based on the weighted average number of shares of common stock outstanding during the respective fiscal year.
OPERATING ENVIRONMENT
Amid a slump in personal consumption, the deceleration of the U.S. and Asian economies,
and deflationary domestic trends, the Japanese economy appeared to slip back into reces-
sion. In industrial sectors, there was an increasing number of business reorganizations,
including mergers and tie-ups outside traditional frameworks.
MAJOR POLICIES
In the second year of its 21•UBE consolidated medium-term management plan, the UBE
Group worked on the following areas: (1) focusing its managerial resources on new core
businesses, (2) reorganizing its operational structure, (3) creating a management system
capable of dealing with the highly information-oriented society of today, and (4) changing its
corporate culture through the adoption of a new wage system based on performance.
As a result, the Company was able to achieve its management reform goals of cutting
back interest-bearing debt levels and disposing of poorly performing affiliated companies
one year ahead of schedule.
PERFORMANCE
•Consolidated net sales rose 3.9%, to ¥535.0 billion (US$4,315 million).
•Operating income increased 26.7%, to ¥28.5 billion (US$230 million). Despite the large
increase in raw material prices following a skyrocketing of crude oil prices, operating income
increased as a result of the Company’s cost reduction measures and increased revenues
from the specialty products business.
•Net income fell 24.8%, to ¥7.9 billion (US$64 million), due to increases in the provision for
doubtful receivables and income taxes. The increase in income taxes came as a result of
higher earnings during the period under review.
•Diluted net income per share amounted to ¥8.78 (US$0.071).
•Cash dividends applicable to the period remained the same as for the previous term, at
¥3.00 (US$0.024).
SEGMENT REVIEW
Chemicals & Plastics
•Sales rose 7.4%, to ¥227.1 billion (US$1,831 million).
•Operating income grew 20.3%, to ¥11.6 billion (US$94 million), despite the large increase
in raw material prices, as a result of good performances by the specialty product and nylon
resin businesses.
Financial Review
23
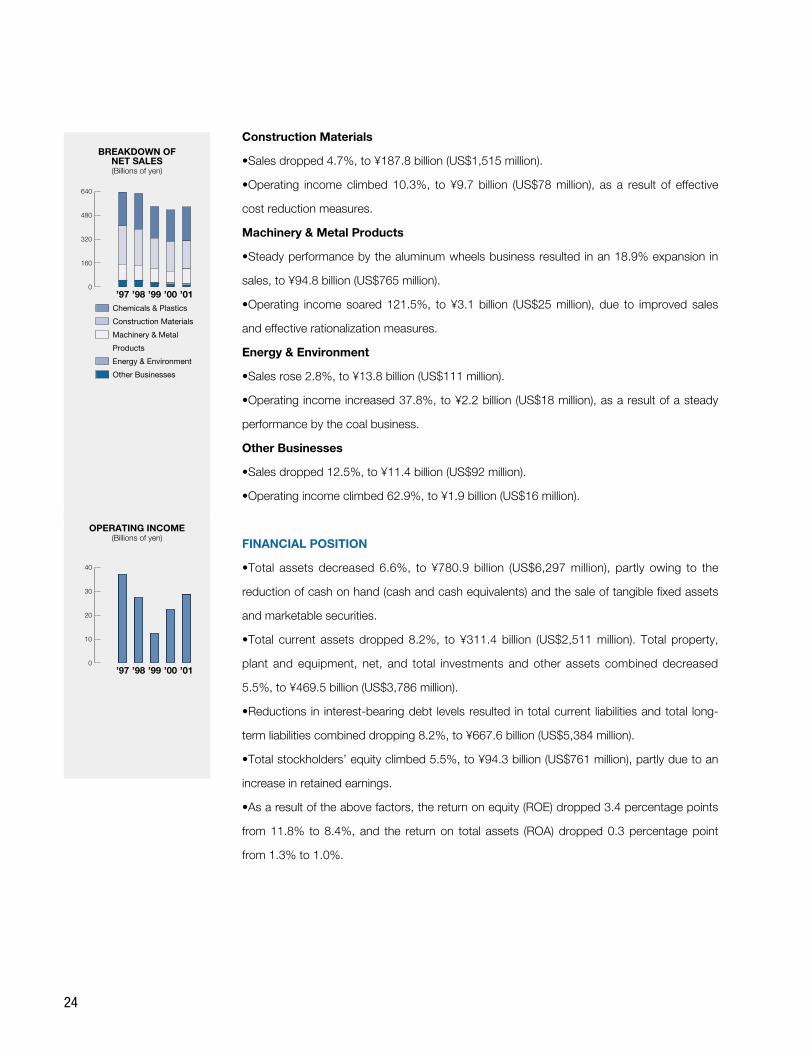
24
Construction Materials
•Sales dropped 4.7%, to ¥187.8 billion (US$1,515 million).
•Operating income climbed 10.3%, to ¥9.7 billion (US$78 million), as a result of effective
cost reduction measures.
Machinery & Metal Products
•Steady performance by the aluminum wheels business resulted in an 18.9% expansion in
sales, to ¥94.8 billion (US$765 million).
•Operating income soared 121.5%, to ¥3.1 billion (US$25 million), due to improved sales
and effective rationalization measures.
Energy & Environment
•Sales rose 2.8%, to ¥13.8 billion (US$111 million).
•Operating income increased 37.8%, to ¥2.2 billion (US$18 million), as a result of a steady
performance by the coal business.
Other Businesses
•Sales dropped 12.5%, to ¥11.4 billion (US$92 million).
•Operating income climbed 62.9%, to ¥1.9 billion (US$16 million).
FINANCIAL POSITION
•Total assets decreased 6.6%, to ¥780.9 billion (US$6,297 million), partly owing to the
reduction of cash on hand (cash and cash equivalents) and the sale of tangible fixed assets
and marketable securities.
•Total current assets dropped 8.2%, to ¥311.4 billion (US$2,511 million). Total property,
plant and equipment, net, and total investments and other assets combined decreased
5.5%, to ¥469.5 billion (US$3,786 million).
•Reductions in interest-bearing debt levels resulted in total current liabilities and total long-
term liabilities combined dropping 8.2%, to ¥667.6 billion (US$5,384 million).
•Total stockholders’ equity climbed 5.5%, to ¥94.3 billion (US$761 million), partly due to an
increase in retained earnings.
•As a result of the above factors, the return on equity (ROE) dropped 3.4 percentage points
from 11.8% to 8.4%, and the return on total assets (ROA) dropped 0.3 percentage point
from 1.3% to 1.0%.
’97 ’98 ’99 ’00 ’010
160
320
480
640
BREAKDOWN OF NET SALES(Billions of yen)
Chemicals & Plastics
Construction Materials
Machinery & Metal
Products
Energy & Environment
Other Businesses
’97 ’98 ’99 ’00 ’010
10
20
30
40
OPERATING INCOME(Billions of yen)
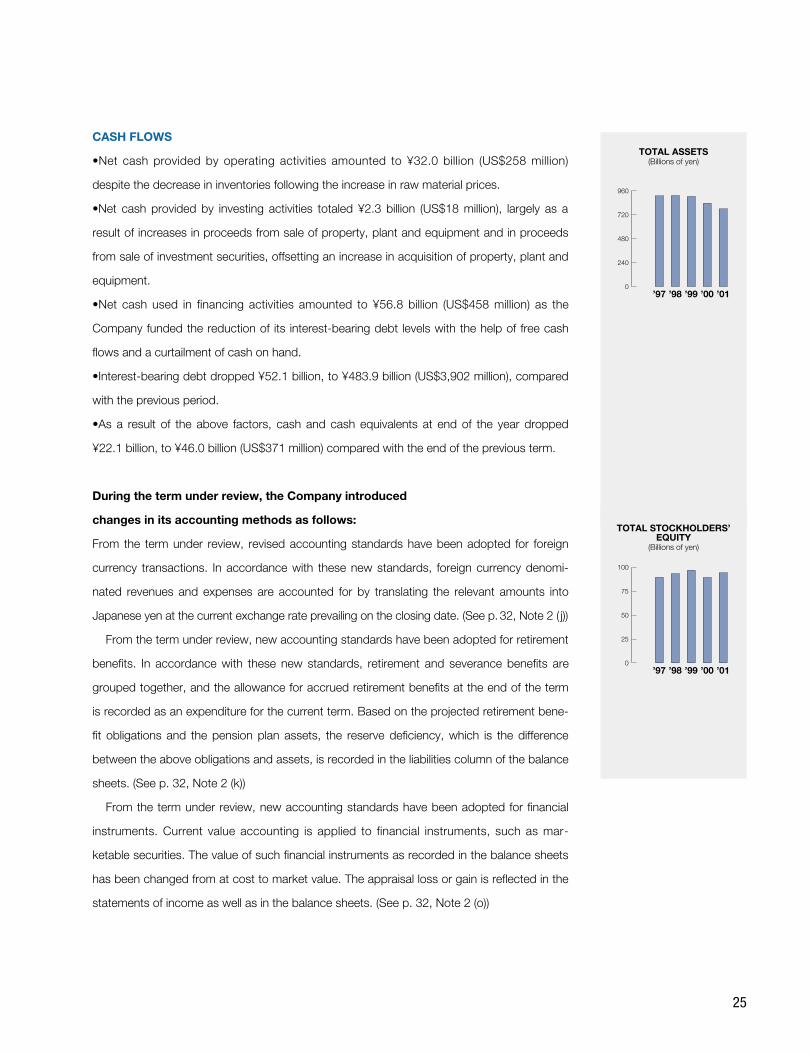
25
CASH FLOWS
•Net cash provided by operating activities amounted to ¥32.0 billion (US$258 million)
despite the decrease in inventories following the increase in raw material prices.
•Net cash provided by investing activities totaled ¥2.3 billion (US$18 million), largely as a
result of increases in proceeds from sale of property, plant and equipment and in proceeds
from sale of investment securities, offsetting an increase in acquisition of property, plant and
equipment.
•Net cash used in financing activities amounted to ¥56.8 billion (US$458 million) as the
Company funded the reduction of its interest-bearing debt levels with the help of free cash
flows and a curtailment of cash on hand.
•Interest-bearing debt dropped ¥52.1 billion, to ¥483.9 billion (US$3,902 million), compared
with the previous period.
•As a result of the above factors, cash and cash equivalents at end of the year dropped
¥22.1 billion, to ¥46.0 billion (US$371 million) compared with the end of the previous term.
During the term under review, the Company introduced
changes in its accounting methods as follows:
From the term under review, revised accounting standards have been adopted for foreign
currency transactions. In accordance with these new standards, foreign currency denomi-
nated revenues and expenses are accounted for by translating the relevant amounts into
Japanese yen at the current exchange rate prevailing on the closing date. (See p. 32, Note 2 ( j))
From the term under review, new accounting standards have been adopted for retirement
benefits. In accordance with these new standards, retirement and severance benefits are
grouped together, and the allowance for accrued retirement benefits at the end of the term
is recorded as an expenditure for the current term. Based on the projected retirement bene-
fit obligations and the pension plan assets, the reserve deficiency, which is the difference
between the above obligations and assets, is recorded in the liabilities column of the balance
sheets. (See p. 32, Note 2 (k))
From the term under review, new accounting standards have been adopted for financial
instruments. Current value accounting is applied to financial instruments, such as mar-
ketable securities. The value of such financial instruments as recorded in the balance sheets
has been changed from at cost to market value. The appraisal loss or gain is reflected in the
statements of income as well as in the balance sheets. (See p. 32, Note 2 (o))
’97 ’98 ’99 ’00 ’010
240
480
720
960
TOTAL ASSETS(Billions of yen)
’97 ’98 ’99 ’00 ’010
25
50
75
100
TOTAL STOCKHOLDERS’EQUITY
(Billions of yen)
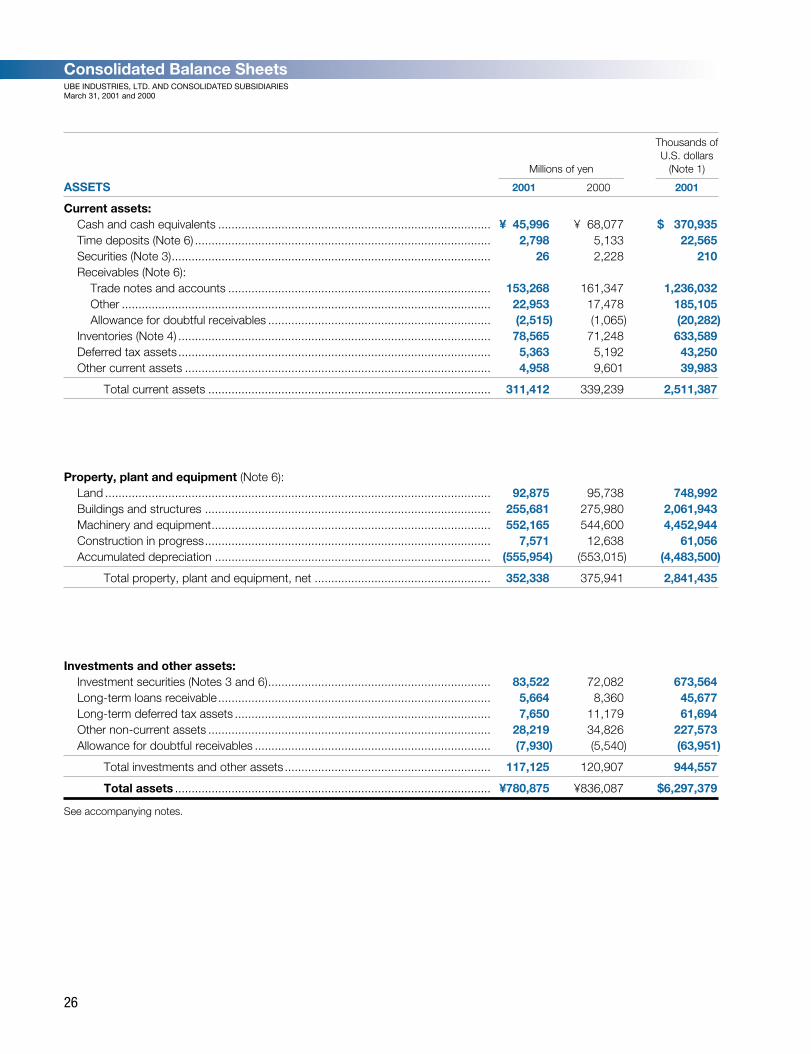
Consolidated Balance SheetsUBE INDUSTRIES, LTD. AND CONSOLIDATED SUBSIDIARIESMarch 31, 2001 and 2000
26
Thousands ofU.S. dollars
Millions of yen (Note 1)
ASSETS 2001 2000 2001
Current assets:Cash and cash equivalents .................................................................................. ¥045,996 ¥068,077 $0,370,935Time deposits (Note 6) ......................................................................................... 2,798 5,133 22,565Securities (Note 3)................................................................................................ 26 2,228 210Receivables (Note 6):
Trade notes and accounts ............................................................................... 153,268 161,347 1,236,032Other ............................................................................................................... 22,953 17,478 185,105Allowance for doubtful receivables ................................................................... (2,515) (1,065) (20,282)
Inventories (Note 4) .............................................................................................. 78,565 71,248 633,589Deferred tax assets.............................................................................................. 5,363 5,192 43,250Other current assets ............................................................................................ 4,958 9,601 39,983
Total current assets ..................................................................................... 311,412 339,239 2,511,387
Property, plant and equipment (Note 6):Land .................................................................................................................... 92,875 95,738 748,992Buildings and structures ...................................................................................... 255,681 275,980 2,061,943Machinery and equipment.................................................................................... 552,165 544,600 4,452,944Construction in progress...................................................................................... 7,571 12,638 61,056Accumulated depreciation ................................................................................... (555,954) (553,015) (4,483,500)
Total property, plant and equipment, net ..................................................... 352,338 375,941 2,841,435
Investments and other assets:Investment securities (Notes 3 and 6)................................................................... 83,522 72,082 673,564Long-term loans receivable.................................................................................. 5,664 8,360 45,677Long-term deferred tax assets ............................................................................. 7,650 11,179 61,694Other non-current assets ..................................................................................... 28,219 34,826 227,573Allowance for doubtful receivables ....................................................................... (7,930) (5,540) (63,951)
Total investments and other assets .............................................................. 117,125 120,907 944,557
Total assets ............................................................................................... ¥780,875 ¥836,087 $6,297,379
See accompanying notes.
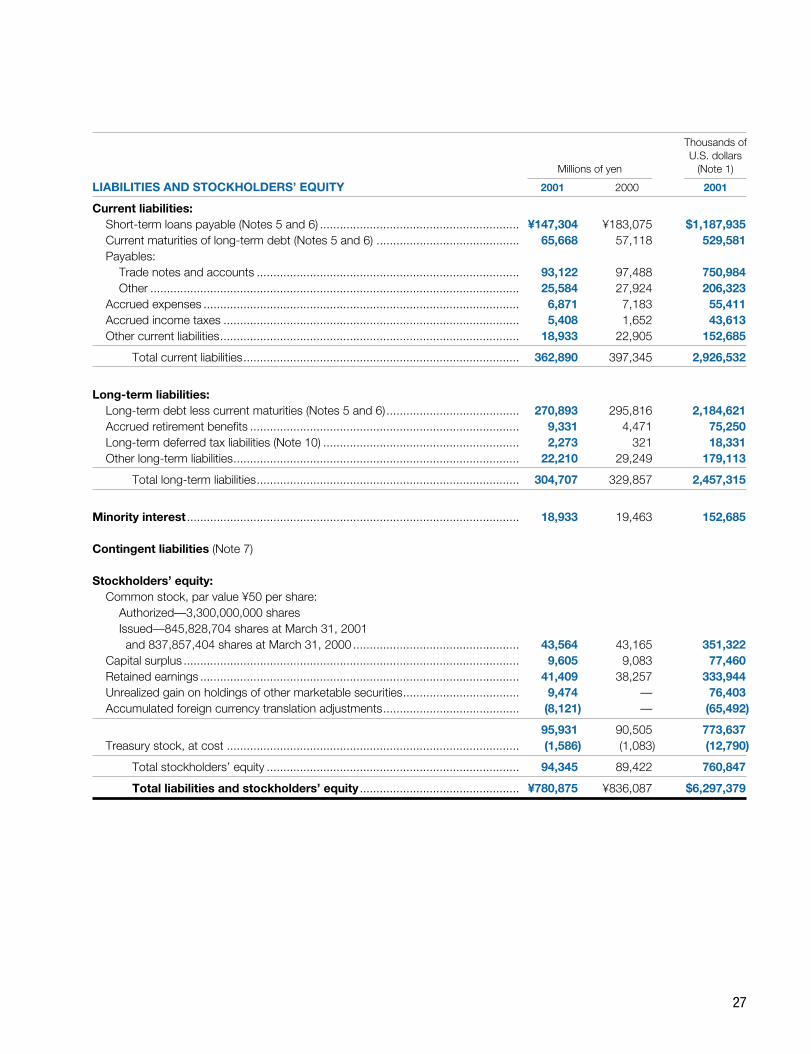
27
Thousands ofU.S. dollars
Millions of yen (Note 1)
LIABILITIES AND STOCKHOLDERS’ EQUITY 2001 2000 2001
Current liabilities:Short-term loans payable (Notes 5 and 6) ............................................................ ¥147,304 ¥183,075 $1,187,935Current maturities of long-term debt (Notes 5 and 6) ........................................... 65,668 57,118 529,581Payables:
Trade notes and accounts ............................................................................... 93,122 97,488 750,984Other ............................................................................................................... 25,584 27,924 206,323
Accrued expenses ............................................................................................... 6,871 7,183 55,411Accrued income taxes ......................................................................................... 5,408 1,652 43,613Other current liabilities.......................................................................................... 18,933 22,905 152,685
Total current liabilities................................................................................... 362,890 397,345 2,926,532
Long-term liabilities:Long-term debt less current maturities (Notes 5 and 6)........................................ 270,893 295,816 2,184,621Accrued retirement benefits ................................................................................. 9,331 4,471 75,250Long-term deferred tax liabilities (Note 10) ........................................................... 2,273 321 18,331Other long-term liabilities...................................................................................... 22,210 29,249 179,113
Total long-term liabilities............................................................................... 304,707 329,857 2,457,315
Minority interest .................................................................................................... 18,933 19,463 152,685
Contingent liabilities (Note 7)
Stockholders’ equity:Common stock, par value ¥50 per share:
Authorized—3,300,000,000 sharesIssued—845,828,704 shares at March 31, 2001 and 837,857,404 shares at March 31, 2000 .................................................. 43,564 43,165 351,322
Capital surplus ..................................................................................................... 9,605 9,083 77,460Retained earnings ................................................................................................ 41,409 38,257 333,944Unrealized gain on holdings of other marketable securities................................... 9,474 — 76,403Accumulated foreign currency translation adjustments......................................... (8,121) — (65,492)
................................................................................................................................ 95,931 90,505 773,637Treasury stock, at cost ........................................................................................ (1,586) (1,083) (12,790)
Total stockholders’ equity ............................................................................ 94,345 89,422 760,847
Total liabilities and stockholders’ equity ................................................ ¥780,875 ¥836,087 $6,297,379
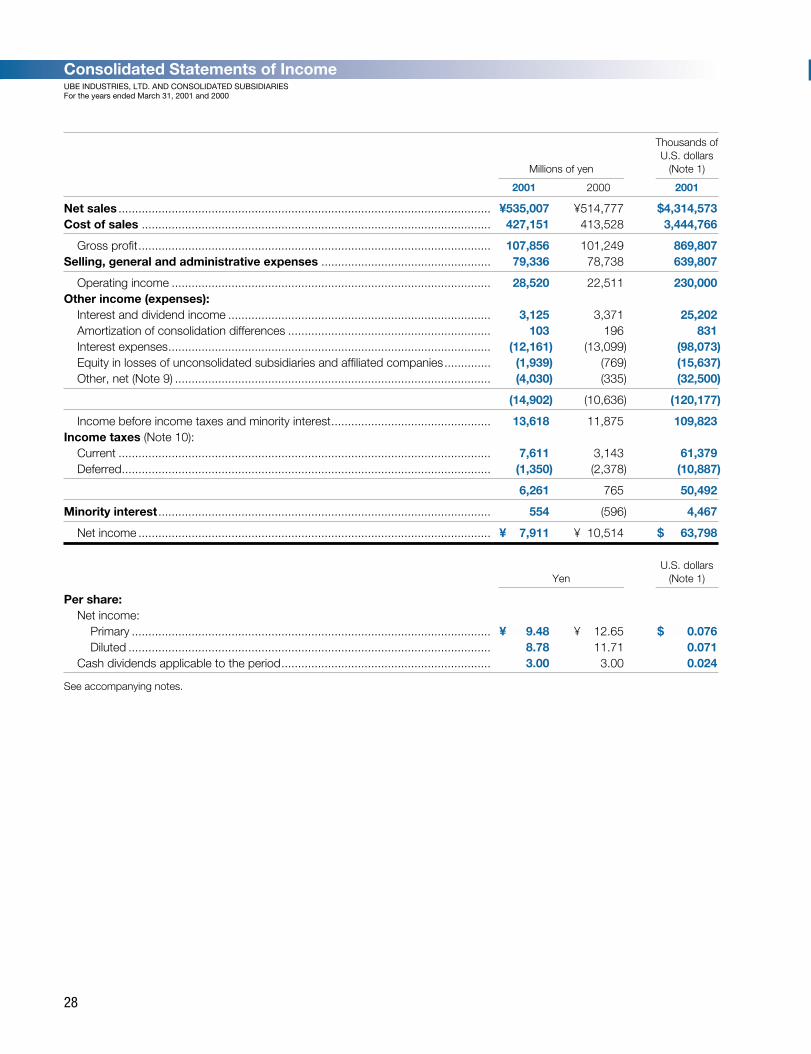
Consolidated Statements of IncomeUBE INDUSTRIES, LTD. AND CONSOLIDATED SUBSIDIARIESFor the years ended March 31, 2001 and 2000
28
Thousands ofU.S. dollars
Millions of yen (Note 1)
2001 2000 2001
Net sales ................................................................................................................ ¥535,007 ¥514,777 $4,314,573Cost of sales ......................................................................................................... 427,151 413,528 3,444,766
Gross profit.......................................................................................................... 107,856 101,249 869,807Selling, general and administrative expenses ................................................... 79,336 78,738 639,807
Operating income ................................................................................................ 28,520 22,511 230,000Other income (expenses):
Interest and dividend income ............................................................................... 3,125 3,371 25,202Amortization of consolidation differences ............................................................. 103 196 831Interest expenses................................................................................................. (12,161) (13,099) (98,073)Equity in losses of unconsolidated subsidiaries and affiliated companies.............. (1,939) (769) (15,637)Other, net (Note 9) ............................................................................................... (4,030) (335) (32,500)
................................................................................................................................ (14,902) (10,636) (120,177)
Income before income taxes and minority interest................................................ 13,618 11,875 109,823Income taxes (Note 10):
Current ................................................................................................................ 7,611 3,143 61,379Deferred............................................................................................................... (1,350) (2,378) (10,887)
................................................................................................................................ 6,261 765 50,492
Minority interest .................................................................................................... 554 (596) 4,467
Net income .......................................................................................................... ¥007,911 ¥010,514 $0,063,798
U.S. dollarsYen (Note 1)
Per share:Net income:
Primary ............................................................................................................ ¥0009.48 ¥0012.65 $0,000.076Diluted ............................................................................................................. 8.78 11.71 0.071
Cash dividends applicable to the period............................................................... 3.00 3.00 0.024
See accompanying notes.
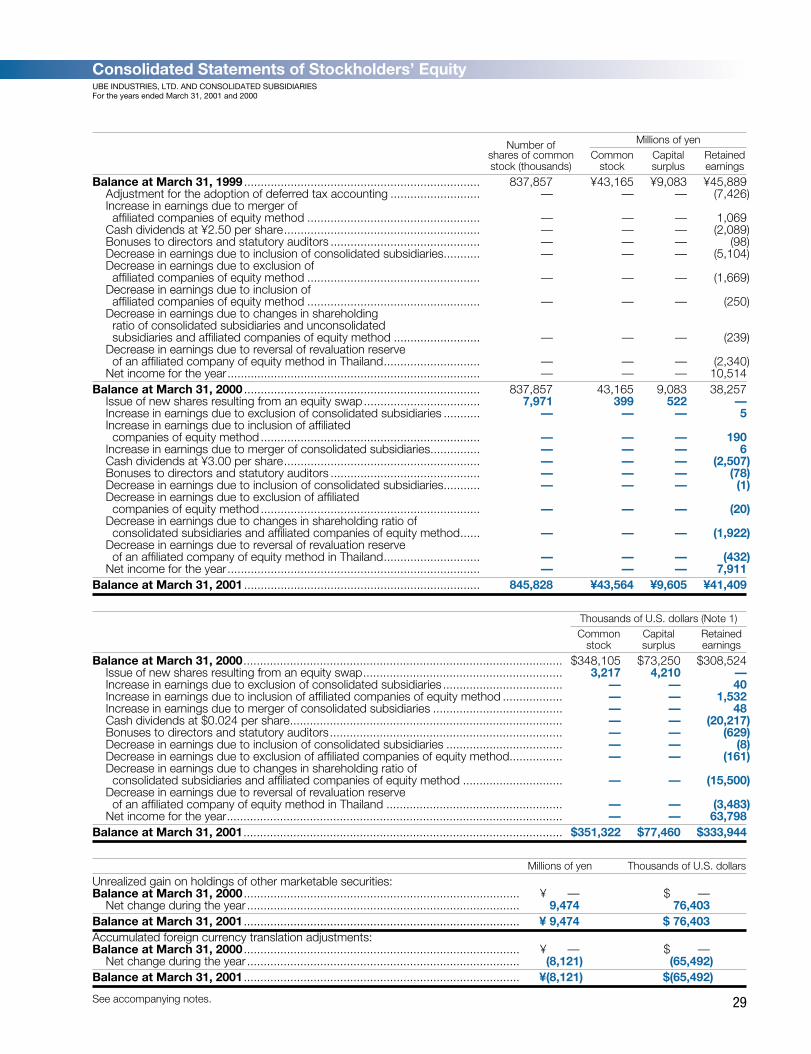
Consolidated Statements of Stockholders’ EquityUBE INDUSTRIES, LTD. AND CONSOLIDATED SUBSIDIARIESFor the years ended March 31, 2001 and 2000
29
Number of Millions of yenshares of common Common Capital Retainedstock (thousands) stock surplus earnings
Balance at March 31, 1999 ....................................................................... 837,857 ¥43,165 ¥9,083 ¥45,889Adjustment for the adoption of deferred tax accounting ........................... — — — (7,426)Increase in earnings due to merger of affiliated companies of equity method .................................................... — — — 1,069
Cash dividends at ¥2.50 per share........................................................... — — — (2,089)Bonuses to directors and statutory auditors ............................................. — — — (98)Decrease in earnings due to inclusion of consolidated subsidiaries........... — — — (5,104)Decrease in earnings due to exclusion of affiliated companies of equity method .................................................... — — — (1,669)
Decrease in earnings due to inclusion of affiliated companies of equity method .................................................... — — — (250)
Decrease in earnings due to changes in shareholding ratio of consolidated subsidiaries and unconsolidated subsidiaries and affiliated companies of equity method .......................... — — — (239)
Decrease in earnings due to reversal of revaluation reserve of an affiliated company of equity method in Thailand............................. — — — (2,340)
Net income for the year............................................................................ — — — 10,514Balance at March 31, 2000 ....................................................................... 837,857 43,165 9,083 38,257
Issue of new shares resulting from an equity swap................................... 7,971 399 522 —Increase in earnings due to exclusion of consolidated subsidiaries ........... — — — 5Increase in earnings due to inclusion of affiliated companies of equity method .................................................................. — — — 190
Increase in earnings due to merger of consolidated subsidiaries............... — — — 6Cash dividends at ¥3.00 per share........................................................... — — — (2,507)Bonuses to directors and statutory auditors ............................................. — — — (78)Decrease in earnings due to inclusion of consolidated subsidiaries........... — — — (1)Decrease in earnings due to exclusion of affiliated companies of equity method .................................................................. — — — (20)
Decrease in earnings due to changes in shareholding ratio of consolidated subsidiaries and affiliated companies of equity method...... — — — (1,922)
Decrease in earnings due to reversal of revaluation reserve of an affiliated company of equity method in Thailand............................. — — — (432)
Net income for the year............................................................................ — — — 7,911Balance at March 31, 2001 ....................................................................... 845,828 ¥43,564 ¥9,605 ¥41,409
Thousands of U.S. dollars (Note 1)Common Capital Retained
stock surplus earnings
Balance at March 31, 2000................................................................................................ $348,105 $73,250 $308,524Issue of new shares resulting from an equity swap............................................................ 3,217 4,210 —Increase in earnings due to exclusion of consolidated subsidiaries .................................... — — 40Increase in earnings due to inclusion of affiliated companies of equity method .................. — — 1,532Increase in earnings due to merger of consolidated subsidiaries ....................................... — — 48Cash dividends at $0.024 per share.................................................................................. — — (20,217)Bonuses to directors and statutory auditors...................................................................... — — (629)Decrease in earnings due to inclusion of consolidated subsidiaries ................................... — — (8)Decrease in earnings due to exclusion of affiliated companies of equity method................ — — (161)Decrease in earnings due to changes in shareholding ratio of consolidated subsidiaries and affiliated companies of equity method .............................. — — (15,500)
Decrease in earnings due to reversal of revaluation reserve of an affiliated company of equity method in Thailand ..................................................... — — (3,483)
Net income for the year..................................................................................................... — — 63,798Balance at March 31, 2001................................................................................................ $351,322 $77,460 $333,944
Millions of yen Thousands of U.S. dollars
Unrealized gain on holdings of other marketable securities:Balance at March 31, 2000 ................................................................................... ¥000— $0000—
Net change during the year .................................................................................. 9,474 76,403Balance at March 31, 2001 ................................................................................... ¥(9,474 $(76,403Accumulated foreign currency translation adjustments:Balance at March 31, 2000 ................................................................................... ¥000— $0000—
Net change during the year .................................................................................. (8,121) (65,492)Balance at March 31, 2001 ................................................................................... ¥(8,121) $(65,492)
See accompanying notes.
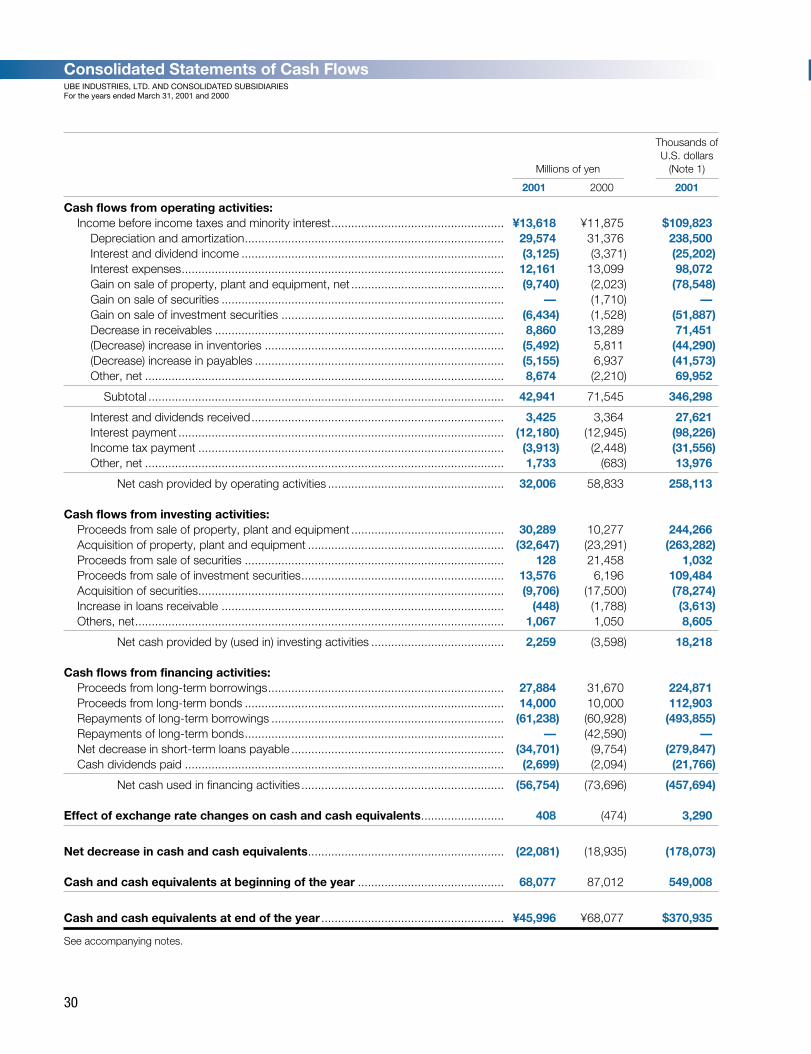
Consolidated Statements of Cash FlowsUBE INDUSTRIES, LTD. AND CONSOLIDATED SUBSIDIARIESFor the years ended March 31, 2001 and 2000
30
Thousands ofU.S. dollars
Millions of yen (Note 1)
2001 2000 2001
Cash flows from operating activities:Income before income taxes and minority interest.................................................... ¥13,618 ¥11,875 $109,823
Depreciation and amortization.............................................................................. 29,574 31,376 238,500Interest and dividend income ............................................................................... (3,125) (3,371) (25,202)Interest expenses................................................................................................. 12,161 13,099 98,072Gain on sale of property, plant and equipment, net .............................................. (9,740) (2,023) (78,548)Gain on sale of securities ..................................................................................... — (1,710) —Gain on sale of investment securities ................................................................... (6,434) (1,528) (51,887)Decrease in receivables ....................................................................................... 8,860 13,289 71,451(Decrease) increase in inventories ........................................................................ (5,492) 5,811 (44,290)(Decrease) increase in payables ........................................................................... (5,155) 6,937 (41,573)Other, net ............................................................................................................ 8,674 (2,210) 69,952
Subtotal ........................................................................................................... 42,941 71,545 346,298
Interest and dividends received............................................................................ 3,425 3,364 27,621Interest payment .................................................................................................. (12,180) (12,945) (98,226)Income tax payment ............................................................................................ (3,913) (2,448) (31,556)Other, net ............................................................................................................ 1,733 (683) 13,976
Net cash provided by operating activities ..................................................... 32,006 58,833 258,113
Cash flows from investing activities:Proceeds from sale of property, plant and equipment .............................................. 30,289 10,277 244,266Acquisition of property, plant and equipment ........................................................... (32,647) (23,291) (263,282)Proceeds from sale of securities .............................................................................. 128 21,458 1,032Proceeds from sale of investment securities............................................................. 13,576 6,196 109,484Acquisition of securities............................................................................................ (9,706) (17,500) (78,274)Increase in loans receivable ..................................................................................... (448) (1,788) (3,613)Others, net............................................................................................................... 1,067 1,050 8,605
Net cash provided by (used in) investing activities ........................................ 2,259 (3,598) 18,218
Cash flows from financing activities:Proceeds from long-term borrowings....................................................................... 27,884 31,670 224,871Proceeds from long-term bonds .............................................................................. 14,000 10,000 112,903Repayments of long-term borrowings ...................................................................... (61,238) (60,928) (493,855)Repayments of long-term bonds.............................................................................. — (42,590) —Net decrease in short-term loans payable ................................................................ (34,701) (9,754) (279,847)Cash dividends paid ................................................................................................ (2,699) (2,094) (21,766)
Net cash used in financing activities ............................................................. (56,754) (73,696) (457,694)
Effect of exchange rate changes on cash and cash equivalents......................... 408 (474) 3,290
Net decrease in cash and cash equivalents........................................................... (22,081) (18,935) (178,073)
Cash and cash equivalents at beginning of the year ............................................ 68,077 87,012 549,008
Cash and cash equivalents at end of the year ....................................................... ¥45,996 ¥68,077 $370,935
See accompanying notes.
Notes to Consolidated Financial StatementsUBE INDUSTRIES, LTD. AND CONSOLIDATED SUBSIDIARIESFor the years ended March 31, 2001 and 2000
31
(a) Ube Industries, Ltd. (the “Company”) and its consolidated subsidiaries maintain their accounting recordsand prepare their financial statements in accordance with accounting principles and practices generallyaccepted and applied in Japan. The accompanying consolidated financial statements have been compiledfrom the consolidated financial statements prepared by the Company as required under the Securities andExchange Law of Japan and, accordingly, have been prepared in accordance with accounting principlesand practices generally accepted in Japan, which may differ in certain material respects from accountingprinciples and practices generally accepted in countries and jurisdictions other than Japan.
Certain modifications have been made to the accompanying financial statements in order to present themin a form which is more familiar to readers outside Japan. (b) The accompanying financial statements are expressed in Japanese yen and, solely for the convenienceof the reader, have been translated into U.S. dollars at ¥124=US$1, the approximate rate of exchange onMarch 31, 2001. The translation should not be construed as a representation that Japanese yen have been,could have been, or could in the future be converted into U.S. dollars at the above or any other rate.
(a) Basis of Consolidation and Accounting for Investments in Unconsolidated Subsidiaries and AffiliatesIn accordance with the revised accounting standards for consolidation which became effective April 1,1999, the accompanying consolidated financial statements for the years ended March 31, 2001 and 2000include the accounts of the Company and its significant companies controlled directly or indirectly by theCompany, and significant companies over which the Company exercises significant influence in terms oftheir operating and financial policies have been included in the consolidated financial statements on an equi-ty basis. All significant intercompany balances and transactions have been eliminated in consolidation.
The excess of cost over underlying net assets at fair value at the date of acquisition is amortized over aperiod of 5 or 20 years on a straight-line basis.
Investments in companies which are not consolidated or accounted for by the equity method are carried at cost. (b) Accounting for Income TaxesIn accordance with a new accounting standard for income taxes which became effective April 1, 1999,deferred tax assets and liabilities have been recognized in the consolidated financial statements for the yearended March 31, 2001 and 2000 with respect to differences between financial reporting and the tax basesof the assets and liabilities, and were measured using the enacted tax rates and laws which will be in effectwhen the differences are expected to reverse.
Until the year ended March 31, 1999, deferred income taxes had been recognized by the Company onlyfor timing differences between financial and tax reporting with respect to the elimination of unrealized inter-company profits and other adjustments for consolidation purposes. The effect of this change in the methodof accounting was to decrease retained earnings by ¥6,871 million at March 31, 2000, and to decrease netincome by ¥578 million for the year ended March 31, 2000. (c) SecuritiesUntil the year ended March 31, 2000, marketable securities and investment securities were stated principallyat cost determined by the moving-average method. A new accounting standard for financial instruments,which became effective April 1, 2000, requires that securities be classified into three categories: trading,held-to-maturity or other securities. Under the new standard, trading securities are carried at fair value andheld-to-maturity securities are carried at amortized cost. Marketable securities classified as other securitiesare carried at fair value with changes in the unrealized holding gain or loss, net of the applicable incometaxes, included directly in stockholders’ equity. Nonmarketable securities classified as other securities arecarried at cost. Cost of securities sold is determined by the moving-average method.
As of April 1, 2000, the Company and its consolidated subsidiaries assessed their intent to hold theirinvestments in securities and classified their investments as “held-to-maturity securities” or “other securities”and accounted for the securities at March 31, 2001 in accordance with the new standard referred to above. (d) Allowance for Doubtful ReceivablesThe allowance for doubtful receivables is provided for by the Company and its consolidated subsidiaries atan amount estimated with reference to individual uncollectible accounts plus an amount calculated by a his-torical rate determined based on the actual uncollectible amounts incurred in prior years. (e) InventoriesInventories are stated at cost principally determined by the weighted-average method. (f) Property, Plant and EquipmentProperty, plant and equipment is stated at cost. Depreciation of property, plant and equipment is computed prin-cipally by the straight-line method for the Company and by the declining-balance method for the consolidated
2. Significant Accounting Policies
1. Basis of Presenting Financial Statements
32
subsidiaries at rates based on the estimated useful lives of the respective assets, ranging from 2 to 75 yearsfor buildings and structures and from 2 to 25 years for machinery and equipment. (g) LeasesNon-cancelable lease transactions are accounted for as operating leases (whether such leases are classifiedas operating leases or finance leases) except that lease agreements which stipulate the transfer of owner-ship of the leased assets to the lessee are accounted for as finance leases. (h) Research and Development CostsResearch and development costs are charged to income when incurred.
A new accounting standard for research and development costs became effective from the fiscal yearended March 31, 2000. However, the adoption of this new standard had no effect on the consolidatedstatement of income for the year ended March 31, 2000. (i) Issue Expenses of NotesIssue expenses of notes are charged to income over a period of three years.(j) Foreign Currency TranslationUntil the year ended March 31, 2000, receivables and payables denominated in foreign currencies, princi-pally in U.S. dollars, were translated into yen at the historical exchange rates in effect at the date the relevanttransactions were effected or at the exchange rates applicable to the respective forward exchange con-tracts. Long-term receivables and long-term debt denominated in foreign currencies hedged by forwardexchange contracts were translated into Japanese yen at the contracted rates of exchange. Gains or lossesresulting from forward exchange contracts were deferred and amortized over the contract periods. In accor-dance with a revised accounting standard for foreign currency translation which became effective April 1, 2000,current and non-current monetary accounts denominated in foreign currencies are translated into yen at thecurrent rates. Foreign currency denominated revenues and expenses are translated at the spot exchangerate on the closing date, and any translation difference is accounted for as a profit or loss for the term. As aresult of this change, income before income taxes rose ¥102 million (US$823 thousand).
In accordance with the revised standard, the Company has presented translation adjustments as a com-ponent of stockholders’ equity and minority interests (instead of as a component of assets or liabilities) in itsconsolidated financial statements for the year ended March 31, 2001. (k) Accrued Retirement BenefitsThe Company has a non-contributory funded pension plan which generally covers all employees. Until theyear ended March 31, 2000, payments to the pension fund, including amortization of past service cost,were charged to income when made.
Most of the consolidated subsidiaries provided the liabilities for retirement benefits which were maintainedfor the retirement allowance payment in the amount of 40% of the required retirement allowance calculatedbased on the consolidated subsidiaries’ retirement benefit policy if all employees retired voluntarily at thebalance sheet date.
A new accounting standard has been applied for retirement benefits, which became effective April 1, 2000.In accordance with this standard, the allowance for accrued retirement benefits at the end of the term hasbeen provided for, the amount acknowledged to have arisen at the end of the term for retirement benefitsfor employees based on the projected retirement benefit obligation and the pension plan assets. The effectof this change was to reduce income before income taxes ¥5,423 million (US$43,734 thousand).(l) Net Income per SharePrimary net income per share is based on the weighted average number of shares of common stockoutstanding during the respective fiscal year.
Diluted net income per share is based on the weighted average number of shares of common stockoutstanding during the respective fiscal year and assuming the conversion of convertible notes.(m) Employees’ Bonus AllowanceEmployees’ bonus allowance is maintained at an amount estimated based on the bonus to be paid subse-quent to the balance sheet date. (n) Cash and Cash EquivalentsCash and cash equivalents comprise cash on hand, demand deposits, and short-term investments. Short-term investments included here are readily convertible into cash, exposed to insignificant risk of changes invalue, and mature or become due within three months of the date of acquisition. (o) Accounting Standards for Financial InstrumentsA new accounting standard has been applied for financial instruments, which became effective April 1, 2000.This resulted in a decline of ¥651 million (US$5,250 thousand) in income before income taxes.
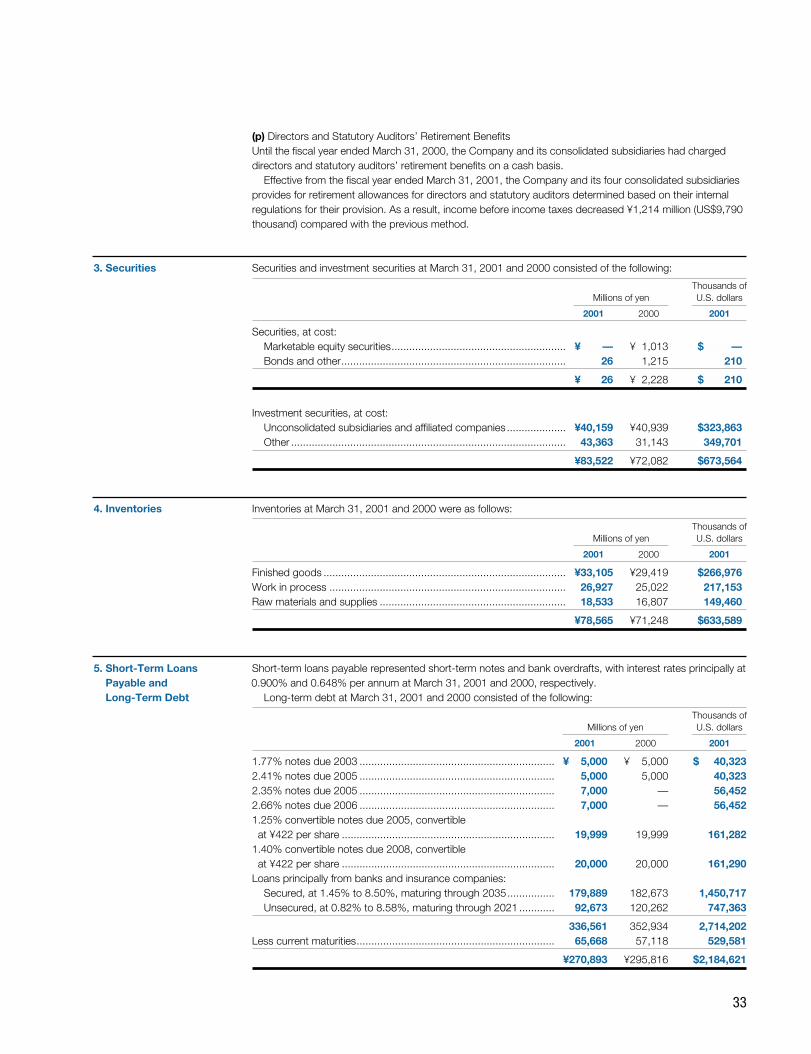
33
(p) Directors and Statutory Auditors’ Retirement BenefitsUntil the fiscal year ended March 31, 2000, the Company and its consolidated subsidiaries had chargeddirectors and statutory auditors’ retirement benefits on a cash basis.
Effective from the fiscal year ended March 31, 2001, the Company and its four consolidated subsidiariesprovides for retirement allowances for directors and statutory auditors determined based on their internalregulations for their provision. As a result, income before income taxes decreased ¥1,214 million (US$9,790thousand) compared with the previous method.
Securities and investment securities at March 31, 2001 and 2000 consisted of the following:
Thousands ofMillions of yen U.S. dollars
2001 2000 2001
Securities, at cost:Marketable equity securities........................................................... ¥00,0— ¥01,013 $000,0—Bonds and other............................................................................ 26 1,215 210
.......................................................................................................... ¥00,026 ¥02,228 $000,210
Investment securities, at cost:Unconsolidated subsidiaries and affiliated companies .................... ¥40,159 ¥40,939 $323,863Other ............................................................................................. 43,363 31,143 349,701
.......................................................................................................... ¥83,522 ¥72,082 $673,564
Inventories at March 31, 2001 and 2000 were as follows:
Thousands ofMillions of yen U.S. dollars
2001 2000 2001
Finished goods .................................................................................. ¥33,105 ¥29,419 $266,976Work in process ................................................................................ 26,927 25,022 217,153Raw materials and supplies ............................................................... 18,533 16,807 149,460
.......................................................................................................... ¥78,565 ¥71,248 $633,589
Short-term loans payable represented short-term notes and bank overdrafts, with interest rates principally at0.900% and 0.648% per annum at March 31, 2001 and 2000, respectively.
Long-term debt at March 31, 2001 and 2000 consisted of the following:
Thousands ofMillions of yen U.S. dollars
2001 2000 2001
1.77% notes due 2003 .................................................................. ¥005,000 ¥005,000 $0,040,3232.41% notes due 2005 .................................................................. 5,000 5,000 40,3232.35% notes due 2005 .................................................................. 7,000 — 56,4522.66% notes due 2006 .................................................................. 7,000 — 56,4521.25% convertible notes due 2005, convertible at ¥422 per share ........................................................................ 19,999 19,999 161,282
1.40% convertible notes due 2008, convertible at ¥422 per share ........................................................................ 20,000 20,000 161,290
Loans principally from banks and insurance companies:Secured, at 1.45% to 8.50%, maturing through 2035................ 179,889 182,673 1,450,717Unsecured, at 0.82% to 8.58%, maturing through 2021 ............ 92,673 120,262 747,363
...................................................................................................... 336,561 352,934 2,714,202Less current maturities................................................................... 65,668 57,118 529,581
...................................................................................................... ¥270,893 ¥295,816 $2,184,621
5. Short-Term LoansPayable and Long-Term Debt
4. Inventories
3. Securities
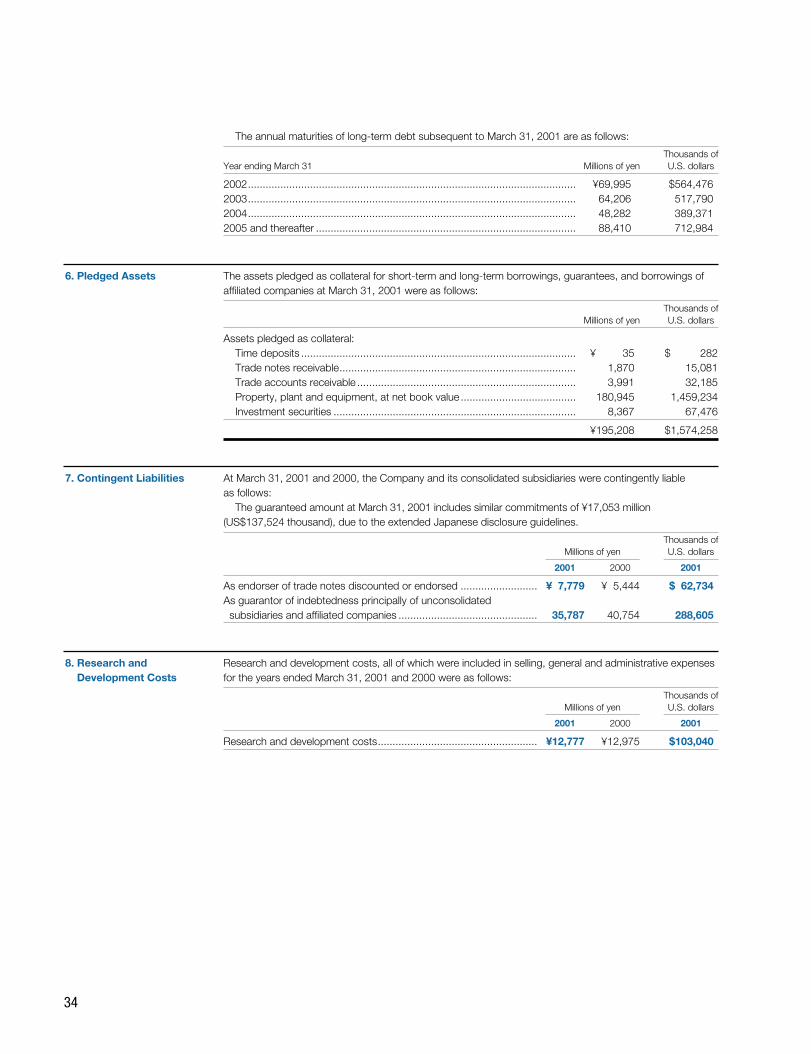
The annual maturities of long-term debt subsequent to March 31, 2001 are as follows:
Thousands ofYear ending March 31 Millions of yen U.S. dollars
2002............................................................................................................... ¥69,995 $564,4762003............................................................................................................... 64,206 517,7902004............................................................................................................... 48,282 389,3712005 and thereafter ........................................................................................ 88,410 712,984
The assets pledged as collateral for short-term and long-term borrowings, guarantees, and borrowings ofaffiliated companies at March 31, 2001 were as follows:
Thousands ofMillions of yen U.S. dollars
Assets pledged as collateral:Time deposits ............................................................................................. ¥000,035 $0,000,282Trade notes receivable................................................................................ 1,870 15,081Trade accounts receivable .......................................................................... 3,991 32,185Property, plant and equipment, at net book value ....................................... 180,945 1,459,234Investment securities .................................................................................. 8,367 67,476
....................................................................................................................... ¥195,208 $1,574,258
At March 31, 2001 and 2000, the Company and its consolidated subsidiaries were contingently liable as follows:
The guaranteed amount at March 31, 2001 includes similar commitments of ¥17,053 million(US$137,524 thousand), due to the extended Japanese disclosure guidelines.
Thousands ofMillions of yen U.S. dollars
2001 2000 2001
As endorser of trade notes discounted or endorsed .......................... ¥07,779 ¥05,444 $062,734As guarantor of indebtedness principally of unconsolidated
subsidiaries and affiliated companies ............................................... 35,787 40,754 288,605
Research and development costs, all of which were included in selling, general and administrative expensesfor the years ended March 31, 2001 and 2000 were as follows:
Thousands ofMillions of yen U.S. dollars
2001 2000 2001
Research and development costs...................................................... ¥12,777 ¥12,975 $103,040
8. Research andDevelopment Costs
7. Contingent Liabilities
6. Pledged Assets
34
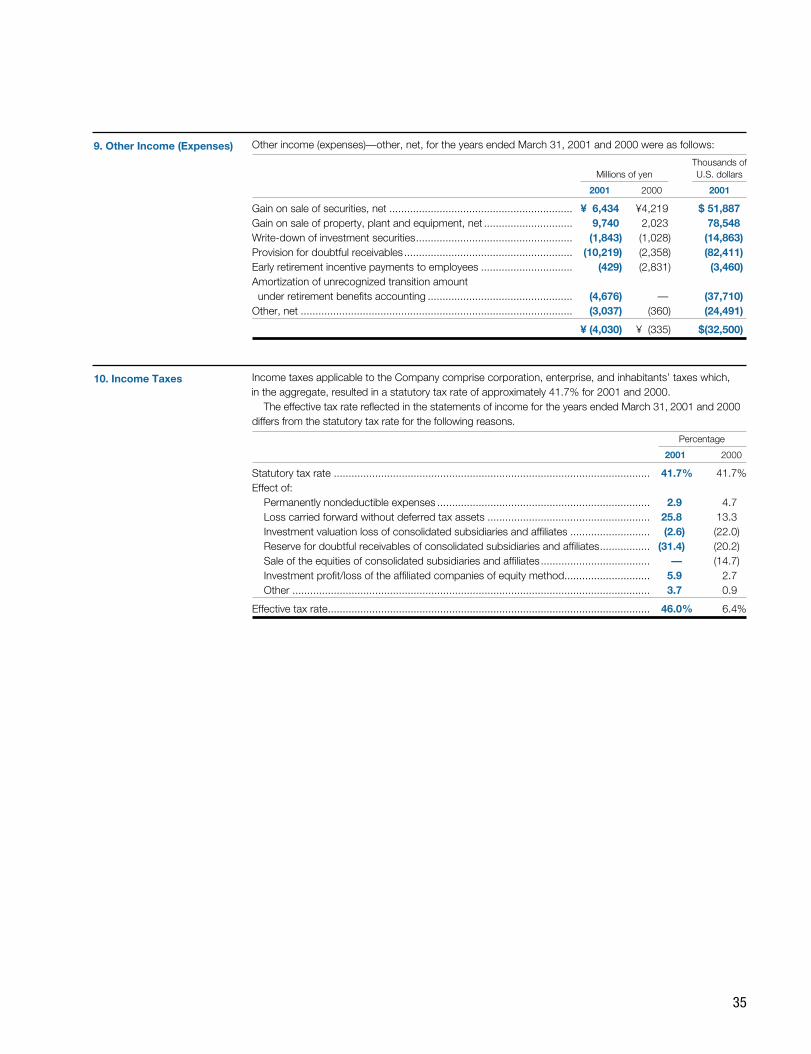
Other income (expenses)—other, net, for the years ended March 31, 2001 and 2000 were as follows:
Thousands ofMillions of yen U.S. dollars
2001 2000 2001
Gain on sale of securities, net .............................................................. ¥06,434 ¥4,219 $(51,887Gain on sale of property, plant and equipment, net .............................. 9,740 2,023 78,548Write-down of investment securities..................................................... (1,843) (1,028) (14,863)Provision for doubtful receivables......................................................... (10,219) (2,358) (82,411)Early retirement incentive payments to employees ............................... (429) (2,831) (3,460)Amortization of unrecognized transition amount under retirement benefits accounting ................................................. (4,676) — (37,710)
Other, net ............................................................................................ (3,037) (360) (24,491)
............................................................................................................ ¥ (4,030) ¥0(335) $(32,500)
Income taxes applicable to the Company comprise corporation, enterprise, and inhabitants’ taxes which,in the aggregate, resulted in a statutory tax rate of approximately 41.7% for 2001 and 2000.
The effective tax rate reflected in the statements of income for the years ended March 31, 2001 and 2000differs from the statutory tax rate for the following reasons.
Percentage
2001 2000
Statutory tax rate ........................................................................................................... 41.7)% 41.7)%Effect of:
Permanently nondeductible expenses ........................................................................ 2.9 4.7Loss carried forward without deferred tax assets ....................................................... 25.8 13.3Investment valuation loss of consolidated subsidiaries and affiliates ........................... (2.6) (22.0)Reserve for doubtful receivables of consolidated subsidiaries and affiliates................. (31.4) (20.2)Sale of the equities of consolidated subsidiaries and affiliates..................................... — (14.7)Investment profit/loss of the affiliated companies of equity method............................. 5.9 2.7Other ......................................................................................................................... 3.7 0.9
Effective tax rate............................................................................................................. 46.0)% 6.4)%
10. Income Taxes
9. Other Income (Expenses)
35
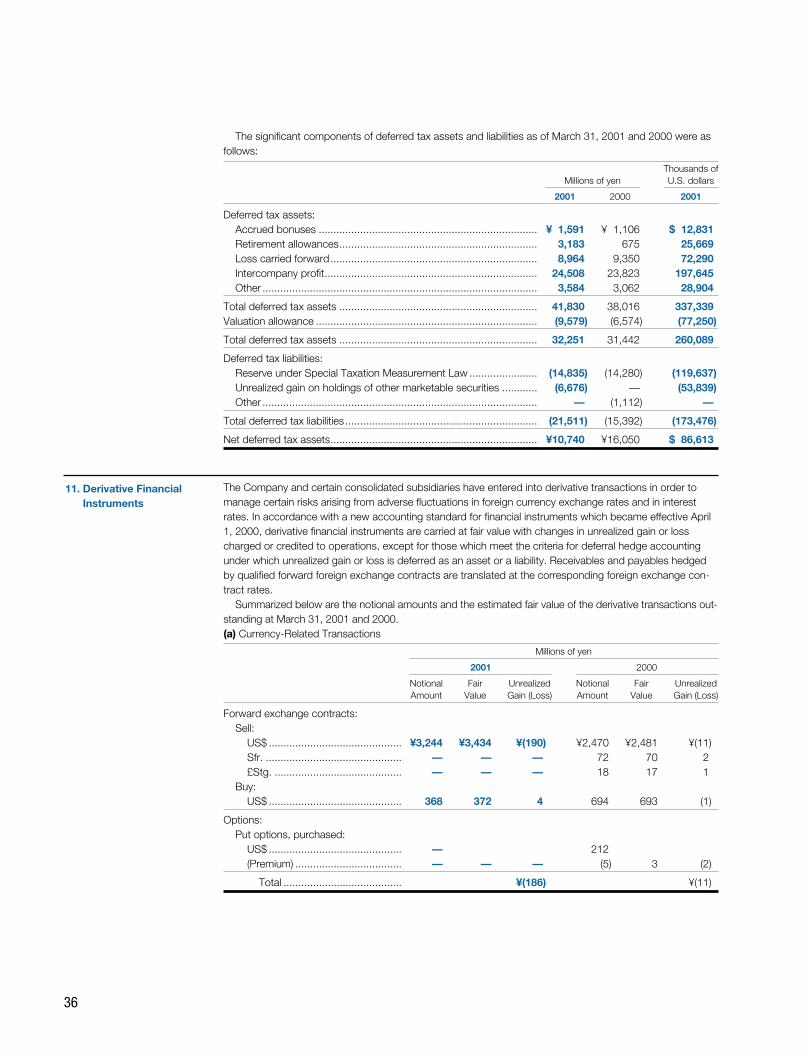
The significant components of deferred tax assets and liabilities as of March 31, 2001 and 2000 were asfollows:
Thousands ofMillions of yen U.S. dollars
2001 2000 2001
Deferred tax assets:Accrued bonuses .......................................................................... ¥01,591 ¥01,106 $012,831Retirement allowances................................................................... 3,183 675 25,669Loss carried forward...................................................................... 8,964 9,350 72,290Intercompany profit........................................................................ 24,508 23,823 197,645Other ............................................................................................. 3,584 3,062 28,904
Total deferred tax assets ................................................................... 41,830 38,016 337,339Valuation allowance ........................................................................... (9,579) (6,574) (77,250)
Total deferred tax assets ................................................................... 32,251 31,442 260,089
Deferred tax liabilities:Reserve under Special Taxation Measurement Law ....................... (14,835) (14,280) (119,637)Unrealized gain on holdings of other marketable securities ............ (6,676) — (53,839)Other ............................................................................................. — (1,112) —
Total deferred tax liabilities ................................................................. (21,511) (15,392) (173,476)
Net deferred tax assets...................................................................... ¥10,740 ¥16,050 $086,613
The Company and certain consolidated subsidiaries have entered into derivative transactions in order tomanage certain risks arising from adverse fluctuations in foreign currency exchange rates and in interestrates. In accordance with a new accounting standard for financial instruments which became effective April1, 2000, derivative financial instruments are carried at fair value with changes in unrealized gain or losscharged or credited to operations, except for those which meet the criteria for deferral hedge accountingunder which unrealized gain or loss is deferred as an asset or a liability. Receivables and payables hedgedby qualified forward foreign exchange contracts are translated at the corresponding foreign exchange con-tract rates.
Summarized below are the notional amounts and the estimated fair value of the derivative transactions out-standing at March 31, 2001 and 2000. (a) Currency-Related Transactions
Millions of yen
2001 2000
Notional Fair Unrealized Notional Fair UnrealizedAmount Value Gain (Loss) Amount Value Gain (Loss)
Forward exchange contracts:Sell:
US$ ............................................. ¥3,244 ¥3,434 ¥(190) ¥2,470 ¥2,481 ¥(11)Sfr. .............................................. — — — 72 70 2£Stg. ........................................... — — — 18 17 1
Buy:US$ ............................................. 368 372 4 694 693 (1)
Options: Put options, purchased:
US$ ............................................. — 212(Premium) .................................... — — — (5) 3 (2)
Total ........................................ ¥(186) ¥(11)
11. Derivative FinancialInstruments
36
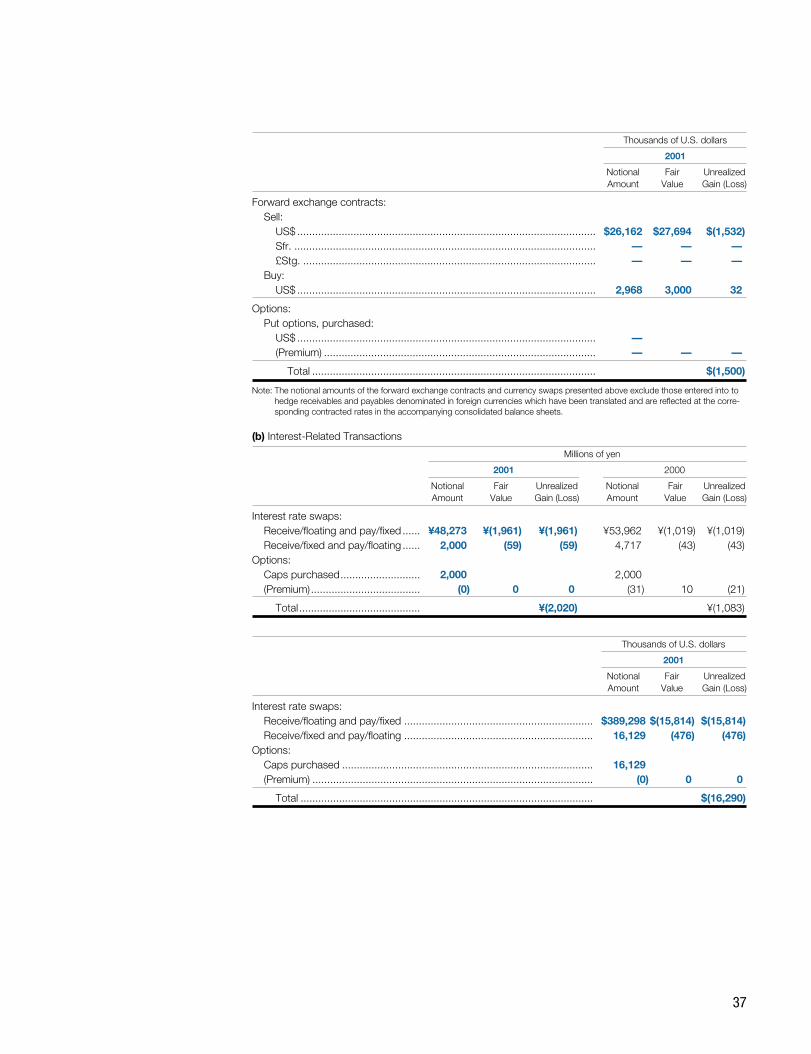
Thousands of U.S. dollars
2001
Notional Fair UnrealizedAmount Value Gain (Loss)
Forward exchange contracts:Sell:
US$ ..................................................................................................... $26,162 $27,694 $(1,532)Sfr. ...................................................................................................... — — —£Stg. ................................................................................................... — — —
Buy:US$ ..................................................................................................... 2,968 3,000 32
Options: Put options, purchased:
US$ ..................................................................................................... —(Premium) ............................................................................................ — — —
Total ................................................................................................ $(1,500)
Note: The notional amounts of the forward exchange contracts and currency swaps presented above exclude those entered into tohedge receivables and payables denominated in foreign currencies which have been translated and are reflected at the corre-sponding contracted rates in the accompanying consolidated balance sheets.
(b) Interest-Related Transactions
Millions of yen
2001 2000
Notional Fair Unrealized Notional Fair UnrealizedAmount Value Gain (Loss) Amount Value Gain (Loss)
Interest rate swaps:Receive/floating and pay/fixed ...... ¥48,273 ¥(1,961) ¥(1,961) ¥53,962 ¥(1,019) ¥(1,019)Receive/fixed and pay/floating ...... 2,000 (59) (59) 4,717 (43) (43)
Options:Caps purchased........................... 2,000 2,000(Premium)..................................... (0) 0 0 (31) 10 (21)
Total......................................... ¥(2,020) ¥(1,083)
Thousands of U.S. dollars
2001
Notional Fair UnrealizedAmount Value Gain (Loss)
Interest rate swaps:Receive/floating and pay/fixed ................................................................ $389,298 $(15,814) $(15,814)Receive/fixed and pay/floating ................................................................ 16,129 (476) (476)
Options:Caps purchased ..................................................................................... 16,129(Premium) ............................................................................................... (0) 0 0
Total ................................................................................................... $(16,290)
37
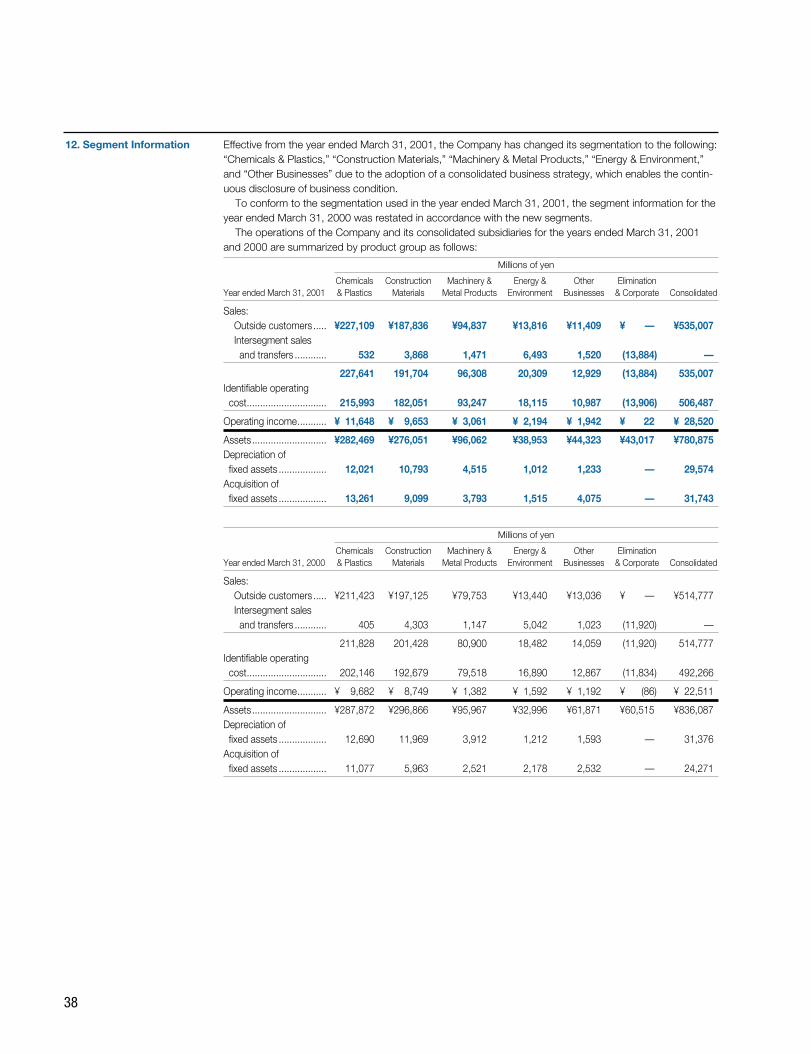
Effective from the year ended March 31, 2001, the Company has changed its segmentation to the following:“Chemicals & Plastics,” “Construction Materials,” “Machinery & Metal Products,” “Energy & Environment,”and “Other Businesses” due to the adoption of a consolidated business strategy, which enables the contin-uous disclosure of business condition.
To conform to the segmentation used in the year ended March 31, 2001, the segment information for theyear ended March 31, 2000 was restated in accordance with the new segments.
The operations of the Company and its consolidated subsidiaries for the years ended March 31, 2001and 2000 are summarized by product group as follows:
Millions of yen
Chemicals Construction Machinery & Energy & Other EliminationYear ended March 31, 2001 & Plastics Materials Metal Products Environment Businesses & Corporate Consolidated
Sales:Outside customers ..... ¥227,109 ¥187,836 ¥94,837 ¥13,816 ¥11,409 ¥000,— ¥535,007Intersegment sales and transfers ............ 532 3,868 1,471 6,493 1,520 (13,884) —
...................................... 227,641 191,704 96,308 20,309 12,929 (13,884) 535,007Identifiable operating cost.............................. 215,993 182,051 93,247 18,115 10,987 (13,906) 506,487
Operating income........... ¥011,648 ¥009,653 ¥03,061 ¥02,194 ¥01,942 ¥00,022 ¥028,520
Assets............................ ¥282,469 ¥276,051 ¥96,062 ¥38,953 ¥44,323 ¥43,017 ¥780,875Depreciation of fixed assets .................. 12,021 10,793 4,515 1,012 1,233 — 29,574
Acquisition of fixed assets .................. 13,261 9,099 3,793 1,515 4,075 — 31,743
Millions of yen
Chemicals Construction Machinery & Energy & Other EliminationYear ended March 31, 2000 & Plastics Materials Metal Products Environment Businesses & Corporate Consolidated
Sales:Outside customers ..... ¥211,423 ¥197,125 ¥79,753 ¥13,440 ¥13,036 ¥ (000— ¥514,777Intersegment sales and transfers ............ 405 4,303 1,147 5,042 1,023 (11,920) —
...................................... 211,828 201,428 80,900 18,482 14,059 (11,920) 514,777Identifiable operating cost.............................. 202,146 192,679 79,518 16,890 12,867 (11,834) 492,266
Operating income........... ¥009,682 ¥008,749 ¥01,382 ¥01,592 ¥01,192 ¥000(86) ¥022,511
Assets............................ ¥287,872 ¥296,866 ¥95,967 ¥32,996 ¥61,871 ¥60,515 ¥836,087Depreciation of fixed assets .................. 12,690 11,969 3,912 1,212 1,593 — 31,376
Acquisition of fixed assets .................. 11,077 5,963 2,521 2,178 2,532 — 24,271
12. Segment Information
38
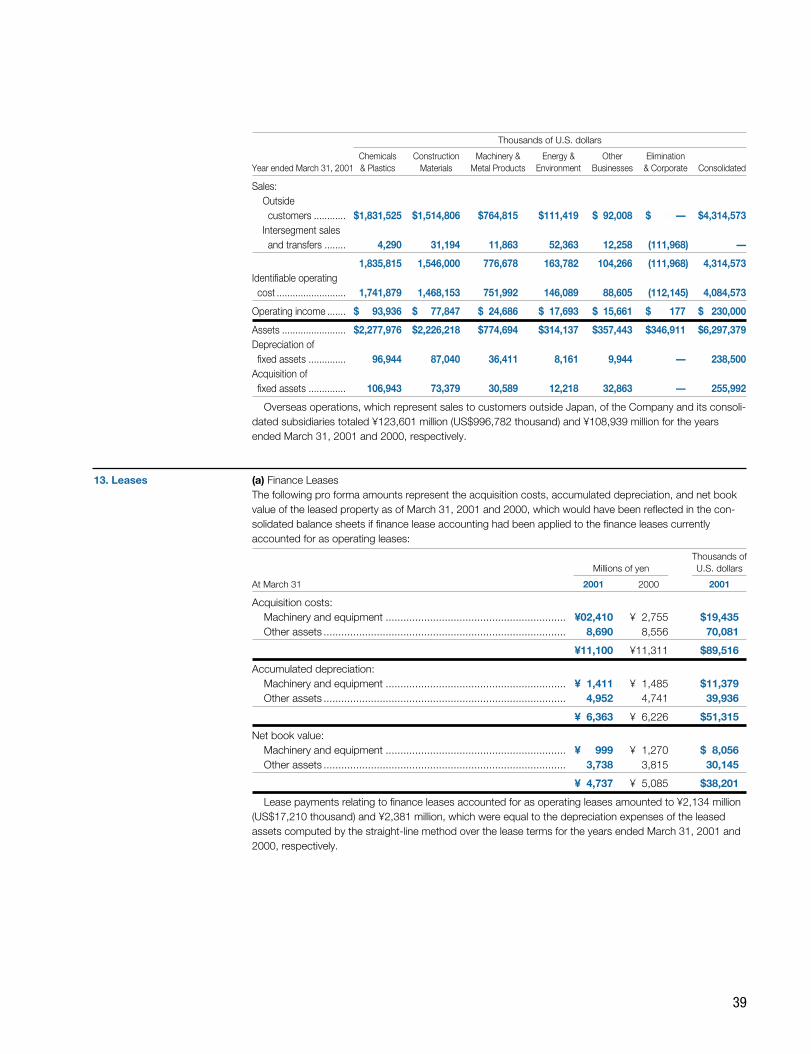
Thousands of U.S. dollars
Chemicals Construction Machinery & Energy & Other EliminationYear ended March 31, 2001 & Plastics Materials Metal Products Environment Businesses & Corporate Consolidated
Sales:Outside customers ............ $1,831,525 $1,514,806 $764,815 $111,419 $092,008 $0,000— $4,314,573
Intersegment sales and transfers ........ 4,290 31,194 11,863 52,363 12,258 (111,968) —
................................... 1,835,815 1,546,000 776,678 163,782 104,266 (111,968) 4,314,573Identifiable operating cost .......................... 1,741,879 1,468,153 751,992 146,089 88,605 (112,145) 4,084,573
Operating income ....... $0,093,936 $0,077,847 $024,686 $017,693 $015,661 $000,177 $0,230,000
Assets ........................ $2,277,976 $2,226,218 $774,694 $314,137 $357,443 $346,911 $6,297,379Depreciation of fixed assets .............. 96,944 87,040 36,411 8,161 9,944 — 238,500
Acquisition of fixed assets .............. 106,943 73,379 30,589 12,218 32,863 — 255,992
Overseas operations, which represent sales to customers outside Japan, of the Company and its consoli-dated subsidiaries totaled ¥123,601 million (US$996,782 thousand) and ¥108,939 million for the yearsended March 31, 2001 and 2000, respectively.
(a) Finance LeasesThe following pro forma amounts represent the acquisition costs, accumulated depreciation, and net bookvalue of the leased property as of March 31, 2001 and 2000, which would have been reflected in the con-solidated balance sheets if finance lease accounting had been applied to the finance leases currentlyaccounted for as operating leases:
Thousands ofMillions of yen U.S. dollars
At March 31 2001 2000 2001
Acquisition costs:Machinery and equipment ............................................................. ¥02,410 ¥02,755 $19,435Other assets .................................................................................. 8,690 8,556 70,081
.......................................................................................................... ¥11,100 ¥11,311 $89,516
Accumulated depreciation:Machinery and equipment ............................................................. ¥01,411 ¥01,485 $11,379Other assets .................................................................................. 4,952 4,741 39,936
.......................................................................................................... ¥06,363 ¥06,226 $51,315
Net book value:Machinery and equipment ............................................................. ¥00,999 ¥01,270 $08,056Other assets .................................................................................. 3,738 3,815 30,145
.......................................................................................................... ¥04,737 ¥05,085 $38,201
Lease payments relating to finance leases accounted for as operating leases amounted to ¥2,134 million(US$17,210 thousand) and ¥2,381 million, which were equal to the depreciation expenses of the leasedassets computed by the straight-line method over the lease terms for the years ended March 31, 2001 and2000, respectively.
13. Leases
39
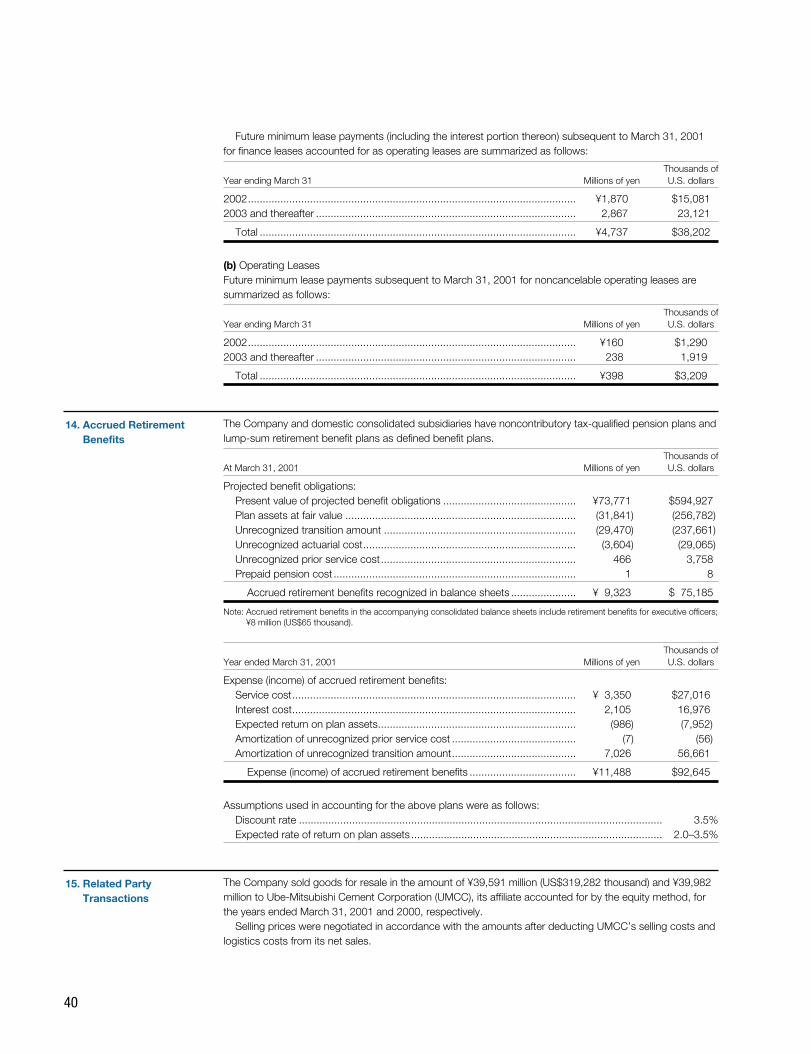
40
Future minimum lease payments (including the interest portion thereon) subsequent to March 31, 2001for finance leases accounted for as operating leases are summarized as follows:
Thousands ofYear ending March 31 Millions of yen U.S. dollars
2002............................................................................................................... ¥1,870 $15,0812003 and thereafter ........................................................................................ 2,867 23,121
Total ........................................................................................................... ¥4,737 $38,202
(b) Operating LeasesFuture minimum lease payments subsequent to March 31, 2001 for noncancelable operating leases aresummarized as follows:
Thousands ofYear ending March 31 Millions of yen U.S. dollars
2002............................................................................................................... ¥160 $1,2902003 and thereafter ........................................................................................ 238 1,919
Total ........................................................................................................... ¥398 $3,209
The Company and domestic consolidated subsidiaries have noncontributory tax-qualified pension plans andlump-sum retirement benefit plans as defined benefit plans.
Thousands ofAt March 31, 2001 Millions of yen U.S. dollars
Projected benefit obligations:Present value of projected benefit obligations ............................................. ¥73,771 $594,927Plan assets at fair value .............................................................................. (31,841) (256,782)Unrecognized transition amount ................................................................. (29,470) (237,661)Unrecognized actuarial cost........................................................................ (3,604) (29,065)Unrecognized prior service cost.................................................................. 466 3,758Prepaid pension cost .................................................................................. 1 8
Accrued retirement benefits recognized in balance sheets ...................... ¥09,323 $075,185
Note: Accrued retirement benefits in the accompanying consolidated balance sheets include retirement benefits for executive officers;¥8 million (US$65 thousand).
Thousands ofYear ended March 31, 2001 Millions of yen U.S. dollars
Expense (income) of accrued retirement benefits:Service cost................................................................................................ ¥03,350 $27,016Interest cost................................................................................................ 2,105 16,976Expected return on plan assets................................................................... (986) (7,952)Amortization of unrecognized prior service cost .......................................... (7) (56)Amortization of unrecognized transition amount.......................................... 7,026 56,661
Expense (income) of accrued retirement benefits .................................... ¥11,488 $92,645
Assumptions used in accounting for the above plans were as follows: Discount rate ........................................................................................................................... 3.5%Expected rate of return on plan assets ..................................................................................... 2.0–3.5%
The Company sold goods for resale in the amount of ¥39,591 million (US$319,282 thousand) and ¥39,982million to Ube-Mitsubishi Cement Corporation (UMCC), its affiliate accounted for by the equity method, forthe years ended March 31, 2001 and 2000, respectively.
Selling prices were negotiated in accordance with the amounts after deducting UMCC’s selling costs andlogistics costs from its net sales.
15. Related Party Transactions
14. Accrued RetirementBenefits
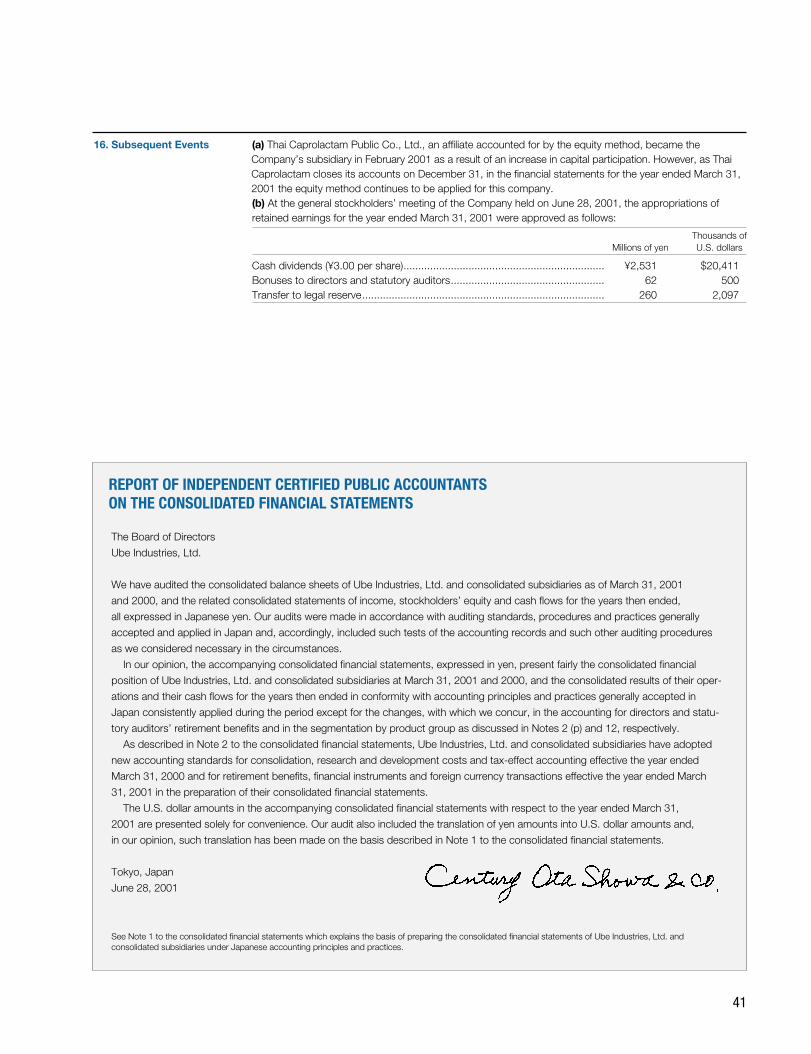
41
(a) Thai Caprolactam Public Co., Ltd., an affiliate accounted for by the equity method, became theCompany’s subsidiary in February 2001 as a result of an increase in capital participation. However, as ThaiCaprolactam closes its accounts on December 31, in the financial statements for the year ended March 31,2001 the equity method continues to be applied for this company.(b) At the general stockholders’ meeting of the Company held on June 28, 2001, the appropriations ofretained earnings for the year ended March 31, 2001 were approved as follows:
Thousands ofMillions of yen U.S. dollars
Cash dividends (¥3.00 per share).................................................................... ¥2,531 $20,411Bonuses to directors and statutory auditors.................................................... 62 500Transfer to legal reserve.................................................................................. 260 2,097
16. Subsequent Events
REPORT OF INDEPENDENT CERTIFIED PUBLIC ACCOUNTANTS ON THE CONSOLIDATED FINANCIAL STATEMENTS
The Board of Directors
Ube Industries, Ltd.
We have audited the consolidated balance sheets of Ube Industries, Ltd. and consolidated subsidiaries as of March 31, 2001
and 2000, and the related consolidated statements of income, stockholders’ equity and cash flows for the years then ended,
all expressed in Japanese yen. Our audits were made in accordance with auditing standards, procedures and practices generally
accepted and applied in Japan and, accordingly, included such tests of the accounting records and such other auditing procedures
as we considered necessary in the circumstances.
In our opinion, the accompanying consolidated financial statements, expressed in yen, present fairly the consolidated financial
position of Ube Industries, Ltd. and consolidated subsidiaries at March 31, 2001 and 2000, and the consolidated results of their oper-
ations and their cash flows for the years then ended in conformity with accounting principles and practices generally accepted in
Japan consistently applied during the period except for the changes, with which we concur, in the accounting for directors and statu-
tory auditors’ retirement benefits and in the segmentation by product group as discussed in Notes 2 (p) and 12, respectively.
As described in Note 2 to the consolidated financial statements, Ube Industries, Ltd. and consolidated subsidiaries have adopted
new accounting standards for consolidation, research and development costs and tax-effect accounting effective the year ended
March 31, 2000 and for retirement benefits, financial instruments and foreign currency transactions effective the year ended March
31, 2001 in the preparation of their consolidated financial statements.
The U.S. dollar amounts in the accompanying consolidated financial statements with respect to the year ended March 31,
2001 are presented solely for convenience. Our audit also included the translation of yen amounts into U.S. dollar amounts and,
in our opinion, such translation has been made on the basis described in Note 1 to the consolidated financial statements.
Tokyo, Japan
June 28, 2001
See Note 1 to the consolidated financial statements which explains the basis of preparing the consolidated financial statements of Ube Industries, Ltd. andconsolidated subsidiaries under Japanese accounting principles and practices.
Board of Directors
42
Managing Executive Officers
Ryusuke Nakamura
Mitsuru Wada
Yasuhisa Chiba
Atsushi Okada
Takashi Matsumoto
Isao Tamura
Kazuhiko Okada
Executive Officers
Koji Kihira
Nobuyuki Takahashi
Akinori Furukawa
Katsumasa Harada
Masaki Kashibe
Kazuma Sekiya
Kenichi Abe
Michio Takeshita
AUDITORS
Hideo Yamamoto
Tadashi Yamamoto
Yoichi Yamada
Meiji Fujita
(As of June 28, 2001)
DIRECTORS
Chairman of the Board
Maomi Nagahiro
President and Representative Director
Kazumasa Tsunemi
Senior Managing Directors
Kazuo Wada
Masayuki Asano
Hiroyuki Koike
Toshio Wakabayashi
Managing Directors
Yukuo Suzuki
Tadaaki Hirano
Mitsuru Wada
Kazuhiko Okada
EXECUTIVE OFFICERS
Chief Executive Officer
Kazumasa Tsunemi
Senior Managing Executive Officers
Toshio Nagasawa
Masayuki Asano
Hiroyuki Koike
Kazuhiko Mitsui
Hiroaki Tamura
Toshio Wakabayashi
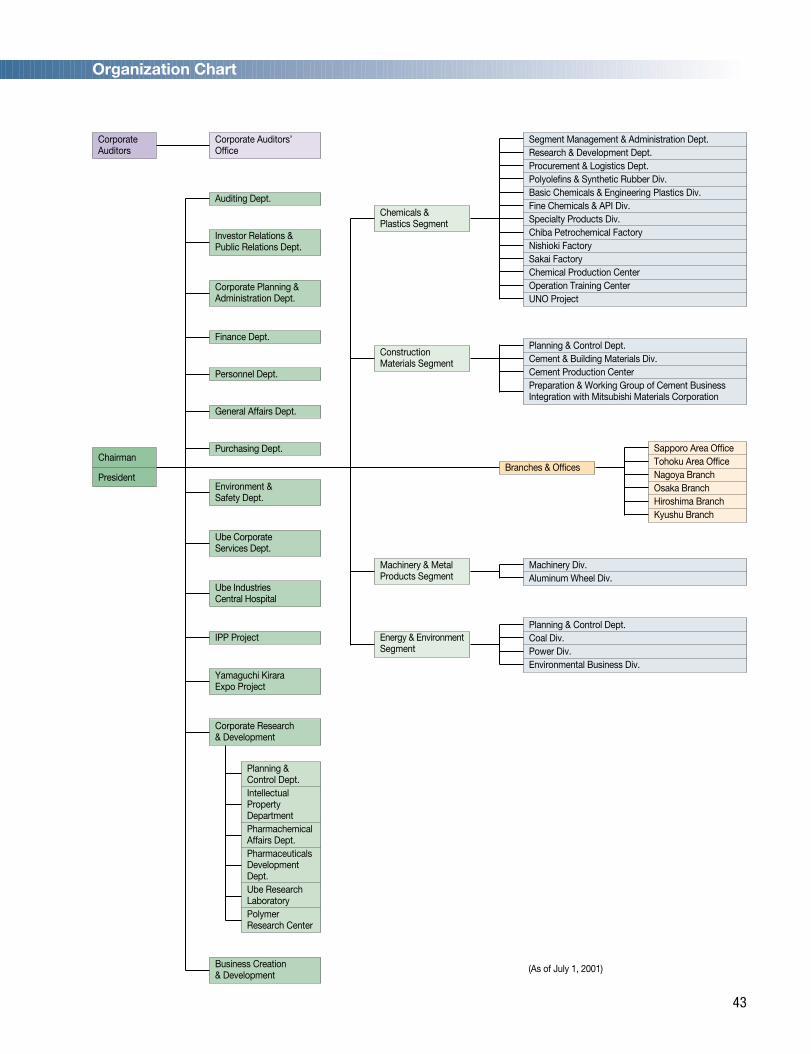
Organization Chart
43
CorporateAuditors
Finance Dept.
Personnel Dept.
General Affairs Dept.
Purchasing Dept.
IPP Project
Corporate Planning &Administration Dept.
Environment & Safety Dept.
Corporate Auditors’Office
Chemicals & Plastics Segment
Construction Materials Segment
Machinery & MetalProducts Segment
Energy & EnvironmentSegment
Branches & OfficesChairman
President
Planning &Control Dept.IntellectualPropertyDepartmentPharmachemicalAffairs Dept.PharmaceuticalsDevelopmentDept.Ube ResearchLaboratoryPolymerResearch Center
Segment Management & Administration Dept.Research & Development Dept.Procurement & Logistics Dept.Polyolefins & Synthetic Rubber Div.Basic Chemicals & Engineering Plastics Div.Fine Chemicals & API Div.Specialty Products Div.Chiba Petrochemical FactoryNishioki FactorySakai FactoryChemical Production Center Operation Training CenterUNO Project
Planning & Control Dept.Cement & Building Materials Div. Cement Production CenterPreparation & Working Group of Cement BusinessIntegration with Mitsubishi Materials Corporation
Sapporo Area OfficeTohoku Area OfficeNagoya BranchOsaka BranchHiroshima BranchKyushu Branch
Planning & Control Dept.Coal Div.Power Div.Environmental Business Div.
Machinery Div. Aluminum Wheel Div.
Auditing Dept.
Investor Relations &Public Relations Dept.
Ube Corporate Services Dept.
Ube Industries Central Hospital
Yamaguchi KiraraExpo Project
Corporate Research & Development
Business Creation& Development
(As of July 1, 2001)
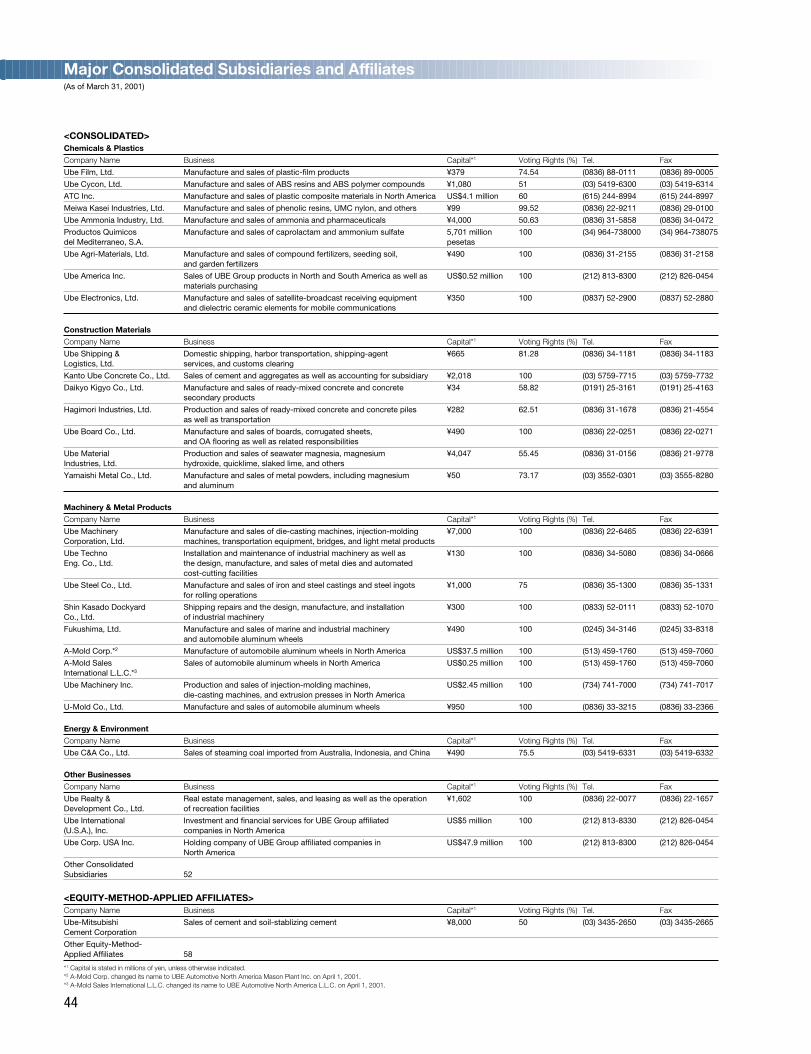
<CONSOLIDATED>Chemicals & Plastics
Company Name Business Capital*1 Voting Rights (%) Tel. Fax
Ube Film, Ltd. Manufacture and sales of plastic-film products ¥379 74.54 (0836) 88-0111 (0836) 89-0005
Ube Cycon, Ltd. Manufacture and sales of ABS resins and ABS polymer compounds ¥1,080 51 (03) 5419-6300 (03) 5419-6314
ATC Inc. Manufacture and sales of plastic composite materials in North America US$4.1 million 60 (615) 244-8994 (615) 244-8997
Meiwa Kasei Industries, Ltd. Manufacture and sales of phenolic resins, UMC nylon, and others ¥99 99.52 (0836) 22-9211 (0836) 29-0100
Ube Ammonia Industry, Ltd. Manufacture and sales of ammonia and pharmaceuticals ¥4,000 50.63 (0836) 31-5858 (0836) 34-0472
Productos Quimicos Manufacture and sales of caprolactam and ammonium sulfate 5,701 million 100 (34) 964-738000 (34) 964-738075del Mediterraneo, S.A. pesetas
Ube Agri-Materials, Ltd. Manufacture and sales of compound fertilizers, seeding soil, ¥490 100 (0836) 31-2155 (0836) 31-2158and garden fertilizers
Ube America Inc. Sales of UBE Group products in North and South America as well as US$0.52 million 100 (212) 813-8300 (212) 826-0454materials purchasing
Ube Electronics, Ltd. Manufacture and sales of satellite-broadcast receiving equipment ¥350 100 (0837) 52-2900 (0837) 52-2880and dielectric ceramic elements for mobile communications
Construction Materials
Company Name Business Capital*1 Voting Rights (%) Tel. Fax
Ube Shipping & Domestic shipping, harbor transportation, shipping-agent ¥665 81.28 (0836) 34-1181 (0836) 34-1183Logistics, Ltd. services, and customs clearing
Kanto Ube Concrete Co., Ltd. Sales of cement and aggregates as well as accounting for subsidiary ¥2,018 100 (03) 5759-7715 (03) 5759-7732
Daikyo Kigyo Co., Ltd. Manufacture and sales of ready-mixed concrete and concrete ¥34 58.82 (0191) 25-3161 (0191) 25-4163secondary products
Hagimori Industries, Ltd. Production and sales of ready-mixed concrete and concrete piles ¥282 62.51 (0836) 31-1678 (0836) 21-4554as well as transportation
Ube Board Co., Ltd. Manufacture and sales of boards, corrugated sheets, ¥490 100 (0836) 22-0251 (0836) 22-0271and OA flooring as well as related responsibilities
Ube Material Production and sales of seawater magnesia, magnesium ¥4,047 55.45 (0836) 31-0156 (0836) 21-9778Industries, Ltd. hydroxide, quicklime, slaked lime, and others
Yamaishi Metal Co., Ltd. Manufacture and sales of metal powders, including magnesium ¥50 73.17 (03) 3552-0301 (03) 3555-8280and aluminum
Machinery & Metal Products
Company Name Business Capital*1 Voting Rights (%) Tel. Fax
Ube Machinery Manufacture and sales of die-casting machines, injection-molding ¥7,000 100 (0836) 22-6465 (0836) 22-6391Corporation, Ltd. machines, transportation equipment, bridges, and light metal products
Ube Techno Installation and maintenance of industrial machinery as well as ¥130 100 (0836) 34-5080 (0836) 34-0666Eng. Co., Ltd. the design, manufacture, and sales of metal dies and automated
cost-cutting facilities
Ube Steel Co., Ltd. Manufacture and sales of iron and steel castings and steel ingots ¥1,000 75 (0836) 35-1300 (0836) 35-1331for rolling operations
Shin Kasado Dockyard Shipping repairs and the design, manufacture, and installation ¥300 100 (0833) 52-0111 (0833) 52-1070Co., Ltd. of industrial machinery
Fukushima, Ltd. Manufacture and sales of marine and industrial machinery ¥490 100 (0245) 34-3146 (0245) 33-8318and automobile aluminum wheels
A-Mold Corp.*2 Manufacture of automobile aluminum wheels in North America US$37.5 million 100 (513) 459-1760 (513) 459-7060
A-Mold Sales Sales of automobile aluminum wheels in North America US$0.25 million 100 (513) 459-1760 (513) 459-7060International L.L.C.*3
Ube Machinery Inc. Production and sales of injection-molding machines, US$2.45 million 100 (734) 741-7000 (734) 741-7017die-casting machines, and extrusion presses in North America
U-Mold Co., Ltd. Manufacture and sales of automobile aluminum wheels ¥950 100 (0836) 33-3215 (0836) 33-2366
Energy & Environment
Company Name Business Capital*1 Voting Rights (%) Tel. Fax
Ube C&A Co., Ltd. Sales of steaming coal imported from Australia, Indonesia, and China ¥490 75.5 (03) 5419-6331 (03) 5419-6332
Other Businesses
Company Name Business Capital*1 Voting Rights (%) Tel. Fax
Ube Realty & Real estate management, sales, and leasing as well as the operation ¥1,602 100 (0836) 22-0077 (0836) 22-1657Development Co., Ltd. of recreation facilities
Ube International Investment and financial services for UBE Group affiliated US$5 million 100 (212) 813-8330 (212) 826-0454(U.S.A.), Inc. companies in North America
Ube Corp. USA Inc. Holding company of UBE Group affiliated companies in US$47.9 million 100 (212) 813-8300 (212) 826-0454North America
Other Consolidated Subsidiaries 52
<EQUITY-METHOD-APPLIED AFFILIATES>Company Name Business Capital*1 Voting Rights (%) Tel. Fax
Ube-Mitsubishi Sales of cement and soil-stablizing cement ¥8,000 50 (03) 3435-2650 (03) 3435-2665Cement Corporation
Other Equity-Method-Applied Affiliates 58
*1 Capital is stated in millions of yen, unless otherwise indicated. *2 A-Mold Corp. changed its name to UBE Automotive North America Mason Plant Inc. on April 1, 2001. *3 A-Mold Sales International L.L.C. changed its name to UBE Automotive North America L.L.C. on April 1, 2001.
44
Major Consolidated Subsidiaries and Affiliates(As of March 31, 2001)
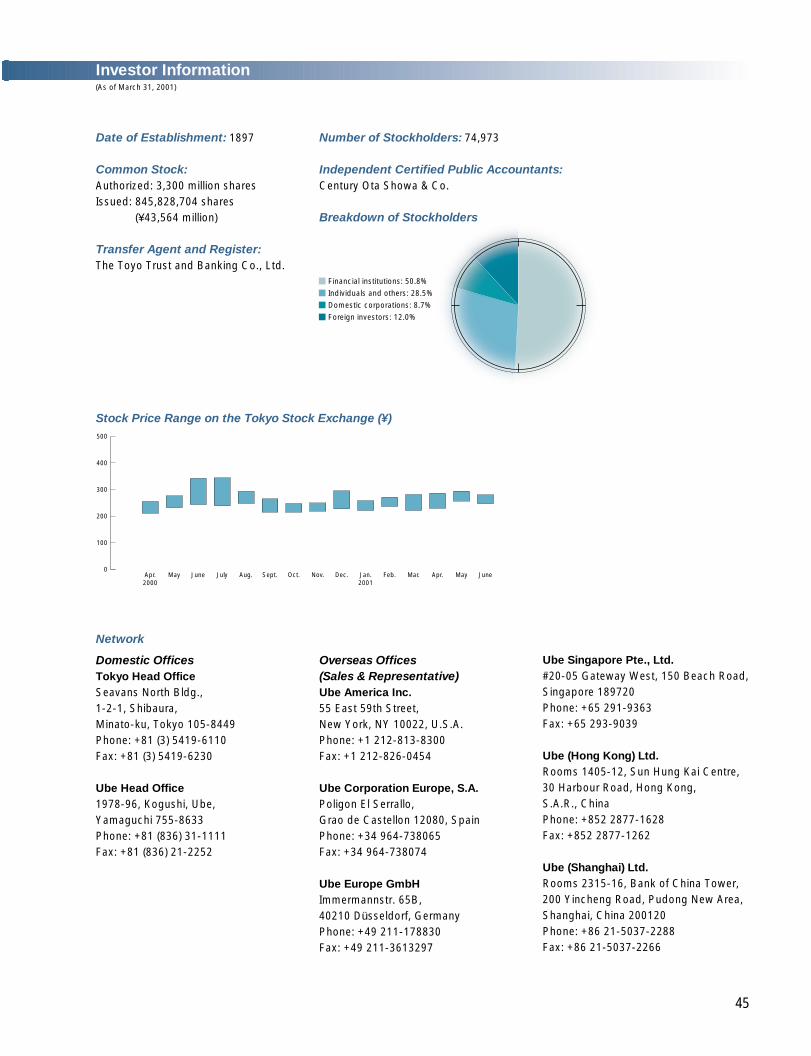
Founded in 1897, Ube Industries, Ltd., is preparing for operations in a third consecutive century. The four seg-
ments that comprise the UBE Group—Chemicals & Plastics, Construction Materials, Machinery & Metal
Products, and Energy & Environment—are pursuing independent business strategies but have the common
goal of strengthening consolidated Group management. Ube Industries is using superior technologies
acquired through extensive R&D to create high-quality, value-added products that are capable of securing
strong positions in domestic and overseas markets.
Profile
Contents
Fiscal 2000 Business Highlights ...................................................... 1A Message from the President ........................................................ 2New 21•UBE (New Three-Year Management
Plan Fiscal 2001–2003) ................................................................. 4Business Highlights:
—Chemicals & Plastics ............................................................... 6—Construction Materials........................................................... 11—Machinery & Metal Products.................................................. 14—Energy & Environment ........................................................... 17—Responsible Care .................................................................. 19—Corporate Research & Development...................................... 20
Consolidated Five-Year Summary ................................................. 22
Financial Review............................................................................ 23Consolidated Balance Sheets ........................................................26Consolidated Statements of Income.............................................. 28Consolidated Statements of Stockholders’ Equity ......................... 29Consolidated Statements of Cash Flows ....................................... 30Notes to Consolidated Financial Statements ................................. 31Report of Independent Certified Public Accountants
on the Consolidated Financial Statements................................... 41Board of Directors......................................................................... 42Organization Chart ........................................................................ 43Major Consolidated Subsidiaries and Affiliates............................... 44Investor Information....................................................................... 45
Thousands ofU.S. dollars
Millions of yen (Note 1)
2001 2000 2001
For the year:Net sales.............................................................................................................. ¥535,007 ¥514,777 $4,314,573Operating income ................................................................................................ 28,520 22,511 230,000Net income .......................................................................................................... 7,911 10,514 63,798
At year-end:Total assets ......................................................................................................... ¥780,875 ¥836,087 $6,297,379Total stockholders’ equity .................................................................................... 94,345 89,422 760,847
U.S. dollarsYen (Note 1)
Per share:Net income, assuming no dilution (Note 2) ........................................................... ¥0009.48 ¥0012.65 $0,000.076Cash dividends applicable to the period............................................................... 3.00 3.00 0.024
Notes: 1. U.S. dollar amounts are translated from yen, for convenience only, at the rate of ¥124=US$1, the approximate rate of exchange onMarch 31, 2001.
Notes: 2. Net income per share is based on the weighted average number of shares of common stock outstanding during the respective fiscal year.
Consolidated Financial HighlightsUBE INDUSTRIES, LTD. AND CONSOLIDATED SUBSIDIARIESFor the years ended March 31, 2001 and 2000
Date of Establishment: 1897
Common Stock: Authorized: 3,300 million sharesIssued: 845,828,704 shares
(¥43,564 million)
Transfer Agent and Register:The Toyo Trust and Banking Co., Ltd.
Investor Information(As of March 31, 2001)
Overseas Offices (Sales & Representative)Ube America Inc.55 East 59th Street, New York, NY 10022, U.S.A.Phone: +1 212-813-8300Fax: +1 212-826-0454
Ube Corporation Europe, S.A.Poligon El Serrallo, Grao de Castellon 12080, SpainPhone: +34 964-738065Fax: +34 964-738074
Ube Europe GmbHImmermannstr. 65B,40210 Düsseldorf, GermanyPhone: +49 211-178830Fax: +49 211-3613297
Ube Singapore Pte., Ltd.#20-05 Gateway West, 150 Beach Road, Singapore 189720Phone: +65 291-9363Fax: +65 293-9039
Ube (Hong Kong) Ltd.Rooms 1405-12, Sun Hung Kai Centre, 30 Harbour Road, Hong Kong, S.A.R., ChinaPhone: +852 2877-1628Fax: +852 2877-1262
Ube (Shanghai) Ltd.Rooms 2315-16, Bank of China Tower,200 Yincheng Road, Pudong New Area, Shanghai, China 200120Phone: +86 21-5037-2288Fax: +86 21-5037-2266
Domestic OfficesTokyo Head OfficeSeavans North Bldg., 1-2-1, Shibaura, Minato-ku, Tokyo 105-8449Phone: +81 (3) 5419-6110Fax: +81 (3) 5419-6230
Ube Head Office1978-96, Kogushi, Ube, Yamaguchi 755-8633Phone: +81 (836) 31-1111Fax: +81 (836) 21-2252
Network
JuneMayApr.Mar.Feb.Jan.2001
Dec.Nov.Oct.Sept.Aug.JulyJuneMayApr.2000
0
100
200
300
400
500
Financial institutions: 50.8%
Individuals and others: 28.5%
Domestic corporations: 8.7%
Foreign investors: 12.0%
Stock Price Range on the Tokyo Stock Exchange (¥)
Number of Stockholders: 74,973
Independent Certified Public Accountants: Century Ota Showa & Co.
Breakdown of Stockholders
45
UB
E IN
DU
ST
RIE
S, LT
D.
AN
NU
AL R
EP
OR
T 2001
ANNUAL REPORT 2001Year Ended March 31, 2001
BUSINESS CONCENTRATION AND GROWTH
Tokyo Head Office
Seavans North Bldg., 1-2-1, Shibaura,
Minato-ku, Tokyo 105-8449, Japan
Phone: +81 (3) 5419-6110 Fax: +81 (3) 5419-6230
Ube Head Office
1978-96, Kogushi, Ube, Yamaguchi 755-8633, Japan
Phone: +81 (836) 31-1111 Fax: +81 (836) 21-2252
URL: http://www.ube-ind.co.jp
Printed in Japan 01-10 3000 TP
Related Documents


